| | OMB APPROVAL |
| | OMB Number: 3235-0570 Expires: September 30, 2026
Estimated average burden hours per response ......... 7.78 |
UNITED STATES
SECURITIES AND EXCHANGE COMMISSION
Washington, D.C. 20549
FORM N-CSR
CERTIFIED SHAREHOLDER REPORT OF REGISTERED
MANAGEMENT INVESTMENT COMPANIES
Investment Company Act file number 811-7762
First Eagle Funds (Exact name of registrant as specified in charter)
1345 Avenue of the Americas
New York, NY 10105-4300
| (Address of principal executive offices) | | (Zip code) |
Sheelyn Michael
First Eagle Funds
1345 Avenue of the Americas
New York, NY 10105
(Name and address of agent for service)
Registrant’s telephone number, including area code: 1-212-632-2700
Date of fiscal year end: October 31
Date of reporting period: October 31, 2024
Form N-CSR is to be used by management investment companies to file reports with the Commission not later than 10 days after the transmission to stockholders of any report that is required to be transmitted to stockholders under Rule 30e-1 under the Investment Company Act of 1940 (17 CFR 270.30e-1). The Commission may use the information provided on Form N-CSR in its regulatory, disclosure review, inspection, and policymaking roles.
A registrant is required to disclose the information specified by Form N-CSR, and the Commission will make this information public. A registrant is not required to respond to the collection of information contained in Form N- CSR unless the Form displays a currently valid Office of Management and Budget (“OMB”) control number. Please direct comments concerning the accuracy of the information collection burden estimate and any suggestions for reducing the burden to Secretary, Securities and Exchange Commission, 100 F Street, NE, Washington, DC 20549- 1090. The OMB has reviewed this collection of information under the clearance requirements of 44 U.S.C. § 3507.
Item 1. Reports to Stockholders.
TABLE OF CONTENTS
First Eagle Global Fund
Class A - SGENX |
| | |
First Eagle Global Fund
Class C - FESGX |
| | |
First Eagle Global Fund
Class I - SGIIX |
| | |
First Eagle Global Fund
Class R6 - FEGRX |
| | |
First Eagle Overseas Fund
Class A - SGOVX |
| | |
First Eagle Overseas Fund
Class C - FESOX |
| | |
First Eagle Overseas Fund
Class I - SGOIX |
| | |
First Eagle Overseas Fund
Class R6 - FEORX |
| | |
First Eagle U.S. Value Fund
Class A - FEVAX |
| | |
First Eagle U.S. Value Fund
Class C - FEVCX |
| | |
First Eagle U.S. Value Fund
Class I - FEVIX |
| | |
First Eagle U.S. Value Fund
Class R6 - FEVRX |
| | |
First Eagle Gold Fund
Class A - SGGDX |
| | |
First Eagle Gold Fund
Class C - FEGOX |
| | |
First Eagle Gold Fund
Class I - FEGIX |
| | |
First Eagle Gold Fund
Class R6 - FEURX |
| | |
First Eagle Global Income Builder Fund
Class A - FEBAX |
| | |
First Eagle Global Income Builder Fund
Class C - FEBCX |
| | |
First Eagle Global Income Builder Fund
Class I - FEBIX |
| | |
First Eagle Global Income Builder Fund
Class R6 - FEBRX |
| | |
First Eagle Rising Dividend Fund
Class A - FEFAX |
| | |
First Eagle Rising Dividend Fund
Class C - FEAMX |
| | |
First Eagle Rising Dividend Fund
Class I - FEAIX |
| | |
First Eagle Rising Dividend Fund
Class R6 - FEFRX |
| | |
First Eagle Small Cap Opportunity Fund
Class A - FESAX |
| | |
First Eagle Small Cap Opportunity Fund
Class I - FESCX |
| | |
First Eagle Small Cap Opportunity Fund
Class R6 - FESRX |
| | |
First Eagle U.S. Smid Cap Opportunity Fund
Class A - FEMAX |
| | |
First Eagle U.S. Smid Cap Opportunity Fund
Class I - FESMX |
| | |
First Eagle U.S. Smid Cap Opportunity Fund
Class R6 - FEXRX |
| | |
First Eagle Global Real Assets Fund
Class A - FERAX |
| | |
First Eagle Global Real Assets Fund
Class I - FEREX |
| | |
First Eagle Global Real Assets Fund
Class R6 - FERRX |
| | |
First Eagle High Yield Municipal Fund
Class A - FEHAX |
| | |
First Eagle High Yield Municipal Fund
Class C - FEHCX |
| | |
First Eagle High Yield Municipal Fund
Class I - FEHIX |
| | |
First Eagle High Yield Municipal Fund
Class R6 - FEHRX |
| | |
First Eagle Short Duration High Yield Municipal Fund
Class A - FDUAX |
| | |
First Eagle Short Duration High Yield Municipal Fund
Class I - FDUIX |
| | |
First Eagle Short Duration High Yield Municipal Fund
Class R6 - FDURX |
| | |
0000906352fei:FRTSRGrowth10kMinusBenchmark18340BroadBasedIndexMember2016-05-310000906352fei:C000030900Member2022-11-300000906352fei:FRTSRTotalReturnMinus1yrMinusBenchmark28350AdditionalIndexMember2023-11-012024-10-310000906352fei:C000109583Member2016-04-300000906352fei:FRTSRGrowth10kMinusBenchmark18357BroadBasedIndexMember2018-04-300000906352fei:FRTSRGrowth10kMinusBenchmark18367BroadBasedIndexMember2020-04-300000906352fei:C000232391Member2023-08-310000906352fei:FRTSRGrowth10kMinusBenchmark18362BroadBasedIndexMember2017-04-30
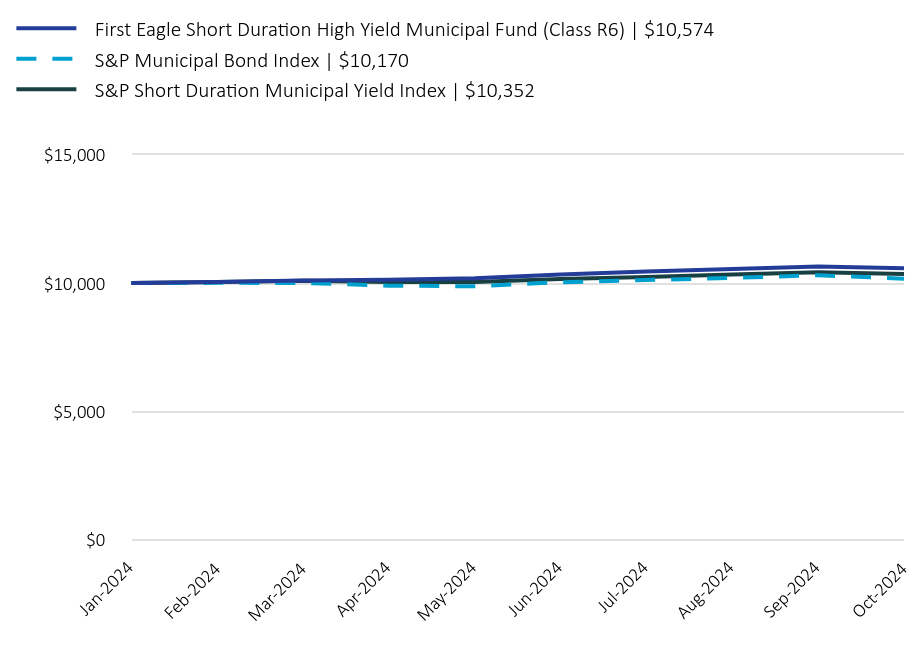
October 31, 2024
Annual Shareholder Report
This Annual Shareholder Report contains important information about the Class A shares of the Fund for the period of November 1, 2023, to October 31, 2024. You can find additional information about the Fund at https://www.firsteagle.com/first-eagle-fund-shareholder-reports. You can also request this information by contacting us at 800.334.2143.
What Were the Fund's Costs for the Year?
Based on a Hypothetical $10,000 Investment
| Class Name | Cost of a $10,000 Investment | Cost Paid as a Percentage of a $10,000 Investment |
|---|
| Class A | $124 | 1.10% |
How Did the Fund Perform Last Year?
The NAV of First Eagle Global Fund Class A Shares1 increased 26.43% in the 12-month period ended October 31, 2024. The MSCI World Index increased 33.68% for the same period.
• Our equity holdings contributed to performance, while gold and gold-related equities also were a contributor.
• All geographic regions contributed to performance. North America and developed Europe were the leading contributors by region, while developed Asia excluding Japan and emerging markets were the worst performing regions.
• Materials, financials and information technology were the largest contributors among equity sectors. Energy was the only detractor, while utilities and real estate were the next worst performing sectors.
• Gold bullion was the leading contributor to performance. Schlumberger NV was the largest detractor.
1 Reflects performance for Class A shares without the effect of sales charges and assumes all distributions have been reinvested; if sales charges were included, values would be lower.
Total Return Based on a $10,000 Investment
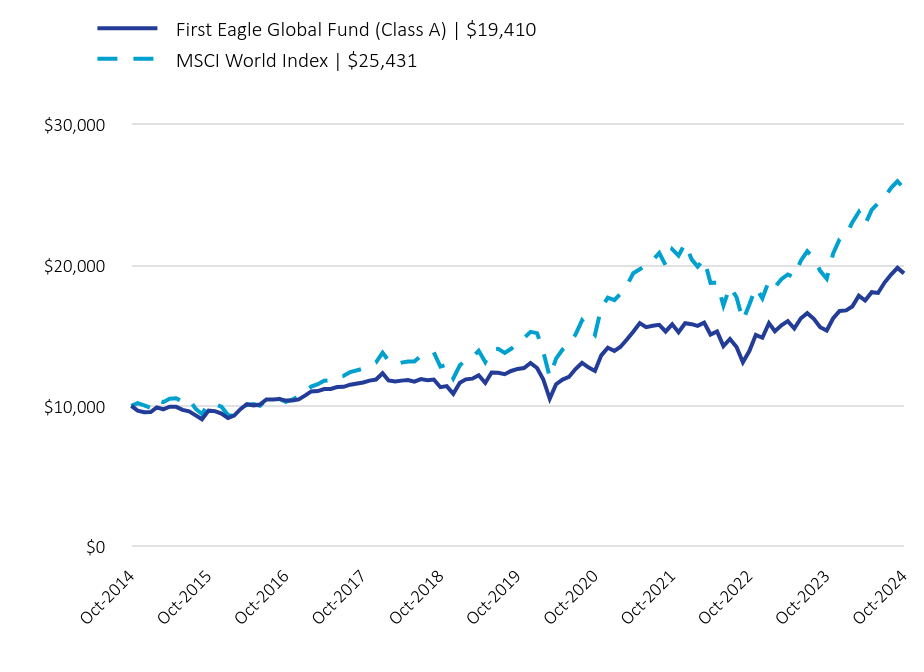
| First Eagle Global Fund (Class A) | $19,410 | MSCI World Index | $25,431 |
|---|
| Oct-2014 | 10,000 | 10,000 |
| Nov-2014 | 9,662.450000 | 10,200.410000 |
| Dec-2014 | 9,548.430000 | 10,035.930000 |
| Jan-2015 | 9,570.390000 | 9,854.080000 |
| Feb-2015 | 9,896.750000 | 10,431.420000 |
| Mar-2015 | 9,764.130000 | 10,268.130000 |
| Apr-2015 | 9,949.650000 | 10,508.940000 |
| May-2015 | 9,936.710000 | 10,545.140000 |
| Jun-2015 | 9,718.110000 | 10,299.940000 |
| Jul-2015 | 9,612.180000 | 10,484.830000 |
| Aug-2015 | 9,327.660000 | 9,791 |
| Sep-2015 | 9,050.630000 | 9,429.860000 |
| Oct-2015 | 9,667.880000 | 10,177.120000 |
| Nov-2015 | 9,631.140000 | 10,126.490000 |
| Dec-2015 | 9,458.740000 | 9,948.490000 |
| Jan-2016 | 9,136.200000 | 9,353.330000 |
| Feb-2016 | 9,313.440000 | 9,283.720000 |
| Mar-2016 | 9,788.430000 | 9,913.700000 |
| Apr-2016 | 10,122.210000 | 10,070.570000 |
| May-2016 | 10,026.050000 | 10,127.130000 |
| Jun-2016 | 10,101.250000 | 10,013.650000 |
| Jul-2016 | 10,460.850000 | 10,436.720000 |
| Aug-2016 | 10,455.620000 | 10,445.390000 |
| Sep-2016 | 10,497.440000 | 10,500.870000 |
| Oct-2016 | 10,380.920000 | 10,297.650000 |
| Nov-2016 | 10,393.380000 | 10,445.720000 |
| Dec-2016 | 10,465.090000 | 10,695.670000 |
| Jan-2017 | 10,748.700000 | 10,953.810000 |
| Feb-2017 | 11,032.120000 | 11,377.630000 |
| Mar-2017 | 11,053.080000 | 11,546.090000 |
| Apr-2017 | 11,197.870000 | 11,790.340000 |
| May-2017 | 11,201.230000 | 11,835.710000 |
| Jun-2017 | 11,336.770000 | 12,118.960000 |
| Jul-2017 | 11,353.770000 | 12,136.030000 |
| Aug-2017 | 11,505.910000 | 12,408.410000 |
| Oct-2017 | 11,662.390000 | 12,642.910000 |
| Nov-2017 | 11,798.840000 | 12,916.860000 |
| Dec-2017 | 11,875.530000 | 13,091.540000 |
| Jan-2018 | 12,319.680000 | 13,782.770000 |
| Feb-2018 | 11,808.410000 | 13,211.790000 |
| Mar-2018 | 11,737.560000 | 12,923.820000 |
| Apr-2018 | 11,796.250000 | 13,072.330000 |
| May-2018 | 11,836.360000 | 13,154.240000 |
| Jun-2018 | 11,719.180000 | 13,147.970000 |
| Jul-2018 | 11,907.860000 | 13,558.630000 |
| Aug-2018 | 11,829.260000 | 13,726.380000 |
| Sep-2018 | 11,871.850000 | 13,802.820000 |
| Oct-2018 | 11,330.490000 | 12,789.300000 |
| Nov-2018 | 11,408.670000 | 12,934.590000 |
| Dec-2018 | 10,863.340000 | 11,951.070000 |
| Jan-2019 | 11,644.410000 | 12,880.930000 |
| Feb-2019 | 11,885.450000 | 13,268.260000 |
| Mar-2019 | 11,936.560000 | 13,442.530000 |
| Apr-2019 | 12,180.070000 | 13,919.190000 |
| May-2019 | 11,633.180000 | 13,116.040000 |
| Jun-2019 | 12,369.560000 | 13,980.320000 |
| Jul-2019 | 12,354.720000 | 14,049.570000 |
| Aug-2019 | 12,248.470000 | 13,762.200000 |
| Sep-2019 | 12,481.190000 | 14,055.070000 |
| Oct-2019 | 12,625.970000 | 14,412.730000 |
| Nov-2019 | 12,694.150000 | 14,814.130000 |
| Dec-2019 | 13,053.390000 | 15,257.940000 |
| Jan-2020 | 12,693.120000 | 15,165.070000 |
| Feb-2020 | 11,895.990000 | 13,883.240000 |
| Mar-2020 | 10,508.920000 | 12,045.890000 |
| Apr-2020 | 11,543 | 13,361.830000 |
| May-2020 | 11,874.280000 | 14,007.320000 |
| Jun-2020 | 12,057.150000 | 14,377.830000 |
| Jul-2020 | 12,620.210000 | 15,065.680000 |
| Aug-2020 | 13,053.090000 | 16,072.290000 |
| Sep-2020 | 12,737.200000 | 15,517.810000 |
| Oct-2020 | 12,485.010000 | 15,041.800000 |
| Nov-2020 | 13,591.180000 | 16,965.070000 |
| Dec-2020 | 14,137.540000 | 17,684.330000 |
| Jan-2021 | 13,897.200000 | 17,508.570000 |
| Feb-2021 | 14,183.490000 | 17,957.220000 |
| Mar-2021 | 14,709.690000 | 18,554.690000 |
| Apr-2021 | 15,264.250000 | 19,418.230000 |
| May-2021 | 15,876.350000 | 19,697.960000 |
| Jun-2021 | 15,585.810000 | 19,991.550000 |
| Jul-2021 | 15,685.560000 | 20,349.660000 |
| Aug-2021 | 15,759.280000 | 20,856.130000 |
| Sep-2021 | 15,286.500000 | 19,990.170000 |
| Oct-2021 | 15,794.010000 | 21,122.420000 |
| Nov-2021 | 15,228.590000 | 20,659.570000 |
| Dec-2021 | 15,869.710000 | 21,542.560000 |
| Jan-2022 | 15,803.060000 | 20,402.720000 |
| Feb-2022 | 15,684.540000 | 19,886.710000 |
| Mar-2022 | 15,913.530000 | 20,432.470000 |
| Apr-2022 | 15,066.930000 | 18,735.080000 |
| May-2022 | 15,285.400000 | 18,749.270000 |
| Jun-2022 | 14,242.940000 | 17,125.170000 |
| Jul-2022 | 14,749.990000 | 18,484.840000 |
| Aug-2022 | 14,179.160000 | 17,712.030000 |
| Sep-2022 | 13,097.290000 | 16,065.520000 |
| Oct-2022 | 13,913.250000 | 17,219.240000 |
| Nov-2022 | 15,047.180000 | 18,416.500000 |
| Dec-2022 | 14,841.040000 | 17,634.400000 |
| Jan-2023 | 15,875.460000 | 18,882.140000 |
| Feb-2023 | 15,303.940000 | 18,428.240000 |
| Mar-2023 | 15,723.270000 | 18,997.670000 |
| Apr-2023 | 16,017.290000 | 19,330.690000 |
| May-2023 | 15,495.130000 | 19,137.700000 |
| Jun-2023 | 16,206.360000 | 20,295.110000 |
| Jul-2023 | 16,585.580000 | 20,976.880000 |
| Aug-2023 | 16,185.870000 | 20,475.830000 |
| Sep-2023 | 15,590.230000 | 19,592.540000 |
| Oct-2023 | 15,354.820000 | 19,024.040000 |
| Nov-2023 | 16,205.480000 | 20,807.590000 |
| Dec-2023 | 16,740.260000 | 21,829.120000 |
| Jan-2024 | 16,782.110000 | 22,091.080000 |
| Feb-2024 | 17,055.660000 | 23,027.690000 |
| Mar-2024 | 17,824.870000 | 23,767.680000 |
| Apr-2024 | 17,482.630000 | 22,884.840000 |
| May-2024 | 18,071.790000 | 23,906.690000 |
| Jun-2024 | 18,019.380000 | 24,393.140000 |
| Jul-2024 | 18,756.380000 | 24,823.010000 |
| Aug-2024 | 19,324.700000 | 25,479.090000 |
| Sep-2024 | 19,800.080000 | 25,945.710000 |
| Oct-2024 | 19,410 | 25,431 |
The above chart represents historical performance of a hypothetical $10,000 investment over the past 10 years. The results of this chart do not predict the results of future time periods and does not guarantee the same results.
| Class/Index Name | 1 Year | 5 Years | 10 Years |
|---|
| Class A - without sales charge | 26.43% | 8.98% | 7.41% |
| Class A - with sales charge | 20.08% | 7.87% | 6.86% |
| MSCI World Index | 33.68% | 12.03% | 9.78% |
The Fund's past performance is not a good predictor of the Fund's future performance.The graph and table do not reflect the deduction of taxes that a shareholder would pay on fund distributions or redemption of fund shares. Call us at 800.334.2143 or visit https://www.firsteagle.com if you have questions about current performance.
- Net Assets$56,336,120,291
- Number of Portfolio Holdings197
- Portfolio Turnover Rate9.51%
- Net Investment Advisory Fees (net of waivers and reimbursements)$393,022,590
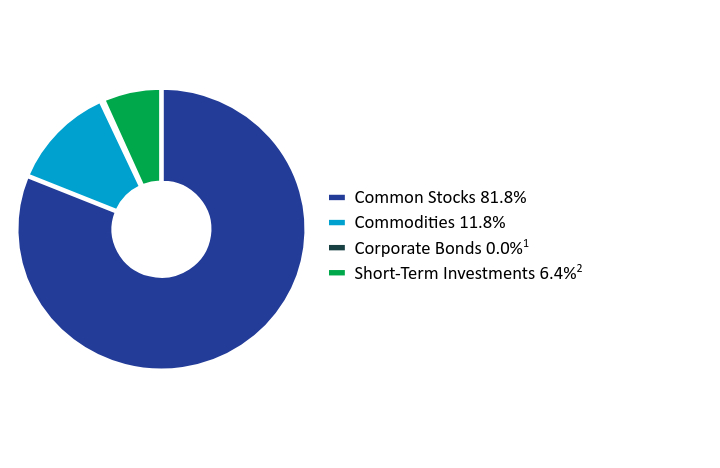
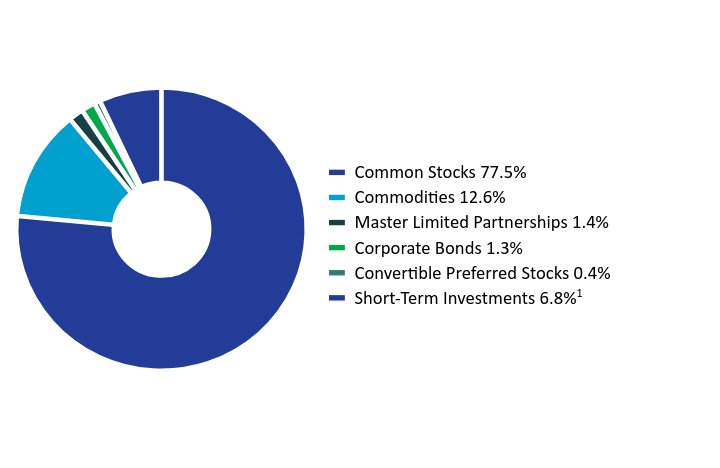
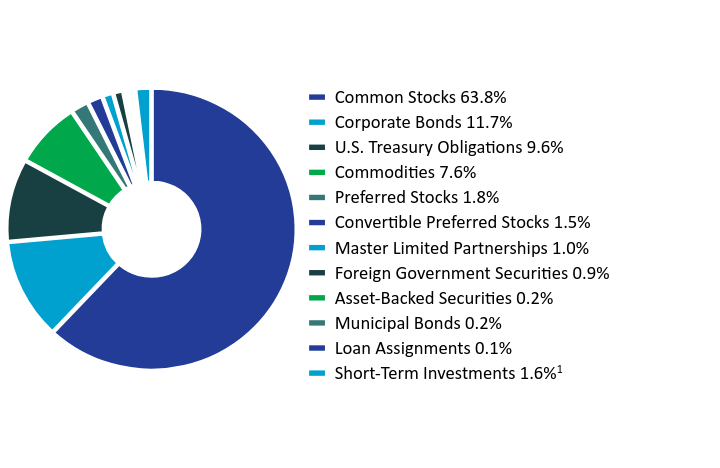
Asset Allocation by Asset Class
Based on total investments in the portfolio
| Value | Value |
|---|
| Common Stocks | 81.8% |
| Commodities | 11.8% |
| Corporate Bonds | 0.0%Footnote Reference1 |
| Short-Term Investments | 6.4%Footnote Reference2 |
Top 10 HoldingsFootnote Reference3
Based on total net assets of the portfolio
Gold bullion (Precious Metal)Footnote Reference4 | 11.8% |
| Oracle Corp. (Software, United States) | 2.9% |
| Meta Platforms, Inc., Class A (Interactive Media & Services, United States) | 2.6% |
| HCA Healthcare, Inc. (Health Care Providers & Services, United States) | 2.0% |
| Exxon Mobil Corp. (Oil, Gas & Consumable Fuels, United States) | 2.0% |
| Philip Morris International, Inc. (Tobacco, United States) | 1.9% |
| Comcast Corp., Class A (Media, United States) | 1.7% |
| Willis Towers Watson plc (Insurance, United States) | 1.5% |
| Bank of New York Mellon Corp. (The) (Capital Markets, United States) | 1.5% |
| CH Robinson Worldwide, Inc. (Air Freight & Logistics, United States) | 1.5% |
| Total | 29.4% |
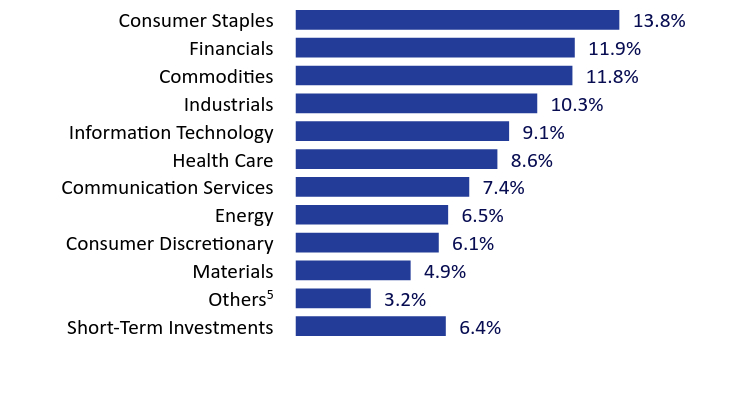
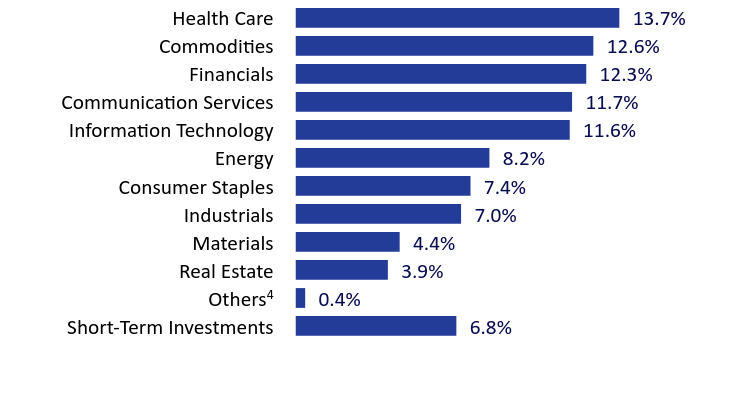
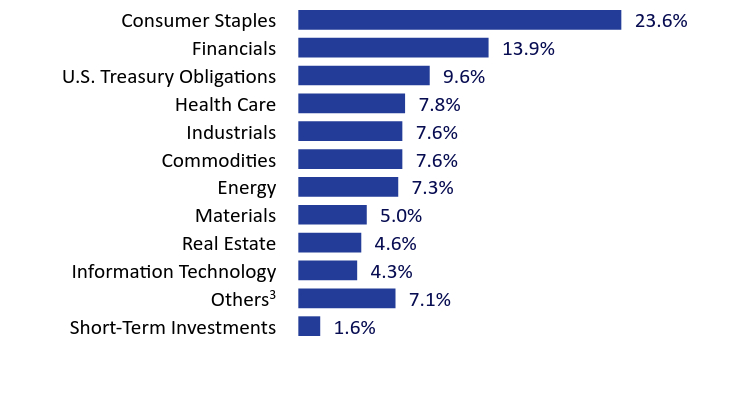
Asset Allocation by Sector
Based on total investments in the portfolio
| Value | Value |
|---|
| Short-Term Investments | 6.4% |
OthersFootnote Reference5 | 3.2% |
| Materials | 4.9% |
| Consumer Discretionary | 6.1% |
| Energy | 6.5% |
| Communication Services | 7.4% |
| Health Care | 8.6% |
| Information Technology | 9.1% |
| Industrials | 10.3% |
| Commodities | 11.8% |
| Financials | 11.9% |
| Consumer Staples | 13.8% |
Asset Allocation by CountryFootnote Reference6
Based on total investments in the portfolio
| United States | 55.9% |
| United Kingdom | 7.2% |
| Japan | 6.3% |
| Canada | 5.0% |
| France | 3.2% |
| Switzerland | 2.9% |
| South Korea | 2.5% |
| China | 2.2% |
| Mexico | 1.4% |
| Hong Kong | 1.2% |
OthersFootnote Reference7 | 5.8% |
| Short-Term Investments | 6.4% |
| Footnote | Description |
Footnote1 | Less than 0.05% |
Footnote2 | Includes short-term commercial paper (1.7% of total investments) that settles in 90 days or less; long-term commercial paper (4.6% of total investments) that settles in 91 days or more; and other short-term investments (0.1% of total investments), such as U.S. treasury bills or money market funds. |
Footnote3 | Holdings in cash, short-term commercial paper, long-term commercial paper and other short-term cash equivalents have been excluded. |
Footnote4 | The Fund invests in gold and precious metals through investment in a wholly owned subsidiary of the Fund organized under the laws of the Cayman Islands (the “Subsidiary”). Gold bullion and commodities include the Fund’s investment in the Subsidiary. |
Footnote5 | Includes additional sectors outside the top 10 listed above. |
Footnote6 | Country allocations reflect country of risk not currency of issue. Bonds of non-U.S. issuers may be U.S. dollar denominated. |
Footnote7 | Includes additional countries outside the top 10 listed above. |
October 31, 2024
Annual Shareholder Report
For more information, please scan the QR code to navigate to tailored shareholder reports and financial statements and other Information. If you wish to view additional information about the Fund, including but not limited to financial statements, holdings, or the Fund's prospectus, please visit http://www.firsteagle.com.
Important Notice Regarding Delivery of Shareholder Materials
Unless we are notified otherwise, we send one copy of these materials to shareholders with the same residential address (provided they have the same last name or are reasonably believed to be family members) for as long as they remain a shareholder of the Fund. If you would like to receive individual mailings, please call 800.334.2143 and we will send separate copies of these materials within 30 days after receiving your request.
October 31, 2024
Annual Shareholder Report
This Annual Shareholder Report contains important information about the Class C shares of the Fund for the period of November 1, 2023, to October 31, 2024. You can find additional information about the Fund at https://www.firsteagle.com/first-eagle-fund-shareholder-reports. You can also request this information by contacting us at 800.334.2143.
What Were the Fund's Costs for the Year?
Based on a Hypothetical $10,000 Investment
| Class Name | Cost of a $10,000 Investment | Cost Paid as a Percentage of a $10,000 Investment |
|---|
| Class C | $209 | 1.86% |
How Did the Fund Perform Last Year?
The NAV of First Eagle Global Fund Class C Shares1 increased 25.47% in the 12-month period ended October 31, 2024. The MSCI World Index increased 33.68% for the same period.
• Our equity holdings contributed to performance, while gold and gold-related equities also were a contributor.
• All geographic regions contributed to performance. North America and developed Europe were the leading contributors by region, while developed Asia excluding Japan and emerging markets were the worst performing regions.
• Materials, financials and information technology were the largest contributors among equity sectors. Energy was the only detractor, while utilities and real estate were the next worst performing sectors.
• Gold bullion was the leading contributor to performance. Schlumberger NV was the largest detractor.
1 Reflects performance for Class C shares without the effect of sales charges and assumes all distributions have been reinvested; if sales charges were included, values would be lower.
Total Return Based on a $10,000 Investment
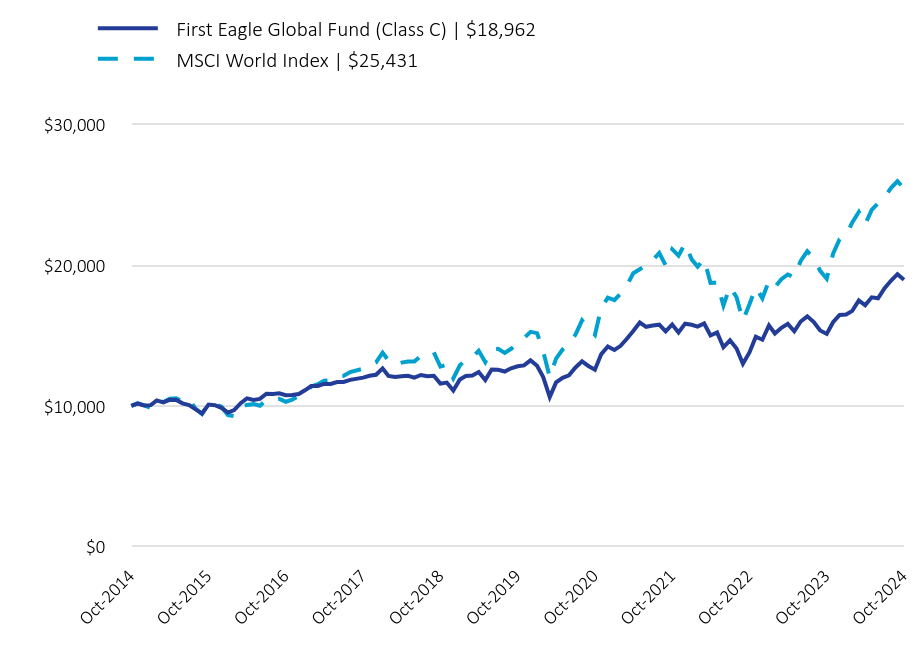
| First Eagle Global Fund (Class C) | $18,962 | MSCI World Index | $25,431 |
|---|
| Oct-2014 | 10,000 | 10,000 |
| Nov-2014 | 10,164 | 10,200.410000 |
| Dec-2014 | 10,038.980000 | 10,035.930000 |
| Jan-2015 | 10,057.050000 | 9,854.080000 |
| Feb-2015 | 10,391.950000 | 10,431.420000 |
| Mar-2015 | 10,247.500000 | 10,268.130000 |
| Apr-2015 | 10,435.030000 | 10,508.940000 |
| May-2015 | 10,415.210000 | 10,545.140000 |
| Jun-2015 | 10,180.870000 | 10,299.940000 |
| Jul-2015 | 10,063.790000 | 10,484.830000 |
| Aug-2015 | 9,758.850000 | 9,791 |
| Sep-2015 | 9,465.110000 | 9,429.860000 |
| Oct-2015 | 10,102.110000 | 10,177.120000 |
| Nov-2015 | 10,056.650000 | 10,126.490000 |
| Dec-2015 | 9,869.600000 | 9,948.490000 |
| Jan-2016 | 9,528.110000 | 9,353.330000 |
| Feb-2016 | 9,706.290000 | 9,283.720000 |
| Mar-2016 | 10,196.450000 | 9,913.700000 |
| Apr-2016 | 10,537.020000 | 10,070.570000 |
| May-2016 | 10,431.650000 | 10,127.130000 |
| Jun-2016 | 10,502.580000 | 10,013.650000 |
| Jul-2016 | 10,870.170000 | 10,436.720000 |
| Aug-2016 | 10,856.040000 | 10,445.390000 |
| Sep-2016 | 10,894.040000 | 10,500.870000 |
| Oct-2016 | 10,765.490000 | 10,297.650000 |
| Nov-2016 | 10,771.950000 | 10,445.720000 |
| Dec-2016 | 10,841.960000 | 10,695.670000 |
| Jan-2017 | 11,127.110000 | 10,953.810000 |
| Feb-2017 | 11,408.110000 | 11,377.630000 |
| Mar-2017 | 11,422.940000 | 11,546.090000 |
| Apr-2017 | 11,563.440000 | 11,790.340000 |
| May-2017 | 11,561.130000 | 11,835.710000 |
| Jun-2017 | 11,694.080000 | 12,118.960000 |
| Jul-2017 | 11,704.610000 | 12,136.030000 |
| Aug-2017 | 11,853.250000 | 12,408.410000 |
| Oct-2017 | 12,008.530000 | 12,642.910000 |
| Nov-2017 | 12,140.630000 | 12,916.860000 |
| Dec-2017 | 12,213.470000 | 13,091.540000 |
| Jan-2018 | 12,662.930000 | 13,782.770000 |
| Feb-2018 | 12,132.350000 | 13,211.790000 |
| Mar-2018 | 12,051.060000 | 12,923.820000 |
| Apr-2018 | 12,104.090000 | 13,072.330000 |
| May-2018 | 12,136.770000 | 13,154.240000 |
| Jun-2018 | 12,010.550000 | 13,147.970000 |
| Jul-2018 | 12,196.710000 | 13,558.630000 |
| Aug-2018 | 12,108.890000 | 13,726.380000 |
| Sep-2018 | 12,145.220000 | 13,802.820000 |
| Oct-2018 | 11,584.110000 | 12,789.300000 |
| Nov-2018 | 11,657.090000 | 12,934.590000 |
| Dec-2018 | 11,092.890000 | 11,951.070000 |
| Jan-2019 | 11,883.810000 | 12,880.930000 |
| Feb-2019 | 12,121.490000 | 13,268.260000 |
| Mar-2019 | 12,165.120000 | 13,442.530000 |
| Apr-2019 | 12,407.210000 | 13,919.190000 |
| May-2019 | 11,842.680000 | 13,116.040000 |
| Jun-2019 | 12,584.030000 | 13,980.320000 |
| Jul-2019 | 12,561.380000 | 14,049.570000 |
| Aug-2019 | 12,443.300000 | 13,762.200000 |
| Sep-2019 | 12,673.510000 | 14,055.070000 |
| Oct-2019 | 12,811.650000 | 14,412.730000 |
| Nov-2019 | 12,874.420000 | 14,814.130000 |
| Dec-2019 | 13,231.050000 | 15,257.940000 |
| Jan-2020 | 12,856.610000 | 15,165.070000 |
| Feb-2020 | 12,042.780000 | 13,883.240000 |
| Mar-2020 | 10,632.570000 | 12,045.890000 |
| Apr-2020 | 11,669.250000 | 13,361.830000 |
| May-2020 | 11,995.990000 | 14,007.320000 |
| Jun-2020 | 12,173.530000 | 14,377.830000 |
| Jul-2020 | 12,734.730000 | 15,065.680000 |
| Aug-2020 | 13,162.620000 | 16,072.290000 |
| Sep-2020 | 12,836.180000 | 15,517.810000 |
| Oct-2020 | 12,573.040000 | 15,041.800000 |
| Nov-2020 | 13,678.210000 | 16,965.070000 |
| Dec-2020 | 14,218.500000 | 17,684.330000 |
| Jan-2021 | 13,968.260000 | 17,508.570000 |
| Feb-2021 | 14,247.620000 | 17,957.220000 |
| Mar-2021 | 14,767.660000 | 18,554.690000 |
| Apr-2021 | 15,314.060000 | 19,418.230000 |
| May-2021 | 15,917.440000 | 19,697.960000 |
| Jun-2021 | 15,616.600000 | 19,991.550000 |
| Jul-2021 | 15,705.610000 | 20,349.660000 |
| Aug-2021 | 15,768.430000 | 20,856.130000 |
| Sep-2021 | 15,287.500000 | 19,990.170000 |
| Oct-2021 | 15,782.810000 | 21,122.420000 |
| Nov-2021 | 15,209.900000 | 20,659.570000 |
| Dec-2021 | 15,838.060000 | 21,542.560000 |
| Jan-2022 | 15,762.040000 | 20,402.720000 |
| Feb-2022 | 15,634.370000 | 19,886.710000 |
| Mar-2022 | 15,853.250000 | 20,432.470000 |
| Apr-2022 | 15,001.930000 | 18,735.080000 |
| May-2022 | 15,210.460000 | 18,749.270000 |
| Jun-2022 | 14,162.460000 | 17,125.170000 |
| Jul-2022 | 14,655.310000 | 18,484.840000 |
| Aug-2022 | 14,080.820000 | 17,712.030000 |
| Sep-2022 | 12,998.010000 | 16,065.520000 |
| Oct-2022 | 13,798.680000 | 17,219.240000 |
| Nov-2022 | 14,915 | 18,416.500000 |
| Dec-2022 | 14,700.220000 | 17,634.400000 |
| Jan-2023 | 15,714.540000 | 18,882.140000 |
| Feb-2023 | 15,142.530000 | 18,428.240000 |
| Mar-2023 | 15,545.320000 | 18,997.670000 |
| Apr-2023 | 15,828.240000 | 19,330.690000 |
| May-2023 | 15,301.160000 | 19,137.700000 |
| Jun-2023 | 15,992.780000 | 20,295.110000 |
| Jul-2023 | 16,359.010000 | 20,976.880000 |
| Aug-2023 | 15,953.310000 | 20,475.830000 |
| Sep-2023 | 15,356.650000 | 19,592.540000 |
| Oct-2023 | 15,112.480000 | 19,024.040000 |
| Nov-2023 | 15,942.160000 | 20,807.590000 |
| Dec-2023 | 16,455.500000 | 21,829.120000 |
| Jan-2024 | 16,488.410000 | 22,091.080000 |
| Feb-2024 | 16,747.270000 | 23,027.690000 |
| Mar-2024 | 17,489.180000 | 23,767.680000 |
| Apr-2024 | 17,142.890000 | 22,884.840000 |
| May-2024 | 17,710.320000 | 23,906.690000 |
| Jun-2024 | 17,644.790000 | 24,393.140000 |
| Jul-2024 | 18,359.410000 | 24,823.010000 |
| Aug-2024 | 18,899.180000 | 25,479.090000 |
| Sep-2024 | 19,354.650000 | 25,945.710000 |
| Oct-2024 | 18,962 | 25,431 |
The above chart represents historical performance of a hypothetical $10,000 investment over the past 10 years. The results of this chart do not predict the results of future time periods and does not guarantee the same results.
| Class/Index Name | 1 Year | 5 Years | 10 Years |
|---|
| Class C - without sales charge | 25.47% | 8.16% | 6.60% |
| Class C - with sales charge | 24.47% | 8.16% | 6.60% |
| MSCI World Index | 33.68% | 12.03% | 9.78% |
The Fund's past performance is not a good predictor of the Fund's future performance.The graph and table do not reflect the deduction of taxes that a shareholder would pay on fund distributions or redemption of fund shares. Call us at 800.334.2143 or visit https://www.firsteagle.com if you have questions about current performance.
- Net Assets$56,336,120,291
- Number of Portfolio Holdings197
- Portfolio Turnover Rate9.51%
- Net Investment Advisory Fees (net of waivers and reimbursements)$393,022,590
Asset Allocation by Asset Class
Based on total investments in the portfolio
| Value | Value |
|---|
| Common Stocks | 81.8% |
| Commodities | 11.8% |
| Corporate Bonds | 0.0%Footnote Reference1 |
| Short-Term Investments | 6.4%Footnote Reference2 |
Top 10 HoldingsFootnote Reference3
Based on total net assets of the portfolio
Gold bullion (Precious Metal)Footnote Reference4 | 11.8% |
| Oracle Corp. (Software, United States) | 2.9% |
| Meta Platforms, Inc., Class A (Interactive Media & Services, United States) | 2.6% |
| HCA Healthcare, Inc. (Health Care Providers & Services, United States) | 2.0% |
| Exxon Mobil Corp. (Oil, Gas & Consumable Fuels, United States) | 2.0% |
| Philip Morris International, Inc. (Tobacco, United States) | 1.9% |
| Comcast Corp., Class A (Media, United States) | 1.7% |
| Willis Towers Watson plc (Insurance, United States) | 1.5% |
| Bank of New York Mellon Corp. (The) (Capital Markets, United States) | 1.5% |
| CH Robinson Worldwide, Inc. (Air Freight & Logistics, United States) | 1.5% |
| Total | 29.4% |
Asset Allocation by Sector
Based on total investments in the portfolio
| Value | Value |
|---|
| Short-Term Investments | 6.4% |
OthersFootnote Reference5 | 3.2% |
| Materials | 4.9% |
| Consumer Discretionary | 6.1% |
| Energy | 6.5% |
| Communication Services | 7.4% |
| Health Care | 8.6% |
| Information Technology | 9.1% |
| Industrials | 10.3% |
| Commodities | 11.8% |
| Financials | 11.9% |
| Consumer Staples | 13.8% |
Asset Allocation by CountryFootnote Reference6
Based on total investments in the portfolio
| United States | 55.9% |
| United Kingdom | 7.2% |
| Japan | 6.3% |
| Canada | 5.0% |
| France | 3.2% |
| Switzerland | 2.9% |
| South Korea | 2.5% |
| China | 2.2% |
| Mexico | 1.4% |
| Hong Kong | 1.2% |
OthersFootnote Reference7 | 5.8% |
| Short-Term Investments | 6.4% |
| Footnote | Description |
Footnote1 | Less than 0.05% |
Footnote2 | Includes short-term commercial paper (1.7% of total investments) that settles in 90 days or less; long-term commercial paper (4.6% of total investments) that settles in 91 days or more; and other short-term investments (0.1% of total investments), such as U.S. treasury bills or money market funds. |
Footnote3 | Holdings in cash, short-term commercial paper, long-term commercial paper and other short-term cash equivalents have been excluded. |
Footnote4 | The Fund invests in gold and precious metals through investment in a wholly owned subsidiary of the Fund organized under the laws of the Cayman Islands (the “Subsidiary”). Gold bullion and commodities include the Fund’s investment in the Subsidiary. |
Footnote5 | Includes additional sectors outside the top 10 listed above. |
Footnote6 | Country allocations reflect country of risk not currency of issue. Bonds of non-U.S. issuers may be U.S. dollar denominated. |
Footnote7 | Includes additional countries outside the top 10 listed above. |
October 31, 2024
Annual Shareholder Report
For more information, please scan the QR code to navigate to tailored shareholder reports and financial statements and other Information. If you wish to view additional information about the Fund, including but not limited to financial statements, holdings, or the Fund's prospectus, please visit http://www.firsteagle.com.
Important Notice Regarding Delivery of Shareholder Materials
Unless we are notified otherwise, we send one copy of these materials to shareholders with the same residential address (provided they have the same last name or are reasonably believed to be family members) for as long as they remain a shareholder of the Fund. If you would like to receive individual mailings, please call 800.334.2143 and we will send separate copies of these materials within 30 days after receiving your request.
October 31, 2024
Annual Shareholder Report
This Annual Shareholder Report contains important information about the Class I shares of the Fund for the period of November 1, 2023, to October 31, 2024. You can find additional information about the Fund at https://www.firsteagle.com/first-eagle-fund-shareholder-reports. You can also request this information by contacting us at 800.334.2143.
What Were the Fund's Costs for the Year?
Based on a Hypothetical $10,000 Investment
| Class Name | Cost of a $10,000 Investment | Cost Paid as a Percentage of a $10,000 Investment |
|---|
| Class I | $98 | 0.86% |
How Did the Fund Perform Last Year?
The NAV of First Eagle Global Fund Class I Shares increased 26.70% in the 12-month period ended October 31, 2024. The MSCI World Index increased 33.68% for the same period.
• Our equity holdings contributed to performance, while gold and gold-related equities also were a contributor.
• All geographic regions contributed to performance. North America and developed Europe were the leading contributors by region, while developed Asia excluding Japan and emerging markets were the worst performing regions.
• Materials, financials and information technology were the largest contributors among equity sectors. Energy was the only detractor, while utilities and real estate were the next worst performing sectors.
• Gold bullion was the leading contributor to performance. Schlumberger NV was the largest detractor.
Total Return Based on a $1,000,000 Investment
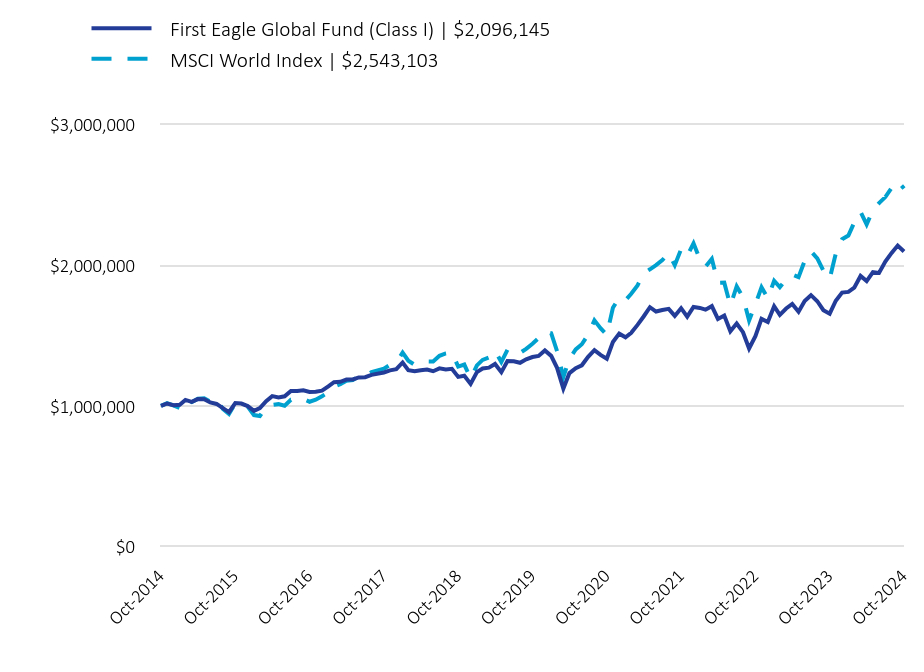
| First Eagle Global Fund (Class I) | $2,096,145 | MSCI World Index | $2,543,103 |
|---|
| Oct-2014 | 1,000,000 | 1,000,000 |
| Nov-2014 | 1,017,200 | 1,020,040.930000 |
| Dec-2014 | 1,005,502.200000 | 1,003,592.650000 |
| Jan-2015 | 1,008,217.060000 | 985,407.900000 |
| Feb-2015 | 1,042,597.260000 | 1,043,141.600000 |
| Mar-2015 | 1,029,043.490000 | 1,026,812.730000 |
| Apr-2015 | 1,048,698.220000 | 1,050,894.140000 |
| May-2015 | 1,047,544.660000 | 1,054,514.170000 |
| Jun-2015 | 1,025,022.450000 | 1,029,994.290000 |
| Jul-2015 | 1,014,157.210000 | 1,048,482.690000 |
| Aug-2015 | 984,340.990000 | 979,099.770000 |
| Sep-2015 | 955,499.800000 | 942,986.340000 |
| Oct-2015 | 1,020,664.880000 | 1,017,712.460000 |
| Nov-2015 | 1,016,888.420000 | 1,012,648.690000 |
| Dec-2015 | 998,889.500000 | 994,848.970000 |
| Jan-2016 | 965,027.140000 | 935,332.940000 |
| Feb-2016 | 984,038.180000 | 928,371.650000 |
| Mar-2016 | 1,034,420.930000 | 991,370.080000 |
| Apr-2016 | 1,069,901.570000 | 1,007,056.990000 |
| May-2016 | 1,060,272.460000 | 1,012,713.250000 |
| Jun-2016 | 1,068,436.550000 | 1,001,365.380000 |
| Jul-2016 | 1,106,793.430000 | 1,043,671.510000 |
| Aug-2016 | 1,106,350.710000 | 1,044,538.900000 |
| Sep-2016 | 1,110,997.380000 | 1,050,087.410000 |
| Oct-2016 | 1,098,776.410000 | 1,029,765.180000 |
| Nov-2016 | 1,100,314.700000 | 1,044,572.200000 |
| Dec-2016 | 1,108,236.960000 | 1,069,567.120000 |
| Jan-2017 | 1,138,491.830000 | 1,095,381.290000 |
| Feb-2017 | 1,168,972.990000 | 1,137,762.520000 |
| Mar-2017 | 1,171,544.730000 | 1,154,609.230000 |
| Apr-2017 | 1,187,009.120000 | 1,179,034.400000 |
| May-2017 | 1,187,602.630000 | 1,183,570.740000 |
| Jun-2017 | 1,202,210.140000 | 1,211,896.470000 |
| Jul-2017 | 1,204,253.900000 | 1,213,603.030000 |
| Aug-2017 | 1,220,752.180000 | 1,240,841.420000 |
| Oct-2017 | 1,237,354.410000 | 1,264,291.420000 |
| Nov-2017 | 1,252,202.660000 | 1,291,685.500000 |
| Dec-2017 | 1,260,717.640000 | 1,309,153.590000 |
| Jan-2018 | 1,308,372.760000 | 1,378,277.170000 |
| Feb-2018 | 1,254,206.130000 | 1,321,178.620000 |
| Mar-2018 | 1,247,182.580000 | 1,292,381.630000 |
| Apr-2018 | 1,253,543.210000 | 1,307,232.610000 |
| May-2018 | 1,258,055.960000 | 1,315,424.290000 |
| Jun-2018 | 1,246,230.240000 | 1,314,796.820000 |
| Jul-2018 | 1,266,419.170000 | 1,355,862.580000 |
| Aug-2018 | 1,258,314.080000 | 1,372,638.460000 |
| Sep-2018 | 1,263,221.510000 | 1,380,281.500000 |
| Oct-2018 | 1,205,997.570000 | 1,278,930.350000 |
| Nov-2018 | 1,214,439.560000 | 1,293,458.880000 |
| Dec-2018 | 1,156,632.230000 | 1,195,106.870000 |
| Jan-2019 | 1,240,141.080000 | 1,288,093.100000 |
| Feb-2019 | 1,265,936.020000 | 1,326,825.840000 |
| Mar-2019 | 1,271,506.140000 | 1,344,252.990000 |
| Apr-2019 | 1,297,826.310000 | 1,391,919.280000 |
| May-2019 | 1,240,073.040000 | 1,311,604.340000 |
| Jun-2019 | 1,318,693.670000 | 1,398,032.370000 |
| Jul-2019 | 1,317,243.110000 | 1,404,957.310000 |
| Aug-2019 | 1,306,178.270000 | 1,376,219.560000 |
| Sep-2019 | 1,331,256.890000 | 1,405,506.850000 |
| Oct-2019 | 1,347,098.850000 | 1,441,273.460000 |
| Nov-2019 | 1,354,777.310000 | 1,481,413.160000 |
| Dec-2019 | 1,393,388.460000 | 1,525,793.690000 |
| Jan-2020 | 1,355,348.960000 | 1,516,506.700000 |
| Feb-2020 | 1,270,368.580000 | 1,388,323.600000 |
| Mar-2020 | 1,122,624.710000 | 1,204,589.060000 |
| Apr-2020 | 1,233,203.250000 | 1,336,183.490000 |
| May-2020 | 1,268,596.180000 | 1,400,732.060000 |
| Jun-2020 | 1,288,513.140000 | 1,437,782.890000 |
| Jul-2020 | 1,349,073.260000 | 1,506,568.380000 |
| Aug-2020 | 1,395,751.190000 | 1,607,228.790000 |
| Sep-2020 | 1,361,974.010000 | 1,551,780.800000 |
| Oct-2020 | 1,335,415.520000 | 1,504,179.890000 |
| Nov-2020 | 1,454,133.960000 | 1,696,506.620000 |
| Dec-2020 | 1,513,026.390000 | 1,768,432.920000 |
| Jan-2021 | 1,487,456.240000 | 1,750,857.040000 |
| Feb-2021 | 1,518,692.820000 | 1,795,721.650000 |
| Mar-2021 | 1,575,188.190000 | 1,855,469.100000 |
| Apr-2021 | 1,634,887.830000 | 1,941,822.840000 |
| May-2021 | 1,700,773.810000 | 1,969,795.650000 |
| Jun-2021 | 1,669,989.800000 | 1,999,155.130000 |
| Jul-2021 | 1,680,844.730000 | 2,034,965.660000 |
| Aug-2021 | 1,689,248.960000 | 2,085,612.620000 |
| Sep-2021 | 1,638,909.340000 | 1,999,016.870000 |
| Oct-2021 | 1,693,648.910000 | 2,112,242.200000 |
| Nov-2021 | 1,633,355.010000 | 2,065,956.720000 |
| Dec-2021 | 1,702,445.930000 | 2,154,256.090000 |
| Jan-2022 | 1,695,636.140000 | 2,040,272.450000 |
| Feb-2022 | 1,683,258 | 1,988,671.480000 |
| Mar-2022 | 1,708,170.220000 | 2,043,247.310000 |
| Apr-2022 | 1,617,637.200000 | 1,873,507.930000 |
| May-2022 | 1,641,578.230000 | 1,874,926.840000 |
| Jun-2022 | 1,529,950.910000 | 1,712,516.930000 |
| Jul-2022 | 1,584,570.150000 | 1,848,484.450000 |
| Aug-2022 | 1,523,405.750000 | 1,771,203.380000 |
| Sep-2022 | 1,407,626.910000 | 1,606,552.490000 |
| Oct-2022 | 1,495,603.590000 | 1,721,923.720000 |
| Nov-2022 | 1,617,943.960000 | 1,841,649.810000 |
| Dec-2022 | 1,595,939.930000 | 1,763,439.920000 |
| Jan-2023 | 1,707,655.720000 | 1,888,213.980000 |
| Feb-2023 | 1,646,521.650000 | 1,842,824.130000 |
| Mar-2023 | 1,691,636.340000 | 1,899,766.830000 |
| Apr-2023 | 1,723,946.590000 | 1,933,068.960000 |
| May-2023 | 1,668,090.720000 | 1,913,770.320000 |
| Jun-2023 | 1,744,822.900000 | 2,029,510.920000 |
| Jul-2023 | 1,786,175.200000 | 2,097,687.790000 |
| Aug-2023 | 1,743,485.610000 | 2,047,583 |
| Sep-2023 | 1,679,674.040000 | 1,959,253.580000 |
| Oct-2023 | 1,654,478.930000 | 1,902,404.200000 |
| Nov-2023 | 1,746,467.960000 | 2,080,758.540000 |
| Dec-2023 | 1,804,450.690000 | 2,182,911.810000 |
| Jan-2024 | 1,809,503.160000 | 2,209,107.800000 |
| Feb-2024 | 1,839,359.960000 | 2,302,768.820000 |
| Mar-2024 | 1,922,499.030000 | 2,376,767.870000 |
| Apr-2024 | 1,886,163.800000 | 2,288,483.530000 |
| May-2024 | 1,950,104.750000 | 2,390,668.870000 |
| Jun-2024 | 1,944,449.440000 | 2,439,313.960000 |
| Jul-2024 | 2,024,560.760000 | 2,482,300.590000 |
| Aug-2024 | 2,086,309.870000 | 2,547,909.010000 |
| Sep-2024 | 2,138,050.350000 | 2,594,571.250000 |
| Oct-2024 | 2,096,145 | 2,543,103 |
The above chart represents historical performance of a hypothetical $1,000,000 investment over the past 10 years. The results of this chart do not predict the results of future time periods and does not guarantee the same results.
| Class/Index Name | 1 Year | 5 Years | 10 Years |
|---|
| Class I | 26.70% | 9.25% | 7.69% |
| MSCI World Index | 33.68% | 12.03% | 9.78% |
The Fund's past performance is not a good predictor of the Fund's future performance.The graph and table do not reflect the deduction of taxes that a shareholder would pay on fund distributions or redemption of fund shares. Call us at 800.334.2143 or visit https://www.firsteagle.com if you have questions about current performance.
- Net Assets$56,336,120,291
- Number of Portfolio Holdings197
- Portfolio Turnover Rate9.51%
- Net Investment Advisory Fees (net of waivers and reimbursements)$393,022,590
Asset Allocation by Asset Class
Based on total investments in the portfolio
| Value | Value |
|---|
| Common Stocks | 81.8% |
| Commodities | 11.8% |
| Corporate Bonds | 0.0%Footnote Reference1 |
| Short-Term Investments | 6.4%Footnote Reference2 |
Top 10 HoldingsFootnote Reference3
Based on total net assets of the portfolio
Gold bullion (Precious Metal)Footnote Reference4 | 11.8% |
| Oracle Corp. (Software, United States) | 2.9% |
| Meta Platforms, Inc., Class A (Interactive Media & Services, United States) | 2.6% |
| HCA Healthcare, Inc. (Health Care Providers & Services, United States) | 2.0% |
| Exxon Mobil Corp. (Oil, Gas & Consumable Fuels, United States) | 2.0% |
| Philip Morris International, Inc. (Tobacco, United States) | 1.9% |
| Comcast Corp., Class A (Media, United States) | 1.7% |
| Willis Towers Watson plc (Insurance, United States) | 1.5% |
| Bank of New York Mellon Corp. (The) (Capital Markets, United States) | 1.5% |
| CH Robinson Worldwide, Inc. (Air Freight & Logistics, United States) | 1.5% |
| Total | 29.4% |
Asset Allocation by Sector
Based on total investments in the portfolio
| Value | Value |
|---|
| Short-Term Investments | 6.4% |
OthersFootnote Reference5 | 3.2% |
| Materials | 4.9% |
| Consumer Discretionary | 6.1% |
| Energy | 6.5% |
| Communication Services | 7.4% |
| Health Care | 8.6% |
| Information Technology | 9.1% |
| Industrials | 10.3% |
| Commodities | 11.8% |
| Financials | 11.9% |
| Consumer Staples | 13.8% |
Asset Allocation by CountryFootnote Reference6
Based on total investments in the portfolio
| United States | 55.9% |
| United Kingdom | 7.2% |
| Japan | 6.3% |
| Canada | 5.0% |
| France | 3.2% |
| Switzerland | 2.9% |
| South Korea | 2.5% |
| China | 2.2% |
| Mexico | 1.4% |
| Hong Kong | 1.2% |
OthersFootnote Reference7 | 5.8% |
| Short-Term Investments | 6.4% |
| Footnote | Description |
Footnote1 | Less than 0.05% |
Footnote2 | Includes short-term commercial paper (1.7% of total investments) that settles in 90 days or less; long-term commercial paper (4.6% of total investments) that settles in 91 days or more; and other short-term investments (0.1% of total investments), such as U.S. treasury bills or money market funds. |
Footnote3 | Holdings in cash, short-term commercial paper, long-term commercial paper and other short-term cash equivalents have been excluded. |
Footnote4 | The Fund invests in gold and precious metals through investment in a wholly owned subsidiary of the Fund organized under the laws of the Cayman Islands (the “Subsidiary”). Gold bullion and commodities include the Fund’s investment in the Subsidiary. |
Footnote5 | Includes additional sectors outside the top 10 listed above. |
Footnote6 | Country allocations reflect country of risk not currency of issue. Bonds of non-U.S. issuers may be U.S. dollar denominated. |
Footnote7 | Includes additional countries outside the top 10 listed above. |
October 31, 2024
Annual Shareholder Report
For more information, please scan the QR code to navigate to tailored shareholder reports and financial statements and other Information. If you wish to view additional information about the Fund, including but not limited to financial statements, holdings, or the Fund's prospectus, please visit http://www.firsteagle.com.
Important Notice Regarding Delivery of Shareholder Materials
Unless we are notified otherwise, we send one copy of these materials to shareholders with the same residential address (provided they have the same last name or are reasonably believed to be family members) for as long as they remain a shareholder of the Fund. If you would like to receive individual mailings, please call 800.334.2143 and we will send separate copies of these materials within 30 days after receiving your request.
October 31, 2024
Annual Shareholder Report
This Annual Shareholder Report contains important information about the Class R6 shares of the Fund for the period of November 1, 2023, to October 31, 2024. You can find additional information about the Fund at https://www.firsteagle.com/first-eagle-fund-shareholder-reports. You can also request this information by contacting us at 800.334.2143.
What Were the Fund's Costs for the Year?
Based on a Hypothetical $10,000 Investment
| Class Name | Cost of a $10,000 Investment | Cost Paid as a Percentage of a $10,000 Investment |
|---|
| Class R6 | $89 | 0.78% |
How Did the Fund Perform Last Year?
The NAV of First Eagle Global Fund Class R6 Shares increased 26.82% in the 12-month period ended October 31, 2024. The MSCI World Index increased 33.68% for the same period.
• Our equity holdings contributed to performance, while gold and gold-related equities also were a contributor.
• All geographic regions contributed to performance. North America and developed Europe were the leading contributors by region, while developed Asia excluding Japan and emerging markets were the worst performing regions.
• Materials, financials and information technology were the largest contributors among equity sectors. Energy was the only detractor, while utilities and real estate were the next worst performing sectors.
• Gold bullion was the leading contributor to performance. Schlumberger NV was the largest detractor.
Total Return Based on a $10,000 Investment
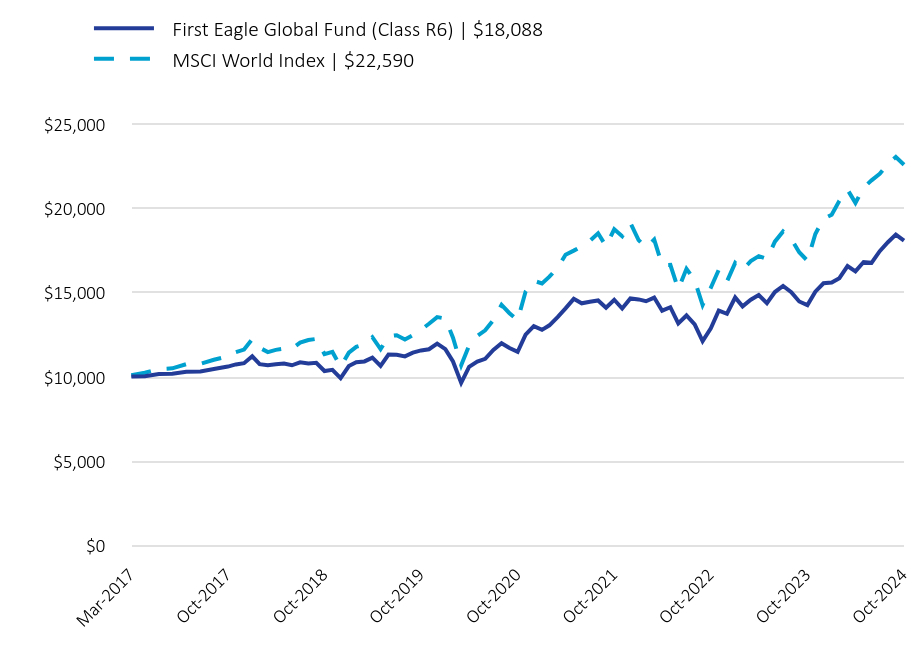
| First Eagle Global Fund (Class R6) | $18,088 | MSCI World Index | $22,590 |
|---|
| Mar-2017 | 10,027.910000 | 10,106.520000 |
| Apr-2017 | 10,048.840000 | 10,256.170000 |
| May-2017 | 10,183.490000 | 10,473.130000 |
| Jun-2017 | 10,190.620000 | 10,513.420000 |
| Jul-2017 | 10,313.930000 | 10,765.040000 |
| Aug-2017 | 10,333.530000 | 10,780.200000 |
| Sep-2017 | 10,474.060000 | 11,022.150000 |
| Oct-2017 | 10,618.600000 | 11,230.450000 |
| Nov-2017 | 10,748.150000 | 11,473.790000 |
| Dec-2017 | 10,820.160000 | 11,628.950000 |
| Jan-2018 | 11,229.170000 | 12,242.960000 |
| Feb-2018 | 10,765.400000 | 11,735.770000 |
| Mar-2018 | 10,705.120000 | 11,479.970000 |
| Apr-2018 | 10,759.710000 | 11,611.890000 |
| May-2018 | 10,799.520000 | 11,684.650000 |
| Jun-2018 | 10,695.850000 | 11,679.080000 |
| Jul-2018 | 10,871.260000 | 12,043.860000 |
| Aug-2018 | 10,803.860000 | 12,192.880000 |
| Sep-2018 | 10,845.990000 | 12,260.770000 |
| Oct-2018 | 10,355.750000 | 11,360.480000 |
| Nov-2018 | 10,430.310000 | 11,489.540000 |
| Dec-2018 | 9,934.880000 | 10,615.900000 |
| Jan-2019 | 10,652.170000 | 11,441.880000 |
| Feb-2019 | 10,875.870000 | 11,785.930000 |
| Mar-2019 | 10,924.810000 | 11,940.730000 |
| Apr-2019 | 11,150.950000 | 12,364.140000 |
| May-2019 | 10,654.740000 | 11,650.720000 |
| Jun-2019 | 11,331.310000 | 12,418.440000 |
| Jul-2019 | 11,322.250000 | 12,479.960000 |
| Aug-2019 | 11,224.870000 | 12,224.690000 |
| Sep-2019 | 11,442.640000 | 12,484.840000 |
| Oct-2019 | 11,578.800000 | 12,802.550000 |
| Nov-2019 | 11,647.120000 | 13,159.100000 |
| Dec-2019 | 11,980.230000 | 13,553.320000 |
| Jan-2020 | 11,653.170000 | 13,470.830000 |
| Feb-2020 | 10,922.510000 | 12,332.200000 |
| Mar-2020 | 9,653.320000 | 10,700.130000 |
| Apr-2020 | 10,606.100000 | 11,869.050000 |
| May-2020 | 10,910.500000 | 12,442.430000 |
| Jun-2020 | 11,081.790000 | 12,771.540000 |
| Jul-2020 | 11,604.850000 | 13,382.550000 |
| Aug-2020 | 12,006.380000 | 14,276.690000 |
| Sep-2020 | 11,718.230000 | 13,784.160000 |
| Oct-2020 | 11,489.720000 | 13,361.330000 |
| Nov-2020 | 12,510.010000 | 15,069.730000 |
| Dec-2020 | 13,017.910000 | 15,708.640000 |
| Jan-2021 | 12,797.910000 | 15,552.520000 |
| Feb-2021 | 13,066.670000 | 15,951.040000 |
| Mar-2021 | 13,555.360000 | 16,481.760000 |
| Apr-2021 | 14,069.110000 | 17,248.830000 |
| May-2021 | 14,636.090000 | 17,497.300000 |
| Jun-2021 | 14,371.180000 | 17,758.100000 |
| Jul-2021 | 14,468.900000 | 18,076.200000 |
| Aug-2021 | 14,541.250000 | 18,526.080000 |
| Sep-2021 | 14,107.920000 | 17,756.870000 |
| Oct-2021 | 14,581.950000 | 18,762.630000 |
| Nov-2021 | 14,064.290000 | 18,351.480000 |
| Dec-2021 | 14,659.210000 | 19,135.830000 |
| Jan-2022 | 14,602.030000 | 18,123.340000 |
| Feb-2022 | 14,495.440000 | 17,664.970000 |
| Mar-2022 | 14,712.870000 | 18,149.760000 |
| Apr-2022 | 13,933.090000 | 16,642 |
| May-2022 | 14,139.300000 | 16,654.600000 |
| Jun-2022 | 13,179.240000 | 15,211.950000 |
| Jul-2022 | 13,651.060000 | 16,419.720000 |
| Aug-2022 | 13,124.130000 | 15,733.250000 |
| Sep-2022 | 12,128.010000 | 14,270.690000 |
| Oct-2022 | 12,887.220000 | 15,295.510000 |
| Nov-2022 | 13,942.680000 | 16,359.010000 |
| Dec-2022 | 13,751.670000 | 15,664.290000 |
| Jan-2023 | 14,717.030000 | 16,772.630000 |
| Feb-2023 | 14,190.160000 | 16,369.440000 |
| Mar-2023 | 14,581.810000 | 16,875.250000 |
| Apr-2023 | 14,860.330000 | 17,171.070000 |
| May-2023 | 14,378.850000 | 16,999.640000 |
| Jun-2023 | 15,041.720000 | 18,027.740000 |
| Jul-2023 | 15,398.200000 | 18,633.340000 |
| Aug-2023 | 15,031.730000 | 18,188.270000 |
| Sep-2023 | 14,481.570000 | 17,403.660000 |
| Oct-2023 | 14,264.340000 | 16,898.680000 |
| Nov-2023 | 15,058.870000 | 18,482.970000 |
| Dec-2023 | 15,560.330000 | 19,390.370000 |
| Jan-2024 | 15,603.900000 | 19,623.070000 |
| Feb-2024 | 15,861.360000 | 20,455.040000 |
| Mar-2024 | 16,583.050000 | 21,112.360000 |
| Apr-2024 | 16,266.320000 | 20,328.150000 |
| May-2024 | 16,821 | 21,235.840000 |
| Jun-2024 | 16,773.900000 | 21,667.940000 |
| Jul-2024 | 17,464.980000 | 22,049.780000 |
| Aug-2024 | 17,997.660000 | 22,632.570000 |
| Sep-2024 | 18,445.810000 | 23,047.060000 |
| Oct-2024 | 18,088 | 22,590 |
The above chart represents historical performance of a hypothetical $10,000 investment since inception. The results of this chart do not predict the results of future time periods and does not guarantee the same results.
| Class/Index Name | 1 Year | 5 Years | Since Inception (3/1/17) |
|---|
| Class R6 | 26.82% | 9.33% | 8.03% |
| MSCI World Index | 33.68% | 12.03% | 11.03% |
The Fund's past performance is not a good predictor of the Fund's future performance.The graph and table do not reflect the deduction of taxes that a shareholder would pay on fund distributions or redemption of fund shares. Call us at 800.334.2143 or visit https://www.firsteagle.com if you have questions about current performance.
- Net Assets$56,336,120,291
- Number of Portfolio Holdings197
- Portfolio Turnover Rate9.51%
- Net Investment Advisory Fees (net of waivers and reimbursements)$393,022,590
Asset Allocation by Asset Class
Based on total investments in the portfolio
| Value | Value |
|---|
| Common Stocks | 81.8% |
| Commodities | 11.8% |
| Corporate Bonds | 0.0%Footnote Reference1 |
| Short-Term Investments | 6.4%Footnote Reference2 |
Top 10 HoldingsFootnote Reference3
Based on total net assets of the portfolio
Gold bullion (Precious Metal)Footnote Reference4 | 11.8% |
| Oracle Corp. (Software, United States) | 2.9% |
| Meta Platforms, Inc., Class A (Interactive Media & Services, United States) | 2.6% |
| HCA Healthcare, Inc. (Health Care Providers & Services, United States) | 2.0% |
| Exxon Mobil Corp. (Oil, Gas & Consumable Fuels, United States) | 2.0% |
| Philip Morris International, Inc. (Tobacco, United States) | 1.9% |
| Comcast Corp., Class A (Media, United States) | 1.7% |
| Willis Towers Watson plc (Insurance, United States) | 1.5% |
| Bank of New York Mellon Corp. (The) (Capital Markets, United States) | 1.5% |
| CH Robinson Worldwide, Inc. (Air Freight & Logistics, United States) | 1.5% |
| Total | 29.4% |
Asset Allocation by Sector
Based on total investments in the portfolio
| Value | Value |
|---|
| Short-Term Investments | 6.4% |
OthersFootnote Reference5 | 3.2% |
| Materials | 4.9% |
| Consumer Discretionary | 6.1% |
| Energy | 6.5% |
| Communication Services | 7.4% |
| Health Care | 8.6% |
| Information Technology | 9.1% |
| Industrials | 10.3% |
| Commodities | 11.8% |
| Financials | 11.9% |
| Consumer Staples | 13.8% |
Asset Allocation by CountryFootnote Reference6
Based on total investments in the portfolio
| United States | 55.9% |
| United Kingdom | 7.2% |
| Japan | 6.3% |
| Canada | 5.0% |
| France | 3.2% |
| Switzerland | 2.9% |
| South Korea | 2.5% |
| China | 2.2% |
| Mexico | 1.4% |
| Hong Kong | 1.2% |
OthersFootnote Reference7 | 5.8% |
| Short-Term Investments | 6.4% |
| Footnote | Description |
Footnote1 | Less than 0.05% |
Footnote2 | Includes short-term commercial paper (1.7% of total investments) that settles in 90 days or less; long-term commercial paper (4.6% of total investments) that settles in 91 days or more; and other short-term investments (0.1% of total investments), such as U.S. treasury bills or money market funds. |
Footnote3 | Holdings in cash, short-term commercial paper, long-term commercial paper and other short-term cash equivalents have been excluded. |
Footnote4 | The Fund invests in gold and precious metals through investment in a wholly owned subsidiary of the Fund organized under the laws of the Cayman Islands (the “Subsidiary”). Gold bullion and commodities include the Fund’s investment in the Subsidiary. |
Footnote5 | Includes additional sectors outside the top 10 listed above. |
Footnote6 | Country allocations reflect country of risk not currency of issue. Bonds of non-U.S. issuers may be U.S. dollar denominated. |
Footnote7 | Includes additional countries outside the top 10 listed above. |
October 31, 2024
Annual Shareholder Report
For more information, please scan the QR code to navigate to tailored shareholder reports and financial statements and other Information. If you wish to view additional information about the Fund, including but not limited to financial statements, holdings, or the Fund's prospectus, please visit http://www.firsteagle.com.
Important Notice Regarding Delivery of Shareholder Materials
Unless we are notified otherwise, we send one copy of these materials to shareholders with the same residential address (provided they have the same last name or are reasonably believed to be family members) for as long as they remain a shareholder of the Fund. If you would like to receive individual mailings, please call 800.334.2143 and we will send separate copies of these materials within 30 days after receiving your request.
October 31, 2024
Annual Shareholder Report
This Annual Shareholder Report contains important information about the Class A shares of the Fund for the period of November 1, 2023, to October 31, 2024. You can find additional information about the Fund at https://www.firsteagle.com/first-eagle-fund-shareholder-reports. You can also request this information by contacting us at 800.334.2143.
First Eagle Overseas Fund
What Were the Fund's Costs for the Year?
Based on a Hypothetical $10,000 Investment
| Class Name | Cost of a $10,000 Investment | Cost Paid as a Percentage of a $10,000 Investment |
|---|
| Class A | $127 | 1.15% |
How Did the Fund Perform Last Year?
The NAV of First Eagle Overseas Fund Class A Shares1 increased 21.29% in the 12-month period ended October 31, 2024. The MSCI EAFE Index increased 22.97% for the same period.
• Our equity holdings contributed to performance, while gold and gold-related equities also were a contributor.
• All geographic regions contributed to performance. Developed Europe and Japan were the leading contributors, while developed Asia excluding Japan and emerging markets were the worst performing regions.
• Materials, financials and consumer staples were the largest contributors among equity sectors; communication services was the only detractor, while real estate and health care were the next worst performing sectors.
• Gold bullion was the leading contributor to performance. CK Asset Holdings Ltd. was the largest detractor.
1 Reflects performance for Class A shares without the effect of sales charges and assumes all distributions have been reinvested; if sales charges were included, values would be lower.
Total Return Based on a $10,000 Investment
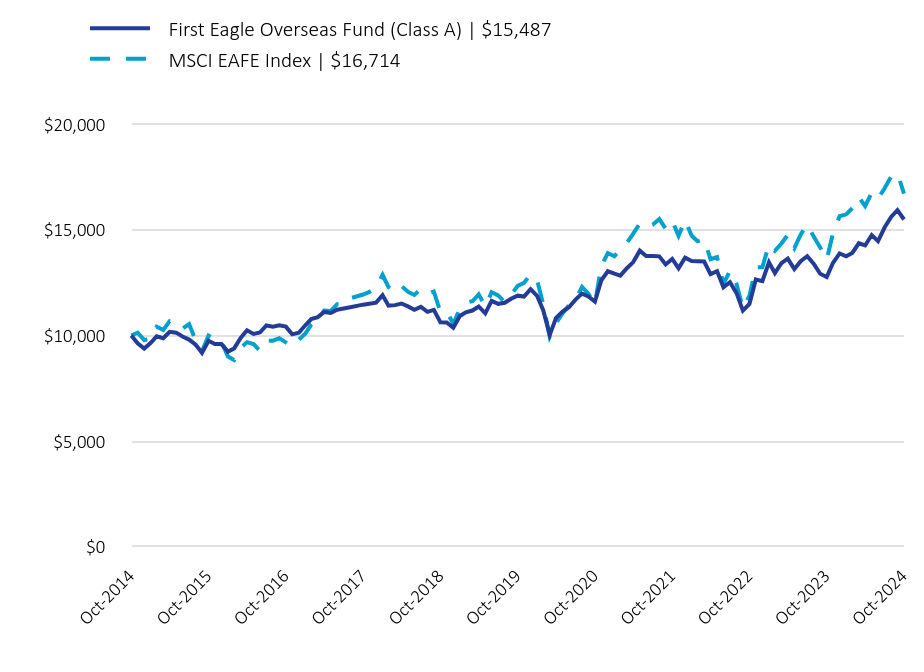
| First Eagle Overseas Fund (Class A) | $15,487 | MSCI EAFE Index | $16,714 |
|---|
| Oct-2014 | 10,000 | 10,000 |
| Nov-2014 | 9,631.100000 | 10,136.020000 |
| Dec-2014 | 9,379.730000 | 9,784.890000 |
| Jan-2015 | 9,650.800000 | 9,832.730000 |
| Feb-2015 | 9,965.420000 | 10,420.530000 |
| Mar-2015 | 9,870.750000 | 10,262.230000 |
| Apr-2015 | 10,172.790000 | 10,681.230000 |
| May-2015 | 10,134.140000 | 10,626.560000 |
| Jun-2015 | 9,952.730000 | 10,325.470000 |
| Jul-2015 | 9,806.430000 | 10,539.860000 |
| Aug-2015 | 9,561.270000 | 9,764.520000 |
| Sep-2015 | 9,177.860000 | 9,268.720000 |
| Oct-2015 | 9,746.890000 | 9,993.250000 |
| Nov-2015 | 9,591.910000 | 9,837.780000 |
| Dec-2015 | 9,593.830000 | 9,705.230000 |
| Jan-2016 | 9,235.980000 | 9,003.410000 |
| Feb-2016 | 9,388.380000 | 8,838.460000 |
| Mar-2016 | 9,885.960000 | 9,413.550000 |
| Apr-2016 | 10,248.770000 | 9,686.080000 |
| May-2016 | 10,074.550000 | 9,598.090000 |
| Jun-2016 | 10,140.030000 | 9,275.910000 |
| Jul-2016 | 10,476.680000 | 9,746.020000 |
| Aug-2016 | 10,420.100000 | 9,752.940000 |
| Sep-2016 | 10,485.750000 | 9,872.750000 |
| Oct-2016 | 10,419.690000 | 9,670.800000 |
| Nov-2016 | 10,052.920000 | 9,478.200000 |
| Dec-2016 | 10,130.330000 | 9,802.300000 |
| Jan-2017 | 10,482.860000 | 10,086.640000 |
| Feb-2017 | 10,776.140000 | 10,512.520000 |
| Mar-2017 | 10,870.970000 | 10,780.010000 |
| Apr-2017 | 11,115.570000 | 11,175.680000 |
| May-2017 | 11,065.550000 | 11,155.910000 |
| Jun-2017 | 11,219.360000 | 11,477.710000 |
| Jul-2017 | 11,273.210000 | 11,473.390000 |
| Aug-2017 | 11,331.830000 | 11,758.850000 |
| Oct-2017 | 11,458.750000 | 11,937.410000 |
| Nov-2017 | 11,504.580000 | 12,062.620000 |
| Dec-2017 | 11,552.900000 | 12,256.240000 |
| Jan-2018 | 11,908.730000 | 12,871.010000 |
| Feb-2018 | 11,413.330000 | 12,290.060000 |
| Mar-2018 | 11,436.160000 | 12,068.550000 |
| Apr-2018 | 11,511.640000 | 12,344.110000 |
| May-2018 | 11,375.800000 | 12,066.640000 |
| Jun-2018 | 11,216.540000 | 11,919.210000 |
| Jul-2018 | 11,352.260000 | 12,212.610000 |
| Aug-2018 | 11,118.400000 | 11,976.750000 |
| Sep-2018 | 11,211.800000 | 12,080.700000 |
| Oct-2018 | 10,626.540000 | 11,119.170000 |
| Nov-2018 | 10,616.980000 | 11,105.160000 |
| Dec-2018 | 10,364.290000 | 10,566.070000 |
| Jan-2019 | 10,923.960000 | 11,260.480000 |
| Feb-2019 | 11,097.650000 | 11,547.520000 |
| Mar-2019 | 11,179.780000 | 11,620.340000 |
| Apr-2019 | 11,372.070000 | 11,947.050000 |
| May-2019 | 11,044.550000 | 11,373.280000 |
| Jun-2019 | 11,637.650000 | 12,048 |
| Jul-2019 | 11,497.990000 | 11,895.030000 |
| Aug-2019 | 11,546.290000 | 11,586.880000 |
| Sep-2019 | 11,739.110000 | 11,918.910000 |
| Oct-2019 | 11,883.500000 | 12,347.150000 |
| Nov-2019 | 11,840.720000 | 12,486.340000 |
| Dec-2019 | 12,190.020000 | 12,892.140000 |
| Jan-2020 | 11,879.180000 | 12,622.850000 |
| Feb-2020 | 11,197.310000 | 11,481.780000 |
| Mar-2020 | 10,031.670000 | 9,949.320000 |
| Apr-2020 | 10,831.190000 | 10,592.080000 |
| May-2020 | 11,126.890000 | 11,053.310000 |
| Jun-2020 | 11,336.070000 | 11,429.670000 |
| Jul-2020 | 11,697.690000 | 11,696.080000 |
| Aug-2020 | 11,983.120000 | 12,297.390000 |
| Sep-2020 | 11,845.310000 | 11,977.860000 |
| Oct-2020 | 11,606.030000 | 11,499.600000 |
| Nov-2020 | 12,604.150000 | 13,282.190000 |
| Dec-2020 | 13,039 | 13,899.760000 |
| Jan-2021 | 12,921.650000 | 13,751.670000 |
| Feb-2021 | 12,829.900000 | 14,060.110000 |
| Mar-2021 | 13,181.440000 | 14,383.400000 |
| Apr-2021 | 13,472.750000 | 14,816.190000 |
| May-2021 | 14,013.010000 | 15,299.360000 |
| Jun-2021 | 13,763.580000 | 15,127.180000 |
| Jul-2021 | 13,758.070000 | 15,241.080000 |
| Aug-2021 | 13,742.940000 | 15,509.920000 |
| Sep-2021 | 13,360.880000 | 15,059.810000 |
| Oct-2021 | 13,621.420000 | 15,430.210000 |
| Nov-2021 | 13,182.810000 | 14,712.030000 |
| Dec-2021 | 13,683.760000 | 15,465.340000 |
| Jan-2022 | 13,526.400000 | 14,718 |
| Feb-2022 | 13,515.570000 | 14,457.760000 |
| Mar-2022 | 13,499.360000 | 14,550.690000 |
| Apr-2022 | 12,904.030000 | 13,609.340000 |
| May-2022 | 13,044.690000 | 13,711.360000 |
| Jun-2022 | 12,277.660000 | 12,439.120000 |
| Jul-2022 | 12,520.760000 | 13,058.960000 |
| Aug-2022 | 12,001.150000 | 12,438.730000 |
| Sep-2022 | 11,174.270000 | 11,275.120000 |
| Oct-2022 | 11,492.730000 | 11,881.440000 |
| Nov-2022 | 12,650.050000 | 13,219.710000 |
| Dec-2022 | 12,574.150000 | 13,230.340000 |
| Jan-2023 | 13,458.120000 | 14,301.690000 |
| Feb-2023 | 12,954.780000 | 14,003.260000 |
| Mar-2023 | 13,425.040000 | 14,350.320000 |
| Apr-2023 | 13,637.160000 | 14,755.470000 |
| May-2023 | 13,139.400000 | 14,131.050000 |
| Jun-2023 | 13,513.870000 | 14,774.150000 |
| Jul-2023 | 13,749.010000 | 15,252.190000 |
| Aug-2023 | 13,384.670000 | 14,667.840000 |
| Sep-2023 | 12,920.220000 | 14,166.820000 |
| Oct-2023 | 12,769.050000 | 13,592.470000 |
| Nov-2023 | 13,440.700000 | 14,854.090000 |
| Dec-2023 | 13,882.900000 | 15,643.280000 |
| Jan-2024 | 13,745.460000 | 15,733.300000 |
| Feb-2024 | 13,906.280000 | 16,021.290000 |
| Mar-2024 | 14,363.800000 | 16,548.230000 |
| Apr-2024 | 14,260.380000 | 16,124.450000 |
| May-2024 | 14,752.360000 | 16,749.030000 |
| Jun-2024 | 14,460.270000 | 16,478.630000 |
| Jul-2024 | 15,108.090000 | 16,962.060000 |
| Aug-2024 | 15,612.700000 | 17,513.600000 |
| Sep-2024 | 15,928.070000 | 17,675.330000 |
| Oct-2024 | 15,487 | 16,714 |
The above chart represents historical performance of a hypothetical $10,000 investment over the past 10 years. The results of this chart do not predict the results of future time periods and does not guarantee the same results.
| Class/Index Name | 1 Year | 5 Years | 10 Years |
|---|
| Class A - without sales charge | 21.29% | 5.44% | 5.01% |
| Class A - with sales charge | 15.23% | 4.36% | 4.47% |
| MSCI EAFE Index | 22.97% | 6.24% | 5.27% |
The Fund's past performance is not a good predictor of the Fund's future performance.The graph and table do not reflect the deduction of taxes that a shareholder would pay on fund distributions or redemption of fund shares. Call us at 800.334.2143 or visit https://www.firsteagle.com if you have questions about current performance.
- Net Assets$12,368,480,904
- Number of Portfolio Holdings133
- Portfolio Turnover Rate6.73%
- Net Investment Advisory Fees (net of waivers and reimbursements)$93,232,514
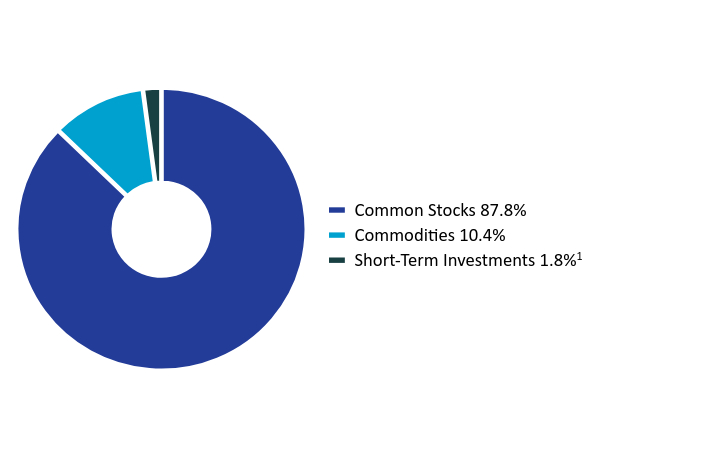
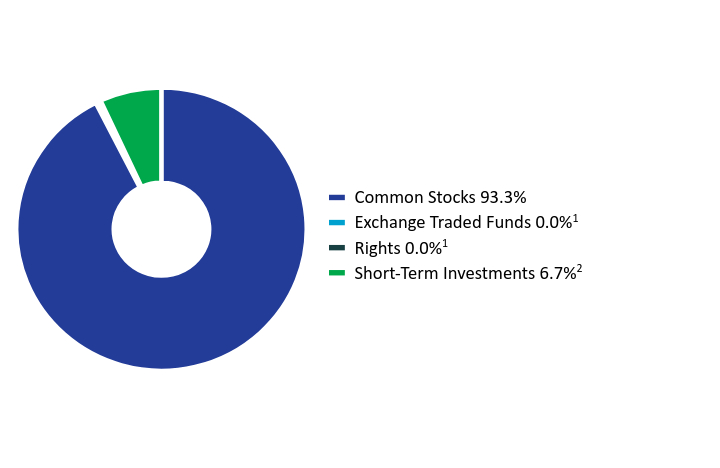
Asset Allocation by Asset Class
Based on total investments in the portfolio
| Value | Value |
|---|
| Common Stocks | 87.8% |
| Commodities | 10.4% |
| Short-Term Investments | 1.8%Footnote Reference1 |
Top 10 HoldingsFootnote Reference2
Based on total net assets of the portfolio
Gold bullion (Precious Metal)Footnote Reference3 | 10.3% |
| Imperial Oil Ltd. (Oil, Gas & Consumable Fuels, Canada) | 3.9% |
| British American Tobacco plc (Tobacco, United Kingdom) | 2.2% |
| Danone SA (Food Products, France) | 2.2% |
| Willis Towers Watson plc (Insurance, United States) | 2.2% |
| Shell plc (Oil, Gas & Consumable Fuels, United Kingdom) | 2.2% |
| Unilever plc (Personal Care Products, United Kingdom) | 2.2% |
| Prosus NV (Broadline Retail, China) | 2.1% |
| Fomento Economico Mexicano SAB de CV, ADR (Beverages, Mexico) | 2.0% |
| Cie Financiere Richemont SA (Registered) (Textiles, Apparel & Luxury Goods, Switzerland) | 1.9% |
| Total | 31.2% |
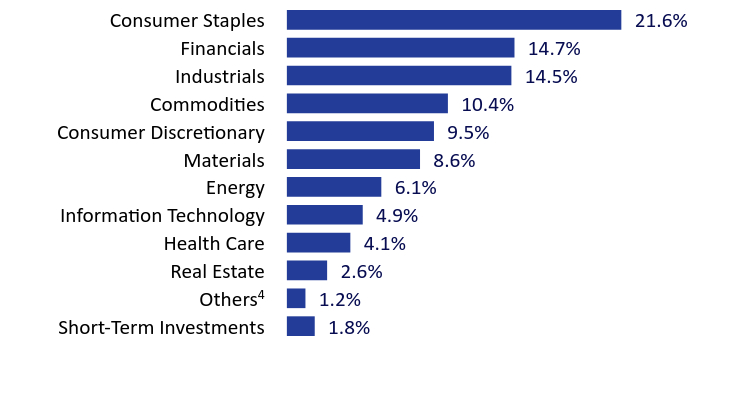
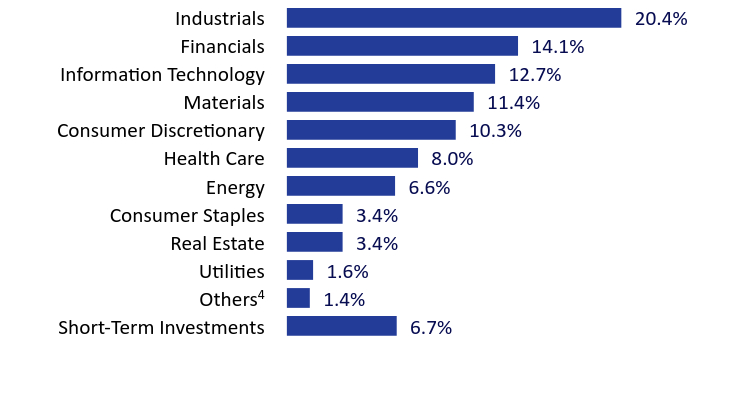
Asset Allocation by Sector
Based on total investments in the portfolio
| Value | Value |
|---|
| Short-Term Investments | 1.8% |
OthersFootnote Reference4 | 1.2% |
| Real Estate | 2.6% |
| Health Care | 4.1% |
| Information Technology | 4.9% |
| Energy | 6.1% |
| Materials | 8.6% |
| Consumer Discretionary | 9.5% |
| Commodities | 10.4% |
| Industrials | 14.5% |
| Financials | 14.7% |
| Consumer Staples | 21.6% |
Asset Allocation by CountryFootnote Reference5
Based on total investments in the portfolio
| Japan | 16.1% |
| United Kingdom | 14.5% |
| United States | 14.0% |
| Canada | 9.2% |
| France | 6.1% |
| South Korea | 5.2% |
| Switzerland | 4.9% |
| China | 3.4% |
| Sweden | 3.3% |
| Hong Kong | 3.3% |
OthersFootnote Reference6 | 18.2% |
| Short-Term Investments | 1.8% |
| Footnote | Description |
Footnote1 | Includes short-term commercial paper (1.4% of total investments) that settles in 90 days or less; long-term commercial paper (0.2% of total investments) that settles in 91 days or more; and other short-term investments (0.2% of total investments), such as U.S. treasury bills or money market funds. |
Footnote2 | Holdings in cash, short-term commercial paper, long-term commercial paper and other short-term cash equivalents have been excluded. |
Footnote3 | The Fund invests in gold and precious metals through investment in a wholly owned subsidiary of the Fund organized under the laws of the Cayman Islands (the “Subsidiary”). Gold bullion and commodities include the Fund’s investment in the Subsidiary. |
Footnote4 | Includes additional sectors outside the top 10 listed above. |
Footnote5 | Country allocations reflect country of risk not currency of issue. Bonds of non-U.S. issuers may be U.S. dollar denominated. |
Footnote6 | Includes additional countries outside the top 10 listed above. |
First Eagle Overseas Fund
October 31, 2024
Annual Shareholder Report
For more information, please scan the QR code to navigate to tailored shareholder reports and financial statements and other Information. If you wish to view additional information about the Fund, including but not limited to financial statements, holdings, or the Fund's prospectus, please visit http://www.firsteagle.com.
Important Notice Regarding Delivery of Shareholder Materials
Unless we are notified otherwise, we send one copy of these materials to shareholders with the same residential address (provided they have the same last name or are reasonably believed to be family members) for as long as they remain a shareholder of the Fund. If you would like to receive individual mailings, please call 800.334.2143 and we will send separate copies of these materials within 30 days after receiving your request.
October 31, 2024
Annual Shareholder Report
This Annual Shareholder Report contains important information about the Class C shares of the Fund for the period of November 1, 2023, to October 31, 2024. You can find additional information about the Fund at https://www.firsteagle.com/first-eagle-fund-shareholder-reports. You can also request this information by contacting us at 800.334.2143.
First Eagle Overseas Fund
What Were the Fund's Costs for the Year?
Based on a Hypothetical $10,000 Investment
| Class Name | Cost of a $10,000 Investment | Cost Paid as a Percentage of a $10,000 Investment |
|---|
| Class C | $207 | 1.88% |
How Did the Fund Perform Last Year?
The NAV of First Eagle Overseas Fund Class C Shares1 increased 20.42% in the 12-month period ended October 31, 2024. The MSCI EAFE Index increased 22.97% for the same period.
• Our equity holdings contributed to performance, while gold and gold-related equities also were a contributor.
• All geographic regions contributed to performance. Developed Europe and Japan were the leading contributors, while developed Asia excluding Japan and emerging markets were the worst performing regions.
• Materials, financials and consumer staples were the largest contributors among equity sectors; communication services was the only detractor, while real estate and health care were the next worst performing sectors.
• Gold bullion was the leading contributor to performance. CK Asset Holdings Ltd. was the largest detractor.
1 Reflects performance for Class C shares without the effect of sales charges and assumes all distributions have been reinvested; if sales charges were included, values would be lower.
Total Return Based on a $10,000 Investment
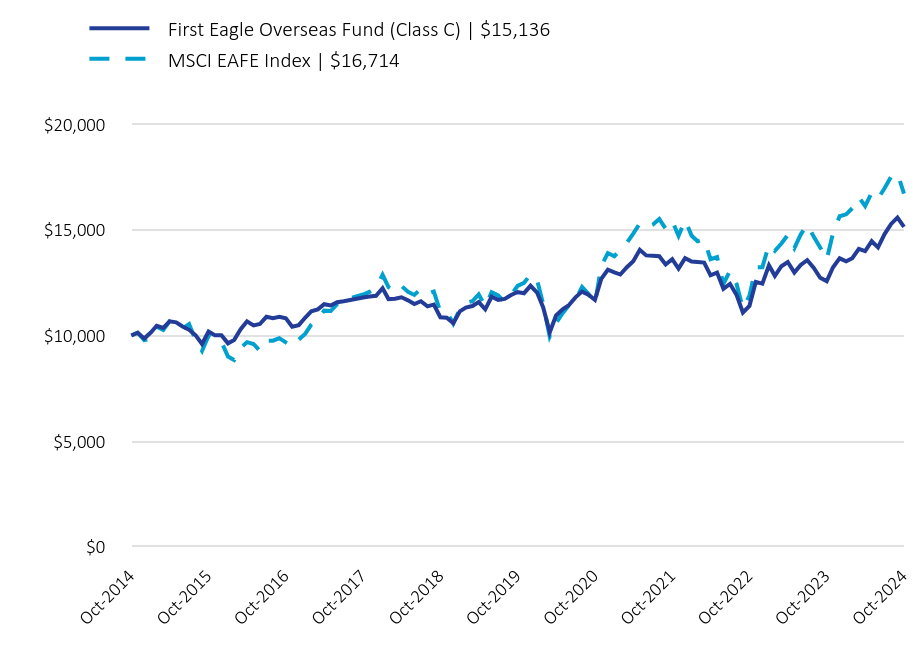
| First Eagle Overseas Fund (Class C) | $15,136 | MSCI EAFE Index | $16,714 |
|---|
| Oct-2014 | 10,000 | 10,000 |
| Nov-2014 | 10,129 | 10,136.020000 |
| Dec-2014 | 9,855.520000 | 9,784.890000 |
| Jan-2015 | 10,140.340000 | 9,832.730000 |
| Feb-2015 | 10,461.790000 | 10,420.530000 |
| Mar-2015 | 10,359.260000 | 10,262.230000 |
| Apr-2015 | 10,672.110000 | 10,681.230000 |
| May-2015 | 10,620.890000 | 10,626.560000 |
| Jun-2015 | 10,425.460000 | 10,325.470000 |
| Jul-2015 | 10,267 | 10,539.860000 |
| Aug-2015 | 10,006.220000 | 9,764.520000 |
| Sep-2015 | 9,595.960000 | 9,268.720000 |
| Oct-2015 | 10,183.230000 | 9,993.250000 |
| Nov-2015 | 10,015.210000 | 9,837.780000 |
| Dec-2015 | 10,010.200000 | 9,705.230000 |
| Jan-2016 | 9,627.810000 | 9,003.410000 |
| Feb-2016 | 9,783.780000 | 8,838.460000 |
| Mar-2016 | 10,298.410000 | 9,413.550000 |
| Apr-2016 | 10,671.210000 | 9,686.080000 |
| May-2016 | 10,478.060000 | 9,598.090000 |
| Jun-2016 | 10,544.080000 | 9,275.910000 |
| Jul-2016 | 10,883.590000 | 9,746.020000 |
| Aug-2016 | 10,817.200000 | 9,752.940000 |
| Sep-2016 | 10,878.860000 | 9,872.750000 |
| Oct-2016 | 10,808.150000 | 9,670.800000 |
| Nov-2016 | 10,416.900000 | 9,478.200000 |
| Dec-2016 | 10,489.810000 | 9,802.300000 |
| Jan-2017 | 10,849.610000 | 10,086.640000 |
| Feb-2017 | 11,141.100000 | 10,512.520000 |
| Mar-2017 | 11,233.570000 | 10,780.010000 |
| Apr-2017 | 11,481.840000 | 11,175.680000 |
| May-2017 | 11,418.690000 | 11,155.910000 |
| Jun-2017 | 11,573.980000 | 11,477.710000 |
| Jul-2017 | 11,617.960000 | 11,473.390000 |
| Aug-2017 | 11,676.050000 | 11,758.850000 |
| Oct-2017 | 11,797.480000 | 11,937.410000 |
| Nov-2017 | 11,841.130000 | 12,062.620000 |
| Dec-2017 | 11,877.840000 | 12,256.240000 |
| Jan-2018 | 12,237.740000 | 12,871.010000 |
| Feb-2018 | 11,722.530000 | 12,290.060000 |
| Mar-2018 | 11,737.770000 | 12,068.550000 |
| Apr-2018 | 11,808.200000 | 12,344.110000 |
| May-2018 | 11,662.960000 | 12,066.640000 |
| Jun-2018 | 11,488.010000 | 11,919.210000 |
| Jul-2018 | 11,622.420000 | 12,212.610000 |
| Aug-2018 | 11,377.190000 | 11,976.750000 |
| Sep-2018 | 11,462.520000 | 12,080.700000 |
| Oct-2018 | 10,863.030000 | 11,119.170000 |
| Nov-2018 | 10,843.470000 | 11,105.160000 |
| Dec-2018 | 10,584.310000 | 10,566.070000 |
| Jan-2019 | 11,142.110000 | 11,260.480000 |
| Feb-2019 | 11,315.920000 | 11,547.520000 |
| Mar-2019 | 11,392.870000 | 11,620.340000 |
| Apr-2019 | 11,581.990000 | 11,947.050000 |
| May-2019 | 11,239.170000 | 11,373.280000 |
| Jun-2019 | 11,832.600000 | 12,048 |
| Jul-2019 | 11,684.690000 | 11,895.030000 |
| Aug-2019 | 11,730.260000 | 11,586.880000 |
| Sep-2019 | 11,914.420000 | 11,918.910000 |
| Oct-2019 | 12,057.400000 | 12,347.150000 |
| Nov-2019 | 12,000.730000 | 12,486.340000 |
| Dec-2019 | 12,349.950000 | 12,892.140000 |
| Jan-2020 | 12,028.850000 | 12,622.850000 |
| Feb-2020 | 11,327.570000 | 11,481.780000 |
| Mar-2020 | 10,149.500000 | 9,949.320000 |
| Apr-2020 | 10,947.250000 | 10,592.080000 |
| May-2020 | 11,236.260000 | 11,053.310000 |
| Jun-2020 | 11,439.630000 | 11,429.670000 |
| Jul-2020 | 11,803.420000 | 11,696.080000 |
| Aug-2020 | 12,076.070000 | 12,297.390000 |
| Sep-2020 | 11,931.160000 | 11,977.860000 |
| Oct-2020 | 11,685.380000 | 11,499.600000 |
| Nov-2020 | 12,680.970000 | 13,282.190000 |
| Dec-2020 | 13,109.590000 | 13,899.760000 |
| Jan-2021 | 12,986.360000 | 13,751.670000 |
| Feb-2021 | 12,885.070000 | 14,060.110000 |
| Mar-2021 | 13,227.810000 | 14,383.400000 |
| Apr-2021 | 13,517.500000 | 14,816.190000 |
| May-2021 | 14,052.790000 | 15,299.360000 |
| Jun-2021 | 13,790 | 15,127.180000 |
| Jul-2021 | 13,773.460000 | 15,241.080000 |
| Aug-2021 | 13,751.420000 | 15,509.920000 |
| Sep-2021 | 13,360.880000 | 15,059.810000 |
| Oct-2021 | 13,612.060000 | 15,430.210000 |
| Nov-2021 | 13,162.860000 | 14,712.030000 |
| Dec-2021 | 13,659.100000 | 15,465.340000 |
| Jan-2022 | 13,496.560000 | 14,718 |
| Feb-2022 | 13,473.620000 | 14,457.760000 |
| Mar-2022 | 13,450.710000 | 14,550.690000 |
| Apr-2022 | 12,848.120000 | 13,609.340000 |
| May-2022 | 12,977.890000 | 13,711.360000 |
| Jun-2022 | 12,207 | 12,439.120000 |
| Jul-2022 | 12,443.820000 | 13,058.960000 |
| Aug-2022 | 11,919.930000 | 12,438.730000 |
| Sep-2022 | 11,086.730000 | 11,275.120000 |
| Oct-2022 | 11,401.590000 | 11,881.440000 |
| Nov-2022 | 12,538.330000 | 13,219.710000 |
| Dec-2022 | 12,455.580000 | 13,230.340000 |
| Jan-2023 | 13,324.980000 | 14,301.690000 |
| Feb-2023 | 12,822.620000 | 14,003.260000 |
| Mar-2023 | 13,277.830000 | 14,350.320000 |
| Apr-2023 | 13,475.670000 | 14,755.470000 |
| May-2023 | 12,974.370000 | 14,131.050000 |
| Jun-2023 | 13,341.550000 | 14,774.150000 |
| Jul-2023 | 13,563.020000 | 15,252.190000 |
| Aug-2023 | 13,195.460000 | 14,667.840000 |
| Sep-2023 | 12,728.340000 | 14,166.820000 |
| Oct-2023 | 12,570.510000 | 13,592.470000 |
| Nov-2023 | 13,229.200000 | 14,854.090000 |
| Dec-2023 | 13,649.890000 | 15,643.280000 |
| Jan-2024 | 13,507.930000 | 15,733.300000 |
| Feb-2024 | 13,656.520000 | 16,021.290000 |
| Mar-2024 | 14,100.360000 | 16,548.230000 |
| Apr-2024 | 13,993.190000 | 16,124.450000 |
| May-2024 | 14,460.570000 | 16,749.030000 |
| Jun-2024 | 14,169.910000 | 16,478.630000 |
| Jul-2024 | 14,797.640000 | 16,962.060000 |
| Aug-2024 | 15,277.080000 | 17,513.600000 |
| Sep-2024 | 15,573.460000 | 17,675.330000 |
| Oct-2024 | 15,136 | 16,714 |
The above chart represents historical performance of a hypothetical $10,000 investment over the past 10 years. The results of this chart do not predict the results of future time periods and does not guarantee the same results.
| Class/Index Name | 1 Year | 5 Years | 10 Years |
|---|
| Class C - without sales charge | 20.42% | 4.66% | 4.23% |
| Class C - with sales charge | 19.42% | 4.66% | 4.23% |
| MSCI EAFE Index | 22.97% | 6.24% | 5.27% |
The Fund's past performance is not a good predictor of the Fund's future performance.The graph and table do not reflect the deduction of taxes that a shareholder would pay on fund distributions or redemption of fund shares. Call us at 800.334.2143 or visit https://www.firsteagle.com if you have questions about current performance.
- Net Assets$12,368,480,904
- Number of Portfolio Holdings133
- Portfolio Turnover Rate6.73%
- Net Investment Advisory Fees (net of waivers and reimbursements)$93,232,514
Asset Allocation by Asset Class
Based on total investments in the portfolio
| Value | Value |
|---|
| Common Stocks | 87.8% |
| Commodities | 10.4% |
| Short-Term Investments | 1.8%Footnote Reference1 |
Top 10 HoldingsFootnote Reference2
Based on total net assets of the portfolio
Gold bullion (Precious Metal)Footnote Reference3 | 10.3% |
| Imperial Oil Ltd. (Oil, Gas & Consumable Fuels, Canada) | 3.9% |
| British American Tobacco plc (Tobacco, United Kingdom) | 2.2% |
| Danone SA (Food Products, France) | 2.2% |
| Willis Towers Watson plc (Insurance, United States) | 2.2% |
| Shell plc (Oil, Gas & Consumable Fuels, United Kingdom) | 2.2% |
| Unilever plc (Personal Care Products, United Kingdom) | 2.2% |
| Prosus NV (Broadline Retail, China) | 2.1% |
| Fomento Economico Mexicano SAB de CV, ADR (Beverages, Mexico) | 2.0% |
| Cie Financiere Richemont SA (Registered) (Textiles, Apparel & Luxury Goods, Switzerland) | 1.9% |
| Total | 31.2% |
Asset Allocation by Sector
Based on total investments in the portfolio
| Value | Value |
|---|
| Short-Term Investments | 1.8% |
OthersFootnote Reference4 | 1.2% |
| Real Estate | 2.6% |
| Health Care | 4.1% |
| Information Technology | 4.9% |
| Energy | 6.1% |
| Materials | 8.6% |
| Consumer Discretionary | 9.5% |
| Commodities | 10.4% |
| Industrials | 14.5% |
| Financials | 14.7% |
| Consumer Staples | 21.6% |
Asset Allocation by CountryFootnote Reference5
Based on total investments in the portfolio
| Japan | 16.1% |
| United Kingdom | 14.5% |
| United States | 14.0% |
| Canada | 9.2% |
| France | 6.1% |
| South Korea | 5.2% |
| Switzerland | 4.9% |
| China | 3.4% |
| Sweden | 3.3% |
| Hong Kong | 3.3% |
OthersFootnote Reference6 | 18.2% |
| Short-Term Investments | 1.8% |
| Footnote | Description |
Footnote1 | Includes short-term commercial paper (1.4% of total investments) that settles in 90 days or less; long-term commercial paper (0.2% of total investments) that settles in 91 days or more; and other short-term investments (0.2% of total investments), such as U.S. treasury bills or money market funds. |
Footnote2 | Holdings in cash, short-term commercial paper, long-term commercial paper and other short-term cash equivalents have been excluded. |
Footnote3 | The Fund invests in gold and precious metals through investment in a wholly owned subsidiary of the Fund organized under the laws of the Cayman Islands (the “Subsidiary”). Gold bullion and commodities include the Fund’s investment in the Subsidiary. |
Footnote4 | Includes additional sectors outside the top 10 listed above. |
Footnote5 | Country allocations reflect country of risk not currency of issue. Bonds of non-U.S. issuers may be U.S. dollar denominated. |
Footnote6 | Includes additional countries outside the top 10 listed above. |
First Eagle Overseas Fund
October 31, 2024
Annual Shareholder Report
For more information, please scan the QR code to navigate to tailored shareholder reports and financial statements and other Information. If you wish to view additional information about the Fund, including but not limited to financial statements, holdings, or the Fund's prospectus, please visit http://www.firsteagle.com.
Important Notice Regarding Delivery of Shareholder Materials
Unless we are notified otherwise, we send one copy of these materials to shareholders with the same residential address (provided they have the same last name or are reasonably believed to be family members) for as long as they remain a shareholder of the Fund. If you would like to receive individual mailings, please call 800.334.2143 and we will send separate copies of these materials within 30 days after receiving your request.
October 31, 2024
Annual Shareholder Report
This Annual Shareholder Report contains important information about the Class I shares of the Fund for the period of November 1, 2023, to October 31, 2024. You can find additional information about the Fund at https://www.firsteagle.com/first-eagle-fund-shareholder-reports. You can also request this information by contacting us at 800.334.2143.
First Eagle Overseas Fund
What Were the Fund's Costs for the Year?
Based on a Hypothetical $10,000 Investment
| Class Name | Cost of a $10,000 Investment | Cost Paid as a Percentage of a $10,000 Investment |
|---|
| Class I | $98 | 0.88% |
How Did the Fund Perform Last Year?
The NAV of First Eagle Overseas Fund Class I Shares increased 21.62% in the 12-month period ended October 31, 2024. The MSCI EAFE Index increased 22.97% for the same period.
• Our equity holdings contributed to performance, while gold and gold-related equities also were a contributor.
• All geographic regions contributed to performance. Developed Europe and Japan were the leading contributors, while developed Asia excluding Japan and emerging markets were the worst performing regions.
• Materials, financials and consumer staples were the largest contributors among equity sectors; communication services was the only detractor, while real estate and health care were the next worst performing sectors.
• Gold bullion was the leading contributor to performance. CK Asset Holdings Ltd. was the largest detractor.
Total Return Based on a $1,000,000 Investment
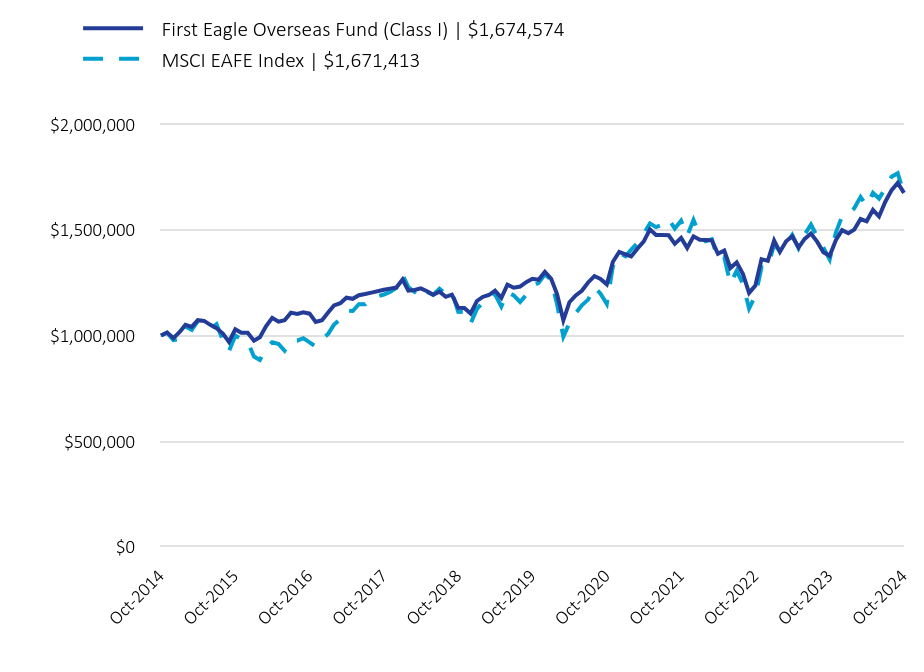
| First Eagle Overseas Fund (Class I) | $1,674,574 | MSCI EAFE Index | $1,671,413 |
|---|
| Oct-2014 | 1,000,000 | 1,000,000 |
| Nov-2014 | 1,014,000 | 1,013,601.700000 |
| Dec-2014 | 987,534.600000 | 978,489.220000 |
| Jan-2015 | 1,016,864.380000 | 983,272.500000 |
| Feb-2015 | 1,050,217.530000 | 1,042,053.480000 |
| Mar-2015 | 1,040,450.510000 | 1,026,223.390000 |
| Apr-2015 | 1,072,496.380000 | 1,068,123.160000 |
| May-2015 | 1,068,957.140000 | 1,062,655.650000 |
| Jun-2015 | 1,050,250.390000 | 1,032,546.910000 |
| Jul-2015 | 1,034,706.690000 | 1,053,985.880000 |
| Aug-2015 | 1,009,356.370000 | 976,451.650000 |
| Sep-2015 | 969,284.930000 | 926,871.730000 |
| Oct-2015 | 1,028,895.950000 | 999,324.680000 |
| Nov-2015 | 1,012,845.170000 | 983,778.270000 |
| Dec-2015 | 1,012,743.890000 | 970,522.860000 |
| Jan-2016 | 975,171.090000 | 900,340.490000 |
| Feb-2016 | 991,944.030000 | 883,845.640000 |
| Mar-2016 | 1,044,814.650000 | 941,355.170000 |
| Apr-2016 | 1,083,263.830000 | 968,608.410000 |
| May-2016 | 1,065,173.320000 | 959,809.400000 |
| Jun-2016 | 1,072,416.500000 | 927,590.950000 |
| Jul-2016 | 1,108,127.970000 | 974,601.950000 |
| Aug-2016 | 1,102,254.890000 | 975,293.900000 |
| Sep-2016 | 1,109,529.770000 | 987,274.800000 |
| Oct-2016 | 1,103,205.450000 | 967,080.240000 |
| Nov-2016 | 1,064,372.620000 | 947,819.840000 |
| Dec-2016 | 1,072,568.290000 | 980,229.950000 |
| Jan-2017 | 1,110,108.180000 | 1,008,664.160000 |
| Feb-2017 | 1,142,069.080000 | 1,051,251.800000 |
| Mar-2017 | 1,152,461.910000 | 1,078,000.770000 |
| Apr-2017 | 1,178,738.040000 | 1,117,567.790000 |
| May-2017 | 1,173,551.600000 | 1,115,591.220000 |
| Jun-2017 | 1,190,450.740000 | 1,147,771.310000 |
| Jul-2017 | 1,196,045.860000 | 1,147,338.840000 |
| Aug-2017 | 1,202,624.110000 | 1,175,885.230000 |
| Oct-2017 | 1,216,213.760000 | 1,193,740.700000 |
| Nov-2017 | 1,221,808.350000 | 1,206,262.160000 |
| Dec-2017 | 1,226,573.400000 | 1,225,624 |
| Jan-2018 | 1,264,965.150000 | 1,287,100.660000 |
| Feb-2018 | 1,212,469.090000 | 1,229,006.140000 |
| Mar-2018 | 1,215,379.020000 | 1,206,854.900000 |
| Apr-2018 | 1,223,157.440000 | 1,234,410.590000 |
| May-2018 | 1,209,580.400000 | 1,206,663.640000 |
| Jun-2018 | 1,192,525.310000 | 1,191,921.490000 |
| Jul-2018 | 1,207,074.120000 | 1,221,261.010000 |
| Aug-2018 | 1,182,811.930000 | 1,197,675.480000 |
| Sep-2018 | 1,192,984.120000 | 1,208,069.780000 |
| Oct-2018 | 1,131,187.540000 | 1,111,917.040000 |
| Nov-2018 | 1,130,169.470000 | 1,110,515.920000 |
| Dec-2018 | 1,103,949.540000 | 1,056,607.140000 |
| Jan-2019 | 1,163,231.630000 | 1,126,047.540000 |
| Feb-2019 | 1,182,308.630000 | 1,154,752.020000 |
| Mar-2019 | 1,191,412.400000 | 1,162,033.610000 |
| Apr-2019 | 1,212,023.840000 | 1,194,704.560000 |
| May-2019 | 1,177,844.770000 | 1,137,327.790000 |
| Jun-2019 | 1,240,623.890000 | 1,204,800.230000 |
| Jul-2019 | 1,225,984.530000 | 1,189,503.100000 |
| Aug-2019 | 1,231,501.460000 | 1,158,687.920000 |
| Sep-2019 | 1,252,560.130000 | 1,191,891.310000 |
| Oct-2019 | 1,268,091.880000 | 1,234,714.900000 |
| Nov-2019 | 1,263,526.750000 | 1,248,634.080000 |
| Dec-2019 | 1,301,432.550000 | 1,289,214.310000 |
| Jan-2020 | 1,268,506.310000 | 1,262,285.440000 |
| Feb-2020 | 1,195,694.050000 | 1,148,177.700000 |
| Mar-2020 | 1,071,939.710000 | 994,932.400000 |
| Apr-2020 | 1,157,480.500000 | 1,059,207.660000 |
| May-2020 | 1,189,311.220000 | 1,105,330.700000 |
| Jun-2020 | 1,211,670.270000 | 1,142,966.740000 |
| Jul-2020 | 1,250,928.380000 | 1,169,608.030000 |
| Aug-2020 | 1,281,200.850000 | 1,229,738.620000 |
| Sep-2020 | 1,267,363.880000 | 1,197,785.920000 |
| Oct-2020 | 1,241,889.870000 | 1,149,959.700000 |
| Nov-2020 | 1,348,692.400000 | 1,328,218.850000 |
| Dec-2020 | 1,395,626.890000 | 1,389,975.690000 |
| Jan-2021 | 1,383,903.620000 | 1,375,167.060000 |
| Feb-2021 | 1,373,801.130000 | 1,406,011.110000 |
| Mar-2021 | 1,411,718.040000 | 1,438,339.780000 |
| Apr-2021 | 1,443,764.040000 | 1,481,618.720000 |
| May-2021 | 1,501,947.730000 | 1,529,935.750000 |
| Jun-2021 | 1,475,213.060000 | 1,512,718.110000 |
| Jul-2021 | 1,475,213.060000 | 1,524,108.120000 |
| Aug-2021 | 1,474,180.410000 | 1,550,992.310000 |
| Sep-2021 | 1,433,640.450000 | 1,505,981.010000 |
| Oct-2021 | 1,461,883.170000 | 1,543,021.200000 |
| Nov-2021 | 1,414,371.960000 | 1,471,203.240000 |
| Dec-2021 | 1,468,966.720000 | 1,546,534.430000 |
| Jan-2022 | 1,452,514.290000 | 1,471,799.780000 |
| Feb-2022 | 1,451,933.290000 | 1,445,776.180000 |
| Mar-2022 | 1,450,190.970000 | 1,455,068.850000 |
| Apr-2022 | 1,386,672.600000 | 1,360,933.590000 |
| May-2022 | 1,401,926 | 1,371,136.220000 |
| Jun-2022 | 1,319,212.370000 | 1,243,911.790000 |
| Jul-2022 | 1,345,860.460000 | 1,305,895.810000 |
| Aug-2022 | 1,290,411.010000 | 1,243,872.820000 |
| Sep-2022 | 1,201,501.690000 | 1,127,512.240000 |
| Oct-2022 | 1,236,585.540000 | 1,188,143.780000 |
| Nov-2022 | 1,361,233.360000 | 1,321,971.370000 |
| Dec-2022 | 1,352,929.840000 | 1,323,033.660000 |
| Jan-2023 | 1,448,717.270000 | 1,430,169.100000 |
| Feb-2023 | 1,395,259.600000 | 1,400,326.380000 |
| Mar-2023 | 1,445,768 | 1,435,032.160000 |
| Apr-2023 | 1,469,334.020000 | 1,475,547.220000 |
| May-2023 | 1,415,850.260000 | 1,413,104.870000 |
| Jun-2023 | 1,457,051.500000 | 1,477,414.650000 |
| Jul-2023 | 1,482,258.490000 | 1,525,218.650000 |
| Aug-2023 | 1,442,830.420000 | 1,466,783.840000 |
| Sep-2023 | 1,393,485.620000 | 1,416,681.930000 |
| Oct-2023 | 1,377,042.490000 | 1,359,247.050000 |
| Nov-2023 | 1,450,438.850000 | 1,485,409.430000 |
| Dec-2023 | 1,498,158.290000 | 1,564,327.760000 |
| Jan-2024 | 1,483,626.150000 | 1,573,330.290000 |
| Feb-2024 | 1,501,132.940000 | 1,602,129.190000 |
| Mar-2024 | 1,551,120.670000 | 1,654,822.630000 |
| Apr-2024 | 1,540,262.830000 | 1,612,444.620000 |
| May-2024 | 1,593,863.970000 | 1,674,902.650000 |
| Jun-2024 | 1,563,102.400000 | 1,647,863.300000 |
| Jul-2024 | 1,632,973.070000 | 1,696,205.870000 |
| Aug-2024 | 1,687,840.970000 | 1,751,360.040000 |
| Sep-2024 | 1,722,104.140000 | 1,767,532.740000 |
| Oct-2024 | 1,674,574 | 1,671,413 |
The above chart represents historical performance of a hypothetical $1,000,000 investment over the past 10 years. The results of this chart do not predict the results of future time periods and does not guarantee the same results.
| Class/Index Name | 1 Year | 5 Years | 10 Years |
|---|
| Class I | 21.62% | 5.72% | 5.30% |
| MSCI EAFE Index | 22.97% | 6.24% | 5.27% |
The Fund's past performance is not a good predictor of the Fund's future performance.The graph and table do not reflect the deduction of taxes that a shareholder would pay on fund distributions or redemption of fund shares. Call us at 800.334.2143 or visit https://www.firsteagle.com if you have questions about current performance.
- Net Assets$12,368,480,904
- Number of Portfolio Holdings133
- Portfolio Turnover Rate6.73%
- Net Investment Advisory Fees (net of waivers and reimbursements)$93,232,514
Asset Allocation by Asset Class
Based on total investments in the portfolio
| Value | Value |
|---|
| Common Stocks | 87.8% |
| Commodities | 10.4% |
| Short-Term Investments | 1.8%Footnote Reference1 |
Top 10 HoldingsFootnote Reference2
Based on total net assets of the portfolio
Gold bullion (Precious Metal)Footnote Reference3 | 10.3% |
| Imperial Oil Ltd. (Oil, Gas & Consumable Fuels, Canada) | 3.9% |
| British American Tobacco plc (Tobacco, United Kingdom) | 2.2% |
| Danone SA (Food Products, France) | 2.2% |
| Willis Towers Watson plc (Insurance, United States) | 2.2% |
| Shell plc (Oil, Gas & Consumable Fuels, United Kingdom) | 2.2% |
| Unilever plc (Personal Care Products, United Kingdom) | 2.2% |
| Prosus NV (Broadline Retail, China) | 2.1% |
| Fomento Economico Mexicano SAB de CV, ADR (Beverages, Mexico) | 2.0% |
| Cie Financiere Richemont SA (Registered) (Textiles, Apparel & Luxury Goods, Switzerland) | 1.9% |
| Total | 31.2% |
Asset Allocation by Sector
Based on total investments in the portfolio
| Value | Value |
|---|
| Short-Term Investments | 1.8% |
OthersFootnote Reference4 | 1.2% |
| Real Estate | 2.6% |
| Health Care | 4.1% |
| Information Technology | 4.9% |
| Energy | 6.1% |
| Materials | 8.6% |
| Consumer Discretionary | 9.5% |
| Commodities | 10.4% |
| Industrials | 14.5% |
| Financials | 14.7% |
| Consumer Staples | 21.6% |
Asset Allocation by CountryFootnote Reference5
Based on total investments in the portfolio
| Japan | 16.1% |
| United Kingdom | 14.5% |
| United States | 14.0% |
| Canada | 9.2% |
| France | 6.1% |
| South Korea | 5.2% |
| Switzerland | 4.9% |
| China | 3.4% |
| Sweden | 3.3% |
| Hong Kong | 3.3% |
OthersFootnote Reference6 | 18.2% |
| Short-Term Investments | 1.8% |
| Footnote | Description |
Footnote1 | Includes short-term commercial paper (1.4% of total investments) that settles in 90 days or less; long-term commercial paper (0.2% of total investments) that settles in 91 days or more; and other short-term investments (0.2% of total investments), such as U.S. treasury bills or money market funds. |
Footnote2 | Holdings in cash, short-term commercial paper, long-term commercial paper and other short-term cash equivalents have been excluded. |
Footnote3 | The Fund invests in gold and precious metals through investment in a wholly owned subsidiary of the Fund organized under the laws of the Cayman Islands (the “Subsidiary”). Gold bullion and commodities include the Fund’s investment in the Subsidiary. |
Footnote4 | Includes additional sectors outside the top 10 listed above. |
Footnote5 | Country allocations reflect country of risk not currency of issue. Bonds of non-U.S. issuers may be U.S. dollar denominated. |
Footnote6 | Includes additional countries outside the top 10 listed above. |
First Eagle Overseas Fund
October 31, 2024
Annual Shareholder Report
For more information, please scan the QR code to navigate to tailored shareholder reports and financial statements and other Information. If you wish to view additional information about the Fund, including but not limited to financial statements, holdings, or the Fund's prospectus, please visit http://www.firsteagle.com.
Important Notice Regarding Delivery of Shareholder Materials
Unless we are notified otherwise, we send one copy of these materials to shareholders with the same residential address (provided they have the same last name or are reasonably believed to be family members) for as long as they remain a shareholder of the Fund. If you would like to receive individual mailings, please call 800.334.2143 and we will send separate copies of these materials within 30 days after receiving your request.
October 31, 2024
Annual Shareholder Report
This Annual Shareholder Report contains important information about the Class R6 shares of the Fund for the period of November 1, 2023, to October 31, 2024. You can find additional information about the Fund at https://www.firsteagle.com/first-eagle-fund-shareholder-reports. You can also request this information by contacting us at 800.334.2143.
First Eagle Overseas Fund
What Were the Fund's Costs for the Year?
Based on a Hypothetical $10,000 Investment
| Class Name | Cost of a $10,000 Investment | Cost Paid as a Percentage of a $10,000 Investment |
|---|
| Class R6 | $88 | 0.80% |
How Did the Fund Perform Last Year?
The NAV of First Eagle Overseas Fund Class R6 Shares increased 21.72% in the 12-month period ended October 31, 2024. The MSCI EAFE Index increased 22.97% for the same period.
• Our equity holdings contributed to performance, while gold and gold-related equities also were a contributor.
• All geographic regions contributed to performance. Developed Europe and Japan were the leading contributors, while developed Asia excluding Japan and emerging markets were the worst performing regions.
• Materials, financials and consumer staples were the largest contributors among equity sectors; communication services was the only detractor, while real estate and health care were the next worst performing sectors.
• Gold bullion was the leading contributor to performance. CK Asset Holdings Ltd. was the largest detractor.
Total Return Based on a $10,000 Investment
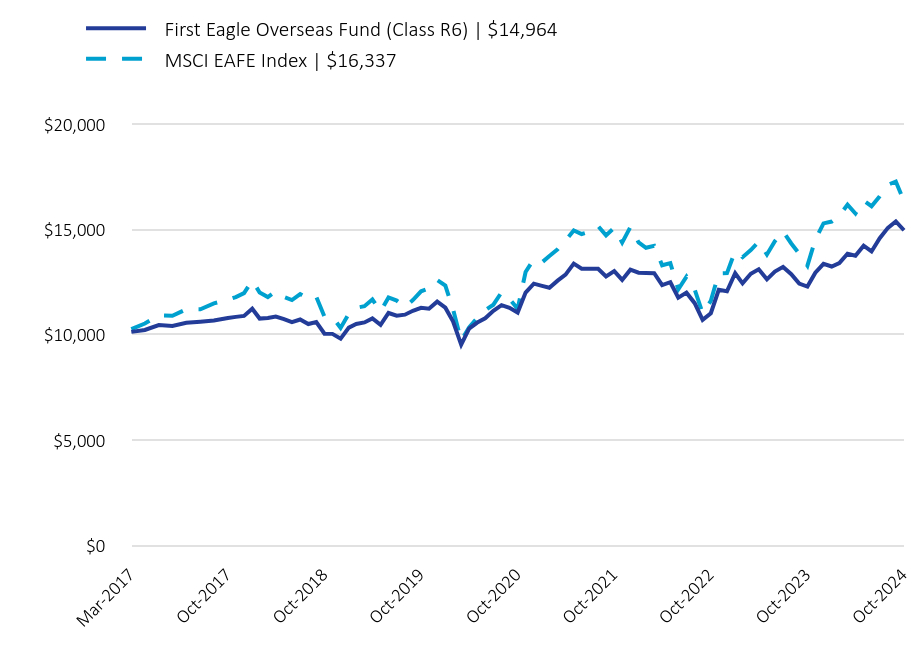
| First Eagle Overseas Fund (Class R6) | $14,964 | MSCI EAFE Index | $16,337 |
|---|
| Mar-2017 | 10,142 | 10,275.290000 |
| Apr-2017 | 10,234.290000 | 10,536.740000 |
| May-2017 | 10,467.630000 | 10,923.480000 |
| Jun-2017 | 10,421.580000 | 10,904.160000 |
| Jul-2017 | 10,571.650000 | 11,218.700000 |
| Aug-2017 | 10,625.560000 | 11,214.470000 |
| Sep-2017 | 10,684 | 11,493.500000 |
| Oct-2017 | 10,804.730000 | 11,668.020000 |
| Nov-2017 | 10,854.430000 | 11,790.410000 |
| Dec-2017 | 10,898.940000 | 11,979.660000 |
| Jan-2018 | 11,240.070000 | 12,580.550000 |
| Feb-2018 | 10,773.610000 | 12,012.720000 |
| Mar-2018 | 10,799.470000 | 11,796.200000 |
| Apr-2018 | 10,872.900000 | 12,065.540000 |
| May-2018 | 10,747.870000 | 11,794.330000 |
| Jun-2018 | 10,600.620000 | 11,650.240000 |
| Jul-2018 | 10,729.950000 | 11,937.010000 |
| Aug-2018 | 10,514.280000 | 11,706.480000 |
| Sep-2018 | 10,604.700000 | 11,808.080000 |
| Oct-2018 | 10,056.440000 | 10,868.250000 |
| Nov-2018 | 10,047.380000 | 10,854.550000 |
| Dec-2018 | 9,818.300000 | 10,327.630000 |
| Jan-2019 | 10,345.550000 | 11,006.370000 |
| Feb-2019 | 10,515.210000 | 11,286.930000 |
| Mar-2019 | 10,590.920000 | 11,358.110000 |
| Apr-2019 | 10,778.380000 | 11,677.440000 |
| May-2019 | 10,474.430000 | 11,116.620000 |
| Jun-2019 | 11,037.960000 | 11,776.120000 |
| Jul-2019 | 10,908.810000 | 11,626.600000 |
| Aug-2019 | 10,957.900000 | 11,325.400000 |
| Sep-2019 | 11,140.900000 | 11,649.940000 |
| Oct-2019 | 11,283.500000 | 12,068.520000 |
| Nov-2019 | 11,242.880000 | 12,204.570000 |
| Dec-2019 | 11,577.920000 | 12,601.210000 |
| Jan-2020 | 11,289.630000 | 12,338 |
| Feb-2020 | 10,641.610000 | 11,222.670000 |
| Mar-2020 | 9,540.200000 | 9,724.800000 |
| Apr-2020 | 10,301.510000 | 10,353.050000 |
| May-2020 | 10,584.800000 | 10,803.870000 |
| Jun-2020 | 10,783.790000 | 11,171.740000 |
| Jul-2020 | 11,138.580000 | 11,432.140000 |
| Aug-2020 | 11,408.130000 | 12,019.880000 |
| Sep-2020 | 11,284.930000 | 11,707.560000 |
| Oct-2020 | 11,058.100000 | 11,240.090000 |
| Nov-2020 | 12,007.990000 | 12,982.460000 |
| Dec-2020 | 12,429.470000 | 13,586.090000 |
| Jan-2021 | 12,325.060000 | 13,441.340000 |
| Feb-2021 | 12,235.090000 | 13,742.820000 |
| Mar-2021 | 12,572.780000 | 14,058.810000 |
| Apr-2021 | 12,858.180000 | 14,481.840000 |
| May-2021 | 13,381.510000 | 14,954.100000 |
| Jun-2021 | 13,143.320000 | 14,785.810000 |
| Jul-2021 | 13,143.320000 | 14,897.140000 |
| Aug-2021 | 13,134.120000 | 15,159.920000 |
| Sep-2021 | 12,772.930000 | 14,719.960000 |
| Oct-2021 | 13,024.550000 | 15,082.010000 |
| Nov-2021 | 12,606.470000 | 14,380.030000 |
| Dec-2021 | 13,090.550000 | 15,116.340000 |
| Jan-2022 | 12,949.180000 | 14,385.860000 |
| Feb-2022 | 12,938.820000 | 14,131.500000 |
| Mar-2022 | 12,928.470000 | 14,222.330000 |
| Apr-2022 | 12,362.200000 | 13,302.220000 |
| May-2022 | 12,498.180000 | 13,401.940000 |
| Jun-2022 | 11,760.790000 | 12,158.410000 |
| Jul-2022 | 12,003.060000 | 12,764.260000 |
| Aug-2022 | 11,503.740000 | 12,158.030000 |
| Sep-2022 | 10,715.730000 | 11,020.680000 |
| Oct-2022 | 11,028.630000 | 11,613.310000 |
| Nov-2022 | 12,139.210000 | 12,921.390000 |
| Dec-2022 | 12,071.230000 | 12,931.770000 |
| Jan-2023 | 12,925.880000 | 13,978.950000 |
| Feb-2023 | 12,443.740000 | 13,687.260000 |
| Mar-2023 | 12,900.430000 | 14,026.480000 |
| Apr-2023 | 13,110.700000 | 14,422.490000 |
| May-2023 | 12,633.470000 | 13,812.160000 |
| Jun-2023 | 13,001.110000 | 14,440.750000 |
| Jul-2023 | 13,226.030000 | 14,908 |
| Aug-2023 | 12,879.500000 | 14,336.840000 |
| Sep-2023 | 12,433.870000 | 13,847.120000 |
| Oct-2023 | 12,292.130000 | 13,285.740000 |
| Nov-2023 | 12,947.300000 | 14,518.890000 |
| Dec-2023 | 13,373.260000 | 15,290.260000 |
| Jan-2024 | 13,243.540000 | 15,378.260000 |
| Feb-2024 | 13,405.110000 | 15,659.750000 |
| Mar-2024 | 13,851.510000 | 16,174.790000 |
| Apr-2024 | 13,754.540000 | 15,760.570000 |
| May-2024 | 14,233.200000 | 16,371.060000 |
| Jun-2024 | 13,958.500000 | 16,106.770000 |
| Jul-2024 | 14,588.030000 | 16,579.280000 |
| Aug-2024 | 15,078.190000 | 17,118.380000 |
| Sep-2024 | 15,384.280000 | 17,276.460000 |
| Oct-2024 | 14,964 | 16,337 |
The above chart represents historical performance of a hypothetical $10,000 investment since inception. The results of this chart do not predict the results of future time periods and does not guarantee the same results.
| Class/Index Name | 1 Year | 5 Years | Since Inception (3/1/17) |
|---|
| Class R6 | 21.72% | 5.81% | 5.40% |
| MSCI EAFE Index | 22.97% | 6.24% | 6.53% |
The Fund's past performance is not a good predictor of the Fund's future performance.The graph and table do not reflect the deduction of taxes that a shareholder would pay on fund distributions or redemption of fund shares. Call us at 800.334.2143 or visit https://www.firsteagle.com if you have questions about current performance.
- Net Assets$12,368,480,904
- Number of Portfolio Holdings133
- Portfolio Turnover Rate6.73%
- Net Investment Advisory Fees (net of waivers and reimbursements)$93,232,514
Asset Allocation by Asset Class
Based on total investments in the portfolio
| Value | Value |
|---|
| Common Stocks | 87.8% |
| Commodities | 10.4% |
| Short-Term Investments | 1.8%Footnote Reference1 |
Top 10 HoldingsFootnote Reference2
Based on total net assets of the portfolio
Gold bullion (Precious Metal)Footnote Reference3 | 10.3% |
| Imperial Oil Ltd. (Oil, Gas & Consumable Fuels, Canada) | 3.9% |
| British American Tobacco plc (Tobacco, United Kingdom) | 2.2% |
| Danone SA (Food Products, France) | 2.2% |
| Willis Towers Watson plc (Insurance, United States) | 2.2% |
| Shell plc (Oil, Gas & Consumable Fuels, United Kingdom) | 2.2% |
| Unilever plc (Personal Care Products, United Kingdom) | 2.2% |
| Prosus NV (Broadline Retail, China) | 2.1% |
| Fomento Economico Mexicano SAB de CV, ADR (Beverages, Mexico) | 2.0% |
| Cie Financiere Richemont SA (Registered) (Textiles, Apparel & Luxury Goods, Switzerland) | 1.9% |
| Total | 31.2% |
Asset Allocation by Sector
Based on total investments in the portfolio
| Value | Value |
|---|
| Short-Term Investments | 1.8% |
OthersFootnote Reference4 | 1.2% |
| Real Estate | 2.6% |
| Health Care | 4.1% |
| Information Technology | 4.9% |
| Energy | 6.1% |
| Materials | 8.6% |
| Consumer Discretionary | 9.5% |
| Commodities | 10.4% |
| Industrials | 14.5% |
| Financials | 14.7% |
| Consumer Staples | 21.6% |
Asset Allocation by CountryFootnote Reference5
Based on total investments in the portfolio
| Japan | 16.1% |
| United Kingdom | 14.5% |
| United States | 14.0% |
| Canada | 9.2% |
| France | 6.1% |
| South Korea | 5.2% |
| Switzerland | 4.9% |
| China | 3.4% |
| Sweden | 3.3% |
| Hong Kong | 3.3% |
OthersFootnote Reference6 | 18.2% |
| Short-Term Investments | 1.8% |
| Footnote | Description |
Footnote1 | Includes short-term commercial paper (1.4% of total investments) that settles in 90 days or less; long-term commercial paper (0.2% of total investments) that settles in 91 days or more; and other short-term investments (0.2% of total investments), such as U.S. treasury bills or money market funds. |
Footnote2 | Holdings in cash, short-term commercial paper, long-term commercial paper and other short-term cash equivalents have been excluded. |
Footnote3 | The Fund invests in gold and precious metals through investment in a wholly owned subsidiary of the Fund organized under the laws of the Cayman Islands (the “Subsidiary”). Gold bullion and commodities include the Fund’s investment in the Subsidiary. |
Footnote4 | Includes additional sectors outside the top 10 listed above. |
Footnote5 | Country allocations reflect country of risk not currency of issue. Bonds of non-U.S. issuers may be U.S. dollar denominated. |
Footnote6 | Includes additional countries outside the top 10 listed above. |
First Eagle Overseas Fund
October 31, 2024
Annual Shareholder Report
For more information, please scan the QR code to navigate to tailored shareholder reports and financial statements and other Information. If you wish to view additional information about the Fund, including but not limited to financial statements, holdings, or the Fund's prospectus, please visit http://www.firsteagle.com.
Important Notice Regarding Delivery of Shareholder Materials
Unless we are notified otherwise, we send one copy of these materials to shareholders with the same residential address (provided they have the same last name or are reasonably believed to be family members) for as long as they remain a shareholder of the Fund. If you would like to receive individual mailings, please call 800.334.2143 and we will send separate copies of these materials within 30 days after receiving your request.
October 31, 2024
Annual Shareholder Report
This Annual Shareholder Report contains important information about the Class A shares of the Fund, and any material changes that occurred for the period of November 1, 2023, to October 31, 2024. You can find additional information about the Fund at https://www.firsteagle.com/first-eagle-fund-shareholder-reports. You can also request this information by contacting us at 800.334.2143.
First Eagle U.S. Value Fund
What Were the Fund's Costs for the Year?
Based on a Hypothetical $10,000 Investment
| Class Name | Cost of a $10,000 Investment | Cost Paid as a Percentage of a $10,000 Investment |
|---|
| Class A | $129 | 1.12% |
How Did the Fund Perform Last Year?
The NAV of First Eagle U.S. Value Fund Class A Shares1 increased 30.07% in the 12-month period ended October 31, 2024. The S&P 500 Index increased 38.02% for the same period.
• Our equity holdings contributed to performance, while gold and gold-related equities also were a contributor.
• Financials, materials and communication services were the largest contributors among equity sectors; energy was the only detractor while utilities and consumer discretionary were the next two worst performing sector.
• Gold bullion was the leading contributor to performance. Schlumberger NV was the largest detractor.
1 Reflects performance for Class A shares without the effect of sales charges and assumes all distributions have been reinvested; if sales charges were included, values would be lower.
Total Return Based on a $10,000 Investment
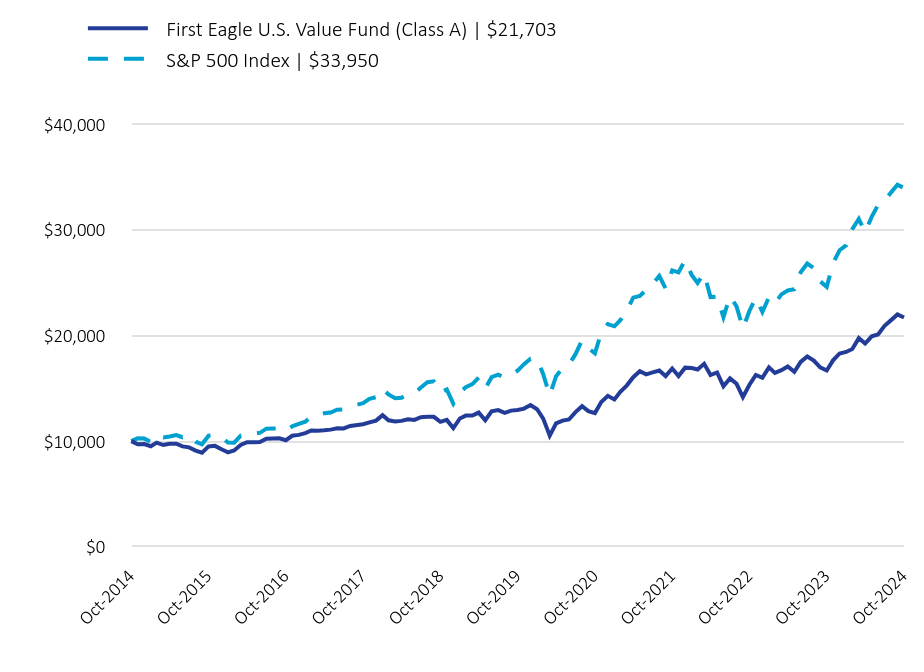
| First Eagle U.S. Value Fund (Class A) | $21,703 | S&P 500 Index | $33,950 |
|---|
| Oct-2014 | 10,000 | 10,000 |
| Nov-2014 | 9,707.100000 | 10,269 |
| Dec-2014 | 9,733.310000 | 10,243 |
| Jan-2015 | 9,522.100000 | 9,936 |
| Feb-2015 | 9,862.040000 | 10,507 |
| Mar-2015 | 9,636.200000 | 10,340 |
| Apr-2015 | 9,755.680000 | 10,440 |
| May-2015 | 9,765.440000 | 10,574 |
| Jun-2015 | 9,506.660000 | 10,369 |
| Jul-2015 | 9,410.640000 | 10,586 |
| Aug-2015 | 9,108.560000 | 9,948 |
| Sep-2015 | 8,902.700000 | 9,702 |
| Oct-2015 | 9,501.860000 | 10,520 |
| Nov-2015 | 9,554.120000 | 10,551 |
| Dec-2015 | 9,232.140000 | 10,385 |
| Jan-2016 | 8,940.410000 | 9,870 |
| Feb-2016 | 9,121 | 9,856 |
| Mar-2016 | 9,633.600000 | 10,525 |
| Apr-2016 | 9,894.670000 | 10,566 |
| May-2016 | 9,889.730000 | 10,755 |
| Jun-2016 | 9,909.510000 | 10,783 |
| Jul-2016 | 10,220.660000 | 11,181 |
| Aug-2016 | 10,260.520000 | 11,196 |
| Sep-2016 | 10,270.780000 | 11,199 |
| Oct-2016 | 10,090.020000 | 10,994 |
| Nov-2016 | 10,511.780000 | 11,401 |
| Dec-2016 | 10,593.770000 | 11,627 |
| Jan-2017 | 10,763.270000 | 11,847 |
| Feb-2017 | 11,014.800000 | 12,332 |
| Mar-2017 | 10,981.760000 | 12,459 |
| Apr-2017 | 11,025.690000 | 12,634 |
| May-2017 | 11,090.740000 | 12,713 |
| Jun-2017 | 11,216.060000 | 12,974 |
| Jul-2017 | 11,204.850000 | 13,014 |
| Aug-2017 | 11,439.030000 | 13,283 |
| Oct-2017 | 11,596.890000 | 13,593 |
| Nov-2017 | 11,776.640000 | 14,009 |
| Dec-2017 | 11,948.580000 | 14,165 |
| Jan-2018 | 12,459.980000 | 14,976 |
| Feb-2018 | 11,977.780000 | 14,424 |
| Mar-2018 | 11,859.200000 | 14,058 |
| Apr-2018 | 11,918.490000 | 14,112 |
| May-2018 | 12,073.430000 | 14,451 |
| Jun-2018 | 12,014.270000 | 14,540 |
| Jul-2018 | 12,264.170000 | 15,081 |
| Aug-2018 | 12,318.130000 | 15,573 |
| Sep-2018 | 12,305.810000 | 15,662 |
| Oct-2018 | 11,829.580000 | 14,591 |
| Nov-2018 | 12,014.120000 | 14,888 |
| Dec-2018 | 11,241.610000 | 13,544 |
| Jan-2019 | 12,148.810000 | 14,629 |
| Feb-2019 | 12,417.300000 | 15,099 |
| Mar-2019 | 12,417.300000 | 15,393 |
| Apr-2019 | 12,705.380000 | 16,016 |
| May-2019 | 11,983.710000 | 14,998 |
| Jun-2019 | 12,828.570000 | 16,055 |
| Jul-2019 | 12,945.310000 | 16,286 |
| Aug-2019 | 12,677.340000 | 16,028 |
| Sep-2019 | 12,890.320000 | 16,328 |
| Oct-2019 | 12,945.750000 | 16,681 |
| Nov-2019 | 13,082.970000 | 17,287 |
| Dec-2019 | 13,417.900000 | 17,809 |
| Jan-2020 | 13,022.070000 | 17,802 |
| Feb-2020 | 12,133.960000 | 16,336 |
| Mar-2020 | 10,522.570000 | 14,319 |
| Apr-2020 | 11,686.370000 | 16,154 |
| May-2020 | 11,946.970000 | 16,923 |
| Jun-2020 | 12,050.910000 | 17,260 |
| Jul-2020 | 12,752.280000 | 18,233 |
| Aug-2020 | 13,312.100000 | 19,544 |
| Sep-2020 | 12,842.180000 | 18,801 |
| Oct-2020 | 12,655.970000 | 18,301 |
| Nov-2020 | 13,707.680000 | 20,305 |
| Dec-2020 | 14,288.890000 | 21,085 |
| Jan-2021 | 13,947.390000 | 20,872 |
| Feb-2021 | 14,668.470000 | 21,448 |
| Mar-2021 | 15,283.070000 | 22,387 |
| Apr-2021 | 16,056.400000 | 23,582 |
| May-2021 | 16,618.370000 | 23,747 |
| Jun-2021 | 16,322.560000 | 24,301 |
| Jul-2021 | 16,505.380000 | 24,878 |
| Aug-2021 | 16,686.940000 | 25,635 |
| Sep-2021 | 16,156.290000 | 24,443 |
| Oct-2021 | 16,870.400000 | 26,155 |
| Nov-2021 | 16,156.780000 | 25,974 |
| Dec-2021 | 16,956.540000 | 27,138 |
| Jan-2022 | 16,914.150000 | 25,734 |
| Feb-2022 | 16,780.530000 | 24,963 |
| Mar-2022 | 17,322.540000 | 25,890 |
| Apr-2022 | 16,257.200000 | 23,632 |
| May-2022 | 16,499.440000 | 23,676 |
| Jun-2022 | 15,200.930000 | 21,721 |
| Jul-2022 | 15,942.740000 | 23,724 |
| Aug-2022 | 15,426.190000 | 22,757 |
| Sep-2022 | 14,176.670000 | 20,661 |
| Oct-2022 | 15,334.900000 | 22,334 |
| Nov-2022 | 16,267.270000 | 23,582 |
| Dec-2022 | 15,992.350000 | 22,223 |
| Jan-2023 | 16,982.280000 | 23,619 |
| Feb-2023 | 16,460.920000 | 23,043 |
| Mar-2023 | 16,712.770000 | 23,889 |
| Apr-2023 | 17,072.100000 | 24,262 |
| May-2023 | 16,568.470000 | 24,367 |
| Jun-2023 | 17,504.590000 | 25,977 |
| Jul-2023 | 18,017.470000 | 26,812 |
| Aug-2023 | 17,630.100000 | 26,385 |
| Sep-2023 | 16,981.310000 | 25,127 |
| Oct-2023 | 16,684.140000 | 24,599 |
| Nov-2023 | 17,646.810000 | 26,845 |
| Dec-2023 | 18,297.980000 | 28,065 |
| Jan-2024 | 18,442.530000 | 28,536 |
| Feb-2024 | 18,721.010000 | 30,060 |
| Mar-2024 | 19,750.670000 | 31,027 |
| Apr-2024 | 19,241.100000 | 29,760 |
| May-2024 | 19,924.160000 | 31,236 |
| Jun-2024 | 20,097.500000 | 32,356 |
| Jul-2024 | 20,915.470000 | 32,750 |
| Aug-2024 | 21,453 | 33,545 |
| Sep-2024 | 21,991.470000 | 34,261 |
| Oct-2024 | 21,703 | 33,950 |
The above chart represents historical performance of a hypothetical $10,000 investment over the past 10 years. The results of this chart do not predict the results of future time periods and does not guarantee the same results.
| Class/Index Name | 1 Year | 5 Years | 10 Years |
|---|
| Class A - without sales charge | 30.07% | 10.88% | 8.61% |
| Class A - with sales charge | 23.54% | 9.75% | 8.06% |
| S&P 500 Index | 38.02% | 15.27% | 13.00% |
The Fund's past performance is not a good predictor of the Fund's future performance.The graph and table do not reflect the deduction of taxes that a shareholder would pay on fund distributions or redemption of fund shares. Call us at 800.334.2143 or visit https://www.firsteagle.com if you have questions about current performance.
- Net Assets$1,397,774,168
- Number of Portfolio Holdings81
- Portfolio Turnover Rate8.63%
- Net Investment Advisory Fees (net of waivers and reimbursements)$9,508,844
Asset Allocation by Asset Class
Based on total investments in the portfolio
| Value | Value |
|---|
| Common Stocks | 77.5% |
| Commodities | 12.6% |
| Master Limited Partnerships | 1.4% |
| Corporate Bonds | 1.3% |
| Convertible Preferred Stocks | 0.4% |
| Short-Term Investments | 6.8%Footnote Reference1 |
Top 10 HoldingsFootnote Reference2
Based on total net assets of the portfolio
Gold bullion (Precious Metal)Footnote Reference3 | 12.6% |
| Oracle Corp. (Software, United States) | 4.4% |
| Meta Platforms, Inc., Class A (Interactive Media & Services, United States) | 3.9% |
| HCA Healthcare, Inc. (Health Care Providers & Services, United States) | 3.8% |
| Philip Morris International, Inc. (Tobacco, United States) | 3.7% |
| Bank of New York Mellon Corp. (The) (Capital Markets, United States) | 3.2% |
| Comcast Corp., Class A (Media, United States) | 2.9% |
| Exxon Mobil Corp. (Oil, Gas & Consumable Fuels, United States) | 2.7% |
| CH Robinson Worldwide, Inc. (Air Freight & Logistics, United States) | 2.6% |
| Elevance Health, Inc. (Health Care Providers & Services, United States) | 2.5% |
| Total | 42.3% |
Asset Allocation by Sector
Based on total investments in the portfolio
| Value | Value |
|---|
| Short-Term Investments | 6.8% |
OthersFootnote Reference4 | 0.4% |
| Real Estate | 3.9% |
| Materials | 4.4% |
| Industrials | 7.0% |
| Consumer Staples | 7.4% |
| Energy | 8.2% |
| Information Technology | 11.6% |
| Communication Services | 11.7% |
| Financials | 12.3% |
| Commodities | 12.6% |
| Health Care | 13.7% |
| Footnote | Description |
Footnote1 | Includes short-term commercial paper (3.7% of total investments) that settles in 90 days or less; long-term commercial paper (0.7% of total investments) that settles in 91 days or more; and other short-term investments (2.4% of total investments), such as U.S. treasury bills or money market funds. |
Footnote2 | Holdings in cash, short-term commercial paper, long-term commercial paper and other short-term cash equivalents have been excluded. |
Footnote3 | The Fund invests in gold and precious metals through investment in a wholly owned subsidiary of the Fund organized under the laws of the Cayman Islands (the “Subsidiary”). Gold bullion and commodities include the Fund’s investment in the Subsidiary. |
Footnote4 | Includes additional sectors outside the top 10 listed above. |
First Eagle U.S. Value Fund
October 31, 2024
Annual Shareholder Report
For more information, please scan the QR code to navigate to tailored shareholder reports and financial statements and other Information. If you wish to view additional information about the Fund, including but not limited to financial statements, holdings, or the Fund's prospectus, please visit http://www.firsteagle.com.
This is a summary of certain changes of the Fund since November 1, 2023. For more information contact 800.334.2143 or you may review the Fund’s next prospectus, which is expected to be available by March 1, 2025 at https://www.firsteagle.com or upon request at 800.334.2143.
Until March 1, 2024, the Adviser contractually agreed to waive its management fee at an annual rate in the amount of 0.05% of the average daily value of the U.S. Value Fund’s net assets.
Important Notice Regarding Delivery of Shareholder Materials
Unless we are notified otherwise, we send one copy of these materials to shareholders with the same residential address (provided they have the same last name or are reasonably believed to be family members) for as long as they remain a shareholder of the Fund. If you would like to receive individual mailings, please call 800.334.2143 and we will send separate copies of these materials within 30 days after receiving your request.
October 31, 2024
Annual Shareholder Report
This Annual Shareholder Report contains important information about the Class C shares of the Fund, and any material changes that occurred for the period of November 1, 2023, to October 31, 2024. You can find additional information about the Fund at https://www.firsteagle.com/first-eagle-fund-shareholder-reports. You can also request this information by contacting us at 800.334.2143.
First Eagle U.S. Value Fund
What Were the Fund's Costs for the Year?
Based on a Hypothetical $10,000 Investment
| Class Name | Cost of a $10,000 Investment | Cost Paid as a Percentage of a $10,000 Investment |
|---|
| Class C | $216 | 1.88% |
How Did the Fund Perform Last Year?
The NAV of First Eagle U.S. Value Fund Class C Shares1 increased 29.10% in the 12-month period ended October 31, 2024. The S&P 500 Index increased 38.02% for the same period.
• Our equity holdings contributed to performance, while gold and gold-related equities also were a contributor.
• Financials, materials and communication services were the largest contributors among equity sectors; energy was the only detractor while utilities and consumer discretionary were the next two worst performing sector.
• Gold bullion was the leading contributor to performance. Schlumberger NV was the largest detractor.
1 Reflects performance for Class C shares without the effect of sales charges and assumes all distributions have been reinvested; if sales charges were included, values would be lower.
Total Return Based on a $10,000 Investment
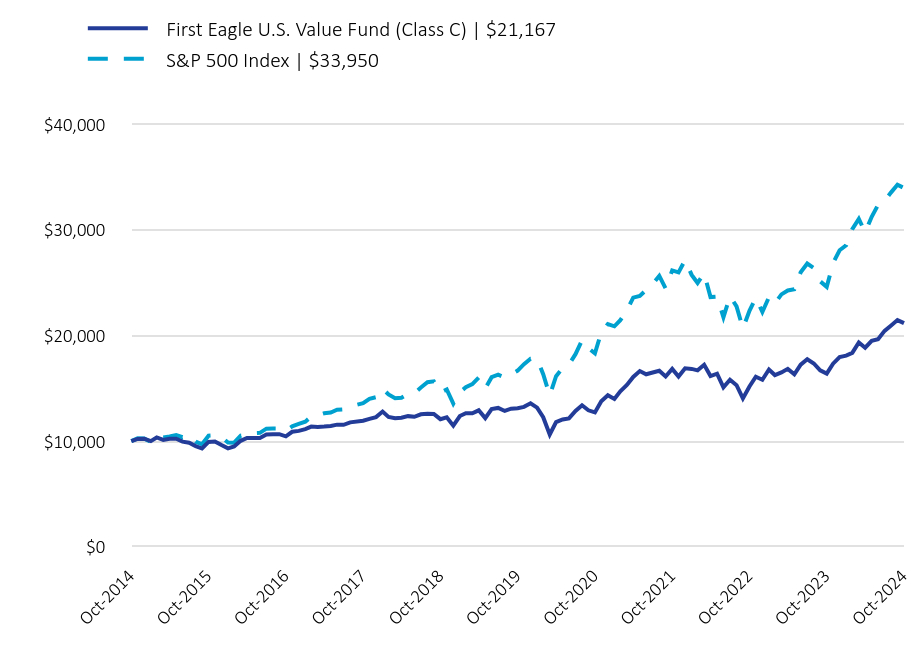
| First Eagle U.S. Value Fund (Class C) | $21,167 | S&P 500 Index | $33,950 |
|---|
| Oct-2014 | 10,000 | 10,000 |
| Nov-2014 | 10,212 | 10,269 |
| Dec-2014 | 10,231.400000 | 10,243 |
| Jan-2015 | 10,006.310000 | 9,936 |
| Feb-2015 | 10,353.530000 | 10,507 |
| Mar-2015 | 10,113.330000 | 10,340 |
| Apr-2015 | 10,230.640000 | 10,440 |
| May-2015 | 10,235.760000 | 10,574 |
| Jun-2015 | 9,959.390000 | 10,369 |
| Jul-2015 | 9,846.850000 | 10,586 |
| Aug-2015 | 9,529.780000 | 9,948 |
| Sep-2015 | 9,304.880000 | 9,702 |
| Oct-2015 | 9,928.310000 | 10,520 |
| Nov-2015 | 9,973.980000 | 10,551 |
| Dec-2015 | 9,632.870000 | 10,385 |
| Jan-2016 | 9,322.690000 | 9,870 |
| Feb-2016 | 9,504.480000 | 9,856 |
| Mar-2016 | 10,033.880000 | 10,525 |
| Apr-2016 | 10,301.790000 | 10,566 |
| May-2016 | 10,291.480000 | 10,755 |
| Jun-2016 | 10,301.780000 | 10,783 |
| Jul-2016 | 10,623.190000 | 11,181 |
| Aug-2016 | 10,655.060000 | 11,196 |
| Sep-2016 | 10,660.390000 | 11,199 |
| Oct-2016 | 10,462.110000 | 10,994 |
| Nov-2016 | 10,890.010000 | 11,401 |
| Dec-2016 | 10,974.950000 | 11,627 |
| Jan-2017 | 11,137.380000 | 11,847 |
| Feb-2017 | 11,381.840000 | 12,332 |
| Mar-2017 | 11,340.870000 | 12,459 |
| Apr-2017 | 11,381.700000 | 12,634 |
| May-2017 | 11,439.740000 | 12,713 |
| Jun-2017 | 11,562.150000 | 12,974 |
| Jul-2017 | 11,544.810000 | 13,014 |
| Aug-2017 | 11,776.860000 | 13,283 |
| Oct-2017 | 11,939.380000 | 13,593 |
| Nov-2017 | 12,113.690000 | 14,009 |
| Dec-2017 | 12,278.440000 | 14,165 |
| Jan-2018 | 12,799.040000 | 14,976 |
| Feb-2018 | 12,297.320000 | 14,424 |
| Mar-2018 | 12,170.660000 | 14,058 |
| Apr-2018 | 12,221.780000 | 14,112 |
| May-2018 | 12,367.210000 | 14,451 |
| Jun-2018 | 12,304.140000 | 14,540 |
| Jul-2018 | 12,545.300000 | 15,081 |
| Aug-2018 | 12,595.480000 | 15,573 |
| Sep-2018 | 12,576.590000 | 15,662 |
| Oct-2018 | 12,081.070000 | 14,591 |
| Nov-2018 | 12,258.660000 | 14,888 |
| Dec-2018 | 11,467.980000 | 13,544 |
| Jan-2019 | 12,377.390000 | 14,629 |
| Feb-2019 | 12,648.460000 | 15,099 |
| Mar-2019 | 12,640.870000 | 15,393 |
| Apr-2019 | 12,918.970000 | 16,016 |
| May-2019 | 12,178.710000 | 14,998 |
| Jun-2019 | 13,028.780000 | 16,055 |
| Jul-2019 | 13,146.040000 | 16,286 |
| Aug-2019 | 12,859.460000 | 16,028 |
| Sep-2019 | 13,071.640000 | 16,328 |
| Oct-2019 | 13,116.080000 | 16,681 |
| Nov-2019 | 13,248.560000 | 17,287 |
| Dec-2019 | 13,579.770000 | 17,809 |
| Jan-2020 | 13,168.300000 | 17,802 |
| Feb-2020 | 12,264.960000 | 16,336 |
| Mar-2020 | 10,632.490000 | 14,319 |
| Apr-2020 | 11,796.750000 | 16,154 |
| May-2020 | 12,050.380000 | 16,923 |
| Jun-2020 | 12,152.810000 | 17,260 |
| Jul-2020 | 12,850.380000 | 18,233 |
| Aug-2020 | 13,396.520000 | 19,544 |
| Sep-2020 | 12,920.940000 | 18,801 |
| Oct-2020 | 12,723.250000 | 18,301 |
| Nov-2020 | 13,776.740000 | 20,305 |
| Dec-2020 | 14,348.470000 | 21,085 |
| Jan-2021 | 13,996.940000 | 20,872 |
| Feb-2021 | 14,714.980000 | 21,448 |
| Mar-2021 | 15,313.880000 | 22,387 |
| Apr-2021 | 16,081.100000 | 23,582 |
| May-2021 | 16,632.690000 | 23,747 |
| Jun-2021 | 16,329.970000 | 24,301 |
| Jul-2021 | 16,498.170000 | 24,878 |
| Aug-2021 | 16,666.450000 | 25,635 |
| Sep-2021 | 16,123.120000 | 24,443 |
| Oct-2021 | 16,834.150000 | 26,155 |
| Nov-2021 | 16,115.340000 | 25,974 |
| Dec-2021 | 16,892.090000 | 27,138 |
| Jan-2022 | 16,839.730000 | 25,734 |
| Feb-2022 | 16,699.960000 | 24,963 |
| Mar-2022 | 17,224.340000 | 25,890 |
| Apr-2022 | 16,159.870000 | 23,632 |
| May-2022 | 16,386.110000 | 23,676 |
| Jun-2022 | 15,085.060000 | 21,721 |
| Jul-2022 | 15,809.140000 | 23,724 |
| Aug-2022 | 15,293.760000 | 22,757 |
| Sep-2022 | 14,045.790000 | 20,661 |
| Oct-2022 | 15,180.690000 | 22,334 |
| Nov-2022 | 16,097.600000 | 23,582 |
| Dec-2022 | 15,811.070000 | 22,223 |
| Jan-2023 | 16,781.860000 | 23,619 |
| Feb-2023 | 16,254.910000 | 23,043 |
| Mar-2023 | 16,500.360000 | 23,889 |
| Apr-2023 | 16,840.270000 | 24,262 |
| May-2023 | 16,331.690000 | 24,367 |
| Jun-2023 | 17,246.270000 | 25,977 |
| Jul-2023 | 17,746.410000 | 26,812 |
| Aug-2023 | 17,350.670000 | 26,385 |
| Sep-2023 | 16,700.020000 | 25,127 |
| Oct-2023 | 16,397.750000 | 24,599 |
| Nov-2023 | 17,330.780000 | 26,845 |
| Dec-2023 | 17,959.880000 | 28,065 |
| Jan-2024 | 18,090.990000 | 28,536 |
| Feb-2024 | 18,351.500000 | 30,060 |
| Mar-2024 | 19,344.320000 | 31,027 |
| Apr-2024 | 18,843.300000 | 29,760 |
| May-2024 | 19,495.280000 | 31,236 |
| Jun-2024 | 19,645.390000 | 32,356 |
| Jul-2024 | 20,437.100000 | 32,750 |
| Aug-2024 | 20,948.030000 | 33,545 |
| Sep-2024 | 21,459.160000 | 34,261 |
| Oct-2024 | 21,167 | 33,950 |
The above chart represents historical performance of a hypothetical $10,000 investment over the past 10 years. The results of this chart do not predict the results of future time periods and does not guarantee the same results.
| Class/Index Name | 1 Year | 5 Years | 10 Years |
|---|
| Class C - without sales charge | 29.10% | 10.04% | 7.79% |
| Class C - with sales charge | 28.10% | 10.04% | 7.79% |
| S&P 500 Index | 38.02% | 15.27% | 13.00% |
The Fund's past performance is not a good predictor of the Fund's future performance.The graph and table do not reflect the deduction of taxes that a shareholder would pay on fund distributions or redemption of fund shares. Call us at 800.334.2143 or visit https://www.firsteagle.com if you have questions about current performance.
- Net Assets$1,397,774,168
- Number of Portfolio Holdings81
- Portfolio Turnover Rate8.63%
- Net Investment Advisory Fees (net of waivers and reimbursements)$9,508,844
Asset Allocation by Asset Class
Based on total investments in the portfolio
| Value | Value |
|---|
| Common Stocks | 77.5% |
| Commodities | 12.6% |
| Master Limited Partnerships | 1.4% |
| Corporate Bonds | 1.3% |
| Convertible Preferred Stocks | 0.4% |
| Short-Term Investments | 6.8%Footnote Reference1 |
Top 10 HoldingsFootnote Reference2
Based on total net assets of the portfolio
Gold bullion (Precious Metal)Footnote Reference3 | 12.6% |
| Oracle Corp. (Software, United States) | 4.4% |
| Meta Platforms, Inc., Class A (Interactive Media & Services, United States) | 3.9% |
| HCA Healthcare, Inc. (Health Care Providers & Services, United States) | 3.8% |
| Philip Morris International, Inc. (Tobacco, United States) | 3.7% |
| Bank of New York Mellon Corp. (The) (Capital Markets, United States) | 3.2% |
| Comcast Corp., Class A (Media, United States) | 2.9% |
| Exxon Mobil Corp. (Oil, Gas & Consumable Fuels, United States) | 2.7% |
| CH Robinson Worldwide, Inc. (Air Freight & Logistics, United States) | 2.6% |
| Elevance Health, Inc. (Health Care Providers & Services, United States) | 2.5% |
| Total | 42.3% |
Asset Allocation by Sector
Based on total investments in the portfolio
| Value | Value |
|---|
| Short-Term Investments | 6.8% |
OthersFootnote Reference4 | 0.4% |
| Real Estate | 3.9% |
| Materials | 4.4% |
| Industrials | 7.0% |
| Consumer Staples | 7.4% |
| Energy | 8.2% |
| Information Technology | 11.6% |
| Communication Services | 11.7% |
| Financials | 12.3% |
| Commodities | 12.6% |
| Health Care | 13.7% |
| Footnote | Description |
Footnote1 | Includes short-term commercial paper (3.7% of total investments) that settles in 90 days or less; long-term commercial paper (0.7% of total investments) that settles in 91 days or more; and other short-term investments (2.4% of total investments), such as U.S. treasury bills or money market funds. |
Footnote2 | Holdings in cash, short-term commercial paper, long-term commercial paper and other short-term cash equivalents have been excluded. |
Footnote3 | The Fund invests in gold and precious metals through investment in a wholly owned subsidiary of the Fund organized under the laws of the Cayman Islands (the “Subsidiary”). Gold bullion and commodities include the Fund’s investment in the Subsidiary. |
Footnote4 | Includes additional sectors outside the top 10 listed above. |
First Eagle U.S. Value Fund
October 31, 2024
Annual Shareholder Report
For more information, please scan the QR code to navigate to tailored shareholder reports and financial statements and other Information. If you wish to view additional information about the Fund, including but not limited to financial statements, holdings, or the Fund's prospectus, please visit http://www.firsteagle.com.
This is a summary of certain changes of the Fund since November 1, 2023. For more information contact 800.334.2143 or you may review the Fund’s next prospectus, which is expected to be available by March 1, 2025 at https://www.firsteagle.com or upon request at 800.334.2143.
Until March 1, 2024, the Adviser contractually agreed to waive its management fee at an annual rate in the amount of 0.05% of the average daily value of the U.S. Value Fund’s net assets.
Important Notice Regarding Delivery of Shareholder Materials
Unless we are notified otherwise, we send one copy of these materials to shareholders with the same residential address (provided they have the same last name or are reasonably believed to be family members) for as long as they remain a shareholder of the Fund. If you would like to receive individual mailings, please call 800.334.2143 and we will send separate copies of these materials within 30 days after receiving your request.
October 31, 2024
Annual Shareholder Report
This Annual Shareholder Report contains important information about the Class I shares of the Fund, and any material changes that occurred for the period of November 1, 2023, to October 31, 2024. You can find additional information about the Fund at https://www.firsteagle.com/first-eagle-fund-shareholder-reports. You can also request this information by contacting us at 800.334.2143.
First Eagle U.S. Value Fund
What Were the Fund's Costs for the Year?
Based on a Hypothetical $10,000 Investment
| Class Name | Cost of a $10,000 Investment | Cost Paid as a Percentage of a $10,000 Investment |
|---|
| Class I | $99 | 0.86% |
How Did the Fund Perform Last Year?
The NAV of First Eagle U.S. Value Fund Class I Shares increased 30.41% in the 12-month period ended October 31, 2024. The S&P 500 Index increased 38.02% for the same period.
• Our equity holdings contributed to performance, while gold and gold-related equities also were a contributor.
• Financials, materials and communication services were the largest contributors among equity sectors; energy was the only detractor while utilities and consumer discretionary were the next two worst performing sector.
• Gold bullion was the leading contributor to performance. Schlumberger NV was the largest detractor.
Total Return Based on a $1,000,000 Investment
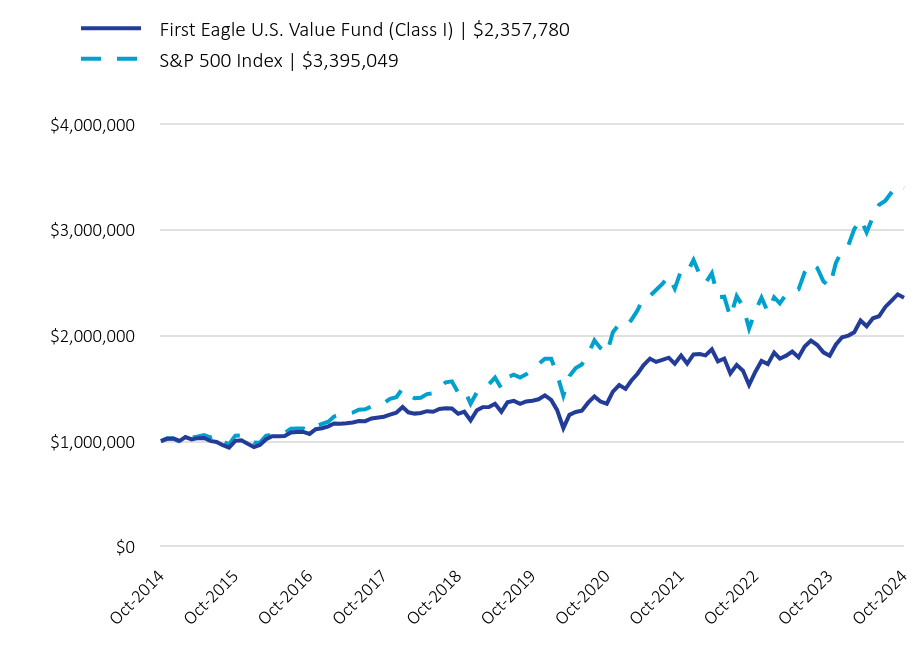
| First Eagle U.S. Value Fund (Class I) | $2,357,780 | S&P 500 Index | $3,395,049 |
|---|
| Oct-2014 | 1,000,000 | 1,000,000 |
| Nov-2014 | 1,022,000 | 1,026,895 |
| Dec-2014 | 1,024,861.600000 | 1,024,308 |
| Jan-2015 | 1,002,929.560000 | 993,559 |
| Feb-2015 | 1,038,834.440000 | 1,050,660 |
| Mar-2015 | 1,015,876.200000 | 1,034,045 |
| Apr-2015 | 1,028,371.480000 | 1,043,964 |
| May-2015 | 1,029,914.030000 | 1,057,389 |
| Jun-2015 | 1,002,930.290000 | 1,036,920 |
| Jul-2015 | 993,001.280000 | 1,058,645 |
| Aug-2015 | 961,622.440000 | 994,773 |
| Sep-2015 | 939,697.440000 | 970,159 |
| Oct-2015 | 1,003,033.050000 | 1,051,995 |
| Nov-2015 | 1,009,051.250000 | 1,055,124 |
| Dec-2015 | 974,945.320000 | 1,038,483 |
| Jan-2016 | 945,014.500000 | 986,949 |
| Feb-2016 | 963,914.790000 | 985,617 |
| Mar-2016 | 1,018,375.970000 | 1,052,480 |
| Apr-2016 | 1,046,177.640000 | 1,056,560 |
| May-2016 | 1,046,177.640000 | 1,075,534 |
| Jun-2016 | 1,048,269.990000 | 1,078,320 |
| Jul-2016 | 1,081,814.630000 | 1,118,077 |
| Aug-2016 | 1,086,033.710000 | 1,119,647 |
| Sep-2016 | 1,087,662.760000 | 1,119,858 |
| Oct-2016 | 1,068,302.360000 | 1,099,431 |
| Nov-2016 | 1,113,384.720000 | 1,140,148 |
| Dec-2016 | 1,122,625.810000 | 1,162,684 |
| Jan-2017 | 1,140,251.040000 | 1,184,736 |
| Feb-2017 | 1,167,010.450000 | 1,233,214 |
| Mar-2017 | 1,164,209.630000 | 1,245,879 |
| Apr-2017 | 1,169,332.150000 | 1,263,412 |
| May-2017 | 1,176,698.940000 | 1,271,298 |
| Jun-2017 | 1,189,760.300000 | 1,297,439 |
| Jul-2017 | 1,189,165.420000 | 1,301,411 |
| Aug-2017 | 1,214,256.810000 | 1,328,257 |
| Oct-2017 | 1,231,377.830000 | 1,359,252 |
| Nov-2017 | 1,250,710.460000 | 1,400,940 |
| Dec-2017 | 1,268,845.760000 | 1,416,516 |
| Jan-2018 | 1,323,659.900000 | 1,497,618 |
| Feb-2018 | 1,273,228.460000 | 1,442,420 |
| Mar-2018 | 1,260,750.820000 | 1,405,763 |
| Apr-2018 | 1,266,928.500000 | 1,411,157 |
| May-2018 | 1,283,778.650000 | 1,445,141 |
| Jun-2018 | 1,278,130.020000 | 1,454,035 |
| Jul-2018 | 1,304,203.870000 | 1,508,145 |
| Aug-2018 | 1,310,464.050000 | 1,557,289 |
| Sep-2018 | 1,309,808.820000 | 1,566,153 |
| Oct-2018 | 1,258,726.280000 | 1,459,106 |
| Nov-2018 | 1,278,614.150000 | 1,488,840 |
| Dec-2018 | 1,197,038.570000 | 1,354,411 |
| Jan-2019 | 1,293,400.170000 | 1,462,948 |
| Feb-2019 | 1,322,113.660000 | 1,509,921 |
| Mar-2019 | 1,322,774.710000 | 1,539,261 |
| Apr-2019 | 1,353,727.640000 | 1,601,586 |
| May-2019 | 1,277,512.780000 | 1,499,808 |
| Jun-2019 | 1,367,449.680000 | 1,605,509 |
| Jul-2019 | 1,381,124.170000 | 1,628,583 |
| Aug-2019 | 1,352,396.790000 | 1,602,786 |
| Sep-2019 | 1,375,387.540000 | 1,632,775 |
| Oct-2019 | 1,381,851.860000 | 1,668,140 |
| Nov-2019 | 1,396,223.120000 | 1,728,692 |
| Dec-2019 | 1,432,943.780000 | 1,780,867 |
| Jan-2020 | 1,390,671.940000 | 1,780,169 |
| Feb-2020 | 1,296,106.250000 | 1,633,627 |
| Mar-2020 | 1,124,112.950000 | 1,431,853 |
| Apr-2020 | 1,249,226.720000 | 1,615,408 |
| May-2020 | 1,276,584.790000 | 1,692,346 |
| Jun-2020 | 1,288,329.370000 | 1,726,002 |
| Jul-2020 | 1,364,211.970000 | 1,823,323 |
| Aug-2020 | 1,423,691.610000 | 1,954,385 |
| Sep-2020 | 1,374,431.880000 | 1,880,124 |
| Oct-2020 | 1,354,090.290000 | 1,830,125 |
| Nov-2020 | 1,468,240.100000 | 2,030,458 |
| Dec-2020 | 1,530,053.010000 | 2,108,525 |
| Jan-2021 | 1,494,249.770000 | 2,087,238 |
| Feb-2021 | 1,571,651.900000 | 2,144,793 |
| Mar-2021 | 1,637,818.450000 | 2,238,726 |
| Apr-2021 | 1,720,692.060000 | 2,358,204 |
| May-2021 | 1,781,260.420000 | 2,374,674 |
| Jun-2021 | 1,750,088.370000 | 2,430,111 |
| Jul-2021 | 1,770,039.370000 | 2,487,838 |
| Aug-2021 | 1,790,040.820000 | 2,563,482 |
| Sep-2021 | 1,733,475.530000 | 2,444,255 |
| Oct-2021 | 1,810,788.540000 | 2,615,504 |
| Nov-2021 | 1,734,192.180000 | 2,597,381 |
| Dec-2021 | 1,820,554.950000 | 2,713,786 |
| Jan-2022 | 1,824,924.290000 | 2,573,355 |
| Feb-2022 | 1,811,784.830000 | 2,496,305 |
| Mar-2022 | 1,869,943.120000 | 2,588,992 |
| Apr-2022 | 1,755,502.600000 | 2,363,227 |
| May-2022 | 1,781,835.140000 | 2,367,563 |
| Jun-2022 | 1,641,070.170000 | 2,172,135 |
| Jul-2022 | 1,721,974.930000 | 2,372,416 |
| Aug-2022 | 1,666,527.330000 | 2,275,664 |
| Sep-2022 | 1,531,871.930000 | 2,066,079 |
| Oct-2022 | 1,657,638.610000 | 2,233,351 |
| Nov-2022 | 1,758,754.570000 | 2,358,160 |
| Dec-2022 | 1,729,207.490000 | 2,222,296 |
| Jan-2023 | 1,837,628.800000 | 2,361,931 |
| Feb-2023 | 1,780,478.540000 | 2,304,303 |
| Mar-2023 | 1,808,966.200000 | 2,388,903 |
| Apr-2023 | 1,848,039.870000 | 2,426,190 |
| May-2023 | 1,793,707.500000 | 2,436,736 |
| Jun-2023 | 1,895,590.080000 | 2,597,744 |
| Jul-2023 | 1,951,699.550000 | 2,681,197 |
| Aug-2023 | 1,909,738.010000 | 2,638,508 |
| Sep-2023 | 1,840,223.550000 | 2,512,709 |
| Oct-2023 | 1,807,835.610000 | 2,459,876 |
| Nov-2023 | 1,912,509.290000 | 2,684,525 |
| Dec-2023 | 1,983,080.890000 | 2,806,485 |
| Jan-2024 | 1,999,342.150000 | 2,853,645 |
| Feb-2024 | 2,030,931.750000 | 3,006,018 |
| Mar-2024 | 2,141,820.630000 | 3,102,735 |
| Apr-2024 | 2,087,846.750000 | 2,976,005 |
| May-2024 | 2,162,591.660000 | 3,123,569 |
| Jun-2024 | 2,181,838.730000 | 3,235,650 |
| Jul-2024 | 2,270,421.380000 | 3,275,035 |
| Aug-2024 | 2,330,360.510000 | 3,354,477 |
| Sep-2024 | 2,389,318.630000 | 3,426,119 |
| Oct-2024 | 2,357,780 | 3,395,049 |
The above chart represents historical performance of a hypothetical $1,000,000 investment over the past 10 years. The results of this chart do not predict the results of future time periods and does not guarantee the same results.
| Class/Index Name | 1 Year | 5 Years | 10 Years |
|---|
| Class I | 30.41% | 11.17% | 8.91% |
| S&P 500 Index | 38.02% | 15.27% | 13.00% |
The Fund's past performance is not a good predictor of the Fund's future performance.The graph and table do not reflect the deduction of taxes that a shareholder would pay on fund distributions or redemption of fund shares. Call us at 800.334.2143 or visit https://www.firsteagle.com if you have questions about current performance.
- Net Assets$1,397,774,168
- Number of Portfolio Holdings81
- Portfolio Turnover Rate8.63%
- Net Investment Advisory Fees (net of waivers and reimbursements)$9,508,844
Asset Allocation by Asset Class
Based on total investments in the portfolio
| Value | Value |
|---|
| Common Stocks | 77.5% |
| Commodities | 12.6% |
| Master Limited Partnerships | 1.4% |
| Corporate Bonds | 1.3% |
| Convertible Preferred Stocks | 0.4% |
| Short-Term Investments | 6.8%Footnote Reference1 |
Top 10 HoldingsFootnote Reference2
Based on total net assets of the portfolio
Gold bullion (Precious Metal)Footnote Reference3 | 12.6% |
| Oracle Corp. (Software, United States) | 4.4% |
| Meta Platforms, Inc., Class A (Interactive Media & Services, United States) | 3.9% |
| HCA Healthcare, Inc. (Health Care Providers & Services, United States) | 3.8% |
| Philip Morris International, Inc. (Tobacco, United States) | 3.7% |
| Bank of New York Mellon Corp. (The) (Capital Markets, United States) | 3.2% |
| Comcast Corp., Class A (Media, United States) | 2.9% |
| Exxon Mobil Corp. (Oil, Gas & Consumable Fuels, United States) | 2.7% |
| CH Robinson Worldwide, Inc. (Air Freight & Logistics, United States) | 2.6% |
| Elevance Health, Inc. (Health Care Providers & Services, United States) | 2.5% |
| Total | 42.3% |
Asset Allocation by Sector
Based on total investments in the portfolio
| Value | Value |
|---|
| Short-Term Investments | 6.8% |
OthersFootnote Reference4 | 0.4% |
| Real Estate | 3.9% |
| Materials | 4.4% |
| Industrials | 7.0% |
| Consumer Staples | 7.4% |
| Energy | 8.2% |
| Information Technology | 11.6% |
| Communication Services | 11.7% |
| Financials | 12.3% |
| Commodities | 12.6% |
| Health Care | 13.7% |
| Footnote | Description |
Footnote1 | Includes short-term commercial paper (3.7% of total investments) that settles in 90 days or less; long-term commercial paper (0.7% of total investments) that settles in 91 days or more; and other short-term investments (2.4% of total investments), such as U.S. treasury bills or money market funds. |
Footnote2 | Holdings in cash, short-term commercial paper, long-term commercial paper and other short-term cash equivalents have been excluded. |
Footnote3 | The Fund invests in gold and precious metals through investment in a wholly owned subsidiary of the Fund organized under the laws of the Cayman Islands (the “Subsidiary”). Gold bullion and commodities include the Fund’s investment in the Subsidiary. |
Footnote4 | Includes additional sectors outside the top 10 listed above. |
First Eagle U.S. Value Fund
October 31, 2024
Annual Shareholder Report
For more information, please scan the QR code to navigate to tailored shareholder reports and financial statements and other Information. If you wish to view additional information about the Fund, including but not limited to financial statements, holdings, or the Fund's prospectus, please visit http://www.firsteagle.com.
This is a summary of certain changes of the Fund since November 1, 2023. For more information contact 800.334.2143 or you may review the Fund’s next prospectus, which is expected to be available by March 1, 2025 at https://www.firsteagle.com or upon request at 800.334.2143.
Until March 1, 2024, the Adviser contractually agreed to waive its management fee at an annual rate in the amount of 0.05% of the average daily value of the U.S. Value Fund’s net assets.
Important Notice Regarding Delivery of Shareholder Materials
Unless we are notified otherwise, we send one copy of these materials to shareholders with the same residential address (provided they have the same last name or are reasonably believed to be family members) for as long as they remain a shareholder of the Fund. If you would like to receive individual mailings, please call 800.334.2143 and we will send separate copies of these materials within 30 days after receiving your request.
October 31, 2024
Annual Shareholder Report
This Annual Shareholder Report contains important information about the Class R6 shares of the Fund, and any material changes that occurred for the period of November 1, 2023, to October 31, 2024. You can find additional information about the Fund at https://www.firsteagle.com/first-eagle-fund-shareholder-reports. You can also request this information by contacting us at 800.334.2143.
First Eagle U.S. Value Fund
What Were the Fund's Costs for the Year?
Based on a Hypothetical $10,000 Investment
| Class Name | Cost of a $10,000 Investment | Cost Paid as a Percentage of a $10,000 Investment |
|---|
| Class R6 | $94 | 0.81% |
How Did the Fund Perform Last Year?
The NAV of First Eagle U.S. Value Fund Class R6 Shares increased 30.50% in the 12-month period ended October 31, 2024. The S&P 500 Index increased 38.02% for the same period.
• Our equity holdings contributed to performance, while gold and gold-related equities also were a contributor.
• Financials, materials and communication services were the largest contributors among equity sectors; energy was the only detractor while utilities and consumer discretionary were the next two worst performing sector.
• Gold bullion was the leading contributor to performance. Schlumberger NV was the largest detractor.
Total Return Based on a $10,000 Investment
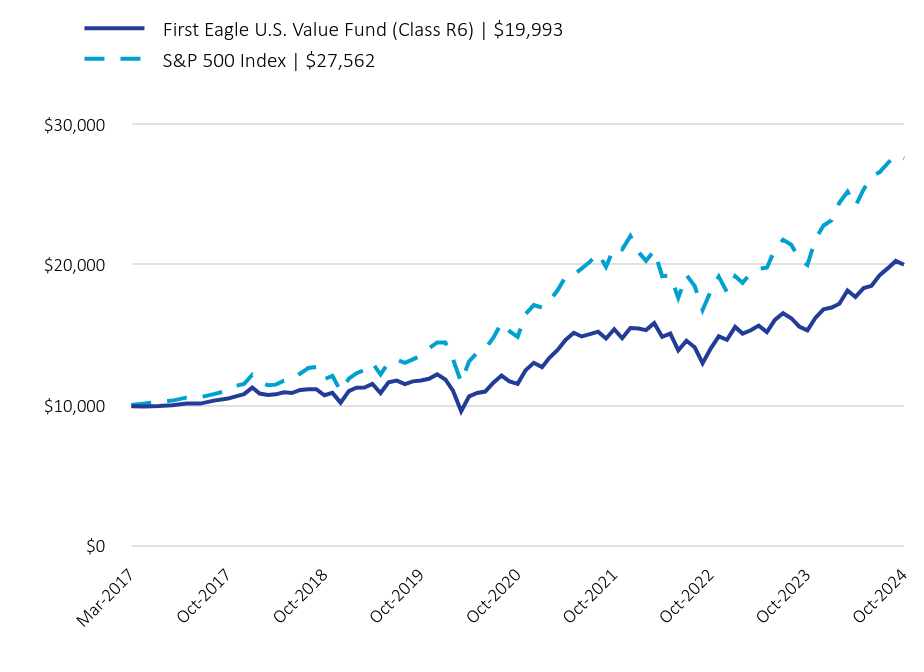
| First Eagle U.S. Value Fund (Class R6) | $19,993 | S&P 500 Index | $27,562 |
|---|
| Mar-2017 | 9,918 | 10,012 |
| Apr-2017 | 9,894.200000 | 10,114 |
| May-2017 | 9,932.780000 | 10,257 |
| Jun-2017 | 9,995.360000 | 10,321 |
| Jul-2017 | 10,111.310000 | 10,533 |
| Aug-2017 | 10,106.250000 | 10,565 |
| Sep-2017 | 10,319.490000 | 10,783 |
| Oct-2017 | 10,465 | 11,035 |
| Nov-2017 | 10,625.110000 | 11,373 |
| Dec-2017 | 10,783.430000 | 11,500 |
| Jan-2018 | 11,249.270000 | 12,158 |
| Feb-2018 | 10,820.670000 | 11,710 |
| Mar-2018 | 10,714.630000 | 11,412 |
| Apr-2018 | 10,767.130000 | 11,456 |
| May-2018 | 10,910.340000 | 11,732 |
| Jun-2018 | 10,862.330000 | 11,804 |
| Jul-2018 | 11,083.920000 | 12,244 |
| Aug-2018 | 11,137.120000 | 12,643 |
| Sep-2018 | 11,131.560000 | 12,715 |
| Oct-2018 | 10,702.990000 | 11,846 |
| Nov-2018 | 10,872.100000 | 12,087 |
| Dec-2018 | 10,176.280000 | 10,996 |
| Jan-2019 | 10,995.470000 | 11,877 |
| Feb-2019 | 11,239.570000 | 12,258 |
| Mar-2019 | 11,245.190000 | 12,496 |
| Apr-2019 | 11,508.330000 | 13,002 |
| May-2019 | 10,860.410000 | 12,176 |
| Jun-2019 | 11,630.420000 | 13,034 |
| Jul-2019 | 11,740.900000 | 13,221 |
| Aug-2019 | 11,496.690000 | 13,012 |
| Sep-2019 | 11,692.140000 | 13,255 |
| Oct-2019 | 11,752.940000 | 13,543 |
| Nov-2019 | 11,875.170000 | 14,034 |
| Dec-2019 | 12,186.300000 | 14,458 |
| Jan-2020 | 11,826.800000 | 14,452 |
| Feb-2020 | 11,022.580000 | 13,262 |
| Mar-2020 | 9,566.500000 | 11,624 |
| Apr-2020 | 10,623.590000 | 13,114 |
| May-2020 | 10,862.620000 | 13,739 |
| Jun-2020 | 10,962.560000 | 14,012 |
| Jul-2020 | 11,600.580000 | 14,802 |
| Aug-2020 | 12,106.370000 | 15,866 |
| Sep-2020 | 11,687.490000 | 15,264 |
| Oct-2020 | 11,514.510000 | 14,858 |
| Nov-2020 | 12,485.190000 | 16,484 |
| Dec-2020 | 13,009.560000 | 17,118 |
| Jan-2021 | 12,703.840000 | 16,945 |
| Feb-2021 | 13,368.250000 | 17,412 |
| Mar-2021 | 13,931.050000 | 18,175 |
| Apr-2021 | 14,635.960000 | 19,145 |
| May-2021 | 15,151.150000 | 19,278 |
| Jun-2021 | 14,886 | 19,728 |
| Jul-2021 | 15,055.700000 | 20,197 |
| Aug-2021 | 15,225.830000 | 20,811 |
| Sep-2021 | 14,744.700000 | 19,843 |
| Oct-2021 | 15,402.310000 | 21,234 |
| Nov-2021 | 14,758.490000 | 21,086 |
| Dec-2021 | 15,487.560000 | 22,031 |
| Jan-2022 | 15,458.140000 | 20,891 |
| Feb-2022 | 15,339.110000 | 20,266 |
| Mar-2022 | 15,831.500000 | 21,018 |
| Apr-2022 | 14,862.610000 | 19,186 |
| May-2022 | 15,092.980000 | 19,221 |
| Jun-2022 | 13,900.630000 | 17,634 |
| Jul-2022 | 14,585.930000 | 19,260 |
| Aug-2022 | 14,116.270000 | 18,475 |
| Sep-2022 | 12,982.730000 | 16,773 |
| Oct-2022 | 14,040.820000 | 18,131 |
| Nov-2022 | 14,897.310000 | 19,144 |
| Dec-2022 | 14,654.490000 | 18,041 |
| Jan-2023 | 15,566 | 19,175 |
| Feb-2023 | 15,089.680000 | 18,707 |
| Mar-2023 | 15,323.570000 | 19,394 |
| Apr-2023 | 15,662.220000 | 19,697 |
| May-2023 | 15,193.920000 | 19,782 |
| Jun-2023 | 16,064.530000 | 21,089 |
| Jul-2023 | 16,540.040000 | 21,767 |
| Aug-2023 | 16,184.430000 | 21,420 |
| Sep-2023 | 15,595.320000 | 20,399 |
| Oct-2023 | 15,320.840000 | 19,970 |
| Nov-2023 | 16,207.910000 | 21,794 |
| Dec-2023 | 16,817.330000 | 22,784 |
| Jan-2024 | 16,946.830000 | 23,167 |
| Feb-2024 | 17,214.590000 | 24,404 |
| Mar-2024 | 18,154.500000 | 25,189 |
| Apr-2024 | 17,697.010000 | 24,160 |
| May-2024 | 18,327.020000 | 25,358 |
| Jun-2024 | 18,490.130000 | 26,268 |
| Jul-2024 | 19,250.080000 | 26,588 |
| Aug-2024 | 19,750.580000 | 27,233 |
| Sep-2024 | 20,260.140000 | 27,814 |
| Oct-2024 | 19,993 | 27,562 |
The above chart represents historical performance of a hypothetical $10,000 investment since inception. The results of this chart do not predict the results of future time periods and does not guarantee the same results.
| Class/Index Name | 1 Year | 5 Years | Since Inception (3/1/17) |
|---|
| Class R6 | 30.50% | 11.22% | 9.46% |
| S&P 500 Index | 38.02% | 15.27% | 13.88% |
The Fund's past performance is not a good predictor of the Fund's future performance.The graph and table do not reflect the deduction of taxes that a shareholder would pay on fund distributions or redemption of fund shares. Call us at 800.334.2143 or visit https://www.firsteagle.com if you have questions about current performance.
- Net Assets$1,397,774,168
- Number of Portfolio Holdings81
- Portfolio Turnover Rate8.63%
- Net Investment Advisory Fees (net of waivers and reimbursements)$9,508,844
Asset Allocation by Asset Class
Based on total investments in the portfolio
| Value | Value |
|---|
| Common Stocks | 77.5% |
| Commodities | 12.6% |
| Master Limited Partnerships | 1.4% |
| Corporate Bonds | 1.3% |
| Convertible Preferred Stocks | 0.4% |
| Short-Term Investments | 6.8%Footnote Reference1 |
Top 10 HoldingsFootnote Reference2
Based on total net assets of the portfolio
Gold bullion (Precious Metal)Footnote Reference3 | 12.6% |
| Oracle Corp. (Software, United States) | 4.4% |
| Meta Platforms, Inc., Class A (Interactive Media & Services, United States) | 3.9% |
| HCA Healthcare, Inc. (Health Care Providers & Services, United States) | 3.8% |
| Philip Morris International, Inc. (Tobacco, United States) | 3.7% |
| Bank of New York Mellon Corp. (The) (Capital Markets, United States) | 3.2% |
| Comcast Corp., Class A (Media, United States) | 2.9% |
| Exxon Mobil Corp. (Oil, Gas & Consumable Fuels, United States) | 2.7% |
| CH Robinson Worldwide, Inc. (Air Freight & Logistics, United States) | 2.6% |
| Elevance Health, Inc. (Health Care Providers & Services, United States) | 2.5% |
| Total | 42.3% |
Asset Allocation by Sector
Based on total investments in the portfolio
| Value | Value |
|---|
| Short-Term Investments | 6.8% |
OthersFootnote Reference4 | 0.4% |
| Real Estate | 3.9% |
| Materials | 4.4% |
| Industrials | 7.0% |
| Consumer Staples | 7.4% |
| Energy | 8.2% |
| Information Technology | 11.6% |
| Communication Services | 11.7% |
| Financials | 12.3% |
| Commodities | 12.6% |
| Health Care | 13.7% |
| Footnote | Description |
Footnote1 | Includes short-term commercial paper (3.7% of total investments) that settles in 90 days or less; long-term commercial paper (0.7% of total investments) that settles in 91 days or more; and other short-term investments (2.4% of total investments), such as U.S. treasury bills or money market funds. |
Footnote2 | Holdings in cash, short-term commercial paper, long-term commercial paper and other short-term cash equivalents have been excluded. |
Footnote3 | The Fund invests in gold and precious metals through investment in a wholly owned subsidiary of the Fund organized under the laws of the Cayman Islands (the “Subsidiary”). Gold bullion and commodities include the Fund’s investment in the Subsidiary. |
Footnote4 | Includes additional sectors outside the top 10 listed above. |
First Eagle U.S. Value Fund
October 31, 2024
Annual Shareholder Report
For more information, please scan the QR code to navigate to tailored shareholder reports and financial statements and other Information. If you wish to view additional information about the Fund, including but not limited to financial statements, holdings, or the Fund's prospectus, please visit http://www.firsteagle.com.
This is a summary of certain changes of the Fund since November 1, 2023. For more information contact 800.334.2143 or you may review the Fund’s next prospectus, which is expected to be available by March 1, 2025 at https://www.firsteagle.com or upon request at 800.334.2143.
Until March 1, 2024, the Adviser contractually agreed to waive its management fee at an annual rate in the amount of 0.05% of the average daily value of the U.S. Value Fund’s net assets.
Important Notice Regarding Delivery of Shareholder Materials
Unless we are notified otherwise, we send one copy of these materials to shareholders with the same residential address (provided they have the same last name or are reasonably believed to be family members) for as long as they remain a shareholder of the Fund. If you would like to receive individual mailings, please call 800.334.2143 and we will send separate copies of these materials within 30 days after receiving your request.
October 31, 2024
Annual Shareholder Report
This Annual Shareholder Report contains important information about the Class A shares of the Fund for the period of November 1, 2023, to October 31, 2024. You can find additional information about the Fund at https://www.firsteagle.com/first-eagle-fund-shareholder-reports. You can also request this information by contacting us at 800.334.2143.
What Were the Fund's Costs for the Year?
Based on a Hypothetical $10,000 Investment
| Class Name | Cost of a $10,000 Investment | Cost Paid as a Percentage of a $10,000 Investment |
|---|
| Class A | $138 | 1.16% |
How Did the Fund Perform Last Year?
The NAV of First Eagle Gold Fund Class A Shares1 increased 37.88% in the 12-month period ended October 31, 2024. The FTSE Gold Mines Index increased 42.99% and MSCI World Index increased 33.68% for the same period.
• Gold bullion and gold-related equities both contributed to performance.
• Wheaton Precious Metals Corp. was the leading contributor to performance. Novagold Resources, Inc. was the largest detractor.
1 Reflects performance for Class A shares without the effect of sales charges and assumes all distributions have been reinvested; if sales charges were included, values would be lower.
Total Return Based on a $10,000 Investment
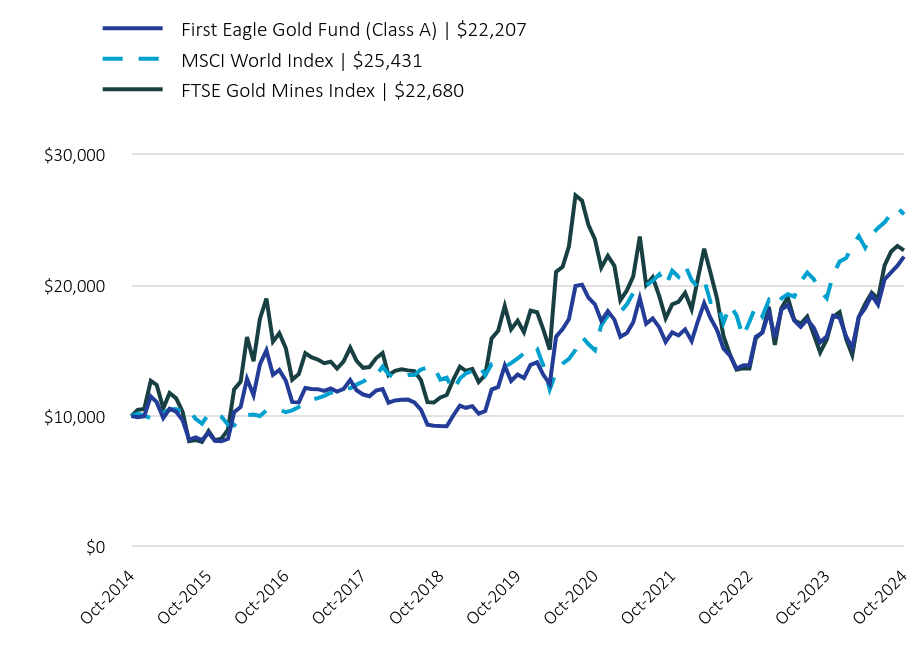
| First Eagle Gold Fund (Class A) | $22,207 | MSCI World Index | $25,431 | FTSE Gold Mines Index | $22,680 |
|---|
| Oct-2014 | 10,000 | 10,000 | 10,000 |
| Nov-2014 | 9,917 | 10,200.410000 | 10,483.270000 |
| Dec-2014 | 10,001 | 10,035.930000 | 10,540.670000 |
| Jan-2015 | 11,513 | 9,854.080000 | 12,699.290000 |
| Feb-2015 | 11,067 | 10,431.420000 | 12,388.120000 |
| Mar-2015 | 9,845 | 10,268.130000 | 10,592.610000 |
| Apr-2015 | 10,559 | 10,508.940000 | 11,768.410000 |
| May-2015 | 10,340 | 10,545.140000 | 11,362.110000 |
| Jun-2015 | 9,697 | 10,299.940000 | 10,344.950000 |
| Jul-2015 | 8,207 | 10,484.830000 | 8,086.020000 |
| Aug-2015 | 8,377 | 9,791 | 8,167.410000 |
| Sep-2015 | 8,165 | 9,429.860000 | 8,024.390000 |
| Oct-2015 | 8,730 | 10,177.120000 | 8,865.500000 |
| Nov-2015 | 8,108 | 10,126.490000 | 8,153.770000 |
| Dec-2015 | 8,073 | 9,948.490000 | 8,283.340000 |
| Jan-2016 | 8,263 | 9,353.330000 | 8,968.540000 |
| Feb-2016 | 10,297 | 9,283.720000 | 12,049.760000 |
| Mar-2016 | 10,700 | 9,913.700000 | 12,641.330000 |
| Apr-2016 | 12,861 | 10,070.570000 | 16,050.940000 |
| May-2016 | 11,597 | 10,127.130000 | 14,203.020000 |
| Jun-2016 | 13,963 | 10,013.650000 | 17,429.710000 |
| Jul-2016 | 15,030 | 10,436.720000 | 18,987.470000 |
| Aug-2016 | 13,165 | 10,445.390000 | 15,701.930000 |
| Sep-2016 | 13,532 | 10,500.870000 | 16,345.750000 |
| Oct-2016 | 12,705 | 10,297.650000 | 15,187.930000 |
| Nov-2016 | 11,088 | 10,445.720000 | 12,784.240000 |
| Dec-2016 | 11,052 | 10,695.670000 | 13,219.040000 |
| Jan-2017 | 12,154 | 10,953.810000 | 14,823.620000 |
| Feb-2017 | 12,083.580000 | 11,257.710000 | 14,509.940000 |
| Mar-2017 | 12,062 | 11,377.630000 | 14,329.130000 |
| Apr-2017 | 11,935 | 11,546.090000 | 14,048.990000 |
| May-2017 | 12,112 | 11,790.340000 | 14,162.430000 |
| Jun-2017 | 11,885 | 11,835.710000 | 13,637.410000 |
| Jul-2017 | 12,083 | 12,118.960000 | 14,181.010000 |
| Aug-2017 | 12,760 | 12,136.030000 | 15,234.160000 |
| Sep-2017 | 11,977 | 12,408.410000 | 14,220.240000 |
| Oct-2017 | 11,652 | 12,642.910000 | 13,697.780000 |
| Nov-2017 | 11,525 | 12,916.860000 | 13,755.360000 |
| Dec-2017 | 11,950 | 13,091.540000 | 14,423.760000 |
| Jan-2018 | 12,069 | 13,782.770000 | 14,833.880000 |
| Feb-2018 | 11,031 | 13,211.790000 | 13,128.080000 |
| Mar-2018 | 11,201 | 12,923.820000 | 13,471.820000 |
| Apr-2018 | 11,244 | 13,072.330000 | 13,585.760000 |
| May-2018 | 11,265 | 13,154.240000 | 13,499.400000 |
| Jun-2018 | 11,053 | 13,147.970000 | 13,445.130000 |
| Jul-2018 | 10,503 | 13,558.630000 | 12,768.220000 |
| Aug-2018 | 9,352 | 13,726.380000 | 11,078.810000 |
| Sep-2018 | 9,267 | 13,802.820000 | 11,042.120000 |
| Oct-2018 | 9,239 | 12,789.300000 | 11,428.660000 |
| Nov-2018 | 9,225 | 12,934.590000 | 11,612.910000 |
| Dec-2018 | 10,051 | 11,951.070000 | 12,792.810000 |
| Jan-2019 | 10,807 | 12,880.930000 | 13,787.220000 |
| Feb-2019 | 10,638 | 13,268.260000 | 13,464.230000 |
| Mar-2019 | 10,765 | 13,442.530000 | 13,620.410000 |
| Apr-2019 | 10,186 | 13,919.190000 | 12,617.280000 |
| May-2019 | 10,384 | 13,116.040000 | 13,141.090000 |
| Jun-2019 | 12,029 | 13,980.320000 | 15,940.300000 |
| Jul-2019 | 12,234 | 14,049.570000 | 16,536.740000 |
| Aug-2019 | 13,859 | 13,762.200000 | 18,421.960000 |
| Sep-2019 | 12,686 | 14,055.070000 | 16,635.940000 |
| Oct-2019 | 13,181 | 14,412.730000 | 17,299.750000 |
| Nov-2019 | 12,912 | 14,814.130000 | 16,421.130000 |
| Dec-2019 | 13,922 | 15,257.940000 | 18,065.080000 |
| Jan-2020 | 14,112 | 15,165.070000 | 17,948.900000 |
| Feb-2020 | 13,180 | 13,883.240000 | 16,653.150000 |
| Mar-2020 | 12,452 | 12,045.890000 | 15,091.770000 |
| Apr-2020 | 16,076 | 13,361.830000 | 21,042.850000 |
| May-2020 | 16,654 | 14,007.320000 | 21,418.540000 |
| Jun-2020 | 17,431 | 14,377.830000 | 22,986.820000 |
| Jul-2020 | 19,953 | 15,065.680000 | 26,893.070000 |
| Aug-2020 | 20,058 | 16,072.290000 | 26,480.270000 |
| Sep-2020 | 19,070 | 15,517.810000 | 24,643.370000 |
| Oct-2020 | 18,560 | 15,041.800000 | 23,527.510000 |
| Nov-2020 | 17,296 | 16,965.070000 | 21,350.740000 |
| Dec-2020 | 18,038 | 17,684.330000 | 22,259.010000 |
| Jan-2021 | 17,380 | 17,508.570000 | 21,496.930000 |
| Feb-2021 | 16,071 | 17,957.220000 | 18,863.730000 |
| Mar-2021 | 16,357 | 18,554.690000 | 19,616.980000 |
| Apr-2021 | 17,187 | 19,418.230000 | 20,685.860000 |
| May-2021 | 19,024 | 19,697.960000 | 23,741.620000 |
| Jun-2021 | 17,065 | 19,991.550000 | 20,031.590000 |
| Jul-2021 | 17,479 | 20,349.660000 | 20,620.080000 |
| Aug-2021 | 16,785 | 20,856.130000 | 19,182.100000 |
| Sep-2021 | 15,677 | 19,990.170000 | 17,488.940000 |
| Oct-2021 | 16,406 | 21,122.420000 | 18,551.330000 |
| Nov-2021 | 16,170 | 20,659.570000 | 18,748.830000 |
| Dec-2021 | 16,636 | 21,542.560000 | 19,428.720000 |
| Jan-2022 | 15,748 | 20,402.720000 | 18,168.120000 |
| Feb-2022 | 17,199 | 19,886.710000 | 20,431.070000 |
| Mar-2022 | 18,651 | 20,432.470000 | 22,806.820000 |
| Apr-2022 | 17,502 | 18,735.080000 | 20,967.530000 |
| May-2022 | 16,585 | 18,749.270000 | 18,978.400000 |
| Jun-2022 | 15,184 | 17,125.170000 | 16,134.700000 |
| Jul-2022 | 14,634 | 18,484.840000 | 14,702.920000 |
| Aug-2022 | 13,645 | 17,712.030000 | 13,545.920000 |
| Sep-2022 | 13,875 | 16,065.520000 | 13,662.130000 |
| Oct-2022 | 13,904 | 17,219.240000 | 13,642.090000 |
| Nov-2022 | 16,064 | 18,416.500000 | 15,949.200000 |
| Dec-2022 | 16,374 | 17,634.400000 | 16,422.260000 |
| Jan-2023 | 17,949 | 18,882.140000 | 18,352.570000 |
| Feb-2023 | 16,036 | 18,428.240000 | 15,454.030000 |
| Mar-2023 | 18,152 | 18,997.670000 | 18,254.790000 |
| Apr-2023 | 18,499 | 19,330.690000 | 19,088.610000 |
| May-2023 | 17,315 | 19,137.700000 | 17,332.740000 |
| Jun-2023 | 16,830 | 20,295.110000 | 17,058.710000 |
| Jul-2023 | 17,379 | 20,976.880000 | 17,610.070000 |
| Aug-2023 | 16,750 | 20,475.830000 | 16,229.510000 |
| Sep-2023 | 15,638 | 19,592.540000 | 14,871.700000 |
| Oct-2023 | 16,107 | 19,024.040000 | 15,861.220000 |
| Nov-2023 | 17,674 | 20,807.590000 | 17,591.170000 |
| Dec-2023 | 17,524 | 21,829.120000 | 17,960.130000 |
| Jan-2024 | 16,096 | 22,091.080000 | 15,880.080000 |
| Feb-2024 | 15,243 | 23,027.690000 | 14,667.610000 |
| Mar-2024 | 17,596 | 23,767.680000 | 17,568.280000 |
| Apr-2024 | 18,259 | 22,884.840000 | 18,587.780000 |
| May-2024 | 19,258 | 23,906.690000 | 19,449.310000 |
| Jun-2024 | 18,522 | 24,393.140000 | 18,986.820000 |
| Jul-2024 | 20,460 | 24,823.010000 | 21,533.810000 |
| Aug-2024 | 20,992 | 25,479.090000 | 22,586.930000 |
| Sep-2024 | 21,508 | 25,945.710000 | 23,018.120000 |
| Oct-2024 | 22,207 | 25,431 | 22,680 |
The above chart represents historical performance of a hypothetical $10,000 investment over the past 10 years. The results of this chart do not predict the results of future time periods and does not guarantee the same results.
| Class/Index Name | 1 Year | 5 Years | 10 Years |
|---|
| Class A - without sales charge | 37.88% | 11.01% | 8.87% |
| Class A - with sales charge | 31.01% | 9.88% | 8.31% |
| MSCI World Index | 33.68% | 12.03% | 9.78% |
| FTSE Gold Mines Index | 42.99% | 5.57% | 8.53% |
The Fund's past performance is not a good predictor of the Fund's future performance.The graph and table do not reflect the deduction of taxes that a shareholder would pay on fund distributions or redemption of fund shares. Call us at 800.334.2143 or visit https://www.firsteagle.com if you have questions about current performance.
- Net Assets$2,831,645,889
- Number of Portfolio Holdings31
- Portfolio Turnover Rate60.97%
- Net Investment Advisory Fees (net of waivers and reimbursements)$17,964,886
Asset Allocation by Asset Class
Based on total investments in the portfolio
| Value | Value |
|---|
| Common Stocks | 81.3% |
| Commodities | 16.7% |
| Rights | 0.1% |
| Short-Term Investments | 1.9%Footnote Reference1 |
Top 10 HoldingsFootnote Reference2
Based on total net assets of the portfolio
| Wheaton Precious Metals Corp. (Metals & Mining, Canada) | 11.1% |
Gold bullion (Precious Metal)Footnote Reference3 | 9.1% |
| Northern Star Resources Ltd. (Metals & Mining, Australia) | 8.0% |
Silver bullion (Precious Metal)Footnote Reference3 | 7.6% |
| Newmont Corp. (Metals & Mining, United States) | 6.5% |
| Agnico Eagle Mines Ltd. (Metals & Mining, Canada) | 6.5% |
| Dundee Precious Metals, Inc. (Metals & Mining, Canada) | 4.9% |
| Franco-Nevada Corp. (Metals & Mining, Canada) | 4.9% |
| Barrick Gold Corp. (Metals & Mining, Canada) | 4.7% |
| Alamos Gold, Inc., Class A (Metals & Mining, Canada) | 4.7% |
| Total | 68.0% |
Asset Allocation by Sector
Based on total investments in the portfolio
| Value | Value |
|---|
| Short-Term Investments | 1.9% |
| Commodities | 16.7% |
| Materials | 81.4% |
Asset Allocation by CountryFootnote Reference4
Based on total investments in the portfolio
| Canada | 53.4% |
| United States | 27.8% |
| Australia | 9.2% |
| South Africa | 4.0% |
| United Kingdom | 2.4% |
| Mexico | 1.3% |
| Short-Term Investments | 1.9% |
| Footnote | Description |
Footnote1 | Includes short-term commercial paper (1.9% of total investments) that settles in 90 days or less; long-term commercial paper (0.0% of total investments) that settles in 91 days or more; and other short-term investments (0.0% of total investments), such as U.S. treasury bills or money market funds. |
Footnote2 | Holdings in cash, short-term commercial paper, long-term commercial paper and other short-term cash equivalents have been excluded. |
Footnote3 | The Fund invests in gold and precious metals through investment in a wholly owned subsidiary of the Fund organized under the laws of the Cayman Islands (the “Subsidiary”). Gold bullion and commodities include the Fund’s investment in the Subsidiary. |
Footnote4 | Country allocations reflect country of risk not currency of issue. Bonds of non-U.S. issuers may be U.S. dollar denominated. |
October 31, 2024
Annual Shareholder Report
For more information, please scan the QR code to navigate to tailored shareholder reports and financial statements and other Information. If you wish to view additional information about the Fund, including but not limited to financial statements, holdings, or the Fund's prospectus, please visit http://www.firsteagle.com.
Important Notice Regarding Delivery of Shareholder Materials
Unless we are notified otherwise, we send one copy of these materials to shareholders with the same residential address (provided they have the same last name or are reasonably believed to be family members) for as long as they remain a shareholder of the Fund. If you would like to receive individual mailings, please call 800.334.2143 and we will send separate copies of these materials within 30 days after receiving your request.
October 31, 2024
Annual Shareholder Report
This Annual Shareholder Report contains important information about the Class C shares of the Fund for the period of November 1, 2023, to October 31, 2024. You can find additional information about the Fund at https://www.firsteagle.com/first-eagle-fund-shareholder-reports. You can also request this information by contacting us at 800.334.2143.
What Were the Fund's Costs for the Year?
Based on a Hypothetical $10,000 Investment
| Class Name | Cost of a $10,000 Investment | Cost Paid as a Percentage of a $10,000 Investment |
|---|
| Class C | $225 | 1.90% |
How Did the Fund Perform Last Year?
The NAV of First Eagle Gold Fund Class C Shares1 increased 36.87% in the 12-month period ended October 31, 2024. The FTSE Gold Mines Index increased 42.99% and MSCI World Index increased 33.68% for the same period.
• Gold bullion and gold-related equities both contributed to performance.
• Wheaton Precious Metals Corp. was the leading contributor to performance. Novagold Resources, Inc. was the largest detractor.
1 Reflects performance for Class C shares without the effect of sales charges and assumes all distributions have been reinvested; if sales charges were included, values would be lower.
Total Return Based on a $10,000 Investment
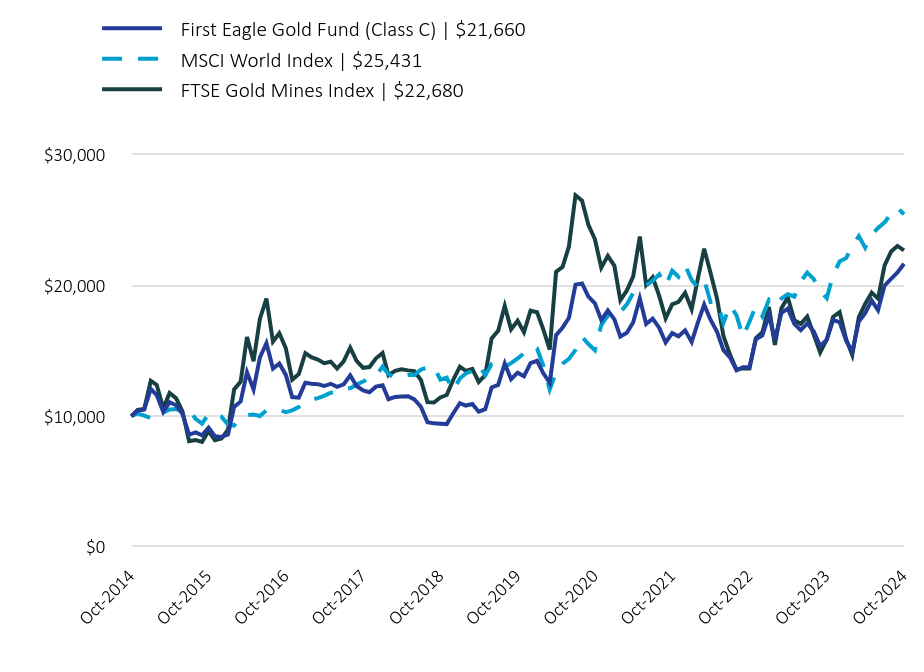
| First Eagle Gold Fund (Class C) | $21,660 | MSCI World Index | $25,431 | FTSE Gold Mines Index | $22,680 |
|---|
| Oct-2014 | 10,000 | 10,000 | 10,000 |
| Nov-2014 | 10,428 | 10,200.410000 | 10,483.270000 |
| Dec-2014 | 10,506 | 10,035.930000 | 10,540.670000 |
| Jan-2015 | 12,087 | 9,854.080000 | 12,699.290000 |
| Feb-2015 | 11,612 | 10,431.420000 | 12,388.120000 |
| Mar-2015 | 10,327 | 10,268.130000 | 10,592.610000 |
| Apr-2015 | 11,066 | 10,508.940000 | 11,768.410000 |
| May-2015 | 10,833 | 10,545.140000 | 11,362.110000 |
| Jun-2015 | 10,147 | 10,299.940000 | 10,344.950000 |
| Jul-2015 | 8,581 | 10,484.830000 | 8,086.020000 |
| Aug-2015 | 8,753 | 9,791 | 8,167.410000 |
| Sep-2015 | 8,527 | 9,429.860000 | 8,024.390000 |
| Oct-2015 | 9,111 | 10,177.120000 | 8,865.500000 |
| Nov-2015 | 8,457 | 10,126.490000 | 8,153.770000 |
| Dec-2015 | 8,411 | 9,948.490000 | 8,283.340000 |
| Jan-2016 | 8,597 | 9,353.330000 | 8,968.540000 |
| Feb-2016 | 10,708 | 9,283.720000 | 12,049.760000 |
| Mar-2016 | 11,120 | 9,913.700000 | 12,641.330000 |
| Apr-2016 | 13,363 | 10,070.570000 | 16,050.940000 |
| May-2016 | 12,039 | 10,127.130000 | 14,203.020000 |
| Jun-2016 | 14,484 | 10,013.650000 | 17,429.710000 |
| Jul-2016 | 15,582 | 10,436.720000 | 18,987.470000 |
| Aug-2016 | 13,636 | 10,445.390000 | 15,701.930000 |
| Sep-2016 | 14,017 | 10,500.870000 | 16,345.750000 |
| Oct-2016 | 13,153 | 10,297.650000 | 15,187.930000 |
| Nov-2016 | 11,462 | 10,445.720000 | 12,784.240000 |
| Dec-2016 | 11,415 | 10,695.670000 | 13,219.040000 |
| Jan-2017 | 12,552 | 10,953.810000 | 14,823.620000 |
| Feb-2017 | 12,474.620000 | 11,257.710000 | 14,509.940000 |
| Mar-2017 | 12,443 | 11,377.630000 | 14,329.130000 |
| Apr-2017 | 12,303 | 11,546.090000 | 14,048.990000 |
| May-2017 | 12,474 | 11,790.340000 | 14,162.430000 |
| Jun-2017 | 12,241 | 11,835.710000 | 13,637.410000 |
| Jul-2017 | 12,428 | 12,118.960000 | 14,181.010000 |
| Aug-2017 | 13,121 | 12,136.030000 | 15,234.160000 |
| Sep-2017 | 12,304 | 12,408.410000 | 14,220.240000 |
| Oct-2017 | 11,961 | 12,642.910000 | 13,697.780000 |
| Nov-2017 | 11,828 | 12,916.860000 | 13,755.360000 |
| Dec-2017 | 12,256 | 13,091.540000 | 14,423.760000 |
| Jan-2018 | 12,365 | 13,782.770000 | 14,833.880000 |
| Feb-2018 | 11,291 | 13,211.790000 | 13,128.080000 |
| Mar-2018 | 11,470 | 12,923.820000 | 13,471.820000 |
| Apr-2018 | 11,501 | 13,072.330000 | 13,585.760000 |
| May-2018 | 11,517 | 13,154.240000 | 13,499.400000 |
| Jun-2018 | 11,283 | 13,147.970000 | 13,445.130000 |
| Jul-2018 | 10,715 | 13,558.630000 | 12,768.220000 |
| Aug-2018 | 9,539 | 13,726.380000 | 11,078.810000 |
| Sep-2018 | 9,446 | 13,802.820000 | 11,042.120000 |
| Oct-2018 | 9,415 | 12,789.300000 | 11,428.660000 |
| Nov-2018 | 9,391 | 12,934.590000 | 11,612.910000 |
| Dec-2018 | 10,224 | 11,951.070000 | 12,792.810000 |
| Jan-2019 | 10,987 | 12,880.930000 | 13,787.220000 |
| Feb-2019 | 10,808 | 13,268.260000 | 13,464.230000 |
| Mar-2019 | 10,932 | 13,442.530000 | 13,620.410000 |
| Apr-2019 | 10,341 | 13,919.190000 | 12,617.280000 |
| May-2019 | 10,528 | 13,116.040000 | 13,141.090000 |
| Jun-2019 | 12,194 | 13,980.320000 | 15,940.300000 |
| Jul-2019 | 12,389 | 14,049.570000 | 16,536.740000 |
| Aug-2019 | 14,032 | 13,762.200000 | 18,421.960000 |
| Sep-2019 | 12,825 | 14,055.070000 | 16,635.940000 |
| Oct-2019 | 13,324 | 14,412.730000 | 17,299.750000 |
| Nov-2019 | 13,045 | 14,814.130000 | 16,421.130000 |
| Dec-2019 | 14,057 | 15,257.940000 | 18,065.080000 |
| Jan-2020 | 14,235 | 15,165.070000 | 17,948.900000 |
| Feb-2020 | 13,293 | 13,883.240000 | 16,653.150000 |
| Mar-2020 | 12,546 | 12,045.890000 | 15,091.770000 |
| Apr-2020 | 16,190 | 13,361.830000 | 21,042.850000 |
| May-2020 | 16,767 | 14,007.320000 | 21,418.540000 |
| Jun-2020 | 17,530 | 14,377.830000 | 22,986.820000 |
| Jul-2020 | 20,061 | 15,065.680000 | 26,893.070000 |
| Aug-2020 | 20,147 | 16,072.290000 | 26,480.270000 |
| Sep-2020 | 19,150 | 15,517.810000 | 24,643.370000 |
| Oct-2020 | 18,629 | 15,041.800000 | 23,527.510000 |
| Nov-2020 | 17,351 | 16,965.070000 | 21,350.740000 |
| Dec-2020 | 18,080 | 17,684.330000 | 22,259.010000 |
| Jan-2021 | 17,405 | 17,508.570000 | 21,496.930000 |
| Feb-2021 | 16,088 | 17,957.220000 | 18,863.730000 |
| Mar-2021 | 16,371 | 18,554.690000 | 19,616.980000 |
| Apr-2021 | 17,188 | 19,418.230000 | 20,685.860000 |
| May-2021 | 19,008 | 19,697.960000 | 23,741.620000 |
| Jun-2021 | 17,047 | 19,991.550000 | 20,031.590000 |
| Jul-2021 | 17,454 | 20,349.660000 | 20,620.080000 |
| Aug-2021 | 16,747 | 20,856.130000 | 19,182.100000 |
| Sep-2021 | 15,633 | 19,990.170000 | 17,488.940000 |
| Oct-2021 | 16,348 | 21,122.420000 | 18,551.330000 |
| Nov-2021 | 16,104 | 20,659.570000 | 18,748.830000 |
| Dec-2021 | 16,562 | 21,542.560000 | 19,428.720000 |
| Jan-2022 | 15,664 | 20,402.720000 | 18,168.120000 |
| Feb-2022 | 17,096 | 19,886.710000 | 20,431.070000 |
| Mar-2022 | 18,528 | 20,432.470000 | 22,806.820000 |
| Apr-2022 | 17,380 | 18,735.080000 | 20,967.530000 |
| May-2022 | 16,451 | 18,749.270000 | 18,978.400000 |
| Jun-2022 | 15,051 | 17,125.170000 | 16,134.700000 |
| Jul-2022 | 14,501 | 18,484.840000 | 14,702.920000 |
| Aug-2022 | 13,509 | 17,712.030000 | 13,545.920000 |
| Sep-2022 | 13,737 | 16,065.520000 | 13,662.130000 |
| Oct-2022 | 13,752 | 17,219.240000 | 13,642.090000 |
| Nov-2022 | 15,877 | 18,416.500000 | 15,949.200000 |
| Dec-2022 | 16,175 | 17,634.400000 | 16,422.260000 |
| Jan-2023 | 17,717 | 18,882.140000 | 18,352.570000 |
| Feb-2023 | 15,821 | 18,428.240000 | 15,454.030000 |
| Mar-2023 | 17,898 | 18,997.670000 | 18,254.790000 |
| Apr-2023 | 18,230 | 19,330.690000 | 19,088.610000 |
| May-2023 | 17,050 | 19,137.700000 | 17,332.740000 |
| Jun-2023 | 16,569 | 20,295.110000 | 17,058.710000 |
| Jul-2023 | 17,096 | 20,976.880000 | 17,610.070000 |
| Aug-2023 | 16,467 | 20,475.830000 | 16,229.510000 |
| Sep-2023 | 15,365 | 19,592.540000 | 14,871.700000 |
| Oct-2023 | 15,825 | 19,024.040000 | 15,861.220000 |
| Nov-2023 | 17,352 | 20,807.590000 | 17,591.170000 |
| Dec-2023 | 17,201 | 21,829.120000 | 17,960.130000 |
| Jan-2024 | 15,780 | 22,091.080000 | 15,880.080000 |
| Feb-2024 | 14,936 | 23,027.690000 | 14,667.610000 |
| Mar-2024 | 17,241 | 23,767.680000 | 17,568.280000 |
| Apr-2024 | 17,880 | 22,884.840000 | 18,587.780000 |
| May-2024 | 18,842 | 23,906.690000 | 19,449.310000 |
| Jun-2024 | 18,109 | 24,393.140000 | 18,986.820000 |
| Jul-2024 | 19,994 | 24,823.010000 | 21,533.810000 |
| Aug-2024 | 20,500 | 25,479.090000 | 22,586.930000 |
| Sep-2024 | 20,996 | 25,945.710000 | 23,018.120000 |
| Oct-2024 | 21,660 | 25,431 | 22,680 |
The above chart represents historical performance of a hypothetical $10,000 investment over the past 10 years. The results of this chart do not predict the results of future time periods and does not guarantee the same results.
| Class/Index Name | 1 Year | 5 Years | 10 Years |
|---|
| Class C - without sales charge | 36.87% | 10.19% | 8.03% |
| Class C - with sales charge | 35.87% | 10.19% | 8.03% |
| MSCI World Index | 33.68% | 12.03% | 9.78% |
| FTSE Gold Mines Index | 42.99% | 5.57% | 8.53% |
The Fund's past performance is not a good predictor of the Fund's future performance.The graph and table do not reflect the deduction of taxes that a shareholder would pay on fund distributions or redemption of fund shares. Call us at 800.334.2143 or visit https://www.firsteagle.com if you have questions about current performance.
- Net Assets$2,831,645,889
- Number of Portfolio Holdings31
- Portfolio Turnover Rate60.97%
- Net Investment Advisory Fees (net of waivers and reimbursements)$17,964,886
Asset Allocation by Asset Class
Based on total investments in the portfolio
| Value | Value |
|---|
| Common Stocks | 81.3% |
| Commodities | 16.7% |
| Rights | 0.1% |
| Short-Term Investments | 1.9%Footnote Reference1 |
Top 10 HoldingsFootnote Reference2
Based on total net assets of the portfolio
| Wheaton Precious Metals Corp. (Metals & Mining, Canada) | 11.1% |
Gold bullion (Precious Metal)Footnote Reference3 | 9.1% |
| Northern Star Resources Ltd. (Metals & Mining, Australia) | 8.0% |
Silver bullion (Precious Metal)Footnote Reference3 | 7.6% |
| Newmont Corp. (Metals & Mining, United States) | 6.5% |
| Agnico Eagle Mines Ltd. (Metals & Mining, Canada) | 6.5% |
| Dundee Precious Metals, Inc. (Metals & Mining, Canada) | 4.9% |
| Franco-Nevada Corp. (Metals & Mining, Canada) | 4.9% |
| Barrick Gold Corp. (Metals & Mining, Canada) | 4.7% |
| Alamos Gold, Inc., Class A (Metals & Mining, Canada) | 4.7% |
| Total | 68.0% |
Asset Allocation by Sector
Based on total investments in the portfolio
| Value | Value |
|---|
| Short-Term Investments | 1.9% |
| Commodities | 16.7% |
| Materials | 81.4% |
Asset Allocation by CountryFootnote Reference4
Based on total investments in the portfolio
| Canada | 53.4% |
| United States | 27.8% |
| Australia | 9.2% |
| South Africa | 4.0% |
| United Kingdom | 2.4% |
| Mexico | 1.3% |
| Short-Term Investments | 1.9% |
| Footnote | Description |
Footnote1 | Includes short-term commercial paper (1.9% of total investments) that settles in 90 days or less; long-term commercial paper (0.0% of total investments) that settles in 91 days or more; and other short-term investments (0.0% of total investments), such as U.S. treasury bills or money market funds. |
Footnote2 | Holdings in cash, short-term commercial paper, long-term commercial paper and other short-term cash equivalents have been excluded. |
Footnote3 | The Fund invests in gold and precious metals through investment in a wholly owned subsidiary of the Fund organized under the laws of the Cayman Islands (the “Subsidiary”). Gold bullion and commodities include the Fund’s investment in the Subsidiary. |
Footnote4 | Country allocations reflect country of risk not currency of issue. Bonds of non-U.S. issuers may be U.S. dollar denominated. |
October 31, 2024
Annual Shareholder Report
For more information, please scan the QR code to navigate to tailored shareholder reports and financial statements and other Information. If you wish to view additional information about the Fund, including but not limited to financial statements, holdings, or the Fund's prospectus, please visit http://www.firsteagle.com.
Important Notice Regarding Delivery of Shareholder Materials
Unless we are notified otherwise, we send one copy of these materials to shareholders with the same residential address (provided they have the same last name or are reasonably believed to be family members) for as long as they remain a shareholder of the Fund. If you would like to receive individual mailings, please call 800.334.2143 and we will send separate copies of these materials within 30 days after receiving your request.
October 31, 2024
Annual Shareholder Report
This Annual Shareholder Report contains important information about the Class I shares of the Fund for the period of November 1, 2023, to October 31, 2024. You can find additional information about the Fund at https://www.firsteagle.com/first-eagle-fund-shareholder-reports. You can also request this information by contacting us at 800.334.2143.
What Were the Fund's Costs for the Year?
Based on a Hypothetical $10,000 Investment
| Class Name | Cost of a $10,000 Investment | Cost Paid as a Percentage of a $10,000 Investment |
|---|
| Class I | $110 | 0.92% |
How Did the Fund Perform Last Year?
The NAV of First Eagle Gold Fund Class I Shares increased 38.28% in the 12-month period ended October 31, 2024. The FTSE Gold Mines Index increased 42.99% and MSCI World Index increased 33.68% for the same period.
• Gold bullion and gold-related equities both contributed to performance.
• Wheaton Precious Metals Corp. was the leading contributor to performance. Novagold Resources, Inc. was the largest detractor.
Total Return Based on a $1,000,000 Investment
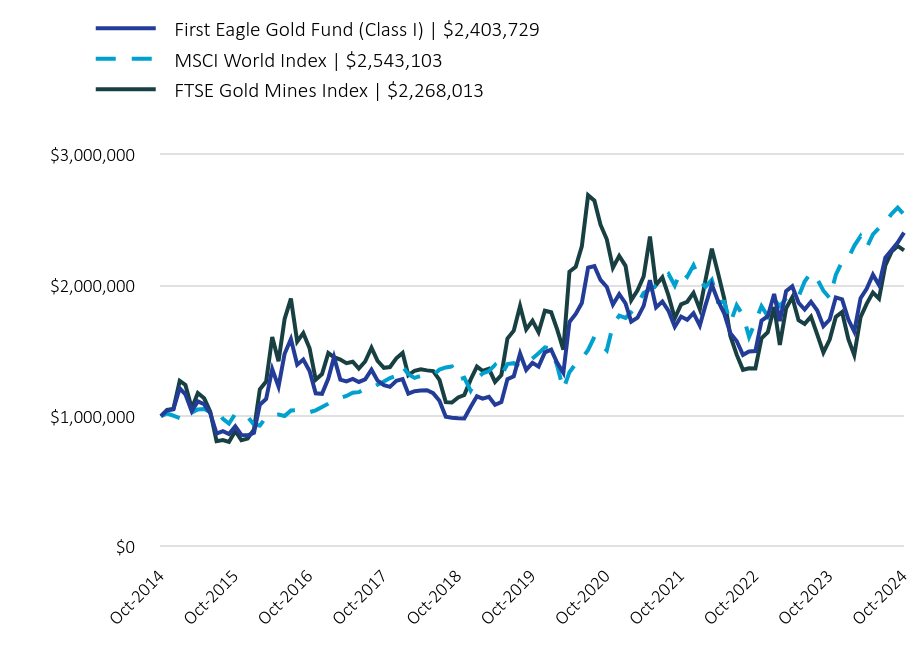
| First Eagle Gold Fund (Class I) | $2,403,729 | MSCI World Index | $2,543,103 | FTSE Gold Mines Index | $2,268,013 |
|---|
| Oct-2014 | 1,000,000 | 1,000,000 | 1,000,000 |
| Nov-2014 | 1,043,900 | 1,020,040.930000 | 1,048,327 |
| Dec-2014 | 1,053,399 | 1,003,592.650000 | 1,054,066.770000 |
| Jan-2015 | 1,212,990 | 985,407.900000 | 1,269,929.240000 |
| Feb-2015 | 1,166,168 | 1,043,141.600000 | 1,238,812.150000 |
| Mar-2015 | 1,038,006 | 1,026,812.730000 | 1,059,260.790000 |
| Apr-2015 | 1,112,639 | 1,050,894.140000 | 1,176,841.430000 |
| May-2015 | 1,090,720 | 1,054,514.170000 | 1,136,211.370000 |
| Jun-2015 | 1,023,422 | 1,029,994.290000 | 1,034,495.090000 |
| Jul-2015 | 866,020 | 1,048,482.690000 | 808,602.130000 |
| Aug-2015 | 884,293 | 979,099.770000 | 816,741.320000 |
| Sep-2015 | 862,363 | 942,986.340000 | 802,438.930000 |
| Oct-2015 | 921,693 | 1,017,712.460000 | 886,550.110000 |
| Nov-2015 | 856,530 | 1,012,648.690000 | 815,376.940000 |
| Dec-2015 | 852,846 | 994,848.970000 | 828,333.770000 |
| Jan-2016 | 872,632 | 935,332.940000 | 896,853.480000 |
| Feb-2016 | 1,087,824 | 928,371.650000 | 1,204,975.720000 |
| Mar-2016 | 1,131,010 | 991,370.080000 | 1,264,133.010000 |
| Apr-2016 | 1,359,361 | 1,007,056.990000 | 1,605,094.280000 |
| May-2016 | 1,226,144 | 1,012,713.250000 | 1,420,301.860000 |
| Jun-2016 | 1,477,258 | 1,001,365.380000 | 1,742,971.130000 |
| Jul-2016 | 1,589,973 | 1,043,671.510000 | 1,898,746.860000 |
| Aug-2016 | 1,393,134 | 1,044,538.900000 | 1,570,193.430000 |
| Sep-2016 | 1,432,699 | 1,050,087.410000 | 1,634,575.210000 |
| Oct-2016 | 1,345,591 | 1,029,765.180000 | 1,518,793.210000 |
| Nov-2016 | 1,174,297 | 1,044,572.200000 | 1,278,424.250000 |
| Dec-2016 | 1,170,657 | 1,069,567.120000 | 1,321,904.330000 |
| Jan-2017 | 1,287,840 | 1,095,381.290000 | 1,482,362.220000 |
| Feb-2017 | 1,450,994.070000 | 1,125,770.920000 | 1,450,994.070000 |
| Mar-2017 | 1,279,091 | 1,137,762.520000 | 1,432,912.790000 |
| Apr-2017 | 1,265,916 | 1,154,609.230000 | 1,404,898.700000 |
| May-2017 | 1,284,905 | 1,179,034.400000 | 1,416,243.350000 |
| Jun-2017 | 1,261,519 | 1,183,570.740000 | 1,363,741.380000 |
| Jul-2017 | 1,281,956 | 1,211,896.470000 | 1,418,100.860000 |
| Aug-2017 | 1,355,156 | 1,213,603.030000 | 1,523,416.370000 |
| Sep-2017 | 1,271,678 | 1,240,841.420000 | 1,422,024.360000 |
| Oct-2017 | 1,237,216 | 1,264,291.420000 | 1,369,778.470000 |
| Nov-2017 | 1,224,101 | 1,291,685.500000 | 1,375,536.140000 |
| Dec-2017 | 1,269,515 | 1,309,153.590000 | 1,442,375.530000 |
| Jan-2018 | 1,282,718 | 1,378,277.170000 | 1,483,388.440000 |
| Feb-2018 | 1,172,148 | 1,321,178.620000 | 1,312,808.340000 |
| Mar-2018 | 1,191,137 | 1,292,381.630000 | 1,347,182.100000 |
| Apr-2018 | 1,195,544 | 1,307,232.610000 | 1,358,575.900000 |
| May-2018 | 1,198,413 | 1,315,424.290000 | 1,349,939.840000 |
| Jun-2018 | 1,175,763 | 1,314,796.820000 | 1,344,513.400000 |
| Jul-2018 | 1,117,210 | 1,355,862.580000 | 1,276,822.360000 |
| Aug-2018 | 994,987 | 1,372,638.460000 | 1,107,881.170000 |
| Sep-2018 | 986,928 | 1,380,281.500000 | 1,104,211.810000 |
| Oct-2018 | 983,967 | 1,278,930.350000 | 1,142,866.320000 |
| Nov-2018 | 982,491 | 1,293,458.880000 | 1,161,290.690000 |
| Dec-2018 | 1,070,326 | 1,195,106.870000 | 1,279,280.570000 |
| Jan-2019 | 1,151,564 | 1,288,093.100000 | 1,378,722.410000 |
| Feb-2019 | 1,133,254 | 1,326,825.840000 | 1,346,423.380000 |
| Mar-2019 | 1,147,193 | 1,344,252.990000 | 1,362,041.260000 |
| Apr-2019 | 1,086,392 | 1,391,919.280000 | 1,261,728.250000 |
| May-2019 | 1,106,925 | 1,311,604.340000 | 1,314,109.170000 |
| Jun-2019 | 1,283,368 | 1,398,032.370000 | 1,594,030.370000 |
| Jul-2019 | 1,305,314 | 1,404,957.310000 | 1,653,673.590000 |
| Aug-2019 | 1,479,573 | 1,376,219.560000 | 1,842,195.550000 |
| Sep-2019 | 1,353,662 | 1,405,506.850000 | 1,663,593.710000 |
| Oct-2019 | 1,407,131 | 1,441,273.460000 | 1,729,974.740000 |
| Nov-2019 | 1,378,566 | 1,481,413.160000 | 1,642,112.950000 |
| Dec-2019 | 1,487,611 | 1,525,793.690000 | 1,806,508.380000 |
| Jan-2020 | 1,508,140 | 1,516,506.700000 | 1,794,890 |
| Feb-2020 | 1,409,206 | 1,388,323.600000 | 1,665,314.750000 |
| Mar-2020 | 1,330,854 | 1,204,589.060000 | 1,509,176.710000 |
| Apr-2020 | 1,719,331 | 1,336,183.490000 | 2,104,285.470000 |
| May-2020 | 1,781,570 | 1,400,732.060000 | 2,141,854.310000 |
| Jun-2020 | 1,865,126 | 1,437,782.890000 | 2,298,682.310000 |
| Jul-2020 | 2,135,569 | 1,506,568.380000 | 2,689,307.220000 |
| Aug-2020 | 2,147,315 | 1,607,228.790000 | 2,648,027.440000 |
| Sep-2020 | 2,041,882 | 1,551,780.800000 | 2,464,337.170000 |
| Oct-2020 | 1,988,384 | 1,504,179.890000 | 2,352,750.620000 |
| Nov-2020 | 1,853,572 | 1,696,506.620000 | 2,135,074.370000 |
| Dec-2020 | 1,933,461 | 1,768,432.920000 | 2,225,901.140000 |
| Jan-2021 | 1,862,696 | 1,750,857.040000 | 2,149,693.160000 |
| Feb-2021 | 1,722,808 | 1,795,721.650000 | 1,886,372.870000 |
| Mar-2021 | 1,753,991 | 1,855,469.100000 | 1,961,697.780000 |
| Apr-2021 | 1,843,269 | 1,941,822.840000 | 2,068,586.390000 |
| May-2021 | 2,040,314 | 1,969,795.650000 | 2,374,161.770000 |
| Jun-2021 | 1,831,386 | 1,999,155.130000 | 2,003,158.590000 |
| Jul-2021 | 1,876,804 | 2,034,965.660000 | 2,062,008.290000 |
| Aug-2021 | 1,802,483 | 2,085,612.620000 | 1,918,210.370000 |
| Sep-2021 | 1,683,519 | 1,999,016.870000 | 1,748,894.100000 |
| Oct-2021 | 1,761,634 | 2,112,242.200000 | 1,855,133.390000 |
| Nov-2021 | 1,737,148 | 2,065,956.720000 | 1,874,882.600000 |
| Dec-2021 | 1,788,220 | 2,154,256.090000 | 1,942,871.510000 |
| Jan-2022 | 1,692,550 | 2,040,272.450000 | 1,816,812.390000 |
| Feb-2022 | 1,849,280 | 1,988,671.480000 | 2,043,107.440000 |
| Mar-2022 | 2,005,174 | 2,043,247.310000 | 2,280,681.610000 |
| Apr-2022 | 1,883,059 | 1,873,507.930000 | 2,096,752.890000 |
| May-2022 | 1,784,387 | 1,874,926.840000 | 1,897,839.640000 |
| Jun-2022 | 1,633,785 | 1,712,516.930000 | 1,613,469.760000 |
| Jul-2022 | 1,574,968 | 1,848,484.450000 | 1,470,292.410000 |
| Aug-2022 | 1,468,816 | 1,771,203.380000 | 1,354,592.360000 |
| Sep-2022 | 1,494,373 | 1,606,552.490000 | 1,366,212.750000 |
| Oct-2022 | 1,497,362 | 1,721,923.720000 | 1,364,209.450000 |
| Nov-2022 | 1,730,052 | 1,841,649.810000 | 1,594,920.160000 |
| Dec-2022 | 1,764,653 | 1,763,439.920000 | 1,642,225.600000 |
| Jan-2023 | 1,934,059 | 1,888,213.980000 | 1,835,256.780000 |
| Feb-2023 | 1,727,695 | 1,842,824.130000 | 1,545,403.420000 |
| Mar-2023 | 1,956,615 | 1,899,766.830000 | 1,825,479.090000 |
| Apr-2023 | 1,994,182 | 1,933,068.960000 | 1,908,861.060000 |
| May-2023 | 1,866,953 | 1,913,770.320000 | 1,733,274.480000 |
| Jun-2023 | 1,815,799 | 2,029,510.920000 | 1,705,870.770000 |
| Jul-2023 | 1,875,357 | 2,097,687.790000 | 1,761,006.740000 |
| Aug-2023 | 1,807,656 | 2,047,583 | 1,622,951.040000 |
| Sep-2023 | 1,687,990 | 1,959,253.580000 | 1,487,169.660000 |
| Oct-2023 | 1,738,460 | 1,902,404.200000 | 1,586,121.900000 |
| Nov-2023 | 1,907,960 | 2,080,758.540000 | 1,759,116.510000 |
| Dec-2023 | 1,893,078 | 2,182,911.810000 | 1,796,012.780000 |
| Jan-2024 | 1,738,414 | 2,209,107.800000 | 1,588,008.360000 |
| Feb-2024 | 1,646,973 | 2,302,768.820000 | 1,466,760.510000 |
| Mar-2024 | 1,902,089 | 2,376,767.870000 | 1,756,828.500000 |
| Apr-2024 | 1,973,608 | 2,288,483.530000 | 1,858,778.120000 |
| May-2024 | 2,082,551 | 2,390,668.870000 | 1,944,930.660000 |
| Jun-2024 | 2,002,581 | 2,439,313.960000 | 1,898,682.090000 |
| Jul-2024 | 2,212,652 | 2,482,300.590000 | 2,153,381.290000 |
| Aug-2024 | 2,270,623 | 2,547,909.010000 | 2,258,693.400000 |
| Sep-2024 | 2,327,616 | 2,594,571.250000 | 2,301,811.520000 |
| Oct-2024 | 2,403,729 | 2,543,103 | 2,268,013 |
The above chart represents historical performance of a hypothetical $1,000,000 investment over the past 10 years. The results of this chart do not predict the results of future time periods and does not guarantee the same results.
| Class/Index Name | 1 Year | 5 Years | 10 Years |
|---|
| Class I | 38.28% | 11.30% | 9.16% |
| MSCI World Index | 33.68% | 12.03% | 9.78% |
| FTSE Gold Mines Index | 42.99% | 5.57% | 8.53% |
The Fund's past performance is not a good predictor of the Fund's future performance.The graph and table do not reflect the deduction of taxes that a shareholder would pay on fund distributions or redemption of fund shares. Call us at 800.334.2143 or visit https://www.firsteagle.com if you have questions about current performance.
- Net Assets$2,831,645,889
- Number of Portfolio Holdings31
- Portfolio Turnover Rate60.97%
- Net Investment Advisory Fees (net of waivers and reimbursements)$17,964,886
Asset Allocation by Asset Class
Based on total investments in the portfolio
| Value | Value |
|---|
| Common Stocks | 81.3% |
| Commodities | 16.7% |
| Rights | 0.1% |
| Short-Term Investments | 1.9%Footnote Reference1 |
Top 10 HoldingsFootnote Reference2
Based on total net assets of the portfolio
| Wheaton Precious Metals Corp. (Metals & Mining, Canada) | 11.1% |
Gold bullion (Precious Metal)Footnote Reference3 | 9.1% |
| Northern Star Resources Ltd. (Metals & Mining, Australia) | 8.0% |
Silver bullion (Precious Metal)Footnote Reference3 | 7.6% |
| Newmont Corp. (Metals & Mining, United States) | 6.5% |
| Agnico Eagle Mines Ltd. (Metals & Mining, Canada) | 6.5% |
| Dundee Precious Metals, Inc. (Metals & Mining, Canada) | 4.9% |
| Franco-Nevada Corp. (Metals & Mining, Canada) | 4.9% |
| Barrick Gold Corp. (Metals & Mining, Canada) | 4.7% |
| Alamos Gold, Inc., Class A (Metals & Mining, Canada) | 4.7% |
| Total | 68.0% |
Asset Allocation by Sector
Based on total investments in the portfolio
| Value | Value |
|---|
| Short-Term Investments | 1.9% |
| Commodities | 16.7% |
| Materials | 81.4% |
Asset Allocation by CountryFootnote Reference4
Based on total investments in the portfolio
| Canada | 53.4% |
| United States | 27.8% |
| Australia | 9.2% |
| South Africa | 4.0% |
| United Kingdom | 2.4% |
| Mexico | 1.3% |
| Short-Term Investments | 1.9% |
| Footnote | Description |
Footnote1 | Includes short-term commercial paper (1.9% of total investments) that settles in 90 days or less; long-term commercial paper (0.0% of total investments) that settles in 91 days or more; and other short-term investments (0.0% of total investments), such as U.S. treasury bills or money market funds. |
Footnote2 | Holdings in cash, short-term commercial paper, long-term commercial paper and other short-term cash equivalents have been excluded. |
Footnote3 | The Fund invests in gold and precious metals through investment in a wholly owned subsidiary of the Fund organized under the laws of the Cayman Islands (the “Subsidiary”). Gold bullion and commodities include the Fund’s investment in the Subsidiary. |
Footnote4 | Country allocations reflect country of risk not currency of issue. Bonds of non-U.S. issuers may be U.S. dollar denominated. |
October 31, 2024
Annual Shareholder Report
For more information, please scan the QR code to navigate to tailored shareholder reports and financial statements and other Information. If you wish to view additional information about the Fund, including but not limited to financial statements, holdings, or the Fund's prospectus, please visit http://www.firsteagle.com.
Important Notice Regarding Delivery of Shareholder Materials
Unless we are notified otherwise, we send one copy of these materials to shareholders with the same residential address (provided they have the same last name or are reasonably believed to be family members) for as long as they remain a shareholder of the Fund. If you would like to receive individual mailings, please call 800.334.2143 and we will send separate copies of these materials within 30 days after receiving your request.
October 31, 2024
Annual Shareholder Report
This Annual Shareholder Report contains important information about the Class R6 shares of the Fund for the period of November 1, 2023, to October 31, 2024. You can find additional information about the Fund at https://www.firsteagle.com/first-eagle-fund-shareholder-reports. You can also request this information by contacting us at 800.334.2143.
What Were the Fund's Costs for the Year?
Based on a Hypothetical $10,000 Investment
| Class Name | Cost of a $10,000 Investment | Cost Paid as a Percentage of a $10,000 Investment |
|---|
| Class R6 | $99 | 0.83% |
How Did the Fund Perform Last Year?
The NAV of First Eagle Gold Fund Class R6 Shares increased 38.37% in the 12-month period ended October 31, 2024. The FTSE Gold Mines Index increased 42.99% and MSCI World Index increased 33.68% for the same period.
• Gold bullion and gold-related equities both contributed to performance.
• Wheaton Precious Metals Corp. was the leading contributor to performance. Novagold Resources, Inc. was the largest detractor.
Total Return Based on a $10,000 Investment
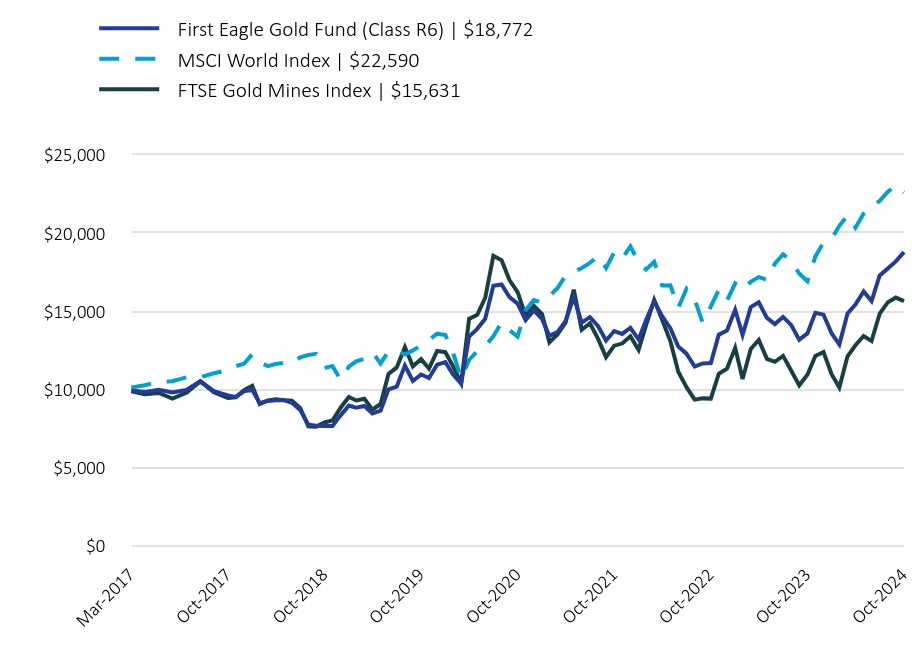
| First Eagle Gold Fund (Class R6) | $18,772 | MSCI World Index | $22,590 | FTSE Gold Mines Index | $15,631 |
|---|
| Mar-2017 | 9,920 | 10,106.520000 | 9,875.390000 |
| Apr-2017 | 9,824 | 10,256.170000 | 9,682.320000 |
| May-2017 | 9,971 | 10,473.130000 | 9,760.500000 |
| Jun-2017 | 9,795 | 10,513.420000 | 9,398.670000 |
| Jul-2017 | 9,953 | 10,765.040000 | 9,773.310000 |
| Aug-2017 | 10,522 | 10,780.200000 | 10,499.120000 |
| Sep-2017 | 9,875 | 11,022.150000 | 9,800.350000 |
| Oct-2017 | 9,608 | 11,230.450000 | 9,440.280000 |
| Nov-2017 | 9,512 | 11,473.790000 | 9,479.960000 |
| Dec-2017 | 9,864 | 11,628.950000 | 9,940.600000 |
| Jan-2018 | 9,961 | 12,242.960000 | 10,223.260000 |
| Feb-2018 | 9,108 | 11,735.770000 | 9,047.650000 |
| Mar-2018 | 9,255 | 11,479.970000 | 9,284.550000 |
| Apr-2018 | 9,290 | 11,611.890000 | 9,363.070000 |
| May-2018 | 9,312 | 11,684.650000 | 9,303.550000 |
| Jun-2018 | 9,136 | 11,679.080000 | 9,266.150000 |
| Jul-2018 | 8,681 | 12,043.860000 | 8,799.640000 |
| Aug-2018 | 7,738 | 12,192.880000 | 7,635.330000 |
| Sep-2018 | 7,670 | 12,260.770000 | 7,610.040000 |
| Oct-2018 | 7,647 | 11,360.480000 | 7,876.440000 |
| Nov-2018 | 7,642 | 11,489.540000 | 8,003.410000 |
| Dec-2018 | 8,330 | 10,615.900000 | 8,816.580000 |
| Jan-2019 | 8,954 | 11,441.880000 | 9,501.920000 |
| Feb-2019 | 8,818 | 11,785.930000 | 9,279.320000 |
| Mar-2019 | 8,926 | 11,940.730000 | 9,386.950000 |
| Apr-2019 | 8,448 | 12,364.140000 | 8,695.610000 |
| May-2019 | 8,624 | 11,650.720000 | 9,056.610000 |
| Jun-2019 | 9,999 | 12,418.440000 | 10,985.780000 |
| Jul-2019 | 10,169 | 12,479.960000 | 11,396.830000 |
| Aug-2019 | 11,515 | 12,224.690000 | 12,696.090000 |
| Sep-2019 | 10,527 | 12,484.840000 | 11,465.200000 |
| Oct-2019 | 10,942 | 12,802.550000 | 11,922.690000 |
| Nov-2019 | 10,721 | 13,159.100000 | 11,317.160000 |
| Dec-2019 | 11,570 | 13,553.320000 | 12,450.140000 |
| Jan-2020 | 11,729 | 13,470.830000 | 12,370.070000 |
| Feb-2020 | 10,961 | 12,332.200000 | 11,477.060000 |
| Mar-2020 | 10,352 | 10,700.130000 | 10,400.980000 |
| Apr-2020 | 13,373 | 11,869.050000 | 14,502.370000 |
| May-2020 | 13,863 | 12,442.430000 | 14,761.290000 |
| Jun-2020 | 14,506 | 12,771.540000 | 15,842.120000 |
| Jul-2020 | 16,612 | 13,382.550000 | 18,534.240000 |
| Aug-2020 | 16,704 | 14,276.690000 | 18,249.750000 |
| Sep-2020 | 15,890 | 13,784.160000 | 16,983.790000 |
| Oct-2020 | 15,475 | 13,361.330000 | 16,214.750000 |
| Nov-2020 | 14,423 | 15,069.730000 | 14,714.560000 |
| Dec-2020 | 15,046 | 15,708.640000 | 15,340.530000 |
| Jan-2021 | 14,503 | 15,552.520000 | 14,815.310000 |
| Feb-2021 | 13,411 | 15,951.040000 | 13,000.560000 |
| Mar-2021 | 13,659 | 16,481.760000 | 13,519.680000 |
| Apr-2021 | 14,353 | 17,248.830000 | 14,256.340000 |
| May-2021 | 15,890 | 17,497.300000 | 16,362.310000 |
| Jun-2021 | 14,260 | 17,758.100000 | 13,805.420000 |
| Jul-2021 | 14,612 | 18,076.200000 | 14,211 |
| Aug-2021 | 14,033 | 18,526.080000 | 13,219.970000 |
| Sep-2021 | 13,114 | 17,756.870000 | 12,053.080000 |
| Oct-2021 | 13,721 | 18,762.630000 | 12,785.260000 |
| Nov-2021 | 13,536 | 18,351.480000 | 12,921.370000 |
| Dec-2021 | 13,931 | 19,135.830000 | 13,389.930000 |
| Jan-2022 | 13,187 | 18,123.340000 | 12,521.160000 |
| Feb-2022 | 14,406 | 17,664.970000 | 14,080.740000 |
| Mar-2022 | 15,625 | 18,149.760000 | 15,718.060000 |
| Apr-2022 | 14,670 | 16,642 | 14,450.460000 |
| May-2022 | 13,903 | 16,654.600000 | 13,079.580000 |
| Jun-2022 | 12,731 | 15,211.950000 | 11,119.750000 |
| Jul-2022 | 12,274 | 16,419.720000 | 10,133 |
| Aug-2022 | 11,448 | 15,733.250000 | 9,335.620000 |
| Sep-2022 | 11,647 | 14,270.690000 | 9,415.700000 |
| Oct-2022 | 11,676 | 15,295.510000 | 9,401.900000 |
| Nov-2022 | 13,486 | 16,359.010000 | 10,991.910000 |
| Dec-2022 | 13,756 | 15,664.290000 | 11,317.930000 |
| Jan-2023 | 15,080 | 16,772.630000 | 12,648.270000 |
| Feb-2023 | 13,474 | 16,369.440000 | 10,650.650000 |
| Mar-2023 | 15,255 | 16,875.250000 | 12,580.890000 |
| Apr-2023 | 15,554 | 17,171.070000 | 13,155.540000 |
| May-2023 | 14,564 | 16,999.640000 | 11,945.430000 |
| Jun-2023 | 14,165 | 18,027.740000 | 11,756.570000 |
| Jul-2023 | 14,628 | 18,633.340000 | 12,136.550000 |
| Aug-2023 | 14,101 | 18,188.270000 | 11,185.100000 |
| Sep-2023 | 13,169 | 17,403.660000 | 10,249.320000 |
| Oct-2023 | 13,567 | 16,898.680000 | 10,931.280000 |
| Nov-2023 | 14,891 | 18,482.970000 | 12,123.530000 |
| Dec-2023 | 14,772 | 19,390.370000 | 12,377.810000 |
| Jan-2024 | 13,568 | 19,623.070000 | 10,944.280000 |
| Feb-2024 | 12,857 | 20,455.040000 | 10,108.660000 |
| Mar-2024 | 14,848 | 21,112.360000 | 12,107.760000 |
| Apr-2024 | 15,411 | 20,328.150000 | 12,810.380000 |
| May-2024 | 16,253 | 21,235.840000 | 13,404.130000 |
| Jun-2024 | 15,637 | 21,667.940000 | 13,085.390000 |
| Jul-2024 | 17,279 | 22,049.780000 | 14,840.730000 |
| Aug-2024 | 17,730 | 22,632.570000 | 15,566.520000 |
| Sep-2024 | 18,175 | 23,047.060000 | 15,863.690000 |
| Oct-2024 | 18,772 | 22,590 | 15,631 |
The above chart represents historical performance of a hypothetical $10,000 investment since inception. The results of this chart do not predict the results of future time periods and does not guarantee the same results.
| Class/Index Name | 1 Year | 5 Years | Since Inception (3/1/17) |
|---|
| Class R6 | 38.37% | 11.40% | 8.56% |
| MSCI World Index | 33.68% | 12.03% | 11.03% |
| FTSE Gold Mines Index | 42.99% | 5.57% | 6.03% |
The Fund's past performance is not a good predictor of the Fund's future performance.The graph and table do not reflect the deduction of taxes that a shareholder would pay on fund distributions or redemption of fund shares. Call us at 800.334.2143 or visit https://www.firsteagle.com if you have questions about current performance.
- Net Assets$2,831,645,889
- Number of Portfolio Holdings31
- Portfolio Turnover Rate60.97%
- Net Investment Advisory Fees (net of waivers and reimbursements)$17,964,886
Asset Allocation by Asset Class
Based on total investments in the portfolio
| Value | Value |
|---|
| Common Stocks | 81.3% |
| Commodities | 16.7% |
| Rights | 0.1% |
| Short-Term Investments | 1.9%Footnote Reference1 |
Top 10 HoldingsFootnote Reference2
Based on total net assets of the portfolio
| Wheaton Precious Metals Corp. (Metals & Mining, Canada) | 11.1% |
Gold bullion (Precious Metal)Footnote Reference3 | 9.1% |
| Northern Star Resources Ltd. (Metals & Mining, Australia) | 8.0% |
Silver bullion (Precious Metal)Footnote Reference3 | 7.6% |
| Newmont Corp. (Metals & Mining, United States) | 6.5% |
| Agnico Eagle Mines Ltd. (Metals & Mining, Canada) | 6.5% |
| Dundee Precious Metals, Inc. (Metals & Mining, Canada) | 4.9% |
| Franco-Nevada Corp. (Metals & Mining, Canada) | 4.9% |
| Barrick Gold Corp. (Metals & Mining, Canada) | 4.7% |
| Alamos Gold, Inc., Class A (Metals & Mining, Canada) | 4.7% |
| Total | 68.0% |
Asset Allocation by Sector
Based on total investments in the portfolio
| Value | Value |
|---|
| Short-Term Investments | 1.9% |
| Commodities | 16.7% |
| Materials | 81.4% |
Asset Allocation by CountryFootnote Reference4
Based on total investments in the portfolio
| Canada | 53.4% |
| United States | 27.8% |
| Australia | 9.2% |
| South Africa | 4.0% |
| United Kingdom | 2.4% |
| Mexico | 1.3% |
| Short-Term Investments | 1.9% |
| Footnote | Description |
Footnote1 | Includes short-term commercial paper (1.9% of total investments) that settles in 90 days or less; long-term commercial paper (0.0% of total investments) that settles in 91 days or more; and other short-term investments (0.0% of total investments), such as U.S. treasury bills or money market funds. |
Footnote2 | Holdings in cash, short-term commercial paper, long-term commercial paper and other short-term cash equivalents have been excluded. |
Footnote3 | The Fund invests in gold and precious metals through investment in a wholly owned subsidiary of the Fund organized under the laws of the Cayman Islands (the “Subsidiary”). Gold bullion and commodities include the Fund’s investment in the Subsidiary. |
Footnote4 | Country allocations reflect country of risk not currency of issue. Bonds of non-U.S. issuers may be U.S. dollar denominated. |
October 31, 2024
Annual Shareholder Report
For more information, please scan the QR code to navigate to tailored shareholder reports and financial statements and other Information. If you wish to view additional information about the Fund, including but not limited to financial statements, holdings, or the Fund's prospectus, please visit http://www.firsteagle.com.
Important Notice Regarding Delivery of Shareholder Materials
Unless we are notified otherwise, we send one copy of these materials to shareholders with the same residential address (provided they have the same last name or are reasonably believed to be family members) for as long as they remain a shareholder of the Fund. If you would like to receive individual mailings, please call 800.334.2143 and we will send separate copies of these materials within 30 days after receiving your request.
October 31, 2024
Annual Shareholder Report
This Annual Shareholder Report contains important information about the Class A shares of the Fund for the period of November 1, 2023, to October 31, 2024. You can find additional information about the Fund at https://www.firsteagle.com/first-eagle-fund-shareholder-reports. You can also request this information by contacting us at 800.334.2143.
First Eagle Global Income Builder Fund
What Were the Fund's Costs for the Year?
Based on a Hypothetical $10,000 Investment
| Class Name | Cost of a $10,000 Investment | Cost Paid as a Percentage of a $10,000 Investment |
|---|
| Class A | $128 | 1.17% |
How Did the Fund Perform Last Year?
The NAV of First Eagle Global Income Builder Fund Class A Shares1 increased 18.89% in the 12-month period ended October 31, 2024. The MSCI World Index increased 33.68%, the Bloomberg U.S. Aggregate Bond Index was up 10.55% and the composite index2increased 24.00% over the same time period.
• Our equity and bond holdings both contributed to performance, while gold and gold-related equities also were a contributor.
• All geographic regions contributed to performance. North America and developed Europe were the leading equity contributors; while developed Europe excluding Japan and Japan were the worst performing regions.
• All equity sectors contributed to performance. Consumer staples and financials were the largest contributors, while utilities and communication services were the worst performing sectors.
• Gold bullion was the leading contributor to performance. Our equity holding in Nestle SA (Registered) was the largest detractor.
1 Reflects performance for Class A shares without the effect of sales charges and assumes all distributions have been reinvested; if sales charges were included, values would be lower.
2 The composite index consists of 60% of the MSCI World Index and 40% of the Bloomberg U.S. Aggregate Bond Index.
Total Return Based on a $10,000 Investment
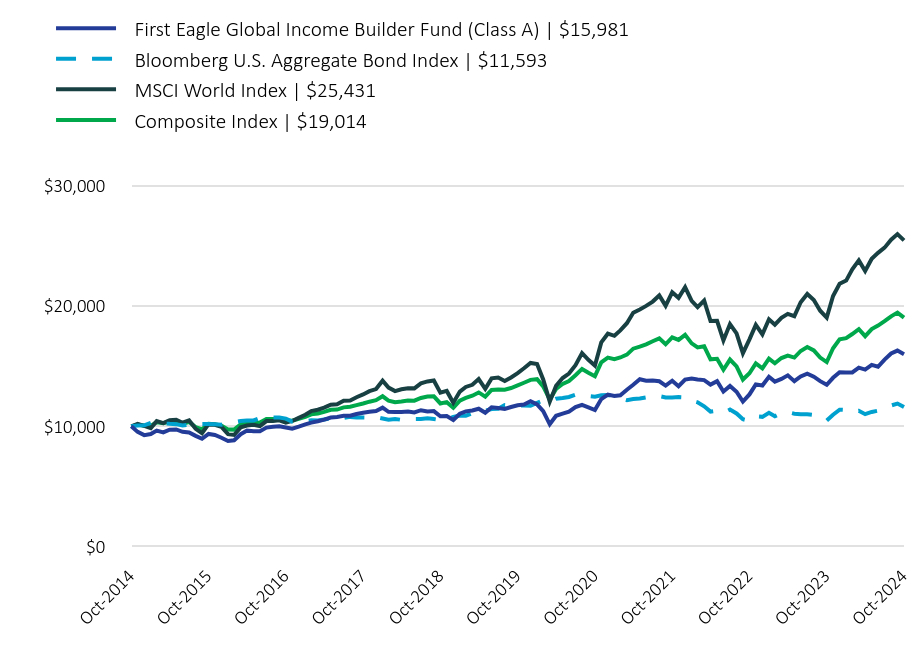
| First Eagle Global Income Builder Fund (Class A) | $15,981 | Bloomberg U.S. Aggregate Bond Index | $11,593 | MSCI World Index | $25,431 | Composite Index | $19,014 |
|---|
| Oct-2014 | 10,000 | 10,000 | 10,000 | 10,000 |
| Nov-2014 | 9,537.050000 | 10,070.940000 | 10,200.410000 | 10,148.620000 |
| Dec-2014 | 9,270.970000 | 10,080.360000 | 10,035.930000 | 10,054.230000 |
| Jan-2015 | 9,355.330000 | 10,291.740000 | 9,854.080000 | 10,029.250000 |
| Feb-2015 | 9,644.410000 | 10,194.970000 | 10,431.420000 | 10,344.090000 |
| Mar-2015 | 9,493.960000 | 10,242.310000 | 10,268.130000 | 10,266.150000 |
| Apr-2015 | 9,723.710000 | 10,205.560000 | 10,508.940000 | 10,395.880000 |
| May-2015 | 9,737.330000 | 10,180.980000 | 10,545.140000 | 10,407.350000 |
| Jun-2015 | 9,546.470000 | 10,069.970000 | 10,299.940000 | 10,216.760000 |
| Jul-2015 | 9,494.920000 | 10,139.970000 | 10,484.830000 | 10,355.210000 |
| Aug-2015 | 9,209.130000 | 10,125.410000 | 9,791 | 9,938.110000 |
| Sep-2015 | 8,964.160000 | 10,193.900000 | 9,429.860000 | 9,745.060000 |
| Oct-2015 | 9,364.860000 | 10,195.590000 | 10,177.120000 | 10,209.050000 |
| Nov-2015 | 9,280.580000 | 10,168.660000 | 10,126.490000 | 10,167.790000 |
| Dec-2015 | 9,054.130000 | 10,135.800000 | 9,948.490000 | 10,047.410000 |
| Jan-2016 | 8,782.510000 | 10,275.280000 | 9,353.330000 | 9,742.070000 |
| Feb-2016 | 8,841.350000 | 10,348.170000 | 9,283.720000 | 9,726.210000 |
| Mar-2016 | 9,347.960000 | 10,443.110000 | 9,913.700000 | 10,157.910000 |
| Apr-2016 | 9,643.360000 | 10,483.200000 | 10,070.570000 | 10,269.940000 |
| May-2016 | 9,582.600000 | 10,485.890000 | 10,127.130000 | 10,305.610000 |
| Jun-2016 | 9,596.980000 | 10,674.300000 | 10,013.650000 | 10,310.390000 |
| Jul-2016 | 9,892.560000 | 10,741.780000 | 10,436.720000 | 10,597.820000 |
| Aug-2016 | 9,958.840000 | 10,729.500000 | 10,445.390000 | 10,598.260000 |
| Sep-2016 | 10,002.660000 | 10,723.210000 | 10,500.870000 | 10,629.550000 |
| Oct-2016 | 9,904.640000 | 10,641.190000 | 10,297.650000 | 10,473.600000 |
| Nov-2016 | 9,810.540000 | 10,389.490000 | 10,445.720000 | 10,464.870000 |
| Dec-2016 | 9,971.440000 | 10,404.140000 | 10,695.670000 | 10,621.020000 |
| Jan-2017 | 10,165.880000 | 10,424.550000 | 10,953.810000 | 10,783.160000 |
| Feb-2017 | 10,304.130000 | 10,494.620000 | 11,257.710000 | 10,991.640000 |
| Mar-2017 | 10,424.690000 | 10,489.110000 | 11,377.630000 | 11,059.590000 |
| Apr-2017 | 10,556.040000 | 10,570.060000 | 11,546.090000 | 11,191.980000 |
| May-2017 | 10,727.050000 | 10,651.420000 | 11,790.340000 | 11,368.490000 |
| Jun-2017 | 10,781.760000 | 10,640.700000 | 11,835.710000 | 11,390.160000 |
| Jul-2017 | 10,869.090000 | 10,686.490000 | 12,118.960000 | 11,573.320000 |
| Aug-2017 | 10,879.960000 | 10,782.340000 | 12,136.030000 | 11,624.630000 |
| Sep-2017 | 11,023.580000 | 10,730.990000 | 12,408.410000 | 11,759.020000 |
| Oct-2017 | 11,131.610000 | 10,737.200000 | 12,642.910000 | 11,895.080000 |
| Nov-2017 | 11,206.190000 | 10,723.420000 | 12,916.860000 | 12,043.620000 |
| Dec-2017 | 11,263.340000 | 10,772.640000 | 13,091.540000 | 12,163.450000 |
| Jan-2018 | 11,549.430000 | 10,648.570000 | 13,782.770000 | 12,492.760000 |
| Feb-2018 | 11,205.260000 | 10,547.630000 | 13,211.790000 | 12,134.860000 |
| Mar-2018 | 11,186.210000 | 10,615.270000 | 12,923.820000 | 12,007.290000 |
| Apr-2018 | 11,196.280000 | 10,536.320000 | 13,072.330000 | 12,054.360000 |
| May-2018 | 11,228.740000 | 10,611.510000 | 13,154.240000 | 12,134.090000 |
| Jun-2018 | 11,146.770000 | 10,598.460000 | 13,147.970000 | 12,124.650000 |
| Jul-2018 | 11,336.270000 | 10,600.980000 | 13,558.630000 | 12,353.020000 |
| Aug-2018 | 11,225.170000 | 10,669.200000 | 13,726.380000 | 12,476.520000 |
| Sep-2018 | 11,261.090000 | 10,600.490000 | 13,802.820000 | 12,486.070000 |
| Oct-2018 | 10,837.680000 | 10,516.720000 | 12,789.300000 | 11,896.500000 |
| Nov-2018 | 10,853.930000 | 10,579.500000 | 12,934.590000 | 12,006 |
| Dec-2018 | 10,531.570000 | 10,773.860000 | 11,951.070000 | 11,546.470000 |
| Jan-2019 | 11,045.510000 | 10,888.270000 | 12,880.930000 | 12,134.550000 |
| Feb-2019 | 11,243.230000 | 10,881.960000 | 13,268.260000 | 12,350.670000 |
| Mar-2019 | 11,310.690000 | 11,090.920000 | 13,442.530000 | 12,542.860000 |
| Apr-2019 | 11,458.860000 | 11,093.760000 | 13,919.190000 | 12,811 |
| May-2019 | 11,119.670000 | 11,290.690000 | 13,116.040000 | 12,458.450000 |
| Jun-2019 | 11,583.370000 | 11,432.480000 | 13,980.320000 | 13,013.600000 |
| Jul-2019 | 11,524.290000 | 11,457.630000 | 14,049.570000 | 13,063.720000 |
| Aug-2019 | 11,444.770000 | 11,754.510000 | 13,762.200000 | 13,038.800000 |
| Sep-2019 | 11,603.850000 | 11,691.910000 | 14,055.070000 | 13,177.510000 |
| Oct-2019 | 11,747.740000 | 11,727.130000 | 14,412.730000 | 13,394.580000 |
| Nov-2019 | 11,805.310000 | 11,721.160000 | 14,814.130000 | 13,615.680000 |
| Dec-2019 | 12,074.470000 | 11,712.990000 | 15,257.940000 | 13,856.630000 |
| Jan-2020 | 11,818.490000 | 11,938.400000 | 15,165.070000 | 13,912.690000 |
| Feb-2020 | 11,253.570000 | 12,153.270000 | 13,883.240000 | 13,307.270000 |
| Mar-2020 | 10,168.720000 | 12,081.750000 | 12,045.890000 | 12,219.270000 |
| Apr-2020 | 10,877.480000 | 12,296.520000 | 13,361.830000 | 13,107.090000 |
| May-2020 | 11,052.610000 | 12,353.770000 | 14,007.320000 | 13,511.400000 |
| Jun-2020 | 11,219.500000 | 12,431.590000 | 14,377.830000 | 13,759.880000 |
| Jul-2020 | 11,588.620000 | 12,617.280000 | 15,065.680000 | 14,237.070000 |
| Aug-2020 | 11,783.310000 | 12,515.430000 | 16,072.290000 | 14,761.850000 |
| Sep-2020 | 11,578.280000 | 12,508.570000 | 15,517.810000 | 14,453.050000 |
| Oct-2020 | 11,352.510000 | 12,452.720000 | 15,041.800000 | 14,161.220000 |
| Nov-2020 | 12,261.840000 | 12,574.910000 | 16,965.070000 | 15,303.210000 |
| Dec-2020 | 12,637.060000 | 12,592.240000 | 17,684.330000 | 15,700.930000 |
| Jan-2021 | 12,510.690000 | 12,501.950000 | 17,508.570000 | 15,562.270000 |
| Feb-2021 | 12,576.990000 | 12,321.420000 | 17,957.220000 | 15,711.650000 |
| Mar-2021 | 13,033.540000 | 12,167.560000 | 18,554.690000 | 15,946.830000 |
| Apr-2021 | 13,449.310000 | 12,263.690000 | 19,418.230000 | 16,442.520000 |
| May-2021 | 13,909.270000 | 12,303.750000 | 19,697.960000 | 16,606.120000 |
| Jun-2021 | 13,786.870000 | 12,390.200000 | 19,991.550000 | 16,801.300000 |
| Jul-2021 | 13,797.900000 | 12,528.740000 | 20,349.660000 | 17,057.020000 |
| Aug-2021 | 13,735.810000 | 12,504.880000 | 20,856.130000 | 17,298.740000 |
| Sep-2021 | 13,378.680000 | 12,396.620000 | 19,990.170000 | 16,807.880000 |
| Oct-2021 | 13,780.040000 | 12,393.200000 | 21,122.420000 | 17,377.230000 |
| Nov-2021 | 13,323.920000 | 12,429.860000 | 20,659.570000 | 17,169.320000 |
| Dec-2021 | 13,879.530000 | 12,398.060000 | 21,542.560000 | 17,592.040000 |
| Jan-2022 | 13,957.250000 | 12,130.950000 | 20,402.720000 | 16,881.950000 |
| Feb-2022 | 13,888.860000 | 11,995.620000 | 19,886.710000 | 16,550.440000 |
| Mar-2022 | 13,831.920000 | 11,662.360000 | 20,432.470000 | 16,639.040000 |
| Apr-2022 | 13,463.990000 | 11,219.790000 | 18,735.080000 | 15,557.110000 |
| May-2022 | 13,746.730000 | 11,292.130000 | 18,749.270000 | 15,604.310000 |
| Jun-2022 | 12,887.560000 | 11,114.980000 | 17,125.170000 | 14,695.380000 |
| Jul-2022 | 13,350.230000 | 11,386.570000 | 18,484.840000 | 15,539.070000 |
| Aug-2022 | 12,866.950000 | 11,064.830000 | 17,712.030000 | 14,973.640000 |
| Sep-2022 | 12,049.900000 | 10,586.760000 | 16,065.520000 | 13,879.690000 |
| Oct-2022 | 12,646.370000 | 10,449.630000 | 17,219.240000 | 14,405.820000 |
| Nov-2022 | 13,481.030000 | 10,833.930000 | 18,416.500000 | 15,218.720000 |
| Dec-2022 | 13,388.010000 | 10,785.060000 | 17,634.400000 | 14,803.490000 |
| Jan-2023 | 14,110.960000 | 11,116.850000 | 18,882.140000 | 15,614.110000 |
| Feb-2023 | 13,708.800000 | 10,829.420000 | 18,428.240000 | 15,227.430000 |
| Mar-2023 | 13,934.990000 | 11,104.510000 | 18,997.670000 | 15,664.470000 |
| Apr-2023 | 14,229.020000 | 11,171.810000 | 19,330.690000 | 15,867.200000 |
| May-2023 | 13,743.810000 | 11,050.170000 | 19,137.700000 | 15,703.040000 |
| Jun-2023 | 14,134.140000 | 11,010.750000 | 20,295.110000 | 16,250.450000 |
| Jul-2023 | 14,371.590000 | 11,003.080000 | 20,976.880000 | 16,573.460000 |
| Aug-2023 | 14,117.210000 | 10,932.800000 | 20,475.830000 | 16,293.590000 |
| Sep-2023 | 13,748.750000 | 10,654.980000 | 19,592.540000 | 15,706.240000 |
| Oct-2023 | 13,450.400000 | 10,486.830000 | 19,024.040000 | 15,333.660000 |
| Nov-2023 | 14,024.740000 | 10,961.740000 | 20,807.590000 | 16,473.960000 |
| Dec-2023 | 14,480.540000 | 11,381.340000 | 21,829.120000 | 17,211.470000 |
| Jan-2024 | 14,474.750000 | 11,350.090000 | 22,091.080000 | 17,316.490000 |
| Feb-2024 | 14,470.410000 | 11,189.730000 | 23,027.690000 | 17,659.140000 |
| Mar-2024 | 14,868.340000 | 11,293.060000 | 23,767.680000 | 18,064.850000 |
| Apr-2024 | 14,706.280000 | 11,007.810000 | 22,884.840000 | 17,479.720000 |
| May-2024 | 15,100.410000 | 11,194.430000 | 23,906.690000 | 18,066.560000 |
| Jun-2024 | 14,943.360000 | 11,300.410000 | 24,393.140000 | 18,355.550000 |
| Jul-2024 | 15,535.120000 | 11,564.350000 | 24,823.010000 | 18,721.120000 |
| Aug-2024 | 16,038.460000 | 11,730.530000 | 25,479.090000 | 19,125.610000 |
| Sep-2024 | 16,282.240000 | 11,887.600000 | 25,945.710000 | 19,438.200000 |
| Oct-2024 | 15,981 | 11,593 | 25,431 | 19,014 |
The above chart represents historical performance of a hypothetical $10,000 investment over the past 10 years. The results of this chart do not predict the results of future time periods and does not guarantee the same results.
| Class/Index Name | 1 Year | 5 Years | 10 Years |
|---|
| Class A - without sales charge | 18.89% | 6.34% | 5.33% |
| Class A - with sales charge | 12.83% | 5.25% | 4.80% |
| Bloomberg U.S. Aggregate Bond Index | 10.55% | -0.23% | 1.49% |
| MSCI World Index | 33.68% | 12.03% | 9.78% |
| Composite Index | 24.00% | 7.26% | 6.64% |
The Fund's past performance is not a good predictor of the Fund's future performance.The graph and table do not reflect the deduction of taxes that a shareholder would pay on fund distributions or redemption of fund shares. Call us at 800.334.2143 or visit https://www.firsteagle.com if you have questions about current performance.
- Net Assets$1,758,899,230
- Number of Portfolio Holdings289
- Portfolio Turnover Rate14.66%
- Net Investment Advisory Fees (net of waivers and reimbursements)$12,900,132
Asset Allocation by Asset Class
Based on total investments in the portfolio
| Value | Value |
|---|
| Common Stocks | 63.8% |
| Corporate Bonds | 11.7% |
| U.S. Treasury Obligations | 9.6% |
| Commodities | 7.6% |
| Preferred Stocks | 1.8% |
| Convertible Preferred Stocks | 1.5% |
| Master Limited Partnerships | 1.0% |
| Foreign Government Securities | 0.9% |
| Asset-Backed Securities | 0.2% |
| Municipal Bonds | 0.2% |
| Loan Assignments | 0.1% |
| Short-Term Investments | 1.6%Footnote Reference1 |
Top 10 HoldingsFootnote Reference2
Based on total net assets of the portfolio
| Gold bullion (Precious Metal) | 7.5% |
| Unilever plc (Personal Care Products, United Kingdom) | 3.0% |
| Philip Morris International, Inc. (Tobacco, United States) | 3.0% |
| Exxon Mobil Corp. (Oil, Gas & Consumable Fuels, United States) | 2.6% |
| British American Tobacco plc (Tobacco, United Kingdom) | 2.4% |
| Nestle SA (Registered) (Food Products, Switzerland) | 2.1% |
| KT&G Corp. (Tobacco, South Korea) | 1.9% |
| Jardine Matheson Holdings Ltd. (Industrial Conglomerates, Hong Kong) | 1.7% |
| Cie Financiere Richemont SA (Registered) (Textiles, Apparel & Luxury Goods, Switzerland) | 1.4% |
| Power Corp. of Canada (Insurance, Canada) | 1.4% |
| Total | 27.0% |
Asset Allocation by Sector
Based on total investments in the portfolio
| Value | Value |
|---|
| Short-Term Investments | 1.6% |
OthersFootnote Reference3 | 7.1% |
| Information Technology | 4.3% |
| Real Estate | 4.6% |
| Materials | 5.0% |
| Energy | 7.3% |
| Commodities | 7.6% |
| Industrials | 7.6% |
| Health Care | 7.8% |
| U.S. Treasury Obligations | 9.6% |
| Financials | 13.9% |
| Consumer Staples | 23.6% |
Asset Allocation by CountryFootnote Reference4
Based on total investments in the portfolio
| United States | 55.4% |
| United Kingdom | 9.9% |
| Canada | 5.1% |
| Switzerland | 4.6% |
| Mexico | 3.3% |
| Hong Kong | 3.2% |
| South Korea | 3.1% |
| Japan | 2.7% |
| Brazil | 1.9% |
| France | 1.6% |
OthersFootnote Reference5 | 7.6% |
| Short-Term Investments | 1.6% |
| Footnote | Description |
Footnote1 | Includes short-term commercial paper (1.6% of total investments) that settles in 90 days or less; long-term commercial paper (0.0% of total investments) that settles in 91 days or more; and other short-term investments (9.6% of total investments), such as U.S. treasury bills or money market funds. |
Footnote2 | Holdings in cash, short-term commercial paper, long-term commercial paper and other short-term cash equivalents have been excluded. |
Footnote3 | Includes additional sectors outside the top 10 listed above. |
Footnote4 | Country allocations reflect country of risk not currency of issue. Bonds of non-U.S. issuers may be U.S. dollar denominated. |
Footnote5 | Includes additional countries outside the top 10 listed above. |
First Eagle Global Income Builder Fund
October 31, 2024
Annual Shareholder Report
For more information, please scan the QR code to navigate to tailored shareholder reports and financial statements and other Information. If you wish to view additional information about the Fund, including but not limited to financial statements, holdings, or the Fund's prospectus, please visit http://www.firsteagle.com.
Important Notice Regarding Delivery of Shareholder Materials
Unless we are notified otherwise, we send one copy of these materials to shareholders with the same residential address (provided they have the same last name or are reasonably believed to be family members) for as long as they remain a shareholder of the Fund. If you would like to receive individual mailings, please call 800.334.2143 and we will send separate copies of these materials within 30 days after receiving your request.
October 31, 2024
Annual Shareholder Report
This Annual Shareholder Report contains important information about the Class C shares of the Fund for the period of November 1, 2023, to October 31, 2024. You can find additional information about the Fund at https://www.firsteagle.com/first-eagle-fund-shareholder-reports. You can also request this information by contacting us at 800.334.2143.
First Eagle Global Income Builder Fund
What Were the Fund's Costs for the Year?
Based on a Hypothetical $10,000 Investment
| Class Name | Cost of a $10,000 Investment | Cost Paid as a Percentage of a $10,000 Investment |
|---|
| Class C | $211 | 1.94% |
How Did the Fund Perform Last Year?
The NAV of First Eagle Global Income Builder Fund Class C Shares1 increased 17.79% in the 12-month period ended October 31, 2024. The MSCI World Index increased 33.68%, the Bloomberg U.S. Aggregate Bond Index was up 10.55% and the composite index2increased 24.00% over the same time period.
• Our equity and bond holdings both contributed to performance, while gold and gold-related equities also were a contributor.
• All geographic regions contributed to performance. North America and developed Europe were the leading equity contributors; while developed Europe excluding Japan and Japan were the worst performing regions.
• All equity sectors contributed to performance. Consumer staples and financials were the largest contributors, while utilities and communication services were the worst performing sectors.
• Gold bullion was the leading contributor to performance. Our equity holding in Nestle SA (Registered) was the largest detractor.
1 Reflects performance for Class C shares without the effect of sales charges and assumes all distributions have been reinvested; if sales charges were included, values would be lower.
2 The composite index consists of 60% of the MSCI World Index and 40% of the Bloomberg U.S. Aggregate Bond Index.
Total Return Based on a $10,000 Investment
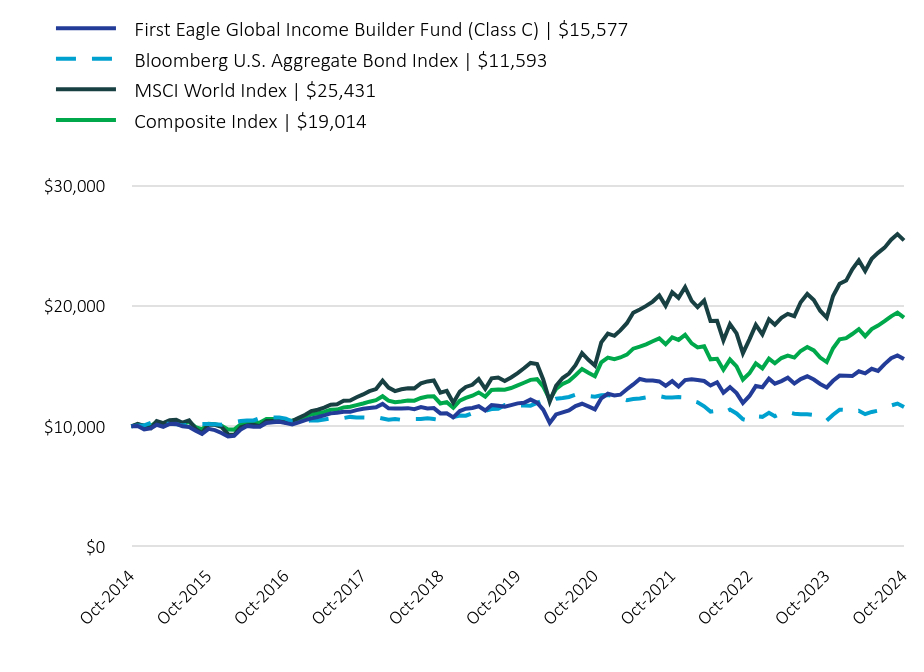
| First Eagle Global Income Builder Fund (Class C) | $15,577 | Bloomberg U.S. Aggregate Bond Index | $11,593 | MSCI World Index | $25,431 | Composite Index | $19,014 |
|---|
| Oct-2014 | 10,000 | 10,000 | 10,000 | 10,000 |
| Nov-2014 | 10,033 | 10,070.940000 | 10,200.410000 | 10,148.620000 |
| Dec-2014 | 9,746.060000 | 10,080.360000 | 10,035.930000 | 10,054.230000 |
| Jan-2015 | 9,828.900000 | 10,291.740000 | 9,854.080000 | 10,029.250000 |
| Feb-2015 | 10,127.700000 | 10,194.970000 | 10,431.420000 | 10,344.090000 |
| Mar-2015 | 9,962.620000 | 10,242.310000 | 10,268.130000 | 10,266.150000 |
| Apr-2015 | 10,198.730000 | 10,205.560000 | 10,508.940000 | 10,395.880000 |
| May-2015 | 10,205.870000 | 10,180.980000 | 10,545.140000 | 10,407.350000 |
| Jun-2015 | 9,998.690000 | 10,069.970000 | 10,299.940000 | 10,216.760000 |
| Jul-2015 | 9,938.700000 | 10,139.970000 | 10,484.830000 | 10,355.210000 |
| Aug-2015 | 9,632.590000 | 10,125.410000 | 9,791 | 9,938.110000 |
| Sep-2015 | 9,378.280000 | 10,193.900000 | 9,429.860000 | 9,745.060000 |
| Oct-2015 | 9,789.990000 | 10,195.590000 | 10,177.120000 | 10,209.050000 |
| Nov-2015 | 9,686.220000 | 10,168.660000 | 10,126.490000 | 10,167.790000 |
| Dec-2015 | 9,443.090000 | 10,135.800000 | 9,948.490000 | 10,047.410000 |
| Jan-2016 | 9,153.190000 | 10,275.280000 | 9,353.330000 | 9,742.070000 |
| Feb-2016 | 9,209.030000 | 10,348.170000 | 9,283.720000 | 9,726.210000 |
| Mar-2016 | 9,732.100000 | 10,443.110000 | 9,913.700000 | 10,157.910000 |
| Apr-2016 | 10,034.770000 | 10,483.200000 | 10,070.570000 | 10,269.940000 |
| May-2016 | 9,964.520000 | 10,485.890000 | 10,127.130000 | 10,305.610000 |
| Jun-2016 | 9,973.490000 | 10,674.300000 | 10,013.650000 | 10,310.390000 |
| Jul-2016 | 10,274.690000 | 10,741.780000 | 10,436.720000 | 10,597.820000 |
| Aug-2016 | 10,337.370000 | 10,729.500000 | 10,445.390000 | 10,598.260000 |
| Sep-2016 | 10,376.650000 | 10,723.210000 | 10,500.870000 | 10,629.550000 |
| Oct-2016 | 10,267.690000 | 10,641.190000 | 10,297.650000 | 10,473.600000 |
| Nov-2016 | 10,162.960000 | 10,389.490000 | 10,445.720000 | 10,464.870000 |
| Dec-2016 | 10,323.540000 | 10,404.140000 | 10,695.670000 | 10,621.020000 |
| Jan-2017 | 10,518.650000 | 10,424.550000 | 10,953.810000 | 10,783.160000 |
| Feb-2017 | 10,655.390000 | 10,494.620000 | 11,257.710000 | 10,991.640000 |
| Mar-2017 | 10,773.670000 | 10,489.110000 | 11,377.630000 | 11,059.590000 |
| Apr-2017 | 10,902.950000 | 10,570.060000 | 11,546.090000 | 11,191.980000 |
| May-2017 | 11,073.040000 | 10,651.420000 | 11,790.340000 | 11,368.490000 |
| Jun-2017 | 11,122.870000 | 10,640.700000 | 11,835.710000 | 11,390.160000 |
| Jul-2017 | 11,206.290000 | 10,686.490000 | 12,118.960000 | 11,573.320000 |
| Aug-2017 | 11,200.690000 | 10,782.340000 | 12,136.030000 | 11,624.630000 |
| Sep-2017 | 11,342.930000 | 10,730.990000 | 12,408.410000 | 11,759.020000 |
| Oct-2017 | 11,457.500000 | 10,737.200000 | 12,642.910000 | 11,895.080000 |
| Nov-2017 | 11,518.220000 | 10,723.420000 | 12,916.860000 | 12,043.620000 |
| Dec-2017 | 11,579.270000 | 10,772.640000 | 13,091.540000 | 12,163.450000 |
| Jan-2018 | 11,857.170000 | 10,648.570000 | 13,782.770000 | 12,492.760000 |
| Feb-2018 | 11,496.710000 | 10,547.630000 | 13,211.790000 | 12,134.860000 |
| Mar-2018 | 11,479.470000 | 10,615.270000 | 12,923.820000 | 12,007.290000 |
| Apr-2018 | 11,482.910000 | 10,536.320000 | 13,072.330000 | 12,054.360000 |
| May-2018 | 11,508.180000 | 10,611.510000 | 13,154.240000 | 12,134.090000 |
| Jun-2018 | 11,417.260000 | 10,598.460000 | 13,147.970000 | 12,124.650000 |
| Jul-2018 | 11,594.230000 | 10,600.980000 | 13,558.630000 | 12,353.020000 |
| Aug-2018 | 11,482.920000 | 10,669.200000 | 13,726.380000 | 12,476.520000 |
| Sep-2018 | 11,512.780000 | 10,600.490000 | 13,802.820000 | 12,486.070000 |
| Oct-2018 | 11,071.840000 | 10,516.720000 | 12,789.300000 | 11,896.500000 |
| Nov-2018 | 11,081.800000 | 10,579.500000 | 12,934.590000 | 12,006 |
| Dec-2018 | 10,744.920000 | 10,773.860000 | 11,951.070000 | 11,546.470000 |
| Jan-2019 | 11,263.900000 | 10,888.270000 | 12,880.930000 | 12,134.550000 |
| Feb-2019 | 11,459.890000 | 10,881.960000 | 13,268.260000 | 12,350.670000 |
| Mar-2019 | 11,521.770000 | 11,090.920000 | 13,442.530000 | 12,542.860000 |
| Apr-2019 | 11,664.640000 | 11,093.760000 | 13,919.190000 | 12,811 |
| May-2019 | 11,310.040000 | 11,290.690000 | 13,116.040000 | 12,458.450000 |
| Jun-2019 | 11,766.960000 | 11,432.480000 | 13,980.320000 | 13,013.600000 |
| Jul-2019 | 11,709.300000 | 11,457.630000 | 14,049.570000 | 13,063.720000 |
| Aug-2019 | 11,619.140000 | 11,754.510000 | 13,762.200000 | 13,038.800000 |
| Sep-2019 | 11,763.220000 | 11,691.910000 | 14,055.070000 | 13,177.510000 |
| Oct-2019 | 11,904.380000 | 11,727.130000 | 14,412.730000 | 13,394.580000 |
| Nov-2019 | 11,955.570000 | 11,721.160000 | 14,814.130000 | 13,615.680000 |
| Dec-2019 | 12,218.590000 | 11,712.990000 | 15,257.940000 | 13,856.630000 |
| Jan-2020 | 11,962 | 11,938.400000 | 15,165.070000 | 13,912.690000 |
| Feb-2020 | 11,381.840000 | 12,153.270000 | 13,883.240000 | 13,307.270000 |
| Mar-2020 | 10,283.500000 | 12,081.750000 | 12,045.890000 | 12,219.270000 |
| Apr-2020 | 10,984.830000 | 12,296.520000 | 13,361.830000 | 13,107.090000 |
| May-2020 | 11,155.090000 | 12,353.770000 | 14,007.320000 | 13,511.400000 |
| Jun-2020 | 11,316.840000 | 12,431.590000 | 14,377.830000 | 13,759.880000 |
| Jul-2020 | 11,683.510000 | 12,617.280000 | 15,065.680000 | 14,237.070000 |
| Aug-2020 | 11,872.780000 | 12,515.430000 | 16,072.290000 | 14,761.850000 |
| Sep-2020 | 11,655.510000 | 12,508.570000 | 15,517.810000 | 14,453.050000 |
| Oct-2020 | 11,410.740000 | 12,452.720000 | 15,041.800000 | 14,161.220000 |
| Nov-2020 | 12,322.460000 | 12,574.910000 | 16,965.070000 | 15,303.210000 |
| Dec-2020 | 12,699.530000 | 12,592.240000 | 17,684.330000 | 15,700.930000 |
| Jan-2021 | 12,558.570000 | 12,501.950000 | 17,508.570000 | 15,562.270000 |
| Feb-2021 | 12,625.130000 | 12,321.420000 | 17,957.220000 | 15,711.650000 |
| Mar-2021 | 13,074.580000 | 12,167.560000 | 18,554.690000 | 15,946.830000 |
| Apr-2021 | 13,473.350000 | 12,263.690000 | 19,418.230000 | 16,442.520000 |
| May-2021 | 13,927.410000 | 12,303.750000 | 19,697.960000 | 16,606.120000 |
| Jun-2021 | 13,803.450000 | 12,390.200000 | 19,991.550000 | 16,801.300000 |
| Jul-2021 | 13,796.550000 | 12,528.740000 | 20,349.660000 | 17,057.020000 |
| Aug-2021 | 13,723.430000 | 12,504.880000 | 20,856.130000 | 17,298.740000 |
| Sep-2021 | 13,363.880000 | 12,396.620000 | 19,990.170000 | 16,807.880000 |
| Oct-2021 | 13,747.420000 | 12,393.200000 | 21,122.420000 | 17,377.230000 |
| Nov-2021 | 13,292.380000 | 12,429.860000 | 20,659.570000 | 17,169.320000 |
| Dec-2021 | 13,833.380000 | 12,398.060000 | 21,542.560000 | 17,592.040000 |
| Jan-2022 | 13,908.080000 | 12,130.950000 | 20,402.720000 | 16,881.950000 |
| Feb-2022 | 13,837.150000 | 11,995.620000 | 19,886.710000 | 16,550.440000 |
| Mar-2022 | 13,758.280000 | 11,662.360000 | 20,432.470000 | 16,639.040000 |
| Apr-2022 | 13,385.430000 | 11,219.790000 | 18,735.080000 | 15,557.110000 |
| May-2022 | 13,657.150000 | 11,292.130000 | 18,749.270000 | 15,604.310000 |
| Jun-2022 | 12,789.920000 | 11,114.980000 | 17,125.170000 | 14,695.380000 |
| Jul-2022 | 13,250.360000 | 11,386.570000 | 18,484.840000 | 15,539.070000 |
| Aug-2022 | 12,752.150000 | 11,064.830000 | 17,712.030000 | 14,973.640000 |
| Sep-2022 | 11,938.560000 | 10,586.760000 | 16,065.520000 | 13,879.690000 |
| Oct-2022 | 12,516.390000 | 10,449.630000 | 17,219.240000 | 14,405.820000 |
| Nov-2022 | 13,339.960000 | 10,833.930000 | 18,416.500000 | 15,218.720000 |
| Dec-2022 | 13,238.580000 | 10,785.060000 | 17,634.400000 | 14,803.490000 |
| Jan-2023 | 13,952.140000 | 11,116.850000 | 18,882.140000 | 15,614.110000 |
| Feb-2023 | 13,536.370000 | 10,829.420000 | 18,428.240000 | 15,227.430000 |
| Mar-2023 | 13,751.590000 | 11,104.510000 | 18,997.670000 | 15,664.470000 |
| Apr-2023 | 14,032.130000 | 11,171.810000 | 19,330.690000 | 15,867.200000 |
| May-2023 | 13,549.420000 | 11,050.170000 | 19,137.700000 | 15,703.040000 |
| Jun-2023 | 13,923.380000 | 11,010.750000 | 20,295.110000 | 16,250.450000 |
| Jul-2023 | 14,148.940000 | 11,003.080000 | 20,976.880000 | 16,573.460000 |
| Aug-2023 | 13,881.530000 | 10,932.800000 | 20,475.830000 | 16,293.590000 |
| Sep-2023 | 13,513.670000 | 10,654.980000 | 19,592.540000 | 15,706.240000 |
| Oct-2023 | 13,224.480000 | 10,486.830000 | 19,024.040000 | 15,333.660000 |
| Nov-2023 | 13,775.940000 | 10,961.740000 | 20,807.590000 | 16,473.960000 |
| Dec-2023 | 14,209.880000 | 11,381.340000 | 21,829.120000 | 17,211.470000 |
| Jan-2024 | 14,188.560000 | 11,350.090000 | 22,091.080000 | 17,316.490000 |
| Feb-2024 | 14,174.370000 | 11,189.730000 | 23,027.690000 | 17,659.140000 |
| Mar-2024 | 14,562.750000 | 11,293.060000 | 23,767.680000 | 18,064.850000 |
| Apr-2024 | 14,395.280000 | 11,007.810000 | 22,884.840000 | 17,479.720000 |
| May-2024 | 14,769.560000 | 11,194.430000 | 23,906.690000 | 18,066.560000 |
| Jun-2024 | 14,596.750000 | 11,300.410000 | 24,393.140000 | 18,355.550000 |
| Jul-2024 | 15,161.650000 | 11,564.350000 | 24,823.010000 | 18,721.120000 |
| Aug-2024 | 15,651.370000 | 11,730.530000 | 25,479.090000 | 19,125.610000 |
| Sep-2024 | 15,878.320000 | 11,887.600000 | 25,945.710000 | 19,438.200000 |
| Oct-2024 | 15,577 | 11,593 | 25,431 | 19,014 |
The above chart represents historical performance of a hypothetical $10,000 investment over the past 10 years. The results of this chart do not predict the results of future time periods and does not guarantee the same results.
| Class/Index Name | 1 Year | 5 Years | 10 Years |
|---|
| Class C - without sales charge | 17.79% | 5.52% | 4.53% |
| Class C - with sales charge | 16.79% | 5.52% | 4.53% |
| Bloomberg U.S. Aggregate Bond Index | 10.55% | -0.23% | 1.49% |
| MSCI World Index | 33.68% | 12.03% | 9.78% |
| Composite Index | 24.00% | 7.26% | 6.64% |
The Fund's past performance is not a good predictor of the Fund's future performance.The graph and table do not reflect the deduction of taxes that a shareholder would pay on fund distributions or redemption of fund shares. Call us at 800.334.2143 or visit https://www.firsteagle.com if you have questions about current performance.
- Net Assets$1,758,899,230
- Number of Portfolio Holdings289
- Portfolio Turnover Rate14.66%
- Net Investment Advisory Fees (net of waivers and reimbursements)$12,900,132
Asset Allocation by Asset Class
Based on total investments in the portfolio
| Value | Value |
|---|
| Common Stocks | 63.8% |
| Corporate Bonds | 11.7% |
| U.S. Treasury Obligations | 9.6% |
| Commodities | 7.6% |
| Preferred Stocks | 1.8% |
| Convertible Preferred Stocks | 1.5% |
| Master Limited Partnerships | 1.0% |
| Foreign Government Securities | 0.9% |
| Asset-Backed Securities | 0.2% |
| Municipal Bonds | 0.2% |
| Loan Assignments | 0.1% |
| Short-Term Investments | 1.6%Footnote Reference1 |
Top 10 HoldingsFootnote Reference2
Based on total net assets of the portfolio
| Gold bullion (Precious Metal) | 7.5% |
| Unilever plc (Personal Care Products, United Kingdom) | 3.0% |
| Philip Morris International, Inc. (Tobacco, United States) | 3.0% |
| Exxon Mobil Corp. (Oil, Gas & Consumable Fuels, United States) | 2.6% |
| British American Tobacco plc (Tobacco, United Kingdom) | 2.4% |
| Nestle SA (Registered) (Food Products, Switzerland) | 2.1% |
| KT&G Corp. (Tobacco, South Korea) | 1.9% |
| Jardine Matheson Holdings Ltd. (Industrial Conglomerates, Hong Kong) | 1.7% |
| Cie Financiere Richemont SA (Registered) (Textiles, Apparel & Luxury Goods, Switzerland) | 1.4% |
| Power Corp. of Canada (Insurance, Canada) | 1.4% |
| Total | 27.0% |
Asset Allocation by Sector
Based on total investments in the portfolio
| Value | Value |
|---|
| Short-Term Investments | 1.6% |
OthersFootnote Reference3 | 7.1% |
| Information Technology | 4.3% |
| Real Estate | 4.6% |
| Materials | 5.0% |
| Energy | 7.3% |
| Commodities | 7.6% |
| Industrials | 7.6% |
| Health Care | 7.8% |
| U.S. Treasury Obligations | 9.6% |
| Financials | 13.9% |
| Consumer Staples | 23.6% |
Asset Allocation by CountryFootnote Reference4
Based on total investments in the portfolio
| United States | 55.4% |
| United Kingdom | 9.9% |
| Canada | 5.1% |
| Switzerland | 4.6% |
| Mexico | 3.3% |
| Hong Kong | 3.2% |
| South Korea | 3.1% |
| Japan | 2.7% |
| Brazil | 1.9% |
| France | 1.6% |
OthersFootnote Reference5 | 7.6% |
| Short-Term Investments | 1.6% |
| Footnote | Description |
Footnote1 | Includes short-term commercial paper (1.6% of total investments) that settles in 90 days or less; long-term commercial paper (0.0% of total investments) that settles in 91 days or more; and other short-term investments (9.6% of total investments), such as U.S. treasury bills or money market funds. |
Footnote2 | Holdings in cash, short-term commercial paper, long-term commercial paper and other short-term cash equivalents have been excluded. |
Footnote3 | Includes additional sectors outside the top 10 listed above. |
Footnote4 | Country allocations reflect country of risk not currency of issue. Bonds of non-U.S. issuers may be U.S. dollar denominated. |
Footnote5 | Includes additional countries outside the top 10 listed above. |
First Eagle Global Income Builder Fund
October 31, 2024
Annual Shareholder Report
For more information, please scan the QR code to navigate to tailored shareholder reports and financial statements and other Information. If you wish to view additional information about the Fund, including but not limited to financial statements, holdings, or the Fund's prospectus, please visit http://www.firsteagle.com.
Important Notice Regarding Delivery of Shareholder Materials
Unless we are notified otherwise, we send one copy of these materials to shareholders with the same residential address (provided they have the same last name or are reasonably believed to be family members) for as long as they remain a shareholder of the Fund. If you would like to receive individual mailings, please call 800.334.2143 and we will send separate copies of these materials within 30 days after receiving your request.
October 31, 2024
Annual Shareholder Report
This Annual Shareholder Report contains important information about the Class I shares of the Fund for the period of November 1, 2023, to October 31, 2024. You can find additional information about the Fund at https://www.firsteagle.com/first-eagle-fund-shareholder-reports. You can also request this information by contacting us at 800.334.2143.
First Eagle Global Income Builder Fund
What Were the Fund's Costs for the Year?
Based on a Hypothetical $10,000 Investment
| Class Name | Cost of a $10,000 Investment | Cost Paid as a Percentage of a $10,000 Investment |
|---|
| Class I | $105 | 0.96% |
How Did the Fund Perform Last Year?
The NAV of First Eagle Global Income Builder Fund Class I Shares increased 19.06% in the 12-month period ended October 31, 2024. The MSCI World Index increased 33.68%, the Bloomberg U.S. Aggregate Bond Index was up 10.55% and the composite index1increased 24.00% over the same time period.
• Our equity and bond holdings both contributed to performance, while gold and gold-related equities also were a contributor.
• All geographic regions contributed to performance. North America and developed Europe were the leading equity contributors; while developed Europe excluding Japan and Japan were the worst performing regions.
• All equity sectors contributed to performance. Consumer staples and financials were the largest contributors, while utilities and communication services were the worst performing sectors.
• Gold bullion was the leading contributor to performance. Our equity holding in Nestle SA (Registered) was the largest detractor.
1 The composite index consists of 60% of the MSCI World Index and 40% of the Bloomberg U.S. Aggregate Bond Index.
Total Return Based on a $1,000,000 Investment
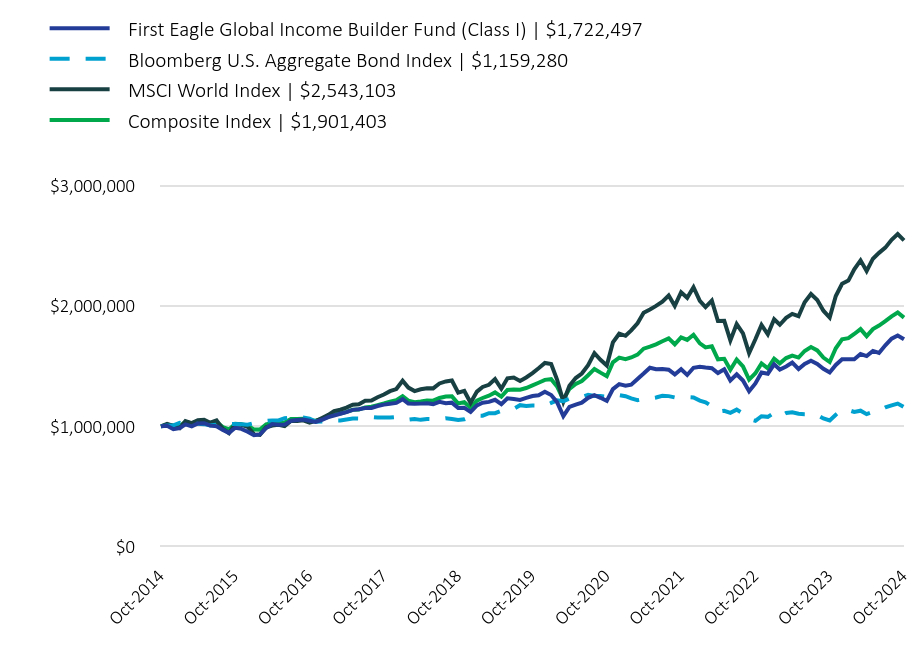
| First Eagle Global Income Builder Fund (Class I) | $1,722,497 | Bloomberg U.S. Aggregate Bond Index | $1,159,280 | MSCI World Index | $2,543,103 | Composite Index | $1,901,403 |
|---|
| Oct-2014 | 1,000,000 | 1,000,000 | 1,000,000 | 1,000,000 |
| Nov-2014 | 1,004,100 | 1,007,093.990000 | 1,020,040.930000 | 1,014,862.150000 |
| Dec-2014 | 976,186.020000 | 1,008,035.880000 | 1,003,592.650000 | 1,005,422.960000 |
| Jan-2015 | 984,385.980000 | 1,029,173.600000 | 985,407.900000 | 1,002,925.370000 |
| Feb-2015 | 1,015,984.770000 | 1,019,496.910000 | 1,043,141.600000 | 1,034,409.430000 |
| Mar-2015 | 999,424.220000 | 1,024,230.990000 | 1,026,812.730000 | 1,026,615.450000 |
| Apr-2015 | 1,023,910.110000 | 1,020,555.920000 | 1,050,894.140000 | 1,039,588.080000 |
| May-2015 | 1,025,548.370000 | 1,018,098.110000 | 1,054,514.170000 | 1,040,735.270000 |
| Jun-2015 | 1,005,550.180000 | 1,006,997.170000 | 1,029,994.290000 | 1,021,676.470000 |
| Jul-2015 | 1,000,421.870000 | 1,013,996.950000 | 1,048,482.690000 | 1,035,520.650000 |
| Aug-2015 | 970,409.220000 | 1,012,540.820000 | 979,099.770000 | 993,810.740000 |
| Sep-2015 | 945,663.780000 | 1,019,389.910000 | 942,986.340000 | 974,506.080000 |
| Oct-2015 | 987,934.950000 | 1,019,559.190000 | 1,017,712.460000 | 1,020,905.130000 |
| Nov-2015 | 979,241.120000 | 1,016,865.760000 | 1,012,648.690000 | 1,016,778.540000 |
| Dec-2015 | 955,445.560000 | 1,013,579.630000 | 994,848.970000 | 1,004,740.810000 |
| Jan-2016 | 926,954.660000 | 1,027,527.660000 | 935,332.940000 | 974,206.690000 |
| Feb-2016 | 932,449.270000 | 1,034,816.800000 | 928,371.650000 | 972,620.680000 |
| Mar-2016 | 986,291.690000 | 1,044,311.240000 | 991,370.080000 | 1,015,790.880000 |
| Apr-2016 | 1,018,712.080000 | 1,048,319.750000 | 1,007,056.990000 | 1,026,994.490000 |
| May-2016 | 1,012,520.450000 | 1,048,588.640000 | 1,012,713.250000 | 1,030,560.800000 |
| Jun-2016 | 1,014,312.110000 | 1,067,429.510000 | 1,001,365.380000 | 1,031,038.870000 |
| Jul-2016 | 1,045,816.640000 | 1,074,178.010000 | 1,043,671.510000 | 1,059,782.110000 |
| Aug-2016 | 1,052,148.020000 | 1,072,949.670000 | 1,044,538.900000 | 1,059,825.830000 |
| Sep-2016 | 1,056,977.380000 | 1,072,321.060000 | 1,050,087.410000 | 1,062,955.290000 |
| Oct-2016 | 1,046,724.700000 | 1,064,118.980000 | 1,029,765.180000 | 1,047,360.360000 |
| Nov-2016 | 1,036,990.160000 | 1,038,948.610000 | 1,044,572.200000 | 1,046,486.780000 |
| Dec-2016 | 1,054,307.890000 | 1,040,413.930000 | 1,069,567.120000 | 1,062,101.600000 |
| Jan-2017 | 1,076,132.070000 | 1,042,455.370000 | 1,095,381.290000 | 1,078,315.590000 |
| Feb-2017 | 1,090,014.170000 | 1,049,461.730000 | 1,125,770.920000 | 1,099,164.250000 |
| Mar-2017 | 1,104,075.350000 | 1,048,911.390000 | 1,137,762.520000 | 1,105,958.600000 |
| Apr-2017 | 1,117,324.260000 | 1,057,005.870000 | 1,154,609.230000 | 1,119,197.960000 |
| May-2017 | 1,136,653.970000 | 1,065,141.800000 | 1,179,034.400000 | 1,136,849.450000 |
| Jun-2017 | 1,141,768.910000 | 1,064,069.770000 | 1,183,570.740000 | 1,139,016.190000 |
| Jul-2017 | 1,151,245.590000 | 1,068,648.640000 | 1,211,896.470000 | 1,157,332.400000 |
| Aug-2017 | 1,152,627.080000 | 1,078,234.170000 | 1,213,603.030000 | 1,162,462.630000 |
| Sep-2017 | 1,168,187.550000 | 1,073,098.670000 | 1,240,841.420000 | 1,175,902.320000 |
| Oct-2017 | 1,179,869.430000 | 1,073,720.340000 | 1,264,291.420000 | 1,189,508.460000 |
| Nov-2017 | 1,188,010.530000 | 1,072,342.100000 | 1,291,685.500000 | 1,204,361.940000 |
| Dec-2017 | 1,194,306.980000 | 1,077,263.670000 | 1,309,153.590000 | 1,216,345.240000 |
| Jan-2018 | 1,225,120.100000 | 1,064,856.980000 | 1,378,277.170000 | 1,249,275.820000 |
| Feb-2018 | 1,188,734.030000 | 1,054,762.710000 | 1,321,178.620000 | 1,213,486.220000 |
| Mar-2018 | 1,186,950.930000 | 1,061,526.900000 | 1,292,381.630000 | 1,200,729.240000 |
| Apr-2018 | 1,188,256.580000 | 1,053,631.830000 | 1,307,232.610000 | 1,205,435.760000 |
| May-2018 | 1,191,940.170000 | 1,061,151.430000 | 1,315,424.290000 | 1,213,409.230000 |
| Jun-2018 | 1,184,430.950000 | 1,059,846.270000 | 1,314,796.820000 | 1,212,464.970000 |
| Jul-2018 | 1,203,737.180000 | 1,060,098.330000 | 1,355,862.580000 | 1,235,302.060000 |
| Aug-2018 | 1,192,181.300000 | 1,066,919.560000 | 1,372,638.460000 | 1,247,652.020000 |
| Sep-2018 | 1,196,234.720000 | 1,060,049.090000 | 1,380,281.500000 | 1,248,606.560000 |
| Oct-2018 | 1,152,332.900000 | 1,051,672.150000 | 1,278,930.350000 | 1,189,650.230000 |
| Nov-2018 | 1,154,291.870000 | 1,057,950.170000 | 1,293,458.880000 | 1,200,599.500000 |
| Dec-2018 | 1,120,240.260000 | 1,077,386.110000 | 1,195,106.870000 | 1,154,647.430000 |
| Jan-2019 | 1,174,235.840000 | 1,088,827.360000 | 1,288,093.100000 | 1,213,455.070000 |
| Feb-2019 | 1,195,489.510000 | 1,088,196.430000 | 1,326,825.840000 | 1,235,066.850000 |
| Mar-2019 | 1,202,901.540000 | 1,109,091.890000 | 1,344,252.990000 | 1,254,286.280000 |
| Apr-2019 | 1,219,862.450000 | 1,109,375.810000 | 1,391,919.280000 | 1,281,100.390000 |
| May-2019 | 1,183,876.510000 | 1,129,068.970000 | 1,311,604.340000 | 1,245,844.650000 |
| Jun-2019 | 1,232,533.830000 | 1,143,248.010000 | 1,398,032.370000 | 1,301,359.750000 |
| Jul-2019 | 1,226,494.420000 | 1,145,762.690000 | 1,404,957.310000 | 1,306,372.380000 |
| Aug-2019 | 1,219,258.100000 | 1,175,451.340000 | 1,376,219.560000 | 1,303,879.760000 |
| Sep-2019 | 1,235,474.230000 | 1,169,190.960000 | 1,405,506.850000 | 1,317,750.710000 |
| Oct-2019 | 1,251,041.210000 | 1,172,712.680000 | 1,441,273.460000 | 1,339,458.450000 |
| Nov-2019 | 1,257,546.620000 | 1,172,115.590000 | 1,481,413.160000 | 1,361,568.130000 |
| Dec-2019 | 1,286,470.200000 | 1,171,298.630000 | 1,525,793.690000 | 1,385,662.650000 |
| Jan-2020 | 1,259,454.320000 | 1,193,839.740000 | 1,516,506.700000 | 1,391,268.790000 |
| Feb-2020 | 1,200,385.910000 | 1,215,327.140000 | 1,388,323.600000 | 1,330,726.720000 |
| Mar-2020 | 1,084,668.710000 | 1,208,175.170000 | 1,204,589.060000 | 1,221,927.080000 |
| Apr-2020 | 1,160,595.520000 | 1,229,651.880000 | 1,336,183.490000 | 1,310,708.660000 |
| May-2020 | 1,179,513.230000 | 1,235,377.020000 | 1,400,732.060000 | 1,351,140.430000 |
| Jun-2020 | 1,196,498.220000 | 1,243,158.890000 | 1,437,782.890000 | 1,375,988.310000 |
| Jul-2020 | 1,236,221.960000 | 1,261,727.970000 | 1,506,568.380000 | 1,423,707.060000 |
| Aug-2020 | 1,258,350.330000 | 1,251,543.490000 | 1,607,228.790000 | 1,476,184.730000 |
| Sep-2020 | 1,236,580.870000 | 1,250,857.400000 | 1,551,780.800000 | 1,445,304.780000 |
| Oct-2020 | 1,211,601.940000 | 1,245,272.050000 | 1,504,179.890000 | 1,416,122.490000 |
| Nov-2020 | 1,309,135.900000 | 1,257,490.960000 | 1,696,506.620000 | 1,530,321.170000 |
| Dec-2020 | 1,349,719.110000 | 1,259,223.740000 | 1,768,432.920000 | 1,570,093.020000 |
| Jan-2021 | 1,336,491.860000 | 1,250,195.260000 | 1,750,857.040000 | 1,556,227.280000 |
| Feb-2021 | 1,344,911.760000 | 1,232,141.810000 | 1,795,721.650000 | 1,571,164.600000 |
| Mar-2021 | 1,392,925.110000 | 1,216,756.490000 | 1,855,469.100000 | 1,594,682.750000 |
| Apr-2021 | 1,437,777.300000 | 1,226,368.740000 | 1,941,822.840000 | 1,644,251.910000 |
| May-2021 | 1,486,230.390000 | 1,230,375.460000 | 1,969,795.650000 | 1,660,612.420000 |
| Jun-2021 | 1,474,489.170000 | 1,239,020.040000 | 1,999,155.130000 | 1,680,130.070000 |
| Jul-2021 | 1,475,816.210000 | 1,252,873.640000 | 2,034,965.660000 | 1,705,701.880000 |
| Aug-2021 | 1,469,470.200000 | 1,250,488.200000 | 2,085,612.620000 | 1,729,874.110000 |
| Sep-2021 | 1,430,382.300000 | 1,239,661.630000 | 1,999,016.870000 | 1,680,788.120000 |
| Oct-2021 | 1,473,722.880000 | 1,239,319.760000 | 2,112,242.200000 | 1,737,723.130000 |
| Nov-2021 | 1,426,121.630000 | 1,242,986.380000 | 2,065,956.720000 | 1,716,932.400000 |
| Dec-2021 | 1,486,018.740000 | 1,239,805.860000 | 2,154,256.090000 | 1,759,204.310000 |
| Jan-2022 | 1,494,637.650000 | 1,213,095.320000 | 2,040,272.450000 | 1,688,195.450000 |
| Feb-2022 | 1,487,463.390000 | 1,199,561.720000 | 1,988,671.480000 | 1,655,043.960000 |
| Mar-2022 | 1,481,662.280000 | 1,166,235.700000 | 2,043,247.310000 | 1,663,903.880000 |
| Apr-2022 | 1,442,250.060000 | 1,121,979.340000 | 1,873,507.930000 | 1,555,711.490000 |
| May-2022 | 1,472,969.990000 | 1,129,213.490000 | 1,874,926.840000 | 1,560,430.710000 |
| Jun-2022 | 1,380,762.070000 | 1,111,498.310000 | 1,712,516.930000 | 1,469,538.080000 |
| Jul-2022 | 1,430,883.730000 | 1,138,657.370000 | 1,848,484.450000 | 1,553,906.670000 |
| Aug-2022 | 1,379,228.830000 | 1,106,482.790000 | 1,771,203.380000 | 1,497,364.170000 |
| Sep-2022 | 1,291,371.950000 | 1,058,675.630000 | 1,606,552.490000 | 1,387,968.980000 |
| Oct-2022 | 1,355,940.550000 | 1,044,963.290000 | 1,721,923.720000 | 1,440,582.460000 |
| Nov-2022 | 1,446,110.600000 | 1,083,392.540000 | 1,841,649.810000 | 1,521,872.410000 |
| Dec-2022 | 1,436,277.040000 | 1,078,505.560000 | 1,763,439.920000 | 1,480,348.580000 |
| Jan-2023 | 1,514,410.520000 | 1,111,684.770000 | 1,888,213.980000 | 1,561,411.370000 |
| Feb-2023 | 1,471,401.260000 | 1,082,941.720000 | 1,842,824.130000 | 1,522,742.610000 |
| Mar-2023 | 1,496,120.800000 | 1,110,451.140000 | 1,899,766.830000 | 1,566,446.550000 |
| Apr-2023 | 1,528,137.780000 | 1,117,181.250000 | 1,933,068.960000 | 1,586,719.560000 |
| May-2023 | 1,476,028.290000 | 1,105,016.630000 | 1,913,770.320000 | 1,570,304.120000 |
| Jun-2023 | 1,518,242.690000 | 1,101,075.450000 | 2,029,510.920000 | 1,625,044.950000 |
| Jul-2023 | 1,544,204.640000 | 1,100,307.930000 | 2,097,687.790000 | 1,657,345.700000 |
| Aug-2023 | 1,517,026.640000 | 1,093,279.910000 | 2,047,583 | 1,629,359.160000 |
| Sep-2023 | 1,477,432.250000 | 1,065,497.770000 | 1,959,253.580000 | 1,570,624.470000 |
| Oct-2023 | 1,446,553.910000 | 1,048,682.970000 | 1,902,404.200000 | 1,533,366.160000 |
| Nov-2023 | 1,508,900.390000 | 1,096,173.920000 | 2,080,758.540000 | 1,647,396.100000 |
| Dec-2023 | 1,557,185.200000 | 1,138,134.360000 | 2,182,911.810000 | 1,721,146.970000 |
| Jan-2024 | 1,556,873.760000 | 1,135,008.880000 | 2,209,107.800000 | 1,731,649.110000 |
| Feb-2024 | 1,556,718.070000 | 1,118,973.200000 | 2,302,768.820000 | 1,765,913.780000 |
| Mar-2024 | 1,599,994.840000 | 1,129,305.700000 | 2,376,767.870000 | 1,806,484.690000 |
| Apr-2024 | 1,582,714.890000 | 1,100,781.140000 | 2,288,483.530000 | 1,747,972.250000 |
| May-2024 | 1,625,606.470000 | 1,119,442.970000 | 2,390,668.870000 | 1,806,656.040000 |
| Jun-2024 | 1,608,862.720000 | 1,130,041.050000 | 2,439,313.960000 | 1,835,554.690000 |
| Jul-2024 | 1,671,930.140000 | 1,156,435.440000 | 2,482,300.590000 | 1,872,112.080000 |
| Aug-2024 | 1,726,769.450000 | 1,173,053.280000 | 2,547,909.010000 | 1,912,561.390000 |
| Sep-2024 | 1,753,534.370000 | 1,188,759.700000 | 2,594,571.250000 | 1,943,820.490000 |
| Oct-2024 | 1,722,497 | 1,159,280 | 2,543,103 | 1,901,403 |
The above chart represents historical performance of a hypothetical $1,000,000 investment over the past 10 years. The results of this chart do not predict the results of future time periods and does not guarantee the same results.
| Class/Index Name | 1 Year | 5 Years | 10 Years |
|---|
| Class I | 19.06% | 6.61% | 5.60% |
| Bloomberg U.S. Aggregate Bond Index | 10.55% | -0.23% | 1.49% |
| MSCI World Index | 33.68% | 12.03% | 9.78% |
| Composite Index | 24.00% | 7.26% | 6.64% |
The Fund's past performance is not a good predictor of the Fund's future performance.The graph and table do not reflect the deduction of taxes that a shareholder would pay on fund distributions or redemption of fund shares. Call us at 800.334.2143 or visit https://www.firsteagle.com if you have questions about current performance.
- Net Assets$1,758,899,230
- Number of Portfolio Holdings289
- Portfolio Turnover Rate14.66%
- Net Investment Advisory Fees (net of waivers and reimbursements)$12,900,132
Asset Allocation by Asset Class
Based on total investments in the portfolio
| Value | Value |
|---|
| Common Stocks | 63.8% |
| Corporate Bonds | 11.7% |
| U.S. Treasury Obligations | 9.6% |
| Commodities | 7.6% |
| Preferred Stocks | 1.8% |
| Convertible Preferred Stocks | 1.5% |
| Master Limited Partnerships | 1.0% |
| Foreign Government Securities | 0.9% |
| Asset-Backed Securities | 0.2% |
| Municipal Bonds | 0.2% |
| Loan Assignments | 0.1% |
| Short-Term Investments | 1.6%Footnote Reference1 |
Top 10 HoldingsFootnote Reference2
Based on total net assets of the portfolio
| Gold bullion (Precious Metal) | 7.5% |
| Unilever plc (Personal Care Products, United Kingdom) | 3.0% |
| Philip Morris International, Inc. (Tobacco, United States) | 3.0% |
| Exxon Mobil Corp. (Oil, Gas & Consumable Fuels, United States) | 2.6% |
| British American Tobacco plc (Tobacco, United Kingdom) | 2.4% |
| Nestle SA (Registered) (Food Products, Switzerland) | 2.1% |
| KT&G Corp. (Tobacco, South Korea) | 1.9% |
| Jardine Matheson Holdings Ltd. (Industrial Conglomerates, Hong Kong) | 1.7% |
| Cie Financiere Richemont SA (Registered) (Textiles, Apparel & Luxury Goods, Switzerland) | 1.4% |
| Power Corp. of Canada (Insurance, Canada) | 1.4% |
| Total | 27.0% |
Asset Allocation by Sector
Based on total investments in the portfolio
| Value | Value |
|---|
| Short-Term Investments | 1.6% |
OthersFootnote Reference3 | 7.1% |
| Information Technology | 4.3% |
| Real Estate | 4.6% |
| Materials | 5.0% |
| Energy | 7.3% |
| Commodities | 7.6% |
| Industrials | 7.6% |
| Health Care | 7.8% |
| U.S. Treasury Obligations | 9.6% |
| Financials | 13.9% |
| Consumer Staples | 23.6% |
Asset Allocation by CountryFootnote Reference4
Based on total investments in the portfolio
| United States | 55.4% |
| United Kingdom | 9.9% |
| Canada | 5.1% |
| Switzerland | 4.6% |
| Mexico | 3.3% |
| Hong Kong | 3.2% |
| South Korea | 3.1% |
| Japan | 2.7% |
| Brazil | 1.9% |
| France | 1.6% |
OthersFootnote Reference5 | 7.6% |
| Short-Term Investments | 1.6% |
| Footnote | Description |
Footnote1 | Includes short-term commercial paper (1.6% of total investments) that settles in 90 days or less; long-term commercial paper (0.0% of total investments) that settles in 91 days or more; and other short-term investments (9.6% of total investments), such as U.S. treasury bills or money market funds. |
Footnote2 | Holdings in cash, short-term commercial paper, long-term commercial paper and other short-term cash equivalents have been excluded. |
Footnote3 | Includes additional sectors outside the top 10 listed above. |
Footnote4 | Country allocations reflect country of risk not currency of issue. Bonds of non-U.S. issuers may be U.S. dollar denominated. |
Footnote5 | Includes additional countries outside the top 10 listed above. |
First Eagle Global Income Builder Fund
October 31, 2024
Annual Shareholder Report
For more information, please scan the QR code to navigate to tailored shareholder reports and financial statements and other Information. If you wish to view additional information about the Fund, including but not limited to financial statements, holdings, or the Fund's prospectus, please visit http://www.firsteagle.com.
Important Notice Regarding Delivery of Shareholder Materials
Unless we are notified otherwise, we send one copy of these materials to shareholders with the same residential address (provided they have the same last name or are reasonably believed to be family members) for as long as they remain a shareholder of the Fund. If you would like to receive individual mailings, please call 800.334.2143 and we will send separate copies of these materials within 30 days after receiving your request.
October 31, 2024
Annual Shareholder Report
This Annual Shareholder Report contains important information about the Class R6 shares of the Fund for the period of November 1, 2023, to October 31, 2024. You can find additional information about the Fund at https://www.firsteagle.com/first-eagle-fund-shareholder-reports. You can also request this information by contacting us at 800.334.2143.
First Eagle Global Income Builder Fund
What Were the Fund's Costs for the Year?
Based on a Hypothetical $10,000 Investment
| Class Name | Cost of a $10,000 Investment | Cost Paid as a Percentage of a $10,000 Investment |
|---|
| Class R6 | $97 | 0.89% |
How Did the Fund Perform Last Year?
The NAV of First Eagle Global Income Builder Fund Class R6 Shares increased 19.18% in the 12-month period ended October 31, 2024. The MSCI World Index increased 33.68%, the Bloomberg U.S. Aggregate Bond Index was up 10.55% and the composite index1increased 24.00% over the same time period.
• Our equity and bond holdings both contributed to performance, while gold and gold-related equities also were a contributor.
• All geographic regions contributed to performance. North America and developed Europe were the leading equity contributors; while developed Europe excluding Japan and Japan were the worst performing regions.
• All equity sectors contributed to performance. Consumer staples and financials were the largest contributors, while utilities and communication services were the worst performing sectors.
• Gold bullion was the leading contributor to performance. Our equity holding in Nestle SA (Registered) was the largest detractor.
1 The composite index consists of 60% of the MSCI World Index and 40% of the Bloomberg U.S. Aggregate Bond Index.
Total Return Based on a $10,000 Investment
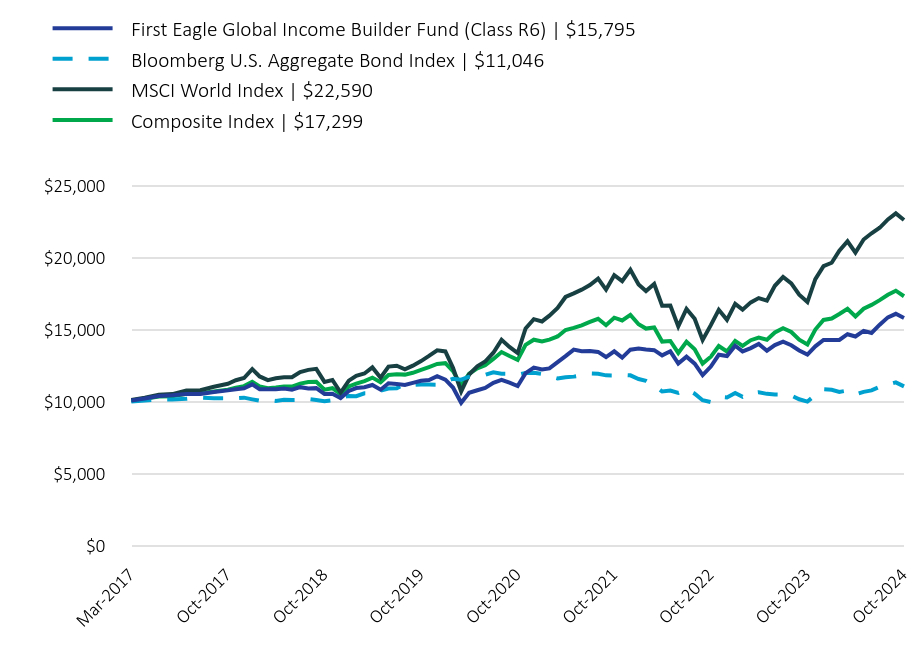
| First Eagle Global Income Builder Fund (Class R6) | $15,795 | Bloomberg U.S. Aggregate Bond Index | $11,046 | MSCI World Index | $22,590 | Composite Index | $17,299 |
|---|
| Mar-2017 | 10,074 | 9,994.760000 | 10,106.520000 | 10,061.810000 |
| Apr-2017 | 10,203.950000 | 10,071.890000 | 10,256.170000 | 10,182.260000 |
| May-2017 | 10,372.320000 | 10,149.410000 | 10,473.130000 | 10,342.850000 |
| Jun-2017 | 10,428.330000 | 10,139.200000 | 10,513.420000 | 10,362.570000 |
| Jul-2017 | 10,514.890000 | 10,182.830000 | 10,765.040000 | 10,529.200000 |
| Aug-2017 | 10,519.090000 | 10,274.160000 | 10,780.200000 | 10,575.880000 |
| Sep-2017 | 10,661.100000 | 10,225.230000 | 11,022.150000 | 10,698.150000 |
| Oct-2017 | 10,768.780000 | 10,231.150000 | 11,230.450000 | 10,821.940000 |
| Nov-2017 | 10,844.160000 | 10,218.020000 | 11,473.790000 | 10,957.070000 |
| Dec-2017 | 10,911.390000 | 10,264.920000 | 11,628.950000 | 11,066.090000 |
| Jan-2018 | 11,184.180000 | 10,146.700000 | 12,242.960000 | 11,365.690000 |
| Feb-2018 | 10,852.010000 | 10,050.510000 | 11,735.770000 | 11,040.080000 |
| Mar-2018 | 10,845.500000 | 10,114.970000 | 11,479.970000 | 10,924.020000 |
| Apr-2018 | 10,848.750000 | 10,039.740000 | 11,611.890000 | 10,966.840000 |
| May-2018 | 10,892.140000 | 10,111.390000 | 11,684.650000 | 11,039.380000 |
| Jun-2018 | 10,814.810000 | 10,098.950000 | 11,679.080000 | 11,030.790000 |
| Jul-2018 | 10,992.170000 | 10,101.350000 | 12,043.860000 | 11,238.560000 |
| Aug-2018 | 10,896.540000 | 10,166.350000 | 12,192.880000 | 11,350.920000 |
| Sep-2018 | 10,924.870000 | 10,100.880000 | 12,260.770000 | 11,359.600000 |
| Oct-2018 | 10,523.930000 | 10,021.060000 | 11,360.480000 | 10,823.230000 |
| Nov-2018 | 10,542.870000 | 10,080.880000 | 11,489.540000 | 10,922.840000 |
| Dec-2018 | 10,231.860000 | 10,266.080000 | 10,615.900000 | 10,504.780000 |
| Jan-2019 | 10,726.060000 | 10,375.100000 | 11,441.880000 | 11,039.800000 |
| Feb-2019 | 10,929.850000 | 10,369.090000 | 11,785.930000 | 11,236.420000 |
| Mar-2019 | 10,988.870000 | 10,568.200000 | 11,940.730000 | 11,411.270000 |
| Apr-2019 | 11,144.910000 | 10,570.900000 | 12,364.140000 | 11,655.220000 |
| May-2019 | 10,816.140000 | 10,758.550000 | 11,650.720000 | 11,334.470000 |
| Jun-2019 | 11,261.760000 | 10,893.660000 | 12,418.440000 | 11,839.540000 |
| Jul-2019 | 11,215.590000 | 10,917.620000 | 12,479.960000 | 11,885.140000 |
| Aug-2019 | 11,140.450000 | 11,200.520000 | 12,224.690000 | 11,862.470000 |
| Sep-2019 | 11,289.730000 | 11,140.860000 | 12,484.840000 | 11,988.660000 |
| Oct-2019 | 11,431.980000 | 11,174.420000 | 12,802.550000 | 12,186.150000 |
| Nov-2019 | 11,490.280000 | 11,168.730000 | 13,159.100000 | 12,387.300000 |
| Dec-2019 | 11,755.710000 | 11,160.950000 | 13,553.320000 | 12,606.510000 |
| Jan-2020 | 11,518.240000 | 11,375.730000 | 13,470.830000 | 12,657.510000 |
| Feb-2020 | 10,968.820000 | 11,580.480000 | 12,332.200000 | 12,106.710000 |
| Mar-2020 | 9,910.330000 | 11,512.330000 | 10,700.130000 | 11,116.870000 |
| Apr-2020 | 10,604.050000 | 11,716.980000 | 11,869.050000 | 11,924.590000 |
| May-2020 | 10,776.900000 | 11,771.530000 | 12,442.430000 | 12,292.430000 |
| Jun-2020 | 10,942.860000 | 11,845.680000 | 12,771.540000 | 12,518.500000 |
| Jul-2020 | 11,297.410000 | 12,022.620000 | 13,382.550000 | 12,952.630000 |
| Aug-2020 | 11,499.640000 | 11,925.580000 | 14,276.690000 | 13,430.070000 |
| Sep-2020 | 11,301.840000 | 11,919.040000 | 13,784.160000 | 13,149.120000 |
| Oct-2020 | 11,073.550000 | 11,865.820000 | 13,361.330000 | 12,883.630000 |
| Nov-2020 | 11,966.070000 | 11,982.250000 | 15,069.730000 | 13,922.590000 |
| Dec-2020 | 12,346.590000 | 11,998.760000 | 15,708.640000 | 14,284.430000 |
| Jan-2021 | 12,215.720000 | 11,912.730000 | 15,552.520000 | 14,158.280000 |
| Feb-2021 | 12,292.680000 | 11,740.700000 | 15,951.040000 | 14,294.170000 |
| Mar-2021 | 12,732.760000 | 11,594.100000 | 16,481.760000 | 14,508.140000 |
| Apr-2021 | 13,142.750000 | 11,685.690000 | 17,248.830000 | 14,959.110000 |
| May-2021 | 13,596.180000 | 11,723.870000 | 17,497.300000 | 15,107.960000 |
| Jun-2021 | 13,479.250000 | 11,806.240000 | 17,758.100000 | 15,285.520000 |
| Jul-2021 | 13,492.730000 | 11,938.250000 | 18,076.200000 | 15,518.170000 |
| Aug-2021 | 13,436.060000 | 11,915.520000 | 18,526.080000 | 15,738.090000 |
| Sep-2021 | 13,081.350000 | 11,812.360000 | 17,756.870000 | 15,291.510000 |
| Oct-2021 | 13,477.710000 | 11,809.100000 | 18,762.630000 | 15,809.490000 |
| Nov-2021 | 13,043.730000 | 11,844.040000 | 18,351.480000 | 15,620.340000 |
| Dec-2021 | 13,594.180000 | 11,813.730000 | 19,135.830000 | 16,004.930000 |
| Jan-2022 | 13,674.380000 | 11,559.210000 | 18,123.340000 | 15,358.900000 |
| Feb-2022 | 13,610.110000 | 11,430.260000 | 17,664.970000 | 15,057.290000 |
| Mar-2022 | 13,558.390000 | 11,112.700000 | 18,149.760000 | 15,137.900000 |
| Apr-2022 | 13,199.100000 | 10,691 | 16,642 | 14,153.590000 |
| May-2022 | 13,481.560000 | 10,759.930000 | 16,654.600000 | 14,196.520000 |
| Jun-2022 | 12,636.260000 | 10,591.130000 | 15,211.950000 | 13,369.590000 |
| Jul-2022 | 13,107.600000 | 10,849.920000 | 16,419.720000 | 14,137.170000 |
| Aug-2022 | 12,623.930000 | 10,543.340000 | 15,733.250000 | 13,622.750000 |
| Sep-2022 | 11,829.880000 | 10,087.800000 | 14,270.690000 | 12,627.490000 |
| Oct-2022 | 12,422.560000 | 9,957.140000 | 15,295.510000 | 13,106.160000 |
| Nov-2022 | 13,239.960000 | 10,323.320000 | 16,359.010000 | 13,845.720000 |
| Dec-2022 | 13,151.250000 | 10,276.750000 | 15,664.290000 | 13,467.950000 |
| Jan-2023 | 13,869.310000 | 10,592.900000 | 16,772.630000 | 14,205.440000 |
| Feb-2023 | 13,475.420000 | 10,319.020000 | 16,369.440000 | 13,853.640000 |
| Mar-2023 | 13,703.160000 | 10,581.150000 | 16,875.250000 | 14,251.250000 |
| Apr-2023 | 13,996.410000 | 10,645.280000 | 17,171.070000 | 14,435.690000 |
| May-2023 | 13,519.130000 | 10,529.370000 | 16,999.640000 | 14,286.350000 |
| Jun-2023 | 13,908.480000 | 10,491.810000 | 18,027.740000 | 14,784.370000 |
| Jul-2023 | 14,147.710000 | 10,484.500000 | 18,633.340000 | 15,078.240000 |
| Aug-2023 | 13,898.710000 | 10,417.530000 | 18,188.270000 | 14,823.620000 |
| Sep-2023 | 13,535.950000 | 10,152.800000 | 17,403.660000 | 14,289.260000 |
| Oct-2023 | 13,254.400000 | 9,992.580000 | 16,898.680000 | 13,950.290000 |
| Nov-2023 | 13,826.990000 | 10,445.110000 | 18,482.970000 | 14,987.720000 |
| Dec-2023 | 14,270.840000 | 10,844.930000 | 19,390.370000 | 15,658.690000 |
| Jan-2024 | 14,269.410000 | 10,815.150000 | 19,623.070000 | 15,754.230000 |
| Feb-2024 | 14,267.980000 | 10,662.350000 | 20,455.040000 | 16,065.970000 |
| Mar-2024 | 14,666.060000 | 10,760.810000 | 21,112.360000 | 16,435.080000 |
| Apr-2024 | 14,507.670000 | 10,489.010000 | 20,328.150000 | 15,902.740000 |
| May-2024 | 14,902.280000 | 10,666.830000 | 21,235.840000 | 16,436.630000 |
| Jun-2024 | 14,750.270000 | 10,767.820000 | 21,667.940000 | 16,699.550000 |
| Jul-2024 | 15,329.960000 | 11,019.320000 | 22,049.780000 | 17,032.140000 |
| Aug-2024 | 15,834.310000 | 11,177.670000 | 22,632.570000 | 17,400.140000 |
| Sep-2024 | 16,079.750000 | 11,327.330000 | 23,047.060000 | 17,684.530000 |
| Oct-2024 | 15,795 | 11,046 | 22,590 | 17,299 |
The above chart represents historical performance of a hypothetical $10,000 investment since inception. The results of this chart do not predict the results of future time periods and does not guarantee the same results.
| Class/Index Name | 1 Year | 5 Years | Since Inception (3/1/17) |
|---|
| Class R6 | 19.18% | 6.67% | 6.14% |
| Bloomberg U.S. Aggregate Bond Index | 10.55% | -0.23% | 1.38% |
| MSCI World Index | 33.68% | 12.03% | 11.03% |
| Composite Index | 24.00% | 7.26% | 7.42% |
The Fund's past performance is not a good predictor of the Fund's future performance.The graph and table do not reflect the deduction of taxes that a shareholder would pay on fund distributions or redemption of fund shares. Call us at 800.334.2143 or visit https://www.firsteagle.com if you have questions about current performance.
- Net Assets$1,758,899,230
- Number of Portfolio Holdings289
- Portfolio Turnover Rate14.66%
- Net Investment Advisory Fees (net of waivers and reimbursements)$12,900,132
Asset Allocation by Asset Class
Based on total investments in the portfolio
| Value | Value |
|---|
| Common Stocks | 63.8% |
| Corporate Bonds | 11.7% |
| U.S. Treasury Obligations | 9.6% |
| Commodities | 7.6% |
| Preferred Stocks | 1.8% |
| Convertible Preferred Stocks | 1.5% |
| Master Limited Partnerships | 1.0% |
| Foreign Government Securities | 0.9% |
| Asset-Backed Securities | 0.2% |
| Municipal Bonds | 0.2% |
| Loan Assignments | 0.1% |
| Short-Term Investments | 1.6%Footnote Reference1 |
Top 10 HoldingsFootnote Reference2
Based on total net assets of the portfolio
| Gold bullion (Precious Metal) | 7.5% |
| Unilever plc (Personal Care Products, United Kingdom) | 3.0% |
| Philip Morris International, Inc. (Tobacco, United States) | 3.0% |
| Exxon Mobil Corp. (Oil, Gas & Consumable Fuels, United States) | 2.6% |
| British American Tobacco plc (Tobacco, United Kingdom) | 2.4% |
| Nestle SA (Registered) (Food Products, Switzerland) | 2.1% |
| KT&G Corp. (Tobacco, South Korea) | 1.9% |
| Jardine Matheson Holdings Ltd. (Industrial Conglomerates, Hong Kong) | 1.7% |
| Cie Financiere Richemont SA (Registered) (Textiles, Apparel & Luxury Goods, Switzerland) | 1.4% |
| Power Corp. of Canada (Insurance, Canada) | 1.4% |
| Total | 27.0% |
Asset Allocation by Sector
Based on total investments in the portfolio
| Value | Value |
|---|
| Short-Term Investments | 1.6% |
OthersFootnote Reference3 | 7.1% |
| Information Technology | 4.3% |
| Real Estate | 4.6% |
| Materials | 5.0% |
| Energy | 7.3% |
| Commodities | 7.6% |
| Industrials | 7.6% |
| Health Care | 7.8% |
| U.S. Treasury Obligations | 9.6% |
| Financials | 13.9% |
| Consumer Staples | 23.6% |
Asset Allocation by CountryFootnote Reference4
Based on total investments in the portfolio
| United States | 55.4% |
| United Kingdom | 9.9% |
| Canada | 5.1% |
| Switzerland | 4.6% |
| Mexico | 3.3% |
| Hong Kong | 3.2% |
| South Korea | 3.1% |
| Japan | 2.7% |
| Brazil | 1.9% |
| France | 1.6% |
OthersFootnote Reference5 | 7.6% |
| Short-Term Investments | 1.6% |
| Footnote | Description |
Footnote1 | Includes short-term commercial paper (1.6% of total investments) that settles in 90 days or less; long-term commercial paper (0.0% of total investments) that settles in 91 days or more; and other short-term investments (9.6% of total investments), such as U.S. treasury bills or money market funds. |
Footnote2 | Holdings in cash, short-term commercial paper, long-term commercial paper and other short-term cash equivalents have been excluded. |
Footnote3 | Includes additional sectors outside the top 10 listed above. |
Footnote4 | Country allocations reflect country of risk not currency of issue. Bonds of non-U.S. issuers may be U.S. dollar denominated. |
Footnote5 | Includes additional countries outside the top 10 listed above. |
First Eagle Global Income Builder Fund
October 31, 2024
Annual Shareholder Report
For more information, please scan the QR code to navigate to tailored shareholder reports and financial statements and other Information. If you wish to view additional information about the Fund, including but not limited to financial statements, holdings, or the Fund's prospectus, please visit http://www.firsteagle.com.
Important Notice Regarding Delivery of Shareholder Materials
Unless we are notified otherwise, we send one copy of these materials to shareholders with the same residential address (provided they have the same last name or are reasonably believed to be family members) for as long as they remain a shareholder of the Fund. If you would like to receive individual mailings, please call 800.334.2143 and we will send separate copies of these materials within 30 days after receiving your request.
October 31, 2024
Annual Shareholder Report
This Annual Shareholder Report contains important information about the Class A shares of the Fund for the period of November 1, 2023, to October 31, 2024. You can find additional information about the Fund at https://www.firsteagle.com/first-eagle-fund-shareholder-reports. You can also request this information by contacting us at 800.334.2143.
First Eagle Rising Dividend Fund
What Were the Fund's Costs for the Year?
Based on a Hypothetical $10,000 Investment
| Class Name | Cost of a $10,000 Investment | Cost Paid as a Percentage of a $10,000 Investment |
|---|
| Class A | $105 | 0.90% |
How Did the Fund Perform Last Year?
The NAV of First Eagle Rising Dividend Fund Class A Shares1 increased 32.95% in the 12-month period ended October 31, 2024. The S&P 500 Index increased 38.02% for the same period.
• All geographic regions contributed to performance. North America was the leading contributor, while emerging markets was the worst performing region.
• All equity sectors contributed to performance. Information technology and communication services were the largest contributors, while materials and real estate were the worst performing sectors.
• Oracle Corp. was the leading contributor to performance. Elevance Health, Inc. was the largest detractor.
1 Reflects performance for Class A shares without the effect of sales charges and assumes all distributions have been reinvested; if sales charges were included, values would be lower.
Total Return Based on a $10,000 Investment
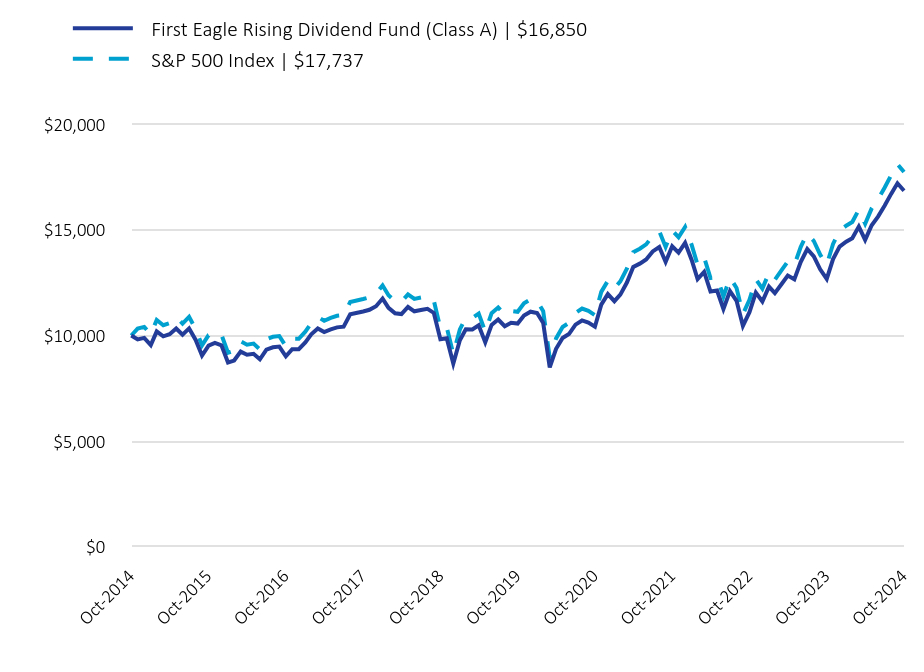
| First Eagle Rising Dividend Fund (Class A) | $16,850 | S&P 500 Index | $17,737 |
|---|
| Oct-2014 | 10,000 | 10,000 |
| Nov-2014 | 9,812.550000 | 10,329 |
| Dec-2014 | 9,886.140000 | 10,406.470000 |
| Jan-2015 | 9,548.040000 | 10,050.570000 |
| Feb-2015 | 10,194.440000 | 10,730.990000 |
| Mar-2015 | 9,959.970000 | 10,484.180000 |
| Apr-2015 | 10,060.560000 | 10,590.070000 |
| May-2015 | 10,332.200000 | 10,876 |
| Jun-2015 | 10,034.630000 | 10,562.770000 |
| Jul-2015 | 10,334.670000 | 10,878.600000 |
| Aug-2015 | 9,786.930000 | 10,302.030000 |
| Sep-2015 | 9,052.910000 | 9,529.380000 |
| Oct-2015 | 9,518.230000 | 10,019.190000 |
| Nov-2015 | 9,645.770000 | 10,153.450000 |
| Dec-2015 | 9,536.780000 | 10,038.710000 |
| Jan-2016 | 8,724.240000 | 9,183.410000 |
| Feb-2016 | 8,814.100000 | 9,278 |
| Mar-2016 | 9,238.060000 | 9,724.280000 |
| Apr-2016 | 9,087.480000 | 9,565.770000 |
| May-2016 | 9,133.830000 | 9,614.560000 |
| Jun-2016 | 8,870.770000 | 9,337.660000 |
| Jul-2016 | 9,333.830000 | 9,825.080000 |
| Aug-2016 | 9,443.030000 | 9,940.040000 |
| Sep-2016 | 9,476.080000 | 9,974.830000 |
| Oct-2016 | 9,013.650000 | 9,488.050000 |
| Nov-2016 | 9,352.560000 | 9,844.800000 |
| Dec-2016 | 9,348.820000 | 9,840.870000 |
| Jan-2017 | 9,669.490000 | 10,178.410000 |
| Feb-2017 | 10,052.390000 | 10,581.460000 |
| Mar-2017 | 10,332.850000 | 10,876.680000 |
| Apr-2017 | 10,163.390000 | 10,698.300000 |
| May-2017 | 10,291.450000 | 10,833.100000 |
| Jun-2017 | 10,385.100000 | 10,931.680000 |
| Jul-2017 | 10,417.290000 | 10,965.570000 |
| Aug-2017 | 11,006.910000 | 11,586.220000 |
| Oct-2017 | 11,137.900000 | 11,724.100000 |
| Nov-2017 | 11,216.970000 | 11,807.340000 |
| Dec-2017 | 11,386.350000 | 11,985.630000 |
| Jan-2018 | 11,747.300000 | 12,365.580000 |
| Feb-2018 | 11,310.300000 | 11,905.580000 |
| Mar-2018 | 11,049.030000 | 11,630.560000 |
| Apr-2018 | 11,013.670000 | 11,593.340000 |
| May-2018 | 11,348.490000 | 11,945.780000 |
| Jun-2018 | 11,143.080000 | 11,729.560000 |
| Jul-2018 | 11,204.370000 | 11,794.070000 |
| Aug-2018 | 11,259.270000 | 11,851.860000 |
| Sep-2018 | 11,068.990000 | 11,651.570000 |
| Oct-2018 | 9,820.410000 | 10,337.270000 |
| Nov-2018 | 9,868.530000 | 10,387.920000 |
| Dec-2018 | 8,671.470000 | 9,127.870000 |
| Jan-2019 | 9,773.620000 | 10,288.020000 |
| Feb-2019 | 10,296.510000 | 10,838.430000 |
| Mar-2019 | 10,288.270000 | 10,829.760000 |
| Apr-2019 | 10,483.750000 | 11,035.520000 |
| May-2019 | 9,673.350000 | 10,182.480000 |
| Jun-2019 | 10,504.290000 | 11,057.150000 |
| Jul-2019 | 10,756.400000 | 11,322.520000 |
| Aug-2019 | 10,436.930000 | 10,986.240000 |
| Sep-2019 | 10,604.970000 | 11,163.120000 |
| Oct-2019 | 10,564.670000 | 11,120.700000 |
| Nov-2019 | 10,948.170000 | 11,524.390000 |
| Dec-2019 | 11,126.620000 | 11,712.230000 |
| Jan-2020 | 11,062.090000 | 11,644.300000 |
| Feb-2020 | 10,594.160000 | 11,151.750000 |
| Mar-2020 | 8,486.980000 | 8,933.670000 |
| Apr-2020 | 9,369.630000 | 9,862.770000 |
| May-2020 | 9,881.210000 | 10,401.270000 |
| Jun-2020 | 10,066.980000 | 10,596.820000 |
| Jul-2020 | 10,513.950000 | 11,067.320000 |
| Aug-2020 | 10,711.610000 | 11,275.380000 |
| Sep-2020 | 10,606.640000 | 11,164.880000 |
| Oct-2020 | 10,413.600000 | 10,961.680000 |
| Nov-2020 | 11,461.210000 | 12,064.430000 |
| Dec-2020 | 11,956.330000 | 12,585.610000 |
| Jan-2021 | 11,622.750000 | 12,234.470000 |
| Feb-2021 | 11,931.910000 | 12,559.910000 |
| Mar-2021 | 12,503.450000 | 13,161.530000 |
| Apr-2021 | 13,241.160000 | 13,938.060000 |
| May-2021 | 13,398.730000 | 14,103.920000 |
| Jun-2021 | 13,594.350000 | 14,309.840000 |
| Jul-2021 | 13,976.350000 | 14,711.950000 |
| Aug-2021 | 14,185.990000 | 14,932.620000 |
| Sep-2021 | 13,479.530000 | 14,188.980000 |
| Oct-2021 | 14,222.250000 | 14,970.790000 |
| Nov-2021 | 13,916.470000 | 14,648.920000 |
| Dec-2021 | 14,381.280000 | 15,138.190000 |
| Jan-2022 | 13,570.180000 | 14,284.400000 |
| Feb-2022 | 12,671.830000 | 13,338.770000 |
| Mar-2022 | 13,011.440000 | 13,696.250000 |
| Apr-2022 | 12,079.820000 | 12,715.600000 |
| May-2022 | 12,129.350000 | 12,767.730000 |
| Jun-2022 | 11,254.820000 | 11,847.180000 |
| Jul-2022 | 12,101.180000 | 12,738.090000 |
| Aug-2022 | 11,637.710000 | 12,250.220000 |
| Sep-2022 | 10,457.650000 | 11,008.050000 |
| Oct-2022 | 11,102.880000 | 11,687.240000 |
| Nov-2022 | 12,027.750000 | 12,660.790000 |
| Dec-2022 | 11,605.580000 | 12,216.400000 |
| Jan-2023 | 12,312.360000 | 12,960.380000 |
| Feb-2023 | 12,003.320000 | 12,635.070000 |
| Mar-2023 | 12,422.230000 | 13,076.030000 |
| Apr-2023 | 12,832.170000 | 13,507.540000 |
| May-2023 | 12,657.650000 | 13,323.840000 |
| Jun-2023 | 13,476.600000 | 14,185.890000 |
| Jul-2023 | 14,091.130000 | 14,832.770000 |
| Aug-2023 | 13,747.310000 | 14,470.850000 |
| Sep-2023 | 13,132.800000 | 13,824 |
| Oct-2023 | 12,674.470000 | 13,341.550000 |
| Nov-2023 | 13,613.650000 | 14,330.150000 |
| Dec-2023 | 14,204.480000 | 14,952.080000 |
| Jan-2024 | 14,436.010000 | 15,195.800000 |
| Feb-2024 | 14,600.580000 | 15,369.030000 |
| Mar-2024 | 15,153.950000 | 15,951.520000 |
| Apr-2024 | 14,523.540000 | 15,287.940000 |
| May-2024 | 15,214.860000 | 16,015.640000 |
| Jun-2024 | 15,625.660000 | 16,448.070000 |
| Jul-2024 | 16,141.310000 | 16,990.850000 |
| Aug-2024 | 16,699.800000 | 17,578.740000 |
| Sep-2024 | 17,200.790000 | 18,106.100000 |
| Oct-2024 | 16,850 | 17,737 |
The above chart represents historical performance of a hypothetical $10,000 investment over the past 10 years. The results of this chart do not predict the results of future time periods and does not guarantee the same results.
| Class/Index Name | 1 Year | 5 Years | 10 Years |
|---|
| Class A - without sales charge | 32.95% | 9.79% | 5.90% |
| Class A - with sales charge | 26.30% | 8.67% | 5.36% |
| S&P 500 Index | 38.02% | 15.27% | 13.00% |
The Fund's past performance is not a good predictor of the Fund's future performance.The graph and table do not reflect the deduction of taxes that a shareholder would pay on fund distributions or redemption of fund shares. Call us at 800.334.2143 or visit https://www.firsteagle.com if you have questions about current performance.
- Net Assets$432,924,939
- Number of Portfolio Holdings41
- Portfolio Turnover Rate15.44%
- Net Investment Advisory Fees (net of waivers and reimbursements)$1,497,303
Asset Allocation by Asset Class
Based on total investments in the portfolio
| Value | Value |
|---|
| Common Stocks | 96.6% |
| Master Limited Partnerships | 2.3% |
| Short-Term Investments | 1.1%Footnote Reference1 |
Top 10 HoldingsFootnote Reference2
Based on total net assets of the portfolio
| Oracle Corp. (Software, United States) | 6.7% |
| Alphabet, Inc., Class A (Interactive Media & Services, United States) | 5.8% |
| Texas Instruments, Inc. (Semiconductors & Semiconductor Equipment, United States) | 5.7% |
| Comcast Corp., Class A (Media, United States) | 5.6% |
| UnitedHealth Group, Inc. (Health Care Providers & Services, United States) | 5.2% |
| Home Depot, Inc. (The) (Specialty Retail, United States) | 5.0% |
| Meta Platforms, Inc., Class A (Interactive Media & Services, United States) | 4.7% |
| Philip Morris International, Inc. (Tobacco, United States) | 4.6% |
| Schindler Holding AG (Machinery, Switzerland) | 4.5% |
| TE Connectivity plc (Electronic Equipment, Instruments & Components, Ireland) | 4.3% |
| Total | 52.1% |
Asset Allocation by Sector
Based on total investments in the portfolio
| Value | Value |
|---|
| Short-Term Investments | 1.1% |
| Real Estate | 2.6% |
| Financials | 3.1% |
| Energy | 7.3% |
| Industrials | 9.7% |
| Consumer Staples | 10.5% |
| Consumer Discretionary | 11.1% |
| Communication Services | 16.1% |
| Health Care | 17.4% |
| Information Technology | 21.1% |
| Footnote | Description |
Footnote1 | Includes short-term commercial paper (1.1% of total investments) that settles in 90 days or less; long-term commercial paper (0.0% of total investments) that settles in 91 days or more; and other short-term investments (0.0% of total investments), such as U.S. treasury bills or money market funds. |
Footnote2 | Holdings in cash, short-term commercial paper, long-term commercial paper and other short-term cash equivalents have been excluded. |
First Eagle Rising Dividend Fund
October 31, 2024
Annual Shareholder Report
For more information, please scan the QR code to navigate to tailored shareholder reports and financial statements and other Information. If you wish to view additional information about the Fund, including but not limited to financial statements, holdings, or the Fund's prospectus, please visit http://www.firsteagle.com.
Important Notice Regarding Delivery of Shareholder Materials
Unless we are notified otherwise, we send one copy of these materials to shareholders with the same residential address (provided they have the same last name or are reasonably believed to be family members) for as long as they remain a shareholder of the Fund. If you would like to receive individual mailings, please call 800.334.2143 and we will send separate copies of these materials within 30 days after receiving your request.
October 31, 2024
Annual Shareholder Report
This Annual Shareholder Report contains important information about the Class C shares of the Fund for the period of November 1, 2023, to October 31, 2024. You can find additional information about the Fund at https://www.firsteagle.com/first-eagle-fund-shareholder-reports. You can also request this information by contacting us at 800.334.2143.
First Eagle Rising Dividend Fund
What Were the Fund's Costs for the Year?
Based on a Hypothetical $10,000 Investment
| Class Name | Cost of a $10,000 Investment | Cost Paid as a Percentage of a $10,000 Investment |
|---|
| Class C | $191 | 1.65% |
How Did the Fund Perform Last Year?
The NAV of First Eagle Rising Dividend Fund Class C Shares1 increased 31.86% in the 12-month period ended October 31, 2024. The S&P 500 Index increased 38.02% for the same period.
• All geographic regions contributed to performance. North America was the leading contributor, while emerging markets was the worst performing region.
• All equity sectors contributed to performance. Information technology and communication services were the largest contributors, while materials and real estate were the worst performing sectors.
• Oracle Corp. was the leading contributor to performance. Elevance Health, Inc. was the largest detractor.
1 Reflects performance for Class C shares without the effect of sales charges and assumes all distributions have been reinvested; if sales charges were included, values would be lower.
Total Return Based on a $10,000 Investment
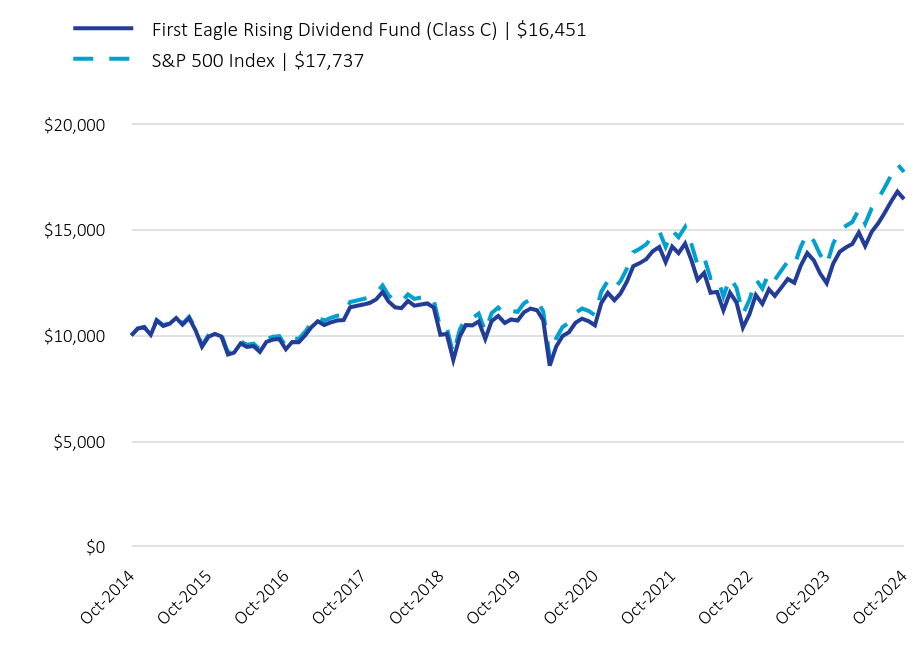
| First Eagle Rising Dividend Fund (Class C) | $16,451 | S&P 500 Index | $17,737 |
|---|
| Oct-2014 | 10,000 | 10,000 |
| Nov-2014 | 10,324 | 10,329 |
| Dec-2014 | 10,394.200000 | 10,406.470000 |
| Jan-2015 | 10,033.520000 | 10,050.570000 |
| Feb-2015 | 10,704.770000 | 10,730.990000 |
| Mar-2015 | 10,453.210000 | 10,484.180000 |
| Apr-2015 | 10,552.510000 | 10,590.070000 |
| May-2015 | 10,830.040000 | 10,876 |
| Jun-2015 | 10,512.720000 | 10,562.770000 |
| Jul-2015 | 10,819.690000 | 10,878.600000 |
| Aug-2015 | 10,237.590000 | 10,302.030000 |
| Sep-2015 | 9,466.700000 | 9,529.380000 |
| Oct-2015 | 9,942.880000 | 10,019.190000 |
| Nov-2015 | 10,072.140000 | 10,153.450000 |
| Dec-2015 | 9,953.280000 | 10,038.710000 |
| Jan-2016 | 9,098.300000 | 9,183.410000 |
| Feb-2016 | 9,187.460000 | 9,278 |
| Mar-2016 | 9,625.700000 | 9,724.280000 |
| Apr-2016 | 9,458.220000 | 9,565.770000 |
| May-2016 | 9,502.670000 | 9,614.560000 |
| Jun-2016 | 9,225.190000 | 9,337.660000 |
| Jul-2016 | 9,701.210000 | 9,825.080000 |
| Aug-2016 | 9,806.950000 | 9,940.040000 |
| Sep-2016 | 9,834.410000 | 9,974.830000 |
| Oct-2016 | 9,348.590000 | 9,488.050000 |
| Nov-2016 | 9,694.490000 | 9,844.800000 |
| Dec-2016 | 9,684.800000 | 9,840.870000 |
| Jan-2017 | 10,009.240000 | 10,178.410000 |
| Feb-2017 | 10,389.230000 | 10,581.460000 |
| Mar-2017 | 10,672.850000 | 10,876.680000 |
| Apr-2017 | 10,492.480000 | 10,698.300000 |
| May-2017 | 10,617.340000 | 10,833.100000 |
| Jun-2017 | 10,709.720000 | 10,931.680000 |
| Jul-2017 | 10,732.210000 | 10,965.570000 |
| Aug-2017 | 11,333.210000 | 11,586.220000 |
| Oct-2017 | 11,462.410000 | 11,724.100000 |
| Nov-2017 | 11,535.770000 | 11,807.340000 |
| Dec-2017 | 11,701.880000 | 11,985.630000 |
| Jan-2018 | 12,064.640000 | 12,365.580000 |
| Feb-2018 | 11,611.010000 | 11,905.580000 |
| Mar-2018 | 11,335.830000 | 11,630.560000 |
| Apr-2018 | 11,293.890000 | 11,593.340000 |
| May-2018 | 11,631.570000 | 11,945.780000 |
| Jun-2018 | 11,410.570000 | 11,729.560000 |
| Jul-2018 | 11,464.200000 | 11,794.070000 |
| Aug-2018 | 11,514.650000 | 11,851.860000 |
| Sep-2018 | 11,314.290000 | 11,651.570000 |
| Oct-2018 | 10,031.250000 | 10,337.270000 |
| Nov-2018 | 10,073.380000 | 10,387.920000 |
| Dec-2018 | 8,847.450000 | 9,127.870000 |
| Jan-2019 | 9,964.880000 | 10,288.020000 |
| Feb-2019 | 10,496.010000 | 10,838.430000 |
| Mar-2019 | 10,479.220000 | 10,829.760000 |
| Apr-2019 | 10,666.800000 | 11,035.520000 |
| May-2019 | 9,836.920000 | 10,182.480000 |
| Jun-2019 | 10,676.990000 | 11,057.150000 |
| Jul-2019 | 10,925.770000 | 11,322.520000 |
| Aug-2019 | 10,593.620000 | 10,986.240000 |
| Sep-2019 | 10,759.940000 | 11,163.120000 |
| Oct-2019 | 10,710.450000 | 11,120.700000 |
| Nov-2019 | 11,097.100000 | 11,524.390000 |
| Dec-2019 | 11,271.320000 | 11,712.230000 |
| Jan-2020 | 11,193.550000 | 11,644.300000 |
| Feb-2020 | 10,717.820000 | 11,151.750000 |
| Mar-2020 | 8,575.330000 | 8,933.670000 |
| Apr-2020 | 9,464.590000 | 9,862.770000 |
| May-2020 | 9,973.790000 | 10,401.270000 |
| Jun-2020 | 10,158.300000 | 10,596.820000 |
| Jul-2020 | 10,600.190000 | 11,067.320000 |
| Aug-2020 | 10,796.290000 | 11,275.380000 |
| Sep-2020 | 10,684.010000 | 11,164.880000 |
| Oct-2020 | 10,483.150000 | 10,961.680000 |
| Nov-2020 | 11,529.370000 | 12,064.430000 |
| Dec-2020 | 12,019.370000 | 12,585.610000 |
| Jan-2021 | 11,670.800000 | 12,234.470000 |
| Feb-2021 | 11,976.580000 | 12,559.910000 |
| Mar-2021 | 12,544.270000 | 13,161.530000 |
| Apr-2021 | 13,275.600000 | 13,938.060000 |
| May-2021 | 13,424.290000 | 14,103.920000 |
| Jun-2021 | 13,609.540000 | 14,309.840000 |
| Jul-2021 | 13,986.530000 | 14,711.950000 |
| Aug-2021 | 14,185.140000 | 14,932.620000 |
| Sep-2021 | 13,474.460000 | 14,188.980000 |
| Oct-2021 | 14,206.120000 | 14,970.790000 |
| Nov-2021 | 13,893.590000 | 14,648.920000 |
| Dec-2021 | 14,349.300000 | 15,138.190000 |
| Jan-2022 | 13,532.820000 | 14,284.400000 |
| Feb-2022 | 12,628.830000 | 13,338.770000 |
| Mar-2022 | 12,959.710000 | 13,696.250000 |
| Apr-2022 | 12,021.420000 | 12,715.600000 |
| May-2022 | 12,064.700000 | 12,767.730000 |
| Jun-2022 | 11,188.800000 | 11,847.180000 |
| Jul-2022 | 12,024.610000 | 12,738.090000 |
| Aug-2022 | 11,554.440000 | 12,250.220000 |
| Sep-2022 | 10,374.740000 | 11,008.050000 |
| Oct-2022 | 11,010.710000 | 11,687.240000 |
| Nov-2022 | 11,916.890000 | 12,660.790000 |
| Dec-2022 | 11,495.030000 | 12,216.400000 |
| Jan-2023 | 12,183.580000 | 12,960.380000 |
| Feb-2023 | 11,875.340000 | 12,635.070000 |
| Mar-2023 | 12,275.540000 | 13,076.030000 |
| Apr-2023 | 12,675.720000 | 13,507.540000 |
| May-2023 | 12,494.460000 | 13,323.840000 |
| Jun-2023 | 13,295.350000 | 14,185.890000 |
| Jul-2023 | 13,897.630000 | 14,832.770000 |
| Aug-2023 | 13,550.190000 | 14,470.850000 |
| Sep-2023 | 12,932.300000 | 13,824 |
| Oct-2023 | 12,474.500000 | 13,341.550000 |
| Nov-2023 | 13,390.130000 | 14,330.150000 |
| Dec-2023 | 13,953.850000 | 14,952.080000 |
| Jan-2024 | 14,171.530000 | 15,195.800000 |
| Feb-2024 | 14,327.420000 | 15,369.030000 |
| Mar-2024 | 14,870.430000 | 15,951.520000 |
| Apr-2024 | 14,235.460000 | 15,287.940000 |
| May-2024 | 14,911.640000 | 16,015.640000 |
| Jun-2024 | 15,293.380000 | 16,448.070000 |
| Jul-2024 | 15,795 | 16,990.850000 |
| Aug-2024 | 16,338.350000 | 17,578.740000 |
| Sep-2024 | 16,807.260000 | 18,106.100000 |
| Oct-2024 | 16,451 | 17,737 |
The above chart represents historical performance of a hypothetical $10,000 investment over the past 10 years. The results of this chart do not predict the results of future time periods and does not guarantee the same results.
| Class/Index Name | 1 Year | 5 Years | 10 Years |
|---|
| Class C - without sales charge | 31.86% | 8.96% | 5.11% |
| Class C - with sales charge | 30.86% | 8.96% | 5.11% |
| S&P 500 Index | 38.02% | 15.27% | 13.00% |
The Fund's past performance is not a good predictor of the Fund's future performance.The graph and table do not reflect the deduction of taxes that a shareholder would pay on fund distributions or redemption of fund shares. Call us at 800.334.2143 or visit https://www.firsteagle.com if you have questions about current performance.
- Net Assets$432,924,939
- Number of Portfolio Holdings41
- Portfolio Turnover Rate15.44%
- Net Investment Advisory Fees (net of waivers and reimbursements)$1,497,303
Asset Allocation by Asset Class
Based on total investments in the portfolio
| Value | Value |
|---|
| Common Stocks | 96.6% |
| Master Limited Partnerships | 2.3% |
| Short-Term Investments | 1.1%Footnote Reference1 |
Top 10 HoldingsFootnote Reference2
Based on total net assets of the portfolio
| Oracle Corp. (Software, United States) | 6.7% |
| Alphabet, Inc., Class A (Interactive Media & Services, United States) | 5.8% |
| Texas Instruments, Inc. (Semiconductors & Semiconductor Equipment, United States) | 5.7% |
| Comcast Corp., Class A (Media, United States) | 5.6% |
| UnitedHealth Group, Inc. (Health Care Providers & Services, United States) | 5.2% |
| Home Depot, Inc. (The) (Specialty Retail, United States) | 5.0% |
| Meta Platforms, Inc., Class A (Interactive Media & Services, United States) | 4.7% |
| Philip Morris International, Inc. (Tobacco, United States) | 4.6% |
| Schindler Holding AG (Machinery, Switzerland) | 4.5% |
| TE Connectivity plc (Electronic Equipment, Instruments & Components, Ireland) | 4.3% |
| Total | 52.1% |
Asset Allocation by Sector
Based on total investments in the portfolio
| Value | Value |
|---|
| Short-Term Investments | 1.1% |
| Real Estate | 2.6% |
| Financials | 3.1% |
| Energy | 7.3% |
| Industrials | 9.7% |
| Consumer Staples | 10.5% |
| Consumer Discretionary | 11.1% |
| Communication Services | 16.1% |
| Health Care | 17.4% |
| Information Technology | 21.1% |
| Footnote | Description |
Footnote1 | Includes short-term commercial paper (1.1% of total investments) that settles in 90 days or less; long-term commercial paper (0.0% of total investments) that settles in 91 days or more; and other short-term investments (0.0% of total investments), such as U.S. treasury bills or money market funds. |
Footnote2 | Holdings in cash, short-term commercial paper, long-term commercial paper and other short-term cash equivalents have been excluded. |
First Eagle Rising Dividend Fund
October 31, 2024
Annual Shareholder Report
For more information, please scan the QR code to navigate to tailored shareholder reports and financial statements and other Information. If you wish to view additional information about the Fund, including but not limited to financial statements, holdings, or the Fund's prospectus, please visit http://www.firsteagle.com.
Important Notice Regarding Delivery of Shareholder Materials
Unless we are notified otherwise, we send one copy of these materials to shareholders with the same residential address (provided they have the same last name or are reasonably believed to be family members) for as long as they remain a shareholder of the Fund. If you would like to receive individual mailings, please call 800.334.2143 and we will send separate copies of these materials within 30 days after receiving your request.
October 31, 2024
Annual Shareholder Report
This Annual Shareholder Report contains important information about the Class I shares of the Fund for the period of November 1, 2023, to October 31, 2024. You can find additional information about the Fund at https://www.firsteagle.com/first-eagle-fund-shareholder-reports. You can also request this information by contacting us at 800.334.2143.
First Eagle Rising Dividend Fund
What Were the Fund's Costs for the Year?
Based on a Hypothetical $10,000 Investment
| Class Name | Cost of a $10,000 Investment | Cost Paid as a Percentage of a $10,000 Investment |
|---|
| Class I | $76 | 0.65% |
How Did the Fund Perform Last Year?
The NAV of First Eagle Rising Dividend Fund Class I Shares increased 33.28% in the 12-month period ended October 31, 2024. The S&P 500 Index increased 38.02% for the same period.
• All geographic regions contributed to performance. North America was the leading contributor, while emerging markets was the worst performing region.
• All equity sectors contributed to performance. Information technology and communication services were the largest contributors, while materials and real estate were the worst performing sectors.
• Oracle Corp. was the leading contributor to performance. Elevance Health, Inc. was the largest detractor.
Total Return Based on a $1,000,000 Investment
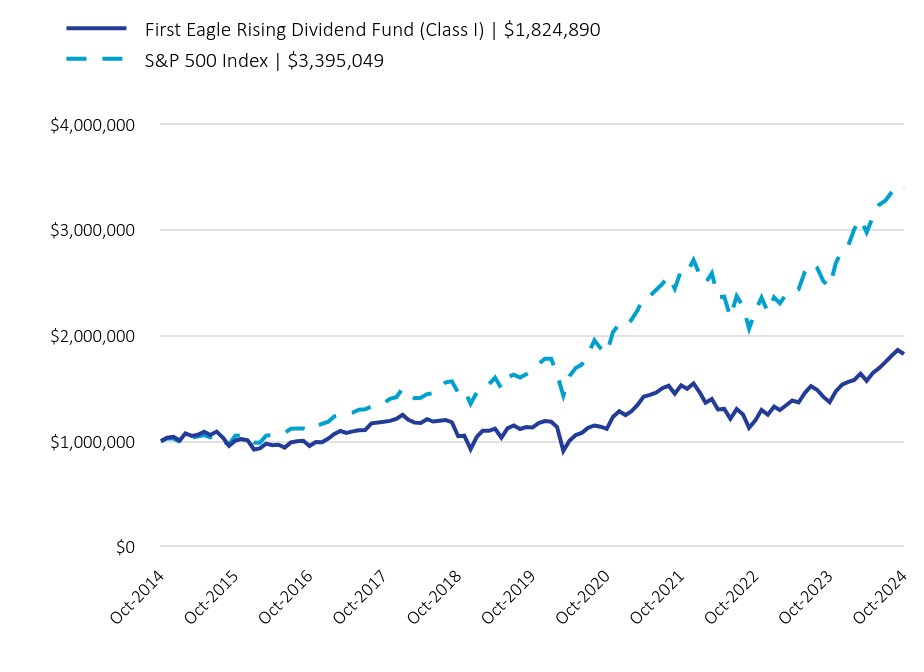
| First Eagle Rising Dividend Fund (Class I) | $1,824,890 | S&P 500 Index | $3,395,049 |
|---|
| Oct-2014 | 1,000,000 | 1,000,000 |
| Nov-2014 | 1,033,300 | 1,026,894.730000 |
| Dec-2014 | 1,041,153.080000 | 1,024,307.880000 |
| Jan-2015 | 1,005,962.110000 | 993,558.940000 |
| Feb-2015 | 1,074,065.740000 | 1,050,660.270000 |
| Mar-2015 | 1,049,899.260000 | 1,034,044.630000 |
| Apr-2015 | 1,060,923.200000 | 1,043,964.430000 |
| May-2015 | 1,089,780.310000 | 1,057,389.040000 |
| Jun-2015 | 1,058,503.620000 | 1,036,920.050000 |
| Jul-2015 | 1,090,682.130000 | 1,058,644.800000 |
| Aug-2015 | 1,033,312.250000 | 994,772.700000 |
| Sep-2015 | 956,123.820000 | 970,158.550000 |
| Oct-2015 | 1,004,981.750000 | 1,051,995.370000 |
| Nov-2015 | 1,018,951 | 1,055,123.850000 |
| Dec-2015 | 1,007,844.430000 | 1,038,482.590000 |
| Jan-2016 | 921,774.520000 | 986,948.680000 |
| Feb-2016 | 931,729.680000 | 985,617.100000 |
| Mar-2016 | 977,011.750000 | 1,052,479.580000 |
| Apr-2016 | 961,184.160000 | 1,056,559.770000 |
| May-2016 | 966,566.790000 | 1,075,533.630000 |
| Jun-2016 | 938,826.320000 | 1,078,320.410000 |
| Jul-2016 | 988,396.350000 | 1,118,076.730000 |
| Aug-2016 | 999,960.590000 | 1,119,646.560000 |
| Sep-2016 | 1,003,660.440000 | 1,119,858.250000 |
| Oct-2016 | 954,681.810000 | 1,099,430.710000 |
| Nov-2016 | 990,959.720000 | 1,140,148.010000 |
| Dec-2016 | 990,761.530000 | 1,162,684.290000 |
| Jan-2017 | 1,025,240.030000 | 1,184,736.280000 |
| Feb-2017 | 1,066,051.080000 | 1,233,214.160000 |
| Mar-2017 | 1,096,007.120000 | 1,245,879.170000 |
| Apr-2017 | 1,078,471 | 1,263,412.180000 |
| May-2017 | 1,092,383.280000 | 1,271,297.810000 |
| Jun-2017 | 1,102,651.680000 | 1,297,439.100000 |
| Jul-2017 | 1,106,290.430000 | 1,301,410.840000 |
| Aug-2017 | 1,169,127.730000 | 1,328,256.540000 |
| Oct-2017 | 1,183,040.350000 | 1,359,251.930000 |
| Nov-2017 | 1,192,149.760000 | 1,400,939.900000 |
| Dec-2017 | 1,210,270.440000 | 1,416,516.470000 |
| Jan-2018 | 1,248,878.060000 | 1,497,617.640000 |
| Feb-2018 | 1,202,669.580000 | 1,442,419.760000 |
| Mar-2018 | 1,175,368.980000 | 1,405,763.160000 |
| Apr-2018 | 1,171,725.330000 | 1,411,157.170000 |
| May-2018 | 1,207,697.300000 | 1,445,140.610000 |
| Jun-2018 | 1,186,079.520000 | 1,454,035.350000 |
| Jul-2018 | 1,192,721.560000 | 1,508,145.270000 |
| Aug-2018 | 1,199,400.800000 | 1,557,288.640000 |
| Sep-2018 | 1,179,130.930000 | 1,566,152.630000 |
| Oct-2018 | 1,046,714.530000 | 1,459,105.840000 |
| Nov-2018 | 1,052,052.770000 | 1,488,840.070000 |
| Dec-2018 | 924,649.180000 | 1,354,411.440000 |
| Jan-2019 | 1,042,357.020000 | 1,462,948.300000 |
| Feb-2019 | 1,098,540.060000 | 1,509,920.990000 |
| Mar-2019 | 1,097,661.230000 | 1,539,261.370000 |
| Apr-2019 | 1,118,516.800000 | 1,601,585.520000 |
| May-2019 | 1,032,391 | 1,499,807.690000 |
| Jun-2019 | 1,121,383.110000 | 1,605,508.550000 |
| Jul-2019 | 1,148,856.990000 | 1,628,583.090000 |
| Aug-2019 | 1,114,850.830000 | 1,602,785.820000 |
| Sep-2019 | 1,133,245.870000 | 1,632,774.640000 |
| Oct-2019 | 1,129,166.180000 | 1,668,140.100000 |
| Nov-2019 | 1,170,606.580000 | 1,728,691.720000 |
| Dec-2019 | 1,190,389.830000 | 1,780,867.110000 |
| Jan-2020 | 1,183,723.650000 | 1,780,168.870000 |
| Feb-2020 | 1,133,888.880000 | 1,633,626.820000 |
| Mar-2020 | 908,471.770000 | 1,431,852.910000 |
| Apr-2020 | 1,003,134.530000 | 1,615,407.510000 |
| May-2020 | 1,058,306.930000 | 1,692,346.240000 |
| Jun-2020 | 1,078,626.420000 | 1,726,002.270000 |
| Jul-2020 | 1,126,733.160000 | 1,823,323.150000 |
| Aug-2020 | 1,148,366.440000 | 1,954,384.570000 |
| Sep-2020 | 1,137,112.450000 | 1,880,124.470000 |
| Oct-2020 | 1,116,758.130000 | 1,830,124.830000 |
| Nov-2020 | 1,229,215.680000 | 2,030,457.540000 |
| Dec-2020 | 1,282,686.560000 | 2,108,524.920000 |
| Jan-2021 | 1,247,027.870000 | 2,087,237.700000 |
| Feb-2021 | 1,280,198.820000 | 2,144,793.100000 |
| Mar-2021 | 1,342,288.460000 | 2,238,725.750000 |
| Apr-2021 | 1,421,617.710000 | 2,358,203.770000 |
| May-2021 | 1,438,677.120000 | 2,374,674.350000 |
| Jun-2021 | 1,459,681.800000 | 2,430,110.630000 |
| Jul-2021 | 1,501,136.770000 | 2,487,837.680000 |
| Aug-2021 | 1,524,104.160000 | 2,563,482.020000 |
| Sep-2021 | 1,448,203.770000 | 2,444,255.040000 |
| Oct-2021 | 1,528,434.260000 | 2,615,503.920000 |
| Nov-2021 | 1,496,031.460000 | 2,597,381.210000 |
| Dec-2021 | 1,546,298.110000 | 2,713,785.790000 |
| Jan-2022 | 1,459,396.160000 | 2,573,355.400000 |
| Feb-2022 | 1,363,221.950000 | 2,496,305.410000 |
| Mar-2022 | 1,399,756.300000 | 2,588,992.060000 |
| Apr-2022 | 1,300,093.650000 | 2,363,227.200000 |
| May-2022 | 1,305,164.020000 | 2,367,562.820000 |
| Jun-2022 | 1,211,453.240000 | 2,172,135.270000 |
| Jul-2022 | 1,303,523.690000 | 2,372,415.830000 |
| Aug-2022 | 1,253,338.020000 | 2,275,664.250000 |
| Sep-2022 | 1,126,625.550000 | 2,066,078.690000 |
| Oct-2022 | 1,196,589 | 2,233,351.220000 |
| Nov-2022 | 1,296,264.860000 | 2,358,159.870000 |
| Dec-2022 | 1,251,025.220000 | 2,222,295.700000 |
| Jan-2023 | 1,327,337.750000 | 2,361,931.250000 |
| Feb-2023 | 1,294,685.250000 | 2,304,302.600000 |
| Mar-2023 | 1,339,999.230000 | 2,388,903.290000 |
| Apr-2023 | 1,384,889.200000 | 2,426,190.370000 |
| May-2023 | 1,365,916.220000 | 2,436,736.200000 |
| Jun-2023 | 1,454,564.180000 | 2,597,744.210000 |
| Jul-2023 | 1,521,619.590000 | 2,681,196.620000 |
| Aug-2023 | 1,484,644.240000 | 2,638,507.870000 |
| Sep-2023 | 1,418,577.570000 | 2,512,709.330000 |
| Oct-2023 | 1,369,352.930000 | 2,459,875.750000 |
| Nov-2023 | 1,471,369.720000 | 2,684,524.910000 |
| Dec-2023 | 1,534,932.890000 | 2,806,484.520000 |
| Jan-2024 | 1,560,412.780000 | 2,853,645.430000 |
| Feb-2024 | 1,579,137.730000 | 3,006,017.560000 |
| Mar-2024 | 1,638,987.050000 | 3,102,734.960000 |
| Apr-2024 | 1,570,805.190000 | 2,976,005.130000 |
| May-2024 | 1,646,360.920000 | 3,123,569.360000 |
| Jun-2024 | 1,690,648.030000 | 3,235,649.580000 |
| Jul-2024 | 1,747,622.870000 | 3,275,035.130000 |
| Aug-2024 | 1,808,440.140000 | 3,354,476.670000 |
| Sep-2024 | 1,862,512.500000 | 3,426,118.580000 |
| Oct-2024 | 1,824,890 | 3,395,049 |
The above chart represents historical performance of a hypothetical $1,000,000 investment over the past 10 years. The results of this chart do not predict the results of future time periods and does not guarantee the same results.
| Class/Index Name | 1 Year | 5 Years | 10 Years |
|---|
| Class I | 33.28% | 10.08% | 6.20% |
| S&P 500 Index | 38.02% | 15.27% | 13.00% |
The Fund's past performance is not a good predictor of the Fund's future performance.The graph and table do not reflect the deduction of taxes that a shareholder would pay on fund distributions or redemption of fund shares. Call us at 800.334.2143 or visit https://www.firsteagle.com if you have questions about current performance.
- Net Assets$432,924,939
- Number of Portfolio Holdings41
- Portfolio Turnover Rate15.44%
- Net Investment Advisory Fees (net of waivers and reimbursements)$1,497,303
Asset Allocation by Asset Class
Based on total investments in the portfolio
| Value | Value |
|---|
| Common Stocks | 96.6% |
| Master Limited Partnerships | 2.3% |
| Short-Term Investments | 1.1%Footnote Reference1 |
Top 10 HoldingsFootnote Reference2
Based on total net assets of the portfolio
| Oracle Corp. (Software, United States) | 6.7% |
| Alphabet, Inc., Class A (Interactive Media & Services, United States) | 5.8% |
| Texas Instruments, Inc. (Semiconductors & Semiconductor Equipment, United States) | 5.7% |
| Comcast Corp., Class A (Media, United States) | 5.6% |
| UnitedHealth Group, Inc. (Health Care Providers & Services, United States) | 5.2% |
| Home Depot, Inc. (The) (Specialty Retail, United States) | 5.0% |
| Meta Platforms, Inc., Class A (Interactive Media & Services, United States) | 4.7% |
| Philip Morris International, Inc. (Tobacco, United States) | 4.6% |
| Schindler Holding AG (Machinery, Switzerland) | 4.5% |
| TE Connectivity plc (Electronic Equipment, Instruments & Components, Ireland) | 4.3% |
| Total | 52.1% |
Asset Allocation by Sector
Based on total investments in the portfolio
| Value | Value |
|---|
| Short-Term Investments | 1.1% |
| Real Estate | 2.6% |
| Financials | 3.1% |
| Energy | 7.3% |
| Industrials | 9.7% |
| Consumer Staples | 10.5% |
| Consumer Discretionary | 11.1% |
| Communication Services | 16.1% |
| Health Care | 17.4% |
| Information Technology | 21.1% |
| Footnote | Description |
Footnote1 | Includes short-term commercial paper (1.1% of total investments) that settles in 90 days or less; long-term commercial paper (0.0% of total investments) that settles in 91 days or more; and other short-term investments (0.0% of total investments), such as U.S. treasury bills or money market funds. |
Footnote2 | Holdings in cash, short-term commercial paper, long-term commercial paper and other short-term cash equivalents have been excluded. |
First Eagle Rising Dividend Fund
October 31, 2024
Annual Shareholder Report
For more information, please scan the QR code to navigate to tailored shareholder reports and financial statements and other Information. If you wish to view additional information about the Fund, including but not limited to financial statements, holdings, or the Fund's prospectus, please visit http://www.firsteagle.com.
Important Notice Regarding Delivery of Shareholder Materials
Unless we are notified otherwise, we send one copy of these materials to shareholders with the same residential address (provided they have the same last name or are reasonably believed to be family members) for as long as they remain a shareholder of the Fund. If you would like to receive individual mailings, please call 800.334.2143 and we will send separate copies of these materials within 30 days after receiving your request.
October 31, 2024
Annual Shareholder Report
This Annual Shareholder Report contains important information about the Class R6 shares of the Fund for the period of November 1, 2023, to October 31, 2024. You can find additional information about the Fund at https://www.firsteagle.com/first-eagle-fund-shareholder-reports. You can also request this information by contacting us at 800.334.2143.
First Eagle Rising Dividend Fund
What Were the Fund's Costs for the Year?
Based on a Hypothetical $10,000 Investment
| Class Name | Cost of a $10,000 Investment | Cost Paid as a Percentage of a $10,000 Investment |
|---|
| Class R6 | $76 | 0.65% |
How Did the Fund Perform Last Year?
The NAV of First Eagle Rising Dividend Fund Class R6 Shares increased 33.24% in the 12-month period ended October 31, 2024. The S&P 500 Index increased 38.02% for the same period.
• All geographic regions contributed to performance. North America was the leading contributor, while emerging markets was the worst performing region.
• All equity sectors contributed to performance. Information technology and communication services were the largest contributors, while materials and real estate were the worst performing sectors.
• Oracle Corp. was the leading contributor to performance. Elevance Health, Inc. was the largest detractor.
Total Return Based on a $10,000 Investment
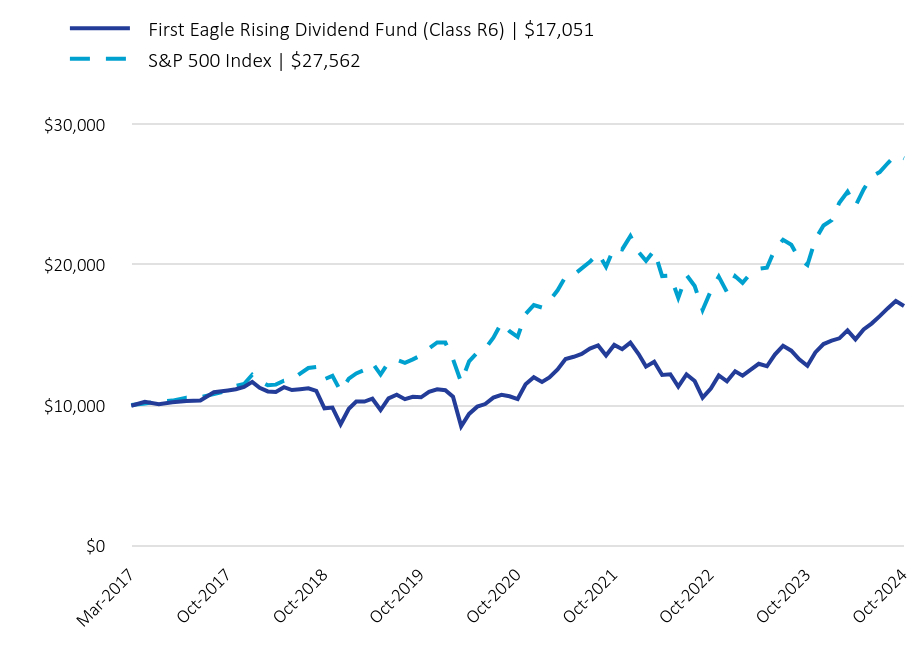
| First Eagle Rising Dividend Fund (Class R6) | $17,051 | S&P 500 Index | $27,562 |
|---|
| Mar-2017 | 9,952 | 10,011.660000 |
| Apr-2017 | 10,234.640000 | 10,114.480000 |
| May-2017 | 10,070.880000 | 10,256.820000 |
| Jun-2017 | 10,200.800000 | 10,320.840000 |
| Jul-2017 | 10,296.680000 | 10,533.070000 |
| Aug-2017 | 10,327.570000 | 10,565.310000 |
| Sep-2017 | 10,914.180000 | 10,783.250000 |
| Oct-2017 | 11,046.240000 | 11,034.880000 |
| Nov-2017 | 11,127.980000 | 11,373.320000 |
| Dec-2017 | 11,297.130000 | 11,499.780000 |
| Jan-2018 | 11,657.510000 | 12,158.180000 |
| Feb-2018 | 11,228.510000 | 11,710.070000 |
| Mar-2018 | 10,973.620000 | 11,412.480000 |
| Apr-2018 | 10,939.610000 | 11,456.270000 |
| May-2018 | 11,275.450000 | 11,732.160000 |
| Jun-2018 | 11,073.620000 | 11,804.370000 |
| Jul-2018 | 11,135.630000 | 12,243.650000 |
| Aug-2018 | 11,194.650000 | 12,642.610000 |
| Sep-2018 | 11,007.700000 | 12,714.580000 |
| Oct-2018 | 9,771.540000 | 11,845.530000 |
| Nov-2018 | 9,821.370000 | 12,086.930000 |
| Dec-2018 | 8,635.930000 | 10,995.590000 |
| Jan-2019 | 9,738.740000 | 11,876.730000 |
| Feb-2019 | 10,259.760000 | 12,258.070000 |
| Mar-2019 | 10,255.660000 | 12,496.260000 |
| Apr-2019 | 10,454.620000 | 13,002.230000 |
| May-2019 | 9,650.660000 | 12,175.960000 |
| Jun-2019 | 10,481.580000 | 13,034.080000 |
| Jul-2019 | 10,738.380000 | 13,221.410000 |
| Aug-2019 | 10,420.520000 | 13,011.980000 |
| Sep-2019 | 10,589.340000 | 13,255.440000 |
| Oct-2019 | 10,554.390000 | 13,542.550000 |
| Nov-2019 | 10,940.680000 | 14,034.130000 |
| Dec-2019 | 11,120.110000 | 14,457.700000 |
| Jan-2020 | 11,057.840000 | 14,452.030000 |
| Feb-2020 | 10,596.730000 | 13,262.360000 |
| Mar-2020 | 8,487.980000 | 11,624.280000 |
| Apr-2020 | 9,375.820000 | 13,114.440000 |
| May-2020 | 9,891.490000 | 13,739.060000 |
| Jun-2020 | 10,077.450000 | 14,012.290000 |
| Jul-2020 | 10,530.930000 | 14,802.380000 |
| Aug-2020 | 10,732.080000 | 15,866.380000 |
| Sep-2020 | 10,626.900000 | 15,263.510000 |
| Oct-2020 | 10,433.490000 | 14,857.590000 |
| Nov-2020 | 11,487.270000 | 16,483.970000 |
| Dec-2020 | 11,986.970000 | 17,117.740000 |
| Jan-2021 | 11,653.730000 | 16,944.930000 |
| Feb-2021 | 11,963.720000 | 17,412.180000 |
| Mar-2021 | 12,543.960000 | 18,174.760000 |
| Apr-2021 | 13,285.310000 | 19,144.720000 |
| May-2021 | 13,440.750000 | 19,278.440000 |
| Jun-2021 | 13,642.360000 | 19,728.490000 |
| Jul-2021 | 14,029.800000 | 20,197.140000 |
| Aug-2021 | 14,244.460000 | 20,811.250000 |
| Sep-2021 | 13,535.080000 | 19,843.320000 |
| Oct-2021 | 14,284.930000 | 21,233.580000 |
| Nov-2021 | 13,982.090000 | 21,086.450000 |
| Dec-2021 | 14,451.890000 | 22,031.460000 |
| Jan-2022 | 13,639.690000 | 20,891.400000 |
| Feb-2022 | 12,740.830000 | 20,265.880000 |
| Mar-2022 | 13,082.290000 | 21,018.340000 |
| Apr-2022 | 12,145.600000 | 19,185.510000 |
| May-2022 | 12,197.820000 | 19,220.700000 |
| Jun-2022 | 11,322.020000 | 17,634.160000 |
| Jul-2022 | 12,182.490000 | 19,260.100000 |
| Aug-2022 | 11,713.470000 | 18,474.640000 |
| Sep-2022 | 10,529.240000 | 16,773.150000 |
| Oct-2022 | 11,177.840000 | 18,131.130000 |
| Nov-2022 | 12,114.540000 | 19,144.370000 |
| Dec-2022 | 11,691.740000 | 18,041.380000 |
| Jan-2023 | 12,404.940000 | 19,174.990000 |
| Feb-2023 | 12,099.780000 | 18,707.140000 |
| Mar-2023 | 12,523.270000 | 19,393.950000 |
| Apr-2023 | 12,942.800000 | 19,696.660000 |
| May-2023 | 12,765.480000 | 19,782.280000 |
| Jun-2023 | 13,593.960000 | 21,089.400000 |
| Jul-2023 | 14,220.640000 | 21,766.890000 |
| Aug-2023 | 13,875.080000 | 21,420.330000 |
| Sep-2023 | 13,257.640000 | 20,399.050000 |
| Oct-2023 | 12,797.600000 | 19,970.130000 |
| Nov-2023 | 13,751.020000 | 21,793.910000 |
| Dec-2023 | 14,346.440000 | 22,784.020000 |
| Jan-2024 | 14,584.590000 | 23,166.890000 |
| Feb-2024 | 14,753.770000 | 24,403.900000 |
| Mar-2024 | 15,320.320000 | 25,189.090000 |
| Apr-2024 | 14,682.990000 | 24,160.250000 |
| May-2024 | 15,383.370000 | 25,358.230000 |
| Jun-2024 | 15,803.340000 | 26,268.140000 |
| Jul-2024 | 16,331.170000 | 26,587.880000 |
| Aug-2024 | 16,899.490000 | 27,232.820000 |
| Sep-2024 | 17,409.860000 | 27,814.430000 |
| Oct-2024 | 17,051 | 27,562 |
The above chart represents historical performance of a hypothetical $10,000 investment since inception. The results of this chart do not predict the results of future time periods and does not guarantee the same results.
| Class/Index Name | 1 Year | 5 Years | Since Inception (3/1/17) |
|---|
| Class R6 | 33.24% | 10.07% | 7.21% |
| S&P 500 Index | 38.02% | 15.27% | 13.88% |
The Fund's past performance is not a good predictor of the Fund's future performance.The graph and table do not reflect the deduction of taxes that a shareholder would pay on fund distributions or redemption of fund shares. Call us at 800.334.2143 or visit https://www.firsteagle.com if you have questions about current performance.
- Net Assets$432,924,939
- Number of Portfolio Holdings41
- Portfolio Turnover Rate15.44%
- Net Investment Advisory Fees (net of waivers and reimbursements)$1,497,303
Asset Allocation by Asset Class
Based on total investments in the portfolio
| Value | Value |
|---|
| Common Stocks | 96.6% |
| Master Limited Partnerships | 2.3% |
| Short-Term Investments | 1.1%Footnote Reference1 |
Top 10 HoldingsFootnote Reference2
Based on total net assets of the portfolio
| Oracle Corp. (Software, United States) | 6.7% |
| Alphabet, Inc., Class A (Interactive Media & Services, United States) | 5.8% |
| Texas Instruments, Inc. (Semiconductors & Semiconductor Equipment, United States) | 5.7% |
| Comcast Corp., Class A (Media, United States) | 5.6% |
| UnitedHealth Group, Inc. (Health Care Providers & Services, United States) | 5.2% |
| Home Depot, Inc. (The) (Specialty Retail, United States) | 5.0% |
| Meta Platforms, Inc., Class A (Interactive Media & Services, United States) | 4.7% |
| Philip Morris International, Inc. (Tobacco, United States) | 4.6% |
| Schindler Holding AG (Machinery, Switzerland) | 4.5% |
| TE Connectivity plc (Electronic Equipment, Instruments & Components, Ireland) | 4.3% |
| Total | 52.1% |
Asset Allocation by Sector
Based on total investments in the portfolio
| Value | Value |
|---|
| Short-Term Investments | 1.1% |
| Real Estate | 2.6% |
| Financials | 3.1% |
| Energy | 7.3% |
| Industrials | 9.7% |
| Consumer Staples | 10.5% |
| Consumer Discretionary | 11.1% |
| Communication Services | 16.1% |
| Health Care | 17.4% |
| Information Technology | 21.1% |
| Footnote | Description |
Footnote1 | Includes short-term commercial paper (1.1% of total investments) that settles in 90 days or less; long-term commercial paper (0.0% of total investments) that settles in 91 days or more; and other short-term investments (0.0% of total investments), such as U.S. treasury bills or money market funds. |
Footnote2 | Holdings in cash, short-term commercial paper, long-term commercial paper and other short-term cash equivalents have been excluded. |
First Eagle Rising Dividend Fund
October 31, 2024
Annual Shareholder Report
For more information, please scan the QR code to navigate to tailored shareholder reports and financial statements and other Information. If you wish to view additional information about the Fund, including but not limited to financial statements, holdings, or the Fund's prospectus, please visit http://www.firsteagle.com.
Important Notice Regarding Delivery of Shareholder Materials
Unless we are notified otherwise, we send one copy of these materials to shareholders with the same residential address (provided they have the same last name or are reasonably believed to be family members) for as long as they remain a shareholder of the Fund. If you would like to receive individual mailings, please call 800.334.2143 and we will send separate copies of these materials within 30 days after receiving your request.
October 31, 2024
Annual Shareholder Report
This Annual Shareholder Report contains important information about the Class A shares of the Fund for the period of November 1, 2023, to October 31, 2024. You can find additional information about the Fund at https://www.firsteagle.com/first-eagle-fund-shareholder-reports. You can also request this information by contacting us at 800.334.2143.
First Eagle Small Cap Opportunity Fund
What Were the Fund's Costs for the Year?
Based on a Hypothetical $10,000 Investment
| Class Name | Cost of a $10,000 Investment | Cost Paid as a Percentage of a $10,000 Investment |
|---|
| Class A | $142 | 1.25% |
How Did the Fund Perform Last Year?
The NAV of First Eagle Small Cap Opportunity Fund Class A Shares1 increased 26.69% in the 12-month period ended October 31, 2024. The Russell 2000® Index increased 34.07%, Russell 2000® Value Index increased 31.77% and the S&P 500 increased 38.02% for the same period.
• Industrials, information technology and financials were the largest contributors among equity sectors; energy was the only detractor, while utilities and communication services were the next worst performing sectors.
• FTAI Infrastructure, Inc. was the leading contributor to performance. PBF Energy, Inc., Class A was the largest detractor.
1 Reflects performance for Class A shares without the effect of sales charges and assumes all distributions have been reinvested; if sales charges were included, values would be lower.
Total Return Based on a $10,000 Investment
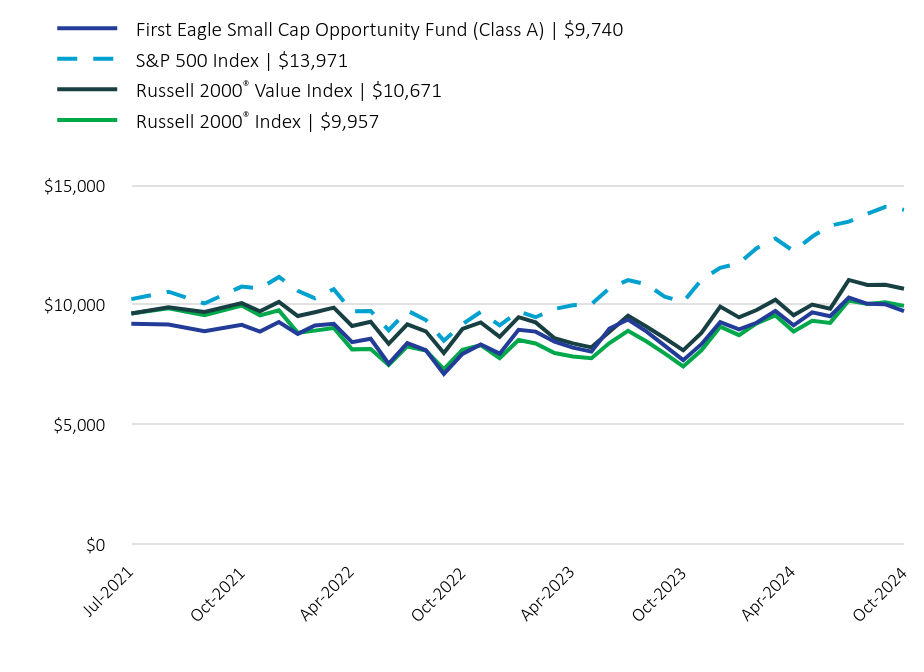
| First Eagle Small Cap Opportunity Fund (Class A) | $9,740 | S&P 500 Index | $13,971 | Russell 2000® Value Index | $10,671 | Russell 2000® Index | $9,957 |
|---|
| Jul-2021 | 9,209.300000 | 10,237.550000 | 9,642.060000 | 9,638.910000 |
| Aug-2021 | 9,180.750000 | 10,548.830000 | 9,900.230000 | 9,854.520000 |
| Sep-2021 | 8,898.900000 | 10,058.200000 | 9,701.890000 | 9,563.960000 |
| Oct-2021 | 9,161.420000 | 10,762.900000 | 10,071.810000 | 9,970.810000 |
| Nov-2021 | 8,880.160000 | 10,688.320000 | 9,727.780000 | 9,555.320000 |
| Dec-2021 | 9,284.210000 | 11,167.330000 | 10,124.490000 | 9,768.770000 |
| Jan-2022 | 8,786.580000 | 10,589.460000 | 9,534.180000 | 8,828.300000 |
| Feb-2022 | 9,133.650000 | 10,272.390000 | 9,691.950000 | 8,922.540000 |
| Mar-2022 | 9,208.540000 | 10,653.800000 | 9,881.590000 | 9,033.590000 |
| Apr-2022 | 8,438.710000 | 9,724.770000 | 9,114.720000 | 8,138.280000 |
| May-2022 | 8,579.640000 | 9,742.610000 | 9,289.650000 | 8,150.580000 |
| Jun-2022 | 7,538.070000 | 8,938.420000 | 8,371.950000 | 7,480.250000 |
| Jul-2022 | 8,401.930000 | 9,762.580000 | 9,182.500000 | 8,261.210000 |
| Aug-2022 | 8,101.140000 | 9,364.450000 | 8,892.130000 | 8,092.160000 |
| Sep-2022 | 7,115.230000 | 8,501.990000 | 7,986 | 7,316.640000 |
| Oct-2022 | 7,950.560000 | 9,190.330000 | 8,991.370000 | 8,122.130000 |
| Nov-2022 | 8,344.910000 | 9,703.920000 | 9,266.080000 | 8,311.840000 |
| Dec-2022 | 7,960.210000 | 9,144.830000 | 8,658.120000 | 7,772.380000 |
| Jan-2023 | 8,955.230000 | 9,719.440000 | 9,484.340000 | 8,529.930000 |
| Feb-2023 | 8,880.010000 | 9,482.300000 | 9,265.680000 | 8,385.850000 |
| Mar-2023 | 8,457.320000 | 9,830.430000 | 8,601.250000 | 7,985.170000 |
| Apr-2023 | 8,212.910000 | 9,983.870000 | 8,386.760000 | 7,841.610000 |
| May-2023 | 8,043.720000 | 10,027.260000 | 8,221.790000 | 7,769.180000 |
| Jun-2023 | 9,010.580000 | 10,689.820000 | 8,874.900000 | 8,400.830000 |
| Jul-2023 | 9,386.320000 | 11,033.230000 | 9,544.620000 | 8,914.570000 |
| Aug-2023 | 8,879.460000 | 10,857.560000 | 9,085.490000 | 8,468.590000 |
| Sep-2023 | 8,297.850000 | 10,339.900000 | 8,612.290000 | 7,970.020000 |
| Oct-2023 | 7,687.960000 | 10,122.480000 | 8,098.560000 | 7,426.470000 |
| Nov-2023 | 8,354.500000 | 11,046.920000 | 8,827.550000 | 8,098.640000 |
| Dec-2023 | 9,277.680000 | 11,548.790000 | 9,926.240000 | 9,088.160000 |
| Jan-2024 | 8,976.150000 | 11,742.860000 | 9,475.340000 | 8,734.690000 |
| Feb-2024 | 9,249.930000 | 12,369.880000 | 9,785.320000 | 9,228.570000 |
| Mar-2024 | 9,749.420000 | 12,767.880000 | 10,214.180000 | 9,558.940000 |
| Apr-2024 | 9,145.930000 | 12,246.380000 | 9,563.350000 | 8,886.160000 |
| May-2024 | 9,683.710000 | 12,853.610000 | 10,010.600000 | 9,331.950000 |
| Jun-2024 | 9,522.960000 | 13,314.820000 | 9,841.890000 | 9,245.630000 |
| Jul-2024 | 10,305.750000 | 13,476.900000 | 11,041.340000 | 10,184.970000 |
| Aug-2024 | 10,041.920000 | 13,803.800000 | 10,834.090000 | 10,032.830000 |
| Sep-2024 | 10,022.840000 | 14,098.610000 | 10,841.010000 | 10,102.950000 |
| Oct-2024 | 9,740 | 13,971 | 10,671 | 9,957 |
The above chart represents historical performance of a hypothetical $10,000 investment since inception. The results of this chart do not predict the results of future time periods and does not guarantee the same results.
| Class/Index Name | 1 Year | Since Inception (7/1/21) |
|---|
| Class A - without sales charge | 26.69% | 0.75% |
| Class A - with sales charge | 20.37% | -0.78% |
| S&P 500 Index | 38.02% | 10.34% |
Russell 2000® Value Index | 31.77% | 1.70% |
Russell 2000® Index | 34.07% | -0.37% |
The Fund's past performance is not a good predictor of the Fund's future performance.The graph and table do not reflect the deduction of taxes that a shareholder would pay on fund distributions or redemption of fund shares. Call us at 800.334.2143 or visit https://www.firsteagle.com if you have questions about current performance.
- Net Assets$1,868,520,245
- Number of Portfolio Holdings245
- Portfolio Turnover Rate45.67%
- Net Investment Advisory Fees (net of waivers and reimbursements)$14,244,221
Asset Allocation by Asset Class
Based on total investments in the portfolio
| Value | Value |
|---|
| Common Stocks | 93.3% |
| Exchange Traded Funds | 0.0%Footnote Reference1 |
| Rights | 0.0%Footnote Reference1 |
| Short-Term Investments | 6.7%Footnote Reference2 |
Top 10 HoldingsFootnote Reference3
Based on total net assets of the portfolio
| TTM Technologies, Inc. (Electronic Equipment, Instruments & Components, United States) | 0.9% |
| Black Hills Corp. (Multi-Utilities, United States) | 0.9% |
| Lincoln National Corp. (Insurance, United States) | 0.9% |
| Ameris Bancorp (Banks, United States) | 0.9% |
| MGIC Investment Corp. (Financial Services, United States) | 0.9% |
| Seacoast Banking Corp. of Florida (Banks, United States) | 0.8% |
| GXO Logistics, Inc. (Air Freight & Logistics, United States) | 0.8% |
| Kemper Corp. (Insurance, United States) | 0.8% |
| Beazer Homes USA, Inc. (Household Durables, United States) | 0.8% |
| Evercore, Inc., Class A (Capital Markets, United States) | 0.8% |
| Total | 8.5% |
Asset Allocation by Sector
Based on total investments in the portfolio
| Value | Value |
|---|
| Short-Term Investments | 6.7% |
OthersFootnote Reference4 | 1.4% |
| Utilities | 1.6% |
| Real Estate | 3.4% |
| Consumer Staples | 3.4% |
| Energy | 6.6% |
| Health Care | 8.0% |
| Consumer Discretionary | 10.3% |
| Materials | 11.4% |
| Information Technology | 12.7% |
| Financials | 14.1% |
| Industrials | 20.4% |
| Footnote | Description |
Footnote1 | Less than 0.05% |
Footnote2 | Includes short-term commercial paper (0.0% of total investments) that settles in 90 days or less; long-term commercial paper (0.0% of total investments) that settles in 91 days or more; and other short-term investments (6.7% of total investments), such as U.S. treasury bills or money market funds. |
Footnote3 | Holdings in cash, short-term commercial paper, long-term commercial paper and other short-term cash equivalents have been excluded. |
Footnote4 | Includes additional sectors outside the top 10 listed above. |
First Eagle Small Cap Opportunity Fund
October 31, 2024
Annual Shareholder Report
For more information, please scan the QR code to navigate to tailored shareholder reports and financial statements and other Information. If you wish to view additional information about the Fund, including but not limited to financial statements, holdings, or the Fund's prospectus, please visit http://www.firsteagle.com.
Important Notice Regarding Delivery of Shareholder Materials
Unless we are notified otherwise, we send one copy of these materials to shareholders with the same residential address (provided they have the same last name or are reasonably believed to be family members) for as long as they remain a shareholder of the Fund. If you would like to receive individual mailings, please call 800.334.2143 and we will send separate copies of these materials within 30 days after receiving your request.
October 31, 2024
Annual Shareholder Report
This Annual Shareholder Report contains important information about the Class I shares of the Fund for the period of November 1, 2023, to October 31, 2024. You can find additional information about the Fund at https://www.firsteagle.com/first-eagle-fund-shareholder-reports. You can also request this information by contacting us at 800.334.2143.
First Eagle Small Cap Opportunity Fund
What Were the Fund's Costs for the Year?
Based on a Hypothetical $10,000 Investment
| Class Name | Cost of a $10,000 Investment | Cost Paid as a Percentage of a $10,000 Investment |
|---|
| Class I | $114 | 1.00% |
How Did the Fund Perform Last Year?
The NAV of First Eagle Small Cap Opportunity Fund Class I Shares increased 26.95% in the 12-month period ended October 31, 2024. The Russell 2000® Index increased 34.07%, Russell 2000® Value Index increased 31.77% and the S&P 500 increased 38.02% for the same period.
• Industrials, information technology and financials were the largest contributors among equity sectors; energy was the only detractor, while utilities and communication services were the next worst performing sectors.
• FTAI Infrastructure, Inc. was the leading contributor to performance. PBF Energy, Inc., Class A was the largest detractor.
Total Return Based on a $1,000,000 Investment
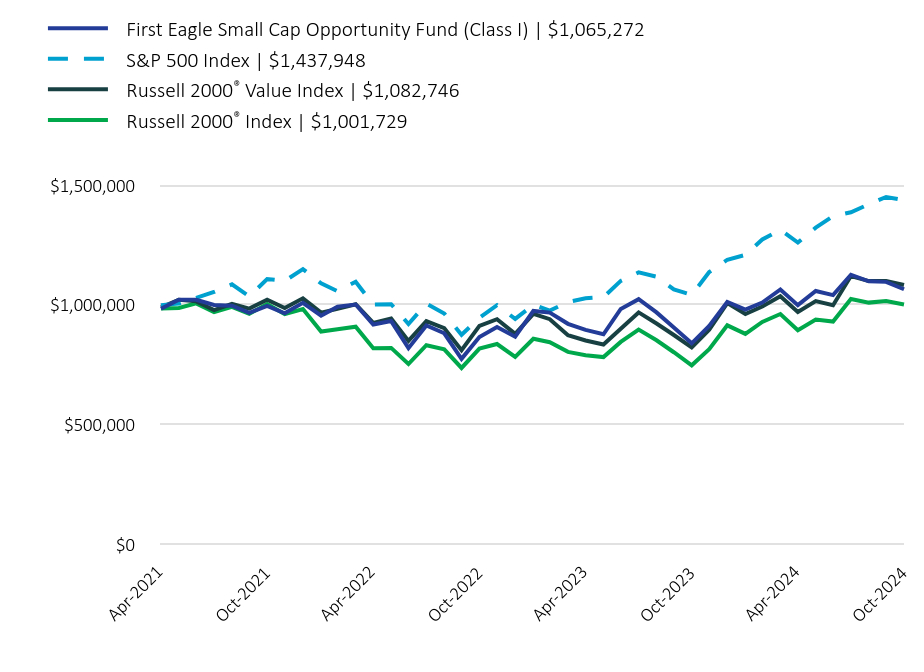
| First Eagle Small Cap Opportunity Fund (Class I) | $1,065,272 | S&P 500 Index | $1,437,948 | Russell 2000® Value Index | $1,082,746 | Russell 2000® Index | $1,001,729 |
|---|
| Apr-2021 | 984,000 | 998,800 | 990,000 | 984,900 |
| May-2021 | 1,020,998.400000 | 1,005,775.990000 | 1,020,807.380000 | 986,930.520000 |
| Jun-2021 | 1,020,794.200000 | 1,029,255.630000 | 1,014,622.050000 | 1,006,051.800000 |
| Jul-2021 | 999,357.520000 | 1,053,705.500000 | 978,304.150000 | 969,724.550000 |
| Aug-2021 | 996,259.510000 | 1,085,744.100000 | 1,004,499.210000 | 991,415.670000 |
| Sep-2021 | 966,718.080000 | 1,035,246.390000 | 984,375.490000 | 962,183.930000 |
| Oct-2021 | 995,236.260000 | 1,107,777.600000 | 1,021,908.490000 | 1,003,114.640000 |
| Nov-2021 | 964,682.510000 | 1,100,101.860000 | 987,002.180000 | 961,315.090000 |
| Dec-2021 | 1,008,479.090000 | 1,149,404.170000 | 1,027,252.740000 | 982,789.310000 |
| Jan-2022 | 954,525.460000 | 1,089,925.900000 | 967,359.380000 | 888,172.560000 |
| Feb-2022 | 992,229.220000 | 1,057,291.940000 | 983,366.060000 | 897,653.800000 |
| Mar-2022 | 1,001,357.720000 | 1,096,548.690000 | 1,002,607.820000 | 908,826.070000 |
| Apr-2022 | 917,844.490000 | 1,000,927.640000 | 924,799.720000 | 818,752.960000 |
| May-2022 | 932,071.080000 | 1,002,763.960000 | 942,548.440000 | 819,990.270000 |
| Jun-2022 | 819,010.860000 | 919,992.050000 | 849,436.480000 | 752,551.730000 |
| Jul-2022 | 913,770.410000 | 1,004,819.410000 | 931,676.450000 | 831,120.260000 |
| Aug-2022 | 881,148.810000 | 963,840.990000 | 902,214.940000 | 814,113.230000 |
| Sep-2022 | 774,177.350000 | 875,072.550000 | 810,276.820000 | 736,092.290000 |
| Oct-2022 | 865,839.940000 | 945,919.610000 | 912,284.300000 | 817,127.960000 |
| Nov-2022 | 907,573.430000 | 998,781.410000 | 940,156.930000 | 836,214.240000 |
| Dec-2022 | 866,641.870000 | 941,237.130000 | 878,472.250000 | 781,941.950000 |
| Jan-2023 | 974,712.110000 | 1,000,378.750000 | 962,302.320000 | 858,154.760000 |
| Feb-2023 | 967,596.710000 | 975,970.550000 | 940,116.160000 | 843,659.770000 |
| Mar-2023 | 920,668.270000 | 1,011,802.560000 | 872,701.480000 | 803,349.910000 |
| Apr-2023 | 895,165.760000 | 1,027,595.230000 | 850,939.130000 | 788,906.960000 |
| May-2023 | 876,814.860000 | 1,032,061.840000 | 834,200.910000 | 781,619.490000 |
| Jun-2023 | 982,821.780000 | 1,100,255.600000 | 900,467.160000 | 845,166.480000 |
| Jul-2023 | 1,023,608.880000 | 1,135,601.270000 | 968,417.940000 | 896,851.400000 |
| Aug-2023 | 968,538.720000 | 1,117,520.760000 | 921,833.570000 | 851,983.530000 |
| Sep-2023 | 905,293.140000 | 1,064,239.700000 | 873,821.500000 | 801,825.400000 |
| Oct-2023 | 839,025.690000 | 1,041,862.420000 | 821,697.340000 | 747,141.790000 |
| Nov-2023 | 911,433.600000 | 1,137,010.930000 | 895,662.220000 | 814,765.250000 |
| Dec-2023 | 1,011,782.440000 | 1,188,666.040000 | 1,007,137.820000 | 914,316.210000 |
| Jan-2024 | 980,012.470000 | 1,208,640.700000 | 961,388.970000 | 878,755.210000 |
| Feb-2024 | 1,009,804.850000 | 1,273,176.800000 | 992,840.470000 | 928,441.530000 |
| Mar-2024 | 1,064,233.330000 | 1,314,140.750000 | 1,036,352.900000 | 961,678.740000 |
| Apr-2024 | 998,570.140000 | 1,260,465.260000 | 970,318.590000 | 893,993.300000 |
| May-2024 | 1,058,084.920000 | 1,322,965.010000 | 1,015,697.510000 | 938,842.460000 |
| Jun-2024 | 1,040,626.520000 | 1,370,435.770000 | 998,579.730000 | 930,157.880000 |
| Jul-2024 | 1,125,853.830000 | 1,387,117.230000 | 1,120,278.360000 | 1,024,661.130000 |
| Aug-2024 | 1,098,157.820000 | 1,420,764.120000 | 1,099,250.870000 | 1,009,354.900000 |
| Sep-2024 | 1,096,071.320000 | 1,451,107.520000 | 1,099,952.350000 | 1,016,409.280000 |
| Oct-2024 | 1,065,272 | 1,437,948 | 1,082,746 | 1,001,729 |
The above chart represents historical performance of a hypothetical $1,000,000 investment since inception. The results of this chart do not predict the results of future time periods and does not guarantee the same results.
| Class/Index Name | 1 Year | Since Inception (4/27/21) |
|---|
| Class I | 26.95% | 1.82% |
| S&P 500 Index | 38.02% | 10.85% |
Russell 2000® Value Index | 31.77% | 2.38% |
Russell 2000® Index | 34.07% | 0.09% |
The Fund's past performance is not a good predictor of the Fund's future performance.The graph and table do not reflect the deduction of taxes that a shareholder would pay on fund distributions or redemption of fund shares. Call us at 800.334.2143 or visit https://www.firsteagle.com if you have questions about current performance.
- Net Assets$1,868,520,245
- Number of Portfolio Holdings245
- Portfolio Turnover Rate45.67%
- Net Investment Advisory Fees (net of waivers and reimbursements)$14,244,221
Asset Allocation by Asset Class
Based on total investments in the portfolio
| Value | Value |
|---|
| Common Stocks | 93.3% |
| Exchange Traded Funds | 0.0%Footnote Reference1 |
| Rights | 0.0%Footnote Reference1 |
| Short-Term Investments | 6.7%Footnote Reference2 |
Top 10 HoldingsFootnote Reference3
Based on total net assets of the portfolio
| TTM Technologies, Inc. (Electronic Equipment, Instruments & Components, United States) | 0.9% |
| Black Hills Corp. (Multi-Utilities, United States) | 0.9% |
| Lincoln National Corp. (Insurance, United States) | 0.9% |
| Ameris Bancorp (Banks, United States) | 0.9% |
| MGIC Investment Corp. (Financial Services, United States) | 0.9% |
| Seacoast Banking Corp. of Florida (Banks, United States) | 0.8% |
| GXO Logistics, Inc. (Air Freight & Logistics, United States) | 0.8% |
| Kemper Corp. (Insurance, United States) | 0.8% |
| Beazer Homes USA, Inc. (Household Durables, United States) | 0.8% |
| Evercore, Inc., Class A (Capital Markets, United States) | 0.8% |
| Total | 8.5% |
Asset Allocation by Sector
Based on total investments in the portfolio
| Value | Value |
|---|
| Short-Term Investments | 6.7% |
OthersFootnote Reference4 | 1.4% |
| Utilities | 1.6% |
| Real Estate | 3.4% |
| Consumer Staples | 3.4% |
| Energy | 6.6% |
| Health Care | 8.0% |
| Consumer Discretionary | 10.3% |
| Materials | 11.4% |
| Information Technology | 12.7% |
| Financials | 14.1% |
| Industrials | 20.4% |
| Footnote | Description |
Footnote1 | Less than 0.05% |
Footnote2 | Includes short-term commercial paper (0.0% of total investments) that settles in 90 days or less; long-term commercial paper (0.0% of total investments) that settles in 91 days or more; and other short-term investments (6.7% of total investments), such as U.S. treasury bills or money market funds. |
Footnote3 | Holdings in cash, short-term commercial paper, long-term commercial paper and other short-term cash equivalents have been excluded. |
Footnote4 | Includes additional sectors outside the top 10 listed above. |
First Eagle Small Cap Opportunity Fund
October 31, 2024
Annual Shareholder Report
For more information, please scan the QR code to navigate to tailored shareholder reports and financial statements and other Information. If you wish to view additional information about the Fund, including but not limited to financial statements, holdings, or the Fund's prospectus, please visit http://www.firsteagle.com.
Important Notice Regarding Delivery of Shareholder Materials
Unless we are notified otherwise, we send one copy of these materials to shareholders with the same residential address (provided they have the same last name or are reasonably believed to be family members) for as long as they remain a shareholder of the Fund. If you would like to receive individual mailings, please call 800.334.2143 and we will send separate copies of these materials within 30 days after receiving your request.
October 31, 2024
Annual Shareholder Report
This Annual Shareholder Report contains important information about the Class R6 shares of the Fund for the period of November 1, 2023, to October 31, 2024. You can find additional information about the Fund at https://www.firsteagle.com/first-eagle-fund-shareholder-reports. You can also request this information by contacting us at 800.334.2143.
First Eagle Small Cap Opportunity Fund
What Were the Fund's Costs for the Year?
Based on a Hypothetical $10,000 Investment
| Class Name | Cost of a $10,000 Investment | Cost Paid as a Percentage of a $10,000 Investment |
|---|
| Class R6 | $113 | 1.00% |
How Did the Fund Perform Last Year?
The NAV of First Eagle Small Cap Opportunity Fund Class R6 Shares increased 27.07% in the 12-month period ended October 31, 2024. The Russell 2000® Index increased 34.07%, Russell 2000® Value Index increased 31.77% and the S&P 500 increased 38.02% for the same period.
• Industrials, information technology and financials were the largest contributors among equity sectors; energy was the only detractor, while utilities and communication services were the next worst performing sectors.
• FTAI Infrastructure, Inc. was the leading contributor to performance. PBF Energy, Inc., Class A was the largest detractor.
Total Return Based on a $10,000 Investment
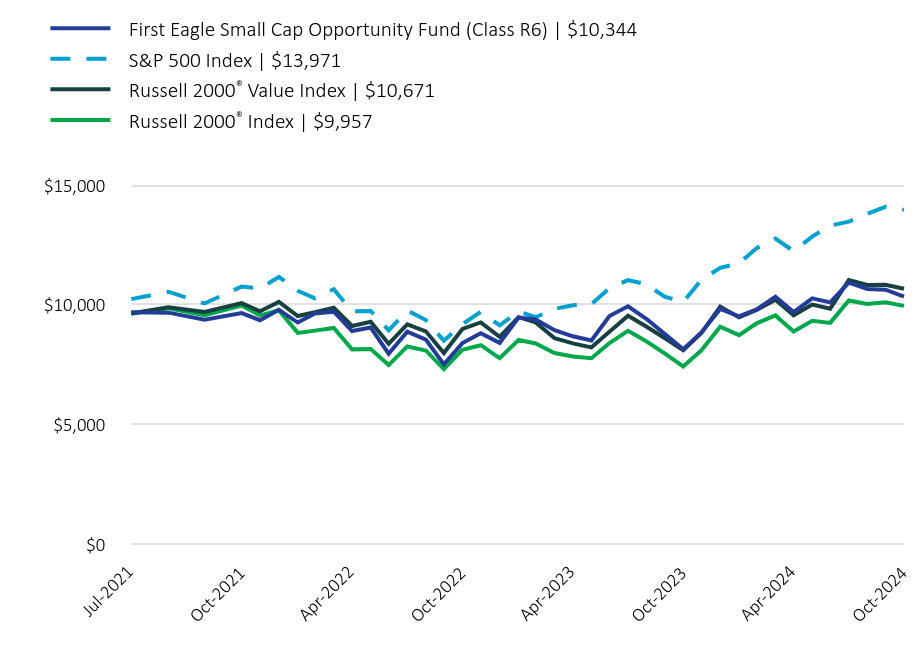
| First Eagle Small Cap Opportunity Fund (Class R6) | $10,344 | S&P 500 Index | $13,971 | Russell 2000® Value Index | $10,671 | Russell 2000® Index | $9,957 |
|---|
| Jul-2021 | 9,694 | 10,237.550000 | 9,642.060000 | 9,638.910000 |
| Aug-2021 | 9,674.610000 | 10,548.830000 | 9,900.230000 | 9,854.520000 |
| Sep-2021 | 9,378.570000 | 10,058.200000 | 9,701.890000 | 9,563.960000 |
| Oct-2021 | 9,655.240000 | 10,762.900000 | 10,071.810000 | 9,970.810000 |
| Nov-2021 | 9,358.820000 | 10,688.320000 | 9,727.780000 | 9,555.320000 |
| Dec-2021 | 9,794.010000 | 11,167.330000 | 10,124.490000 | 9,768.770000 |
| Jan-2022 | 9,260.230000 | 10,589.460000 | 9,534.180000 | 8,828.300000 |
| Feb-2022 | 9,636.200000 | 10,272.390000 | 9,691.950000 | 8,922.540000 |
| Mar-2022 | 9,715.220000 | 10,653.800000 | 9,881.590000 | 9,033.590000 |
| Apr-2022 | 8,904.970000 | 9,724.770000 | 9,114.720000 | 8,138.280000 |
| May-2022 | 9,052.790000 | 9,742.610000 | 9,289.650000 | 8,150.580000 |
| Jun-2022 | 7,955.590000 | 8,938.420000 | 8,371.950000 | 7,480.250000 |
| Jul-2022 | 8,874.460000 | 9,762.580000 | 9,182.500000 | 8,261.210000 |
| Aug-2022 | 8,548.770000 | 9,364.450000 | 8,892.130000 | 8,092.160000 |
| Sep-2022 | 7,510.950000 | 8,501.990000 | 7,986 | 7,316.640000 |
| Oct-2022 | 8,400.240000 | 9,190.330000 | 8,991.370000 | 8,122.130000 |
| Nov-2022 | 8,815.220000 | 9,703.920000 | 9,266.080000 | 8,311.840000 |
| Dec-2022 | 8,408.840000 | 9,144.830000 | 8,658.120000 | 7,772.380000 |
| Jan-2023 | 9,467.510000 | 9,719.440000 | 9,484.340000 | 8,529.930000 |
| Feb-2023 | 9,387.980000 | 9,482.300000 | 9,265.680000 | 8,385.850000 |
| Mar-2023 | 8,942.990000 | 9,830.430000 | 8,601.250000 | 7,985.170000 |
| Apr-2023 | 8,685.430000 | 9,983.870000 | 8,386.760000 | 7,841.610000 |
| May-2023 | 8,507.380000 | 10,027.260000 | 8,221.790000 | 7,769.180000 |
| Jun-2023 | 9,535.920000 | 10,689.820000 | 8,874.900000 | 8,400.830000 |
| Jul-2023 | 9,941.200000 | 11,033.230000 | 9,544.620000 | 8,914.570000 |
| Aug-2023 | 9,407.360000 | 10,857.560000 | 9,085.490000 | 8,468.590000 |
| Sep-2023 | 8,784.590000 | 10,339.900000 | 8,612.290000 | 7,970.020000 |
| Oct-2023 | 8,141.560000 | 10,122.480000 | 8,098.560000 | 7,426.470000 |
| Nov-2023 | 8,844.170000 | 11,046.920000 | 8,827.550000 | 8,098.640000 |
| Dec-2023 | 9,827.650000 | 11,548.790000 | 9,926.240000 | 9,088.160000 |
| Jan-2024 | 9,519.060000 | 11,742.860000 | 9,475.340000 | 8,734.690000 |
| Feb-2024 | 9,807.490000 | 12,369.880000 | 9,785.320000 | 9,228.570000 |
| Mar-2024 | 10,335.130000 | 12,767.880000 | 10,214.180000 | 9,558.940000 |
| Apr-2024 | 9,697.450000 | 12,246.380000 | 9,563.350000 | 8,886.160000 |
| May-2024 | 10,274.450000 | 12,853.610000 | 10,010.600000 | 9,331.950000 |
| Jun-2024 | 10,104.920000 | 13,314.820000 | 9,841.890000 | 9,245.630000 |
| Jul-2024 | 10,931.500000 | 13,476.900000 | 11,041.340000 | 10,184.970000 |
| Aug-2024 | 10,662.590000 | 13,803.800000 | 10,834.090000 | 10,032.830000 |
| Sep-2024 | 10,632.730000 | 14,098.610000 | 10,841.010000 | 10,102.950000 |
| Oct-2024 | 10,344 | 13,971 | 10,671 | 9,957 |
The above chart represents historical performance of a hypothetical $10,000 investment since inception. The results of this chart do not predict the results of future time periods and does not guarantee the same results.
| Class/Index Name | 1 Year | Since Inception (7/1/21) |
|---|
| Class R6 | 27.07% | 1.02% |
| S&P 500 Index | 38.02% | 10.34% |
Russell 2000® Value Index | 31.77% | 1.70% |
Russell 2000® Index | 34.07% | -0.37% |
The Fund's past performance is not a good predictor of the Fund's future performance.The graph and table do not reflect the deduction of taxes that a shareholder would pay on fund distributions or redemption of fund shares. Call us at 800.334.2143 or visit https://www.firsteagle.com if you have questions about current performance.
- Net Assets$1,868,520,245
- Number of Portfolio Holdings245
- Portfolio Turnover Rate45.67%
- Net Investment Advisory Fees (net of waivers and reimbursements)$14,244,221
Asset Allocation by Asset Class
Based on total investments in the portfolio
| Value | Value |
|---|
| Common Stocks | 93.3% |
| Exchange Traded Funds | 0.0%Footnote Reference1 |
| Rights | 0.0%Footnote Reference1 |
| Short-Term Investments | 6.7%Footnote Reference2 |
Top 10 HoldingsFootnote Reference3
Based on total net assets of the portfolio
| TTM Technologies, Inc. (Electronic Equipment, Instruments & Components, United States) | 0.9% |
| Black Hills Corp. (Multi-Utilities, United States) | 0.9% |
| Lincoln National Corp. (Insurance, United States) | 0.9% |
| Ameris Bancorp (Banks, United States) | 0.9% |
| MGIC Investment Corp. (Financial Services, United States) | 0.9% |
| Seacoast Banking Corp. of Florida (Banks, United States) | 0.8% |
| GXO Logistics, Inc. (Air Freight & Logistics, United States) | 0.8% |
| Kemper Corp. (Insurance, United States) | 0.8% |
| Beazer Homes USA, Inc. (Household Durables, United States) | 0.8% |
| Evercore, Inc., Class A (Capital Markets, United States) | 0.8% |
| Total | 8.5% |
Asset Allocation by Sector
Based on total investments in the portfolio
| Value | Value |
|---|
| Short-Term Investments | 6.7% |
OthersFootnote Reference4 | 1.4% |
| Utilities | 1.6% |
| Real Estate | 3.4% |
| Consumer Staples | 3.4% |
| Energy | 6.6% |
| Health Care | 8.0% |
| Consumer Discretionary | 10.3% |
| Materials | 11.4% |
| Information Technology | 12.7% |
| Financials | 14.1% |
| Industrials | 20.4% |
| Footnote | Description |
Footnote1 | Less than 0.05% |
Footnote2 | Includes short-term commercial paper (0.0% of total investments) that settles in 90 days or less; long-term commercial paper (0.0% of total investments) that settles in 91 days or more; and other short-term investments (6.7% of total investments), such as U.S. treasury bills or money market funds. |
Footnote3 | Holdings in cash, short-term commercial paper, long-term commercial paper and other short-term cash equivalents have been excluded. |
Footnote4 | Includes additional sectors outside the top 10 listed above. |
First Eagle Small Cap Opportunity Fund
October 31, 2024
Annual Shareholder Report
For more information, please scan the QR code to navigate to tailored shareholder reports and financial statements and other Information. If you wish to view additional information about the Fund, including but not limited to financial statements, holdings, or the Fund's prospectus, please visit http://www.firsteagle.com.
Important Notice Regarding Delivery of Shareholder Materials
Unless we are notified otherwise, we send one copy of these materials to shareholders with the same residential address (provided they have the same last name or are reasonably believed to be family members) for as long as they remain a shareholder of the Fund. If you would like to receive individual mailings, please call 800.334.2143 and we will send separate copies of these materials within 30 days after receiving your request.
October 31, 2024
Annual Shareholder Report
This Annual Shareholder Report contains important information about the Class A shares of the Fund for the period of November 1, 2023, to October 31, 2024. You can find additional information about the Fund at https://www.firsteagle.com/first-eagle-fund-shareholder-reports. You can also request this information by contacting us at 800.334.2143.
First Eagle U.S. Smid Cap Opportunity Fund
What Were the Fund's Costs for the Year?
Based on a Hypothetical $10,000 Investment
| Class Name | Cost of a $10,000 Investment | Cost Paid as a Percentage of a $10,000 Investment |
|---|
| Class A | $141 | 1.20% |
How Did the Fund Perform Last Year?
The NAV of First Eagle U.S. Smid Cap Opportunity Fund Class A Shares1 increased 34.32% in the 12-month period ended October 31, 2024. The Russell 2500™ Index increased 33.08%, Russell 2500™ Value Index increased 32.42% and S&P 500 increased 38.02% for the same period.
• Industrials, information technology and health care were the largest contributors among equity sectors; energy was the only detractor, while utilities and materials were the next worst performing sectors.
• Tenet Healthcare Corp. was the leading contributor to performance. HF Sinclair Corp. was the largest detractor.
1 Reflects performance for Class A shares without the effect of sales charges and assumes all distributions have been reinvested; if sales charges were included, values would be lower.
Total Return Based on a $10,000 Investment
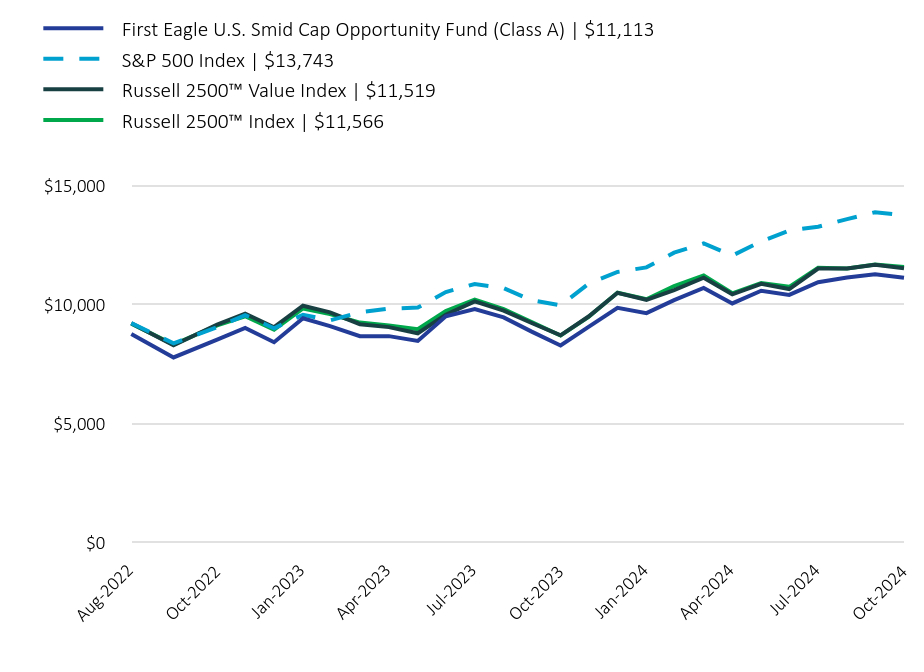
| First Eagle U.S. Smid Cap Opportunity Fund (Class A) | $11,113 | S&P 500 Index | $13,743 | Russell 2500™ Value Index | $11,519 | Russell 2500™ Index | $11,566 |
|---|
| Aug-2022 | 8,759 | 9,212 | 9,208 | 9,190 |
| Sep-2022 | 7,770.990000 | 8,363.590000 | 8,276.830000 | 8,314.640000 |
| Oct-2022 | 8,521.660000 | 9,040.720000 | 9,150.710000 | 9,112.370000 |
| Nov-2022 | 9,006.540000 | 9,545.950000 | 9,610.380000 | 9,497.060000 |
| Dec-2022 | 8,408.510000 | 8,995.960000 | 9,039.160000 | 8,932.230000 |
| Jan-2023 | 9,416.690000 | 9,561.210000 | 9,942.330000 | 9,825.320000 |
| Feb-2023 | 9,083.340000 | 9,327.930000 | 9,660.850000 | 9,594.720000 |
| Mar-2023 | 8,664.600000 | 9,670.400000 | 9,165.260000 | 9,235.060000 |
| Apr-2023 | 8,664.600000 | 9,821.340000 | 9,043.130000 | 9,114.580000 |
| May-2023 | 8,464.450000 | 9,864.030000 | 8,785.050000 | 8,954.760000 |
| Jun-2023 | 9,501.340000 | 10,515.800000 | 9,565.980000 | 9,717.580000 |
| Jul-2023 | 9,805.380000 | 10,853.610000 | 10,126.730000 | 10,200.710000 |
| Aug-2023 | 9,453.370000 | 10,680.810000 | 9,736.870000 | 9,800.210000 |
| Sep-2023 | 8,854.030000 | 10,171.570000 | 9,215.760000 | 9,252.880000 |
| Oct-2023 | 8,274.090000 | 9,957.700000 | 8,698.670000 | 8,690.890000 |
| Nov-2023 | 9,054.330000 | 10,867.090000 | 9,488.090000 | 9,473.230000 |
| Dec-2023 | 9,852.930000 | 11,360.790000 | 10,483.720000 | 10,488.510000 |
| Jan-2024 | 9,630.250000 | 11,551.700000 | 10,189.570000 | 10,214.180000 |
| Feb-2024 | 10,173.400000 | 12,168.510000 | 10,598.010000 | 10,769.780000 |
| Mar-2024 | 10,687.150000 | 12,560.020000 | 11,120.120000 | 11,214.260000 |
| Apr-2024 | 10,037.370000 | 12,047.010000 | 10,420.950000 | 10,462.990000 |
| May-2024 | 10,570.360000 | 12,644.360000 | 10,860.150000 | 10,898.210000 |
| Jun-2024 | 10,395.950000 | 13,098.070000 | 10,641.370000 | 10,734.900000 |
| Jul-2024 | 10,929.260000 | 13,257.500000 | 11,503.130000 | 11,532.450000 |
| Aug-2024 | 11,122.710000 | 13,579.090000 | 11,502.680000 | 11,502.800000 |
| Sep-2024 | 11,258.400000 | 13,869.100000 | 11,665.840000 | 11,674.060000 |
| Oct-2024 | 11,113 | 13,743 | 11,519 | 11,566 |
The above chart represents historical performance of a hypothetical $10,000 investment since inception. The results of this chart do not predict the results of future time periods and does not guarantee the same results.
| Class/Index Name | 1 Year | Since Inception (8/15/22) |
|---|
| Class A - without sales charge | 34.32% | 7.36% |
| Class A - with sales charge | 27.57% | 4.88% |
| S&P 500 Index | 38.02% | 15.38% |
| Russell 2500™ Value Index | 32.42% | 6.59% |
| Russell 2500™ Index | 33.08% | 6.82% |
The Fund's past performance is not a good predictor of the Fund's future performance.The graph and table do not reflect the deduction of taxes that a shareholder would pay on fund distributions or redemption of fund shares. Call us at 800.334.2143 or visit https://www.firsteagle.com if you have questions about current performance.
- Net Assets$49,943,437
- Number of Portfolio Holdings76
- Portfolio Turnover Rate26.23%
- Net Investment Advisory Fees (net of waivers and reimbursements)$5,249
Asset Allocation by Asset Class
Based on total investments in the portfolio
| Value | Value |
|---|
| Common Stocks | 95.0% |
| Short-Term Investments | 5.0%Footnote Reference1 |
Top 10 HoldingsFootnote Reference2
Based on total net assets of the portfolio
| Curtiss-Wright Corp. (Aerospace & Defense, United States) | 3.3% |
| Tenet Healthcare Corp. (Health Care Providers & Services, United States) | 3.1% |
| Evercore, Inc., Class A (Capital Markets, United States) | 2.6% |
| Bio-Rad Laboratories, Inc., Class A (Life Sciences Tools & Services, United States) | 2.3% |
| Quanta Services, Inc. (Construction & Engineering, United States) | 2.3% |
| Cardinal Health, Inc. (Health Care Providers & Services, United States) | 2.2% |
| Lennox International, Inc. (Building Products, United States) | 2.1% |
| XPO, Inc. (Ground Transportation, United States) | 2.0% |
| Onto Innovation, Inc. (Semiconductors & Semiconductor Equipment, United States) | 1.9% |
| Radian Group, Inc. (Financial Services, United States) | 1.8% |
| Total | 23.6% |
Asset Allocation by Sector
Based on total investments in the portfolio
| Value | Value |
|---|
| Short-Term Investments | 5.0% |
| Utilities | 1.0% |
| Materials | 4.3% |
| Energy | 5.4% |
| Consumer Staples | 6.0% |
| Information Technology | 11.2% |
| Consumer Discretionary | 13.6% |
| Financials | 15.4% |
| Health Care | 16.2% |
| Industrials | 21.9% |
| Footnote | Description |
Footnote1 | Includes short-term commercial paper (0.0% of total investments) that settles in 90 days or less; long-term commercial paper (0.0% of total investments) that settles in 91 days or more; and other short-term investments (5.0% of total investments), such as U.S. treasury bills or money market funds. |
Footnote2 | Holdings in cash, short-term commercial paper, long-term commercial paper and other short-term cash equivalents have been excluded. |
First Eagle U.S. Smid Cap Opportunity Fund
October 31, 2024
Annual Shareholder Report
For more information, please scan the QR code to navigate to tailored shareholder reports and financial statements and other Information. If you wish to view additional information about the Fund, including but not limited to financial statements, holdings, or the Fund's prospectus, please visit http://www.firsteagle.com.
Important Notice Regarding Delivery of Shareholder Materials
Unless we are notified otherwise, we send one copy of these materials to shareholders with the same residential address (provided they have the same last name or are reasonably believed to be family members) for as long as they remain a shareholder of the Fund. If you would like to receive individual mailings, please call 800.334.2143 and we will send separate copies of these materials within 30 days after receiving your request.
October 31, 2024
Annual Shareholder Report
This Annual Shareholder Report contains important information about the Class I shares of the Fund for the period of November 1, 2023, to October 31, 2024. You can find additional information about the Fund at https://www.firsteagle.com/first-eagle-fund-shareholder-reports. You can also request this information by contacting us at 800.334.2143.
First Eagle U.S. Smid Cap Opportunity Fund
What Were the Fund's Costs for the Year?
Based on a Hypothetical $10,000 Investment
| Class Name | Cost of a $10,000 Investment | Cost Paid as a Percentage of a $10,000 Investment |
|---|
| Class I | $111 | 0.95% |
How Did the Fund Perform Last Year?
The NAV of First Eagle U.S. Smid Cap Opportunity Fund Class I Shares increased 34.58% in the 12-month period ended October 31, 2024. The Russell 2500™ Index increased 33.08%, Russell 2500™ Value Index increased 32.42% and S&P 500 increased 38.02% for the same period.
• Industrials, information technology and health care were the largest contributors among equity sectors; energy was the only detractor, while utilities and materials were the next worst performing sectors.
• Tenet Healthcare Corp. was the leading contributor to performance. HF Sinclair Corp. was the largest detractor.
Total Return Based on a $1,000,000 Investment
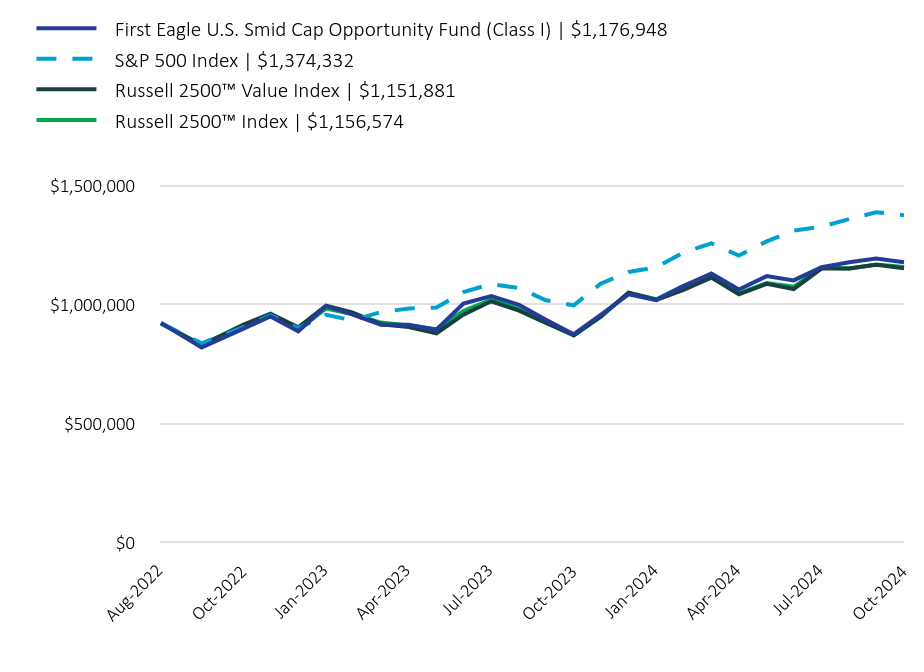
| First Eagle U.S. Smid Cap Opportunity Fund (Class I) | $1,176,948 | S&P 500 Index | $1,374,332 | Russell 2500™ Value Index | $1,151,881 | Russell 2500™ Index | $1,156,574 |
|---|
| Aug-2022 | 922,000 | 921,200 | 920,800 | 919,000 |
| Sep-2022 | 819,012.600000 | 836,358.740000 | 827,682.590000 | 831,464.040000 |
| Oct-2022 | 898,047.320000 | 904,071.480000 | 915,071.350000 | 911,236.980000 |
| Nov-2022 | 949,056.400000 | 954,594.630000 | 961,037.520000 | 949,706.370000 |
| Dec-2022 | 886,798.300000 | 899,596.150000 | 903,915.780000 | 893,222.560000 |
| Jan-2023 | 993,125.420000 | 956,121.300000 | 994,232.700000 | 982,531.600000 |
| Feb-2023 | 957,968.780000 | 932,792.940000 | 966,084.640000 | 959,471.950000 |
| Mar-2023 | 913,806.420000 | 967,039.720000 | 916,525.620000 | 923,505.660000 |
| Apr-2023 | 913,806.420000 | 982,133.710000 | 904,312.870000 | 911,457.520000 |
| May-2023 | 893,702.680000 | 986,402.710000 | 878,505.360000 | 895,475.890000 |
| Jun-2023 | 1,003,002.520000 | 1,051,579.540000 | 956,598.390000 | 971,758.300000 |
| Jul-2023 | 1,035,098.600000 | 1,085,361.490000 | 1,012,673.230000 | 1,020,070.650000 |
| Aug-2023 | 997,938.560000 | 1,068,080.870000 | 973,686.640000 | 980,020.570000 |
| Sep-2023 | 934,769.050000 | 1,017,157.010000 | 921,575.890000 | 925,288.120000 |
| Oct-2023 | 874,569.920000 | 995,769.720000 | 869,866.840000 | 869,088.490000 |
| Nov-2023 | 955,817.460000 | 1,086,708.790000 | 948,809.070000 | 947,323.150000 |
| Dec-2023 | 1,042,032.200000 | 1,136,078.640000 | 1,048,372.220000 | 1,048,851.190000 |
| Jan-2024 | 1,017,857.050000 | 1,155,169.600000 | 1,018,956.840000 | 1,021,417.720000 |
| Feb-2024 | 1,075,264.190000 | 1,216,850.590000 | 1,059,801.380000 | 1,076,978.400000 |
| Mar-2024 | 1,129,672.560000 | 1,256,002.260000 | 1,112,012.450000 | 1,121,426.200000 |
| Apr-2024 | 1,062,231.110000 | 1,204,701.410000 | 1,042,095.040000 | 1,046,299.030000 |
| May-2024 | 1,118,635.580000 | 1,264,436.130000 | 1,086,015.460000 | 1,089,821.160000 |
| Jun-2024 | 1,100,513.680000 | 1,309,806.750000 | 1,064,136.530000 | 1,073,489.780000 |
| Jul-2024 | 1,155,869.520000 | 1,325,750.210000 | 1,150,312.560000 | 1,153,245.110000 |
| Aug-2024 | 1,177,021.930000 | 1,357,908.540000 | 1,150,268.050000 | 1,150,280.420000 |
| Sep-2024 | 1,192,087.810000 | 1,386,909.530000 | 1,166,583.820000 | 1,167,405.750000 |
| Oct-2024 | 1,176,948 | 1,374,332 | 1,151,881 | 1,156,574 |
The above chart represents historical performance of a hypothetical $1,000,000 investment since inception. The results of this chart do not predict the results of future time periods and does not guarantee the same results.
| Class/Index Name | 1 Year | Since Inception (8/15/22) |
|---|
| Class I | 34.58% | 7.65% |
| S&P 500 Index | 38.02% | 15.38% |
| Russell 2500™ Value Index | 32.42% | 6.59% |
| Russell 2500™ Index | 33.08% | 6.82% |
The Fund's past performance is not a good predictor of the Fund's future performance.The graph and table do not reflect the deduction of taxes that a shareholder would pay on fund distributions or redemption of fund shares. Call us at 800.334.2143 or visit https://www.firsteagle.com if you have questions about current performance.
- Net Assets$49,943,437
- Number of Portfolio Holdings76
- Portfolio Turnover Rate26.23%
- Net Investment Advisory Fees (net of waivers and reimbursements)$5,249
Asset Allocation by Asset Class
Based on total investments in the portfolio
| Value | Value |
|---|
| Common Stocks | 95.0% |
| Short-Term Investments | 5.0%Footnote Reference1 |
Top 10 HoldingsFootnote Reference2
Based on total net assets of the portfolio
| Curtiss-Wright Corp. (Aerospace & Defense, United States) | 3.3% |
| Tenet Healthcare Corp. (Health Care Providers & Services, United States) | 3.1% |
| Evercore, Inc., Class A (Capital Markets, United States) | 2.6% |
| Bio-Rad Laboratories, Inc., Class A (Life Sciences Tools & Services, United States) | 2.3% |
| Quanta Services, Inc. (Construction & Engineering, United States) | 2.3% |
| Cardinal Health, Inc. (Health Care Providers & Services, United States) | 2.2% |
| Lennox International, Inc. (Building Products, United States) | 2.1% |
| XPO, Inc. (Ground Transportation, United States) | 2.0% |
| Onto Innovation, Inc. (Semiconductors & Semiconductor Equipment, United States) | 1.9% |
| Radian Group, Inc. (Financial Services, United States) | 1.8% |
| Total | 23.6% |
Asset Allocation by Sector
Based on total investments in the portfolio
| Value | Value |
|---|
| Short-Term Investments | 5.0% |
| Utilities | 1.0% |
| Materials | 4.3% |
| Energy | 5.4% |
| Consumer Staples | 6.0% |
| Information Technology | 11.2% |
| Consumer Discretionary | 13.6% |
| Financials | 15.4% |
| Health Care | 16.2% |
| Industrials | 21.9% |
| Footnote | Description |
Footnote1 | Includes short-term commercial paper (0.0% of total investments) that settles in 90 days or less; long-term commercial paper (0.0% of total investments) that settles in 91 days or more; and other short-term investments (5.0% of total investments), such as U.S. treasury bills or money market funds. |
Footnote2 | Holdings in cash, short-term commercial paper, long-term commercial paper and other short-term cash equivalents have been excluded. |
First Eagle U.S. Smid Cap Opportunity Fund
October 31, 2024
Annual Shareholder Report
For more information, please scan the QR code to navigate to tailored shareholder reports and financial statements and other Information. If you wish to view additional information about the Fund, including but not limited to financial statements, holdings, or the Fund's prospectus, please visit http://www.firsteagle.com.
Important Notice Regarding Delivery of Shareholder Materials
Unless we are notified otherwise, we send one copy of these materials to shareholders with the same residential address (provided they have the same last name or are reasonably believed to be family members) for as long as they remain a shareholder of the Fund. If you would like to receive individual mailings, please call 800.334.2143 and we will send separate copies of these materials within 30 days after receiving your request.
October 31, 2024
Annual Shareholder Report
This Annual Shareholder Report contains important information about the Class R6 shares of the Fund for the period of November 1, 2023, to October 31, 2024. You can find additional information about the Fund at https://www.firsteagle.com/first-eagle-fund-shareholder-reports. You can also request this information by contacting us at 800.334.2143.
First Eagle U.S. Smid Cap Opportunity Fund
What Were the Fund's Costs for the Year?
Based on a Hypothetical $10,000 Investment
| Class Name | Cost of a $10,000 Investment | Cost Paid as a Percentage of a $10,000 Investment |
|---|
| Class R6 | $111 | 0.95% |
How Did the Fund Perform Last Year?
The NAV of First Eagle U.S. Smid Cap Opportunity Fund Class R6 Shares increased 34.65% in the 12-month period ended October 31, 2024. The Russell 2500™ Index increased 33.08%, Russell 2500™ Value Index increased 32.42% and S&P 500 increased 38.02% for the same period.
• Industrials, information technology and health care were the largest contributors among equity sectors; energy was the only detractor, while utilities and materials were the next worst performing sectors.
• Tenet Healthcare Corp. was the leading contributor to performance. HF Sinclair Corp. was the largest detractor.
Total Return Based on a $10,000 Investment
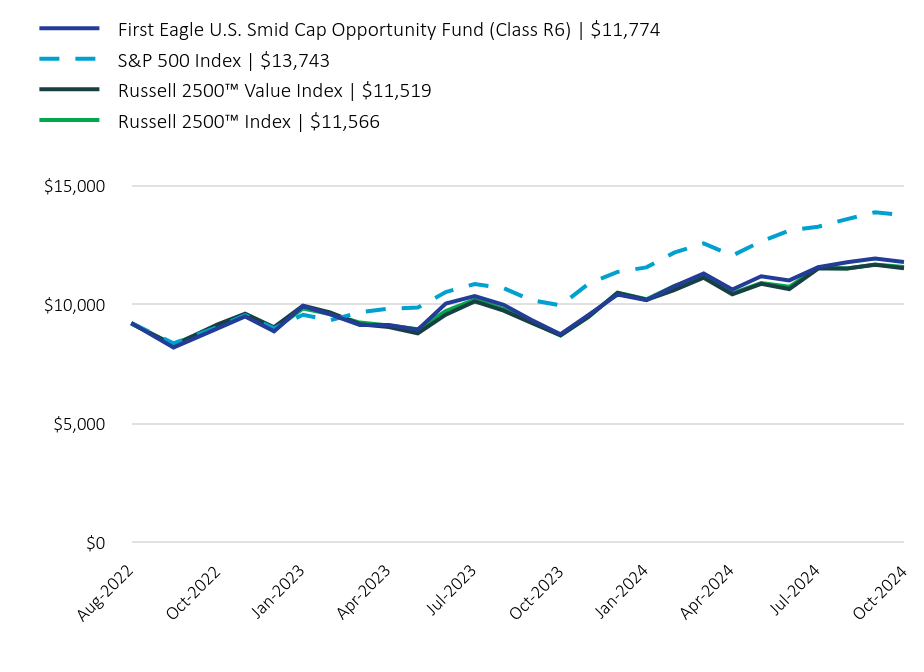
| First Eagle U.S. Smid Cap Opportunity Fund (Class R6) | $11,774 | S&P 500 Index | $13,743 | Russell 2500™ Value Index | $11,519 | Russell 2500™ Index | $11,566 |
|---|
| Aug-2022 | 9,220 | 9,212 | 9,208 | 9,190 |
| Sep-2022 | 8,190.130000 | 8,363.590000 | 8,276.830000 | 8,314.640000 |
| Oct-2022 | 8,980.470000 | 9,040.720000 | 9,150.710000 | 9,112.370000 |
| Nov-2022 | 9,490.560000 | 9,545.950000 | 9,610.380000 | 9,497.060000 |
| Dec-2022 | 8,864.190000 | 8,995.960000 | 9,039.160000 | 8,932.230000 |
| Jan-2023 | 9,927.890000 | 9,561.210000 | 9,942.330000 | 9,825.320000 |
| Feb-2023 | 9,576.440000 | 9,327.930000 | 9,660.850000 | 9,594.720000 |
| Mar-2023 | 9,134.970000 | 9,670.400000 | 9,165.260000 | 9,235.060000 |
| Apr-2023 | 9,134.970000 | 9,821.340000 | 9,043.130000 | 9,114.580000 |
| May-2023 | 8,934 | 9,864.030000 | 8,785.050000 | 8,954.760000 |
| Jun-2023 | 10,028.410000 | 10,515.800000 | 9,565.980000 | 9,717.580000 |
| Jul-2023 | 10,349.320000 | 10,853.610000 | 10,126.730000 | 10,200.710000 |
| Aug-2023 | 9,977.780000 | 10,680.810000 | 9,736.870000 | 9,800.210000 |
| Sep-2023 | 9,345.190000 | 10,171.570000 | 9,215.760000 | 9,252.880000 |
| Oct-2023 | 8,743.360000 | 9,957.700000 | 8,698.670000 | 8,690.890000 |
| Nov-2023 | 9,556.490000 | 10,867.090000 | 9,488.090000 | 9,473.230000 |
| Dec-2023 | 10,410.840000 | 11,360.790000 | 10,483.720000 | 10,488.510000 |
| Jan-2024 | 10,171.390000 | 11,551.700000 | 10,189.570000 | 10,214.180000 |
| Feb-2024 | 10,754.210000 | 12,168.510000 | 10,598.010000 | 10,769.780000 |
| Mar-2024 | 11,295.150000 | 12,560.020000 | 11,120.120000 | 11,214.260000 |
| Apr-2024 | 10,618.570000 | 12,047.010000 | 10,420.950000 | 10,462.990000 |
| May-2024 | 11,180.290000 | 12,644.360000 | 10,860.150000 | 10,898.210000 |
| Jun-2024 | 11,003.650000 | 13,098.070000 | 10,641.370000 | 10,734.900000 |
| Jul-2024 | 11,554.930000 | 13,257.500000 | 11,503.130000 | 11,532.450000 |
| Aug-2024 | 11,762.920000 | 13,579.090000 | 11,502.680000 | 11,502.800000 |
| Sep-2024 | 11,919.360000 | 13,869.100000 | 11,665.840000 | 11,674.060000 |
| Oct-2024 | 11,774 | 13,743 | 11,519 | 11,566 |
The above chart represents historical performance of a hypothetical $10,000 investment since inception. The results of this chart do not predict the results of future time periods and does not guarantee the same results.
| Class/Index Name | 1 Year | Since Inception (8/15/22) |
|---|
| Class R6 | 34.65% | 7.66% |
| S&P 500 Index | 38.02% | 15.38% |
| Russell 2500™ Value Index | 32.42% | 6.59% |
| Russell 2500™ Index | 33.08% | 6.82% |
The Fund's past performance is not a good predictor of the Fund's future performance.The graph and table do not reflect the deduction of taxes that a shareholder would pay on fund distributions or redemption of fund shares. Call us at 800.334.2143 or visit https://www.firsteagle.com if you have questions about current performance.
- Net Assets$49,943,437
- Number of Portfolio Holdings76
- Portfolio Turnover Rate26.23%
- Net Investment Advisory Fees (net of waivers and reimbursements)$5,249
Asset Allocation by Asset Class
Based on total investments in the portfolio
| Value | Value |
|---|
| Common Stocks | 95.0% |
| Short-Term Investments | 5.0%Footnote Reference1 |
Top 10 HoldingsFootnote Reference2
Based on total net assets of the portfolio
| Curtiss-Wright Corp. (Aerospace & Defense, United States) | 3.3% |
| Tenet Healthcare Corp. (Health Care Providers & Services, United States) | 3.1% |
| Evercore, Inc., Class A (Capital Markets, United States) | 2.6% |
| Bio-Rad Laboratories, Inc., Class A (Life Sciences Tools & Services, United States) | 2.3% |
| Quanta Services, Inc. (Construction & Engineering, United States) | 2.3% |
| Cardinal Health, Inc. (Health Care Providers & Services, United States) | 2.2% |
| Lennox International, Inc. (Building Products, United States) | 2.1% |
| XPO, Inc. (Ground Transportation, United States) | 2.0% |
| Onto Innovation, Inc. (Semiconductors & Semiconductor Equipment, United States) | 1.9% |
| Radian Group, Inc. (Financial Services, United States) | 1.8% |
| Total | 23.6% |
Asset Allocation by Sector
Based on total investments in the portfolio
| Value | Value |
|---|
| Short-Term Investments | 5.0% |
| Utilities | 1.0% |
| Materials | 4.3% |
| Energy | 5.4% |
| Consumer Staples | 6.0% |
| Information Technology | 11.2% |
| Consumer Discretionary | 13.6% |
| Financials | 15.4% |
| Health Care | 16.2% |
| Industrials | 21.9% |
| Footnote | Description |
Footnote1 | Includes short-term commercial paper (0.0% of total investments) that settles in 90 days or less; long-term commercial paper (0.0% of total investments) that settles in 91 days or more; and other short-term investments (5.0% of total investments), such as U.S. treasury bills or money market funds. |
Footnote2 | Holdings in cash, short-term commercial paper, long-term commercial paper and other short-term cash equivalents have been excluded. |
First Eagle U.S. Smid Cap Opportunity Fund
October 31, 2024
Annual Shareholder Report
For more information, please scan the QR code to navigate to tailored shareholder reports and financial statements and other Information. If you wish to view additional information about the Fund, including but not limited to financial statements, holdings, or the Fund's prospectus, please visit http://www.firsteagle.com.
Important Notice Regarding Delivery of Shareholder Materials
Unless we are notified otherwise, we send one copy of these materials to shareholders with the same residential address (provided they have the same last name or are reasonably believed to be family members) for as long as they remain a shareholder of the Fund. If you would like to receive individual mailings, please call 800.334.2143 and we will send separate copies of these materials within 30 days after receiving your request.
October 31, 2024
Annual Shareholder Report
This Annual Shareholder Report contains important information about the Class A shares of the Fund for the period of November 1, 2023, to October 31, 2024. You can find additional information about the Fund at https://www.firsteagle.com/first-eagle-fund-shareholder-reports. You can also request this information by contacting us at 800.334.2143.
First Eagle Global Real Assets Fund
What Were the Fund's Costs for the Year?
Based on a Hypothetical $10,000 Investment
| Class Name | Cost of a $10,000 Investment | Cost Paid as a Percentage of a $10,000 Investment |
|---|
| Class A | $120 | 1.10% |
How Did the Fund Perform Last Year?
The NAV of First Eagle Global Real Assets Fund Class A Shares1 increased 18.66% in the 12-month period ended October 31, 2024. The MSCI World Index increased 33.68% and the consumer price index increased 2.58% for the same period.
• Our equity holdings contributed to performance, while gold and gold-related equities also were a contributor.
• All geographic regions contributed to performance. North America and developed Europe were the leading contributors, while developed Asia excluding Japan and emerging markets were the worst performing regions.
• Materials, real estate and industrials were the largest contributors among equity sectors; communication services and information technology were the detractors, while consumer discretionary was the next worst performing sector.
• Gold bullion was the leading contributor to performance. Schlumberger NV was the largest detractor.
1 Reflects performance for Class A shares without the effect of sales charges and assumes all distributions have been reinvested; if sales charges were included, values would be lower.
Total Return Based on a $10,000 Investment
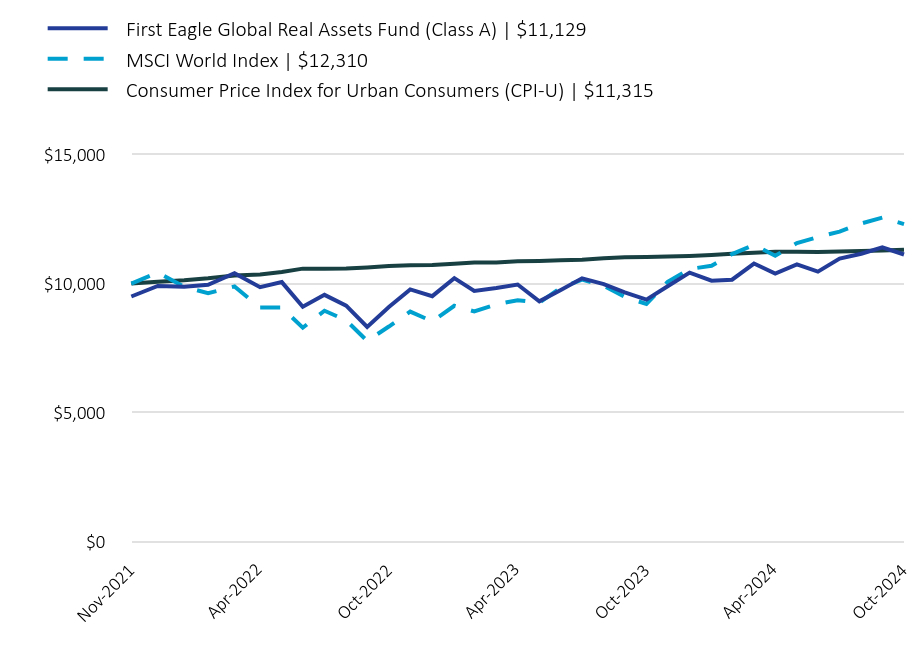
| First Eagle Global Real Assets Fund (Class A) | $11,129 | MSCI World Index | $12,310 | Consumer Price Index for Urban Consumers (CPI-U) | $11,315 |
|---|
| Nov-2021 | 9,500 | 10,000 | 10,000 |
| Dec-2021 | 9,908.500000 | 10,427.400000 | 10,072.060000 |
| Jan-2022 | 9,879.770000 | 9,875.680000 | 10,128.800000 |
| Feb-2022 | 9,955.840000 | 9,625.910000 | 10,205.740000 |
| Mar-2022 | 10,401.860000 | 9,890.080000 | 10,313.990000 |
| Apr-2022 | 9,859.920000 | 9,068.480000 | 10,357.430000 |
| May-2022 | 10,059.090000 | 9,075.340000 | 10,450.500000 |
| Jun-2022 | 9,099.460000 | 8,289.220000 | 10,580.960000 |
| Jul-2022 | 9,564.440000 | 8,947.350000 | 10,580.270000 |
| Aug-2022 | 9,146.470000 | 8,573.280000 | 10,588.600000 |
| Sep-2022 | 8,320.550000 | 7,776.310000 | 10,629.200000 |
| Oct-2022 | 9,090.200000 | 8,334.750000 | 10,683.790000 |
| Nov-2022 | 9,773.780000 | 8,914.270000 | 10,711.950000 |
| Dec-2022 | 9,512.820000 | 8,535.710000 | 10,717.830000 |
| Jan-2023 | 10,212.960000 | 9,139.660000 | 10,773.210000 |
| Feb-2023 | 9,714.570000 | 8,919.960000 | 10,814.570000 |
| Mar-2023 | 9,829.200000 | 9,195.580000 | 10,822.990000 |
| Apr-2023 | 9,963.860000 | 9,356.770000 | 10,869.190000 |
| May-2023 | 9,312.230000 | 9,263.360000 | 10,881.140000 |
| Jun-2023 | 9,743.380000 | 9,823.590000 | 10,904.020000 |
| Jul-2023 | 10,203.270000 | 10,153.590000 | 10,926.440000 |
| Aug-2023 | 9,982.880000 | 9,911.060000 | 10,982.360000 |
| Sep-2023 | 9,656.440000 | 9,483.520000 | 11,021.850000 |
| Oct-2023 | 9,378.330000 | 9,208.350000 | 11,030.560000 |
| Nov-2023 | 9,896.020000 | 10,071.650000 | 11,048.250000 |
| Dec-2023 | 10,425.460000 | 10,566.110000 | 11,074 |
| Jan-2024 | 10,113.730000 | 10,692.900000 | 11,107.820000 |
| Feb-2024 | 10,153.180000 | 11,146.260000 | 11,156.930000 |
| Mar-2024 | 10,777.600000 | 11,504.440000 | 11,199.110000 |
| Apr-2024 | 10,387.450000 | 11,077.110000 | 11,234.150000 |
| May-2024 | 10,747.890000 | 11,571.730000 | 11,234.800000 |
| Jun-2024 | 10,465.220000 | 11,807.190000 | 11,228.480000 |
| Jul-2024 | 10,972.790000 | 12,015.260000 | 11,245.880000 |
| Aug-2024 | 11,158.230000 | 12,332.830000 | 11,266.930000 |
| Sep-2024 | 11,402.590000 | 12,558.690000 | 11,287.200000 |
| Oct-2024 | 11,129 | 12,310 | 11,315 |
The above chart represents historical performance of a hypothetical $10,000 investment since inception. The results of this chart do not predict the results of future time periods and does not guarantee the same results.
| Class/Index Name | 1 Year | Since Inception (11/30/21) |
|---|
| Class A - without sales charge | 18.66% | 5.58% |
| Class A - with sales charge | 12.78% | 3.73% |
| MSCI World Index | 33.68% | 7.38% |
| Consumer Price Index for Urban Consumers (CPI-U) | 2.58% | 4.33% |
The Fund's past performance is not a good predictor of the Fund's future performance.The graph and table do not reflect the deduction of taxes that a shareholder would pay on fund distributions or redemption of fund shares. Call us at 800.334.2143 or visit https://www.firsteagle.com if you have questions about current performance.
- Net Assets$14,297,966
- Number of Portfolio Holdings72
- Portfolio Turnover Rate40.98%
- Net Investment Advisory Fees (net of waivers and reimbursements)$-
Asset Allocation by Asset Class
Based on total investments in the portfolio
| Value | Value |
|---|
| Common Stocks | 90.7% |
| Commodities | 3.8% |
| Master Limited Partnerships | 3.1% |
| Exchange Traded Funds | 1.2% |
| Short-Term Investments | 1.2%Footnote Reference1 |
Top 10 HoldingsFootnote Reference2
Based on total net assets of the portfolio
Gold bullion (Precious Metal)Footnote Reference3 | 3.9% |
| CRH plc (Construction Materials, United States) | 2.8% |
| Wheaton Precious Metals Corp. (Metals & Mining, Canada) | 2.7% |
| Extra Space Storage, Inc., REIT (Specialized REITs, United States) | 2.6% |
| ONEOK, Inc. (Oil, Gas & Consumable Fuels, United States) | 2.6% |
| Imperial Oil Ltd. (Oil, Gas & Consumable Fuels, Canada) | 2.5% |
| Enterprise Products Partners LP (Oil, Gas & Consumable Fuels, United States) | 2.5% |
| Shell plc (Oil, Gas & Consumable Fuels, United Kingdom) | 2.3% |
| Grupo Mexico SAB de CV, Series B (Metals & Mining, Mexico) | 2.2% |
| FUCHS SE (Preference) (Chemicals, Germany) | 2.2% |
| Total | 26.3% |
Asset Allocation by Sector
Based on total investments in the portfolio
| Value | Value |
|---|
| Short-Term Investments | 1.2% |
OthersFootnote Reference4 | 1.0% |
| Investment Funds | 1.2% |
| Communication Services | 2.2% |
| Health Care | 3.1% |
| Commodities | 3.8% |
| Consumer Staples | 4.8% |
| Utilities | 7.6% |
| Industrials | 10.6% |
| Energy | 15.7% |
| Materials | 24.0% |
| Real Estate | 24.8% |
Asset Allocation by CountryFootnote Reference5
Based on total investments in the portfolio
| United States | 48.3% |
| Canada | 12.9% |
| United Kingdom | 10.7% |
| Mexico | 6.2% |
| Japan | 4.0% |
| Hong Kong | 3.6% |
| Germany | 2.2% |
| Australia | 2.0% |
| Singapore | 2.0% |
| Faroe Islands | 1.5% |
OthersFootnote Reference6 | 5.4% |
| Short-Term Investments | 1.2% |
| Footnote | Description |
Footnote1 | Includes short-term commercial paper (0.0% of total investments) that settles in 90 days or less; long-term commercial paper (0.0% of total investments) that settles in 91 days or more; and other short-term investments (1.2% of total investments), such as U.S. treasury bills or money market funds. |
Footnote2 | Holdings in cash, short-term commercial paper, long-term commercial paper and other short-term cash equivalents have been excluded. |
Footnote3 | The Fund invests in gold and precious metals through investment in a wholly owned subsidiary of the Fund organized under the laws of the Cayman Islands (the “Subsidiary”). Gold bullion and commodities include the Fund’s investment in the Subsidiary. |
Footnote4 | Includes additional sectors outside the top 10 listed above. |
Footnote5 | Country allocations reflect country of risk not currency of issue. Bonds of non-U.S. issuers may be U.S. dollar denominated. |
Footnote6 | Includes additional countries outside the top 10 listed above. |
First Eagle Global Real Assets Fund
October 31, 2024
Annual Shareholder Report
For more information, please scan the QR code to navigate to tailored shareholder reports and financial statements and other Information. If you wish to view additional information about the Fund, including but not limited to financial statements, holdings, or the Fund's prospectus, please visit http://www.firsteagle.com.
Important Notice Regarding Delivery of Shareholder Materials
Unless we are notified otherwise, we send one copy of these materials to shareholders with the same residential address (provided they have the same last name or are reasonably believed to be family members) for as long as they remain a shareholder of the Fund. If you would like to receive individual mailings, please call 800.334.2143 and we will send separate copies of these materials within 30 days after receiving your request.
October 31, 2024
Annual Shareholder Report
This Annual Shareholder Report contains important information about the Class I shares of the Fund for the period of November 1, 2023, to October 31, 2024. You can find additional information about the Fund at https://www.firsteagle.com/first-eagle-fund-shareholder-reports. You can also request this information by contacting us at 800.334.2143.
First Eagle Global Real Assets Fund
What Were the Fund's Costs for the Year?
Based on a Hypothetical $10,000 Investment
| Class Name | Cost of a $10,000 Investment | Cost Paid as a Percentage of a $10,000 Investment |
|---|
| Class I | $93 | 0.85% |
How Did the Fund Perform Last Year?
The NAV of First Eagle Global Real Assets Fund Class I Shares increased 19.04% in the 12-month period ended October 31, 2024. The MSCI World Index increased 33.68% and the consumer price index increased 2.58% for the same period.
• Our equity holdings contributed to performance, while gold and gold-related equities also were a contributor.
• All geographic regions contributed to performance. North America and developed Europe were the leading contributors, while developed Asia excluding Japan and emerging markets were the worst performing regions.
• Materials, real estate and industrials were the largest contributors among equity sectors; communication services and information technology were the detractors, while consumer discretionary was the next worst performing sector.
• Gold bullion was the leading contributor to performance. Schlumberger NV was the largest detractor.
Total Return Based on a $1,000,000 Investment
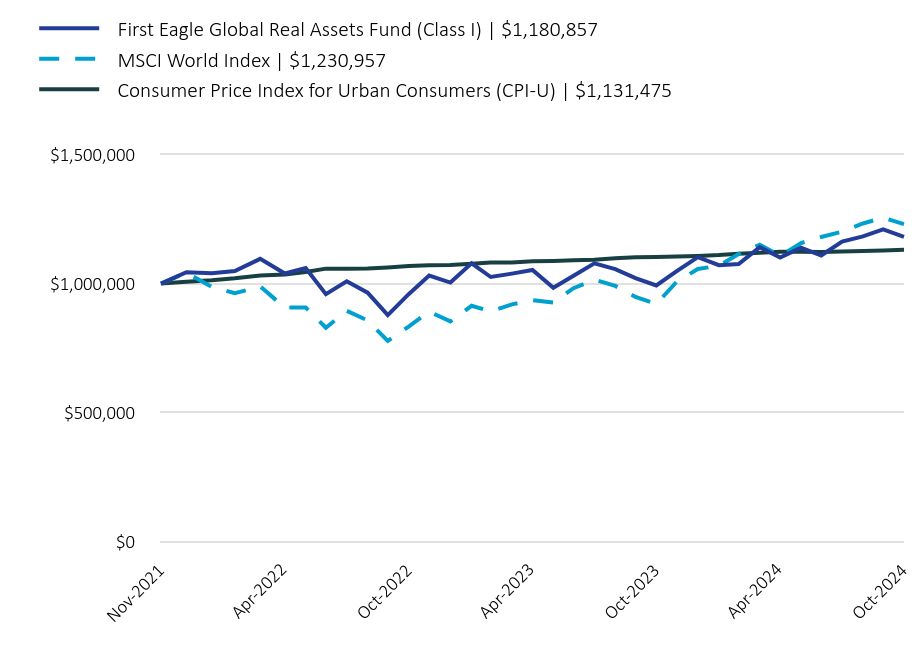
| First Eagle Global Real Assets Fund (Class I) | $1,180,857 | MSCI World Index | $1,230,957 | Consumer Price Index for Urban Consumers (CPI-U) | $1,131,475 |
|---|
| Nov-2021 | 1,000,000 | 1,000,000 | 1,000,000 |
| Dec-2021 | 1,044,000 | 1,042,740.190000 | 1,007,205.910000 |
| Jan-2022 | 1,040,032.800000 | 987,567.860000 | 1,012,880.250000 |
| Feb-2022 | 1,049,081.090000 | 962,591.070000 | 1,020,573.960000 |
| Mar-2022 | 1,096,079.920000 | 989,007.800000 | 1,031,398.960000 |
| Apr-2022 | 1,039,083.760000 | 906,847.620000 | 1,035,742.600000 |
| May-2022 | 1,060,073.250000 | 907,534.420000 | 1,045,050.380000 |
| Jun-2022 | 959,048.270000 | 828,921.980000 | 1,058,095.620000 |
| Jul-2022 | 1,009,014.690000 | 894,735.320000 | 1,058,027.470000 |
| Aug-2022 | 965,021.650000 | 857,328.400000 | 1,058,859.610000 |
| Sep-2022 | 877,976.700000 | 777,631.240000 | 1,062,919.880000 |
| Oct-2022 | 959,013.940000 | 833,475.220000 | 1,068,379.010000 |
| Nov-2022 | 1,031,035.890000 | 891,427.100000 | 1,071,194.660000 |
| Dec-2022 | 1,004,125.850000 | 853,570.600000 | 1,071,782.900000 |
| Jan-2023 | 1,078,531.580000 | 913,965.900000 | 1,077,320.940000 |
| Feb-2023 | 1,025,575.680000 | 891,995.520000 | 1,081,456.530000 |
| Mar-2023 | 1,038,805.610000 | 919,557.900000 | 1,082,299.430000 |
| Apr-2023 | 1,053,037.240000 | 935,677.370000 | 1,086,919.250000 |
| May-2023 | 983,747.390000 | 926,336.120000 | 1,088,113.660000 |
| Jun-2023 | 1,030,672.140000 | 982,358.880000 | 1,090,402.050000 |
| Jul-2023 | 1,078,598.400000 | 1,015,359.020000 | 1,092,643.800000 |
| Aug-2023 | 1,056,163.550000 | 991,106.440000 | 1,098,235.650000 |
| Sep-2023 | 1,021,521.390000 | 948,351.710000 | 1,102,184.730000 |
| Oct-2023 | 993,020.940000 | 920,834.490000 | 1,103,056.320000 |
| Nov-2023 | 1,048,034.300000 | 1,007,164.630000 | 1,104,824.620000 |
| Dec-2023 | 1,102,741.690000 | 1,056,610.620000 | 1,107,399.950000 |
| Jan-2024 | 1,071,534.100000 | 1,069,290.460000 | 1,110,782.320000 |
| Feb-2024 | 1,075,713.080000 | 1,114,625.880000 | 1,115,692.670000 |
| Mar-2024 | 1,141,331.580000 | 1,150,444.180000 | 1,119,910.760000 |
| Apr-2024 | 1,100,700.180000 | 1,107,711.270000 | 1,123,415.080000 |
| May-2024 | 1,139,224.680000 | 1,157,172.770000 | 1,123,479.640000 |
| Jun-2024 | 1,109,035.230000 | 1,180,718.810000 | 1,122,848.360000 |
| Jul-2024 | 1,163,156.150000 | 1,201,525.940000 | 1,124,587.960000 |
| Aug-2024 | 1,182,929.800000 | 1,233,282.860000 | 1,126,693.420000 |
| Sep-2024 | 1,210,018.900000 | 1,255,869.130000 | 1,128,719.970000 |
| Oct-2024 | 1,180,857 | 1,230,957 | 1,131,475 |
The above chart represents historical performance of a hypothetical $1,000,000 investment since inception. The results of this chart do not predict the results of future time periods and does not guarantee the same results.
| Class/Index Name | 1 Year | Since Inception (11/30/21) |
|---|
| Class I | 19.04% | 5.86% |
| MSCI World Index | 33.68% | 7.38% |
| Consumer Price Index for Urban Consumers (CPI-U) | 2.58% | 4.33% |
The Fund's past performance is not a good predictor of the Fund's future performance.The graph and table do not reflect the deduction of taxes that a shareholder would pay on fund distributions or redemption of fund shares. Call us at 800.334.2143 or visit https://www.firsteagle.com if you have questions about current performance.
- Net Assets$14,297,966
- Number of Portfolio Holdings72
- Portfolio Turnover Rate40.98%
- Net Investment Advisory Fees (net of waivers and reimbursements)$-
Asset Allocation by Asset Class
Based on total investments in the portfolio
| Value | Value |
|---|
| Common Stocks | 90.7% |
| Commodities | 3.8% |
| Master Limited Partnerships | 3.1% |
| Exchange Traded Funds | 1.2% |
| Short-Term Investments | 1.2%Footnote Reference1 |
Top 10 HoldingsFootnote Reference2
Based on total net assets of the portfolio
Gold bullion (Precious Metal)Footnote Reference3 | 3.9% |
| CRH plc (Construction Materials, United States) | 2.8% |
| Wheaton Precious Metals Corp. (Metals & Mining, Canada) | 2.7% |
| Extra Space Storage, Inc., REIT (Specialized REITs, United States) | 2.6% |
| ONEOK, Inc. (Oil, Gas & Consumable Fuels, United States) | 2.6% |
| Imperial Oil Ltd. (Oil, Gas & Consumable Fuels, Canada) | 2.5% |
| Enterprise Products Partners LP (Oil, Gas & Consumable Fuels, United States) | 2.5% |
| Shell plc (Oil, Gas & Consumable Fuels, United Kingdom) | 2.3% |
| Grupo Mexico SAB de CV, Series B (Metals & Mining, Mexico) | 2.2% |
| FUCHS SE (Preference) (Chemicals, Germany) | 2.2% |
| Total | 26.3% |
Asset Allocation by Sector
Based on total investments in the portfolio
| Value | Value |
|---|
| Short-Term Investments | 1.2% |
OthersFootnote Reference4 | 1.0% |
| Investment Funds | 1.2% |
| Communication Services | 2.2% |
| Health Care | 3.1% |
| Commodities | 3.8% |
| Consumer Staples | 4.8% |
| Utilities | 7.6% |
| Industrials | 10.6% |
| Energy | 15.7% |
| Materials | 24.0% |
| Real Estate | 24.8% |
Asset Allocation by CountryFootnote Reference5
Based on total investments in the portfolio
| United States | 48.3% |
| Canada | 12.9% |
| United Kingdom | 10.7% |
| Mexico | 6.2% |
| Japan | 4.0% |
| Hong Kong | 3.6% |
| Germany | 2.2% |
| Australia | 2.0% |
| Singapore | 2.0% |
| Faroe Islands | 1.5% |
OthersFootnote Reference6 | 5.4% |
| Short-Term Investments | 1.2% |
| Footnote | Description |
Footnote1 | Includes short-term commercial paper (0.0% of total investments) that settles in 90 days or less; long-term commercial paper (0.0% of total investments) that settles in 91 days or more; and other short-term investments (1.2% of total investments), such as U.S. treasury bills or money market funds. |
Footnote2 | Holdings in cash, short-term commercial paper, long-term commercial paper and other short-term cash equivalents have been excluded. |
Footnote3 | The Fund invests in gold and precious metals through investment in a wholly owned subsidiary of the Fund organized under the laws of the Cayman Islands (the “Subsidiary”). Gold bullion and commodities include the Fund’s investment in the Subsidiary. |
Footnote4 | Includes additional sectors outside the top 10 listed above. |
Footnote5 | Country allocations reflect country of risk not currency of issue. Bonds of non-U.S. issuers may be U.S. dollar denominated. |
Footnote6 | Includes additional countries outside the top 10 listed above. |
First Eagle Global Real Assets Fund
October 31, 2024
Annual Shareholder Report
For more information, please scan the QR code to navigate to tailored shareholder reports and financial statements and other Information. If you wish to view additional information about the Fund, including but not limited to financial statements, holdings, or the Fund's prospectus, please visit http://www.firsteagle.com.
Important Notice Regarding Delivery of Shareholder Materials
Unless we are notified otherwise, we send one copy of these materials to shareholders with the same residential address (provided they have the same last name or are reasonably believed to be family members) for as long as they remain a shareholder of the Fund. If you would like to receive individual mailings, please call 800.334.2143 and we will send separate copies of these materials within 30 days after receiving your request.
October 31, 2024
Annual Shareholder Report
This Annual Shareholder Report contains important information about the Class R6 shares of the Fund for the period of November 1, 2023, to October 31, 2024. You can find additional information about the Fund at https://www.firsteagle.com/first-eagle-fund-shareholder-reports. You can also request this information by contacting us at 800.334.2143.
First Eagle Global Real Assets Fund
What Were the Fund's Costs for the Year?
Based on a Hypothetical $10,000 Investment
| Class Name | Cost of a $10,000 Investment | Cost Paid as a Percentage of a $10,000 Investment |
|---|
| Class R6 | $93 | 0.85% |
How Did the Fund Perform Last Year?
The NAV of First Eagle Global Real Assets Fund Class R6 Shares increased 18.96% in the 12-month period ended October 31, 2024. The MSCI World Index increased 33.68% and the consumer price index increased 2.58% for the same period.
• Our equity holdings contributed to performance, while gold and gold-related equities also were a contributor.
• All geographic regions contributed to performance. North America and developed Europe were the leading contributors, while developed Asia excluding Japan and emerging markets were the worst performing regions.
• Materials, real estate and industrials were the largest contributors among equity sectors; communication services and information technology were the detractors, while consumer discretionary was the next worst performing sector.
• Gold bullion was the leading contributor to performance. Schlumberger NV was the largest detractor.
Total Return Based on a $10,000 Investment
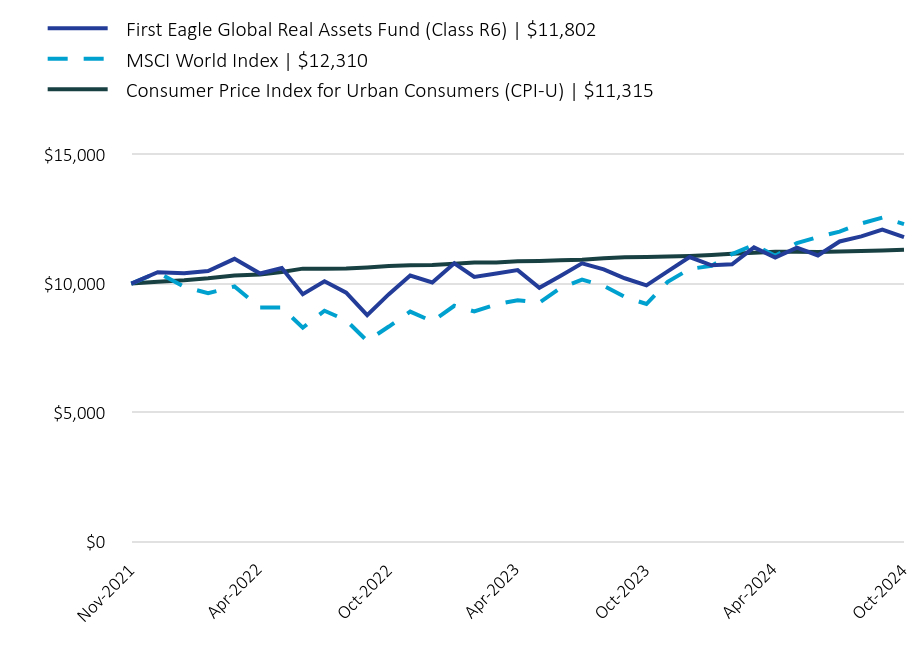
| First Eagle Global Real Assets Fund (Class R6) | $11,802 | MSCI World Index | $12,310 | Consumer Price Index for Urban Consumers (CPI-U) | $11,315 |
|---|
| Nov-2021 | 10,000 | 10,000 | 10,000 |
| Dec-2021 | 10,440 | 10,427.400000 | 10,072.060000 |
| Jan-2022 | 10,400.330000 | 9,875.680000 | 10,128.800000 |
| Feb-2022 | 10,490.810000 | 9,625.910000 | 10,205.740000 |
| Mar-2022 | 10,960.800000 | 9,890.080000 | 10,313.990000 |
| Apr-2022 | 10,390.840000 | 9,068.480000 | 10,357.430000 |
| May-2022 | 10,600.730000 | 9,075.340000 | 10,450.500000 |
| Jun-2022 | 9,590.480000 | 8,289.220000 | 10,580.960000 |
| Jul-2022 | 10,090.150000 | 8,947.350000 | 10,580.270000 |
| Aug-2022 | 9,650.220000 | 8,573.280000 | 10,588.600000 |
| Sep-2022 | 8,779.770000 | 7,776.310000 | 10,629.200000 |
| Oct-2022 | 9,590.140000 | 8,334.750000 | 10,683.790000 |
| Nov-2022 | 10,310.360000 | 8,914.270000 | 10,711.950000 |
| Dec-2022 | 10,043.320000 | 8,535.710000 | 10,717.830000 |
| Jan-2023 | 10,787.530000 | 9,139.660000 | 10,773.210000 |
| Feb-2023 | 10,257.860000 | 8,919.960000 | 10,814.570000 |
| Mar-2023 | 10,390.190000 | 9,195.580000 | 10,822.990000 |
| Apr-2023 | 10,523.180000 | 9,356.770000 | 10,869.190000 |
| May-2023 | 9,840.230000 | 9,263.360000 | 10,881.140000 |
| Jun-2023 | 10,298.780000 | 9,823.590000 | 10,904.020000 |
| Jul-2023 | 10,787.980000 | 10,153.590000 | 10,926.440000 |
| Aug-2023 | 10,553.880000 | 9,911.060000 | 10,982.360000 |
| Sep-2023 | 10,207.710000 | 9,483.520000 | 11,021.850000 |
| Oct-2023 | 9,932.100000 | 9,208.350000 | 11,030.560000 |
| Nov-2023 | 10,472.410000 | 10,071.650000 | 11,048.250000 |
| Dec-2023 | 11,031.630000 | 10,566.110000 | 11,074 |
| Jan-2024 | 10,708.410000 | 10,692.900000 | 11,107.820000 |
| Feb-2024 | 10,750.170000 | 11,146.260000 | 11,156.930000 |
| Mar-2024 | 11,405.930000 | 11,504.440000 | 11,199.110000 |
| Apr-2024 | 11,010.150000 | 11,077.110000 | 11,234.150000 |
| May-2024 | 11,395.500000 | 11,571.730000 | 11,234.800000 |
| Jun-2024 | 11,093.520000 | 11,807.190000 | 11,228.480000 |
| Jul-2024 | 11,634.880000 | 12,015.260000 | 11,245.880000 |
| Aug-2024 | 11,832.680000 | 12,332.830000 | 11,266.930000 |
| Sep-2024 | 12,093 | 12,558.690000 | 11,287.200000 |
| Oct-2024 | 11,802 | 12,310 | 11,315 |
The above chart represents historical performance of a hypothetical $10,000 investment since inception. The results of this chart do not predict the results of future time periods and does not guarantee the same results.
| Class/Index Name | 1 Year | Since Inception (11/30/21) |
|---|
| Class R6 | 18.96% | 5.84% |
| MSCI World Index | 33.68% | 7.38% |
| Consumer Price Index for Urban Consumers (CPI-U) | 2.58% | 4.33% |
The Fund's past performance is not a good predictor of the Fund's future performance.The graph and table do not reflect the deduction of taxes that a shareholder would pay on fund distributions or redemption of fund shares. Call us at 800.334.2143 or visit https://www.firsteagle.com if you have questions about current performance.
- Net Assets$14,297,966
- Number of Portfolio Holdings72
- Portfolio Turnover Rate40.98%
- Net Investment Advisory Fees (net of waivers and reimbursements)$-
Asset Allocation by Asset Class
Based on total investments in the portfolio
| Value | Value |
|---|
| Common Stocks | 90.7% |
| Commodities | 3.8% |
| Master Limited Partnerships | 3.1% |
| Exchange Traded Funds | 1.2% |
| Short-Term Investments | 1.2%Footnote Reference1 |
Top 10 HoldingsFootnote Reference2
Based on total net assets of the portfolio
Gold bullion (Precious Metal)Footnote Reference3 | 3.9% |
| CRH plc (Construction Materials, United States) | 2.8% |
| Wheaton Precious Metals Corp. (Metals & Mining, Canada) | 2.7% |
| Extra Space Storage, Inc., REIT (Specialized REITs, United States) | 2.6% |
| ONEOK, Inc. (Oil, Gas & Consumable Fuels, United States) | 2.6% |
| Imperial Oil Ltd. (Oil, Gas & Consumable Fuels, Canada) | 2.5% |
| Enterprise Products Partners LP (Oil, Gas & Consumable Fuels, United States) | 2.5% |
| Shell plc (Oil, Gas & Consumable Fuels, United Kingdom) | 2.3% |
| Grupo Mexico SAB de CV, Series B (Metals & Mining, Mexico) | 2.2% |
| FUCHS SE (Preference) (Chemicals, Germany) | 2.2% |
| Total | 26.3% |
Asset Allocation by Sector
Based on total investments in the portfolio
| Value | Value |
|---|
| Short-Term Investments | 1.2% |
OthersFootnote Reference4 | 1.0% |
| Investment Funds | 1.2% |
| Communication Services | 2.2% |
| Health Care | 3.1% |
| Commodities | 3.8% |
| Consumer Staples | 4.8% |
| Utilities | 7.6% |
| Industrials | 10.6% |
| Energy | 15.7% |
| Materials | 24.0% |
| Real Estate | 24.8% |
Asset Allocation by CountryFootnote Reference5
Based on total investments in the portfolio
| United States | 48.3% |
| Canada | 12.9% |
| United Kingdom | 10.7% |
| Mexico | 6.2% |
| Japan | 4.0% |
| Hong Kong | 3.6% |
| Germany | 2.2% |
| Australia | 2.0% |
| Singapore | 2.0% |
| Faroe Islands | 1.5% |
OthersFootnote Reference6 | 5.4% |
| Short-Term Investments | 1.2% |
| Footnote | Description |
Footnote1 | Includes short-term commercial paper (0.0% of total investments) that settles in 90 days or less; long-term commercial paper (0.0% of total investments) that settles in 91 days or more; and other short-term investments (1.2% of total investments), such as U.S. treasury bills or money market funds. |
Footnote2 | Holdings in cash, short-term commercial paper, long-term commercial paper and other short-term cash equivalents have been excluded. |
Footnote3 | The Fund invests in gold and precious metals through investment in a wholly owned subsidiary of the Fund organized under the laws of the Cayman Islands (the “Subsidiary”). Gold bullion and commodities include the Fund’s investment in the Subsidiary. |
Footnote4 | Includes additional sectors outside the top 10 listed above. |
Footnote5 | Country allocations reflect country of risk not currency of issue. Bonds of non-U.S. issuers may be U.S. dollar denominated. |
Footnote6 | Includes additional countries outside the top 10 listed above. |
First Eagle Global Real Assets Fund
October 31, 2024
Annual Shareholder Report
For more information, please scan the QR code to navigate to tailored shareholder reports and financial statements and other Information. If you wish to view additional information about the Fund, including but not limited to financial statements, holdings, or the Fund's prospectus, please visit http://www.firsteagle.com.
Important Notice Regarding Delivery of Shareholder Materials
Unless we are notified otherwise, we send one copy of these materials to shareholders with the same residential address (provided they have the same last name or are reasonably believed to be family members) for as long as they remain a shareholder of the Fund. If you would like to receive individual mailings, please call 800.334.2143 and we will send separate copies of these materials within 30 days after receiving your request.
October 31, 2024
Annual Shareholder Report
This Annual Shareholder Report contains important information about the Class A shares of the Fund, and any material changes that occurred for the period of November 1, 2023, to October 31, 2024. You can find additional information about the Fund at https://www.firsteagle.com/first-eagle-fund-shareholder-reports. You can also request this information by contacting us at 800.334.2143.
First Eagle High Yield Municipal Fund
What Were the Fund's Costs for the Year?
Based on a Hypothetical $10,000 Investment
| Class Name | Cost of a $10,000 Investment | Cost Paid as a Percentage of a $10,000 Investment |
|---|
| Class A | $87 | 0.80% |
How Did the Fund Perform Last Year?
The NAV of First Eagle High Yield Municipal Fund Class A Shares1 increased 17.15% in the 12-month period ended October 31, 2024. The S&P Municipal Yield Index increased 16.94%, the S&P Municipal Bond Index increased 10.08% and the Bloomberg U.S. Corporate High Yield Index increased 16.47% for the same period.
• Transportation and health care were the largest contributors among sectors, while tobacco settlement was the only detractor and education was the next worst performing sector.
• Sanctuary LTC LLC was the leading contributor to performance.
• Buckeye Tobacco Settlement Financing Authority was the largest detractor to performance.
1 Reflects performance for Class A shares without the effect of sales charges and assumes all distributions have been reinvested; if sales charges were included, values would be lower.
Total Return Based on a $10,000 Investment
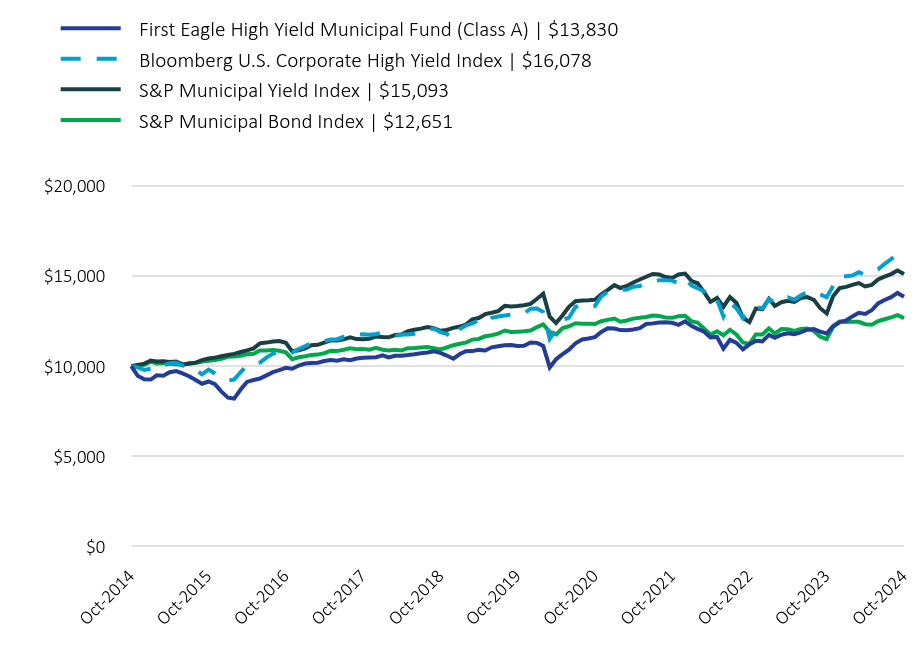
| First Eagle High Yield Municipal Fund (Class A) | $13,830 | Bloomberg U.S. Corporate High Yield Index | $16,078 | S&P Municipal Yield Index | $15,093 | S&P Municipal Bond Index | $12,651 |
|---|
| Oct-2014 | 10,000 | 10,000 | 10,000 | 10,000 |
| Nov-2014 | 9,459.280000 | 9,927.160000 | 10,065.350000 | 10,016.890000 |
| Dec-2014 | 9,266.310000 | 9,783.450000 | 10,135.980000 | 10,070.750000 |
| Jan-2015 | 9,254.260000 | 9,848.090000 | 10,309.570000 | 10,241.910000 |
| Feb-2015 | 9,487.470000 | 10,085.420000 | 10,257.140000 | 10,147.880000 |
| Mar-2015 | 9,462.800000 | 10,030.230000 | 10,262 | 10,172.990000 |
| Apr-2015 | 9,655.840000 | 10,151.260000 | 10,218.590000 | 10,126.890000 |
| May-2015 | 9,718.600000 | 10,182.070000 | 10,253.580000 | 10,105.440000 |
| Jun-2015 | 9,593.230000 | 10,030.500000 | 10,092.100000 | 10,071.660000 |
| Jul-2015 | 9,436.860000 | 9,972.090000 | 10,138.950000 | 10,142.860000 |
| Aug-2015 | 9,231.140000 | 9,798.380000 | 10,188.410000 | 10,168.880000 |
| Sep-2015 | 9,023.440000 | 9,543.410000 | 10,329.260000 | 10,244.190000 |
| Oct-2015 | 9,146.160000 | 9,805.770000 | 10,415.900000 | 10,287.550000 |
| Nov-2015 | 8,999.820000 | 9,587.810000 | 10,465.240000 | 10,331.830000 |
| Dec-2015 | 8,582.230000 | 9,346.330000 | 10,537.890000 | 10,404.860000 |
| Jan-2016 | 8,250.950000 | 9,196.120000 | 10,609.580000 | 10,514.860000 |
| Feb-2016 | 8,200.620000 | 9,248.680000 | 10,674.400000 | 10,531.290000 |
| Mar-2016 | 8,700.040000 | 9,659.730000 | 10,777.530000 | 10,575.110000 |
| Apr-2016 | 9,124.600000 | 10,037.910000 | 10,865.420000 | 10,649.500000 |
| May-2016 | 9,228.620000 | 10,099.890000 | 10,974.720000 | 10,682.820000 |
| Jun-2016 | 9,308.910000 | 10,192.850000 | 11,255.640000 | 10,857.640000 |
| Jul-2016 | 9,483.920000 | 10,468.450000 | 11,296.680000 | 10,859.010000 |
| Aug-2016 | 9,666.010000 | 10,687.440000 | 11,356.340000 | 10,883.660000 |
| Sep-2016 | 9,770.410000 | 10,758.670000 | 11,378.930000 | 10,842.580000 |
| Oct-2016 | 9,899.370000 | 10,800.220000 | 11,282.920000 | 10,754.030000 |
| Nov-2016 | 9,852.850000 | 10,748.940000 | 10,814.120000 | 10,381.580000 |
| Dec-2016 | 10,027.240000 | 10,947.330000 | 10,872.360000 | 10,485.190000 |
| Jan-2017 | 10,136.540000 | 11,106.330000 | 10,978.400000 | 10,539.960000 |
| Feb-2017 | 10,168 | 11,267.970000 | 11,146.110000 | 10,610.710000 |
| Mar-2017 | 10,188.300000 | 11,242.820000 | 11,176.890000 | 10,633.530000 |
| Apr-2017 | 10,275.920000 | 11,372.650000 | 11,295.020000 | 10,710.210000 |
| May-2017 | 10,329.350000 | 11,471.540000 | 11,414.750000 | 10,851.210000 |
| Jun-2017 | 10,292.170000 | 11,487.060000 | 11,407.220000 | 10,826.710000 |
| Jul-2017 | 10,369.360000 | 11,614.270000 | 11,478.030000 | 10,898.190000 |
| Aug-2017 | 10,322.700000 | 11,609.720000 | 11,591 | 10,983.440000 |
| Sep-2017 | 10,414.570000 | 11,713.970000 | 11,490.660000 | 10,933.600000 |
| Oct-2017 | 10,464.560000 | 11,763.450000 | 11,483.130000 | 10,947.870000 |
| Nov-2017 | 10,473.980000 | 11,733.420000 | 11,514.500000 | 10,900.590000 |
| Dec-2017 | 10,484.450000 | 11,768.870000 | 11,636.020000 | 11,003.940000 |
| Jan-2018 | 10,588.250000 | 11,839.460000 | 11,607.670000 | 10,899.420000 |
| Feb-2018 | 10,477.070000 | 11,738.840000 | 11,591.240000 | 10,857.080000 |
| Mar-2018 | 10,570.320000 | 11,667.930000 | 11,715.010000 | 10,902.390000 |
| Apr-2018 | 10,575.600000 | 11,743.850000 | 11,749.110000 | 10,864.750000 |
| May-2018 | 10,606.270000 | 11,740.590000 | 11,936.210000 | 10,987.710000 |
| Jun-2018 | 10,652.940000 | 11,787.720000 | 12,003.940000 | 11,001.550000 |
| Jul-2018 | 10,709.400000 | 11,916.360000 | 12,068.340000 | 11,029.750000 |
| Aug-2018 | 10,751.160000 | 12,004.240000 | 12,156.410000 | 11,050.160000 |
| Sep-2018 | 10,817.820000 | 12,071.090000 | 12,097.990000 | 10,986.050000 |
| Oct-2018 | 10,730.200000 | 11,878.120000 | 11,951.100000 | 10,913.970000 |
| Nov-2018 | 10,581.050000 | 11,775.930000 | 11,994.510000 | 11,027.200000 |
| Dec-2018 | 10,407.520000 | 11,523.800000 | 12,113.710000 | 11,153.140000 |
| Jan-2019 | 10,664.580000 | 12,044.710000 | 12,184.520000 | 11,235.110000 |
| Feb-2019 | 10,818.150000 | 12,245 | 12,296.130000 | 11,294.220000 |
| Mar-2019 | 10,826.810000 | 12,360.180000 | 12,586.720000 | 11,461.120000 |
| Apr-2019 | 10,893.940000 | 12,535.910000 | 12,654.500000 | 11,499.390000 |
| May-2019 | 10,859.070000 | 12,386.930000 | 12,869.660000 | 11,654.070000 |
| Jun-2019 | 11,036.080000 | 12,669.240000 | 12,947.400000 | 11,704.040000 |
| Jul-2019 | 11,092.360000 | 12,740.680000 | 13,040.390000 | 11,794.190000 |
| Aug-2019 | 11,152.260000 | 12,791.640000 | 13,328.490000 | 11,963.320000 |
| Sep-2019 | 11,157.840000 | 12,838.230000 | 13,298.190000 | 11,886.080000 |
| Oct-2019 | 11,109.860000 | 12,873.680000 | 13,319.240000 | 11,903.750000 |
| Nov-2019 | 11,122.080000 | 12,915.710000 | 13,362 | 11,923.820000 |
| Dec-2019 | 11,304.480000 | 13,173.930000 | 13,436.360000 | 11,962.830000 |
| Jan-2020 | 11,281.870000 | 13,177.440000 | 13,724.760000 | 12,157.610000 |
| Feb-2020 | 11,114.900000 | 12,991.620000 | 13,999.690000 | 12,304.380000 |
| Mar-2020 | 9,927.830000 | 11,502.830000 | 12,725.130000 | 11,893.800000 |
| Apr-2020 | 10,379.540000 | 12,021.080000 | 12,374.470000 | 11,753.840000 |
| May-2020 | 10,653.560000 | 12,550.660000 | 12,812.900000 | 12,104.960000 |
| Jun-2020 | 10,901.790000 | 12,673.510000 | 13,279.980000 | 12,198.980000 |
| Jul-2020 | 11,258.280000 | 13,267.660000 | 13,589.660000 | 12,370.660000 |
| Aug-2020 | 11,469.940000 | 13,393.790000 | 13,631.770000 | 12,340.610000 |
| Sep-2020 | 11,522.700000 | 13,256.020000 | 13,638.650000 | 12,343.360000 |
| Oct-2020 | 11,597.600000 | 13,323.340000 | 13,663.970000 | 12,325.910000 |
| Nov-2020 | 11,886.380000 | 13,850.410000 | 13,968.080000 | 12,482.290000 |
| Dec-2020 | 12,084.880000 | 14,111.090000 | 14,210.160000 | 12,555.390000 |
| Jan-2021 | 12,075.210000 | 14,157.770000 | 14,474.540000 | 12,626.080000 |
| Feb-2021 | 11,989.480000 | 14,209.780000 | 14,318.090000 | 12,454.460000 |
| Mar-2021 | 11,975.090000 | 14,231.040000 | 14,431.600000 | 12,522.970000 |
| Apr-2021 | 12,022.990000 | 14,385.610000 | 14,623.870000 | 12,623.640000 |
| May-2021 | 12,098.730000 | 14,428.160000 | 14,785.470000 | 12,674.430000 |
| Jun-2021 | 12,324.980000 | 14,621.440000 | 14,941.850000 | 12,710.910000 |
| Jul-2021 | 12,360.720000 | 14,677.130000 | 15,095.980000 | 12,799.790000 |
| Aug-2021 | 12,412.640000 | 14,752.530000 | 15,060.760000 | 12,765.260000 |
| Sep-2021 | 12,422.570000 | 14,750.910000 | 14,924.650000 | 12,678.250000 |
| Oct-2021 | 12,391.510000 | 14,725.650000 | 14,876.560000 | 12,665.810000 |
| Nov-2021 | 12,277.510000 | 14,582.440000 | 15,067.460000 | 12,759.170000 |
| Dec-2021 | 12,466.580000 | 14,855.780000 | 15,113.060000 | 12,777.500000 |
| Jan-2022 | 12,213.510000 | 14,449.570000 | 14,695.740000 | 12,472.440000 |
| Feb-2022 | 12,054.740000 | 14,301.220000 | 14,579.210000 | 12,408.580000 |
| Mar-2022 | 11,900.440000 | 14,137.260000 | 14,071.570000 | 12,070.820000 |
| Apr-2022 | 11,586.260000 | 13,634.560000 | 13,549.870000 | 11,744 |
| May-2022 | 11,600.170000 | 13,667.990000 | 13,767.100000 | 11,917.460000 |
| Jun-2022 | 10,964.480000 | 12,747.730000 | 13,282.230000 | 11,705.750000 |
| Jul-2022 | 11,449.110000 | 13,500.270000 | 13,817.870000 | 12,008.460000 |
| Aug-2022 | 11,281.950000 | 13,189.170000 | 13,493.410000 | 11,733.740000 |
| Sep-2022 | 10,926.570000 | 12,665.310000 | 12,669.740000 | 11,307.780000 |
| Oct-2022 | 11,203.010000 | 12,994.450000 | 12,434.130000 | 11,227.060000 |
| Nov-2022 | 11,392.340000 | 13,276.490000 | 13,182.190000 | 11,746.650000 |
| Dec-2022 | 11,367.280000 | 13,193.630000 | 13,150.820000 | 11,749.390000 |
| Jan-2023 | 11,721.940000 | 13,695.940000 | 13,721.620000 | 12,080.880000 |
| Feb-2023 | 11,562.520000 | 13,519.880000 | 13,328.020000 | 11,799.560000 |
| Mar-2023 | 11,730.180000 | 13,664.390000 | 13,532.670000 | 12,044.870000 |
| Apr-2023 | 11,808.770000 | 13,800.840000 | 13,611.250000 | 12,030.200000 |
| May-2023 | 11,757.990000 | 13,674.380000 | 13,544.120000 | 11,940.040000 |
| Jun-2023 | 11,867.340000 | 13,903.190000 | 13,764.670000 | 12,045.990000 |
| Jul-2023 | 12,008.560000 | 14,095.010000 | 13,816.320000 | 12,076.470000 |
| Aug-2023 | 12,045.790000 | 14,134.050000 | 13,660.350000 | 11,943.560000 |
| Sep-2023 | 11,901.240000 | 13,966.840000 | 13,200.930000 | 11,623.920000 |
| Oct-2023 | 11,803.650000 | 13,804.190000 | 12,907.140000 | 11,492.220000 |
| Nov-2023 | 12,206.150000 | 14,429.580000 | 13,860.680000 | 12,170.250000 |
| Dec-2023 | 12,425.870000 | 14,967.520000 | 14,309.080000 | 12,458.120000 |
| Jan-2024 | 12,529 | 14,966.920000 | 14,380.390000 | 12,439.070000 |
| Feb-2024 | 12,747 | 15,010.660000 | 14,486.400000 | 12,448.630000 |
| Mar-2024 | 12,947.130000 | 15,188.230000 | 14,588.750000 | 12,446.640000 |
| Apr-2024 | 12,883.690000 | 15,045.460000 | 14,404.950000 | 12,313.240000 |
| May-2024 | 13,087.250000 | 15,210.760000 | 14,485.710000 | 12,283.400000 |
| Jun-2024 | 13,464.170000 | 15,354.400000 | 14,787.600000 | 12,479.310000 |
| Jul-2024 | 13,655.360000 | 15,652.910000 | 14,941.920000 | 12,586.910000 |
| Aug-2024 | 13,811.030000 | 15,908.240000 | 15,086.090000 | 12,690.160000 |
| Sep-2024 | 14,043.050000 | 16,165.620000 | 15,289.520000 | 12,817.790000 |
| Oct-2024 | 13,830 | 16,078 | 15,093 | 12,651 |
The above chart represents historical performance of a hypothetical $10,000 investment over the past 10 years. The results of this chart do not predict the results of future time periods and does not guarantee the same results.
| Class/Index Name | 1 Year | 5 Years | 10 Years |
|---|
| Class A - without sales charge | 17.15% | 4.51% | 3.79% |
| Class A - with sales charge | 11.83% | 3.55% | 3.31% |
| Bloomberg U.S. Corporate High Yield Index | 16.47% | 4.55% | 4.86% |
| S&P Municipal Yield Index | 16.94% | 2.53% | 4.20% |
| S&P Municipal Bond Index | 10.08% | 1.22% | 2.38% |
The Fund's past performance is not a good predictor of the Fund's future performance.The graph and table do not reflect the deduction of taxes that a shareholder would pay on fund distributions or redemption of fund shares. Call us at 800.334.2143 or visit https://www.firsteagle.com if you have questions about current performance.
- Net Assets$4,237,049,109
- Number of Portfolio Holdings1,182
- Portfolio Turnover Rate136.03%
- Net Investment Advisory Fees (net of waivers and reimbursements)$5,268,220
Asset Allocation by Asset Class
Based on total investments in the portfolio
| Value | Value |
|---|
| Municipal Bonds | 100.0%Footnote Reference1 |
| Short-Term Investments | 0.0%Footnote Reference2Footnote Reference3 |
Bond Credit QualityFootnote Reference4
Based on total investments in the portfolio
| AAA | 4.9% |
| AA | 7.1% |
| A | 1.1% |
| BBB | 8.7% |
| BB or lower | 7.8% |
| N/R (Not Rated) | 70.4% |
| N/A (not applicable) | 0.0%Footnote Reference3 |
| Footnote | Description |
Footnote1 | Total investments include the Fund’s assets attributable to financial leverage. Inverse floating rate interests (“Inverse Floaters”) are issued in connection with municipal tender option bond (“TOB”) financing transactions (secured borrowing) to generate leverage for a Fund. |
Footnote2 | Includes short-term commercial paper (0.0% of total investments) that settles in 90 days or less; long-term commercial paper (0.0% of total investments) that settles in 91 days or more; and other short-term investments (0.0% of total investments), such as U.S. treasury bills or money market funds. |
Footnote3 | Less than 0.05% |
Footnote4 | The credit quality ratings shown above are assigned by S&P Global Ratings. S&P Global Ratings is a nationally recognized statistical rating organization. Investment grade ratings are credit ratings of BB or higher. Below investment grade are credit ratings of BB or lower. Investments designated N/R are not rated by S&P Global Ratings. Unrated investments do not necessarily indicate low credit quality. Credit quality ratings are subject to change. |
This is a summary of certain changes of the Fund since November 1, 2023. For more information contact 800.334.2143 or you may review the Fund’s next prospectus, which is expected to be available by March 1, 2025 at https://www.firsteagle.com or upon request at 800.334.2143.
Effective December 27, 2023, The Fund changed name from First Eagle High Income Fund to First Eagle High Yield Municipal Fund. The Fund also changed its investment objectives, principal investment strategies, and principal risks accordingly.
Effective March 1, 2024, the maximum sales charge on purchases changed from 4.50% to 2.50%.
The Adviser has contractually agreed to waive its management fee for the period from November 1, 2023 through April 30, 2024.
Prior to December 27, 2023, the Fund paid the Adviser an administrative fee at an annual rate of 0.05% of the Fund’s average daily net assets. Effective December 27, 2023, the Fund reimbursed the Adviser administrative costs not exceeding 0.05% of the Fund's average daily net assets.
First Eagle High Yield Municipal Fund
October 31, 2024
Annual Shareholder Report
For more information, please scan the QR code to navigate to tailored shareholder reports and financial statements and other Information. If you wish to view additional information about the Fund, including but not limited to financial statements, holdings, or the Fund's prospectus, please visit http://www.firsteagle.com.
Important Notice Regarding Delivery of Shareholder Materials
Unless we are notified otherwise, we send one copy of these materials to shareholders with the same residential address (provided they have the same last name or are reasonably believed to be family members) for as long as they remain a shareholder of the Fund. If you would like to receive individual mailings, please call 800.334.2143 and we will send separate copies of these materials within 30 days after receiving your request.
October 31, 2024
Annual Shareholder Report
This Annual Shareholder Report contains important information about the Class C shares of the Fund, and any material changes that occurred for the period of November 1, 2023, to October 31, 2024. You can find additional information about the Fund at https://www.firsteagle.com/first-eagle-fund-shareholder-reports. You can also request this information by contacting us at 800.334.2143.
First Eagle High Yield Municipal Fund
What Were the Fund's Costs for the Year?
Based on a Hypothetical $10,000 Investment
| Class Name | Cost of a $10,000 Investment | Cost Paid as a Percentage of a $10,000 Investment |
|---|
| Class C | $167 | 1.55% |
How Did the Fund Perform Last Year?
The NAV of First Eagle High Yield Municipal Fund Class C Shares1 increased 16.44% in the 12-month period ended October 31, 2024. The S&P Municipal Yield Index increased 16.94%, the S&P Municipal Bond Index increased 10.08% and the Bloomberg U.S. Corporate High Yield Index increased 16.47% for the same period.
• Transportation and health care were the largest contributors among sectors, while tobacco settlement was the only detractor and education was the next worst performing sector.
• Sanctuary LTC LLC was the leading contributor to performance.
• Buckeye Tobacco Settlement Financing Authority was the largest detractor to performance.
1 Reflects performance for Class C shares without the effect of sales charges and assumes all distributions have been reinvested; if sales charges were included, values would be lower.
Total Return Based on a $10,000 Investment
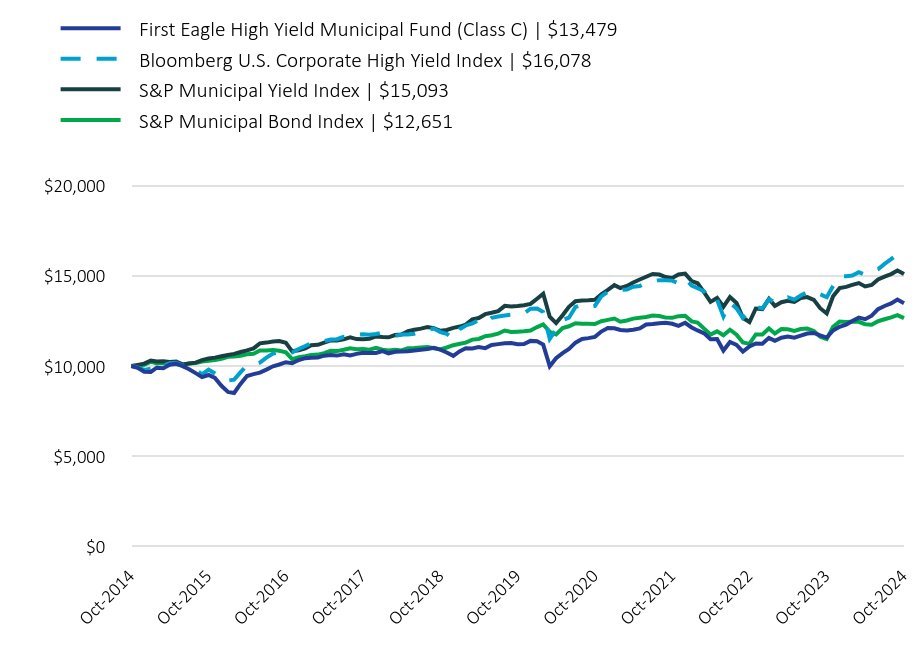
| First Eagle High Yield Municipal Fund (Class C) | $13,479 | Bloomberg U.S. Corporate High Yield Index | $16,078 | S&P Municipal Yield Index | $15,093 | S&P Municipal Bond Index | $12,651 |
|---|
| Oct-2014 | 10,000 | 10,000 | 10,000 | 10,000 |
| Nov-2014 | 9,899 | 9,927.160000 | 10,065.350000 | 10,016.890000 |
| Dec-2014 | 9,680.230000 | 9,783.450000 | 10,135.980000 | 10,070.750000 |
| Jan-2015 | 9,671.520000 | 9,848.090000 | 10,309.570000 | 10,241.910000 |
| Feb-2015 | 9,909.440000 | 10,085.420000 | 10,257.140000 | 10,147.880000 |
| Mar-2015 | 9,877.730000 | 10,030.230000 | 10,262 | 10,172.990000 |
| Apr-2015 | 10,073.310000 | 10,151.260000 | 10,218.590000 | 10,126.890000 |
| May-2015 | 10,132.740000 | 10,182.070000 | 10,253.580000 | 10,105.440000 |
| Jun-2015 | 9,995.950000 | 10,030.500000 | 10,092.100000 | 10,071.660000 |
| Jul-2015 | 9,827.020000 | 9,972.090000 | 10,138.950000 | 10,142.860000 |
| Aug-2015 | 9,606.890000 | 9,798.380000 | 10,188.410000 | 10,168.880000 |
| Sep-2015 | 9,384.970000 | 9,543.410000 | 10,329.260000 | 10,244.190000 |
| Oct-2015 | 9,504.160000 | 9,805.770000 | 10,415.900000 | 10,287.550000 |
| Nov-2015 | 9,346.390000 | 9,587.810000 | 10,465.240000 | 10,331.830000 |
| Dec-2015 | 8,907.110000 | 9,346.330000 | 10,537.890000 | 10,404.860000 |
| Jan-2016 | 8,568.640000 | 9,196.120000 | 10,609.580000 | 10,514.860000 |
| Feb-2016 | 8,511.230000 | 9,248.680000 | 10,674.400000 | 10,531.290000 |
| Mar-2016 | 9,024.460000 | 9,659.730000 | 10,777.530000 | 10,575.110000 |
| Apr-2016 | 9,448.610000 | 10,037.910000 | 10,865.420000 | 10,649.500000 |
| May-2016 | 9,550.650000 | 10,099.890000 | 10,974.720000 | 10,682.820000 |
| Jun-2016 | 9,638.520000 | 10,192.850000 | 11,255.640000 | 10,857.640000 |
| Jul-2016 | 9,803.340000 | 10,468.450000 | 11,296.680000 | 10,859.010000 |
| Aug-2016 | 9,985.680000 | 10,687.440000 | 11,356.340000 | 10,883.660000 |
| Sep-2016 | 10,086.540000 | 10,758.670000 | 11,378.930000 | 10,842.580000 |
| Oct-2016 | 10,212.620000 | 10,800.220000 | 11,282.920000 | 10,754.030000 |
| Nov-2016 | 10,158.490000 | 10,748.940000 | 10,814.120000 | 10,381.580000 |
| Dec-2016 | 10,332.200000 | 10,947.330000 | 10,872.360000 | 10,485.190000 |
| Jan-2017 | 10,437.590000 | 11,106.330000 | 10,978.400000 | 10,539.960000 |
| Feb-2017 | 10,464 | 11,267.970000 | 11,146.110000 | 10,610.710000 |
| Mar-2017 | 10,478.330000 | 11,242.820000 | 11,176.890000 | 10,633.530000 |
| Apr-2017 | 10,573.690000 | 11,372.650000 | 11,295.020000 | 10,710.210000 |
| May-2017 | 10,610.690000 | 11,471.540000 | 11,414.750000 | 10,851.210000 |
| Jun-2017 | 10,577.800000 | 11,487.060000 | 11,407.220000 | 10,826.710000 |
| Jul-2017 | 10,650.790000 | 11,614.270000 | 11,478.030000 | 10,898.190000 |
| Aug-2017 | 10,584.750000 | 11,609.720000 | 11,591 | 10,983.440000 |
| Sep-2017 | 10,673.660000 | 11,713.970000 | 11,490.660000 | 10,933.600000 |
| Oct-2017 | 10,729.170000 | 11,763.450000 | 11,483.130000 | 10,947.870000 |
| Nov-2017 | 10,720.580000 | 11,733.420000 | 11,514.500000 | 10,900.590000 |
| Dec-2017 | 10,723.800000 | 11,768.870000 | 11,636.020000 | 11,003.940000 |
| Jan-2018 | 10,823.530000 | 11,839.460000 | 11,607.670000 | 10,899.420000 |
| Feb-2018 | 10,704.470000 | 11,738.840000 | 11,591.240000 | 10,857.080000 |
| Mar-2018 | 10,793.320000 | 11,667.930000 | 11,715.010000 | 10,902.390000 |
| Apr-2018 | 10,805.190000 | 11,743.850000 | 11,749.110000 | 10,864.750000 |
| May-2018 | 10,817.080000 | 11,740.590000 | 11,936.210000 | 10,987.710000 |
| Jun-2018 | 10,858.180000 | 11,787.720000 | 12,003.940000 | 11,001.550000 |
| Jul-2018 | 10,907.040000 | 11,916.360000 | 12,068.340000 | 11,029.750000 |
| Aug-2018 | 10,943.040000 | 12,004.240000 | 12,156.410000 | 11,050.160000 |
| Sep-2018 | 11,004.320000 | 12,071.090000 | 12,097.990000 | 10,986.050000 |
| Oct-2018 | 10,907.480000 | 11,878.120000 | 11,951.100000 | 10,913.970000 |
| Nov-2018 | 10,749.320000 | 11,775.930000 | 11,994.510000 | 11,027.200000 |
| Dec-2018 | 10,566.580000 | 11,523.800000 | 12,113.710000 | 11,153.140000 |
| Jan-2019 | 10,821.240000 | 12,044.710000 | 12,184.520000 | 11,235.110000 |
| Feb-2019 | 10,983.560000 | 12,245 | 12,296.130000 | 11,294.220000 |
| Mar-2019 | 10,972.570000 | 12,360.180000 | 12,586.720000 | 11,461.120000 |
| Apr-2019 | 11,046.090000 | 12,535.910000 | 12,654.500000 | 11,499.390000 |
| May-2019 | 10,990.860000 | 12,386.930000 | 12,869.660000 | 11,654.070000 |
| Jun-2019 | 11,163.420000 | 12,669.240000 | 12,947.400000 | 11,704.040000 |
| Jul-2019 | 11,213.650000 | 12,740.680000 | 13,040.390000 | 11,794.190000 |
| Aug-2019 | 11,266.360000 | 12,791.640000 | 13,328.490000 | 11,963.320000 |
| Sep-2019 | 11,277.620000 | 12,838.230000 | 13,298.190000 | 11,886.080000 |
| Oct-2019 | 11,208.830000 | 12,873.680000 | 13,319.240000 | 11,903.750000 |
| Nov-2019 | 11,214.430000 | 12,915.710000 | 13,362 | 11,923.820000 |
| Dec-2019 | 11,391.620000 | 13,173.930000 | 13,436.360000 | 11,962.830000 |
| Jan-2020 | 11,374.530000 | 13,177.440000 | 13,724.760000 | 12,157.610000 |
| Feb-2020 | 11,186.850000 | 12,991.620000 | 13,999.690000 | 12,304.380000 |
| Mar-2020 | 9,984.270000 | 11,502.830000 | 12,725.130000 | 11,893.800000 |
| Apr-2020 | 10,432.560000 | 12,021.080000 | 12,374.470000 | 11,753.840000 |
| May-2020 | 10,714.240000 | 12,550.660000 | 12,812.900000 | 12,104.960000 |
| Jun-2020 | 10,943.520000 | 12,673.510000 | 13,279.980000 | 12,198.980000 |
| Jul-2020 | 11,294.810000 | 13,267.660000 | 13,589.660000 | 12,370.660000 |
| Aug-2020 | 11,500.380000 | 13,393.790000 | 13,631.770000 | 12,340.610000 |
| Sep-2020 | 11,545.230000 | 13,256.020000 | 13,638.650000 | 12,343.360000 |
| Oct-2020 | 11,613.350000 | 13,323.340000 | 13,663.970000 | 12,325.910000 |
| Nov-2020 | 11,908.320000 | 13,850.410000 | 13,968.080000 | 12,482.290000 |
| Dec-2020 | 12,100.050000 | 14,111.090000 | 14,210.160000 | 12,555.390000 |
| Jan-2021 | 12,089.160000 | 14,157.770000 | 14,474.540000 | 12,626.080000 |
| Feb-2021 | 11,994.860000 | 14,209.780000 | 14,318.090000 | 12,454.460000 |
| Mar-2021 | 11,972.070000 | 14,231.040000 | 14,431.600000 | 12,522.970000 |
| Apr-2021 | 12,012.780000 | 14,385.610000 | 14,623.870000 | 12,623.640000 |
| May-2021 | 12,081.250000 | 14,428.160000 | 14,785.470000 | 12,674.430000 |
| Jun-2021 | 12,299.920000 | 14,621.440000 | 14,941.850000 | 12,710.910000 |
| Jul-2021 | 12,328.210000 | 14,677.130000 | 15,095.980000 | 12,799.790000 |
| Aug-2021 | 12,372.590000 | 14,752.530000 | 15,060.760000 | 12,765.260000 |
| Sep-2021 | 12,388.680000 | 14,750.910000 | 14,924.650000 | 12,678.250000 |
| Oct-2021 | 12,335.410000 | 14,725.650000 | 14,876.560000 | 12,665.810000 |
| Nov-2021 | 12,226.850000 | 14,582.440000 | 15,067.460000 | 12,759.170000 |
| Dec-2021 | 12,393.140000 | 14,855.780000 | 15,113.060000 | 12,777.500000 |
| Jan-2022 | 12,132.880000 | 14,449.570000 | 14,695.740000 | 12,472.440000 |
| Feb-2022 | 11,969.090000 | 14,301.220000 | 14,579.210000 | 12,408.580000 |
| Mar-2022 | 11,807.510000 | 14,137.260000 | 14,071.570000 | 12,070.820000 |
| Apr-2022 | 11,487.520000 | 13,634.560000 | 13,549.870000 | 11,744 |
| May-2022 | 11,494.420000 | 13,667.990000 | 13,767.100000 | 11,917.460000 |
| Jun-2022 | 10,857.630000 | 12,747.730000 | 13,282.230000 | 11,705.750000 |
| Jul-2022 | 11,332.100000 | 13,500.270000 | 13,817.870000 | 12,008.460000 |
| Aug-2022 | 11,173.450000 | 13,189.170000 | 13,493.410000 | 11,733.740000 |
| Sep-2022 | 10,801.380000 | 12,665.310000 | 12,669.740000 | 11,307.780000 |
| Oct-2022 | 11,083.290000 | 12,994.450000 | 12,434.130000 | 11,227.060000 |
| Nov-2022 | 11,249.540000 | 13,276.490000 | 13,182.190000 | 11,746.650000 |
| Dec-2022 | 11,231.540000 | 13,193.630000 | 13,150.820000 | 11,749.390000 |
| Jan-2023 | 11,559.510000 | 13,695.940000 | 13,721.620000 | 12,080.880000 |
| Feb-2023 | 11,395.360000 | 13,519.880000 | 13,328.020000 | 11,799.560000 |
| Mar-2023 | 11,568.570000 | 13,664.390000 | 13,532.670000 | 12,044.870000 |
| Apr-2023 | 11,639.140000 | 13,800.840000 | 13,611.250000 | 12,030.200000 |
| May-2023 | 11,566.980000 | 13,674.380000 | 13,544.120000 | 11,940.040000 |
| Jun-2023 | 11,682.650000 | 13,903.190000 | 13,764.670000 | 12,045.990000 |
| Jul-2023 | 11,799.470000 | 14,095.010000 | 13,816.320000 | 12,076.470000 |
| Aug-2023 | 11,828.970000 | 14,134.050000 | 13,660.350000 | 11,943.560000 |
| Sep-2023 | 11,695.300000 | 13,966.840000 | 13,200.930000 | 11,623.920000 |
| Oct-2023 | 11,577.180000 | 13,804.190000 | 12,907.140000 | 11,492.220000 |
| Nov-2023 | 11,965.020000 | 14,429.580000 | 13,860.680000 | 12,170.250000 |
| Dec-2023 | 12,172.010000 | 14,967.520000 | 14,309.080000 | 12,458.120000 |
| Jan-2024 | 12,282.780000 | 14,966.920000 | 14,380.390000 | 12,439.070000 |
| Feb-2024 | 12,489.130000 | 15,010.660000 | 14,486.400000 | 12,448.630000 |
| Mar-2024 | 12,677.710000 | 15,188.230000 | 14,588.750000 | 12,446.640000 |
| Apr-2024 | 12,592.770000 | 15,045.460000 | 14,404.950000 | 12,313.240000 |
| May-2024 | 12,782.920000 | 15,210.760000 | 14,485.710000 | 12,283.400000 |
| Jun-2024 | 13,143.400000 | 15,354.400000 | 14,787.600000 | 12,479.310000 |
| Jul-2024 | 13,322.150000 | 15,652.910000 | 14,941.920000 | 12,586.910000 |
| Aug-2024 | 13,464.700000 | 15,908.240000 | 15,086.090000 | 12,690.160000 |
| Sep-2024 | 13,681.480000 | 16,165.620000 | 15,289.520000 | 12,817.790000 |
| Oct-2024 | 13,479 | 16,078 | 15,093 | 12,651 |
The above chart represents historical performance of a hypothetical $10,000 investment over the past 10 years. The results of this chart do not predict the results of future time periods and does not guarantee the same results.
| Class/Index Name | 1 Year | 5 Years | 10 Years |
|---|
| Class C - without sales charge | 16.44% | 3.75% | 3.03% |
| Class C - with sales charge | 15.44% | 3.75% | 3.03% |
| Bloomberg U.S. Corporate High Yield Index | 16.47% | 4.55% | 4.86% |
| S&P Municipal Yield Index | 16.94% | 2.53% | 4.20% |
| S&P Municipal Bond Index | 10.08% | 1.22% | 2.38% |
The Fund's past performance is not a good predictor of the Fund's future performance.The graph and table do not reflect the deduction of taxes that a shareholder would pay on fund distributions or redemption of fund shares. Call us at 800.334.2143 or visit https://www.firsteagle.com if you have questions about current performance.
- Net Assets$4,237,049,109
- Number of Portfolio Holdings1,182
- Portfolio Turnover Rate136.03%
- Net Investment Advisory Fees (net of waivers and reimbursements)$5,268,220
Asset Allocation by Asset Class
Based on total investments in the portfolio
| Value | Value |
|---|
| Municipal Bonds | 100.0%Footnote Reference1 |
| Short-Term Investments | 0.0%Footnote Reference2Footnote Reference3 |
Bond Credit QualityFootnote Reference4
Based on total investments in the portfolio
| AAA | 4.9% |
| AA | 7.1% |
| A | 1.1% |
| BBB | 8.7% |
| BB or lower | 7.8% |
| N/R (Not Rated) | 70.4% |
| N/A (not applicable) | 0.0%Footnote Reference3 |
| Footnote | Description |
Footnote1 | Total investments include the Fund’s assets attributable to financial leverage. Inverse floating rate interests (“Inverse Floaters”) are issued in connection with municipal tender option bond (“TOB”) financing transactions (secured borrowing) to generate leverage for a Fund. |
Footnote2 | Includes short-term commercial paper (0.0% of total investments) that settles in 90 days or less; long-term commercial paper (0.0% of total investments) that settles in 91 days or more; and other short-term investments (0.0% of total investments), such as U.S. treasury bills or money market funds. |
Footnote3 | Less than 0.05% |
Footnote4 | The credit quality ratings shown above are assigned by S&P Global Ratings. S&P Global Ratings is a nationally recognized statistical rating organization. Investment grade ratings are credit ratings of BB or higher. Below investment grade are credit ratings of BB or lower. Investments designated N/R are not rated by S&P Global Ratings. Unrated investments do not necessarily indicate low credit quality. Credit quality ratings are subject to change. |
This is a summary of certain changes of the Fund since November 1, 2023. For more information contact 800.334.2143 or you may review the Fund’s next prospectus, which is expected to be available by March 1, 2025 at https://www.firsteagle.com or upon request at 800.334.2143.
Effective December 27, 2023, The Fund changed name from First Eagle High Income Fund to First Eagle High Yield Municipal Fund. The Fund also changed its investment objectives, principal investment strategies, and principal risks accordingly.
The Adviser has contractually agreed to waive its management fee for the period from November 1, 2023 through April 30, 2024.
Prior to December 27, 2023, the Fund paid the Adviser an administrative fee at an annual rate of 0.05% of the Fund’s average daily net assets. Effective December 27, 2023, the Fund reimbursed the Adviser administrative costs not exceeding 0.05% of the Fund's average daily net assets.
First Eagle High Yield Municipal Fund
October 31, 2024
Annual Shareholder Report
For more information, please scan the QR code to navigate to tailored shareholder reports and financial statements and other Information. If you wish to view additional information about the Fund, including but not limited to financial statements, holdings, or the Fund's prospectus, please visit http://www.firsteagle.com.
Important Notice Regarding Delivery of Shareholder Materials
Unless we are notified otherwise, we send one copy of these materials to shareholders with the same residential address (provided they have the same last name or are reasonably believed to be family members) for as long as they remain a shareholder of the Fund. If you would like to receive individual mailings, please call 800.334.2143 and we will send separate copies of these materials within 30 days after receiving your request.
October 31, 2024
Annual Shareholder Report
This Annual Shareholder Report contains important information about the Class I shares of the Fund, and any material changes that occurred for the period of November 1, 2023, to October 31, 2024. You can find additional information about the Fund at https://www.firsteagle.com/first-eagle-fund-shareholder-reports. You can also request this information by contacting us at 800.334.2143.
First Eagle High Yield Municipal Fund
What Were the Fund's Costs for the Year?
Based on a Hypothetical $10,000 Investment
| Class Name | Cost of a $10,000 Investment | Cost Paid as a Percentage of a $10,000 Investment |
|---|
| Class I | $63 | 0.57% |
How Did the Fund Perform Last Year?
The NAV of First Eagle High Yield Municipal Fund Class I Shares increased 17.55% in the 12-month period ended October 31, 2024. The S&P Municipal Yield Index increased 16.94%, the S&P Municipal Bond Index increased 10.08% and the Bloomberg U.S. Corporate High Yield Index increased 16.47% for the same period.
• Transportation and health care were the largest contributors among sectors, while tobacco settlement was the only detractor and education was the next worst performing sector.
• Sanctuary LTC LLC was the leading contributor to performance.
• Buckeye Tobacco Settlement Financing Authority was the largest detractor to performance.
Total Return Based on a $1,000,000 Investment
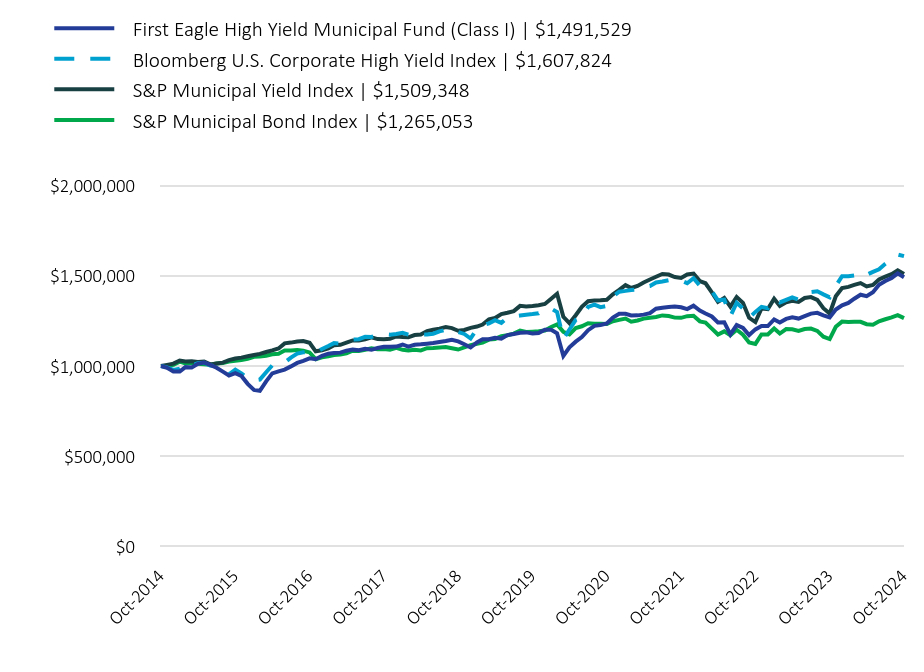
| First Eagle High Yield Municipal Fund (Class I) | $1,491,529 | Bloomberg U.S. Corporate High Yield Index | $1,607,824 | S&P Municipal Yield Index | $1,509,348 | S&P Municipal Bond Index | $1,265,053 |
|---|
| Oct-2014 | 1,000,000 | 1,000,000 | 1,000,000 | 1,000,000 |
| Nov-2014 | 990,700 | 992,715.860000 | 1,006,535.290000 | 1,001,688.800000 |
| Dec-2014 | 969,697.160000 | 978,344.660000 | 1,013,598.380000 | 1,007,074.720000 |
| Jan-2015 | 969,697.160000 | 984,808.480000 | 1,030,956.630000 | 1,024,190.970000 |
| Feb-2015 | 994,230.500000 | 1,008,542.410000 | 1,025,714.170000 | 1,014,788.440000 |
| Mar-2015 | 991,943.770000 | 1,003,022.830000 | 1,026,200.460000 | 1,017,298.830000 |
| Apr-2015 | 1,012,477 | 1,015,125.730000 | 1,021,859.410000 | 1,012,688.850000 |
| May-2015 | 1,019,463.100000 | 1,018,207.150000 | 1,025,358.340000 | 1,010,543.610000 |
| Jun-2015 | 1,006,617.860000 | 1,003,050.120000 | 1,009,209.890000 | 1,007,166 |
| Jul-2015 | 990,511.970000 | 997,209.390000 | 1,013,894.900000 | 1,014,286.370000 |
| Aug-2015 | 969,215.970000 | 979,837.780000 | 1,018,840.850000 | 1,016,888.040000 |
| Sep-2015 | 947,699.370000 | 954,341.430000 | 1,032,925.520000 | 1,024,419.190000 |
| Oct-2015 | 960,398.540000 | 980,577.320000 | 1,041,589.820000 | 1,028,755.310000 |
| Nov-2015 | 945,320.290000 | 958,780.540000 | 1,046,523.900000 | 1,033,182.710000 |
| Dec-2015 | 901,551.960000 | 934,632.550000 | 1,053,788.630000 | 1,040,485.650000 |
| Jan-2016 | 868,104.380000 | 919,612.070000 | 1,060,958.470000 | 1,051,485.690000 |
| Feb-2016 | 862,982.560000 | 924,868.270000 | 1,067,440.390000 | 1,053,128.850000 |
| Mar-2016 | 915,710.800000 | 965,972.480000 | 1,077,753.330000 | 1,057,510.610000 |
| Apr-2016 | 959,481.780000 | 1,003,791.090000 | 1,086,542.170000 | 1,064,950.480000 |
| May-2016 | 970,707.710000 | 1,009,989.350000 | 1,097,471.880000 | 1,068,282.440000 |
| Jun-2016 | 980,511.860000 | 1,019,284.690000 | 1,125,564.130000 | 1,085,763.840000 |
| Jul-2016 | 998,063.020000 | 1,046,845.100000 | 1,129,667.960000 | 1,085,900.770000 |
| Aug-2016 | 1,017,525.250000 | 1,068,744.330000 | 1,135,633.930000 | 1,088,365.510000 |
| Sep-2016 | 1,028,718.030000 | 1,075,867.480000 | 1,137,893.410000 | 1,084,257.610000 |
| Oct-2016 | 1,042,502.850000 | 1,080,021.700000 | 1,128,292.110000 | 1,075,402.800000 |
| Nov-2016 | 1,037,811.590000 | 1,074,894.470000 | 1,081,412.380000 | 1,038,157.830000 |
| Dec-2016 | 1,056,492.200000 | 1,094,732.710000 | 1,087,236.020000 | 1,048,518.870000 |
| Jan-2017 | 1,068,219.260000 | 1,110,632.750000 | 1,097,839.560000 | 1,053,996.070000 |
| Feb-2017 | 1,071,744 | 1,126,796.950000 | 1,114,610.700000 | 1,061,070.790000 |
| Mar-2017 | 1,074,209.400000 | 1,124,282.240000 | 1,117,688.570000 | 1,063,352.960000 |
| Apr-2017 | 1,084,951.490000 | 1,137,264.760000 | 1,129,501.910000 | 1,071,021.040000 |
| May-2017 | 1,090,918.720000 | 1,147,154.410000 | 1,141,475.360000 | 1,085,121.430000 |
| Jun-2017 | 1,087,209.600000 | 1,148,705.810000 | 1,140,722.200000 | 1,082,670.820000 |
| Jul-2017 | 1,095,689.830000 | 1,161,427.480000 | 1,147,803.090000 | 1,089,819.110000 |
| Aug-2017 | 1,089,882.680000 | 1,160,972.470000 | 1,159,100.480000 | 1,098,344.430000 |
| Sep-2017 | 1,099,909.600000 | 1,171,397.110000 | 1,149,066.260000 | 1,093,360.150000 |
| Oct-2017 | 1,106,619.050000 | 1,176,344.530000 | 1,148,313.100000 | 1,094,787.420000 |
| Nov-2017 | 1,106,619.050000 | 1,173,341.610000 | 1,151,450.280000 | 1,090,059.010000 |
| Dec-2017 | 1,107,946.990000 | 1,176,887.340000 | 1,163,601.640000 | 1,100,394.080000 |
| Jan-2018 | 1,119,248.050000 | 1,183,945.720000 | 1,160,766.920000 | 1,089,941.540000 |
| Feb-2018 | 1,107,831.720000 | 1,173,883.850000 | 1,159,124.200000 | 1,085,707.880000 |
| Mar-2018 | 1,118,023.770000 | 1,166,793.220000 | 1,171,500.920000 | 1,090,238.750000 |
| Apr-2018 | 1,120,148.020000 | 1,174,384.810000 | 1,174,910.900000 | 1,086,475.370000 |
| May-2018 | 1,123,620.470000 | 1,174,059.270000 | 1,193,621.270000 | 1,098,770.870000 |
| Jun-2018 | 1,127,553.150000 | 1,178,772.060000 | 1,200,393.780000 | 1,100,154.660000 |
| Jul-2018 | 1,133,529.180000 | 1,191,636.470000 | 1,206,834.180000 | 1,102,974.560000 |
| Aug-2018 | 1,138,290 | 1,200,424.450000 | 1,215,640.810000 | 1,105,015.970000 |
| Sep-2018 | 1,145,575.060000 | 1,207,109.310000 | 1,209,799.380000 | 1,098,605.350000 |
| Oct-2018 | 1,136,525.010000 | 1,187,811.760000 | 1,195,109.800000 | 1,091,396.800000 |
| Nov-2018 | 1,120,954.620000 | 1,177,592.650000 | 1,199,450.850000 | 1,102,719.650000 |
| Dec-2018 | 1,102,795.160000 | 1,152,380.100000 | 1,211,370.930000 | 1,115,313.670000 |
| Jan-2019 | 1,130,254.760000 | 1,204,471.030000 | 1,218,451.820000 | 1,123,511.070000 |
| Feb-2019 | 1,148,112.780000 | 1,224,500.500000 | 1,229,612.810000 | 1,129,422.220000 |
| Mar-2019 | 1,147,997.970000 | 1,236,017.610000 | 1,258,671.720000 | 1,146,112.390000 |
| Apr-2019 | 1,156,722.750000 | 1,253,591.130000 | 1,265,450.150000 | 1,149,939.110000 |
| May-2019 | 1,151,980.190000 | 1,238,693.080000 | 1,286,965.600000 | 1,165,407.120000 |
| Jun-2019 | 1,171,103.060000 | 1,266,924.300000 | 1,294,740.340000 | 1,170,403.950000 |
| Jul-2019 | 1,177,427.020000 | 1,274,067.710000 | 1,304,039.190000 | 1,179,418.560000 |
| Aug-2019 | 1,184,020.610000 | 1,279,164.340000 | 1,332,849.020000 | 1,196,332.360000 |
| Sep-2019 | 1,186,151.850000 | 1,283,822.890000 | 1,329,818.590000 | 1,188,607.580000 |
| Oct-2019 | 1,179,983.860000 | 1,287,368.400000 | 1,331,923.880000 | 1,190,375.010000 |
| Nov-2019 | 1,182,933.820000 | 1,291,571.250000 | 1,336,199.690000 | 1,192,381.940000 |
| Dec-2019 | 1,201,269.290000 | 1,317,393.460000 | 1,343,636.400000 | 1,196,283.280000 |
| Jan-2020 | 1,200,548.530000 | 1,317,743.800000 | 1,372,475.880000 | 1,215,761.300000 |
| Feb-2020 | 1,181,699.920000 | 1,299,162.150000 | 1,399,969.160000 | 1,230,438.460000 |
| Mar-2020 | 1,055,848.880000 | 1,150,283.220000 | 1,272,513.240000 | 1,189,380.390000 |
| Apr-2020 | 1,104,101.170000 | 1,202,107.960000 | 1,237,446.850000 | 1,175,383.840000 |
| May-2020 | 1,134,905.590000 | 1,255,065.920000 | 1,281,290.220000 | 1,210,495.740000 |
| Jun-2020 | 1,160,213.990000 | 1,267,350.900000 | 1,327,997.960000 | 1,219,898.480000 |
| Jul-2020 | 1,198,385.030000 | 1,326,766.050000 | 1,358,966.450000 | 1,237,065.900000 |
| Aug-2020 | 1,222,592.400000 | 1,339,378.680000 | 1,363,177.030000 | 1,234,061.120000 |
| Sep-2020 | 1,226,993.740000 | 1,325,602.400000 | 1,363,864.950000 | 1,234,335.520000 |
| Oct-2020 | 1,235,337.290000 | 1,332,333.580000 | 1,366,397.230000 | 1,232,591.490000 |
| Nov-2020 | 1,267,703.130000 | 1,385,041.130000 | 1,396,808.270000 | 1,248,229.440000 |
| Dec-2020 | 1,289,254.090000 | 1,411,109.420000 | 1,421,016.110000 | 1,255,538.900000 |
| Jan-2021 | 1,289,125.160000 | 1,415,776.750000 | 1,447,453.790000 | 1,262,607.700000 |
| Feb-2021 | 1,280,230.200000 | 1,420,978.140000 | 1,431,809.420000 | 1,245,446.370000 |
| Mar-2021 | 1,280,358.220000 | 1,423,103.520000 | 1,443,160.190000 | 1,252,296.930000 |
| Apr-2021 | 1,284,327.330000 | 1,438,561.100000 | 1,462,386.510000 | 1,262,363.750000 |
| May-2021 | 1,292,675.460000 | 1,442,816.060000 | 1,478,546.820000 | 1,267,442.900000 |
| Jun-2021 | 1,317,107.020000 | 1,462,143.820000 | 1,494,185.260000 | 1,271,090.710000 |
| Jul-2021 | 1,322,770.580000 | 1,467,712.730000 | 1,509,598.340000 | 1,279,979.300000 |
| Aug-2021 | 1,327,135.730000 | 1,475,252.710000 | 1,506,075.690000 | 1,276,526.340000 |
| Sep-2021 | 1,329,922.710000 | 1,475,091.430000 | 1,492,465.440000 | 1,267,825.220000 |
| Oct-2021 | 1,325,400.970000 | 1,472,565.460000 | 1,487,655.900000 | 1,266,580.800000 |
| Nov-2021 | 1,314,930.310000 | 1,458,244.350000 | 1,506,745.820000 | 1,275,917.350000 |
| Dec-2021 | 1,333,996.800000 | 1,485,577.990000 | 1,511,306.290000 | 1,277,750.240000 |
| Jan-2022 | 1,307,183.460000 | 1,444,957.230000 | 1,469,574.140000 | 1,247,244 |
| Feb-2022 | 1,290,451.510000 | 1,430,121.520000 | 1,457,920.930000 | 1,240,857.530000 |
| Mar-2022 | 1,274,191.820000 | 1,413,726.130000 | 1,407,156.800000 | 1,207,081.940000 |
| Apr-2022 | 1,240,808 | 1,363,456.100000 | 1,354,987.160000 | 1,174,400.190000 |
| May-2022 | 1,242,545.130000 | 1,366,798.740000 | 1,376,710.180000 | 1,191,745.930000 |
| Jun-2022 | 1,174,702.160000 | 1,274,772.660000 | 1,328,223.310000 | 1,170,575.150000 |
| Jul-2022 | 1,226,858.940000 | 1,350,027.040000 | 1,381,786.590000 | 1,200,845.870000 |
| Aug-2022 | 1,210,664.400000 | 1,318,917.320000 | 1,349,341.430000 | 1,173,374.210000 |
| Sep-2022 | 1,171,317.810000 | 1,266,530.590000 | 1,266,974.260000 | 1,130,778.310000 |
| Oct-2022 | 1,202,826.260000 | 1,299,444.850000 | 1,243,412.820000 | 1,122,705.620000 |
| Nov-2022 | 1,221,830.910000 | 1,327,649.460000 | 1,318,218.750000 | 1,174,664.590000 |
| Dec-2022 | 1,220,975.630000 | 1,319,363.350000 | 1,315,081.570000 | 1,174,939.030000 |
| Jan-2023 | 1,257,727 | 1,369,594.310000 | 1,372,161.570000 | 1,208,088.040000 |
| Feb-2023 | 1,240,873.460000 | 1,351,987.580000 | 1,332,801.580000 | 1,179,956.120000 |
| Mar-2023 | 1,260,727.430000 | 1,366,439.320000 | 1,353,267.350000 | 1,204,486.780000 |
| Apr-2023 | 1,269,426.450000 | 1,380,084.330000 | 1,361,125.110000 | 1,203,020.490000 |
| May-2023 | 1,262,571.550000 | 1,367,437.810000 | 1,354,411.910000 | 1,194,004.440000 |
| Jun-2023 | 1,276,207.320000 | 1,390,318.590000 | 1,376,467.030000 | 1,204,599 |
| Jul-2023 | 1,289,990.360000 | 1,409,501.210000 | 1,381,632.400000 | 1,207,647.370000 |
| Aug-2023 | 1,294,247.330000 | 1,413,405.220000 | 1,366,035.480000 | 1,194,355.510000 |
| Sep-2023 | 1,280,657.730000 | 1,396,683.990000 | 1,320,092.750000 | 1,162,392.440000 |
| Oct-2023 | 1,268,747.610000 | 1,380,419.170000 | 1,290,713.600000 | 1,149,221.630000 |
| Nov-2023 | 1,312,265.660000 | 1,442,958.120000 | 1,386,068.330000 | 1,217,024.980000 |
| Dec-2023 | 1,336,017.670000 | 1,496,751.680000 | 1,430,908 | 1,245,812.040000 |
| Jan-2024 | 1,348,977.040000 | 1,496,692.220000 | 1,438,038.960000 | 1,243,906.750000 |
| Feb-2024 | 1,372,584.140000 | 1,501,065.710000 | 1,448,640.340000 | 1,244,863 |
| Mar-2024 | 1,394,545.480000 | 1,518,823.390000 | 1,458,875.380000 | 1,244,664.130000 |
| Apr-2024 | 1,386,317.660000 | 1,504,545.980000 | 1,440,494.670000 | 1,231,324.150000 |
| May-2024 | 1,408,498.750000 | 1,521,075.500000 | 1,448,570.710000 | 1,228,340.440000 |
| Jun-2024 | 1,449,345.210000 | 1,535,440.440000 | 1,478,759.610000 | 1,247,931.180000 |
| Jul-2024 | 1,470,215.780000 | 1,565,290.970000 | 1,494,191.760000 | 1,258,691.280000 |
| Aug-2024 | 1,487,270.280000 | 1,590,823.700000 | 1,508,609.440000 | 1,269,016.440000 |
| Sep-2024 | 1,512,553.880000 | 1,616,561.730000 | 1,528,951.590000 | 1,281,778.730000 |
| Oct-2024 | 1,491,529 | 1,607,824 | 1,509,348 | 1,265,053 |
The above chart represents historical performance of a hypothetical $1,000,000 investment over the past 10 years. The results of this chart do not predict the results of future time periods and does not guarantee the same results.
| Class/Index Name | 1 Year | 5 Years | 10 Years |
|---|
| Class I | 17.55% | 4.80% | 4.08% |
| Bloomberg U.S. Corporate High Yield Index | 16.47% | 4.55% | 4.86% |
| S&P Municipal Yield Index | 16.94% | 2.53% | 4.20% |
| S&P Municipal Bond Index | 10.08% | 1.22% | 2.38% |
The Fund's past performance is not a good predictor of the Fund's future performance.The graph and table do not reflect the deduction of taxes that a shareholder would pay on fund distributions or redemption of fund shares. Call us at 800.334.2143 or visit https://www.firsteagle.com if you have questions about current performance.
- Net Assets$4,237,049,109
- Number of Portfolio Holdings1,182
- Portfolio Turnover Rate136.03%
- Net Investment Advisory Fees (net of waivers and reimbursements)$5,268,220
Asset Allocation by Asset Class
Based on total investments in the portfolio
| Value | Value |
|---|
| Municipal Bonds | 100.0%Footnote Reference1 |
| Short-Term Investments | 0.0%Footnote Reference2Footnote Reference3 |
Bond Credit QualityFootnote Reference4
Based on total investments in the portfolio
| AAA | 4.9% |
| AA | 7.1% |
| A | 1.1% |
| BBB | 8.7% |
| BB or lower | 7.8% |
| N/R (Not Rated) | 70.4% |
| N/A (not applicable) | 0.0%Footnote Reference3 |
| Footnote | Description |
Footnote1 | Total investments include the Fund’s assets attributable to financial leverage. Inverse floating rate interests (“Inverse Floaters”) are issued in connection with municipal tender option bond (“TOB”) financing transactions (secured borrowing) to generate leverage for a Fund. |
Footnote2 | Includes short-term commercial paper (0.0% of total investments) that settles in 90 days or less; long-term commercial paper (0.0% of total investments) that settles in 91 days or more; and other short-term investments (0.0% of total investments), such as U.S. treasury bills or money market funds. |
Footnote3 | Less than 0.05% |
Footnote4 | The credit quality ratings shown above are assigned by S&P Global Ratings. S&P Global Ratings is a nationally recognized statistical rating organization. Investment grade ratings are credit ratings of BB or higher. Below investment grade are credit ratings of BB or lower. Investments designated N/R are not rated by S&P Global Ratings. Unrated investments do not necessarily indicate low credit quality. Credit quality ratings are subject to change. |
This is a summary of certain changes of the Fund since November 1, 2023. For more information contact 800.334.2143 or you may review the Fund’s next prospectus, which is expected to be available by March 1, 2025 at https://www.firsteagle.com or upon request at 800.334.2143.
Effective December 27, 2023, The Fund changed name from First Eagle High Income Fund to First Eagle High Yield Municipal Fund. The Fund also changed its investment objectives, principal investment strategies, and principal risks accordingly.
The Adviser has contractually agreed to waive its management fee for the period from November 1, 2023 through April 30, 2024.
Prior to December 27, 2023, the Fund paid the Adviser an administrative fee at an annual rate of 0.05% of the Fund’s average daily net assets. Effective December 27, 2023, the Fund reimbursed the Adviser administrative costs not exceeding 0.05% of the Fund's average daily net assets.
First Eagle High Yield Municipal Fund
October 31, 2024
Annual Shareholder Report
For more information, please scan the QR code to navigate to tailored shareholder reports and financial statements and other Information. If you wish to view additional information about the Fund, including but not limited to financial statements, holdings, or the Fund's prospectus, please visit http://www.firsteagle.com.
Important Notice Regarding Delivery of Shareholder Materials
Unless we are notified otherwise, we send one copy of these materials to shareholders with the same residential address (provided they have the same last name or are reasonably believed to be family members) for as long as they remain a shareholder of the Fund. If you would like to receive individual mailings, please call 800.334.2143 and we will send separate copies of these materials within 30 days after receiving your request.
October 31, 2024
Annual Shareholder Report
This Annual Shareholder Report contains important information about the Class R6 shares of the Fund, and any material changes that occurred for the period of November 1, 2023, to October 31, 2024. You can find additional information about the Fund at https://www.firsteagle.com/first-eagle-fund-shareholder-reports. You can also request this information by contacting us at 800.334.2143.
First Eagle High Yield Municipal Fund
What Were the Fund's Costs for the Year?
Based on a Hypothetical $10,000 Investment
| Class Name | Cost of a $10,000 Investment | Cost Paid as a Percentage of a $10,000 Investment |
|---|
| Class R6 | $28 | 0.26% |
How Did the Fund Perform Last Year?
The NAV of First Eagle High Yield Municipal Fund Class R6 Shares increased 17.89% in the 12-month period ended October 31, 2024. The S&P Municipal Yield Index increased 16.94%, the S&P Municipal Bond Index increased 10.08% and the Bloomberg U.S. Corporate High Yield Index increased 16.47% for the same period.
• Transportation and health care were the largest contributors among sectors, while tobacco settlement was the only detractor and education was the next worst performing sector.
• Sanctuary LTC LLC was the leading contributor to performance.
• Buckeye Tobacco Settlement Financing Authority was the largest detractor to performance.
Total Return Based on a $10,000 Investment
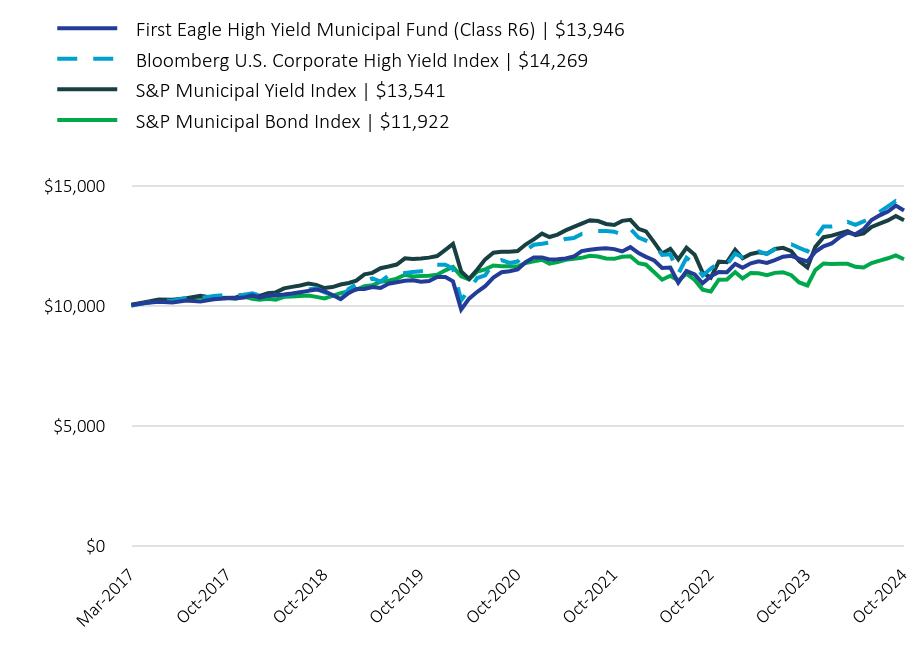
| First Eagle High Yield Municipal Fund (Class R6) | $13,946 | Bloomberg U.S. Corporate High Yield Index | $14,269 | S&P Municipal Yield Index | $13,541 | S&P Municipal Bond Index | $11,922 |
|---|
| Mar-2017 | 10,011 | 9,977.680000 | 10,027.610000 | 10,021.510000 |
| Apr-2017 | 10,100.100000 | 10,092.900000 | 10,133.600000 | 10,093.780000 |
| May-2017 | 10,155.650000 | 10,180.670000 | 10,241.020000 | 10,226.660000 |
| Jun-2017 | 10,122.130000 | 10,194.430000 | 10,234.270000 | 10,203.570000 |
| Jul-2017 | 10,201.090000 | 10,307.340000 | 10,297.790000 | 10,270.940000 |
| Aug-2017 | 10,158.240000 | 10,303.300000 | 10,399.150000 | 10,351.280000 |
| Sep-2017 | 10,251.700000 | 10,395.810000 | 10,309.130000 | 10,304.310000 |
| Oct-2017 | 10,299.880000 | 10,439.720000 | 10,302.370000 | 10,317.760000 |
| Nov-2017 | 10,299.880000 | 10,413.070000 | 10,330.520000 | 10,273.200000 |
| Dec-2017 | 10,323.570000 | 10,444.540000 | 10,439.530000 | 10,370.600000 |
| Jan-2018 | 10,428.870000 | 10,507.180000 | 10,414.100000 | 10,272.090000 |
| Feb-2018 | 10,322.500000 | 10,417.880000 | 10,399.360000 | 10,232.190000 |
| Mar-2018 | 10,405.080000 | 10,354.960000 | 10,510.400000 | 10,274.890000 |
| Apr-2018 | 10,424.850000 | 10,422.330000 | 10,541 | 10,239.420000 |
| May-2018 | 10,456.120000 | 10,419.440000 | 10,708.860000 | 10,355.300000 |
| Jun-2018 | 10,494.810000 | 10,461.260000 | 10,769.620000 | 10,368.340000 |
| Jul-2018 | 10,549.380000 | 10,575.430000 | 10,827.410000 | 10,394.920000 |
| Aug-2018 | 10,604.240000 | 10,653.420000 | 10,906.420000 | 10,414.160000 |
| Sep-2018 | 10,659.380000 | 10,712.750000 | 10,854.010000 | 10,353.740000 |
| Oct-2018 | 10,586.900000 | 10,541.490000 | 10,722.220000 | 10,285.810000 |
| Nov-2018 | 10,431.270000 | 10,450.800000 | 10,761.160000 | 10,392.520000 |
| Dec-2018 | 10,263.330000 | 10,227.040000 | 10,868.110000 | 10,511.210000 |
| Jan-2019 | 10,518.880000 | 10,689.340000 | 10,931.640000 | 10,588.460000 |
| Feb-2019 | 10,685.080000 | 10,867.090000 | 11,031.770000 | 10,644.170000 |
| Mar-2019 | 10,684.010000 | 10,969.300000 | 11,292.480000 | 10,801.470000 |
| Apr-2019 | 10,765.210000 | 11,125.260000 | 11,353.290000 | 10,837.530000 |
| May-2019 | 10,722.150000 | 10,993.050000 | 11,546.320000 | 10,983.310000 |
| Jun-2019 | 10,900.140000 | 11,243.590000 | 11,616.080000 | 11,030.400000 |
| Jul-2019 | 10,959 | 11,306.990000 | 11,699.500000 | 11,115.360000 |
| Aug-2019 | 11,021.470000 | 11,352.220000 | 11,957.980000 | 11,274.760000 |
| Sep-2019 | 11,042.410000 | 11,393.560000 | 11,930.790000 | 11,201.960000 |
| Oct-2019 | 10,984.990000 | 11,425.030000 | 11,949.680000 | 11,218.620000 |
| Nov-2019 | 11,012.450000 | 11,462.320000 | 11,988.040000 | 11,237.530000 |
| Dec-2019 | 11,183.140000 | 11,691.490000 | 12,054.760000 | 11,274.300000 |
| Jan-2020 | 11,176.430000 | 11,694.600000 | 12,313.500000 | 11,457.870000 |
| Feb-2020 | 11,000.960000 | 11,529.690000 | 12,560.160000 | 11,596.200000 |
| Mar-2020 | 9,829.360000 | 10,208.430000 | 11,416.660000 | 11,209.250000 |
| Apr-2020 | 10,279.540000 | 10,668.360000 | 11,102.050000 | 11,077.340000 |
| May-2020 | 10,566.340000 | 11,138.350000 | 11,495.410000 | 11,408.250000 |
| Jun-2020 | 10,801.970000 | 11,247.380000 | 11,914.460000 | 11,496.860000 |
| Jul-2020 | 11,158.440000 | 11,774.670000 | 12,192.300000 | 11,658.660000 |
| Aug-2020 | 11,380.490000 | 11,886.600000 | 12,230.070000 | 11,630.340000 |
| Sep-2020 | 11,419.180000 | 11,764.340000 | 12,236.240000 | 11,632.920000 |
| Oct-2020 | 11,494.550000 | 11,824.080000 | 12,258.960000 | 11,616.490000 |
| Nov-2020 | 11,796.860000 | 12,291.840000 | 12,531.800000 | 11,763.870000 |
| Dec-2020 | 11,997.400000 | 12,523.190000 | 12,748.990000 | 11,832.750000 |
| Jan-2021 | 11,997.400000 | 12,564.610000 | 12,986.180000 | 11,899.370000 |
| Feb-2021 | 11,914.620000 | 12,610.770000 | 12,845.830000 | 11,737.640000 |
| Mar-2021 | 11,915.810000 | 12,629.640000 | 12,947.660000 | 11,802.200000 |
| Apr-2021 | 11,952.750000 | 12,766.820000 | 13,120.150000 | 11,897.070000 |
| May-2021 | 12,031.640000 | 12,804.580000 | 13,265.140000 | 11,944.940000 |
| Jun-2021 | 12,260.240000 | 12,976.110000 | 13,405.450000 | 11,979.320000 |
| Jul-2021 | 12,312.960000 | 13,025.530000 | 13,543.730000 | 12,063.090000 |
| Aug-2021 | 12,354.820000 | 13,092.440000 | 13,512.120000 | 12,030.550000 |
| Sep-2021 | 12,382.010000 | 13,091.010000 | 13,390.020000 | 11,948.550000 |
| Oct-2021 | 12,341.140000 | 13,068.600000 | 13,346.870000 | 11,936.820000 |
| Nov-2021 | 12,244.880000 | 12,941.500000 | 13,518.140000 | 12,024.810000 |
| Dec-2021 | 12,423.660000 | 13,184.080000 | 13,559.050000 | 12,042.080000 |
| Jan-2022 | 12,175.190000 | 12,823.580000 | 13,184.640000 | 11,754.580000 |
| Feb-2022 | 12,020.560000 | 12,691.920000 | 13,080.090000 | 11,694.390000 |
| Mar-2022 | 11,870.300000 | 12,546.410000 | 12,624.650000 | 11,376.070000 |
| Apr-2022 | 11,560.490000 | 12,100.280000 | 12,156.600000 | 11,068.070000 |
| May-2022 | 11,577.830000 | 12,129.950000 | 12,351.490000 | 11,231.540000 |
| Jun-2022 | 10,946.840000 | 11,313.240000 | 11,916.480000 | 11,032.020000 |
| Jul-2022 | 11,433.970000 | 11,981.100000 | 12,397.030000 | 11,317.300000 |
| Aug-2022 | 11,284.190000 | 11,705.010000 | 12,105.940000 | 11,058.400000 |
| Sep-2022 | 10,918.580000 | 11,240.100000 | 11,366.970000 | 10,656.950000 |
| Oct-2022 | 11,211.200000 | 11,532.200000 | 11,155.580000 | 10,580.870000 |
| Nov-2022 | 11,389.460000 | 11,782.510000 | 11,826.720000 | 11,070.560000 |
| Dec-2022 | 11,381.480000 | 11,708.970000 | 11,798.570000 | 11,073.140000 |
| Jan-2023 | 11,724.070000 | 12,154.760000 | 12,310.680000 | 11,385.560000 |
| Feb-2023 | 11,566.960000 | 11,998.500000 | 11,957.550000 | 11,120.430000 |
| Mar-2023 | 11,752.030000 | 12,126.760000 | 12,141.170000 | 11,351.620000 |
| Apr-2023 | 11,833.120000 | 12,247.850000 | 12,211.660000 | 11,337.800000 |
| May-2023 | 11,769.220000 | 12,135.620000 | 12,151.430000 | 11,252.830000 |
| Jun-2023 | 11,879.860000 | 12,338.680000 | 12,349.310000 | 11,352.670000 |
| Jul-2023 | 12,023.600000 | 12,508.920000 | 12,395.650000 | 11,381.400000 |
| Aug-2023 | 12,063.280000 | 12,543.570000 | 12,255.720000 | 11,256.130000 |
| Sep-2023 | 11,936.620000 | 12,395.170000 | 11,843.530000 | 10,954.900000 |
| Oct-2023 | 11,825.600000 | 12,250.820000 | 11,579.950000 | 10,830.770000 |
| Nov-2023 | 12,232.410000 | 12,805.840000 | 12,435.450000 | 11,469.780000 |
| Dec-2023 | 12,456.260000 | 13,283.240000 | 12,837.740000 | 11,741.080000 |
| Jan-2024 | 12,577.080000 | 13,282.710000 | 12,901.710000 | 11,723.130000 |
| Feb-2024 | 12,831.140000 | 13,321.530000 | 12,996.830000 | 11,732.140000 |
| Mar-2024 | 13,023.610000 | 13,479.120000 | 13,088.650000 | 11,730.260000 |
| Apr-2024 | 12,963.700000 | 13,352.410000 | 12,923.750000 | 11,604.540000 |
| May-2024 | 13,171.120000 | 13,499.110000 | 12,996.200000 | 11,576.420000 |
| Jun-2024 | 13,553.080000 | 13,626.590000 | 13,267.050000 | 11,761.050000 |
| Jul-2024 | 13,748.250000 | 13,891.510000 | 13,405.500000 | 11,862.460000 |
| Aug-2024 | 13,907.730000 | 14,118.100000 | 13,534.860000 | 11,959.770000 |
| Sep-2024 | 14,151.110000 | 14,346.520000 | 13,717.360000 | 12,080.050000 |
| Oct-2024 | 13,946 | 14,269 | 13,541 | 11,922 |
The above chart represents historical performance of a hypothetical $10,000 investment since inception. The results of this chart do not predict the results of future time periods and does not guarantee the same results.
| Class/Index Name | 1 Year | 5 Years | Since Inception (3/1/17) |
|---|
| Class R6 | 17.89% | 4.88% | 4.42% |
| Bloomberg U.S. Corporate High Yield Index | 16.47% | 4.55% | 4.70% |
| S&P Municipal Yield Index | 16.94% | 2.53% | 4.04% |
| S&P Municipal Bond Index | 10.08% | 1.22% | 2.34% |
The Fund's past performance is not a good predictor of the Fund's future performance.The graph and table do not reflect the deduction of taxes that a shareholder would pay on fund distributions or redemption of fund shares. Call us at 800.334.2143 or visit https://www.firsteagle.com if you have questions about current performance.
- Net Assets$4,237,049,109
- Number of Portfolio Holdings1,182
- Portfolio Turnover Rate136.03%
- Net Investment Advisory Fees (net of waivers and reimbursements)$5,268,220
Asset Allocation by Asset Class
Based on total investments in the portfolio
| Value | Value |
|---|
| Municipal Bonds | 100.0%Footnote Reference1 |
| Short-Term Investments | 0.0%Footnote Reference2Footnote Reference3 |
Bond Credit QualityFootnote Reference4
Based on total investments in the portfolio
| AAA | 4.9% |
| AA | 7.1% |
| A | 1.1% |
| BBB | 8.7% |
| BB or lower | 7.8% |
| N/R (Not Rated) | 70.4% |
| N/A (not applicable) | 0.0%Footnote Reference3 |
| Footnote | Description |
Footnote1 | Total investments include the Fund’s assets attributable to financial leverage. Inverse floating rate interests (“Inverse Floaters”) are issued in connection with municipal tender option bond (“TOB”) financing transactions (secured borrowing) to generate leverage for a Fund. |
Footnote2 | Includes short-term commercial paper (0.0% of total investments) that settles in 90 days or less; long-term commercial paper (0.0% of total investments) that settles in 91 days or more; and other short-term investments (0.0% of total investments), such as U.S. treasury bills or money market funds. |
Footnote3 | Less than 0.05% |
Footnote4 | The credit quality ratings shown above are assigned by S&P Global Ratings. S&P Global Ratings is a nationally recognized statistical rating organization. Investment grade ratings are credit ratings of BB or higher. Below investment grade are credit ratings of BB or lower. Investments designated N/R are not rated by S&P Global Ratings. Unrated investments do not necessarily indicate low credit quality. Credit quality ratings are subject to change. |
This is a summary of certain changes of the Fund since November 1, 2023. For more information contact 800.334.2143 or you may review the Fund’s next prospectus, which is expected to be available by March 1, 2025 at https://www.firsteagle.com or upon request at 800.334.2143.
Effective December 27, 2023, The Fund changed name from First Eagle High Income Fund to First Eagle High Yield Municipal Fund. The Fund also changed its investment objectives, principal investment strategies, and principal risks accordingly.
The Adviser has contractually agreed to waive its management fee for the period from November 1, 2023 through April 30, 2024.
Prior to December 27, 2023, the Fund paid the Adviser an administrative fee at an annual rate of 0.05% of the Fund’s average daily net assets. Effective December 27, 2023, the Fund reimbursed the Adviser administrative costs not exceeding 0.05% of the Fund's average daily net assets.
First Eagle High Yield Municipal Fund
October 31, 2024
Annual Shareholder Report
For more information, please scan the QR code to navigate to tailored shareholder reports and financial statements and other Information. If you wish to view additional information about the Fund, including but not limited to financial statements, holdings, or the Fund's prospectus, please visit http://www.firsteagle.com.
Important Notice Regarding Delivery of Shareholder Materials
Unless we are notified otherwise, we send one copy of these materials to shareholders with the same residential address (provided they have the same last name or are reasonably believed to be family members) for as long as they remain a shareholder of the Fund. If you would like to receive individual mailings, please call 800.334.2143 and we will send separate copies of these materials within 30 days after receiving your request.
October 31, 2024
Annual Shareholder Report
This Annual Shareholder Report contains important information about the Class A shares of the Fund, and any material changes that occurred for the period of January 2, 2024, to October 31, 2024. You can find additional information about the Fund at https://www.firsteagle.com/first-eagle-fund-shareholder-reports. You can also request this information by contacting us at 800.334.2143.
First Eagle Short Duration High Yield Municipal Fund
What Were the Fund's Costs for the period January 2, 2024 to October 31, 2024?
Based on a Hypothetical $10,000 Investment
| Class Name | Cost of a $10,000 Investment | Cost Paid as a Percentage of a $10,000 Investment |
|---|
| Class A | $37Footnote Reference1 | 0.43%Footnote Reference2 |
| Footnote | Description |
Footnote1 | The cost of a $10,000 investment is based on the period January 2, 2024 to October 31, 2024. Had the class been open for the full fiscal year, the cost of a $10,000 investment would have been higher. |
Footnote2 | Annualized. |
How Did the Fund Perform Last Year?
The NAV of First Eagle Short Duration High Yield Municipal Fund Class A Shares1 increased 6.30% in the period since inception January 2, 2024 and ended October 31, 2024. The S&P Short Duration Municipal Yield Index increased 3.84% and the S&P Municipal Bond Index increased 1.54% for the same period.
• All sectors contributed to performance. Industrial development revenue/pollution control revenue and health care were the largest contributors, while tax-supported and utility were the worst performing sectors.
• AAF Operations Holdings LLC was the leading contributor to performance.
• Denton County Municipal Utility District No 16 was the largest detractor to performance.
1 Reflects performance for Class A shares without the effect of sales charges and assumes all distributions have been reinvested; if sales charges were included, values would be lower.
Total Return Based on a $10,000 Investment
| First Eagle Short Duration High Yield Municipal Fund (Class A) | $10,289 | S&P Municipal Bond Index | $10,170 | S&P Short Duration Municipal Yield Index | $10,352 |
|---|
| Jan-2024 | 9,750 | 10,000 | 10,000 |
| Feb-2024 | 9,789 | 10,007.690000 | 10,041.700000 |
| Mar-2024 | 9,839.900000 | 10,006.090000 | 10,093.850000 |
| Apr-2024 | 9,865.490000 | 9,898.850000 | 10,041.410000 |
| May-2024 | 9,920.730000 | 9,874.860000 | 10,043.340000 |
| Jun-2024 | 10,064.580000 | 10,032.350000 | 10,154.200000 |
| Jul-2024 | 10,170.260000 | 10,118.860000 | 10,236.050000 |
| Aug-2024 | 10,267.900000 | 10,201.860000 | 10,335.330000 |
| Sep-2024 | 10,349.010000 | 10,304.460000 | 10,424.830000 |
| Oct-2024 | 10,289 | 10,170 | 10,352 |
The above chart represents historical performance of a hypothetical $10,000 investment since inception. The results of this chart do not predict the results of future time periods and does not guarantee the same results.
| Class/Index Name | Since Inception (1/2/24) |
|---|
| Class A - without sales charge | 6.30% |
| Class A - with sales charge | 3.60% |
| S&P Municipal Bond Index | 1.54% |
| S&P Short Duration Municipal Yield Index | 3.84% |
The Fund's past performance is not a good predictor of the Fund's future performance.The graph and table do not reflect the deduction of taxes that a shareholder would pay on fund distributions or redemption of fund shares. Call us at 800.334.2143 or visit https://www.firsteagle.com if you have questions about current performance.
- Net Assets$160,676,830
- Number of Portfolio Holdings201
- Portfolio Turnover Rate202.33%Footnote Reference1
- Net Investment Advisory Fees (net of waivers and reimbursements)$-
| Footnote | Description |
Footnote1 | Not annualized. |
Asset Allocation by Asset Class
Based on total investments in the portfolio
| Value | Value |
|---|
| Municipal Bonds | 99.9% |
| Short-Term Investments | 0.1%Footnote Reference1 |
Bond Credit QualityFootnote Reference2
Based on total investments in the portfolio
| AA | 1.1% |
| A | 1.1% |
| BBB | 7.0% |
| BB or lower | 10.2% |
| N/R (Not Rated) | 80.5% |
| N/A (not applicable) | 0.1% |
| Footnote | Description |
Footnote1 | Includes short-term commercial paper (0.0% of total investments) that settles in 90 days or less; long-term commercial paper (0.0% of total investments) that settles in 91 days or more; and other short-term investments (0.1% of total investments), such as U.S. treasury bills or money market funds. |
Footnote2 | The credit quality ratings shown above are assigned by S&P Global Ratings. S&P Global Ratings is a nationally recognized statistical rating organization. Investment grade ratings are credit ratings of BB or higher. Below investment grade are credit ratings of BB or lower. Investments designated N/R are not rated by S&P Global Ratings. Unrated investments do not necessarily indicate low credit quality. Credit quality ratings are subject to change. |
This is a summary of certain changes of the Fund since January 2, 2024. For more information contact 800.334.2143 or you may review the Fund’s next prospectus, which is expected to be available by March 1, 2025 at https://www.firsteagle.com or upon request at 800.334.2143.
The Fund incepted on January 2, 2024. The Adviser has contractually agreed to waive its management fee for the period from May 1, 2024 through October 31, 2024.
First Eagle Short Duration High Yield Municipal Fund
October 31, 2024
Annual Shareholder Report
For more information, please scan the QR code to navigate to tailored shareholder reports and financial statements and other Information. If you wish to view additional information about the Fund, including but not limited to financial statements, holdings, or the Fund's prospectus, please visit http://www.firsteagle.com.
Important Notice Regarding Delivery of Shareholder Materials
Unless we are notified otherwise, we send one copy of these materials to shareholders with the same residential address (provided they have the same last name or are reasonably believed to be family members) for as long as they remain a shareholder of the Fund. If you would like to receive individual mailings, please call 800.334.2143 and we will send separate copies of these materials within 30 days after receiving your request.
October 31, 2024
Annual Shareholder Report
This Annual Shareholder Report contains important information about the Class I shares of the Fund, and any material changes that occurred for the period of January 2, 2024, to October 31, 2024. You can find additional information about the Fund at https://www.firsteagle.com/first-eagle-fund-shareholder-reports. You can also request this information by contacting us at 800.334.2143.
First Eagle Short Duration High Yield Municipal Fund
What Were the Fund's Costs for the period January 2, 2024 to October 31, 2024?
Based on a Hypothetical $10,000 Investment
| Class Name | Cost of a $10,000 Investment | Cost Paid as a Percentage of a $10,000 Investment |
|---|
| Class I | $19Footnote Reference1 | 0.22%Footnote Reference2 |
| Footnote | Description |
Footnote1 | The cost of a $10,000 investment is based on the period January 2, 2024 to October 31, 2024. Had the class been open for the full fiscal year, the cost of a $10,000 investment would have been higher. |
Footnote2 | Annualized. |
How Did the Fund Perform Last Year?
The NAV of First Eagle Short Duration High Yield Municipal Fund Class I Shares increased 6.56% in the period since inception January 2, 2024 and ended October 31, 2024. The S&P Short Duration Municipal Yield Index increased 3.84% and the S&P Municipal Bond Index increased 1.54% for the same period.
• All sectors contributed to performance. Industrial development revenue/pollution control revenue and health care were the largest contributors, while tax-supported and utility were the worst performing sectors.
• AAF Operations Holdings LLC was the leading contributor to performance.
• Denton County Municipal Utility District No 16 was the largest detractor to performance.
Total Return Based on a $1,000,000 Investment
| First Eagle Short Duration High Yield Municipal Fund (Class I) | $1,057,064 | S&P Municipal Bond Index | $1,017,000 | S&P Short Duration Municipal Yield Index | $1,035,155 |
|---|
| Jan-2024 | 1,000,000 | 1,000,000 | 1,000,000 |
| Feb-2024 | 1,003,700 | 1,000,768.750000 | 1,004,169.840000 |
| Mar-2024 | 1,009,722.200000 | 1,000,608.870000 | 1,009,385.320000 |
| Apr-2024 | 1,012,549.420000 | 989,884.610000 | 1,004,140.930000 |
| May-2024 | 1,018,422.210000 | 987,485.950000 | 1,004,333.800000 |
| Jun-2024 | 1,033,393.020000 | 1,003,235.320000 | 1,015,419.670000 |
| Jul-2024 | 1,043,416.930000 | 1,011,885.560000 | 1,023,604.870000 |
| Aug-2024 | 1,054,581.490000 | 1,020,186.150000 | 1,033,533.380000 |
| Sep-2024 | 1,063,123.600000 | 1,030,445.990000 | 1,042,483.030000 |
| Oct-2024 | 1,057,064 | 1,017,000 | 1,035,155 |
The above chart represents historical performance of a hypothetical $1,000,000 investment since inception. The results of this chart do not predict the results of future time periods and does not guarantee the same results.
| Class/Index Name | Since Inception (1/2/24) |
|---|
| Class I | 6.56% |
| S&P Municipal Bond Index | 1.54% |
| S&P Short Duration Municipal Yield Index | 3.84% |
The Fund's past performance is not a good predictor of the Fund's future performance.The graph and table do not reflect the deduction of taxes that a shareholder would pay on fund distributions or redemption of fund shares. Call us at 800.334.2143 or visit https://www.firsteagle.com if you have questions about current performance.
- Net Assets$160,676,830
- Number of Portfolio Holdings201
- Portfolio Turnover Rate202.33%Footnote Reference1
- Net Investment Advisory Fees (net of waivers and reimbursements)$-
| Footnote | Description |
Footnote1 | Not annualized. |
Asset Allocation by Asset Class
Based on total investments in the portfolio
| Value | Value |
|---|
| Municipal Bonds | 99.9% |
| Short-Term Investments | 0.1%Footnote Reference1 |
Bond Credit QualityFootnote Reference2
Based on total investments in the portfolio
| AA | 1.1% |
| A | 1.1% |
| BBB | 7.0% |
| BB or lower | 10.2% |
| N/R (Not Rated) | 80.5% |
| N/A (not applicable) | 0.1% |
| Footnote | Description |
Footnote1 | Includes short-term commercial paper (0.0% of total investments) that settles in 90 days or less; long-term commercial paper (0.0% of total investments) that settles in 91 days or more; and other short-term investments (0.1% of total investments), such as U.S. treasury bills or money market funds. |
Footnote2 | The credit quality ratings shown above are assigned by S&P Global Ratings. S&P Global Ratings is a nationally recognized statistical rating organization. Investment grade ratings are credit ratings of BB or higher. Below investment grade are credit ratings of BB or lower. Investments designated N/R are not rated by S&P Global Ratings. Unrated investments do not necessarily indicate low credit quality. Credit quality ratings are subject to change. |
This is a summary of certain changes of the Fund since January 2, 2024. For more information contact 800.334.2143 or you may review the Fund’s next prospectus, which is expected to be available by March 1, 2025 at https://www.firsteagle.com or upon request at 800.334.2143.
The Fund incepted on January 2, 2024. The Adviser has contractually agreed to waive its management fee for the period from May 1, 2024 through October 31, 2024.
First Eagle Short Duration High Yield Municipal Fund
October 31, 2024
Annual Shareholder Report
For more information, please scan the QR code to navigate to tailored shareholder reports and financial statements and other Information. If you wish to view additional information about the Fund, including but not limited to financial statements, holdings, or the Fund's prospectus, please visit http://www.firsteagle.com.
Important Notice Regarding Delivery of Shareholder Materials
Unless we are notified otherwise, we send one copy of these materials to shareholders with the same residential address (provided they have the same last name or are reasonably believed to be family members) for as long as they remain a shareholder of the Fund. If you would like to receive individual mailings, please call 800.334.2143 and we will send separate copies of these materials within 30 days after receiving your request.
October 31, 2024
Annual Shareholder Report
This Annual Shareholder Report contains important information about the Class R6 shares of the Fund, and any material changes that occurred for the period of January 2, 2024, to October 31, 2024. You can find additional information about the Fund at https://www.firsteagle.com/first-eagle-fund-shareholder-reports. You can also request this information by contacting us at 800.334.2143.
First Eagle Short Duration High Yield Municipal Fund
What Were the Fund's Costs for the period January 2, 2024 to October 31, 2024?
Based on a Hypothetical $10,000 Investment
| Class Name | Cost of a $10,000 Investment | Cost Paid as a Percentage of a $10,000 Investment |
|---|
| Class R6 | $28Footnote Reference1 | 0.32%Footnote Reference2 |
| Footnote | Description |
Footnote1 | The cost of a $10,000 investment is based on the period January 2, 2024 to October 31, 2024. Had the class been open for the full fiscal year, the cost of a $10,000 investment would have been higher. |
Footnote2 | Annualized. |
How Did the Fund Perform Last Year?
The NAV of First Eagle Short Duration High Yield Municipal Fund Class R6 Shares increased 6.54% in the period since inception January 2, 2024 and ended October 31, 2024. The S&P Short Duration Municipal Yield Index increased 3.84% and the S&P Municipal Bond Index increased 1.54% for the same period.
• All sectors contributed to performance. Industrial development revenue/pollution control revenue and health care were the largest contributors, while tax-supported and utility were the worst performing sectors.
• AAF Operations Holdings LLC was the leading contributor to performance.
• Denton County Municipal Utility District No 16 was the largest detractor to performance.
Total Return Based on a $10,000 Investment
| First Eagle Short Duration High Yield Municipal Fund (Class R6) | $10,574 | S&P Municipal Bond Index | $10,170 | S&P Short Duration Municipal Yield Index | $10,352 |
|---|
| Jan-2024 | 10,000 | 10,000 | 10,000 |
| Feb-2024 | 10,042 | 10,007.690000 | 10,041.700000 |
| Mar-2024 | 10,096.230000 | 10,006.090000 | 10,093.850000 |
| Apr-2024 | 10,124.500000 | 9,898.850000 | 10,041.410000 |
| May-2024 | 10,184.230000 | 9,874.860000 | 10,043.340000 |
| Jun-2024 | 10,333.940000 | 10,032.350000 | 10,154.200000 |
| Jul-2024 | 10,445.550000 | 10,118.860000 | 10,236.050000 |
| Aug-2024 | 10,547.910000 | 10,201.860000 | 10,335.330000 |
| Sep-2024 | 10,643.900000 | 10,304.460000 | 10,424.830000 |
| Oct-2024 | 10,574 | 10,170 | 10,352 |
The above chart represents historical performance of a hypothetical $10,000 investment since inception. The results of this chart do not predict the results of future time periods and does not guarantee the same results.
| Class/Index Name | Since Inception (1/2/24) |
|---|
| Class R6 | 6.54% |
| S&P Municipal Bond Index | 1.54% |
| S&P Short Duration Municipal Yield Index | 3.84% |
The Fund's past performance is not a good predictor of the Fund's future performance.The graph and table do not reflect the deduction of taxes that a shareholder would pay on fund distributions or redemption of fund shares. Call us at 800.334.2143 or visit https://www.firsteagle.com if you have questions about current performance.
- Net Assets$160,676,830
- Number of Portfolio Holdings201
- Portfolio Turnover Rate202.33%Footnote Reference1
- Net Investment Advisory Fees (net of waivers and reimbursements)$-
| Footnote | Description |
Footnote1 | Not annualized. |
Asset Allocation by Asset Class
Based on total investments in the portfolio
| Value | Value |
|---|
| Municipal Bonds | 99.9% |
| Short-Term Investments | 0.1%Footnote Reference1 |
Bond Credit QualityFootnote Reference2
Based on total investments in the portfolio
| AA | 1.1% |
| A | 1.1% |
| BBB | 7.0% |
| BB or lower | 10.2% |
| N/R (Not Rated) | 80.5% |
| N/A (not applicable) | 0.1% |
| Footnote | Description |
Footnote1 | Includes short-term commercial paper (0.0% of total investments) that settles in 90 days or less; long-term commercial paper (0.0% of total investments) that settles in 91 days or more; and other short-term investments (0.1% of total investments), such as U.S. treasury bills or money market funds. |
Footnote2 | The credit quality ratings shown above are assigned by S&P Global Ratings. S&P Global Ratings is a nationally recognized statistical rating organization. Investment grade ratings are credit ratings of BB or higher. Below investment grade are credit ratings of BB or lower. Investments designated N/R are not rated by S&P Global Ratings. Unrated investments do not necessarily indicate low credit quality. Credit quality ratings are subject to change. |
This is a summary of certain changes of the Fund since January 2, 2024. For more information contact 800.334.2143 or you may review the Fund’s next prospectus, which is expected to be available by March 1, 2025 at https://www.firsteagle.com or upon request at 800.334.2143.
The Fund incepted on January 2, 2024. The Adviser has contractually agreed to waive its management fee for the period from May 1, 2024 through October 31, 2024.
First Eagle Short Duration High Yield Municipal Fund
October 31, 2024
Annual Shareholder Report
For more information, please scan the QR code to navigate to tailored shareholder reports and financial statements and other Information. If you wish to view additional information about the Fund, including but not limited to financial statements, holdings, or the Fund's prospectus, please visit http://www.firsteagle.com.
Important Notice Regarding Delivery of Shareholder Materials
Unless we are notified otherwise, we send one copy of these materials to shareholders with the same residential address (provided they have the same last name or are reasonably believed to be family members) for as long as they remain a shareholder of the Fund. If you would like to receive individual mailings, please call 800.334.2143 and we will send separate copies of these materials within 30 days after receiving your request.
Item 2. Code of Ethics.
The Registrant has adopted a code of ethics that applies to its principal executive officer and principal financial officer. Copies of the code of ethics may be requested free of charge by calling 1-800-334-2143 (toll free).
Item 3. Audit Committee Financial Expert.
The Board of Trustees of the registrant has designated Mandakini Puri, Paul J. Lawler, William M. Kelly and Jean Hamilton as Audit Committee Financial Experts. Ms. Puri, Mr. Lawler, Mr. Kelly and Ms. Hamilton are considered by the Board to be independent trustees.
Item 4. Principal Accountant Fees and Services.
(a) Audit Fees:
For the Fiscal years ended October 31, 2024 and October 31, 2023, the aggregate PricewaterhouseCoopers LLP (PwC) audit fees for professional services rendered to the registrant were approximately $700,443 and $631,499, respectively. Fees included in the audit fees category are those associated with the annual audits of the financial statements and services that are normally provided in connection with statutory and regulatory filings.
(b) Audit Related Fees:
For the fiscal years ended October 31, 2024 and October 31, 2023, the aggregate PwC fees for assurance and related services rendered to the registrant were approximately $0 and $0, respectively.
(c) Tax Fees
In each fiscal year ended October 31, 2024 and October 31, 2023, the aggregate tax fees billed by PwC for professional services rendered to the registrant were approximately $700,335 and $627,600, respectively.
Fees included in the tax fees category comprise all services performed by professional staff in the independent accountant’s tax division except those services related to audits. This category comprises fees for tax compliance and preparation of tax returns.
(d) All Other Fees:
In each of the fiscal years ended October 31, 2024 and October 31, 2023, there were no fees billed by PwC for products and services, other than 4(a)-(c) above, rendered to the registrant.
(e)(1) The registrant’s audit committee has adopted a policy whereby audit and non-audit services performed by the registrant’s principal accountant for the registrant, its investment adviser, and any entity controlling, controlled by, or under common control with the investment adviser that provides ongoing services to the registrant require pre-approval by the committee or a designated member thereof. If such a service is required between regularly scheduled audit committee meetings, pre-approval may be authorized by one audit committee member with ratification at the next scheduled audit committee meeting. Waiver of pre-approval for audit and non-audit services requiring fees of a de minimis amount is not permitted.
(e)(2) No services included in (b) – (d) above were approved pursuant to paragraph (c)(7)(i)(C) of Rule 2-01 of Regulation S-X.
(f) According to PwC, for the fiscal year ended October 31, 2024, the percentage of hours spent on the audit of the registrant’s financial statements for the most recent fiscal year that were attributable to work performed by persons who are not full-time, permanent employees of PwC was 0%.
(g) Other than as described in the table above, the aggregate fees billed for the most recent fiscal year and the preceding fiscal year by the registrant’s principal accountant for non-audit services rendered to the registrant (“covered”), its investment adviser, and any entity controlling, controlled by, or under common control with the investment adviser (“non-covered”) that provides ongoing services to the registrant was $0 in 2024 and 2023.
(h) Not applicable.
(i) Not applicable.
(j) Not applicable.
Item 5. Audit Committee of Listed Registrants
Not applicable to this report.
Item 6. Investments.
Please see the schedule of investments contained under Item 7 of this Form N-CSR.
Item 7. Financial Statements and Financial Highlights for Open-End Management Investment Companies.

Annual Report
October 31, 2024
First Eagle Global Fund
First Eagle Overseas Fund
First Eagle U.S. Value Fund
First Eagle Gold Fund
First Eagle Global Income Builder Fund
First Eagle Rising Dividend Fund
First Eagle Small Cap Opportunity Fund
First Eagle U.S. Smid Cap Opportunity Fund
First Eagle Global Real Assets Fund
First Eagle High Yield Municipal Fund (formerly First Eagle High Income Fund)
First Eagle Short Duration High Yield Municipal Fund
Advised by First Eagle Investment Management, LLC

Forward-Looking Statement Disclosure
One of our most important responsibilities as mutual fund managers is to communicate with shareholders in an open and direct manner. Some of our comments in our letters to shareholders are based on current management expectations and are considered "forward-looking statements". Actual future results, however, may prove to be different from our expectations. You can identify forward-looking statements by words such as "may", "will", "believe", "attempt", "seek", "think", "ought", "try" and other similar terms. We cannot promise future returns. Our opinions are a reflection of our best judgment at the time this report is compiled, and we disclaim any obligation to update or alter forward-looking statements as a result of new information, future events, or otherwise.
First Eagle Funds | Annual Report | October 31, 2024
2
Table of Contents
Item 7
First Eagle Global Fund Consolidated Schedule of Investments | | | 4 | | |
First Eagle Overseas Fund Consolidated Schedule of Investments | | | 15 | | |
First Eagle U.S. Value Fund Consolidated Schedule of Investments | | | 24 | | |
First Eagle Gold Fund Consolidated Schedule of Investments | | | 30 | | |
First Eagle Global Income Builder Fund Schedule of Investments | | | 34 | | |
First Eagle Rising Dividend Schedule of Investments | | | 50 | | |
First Eagle Small Cap Opportunity Fund Schedule of Investments | | | 54 | | |
First Eagle U.S. Smid Cap Opportunity Fund Schedule of Investments | | | 66 | | |
First Eagle Global Real Assets Fund Consolidated Schedule of Investments | | | 71 | | |
First Eagle High Yield Municipal Fund (formerly First Eagle High Income Fund) Schedule of Investments | | | 75 | | |
First Eagle Short Duration High Yield Municipal Fund Schedule of
Investments | | | 153 | | |
Statements of Assets and Liabilities | | | 170 | | |
Statements of Operations | | | 182 | | |
Statements of Changes in Net Assets | | | 194 | | |
Financial Highlights | | | 212 | | |
Notes to Financial Statements | | | 226 | | |
Report of Independent Registered Accounting Firm | | | 261 | | |
Item 8 Changes in and Disagreements with Accountants | | | 263 | | |
Item 9 Proxy Disclosures | | | 263 | | |
Item 10 Remuneration Paid to Directors, Officers, and Others | | | 263 | | |
Item 11 Statement Regarding Basis for Approval of Investment
Advisory Contract | | | 263 | | |
General Information | | | 268 | | |
Tax Information | | | 269 | | |
Privacy Notice | | | 270 | | |
First Eagle Funds | Annual Report | October 31, 2024
3
First Eagle Global Fund | Consolidated Schedule of Investments | October 31, 2024
Investments | | Shares | | Value ($) | |
Common Stocks — 81.7% | |
Belgium — 0.8% | |
Groupe Bruxelles Lambert NV | | | 6,469,396 | | | | 467,444,418 | | |
Brazil — 1.1% | |
Ambev SA, ADR | | | 166,791,911 | | | | 363,606,366 | | |
Itausa SA (Preference) | | | 141,581,549 | | | | 259,852,313 | | |
| | | 623,458,679 | | |
Canada — 4.9% | |
Agnico Eagle Mines Ltd. | | | 2,830,107 | | | | 244,279,282 | | |
Barrick Gold Corp. | | | 25,083,139 | | | | 484,606,245 | | |
Franco-Nevada Corp. | | | 1,260,834 | | | | 167,362,617 | | |
Imperial Oil Ltd. | | | 10,896,401 | | | | 813,111,692 | | |
Nutrien Ltd. | | | 4,461,321 | | | | 212,715,785 | | |
Power Corp. of Canada | | | 10,763,570 | | | | 340,219,568 | | |
Wheaton Precious Metals Corp. | | | 7,936,282 | | | | 523,873,975 | | |
| | | | 2,786,169,164 | | |
China — 2.2% | |
Alibaba Group Holding Ltd. | | | 37,671,592 | | | | 460,810,786 | | |
Prosus NV | | | 18,115,368 | | | | 763,469,897 | | |
| | | | 1,224,280,683 | | |
France — 3.2% | |
Danone SA | | | 8,646,144 | | | | 617,667,965 | | |
Legrand SA | | | 1,954,335 | | | | 220,582,751 | | |
LVMH Moet Hennessy Louis Vuitton SE | | | 331,920 | | | | 220,965,965 | | |
Pluxee NV* | | | 2,131,829 | | | | 44,869,200 | | |
Sanofi SA | | | 4,031,951 | | | | 426,095,872 | | |
Sodexo SA | | | 2,131,829 | | | | 185,047,980 | | |
Wendel SE | | | 867,489 | | | | 86,217,250 | | |
| | | 1,801,446,983 | | |
Germany — 0.9% | |
Brenntag SE | | | 1,126,149 | | | | 73,462,174 | | |
Henkel AG & Co. KGaA (Preference) | | | 3,516,726 | | | | 304,523,796 | | |
Merck KGaA | | | 597,571 | | | | 98,793,636 | | |
| | | | 476,779,606 | | |
First Eagle Funds | Annual Report | October 31, 2024
4
First Eagle Global Fund | Consolidated Schedule of Investments | October 31, 2024
Investments | | Shares | | Value ($) | |
Hong Kong — 1.3% | |
CK Asset Holdings Ltd. | | | 44,146,500 | | | | 180,469,382 | | |
Guoco Group Ltd. | | | 12,748,580 | | | | 120,531,075 | | |
Hongkong Land Holdings Ltd. | | | 31,759,300 | | | | 136,170,794 | | |
Jardine Matheson Holdings Ltd. | | | 7,051,271 | | | | 271,473,933 | | |
| | | | 708,645,184 | | |
Japan — 6.3% | |
Chofu Seisakusho Co. Ltd. (a) | | | 2,811,500 | | | | 36,095,872 | | |
FANUC Corp. | | | 16,005,400 | | | | 424,644,392 | | |
Hirose Electric Co. Ltd. | | | 1,258,915 | | | | 149,823,347 | | |
Hoshizaki Corp. | | | 6,107,800 | | | | 200,752,605 | | |
Keyence Corp. | | | 263,400 | | | | 118,902,364 | | |
Komatsu Ltd. | | | 6,756,000 | | | | 174,881,106 | | |
Mitsubishi Electric Corp. | | | 24,592,300 | | | | 432,640,805 | | |
MS&AD Insurance Group Holdings, Inc. | | | 26,041,160 | | | | 576,013,112 | | |
Secom Co. Ltd. | | | 12,674,260 | | | | 450,733,564 | | |
Shimano, Inc. | | | 2,469,690 | | | | 362,821,426 | | |
SMC Corp. | | | 496,356 | | | | 210,726,233 | | |
Sompo Holdings, Inc. | | | 14,953,900 | | | | 320,597,927 | | |
T Hasegawa Co. Ltd. (a) | | | 3,002,800 | | | | 65,161,051 | | |
USS Co. Ltd. | | | 2,597,200 | | | | 21,750,960 | | |
| | | | 3,545,544,764 | | |
Mexico — 1.4% | |
Fomento Economico Mexicano SAB de CV, ADR | | | 6,562,745 | | | | 635,864,363 | | |
Fresnillo plc | | | 5,590,827 | | | | 53,200,640 | | |
Industrias Penoles SAB de CV* | | | 6,401,020 | | | | 100,547,470 | | |
| | | | 789,612,473 | | |
Netherlands — 0.4% | |
Heineken Holding NV | | | 3,269,505 | | | | 226,537,886 | | |
Norway — 0.3% | |
Orkla ASA | | | 16,166,787 | | | | 149,357,646 | | |
South Korea — 2.5% | |
Hyundai Mobis Co. Ltd. | | | 999,985 | | | | 179,730,143 | | |
KT&G Corp. | | | 5,242,098 | | | | 416,401,982 | | |
NAVER Corp. | | | 1,363,651 | | | | 166,804,228 | | |
First Eagle Funds | Annual Report | October 31, 2024
5
First Eagle Global Fund | Consolidated Schedule of Investments | October 31, 2024
Investments | | Shares | | Value ($) | |
South Korea — 2.5% (continued) | |
Samsung Electronics Co. Ltd. | | | 3,422,255 | | | | 145,312,335 | | |
Samsung Electronics Co. Ltd. (Preference) | | | 12,016,075 | | | | 413,356,411 | | |
Samsung Life Insurance Co. Ltd. | | | 1,218,958 | | | | 89,196,613 | | |
| | | | 1,410,801,712 | | |
Sweden — 1.0% | |
Investor AB, Class A | | | 4,970,940 | | | | 141,129,670 | | |
Investor AB, Class B | | | 11,255,824 | | | | 318,585,550 | | |
Svenska Handelsbanken AB, Class A | | | 10,429,006 | | | | 108,364,047 | | |
| | | | 568,079,267 | | |
Switzerland — 2.9% | |
Cie Financiere Richemont SA (Registered) | | | 4,644,824 | | | | 676,288,675 | | |
Nestle SA (Registered) | | | 3,956,506 | | | | 373,860,712 | | |
Schindler Holding AG | | | 1,798,637 | | | | 523,453,906 | | |
Schindler Holding AG (Registered) | | | 211,870 | | | | 60,402,513 | | |
| | | | 1,634,005,806 | | |
Taiwan — 1.0% | |
Taiwan Semiconductor Manufacturing Co. Ltd., ADR | | | 2,980,143 | | | | 567,836,447 | | |
Thailand — 0.3% | |
Bangkok Bank PCL, NVDR | | | 42,690,800 | | | | 185,799,056 | | |
United Kingdom — 7.2% | |
BAE Systems plc | | | 30,239,911 | | | | 487,386,003 | | |
Berkeley Group Holdings plc (a) | | | 6,528,960 | | | | 372,574,034 | | |
British American Tobacco plc | | | 20,559,170 | | | | 718,935,874 | | |
Derwent London plc, REIT | | | 4,758,461 | | | | 134,373,966 | | |
Diageo plc | | | 6,329,982 | | | | 195,481,104 | | |
Haleon plc | | | 107,935,852 | | | | 518,746,821 | | |
Lloyds Banking Group plc | | | 396,239,696 | | | | 271,979,060 | | |
Reckitt Benckiser Group plc | | | 9,376,596 | | | | 568,822,096 | | |
Unilever plc | | | 12,894,404 | | | | 787,353,563 | | |
| | | | 4,055,652,521 | | |
United States — 44.0% | |
Alphabet, Inc., Class A | | | 2,694,360 | | | | 461,031,940 | | |
Alphabet, Inc., Class C | | | 4,503,302 | | | | 777,675,222 | | |
American Express Co. | | | 1,903,714 | | | | 514,155,077 | | |
First Eagle Funds | Annual Report | October 31, 2024
6
First Eagle Global Fund | Consolidated Schedule of Investments | October 31, 2024
Investments | | Shares | | Value ($) | |
United States — 44.0% (continued) | |
Analog Devices, Inc. | | | 2,478,362 | | | | 552,947,346 | | |
Bank of New York Mellon Corp. (The) | | | 11,016,077 | | | | 830,171,563 | | |
Becton Dickinson & Co. | | | 2,274,823 | | | | 531,375,905 | | |
Berkshire Hathaway, Inc., Class A* | | | 675 | | | | 456,947,663 | | |
Bio-Rad Laboratories, Inc., Class A* | | | 525,458 | | | | 188,213,801 | | |
Brown & Brown, Inc. | | | 1,759,253 | | | | 184,088,234 | | |
BXP, Inc., REIT | | | 2,473,129 | | | | 199,235,272 | | |
CH Robinson Worldwide, Inc. (a) | | | 7,996,857 | | | | 823,996,146 | | |
Charles Schwab Corp. (The) | | | 2,570,105 | | | | 182,040,537 | | |
Charter Communications, Inc., Class A* | | | 257,512 | | | | 84,363,506 | | |
Colgate-Palmolive Co. | | | 5,896,055 | | | | 552,519,314 | | |
Comcast Corp., Class A | | | 21,961,227 | | | | 959,046,783 | | |
Cummins, Inc. | | | 1,119,800 | | | | 368,391,804 | | |
Deere & Co. | | | 381,724 | | | | 154,479,886 | | |
Dentsply Sirona, Inc. (a) | | | 10,435,979 | | | | 241,801,633 | | |
Dollar General Corp. | | | 3,160,328 | | | | 252,952,653 | | |
Douglas Emmett, Inc., REIT (a) | | | 9,162,021 | | | | 162,992,354 | | |
Elevance Health, Inc. | | | 1,904,509 | | | | 772,773,572 | | |
Equity Residential, REIT | | | 6,189,955 | | | | 435,587,133 | | |
Expeditors International of Washington, Inc. | | | 2,376,047 | | | | 282,749,593 | | |
Extra Space Storage, Inc., REIT | | | 1,155,209 | | | | 188,645,630 | | |
Exxon Mobil Corp. | | | 9,538,191 | | | | 1,113,869,945 | | |
Fidelity National Financial, Inc. | | | 4,297,027 | | | | 258,552,115 | | |
Flowserve Corp. (a) | | | 7,892,216 | | | | 415,446,250 | | |
HCA Healthcare, Inc. | | | 3,109,934 | | | | 1,115,657,723 | | |
IPG Photonics Corp.* (a) | | | 3,319,802 | | | | 268,771,170 | | |
JG Boswell Co. | | | 2,485 | | | | 1,422,675 | | |
Kraft Heinz Co. (The) | | | 3,886,410 | | | | 130,039,279 | | |
Medtronic plc | | | 6,658,084 | | | | 594,233,997 | | |
Meta Platforms, Inc., Class A | | | 2,584,560 | | | | 1,466,944,565 | | |
Microsoft Corp. | | | 466,954 | | | | 189,746,758 | | |
Mills Music Trust (a) | | | 31,592 | | | | 1,137,312 | | |
Newmont Corp. | | | 8,257,354 | | | | 375,214,166 | | |
Noble Corp. plc | | | 5,364,876 | | | | 171,568,734 | | |
First Eagle Funds | Annual Report | October 31, 2024
7
First Eagle Global Fund | Consolidated Schedule of Investments | October 31, 2024
Investments | | Shares | | Value ($) | |
United States — 44.0% (continued) | |
NOV, Inc. (a) | | | 28,255,276 | | | | 438,239,331 | | |
ONEOK, Inc. | | | 2,398,383 | | | | 232,355,345 | | |
Oracle Corp. | | | 9,822,058 | | | | 1,648,534,215 | | |
Philip Morris International, Inc. | | | 7,954,243 | | | | 1,055,528,046 | | |
PPG Industries, Inc. | | | 1,562,422 | | | | 194,537,163 | | |
Ross Stores, Inc. | | | 1,159,115 | | | | 161,951,548 | | |
Royal Gold, Inc. | | | 1,476,988 | | | | 215,728,867 | | |
RPM International, Inc. | | | 850,166 | | | | 108,064,600 | | |
Salesforce, Inc. | | | 1,878,799 | | | | 547,425,665 | | |
Schlumberger NV | | | 20,475,698 | | | | 820,461,219 | | |
Texas Instruments, Inc. | | | 2,603,801 | | | | 528,988,211 | | |
UnitedHealth Group, Inc. | | | 275,783 | | | | 155,679,503 | | |
Universal Health Services, Inc., Class B | | | 3,368,166 | | | | 688,149,995 | | |
US Bancorp | | | 5,965,007 | | | | 288,169,488 | | |
Walt Disney Co. (The) | | | 2,946,738 | | | | 283,476,196 | | |
Weyerhaeuser Co., REIT | | | 10,347,140 | | | | 322,416,882 | | |
Willis Towers Watson plc | | | 2,814,965 | | | | 850,654,273 | | |
| | | | 24,801,147,803 | | |
Total Common Stocks
(Cost $29,152,277,606) | | | 46,022,600,098 | | |
| | | Ounces | | | |
Commodities — 11.8% | |
Gold bullion*
(Cost $2,461,714,969) | | | 2,426,222 | | | | 6,663,738,941 | | |
| | | Principal Amount ($) | | | |
Corporate Bonds — 0.0% (b) | |
United States — 0.0% (b) | |
Bausch & Lomb, Inc.
7.13%, 8/1/2028‡ (Cost $5,210,587) | | | 5,467,000 | | | | 5,248,320 | | |
First Eagle Funds | Annual Report | October 31, 2024
8
First Eagle Global Fund | Consolidated Schedule of Investments | October 31, 2024
Investments | | Principal Amount ($) | | Value ($) | |
Short-Term Investments — 6.4% | |
Commercial Paper — 6.3% | |
AES Corp. (The)
5.24%, 11/1/2024 (c) | | | 38,138,000 | | | | 38,132,435 | | |
Amphenol Corp.
4.84%, 11/1/2024 (c)(d) | | | 23,255,000 | | | | 23,251,885 | | |
Apple, Inc.
4.69%, 11/29/2024 (c)(d) | | | 50,000,000 | | | | 49,810,940 | | |
4.77%, 12/4/2024 (c)(d) | | | 50,000,000 | | | | 49,778,906 | | |
4.72%, 12/9/2024 (c)(d) | | | 100,000,000 | | | | 99,493,867 | | |
4.73%, 12/12/2024 (c)(d) | | | 150,000,000 | | | | 149,183,450 | | |
BNG Bank NV
4.68%, 12/20/2024 (c)(d) | | | 70,000,000 | | | | 69,554,722 | | |
Cisco Systems, Inc.
5.17%, 11/27/2024 (c)(d) | | | 100,000,000 | | | | 99,645,125 | | |
5.17%, 12/4/2024 (c)(d) | | | 50,000,000 | | | | 49,777,363 | | |
Credit Agricole Corporate and Investment Bank
4.81%, 11/1/2024 (c) | | | 26,280,000 | | | | 26,276,477 | | |
Duke Energy Corp.
4.84%, 11/1/2024 (c)(d) | | | 33,674,000 | | | | 33,669,451 | | |
Engie SA
5.38%, 11/1/2024 (c) | | | 64,139,000 | | | | 64,130,514 | | |
5.34%, 11/4/2024 (c) | | | 45,000,000 | | | | 44,976,143 | | |
5.21%, 11/18/2024 (c) | | | 50,000,000 | | | | 49,883,213 | | |
5.21%, 11/20/2024 (c) | | | 50,000,000 | | | | 49,870,875 | | |
5.21%, 11/21/2024 (c) | | | 50,000,000 | | | | 49,864,754 | | |
5.13%, 11/25/2024 (c) | | | 100,000,000 | | | | 99,676,042 | | |
4.75%, 12/5/2024 (c) | | | 80,000,000 | | | | 79,635,611 | | |
4.88%, 12/19/2024 (c) | | | 45,000,000 | | | | 44,715,943 | | |
4.78%, 12/20/2024 (c) | | | 45,000,000 | | | | 44,710,416 | | |
Entergy Corp.
4.90%, 11/1/2024 (c)(d) | | | 30,232,000 | | | | 30,227,883 | | |
General Motors Financial Co., Inc.
4.93%, 11/1/2024 (c)(d) | | | 93,720,000 | | | | 93,707,218 | | |
Government of Quebec
4.99%, 11/19/2024 (c)(d) | | | 55,000,000 | | | | 54,862,031 | | |
First Eagle Funds | Annual Report | October 31, 2024
9
First Eagle Global Fund | Consolidated Schedule of Investments | October 31, 2024
Investments | | Principal Amount ($) | | Value ($) | |
Commercial Paper — 6.3% (continued) | |
Hydro-Quebec
5.27%, 11/1/2024 (c)(d) | | | 32,650,000 | | | | 32,645,673 | | |
5.13%, 11/19/2024 (c) | | | 50,000,000 | | | | 49,875,101 | | |
Kreditanstalt fuer Wiederaufbau
4.65%, 1/22/2021 (c)(d) | | | 75,000,000 | | | | 74,213,373 | | |
5.12%, 11/25/2024 (c)(d) | | | 50,000,000 | | | | 49,839,352 | | |
4.97%, 12/11/2024 (c)(d) | | | 100,000,000 | | | | 99,478,313 | | |
4.71%, 1/8/2025 (c)(d) | | | 75,000,000 | | | | 74,347,735 | | |
4.65%, 1/23/2025 (c)(d) | | | 75,000,000 | | | | 74,203,750 | | |
4.55%, 1/28/2025 (c)(d) | | | 81,000,000 | | | | 80,088,028 | | |
LVMH Moet Hennessy Louis Vuitton, Inc.
5.03%, 12/13/2024 (c)(d) | | | 65,000,000 | | | | 64,635,563 | | |
Nestle Finance International Ltd.
4.91%, 12/13/2024 (c)(d) | | | 100,000,000 | | | | 99,444,106 | | |
NRW Bank
5.05%, 11/5/2020 (c)(d) | | | 75,000,000 | | | | 74,950,297 | | |
5.17%, 11/12/2020 (c) | | | 75,000,000 | | | | 74,881,003 | | |
5.22%, 11/20/2024 (c)(d) | | | 80,000,000 | | | | 79,789,037 | | |
5.07%, 11/26/2024 (c)(d) | | | 50,000,000 | | | | 49,828,954 | | |
Province of Quebec Canada
5.16%, 11/12/2024 (c)(d) | | | 50,000,000 | | | | 49,920,323 | | |
5.15%, 11/13/2024 (c)(d) | | | 100,000,000 | | | | 99,827,506 | | |
5.14%, 11/14/2024 (c)(d) | | | 100,000,000 | | | | 99,814,388 | | |
5.14%, 11/15/2024 (c)(d) | | | 100,000,000 | | | | 99,801,292 | | |
5.13%, 11/21/2024 (c) | | | 25,000,000 | | | | 24,930,802 | | |
PSP Capital, Inc.
5.14%, 11/25/2024 (c)(d) | | | 75,000,000 | | | | 74,755,990 | | |
4.66%, 1/2/2025 (c)(d) | | | 50,000,000 | | | | 49,596,800 | | |
4.66%, 1/21/2025 (c)(d) | | | 50,000,000 | | | | 49,476,642 | | |
4.68%, 1/29/2025 (c)(d) | | | 64,650,000 | | | | 63,908,141 | | |
4.64%, 1/31/2025 (c)(d) | | | 50,000,000 | | | | 49,413,875 | | |
Roche Holdings, Inc.
4.96%, 12/10/2024 (c) | | | 75,000,000 | | | | 74,611,666 | | |
Sanofi SA
5.13%, 11/6/2024 (c)(d) | | | 80,000,000 | | | | 79,935,885 | | |
5.22%, 11/21/2024 (c)(d) | | | 75,000,000 | | | | 74,791,969 | | |
First Eagle Funds | Annual Report | October 31, 2024
10
First Eagle Global Fund | Consolidated Schedule of Investments | October 31, 2024
Investments | | Principal Amount ($) | | Value ($) | |
Commercial Paper — 6.3% (continued) | |
Svensk Exportkredit AB
5.14%, 12/2/2024 (c) | | | 75,000,000 | | | | 74,688,267 | | |
5.10%, 12/3/2024 (c) | | | 100,000,000 | | | | 99,571,550 | | |
Sysco Corp.
4.85%, 11/1/2024 (c)(d) | | | 27,906,000 | | | | 27,902,234 | | |
Walt Disney Co. (The)
5.26%, 11/18/2024 (c) | | | 75,000,000 | | | | 74,819,006 | | |
Total Commercial Paper
(Cost $3,540,802,949) | | | 3,540,821,885 | | |
U.S. Treasury Obligations — 0.1% | |
U.S. Treasury Bills
5.28%, 12/5/2024 (c) | | | 20,000,000 | | | | 19,913,154 | | |
4.76%, 2/6/2025 (c) | | | 20,000,000 | | | | 19,760,814 | | |
5.12%, 3/20/2025 (c) | | | 20,000,000 | | | | 19,661,750 | | |
Total U.S. Treasury Obligations
(Cost $59,270,625) | | | 59,335,718 | | |
| | | Shares | | | |
Investment Companies — 0.0% (b) | |
JP Morgan U.S. Government Money Market Fund,
Capital Shares 4.86% (e) (Cost $739,001) | | | 739,001 | | | | 739,001 | | |
Total Short-Term Investments
(Cost $3,600,812,575) | | | 3,600,896,604 | | |
Total Investments — 99.9%
(Cost $35,220,015,737) | | | 56,292,483,963 | | |
Other Assets Less Liabilities — 0.1% | | | 43,636,328 | | |
Net Assets — 100.0% | | | 56,336,120,291 | | |
* Non-income producing security.
‡ Value determined using significant unobservable inputs.
(a) Affiliated company as defined under the Investment Company Act of 1940.
(b) Represents less than 0.05% of net assets.
(c) The rate shown was the current yield as of October 31, 2024.
(d) Securities exempt from registration under Rule 144A or section 4(a)(2) of the Securities Act of 1933. Total value of all such securities at October 31, 2024 amounted to $2,475,572,067, which represents approximately 4.39% of net assets of the Fund.
(e) Represents 7-day effective yield as of October 31, 2024.
First Eagle Funds | Annual Report | October 31, 2024
11
First Eagle Global Fund | Consolidated Schedule of Investments | October 31, 2024
As of October 31, 2024, the gross unrealized appreciation (depreciation) of investments based on the aggregate cost of investments for federal income tax purposes was as follows:
Aggregate gross unrealized appreciation | | $ | 22,639,004,449 | | |
Aggregate gross unrealized depreciation | | | (2,112,868,278 | ) | |
Net unrealized appreciation | | $ | 20,526,136,171 | | |
Federal income tax cost of investments | | $ | 35,818,011,333 | | |
Forward Foreign Currency Exchange Contracts outstanding as of October 31, 2024
Currency
Purchased | | Currency Sold | | Counterparty | | Settlement
Date | | Unrealized
Appreciation
(Depreciation) | |
EUR | 244,054,000 | | | USD | 265,286,698 | | | UBS AG | | 11/6/2024 | | $ | 208,980 | | |
JPY | 13,296,179,000 | | | USD | 87,023,428 | | | UBS AG | | 11/6/2024 | | | 508,589 | | |
USD | 95,297,399 | | | JPY | 13,296,179,000 | | | UBS AG | | 11/6/2024 | | | 7,765,382 | | |
USD | 95,541,177 | | | JPY | 13,296,179,000 | | | Bank of New York Mellon | | 12/4/2024 | | | 7,693,802 | | |
USD | 302,224,130 | | | EUR | 270,165,000 | | | Goldman Sachs | | 1/8/2025 | | | 7,482,220 | | |
USD | 110,484,926 | | | GBP | 83,682,000 | | | Goldman Sachs | | 1/8/2025 | | | 2,598,870 | | |
USD | 95,921,646 | | | JPY | 13,296,179,000 | | | Goldman Sachs | | 1/8/2025 | | | 7,615,021 | | |
USD | 348,792,226 | | | EUR | 310,021,000 | | | JPMorgan Chase Bank | | 2/5/2025 | | | 10,164,927 | | |
USD | 107,811,709 | | | GBP | 80,458,000 | | | JPMorgan Chase Bank | | 2/5/2025 | | | 4,097,106 | | |
USD | 96,117,188 | | | JPY | 13,296,179,000 | | | JPMorgan Chase Bank | | 2/5/2025 | | | 7,512,542 | | |
Total unrealized appreciation | | | | | | | | | 55,647,439 | | |
USD | 262,647,254 | | | EUR | 244,054,000 | | | UBS AG | | 11/6/2024 | | | (2,848,424 | ) | |
USD | 238,009,426 | | | EUR | 218,819,000 | | | Bank of New York Mellon | | 12/4/2024 | | | (301,533 | ) | |
USD | 263,788,821 | | | EUR | 241,409,000 | | | UBS AG | | 3/5/2025 | | | (260,813 | ) | |
USD | 94,301,898 | | | JPY | 14,191,304,000 | | | UBS AG | | 3/5/2025 | | | (573,128 | ) | |
Total unrealized depreciation | | | | | | | | | (3,983,898 | ) | |
Net unrealized appreciation | | | | | | | | $ | 51,663,541 | | |
Abbreviations
ADR — American Depositary Receipt
EUR — Euro
GBP — British Pound
JPY — Japanese Yen
NVDR — Non-Voting Depositary Receipt
Preference — A special type of equity investment that shares in the earnings of the company, has limited voting rights, and may have a dividend preference. Preference shares may also have liquidation preference.
REIT — Real Estate Investment Trust
USD — United States Dollar
First Eagle Funds | Annual Report | October 31, 2024
12
First Eagle Global Fund | Consolidated Schedule of Investments | October 31, 2024
Affiliated Securities
Security Description | | Shares at
October 31, 2024 | | Market Value
October 31, 2023 | | Purchases at
Cost | | Proceeds from
Sales | |
Common Stocks — 5.1% | |
Japan — 0.2% | |
Chofu Seisakusho Co. Ltd. | | | 2,811,500 | | | $ | 44,698,784 | | | $ | — | | | $ | (4,539,600 | ) | |
T Hasegawa Co. Ltd. | | | 3,002,800 | | | | 62,909,936 | | | | — | | | | — | | |
| | | | | | 107,608,720 | | | | — | | | | (4,539,600 | ) | |
United Kingdom — 0.7% | |
Berkeley Group Holdings plc | | | 6,528,960 | | | | 332,616,729 | | | | — | | | | (10 | ) | |
United States — 4.2% | |
CH Robinson Worldwide, Inc. | | | 7,996,857 | | | | 547,603,660 | | | | 111,156,693 | | | | (9,646,411 | ) | |
Dentsply Sirona, Inc.^ | | | 10,435,979 | | | | 209,857,889 | | | | 98,610,927 | | | | — | | |
Douglas Emmett, Inc., REIT | | | 9,162,021 | | | | 102,706,255 | | | | — | | | | — | | |
Flowserve Corp. | | | 7,892,216 | | | | 289,802,171 | | | | — | | | | — | | |
IPG Photonics Corp.* | | | 3,319,802 | | | | 266,058,242 | | | | 19,827,887 | | | | — | | |
Mills Music Trust | | | 31,592 | | | | 1,074,444 | | | | — | | | | — | | |
NOV, Inc. | | | 28,255,276 | | | | 537,029,309 | | | | 26,137,540 | | | | — | | |
| | | | | | 1,954,131,970 | | | | 255,733,047 | | | | (9,646,411 | ) | |
Total Common Stocks | | | | | 2,394,357,419 | | | | 255,733,047 | | | | (14,186,021 | ) | |
Total | | | | $ | 2,394,357,419 | | | $ | 255,733,047 | | | $ | (14,186,021 | ) | |
First Eagle Funds | Annual Report | October 31, 2024
13
First Eagle Global Fund | Consolidated Schedule of Investments | October 31, 2024
Affiliated Securities (continued)
Security Description | | Net Realized
Gains
(Loss) | | Change in
Unrealized
Appreciation/
Depreciation | | Market Value
October 31, 2024 | | Dividend
Income | |
Common Stocks — 5.1% | |
Japan — 0.2% | |
Chofu Seisakusho Co. Ltd. | | $ | (2,291,643 | ) | | $ | (1,771,669 | ) | | $ | 36,095,872 | | | $ | 847,259 | | |
T Hasegawa Co. Ltd. | | | — | | | | 2,251,115 | | | | 65,161,051 | | | | 1,294,575 | | |
| | | | (2,291,643 | ) | | | 479,446 | | | | 101,256,923 | | | | 2,141,834 | | |
United Kingdom — 0.7% | |
Berkeley Group Holdings plc | | | — | | | | 39,957,315 | | | | 372,574,034 | | | | 21,073,242 | | |
United States — 4.2% | |
CH Robinson Worldwide, Inc. | | | 2,657,681 | | | | 172,224,523 | | | | 823,996,146 | | | | 18,957,258 | | |
Dentsply Sirona, Inc.^ | | | — | | | | (66,667,183 | ) | | | 241,801,633 | | | | 5,273,052 | | |
Douglas Emmett, Inc., REIT | | | — | | | | 60,286,099 | | | | 162,992,354 | | | | 6,963,136 | | |
Flowserve Corp. | | | — | | | | 125,644,079 | | | | 415,446,250 | | | | 6,550,539 | | |
IPG Photonics Corp.* | | | — | | | | (17,114,959 | ) | | | 268,771,170 | | | | — | | |
Mills Music Trust | | | — | | | | 62,868 | | | | 1,137,312 | | | | 95,173 | | |
NOV, Inc. | | | — | | | | (124,927,518 | ) | | | 438,239,331 | | | | 6,827,569 | | |
| | | | 2,657,681 | | | | 149,507,909 | | | | 2,352,384,196 | | | | 44,666,727 | | |
Total Common Stocks | | | 366,038 | | | | 189,944,670 | | | | 2,826,215,153 | | | | 67,881,803 | | |
Total | | $ | 366,038 | | | $ | 189,944,670 | | | $ | 2,826,215,153 | | | $ | 67,881,803 | | |
* Non-income producing security.
^ Represents an unaffiliated issuer as of October 31, 2023.
See Notes to Financial Statements.
First Eagle Funds | Annual Report | October 31, 2024
14
First Eagle Overseas Fund | Consolidated Schedule of Investments | October 31, 2024
Investments | | Shares | | Value ($) | |
Common Stocks — 87.7% | |
Belgium — 1.8% | |
Groupe Bruxelles Lambert NV | | | 2,721,717 | | | | 196,656,909 | | |
Legris Industries SA*‡ (a)(b)(c) | | | 905,366 | | | | 22,955,965 | | |
| | | | 219,612,874 | | |
Brazil — 2.1% | |
Ambev SA, ADR | | | 75,441,038 | | | | 164,461,463 | | |
Itausa SA (Preference) | | | 50,723,362 | | | | 93,095,343 | | |
| | | 257,556,806 | | |
Canada — 9.2% | |
Agnico Eagle Mines Ltd. | | | 814,125 | | | | 70,270,796 | | |
Barrick Gold Corp. | | | 6,165,298 | | | | 119,113,557 | | |
CAE, Inc.* | | | 761,621 | | | | 13,401,598 | | |
Franco-Nevada Corp. | | | 316,575 | | | | 42,022,043 | | |
Imperial Oil Ltd. | | | 6,477,070 | | | | 483,332,189 | | |
Nutrien Ltd. | | | 2,328,574 | | | | 111,026,408 | | |
Power Corp. of Canada | | | 4,755,154 | | | | 150,302,961 | | |
Wheaton Precious Metals Corp. | | | 2,235,283 | | | | 147,551,031 | | |
| | | | 1,137,020,583 | | |
Chile — 0.8% | |
Cia Cervecerias Unidas SA, ADR (c) | | | 9,392,572 | | | | 101,909,406 | | |
China — 3.4% | |
Alibaba Group Holding Ltd. | | | 13,648,128 | | | | 166,948,203 | | |
Prosus NV | | | 6,105,285 | | | | 257,306,465 | | |
| | | | 424,254,668 | | |
Faroe Islands — 0.5% | |
Bakkafrost P/F | | | 1,037,685 | | | | 62,578,196 | | |
Finland — 0.2% | |
Kesko OYJ, Class B | | | 999,829 | | | | 21,474,555 | | |
France — 6.1% | |
Danone SA | | | 3,816,797 | | | | 272,666,432 | | |
Laurent-Perrier (c) | | | 558,938 | | | | 61,102,473 | | |
Legrand SA | | | 812,472 | | | | 91,702,451 | | |
LVMH Moet Hennessy Louis Vuitton SE | | | 74,114 | | | | 49,339,213 | | |
Pluxee NV* | | | 801,545 | | | | 16,870,341 | | |
First Eagle Funds | Annual Report | October 31, 2024
15
First Eagle Overseas Fund | Consolidated Schedule of Investments | October 31, 2024
Investments | | Shares | | Value ($) | |
France — 6.1% (continued) | |
Sanofi SA | | | 1,535,347 | | | | 162,255,201 | | |
Sodexo SA | | | 686,065 | | | | 59,552,123 | | |
Wendel SE | | | 439,181 | | | | 43,648,943 | | |
| | | 757,137,177 | | |
Germany — 2.5% | |
Brenntag SE | | | 557,632 | | | | 36,376,056 | | |
FUCHS SE (Preference) | | | 2,322,615 | | | | 108,400,996 | | |
Henkel AG & Co. KGaA (Preference) | | | 1,476,257 | | | | 127,833,498 | | |
Merck KGaA | | | 226,858 | | | | 37,505,379 | | |
| | | | 310,115,929 | | |
Hong Kong — 3.2% | |
CK Asset Holdings Ltd. | | | 20,694,000 | | | | 84,596,364 | | |
Great Eagle Holdings Ltd. | | | 22,777,700 | | | | 33,636,858 | | |
Guoco Group Ltd. | | | 7,806,340 | | | | 73,804,812 | | |
Hongkong Land Holdings Ltd. | | | 15,883,500 | | | | 68,101,904 | | |
Jardine Matheson Holdings Ltd. | | | 3,666,800 | | | | 141,171,800 | | |
| | | | 401,311,738 | | |
Japan — 16.0% | |
As One Corp. | | | 2,756,760 | | | | 51,553,810 | | |
Chofu Seisakusho Co. Ltd. | | | 1,531,600 | | | | 19,663,681 | | |
Daiichikosho Co. Ltd. (c) | | | 5,732,560 | | | | 71,632,170 | | |
FANUC Corp. | | | 6,414,300 | | | | 170,179,847 | | |
Hirose Electric Co. Ltd. | | | 758,730 | | | | 90,296,381 | | |
Hoshizaki Corp. | | | 2,796,700 | | | | 91,922,592 | | |
Kansai Paint Co. Ltd. | | | 8,724,230 | | | | 142,088,475 | | |
Keyence Corp. | | | 74,800 | | | | 33,765,743 | | |
Komatsu Ltd. | | | 3,814,300 | | | | 98,734,311 | | |
MISUMI Group, Inc. | | | 830,100 | | | | 13,510,340 | | |
Mitsubishi Electric Corp. | | | 10,362,800 | | | | 182,307,882 | | |
MS&AD Insurance Group Holdings, Inc. | | | 9,067,500 | | | | 200,567,060 | | |
Nagaileben Co. Ltd. | | | 1,687,224 | | | | 25,314,873 | | |
Nihon Kohden Corp. | | | 5,018,000 | | | | 74,799,880 | | |
Pilot Corp. | | | 737,800 | | | | 22,933,019 | | |
Secom Co. Ltd. | | | 5,436,500 | | | | 193,337,759 | | |
First Eagle Funds | Annual Report | October 31, 2024
16
First Eagle Overseas Fund | Consolidated Schedule of Investments | October 31, 2024
Investments | | Shares | | Value ($) | |
Japan — 16.0% (continued) | |
Shimano, Inc. | | | 971,870 | | | | 142,777,134 | | |
SK Kaken Co. Ltd. | | | 437,805 | | | | 25,558,315 | | |
SMC Corp. | | | 210,690 | | | | 89,447,715 | | |
Sompo Holdings, Inc. | | | 5,492,200 | | | | 117,747,741 | | |
T Hasegawa Co. Ltd. | | | 1,906,436 | | | | 41,369,846 | | |
TIS, Inc. | | | 2,317,600 | | | | 57,792,751 | | |
USS Co. Ltd. | | | 3,021,400 | | | | 25,303,538 | | |
| | | | 1,982,604,863 | | |
Mexico — 2.7% | |
Fomento Economico Mexicano SAB de CV, ADR | | | 2,506,211 | | | | 242,826,784 | | |
Fresnillo plc | | | 1,426,722 | | | | 13,576,261 | | |
Grupo Mexico SAB de CV, Series B | | | 6,905,948 | | | | 36,132,022 | | |
Industrias Penoles SAB de CV* | | | 2,246,692 | | | | 35,291,125 | | |
| | | | 327,826,192 | | |
Netherlands — 1.2% | |
HAL Trust | | | 644,459 | | | | 79,910,225 | | |
Heineken Holding NV | | | 1,150,489 | | | | 79,715,231 | | |
| | | | 159,625,456 | | |
Norway — 1.1% | |
Orkla ASA | | | 14,687,852 | | | | 135,694,433 | | |
Singapore — 1.8% | |
Haw Par Corp. Ltd. (c) | | | 19,436,313 | | | | 157,504,310 | | |
UOL Group Ltd. | | | 15,047,300 | | | | 60,801,587 | | |
| | | | 218,305,897 | | |
South Korea — 5.2% | |
Fursys, Inc. (c) | | | 872,463 | | | | 26,431,518 | | |
Hyundai Mobis Co. Ltd. | | | 505,396 | | | | 90,836,258 | | |
KT&G Corp. | | | 2,259,458 | | | | 179,478,291 | | |
NAVER Corp. | | | 609,111 | | | | 74,507,546 | | |
NongShim Co. Ltd. | | | 197,002 | | | | 53,317,278 | | |
Samsung Electronics Co. Ltd. | | | 1,136,571 | | | | 48,259,930 | | |
Samsung Electronics Co. Ltd. (Preference) | | | 4,008,416 | | | | 137,890,655 | | |
Samsung Life Insurance Co. Ltd. | | | 410,775 | | | | 30,058,245 | | |
| | | | 640,779,721 | | |
First Eagle Funds | Annual Report | October 31, 2024
17
First Eagle Overseas Fund | Consolidated Schedule of Investments | October 31, 2024
Investments | | Shares | | Value ($) | |
Sweden — 3.3% | |
Industrivarden AB, Class A | | | 123,708 | | | | 4,266,781 | | |
Industrivarden AB, Class C | | | 1,572,517 | | | | 54,050,503 | | |
Investor AB, Class A | | | 966,810 | | | | 27,448,647 | | |
Investor AB, Class B | | | 8,027,455 | | | | 227,209,591 | | |
L E Lundbergforetagen AB, Class B | | | 384,245 | | | | 19,023,909 | | |
Svenska Handelsbanken AB, Class A | | | 6,838,494 | | | | 71,056,329 | | |
| | | | 403,055,760 | | |
Switzerland — 4.9% | |
Cie Financiere Richemont SA (Registered) | | | 1,639,732 | | | | 238,745,791 | | |
Nestle SA (Registered) | | | 1,530,593 | | | | 144,629,779 | | |
Schindler Holding AG | | | 663,835 | | | | 193,194,638 | | |
Schindler Holding AG (Registered) | | | 82,435 | | | | 23,501,587 | | |
| | | | 600,071,795 | | |
Taiwan — 2.2% | |
Taiwan Secom Co. Ltd. | | | 8,545,694 | | | | 36,180,093 | | |
Taiwan Semiconductor Manufacturing Co. Ltd., ADR | | | 1,215,919 | | | | 231,681,206 | | |
| | | | 267,861,299 | | |
Thailand — 0.9% | |
Bangkok Bank PCL, NVDR | | | 20,440,959 | | | | 88,963,217 | | |
Thai Beverage PCL | | | 52,214,985 | | | | 20,885,275 | | |
| | | | 109,848,492 | | |
Turkey — 0.5% | |
AG Anadolu Grubu Holding A/S | | | 7,420,450 | | | | 62,826,546 | | |
United Kingdom — 14.5% | |
BAE Systems plc | | | 12,101,334 | | | | 195,040,945 | | |
Berkeley Group Holdings plc | | | 2,267,500 | | | | 129,394,516 | | |
Big Yellow Group plc, REIT | | | 2,602,379 | | | | 40,536,102 | | |
British American Tobacco plc | | | 7,827,992 | | | | 273,737,912 | | |
Diageo plc | | | 2,131,432 | | | | 65,822,412 | | |
Great Portland Estates plc, REIT | | | 7,832,988 | | | | 31,664,272 | | |
Haleon plc | | | 35,038,000 | | | | 168,394,938 | | |
Lloyds Banking Group plc | | | 182,339,363 | | | | 125,157,800 | | |
First Eagle Funds | Annual Report | October 31, 2024
18
First Eagle Overseas Fund | Consolidated Schedule of Investments | October 31, 2024
Investments | | Shares | | Value ($) | |
United Kingdom — 14.5% (continued) | |
Reckitt Benckiser Group plc | | | 3,624,203 | | | | 219,858,757 | | |
Shell plc | | | 8,047,499 | | | | 270,853,654 | | |
Unilever plc | | | 4,381,409 | | | | 267,536,056 | | |
| | | | 1,787,997,364 | | |
United States — 3.6% | |
Newmont Corp. | | | 2,487,576 | | | | 113,035,453 | | |
Royal Gold, Inc. | | | 454,973 | | | | 66,453,356 | | |
Willis Towers Watson plc | | | 900,560 | | | | 272,140,226 | | |
| | | | 451,629,035 | | |
Total Common Stocks
(Cost $7,777,289,322) | | | 10,841,098,785 | | |
| | | Ounces | | | |
Commodities — 10.3% | |
Gold bullion*
(Cost $357,409,268) | | | 465,523 | | | | 1,278,581,767 | | |
Short-Term Investments — 1.8% | |
Commercial Paper — 1.6% | |
AES Corp. (The)
5.24%, 11/1/2024 (d) | | | 24,058,000 | | | | 24,054,490 | | |
Amphenol Corp.
4.84%, 11/1/2024 (d)(e) | | | 14,669,000 | | | | 14,667,035 | | |
BNG Bank NV
4.68%, 12/20/2024 (d)(e) | | | 5,000,000 | | | | 4,968,194 | | |
Credit Agricole Corporate and Investment Bank
4.81%, 11/1/2024 (d) | | | 16,576,000 | | | | 16,573,778 | | |
Duke Energy Corp.
4.84%, 11/1/2024 (d)(e) | | | 21,241,000 | | | | 21,238,131 | | |
Engie SA
5.38%, 11/1/2024 (d) | | | 10,561,000 | | | | 10,559,603 | | |
4.88%, 12/19/2024 (d) | | | 5,000,000 | | | | 4,968,438 | | |
4.78%, 12/20/2024 (d) | | | 5,000,000 | | | | 4,967,824 | | |
Entergy Corp.
4.90%, 11/1/2024 (d)(e) | | | 19,070,000 | | | | 19,067,403 | | |
First Eagle Funds | Annual Report | October 31, 2024
19
First Eagle Overseas Fund | Consolidated Schedule of Investments | October 31, 2024
Investments | | Ounces | | Value ($) | |
Commercial Paper — 1.6% (continued) | |
General Motors Financial Co., Inc.
4.93%, 11/1/2024 (d)(e) | | | 59,117,000 | | | | 59,108,937 | | |
Sysco Corp.
4.85%, 11/1/2024 (d)(e) | | | 17,603,000 | | | | 17,600,624 | | |
Total Commercial Paper
(Cost $197,799,234) | | | 197,774,457 | | |
U.S. Treasury Obligations — 0.2% | |
U.S. Treasury Bills
5.28%, 12/5/2024 (d) | | | 10,000,000 | | | | 9,956,577 | | |
4.76%, 2/6/2025 (d) | | | 10,000,000 | | | | 9,880,407 | | |
5.12%, 3/20/2025 (d) | | | 10,000,000 | | | | 9,830,875 | | |
Total U.S. Treasury Obligations
(Cost $29,635,313) | | | 29,667,859 | | |
| | | Shares | | | |
Investment Companies — 0.0% (f) | |
JP Morgan U.S. Government Money Market Fund,
Capital Shares 4.86% (g) (Cost $60,011) | | | 60,011 | | | | 60,011 | | |
Total Short-Term Investments
(Cost $227,494,558) | | | 227,502,327 | | |
Total Investments — 99.8%
(Cost $8,362,193,148) | | | 12,347,182,879 | | |
Other Assets Less Liabilities — 0.2% | | | 21,298,025 | | |
Net Assets — 100.0% | | | 12,368,480,904 | | |
* Non-income producing security.
‡ Value determined using significant unobservable inputs.
(a) Represents a security that is subject to legal or contractual restrictions on resale. The Fund generally acquires its investments in private transactions exempt from registration under the Securities Act of 1933. Its investments are therefore generally subject to certain limitations on resale, and may be deemed to be "restricted securities" under the Securities Act of 1933. Total value of all such securities at October 31, 2024 amounted to $22,955,965, which represents approximately 0.19% of net assets of the Fund.
Restricted Securities | | Acquisition Date | | Cost | | Carrying Value
Per
Share/Principal | |
Legris Industries SA | | 04/30/04 | | $ | 23,433,066 | | | $ | 25.36 | | |
(b) Security fair valued as of October 31, 2024 by the Adviser as "valuation designee" under the oversight of the Fund's Board of Trustees. Total value of all such securities at October 31, 2024 amounted to $22,955,965, which represents approximately 0.19% of net assets of the Fund.
First Eagle Funds | Annual Report | October 31, 2024
20
First Eagle Overseas Fund | Consolidated Schedule of Investments | October 31, 2024
(c) Affiliated company as defined under the Investment Company Act of 1940.
(d) The rate shown was the current yield as of October 31, 2024.
(e) Securities exempt from registration under Rule 144A or section 4(a)(2) of the Securities Act of 1933. Total value of all such securities at October 31, 2024 amounted to $136,650,324, which represents approximately 1.10% of net assets of the Fund.
(f) Represents less than 0.05% of net assets.
(g) Represents 7-day effective yield as of October 31, 2024.
As of October 31, 2024, the gross unrealized appreciation (depreciation) of investments based on the aggregate cost of investments for federal income tax purposes was as follows:
Aggregate gross unrealized appreciation | | $ | 4,516,620,453 | | |
Aggregate gross unrealized depreciation | | | (1,067,324,923 | ) | |
Net unrealized appreciation | | $ | 3,449,295,530 | | |
Federal income tax cost of investments | | $ | 8,924,511,940 | | |
Forward Foreign Currency Exchange Contracts outstanding as of October 31, 2024
Currency
Purchased | | Currency Sold | | Counterparty | | Settlement
Date | | Unrealized
Appreciation
(Depreciation) | |
EUR | 118,916,000 | | | USD | 129,261,692 | | | UBS AG | | 11/6/2024 | | $ | 101,826 | | |
JPY | 7,376,839,000 | | | USD | 48,281,376 | | | UBS AG | | 11/6/2024 | | | 282,170 | | |
USD | 52,871,849 | | | JPY | 7,376,839,000 | | | UBS AG | | 11/6/2024 | | | 4,308,303 | | |
USD | 53,007,099 | | | JPY | 7,376,839,000 | | | Bank of New York Mellon | | 12/4/2024 | | | 4,268,590 | | |
USD | 169,402,797 | | | EUR | 151,433,000 | | | Goldman Sachs | | 1/8/2025 | | | 4,193,937 | | |
USD | 42,402,594 | | | GBP | 32,116,000 | | | Goldman Sachs | | 1/8/2025 | | | 997,411 | | |
USD | 53,218,187 | | | JPY | 7,376,839,000 | | | Goldman Sachs | | 1/8/2025 | | | 4,224,881 | | |
USD | 151,355,447 | | | EUR | 134,531,000 | | | JPMorgan Chase Bank | | 2/5/2025 | | | 4,410,985 | | |
USD | 43,967,260 | | | GBP | 32,812,000 | | | JPMorgan Chase Bank | | 2/5/2025 | | | 1,670,863 | | |
USD | 53,326,675 | | | JPY | 7,376,839,000 | | | JPMorgan Chase Bank | | 2/5/2025 | | | 4,168,025 | | |
Total unrealized appreciation | | | | | | | | | 28,626,991 | | |
USD | 127,975,615 | | | EUR | 118,916,000 | | | UBS AG | | 11/6/2024 | | | (1,387,902 | ) | |
USD | 131,935,835 | | | EUR | 121,298,000 | | | Bank of New York Mellon | | 12/4/2024 | | | (167,149 | ) | |
USD | 121,609,325 | | | EUR | 111,292,000 | | | UBS AG | | 3/5/2025 | | | (120,237 | ) | |
USD | 53,822,571 | | | JPY | 8,099,651,000 | | | UBS AG | | 3/5/2025 | | | (327,112 | ) | |
Total unrealized depreciation | | | | | | | | | (2,002,400 | ) | |
Net unrealized appreciation | | | | | | | | $ | 26,624,591 | | |
First Eagle Funds | Annual Report | October 31, 2024
21
First Eagle Overseas Fund | Consolidated Schedule of Investments | October 31, 2024
Abbreviations
ADR — American Depositary Receipt
EUR — Euro
GBP — British Pound
JPY — Japanese Yen
NVDR — Non-Voting Depositary Receipt
OYJ — Public Limited Company
Preference — A special type of equity investment that shares in the earnings of the company, has limited voting rights, and may have a dividend preference. Preference shares may also have liquidation preference.
REIT — Real Estate Investment Trust
USD — United States Dollar
Affiliated Securities
Security Description | | Shares at
October 31, 2024 | | Market Value
October 31, 2023 | | Purchases at
Cost | | Proceeds from
Sales | |
Common Stocks — 3.6% | |
Belgium — 0.2% | |
Legris Industries SA*‡ (a)(b) | | | 905,366 | | | $ | 15,384,962 | | | $ | — | | | $ | — | | |
Chile — 0.8% | |
Cia Cervecerias Unidas SA, ADR | | | 9,392,572 | | | | 105,666,435 | | | | — | | | | — | | |
France — 0.5% | |
Laurent-Perrier | | | 558,938 | | | | 69,786,652 | | | | — | | | | — | | |
Japan — 0.6% | |
Daiichikosho Co. Ltd. | | | 5,732,560 | | | | 84,735,608 | | | | — | | | | — | | |
Singapore — 1.3% | |
Haw Par Corp. Ltd. | | | 19,436,313 | | | | 135,861,236 | | | | — | | | | (78,442 | ) | |
South Korea — 0.2% | |
Fursys, Inc. | | | 872,463 | | | | 18,766,466 | | | | — | | | | — | | |
Total Common Stocks | | | | | 430,201,359 | | | | — | | | | (78,442 | ) | |
Total | | | | $ | 430,201,359 | | | $ | — | | | $ | (78,442 | ) | |
First Eagle Funds | Annual Report | October 31, 2024
22
First Eagle Overseas Fund | Consolidated Schedule of Investments | October 31, 2024
Affiliated Securities (continued)
Security Description | | Net Realized
Gains
(Loss) | | Change in
Unrealized
Appreciation/
Depreciation | | Market Value
October 31, 2024 | | Dividend
Income | |
Common Stocks — 3.6% | |
Belgium — 0.2% | |
Legris Industries SA*‡ (a)(b) | | $ | — | | | $ | 7,571,003 | | | $ | 22,955,965 | | | $ | — | | |
Chile — 0.8% | |
Cia Cervecerias Unidas SA, ADR | | | — | | | | (3,757,029 | ) | | | 101,909,406 | | | | 2,390,913 | | |
France — 0.5% | |
Laurent-Perrier | | | — | | | | (8,684,179 | ) | | | 61,102,473 | | | | 1,087,248 | | |
Japan — 0.6% | |
Daiichikosho Co. Ltd. | | | — | | | | (13,103,438 | ) | | | 71,632,170 | | | | 1,999,353 | | |
Singapore — 1.3% | |
Haw Par Corp. Ltd. | | | 31,778 | | | | 21,689,738 | | | | 157,504,310 | | | | 5,846,332 | | |
South Korea — 0.2% | |
Fursys, Inc. | | | — | | | | 7,665,052 | | | | 26,431,518 | | | | 632,116 | | |
Total Common Stocks | | | 31,778 | | | | 11,381,147 | | | | 441,535,842 | | | | 11,955,962 | | |
Total | | $ | 31,778 | | | $ | 11,381,147 | | | $ | 441,535,842 | | | $ | 11,955,962 | | |
* Non-income producing security.
‡ Value determined using significant unobservable inputs.
(a) Security fair valued as of October 31, 2024 by the Adviser as "valuation designee" under the oversight of the Fund's Board of Trustees. Total value of all such securities at October 31, 2024 amounted to $22,955,965, which represents approximately 0.19% of net assets of the Fund.
(b) Represents a security that is subject to legal or contractual restrictions on resale. The Fund generally acquires its investments in private transactions exempt from registration under the Securities Act of 1933. Its investments are therefore generally subject to certain limitations on resale, and may be deemed to be "restricted securities" under the Securities Act of 1933. Total value of all such securities at October 31, 2024 amounted to $22,955,965, which represents approximately 0.19% of net assets of the Fund.
See Notes to Financial Statements.
First Eagle Funds | Annual Report | October 31, 2024
23
First Eagle U.S. Value Fund | Consolidated Schedule of Investments | October 31, 2024
Investments | | Shares | | Value ($) | |
Common Stocks — 77.6% | |
Air Freight & Logistics — 3.6% | |
CH Robinson Worldwide, Inc. | | | 354,218 | | | | 36,498,623 | | |
Expeditors International of Washington, Inc. | | | 111,924 | | | | 13,318,956 | | |
| | | | 49,817,579 | | |
Banks — 1.1% | |
US Bancorp | | | 330,658 | | | | 15,974,088 | | |
Capital Markets — 3.9% | |
Bank of New York Mellon Corp. (The) | | | 589,455 | | | | 44,421,329 | | |
Charles Schwab Corp. (The) | | | 143,493 | | | | 10,163,609 | | |
| | | | 54,584,938 | | |
Chemicals — 1.4% | |
Nutrien Ltd. (Canada) | | | 178,461 | | | | 8,509,020 | | |
PPG Industries, Inc. | | | 55,033 | | | | 6,852,159 | | |
RPM International, Inc. | | | 30,241 | | | | 3,843,934 | | |
| | | | 19,205,113 | | |
Consumer Finance — 1.4% | |
American Express Co. | | | 73,294 | | | | 19,795,244 | | |
Consumer Staples Distribution & Retail — 0.7% | |
Dollar General Corp. | | | 117,633 | | | | 9,415,345 | | |
Electronic Equipment, Instruments & Components — 1.1% | |
IPG Photonics Corp.* | | | 186,242 | | | | 15,078,152 | | |
Energy Equipment & Services — 3.0% | |
Noble Corp. plc | | | 189,081 | | | | 6,046,811 | | |
NOV, Inc. | | | 1,034,361 | | | | 16,042,939 | | |
Schlumberger NV | | | 486,530 | | | | 19,495,257 | | |
| | | | 41,585,007 | | |
Entertainment — 0.8% | |
Walt Disney Co. (The) | | | 109,127 | | | | 10,498,017 | | |
Financial Services — 1.6% | |
Berkshire Hathaway, Inc., Class A* | | | 32 | | | | 21,662,704 | | |
Food Products — 0.6% | |
Kraft Heinz Co. (The) | | | 262,298 | | | | 8,776,491 | | |
Health Care Equipment & Supplies — 3.8% | |
Becton Dickinson & Co. | | | 85,355 | | | | 19,938,074 | | |
First Eagle Funds | Annual Report | October 31, 2024
24
First Eagle U.S. Value Fund | Consolidated Schedule of Investments | October 31, 2024
Investments | | Shares | | Value ($) | |
Health Care Equipment & Supplies — 3.8% (continued) | |
Dentsply Sirona, Inc. | | | 503,680 | | | | 11,670,266 | | |
Medtronic plc | | | 246,406 | | | | 21,991,736 | | |
| | | | 53,600,076 | | |
Health Care Providers & Services — 9.2% | |
Elevance Health, Inc. | | | 87,777 | | | | 35,616,395 | | |
HCA Healthcare, Inc. | | | 147,442 | | | | 52,893,343 | | |
UnitedHealth Group, Inc. | | | 10,154 | | | | 5,731,933 | | |
Universal Health Services, Inc., Class B | | | 170,425 | | | | 34,819,532 | | |
| | | | 129,061,203 | | |
Household Products — 2.4% | |
Colgate-Palmolive Co. | | | 365,303 | | | | 34,232,544 | | |
Insurance — 3.4% | |
Brown & Brown, Inc. | | | 65,306 | | | | 6,833,620 | | |
Fidelity National Financial, Inc. | | | 158,855 | | | | 9,558,305 | | |
Willis Towers Watson plc | | | 104,185 | | | | 31,483,665 | | |
| | | | 47,875,590 | | |
Interactive Media & Services — 7.8% | |
Alphabet, Inc., Class A | | | 126,759 | | | | 21,689,733 | | |
Alphabet, Inc., Class C | | | 188,322 | | | | 32,521,326 | | |
Meta Platforms, Inc., Class A | | | 95,714 | | | | 54,325,352 | | |
| | | | 108,536,411 | | |
Life Sciences Tools & Services — 0.5% | |
Bio-Rad Laboratories, Inc., Class A* | | | 19,277 | | | | 6,904,829 | | |
Machinery — 3.3% | |
Cummins, Inc. | | | 55,552 | | | | 18,275,497 | | |
Deere & Co. | | | 20,543 | | | | 8,313,547 | | |
Flowserve Corp. | | | 378,708 | | | | 19,935,189 | | |
| | | | 46,524,233 | | |
Media — 3.1% | |
Charter Communications, Inc., Class A* | | | 9,493 | | | | 3,110,002 | | |
Comcast Corp., Class A | | | 920,308 | | | | 40,189,850 | | |
| | | | 43,299,852 | | |
Metals & Mining — 3.0% | |
Agnico Eagle Mines Ltd. (Canada) | | | 82,024 | | | | 7,079,861 | | |
First Eagle Funds | Annual Report | October 31, 2024
25
First Eagle U.S. Value Fund | Consolidated Schedule of Investments | October 31, 2024
Investments | | Shares | | Value ($) | |
Metals & Mining — 3.0% (continued) | |
Barrick Gold Corp. (Canada) | | | 619,890 | | | | 11,976,275 | | |
Franco-Nevada Corp. (Canada) | | | 31,259 | | | | 4,149,307 | | |
Newmont Corp. | | | 278,379 | | | | 12,649,542 | | |
Royal Gold, Inc. | | | 38,764 | | | | 5,661,870 | | |
| | | | 41,516,855 | | |
Office REITs — 1.0% | |
BXP, Inc., REIT | | | 102,688 | | | | 8,272,546 | | |
Douglas Emmett, Inc., REIT | | | 359,380 | | | | 6,393,370 | | |
| | | | 14,665,916 | | |
Oil, Gas & Consumable Fuels — 3.3% | |
Exxon Mobil Corp. | | | 317,531 | | | | 37,081,270 | | |
ONEOK, Inc. | | | 88,869 | | | | 8,609,629 | | |
| | | | 45,690,899 | | |
Residential REITs — 1.5% | |
Equity Residential, REIT | | | 296,839 | | | | 20,888,560 | | |
Semiconductors & Semiconductor Equipment — 3.9% | |
Analog Devices, Inc. | | | 123,513 | | | | 27,556,985 | | |
Texas Instruments, Inc. | | | 129,224 | | | | 26,253,148 | | |
| | | | 53,810,133 | | |
Software — 6.7% | |
Microsoft Corp. | | | 22,886 | | | | 9,299,726 | | |
Oracle Corp. | | | 363,657 | | | | 61,036,191 | | |
Salesforce, Inc. | | | 80,777 | | | | 23,535,994 | | |
| | | | 93,871,911 | | |
Specialized REITs — 1.4% | |
Extra Space Storage, Inc., REIT | | | 42,904 | | | | 7,006,223 | | |
Weyerhaeuser Co., REIT | | | 401,701 | | | | 12,517,003 | | |
| | | | 19,523,226 | | |
Specialty Retail — 0.4% | |
Ross Stores, Inc. | | | 42,875 | | | | 5,990,495 | | |
Tobacco — 3.7% | |
Philip Morris International, Inc. | | | 390,627 | | | | 51,836,203 | | |
Total Common Stocks
(Cost $563,838,935) | | | 1,084,221,614 | | |
First Eagle Funds | Annual Report | October 31, 2024
26
First Eagle U.S. Value Fund | Consolidated Schedule of Investments | October 31, 2024
Investments | | Ounces | | Value ($) | |
Commodities — 12.6% | |
Gold bullion*
(Cost $67,628,124) | | | 64,102 | | | | 176,060,378 | | |
| | | Shares | | | |
Master Limited Partnerships — 1.4% | |
Oil, Gas & Consumable Fuels — 1.4% | |
Enterprise Products Partners LP (Cost $14,041,160) | | | 685,243 | | | | 19,639,064 | | |
| | | Principal Amount ($) | | | |
Corporate Bonds — 1.3% | |
Banks — 0.1% | |
Manufacturers & Traders Trust Co.
4.65%, 1/27/2026 | | | 1,205,000 | | | | 1,200,221 | | |
Energy Equipment & Services — 0.1% | |
Noble Finance II LLC
8.00%, 4/15/2030 (a) | | | 1,400,000 | | | | 1,419,099 | | |
Financial Services — 0.4% | |
Mexico Remittances Funding Fiduciary Estate
Management Sarl
12.50%, 10/15/2031 (a) | | | 5,500,000 | | | | 5,512,100 | | |
Health Care Equipment & Supplies — 0.2% | |
Bausch & Lomb, Inc.
7.13%, 8/1/2028‡ | | | 600,000 | | | | 576,000 | | |
Embecta Corp.
5.00%, 2/15/2030 (a) | | | 3,000,000 | | | | 2,715,502 | | |
| | | | 3,291,502 | | |
Machinery — 0.1% | |
Roller Bearing Co. of America, Inc.
4.38%, 10/15/2029 (a) | | | 1,490,000 | | | | 1,399,982 | | |
Oil, Gas & Consumable Fuels — 0.4% | |
Enterprise Products Operating LLC
Series E, (CME Term SOFR 3 Month + 3.29%),
5.25%, 8/16/2077 (b) | | | 2,600,000 | | | | 2,554,271 | | |
(CME Term SOFR 3 Month + 2.83%),
5.38%, 2/15/2078 (b) | | | 2,750,000 | | | | 2,639,172 | | |
| | | | 5,193,443 | | |
Total Corporate Bonds
(Cost $17,651,742) | | | 18,016,347 | | |
First Eagle Funds | Annual Report | October 31, 2024
27
First Eagle U.S. Value Fund | Consolidated Schedule of Investments | October 31, 2024
Investments | | Principal Amount ($) | | Value ($) | |
Convertible Preferred Stocks — 0.4% | |
Banks — 0.4% | |
Bank of America Corp.
Series L, 7.25% (c) (Cost $5,693,463) | | | 4,250 | | | | 5,248,750 | | |
Short-Term Investments — 6.8% | |
Commercial Paper — 4.4% | |
AES Corp. (The)
5.24%, 11/1/2024 (d) | | | 7,204,000 | | | | 7,202,949 | | |
Amphenol Corp.
4.84%, 11/1/2024 (a)(d) | | | 4,392,000 | | | | 4,391,411 | | |
Credit Agricole Corporate and Investment Bank
4.81%, 11/1/2024 (d) | | | 4,963,000 | | | | 4,962,334 | | |
Duke Energy Corp.
4.84%, 11/1/2024 (a)(d) | | | 6,360,000 | | | | 6,359,141 | | |
Entergy Corp.
4.90%, 11/1/2024 (a)(d) | | | 5,710,000 | | | | 5,709,222 | | |
General Motors Financial Co., Inc.
4.93%, 11/1/2024 (a)(d) | | | 17,701,000 | | | | 17,698,586 | | |
Honeywell International, Inc.
5.40%, 12/9/2024 (a)(d) | | | 10,000,000 | | | | 9,949,062 | | |
Sysco Corp.
4.85%, 11/1/2024 (a)(d) | | | 5,271,000 | | | | 5,270,289 | | |
Total Commercial Paper
(Cost $61,545,372) | | | 61,542,994 | | |
| | | Shares | | | |
Investment Companies — 0.0% (e) | |
JP Morgan U.S. Government Money Market Fund,
Capital Shares 4.86% (f) (Cost $31,170) | | | 31,170 | | | | 31,170 | | |
| | | Principal Amount ($) | | | |
U.S. Treasury Obligations — 2.4% | |
U.S. Treasury Bills
5.20%, 11/14/2024 (d) | | | 9,000,000 | | | | 8,984,931 | | |
5.28%, 12/5/2024 (d) | | | 5,000,000 | | | | 4,978,288 | | |
4.67%, 1/9/2025 (d) | | | 10,000,000 | | | | 9,914,421 | | |
4.76%, 2/6/2025 (d) | | | 5,000,000 | | | | 4,940,204 | | |
First Eagle Funds | Annual Report | October 31, 2024
28
First Eagle U.S. Value Fund | Consolidated Schedule of Investments | October 31, 2024
Investments | | Principal Amount ($) | | Value ($) | |
U.S. Treasury Obligations — 2.4% (continued) | |
4.57%, 3/20/2025 (d) | | | 5,000,000 | | | | 4,915,438 | | |
Total U.S. Treasury Obligations
(Cost $33,722,056) | | | 33,733,282 | | |
Total Short-Term Investments
(Cost $95,298,598) | | | 95,307,446 | | |
Total Investments — 100.1%
(Cost $764,152,022) | | | 1,398,493,599 | | |
Liabilities in Excess of Other Assets — (0.1%) | | | (719,431 | ) | |
Net Assets — 100.0% | | | 1,397,774,168 | | |
* Non-income producing security.
‡ Value determined using significant unobservable inputs.
(a) Securities exempt from registration under Rule 144A or section 4(a)(2) of the Securities Act of 1933. Total value of all such securities at October 31, 2024 amounted to $60,424,394, which represents approximately 4.32% of net assets of the Fund.
(b) Variable or floating rate security, linked to the referenced benchmark. The interest rate shown is the rate in effect as of October 31, 2024.
(c) Perpetual security. The rate reflected was the rate in effect on October 31, 2024. The maturity date reflects the next call date.
(d) The rate shown was the current yield as of October 31, 2024.
(e) Represents less than 0.05% of net assets.
(f) Represents 7-day effective yield as of October 31, 2024.
As of October 31, 2024, the gross unrealized appreciation (depreciation) of investments based on the aggregate cost of investments for federal income tax purposes was as follows:
Aggregate gross unrealized appreciation | | $ | 672,999,988 | | |
Aggregate gross unrealized depreciation | | | (33,586,677 | ) | |
Net unrealized appreciation | | $ | 639,413,311 | | |
Federal income tax cost of investments | | $ | 759,080,288 | | |
Abbreviations
REIT — Real Estate Investment Trust
SOFR — Secured Overnight Financing Rate
See Notes to Financial Statements.
First Eagle Funds | Annual Report | October 31, 2024
29
First Eagle Gold Fund | Consolidated Schedule of Investments | October 31, 2024
Investments | | Shares | | Value ($) | |
Common Stocks — 81.5% | |
Australia — 9.2% | |
Northern Star Resources Ltd. | | | 19,552,128 | | | | 226,890,586 | | |
Ora Banda Mining Ltd.* | | | 56,153,152 | | | | 34,275,938 | | |
| | | | 261,166,524 | | |
Canada — 53.5% | |
Agnico Eagle Mines Ltd. | | | 2,132,360 | | | | 184,053,596 | | |
Alamos Gold, Inc., Class A | | | 6,525,232 | | | | 131,830,916 | | |
B2Gold Corp. (a) | | | 17,553,298 | | | | 57,992,007 | | |
Barrick Gold Corp. | | | 6,944,076 | | | | 134,159,548 | | |
Dundee Precious Metals, Inc. (b) | | | 13,610,210 | | | | 138,413,886 | | |
Franco-Nevada Corp. | | | 1,042,524 | | | | 138,384,232 | | |
G Mining Ventures Corp. | | | 6,701,347 | | | | 57,226,284 | | |
Kinross Gold Corp. | | | 12,289,880 | | | | 123,881,990 | | |
MAG Silver Corp.* (b) | | | 6,317,015 | | | | 108,160,763 | | |
Novagold Resources, Inc.* (b) | | | 25,384,555 | | | | 87,830,560 | | |
Orla Mining Ltd.* | | | 7,840,941 | | | | 37,674,360 | | |
Wheaton Precious Metals Corp. | | | 4,773,406 | | | | 315,092,530 | | |
| | | | 1,514,700,672 | | |
Mexico — 1.3% | |
Fresnillo plc | | | 1,477,558 | | | | 14,060,001 | | |
Industrias Penoles SAB de CV* | | | 1,403,600 | | | | 22,047,803 | | |
| | | | 36,107,804 | | |
South Africa — 4.0% | |
Gold Fields Ltd., ADR | | | 6,827,329 | | | | 112,514,382 | | |
United Kingdom — 2.4% | |
Anglogold Ashanti plc | | | 2,420,265 | | | | 67,283,367 | | |
United States — 11.1% | |
Newmont Corp. | | | 4,060,970 | | | | 184,530,477 | | |
Royal Gold, Inc. | | | 891,278 | | | | 130,180,065 | | |
| | | | 314,710,542 | | |
Total Common Stocks
(Cost $1,400,930,100) | | | 2,306,483,291 | | |
First Eagle Funds | Annual Report | October 31, 2024
30
First Eagle Gold Fund | Consolidated Schedule of Investments | October 31, 2024
Investments | | Ounces | | Value ($) | |
Commodities — 16.7% | |
Gold bullion* | | | 93,735 | | | | 257,448,902 | | |
Silver bullion* | | | 6,587,194 | | | | 215,376,227 | | |
Total Commodities
(Cost $300,347,574) | | | 472,825,129 | | |
| | | Number of Rights | | | |
Rights — 0.1% | |
Canada — 0.1% | |
Pan American Silver Corp., CVR, expiring 2/22/2029*
Cost $45,973,716 | | | 6,835,667 | | | | 3,178,585 | | |
| | | Principal Amount ($) | | | |
Short-Term Investments — 1.9% | |
Commercial Paper — 1.9% | |
AES Corp. (The)
5.24%, 11/1/2024 (c) | | | 7,616,000 | | | | 7,614,889 | | |
Amphenol Corp.
4.84%, 11/1/2024 (c)(d) | | | 4,644,000 | | | | 4,643,378 | | |
Credit Agricole Corporate and Investment Bank
4.81%, 11/1/2024 (c) | | | 5,248,000 | | | | 5,247,296 | | |
Duke Energy Corp.
4.84%, 11/1/2024 (c)(d) | | | 6,725,000 | | | | 6,724,092 | | |
Entergy Corp.
4.90%, 11/1/2024 (c)(d) | | | 6,037,000 | | | | 6,036,178 | | |
General Motors Financial Co., Inc.
4.93%, 11/1/2024 (c)(d) | | | 18,715,000 | | | | 18,712,447 | | |
Sysco Corp.
4.85%, 11/1/2024 (c)(d) | | | 5,573,000 | | | | 5,572,248 | | |
Total Commercial Paper
(Cost $54,558,000) | | | 54,550,528 | | |
First Eagle Funds | Annual Report | October 31, 2024
31
First Eagle Gold Fund | Consolidated Schedule of Investments | October 31, 2024
Investments | | Shares | | Value ($) | |
Investment Companies — 0.0% (e) | |
JP Morgan U.S. Government Money Market Fund,
Capital Shares 4.86% (f) (Cost $28,799) | | | 28,799 | | | | 28,799 | | |
Total Short-Term Investments
(Cost $54,586,799) | | | 54,579,327 | | |
Total Investments — 100.2%
(Cost $1,801,838,189) | | | 2,837,066,332 | | |
Liabilities in Excess of Other Assets — (0.2)% | | | (5,420,443 | ) | |
Net Assets — 100.0% | | | 2,831,645,889 | | |
* Non-income producing security.
(a) Represents a security that is subject to legal restrictions on resale due to the compliance obligations of the adviser. Total value of all such securities at October 31, 2024 amounted to $57,992,007, which represents approximately 2.05% of net assets of the Fund.
| Restricted Securities | | Acquisition Date | | Cost | | Carrying Value
Per
Share/Principal | |
B2Gold Corp. | | 07/17/15 - 02/05/24 | | $ | 43,437,872 | | | $ | 3.30 | | |
(b) Affiliated company as defined under the Investment Company Act of 1940.
(c) The rate shown was the current yield as of October 31, 2024.
(d) Securities exempt from registration under Rule 144A or section 4(a)(2) of the Securities Act of 1933. Total value of all such securities at October 31, 2024 amounted to $41,688,343, which represents approximately 1.47% of net assets of the Fund.
(e) Represents less than 0.05% of net assets.
(f) Represents 7-day effective yield as of October 31, 2024.
Abbreviations
ADR — American Depositary Receipt
CVR — Contingent Value Rights
As of October 31, 2024, the gross unrealized appreciation (depreciation) of investments based on the aggregate cost of investments for federal income tax purposes was as follows:
Aggregate gross unrealized appreciation | | $ | 1,120,425,586 | | |
Aggregate gross unrealized depreciation | | | (170,900,173 | ) | |
Net unrealized appreciation | | $ | 949,525,413 | | |
Federal income tax cost of investments | | $ | 1,887,540,919 | | |
First Eagle Funds | Annual Report | October 31, 2024
32
First Eagle Gold Fund | Consolidated Schedule of Investments | October 31, 2024
Affiliated Securities
Security Description | | Shares at
October 31, 2024 | | Market Value
October 31, 2023 | | Purchases at
Cost | | Proceeds from
Sales | |
Common Stocks — 11.8% | |
Canada — 11.8% | |
Dundee Precious Metals, Inc. | | | 13,610,210 | | | $ | 93,341,751 | | | $ | 6,655,129 | | | $ | (15,182,249 | ) | |
MAG Silver Corp.* | | | 6,317,015 | | | | 54,322,011 | | | | 27,422,906 | | | | (11,382,103 | ) | |
Novagold Resources, Inc.* | | | 25,384,555 | | | | 62,447,299 | | | | 32,500,679 | | | | — | | |
Total Common Stocks | | | | | 210,111,061 | | | | 66,578,714 | | | | (26,564,352 | ) | |
Total | | | | $ | 210,111,061 | | | $ | 66,578,714 | | | $ | (26,564,352 | ) | |
Security Description | | Net Realized
Gain
(Loss) | | Change in
Unrealized
Appreciation/
(Depreciation) | | Market Value
October 31, 2024 | | Dividend
Income | |
Common Stocks — 11.8% | |
Canada — 11.8% | |
Dundee Precious Metals, Inc. | | $ | 5,136,673 | | | $ | 48,462,582 | | | $ | 138,413,886 | | | $ | 2,048,459 | | |
MAG Silver Corp.* | | | (2,304,442 | ) | | | 40,102,391 | | | | 108,160,763 | | | | — | | |
Novagold Resources, Inc.* | | | — | | | | (7,117,418 | ) | | | 87,830,560 | | | | — | | |
Total Common Stocks | | | 2,832,231 | | | | 81,447,555 | | | | 334,405,209 | | | | 2,048,459 | | |
Total | | $ | 2,832,231 | | | $ | 81,447,555 | | | $ | 334,405,209 | | | $ | 2,048,459 | | |
* Non-income producing security.
See Notes to Financial Statements.
First Eagle Funds | Annual Report | October 31, 2024
33
First Eagle Global Income Builder Fund | Schedule of Investments | October 31, 2024
Investments | | Shares | | Value ($) | |
Common Stocks — 63.4% | |
Brazil — 1.5% | |
Ambev SA, ADR | | | 8,541,286 | | | | 18,620,008 | | |
Itausa SA (Preference) | | | 4,565,824 | | | | 8,379,905 | | |
| | | | 26,999,913 | | |
Canada — 4.5% | |
Agnico Eagle Mines Ltd. | | | 16,806 | | | | 1,450,602 | | |
Barrick Gold Corp. | | | 90,496 | | | | 1,748,383 | | |
Franco-Nevada Corp. | | | 42,649 | | | | 5,661,212 | | |
Franco-Nevada Corp. | | | 32,962 | | | | 4,372,739 | | |
Imperial Oil Ltd. | | | 238,922 | | | | 17,828,847 | | |
Nutrien Ltd. | | | 111,016 | | | | 5,293,243 | | |
Power Corp. of Canada | | | 776,074 | | | | 24,530,482 | | |
Wheaton Precious Metals Corp. (a) | | | 281,516 | | | | 18,582,871 | | |
| | | | 79,468,379 | | |
Chile — 1.2% | |
Cia Cervecerias Unidas SA, ADR | | | 1,327,830 | | | | 14,406,956 | | |
Quinenco SA | | | 2,083,758 | | | | 6,706,245 | | |
| | | | 21,113,201 | | |
Finland — 0.2% | |
Kesko OYJ, Class B | | | 139,183 | | | | 2,989,404 | | |
France — 1.6% | |
Danone SA | | | 91,535 | | | | 6,539,127 | | |
Sanofi SA | | | 152,652 | | | | 16,132,236 | | |
Sodexo SA | | | 38,666 | | | | 3,356,304 | | |
Wendel SE | | | 19,995 | | | | 1,987,246 | | |
| | | | 28,014,913 | | |
Germany — 1.1% | |
FUCHS SE (Preference) | | | 318,042 | | | | 14,843,644 | | |
Henkel AG & Co. KGaA (Preference) | | | 56,692 | | | | 4,909,129 | | |
| | | | 19,752,773 | | |
Hong Kong — 3.2% | |
CK Asset Holdings Ltd. | | | 2,483,000 | | | | 10,150,419 | | |
Hongkong Land Holdings Ltd. | | | 3,179,200 | | | | 13,631,100 | | |
First Eagle Funds | Annual Report | October 31, 2024
34
First Eagle Global Income Builder Fund | Schedule of Investments | October 31, 2024
Investments | | Shares | | Value ($) | |
Hong Kong — 3.2% (continued) | |
Jardine Matheson Holdings Ltd. | | | 802,500 | | | | 30,896,250 | | |
Mandarin Oriental International Ltd. | | | 1,047,200 | | | | 1,853,544 | | |
| | | | 56,531,313 | | |
Japan — 2.7% | |
FANUC Corp. | | | 294,600 | | | | 7,816,127 | | |
MS&AD Insurance Group Holdings, Inc. | | | 189,700 | | | | 4,196,038 | | |
Nagaileben Co. Ltd. | | | 22,700 | | | | 340,588 | | |
Nohmi Bosai Ltd. | | | 70,300 | | | | 1,388,045 | | |
Secom Co. Ltd. | | | 353,400 | | | | 12,567,932 | | |
Shimano, Inc. | | | 91,300 | | | | 13,412,856 | | |
Sompo Holdings, Inc. | | | 204,800 | | | | 4,390,724 | | |
USS Co. Ltd. | | | 429,800 | | | | 3,599,477 | | |
| | | | 47,711,787 | | |
Mexico — 2.7% | |
Coca-Cola Femsa SAB de CV, ADR (a) | | | 179,026 | | | | 14,925,398 | | |
Fomento Economico Mexicano SAB de CV, ADR | | | 203,458 | | | | 19,713,046 | | |
GMexico Transportes SAB de CV (b) | | | 1,331,937 | | | | 2,007,607 | | |
Grupo Mexico SAB de CV, Series B | | | 2,026,562 | | | | 10,603,002 | | |
| | | | 47,249,053 | | |
Netherlands — 0.8% | |
HAL Trust | | | 40,521 | | | | 5,024,435 | | |
Heineken Holding NV | | | 136,892 | | | | 9,484,990 | | |
| | | | 14,509,425 | | |
Norway — 1.0% | |
Orkla ASA | | | 1,828,544 | | | | 16,893,092 | | |
Singapore — 0.7% | |
United Overseas Bank Ltd. | | | 386,000 | | | | 9,383,294 | | |
UOL Group Ltd. | | | 764,200 | | | | 3,087,901 | | |
| | | | 12,471,195 | | |
South Korea — 3.1% | |
KT&G Corp. | | | 419,335 | | | | 33,309,550 | | |
Samsung Electronics Co. Ltd. | | | 106,119 | | | | 4,505,918 | | |
Samsung Electronics Co. Ltd. (Preference) | | | 372,602 | | | | 12,817,615 | | |
Samsung Life Insurance Co. Ltd. | | | 38,495 | | | | 2,816,851 | | |
| | | | 53,449,934 | | |
First Eagle Funds | Annual Report | October 31, 2024
35
First Eagle Global Income Builder Fund | Schedule of Investments | October 31, 2024
Investments | | Shares | | Value ($) | |
Sweden — 0.6% | |
Svenska Handelsbanken AB, Class A | | | 996,753 | | | | 10,356,902 | | |
Switzerland — 4.6% | |
Cie Financiere Richemont SA (Registered) | | | 168,707 | | | | 24,563,823 | | |
Nestle SA (Registered) | | | 382,445 | | | | 36,138,239 | | |
Schindler Holding AG | | | 61,668 | | | | 17,947,121 | | |
Schindler Holding AG (Registered) | | | 7,544 | | | | 2,150,736 | | |
| | | | 80,799,919 | | |
Taiwan — 0.5% | |
Taiwan Semiconductor Manufacturing Co. Ltd., ADR (a) | | | 47,844 | | | | 9,116,196 | | |
Thailand — 0.8% | |
Bangkok Bank PCL, NVDR | | | 1,467,900 | | | | 6,388,600 | | |
Thai Beverage PCL | | | 17,954,100 | | | | 7,181,393 | | |
| | | | 13,569,993 | | |
United Kingdom — 9.7% | |
BAE Systems plc | | | 807,624 | | | | 13,016,726 | | |
Berkeley Group Holdings plc | | | 214,849 | | | | 12,260,323 | | |
British American Tobacco plc | | | 1,195,354 | | | | 41,800,465 | | |
Diageo plc | | | 199,933 | | | | 6,174,287 | | |
Great Portland Estates plc, REIT | | | 523,564 | | | | 2,116,468 | | |
Haleon plc | | | 4,109,584 | | | | 19,750,932 | | |
Lloyds Banking Group plc | | | 11,546,087 | | | | 7,925,238 | | |
Reckitt Benckiser Group plc | | | 243,748 | | | | 14,786,736 | | |
Unilever plc | | | 871,901 | | | | 53,239,710 | | |
| | | | 171,070,885 | | |
United States — 22.9% | |
Analog Devices, Inc. (a) | | | 64,448 | | | | 14,378,993 | | |
Bank of New York Mellon Corp. (The) (a) | | | 258,534 | | | | 19,483,122 | | |
Becton Dickinson & Co. (a) | | | 93,759 | | | | 21,901,165 | | |
BXP, Inc., REIT (a) | | | 97,307 | | | | 7,839,052 | | |
CH Robinson Worldwide, Inc. (a) | | | 150,984 | | | | 15,557,391 | | |
Colgate-Palmolive Co. (a) | | | 232,838 | | | | 21,819,249 | | |
Comcast Corp., Class A | | | 541,473 | | | | 23,646,126 | | |
Douglas Emmett, Inc., REIT | | | 366,396 | | | | 6,518,185 | | |
Elevance Health, Inc. | | | 17,617 | | | | 7,148,274 | | |
First Eagle Funds | Annual Report | October 31, 2024
36
First Eagle Global Income Builder Fund | Schedule of Investments | October 31, 2024
Investments | | Shares | | Value ($) | |
United States — 22.9% (continued) | |
Equity Residential, REIT (a) | | | 345,193 | | | | 24,291,231 | | |
Exxon Mobil Corp. (a) | | | 395,470 | | | | 46,182,987 | | |
Fidelity National Financial, Inc. (a) | | | 84,603 | | | | 5,090,563 | | |
General Dynamics Corp. (a) | | | 7,297 | | | | 2,127,878 | | |
HCA Healthcare, Inc. (a) | | | 66,205 | | | | 23,750,382 | | |
IDACORP, Inc. | | | 62,953 | | | | 6,514,376 | | |
Kraft Heinz Co. (The) (a) | | | 133,886 | | | | 4,479,826 | | |
Linde plc | | | 53 | | | | 24,176 | | |
Medtronic plc (a) | | | 233,926 | | | | 20,877,896 | | |
Noble Corp. plc | | | 47,527 | | | | 1,519,913 | | |
ONEOK, Inc. (a) | | | 77,514 | | | | 7,509,556 | | |
Oracle Corp. (a) | | | 16,238 | | | | 2,725,386 | | |
Philip Morris International, Inc. (a) | | | 395,992 | | | | 52,548,137 | | |
Royal Gold, Inc. (a) | | | 90,423 | | | | 13,207,183 | | |
Schlumberger NV (a) | | | 153,224 | | | | 6,139,686 | | |
Texas Instruments, Inc. (a) | | | 116,702 | | | | 23,709,178 | | |
Universal Health Services, Inc., Class B | | | 19,258 | | | | 3,934,602 | | |
US Bancorp (a) | | | 326,193 | | | | 15,758,384 | | |
Weyerhaeuser Co., REIT | | | 129,131 | | | | 4,023,722 | | |
| | | | 402,706,619 | | |
Total Common Stocks
(Cost $925,357,055) | | | 1,114,774,896 | | |
| | | Principal Amount ($) | | | |
Corporate Bonds — 11.6% | |
Australia — 0.1% | |
Nufarm Australia Ltd.
5.00%, 1/27/2030 (c) | | | 2,595,000 | | | | 2,404,696 | | |
Canada — 0.5% | |
Transcanada Trust
Series 16-A, 5.88%, 8/15/2076 | | | 9,142,000 | | | | 9,109,144 | | |
Mexico — 0.4% | |
Mexico Remittances Funding Fiduciary
Estate Management Sarl
12.50%, 10/15/2031 (c) | | | 7,000,000 | | | | 7,015,400 | | |
First Eagle Funds | Annual Report | October 31, 2024
37
First Eagle Global Income Builder Fund | Schedule of Investments | October 31, 2024
Investments | | Principal Amount ($) | | Value ($) | |
Norway — 0.1% | |
DNB Boligkreditt A/S
(NIBOR 3 Month + 0.45%), 5.17%, 10/5/2027 (d) | | | 26,000,000 | | | | 2,374,726 | | |
Poland — 0.1% | |
Canpack SA
3.13%, 11/1/2025 (c) | | | 420,000 | | | | 406,243 | | |
3.88%, 11/15/2029 (c) | | | 1,000,000 | | | | 909,679 | | |
| | | | 1,315,922 | | |
United Kingdom — 0.1% | |
BAT Capital Corp.
3.22%, 9/6/2026 | | | 2,425,000 | | | | 2,357,612 | | |
United States — 10.3% | |
ACCO Brands Corp.
4.25%, 3/15/2029 (c) | | | 6,858,000 | | | | 6,291,686 | | |
American Airlines, Inc.
5.50%, 4/20/2026 (c) | | | 2,133,921 | | | | 2,127,508 | | |
5.75%, 4/20/2029 (c) | | | 502,000 | | | | 497,099 | | |
AMN Healthcare, Inc.
4.63%, 10/1/2027 (c) | | | 2,959,000 | | | | 2,851,012 | | |
Aramark Services, Inc.
5.00%, 2/1/2028 (c) | | | 1,800,000 | | | | 1,767,500 | | |
Ball Corp.
6.88%, 3/15/2028 | | | 4,152,000 | | | | 4,267,874 | | |
Bank of New York Mellon Corp. (The)
Series F, (CME Term SOFR 3 Month + 3.39%),
4.63%, 9/20/2026 (d)(e) | | | 1,775,000 | | | | 1,746,309 | | |
Series I, (US Treasury Yield Curve Rate T Note
Constant Maturity 5 Year + 2.63%),
3.75%, 12/20/2026 (d)(e) | | | 9,889,000 | | | | 9,330,060 | | |
Boston Properties LP
REIT, 3.20%, 1/15/2025 | | | 1,817,000 | | | | 1,809,608 | | |
Carnival Corp.
4.00%, 8/1/2028 (c) | | | 1,206,000 | | | | 1,149,611 | | |
CCO Holdings LLC
5.13%, 5/1/2027 (c) | | | 1,807,000 | | | | 1,769,347 | | |
5.38%, 6/1/2029 (c) | | | 1,900,000 | | | | 1,813,646 | | |
6.38%, 9/1/2029 (c) | | | 1,835,000 | | | | 1,816,876 | | |
Centene Corp.
4.25%, 12/15/2027 | | | 3,573,000 | | | | 3,456,052 | | |
4.63%, 12/15/2029 | | | 900,000 | | | | 860,052 | | |
First Eagle Funds | Annual Report | October 31, 2024
38
First Eagle Global Income Builder Fund | Schedule of Investments | October 31, 2024
Investments | | Principal Amount ($) | | Value ($) | |
United States — 10.3% (continued) | |
Charles River Laboratories International, Inc.
4.25%, 5/1/2028 (c) | | | 2,282,000 | | | | 2,169,462 | | |
3.75%, 3/15/2029 (c) | | | 1,522,000 | | | | 1,395,237 | | |
Charter Communications Operating LLC
4.20%, 3/15/2028 | | | 3,640,000 | | | | 3,507,580 | | |
CITGO Petroleum Corp.
7.00%, 6/15/2025 (c) | | | 9,457,000 | | | | 9,459,894 | | |
6.38%, 6/15/2026 (c) | | | 4,182,000 | | | | 4,182,389 | | |
Crown Americas LLC
4.75%, 2/1/2026 | | | 875,000 | | | | 868,574 | | |
5.25%, 4/1/2030 | | | 900,000 | | | | 885,199 | | |
Diamond Foreign Asset Co.
8.50%, 10/1/2030 (c) | | | 1,775,000 | | | | 1,832,826 | | |
Dollar General Corp.
3.50%, 4/3/2030 | | | 1,900,000 | | | | 1,750,310 | | |
Edgewell Personal Care Co.
5.50%, 6/1/2028 (c) | | | 1,770,000 | | | | 1,743,911 | | |
4.13%, 4/1/2029 (c) | | | 1,557,000 | | | | 1,453,612 | | |
Embecta Corp.
5.00%, 2/15/2030 (c) | | | 4,893,000 | | | | 4,428,983 | | |
6.75%, 2/15/2030 (c) | | | 2,292,000 | | | | 2,137,953 | | |
Enterprise Products Operating LLC
Series E,
5.25%, 8/16/2077 (d) | | | 6,250,000 | | | | 6,140,074 | | |
Fair Isaac Corp.
5.25%, 5/15/2026 (c) | | | 1,715,000 | | | | 1,716,996 | | |
4.00%, 6/15/2028 (c) | | | 2,764,000 | | | | 2,624,841 | | |
GE HealthCare Technologies, Inc.
5.60%, 11/15/2025 | | | 2,525,000 | | | | 2,545,759 | | |
HCA, Inc.
5.38%, 2/1/2025 | | | 8,401,000 | | | | 8,401,386 | | |
5.88%, 2/15/2026 | | | 3,449,000 | | | | 3,472,874 | | |
3.50%, 9/1/2030 | | | 2,788,000 | | | | 2,557,200 | | |
5.45%, 4/1/2031 | | | 4,150,000 | | | | 4,196,311 | | |
Iron Mountain, Inc.
REIT, 4.88%, 9/15/2027 (c) | | | 3,609,000 | | | | 3,547,059 | | |
REIT, 5.25%, 3/15/2028 (c) | | | 1,005,000 | | | | 986,327 | | |
REIT, 5.00%, 7/15/2028 (c) | | | 1,596,000 | | | | 1,555,277 | | |
REIT, 4.88%, 9/15/2029 (c) | | | 1,322,000 | | | | 1,273,158 | | |
First Eagle Funds | Annual Report | October 31, 2024
39
First Eagle Global Income Builder Fund | Schedule of Investments | October 31, 2024
Investments | | Principal Amount ($) | | Value ($) | |
United States — 10.3% (continued) | |
JPMorgan Chase & Co.
2.60%, 2/24/2026 (d) | | | 1,750,000 | | | | 1,736,234 | | |
KeyBank NA
4.15%, 8/8/2025 | | | 2,575,000 | | | | 2,556,562 | | |
KFC Holding Co.
4.75%, 6/1/2027 (c) | | | 2,322,000 | | | | 2,300,330 | | |
Kraft Heinz Foods Co.
3.00%, 6/1/2026 | | | 1,800,000 | | | | 1,752,505 | | |
Laboratory Corp. of America Holdings
3.60%, 2/1/2025 | | | 2,625,000 | | | | 2,613,705 | | |
Lamb Weston Holdings, Inc.
4.13%, 1/31/2030 (c) | | | 2,583,000 | | | | 2,398,202 | | |
Manufacturers & Traders Trust Co.
4.65%, 1/27/2026 | | | 3,480,000 | | | | 3,466,200 | | |
4.70%, 1/27/2028 | | | 3,825,000 | | | | 3,789,688 | | |
Mellon Capital IV
Series 1, (CME Term SOFR 3 Month + 0.83%, 4.00% Floor),
5.64%, 11/30/2024 (d)(e) | | | 6,183,000 | | | | 5,431,548 | | |
Mileage Plus Holdings LLC
6.50%, 6/20/2027 (c) | | | 2,991,761 | | | | 3,021,289 | | |
MSCI, Inc.
4.00%, 11/15/2029 (c) | | | 4,725,000 | | | | 4,478,084 | | |
Noble Finance II LLC
8.00%, 4/15/2030 (c) | | | 1,750,000 | | | | 1,773,874 | | |
Roller Bearing Co. of America, Inc.
4.38%, 10/15/2029 (c) | | | 6,359,000 | | | | 5,974,823 | | |
Service Corp. International
4.63%, 12/15/2027 | | | 1,749,000 | | | | 1,712,682 | | |
5.13%, 6/1/2029 | | | 857,000 | | | | 840,842 | | |
Teleflex, Inc.
4.63%, 11/15/2027 | | | 2,919,000 | | | | 2,869,348 | | |
4.25%, 6/1/2028 (c) | | | 782,000 | | | | 749,697 | | |
Truist Financial Corp.
Series N, (US Treasury Yield Curve Rate T Note
Constant Maturity 5 Year + 3.00%),
4.80%, 3/1/2025 (d)(e) | | | 14,157,000 | | | | 14,081,407 | | |
WESCO Distribution, Inc.
7.25%, 6/15/2028 (c) | | | 2,136,000 | | | | 2,186,262 | | |
| | | 180,120,714 | | |
Total Corporate Bonds
(Cost $202,297,464) | | | 204,698,214 | | |
First Eagle Funds | Annual Report | October 31, 2024
40
First Eagle Global Income Builder Fund | Schedule of Investments | October 31, 2024
Investments | | Principal Amount ($) | | Value ($) | |
U.S. Treasury Obligations — 9.5% | |
U.S. Treasury Bonds
6.63%, 2/15/2027 | | | 14,150,000 | | | | 14,970,258 | | |
6.13%, 11/15/2027 | | | 21,467,400 | | | | 22,690,035 | | |
U.S. Treasury Inflation Linked Notes
0.38%, 7/15/2025 | | | 13,375,000 | | | | 17,534,840 | | |
0.13%, 4/15/2027 | | | 16,530,800 | | | | 17,644,721 | | |
1.25%, 4/15/2028 | | | 13,225,000 | | | | 13,592,290 | | |
2.13%, 4/15/2029 | | | 4,300,000 | | | | 4,422,624 | | |
1.88%, 7/15/2034 | | | 1,800,000 | | | | 1,793,056 | | |
U.S. Treasury Notes
1.75%, 12/31/2024 | | | 17,647,000 | | | | 17,566,348 | | |
1.75%, 3/15/2025 | | | 12,430,000 | | | | 12,305,117 | | |
2.75%, 6/30/2025 | | | 17,750,000 | | | | 17,567,820 | | |
1.75%, 12/31/2026 | | | 18,610,000 | | | | 17,699,128 | | |
3.38%, 5/15/2033 | | | 6,650,000 | | | | 6,229,180 | | |
3.88%, 8/15/2034 | | | 3,600,000 | | | | 3,483,000 | | |
Total U.S. Treasury Obligations
(Cost 168,209,456) | | | 167,498,417 | | |
| | | Ounces | | | |
Commodities — 7.5% | |
Gold bullion*
(Cost $59,207,085) | | | 48,278 | | | | 132,598,740 | | |
| | | Shares | | | |
Preferred Stocks — 1.8% | |
United States — 1.8% | |
Charles Schwab Corp. (The)
Series D, 5.95%, (e) | | | 139,464 | | | | 3,540,991 | | |
MetLife, Inc.
Series A, (SOFR + 1.00%, 4.00% Floor), 6.21%, (d)(e) | | | 128,986 | | | | 3,193,693 | | |
Northern Trust Corp.
Series E, 4.70%, (e) | | | 135,349 | | | | 2,997,980 | | |
State Street Corp.
Series G, 5.35%, (e) | | | 100,371 | | | | 2,498,234 | | |
Truist Financial Corp.
Series R, 4.75%, (e) | | | 499,123 | | | | 10,536,487 | | |
First Eagle Funds | Annual Report | October 31, 2024
41
First Eagle Global Income Builder Fund | Schedule of Investments | October 31, 2024
Investments | | Shares | | Value ($) | |
United States — 1.8% (continued) | |
US Bancorp
Series A, (CME Term SOFR 3 Month + 1.28%), 5.94%, (d)(e) | | | 5,200 | | | | 4,510,480 | | |
Series B, (CME Term SOFR 3 Month + 0.86%, 1.02% Floor),
5.52%, (d)(e) | | | 213,750 | | | | 4,732,425 | | |
Total Preferred Stocks
(Cost 32,496,796) | | | 32,010,290 | | |
| | | Principal Amount ($) | | | |
Convertible Preferred Stocks — 1.5% | |
United States — 1.5% | |
Bank of America Corp.
Series L, 7.25%, (e) | | | 10,496 | | | | 12,962,560 | | |
Wells Fargo & Co.
Series L, 7.50%, (e) | | | 11,123 | | | | 13,735,570 | | |
Total Convertible Preferred Stocks
(Cost $30,438,618) | | | 26,698,130 | | |
| | | Shares | | | |
Master Limited Partnerships — 1.0% | |
United States — 1.0% | |
Enterprise Products Partners LP (Cost $11,024,328) | | | 612,186 | | | | 17,545,251 | | |
| | | Principal Amount ($) | | | |
Foreign Government Securities — 0.9% | |
Brazil — 0.4% | |
Notas do Tesouro Nacional
10.00%, 1/1/2027 | | BRL | 30,000,000 | | | | 5,068,461 | | |
6.25%, 3/18/2031 | | | 1,650,000 | | | | 1,679,181 | | |
| | | | 6,747,642 | | |
Canada — 0.1% | |
Province of Quebec
2.50%, 4/20/2026 | | | 893,000 | | | | 868,990 | | |
Colombia — 0.2% | |
Republic of Colombia
3.00%, 1/30/2030 | | | 4,290,000 | | | | 3,562,972 | | |
Mexico — 0.1% | |
Mex Bonos Desarr Fix Rt
Series M, 5.75%, 3/5/2026 | | MXN | 55,300,000 | | | | 2,607,954 | | |
First Eagle Funds | Annual Report | October 31, 2024
42
First Eagle Global Income Builder Fund | Schedule of Investments | October 31, 2024
Investments | | Principal Amount ($) | | Value ($) | |
Saudi Arabia — 0.1% | |
Kingdom of Saudi Arabia
4.75%, 1/18/2028 (c) | | | 2,600,000 | | | | 2,611,960 | | |
Total Foreign Government Securities
(Cost 16,917,316) | | | 16,399,518 | | |
Municipal Bonds — 0.2% | |
New York 0.2% | |
Oneida Indian Nation of New York,
Revenue, Series 2024 A, 8.00%, 09/01/2040 (c)
(Cost $2,934,073) | | | 3,000,000 | | | | 2,977,739 | | |
Loan Assignments — 0.2% | |
United States — 0.2% | |
Aramark Services, Inc., First Lien Term Loan B7
(CME Term SOFR 1 Month + 2.00%), 6.69%, 4/6/2028 (d)
(Cost $2,500,000) | | | 2,500,000 | | | | 2,505,625 | | |
Asset-Backed Securities — 0.2% | |
United States — 0.2% | |
United Airlines Pass-Through Trust
Series 2020-1, Class A, 5.88%, 10/15/2027
(Cost $3,012,902) | | | 3,023,035 | | | | 3,090,852 | | |
Short-Term Investments — 1.6% | |
Commercial Paper — 1.6% | |
AES Corp. (The)
5.24%, 11/1/2024 (f) | | | 3,834,000 | | | | 3,833,440 | | |
Amphenol Corp.
4.84%, 11/1/2024 (c)(f) | | | 2,338,000 | | | | 2,337,687 | | |
Credit Agricole Corporate and Investment Bank
4.81%, 11/1/2024 (f) | | | 2,641,000 | | | | 2,640,646 | | |
Duke Energy Corp.
4.84%, 11/1/2024 (c)(f) | | | 3,385,000 | | | | 3,384,543 | | |
Entergy Corp.
4.90%, 11/1/2024 (c)(f) | | | 3,039,000 | | | | 3,038,586 | | |
General Motors Financial Co., Inc.
4.93%, 11/1/2024 (c)(f) | | | 9,421,000 | | | | 9,419,715 | | |
First Eagle Funds | Annual Report | October 31, 2024
43
First Eagle Global Income Builder Fund | Schedule of Investments | October 31, 2024
Investments | | Principal Amount ($) | | Value ($) | |
Commercial Paper — 1.6% (continued) | |
Sysco Corp.
4.85%, 11/1/2024 (c)(f) | | | 2,805,000 | | | | 2,804,621 | | |
Total Commercial Paper
(Cost $27,463,000) | | | 27,459,238 | | |
| | | Shares | | | |
Investment Companies — 0.0% (g) | |
JP Morgan U.S. Government Money Market Fund,
Capital Shares 4.86% (h) (Cost $47,687) | | | 47,687 | | | | 47,687 | | |
Total Short-Term Investments
(Cost $27,510,687) | | | 27,506,925 | | |
Total Investments — 99.4%
(Cost $1,481,905,780) | | | 1,748,304,597 | | |
Other Assets Less Liabilities — 0.6% | | | 10,594,633 | | |
Net Assets — 100.0% | | | 1,758,899,230 | | |
* Non-income producing security.
(a) All or a portion of the security pledged as collateral for call options written.
(b) Security exempt from registration pursuant to Regulation S under the Securities Act of 1933. Regulation S applies to securities offerings that are made outside of the United States and do not involve direct selling efforts in the United States and as such may have restrictions on resale.
(c) Securities exempt from registration under Rule 144A or section 4(a)(2) of the Securities Act of 1933. Total value of all such securities at October 31, 2024 amounted to $120,785,640, which represents approximately 6.87% of net assets of the Fund.
(d) Variable or floating rate security, linked to the referenced benchmark. The interest rate shown is the rate in effect as of October 31, 2024.
(e) Perpetual security. The rate reflected was the rate in effect on October 31, 2024. The maturity date reflects the next call date.
(f) The rate shown was the current yield as of October 31, 2024.
(g) Represents less than 0.05% of net assets.
(h) Represents 7-day effective yield as of October 31, 2024.
As of October 31, 2024, the gross unrealized appreciation (depreciation) of investments based on the aggregate cost of investments for federal income tax purposes was as follows:
Aggregate gross unrealized appreciation | | $ | 338,957,210 | | |
Aggregate gross unrealized depreciation | | | (70,615,906 | ) | |
Net unrealized appreciation | | $ | 268,341,304 | | |
Federal income tax cost of investments | | $ | 1,475,646,381 | | |
First Eagle Funds | Annual Report | October 31, 2024
44
First Eagle Global Income Builder Fund | Schedule of Investments | October 31, 2024
Forward Foreign Currency Exchange Contracts outstanding as of October 31, 2024
Currency
Purchased | | Currency Sold | | Counterparty | | Settlement
Date | | Unrealized
Appreciation
(Depreciation) | |
EUR | 6,486,000 | | | USD | 7,050,282 | | | UBS AG | | 11/6/2024 | | $ | 5,554 | | |
JPY | 190,539,000 | | | USD | 1,247,077 | | | UBS AG | | 11/6/2024 | | | 7,288 | | |
USD | 1,365,646 | | | JPY | 190,539,000 | | | UBS AG | | 11/6/2024 | | | 111,281 | | |
USD | 1,369,139 | | | JPY | 190,539,000 | | | Bank of New York Mellon | | 12/4/2024 | | | 110,255 | | |
USD | 8,329,580 | | | EUR | 7,446,000 | | | Goldman Sachs | | 1/8/2025 | | | 206,217 | | |
USD | 3,212,278 | | | GBP | 2,433,000 | | | Goldman Sachs | | 1/8/2025 | | | 75,560 | | |
USD | 1,374,591 | | | JPY | 190,539,000 | | | Goldman Sachs | | 1/8/2025 | | | 109,126 | | |
USD | 8,349,070 | | | EUR | 7,421,000 | | | JPMorgan Chase Bank | | 2/5/2025 | | | 243,319 | | |
USD | 3,623,292 | | | GBP | 2,704,000 | | | JPMorgan Chase Bank | | 2/5/2025 | | | 137,694 | | |
USD | 1,377,394 | | | JPY | 190,539,000 | | | JPMorgan Chase Bank | | 2/5/2025 | | | 107,657 | | |
Total unrealized appreciation | | | | | | | | | 1,113,951 | | |
USD | 6,980,136 | | | EUR | 6,486,000 | | | UBS AG | | 11/6/2024 | | | (75,700 | ) | |
USD | 6,936,263 | | | EUR | 6,377,000 | | | Bank of New York Mellon | | 12/4/2024 | | | (8,787 | ) | |
USD | 6,581,362 | | | EUR | 6,023,000 | | | UBS AG | | 3/5/2025 | | | (6,507 | ) | |
USD | 1,095,443 | | | JPY | 164,851,000 | | | UBS AG | | 3/5/2025 | | | (6,658 | ) | |
Total unrealized depreciation | | | | | | | | | (97,652 | ) | |
Net unrealized appreciation | | | | | | | | $ | 1,016,299 | | |
Abbreviations
ADR — American Depositary Receipt
BRL — Brazilian Real
EUR — Euro
Fix Rt — Fixed Rate
GBP — British Pound
JPY — Japanese Yen
MXN — Mexican Peso
NIBOR — Norwegian Interbank Offered Rate
NVDR — Non-Voting Depositary Receipt
OYJ — Public Limited Company
Preference — A special type of equity investment that shares in the earnings of the company, has limited voting rights, and may have a dividend preference. Preference shares may also have liquidation preference.
REIT — Real Estate Investment Trust
SOFR — Secured Overnight Financing Rate
USD — United States Dollar
First Eagle Funds | Annual Report | October 31, 2024
45
First Eagle Global Income Builder Fund | Schedule of Investments | October 31, 2024
Written Call Options Contracts as of October 31, 2024:
Description | | Counterparty | | Number of
Contracts | | Notional
Amount | | Exercise
Price | | Expiration
Date | | Value ($) | |
Analog Devices, Inc. | | Exchange Traded | | | 76 | | | USD | (1,695,636 | ) | | USD | 290.00 | | | 12/20/2024 | | | (6,650 | ) | |
Analog Devices, Inc. | | Exchange Traded | | | 75 | | | USD | (1,673,325 | ) | | USD | 310.00 | | | 12/20/2024 | | | (10,875 | ) | |
Analog Devices, Inc. | | Exchange Traded | | | 75 | | | USD | (1,673,325 | ) | | USD | 320.00 | | | 12/20/2024 | | | (10,125 | ) | |
Bank of New York
Mellon Corp. (The) | | Exchange Traded | | | 702 | | | USD | (5,290,272 | ) | | USD | 60.00 | | | 12/20/2024 | | | (1,144,260 | ) | |
Bank of New York
Mellon Corp. (The) | | Exchange Traded | | | 328 | | | USD | (2,471,808 | ) | | USD | 62.50 | | | 12/20/2024 | | | (442,800 | ) | |
Bank of New York
Mellon Corp. (The) | | Exchange Traded | | | 330 | | | USD | (2,486,880 | ) | | USD | 65.00 | | | 12/20/2024 | | | (338,250 | ) | |
Bank of New York
Mellon Corp. (The) | | Exchange Traded | | | 263 | | | USD | (1,981,968 | ) | | USD | 75.00 | | | 12/20/2024 | | | (80,872 | ) | |
Bank of New York
Mellon Corp. (The) | | Exchange Traded | | | 311 | | | USD | (2,343,696 | ) | | USD | 75.00 | | | 1/17/2025 | | | (130,620 | ) | |
Bank of New York
Mellon Corp. (The) | | Exchange Traded | | | 125 | | | USD | (942,000 | ) | | USD | 80.00 | | | 11/15/2024 | | | (3,750 | ) | |
Bank of New York
Mellon Corp. (The) | | Exchange Traded | | | 526 | | | USD | (3,963,936 | ) | | USD | 80.00 | | | 1/17/2025 | | | (94,680 | ) | |
Becton Dickinson &
Co. | | Exchange Traded | | | 73 | | | USD | (1,705,207 | ) | | USD | 280.00 | | | 12/20/2024 | | | (16,425 | ) | |
Becton Dickinson &
Co. | | Exchange Traded | | | 74 | | | USD | (1,728,566 | ) | | USD | 285.00 | | | 12/20/2024 | | | (16,280 | ) | |
Becton Dickinson &
Co. | | Exchange Traded | | | 75 | | | USD | (1,751,925 | ) | | USD | 285.00 | | | 3/21/2025 | | | (6,750 | ) | |
Becton Dickinson &
Co. | | Exchange Traded | | | 73 | | | USD | (1,705,207 | ) | | USD | 290.00 | | | 1/17/2025 | | | (8,578 | ) | |
Becton Dickinson &
Co. | | Exchange Traded | | | 73 | | | USD | (1,705,207 | ) | | USD | 290.00 | | | 3/21/2025 | | | (9,855 | ) | |
BXP, Inc., REIT | | Exchange Traded | | | 286 | | | USD | (2,304,016 | ) | | USD | 90.00 | | | 1/17/2025 | | | (42,900 | ) | |
BXP, Inc., REIT | | Exchange Traded | | | 250 | | | USD | (2,014,000 | ) | | USD | 95.00 | | | 1/17/2025 | | | (20,000 | ) | |
BXP, Inc., REIT | | Exchange Traded | | | 220 | | | USD | (1,772,320 | ) | | USD | 100.00 | | | 1/17/2025 | | | (9,460 | ) | |
CH Robinson
Worldwide, Inc. | | Exchange Traded | | | 195 | | | USD | (2,009,280 | ) | | USD | 105.00 | | | 1/17/2025 | | | (87,750 | ) | |
CH Robinson
Worldwide, Inc. | | Exchange Traded | | | 173 | | | USD | (1,782,592 | ) | | USD | 110.00 | | | 11/15/2024 | | | (10,380 | ) | |
CH Robinson
Worldwide, Inc. | | Exchange Traded | | | 195 | | | USD | (2,009,280 | ) | | USD | 110.00 | | | 1/17/2025 | | | (52,650 | ) | |
CH Robinson
Worldwide, Inc. | | Exchange Traded | | | 439 | | | USD | (4,523,456 | ) | | USD | 120.00 | | | 11/15/2024 | | | (4,390 | ) | |
CH Robinson
Worldwide, Inc. | | Exchange Traded | | | 167 | | | USD | (1,720,768 | ) | | USD | 120.00 | | | 1/17/2025 | | | (15,030 | ) | |
First Eagle Funds | Annual Report | October 31, 2024
46
First Eagle Global Income Builder Fund | Schedule of Investments | October 31, 2024
Written Call Options Contracts as of October 31, 2024: (continued)
Description | | Counterparty | | Number of
Contracts | | Notional
Amount | | Exercise
Price | | Expiration
Date | | Value ($) | |
CH Robinson
Worldwide, Inc. | | Exchange Traded | | | 170 | | | USD | (1,751,680 | ) | | USD | 125.00 | | | 11/15/2024 | | | (1,700 | ) | |
CH Robinson
Worldwide, Inc. | | Exchange Traded | | | 170 | | | USD | (1,751,680 | ) | | USD | 130.00 | | | 1/17/2025 | | | (3,825 | ) | |
Coca-Cola Femsa
SAB de CV, ADR | | Exchange Traded | | | 202 | | | USD | (1,684,074 | ) | | USD | 100.00 | | | 11/15/2024 | | | (5,050 | ) | |
Coca-Cola Femsa
SAB de CV, ADR | | Exchange Traded | | | 194 | | | USD | (1,617,378 | ) | | USD | 110.00 | | | 11/15/2024 | | | (4,850 | ) | |
Colgate-Palmolive
Co. | | Exchange Traded | | | 205 | | | USD | (1,921,055 | ) | | USD | 97.50 | | | 1/17/2025 | | | (39,975 | ) | |
Colgate-Palmolive
Co. | | Exchange Traded | | | 524 | | | USD | (4,910,404 | ) | | USD | 110.00 | | | 11/15/2024 | | | (2,620 | ) | |
Colgate-Palmolive
Co. | | Exchange Traded | | | 170 | | | USD | (1,593,070 | ) | | USD | 110.00 | | | 1/17/2025 | | | (1,700 | ) | |
Colgate-Palmolive
Co. | | Exchange Traded | | | 353 | | | USD | (3,307,963 | ) | | USD | 115.00 | | | 11/15/2024 | | | (3,530 | ) | |
Colgate-Palmolive
Co. | | Exchange Traded | | | 162 | | | USD | (1,518,102 | ) | | USD | 125.00 | | | 1/17/2025 | | | (12,150 | ) | |
Equity Residential,
REIT | | Exchange Traded | | | 263 | | | USD | (1,850,731 | ) | | USD | 75.00 | | | 11/15/2024 | | | (8,942 | ) | |
Equity Residential,
REIT | | Exchange Traded | | | 514 | | | USD | (3,617,018 | ) | | USD | 80.00 | | | 11/15/2024 | | | (5,140 | ) | |
Equity Residential,
REIT | | Exchange Traded | | | 255 | | | USD | (1,794,435 | ) | | USD | 80.00 | | | 1/17/2025 | | | (7,013 | ) | |
Equity Residential,
REIT | | Exchange Traded | | | 244 | | | USD | (1,717,028 | ) | | USD | 85.00 | | | 1/17/2025 | | | (23,180 | ) | |
Equity Residential,
REIT | | Exchange Traded | | | 238 | | | USD | (1,674,806 | ) | | USD | 85.00 | | | 4/17/2025 | | | (8,330 | ) | |
Exxon Mobil Corp. | | Exchange Traded | | | 169 | | | USD | (1,973,582 | ) | | USD | 130.00 | | | 3/21/2025 | | | (40,053 | ) | |
Exxon Mobil Corp. | | Exchange Traded | | | 150 | | | USD | (1,751,700 | ) | | USD | 135.00 | | | 11/15/2024 | | | (750 | ) | |
Exxon Mobil Corp. | | Exchange Traded | | | 170 | | | USD | (1,985,260 | ) | | USD | 145.00 | | | 12/20/2024 | | | (850 | ) | |
Exxon Mobil Corp. | | Exchange Traded | | | 143 | | | USD | (1,669,954 | ) | | USD | 150.00 | | | 12/20/2024 | | | (429 | ) | |
Exxon Mobil Corp. | | Exchange Traded | | | 143 | | | USD | (1,669,954 | ) | | USD | 150.00 | | | 1/17/2025 | | | (1,716 | ) | |
Exxon Mobil Corp. | | Exchange Traded | | | 149 | | | USD | (1,740,022 | ) | | USD | 155.00 | | | 12/20/2024 | | | (596 | ) | |
Exxon Mobil Corp. | | Exchange Traded | | | 143 | | | USD | (1,669,954 | ) | | USD | 155.00 | | | 2/21/2025 | | | (1,930 | ) | |
Fidelity National
Financial, Inc. | | Exchange Traded | | | 302 | | | USD | (1,817,134 | ) | | USD | 65.00 | | | 12/20/2024 | | | (22,650 | ) | |
General Dynamics
Corp. | | Exchange Traded | | | 72 | | | USD | (2,099,592 | ) | | USD | 280.00 | | | 1/17/2025 | | | (158,400 | ) | |
HCA Healthcare, Inc. | | Exchange Traded | | | 66 | | | USD | (2,367,684 | ) | | USD | 350.00 | | | 1/17/2025 | | | (158,400 | ) | |
First Eagle Funds | Annual Report | October 31, 2024
47
First Eagle Global Income Builder Fund | Schedule of Investments | October 31, 2024
Written Call Options Contracts as of October 31, 2024: (continued)
Description | | Counterparty | | Number of
Contracts | | Notional
Amount | | Exercise
Price | | Expiration
Date | | Value ($) | |
Kraft Heinz Co. (The) | | Exchange Traded | | | 495 | | | USD | (1,656,270 | ) | | USD | 40.00 | | | 12/20/2024 | | | (2,475 | ) | |
Medtronic plc | | Exchange Traded | | | 204 | | | USD | (1,820,700 | ) | | USD | 100.00 | | | 1/17/2025 | | | (12,648 | ) | |
Medtronic plc | | Exchange Traded | | | 398 | | | USD | (3,552,150 | ) | | USD | 105.00 | | | 1/17/2025 | | | (8,358 | ) | |
Medtronic plc | | Exchange Traded | | | 200 | | | USD | (1,785,000 | ) | | USD | 120.00 | | | 11/15/2024 | | | (2,600 | ) | |
ONEOK, Inc. | | Exchange Traded | | | 217 | | | USD | (2,102,296 | ) | | USD | 92.50 | | | 1/17/2025 | | | (162,750 | ) | |
ONEOK, Inc. | | Exchange Traded | | | 210 | | | USD | (2,034,480 | ) | | USD | 95.00 | | | 1/17/2025 | | | (114,030 | ) | |
ONEOK, Inc. | | Exchange Traded | | | 194 | | | USD | (1,879,472 | ) | | USD | 105.00 | | | 1/17/2025 | | | (27,160 | ) | |
Oracle Corp. | | Exchange Traded | | | 113 | | | USD | (1,896,592 | ) | | USD | 180.00 | | | 1/17/2025 | | | (70,851 | ) | |
Oracle Corp. | | Exchange Traded | | | 49 | | | USD | (822,416 | ) | | USD | 200.00 | | | 1/17/2025 | | | (9,212 | ) | |
Philip Morris
International, Inc. | | Exchange Traded | | | 508 | | | USD | (6,741,160 | ) | | USD | 120.00 | | | 12/20/2024 | | | (749,300 | ) | |
Philip Morris
International, Inc. | | Exchange Traded | | | 334 | | | USD | (4,432,180 | ) | | USD | 120.00 | | | 1/17/2025 | | | (473,946 | ) | |
Philip Morris
International, Inc. | | Exchange Traded | | | 147 | | | USD | (1,950,690 | ) | | USD | 120.00 | | | 3/21/2025 | | | (235,935 | ) | |
Philip Morris
International, Inc. | | Exchange Traded | | | 168 | | | USD | (2,229,360 | ) | | USD | 125.00 | | | 12/20/2024 | | | (171,360 | ) | |
Philip Morris
International, Inc. | | Exchange Traded | | | 146 | | | USD | (1,937,420 | ) | | USD | 135.00 | | | 12/20/2024 | | | (52,560 | ) | |
Philip Morris
International, Inc. | | Exchange Traded | | | 150 | | | USD | (1,990,500 | ) | | USD | 140.00 | | | 1/17/2025 | | | (34,500 | ) | |
Philip Morris
International, Inc. | | Exchange Traded | | | 135 | | | USD | (1,791,450 | ) | | USD | 145.00 | | | 1/17/2025 | | | (17,145 | ) | |
Philip Morris
International, Inc. | | Exchange Traded | | | 142 | | | USD | (1,884,340 | ) | | USD | 150.00 | | | 12/20/2024 | | | (4,970 | ) | |
Philip Morris
International, Inc. | | Exchange Traded | | | 135 | | | USD | (1,791,450 | ) | | USD | 150.00 | | | 1/17/2025 | | | (8,775 | ) | |
Philip Morris
International, Inc. | | Exchange Traded | | | 135 | | | USD | (1,791,450 | ) | | USD | 150.00 | | | 3/21/2025 | | | (26,865 | ) | |
Philip Morris
International, Inc. | | Exchange Traded | | | 135 | | | USD | (1,791,450 | ) | | USD | 160.00 | | | 3/21/2025 | | | (8,775 | ) | |
Royal Gold, Inc. | | Exchange Traded | | | 127 | | | USD | (1,854,962 | ) | | USD | 190.00 | | | 1/17/2025 | | | (6,350 | ) | |
Royal Gold, Inc. | | Exchange Traded | | | 235 | | | USD | (3,432,410 | ) | | USD | 195.00 | | | 1/17/2025 | | | (8,225 | ) | |
Schlumberger NV | | Exchange Traded | | | 392 | | | USD | (1,570,744 | ) | | USD | 50.00 | | | 11/15/2024 | | | (784 | ) | |
Schlumberger NV | | Exchange Traded | | | 414 | | | USD | (1,658,898 | ) | | USD | 52.50 | | | 1/17/2025 | | | (7,866 | ) | |
Taiwan
Semiconductor
Manufacturing Co.
Ltd., ADR | | Exchange Traded | | | 85 | | | USD | (1,619,590 | ) | | USD | 250.00 | | | 11/15/2024 | | | (170 | ) | |
First Eagle Funds | Annual Report | October 31, 2024
48
First Eagle Global Income Builder Fund | Schedule of Investments | October 31, 2024
Written Call Options Contracts as of October 31, 2024: (continued)
Description | | Counterparty | | Number of
Contracts | | Notional
Amount | | Exercise
Price | | Expiration
Date | | Value ($) | |
Texas Instruments,
Inc. | | Exchange Traded | | | 87 | | | USD | (1,767,492 | ) | | USD | 250.00 | | | 12/20/2024 | | | (1,827 | ) | |
Texas Instruments,
Inc. | | Exchange Traded | | | 87 | | | USD | (1,767,492 | ) | | USD | 250.00 | | | 1/17/2025 | | | (4,350 | ) | |
Texas Instruments,
Inc. | | Exchange Traded | | | 85 | | | USD | (1,726,860 | ) | | USD | 260.00 | | | 12/20/2024 | | | (1,105 | ) | |
Texas Instruments,
Inc. | | Exchange Traded | | | 85 | | | USD | (1,726,860 | ) | | USD | 280.00 | | | 12/20/2024 | | | (9,775 | ) | |
US Bancorp | | Exchange Traded | | | 354 | | | USD | (1,710,174 | ) | | USD | 60.00 | | | 1/17/2025 | | | (4,425 | ) | |
Wheaton Precious
Metals Corp. | | Exchange Traded | | | 296 | | | USD | (1,954,784 | ) | | USD | 80.00 | | | 11/15/2024 | | | (2,960 | ) | |
Wheaton Precious
Metals Corp. | | Exchange Traded | | | 281 | | | USD | (1,855,724 | ) | | USD | 80.00 | | | 1/17/2025 | | | (14,050 | ) | |
| | | | | | | | | | | | | | (5,333,211 | ) | |
Total Written Options Contracts (Premiums Received ($1,984,616)) | | | | | | | | | | | | | (5,333,211 | ) | |
See Notes to Financial Statements.
First Eagle Funds | Annual Report | October 31, 2024
49
First Eagle Rising Dividend Fund | Schedule of Investments | October 31, 2024
Investments | | Shares | | Value ($) | |
Common Stocks — 96.7% | |
Air Freight & Logistics — 5.2% | |
CH Robinson Worldwide, Inc. | | | 114,767 | | | | 11,825,592 | | |
Expeditors International of Washington, Inc. | | | 89,627 | | | | 10,665,613 | | |
| | | | 22,491,205 | | |
Beverages — 2.4% | |
PepsiCo, Inc. | | | 62,305 | | | | 10,347,614 | | |
Electronic Equipment, Instruments & Components — 4.3% | |
TE Connectivity plc (Ireland) | | | 127,282 | | | | 18,763,912 | | |
Health Care Equipment & Supplies — 6.9% | |
Becton Dickinson & Co. | | | 63,824 | | | | 14,908,648 | | |
Medtronic plc | | | 169,662 | | | | 15,142,334 | | |
| | | | 30,050,982 | | |
Health Care Providers & Services — 10.5% | |
Elevance Health, Inc. | | | 15,020 | | | | 6,094,515 | | |
HCA Healthcare, Inc. | | | 47,483 | | | | 17,034,051 | | |
UnitedHealth Group, Inc. | | | 39,877 | | | | 22,510,567 | | |
| | | | 45,639,133 | | |
Hotels, Restaurants & Leisure — 1.1% | |
Starbucks Corp. | | | 49,502 | | | | 4,836,345 | | |
Household Products — 2.5% | |
Colgate-Palmolive Co. | | | 115,643 | | | | 10,836,906 | | |
Insurance — 3.1% | |
Fidelity National Financial, Inc. | | | 79,432 | | | | 4,779,423 | | |
Willis Towers Watson plc | | | 28,035 | | | | 8,471,897 | | |
| | | | 13,251,320 | | |
Interactive Media & Services — 10.5% | |
Alphabet, Inc., Class A | | | 148,001 | | | | 25,324,451 | | |
Meta Platforms, Inc., Class A | | | 35,618 | | | | 20,216,065 | | |
| | | | 45,540,516 | | |
IT Services — 0.2% | |
Accenture plc, Class A | | | 2,654 | | | | 915,152 | | |
Machinery — 4.5% | |
Schindler Holding AG (Switzerland) | | | 66,340 | | | | 19,306,804 | | |
First Eagle Funds | Annual Report | October 31, 2024
50
First Eagle Rising Dividend Fund | Schedule of Investments | October 31, 2024
Investments | | Shares | | Value ($) | |
Media — 5.6% | |
Comcast Corp., Class A | | | 559,662 | | | | 24,440,440 | | |
Oil, Gas & Consumable Fuels — 5.0% | |
Exxon Mobil Corp. | | | 110,240 | | | | 12,873,827 | | |
ONEOK, Inc. | | | 91,980 | | | | 8,911,023 | | |
| | | | 21,784,850 | | |
Semiconductors & Semiconductor Equipment — 6.4% | |
Taiwan Semiconductor Manufacturing Co. Ltd., ADR (Taiwan) | | | 15,224 | | | | 2,900,781 | | |
Texas Instruments, Inc. | | | 121,683 | | | | 24,721,118 | | |
| | | | 27,621,899 | | |
Software — 9.3% | |
Microsoft Corp. | | | 14,933 | | | | 6,068,025 | | |
Oracle Corp. | | | 172,044 | | | | 28,875,865 | | |
Salesforce, Inc. | | | 17,523 | | | | 5,105,676 | | |
| | | | 40,049,566 | | |
Specialized REITs — 2.6% | |
Extra Space Storage, Inc., REIT | | | 68,687 | | | | 11,216,587 | | |
Specialty Retail — 7.4% | |
Home Depot, Inc. (The) | | | 54,592 | | | | 21,495,600 | | |
Ross Stores, Inc. | | | 75,583 | | | | 10,560,457 | | |
| | | | 32,056,057 | | |
Technology Hardware, Storage & Peripherals — 1.0% | |
Samsung Electronics Co. Ltd. (Preference) (South Korea) | | | 122,358 | | | | 4,209,150 | | |
Textiles, Apparel & Luxury Goods — 2.6% | |
LVMH Moet Hennessy Louis Vuitton SE (France) | | | 16,771 | | | | 11,164,799 | | |
Tobacco — 5.6% | |
British American Tobacco plc (United Kingdom) | | | 127,551 | | | | 4,460,345 | | |
Philip Morris International, Inc. | | | 148,593 | | | | 19,718,291 | | |
| | | | 24,178,636 | | |
Total Common Stocks
(Cost $292,234,485) | | | 418,701,873 | | |
Master Limited Partnerships — 2.3% | |
Oil, Gas & Consumable Fuels — 2.3% | |
Enterprise Products Partners LP
(Cost $8,598,968) | | | 344,214 | | | | 9,865,173 | | |
First Eagle Funds | Annual Report | October 31, 2024
51
First Eagle Rising Dividend Fund | Schedule of Investments | October 31, 2024
Investments | | Principal Amount ($) | | Value ($) | |
Short-Term Investments — 1.1% | |
Commercial Paper — 1.1% | |
AES Corp. (The)
5.24%, 11/1/2024 (a) | | | 650,000 | | | | 649,905 | | |
Amphenol Corp.
4.84%, 11/1/2024 (a)(b) | | | 397,000 | | | | 396,947 | | |
Credit Agricole Corporate and Investment Bank
4.81%, 11/1/2024 (a) | | | 448,000 | | | | 447,940 | | |
Duke Energy Corp.
4.84%, 11/1/2024 (a)(b) | | | 574,000 | | | | 573,922 | | |
Entergy Corp.
4.90%, 11/1/2024 (a)(b) | | | 516,000 | | | | 515,930 | | |
General Motors Financial Co., Inc.
4.93%, 11/1/2024 (a)(b) | | | 1,598,000 | | | | 1,597,782 | | |
Sysco Corp.
4.85%, 11/1/2024 (a)(b) | | | 476,000 | | | | 475,936 | | |
Total Commercial Paper
(Cost $4,659,000) | | | 4,658,362 | | |
| | | Shares | | | |
Investment Companies — 0.0% (c) | |
JP Morgan U.S. Government Money Market Fund,
Capital Shares 4.86% (d) (Cost $1,650) | | | 1,650 | | | | 1,650 | | |
Total Short-Term Investments
(Cost $4,660,650) | | | 4,660,012 | | |
Total Investments — 100.1%
(Cost $305,494,103) | | | 433,227,058 | | |
Liabilities in Excess of Other Assets — (0.1%) | | | (302,119 | ) | |
Net Assets — 100.0% | | | 432,924,939 | | |
(a) The rate shown was the current yield as of October 31, 2024.
(b) Securities exempt from registration under Rule 144A or section 4(a)(2) of the Securities Act of 1933. Total value of all such securities at October 31, 2024 amounted to $3,560,517, which represents approximately 0.82% of net assets of the Fund.
(c) Represents less than 0.05% of net assets.
(d) Represents 7-day effective yield as of October 31, 2024.
Abbreviations
ADR — American Depositary Receipt
Preference — A special type of equity investment that shares in the earnings of the company, has limited voting rights, and may have a dividend preference. Preference shares may also have liquidation preference.
REIT — Real Estate Investment Trust
First Eagle Funds | Annual Report | October 31, 2024
52
First Eagle Rising Dividend Fund | Schedule of Investments | October 31, 2024
As of October 31, 2024, the gross unrealized appreciation (depreciation) of investments based on the aggregate cost of investments for federal income tax purposes was as follows:
Aggregate gross unrealized appreciation | | $ | 132,568,755 | | |
Aggregate gross unrealized depreciation | | | (4,439,234 | ) | |
Net unrealized appreciation | | $ | 128,129,521 | | |
Federal income tax cost of investments | | $ | 305,097,537 | | |
See Notes to Financial Statements.
First Eagle Funds | Annual Report | October 31, 2024
53
First Eagle Small Cap Opportunity Fund | Schedule of Investments | October 31, 2024
Investments | | Shares | | Value ($) | |
Common Stocks — 93.3% | |
Aerospace & Defense — 3.9% | |
AAR Corp.* | | | 192,017 | | | | 11,271,398 | | |
Astronics Corp.* | | | 355,397 | | | | 6,180,354 | | |
Curtiss-Wright Corp. | | | 30,749 | | | | 10,607,175 | | |
Ducommun, Inc.* | | | 222,097 | | | | 13,057,083 | | |
Kratos Defense & Security Solutions, Inc.* | | | 381,781 | | | | 8,674,064 | | |
Leonardo DRS, Inc.* | | | 325,158 | | | | 9,777,501 | | |
Triumph Group, Inc.* | | | 269,926 | | | | 3,735,776 | | |
V2X, Inc.* | | | 161,715 | | | | 9,961,644 | | |
| | | | 73,264,995 | | |
Air Freight & Logistics — 1.4% | |
Air Transport Services Group, Inc.* | | | 468,573 | | | | 8,078,199 | | |
GXO Logistics, Inc.* | | | 265,319 | | | | 15,868,729 | | |
Radiant Logistics, Inc.* | | | 462,611 | | | | 3,076,363 | | |
| | | | 27,023,291 | | |
Automobile Components — 0.4% | |
Goodyear Tire & Rubber Co. (The)* | | | 911,408 | | | | 7,300,378 | | |
Holley, Inc.* | | | 127,938 | | | | 331,359 | | |
| | | | 7,631,737 | | |
Banks — 4.2% | |
Ameris Bancorp | | | 259,118 | | | | 16,062,725 | | |
Axos Financial, Inc.* | | | 184,342 | | | | 12,483,640 | | |
Dime Community Bancshares, Inc. | | | 487,945 | | | | 14,672,506 | | |
Hilltop Holdings, Inc. | | | 72,352 | | | | 2,216,142 | | |
Old National Bancorp | | | 500,067 | | | | 9,631,290 | | |
Seacoast Banking Corp. of Florida | | | 595,745 | | | | 15,906,392 | | |
Valley National Bancorp | | | 844,629 | | | | 7,998,637 | | |
| | | | 78,971,332 | | |
Beverages — 0.1% | |
Duckhorn Portfolio, Inc. (The)* | | | 259,967 | | | | 2,849,238 | | |
Biotechnology — 0.6% | |
CareDx, Inc.* | | | 497,751 | | | | 11,015,230 | | |
Building Products — 1.9% | |
American Woodmark Corp.* | | | 31,994 | | | | 2,902,176 | | |
First Eagle Funds | Annual Report | October 31, 2024
54
First Eagle Small Cap Opportunity Fund | Schedule of Investments | October 31, 2024
Investments | | Shares | | Value ($) | |
Building Products — 1.9% (continued) | |
AZEK Co., Inc. (The), Class A* | | | 54,592 | | | | 2,402,048 | | |
Gibraltar Industries, Inc.* | | | 37,989 | | | | 2,563,877 | | |
Insteel Industries, Inc. | | | 401,745 | | | | 10,835,063 | | |
Janus International Group, Inc.* | | | 832,808 | | | | 6,129,467 | | |
JELD-WEN Holding, Inc.* | | | 351,970 | | | | 4,983,895 | | |
Quanex Building Products Corp. | | | 208,432 | | | | 6,057,034 | | |
| | | | 35,873,560 | | |
Capital Markets — 1.7% | |
Evercore, Inc., Class A | | | 56,672 | | | | 14,971,042 | | |
Forge Global Holdings, Inc.* | | | 203,783 | | | | 236,388 | | |
Moelis & Co., Class A | | | 108,754 | | | | 7,221,266 | | |
Perella Weinberg Partners, Class A | | | 488,224 | | | | 9,876,772 | | |
| | | | 32,305,468 | | |
Chemicals — 4.9% | |
AdvanSix, Inc. | | | 484,537 | | | | 13,746,315 | | |
Ashland, Inc. | | | 116,767 | | | | 9,874,985 | | |
Huntsman Corp. | | | 536,931 | | | | 11,812,482 | | |
Intrepid Potash, Inc.* | | | 573,186 | | | | 14,381,237 | | |
Kronos Worldwide, Inc. | | | 436,277 | | | | 5,034,636 | | |
LSB Industries, Inc.* | | | 1,533,973 | | | | 12,578,578 | | |
Mativ Holdings, Inc. | | | 447,044 | | | | 6,906,830 | | |
Minerals Technologies, Inc. | | | 38,185 | | | | 2,874,949 | | |
Stepan Co. | | | 60,955 | | | | 4,409,485 | | |
Tronox Holdings plc, Class A | | | 778,413 | | | | 9,434,365 | | |
| | | | 91,053,862 | | |
Commercial Services & Supplies — 1.6% | |
ACCO Brands Corp. | | | 337,225 | | | | 1,652,403 | | |
CECO Environmental Corp.* | | | 558,871 | | | | 13,301,130 | | |
Healthcare Services Group, Inc.* | | | 60,290 | | | | 661,381 | | |
Interface, Inc., Class A | | | 187,640 | | | | 3,278,071 | | |
Quest Resource Holding Corp.* | | | 80,094 | | | | 624,733 | | |
VSE Corp. | | | 106,691 | | | | 10,948,630 | | |
| | | | 30,466,348 | | |
First Eagle Funds | Annual Report | October 31, 2024
55
First Eagle Small Cap Opportunity Fund | Schedule of Investments | October 31, 2024
Investments | | Shares | | Value ($) | |
Communications Equipment — 1.6% | |
ADTRAN Holdings, Inc.* | | | 951,210 | | | | 5,778,601 | | |
Ceragon Networks Ltd. (Israel)* | | | 428,923 | | | | 1,063,729 | | |
Digi International, Inc.* | | | 192,138 | | | | 5,566,238 | | |
Lantronix, Inc.* | | | 854,932 | | | | 3,342,784 | | |
NETGEAR, Inc.* | | | 113,860 | | | | 2,495,811 | | |
NetScout Systems, Inc.* | | | 223,535 | | | | 4,700,941 | | |
Ribbon Communications, Inc.* | | | 315,648 | | | | 1,123,707 | | |
Viavi Solutions, Inc.* | | | 641,752 | | | | 5,916,953 | | |
| | | | 29,988,764 | | |
Construction & Engineering — 1.1% | |
Ameresco, Inc., Class A* | | | 235,986 | | | | 7,261,289 | | |
Arcosa, Inc. | | | 135,001 | | | | 12,641,494 | | �� |
Orion Group Holdings, Inc.* | | | 132,744 | | | | 811,066 | | |
| | | | 20,713,849 | | |
Construction Materials — 0.5% | |
Summit Materials, Inc., Class A* | | | 191,568 | | | | 9,082,239 | | |
Consumer Staples Distribution & Retail — 1.1% | |
Chefs' Warehouse, Inc. (The)* | | | 337,160 | | | | 13,459,427 | | |
Grocery Outlet Holding Corp.* | | | 317,673 | | | | 4,542,724 | | |
Natural Grocers by Vitamin Cottage, Inc. | | | 78,481 | | | | 2,148,810 | | |
| | | | 20,150,961 | | |
Containers & Packaging — 0.9% | |
Sealed Air Corp. | | | 284,277 | | | | 10,285,142 | | |
TriMas Corp. | | | 227,792 | | | | 6,116,215 | | |
| | | | 16,401,357 | | |
Diversified Consumer Services — 0.9% | |
Lincoln Educational Services Corp.* | | | 712,673 | | | | 9,464,297 | | |
Universal Technical Institute, Inc.* | | | 421,487 | | | | 7,013,544 | | |
| | | | 16,477,841 | | |
Diversified REITs — 0.4% | |
Armada Hoffler Properties, Inc., REIT | | | 669,632 | | | | 7,252,115 | | |
Electrical Equipment — 0.7% | |
LSI Industries, Inc. | | | 399,746 | | | | 6,539,844 | | |
Thermon Group Holdings, Inc.* | | | 250,460 | | | | 6,564,557 | | |
| | | | 13,104,401 | | |
First Eagle Funds | Annual Report | October 31, 2024
56
First Eagle Small Cap Opportunity Fund | Schedule of Investments | October 31, 2024
Investments | | Shares | | Value ($) | |
Electronic Equipment, Instruments & Components — 4.7% | |
Advanced Energy Industries, Inc. | | | 97,620 | | | | 10,594,699 | | |
Airgain, Inc.* | | | 519,679 | | | | 4,817,424 | | |
Avnet, Inc. | | | 130,040 | | | | 7,049,468 | | |
Belden, Inc. | | | 69,233 | | | | 7,883,562 | | |
Benchmark Electronics, Inc. | | | 206,744 | | | | 8,952,015 | | |
Coherent Corp.* | | | 29,882 | | | | 2,762,292 | | |
Fabrinet (Thailand)* | | | 44,685 | | | | 10,767,745 | | |
OSI Systems, Inc.* | | | 11,330 | | | | 1,497,939 | | |
Plexus Corp.* | | | 19,680 | | | | 2,835,888 | | |
Sanmina Corp.* | | | 189,212 | | | | 13,263,761 | | |
TTM Technologies, Inc.* | | | 742,246 | | | | 16,656,000 | | |
| | | | 87,080,793 | | |
Energy Equipment & Services — 1.9% | |
Geospace Technologies Corp.* | | | 94,615 | | | | 1,059,688 | | |
Helix Energy Solutions Group, Inc.* | | | 245,399 | | | | 2,269,941 | | |
Helmerich & Payne, Inc. | | | 120,009 | | | | 4,032,302 | | |
Liberty Energy, Inc., Class A | | | 250,499 | | | | 4,276,018 | | |
Natural Gas Services Group, Inc.* | | | 146,014 | | | | 2,857,494 | | |
NOV, Inc. | | | 182,764 | | | | 2,834,670 | | |
Oil States International, Inc.* | | | 2,053,229 | | | | 9,711,773 | | |
ProPetro Holding Corp.* | | | 372,859 | | | | 2,576,456 | | |
RPC, Inc. | | | 275,361 | | | | 1,564,050 | | |
SEACOR Marine Holdings, Inc.* | | | 619,575 | | | | 4,213,110 | | |
Smart Sand, Inc. | | | 175,012 | | | | 362,275 | | |
| | | | 35,757,777 | | |
Financial Services — 3.7% | |
Cantaloupe, Inc.* | | | 532,947 | | | | 4,721,911 | | |
International Money Express, Inc.* | | | 615,917 | | | | 10,833,980 | | |
MGIC Investment Corp. | | | 641,101 | | | | 16,053,169 | | |
NMI Holdings, Inc., Class A* | | | 373,025 | | | | 14,428,607 | | |
Radian Group, Inc. | | | 419,163 | | | | 14,632,980 | | |
Remitly Global, Inc.* | | | 466,282 | | | | 8,383,750 | | |
| | | | 69,054,397 | | |
First Eagle Funds | Annual Report | October 31, 2024
57
First Eagle Small Cap Opportunity Fund | Schedule of Investments | October 31, 2024
Investments | | Shares | | Value ($) | |
Food Products — 1.4% | |
Ingredion, Inc. | | | 92,320 | | | | 12,256,403 | | |
Mama's Creations, Inc.* | | | 988,209 | | | | 7,362,157 | | |
Utz Brands, Inc. | | | 414,611 | | | | 7,139,602 | | |
| | | | 26,758,162 | | |
Gas Utilities — 0.4% | |
ONE Gas, Inc. | | | 109,763 | | | | 7,822,809 | | |
Ground Transportation — 1.7% | |
FTAI Infrastructure, Inc. | | | 626,047 | | | | 5,052,199 | | |
Heartland Express, Inc. | | | 583,519 | | | | 6,304,923 | | |
Proficient Auto Logistics, Inc.* | | | 193,730 | | | | 1,586,649 | | |
RXO, Inc.* | | | 269,819 | | | | 7,606,197 | | |
Werner Enterprises, Inc. | | | 301,249 | | | | 11,113,076 | | |
| | | | 31,663,044 | | |
Health Care Equipment & Supplies — 2.5% | |
Alphatec Holdings, Inc.* | | | 496,652 | | | | 3,898,718 | | |
AngioDynamics, Inc.* | | | 360,337 | | | | 2,410,655 | | |
Artivion, Inc.* | | | 564,558 | | | | 14,864,812 | | |
Embecta Corp. | | | 356,762 | | | | 5,023,209 | | |
Enovis Corp.* | | | 251,898 | | | | 10,395,830 | | |
ICU Medical, Inc.* | | | 23,927 | | | | 4,085,057 | | |
Varex Imaging Corp.* | | | 232,222 | | | | 3,049,075 | | |
Zimvie, Inc.* | | | 183,468 | | | | 2,525,437 | | |
| | | | 46,252,793 | | |
Health Care Providers & Services — 4.1% | |
AdaptHealth Corp., Class A* | | | 787,159 | | | | 8,099,866 | | |
Brookdale Senior Living, Inc.* | | | 1,212,668 | | | | 7,603,428 | | |
InfuSystem Holdings, Inc.* | | | 722,251 | | | | 4,470,734 | | |
LifeStance Health Group, Inc.* | | | 508,880 | | | | 3,414,585 | | |
Option Care Health, Inc.* | | | 211,198 | | | | 4,866,002 | | |
Pennant Group, Inc. (The)* | | | 344,352 | | | | 11,008,933 | | |
Performant Financial Corp.* | | | 2,218,025 | | | | 8,628,117 | | |
RadNet, Inc.* | | | 91,271 | | | | 5,936,266 | | |
Select Medical Holdings Corp. | | | 305,526 | | | | 9,801,274 | | |
Surgery Partners, Inc.* | | | 197,077 | | | | 5,675,818 | | |
First Eagle Funds | Annual Report | October 31, 2024
58
First Eagle Small Cap Opportunity Fund | Schedule of Investments | October 31, 2024
Investments | | Shares | | Value ($) | |
Health Care Providers & Services — 4.1% (continued) | |
Talkspace, Inc.* | | | 339,878 | | | | 1,063,818 | | |
Tenet Healthcare Corp.* | | | 32,479 | | | | 5,034,895 | | |
Viemed Healthcare, Inc.* | | | 165,701 | | | | 1,416,743 | | |
| | | | 77,020,479 | | |
Health Care Technology — 0.8% | |
HealthStream, Inc. | | | 494,258 | | | | 14,449,632 | | |
iCAD, Inc.* | | | 626,352 | | | | 1,165,015 | | |
| | | | 15,614,647 | | |
Hotels, Restaurants & Leisure — 1.8% | |
Cheesecake Factory, Inc. (The) | | | 287,833 | | | | 13,303,641 | | |
Denny's Corp.* | | | 1,268,271 | | | | 8,129,617 | | |
El Pollo Loco Holdings, Inc.* | | | 329,822 | | | | 4,030,425 | | |
Potbelly Corp.* | | | 1,022,159 | | | | 7,543,534 | | |
| | | | 33,007,217 | | |
Household Durables — 4.3% | |
Beazer Homes USA, Inc.* | | | 495,634 | | | | 15,245,702 | | |
Cavco Industries, Inc.* | | | 9,088 | | | | 3,724,217 | | |
Century Communities, Inc. | | | 124,976 | | | | 11,080,372 | | |
Champion Homes, Inc.* | | | 104,199 | | | | 9,193,478 | | |
Ethan Allen Interiors, Inc. | | | 135,600 | | | | 3,752,052 | | |
Hooker Furnishings Corp. | | | 61,433 | | | | 984,771 | | |
Installed Building Products, Inc. | | | 45,622 | | | | 9,895,412 | | |
LGI Homes, Inc.* | | | 93,718 | | | | 9,518,000 | | |
Smith Douglas Homes Corp., Class A* | | | 87,755 | | | | 2,906,445 | | |
Taylor Morrison Home Corp., Class A* | | | 186,004 | | | | 12,741,274 | | |
Universal Electronics, Inc.* | | | 146,675 | | | | 1,292,207 | | |
| | | | 80,333,930 | | |
Household Products — 0.8% | |
Spectrum Brands Holdings, Inc. | | | 157,312 | | | | 14,098,301 | | |
Insurance — 4.5% | |
Axis Capital Holdings Ltd. | | | 179,226 | | | | 14,026,227 | | |
Citizens, Inc., Class A* | | | 441,036 | | | | 2,086,100 | | |
First American Financial Corp. | | | 165,205 | | | | 10,597,901 | | |
Kemper Corp. | | | 251,732 | | | | 15,675,352 | | |
First Eagle Funds | Annual Report | October 31, 2024
59
First Eagle Small Cap Opportunity Fund | Schedule of Investments | October 31, 2024
Investments | | Shares | | Value ($) | |
Insurance — 4.5% (continued) | |
Lincoln National Corp. | | | 472,103 | | | | 16,405,579 | | |
Old Republic International Corp. | | | 387,400 | | | | 13,531,882 | | |
Stewart Information Services Corp. | | | 167,627 | | | | 11,532,737 | | |
| | | | 83,855,778 | | |
Interactive Media & Services — 1.4% | |
Cars.com, Inc.* | | | 541,500 | | | | 8,658,585 | | |
DHI Group, Inc.* | | | 561,923 | | | | 921,554 | | |
EverQuote, Inc., Class A* | | | 224,856 | | | | 4,042,911 | | |
QuinStreet, Inc.* | | | 577,211 | | | | 12,121,431 | | |
| | | | 25,744,481 | | |
IT Services — 0.5% | |
Backblaze, Inc., Class A* | | | 1,015,439 | | | | 7,331,469 | | |
Brightcove, Inc.* | | | 609,135 | | | | 1,315,732 | | |
| | | | 8,647,201 | | |
Leisure Products — 0.4% | |
AMMO, Inc.* | | | 1,366,387 | | | | 1,475,698 | | |
Clarus Corp. | | | 597,076 | | | | 2,513,690 | | |
YETI Holdings, Inc.* | | | 115,559 | | | | 4,068,832 | | |
| | | | 8,058,220 | | |
Machinery — 4.7% | |
Astec Industries, Inc. | | | 199,622 | | | | 6,343,987 | | |
Barnes Group, Inc. | | | 294,070 | | | | 13,750,713 | | |
Columbus McKinnon Corp. | | | 155,372 | | | | 4,942,383 | | |
Enpro, Inc. | | | 58,300 | | | | 8,489,063 | | |
Gencor Industries, Inc.* | | | 63,907 | | | | 1,273,028 | | |
Graham Corp.* | | | 318,693 | | | | 8,929,778 | | |
John Bean Technologies Corp. | | | 72,615 | | | | 8,090,763 | | |
Luxfer Holdings plc (United Kingdom) | | | 324,476 | | | | 4,659,476 | | |
Manitowoc Co., Inc. (The)* | | | 320,430 | | | | 2,992,816 | | |
Mayville Engineering Co., Inc.* | | | 277,224 | | | | 5,674,775 | | |
Park-Ohio Holdings Corp. | | | 193,622 | | | | 5,512,418 | | |
Shyft Group, Inc. (The) | | | 386,119 | | | | 4,988,658 | | |
Trinity Industries, Inc. | | | 376,175 | | | | 12,895,279 | | |
| | | | 88,543,137 | | |
First Eagle Funds | Annual Report | October 31, 2024
60
First Eagle Small Cap Opportunity Fund | Schedule of Investments | October 31, 2024
Investments | | Shares | | Value ($) | |
Metals & Mining — 4.4% | |
Arch Resources, Inc. | | | 60,494 | | | | 8,878,099 | | |
Carpenter Technology Corp. | | | 71,555 | | | | 10,697,473 | | |
Century Aluminum Co.* | | | 534,588 | | | | 9,435,478 | | |
Coeur Mining, Inc.* | | | 2,320,063 | | | | 14,941,206 | | |
Commercial Metals Co. | | | 214,994 | | | | 11,566,677 | | |
Ferroglobe plc | | | 1,672,530 | | | | 7,007,901 | | |
Hecla Mining Co. | | | 1,635,532 | | | | 10,614,603 | | |
Kaiser Aluminum Corp. | | | 122,120 | | | | 9,068,631 | | |
| | | | 82,210,068 | | |
Multi-Utilities — 1.2% | |
Black Hills Corp. | | | 277,862 | | | | 16,446,652 | | |
Northwestern Energy Group, Inc. | | | 109,296 | | | | 5,842,964 | | |
| | | | 22,289,616 | | |
Oil, Gas & Consumable Fuels — 4.7% | |
Dorian LPG Ltd. | | | 278,553 | | | | 8,036,254 | | |
Golar LNG Ltd. (Bermuda) | | | 174,733 | | | | 6,335,819 | | |
Kosmos Energy Ltd. (Ghana)* | | | 754,566 | | | | 2,837,168 | | |
Matador Resources Co. | | | 273,600 | | | | 14,257,296 | | |
Navigator Holdings Ltd. | | | 551,556 | | | | 8,499,478 | | |
PBF Energy, Inc., Class A | | | 352,608 | | | | 10,056,380 | | |
Permian Resources Corp., Class A | | | 658,939 | | | | 8,981,339 | | |
Riley Exploration Permian, Inc. | | | 254,782 | | | | 6,805,227 | | |
Scorpio Tankers, Inc. (Monaco) | | | 155,550 | | | | 9,063,899 | | |
SM Energy Co. | | | 181,221 | | | | 7,605,845 | | |
Vital Energy, Inc.* | | | 188,271 | | | | 5,134,150 | | |
| | | | 87,612,855 | | |
Paper & Forest Products — 0.7% | |
Louisiana-Pacific Corp. | | | 136,591 | | | | 13,508,850 | | |
Professional Services — 0.4% | |
Asure Software, Inc.* | | | 339,141 | | | | 3,364,279 | | |
NV5 Global, Inc.* | | | 149,989 | | | | 3,427,248 | | |
| | | | 6,791,527 | | |
First Eagle Funds | Annual Report | October 31, 2024
61
First Eagle Small Cap Opportunity Fund | Schedule of Investments | October 31, 2024
Investments | | Shares | | Value ($) | |
Real Estate Management & Development — 0.7% | |
Douglas Elliman, Inc.* | | | 493,958 | | | | 992,855 | | |
Forestar Group, Inc.* | | | 364,061 | | | | 11,493,406 | | |
| | | | 12,486,261 | | |
Residential REITs — 0.3% | |
UMH Properties, Inc., REIT | | | 264,195 | | | | 4,927,237 | | |
Retail REITs — 1.4% | |
Macerich Co. (The), REIT | | | 388,985 | | | | 7,274,020 | | |
Tanger, Inc., REIT | | | 130,833 | | | | 4,347,581 | | |
Whitestone REIT, REIT | | | 1,065,416 | | | | 14,681,432 | | |
| | | | 26,303,033 | | |
Semiconductors & Semiconductor Equipment — 4.9% | |
Alpha & Omega Semiconductor Ltd.* | | | 351,532 | | | | 11,614,617 | | |
Amkor Technology, Inc. | | | 457,344 | | | | 11,639,405 | | |
Amtech Systems, Inc.* (a) | | | 723,575 | | | | 4,023,077 | | |
Cohu, Inc.* | | | 116,882 | | | | 2,912,699 | | |
FormFactor, Inc.* | | | 79,170 | | | | 3,006,877 | | |
Ichor Holdings Ltd.* | | | 372,275 | | | | 10,148,216 | | |
inTEST Corp.* | | | 520,988 | | | | 3,735,484 | | |
Kulicke & Soffa Industries, Inc. (Singapore) | | | 140,426 | | | | 6,299,510 | | |
MKS Instruments, Inc. | | | 115,387 | | | | 11,461,391 | | |
Penguin Solutions, Inc.* | | | 340,441 | | | | 5,123,637 | | |
Ultra Clean Holdings, Inc.* | | | 339,524 | | | | 11,357,078 | | |
Veeco Instruments, Inc.* | | | 367,470 | | | | 10,575,787 | | |
| | | | 91,897,778 | | |
Software — 1.0% | |
SecureWorks Corp., Class A* | | | 712,627 | | | | 5,964,688 | | |
Silvaco Group, Inc.* | | | 256,917 | | | | 1,605,731 | | |
Zeta Global Holdings Corp., Class A* | | | 378,430 | | | | 10,474,943 | | |
| | | | 18,045,362 | | |
Specialized REITs — 0.6% | |
Outfront Media, Inc., REIT | | | 672,729 | | | | 11,947,667 | | |
Specialty Retail — 2.3% | |
1-800-Flowers.com, Inc., Class A* | | | 227,211 | | | | 1,890,395 | | |
Lithia Motors, Inc., Class A | | | 15,847 | | | | 5,267,067 | | |
First Eagle Funds | Annual Report | October 31, 2024
62
First Eagle Small Cap Opportunity Fund | Schedule of Investments | October 31, 2024
Investments | | Shares | | Value ($) | |
Specialty Retail — 2.3% (continued) | |
Monro, Inc. | | | 280,082 | | | | 7,677,048 | | |
National Vision Holdings, Inc.* | | | 491,524 | | | | 5,111,850 | | |
Shoe Carnival, Inc. | | | 149,122 | | | | 5,110,411 | | |
Sonic Automotive, Inc., Class A | | | 112,866 | | | | 6,402,888 | | |
Tile Shop Holdings, Inc.* | | | 287,490 | | | | 1,900,309 | | |
Tilly's, Inc., Class A* | | | 371,183 | | | | 1,492,156 | | |
Warby Parker, Inc., Class A* | | | 106,496 | | | | 1,802,977 | | |
Zumiez, Inc.* | | | 287,260 | | | | 5,917,556 | | |
| | | | 42,572,657 | | |
Textiles, Apparel & Luxury Goods — 0.2% | |
Steven Madden Ltd. | | | 68,767 | | | | 3,092,452 | | |
Trading Companies & Distributors — 3.0% | |
Air Lease Corp., Class A | | | 235,025 | | | | 10,423,359 | | |
Alta Equipment Group, Inc. | | | 70,242 | | | | 456,573 | | |
Beacon Roofing Supply, Inc.* | | | 29,547 | | | | 2,720,392 | | |
DNOW, Inc.* | | | 218,694 | | | | 2,587,150 | | |
FTAI Aviation Ltd. | | | 80,594 | | | | 10,835,057 | | |
H&E Equipment Services, Inc. | | | 224,196 | | | | 11,714,241 | | |
Herc Holdings, Inc. | | | 20,221 | | | | 4,229,020 | | |
Titan Machinery, Inc.* | | | 445,892 | | | | 6,119,868 | | |
WESCO International, Inc. | | | 39,755 | | | | 7,631,767 | | |
| | | | 56,717,427 | | |
Total Common Stocks
(Cost $1,483,398,927) | | | 1,743,342,544 | | |
Exchange Traded Funds — 0.0% (b) | |
Global X Uranium ETF
(Cost $287,238) | | | 9,429 | | | | 289,753 | | |
Investments | | Number of Rights | | | |
Rights — 0.0% (b) | |
IT Services — 0.0% (b) | |
Flexion, Inc., CVR*‡ (c)
(Cost $27,801) | | | 44,841 | | | | — | | |
First Eagle Funds | Annual Report | October 31, 2024
63
First Eagle Small Cap Opportunity Fund | Schedule of Investments | October 31, 2024
Investments | | Shares | | Value ($) | |
Short-Term Investments — 6.7% | |
Investment Companies — 6.7% | |
JP Morgan U.S. Government Money Market Fund,
Capital Shares 4.86% (d) (Cost $125,800,379) | | | 125,800,379 | | | | 125,800,379 | | |
Total Investments — 100.0%
(Cost $1,609,514,345) | | | 1,869,432,676 | | |
Liabilities in Excess of Other Assets — 0.0% (b) | | | (912,431 | ) | |
Net Assets — 100.0% | | | 1,868,520,245 | | |
* Non-income producing security.
‡ Value determined using significant unobservable inputs.
(a) Affiliated company as defined under the Investment Company Act of 1940.
(b) Represents less than 0.05% of net assets.
(c) Security fair valued as of October 31, 2024 by the Adviser as "valuation designee" under the oversight of the Fund's Board of Trustees. Total value of all such securities at October 31, 2024 amounted to $0, which represents approximately 0.00% of net assets of the Fund.
(d) Represents 7-day effective yield as of October 31, 2024.
Abbreviations
CVR — Contingent Value Rights
ETF — Exchange Traded Fund
REIT — Real Estate Investment Trust
As of October 31, 2024, the gross unrealized appreciation (depreciation) of investments based on the aggregate cost of investments for federal income tax purposes was as follows:
Aggregate gross unrealized appreciation | | $ | 345,504,441 | | |
Aggregate gross unrealized depreciation | | | (100,452,879 | ) | |
Net unrealized appreciation | | $ | 245,051,562 | | |
Federal income tax cost of investments | | $ | 1,624,381,114 | | |
Affiliated Securities
Security Description | | Shares at
October 31, 2024 | | Market Value
October 31, 2023 | | Purchases at
Cost | | Proceeds from
Sales | |
Common Stocks — 0.2% | |
United States — 0.2% | |
Amtech Systems, Inc.*^ | | | 723,575 | | | $ | 3,925,782 | | | $ | 1,292,032 | | | $ | (157,436 | ) | |
Total Common Stocks | | | | | 3,925,782 | | | | 1,292,032 | | | | (157,436 | ) | |
Total | | | | $ | 3,925,782 | | | $ | 1,292,032 | | | $ | (157,436 | ) | |
First Eagle Funds | Annual Report | October 31, 2024
64
First Eagle Small Cap Opportunity Fund | Schedule of Investments | October 31, 2024
Affiliated Securities (continued)
Security Description | | Net Realized
Gains
(Loss) | | Change in
Unrealized
Appreciation/
Depreciation | | Market Value
October 31,
2024 | | Dividend
Income | |
Common Stocks — 0.2% | |
United States — 0.2% | |
Amtech Systems, Inc.*^ | | $ | (228,378 | ) | | $ | (808,923 | ) | | $ | 4,023,077 | | | $ | — | | |
Total Common Stocks | | | (228,378 | ) | | | (808,923 | ) | | | 4,023,077 | | | | — | | |
Total | | $ | (228,378 | ) | | $ | (808,923 | ) | | $ | 4,023,077 | | | $ | — | | |
* Non-income producing security.
^ Represents an unaffiliated issuer as of October 31, 2023.
See Notes to Financial Statements.
First Eagle Funds | Annual Report | October 31, 2024
65
First Eagle U.S. Smid Cap Opportunity Fund | Schedule of Investments | October 31, 2024
Investments | | Shares | | Value ($) | |
Common Stocks — 95.2% | |
Aerospace & Defense — 4.3% | |
AAR Corp.* | | | 8,768 | | | | 514,681 | | |
Curtiss-Wright Corp. | | | 4,706 | | | | 1,623,382 | | |
| | | | 2,138,063 | | |
Air Freight & Logistics — 1.4% | |
GXO Logistics, Inc.* | | | 11,311 | | | | 676,511 | | |
Automobile Components — 0.7% | |
Goodyear Tire & Rubber Co. (The)* | | | 42,999 | | | | 344,422 | | |
Biotechnology — 1.6% | |
CareDx, Inc.* | | | 10,015 | | | | 221,632 | | |
Exelixis, Inc.* | | | 17,071 | | | | 566,757 | | |
| | | | 788,389 | | |
Building Products — 2.6% | |
AZEK Co., Inc. (The), Class A* | | | 5,900 | | | | 259,600 | | |
Lennox International, Inc. | | | 1,702 | | | | 1,025,574 | | |
| | | | 1,285,174 | | |
Capital Markets — 5.4% | |
Evercore, Inc., Class A | | | 4,940 | | | | 1,305,000 | | |
Houlihan Lokey, Inc., Class A | | | 4,152 | | | | 717,341 | | |
Raymond James Financial, Inc. | | | 4,693 | | | | 695,596 | | |
| | | | 2,717,937 | | |
Chemicals — 3.5% | |
Huntsman Corp. | | | 18,132 | | | | 398,904 | | |
International Flavors & Fragrances, Inc. | | | 5,927 | | | | 589,321 | | |
Westlake Corp. | | | 5,952 | | | | 785,307 | | |
| | | | 1,773,532 | | |
Construction & Engineering — 2.6% | |
Arcosa, Inc. | | | 1,696 | | | | 158,814 | | |
Quanta Services, Inc. | | | 3,718 | | | | 1,121,460 | | |
| | | | 1,280,274 | | |
Consumer Staples Distribution & Retail — 4.1% | |
Casey's General Stores, Inc. | | | 2,293 | | | | 903,488 | | |
Chefs' Warehouse, Inc. (The)* | | | 10,679 | | | | 426,306 | | |
Performance Food Group Co.* | | | 8,600 | | | | 698,750 | | |
| | | | 2,028,544 | | |
First Eagle Funds | Annual Report | October 31, 2024
66
First Eagle U.S. Smid Cap Opportunity Fund | Schedule of Investments | October 31, 2024
Investments | | Shares | | Value ($) | |
Containers & Packaging — 0.8% | |
Sealed Air Corp. | | | 10,762 | | | | 389,369 | | |
Electrical Equipment — 0.8% | |
Generac Holdings, Inc.* | | | 2,435 | | | | 403,114 | | |
Electronic Equipment, Instruments & Components — 6.1% | |
Avnet, Inc. | | | 5,528 | | | | 299,673 | | |
Belden, Inc. | | | 5,525 | | | | 629,132 | | |
Coherent Corp.* | | | 5,901 | | | | 545,488 | | |
Fabrinet (Thailand)* | | | 3,316 | | | | 799,057 | | |
Flex Ltd.* | | | 15,448 | | | | 535,582 | | |
Trimble, Inc.* | | | 3,603 | | | | 217,981 | | |
| | | | 3,026,913 | | |
Financial Services — 6.1% | |
MGIC Investment Corp. | | | 30,925 | | | | 774,362 | | |
Radian Group, Inc. | | | 26,231 | | | | 915,724 | | |
Rocket Cos., Inc., Class A* | | | 55,000 | | | | 885,500 | | |
Walker & Dunlop, Inc. | | | 4,542 | | | | 496,759 | | |
| | | | 3,072,345 | | |
Food Products — 1.7% | |
Ingredion, Inc. | | | 6,282 | | | | 833,998 | | |
Ground Transportation — 2.7% | |
Knight-Swift Transportation Holdings, Inc., Class A | | | 6,395 | | | | 333,052 | | |
XPO, Inc.* | | | 7,785 | | | | 1,016,176 | | |
| | | | 1,349,228 | | |
Health Care Equipment & Supplies — 2.9% | |
Align Technology, Inc.* | | | 3,926 | | | | 804,948 | | |
Enovis Corp.* | | | 4,708 | | | | 194,299 | | |
Zimmer Biomet Holdings, Inc. | | | 4,436 | | | | 474,297 | | |
| | | | 1,473,544 | | |
Health Care Providers & Services — 8.3% | |
Cardinal Health, Inc. | | | 10,079 | | | | 1,093,773 | | |
Ensign Group, Inc. (The) | | | 4,675 | | | | 724,578 | | |
Quest Diagnostics, Inc. | | | 4,835 | | | | 748,603 | | |
Tenet Healthcare Corp.* | | | 10,033 | | | | 1,555,316 | | |
| | | | 4,122,270 | | |
First Eagle Funds | Annual Report | October 31, 2024
67
First Eagle U.S. Smid Cap Opportunity Fund | Schedule of Investments | October 31, 2024
Investments | | Shares | | Value ($) | |
Hotels, Restaurants & Leisure — 5.1% | |
Aramark | | | 14,885 | | | | 563,099 | | |
Cheesecake Factory, Inc. (The) | | | 17,515 | | | | 809,543 | | |
Denny's Corp.* | | | 83,748 | | | | 536,825 | | |
Texas Roadhouse, Inc., Class A | | | 3,365 | | | | 643,119 | | |
| | | | 2,552,586 | | |
Household Durables — 4.7% | |
Beazer Homes USA, Inc.* | | | 23,080 | | | | 709,941 | | |
Champion Homes, Inc.* | | | 3,295 | | | | 290,718 | | |
LGI Homes, Inc.* | | | 3,789 | | | | 384,811 | | |
PulteGroup, Inc. | | | 2,976 | | | | 385,481 | | |
Toll Brothers, Inc. | | | 3,791 | | | | 555,154 | | |
| | | | 2,326,105 | | |
Insurance — 3.9% | |
Axis Capital Holdings Ltd. | | | 9,312 | | | | 728,757 | | |
First American Financial Corp. | | | 5,947 | | | | 381,500 | | |
Old Republic International Corp. | | | 23,460 | | | | 819,458 | | |
| | | | 1,929,715 | | |
Life Sciences Tools & Services — 3.5% | |
Avantor, Inc.* | | | 20,114 | | | | 449,950 | | |
Bio-Rad Laboratories, Inc., Class A* | | | 3,173 | | | | 1,136,537 | | |
Revvity, Inc. | | | 1,494 | | | | 177,173 | | |
| | | | 1,763,660 | | |
Machinery — 3.4% | |
Donaldson Co., Inc. | | | 10,571 | | | | 773,374 | | |
Dover Corp. | | | 4,826 | | | | 913,707 | | |
| | | | 1,687,081 | | |
Multi-Utilities — 1.0% | |
Black Hills Corp. | | | 8,830 | | | | 522,648 | | |
Oil, Gas & Consumable Fuels — 5.4% | |
Expand Energy Corp. | | | 9,974 | | | | 844,997 | | |
HF Sinclair Corp. | | | 13,991 | | | | 540,193 | | |
Matador Resources Co. | | | 14,137 | | | | 736,679 | | |
Permian Resources Corp., Class A | | | 43,871 | | | | 597,962 | | |
| | | | 2,719,831 | | |
First Eagle Funds | Annual Report | October 31, 2024
68
First Eagle U.S. Smid Cap Opportunity Fund | Schedule of Investments | October 31, 2024
Investments | | Shares | | Value ($) | |
Passenger Airlines — 1.6% | |
Delta Air Lines, Inc. | | | 13,694 | | | | 783,571 | | |
Personal Care Products — 0.2% | |
Coty, Inc., Class A* | | | 16,674 | | | | 124,055 | | |
Semiconductors & Semiconductor Equipment — 5.1% | |
Amkor Technology, Inc. | | | 16,976 | | | | 432,039 | | |
Entegris, Inc. | | | 4,726 | | | | 494,860 | | |
MKS Instruments, Inc. | | | 6,997 | | | | 695,012 | | |
Onto Innovation, Inc.* | | | 4,743 | | | | 940,679 | | |
| | | | 2,562,590 | | |
Specialty Retail — 2.4% | |
Lithia Motors, Inc., Class A | | | 1,694 | | | | 563,035 | | |
RH* | | | 135 | | | | 42,936 | | |
Warby Parker, Inc., Class A* | | | 35,000 | | | | 592,550 | | |
| | | | 1,198,521 | | |
Textiles, Apparel & Luxury Goods — 0.8% | |
Steven Madden Ltd. | | | 9,178 | | | | 412,735 | | |
Trading Companies & Distributors — 2.5% | |
Air Lease Corp., Class A | | | 19,392 | | | | 860,035 | | |
FTAI Aviation Ltd. | | | 2,949 | | | | 396,464 | | |
| | | | 1,256,499 | | |
Total Common Stocks
(Cost $37,687,813) | | | 47,543,224 | | |
Short-Term Investments — 5.0% | |
Investment Companies — 5.0% | |
JP Morgan U.S. Government Money Market Fund,
Capital Shares 4.86% (a) (Cost $2,492,498) | | | 2,492,498 | | | | 2,492,498 | | |
Total Investments — 100.2%
(Cost $40,180,311) | | | 50,035,722 | | |
Liabilities in Excess of Other Assets — (0.2%) | | | (92,285 | ) | |
Net Assets — 100.0% | | | 49,943,437 | | |
* Non-income producing security.
(a) Represents 7-day effective yield as of October 31, 2024.
First Eagle Funds | Annual Report | October 31, 2024
69
First Eagle U.S. Smid Cap Opportunity Fund | Schedule of Investments | October 31, 2024
As of October 31, 2024, the gross unrealized appreciation (depreciation) of investments based on the aggregate cost of investments for federal income tax purposes was as follows:
Aggregate gross unrealized appreciation | | $ | 10,677,886 | | |
Aggregate gross unrealized depreciation | | | (981,018 | ) | |
Net unrealized appreciation | | $ | 9,696,868 | | |
Federal income tax cost of investments | | $ | 40,338,854 | | |
See Notes to Financial Statements.
First Eagle Funds | Annual Report | October 31, 2024
70
First Eagle Global Real Assets Fund | Consolidated Schedule of Investments | October 31, 2024
Investments | | Shares | | Value ($) | |
Common Stocks — 91.4% | |
Australia — 2.0% | |
Glencore plc | | | 54,296 | | | | 284,763 | | |
Belgium — 1.2% | |
Shurgard Self Storage Ltd., REIT | | | 3,951 | | | | 169,198 | | |
Canada — 13.0% | |
Agnico Eagle Mines Ltd. | | | 2,152 | | | | 185,749 | | |
Canadian National Railway Co. | | | 1,703 | | | | 183,895 | | |
Canadian Pacific Kansas City Ltd. | | | 2,359 | | | | 181,980 | | |
Franco-Nevada Corp. | | | 938 | | | | 124,510 | | |
Imperial Oil Ltd. | | | 4,883 | | | | 364,380 | | |
Nutrien Ltd. | | | 5,550 | | | | 264,635 | | |
StorageVault Canada, Inc. | | | 29,891 | | | | 87,375 | | |
TransAlta Corp. | | | 6,771 | | | | 70,805 | | |
Wheaton Precious Metals Corp. | | | 5,942 | | | | 392,406 | | |
| | | | 1,855,735 | | |
Faroe Islands — 1.5% | |
Bakkafrost P/F | | | 3,667 | | | | 221,141 | | |
France — 1.0% | |
Air Liquide SA | | | 794 | | | | 142,365 | | |
Germany — 2.2% | |
FUCHS SE (Preference) | | | 6,799 | | | | 317,323 | | |
Hong Kong — 3.7% | |
CK Asset Holdings Ltd. | | | 32,000 | | | | 130,815 | | |
Guoco Group Ltd. | | | 15,000 | | | | 141,817 | | |
Hongkong Land Holdings Ltd. | | | 58,800 | | | | 252,110 | | |
| | | | 524,742 | | |
Japan — 4.0% | |
Kansai Paint Co. Ltd. | | | 18,500 | | | | 301,303 | | |
Komatsu Ltd. | | | 7,800 | | | | 201,905 | | |
Shin-Etsu Chemical Co. Ltd. | | | 2,000 | | | | 73,288 | | |
| | | | 576,496 | | |
Mexico — 6.3% | |
FIBRA Macquarie Mexico, REIT (a) | | | 173,890 | | | | 287,825 | | |
GMexico Transportes SAB de CV (a) | | | 61,685 | | | | 92,977 | | |
First Eagle Funds | Annual Report | October 31, 2024
71
First Eagle Global Real Assets Fund | Consolidated Schedule of Investments | October 31, 2024
Investments | | Shares | | Value ($) | |
Mexico — 6.3% (continued) | |
Grupo Mexico SAB de CV, Series B | | | 61,246 | | | | 320,440 | | |
Prologis Property Mexico SA de CV, REIT | | | 59,405 | | | | 198,823 | | |
| | | | 900,065 | | |
Russia — 0.0% | |
Alrosa PJSC‡ (b) | | | 48,132 | | | | — | | |
Singapore — 1.9% | |
Sheng Siong Group Ltd. | | | 137,800 | | | | 165,923 | | |
UOL Group Ltd. | | | 28,300 | | | | 114,352 | | |
| | | | 280,275 | | |
South Korea — 1.0% | |
Samsung Electronics Co. Ltd. (Preference) | | | 4,309 | | | | 148,231 | | |
Spain — 1.3% | |
Aena SME SA (a) | | | 829 | | | | 183,723 | | |
Switzerland — 1.0% | |
Barry Callebaut AG (Registered) | | | 80 | | | | 140,311 | | |
United Kingdom — 10.8% | |
Ashtead Group plc | | | 3,021 | | | | 225,994 | | |
Big Yellow Group plc, REIT | | | 13,253 | | | | 206,436 | | |
Cranswick plc | | | 2,503 | | | | 163,634 | | |
Derwent London plc, REIT | | | 6,732 | | | | 190,104 | | |
Great Portland Estates plc, REIT | | | 49,443 | | | | 199,870 | | |
Shell plc | | | 9,873 | | | | 332,294 | | |
United Utilities Group plc | | | 17,178 | | | | 226,706 | | |
| | | | 1,545,038 | | |
United States — 40.5% | |
American Homes 4 Rent, Class A, REIT | | | 1,831 | | | | 64,524 | | |
American Water Works Co., Inc. | | | 1,162 | | | | 160,484 | | |
BXP, Inc., REIT | | | 3,643 | | | | 293,480 | | |
Charter Communications, Inc., Class A* | | | 209 | | | | 68,471 | | |
Comcast Corp., Class A | | | 5,674 | | | | 247,784 | | |
CRH plc | | | 4,250 | | | | 405,165 | | |
Cummins, Inc. | | | 486 | | | | 159,884 | | |
Deere & Co. | | | 342 | | | | 138,404 | | |
Douglas Emmett, Inc., REIT | | | 8,012 | | | | 142,534 | | |
First Eagle Funds | Annual Report | October 31, 2024
72
First Eagle Global Real Assets Fund | Consolidated Schedule of Investments | October 31, 2024
Investments | | Shares | | Value ($) | |
United States — 40.5% (continued) | |
EastGroup Properties, Inc., REIT | | | 530 | | | | 90,778 | | |
Equinix, Inc., REIT | | | 216 | | | | 196,145 | | |
Equity Residential, REIT | | | 3,945 | | | | 277,610 | | |
Extra Space Storage, Inc., REIT | | | 2,273 | | | | 371,181 | | |
Exxon Mobil Corp. | | | 1,012 | | | | 118,181 | | |
HCA Healthcare, Inc. | | | 858 | | | | 307,799 | | |
IDACORP, Inc. | | | 2,580 | | | | 266,978 | | |
Mid-America Apartment Communities, Inc., REIT | | | 730 | | | | 110,478 | | |
Noble Corp. plc | | | 8,907 | | | | 284,846 | | |
NOV, Inc. | | | 1,755 | | | | 27,220 | | |
ONEOK, Inc. | | | 3,780 | | | | 366,206 | | |
Reliance, Inc. | | | 651 | | | | 186,407 | | |
Royal Gold, Inc. | | | 1,594 | | | | 232,820 | | |
RPM International, Inc. | | | 1,759 | | | | 223,587 | | |
SBA Communications Corp., Class A, REIT | | | 384 | | | | 88,116 | | |
Schlumberger NV | | | 4,265 | | | | 170,899 | | |
Terreno Realty Corp., REIT | | | 1,956 | | | | 117,262 | | |
TXNM Energy, Inc. | | | 3,598 | | | | 156,657 | | |
UGI Corp. | | | 8,311 | | | | 198,716 | | |
Universal Health Services, Inc., Class B | | | 740 | | | | 151,189 | | |
Williams Cos., Inc. (The) | | | 3,078 | | | | 161,195 | | |
| | | | 5,785,000 | | |
Total Common Stocks
(Cost $11,894,215) | | | 13,074,406 | | |
| | | Ounces | | | |
Commodities — 3.9% | |
Gold bullion*
(Cost $423,554) | | | 201 | | | | 551,559 | | |
| | | Shares | | | |
Master Limited Partnerships — 3.1% | |
United States — 3.1% | |
Black Stone Minerals LP | | | 5,560 | | | | 82,066 | | |
Enterprise Products Partners LP | | | 12,582 | | | | 360,600 | | |
Total Master Limited Partnerships
(Cost 388,683) | | | 442,666 | | |
First Eagle Funds | Annual Report | October 31, 2024
73
First Eagle Global Real Assets Fund | Consolidated Schedule of Investments | October 31, 2024
Investments | | Shares | | Value ($) | |
Exchange Traded Funds — 1.2% | |
United States | |
iShares Gold Trust
(Cost $137,975) | | | 3,447 | | | | 178,693 | | |
Short-Term Investment — 1.2% | |
Investment Companies — 1.2% | |
JP Morgan U.S. Government Money Market Fund,
Capital Shares 4.86% (c) (Cost $167,137) | | | 167,137 | | | | 167,137 | | |
Total Investments — 100.8%
(Cost $13,011,564) | | | 14,414,461 | | |
Liabilities in Excess of Other Assets — (0.8)% | | | (116,495 | ) | |
Net Assets — 100.0% | | | 14,297,966 | | |
* Non-income producing security.
‡ Value determined using significant unobservable inputs.
(a) Security exempt from registration pursuant to Regulation S under the Securities Act of 1933. Regulation S applies to securities offerings that are made outside of the United States and do not involve direct selling efforts in the United States and as such may have restrictions on resale.
(b) Security fair valued as of October 31, 2024 by the Adviser as "valuation designee" under the oversight of the Fund's Board of Trustees. Total value of all such securities at October 31, 2024 amounted to $0, which represents approximately 0.00% of net assets of the Fund.
(c) Represents 7-day effective yield as of October 31, 2024.
As of October 31, 2024, the gross unrealized appreciation (depreciation) of investments based on the aggregate cost of investments for federal income tax purposes was as follows:
Aggregate gross unrealized appreciation | | $ | 2,180,527 | | |
Aggregate gross unrealized depreciation | | | (837,842 | ) | |
Net unrealized appreciation | | $ | 1,342,685 | | |
Federal income tax cost of investments | | $ | 13,071,776 | | |
Abbreviations
PJSC — Public Joint Stock Company
Preference — A special type of equity investment that shares in the earnings of the company, has limited voting rights, and may have a dividend preference. Preference shares may also have liquidation preference.
REIT — Real Estate Investment Trust
See Notes to Financial Statements.
First Eagle Funds | Annual Report | October 31, 2024
74
First Eagle High Yield Municipal Fund | Schedule of Investments | October 31, 2024
Investments | | Principal Amount ($) | | Value ($) | |
Municipal Bonds — 112.0% | |
Alabama — 1.4% | |
Alabama Housing Finance Authority,
Revenue, GNMA Insured,
Series 2024 C, 4.70%, 10/01/2054 | | | 7,500,000 | | | | 7,520,083 | | |
Homewood Educational Building Authority,
CHF — Horizons I LLC, Revenue,
Series 2024 A, 5.50%, 10/01/2049 | | | 2,000,000 | | | | 2,114,672 | | |
CHF — Horizons I LLC, Revenue,
Series 2024 A, 5.50%, 10/01/2054 | | | 11,020,000 | | | | 11,574,976 | | |
CHF — Horizons II LLC, Revenue,
Series 2024 C, 5.50%, 10/01/2049 | | | 5,615,000 | | | | 5,936,942 | | |
CHF — Horizons II LLC, Revenue,
Series 2024 C, 5.50%, 10/01/2054 | | | 6,575,000 | | | | 6,906,122 | | |
CHF — Horizons II LLC, Revenue,
Series 2024 C, 5.00%, 10/01/2056 | | | 7,505,000 | | | | 7,517,236 | | |
Hoover Industrial Development Board,
United States Steel Corp., Revenue, AMT,
Series 2019, 5.75%, 10/01/2049 | | | 1,750,000 | | | | 1,828,317 | | |
Mobile County Industrial Development Authority,
AM/NS Calvert LLC, Revenue, AMT,
Series 2024 A, 5.00%, 06/01/2054 | | | 17,000,000 | | | | 17,355,183 | | |
| | | | 60,753,531 | | |
American Samoa — 0.0% (a) | |
American Samoa Economic Development
Authority, Revenue,
Series 2018, 6.50%, 09/01/2028 (b) | | | 150,000 | | | | 156,890 | | |
Revenue, Series 2021 A, 5.00%, 09/01/2038 (b) | | | 1,000,000 | | | | 997,081 | | |
| | | | 1,153,971 | | |
Arizona — 1.3% | |
Arizona Industrial Development Authority,
Revenue, Refunding, GNMA Insured,
Series 2024 C, 4.65%, 10/01/2049 | | | 1,000,000 | | | | 1,009,466 | | |
Revenue, Refunding, GNMA Insured,
Series 2024 C, 4.70%, 10/01/2054 | | | 1,095,000 | | | | 1,107,695 | | |
Doral Academy of Northern Nevada Obligated
Group, Revenue, Refunding,
Series 2021 A, 4.00%, 07/15/2051 (b) | | | 1,115,000 | | | | 937,102 | | |
KIPP NYC Public Charter Schools, Revenue,
Series 2021 A, 4.00%, 07/01/2061 | | | 7,600,000 | | | | 6,488,790 | | |
Mater Academy of Nevada Obligated Group, Revenue,
Series 2020 A, 5.00%, 12/15/2040 (b) | | | 1,840,000 | | | | 1,863,623 | | |
First Eagle Funds | Annual Report | October 31, 2024
75
First Eagle High Yield Municipal Fund | Schedule of Investments | October 31, 2024
Investments | | Principal Amount ($) | | Value ($) | |
Arizona — 1.3% (continued) | |
Industrial Development Authority of the
County of Pima (The), Revenue, GNMA Insured,
Series 2024 D-1, 4.60%, 07/01/2049 | | | 475,000 | | | | 477,730 | | |
Revenue, GNMA Insured,
Series 2024 D-1, 4.65%, 07/01/2054 | | | 575,000 | | | | 579,970 | | |
Maricopa County Industrial Development Authority,
Arizona Christian University, Revenue,
Series 2024 A, 6.38%, 10/1/2041 (b)(c)(d) | | | 8,400,000 | | | | 8,547,442 | | |
Choice Academies, Inc., Revenue, Refunding,
Series 2022, 5.75%, 09/01/2045 (b) | | | 2,275,000 | | | | 2,322,819 | | |
Morrison Education Group Obligated Group,
Revenue, Refunding,
Series 2024 A, 6.75%, 07/01/2063 (b) | | | 2,000,000 | | | | 2,094,614 | | |
Prescott Valley Charter School, Revenue,
Series 2024, 6.50%, 07/01/2039 (b) | | | 380,000 | | | | 384,165 | | |
Prescott Valley Charter School, Revenue,
Series 2024, 7.13%, 07/01/2054 (b) | | | 2,000,000 | | | | 2,006,763 | | |
Prescott Valley Charter School, Revenue,
Series 2024, 7.38%, 07/01/2063 (b) | | | 1,850,000 | | | | 1,856,173 | | |
Sierra Vista Industrial Development Authority,
American Leadership Academy, Inc., Revenue,
Series 2024, 5.00%, 06/15/2044 (b) | | | 2,250,000 | | | | 2,263,001 | | |
American Leadership Academy, Inc., Revenue,
Series 2024, 5.00%, 06/15/2054 (b) | | | 2,500,000 | | | | 2,476,958 | | |
American Leadership Academy, Inc., Revenue,
Series 2024, 5.00%, 06/15/2059 (b) | | | 1,500,000 | | | | 1,471,722 | | |
American Leadership Academy, Inc., Revenue,
Series 2024, 5.00%, 06/15/2064 (b) | | | 5,450,000 | | | | 5,297,763 | | |
Fit Kids, Inc., Revenue,
Series 2024, 5.38%, 06/15/2034 (b) | | | 325,000 | | | | 326,489 | | |
Fit Kids, Inc., Revenue,
Series 2024, 6.00%, 06/15/2044 (b) | | | 550,000 | | | | 552,846 | | |
Fit Kids, Inc., Revenue,
Series 2024, 6.30%, 06/15/2054 (b) | | | 1,120,000 | | | | 1,121,097 | | |
Fit Kids, Inc., Revenue,
Series 2024, 6.38%, 06/15/2064 (b) | | | 1,640,000 | | | | 1,637,789 | | |
Superstition Vistas, Community Facilities District No. 1
Assessment Area 3, Special Assessment,
Series 2024, 5.80%, 07/01/2048 | | | 348,000 | | | | 356,496 | | |
First Eagle Funds | Annual Report | October 31, 2024
76
First Eagle High Yield Municipal Fund | Schedule of Investments | October 31, 2024
Investments | | Principal Amount ($) | | Value ($) | |
Arizona — 1.3% (continued) | |
Superstition Vistas Community Facilities District No. 1,
Assessment Area 4, Special Assessment,
Series 2024, 4.70%, 07/01/2039 | | | 75,000 | | | | 72,949 | | |
Assessment Area 4, Special Assessment,
Series 2024, 5.25%, 07/01/2049 | | | 325,000 | | | | 314,549 | | |
Tempe Industrial Development Authority,
Tempe Life Care Village Obligated Group, Revenue,
Series 2019, 5.00%, 12/01/2050 | | | 1,905,000 | | | | 1,867,106 | | |
Tempe Life Care Village Obligated Group, Revenue,
Series 2019, 5.00%, 12/01/2054 | | | 150,000 | | | | 145,256 | | |
Tempe Life Care Village Obligated Group,
Revenue, Refunding,
Series 2021 A, 4.00%, 12/01/2038 | | | 250,000 | | | | 234,794 | | |
Tempe Life Care Village Obligated Group,
Revenue, Refunding,
Series 2021 A, 4.00%, 12/01/2046 | | | 6,555,000 | | | | 5,669,285 | | |
Town of Florence,
Merrill Ranch Community Facilities District No. 2
Assessment Area 11, Special Assessment,
5.00%, 07/01/2039 | | | 75,000 | | | | 75,143 | | |
Merrill Ranch Community Facilities District No. 2
Assessment Area 11, Special Assessment,
5.60%, 07/01/2049 | | | 275,000 | | | | 275,813 | | |
| | | | 53,835,408 | | |
Arkansas — 1.0% | |
Arkansas Development Finance Authority,
Big River Steel LLC, Revenue, AMT,
Series 2019, 4.50%, 09/01/2049 (b) | | | 1,250,000 | | | | 1,219,172 | | |
Hybar LLC, Revenue, AMT,
Series 2023 B, 7.37%, 07/01/2048 (b) | | | 11,250,000 | | | | 12,534,934 | | |
United States Steel Corp., Revenue, AMT,
Series 2023, 5.70%, 05/01/2053 | | | 8,400,000 | | | | 8,871,401 | | |
Batesville Public Facilities Board, White River
Health System Obligated Group, Revenue, Refunding,
Series 2020, 5.00%, 06/01/2026 | | | 1,440,000 | | | | 1,438,279 | | |
White River Health System Obligated Group,
Revenue, Refunding,
Series 2020, 5.00%, 06/01/2027 | | | 2,045,000 | | | | 2,045,333 | | |
White River Health System Obligated Group,
Revenue, Refunding,
Series 2020, 3.00%, 06/01/2028 | | | 1,040,000 | | | | 966,645 | | |
First Eagle Funds | Annual Report | October 31, 2024
77
First Eagle High Yield Municipal Fund | Schedule of Investments | October 31, 2024
Investments | | Principal Amount ($) | | Value ($) | |
Arkansas — 1.0% (continued) | |
White River Health System Obligated Group,
Revenue, Refunding,
Series 2020, 3.25%, 04/01/2032 | | | 395,000 | | | | 343,895 | | |
Clarksville Public Educational Facilities Board,
University of the Ozarks, Revenue, Refunding,
Series 2024 B, 6.00%, 08/01/2044 | | | 1,080,000 | | | | 1,124,490 | | |
University of the Ozarks, Revenue, Refunding,
Series 2024 B, 6.25%, 08/01/2049 | | | 3,365,000 | | | | 3,519,784 | | |
University of the Ozarks, Revenue, Refunding,
Series 2024 B, 6.25%, 08/01/2056 | | | 6,500,000 | | | | 6,778,488 | | |
County of Johnson, Johnson Regional Medical Center,
Revenue, Refunding,
Series 2018, 4.50%, 11/01/2035 | | | 3,500,000 | | | | 3,234,084 | | |
| | | | 42,076,505 | | |
California — 11.2% | |
Antelope Valley Healthcare District,
Obligated Group, Revenue, Refunding,
Series 2016, 5.00%, 03/01/2031 | | | 2,765,000 | | | | 2,788,460 | | |
Obligated Group, Revenue, Refunding,
Series 2016, 5.25%, 03/01/2036 | | | 1,885,000 | | | | 1,900,685 | | |
Obligated Group, Revenue, Refunding,
Series 2016, 5.00%, 03/01/2041 | | | 2,280,000 | | | | 2,282,726 | | |
Obligated Group, Revenue, Refunding,
Series 2016, 5.00%, 03/01/2046 | | | 3,190,000 | | | | 3,121,016 | | |
California Community Housing Agency, Arbors
Apartments, Revenue,
Series 2020 A, 5.00%, 08/01/2050 (b) | | | 1,900,000 | | | | 1,829,559 | | |
Brio Apartments & Next on Lex Apartments,
Revenue, Senior Lien,
Series 2021 A-1, 4.00%, 02/01/2056 (b) | | | 7,800,000 | | | | 6,637,213 | | |
Creekwood Apartments, Revenue,
Series 2021 A, 4.00%, 02/01/2056 (b) | | | 64,255,000 | | | | 43,161,966 | | |
Exchange at Bayfront Apartments,
Revenue, Senior Lien,
Series 2021 A-1, 3.00%, 02/01/2057 (b) | | | 3,350,000 | | | | 2,130,181 | | |
Stoneridge Apartments, Revenue,
Series 2021 A, 4.00%, 02/01/2056 (b) | | | 13,490,000 | | | | 11,126,304 | | |
California County Tobacco Securitization Agency,
Stanislaus County Tobacco Funding Corp., Revenue,
Series 2006 A, 0.00%, 06/01/2046 (e) | | | 27,000,000 | | | | 7,243,368 | | |
First Eagle Funds | Annual Report | October 31, 2024
78
First Eagle High Yield Municipal Fund | Schedule of Investments | October 31, 2024
Investments | | Principal Amount ($) | | Value ($) | |
California — 11.2% (continued) | |
California Educational Facilities Authority,
St. Mary's College of California, Revenue, Refunding,
Series 2023 A, 5.50%, 10/01/2053 | | | 3,030,000 | | | | 3,198,244 | | |
California Enterprise Development Authority,
Rocklin Academy Obligated Group, Revenue,
Series 2024, 5.00%, 06/01/2054 (b) | | | 700,000 | | | | 717,259 | | |
Rocklin Academy Obligated Group, Revenue,
Series 2024, 5.00%, 06/01/2064 (b) | | | 1,200,000 | | | | 1,223,438 | | |
California Health Facilities Financing Authority,
Sutter Health Obligated Group, Revenue,
Series 2016 A, 5.00%, 11/15/2024 | | | 10,000 | | | | 10,006 | | |
California Housing Finance Agency,
Found Middle, Revenue,
Series 2024 L, 5.20%, 12/01/2027 (b) | | | 5,000,000 | | | | 5,034,896 | | |
California Infrastructure & Economic
Development Bank, Revenue,
Series 2024 C, 5.00%, 06/01/2038 (b)(f) | | | 9,400,000 | | | | 9,400,581 | | |
DesertXpress Enterprises LLC, Revenue, AMT,
Series 2020 A-4, 8.00%, 8/15/2025 (b)(c)(d) | | | 110,500,000 | | | | 113,870,128 | | |
La Scuola International School, Revenue,
Series 2024, 5.00%, 07/01/2044 (b) | | | 2,145,000 | | | | 2,140,805 | | |
La Scuola International School, Revenue,
Series 2024, 5.13%, 07/01/2054 (b) | | | 2,100,000 | | | | 2,087,104 | | |
La Scuola International School, Revenue,
Series 2024, 5.25%, 07/01/2064 (b) | | | 4,800,000 | | | | 4,804,973 | | |
WFCS Holdings II LLC, Revenue,
Series 2021 A-1, 5.00%, 01/01/2056 (b) | | | 4,335,000 | | | | 4,327,900 | | |
WFCS Holdings II LLC, Revenue,
Series 2021 B, 0.00%, 01/01/2061 (b)(e) | | | 10,100,000 | | | | 790,953 | | |
WFCS Holdings LLC, Revenue,
Series 2020 A-1, 5.00%, 01/01/2055 (b) | | | 2,000,000 | | | | 1,996,768 | | |
California Municipal Finance Authority,
BOLD Program, Special Tax,
Series 2024 A, 5.13%, 09/01/2054 | | | 1,000,000 | | | | 1,039,061 | | |
BOLD Program, Special Tax,
Series 2024 B, 5.00%, 09/01/2049 | | | 1,070,000 | | | | 1,109,358 | | |
BOLD Program, Special Tax,
Series 2024 B, 5.00%, 09/01/2054 | | | 1,250,000 | | | | 1,287,975 | | |
Catalyst Impact Fund 1 LLC, Revenue,
Series 2024, Class I, 6.00%, 01/01/2039 (b) | | | 2,000,000 | | | | 2,099,999 | | |
First Eagle Funds | Annual Report | October 31, 2024
79
First Eagle High Yield Municipal Fund | Schedule of Investments | October 31, 2024
Investments | | Principal Amount ($) | | Value ($) | |
California — 11.2% (continued) | |
City of Elk Grove Community Facilities
District No. 2023-7 Area No. 1, Special Tax,
Series 2024, 5.00%, 09/01/2054 | | | 1,000,000 | | | | 1,032,266 | | |
Clinicas del Camino Real, Inc., Revenue,
Series 2020, 4.00%, 03/01/2050 | | | 4,000,000 | | | | 3,312,331 | | |
Community Facilities District No. 2023-11
Improvement Area A, Special Tax,
Series 2024, 5.00%, 09/01/2044 | | | 325,000 | | | | 340,191 | | |
Community Facilities District No. 2023-11
Improvement Area A, Special Tax,
Series 2024, 5.00%, 09/01/2049 | | | 670,000 | | | | 694,106 | | |
Community Facilities District No. 2023-11
Improvement Area A, Special Tax,
Series 2024, 5.00%, 09/01/2054 | | | 800,000 | | | | 823,666 | | |
Community Facilities District No. 2023-11
Improvement Area A, Special Tax,
Series 2024, 5.13%, 09/01/2059 | | | 1,250,000 | | | | 1,300,215 | | |
John Adams Academy — Roseville, Revenue,
Series 2014 A, 5.00%, 10/01/2044 | | | 1,810,000 | | | | 1,767,540 | | |
John Adams Academy — Roseville, Revenue,
Series 2015 A, 5.25%, 10/01/2045 | | | 1,325,000 | | | | 1,324,885 | | |
MWLA, Inc., Revenue, Refunding,
Series 2024, 5.00%, 06/01/2034 (b) | | | 500,000 | | | | 513,121 | | |
MWLA, Inc., Revenue, Refunding,
Series 2024, 5.25%, 06/01/2044 (b) | | | 1,000,000 | | | | 996,327 | | |
MWLA, Inc., Revenue, Refunding,
Series 2024, 5.50%, 06/01/2054 (b) | | | 1,250,000 | | | | 1,242,696 | | |
Nova Academy, Revenue,
Series 2016 A, 5.00%, 06/15/2036 (b) | | | 2,825,000 | | | | 2,826,037 | | |
Nova Academy, Revenue,
Series 2016 A, 5.00%, 06/15/2046 (b) | | | 4,500,000 | | | | 4,338,423 | | |
Palmdale Aerospace Academy, Inc. (The), Revenue,
Series 2016 A, 5.00%, 07/01/2046 (b) | | | 1,670,000 | | | | 1,645,981 | | |
St. Mary and All Angels Christian Church, Revenue,
Series 2024 A, 5.75%, 05/01/2054 (b) | | | 710,000 | | | | 735,055 | | |
St. Mary and All Angels Christian Church, Revenue,
Series 2024 A, 5.88%, 05/01/2059 (b) | | | 695,000 | | | | 722,334 | | |
Westside Neighborhood School, Revenue,
Series 2024, 5.90%, 06/15/2044 (b) | | | 775,000 | | | | 833,451 | | |
Westside Neighborhood School, Revenue,
Series 2024, 6.20%, 06/15/2054 (b) | | | 2,200,000 | | | | 2,369,771 | | |
First Eagle Funds | Annual Report | October 31, 2024
80
First Eagle High Yield Municipal Fund | Schedule of Investments | October 31, 2024
Investments | | Principal Amount ($) | | Value ($) | |
California — 11.2% (continued) | |
Westside Neighborhood School, Revenue,
Series 2024, 6.38%, 06/15/2064 (b) | | | 4,500,000 | | | | 4,891,082 | | |
California Public Finance Authority,
California University of Science & Medicine
Obligated Group, Revenue,
Series 2019 A, 6.25%, 07/01/2054 (b) | | | 1,500,000 | | | | 1,569,709 | | |
EEC, Inc., Revenue,
Series 2020 A, 5.00%, 06/15/2050 (b) | | | 400,000 | | | | 387,620 | | |
California School Finance Authority,
Envision Education Obligated Group, Revenue,
Series 2024 A, 5.00%, 06/01/2064 (b) | | | 2,735,000 | | | | 2,711,753 | | |
Harbor Springs Obligated Group, Revenue,
Series 2024 A, 5.63%, 07/01/2063 (b) | | | 1,000,000 | | | | 1,037,283 | | |
New Designs Charter School, Revenue, Refunding,
Series 2024 A, 4.75%, 06/01/2044 (b) | | | 1,000,000 | | | | 987,408 | | |
New Designs Charter School, Revenue, Refunding,
Series 2024 A, 5.00%, 06/01/2054 (b) | | | 735,000 | | | | 732,716 | | |
New Designs Charter School, Revenue, Refunding,
Series 2024 A, 5.00%, 06/01/2064 (b) | | | 5,475,000 | | | | 5,363,784 | | |
Rex & Margaret Fortune School of Education, Revenue,
Series 2024 A, 5.00%, 06/01/2044 (b)(f) | | | 2,000,000 | | | | 1,980,259 | | |
Rex & Margaret Fortune School of Education, Revenue,
Series 2024 A, 5.00%, 06/01/2054 (b)(f) | | | 2,350,000 | | | | 2,272,492 | | |
Rex & Margaret Fortune School of Education, Revenue,
Series 2024 A, 5.13%, 06/01/2059 (b)(f) | | | 1,500,000 | | | | 1,467,949 | | |
Rex & Margaret Fortune School of Education, Revenue,
Series 2024 A, 5.13%, 06/01/2064 (b)(f) | | | 2,350,000 | | | | 2,274,748 | | |
Stockton Collegiate International Schools
Obligated Group, Revenue,
Series 2024 A, 6.00%, 06/15/2053 (b) | | | 5,340,000 | | | | 5,285,777 | | |
Stockton Collegiate International Schools
Obligated Group, Revenue,
Series 2024 B, 7.50%, 06/15/2029 (b) | | | 360,000 | | | | 358,778 | | |
Vista Charter Public Schools Obligated Group, Revenue,
Series 2021 A, 4.00%, 06/01/2051 (b) | | | 6,790,000 | | | | 5,709,241 | | |
Vista Charter Public Schools Obligated Group, Revenue,
Series 2021 A, 4.00%, 06/01/2061 (b) | | | 1,455,000 | | | | 1,170,515 | | |
California Statewide Communities Development
Authority, Special Assessment,
Series 2024 A, 5.00%, 09/02/2054 | | | 1,150,000 | | | | 1,180,379 | | |
First Eagle Funds | Annual Report | October 31, 2024
81
First Eagle High Yield Municipal Fund | Schedule of Investments | October 31, 2024
Investments | | Principal Amount ($) | | Value ($) | |
California — 11.2% (continued) | |
Community Facilities District 2022-12 Improvement
Area No. 1, Special Tax,
Series 2024, 5.00%, 09/01/2054 | | | 1,000,000 | | | | 1,016,975 | | |
Community Facilities District No. 2021-03, Special Tax,
Series 2024, 5.00%, 09/01/2044 | | | 850,000 | | | | 875,355 | | |
Community Facilities District No. 2021-03, Special Tax,
Series 2024, 5.00%, 09/01/2049 | | | 820,000 | | | | 836,454 | | |
Community Facilities District No. 2021-03, Special Tax,
Series 2024, 5.00%, 09/01/2054 | | | 850,000 | | | | 865,721 | | |
Community Facilities District No. 2024-9, Special Tax,
Series 2024, 5.00%, 09/01/2044 | | | 400,000 | | | | 407,811 | | |
Community Facilities District No. 2024-9, Special Tax,
Series 2024, 5.00%, 09/01/2054 | | | 800,000 | | | | 805,420 | | |
Front Porch Communities & Services Obligated Group,
Revenue, Refunding,
Series 2021 A, 3.00%, 04/01/2051 | | | 9,000,000 | | | | 6,829,971 | | |
Loma Linda University Medical Center Obligated
Group, Revenue,
Series 2014 A, 5.50%, 12/01/2054 | | | 1,055,000 | | | | 1,055,416 | | |
California Statewide Financing Authority,
TSR Multi-County Special Purpose Trust, Revenue,
Series 2002 A, 6.00%, 05/01/2037 | | | 1,000,000 | | | | 1,022,895 | | |
TSR Multi-County Special Purpose Trust, Revenue,
Series 2002 A, 6.00%, 05/01/2043 | | | 800,000 | | | | 818,324 | | |
TSR Multi-County Special Purpose Trust, Revenue,
Series 2002 B, 6.00%, 05/01/2037 | | | 290,000 | | | | 296,640 | | |
Chino Community Facilities District, City of Chino
Community Facilities District No. 2003-3
Improvement Area No. 10, Special Tax,
Series 2024, 5.00%, 09/01/2049 | | | 680,000 | | | | 708,852 | | |
City & County of San Francisco, Infrastructure &
Revitalization Financing District No. 1 Facilities
Increment, Tax Allocation,
Series 2022 A, 5.00%, 09/01/2052 (b) | | | 1,000,000 | | | | 990,416 | | |
City of Long Beach,
Marina System, Revenue,
Series 2015, 5.00%, 05/15/2045 | | | 500,000 | | | | 501,263 | | |
City of Ontario,
Community Facilities District No. 35, Special Tax,
Series 2024, 5.00%, 09/01/2054 | | | 1,000,000 | | | | 1,035,984 | | |
First Eagle Funds | Annual Report | October 31, 2024
82
First Eagle High Yield Municipal Fund | Schedule of Investments | October 31, 2024
Investments | | Principal Amount ($) | | Value ($) | |
California — 11.2% (continued) | |
City of Rancho,
Mirage Community Facilities District No. 5
Improvement Area No. 1, Special Tax,
Series 2024 A, 5.00%, 09/01/2054 | | | 1,400,000 | | | | 1,434,738 | | |
City of Rancho Cordova,
Grantline 220 Community Facilities District No. 2023-1
Improvement Area No. 1, Special Tax,
Series 2024, 5.00%, 09/01/2049 | | | 550,000 | | | | 565,729 | | |
Grantline 220 Community Facilities District No. 2023-1
Improvement Area No. 1, Special Tax,
Series 2024, 5.00%, 09/01/2053 | | | 545,000 | | | | 558,145 | | |
CMFA Special Finance Agency I, Mix at CTR City (The),
Revenue, Series 2021 A-2, 4.00%, 04/01/2056 (b) | | | 12,240,000 | | | | 9,517,465 | | |
CSCDA Community Improvement Authority,
777 Place-Pomona, Revenue, Senior Lien,
Series 2021 A-2, 3.25%, 05/01/2057 (b) | | | 900,000 | | | | 626,783 | | |
Altana Apartments, Revenue,
Series 2021 A-2, 4.00%, 10/01/2056 (b) | | | 11,475,000 | | | | 9,334,873 | | |
CTR City Anaheim, Revenue,
Series 2020 A, 5.00%, 01/01/2054 (b) | | | 5,500,000 | | | | 4,860,249 | | |
Escondido Portfolio, Revenue, Senior Lien,
Series 2021 A-2, 4.00%, 06/01/2058 (b) | | | 9,875,000 | | | | 7,724,409 | | |
Link — Glendale (The), Revenue,
Series 2021 A-2, 4.00%, 07/01/2056 (b) | | | 1,295,000 | | | | 1,017,376 | | |
Millennium South Bay-Hawthorne, Revenue,
Series 2021 A-2, 3.25%, 07/01/2056 (b) | | | 23,865,000 | | | | 16,749,934 | | |
MODA at Monrovia Station, Revenue,
Series 2021 A-1, 3.40%, 10/01/2046 (b) | | | 150,000 | | | | 121,119 | | |
Monterey Station Apartments, Revenue, Senior Lien,
Series 2021 A-2, 3.13%, 07/01/2056 (b) | | | 6,250,000 | | | | 4,310,128 | | |
Oceanaire Apartments, Revenue,
Series 2021 A-2, 4.00%, 09/01/2056 (b) | | | 20,365,000 | | | | 15,771,933 | | |
Parallel-Anaheim, Revenue,
Series 2021 A, 4.00%, 08/01/2056 (b) | | | 3,400,000 | | | | 2,970,015 | | |
Renaissance at City Center, Revenue,
Series 2020 A, 5.00%, 07/01/2051 (b) | | | 1,000,000 | | | | 972,094 | | |
Vineyard Garden Apartments, Revenue, Senior Lien,
Series 2021 A, 3.25%, 10/01/2058 (b) | | | 160,000 | | | | 112,818 | | |
Waterscape Apartments, Revenue, Senior Lien,
Series 2021 A, 3.00%, 09/01/2056 (b) | | | 4,950,000 | | | | 3,513,734 | | |
First Eagle Funds | Annual Report | October 31, 2024
83
First Eagle High Yield Municipal Fund | Schedule of Investments | October 31, 2024
Investments | | Principal Amount ($) | | Value ($) | |
California — 11.2% (continued) | |
Westgate Apartments, Revenue, Senior Lien,
Series 2021 A-1, 3.00%, 06/01/2047 (b) | | | 2,000,000 | | | | 1,399,591 | | |
Westgate Apartments, Revenue, Senior Lien,
Series 2021 A-2, 3.13%, 06/01/2057 (b) | | | 39,995,000 | | | | 24,154,004 | | |
Wood Creek Apartments, Revenue, Senior Lien,
Series 2021 A-1, 3.00%, 12/01/2049 (b) | | | 5,000,000 | | | | 3,493,311 | | |
Wood Creek Apartments, Revenue, Senior Lien,
Series 2021 A-2, 4.00%, 12/01/2058 (b) | | | 31,100,000 | | | | 24,116,651 | | |
Folsom Ranch Financing Authority,
City of Folsom Community Facilities District No. 23
Improvement Area No. 2, Special Tax,
Series 2024, 5.00%, 09/01/2049 | | | 400,000 | | | | 417,341 | | |
City of Folsom Community Facilities District No. 23
Improvement Area No. 2, Special Tax,
Series 2024, 5.00%, 09/01/2053 | | | 460,000 | | | | 477,848 | | |
Kaweah Delta Health Care District Guild,
Revenue, Series 2015 B, 3.25%, 06/01/2030 | | | 65,000 | | | | 59,007 | | |
Revenue, Series 2015 B, 3.38%, 06/01/2031 | | | 45,000 | | | | 40,130 | | |
Revenue, Series 2015 B, 3.50%, 06/01/2032 | | | 125,000 | | | | 110,404 | | |
Revenue, Series 2015 B, 3.50%, 06/01/2033 | | | 100,000 | | | | 86,792 | | |
Revenue, Series 2015 B, 4.00%, 06/01/2037 | | | 440,000 | | | | 393,640 | | |
Revenue, Series 2015 B, 5.00%, 06/01/2040 | | | 500,000 | | | | 492,987 | | |
Revenue, Series 2015 B, 4.00%, 06/01/2045 | | | 6,115,000 | | | | 5,070,283 | | |
Palomar Health,
Obligated Group, COP, 4.00%, 11/01/2038 | | | 30,000 | | | | 26,277 | | |
Obligated Group, COP, 4.00%, 11/01/2047 | | | 25,000 | | | | 19,574 | | |
Obligated Group, Revenue, Refunding,
Series 2016, 5.00%, 11/01/2031 | | | 2,485,000 | | | | 2,488,604 | | |
Obligated Group, Revenue, Refunding,
Series 2016, 5.00%, 11/01/2036 | | | 750,000 | | | | 738,547 | | |
Obligated Group, Revenue, Refunding,
Series 2016, 5.00%, 11/01/2039 | | | 1,600,000 | | | | 1,532,064 | | |
Obligated Group, COP,
Series 2017, 5.00%, 11/01/2032 | | | 2,000,000 | | | | 2,001,865 | | |
Obligated Group, Revenue, Refunding,
Series 2017, 5.00%, 11/01/2042 | | | 1,455,000 | | | | 1,356,937 | | |
River Islands Public Financing Authority,
Community Facilities District No. 2023-1
Improvement Area No. 2, Special Tax,
Series 2024, 5.00%, 09/01/2054 | | | 2,750,000 | | | | 2,768,632 | | |
First Eagle Funds | Annual Report | October 31, 2024
84
First Eagle High Yield Municipal Fund | Schedule of Investments | October 31, 2024
Investments | | Principal Amount ($) | | Value ($) | |
California — 11.2% (continued) | |
Tejon Ranch Public Facilities Finance Authority,
Community Facilities District No. 2008-1,
Special Tax, Refunding,
Series 2024 A, 5.00%, 09/01/2054 | | | 2,250,000 | | | | 2,316,561 | | |
Woodland-Davis Clean Water Agency,
Revenue, Sub. Lien, Refunding,
Series 2015 B, 4.70%, 03/01/2039 (b) | | | 1,590,952 | | | | 1,404,435 | | |
| | | | 476,755,339 | | |
Colorado — 2.1% | |
Baseline Metropolitan District No. 1,
Revenue, Refunding,
Series 2018 A-1, 5.38%, 12/01/2034 | | | 5,567,000 | | | | 5,686,253 | | |
Revenue, Refunding,
Series 2018 A-2, 5.50%, 12/01/2034 | | | 9,340,000 | | | | 9,541,031 | | |
Revenue, Refunding,
Series 2018 A-2, 5.85%, 12/01/2048 | | | 3,000,000 | | | | 3,065,431 | | |
Canyons Metropolitan District No. 5, GO, Refunding,
Series 2024 B, 6.50%, 12/01/2054 | | | 3,400,000 | | | | 3,504,275 | | |
CCP Metropolitan District No. 3, GO, Refunding,
Series 2024, 5.00%, 12/01/2053 | | | 1,200,000 | | | | 1,198,004 | | |
Colorado Educational & Cultural Facilities Authority,
Aspen View Academy, Inc., Revenue,
Series 2021, 4.00%, 05/01/2051 | | | 1,235,000 | | | | 1,070,701 | | |
Expeditionary Learning School Board of Cooperative
Educational Services, Revenue,
Series 2019, 5.00%, 03/01/2050 (b) | | | 2,000,000 | | | | 1,902,216 | | |
Colorado Health Facilities Authority, BSLC Obligated
Group, Revenue, Refunding,
Series 2018 A-1, 4.25%, 09/15/2038 | | | 160,000 | | | | 148,682 | | |
BSLC Obligated Group, Revenue, Refunding,
Series 2018 A-1, 5.00%, 09/15/2048 | | | 7,000,000 | | | | 6,745,453 | | |
BSLC Obligated Group, Revenue, Second Tier,
Refunding, Series 2018 B, 4.50%, 09/15/2038 | | | 190,000 | | | | 171,189 | | |
BSLC Obligated Group, Revenue, Second Tier,
Refunding, Series 2018 B, 5.00%, 09/15/2053 | | | 50,000 | | | | 44,113 | | |
Colorado Housing and Finance Authority,
Revenue, Series 2024 A-1, Class I, 4.60%, 10/01/2049 | | | 2,620,000 | | | | 2,581,420 | | |
Revenue, Series 2024 A-1, Class I, 4.70%, 10/01/2054 | | | 3,500,000 | | | | 3,460,692 | | |
Revenue, Series 2024 A-1, Class I, 4.80%, 10/01/2059 | | | 2,765,000 | | | | 2,766,581 | | |
Revenue, Series 2024 A-1, Class I, 4.85%, 10/01/2064 | | | 2,150,000 | | | | 2,163,876 | | |
First Eagle Funds | Annual Report | October 31, 2024
85
First Eagle High Yield Municipal Fund | Schedule of Investments | October 31, 2024
Investments | | Principal Amount ($) | | Value ($) | |
Colorado — 2.1% (continued) | |
Revenue, Series 2024 A-1, Class I, 4.88%, 10/01/2067 | | | 2,230,000 | | | | 2,219,706 | | |
Revenue, Series 2024 B-1, Class I, 4.60%, 10/01/2064 | | | 1,000,000 | | | | 959,322 | | |
Hess Ranch Metropolitan District No. 5, Special
Improvement District No. 1, Special Assessment,
Series 2024 A-1, 6.00%, 12/01/2043 | | | 2,500,000 | | | | 2,552,210 | | |
Special Improvement District No. 1,
Special Assessment,
Series 2024 A-2, 6.50%, 12/01/2043 | | | 2,250,000 | | | | 2,322,892 | | |
Ledge Rock Center Residential Metropolitan
District No. 1, GO,
Series 2024 A, 6.38%, 12/01/2054 | | | 4,050,000 | | | | 4,119,588 | | |
Mineral Business Improvement District, GO,
Series 2024 A, 5.75%, 12/01/2054 (b)(f) | | | 3,125,000 | | | | 3,153,410 | | |
Newlin Crossing Metropolitan District, GO,
Series 2024 A, 5.38%, 12/01/2054 (b) | | | 1,145,000 | | | | 1,150,708 | | |
GO,
Series 2024 B, 7.75%, 12/15/2054 (b) | | | 603,000 | | | | 603,318 | | |
Poudre Heights Valley Metropolitan District, GO,
Series 2024 A, 5.50%, 12/01/2054 (b) | | | 980,000 | | | | 950,855 | | |
Prairie Center Metropolitan District No. 3,
GO, Refunding,
Series 2024 A, 5.88%, 12/15/2046 | | | 2,125,000 | | | | 2,271,781 | | |
GO,
Series 2024 B, 5.88%, 12/15/2046 | | | 1,000,000 | | | | 1,069,073 | | |
Rocky Mountain Rail Park Metropolitan District, GO,
Series 2021 A, 5.00%, 12/01/2051 (b) | | | 6,000,000 | | | | 4,969,594 | | |
Sky Dance Metropolitan District No. 2, GO,
Series 2024 A, 6.00%, 12/01/2054 (f) | | | 2,500,000 | | | | 2,506,360 | | |
Sky Ranch Community Authority Board, GO,
Series 2024 B, 6.50%, 12/15/2054 | | | 550,000 | | | | 552,704 | | |
St. Vrain Lakes Metropolitan District No. 4, GO,
Series 2024 A, 0.00%, 09/20/2054 (b) | | | 17,585,000 | | | | 12,621,927 | | |
Sterling Ranch Community Authority Board,
Sterling Ranch Metropolitan District No. 1,
Special Assessment,
Series 2024, 5.63%, 12/01/2043 | | | 3,000,000 | | | | 3,085,217 | | |
Sunset Parks Metropolitan District, GO,
Series 2024 A, 5.13%, 12/01/2054 (b) | | | 1,415,000 | | | | 1,414,313 | | |
Water Valley Metropolitan District No. 3, GO,
Series 2024 A, 5.25%, 12/01/2054 | | | 600,000 | | | | 605,176 | | |
| | | | 91,178,071 | | |
First Eagle Funds | Annual Report | October 31, 2024
86
First Eagle High Yield Municipal Fund | Schedule of Investments | October 31, 2024
Investments | | Principal Amount ($) | | Value ($) | |
Connecticut — 2.3% | |
Connecticut Housing Finance Authority,
Revenue, Refunding,
Series 2024 F-1, 4.60%, 11/15/2044 (f)(g) | | | 21,770,000 | | | | 21,801,366 | | |
Revenue, Refunding,
Series 2024 F-1, 4.75%, 11/15/2049 (f)(g) | | | 34,810,000 | | | | 35,131,457 | | |
Revenue, Refunding,
Series 2024 F-1, 4.80%, 11/15/2052 (f)(g) | | | 10,010,000 | | | | 10,087,194 | | |
Connecticut State Health & Educational Facilities
Authority, Connecticut State University System,
Revenue, Series N, 5.00%, 11/01/2024 | | | 25,000 | | | | 25,000 | | |
Goodwin University Obligated Group, Revenue,
Series A-1, 5.00%, 07/01/2044 | | | 3,000,000 | | | | 3,008,230 | | |
Goodwin University Obligated Group, Revenue,
Series A-1, 5.38%, 07/01/2054 | | | 6,340,000 | | | | 6,350,337 | | |
Griffin Health Obligated Group, Revenue, Refunding,
Series G-1, 5.00%, 07/01/2044 (b) | | | 3,850,000 | | | | 3,713,190 | | |
Griffin Health Obligated Group, Revenue, Refunding,
Series G-1, 5.00%, 07/01/2050 (b) | | | 1,265,000 | | | | 1,181,405 | | |
Nuvance Health Obligated Group, Revenue, Refunding,
Series 2019 A, 4.00%, 07/01/2041 | | | 4,645,000 | | | | 4,377,574 | | |
University of Hartford (The), Revenue, Refunding,
Series 2019 N, 4.00%, 07/01/2049 | | | 3,875,000 | | | | 3,001,486 | | |
University of Hartford (The), Revenue,
Series 2022 P, 5.38%, 07/01/2052 | | | 3,750,000 | | | | 3,523,935 | | |
University of Hartford (The), Revenue, Refunding,
Series N, 4.00%, 07/01/2039 | | | 60,000 | | | | 50,699 | | |
Steel Point Infrastructure Improvement District,
Tax Allocation,
Series 2024, 5.63%, 04/01/2044 (b) | | | 1,000,000 | | | | 1,041,064 | | |
Tax Allocation,
Series 2024, 6.00%, 04/01/2052 (b) | | | 2,500,000 | | | | 2,649,243 | | |
| | | | 95,942,180 | | |
Delaware — 0.2% | |
Delaware State Housing Authority,
Revenue, GNMA Insured,
Series 2024 D, 4.50%, 07/01/2054 (f) | | | 2,000,000 | | | | 1,964,365 | | |
Town of Bridgeville,
Heritage Shores Special Development District,
Special Tax, Series 2024, 5.25%, 07/01/2044 (b) | | | 875,000 | | | | 908,100 | | |
First Eagle Funds | Annual Report | October 31, 2024
87
First Eagle High Yield Municipal Fund | Schedule of Investments | October 31, 2024
Investments | | Principal Amount ($) | | Value ($) | |
Delaware — 0.2% (continued) | |
Heritage Shores Special Development District,
Special Tax, Series 2024, 5.63%, 07/01/2053 (b) | | | 1,535,000 | | | | 1,605,333 | | |
Town of Milton,
Granary at Draper Farm Special Development District,
Special Tax, Series 2024, 5.70%, 09/01/2044 (b) | | | 1,265,000 | | | | 1,291,837 | | |
Granary at Draper Farm Special Development
District, Special Tax,
Series 2024, 5.95%, 09/01/2053 (b) | | | 3,165,000 | | | | 3,236,563 | | |
| | | | 9,006,198 | | |
District of Columbia — 1.1% | |
District of Columbia,
Latin American Montessori Bilingual Public Charter
School Obligated Group, Revenue, Refunding,
Series 2020, 5.00%, 06/01/2050 | | | 3,220,000 | | | | 3,185,021 | | |
Rocketship DC Obligated Group, Revenue,
Series 2019 A, 5.00%, 06/01/2049 (b) | | | 4,100,000 | | | | 4,014,614 | | |
Rocketship Obligated Group, Revenue,
Series 2021 A, 5.00%, 06/01/2061 (b) | | | 7,970,000 | | | | 7,572,748 | | |
Rocketship Obligated Group, Revenue,
Series 2024 A, 5.75%, 06/01/2054 | | | 3,100,000 | | | | 3,200,842 | | |
Rocketship Obligated Group, Revenue,
Series 2024 A, 6.00%, 06/01/2058 | | | 400,000 | | | | 418,533 | | |
Tobacco Settlement Financing Corp., Revenue,
Series 2006 A, 0.00%, 06/15/2046 (e) | | | 20,000,000 | | | | 5,026,568 | | |
Union Market TIF Area, Tax Allocation,
Series 2021 A, 0.00%, 06/01/2031 (b) | | | 2,162,000 | | | | 1,910,665 | | |
Union Market TIF Area, Tax Allocation,
Series 2021 A, 0.00%, 06/01/2046 (b) | | | 8,635,000 | | | | 6,520,591 | | |
Union Market TIF Area, Tax Allocation,
Series 2024 B, 0.00%, 06/01/2041 (b) | | | 6,010,000 | | | | 3,570,094 | | |
Union Market TIF Area, Tax Allocation,
Series 2024 B, 0.00%, 06/01/2049 (b) | | | 14,470,000 | | | | 8,415,283 | | |
| | | | 43,834,959 | | |
Florida — 19.4% | |
Academical Village Community Development District,
Special Assessment,
Series 2020, 3.63%, 05/01/2040 | | | 4,320,000 | | | | 3,645,549 | | |
Anabelle Island Community Development District,
Special Assessment,
Series 2022, 4.00%, 05/01/2052 | | | 180,000 | | | | 149,209 | | |
First Eagle Funds | Annual Report | October 31, 2024
88
First Eagle High Yield Municipal Fund | Schedule of Investments | October 31, 2024
Investments | | Principal Amount ($) | | Value ($) | |
Florida — 19.4% (continued) | |
Antillia Community Development District,
Special Assessment,
Series 2024, 5.60%, 05/01/2044 | | | 720,000 | | | | 730,682 | | |
Special Assessment,
Series 2024, 5.88%, 05/01/2054 | | | 1,000,000 | | | | 1,014,663 | | |
Ave Maria Stewardship Community District,
Assessment Phase 5, Special Assessment,
Series 2022, 4.00%, 05/01/2052 | | | 1,000,000 | | | | 820,444 | | |
Ave Maria Stewardship Community District
Series 2021 Assessment, Special Assessment,
Series 2021, 4.00%, 05/01/2051 | | | 200,000 | | | | 167,119 | | |
Bella Collina Community Development District,
Special Assessment,
Series 2024, 5.00%, 05/01/2044 | | | 685,000 | | | | 671,820 | | |
Special Assessment,
Series 2024, 5.30%, 05/01/2055 | | | 915,000 | | | | 897,689 | | |
Berry Bay II Community Development District,
Assessment Area 1, Special Assessment,
Series 2024, 5.20%, 05/01/2044 | | | 550,000 | | | | 544,342 | | |
Assessment Area 1, Special Assessment,
Series 2024, 5.45%, 05/01/2054 | | | 1,000,000 | | | | 984,706 | | |
Boggy Branch Community Development District,
Special Assessment,
Series 2021, 4.00%, 05/01/2051 | | | 1,595,000 | | | | 1,347,326 | | |
Bridgewater North Community Development District,
Special Assessment,
Series 2022, 4.00%, 05/01/2052 | | | 2,000,000 | | | | 1,668,137 | | |
Buckhead Trails Community Development District,
Special Assessment,
Series 2024, 5.60%, 05/01/2044 | | | 1,000,000 | | | | 1,006,436 | | |
Special Assessment,
Series 2024, 5.88%, 05/01/2054 | | | 1,675,000 | | | | 1,685,661 | | |
Caldera Community Development District,
Assessment Area 1, Special Assessment,
Series 2024, 5.00%, 05/01/2044 | | | 725,000 | | | | 721,345 | | |
Assessment Area 1, Special Assessment,
Series 2024, 5.20%, 05/01/2054 | | | 1,000,000 | | | | 982,122 | | |
Capital Projects Finance Authority,
Kissimmee Charter Academy, Revenue,
Series 2024, 6.13%, 06/15/2044 (b) | | | 420,000 | | | | 430,391 | | |
Kissimmee Charter Academy, Revenue,
Series 2024, 6.50%, 06/15/2054 (b) | | | 235,000 | | | | 240,886 | | |
First Eagle Funds | Annual Report | October 31, 2024
89
First Eagle High Yield Municipal Fund | Schedule of Investments | October 31, 2024
Investments | | Principal Amount ($) | | Value ($) | |
Florida — 19.4% (continued) | |
Kissimmee Charter Academy, Revenue,
Series 2024, 6.63%, 06/15/2059 (b) | | | 1,015,000 | | | | 1,040,276 | | |
Navigator Academy of Leadership, Inc.
Obligated Group, Revenue, Refunding,
Series 2024, 5.00%, 06/15/2054 (b) | | | 1,200,000 | | | | 1,179,893 | | |
Navigator Academy of Leadership, Inc.
Obligated Group, Revenue, Refunding,
Series 2024, 5.00%, 06/15/2064 (b) | | | 5,485,000 | | | | 5,293,287 | | |
Capital Trust Agency, Inc.,
Babcock Neighborhood School, Inc., Revenue,
Series 2021, 4.20%, 08/15/2056 (b) | | | 1,450,000 | | | | 1,174,925 | | |
Babcock Neighborhood School, Inc., Revenue,
Series 2021, 4.25%, 08/15/2061 (b) | | | 2,250,000 | | | | 1,789,053 | | |
Franklin Academy Obligated Group, Revenue,
Series 2020, 5.00%, 12/15/2035 (b) | | | 1,085,000 | | | | 1,086,627 | | |
Marie Selby Botanical Gardens, Inc. (The), Revenue,
Series 2021, 4.00%, 06/15/2051 (b) | | | 2,000,000 | | | | 1,549,074 | | |
Renaissance Charter School, Inc.
Obligated Group, Revenue,
Series 2019 A, 5.00%, 06/15/2049 (b) | | | 4,365,000 | | | | 4,151,270 | | |
WFCS Holdings II LLC, Revenue,
Series 2021 A-1, 5.00%, 01/01/2056 (b) | | | 4,150,000 | | | | 4,047,323 | | |
Capital Trust Authority,
IDEA Florida, Inc., Revenue, Refunding,
Series 2023 A, 6.38%, 06/15/2058 (b) | | | 1,500,000 | | | | 1,571,471 | | |
KIPP Miami Obligated Group, Revenue, Refunding,
Series 2024 A, 5.63%, 06/15/2044 (b) | | | 810,000 | | | | 841,189 | | |
KIPP Miami Obligated Group, Revenue, Refunding,
Series 2024 A, 6.00%, 06/15/2054 (b) | | | 1,250,000 | | | | 1,305,788 | | |
KIPP Miami Obligated Group, Revenue, Refunding,
Series 2024 A, 6.13%, 06/15/2060 (b) | | | 1,100,000 | | | | 1,150,610 | | |
Seaside School Consortium, Inc., Revenue,
Series 2024 A, 5.13%, 06/15/2059 | | | 2,970,000 | | | | 2,898,117 | | |
Caymas Community Development District,
Assessment Area 1, Special Assessment,
Series 2024, 5.63%, 05/01/2054 | | | 1,000,000 | | | | 1,004,542 | | |
Central Parc Community Development District,
Special Assessment,
Series 2024, 4.90%, 05/01/2031 | | | 475,000 | | | | 475,710 | | |
Special Assessment,
Series 2024, 5.70%, 05/01/2044 | | | 750,000 | | | | 753,142 | | |
First Eagle Funds | Annual Report | October 31, 2024
90
First Eagle High Yield Municipal Fund | Schedule of Investments | October 31, 2024
Investments | | Principal Amount ($) | | Value ($) | |
Florida — 19.4% (continued) | |
Special Assessment,
Series 2024, 6.00%, 05/01/2054 | | | 750,000 | | | | 755,841 | | |
Chapel Creek Community Development District,
Assessment Area, Special Assessment,
Series 2024, 5.75%, 05/01/2054 | | | 1,000,000 | | | | 1,012,934 | | |
Charlotte County Industrial Development Authority,
MSKP Town & Country Utility LLC, Revenue, AMT,
Series 2021 A, 4.00%, 10/01/2051 (b) | | | 8,735,000 | | | | 7,197,447 | | |
City of Pompano Beach,
John Knox Village of Florida, Inc.
Obligated Group, Revenue,
Series 2021 A, 4.00%, 09/01/2056 | | | 500,000 | | | | 418,023 | | |
Coral Bay Lee County Community Development District,
Assessment Area 2, Revenue,
Series 2024, 5.25%, 05/01/2044 | | | 1,000,000 | | | | 1,003,641 | | |
Assessment Area 2, Revenue,
Series 2024, 5.55%, 05/01/2054 | | | 1,220,000 | | | | 1,226,243 | | |
Coral Creek Community Development District,
Special Assessment,
Series 2024, 5.75%, 05/01/2054 | | | 1,700,000 | | | | 1,725,745 | | |
Coral Lakes Community Development District,
Assessment Area 1, Special Assessment,
Series 2024, 5.75%, 11/01/2053 | | | 1,000,000 | | | | 1,024,221 | | |
County of Lee,
Airport, Revenue, AMT,
Series 2024, 5.25%, 10/01/2049 (g) | | | 9,500,000 | | | | 10,149,092 | | |
Airport, Revenue, AMT,
Series 2024, 5.25%, 10/01/2054 (g) | | | 25,750,000 | | | | 27,379,914 | | |
County of Palm Beach,
Provident Group — LU Properties LLC, Revenue,
Series 2021 A, 5.00%, 06/01/2057 (b) | | | 1,000,000 | | | | 940,241 | | |
Provident Group — LU Properties LLC, Revenue,
Series 2024 A, 6.13%, 06/01/2054 | | | 13,250,000 | | | | 13,320,633 | | |
Provident Group — LU Properties LLC, Revenue,
Series 2024 A, 6.25%, 06/01/2059 | | | 10,890,000 | | | | 11,005,730 | | |
Provident Group-PBAU Properties LLC, Revenue,
Series 2019 A, 5.00%, 04/01/2039 (b) | | | 1,950,000 | | | | 1,916,513 | | |
Creekview Community Development District,
Phase 2, Special Assessment,
Series 2024, 5.38%, 05/01/2044 (b) | | | 2,000,000 | | | | 1,969,885 | | |
Phase 2, Special Assessment,
Series 2024, 5.63%, 05/01/2055 (b) | | | 3,500,000 | | | | 3,436,517 | | |
First Eagle Funds | Annual Report | October 31, 2024
91
First Eagle High Yield Municipal Fund | Schedule of Investments | October 31, 2024
Investments | | Principal Amount ($) | | Value ($) | |
Florida — 19.4% (continued) | |
Crossings Community Development District,
Area 2, Special Assessment,
Series 2024, 5.35%, 05/01/2044 | | | 1,000,000 | | | | 997,633 | | |
Area 2, Special Assessment,
Series 2024, 5.60%, 05/01/2054 | | | 1,375,000 | | | | 1,371,137 | | |
Crosswinds East Community Development District,
Assessment Area 1, Special Assessment,
Series 2024, 5.75%, 05/01/2054 | | | 1,500,000 | | | | 1,523,821 | | |
Assessment Area 2, Special Assessment,
Series 2024, 5.15%, 05/01/2044 | | | 775,000 | | | | 763,679 | | |
Assessment Area 2, Special Assessment,
Series 2024, 5.45%, 05/01/2054 | | | 1,000,000 | | | | 987,027 | | |
Dowden West Community Development District,
Special Assessment,
Series 2024, 5.25%, 05/01/2044 | | | 495,000 | | | | 498,234 | | |
Special Assessment,
Series 2024, 5.55%, 05/01/2054 | | | 855,000 | | | | 860,515 | | |
East Nassau Stewardship District,
Assessments, Special Assessment,
Series 2021, 4.00%, 05/01/2051 | | | 1,510,000 | | | | 1,258,004 | | |
Wildlight Village Phase 3, Special Assessment,
Series 2024, 5.25%, 05/01/2044 | | | 1,505,000 | | | | 1,493,828 | | |
Wildlight Village Phase 3, Special Assessment,
Series 2024, 5.50%, 05/01/2055 | | | 1,605,000 | | | | 1,583,593 | | |
Edgewater East Community Development District,
Assessment Area 1, Special Assessment,
Series 2021, 4.00%, 05/01/2051 | | | 1,310,000 | | | | 1,092,557 | | |
Assessment Area 2, Special Assessment,
Series 2022, 4.00%, 05/01/2052 | | | 10,180,000 | | | | 8,428,844 | | |
Edgewater West Community Development District,
Assessment Area 1, Special Assessment,
Series 2024, 5.25%, 05/01/2044 | | | 2,000,000 | | | | 1,962,299 | | |
Assessment Area 1, Special Assessment,
Series 2024, 5.50%, 05/01/2054 | | | 2,500,000 | | | | 2,436,497 | | |
Entrada Community Development District,
Assessments, Special Assessment,
Series 2024, 5.00%, 05/01/2044 | | | 600,000 | | | | 589,622 | | |
Assessments, Special Assessment,
Series 2024, 5.30%, 05/01/2055 | | | 725,000 | | | | 711,922 | | |
Epperson North Community Development District,
Assessment Area 3, Special Assessment,
Series 2021 A, 4.00%, 11/01/2051 | | | 1,985,000 | | | | 1,648,299 | | |
First Eagle Funds | Annual Report | October 31, 2024
92
First Eagle High Yield Municipal Fund | Schedule of Investments | October 31, 2024
Investments | | Principal Amount ($) | | Value ($) | |
Florida — 19.4% (continued) | |
Assessment Area 4, Special Assessment,
Series 2024, 5.30%, 05/01/2044 | | | 465,000 | | | | 465,745 | | |
Assessment Area 4, Special Assessment,
Series 2024, 5.60%, 05/01/2055 | | | 750,000 | | | | 751,153 | | |
Everlands Community Development District,
Assessment Area 2, Special Assessment,
Series 2024, 5.55%, 06/15/2054 | | | 1,000,000 | | | | 1,013,111 | | |
Assessment Area 2 Phase 2, Special Assessment,
Series 2024, 5.20%, 06/15/2044 (b)(f) | | | 750,000 | | | | 750,051 | | |
Assessment Area 2 Phase 2, Special Assessment,
Series 2024, 5.50%, 06/15/2054 (b)(f) | | | 1,000,000 | | | | 1,000,059 | | |
Everlands II Community Development District,
Special Assessment,
Series 2024, 5.20%, 06/15/2044 | | | 725,000 | | | | 722,168 | | |
Special Assessment,
Series 2024, 5.45%, 06/15/2054 | | | 1,000,000 | | | | 990,870 | | |
Florida Development Finance Corp.,
AAF Operations Holdings LLC, Revenue, AMT, Refunding,
Series 2024, 12.00%, 7/15/2028 (b)(c)(d) | | | 121,410,000 | | | | 128,775,738 | | |
Assistance Unlimited, Inc., Revenue, Refunding,
Series 2022, 6.00%, 08/15/2057 (b) | | | 5,000,000 | | | | 5,011,782 | | |
Brightline Florida Holdings LLC, Revenue, AMT,
Series 2024 A, 8.25%, 2/14/2025 (b)(c)(d) | | | 63,210,000 | | | | 65,137,785 | | |
Brightline Trains Florida LLC, Revenue, AMT, Refunding,
Series 2024, 5.00%, 07/01/2041 | | | 17,595,000 | | | | 17,842,959 | | |
Brightline Trains Florida LLC, Revenue, AMT, Refunding,
Series 2024, 5.25%, 07/01/2047 | | | 54,690,000 | | | | 55,898,130 | | |
Brightline Trains Florida LLC, Revenue, AMT, Refunding,
Series 2024, 5.50%, 07/01/2053 | | | 59,275,000 | | | | 61,175,232 | | |
Cornerstone Classical Academy, Inc., Revenue,
Series 2024 A, 5.00%, 06/01/2034 (b) | | | 1,190,000 | | | | 1,223,774 | | |
Cornerstone Classical Academy, Inc., Revenue,
Series 2024 A, 5.25%, 06/01/2044 (b) | | | 1,000,000 | | | | 1,011,170 | | |
Cornerstone Classical Academy, Inc., Revenue,
Series 2024 A, 5.50%, 06/01/2054 (b) | | | 2,790,000 | | | | 2,829,529 | | |
Cornerstone Classical Academy, Inc., Revenue,
Series 2024 A, 5.50%, 06/01/2059 (b) | | | 1,500,000 | | | | 1,511,941 | | |
Downtown Doral Charter Elementary
School, Inc.,
Revenue, Series 2017 C, 5.75%, 07/01/2047 (b) | | | 2,000,000 | | | | 2,022,835 | | |
First Eagle Funds | Annual Report | October 31, 2024
93
First Eagle High Yield Municipal Fund | Schedule of Investments | October 31, 2024
Investments | | Principal Amount ($) | | Value ($) | |
Florida — 19.4% (continued) | |
IDEA Florida, Inc., Revenue,
Series 2022, 5.25%, 06/15/2029 (b) | | | 2,230,000 | | | | 2,253,314 | | |
Renaissance Charter School, Inc. Obligated
Group, Revenue, Refunding,
Series 2020 A, 6.00%, 06/15/2050 | | | 1,000,000 | | | | 1,026,807 | | |
Renaissance Charter School, Inc. Obligated
Group, Revenue,
Series 2021 A, 5.50%, 06/15/2051 | | | 1,000,000 | | | | 1,006,996 | | |
SFP — Tampa I LLC, Revenue, Senior Lien,
Series 2024 A-1, 5.00%, 06/01/2044 (b) | | | 1,600,000 | | | | 1,626,746 | | |
SFP — Tampa I LLC, Revenue, Senior Lien,
Series 2024 A-1, 5.25%, 06/01/2054 (b) | | | 7,200,000 | | | | 7,329,921 | | |
SFP — Tampa I LLC, Revenue, Senior Lien,
Series 2024 A-1, 5.25%, 06/01/2059 (b) | | | 6,550,000 | | | | 6,643,290 | | |
Waste Pro USA, Inc., Revenue, AMT,
Series 2021, 3.00%, 06/01/2032 | | | 10,035,000 | | | | 9,043,820 | | |
Waste Pro USA, Inc., Revenue, AMT,
Series 2023, 6.13%, 7/1/2026 (b)(c)(d) | | | 1,265,000 | | | | 1,296,326 | | |
Florida Municipal Loan Council,
Shingle Creek Transit & Utility Community
Development District, Special Assessment, AMT,
Series 2024, 5.15%, 05/01/2044 | | | 650,000 | | | | 647,798 | | |
Shingle Creek Transit & Utility Community
Development District, Special Assessment, AMT,
Series 2024, 5.40%, 05/01/2054 | | | 825,000 | | | | 818,721 | | |
Gardens at Hammock Beach Community
Development District,
Assessment Area 1, Special Assessment,
Series 2024-1, 5.38%, 05/01/2044 | | | 305,000 | | | | 304,215 | | |
Assessment Area 1, Special Assessment,
Series 2024-1, 5.65%, 05/01/2054 | | | 535,000 | | | | 533,369 | | |
Assessment Area 2, Special Assessment,
Series 2024-2, 5.00%, 05/01/2031 | | | 270,000 | | | | 269,196 | | |
Assessment Area 2, Special Assessment,
Series 2024-2, 5.60%, 05/01/2044 | | | 990,000 | | | | 986,183 | | |
Assessment Area 2, Special Assessment,
Series 2024-2, 5.88%, 05/01/2055 | | | 1,250,000 | | | | 1,243,358 | | |
Golden Gem Community Development District,
Special Assessment,
Series 2024, 5.15%, 05/01/2031 | | | 535,000 | | | | 540,224 | | |
Special Assessment,
Series 2024, 5.70%, 05/01/2044 | | | 2,900,000 | | | | 2,932,305 | | |
First Eagle Funds | Annual Report | October 31, 2024
94
First Eagle High Yield Municipal Fund | Schedule of Investments | October 31, 2024
Investments | | Principal Amount ($) | | Value ($) | |
Florida — 19.4% (continued) | |
Special Assessment,
Series 2024, 6.00%, 05/01/2055 | | | 5,000,000 | | | | 5,073,114 | | |
Gracewater Sarasota Community Development District,
Assessments, Special Assessment,
Series 2021, 3.35%, 05/01/2041 | | | 3,170,000 | | | | 2,572,897 | | |
Assessments, Special Assessment,
Series 2021, 4.00%, 05/01/2052 | | | 3,815,000 | | | | 3,114,206 | | |
Gulfstream Polo Community Development District,
Phase 2, Special Assessment,
Series 2019, 4.38%, 11/01/2049 | | | 805,000 | | | | 731,216 | | |
Halifax Hospital Medical Center,
Obligated Group, Revenue,
Series 2024, 4.25%, 06/01/2054 | | | 2,500,000 | | | | 2,400,459 | | |
Hamilton Bluff Community Development District,
Assessment Area 1, Special Assessment,
Series 2024, 5.50%, 05/01/2044 | | | 1,360,000 | | | | 1,372,738 | | |
Assessment Area 1, Special Assessment,
Series 2024, 5.80%, 05/01/2054 | | | 2,000,000 | | | | 2,015,567 | | |
Hammock Oaks Community Development District,
Assessment Area 2, Special Assessment,
Series 2024, 6.15%, 05/01/2054 | | | 1,250,000 | | | | 1,272,459 | | |
Harvest Ridge Community Development District,
Special Assessment,
Series 2024, 5.38%, 05/01/2054 (f) | | | 650,000 | | | | 646,654 | | |
Hawthorne Mill North Community Development District,
Assessment Area 2, Special Assessment,
Series 2024, 5.20%, 05/01/2044 (b) | | | 1,000,000 | | | | 995,339 | | |
Assessment Area 2, Special Assessment,
Series 2024, 5.50%, 05/01/2054 (b) | | | 1,400,000 | | | | 1,396,251 | | |
Hickory Tree Community Development District,
Assessment Area 1, Special Assessment,
Series 2024, 5.45%, 05/01/2055 | | | 1,500,000 | | | | 1,480,112 | | |
Highland Trails Community Development District,
Assessments, Special Assessment,
Series 2024, 5.85%, 05/01/2054 | | | 880,000 | | | | 892,622 | | |
Hillcrest Community Development District,
Special Assessment,
Series 2018, 5.00%, 11/01/2048 | | | 300,000 | | | | 299,880 | | |
Hills of Minneola Community Development District,
North Parcel Assessment Area 1, Special Assessment,
Series 2024, 5.55%, 05/01/2044 | | | 650,000 | | | | 660,516 | | |
First Eagle Funds | Annual Report | October 31, 2024
95
First Eagle High Yield Municipal Fund | Schedule of Investments | October 31, 2024
Investments | | Principal Amount ($) | | Value ($) | |
Florida — 19.4% (continued) | |
North Parcel Assessment Area 1, Special Assessment,
Series 2024, 5.88%, 05/01/2054 | | | 1,000,000 | | | | 1,015,936 | | |
South Parcel Assessment Area, Special Assessment,
Series 2020, 4.00%, 05/01/2050 (b) | | | 3,000,000 | | | | 2,536,350 | | |
South Parcel Assessment Area Phase 2,
Special Assessment,
Series 2021, 4.00%, 05/01/2052 | | | 1,900,000 | | | | 1,587,865 | | |
Hillsborough County Aviation Authority,
Revenue, AMT,
Series 2024 B, 5.50%, 10/01/2049 (g) | | | 10,000,000 | | | | 10,992,213 | | |
Revenue, AMT,
Series 2024 B, 5.50%, 10/01/2054 (g) | | | 25,345,000 | | | | 27,666,957 | | |
Hobe-St. Lucie Conservancy District,
Unit of Development No. 1A, Special Assessment,
Series 2024, 5.60%, 05/01/2044 | | | 1,900,000 | | | | 1,958,449 | | |
Unit of Development No. 1A, Special Assessment,
Series 2024, 5.88%, 05/01/2055 | | | 2,690,000 | | | | 2,766,716 | | |
Hyde Park Community Development District No. 1,
Assessments, Special Assessment,
Series 2024 A, 4.75%, 05/01/2031 | | | 295,000 | | | | 294,818 | | |
Assessments, Special Assessment,
Series 2024 A, 5.35%, 05/01/2044 | | | 425,000 | | | | 424,975 | | |
Assessments, Special Assessment,
Series 2024 A, 5.63%, 05/01/2055 | | | 685,000 | | | | 685,011 | | |
Assessments, Special Assessment,
Series 2024 B, 5.25%, 05/01/2034 | | | 1,705,000 | | | | 1,702,345 | | |
Lake Hideaway Community Development District,
Assessment Area 1, Special Assessment,
Series 2024, 5.65%, 05/01/2044 | | | 2,000,000 | | | | 2,008,458 | | |
Assessment Area 1, Special Assessment,
Series 2024, 5.90%, 05/01/2054 | | | 2,750,000 | | | | 2,751,425 | | |
Lake Mattie Preserve Community Development District,
Special Assessment,
Series 2024, 5.85%, 05/01/2054 | | | 570,000 | | | | 572,770 | | |
Lakes of Sarasota Community Development District,
Assessments, Special Assessment,
Series 2024 A, 5.30%, 05/01/2044 | | | 425,000 | | | | 422,915 | | |
Assessments, Special Assessment,
Series 2024 A, 5.60%, 05/01/2055 | | | 685,000 | | | | 681,936 | | |
Assessments, Special Assessment,
Series 2024 B, 5.25%, 05/01/2034 | | | 2,325,000 | | | | 2,321,559 | | |
First Eagle Funds | Annual Report | October 31, 2024
96
First Eagle High Yield Municipal Fund | Schedule of Investments | October 31, 2024
Investments | | Principal Amount ($) | | Value ($) | |
Florida — 19.4% (continued) | |
Lakewood Ranch Stewardship District,
Special Assessment,
Series 2024, 5.25%, 05/01/2044 (f)(h) | | | 585,000 | | | | 585,000 | | |
Special Assessment,
Series 2024, 5.30%, 05/01/2044 | | | 485,000 | | | | 489,990 | | |
Special Assessment,
Series 2024, 5.55%, 05/01/2054 | | | 530,000 | | | | 534,220 | | |
Special Assessment,
Series 2024, 5.50%, 05/01/2055 (f)(h) | | | 765,000 | | | | 761,603 | | |
Assessment Star Farms Phase 1/2, Special
Assessment, Series 2021, 4.00%, 05/01/2052 | | | 430,000 | | | | 363,415 | | |
Assessments, Special Assessment,
Series 2015, 4.88%, 05/01/2045 | | | 160,000 | | | | 159,532 | | |
Landings Community Development District,
Special Assessment,
Series 2024, 5.00%, 05/01/2031 | | | 275,000 | | | | 275,767 | | |
Special Assessment,
Series 2024, 5.50%, 05/01/2044 | | | 1,030,000 | | | | 1,033,564 | | |
Special Assessment,
Series 2024, 5.80%, 05/01/2055 | | | 855,000 | | | | 859,234 | | |
Liberty Cove Community Development District,
Assessment Area 1, Special Assessment,
Series 2024, 4.80%, 05/01/2031 | | | 340,000 | | | | 339,415 | | |
Assessment Area 1, Special Assessment,
Series 2024, 5.38%, 05/01/2044 | | | 1,085,000 | | | | 1,075,204 | | |
Assessment Area 1, Special Assessment,
Series 2024, 5.70%, 05/01/2054 | | | 2,000,000 | | | | 1,994,450 | | |
Live Oak Lake Community Development District,
Assessments, Special Assessment,
Series 2020, 4.40%, 05/01/2040 | | | 1,600,000 | | | | 1,455,926 | | |
Assessments, Special Assessment,
Series 2020, 4.60%, 05/01/2051 | | | 5,000,000 | | | | 4,465,834 | | |
Longleaf Community Development District,
Neighborhood 4 Assessment Area 1,
Special Assessment,
Series 2024, 5.75%, 05/01/2054 (b) | | | 1,000,000 | | | | 1,023,300 | | |
Neighborhood 4 Assessment Area 2,
Special Assessment,
Series 2024 A, 5.20%, 05/01/2044 | | | 700,000 | | | | 685,026 | | |
Neighborhood 4 Assessment Area 2,
Special Assessment,
Series 2024 A, 5.45%, 05/01/2055 | | | 1,150,000 | | | | 1,118,069 | | |
First Eagle Funds | Annual Report | October 31, 2024
97
First Eagle High Yield Municipal Fund | Schedule of Investments | October 31, 2024
Investments | | Principal Amount ($) | | Value ($) | |
Florida — 19.4% (continued) | |
Los Cayos Community Development District,
Special Assessment,
Series 2024, 5.55%, 06/15/2054 | | | 800,000 | | | | 809,360 | | |
LT Ranch Community Development District,
Assessments, Special Assessment,
Series 2019, 4.00%, 05/01/2050 | | | 1,000,000 | | | | 852,306 | | |
Phase IIB Assessment Area, Special Assessment,
Series 2024, 5.50%, 05/01/2044 | | | 275,000 | | | | 280,052 | | |
Phase IIB Assessment Area, Special Assessment,
Series 2024, 5.85%, 05/01/2054 | | | 1,000,000 | | | | 1,018,038 | | |
LTC Ranch West Residential Community
Development District,
Assessment Area 2, Special Assessment,
Series 2024 AA-2, 6.00%, 05/01/2054 | | | 605,000 | | | | 611,396 | | |
Assessment Area 3, Special Assessment,
Series 2024 AA-3, 6.05%, 05/01/2054 | | | 1,405,000 | | | | 1,425,002 | | |
Assessment Area 4, Special Assessment, Refunding,
Series 2024 AA-4, 5.38%, 05/01/2044 | | | 1,000,000 | | | | 997,542 | | |
Assessment Area 4, Special Assessment, Refunding,
Series 2024 AA-4, 5.65%, 05/01/2054 | | | 1,250,000 | | | | 1,244,167 | | |
Malabar Springs Community Development District,
Assessment Area 1, Special Assessment,
Series 2024, 5.20%, 05/01/2044 | | | 1,000,000 | | | | 986,552 | | |
Assessment Area 1, Special Assessment,
Series 2024, 5.50%, 05/01/2054 | | | 1,500,000 | | | | 1,476,028 | | |
Marion Ranch Community Development District,
Special Assessment,
Series 2024, 5.70%, 05/01/2044 | | | 795,000 | | | | 806,255 | | |
Special Assessment,
Series 2024, 5.95%, 05/01/2054 | | | 1,375,000 | | | | 1,394,261 | | |
Miami Health Facilities Authority,
Miami Jewish Health Systems Obligated Group,
Revenue, Refunding,
Series 2017, 5.00%, 07/01/2026 | | | 1,260,000 | | | | 1,249,213 | | |
Miami Jewish Health Systems Obligated Group,
Revenue, Refunding,
Series 2017, 5.00%, 07/01/2027 | | | 1,000,000 | | | | 990,304 | | |
Middleton Community Development District A,
Special Assessment,
Series 2024, 4.55%, 05/01/2044 | | | 725,000 | | | | 714,966 | | |
Special Assessment,
Series 2024, 4.75%, 05/01/2055 | | | 2,100,000 | | | | 2,063,851 | | |
First Eagle Funds | Annual Report | October 31, 2024
98
First Eagle High Yield Municipal Fund | Schedule of Investments | October 31, 2024
Investments | | Principal Amount ($) | | Value ($) | |
Florida — 19.4% (continued) | |
Mirada Community Development District,
Assessment Area 3, Special Assessment, Refunding,
Series 2024, 6.00%, 05/01/2055 | | | 2,000,000 | | | | 2,022,744 | | |
Normandy Community Development District,
Assessment Area 1, Special Assessment,
Series 2024, 5.30%, 05/01/2044 (b) | | | 1,500,000 | | | | 1,468,055 | | |
Assessment Area 1, Special Assessment,
Series 2024, 5.55%, 05/01/2054 (b) | | | 2,500,000 | | | | 2,430,688 | | |
North AR-1 Pasco Community Development District,
Assessment Area 4, Special Assessment,
Series 2024, 5.75%, 05/01/2054 | | | 1,085,000 | | | | 1,093,713 | | |
Assessment Area 5, Special Assessment,
Series 2024 A, 5.75%, 05/01/2044 | | | 1,500,000 | | | | 1,521,712 | | |
Assessment Area 5, Special Assessment,
Series 2024 A, 6.00%, 05/01/2054 | | | 2,000,000 | | | | 2,032,882 | | |
Paddocks Community Development District,
Assessments, Special Assessment,
Series 2024, 5.13%, 05/01/2044 (b) | | | 1,000,000 | | | | 978,555 | | |
Assessments, Special Assessment,
Series 2024, 5.45%, 05/01/2055 (b) | | | 1,375,000 | | | | 1,344,475 | | |
Palm Beach County Health Facilities Authority,
Federation CCRC Operations Corp.
Obligated Group, Revenue,
Series 2020 A, 5.00%, 06/01/2055 | | | 145,000 | | | | 141,684 | | |
Lifespace Communities, Inc. Obligated Group, Revenue,
Series 2016 B, 5.00%, 05/15/2047 | | | 925,000 | | | | 924,993 | | |
Lifespace Communities, Inc. Obligated Group, Revenue,
Series 2019 B, 4.00%, 05/15/2053 | | | 150,000 | | | | 124,565 | | |
Lifespace Communities, Inc. Obligated Group, Revenue,
Series 2019 B, 5.00%, 05/15/2053 | | | 2,175,000 | | | | 2,129,947 | | |
Lifespace Communities, Inc. Obligated Group,
Revenue, Refunding,
Series 2023 C, 7.50%, 05/15/2053 | | | 965,000 | | | | 1,090,436 | | |
Palm Coast Park Community Development District,
Sawmill Branch — Phase 7, Special Assessment,
Series 2024, 5.00%, 05/01/2044 | | | 1,270,000 | | | | 1,246,618 | | |
Sawmill Branch — Phase 7, Special Assessment,
Series 2024, 5.30%, 05/01/2055 | | | 1,935,000 | | | | 1,897,485 | | |
Parker Pointe Community Development District,
Special Assessment,
Series 2024, 5.50%, 05/01/2044 | | | 700,000 | | | | 704,687 | | |
First Eagle Funds | Annual Report | October 31, 2024
99
First Eagle High Yield Municipal Fund | Schedule of Investments | October 31, 2024
Investments | | Principal Amount ($) | | Value ($) | |
Florida — 19.4% (continued) | |
Special Assessment,
Series 2024, 5.75%, 05/01/2054 | | | 1,000,000 | | | | 1,004,356 | | |
Parker Road Community Development District,
Assessment Area, Special Assessment, Refunding,
Series 2020, 4.10%, 05/01/2050 | | | 2,000,000 | | | | 1,580,255 | | |
Parrish Lakes Community Development District,
Assessment Area 3, Special Assessment,
Series 2024, 5.50%, 05/01/2044 | | | 1,555,000 | | | | 1,554,781 | | |
Assessment Area 3, Special Assessment,
Series 2024, 5.80%, 05/01/2054 | | | 2,000,000 | | | | 1,999,872 | | |
Parrish Lakes II Community Development District,
Assessment Area 1, Special Assessment,
Series 2024, 5.13%, 05/01/2044 | | | 3,000,000 | | | | 2,936,019 | | |
Assessment Area 1, Special Assessment,
Series 2024, 5.45%, 05/01/2054 | | | 5,000,000 | | | | 4,891,060 | | |
Parrish Plantation Community Development District,
Assessment Area 3, Special Assessment,
Series 2024, 5.80%, 05/01/2044 | | | 700,000 | | | | 716,273 | | |
Assessment Area 3, Special Assessment,
Series 2024, 6.05%, 05/01/2054 | | | 1,545,000 | | | | 1,583,928 | | |
Peace Creek Village Community Development District,
Special Assessment,
Series 2024, 5.75%, 05/01/2054 | | | 905,000 | | | | 914,709 | | |
Peace Crossing Community Development District,
Assessment Area 1, Special Assessment,
Series 2024, 5.70%, 05/01/2044 (f) | | | 2,820,000 | | | | 2,773,792 | | |
Assessment Area 1, Special Assessment,
Series 2024, 6.00%, 05/01/2054 (f) | | | 4,000,000 | | | | 3,922,655 | | |
Pine Island Community Development District,
Special Assessment,
Series 2004, 5.75%, 05/01/2035 | | | 2,300,000 | | | | 2,310,509 | | |
Pioneer Ranch Community Development District,
Special Assessment,
Series 2024, 5.00%, 05/01/2044 (b) | | | 1,000,000 | | | | 970,987 | | |
Special Assessment,
Series 2024, 5.30%, 05/01/2055 (b) | | | 1,250,000 | | | | 1,206,131 | | |
Preston Cove Community Development District,
Assessments, Special Assessment,
Series 2022, 4.13%, 05/01/2052 | | | 1,870,000 | | | | 1,572,152 | | |
Regal Village Community Development District,
Special Assessment,
Series 2024, 5.50%, 05/01/2054 | | | 725,000 | | | | 730,220 | | |
First Eagle Funds | Annual Report | October 31, 2024
100
First Eagle High Yield Municipal Fund | Schedule of Investments | October 31, 2024
Investments | | Principal Amount ($) | | Value ($) | |
Florida — 19.4% (continued) | |
River Hall Community Development District,
Assessment Area 3, Special Assessment,
Series 2020 A, 3.88%, 05/01/2051 | | | 3,690,000 | | | | 3,012,594 | | |
Rivers Edge II Community Development District,
Special Assessment,
Series 2021, 4.00%, 05/01/2051 | | | 910,000 | | | | 754,699 | | |
Rivers Edge III Community Development District,
Assessments, Special Assessment,
Series 2024, 5.65%, 05/01/2044 | | | 1,665,000 | | | | 1,691,924 | | |
Assessments, Special Assessment,
Series 2024, 5.95%, 05/01/2055 | | | 2,225,000 | | | | 2,260,423 | | |
Rookery Community Development District,
Assessment Area 1, Special Assessment,
Series 2024, 5.00%, 05/01/2044 | | | 800,000 | | | | 779,584 | | |
Assessment Area 1, Special Assessment,
Series 2024, 5.35%, 05/01/2055 | | | 1,500,000 | | | | 1,464,909 | | |
Rustic Oaks Community Development District,
Assessments, Special Assessment,
Series 2022, 3.45%, 05/01/2042 | | | 2,000,000 | | | | 1,663,015 | | |
Rye Crossing Community Development District,
Assessment Area 2, Special Assessment,
Series 2024, 5.00%, 05/01/2044 | | | 650,000 | | | | 637,300 | | |
Assessment Area 2, Special Assessment,
Series 2024, 5.25%, 05/01/2054 | | | 710,000 | | | | 693,337 | | |
Saltleaf Community Development District,
Assessments, Special Assessment,
Series 2024, 5.63%, 05/01/2044 | | | 3,250,000 | | | | 3,273,917 | | |
Assessments, Special Assessment,
Series 2024, 6.00%, 05/01/2056 | | | 3,000,000 | | | | 3,045,148 | | |
Savanna Lakes Community Development District,
Assessment Area 2, Special Assessment,
Series 2024, 5.25%, 06/15/2044 | | | 625,000 | | | | 623,319 | | |
Assessment Area 2, Special Assessment,
Series 2024, 5.50%, 06/15/2054 | | | 750,000 | | | | 747,604 | | |
Sawgrass Village Community Development District,
Assessment Area 3, Special Assessment,
Series 2024, 5.55%, 05/01/2044 (b) | | | 700,000 | | | | 707,204 | | |
Assessment Area 3, Special Assessment,
Series 2024, 5.88%, 05/01/2054 (b) | | | 1,380,000 | | | | 1,396,741 | | |
Seagrove Community Development District,
Special Assessment,
Series 2024, 4.88%, 06/15/2044 | | | 750,000 | | | | 737,329 | | |
First Eagle Funds | Annual Report | October 31, 2024
101
First Eagle High Yield Municipal Fund | Schedule of Investments | October 31, 2024
Investments | | Principal Amount ($) | | Value ($) | |
Florida — 19.4% (continued) | |
Special Assessment,
Series 2024, 5.20%, 06/15/2054 | | | 1,250,000 | | | | 1,233,036 | | |
Seminole Palms Community Development District,
Assessment Area 2, Special Assessment,
Series 2024, 5.20%, 05/01/2044 (b) | | | 1,250,000 | | | | 1,229,694 | | |
Assessment Area 2, Special Assessment,
Series 2024, 5.50%, 05/01/2055 (b) | | | 1,750,000 | | | | 1,720,370 | | |
Shadowlawn Community Development District,
Special Assessment,
Series 2024, 5.50%, 05/01/2044 | | | 1,585,000 | | | | 1,594,073 | | |
Special Assessment,
Series 2024, 5.85%, 05/01/2054 | | | 1,500,000 | | | | 1,508,465 | | |
Silver Oaks Community Development District,
Special Assessment,
Series 2024, 5.85%, 05/01/2054 | | | 1,500,000 | | | | 1,523,859 | | |
Silverlake Community Development District,
Assessment Area 2, Special Assessment,
Series 2024, 5.38%, 05/01/2044 | | | 505,000 | | | | 509,033 | | |
Six Mile Creek Community Development District,
Assessment Area 2, Special Assessment, Refunding,
Series 2021, 4.00%, 05/01/2052 | | | 2,255,000 | | | | 1,878,822 | | |
Project Area, Special Assessment,
Series 2024, 5.10%, 05/01/2044 | | | 625,000 | | | | 612,325 | | |
Project Area, Special Assessment,
Series 2024, 5.38%, 05/01/2055 | | | 1,000,000 | | | | 975,417 | | |
Solaeris Community Development District,
Assessment Area 1, Special Assessment,
Series 2024, 5.20%, 05/01/2031 | | | 500,000 | | | | 504,381 | | |
Assessment Area 1, Special Assessment,
Series 2024, 6.00%, 05/01/2044 | | | 1,790,000 | | | | 1,839,942 | | |
Assessment Area 1, Special Assessment,
Series 2024, 6.25%, 05/01/2055 | | | 2,750,000 | | | | 2,807,188 | | |
Somerset Bay Community Development District,
Assessment Area 1, Special Assessment,
Series 2024, 5.63%, 05/01/2044 (b) | | | 920,000 | | | | 926,006 | | |
Assessment Area 1, Special Assessment,
Series 2024, 5.90%, 05/01/2054 (b) | | | 1,405,000 | | | | 1,414,045 | | |
Southern Groves Community Development
District No. 5, Assessment Area, Special Assessment,
Series 2024, 5.45%, 05/01/2044 | | | 1,350,000 | | | | 1,367,780 | | |
Assessment Area, Special Assessment,
Series 2024, 5.70%, 05/01/2050 | | | 1,035,000 | | | | 1,048,469 | | |
First Eagle Funds | Annual Report | October 31, 2024
102
First Eagle High Yield Municipal Fund | Schedule of Investments | October 31, 2024
Investments | | Principal Amount ($) | | Value ($) | |
Florida — 19.4% (continued) | |
Southshore Bay Community Development District,
Assessment Area 2, Special Assessment,
Series 2024, 5.38%, 05/01/2044 | | | 675,000 | | | | 675,940 | | |
Assessment Area 2, Special Assessment,
Series 2024, 5.63%, 05/01/2054 | | | 930,000 | | | | 931,287 | | |
St. Johns County Industrial Development Authority,
Presbyterian Retirement Communities, Inc.
Obligated Group, Revenue, Refunding,
Series 2020 A, 4.00%, 08/01/2055 | | | 2,325,000 | | | | 2,004,431 | | |
Summit View Community Development District,
Assessment Area 2, Special Assessment,
Series 2024, 5.63%, 05/01/2044 | | | 1,025,000 | | | | 1,032,353 | | |
Assessment Area 2, Special Assessment,
Series 2024, 6.00%, 05/01/2054 | | | 1,425,000 | | | | 1,438,159 | | |
Talavera Community Development District,
Assessments, Special Assessment,
Series 2019, 3.50%, 05/01/2025 | | | 95,000 | | | | 94,682 | | |
Tern Bay Community Development District,
Special Assessment,
Series 2022, 4.00%, 06/15/2052 | | | 9,260,000 | | | | 7,771,780 | | |
Timber Creek Southwest Community
Development District,
Assessment Area 2, Special Assessment,
Series 2021, 3.30%, 12/15/2041 | | | 2,175,000 | | | | 1,791,442 | | |
Tolomato Community Development District,
Assessment Area, Special Assessment,
Series 2024, 4.80%, 05/01/2044 | | | 880,000 | | | | 854,866 | | |
Assessment Area, Special Assessment,
Series 2024, 5.13%, 05/01/2054 | | | 885,000 | | | | 857,966 | | |
Triple Creek Community Development District,
Assessment Area, Special Assessment,
Series 2019 A, 4.75%, 05/01/2050 | | | 325,000 | | | | 306,373 | | |
Villages Q & R Assessment Area, Special Assessment,
Series 2021, 4.00%, 11/01/2051 (b) | | | 850,000 | | | | 703,454 | | |
Twisted Oaks Pointe Community Development District,
Assessment Area 3, Special Assessment,
Series 2024, 5.63%, 05/01/2044 | | | 1,065,000 | | | | 1,078,065 | | |
Assessment Area 3, Special Assessment,
Series 2024, 6.00%, 05/01/2055 | | | 1,375,000 | | | | 1,394,590 | | |
Two Rivers West Community Development District,
Special Assessment,
Series 2024, 5.63%, 05/01/2044 (b) | | | 750,000 | | | | 754,303 | | |
First Eagle Funds | Annual Report | October 31, 2024
103
First Eagle High Yield Municipal Fund | Schedule of Investments | October 31, 2024
Investments | | Principal Amount ($) | | Value ($) | |
Florida — 19.4% (continued) | |
Special Assessment,
Series 2024, 5.88%, 05/01/2054 (b) | | | 1,250,000 | | | | 1,257,059 | | |
Veranda Community Development District II,
Assessment Area 4, Special Assessment, Refunding,
Series 2021, 4.00%, 05/01/2051 (b) | | | 185,000 | | | | 153,567 | | |
Assessment Area 5 Phase 2, Special
Assessment, Refunding,
Series 2024, 5.63%, 05/01/2054 | | | 1,000,000 | | | | 1,014,115 | | |
Verano No. 2 Community Development District,
Pod D, Special Assessment,
Series 2024, 5.80%, 05/01/2054 | | | 1,000,000 | | | | 1,012,172 | | |
Village Community Development District No. 13,
Phase III, Special Assessment,
Series 2021, 3.25%, 05/01/2052 | | | 1,740,000 | | | | 1,334,262 | | |
Village Community Development District No. 15,
Special Assessment,
Series 2024, 4.55%, 05/01/2044 (b) | | | 1,100,000 | | | | 1,101,192 | | |
Special Assessment,
Series 2024, 4.80%, 05/01/2055 (b) | | | 1,250,000 | | | | 1,247,435 | | |
Villages of Westport Community Development District,
Assessments, Special Assessment,
Series 2005 A, 5.70%, 05/01/2035 | | | 3,035,000 | | | | 3,048,737 | | |
Villamar Community Development District,
Assessment Area 6, Special Assessment,
Series 2024, 5.75%, 05/01/2054 | | | 1,000,000 | | | | 1,021,065 | | |
Waterford Community Development District,
Assessment Area 2, Special Assessment,
Series 2024, 5.20%, 05/01/2044 | | | 650,000 | | | | 636,094 | | |
Assessment Area 2, Special Assessment,
Series 2024, 5.45%, 05/01/2054 | | | 900,000 | | | | 877,008 | | |
West Villages Improvement District,
Unit of Development No. 10 Assessment Area 1,
Special Assessment,
Series 2024, 5.38%, 05/01/2044 | | | 1,000,000 | | | | 1,006,818 | | |
Unit of Development No. 10 Assessment Area 1,
Special Assessment,
Series 2024, 5.63%, 05/01/2054 | | | 1,500,000 | | | | 1,504,618 | | |
Unit of Development No. 7, Special Assessment,
Series 2019, 5.00%, 05/01/2050 | | | 2,500,000 | | | | 2,446,124 | | |
Unit of Development No. 8, Special Assessment,
Series 2021, 3.50%, 05/01/2041 | | | 2,500,000 | | | | 2,082,798 | | |
First Eagle Funds | Annual Report | October 31, 2024
104
First Eagle High Yield Municipal Fund | Schedule of Investments | October 31, 2024
Investments | | Principal Amount ($) | | Value ($) | |
Florida — 19.4% (continued) | |
Westside Haines City Community Development District,
Assessment Area 2, Special Assessment,
Series 2024, 6.00%, 05/01/2054 | | | 2,500,000 | | | | 2,543,003 | | |
Willowbrook Community Development District,
Assessment Area 1, Special Assessment,
Series 2024, 5.63%, 05/01/2044 | | | 750,000 | | | | 755,255 | | |
Assessment Area 1, Special Assessment,
Series 2024, 5.90%, 05/01/2055 | | | 1,100,000 | | | | 1,107,216 | | |
Windsor Cay Community Development District,
Assessment Area 1, Special Assessment,
Series 2024, 5.75%, 05/01/2054 | | | 1,000,000 | | | | 1,012,199 | | |
Wiregrass Community Development District,
Assessment Area 2, Special Assessment,
Series 2016, 5.00%, 05/01/2047 | | | 1,020,000 | | | | 1,015,525 | | |
Yarborough Lane Community Development District,
Yarborough Lane Community Development District
Series 2024 Special Assessment, Special Assessment,
Series 2024, 5.35%, 05/01/2044 (b) | | | 780,000 | | | | 776,287 | | |
Yarborough Lane Community Development District
Series 2024 Special Assessment, Special Assessment,
Series 2024, 5.60%, 05/01/2055 (b) | | | 1,620,000 | | | | 1,610,704 | | |
| | | | 816,056,980 | | |
Georgia — 5.9% | |
Atlanta Development Authority (The),
City of Atlanta Westside Tax Allocation District
Gulch Area, Tax Allocation,
Series 2024 A-2, 5.50%, 04/01/2039 (b) | | | 30,425,000 | | | | 30,838,391 | | |
City of Atlanta Westside Tax Allocation District
Gulch Area, Revenue,
Series 2024-1, Class A, 0.00%, 12/15/2048 (b) | | | 123,635,000 | | | | 103,244,362 | | |
Atlanta Urban Residential Finance Authority,
Flats at Stone Hogan LP, Revenue, FNMA Insured,
Series 2024 A, 4.37%, 05/01/2044 | | | 5,000,000 | | | | 5,016,537 | | |
DeKalb County Development Authority,
GLOBE Academy, Inc. (The), Revenue,
Series 2024 A, 5.00%, 06/01/2055 | | | 500,000 | | | | 493,226 | | |
GLOBE Academy, Inc. (The), Revenue,
Series 2024 A, 5.00%, 06/01/2063 | | | 1,320,000 | | | | 1,274,574 | | |
Development Authority of Bulloch County,
Charter Conservatory for Liberal Arts &
Technology, Inc., Revenue,
Series 2024 A, 6.75%, 06/15/2064 (b) | | | 3,225,000 | | | | 3,297,882 | | |
First Eagle Funds | Annual Report | October 31, 2024
105
First Eagle High Yield Municipal Fund | Schedule of Investments | October 31, 2024
Investments | | Principal Amount ($) | | Value ($) | |
Georgia — 5.9% (continued) | |
Charter Conservatory for Liberal Arts &
Technology, Inc., Revenue,
Series 2024 B, 7.50%, 06/15/2031 (b) | | | 265,000 | | | | 262,692 | | |
Development Authority of Lagrange,
LaGrange College Obligated Group,
Revenue, Refunding,
Series 2021 A, 5.00%, 10/15/2052 | | | 14,550,000 | | | | 12,975,745 | | |
Development Authority of The City of Marietta,
Life University, Inc., Revenue, Refunding,
Series 2017 A, 5.00%, 11/01/2047 (b) | | | 10,000,000 | | | | 9,889,921 | | |
Fulton County Residential Care Facilities for the
Elderly Authority,
All Saints-St. Luke's Episcopal Home for the Retired
Obligated Group, Revenue, Refunding,
Series 2019 A, 5.00%, 04/01/2047 (b) | | | 3,540,000 | | | | 3,465,571 | | |
All Saints-St. Luke's Episcopal Home for the Retired
Obligated Group, Revenue, Refunding,
Series 2019 A, 5.00%, 04/01/2054 (b) | | | 2,415,000 | | | | 2,314,817 | | |
All Saints-St. Luke's Episcopal Home for the Retired
Obligated Group, Revenue,
Series 2021 A, 4.00%, 04/01/2041 (b) | | | 4,000,000 | | | | 3,669,523 | | |
All Saints-St. Luke's Episcopal Home for the Retired
Obligated Group, Revenue,
Series 2021 A, 4.00%, 04/01/2051 (b) | | | 17,500,000 | | | | 14,725,030 | | |
All Saints-St. Luke's Episcopal Home for the Retired
Obligated Group, Revenue,
Series 2021 A, 4.00%, 04/01/2056 (b) | | | 3,615,000 | | | | 2,957,016 | | |
Gainesville & Hall County Hospital Authority,
Northeast Georgia Health System Obligated Group,
Revenue,
Series 2021 A, 2.50%, 02/15/2051 | | | 1,350,000 | | | | 897,125 | | |
George L Smith II Congress Center Authority,
Signia Hotel Management LLC, Revenue, Second Tier,
Series 2021 B, 5.00%, 01/01/2054 (b) | | | 14,900,000 | | | | 14,027,176 | | |
Georgia Housing & Finance Authority,
Revenue, Refunding,
Series 2024 C, 4.40%, 12/01/2044 (g) | | | 4,500,000 | | | | 4,476,269 | | |
Revenue, Refunding,
Series 2024 C, 4.55%, 12/01/2049 (g) | | | 27,010,000 | | | | 26,960,079 | | |
Revenue, Refunding,
Series 2024 C, 4.60%, 12/01/2054 (g) | | | 12,750,000 | | | | 12,724,611 | | |
First Eagle Funds | Annual Report | October 31, 2024
106
First Eagle High Yield Municipal Fund | Schedule of Investments | October 31, 2024
Investments | | Principal Amount ($) | | Value ($) | |
Georgia — 5.9% (continued) | |
Oconee County Industrial Development Authority,
Westminster Presbyterian Homes
Obligated Group, Revenue,
Series 2018 A-1, 6.25%, 12/01/2048 | | | 3,000,000 | | | | 3,028,881 | | |
Westminster Presbyterian Homes
Obligated Group, Revenue,
Series 2018 A-1, 6.38%, 12/01/2053 | | | 3,000,000 | | | | 3,030,411 | | |
| | | | 259,569,839 | | |
Guam — 0.0% (a) | |
Port Authority of Guam,
Revenue, Series 2018 A, 5.00%, 07/01/2048 | | | 1,050,000 | | | | 1,058,856 | | |
Territory of Guam,
Section 30, Revenue, Refunding,
Series 2016 A, 5.00%, 12/01/2024 | | | 10,000 | | | | 10,007 | | |
| | | | 1,068,863 | | |
Hawaii — 0.2% | |
State of Hawaii Department of Budget & Finance,
Hawai`i Pacific University, Revenue, Refunding,
Series 2024, 5.00%, 07/01/2034 (b) | | | 3,000,000 | | | | 3,069,302 | | |
Hawai`i Pacific University, Revenue, Refunding,
Series 2024, 5.00%, 07/01/2039 (b) | | | 2,780,000 | | | | 2,784,246 | | |
Hawai`i Pacific University, Revenue, Refunding,
Series 2024, 5.13%, 07/01/2043 (b) | | | 2,500,000 | | | | 2,452,378 | | |
| | | | 8,305,926 | | |
Idaho — 0.4% | |
Avimor Community Infrastructure District No. 1,
Assessment Area 5, Special Assessment,
Series 2024, 5.88%, 09/01/2053 (b) | | | 2,550,000 | | | | 2,634,672 | | |
Assessment Area 6, Special Assessment,
Series 2024 B, 5.50%, 09/01/2053 (b) | | | 3,000,000 | | | | 3,016,261 | | |
Spring Valley Community Infrastructure District No. 1,
Assessment Area 1, Special Assessment,
Series 2021, 3.75%, 09/01/2051 (b) | | | 1,413,000 | | | | 1,294,274 | | |
Assessment Area 2, Special Assessment,
Series 2024, 6.25%, 09/01/2053 (b) | | | 9,000,000 | | | | 9,448,518 | | |
| | | | 16,393,725 | | |
Illinois — 3.3% | |
Bellwood Municipal Housing Corp.,
Village of Bellwood, Revenue,
Series 2024, 6.38%, 12/01/2059 (b) | | | 8,450,000 | | | | 8,369,863 | | |
First Eagle Funds | Annual Report | October 31, 2024
107
First Eagle High Yield Municipal Fund | Schedule of Investments | October 31, 2024
Investments | | Principal Amount ($) | | Value ($) | |
Illinois — 3.3% (continued) | |
Chicago Board of Education, GO,
Series 2012 A, 5.00%, 12/01/2042 | | | 2,885,000 | | | | 2,831,163 | | |
GO,
Series 2017 H, 5.00%, 12/01/2046 | | | 16,525,000 | | | | 16,135,418 | | |
GO,
Series 2018 D, 5.00%, 12/01/2046 | | | 17,665,000 | | | | 17,248,542 | | |
GO,
Series 2022 A, 5.00%, 12/01/2047 | | | 1,000,000 | | | | 983,872 | | |
Chicago O'Hare International Airport,
Revenue, Senior Lien, AMT,
Series 2024 A, 5.50%, 01/01/2059 | | | 10,000,000 | | | | 10,749,824 | | |
Revenue, Senior Lien,
Series 2024 B, 5.50%, 01/01/2059 | | | 2,500,000 | | | | 2,740,596 | | |
City of Harvey,
GO, Refunding,
Series 2023 A, 4.50%, 01/01/2054 | | | 1,575,000 | | | | 1,180,690 | | |
Illinois Finance Authority,
Benedictine University, Revenue, Refunding,
Series 2017, 5.00%, 10/01/2038 | | | 5,320,000 | | | | 4,734,846 | | |
Bradley University, Revenue, Refunding,
Series 2021 A, 4.00%, 08/01/2051 | | | 4,750,000 | | | | 4,002,466 | | |
Columbia College Chicago, Revenue,
Series 2019, 5.00%, 12/01/2029 | | | 2,055,000 | | | | 2,059,487 | | |
Columbia College Chicago, Revenue,
Series 2019, 5.00%, 12/01/2044 | | | 2,175,000 | | | | 2,024,801 | | |
Illinois Institute of Technology, Revenue, Refunding,
Series 2019, 4.00%, 09/01/2037 | | | 350,000 | | | | 301,537 | | |
Illinois Institute of Technology, Revenue, Refunding,
Series 2019, 5.00%, 09/01/2040 | | | 250,000 | | | | 233,964 | | |
OSF Healthcare System Obligated Group,
Revenue, Refunding,
Series 2020 B-1, 5.00%, 11/15/2024 (c)(d) | | | 4,000,000 | | | | 4,002,022 | | |
Plymouth Place Obligated Group, Revenue, Refunding,
Series 2021 A, 5.00%, 05/15/2036 | | | 325,000 | | | | 325,858 | | |
Plymouth Place Obligated Group, Revenue, Refunding,
Series 2021 A, 5.00%, 05/15/2051 | | | 410,000 | | | | 374,675 | | |
Plymouth Place Obligated Group, Revenue, Refunding,
Series 2021 A, 5.00%, 05/15/2056 | | | 1,255,000 | | | | 1,123,838 | | |
Plymouth Place Obligated Group, Revenue,
Series 2022 A, 6.63%, 05/15/2052 | | | 1,085,000 | | | | 1,166,858 | | |
First Eagle Funds | Annual Report | October 31, 2024
108
First Eagle High Yield Municipal Fund | Schedule of Investments | October 31, 2024
Investments | | Principal Amount ($) | | Value ($) | |
Illinois — 3.3% (continued) | |
Roosevelt University, Revenue, Refunding,
Series 2018 B, 6.00%, 04/01/2038 (b) | | | 1,290,000 | | | | 1,301,886 | | |
Washington and Jane Smith Community — Orland Park,
Revenue, Refunding,
Series 2022, 4.00%, 10/15/2027 | | | 485,000 | | | | 473,171 | | |
Washington and Jane Smith Community — Orland Park,
Revenue, Refunding,
Series 2022, 4.00%, 10/15/2028 | | | 670,000 | | | | 647,731 | | |
Washington and Jane Smith Community — Orland Park,
Revenue, Refunding,
Series 2022, 4.00%, 10/15/2029 | | | 1,050,000 | | | | 1,005,113 | | |
Washington and Jane Smith Community — Orland Park,
Revenue, Refunding,
Series 2022, 4.00%, 10/15/2030 | | | 725,000 | | | | 686,864 | | |
Washington and Jane Smith Community — Orland Park,
Revenue, Refunding,
Series 2022, 4.00%, 10/15/2037 | | | 6,000,000 | | | | 5,389,780 | | |
Westminster Village, Inc. Obligated Group,
Revenue, Refunding,
Series 2018 A, 5.25%, 05/01/2038 | | | 2,165,000 | | | | 2,171,792 | | |
Westminster Village, Inc. Obligated Group,
Revenue, Refunding,
Series 2018 A, 5.00%, 05/01/2048 | | | 4,030,000 | | | | 3,658,000 | | |
Southwestern Illinois Development Authority,
United States Steel Corp., Revenue, AMT,
Series 2012, 5.75%, 08/01/2042 | | | 2,000,000 | | | | 2,001,727 | | |
State of Illinois, GO,
Series 2024 C, 4.00%, 10/01/2048 | | | 10,000,000 | | | | 9,257,812 | | |
Upper Illinois River Valley Development Authority,
Northern Kane Educational Corp., Revenue,
Refunding, Series 2017 A, 5.25%, 12/01/2047 (b) | | | 2,000,000 | | | | 1,909,814 | | |
Village of Bellwood,
Tax Allocation,
Series 2024, 5.00%, 12/01/2050 | | | 6,750,000 | | | | 6,830,357 | | |
Village of Lincolnwood,
North Lincoln Redevelopment Project Area, COP,
Series 2021 A, 4.82%, 01/01/2041 (b) | | | 6,040,000 | | | | 5,782,283 | | |
Village of Rantoul,
Evans Road Redevelopment Area, Tax Allocation,
Refunding, Series 2024, 5.25%, 12/01/2033 (b) | | | 6,795,000 | | | | 6,787,152 | | |
First Eagle Funds | Annual Report | October 31, 2024
109
First Eagle High Yield Municipal Fund | Schedule of Investments | October 31, 2024
Investments | | Principal Amount ($) | | Value ($) | |
Illinois — 3.3% (continued) | |
Village of Romeoville,
Lewis University, Revenue, Refunding,
Series 2018 B, 4.13%, 10/01/2041 | | | 4,940,000 | | | | 4,333,825 | | |
Lewis University, Revenue, Refunding,
Series 2018 B, 4.13%, 10/01/2046 | | | 2,525,000 | | | | 2,128,502 | | |
Western Illinois Economic Development Authority,
Memorial Hospital Association, Revenue, Refunding,
Series 2016, 4.00%, 06/01/2036 | | | 1,500,000 | | | | 1,344,424 | | |
| | | | 136,300,553 | | |
Indiana — 1.9% | |
Indiana Finance Authority,
Lutheran University Association, Inc. (The), Revenue,
Series 2014, 5.00%, 10/01/2039 | | | 750,000 | | | | 750,115 | | |
Rock Creek Community Academy, Inc., Revenue,
Series 2018 A, 5.88%, 07/01/2038 (b) | | | 1,800,000 | | | | 1,826,025 | | |
Indiana Housing & Community Development Authority,
Revenue, GNMA Insured,
Series 2024 C-1, 4.70%, 07/01/2049 | | | 16,030,000 | | | | 16,179,914 | | |
Revenue, GNMA Insured,
Series 2024 C-1, 4.80%, 07/01/2054 | | | 3,890,000 | | | | 3,915,724 | | |
Revenue, Refunding, GNMA Insured,
Series 2024 D-1, 4.55%, 07/01/2044 (f)(g) | | | 11,235,000 | | | | 11,279,391 | | |
Revenue, Refunding, GNMA Insured,
Series 2024 D-1, 4.70%, 07/01/2049 (f)(g) | | | 15,760,000 | | | | 15,734,871 | | |
Revenue, Refunding, GNMA Insured,
Series 2024 D-1, 4.75%, 07/01/2054 (f)(g) | | | 28,130,000 | | | | 28,081,392 | | |
Town of Whiteland,
Patch Economic Development Area, Tax Allocation,
Series 2022 A, 5.75%, 09/01/2047 (b) | | | 1,125,000 | | | | 1,092,607 | | |
Patch Economic Development Area, Tax Allocation,
Series 2024 A, 6.13%, 03/01/2049 (b) | | | 2,725,000 | | | | 2,746,858 | | |
| | | | 81,606,897 | | |
Iowa — 1.7% | |
Crawford County Memorial Hospital, Inc.,
Revenue, Series 2024, 5.00%, 06/15/2027 | | | 1,515,000 | | | | 1,536,551 | | |
Iowa Finance Authority,
Revenue, GNMA Insured,
Series 2024 E, 4.60%, 07/01/2049 | | | 2,625,000 | | | | 2,641,516 | | |
Revenue, GNMA Insured,
Series 2024 E, 4.63%, 07/01/2054 | | | 5,000,000 | | | | 5,004,792 | | |
First Eagle Funds | Annual Report | October 31, 2024
110
First Eagle High Yield Municipal Fund | Schedule of Investments | October 31, 2024
Investments | | Principal Amount ($) | | Value ($) | |
Iowa — 1.7% (continued) | |
Revenue, GNMA Insured,
Series 2024 G, 4.35%, 07/01/2044 (f) | | | 7,820,000 | | | | 7,750,114 | | |
Revenue, GNMA Insured,
Series 2024 G, 4.50%, 07/01/2049 (f) | | | 9,440,000 | | | | 9,424,688 | | |
Revenue, GNMA Insured,
Series 2024 G, 4.55%, 07/01/2052 (f) | | | 3,870,000 | | | | 3,802,112 | | |
Lifespace Communities, Inc. Obligated Group, Revenue,
Series 2016 A, 5.00%, 05/15/2041 | | | 6,385,000 | | | | 6,400,871 | | |
Lifespace Communities, Inc. Obligated Group, Revenue,
Series 2016 A, 5.00%, 05/15/2047 | | | 4,000,000 | | | | 3,999,970 | | |
Lifespace Communities, Inc. Obligated Group, Revenue,
Series 2018 A, 5.00%, 05/15/2043 | | | 2,160,000 | | | | 2,166,124 | | |
Lifespace Communities, Inc. Obligated Group, Revenue,
Series 2018 A, 5.00%, 05/15/2048 | | | 17,790,000 | | | | 17,718,883 | | |
Lifespace Communities, Inc. Obligated Group, Revenue,
Series 2019 A-1, 5.00%, 05/15/2055 | | | 7,065,000 | | | | 6,882,460 | | |
Lifespace Communities, Inc. Obligated Group,
Revenue, Refunding,
Series 2021 A, 4.00%, 05/15/2029 | | | 1,000,000 | | | | 990,424 | | |
Lifespace Communities, Inc. Obligated Group,
Revenue, Refunding,
Series 2021 A, 4.00%, 05/15/2053 | | | 1,500,000 | | | | 1,245,649 | | |
Iowa Student Loan Liquidity Corp.,
Revenue, AMT,
Series 2024 C, 5.00%, 12/01/2054 | | | 2,500,000 | | | | 2,398,649 | | |
| | | | 71,962,803 | | |
Kansas — 0.6% | |
City of Colby,
Citizens Medical Center, Inc., Revenue,
Series 2024, 5.50%, 07/01/2026 | | | 7,000,000 | | | | 7,020,895 | | |
City of Wichita,
Presbyterian Manors Obligated Group,
Revenue, Refunding,
Series 2019 III, 5.00%, 05/15/2050 | | | 335,000 | | | | 300,374 | | |
Presbyterian Manors Obligated Group,
Revenue, Refunding,
Series 2024 VIII, 5.75%, 05/15/2045 | | | 1,000,000 | | | | 1,019,898 | | |
Presbyterian Manors Obligated Group,
Revenue, Refunding,
Series 2024 VIII, 5.88%, 05/15/2050 | | | 1,000,000 | | | | 1,014,254 | | |
First Eagle Funds | Annual Report | October 31, 2024
111
First Eagle High Yield Municipal Fund | Schedule of Investments | October 31, 2024
Investments | | Principal Amount ($) | | Value ($) | |
Kansas — 0.6% (continued) | |
Wyandotte County-Kansas City Unified Government,
Sales Tax, Tax Allocation, Refunding,
Series 2022, 5.75%, 09/01/2039 (b) | | | 2,500,000 | | | | 2,546,943 | | |
Sales Tax, Revenue,
Series 2024 A, 5.25%, 03/01/2046 (b) | | | 10,230,000 | | | | 9,766,014 | | |
| | | | 21,668,378 | | |
Kentucky — 0.2% | |
City of Campbellsville,
Campbellsville University, Inc., Revenue, Refunding,
Series 2017, 4.50%, 03/01/2047 | | | 840,000 | | | | 714,350 | | |
Louisville/Jefferson County Metropolitan Government,
Bellarmine University, Inc., Revenue, Refunding,
Series 2015, 5.00%, 05/01/2027 | | | 500,000 | | | | 498,469 | | |
Bellarmine University, Inc., Revenue, Refunding,
Series 2015, 5.00%, 05/01/2031 | | | 1,790,000 | | | | 1,770,008 | | |
Bellarmine University, Inc., Revenue, Refunding,
Series 2015, 5.00%, 05/01/2040 | | | 1,210,000 | | | | 1,134,580 | | |
Bellarmine University, Inc., Revenue, Refunding,
Series 2017 A, 5.00%, 05/01/2033 | | | 2,270,000 | | | | 2,232,992 | | |
Bellarmine University, Inc., Revenue, Refunding,
Series 2017 A, 5.00%, 05/01/2036 | | | 2,715,000 | | | | 2,634,220 | | |
| | | | 8,984,619 | | |
Louisiana — 3.4% | |
Calcasieu Parish Memorial Hospital Service District,
Southwest Louisiana Healthcare System Obligated
Group, Revenue, Refunding,
Series 2019, 5.00%, 12/01/2034 | | | 250,000 | | | | 251,539 | | |
Southwest Louisiana Healthcare System Obligated
Group, Revenue, Refunding,
Series 2019, 5.00%, 12/01/2039 | | | 8,305,000 | | | | 8,160,481 | | |
Louisiana Local Government Environmental
Facilities & Community Development Authority,
Provident Group — ULM Properties LLC, Revenue,
Series 2019 A, 5.00%, 07/01/2029 (b) | | | 975,000 | | | | 971,128 | | |
Provident Group — ULM Properties LLC, Revenue,
Series 2019 A, 5.00%, 07/01/2039 (b) | | | 2,900,000 | | | | 2,735,590 | | |
Provident Group — ULM Properties LLC, Revenue,
Series 2019 A, 5.00%, 07/01/2054 (b) | | | 8,265,000 | | | | 7,155,920 | | |
Louisiana Public Facilities Authority,
Athlos Academy of Jefferson, Revenue,
Series 2024 A, 7.38%, 06/01/2054 (b) | | | 6,000,000 | | | | 6,244,764 | | |
First Eagle Funds | Annual Report | October 31, 2024
112
First Eagle High Yield Municipal Fund | Schedule of Investments | October 31, 2024
Investments | | Principal Amount ($) | | Value ($) | |
Louisiana — 3.4% (continued) | |
Calcasieu Bridge Partners LLC, Revenue,
Senior Lien, AMT,
Series 2024, 5.50%, 09/01/2054 | | | 4,500,000 | | | | 4,854,107 | | |
Calcasieu Bridge Partners LLC, Revenue,
Senior Lien, AMT,
Series 2024, 5.50%, 09/01/2059 | | | 15,000,000 | | | | 15,996,435 | | |
Calcasieu Bridge Partners LLC, Revenue,
Senior Lien, AMT,
Series 2024, 5.75%, 09/01/2064 | | | 23,000,000 | | | | 24,882,539 | | |
Calcasieu Bridge Partners LLC, Revenue,
Senior Lien, AMT,
Series 2024, 5.00%, 09/01/2066 | | | 44,745,000 | | | | 45,648,084 | | |
Lake Charles Charter Academy Foundation, Inc.,
Revenue, Refunding,
Series 2024 A, 5.00%, 12/15/2043 (b) | | | 3,335,000 | | | | 3,348,439 | | |
Lake Charles College Prep, Revenue,
Series 2019 A, 5.00%, 06/01/2049 (b) | | | 6,315,000 | | | | 6,056,055 | | |
Lake Charles College Prep, Revenue,
Series 2019 A, 5.00%, 06/01/2058 (b) | | | 8,760,000 | | | | 8,283,827 | | |
Parish of St. James,
NuStar Logistics LP, Revenue,
Series 2010, 6.35%, 07/01/2040 (b) | | | 1,000,000 | | | | 1,099,868 | | |
Plaquemines Port Harbor & Terminal District,
Nola Terminal LLC, Revenue, AMT,
Series 2024 A, 9.00%, 12/01/2044 (b) | | | 5,000,000 | | | | 5,089,707 | | |
| | | | 140,778,483 | | |
Maine — 1.0% | |
Maine Health & Higher Educational Facilities Authority,
Eastern Maine Healthcare Systems Obligated
Group, Revenue,
Series 2016 A, 5.00%, 07/01/2046 | | | 8,000,000 | | | | 7,887,061 | | |
Maine State Housing Authority,
Revenue, Series 2024 D, 4.75%, 11/15/2054 (g) | | | 8,750,000 | | | | 8,748,675 | | |
Revenue, Series 2024 F, 4.55%, 11/15/2044 (f)(g) | | | 5,600,000 | | | | 5,622,010 | | |
Revenue, Series 2024 F, 4.70%, 11/15/2049 (f)(g) | | | 9,410,000 | | | | 9,421,424 | | |
Revenue, Series 2024 F, 4.75%, 11/15/2054 (f)(g) | | | 8,000,000 | | | | 8,009,716 | | |
| | | | 39,688,886 | | |
Maryland — 0.2% | |
City of Baltimore,
Poppleton Development District, Tax Allocation,
Series A, 5.38%, 06/01/2036 | | | 1,000,000 | | | | 971,110 | | |
First Eagle Funds | Annual Report | October 31, 2024
113
First Eagle High Yield Municipal Fund | Schedule of Investments | October 31, 2024
Investments | | Principal Amount ($) | | Value ($) | |
Maryland — 0.2% (continued) | |
Poppleton Development District, Tax Allocation,
Series A, 5.50%, 06/01/2043 | | | 1,450,000 | | | | 1,411,889 | | |
County of Prince George's,
Westphalia Town Center Development District,
Tax Allocation, Series 2018, 5.25%, 07/01/2048 (b) | | | 3,000,000 | | | | 3,018,612 | | |
Maryland Economic Development Corp.,
PRG-Towson Place Properties LLC, Revenue,
Senior Lien, Refunding,
Series 2024 A-1, 5.00%, 06/01/2038 | | | 1,000,000 | | | | 1,026,330 | | |
Maryland Health & Higher Educational
Facilities Authority, Maryland Institute College of Art,
Revenue, Refunding,
Series 2024, 5.50%, 06/01/2047 | | | 1,830,000 | | | | 1,921,909 | | |
| | | | 8,349,850 | | |
Massachusetts — 0.6% | |
Massachusetts Development Finance Agency,
Ascentria Care Alliance Obligated Group, Revenue,
Refunding, Series 2021, 5.00%, 07/01/2056 (b) | | | 2,310,000 | | | | 1,938,780 | | |
CHF Merrimack, Inc., Revenue,
Series 2024 A, 4.25%, 07/01/2034 (b) | | | 500,000 | | | | 505,508 | | |
CHF Merrimack, Inc., Revenue,
Series 2024 A, 5.00%, 07/01/2044 (b) | | | 1,000,000 | | | | 1,034,818 | | |
CHF Merrimack, Inc., Revenue,
Series 2024 A, 5.00%, 07/01/2054 (b) | | | 1,200,000 | | | | 1,222,029 | | |
CHF Merrimack, Inc., Revenue,
Series 2024 A, 5.00%, 07/01/2060 (b) | | | 1,100,000 | | | | 1,111,719 | | |
Suffolk University, Revenue,
Series 2021, 4.00%, 07/01/2051 | | | 2,675,000 | | | | 2,227,338 | | |
Massachusetts Educational Financing Authority,
Revenue, AMT, Series 2021 C, 3.00%, 07/01/2051 | | | 1,470,000 | | | | 1,022,931 | | |
Revenue, AMT, Series 2022 C, 4.13%, 07/01/2052 | | | 1,000,000 | | | | 859,855 | | |
Revenue, AMT, Refunding,
Series 2024 D, 5.00%, 07/01/2054 | | | 14,855,000 | | | | 14,673,221 | | |
| | | | 24,596,199 | | |
Michigan — 2.0% | |
Detroit Downtown Development Authority,
Catalyst Development Area, Tax Allocation, Refunding,
Series 2024, 5.00%, 07/01/2048 | | | 8,000,000 | | | | 8,317,328 | | |
Flint Hospital Building Authority,
Hurley Medical Center, Revenue,
Series 2013 A, 5.25%, 07/01/2039 | | | 2,000,000 | | | | 1,995,960 | | |
First Eagle Funds | Annual Report | October 31, 2024
114
First Eagle High Yield Municipal Fund | Schedule of Investments | October 31, 2024
Investments | | Principal Amount ($) | | Value ($) | |
Michigan — 2.0% (continued) | |
Hurley Medical Center, Revenue, Refunding,
Series 2020, 4.00%, 07/01/2041 | | | 145,000 | | | | 128,815 | | |
Kalamazoo Economic Development Corp.,
Heritage Community of Kalamazoo Obligated Group,
Revenue, Refunding,
Series 2019, 5.00%, 05/15/2042 | | | 425,000 | | | | 410,121 | | |
Michigan Finance Authority,
Albion College, Revenue, Refunding,
Series 2022, 5.00%, 12/01/2027 | | | 5,000 | | | | 4,190 | | |
Albion College, Revenue, Refunding,
Series 2022, 5.00%, 12/01/2028 | | | 100,000 | | | | 82,591 | | |
Albion College, Revenue, Refunding,
Series 2022, 5.00%, 12/01/2029 | | | 525,000 | | | | 427,414 | | |
Albion College, Revenue, Refunding,
Series 2022, 5.00%, 12/01/2030 | | | 945,000 | | | | 758,836 | | |
Albion College, Revenue, Refunding,
Series 2022, 5.00%, 12/01/2031 | | | 685,000 | | | | 542,333 | | |
Albion College, Revenue, Refunding,
Series 2022, 5.00%, 12/01/2032 | | | 925,000 | | | | 722,054 | | |
Albion College, Revenue, Refunding,
Series 2022, 4.00%, 12/01/2034 | | | 650,000 | | | | 492,759 | | |
Albion College, Revenue, Refunding,
Series 2022, 4.00%, 12/01/2041 | | | 4,025,000 | | | | 2,869,357 | | |
Albion College, Revenue, Refunding,
Series 2022, 4.00%, 12/01/2051 | | | 1,710,000 | | | | 1,144,767 | | |
Aquinas College, Revenue, Refunding,
Series 2021, 4.00%, 05/01/2031 | | | 1,080,000 | | | | 961,360 | | |
Hanley International Academy, Inc.,
Revenue, Refunding,
Series 2021, 5.00%, 09/01/2040 | | | 2,000,000 | | | | 1,980,410 | | |
Huron Academy, Revenue, Refunding,
Series 2024, 5.00%, 10/01/2044 (f) | | | 1,375,000 | | | | 1,363,010 | | |
Huron Academy, Revenue, Refunding,
Series 2024, 5.00%, 10/01/2054 (f) | | | 2,000,000 | | | | 1,925,027 | | |
Michigan State Housing Development Authority,
Revenue, Series 2018 A, 4.15%, 10/01/2053 | | | 1,450,000 | | | | 1,376,832 | | |
Revenue, Series 2021 A, 2.55%, 10/01/2051 | | | 3,005,000 | | | | 1,994,488 | | |
Revenue, Series 2023 A, 5.10%, 10/01/2053 | | | 10,000,000 | | | | 10,240,137 | | |
Revenue, Series 2024 A, 4.70%, 10/01/2054 (g) | | | 1,485,000 | | | | 1,517,302 | | |
Revenue, Series 2024 A, 4.75%, 10/01/2059 (g) | | | 7,100,000 | | | | 7,171,413 | | |
First Eagle Funds | Annual Report | October 31, 2024
115
First Eagle High Yield Municipal Fund | Schedule of Investments | October 31, 2024
Investments | | Principal Amount ($) | | Value ($) | |
Michigan — 2.0% (continued) | |
Revenue, Series 2024 A, 4.80%, 10/01/2064 (g) | | | 11,880,000 | | | | 11,964,725 | | |
Revenue, Series 2024 D, 4.45%, 12/01/2049 (g) | | | 5,000,000 | | | | 4,954,537 | | |
Revenue, Series 2024 D, 4.55%, 06/01/2055 (g) | | | 21,360,000 | | | | 21,079,007 | | |
Michigan Strategic Fund,
United Methodist Retirement Communities, Inc.
Obligated Group, Revenue, Refunding,
Series 2020, 5.00%, 05/15/2044 | | | 1,000,000 | | | | 931,609 | | |
Universal Academy, Revenue, Refunding,
Series 2021, 4.00%, 12/01/2040 | | | 2,215,000 | | | | 2,060,222 | | |
| | | | 87,416,604 | | |
Minnesota — 0.2% | |
City of Bethel,
Spectrum Building Co., Revenue,
Series 2024, 5.00%, 07/01/2059 | | | 1,750,000 | | | | 1,730,539 | | |
City of Bethel Housing and Health Care Facilities,
Second Century Housing & Owatonna Senior
Living LLC Obligated Group, Revenue, Refunding,
Series 2024 A, 6.13%, 03/01/2044 | | | 1,250,000 | | | | 1,286,102 | | |
Second Century Housing & Owatonna Senior
Living LLC Obligated Group, Revenue, Refunding,
Series 2024 A, 6.13%, 03/01/2049 | | | 1,400,000 | | | | 1,415,217 | | |
City of Cologne,
Cologne Academy, Revenue,
Series 2014 A, 5.00%, 07/01/2045 | | | 3,565,000 | | | | 3,510,586 | | |
City of Marshall,
Southwest & West Central Service Cooperatives,
Revenue, Series 2024 A, 5.13%, 02/01/2041 | | | 675,000 | | | | 682,956 | | |
Southwest & West Central Service Cooperatives,
Revenue, Series 2024 A, 5.38%, 02/01/2045 | | | 725,000 | | | | 734,496 | | |
| | | | 9,359,896 | | |
Mississippi — 0.8% | |
County of Hinds,
COP, BAM Insured,
Series 2024 A, 4.63%, 09/01/2054 (b) | | | 10,600,000 | | | | 10,467,441 | | |
Mississippi Home Corp.,
Revenue, GNMA Insured,
Series 2024 E, 4.60%, 12/01/2049 (f) | | | 7,630,000 | | | | 7,685,324 | | |
Revenue, GNMA Insured,
Series 2024 E, 4.65%, 12/01/2054 (f) | | | 12,775,000 | | | | 12,877,446 | | |
| | | | 31,030,211 | | |
First Eagle Funds | Annual Report | October 31, 2024
116
First Eagle High Yield Municipal Fund | Schedule of Investments | October 31, 2024
Investments | | Principal Amount ($) | | Value ($) | |
Missouri — 1.2% | |
Cape Girardeau County Industrial
Development Authority,
West Park Mall Redevelopment Area, Tax Allocation,
Series 2024, 5.50%, 05/01/2044 (b) | | | 3,570,000 | | | | 3,420,218 | | |
West Park Mall Redevelopment Area, Tax Allocation,
Series 2024, 5.75%, 05/01/2054 (b) | | | 10,000,000 | | | | 9,460,611 | | |
Citizens Memorial Hospital District,
Revenue, Series 2024 D, 6.75%, 02/01/2053 | | | 575,000 | | | | 568,328 | | |
Grindstone Plaza Transportation Development District,
Revenue, Series 2006 A, 5.40%, 10/01/2026 | | | 250,000 | | | | 249,992 | | |
Revenue, Series 2006 A, 5.50%, 10/01/2031 | | | 2,280,000 | | | | 2,261,228 | | |
Revenue, Series 2006 A, 5.55%, 10/01/2036 | | | 1,840,000 | | | | 1,776,530 | | |
Health & Educational Facilities Authority of the
State of Missouri,
Lutheran Senior Services Obligated Group,
Revenue, Refunding,
Series 2019 C, 4.00%, 02/01/2048 | | | 1,000,000 | | | | 900,400 | | |
Industrial Development Authority of the City of
St. Louis Missouri (The), Revenue, Refunding,
Series 2024 A, 4.88%, 06/15/2034 | | | 560,000 | | | | 559,704 | | |
Revenue, Refunding,
Series 2024 A, 5.75%, 06/15/2054 | | | 7,200,000 | | | | 7,301,067 | | |
Kansas City Industrial Development Authority,
City of Kansas City Historic Northeast Redevelopment
Area, Revenue,
Series 2024 A-1, 5.00%, 06/01/2046 (b) | | | 1,875,000 | | | | 1,851,614 | | |
City of Kansas City Historic Northeast Redevelopment
Area, Revenue,
Series 2024 A-1, 5.00%, 06/01/2054 (b) | | | 3,000,000 | | | | 2,905,377 | | |
Ward Parkway Center Community Improvement
District, Revenue, Refunding,
Series 2016 A, 5.00%, 04/01/2036 (b) | | | 1,000,000 | | | | 968,724 | | |
Ward Parkway Center Community Improvement
District, Revenue, Refunding,
Series 2016 A, 5.00%, 04/01/2046 (b) | | | 1,100,000 | | | | 1,006,700 | | |
Lees Summit Industrial Development Authority,
John Knox Village Obligated Group, Revenue, Refunding,
Series 2024 A, 5.25%, 08/15/2044 | | | 540,000 | | | | 561,373 | | |
John Knox Village Obligated Group, Revenue, Refunding,
Series 2024 A, 5.63%, 08/15/2054 | | | 1,940,000 | | | | 2,020,745 | | |
John Knox Village Obligated Group, Revenue, Refunding,
Series 2024 A, 5.75%, 08/15/2059 | | | 1,835,000 | | | | 1,908,784 | | |
First Eagle Funds | Annual Report | October 31, 2024
117
First Eagle High Yield Municipal Fund | Schedule of Investments | October 31, 2024
Investments | | Principal Amount ($) | | Value ($) | |
Missouri — 1.2% (continued) | |
Missouri Housing Development Commission,
Revenue, GNMA Insured,
Series 2024 G, 4.35%, 11/01/2044 | | | 6,700,000 | | | | 6,639,668 | | |
Revenue, GNMA Insured,
Series 2024 G, 4.45%, 11/01/2049 | | | 2,000,000 | | | | 1,981,917 | | |
Revenue, GNMA Insured,
Series 2024 G, 4.50%, 11/01/2054 | | | 3,500,000 | | | | 3,437,412 | | |
Rolla Industrial Development Authority,
Westside Marketplace Redevelopment
Project — RPA 1, Tax Allocation,
Series 2017 A, 5.38%, 05/01/2044 | | | 860,000 | | | | 849,879 | | |
St. Charles County Industrial Development Authority,
Economic Development Council of St. Charles County
Suemandy/Mid-Rivers Sales Tax, Revenue,
Series 2016, 4.25%, 10/01/2034 (b) | | | 1,320,000 | | | | 1,161,768 | | |
Economic Development Council of St. Charles County
Suemandy/Mid-Rivers Sales Tax, Revenue,
Series 2016, 5.00%, 10/01/2046 (b) | | | 3,775,000 | | | | 3,185,081 | | |
| | | | 54,977,120 | | |
Montana — 0.0% (a) | |
Montana Facility Finance Authority,
Montana Children's Home and Hospital, Revenue,
Series 2020 A, 4.00%, 07/01/2040 | | | 50,000 | | | | 40,452 | | |
Montana Children's Home and Hospital, Revenue,
Series 2020 A, 4.00%, 07/01/2044 | | | 600,000 | | | | 446,010 | | |
Montana Children's Home and Hospital, Revenue,
Series 2020 A, 4.00%, 07/01/2050 | | | 760,000 | | | | 525,525 | | |
| | | | 1,011,987 | | |
Nebraska — 0.1% | |
Nebraska Investment Finance Authority,
Revenue, GNMA Insured,
Series 2024 E, 4.80%, 09/01/2054 | | | 4,500,000 | | | | 4,531,744 | | |
Nevada — 0.6% | |
City of Las Vegas,
Special Improvement District No. 613,
Special Assessment,
Series 2024, 5.25%, 12/01/2047 | | | 550,000 | | | | 558,532 | | |
Special Improvement District No. 613,
Special Assessment,
Series 2024, 5.50%, 12/01/2053 | | | 600,000 | | | | 609,689 | | |
First Eagle Funds | Annual Report | October 31, 2024
118
First Eagle High Yield Municipal Fund | Schedule of Investments | October 31, 2024
Investments | | Principal Amount ($) | | Value ($) | |
Nevada — 0.6% (continued) | |
City of Sparks,
Special Improvement District No. 1,
Special Assessment,
Series 2024, 5.13%, 06/01/2054 (f) | | | 500,000 | | | | 500,924 | | |
Nevada Housing Division,
Revenue, Senior Lien, GNMA Insured,
Series 2024 E, 4.70%, 10/01/2054 | | | 1,500,000 | | | | 1,517,390 | | |
State of Nevada Department of Business & Industry,
DesertXpress Enterprises LLC, Revenue, AMT,
Series 2020 A-4, 8.13%, 8/15/2025 (c)(d) | | | 23,000,000 | | | | 23,701,431 | | |
| | | | 26,887,966 | | |
New Hampshire — 3.0% | |
New Hampshire Business Finance Authority,
Revenue, Series 2024, 5.63%, 02/01/2030 (b)(f) | | | 5,000,000 | | | | 5,000,000 | | |
Revenue, Series 2024, 5.13%, 12/15/2030 | | | 8,000,000 | | | | 7,906,225 | | |
Revenue, Series 2024, 5.30%, 12/01/2032 (b) | | | 7,728,000 | | | | 7,735,988 | | |
Revenue, Series 2024, 5.25%, 12/01/2035 (b) | | | 35,000,000 | | | | 34,310,626 | | |
Revenue, Series 2024, 5.38%, 12/15/2035 (b) | | | 38,000,000 | | | | 38,052,345 | | |
Ascentria Care Alliance Obligated Group, Revenue,
Series 2021, 5.00%, 07/01/2041 (b) | | | 1,885,000 | | | | 1,738,935 | | |
Ascentria Care Alliance Obligated Group, Revenue,
Series 2021, 5.00%, 07/01/2051 (b) | | | 1,220,000 | | | | 1,047,208 | | |
Ascentria Care Alliance Obligated Group, Revenue,
Series 2021, 5.00%, 07/01/2056 (b) | | | 1,910,000 | | | | 1,603,061 | | |
Brazoria-Fort Bend County Municipal Utility
District No. 3, Revenue,
Series 2024, 4.88%, 12/01/2033 (b) | | | 8,000,000 | | | | 7,935,935 | | |
Pennichuck Water Works, Inc., Revenue, AMT,
Series 2024 A, 5.50%, 04/01/2043 | | | 200,000 | | | | 209,424 | | |
Pennichuck Water Works, Inc., Revenue, AMT,
Series 2024 A, 5.38%, 04/01/2049 | | | 295,000 | | | | 300,451 | | |
Pennichuck Water Works, Inc., Revenue, AMT,
Series 2024 A, 5.50%, 04/01/2054 | | | 275,000 | | | | 280,143 | | |
Pennichuck Water Works, Inc., Revenue, AMT,
Series 2024 A, 5.63%, 04/01/2059 | | | 350,000 | | | | 359,211 | | |
Reworld Holding Corp., Revenue, Refunding,
Series 2018 B, 4.63%, 11/01/2042 (b) | | | 11,840,000 | | | | 11,280,568 | | |
Reworld Holding Corp., Revenue, AMT, Refunding,
Series 2018 C, 4.88%, 11/01/2042 (b) | | | 3,805,000 | | | | 3,769,894 | | |
First Eagle Funds | Annual Report | October 31, 2024
119
First Eagle High Yield Municipal Fund | Schedule of Investments | October 31, 2024
Investments | | Principal Amount ($) | | Value ($) | |
New Hampshire — 3.0% (continued) | |
Reworld Holding Corp., Revenue, Refunding,
Series 2020 A, 3.63%, 7/2/2040 (b)(c)(d) | | | 250,000 | | | | 209,163 | | |
Reworld Holding Corp., Revenue, AMT, Refunding,
Series 2020 B, 3.75%, 7/2/2040 (b)(c)(d) | | | 5,000,000 | | | | 4,226,348 | | |
New Hampshire Health and Education
Facilities Authority,
Catholic Medical Center Obligated Group, Revenue,
Series 2017, 3.50%, 07/01/2034 | | | 20,000 | | | | 17,854 | | |
New Hampshire Health and Education Facilities
Authority Act,
Catholic Medical Center Obligated Group, Revenue,
Series 2017, 3.75%, 07/01/2040 | | | 1,325,000 | | | | 1,116,792 | | |
Catholic Medical Center Obligated Group, Revenue,
Series 2017, 5.00%, 07/01/2044 | | | 40,000 | | | | 39,788 | | |
New Hampshire Municipal Bond Bank,
Revenue, Series 2022 A, 2.50%, 02/15/2047 | | | 185,000 | | | | 130,067 | | |
| | | | 127,270,026 | | |
New Jersey — 0.2% | |
Hillsborough Township School District,
GO, Series 2020, 2.00%, 07/15/2036 | | | 285,000 | | | | 220,635 | | |
New Jersey Economic Development Authority,
LEAP Academy University Charter School, Inc., Revenue,
Series 2014 A, 6.20%, 10/01/2044 (b) | | | 100,000 | | | | 100,067 | | |
Teaneck Community Charter School A New Jersey
Nonprofit Corp., Revenue, Refunding,
Series 2017 A, 5.00%, 09/01/2037 (b) | | | 1,120,000 | | | | 1,135,742 | | |
United Airlines, Inc., Revenue, AMT, Refunding,
Series 2012, 5.75%, 09/15/2027 | | | 500,000 | | | | 500,706 | | |
New Jersey Educational Facilities Authority,
Rider University A New Jersey Non-Profit Corp.,
Revenue, Series 2017 F, 3.63%, 07/01/2034 | | | 20,000 | | | | 16,270 | | |
Rider University A New Jersey Non-Profit Corp.,
Revenue,
Series 2017 F, 5.00%, 07/01/2047 | | | 3,250,000 | | | | 2,483,141 | | |
New Jersey Higher Education Student
Assistance Authority, Revenue, AMT,
Series 2024 C, 5.25%, 12/01/2054 | | | 4,050,000 | | | | 4,019,621 | | |
New Jersey Housing & Mortgage Finance Agency,
Forest Hill House Preservation Urban Renewal LLC,
Revenue, GNMA Insured,
Series 2024 A-1, 5.00%, 01/20/2066 | | | 500,000 | | | | 511,953 | | |
| | | | 8,988,135 | | |
First Eagle Funds | Annual Report | October 31, 2024
120
First Eagle High Yield Municipal Fund | Schedule of Investments | October 31, 2024
Investments | | Principal Amount ($) | | Value ($) | |
New Mexico — 0.0% (a) | |
Aspire Public Improvement District,
Special Tax, Series 2024, 5.05%, 10/01/2044 | | | 500,000 | | | | 492,527 | | |
Special Tax, Series 2024, 5.30%, 10/01/2053 | | | 810,000 | | | | 797,656 | | |
Lower Petroglyphs Public Improvement District,
Special Tax, Refunding,
Series 2018, 5.00%, 10/01/2048 | | | 1,150,000 | | | | 1,118,911 | | |
New Mexico Hospital Equipment Loan Council,
Haverland Carter Lifestyle Obligated Group, Revenue,
Series 2019 A, 5.00%, 07/01/2039 | | | 2,000,000 | | | | 2,008,568 | | |
| | | | 4,417,662 | | |
New York — 9.8% | |
Allegany County Capital Resource Corp.,
Houghton College, Revenue, Refunding,
Series 2022 A, 5.00%, 12/01/2037 | | | 1,525,000 | | | | 1,457,285 | | |
Houghton College, Revenue, Refunding,
Series 2022 A, 5.00%, 12/01/2042 | | | 1,925,000 | | | | 1,770,769 | | |
Houghton College, Revenue, Refunding,
Series 2022 A, 5.00%, 12/01/2052 | | | 6,185,000 | | | | 5,406,018 | | |
Build NYC Resource Corp.,
Albert Einstein College of Medicine, Inc., Revenue,
Series 2015, 5.50%, 09/01/2045 (b) | | | 1,000,000 | | | | 1,001,972 | | |
Shefa School, Revenue,
Series 2021 A, 5.00%, 06/15/2051 (b) | | | 5,750,000 | | | | 5,621,205 | | |
City of New York, GO,
Series 2021-2, 4.00%, 11/07/2024 (d)(i) | | | 1,000,000 | | | | 1,000,000 | | |
Dutchess County Local Development Corp.,
Nuvance Health Obligated Group, Revenue,
Series 2016 B, 5.00%, 07/01/2046 | | | 860,000 | | | | 865,735 | | |
Hempstead Town Local Development Corp.,
Evergreen Charter School, Inc., Revenue,
Series 2022 A, 5.25%, 06/15/2052 | | | 7,000,000 | | | | 7,131,580 | | |
Monroe County Industrial Development Corp.,
Eugenio Maria de Hostos Charter School, Revenue,
Series 2024 A, 5.00%, 07/01/2044 (b) | | | 1,000,000 | | | | 1,027,767 | | |
Eugenio Maria de Hostos Charter School, Revenue,
Series 2024 A, 5.00%, 07/01/2054 (b) | | | 2,000,000 | | | | 2,014,571 | | |
Eugenio Maria de Hostos Charter School, Revenue,
Series 2024 A, 5.00%, 07/01/2059 (b) | | | 1,350,000 | | | | 1,359,564 | | |
St. Ann's of Greater Rochester Obligated Group,
Revenue, Refunding,
Series 2019, 4.00%, 01/01/2030 | | | 800,000 | | | | 770,524 | | |
First Eagle Funds | Annual Report | October 31, 2024
121
First Eagle High Yield Municipal Fund | Schedule of Investments | October 31, 2024
Investments | | Principal Amount ($) | | Value ($) | |
New York — 9.8% (continued) | |
St. Ann's of Greater Rochester Obligated Group,
Revenue, Refunding,
Series 2019, 5.00%, 01/01/2040 | | | 14,850,000 | | | | 14,270,364 | | |
St. Ann's of Greater Rochester Obligated Group,
Revenue, Refunding,
Series 2019, 5.00%, 01/01/2050 | | | 3,750,000 | | | | 3,355,599 | | |
New York City Housing Development Corp.,
Revenue, Series 2024 D-2, 4.50%, 11/01/2054 (g) | | | 18,000,000 | | | | 17,706,874 | | |
CSA Preservation Partners LLC, Revenue,
Series 2023 A, 4.60%, 08/01/2048 | | | 5,000,000 | | | | 5,043,441 | | |
New York City Industrial Development Agency,
Yankee Stadium LLC, Revenue, Refunding,
Series 2020 A, 3.00%, 03/01/2049 | | | 4,000,000 | | | | 2,938,531 | | |
New York City Transitional Finance Authority,
Future Tax Secured, Revenue,
Series 2025 C-1, 4.00%, 05/01/2051 (g) | | | 17,000,000 | | | | 16,512,175 | | |
Future Tax Secured, Revenue,
Series 2025 D, 4.25%, 05/01/2054 (g) | | | 10,115,000 | | | | 9,947,493 | | |
New York Liberty Development Corp.,
3 World Trade Center LLC, Revenue, Refunding,
Series 2014, Class 3, 7.25%, 11/15/2044 (b) | | | 2,000,000 | | | | 2,001,185 | | |
New York State Dormitory Authority,
Garnet Health Medical Center Obligated Group,
Revenue, Refunding,
Series 2017, 5.00%, 12/01/2031 (b) | | | 1,000,000 | | | | 989,717 | | |
Garnet Health Medical Center Obligated Group,
Revenue, Refunding,
Series 2017, 5.00%, 12/01/2032 (b) | | | 1,100,000 | | | | 1,083,525 | | |
Garnet Health Medical Center Obligated Group,
Revenue, Refunding,
Series 2017, 5.00%, 12/01/2037 (b) | | | 2,000,000 | | | | 1,914,703 | | |
Northwell Health Obligated Group, Revenue, Refunding,
Series 2024 A, 4.00%, 05/01/2054 | | | 5,000,000 | | | | 4,669,077 | | |
Pace University, Revenue, Refunding,
Series 2013 A, 4.00%, 05/01/2033 | | | 25,000 | | | | 25,007 | | |
St. Joseph's College, Revenue,
Series 2021, 5.00%, 07/01/2051 | | | 1,750,000 | | | | 1,575,867 | | |
New York Transportation Development Corp.,
JFK Millennium Partners LLC, Revenue, AMT,
Refunding, AGMC Insured,
Series 2024 A, 4.50%, 12/31/2054 | | | 5,000,000 | | | | 4,870,978 | | |
First Eagle Funds | Annual Report | October 31, 2024
122
First Eagle High Yield Municipal Fund | Schedule of Investments | October 31, 2024
Investments | | Principal Amount ($) | | Value ($) | |
New York — 9.8% (continued) | |
JFK Millennium Partners LLC, Revenue, AMT,
Refunding, AGMC Insured,
Series 2024 A, 5.25%, 12/31/2054 | | | 40,000,000 | | | | 42,155,116 | | |
JFK Millennium Partners LLC, Revenue, AMT, Refunding,
Series 2024 A, 5.50%, 12/31/2054 | | | 10,000,000 | | | | 10,656,291 | | |
JFK Millennium Partners LLC, Revenue, AMT, Refunding,
Series 2024 A, 5.50%, 12/31/2060 | | | 30,000,000 | | | | 31,720,212 | | |
JFK Millennium Partners LLC, Revenue, AMT,
Refunding, AGMC Insured,
Series 2024 B, 0.00%, 12/31/2054 | | | 16,050,000 | | | | 10,305,923 | | |
JFK NTO LLC, Revenue, AMT, AGMC Insured,
Series 2024, 5.00%, 06/30/2049 | | | 3,975,000 | | | | 4,113,207 | | |
JFK NTO LLC, Revenue, AMT,
Series 2024, 5.00%, 06/30/2060 | | | 30,790,000 | | | | 31,351,813 | | |
JFK NTO LLC, Revenue, AMT, AGMC Insured,
Series 2024, 5.25%, 06/30/2060 | | | 34,510,000 | | | | 36,096,218 | | |
JFK NTO LLC, Revenue, AMT,
Series 2024, 5.50%, 06/30/2060 | | | 43,730,000 | | | | 46,098,321 | | |
Niagara Area Development Corp.,
Reworld Holding Corp., Revenue, AMT, Refunding,
Series 2018 A, 4.75%, 11/01/2042 (b) | | | 3,195,000 | | | | 3,054,516 | | |
Oneida Indian Nation of New York,
Revenue, Series 2024 B, 6.00%, 09/01/2043 (b) | | | 5,500,000 | | | | 5,990,062 | | |
Onondaga Civic Development Corp.,
Crouse Health Hospital, Inc. Obligated Group,
Revenue, Refunding,
Series 2024 A, 5.00%, 08/01/2032 | | | 425,000 | | | | 440,340 | | |
Crouse Health Hospital, Inc. Obligated Group,
Revenue, Refunding,
Series 2024 A, 5.00%, 08/01/2033 | | | 385,000 | | | | 398,895 | | |
Crouse Health Hospital, Inc. Obligated Group,
Revenue, Refunding,
Series 2024 A, 5.00%, 08/01/2034 | | | 350,000 | | | | 362,234 | | |
Crouse Health Hospital, Inc. Obligated Group,
Revenue, Refunding,
Series 2024 A, 5.13%, 08/01/2044 | | | 1,250,000 | | | | 1,263,038 | | |
Crouse Health Hospital, Inc. Obligated Group,
Revenue, Refunding,
Series 2024 A, 5.38%, 08/01/2054 | | | 12,980,000 | | | | 13,100,784 | | |
Suffolk Regional Off-Track Betting Co.,
Revenue, Series 2024, 5.75%, 12/01/2044 | | | 18,000,000 | | | | 18,652,172 | | |
First Eagle Funds | Annual Report | October 31, 2024
123
First Eagle High Yield Municipal Fund | Schedule of Investments | October 31, 2024
Investments | | Principal Amount ($) | | Value ($) | |
New York — 9.8% (continued) | |
Revenue, Series 2024, 6.00%, 12/01/2053 | | | 21,200,000 | | | | 22,073,563 | | |
Westchester County Industrial Development Agency,
Million Air Two LLC Obligated Group, Revenue, AMT,
Series 2017 A, 7.00%, 06/01/2046 (b) | | | 4,000,000 | | | | 4,203,058 | | |
Westchester County Local Development Corp.,
Purchase Senior Learning Community Obligated Group,
Revenue, Refunding,
Series 2021 A, 5.00%, 07/01/2046 (b) | | | 3,135,000 | | | | 3,157,932 | | |
Purchase Senior Learning Community Obligated
Group, Revenue, Refunding,
Series 2021 A, 4.50%, 07/01/2056 (b) | | | 2,500,000 | | | | 2,287,736 | | |
Purchase Senior Learning Community Obligated
Group, Revenue, Refunding,
Series 2021 A, 5.00%, 07/01/2056 (b) | | | 6,410,000 | | | | 6,370,206 | | |
Western Regional Off-Track Betting Corp.,
Revenue, Refunding,
Series 2021, 4.13%, 12/01/2041 (b) | | | 1,000,000 | | | | 912,293 | | |
| | | | 411,095,456 | | |
North Carolina — 0.2% | |
North Carolina Capital Facilities Finance Agency,
Meredith College, Revenue, Refunding,
Series 2018, 5.00%, 06/01/2038 | | | 2,000,000 | | | | 1,956,749 | | |
North Carolina Medical Care Commission,
Carolina Meadows, Inc. Obligated Group, Revenue,
Series 2024, 5.25%, 12/01/2054 | | | 4,000,000 | | | | 4,264,598 | | |
Penick Village Obligated Group, Revenue,
Series 2024 A, 5.50%, 09/01/2044 (f) | | | 1,380,000 | | | | 1,428,684 | | |
Penick Village Obligated Group, Revenue,
Series 2024 A, 5.50%, 09/01/2054 (f) | | | 3,530,000 | | | | 3,586,174 | | |
Presbyterian Home at Charlotte, Inc. (The),
Revenue, Refunding,
Series 2019 A, 5.00%, 07/01/2049 | | | 600,000 | | | | 597,515 | | |
| | | | 11,833,720 | | |
North Dakota — 0.5% | |
City of Horace,
GO, Special Assessment, Refunding,
Series 2024 A, 5.38%, 05/01/2050 | | | 800,000 | | | | 813,015 | | |
GO, Special Assessment, Refunding,
Series 2024 C, 4.75%, 05/01/2044 | | | 1,100,000 | | | | 1,088,071 | | |
GO, Special Assessment, Refunding,
Series 2024 C, 5.00%, 05/01/2050 | | | 1,500,000 | | | | 1,514,856 | | |
First Eagle Funds | Annual Report | October 31, 2024
124
First Eagle High Yield Municipal Fund | Schedule of Investments | October 31, 2024
Investments | | Principal Amount ($) | | Value ($) | |
North Dakota — 0.5% (continued) | |
City of Mayville,
GO, Special Assessment, Refunding,
Series 2024, 5.00%, 05/01/2044 | | | 2,825,000 | | | | 2,732,193 | | |
County of Ward,
Trinity Health Obligated Group, Revenue,
Series 2017 C, 5.00%, 06/01/2029 | | | 1,300,000 | | | | 1,337,412 | | |
Trinity Health Obligated Group, Revenue,
Series 2017 C, 5.00%, 06/01/2031 | | | 1,665,000 | | | | 1,703,956 | | |
Trinity Health Obligated Group, Revenue,
Series 2017 C, 5.00%, 06/01/2038 | | | 2,000,000 | | | | 2,023,007 | | |
Trinity Health Obligated Group, Revenue,
Series 2017 C, 5.00%, 06/01/2043 | | | 2,800,000 | | | | 2,806,424 | | |
Trinity Health Obligated Group, Revenue,
Series 2017 C, 5.00%, 06/01/2048 | | | 3,500,000 | | | | 3,443,230 | | |
| | | | 17,462,164 | | |
Ohio — 5.2% | |
Buckeye Tobacco Settlement Financing Authority,
Revenue, Senior Lien, Refunding,
Series 2020 B-3, Class 2, 0.00%, 06/01/2057 (e) | | | 308,700,000 | | | | 28,591,640 | | |
City of Brecksville,
Valor Acres TIF Area, Tax Allocation,
Series 2022, 5.63%, 12/01/2053 (b) | | | 3,880,000 | | | | 3,789,893 | | |
Cleveland-Cuyahoga County Port Authority,
Playhouse Square Foundation, Revenue, Refunding,
Series 2018, 5.50%, 12/01/2043 | | | 1,290,000 | | | | 1,320,331 | | |
Columbus-Franklin County Finance Authority,
Revenue, Series 2019 A-1, 5.00%, 12/01/2051 | | | 5,000,000 | | | | 4,982,283 | | |
ECG Westerville LP, Revenue, FNMA Insured,
Series 2024 A, 4.38%, 06/01/2043 | | | 7,500,000 | | | | 7,332,319 | | |
County of Butler,
UC Health Obligated Group, Revenue, Refunding,
Series 2016, 5.00%, 11/15/2045 | | | 1,000,000 | | | | 989,352 | | |
County of Cuyahoga,
Eliza Jennings Obligated Group, Revenue, Refunding,
Series 2022 A, 5.00%, 05/15/2032 | | | 2,295,000 | | | | 2,304,258 | | |
County of Fairfield,
Fairfield Medical Center Obligated Group,
Revenue, Refunding,
Series 2013, 5.13%, 06/15/2033 | | | 9,615,000 | | | | 9,434,894 | | |
Fairfield Medical Center Obligated Group,
Revenue, Refunding,
Series 2013, 5.00%, 06/15/2043 | | | 4,345,000 | | | | 3,860,490 | | |
First Eagle Funds | Annual Report | October 31, 2024
125
First Eagle High Yield Municipal Fund | Schedule of Investments | October 31, 2024
Investments | | Principal Amount ($) | | Value ($) | |
Ohio — 5.2% (continued) | |
County of Franklin,
OhioHealth Obligated Group, Revenue,
Series 2018 A, 4.00%, 05/15/2047 | | | 7,000,000 | | | | 6,674,007 | | |
County of Hamilton,
UC Health Obligated Group, Revenue,
Series 2020, 4.00%, 09/15/2050 | | | 3,175,000 | | | | 2,703,620 | | |
UC Health Obligated Group, Revenue,
Series 2020, 5.00%, 09/15/2050 | | | 7,000,000 | | | | 7,006,682 | | |
County of Hardin,
Ohio Northern University, Revenue, Refunding,
Series 2020, 4.00%, 05/01/2026 | | | 195,000 | | | | 191,438 | | |
Ohio Northern University, Revenue, Refunding,
Series 2020, 5.00%, 05/01/2030 | | | 1,000,000 | | | | 992,861 | | |
Ohio Northern University, Revenue, Refunding,
Series 2020, 5.25%, 05/01/2040 | | | 1,425,000 | | | | 1,365,779 | | |
Ohio Northern University, Revenue, Refunding,
Series 2020, 5.50%, 05/01/2050 | | | 3,000,000 | | | | 2,825,795 | | |
County of Lucas,
Promedica Healthcare Obligated Group, Revenue,
Series 2015 B, 4.00%, 11/15/2045 | | | 1,060,000 | | | | 918,898 | | |
Promedica Healthcare Obligated Group,
Revenue, Refunding,
Series 2018 A, 5.25%, 11/15/2048 | | | 16,595,000 | | | | 16,716,897 | | |
County of Montgomery,
Community Blood Center Obligated Group,
Revenue, Refunding,
Series 2024, 5.25%, 09/01/2049 | | | 1,500,000 | | | | 1,585,973 | | |
Community Blood Center Obligated Group,
Revenue, Refunding,
Series 2024, 5.25%, 09/01/2054 | | | 2,500,000 | | | | 2,625,060 | | |
County of Muskingum,
Genesis Healthcare System Obligated Group, Revenue,
Series 2013, 5.00%, 02/15/2044 | | | 2,115,000 | | | | 2,088,472 | | |
Genesis Healthcare System Obligated Group, Revenue,
Series 2013, 5.00%, 02/15/2048 | | | 4,000,000 | | | | 3,919,418 | | |
County of Washington,
Marietta Area Health Care, Inc. Obligated Group,
Revenue, Refunding,
Series 2022, 6.63%, 12/01/2042 | | | 100,000 | | | | 109,621 | | |
Marietta Area Health Care, Inc. Obligated Group,
Revenue, Refunding,
Series 2022, 6.75%, 12/01/2052 | | | 11,700,000 | | | | 12,808,012 | | |
First Eagle Funds | Annual Report | October 31, 2024
126
First Eagle High Yield Municipal Fund | Schedule of Investments | October 31, 2024
Investments | | Principal Amount ($) | | Value ($) | |
Ohio — 5.2% (continued) | |
Dayton-Montgomery County Port Authority,
Dayton Regional STEM Schools, Inc., Revenue,
Series 2024, 5.00%, 12/01/2044 | | | 650,000 | | | | 668,003 | | |
Dayton Regional STEM Schools, Inc., Revenue,
Series 2024, 5.00%, 12/01/2054 | | | 1,000,000 | | | | 1,010,722 | | |
Dayton Regional STEM Schools, Inc., Revenue,
Series 2024, 5.00%, 12/01/2060 | | | 1,000,000 | | | | 1,006,731 | | |
Delaware County Finance Authority,
Common Bond Fund, Revenue,
Series 2024 B, 5.38%, 12/01/2038 | | | 3,675,000 | | | | 3,588,353 | | |
Ohio Air Quality Development Authority,
Ohio Valley Electric Corp., Revenue,
Series 2009 C, 1.50%, 11/4/2025 (c)(d) | | | 1,045,000 | | | | 1,006,341 | | |
Ohio Housing Finance Agency,
Revenue, GNMA Insured,
Series 2024 C, 4.50%, 09/01/2044 (f)(g) | | | 28,865,000 | | | | 28,986,040 | | |
Revenue, GNMA Insured,
Series 2024 C, 4.65%, 09/01/2049 (f)(g) | | | 12,115,000 | | | | 12,247,687 | | |
Revenue, GNMA Insured,
Series 2024 C, 4.70%, 09/01/2054 (f)(g) | | | 16,000,000 | | | | 16,094,026 | | |
Port of Greater Cincinnati Development Authority,
RBM Phase 3 Garage Project, Tax Allocation,
Series 2024, 5.13%, 12/01/2055 | | | 2,250,000 | | | | 2,258,229 | | |
Southeastern Ohio Port Authority,
Marietta Area Health Care, Inc. Obligated Group,
Revenue, Refunding,
Series 2015, 5.00%, 12/01/2035 | | | 1,750,000 | | | | 1,646,143 | | |
Marietta Area Health Care, Inc. Obligated Group,
Revenue, Refunding,
Series 2015, 5.00%, 12/01/2043 | | | 6,695,000 | | | | 6,044,169 | | |
Marietta Area Health Care, Inc. Obligated Group,
Revenue, Refunding,
Series 2015, 5.50%, 12/01/2043 | | | 6,375,000 | | | | 6,118,753 | | |
State of Ohio,
University Hospitals Health System, Inc. Obligated
Group, Revenue, Refunding,
Series 2014 B, 3.50%, 11/07/2024 (d)(i) | | | 2,000,000 | | | | 2,000,000 | | |
University Hospitals Health System, Inc. Obligated
Group, Revenue, Refunding,
Series 2015 A, 3.50%, 11/07/2024 (d)(i) | | | 2,750,000 | | | | 2,750,000 | | |
Summit County Development Finance Authority,
UAkronPark, Inc., Revenue,
Series 2023, 5.63%, 12/01/2048 | | | 800,000 | | | | 858,642 | | |
First Eagle Funds | Annual Report | October 31, 2024
127
First Eagle High Yield Municipal Fund | Schedule of Investments | October 31, 2024
Investments | | Principal Amount ($) | | Value ($) | |
Ohio — 5.2% (continued) | |
UAkronPark, Inc., Revenue,
Series 2023, 5.75%, 12/01/2053 | | | 1,400,000 | | | | 1,503,664 | | |
UAkronPark, Inc., Revenue,
Series 2023, 6.00%, 12/01/2058 | | | 3,000,000 | | | | 3,274,662 | | |
Warren County Port Authority,
Ohio Communities Accelerator Fund, Revenue,
Series 2024 A, 6.70%, 12/01/2056 | | | 605,000 | | | | 657,875 | | |
| | | | 216,858,033 | | |
Oklahoma — 0.6% | |
Norman Regional Hospital Authority,
Obligated Group, Revenue, Refunding,
Series 2016, 4.00%, 09/01/2037 | | | 740,000 | | | | 642,531 | | |
Obligated Group, Revenue,
Series 2019, 3.25%, 09/01/2039 | | | 10,000 | | | | 7,350 | | |
Obligated Group, Revenue,
Series 2019, 4.00%, 09/01/2045 | | | 630,000 | | | | 521,638 | | |
Oklahoma County Finance Authority,
Aerospace Science and Technology Education
Center, Inc., Revenue,
Series 2024, 6.00%, 06/15/2044 (b) | | | 1,800,000 | | | | 1,841,163 | | |
Aerospace Science and Technology Education
Center, Inc., Revenue,
Series 2024, 6.25%, 06/15/2054 (b) | | | 3,200,000 | | | | 3,262,930 | | |
Aerospace Science and Technology Education
Center, Inc., Revenue,
Series 2024, 6.50%, 06/15/2064 (b) | | | 11,650,000 | | | | 11,994,088 | | |
Oklahoma Development Finance Authority,
OU Medicine Obligated Group, Revenue,
Series 2018 B, 5.00%, 08/15/2038 | | | 1,500,000 | | | | 1,528,031 | | |
Oklahoma Housing Finance Agency,
Revenue, GNMA Insured,
Series 2024 C, 4.65%, 03/01/2056 | | | 3,500,000 | | | | 3,381,794 | | |
Tulsa Airports Improvement Trust,
American Airlines, Inc., Revenue, AMT, Refunding,
Series 2001 B, 5.50%, 12/01/2035 | | | 2,800,000 | | | | 2,804,944 | | |
Tulsa Authority for Economic Opportunity,
Increment District No. 8, Tax Allocation,
Series 2021, 4.38%, 12/01/2041 (b) | | | 1,980,000 | | | | 1,798,578 | | |
| | | | 27,783,047 | | |
First Eagle Funds | Annual Report | October 31, 2024
128
First Eagle High Yield Municipal Fund | Schedule of Investments | October 31, 2024
Investments | | Principal Amount ($) | | Value ($) | |
Oregon — 0.9% | |
Medford Hospital Facilities Authority,
Asante Health System Obligated Group,
Revenue, Refunding, AGMC Insured,
Series 2020 A, 3.00%, 08/15/2050 | | | 605,000 | | | | 462,133 | | |
Oregon State Facilities Authority,
Portland Village School, Revenue,
Series 2024 A, 6.75%, 12/15/2054 (b) | | | 2,000,000 | | | | 2,006,320 | | |
Portland Village School, Revenue,
Series 2024 A, 7.00%, 12/15/2060 (b) | | | 2,000,000 | | | | 2,024,338 | | |
Polk County Hospital Facility Authority,
Dallas Mennonite Retirement Community
Obligated Group, Revenue,
Series 2020 A, 5.13%, 07/01/2055 | | | 1,000,000 | | | | 963,429 | | |
Port of Morrow, GO,
Series 2024 A, 5.15%, 10/01/2026 (b) | | | 35,140,000 | | | | 34,758,499 | | |
Yamhill County Hospital Authority,
Friendsview Manor Obligated Group,
Revenue, Refunding,
Series 2016 A, 5.00%, 11/15/2046 | | | 1,300,000 | | | | 1,164,230 | | |
| | | | 41,378,949 | | |
Pennsylvania — 3.0% | |
Allegheny County Higher Education Building Authority,
Carnegie Mellon University, Revenue, Refunding,
Series 2008 A, 4.00%, 11/01/2024 (d)(i) | | | 2,500,000 | | | | 2,500,000 | | |
Allentown Neighborhood Improvement Zone
Development Authority,
Total Waterfront, Revenue,
Series 2024 A, 5.25%, 05/01/2032 (b) | | | 750,000 | | | | 776,808 | | |
Total Waterfront, Revenue,
Series 2024 A, 5.25%, 05/01/2042 (b) | | | 1,725,000 | | | | 1,742,625 | | |
Total Waterfront, Revenue,
Series 2024 B, 6.00%, 05/01/2042 (b) | | | 12,750,000 | | | | 13,233,193 | | |
Beaver County Industrial Development Authority,
Energy Harbor Generation LLC, Revenue, Refunding,
Series 2008 B, 3.75%, 10/01/2047 | | | 10,060,000 | | | | 8,598,203 | | |
Berks County Municipal Authority (The),
Tower Health Obligated Group, Revenue,
Series 2024 A-3, 5.00%, 06/30/2039 | | | 13,626,000 | | | | 13,463,528 | | |
Tower Health Obligated Group, Revenue,
Series 2024 B-1, 0.00%, 06/30/2044 | | | 5,717,000 | | | | 4,073,676 | | |
First Eagle Funds | Annual Report | October 31, 2024
129
First Eagle High Yield Municipal Fund | Schedule of Investments | October 31, 2024
Investments | | Principal Amount ($) | | Value ($) | |
Pennsylvania — 3.0% (continued) | |
Bucks County Industrial Development Authority,
Grand View Hospital/Sellersville Obligated Group,
Revenue, Series 2021, 5.00%, 07/01/2027 | | | 275,000 | | | | 279,189 | | |
Grand View Hospital/Sellersville Obligated Group,
Revenue, Series 2021, 5.00%, 07/01/2028 | | | 525,000 | | | | 535,819 | | |
Grand View Hospital/Sellersville Obligated Group,
Revenue, Series 2021, 5.00%, 07/01/2029 | | | 550,000 | | | | 563,561 | | |
Grand View Hospital/Sellersville Obligated Group,
Revenue, Series 2021, 5.00%, 07/01/2032 | | | 1,000,000 | | | | 1,022,685 | | |
Grand View Hospital/Sellersville Obligated Group,
Revenue, Series 2021, 5.00%, 07/01/2033 | | | 1,150,000 | | | | 1,172,682 | | |
Grand View Hospital/Sellersville Obligated Group,
Revenue, Series 2021, 5.00%, 07/01/2034 | | | 1,355,000 | | | | 1,377,393 | | |
Grand View Hospital/Sellersville Obligated Group,
Revenue, Series 2021, 5.00%, 07/01/2035 | | | 1,100,000 | | | | 1,114,875 | | |
Grand View Hospital/Sellersville Obligated Group,
Revenue, Series 2021, 5.00%, 07/01/2036 | | | 1,250,000 | | | | 1,263,488 | | |
Grand View Hospital/Sellersville Obligated Group,
Revenue, Series 2021, 5.00%, 07/01/2037 | | | 2,650,000 | | | | 2,671,863 | | |
Grand View Hospital/Sellersville Obligated Group,
Revenue, Series 2021, 5.00%, 07/01/2038 | | | 1,725,000 | | | | 1,734,659 | | |
Grand View Hospital/Sellersville Obligated Group,
Revenue, Series 2021, 5.00%, 07/01/2039 | | | 2,940,000 | | | | 2,944,956 | | |
Grand View Hospital/Sellersville Obligated Group,
Revenue, Series 2021, 5.00%, 07/01/2040 | | | 3,000,000 | | | | 2,989,661 | | |
Grand View Hospital/Sellersville Obligated Group,
Revenue, Series 2021, 4.00%, 07/01/2046 | | | 9,920,000 | | | | 8,249,448 | | |
Grand View Hospital/Sellersville Obligated Group,
Revenue, Series 2021, 4.00%, 07/01/2051 | | | 5,480,000 | | | | 4,435,157 | | |
Grand View Hospital/Sellersville Obligated Group,
Revenue, Series 2021, 5.00%, 07/01/2054 | | | 9,120,000 | | | | 8,640,243 | | |
Grand View Hospital/Sellersville PA Obligated Group,
Revenue, Series 2021, 5.00%, 07/01/2041 | | | 1,225,000 | | | | 1,212,074 | | |
Lancaster Municipal Authority,
Garden Spot Village Obligated Group, Revenue,
Series 2024 B, 5.00%, 05/01/2059 | | | 535,000 | | | | 547,626 | | |
Lehigh County General Purpose Authority,
Muhlenberg College, Revenue, Refunding,
Series 2024, 5.25%, 02/01/2054 | | | 1,600,000 | | | | 1,664,215 | | |
First Eagle Funds | Annual Report | October 31, 2024
130
First Eagle High Yield Municipal Fund | Schedule of Investments | October 31, 2024
Investments | | Principal Amount ($) | | Value ($) | |
Pennsylvania — 3.0% (continued) | |
Lehigh County Industrial Development Authority,
Seven Generations Charter School, Revenue,
Series 2021 A, 4.00%, 05/01/2041 | | | 1,775,000 | | | | 1,541,123 | | |
Northeastern Pennsylvania Hospital and
Education Authority,
King's College, Revenue,
Series 2019, 5.00%, 05/01/2044 | | | 1,000,000 | | | | 948,038 | | |
Pennsylvania Economic Development
Financing Authority,
Reworld Holding Corp., Revenue, AMT,
Series 2019 A, 3.25%, 08/01/2039 (b) | | | 3,000,000 | | | | 2,448,423 | | |
Talen Energy Supply LLC, Revenue, Refunding,
Series 2009 B, 5.25%, 6/1/2027 (c)(d) | | | 4,500,000 | | | | 4,557,605 | | |
Talen Energy Supply LLC, Revenue, Refunding,
Series 2009 C, 5.25%, 6/1/2027 (c)(d) | | | 6,675,000 | | | | 6,758,281 | | |
Pennsylvania Higher Education Assistance Agency,
Revenue, AMT, Series 2020 B, 3.00%, 06/01/2047 | | | 835,000 | | | | 607,266 | | |
Pennsylvania Higher Educational Facilities Authority,
Foundation for Indiana University of Pennsylvania
Phase II Student Housing, Revenue, AGMC Insured,
Series 2007 A, (3-month SOFR + 0.65%),
3.90%, 07/01/2039 (c) | | | 500,000 | | | | 459,238 | | |
Widener University, Revenue, Refunding,
Series 2014, 5.00%, 07/15/2038 | | | 1,810,000 | | | | 1,795,724 | | |
Philadelphia Authority for Industrial Development,
Frankford Valley Foundation for Literacy,
Revenue, Refunding,
Series 2024, 5.00%, 06/15/2043 (b) | | | 1,475,000 | | | | 1,489,487 | | |
Philadelphia Performing Arts Charter School,
Revenue, Refunding,
Series 2020, 5.00%, 06/15/2050 (b) | | | 2,000,000 | | | | 1,981,309 | | |
St. Mary Hospital Authority,
Trinity Health Corp. Obligated Group, Revenue,
Series 2007 F, (3-month SOFR + 0.83%),
4.43%, 11/15/2034 (c) | | | 2,035,000 | | | | 1,989,190 | | |
Westmoreland County Industrial Development
Authority, Redstone Presbyterian Seniorcare
Obligated Group, Revenue, Refunding,
Series 2021, 4.00%, 05/15/2041 | | | 7,980,000 | | | | 6,807,910 | | |
Redstone Presbyterian Seniorcare Obligated Group,
Revenue, Refunding,
Series 2021, 4.00%, 05/15/2047 | | | 6,150,000 | | | | 4,866,119 | | |
| | | | 123,057,340 | | |
First Eagle Funds | Annual Report | October 31, 2024
131
First Eagle High Yield Municipal Fund | Schedule of Investments | October 31, 2024
Investments | | Principal Amount ($) | | Value ($) | |
Puerto Rico — 0.6% | |
Children's Trust Fund, Revenue,
Series 2002, 5.63%, 05/15/2043 | | | 295,000 | | | | 298,774 | | |
Puerto Rico Industrial Tourist Educational Medical &
Environmental Control Facilities Financing Authority,
San Juan Cruise Port LLC, Revenue, AMT,
Series 2023 A-1, 6.75%, 01/01/2045 | | | 5,000,000 | | | | 5,949,985 | | |
San Juan Cruise Port LLC, Revenue, AMT,
Series 2023 A-2, 6.75%, 01/01/2045 | | | 5,000,000 | | | | 5,949,984 | | |
San Juan Cruise Port LLC, Revenue, AMT,
Series 2023 A-3, 6.25%, 01/01/2040 | | | 2,000,000 | | | | 2,336,980 | | |
San Juan Cruise Port LLC, Revenue, AMT,
Series 2023 A-3, 6.50%, 01/01/2041 | | | 3,500,000 | | | | 4,150,710 | | |
San Juan Cruise Port LLC, Revenue, AMT,
Series 2023 A-3, 6.50%, 01/01/2042 | | | 1,765,000 | | | | 2,085,213 | | |
San Juan Cruise Port LLC, Revenue, AMT,
Series 2023 A-3, 6.75%, 01/01/2046 | | | 3,750,000 | | | | 4,462,624 | | |
| | | | 25,234,270 | | |
Rhode Island — 0.9% | |
Rhode Island Housing & Mortgage Finance Corp.,
Revenue, FHA Insured,
Series 2024 1-C, 4.75%, 10/01/2059 | | | 900,000 | | | | 868,655 | | |
Revenue, FHA Insured,
Series 2024 1-C, 4.80%, 04/01/2066 | | | 1,935,000 | | | | 1,864,054 | | |
Revenue, GNMA Insured,
Series 83-A, 4.90%, 10/01/2054 | | | 16,760,000 | | | | 16,757,206 | | |
Tobacco Settlement Financing Corp., Revenue,
Series 2007 A, 0.00%, 06/01/2052 (e) | | | 105,945,000 | | | | 17,112,003 | | |
| | | | 36,601,918 | | |
South Carolina — 0.2% | |
South Carolina Jobs-Economic Development Authority,
Beaufort Memorial Hospital Obligated Group, Revenue,
Series 2024, 5.50%, 11/15/2044 | | | 1,250,000 | | | | 1,323,365 | | |
Beaufort Memorial Hospital Obligated Group, Revenue,
Series 2024, 5.75%, 11/15/2054 | | | 2,500,000 | | | | 2,648,411 | | |
South Carolina State Housing Finance &
Development Authority, Revenue,
Series 2024 B, 4.63%, 07/01/2054 | | | 5,000,000 | | | | 5,004,792 | | |
| | | | 8,976,568 | | |
First Eagle Funds | Annual Report | October 31, 2024
132
First Eagle High Yield Municipal Fund | Schedule of Investments | October 31, 2024
Investments | | Principal Amount ($) | | Value ($) | |
South Dakota — 0.2% | |
South Dakota Housing Development Authority,
Revenue, Refunding, GNMA Insured,
Series 2024 C, 4.70%, 11/01/2049 | | | 8,500,000 | | | | 8,582,674 | | |
Tennessee — 0.2% | |
Metropolitan Government Nashville & Davidson
County Industrial Development Board,
South Nashville Central Business Improvement
District, Special Assessment,
Series 2021 A, 4.00%, 06/01/2051 (b) | | | 3,140,000 | | | | 2,687,100 | | |
South Nashville Central Business Improvement
District, Special Assessment, Senior Lien,
Series 2021 B, 0.00%, 06/01/2043 (b)(e) | | | 1,800,000 | | | | 727,844 | | |
Shelby County Health & Educational Facilities Board,
Madrone Memphis Student Housing I LLC, Revenue,
Series 2024 A-1, 5.25%, 06/01/2056 (b) | | | 2,000,000 | | | | 2,043,727 | | |
| | | | 5,458,671 | | |
Texas — 6.7% | |
Arlington Higher Education Finance Corp.,
BASIS Texas Charter Schools, Inc., Revenue,
Series 2024, 4.75%, 06/15/2049 (b) | | | 1,785,000 | | | | 1,744,357 | | |
BASIS Texas Charter Schools, Inc., Revenue,
Series 2024, 4.88%, 06/15/2054 (b) | | | 1,050,000 | | | | 1,036,163 | | |
BASIS Texas Charter Schools, Inc., Revenue,
Series 2024, 4.88%, 06/15/2059 (b) | | | 1,000,000 | | | | 977,856 | | |
BASIS Texas Charter Schools, Inc., Revenue,
Series 2024, 5.00%, 06/15/2064 (b) | | | 1,200,000 | | | | 1,187,666 | | |
Brooks Collegiate Academy / Brooks Lone Star
Academy, Revenue,
Series 2021 A, 5.00%, 06/15/2041 | | | 3,000,000 | | | | 2,869,180 | | |
Brooks Collegiate Academy / Brooks Lone Star
Academy, Revenue,
Series 2021 A, 5.00%, 06/15/2051 | | | 4,505,000 | | | | 4,132,974 | | |
Cypress Christian School, Inc., Revenue,
Series 2024, 5.75%, 06/01/2043 (b) | | | 1,500,000 | | | | 1,547,431 | | |
Leadership Prep School, Revenue, PSF Guaranty,
Series 2024, 4.00%, 06/15/2049 | | | 250,000 | | | | 240,720 | | |
Leadership Prep School, Revenue, PSF Guaranty,
Series 2024, 4.13%, 06/15/2054 | | | 475,000 | | | | 459,322 | | |
Leadership Prep School, Revenue, PSF Guaranty,
Series 2024, 4.25%, 06/15/2059 | | | 1,250,000 | | | | 1,225,422 | | |
First Eagle Funds | Annual Report | October 31, 2024
133
First Eagle High Yield Municipal Fund | Schedule of Investments | October 31, 2024
Investments | | Principal Amount ($) | | Value ($) | |
Texas — 6.7% (continued) | |
Lifeschool of Dallas, Revenue, PSF Guaranty,
Series 2024, 4.00%, 08/15/2044 | | | 14,000,000 | | | | 13,629,412 | | |
Lifeschool of Dallas, Revenue, PSF Guaranty,
Series 2024, 4.13%, 08/15/2054 | | | 6,500,000 | | | | 6,183,432 | | |
City of Anna,
Meadow Vista Public Improvement District
Improvement Area No. 1, Special Assessment,
Series 2024, 5.50%, 09/15/2044 (b) | | | 850,000 | | | | 841,889 | | |
Meadow Vista Public Improvement District
Improvement Area No. 1, Special Assessment,
Series 2024, 5.75%, 09/15/2054 (b) | | | 1,200,000 | | | | 1,190,534 | | |
Sherley Tract Public Improvement District No. 2
Improvement Area No. 1, Special Assessment,
Series 2021, 4.00%, 09/15/2041 (b) | | | 1,867,000 | | | | 1,646,535 | | |
Sherley Tract Public Improvement District No. 2
Improvement Area No. 1, Special Assessment,
Series 2021, 4.25%, 09/15/2051 (b) | | | 1,407,000 | | | | 1,177,103 | | |
City of Celina,
Special Assessment,
Series 2024, 5.50%, 09/01/2044 (b) | | | 475,000 | | | | 480,450 | | |
Special Assessment,
Series 2024, 5.75%, 09/01/2054 (b) | | | 1,350,000 | | | | 1,369,879 | | |
Celina Hills Public Improvement District,
Special Assessment,
Series 2022, 4.88%, 09/01/2042 (b) | | | 1,084,000 | | | | 1,048,039 | | |
North Sky Public Improvement District Improvement
Area No. 1, Special Assessment,
Series 2024, 5.00%, 09/01/2044 | | | 600,000 | | | | 588,291 | | |
North Sky Public Improvement District Improvement
Area No. 1, Special Assessment,
Series 2024, 5.25%, 09/01/2052 | | | 535,000 | | | | 519,173 | | |
Sutton Fields East Public Improvement District
Phase No. 1, Special Assessment,
Series 2022, 4.00%, 09/01/2043 (b) | | | 2,059,000 | | | | 1,750,194 | | |
Sutton Fields II Public Improvement District
Neighborhood Improvement Area No. 5,
Special Assessment,
Series 2022, 4.00%, 09/01/2051 (b) | | | 1,000,000 | | | | 826,205 | | |
City of Corpus Christi,
Whitecap Public Improvement District No. 1
Improvement Area No. 1, Special Assessment,
Series 2024, 6.13%, 09/15/2044 | | | 1,150,000 | | | | 1,149,314 | | |
First Eagle Funds | Annual Report | October 31, 2024
134
First Eagle High Yield Municipal Fund | Schedule of Investments | October 31, 2024
Investments | | Principal Amount ($) | | Value ($) | |
Texas — 6.7% (continued) | |
Whitecap Public Improvement District No. 1
Improvement Area No. 1, Special Assessment,
Series 2024, 6.50%, 09/15/2054 | | | 2,000,000 | | | | 2,009,144 | | |
City of Dayton,
Westpointe Villages Public Improvement District
Improvement Area No. 2, Special Assessment,
Senior Lien, Series 2024 A, 5.38%, 09/01/2044 (b) | | | 610,000 | | | | 595,224 | | |
Westpointe Villages Public Improvement District
Improvement Area No. 2, Special Assessment,
Senior Lien,
Series 2024 A, 5.75%, 09/01/2054 (b) | | | 900,000 | | | | 889,217 | | |
Westpointe Villages Public Improvement District
Improvement Area No. 2, Special Assessment,
Junior Lien,
Series 2024 B, 6.25%, 09/01/2054 (b) | | | 1,250,000 | | | | 1,239,081 | | |
City of Dorchester,
Cottonwood Public Improvement District Major
Improvement Area, Special Assessment,
Series 2024, 7.00%, 09/15/2044 (b) | | | 1,331,000 | | | | 1,294,804 | | |
Cottonwood Public Improvement District Major
Improvement Area, Special Assessment,
Series 2024, 7.25%, 09/15/2054 (b) | | | 1,459,000 | | | | 1,411,304 | | |
Cottonwood Public Improvement District Major
Improvement Area No. 1, Special Assessment,
Series 2024, 6.00%, 09/15/2044 (b) | | | 1,050,000 | | | | 1,020,333 | | |
Cottonwood Public Improvement District Major
Improvement Area No. 1, Special Assessment,
Series 2024, 6.25%, 09/15/2054 (b) | | | 1,500,000 | | | | 1,447,764 | | |
City of Dripping Springs,
Heritage Public Improvement District Improvement
Area No. 2, Special Assessment,
Series 2024, 5.00%, 09/01/2044 (b) | | | 645,000 | | | | 623,090 | | |
Heritage Public Improvement District Improvement
Area No. 2, Special Assessment,
Series 2024, 5.25%, 09/01/2054 (b) | | | 840,000 | | | | 800,507 | | |
City of Fate,
Monterra Public Improvement District Improvement
Area No. 2, Special Assessment,
Series 2024, 5.38%, 08/15/2044 (b) | | | 900,000 | | | | 886,887 | | |
Monterra Public Improvement District Improvement
Area No. 2, Special Assessment,
Series 2024, 5.75%, 08/15/2054 (b) | | | 1,350,000 | | | | 1,347,231 | | |
First Eagle Funds | Annual Report | October 31, 2024
135
First Eagle High Yield Municipal Fund | Schedule of Investments | October 31, 2024
Investments | | Principal Amount ($) | | Value ($) | |
Texas — 6.7% (continued) | |
City of Huntsville,
Reserves of Huntsville Public Improvement
District (The), Special Assessment,
Series 2024, 5.38%, 09/15/2044 (b) | | | 775,000 | | | | 778,182 | | |
Reserves of Huntsville Public Improvement
District (The), Special Assessment,
Series 2024, 5.63%, 09/15/2054 (b) | | | 740,000 | | | | 741,327 | | |
City of Justin,
Timberbrook Public Improvement District No. 2
Area No. 1, Special Assessment,
Series 2024, 5.50%, 09/01/2044 (b) | | | 580,000 | | | | 587,082 | | |
Timberbrook Public Improvement District No. 2
Area No. 1, Special Assessment,
Series 2024, 5.75%, 09/01/2053 (b) | | | 1,000,000 | | | | 1,011,440 | | |
City of Kyle,
6 Creeks Public Improvement District Improvement
Area No. 3, Special Assessment,
Series 2021, 3.75%, 09/01/2041 (b) | | | 2,000,000 | | | | 1,735,193 | | |
Limestone Creek Public Improvement District
Improvement Area No. 1, Special Assessment,
Series 2024, 5.50%, 09/01/2044 (b) | | | 550,000 | | | | 551,567 | | |
Limestone Creek Public Improvement District
Improvement Area No. 1, Special Assessment,
Series 2024, 5.75%, 09/01/2053 (b) | | | 1,125,000 | | | | 1,130,622 | | |
Plum Creek North Public Improvement District
Improvement Area No. 2, Special Assessment,
Series 2024, 5.00%, 09/01/2044 (b) | | | 520,000 | | | | 520,374 | | |
Plum Creek North Public Improvement District
Improvement Area No. 2, Special Assessment,
Series 2024, 5.38%, 09/01/2054 (b) | | | 805,000 | | | | 808,020 | | |
City of Lago Vista,
Tessera on Lake Travis Public Improvement District
Improvement Area No. 3, Special Assessment,
Series 2024, 6.00%, 09/01/2054 (b) | | | 1,000,000 | | | | 1,011,404 | | |
City of Lavon,
Elevon Public Improvement District Improvement
Area No. 1, Special Assessment,
Series 2022, 4.13%, 09/15/2052 (b) | | | 900,000 | | | | 742,529 | | |
Elevon Public Improvement District Improvement
Area No. 1, Special Assessment,
Series 2024, 5.00%, 09/15/2044 (b)(f) | | | 500,000 | | | | 500,305 | | |
Elevon Public Improvement District Improvement
Area No. 1, Special Assessment,
Series 2024, 5.38%, 09/15/2052 (b)(f) | | | 500,000 | | | | 502,084 | | |
First Eagle Funds | Annual Report | October 31, 2024
136
First Eagle High Yield Municipal Fund | Schedule of Investments | October 31, 2024
Investments | | Principal Amount ($) | | Value ($) | |
Texas — 6.7% (continued) | |
Elevon Public Improvement District Improvement
Area No. 2A-2B, Special Assessment,
Series 2024, 5.13%, 09/15/2044 (b)(f) | | | 600,000 | | | | 584,328 | | |
Elevon Public Improvement District Improvement
Area No. 2A-2B, Special Assessment,
Series 2024, 5.50%, 09/15/2054 (b)(f) | | | 800,000 | | | | 782,118 | | |
City of Manor,
Manor Heights Public Improvement District
Area No. 4, Special Assessment,
Series 2024, 5.38%, 09/15/2044 (b) | | | 515,000 | | | | 515,146 | | |
Manor Heights Public Improvement District
Area No. 4, Special Assessment,
Series 2024, 5.63%, 09/15/2054 (b) | | | 685,000 | | | | 683,930 | | |
City of Mesquite,
Solterra Public Improvement District Improvement
Area No. C-3, Special Assessment,
Series 2024, 5.00%, 09/01/2044 (b) | | | 500,000 | | | | 490,244 | | |
Solterra Public Improvement District Improvement
Area No. C-3, Special Assessment,
Series 2024, 5.25%, 09/01/2053 (b) | | | 560,000 | | | | 543,294 | | |
City of Oak Point,
Chaparral Park Public Improvement District
Improvement Area No. 1, Special Assessment,
Series 2024, 5.10%, 09/15/2044 (b) | | | 725,000 | | | | 701,264 | | |
Chaparral Park Public Improvement District
Improvement Area No. 1, Special Assessment,
Series 2024, 5.25%, 09/15/2054 (b) | | | 1,000,000 | | | | 952,865 | | |
Oak Point 720 Public Improvement District
Area No. 1, Special Assessment,
Series 2024, 5.35%, 09/15/2044 (b) | | | 570,000 | | | | 558,391 | | |
Oak Point 720 Public Improvement District
Area No. 1, Special Assessment,
Series 2024, 5.63%, 09/15/2054 (b) | | | 1,000,000 | | | | 978,642 | | |
City of Plano,
Collin Creek West Public Improvement District,
Special Assessment,
Series 2021, 4.00%, 09/15/2051 (b) | | | 500,000 | | | | 406,172 | | |
City of Port Isabel, GO,
Series 2024, 5.25%, 02/15/2044 | | | 3,270,000 | | | | 3,376,811 | | |
GO,
Series 2024, 5.50%, 02/15/2054 | | | 2,020,000 | | | | 2,077,331 | | |
First Eagle Funds | Annual Report | October 31, 2024
137
First Eagle High Yield Municipal Fund | Schedule of Investments | October 31, 2024
Investments | | Principal Amount ($) | | Value ($) | |
Texas — 6.7% (continued) | |
City of Princeton,
Eastridge Public Improvement District Improvement
Area No. 2, Special Assessment,
Series 2023, 5.25%, 09/01/2043 (b) | | | 1,000,000 | | | | 1,000,239 | | |
Eastridge Public Improvement District Improvement
Area No. 3, Special Assessment,
Series 2024, 5.00%, 09/01/2044 (b) | | | 700,000 | | | | 685,489 | | |
Eastridge Public Improvement District Improvement
Area No. 3, Special Assessment,
Series 2024, 5.25%, 09/01/2054 (b) | | | 1,000,000 | | | | 971,379 | | |
Southbridge Public Improvement District
Improvement Area No. 2, Special Assessment,
Series 2024, 5.25%, 09/01/2044 (b)(f) | | | 880,000 | | | | 880,047 | | |
Southbridge Public Improvement District
Improvement Area No. 2, Special Assessment,
Series 2024, 5.50%, 09/01/2054 (b)(f) | | | 1,220,000 | | | | 1,212,978 | | |
Winchester Crossing Public Improvement
District No. 3, Special Assessment,
Series 2024, 5.13%, 09/01/2044 (b) | | | 875,000 | | | | 857,571 | | |
Winchester Crossing Public Improvement
District No. 3, Special Assessment,
Series 2024, 5.38%, 09/01/2054 (b) | | | 1,200,000 | | | | 1,170,379 | | |
Windmore Public Improvement District Improvement
Area No. 1, Special Assessment,
Series 2024, 5.13%, 09/01/2044 (b)(f) | | | 410,000 | | | | 406,245 | | |
Windmore Public Improvement District Improvement
Area No. 1, Special Assessment,
Series 2024, 5.50%, 09/01/2054 (b)(f) | | | 565,000 | | | | 565,034 | | |
City of Royse City,
Liberty Crossing Public Improvement District
improvement Area No. 2, Special Assessment,
Series 2024, 5.63%, 09/15/2054 (b) | | | 746,000 | | | | 731,107 | | |
City of Seagoville,
Santorini Public Improvement District Improvement
Area, Special Assessment,
Series 2024, 7.00%, 09/15/2054 (b) | | | 5,000,000 | | | | 4,928,397 | | |
Santorini Public Improvement District Improvement
Area No. 1, Special Assessment,
Series 2024, 6.00%, 09/15/2044 (b) | | | 2,100,000 | | | | 2,101,455 | | |
Santorini Public Improvement District Improvement
Area No. 1, Special Assessment,
Series 2024, 6.25%, 09/15/2054 (b) | | | 2,500,000 | | | | 2,494,613 | | |
First Eagle Funds | Annual Report | October 31, 2024
138
First Eagle High Yield Municipal Fund | Schedule of Investments | October 31, 2024
Investments | | Principal Amount ($) | | Value ($) | |
Texas — 6.7% (continued) | |
City of Uhland,
Anderson Park Public Improvement District
Area No. 1, Special Assessment,
Series 2024, 5.13%, 09/01/2044 (b)(f) | | | 605,000 | | | | 599,386 | | |
Anderson Park Public Improvement District
Area No. 1, Special Assessment,
Series 2024, 5.50%, 09/01/2055 (b)(f) | | | 950,000 | | | | 950,000 | | |
City of Venus,
Patriot Estates Public Improvement District,
Special Assessment,
Series 2021, 4.00%, 09/15/2051 (b) | | | 163,000 | | | | 134,844 | | |
Clifton Higher Education Finance Corp.,
Valor Texas Education Foundation, Revenue,
Series 2024 A, 5.75%, 06/15/2044 (b) | | | 870,000 | | | | 871,832 | | |
Valor Texas Education Foundation, Revenue,
Series 2024 A, 6.00%, 06/15/2054 (b) | | | 2,240,000 | | | | 2,241,026 | | |
County of Bastrop,
Double Eagle Ranch Public Improvement District
Improvement Area No. 2, Special Assessment,
Series 2024, 5.25%, 09/01/2044 (f) | | | 605,000 | | | | 601,345 | | |
Double Eagle Ranch Public Improvement District
Improvement Area No. 2, Special Assessment,
Series 2024, 5.50%, 09/01/2054 (f) | | | 770,000 | | | | 763,350 | | |
County of Medina,
Talley Ho Public Improvement District Improvement
Area No. 1, Special Assessment,
Series 2024, 5.13%, 09/01/2044 (b) | | | 2,519,000 | | | | 2,432,813 | | |
Talley Ho Public Improvement District Improvement
Area No. 1, Special Assessment,
Series 2024, 5.35%, 09/01/2054 (b) | | | 1,800,000 | | | | 1,726,264 | | |
Woodlands Public Improvement District Neighborhood
Improvement Area No. 1, Special Assessment,
Series 2021, 4.75%, 09/01/2050 (b) | | | 1,000,000 | | | | 902,019 | | |
Greater Texas Cultural Education Facilities
Finance Corp.,
CFC — WLH LLC, Revenue,
Series 2024 A, 6.38%, 09/01/2034 (b) | | | 1,470,000 | | | | 1,444,625 | | |
CFC — WLH LLC, Revenue,
Series 2024 A, 6.50%, 09/01/2049 (b) | | | 7,495,000 | | | | 7,337,583 | | |
CFC — WLH LLC, Revenue,
Series 2024 B, 11.00%, 09/01/2029 (b) | | | 785,000 | | | | 780,252 | | |
First Eagle Funds | Annual Report | October 31, 2024
139
First Eagle High Yield Municipal Fund | Schedule of Investments | October 31, 2024
Investments | | Principal Amount ($) | | Value ($) | |
Texas — 6.7% (continued) | |
Hidalgo County Regional Mobility Authority,
Revenue, Senior Lien,
Series 2022 A, 0.00%, 12/01/2044 (e) | | | 3,000,000 | | | | 1,104,017 | | |
Revenue, Senior Lien,
Series 2022 A, 0.00%, 12/01/2045 (e) | | | 4,000,000 | | | | 1,397,669 | | |
Revenue, Senior Lien,
Series 2022 A, 0.00%, 12/01/2046 (e) | | | 6,000,000 | | | | 1,990,218 | | |
Revenue, Senior Lien,
Series 2022 A, 0.00%, 12/01/2047 (e) | | | 6,125,000 | | | | 1,906,724 | | |
Revenue, Senior Lien,
Series 2022 A, 0.00%, 12/01/2048 (e) | | | 7,130,000 | | | | 2,100,273 | | |
Revenue, Senior Lien,
Series 2022 A, 0.00%, 12/01/2049 (e) | | | 7,135,000 | | | | 1,978,298 | | |
Revenue, Senior Lien,
Series 2022 A, 0.00%, 12/01/2050 (e) | | | 5,145,000 | | | | 1,348,543 | | |
Revenue, Senior Lien,
Series 2022 A, 0.00%, 12/01/2052 (e) | | | 1,675,000 | | | | 391,877 | | |
Revenue, Senior Lien,
Series 2022 A, 0.00%, 12/01/2054 (e) | | | 5,000,000 | | | | 1,048,651 | | |
Revenue, Senior Lien,
Series 2022 A, 0.00%, 12/01/2055 (e) | | | 6,100,000 | | | | 1,207,291 | | |
Revenue, Senior Lien,
Series 2022 A, 0.00%, 12/01/2056 (e) | | | 1,000,000 | | | | 187,866 | | |
Revenue, Junior Lien, Refunding,
Series 2022 B, 0.00%, 12/01/2045 (e) | | | 5,805,000 | | | | 1,914,949 | | |
Revenue, Junior Lien, Refunding,
Series 2022 B, 0.00%, 12/01/2046 (e) | | | 2,945,000 | | | | 919,732 | | |
Revenue, Senior Lien,
Series A, 0.00%, 12/01/2043 (e) | | | 2,000,000 | | | | 775,160 | | |
Lubbock Educational Facilities Authority, Inc.,
Lubbock Christian University, Revenue, Refunding,
Series 2016, 2.75%, 11/01/2031 | | | 2,585,000 | | | | 2,221,437 | | |
New Hope Cultural Education Facilities Finance Corp.,
Jubilee Academic Center, Inc., Revenue, Refunding,
Series 2021, 4.00%, 08/15/2041 (b) | | | 200,000 | | | | 180,184 | | |
Sanctuary LTC LLC, Revenue,
Series 2021 A-1, 5.00%, 01/01/2032 | | | 6,250,000 | | | | 6,268,381 | | |
Sanctuary LTC LLC, Revenue,
Series 2021 A-1, 5.25%, 01/01/2042 | | | 25,180,000 | | | | 24,569,040 | | |
Sanctuary LTC LLC, Revenue,
Series 2021 A-1, 5.50%, 01/01/2057 | | | 59,215,000 | | | | 57,227,620 | | |
First Eagle Funds | Annual Report | October 31, 2024
140
First Eagle High Yield Municipal Fund | Schedule of Investments | October 31, 2024
Investments | | Principal Amount ($) | | Value ($) | |
Texas — 6.7% (continued) | |
Westminster Manor, Revenue,
Series 2021, 4.00%, 11/01/2049 | | | 2,000,000 | | | | 1,809,298 | | |
Olney Hamilton Hospital District, GO,
Series 2024, 6.25%, 09/15/2054 (b) | | | 24,600,000 | | | | 25,775,034 | | |
Port of Beaumont Navigation District,
Jefferson 2020 Bond Lessee & Borrower LLC
Obligated Group, Revenue, AMT, Refunding,
Series 2020 A, 4.00%, 01/01/2050 (b) | | | 15,000,000 | | | | 12,756,419 | | |
Jefferson 2020 Bond Lessee & Borrower LLC
Obligated Group, Revenue, AMT,
Series 2024 A, 5.13%, 01/01/2044 (b) | | | 6,000,000 | | | | 6,162,194 | | |
Jefferson 2020 Bond Lessee & Borrower LLC
Obligated Group, Revenue, AMT,
Series 2024 A, 5.25%, 01/01/2054 (b) | | | 1,000,000 | | | | 1,028,742 | | |
Texas Transportation Commission,
State Highway 249 System, Revenue, First Tier,
Series 2019 A, 0.00%, 08/01/2052 (e) | | | 5,000,000 | | | | 1,247,225 | | |
Texas Water Development Board,
State Water Implementation Revenue Fund for
Texas, Revenue,
Series 2024 A, 4.38%, 10/15/2059 | | | 11,495,000 | | | | 11,441,226 | | |
Tioga Independent School District,
GO, Refunding, BAM Insured,
Series 2024, 4.50%, 08/15/2048 | | | 265,000 | | | | 253,247 | | |
Town of Little Elm,
Spiritas East Public Improvement District,
Special Assessment,
Series 2022, 4.00%, 09/01/2051 (b) | | | 1,509,000 | | | | 1,218,767 | | |
Town of Providence Village,
Foree Ranch Public Improvement District
Improvement Area No. 1, Special Assessment,
Series 2024, 5.00%, 09/01/2044 (b) | | | 650,000 | | | | 631,031 | | |
Foree Ranch Public Improvement District
Improvement Area No. 1, Special Assessment,
Series 2024, 5.25%, 09/01/2054 (b) | | | 865,000 | | | | 835,299 | | |
Travis County Development Authority,
Bella Fortuna Public Improvement District,
Special Assessment,
Series 2024, 5.38%, 09/01/2044 (b) | | | 900,000 | | | | 898,542 | | |
Bella Fortuna Public Improvement District,
Special Assessment,
Series 2024, 5.63%, 09/01/2051 (b) | | | 765,000 | | | | 766,167 | | |
First Eagle Funds | Annual Report | October 31, 2024
141
First Eagle High Yield Municipal Fund | Schedule of Investments | October 31, 2024
Investments | | Principal Amount ($) | | Value ($) | |
Texas — 6.7% (continued) | |
Village of Salado,
Sanctuary East Public Improvement District
Area No. 1, Special Assessment,
Series 2024, 6.25%, 09/01/2044 (b) | | | 718,000 | | | | 722,757 | | |
Sanctuary East Public Improvement District
Area No. 1, Special Assessment,
Series 2024, 6.50%, 09/01/2054 (b) | | | 707,000 | | | | 710,762 | | |
| | | | 298,441,704 | | |
Utah — 3.6% | |
Black Desert Public Infrastructure District, GO,
Series 2021 A, 4.00%, 03/01/2051 (b) | | | 8,280,000 | | | | 6,925,284 | | |
Assessment Area 1, Special Assessment,
Series 2024, 5.63%, 12/01/2053 (b) | | | 36,885,000 | | | | 37,784,135 | | |
Chelsey Public Infrastructure District No. 1, GO,
Series 2024, 7.25%, 03/01/2054 (b) | | | 1,610,000 | | | | 1,621,409 | | |
Assessment Area 1, Special Assessment,
Series 2024, 7.00%, 12/01/2042 (b) | | | 1,350,000 | | | | 1,374,963 | | |
Fields Estates Public Infrastructure District, GO,
Series 2024 A-1, 6.13%, 03/01/2055 (b) | | | 1,250,000 | | | | 1,256,351 | | |
Assessment Area, Special Assessment,
Series 2024 A-2, 5.25%, 12/01/2053 (b) | | | 6,935,000 | | | | 6,913,490 | | |
Firefly Public Infrastructure District No. 1, GO,
Series 2024 A-1, 6.63%, 03/01/2054 (b) | | | 3,645,000 | | | | 3,737,983 | | |
Assessment Area 1, Special Assessment,
Series 2024 A-2, 5.63%, 12/01/2043 (b) | | | 1,805,000 | | | | 1,850,583 | | |
MIDA Mountain Veterans Program Public
Infrastructure District, Tax Allocation,
Series 2024, 5.00%, 06/01/2044 (b) | | | 2,750,000 | | | | 2,733,788 | | |
Tax Allocation,
Series 2024, 5.20%, 06/01/2054 (b) | | | 4,705,000 | | | | 4,713,564 | | |
Military Installation Development Authority,
Military Recreation Assessment Area, Revenue,
Series 2021 A-1, 4.00%, 06/01/2052 | | | 6,500,000 | | | | 5,461,838 | | |
Military Recreation Assessment Area, Revenue,
Series 2021 A-2, 4.00%, 06/01/2041 | | | 3,215,000 | | | | 2,852,282 | | |
Military Recreation Assessment Area, Revenue,
Series 2021 A-2, 4.00%, 06/01/2052 | | | 12,530,000 | | | | 10,383,127 | | |
Olympia Public Infrastructure District No. 1,
Revenue, Series 2024 A-2, 5.13%, 12/01/2029 (b) | | | 4,000,000 | | | | 4,048,387 | | |
Limited Tax Pledged, GO,
Series 2024 A-1, 6.38%, 03/01/2055 (b) | | | 1,985,000 | | | | 2,016,745 | | |
First Eagle Funds | Annual Report | October 31, 2024
142
First Eagle High Yield Municipal Fund | Schedule of Investments | October 31, 2024
Investments | | Principal Amount ($) | | Value ($) | |
Utah — 3.6% (continued) | |
Utah Charter School Finance Authority,
Ascent Academies of Utah, Revenue, Refunding,
Series 2022, 5.00%, 06/15/2052 (b) | | | 3,000,000 | | | | 2,675,072 | | |
Ascent Academies of Utah, Revenue, Refunding,
Series 2022, 5.00%, 06/15/2057 (b) | | | 8,500,000 | | | | 7,463,789 | | |
Ascent Academies of Utah, Revenue,
Series 2024, 6.75%, 06/15/2059 (b) | | | 17,000,000 | | | | 17,917,937 | | |
Athenian Academy, Inc. (The), Revenue,
Series 2024 A, 6.50%, 04/15/2058 (b) | | | 9,060,000 | | | | 8,725,604 | | |
Freedom Academy Foundation, Revenue, Refunding,
Series 2017, 5.38%, 06/15/2048 (b) | | | 4,820,000 | | | | 4,581,729 | | |
Freedom Academy Foundation, Revenue,
Series 2021 A, 5.00%, 06/15/2052 (b) | | | 3,895,000 | | | | 3,468,237 | | |
Wallace Stegner Academy, Revenue,
Series 2019 A, 5.00%, 06/15/2049 (b) | | | 1,590,000 | | | | 1,489,869 | | |
Utah Infrastructure Agency,
Revenue, Series 2021, 3.00%, 10/15/2045 | | | 1,000,000 | | | | 732,695 | | |
Ventana Resort Village Public
Infrastructure District, GO,
Series 2024, 5.50%, 03/01/2054 (b) | | | 4,000,000 | | | | 3,910,688 | | |
Viridian Farm Public Infrastructure District No. 1, GO,
Series 2024 A, 5.88%, 03/01/2054 (b) | | | 1,130,000 | | | | 1,132,084 | | |
Wood Ranch Public Infrastructure District,
Assessment Area 1, Special Assessment,
Series 2024, 5.63%, 12/01/2053 (b) | | | 4,285,000 | | | | 4,367,310 | | |
| | | | 150,138,943 | | |
Vermont — 0.0% (a) | |
Vermont Economic Development Authority,
Wake Robin Corp., Revenue, Refunding,
Series 2021 A, 4.00%, 05/01/2045 | | | 460,000 | | | | 409,621 | | |
Virgin Islands — 0.3% | |
Virgin Islands Public Finance Authority,
United States Virgin Islands, Revenue,
Series 2012 C, 5.00%, 10/01/2042 | | | 500,000 | | | | 449,949 | | |
United States Virgin Islands, Revenue, Refunding,
Series 2014 C, 5.00%, 10/01/2030 (b) | | | 7,500,000 | | | | 7,499,613 | | |
United States Virgin Islands Frenchman's Reef
Hotel Room Occupancy Tax, Revenue,
Series 2024 A, 6.00%, 04/01/2053 (b)(f) | | | 3,500,000 | | | | 3,692,459 | | |
| | | | 11,642,021 | | |
First Eagle Funds | Annual Report | October 31, 2024
143
First Eagle High Yield Municipal Fund | Schedule of Investments | October 31, 2024
Investments | | Principal Amount ($) | | Value ($) | |
Virginia — 1.5% | |
Lynchburg Economic Development Authority,
Centra Health Obligated Group, Revenue, Refunding,
Series 2021, 4.00%, 01/01/2055 | | | 3,000,000 | | | | 2,774,356 | | |
Prince William County Industrial Development Authority,
Westminster Presbyterian Retirement Community
Obligated Group, Revenue, Refunding,
Series 2016, 5.00%, 01/01/2046 | | | 1,530,000 | | | | 1,468,334 | | |
Virginia Beach Development Authority,
Westminster-Canterbury on Chesapeake Bay
Obligated Group, Revenue, Refunding,
Series 2018, 4.00%, 09/01/2048 | | | 4,395,000 | | | | 3,716,674 | | |
Virginia College Building Authority,
Marymount University, Revenue, Refunding,
Series 2015 A, 5.00%, 07/01/2045 (b) | | | 1,000,000 | | | | 874,855 | | |
Marymount University, Revenue,
Series 2015 B, 5.00%, 07/01/2045 (b) | | | 1,000,000 | | | | 874,856 | | |
Virginia Housing Development Authority,
Revenue, Series 2023 E-3, 4.65%, 10/01/2054 | | | 3,000,000 | | | | 3,024,059 | | |
Revenue, Series 2023 E-4, 4.70%, 07/01/2055 | | | 1,955,000 | | | | 1,980,965 | | |
Revenue, Series 2024 D, 4.63%, 08/01/2060 | | | 11,835,000 | | | | 11,871,732 | | |
Revenue, Series 2024 E, 4.35%, 10/01/2054 | | | 7,540,000 | | | | 7,428,070 | | |
Revenue, Series 2024 E, 4.45%, 10/01/2059 | | | 10,375,000 | | | | 10,210,738 | | |
Revenue, Series 2024 E, 4.50%, 04/01/2066 | | | 3,390,000 | | | | 3,333,167 | | |
Virginia Small Business Financing Authority,
LifeSpire of Virginia Obligated Group,
Revenue, Refunding,
Series 2024 A, 4.50%, 12/01/2044 (f) | | | 5,500,000 | | | | 5,400,695 | | |
LifeSpire of Virginia Obligated Group,
Revenue, Refunding,
Series 2024 A, 5.50%, 12/01/2054 (f) | | | 4,000,000 | | | | 4,195,047 | | |
National Senior Communities, Inc. Obligated Group,
Revenue, Refunding,
Series 2020 A, 3.38%, 01/01/2051 | | | 4,075,000 | | | | 3,182,467 | | |
| | | | 60,336,015 | | |
Washington — 0.8% | |
Grant County Public Hospital District No. 2, GO,
Series 2024, 5.50%, 12/01/2039 | | | 500,000 | | | | 539,885 | | |
GO,
Series 2024, 5.50%, 12/01/2044 | | | 1,050,000 | | | | 1,110,307 | | |
First Eagle Funds | Annual Report | October 31, 2024
144
First Eagle High Yield Municipal Fund | Schedule of Investments | October 31, 2024
Investments | | Principal Amount ($) | | Value ($) | |
Washington — 0.8% (continued) | |
King County Public Hospital District No. 4,
Revenue, Series 2015 A, 6.25%, 12/01/2045 | | | 1,300,000 | | | | 1,301,913 | | |
Port of Woodland,
Revenue, Series 2024, 5.25%, 12/01/2034 | | | 1,270,000 | | | | 1,230,008 | | |
Revenue, Series 2024, 6.00%, 12/01/2047 | | | 3,090,000 | | | | 2,951,170 | | |
Washington Health Care Facilities Authority,
Overlake Hospital Medical Center Obligated Group,
Revenue, Refunding,
Series A, 4.00%, 07/01/2042 | | | 100,000 | | | | 91,666 | | |
Washington State Housing Finance Commission,
Bayview Manor Homes Obligated Group, Revenue,
Series 2024, 6.00%, 07/01/2059 | | | 1,645,000 | | | | 1,681,234 | | |
German Retirement Home of the State of Washington
Obligated Group, Revenue,
Series 2024 A, 5.50%, 01/01/2044 (b) | | | 1,000,000 | | | | 983,755 | | |
German Retirement Home of the State of Washington
Obligated Group, Revenue,
Series 2024 A, 5.75%, 01/01/2053 (b) | | | 2,540,000 | | | | 2,501,802 | | |
German Retirement Home of the State of Washington
Obligated Group, Revenue,
Series 2024 A, 5.88%, 01/01/2059 (b) | | | 3,320,000 | | | | 3,283,957 | | |
Horizon House Obligated Group, Revenue, Refunding,
Series 2017, 5.00%, 01/01/2038 (b) | | | 2,000,000 | | | | 1,954,445 | | |
Provident Group-SH I Properties LLC, Revenue,
Series 2024, 5.00%, 07/01/2054 | | | 4,305,000 | | | | 4,410,362 | | |
Provident Group-SH I Properties LLC, Revenue,
Series 2024, 5.50%, 07/01/2059 | | | 8,000,000 | | | | 8,499,976 | | |
Spokane United Methodist Homes Obligated
Group, Revenue,
Series 2020 A, 5.00%, 01/01/2051 (b) | | | 3,510,000 | | | | 3,319,389 | | |
| | | | 33,859,869 | | |
West Virginia — 0.3% | |
City of Huntington,
Downtown Development/Redevelopment
District No. 1, Tax Allocation, Refunding,
Series 2024 A, 5.00%, 06/01/2039 | | | 415,000 | | | | 418,624 | | |
Downtown Development/Redevelopment
District No. 1, Tax Allocation, Refunding,
Series 2024 A, 5.50%, 06/01/2049 | | | 450,000 | | | | 454,763 | | |
Kinetic Park Development/Redevelopment
District No. 2, Tax Allocation, Refunding,
Series 2024, 5.13%, 06/01/2039 | | | 480,000 | | | | 480,193 | | |
First Eagle Funds | Annual Report | October 31, 2024
145
First Eagle High Yield Municipal Fund | Schedule of Investments | October 31, 2024
Investments | | Principal Amount ($) | | Value ($) | |
West Virginia — 0.3% (continued) | |
Kinetic Park Development/Redevelopment
District No. 2, Tax Allocation, Refunding,
Series 2024, 5.63%, 05/01/2050 | | | 955,000 | | | | 959,788 | | |
County of Ohio,
Tax Allocation, Refunding,
Series 2024, 5.25%, 06/01/2053 | | | 2,000,000 | | | | 2,041,150 | | |
West Virginia Housing Development Fund,
Revenue, Series 2024 D, 4.50%, 11/01/2054 | | | 4,000,000 | | | | 3,973,514 | | |
| | | | 8,328,032 | | |
Wisconsin — 9.0% | |
FHLMC Multi-family ML Certificates,
Revenue, 4.16%, 05/25/2041 (c) | | | 4,495,739 | | | | 4,447,795 | | |
Public Finance Authority,
Revenue, Series 2023-1, Class A, 5.75%, 07/01/2062 | | | 22,712,672 | | | | 23,836,252 | | |
Revenue, Series 2024, 5.50%, 12/15/2038 (b) | | | 21,075,000 | | | | 21,095,761 | | |
Revenue, Series 2024, 8.00%, 06/01/2067 (b) | | | 1,000,000 | | | | 983,382 | | |
Ameream LLC, Revenue,
Series 2017, 6.50%, 12/01/2037 (b) | | | 3,000,000 | | | | 3,067,337 | | |
Ameream LLC, Revenue,
Series 2017, 6.75%, 12/01/2042 (b) | | | 13,000,000 | | | | 13,277,004 | | |
Ameream LLC, Revenue,
Series 2017, 7.00%, 12/01/2050 (b) | | | 36,030,000 | | | | 36,819,749 | | |
Austin FBO LLC, Revenue, AMT,
Series 2018 A, 7.05%, 9/1/2027 (b)(c)(d) | | | 1,810,000 | | | | 1,819,889 | | |
Bonnie Cone Classical Academy, Inc., Revenue,
Series 2021 A, 4.00%, 06/15/2040 (b) | | | 2,020,000 | | | | 1,757,431 | | |
Bonnie Cone Classical Academy, Inc., Revenue,
Series 2021 A, 4.00%, 06/15/2050 (b) | | | 2,995,000 | | | | 2,377,717 | | |
Bonnie Cone Classical Academy, Inc., Revenue,
Series 2021 A, 4.00%, 06/15/2056 (b) | | | 2,445,000 | | | | 1,873,381 | | |
CHF — Manoa LLC, Revenue,
Series 2023 B, 6.75%, 07/01/2063 (b) | | | 2,500,000 | | | | 2,700,546 | | |
Cincinnati Classical Academy, Revenue,
Series 2024 A, 5.38%, 06/15/2039 (b) | | | 250,000 | | | | 250,992 | | |
Cincinnati Classical Academy, Revenue,
Series 2024 A, 5.70%, 06/15/2044 (b) | | | 410,000 | | | | 413,340 | | |
Cincinnati Classical Academy, Revenue,
Series 2024 A, 5.88%, 06/15/2054 (b) | | | 1,000,000 | | | | 1,006,727 | | |
Cincinnati Classical Academy, Revenue,
Series 2024 A, 6.00%, 06/15/2064 (b) | | | 2,415,000 | | | | 2,434,461 | | |
First Eagle Funds | Annual Report | October 31, 2024
146
First Eagle High Yield Municipal Fund | Schedule of Investments | October 31, 2024
Investments | | Principal Amount ($) | | Value ($) | |
Wisconsin — 9.0% (continued) | |
Coral Academy of Science Las Vegas, Revenue,
Series 2021 A, 4.00%, 07/01/2041 | | | 1,000,000 | | | | 915,753 | | |
Coral Academy of Science Las Vegas, Revenue,
Series 2021 A, 4.00%, 07/01/2051 | | | 1,000,000 | | | | 841,578 | | |
Cornerstone Charter Academy: A Challenge
Foundation Academy, Inc., Revenue,
Series 2024, 5.00%, 02/01/2054 | | | 900,000 | | | | 909,883 | | |
Cornerstone Charter Academy: A Challenge
Foundation Academy, Inc., Revenue,
Series 2024, 5.00%, 02/01/2064 | | | 2,000,000 | | | | 2,009,805 | | |
Denton County Municipal Utility District No. 16,
Revenue, Series 2024, 5.75%, 12/15/2033 (b) | | | 5,000,000 | | | | 4,838,597 | | |
Dominium Holdings I LLC, Revenue,
Series 2024-1, Class B-1, 6.81%, 04/28/2036 (b) | | | 27,155,000 | | | | 27,613,482 | | |
FAH Tree House LLC, Revenue,
Series 2023 A, 6.50%, 08/01/2053 (b) | | | 200,000 | | | | 199,638 | | |
Foundation of The University of North Carolina at
Charlotte, Inc. (The), Revenue,
Series 2021 A, 4.00%, 09/01/2036 (b) | | | 3,920,000 | | | | 3,464,426 | | |
Foundation of The University of North Carolina at
Charlotte, Inc. (The), Revenue,
Series 2021 A, 4.00%, 09/01/2056 (b) | | | 2,440,000 | | | | 1,731,595 | | |
Guilford Charter School Corp., Revenue,
Series 2022 A, 5.00%, 04/01/2047 (b) | | | 2,000,000 | | | | 1,775,402 | | |
Guilford Charter School Corp., Revenue,
Series 2022 A, 5.00%, 04/01/2057 (b) | | | 1,700,000 | | | | 1,443,373 | | |
Harris County Municipal Utility District No. 544,
Revenue, Series 2024, 5.88%, 11/15/2029 (b) | | | 2,500,000 | | | | 2,488,429 | | |
KIPP Charlotte, Inc. Obligated Group, Revenue,
Series 2020 A, 5.00%, 10/15/2040 (b) | | | 2,815,000 | | | | 2,769,304 | | |
KIPP Charlotte, Inc. Obligated Group, Revenue,
Series 2020 A, 5.00%, 10/15/2050 (b) | | | 4,640,000 | | | | 4,451,111 | | |
KIPP Charlotte, Inc. Obligated Group, Revenue,
Series 2020 A, 5.00%, 10/15/2055 (b) | | | 4,060,000 | | | | 3,822,745 | | |
Mater Academy of Nevada, Revenue,
Series 2024 A, 5.00%, 12/15/2044 (b) | | | 690,000 | | | | 696,029 | | |
Mater Academy of Nevada, Revenue,
Series 2024 A, 5.00%, 12/15/2054 (b) | | | 2,000,000 | | | | 1,984,491 | | |
Million Air Two LLC Obligated Group, Revenue,
AMT, Refunding,
Series 2017 B, 7.13%, 06/01/2041 (b) | | | 3,500,000 | | | | 3,677,667 | | |
First Eagle Funds | Annual Report | October 31, 2024
147
First Eagle High Yield Municipal Fund | Schedule of Investments | October 31, 2024
Investments | | Principal Amount ($) | | Value ($) | |
Wisconsin — 9.0% (continued) | |
Montgomery County Municipal Utility District
Nos. 123 & 153, Revenue,
Series 2024, 0.00%, 12/15/2034 (b)(e) | | | 12,428,000 | | | | 6,800,422 | | |
NC A&T Real Estate Foundation LLC, Revenue,
Series 2024 A, 5.25%, 06/01/2054 | | | 1,000,000 | | | | 1,025,006 | | |
Nevada Charter Academies, Revenue,
Series 2019 A, 5.00%, 07/15/2039 (b) | | | 450,000 | | | | 453,793 | | |
New Plan Learning, Inc. Obligated Group,
Revenue, Refunding,
Series 2021 A, 3.75%, 07/01/2031 | | | 3,490,000 | | | | 3,269,008 | | |
North East Carolina Preparatory School, Inc.,
Revenue, Refunding,
Series 2024 A, 5.00%, 06/15/2044 | | | 1,000,000 | | | | 1,010,330 | | |
North East Carolina Preparatory School, Inc.,
Revenue, Refunding,
Series 2024 A, 5.25%, 06/15/2054 | | | 1,500,000 | | | | 1,522,722 | | |
Phoenix Montessori Academy, Revenue,
Series 2024 A, 7.00%, 07/01/2059 (b) | | | 21,895,000 | | | | 21,726,233 | | |
Phoenix Montessori Academy, Revenue,
Series 2024 B, 8.00%, 07/01/2029 (b) | | | 400,000 | | | | 396,685 | | |
Puerto Rico Tollroads LLC, Revenue, Senior Lien, AMT,
Series 2024, 5.75%, 07/01/2049 | | | 4,000,000 | | | | 4,271,393 | | |
Puerto Rico Tollroads LLC, Revenue, Senior Lien, AMT,
Series 2024, 5.75%, 07/01/2054 | | | 4,000,000 | | | | 4,258,689 | | |
QCF Behavioral Hospitals I Obligated Group, Revenue,
Series 2024 A, 7.50%, 07/01/2059 (b) | | | 37,000,000 | | | | 41,134,894 | | |
Rider University A New Jersey Non-Profit Corp.,
Revenue, Refunding,
Series 2021 A, 4.50%, 07/01/2048 (b) | | | 6,920,000 | | | | 5,440,572 | | |
Rider University A New Jersey Non-Profit Corp.,
Revenue, Series 2024, 12.75%, 01/01/2030 | | | 4,700,000 | | | | 4,684,592 | | |
Sarpy County Sanitary & Improvement District
No. 365, Special Assessment,
Series 2024 A, 7.00%, 06/17/2029 (b) | | | 1,000,000 | | | | 1,012,960 | | |
Sarpy County Sanitary & Improvement District
No. 365, Special Assessment,
Series 2024 B, 7.00%, 07/15/2029 (b) | | | 706,646 | | | | 706,498 | | |
Southeast Overtown Park West Community
Redevelopment Agency, Tax Allocation,
Series 2024 A, 5.00%, 06/01/2041 (b) | | | 6,000,000 | | | | 6,149,956 | | |
First Eagle Funds | Annual Report | October 31, 2024
148
First Eagle High Yield Municipal Fund | Schedule of Investments | October 31, 2024
Investments | | Principal Amount ($) | | Value ($) | |
Wisconsin — 9.0% (continued) | |
Southeast Overtown Park West Community
Redevelopment Agency, Tax Allocation,
Series 2024 B, 8.00%, 06/15/2042 (b) | | | 21,000,000 | | | | 21,221,050 | | |
Southeastern Regional Medical Center
Obligated Group, Revenue, Refunding,
Series 2021 A, 4.00%, 02/01/2041 | | | 5,145,000 | | | | 4,252,558 | | |
Southeastern Regional Medical Center Obligated
Group, Revenue, Refunding,
Series 2021 A, 4.00%, 02/01/2051 | | | 2,000,000 | | | | 1,539,781 | | |
Southeastern Regional Medical Center Obligated
Group, Revenue, Refunding,
Series 2022 A, 5.00%, 02/01/2030 | | | 200,000 | | | | 196,014 | | |
Town of Scarborough Downtown Omnibus Municipal
Development & TIF District, Tax Allocation,
Series 2024, 5.00%, 08/01/2039 | | | 1,600,000 | | | | 1,581,892 | | |
UNC Health Appalachian Obligated Group, Revenue,
Series 2021 A, 4.00%, 07/01/2051 | | | 1,675,000 | | | | 1,315,755 | | |
Washoe Barton Medical Clinic, Revenue, Refunding,
Series 2021 A, 4.00%, 12/01/2041 | | | 365,000 | | | | 329,859 | | |
Washoe Barton Medical Clinic, Revenue, Refunding,
Series 2021 A, 4.00%, 12/01/2051 (b) | | | 510,000 | | | | 433,413 | | |
WFCS Holdings II LLC, Revenue,
Series 2021 A-1, 5.00%, 01/01/2056 (b) | | | 12,120,000 | | | | 11,820,134 | | |
WFCS Holdings LLC, Revenue,
Series 2020 A-1, 5.00%, 01/01/2055 (b) | | | 1,750,000 | | | | 1,707,282 | | |
Wittenberg University, Revenue,
Series 2016, 4.13%, 12/01/2024 (b) | | | 960,000 | | | | 958,410 | | |
Wittenberg University, Revenue,
Series 2016, 5.25%, 12/01/2039 (b) | | | 21,070,000 | | | | 18,767,262 | | |
WVC, Revenue,
Series 2022 A, 4.00%, 12/01/2041 (b) | | | 2,610,000 | | | | 2,224,347 | | |
Wisconsin Health & Educational Facilities Authority,
Cedar Crest, Inc. Obligated Group, Revenue, Refunding,
Series 2022 A, 4.75%, 04/01/2057 | | | 3,020,000 | | | | 2,543,796 | | |
Cedar Crest, Inc. Obligated Group, Revenue, Refunding,
Series 2022 A, 5.13%, 04/01/2057 | | | 3,630,000 | | | | 3,353,288 | | |
Chiara Communities, Inc., Revenue,
Series 2018 B, 5.00%, 07/01/2048 | | | 1,380,000 | | | | 1,135,955 | | |
Chiara Communities, Inc., Revenue,
Series 2018 B, 5.00%, 07/01/2053 | | | 1,250,000 | | | | 996,788 | | |
First Eagle Funds | Annual Report | October 31, 2024
149
First Eagle High Yield Municipal Fund | Schedule of Investments | October 31, 2024
Investments | | Principal Amount ($) | | Value ($) | |
Wisconsin — 9.0% (continued) | |
Marshfield Clinic Health System Obligated Group,
Revenue, Series 2016 A, 3.50%, 02/15/2046 | | | 850,000 | | | | 640,169 | | |
Marshfield Clinic Health System Obligated Group,
Revenue, Refunding,
Series 2017 C, 3.25%, 02/15/2033 | | | 1,060,000 | | | | 930,676 | | |
Marshfield Clinic Health System Obligated Group,
Revenue, Refunding,
Series 2017 C, 3.50%, 02/15/2036 | | | 965,000 | | | | 834,458 | | |
Marshfield Clinic Health System Obligated Group,
Revenue, Refunding,
Series 2017 C, 4.00%, 02/15/2050 | | | 50,000 | | | | 41,966 | | |
Oakwood Lutheran Senior Ministries Obligated Group,
Revenue, Refunding,
Series 2021, 4.00%, 01/01/2047 | | | 3,100,000 | | | | 2,687,680 | | |
Oakwood Lutheran Senior Ministries Obligated Group,
Revenue, Refunding,
Series 2021, 4.00%, 01/01/2057 | | | 1,500,000 | | | | 1,224,368 | | |
PHW Menomonee Falls, Inc., Revenue,
Series 2024, 6.00%, 10/01/2049 | | | 1,000,000 | | | | 1,024,789 | | |
PHW Menomonee Falls, Inc., Revenue,
Series 2024, 6.00%, 10/01/2054 | | | 2,000,000 | | | | 2,043,492 | | |
Sauk-Prairie Memorial Hospital, Inc. Obligated Group,
Revenue, Series 2013 A, 5.13%, 02/01/2038 | | | 2,000,000 | | | | 1,999,996 | | |
Sauk-Prairie Memorial Hospital, Inc. Obligated Group,
Revenue, Series 2013 A, 5.25%, 02/01/2043 | | | 30,000 | | | | 29,848 | | |
Wisconsin Masonic Home Obligated Group, Revenue,
Series 2021 A, 4.00%, 08/15/2046 | | | 1,595,000 | | | | 1,394,468 | | |
Wisconsin Masonic Home Obligated Group, Revenue,
Series 2021 A, 4.00%, 08/15/2051 | | | 1,200,000 | | | | 1,016,169 | | |
Wisconsin Masonic Home Obligated Group, Revenue,
Series 2021 A, 4.00%, 08/15/2055 | | | 1,700,000 | | | | 1,413,537 | | |
Wisconsin Masonic Home Obligated Group, Revenue,
Series 2024 A, 5.75%, 08/15/2059 | | | 3,000,000 | | | | 3,213,269 | | |
| | | | 380,531,294 | | |
Total Municipal Bonds
(Cost $4,692,214,544) | | | 4,743,769,823 | | |
First Eagle Funds | Annual Report | October 31, 2024
150
First Eagle High Yield Municipal Fund | Schedule of Investments | October 31, 2024
Investments | | Shares | | Value ($) | |
Short-Term Investments — 0.0% (a) | |
Investment Companies — 0.0% (a) | |
JP Morgan U.S. Government Money Market Fund,
Capital Shares 4.86% (j) (Cost $334,513) | | | 334,513 | | | | 334,513 | | |
Total Investments — 112.0%
(Cost $4,692,549,057) | | | 4,744,104,336 | | |
Floating Rate Note Obligations — (7.7%) (k) | | | | | (326,775,000 | ) | |
Liabilities in Excess of Other Assets — (4.3)% | | | (180,280,227 | ) | |
Net Assets — 100.0% | | | 4,237,049,109 | | |
(a) Represents less than 0.05% of net assets.
(b) Securities exempt from registration under Rule 144A or section 4(a)(2) of the Securities Act of 1933. Total value of all such securities at October 31, 2024 amounted to $1,997,814,090, which represents approximately 47.15% of net assets of the Fund.
(c) Variable or floating rate security, linked to the referenced benchmark. The interest rate shown was the current rate as of October 31, 2024.
(d) Security with "Put" features and resetting interest rates. Maturity dates disclosed are the puttable dates. Interest rate disclosed is that which is in effect on October 31, 2024.
(e) Zero Coupon Security. Debt security that pays no cash income but is sold at substantial discount from its value at maturity.
(f) When-issued security.
(g) All or portion of principal amount transferred to a Tender Option Bond ("TOB") Issuer in exchange for TOB Residuals and cash.
(h) Security fair valued as of October 31, 2024 by the Adviser as "valuation designee" under the oversight of the Fund's Board of Trustees. Total value of all such securities at October 31, 2024 amounted to $1,346,603, which represents approximately 0.03% of net assets of the Fund.
(i) Variable rate demand notes (VRDNs) are obligations which contain a floating or variable interest rate adjustment formula and an unconditional right of demand to receive payment of the principal balance plus accrued interest at specified dates. Unless otherwise noted, the coupon rate is determined based on factors including supply and demand, underlying credit, tax treatment, and current short term rates. The coupon rate shown represents the rate at period end.
(j) Represents 7-day effective yield as of October 31, 2024.
(k) Face value of Floating Rate Notes issued in TOB transactions.
Abbreviations
AGMC — Insured by Assured Guaranty Municipal Corp.
AMT — Alternative Minimum Tax
ETM — Escrowed to Maturity.
FHLMC — Federal Home Loan Mortgage Corp.
GO — General Obligation
SOFR — Secured Overnight Financing Rate
First Eagle Funds | Annual Report | October 31, 2024
151
First Eagle High Yield Municipal Fund | Schedule of Investments | October 31, 2024
As of October 31, 2024, the gross unrealized appreciation (depreciation) of investments based on the aggregate cost of investments for federal income tax purposes was as follows:
Aggregate gross unrealized appreciation | | $ | 78,405,819 | | |
Aggregate gross unrealized depreciation | | | (27,548,886 | ) | |
Net unrealized appreciation | | $ | 50,856,933 | | |
Federal income tax cost of investments | | $ | 4,693,247,403 | | |
See Notes to Financial Statements.
First Eagle Funds | Annual Report | October 31, 2024
152
First Eagle Short Duration High Yield Municipal Fund | Schedule of Investments | October 31, 2024
Investments | | Principal Amount ($) | | Value ($) | |
Municipal Bonds — 96.4% | |
Alaska — 0.6% | |
Alaska Industrial Development & Export Authority,
Interior Alaska Natural Gas Utility, Revenue,
Series 2020 A, 5.00%, 06/01/2028 | | | 930,000 | | | | 968,478 | | |
American Samoa — 0.1% | |
American Samoa Economic Development Authority,
Revenue, Refunding,
Series 2015 A, 6.63%, 09/01/2035 | | | 100,000 | | | | 101,780 | | |
Arizona — 6.9% | |
Arizona Industrial Development Authority,
Doral Academy of Northern Nevada Obligated Group,
Revenue, Refunding,
Series 2021 A, 4.00%, 07/15/2028 (a) | | | 200,000 | | | | 200,444 | | |
Industrial Development Authority of the
County of Pima (The), La Posada at Park Centre, Inc.
Obligated Group, Revenue,
Series 2022 A, 5.75%, 11/15/2025 (a) | | | 665,000 | | | | 671,866 | | |
La Posada at Park Centre, Inc. Obligated Group,
Revenue,
Series 2022 A, 6.25%, 11/15/2035 (a) | | | 1,000,000 | | | | 1,091,507 | | |
La Posada at Park Centre, Inc. Obligated Group,
Revenue,
Series 2022 A, 7.00%, 11/15/2057 (a) | | | 900,000 | | | | 979,684 | | |
Leading Edge Academy Maricopa, Revenue,
Series 2015, 6.25%, 12/01/2045 (a) | | | 4,925,000 | | | | 4,986,456 | | |
PLC Charter Schools, Revenue, Refunding,
Series 2016, 6.00%, 12/01/2036 (a) | | | 3,000,000 | | | | 3,039,421 | | |
Superstition Vistas Community Facilities District No. 1,
Assessment Area 4, Special Assessment,
Series 2024, 4.30%, 07/01/2034 | | | 125,000 | | | | 120,896 | | |
| | | | 11,090,274 | | |
Arkansas — 1.1% | |
Batesville Public Facilities Board,
White River Health System Obligated Group,
Revenue, Refunding,
Series 2020, 5.00%, 06/01/2026 | | | 500,000 | | | | 499,402 | | |
Clarksville Public Educational Facilities Board,
University of the Ozarks, Revenue, Refunding,
Series 2024 B, 5.25%, 08/01/2029 | | | 195,000 | | | | 201,083 | | |
University of the Ozarks, Revenue, Refunding,
Series 2024 B, 5.25%, 08/01/2034 | | | 1,040,000 | | | | 1,074,505 | | |
| | | | 1,774,990 | | |
First Eagle Funds | Annual Report | October 31, 2024
153
First Eagle Short Duration High Yield Municipal Fund | Schedule of Investments | October 31, 2024
Investments | | Principal Amount ($) | | Value ($) | |
California — 2.4% | |
California Community College Financing Authority,
NCCD-Orange Coast Properties LLC, Revenue,
Series 2018, 5.00%, 05/01/2025 | | | 50,000 | | | | 50,345 | | |
California Health Facilities Financing Authority,
Providence St. Joseph Health Obligated Group,
Revenue, Series 2014 B, 5.00%, 10/01/2044 | | | 1,300,000 | | | | 1,300,058 | | |
California Infrastructure & Economic Development Bank,
DesertXpress Enterprises LLC, Revenue, AMT,
Series 2020 A-4, 8.00%, 8/15/2025 (a)(b)(c) | | | 1,000,000 | | | | 1,030,499 | | |
California Statewide Financing Authority,
TSR Multi-County Special Purpose Trust, Revenue,
Series 2002 A, 6.00%, 05/01/2043 | | | 200,000 | | | | 204,581 | | |
Kaweah Delta Health Care District Guild,
Revenue, Series 2015 B, 3.25%, 06/01/2029 | | | 300,000 | | | | 278,649 | | |
Palomar Health, Obligated Group,
Revenue, Refunding,
Series 2016, 5.00%, 11/01/2024 | | | 355,000 | | | | 355,000 | | |
Obligated Group, Revenue, Refunding,
Series 2016, 5.00%, 11/01/2036 | | | 500,000 | | | | 492,365 | | |
| | | | 3,711,497 | | |
Colorado — 3.2% | |
Baseline Metropolitan District No. 1, Revenue,
Refunding, Series 2018 A-1, 5.75%, 12/01/2048 | | | 3,850,000 | | | | 3,933,654 | | |
Colorado Educational & Cultural Facilities Authority,
Vega Collegiate Academy, Revenue,
Series 2021 A, 5.00%, 02/01/2034 (a) | | | 600,000 | | | | 607,440 | | |
Colorado Health Facilities Authority,
BSLC Obligated Group, Revenue, Refunding,
Series 2018 A-1, 5.00%, 03/15/2025 | | | 325,000 | | | | 325,156 | | |
Denver Convention Center Hotel Authority,
Revenue, Senior Lien, Refunding,
Series 2016, 5.00%, 12/01/2024 | | | 60,000 | | | | 60,048 | | |
Pueblo Urban Renewal Authority,
City of Pueblo Sales Tax, Revenue,
Series 2017, 5.00%, 06/01/2036 | | | 100,000 | | | | 97,180 | | |
| | | | 5,023,478 | | |
Connecticut — 0.4% | |
Connecticut State Health & Educational
Facilities Authority, Griffin Health Obligated Group,
Revenue, Refunding,
Series G-1, 5.00%, 07/01/2027 (a) | | | 100,000 | | | | 101,523 | | |
First Eagle Funds | Annual Report | October 31, 2024
154
First Eagle Short Duration High Yield Municipal Fund | Schedule of Investments | October 31, 2024
Investments | | Principal Amount ($) | | Value ($) | |
Connecticut — 0.4% (continued) | |
Griffin Health Obligated Group, Revenue, Refunding,
Series G-1, 5.00%, 07/01/2028 (a) | | | 100,000 | | | | 101,891 | | |
Griffin Health Obligated Group, Revenue, Refunding,
Series G-1, 5.00%, 07/01/2029 (a) | | | 100,000 | | | | 102,254 | | |
Griffin Health Obligated Group, Revenue, Refunding,
Series G-1, 5.00%, 07/01/2030 (a) | | | 100,000 | | | | 101,949 | | |
Griffin Health Obligated Group, Revenue, Refunding,
Series G-1, 5.00%, 07/01/2032 (a) | | | 150,000 | | | | 152,165 | | |
Griffin Health Obligated Group, Revenue, Refunding,
Series G-1, 5.00%, 07/01/2034 (a) | | | 125,000 | | | | 126,245 | | |
| | | | 686,027 | | |
Florida — 11.3% | |
Antillia Community Development District,
Special Assessment, Series 2024, 5.00%, 05/01/2031 | | | 250,000 | | | | 251,759 | | |
Capital Trust Agency, Inc.,
Franklin Academy Obligated Group, Revenue,
Series 2020, 4.00%, 12/15/2024 (a) | | | 385,000 | | | | 384,401 | | |
Marie Selby Botanical Gardens, Inc. (The), Revenue,
Series 2021, 4.00%, 06/15/2031 (a) | | | 500,000 | | | | 468,787 | | |
Sarasota-Manatee Jewish Housing Council
Obligated Group, Revenue, Refunding,
Series 2017, 5.00%, 07/01/2027 (a) | | | 625,000 | | | | 607,282 | | |
Century Park South Community Development District,
Special Assessment,
Series 2020, 3.00%, 05/01/2025 | | | 50,000 | | | | 49,557 | | |
County of Palm Beach, Provident Group-PBAU
Properties LLC, Revenue,
Series 2019 A, 5.00%, 04/01/2029 (a) | | | 810,000 | | | | 818,042 | | |
Crossings Community Development District,
Area 2, Special Assessment,
Series 2024, 4.75%, 05/01/2031 | | | 300,000 | | | | 299,835 | | |
Crosswinds East Community Development District,
Assessment Area 2, Special Assessment,
Series 2024, 4.50%, 05/01/2031 | | | 240,000 | | | | 238,936 | | |
East Nassau Stewardship District,
Wildlight Village Phase 3, Special Assessment,
Series 2024, 4.70%, 05/01/2031 | | | 840,000 | | | | 839,025 | | |
Entrada Community Development District,
Assessments, Special Assessment,
Series 2024, 4.38%, 05/01/2031 | | | 325,000 | | | | 323,534 | | |
First Eagle Funds | Annual Report | October 31, 2024
155
First Eagle Short Duration High Yield Municipal Fund | Schedule of Investments | October 31, 2024
Investments | | Principal Amount ($) | | Value ($) | |
Florida — 11.3% (continued) | |
Epperson North Community Development District,
Assessment Area 1, Special Assessment,
Series 2018 A-1, 5.75%, 11/01/2049 (a) | | | 995,000 | | | | 1,023,388 | | |
Florida Development Finance Corp.,
AAF Operations Holdings LLC, Revenue, AMT,
Refunding, Series 2024, 12.00%, 7/15/2028 (a)(b)(c) | | | 7,750,000 | | | | 8,220,179 | | |
Waste Pro USA, Inc., Revenue, AMT,
Series 2019, 5.00%, 05/01/2029 (a) | | | 140,000 | | | | 142,480 | | |
Florida Municipal Loan Council,
Shingle Creek Transit & Utility Community
Development District, Special Assessment, AMT,
Series 2024, 4.50%, 05/01/2031 | | | 275,000 | | | | 273,420 | | |
LTC Ranch West Residential Community
Development District, Assessment Area 4,
Special Assessment, Refunding,
Series 2024 AA-4, 4.75%, 05/01/2031 | | | 345,000 | | | | 344,791 | | |
Marion Ranch Community Development District,
Special Assessment, Series 2024, 5.10%, 05/01/2031 | | | 250,000 | | | | 251,694 | | |
Miami-Dade County Industrial Development Authority,
Miami Community Charter School, Revenue,
Refunding, Series 2020 A, 4.25%, 06/01/2030 (a) | | | 570,000 | | | | 548,218 | | |
Osceola Chain Lakes Community Development District,
Assessments, Special Assessment,
Series 2020, 3.50%, 05/01/2030 | | | 350,000 | | | | 330,055 | | |
Palm Beach County Health Facilities Authority,
Lifespace Communities, Inc. Obligated Group,
Revenue, Refunding,
Series 2015 C, 5.00%, 05/15/2028 | | | 20,000 | | | | 20,020 | | |
Palm Coast Park Community Development District,
Sawmill Branch — Phase 7, Special Assessment,
Series 2024, 4.38%, 05/01/2031 | | | 470,000 | | | | 466,564 | | |
Peace Crossing Community Development District,
Assessment Area 1, Special Assessment,
Series 2024, 5.00%, 05/01/2031 (d) | | | 875,000 | | | | 868,196 | | |
Pine Island Community Development District,
Special Assessment, Series 2004, 5.75%, 05/01/2035 | | | 670,000 | | | | 673,061 | | |
Sarasota County Health Facilities Authority,
Southwest Florida Retirement Center, Inc.
Obligated Group, Revenue, Refunding,
Series 2016, 5.00%, 01/01/2025 | | | 25,000 | | | | 25,022 | | |
Silverlake Community Development District,
Assessment Area 2, Special Assessment,
Series 2024, 4.50%, 05/01/2031 | | | 400,000 | | | | 387,072 | | |
First Eagle Funds | Annual Report | October 31, 2024
156
First Eagle Short Duration High Yield Municipal Fund | Schedule of Investments | October 31, 2024
Investments | | Principal Amount ($) | | Value ($) | |
Florida — 11.3% (continued) | |
Southern Groves Community Development
District No. 5, Assessment Area, Special Assessment,
Refunding, Series 2019, 3.25%, 05/01/2029 | | | 290,000 | | | | 276,770 | | |
Villages of Westport Community Development District,
Assessments, Special Assessment,
Series 2005 A, 5.70%, 05/01/2035 | | | 40,000 | | | | 40,181 | | |
Yarborough Lane Community Development District,
Yarborough Lane Community Development District
Series 2024 Special Assessment, Special Assessment,
Series 2024, 4.75%, 05/01/2031 (a) | | | 250,000 | | | | 249,590 | | |
| | | | 18,421,859 | | |
Georgia — 4.6% | |
Atlanta Development Authority (The),
City of Atlanta Westside Tax Allocation District
Gulch Area, Tax Allocation,
Series 2024 A-1, 5.00%, 04/01/2034 (a) | | | 3,250,000 | | | | 3,267,375 | | |
City of Atlanta Westside Tax Allocation District
Gulch Area, Tax Allocation,
Series 2024 A-2, 5.50%, 04/01/2039 (a) | | | 2,850,000 | | | | 2,888,724 | | |
Development Authority of Cobb County (The),
Kennesaw State University Real Estate Obligated
Group 2015 ABC, Revenue, Junior Lien,
Series 2014 C, 5.00%, 07/15/2029 | | | 235,000 | | | | 235,095 | | |
Development Authority of The City of Marietta,
Life University, Inc., Revenue, Refunding,
Series 2017 A, 5.00%, 11/01/2027 (a) | | | 500,000 | | | | 505,159 | | |
Main Street Natural Gas, Inc.,
Revenue, Series 2022 C, 4.00%, 11/1/2027 (a)(b)(c) | | | 500,000 | | | | 498,293 | | |
| | | | 7,394,646 | | |
Illinois — 6.2% | |
Chicago Board of Education,
GO, Series 2015 C, 5.25%, 12/01/2039 | | | 120,000 | | | | 120,005 | | |
City of Calumet City,
GO, Series 2023 B, 4.50%, 03/01/2037 | | | 600,000 | | | | 556,879 | | |
City of Chicago,
GO, Series 2002 B, 5.50%, 01/01/2030 | | | 15,000 | | | | 15,025 | | |
GO, Refunding, Series 2005 D, 5.50%, 01/01/2040 | | | 3,355,000 | | | | 3,354,520 | | |
Illinois Finance Authority, Acero Charter Schools, Inc.
Obligated Group, Revenue, Refunding,
Series 2021, 4.00%, 10/01/2028 (a) | | | 580,000 | | | | 579,579 | | |
Benedictine University, Revenue, Refunding,
Series 2017, 5.00%, 10/01/2030 | | | 1,000,000 | | | | 957,314 | | |
First Eagle Funds | Annual Report | October 31, 2024
157
First Eagle Short Duration High Yield Municipal Fund | Schedule of Investments | October 31, 2024
Investments | | Principal Amount ($) | | Value ($) | |
Illinois — 6.2% (continued) | |
Lifespace Communities, Inc. Obligated Group,
Revenue, Refunding,
Series 2015 A, 5.00%, 05/15/2035 | | | 250,000 | | | | 247,136 | | |
OSF Healthcare System Obligated Group,
Revenue, Refunding,
Series 2020 B-1, 5.00%, 11/15/2024 (b)(c) | | | 250,000 | | | | 250,126 | | |
Plymouth Place Obligated Group, Revenue,
Series 2022 A, 6.75%, 05/15/2058 | | | 100,000 | | | | 107,720 | | |
Washington and Jane Smith Community — Orland Park,
Revenue, Refunding,
Series 2022, 4.00%, 10/15/2026 | | | 465,000 | | | | 457,900 | | |
Marshall Putnam & Bureau Counties,
Community Unit School District No. 5 Henry, Revenue,
Series 2024, 4.75%, 12/01/2030 | | | 2,220,000 | | | | 2,219,995 | | |
Village of Rantoul,
Evans Road Redevelopment Area,
Tax Allocation, Refunding,
Series 2024, 5.25%, 12/01/2033 (a) | | | 400,000 | | | | 399,538 | | |
Western Illinois Economic Development Authority,
Memorial Hospital Association, Revenue, Refunding,
Series 2016, 4.00%, 06/01/2033 | | | 620,000 | | | | 577,286 | | |
| | | | 9,843,023 | | |
Indiana — 0.8% | |
Indiana Finance Authority,
Retirement Living, Inc., Revenue, Refunding,
Series 2015 A, 5.00%, 03/01/2039 | | | 125,000 | | | | 125,074 | | |
Rock Creek Community Academy, Inc., Revenue,
Series 2018 A, 5.25%, 07/01/2028 (a) | | | 700,000 | | | | 704,453 | | |
Rock Creek Community Academy, Inc., Revenue,
Series 2018 A, 5.88%, 07/01/2038 (a) | | | 540,000 | | | | 547,808 | | |
| | | | 1,377,335 | | |
Iowa — 0.6% | |
Crawford County Memorial Hospital, Inc., Revenue,
Series 2024, 5.00%, 06/15/2027 | | | 1,000,000 | | | | 1,014,225 | | |
Kentucky — 1.3% | |
Louisville/Jefferson County Metropolitan Government,
Bellarmine University, Inc., Revenue, Refunding,
Series 2017 A, 4.00%, 05/01/2029 | | | 100,000 | | | | 95,312 | | |
Bellarmine University, Inc., Revenue, Refunding,
Series 2015, 5.00%, 05/01/2031 | | | 2,000,000 | | | | 1,977,663 | | |
| | | | 2,072,975 | | |
First Eagle Funds | Annual Report | October 31, 2024
158
First Eagle Short Duration High Yield Municipal Fund | Schedule of Investments | October 31, 2024
Investments | | Principal Amount ($) | | Value ($) | |
Louisiana — 2.6% | |
Calcasieu Parish Memorial Hospital Service District,
Southwest Louisiana Healthcare System Obligated
Group, Revenue, Refunding,
Series 2019, 5.00%, 12/01/2034 | | | 2,000,000 | | | | 2,012,316 | | |
Louisiana Local Government Environmental
Facilities & Community Development Authority,
Glen Retirement System Obligated Group, Revenue,
Series 2019 A, 5.00%, 01/01/2025 | | | 370,000 | | | | 368,961 | | |
Glen Retirement System Obligated Group, Revenue,
Series 2019 A, 5.00%, 01/01/2026 | | | 390,000 | | | | 383,104 | | |
Glen Retirement System Obligated Group, Revenue,
Series 2019 A, 5.00%, 01/01/2027 | | | 410,000 | | | | 396,999 | | |
Glen Retirement System Obligated Group, Revenue,
Series 2019 A, 5.00%, 01/01/2028 | | | 430,000 | | | | 410,138 | | |
Glen Retirement System Obligated Group, Revenue,
Series 2019 A, 5.00%, 01/01/2029 | | | 450,000 | | | | 422,757 | | |
Provident Group — ULM Properties LLC, Revenue,
Series 2019 A, 5.00%, 07/01/2039 (a) | | | 100,000 | | | | 94,331 | | |
| | | | 4,088,606 | | |
Maryland — 3.2% | |
City of Baltimore,
Baltimore Hotel Corp., Revenue, Refunding,
Series 2017, 5.00%, 09/01/2033 | | | 1,105,000 | | | | 1,114,434 | | |
County of Frederick,
Mount St Mary's University, Inc., Revenue, Refunding,
Series 2017 A, 5.00%, 09/01/2032 (a) | | | 740,000 | | | | 745,576 | | |
County of Prince George's, Westphalia Town Center
Development District, Tax Allocation,
Series 2018, 5.00%, 07/01/2030 (a) | | | 1,200,000 | | | | 1,221,084 | | |
Prince George's County Revenue Authority,
County of Prince George's MD Suitland-Naylor Road
Development District, Tax Allocation,
Series 2016, 5.00%, 07/01/2046 (a) | | | 2,000,000 | | | | 2,001,466 | | |
| | | | 5,082,560 | | |
Massachusetts — 1.0% | |
Massachusetts Development Finance Agency,
Lawrence General Hospital Obligated Group,
Revenue, Refunding,
Series 2017, 5.00%, 07/01/2028 | | | 675,000 | | | | 667,949 | | |
Salem Community Corp. Obligated Group,
Revenue, Refunding,
Series 2022, 5.00%, 01/01/2030 | | | 465,000 | | | | 466,589 | | |
First Eagle Funds | Annual Report | October 31, 2024
159
First Eagle Short Duration High Yield Municipal Fund | Schedule of Investments | October 31, 2024
Investments | | Principal Amount ($) | | Value ($) | |
Massachusetts — 1.0% (continued) | |
Salem Community Corp. Obligated Group,
Revenue, Refunding,
Series 2022, 5.00%, 01/01/2031 | | | 485,000 | | | | 486,938 | | |
| | | | 1,621,476 | | |
Michigan — 2.0% | |
Flint Hospital Building Authority,
Hurley Medical Center, Revenue, Refunding,
Series 2020, 5.00%, 07/01/2026 | | | 500,000 | | | | 501,504 | | |
Kalamazoo Economic Development Corp.,
Friendship Village of Kalamazoo Obligated Group,
Revenue, Refunding,
Series 2021, 5.00%, 08/15/2031 (a) | | | 890,000 | | | | 869,280 | | |
Michigan Finance Authority, Albion College,
Revenue, Refunding,
Series 2022, 5.00%, 12/01/2027 | | | 85,000 | | | | 71,239 | | |
Albion College, Revenue, Refunding,
Series 2022, 5.00%, 12/01/2033 | | | 40,000 | | | | 30,785 | | |
Albion College, Revenue, Refunding,
Series 2022, 5.00%, 12/01/2036 | | | 1,000,000 | | | | 747,092 | | |
Aquinas College, Revenue, Refunding,
Series 2021, 4.00%, 05/01/2031 | | | 500,000 | | | | 445,074 | | |
Detroit Public Lighting Authority Utility Users Tax,
Revenue, Series 2014 B, 5.00%, 07/01/2026 | | | 25,000 | | | | 25,033 | | |
Michigan Strategic Fund, Friendship Village of
Kalamazoo Obligated Group, Revenue, Refunding,
Series 2021, 5.00%, 08/15/2031 (a) | | | 665,000 | | | | 649,518 | | |
| | | | 3,339,525 | | |
Minnesota — 0.7% | |
City of Landfall Village, Pines of Richfield LLC (The),
Revenue, Series 2024, 4.75%, 08/01/2029 | | | 205,000 | | | | 205,793 | | |
Pines of Richfield LLC (The), Revenue,
Series 2024, 4.80%, 08/01/2030 | | | 215,000 | | | | 216,003 | | |
Pines of Richfield LLC (The), Revenue,
Series 2024, 4.85%, 08/01/2031 | | | 225,000 | | | | 226,073 | | |
Pines of Richfield LLC (The), Revenue,
Series 2024, 4.90%, 08/01/2032 | | | 235,000 | | | | 236,119 | | |
Pines of Richfield LLC (The), Revenue,
Series 2024, 5.00%, 08/01/2033 | | | 250,000 | | | | 251,186 | | |
| | | | 1,135,174 | | |
First Eagle Funds | Annual Report | October 31, 2024
160
First Eagle Short Duration High Yield Municipal Fund | Schedule of Investments | October 31, 2024
Investments | | Principal Amount ($) | | Value ($) | |
Mississippi — 0.0% (e) | |
Mississippi Home Corp., Revenue, GNMA Insured,
Series 2018 A, 2.65%, 12/01/2024 | | | 15,000 | | | | 14,981 | | |
Missouri — 0.2% | |
Grindstone Plaza Transportation Development District,
Revenue, Series 2006 A, 5.40%, 10/01/2026 | | | 205,000 | | | | 204,994 | | |
Health & Educational Facilities Authority of the
State of Missouri, Mercy Health, Revenue,
Series 2014 F, 5.00%, 11/15/2045 | | | 150,000 | | | | 150,013 | | |
| | | | 355,007 | | |
Nevada — 3.6% | |
City of Las Vegas, Special Improvement
District No. 812, Special Assessment,
Series 2015, 5.00%, 12/01/2031 | | | 550,000 | | | | 556,243 | | |
City of Sparks, Special Improvement
District No. 1, Special Assessment,
Series 2024, 5.00%, 06/01/2044 (d) | | | 400,000 | | | | 403,090 | | |
State of Nevada Department of Business & Industry,
DesertXpress Enterprises LLC, Revenue, AMT,
Series 2020 A-4, 8.13%, 8/15/2025 (b)(c) | | | 4,520,000 | | | | 4,657,847 | | |
| | | | 5,617,180 | | |
New Hampshire — 2.6% | |
New Hampshire Business Finance Authority,
Revenue, Series 2024, 5.30%, 12/01/2032 (a) | | | 272,000 | | | | 272,281 | | |
Revenue, Series 2024, 5.25%, 12/01/2035 (a) | | | 2,000,000 | | | | 1,960,607 | | |
Revenue, Series 2024, 5.38%, 12/15/2035 (a) | | | 2,000,000 | | | | 2,002,755 | | |
| | | | 4,235,643 | | |
New Jersey — 0.6% | |
City of Atlantic City,
GO, Refunding, Series 2013, 5.00%, 12/01/2024 | | | 540,000 | | | | 539,818 | | |
GO, Refunding, Series 2013, 5.00%, 12/01/2025 | | | 45,000 | | | | 44,923 | | |
New Jersey Economic Development Authority,
United Airlines, Inc., Revenue, AMT, Refunding,
Series 2012, 5.75%, 09/15/2027 | | | 100,000 | | | | 100,141 | | |
United Airlines, Inc., Revenue, AMT,
Series 1999, 5.25%, 09/15/2029 | | | 210,000 | | | | 210,215 | | |
New Jersey Educational Facilities Authority,
Rider University A New Jersey Non-Profit Corp.,
Revenue, Series 2017 F, 3.25%, 07/01/2030 | | | 25,000 | | | | 21,402 | | |
| | | | 916,499 | | |
First Eagle Funds | Annual Report | October 31, 2024
161
First Eagle Short Duration High Yield Municipal Fund | Schedule of Investments | October 31, 2024
Investments | | Principal Amount ($) | | Value ($) | |
New York — 5.4% | |
Allegany County Capital Resource Corp.,
Houghton College, Revenue, Refunding,
Series 2022 A, 5.00%, 12/01/2026 | | | 170,000 | | | | 168,892 | | |
Houghton College, Revenue, Refunding,
Series 2022 A, 5.00%, 12/01/2032 | | | 1,385,000 | | | | 1,356,095 | | |
Build NYC Resource Corp.,
East Harlem Scholars Academy Charter School
Obligated Group, Revenue,
Series 2022, 5.75%, 06/01/2052 (a) | | | 750,000 | | | | 788,231 | | |
City of Glens Falls, Revenue,
Series 2011, 5.00%, 06/15/2026 | | | 1,485,000 | | | | 1,486,171 | | |
Dobbs Ferry Local Development Corp.,
Mercy University, Revenue,
Series 2014, 5.00%, 07/01/2039 | | | 20,000 | | | | 20,003 | | |
Monroe County Industrial Development Corp.,
St. Ann's of Greater Rochester Obligated Group,
Revenue, Refunding,
Series 2019, 4.00%, 01/01/2030 | | | 1,070,000 | | | | 1,030,576 | | |
MTA Hudson Rail Yards Trust Obligations,
Revenue, Series 2016 A, 5.00%, 11/15/2056 | | | 20,000 | | | | 20,002 | | |
New York City Housing Development Corp.,
Revenue, Series 2022 E-1, 2.20%, 11/01/2024 | | | 25,000 | | | | 25,000 | | |
New York Liberty Development Corp.,
3 World Trade Center LLC, Revenue, Refunding,
Series 2014, Class 3, 7.25%, 11/15/2044 (a) | | | 500,000 | | | | 500,296 | | |
New York State Dormitory Authority,
Pace University, Revenue, Refunding,
Series 2013 A, 4.25%, 05/01/2042 | | | 25,000 | | | | 25,011 | | |
New York State Housing Finance Agency,
Revenue, GNMA Insured,
Series 2017 L, 2.10%, 11/01/2024 | | | 20,000 | | | | 20,000 | | |
New York Transportation Development Corp.,
Laguardia Gateway Partners LLC, Revenue, AMT,
Series 2016 A, 5.00%, 07/01/2041 | | | 1,000,000 | | | | 994,550 | | |
Laguardia Gateway Partners LLC, Revenue, AMT,
Series 2016 A, 5.00%, 07/01/2046 | | | 105,000 | | | | 104,274 | | |
Laguardia Gateway Partners LLC, Revenue, AMT,
Series 2016 A, 5.25%, 01/01/2050 | | | 780,000 | | | | 779,967 | | |
Oneida County Local Development Corp.,
Utica University, Revenue, Refunding,
Series 2019, 5.00%, 07/01/2025 | | | 80,000 | | | | 80,179 | | |
First Eagle Funds | Annual Report | October 31, 2024
162
First Eagle Short Duration High Yield Municipal Fund | Schedule of Investments | October 31, 2024
Investments | | Principal Amount ($) | | Value ($) | |
New York — 5.4% (continued) | |
Oneida Indian Nation of New York,
Revenue, Series 2024 B, 6.00%, 09/01/2043 (a) | | | 145,000 | | | | 157,920 | | |
Onondaga Civic Development Corp.,
Crouse Health Hospital, Inc. Obligated Group,
Revenue, Refunding,
Series 2024 A, 5.00%, 08/01/2031 | | | 350,000 | | | | 362,206 | | |
Suffolk Regional Off-Track Betting Co., Revenue,
Series 2024, 6.00%, 12/01/2053 | | | 675,000 | | | | 702,814 | | |
| | | | 8,622,187 | | |
North Dakota — 2.8% | |
City of Horace, GO, Special Assessment, Refunding,
Series 2024 B, 4.85%, 08/01/2026 | | | 1,000,000 | | | | 1,000,688 | | |
County of Ward, Trinity Health Obligated Group,
Revenue, Series 2017 C, 5.00%, 06/01/2034 | | | 1,000,000 | | | | 1,018,202 | | |
Trinity Health Obligated Group, Revenue,
Series 2017 C, 5.00%, 06/01/2048 | | | 2,610,000 | | | | 2,567,666 | | |
| | | | 4,586,556 | | |
Ohio — 4.1% | |
County of Fairfield,
Fairfield Medical Center Obligated Group,
Revenue, Refunding,
Series 2013, 5.13%, 06/15/2033 | | | 5,000,000 | | | | 4,906,341 | | |
County of Hardin,
Ohio Northern University, Revenue, Refunding,
Series 2020, 4.00%, 05/01/2026 | | | 75,000 | | | | 73,630 | | |
County of Washington,
Marietta Area Health Care, Inc. Obligated Group,
Revenue, Refunding,
Series 2022, 6.75%, 12/01/2052 | | | 500,000 | | | | 547,351 | | |
Ohio Air Quality Development Authority,
Ohio Valley Electric Corp., Revenue,
Series 2009 C, 1.50%, 11/4/2025 (b)(c) | | | 1,000,000 | | | | 963,006 | | |
| | | | 6,490,328 | | |
Oklahoma — 0.9% | |
Oklahoma County Finance Authority,
Aerospace Science and Technology Education
Center, Inc., Revenue,
Series 2024, 5.25%, 06/15/2034 (a) | | | 775,000 | | | | 787,164 | | |
First Eagle Funds | Annual Report | October 31, 2024
163
First Eagle Short Duration High Yield Municipal Fund | Schedule of Investments | October 31, 2024
Investments | | Principal Amount ($) | | Value ($) | |
Oklahoma — 0.9% (continued) | |
Tulsa Airports Improvement Trust,
American Airlines, Inc., Revenue, AMT, Refunding,
Series 2001 B, 5.50%, 12/01/2035 | | | 700,000 | | | | 701,236 | | |
| | | | 1,488,400 | | |
Oregon — 2.4% | |
Port of Morrow,
GO, Series 2024 A, 5.15%, 10/01/2026 (a) | | | 3,905,000 | | | | 3,862,605 | | |
Pennsylvania — 0.8% | |
Bucks County Industrial Development Authority,
Grand View Hospital/Sellersville Obligated Group,
Revenue, Series 2021, 5.00%, 07/01/2027 | | | 200,000 | | | | 203,047 | | |
Grand View Hospital/Sellersville Obligated Group,
Revenue, Series 2021, 5.00%, 07/01/2029 | | | 275,000 | | | | 281,780 | | |
Butler County Hospital Authority,
Butler Health System Obligated Group,
Revenue, Refunding,
Series 2015 A, 5.00%, 07/01/2026 | | | 20,000 | | | | 20,011 | | |
City of Erie Higher Education Building Authority,
Mercyhurst University, Revenue,
Series 2016, 5.00%, 09/15/2026 (a) | | | 230,000 | | | | 230,180 | | |
Cumberland County Municipal Authority,
Diakon Lutheran Social Ministries Obligated Group,
Revenue, Refunding,
Series 2016, 5.00%, 01/01/2025 | | | 25,000 | | | | 25,022 | | |
Montgomery County Higher Education and
Health Authority, Holy Redeemer Health System
Obligated Group, Revenue, Refunding,
Series 2014 A, 5.00%, 10/01/2026 | | | 50,000 | | | | 50,009 | | |
St. Mary Hospital Authority, Trinity Health Corp.
Obligated Group, Revenue, Series 2007 F,
(3-month SOFR+ 0.83%), 4.43%, 11/15/2034 (b) | | | 715,000 | | | | 698,905 | | |
| | | | 1,508,954 | | |
Texas — 4.4% | |
Abilene Convention Center Hotel Development Corp.,
City of Abilene Abilene Convention Center, Revenue,
Second Lien, Series 2021 B, 3.75%, 10/01/2031 (a) | | | 500,000 | | | | 454,840 | | |
Arlington Higher Education Finance Corp.,
Newman International Academy, Revenue,
Series 2021 A, 4.00%, 08/15/2031 | | | 350,000 | | | | 330,754 | | |
Austin Convention Enterprises, Inc.,
Revenue, First Tier, Refunding,
Series 2017 A, 5.00%, 01/01/2026 | | | 150,000 | | | | 150,650 | | |
First Eagle Funds | Annual Report | October 31, 2024
164
First Eagle Short Duration High Yield Municipal Fund | Schedule of Investments | October 31, 2024
Investments | | Principal Amount ($) | | Value ($) | |
Texas — 4.4% (continued) | |
City of Dorchester, Cottonwood Public Improvement
District Major Improvement Area No. 1, Special
Assessment, Series 2024, 5.25%, 09/15/2031 (a) | | | 350,000 | | | | 343,239 | | |
City of Huntsville, Reserves of Huntsville Public
Improvement District (The), Special Assessment,
Series 2024, 4.50%, 09/15/2031 (a) | | | 355,000 | | | | 355,840 | | |
Clifton Higher Education Finance Corp.,
Valor Texas Education Foundation, Revenue,
Series 2024 A, 5.00%, 06/15/2034 (a) | | | 325,000 | | | | 322,227 | | |
County of Medina, Talley Ho Public Improvement
District Improvement Area No. 1, Special Assessment,
Series 2024, 4.88%, 09/01/2034 (a) | | | 1,453,000 | | | | 1,406,587 | | |
Edinburg Economic Development Corp.,
Revenue, Series 2019, 4.00%, 08/15/2029 (a) | | | 585,000 | | | | 561,362 | | |
Hidalgo County Regional Mobility Authority, Revenue,
Junior Lien, Refunding,
Series 2022 B, 4.00%, 12/01/2038 | | | 100,000 | | | | 95,067 | | |
New Hope Cultural Education Facilities Finance Corp.,
CHF-Collegiate Housing College Station I LLC, Revenue,
AGMC Insured, Series 2014 A, 5.00%, 04/01/2046 | | | 1,000,000 | | | | 1,000,056 | | |
Jubilee Academic Center, Inc., Revenue, Refunding,
Series 2021, 4.00%, 08/15/2025 (a) | | | 440,000 | | | | 438,881 | | |
Sanctuary LTC LLC, Revenue,
Series 2021 A-1, 5.00%, 01/01/2032 | | | 750,000 | | | | 752,206 | | |
Reagan Hospital District of Reagan County,
GO, Series 2014 A, 5.00%, 02/01/2029 | | | 700,000 | | | | 699,910 | | |
| | | | 6,911,619 | | |
Utah — 0.9% | |
Utah Charter School Finance Authority, Freedom
Academy Foundation, Revenue, Refunding,
Series 2017, 4.50%, 06/15/2027 (a) | | | 1,510,000 | | | | 1,499,111 | | |
Vermont — 0.0% (e) | |
East Central Vermont Telecommunications District,
Revenue, Refunding, Series 2017 A, 5.75%, 12/01/2031 (a) | | | 10,000 | | | | 10,006 | | |
Virgin Islands — 1.0% | |
Virgin Islands Public Finance Authority,
United States Virgin Islands, Revenue, Refunding,
Series 2014 C, 5.00%, 10/01/2030 (a) | | | 1,500,000 | | | | 1,499,923 | | |
United States Virgin Islands, Revenue, Refunding,
Series 2012 A, 5.00%, 10/01/2032 | | | 100,000 | | | | 98,092 | | |
| | | | 1,598,015 | | |
First Eagle Funds | Annual Report | October 31, 2024
165
First Eagle Short Duration High Yield Municipal Fund | Schedule of Investments | October 31, 2024
Investments | | Principal Amount ($) | | Value ($) | |
Washington — 2.0% | |
Washington State Housing Finance Commission,
German Retirement Home of the State of Washington
Obligated Group, Revenue,
Series 2024 B-1, 4.50%, 07/01/2030 (a) | | | 1,000,000 | | | | 999,991 | | |
Horizon House Obligated Group, Revenue, Refunding,
Series 2017, 5.00%, 01/01/2027 (a) | | | 1,560,000 | | | | 1,571,490 | | |
Spokane International Academy, Revenue,
Series 2021 A, 4.00%, 07/01/2028 (a) | | | 305,000 | | | | 295,439 | | |
Spokane International Academy, Revenue,
Series 2021 A, 4.00%, 07/01/2029 (a) | | | 320,000 | | | | 307,408 | | |
| | | | 3,174,328 | | |
West Virginia — 0.3% | |
City of Huntington, Downtown
Development/Redevelopment District No. 1,
Tax Allocation, Refunding,
Series 2024 A, 5.50%, 06/01/2049 | | | 450,000 | | | | 454,763 | | |
West Virginia Hospital Finance Authority,
Vandalia Health, Inc. Obligated Group,
Revenue, Refunding,
Series 2014 A, 5.00%, 09/01/2025 | | | 10,000 | | | | 10,008 | | |
| | | | 464,771 | | |
Wisconsin — 15.4% | |
Public Finance Authority, Revenue,
Series 2023-1, Class A, 5.75%, 07/01/2062 | | | 2,862,581 | | | | 3,004,191 | | |
Ameream LLC, Revenue,
Series 2017, 6.50%, 12/01/2037 (a) | | | 2,500,000 | | | | 2,556,114 | | |
Austin FBO LLC, Revenue, AMT,
Series 2018 A, 7.05%, 9/1/2027 (a)(b)(c) | | | 495,000 | | | | 497,704 | | |
Bancroft Neurohealth Obligated Group, Revenue,
Series 2016 A, 5.00%, 06/01/2026 (a) | | | 1,005,000 | | | | 1,015,191 | | |
Cincinnati Classical Academy, Revenue,
Series 2024 A, 5.25%, 06/15/2035 (a) | | | 1,075,000 | | | | 1,075,047 | | |
Denton County Municipal Utility District No. 16,
Revenue, Series 2024, 5.75%, 12/15/2033 (a) | | | 5,000,000 | | | | 4,838,597 | | |
Dominium Holdings I LLC, Revenue,
Series 2024-1, Class B-1, 6.81%, 04/28/2036 (a) | | | 900,000 | | | | 915,196 | | |
Guilford College, Revenue, Refunding,
Series 2016, 5.00%, 01/01/2026 | | | 685,000 | | | | 681,355 | | |
Harris County Municipal Utility District No. 544,
Revenue, Series 2024, 5.88%, 11/15/2029 (a) | | | 1,000,000 | | | | 995,371 | | |
First Eagle Funds | Annual Report | October 31, 2024
166
First Eagle Short Duration High Yield Municipal Fund | Schedule of Investments | October 31, 2024
Investments | | Principal Amount ($) | | Value ($) | |
Wisconsin — 15.4% (continued) | |
Mary's Woods at Marylhurst Obligated Group,
Revenue, Refunding,
Series 2017 A, 5.00%, 05/15/2029 (a) | | | 85,000 | | | | 86,081 | | |
Montgomery County Municipal Utility
District Nos. 123 & 153, Revenue,
Series 2024, 0.00%, 12/15/2034 (a)(f) | | | 1,072,000 | | | | 586,583 | | |
QCF Behavioral Hospitals I Obligated Group,
Revenue, Series 2024 A, 7.50%, 07/01/2059 (a) | | | 3,000,000 | | | | 3,335,262 | | |
Sarpy County Sanitary & Improvement
District No. 365, Special Assessment,
Series 2024 A, 7.00%, 06/17/2029 (a) | | | 503,303 | | | | 509,825 | | |
Sarpy County Sanitary & Improvement
District No. 365, Special Assessment,
Series 2024 C, 7.00%, 08/26/2029 (a) | | | 878,882 | | | | 868,179 | | |
Sarpy County Sanitary & Improvement
District No. 365, Special Assessment,
Series 2024 D, 7.00%, 09/23/2029 (a) | | | 592,372 | | | | 592,441 | | |
Sarpy County Sanitary & Improvement
District No. 376, Special Assessment,
Series 2024 A, 7.00%, 09/17/2029 (a) | | | 462,737 | | | | 454,028 | | |
Wittenberg University, Revenue,
Series 2016, 5.00%, 12/01/2031 (a) | | | 3,000,000 | | | | 2,818,803 | | |
Wisconsin Health & Educational Facilities Authority,
Ascension Health Credit Group, Revenue, Refunding,
Series 2016 A, 5.00%, 11/15/2024 | | | 10,000 | | | | 10,005 | | |
| | | | 24,839,973 | | |
Total Municipal Bonds
(Cost $154,956,528) | | | 154,944,091 | | |
| | | Shares | | | |
Short-Term Investments — 0.1% | |
Investment Companies — 0.1% | |
JP Morgan U.S. Government Money Market Fund,
Capital Shares 4.86% (g) (Cost $153,972) | | | 153,972 | | | | 153,972 | | |
Total Investments — 96.5%
(Cost $155,110,500) | | | 155,098,063 | | |
Other Assets Less Liabilities — 3.5% | | | 5,578,767 | | |
Net Assets — 100.0% | | | 160,676,830 | | |
First Eagle Funds | Annual Report | October 31, 2024
167
First Eagle Short Duration High Yield Municipal Fund | Schedule of Investments | October 31, 2024
(a) Securities exempt from registration under Rule 144A or section 4(a)(2) of the Securities Act of 1933. Total value of all such securities at October 31, 2024 amounted to $82,500,700, which represents approximately 51.35% of net assets of the Fund.
(b) Variable or floating rate security, linked to the referenced benchmark. The interest rate shown was the current rate as of October 31, 2024.
(c) Security with "Put" features and resetting interest rates. Maturity dates disclosed are the puttable dates. Interest rate disclosed is that which is in effect on October 31, 2024.
(d) When-issued security.
(e) Represents less than 0.05% of net assets.
(f) Zero Coupon Security. Debt security that pays no cash income but is sold at substantial discount from its value at maturity.
(g) Represents 7-day effective yield as of October 31, 2024.
Abbreviations
AGMC — Insured by Assured Guaranty Municipal Corp.
AMT — Alternative Minimum Tax
GO — General Obligation
SOFR — Secured Overnight Financing Rate
As of October 31, 2024, the gross unrealized appreciation (depreciation) of investments based on the aggregate cost of investments for federal income tax purposes was as follows:
Aggregate gross unrealized appreciation | | $ | 887,678 | | |
Aggregate gross unrealized depreciation | | | (912,211 | ) | |
Net unrealized depreciation | | $ | (24,533 | ) | |
Federal income tax cost of investments | | $ | 155,122,596 | | |
See Notes to Financial Statements.
First Eagle Funds | Annual Report | October 31, 2024
168
This page was intentionally left blank.
Statements of Assets and Liabilities
| | | First Eagle
Global Fund* | | First Eagle
Overseas Fund* | |
Assets | |
Investments, at Cost (Note 1) | |
Investments in non-affiliates | | $ | 29,809,904,207 | | | $ | 7,677,775,668 | | |
Investments in affiliates | | | 2,948,396,561 | | | | 327,008,212 | | |
Gold bullion | | | 2,461,714,969 | | | | 357,409,268 | | |
Silver bullion | | | — | | | | — | | |
Investments, at Value (Note 1) | |
Investments in non-affiliates | | | 46,802,529,869 | | | | 10,627,065,270 | | |
Investments in affiliates | | | 2,826,215,153 | | | | 441,535,842 | | |
Gold bullion | | | 6,663,738,941 | | | | 1,278,581,767 | | |
Silver bullion | | | — | | | | — | | |
Due from custodian | | | — | | | | — | | |
Unrealized appreciation on forward foreign currency exchange contracts | | | 55,647,439 | | | | 28,626,991 | | |
Receivable for investment securities sold | | | 123,480 | | | | 54,573 | | |
Foreign tax reclaims receivable | | | 59,960,675 | | | | 26,117,758 | | |
Receivable for Fund shares sold | | | 42,337,285 | | | | 9,380,446 | | |
Accrued interest and dividends receivable | | | 87,699,680 | | | | 30,454,015 | | |
Investment for trustee deferred compensation plan (Note 2) | | | 10,451,484 | | | | 2,067,115 | | |
Other assets | | | 358,583 | | | | 89,176 | | |
Total Assets | | | 56,549,062,589 | | | | 12,443,972,953 | | |
Liabilities | |
Investment advisory fees payable (Note 2) | | | 36,485,028 | | | | 8,072,002 | | |
Payable for investment securities purchased | | | 85,857,095 | | | | 15,035,250 | | |
Distribution fees payable (Note 3) | | | 4,218,208 | | | | 354,819 | | |
Administrative fees payable (Note 2) | | | 442,023 | | | | 82,565 | | |
Trustee deferred compensation plan (Note 2) | | | 10,451,484 | | | | 2,067,115 | | |
Service fees payable (Note 3) | | | 316,343 | | | | 13,255 | | |
Trustee fees payable | | | 204,640 | | | | 85,596 | | |
IRS compliance fees for foreign withholding tax claims payable | | | 20,941,890 | | | | 37,211,235 | | |
Unrealized depreciation on forward foreign currency exchange contracts | | | 3,983,898 | | | | 2,002,400 | | |
Payable for Fund shares redeemed | | | 37,121,746 | | | | 6,522,127 | | |
Accrued expenses and other liabilities | | | 12,919,943 | | | | 4,045,685 | | |
Total Liabilities | | | 212,942,298 | | | | 75,492,049 | | |
Commitments and contingent liabilities^ | | | — | | | | — | | |
Net Assets | | $ | 56,336,120,291 | | | $ | 12,368,480,904 | | |
Net Assets Consist of | |
Capital stock (par value, $0.001 per share) | | $ | 767,081 | | | $ | 446,672 | | |
Capital surplus | | | 33,071,993,520 | | | | 8,036,484,923 | | |
Total distributable earnings (losses) | | | 23,263,359,690 | | | | 4,331,549,309 | | |
Net Assets | | $ | 56,336,120,291 | | | $ | 12,368,480,904 | | |
First Eagle Funds | Annual Report | October 31, 2024
170
October 31, 2024
| | | First Eagle
U.S. Value Fund* | | First Eagle
Gold Fund* | |
Assets | |
Investments, at Cost (Note 1) | |
Investments in non-affiliates | | $ | 696,523,898 | | | $ | 1,256,014,978 | | |
Investments in affiliates | | | — | | | | 245,475,637 | | |
Gold bullion | | | 67,628,124 | | | | 127,912,284 | | |
Silver bullion | | | — | | | | 172,435,290 | | |
Investments, at Value (Note 1) | |
Investments in non-affiliates | | | 1,222,433,221 | | | | 2,029,835,994 | | |
Investments in affiliates | | | — | | | | 334,405,209 | | |
Gold bullion | | | 176,060,378 | | | | 257,448,902 | | |
Silver bullion | | | — | | | | 215,376,227 | | |
Due from custodian | | | — | | | | 4,316,082 | | |
Unrealized appreciation on forward foreign currency exchange contracts | | | — | | | | — | | |
Receivable for investment securities sold | | | — | | | | 5,248 | | |
Foreign tax reclaims receivable | | | 27,671 | | | | 1,019,744 | | |
Receivable for Fund shares sold | | | 891,640 | | | | 5,127,425 | | |
Accrued interest and dividends receivable | | | 1,713,408 | | | | 195 | | |
Investment for trustee deferred compensation plan (Note 2) | | | 1,498,697 | | | | 437,781 | | |
Other assets | | | 11,031 | | | | 19,091 | | |
Total Assets | | | 1,402,636,046 | | | | 2,847,991,898 | | |
Liabilities | |
Investment advisory fees payable (Note 2) | | | 903,535 | | | | 1,800,098 | | |
Payable for investment securities purchased | | | 1,317,035 | | | | 11,430,330 | | |
Distribution fees payable (Note 3) | | | 156,670 | | | | 239,838 | | |
Administrative fees payable (Note 2) | | | 6,109 | | | | 32,244 | | |
Trustee deferred compensation plan (Note 2) | | | 1,498,697 | | | | 437,781 | | |
Service fees payable (Note 3) | | | 6,346 | | | | 27,747 | | |
Trustee fees payable | | | 6,773 | | | | 11,534 | | |
IRS compliance fees for foreign withholding tax claims payable | | | — | | | | — | | |
Unrealized depreciation on forward foreign currency exchange contracts | | | — | | | | — | | |
Payable for Fund shares redeemed | | | 513,803 | | | | 1,546,908 | | |
Accrued expenses and other liabilities | | | 452,910 | | | | 819,529 | | |
Total Liabilities | | | 4,861,878 | | | | 16,346,009 | | |
Commitments and contingent liabilities^ | | | — | | | | — | | |
Net Assets | | $ | 1,397,774,168 | | | $ | 2,831,645,889 | | |
Net Assets Consist of | |
Capital stock (par value, $0.001 per share) | | $ | 61,184 | | | $ | 91,135 | | |
Capital surplus | | | 675,383,251 | | | | 2,287,590,304 | | |
Total distributable earnings (losses) | | | 722,329,733 | | | | 543,964,450 | | |
Net Assets | | $ | 1,397,774,168 | | | $ | 2,831,645,889 | | |
First Eagle Funds | Annual Report | October 31, 2024
171
Statements of Assets and Liabilities (continued)
| | | First Eagle
Global Fund* | | First Eagle
Overseas Fund* | |
Class A | |
Net assets | | $ | 15,127,580,377 | | | $ | 1,453,841,100 | | |
Shares outstanding | | | 206,799,517 | | | | 53,773,662 | | |
Net asset value per share and redemption proceeds per share | | $ | 73.15 | | | $ | 27.04 | | |
Offering price per share (NAV per share plus maximum sales charge)** | | $ | 77.00 | (1) | | $ | 28.46 | (1) | |
Class C | |
Net assets | | $ | 1,444,249,985 | | | $ | 60,222,280 | | |
Shares outstanding | | | 20,772,700 | | | | 2,357,034 | | |
Net asset value per share and redemption proceeds per share | | $ | 69.53 | | | $ | 25.55 | | |
Redemption proceeds per share (NAV per share less maximum contingent
deferred sale charge)(2) | | $ | 68.83 | | | $ | 25.29 | | |
Class I | |
Net assets | | $ | 37,097,842,302 | | | $ | 9,627,066,963 | | |
Shares outstanding | | | 503,356,923 | | | | 346,399,690 | | |
Net asset value per share and redemption proceeds per share | | $ | 73.70 | | | $ | 27.79 | | |
Class R6 | |
Net assets | | $ | 2,666,447,627 | | | $ | 1,227,350,561 | | |
Shares outstanding | | | 36,151,867 | | | | 44,141,524 | | |
Net asset value per share and redemption proceeds per share | | $ | 73.76 | | | $ | 27.80 | | |
* First Eagle Global Fund, First Eagle Overseas Fund, First Eagle U.S. Value Fund and First Eagle Gold Fund financial statements are shown on a consolidated basis and includes the balances of the First Eagle Global Cayman Fund, Ltd., First Eagle Overseas Cayman Fund, Ltd., First Eagle U.S. Value Cayman Fund, Ltd., and First Eagle Gold Cayman Fund, Ltd., respectively.
^ See Note 2 and Note 5 in the Notes to the Consolidated Financial Statements
** A contingent deferred sales charge (CDSC) of 1.00% may apply on redemptions of Class A shares made within 18 months following a purchase of $1,000,000 or more without an initial sales charge.
(1) The maximum sales charge is 5.00% for Class A shares. Classes C, I and R6 have no front-end sales charges.
(2) The maximum CDSC is 1.00% for Class C shares, which is charged on the lesser of the original purchase price or the current market value at the time of sale. This pertains to shares sold or redeemed within the first year of purchase.
See Notes to Financial Statements.
First Eagle Funds | Annual Report | October 31, 2024
172
October 31, 2024
| | | First Eagle
U.S. Value Fund* | | First Eagle
Gold Fund* | |
Class A | |
Net assets | | $ | 638,522,016 | | | $ | 742,946,956 | | |
Shares outstanding | | | 28,292,500 | | | | 24,372,239 | | |
Net asset value per share and redemption proceeds per share | | $ | 22.57 | | | $ | 30.48 | | |
Offering price per share (NAV per share plus maximum sales charge)** | | $ | 23.76 | (1) | | $ | 32.08 | (1) | |
Class C | |
Net assets | | $ | 29,231,550 | | | $ | 130,211,624 | | |
Shares outstanding | | | 1,384,879 | | | | 4,743,206 | | |
Net asset value per share and redemption proceeds per share | | $ | 21.11 | | | $ | 27.45 | | |
Redemption proceeds per share (NAV per share less maximum contingent
deferred sale charge)(2) | | $ | 20.90 | | | $ | 27.18 | | |
Class I | |
Net assets | | $ | 688,338,654 | | | $ | 1,731,704,198 | | |
Shares outstanding | | | 29,707,684 | | | | 54,858,882 | | |
Net asset value per share and redemption proceeds per share | | $ | 23.17 | | | $ | 31.57 | | |
Class R6 | |
Net assets | | $ | 41,681,948 | | | $ | 226,783,111 | | |
Shares outstanding | | | 1,798,949 | | | | 7,160,987 | | |
Net asset value per share and redemption proceeds per share | | $ | 23.17 | | | $ | 31.67 | | |
First Eagle Funds | Annual Report | October 31, 2024
173
Statements of Assets and Liabilities (continued)
| | | First Eagle
Global Income
Builder Fund | | First Eagle
Rising
Dividend Fund | |
Assets | |
Investments, at Cost (Note 1) | |
Investments in non-affiliates | | $ | 1,422,698,695 | | | $ | 305,494,103 | | |
Investments in affiliates | | | — | | | | — | | |
Gold bullion | | | 59,207,085 | | | | — | | |
Foreign currency | | | — | | | | — | | |
Investments, at Value (Note 1) | |
Investments in non-affiliates | | | 1,615,705,857 | | | | 433,227,058 | | |
Investments in affiliates | | | — | | | | — | | |
Gold bullion | | | 132,598,740 | | | | — | | |
Foreign currency | | | — | | | | — | | |
Cash | | | 14,737 | | | | — | | |
Unrealized appreciation on forward foreign currency exchange contracts | | | 1,113,951 | | | | — | | |
Receivable for investment securities sold | | | 25,137,038 | | | | — | | |
Foreign tax reclaims receivable | | | 2,114,918 | | | | 191,695 | | |
Receivable for Fund shares sold | | | 2,079,055 | | | | 328,215 | | |
Accrued interest and dividends receivable | | | 6,866,431 | | | | 504,427 | | |
Investment for trustee deferred compensation plan (Note 2) | | | 1,006,155 | | | | 1,895,988 | | |
Due from adviser | | | — | | | | 21,184 | | |
Other assets | | | 14,091 | | | | 4,772 | | |
Total Assets | | | 1,786,650,973 | | | | 436,173,339 | | |
Liabilities | |
Investment advisory fees payable (Note 2) | | | 1,131,500 | | | | 187,145 | | |
Option contracts written, at value (premiums received $1,984,616, $—, $— and
$—, respectively) | | | 5,333,211 | | | | — | | |
Payable for investment securities purchased | | | 16,998,489 | | | | — | | |
Distribution fees payable (Note 3) | | | 193,742 | | | | 65,120 | | |
Administrative fees payable (Note 2) | | | 75,432 | | | | 15,279 | | |
Trustee deferred compensation plan (Note 2) | | | 1,006,155 | | | | 1,895,988 | | |
Service fees payable (Note 3) | | | 16,034 | | | | 1,122 | | |
Trustee fees payable | | | 6,930 | | | | 2,326 | | |
IRS compliance fees for foreign withholding tax claims payable | | | 276,252 | | | | — | | |
Payable for dividends to shareholders | | | 120,628 | | | | — | | |
Unrealized depreciation on forward foreign currency exchange contracts | | | 97,652 | | | | — | | |
Payable for Fund shares redeemed | | | 1,564,663 | | | | 640,453 | | |
Accrued expenses and other liabilities | | | 931,055 | | | | 440,967 | | |
Total Liabilities | | | 27,751,743 | | | | 3,248,400 | | |
Commitments and contingent liabilities^ | | | — | | | | — | | |
Net Assets | | $ | 1,758,899,230 | | | $ | 432,924,939 | | |
Net Assets Consist of | |
Capital stock (par value, $0.001 per share) | | $ | 128,003 | | | $ | 15,663 | | |
Capital surplus | | | 1,467,162,591 | | | | 287,440,093 | | |
Total distributable earnings (losses) | | | 291,608,636 | | | | 145,469,183 | | |
Net Assets | | $ | 1,758,899,230 | | | $ | 432,924,939 | | |
First Eagle Funds | Annual Report | October 31, 2024
174
October 31, 2024
| | | First Eagle
Small Cap
Opportunity Fund | | First Eagle
U.S. Smid Cap
Opportunity Fund | |
Assets | |
Investments, at Cost (Note 1) | |
Investments in non-affiliates | | $ | 1,603,827,093 | | | $ | 40,180,311 | | |
Investments in affiliates | | | 5,687,252 | | | | — | | |
Gold bullion | | | — | | | | — | | |
Foreign currency | | | — | | | | — | | |
Investments, at Value (Note 1) | |
Investments in non-affiliates | | | 1,865,409,599 | | | | 50,035,722 | | |
Investments in affiliates | | | 4,023,077 | | | | — | | |
Gold bullion | | | — | | | | — | | |
Foreign currency | | | — | | | | — | | |
Cash | | | — | | | | — | | |
Unrealized appreciation on forward foreign currency exchange contracts | | | — | | | | — | | |
Receivable for investment securities sold | | | 3,503,521 | | | | — | | |
Foreign tax reclaims receivable | | | — | | | | — | | |
Receivable for Fund shares sold | | | 2,945,640 | | | | 84,954 | | |
Accrued interest and dividends receivable | | | 993,140 | | | | 9,623 | | |
Investment for trustee deferred compensation plan (Note 2) | | | 3,622,337 | | | | 200,957 | | |
Due from adviser | | | 254,505 | | | | 44,642 | | |
Other assets | | | 13,776 | | | | 1,679 | | |
Total Assets | | | 1,880,765,595 | | | | 50,377,577 | | |
Liabilities | |
Investment advisory fees payable (Note 2) | | | 1,389,088 | | | | 31,833 | | |
Option contracts written, at value (premiums received $1,984,616, $—, $— and
$—, respectively) | | | — | | | | — | | |
Payable for investment securities purchased | | | 5,026,437 | | | | — | | |
Distribution fees payable (Note 3) | | | 22,149 | | | | 274 | | |
Administrative fees payable (Note 2) | | | 55,951 | | | | 25,843 | | |
Trustee deferred compensation plan (Note 2) | | | 3,622,337 | | | | 200,957 | | |
Service fees payable (Note 3) | | | — | | | | — | | |
Trustee fees payable | | | 4,039 | | | | — | | |
IRS compliance fees for foreign withholding tax claims payable | | | — | | | | — | | |
Payable for dividends to shareholders | | | — | | | | — | | |
Unrealized depreciation on forward foreign currency exchange contracts | | | — | | | | — | | |
Payable for Fund shares redeemed | | | 1,364,425 | | | | — | | |
Accrued expenses and other liabilities | | | 760,924 | | | | 175,233 | | |
Total Liabilities | | | 12,245,350 | | | | 434,140 | | |
Commitments and contingent liabilities^ | | | — | | | | — | | |
Net Assets | | $ | 1,868,520,245 | | | $ | 49,943,437 | | |
Net Assets Consist of | |
Capital stock (par value, $0.001 per share) | | $ | 180,009 | | | $ | 4,274 | | |
Capital surplus | | | 1,662,040,350 | | | | 40,515,132 | | |
Total distributable earnings (losses) | | | 206,299,886 | | | | 9,424,031 | | |
Net Assets | | $ | 1,868,520,245 | | | $ | 49,943,437 | | |
First Eagle Funds | Annual Report | October 31, 2024
175
Statements of Assets and Liabilities (continued)
| | | First Eagle
Global Income
Builder Fund | | First Eagle
Rising
Dividend Fund | |
Class A | |
Net assets | | $ | 679,029,307 | | | $ | 285,394,505 | | |
Shares outstanding | | | 49,293,828 | | | | 10,420,922 | | |
Net asset value per share and redemption proceeds per share | | $ | 13.78 | | | $ | 27.39 | | |
Offering price per share (NAV per share plus maximum sales charge)* | | $ | 14.51 | (1) | | $ | 28.83 | (1) | |
Class C | |
Net assets | | $ | 73,815,421 | | | $ | 5,485,130 | | |
Shares outstanding | | | 5,323,986 | | | | 348,828 | | |
Net asset value per share and redemption proceeds per share | | $ | 13.86 | | | $ | 15.72 | | |
Redemption proceeds per share (NAV per share less maximum contingent
deferred sale charge)(2) | | $ | 13.72 | | | $ | 15.56 | | |
Class I | |
Net assets | | $ | 929,623,191 | | | $ | 133,670,223 | | |
Shares outstanding | | | 67,802,292 | | | | 4,604,708 | | |
Net asset value per share and redemption proceeds per share | | $ | 13.71 | | | $ | 29.03 | | |
Class R6 | |
Net assets | | $ | 76,431,311 | | | $ | 8,375,081 | | |
Shares outstanding | | | 5,583,058 | | | | 288,554 | | |
Net asset value per share and redemption proceeds per share | | $ | 13.69 | | | $ | 29.02 | | |
^ See Note 2 and Note 5 in the Notes to the Consolidated Financial Statements
* A contingent deferred sales charge (CDSC) of 1.00% may apply on redemptions of Class A shares made within 18 months following a purchase of $1,000,000 or more without an initial sales charge. With respect to the First Eagle Global Income Builder Fund, a contingent deferred sales charge of 1.00% may apply on certain redemptions of Class A shares made within 18 months following a purchase of $250,000 or more without an initial sales charge.
(1) The maximum sales charge is 5.00% for Class A shares. Classes C, I and R6 have no front-end sales charges.
(2) The maximum CDSC is 1.00% for Class C shares, which is charged on the lesser of the original purchase price or the current market value at the time of sale. This pertains to shares sold or redeemed within the first year of purchase.
See Notes to Financial Statements.
First Eagle Funds | Annual Report | October 31, 2024
176
October 31, 2024
| | | First Eagle
Small Cap
Opportunity Fund | | First Eagle
U.S. Smid Cap
Opportunity Fund | |
Class A | |
Net assets | | $ | 102,705,444 | | | $ | 1,297,650 | | |
Shares outstanding | | | 9,940,432 | | | | 113,192 | | |
Net asset value per share and redemption proceeds per share | | $ | 10.33 | | | $ | 11.46 | | |
Offering price per share (NAV per share plus maximum sales charge)* | | $ | 10.87 | (1) | | $ | 12.06 | (1) | |
Class C | |
Net assets | | $ | — | | | $ | — | | |
Shares outstanding | | | — | | | | — | | |
Net asset value per share and redemption proceeds per share | | $ | — | | | $ | — | | |
Redemption proceeds per share (NAV per share less maximum contingent
deferred sale charge)(2) | | $ | — | | | $ | — | | |
Class I | |
Net assets | | $ | 1,657,407,784 | | | $ | 48,532,281 | | |
Shares outstanding | | | 159,633,477 | | | | 4,151,011 | | |
Net asset value per share and redemption proceeds per share | | $ | 10.38 | | | $ | 11.69 | | |
Class R6 | |
Net assets | | $ | 108,407,017 | | | $ | 113,506 | | |
Shares outstanding | | | 10,435,226 | | | | 10,030 | | |
Net asset value per share and redemption proceeds per share | | $ | 10.39 | | | $ | 11.32 | | |
First Eagle Funds | Annual Report | October 31, 2024
177
Statements of Assets and Liabilities (continued)
| | | First Eagle
Global Real
Assets Fund* | | First Eagle
High Yield
Municipal Fund** | |
Assets | |
Investments, at Cost (Note 1) | |
Investments in non-affiliates | | $ | 12,588,010 | | | $ | 4,692,549,057 | | |
Gold bullion | | | 423,554 | | | | — | | |
Investments, at Value (Note 1) | |
Investments in non-affiliates | | | 13,862,902 | | | | 4,744,104,336 | | |
Gold bullion | | | 551,559 | | | | — | | |
Receivable for investment securities sold | | | — | | | | 237,470,633 | | |
Foreign tax reclaims receivable | | | 6,972 | | | | — | | |
Receivable for Fund shares sold | | | 77,243 | | | | 33,810,778 | | |
Accrued interest and dividends receivable | | | 18,605 | | | | 63,489,368 | | |
Investment for trustee deferred compensation plan (Note 2) | | | 155,684 | | | | — | | |
Due from adviser | | | 61,926 | | | | 60,271 | | |
Other assets | | | 2,105 | | | | 7,456 | | |
Total Assets | | | 14,736,996 | | | | 5,078,942,842 | | |
Liabilities | |
Investment advisory fees payable (Note 2) | | | 7,909 | | | | 1,564,773 | | |
Due to custodian | | | — | | | | 7,827 | | |
Payable for investment securities purchased | | | — | | | | 503,529,417 | | |
Payable for Floating Rate Note Obligations | | | — | | | | 326,775,000 | | |
Distribution fees payable (Note 3) | | | 435 | | | | 275,396 | | |
Administrative fees payable (Note 2) | | | 15,466 | | | | 55,763 | | |
Trustee deferred compensation plan (Note 2) | | | 155,684 | | | | — | | |
Service fees payable (Note 3) | | | — | | | | 15,818 | | |
Trustee fees payable | | | 45 | | | | 14,902 | | |
Payable for dividends to shareholders | | | — | | | | 170,339 | | |
Payable for Fund shares redeemed | | | 4,084 | | | | 8,505,992 | | |
Interest expense and fees payable | | | — | | | | 567,900 | | |
Accrued expenses and other liabilities | | | 255,407 | | | | 410,606 | | |
Total Liabilities | | | 439,030 | | | | 841,893,733 | | |
Commitments and contingent liabilities^ | | | — | | | | — | | |
Net Assets | | $ | 14,297,966 | | | $ | 4,237,049,109 | | |
Net Assets Consist of | |
Capital stock (par value, $0.001 per share) | | $ | 1,260 | | | $ | 490,378 | | |
Capital surplus | | | 12,666,767 | | | | 4,312,859,647 | | |
Total distributable earnings (losses) | | | 1,629,939 | | | | (76,300,916 | ) | |
Net Assets | | $ | 14,297,966 | | | $ | 4,237,049,109 | | |
First Eagle Funds | Annual Report | October 31, 2024
178
October 31, 2024
| | | First Eagle
Short Duration
High Yield
Municipal Fund | |
Assets | |
Investments, at Cost (Note 1) | |
Investments in non-affiliates | | $ | 155,110,500 | | |
Gold bullion | | | — | | |
Investments, at Value (Note 1) | |
Investments in non-affiliates | | | 155,098,063 | | |
Gold bullion | | | — | | |
Receivable for investment securities sold | | | — | | |
Foreign tax reclaims receivable | | | — | | |
Receivable for Fund shares sold | | | 6,790,025 | | |
Accrued interest and dividends receivable | | | 2,557,750 | | |
Investment for trustee deferred compensation plan (Note 2) | | | — | | |
Due from adviser | | | 134,178 | | |
Other assets | | | 2,352 | | |
Total Assets | | | 164,582,368 | | |
Liabilities | |
Investment advisory fees payable (Note 2) | | | 53,521 | | |
Due to custodian | | | — | | |
Payable for investment securities purchased | | | 3,496,496 | | |
Payable for Floating Rate Note Obligations | | | — | | |
Distribution fees payable (Note 3) | | | 7,623 | | |
Administrative fees payable (Note 2) | | | 4,985 | | |
Trustee deferred compensation plan (Note 2) | | | — | | |
Service fees payable (Note 3) | | | — | | |
Trustee fees payable | | | 620 | | |
Payable for dividends to shareholders | | | 7,204 | | |
Payable for Fund shares redeemed | | | 172,773 | | |
Interest expense and fees payable | | | — | | |
Accrued expenses and other liabilities | | | 162,316 | | |
Total Liabilities | | | 3,905,538 | | |
Commitments and contingent liabilities^ | | | — | | |
Net Assets | | $ | 160,676,830 | | |
Net Assets Consist of | |
Capital stock (par value, $0.001 per share) | | $ | 15,673 | | |
Capital surplus | | | 160,649,737 | | |
Total distributable earnings (losses) | | | 11,420 | | |
Net Assets | | $ | 160,676,830 | | |
First Eagle Funds | Annual Report | October 31, 2024
179
Statements of Assets and Liabilities (continued)
| | | First Eagle
Global Real
Assets Fund* | | First Eagle
High Yield
Municipal Fund** | |
Class A | |
Net assets | | $ | 2,010,918 | | | $ | 1,109,653,979 | | |
Shares outstanding | | | 176,193 | | | | 128,366,630 | | |
Net asset value per share and redemption proceeds per share | | $ | 11.41 | | | $ | 8.64 | | |
Offering price per share (NAV per share plus maximum sales charge)*** | | $ | 12.01 | (1) | | $ | 8.86 | (2) | |
Class C | |
Net assets | | $ | — | | | $ | 79,515,004 | | |
Shares outstanding | | | — | | | | 9,205,822 | | |
Net asset value per share and redemption proceeds per share | | $ | — | | | $ | 8.64 | | |
Redemption proceeds per share (NAV per share less maximum contingent
deferred sale charge)(3) | | $ | — | | | $ | 8.55 | | |
Class I | |
Net assets | | $ | 11,075,321 | | | $ | 3,046,661,749 | | |
Shares outstanding | | | 976,752 | | | | 352,664,774 | | |
Net asset value per share and redemption proceeds per share | | $ | 11.34 | | | $ | 8.64 | | |
Class R6 | |
Net assets | | $ | 1,211,727 | | | $ | 1,218,377 | | |
Shares outstanding | | | 106,908 | | | | 140,756 | | |
Net asset value per share and redemption proceeds per share | | $ | 11.33 | | | $ | 8.66 | | |
* First Eagle Global Real Assets Fund financial statements are shown on a consolidated basis and includes the balances of the First Eagle Global Real Asset Cayman Fund, Ltd.
** First Eagle High Yield Municipal Fund was known as First Eagle High Income Fund prior to December 27, 2023.
*** A contingent deferred sales charge (CDSC) of 1.00% may apply on redemptions of Class A shares made within 18 months following a purchase of $1,000,000 or more without an initial sales charge. With respect to the First Eagle High Yield Municipal Fund and the First Eagle Short Duration High Yield Municipal Fund, a contingent deferred sales charge of 1.00% may apply on certain redemptions of Class A shares made within 18 months following a purchase of $250,000 or more without an initial sales charge.
^ See Note 2 and Note 5 in the Notes to the Consolidated Financial Statements
(1) The maximum sales charge is 5.00% for Class A shares. Classes C, I and R6 have no front-end sales charges.
(2) The maximum sales charge is 2.50% for Class A shares. Classes C, I and R6 have no front-end sales charges.
(3) The maximum CDSC is 1.00% for Class C shares, which is charged on the lesser of the original purchase price or the current market value at the time of sale. This pertains to shares sold or redeemed within the first year of purchase.
See Notes to Financial Statements.
First Eagle Funds | Annual Report | October 31, 2024
180
October 31, 2024
| | | First Eagle
Short Duration
High Yield
Municipal Fund | |
Class A | |
Net assets | | $ | 43,432,869 | | |
Shares outstanding | | | 4,232,723 | | |
Net asset value per share and redemption proceeds per share | | $ | 10.26 | | |
Offering price per share (NAV per share plus maximum sales charge)*** | | $ | 10.52 | (2) | |
Class C | |
Net assets | | $ | — | | |
Shares outstanding | | | — | | |
Net asset value per share and redemption proceeds per share | | $ | — | | |
Redemption proceeds per share (NAV per share less maximum contingent
deferred sale charge)(3) | | $ | — | | |
Class I | |
Net assets | | $ | 116,167,964 | | |
Shares outstanding | | | 11,335,372 | | |
Net asset value per share and redemption proceeds per share | | $ | 10.25 | | |
Class R6 | |
Net assets | | $ | 1,075,997 | | |
Shares outstanding | | | 104,854 | | |
Net asset value per share and redemption proceeds per share | | $ | 10.26 | | |
First Eagle Funds | Annual Report | October 31, 2024
181
| | | First Eagle
Global Fund* | | First Eagle
Overseas Fund* | |
Investment Income | |
Interest (net of $170,004, $53,255, $— and $— foreign taxes withheld) | | $ | 246,538,186 | | | $ | 22,835,918 | | |
Dividends from: | |
Non-affiliates (net of $61,835,633, $31,265,188, $142,587 and $4,439,715
foreign taxes withheld) | | | 956,359,897 | | | | 312,110,341 | | |
Affiliated issuers (net of $239,098, $1,596,078, $— and $362,307
foreign taxes withheld) | | | 67,881,803 | | | | 11,955,962 | | |
Total Income | | | 1,270,779,886 | | | | 346,902,221 | | |
Expenses | |
Investment advisory fees (Note 2) | | | 393,022,590 | | | | 93,232,514 | | |
Distributions fees (Note 3) | |
Class A | | | 35,809,583 | | | | 3,584,878 | | |
Class C | | | 11,352,683 | | | | 517,828 | | |
Class R3 | | | 10,962 | | | | 354 | | |
Class R4 | | | 587 | | | | 1,635 | | |
Shareholder servicing agent fees | | | 39,164,390 | | | | 10,596,493 | | |
Service fees (Note 3) | |
Class C | | | 3,784,228 | | | | 172,609 | | |
Class R3 | | | 4,348 | | | | 141 | | |
Administrative fees (Note 2) | | | 3,854,189 | | | | 1,012,105 | | |
Professional fees | | | 980,220 | | | | 292,224 | | |
Custodian and accounting fees | | | 6,017,132 | | | | 2,167,532 | | |
Shareholder reporting fees | | | 2,600,186 | | | | 790,651 | | |
Trustees' fees | | | 1,980,487 | | | | 533,273 | | |
Registration and filing fees | | | 424,339 | | | | 344,695 | | |
Other expenses | | | 948,649 | | | | 251,745 | | |
Total Expenses | | | 499,954,573 | | | | 113,498,677 | | |
Expense waiver (Note 2) | | | — | | | | — | | |
Expense reductions due to earnings credits (Note 1) | | | (1,572,543 | ) | | | (213,106 | ) | |
Net Expenses | | | 498,382,030 | | | | 113,285,571 | | |
Net Investment Income (Note 1) | | | 772,397,856 | | | | 233,616,650 | | |
Realized and Unrealized Gains (Losses) on Investments and Foreign
Currency Related Transactions (Note 1) | |
Net realized gains (losses) on: | |
Transactions from investments in non-affiliates | | | 1,640,482,075 | | | | 309,583,085 | | |
Transactions from investments in affiliates | | | 366,038 | | | | 31,778 | | |
Commodity related transactions | | | 403,823,456 | | | | 298,066,536 | | |
Settlement of foreign currency and foreign currency transactions | | | (1,556,143 | ) | | | (4,013,068 | ) | |
Settlement of forward foreign currency exchange contracts | | | 33,427,622 | | | | 21,435,204 | | |
| | | 2,076,543,048 | | | | 625,103,535 | | |
First Eagle Funds | Annual Report | October 31, 2024
182
October 31, 2024
| | | First Eagle
U.S. Value Fund* | | First Eagle
Gold Fund* | |
Investment Income | |
Interest (net of $170,004, $53,255, $— and $— foreign taxes withheld) | | $ | 7,487,660 | | | $ | 3,107,360 | | |
Dividends from: | |
Non-affiliates (net of $61,835,633, $31,265,188, $142,587 and $4,439,715
foreign taxes withheld) | | | 20,147,543 | | | | 29,094,257 | | |
Affiliated issuers (net of $239,098, $1,596,078, $— and $362,307
foreign taxes withheld) | | | — | | | | 2,048,459 | | |
Total Income | | | 27,635,203 | | | | 34,250,076 | | |
Expenses | |
Investment advisory fees (Note 2) | | | 9,707,346 | | | | 17,964,886 | | |
Distributions fees (Note 3) | |
Class A | | | 1,493,077 | | | | 1,543,986 | | |
Class C | | | 225,666 | | | | 858,845 | | |
Class R3 | | | 63 | | | | 1,026 | | |
Class R4 | | | 15 | | | | 509 | | |
Shareholder servicing agent fees | | | 834,109 | | | | 2,267,498 | | |
Service fees (Note 3) | |
Class C | | | 75,222 | | | | 286,282 | | |
Class R3 | | | 25 | | | | 408 | | |
Administrative fees (Note 2) | | | 195,294 | | | | 309,890 | | |
Professional fees | | | 211,396 | | | | 268,107 | | |
Custodian and accounting fees | | | 240,188 | | | | 623,183 | | |
Shareholder reporting fees | | | 92,775 | | | | 230,091 | | |
Trustees' fees | | | 60,503 | | | | 102,301 | | |
Registration and filing fees | | | 128,433 | | | | 162,236 | | |
Other expenses | | | 36,531 | | | | 58,596 | | |
Total Expenses | | | 13,300,643 | | | | 24,677,844 | | |
Expense waiver (Note 2) | | | (198,502 | ) | | | — | | |
Expense reductions due to earnings credits (Note 1) | | | (108,273 | ) | | | (140,202 | ) | |
Net Expenses | | | 12,993,868 | | | | 24,537,642 | | |
Net Investment Income (Note 1) | | | 14,641,335 | | | | 9,712,434 | | |
Realized and Unrealized Gains (Losses) on Investments and Foreign
Currency Related Transactions (Note 1) | |
Net realized gains (losses) on: | |
Transactions from investments in non-affiliates | | | 66,435,780 | | | | 83,241,972 | | |
Transactions from investments in affiliates | | | — | | | | 2,832,231 | | |
Commodity related transactions | | | 9,670,813 | | | | 147,320,589 | | |
Settlement of foreign currency and foreign currency transactions | | | (33 | ) | | | (190,967 | ) | |
Settlement of forward foreign currency exchange contracts | | | — | | | | — | | |
| | | 76,106,560 | | | | 233,203,825 | | |
First Eagle Funds | Annual Report | October 31, 2024
183
Statements of Operations (continued)
| | | First Eagle
Global Fund* | | First Eagle
Overseas Fund* | |
Changes in unrealized appreciation (depreciation) on: | |
Investment in non-affiliates and commodity related transactions (net of increase
in deferred capital gain country tax accruals of $1,274,899, $448,364, $— and $—) | | $ | 9,045,858,447 | | | $ | 1,540,075,178 | | |
Investment in affiliates | | | 189,944,670 | | | | 11,381,147 | | |
Foreign currency and foreign currency translations | | | (937,759 | ) | | | (358,552 | ) | |
Forward foreign currency exchange contracts | | | 6,056,341 | | | | 1,284,704 | | |
| | | 9,240,921,699 | | | | 1,552,382,477 | | |
Net realized and unrealized gains (losses) on investments, commodity,
foreign currency and forward contract related transactions | | | 11,317,464,747 | | | | 2,177,486,012 | | |
Net Increase in Net Assets Resulting from Operations | | $ | 12,089,862,603 | | | $ | 2,411,102,662 | | |
* First Eagle Global Fund, First Eagle Overseas Fund, First Eagle U.S. Value Fund and First Eagle Gold Fund financial statements are shown on a consolidated basis and includes the balances of the First Eagle Global Cayman Fund, Ltd., First Eagle Overseas Cayman Fund, Ltd., First Eagle U.S. Value Cayman Fund, Ltd., and First Eagle Gold Cayman Fund, Ltd., respectively.
See Notes to Financial Statements.
First Eagle Funds | Annual Report | October 31, 2024
184
October 31, 2024
| | | First Eagle
U.S. Value Fund* | | First Eagle
Gold Fund* | |
Changes in unrealized appreciation (depreciation) on: | |
Investment in non-affiliates and commodity related transactions (net of increase
in deferred capital gain country tax accruals of $1,274,899, $448,364, $— and $—) | | $ | 243,691,369 | | | $ | 460,460,786 | | |
Investment in affiliates | | | — | | | | 81,447,555 | | |
Foreign currency and foreign currency translations | | | (297 | ) | | | (16,031 | ) | |
Forward foreign currency exchange contracts | | | — | | | | — | | |
| | | 243,691,072 | | | | 541,892,310 | | |
Net realized and unrealized gains (losses) on investments, commodity,
foreign currency and forward contract related transactions | | | 319,797,632 | | | | 775,096,135 | | |
Net Increase in Net Assets Resulting from Operations | | $ | 334,438,967 | | | $ | 784,808,569 | | |
First Eagle Funds | Annual Report | October 31, 2024
185
Statements of Operations (continued)
| | | First Eagle
Global Income
Builder Fund | | First Eagle
Rising
Dividend Fund | |
Investment Income | |
Interest (net of $—, $—, $— and $— foreign taxes withheld) | | $ | 23,978,107 | | | $ | 313,127 | | |
Dividends from: | |
Non-affiliates (net of $2,581,902, $104,767, $— and $— foreign taxes withheld) | | | 41,411,518 | | | | 9,372,560 | | |
Total Income | | | 65,389,625 | | | | 9,685,687 | | |
Expenses | |
Investment advisory fees (Note 2) | | | 12,900,132 | | | | 2,041,075 | | |
Distributions fees (Note 3) | |
Class A | | | 1,642,398 | | | | 684,478 | | |
Class C | | | 587,855 | | | | 49,332 | | |
Class R3 | | | 21 | | | | 21 | | |
Class R4 | | | 20 | | | | 14 | | |
Shareholder servicing agent fees | | | 1,108,037 | | | | 461,671 | | |
Service fees (Note 3) | |
Class C | | | 195,952 | | | | 16,444 | | |
Class R3 | | | 9 | | | | 9 | | |
Administrative fees (Note 2) | | | 859,998 | | | | 186,792 | | |
Professional fees | | | 601,767 | | | | 262,077 | | |
Custodian and accounting fees | | | 310,038 | | | | 132,008 | | |
Shareholder reporting fees | | | 118,554 | | | | 70,601 | | |
Trustees' fees | | | 68,094 | | | | 16,736 | | |
Recoupment expense | | | — | | | | — | | |
Registration and filing fees | | | 216,358 | | | | 100,267 | | |
Other expenses | | | 44,468 | | | | 19,645 | | |
Total Expenses | | | 18,653,701 | | | | 4,041,170 | | |
Expense waiver (Note 2) | | | — | | | | (543,772 | ) | |
Expense reductions due to earnings credits (Note 1) | | | (74,790 | ) | | | (90,029 | ) | |
Net Expenses | | | 18,578,911 | | | | 3,407,369 | | |
Net Investment Income (Note 1) | | | 46,810,714 | | | | 6,278,318 | | |
Realized and Unrealized Gains (Losses) on Investments and Foreign
Currency Related Transactions (Note 1) | |
Net realized gains (losses) on: | |
Transactions from investments in non-affiliates | | | 16,137,351 | | | | 15,314,522 | | |
Transactions from investments in affiliates | | | — | | | | — | | |
Commodity related transactions | | | 7,923,859 | | | | — | | |
Settlement of foreign currency and foreign currency transactions | | | (297,013 | ) | | | (13,699 | ) | |
Settlement of forward foreign currency exchange contracts | | | 481,800 | | | | — | | |
Expiration or closing of option contracts written | | | 1,447,908 | | | | — | | |
| | | 25,693,905 | | | | 15,300,823 | | |
First Eagle Funds | Annual Report | October 31, 2024
186
October 31, 2024
| | | First Eagle
Small Cap
Opportunity Fund | | First Eagle
U.S. Smid Cap
Opportunity Fund | |
Investment Income | |
Interest (net of $—, $—, $— and $— foreign taxes withheld) | | $ | — | | | $ | — | | |
Dividends from: | |
Non-affiliates (net of $2,581,902, $104,767, $— and $— foreign taxes withheld) | | | 25,346,431 | | | | 491,829 | | |
Total Income | | | 25,346,431 | | | | 491,829 | | |
Expenses | |
Investment advisory fees (Note 2) | | | 15,237,819 | | | | 290,613 | | |
Distributions fees (Note 3) | |
Class A | | | 228,802 | | | | 1,177 | | |
Class C | | | — | | | | — | | |
Class R3 | | | — | | | | — | | |
Class R4 | | | — | | | | — | | |
Shareholder servicing agent fees | | | 2,265,340 | | | | 9,489 | | |
Service fees (Note 3) | |
Class C | | | — | | | | — | | |
Class R3 | | | — | | | | — | | |
Administrative fees (Note 2) | | | 371,257 | | | | 86,047 | | |
Professional fees | | | 232,524 | | | | 160,307 | | |
Custodian and accounting fees | | | 236,655 | | | | 91,979 | | |
Shareholder reporting fees | | | 287,553 | | | | 15,243 | | |
Trustees' fees | | | 64,644 | | | | 2,079 | | |
Recoupment expense | | | 24,132 | | | | — | | |
Registration and filing fees | | | 245,525 | | | | 57,674 | | |
Other expenses | | | 36,893 | | | | 10,121 | | |
Total Expenses | | | 19,231,144 | | | | 724,729 | | |
Expense waiver (Note 2) | | | (1,017,730 | ) | | | (351,412 | ) | |
Expense reductions due to earnings credits (Note 1) | | | (32,772 | ) | | | (3,218 | ) | |
Net Expenses | | | 18,180,642 | | | | 370,099 | | |
Net Investment Income (Note 1) | | | 7,165,789 | | | | 121,730 | | |
Realized and Unrealized Gains (Losses) on Investments and Foreign
Currency Related Transactions (Note 1) | |
Net realized gains (losses) on: | |
Transactions from investments in non-affiliates | | | 5,613,170 | | | | (430,268 | ) | |
Transactions from investments in affiliates | | | (228,378 | ) | | | — | | |
Commodity related transactions | | | — | | | | — | | |
Settlement of foreign currency and foreign currency transactions | | | — | | | | — | | |
Settlement of forward foreign currency exchange contracts | | | — | | | | — | | |
Expiration or closing of option contracts written | | | — | | | | — | | |
| | | 5,384,792 | | | | (430,268 | ) | |
First Eagle Funds | Annual Report | October 31, 2024
187
Statements of Operations (continued)
| | | First Eagle
Global Income
Builder Fund | | First Eagle
Rising
Dividend Fund | |
Changes in unrealized appreciation (depreciation) on: | |
Investment in non-affiliates and commodity related transactions (net of increase
in deferred capital gain country tax accruals of $17,387, $—, $— and $—) | | $ | 227,150,957 | | | $ | 91,667,386 | | |
Investment in affiliates | | | — | | | | — | | |
Foreign currency and foreign currency translations | | | (97,944 | ) | | | 18,806 | | |
Forward foreign currency exchange contracts | | | (179,785 | ) | | | — | | |
Option contracts written | | | (3,742,884 | ) | | | — | | |
| | | 223,130,344 | | | | 91,686,192 | | |
Net realized and unrealized gains (losses) on investments, commodity, foreign
currency and forward contract related transactions | | | 248,824,249 | | | | 106,987,015 | | |
Net Increase in Net Assets Resulting from Operations | | $ | 295,634,963 | | | $ | 113,265,333 | | |
See Notes to Financial Statements.
First Eagle Funds | Annual Report | October 31, 2024
188
October 31, 2024
| | | First Eagle
Small Cap
Opportunity Fund | | First Eagle
U.S. Smid Cap
Opportunity Fund | |
Changes in unrealized appreciation (depreciation) on: | |
Investment in non-affiliates and commodity related transactions (net of increase
in deferred capital gain country tax accruals of $17,387, $—, $— and $—) | | $ | 363,781,753 | | | $ | 10,690,345 | | |
Investment in affiliates | | | (808,923 | ) | | | — | | |
Foreign currency and foreign currency translations | | | — | | | | — | | |
Forward foreign currency exchange contracts | | | — | | | | — | | |
Option contracts written | | | — | | | | — | | |
| | | 362,972,830 | | | | 10,690,345 | | |
Net realized and unrealized gains (losses) on investments, commodity, foreign
currency and forward contract related transactions | | | 368,357,622 | | | | 10,260,077 | | |
Net Increase in Net Assets Resulting from Operations | | $ | 375,523,411 | | | $ | 10,381,807 | | |
First Eagle Funds | Annual Report | October 31, 2024
189
Statements of Operations (continued)
| | | First Eagle
Global Real
Assets Fund* | | First Eagle
High Yield
Municipal Fund** | |
Investment Income | |
Interest (net of $—, $— and $— foreign taxes withheld) | | $ | — | | | $ | 79,127,686 | | |
Dividends from: | |
Non-affiliates (net of $26,561, $— and $— foreign taxes withheld) | | | 371,914 | | | | 270,202 | | |
Total Income | | | 371,914 | | | | 79,397,888 | | |
Expenses | |
Investment advisory fees (Note 2) | | | 84,873 | | | | 6,470,622 | | |
Distributions fees (Note 3) | |
Class A | | | 4,751 | | | | 999,497 | | |
Class C | | | — | | | | 213,081 | | |
Class R3 | | | — | | | | 282 | | |
Class R4 | | | — | | | | 2 | | |
Shareholder servicing agent fees | | | 6,098 | | | | 882,318 | | |
Service fees (Note 3) | |
Class C | | | — | | | | 71,027 | | |
Class R3 | | | — | | | | 113 | | |
Administrative fees (Note 2) | | | 86,660 | | | | 355,232 | | |
Professional fees | | | 227,286 | | | | 263,234 | | |
Custodian and accounting fees | | | 136,506 | | | | 174,302 | | |
Shareholder reporting fees | | | 15,080 | | | | 88,065 | | |
Trustees' fees | | | 10,833 | | | | 31,752 | | |
Interest expense | | | — | | | | 287,800 | | |
Registration and filing fees | | | 56,340 | | | | 883,583 | | |
Other expenses | | | 11,901 | | | | 22,686 | | |
Total Expenses | | | 640,328 | | | | 10,743,596 | | |
Expense waiver (Note 2) | | | (521,440 | ) | | | (1,202,402 | ) | |
Expense reductions due to earnings credits (Note 1) | | | (3,009 | ) | | | (46,246 | ) | |
Net Expenses | | | 115,879 | | | | 9,494,948 | | |
Net Investment Income (Note 1) | | | 256,035 | | | | 69,902,940 | | |
Realized and Unrealized Gains (Losses) on Investments and Foreign
Currency Related Transactions (Note 1) | |
Net realized gains (losses) on: | |
Transactions from investments in non-affiliates | | | (83,406 | ) | | | (2,097,494 | ) | |
Commodity related transactions | | | 176,660 | | | | — | | |
Settlement of foreign currency and foreign currency transactions | | | (9,576 | ) | | | 10 | | |
| | | 83,678 | | | | (2,097,484 | ) | |
First Eagle Funds | Annual Report | October 31, 2024
190
October 31, 2024
| | | First Eagle
Short Duration
High Yield
Municipal Fund
1/2/24† - 10/31/24 | |
Investment Income | |
Interest (net of $—, $— and $— foreign taxes withheld) | | $ | 1,866,754 | | |
Dividends from: | |
Non-affiliates (net of $26,561, $— and $— foreign taxes withheld) | | | 20,193 | | |
Total Income | | | 1,886,947 | | |
Expenses | |
Investment advisory fees (Note 2) | | | 168,828 | | |
Distributions fees (Note 3) | |
Class A | | | 16,304 | | |
Class C | | | — | | |
Class R3 | | | — | | |
Class R4 | | | — | | |
Shareholder servicing agent fees | | | 18,946 | | |
Service fees (Note 3) | |
Class C | | | — | | |
Class R3 | | | — | | |
Administrative fees (Note 2) | | | 25,315 | | |
Professional fees | | | 192,052 | | |
Custodian and accounting fees | | | 66,257 | | |
Shareholder reporting fees | | | 15,737 | | |
Trustees' fees | | | 1,558 | | |
Interest expense | | | — | | |
Registration and filing fees | | | 79,653 | | |
Other expenses | | | 6,952 | | |
Total Expenses | | | 591,602 | | |
Expense waiver (Note 2) | | | (492,722 | ) | |
Expense reductions due to earnings credits (Note 1) | | | (824 | ) | |
Net Expenses | | | 98,056 | | |
Net Investment Income (Note 1) | | | 1,788,891 | | |
Realized and Unrealized Gains (Losses) on Investments and Foreign
Currency Related Transactions (Note 1) | |
Net realized gains (losses) on: | |
Transactions from investments in non-affiliates | | | (4,872 | ) | |
Commodity related transactions | | | — | | |
Settlement of foreign currency and foreign currency transactions | | | — | | |
| | | (4,872 | ) | |
First Eagle Funds | Annual Report | October 31, 2024
191
Statements of Operations (continued)
| | | First Eagle
Global Real
Assets Fund* | | First Eagle
High Yield
Municipal Fund** | |
Changes in unrealized appreciation (depreciation) on: | |
Investment in non-affiliates and commodity related transactions | | $ | 1,850,975 | | | $ | 65,159,338 | | |
Foreign currency and foreign currency translations | | | (332 | ) | | | — | | |
| | | 1,850,643 | | | | 65,159,338 | | |
Net realized and unrealized gains (losses) on investments, commodity and
foreign currency related transactions | | | 1,934,321 | | | | 63,061,854 | | |
Net Increase in Net Assets Resulting from Operations | | $ | 2,190,356 | | | $ | 132,964,794 | | |
* First Eagle Global Real Assets Fund financial statements are shown on a consolidated basis and includes the balances of the First Eagle Global Real Asset Cayman Fund, Ltd.
** First Eagle High Yield Municipal Fund was known as First Eagle High Income Fund prior to December 27, 2023.
† Inception date.
See Notes to Financial Statements.
First Eagle Funds | Annual Report | October 31, 2024
192
October 31, 2024
| | | First Eagle
Short Duration
High Yield
Municipal Fund
1/2/24† - 10/31/24 | |
Changes in unrealized appreciation (depreciation) on: | |
Investment in non-affiliates and commodity related transactions | | $ | (12,437 | ) | |
Foreign currency and foreign currency translations | | | — | | |
| | | (12,437 | ) | |
Net realized and unrealized gains (losses) on investments, commodity and
foreign currency related transactions | | | (17,309 | ) | |
Net Increase in Net Assets Resulting from Operations | | $ | 1,771,582 | | |
First Eagle Funds | Annual Report | October 31, 2024
193
Statements of Changes in Net Assets
| | | First Eagle
Global Fund* | | First Eagle
Overseas Fund* | |
| | | For the
Year Ended
October 31, 2024 | | For the
Year Ended
October 31, 2023 | | For the
Year Ended
October 31, 2024 | | For the
Year Ended
October 31, 2023 | |
Operations | |
Net investment income | | $ | 772,397,856 | | | $ | 712,933,093 | | | $ | 233,616,650 | | | $ | 224,865,752 | | |
Net realized gain on investments, foreign currency and forward
contract related transactions | | | 2,076,543,048 | | | | 1,072,241,912 | | | | 625,103,535 | | | | 55,079,458 | | |
Change in unrealized appreciation (depreciation) on investments,
foreign currency and forward contract related translations | | | 9,240,921,699 | | | | 2,687,436,861 | | | | 1,552,382,477 | | | | 971,276,633 | | |
Net increase in net assets resulting from operations | | | 12,089,862,603 | | | | 4,472,611,866 | | | | 2,411,102,662 | | | | 1,251,221,843 | | |
Distributions to Shareholders | |
Distributable earnings: | |
Class A | | | (476,472,548 | ) | | | (532,262,215 | ) | | | (31,790,527 | ) | | | (51,515,550 | ) | |
Class C | | | (43,860,612 | ) | | | (73,844,904 | ) | | | (1,164,501 | ) | | | (3,499,629 | ) | |
Class I | | | (1,170,598,120 | ) | | | (1,201,145,307 | ) | | | (235,095,957 | ) | | | (330,889,508 | ) | |
Class R3 | | | (467,965 | ) | | | (300,468 | ) | | | (8,462 | ) | | | (10,928 | ) | |
Class R4 | | | (65,416 | ) | | | (52,892 | ) | | | (114,289 | ) | | | (516,040 | ) | |
Class R5 | | | (7,978 | ) | | | (4,292 | ) | | | (1,027 | ) | | | (1,389 | ) | |
Class R6 | | | (84,348,553 | ) | | | (78,042,283 | ) | | | (34,779,408 | ) | | | (51,189,271 | ) | |
Decrease in net assets resulting from distributions | | | (1,775,821,192 | ) | | | (1,885,652,361 | ) | | | (302,954,171 | ) | | | (437,622,315 | ) | |
Fund Share Transactions | |
Class A | |
Net proceeds from shares sold | | | 902,898,419 | | | | 932,378,681 | | | | 103,751,530 | | | | 129,738,590 | | |
Net asset value of shares issued for reinvested dividends and distributions | | | 417,748,177 | | | | 462,969,675 | | | | 29,118,152 | | | | 46,987,934 | | |
Cost of shares redeemed | | | (1,990,276,449 | ) | | | (1,756,209,796 | ) | | | (281,759,302 | ) | | | (315,584,580 | ) | |
Decrease in net assets from Fund share transactions | | | (669,629,853 | ) | | | (360,861,440 | ) | | | (148,889,620 | ) | | | (138,858,056 | ) | |
Class C | |
Net proceeds from shares sold | | | 168,806,447 | | | | 159,243,316 | | | | 5,485,918 | | | | 10,028,422 | | |
Net asset value of shares issued for reinvested dividends and distributions | | | 41,505,889 | | | | 69,690,281 | | | | 1,096,427 | | | | 3,306,288 | | |
Cost of shares redeemed | | | (554,768,126 | ) | | | (577,794,408 | ) | | | (32,627,078 | ) | | | (38,244,224 | ) | |
Decrease in net assets from Fund share transactions | | | (344,455,790 | ) | | | (348,860,811 | ) | | | (26,044,733 | ) | | | (24,909,514 | ) | |
Class I | |
Net proceeds from shares sold | | | 4,853,052,805 | | | | 5,159,536,258 | | | | 1,399,043,949 | | | | 2,516,370,739 | | |
Net asset value of shares issued for reinvested dividends and distributions | | | 1,018,464,881 | | | | 1,040,505,108 | | | | 210,292,492 | | | | 293,043,001 | | |
Cost of shares redeemed | | | (5,425,587,580 | ) | | | (4,792,999,401 | ) | | | (2,733,965,845 | ) | | | (2,754,833,013 | ) | |
Increase (decrease) in net assets from Fund share transactions | | | 445,930,106 | | | | 1,407,041,965 | | | | (1,124,629,404 | ) | | | 54,580,727 | | |
Class R3^ | |
Net proceeds from shares sold | | | 800,063 | | | | 9,928,674 | | | | 16,549 | | | | 96,333 | | |
Net asset value of shares issued for reinvested dividends and distributions | | | 467,965 | | | | 300,468 | | | | 8,462 | | | | 10,928 | | |
Cost of shares redeemed | | | (14,441,910 | ) | | | (5,240,478 | ) | | | (449,739 | ) | | | (24,725 | ) | |
Increase (decrease) in net assets from Fund share transactions | | | (13,173,882 | ) | | | 4,988,664 | | | | (424,728 | ) | | | 82,536 | | |
First Eagle Funds | Annual Report | October 31, 2024
194
| | | First Eagle
U.S. Value Fund* | | First Eagle
Gold Fund* | |
| | | For the
Year Ended
October 31, 2024 | | For the
Year Ended
October 31, 2023 | | For the
Year Ended
October 31, 2024 | | For the
Year Ended
October 31, 2023 | |
Operations | |
Net investment income | | $ | 14,641,335 | | | $ | 15,318,841 | | | $ | 9,712,434 | | | $ | 21,431,446 | | |
Net realized gain on investments, foreign currency and forward
contract related transactions | | | 76,106,560 | | | | 64,143,466 | | | | 233,203,825 | | | | 16,711,465 | | |
Change in unrealized appreciation (depreciation) on investments,
foreign currency and forward contract related translations | | | 243,691,072 | | | | 21,683,493 | | | | 541,892,310 | | | | 232,407,167 | | |
Net increase in net assets resulting from operations | | | 334,438,967 | | | | 101,145,800 | | | | 784,808,569 | | | | 270,550,078 | | |
Distributions to Shareholders | |
Distributable earnings: | |
Class A | | | (35,915,770 | ) | | | (42,377,864 | ) | | | (5,154,188 | ) | | | — | | |
Class C | | | (1,826,542 | ) | | | (2,657,277 | ) | | | (253,973 | ) | | | — | | |
Class I | | | (37,008,037 | ) | | | (42,529,115 | ) | | | (15,422,133 | ) | | | — | | |
Class R3 | | | (4,458 | ) | | | (4,891 | ) | | | (3,861 | ) | | | — | | |
Class R4 | | | (2,849 | ) | | | (2,596 | ) | | | (14,386 | ) | | | — | | |
Class R5 | | | (5,869 | ) | | | (5,988 | ) | | | (5,118 | ) | | | — | | |
Class R6 | | | (2,193,025 | ) | | | (2,106,071 | ) | | | (1,860,249 | ) | | | — | | |
Decrease in net assets resulting from distributions | | | (76,956,550 | ) | | | (89,683,802 | ) | | | (22,713,908 | ) | | | — | | |
Fund Share Transactions | |
Class A | |
Net proceeds from shares sold | | | 27,323,134 | | | | 31,596,683 | | | | 122,745,062 | | | | 119,158,024 | | |
Net asset value of shares issued for reinvested dividends and distributions | | | 31,617,086 | | | | 37,419,319 | | | | 4,911,757 | | | | — | | |
Cost of shares redeemed | | | (74,766,587 | ) | | | (78,260,209 | ) | | | (130,806,208 | ) | | | (141,281,427 | ) | |
Decrease in net assets from Fund share transactions | | | (15,826,367 | ) | | | (9,244,207 | ) | | | (3,149,389 | ) | | | (22,123,403 | ) | |
Class C | |
Net proceeds from shares sold | | | 3,487,062 | | | | 4,437,835 | | | | 14,376,527 | | | | 16,654,612 | | |
Net asset value of shares issued for reinvested dividends and distributions | | | 1,664,563 | | | | 2,429,213 | | | | 241,570 | | | | — | | |
Cost of shares redeemed | | | (11,000,964 | ) | | | (12,768,012 | ) | | | (28,797,729 | ) | | | (29,044,356 | ) | |
Decrease in net assets from Fund share transactions | | | (5,849,339 | ) | | | (5,900,964 | ) | | | (14,179,632 | ) | | | (12,389,744 | ) | |
Class I | |
Net proceeds from shares sold | | | 98,186,740 | | | | 90,166,671 | | | | 338,846,341 | | | | 511,516,624 | | |
Net asset value of shares issued for reinvested dividends and distributions | | | 25,055,673 | | | | 28,326,301 | | | | 13,851,484 | | | | — | | |
Cost of shares redeemed | | | (102,024,784 | ) | | | (121,635,227 | ) | | | (443,077,982 | ) | | | (398,085,068 | ) | |
Increase (decrease) in net assets from Fund share transactions | | | 21,217,629 | | | | (3,142,255 | ) | | | (90,380,157 | ) | | | 113,431,556 | | |
Class R3^ | |
Net proceeds from shares sold | | | 200 | | | | 765 | | | | 45,937 | | | | 1,343,375 | | |
Net asset value of shares issued for reinvested dividends and distributions | | | 4,458 | | | | 4,890 | | | | 3,861 | | | | — | | |
Cost of shares redeemed | | | (79,036 | ) | | | (67 | ) | | | (1,247,931 | ) | | | (1,292,873 | ) | |
Increase (decrease) in net assets from Fund share transactions | | | (74,378 | ) | | | 5,588 | | | | (1,198,133 | ) | | | 50,502 | | |
First Eagle Funds | Annual Report | October 31, 2024
195
Statements of Changes in Net Assets (continued)
| | | First Eagle
Global Fund* | | First Eagle
Overseas Fund* | |
| | | For the
Year Ended
October 31, 2024 | | For the
Year Ended
October 31, 2023 | | For the
Year Ended
October 31, 2024 | | For the
Year Ended
October 31, 2023 | |
Class R4^ | |
Net proceeds from shares sold | | | 77,216 | | | | 578,415 | | | | 164,674 | | | | 1,937,720 | | |
Net asset value of shares issued for reinvested dividends and distributions | | | 65,416 | | | | 52,892 | | | | 114,289 | | | | 516,040 | | |
Cost of shares redeemed | | | (2,018,348 | ) | | | (216,094 | ) | | | (5,639,834 | ) | | | (11,386,911 | ) | |
Increase (decrease) in net assets from Fund share transactions | | | (1,875,716 | ) | | | 415,213 | | | | (5,360,871 | ) | | | (8,933,151 | ) | |
Class R5^ | |
Net proceeds from shares sold | | | 6,261 | | | | 137,361 | | | | 4,136 | | | | 14,664 | | |
Net asset value of shares issued for reinvested dividends and distributions | | | 4,799 | | | | 4,292 | | | | 1,027 | | | | 1,389 | | |
Cost of shares redeemed | | | (231,679 | ) | | | (37,471 | ) | | | (47,190 | ) | | | (17,469 | ) | |
Increase (decrease) in net assets from Fund share transactions | | | (220,619 | ) | | | 104,182 | | | | (42,027 | ) | | | (1,416 | ) | |
Class R6 | |
Net proceeds from shares sold | | | 628,328,209 | | | | 519,884,403 | | | | 151,540,868 | | | | 201,676,513 | | |
Net asset value of shares issued for reinvested dividends and distributions | | | 74,502,423 | | | | 69,480,659 | | | | 34,097,431 | | | | 50,566,252 | | |
Cost of shares redeemed | | | (579,349,948 | ) | | | (326,508,848 | ) | | | (472,380,559 | ) | | | (313,273,802 | ) | |
Increase (decrease) in net assets from Fund share transactions | | | 123,480,684 | | | | 262,856,214 | | | | (286,742,260 | ) | | | (61,031,037 | ) | |
Increase (decrease) in net assets from Fund share transactions | | | (459,945,070 | ) | | | 965,683,987 | | | | (1,592,133,643 | ) | | | (179,069,911 | ) | |
Net increase (decrease) in net assets | | | 9,854,096,341 | | | | 3,552,643,492 | | | | 516,014,848 | | | | 634,529,617 | | |
Net Assets (Note 1) | |
Beginning of period | | | 46,482,023,950 | | | | 42,929,380,458 | | | | 11,852,466,056 | | | | 11,217,936,439 | | |
End of period | | $ | 56,336,120,291 | | | $ | 46,482,023,950 | | | $ | 12,368,480,904 | | | $ | 11,852,466,056 | | |
Changes in Shares Outstanding | |
Class A | |
Shares outstanding, beginning of period | | | 216,362,656 | | | | 222,066,205 | | | | 59,656,595 | | | | 65,581,973 | | |
Shares sold | | | 13,505,416 | | | | 15,270,294 | | | | 4,116,476 | | | | 5,528,830 | | |
Shares issued on reinvestment of distributions | | | 6,858,457 | | | | 7,841,628 | | | | 1,243,303 | | | | 2,061,779 | | |
Shares redeemed | | | (29,927,012 | ) | | | (28,815,471 | ) | | | (11,242,712 | ) | | | (13,515,987 | ) | |
Shares outstanding, end of period | | | 206,799,517 | | | | 216,362,656 | | | | 53,773,662 | | | | 59,656,595 | | |
Class C | |
Shares outstanding, beginning of period | | | 26,084,098 | | | | 32,037,627 | | | | 3,444,418 | | | | 4,564,760 | | |
Shares sold | | | 2,647,035 | | | | 2,722,928 | | | | 233,000 | | | | 449,507 | | |
Shares issued on reinvestment of distributions | | | 712,058 | | | | 1,232,366 | | | | 49,211 | | | | 152,504 | | |
Shares redeemed | | | (8,670,491 | ) | | | (9,908,823 | ) | | | (1,369,595 | ) | | | (1,722,353 | ) | |
Shares outstanding, end of period | | | 20,772,700 | | | | 26,084,098 | | | | 2,357,034 | | | | 3,444,418 | | |
Class I | |
Shares outstanding, beginning of period | | | 495,595,080 | | | | 472,421,232 | | | | 389,313,607 | | | | 387,720,084 | | |
Shares sold | | | 72,240,354 | | | | 83,957,617 | | | | 54,468,069 | | | | 104,305,822 | | |
Shares issued on reinvestment of distributions | | | 16,630,713 | | | | 17,531,678 | | | | 8,754,891 | | | | 12,544,649 | | |
Shares redeemed | | | (81,109,224 | ) | | | (78,315,447 | ) | | | (106,136,877 | ) | | | (115,256,948 | ) | |
Shares outstanding, end of period | | | 503,356,923 | | | | 495,595,080 | | | | 346,399,690 | | | | 389,313,607 | | |
First Eagle Funds | Annual Report | October 31, 2024
196
| | | First Eagle
U.S. Value Fund* | | First Eagle
Gold Fund* | |
| | | For the
Year Ended
October 31, 2024 | | For the
Year Ended
October 31, 2023 | | For the
Year Ended
October 31, 2024 | | For the
Year Ended
October 31, 2023 | |
Class R4^ | |
Net proceeds from shares sold | | | 1,297 | | | | 7,615 | | | | 77,494 | | | | 398,418 | | |
Net asset value of shares issued for reinvested dividends and distributions | | | 2,849 | | | | 2,596 | | | | 14,386 | | | | — | | |
Cost of shares redeemed | | | (49,419 | ) | | | (53 | ) | | | (1,551,853 | ) | | | (343,359 | ) | |
Increase (decrease) in net assets from Fund share transactions | | | (45,273 | ) | | | 10,158 | | | | (1,459,973 | ) | | | 55,059 | | |
Class R5^ | |
Net proceeds from shares sold | | | 6,722 | | | | 11,188 | | | | 45,674 | | | | 188,286 | | |
Net asset value of shares issued for reinvested dividends and distributions | | | 868 | | | | 928 | | | | 4,271 | | | | — | | |
Cost of shares redeemed | | | (96,780 | ) | | | (1,937 | ) | | | (479,637 | ) | | | (408,878 | ) | |
Increase (decrease) in net assets from Fund share transactions | | | (89,190 | ) | | | 10,179 | | | | (429,692 | ) | | | (220,592 | ) | |
Class R6 | |
Net proceeds from shares sold | | | 8,513,801 | | | | 10,454,050 | | | | 69,141,467 | | | | 61,445,816 | | |
Net asset value of shares issued for reinvested dividends and distributions | | | 2,189,335 | | | | 2,096,998 | | | | 1,748,970 | | | | — | | |
Cost of shares redeemed | | | (8,878,747 | ) | | | (6,373,402 | ) | | | (48,120,317 | ) | | | (35,549,281 | ) | |
Increase (decrease) in net assets from Fund share transactions | | | 1,824,389 | | | | 6,177,646 | | | | 22,770,120 | | | | 25,896,535 | | |
Increase (decrease) in net assets from Fund share transactions | | | 1,157,471 | | | | (12,083,855 | ) | | | (88,026,856 | ) | | | 104,699,913 | | |
Net increase (decrease) in net assets | | | 258,639,888 | | | | (621,857 | ) | | | 674,067,805 | | | | 375,249,991 | | |
Net Assets (Note 1) | |
Beginning of period | | | 1,139,134,280 | | | | 1,139,756,137 | | | | 2,157,578,084 | | | | 1,782,328,093 | | |
End of period | | $ | 1,397,774,168 | | | $ | 1,139,134,280 | | | $ | 2,831,645,889 | | | $ | 2,157,578,084 | | |
Changes in Shares Outstanding | |
Class A | |
Shares outstanding, beginning of period | | | 28,915,983 | | | | 29,351,025 | | | | 24,654,077 | | | | 25,679,365 | | |
Shares sold | | | 1,356,290 | | | | 1,704,389 | | | | 4,691,119 | | | | 5,013,496 | | |
Shares issued on reinvestment of distributions | | | 1,727,710 | | | | 2,066,224 | | | | 206,811 | | | | — | | |
Shares redeemed | | | (3,707,483 | ) | | | (4,205,655 | ) | | | (5,179,768 | ) | | | (6,038,784 | ) | |
Shares outstanding, end of period | | | 28,292,500 | | | | 28,915,983 | | | | 24,372,239 | | | | 24,654,077 | | |
Class C | |
Shares outstanding, beginning of period | | | 1,679,875 | | | | 2,009,999 | | | | 5,376,559 | | | | 5,969,493 | | |
Shares sold | | | 184,827 | | | | 253,839 | | | | 604,989 | | | | 769,747 | | |
Shares issued on reinvestment of distributions | | | 96,609 | | | | 141,976 | | | | 11,220 | | | | — | | |
Shares redeemed | | | (576,432 | ) | | | (725,939 | ) | | | (1,249,562 | ) | | | (1,362,681 | ) | |
Shares outstanding, end of period | | | 1,384,879 | | | | 1,679,875 | | | | 4,743,206 | | | | 5,376,559 | | |
Class I | |
Shares outstanding, beginning of period | | | 28,483,950 | | | | 28,579,801 | | | | 58,456,099 | | | | 54,080,450 | | |
Shares sold | | | 4,787,322 | | | | 4,743,922 | | | | 13,006,767 | | | | 20,867,430 | | |
Shares issued on reinvestment of distributions | | | 1,337,016 | | | | 1,529,498 | | | | 564,445 | | | | — | | |
Shares redeemed | | | (4,900,604 | ) | | | (6,369,271 | ) | | | (17,168,429 | ) | | | (16,491,781 | ) | |
Shares outstanding, end of period | | | 29,707,684 | | | | 28,483,950 | | | | 54,858,882 | | | | 58,456,099 | | |
First Eagle Funds | Annual Report | October 31, 2024
197
Statements of Changes in Net Assets (continued)
| | | First Eagle
Global Fund* | | First Eagle
Overseas Fund* | |
| | | For the
Year Ended
October 31, 2024 | | For the
Year Ended
October 31, 2023 | | For the
Year Ended
October 31, 2024 | | For the
Year Ended
October 31, 2023 | |
Class R3^ | |
Shares outstanding, beginning of period | | | 205,968 | | | | 126,209 | | | | 17,092 | | | | 13,692 | | |
Shares sold | | | 12,834 | | | | 161,680 | | | | 679 | | | | 3,975 | | |
Shares issued on reinvestment of distributions | | | 7,705 | | | | 5,091 | | | | 354 | | | | 469 | | |
Shares redeemed | | | (226,507 | ) | | | (87,012 | ) | | | (18,125 | ) | | | (1,044 | ) | |
Shares outstanding, end of period | | | — | | | | 205,968 | | | | — | | | | 17,092 | | |
Class R4^ | |
Shares outstanding, beginning of period | | | 29,134 | | | | 22,267 | | | | 216,836 | | | | 576,504 | | |
Shares sold | | | 1,226 | | | | 9,476 | | | | 6,744 | | | | 81,848 | | |
Shares issued on reinvestment of distributions | | | 1,068 | | | | 890 | | | | 4,767 | | | | 22,138 | | |
Shares redeemed | | | (31,428 | ) | | | (3,499 | ) | | | (228,347 | ) | | | (463,654 | ) | |
Shares outstanding, end of period | | | — | | | | 29,134 | | | | — | | | | 216,836 | | |
Class R5^ | |
Shares outstanding, beginning of period | | | 3,470 | | | | 1,782 | | | | 1,689 | | | | 1,735 | | |
Shares sold | | | 102 | | | | 2,209 | | | | 169 | | | | 604 | | |
Shares issued on reinvestment of distributions | | | 80 | | | | 73 | | | | 43 | | | | 60 | | |
Shares redeemed | | | (3,652 | ) | | | (594 | ) | | | (1,901 | ) | | | (710 | ) | |
Shares outstanding, end of period | | | — | | | | 3,470 | | | | — | | | | 1,689 | | |
Class R6 | |
Shares outstanding, beginning of period | | | 34,101,190 | | | | 29,816,528 | | | | 55,025,651 | | | | 57,482,854 | | |
Shares sold | | | 9,402,409 | | | | 8,429,172 | | | | 5,881,268 | | | | 8,315,489 | | |
Shares issued on reinvestment of distributions | | | 1,216,565 | | | | 1,170,694 | | | | 1,420,135 | | | | 2,165,578 | | |
Shares redeemed | | | (8,568,297 | ) | | | (5,315,204 | ) | | | (18,185,530 | ) | | | (12,938,270 | ) | |
Shares outstanding, end of period | | | 36,151,867 | | | | 34,101,190 | | | | 44,141,524 | | | | 55,025,651 | | |
* First Eagle Global Fund, First Eagle Overseas Fund, First Eagle U.S. Value Fund and First Eagle Gold Fund financial statements are shown on a consolidated basis and includes the balances of the First Eagle Global Cayman Fund, Ltd., First Eagle Overseas Cayman Fund, Ltd., First Eagle U.S. Value Cayman Fund, Ltd., and First Eagle Gold Cayman Fund, Ltd., respectively.
^ On February 29, 2024, Class R3, Class R4 and Class R5 shares converted into Class R6 shares. As a result, Class R3, Class R4 and Class R5 shares were terminated.
See Notes to Financial Statements.
First Eagle Funds | Annual Report | October 31, 2024
198
| | | First Eagle
U.S. Value Fund* | | First Eagle
Gold Fund* | |
| | | For the
Year Ended
October 31, 2024 | | For the
Year Ended
October 31, 2023 | | For the
Year Ended
October 31, 2024 | | For the
Year Ended
October 31, 2023 | |
Class R3^ | |
Shares outstanding, beginning of period | | | 3,737 | | | | 3,437 | | | | 55,925 | | | | 51,308 | | |
Shares sold | | | 10 | | | | 40 | | | | 1,927 | | | | 59,899 | | |
Shares issued on reinvestment of distributions | | | 238 | | | | 264 | | | | 158 | | | | — | | |
Shares redeemed | | | (3,985 | ) | | | (4 | ) | | | (58,010 | ) | | | (55,282 | ) | |
Shares outstanding, end of period | | | — | | | | 3,737 | | | | — | | | | 55,925 | | |
Class R4^ | |
Shares outstanding, beginning of period | | | 2,281 | | | | 1,735 | | | | 68,292 | | | | 66,536 | | |
Shares sold | | | 67 | | | | 408 | | | | 3,345 | | | | 15,900 | | |
Shares issued on reinvestment of distributions | | | 152 | | | | 141 | | | | 586 | | | | — | | |
Shares redeemed | | | (2,500 | ) | | | (3 | ) | | | (72,223 | ) | | | (14,144 | ) | |
Shares outstanding, end of period | | | — | | | | 2,281 | | | | — | | | | 68,292 | | |
Class R5^ | |
Shares outstanding, beginning of period | | | 4,552 | | | | 4,005 | | | | 20,143 | | | | 29,137 | | |
Shares sold | | | 356 | | | | 594 | | | | 1,934 | | | | 7,209 | | |
Shares issued on reinvestment of distributions | | | 46 | | | | 50 | | | | 174 | | | | — | | |
Shares redeemed | | | (4,954 | ) | | | (97 | ) | | | (22,251 | ) | | | (16,203 | ) | |
Shares outstanding, end of period | | | — | | | | 4,552 | | | | — | | | | 20,143 | | |
Class R6 | |
Shares outstanding, beginning of period | | | 1,705,115 | | | | 1,375,767 | | | | 6,353,503 | | | | 5,291,172 | | |
Shares sold | | | 403,727 | | | | 546,773 | | | | 2,561,618 | | | | 2,500,821 | | |
Shares issued on reinvestment of distributions | | | 116,826 | | | | 113,290 | | | | 71,096 | | | | — | | |
Shares redeemed | | | (426,719 | ) | | | (330,715 | ) | | | (1,825,230 | ) | | | (1,438,490 | ) | |
Shares outstanding, end of period | | | 1,798,949 | | | | 1,705,115 | | | | 7,160,987 | | | | 6,353,503 | | |
First Eagle Funds | Annual Report | October 31, 2024
199
Statements of Changes in Net Assets (continued)
| | | First Eagle
Global Income Builder Fund | | First Eagle
Rising Dividend Fund** | |
| | | For the
Year Ended
October 31, 2024 | | For the
Year Ended
October 31, 2023 | | For the
Year Ended
October 31, 2024 | | For the
Year Ended
October 31, 2023 | |
Operations | |
Net investment income | | $ | 46,810,714 | | | $ | 44,634,372 | | | $ | 6,278,318 | | | $ | 5,998,165 | | |
Net realized gain (loss) on investments, commodity, foreign currency
and forward contract related transactions and option contracts written | | | 25,693,905 | | | | 14,423,969 | | | | 15,300,823 | | | | 24,985,141 | | |
Change in unrealized appreciation (depreciation) on investments,
commodity, foreign currency and forward contract related translations
and option contracts written | | | 223,130,344 | | | | 30,873,761 | | | | 91,686,192 | | | | 19,172,197 | | |
Net increase (decrease) in net assets resulting from operations | | | 295,634,963 | | | | 89,932,102 | | | | 113,265,333 | | | | 50,155,503 | | |
Distributions to Shareholders | |
Distributable earnings: | |
Class A | | | (16,847,331 | ) | | | (23,879,471 | ) | | | (21,201,944 | ) | | | (8,920,725 | ) | |
Class C | | | (1,412,038 | ) | | | (2,938,884 | ) | | | (1,012,252 | ) | | | (717,656 | ) | |
Class I | | | (25,608,733 | ) | | | (35,201,941 | ) | | | (8,088,133 | ) | | | (3,513,420 | ) | |
Class R3 | | | (105 | ) | | | (2,189 | ) | | | (4,079 | ) | | | (1,757 | ) | |
Class R4 | | | (380 | ) | | | (2,016 | ) | | | (2,834 | ) | | | (1,175 | ) | |
Class R5 | | | (23 | ) | | | (456 | ) | | | (837 | ) | | | (399 | ) | |
Class R6 | | | (1,992,069 | ) | | | (2,430,376 | ) | | | (555,937 | ) | | | (203,647 | ) | |
Decrease in net assets resulting from distributions | | | (45,860,679 | ) | | | (64,455,333 | ) | | | (30,866,016 | ) | | | (13,358,779 | ) | |
Fund Share Transactions | |
Class A | | | | | | | | | |
Net proceeds from shares sold | | | 95,460,012 | | | | 158,702,246 | | | | 15,002,736 | | | | 18,109,802 | | |
Net asset value of shares issued for reinvested dividends and distributions | | | 15,529,327 | | | | 21,600,036 | | | | 20,071,573 | | | | 8,391,015 | | |
Cost of shares redeemed | | | (149,430,352 | ) | | | (108,924,372 | ) | | | (48,637,648 | ) | | | (54,121,330 | ) | |
Increase (decrease) in net assets from Fund share transactions | | | (38,441,013 | ) | | | 71,377,910 | | | | (13,563,339 | ) | | | (27,620,513 | ) | |
Class C | | | | | | | | | |
Net proceeds from shares sold | | | 7,773,276 | | | | 14,625,134 | | | | 860,400 | | | | 415,939 | | |
Net asset value of shares issued for reinvested dividends and distributions | | | 1,359,002 | | | | 2,788,213 | | | | 1,006,066 | | | | 712,791 | | |
Cost of shares redeemed | | | (29,137,271 | ) | | | (37,629,227 | ) | | | (5,413,836 | ) | | | (10,293,049 | ) | |
Decrease in net assets from Fund share transactions | | | (20,004,993 | ) | | | (20,215,880 | ) | | | (3,547,370 | ) | | | (9,164,319 | ) | |
Class I | | | | | | | | | |
Net proceeds from shares sold | | | 114,972,376 | | | | 286,707,410 | | | | 26,590,666 | | | | 6,842,143 | | |
Net asset value of shares issued for reinvested dividends and distributions | | | 23,060,802 | | | | 31,611,236 | | | | 4,708,771 | | | | 1,945,418 | | |
Cost of shares redeemed | | | (215,857,981 | ) | | | (206,948,702 | ) | | | (17,753,843 | ) | | | (20,221,706 | ) | |
Increase (decrease) in net assets from Fund share transactions | | | (77,824,803 | ) | | | 111,369,944 | | | | 13,545,594 | | | | (11,434,145 | ) | |
Class R3^ | | | | | | | | | |
Net proceeds from shares sold | | | — | | | | — | | | | 13 | | | | — | | |
Net asset value of shares issued for reinvested dividends and distributions | | | 37 | | | | 2,189 | | | | 4,079 | | | | 1,757 | | |
Cost of shares redeemed | | | (63,414 | ) | | | — | | | | (63,761 | ) | | | — | | |
Increase (decrease) in net assets from Fund share transactions | | | (63,377 | ) | | | 2,189 | | | | (59,669 | ) | | | 1,757 | | |
First Eagle Funds | Annual Report | October 31, 2024
200
| | | First Eagle
Small Cap Opportunity Fund | | First Eagle
U.S. Smid Cap Opportunity Fund | |
| | | For the
Year Ended
October 31, 2024 | | For the
Year Ended
October 31, 2023 | | For the
Year Ended
October 31, 2024 | | For the
Year Ended
October 31, 2023 | |
Operations | |
Net investment income | | $ | 7,165,789 | | | $ | 2,965,536 | | | $ | 121,730 | | | $ | 80,149 | | |
Net realized gain (loss) on investments, commodity, foreign currency
and forward contract related transactions and option contracts written | | | 5,384,792 | | | | (46,405,081 | ) | | | (430,268 | ) | | | (71,616 | ) | |
Change in unrealized appreciation (depreciation) on investments,
commodity, foreign currency and forward contract related translations
and option contracts written | | | 362,972,830 | | | | (60,991,729 | ) | | | 10,690,345 | | | | (716,756 | ) | |
Net increase (decrease) in net assets resulting from operations | | | 375,523,411 | | | | (104,431,274 | ) | | | 10,381,807 | | | | (708,223 | ) | |
Distributions to Shareholders | |
Distributable earnings: | |
Class A | | | (331,193 | ) | | | — | | | | (1,661 | ) | | | (60 | ) | |
Class C | | | — | | | | — | | | | — | | | | — | | |
Class I | | | (8,732,209 | ) | | | (580,596 | ) | | | (117,436 | ) | | | (3,378 | ) | |
Class R3 | | | — | | | | — | | | | — | | | | — | | |
Class R4 | | | — | | | | — | | | | — | | | | — | | |
Class R5 | | | — | | | | — | | | | — | | | | — | | |
Class R6 | | | (479,410 | ) | | | (27,517 | ) | | | (1,676 | ) | | | (180 | ) | |
Decrease in net assets resulting from distributions | | | (9,542,812 | ) | | | (608,113 | ) | | | (120,773 | ) | | | (3,618 | ) | |
Fund Share Transactions | |
Class A | | | | | | | | | |
Net proceeds from shares sold | | | 38,906,104 | | | | 33,971,074 | | | | 1,152,604 | | | | 34,770 | | |
Net asset value of shares issued for reinvested dividends and distributions | | | 321,596 | | | | — | | | | 1,661 | | | | 60 | | |
Cost of shares redeemed | | | (15,951,866 | ) | | | (6,191,272 | ) | | | (33,000 | ) | | | — | | |
Increase (decrease) in net assets from Fund share transactions | | | 23,275,834 | | | | 27,779,802 | | | | 1,121,265 | | | | 34,830 | | |
Class C | | | | | | | | | |
Net proceeds from shares sold | | | — | | | | — | | | | — | | | | — | | |
Net asset value of shares issued for reinvested dividends and distributions | | | — | | | | — | | | | — | | | | — | | |
Cost of shares redeemed | | | — | | | | — | | | | — | | | | — | | |
Decrease in net assets from Fund share transactions | | | — | | | | — | | | | — | | | | — | | |
Class I | | | | | | | | | |
Net proceeds from shares sold | | | 812,758,873 | | | | 1,026,258,605 | | | | 11,983,423 | | | | 27,289,152 | | |
Net asset value of shares issued for reinvested dividends and distributions | | | 8,438,320 | | | | 551,566 | | | | 12,922 | | | | 3,378 | | |
Cost of shares redeemed | | | (677,149,839 | ) | | | (248,023,159 | ) | | | (1,246,787 | ) | | | (161 | ) | |
Increase (decrease) in net assets from Fund share transactions | | | 144,047,354 | | | | 778,787,012 | | | | 10,749,558 | | | | 27,292,369 | | |
Class R3^ | | | | | | | | | |
Net proceeds from shares sold | | | — | | | | — | | | | — | | | | — | | |
Net asset value of shares issued for reinvested dividends and distributions | | | — | | | | — | | | | — | | | | — | | |
Cost of shares redeemed | | | — | | | | — | | | | — | | | | — | | |
Increase (decrease) in net assets from Fund share transactions | | | — | | | | — | | | | — | | | | — | | |
First Eagle Funds | Annual Report | October 31, 2024
201
Statements of Changes in Net Assets (continued)
| | | First Eagle
Global Income Builder Fund | | First Eagle
Rising Dividend Fund** | |
| | | For the
Year Ended
October 31, 2024 | | For the
Year Ended
October 31, 2023 | | For the
Year Ended
October 31, 2024 | | For the
Year Ended
October 31, 2023 | |
Class R4^ | | | | | | | | | |
Net proceeds from shares sold | | | 2,063 | | | | 6,730 | | | | 1,228 | | | | 3,450 | | |
Net asset value of shares issued for reinvested dividends and distributions | | | 300 | | | | 2,016 | | | | 2,834 | | | | 1,175 | | |
Cost of shares redeemed | | | (64,263 | ) | | | (97 | ) | | | (45,125 | ) | | | (40 | ) | |
Increase (decrease) in net assets from Fund share transactions | | | (61,900 | ) | | | 8,649 | | | | (41,063 | ) | | | 4,585 | | |
Class R5^ | | | | | | | | | |
Net proceeds from shares sold | | | — | | | | — | | | | 2 | | | | — | | |
Net asset value of shares issued for reinvested dividends and distributions | | | 7 | | | | 456 | | | | 837 | | | | 399 | | |
Cost of shares redeemed | | | (12,281 | ) | | | — | | | | (13,180 | ) | | | — | | |
Increase (decrease) in net assets from Fund share transactions | | | (12,274 | ) | | | 456 | | | | (12,341 | ) | | | 399 | | |
Class R6 | | | | | | | | | |
Net proceeds from shares sold | | | 21,352,716 | | | | 28,315,324 | | | | 2,216,374 | | | | 1,655,761 | | |
Net asset value of shares issued for reinvested dividends and distributions | | | 1,985,130 | | | | 2,421,057 | | | | 539,169 | | | | 199,816 | | |
Cost of shares redeemed | | | (19,396,610 | ) | | | (14,429,131 | ) | | | (2,366,664 | ) | | | (1,177,419 | ) | |
Increase in net assets from Fund share transactions | | | 3,941,236 | | | | 16,307,250 | | | | 388,879 | | | | 678,158 | | |
Increase (decrease) in net assets from Fund share transactions | | | (132,467,124 | ) | | | 178,850,518 | | | | (3,289,309 | ) | | | (47,534,078 | ) | |
Net increase (decrease) in net assets | | | 117,307,160 | | | | 204,327,287 | | | | 79,110,008 | | | | (10,737,354 | ) | |
Net Assets (Note 1) | |
Beginning of period | | | 1,641,592,070 | | | | 1,437,264,783 | | | | 353,814,931 | | | | 364,552,285 | | |
End of period | | $ | 1,758,899,230 | | | $ | 1,641,592,070 | | | $ | 432,924,939 | | | $ | 353,814,931 | | |
Changes in Shares Outstanding | |
Class A | |
Shares outstanding, beginning of period | | | 52,313,628 | | | | 46,560,925 | | | | 10,885,417 | | | | 12,125,113 | | |
Shares sold | | | 7,305,639 | | | | 12,771,686 | | | | 618,865 | | | | 797,792 | | |
Shares issued on reinvestment of distributions | | | 1,183,813 | | | | 1,754,983 | | | | 881,509 | | | | 383,785 | | |
Shares redeemed | | | (11,509,252 | ) | | | (8,773,966 | ) | | | (1,964,869 | ) | | | (2,421,273 | ) | |
Shares outstanding, end of period | | | 49,293,828 | | | | 52,313,628 | | | | 10,420,922 | | | | 10,885,417 | | |
Class C | |
Shares outstanding, beginning of period | | | 6,859,097 | | | | 8,456,225 | | | | 594,264 | | | | 1,267,183 | | |
Shares sold | | | 588,856 | | | | 1,173,224 | | | | 58,125 | | | | 29,623 | | |
Shares issued on reinvestment of distributions | | | 103,084 | | | | 225,272 | | | | 76,976 | | | | 53,658 | | |
Shares redeemed | | | (2,227,051 | ) | | | (2,995,624 | ) | | | (380,537 | ) | | | (756,200 | ) | |
Shares outstanding, end of period | | | 5,323,986 | | | | 6,859,097 | | | | 348,828 | | | | 594,264 | | |
Class I | |
Shares outstanding, beginning of period | | | 73,870,683 | | | | 64,970,999 | | | | 4,041,364 | | | | 4,542,657 | | |
Shares sold | | | 8,905,990 | | | | 23,208,393 | | | | 1,046,492 | | | | 283,305 | | |
Shares issued on reinvestment of distributions | | | 1,767,171 | | | | 2,579,194 | | | | 193,529 | | | | 84,287 | | |
Shares redeemed | | | (16,741,552 | ) | | | (16,887,903 | ) | | | (676,677 | ) | | | (868,885 | ) | |
Shares outstanding, end of period | | | 67,802,292 | | | | 73,870,683 | | | | 4,604,708 | | | | 4,041,364 | | |
First Eagle Funds | Annual Report | October 31, 2024
202
| | | First Eagle
Small Cap Opportunity Fund | | First Eagle
U.S. Smid Cap Opportunity Fund | |
| | | For the
Year Ended
October 31, 2024 | | For the
Year Ended
October 31, 2023 | | For the
Year Ended
October 31, 2024 | | For the
Year Ended
October 31, 2023 | |
Class R4^ | | | | | | | | | |
Net proceeds from shares sold | | | — | | | | — | | | | — | | | | — | | |
Net asset value of shares issued for reinvested dividends and distributions | | | — | | | | — | | | | — | | | | — | | |
Cost of shares redeemed | | | — | | | | — | | | | — | | | | — | | |
Increase (decrease) in net assets from Fund share transactions | | | — | | | | — | | | | — | | | | — | | |
Class R5^ | | | | | | | | | |
Net proceeds from shares sold | | | — | | | | — | | | | — | | | | — | | |
Net asset value of shares issued for reinvested dividends and distributions | | | — | | | | — | | | | — | | | | — | | |
Cost of shares redeemed | | | — | | | | — | | | | — | | | | — | | |
Increase (decrease) in net assets from Fund share transactions | | | — | | | | — | | | | — | | | | — | | |
Class R6 | | | | | | | | | |
Net proceeds from shares sold | | | 44,595,999 | | | | 54,252,946 | | | | 55,000 | | | | — | | |
Net asset value of shares issued for reinvested dividends and distributions | | | 479,410 | | | | 27,517 | | | | 1,676 | | | | 180 | | |
Cost of shares redeemed | | | (19,555,934 | ) | | | (7,415,134 | ) | | | — | | | | — | | |
Increase in net assets from Fund share transactions | | | 25,519,475 | | | | 46,865,329 | | | | 56,676 | | | | 180 | | |
Increase (decrease) in net assets from Fund share transactions | | | 192,842,663 | | | | 853,432,143 | | | | 11,927,499 | | | | 27,327,379 | | |
Net increase (decrease) in net assets | | | 558,823,262 | | | | 748,392,756 | | | | 22,188,533 | | | | 26,615,538 | | |
Net Assets (Note 1) | |
Beginning of period | | | 1,309,696,983 | | | | 561,304,227 | | | | 27,754,904 | | | | 1,139,366 | | |
End of period | | $ | 1,868,520,245 | | | $ | 1,309,696,983 | | | $ | 49,943,437 | | | $ | 27,754,904 | | |
Changes in Shares Outstanding | |
Class A | |
Shares outstanding, beginning of period | | | 7,490,976 | | | | 4,392,441 | | | | 8,975 | | | | 5,413 | | |
Shares sold | | | 4,018,628 | | | | 3,798,896 | | | | 107,150 | | | | 3,556 | | |
Shares issued on reinvestment of distributions | | | 35,693 | | | | — | | | | 177 | | | | 6 | | |
Shares redeemed | | | (1,604,865 | ) | | | (700,361 | ) | | | (3,110 | ) | | | — | | |
Shares outstanding, end of period | | | 9,940,432 | | | | 7,490,976 | | | | 113,192 | | | | 8,975 | | |
Class C | |
Shares outstanding, beginning of period | | | — | | | | — | | | | — | | | | — | | |
Shares sold | | | — | | | | — | | | | — | | | | — | | |
Shares issued on reinvestment of distributions | | | — | | | | — | | | | — | | | | — | | |
Shares redeemed | | | — | | | | — | | | | — | | | | — | | |
Shares outstanding, end of period | | | — | | | | — | | | | — | | | | — | | |
Class I | |
Shares outstanding, beginning of period | | | 143,815,321 | | | | 58,977,677 | | | | 3,170,551 | | | | 116,486 | | |
Shares sold | | | 82,436,449 | | | | 112,506,979 | | | | 1,086,602 | | | | 3,053,725 | | |
Shares issued on reinvestment of distributions | | | 934,476 | | | | 61,765 | | | | 1,350 | | | | 357 | | |
Shares redeemed | | | (67,552,769 | ) | | | (27,731,100 | ) | | | (107,492 | ) | | | (17 | ) | |
Shares outstanding, end of period | | | 159,633,477 | | | | 143,815,321 | | | | 4,151,011 | | | | 3,170,551 | | |
First Eagle Funds | Annual Report | October 31, 2024
203
Statements of Changes in Net Assets (continued)
| | | First Eagle
Global Income Builder Fund | | First Eagle
Rising Dividend Fund** | |
| | | For the
Year Ended
October 31, 2024 | | For the
Year Ended
October 31, 2023 | | For the
Year Ended
October 31, 2024 | | For the
Year Ended
October 31, 2023 | |
Class R3^ | |
Shares outstanding, beginning of period | | | 5,010 | | | | 4,832 | | | | 2,445 | | | | 2,368 | | |
Shares issued on reinvestment of distributions | | | 3 | | | | 178 | | | | 173 | | | | 77 | | |
Shares redeemed | | | (5,013 | ) | | | — | | | | (2,618 | ) | | | — | | |
Shares outstanding, end of period | | | — | | | | 5,010 | | | | — | | | | 2,445 | | |
Class R4^ | |
Shares outstanding, beginning of period | | | 4,899 | | | | 4,202 | | | | 1,619 | | | | 1,425 | | |
Shares sold | | | 164 | | | | 541 | | | | 49 | | | | 145 | | |
Shares issued on reinvestment of distributions | | | 24 | | | | 164 | | | | 120 | | | | 51 | | |
Shares redeemed | | | (5,087 | ) | | | (8 | ) | | | (1,788 | ) | | | (2 | ) | |
Shares outstanding, end of period | | | — | | | | 4,899 | | | | — | | | | 1,619 | | |
Class R5^ | |
Shares outstanding, beginning of period | | | 973 | | | | 936 | | | | 501 | | | | 484 | | |
Shares issued on reinvestment of distributions | | | — | | | | 37 | | | | 35 | | | | 17 | | |
Shares redeemed | | | (973 | ) | | | — | | | | (536 | ) | | | — | | |
Shares outstanding, end of period | | | — | | | | 973 | | | | — | | | | 501 | | |
Class R6 | |
Shares outstanding, beginning of period | | | 5,292,142 | | | | 3,973,194 | | | | 272,124 | | | | 243,545 | | |
Shares sold | | | 1,636,871 | | | | 2,285,965 | | | | 82,177 | | | | 69,896 | | |
Shares issued on reinvestment of distributions | | | 152,167 | | | | 197,819 | | | | 22,269 | | | | 8,628 | | |
Shares redeemed | | | (1,498,122 | ) | | | (1,164,836 | ) | | | (88,016 | ) | | | (49,945 | ) | |
Shares outstanding, end of period | | | 5,583,058 | | | | 5,292,142 | | | | 288,554 | | | | 272,124 | | |
^ On February 29, 2024, Class R3, Class R4 and Class R5 shares converted into Class R6 shares. As a result, Class R3, Class R4 and Class R5 shares were terminated.
** First Eagle Rising Dividend Fund was known as First Eagle Fund of America prior to March 1, 2023.
See Notes to Financial Statements.
First Eagle Funds | Annual Report | October 31, 2024
204
| | | First Eagle
Small Cap Opportunity Fund | | First Eagle
U.S. Smid Cap Opportunity Fund | |
| | | For the
Year Ended
October 31, 2024 | | For the
Year Ended
October 31, 2023 | | For the
Year Ended
October 31, 2024 | | For the
Year Ended
October 31, 2023 | |
Class R3^ | |
Shares outstanding, beginning of period | | | — | | | | — | | | | — | | | | — | | |
Shares issued on reinvestment of distributions | | | — | | | | — | | | | — | | | | — | | |
Shares redeemed | | | — | | | | — | | | | — | | | | — | | |
Shares outstanding, end of period | | | — | | | | — | | | | — | | | | — | | |
Class R4^ | |
Shares outstanding, beginning of period | | | — | | | | — | | | | — | | | | — | | |
Shares sold | | | — | | | | — | | | | — | | | | — | | |
Shares issued on reinvestment of distributions | | | — | | | | — | | | | — | | | | — | | |
Shares redeemed | | | — | | | | — | | | | — | | | | — | | |
Shares outstanding, end of period | | | — | | | | — | | | | — | | | | — | | |
Class R5^ | |
Shares outstanding, beginning of period | | | — | | | | — | | | | — | | | | — | | |
Shares issued on reinvestment of distributions | | | — | | | | — | | | | — | | | | — | | |
Shares redeemed | | | — | | | | — | | | | — | | | | — | | |
Shares outstanding, end of period | | | — | | | | — | | | | — | | | | — | | |
Class R6 | |
Shares outstanding, beginning of period | | | 7,850,147 | | | | 2,688,408 | | | | 5,019 | | | | 5,000 | | |
Shares sold | | | 4,491,578 | | | | 5,983,392 | | | | 4,830 | | | | — | | |
Shares issued on reinvestment of distributions | | | 53,032 | | | | 3,078 | | | | 181 | | | | 19 | | |
Shares redeemed | | | (1,959,531 | ) | | | (824,731 | ) | | | — | | | | — | | |
Shares outstanding, end of period | | | 10,435,226 | | | | 7,850,147 | | | | 10,030 | | | | 5,019 | | |
First Eagle Funds | Annual Report | October 31, 2024
205
Statements of Changes in Net Assets (continued)
| | | First Eagle
Global Real Assets Fund* | |
| | | For the
Year Ended
October 31, 2024 | | For the
Year Ended
October 31, 2023 | |
Operations | |
Net investment income | | $ | 256,035 | | | $ | 227,985 | | |
Net realized gain (loss) on investments, commodity and foreign
currency related transactions | | | 83,678 | | | | (36,039 | ) | |
Change in unrealized appreciation (depreciation) on investments,
commodity and foreign currency related translations | | | 1,850,643 | | | | 74,559 | | |
Net increase (decrease) in net assets resulting from operations | | | 2,190,356 | | | | 266,505 | | |
Distributions to Shareholders | |
Distributable earnings: | |
Class A | | | (29,923 | ) | | | (13,695 | ) | |
Class C | | | — | | | | — | | |
Class I | | | (189,360 | ) | | | (145,313 | ) | |
Class R3 | | | — | | | | — | | |
Class R4 | | | — | | | | — | | |
Class R5 | | | — | | | | — | | |
Class R6 | | | (22,956 | ) | | | (20,751 | ) | |
Return of capital: | |
Class A | | | — | | | | — | | |
Class C | | | — | | | | — | | |
Class I | | | — | | | | — | | |
Class R3 | | | — | | | | — | | |
Class R4 | | | — | | | | — | | |
Class R5 | | | — | | | | — | | |
Class R6 | | | — | | | | — | | |
Decrease in net assets resulting from distributions | | | (242,239 | ) | | | (179,759 | ) | |
Fund Share Transactions | |
Class A | |
Net proceeds from shares sold | | | 26,458 | | | | 394,672 | | |
Net asset value of shares issued for reinvested dividends and distributions | | | 29,923 | | | | 13,695 | | |
Cost of shares redeemed | | | (31,302 | ) | | | (3,430 | ) | |
Increase (decrease) in net assets from Fund share transactions | | | 25,079 | | | | 404,937 | | |
Class C | |
Net proceeds from shares sold | | | — | | | | — | | |
Net asset value of shares issued for reinvested dividends and distributions | | | — | | | | — | | |
Cost of shares redeemed | | | — | | | | — | | |
Increase (decrease) in net assets from Fund share transactions | | | — | | | | — | | |
Class I | |
Net proceeds from shares sold | | | 1,448,354 | | | | 2,749,565 | | |
Net asset value of shares issued for reinvested dividends and distributions | | | 186,621 | | | | 145,313 | | |
Cost of shares redeemed | | | (623,889 | ) | | | (1,458,613 | ) | |
Increase (decrease) in net assets from Fund share transactions | | | 1,011,086 | | | | 1,436,265 | | |
First Eagle Funds | Annual Report | October 31, 2024
206
| | | First Eagle
High Yield Municipal Fund** | | First Eagle
Short Duration
High Yield
Municipal Fund | |
| | | For the
Year Ended
October 31, 2024 | | For the
Year Ended
October 31, 2023 | | For the Period
1/2/24† -
10/31/24 | |
Operations | |
Net investment income | | $ | 69,902,940 | | | $ | 9,244,662 | | | $ | 1,788,891 | | |
Net realized gain (loss) on investments, commodity and foreign
currency related transactions | | | (2,097,484 | ) | | | (5,689,578 | ) | | | (4,872 | ) | |
Change in unrealized appreciation (depreciation) on investments,
commodity and foreign currency related translations | | | 65,159,338 | | | | 6,112,959 | | | | (12,437 | ) | |
Net increase (decrease) in net assets resulting from operations | | | 132,964,794 | | | | 9,668,043 | | | | 1,771,582 | | |
Distributions to Shareholders | |
Distributable earnings: | |
Class A | | | (19,144,908 | ) | | | (3,483,395 | ) | | | (293,307 | ) | |
Class C | | | (1,150,729 | ) | | | (280,628 | ) | | | — | | |
Class I | | | (50,728,750 | ) | | | (5,193,256 | ) | | | (1,428,197 | ) | |
Class R3 | | | (5,040 | ) | | | (22,398 | ) | | | — | | |
Class R4 | | | (74 | ) | | | (458 | ) | | | — | | |
Class R5 | | | (77 | ) | | | (561 | ) | | | — | | |
Class R6 | | | (171,660 | ) | | | (190,124 | ) | | | (39,335 | ) | |
Return of capital: | |
Class A | | | (1,875,965 | ) | | | — | | | | — | | |
Class C | | | (133,571 | ) | | | — | | | | — | | |
Class I | | | (4,709,853 | ) | | | — | | | | — | | |
Class R3 | | | (555 | ) | | | — | | | | — | | |
Class R4 | | | (7 | ) | | | — | | | | — | | |
Class R5 | | | (8 | ) | | | — | | | | — | | |
Class R6 | | | (16,143 | ) | | | — | | | | — | | |
Decrease in net assets resulting from distributions | | | (77,937,340 | ) | | | (9,170,820 | ) | | | (1,760,839 | ) | |
Fund Share Transactions | |
Class A | |
Net proceeds from shares sold | | | 1,098,379,117 | | | | 12,149,183 | | | | 45,800,341 | | |
Net asset value of shares issued for reinvested dividends and distributions | | | 20,753,148 | | | | 3,349,892 | | | | 279,927 | | |
Cost of shares redeemed | | | (90,636,544 | ) | | | (20,147,817 | ) | | | (2,490,434 | ) | |
Increase (decrease) in net assets from Fund share transactions | | | 1,028,495,721 | | | | (4,648,742 | ) | | | 43,589,834 | | |
Class C | |
Net proceeds from shares sold | | | 76,487,644 | | | | 1,457,329 | | | | — | | |
Net asset value of shares issued for reinvested dividends and distributions | | | 1,277,666 | | | | 279,899 | | | | — | | |
Cost of shares redeemed | | | (4,511,297 | ) | | | (4,216,419 | ) | | | — | | |
Increase (decrease) in net assets from Fund share transactions | | | 73,254,013 | | | | (2,479,191 | ) | | | — | | |
Class I | |
Net proceeds from shares sold | | | 3,187,507,157 | | | | 17,071,435 | | | | 134,025,223 | | |
Net asset value of shares issued for reinvested dividends and distributions | | | 55,031,988 | | | | 4,336,097 | | | | 1,421,281 | | |
Cost of shares redeemed | | | (308,239,589 | ) | | | (44,744,552 | ) | | | (19,419,586 | ) | |
Increase (decrease) in net assets from Fund share transactions | | | 2,934,299,556 | | | | (23,337,020 | ) | | | 116,026,918 | | |
First Eagle Funds | Annual Report | October 31, 2024
207
Statements of Changes in Net Assets (continued)
| | First Eagle
Global Real Assets Fund* | |
| | | For the
Year Ended
October 31, 2024 | | For the
Year Ended
October 31, 2023 | |
Class R3^ | |
Net proceeds from shares sold | | | — | | | | — | | |
Net asset value of shares issued for reinvested dividends and distributions | | | — | | | | — | | |
Cost of shares redeemed | | | — | | | | — | | |
Increase (decrease) in net assets from Fund share transactions | | | — | | | | — | | |
Class R4^ | |
Net asset value of shares issued for reinvested dividends and distributions | | | — | | | | — | | |
Cost of shares redeemed | | | — | | | | — | | |
Increase (decrease) in net assets from Fund share transactions | | | — | | | | — | | |
Class R5^ | |
Net proceeds from shares sold | | | — | | | | — | | |
Net asset value of shares issued for reinvested dividends and distributions | | | — | | | | — | | |
Cost of shares redeemed | | | — | | | | — | | |
Increase (decrease) in net assets from Fund share transactions | | | — | | | | — | | |
Class R6 | |
Net proceeds from shares sold | | | 21,815 | | | | 4,549 | | |
Net asset value of shares issued for reinvested dividends and distributions | | | 22,956 | | | | 20,751 | | |
Cost of shares redeemed | | | (34,589 | ) | | | (10,141 | ) | |
Increase (decrease) in net assets from Fund share transactions | | | 10,182 | | | | 15,159 | | |
Increase (decrease) in net assets from Fund share transactions | | | 1,046,347 | | | | 1,856,361 | | |
Net increase (decrease) in net assets | | | 2,994,464 | | | | 1,943,107 | | |
Net Assets (Note 1) | |
Beginning of period | | | 11,303,502 | | | | 9,360,395 | | |
End of period | | $ | 14,297,966 | | | $ | 11,303,502 | | |
Changes in Shares Outstanding | |
Class A | |
Shares outstanding, beginning of period | | | 173,842 | | | | 134,467 | | |
Shares sold | | | 2,405 | | | | 38,372 | | |
Shares issued on reinvestment of distributions | | | 2,953 | | | | 1,338 | | |
Shares redeemed | | | (3,007 | ) | | | (335 | ) | |
Shares outstanding, end of period | | | 176,193 | | | | 173,842 | | |
Class C | |
Shares outstanding, beginning of period | | | — | | | | — | | |
Shares sold | | | — | | | | — | | |
Shares issued on reinvestment of distributions | | | — | | | | — | | |
Shares redeemed | | | — | | | | — | | |
Shares outstanding, end of period | | | — | | | | — | | |
First Eagle Funds | Annual Report | October 31, 2024
208
| | | First Eagle
High Yield Municipal Fund** | | First Eagle
Short Duration
High Yield
Municipal Fund | |
| | | For the
Year Ended
October 31, 2024 | | For the
Year Ended
October 31, 2023 | | For the Period
1/2/24† -
10/31/24 | |
Class R3^ | |
Net proceeds from shares sold | | | 4,090 | | | | 56,063 | | | | — | | |
Net asset value of shares issued for reinvested dividends and distributions | | | 5,368 | | | | 22,383 | | | | — | | |
Cost of shares redeemed | | | (511,451 | ) | | | (760 | ) | | | — | | |
Increase (decrease) in net assets from Fund share transactions | | | (501,993 | ) | | | 77,686 | | | | — | | |
Class R4^ | |
Net asset value of shares issued for reinvested dividends and distributions | | | 47 | | | | 458 | | | | — | | |
Cost of shares redeemed | | | (10,902 | ) | | | — | | | | — | | |
Increase (decrease) in net assets from Fund share transactions | | | (10,855 | ) | | | 458 | | | | — | | |
Class R5^ | |
Net proceeds from shares sold | | | 1 | | | | — | | | | — | | |
Net asset value of shares issued for reinvested dividends and distributions | | | 50 | | | | 561 | | | | — | | |
Cost of shares redeemed | | | (11,190 | ) | | | — | | | | — | | |
Increase (decrease) in net assets from Fund share transactions | | | (11,139 | ) | | | 561 | | | | — | | |
Class R6 | |
Net proceeds from shares sold | | | 1,668,663 | | | | 7,992,381 | | | | 1,010,000 | | |
Net asset value of shares issued for reinvested dividends and distributions | | | 187,704 | | | | 189,821 | | | | 39,335 | | |
Cost of shares redeemed | | | (8,944,231 | ) | | | (1,193,607 | ) | | | — | | |
Increase (decrease) in net assets from Fund share transactions | | | (7,087,864 | ) | | | 6,988,595 | | | | 1,049,335 | | |
Increase (decrease) in net assets from Fund share transactions | | | 4,028,437,439 | | | | (23,397,653 | ) | | | 160,666,087 | | |
Net increase (decrease) in net assets | | | 4,083,464,893 | | | | (22,900,430 | ) | | | 160,676,830 | | |
Net Assets (Note 1) | |
Beginning of period | | | 153,584,216 | | | | 176,484,646 | | | | — | | |
End of period | | $ | 4,237,049,109 | | | $ | 153,584,216 | | | $ | 160,676,830 | | |
Changes in Shares Outstanding | |
Class A | |
Shares outstanding, beginning of period | | | 8,207,087 | | | | 8,796,579 | | | | — | | |
Shares sold | | | 128,396,378 | | | | 1,538,050 | | | | 4,446,936 | | |
Shares issued on reinvestment of distributions | | | 2,417,593 | | | | 422,540 | | | | 27,247 | | |
Shares redeemed | | | (10,654,428 | ) | | | (2,550,082 | ) | | | (241,460 | ) | |
Shares outstanding, end of period | | | 128,366,630 | | | | 8,207,087 | | | | 4,232,723 | | |
Class C | |
Shares outstanding, beginning of period | | | 637,855 | | | | 949,515 | | | | — | | |
Shares sold | | | 8,955,332 | | | | 185,200 | | | | — | | |
Shares issued on reinvestment of distributions | | | 149,177 | | | | 35,330 | | | | — | | |
Shares redeemed | | | (536,542 | ) | | | (532,190 | ) | | | — | | |
Shares outstanding, end of period | | | 9,205,822 | | | | 637,855 | | | | — | | |
First Eagle Funds | Annual Report | October 31, 2024
209
Statements of Changes in Net Assets (continued)
| | | First Eagle
Global Real Assets Fund* | |
| | | For the
Year Ended
October 31, 2024 | | For the
Year Ended
October 31, 2023 | |
Class I | |
Shares outstanding, beginning of period | | | 880,735 | | | | 737,628 | | |
Shares sold | | | 133,357 | | | | 276,322 | | |
Shares issued on reinvestment of distributions | | | 18,569 | | | | 14,288 | | |
Shares redeemed | | | (55,909 | ) | | | (147,503 | ) | |
Shares outstanding, end of period | | | 976,752 | | | | 880,735 | | |
Class R3^ | |
Shares outstanding, beginning of period | | | — | | | | — | | |
Shares sold | | | — | | | | — | | |
Shares issued on reinvestment of distributions | | | — | | | | — | | |
Shares redeemed | | | — | | | | — | | |
Shares outstanding, end of period | | | — | | | | — | | |
Class R4^ | |
Shares outstanding, beginning of period | | | — | | | | — | | |
Shares issued on reinvestment of distributions | | | — | | | | — | | |
Shares redeemed | | | — | | | | — | | |
Shares outstanding, end of period | | | — | | | | — | | |
Class R5^ | |
Shares outstanding, beginning of period | | | — | | | | — | | |
Shares issued on reinvestment of distributions | | | — | | | | — | | |
Shares redeemed | | | — | | | | — | | |
Shares outstanding, end of period | | | — | | | | — | | |
Class R6 | |
Shares outstanding, beginning of period | | | 105,765 | | | | 104,276 | | |
Shares sold | | | 2,085 | | | | 447 | | |
Shares issued on reinvestment of distributions | | | 2,286 | | | | 2,040 | | |
Shares redeemed | | | (3,228 | ) | | | (998 | ) | |
Shares outstanding, end of period | | | 106,908 | | | | 105,765 | | |
* First Eagle Global Real Assets Fund financial statements are shown on a consolidated basis and includes the balances of the First Eagle Global Real Assets Cayman Fund, Ltd.
** First Eagle High Yield Municipal Fund was known as First Eagle High Income Fund prior to December 27, 2023.
† Inception date.
^ On February 29, 2024, Class R3, Class R4 and Class R5 shares converted into Class R6 shares. As a result, Class R3, Class R4 and Class R5 shares were terminated.
See Notes to Financial Statements.
First Eagle Funds | Annual Report | October 31, 2024
210
| | | First Eagle
High Yield Municipal Fund** | | First Eagle
Short Duration
High Yield
Municipal Fund | |
| | | For the
Year Ended
October 31, 2024 | | For the
Year Ended
October 31, 2023 | | For the Period
1/2/24† -
10/31/24 | |
Class I | |
Shares outstanding, beginning of period | | | 9,828,992 | | | | 12,765,238 | | | | — | | |
Shares sold | | | 372,578,199 | | | | 2,150,591 | | | | 13,094,425 | | |
Shares issued on reinvestment of distributions | | | 6,393,708 | | | | 546,360 | | | | 138,918 | | |
Shares redeemed | | | (36,136,125 | ) | | | (5,633,197 | ) | | | (1,897,971 | ) | |
Shares outstanding, end of period | | | 352,664,774 | | | | 9,828,992 | | | | 11,335,372 | | |
Class R3^ | |
Shares outstanding, beginning of period | | | 61,473 | | | | 51,721 | | | | — | | |
Shares sold | | | 506 | | | | 7,027 | | | | — | | |
Shares issued on reinvestment of distributions | | | 663 | | | | 2,821 | | | | — | | |
Shares redeemed | | | (62,642 | ) | | | (96 | ) | | | — | | |
Shares outstanding, end of period | | | — | | | | 61,473 | | | | — | | |
Class R4^ | |
Shares outstanding, beginning of period | | | 1,336 | | | | 1,278 | | | | — | | |
Shares issued on reinvestment of distributions | | | 6 | | | | 58 | | | | — | | |
Shares redeemed | | | (1,342 | ) | | | — | | | | — | | |
Shares outstanding, end of period | | | — | | | | 1,336 | | | | — | | |
Class R5^ | |
Shares outstanding, beginning of period | | | 1,373 | | | | 1,302 | | | | — | | |
Shares issued on reinvestment of distributions | | | 6 | | | | 71 | | | | — | | |
Shares redeemed | | | (1,379 | ) | | | — | | | | — | | |
Shares outstanding, end of period | | | — | | | | 1,373 | | | | — | | |
Class R6 | |
Shares outstanding, beginning of period | | | 1,005,589 | | | | 128,496 | | | | — | | |
Shares sold | | | 204,881 | | | | 1,004,508 | | | | 100,990 | | |
Shares issued on reinvestment of distributions | | | 22,755 | | | | 23,948 | | | | 3,864 | | |
Shares redeemed | | | (1,092,469 | ) | | | (151,363 | ) | | | — | | |
Shares outstanding, end of period | | | 140,756 | | | | 1,005,589 | | | | 104,854 | | |
First Eagle Funds | Annual Report | October 31, 2024
211
| | | Per share operating performance* | |
| | | | | Change in net assets resulting
from operations | | Less dividends and distributions | |
Selected per
share data for
the period ended: | | Net asset
value,
beginning
of year | | Net
investment
income/
loss | | Net
realized
and
unrealized
gains
(losses) on
investments | | Total
investment
operations | | From net
investment
income | | From
capital
gains | | Return of
capital | | Total
distributions | |
First Eagle Global Fund Class A*** | |
October 31, 2024 | | $ | 59.97 | | | | 0.89 | | | | 14.51 | (j) | | | 15.40 | | | | (0.81 | ) | | | (1.41 | ) | | | — | | | | (2.22 | ) | |
October 31, 2023 | | $ | 56.57 | | | | 0.84 | | | | 4.98 | | | | 5.82 | | | | (0.06 | ) | | | (2.36 | ) | | | — | | | | (2.42 | ) | |
October 31, 2022 | | $ | 68.42 | | | | 0.51 | | | | (8.32 | ) | | | (7.81 | ) | | | (1.24 | ) | | | (2.80 | ) | | | — | | | | (4.04 | ) | |
October 31, 2021 | | $ | 55.42 | | | | 0.67 | (d) | | | 13.79 | | | | 14.46 | | | | (0.51 | ) | | | (0.95 | ) | | | — | | | | (1.46 | ) | |
October 31, 2020 | | $ | 59.15 | | | | 0.48 | | | | (1.03 | ) | | | (0.55 | ) | | | (0.73 | ) | | | (2.45 | ) | | | — | | | | (3.18 | ) | |
First Eagle Global Fund Class C*** | |
October 31, 2024 | | $ | 57.05 | | | | 0.36 | | | | 13.84 | (j) | | | 14.20 | | | | (0.31 | ) | | | (1.41 | ) | | | — | | | | (1.72 | ) | |
October 31, 2023 | | $ | 54.26 | | | | 0.35 | | | | 4.80 | | | | 5.15 | | | | — | | | | (2.36 | ) | | | — | | | | (2.36 | ) | |
October 31, 2022 | | $ | 65.60 | | | | 0.04 | | | | (7.99 | ) | | | (7.95 | ) | | | (0.59 | ) | | | (2.80 | ) | | | — | | | | (3.39 | ) | |
October 31, 2021 | | $ | 53.12 | | | | 0.15 | (d) | | | 13.28 | | | | 13.43 | | | | — | | | | (0.95 | ) | | | — | | | | (0.95 | ) | |
October 31, 2020 | | $ | 56.69 | | | | 0.07 | | | | (1.01 | ) | | | (0.94 | ) | | | (0.18 | ) | | | (2.45 | ) | | | — | | | | (2.63 | ) | |
First Eagle Global Fund Class I*** | |
October 31, 2024 | | $ | 60.42 | | | | 1.06 | | | | 14.60 | (j) | | | 15.66 | | | | (0.97 | ) | | | (1.41 | ) | | | — | | | | (2.38 | ) | |
October 31, 2023 | | $ | 56.98 | | | | 0.99 | | | | 5.02 | | | | 6.01 | | | | (0.21 | ) | | | (2.36 | ) | | | — | | | | (2.57 | ) | |
October 31, 2022 | | $ | 68.90 | | | | 0.67 | | | | (8.38 | ) | | | (7.71 | ) | | | (1.41 | ) | | | (2.80 | ) | | | — | | | | (4.21 | ) | |
October 31, 2021 | | $ | 55.79 | | | | 0.85 | (d) | | | 13.87 | | | | 14.72 | | | | (0.66 | ) | | | (0.95 | ) | | | — | | | | (1.61 | ) | |
October 31, 2020 | | $ | 59.52 | | | | 0.63 | | | | (1.03 | ) | | | (0.40 | ) | | | (0.88 | ) | | | (2.45 | ) | | | — | | | | (3.33 | ) | |
First Eagle Global Fund Class R6*** | |
October 31, 2024 | | $ | 60.46 | | | | 1.11 | | | | 14.61 | (j) | | | 15.72 | | | | (1.01 | ) | | | (1.41 | ) | | | — | | | | (2.42 | ) | |
October 31, 2023 | | $ | 57.02 | | | | 1.04 | | | | 5.01 | | | | 6.05 | | | | (0.25 | ) | | | (2.36 | ) | | | — | | | | (2.61 | ) | |
October 31, 2022 | | $ | 68.95 | | | | 0.71 | | | | (8.38 | ) | | | (7.67 | ) | | | (1.46 | ) | | | (2.80 | ) | | | — | | | | (4.26 | ) | |
October 31, 2021 | | $ | 55.83 | | | | 0.90 | (d) | | | 13.87 | | | | 14.77 | | | | (0.70 | ) | | | (0.95 | ) | | | — | | | | (1.65 | ) | |
October 31, 2020 | | $ | 59.55 | | | | 0.64 | | | | (0.99 | ) | | | (0.35 | ) | | | (0.92 | ) | | | (2.45 | ) | | | — | | | | (3.37 | ) | |
First Eagle Overseas Fund Class A*** | |
October 31, 2024 | | $ | 22.81 | | | | 0.41 | | | | 4.36 | | | | 4.77 | | | | (0.41 | ) | | | (0.13 | ) | | | — | | | | (0.54 | ) | |
October 31, 2023 | | $ | 21.26 | | | | 0.37 | | | | 1.99 | | | | 2.36 | | | | (0.02 | ) | | | (0.79 | ) | | | — | | | | (0.81 | ) | |
October 31, 2022 | | $ | 26.71 | | | | 0.30 | | | | (4.30 | ) | | | (4.00 | ) | | | (0.87 | ) | | | (0.58 | ) | | | — | | | | (1.45 | ) | |
October 31, 2021 | | $ | 22.80 | | | | 0.31 | (e) | | | 3.65 | | | | 3.96 | | | | (0.05 | ) | | | — | | | | — | | | | (0.05 | ) | |
October 31, 2020 | | $ | 24.65 | | | | 0.19 | | | | (0.71 | ) | | | (0.52 | ) | | | (0.50 | ) | | | (0.83 | ) | | | — | | | | (1.33 | ) | |
First Eagle Overseas Fund Class C*** | |
October 31, 2024 | | $ | 21.55 | | | | 0.22 | | | | 4.13 | | | | 4.35 | | | | (0.22 | ) | | | (0.13 | ) | | | — | | | | (0.35 | ) | |
October 31, 2023 | | $ | 20.26 | | | | 0.18 | | | | 1.90 | | | | 2.08 | | | | — | | | | (0.79 | ) | | | — | | | | (0.79 | ) | |
October 31, 2022 | | $ | 25.44 | | | | 0.11 | | | | (4.09 | ) | | | (3.98 | ) | | | (0.62 | ) | | | (0.58 | ) | | | — | | | | (1.20 | ) | |
October 31, 2021 | | $ | 21.83 | | | | 0.10 | (e) | | | 3.51 | | | | 3.61 | | | | — | | | | — | | | | — | | | | — | | |
October 31, 2020 | | $ | 23.58 | | | | 0.02 | | | | (0.69 | ) | | | (0.67 | ) | | | (0.25 | ) | | | (0.83 | ) | | | — | | | | (1.08 | ) | |
First Eagle Overseas Fund Class I*** | |
October 31, 2024 | | $ | 23.43 | | | | 0.49 | | | | 4.48 | | | | 4.97 | | | | (0.48 | ) | | | (0.13 | ) | | | — | | | | (0.61 | ) | |
October 31, 2023 | | $ | 21.83 | | | | 0.44 | | | | 2.03 | | | | 2.47 | | | | (0.08 | ) | | | (0.79 | ) | | | — | | | | (0.87 | ) | |
October 31, 2022 | | $ | 27.39 | | | | 0.37 | | | | (4.40 | ) | | | (4.03 | ) | | | (0.95 | ) | | | (0.58 | ) | | | — | | | | (1.53 | ) | |
October 31, 2021 | | $ | 23.38 | | | | 0.40 | (e) | | | 3.73 | | | | 4.13 | | | | (0.12 | ) | | | — | | | | — | | | | (0.12 | ) | |
October 31, 2020 | | $ | 25.24 | | | | 0.26 | | | | (0.72 | ) | | | (0.46 | ) | | | (0.57 | ) | | | (0.83 | ) | | | — | | | | (1.40 | ) | |
First Eagle Funds | Annual Report | October 31, 2024
212
| | | | | | | | | Ratios/Supplemental data | | | |
| | | | | | | | | Ratios to Average Net Assets of: | | | |
Selected per
share data for
the period ended: | | Net asset
value, end
of period | | Total
return(a) | | Net assets,
end of
period
(thousands) | | Operating
expenses
excluding
earnings
credits
and/or fee
waivers | | Operating
expenses
including
earnings
credits
and/or fee
waivers | | Net
investment
income
excluding
earnings
credits
and/or fee
waivers | | Net
investment
income
including
earnings
credits
and/or fee
waivers | | Portfolio
turnover
rate | |
First Eagle Global Fund Class A*** | |
October 31, 2024 | | $ | 73.15 | | | | 26.43 | %(k) | | $ | 15,127,580 | | | | 1.10 | % | | | 1.10 | % | | | 1.33 | % | | | 1.33 | % | | | 9.51 | % | |
October 31, 2023 | | $ | 59.97 | | | | 10.35 | % | | $ | 12,976,288 | | | | 1.10 | % | | | 1.10 | % | | | 1.36 | % | | | 1.37 | % | | | 6.00 | % | |
October 31, 2022 | | $ | 56.57 | | | | (11.90 | )% | | $ | 12,562,351 | | | | 1.11 | % | | | 1.11 | % | | | 0.84 | % | | | 0.84 | % | | | 10.87 | % | |
October 31, 2021 | | $ | 68.42 | | | | 26.49 | %(g) | | $ | 15,108,210 | | | | 1.11 | % | | | 1.11 | % | | | 1.03 | %(d) | | | 1.03 | %(d) | | | 7.29 | % | |
October 31, 2020 | | $ | 55.42 | | | | (1.12 | )% | | $ | 12,112,205 | | | | 1.11 | % | | | 1.11 | % | | | 0.87 | % | | | 0.87 | % | | | 10.84 | % | |
First Eagle Global Fund Class C*** | |
October 31, 2024 | | $ | 69.53 | | | | 25.47 | %(k) | | $ | 1,444,250 | | | | 1.86 | % | | | 1.86 | % | | | 0.56 | % | | | 0.57 | % | | | 9.51 | % | |
October 31, 2023 | | $ | 57.05 | | | | 9.53 | % | | $ | 1,488,095 | | | | 1.86 | % | | | 1.86 | % | | | 0.59 | % | | | 0.60 | % | | | 6.00 | % | |
October 31, 2022 | | $ | 54.26 | | | | (12.57 | )% | | $ | 1,738,497 | | | | 1.87 | % | | | 1.87 | % | | | 0.06 | % | | | 0.06 | % | | | 10.87 | % | |
October 31, 2021 | | $ | 65.60 | | | | 25.53 | %(g) | | $ | 2,623,491 | | | | 1.87 | % | | | 1.87 | % | | | 0.24 | %(d) | | | 0.24 | %(d) | | | 7.29 | % | |
October 31, 2020 | | $ | 53.12 | | | | (1.86 | )% | | $ | 3,423,967 | | | | 1.87 | % | | | 1.87 | % | | | 0.13 | % | | | 0.13 | % | | | 10.84 | % | |
First Eagle Global Fund Class I*** | |
October 31, 2024 | | $ | 73.70 | | | | 26.70 | %(k) | | $ | 37,097,842 | | | | 0.86 | % | | | 0.86 | % | | | 1.56 | % | | | 1.56 | % | | | 9.51 | % | |
October 31, 2023 | | $ | 60.42 | | | | 10.63 | % | | $ | 29,941,639 | | | | 0.86 | % | | | 0.86 | % | | | 1.60 | % | | | 1.61 | % | | | 6.00 | % | |
October 31, 2022 | | $ | 56.98 | | | | (11.69 | )% | | $ | 26,919,899 | | | | 0.86 | % | | | 0.86 | % | | | 1.09 | % | | | 1.09 | % | | | 10.87 | % | |
October 31, 2021 | | $ | 68.90 | | | | 26.82 | %(g) | | $ | 30,248,818 | | | | 0.86 | % | | | 0.86 | % | | | 1.29 | %(d) | | | 1.29 | %(d) | | | 7.29 | % | |
October 31, 2020 | | $ | 55.79 | | | | (0.86 | )% | | $ | 24,274,791 | | | | 0.86 | % | | | 0.86 | % | | | 1.14 | % | | | 1.14 | % | | | 10.84 | % | |
First Eagle Global Fund Class R6*** | |
October 31, 2024 | | $ | 73.76 | | | | 26.82 | %(k) | | $ | 2,666,448 | | | | 0.79 | % | | | 0.78 | % | | | 1.64 | % | | | 1.64 | % | | | 9.51 | % | |
October 31, 2023 | | $ | 60.46 | | | | 10.70 | % | | $ | 2,061,709 | | | | 0.79 | % | | | 0.79 | % | | | 1.68 | % | | | 1.68 | % | | | 6.00 | % | |
October 31, 2022 | | $ | 57.02 | | | | (11.62 | )% | | $ | 1,700,134 | | | | 0.79 | % | | | 0.79 | % | | | 1.15 | % | | | 1.15 | % | | | 10.87 | % | |
October 31, 2021 | | $ | 68.95 | | | | 26.91 | %(g) | | $ | 2,122,258 | | | | 0.78 | % | | | 0.78 | % | | | 1.38 | %(d) | | | 1.38 | %(d) | | | 7.29 | % | |
October 31, 2020 | | $ | 55.83 | | | | (0.79 | )% | | $ | 1,555,290 | | | | 0.79 | % | | | 0.79 | % | | | 1.15 | % | | | 1.15 | % | | | 10.84 | % | |
First Eagle Overseas Fund Class A*** | |
October 31, 2024 | | $ | 27.04 | | | | 21.29 | % | | $ | 1,453,841 | | | | 1.15 | % | | | 1.15 | % | | | 1.64 | % | | | 1.64 | % | | | 6.73 | % | |
October 31, 2023 | | $ | 22.81 | | | | 11.11 | % | | $ | 1,360,488 | | | | 1.15 | % | | | 1.15 | % | | | 1.56 | % | | | 1.56 | % | | | 3.98 | % | |
October 31, 2022 | | $ | 21.26 | | | | (15.62 | )% | | $ | 1,394,388 | | | | 1.15 | % | | | 1.15 | % | | | 1.24 | % | | | 1.24 | % | | | 8.99 | % | |
October 31, 2021 | | $ | 26.71 | | | | 17.35 | %(h) | | $ | 1,895,378 | | | | 1.16 | % | | | 1.16 | % | | | 1.20 | %(e) | | | 1.20 | %(e) | | | 9.93 | % | |
October 31, 2020 | | $ | 22.80 | | | | (2.35 | )% | | $ | 1,742,861 | | | | 1.15 | % | | | 1.15 | % | | | 0.82 | % | | | 0.82 | % | | | 13.20 | % | |
First Eagle Overseas Fund Class C*** | |
October 31, 2024 | | $ | 25.55 | | | | 20.42 | % | | $ | 60,222 | | | | 1.88 | % | | | 1.88 | % | | | 0.90 | % | | | 0.90 | % | | | 6.73 | % | |
October 31, 2023 | | $ | 21.55 | | | | 10.26 | % | | $ | 74,231 | | | | 1.88 | % | | | 1.88 | % | | | 0.82 | % | | | 0.82 | % | | | 3.98 | % | |
October 31, 2022 | | $ | 20.26 | | | | (16.23 | )% | | $ | 92,476 | | | | 1.89 | % | | | 1.89 | % | | | 0.48 | % | | | 0.48 | % | | | 8.99 | % | |
October 31, 2021 | | $ | 25.44 | | | | 16.49 | %(h) | | $ | 157,203 | | | | 1.89 | % | | | 1.89 | % | | | 0.41 | %(e) | | | 0.41 | %(e) | | | 9.93 | % | |
October 31, 2020 | | $ | 21.83 | | | | (3.07 | )% | | $ | 228,072 | | | | 1.89 | % | | | 1.89 | % | | | 0.08 | % | | | 0.08 | % | | | 13.20 | % | |
First Eagle Overseas Fund Class I*** | |
October 31, 2024 | | $ | 27.79 | | | | 21.62 | % | | $ | 9,627,067 | | | | 0.89 | % | | | 0.88 | % | | | 1.90 | % | | | 1.90 | % | | | 6.73 | % | |
October 31, 2023 | | $ | 23.43 | | | | 11.36 | % | | $ | 9,122,327 | | | | 0.88 | % | | | 0.88 | % | | | 1.84 | % | | | 1.84 | % | | | 3.98 | % | |
October 31, 2022 | | $ | 21.83 | | | | (15.40 | )% | | $ | 8,462,922 | | | | 0.89 | % | | | 0.89 | % | | | 1.49 | % | | | 1.49 | % | | | 8.99 | % | |
October 31, 2021 | | $ | 27.39 | | | | 17.71 | %(h) | | $ | 11,072,223 | | | | 0.88 | % | | | 0.88 | % | | | 1.49 | %(e) | | | 1.49 | %(e) | | | 9.93 | % | |
October 31, 2020 | | $ | 23.38 | | | | (2.06 | )% | | $ | 9,698,986 | | | | 0.87 | % | | | 0.87 | % | | | 1.11 | % | | | 1.11 | % | | | 13.20 | % | |
First Eagle Funds | Annual Report | October 31, 2024
213
| | | Per share operating performance* | |
| | | | | Change in net assets resulting
from operations | | Less dividends and distributions | |
Selected per
share data for
the period ended: | | Net asset
value,
beginning
of year | | Net
investment
income/
loss | | Net
realized
and
unrealized
gains
(losses) on
investments | | Total
investment
operations | | From net
investment
income | | From
capital
gains | | Return of
capital | | Total
distributions | |
First Eagle Overseas Fund Class R6*** | |
October 31, 2024 | | $ | 23.44 | | | | 0.52 | | | | 4.47 | | | | 4.99 | | | | (0.50 | ) | | | (0.13 | ) | | | — | | | | (0.63 | ) | |
October 31, 2023 | | $ | 21.84 | | | | 0.46 | | | | 2.03 | | | | 2.49 | | | | (0.10 | ) | | | (0.79 | ) | | | — | | | | (0.89 | ) | |
October 31, 2022 | | $ | 27.40 | | | | 0.39 | | | | (4.40 | ) | | | (4.01 | ) | | | (0.97 | ) | | | (0.58 | ) | | | — | | | | (1.55 | ) | |
October 31, 2021 | | $ | 23.39 | | | | 0.45 | (e) | | | 3.70 | | | | 4.15 | | | | (0.14 | ) | | | — | | | | — | | | | (0.14 | ) | |
October 31, 2020 | | $ | 25.25 | | | | 0.28 | | | | (0.72 | ) | | | (0.44 | ) | | | (0.59 | ) | | | (0.83 | ) | | | — | | | | (1.42 | ) | |
First Eagle U.S. Value Fund Class A*** | |
October 31, 2024 | | $ | 18.54 | | | | 0.21 | | | | 5.07 | | | | 5.28 | | | | (0.24 | ) | | | (1.01 | ) | | | — | | | | (1.25 | ) | |
October 31, 2023 | | $ | 18.41 | | | | 0.22 | | | | 1.37 | | | | 1.59 | | | | (0.10 | ) | | | (1.36 | ) | | | — | | | | (1.46 | ) | |
October 31, 2022 | | $ | 22.23 | | | | 0.13 | | | | (2.08 | ) | | | (1.95 | ) | | | (0.17 | ) | | | (1.70 | ) | | | — | | | | (1.87 | ) | |
October 31, 2021 | | $ | 16.97 | | | | 0.09 | | | | 5.49 | | | | 5.58 | | | | (0.20 | ) | | | (0.12 | ) | | | — | | | | (0.32 | ) | |
October 31, 2020 | | $ | 18.84 | | | | 0.14 | | | | (0.48 | ) | | | (0.34 | ) | | | (0.16 | ) | | | (1.37 | ) | | | — | | | | (1.53 | ) | |
First Eagle U.S. Value Fund Class C*** | |
October 31, 2024 | | $ | 17.40 | | | | 0.05 | | | | 4.76 | | | | 4.81 | | | | (0.09 | ) | | | (1.01 | ) | | | — | | | | (1.10 | ) | |
October 31, 2023 | | $ | 17.39 | | | | 0.08 | | | | 1.29 | | | | 1.37 | | | | — | | | | (1.36 | ) | | | — | | | | (1.36 | ) | |
October 31, 2022 | | $ | 21.08 | | | | (0.02 | ) | | | (1.97 | ) | | | (1.99 | ) | | | — | | | | (1.70 | ) | | | — | | | | (1.70 | ) | |
October 31, 2021 | | $ | 16.06 | | | | (0.06 | ) | | | 5.22 | | | | 5.16 | | | | (0.02 | ) | | | (0.12 | ) | | | — | | | | (0.14 | ) | |
October 31, 2020 | | $ | 17.89 | | | | 0.01 | | | | (0.47 | ) | | | (0.46 | ) | | | — | | | | (1.37 | ) | | | — | | | | (1.37 | ) | |
First Eagle U.S. Value Fund Class I*** | |
October 31, 2024 | | $ | 19.00 | | | | 0.27 | | | | 5.20 | | | | 5.47 | | | | (0.29 | ) | | | (1.01 | ) | | | — | | | | (1.30 | ) | |
October 31, 2023 | | $ | 18.84 | | | | 0.28 | | | | 1.39 | | | | 1.67 | | | | (0.15 | ) | | | (1.36 | ) | | | — | | | | (1.51 | ) | |
October 31, 2022 | | $ | 22.71 | | | | 0.19 | | | | (2.13 | ) | | | (1.94 | ) | | | (0.23 | ) | | | (1.70 | ) | | | — | | | | (1.93 | ) | |
October 31, 2021 | | $ | 17.32 | | | | 0.15 | | | | 5.61 | | | | 5.76 | | | | (0.25 | ) | | | (0.12 | ) | | | — | | | | (0.37 | ) | |
October 31, 2020 | | $ | 19.21 | | | | 0.20 | | | | (0.51 | ) | | | (0.31 | ) | | | (0.21 | ) | | | (1.37 | ) | | | — | | | | (1.58 | ) | |
First Eagle U.S. Value Fund Class R6*** | |
October 31, 2024 | | $ | 19.00 | | | | 0.28 | | | | 5.20 | | | | 5.48 | | | | (0.30 | ) | | | (1.01 | ) | | | — | | | | (1.31 | ) | |
October 31, 2023 | | $ | 18.84 | | | | 0.29 | | | | 1.39 | | | | 1.68 | | | | (0.16 | ) | | | (1.36 | ) | | | — | | | | (1.52 | ) | |
October 31, 2022 | | $ | 22.71 | | | | 0.20 | | | | (2.13 | ) | | | (1.93 | ) | | | (0.24 | ) | | | (1.70 | ) | | | — | | | | (1.94 | ) | |
October 31, 2021 | | $ | 17.32 | | | | 0.16 | | | | 5.61 | | | | 5.77 | | | | (0.26 | ) | | | (0.12 | ) | | | — | | | | (0.38 | ) | |
October 31, 2020 | | $ | 19.22 | | | | 0.19 | | | | (0.50 | ) | | | (0.31 | ) | | | (0.22 | ) | | | (1.37 | ) | | | — | | | | (1.59 | ) | |
First Eagle Gold Fund Class A*** | |
October 31, 2024 | | $ | 22.30 | | | | 0.07 | | | | 8.32 | | | | 8.39 | | | | (0.21 | ) | | | — | | | | — | | | | (0.21 | ) | |
October 31, 2023 | | $ | 19.25 | | | | 0.19 | | | | 2.86 | | | | 3.05 | | | | — | | | | — | | | | — | | | | — | | |
October 31, 2022 | | $ | 22.94 | | | | 0.05 | | | | (3.52 | ) | | | (3.47 | ) | | | (0.22 | ) | | | — | | | | — | | | | (0.22 | ) | |
October 31, 2021 | | $ | 26.28 | | | | (0.01 | ) | | | (3.01 | ) | | | (3.02 | ) | | | (0.32 | ) | | | — | | | | — | | | | (0.32 | ) | |
October 31, 2020 | | $ | 18.66 | | | | (0.12 | ) | | | 7.74 | | | | 7.62 | | | | — | | | | — | | | | — | | | | — | | |
First Eagle Gold Fund Class C*** | |
October 31, 2024 | | $ | 20.10 | | | | (0.11 | ) | | | 7.51 | | | | 7.40 | | | | (0.05 | ) | | | — | | | | — | | | | (0.05 | ) | |
October 31, 2023 | | $ | 17.48 | | | | 0.01 | | | | 2.61 | | | | 2.62 | | | | — | | | | — | | | | — | | | | — | | |
October 31, 2022 | | $ | 20.82 | | | | (0.10 | ) | | | (3.19 | ) | | | (3.29 | ) | | | (0.05 | ) | | | — | | | | — | | | | (0.05 | ) | |
October 31, 2021 | | $ | 23.92 | | | | (0.17 | ) | | | (2.76 | ) | | | (2.93 | ) | | | (0.17 | ) | | | — | | | | — | | | | (0.17 | ) | |
October 31, 2020 | | $ | 17.11 | | | | (0.26 | ) | | | 7.07 | | | | 6.81 | | | | — | | | | — | | | | — | | | | — | | |
First Eagle Funds | Annual Report | October 31, 2024
214
| | | | | | | | | Ratios/Supplemental data | | | |
| | | | | | | | | Ratios to Average Net Assets of: | | | |
Selected per
share data for
the period ended: | | Net asset
value, end
of period | | Total
return(a) | | Net assets,
end of
period
(thousands) | | Operating
expenses
excluding
earnings
credits
and/or fee
waivers | | Operating
expenses
including
earnings
credits
and/or fee
waivers | | Net
investment
income
excluding
earnings
credits
and/or fee
waivers | | Net
investment
income
including
earnings
credits
and/or fee
waivers | | Portfolio
turnover
rate | |
First Eagle Overseas Fund Class R6*** | |
October 31, 2024 | | $ | 27.80 | | | | 21.72 | % | | $ | 1,227,351 | | | | 0.80 | % | | | 0.80 | % | | | 2.02 | % | | | 2.02 | % | | | 6.73 | % | |
October 31, 2023 | | $ | 23.44 | | | | 11.45 | % | | $ | 1,289,925 | | | | 0.80 | % | | | 0.80 | % | | | 1.91 | % | | | 1.92 | % | | | 3.98 | % | |
October 31, 2022 | | $ | 21.84 | | | | (15.32 | )% | | $ | 1,255,272 | | | | 0.80 | % | | | 0.80 | % | | | 1.58 | % | | | 1.58 | % | | | 8.99 | % | |
October 31, 2021 | | $ | 27.40 | | | | 17.78 | %(h) | | $ | 1,566,467 | | | | 0.79 | % | | | 0.79 | % | | | 1.65 | %(e) | | | 1.65 | %(e) | | | 9.93 | % | |
October 31, 2020 | | $ | 23.39 | | | | (1.99 | )% | | $ | 919,645 | | | | 0.80 | % | | | 0.80 | % | | | 1.19 | % | | | 1.19 | % | | | 13.20 | % | |
First Eagle U.S. Value Fund Class A*** | |
October 31, 2024 | | $ | 22.57 | | | | 30.07 | % | | $ | 638,522 | | | | 1.15 | % | | | 1.12 | % | | | 0.99 | % | | | 1.01 | % | | | 8.63 | % | |
October 31, 2023 | | $ | 18.54 | | | | 8.81 | % | | $ | 536,105 | | | | 1.16 | % | | | 1.10 | % | | | 1.14 | % | | | 1.19 | % | | | 6.62 | % | |
October 31, 2022 | | $ | 18.41 | | | | (9.12 | )% | | $ | 540,287 | | | | 1.16 | % | | | 1.11 | % | | | 0.60 | % | | | 0.65 | % | | | 10.33 | % | |
October 31, 2021 | | $ | 22.23 | | | | 33.28 | % | | $ | 638,937 | | | | 1.16 | % | | | 1.11 | % | | | 0.40 | % | | | 0.45 | % | | | 4.02 | % | |
October 31, 2020 | | $ | 16.97 | | | | (2.23 | )% | | $ | 485,589 | | | | 1.18 | % | | | 1.13 | % | | | 0.78 | % | | | 0.83 | % | | | 10.30 | % | |
First Eagle U.S. Value Fund Class C*** | |
October 31, 2024 | | $ | 21.11 | | | | 29.10 | % | | $ | 29,232 | | | | 1.91 | % | | | 1.88 | % | | | 0.22 | % | | | 0.25 | % | | | 8.63 | % | |
October 31, 2023 | | $ | 17.40 | | | | 8.00 | % | | $ | 29,230 | | | | 1.91 | % | | | 1.86 | % | | | 0.37 | % | | | 0.43 | % | | | 6.62 | % | |
October 31, 2022 | | $ | 17.39 | | | | (9.82 | )% | | $ | 34,953 | | | | 1.92 | % | | | 1.87 | % | | | (0.18 | )% | | | (0.13 | )% | | | 10.33 | % | |
October 31, 2021 | | $ | 21.08 | | | | 32.29 | % | | $ | 53,912 | | | | 1.95 | % | | | 1.90 | % | | | (0.38 | )% | | | (0.33 | )% | | | 4.02 | % | |
October 31, 2020 | | $ | 16.06 | | | | (3.00 | )% | | $ | 101,600 | | | | 1.94 | % | | | 1.89 | % | | | 0.03 | % | | | 0.08 | % | | | 10.30 | % | |
First Eagle U.S. Value Fund Class I*** | |
October 31, 2024 | | $ | 23.17 | | | | 30.41 | % | | $ | 688,339 | | | | 0.88 | % | | | 0.86 | % | | | 1.25 | % | | | 1.28 | % | | | 8.63 | % | |
October 31, 2023 | | $ | 19.00 | | | | 9.08 | % | | $ | 541,195 | | | | 0.91 | % | | | 0.86 | % | | | 1.38 | % | | | 1.44 | % | | | 6.62 | % | |
October 31, 2022 | | $ | 18.84 | | | | (8.88 | )% | | $ | 538,424 | | | | 0.88 | % | | | 0.83 | % | | | 0.88 | % | | | 0.93 | % | | | 10.33 | % | |
October 31, 2021 | | $ | 22.71 | | | | 33.72 | % | | $ | 584,344 | | | | 0.89 | % | | | 0.84 | % | | | 0.68 | % | | | 0.73 | % | | | 4.02 | % | |
October 31, 2020 | | $ | 17.32 | | | | (2.01 | )% | | $ | 505,997 | | | | 0.89 | % | | | 0.84 | % | | | 1.08 | % | | | 1.13 | % | | | 10.30 | % | |
First Eagle U.S. Value Fund Class R6*** | |
October 31, 2024 | | $ | 23.17 | | | | 30.50 | % | | $ | 41,682 | | | | 0.84 | % | | | 0.81 | % | | | 1.30 | % | | | 1.32 | % | | | 8.63 | % | |
October 31, 2023 | | $ | 19.00 | | | | 9.14 | % | | $ | 32,405 | | | | 0.84 | % | | | 0.79 | % | | | 1.46 | % | | | 1.51 | % | | | 6.62 | % | |
October 31, 2022 | | $ | 18.84 | | | | (8.83 | )% | | $ | 25,921 | | | | 0.83 | % | | | 0.78 | % | | | 0.94 | % | | | 0.99 | % | | | 10.33 | % | |
October 31, 2021 | | $ | 22.71 | | | | 33.78 | % | | $ | 25,676 | | | | 0.84 | % | | | 0.79 | % | | | 0.72 | % | | | 0.77 | % | | | 4.02 | % | |
October 31, 2020 | | $ | 17.32 | | | | (2.02 | )% | | $ | 15,058 | | | | 0.86 | % | | | 0.81 | % | | | 1.03 | % | | | 1.08 | % | | | 10.30 | % | |
First Eagle Gold Fund Class A*** | |
October 31, 2024 | | $ | 30.48 | | | | 37.88 | % | | $ | 742,947 | | | | 1.16 | % | | | 1.16 | % | | | 0.27 | % | | | 0.27 | % | | | 60.97 | % | |
October 31, 2023 | | $ | 22.30 | | | | 15.84 | % | | $ | 549,712 | | | | 1.19 | % | | | 1.18 | % | | | 0.81 | % | | | 0.81 | % | | | 16.39 | % | |
October 31, 2022 | | $ | 19.25 | | | | (15.24 | )% | | $ | 494,372 | | | | 1.19 | % | | | 1.19 | % | | | 0.24 | % | | | 0.24 | % | | | 17.78 | % | |
October 31, 2021 | | $ | 22.94 | | | | (11.60 | )% | | $ | 578,968 | | | | 1.22 | % | | | 1.22 | % | | | (0.03 | )% | | | (0.03 | )% | | | 5.13 | % | |
October 31, 2020 | | $ | 26.28 | | | | 40.84 | % | | $ | 643,945 | | | | 1.21 | % | | | 1.21 | % | | | (0.52 | )% | | | (0.52 | )% | | | 3.34 | % | |
First Eagle Gold Fund Class C*** | |
October 31, 2024 | | $ | 27.45 | | | | 36.87 | % | | $ | 130,212 | | | | 1.91 | % | | | 1.90 | % | | | (0.47 | )% | | | (0.47 | )% | | | 60.97 | % | |
October 31, 2023 | | $ | 20.10 | | | | 14.99 | % | | $ | 108,058 | | | | 1.92 | % | | | 1.92 | % | | | 0.06 | % | | | 0.07 | % | | | 16.39 | % | |
October 31, 2022 | | $ | 17.48 | | | | (15.87 | )% | | $ | 104,359 | | | | 1.93 | % | | | 1.93 | % | | | (0.51 | )% | | | (0.51 | )% | | | 17.78 | % | |
October 31, 2021 | | $ | 20.82 | | | | (12.25 | )% | | $ | 144,502 | | | | 1.95 | % | | | 1.95 | % | | | (0.77 | )% | | | (0.77 | )% | | | 5.13 | % | |
October 31, 2020 | | $ | 23.92 | | | | 39.80 | % | | $ | 179,978 | | | | 1.95 | % | | | 1.95 | % | | | (1.25 | )% | | | (1.25 | )% | | | 3.34 | % | |
First Eagle Funds | Annual Report | October 31, 2024
215
| | | Per share operating performance* | |
| | | | | Change in net assets resulting
from operations | | Less dividends and distributions | |
Selected per
share data for
the period ended: | | Net asset
value,
beginning
of year | | Net
investment
income/
loss | | Net
realized
and
unrealized
gains
(losses) on
investments | | Total
investment
operations | | From net
investment
income | | From
capital
gains | | Return of
capital | | Total
distributions | |
First Eagle Gold Fund Class I*** | |
October 31, 2024 | | $ | 23.08 | | | | 0.13 | | | | 8.63 | | | | 8.76 | | | | (0.27 | ) | | | — | | | | — | | | | (0.27 | ) | |
October 31, 2023 | | $ | 19.88 | | | | 0.26 | | | | 2.94 | | | | 3.20 | | | | — | | | | — | | | | — | | | | — | | |
October 31, 2022 | | $ | 23.68 | | | | 0.12 | | | | (3.64 | ) | | | (3.52 | ) | | | (0.28 | ) | | | — | | | | — | | | | (0.28 | ) | |
October 31, 2021 | | $ | 27.13 | | | | 0.06 | | | | (3.13 | ) | | | (3.07 | ) | | | (0.38 | ) | | | — | | | | — | | | | (0.38 | ) | |
October 31, 2020 | | $ | 19.22 | | | | (0.06 | ) | | | 7.99 | | | | 7.93 | | | | (0.02 | ) | | | — | | | | — | | | | (0.02 | ) | |
First Eagle Gold Fund Class R6*** | |
October 31, 2024 | | $ | 23.16 | | | | 0.16 | | | | 8.64 | | | | 8.80 | | | | (0.29 | ) | | | — | | | | — | | | | (0.29 | ) | |
October 31, 2023 | | $ | 19.93 | | | | 0.29 | | | | 2.94 | | | | 3.23 | | | | — | | | | — | | | | — | | | | — | | |
October 31, 2022 | | $ | 23.74 | | | | 0.13 | | | | (3.63 | ) | | | (3.50 | ) | | | (0.31 | ) | | | — | | | | — | | | | (0.31 | ) | |
October 31, 2021 | | $ | 27.19 | | | | 0.08 | | | | (3.13 | ) | | | (3.05 | ) | | | (0.40 | ) | | | — | | | | — | | | | (0.40 | ) | |
October 31, 2020 | | $ | 19.26 | | | | (0.03 | ) | | | 7.99 | | | | 7.96 | | | | (0.03 | ) | | | — | | | | — | | | | (0.03 | ) | |
First Eagle Global Income Builder Fund Class A | |
October 31, 2024 | | $ | 11.89 | | | | 0.34 | | | | 1.89 | | | | 2.23 | | | | (0.33 | ) | | | (0.01 | ) | | | — | | | | (0.34 | ) | |
October 31, 2023 | | $ | 11.62 | | | | 0.32 | | | | 0.43 | | | | 0.75 | | | | (0.29 | ) | | | (0.19 | ) | | | — | | | | (0.48 | ) | |
October 31, 2022 | | $ | 13.52 | | | | 0.27 | | | | (1.34 | ) | | | (1.07 | ) | | | (0.26 | ) | | | (0.57 | ) | | | — | | | | (0.83 | ) | |
October 31, 2021 | | $ | 11.47 | | | | 0.27 | (f) | | | 2.17 | | | | 2.44 | | | | (0.26 | ) | | | (0.13 | ) | | | — | | | | (0.39 | ) | |
October 31, 2020 | | $ | 12.15 | | | | 0.22 | | | | (0.64 | ) | | | (0.42 | ) | | | (0.22 | ) | | | (0.04 | ) | | | — | | | | (0.26 | ) | |
First Eagle Global Income Builder Fund Class C | |
October 31, 2024 | | $ | 11.98 | | | | 0.24 | | | | 1.88 | | | | 2.12 | | | | (0.23 | ) | | | (0.01 | ) | | | — | | | | (0.24 | ) | |
October 31, 2023 | | $ | 11.70 | | | | 0.23 | | | | 0.44 | | | | 0.67 | | | | (0.20 | ) | | | (0.19 | ) | | | — | | | | (0.39 | ) | |
October 31, 2022 | | $ | 13.47 | | | | 0.17 | | | | (1.34 | ) | | | (1.17 | ) | | | (0.03 | ) | | | (0.57 | ) | | | — | | | | (0.60 | ) | |
October 31, 2021 | | $ | 11.44 | | | | 0.16 | (f) | | | 2.17 | | | | 2.33 | | | | (0.17 | ) | | | (0.13 | ) | | | — | | | | (0.30 | ) | |
October 31, 2020 | | $ | 12.11 | | | | 0.13 | | | | (0.63 | ) | | | (0.50 | ) | | | (0.13 | ) | | | (0.04 | ) | | | — | | | | (0.17 | ) | |
First Eagle Global Income Builder Fund Class I | |
October 31, 2024 | | $ | 11.84 | | | | 0.37 | | | | 1.86 | | | | 2.23 | | | | (0.35 | ) | | | (0.01 | ) | | | — | | | | (0.36 | ) | |
October 31, 2023 | | $ | 11.56 | | | | 0.35 | | | | 0.43 | | | | 0.78 | | | | (0.31 | ) | | | (0.19 | ) | | | — | | | | (0.50 | ) | |
October 31, 2022 | | $ | 13.48 | | | | 0.30 | | | | (1.34 | ) | | | (1.04 | ) | | | (0.31 | ) | | | (0.57 | ) | | | — | | | | (0.88 | ) | |
October 31, 2021 | | $ | 11.45 | | | | 0.30 | (f) | | | 2.15 | | | | 2.45 | | | | (0.29 | ) | | | (0.13 | ) | | | — | | | | (0.42 | ) | |
October 31, 2020 | | $ | 12.12 | | | | 0.25 | | | | (0.63 | ) | | | (0.38 | ) | | | (0.25 | ) | | | (0.04 | ) | | | — | | | | (0.29 | ) | |
First Eagle Global Income Builder Fund Class R6 | |
October 31, 2024 | | $ | 11.82 | | | | 0.38 | | | | 1.86 | | | | 2.24 | | | | (0.36 | ) | | | (0.01 | ) | | | — | | | | (0.37 | ) | |
October 31, 2023 | | $ | 11.55 | | | | 0.36 | | | | 0.42 | | | | 0.78 | | | | (0.32 | ) | | | (0.19 | ) | | | — | | | | (0.51 | ) | |
October 31, 2022 | | $ | 13.47 | | | | 0.31 | | | | (1.33 | ) | | | (1.02 | ) | | | (0.33 | ) | | | (0.57 | ) | | | — | | | | (0.90 | ) | |
October 31, 2021 | | $ | 11.44 | | | | 0.31 | (f) | | | 2.15 | | | | 2.46 | | | | (0.30 | ) | | | (0.13 | ) | | | — | | | | (0.43 | ) | |
October 31, 2020 | | $ | 12.11 | | | | 0.24 | | | | (0.62 | ) | | | (0.38 | ) | | | (0.25 | ) | | | (0.04 | ) | | | — | | | | (0.29 | ) | |
First Eagle Rising Dividend Fund Class A | |
October 31, 2024 | | $ | 22.39 | | | | 0.37 | | | | 6.59 | (l) | | | 6.96 | | | | (0.29 | ) | | | (1.67 | ) | | | — | | | | (1.96 | ) | |
October 31, 2023 | | $ | 20.30 | | | | 0.35 | | | | 2.50 | (n) | | | 2.85 | | | | (0.26 | ) | | | (0.50 | ) | | | — | | | | (0.76 | ) | |
October 31, 2022 | | $ | 29.80 | | | | 0.16 | | | | (6.00 | ) | | | (5.84 | ) | | | (0.12 | ) | | | (3.54 | ) | | | — | | | | (3.66 | ) | |
October 31, 2021 | | $ | 25.84 | | | | 0.09 | | | | 8.37 | | | | 8.46 | | | | (0.06 | ) | | | (4.44 | ) | | | — | | | | (4.50 | ) | |
October 31, 2020 | | $ | 26.45 | | | | 0.01 | | | | (0.38 | ) | | | (0.37 | ) | | | (0.01 | ) | | | (0.23 | ) | | | — | | | | (0.24 | ) | |
First Eagle Funds | Annual Report | October 31, 2024
216
| | | | | | | | | Ratios/Supplemental data | | | |
| | | | | | | | | Ratios to Average Net Assets of: | | | |
Selected per
share data for
the period ended: | | Net asset
value, end
of period | | Total
return(a) | | Net assets,
end of
period
(thousands) | | Operating
expenses
excluding
earnings
credits
and/or fee
waivers | | Operating
expenses
including
earnings
credits
and/or fee
waivers | | Net
investment
income
excluding
earnings
credits
and/or fee
waivers | | Net
investment
income
including
earnings
credits
and/or fee
waivers | | Portfolio
turnover
rate | |
First Eagle Gold Fund Class I*** | |
October 31, 2024 | | $ | 31.57 | | | | 38.28 | % | | $ | 1,731,704 | | | | 0.93 | % | | | 0.92 | % | | | 0.50 | % | | | 0.51 | % | | | 60.97 | % | |
October 31, 2023 | | $ | 23.08 | | | | 16.10 | % | | $ | 1,349,359 | | | | 0.94 | % | | | 0.94 | % | | | 1.07 | % | | | 1.07 | % | | | 16.39 | % | |
October 31, 2022 | | $ | 19.88 | | | | (15.00 | )% | | $ | 1,075,242 | | | | 0.94 | % | | | 0.94 | % | | | 0.50 | % | | | 0.50 | % | | | 17.78 | % | |
October 31, 2021 | | $ | 23.68 | | | | (11.41 | )% | | $ | 1,349,701 | | | | 0.96 | % | | | 0.96 | % | | | 0.23 | % | | | 0.23 | % | | | 5.13 | % | |
October 31, 2020 | | $ | 27.13 | | | | 41.29 | % | | $ | 1,424,181 | | | | 0.92 | % | | | 0.92 | % | | | (0.25 | )% | | | (0.25 | )% | | | 3.34 | % | |
First Eagle Gold Fund Class R6*** | |
October 31, 2024 | | $ | 31.67 | | | | 38.37 | % | | $ | 226,783 | | | | 0.83 | % | | | 0.83 | % | | | 0.59 | % | | | 0.59 | % | | | 60.97 | % | |
October 31, 2023 | | $ | 23.16 | | | | 16.21 | % | | $ | 147,133 | | | | 0.85 | % | | | 0.84 | % | | | 1.18 | % | | | 1.19 | % | | | 16.39 | % | |
October 31, 2022 | | $ | 19.93 | | | | (14.91 | )% | | $ | 105,438 | | | | 0.85 | % | | | 0.85 | % | | | 0.59 | % | | | 0.59 | % | | | 17.78 | % | |
October 31, 2021 | | $ | 23.74 | | | | (11.33 | )% | | $ | 103,234 | | | | 0.85 | % | | | 0.85 | % | | | 0.31 | % | | | 0.31 | % | | | 5.13 | % | |
October 31, 2020 | | $ | 27.19 | | | | 41.42 | % | | $ | 209,208 | | | | 0.85 | % | | | 0.85 | % | | | (0.14 | )% | | | (0.14 | )% | | | 3.34 | % | |
First Eagle Global Income Builder Fund Class A | |
October 31, 2024 | | $ | 13.78 | | | | 18.89 | % | | $ | 679,029 | | | | 1.17 | % | | | 1.17 | % | | | 2.62 | % | | | 2.62 | % | | | 14.66 | % | |
October 31, 2023 | | $ | 11.89 | | | | 6.35 | % | | $ | 622,236 | | | | 1.18 | % | | | 1.18 | % | | | 2.60 | % | | | 2.60 | % | | | 20.41 | % | |
October 31, 2022 | | $ | 11.62 | | | | (8.23 | )% | | $ | 541,002 | | | | 1.16 | % | | | 1.16 | % | | | 2.17 | % | | | 2.18 | % | | | 13.76 | % | |
October 31, 2021 | | $ | 13.52 | | | | 21.36 | %(i) | | $ | 492,402 | | | | 1.17 | % | | | 1.17 | % | | | 2.04 | %(f) | | | 2.04 | %(f) | | | 22.80 | % | |
October 31, 2020 | | $ | 11.47 | | | | (3.38 | )% | | $ | 359,442 | | | | 1.19 | % | | | 1.19 | % | | | 1.87 | % | | | 1.87 | % | | | 28.98 | % | |
First Eagle Global Income Builder Fund Class C | |
October 31, 2024 | | $ | 13.86 | | | | 17.79 | % | | $ | 73,815 | | | | 1.94 | % | | | 1.94 | % | | | 1.82 | % | | | 1.82 | % | | | 14.66 | % | |
October 31, 2023 | | $ | 11.98 | | | | 5.65 | % | | $ | 82,141 | | | | 1.94 | % | | | 1.94 | % | | | 1.79 | % | | | 1.79 | % | | | 20.41 | % | |
October 31, 2022 | | $ | 11.70 | | | | (8.95 | )% | | $ | 98,977 | | | | 1.94 | % | | | 1.94 | % | | | 1.38 | % | | | 1.38 | % | | | 13.76 | % | |
October 31, 2021 | | $ | 13.47 | | | | 20.48 | %(i) | | $ | 153,654 | | | | 1.94 | % | | | 1.94 | % | | | 1.25 | %(f) | | | 1.25 | %(f) | | | 22.80 | % | |
October 31, 2020 | | $ | 11.44 | | | | (4.15 | )% | | $ | 186,154 | | | | 1.95 | % | | | 1.95 | % | | | 1.11 | % | | | 1.11 | % | | | 28.98 | % | |
First Eagle Global Income Builder Fund Class I | |
October 31, 2024 | | $ | 13.71 | | | | 19.06 | % | | $ | 929,623 | | | | 0.96 | % | | | 0.96 | % | | | 2.85 | % | | | 2.85 | % | | | 14.66 | % | |
October 31, 2023 | | $ | 11.84 | | | | 6.69 | % | | $ | 874,530 | | | | 0.97 | % | | | 0.97 | % | | | 2.83 | % | | | 2.84 | % | | | 20.41 | % | |
October 31, 2022 | | $ | 11.56 | | | | (7.98 | )% | | $ | 751,297 | | | | 0.93 | % | | | 0.93 | % | | | 2.43 | % | | | 2.43 | % | | | 13.76 | % | |
October 31, 2021 | | $ | 13.48 | | | | 21.62 | %(i) | | $ | 668,678 | | | | 0.93 | % | | | 0.93 | % | | | 2.26 | %(f) | | | 2.26 | %(f) | | | 22.80 | % | |
October 31, 2020 | | $ | 11.45 | | | | (3.14 | )% | | $ | 630,351 | | | | 0.94 | % | | | 0.94 | % | | | 2.11 | % | | | 2.11 | % | | | 28.98 | % | |
First Eagle Global Income Builder Fund Class R6 | |
October 31, 2024 | | $ | 13.69 | | | | 19.18 | % | | $ | 76,431 | | | | 0.89 | % | | | 0.89 | % | | | 2.92 | % | | | 2.93 | % | | | 14.66 | % | |
October 31, 2023 | | $ | 11.82 | | | | 6.68 | % | | $ | 62,556 | | | | 0.89 | % | | | 0.89 | % | | | 2.92 | % | | | 2.93 | % | | | 20.41 | % | |
October 31, 2022 | | $ | 11.55 | | | | (7.85 | )% | | $ | 45,873 | | | | 0.87 | % | | | 0.87 | % | | | 2.49 | % | | | 2.49 | % | | | 13.76 | % | |
October 31, 2021 | | $ | 13.47 | | | | 21.72 | %(i) | | $ | 24,506 | | | | 0.87 | % | | | 0.87 | % | | | 2.35 | %(f) | | | 2.35 | %(f) | | | 22.80 | % | |
October 31, 2020 | | $ | 11.44 | | | | (3.14 | )% | | $ | 15,649 | | | | 0.90 | % | | | 0.90 | % | | | 2.01 | % | | | 2.01 | % | | | 28.98 | % | |
First Eagle Rising Dividend Fund Class A | |
October 31, 2024 | | $ | 27.39 | | | | 32.95 | %(m) | | $ | 285,395 | | | | 1.07 | % | | | 0.90 | % | | | 1.30 | % | | | 1.47 | % | | | 15.44 | % | |
October 31, 2023 | | $ | 22.39 | | | | 14.17 | %(o) | | $ | 243,724 | | | | 1.10 | % | | | 0.90 | % | | | 1.36 | % | | | 1.56 | % | | | 30.98 | % | |
October 31, 2022 | | $ | 20.30 | | | | (21.94 | )% | | $ | 246,151 | | | | 1.05 | % | | | 0.90 | % | | | 0.54 | % | | | 0.69 | % | | | 10.87 | % | |
October 31, 2021 | | $ | 29.80 | | | | 36.58 | % | | $ | 235,888 | | | | 1.04 | % | | | 0.90 | % | | | 0.20 | % | | | 0.34 | % | | | 40.70 | % | |
October 31, 2020 | | $ | 25.84 | | | | (1.43 | )% | | $ | 203,581 | | | | 1.34 | % | | | 1.28 | % | | | (0.04 | )% | | | 0.02 | % | | | 97.86 | % | |
First Eagle Funds | Annual Report | October 31, 2024
217
| | | Per share operating performance* | |
| | | | | Change in net assets resulting
from operations | | Less dividends and distributions | |
Selected per
share data for
the period ended: | | Net asset
value,
beginning
of year | | Net
investment
income/
loss | | Net
realized
and
unrealized
gains
(losses) on
investments | | Total
investment
operations | | From net
investment
income | | From
capital
gains | | Return of
capital | | Total
distributions | |
First Eagle Rising Dividend Fund Class C | |
October 31, 2024 | | $ | 13.63 | | | | 0.10 | | | | 3.85 | (l) | | | 3.95 | | | | (0.19 | ) | | | (1.67 | ) | | | — | | | | (1.86 | ) | |
October 31, 2023 | | $ | 12.63 | | | | 0.10 | | | | 1.56 | (n) | | | 1.66 | | | | (0.16 | ) | | | (0.50 | ) | | | — | | | | (0.66 | ) | |
October 31, 2022 | | $ | 20.00 | | | | (0.03 | ) | | | (3.76 | ) | | | (3.79 | ) | | | (0.04 | ) | | | (3.54 | ) | | | — | | | | (3.58 | ) | |
October 31, 2021 | | $ | 18.74 | | | | (0.07 | ) | | | 5.77 | | | | 5.70 | | | | — | | | | (4.44 | ) | | | — | | | | (4.44 | ) | |
October 31, 2020 | | $ | 19.37 | | | | (0.14 | ) | | | (0.26 | ) | | | (0.40 | ) | | | — | | | | (0.23 | ) | | | — | | | | (0.23 | ) | |
First Eagle Rising Dividend Fund Class I | |
October 31, 2024 | | $ | 23.62 | | | | 0.45 | | | | 6.98 | (l) | | | 7.43 | | | | (0.35 | ) | | | (1.67 | ) | | | — | | | | (2.02 | ) | |
October 31, 2023 | | $ | 21.38 | | | | 0.43 | | | | 2.62 | (n) | | | 3.05 | | | | (0.31 | ) | | | (0.50 | ) | | | — | | | | (0.81 | ) | |
October 31, 2022 | | $ | 31.17 | | | | 0.21 | | | | (6.29 | ) | | | (6.08 | ) | | | (0.17 | ) | | | (3.54 | ) | | | — | | | | (3.71 | ) | |
October 31, 2021 | | $ | 26.91 | | | | 0.17 | | | | 8.72 | | | | 8.89 | | | | (0.19 | ) | | | (4.44 | ) | | | — | | | | (4.63 | ) | |
October 31, 2020 | | $ | 27.54 | | | | 0.09 | | | | (0.37 | ) | | | (0.28 | ) | | | (0.12 | ) | | | (0.23 | ) | | | — | | | | (0.35 | ) | |
First Eagle Rising Dividend Fund Class R6 | |
October 31, 2024 | | $ | 23.62 | | | | 0.46 | | | | 6.96 | (l) | | | 7.42 | | | | (0.35 | ) | | | (1.67 | ) | | | — | | | | (2.02 | ) | |
October 31, 2023 | | $ | 21.37 | | | | 0.43 | | | | 2.63 | (n) | | | 3.06 | | | | (0.31 | ) | | | (0.50 | ) | | | — | | | | (0.81 | ) | |
October 31, 2022 | | $ | 31.17 | | | | 0.21 | | | | (6.30 | ) | | | (6.09 | ) | | | (0.17 | ) | | | (3.54 | ) | | | — | | | | (3.71 | ) | |
October 31, 2021 | | $ | 26.92 | | | | 0.17 | | | | 8.74 | | | | 8.91 | | | | (0.22 | ) | | | (4.44 | ) | | | — | | | | (4.66 | ) | |
October 31, 2020 | | $ | 27.57 | | | | 0.07 | | | | (0.37 | ) | | | (0.30 | ) | | | (0.12 | ) | | | (0.23 | ) | | | — | | | | (0.35 | ) | |
First Eagle Small Cap Opportunity Fund Class A | |
October 31, 2024 | | $ | 8.19 | | | | 0.02 | | | | 2.16 | | | | 2.18 | | | | (0.04 | ) | | | — | | | | — | | | | (0.04 | ) | |
October 31, 2023 | | $ | 8.47 | | | | 0.01 | | | | (0.29 | ) | | | (0.28 | ) | | | — | | | | — | | | | — | | | | — | | |
October 31, 2022 | | $ | 9.76 | | | | (0.02 | ) | | | (1.27 | ) | | | (1.29 | ) | | | — | | | | — | | | | — | | | | — | | |
For The Period
7/1/21^-10/31/21 | | $ | 10.12 | | | | (0.02 | ) | | | (0.34 | ) | | | (0.36 | ) | | | — | | | | — | | | | — | | | | — | | |
First Eagle Small Cap Opportunity Fund Class I | |
October 31, 2024 | | $ | 8.23 | | | | 0.04 | | | | 2.17 | | | | 2.21 | | | | (0.06 | ) | | | — | | | | — | | | | (0.06 | ) | |
October 31, 2023 | | $ | 8.50 | | | | 0.03 | | | | (0.29 | ) | | | (0.26 | ) | | | (0.01 | ) | | | — | | | | — | | | | (0.01 | ) | |
October 31, 2022 | | $ | 9.77 | | | | 0.00 | ** | | | (1.27 | ) | | | (1.27 | ) | | | — | | | | — | | | | — | | | | — | | |
For The Period
4/27/21^-10/31/21 | | $ | 10.00 | | | | (0.02 | ) | | | (0.02 | ) | | | (0.04 | ) | | | (0.00 | )** | | | (0.19 | ) | | | (0.00 | )** | | | (0.19 | ) | |
First Eagle Small Cap Opportunity Fund Class R6 | |
October 31, 2024 | | $ | 8.23 | | | | 0.04 | | | | 2.18 | | | | 2.22 | | | | (0.06 | ) | | | — | | | | — | | | | (0.06 | ) | |
October 31, 2023 | | $ | 8.50 | | | | 0.03 | | | | (0.29 | ) | | | (0.26 | ) | | | (0.01 | ) | | | — | | | | — | | | | (0.01 | ) | |
October 31, 2022 | | $ | 9.77 | | | | 0.00 | ** | | | (1.27 | ) | | | (1.27 | ) | | | — | | | | — | | | | — | | | | — | | |
For The Period
7/1/21^-10/31/21 | | $ | 10.12 | | | | (0.01 | ) | | | (0.34 | ) | | | (0.35 | ) | | | — | | | | — | | | | — | | | | — | | |
First Eagle U.S. Smid Cap Opportunity Fund Class A | |
October 31, 2024 | | $ | 8.70 | | | | 0.00 | ** | | | 2.95 | | | | 2.95 | | | | (0.19 | ) | | | — | | | | — | | | | (0.19 | ) | |
October 31, 2023 | | $ | 8.97 | | | | 0.03 | | | | (0.29 | ) | | | (0.26 | ) | | | (0.01 | ) | | | — | | | | — | | | | (0.01 | ) | |
For The Period
8/15/22^-10/31/22 | | $ | 10.00 | | | | 0.01 | | | | (1.04 | ) | | | (1.03 | ) | | | — | | | | — | | | | — | | | | — | | |
First Eagle Funds | Annual Report | October 31, 2024
218
| | | | | | | | | Ratios/Supplemental data | | | |
| | | | | | | | | Ratios to Average Net Assets of: | | | |
Selected per
share data for
the period ended: | | Net asset
value, end
of period | | Total
return(a) | | Net assets,
end of
period
(thousands) | | Operating
expenses
excluding
earnings
credits
and/or fee
waivers | | Operating
expenses
including
earnings
credits
and/or fee
waivers | | Net
investment
income
excluding
earnings
credits
and/or fee
waivers | | Net
investment
income
including
earnings
credits
and/or fee
waivers | | Portfolio
turnover
rate | |
First Eagle Rising Dividend Fund Class C | |
October 31, 2024 | | $ | 15.72 | | | | 31.86 | %(m) | | $ | 5,485 | | | | 1.82 | % | | | 1.65 | % | | | 0.55 | % | | | 0.72 | % | | | 15.44 | % | |
October 31, 2023 | | $ | 13.63 | | | | 13.31 | %(o) | | $ | 8,098 | | | | 1.82 | % | | | 1.65 | % | | | 0.57 | % | | | 0.74 | % | | | 30.98 | % | |
October 31, 2022 | | $ | 12.63 | | | | (22.50 | )% | | $ | 16,002 | | | | 1.84 | % | | | 1.65 | % | | | (0.36 | )% | | | (0.17 | )% | | | 10.87 | % | |
October 31, 2021 | | $ | 20.00 | | | | 35.52 | % | | $ | 37,722 | | | | 1.79 | % | | | 1.65 | % | | | (0.54 | )% | | | (0.40 | )% | | | 40.70 | % | |
October 31, 2020 | | $ | 18.74 | | | | (2.12 | )% | | $ | 62,901 | | | | 2.09 | % | | | 2.03 | % | | | (0.79 | )% | | | (0.73 | )% | | | 97.86 | % | |
First Eagle Rising Dividend Fund Class I | |
October 31, 2024 | | $ | 29.03 | | | | 33.28 | %(m) | | $ | 133,670 | | | | 0.78 | % | | | 0.65 | % | | | 1.59 | % | | | 1.71 | % | | | 15.44 | % | |
October 31, 2023 | | $ | 23.62 | | | | 14.43 | %(o) | | $ | 95,458 | | | | 0.77 | % | | | 0.65 | % | | | 1.68 | % | | | 1.81 | % | | | 30.98 | % | |
October 31, 2022 | | $ | 21.38 | | | | (21.71 | )% | | $ | 97,103 | | | | 0.74 | % | | | 0.65 | % | | | 0.77 | % | | | 0.86 | % | | | 10.87 | % | |
October 31, 2021 | | $ | 31.17 | | | | 36.88 | % | | $ | 162,113 | | | | 0.70 | % | | | 0.65 | % | | | 0.53 | % | | | 0.58 | % | | | 40.70 | % | |
October 31, 2020 | | $ | 26.91 | | | | (1.09 | )% | | $ | 167,093 | | | | 1.01 | % | | | 0.96 | % | | | 0.28 | % | | | 0.33 | % | | | 97.86 | % | |
First Eagle Rising Dividend Fund Class R6 | |
October 31, 2024 | | $ | 29.02 | | | | 33.24 | %(m) | | $ | 8,375 | | | | 0.73 | % | | | 0.65 | % | | | 1.65 | % | | | 1.72 | % | | | 15.44 | % | |
October 31, 2023 | | $ | 23.62 | | | | 14.48 | %(o) | | $ | 6,427 | | | | 0.74 | % | | | 0.65 | % | | | 1.73 | % | | | 1.82 | % | | | 30.98 | % | |
October 31, 2022 | | $ | 21.37 | | | | (21.75 | )% | | $ | 5,206 | | | | 0.69 | % | | | 0.65 | % | | | 0.84 | % | | | 0.88 | % | | | 10.87 | % | |
October 31, 2021 | | $ | 31.17 | | | | 36.93 | % | | $ | 7,056 | | | | 0.67 | % | | | 0.65 | % | | | 0.57 | % | | | 0.59 | % | | | 40.70 | % | |
October 31, 2020 | | $ | 26.92 | | | | (1.13 | )% | | $ | 5,471 | | | | 1.00 | % | | | 0.95 | % | | | 0.20 | % | | | 0.26 | % | | | 97.86 | % | |
First Eagle Small Cap Opportunity Fund Class A | |
October 31, 2024 | | $ | 10.33 | | | | 26.69 | % | | $ | 102,705 | | | | 1.27 | % | | | 1.25 | % | | | 0.13 | % | | | 0.16 | % | | | 45.67 | % | |
October 31, 2023 | | $ | 8.19 | | | | (3.31 | )% | | $ | 61,379 | | | | 1.32 | % | | | 1.25 | % | | | (0.01 | )% | | | 0.06 | % | | | 41.12 | % | |
October 31, 2022 | | $ | 8.47 | | | | (13.22 | )% | | $ | 37,220 | | | | 1.41 | % | | | 1.25 | % | | | (0.42 | )% | | | (0.26 | )% | | | 45.84 | % | |
For The Period
7/1/21^-10/31/21 | | $ | 9.76 | | | | (3.56 | )%(b) | | $ | 10,060 | | | | 1.95 | %(c) | | | 1.25 | %(c) | | | (1.30 | )%(c) | | | (0.60 | )%(c) | | | 13.63 | %(b) | |
First Eagle Small Cap Opportunity Fund Class I | |
October 31, 2024 | | $ | 10.38 | | | | 26.95 | % | | $ | 1,657,408 | | | | 1.06 | % | | | 1.00 | % | | | 0.35 | % | | | 0.41 | % | | | 45.67 | % | |
October 31, 2023 | | $ | 8.23 | | | | (3.08 | )% | | $ | 1,183,672 | | | | 1.09 | % | | | 1.00 | % | | | 0.22 | % | | | 0.31 | % | | | 41.12 | % | |
October 31, 2022 | | $ | 8.50 | | | | (13.00 | )% | | $ | 501,227 | | | | 1.17 | % | | | 1.00 | % | | | (0.16 | )% | | | 0.01 | % | | | 45.84 | % | |
For The Period
4/27/21^-10/31/21 | | $ | 9.77 | | | | (0.47 | )%(b) | | $ | 93,195 | | | | 2.07 | %(c) | | | 1.00 | %(c) | | | (1.37 | )%(c) | | | (0.30 | )%(c) | | | 13.63 | %(b) | |
First Eagle Small Cap Opportunity Fund Class R6 | |
October 31, 2024 | | $ | 10.39 | | | | 27.07 | % | | $ | 108,407 | | | | 1.00 | % | | | 1.00 | % | | | 0.40 | % | | | 0.41 | % | | | 45.67 | % | |
October 31, 2023 | | $ | 8.23 | | | | (3.08 | )% | | $ | 64,646 | | | | 1.02 | % | | | 1.00 | % | | | 0.29 | % | | | 0.31 | % | | | 41.12 | % | |
October 31, 2022 | | $ | 8.50 | | | | (13.00 | )% | | $ | 22,857 | | | | 1.28 | % | | | 1.00 | % | | | (0.23 | )% | | | 0.04 | % | | | 45.84 | % | |
For The Period
7/1/21^-10/31/21 | | $ | 9.77 | | | | (3.46 | )%(b) | | $ | 1,236 | | | | 1.98 | %(c) | | | 1.00 | %(c) | | | (1.29 | )%(c) | | | (0.31 | )%(c) | | | 13.63 | %(b) | |
First Eagle U.S. Smid Cap Opportunity Fund Class A | |
October 31, 2024 | | $ | 11.46 | | | | 34.32 | % | | $ | 1,298 | | | | 2.27 | % | | | 1.20 | % | | | (1.06 | )% | | | — | %(p) | | | 26.23 | % | |
October 31, 2023 | | $ | 8.70 | | | | (2.90 | )% | | $ | 78 | | | | 7.08 | % | | | 1.20 | % | | | (5.56 | )% | | | 0.31 | % | | | 30.48 | % | |
For The Period
8/15/22^-10/31/22 | | $ | 8.97 | | | | (10.30 | )%(b) | | $ | 49 | | | | 57.34 | %(c) | | | 1.18 | %(c) | | | (55.81 | )%(c) | | | 0.35 | %(c) | | | 4.00 | %(b) | |
First Eagle Funds | Annual Report | October 31, 2024
219
| | | Per share operating performance* | |
| | | | | Change in net assets resulting
from operations | | Less dividends and distributions | |
Selected per
share data for
the period ended: | | Net asset
value,
beginning
of year | | Net
investment
income/
loss | | Net
realized
and
unrealized
gains
(losses) on
investments | | Total
investment
operations | | From net
investment
income | | From
capital
gains | | Return of
capital | | Total
distributions | |
First Eagle U.S. Smid Cap Opportunity Fund Class I | |
October 31, 2024 | | $ | 8.72 | | | | 0.03 | | | | 2.98 | | | | 3.01 | | | | (0.04 | ) | | | — | | | | — | | | | (0.04 | ) | |
October 31, 2023 | | $ | 8.98 | | | | 0.04 | | | | (0.27 | ) | | | (0.23 | ) | | | (0.03 | ) | | | — | | | | — | | | | (0.03 | ) | |
For The Period
8/15/22^-10/31/22 | | $ | 10.00 | | | | 0.01 | | | | (1.03 | ) | | | (1.02 | ) | | | — | | | | — | | | | — | | | | — | | |
First Eagle U.S. Smid Cap Opportunity Fund Class R6 | |
October 31, 2024 | | $ | 8.71 | | | | 0.03 | | | | 2.91 | | | | 2.94 | | | | (0.33 | ) | | | — | | | | — | | | | (0.33 | ) | |
October 31, 2023 | | $ | 8.98 | | | | 0.06 | | | | (0.29 | ) | | | (0.23 | ) | | | (0.04 | ) | | | — | | | | — | | | | (0.04 | ) | |
For The Period
8/15/22^-10/31/22 | | $ | 10.00 | | | | 0.01 | | | | (1.03 | ) | | | (1.02 | ) | | | — | | | | — | | | | — | | | | — | | |
First Eagle Global Real Assets Fund Class A*** | |
October 31, 2024 | | $ | 9.78 | | | | 0.19 | | | | 1.61 | | | | 1.80 | | | | (0.17 | ) | | | — | | | | — | | | | (0.17 | ) | |
October 31, 2023 | | $ | 9.57 | | | | 0.19 | | | | 0.12 | | | | 0.31 | | | | (0.10 | ) | | | — | | | | — | | | | (0.10 | ) | |
For The Period
11/30/21^-10/31/22 | | $ | 10.00 | | | | 0.13 | | | | (0.56 | ) | | | (0.43 | ) | | | — | | | | — | | | | — | | | | — | | |
First Eagle Global Real Assets Fund Class I*** | |
October 31, 2024 | | $ | 9.73 | | | | 0.22 | | | | 1.61 | | | | 1.83 | | | | (0.22 | ) | | | — | | | | — | | | | (0.22 | ) | |
October 31, 2023 | | $ | 9.59 | | | | 0.20 | | | | 0.14 | | | | 0.34 | | | | (0.20 | ) | | | — | | | | — | | | | (0.20 | ) | |
For The Period
11/30/21^-10/31/22 | | $ | 10.00 | | | | 0.15 | | | | (0.56 | ) | | | (0.41 | ) | | | — | | | | — | | | | — | | | | — | | |
First Eagle Global Real Assets Fund Class R6*** | |
October 31, 2024 | | $ | 9.73 | | | | 0.21 | | | | 1.61 | | | | 1.82 | | | | (0.22 | ) | | | — | | | | — | | | | (0.22 | ) | |
October 31, 2023 | | $ | 9.59 | | | | 0.21 | | | | 0.13 | | | | 0.34 | | | | (0.20 | ) | | | — | | | | — | | | | (0.20 | ) | |
For The Period
11/30/21^-10/31/22 | | $ | 10.00 | | | | 0.15 | | | | (0.56 | ) | | | (0.41 | ) | | | — | | | | — | | | | — | | | | — | | |
First Eagle High Yield Municipal Fund Class A (formerly named First Eagle High Income Fund) | |
October 31, 2024 | | $ | 7.78 | | | | 0.40 | | | | 0.91 | | | | 1.31 | | | | (0.41 | ) | | | — | | | | (0.04 | ) | | | (0.45 | ) | |
October 31, 2023 | | $ | 7.77 | | | | 0.41 | | | | 0.01 | | | | 0.42 | | | | (0.41 | ) | | | — | | | | — | | | | (0.41 | ) | |
October 31, 2022 | | $ | 8.98 | | | | 0.36 | | | | (1.21 | ) | | | (0.85 | ) | | | (0.36 | ) | | | — | | | | — | | | | (0.36 | ) | |
October 31, 2021 | | $ | 8.71 | | | | 0.33 | | | | 0.27 | | | | 0.60 | | | | (0.33 | ) | | | — | | | | — | | | | (0.33 | ) | |
October 31, 2020 | | $ | 8.71 | | | | 0.37 | | | | (0.01 | ) | | | 0.36 | | | | (0.36 | ) | | | — | | | | — | | | | (0.36 | ) | |
First Eagle High Yield Municipal Fund Class C (formerly named First Eagle High Income Fund) | |
October 31, 2024 | | $ | 7.77 | | | | 0.34 | | | | 0.92 | | | | 1.26 | | | | (0.35 | ) | | | — | | | | (0.04 | ) | | | (0.39 | ) | |
October 31, 2023 | | $ | 7.77 | | | | 0.35 | | | | 0.00 | ** | | | 0.35 | | | | (0.35 | ) | | | — | | | | — | | | | (0.35 | ) | |
October 31, 2022 | | $ | 8.97 | | | | 0.30 | | | | (1.19 | ) | | | (0.89 | ) | | | (0.31 | ) | | | — | | | | — | | | | (0.31 | ) | |
October 31, 2021 | | $ | 8.70 | | | | 0.26 | | | | 0.28 | | | | 0.54 | | | | (0.27 | ) | | | — | | | | — | | | | (0.27 | ) | |
October 31, 2020 | | $ | 8.70 | | | | 0.31 | | | | (0.01 | ) | | | 0.30 | | | | (0.30 | ) | | | — | | | | — | | | | (0.30 | ) | |
First Eagle Funds | Annual Report | October 31, 2024
220
| | | | | | | | | Ratios/Supplemental data | | | |
| | | | | | | | | Ratios to Average Net Assets of: | | | |
Selected per
share data for
the period ended: | | Net asset
value, end
of period | | Total
return(a) | | Net assets,
end of
period
(thousands) | | Operating
expenses
excluding
earnings
credits
and/or fee
waivers | | Operating
expenses
including
earnings
credits
and/or fee
waivers | | Net
investment
income
excluding
earnings
credits
and/or fee
waivers | | Net
investment
income
including
earnings
credits
and/or fee
waivers | | Portfolio
turnover
rate | |
First Eagle U.S. Smid Cap Opportunity Fund Class I | |
October 31, 2024 | | $ | 11.69 | | | | 34.58 | % | | $ | 48,532 | | | | 1.86 | % | | | 0.95 | % | | | (0.59 | )% | | | 0.32 | % | | | 26.23 | % | |
October 31, 2023 | | $ | 8.72 | | | | (2.60 | )% | | $ | 27,633 | | | | 2.96 | % | | | 0.95 | % | | | (1.56 | )% | | | 0.44 | % | | | 30.48 | % | |
For The Period
8/15/22^-10/31/22 | | $ | 8.98 | | | | (10.20 | )%(b) | | $ | 1,046 | | | | 46.97 | %(c) | | | 0.95 | %(c) | | | (45.46 | )%(c) | | | 0.56 | %(c) | | | 4.00 | %(b) | |
First Eagle U.S. Smid Cap Opportunity Fund Class R6 | |
October 31, 2024 | | $ | 11.32 | | | | 34.65 | % | | $ | 114 | | | | 1.88 | % | | | 0.95 | % | | | (0.61 | )% | | | 0.32 | % | | | 26.23 | % | |
October 31, 2023 | | $ | 8.71 | | | | (2.64 | )% | | $ | 44 | | | | 8.96 | % | | | 0.95 | % | | | (7.42 | )% | | | 0.60 | % | | | 30.48 | % | |
For The Period
8/15/22^-10/31/22 | | $ | 8.98 | | | | (10.20 | )%(b) | | $ | 45 | | | | 47.13 | %(c) | | | 0.94 | %(c) | | | (45.59 | )%(c) | | | 0.60 | %(c) | | | 4.00 | %(b) | |
First Eagle Global Real Assets Fund Class A*** | |
October 31, 2024 | | $ | 11.41 | | | | 18.66 | % | | $ | 2,011 | | | | 5.11 | % | | | 1.10 | % | | | (2.28 | )% | | | 1.74 | % | | | 40.98 | % | |
October 31, 2023 | | $ | 9.78 | | | | 3.17 | % | | $ | 1,700 | | | | 5.91 | % | | | 1.09 | % | | | (3.00 | )% | | | 1.82 | % | | | 39.01 | % | |
For The Period
11/30/21^-10/31/22 | | $ | 9.57 | | | | (4.30 | )%(b) | | $ | 1,286 | | | | 5.23 | %(c) | | | 1.09 | %(c) | | | (2.78 | )%(c) | | | 1.37 | %(c) | | | 12.37 | %(b) | |
First Eagle Global Real Assets Fund Class I*** | |
October 31, 2024 | | $ | 11.34 | | | | 19.04 | % | | $ | 11,075 | | | | 4.86 | % | | | 0.85 | % | | | (2.01 | )% | | | 2.00 | % | | | 40.98 | % | |
October 31, 2023 | | $ | 9.73 | | | | 3.43 | % | | $ | 8,574 | | | | 5.46 | % | | | 0.85 | % | | | (2.59 | )% | | | 2.01 | % | | | 39.01 | % | |
For The Period
11/30/21^-10/31/22 | | $ | 9.59 | | | | (4.10 | )%(b) | | $ | 7,074 | | | | 4.85 | %(c) | | | 0.85 | %(c) | | | (2.34 | )%(c) | | | 1.65 | %(c) | | | 12.37 | %(b) | |
First Eagle Global Real Assets Fund Class R6*** | |
October 31, 2024 | | $ | 11.33 | | | | 18.96 | % | | $ | 1,212 | | | | 4.90 | % | | | 0.85 | % | | | (2.07 | )% | | | 1.99 | % | | | 40.98 | % | |
October 31, 2023 | | $ | 9.73 | | | | 3.45 | % | | $ | 1,029 | | | | 5.51 | % | | | 0.85 | % | | | (2.63 | )% | | | 2.03 | % | | | 39.01 | % | |
For The Period
11/30/21^-10/31/22 | | $ | 9.59 | | | | (4.10 | )%(b) | | $ | 1,000 | | | | 4.86 | %(c) | | | 0.85 | %(c) | | | (2.38 | )%(c) | | | 1.63 | %(c) | | | 12.37 | %(b) | |
First Eagle High Yield Municipal Fund Class A (formerly named First Eagle High Income Fund) | |
October 31, 2024 | | $ | 8.64 | | | | 17.15 | % | | $ | 1,109,654 | | | | 0.89 | % | | | 0.80 | %(q) | | | 4.60 | % | | | 4.70 | % | | | 136.03 | % | |
October 31, 2023 | | $ | 7.78 | | | | 5.37 | % | | $ | 63,824 | | | | 1.14 | % | | | 0.98 | % | | | 4.98 | % | | | 5.15 | % | | | 24.60 | % | |
October 31, 2022 | | $ | 7.77 | | | | (9.59 | )% | | $ | 68,391 | | | | 1.13 | % | | | 1.13 | % | | | 4.37 | % | | | 4.37 | % | | | 28.00 | % | |
October 31, 2021 | | $ | 8.98 | | | | 7.01 | % | | $ | 83,819 | | | | 1.23 | % | | | 1.16 | % | | | 3.56 | % | | | 3.63 | % | | | 64.11 | % | |
October 31, 2020 | | $ | 8.71 | | | | 4.39 | % | | $ | 73,112 | | | | 1.33 | % | | | 1.23 | % | | | 4.27 | % | | | 4.37 | % | | | 55.38 | % | |
First Eagle High Yield Municipal Fund Class C (formerly named First Eagle High Income Fund) | |
October 31, 2024 | | $ | 8.64 | | | | 16.44 | % | | $ | 79,515 | | | | 1.65 | % | | | 1.55 | %(q) | | | 3.87 | % | | | 3.98 | % | | | 136.03 | % | |
October 31, 2023 | | $ | 7.77 | | | | 4.45 | % | | $ | 4,957 | | | | 1.89 | % | | | 1.74 | % | | | 4.24 | % | | | 4.39 | % | | | 24.60 | % | |
October 31, 2022 | | $ | 7.77 | | | | (10.15 | )% | | $ | 7,376 | | | | 1.88 | % | | | 1.88 | % | | | 3.55 | % | | | 3.55 | % | | | 28.00 | % | |
October 31, 2021 | | $ | 8.97 | | | | 6.20 | % | | $ | 15,129 | | | | 2.01 | % | | | 1.94 | % | | | 2.81 | % | | | 2.88 | % | | | 64.11 | % | |
October 31, 2020 | | $ | 8.70 | | | | 3.60 | % | | $ | 31,972 | | | | 2.10 | % | | | 2.00 | % | | | 3.53 | % | | | 3.63 | % | | | 55.38 | % | |
First Eagle Funds | Annual Report | October 31, 2024
221
| | | Per share operating performance* | |
| | | | | Change in net assets resulting
from operations | | Less dividends and distributions | |
Selected per
share data for
the period ended: | | Net asset
value,
beginning
of year | | Net
investment
income/
loss | | Net
realized
and
unrealized
gains
(losses) on
investments | | Total
investment
operations | | From net
investment
income | | From
capital
gains | | Return of
capital | | Total
distributions | |
First Eagle High Yield Municipal Fund Class I (formerly named First Eagle High Income Fund) | |
October 31, 2024 | | $ | 7.78 | | | | 0.42 | | | | 0.92 | | | | 1.34 | | | | (0.44 | ) | | | — | | | | (0.04 | ) | | | (0.48 | ) | |
October 31, 2023 | | $ | 7.78 | | | | 0.43 | | | | (0.01 | ) | | | 0.42 | | | | (0.42 | ) | | | — | | | | — | | | | (0.42 | ) | |
October 31, 2022 | | $ | 8.98 | | | | 0.39 | | | | (1.21 | ) | | | (0.82 | ) | | | (0.38 | ) | | | — | | | | — | | | | (0.38 | ) | |
October 31, 2021 | | $ | 8.71 | | | | 0.35 | | | | 0.28 | | | | 0.63 | | | | (0.36 | ) | | | — | | | | — | | | | (0.36 | ) | |
October 31, 2020 | | $ | 8.71 | | | | 0.39 | | | | 0.00 | ** | | | 0.39 | | | | (0.39 | ) | | | — | | | | — | | | | (0.39 | ) | |
First Eagle High Yield Municipal Fund Class R6 (formerly named First Eagle High Income Fund) | |
October 31, 2024 | | $ | 7.78 | | | | 0.46 | | | | 0.91 | | | | 1.37 | | | | (0.45 | ) | | | — | | | | (0.04 | ) | | | (0.49 | ) | |
October 31, 2023 | | $ | 7.78 | | | | 0.43 | | | | (0.01 | ) | | | 0.42 | | | | (0.42 | ) | | | — | | | | — | | | | (0.42 | ) | |
October 31, 2022 | | $ | 8.98 | | | | 0.39 | | | | (1.19 | ) | | | (0.80 | ) | | | (0.40 | ) | | | — | | | | — | | | | (0.40 | ) | |
October 31, 2021 | | $ | 8.71 | | | | 0.35 | | | | 0.28 | | | | 0.63 | | | | (0.36 | ) | | | — | | | | — | | | | (0.36 | ) | |
October 31, 2020 | | $ | 8.71 | | | | 0.39 | | | | (0.01 | ) | | | 0.38 | | | | (0.38 | ) | | | — | | | | — | | | | (0.38 | ) | |
First Eagle Short Duration High Yield Municipal Fund Class A | |
For The Period
1/2/24^-10/31/24 | | $ | 10.00 | | | | 0.38 | | | | 0.24 | | | | 0.62 | | | | (0.36 | ) | | | — | | | | — | | | | (0.36 | ) | |
First Eagle Short Duration High Yield Municipal Fund Class I | |
For The Period
1/2/24^-10/31/24 | | $ | 10.00 | | | | 0.40 | | | | 0.25 | | | | 0.65 | | | | (0.40 | ) | | | — | | | | — | | | | (0.40 | ) | |
First Eagle Short Duration High Yield Municipal Fund Class R6 | |
For The Period
1/2/24^-10/31/24 | | $ | 10.00 | | | | 0.40 | | | | 0.24 | | | | 0.64 | | | | (0.38 | ) | | | — | | | | — | | | | (0.38 | ) | |
^ Inception date.
* Per share amounts have been calculated using the average shares method.
** Amount represents less than $0.01 per share.
*** First Eagle Global Fund, First Eagle Overseas Fund, First Eagle U.S. Value Fund, First Eagle Gold Fund and First Eagle Global Real Assets Fund financial statements are shown on a consolidated basis and includes the balances of the First Eagle Global Cayman Fund, Ltd., First Eagle Overseas Cayman Fund, Ltd., First Eagle U.S. Value Cayman Fund, Ltd., First Eagle Gold Cayman Fund, Ltd., and First Eagle Global Real Assets Cayman Fund, Ltd., respectively.
(a) Does not take into account the sales charge of 5.00% for Class A shares for all Funds, except First Eagle High Yield Municipal Fund and First Eagle Short Duration High Yield Municipal Fund, which have a sales charge of 2.50% and the maximum contingent deferred sales charge (CDSC) of 1.00% for Class C shares. Prior to March 1, 2024, the sales charge for Class A was 4.50% for First Eagle High Yield Municipal Fund, which was also not taken into account. A contingent deferred sales charge of 1.00% may apply on redemptions of Class A shares made within 18 months following a purchase of $1,000,000 or more without an initial sales charge for all funds, except First Eagle Global Income Builder Fund, First Eagle High Yield Municipal Fund, and First Eagle Short Duration High Yield Municipal Fund. With respect to the First Eagle Global Income Builder Fund, First Eagle High Yield Municipal Fund, and First Eagle Short Duration High Yield Municipal Fund, a CDSC of 1.00% may apply on certain redemptions of Class A shares made within 18 months following a purchase of $250,000 or more without an initial sales charge.
First Eagle Funds | Annual Report | October 31, 2024
222
| | | | | | | | | Ratios/Supplemental data | | | |
| | | | | | | | | Ratios to Average Net Assets of: | | | |
Selected per
share data for
the period ended: | | Net asset
value, end
of period | | Total
return(a) | | Net assets,
end of
period
(thousands) | | Operating
expenses
excluding
earnings
credits
and/or fee
waivers | | Operating
expenses
including
earnings
credits
and/or fee
waivers | | Net
investment
income
excluding
earnings
credits
and/or fee
waivers | | Net
investment
income
including
earnings
credits
and/or fee
waivers | | Portfolio
turnover
rate | |
First Eagle High Yield Municipal Fund Class I (formerly named First Eagle High Income Fund) | |
October 31, 2024 | | $ | 8.64 | | | | 17.55 | % | | $ | 3,046,662 | | | | 0.66 | % | | | 0.57 | %(q) | | | 4.81 | % | | | 4.89 | % | | | 136.03 | % | |
October 31, 2023 | | $ | 7.78 | | | | 5.49 | % | | $ | 76,482 | | | | 0.89 | % | | | 0.73 | % | | | 5.23 | % | | | 5.39 | % | | | 24.60 | % | |
October 31, 2022 | | $ | 7.78 | | | | (9.23 | )% | | $ | 99,295 | | | | 0.86 | % | | | 0.86 | % | | | 4.62 | % | | | 4.62 | % | | | 28.00 | % | |
October 31, 2021 | | $ | 8.98 | | | | 7.29 | % | | $ | 132,026 | | | | 0.97 | % | | | 0.90 | % | | | 3.82 | % | | | 3.89 | % | | | 64.11 | % | |
October 31, 2020 | | $ | 8.71 | | | | 4.68 | % | | $ | 126,527 | | | | 1.04 | % | | | 0.94 | % | | | 4.54 | % | | | 4.64 | % | | | 55.38 | % | |
First Eagle High Yield Municipal Fund Class R6 (formerly named First Eagle High Income Fund) | |
October 31, 2024 | | $ | 8.66 | | | | 17.89 | % | | $ | 1,218 | | | | 0.86 | % | | | 0.26 | %(q) | | | 4.95 | % | | | 5.56 | % | | | 136.03 | % | |
October 31, 2023 | | $ | 7.78 | | | | 5.48 | % | | $ | 7,823 | | | | 0.81 | % | | | 0.70 | % | | | 5.32 | % | | | 5.44 | % | | | 24.60 | % | |
October 31, 2022 | | $ | 7.78 | | | | (9.16 | )% | | $ | 1,000 | | | | 0.78 | % | | | 0.78 | % | | | 4.74 | % | | | 4.74 | % | | | 28.00 | % | |
October 31, 2021 | | $ | 8.98 | | | | 7.34 | % | | $ | 1,066 | | | | 0.92 | % | | | 0.85 | % | | | 3.87 | % | | | 3.94 | % | | | 64.11 | % | |
October 31, 2020 | | $ | 8.71 | | | | 4.64 | % | | $ | 1,033 | | | | 1.07 | % | | | 0.97 | % | | | 4.47 | % | | | 4.57 | % | | | 55.38 | % | |
First Eagle Short Duration High Yield Municipal Fund Class A | |
For The Period
1/2/24^-10/31/24 | | $ | 10.26 | | | | 6.30 | %(b) | | $ | 43,433 | | | | 1.45 | %(c) | | | 0.43 | %(c) | | | 3.48 | %(c) | | | 4.51 | %(c) | | | 202.33 | %(b) | |
First Eagle Short Duration High Yield Municipal Fund Class I | |
For The Period
1/2/24^-10/31/24 | | $ | 10.25 | | | | 6.56 | %(b) | | $ | 116,168 | | | | 1.56 | %(c) | | | 0.22 | %(c) | | | 3.43 | %(c) | | | 4.77 | %(c) | | | 202.33 | %(b) | |
First Eagle Short Duration High Yield Municipal Fund Class R6 | |
For The Period
1/2/24^-10/31/24 | | $ | 10.26 | | | | 6.54 | %(b) | | $ | 1,076 | | | | 2.45 | %(c) | | | 0.32 | %(c) | | | 2.59 | %(c) | | | 4.72 | %(c) | | | 202.33 | %(b) | |
(b) Not Annualized.
(c) Annualized.
(d) Net investment income/loss includes income from foreign withholding tax claims less IRS compliance fees. Without these proceeds, the net investment income per share for First Eagle Global Fund would have been 0.44, (0.15), 0.62 and 0.67 for Class A, Class C, Class I and Class R6 shares, respectively. The net investment income excluding earnings credits and/or fee waivers ratios would have been 0.68%, (0.12)%, 0.93% and 1.02% for Class A, Class C, Class I and Class R6 shares, respectively.
(e) Net investment income/loss includes income from foreign withholding tax claims less IRS compliance fees. Without these proceeds, the net investment income per share for First Eagle Overseas Fund would have been 0.20, (0.03), 0.29 and 0.35 for Class A, Class C, Class I and Class R6 shares, respectively. The net investment income excluding earnings credits and/or fee waivers income ratios would have been 0.82%, 0.03%, 1.12% and 1.28% for Class A, Class C, Class I and Class R6 shares, respectively.
(f) Net investment income/loss includes income from foreign withholding tax claims less IRS compliance fees. Without these proceeds, the net investment income per share for First Eagle Global Income Builder Fund would have been 0.24, 0.13, 0.28 and 0.29 for Class A, Class C, Class I and Class R6 shares, respectively. The net investment income excluding earnings credits and/or fee waivers ratios would have been 1.85%, 1.06%, 2.08% and 2.16% for Class A, Class C, Class I and Class R6 shares, respectively.
First Eagle Funds | Annual Report | October 31, 2024
223
(g) Total return includes income from foreign withholding tax claims less IRS compliance fees. Without these proceeds, the total returns for First Eagle Global Fund would have been 26.05%, 24.96%, 26.38% and 26.48% for Class A, Class C, Class I and Class R6 shares, respectively.
(h) Total return includes income from foreign withholding tax claims less IRS compliance fees. Without these proceeds, the total returns for First Eagle Overseas Fund would have been 16.90%, 15.94%, 17.24% and 17.35% for Class A, Class C, Class I and Class R6 shares, respectively.
(i) Total return includes income from foreign withholding tax claims less IRS compliance fees. Without these proceeds, the total returns for First Eagle Global Income Builder Fund would have been 21.09%, 20.21%, 21.44% and 21.54% for Class A, Class C, Class I and Class R6 shares, respectively.
(j) Net realized and unrealized gains (losses) includes litigation proceeds. Without these proceeds, the net realized and unrealized gains (losses) per share for First Eagle Global Fund would have been 14.50, 13.82, 14.59 and 14.59 for Class A, Class C, Class I and Class R6 shares, respectively.
(k) Total return includes litigation proceeds. Without these proceeds, the total returns for First Eagle Global Fund would have been 26.41%, 25.43%, 26.69% and 26.78% for Class A, Class C, Class I and Class R6 shares, respectively.
(l) Net realized and unrealized gains (losses) includes litigation proceeds. Without these proceeds, the net realized and unrealized gains (losses) per share for First Eagle Rising Dividend Fund would have been 6.56, 3.84, 6.95 and 6.94 for Class A, Class C, Class I and Class R6 shares, respectively.
(m) Total return includes litigation proceeds. Without these proceeds, the total returns for First Eagle Rising Dividend Fund would have been 32.81%, 31.78%, 33.14% and 33.15% for Class A, Class C, Class I and Class R6 shares, respectively.
(n) Net realized and unrealized gains (losses) includes litigation proceeds. Without these proceeds, the net realized and unrealized gains (losses) per share for First Eagle Rising Dividend Fund would have been 2.13, 1.23, 2.24 and 2.27 for Class A, Class C, Class I and Class R6 shares, respectively.
(o) Total return includes litigation proceeds. Without these proceeds, the total returns for First Eagle Rising Dividend Fund would have been 12.28%, 10.57%, 12.58% and 12.73% for Class A, Class C, Class I and Class R6 shares, respectively.
(p) Amount represents less than 0.005%.
(q) Interest expense and fees relate to the costs of tender option bond transactions (See Note 1(g)) representing 0.02% for the year ended October 31, 2024. Without the interest expense and fees, the operating expenses including earnings credits and/or fee waivers would have been 0.78%, 1.53%, 0.56% and 0.24% for Class A, Class C, Class I, and Class R6, respectively.
First Eagle Funds | Annual Report | October 31, 2024
224
This page was intentionally left blank.
Notes to Financial Statements
Note 1 — Significant Accounting Policies
First Eagle Funds (the "Trust"), is an open-end management investment company registered under the Investment Company Act of 1940, as amended ("1940 Act"). As of October 31, 2024, the Trust consists of eleven separate portfolios, the First Eagle Global Fund, First Eagle Overseas Fund, First Eagle U.S. Value Fund, First Eagle Gold Fund, First Eagle Global Income Builder Fund, First Eagle Rising Dividend Fund, First Eagle Small Cap Opportunity Fund, First Eagle U.S. Smid Cap Opportunity Fund, First Eagle Global Real Assets Fund, First Eagle High Yield Municipal Fund (formerly named First Eagle High Income Fund) and First Eagle Short Duration High Yield Municipal Fund (each individually a "Fund" or collectively the "Funds"). All the Funds are diversified mutual funds except for First Eagle Gold Fund and First Eagle Rising Dividend Fund, which are non-diversified. The Trust is a Delaware statutory trust. The First Eagle Global Fund seeks long-term growth of capital by investing in a range of asset classes from markets in the United States and throughout the world. The First Eagle Overseas Fund seeks long-term growth of capital by investing primarily in equities issued by non-U.S. corporations. The First Eagle U.S. Value Fund seeks long-term growth of capital by investing, under normal market conditions, at least 80% of its net assets (plus any borrowings for investment purposes) in domestic equity and debt securities. The First Eagle Gold Fund seeks to provide investors the opportunity to participate in the investment characteristics of gold (and to a limited extent other precious metals) for a portion of their overall investment portfolio. The First Eagle Global Income Builder Fund seeks current income generation and long-term growth of capital. The First Eagle Rising Dividend Fund seeks capital appreciation and current income. The First Eagle Small Cap Opportunity Fund seeks long-term growth of capital. The First Eagle U.S. Smid Cap Opportunity Fund seeks long-term growth of capital. The First Eagle Global Real Assets Fund seeks long-term growth of capital. The First Eagle High Yield Municipal Fund seeks to provide high current income exempt from regular federal income taxes; capital appreciation is a secondary objective when consistent with the Fund's primary objective. The First Eagle Short Duration High Yield Municipal Fund seeks to provide high current income exempt from regular federal income taxes; capital appreciation is a secondary objective when consistent with the Fund's primary objective. The First Eagle Short Duration High Yield Municipal Fund incepted on January 2, 2024.
The Funds generally offer up to four share classes, Class A shares, Class C shares, Class I shares and Class R6 shares, except for the First Eagle Small Cap Opportunity Fund, First Eagle U.S. Smid Cap Opportunity Fund, First Eagle Global Real Assets Fund and First Eagle Short Duration High Yield Municipal Fund, which offer Class A shares, Class I shares and Class R6 shares only. On December 1, 2023, Class R3 Shares, Class R4 Shares, Class R5 Shares of the Funds were closed to new investors. On February 28, 2024, all remaining Class R3 shares, Class R4 shares, and Class R5 shares of the Funds converted into Class R6 shares. As a result, Class R3 shares, Class R4 shares, and Class R5 shares were terminated.
First Eagle Funds | Annual Report | October 31, 2024
226
Notes to Financial Statements
First Eagle Investment Management, LLC (the "Adviser"), a subsidiary of First Eagle Holdings, Inc. ("First Eagle Holdings"), manages the Funds. A controlling interest in First Eagle Holdings is owned by BCP CC Holdings L.P., a Delaware limited partnership ("BCP CC Holdings"). BCP CC Holdings GP L.L.C., a Delaware limited liability company ("BCP CC Holdings GP"), is the general partner of BCP CC Holdings and has two managing members, Blackstone Capital Partners VI L.P. ("BCP VI") and Corsair IV Financial Services Capital Partners L.P. ("Corsair IV"). BCP VI and Corsair IV are indirectly controlled by Blackstone Inc. ("Blackstone") and Corsair Capital LLC ("Corsair"), respectively. Investment vehicles indirectly controlled by Blackstone and Corsair and certain co-investors own a majority economic interest in First Eagle Holdings and the Adviser through BCP CC Holdings.
The following is a summary of significant accounting policies that are adhered to by the Funds. The Funds are investment companies and, accordingly, follow the investment company accounting and reporting guidance of the Financial Accounting Standards Board Accounting Standards Codification Topic 946 — Investment Companies, which is part of U.S. generally accepted accounting principles ("GAAP").
a) Investments in Subsidiaries — The First Eagle Global Fund (the "Global Fund"), First Eagle Overseas Fund (the "Overseas Fund"), First Eagle U.S. Value Fund (the "U.S. Value Fund"), First Eagle Gold Fund (the "Gold Fund") and First Eagle Global Real Assets Fund (the "Global Real Assets Fund") may invest in certain precious metals through their investment in the First Eagle Global Cayman Fund, Ltd., First Eagle Overseas Cayman Fund, Ltd., First Eagle U.S. Value Cayman Fund, Ltd., First Eagle Gold Cayman Fund, Ltd., and First Eagle Global Real Assets Cayman Fund, Ltd., respectively, each a wholly owned subsidiary (each referred to herein as a "Subsidiary" or collectively "the Subsidiaries"). Each Fund may invest up to 25% of its total assets in shares of its respective Subsidiary. Each Subsidiary has the ability to invest in commodities and securities consistent with the investment objective of its respective Fund. Substantially all of each Subsidiary's assets represent physical gold bullion, and First Eagle Gold Cayman Fund, Ltd. also holds physical silver. Trading in bullion directly by the Funds presents the risk of tax consequences (e.g., a change in the Funds' tax status subjecting the Funds to be taxed at the Fund level on all of their income if the Funds' "non-qualifying income" exceeds 10% of the Funds' gross income in any taxable year). Trading in bullion by the Subsidiaries generally does not present the same tax risks.
The First Eagle Global Cayman Fund, Ltd., established on October 18, 2013, is an exempted company under the laws of the Cayman Islands. The consolidated financial statements include the accounts of the Global Fund and the First Eagle Global Cayman Fund, Ltd. All intercompany transactions and balances have been eliminated. As of October 31, 2024, the First Eagle Global Cayman Fund, Ltd. has $5,826,992,443 in net assets, representing 10.34% of the Global Fund's net assets.
The First Eagle Overseas Cayman Fund, Ltd., established on October 18, 2013, is an exempted company under the laws of the Cayman Islands. The consolidated
First Eagle Funds | Annual Report | October 31, 2024
227
Notes to Financial Statements
financial statements include the accounts of the Overseas Fund and the First Eagle Overseas Cayman Fund, Ltd. All intercompany transactions and balances have been eliminated. As of October 31, 2024, the First Eagle Overseas Cayman Fund, Ltd. has $773,450,229 in net assets, representing 6.25% of the Overseas Fund's net assets.
The First Eagle U.S. Value Cayman Fund, Ltd., established on January 24, 2012, is an exempted company under the laws of the Cayman Islands. The consolidated financial statements include the accounts of the U.S. Value Fund and the First Eagle U.S. Value Cayman Fund, Ltd. All intercompany transactions and balances have been eliminated. As of October 31, 2024, the First Eagle U.S. Value Cayman Fund, Ltd. has $176,053,324 in net assets, representing 12.60% of the U.S. Value Fund's net assets.
The First Eagle Gold Cayman Fund, Ltd., established on May 28, 2010, is an exempted company under the laws of the Cayman Islands. The consolidated financial statements include the accounts of the Gold Fund and the First Eagle Gold Cayman Fund, Ltd. All intercompany transactions and balances have been eliminated. As of October 31, 2024, the First Eagle Gold Cayman Fund, Ltd. has $472,729,450 in net assets, representing 16.69% of the Gold Fund's net assets.
The First Eagle Global Real Assets Cayman Fund, Ltd., established on September 9, 2021, is an exempted company under the laws of the Cayman Islands. The consolidated financial statements include the accounts of the Global Real Assets Fund and the First Eagle Global Real Assets Cayman Fund, Ltd. All intercompany transactions and balances have been eliminated. As of October 31, 2024, the First Eagle Global Real Assets Cayman Fund, Ltd. has $732,606 in net assets, representing 5.12% of the Global Real Assets Fund's net assets.
b) Investment Valuation — Each Fund computes its net asset value once daily as of the close of trading on each day the New York Stock Exchange ("NYSE") is open for trading. The net asset value per share is computed by dividing the total current value of the assets of a Fund, less its liabilities, by the total number of shares outstanding at the time of such computation.
A portfolio security (including an option or warrant), other than a bond, which is traded on a U.S. national securities exchange or a securities exchange abroad is generally valued at the price of the official close (last quoted sales price if an official closing price is not available) as of the local market close on the primary exchange. If there are no round lot sales on such date, such security will be valued at the mean between the closing bid and asked prices (and if there is only a bid or only an asked price on such date, valuation will be at such bid or asked price for long or short positions, respectively). Securities, other than bonds, traded in the over-the-counter market are valued at the mean between the last bid and asked prices prior to the time of valuation (and if there is only a bid or only an asked price on such date, valuation will be at such bid or asked price for long or short positions, respectively), except if such unlisted security is traded
First Eagle Funds | Annual Report | October 31, 2024
228
Notes to Financial Statements
on the NASDAQ in which case it is valued at the NASDAQ Official Closing Price. Such prices are provided by approved pricing vendors or other independent pricing sources.
All bonds, whether listed on an exchange or traded in the over-counter-market for which market quotations are available are generally priced at the evaluated bid price provided by an approved pricing service as of the close of the NYSE (normally 4:00 p.m. Eastern Time), or dealers in the over-the-counter markets in the United States or abroad. Pricing services and broker-dealers use multiple valuation techniques to determine value. In instances where sufficient market activity exists, dealers or pricing services utilize a market-based approach through which quotes from market makers are used to determine fair value. In instances where sufficient market activity may not exist or is limited, the dealers or pricing services also utilize proprietary valuation models which may consider market transactions in comparable securities and the various relationships between securities in determining value and/or market characteristics such as benchmark yield curves, option-adjusted spreads, credit spreads, estimated default rates, coupon rates, anticipated timing of principal repayments, underlying collateral, and other unique security features in order to estimate the relevant cash flows, which are then discounted to calculate the fair values. The Adviser's Valuation Committee, at least annually, will review the pricing service's inputs, methods, models and assumptions for its evaluated prices. Short-term debt maturing in 60 days or less is valued at evaluated bid prices.
Commodities (such as physical metals) are valued at a calculated evaluated mean price, as provided by an independent price source as of the close of the NYSE.
Forward foreign currency exchange contracts are valued at the current cost of covering or offsetting such contracts, by reference to forward currency rates at the time the NYSE closes, as provided by an independent pricing source.
The spot exchange rates, as provided by an independent price source as of the close of the NYSE, are used to convert foreign security prices into U.S. dollars.
Any security that is listed or traded on more than one exchange (or traded in multiple markets) is valued at the official close on the primary exchange or market on which they are traded. In the absence of such a quotation, a security may be valued at the last quoted sales price on the most active exchange or market as determined by the independent pricing agent. The Funds use pricing services to identify the market prices of publicly traded securities in their portfolios. When market prices are determined to be "stale" as a result of limited market activity for a particular holding or have been materially affected by events occurring after the close of trading on the exchange or market on which the security is principally traded but before the Fund's NAV is calculated, or in other circumstances when market quotations are not readily available within the meaning of applicable regulations, such as for private placements, or determined to be unreliable for a particular holding, such holdings may be "fair
First Eagle Funds | Annual Report | October 31, 2024
229
Notes to Financial Statements
valued" in accordance with procedures adopted by the Board of Trustees ("Board") . The values assigned to a Fund's holdings therefore may differ on occasion from reported market values.
Additionally, trading of foreign equity securities on most foreign markets is completed before the close in trading in the U.S. markets. The Funds have implemented fair value pricing on a daily basis for all foreign securities, as available, to account for the market movement between the close of the foreign market and the close of the NYSE. The fair value pricing utilizes factors provided by an independent pricing service. The values assigned to a Fund's holdings therefore may differ on occasion from reported market values, especially during periods of higher market price volatility. The Board and the Adviser believe relying on the procedures as just described will result in prices that are more reflective of the actual market value of portfolio securities held by the Funds than relying solely on reported market values.
The Funds adopted provisions surrounding fair value measurements and disclosures that define fair value, establish a framework for measuring fair value in GAAP and expand disclosures about fair value measurements. This applies to fair value measurements that are already required or permitted by other accounting standards and is intended to increase consistency of those measurements and applies broadly to securities and other types of assets and liabilities.
The Funds disclose the fair value of their investments in a hierarchy that prioritizes the inputs or assumptions to valuation techniques used to measure fair value. These inputs are used in determining the value of the Funds' investments and are summarized in the following fair value hierarchy:
Level 1 — Quoted prices in active markets for identical securities.
Level 2 — Other significant observable inputs (including quoted prices for similar securities, interest rates, prepayment speeds, credit risk, etc.).
Level 3 — Other significant unobservable inputs (including the Fund's own assumption in determining the fair value of investments).
The significant unobservable inputs that may be used in determining valuations for investments identified within Level 3 are market comparables and the enterprise value of a company. Indications of value and quotations may be observable at any given time, but are currently treated by the Funds as unobservable. Significant changes in any of the unobservable inputs may significantly impact the fair value measurement. The impact is based on the relationship between each unobservable input and the fair value measurement.
Significant increases (decreases) in enterprise multiples may increase (decrease) the fair value measurement. Significant increases (decreases) in the discount for marketability, probability of insolvency and probability of default may decrease (increase) the fair value measurement.
Fair valuation of securities, other financial investments or other assets (collectively, "securities") held by the Funds are determined in good faith by the
First Eagle Funds | Annual Report | October 31, 2024
230
Notes to Financial Statements
Adviser as "valuation designee" under the oversight of the Board. The Board Valuation, Liquidity and Allocations Committee (the "Committee") oversees the execution of the valuation and liquidity procedures for the Funds. In accordance with Rule 2a-5 under the 1940 Act, the Funds' Board has designated the Adviser the "valuation designee" to perform the Fund's fair value determinations. The Adviser's fair valuation process is subject to Board oversight and certain reporting and other requirements.
The following is a summary of the Funds' inputs used to value the Funds' investments as of October 31, 2024. A reconciliation of Level 3 investments is presented when the fund has a material amount of Level 3 investments at the beginning or end of the period in relation to the Fund's net assets. Management has determined not to provide a reconciliation as the balance of Level 3 investments were not considered to be material to each Fund's net assets at the beginning or end of the period.
First Eagle Global Fund
Description† | | Level 1 | | Level 2 | | Level 3‡ | | Total | |
Assets: | |
Common Stocks | | $ | 30,988,783,465 | | | $ | 15,033,816,633 | (a) | | $ | — | | | $ | 46,022,600,098 | | |
Corporate Bonds | | | — | | | | — | | | | 5,248,320 | | | | 5,248,320 | | |
Commodities* | | | — | | | | 6,663,738,941 | | | | — | | | | 6,663,738,941 | | |
Short-Term Investments | | | 739,001 | | | | 3,600,157,603 | | | | — | | | | 3,600,896,604 | | |
Forward Foreign Currency
Exchange Contracts** | | | — | | | | 55,647,439 | | | | — | | | | 55,647,439 | | |
Total | | $ | 30,989,522,466 | | | $ | 25,353,360,616 | | | $ | 5,248,320 | | | $ | 56,348,131,402 | | |
Liabilities: | |
Forward Foreign Currency
Exchange Contracts** | | $ | — | | | $ | (3,983,898 | ) | | $ | — | | | $ | (3,983,898 | ) | |
Total | | $ | — | | | $ | (3,983,898 | ) | | $ | — | | | $ | (3,983,898 | ) | |
(a) The Fund has implemented fair value pricing on a daily basis for all foreign securities, as available, to account for the market movement between the close of the foreign market and the close of the NYSE. See Note 1(b) for additional details.
† See Consolidated Schedule of Investments for additional detailed categorizations.
‡ Value determined using significant unobservable inputs.
* Represents gold bullion.
** Forward Foreign Currency Exchange Contracts are valued at net unrealized appreciation (depreciation) on the contracts.
First Eagle Funds | Annual Report | October 31, 2024
231
Notes to Financial Statements
First Eagle Overseas Fund
Description† | | Level 1 | | Level 2 | | Level 3‡ | | Total | |
Assets: | |
Common Stocks | | $ | 3,184,743,329 | | | $ | 7,633,399,491 | (a) | | $ | 22,955,965 | | | $ | 10,841,098,785 | | |
Commodities* | | | — | | | | 1,278,581,767 | | | | — | | | | 1,278,581,767 | | |
Short-Term Investments | | | 60,011 | | | | 227,442,316 | | | | — | | | | 227,502,327 | | |
Forward Foreign Currency
Exchange Contracts** | | | — | | | | 28,626,991 | | | | — | | | | 28,626,991 | | |
Total | | $ | 3,184,803,340 | | | $ | 9,168,050,565 | | | $ | 22,955,965 | | | $ | 12,375,809,870 | | |
Liabilities: | |
Forward Foreign Currency
Exchange Contracts** | | $ | — | | | $ | (2,002,400 | ) | | $ | — | | | $ | (2,002,400 | ) | |
Total | | $ | — | | | $ | (2,002,400 | ) | | $ | — | | | $ | (2,002,400 | ) | |
(a) The Fund has implemented fair value pricing on a daily basis for all foreign securities, as available, to account for the market movement between the close of the foreign market and the close of the NYSE. See Note 1(b) for additional details.
† See Consolidated Schedule of Investments for additional detailed categorizations.
‡ Value determined using significant unobservable inputs.
* Represents gold bullion.
** Forward Foreign Currency Exchange Contracts are valued at net unrealized appreciation (depreciation) on the contracts.
First Eagle U.S. Value Fund
Description† | | Level 1 | | Level 2 | | Level 3‡ | | Total | |
Assets: | |
Common Stocks | | $ | 1,084,221,614 | | | $ | — | | | $ | — | | | $ | 1,084,221,614 | | |
Convertible Preferred Stocks | | | 5,248,750 | | | | — | | | | — | | | | 5,248,750 | | |
Corporate Bonds | | | — | | | | 17,440,347 | | | | 576,000 | | | | 18,016,347 | | |
Commodities* | | | — | | | | 176,060,378 | | | | — | | | | 176,060,378 | | |
Master Limited Partnerships | | | 19,639,064 | | | | — | | | | — | | | | 19,639,064 | | |
Short-Term Investments | | | 31,170 | | | | 95,276,276 | | | | — | | | | 95,307,446 | | |
Total | | $ | 1,109,140,598 | | | $ | 288,777,001 | | | $ | 576,000 | | | $ | 1,398,493,599 | | |
† See Consolidated Schedule of Investments for additional detailed categorizations.
‡ Value determined using significant unobservable inputs.
* Represents gold bullion.
First Eagle Funds | Annual Report | October 31, 2024
232
Notes to Financial Statements
First Eagle Gold Fund
Description† | | Level 1 | | Level 2 | | Level 3 | | Total | |
Assets: | |
Common Stocks | | $ | 2,031,256,766 | | | $ | 275,226,525 | (a) | | $ | — | | | $ | 2,306,483,291 | | |
Commodities* | | | — | | | | 472,825,129 | | | | — | | | | 472,825,129 | | |
Rights | | | 3,178,585 | | | | — | | | | — | | | | 3,178,585 | | |
Short-Term Investments | | | 28,799 | | | | 54,550,528 | | | | — | | | | 54,579,327 | | |
Total | | $ | 2,034,464,150 | | | $ | 802,602,182 | | | $ | — | | | $ | 2,837,066,332 | | |
(a) The Fund has implemented fair value pricing on a daily basis for all foreign securities, as available, to account for the market movement between the close of the foreign market and the close of the NYSE. See Note 1(b) for additional details.
† See Consolidated Schedule of Investments for additional detailed categorizations.
* Represents gold and silver bullion.
First Eagle Global Income Builder Fund
Description† | | Level 1 | | Level 2 | | Level 3 | | Total | |
Assets: | |
Common Stocks | | $ | 618,169,682 | | | $ | 496,605,214 | (a) | | $ | — | | | $ | 1,114,774,896 | | |
Convertible Preferred Stocks | | | 26,698,130 | | | | — | | | | — | | | | 26,698,130 | | |
Corporate Bonds | | | — | | | | 204,698,214 | | | | — | | | | 204,698,214 | | |
Asset-Backed Securities | | | — | | | | 3,090,852 | | | | — | | | | 3,090,852 | | |
Commodities* | | | — | | | | 132,598,740 | | | | — | | | | 132,598,740 | | |
Foreign Government Securities | | | — | | | | 16,399,518 | | | | — | | | | 16,399,518 | | |
Loan Assignments | | | — | | | | 2,505,625 | | | | — | | | | 2,505,625 | | |
Master Limited Partnerships | | | 17,545,251 | | | | — | | | | — | | | | 17,545,251 | | |
Municipal Bonds | | | — | | | | 2,977,739 | | | | — | | | | 2,977,739 | | |
Preferred Stocks | | | 32,010,290 | | | | — | | | | — | | | | 32,010,290 | | |
U.S. Treasury Obligations | | | — | | | | 167,498,417 | | | | — | | | | 167,498,417 | | |
Short-Term Investments | | | 47,687 | | | | 27,459,238 | | | | — | | | | 27,506,925 | | |
Forward Foreign Currency
Exchange Contracts** | | | — | | | | 1,113,951 | | | | — | | | | 1,113,951 | | |
Total | | $ | 694,471,040 | | | $ | 1,054,947,508 | | | $ | — | | | $ | 1,749,418,548 | | |
First Eagle Funds | Annual Report | October 31, 2024
233
Notes to Financial Statements
First Eagle Global Income Builder Fund (continued)
Description† | | Level 1 | | Level 2 | | Level 3 | | Total | |
Liabilities: | |
Forward Foreign Currency
Exchange Contracts** | | $ | — | | | $ | (97,652 | ) | | $ | — | | | $ | (97,652 | ) | |
Options Written | | | (5,333,211 | ) | | | — | | | | — | | | | (5,333,211 | ) | |
Total | | $ | (5,333,211 | ) | | $ | (97,652 | ) | | $ | — | | | $ | (5,430,863 | ) | |
(a) The Fund has implemented fair value pricing on a daily basis for all foreign securities, as available, to account for the market movement between the close of the foreign market and the close of the NYSE. See Note 1(b) for additional details.
† See Schedule of Investments for additional detailed categorizations.
* Represents gold bullion.
** Forward Foreign Currency Exchange Contracts are valued at net unrealized appreciation (depreciation) on the contracts.
First Eagle Rising Dividend Fund
Description† | | Level 1 | | Level 2 | | Level 3 | | Total | |
Assets: | |
Common Stocks | | $ | 379,560,775 | | | $ | 39,141,098 | (a) | | $ | — | | | $ | 418,701,873 | | |
Master Limited Partnerships | | | 9,865,173 | | | | — | | | | — | | | | 9,865,173 | | |
Short-Term Investments | | | 1,650 | | | | 4,658,362 | | | | — | | | | 4,660,012 | | |
Total | | $ | 389,427,598 | | | $ | 43,799,460 | | | $ | — | | | $ | 433,227,058 | | |
(a) The Fund has implemented fair value pricing on a daily basis for all foreign securities, as available, to account for the market movement between the close of the foreign market and the close of the NYSE. See Note 1(b) for additional details.
† See Schedule of Investments for additional detailed categorizations.
First Eagle Small Cap Opportunity Fund
Description† | | Level 1 | | Level 2 | | Level 3‡ | | Total | |
Assets: | |
Common Stocks | | $ | 1,743,342,544 | | | $ | — | | | $ | — | | | $ | 1,743,342,544 | | |
Exchange-Traded Funds | | | 289,753 | | | | — | | | | — | | | | 289,753 | | |
Rights | | | — | | | | — | | | | — | ^ | | | — | | |
Short-Term Investments | | | 125,800,379 | | | | — | | | | — | | | | 125,800,379 | | |
Total | | $ | 1,869,432,676 | | | $ | — | | | $ | — | | | $ | 1,869,432,676 | | |
† See Schedule of Investments for additional detailed categorizations.
‡ Value determined using significant unobservable inputs.
^ Fair value represents zero.
First Eagle Funds | Annual Report | October 31, 2024
234
Notes to Financial Statements
First Eagle U.S. Smid Cap Opportunity Fund
Description† | | Level 1 | | Level 2 | | Level 3 | | Total | |
Assets: | |
Common Stocks | | $ | 47,543,224 | | | $ | — | | | $ | — | | | $ | 47,543,224 | | |
Short-Term Investments | | | 2,492,498 | | | | — | | | | — | | | | 2,492,498 | | |
Total | | $ | 50,035,722 | | | $ | — | | | $ | — | | | $ | 50,035,722 | | |
† See Schedule of Investments for additional detailed categorizations.
First Eagle Global Real Assets Fund
Description† | | Level 1 | | Level 2 | | Level 3‡ | | Total | |
Assets: | |
Common Stocks | | $ | 9,203,419 | | | $ | 3,870,987 | (a) | | $ | — | ^ | | $ | 13,074,406 | | |
Commodities* | | | — | | | | 551,559 | | | | — | | | | 551,559 | | |
Exchange-Traded Funds | | | 178,693 | | | | — | | | | — | | | | 178,693 | | |
Master Limited Partnerships | | | 442,666 | | | | — | | | | — | | | | 442,666 | | |
Short-Term Investments | | | 167,137 | | | | — | | | | — | | | | 167,137 | | |
Total | | $ | 9,991,915 | | | $ | 4,422,546 | | | $ | — | | | $ | 14,414,461 | | |
(a) The Fund has implemented fair value pricing on a daily basis for all foreign securities, as available, to account for the market movement between the close of the foreign market and the close of the NYSE. See Note 1 for additional details.
† See Consolidated Schedule of Investments for additional detailed categorizations.
‡ Value determined using significant unobservable inputs.
* Represents gold bullion.
^ Fair value represents zero.
First Eagle High Yield Municipal Fund
Description† | | Level 1 | | Level 2 | | Level 3 | | Total | |
Assets: | |
Municipal Bonds | | $ | — | | | $ | 4,743,769,823 | | | $ | — | | | $ | 4,743,769,823 | | |
Short-Term Investments | | | 334,513 | | | | — | | | | — | | | | 334,513 | | |
Total | | $ | 334,513 | | | $ | 4,743,769,823 | | | $ | — | | | $ | 4,744,104,336 | | |
† See Schedule of Investments for additional detailed categorizations.
First Eagle Funds | Annual Report | October 31, 2024
235
Notes to Financial Statements
First Eagle Short Duration High Yield Municipal Fund
Description† | | Level 1 | | Level 2 | | Level 3 | | Total | |
Assets: | |
Municipal Bonds | | $ | — | | | $ | 154,944,091 | | | $ | — | | | $ | 154,944,091 | | |
Short-Term Investments | | | 153,972 | | | | — | | | | — | | | | 153,972 | | |
Total | | $ | 153,972 | | | $ | 154,944,091 | | | $ | — | | | $ | 155,098,063 | | |
† See Schedule of Investments for additional detailed categorizations.
c) Investment Transactions and Income — Investment transactions are accounted for on a trade date basis. The specific identification method is used in determining realized gains and losses from investment transactions. Dividend income is recorded on the ex-dividend date, except for certain dividends on foreign securities, which are recorded as soon as the Fund is informed after the ex-dividend date. The Funds may be subject to withholding tax on income, capital gains or repatriation taxes imposed by certain countries, a portion of which may be recoverable. Foreign taxes are recorded in accordance with the applicable foreign tax regulations and rates that exist in the foreign jurisdictions in which a Fund invests. Investment income is recorded net of foreign withholding taxes. Foreign taxes are accrued based on gains realized by a Fund as a result of certain foreign security sales. In certain circumstances, estimated taxes are accrued based on unrealized appreciation of such securities. Interest income is recorded daily on the accrual basis. In computing investment income, each Fund accretes discounts and amortizes premiums on debt obligations using the effective yield method. Investment income is allocated to each Fund's share class in proportion to its relative net assets. Payments received from certain investments held by the Funds may be comprised of dividends, capital gains and return of capital. The Funds originally estimate the expected classification of such payments. The amounts may subsequently be reclassified upon receipt of information from the issuer.
d) Expenses — Expenses arising in connection with a Fund are charged directly to that Fund. Expenses common to all Funds may be allocated to each Fund in proportion to its relative net assets. Certain expenses are shared with the First Eagle Variable Funds, an affiliated fund group, and certain other funds also managed by the Adviser. Generally, expenses that do not pertain specifically to a Fund are allocated to each Fund based upon the percentage of net assets a Fund bears to the total net assets of all the Funds that share the expense. Earnings credits may reduce shareholder servicing agent fees by the amount of interest earned on balances with such service provider.
e) Foreign Currency Translation — The books and records of the Funds are maintained in U.S. dollars. The market values of securities which are not traded in U.S. currency are recorded in the financial statements after translation to U.S. dollars based on the applicable exchange rates at the end of the period. The costs of such securities are translated at exchange rates prevailing when
First Eagle Funds | Annual Report | October 31, 2024
236
Notes to Financial Statements
acquired. Related interest, dividends and withholding taxes are accrued at the rates of exchange prevailing on the respective dates of such transactions.
The net assets of each of the Funds are presented at the foreign exchange rates and market values at the close of the period. The Funds do not isolate that portion of gains and losses on investments which is due to changes in foreign exchange rates from that which is due to changes in market prices of the securities. Accordingly, such foreign currency gains (losses) are included in the reported net realized and unrealized gains (losses) on investment transactions on the Statements of Operations. However, for federal income tax purposes each Fund does isolate the effect of changes in foreign exchange rates from the changes in market prices for realized gains and losses on debt obligations.
f) Forward Foreign Currency Exchange Contracts — In connection with portfolio purchases and sales of securities denominated in foreign currencies, each Fund may enter into forward foreign currency exchange contracts. The First Eagle Global Fund, First Eagle Overseas Fund and First Eagle Global Income Builder Fund enter into forward foreign currency exchange contracts primarily to man- age and/or gain exposure to certain foreign currencies. The Funds' currency transactions include portfolio hedging on portfolio positions. Portfolio hedging is the use of a forward foreign currency exchange contract (or other cash management position) with respect to one or more portfolio security positions denominated or quoted in a particular currency. Currency exchange transactions involve currencies of different countries that the Funds invest in and serve as hedges against possible variations in the exchange rates between these currencies and the U.S. dollar. Each Fund may engage in portfolio hedging with respect to the currency of a particular country in amounts approximating actual or anticipated positions in securities denominated in that currency. Hedging can reduce exposure to currency exchange movements, but cannot eliminate that exposure. It is possible to lose money under a hedge.
Funds investing in forward foreign currency exchange contracts are exposed to risk if the value of the currency changes unfavorably, if the counterparties to the contracts are unable to meet the terms of their contracts or if the Fund is unable to enter into a closing position. Forward foreign currency exchange contracts outstanding at period end, if any, are listed after each Fund's portfolio. For the year ended October 31, 2024, the average monthly outstanding currency purchased or sold in U.S. dollars for forward foreign currency exchange contracts held by the Funds were as follows:
| | | First Eagle
Global
Fund | | First Eagle
Overseas
Fund | | First Eagle
Global
Income
Builder
Fund | |
Forward Foreign Currency Exchange Contracts: | |
Average Settlement Value — Purchased | | $ | 329,429,226 | | | $ | 168,596,856 | | | $ | 8,918,619 | | |
Average Settlement Value — Sold | | | 1,692,300,503 | | | | 886,243,915 | | | | 44,442,812 | | |
First Eagle Funds | Annual Report | October 31, 2024
237
Notes to Financial Statements
The Funds adopted provisions surrounding disclosures of derivative instruments and hedging activities which require qualitative disclosures about objectives and strategies for using derivatives, quantitative disclosures about fair value amounts of gains and losses on derivative instruments, and disclosures about currency-risk-related contingent features in derivative agreements.
In order to better define its contractual rights and to secure rights that may help the Funds mitigate counterparty risk, the Funds may enter into an International Swaps and Derivatives Association, Inc. Master Agreement ("ISDA Master Agreement") or similar agreement with derivative contract counterparties. An ISDA Master Agreement is a bilateral agreement between a Fund and a counterparty that governs over-the-counter ("OTC") derivatives and forward foreign currency exchange contracts and typically contains, among other things, collateral posting terms and netting provisions in the event of a default and/or termination event. Under an ISDA Master Agreement, the Funds may, under certain circumstances, offset with the counterparty certain derivative financial instrument's payables and/or receivables with collateral held and/or posted and create one single net payment. With respect to certain counterparties, in accordance with the terms of the ISDA Master Agreement, the Funds may be required to post or receive collateral in the form of cash or debt securities issued by the U.S. Government or related agencies. Daily movement of cash collateral is subject to minimum threshold amounts. Cash collateral that has been pledged to cover obligations of a Fund, if any, is reported separately on the Statements of Assets and Liabilities as cash pledged. Non-cash collateral pledged by a Fund, if any, is noted in the Schedules of Investments. Collateral received by the Funds is held in a segregated account at the Funds' custodian bank. These amounts are not reflected on the Funds' Statements of Assets and Liabilities and are disclosed in the table below. The provisions of the ISDA Master Agreement typically permit a single net payment in the event of default (close-out netting) including the bankruptcy or insolvency of the counterparty. Note, however, that bankruptcy or insolvency laws of a particular jurisdiction may impose restrictions on or prohibitions against the right of offset in bankruptcy, insolvency or other events.
For financial reporting purposes, the Funds do not offset derivative assets and derivative liabilities that are subject to netting arrangements in the Statements of Asset and Liabilities.
First Eagle Funds | Annual Report | October 31, 2024
238
Notes to Financial Statements
At October 31, 2024, the Funds had the following forward foreign currency exchange contracts grouped into appropriate risk categories illustrated below:
First Eagle Global Fund
| | | | | | | Gain or (Loss)
Derivative Recognized
in Income | |
Risk Type | | Asset Derivative
Fair Value(1) | | Liability Derivative
Fair Value(2) | | Net realized
Gains
(Losses)(3) | | Change in
Appreciation
(Depreciation)(4) | |
Foreign currency | | $ | 55,647,439 | | | $ | 3,983,898 | | | $ | 33,427,622 | | | $ | 6,056,341 | | |
First Eagle Overseas Fund
| | | | | | | Gain or (Loss)
Derivative Recognized
in Income | |
Risk Type | | Asset Derivative
Fair Value(1) | | Liability Derivative
Fair Value(2) | | Net realized
Gains
(Losses)(3) | | Change in
Appreciation
(Depreciation)(4) | |
Foreign currency | | $ | 28,626,991 | | | $ | 2,002,400 | | | $ | 21,435,204 | | | $ | 1,284,704 | | |
First Eagle Global Income Builder Fund
| | | | | | | Gain or (Loss)
Derivative Recognized
in Income | |
Risk Type | | Asset Derivative
Fair Value(1) | | Liability Derivative
Fair Value(2) | | Net realized
Gains
(Losses)(3) | | Change in
Appreciation
(Depreciation)(4) | |
Foreign currency | | $ | 1,113,951 | | | $ | 97,652 | | | $ | 481,800 | | | $ | (179,785 | ) | |
(1) Statement of Assets and Liabilities location: Unrealized appreciation on forward foreign currency exchange contracts.
(2) Statement of Assets and Liabilities location: Unrealized depreciation on forward foreign currency exchange contracts.
(3) Statement of Operations location: Net realized gains (losses) from settlement of forward foreign currency exchange contracts.
(4) Statement of Operations location: Changes in unrealized appreciation (depreciation) of forward foreign currency exchange contracts.
First Eagle Funds | Annual Report | October 31, 2024
239
Notes to Financial Statements
The following tables present each Fund's gross derivative assets and liabilities by counterparty net of amounts available for offset under netting arrangements and any related collateral received or pledged by each fund as of October 31, 2024:
First Eagle Global Fund
Counterparty | | Gross Amount
of Assets
Presented in
the Statement of
Assets and
Liabilities | | Derivatives
Available for
Offset | | Collateral
Received* | | Net Amount
(Not Less
Than $0) | |
Bank of New York Mellon | | $ | 7,693,802 | | | $ | (301,533 | ) | | $ | (7,392,269 | ) | | $ | — | | |
Goldman Sachs | | | 17,696,111 | | | | — | | | | (17,696,111 | ) | | | — | | |
JPMorgan Chase Bank | | | 21,774,575 | | | | — | | | | (21,774,575 | ) | | | — | | |
UBS AG | | | 8,482,951 | | | | (3,682,365 | ) | | | (4,800,586 | ) | | | — | | |
| | | $ | 55,647,439 | | | $ | (3,983,898 | ) | | $ | (51,663,541 | ) | | $ | — | | |
Counterparty | | Gross Amount
of Liabilities
Presented in
the Statement of
Assets and
Liabilities | | Derivatives
Available for
Offset | | Collateral
Pledged* | | Net Amount
(Not Less
Than $0) | |
Bank of New York Mellon | | $ | 301,533 | | | $ | (301,533 | ) | | $ | — | | | $ | — | | |
UBS AG | | | 3,682,365 | | | | (3,682,365 | ) | | | — | | | | — | | |
| | | $ | 3,983,898 | | | $ | (3,983,898 | ) | | $ | — | | | $ | — | | |
First Eagle Overseas Fund
Counterparty | | Gross Amount
of Assets
Presented in
the Statement of
Assets and
Liabilities | | Derivatives
Available for
Offset | | Collateral
Received* | | Net Amount
(Not Less
Than $0) | |
Bank of New York Mellon | | $ | 4,268,590 | | | $ | (167,149 | ) | | $ | (4,101,441 | ) | | $ | — | | |
Goldman Sachs | | | 9,416,229 | | | | — | | | | (9,416,229 | ) | | | — | | |
JPMorgan Chase Bank | | | 10,249,873 | | | | — | | | | (10,249,873 | ) | | | — | | |
UBS AG | | | 4,692,299 | | | | (1,835,251 | ) | | | (2,857,048 | ) | | | — | | |
| | | $ | 28,626,991 | | | $ | (2,002,400 | ) | | $ | (26,624,591 | ) | | $ | — | | |
First Eagle Funds | Annual Report | October 31, 2024
240
Notes to Financial Statements
First Eagle Overseas Fund (continued)
Counterparty | | Gross Amount
of Liabilities
Presented in
the Statement of
Assets and
Liabilities | | Derivatives
Available for
Offset | | Collateral
Pledged* | | Net Amount
(Not Less
Than $0) | |
Bank of New York Mellon | | $ | 167,149 | | | $ | (167,149 | ) | | $ | — | | | $ | — | | |
UBS AG | | | 1,835,251 | | | | (1,835,251 | ) | | | — | | | | — | | |
| | | $ | 2,002,400 | | | $ | (2,002,400 | ) | | $ | — | | | $ | — | | |
First Eagle Global Income Builder Fund
Counterparty | | Gross Amount
of Assets
Presented in
the Statement of
Assets and
Liabilities | | Derivatives
Available for
Offset | | Collateral
Received* | | Net Amount
(Not Less
Than $0) | |
Bank of New York Mellon | | $ | 110,255 | | | $ | (8,787 | ) | | $ | (101,468 | ) | | $ | — | | |
Goldman Sachs | | | 390,903 | | | | — | | | | (360,000 | ) | | | 30,903 | | |
JPMorgan Chase Bank | | | 488,670 | | | | — | | | | (462,888 | ) | | | 25,782 | | |
UBS AG | | | 124,123 | | | | (88,865 | ) | | | — | | | | 35,258 | | |
| | | $ | 1,113,951 | | | $ | (97,652 | ) | | $ | (924,356 | ) | | $ | 91,943 | | |
Counterparty | | Gross Amount
of Liabilities
Presented in
the Statement of
Assets and
Liabilities | | Derivatives
Available for
Offset | | Collateral
Pledged* | | Net Amount
(Not Less
Than $0) | |
Bank of New York Mellon | | $ | 8,787 | | | $ | (8,787 | ) | | $ | — | | | $ | — | | |
UBS AG | | | 88,865 | | | | (88,865 | ) | | | — | | | | — | | |
| | | $ | 97,652 | | | $ | (97,652 | ) | | $ | — | | | $ | — | | |
* The actual collateral received/pledged may be more than the amount reported due to over collateralization.
g) Tender Option Bonds — Inverse floating rate interests ("Inverse Floaters") are issued in connection with municipal tender option bond ("TOB") financing transactions (secured borrowing) to generate leverage for a Fund. Such instruments are created by a special purpose trust (a "TOB Trust") that holds long-term fixed rate bonds sold to it by a Fund (the underlying security), and issues two classes of beneficial interests: short-term floating rate interests ("Floaters"), which are sold to other investors, and Inverse Floaters, which are purchased by the Fund. A Fund also may (and the High Yield Municipal Fund and Short Duration High Yield Municipal Fund generally will) purchase Floaters issued by a TOB Trust. The Floaters have first priority on the cash flow from the
First Eagle Funds | Annual Report | October 31, 2024
241
Notes to Financial Statements
underlying security held by the TOB Trust, have a tender option feature that allows holders to tender the Floaters back to the TOB Trust for their par amount and accrued interest at specified intervals and bear interest at prevailing short-term interest rates. Tendered Floaters are remarketed for sale to other investors for their par amount and accrued interest by a remarketing agent to the TOB Trust and are ultimately supported by a liquidity facility provided by a bank, upon which the TOB Trust can draw funds to pay such amount to holders of Tendered Floaters that cannot be remarketed. A Fund, as holder of the Inverse Floaters, is paid the residual cash flow from the underlying security. Accordingly, the Inverse Floaters provide a Fund with leveraged exposure to the underlying security. When short-term interest rates rise or fall, the interest payable on the Floaters issued by a TOB Trust will, respectively, rise or fall, leaving less or more, respectively, residual interest cash flow from the underlying security available for payment on the Inverse Floaters. Thus, as short-term interest rates rise, Inverse Floaters produce less income for a Fund, and as short-term interest rates decline, Inverse Floaters produce more income for the Fund. The price of Inverse Floaters is expected to decline when interest rates rise and increase when interest rates decline, in either case generally more so than the price of a bond with a similar maturity, because of the effect of leverage. As a result, the price of Inverse Floaters is typically more volatile than the price of bonds with similar maturities, especially if the relevant TOB Trust is structured to provide the holder of the Inverse Floaters relatively greater leveraged exposure to the underlying security (e.g., if the par amount of the Floaters, as a percentage of the par amount of the underlying security, is relatively greater). Upon the occurrence of certain adverse events (including a credit ratings downgrade of the underlying security or a substantial decrease in the market value of the underlying security), a TOB Trust may be collapsed by the remarketing agent or liquidity provider and the underlying security liquidated, and the Fund could lose the entire amount of its investment in the Inverse Floater and may, in some cases, be contractually required to pay the shortfall, if any, between the liquidation value of the underlying security and the principal amount of the Floaters. Consequently, in a rising interest rate environment, the Fund's investments in Inverse Floaters could negatively impact the Fund's performance and yield, especially when those Inverse Floaters provide the Fund with relatively greater leveraged exposure to the underlying securities held by the relevant TOB Trusts.
A Fund may invest in Inverse Floaters on a non-recourse or recourse basis. If a Fund invests in an Inverse Floater on a recourse basis, the Fund will be required to reimburse the liquidity provider of a TOB Trust for any shortfall between the liquidation value of the underlying security and the principal amount of the Floaters in the event the Floaters cannot be successfully remarketed and the Fund could suffer losses in excess of the amount of its investment in the Inverse Floater.
The Underlying Bond deposited into the TOB Trust is identified in the Fund's Portfolio of Investments as "(g) All or portion of principal amount transferred to
First Eagle Funds | Annual Report | October 31, 2024
242
Notes to Financial Statements
a Tender Option Bond ("TOB") Issuer in exchange for TOB Residuals and cash." with the Fund recognizing as liabilities, labeled "Payable for Floating Rate Note Obligation" on the Statement of Assets and Liabilities, (a) the liquidation value of Floaters issued by the TOB Trust, and (b) the amount of any borrowings by the TOB Trust from a Liquidity Provider to enable the TOB Trust to purchase outstanding Floaters in lieu of a remarketing. In addition, the Fund recognizes in "Investment Income" the entire earnings of the Underlying Bond, and recognizes (a) the interest paid to the holders of the Floaters or on the TOB Trust's borrowings, and (b) other expenses related to remarketing, administration, trustee, liquidity and other services to a TOB Trust, as a component of "Interest expense" on the Statement of Operations. Earnings due from the Underlying Bond and interest due to the holders of the Floaters as of the end of the reporting period are recognized as components of "Accrued interest and dividends receivable" and "Interest expense and fees payable" on the Statement of Assets and Liabilities, respectively.
As of October 31, 2024, the aggregrate value of Floaters issued by the Fund's TOB Trusts were as follows:
| | Floating Rate
Obligations: | |
First Eagle High Yield Municipal Fund | | $ | 326,775,000 | | |
For period ended October 31, 2024, the average amount of Floaters outstanding (beginning September 12, 2024, when the Fund began investing in TOB transactions), and the average annual interest rates and fees related to Inverse Floaters (starting from October 1, 2024, when the Fund 's first TOB settled), were as follows:
| | Average Floating
Rate Obligations
Outstanding | | Average Annual
Interest Rate
and Fees | |
First Eagle High Yield Municipal Fund | | $ | 93,791,700 | | | | 3.69 | % | |
h) Options — In order to seek to produce incremental earnings or protect against declines in the value of portfolio securities, each Fund may write "covered" call options on portfolio securities. The Funds may also use options for speculative purposes, although they generally do not employ options for this purpose.
Options contracts are valued daily based upon the official closing price on the relevant exchange on which the option is traded. If there is no official closing price, the mean between the last bid and asked prices may be used. When an option is exercised, the proceeds on the sale of a written call option are adjusted by the amount of premium received or paid. When a written option expires, the Funds will realize a gain equal to the amount of the premium received. When the Funds enter into a closing purchase transaction, the Funds will realize a gain (or loss, if the cost of the closing purchase transaction exceeds the premium received when the option was written) without regard to any unrealized gain or loss on the underlying security and the liability related to such option is eliminated.
First Eagle Funds | Annual Report | October 31, 2024
243
Notes to Financial Statements
In general, a call option is covered if a Fund holds, on a share-for-share basis, either the underlying shares or a call on the same security as the call written where the exercise price of the call held is equal to or less than the exercise price of the call written (or greater than the exercise price of the call written if the difference is maintained by the Funds in cash, Treasury bills or other high grade short-term obligations earmarked with its custodian). One reason for writing options is to attempt to realize, through the receipt of premiums, a greater return than would be realized on the securities alone. Another reason for writing options is to hedge against a moderate decline in the value of securities owned by a Fund in the case of a call option. If an increase occurs in the underlying security or stock index sufficient to result in the exercise of a call written by a Fund, it may be required to deliver securities or cash and may thereby forego some or all of the gain that otherwise may have been realized on the securities underlying the call option. This "opportunity cost" may be partially or wholly offset by the premium received for the covered call written by a Fund. The risk in writing a covered call option is that a Fund gives up the opportunity for profit if the market price of the underlying security increases and the option is exercised. A Fund also has the additional risk of not being able to enter into a closing transaction if a liquid secondary market does not exist.
A Fund may also write over-the-counter options where the completion of the obligation is dependent upon the credit standing of the counterparty.
Rule 18f-4 under the 1940 Act permits the Funds to enter into Derivatives Transactions (as defined below) and certain other transactions notwithstanding the restrictions on the issuance of "senior securities" under Section 18 of the 1940 Act. Section 18 of the 1940 Act, among other things, prohibits open-end funds, including the Funds, from issuing or selling any "senior security," other than borrowing from a bank (subject to a requirement to maintain 300% "asset coverage").
Under Rule 18f-4, "Derivatives Transactions" include the following: (1) any swap, security-based swap (including a contract for differences), futures contract, forward contract, option (excluding purchased options), any combination of the foregoing, or any similar instrument, under which a Fund is or may be required to make any payment or delivery of cash or other assets during the life of the instrument or at maturity or early termination, whether as margin or settlement payment or otherwise; (2) any short sale borrowing; (3) reverse repurchase agreements and similar financing transactions (e.g., recourse and nonrecourse tender option bonds, and borrowed bonds), if a Fund elects to treat these transactions as Derivatives Transactions under Rule 18f-4; and (4) when issued or forward-settling securities (e.g., firm and standby commitments, including to-be-announced ("TBA") commitments, and dollar rolls) and nonstandard settlement cycle securities, unless a Fund intends to physically settle the transaction and the transaction will settle within 35 days of its trade date.
Unless a fund is relying on the Limited Derivatives User Exception (as defined below), a fund must comply with Rule 18f-4 with respect to its Derivatives
First Eagle Funds | Annual Report | October 31, 2024
244
Notes to Financial Statements
Transactions. Rule 18f-4, among other things, requires a fund to adopt and implement a comprehensive written derivatives risk management program ("DRMP") and comply with a relative or absolute limit on fund leverage risk calculated based on value-at-risk ("VaR"). The DRMP is administered by a "derivatives risk manager," who is appointed by the Board, including a majority of Independent Trustees, and periodically reviews the DRMP and reports to the Board.
Rule 18f-4 provides an exception from the DRMP, VaR limit and certain other requirements if the Fund's "derivatives exposure" (as defined in Rule 18f-4) is limited to 10% of its net assets (as calculated in accordance with Rule 18f-4) and the Fund adopts and implements written policies and procedures reasonably designed to manage its derivatives risks (the "Limited Derivatives User Exception"). As of the date hereof, each Fund is relying on the Limited Derivatives User Exception.
As of October 31, 2024, portfolio securities valued at $165,711,884 were earmarked to cover collateral requirements for written options for First Eagle Global Income Builder Fund.
For the year ended October 31, 2024, the average monthly number of contracts outstanding for written options and purchased options held by the Funds were as follows:
| | | First Eagle
Global Income
Builder Fund | |
Options: | |
Average Number of Contracts — Written | | | 13,047 | | |
At October 31, 2024, the Funds had the following options grouped into appropriate risk categories illustrated below:
First Eagle Global Income Builder Fund
| | | | | | | Gain or (Loss)
Derivative Recognized
in Income | |
Risk Type | | Asset Derivative
Fair Value(1) | | Liability Derivative
Fair Value(2) | | Net Realized
Gains (Losses)(3) | | Change in
Appreciation
(Depreciation)(4) | |
Equity — Written options | | $ | — | | | $ | 5,333,211 | | | $ | 1,447,908 | | | $ | (3,742,884 | ) | |
(1) Statements of Assets and Liabilities location: Investments in securities of unaffiliated issuers.
(2) Statements of Assets and Liabilities location: Option contracts written, at value.
(3) Statements of Operations location: Net realized gains (losses) from expiration or closing of option contracts written.
(4) Statements of Operations location: Changes in unrealized appreciation (depreciation) of option contracts written.
First Eagle Funds | Annual Report | October 31, 2024
245
Notes to Financial Statements
i) Repurchase Agreements — The Funds may enter into repurchase agreement transactions with institutions that meet the Adviser's credit guidelines. Each repurchase agreement is valued at market. The Funds require that the collateral received in a repurchase agreement transaction be transferred to a custodian in a manner sufficient to enable the Funds to obtain collateral in the event of a counterparty default. If the counterparty defaults and the fair value of the collateral declines, realization of the collateral by the Funds may be delayed or limited.
j) Bank Loans — A Fund may invest in bank loans, which usually take the form of loan participations and assignments. Loan participations and assignments are agreements to make money available to U.S. or foreign corporations, partnerships or other business entities (the "Borrower") in a specified amount, at a specified rate and within a specified time. A loan is typically originated, negotiated and structured by a U.S. or foreign bank, insurance company or other financial institution (the "Agent") for a group of loan investors ("Loan Investors"). The Agent typically administers and enforces the loan on behalf of the other Loan Investors in the syndicate and may hold any collateral on behalf of the Loan Investors. Such loan participations and assignments are typically senior, secured and collateralized in nature. A Fund records an investment when the Borrower withdraws money and records interest as earned. A Fund generally has no right to enforce compliance with the terms of the loan agreement with the Borrower. As a result, a Fund assumes the credit risk of the Borrower, the selling participant and any intermediary between a Fund and the Borrower ("Intermediate Participants"). In the event that the Borrower, selling participant or Intermediate Participants becomes insolvent or enters into bankruptcy, each Fund may incur certain costs and delays in realizing payment or may suffer a loss of principal and/or interest.
k) Treasury Inflation-Protected Securities — The Funds may invest in Treasury Inflation-Protected Securities ("TIPS") which are specially structured bonds in which the principal amount is adjusted to keep pace with inflation. The principal value of TIPS will be adjusted upward or downward. These adjustments are recorded as increases or decreases to interest income on the Statements of Operations and reflected in market value of the securities. TIPS are subject to interest rate risk.
l) Restricted Securities — The Funds may invest in securities that are subject to legal or contractual restrictions on resale. These securities generally may be resold in transactions exempt from registration or to the public if the securities are registered. Disposal of these securities may involve time-consuming negotiations and expenses, and prompt sale at an acceptable price may be difficult. Information regarding restricted securities, if any, is included at the end of each Fund's Schedule of Investments.
m) New Accounting Pronouncements — In June 2022, FASB issued Accounting Standards Update ("ASU") 2022-03, Fair Value Measurement (Topic 820) — Fair Value Measurement of Equity Securities Subject to Contractual Sale Restrictions. The amendments in the ASU clarify that a contractual restriction
First Eagle Funds | Annual Report | October 31, 2024
246
Notes to Financial Statements
on the sale of an equity security is not considered part of the unit of account of the equity security and, therefore, should not be considered in measuring fair value. The ASU is effective for interim and annual reporting periods beginning after December 15, 2023, with the option of early adoption. There is no material impact to the financial statements and related disclosures.
n) United States Income Taxes — No provision has been made for U.S. federal income taxes since it is the intention of each Fund to distribute to shareholders all taxable net investment income and net realized gains on investments, if any, within the allowable time limit, and to comply with the provisions of Subchapter M of the Internal Revenue Code applicable to the regulated investment company. The Funds declare and pay such income and capital gains on an annual basis except for the First Eagle Global Income Builder Fund, the First Eagle High Yield Municipal Fund, and the First Eagle Short Duration High Yield Municipal Fund which declare income daily and pay monthly, and First Eagle Rising Dividend Fund which distributes income on a quarterly basis.
The Funds adopted provisions surrounding income taxes, which require the tax effects of certain tax positions to be recognized. These tax positions must meet a "more likely than not" standard that, based on their technical merits, have a more than 50% likelihood of being sustained upon examination. Management of the Trust has analyzed the Funds' tax positions taken on federal and state income tax returns for all open tax years (the current and the prior three tax years) and has concluded that no provision for income tax is required in the Funds' financial statements.
At October 31, 2024, the components of accumulated earnings on a tax basis were as follows:
| | Undistributed
Tax-Exempt | | Undistributed
Ordinary | | Undistributed
Net Realized | | Net Unrealized
Appreciation | | Capital Loss
Carryforward | |
| | Income | | Income | | Gains | | (Depreciation) | | Short-Term | | Long-Term | |
First Eagle
Global Fund | | $ | — | | | $ | 1,193,840,783 | | | $ | 1,560,172,105 | | | $ | 20,519,863,759 | | | $ | — | | | $ | — | | |
First Eagle
Overseas Fund | | | — | | | | 612,446,629 | | | | 275,308,003 | | | | 3,447,174,277 | | | | — | | | | — | | |
First Eagle
U.S. Value
Fund | | | — | | | | 20,055,443 | | | | 63,308,490 | | | | 639,413,013 | | | | — | | | | — | | |
First Eagle
Gold Fund | | | — | | | | 122,554,661 | | | | — | | | | 949,508,873 | | | | — | | | | 527,588,802 | | |
First Eagle
Global
Income
Builder
Fund | | | — | | | | 1,118,229 | | | | 22,666,003 | | | | 268,146,890 | | | | — | | | | — | | |
First Eagle Rising
Dividend Fund | | | — | | | | 4,857,273 | | | | 12,869,966 | | | | 128,134,676 | | | | — | | | | — | | |
First Eagle Funds | Annual Report | October 31, 2024
247
Notes to Financial Statements
| | Undistributed
Tax-Exempt | | Undistributed
Ordinary | | Undistributed
Net Realized | | Net Unrealized
Appreciation | | Capital Loss
Carryforward | |
| | Income | | Income | | Gains | | (Depreciation) | | Short-Term | | Long-Term | |
First Eagle Small
Cap Opportunity
Fund | | $ | — | | | $ | 25,393,888 | | | $ | — | | | $ | 245,051,562 | | | $ | 64,086,797 | | | $ | — | | |
First Eagle
U.S. Smid Cap
Opportunity Fund | | | — | | | | 218,011 | | | | — | | | | 9,696,868 | | | | 490,282 | | | | — | | |
First Eagle Global
Real Assets Fund | | | — | | | | 422,207 | | | | — | | | | 1,342,218 | | | | 26,559 | | | | 107,473 | | |
First Eagle High
Yield Municipal
Fund | | | — | | | | — | | | | — | | | | 50,856,933 | | | | 2,054,619 | | | | 124,856,923 | | |
First Eagle Short
Duration High
Yield Municipal
Fund | | | 47,643 | | | | — | | | | — | | | | (24,533 | ) | | | 4,689 | | | | — | | |
The components of distributable earnings' differences between book basis and tax basis are primarily due to the treatment of passive foreign investment companies, distributions from real estate investment trusts, the treatment of forward foreign currencies contracts, straddle loss deferral, foreign repatriated earnings for First Eagle Overseas Fund, investment in partnerships, global intangible low-taxed income from investment in certain foreign corporations for First Eagle Overseas Fund, wash sales and amortization on certain callable bond investments for First Eagle Global Income Builder Fund, First Eagle High Yield Municipal Fund and First Eagle Short Duration High Yield Fund.
Under the Regulated Investment Company Modernization Act of 2010 (the "Act"), net capital losses recognized by the Funds after December 31, 2010, may get carried forward indefinitely, and retain their character as short-term and/or long-term losses. For the current year, the First Eagle Gold Fund utilized $80,626,187 in net capital loss carryforward.
Late year ordinary losses incurred after December 31st and within the taxable year are deemed to arise on the first business day of the Funds' next taxable year For the year ended October 31, 2024, none of the Funds had late year loss deferrals.
o) Reclassification of Capital Accounts — As a result of certain differences in the computation of net investment income and net realized capital gains under federal income tax rules and regulations versus GAAP, a reclassification has been
First Eagle Funds | Annual Report | October 31, 2024
248
Notes to Financial Statements
made on the Statements of Assets and Liabilities to increase (decrease) distributable earnings and capital surplus for the Funds as follows:
| | Undistributed Net
Investment Income
(Loss) | | Undistributed Net
Realized Gains
(Losses) | | Capital Surplus | |
First Eagle Global Fund | | $ | 420,872,805 | | | $ | (501,377,467 | ) | | $ | 80,504,662 | | |
First Eagle Overseas Fund | | | 325,237,143 | | | | (344,859,725 | ) | | | 19,622,582 | | |
First Eagle U.S. Value Fund | | | 9,048,031 | | | | (12,229,017 | ) | | | 3,180,986 | | |
First Eagle Gold Fund | | | 105,343,730 | | | | (148,240,205 | ) | | | 42,896,475 | | |
First Eagle Global Income Builder Fund | | | 1,943,295 | | | | (1,944,413 | ) | | | 1,118 | | |
First Eagle Rising Dividend Fund | | | 418,521 | | | | (283,293 | ) | | | (135,228 | ) | |
First Eagle Small Cap Opportunity Fund | | | 16,283,105 | | | | (16,283,105 | ) | | | — | | |
First Eagle U.S. Smid Cap Opportunity Fund | | | (17 | ) | | | 17 | | | | — | | |
First Eagle Global Real Assets Fund | | | 234,361 | | | | (233,541 | ) | | | (820 | ) | |
First Eagle High Yield Municipal Fund | | | (75,660 | ) | | | 88,088 | | | | (12,428 | ) | |
First Eagle Short Duration High Yield
Municipal Fund | | | 494 | | | | 183 | | | | (677 | ) | |
The primary permanent differences causing such reclassification include the tax treatment of currency gains and losses, distributions paid in connection with the redemption of Fund shares, adjustments on certain callable bonds, investments in passive foreign investment companies and differing book and tax treatment of transactions with the Subsidiary.
At the year ended October 31, 2024, the First Eagle Global Cayman Fund, Ltd., First Eagle Overseas Cayman Fund, Ltd., First Eagle Gold Cayman Fund Ltd., and First Eagle U.S. Value Cayman Fund, Ltd. had unrealized gains for tax purposes. Any unrealized losses to be recognized for tax purposes in the future can only be utilized by the Funds to the extent of tax basis realized gains in the Subsidiaries in the same year. Given the uncertainty of their future use, tax losses have been reclassified to Capital surplus.
p) Distribution to Shareholders — Distributions to shareholders during the fiscal year ended October 31, 2024, which are determined in accordance with income tax regulations, are recorded on ex-dividend date.
First Eagle Funds | Annual Report | October 31, 2024
249
Notes to Financial Statements
| | | Tax-Exempt Income | | Ordinary Income | |
| | 2024 | | 2023 | | 2024 | | 2023 | |
First Eagle Global Fund | | $ | — | | | $ | — | | | $ | 694,254,260 | | | $ | 119,665,749 | | |
First Eagle Overseas Fund | | | — | | | | — | | | | 249,161,450 | | | | 38,362,057 | | |
First Eagle U.S. Value Fund | | | — | | | | — | | | | 15,644,440 | | | | 7,439,013 | | |
First Eagle Gold Fund | | | — | | | | — | | | | 22,713,907 | | | | — | | |
First Eagle Global Income Builder Fund | | | — | | | | — | | | | 45,860,679 | | | | 39,839,758 | | |
First Eagle Rising Dividend Fund | | | — | | | | — | | | | 5,079,555 | | | | 4,688,085 | | |
First Eagle Small Cap Opportunity Fund | | | — | | | | — | | | | 9,542,812 | | | | 608,113 | | |
First Eagle U.S. Smid Cap Opportunity
Fund | | | — | | | | — | | | | 120,773 | | | | 3,618 | | |
First Eagle Global Real Assets Fund | | | — | | | | — | | | | 242,239 | | | | 179,759 | | |
First Eagle High Yield Municipal Fund | | | 66,148,989 | | | | — | | | | 5,052,249 | | | | 9,170,821 | | |
First Eagle Short Duration High Yield
Municipal Fund | | | 1,650,374 | | | | — | | | | 110,465 | | | | — | | |
| | | Long Term Capital Gains | | Return of Capital | |
| | 2024 | | 2023 | | 2024 | | 2023 | |
First Eagle Global Fund | | $ | 1,081,566,934 | | | $ | 1,765,986,613 | | | $ | — | | | $ | — | | |
First Eagle Overseas Fund | | | 53,792,723 | | | | 399,260,258 | | | | — | | | | — | | |
First Eagle U.S. Value Fund | | | 61,312,109 | | | | 82,244,788 | | | | — | | | | — | | |
First Eagle Gold Fund | | | — | | | | — | | | | — | | | | — | | |
First Eagle Global Income Builder Fund | | | — | | | | 24,615,575 | | | | — | | | | — | | |
First Eagle Rising Dividend Fund | | | 25,786,460 | | | | 8,670,693 | | | | — | | | | — | | |
First Eagle Small Cap Opportunity Fund | | | — | | | | — | | | | — | | | | — | | |
First Eagle U.S. Smid Cap Opportunity
Fund | | | — | | | | — | | | | — | | | | — | | |
First Eagle Global Real Assets Fund | | | — | | | | — | | | | — | | | | — | | |
First Eagle High Yield Municipal Fund | | | — | | | | — | | | | 6,736,102 | | | | — | | |
First Eagle Short Duration High Yield
Municipal Fund | | | — | | | | — | | | | — | | | | — | | |
q) Class Accounting — Investment income, common expenses and realized/ unrealized gain or loss on investments are allocated to the various classes of the Fund on the basis of daily net assets of each class. Fees relating to a specific class are charged directly to that class.
First Eagle Funds | Annual Report | October 31, 2024
250
Notes to Financial Statements
r) Use of Estimates — The preparation of financial statements in conformity with GAAP requires management to make estimates and assumptions that affect the reported amounts of assets and liabilities at the date of the financial statements and the reported amounts of revenues and expenses during the reporting period. Actual results could differ from those estimates.
s) Foreign Taxes — The Funds may be subject to foreign taxes on income, and gains on investments or currency purchases/repatriation, a portion of which may be recoverable. The Funds will accrue such taxes and recoveries as applicable, based upon their current interpretation of tax rules and regulations that exist in the markets in which they invest.
Note 2 — Investment Advisory, Custody and Administration Agreements; Transactions with Related Persons
For its services, the Adviser receives, pursuant to an Investment Advisory Agreement between the Funds and the Adviser (the "Advisory Agreement"), an annual fee as follows:
Fund | | Management Fee
(% of Average Daily Net Assets) | |
First Eagle Global Fund | | | 0.75 | % | |
First Eagle Overseas Fund | | | 0.75 | | |
First Eagle U.S. Value Fund | | | 0.75 | (1) | |
First Eagle Gold Fund | | | 0.75 | | |
First Eagle Global Income Builder Fund | | | 0.75 | | |
First Eagle Rising Dividend Fund | | | 0.50 | (2) | |
First Eagle Small Cap Opportunity Fund | | | 0.85 | (3) | |
First Eagle U.S. Smid Cap Opportunity Fund | | | 0.75 | (4) | |
First Eagle Global Real Assets Fund | | | 0.65 | (5) | |
First Eagle High Yield Municipal Fund | | | 0.45 | (6) | |
First Eagle Short Duration High Yield Municipal Fund | | | 0.45 | (7) | |
(1) The Adviser has agreed to waive First Eagle U.S. Value Fund's management fee at an annual rate in the amount of 0.05% of the average daily value of the Fund's net assets for the period through February 29, 2024. This waiver has the effect of reducing the management fee shown in the table for the term of the waiver from 0.75% to 0.70%. For the year ended October 31, 2024, the Adviser waived $198,502 of the management fee which are included under Expense waiver in the Statement of Operations. As of October 31, 2024, the Fund has $- receivable from the Adviser for the management fee waiver, which are included under due from adviser on its Statement of Assets and Liabilities.
(2) The Adviser has contractually agreed to waive and/or reimburse certain fees and expenses of Classes A, C, I, R3, R4, R5 and R6 for First Eagle Rising Dividend Fund so that the total annual operating expenses (excluding interest, taxes, brokerage commissions, acquired fund fees and expenses, dividend and interest expenses relating to short sales, and extraordinary expenses, if any) ("annual operating expenses") of each class are limited to 0.90%, 1.65%, 0.65%, 1.00%, 0.75%, 0.65% and 0.65% of
First Eagle Funds | Annual Report | October 31, 2024
251
Notes to Financial Statements
average net assets, respectively. Each of these undertakings lasts until February 28, 2025 and may not be terminated during its term without the consent of the Board. First Eagle Rising Dividend Fund has agreed that each of Classes A, C, I, R3, R4, R5 and R6 will repay the Adviser for fees and expenses waived or reimbursed for the class provided that repayment does not cause annual operating expenses (after the repayment is taken into account) to exceed the lesser of: (1) 0.90%, 1.65%, 0.65%, 1.00%, 0.75%, 0.65% and 0.65% of the class' average net assets, respectively; or (2) if applicable, the then-current expense limitations. Any such repayment must be made within three years after the year in which the Adviser incurred the expense. Effective February 28, 2024, all of the issued and outstanding Class R3, Class R4 and Class R5 shares of the applicable funds were converted into Class R6 shares of the same Fund. For the year ended October 31, 2024, the Adviser reimbursed $543,772 (Includes $16, $56, and $5 for R3, R4, and R5 respectively) in expenses which are included under Expense waiver in the Statement of Operations. As of October 31, 2024, the Fund has $21,184 receivable from the Adviser for reimbursement of expenses, which are included under due from adviser on its Statement of Assets and Liabilities.
For the year ended October 31, 2024, the amounts available for potential future repayment by the Adviser and the expiration schedule are as follows:
| | | | Potential Recoupment
Amounts Expiring
October 31, | |
| | Total Eligible
for Recoupment | | 2025 | | 2026 | | 2027 | |
Class A | | $ | 1,157,440 | | | $ | 305,896 | | | $ | 445,261 | | | $ | 406,283 | | |
Class C | | | 67,934 | | | | 41,567 | | | | 16,714 | | | | 9,653 | | |
Class I | | | 292,354 | | | | 75,472 | | | | 93,128 | | | | 123,754 | | |
Class R6 | | | 8,519 | | | | 524 | | | | 3,990 | | | | 4,005 | | |
Total | | $ | 1,526,247 | | | $ | 423,459 | | | $ | 559,093 | | | $ | 543,695 | | |
(3) The Adviser has contractually agreed to waive and/or reimburse certain fees and expenses of Classes A, I and R6 for First Eagle Small Cap Opportunity Fund so that the total annual operating expenses (excluding interest, taxes, brokerage commissions, acquired fund fees and expenses, dividend and interest expenses relating to short sales, and extraordinary expenses, if any) ("annual operating expenses") of each class are limited to 1.25%, 1.00% and 1.00% of average net assets, respectively. Each of these undertakings lasts until February 28, 2025 and may not be terminated during its term without the consent of the Board. The Fund has agreed that each of Classes A, I and R6 will repay the Adviser for fees and expenses waived or reimbursed for the class provided that repayment does not cause annual operating expenses (after the repayment is taken into account) to exceed the lesser of: (1) 1.25%, 1.00% and 1.00% of the class' average net assets, respectively; or (2) if applicable, the then current expense limitations. Any such repayment must be made within three years after the year in which the Adviser incurred the expense. For the year ended October 31, 2024, the Adviser reimbursed $1,017,730 in expenses which are included under Expense waiver in the Statement of Operations. As of October 31, 2024, the Fund has $254,505 receivable from the Adviser for reimbursement of expenses, which are included under due from adviser on its Statement of Assets and Liabilities.
First Eagle Funds | Annual Report | October 31, 2024
252
Notes to Financial Statements
For the year ended October 31, 2024, the amounts available for potential future repayment by the Adviser and the expiration schedule are as follows:
| | | | Potential Recoupment
Amounts Expiring
October 31, | |
| | Total Eligible
for Recoupment | | 2025 | | 2026 | | 2027 | |
Class A | | $ | 90,010 | | | $ | 35,559 | | | $ | 34,918 | | | $ | 19,533 | | |
Class I | | | 2,292,398 | | | | 467,141 | | | | 827,060 | | | | 998,197 | | |
Class R6 | | | 1,399 | | | | — | | | | 1,399 | | | | — | | |
Total | | $ | 2,383,807 | | | $ | 502,700 | | | $ | 863,377 | | | $ | 1,017,730 | | |
(4) The Adviser has contractually agreed to waive and/or reimburse certain fees and expenses of Classes A, I, and R6 for First Eagle U.S. Smid Cap Opportunity Fund so that the total annual operating expenses (excluding interest, taxes, brokerage commissions, acquired fund fees and expenses, dividend and interest expenses relating to short sales, and extraordinary expenses, if any) ("annual operating expenses") of each class are limited to 1.20%, 0.95% and 0.95% of average net assets, respectively. Each of these undertakings lasts until February 28, 2025 and may not be terminated during its term without the consent of the Board. The Fund has agreed that each of Classes A, I and R6 will repay the Adviser for fees and expenses waived or reimbursed for the class provided that repayment does not cause annual operating expenses (after the repayment is taken into account) to exceed the lesser of: (1) 1.20%, 0.90% and 0.95% of the class' average net assets, respectively; or (2) if applicable, the then current expense limitations. Any such repayment must be made within three years after the year in which the Adviser incurred the expense. For the year ended October 31, 2024, the Adviser reimbursed $285,364 in expenses which are included under Expense waiver in the Statement of Operations. As of October 31, 2024, the Fund has $20,916 receivable from the Adviser for reimbursement of expenses, which are included under due from adviser on its Statement of Assets and Liabilities.
For the year ended October 31, 2024, the amounts available for potential future repayment by the Adviser and the expiration schedule are as follows:
| | | | Potential Recoupment
Amounts Expiring
October 31, | |
| | Total Eligible
for Recoupment | | 2025 | | 2026 | | 2027 | |
Class A | | $ | 12,312 | | | $ | 5,340 | | | $ | 3,555 | | | $ | 3,417 | | |
Class I | | | 728,347 | | | | 98,971 | | | | 347,861 | | | | 281,515 | | |
Class R6 | | | 8,507 | | | | 4,332 | | | | 3,743 | | | | 432 | | |
Total | | $ | 749,166 | | | $ | 108,643 | | | $ | 355,159 | | | $ | 285,364 | | |
(5) Classes A, I, and R6 for First Eagle Global Real Assets Fund so that the total annual operating expenses (excluding interest, taxes, brokerage commissions, acquired fund fees and expenses, dividend and interest expenses relating to short sales, and extraordinary expenses, if any) ("annual operating expenses") of each class are limited to 1.10%, 0.85% and 0.85% of average net assets, respectively. Each of these undertakings lasts until February 28, 2025 and may not be terminated during its term without the consent of the Board. The Fund has agreed that each of Classes A, I and R6 will repay the Adviser for fees and expenses waived or reimbursed for the class provided that repayment does not cause annual operating expenses (after the repayment is taken into account) to
First Eagle Funds | Annual Report | October 31, 2024
253
Notes to Financial Statements
exceed the lesser of: (1) 1.10%, 0.85% and 0.85% of the class' average net assets, respectively; or (2) if applicable, the then current expense limitations. Any such repayment must be made within three years after the year in which the Adviser incurred the expense. For the year ended October 31, 2024, the Adviser reimbursed $441,518 in expenses which are included under Expense waiver in the Consolidated Statement of Operations. As of October 31, 2024, the Fund has $47,067 receivable from the Adviser for reimbursement of expenses, which are included under due from adviser on its Consolidated Statement of Assets and Liabilities.
For the year ended October 31, 2024, the amounts available for potential future repayment by the Adviser and the expiration schedule are as follows:
| | | | Potential Recoupment
Amounts Expiring
October 31, | |
| | Total Eligible
for Recoupment | | 2025 | | 2026 | | 2027 | |
Class A | | $ | 168,539 | | | $ | 40,189 | | | $ | 64,115 | | | $ | 64,235 | | |
Class I | | | 939,938 | | | | 262,027 | | | | 339,917 | | | | 337,994 | | |
Class R6 | | | 119,608 | | | | 38,082 | | | | 42,237 | | | | 39,289 | | |
Total | | $ | 1,228,085 | | | $ | 340,298 | | | $ | 446,269 | | | $ | 441,518 | | |
(6) The Adviser has waived the Fund's management fees in full from November 1, 2023 through April 30, 2024. This waiver has the effect of reducing the management fee shown in the table for the term of the waiver from 0.45% to 0.00%. For the year ended October 31, 2024, the Adviser waived $770,905 of the management fee which are included under Expense waiver in the Statement of Operations. As of October 31, 2024, the Fund has $- receivable from the Adviser for the management fee waiver, which are included under Due from adviser on its Statement of Assets and Liabilities. Effective November 1, 2023, the Adviser has contractually agreed to waive and/or reimburse certain fees and expenses of Classes A, C, I, R3, R4, R5 and R6 for First Eagle High Yield Municipal Fund so that the total annual operating expenses (excluding interest, taxes, brokerage commissions, acquired fund fees and expenses, dividend and interest expenses relating to short sales, and extraordinary expenses, if any) ("annual operating expenses") of each class are limited to 0.85%, 1.60%, 0.60%, 0.95%, 0.70%, 0.60% and 0.60% of average net assets, respectively. Each of these undertakings lasts until February 28, 2025 and may not be terminated during its term without the consent of the Board. First Eagle High Yield Municipal Fund has agreed that each of Classes A, C, I, R3, R4, R5 and R6 will repay the Adviser for fees and expenses waived or reimbursed for the class provided that repayment does not cause annual operating expenses (after the repayment is taken into account) to exceed the lesser of: (1) 0.85%, 1.60%, 0.60%, 0.95%, 0.70%, 0.60% and 0.60% of the class' average net assets, respectively; or (2) if applicable, the then-current expense limitations. Any such repayment must be made within three years after the year in which the Adviser incurred the expense. Effective February 28, 2024, all of the issued and outstanding Class R3, Class R4 and Class R5 shares of the applicable funds were converted into Class R6 shares of the same Fund. For the year ended October 31, 2024, the Adviser reimbursed $431,497 (Includes $743, $6 and $—, for R3, R4 and R5 respectively) in expenses which are included under Expense waiver in the Statement of Operations. As of October 31, 2024, the Fund has $60,271 receivable from the Adviser for reimbursement of expenses, which are included under Due from adviser on its Statement of Assets and Liabilities.
First Eagle Funds | Annual Report | October 31, 2024
254
Notes to Financial Statements
For the year ended October 31, 2024, the amounts available for potential future repayment by the Adviser and the expiration schedule are as follows:
| | | | Potential Recoupment
Amounts Expiring
October 31, | |
| | Total Eligible
for Recoupment | | 2026 | | 2027 | |
Class A | | $ | 189,657 | | | $ | 102,116 | | | $ | 87,541 | | |
Class C | | | 17,023 | | | | 8,380 | | | | 8,643 | | |
Class I | | | 469,493 | | | | 142,781 | | | | 326,712 | | |
Class R6 | | | 11,238 | | | | 3,386 | | | | 7,852 | | |
Total | | $ | 687,411 | | | $ | 256,663 | | | $ | 430,748 | | |
(7) Effective May 1, 2024, the Adviser has agreed to waive the First Eagle Short Duration High Yield Municipal Fund's management fees in full from May 1, 2024 through October 31, 2024, with the result that no management fees will be paid by the Fund during that period. For the year ended October 31, 2024, the Adviser waived $144,432 of the management fee which are included under Expense waiver in the Statement of Operations. As of October 31, 2024, the Fund has $53,521 receivable from the Adviser for the management fee waiver, which are included under Due from adviser on its Statement of Assets and Liabilities. The Adviser has contractually agreed to waive and/or reimburse certain fees and expenses of Classes A, I, and R6 for First Eagle Short Duration High Yield Municipal Fund so that the total annual operating expenses (excluding interest, taxes, brokerage commissions, acquired fund fees and expenses, dividend and interest expenses relating to short sales, and extraordinary expenses, if any) ("annual operating expenses") of each class are limited to 0.85%, 0.60% and 0.60% of average net assets, respectively. Each of these undertakings lasts until February 28, 2025 and may not be terminated during its term without the consent of the Board. The Fund has agreed that each of Classes A, I and R6 will repay the Adviser for fees and expenses waived or reimbursed for the class provided that repayment does not cause annual operating expenses (after the repayment is taken into account) to exceed the lesser of: (1) 0.85%, 0.60% and 0.60% of the class' average net assets, respectively; or (2) if applicable, the then current expense limitations. Any such repayment must be made within three years after the year in which the Adviser incurred the expense. For the year ended October 31, 2024, the Adviser reimbursed $341,579 in expenses which are included under Expense waiver in the Statement of Operations. As of October 31, 2024, the Fund has $80,657 receivable from the Adviser for reimbursement of expenses, which are included under Due from adviser on its Statement of Assets and Liabilities.
For the year ended October 31, 2024, the amounts available for potential future repayment by the Adviser and the expiration schedule are as follows:
| | | | Potential Recoupment
Amounts Expiring
October 31, | |
| | Total Eligible
for Recoupment | | 2027 | |
Class A | | $ | 41,503 | | | $ | 41,503 | | |
Class I | | | 285,309 | | | | 285,309 | | |
Class R6 | | | 14,767 | | | | 14,767 | | |
Total | | $ | 341,579 | | | $ | 341,579 | | |
First Eagle Funds | Annual Report | October 31, 2024
255
Notes to Financial Statements
The Adviser also performs certain administrative, accounting, operations, compliance and other services on behalf of the Funds, and in accordance with its agreement with the Adviser, the Funds (except for First Eagle Global Income Builder Fund and First Eagle High Yield Municipal Fund before December 27, 2023, which pay the fee described in the next paragraphs) reimburse the Adviser for costs (including personnel and other costs) related to those services. These reimbursements may not exceed an annual rate of 0.05% of a Fund's average daily net assets.
Pursuant to Administrative Services Agreements between each of First Eagle Global Income Builder Fund and First Eagle High Yield Municipal Fund before it changed its name and strategy on December 27, 2023, and the Adviser, each pay the Adviser a monthly administration fee that is accrued daily at an annual rate of 0.05% of the Fund's average daily net assets.
For the year ended October 31, 2024, The Adviser waived and the Funds had due from Adviser amounts shown below:
| | | Adviser Waived Amount | | Due From Adviser | |
First Eagle Global Fund | | $ | — | | | $ | — | | |
First Eagle Overseas Fund | | | — | | | | — | | |
First Eagle U.S. Value Fund | | | — | | | | — | | |
First Eagle Gold Fund | | | — | | | | — | | |
First Eagle Global Income Builder Fund | | | — | | | | — | | |
First Eagle Rising Dividend Fund | | | — | | | | — | | |
First Eagle Small Cap Opportunity Fund | | | — | | | | — | | |
First Eagle U.S. Smid Cap Opportunity Fund | | | 66,048 | | | | 23,726 | | |
First Eagle Global Real Assets Fund | | | 79,922 | | | | 14,859 | | |
First Eagle High Yield Municipal Fund | | | — | | | | — | | |
First Eagle Short Duration High Yield Municipal Fund | | | 6,711 | | | | — | | |
The Funds have entered into a custody agreement with J.P. Morgan Chase Bank, N.A. ("JPM"). The custody agreement provides for an annual fee based on the amount of assets under custody plus transaction charges. JPM serves as custodian of the Funds' portfolio securities and other assets. JPM has directly entered into sub-custodial agreements to maintain the custody of gold and silver bullion in the Funds. Under the terms of the custody agreement between the Funds and JPM, JPM maintains and deposits in separate accounts, cash, securities and other assets of the Funds. JPM is also required, upon the order of the Funds, to deliver securities held by JPM and the sub-custodian, and to make payments for securities purchased by the Funds. JPM has also entered into sub-custodian agreements with a number of foreign banks and clearing agencies, pursuant to which portfolio securities purchased outside the United States are maintained in the custody of these entities.
First Eagle Funds | Annual Report | October 31, 2024
256
Notes to Financial Statements
The Funds have also entered into an agreement for administrative services with JPM, pursuant to which JPM provides certain financial reporting and other administrative services. JPM, as the Funds' administrator, receives annual fees separate from and in addition to the fees it receives for its services as the Funds' custodian.
FEF Distributors, LLC, a wholly owned subsidiary of the Adviser, serves as the Funds' principal underwriter. For the year ended October 31, 2024, FEF Distributors, LLC realized $354,156, $12,491, $15,345, $53,563, $12,628, $4,315, $30,553, $526, $36, $158,302 and $3,433 pertaining to the sales of shares of First Eagle Global Fund, First Eagle Overseas Fund, First Eagle U.S. Value Fund, First Eagle Gold Fund, First Eagle Global Income Builder Fund, First Eagle Rising Dividend Fund, First Eagle Small Cap Opportunity Fund, First Eagle U.S. Smid Cap Opportunity Fund, First Eagle Global Real Assets Fund, First Eagle High Yield Municipal Fund and First Eagle Short Duration High Yield Municipal Fund, respectively. For the year ended October 31, 2024, FEF Distributors, LLC realized $81,077, $5,904, $1,717, $6,699, $3,228, $420 and $4,364 CDSC pertaining to the redemption of shares of First Eagle Global Fund, First Eagle Overseas Fund, First Eagle U.S. Value Fund, First Eagle Gold Fund, First Eagle Global Income Builder Fund, First Eagle Rising Dividend Fund and First Eagle High Yield Municipal Fund, respectively; and the adviser realized $27,846, $4,406, $(90), $1,017, $46,554, $71, $(2,057), $208,673 and $(805) CDSC pertaining to the redemption of shares of First Eagle Global Fund, First Eagle Overseas Fund, First Eagle Gold Fund, First Eagle Global Income Builder Fund, First Eagle Rising Dividend Fund, First Eagle Small Cap Opportunity Fund, First Eagle High Yield Municipal Fund and First Eagle Short Duration High Yield Municipal Fund, respectively.
The Trust adopted a Trustee Deferred Compensation Plan (the "Plan"), which allows the Independent Trustees to defer the receipt of all or a portion of compensation related to performance of their duties as a Trustee. The deferred fees are invested in various First Eagle Funds until distribution in accordance with the Trustee Deferred Compensation Plan. As of October 31, 2024, balances to the Plan are included in the fees payable to the Trustees on the Statements of Assets and Liabilities.
Note 3 — Plans of Distribution
Under the terms of the Distribution Plans and Agreements ("the Plans") with FEF Distributors, LLC (the "Distributor"), pursuant to the provisions of Rule 12b-1 under the 1940 Act, the First Eagle Global Fund, First Eagle Overseas Fund, First Eagle U.S. Value Fund, First Eagle Gold Fund, First Eagle Global Income Builder Fund, First Eagle Rising Dividend Fund, First Eagle Small Cap Opportunity Fund, First Eagle U.S. Smid Cap Opportunity Fund and First Eagle Global Real Assets Fund, First Eagle High Yield Municipal Fund, and First Eagle Short Duration High Yield Municipal Fund pay the Distributor monthly a distribution and/or service fee with respect to Class A, Class C, Class R3 and Class R4 shares based on each Fund's average daily
First Eagle Funds | Annual Report | October 31, 2024
257
Notes to Financial Statements
net assets as shown in the table below. Under the Plans, the Distributor is obligated to use the amounts received under the Plans for, among other things, payments to qualifying dealers for their assistance in the distribution of a Fund's shares and the provision of shareholder services and for other expenses such as advertising costs and the payment for the printing and distribution of prospectuses to prospective investors.
Fund | | Class A | | Class C | | Class R3 | | Class R4 | |
First Eagle Global Fund | | | 0.25 | % | | | 1.00 | % | | | 0.35 | % | | | 0.10 | % | |
First Eagle Overseas Fund | | | 0.25 | % | | | 1.00 | % | | | 0.35 | % | | | 0.10 | % | |
First Eagle U.S. Value Fund | | | 0.25 | % | | | 1.00 | % | | | 0.35 | % | | | 0.10 | % | |
First Eagle Gold Fund | | | 0.25 | % | | | 1.00 | % | | | 0.35 | % | | | 0.10 | % | |
First Eagle Global Income Builder Fund | | | 0.25 | % | | | 1.00 | % | | | 0.35 | % | | | 0.10 | % | |
First Eagle Rising Dividend Fund | | | 0.25 | % | | | 1.00 | % | | | 0.35 | % | | | 0.10 | % | |
First Eagle Small Cap Opportunity Fund | | | 0.25 | % | | | n/a | | | | n/a | | | | n/a | | |
First Eagle U.S. Smid Cap Opportunity Fund | | | 0.25 | % | | | n/a | | | | n/a | | | | n/a | | |
First Eagle Global Real Assets Fund | | | 0.25 | % | | | n/a | | | | n/a | | | | n/a | | |
First Eagle High Yield Municipal Fund | | | 0.25 | % | | | 1.00 | % | | | n/a | | | | n/a | | |
First Eagle Short Duration High Yield Municipal Fund | | | 0.25 | % | | | 1.00 | % | | | n/a | | | | n/a | | |
The Distributor bears distribution costs of a Fund to the extent they exceed payments received under the Plan. For the year ended October 31, 2024, the distribution fees incurred by the Funds are disclosed in the Statements of Operations.
The Service fee covers expenses incurred by the Distributor for providing shareholder liaison services, including assistance with subscriptions, redemptions and other shareholder questions. For the year ended October 31, 2024, the services fees incurred by the Funds are disclosed in the Statements of Operations.
Note 4 — Purchases and Sales of Securities
For the year ended October 31, 2024, purchases and proceeds from sales of investments, excluding short-term securities, were as follows:
Fund | | Purchases
excluding
U.S. Government
Securities | | Sales and
Maturities
excluding
U.S. Government
Securities | | Purchases of
U.S. Government
Securities | | Sales and
Maturities of
U.S. Government
Securities | |
First Eagle Global Fund | | $ | 4,551,484,107 | | | $ | 5,005,085,868 | | | $ | — | | | $ | — | | |
First Eagle Overseas Fund | | | 810,594,679 | | | | 2,083,796,170 | | | | — | | | | — | | |
First Eagle U.S. Value Fund | | | 101,494,134 | | | | 140,973,204 | | | | — | | | | — | | |
First Eagle Gold Fund | | | 1,474,187,539 | | | | 1,418,727,460 | | | | — | | | | — | | |
First Eagle Funds | Annual Report | October 31, 2024
258
Notes to Financial Statements
Fund | | Purchases
excluding
U.S. Government
Securities | | Sales and
Maturities
excluding
U.S. Government
Securities | | Purchases of
U.S. Government
Securities | | Sales and
Maturities of
U.S. Government
Securities | |
First Eagle Global Income
Builder Fund | | $ | 204,167,356 | | | $ | 257,295,590 | | | $ | 41,234,484 | | | $ | 112,992,198 | | |
First Eagle Rising
Dividend Fund | | | 62,028,928 | | | | 88,877,570 | | | | — | | | | — | | |
First Eagle Small Cap
Opportunity Fund | | | 946,055,410 | | | | 768,068,637 | | | | — | | | | — | | |
First Eagle U.S. Smid Cap
Opportunity Fund | | | 20,438,307 | | | | 9,729,056 | | | | — | | | | — | | |
First Eagle Global Real
Assets Fund | | | 6,491,716 | | | | 5,304,145 | | | | — | | | | — | | |
First Eagle High Yield
Municipal Fund | | | 6,697,470,917 | | | | 2,143,539,954 | | | | — | | | | — | | |
First Eagle Short Duration
High Yield Municipal Fund | | | 248,969,624 | | | | 95,958,051 | | | | — | | | | — | | |
Note 5 — Line of Credit
On June 24, 2024, the Funds renewed a $200 million committed, unsecured line of credit ("Credit Facility") with JPM for the First Eagle Funds and First Eagle Variable Funds to be utilized for temporarily financing the purchase or sale of securities for prompt delivery in the ordinary course of business or for temporarily financing the redemption of shares of each Fund at the request of shareholders and other temporary or emergency purposes with a termination date of June 23, 2025. Under the Credit Facility arrangement, each Fund has agreed to pay a per annum rate of interest for borrowings generally based on 1.00% plus the higher of Daily Simple Secured Overnight Financing Rate plus a ten basis point credit spread adjustment, Overnight Bank Funding Rate or Effective Federal Funds Rate and a commitment fee of 0.20% per annum on the unused portion of the Credit Facility. A portion of the commitment fees related to the Credit Facility are paid by the Funds and are included in other expenses in the Statements of Operations. During the period, the Funds had no borrowings under the agreement.
Note 6 — Indemnification and Investment Risk
In the normal course of business, the Funds enter into contracts that contain a variety of representations which provide general indemnifications. Each Fund's maximum exposure under these arrangements is unknown, as this would involve future claims that may be made against each Fund that have not yet occurred.
First Eagle Funds | Annual Report | October 31, 2024
259
Notes to Financial Statements
However, based on experience, the Funds expect the risk of loss to be remote. The Funds may have elements of risk not typically associated with investments in the United States due to their investments in foreign countries or regions. Such foreign investments may subject the Funds to additional risks resulting from political or economic conditions in such countries or regions and the possible imposition of adverse governmental laws or currency exchange restrictions could cause the securities and their markets to be less liquid and their prices to be more volatile than those of comparable U.S. securities. The securities markets in many emerging-market countries are substantially smaller, less developed, less liquid and more volatile than the securities markets of developed countries.
The First Eagle Global Income Builder Fund, First Eagle High Yield Municipal Fund and First Eagle Short Duration High Yield Municipal Fund invest in high yield securities which may be subject to greater levels of interest rate, credit and liquidity risk than investment grade securities. These high yield securities may be considered speculative with respect to the issuer's continuing ability to make principal and interest payments and may be subject to significant price fluctuations.
The Funds are subject to interest rate and credit risk. The value of debt securities may decline as interest rates increase. The Funds could lose money if the issuer of a fixed income security is unable to pay interest or repay principal when it is due. The ability of the issuers of debt to meet their obligations may be affected by the economic and political developments in a specific industry or region.
The Funds enter into derivatives which may represent off-balance sheet risk. Off- balance sheet risk exists when the maximum potential loss on a particular investment is greater than the value of such investment as reflected in the Statements of Assets and Liabilities.
Note 7 — Redemption In-Kind Transactions
The redemption in-kind policy for all of the Funds reserves the right of the Funds to pay redemptions in-kind (i.e., payments in the form of marketable securities or, as needed, other traded assets, rather than cash) if the redemption request is large enough to affect a Fund's operations (for example, if it represents more than $250,000 or 1% of the Fund's assets). When receiving assets distributed in-kind, the recipient will bear applicable commissions or other costs on their sale. There were no redemptions in-kind during the year ended October 31, 2024.
Note 8 — Subsequent Events
The First Eagle Global Income Builder Fund is in the process of establishing a wholly owned subsidiary (First Eagle Global Income Builder Cayman Fund, Ltd.), which will be an exempted company under the laws of the Cayman Islands.
First Eagle Funds | Annual Report | October 31, 2024
260
Report of Independent Registered Public Accounting Firm
To the Board of Trustees of First Eagle Funds and Shareholders of each of the eleven funds listed in the table below
Opinions on the Financial Statements
We have audited the accompanying statements of assets and liabilities, including the schedules of investments, of each of the funds listed in the table below (constituting the First Eagle Funds, hereafter collectively referred to as the "Funds") as of October 31, 2024, the related statements of operations and of changes in net assets for each of the periods indicated in the table below, including the related notes, and the financial highlights for each of the periods indicated therein (collectively referred to as the "financial statements"). In our opinion, the financial statements present fairly, in all material respects, the financial position of each of the Funds as of October 31, 2024, the results of each of their operations and the changes in each of their net assets for the periods indicated in the table below, and each of the financial highlights for each of the periods indicated therein, in conformity with accounting principles generally accepted in the United States of America.
First Eagle Global Fund(1) | | First Eagle Rising Dividend Fund(2) | |
First Eagle Overseas Fund(1) | | First Eagle Small Cap Opportunity Fund(3) | |
First Eagle U.S. Value Fund(1) | | First Eagle U.S. Smid Cap Opportunity Fund(4) | |
First Eagle Gold Fund(1) | | First Eagle Global Real Assets Fund(5) | |
First Eagle Global Income Builder Fund(2)
| | First Eagle High Yield Municipal Fund
(formerly First Eagle High Income Fund)(2) | |
First Eagle Short Duration High Yield Municipal Fund(6) | | | |
(1) Consolidated statement of assets and liabilities, including the consolidated schedule of investments as of October 31, 2024, and the related consolidated statement of operations for the year ended October 31, 2024, consolidated statement of changes in net assets for each of the two years in the period ended October 31, 2024 and the consolidated financial highlights for each of the five years in the period ended October 31, 2024
(2) Statement of assets and liabilities, including the schedule of investments, as of October 31, 2024, and the related statement of operations for the year ended October 31, 2024, statement of changes in net assets for each of the two years in the period ended October 31, 2024, and the financial highlights for each of the five years in the period ended October 31, 2024
(3) Statement of assets and liabilities, including the schedule of investments, as of October 31, 2024, and the related statement of operations for the year ended October 31, 2024, statement of changes in net assets for each of the two years in the period ended October 31, 2024, and the financial highlights for each of the periods indicated therein
(4) Statement of assets and liabilities, including the schedule of investments, as of October 31, 2024, and the related statement of operations for the year ended October 31, 2024, statement of changes in net assets for each of the two years in the period ended October 31, 2024, and the financial highlights for each of the two years in the period ended October 31, 2024 and for the period August 15, 2022 (inception date) through October 31, 2022
(5) Consolidated statement of assets and liabilities, including the consolidated schedule of investments, as of October 31, 2024, and the related consolidated statement of operations for the year ended October 31, 2024, consolidated statement of changes in net assets for each of the two years in the period ended October 31, 2024, and the financial highlights for each of the two years in the period ended October 31, 2024 and for the period November 30, 2021 (inception date) through October 31, 2022
(6) Statement of assets and liabilities, including the schedule of investments, as of October 31, 2024, and the related statement of operations, statement of changes in net assets and the financial highlights for the period January 2, 2024 (inception date) through October 31, 2024
First Eagle Funds | Annual Report | October 31, 2024
261
Report of Independent Registered Public Accounting Firm
Basis for Opinions
These financial statements are the responsibility of the Funds' management. Our responsibility is to express an opinion on the Funds' financial statements based on our audits. We are a public accounting firm registered with the Public Company Accounting Oversight Board (United States) (PCAOB) and are required to be independent with respect to the Funds in accordance with the U.S. federal securities laws and the applicable rules and regulations of the Securities and Exchange Commission and the PCAOB.
We conducted our audits of these financial statements in accordance with the standards of the PCAOB. Those standards require that we plan and perform the audit to obtain reasonable assurance about whether the financial statements are free of material misstatement, whether due to error or fraud.
Our audits included performing procedures to assess the risks of material misstatement of the financial statements, whether due to error or fraud, and performing procedures that respond to those risks. Such procedures included examining, on a test basis, evidence regarding the amounts and disclosures in the financial statements. Our audits also included evaluating the accounting principles used and significant estimates made by management, as well as evaluating the overall presentation of the financial statements. Our procedures included confirmation of securities owned as of October 31, 2024 by correspondence with the custodian, agent banks and brokers; when replies were not received from brokers, we performed other auditing procedures. We believe that our audits provide a reasonable basis for our opinions.
/s/PricewaterhouseCoopers LLP
New York, New York
December 26, 2024
We have served as the auditor of one or more investment companies advised by First Eagle Investment Management, LLC since 2006.
First Eagle Funds | Annual Report | October 31, 2024
262
Item 8 Changes In and Disagreements with Accountants For the period covered by this report
Not applicable.
Item 9 Proxy Disclosures For the period covered by this report
Not applicable.
Item 10 Remuneration Paid to Directors, Officers and Others For the period covered by this report
Refer to the financial statements included herein.
Item 11 Statement Regarding Basis for Approval of Investment Advisory Contract
At a meeting held on June 5-6, 2024, the Board of Trustees of the Funds, including a majority of the independent trustees (the "Independent Trustees"), approved the continuation of the Funds' advisory agreements (the "Advisory Agreements"). The Advisory Agreement for First Eagle Short Duration High Yield Municipal Fund was reviewed but no action was required as the agreement was still within its initial two-year term.
In response to a letter sent to the Adviser on behalf of the Independent Trustees requesting information about the Advisory Agreements and other arrangements and plans, the Trustees received extensive materials from the Adviser, including reviews of performance and expense information compared against the Funds' respective composites, benchmarks and peer groups compiled by an independent data provider. The Trustees also had the benefit of receiving presentations from and holding discussions with management throughout the year.
Prior to approving the continuation of the Advisory Agreements, the Independent Trustees met in executive sessions with their independent counsel to discuss management's responses to their information request and reviewed their legal and fiduciary obligations and the factors relating to their evaluation and approval. In their deliberations, Trustees attributed different weights to the various factors, and no factor alone was considered dispositive. At the conclusion of their review, the Trustees determined that the advisory fees were fair and reasonable under the circumstances and within the range of what could be negotiated at arm's length, and that the continuance of the Advisory Agreements should serve the best interests of each Fund and its shareholders. The Trustees considered the following topics in reaching their conclusion to continue the Advisory Agreements:
Nature, Quality, and Extent of Services Provided by Adviser
• The Trustees reviewed the services provided by the Adviser to the Funds. The Adviser provides the Funds with investment research, advice and supervision, and continuously furnishes an investment portfolio for each Fund consistent with the Fund's investment objectives, policies and restrictions as set forth in each Fund's Prospectus. The Trustees were assured that service levels for the Funds subject to fee waivers, breakpoints or fee reductions are not affected by the terms of the applicable fee waiver, breakpoint or fee reduction.
First Eagle Funds | Annual Report | October 31, 2024
263
• The Trustees reviewed each Fund's generally long-standing historical relationship with the Adviser and the institutional resources available to the Funds under that relationship. The Trustees, in their deliberations, recognized that, for many of the Funds' shareholders, the decision to purchase Fund shares included a decision to select the Adviser as the investment adviser and that there is a strong association in the minds of Fund shareholders between the Adviser and each of the Funds.
• The Trustees commented on the background and experience of the Funds' Portfolio Managers and the quality of the Trustees' frequent meetings with them both individually and as a group throughout the year and in prior periods. The Trustees also appreciated new product development as a further indication of investment in the Adviser's capabilities. The Trustees noted, based on reports by senior management, that the Adviser's ownership group continues to be strongly supportive of the business and is engaged in appropriate and thoughtful strategic planning for the future.
Investment Performance of Fund and Adviser
• The Trustees reviewed the performance of each Fund on both an absolute and a relative basis over 1-year, 3-year, 5-year and 10-year periods (where applicable, with no performance presented for the Short Duration High Yield Municipal Fund given it is recently formed, has very limited performance to review and does not have an advisory contract subject to review at this time).
• The Trustees noted that the Rising Dividend Fund changed management teams and its investment objective as of August 1, 2020, and changed its strategy as of August 1, 2020 and March 1, 2023, and that performance for prior periods was under the prior management team and prior objective and strategy.
• The Trustees also noted that the High Yield Municipal Fund changed management teams, investment objective and strategy as of December 27, 2023, and that performance for prior periods was under the prior management team and prior objective and strategy.
• Performance over these various periods was noted relative to the Funds' respective benchmarks, to the performance of peer mutual funds and to Morningstar and Lipper Category Averages (the category averages being referred to as "composites"). The comparative review reflected research and benchmarking by an independent data provider, with periods of outperformance and lagging performance generally as follows (all periods ended as of March 31, 2024):
| | Composite #1 | | Composite #2 | | Peer Group | | Benchmark | |
Global Fund | | Outperformed over all periods shown | | Outperformed over trailing 3-, 5- and 10-year periods
Lagged over trailing 1-year period | | Matched over trailing 1-year period
Outperformed all other periods shown | | Lagged all periods shown | |
First Eagle Funds | Annual Report | October 31, 2024
264
| | | Composite #1 | | Composite #2 | | Peer Group | | Benchmark | |
Overseas Fund | | Lagged all periods shown | | Outperformed over trailing 10-year period
Lagged all other periods shown | | Outperformed over trailing 3-year period
Lagged all other periods shown | | Lagged all periods shown | |
U.S. Value Fund | | Outperformed over all periods shown | | Outperformed over trailing 3-year period
Lagged all other periods shown | | Outperformed over trailing 3-year period
Lagged all other periods shown | | Lagged all periods shown | |
Gold Fund | | Outperformed over all periods shown | | Outperformed over trailing 3-, 5- and 10-year periods
Lagged over trailing 1-year period | | Outperformed over trailing 3-, 5- and 10-year periods
Lagged over trailing 1-year period | | Outperformed over all periods shown | |
Global Income Builder Fund | | Outperformed over trailing 3-, 5- and 10-year periods
Lagged over trailing 1-year period | | Outperformed over trailing 3-year period
Lagged all other periods shown | | Outperformed over trailing 3- and 5-year periods
Lagged all other periods shown | | Outperformed over trailing 3-year period
Lagged all other periods shown | |
High Yield Municipal Fund | | Outperformed over all periods shown | | Lagged over trailing 10-year period
Outperformed all other periods shown | | Lagged over trailing 10-year period
Outperformed all other periods shown | | Lagged over trailing 10-year period
Outperformed all other periods shown | |
Rising Dividend Fund | | Lagged all periods shown | | Outperformed over trailing 1-year period
Lagged all other periods shown | | Outperformed over trailing 1-year period
Lagged all other periods shown | | Lagged all periods shown | |
Small Cap Opportunity Fund | | Lagged over trailing 1-year period | | Lagged over trailing 1-year period | | Lagged over trailing 1-year period | | Lagged over trailing 1-year period | |
Global Real Assets Fund | | Lagged over trailing 1-year period | | Outperformed over trailing 1-year period | | Outperformed over trailing 1-year period | | Lagged over trailing 1-year period | |
Smid Cap Opportunity Fund | | Outperformed over trailing 1-year period | | Outperformed over trailing 1-year period | | Outperformed over trailing 1-year period | | Outperformed over trailing 1-year period | |
• For Funds with comparatively lagging performance over longer periods, the Trustees noted that, while comparative performance review showed lagging performance relative to comparison groups and benchmarks, there have been periods of outperformance by these and other metrics in prior years. Performance for each Fund was determined to be adequate as compared to their respective benchmarks, peer comparisons and on an absolute basis, and reflective of each Fund's investment objective and philosophy.
• Memoranda provided to the Trustees with management commentary on performance was discussed. This included supplemental information showing downside risk analysis intended to support management's view that an emphasis on managing downside risk is an important consideration in assessing the performance of a number of the Funds. Certain of these Funds showed stronger downside risk protection relative to peers while others did not.
First Eagle Funds | Annual Report | October 31, 2024
265
• The Trustees commented, for the Global Value Funds, on holdings of short-term investments and, in some cases, gold positions, and noted that short-term investments and gold are important elements of the First Eagle Global Value team's investment philosophy and typically represent differentiating factors from peers for those Funds.
Costs of Services To Be Provided and Profits To Be Realized by Adviser and its Affiliates From Relationship with Funds; Economies of Scale; Fall-Out Benefits
• The Trustees reviewed the total compensation received by the Adviser and the Funds' total costs for using the Adviser's services, taking into account expenses incurred by the Adviser that are passed through to the Funds (notably under the administrative cost reimbursement program). They concluded that this compensation was commensurate with the nature, extent, and quality of the services provided and therefore fair and reasonable under the circumstances, and referred to their prior discussion on the performance of each Fund, including a review of performance against each Fund's respective composites, benchmark and peer group. As part of their analysis, the Trustees considered fees charged by investment advisers to peer mutual funds for services comparable to those provided by the Adviser and referred to an independent data provider fee report, together with a management summary of the same. They determined that the Adviser's fees were competitive, with the net management fees for some Funds being higher and for some Funds being lower than their peer averages/medians, but all being within the range of peers. The Trustees also considered, where applicable and available, the advisory fees charged to other clients of the Adviser with similar investment objective(s) to a Fund and received information that for some Funds, the fees charged to these other clients were higher or lower relative to the respective Fund. The Trustees were apprised that for some of the Adviser's other accounts, there were operational differences and the Adviser provided different categories of services compared to the Funds (e.g., regulatory and operational structures may differ, frequency and scale of cash flows may differ, etc.), which has resulted in lower fees charged relative to certain Funds.
• Memoranda provided to the Trustees with management commentary on fees and expenses was discussed.
• While analyzing the effects of direct and indirect compensation to the Adviser and its affiliates (sometimes referred to as "fall-out benefits"), the Trustees considered the absence of affiliated broker-dealer relationships and the effects of the administrative service fees and reimbursements paid to the Adviser. The Trustees noted that the Adviser is currently absorbing soft dollar costs and paying them itself. With regard to other possible benefits associated with the Adviser's management of the Funds, the Trustees noted, among other things, that the Distributor is generally able to retain revenue associated with Rule 12b-1 fees on the relatively limited amount of shareholders it services
First Eagle Funds | Annual Report | October 31, 2024
266
directly and that the Adviser may be able to extend investment and operational efficiencies associated with the Funds to its management of other types of accounts.
• The Trustees reviewed the Funds' expense ratios, which were deemed reasonable both on an absolute basis and in comparison to peer funds. The Trustees noted changes in the Funds' expense ratios over time, with some Funds showing decreases and some showing increases. In general, a contributing factor to the change in the Funds' expense ratios was an increase or decrease in the respective Fund's average net assets over the relevant period. In the case of each of High Yield Municipal Fund, Small Cap Opportunity Fund, Smid Cap Opportunity Fund, Rising Dividend Fund and Global Real Assets Fund, the Trustees considered that the Adviser contractually agreed to cover certain expenses through expense limitation agreements. The Trustees also considered the effect of Fund asset size on particular categories of expenses, both currently and relative to prior periods. The Trustees noted the impact on the Funds' expense ratios resulting from the administrative fees or reimbursements paid to or charged by the Adviser, as the case may be. While economies of scale can be complex to assess and typically are not directly measurable, the Trustees noted that the Adviser may be able to employ economies of scale in certain areas relating to the management of the Funds, potentially including investment management, trading, compliance and back-office operations. In the case of the administrative expense reimbursements, which is the method by which the majority of the Funds "pay" for administrative services performed by the Adviser, because they represent the provision of services at cost, any economies of scale realized are, by definition, for the benefit of the Funds.
• The Trustees reviewed the Adviser's financial condition and profitability. Profits to the Adviser vary meaningfully depending on the particular Fund, with some Funds showing losses to the Adviser and others showing profits. Overall, profits were viewed as not excessive and providing appropriate incentives to the Adviser. The Trustees noted the cyclical and competitive nature of the global asset management industry and the related importance of profitability (when considered across the business) in maintaining the Adviser's culture and management continuity. The Trustees also noted that the Adviser has always shown the willingness to commit resources to support investment in the business and to maintain the generally high quality of the overall shareholder experience in the Funds, such as attracting and retaining qualified personnel and investing in technology. Levels of support are not dependent on or reflective of the profits realized on a per-Fund basis. The Trustees reviewed personal investments maintained in the Funds by certain portfolio managers (with those investments being both direct and "notional" under the Adviser's compensation plans), which was viewed as evidence of commitment to the Funds by key personnel.
First Eagle Funds | Annual Report | October 31, 2024
267
Form N-PORT portfolio schedule
The Funds file their complete schedule of portfolio holdings with the Securities and Exchange Commission ("SEC") for the first and third quarters of each fiscal year as an exhibit to its reports on Form N-PORT. The Funds' Form N-PORT is available on the SEC's Web site at www.sec.gov. Additionally, you may obtain copies of Form N-PORT from the Fund upon request by calling 1.800.334.2143.
Proxy voting policies, procedures and record
You may obtain (1) a description of the Funds' proxy voting policies, (2) a description of the Funds' proxy voting procedures and (3) information regarding how the Funds voted any proxies related to portfolio securities during the most recent twelve-month period ended June 30 for which an SEC filing has been made, without charge, upon request by contacting the Funds directly at 1.800.334.2143 or on the EDGAR Database on the SEC's Web site at www.sec.gov.
First Eagle Funds | Annual Report | October 31, 2024
268
Fiscal Year Ended October 31, 2024 (unaudited)
Each Fund designates at the following amounts (or the maximum amount allowable) distributed during the fiscal year ended October 31, 2024, if any, as dividends exempt from federal income tax, capital gain dividends, dividends eligible for the corporate dividends received deduction and/or qualified dividend income:
| | % of Qualifying
Dividend
Income | | % of Dividends
Eligible for
the Dividends
Received
Deduction | | Tax-Exempt
Income | | Long-Term
Capital Gains | | Long-Term
Capital
Gains
28% | |
First Eagle Global Fund | | | 93.75 | % | | | 41.36 | % | | $ | — | | | $ | 1,127,173,521 | | | $ | — | | |
First Eagle Overseas Fund | | | 84.40 | % | | | 1.72 | % | | | — | | | | 59,384,628 | | | | 493,395 | | |
First Eagle U.S. Value Fund | | | 95.80 | % | | | 87.72 | % | | | — | | | | 63,679,067 | | | | — | | |
First Eagle Gold Fund | | | 87.26 | % | | | 37.54 | % | | | — | | | | — | | | | — | | |
First Eagle Global Income Builder Fund | | | 73.42 | % | | | 22.75 | % | | | — | | | | — | | | | — | | |
First Eagle Rising Dividend Fund | | | 100.00 | % | | | 89.76 | % | | | — | | | | 25,786,460 | | | | — | | |
First Eagle Small Cap Opportunity Fund | | | 89.33 | % | | | 84.72 | % | | | — | | | | — | | | | — | | |
First Eagle U.S. Smid Cap Opportunity Fund | | | 100.00 | % | | | 100.00 | % | | | — | | | | — | | | | — | | |
First Eagle Global Real Assets Fund | | | 79.33 | % | | | 32.72 | % | | | — | | | | — | | | | — | | |
First Eagle High Yield Municipal Fund | | | 0.00 | % | | | 0.00 | % | | | 66,148,989 | | | | — | | | | — | | |
First Eagle Short Duration High Yield
Municipal Fund | | | 0.00 | % | | | 0.00 | % | | | 1,650,374 | | | | — | | | | — | | |
First Eagle Overseas Fund paid foreign taxes of $26,506,634 and recognized Section 853 foreign source income of $536,039,639. Pursuant to Section 853 of the Internal Revenue Code, the First Eagle Overseas Fund designates such amount (or the maximum amount allowable) as having been paid in connection with dividends distributed from investment company taxable income during the fiscal year ended October 31, 2024.
First Eagle Gold Fund paid foreign taxes of $4,786,042 and recognized Section 853 foreign source income of $112,310,515. Pursuant to Section 853 of the Internal Revenue Code, the First Eagle Gold Fund designates such amount (or the maximum amount allowable) as having been paid in connection with dividends distributed from investment company taxable income during the fiscal year ended October 31, 2024.
First Eagle Funds | Annual Report | October 31, 2024
269
The Trust is providing you with this privacy notice to inform you of how we process your personal information. If the Trust changes its information practices, we will provide you with notice of any material changes. This privacy policy supersedes any of our previous policies relating to the information you disclose to us.
FACTS | |
WHAT DOES THE TRUST DO WITH YOUR PERSONAL INFORMATION? | |
Why? | | Financial companies choose how they share your personal information. Federal law gives consumers the right to limit some but not all sharing. Federal law also requires us to tell you how we collect, share, and protect your personal information. Please read this notice carefully to understand what we do. | |
What? | | The types of personal information we collect and share depend on the product or service you have with us. This information can include:
◼ Social Security number, income, and assets
◼ account balances, payment history, and account activity
◼ credit history and credit scores
◼ name, address, telephone number, occupation
◼ online information, such as your IP address and data gathered from your browsing activity and location
◼ information we encounter in public records in the ordinary course of business | |
How? | | All financial companies need to share customers' personal information to run their everyday business. In the section below, we list the reasons financial companies can share their customers' personal information; the reasons the Trust chooses to share; and whether you can limit this sharing. | |
First Eagle Funds | Annual Report | October 31, 2024
270
Reasons we can share your personal information | | Does the Trust share? | | Can you limit this sharing? | |
For our everyday business purposes—
such as to process your transactions, maintain your account(s), respond to court orders and legal investigations, or report to credit bureaus | | Yes | | No | |
For our marketing purposes—
to offer our products and services to you | | Yes | | Yes | |
For joint marketing with other financial companies | | No | | N/A | |
For our affiliates' everyday business
purposes—
information about your transactions and experiences | | Yes | | No | |
For our affiliates' everyday business
purposes—
information about your creditworthiness | | Yes | | Yes | |
For our affiliates to market to you | | Yes | | Yes | |
For nonaffiliates to market to you | | No | | N/A | |
To limit our sharing | | ◼ Call 800.334.2143 and indicate your desire to limit our sharing
◼ Visit us online: www.firsteagle.com/individuals-home or
◼ Mail the form below
Please note:
If you are a new customer, we can begin sharing your information 30 days from the date we sent this notice. When you are no longer our customer, we continue to share your information as described in this notice.
However, you can contact us at any time to limit our sharing. | |
Questions? | | Call 800.334.2143 or go to www.firsteagle.com/individuals-home | |
First Eagle Funds | Annual Report | October 31, 2024
271
#
Mail-in Form
If you have a joint account, your choice(s) will apply to everyone on your account unless you mark below.
❑ Apply my choices only to me | | Mark any/all you want to limit:
❑ Do not share information about my creditworthiness with your affiliates for their everyday business purposes.
❑ Do not allow your affiliates to use my personal information to market to me.
❑ Do not share my personal information with nonaffiliates to market their products and services to me.
Name
Address
City, State, Zip
Account #
Mail to:
First Eagle Funds
P.O. Box 219324
Kansas City, MO
64121-9324
| |
#
What we do
How does the Trust protect my personal information? | | We maintain physical, electronic and procedural safeguards that comply with federal standards to guard consumer information. We permit only authorized individuals, who are trained in the proper handling of individual shareholder information and need to access this information to do their job, to have access to this information. | |
How does the Trust collect my personal information? | | We collect your personal information, for example, when you
◼ open an account, make transactions using your account, or deposit money
◼ subscribe to receive information, submit an application, or otherwise submit a form containing personal information
◼ use our services online
We also collect your personal information from others, such as credit bureaus, affiliates, or other companies. | |
First Eagle Funds | Annual Report | October 31, 2024
272
Why can't I limit all sharing? | | Federal law gives you the right to limit only
◼ sharing for affiliates' everyday business purposes — information about your creditworthiness
◼ affiliates from using your information to market to you
◼ sharing for nonaffiliates to market to you
State laws and individual companies may give you additional rights to limit sharing. | |
What happens when I limit sharing for an account I hold jointly with someone else? | | Your choices will apply to everyone on your account. | |
Definitions
Affiliates | | Companies related by common ownership or control. They can be financial and nonfinancial companies.
◼ Affiliated companies include First Eagle Investments; First Eagle Holdings, Inc.; First Eagle Investment Management, LLC; FEF Distributors, LLC; First Eagle Separate Account Management, LLC; First Eagle Alternative Credit, LLC; Napier Park Global Capital Ltd; Napier Park Global Capital GmbH, Napier Park Global Capital (US) LP; First Eagle Investment Management Ltd; First Eagle Investment Management GmbH; First Eagle Funds (Ireland) ICAV; First Eagle Amundi Sub-Funds (Luxembourg) SICAV; First Eagle Overseas Variable Fund, a portfolio of First Eagle Variable Funds, an open-end investment management company; First Eagle Credit Opportunities Fund, a closed-end interval fund; First Eagle Private Credit Fund, a business development company; First Eagle Global Equity ETF (FEGE) and First Eagle Overseas Equity ETF (FEOE)., exchange traded funds; and any other First Eagle Funds and any sub-funds, as applicable. | |
First Eagle Funds | Annual Report | October 31, 2024
273
Nonaffiliates | | Companies not related by common ownership or control. They can be financial and nonfinancial companies.
◼ Nonaffiliated third parties may include service providers such as the Trust's distributors, registrar and transfer agent for shareholder transactions, other parties providing individual shareholder servicing, accounting and recordkeeping services, attorneys, accountants, and auditors. | |
Data Subject Rights
Individuals in some jurisdictions may have certain data subject rights. These rights vary, but they may include the right for individuals to: (i) request access to and rectification or erasure of their personal data; (ii) restrict or object to the processing of their personal data; and (iii) obtain a copy of their personal data in a portable format. Individuals may also have the right to lodge a complaint about the processing of personal data with a data protection authority. If you have any questions about exercising these rights call 800.334.2143 or go to www.firsteagle.com/individuals-home.
Special Notice for Residents of California
First Eagle does not sell non-public personal information or share non-public personal information for cross-context behavioral advertising. We will not share information we collect about you with nonaffiliates, except as permitted by California law and described above. While the law provides California residents with data rights in some circumstances, the state protections do not apply to personal information collected about current or former investors whose information is protected by federal financial privacy law under the Gramm Leach Bliley Act and the SEC's Reg S-P.
First Eagle Funds | Annual Report | October 31, 2024
274
Other important information
Sharing of Personal Information with Nonaffiliated Third Parties
We will only share your personal information collected, as described above, with nonaffiliated third parties:
• At your request;
• When you authorize us to process or service a transaction or product (nonaffiliated third parties in this instance may include service providers such as the Trust's distributors, registrar and transfer agent for shareholder transactions, and other parties providing individual shareholder servicing, accounting and recordkeeping services);
• With companies that perform sales and marketing services on our behalf with whom we have agreements to protect the confidentiality of your information and to use the information only for the purposes for which we disclose the information to them; or
• When required by law to disclose such information to appropriate authorities.
We do not otherwise provide information about you to outside firms, organizations or individuals except as permitted by law.
What We do with Personal Information about Our Former Customers
If you decide to discontinue doing business with us, the Trust will continue to adhere to this privacy policy with respect to the information we have in our possession about you and your account following the termination of our shareholder relationship.
First Eagle Funds | Annual Report | October 31, 2024
275
Trustees
Lisa Anderson
John P. Arnhold
Candace K. Beinecke (Chair)
Peter Davidson
Jean D. Hamilton
William M. Kelly
Paul J. Lawler
Mehdi Mahmud
Mandakini Puri
Trustee Emeritus
Jean-Marie Eveillard*
Officers
Mehdi Mahmud
President
Robert Bruno
Senior Vice President
Brandon Webster
Chief Financial Officer
Seth Gelman
Chief Compliance Officer
David O'Connor
General Counsel
Sheelyn Michael
Secretary & Deputy General Counsel
Michael Luzzatto
Vice President
Shuang Wu
Treasurer
Investment Adviser
First Eagle Investment Management, LLC
1345 Avenue of the Americas
New York, NY 10105
Legal Counsel
Sidley Austin LLP
787 Seventh Avenue
New York, NY 10019
Custodian
JPMorgan Chase Bank, N.A.
4 Chase Metrotech Center, Floor 16,
Brooklyn, NY 11245
Shareholder Servicing Agent
SS&C GIDS, Inc.
801 Pennsylvania Avenue, Suite 219324
Kansas City, MO 64105
800.334.2143
Underwriter
FEF Distributors, LLC
1345 Avenue of the Americas
New York, NY 10105
Independent Registered Public
Accounting Firm
PricewaterhouseCoopers LLP
300 Madison Avenue
New York, NY 10017
Additional information about the Trustees and Officers is included in the Funds' Statement of Additional Information.
* Mr. Eveillard is a former member of the Board of Trustees and is invited to attend all Board meetings. He is not a Trustee for purposes of the Trust's Declaration of Trust, Delaware law or the Investment Company Act.
This report is not authorized for distribution to prospective investors unless preceded or accompanied by a currently effective prospectus of First Eagle Funds.
First Eagle Funds | Annual Report | October 31, 2024
276

First Eagle Funds are offered by FEF Distributors, LLC,
1345 Avenue of the Americas, New York, NY 10105.
First Eagle Investment Management, LLC
1345 Avenue of the Americas, New York, NY 10105-0048
800.334.2143 www.firsteagle.com
Item 8. Changes in and Disagreements with Accountants for Open-End Management Investment Companies.
Not applicable.
Item 9. Proxy Disclosures for Open-End Management Investment Companies.
Not applicable.
Item 10. Remuneration Paid to Directors, Officers, and Others of Open-End Management Investment Companies.
Please see Renumeration Paid included under Item 7 of this Form N-CSR.
Item 11. Statement Regarding Basis for Approval of Investment Advisory Contract.
Please see Approval of Investment Advisory Contract included under Item 7 of this Form N-CSR.
Item 12. Disclosure of Proxy Voting Policies and Procedures for Closed-End Management Investment Companies.
Not applicable.
Item 13. Portfolio Managers of Closed-End Management Investment Companies.
Not applicable.
Item 14. Purchases of Equity Securities by Closed-End Management Investment Company and Affiliated Purchasers.
Not applicable.
Item 15. Submission of Matters to a Vote of Security Holders.
No material change to report at this time.
Item 16. Controls and Procedures.
| (a) | In the opinion of the principal executive officer and principal financial officer, based on their evaluation, the registrant's disclosure controls and procedures are adequately designed and are operating effectively to ensure (i) that material information relating to the registrant, including its consolidated subsidiaries, is made known to them by others within those entities, particularly during the period in which this report is being prepared; and (ii) that information required to be disclosed by the registrant on Form N-CSR is recorded, processed, summarized and reported within the time periods specified in the Securities and Exchange Commission's rules and forms. |
| | | |
| | (b) | There were no changes in the registrant's internal control over financial reporting that occurred during the period covered by this report that have materially affected, or are reasonably likely to materially affect, the registrant's internal control over financial reporting. |
Item 17. Disclosure of Securities Lending Activities for Closed-End Management Investment Companies.
Not applicable.
Item 18. Recovery of Erroneously Awarded Compensation.
Not applicable.
Item 19. Exhibits.
(a)(1) Code of ethics required to be disclosed under Item 2 of Form N-CSR.
(a)(2) Not Applicalbe
(a)(3) Certifications pursuant to Rule 30a-2(a) under the Investment Company Act of 1940 (17 CFR 270.30a-2(a)): Attached hereto.
(b) Certification pursuant to Rule 30a-2(b) under the Investment Company Act of 1940 (17 CFR 270.30a-2(b)): Attached hereto.
SIGNATURES
Pursuant to the requirements of the Securities Exchange Act of 1934 and the Investment Company Act of 1940, the registrant has duly caused this report to be signed on its behalf by the undersigned, thereunto duly authorized.
| (Registrant) | | First Eagle Funds |
| | | |
| By (Signature and Title)* | | /s/ Mehdi Mahmud |
| | | Mehdi Mahmud, President |
| | | |
| Date January 2, 2025 | | |
Pursuant to the requirements of the Securities Exchange Act of 1934 and the Investment Company Act of 1940, this report has been signed below by the following persons on behalf of the registrant and in the capacities and on the dates indicated.
| By (Signature and Title)* | | /s/ Mehdi Mahmud |
| | | Mehdi Mahmud, President |
| | | |
| Date January 2, 2025 | | |
| | | |
| By (Signature and Title)* | | /s/ Brandon Webster |
| | | Brandon Webster, Principal Financial Officer |
| | | |
| Date January 2, 2025 | | |
*Print the name and title of each signing officer under his or her signature.