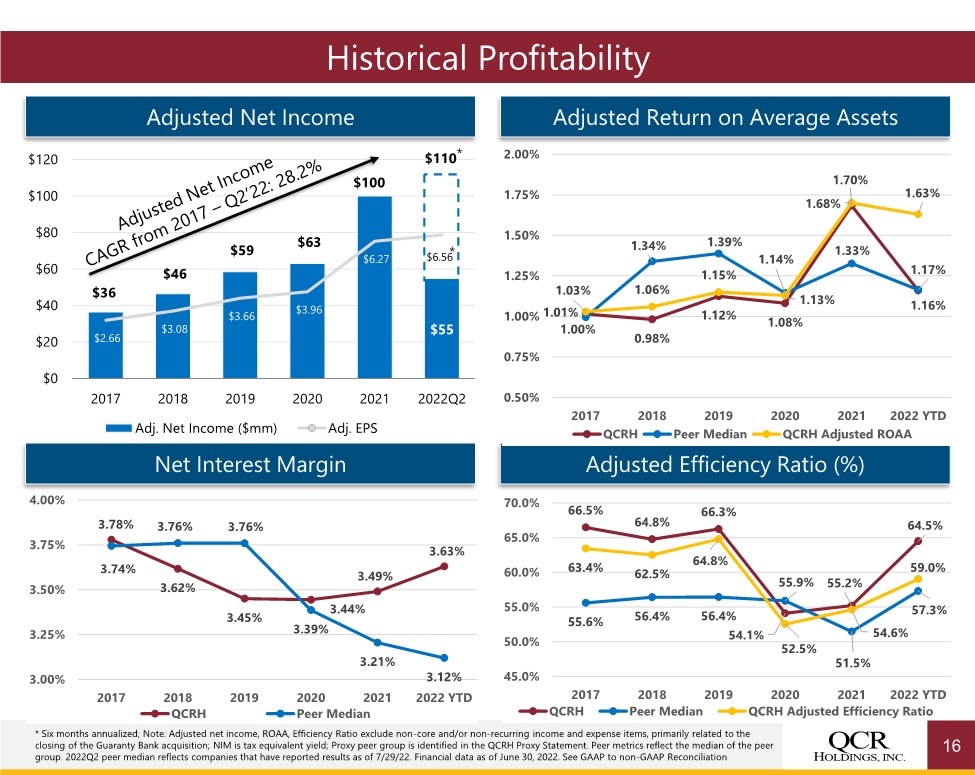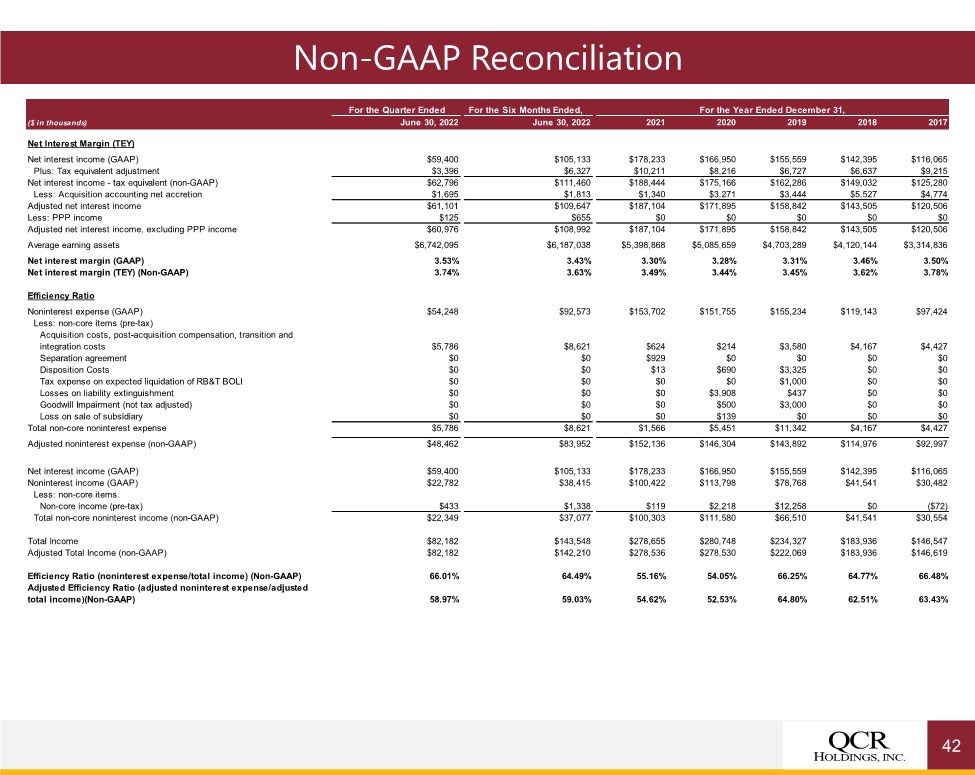
| Non-GAAP Reconciliation 42 For the Quarter Ended For the Six Months Ended, For the Year Ended December 31, ($ in thousands) June 30, 2022 June 30, 2022 2021 2020 2019 2018 2017 Net Interest Margin (TEY) Net interest income (GAAP) $59,400 $105,133 $178,233 $166,950 $155,559 $142,395 $116,065 Plus: Tax equivalent adjustment $3,396 $6,327 $10,211 $8,216 $6,727 $6,637 $9,215 Net interest income - tax equivalent (non-GAAP) $62,796 $111,460 $188,444 $175,166 $162,286 $149,032 $125,280 Less: Acquisition accounting net accretion $1,695 $1,813 $1,340 $3,271 $3,444 $5,527 $4,774 Adjusted net interest income $61,101 $109,647 $187,104 $171,895 $158,842 $143,505 $120,506 Less: PPP income $125 $655 $0 $0 $0 $0 $0 Adjusted net interest income, excluding PPP income $60,976 $108,992 $187,104 $171,895 $158,842 $143,505 $120,506 Average earning assets $6,742,095 $6,187,038 $5,398,868 $5,085,659 $4,703,289 $4,120,144 $3,314,836 Net interest margin (GAAP) 3.53% 3.43% 3.30% 3.28% 3.31% 3.46% 3.50% Net interest margin (TEY) (Non-GAAP) 3.74% 3.63% 3.49% 3.44% 3.45% 3.62% 3.78% Efficiency Ratio Noninterest expense (GAAP) $54,248 $92,573 $153,702 $151,755 $155,234 $119,143 $97,424 Less: non-core items (pre-tax) $5,786 $8,621 $624 $214 $3,580 $4,167 $4,427 Separation agreement $0 $0 $929 $0 $0 $0 $0 Disposition Costs $0 $0 $13 $690 $3,325 $0 $0 Tax expense on expected liquidation of RB&T BOLI $0 $0 $0 $0 $1,000 $0 $0 Losses on liability extinguishment $0 $0 $0 $3,908 $437 $0 $0 Goodwill Impairment (not tax adjusted) $0 $0 $0 $500 $3,000 $0 $0 Loss on sale of subsidiary $0 $0 $0 $139 $0 $0 $0 Total non-core noninterest expense $5,786 $8,621 $1,566 $5,451 $11,342 $4,167 $4,427 Adjusted noninterest expense (non-GAAP) $48,462 $83,952 $152,136 $146,304 $143,892 $114,976 $92,997 Net interest income (GAAP) $59,400 $105,133 $178,233 $166,950 $155,559 $142,395 $116,065 Noninterest income (GAAP) $22,782 $38,415 $100,422 $113,798 $78,768 $41,541 $30,482 Less: non-core items Non-core income (pre-tax) $433 $1,338 $119 $2,218 $12,258 $0 ($72) Total non-core noninterest income (non-GAAP) $22,349 $37,077 $100,303 $111,580 $66,510 $41,541 $30,554 Total Income $82,182 $143,548 $278,655 $280,748 $234,327 $183,936 $146,547 Adjusted Total Income (non-GAAP) $82,182 $142,210 $278,536 $278,530 $222,069 $183,936 $146,619 Efficiency Ratio (noninterest expense/total income) (Non-GAAP) 66.01% 64.49% 55.16% 54.05% 66.25% 64.77% 66.48% 58.97% 59.03% 54.62% 52.53% 64.80% 62.51% 63.43% Acquisition costs, post-acquisition compensation, transition and integration costs Adjusted Efficiency Ratio (adjusted noninterest expense/adjusted total income)(Non-GAAP) |