Table of Contents
UNITED STATES
SECURITIES AND EXCHANGE COMMISSION
Washington, D.C. 20549
SCHEDULE 14A
(Rule 14a-101)
SCHEDULE 14A INFORMATION
Proxy Statement Pursuant to Section 14(a) of the
Securities Exchange Act of 1934
Filed by the Registrantx Filed by a Party other than the Registrant¨
Check the appropriate box:
| x | Preliminary Proxy Statement |
| ¨ | Confidential, for Use of the Commission Only (as permitted by Rule 14a-6(e)(2)) |
| ¨ | Definitive Proxy Statement |
| ¨ | Definitive Additional Materials |
| ¨ | Soliciting Material Pursuant to § 240.14a-12 |
BANK BUILDING CORPORATION
(Name of Registrant as Specified In Its Charter)
(Name of Person(s) Filing Proxy Statement, if other than the Registrant)
Payment of Filing Fee (Check the appropriate box):
| ¨ | No fee required. |
| ¨ | $125 per Exchange Act Rules 0-11(c)(1)(ii), 14a-6(i)(1), 14a-6(i)(2) or Item 22(a)(2) of Rule 14A |
| ¨ | Fee computed on table below per Exchange Act Rules 14a-6(i)(4) and 0-11. |
| (1) | Title of each class of securities to which transaction applies: |
| (2) | Aggregate number of securities to which transaction applies: |
| (3) | Per unit price or other underlying value of transaction computed pursuant to Exchange Act Rule 0-11 (set forth the amount on which the filing fee is calculated and state how it was determined): |
| (4) | Proposed maximum aggregate value of transaction: |
| (5) | Total Fee Paid: |
| x | Fee paid previously with preliminary materials. |
| ¨ | Check box if any part of the fee is offset as provided by Exchange Act Rule 0-11(a)(2) and identify the filing for which the offsetting fee was paid previously. Identify the previous filing by registration statement number, or the Form or Schedule and the date of its filing. |
| (1) | Amount Previously Paid: |
$316.00
| (2) | Form, Schedule or Registration Statement No.: |
Preliminary Schedule 14A
| (3) | Filing Party: |
Bank Building Corporation
| (4) | Date Filed: |
January 17, 2008
Table of Contents
[BANK BUILDING CORPORATION LETTERHEAD]
[ ], 2008
Dear Stockholders:
The board of directors of Bank Building Corporation is excited to inform you that on January 8, 2008 Bank Building and Carter Bank & Trust entered into a definitive agreement for Carter Bank to acquire Bank Building pursuant to a merger whereby Bank Building will be merged with and into Carter Bank. Carter Bank will be the surviving corporation following the merger. The merger agreement and related plan of merger were unanimously approved by the members of a special committee of the board of directors of Carter Bank present at the meeting and the board of directors of Bank Building.
Pursuant to the merger agreement and related plan of merger, holders of Bank Building common stock will receive 2.255 shares of Carter Bank common stock for each share of Bank Building common stock they hold as of the record date.1
A special meeting of our stockholders will be held on [March 25], 2008, at 1:00 p.m., local time, to vote on a proposal to approve and adopt the merger agreement and the related plan of merger so that the merger can occur. The special meeting of stockholders will be held at the Bank Services of Virginia Operations Center, 320 College Drive, Martinsville, Virginia 24112. Notice of the special meeting is enclosed. This proxy statement gives you detailed information about the special meeting and the merger and includes the merger agreement and the related plan of merger asAnnex A. We encourage you to read the proxy statement, the merger agreement and the related plan of merger carefully.
Your vote is important. We cannot complete the merger unless the holders of two-thirds of the outstanding shares of our common stock on the record date approve and adopt the merger agreement and the related plan of merger.Our board of directors recommends that you vote “FOR” approval and adoption of the merger proposal. The failure of any stockholder to vote on the merger proposal will have the same effect as a vote “AGAINST” the merger. Each of our directors and executive officers has indicated that he or she intends to vote his or her own shares in favor of the merger proposal.
Whether or not you plan to attend the special meeting, please vote your shares promptly by completing, signing and dating the accompanying proxy card and returning it in the enclosed prepaid envelope.
Very truly yours,
Worth Harris Carter, Jr.
Chairman of the Board and President
Neither the Securities and Exchange Commission, the Federal Deposit Insurance Corporation, nor any state securities regulator has approved or disapproved of the Carter Bank common stock to be issued in the merger or determined if this proxy statement/offering circular is accurate or adequate. Any representation to the contrary is a criminal offense. The shares of Carter Bank common stock to be issued in the merger are not savings or deposit accounts or other obligations of any bank or savings association and are not insured by the Federal Deposit Insurance Corporation or any other governmental agency.
This proxy statement/offering circular is dated [ ], 2008 and is first being mailed to stockholders on or about [ ], 2008.
1 | Explanatory Note: The minimum exchange ratio is 2.255 and is subject to upward adjustment pursuant to an appraisal of the real estate assets of Bank Building. The final exchange ratio will be included in this proxy statement prior to mailing to the Bank Building stockholders. |
Table of Contents
[BANK BUILDING CORPORATION, LOGO]
BANK BUILDING CORPORATION
NOTICE OF SPECIAL MEETING OF STOCKHOLDERS
TO BE HELD ON [MARCH 25, 2008]
YOU ARE HEREBY NOTIFIED of and invited to attend a special meeting of stockholders of Bank Building Corporation, a Virginia corporation, to be held at the Bank Services of Virginia Operations Center, 320 College Drive, Martinsville, Virginia 24112, on [March 25], 2008, at 1:00 p.m., local time, for the purpose of considering and voting upon the following:
| 1. | A proposal to approve and adopt the agreement and plan of merger, dated January 8, 2008, between Carter Bank & Trust and Bank Building Corporation, the plan of merger attached to the agreement and plan of merger, and the transactions contemplated thereby. The agreement and plan of merger and the related plan of merger provide that Bank Building Corporation will merge with and into Carter Bank & Trust, a Virginia state-chartered bank, upon the terms and subject to the conditions set forth in the agreement and plan of merger, as more fully described in the accompanying proxy statement/offering circular. (See Proposal I.) |
| 2. | A proposal to adjourn the meeting to a later date or dates, if necessary, to permit further solicitation of proxies in the event there are not sufficient votes at the time of the meeting to approve the matters to be considered by the stockholders at the meeting, as more fully described in the accompanying proxy statement/offering circular. (See Proposal II.) |
Our board of directors has determined that the terms of the merger are fair to and in the best interests of Bank Building Corporation and our stockholders, has approved and adopted the agreement and plan of merger and the related plan of merger, and unanimously recommends that our stockholders vote “FOR” the approval and adoption of the agreement and plan of merger and the related plan of merger.
Our board of directors has fixed the close of business on [ ], 2008 as the record date for determination of our stockholders entitled to receive notice of and to vote at the special meeting. The special meeting may be adjourned or postponed from time to time upon approval of our stockholders without any notice other than by announcement at the special meeting of any adjournment or postponement thereof, and any and all business for which notice is hereby given may be transacted at such adjourned or postponed special meeting.
The affirmative vote of the holders of two-thirds of the outstanding shares of our common stock on the record date is required to approve and adopt the agreement and plan of merger and the related plan of merger. Please complete, date, sign and promptly return the enclosed proxy, which is solicited by your board of directors, in the enclosed envelope, whether or not you expect to attend the special meeting. You may revoke the proxy at any time before its exercise by delivering to us a written notice of revocation, delivering to us a duly executed proxy bearing a later date or by voting in person at the special meeting. Failure to return a properly executed proxy, or to vote at the special meeting, will have the same effect as a vote against the agreement and plan of merger, the plan of merger and the transactions contemplated thereby.
By Order of the Board of Directors
Worth Harris Carter, Jr.
Chairman of the Board and President
[ ], 2008
Table of Contents
| Page | ||||
| 1 | ||||
QUESTIONS AND ANSWERS ABOUT THE MERGER AND THE STOCKHOLDER MEETING | 5 | |||
| 7 | ||||
| 8 | ||||
| 9 | ||||
| 10 | ||||
| 14 | ||||
| 14 | ||||
| 14 | ||||
| 14 | ||||
| 14 | ||||
| 15 | ||||
| 15 | ||||
| 15 | ||||
| 16 | ||||
| 16 | ||||
| 16 | ||||
| 18 | ||||
| 20 | ||||
| 25 | ||||
| 25 | ||||
Manner and Basis of Converting Shares; Procedure; No Fractional Shares; Effect on Certificates | 26 | |||
| 26 | ||||
| 26 | ||||
| 27 | ||||
| 27 | ||||
| 28 | ||||
| 28 | ||||
| 29 | ||||
| 29 | ||||
| 30 | ||||
| 31 | ||||
| 31 | ||||
| 31 | ||||
| 32 | ||||
| 32 | ||||
| 32 | ||||
| 32 | ||||
| 32 | ||||
| 33 | ||||
| 34 | ||||
| 34 | ||||
| 35 | ||||
| 36 | ||||
| 37 | ||||
| 38 | ||||
| 38 | ||||
| 39 | ||||
| 40 | ||||
Tax Consequences of the Merger to Bank Building Stockholders | 41 | |||
| 42 | ||||
| 42 | ||||
| 45 | ||||
PRO FORMA UNAUDITED COMBINED CONSOLIDATED FINANCIAL INFORMATION | 48 | |||
| 50 | ||||
| 51 | ||||
| 55 | ||||
| 55 | ||||
| 55 | ||||
| 55 | ||||
| 55 | ||||
FINANCIAL STATEMENTS OF BANK BUILDING CORPORATION | ||||
Bank Building Corporation annual report on Form 10-KSB for the year ended December 31, 2006 | ||||
Bank Building Corporation quarterly report on Form 10-QSB for the quarter ended September 30, 2007 | ||||
FINANCIAL STATEMENTS OF CARTER BANK & TRUST | ||||
Carter Bank & Trust annual report on Form 10-K for the year ended December 31, 2006 | ||||
Carter Bank & Trust quarterly report on Form 10-Q for the quarter ended September 30, 2007 | ||||
Selected Financial Data for Carter Bank & Trust excerpted from the joint proxy statement/offering circular for Blue Ridge Bank, N.A., Central National Bank, Community National Bank, First National Bank, First National Exchange Bank, Mountain National Bank, Patrick Henry National Bank, Patriot Bank, N.A., Peoples National Bank and Shenandoah National Bank on Schedule 14A dated September 27, 2006 | ||||
Pro Forma Unaudited Combined Consolidated Financial Information for Carter Bank & Trust excerpted from the joint proxy statement/offering circular for Blue Ridge Bank, N.A., Central National Bank, Community National Bank, First National Bank, First National Exchange Bank, Mountain National Bank, Patrick Henry National Bank, Patriot Bank, N.A., Peoples National Bank and Shenandoah National Bank on Schedule 14A dated September 27, 2006 | ||||
FINANCIAL STATEMENTS OF MERGED BANKS | ||||
Blue Ridge Bank, N.A. annual report for the year ended December 31, 2005 | ||||
Blue Ridge Bank, N.A. quarterly report for the quarter ended September 30, 2006 | ||||
Central National Bank annual report on Form 10-KSB/A for the year ended December 31, 2005 | ||||
Central National Bank quarterly report on Form 10-QSB for the quarter ended September 30, 2006 | ||||
Community National Bank annual report for the year ended December 31, 2005 | ||||
Community National Bank quarterly report for the quarter ended September 30, 2006 | ||||
First National Bank annual report on Form 10-KSB for the year ended December 31, 2005 | ||||
First National Bank quarterly report on Form 10-QSB for the quarter ended September 30, 2006 | ||||
First National Exchange Bank annual report on Form 10-KSB for the year ended December 31, 2005 | ||||
First National Exchange Bank quarterly report on Form 10-QSB for the quarter ended September 30, 2006 | ||||
Mountain National Bank annual report on Form 10-KSB/A for the year ended December 31, 2005 | ||||
Mountain National Bank quarterly report on Form 10-QSB for the quarter ended September 30, 2006 | ||||
Patrick Henry National Bank annual report on Form 10-K for the year ended December 31, 2005 | ||||
Patrick Henry National Bank quarterly report on Form 10-Q for the quarter ended September 30, 2006 | ||||
Patriot Bank, N.A. annual report on Form 10-KSB for the year ended December 31, 2005 | ||||
Patriot Bank, N.A. quarterly report on Form 10-QSB for the quarter ended September 30, 2006 | ||||
Peoples National Bank annual report on Form 10-K/A for the year ended December 31, 2005 | ||||
Peoples National Bank quarterly report on Form 10-Q for the quarter ended September 30, 2006 | ||||
Shenandoah National Bank annual report on Form 10-KSB/A for the year ended December 31, 2005 | ||||
Shenandoah National Bank quarterly report on Form 10-QSB for the quarter ended September 30, 2006 | ||||
i
Table of Contents
| Annex A — | Agreement and Plan of Merger dated as of January 8, 2008 between Carter Bank & Trust and Bank Building Corporation | |
| Annex B — | Opinion of Davenport & Company LLC to the board of directors of Bank Building Corporation | |
| Annex C — | Real Estate Appraisals of Bank Building Corporation Properties | |
| Annex D — | Section 13.1-730 of the Virginia Stock Corporation Act |
ii
Table of Contents
This brief summary highlights selected information from this proxy statement/offering circular. It does not contain all of the information that is important to you. We urge you to read carefully the entire proxy statement/offering circular and the other documents to which this proxy statement/offering circular refers to fully understand the merger and the other matters to be considered at the stockholder meeting. See “Where You Can Find More Information” beginning on page [ ]. Each item in this summary includes a page reference directing you to a more complete description of that item.
Throughout this proxy statement/offering circular, Bank Building Corporation is referred to as “Bank Building,” Carter Bank & Trust is referred to as “Carter Bank,” the merger between Bank Building and Carter Bank is referred to as the “merger,” the Agreement and Plan of Merger, dated January 8, 2008, between Bank Building and Carter Bank, including the related Plan of Merger, is referred to collectively as the “merger agreement,” and this proxy statement/offering circular, including the financial statements included herein, is referred to as this “proxy statement.”
The Merger (page [ ])
We have included the merger agreement in this proxy statement asAnnex A. Please read the merger agreement. It is the legal document that governs the merger.
In the merger, Bank Building, a Virginia corporation, will be merged with and into Carter Bank, a Virginia state-chartered bank, which will be the surviving entity. The officers and employees of Carter Bank will not change after the merger. Each share of Bank Building common stock outstanding will be cancelled in the merger and will be converted into shares of Carter Bank common stock as further described below. We expect to complete the merger in the first quarter of 2008.
The Parties (pages [ ])
The parties involved in the merger are Bank Building and Carter Bank.
Bank Building
Bank Building is a corporation organized under the laws of the Commonwealth of Virginia. Bank Building’s principal business activity is to acquire and develop property for lease as bank offices to Carter Bank.
As of September 30, 2007, Bank Building reported total assets of $31.7 million, total liabilities of $30.1 million and total stockholders’ equity of $1.6 million.
Carter Bank
Carter Bank is a banking institution incorporated under Virginia law. Carter Bank’s services include commercial, real estate and installment loans and checking, savings and time deposit accounts.
As of September 30, 2007, Carter Bank reported total assets of $2.6 billion, net loans of $1.4 billion, deposits of $2.2 billion and total stockholders’ equity of $292 million.
Our Reasons for the Merger (page [ ])
The board of directors of Bank Building is proposing the merger because, among other reasons:
| • | the board’s belief that the proposed merger is in the best interests of Bank Building and its stockholders; |
| • | the opinion of Davenport & Company LLC rendered to the board of directors of Bank Building as to the fairness, from a financial point of view, of the merger consideration to holders of Bank Building common stock; See “Opinion of Bank Building’s Financial Advisor;” |
| • | the board’s belief that merging with Carter Bank is the best way to maximize stockholder value for the stockholders of Bank Building; |
| • | the merger consideration is based on independent appraisals of the fair market value of the real estate assets of Bank Building; |
| • | there is no established trading market for the Bank Building common stock; and |
1
Table of Contents
| • | the merged entity will have thousands of stockholders with a market capitalization of approximately $240,000,000, and may seek to have its common stock listed for trading on a national exchange such as the New York Stock Exchange, American Stock Exchange or the NASDAQ Stock Market, which will provide more liquidity for stockholders. |
What Will Stockholders Receive (page [ ])
Your shares of Bank Building common stock will be converted into shares of Carter Bank common stock based on an exchange ratio. In the proposed merger, Bank Building stockholders will receive 2.255 shares of Carter Bank common stock for each share of Bank Building common stock they hold as of the record date.2
Carter Bank will not issue any fractional shares in the merger. Instead, you will receive cash for any fractional share of Carter Bank common stock owed to you. The amount of cash you will receive for any such fractional shares will be calculated by multiplying the fractional share amount by $9.25, which has been determined by the board of directors of Carter Bank to be the fair value of a share of Carter Bank common stock for fractional shares.
The exchange ratio for the merger is a “fixed” exchange ratio, meaning that the number of shares of Carter Bank common stock to be issued in the merger for each share of common stock of Bank Building will not change.
Appraisal Rights (page [ ])
Our stockholders will have appraisal rights in connection with the merger as provided under Section 13.1-730 of the Virginia Stock Corporation Act. Pursuant to the Virginia Stock Corporation Act, a stockholder may dissent to a merger and receive cash for the value of shares held by the stockholder. Any stockholder seeking appraisal rights must follow the process described under the Virginia Stock Corporation Act.
The cash received for shares by dissenting stockholders instead of stock in Carter Bank will be taxable to the stockholders. Stockholders who do not elect their appraisal rights and, therefore, receive stock in Carter Bank will not be subject to federal and/or state income tax in connection therewith, except for cash paid for fractional shares.
Our Recommendations (page [ ])
Our board of directors believes that the merger is fair to the stockholders of Bank Building and unanimously recommends that the stockholders vote “FOR” the merger and “FOR” the continuation of the special meeting if necessary.
Opinion of Financial Advisor (page [ ])
Davenport & Company LLC delivered a written opinion to our board of directors on January 8, 2008 that, as of the date the merger agreement was signed, the merger consideration to be received by the stockholders of Bank Building is fair to the stockholders from a financial point of view. We have enclosed a copy of this opinion in this proxy statement asAnnex B. You should read the opinion completely to understand the assumptions made, matters considered and limitations of the review undertaken by Davenport & Company LLC in providing its opinion.
Real Estate Appraisals (page [ ])
The merger agreement provides that the parties will conduct an appraisal of the real property assets of Bank Building within 45 days of the date of the merger agreement. Based on the results of the real estate appraisals, the parties determined the final exchange ratio for converting Bank Building common stock into Carter Bank common stock.
Accounting Treatment (page [ ])
The merger will be accounted for under the purchase method of accounting.
Certain Federal Income Tax Consequences (page [ ])
Tax laws are complex, and the tax consequences of the merger may vary depending upon your particular circumstances or treatment under United States federal income tax law. For these reasons, we recommend that you consult your tax advisor concerning the United States federal, state, local and foreign income and other tax consequences of the merger to you.
2 | Explanatory Note: The minimum exchange ratio is 2.255 and is subject to upward adjustment pursuant to an appraisal of the real estate assets of Bank Building. The final exchange ratio will be included in this proxy statement prior to mailing to the Bank Building stockholders. |
2
Table of Contents
A Bank Building stockholder that exchanges shares of Bank Building common stock solely for shares of Carter Bank common stock in the merger generally will not recognize gain or loss, except with respect to any cash received instead of fractional share interests in Carter Bank common stock. A Bank Building stockholder that exercises his or her appraisal rights with respect to his or her shares and receives a cash payment with respect to those shares generally will recognize gain or loss equal to the difference between the amount of the cash received and such stockholder’s tax basis in those shares. Such gain or loss will generally constitute capital gain or loss. The completion of the merger is conditioned on the receipt of tax opinions from Troutman Sanders LLP, dated as of the effective date of the merger, to the effect that the merger will qualify as a “reorganization” within the meaning of Section 368(a) of the Internal Revenue Code of 1986, as amended.
The Stockholders’ Meeting (page [ ] and pages [ ])
The special meeting for the stockholders of Bank Building will be held on [March 25], 2008 at 1:00 pm, local time.
At the special meeting, the stockholders of Bank Building will be asked:
| • | to approve the merger agreement and the transactions contemplated thereby (See Proposal I); or |
| • | to consider and vote upon a proposal to adjourn the meeting to a later date or dates, if necessary, to permit further solicitation of proxies in the event there are not sufficient votes at the time of the meeting to approve the matters to be considered by the stockholders at the meeting (See Proposal II). |
Record Dates; Votes Required (pages [ ])
You can vote at the special meeting of stockholders if you owned common stock of Bank Building at the close of business on [ , 2008]. On that date, Bank Building had 398,244 shares of common stock outstanding and entitled to vote.
You can cast one vote on each matter to be voted upon by the stockholders of Bank Building at the special meeting for each share of common stock you owned on the record date.
THE MERGER AGREEMENT (page [ ])
Conditions to Completion of the Merger (page [ ])
The obligations to complete the merger depend on a number of conditions being met. These include:
| • | Bank Building stockholders’ approval of the merger agreement; |
| • | the absence of any order, injunction, decree, law or regulation that would prohibit the merger or make it illegal; and |
| • | receipt of an opinion that, for United States federal income tax purposes, the transaction will constitute a reorganization within the meaning of Section 368 of the Internal Revenue Code. |
Where the law permits, either Bank Building or Carter Bank could choose to waive a condition to their obligations to complete the merger although that condition has not been satisfied. We cannot be certain when, or if, the conditions to the merger will be satisfied or waived, or that the merger will be completed.
Termination of the Merger Agreement; Expenses (page [ ])
Bank Building and Carter Bank can mutually agree at any time to terminate the merger agreement without completing the merger, even if the Bank Building stockholders have approved it. Also, either party can decide, without the consent of the other, to terminate the merger agreement in a number of other situations, including:
| • | the failure of Bank Building to obtain the required stockholder vote; |
| • | an unremedied breach of the merger agreement by another party, so long as the party that is seeking to terminate the merger agreement has not itself breached the merger agreement; and |
3
Table of Contents
| • | the failure to complete the merger by June 30, 2008. |
Upon a termination, each party shall bear its own expenses.
Waiver and Amendment (page [ ])
The parties may amend the merger agreement, and either of the parties may waive the right to require another party to adhere to the terms and conditions of the merger agreement. However, neither party may do so after the stockholders of Bank Building approve the necessary transactions if the amendment or waiver reduces or changes the consideration that will be received by you or adversely affects the tax consequences of the consideration received by you.
Potential Conflicts of Interest (page [ ])
The boards of directors of Carter Bank and Bank Building may have certain conflicts of interest. All five members of our board of directors are also members of the Carter Bank board of directors. In addition, Worth Harris Carter, Jr. is the Chairman of the Board and President of both companies. All of the directors of Bank Building own shares of Carter Bank common stock.
Material Differences in the Rights of the Stockholders of Bank Building and the Stockholders of Carter Bank (pages [ ])
Rights of the stockholders of Bank Building are governed by the Securities and Exchange Act of 1934, by the Virginia Stock Corporation Act and by Bank Building’s articles of incorporation and bylaws. The rights of the stockholders of Carter Bank are governed by the Federal Deposit Insurance Corporation Act, by the Virginia Stock Corporation Act and by Carter Bank’s articles of incorporation and bylaws. Upon completion of the merger, the rights of the stockholders of Bank Building will be governed by the Federal Deposit Insurance Corporation Act, by the Virginia Stock Corporation Act and by Carter Bank’s articles of incorporation and bylaws.
Management of Carter Bank After the Merger
The officers and employees of Carter Bank after the merger will remain unchanged. Mr. Carter will continue to serve as Chairman of the Board and President of Carter Bank and all other executive officers of Carter Bank will remain unchanged.
4
Table of Contents
ABOUT THE MERGER AND THE STOCKHOLDER MEETING
| Q: | How can I participate? |
| A: | By either attending the special meeting of stockholders or by mailing your signed proxy card as soon as possible. |
| Q: | When and where is the stockholder meeting? |
| A: | The Bank Building special meeting of stockholders is scheduled to take place on [March 25], 2008, at 1:00 p.m., local time, at the Bank Services of Virginia Operations Center, 320 College Drive, Martinsville, Virginia. |
| Q: | What can I do now? |
| A: | Mail your signed proxy in the enclosed return envelope as soon as possible so that your shares may be represented at the stockholder meeting for Bank Building. It is important that your proxy be returned as soon as possible and in any event before the stockholder meeting. |
| Q: | How will I receive my shares of Carter Bank common stock and cash for fractional shares if I vote “FOR” the proposed merger? |
| A: | After consummation of the merger on the anticipated effective date of [ , 2008] or as soon thereafter as possible, you will receive a letter of instruction explaining how stockholders should send in their stock certificates to Bank Services of Virginia, Inc., which will serve as Exchange Agent for the transaction. The letter of instruction will also include the appropriate forms to be completed by stockholders and an envelope for mailing your stock certificates. Following the Exchange Agent’s receipt of stock certificates, the Exchange Agent will mail to stockholders stock certificates representing their interests in Carter Bank and a check for the amount of any fractional share involved in each of the exchange transactions. |
| Q: | Can I change my vote after I mail my proxy? |
| A: | Yes. You can change your vote at any time before your proxy is voted at the stockholder meeting. You can do this in one of three ways: |
| • | First, you can send a written notice stating that you would like to revoke your proxy. |
| • | Second, you can complete and submit a new proxy. |
| • | Third, you can attend the stockholder meeting and vote in person. Simply attending the stockholder meeting, however, will not revoke your proxy. |
If you choose either of the first or second methods, you must submit your notice of revocation or your new proxy to Bank Building prior to the applicable stockholder meeting. Your submissions must be mailed to Bank Building at the following applicable address:
Bank Building Corporation
1300 Kings Mountain Rd.
Martinsville, Virginia 24112
Attention: Mr. Worth Harris Carter, Jr.
5
Table of Contents
| Q: | What if I do not vote or I abstain from voting? |
| A: | If you do not vote or you abstain from voting, your abstention will count as a “NO” vote on the merger and the other items being considered. |
| Q: | If my shares are held by my broker in “street name,” will my broker vote my shares for me on the merger proposal? |
| A: | Your broker will vote your shares on the merger proposal only if you provide instructions on how to vote. You should follow the directions provided by your broker to vote your shares. If you do not provide your broker with instructions on how to vote your shares held in “street name,” your broker will not be permitted to vote your shares on the merger proposal, which will have the effect of a “NO” vote on the merger proposal. |
| Q: | Will I be able to sell the Carter Bank common stock I receive in the merger? |
| A: | Yes. The shares of Carter Bank common stock to be issued in the merger will be freely transferable. Carter Bank is a “bank” as defined in the Securities Act of 1933 and, as such, is exempt from registering its shares of common stock for sale or exchange under Section 3(a)(2) of the Securities Act of 1933, as amended. |
| Q: | Who should stockholders call with questions? |
| A: | If you have more questions about the merger you should contact: |
Mr. Worth Harris Carter, Jr.
Bank Building Corporation
1300 Kings Mountain Road
Martinsville, Virginia 24112
276-656-1776
| Q: | Where can I find more information about Bank Building and Carter Bank? |
| A: | Bank Building and Carter Bank file periodic reports and other information with the Securities and Exchange Commission and the Federal Deposit Insurance Corporation respectively. Any such information about Bank Building is available without charge via the Security and Exchange Commission’s website http://www.sec.gov. Any such information about Carter Bank is available without charge upon oral or written request to: |
Mr. Worth Harris Carter, Jr.
Carter Bank & Trust
1300 Kings Mountain Road
Martinsville, Virginia 24112
(276) 656-1776
If you would like to request any documents, please do so by [ , 2008] in order to receive them before the special stockholder meeting. Please refer to “Where You Can Find More Information” on page [ ] of this proxy statement.
6
Table of Contents
COMPARATIVE UNAUDITED PER SHARE DATA
The following table shows per share data for the periods presented regarding net income, book value and cash dividends declared for Carter Bank and Bank Building on a historical and pro forma basis. The pro forma equivalent per share amounts are calculated by multiplying the pro forma combined data by the exchange ratio of 2.2553 shares of Carter Bank common stock for each share of Bank Building common stock so that the per share amounts equate to the respective values for one share of Bank Building common stock. See “Merger Consideration” beginning on page [ ].
The information set forth below, while helpful in illustrating the financial characteristics of the combined company under one set of assumptions, may not reflect all of these anticipated financial expenses and, accordingly, does not attempt to predict or suggest future results. It also does not necessarily reflect what the historical results of the combined company would have been had our companies been combined during the periods presented.
The information in the following table is based on, and you should read it together with, the historical financial information and the notes thereto for each of Carter Bank and Bank Building contained in this proxy statement. See “Financial Statements of Bank Building Corporation” and “Financial Statements of Carter Bank & Trust.”
| Nine Months Ended September 30, 2007 | Year Ended December 31, 2006 | |||||
Carter Bank | ||||||
Basic and diluted earnings per common share: | ||||||
Historical | $ | 0.42 | $ | 0.76 | ||
Pro Forma | 0.41 | 0.59 | ||||
Cash earnings per common share(1): | ||||||
Historical | 0.41 | 0.76 | ||||
Pro Forma | 0.40 | 0.59 | ||||
Dividends declared on common stock: | ||||||
Historical | 0.30 | 0.80 | ||||
Pro Forma | 0.30 | 0.80 | ||||
Book value per common share: | ||||||
Historical | 11.69 | 11.57 | ||||
Pro Forma | 11.59 | 11.61 | ||||
Bank Building | ||||||
Basic and diluted earnings per common share: | ||||||
Historical | $ | 0.50 | $ | 0.57 | ||
Pro Forma Equivalent | 0.92 | 1.33 | ||||
Cash earnings per common share(1): | ||||||
Historical | 0.50 | 0.57 | ||||
Pro Forma Equivalent | 0.90 | 1.33 | ||||
Dividends declared on common stock: | ||||||
Historical | — | — | ||||
Pro Forma Equivalent | 0.68 | 1.80 | ||||
Book value per common share: | ||||||
Historical | 3.98 | 3.48 | ||||
Pro Forma Equivalent | 25.79 | 26.18 | ||||
| (1) | “Cash earnings per common share” is defined as basic and diluted earnings per share plus core deposit intangible amortization, net of income taxes. |
3 | Explanatory Note: The minimum exchange ratio is 2.255 and is subject to upward adjustment pursuant to an appraisal of the real estate assets of Bank Building. The final exchange ratio will be included in this proxy statement prior to mailing to the Bank Building stockholders. |
7
Table of Contents
The following table sets forth certain of Carter Bank’s consolidated financial data as of and for the nine months ended September 30, 2007 and the years ended December 31, 2006, 2005, 2004, 2003 and 2002. The financial information for the years ended December 31, 2006, 2005 and 2004 is derived from Carter Bank’s audited consolidated financial statements, included in this proxy statement. See “Financial Statements of Carter Bank & Trust.” The consolidated financial information for the years ended December 31, 2003 and 2002 is derived from Peoples National Bank, the predecessor to Carter Bank, and is included in this proxy statement. See “Financial Statements of Merged Banks–Peoples National Bank.” The consolidated financial information as of and for the nine months ended September 30, 2007 is derived from Carter Bank’s unaudited consolidated financial statements included inthis proxy statement. See “Financial Statements of Carter Bank of Trust.” In Carter Bank’s opinion, such unaudited consolidated financial statements include all adjustments (consisting of normal recurring adjustments) necessary for a fair presentation of its financial position and results of operations for such periods. Interim results for the nine months ended September 30, 2007 are not necessarily indicative of, and are not projections for, the results to be expected for the full year ended December 31, 2007.
Carter Bank did not commence business until December 29, 2006, when ten banking institutions (the “Merged Banks”), each of which had been in business for a number of years, were merged into Carter Bank concurrently (the “Bank Merger”). Selected financial data with respect to each of the Merged Banks for the years 2005, 2004, 2003 and 2002 is included inthis proxy statement. See “Financial Statements of Carter Bank & Trust–Selected Financial Data.” Certain additional information with respect to Carter Bank, presented on a pro forma basis for the year ended December 31, 2006, and the six months ended June 30, 2007, is included in this proxy statement. See “Financial Statements of Carter Bank & Trust–Pro Forma Unaudited Combined Consolidated Financial Information.”
The selected historical financial data belowshould be read in conjunction with the consolidated financial statements and their accompanying notes that are included as part of this proxy statement.
| As of and for the Nine Months Ended September 30, | As of and for the Years Ended December 31, | ||||||||||||||||||||
| 2007 | 2006 | 2006 | 2005 | 2004 | 2003 | 2002 | |||||||||||||||
| (In thousands except per share data) | |||||||||||||||||||||
Income Statement Data | |||||||||||||||||||||
Total Interest income | $ | 110,883 | $ | 14,654 | $ | 20,477 | $ | 17,364 | $ | 17,741 | $ | 18,982 | $ | 20,766 | |||||||
Total Interest expense | 56,695 | 6,765 | 9,728 | 7,385 | 6,963 | 7,935 | 10,223 | ||||||||||||||
Net interest income | 54,188 | 7,889 | 10,749 | 9,979 | 10,778 | 11,047 | 10,543 | ||||||||||||||
Provision for loan losses | 648 | 90 | 120 | 120 | 120 | 821 | 120 | ||||||||||||||
Net interest income after provision for loan losses | 53,540 | 7,799 | 10,629 | 9,859 | 10,658 | 10,226 | 10,423 | ||||||||||||||
Noninterest income | 6,935 | 704 | 1,017 | 1,119 | 1,294 | 1,118 | 1,110 | ||||||||||||||
Noninterest expense | 47,419 | 6,323 | 8,973 | 8,299 | 7,841 | 7,001 | 6,573 | ||||||||||||||
Income before income taxes | 13,056 | 2,180 | 2,673 | 2,679 | 4,111 | 4,343 | 4,960 | ||||||||||||||
Income tax expense | 2,627 | 645 | 782 | 660 | 1,275 | 1,374 | 1,600 | ||||||||||||||
Net income | $ | 10,429 | $ | 1,535 | $ | 1,891 | $ | 2,019 | $ | 2,836 | $ | 2,969 | $ | 3,360 | |||||||
Per Share Data | |||||||||||||||||||||
Net income – basic and diluted | $ | 0.42 | $ | 0.65 | $ | 0.76 | $ | 0.85 | $ | 1.19 | $ | 1.25 | $ | 1.41 | |||||||
Cash dividends declared per share | 0.30 | 0.60 | 0.80 | 0.80 | 0.80 | 0.75 | 0.80 | ||||||||||||||
Book value per share | 11.69 | 15.96 | 11.57 | 15.92 | 15.87 | 15.48 | 14.98 | ||||||||||||||
Balance Sheet Data | |||||||||||||||||||||
Total Assets | $ | 2,568,800 | $ | 363,270 | $ | 2,690,178 | $ | 357,244 | $ | 356,992 | $ | 371,213 | $ | 359,641 | |||||||
Loans, net | 1,398,919 | 211,476 | 1,395,316 | 204,563 | 206,689 | 195,653 | 213,674 | ||||||||||||||
Investment securities | 552,880 | 88,851 | 452,181 | 95,665 | 75,613 | 118,250 | 105,952 | ||||||||||||||
Deposits | 2,244,619 | 322,463 | 2,371,550 | 318,818 | 318,710 | 333,337 | 321,543 | ||||||||||||||
Shareholders’ equity | 292,176 | 37,929 | 289,292 | 37,820 | 37,701 | 36,766 | 35,577 | ||||||||||||||
Shares outstanding | 24,997 | 2,376 | 24,997 | 2,376 | 2,376 | 2,376 | 2,160 | ||||||||||||||
8
Table of Contents
Certain statements, data and information contained in this proxy statement may constitute “forward-looking statements” within the meaning of Section 27A of the Securities Act of 1933. These forward-looking statements are based on current expectations that involve a number of risks and uncertainties regarding, among other things, the timing and completion of the merger of Bank Building with and into Carter Bank and the expected effect of the merger. Actual results may differ materially from the results expressed in these forward-looking statements. A number of important factors could cause actual events to differ materially from those indicated by such forward looking statements. These factors include, but are not limited to: the ability to complete the merger on the terms contemplated, the ability of the companies to obtain the required stockholder or regulatory approvals for the merger, the anticipated impact of the merger on Bank Building’s operations and financial results, a material adverse change in the financial condition, operations or prospects of either Bank Building or Carter Bank, a change in general business or economic conditions, a change in real estate values, a change in accounting principles or guidelines, a change in legislation or regulation, other risk factors described in this proxy statement and other “forward looking statements” within the meaning of Section 27A of the Securities Act of 1933 and Section 21E of the Securities Exchange Act of 1934, including those in Bank Building’s Annual Report on Form 10-KSB filed with the Securities and Exchange Commission on March 30, 2007 and other filings with the Securities and Exchange Commission, which investors are urged to carefully review and consider. These risks and uncertainties should be considered in evaluating the forward-looking statements contained herein, and readers are cautioned not to place undue reliance on such statements, which speak only as of the date of this proxy statement. Bank Building does not undertake any obligation to update or clarify these forward-looking statements, whether as a result of new information, future events or otherwise.
9
Table of Contents
You should carefully read and consider the following risk factors associated with the merger and with Carter Bank before you decide whether to vote to approve the merger and/or the other matters to be considered and voted upon at the stockholder meetings.
Risks Associated with the Merger
The merger may distract management from its other responsibilities.
Completion of the merger could present challenges for management and cause management to focus its time and energies on matters related to the merger that otherwise would be directed to the business and operations of Carter Bank. Any significant, merger-related distraction of management could impact management’s ability to service existing business and develop new business and adversely affect the business and earnings of Carter Bank.
The parties may be subject to certain conflicts of interest.
The terms of the merger agreement were negotiated between the boards of directors of Carter Bank and Bank Building. Worth Harris Carter, Jr. is Chairman of the Board and President of Carter Bank and Bank Building. In addition to Mr. Carter, all members of the board of directors of Bank Building also serve as members of the board of directors of Carter Bank. All members of the board of directors of Bank Building own shares of common stock in both Bank Building and Carter Bank.
Additionally, Mr. Carter and each other person serving as a director of both companies owe separate fiduciary duties to each entity that they represent and those entities’ respective stockholders. Under certain circumstances, these individuals could have potential conflicts of interest by reason of the separate fiduciary duties they owe to each entity.
The merger consideration is fixed, despite potential changes in relative prices of the common stock of Carter Bank.
The exchange ratio for the merger is a “fixed” exchange ratio. This means that the number of shares of Carter Bank common stock to be issued in the merger for each share of common stock of Bank Building will not change, even if the price of Carter Bank stock changes after the exchange ratio has been fixed. As such, stockholders of Bank Building will not know the value of the consideration they are receiving in the merger until the date the merger is consummated. The price for common stock of Carter Bank before the merger may vary from the price at the date of this document and the date of Bank Building’s special meeting. Variations in common stock prices of Carter Bank could result from changes in the business operations or prospects, market assessments of the likelihood that the merger will be consummated and the timing thereof, regulatory considerations, general market and economic conditions and other factors. Such changes in price could reduce the monetary value of the consideration received in the merger by Bank Building stockholders.
The merger agreement limits Bank Building’s ability to pursue alternatives to the merger.
The merger agreement contains terms and conditions that make it more difficult for Bank Building to sell their businesses to a party other than Carter Bank. These “no shop” provisions impose restrictions on Bank Building that, subject to certain exceptions, limit Bank Building’s ability to discuss or facilitate competing third-party proposals to acquire all or a significant part of Bank Building, except where the failure to do so, on the advice of counsel, would be inconsistent with the fiduciary duties of the board of directors of Bank Building to its stockholders.
These provisions might discourage a third party that might have an interest in acquiring Bank Building from considering or proposing that acquisition.
10
Table of Contents
Risks Associated with Carter Bank
Carter Bank’s business is subject to interest rate risk and fluctuations in interest rates may adversely affect its earnings and capital levels.
The majority of Carter Bank’s assets are monetary in nature and, as a result, Carter Bank is subject to significant risk from changes in interest rates. Changes in interest rates can impact Carter Bank’s net interest income as well as the valuation of its assets and liabilities. Also, Carter Bank’s earnings are significantly dependent on its net interest income, which is the difference between interest income on interest-earning assets, such as loans and securities, and interest expense on interest-bearing liabilities, such as deposits and borrowings. Carter Bank expects that it will periodically experience “gaps” in the interest rate sensitivities of its assets and liabilities, meaning that either its interest-bearing liabilities will be more sensitive to changes in market interest rates than its interest-earning assets, or vice versa. In either event, if market interest rates should move contrary to Carter Bank’s position, this “gap” will work against it and its earnings may be negatively affected.
An increase in the general level of interest rates may also, among other things, reduce the demand for loans and Carter Bank’s ability to originate loans or increase the rate of default on existing loans. Conversely, a decrease in the general level of interest rates may, among other things, lead to an increase in prepayments on loan and increased competition for deposits. Accordingly, changes in the general level of market interest rates may affect net yield on interest-earning assets, loan origination volume, loan portfolios and Carter Bank’s overall results.
Although Carter Bank’s asset-liability management strategy is designed to control its risk from changes in the general level of market interest rates, market interest rates will be affected by many factors outside of its control, including inflation, recession, changes in unemployment, money supply and international disorder and instability in domestic and foreign financial markets. It is possible that significant or unexpected changes in interest rates may take place in the future, and Carter Bank cannot always accurately predict the nature or magnitude of such changes or how such changes may affect its business.
Carter Bank’s profitability depends significantly on local economic conditions.
Carter Bank’s success depends primarily on the general economic conditions of the geographic markets in which it operates. The local economic conditions in the areas where it operates has a significant impact on its commercial, real estate and construction loans, the ability of its borrowers to repay their loans and the value of the collateral securing these loans. A significant decline in general economic conditions, caused by inflation, recession, acts of terrorism, outbreak of hostilities or other international or domestic calamities, unemployment or other factors could impact these local economic conditions and negatively affect Carter Bank’s financial results.
Carter Bank faces strong competition from financial services companies and other companies that offer banking services which could negatively affect its business.
Carter Bank conducts its banking operations primarily in Virginia and North Carolina, including Roanoke, Lynchburg, Danville, Fredericksburg, Northern Virginia, Greensboro, Durham, Wilson and Fayetteville. Increased competition in these markets may result in reduced loans and deposits. Ultimately, Carter Bank may not be able to compete successfully against current and future competitors. Many competitors offer the same banking services that Carter Bank offers in its service area. These competitors include national banks, regional banks and other community banks. Carter Bank also faces competition from many other types of financial institutions, including without limitation, savings and loan institutions, finance companies, brokerage firms, insurance companies, credit unions, mortgage banks and other financial intermediaries. In particular, Carter Bank’s competitors include several major financial companies whose greater resources may afford them a marketplace advantage by enabling them to maintain numerous banking locations and ATMs and conduct extensive promotional and advertising campaigns.
Additionally, banks and other financial institutions with larger capitalization and financial intermediaries not subject to bank regulatory restrictions have larger lending limits and are thereby able to serve the credit needs of larger customers. Areas of competition include interest rates for loans and deposits, efforts to obtain deposits, and range and quality of products and services provided, including new technology-driven products and services. Technological innovation continues to contribute to greater competition in domestic and international financial services markets as technological advances enable more companies to provide financial services. Carter Bank also
11
Table of Contents
faces competition from out-of-state financial intermediaries that have opened low-end production offices or that solicit deposits in its market areas. If Carter Bank is unable to attract and retain banking customers, it may be unable to continue to grow its loan and deposit portfolios and its results of operations and financial condition may otherwise be adversely affected.
A large percentage of Carter Bank’s loans are secured by real estate, and an adverse change in the real estate market may result in losses and adversely affect Carter Bank’s profitability.
Approximately 70% of Carter Bank’s loan portfolio as of September 30, 2007 was comprised of loans secured by real estate, exclusive of municipal loans. An adverse change in the economy affecting values of real estate generally or in the market areas to be served by Carter Bank specifically could impair the value of Carter Bank’s collateral and its ability to sell the collateral upon foreclosure. In the event of a default with respect to any of these loans, the amounts Carter Bank receives upon sale of the collateral may be insufficient to recover outstanding principal and interest on the loan. As a result, Carter Bank’s profitability and financial condition could be negatively impacted by an adverse change in the real estate market.
Carter Bank is dependent on its management team, and the loss of its senior executive officers or other key employees could impair its relationship with its customers and adversely affect its business and financial results.
The success of Carter Bank is dependent upon the continued service and skills of Worth Harris Carter, Jr. and other senior officers. The unexpected loss of services of one or more of these key personnel could have an adverse impact on the business of Carter Bank because of their skills, knowledge of the market, years of industry experience and the difficulty of promptly finding qualified replacement personnel.
An interruption in or breach in security of Carter Bank’s information systems may result in a loss of customer business and negatively affect its results of operations and financial condition.
Carter Bank relies heavily on communications and information systems to conduct its business. Any failure or interruption or breach in security of these systems could result in failures or disruptions in customer relationship management, general ledger, deposits, servicing or loan origination systems. Carter Bank cannot assure its stockholders that such failures or interruptions will not occur or, if they do occur, that they will be adequately addressed by the bank. The occurrence of any failures or interruptions could result in a loss of customer business, costs to Carter Bank or damages to others and have a negative effect on Carter Bank’s results of operations and financial condition.
Carter Bank operates in a highly regulated environment and, as a result, is subject to extensive regulation and supervision that could adversely affect its financial performance.
Carter Bank is subject to extensive regulation, supervision and examination by federal and state banking authorities. Any change in applicable regulations or federal or state legislation could have a substantial impact on Carter Bank, its subsidiaries and its operations. Additional legislation and regulations may be enacted or adopted in the future that could significantly affect Carter Bank’s powers, authority and operations, which could have a material adverse effect on Carter Bank’s financial condition and results of operations. Further, regulators have significant discretion and power to prevent or remedy unsafe or unsound practices or violations of laws by banks in the performance of their supervisory and enforcement duties. The exercise of this regulatory discretion and power may have a negative impact on Carter Bank and could limit growth and the return to investors by restricting activities such as the payment of dividends, mergers with, or acquisitions by, other institutions, investments, loans and interest rates, interest rates paid on deposits and the creation of branch offices. Although these regulations impose costs upon Carter Bank, they are intended to protect depositors, and stockholders should not assume that they protect their interests as a stockholder.
The trading volume in Carter Bank’s common stock may be low following the merger.
Carter Bank is a bank that is establishing its identity and credibility in the markets. There is currently no established public market for Carter Bank’s common stock and its common stock is not listed or traded on any national securities exchange or included in any automatic quotation system. Although Carter Bank intends to apply
12
Table of Contents
to have its common stock listed for trading on a national securities exchanges such as the New York Stock Exchange, American Stock Exchange or the NASDAQ Stock Market, no assurance can be given that such application will be successful. A public trading market having the desired characteristics of depth, liquidity and orderliness depends on the presence in the market place of willing buyers and sellers of Carter Bank’s common stock at any given time. This presence depends on the individual decisions of investors and general economic and market conditions over which Carter Bank has no control. Accordingly, it is uncertain at what price the shares of Carter Bank will trade upon completion of the merger or upon listing, if any, on a national securities exchange. Given the absence of an established public market, significant sales of its common stock by stockholders, or the expectation of these sales, could adversely affect Carter Bank’s stock price and increase its volatility.
13
Table of Contents
This proxy statement is first being mailed by Bank Building to the holders of Bank Building common stock, no par value per share, on or about [ , 2008], and is accompanied by the notice of the Bank Building special meeting and a form of proxy that is solicited by the board of directors of Bank Building for use at the Bank Building special meeting, to be held as follows:
Date: | [March 25], 2008 | |
| Time: | 1:00 p.m., local time | |
| Location: | Bank Services of Virginia Operations Center | |
| 320 College Drive | ||
| Martinsville, Virginia 24112 |
This special meeting may continue at any adjournment or postponement of that meeting.
At the special meeting, the stockholders of Bank Building will be asked:
| • | to approve the merger agreement and the transactions contemplated thereby (See Proposal I); or |
| • | to consider and vote upon a proposal to adjourn the meeting to a later date or dates, if necessary, to permit further solicitation of proxies in the event there are not sufficient votes at the time of the meeting to approve the matters to be considered by the stockholders at the meeting (See Proposal II). |
The accompanying form of proxy is for use at the special meeting if you are unable or do not desire to attend in person. You may attend the special meeting even if you have previously delivered a proxy to Bank Building. You can revoke your proxy at any time before the vote is taken at the special meeting by submitting to Bank Building written notice of revocation or a properly executed proxy of a later date, or by attending the special meeting and electing to vote in person. Written notices of revocation and other communications about revoking your proxy should be addressed to:
Worth Harris Carter, Jr.
Bank Building Corporation
1300 Kings Mountain Road
Martinsville, Virginia 24112
All shares represented by valid proxies that Bank Building receives through this solicitation, and not revoked before they are exercised, will be voted in the manner specified in such proxies. If you make no specification on your returned proxy, your proxy will be voted “FOR” the matters to be considered at the special meeting as described above.
Bank Building will bear the entire cost of soliciting proxies from you. In addition to solicitation of proxies by mail, Bank Building will request banks, brokers and other record holders to send proxies and proxy material to the beneficial owners of the stock and secure their voting instructions, if necessary. Bank Building will reimburse those record holders for their reasonable expenses in taking those actions. If necessary, Bank Building also may use its executive officers, who will not be specially compensated, to solicit proxies from its stockholders, either personally or by telephone, the Internet, fax, letter or special delivery letter.
14
Table of Contents
[ , 2008] has been fixed as the record date for determining the stockholders entitled to notice of and to vote at the special meeting. Accordingly, you are only entitled to notice of, and to vote at, the special meeting if you were a record holder of the common stock of Bank Building at the close of business on the record date. At that time, 398,244 shares of Bank Building common stock were outstanding, held by approximately 2,650 holders of record.
You are entitled to one vote for each outstanding share of the common stock of Bank Building you held as of the close of business on the record date.
Holders of shares of Bank Building common stock present in person at the special meeting but not voting, and shares of the common stock for which Bank Building has received proxies indicating that their holders have abstained, will be counted as present at the special meeting for purposes of determining whether Bank Building has a quorum for transacting business. Shares held in street name that have been designated by brokers on proxies as not voted will not be counted as votes cast for or against any proposal. These broker non-votes will, however, be counted for purposes of determining whether a quorum exists.
The approval of the merger agreement and the transactions contemplated thereby requires the affirmative vote of the holders of two-thirds of Bank Building’s outstanding shares.
Less than a quorum may adjourn the meeting.
Because approval of the merger agreement and the transactions contemplated thereby require the affirmative vote of the holders of two-thirds of the outstanding shares of Bank Building’s common stock entitled to vote at the special meeting, abstentions and broker non-votes will have the same effect as votes against these matters. Accordingly, Bank Building’s board of directors urges you to complete, date and sign the accompanying proxy and return it promptly in the enclosed pre-addressed, postage-paid envelope.
As of the record date, directors and executive officers of Bank Building beneficially owned 51,945 shares of Bank Building’s common stock, entitling them to exercise approximately 13.04% of the voting power of Bank Building common stock entitled to vote at the special meeting. In addition, the directors and executive officers of Carter Bank, other than the persons who are also directors and executive officers of Bank Building, beneficially owned 37,373 shares of Bank Building’s common stock, entitling them to exercise approximately 9.4% of the voting power of Bank Building common stock entitled to vote at the special meeting. Each director and executive officer of Bank Building and Carter Bank has indicated he or she will vote each share of his common stock that he or she owns “FOR” approval of the merger agreement and the transactions contemplated thereby.
Recommendation of the Board of Directors
The board of directors of Bank Building has unanimously approved the merger agreement and the transactions contemplated thereby, including the merger. The Bank Building board believes that the merger agreement and the transactions contemplated thereby, including the merger, are fair to, and are in the best interests of Bank Building and its stockholders and unanimously recommends that stockholders vote “FOR” approval of the merger agreement and the transactions contemplated thereby.
15
Table of Contents
PROPOSAL I - APPROVAL OF THE MERGER
This summary of the material terms and provisions of the merger agreement is qualified in its entirety by reference to such documents. The merger agreement is included asAnnex A of this proxy statement. Bank Building incorporates this document into this summary by reference.
Subject to satisfaction or waiver of all conditions in the merger agreement, Bank Building, a Virginia corporation, will merge with and into Carter Bank, a Virginia state-chartered bank. Upon completion of the merger, Bank Building’s corporate existence will terminate and Carter Bank will continue as the surviving entity. All of the executive officers and directors of Bank Building also are executive officers and directors of Carter Bank. Following the merger, the executive officers and directors of Bank Building will cease to be executive officers and directors of Bank Building, but will continue in their current roles with Carter Bank.
Bank Building and Carter Bank have a common heritage involving overlapping board memberships, management, and operations, as well as other similar characteristics and joint activities. Bank Building was formed by a spin off from several of the individual banks that merged to become Carter Bank. Since the inception of Bank Building, Bank Building has shared common senior management, operations and has had an overlapping board of directors with Carter Bank. Included in this overlap, Worth Harris Carter, Jr. has served since the inception of Bank Building and Carter Bank as the Chairman of the Board and President of both companies.
The original purposes behind Bank Building was to acquire and develop property for lease as bank offices to several of the individual banks that merged to become Carter Bank.
On November 16, 2007, MacKenzie Patterson Fuller, LP, on behalf of several of its affiliates (“MacKenzie”), delivered a letter to Bank Building, published a tombstone advertisement in the Investor’s Business Daily and filed its tender offer documents under cover of Schedule TO with the Securities and Exchange Commission (“SEC”) announcing the commencement of a tender offer. After receipt of MacKenzie’s letter on November 16, 2007, Bank Building retained Troutman Sanders LLP (“Troutman Sanders”), its regular outside counsel, to provide legal advice with respect to the tender offer.
On November 20, 2007, Bank Building retained Davenport & Company LLC (“Davenport”) to act as its financial advisor with respect to the tender offer and in connection with any potential strategic transactions. Bank Building selected Davenport as its financial advisor because it is a recognized investment banking firm with substantial experience in transactions similar to the tender offer and with banks and banking properties and because of its prior familiarity with Bank Building.
Between November 20, 2007 and January 7, 2008, representatives of Davenport met with Mr. Carter and other members of senior management of Bank Building numerous times by telephone to discuss background information regarding Bank Building and its properties, assets, operations and financial condition.
The board of directors of Bank Building met in Martinsville, Virginia on November 21, 2007 with one director participating telephonically. Also present at the meeting were representatives of senior management of Bank Building. Representatives of Troutman Sanders and Davenport participated telephonically. The board held preliminary discussions regarding the tender offer and received an overview of the applicable legal and fiduciary principles from its legal counsel and advisors. The board discussed with management and its advisors the financial, legal and other considerations arising out of MacKenzie’s proposal but determined that it needed to gather additional information in order to fully complete its analysis and to formulate a proper response. The board scheduled its next meeting to be held on November 27, 2007.
On November 27, 2007, the board of directors of Bank Building met in Martinsville to further consider the tender offer. Also present at the meeting were representatives of senior management of Bank Building, Troutman Sanders and Davenport. At the meeting, management briefly reviewed with the board the history of Bank Building. Representatives of Troutman Sanders reviewed with members of the board their fiduciary duties under Virginia law
16
Table of Contents
in considering and acting on the proposed tender offer and possible strategic alternatives. Representatives of Davenport reviewed in detail the terms and conditions of the tender offer, their preliminary financial analysis regarding the underlying value of Bank Building’s assets and certain strategic alternatives to the tender offer. The board carefully considered Bank Building’s business, financial condition, prospects, the terms and conditions of the tender offer and other matters, including discussions with and presentations by management and its financial and legal advisors. Among these matters were discussions of a potential acquisition of Bank Building by Carter Bank which would provide Bank Building’s stockholders significantly more value per share than the tender offer. After extensive deliberation and consideration of alternatives, the board unanimously determined that the tender offer was not in the best interest of Bank Building’s stockholders and unanimously decided to recommend rejection of the tender offer. The board authorized Davenport and representatives of senior management to initiate discussions with Carter Bank regarding a potential transaction. Because Troutman Sanders also serves as regular outside counsel to Carter Bank, the board of directors of Bank Building authorized senior management to engage Young, Haskins, Mann, Gregory, McGarry & Wall P.C. (“Young Haskins”) to provide legal representation with respect to merger negotiations between itself and Carter Bank.
On November 28, 2007, Bank Building retained Young Haskins as special outside legal counsel.
On November 28, 2007, the board of directors of Carter Bank met and considered the proposal from Bank Building regarding a potential acquisition of Bank Building by Carter Bank. Also present at the meeting were representatives of Davenport, Troutman Sanders and Young Haskins. The board of directors of Carter Bank created a special committee (the “Special Committee”) comprised of all 21 disinterested members of the board of directors of Carter Bank (excluding the five members who are also members of the board of directors of Bank Building). The Special Committee held a meeting immediately following the Carter Bank board meeting and authorized senior management of Carter Bank to pursue a potential acquisition of Bank Building.
The Special Committee authorized senior management to retain Troutman Sanders, its regular outside counsel, to provide legal representation with respect to merger negotiations between itself and Bank Building, and Troutman Sanders was retained.
Effective November 28, 2007, Bank Building and Carter Bank executed a mutual non-disclosure agreement.
On November 30, 2007, Bank Building filed its response to MacKenzie’s tender offer on Schedule 14D-9 with the SEC recommending that stockholders of Bank Building not tender their shares in connection with MacKenzie’s offer. On the same day, Bank Building and Carter Bank issued a joint press release announcing preliminary discussions regarding a potential acquisition of Bank Building by Carter Bank.
On December 17, 2007, Troutman Sanders distributed an initial draft of the merger agreement to Bank Building and its outside advisors. Between December 18, 2007 and January 7, 2008, Carter Bank and its legal and financial advisors and Bank Building and its legal and financial advisors negotiated the merger agreement.
On December 18, 2007, Carter Bank retained Boxwood Partners, LLC (“Boxwood”) to act as its financial advisor with respect to the proposed merger. Carter Bank selected Boxwood as its financial advisor because it is a recognized boutique mergers and acquisition advisory investment banking firm with experience in transactions similar to the merger and with companies similar in size to Bank Building.
Between December 18, 2007 and January 3, 2008, representatives of Boxwood conducted numerous telephonic meetings with representatives of senior management of Carter Bank to understand the background of the potential transaction and to assemble relevant information needed to perform its analysis. On December 27, 2007, Boxwood met in Martinsville with Mr. Carter and other representatives of senior management of Carter Bank to perform additional due diligence, obtain information and review Boxwood’s progress through that date. During this time, representatives of Boxwood and representatives of Davenport also had several telephonic meetings to discuss valuations and the financial terms of the merger.
On January 2, 2008, MacKenzie filed Amendment No. 1 to its Schedule TO announcing that the tender offer had expired and that MacKenzie had received and accepted for payment 11,482 validly tendered shares of Bank Building common stock representing approximately 2.9% of the issued and outstanding shares.
17
Table of Contents
The Special Committee met on January 4, 2008 in Martinsville, Virginia to consider a proposed merger agreement between Carter Bank and Bank Building. Also present at the meeting were representatives of senior management of Carter Bank, Troutman Sanders and Boxwood. Also present but not participating were representatives of Davenport and Young Haskins. At the meeting, senior management of Carter Bank briefly reviewed with the Special Committee the history of Bank Building. Representatives of Troutman Sanders reviewed with members of the Special Committee their fiduciary duties under Virginia law in considering and acting on the proposed merger. Representatives of Boxwood reviewed in general the terms and conditions of the merger agreement, and presented their financial analysis regarding the underlying value of Bank Building’s assets and the potential effects of the merger on Carter Bank. The board carefully considered Bank Building’s business, financial condition, prospects, the terms and conditions of the merger and other matters, including discussions with and presentations by management and its financial and legal advisors. After deliberation and consideration, the Special Committee determined that the merger agreement was in the best interest of Carter Bank’s stockholders and the 18 members of the Special Committee present at the meeting unanimously approved the merger. Following the vote of the Special Committee, the board of directors of Carter Bank met and approved the merger with the five members who were also on the board of directors of Bank Building abstaining.
The board of directors of Bank Building also met in Martinsville, Virginia on January 4, 2008 to consider the merger agreement. Also present at the meeting were representatives of senior management of Bank Building, Young Haskins and Davenport. Also present but not participating were representatives of Troutman Sanders and Boxwood. At the meeting, senior management briefly reviewed with the board the history of Bank Building. Representatives of Young Haskins reviewed with members of the board their fiduciary duties under Virginia law in considering and acting on the proposed merger. Representatives of Davenport reviewed in detail the terms and conditions of the merger, their financial analysis regarding the underlying value of Bank Building’s assets and provided a written fairness opinion. The board carefully considered Bank Building’s business, financial condition, prospects, the terms and conditions of the merger agreement, the fairness opinion provided by Davenport and other matters, including discussions with and presentations by management and its financial and legal advisors. After deliberation and consideration of alternatives, the board decided to meet again on January 8, 2008 to consider the merger.
On January 8, 2008, the board of directors of Bank Building met telephonically to consider the merger. Also present were representatives of senior management of Bank Building, Davenport and Young Haskins. Davenport confirmed its opinion given on January 4, 2008 and delivered an updated written fairness opinion. Representatives of Young Haskins advised the board of directors with respect to the merger agreement. After deliberations and consideration, the board of directors of Bank Building unanimously approved the merger agreement. The board unanimously decided to submit the merger agreement to the stockholders of Bank Building and recommend the stockholders vote to approve the merger.
On January 8, 2008, Bank Building and Carter Bank executed the merger agreement and issued a joint press release announcing the merger. Also on January 8, 2008, Bank Building sent a letter to its stockholders regarding the proposed merger.
On January 14, 2008, Bank Building and Carter Bank engaged Integra Realty Resources, Inc. (“Integra”) to conduct appraisals of the 46 bank branch building real estate assets of Bank Building. The parties engaged Integra because it is familiar with Bank Building and its real estate assets, it is the largest property valuation and counseling firm in the United States and it has experience in appraising properties similar to the real property assets of Bank Building.
On January 17, 2008, Bank Building filed its preliminary proxy statement with the SEC.
On January 22, 2008, MacKenzie delivered tender offer documents to Bank Building, published a tombstone advertisement in the Investor’s Business Daily and filed its tender offer documents under cover of Schedule TO with the SEC announcing the commencement of a second tender offer.
On January 23, 2008, members of senior management of Bank Building discussed the terms of the second tender offer with Young Haskins, its outside legal advisor. Bank Building requested that Davenport prepare an analysis of the terms of the second tender offer as compared to the terms of the merger. Members of senior management of Carter Bank and Bank Building also met telephonically with representatives of Troutman Sanders, legal advisor to Carter Bank, and Young Haskins to discuss Bank Building’s obligations under the merger agreement with respect to the second tender offer.
On January 24, 2008, the board of directors of Bank Building met in Martinsville, Virginia. Also present at the meeting were representatives of senior management of Bank Building and Young Haskins. Representatives of Davenport participated telephonically. Representatives of Young Haskins summarized for the board its fiduciary duties under Virginia law and Bank Building’s legal obligations under the merger agreement. Representatives of Davenport reviewed the terms of the second tender offer as compared to the terms of the merger. After careful consideration, the board unanimously determined that the terms of the merger were superior to the terms of the second tender offer and unanimously decided to recommend rejection of the second tender offer.
On February 4, 2008, Bank Building filed its response to the second tender offer on Schedule 14D-9 with the SEC recommending that stockholders of Bank Building not tender their shares in connection with MacKenzie’s second tender offer.
On February __, 2008, Bank Building filed an amendment to its preliminary proxy statement with the SEC.
Board Recommendations and Reasons for the Merger
In deciding whether to approve the merger, the board of directors of Bank Building determined that they had a number of reasons for the merger, including the following:
| • | the board’s belief that the proposed merger is in the best interests of Bank Building and its stockholders; |
18
Table of Contents
| • | the opinion of Davenport rendered to the board of directors of Bank Building as to the fairness, from a financial point of view, of the merger consideration to holders of Bank Building common stock; |
| • | the board’s belief that merging with Carter Bank is the best way to maximize stockholder value for the stockholders of Bank Building; |
| • | the merger consideration is based on independent appraisals of the fair market value of the real estate assets of Bank Building; |
| • | there is no established trading market for the Bank Building common stock; |
| • | the merged entity will have thousands of stockholders with a market capitalization of approximately $240,000,000, and may seek to have its common stock listed for trading on a national exchange such as the New York Stock Exchange, American Stock Exchange or the NASDAQ Stock Market, which will provide more liquidity for stockholders; |
| • | the board’s belief that the merger consideration represented the highest consideration that Carter Bank was willing to pay; |
| • | the increasing costs of continuing as an independent public company, including the provisions of the Sarbanes-Oxley Act of 2002; |
| • | the board’s view of Bank Building’s financial condition, future business prospects and future value as an independent corporation and the board’s view that its financial strength as a part of Carter Bank will improve its position in dealing with the challenges facing it in the future; |
| • | the recommendation by Bank Building’s senior management to approve the merger; |
| • | discussions with and among Bank Building’s senior management, including views and advice provided by our senior management and representatives of Davenport and Young Haskins, regarding the merger; |
| • | the terms and conditions of the merger agreement, including the parties’ representation, warranties and covenants, the conditions to their respective obligations, the specified ability of the parties to terminate the merger agreement; and |
| • | the provisions in the merger agreement permitting Bank Building under certain circumstances to provide non-public information to, and engage in discussions with, any third party that proposes an alternative transaction and to terminate the merger agreement to accept a superior proposal and the provisions in the merger agreement permitting the board of directors, in the exercise of its fiduciary duties to stockholders under applicable Virginia law, to terminate the merger agreement in favor of the superior proposal, provided, that following such termination, Bank Building must pay Carter Bank a termination fee of $500,000. |
In reaching its determination to approve and recommend the merger, the board of directors did not assign any relative or specific weights to the various factors considered by it, and individual directors may have given differing weights to different factors. The foregoing discussion of the information and factors considered by the board of directors is not intended to be exhaustive but is believed to include all material factors considered by the board of directors.
Based on the foregoing, the board of directors of Bank Building believes that the merger is in the best interests of Bank Building and its stockholders.Thus, the board of directors unanimously recommends that the stockholders of Bank Building vote “FOR” approval of the merger proposal at the special meeting.
19
Table of Contents
Opinion of Bank Building’s Financial Advisor
Bank Building engaged Davenport to act as its financial advisor in connection with the proposed merger and Davenport agreed to assist Bank Building in analyzing, structuring and negotiating the merger. Davenport also was engaged to render a written opinion to Bank Building’s board of directors as to whether the merger consideration pursuant to the merger agreement was fair from a financial point of view to Bank Building’s stockholders. In requesting Davenport’s advice and opinion, no restrictions or limitations were imposed by Bank Building upon Davenport with respect to the investigations made or the procedures followed by Davenport in rendering its opinion.
Davenport is a regional investment banking firm. As part of its investment banking business, Davenport is regularly engaged in the valuation of businesses and securities in connection with mergers, acquisitions, underwritings, sales and distributions of listed and unlisted securities and valuations for estate, corporate and other purposes. Davenport was selected by Bank Building to act as its financial advisor because of Davenport’s expertise in valuing and advising financial institutions and other businesses in merger and acquisition transactions and because Davenport was familiar with Bank Building and Carter Bank and their respective businesses.
On January 4, 2008, Davenport reviewed the financial aspects of the proposed merger with Bank Building’s board of directors and delivered its written opinion to Bank Building’s board to the effect that, as of that date, and based upon and subject to the assumptions, limitations and qualifications set forth in the opinion, the merger consideration to be received by the stockholders of Bank Building pursuant to the merger agreement was fair, from a financial point of view. On January 8, 2008, Davenport reaffirmed its opinion from January 4, 2008 and delivered an updated written opinion to the Bank Building board of directors.
The full text of the Davenport opinion, which describes, among other things, the assumptions made, matters considered, and the limitations on the review undertaken, is included in this proxy statement asAnnex B and is incorporated herein by reference. The description of the Davenport opinion set forth below is qualified in its entirety by reference to the full text of the Davenport opinion inAnnex B. Bank Building’s stockholders are urged to read the Davenport opinion carefully and in its entirety.
This opinion is addressed to, and for the use and benefit of, the board of directors of Bank Building in connection with and for the purposes of its evaluation of the merger. The Davenport opinion was just one of the many factors taken into consideration by Bank Building’s board of directors in determining to approve the merger agreement. (See “Background of the Merger; Board Recommendations and Reasons for the Merger” on page .) The opinion does not address the relative merits of the merger as compared to any alternative business strategies that might exist for Bank Building, does not address the effect of any other business combination in which Bank Building might engage and does not constitute a recommendation to any stockholder of Bank Building as to how such stockholder should vote with respect to the merger.
The Davenport opinion was not an expression of an opinion as to the prices at which shares of Carter Bank common stock would trade following the announcement of the merger. The Davenport opinion does not express any opinion about the fairness of the amount or nature of the compensation to Bank Building’s executive officers or directors or class of such persons, relative to compensation to the public stockholders of Bank Building, as no such compensation is included or contemplated in the merger agreement. In accordance with internal procedures adopted pursuant to FINRA rules and regulations, the Davenport opinion was not subject to review by its fairness opinion committee and the opinion was directed to the board of directors of Bank Building in connection with its consideration of the transaction. Davenport was not retained as an advisor or agent to Bank Building’s stockholders or any other person, and it is acting only as an advisor to Bank Building’s board of directors.
In arriving at its opinion, Davenport, among other things:
| • | reviewed the most recent draft of the merger agreement; |
| • | reviewed certain business, financial, and other information regarding Bank Building and its prospects that was furnished to it by the management of Bank Building and that it discussed with the management of Bank Building; |
20
Table of Contents
| • | reviewed certain business, financial, and other information regarding Carter Bank and its prospects that was furnished to it by the management of Carter Bank and that it discussed with the management of Carter Bank; |
| • | reviewed the publicly reported historical price and trading activity for Carter Bank’s common stock; |
| • | compared the business, financial, and other information regarding Carter Bank with similar information regarding certain other publicly traded companies which it deemed to be relevant; |
| • | reviewed the pro forma financial impact of the merger on Bank Building and Carter Bank, based on assumptions relating to transaction expenses, purchase accounting adjustments and cost savings determined by the senior management of Bank Building and Carter Bank; and |
| • | considered other information such as financial studies, analyses, and investigations as well as financial and economic and market criteria that it deemed appropriate. |
In rendering its opinion, Davenport assumed and relied upon the accuracy, completeness and fairness of all of the financial and other information that was available to it from public sources, that was provided to it by Bank Building and Carter Bank or their representatives, or that was otherwise reviewed by it. Davenport did not attempt or assume any responsibility to independently verify any of the information reviewed by it. Davenport is not an expert in the evaluation of loan portfolios for the purpose of assessing the adequacy of the allowance for losses, and assumed that such allowances for Carter Bank, are in the aggregate, adequate to cover such losses. Davenport did not review any individual credit files for Carter Bank nor make any independent evaluation, appraisal or physical inspection of the assets, liabilities or individual properties of Bank Building or Carter Bank, nor was Davenport furnished with any evaluation or appraisal of their assets, liabilities or properties.
With respect to the financial information furnished to or discussed with Davenport by Bank Building or Carter Bank, Davenport assumed that such financial information had been reasonably prepared and reflected the best currently available estimates and judgment of Bank Building’s or Carter Bank’s management as to the expected future financial performance of Bank Building or Carter Bank, respectively. Davenport assumed no responsibility for and expressed no view as to any such information or estimates or the assumptions upon which they were based. Davenport assumed that the merger will be completed substantially in accordance with the terms set forth in the merger agreement and that the merger will be accounted for as a purchase under generally accepted accounting principles. The Davenport opinion is necessarily based on economic, market, financial and other conditions as they existed on, and on the information made available to Davenport as of, the date of the Davenport opinion. Davenport does not have any obligation to update, revise or reaffirm this opinion or otherwise comment on any events occurring after January 8, 2008.
In connection with rendering its opinion, Davenport performed a variety of financial analyses. The following is a summary of the material analyses presented to Bank Building’s board of directors at its January 4, 2008 meeting. The financial analyses summarized below include information presented in tabular format. The summary set forth below does not purport to be a complete description of the analyses performed by Davenport, but describes, in summary form, the principal elements of the presentation made by Davenport to Bank Building’s board of directors on January 4, 2008. The preparation of a fairness opinion involves various determinations as to the most appropriate and relevant methods of financial analysis and the application of these methods to the particular circumstances. Therefore, such an opinion is not readily susceptible to summary description. Each of the analyses conducted by Davenport was carried out in order to provide a different perspective on the transaction and add to the total mix of information available.
Davenport did not form a conclusion as to whether any individual analysis, considered in isolation, supported or failed to support an opinion as to fairness from a financial point of view. Rather, in reaching its conclusion, Davenport considered the results of the analyses in light of each other and ultimately reached its opinion based on the results of all analyses taken as a whole. Davenport did not place particular reliance or weight on any individual analysis, but instead concluded that its analyses, taken as a whole, supported its determination. Accordingly, notwithstanding the separate factors summarized below, Davenport believes that its analyses must be considered as a whole and that selecting portions of its analyses and the factors considered by it, without considering all analyses and factors, could create an incomplete or misleading view of the evaluation process underlying its opinion.
21
Table of Contents
In performing its analyses, Davenport made numerous assumptions with respect to industry performance, general business, economic and market conditions and other matters, many of which are beyond the control of Bank Building and Carter Bank. The projections and other information used in the analyses performed by Davenport are not necessarily indicative of actual values or future results, which may be significantly more or less favorable than suggested by the projections and other information used in the analyses, and the results of such analyses.
Transaction Summary. Davenport reviewed the terms of the merger agreement. The merger agreement provides that the parties will conduct an appraisal of the real property assets of Bank Building within 45 days of the date of the merger agreement. In connection with the merger, each issued and outstanding share of Bank Building common stock shall be converted into and become that number of shares of Carter Bank common stock equal to the greater of (i) 2.255 or (ii) the Equity Value (as defined below) divided by 398,244 shares and then dividing the per share result by $9.25. “Equity Value” is defined as (i) 97% of the aggregate amount of the appraised values of the owned real property of Bank Building (the “Appraised Value”), plus (ii) the amount of non-real estate assets, minus (iii) the amount of total liabilities and two-thirds of the Deferred Tax Amount (as defined below).
For purposes of the Appraised Value, the parties agreed to have the banking properties appraised on a third party sale basis without consideration of the existing lease terms. The parties agreed to this methodology because the existing leases will automatically be extinguished by law upon completion of the merger. Both parties believe that the rents pursuant to the existing leases represent below market rents in today’s market and, accordingly, using this appraisal methodology will result in a higher value than would otherwise be the case. “Deferred Tax Amount” is defined as 35% of the amount by which the Appraised Value exceeds Bank Building’s tax basis in its real property. Davenport noted that using the minimum exchange ratio of 2.255 results in a value of $20.86 per Bank Building share, using the $9.25 per share value for Carter Bank common stock.
Valuation Analysis. To provide contextual valuation information, Davenport performed a variety of valuation analyses on the real estate owned by Bank Building to provide an estimated range as to the value of the real property owned by Bank Building. Davenport also analyzed the resulting exchange ratios and per share prices for Bank Building, based on those estimates. In its valuation analysis, Davenport used three methodologies to arrive at estimated values for the real estate owned by Bank Building: (i) the tax-assessed value of the properties; (ii) a market-adjusted, tax-assessed value of the properties; and (iii) a present value analysis of the cash flows generated by each of the property’s leases and the terminal cash flows generated from the eventual sales of properties.
For the tax-assessed value of the real estate, the analysis used the most recent tax-assessed values of each of the properties, as determined by the specific taxing authority for each of Bank Building’s properties. The tax-assessed value of the properties owned by Bank Building was $41.4 million.
For the market-adjusted, tax-assessed value, Davenport adjusted the tax-assessed values for each property owned by Bank Building based on the historical published relationship between the prices of reported property sales in each locality versus the tax-assessed value of the property at the time of the sale. The market-adjusted, tax-assessed value of the properties owned by Bank Building totaled $46.5 million.
In its present value analysis, Davenport estimated the present value of the current and future lease payments associated with each of the Bank Building bank properties and estimated the present value of the terminal value of each property, assuming a sale of the property at the end of the lease term. For the present value analysis, the lease payments were discounted at 5.50% and the terminal values were discounted at rates ranging from 9.0% to 13.0%. The terminal value was calculated by increasing the market-adjusted, tax-assessed value for each property at annual appreciation rates ranging from 2.0% to 4.0% for the remaining term of the lease applicable to each property. For the four commercial properties owned by Bank Building, Davenport applied capitalization rates ranging from 9.0% to 11.0% to the estimated annual net operating income generated by the commercial properties. Using the midpoints of values generated by the range of discount rates and capitalization rates discussed above, and adding the tax-assessed value of other undeveloped land of approximately $775,000, resulted in a total value of the properties owned by Bank Building of $45.8 million in this analysis.
22
Table of Contents
The following table summarizes the resulting exchange ratios per Bank Building share when using the values of the properties estimated through the three methodologies described above. Bank Building’s book value as of September 30, 2007 also is included in the table for comparison.
| Real Estate Valuation Method | ||||||||||||||||
| Tax-assessed Values | Market-Adjusted Values | Present Value Analysis | Book Value | |||||||||||||
| (In thousands, except per share amounts and exchange ratio) | ||||||||||||||||
Owned Real Estate | $ | 41,387 | $ | 46,520 | $ | 45,790 | $ | 31,378 | ||||||||
Less 3% Discount | (1,242 | ) | (1,396 | ) | (1,374 | ) | — | |||||||||
Appraised Value | 40,145 | 45,125 | 44,417 | 31,378 | ||||||||||||
Other Assets | 308 | 308 | 308 | 308 | ||||||||||||
Total Liabilities | (30,102 | ) | (30,102 | ) | (30,102 | ) | (30,102 | ) | ||||||||
Net Asset Value | 10,352 | 15,332 | 14,624 | 1,585 | ||||||||||||
Deferred Tax Amount | (2,046 | ) | (3,208 | ) | (3,042 | ) | — | |||||||||
Equity Value | $ | 8,306 | $ | 12,124 | $ | 11,581 | $ | 1,585 | ||||||||
Shares outstanding | 398.2 | 398.2 | 398.2 | 398.2 | ||||||||||||
Purchase Price/Share | $ | 20.86 | $ | 30.44 | $ | 29.08 | $ | 3.98 | ||||||||
Carter Bank Stock Price | $ | 9.25 | $ | 9.25 | $ | 9.25 | $ | 9.25 | ||||||||
Exchange Ratio | 2.255 | x | 3.291 | x | 3.144 | x | 0.430 | x | ||||||||
Liquidation Analysis. In addition, Davenport provided a comparison between the estimated value to be received by Bank Building stockholders in an asset sale and liquidation of Bank Building versus what would be received in the merger, assuming in both scenarios that the value of the property owned by Bank Building were equal to its tax-assessed values. The sale and liquidation analysis assumed: (i) 6% selling and liquidation costs; (ii) 40% combined federal and state corporate income tax rate for Bank Building; (iii) 20% combined federal and state capital gains tax rate for stockholders of bank Building and (iv) no tax basis in the shares of Bank Building. The analysis resulted in a total value to the Bank Building stockholders of $4.9 million under the sale and liquidation scenario versus $8.3 million in the merger scenario ($6.6 million if the shares of Carter Bank are sold immediately after their receipt in the merger). A summary of the analysis is provided in the following table.
| Asset Sale | Merger | |||||||
| (Dollars in thousands) | ||||||||
Gross Sales Price | $ | 41,386 | $ | 41,386 | ||||
Less Selling Costs (6%/3%) | (2,483 | ) | (1,242 | ) | ||||
Less Deferred Tax Amount (1) | — | (2,045 | ) | |||||
Net Sales Proceeds | 38,903 | 38,099 | ||||||
Less Debt | (29,801 | ) | (29,801 | ) | ||||
Add Other Assets, Net of Liabilities | 8 | 8 | ||||||
Stockholder Value Before Corporate Taxes | 9,110 | 8,306 | ||||||
Corporate Taxes (2) | (3,010 | ) | NA | |||||
Stockholder Distribution | $ | 6,100 | $ | 8,306 | ||||
Value Received by Stockholders | 6,100 | 8,306 | ||||||
Less Stock Basis of Stockholders (assumed at zero) | — | — | ||||||
Stockholder Gain | 6,100 | 8,306 | ||||||
Less Stockholder Long-term Capital Gains Tax at 20% | (1,220 | ) | NA | |||||
Net After Tax Value to Stockholders | $ | 4,880 | $ | 8,306 | ||||
Built-in Gain Remaining | 8,306 | |||||||
Less Stockholder Long-term Capital Gains Tax at 20% | (1,661 | ) | ||||||
Net After Tax Value to Stockholders Upon Sale of Carter Bank Shares | $ | 6,645 | ||||||
23
Table of Contents
| (1) | As defined in the merger agreement |
| (2) | Calculation of Corporate Tax |
Net Sales Proceeds | $ | 38,903 | ||
Less Net Book Value | 31,378 | |||
Net Gain | 7,525 | |||
Combined Corporate Tax Rate | 40 | % | ||
Corporate Income Taxes | $ | 3,010 | ||
Analysis of Certain Other Publicly Traded Companies. To provide contextual data and comparative market information, Davenport compared selected financial information for Carter Bank to the corresponding publicly available information of certain other peer group companies whose securities are publicly traded. The peer group companies were chosen because they possess general business, operating and financial characteristics representative of companies in the region and the industry in which Carter Bank operates. The peer group companies were comprised of Virginia banks with total assets between $750 million and $2.5 billion. The peer group companies were: Burke & Herbert Bank & Trust Company, C&F Financial Corporation, Cardinal Financial Corporation, Commonwealth Bankshares, Inc., Eastern Virginia Bankshares, Inc., First Community Bankshares, Inc., FNB Corporation, Gateway Financial Holdings, Inc., Middleburg Financial Corporation, National Bankshares, Inc., Old Point Financial Corporation, TowneBank, Union Bankshares Corporation, Virginia Commerce Bancorp, Inc and Virginia Financial Group, Inc.
To perform this analysis, Davenport used the most recent financial information and the market price information available for each of the peer group companies. The following table summarizes the relevant financial and market data items for Carter Bank and the peer group.
| Carter Bank (1) | Peer Median (2) | |||||
Financial Data: | ||||||
Total Assets ($ in millions) | 2,568.8 | 1,515.7 | ||||
ROAA (%) | 0.55 | 1.06 | ||||
ROAE (%) | 4.9 | 10.8 | ||||
Net Interest Margin (%) | 2.77 | 3.88 | ||||
Efficiency Ratio (%) | 68.5 | 64.3 | ||||
Nonperforming Assets/Assets (%) | 1.18 | 0.18 | ||||
Net Charge Offs/Average Loans (%) | 0.01 | 0.05 | ||||
Reserves/Loans (%) | 0.95 | 1.06 | ||||
Market Data: | ||||||
Market Value ($ in millions) | 221.2 | 173.4 | ||||
Price/LTM Earnings | 15.8 | x | 12.1 | x | ||
Price/Tangible Book (%) | 126.2 | 154.9 | ||||
Price/Book (%) | 75.7 | 118.8 | ||||
Current Dividend Yield (%) | 4.52 | 3.29 | ||||
Davenport also reviewed Carter Bank’s stock price performance in 2007, and noted that Carter Bank’s stock price had ranged from a high of $14.20 on April 9, 2007 to a low of $8.85 on December 31, 2007. The closing price of Carter Bank’s stock was $9.00 on January 7, 2008.
Pro Forma Financial Impact - Accretion/Dilution Analyses.Based on the minimum exchange ratio of 2.255 shares of Carter Bank common stock for each share of Bank Building common stock, Davenport calculated the pro forma per share financial consequences reflecting the merger on each company’s 2007 year-to-date (through September 30, 2007) earnings per share, book value per share, tangible book value per share and dividend per share. The analysis assumed pre-tax cost synergies of $242,000 for the year-to-date period ended September 30, 2007. This information is presented in the following tables.
24
Table of Contents
| As of and for the periods ended September 30, 2007 | ||||||||||||
| Per Share Values | Accretion/Dilution | |||||||||||
| Bank Building | Pro Forma Equivalent | Bank Building | Carter Bank | |||||||||
EPS | $ | 0.50 | $ | 0.94 | 89.7 | % | 0.1 | % | ||||
Book Value per Share | $ | 3.98 | $ | 26.17 | 557.4 | % | (0.7 | )% | ||||
Tangible Book Value per Share | $ | 3.98 | $ | 17.75 | 346.1 | % | 0.1 | % | ||||
Dividends per Share | $ | 0.00 | $ | 0.68 | Infinite | 0.0 | % | |||||
Other Analyses. Davenport also reviewed the balance sheet composition, historical financial results, historical stock performance, current and historical stock pricing multiples and stock liquidity for Carter Bank.
Other.In the ordinary course of its business as a broker-dealer, Davenport may, from time to time, purchase securities from, and sell securities to, Carter Bank. As a market maker in securities, Davenport may from time to time have a long or short position in, and buy or sell, equity securities of Bank Building and Carter Bank for Davenport’s own account or for the accounts of its customers.
Fees. Bank Building and Davenport have entered into an agreement relating to the services provided by Davenport in connection with the transaction. Bank Building has agreed to pay Davenport a total a fee of $95,000 in connection with the merger of which $60,000 has been invoiced and the balance of which is contingent, and payable, upon closing of the merger. According to the terms of the agreement between Bank Building and Davenport, Davenport invoiced $25,000 upon the signing of the engagement letter with Bank Building and invoiced an additional $35,000 upon issuance of the fairness opinion. Bank Building has also agreed to reimburse Davenport for reasonable out-of-pocket expenses incurred in connection with its engagement and to indemnify Davenport and certain related persons against certain liabilities in connection with its engagement, including liabilities under the federal securities laws.
The terms of the fee arrangement with Davenport, which Davenport and Bank Building believe are customary in transactions of this nature, were negotiated at arm’s length between Bank Building and Davenport, and Bank Building’s board was aware of such arrangement. In the past two years, Davenport has had no material relationship with Bank Building unrelated to the Merger. However, in the past two years, Davenport has provided financial advisory services to the predecessors of Carter Bank that were unrelated to the merger, and for which Davenport received compensation.
On January 14, 2008, Bank Building and Carter Bank engaged Integra to conduct appraisals of the 46 bank branch building real estate assets of Bank Building. The representatives of Integra responsible for conducting the appraisals are members of the Appraisal Institute and experienced in appraising real estate assets owned or leased as bank branches. The parties engaged another real estate appraiser to conduct appraisals of the four commercial properties owned by Bank Building as well as the four unimproved lots adjacent to four of the bank branches.
A summary of the values determined by the real estate appraisals is included in this proxy statement asAnnex C and is incorporated herein by reference.
Each share of common stock of Bank Building will be converted in the merger into the right to receive 2.255 shares of common stock of Carter Bank.4
The amount and nature of the merger consideration reflects the balancing of a number of factors and was established by negotiations between the board of directors of Bank Building, with the assistance of Davenport, and Carter Bank, with the assistance of Boxwood. In addition, Davenport has rendered its opinion to the board of
| 4 | Explanatory Note: The minimum exchange ratio is 2.255 and is subject to upward adjustment pursuant to an appraisal of the real estate assets of Bank Building. The final exchange ratio will be included in this proxy statement prior to mailing to the Bank Building stockholders. |
25
Table of Contents
directors of Bank Building as to the fairness of the merger consideration, from a financial point of view, to the stockholders of Bank Building. The amounts of the merger consideration reflect a number of strategic, business and economic factors that the parties concluded were appropriate. See “Background of the Merger; Board Recommendations and Reasons for the Merger” beginning on page [ ]. The parties have structured the merger, in part, to have the favorable tax attributes of a “reorganization” for federal income tax purposes. See “Certain Federal Income Tax Consequences of the Merger” beginning on page [ ].
Bank Building cannot assure its stockholders that the current fair market value of the common stock of Bank Building will be equivalent to the fair market value of common stock of Carter Bank on the effective date of the merger.
Manner and Basis of Converting Shares; Procedure; No Fractional Shares; Effect on Certificates
After the effective date of the merger, transmittal forms and exchange instructions will be mailed to each holder of the common stock of Bank Building. The transmittal forms will be used to surrender and exchange certificates formerly evidencing shares of Bank Building’s common stock for certificates representing shares of Carter Bank common stock and cash in lieu of fractional shares to which such holder has become entitled. After receipt of such transmittal forms, each holder of certificates formerly representing Bank Building’s common stock will be able to surrender such certificates to the Exchange Agent, and each such holder will receive in exchange therefor certificates evidencing the number of whole shares of Carter Bank common stock to which such holder is entitled and any cash which may be payable in lieu of a fractional share of Carter Bank common stock.Stockholders should not send in their certificates until they receive a transmittal form and instructions.
Each holder of shares of common stock exchanged pursuant to the merger who would otherwise have been entitled to receive a fraction of a share of Carter Bank common stock shall receive, in lieu thereof, cash (without interest) in an amount equal to the product of (i) such fractional part of a share of the common stock of Carter Bank multiplied by (ii) $9.25, which has been determined by the board of directors of Carter Bank to be the fair value of a share of Carter Bank common stock for fractional shares.
After the effective time of the merger, each certificate formerly representing Bank Building’s common stock, until so surrendered and exchanged, will evidence only the right to receive, the number of whole shares of Carter Bank common stock that the holder is entitled to receive in the merger, any cash payment in lieu of a fractional share of Carter Bank common stock and any dividend or other distribution with respect to Bank Building’s common stock with a record date prior to the effective time of the merger. After [ , 2008], or such other date set by the board of directors of Carter Bank, the holder of such unexchanged certificate will not be entitled to receive any dividends or distributions payable by Carter Bank until the certificate for the old Bank Building shares has been exchanged. Subject to applicable laws, following surrender of such certificates, such dividends and distributions, together with any cash payment in lieu of a fractional share of Carter Bank common stock, will be paid without interest.
Resales of Carter Bank Common Stock
The shares of Carter Bank common stock to be issued to stockholders of Bank Building under the merger agreement may be freely traded without restriction by holders after the merger. Carter Bank is a “bank” as defined in the Securities Act of 1933, as amended (the “Securities Act”), and as such is exempt from registering its shares of common stock for sale or exchange under Section 3(a)(2) of the Securities Act.
Interests of Certain Persons in the Merger
Bank Building’s executive officers do not have interests in the merger in addition to their interests as stockholders of Bank Building and as stockholders of Carter Bank. For a detailed description of the interests of directors and management as stockholders of Bank Building and Carter Bank see “Security Ownership of Certain Beneficial Owners and Management” on pages [ ]. The executive officers of Bank Building do not have and do not participate in employment agreements, noncompete agreements, stock option plans, warrants or other equity based compensation arrangements or plans. The executive officers of Bank Building receive no salary or benefits from Bank Building. All five members of Bank Building’s board of directors are also members of the board of directors of Carter Bank. Worth Harris Carter, Jr., the Chairman of the Board and President of Bank Building, is also the Chairman of the Board and President of Carter Bank.
26
Table of Contents
Bank Building has no paid officers, directors or employees, and everyone currently serving as an executive officer or director of Bank Building also serves as an officer or director of Carter Bank. As a result of the merger, the officers, directors and employees of Carter Bank will remain unchanged and the executive officers and directors of Bank Building will no longer serve in such capacity. Bank Building has no employee benefit plans. All of Bank Building’s accounting, record keeping and other operational needs are currently provided by a subsidiary of Carter Bank on a fee for services basis.
The principal business activity of Bank Building is to acquire and develop property for lease as bank offices to Carter Bank. At September 30, 2007, December 31, 2006 and 2005, Bank Building had outstanding mortgage loans with Carter Bank totaling $28.0 million, $28.8 million and $29.8 million, respectively. Bank Building is directly obligated on these loans. Principal payments on these loans were $871,259 for the nine months ended September 30, 2007 and $968,464 for 2006 and $985,132 for 2005. The loan transactions between Carter Bank and Bank Building were made on terms substantially the same as those prevailing at the time for comparable loans with other persons and did not involve more than normal risk of collectability or present other unfavorable features.
Bank Building leases 46 branches to Carter Bank. Aggregate rental expense under these leases was $2.0 million for the nine months ended September 30, 2007 and $2.6 million in 2006. Future minimum lease payments to Bank Building and from Carter Bank will be approximately $3.7 million per year through 2010 and thereafter totaling $18.2 million (this figure may vary based on changing interest rates).
In the ordinary course of business, Carter Bank’s and Bank Building’s respective directors and executive officers and their related interests were customers of, and had transactions with Carter Bank. Loan transactions with directors and officers, principal security holders and associates were made on substantially the same terms as those prevailing at the time for comparable loans to other persons and did not involve more than normal risk of collectability or present other unfavorable features. These extensions of credit equaled $14.9 million, or 5% of the equity capital of Carter Bank as of December 31, 2006 and $13.0 million or 4.5% of the equity capital of Carter Bank as of September 30, 2007.
Troutman Sanders serves as regular outside counsel to both Bank Building and Carter Bank. Troutman Sanders advised Bank Building in connection with the MacKenzie tender offer and served as outside legal advisor to Carter Bank in connection with the merger and the negotiation of the merger agreement.
Davenport has acted as financial advisor to Carter Bank in the past, including serving as financial advisor in connection with the Bank Merger. See “Opinion of Bank Building’s Financial Advisor.”
The boards of directors of Bank Building and Carter Bank considered these facts, among other matters, in approving the merger agreement and the transactions contemplated thereby.
Management and Operations after the Merger
Board of Directors and Management. The board of directors and officers of Carter Bank upon consummation of the merger will continue to consist of its current directors and officers.
Articles of Incorporation and Bylaws. The articles of incorporation and bylaws of Carter Bank will not change as a result of the merger.
Banking Approvals. The merger and the other transactions contemplated by the merger agreement require separate notices to be filed with the Federal Deposit Insurance Corporation (the “FDIC”) and the Virginia State Corporation Commission (the “SCC”). Carter Bank and Bank Building have filed all required notices and related documentation with the FDIC and the SCC.
27
Table of Contents
While the merger does not require regulatory approval, the continued ownership by Carter Bank of real estate assets not used in the business of banking, and the structure used for the continued ownership of those assets, is subject to the ongoing approval by the FDIC and compliance with applicable federal and state banking laws and regulations.
Neither Bank Building nor Carter Bank is aware of any governmental approvals or actions that may be required for the consummation of the merger other than as described above. Should any other approval or action be required, it is presently contemplated that such approval or action would be sought. There can be no assurance that any necessary regulatory approvals or actions will be timely received or taken, that no action will be brought challenging such approval or action or, if such a challenge is brought, as to the result thereof, or that any such approval or action will not be conditioned in a manner that would cause the parties to abandon the merger.
Virginia Affiliated Transactions Statute
Article 14 of Chapter 9 of Title 13.1 of the Virginia Stock Corporation Act (the “VSCA”) contains provisions governing Affiliated Transactions. “Affiliated Transactions” include: (i) any merger or share exchange with an interested stockholder; (ii) the transfer to any interested stockholder of corporate assets with a fair market value greater than 5% of the corporation’s consolidated net worth; (iii) the issuance to any interested stockholder of voting shares with a fair market value greater than 5% of the fair market value of all outstanding voting shares of the corporation; (iv) any reclassification of securities or corporate reorganization that will have the effect of increasing by 5% or more the percentage of the corporation’s outstanding voting shares held by any interested stockholder; and (v) any plan or proposal for dissolution of the corporation proposed by or on behalf of any interested stockholder. For purposes of the VSCA, an “Interested Stockholder” is defined as any beneficial owner of more than 10% of any class of the voting securities of a Virginia corporation.
Subject to certain exceptions discussed below, the provisions governing Affiliated Transactions require that, for three years following the date upon which any stockholder becomes an Interested Stockholder, a Virginia corporation cannot engage in an Affiliated Transaction with such Interested Stockholder. This prohibition is subject to the approval of the Affiliated Transaction by the affirmative vote of the holders of two-thirds of the voting shares of the corporation, other than the shares beneficially owned by the Interested Stockholder, and by a majority (but not less than two) of the Disinterested Directors. A “Disinterested Director” means, with respect to a particular Interested Stockholder, a member of a corporation’s board of directors who (i) was a member before the later of January 1, 1988 and the date on which an Interested Stockholder became an Interested Stockholder or (ii) was recommended for election by, or was elected to fill a vacancy and received the affirmative vote of, a majority of the Disinterested Directors then on the board. At the expiration of the three-year period, these provisions require approval of Affiliated Transactions by the affirmative vote of the holders of two-thirds of the voting shares of the corporation, other than those beneficially owned by the Interested Stockholder, or require either that the transaction be approved by a majority of the Disinterested Directors or that the transaction satisfy certain fair price requirements of the statute. In general, the fair price requirements provide that the stockholders must receive the highest per share price for their shares as was paid by the Interested Stockholder for his shares or the fair market value of their shares, whichever is higher. They also require that, during the three years preceding the announcement of the proposed Affiliated Transaction, all required dividends have been paid and no special financial accommodations have been accorded the Interested Stockholder unless approved by a majority of the Disinterested Directors.
None of the foregoing limitations and special voting requirements applies to an Affiliated Transaction with an Interested Stockholder whose acquisition of shares making such person an Interested Stockholder was approved by a majority of the corporation’s Disinterested Directors or if the person became an Interested Stockholder on the date that the corporation first had 300 stockholders of record. In addition, after the expiration of three years from the date that a person became an Interested Stockholder, an Affiliated Transaction may be approved by a majority of the corporation’s Disinterested Directors. Based on the foregoing, the board of directors of Bank Building has determined that the merger agreement, the merger and the transactions contemplated thereby are not subject to the Affiliated Transactions statute.
Control Share Acquisitions Statute
The VSCA also contains a “control share acquisitions statute” which provides that shares of a publicly held Virginia corporation that are acquired in a “control share acquisition” generally will have no voting rights unless
28
Table of Contents
such rights are conferred on those shares by a majority vote of all outstanding shares other than those held by the acquiring person or any officer or employee director of the corporation. A control share acquisition is defined, with certain exceptions, as the acquisition of the beneficial ownership of voting shares which would cause the acquirer to have voting power within the following ranges or to move upward from one range into another: (i) 20% to 33%; (ii) 331/3% to 50%; or (iii) more than 50%, of such votes. Since no person will be acquiring any shares of Bank Building common stock in connection with the merger, the control share acquisition statute is not applicable to the merger agreement, the merger or the transactions contemplated thereby.
Generally accepted accounting standards require that all business combinations be accounted for by the “purchase” method of accounting; therefore, the merger will be accounted for in this manner. Under the purchase method of accounting, the assets and liabilities of Bank Building, as of the completion of the merger, will be recorded at their fair values and the excess of purchase price over the fair value of net assets will be allocated to goodwill. Financial statements of Carter Bank issued after the consummation of the merger will reflect such values and will not be restated retroactively to reflect the historical position or results of operations of Bank Building. The operating results of Bank Building will be reflected in Carter Bank’s financial statements from and after the date the merger is consummated.
Stockholders of Bank Building will have appraisal rights in connection with the merger as provided under the VSCA. Pursuant to Section 13.1-730 of the VSCA, a stockholder may dissent to a merger and receive cash for the value of shares held by the stockholder. Any stockholder seeking appraisal rights must follow the process described under the VSCA. The VSCA provides that each share of Bank Building common stock issued and outstanding immediately prior to the effective date of the merger that is held by stockholders who have not voted in favor of the merger or consented thereto in writing and who shall have demanded appraisal for such shares in writing in accordance with Virginia law will not be converted into or represent the right to receive the merger consideration. Such shares will instead be cancelled and will represent only the right to receive payment of the appraised value of such shares held by them in accordance with Virginia law, except that all shares held by stockholders who have failed to perfect or who effectively have withdrawn or lost their rights to appraisal of such shares of Bank Building common stock under Virginia law will thereupon be deemed to have been converted into and to have become exchangeable, as of the effective time, for the right to receive the merger consideration upon surrender of the certificate or certificates that evidenced such shares.
In addition, the cash received for shares by dissenting stockholders instead of stock in Carter Bank will be taxable to the stockholders. Stockholders who do not elect their appraisal rights and, therefore, receive stock in Carter Bank will not be subject to federal and/or state income tax in connection therewith, except for cash paid for fractional shares.
THE FOREGOING SUMMARY OF THE RIGHTS OF DISSENTING STOCKHOLDERS UNDER THE VSCA DOES NOT PURPORT TO BE A COMPLETE STATEMENT OF THE PROCEDURES TO BE FOLLOWED BY STOCKHOLDERS DESIRING TO EXERCISE ANY APPRAISAL RIGHTS AVAILABLE UNDER THE VSCA. THE PRESERVATION AND EXERCISE OF APPRAISAL RIGHTS REQUIRE STRICT ADHERENCE TO THE APPLICABLE PROVISIONS OF THE VSCA. A COPY OF SECTION 13.1-730 OF THE VSCA IS ATTACHED ASANNEX D OF THIS PROXY STATEMENT AND THE FOREGOING SUMMARY IS QUALIFIED IN ITS ENTIRETY BY REFERENCE TOANNEX D. THE FOREGOING DESCRIPTION OF CERTAIN PROVISIONS OF THE VSCA IS NOT NECESSARILY COMPLETE AND IS QUALIFIED IN ITS ENTIRETY BY REFERENCE TO THE VSCA.
29
Table of Contents
PROPOSAL II - ADJOURNMENT OF THE MEETING
With respect to Bank Building’s special meeting, in the event that there are not sufficient votes to constitute a quorum or approve the matters to be considered at the time of the special meeting, the merger agreement could not be approved unless such special meeting was adjourned to a later date or dates in order to permit further solicitation of proxies. In order to allow proxies that have been received at the time of the meeting to be voted for an adjournment, if necessary, Bank Building has submitted the question of adjournment to its stockholders as a separate matter for their consideration. The board of directors of Bank Building unanimously recommends that its stockholders vote “FOR” the adjournment proposal. If it is necessary to adjourn the meeting, no notice of such adjourned meeting is required to be given to Bank Building’s stockholders, other than an announcement at the special meeting of the place, date and time to which the meeting is adjourned, if the meeting is adjourned for 30 days or less.
The board of directors of Bank Building recommend that you vote “FOR” approval of this proposal.
30
Table of Contents
This section of the proxy statement describes the material provisions of the merger agreement but does not purport to describe all of the terms of the merger agreement. The following summary is qualified in its entirety by reference to the complete text of the merger agreement, which is attached asAnnex A to this proxy statement and incorporated into this proxy statement by reference. Bank Building urges you to read the merger agreement in its entirety because it is the primary legal document that governs the merger.
The merger agreement has been included to provide information regarding the terms of the merger. Except for its status as the contractual document that establishes and governs the legal relations between Carter Bank and Bank Building with respect to the merger, the merger agreement is not intended to be a source of factual, business or operational information about Carter Bank and Bank Building.
The merger agreement contains representations and warranties that Bank Building and Carter Bank made to each other as of the date of the merger agreement or other specific dates, and such representations and warranties should not be relied upon by any other person. The assertions embodied in those representations and warranties were made solely for purposes of the contract between Bank Building and Carter Bank and are subject to important qualifications and limitations agreed to by Bank Building and Carter Bank in connection with negotiating the merger agreement. Accordingly, stockholders should not rely on the representations and warranties as accurate or complete or characterizations of the actual state of facts as of any specified date since they are modified in important part by the underlying disclosure schedules which are not filed publicly and which are subject to a contractual standard of materiality different from that generally applicable to stockholders and were used for the purpose of allocating risk between Bank Building and Carter Bank rather than establishing matters as facts.
The merger agreement provides for the merger of Bank Building with and into Carter Bank upon the terms, and subject to the conditions, of the merger agreement. Carter Bank will be the surviving corporation. The separate corporate existence of Bank Building will terminate as of the effective time of the merger. The merger will be effective upon the issuance of a certificate of merger by the SCC, or at such later time reflected in the articles of merger as agreed to by Carter Bank and Bank Building. Bank Building expects to complete the merger as promptly as practicable after its stockholders approve the merger agreement.
Bank Building or Carter Bank may terminate the merger agreement before the completion of the merger in certain circumstances, whether before or after the approval of the merger by the Bank Building stockholders. Additional details on the termination of the merger agreement are described in “Termination of the Merger Agreement.”
The merger agreement provides that the parties will conduct an appraisal of the real property assets of Bank Building within 45 days of the date of the merger agreement. The “Appraised Value” is defined to mean 97% of the aggregate of the appraisals of the real property of Bank Building. In connection with the merger, each issued and outstanding share of Bank Building common stock shall be converted into and become that number of shares of Carter Bank common stock equal to the greater of (i) 2.255 or (ii) the number that is derived by taking the Appraised Value plus the assets of Bank Building other than real estate less the total liabilities of Bank Building less two-thirds of the Deferred Tax Amount and dividing the resulting number by 398,244 and then dividing the per share result by $9.25. The “Deferred Tax Amount” is defined to mean 35% of the amount that the Appraised Value exceeds Bank Building’s current tax basis in its real property.
After the merger is effective, each holder of Bank Building common stock at the time of the completion of the merger, will no longer have any rights with respect to the shares, except for the right to receive the merger consideration. Each certificate previously evidencing shares of Bank Building common stock after conversion will thereafter be deemed for all purposes to evidence ownership of and to represent the number of shares of Carter Bank common stock into which such shares will have been converted. Shares held directly or indirectly by Bank Building or any of its wholly owned subsidiaries or by Carter Bank will be canceled at the effective time of the merger.
31
Table of Contents
No certificates or scrip representing fractional shares of Carter Bank common stock will be issued, and no holder of shares of Bank Building common stock will be entitled to any voting rights, rights to receive any dividends or distributions or other rights as a stockholder of Carter Bank that would otherwise be issued as fractional shares to such stockholder. In lieu of any fractional shares of stock that would otherwise be issued, each stockholder that would have been entitled to receive a fractional share of Carter Bank common stock will, upon proper surrender of such person’s stock certificates representing Bank Building common stock, receive a cash payment equal to such fraction multiplied by $9.25, which has been determined by the board of directors of Carter Bank to be the fair value of a share of Carter Bank common stock for fractional shares.
Each share of Bank Building common stock issued and outstanding immediately prior to the effective time that is held by stockholders who have not voted in favor of the merger or consented thereto in writing and who have demanded appraisal for such shares in writing in accordance with Section 13.1-730 of the VSCA will not be converted into or represent the right to receive the merger consideration. Such shares will instead be cancelled and will represent only the right to receive payment of the appraised value of such shares held by them in accordance with the VSCA, except that all shares held by stockholders who have failed to perfect or who effectively have withdrawn or lost their rights to appraisal of such shares of Bank Building’s common stock under the VSCA will thereupon be deemed to have been converted into and to have become exchangeable, as of the effective time, for the right to receive the merger consideration upon surrender of the certificate or certificates that evidenced such shares.
Articles of Incorporation and Bylaws
Upon completion of the merger, the articles of incorporation and bylaws of Carter Bank in effect immediately prior to the effective time will be the articles of incorporation of Carter Bank.
Upon completion of the merger, the directors and officers of Carter Bank immediately prior to the effective time will be the directors and officers of Carter Bank.
At or prior to the completion of the merger, Carter Bank will designate a transfer agent to receive surrendered certificates representing shares of Bank Building common stock and to issue the merger consideration in exchange therefor. Carter Bank will deposit with the transfer agent stock certificates representing shares of Carter Bank common stock and funds appropriate to pay the merger consideration to Bank Building stockholders.
As of the effective time of the merger, Bank Building’s stock ledger with respect to its common stock will be closed and after that time there will be no transfer of Bank Building common stock on the stock transfer books of Bank Building.
Upon surrender of any certificate with a duly completed and validly executed letter of transmittal, the holder of such certificate will be entitled to receive the merger consideration in respect thereof.
Promptly following the effective time, the Exchange Agent will send the Bank Building stockholders a letter of transmittal and instructions advising the stockholders of the procedure to surrender their certificates representing their shares of common stock of Bank Building in exchange for the merger consideration. The Exchange Agent will send each stockholder the merger consideration after the stockholder has (1) surrendered their certificates to the Exchange Agent and (2) provided to the Exchange Agent a signed and completed letter of transmittal and any other items specified by the letter of transmittal. Interest will not be paid or accrue in respect of the merger consideration. Carter Bank will reduce the amount of any merger consideration paid to the stockholders by any applicable withholding taxes.Stockholders should not forward their stock certificates to the Exchange Agent without a letter of transmittal, and they should not return their stock certificates with the enclosed proxy.
32
Table of Contents
The transmittal instructions will tell stockholders what to do if they have lost their certificate, or if it has been stolen or destroyed. Stockholders will have to provide an affidavit to that fact and, if required by Carter Bank, post a bond in an amount that Carter Bank reasonably directs as indemnity against any claim that may be made against it in respect of the certificate.
Representations and Warranties
In the merger agreement, Bank Building and Carter Bank each made representations and warranties relating to, among other things:
| • | corporate organization and existence; |
| • | corporate power and authority to enter into and perform obligations under, and enforceability of, the merger agreement; |
| • | capital structure; |
| • | the absence of conflicts with or defaults under organizational documents, debt instruments, other contracts and applicable laws and judgments; |
| • | required regulatory filings and consents and approvals of governmental entities; |
| • | the accuracy of certain documents filed with the SEC or FDIC, as applicable, since December 31, 2006, that each party’s financial statements fairly present such party’s consolidated financial position and the absence of undisclosed liabilities; |
| • | the absence of certain material adverse changes or events since September 30, 2007; |
| • | the absence of cease and desist orders, decrees, agreements, memoranda of understanding or similar arrangements with governmental authorities; |
| • | the absence of material litigation; |
| • | regulatory approvals; |
| • | labor relations; |
| • | tax matters; |
| • | title to properties and assets; |
| • | insurance matters; |
| • | compliance with environmental laws and regulations; |
| • | broker’s fees; |
| • | information supplied for inclusion in this proxy statement; |
| • | material contracts; |
| • | intellectual property matters; |
| • | state takeover provisions; |
| • | corporate record books and minute books; and |
| • | affiliated transactions. |
In the merger agreement, Carter Bank also made representations and warranties relating to, among other things:
| • | the filing of reports and statements with governmental authorities; |
| • | compliance with the Employee Retirement Income Securities Act of 1974, as amended, and other employee benefit matters; |
| • | investment securities; and |
| • | loans, other real estate owned and allowance for loan losses. |
Bank Building also made representations and warranties relating to, among other things:
| • | the absence of paid employees; and |
| • | the vote required by its stockholders to approve and adopt the merger agreement. |
33
Table of Contents
Conduct of Business Pending the Merger
Bank Building has agreed in the merger agreement that, until the effective date of the merger, unless contemplated or permitted by the merger agreement or as approved in writing by Carter Bank, Bank Building will operate its business substantially as presently operated and only in the ordinary course and in a manner consistent with past practice and use its best efforts to preserve intact its relationships with those having business dealings with Bank Building. In addition, Bank Building has agreed that it will not:
| • | make any change in its authorized capital stock or issue or sell any shares of its capital stock or issue any securities convertible into or exchangeable for options or warrants to purchase any shares of its capital stock, nor purchase, redeem or otherwise acquire any of its outstanding shares of capital stock; |
| • | voluntarily make any changes in the composition of its officers, directors or other key management personnel; |
| • | make any change in the compensation or title of any executive officer or director or make any change in the compensation or title of any other person; |
| • | enter into any employee benefit plan or any employment, retention, change in control or consulting agreement; |
| • | incur any obligation or liability, make any pledge, or encumber any of its assets, nor dispose of any of its assets in any other manner, except in the ordinary course of business and for adequate value, or as otherwise specifically permitted in the merger agreement; |
| • | knowingly waive any right to substantial value; |
| • | enter into material transactions otherwise than in the ordinary course of its business; |
| • | alter, amend or repeal its articles of incorporation or bylaws; or |
| • | propose or take any other action that would make any of its representations or warranties under the merger agreement untrue. |
Efforts to Complete the Merger
In the merger agreement, Bank Building has agreed to a number of additional agreements, including agreements relating to:
| • | obtaining appraisals for all of its owned real property by disinterested appraisers; |
| • | calling a meeting of its stockholders to vote on the merger proposal; |
| • | recommending, through its board of directors, that its stockholders approve the merger agreement; |
| • | mailing this proxy statement to its stockholders and taking all reasonably required action to solicit proxies in favor of the approval and adoption of the merger agreement and approval of the merger; |
| • | affording Carter Bank reasonable access to its properties, books, contracts, records and employees; |
| • | using reasonable best efforts to cause its consultants and independent public accountants to provide access to their work papers and such other information as Carter Bank may reasonably request; and |
| • | furnishing promptly to Carter Bank (i) a copy of each report, schedule and other document filed by Bank Building pursuant to federal or state securities laws; (ii) each written update provided to its board of directors on Bank Building and its subsidiaries’ financial performance and projections; and (iii) other information concerning Bank Building’s business and properties as Carter Bank may reasonably request. |
The merger agreement also contains a number of mutual additional agreements by Carter Bank and Bank Building, including agreements relating to:
| • | preparing this proxy statement as promptly as practicable; |
| • | obtaining all necessary actions or nonactions, waivers, consents and approvals from governmental authorities and making all necessary registrations and filings and taking all reasonable steps as may be necessary to obtain an approval or waiver from, or to avoid an action or proceeding by, any governmental authority; |
34
Table of Contents
| • | obtaining all necessary consents, approvals or waivers from third parties; |
| • | defending any lawsuits or other legal proceedings, whether judicial or administrative, investigating or challenging the merger agreement or the consummation of any of the transactions contemplated thereby; |
| • | executing and delivering any additional instruments necessary to consummate the transactions contemplated by, and carrying out the purposes of, the merger agreement; |
| • | furnishing the other party with all information concerning itself, its subsidiaries, directors, officers and stockholders and such other matters as may be reasonably necessary or advisable in connection with any statement, filing, notice or application made by or on behalf of Bank Building, Carter Bank, or either of their respective subsidiaries to any third party and/or any governmental authority in connection with the merger and the transactions contemplated by the merger agreement; |
| • | keeping the other party apprised of the status of matters relating to completion of the transactions contemplated by the merger agreement, including promptly furnishing the other party with copies of material notices or other material communications received by such party or its subsidiaries, from any third party and/or any governmental authority with respect to the merger and the other transactions contemplated by the merger agreement; and |
| • | if any anti-takeover or similar statute or regulation is or may become applicable to the merger or the other transactions contemplated by the merger agreement, granting such approvals and taking such actions as are necessary so that such transactions may be consummated as promptly as practicable on the terms contemplated by the merger agreement or by the merger and otherwise to act to eliminate or minimize the effects of such statute or regulation on such transactions. |
Additionally, the merger agreement also contains a number of additional agreements by Carter Bank, including agreements relating to:
| • | furnishing to Bank Building, upon its request, all information concerning Carter Bank, its subsidiaries, directors, officers and stockholders and such other matters as may be reasonably necessary or advisable in connection with the preparation of this proxy statement; and |
| • | voting, or causing to be voted, all of the shares then owned by Carter Bank or any of its subsidiaries in favor of the approval of the merger and the merger agreement. |
The parties’ obligations to complete the merger are subject to the following conditions:
| • | the approval of the merger by the requisite stockholder vote of Bank Building at the special meeting; |
| • | receipt of an opinion from Troutman Sanders that the merger qualifies as a tax-free reorganization under Section 368 of the Internal Revenue Code; and |
| • | no law, rule or regulation or judgment, injunction, ruling, order or decree of a court of competent jurisdiction or any governmental entity having been issued preventing the consummation of the merger. |
Carter Bank’s obligation to complete the merger is subject to the following additional conditions:
| • | Bank Building’s representations and warranties contained in the merger agreement must be true and correct (i) in all respects at and as of the effective time (as to representations and warranties qualified or limited by the term “material adverse effect” (as such term is defined below under “The Merger Agreement – Material Adverse Effect”), the word “material” and phrases of like import) and (ii) in all material respects at and as of the effective time (as to representations and warranties not qualified or limited by the term “material adverse effect,” the word “material” and phrases of like import); |
| • | Bank Building will have performed in all material respects all obligations and covenants that it is required to perform under the merger agreement; |
35
Table of Contents
| • | Bank Building will not have suffered a material adverse effect since January 8, 2008 that continues to exist on the closing date; |
| • | Bank Building will have delivered a certificate of its chief executive officer and chief financial officer certifying the fulfillment of the foregoing conditions; |
| • | no governmental authority shall have instituted an action or proceeding that remains pending seeking to enjoin, restrain, prevent or prohibit consummation of the merger; and |
| • | all proceedings to be taken by Bank Building in connection with the merger agreement, and all documents incident thereto, will be reasonably satisfactory in form and substance to Carter Bank and its counsel. |
Bank Building’s obligation to complete the merger is subject to the following additional conditions:
| • | the representations and warranties of Carter Bank contained in the merger agreement must be true and correct (i) in all respects at and as of the effective time (as to representations and warranties qualified or limited by the term “material adverse effect,” the word “material” and phrases of like import) and (ii) in all material respects at and as of the effective time (as to representations and warranties not qualified or limited by the term “material adverse effect,” the word “material” and phrases of like import); |
| • | Carter Bank will have performed in all material respects all obligations and covenants that it is required to perform under the merger agreement; and |
| • | Carter Bank will have delivered a certificate of its chief executive officer and chief financial officer certifying the fulfillment of the foregoing conditions. |
No Solicitation of Other Offers
Bank Building has agreed, before the merger becoming effective, to certain limitations on its ability to take action with respect to other acquisition proposals. Notwithstanding these limitations, Bank Building may respond to certain superior proposals. Under the merger agreement:
| • | the term “takeover proposal” means any inquiry, proposal or offer from any person (other than Carter Bank and its subsidiaries) relating to: |
| • | any acquisition of the assets of Bank Building and its subsidiaries (including securities of its subsidiaries, but excluding sales of assets in the ordinary course of business) equal to 20% or more of Bank Building’s consolidated assets or to which 20% or more of its revenues or earnings on a consolidated basis are attributable; |
| • | any acquisition of 20% or more of Bank Building’s outstanding common stock; |
| • | any tender offer or exchange offer that if consummated would result in any person beneficially owning 20% or more of Bank Building’s outstanding common stock; or |
| • | any merger, consolidation, share exchange, business combination, recapitalization, liquidation, dissolution or similar transaction involving Bank Building. |
| • | the term “superior proposal” means a proposal or offer to acquire, directly or indirectly, for consideration consisting of cash and/or securities, more than 50% of Bank Building’s issued and outstanding common stock, or substantially all of Bank Building’s and its subsidiaries’ assets on a consolidated basis, made by a third party, and which is otherwise on terms and conditions that Bank Building’s board of directors determines in its good faith and reasonable judgment (after consultation with a recognized financial advisor with expertise in bank and banking property transactions and in light of all relevant circumstances, including all the terms and conditions of such proposal and the merger agreement) to be more favorable to its stockholders than the merger. |
Bank Building has agreed:
| • | not to, and not to authorize or permit its subsidiaries, any of Bank Building’s or its subsidiary’s respective directors, officers or employees or any investment banker, financial advisor, attorney, accountant or other advisor, agent or representative retained by Bank Building or its subsidiaries in connection with the merger to, directly or indirectly through another person: |
| • | solicit, initiate or knowingly encourage or facilitate any inquiries or the making of any proposal that constitutes, or is reasonably likely to lead to a takeover proposal; or |
36
Table of Contents
| • | other than solely informing persons of the non-solicitation provisions of the merger agreement, participate in any discussions or negotiations regarding any takeover proposal, or furnish to any person any information in connection with, or in furtherance of, any takeover proposal; |
| • | to immediately cease, and to cause its subsidiaries and instruct its representatives to immediately cease, and cause to be terminated all existing discussions or negotiations with any person previously conducted with respect to any takeover proposal. |
However, at any time before Bank Building’s stockholders have voted on the approval of the merger at the special meeting, in response to an unsolicited bona fide written takeover proposal made after the date of the merger agreement that Bank Building’s board of directors determines in good faith (after consultation with outside legal counsel) constitutes or is reasonably likely to result in a superior proposal, Bank Building may, if its board of directors determines in good faith that there is a reasonable probability that failure to take such action would be inconsistent with its fiduciary duties to Bank Building’s stockholders under applicable law, and after giving Carter Bank prompt written notice of such determination:
| • | furnish information with respect to Bank Building and its subsidiaries to the person making such takeover proposal pursuant to a confidentiality agreement not less restrictive on such person than the mutual non-disclosure agreement between Carter Bank and Bank Building, provided that all such information is provided or made available to Carter Bank; and |
| • | participate in discussions or negotiations with the person making such takeover proposal regarding such takeover proposal. |
Subject to certain exceptions described below, the merger agreement provides that Bank Building’s board of directors will not withdraw or modify, in a manner adverse to Carter Bank, the recommendation by the board of directors that Bank Building’s stockholders approve the merger agreement or publicly recommend to its stockholders a takeover proposal.
Notwithstanding the foregoing, at any time prior to obtaining Bank Building’s stockholders’ approval of the merger, in response to a superior proposal, Bank Building’s board of directors may, if it determines in good faith (after consultation with outside legal counsel) that there is a reasonable probability that failure to take such action would be inconsistent with its fiduciary duties to its stockholders under applicable law, withdraw or modify its recommendation to approve the merger agreement, recommend such superior proposal and/or terminate the merger agreement (and concurrently with or after such termination, if it so chooses, cause it to enter into any acquisition agreement with respect to any superior proposal), but only after the third business day following Carter Bank’s receipt of written notice from Bank Building containing a description of the material terms of such superior proposal, and provided that Bank Building’s board of directors continues to believe, following such third business day that such takeover proposal still constitutes a superior proposal after taking into account any changes to the terms of the merger agreement proposed by Carter Bank in response to the notice.
Termination of the Merger Agreement
Bank Building and Carter Bank may terminate the merger agreement under certain circumstances, including:
| • | by mutual consent of Carter Bank and Bank Building; |
| • | by either Carter Bank or Bank Building if: |
| • | the merger shall not have been consummated on or prior to June 30, 2008 (the “walk-away date”); or |
| • | the requisite vote on the merger proposal is not obtained at a duly held special meeting or at any adjournment or postponement thereof; |
37
Table of Contents
| • | by Bank Building if: |
| • | Carter Bank shall have breached or failed to perform any of its representations, warranties, covenants or other agreements contained in the merger agreement that is a condition to consummation of the merger and such breach is not cured within a specified time period or cannot be cured; or |
| • | Bank Building’s board of directors withdraws, modifies or changes its recommendation that its stockholders approve the merger agreement in a manner adverse to Carter Bank and its stockholders; |
| • | by Carter Bank if: |
| • | Bank Building shall have breached or failed to perform any of its representations, warranties, covenants or other agreements contained in the merger agreement that is a condition to consummation of the merger and such breach is not cured within a specified time period or cannot be cured; |
| • | Bank Building’s board of directors withdraws, modifies or changes its recommendation that its stockholders approve the merger agreement in a manner adverse to Carter Bank and its stockholders, unless such withdrawal, modification or change is as a result of a breach by Carter Bank that would entitle Bank Building to terminate the merger agreement or as a result of a material adverse effect on Carter Bank; or |
| • | the appraised value of Bank Building’s real estate assets is less than 97% of the tax assessed value of such assets as of December 31, 2007. |
Bank Building must pay Carter Bank a termination fee of $500,000 if:
| • | Prior to consummation of the merger, Bank Building exercises its “fiduciary out” and terminates the merger agreement to enter into a definitive agreement with a third party with respect to a superior proposal; |
| • | Carter Bank terminates the merger agreement prior to consummation of the merger due to Bank Building’s board of directors changing its recommendation of the merger in a manner adverse to Carter Bank, unless such change is as a result of a breach by Carter Bank, and an agreement is entered into with respect to a takeover proposal within six months of such termination; or |
| • | Prior to consummation of the merger, (i) the merger agreement is terminated (A) by Carter Bank due to a failure of the conditions to closing to be satisfied as a result of a breach or failure to perform by Bank Building of its representations, warranties, covenants or agreements, or (B) by either Bank Building or Carter Bank due to the walk-away date having occurred without the merger being consummated, (ii) at the time of the event triggering the termination right a takeover proposal has been publicly announced and not withdrawn or rejected and (iii) within six months of such termination Bank Building enters into a definitive agreement with respect to, or consummates, a takeover proposal. |
For these purposes, takeover proposal has the same meaning as in the no-shop provision, except that the threshold is a majority instead of 20%.
Amendment, Extension and Waiver
The merger agreement may be amended by Carter Bank and Bank Building at any time before or after any approval of the merger agreement by Bank Building’s stockholders, provided that after the approval of the merger agreement by Bank Building’s stockholders, the merger agreement may not be amended to change any provision which by law would require further approval by Bank Building’s stockholders without such approval.
The merger agreement may not be amended except by a written instrument executed by all parties.
38
Table of Contents
Subject to the express limitations contained in the merger agreement, Bank Building and Carter Bank may, before the effective time of the merger:
| • | extend the time for the performance of any obligations or other acts of the other parties; |
| • | waive any inaccuracies in the representations and warranties contained in the merger agreement by any other applicable party or in any document delivered pursuant to the merger agreement by any other applicable party; or |
| • | waive compliance with any of the agreements or conditions contained in the merger agreement. |
Many of the representations and warranties in the merger agreement and Carter Bank’s obligations to complete the merger are qualified by reference to whether the item in question is reasonably likely to have a “material adverse effect” on Bank Building, which is defined as any effect or change that would be (or could reasonably be expected to be) materially adverse to Bank Building or its subsidiaries’ business, assets, condition (financial or otherwise), operating results, operations or business prospects. The definition of “material adverse effect” does not include any adverse change, event, development or effect arising from or relating to:
| • | general business or economic conditions; |
| • | national or international political or social conditions, including the engagement by the United States in hostilities, whether or not pursuant to the declaration of a national emergency or war, or the occurrence of any military or terrorist attack upon the United States; |
| • | financial, banking or securities markets; |
| • | changes in generally accepted accounting principles; |
| • | changes in any federal, state, foreign, supranational, provincial, local or other laws or binding directives issued by any governmental entity; and |
| • | the taking of any action contemplated by the merger agreement and the other agreements contemplated thereby, other than to the extent that any adverse change, event, development, or effect referred to in each of the clauses above has had or would reasonably be expected to have a disproportionately adverse effect on Bank Building and its subsidiaries as generally compared to other participants in the industries in which Bank Building and its subsidiaries conduct business. |
39
Table of Contents
CERTAIN FEDERAL INCOME TAX CONSEQUENCES OF THE MERGER
The following is a summary of material U.S. federal income tax consequences applicable to Bank Building stockholders that receive Carter Bank common stock or cash and cash in lieu of fractional shares in the merger. This summary is based upon the provisions of the Internal Revenue Code of 1986, as amended (the “Code”), applicable Treasury regulations thereunder, judicial decisions, and current administrative rulings, all as in effect on the date of this proxy statement and all of which are subject to change, possibly with retroactive effect.
This discussion addresses only those Bank Building stockholders that hold their shares as a capital asset (generally, property held for investment). In addition, this discussion does not address all the U.S. federal income tax consequences that may be relevant to these stockholders in light of their particular circumstances, or the U.S. federal income tax consequences to those stockholders that are subject to special rules, such as, without limitation:
| • | partnerships, subchapter S corporations and other pass-through entities (and the holders of interests therein); |
| • | foreign persons and entities; |
| • | banks, thrifts, mutual funds and other financial institutions; |
| • | tax-exempt organizations and pension funds; |
| • | insurance companies; |
| • | dealers or traders in securities; |
| • | stockholders who received their shares of common stock through a benefit plan or a tax-qualified retirement plan or through the exercise of employee stock options or similar derivative securities or otherwise as compensation; |
| • | stockholders whose shares are qualified small business stock for purposes of section 1202 of the Code; |
| • | stockholders who may be subject to the alternative minimum tax provisions of the Code; |
| • | stockholders whose functional currency is not the U.S. dollar; and |
| • | stockholders who hold their shares other than as a capital asset or who hold their shares as part of a hedge, appreciated financial position, straddle, synthetic security, conversion transaction or other integrated investment. |
Furthermore, this discussion does not address any tax consequences arising under the laws of any state, locality or foreign jurisdiction. This discussion does not purport to be a comprehensive analysis or description of all potential U.S. federal income tax consequences of the proposed transaction.
Carter Bank and Bank Building anticipate that the merger will qualify as a “reorganization” within the meaning of Section 368(a) of the Code. It is a condition to the completion of the merger that Carter Bank and Bank Building receive written opinions from Troutman Sanders LLP, dated as of the effective date of the merger, to the effect that the merger will qualify as a “reorganization” within the meaning of Section 368(a) of the Code. Neither Carter Bank nor Bank Building currently intends to waive this condition. The opinions of Troutman Sanders LLP will be based upon representation letters of Carter Bank and Bank Building, and upon customary assumptions. Any inaccuracy in the representations or assumptions, or any actions by Carter Bank or Bank Building contrary to the representations or assumptions, could adversely affect the conclusions reached in the opinions and the tax discussion set forth below.
The opinions represent the best judgment of Troutman Sanders LLP as to the U.S. federal income tax treatment of the merger and as to the U.S. federal income tax consequences of the merger to the Bank Building
40
Table of Contents
stockholders, but will not be binding on the Internal Revenue Service (the “IRS”) or the courts. No rulings have been or will be requested from the IRS with respect to any of the matters discussed herein. There can be no assurance that future legislation, regulations, administrative rulings or court decisions will not adversely affect the accuracy of the statements in this summary. The following discussion assumes that the foregoing factual conditions are met, and therefore, the merger qualifies as a “reorganization” within the meaning of Section 368(a) of the Code.
Tax Consequences of the Merger to Bank Building Stockholders
Exchanges of Bank Building Common Stock for Carter Bank Common Stock. A Bank Building stockholder that exchanges shares of Bank Building common stock solely for shares of Carter Bank common stock in the merger will not recognize gain or loss, except with respect to any cash received instead of fractional share interests in Carter Bank common stock. The aggregate tax basis of the Carter Bank common stock received by a Bank Building stockholder in the merger will be the same as the aggregate tax basis of the Bank Building common stock for which it is exchanged, less any tax basis attributable to fractional share interests in Carter Bank common stock for which cash is received. The holding period of Carter Bank common stock received in exchange for shares of Bank Building common stock will include the holding period of the Bank Building common stock surrendered in exchange therefor. For the consequences of receipt of cash instead of a fractional share interest in Carter Bank common stock, see “Cash Received Instead of a Fractional Share” below.
Cash Received Instead of a Fractional Share. No fractional shares of Carter Bank common stock will be issued in connection with the merger. Instead, Carter Bank will make a cash payment without interest to each Bank Building stockholder who would otherwise receive a fractional share. A Bank Building stockholder who receives cash instead of a fractional share of Carter Bank common stock will be treated as having received the fractional share pursuant to the merger, and then as having exchanged the fractional share for cash in a redemption by Carter Bank. Any gain or loss attributable to this deemed redemption will be capital gain or loss. The amount of this gain or loss will be equal to the difference between the portion of the tax basis of the Bank Building common stock surrendered in the merger transaction that is allocated to the fractional share and the cash received therefor. Any capital gain or loss of this type will constitute long-term capital gain or loss if the holding period for the Bank Building common stock surrendered is greater than one year as of the date of the merger.
Cash Received on Exercise of Appraisal Rights. A Bank Building stockholder who exercises appraisal rights and receives a cash payment with respect to those shares generally will recognize gain or loss equal to the difference between the amount of the cash received and such stockholder’s tax basis in those shares. Such gain or loss will generally constitute capital gain or loss.
Information Reporting and Backup Withholding. Cash payments received by a Bank Building stockholder in the merger may, under certain circumstances, be subject to information reporting and backup withholding (currently at the rate of 28%) of the cash payable to such stockholder, unless such stockholder provides proof of an applicable exemption or furnishes its taxpayer identification number, and otherwise complies with all applicable requirements of the backup withholding rules. Any amounts withheld from payments to Bank Building stockholders under the backup withholding rules are not an additional tax and will be allowed as a refund or credit against such stockholder’s federal income tax liability provided that the required information is timely furnished to the IRS.
This U.S. federal income tax discussion is for general information only and may not apply to all Bank Building stockholders. Bank Building stockholders are strongly urged to consult their own tax advisors as to the specific tax consequences of the proposed transaction to them, including state, local and foreign tax consequences.
41
Table of Contents
INFORMATION ABOUT BANK BUILDING AND CARTER BANK
General
The primary purpose of Bank Building is to acquire and develop property for lease as bank offices to Carter Bank. Bank Building also acquires funds for site acquisition and development from banks other than Carter Bank.
The selection of sites and construction of the offices is performed by Carter Bank to insure the needs of Carter Bank are met. Should Bank Building decide to participate in the particular project, the site is titled in the name of Bank Building and all loans in connection with the site are made to Bank Building. There are, however, no commitments on the part of Carter Bank to present prospective office properties to Bank Building, nor are there any commitments on the part of Bank Building to accept any prospective office properties offered by Carter Bank.
Following construction of a bank branch, the property is leased to Carter Bank under a triple net operating lease. Carter Bank is responsible for all property taxes, insurance and maintenance costs on that office. It is anticipated that the lease payments and other costs approximate the cost which would have been experienced by Carter Bank had the office been developed by Carter Bank or leased from a third party. The lease payments cover all acquisition and loan costs and other costs associated with the site (just as though Carter Bank had acquired the site itself) plus a small additional fee to cover the accounting and processing costs.
In order to obtain the most desirable branch locations, it is often necessary to acquire more property than will be required for an individual office. Currently, banking regulations restrict the ability of banks to acquire such property if it is not used for banking purposes. Bank Building is not subject to such restrictions and can acquire the most desirable property and either sell any excess property or develop it for subsequent sale or lease to other parties.
Regardless of the size of any given property purchased by Bank Building, the lease with Carter Bank includes only the portion of the property utilized for the branch. The allocation of costs between the branch site and other property is based on the relative size and market value of each segment. Any property other than that used for the branch is developed, leased or sold by Bank Building. Any buildings or other developments on this property is compatible with the design of Carter Bank office and consistent with the conduct of the business of banking.
Both interest and depreciation expenses are incurred on each office as well as other, minimal operating costs. These expenses result in net operating losses during the initial years of each project although adequate cash flow from rental payments is expected to be available to meet all cash needs. During the initial lease term, all leases are structured for the adjustments to the monthly lease payments to track adjustments in the payments required by the underlying mortgage. After the initial period of the lease, terms are renegotiated. Such terms could provide for lease payments in excess of or less than payments required by the underlying mortgage and operating expenses. Additionally, Carter Bank may determine not to renew its lease on a particular branch. Under these circumstances, such branch could be sold or leased to another tenant. Such sale or lease could be profitable, although there can be no assurance that this will occur.
While it is anticipated that renewed leases with Carter Bank will produce sufficient rental payments to cover mortgage payments and other costs, there can be no assurance that this will, in fact, be accomplished. Failure to obtain renewal lease payments sufficient to cover these costs may result in a forced sale or foreclosure of the particular branch at a loss.
Bank Building does not have any paid employees or directors. All of its accounting, other professional services, record keeping and other operational needs are met by other organizations on a fee-for-service basis. At the present time, Bank Services of Virginia, Inc. provides these services. Bank Services of Virginia, Inc. is a bank service corporation owned by Carter Bank that currently provides various bookkeeping and related services to Carter Bank. Bank Services of Virginia, Inc. is a subsidiary of The Mortgage Company of Virginia, which is the wholly owned subsidiary of Carter Bank.
As of September 30, 2007, Bank Building reported total assets of $31.7 million, total liabilities of $30.1 million and stockholders’ equity of $1.6 million.
42
Table of Contents
The principal executive offices of Bank Building are located at 1300 Kings Mountain Road, Martinsville, Virginia 24112 telephone number (276) 656-1776.
Additional Information and Incorporation of Certain Information by Reference
Additional business and financial information relating to Bank Building is included in Bank Building’s Annual Report on Form 10-KSB for the year ended December 31, 2006 and its Quarterly Report on Form 10-QSB for the nine months ended September 30, 2007, copies of which are included in this proxy statement. See “Where You Can Find More Information” beginning on page [ ] and “Financial Statements of Bank Building Corporation.”
Bank Building Security Ownership of Certain Beneficial Owners and Management of Bank Building
The following table shows as of December 30, 2007, the beneficial ownership of Bank Building’s common stock of each director and executive officer as well as of Bank Building’s directors and executive officers as a group. To Bank Building’s knowledge, Worth Harris Carter, Jr., the Chairman of the Board and President of Bank Building, is Bank Building’s only stockholder beneficially holding more than 5% of Bank Building’s outstanding common stock. As of December 31, 2007, Bank Building’s directors and executive officers, as a group, beneficially owned 51,945 shares (or 13.04%) of Bank Building’s outstanding common stock.
Name | Amount and Nature of Beneficial Ownership (1)(2)(3) | Ownership as a Percentage of Common Stock Outstanding | ||||
Carter, Worth Harris, Jr. | 46,166 | (4) | 11.59 | % | ||
Conner, Robert W. | 900 | (5) | * | |||
Hall, Charles E. | 123 | (6) | * | |||
Prillaman, Haller G. | 3,470 | * | ||||
Williams, R.E. | 1,156 | * | ||||
Davis, Jane Ann | 130 | (7) | * | |||
All Directors and Executive Officers as a Group (6 persons) | 51,945 | 13.04 | % |
| * | less than 1% |
| (1) | For purposes of this table, beneficial ownership has been determined in accordance with the provisions of Rule 13d-3 of the Securities Exchange Act of 1934 under which, in general, a person is deemed to be the beneficial owner of a security if he has or shares the power to vote or direct the voting of the security or the power to dispose of or direct the disposition of the security, or if he has the right to acquire beneficial ownership of the security within sixty days. |
| (2) | Includes shares held by affiliated corporations, spouses, minor or dependent children, relatives individual’s home, and shares held as custodian or trustee. |
| (3) | Unless otherwise indicated, the shares listed in the table represent sole voting and investment power. |
| (4) | Includes the following shares with respect to which Mr. Carter is deemed to be the beneficial owner: 4,714 shares held by Mr. Carter as custodian for his children and grandchildren, 363 shares held in the Non-Qualified Profit-Sharing Plan of Carter Bank, and 538 shares held by C&C Realty of which Mr. Carter is President and 50% owner. |
| (5) | Includes 839 shares held jointly with Mr. Conner’s wife. |
| (6) | Includes 41 shares with respect to which Mr. Hall shares voting and investment power. |
| (7) | Shares held jointly with Mrs. Davis’ husband. |
Bank Building knows of no arrangements, including any pledge by any person of securities of Bank Building, which may at a subsequent date result in a change in control of Bank Building, except as set forth in this proxy statement with respect to the merger.
43
Table of Contents
Carter Bank Security Ownership of Certain Beneficial Owners and Management of Bank Building
The following table shows as of December 31, 2007, the beneficial ownership of Carter Bank’s common stock of each director and executive officer of Bank Building. To Bank Building’s knowledge, Worth Harris Carter, Jr., Chairman of the Board and President of Bank Building, is Bank Building’s only director or executive officer beneficially holding more than 5% of Carter Bank’s outstanding common stock. As of December 31, 2007, Bank Building’s directors and executive officers, as a group, beneficially owned 3,423,028 (or 13.69%) of Carter Bank’s outstanding common stock.
Name | Amount and Nature of Beneficial Ownership (1)(2) | Ownership as a Percentage of Common Stock Outstanding | ||||
Carter, Worth Harris, Jr. | 3,070,815 | (3) | 12.28 | % | ||
Conner, Robert W. | 64,013 | (4) | * | |||
Hall, Charles E. | 30,179 | (5) | * | |||
Prillaman, Haller G. | 191,551 | * | ||||
Williams, R.E. | 66,124 | * | ||||
Davis, Jane Ann | 346 | (6) | * | |||
All Directors and Executive Officers as a Group (6 persons) | 3,423,028 | 13.69 | % |
| * | less than 1% |
| (1) | For purposes of this table, beneficial ownership has been determined in accordance with the provisions of Rule 13d-3 of the Exchange Act under which, in general, a person is deemed to be the beneficial owner of a security if he/she has or shares the power to vote or direct the voting of the security or the power to dispose of or direct the disposition of the security, or if he/she has the right to acquire beneficial ownership of the security within sixty days. |
| (2) | Unless otherwise indicated, the shares listed in the table represent sole voting and investment power. |
| (3) | Includes 114,865 shares held by Mr. Carter as executor for his wife’s estate, 452,682 shares held by Mr. Carter as custodian for his children and grandchildren, 47,284 shares held for Mr. Carter’s account in the Nonqualified Profit Sharing Plan of Carter Bank, and 127,462 shares held by C&C Realty, Inc., of which Mr. Carter is president and a 50% owner. |
| (4) | Includes 59,672 shares held jointly with Mr. Conner’s wife. |
| (5) | Includes 27,352 shares held jointly with Mr. Hall’s wife. |
| (6) | Includes 96 shares held as custodian for Mrs. Davis’ children. |
44
Table of Contents
General
Carter Bank is a banking institution, incorporated under Virginia law. It is not a member of the Federal Reserve System. Carter Bank commenced business on December 29, 2006, with the concurrent merging of the ten Merged Banks. Each of the Merged Banks had been in business for a number of years. The Merged Banks, and their respective main office locations, were:
Blue Ridge Bank, N.A. - Floyd, Virginia
Central National Bank - Lynchburg, Virginia
Community National Bank - South Boston, Virginia
First National Bank - Rocky Mount, Virginia
First National Exchange Bank - Roanoke, Virginia
Mountain National Bank - Galax, Virginia
Patrick Henry National Bank - Martinsville, Virginia
Patriot Bank, N.A. - Fredericksburg, Virginia
Peoples National Bank - Danville, Virginia
Shenandoah National Bank - Staunton, Virginia
The principal executive offices of Carter Bank are located at 1300 Kings Mountain Road, Martinsville, Virginia 24112 and telephone number is (276) 656-1776. All officers and employees of the Merged Banks have continued as officers and employees of Carter Bank. Worth Harris Carter, Jr., who served as Chairman of the Board and President of each of the Merged Banks, serves as Chairman of the Board and President of Carter Bank.
By virtue of the Bank Merger, Carter Bank, with total assets at December 31, 2006 in excess of $2.6 billion, is now the largest state chartered commercial bank headquartered in Virginia, operating 124 branches in Virginia and North Carolina. At September 30, 2007, the Bank had $2.6 billion in assets, $1.4 billion in net loans, $2.2 billion in deposits and $292 million in total stockholders’ equity.
As a result of the Bank Merger, Carter Bank owns 100% of the capital stock of The Mortgage Company of Virginia, Inc. The Mortgage Company of Virginia, Inc., in turn, owns 100% of the capital stock of Bank Services of Virginia, Inc. and 100% of the capital stock of Bank Services Insurance, Inc. and 50% of the capital stock of Coresoft, Inc.
Additional Information and Incorporation of Certain Information by Reference
Additional business and financial information relating to Carter Bank is included in Carter Bank’s Annual Report on Form 10-K for the year ended December 31, 2006 and its Quarterly Report on Form 10-Q for the quarter ended September 30, 2007, which are included in this proxy statement. See “Financial Statements of Carter Bank & Trust.” Because Carter Bank was created by the Bank Merger effective on December 29, 2006, no financial statements exist for Carter Bank for the years ended prior to December 31, 2006. However, Peoples National Bank is the predecessor of Carter Bank and its financial statements are included in this proxy statement. See “Financial Statements of Merged Banks–Peoples National Bank.” Additional business and audited and unaudited financial information is included in the annual reports of the Merged Banks for the years ended December 31, 2005 and in the quarterly reports for the nine months ended September 30, 2006, which are included in this proxy statement. See “Where You Can Find More Information” beginning on page [ ].
Carter Bank Security Ownership of Certain Beneficial Owners and Management of Carter Bank
The following table shows as of December 31, 2007, the beneficial ownership of Carter Bank’s common stock of each director and executive officer of Carter Bank and Carter Bank’s directors and executive officers as a group. To Carter Bank’s knowledge, Worth Harris Carter, Jr., Chairman of the Board and President of Carter Bank, is the only Carter Bank stockholder beneficially holding 5% or more of Carter Bank’s outstanding common stock. As of December 31, 2007, Carter Bank’s directors and executive officers as a group, beneficially owned 7,311,723 shares (or 29.25%) of Carter Bank’s outstanding common stock.
45
Table of Contents
Name† | Amount and Nature of Beneficial Ownership (1) (2) | Ownership as a Percentage of Common Stock Outstanding | ||||
Bondurant, Carol Ann | 74,234 | (3) | * | |||
Carter, Worth Harris, Jr. | 3,070,815 | (4) | 12.28 | % | ||
Chandler, Joseph L. | 27,243 | (5) | * | |||
Conner, Robert W. | 64,013 | (6) | * | |||
Gallimore, Charles A. | 99,858 | * | ||||
Hall, Charles E. | 30,179 | (7) | * | |||
Haskins, James W. | 100,909 | (8) | * | |||
Karavatakis, Phyllis Q. | 16,638 | (9) | * | |||
Kendrick, Bradford M. | 78,771 | * | ||||
Kingery, Walter P. | 196,777 | (10) | * | |||
Kyle, Lanny A., O.D | 59,428 | * | ||||
Lester, George W., II | 997,351 | (11) | 3.99 | % | ||
Mapp, Harry L., Jr. | 48,145 | * | ||||
Mason, Sidney D. | 584,592 | (12) | 2.34 | % | ||
Matthews, E. Warren | 1,157 | * | ||||
Midkiff, H. Marvin, DDS | 68,028 | (13) | * | |||
Moses, James C. | 16,223 | (14) | * | |||
Oeters, William E. | 7,161 | * | ||||
Pigg, Joseph E. | 276,102 | (15) | 1.10 | % | ||
Prillaman, Haller G. | 191,551 | * | ||||
Ramsey, Mary A. | 376,168 | 1.50 | % | |||
Roach, Larry N. | 15,037 | (16) | * | |||
Scott, Leo H. | 370,587 | (17) | 1.48 | % | ||
Spencer, Simon C. | 10,417 | (18) | * | |||
Sumner, William B. | 30,924 | (19) | * | |||
Thomasson, James M. | 135,199 | (20) | * | |||
Trent, W.C., Jr. | 100,812 | (21) | * | |||
Williams, Betty A. | 48,050 | * | ||||
Williams, R. E. | 66,124 | * | ||||
All Directors and Executive Officers as a Group (36 Persons) (22) | 7,311,723 | 29.25 | % |
| † | W. Lynwood Craig, who was a member of the board of directors of Carter Bank as of December 31, 2007, died on January 8, 2008 and is not included in this table. |
| * | less than 1% |
| (1) | For purposes of this table, beneficial ownership has been determined in accordance with the provisions of Rule 13d-3 of the Exchange Act under which, in general, a person is deemed to be the beneficial owner of a security if he/she has or shares the power to vote or direct the voting of the security or the power to dispose of or direct the disposition of the security, or if he/she has the right to acquire beneficial ownership of the security within sixty days. |
| (2) | Unless otherwise indicated, the shares listed in the table represent sole voting and investment power. |
| (3) | Shares held jointly with Mrs. Bondurant’s husband. |
| (4) | Includes 114,865 shares held by Mr. Carter as executor for his wife’s estate, 452,682 shares held by Mr. Carter as custodian for his children and grandchildren, 47,284 shares held for Mr. Carter’s account in the Nonqualified Profit Sharing Plan of Carter Bank, and 127,462 shares held by C&C Realty, Inc., of which Mr. Carter is president and a 50% owner. |
| (5) | Includes 526 shares held as custodian for grandchild. |
| (6) | Includes 59,672 shares held jointly with Mr. Conner’s wife. |
| (7) | Includes 27,352 shares held jointly with Mr. Hall’s wife. |
| (8) | Includes 1,656 shares held by Mr. Haskins’ wife. |
| (9) | Includes 7,736 shares held jointly with Mrs. Karavatakis’s husband and 4,726 held by Mrs. Karavatakis as custodian for her daughter. |
| (10) | Includes 3,382 shares held by Mr. Kingery’s wife. |
| (11) | Includes 152,451 shares held by the Lester Group, Inc., of which Mr. Lester is president, 1,043 shares held by Beaver Hills Dev. Corp., of which Mr. Lester is president, 4,269 shares held by Carriage Square, LTD, of which Mr. Lester is president, 25,691 shares held by Lester Group ESOP, of which Mr. Lester is trustee, 322,333 shares held by EASG, LLC, of which Mr. Lester is manager, and 79,082 shares held by Mr. Lester as trustee for the benefit of his children. |
| (12) | Includes 453,940 shares held by the Sidney D. Mason Revocable Trust, of which Mr. Mason is trustee, and 130,652 shares held by the Dale W. Mason Revocable Trust, of which Mr. Mason’s wife is trustee. |
46
Table of Contents
| (13) | Includes 13,751 shares held by Mr. Midkiff’s wife. |
| (14) | Includes 11,241 shares held by the James C. Moses, Sr. & Nancy Wells Moses Revocable Living Trust, of which Mr. Moses and his wife are co-trustees. |
| (15) | Includes 94,714 shares held by Mr. Pigg’s wife, and 23,722 held by Millards Machinery, a company owned by Mr. Pigg. |
| (16) | Includes 5,623 shares held jointly with Mr. Roach’s wife, and 3,694 shares held by Mr. Roach’s wife. |
| (17) | Includes 183,605 shares held by the Leo H. Scott Revocable Trust, of which Mr. Scott is trustee, and 186,982 shares held by the Geraldine N. Scott Revocable Trust, of which Mr. Scott’s wife is trustee. |
| (18) | Includes 3,804 shares held jointly with Mr. Spencer’s wife and 243 shares held by Mr. Spencer’s wife. |
| (19) | Includes 21,343 shares held jointly with Mr. Sumner’s wife. |
| (20) | Includes 86,663 shares held by Mr. Thomasson’s wife. |
| (21) | Includes 21,938 shares held by Mr. Trent as custodian for his children and 2,248 shares held by Mr. Trent’s wife. |
| (22) | Includes shares held by Jane Ann Davis, Vice President, Robert L. Dye, III, Vice President, Wright L. Garrett, Senior Vice President, Dianne S. Hall, Senior Vice President, Brenda A. Kendrick, Senior Vice President, Steven M. Moses, Jr., Vice President and Williams Wells, Senior Vice President. |
Carter Bank knows of no arrangements, including any pledge by any person of securities of Carter Bank, which may at a subsequent date result in a change in control of Carter Bank.
Bank Building Security Ownership of Certain Beneficial Owners and Management of Carter Bank
The following table shows as of December 31, 2007, the beneficial ownership of Bank Building’s common stock of each director and executive officer of Carter Bank. To Bank Building’s knowledge, Worth Harris Carter, Jr., Chairman of the Board and President of Carter Bank is Carter Bank’s only director or executive officer beneficially holding more than 5% of Bank Building’s outstanding common stock.
Name | Amount and Nature of Beneficial Ownership (1)(2)(3) | Ownership as a Percentage of Common Stock Outstanding | ||||
Bondurant, Carol Ann | 1,299 | (4) | * | |||
Carter, Worth Harris, Jr. | 46,166 | (5) | 11.59 | % | ||
Chandler, Joseph L. | 434 | (6) | * | |||
Conner, Robert W. | 900 | (7) | * | |||
Gallimore, Charles A. | 1,389 | * | ||||
Hall, Charles E. | 123 | (8) | * | |||
Haskins, James W. | 2,123 | * | ||||
Karavatakis, Phyllis Q. | 256 | (9) | * | |||
Kendrick, Bradford M. | 968 | * | ||||
Kingery, Walter P. | 468 | * | ||||
Kyle, Lanny A., O.D. | 1,074 | * | ||||
Lester, George W., II | 17,039 | (10) | 4.28 | % | ||
Mapp, Harry L., Jr. | 737 | * | ||||
Mason, Sidney D. | 40 | * | ||||
Matthews, E. Warren | — | * | ||||
Midkiff, H. Marvin, DDS | 1,128 | (11) | * | |||
Moses, James C. | 461 | (12) | * | |||
Oeters, William E. | — | * | ||||
Pigg, Joseph E. | 2,140 | (13) | * | |||
Prillaman, Haller G. | 3,470 | * | ||||
Ramsey, Mary A. | 54 | * | ||||
Roach, N. Larry | 294 | (14) | * | |||
Scott, Leo H. | — | * | ||||
Spencer, Simon C. | 255 | (15) | * | |||
Sumner, William B. | — | * | ||||
Thomasson, James M. | 2,794 | (16) | * | |||
Trent, W.C., Jr. | 1,755 | (17) | * | |||
Williams, Betty A. | 518 | * | ||||
Williams, R.E. | 1,156 | * | ||||
All Directors and Executive Officers as a Group (36 Persons) (18) | 89,318 | 22.43 | % |
47
Table of Contents
| * | less than 1% |
| (1) | For purposes of this table, beneficial ownership has been determined in accordance with the provisions of Rule 13d-3 of the Exchange Act under which, in general, a person is deemed to be the beneficial owner of a security if he has or shares the power to vote or direct the voting of the security or the power to dispose of or direct the disposition of the security, or if he has the right to acquire beneficial ownership of the security within sixty days. |
| (2) | Includes shares held by affiliated corporations, spouses, minor or dependent children, relatives individual’s home, and shares held as custodian or trustee. |
| (3) | Unless otherwise indicated, the shares listed in the table represent sole voting and investment power. |
| (4) | Includes 1,258 shares held jointly with spouse and 41 shares held as custodian for child. |
| (5) | Includes the following shares with respect to which Mr. Carter is deemed to be the beneficial owner: 4,714 shares held by Mr. Carter as custodian for his children and grandchildren, 363 shares held in the Non-Qualified Profit-Sharing Plan of Carter Bank, and 538 shares held by C&C Realty of which Mr. Carter is President and 50% owner. |
| (6) | Held as custodian for grandchild. |
| (7) | Includes 839 shares held jointly with Mr. Conner’s wife. |
| (8) | Includes 41 shares with respect to which Mr. Hall shares voting and investment power. |
| (9) | Includes 138 shares held jointly with Mrs. Karavatakis’ husband and 51 shares as custodian for child. |
| (10) | Includes 102 shares held by Beaver Hills Dev. Corp., of which Mr. Lester is president, 1,773 shares held by the Lester Group, Inc., of which Mr. Lester is president, 3,874 shares held by Lester Group ESOP and 1,207 shares held by Mr. Lester as trustee for the benefit of his children. |
| (11) | Includes 110 shares held by Mr. Midkiff’s wife and 20 shares held by his wife as custodian for child. |
| (12) | Held by James Carter Moses, Sr. and Nancy Wells Moses as co-trustees. |
| (13) | Includes 299 shares held jointly with Mr. Pigg’s wife. |
| (14) | Includes 11 shares held jointly with Mr. Roach’s wife, 40 shares held jointly with mother, and 40 shares held by his wife. |
| (15) | Includes 71 shares held jointly with Mr. Spencer’s wife and five shares held by his wife. |
| (16) | Includes 191 shares held jointly with Mr. Thomasson’s wife and 1,612 shares held by his wife. |
| (17) | Includes 372 shares held as custodian for children and 153 shares held by Mr. Trent’s wife. |
| (18) | Includes shares held by Jane Ann Davis, Vice President, Robert L. Dye, III, Vice President, Wright L. Garrett, Senior Vice President, Dianne S. Hall, Senior Vice President, Brenda A. Kendrick, Senior Vice President, Steven M. Moses, Jr., Vice President and Williams Wells, Senior Vice President. |
PRO FORMA UNAUDITED COMBINED CONSOLIDATED FINANCIAL INFORMATION
This proxy statement includes the unaudited pro forma combined consolidated financial information for each of the Merged Banks and Carter Bank giving effect to the Bank Merger. See “Financial Statements of Carter Bank & Trust–Pro Forma Unaudited Combined Consolidated Financial Information.” The unaudited pro forma information is designed to show how the Bank Merger might have affected the historical financial statements of Carter Bank and the Merged Banks had the Bank Merger been completed at an earlier time and was prepared based on the historical financial results reported by the Merged Banks for the year ended December 31, 2005 and the six months ended June 30, 2006. See “Financial Statements of Merged Banks.”
48
Table of Contents
COMPARATIVE MARKET PRICES AND DIVIDENDS
Bank Building Common Stock
Bank Building is authorized to issue 400,000 shares of common stock, with no par value. On February 28, 1995, Bank Building distributed 398,244 shares of its common stock to approximately 3,000 stockholders for no consideration. As of December 31, 2007, Bank Building had approximately 2,650 stockholders of record and 398,244 shares outstanding.
There is no established public trading market for the common stock of Bank Building, and none of its shares of common stock are listed for trading on any national securities exchange. Bank Building is not aware of any brokerage firms making a market in Bank Building’s common stock or any securities professionals following Bank Building. Any trades in Bank Building common stock occur sporadically on a local basis and management believes that the consideration for any shares of stock that may have been traded in recent years has been minimal.
To Bank Building’s knowledge, the most recent transaction involving Bank Building common stock is the purchase by MacKenzie of 11,482 shares of Bank Building common stock for $5.00 per share pursuant to the tender offer.
Bank Building has not paid dividends since its incorporation and no dividends are anticipated in the foreseeable future. Carter Bank’s future dividend policy is subject to the discretion of its board of directors and will depend upon a number of factors, including future earnings, financial condition, liquidity and capital requirements following the merger and is subject to restrictions imposed by law and the FDIC on dividends that would impair its paid-in capital or would be deemed an unsafe and unsound practice.
Carter Bank Common Stock
The table below sets forth, for the calendar quarters indicated, the high and low sales prices per share of Carter Bank common stock, and the dividends paid per share of Carter Bank common stock, which is quoted on the OTC Bulletin Board under the symbol “CARE.OB”.
| Sales Price | |||||||||
| High | Low | Dividend Paid | |||||||
2007 | |||||||||
First Quarter (beginning March 15, 2007) | $ | 14.00 | $ | 12.75 | $ | 0.10 | |||
Second Quarter | 14.20 | 12.00 | 0.10 | ||||||
Third Quarter | 12.50 | 9.60 | 0.10 | ||||||
Fourth Quarter | 9.90 | 8.85 | 0.10 | ||||||
2008 | |||||||||
First Quarter (through February 11, 2008) | $ | 9.25 | $ | 8.85 | — | ||||
On January 7, 2008, the date immediately prior to the public announcement of the signing of the merger agreement, the closing sales price per share of Carter Bank common stock was $9.00 on the OTC Bulletin Board. On February 11, 2008, the latest practicable date before the date of this proxy statement, the closing sales price per share of Carter Bank common stock was $9.00 on the OTC Bulletin Board (the closing price on February 7, 2008, the last date on which Carter Bank’s common stock was traded).
During 2007, Carter Bank paid dividends on a quarterly basis and it anticipates declaring and paying quarterly dividends at a rate of $0.10 per share of Carter Bank common stock pending completion of the merger. The board of directors of Carter Bank as the surviving company expects that Carter Bank will continue to pay dividends of approximately $0.10 per share per quarter, subject to, among other things, applicable federal and state law and regulations, the earnings and financial condition of Carter Bank, the ongoing approval of Carter Bank’s board of directors and general economic conditions.
49
Table of Contents
DESCRIPTION OF CARTER BANK COMMON STOCK
Carter Bank’s authorized capital stock consists of 100,000,000 shares of common stock, par value $1.00 per share. As a result of the merger, the stockholders of Bank Building will receive shares of common stock of Carter Bank in accordance with the exchange ratio established for Bank Building. See “Merger Consideration” beginning on page [ ].
Common Stock
Holders of shares of common stock are entitled to receive dividends when and as declared by the board of directors out of funds legally available therefore. In the event of any liquidation, dissolution or winding up of Carter Bank, the holders of common stock (and the holders of any class or series of stock entitled to participate with the common stock in the distribution of assets that may be authorized by the board of directors in the future) will be entitled to receive, in cash or in kind, the assets of Carter Bank available for distribution remaining after payment or provision for payment of Carter Bank’s debts and liabilities.
Holders of common stock are entitled to one vote per share on all matters submitted to stockholders. There are no cumulative voting rights in the election of directors. Carter Bank’s stockholders do not have preemptive rights to purchase additional shares of its capital stock. Holders of common stock have no conversion or redemption rights. The common stock to be issued in connection with the merger will be, when issued, fully paid and nonassessable.
Limitations on Liability of Officers and Directors
As permitted by the VSCA, Carter Bank’s articles of incorporation contain provisions that indemnify its directors and officers to the full extent permitted by Virginia law and eliminate the personal liability of its directors and officers for monetary damages to Carter Bank or its stockholders for breach of their fiduciary duties, except to the extent that the VSCA prohibits indemnification or elimination of liability. These provisions do not limit or eliminate the rights of Carter Bank or any stockholder of Carter Bank to seek an injunction or any other non-monetary relief in the event of a breach of a director’s or officer’s fiduciary duty. In addition, these provisions apply only to claims against a director or officer arising out of his or her role as a director or officer and do not relieve a director or officer from liability if he or she engaged in willful misconduct or a knowing violation of the criminal law or any federal or state securities law.
In addition, Carter Bank’s articles of incorporation provide for the indemnification of both directors and officers for expenses that they incur in connection with the defense or settlement of claims asserted against them in their capacities as directors and officers. This right of indemnification extends to judgments or penalties assessed against them. The rights of indemnification provided in Carter Bank’s articles of incorporation are not exclusive of any other rights that may be available under any insurance or other agreement, by vote of stockholders or disinterested directors or otherwise.
Shares Eligible for Future Sale
All of the shares of Carter Bank common stock that will be issued upon consummation of the merger will be freely tradable without restriction or registration under the Securities Act.
Carter Bank cannot predict the effect, if any, that future sales of shares of its common stock, or the availability of shares for future sales, will have on the market price prevailing from time to time. Sales of substantial amounts of shares of its common stock, or the perception that such sales could occur, could adversely affect the prevailing market price of the shares.
50
Table of Contents
COMPARATIVE RIGHTS OF STOCKHOLDERS
The rights of the stockholders of Bank Building are governed by the VSCA and the articles of incorporation and bylaws of Bank Building. The rights of the stockholders of Carter Bank are also governed by the VSCA and the articles of incorporation and bylaws of Carter Bank. This summary does not purport to be a complete discussion of, and is qualified in its entirety by reference to, Bank Building’s articles of incorporation and bylaws, Carter Bank’s articles of incorporation and bylaws and Virginia law.
A comparison of the rights of stockholders of Bank Building, and the stockholders of Carter Bank is as follows:
| Authorized Capital Stock | ||
| Bank Building | Carter Bank | |
| 400,000 shares of common stock, no par value per share. | 100,000,000 shares of common stock, $1.00 par value per share. | |
| Size of Board of Directors | ||
| Bank Building | Carter Bank | |
| Bank Building’s articles of incorporation and bylaws provide that the board of directors shall consist of no less than three directors except under certain circumstances delineated in Bank Building’s bylaws. Currently the board consists of five directors. | Carter Bank’s articles of incorporation and bylaws provide that the board of directors shall consist of no less than five but no more than 30 directors. Currently the board consists of 26 directors. | |
Preemptive Rights
Preemptive rights permit an existing stockholder of a corporation to purchase additional shares issued by the corporation in order to preserve such stockholder’s proportionate ownership interest in the corporation. Preemptive rights are triggered by the issuance of shares which might dilute the ownership interests of existing stockholders. Preemptive rights require a corporation to first give all existing stockholders an opportunity to purchase a sufficient portion of any newly-issued shares to preserve the stockholder’s proportionate ownership interest in such corporation. Virginia law provides that stockholders of corporations incorporated before December 31, 2005 have preemptive rights, but stockholders of corporations incorporated after such date do not.
| Bank Building | Carter Bank | |
| Bank Building’s articles of incorporation and bylaws are silent on the issue of preemptive rights; therefore, the laws of Virginia apply and the stockholders of Bank Building have preemptive rights because Bank Building was incorporated prior to December 31, 2005. | Carter Bank stockholders do not have preemptive rights because the articles of incorporation do not provide such rights and Carter Bank was incorporated after December 31, 2005. | |
Cumulative Voting for Directors
Cumulative voting entitles each stockholder to cast an aggregate number of votes equal to the number of voting shares held, multiplied by the number of directors to be elected. Each stockholder may cast all of his or her votes for one nominee or distribute them among two or more nominees, thus permitting holders of less than a majority of the outstanding shares of voting stock to achieve board representation. Where cumulative voting is not permitted, holders of all outstanding shares of voting stock of a corporation elect the entire board of directors of the corporation, thereby precluding the election of any directors by the holders of less than a majority of the outstanding shares of voting stock. Virginia law provides that stockholders do not have the right to cumulate votes for directors unless the articles of incorporation so provide.
51
Table of Contents
| Bank Building | Carter Bank | |
| Bank Building’s bylaws provide that its stockholders have a right to cumulative voting in the election of directors. | Carter Bank’s stockholders do not have a right to cumulative voting in the election of directors because the articles of incorporation do not provide for such a right. | |
| Classes of Directors | ||
| Bank Building | Carter Bank | |
| Bank Building’s articles of incorporation and bylaws provide for a single class of directors elected annually. | Carter Bank’s articles of incorporation provide for a single class of directors elected annually. | |
| Qualifications of Directors | ||
| Bank Building | Carter Bank | |
| Bank Building’s bylaws set forth no age requirements for directors, nor do the bylaws require that a person own shares of stock of Bank Building to be qualified as a director. | Carter Bank’s bylaws set forth no age requirements for directors, nor do the bylaws require that a person own shares of stock of Carter Bank to be qualified as a director; however, directors are required to own qualifying shares under state law. | |
| Filling Vacancies on the Board | ||
| Bank Building | Carter Bank | |
| Bank Building’s bylaws provide that a majority vote of the directors in office may fill any vacancy occurring on Bank Building’s board of directors. | Carter Bank’s bylaws provide that a majority vote of the directors in office may fill any vacancy occurring on Carter Bank’s board of directors, unless sooner filled by the stockholders. | |
| Removal of Directors | ||
| Bank Building | Carter Bank | |
| Bank Building’s articles of incorporation and bylaws are silent on the issue of removal of directors; however, Virginia law provides that the stockholders may remove a director at any time with or without cause. | Carter Bank’s bylaws provide that at a stockholders’ meeting called and noticed expressly for the purpose of removing a director, a director may be removed, with or without cause, and the vacancy filled by a majority of the votes entitled to be cast at an election of directors. | |
Notice of Director Nominations and Stockholder Proposals
Under the Exchange Act, stockholders of public companies must submit their proposals for inclusion in a corporation’s proxy materials in writing. Stockholders may only submit one proposal for each meeting, and the proposal must be no more than 500 words. The proposal must be received no less than 120 days prior to the first anniversary date of the initial notice given to stockholders of record on the record date for the previous annual meeting, provided that if the annual meeting has been changed by more than 30 days from the date of the previous year’s meeting, such notice must be given a reasonable amount of time before the corporation begins to print its proxy materials for the meeting.
52
Table of Contents
| Bank Building | Carter Bank | |
| Bank Building’s articles of incorporation and bylaws are silent on these issues; therefore, the Exchange Act and the laws of Virginia apply. | Carter Bank’s bylaws provide that the board of directors, its nominating committee, if established, the chairman of the board and the president by written notice to the secretary may nominate directors. Any stockholder entitled to vote may nominate directors at an annual meeting, but only if written notice of such intent is given not less than 90 days in advance of the election. Each such notice must contain specific information as further delineated in Carter Bank’s bylaws. | |
| Carter Bank’s bylaws provide that stockholders must submit their proposals in writing for inclusion in the proxy materials in accordance with the Exchange Act. Stockholder proposals to be presented at the annual meeting, but not included in the proxy materials, must be delivered not less than 90, nor more than 120 days prior to the first anniversary of the preceding year’s annual meeting; provided that in the event that the date of the annual meeting is advanced by more than 30 days or delayed by more than 60 days from such anniversary date, notice must be delivered no earlier than the 120th day prior to such annual meeting and no later than the 90th day prior to such annual meeting or the 10th day following the day on which notice of the date of annual meeting was mailed or public announcement of the date of such meeting was first made. All proposals must contain specific information as further delineated in Carter Bank’s bylaws. | ||
Anti-Takeover Provisions - Business Combinations
Virginia law contains business combination statutes that protect domestic corporations from hostile takeovers, and from actions following such a takeover, by restricting the voting rights of shares acquired by a person who has gained a significant holding in the corporation.
| Bank Building | Carter Bank | |
| Bank Building’s articles of incorporation and bylaws are silent on this issue, therefore the laws of Virginia apply. | Carter Bank’s articles of incorporation and bylaws are silent on this issue, therefore the laws of Virginia apply. | |
53
Table of Contents
| Calling Special Meetings of Stockholders | ||
| Bank Building | Carter Bank | |
| Bank Building’s bylaws provide that special meetings of stockholders may be called by the president or the board of directors, or by the president at the request of stockholders owning at least 10% of the outstanding capital stock entitled to vote at such meeting. The notice must contain specific items as delineated in Bank Building’s bylaws. | Carter Bank’s bylaws provide that a special meeting of the stockholders may be called by the chairman, the president, or a majority of the board of directors. The notice must contain specific items as delineated in Carter Bank’s bylaws. | |
| Notice of Meetings | ||
| Bank Building | Carter Bank | |
| Bank Building’s bylaws require that notice of any annual or special meeting be served on each stockholder, personally or by mail, not less than 10 nor more than 60 days before the date of the meeting. Such notice must contain specific information as delineated in the bylaws. | Carter Bank’s bylaws are substantially similar to Bank Building’s bylaws with respect to notice of meetings, but also require that notice must be given to all stockholders of record not less than 25 days nor more than 60 days before a meeting called to act on an amendment to the articles of incorporation, a plan of merger or share exchange, a proposed sale of the assets of Carter Bank, or the dissolution of Carter Bank, in which case the notice shall state the purpose of the meeting. | |
Vote Required for Amendments to Articles of Incorporation and Certain Transactions
Under Virginia law, a corporation may amend its articles of incorporation at any time to add or change a provision that is required or permitted in the articles or to delete a provision not required in the articles by a vote of two-thirds of the outstanding shares entitled to vote. A lesser vote may be allowed by the articles of incorporation. Virginia law also provides that a plan of merger or share exchange must be approved by a two-thirds vote of each eligible voting group entitled to vote on the transaction at a meeting at which a quorum of the voting group is present, provided that the transaction is approved by a majority of all votes cast. Transactions involving the sale of all or substantially all of a corporation’s assets other than in the regular course of business must be approved by a two-thirds vote of all votes entitled to be cast.
| Bank Building | Carter Bank | |
| Bank Building’s articles of incorporation are silent on these issues; therefore, the laws of Virginia apply. | Carter Bank’s articles of incorporation are silent on these issues; therefore, the laws of Virginia apply. | |
| Amendment of Bylaws | ||
| Bank Building | Carter Bank | |
| Bank Building’s bylaws vest the power to amend the bylaws in the board of directors by a majority of the total number of directors. | Carter Bank’s bylaws vest the power to amend the bylaws in the board of directors by a majority of the total number of directors. | |
54
Table of Contents
Troutman Sanders LLP, Richmond, Virginia, will opine as to the qualification of the merger as a reorganization and the tax treatment of the consideration paid in connection with the merger under the Code.
The financial statements of each of the Merged Banks for the years ended December 31, 2004 and 2005, of Carter Bank for the year ended December 31, 2006 and of Bank Building for the years ended December 31, 2005 and 2006 have been incorporated by reference in this proxy statement in reliance upon the reports of Goodman & Company, LLP, independent certified public accountants, and upon the authority of Goodman & Company, LLP as experts in accounting and auditing.
If the merger is not completed, Bank Building will convene a separate 2008 annual meeting of stockholders. If any stockholder intends to have a proposal considered for inclusion in Bank Building’s proxy materials for the 2008 Annual Meeting of Stockholders, the proposal must be in proper form in accordance with the federal proxy rules and must be received by the Secretary/Treasurer, at Bank Building’s principal office in Martinsville, Virginia no later than August 1, 2008. If any stockholder intends to present a proposal at the 2008 Annual Meeting of Stockholders but does not seek to have the proposal included in Bank Building’s proxy materials for the meeting, the proposal must be received by the Secretary/Treasurer, at Bank Building’s principal office in Martinsville, Virginia no later than October 15, 2008. If the date of the 2008 Annual Meeting changes by more than 30 days from the date of the 2007 Annual Meeting, the deadline for submitting stockholder proposals in either case will be a reasonable time before Bank Building begins to print and mail its proxy materials for the 2008 Annual Meeting.
The bylaws of Bank Building are available to any stockholder of Bank Building, without charge, upon written request to Worth Harris Carter, Jr. at the address listed below on page [ ].
Other than as described in this proxy statement, no business is scheduled to be transacted at the stockholder meetings.
WHERE YOU CAN FIND MORE INFORMATION
Bank Building files annual, quarterly and current reports, proxy statements and other information with the SEC. You may obtain free copies of the documents Bank Building files with the SEC (i) by visiting the SEC’s website http://www.sec.gov, or (ii) by directing a request by telephone or mail to Worth Harris Carter, Jr., Bank Building, 1300 Kings Mountain Road, Martinsville, Virginia 24112; telephone number: (276) 656-1776.
Carter Bank files annual, quarterly and current reports, proxy statements and other information with the FDIC (rather than the SEC). You may obtain free copies of the documents the Carter Bank files with the FDIC by directing a request by telephone or mail to Worth Harris Carter, Jr., Carter Bank, 1300 Kings Mountain Road, Martinsville, Virginia 24112; telephone number: (276) 656-1776.
This proxy statement includes the Annual Reports on Form 10-KSB for the year ended December 31, 2006 and the Quarterly Report on Form 10-QSB for the nine months ended September 30, 2007 for Bank Building. See “Financial Statements of Bank Building Corporation.”
This proxy statement includes the Annual Reports on Form 10-K for the year ended December 31, 2006 and the Quarterly Report on Form 10-Q for the nine months ended September 30, 2007 for Carter Bank. See “Financial Statements of Carter Bank & Trust.” This proxy statement also includes the Selected Financial Data and the Pro Forma Unaudited Combined Consolidated Financial Information for Carter Bank excerpted from the joint proxy statement for Blue Ridge Bank, N.A., Central National Bank, Community National Bank, First National Bank, First National Exchange Bank, Mountain National Bank, Patrick Henry National Bank, Patriot Bank, N.A., Peoples National Bank and Shenandoah National Bank on Schedule 14A dated September 27, 2006. See “Financial Statements of Carter Bank & Trust–Selected Financial Data” and “–Pro Forma Unaudited Combined Consolidated Financial Information.”
55
Table of Contents
This proxy statement includes the annual reports for the year ended December 31, 2005 and the quarterly reports for the nine months ended September 30, 2006 for each of the Merged Banks. See “Financial Statements of Merged Banks.”
These reports contain important information about Bank Building and Carter Bank and their respective financial conditions. You can obtain additional copies of the documents included in this proxy statement free of charge by requesting them in writing or by telephone from the following address:
Mr. Worth Harris Carter, Jr.
Bank Building Corporation
1300 Kings Mountain Road
Martinsville, Virginia 24112
(276) 656-1776
If you would like to request any documents, please do so by [ , 2008] in order to receive them before the special stockholder meetings.
Neither Bank Building nor Carter Bank has authorized anyone to give any information or make any representation about the merger or about Bank Building or Carter Bank that is different from, or in addition to, that contained in this proxy statement or in any of the materials that Bank Building has included in this proxy statement. Therefore, if anyone does give you information of this sort, you should not rely on it. Information in this proxy statement about Bank Building has been supplied by Bank Building and information about Carter Bank has been supplied by Carter Bank. The information contained in this proxy statement speaks only as of the date of this proxy statement unless the information specifically indicates that another date applies.
56
Table of Contents
Annex A
Execution Copy
AGREEMENT AND PLAN OF MERGER
BY AND BETWEEN
CARTER BANK & TRUST
AND
BANK BUILDING CORPORATION
Dated as of January 8, 2008
Table of Contents
TABLE OF CONTENTS
| Page | ||||||
| Article I DEFINITIONS | 1 | |||||
| Section 1.1. | Agreement. | 1 | ||||
| Section 1.2. | Alternative Transaction Notice. | 1 | ||||
| Section 1.3. | Appraised Value. | 1 | ||||
| Section 1.4. | Articles of Merger. | 1 | ||||
| Section 1.5. | Benefit Plans. | 1 | ||||
| Section 1.6. | Certificates. | 1 | ||||
| Section 1.7. | Closing; Closing Date. | 2 | ||||
| Section 1.8. | Code. | 2 | ||||
| Section 1.9. | Company. | 2 | ||||
| Section 1.10. | Company Acquisition Agreement. | 2 | ||||
| Section 1.11. | Company Board Recommendation. | 2 | ||||
| Section 1.12. | Company Common Stock. | 2 | ||||
| Section 1.13. | Company Financial Advisor. | 2 | ||||
| Section 1.14. | Company Intellectual Property. | 2 | ||||
| Section 1.15. | Company Stockholder Approval. | 2 | ||||
| Section 1.16. | Confidentiality Agreement. | 2 | ||||
| Section 1.17. | Contracts. | 3 | ||||
| Section 1.18. | CRA. | 3 | ||||
| Section 1.19. | Deferred Tax Amount. | 3 | ||||
| Section 1.20. | Dissenting Shares. | 3 | ||||
| Section 1.21. | Effective Time. | 3 | ||||
| Section 1.22. | Environmental Claim. | 3 | ||||
| Section 1.23. | Environmental Laws. | 3 | ||||
| Section 1.24. | ERISA. | 4 | ||||
| Section 1.25. | Exchange Act. | 4 | ||||
| Section 1.26. | FDIC. | 4 | ||||
| Section 1.27. | GAAP. | 4 | ||||
| Section 1.28. | Governmental Authority. | 4 | ||||
| Section 1.29. | Hazardous Materials. | 4 | ||||
| Section 1.30. | Knowledge of the Company. | 4 | ||||
| Section 1.31. | Knowledge of the Purchaser. | 4 | ||||
| Section 1.32. | Law. | 5 | ||||
| Section 1.33. | Leased Real Property. | 5 | ||||
| Section 1.34. | Letter of Transmittal. | 5 | ||||
| Section 1.35. | Liens. | 5 | ||||
| Section 1.36. | Material Adverse Effect. | 5 | ||||
| Section 1.37. | Merger. | 5 | ||||
| Section 1.38. | Merger Consideration. | 6 | ||||
| Section 1.39. | OREO. | 6 | ||||
| Section 1.40. | Other Assets. | 6 | ||||
| Section 1.41. | Owned Real Property. | 6 | ||||
-i-
Table of Contents
| Section 1.42. | Permits. | 6 | ||||
| Section 1.43. | Permitted Liens. | 6 | ||||
| Section 1.44. | Person. | 6 | ||||
| Section 1.45. | Proxy Statement. | 6 | ||||
| Section 1.46. | Purchaser. | 6 | ||||
| Section 1.47. | Purchaser Common Stock. | 7 | ||||
| Section 1.48. | Purchaser Financial Advisor. | 7 | ||||
| Section 1.49. | Purchaser Intellectual Property. | 7 | ||||
| Section 1.50. | Real Property Lease. | 7 | ||||
| Section 1.51. | Representatives. | 7 | ||||
| Section 1.52. | Restraints. | 7 | ||||
| Section 1.53. | SCC. | 7 | ||||
| Section 1.54. | SEC. | 7 | ||||
| Section 1.55. | Securities Act. | 7 | ||||
| Section 1.56. | Securities Law Documents. | 7 | ||||
| Section 1.57. | Shares. | 7 | ||||
| Section 1.58. | Special Meeting. | 7 | ||||
| Section 1.59. | Subsidiary; Subsidiaries. | 8 | ||||
| Section 1.60. | Tax Returns. | 8 | ||||
| Section 1.61. | Taxes. | 8 | ||||
| Section 1.62. | Termination Fee. | 8 | ||||
| Section 1.63. | Total Liabilities. | 8 | ||||
| Section 1.64. | Transfer Agent. | 8 | ||||
| Section 1.65. | VSCA. | 9 | ||||
| Section 1.66. | Walk-Away Date. | 9 | ||||
| Article IITHE MERGER | 9 | |||||
| Section 2.1. | The Merger. | 9 | ||||
| Section 2.2. | Closing. | 9 | ||||
| Section 2.3. | Effective Time of the Merger. | 9 | ||||
| Section 2.4. | Effects of the Merger. | 9 | ||||
Article III EFFECT OF THE MERGER ON THE CAPITAL STOCK OF THE CONSTITUENT CORPORATIONS; EXCHANGE OF CERTIFICATES; COMPANY STOCK OPTIONS | 10 | |||||
| Section 3.1. | Effect on Capital Stock. | 10 | ||||
| Section 3.2. | Notices to Stockholders; Payment for Shares. | 11 | ||||
| Section 3.3. | Stock Transfer Books. | 12 | ||||
| Section 3.4. | Adjustments. | 12 | ||||
| Section 3.5. | Appraisal Rights. | 12 | ||||
| Article IVREPRESENTATIONS AND WARRANTIES OF THE PURCHASER | 13 | |||||
| Section 4.1. | Organization. | 13 | ||||
| Section 4.2. | Authority Relative to this Agreement. | 13 | ||||
| Section 4.3. | Capitalization. | 13 | ||||
| Section 4.4. | Consents and Approvals; No Violations. | 14 | ||||
| Section 4.5. | Financial Statements. | 15 | ||||
-ii-
Table of Contents
| Section 4.6. | Absence of Undisclosed Liabilities. | 15 | ||||
| Section 4.7. | Events Subsequent to Latest Financial Statements. | 16 | ||||
| Section 4.8. | Regulatory Matters. | 16 | ||||
| Section 4.9. | Legal Proceedings; Compliance with Laws. | 17 | ||||
| Section 4.10. | Reports. | 17 | ||||
| Section 4.11. | Labor Relations. | 17 | ||||
| Section 4.12. | Tax Matters. | 17 | ||||
| Section 4.13. | Property. | 18 | ||||
| Section 4.14. | Employee Benefit Plans. | 18 | ||||
| Section 4.15. | Investment Securities. | 19 | ||||
| Section 4.16. | Insurance. | 19 | ||||
| Section 4.17. | Loans, OREO, and Allowance for Loan Losses. | 19 | ||||
| Section 4.18. | Environmental Matters. | 20 | ||||
| Section 4.19. | Fees and Expenses of Brokers and Others. | 21 | ||||
| Section 4.20. | Proxy Statement. | 21 | ||||
| Section 4.21. | Material Contracts. | 22 | ||||
| Section 4.22. | Intellectual Property. | 22 | ||||
| Section 4.23. | State Takeover Statutes. | 22 | ||||
| Section 4.24. | Books and Records. | 23 | ||||
| Section 4.25. | Affiliate Transactions. | 23 | ||||
| Article V REPRESENTATIONS AND WARRANTIES OF THE COMPANY | 23 | |||||
| Section 5.1. | Organization, Standing and Corporate Power. | 23 | ||||
| Section 5.2. | Authority Relative to this Agreement. | 23 | ||||
| Section 5.3. | Capitalization. | 24 | ||||
| Section 5.4. | Consents and Approvals; No Violations. | 24 | ||||
| Section 5.5. | Financial Statements. | 25 | ||||
| Section 5.6. | Absence of Undisclosed Liabilities. | 25 | ||||
| Section 5.7. | Events Subsequent to Latest Financial Statements. | 26 | ||||
| Section 5.8. | Regulatory Matters. | 27 | ||||
| Section 5.9. | Legal Proceedings; Compliance with Laws. | 27 | ||||
| Section 5.10. | Labor Relations. | 27 | ||||
| Section 5.11. | Tax Matters. | 27 | ||||
| Section 5.12. | Properties. | 28 | ||||
| Section 5.13. | Employees. | 29 | ||||
| Section 5.14. | Insurance. | 29 | ||||
| Section 5.15. | Environmental Matters. | 29 | ||||
| Section 5.16. | Fees and Expenses of Brokers and Others. | 30 | ||||
| Section 5.17. | Proxy Statement. | 30 | ||||
| Section 5.18. | Material Contracts. | 31 | ||||
| Section 5.19. | Intellectual Property. | 31 | ||||
| Section 5.20. | State Takeover Statutes. | 32 | ||||
| Section 5.21. | Vote Required. | 32 | ||||
| Section 5.22. | Books and Records. | 32 | ||||
| Section 5.23. | Affiliate Transactions. | 32 | ||||
-iii-
Table of Contents
| Article VI COVENANTS | 32 | |||||
| Section 6.1. | Conduct of the Business of the Company. | 32 | ||||
| Section 6.2. | Appraisal. | 33 | ||||
| Section 6.3. | Stockholders’ Meeting. | 33 | ||||
| Section 6.4. | Filings; Approvals and Consents; Cooperation. | 34 | ||||
| Section 6.5. | Access to Information; Confidentiality Agreements. | 35 | ||||
| Section 6.6. | Anti-takeover Statutes. | 35 | ||||
| Section 6.7. | No Solicitation. | 35 | ||||
| Section 6.8. | Tax-Free Reorganization. | 37 | ||||
| Section 6.9. | Restructuring. | 38 | ||||
| Article VII CONDITIONS PRECEDENT TO CONSUMMATION OF THE MERGER | 38 | |||||
| Section 7.1. | Conditions Precedent to Each Party’s Obligation to Effect the Merger. | 38 | ||||
| Section 7.2. | Conditions Precedent to the Purchaser’s Obligation to Effect the Merger. | 39 | ||||
| Section 7.3. | Conditions Precedent to the Company’s Obligation to Effect the Merger. | 39 | ||||
| Article VIIITERMINATION | 40 | |||||
| Section 8.1. | Termination. | 40 | ||||
| Section 8.2. | Rights on Termination. | 41 | ||||
| Section 8.3. | Termination Fees. | 41 | ||||
| Section 8.4. | Remedies. | 42 | ||||
| Article IXMISCELLANEOUS | 42 | |||||
| Section 9.1. | Survival of Representations and Warranties. | 42 | ||||
| Section 9.2. | Amendment. | 42 | ||||
| Section 9.3. | Extension; Waiver. | 43 | ||||
| Section 9.4. | Entire Agreement; Assignment. | 43 | ||||
| Section 9.5. | Notices. | 43 | ||||
| Section 9.6. | Governing Law; Consent to Jurisdiction; Waiver of Jury Trial. | 44 | ||||
| Section 9.7. | Descriptive Headings. | 44 | ||||
| Section 9.8. | Parties in Interest. | 45 | ||||
| Section 9.9. | Counterparts. | 45 | ||||
| Section 9.10. | Specific Performance. | 45 | ||||
| Section 9.11. | Fees and Expenses. | 45 | ||||
| Section 9.12. | Severability. | 45 | ||||
| Section 9.13. | Joint Participation. | 45 | ||||
| Exhibit A | Plan of Merger | |||||
| Schedules | ||||||
| Schedule 4.1 | Subsidiaries of the Purchaser | |||||
| Schedule 5.12(a) | Owned Real Property | |||||
| Schedule 5.12(b) | Leased Real Property | |||||
-iv-
Table of Contents
AGREEMENT AND PLAN OF MERGER
This AGREEMENT AND PLAN OF MERGER, dated as of January 8, 2008, by and among CARTER BANK & TRUST, a Virginia corporation (the “Purchaser”), and BANK BUILDING CORPORATION, a Virginia corporation (the “Company”).
RECITALS
WHEREAS, the respective Boards of Directors of the Purchaser and the Company have determined that it is in the best interests of their respective stockholders that the businesses and operations of the Purchaser and the Company be combined and have approved and adopted this Agreement and the merger of the Company with and into the Purchaser (the “Merger”), with the Purchaser to be the surviving corporation of such Merger, all upon the terms and subject to the conditions set forth herein.
NOW, THEREFORE, in consideration of the foregoing and the mutual premises, representations, warranties, covenants and agreements herein contained, the parties hereto, intending to be legally bound, hereby agree as follows:
ARTICLE I
DEFINITIONS
Section 1.1.Agreement.
“Agreement” shall mean this Agreement, together with the Annexes, Exhibits and Schedules attached hereto, as amended from time to time in accordance with the terms hereof.
Section 1.2.Alternative Transaction Notice.
“Alternative Transaction Notice” shall have the meaning given inSection 6.7(b) hereof.
Section 1.3.Appraised Value.
“Appraised Value” shall mean 97% of the fair market value of the Owned Real Property of the Company as determined by certified appraisals in accordance withSection 6.2.
Section 1.4.Articles of Merger.
“Articles of Merger” shall have the meaning given inSection 2.3 hereof.
Section 1.5.Benefit Plans.
“Benefit Plans” shall have the meaning given inSection 4.14(a) hereof.
Section 1.6.Certificates.
“Certificates” shall mean the certificate or certificates which, immediately prior to the Effective Time, represented outstanding shares of Company Common Stock.
1
Table of Contents
Section 1.7.Closing; Closing Date.
“Closing” shall mean the closing held pursuant toSection 2.2 hereof, and “Closing Date” shall mean the date on which the Closing occurs.
Section 1.8.Code.
“Code” shall mean, as appropriate, the Internal Revenue Code of 1986, as amended and the rules and regulations promulgated thereunder.
Section 1.9.Company.
“Company” shall mean Bank Building Corporation, a Virginia corporation.
Section 1.10.Company Acquisition Agreement.
“Company Acquisition Agreement” shall have the meaning given inSection 6.7(b) hereof.
Section 1.11.Company Board Recommendation.
“Company Board Recommendation” shall have the meaning given inSection 6.7(b) hereof.
Section 1.12.Company Common Stock.
“Company Common Stock” shall mean the common stock, no par value per share, of the Company.
Section 1.13.Company Financial Advisor.
“Company Financial Advisor” shall mean Davenport & Company LLC, financial advisor to the Company.
Section 1.14.Company Intellectual Property.
“Company Intellectual Property” shall have the meaning given inSection 5.19 hereof.
Section 1.15.Company Stockholder Approval.
“Company Stockholder Approval” shall mean the affirmative vote (in person or by proxy) of the holders of at least 662/3% of the outstanding shares of Company Common Stock at the Special Meeting, or any adjournment or postponement thereof, in favor of the adoption of this Agreement.
Section 1.16.Confidentiality Agreement.
“Confidentiality Agreement” shall have the meaning given inSection 6.7(a) hereof.
2
Table of Contents
Section 1.17.Contracts.
“Contracts” shall mean contracts, agreements, leases, licenses, arrangements, understandings, relationships and commitments, written or oral.
Section 1.18.CRA.
“CRA” shall have the meaning given inSection 4.8(c) hereof.
Section 1.19.Deferred Tax Amount.
“Deferred Tax Amount” shall mean 35% of the amount by which the Appraised Value exceeds the Tax basis of the Owned Real Property of the Company as of December 31, 2007.
Section 1.20.Dissenting Shares.
“Dissenting Shares” shall have the meaning given inSection 3.5 hereof.
Section 1.21.Effective Time.
“Effective Time” shall have the meaning given inSection 2.3 hereof.
Section 1.22.Environmental Claim.
“Environmental Claim” means any administrative, regulatory or judicial actions, suits, demands, demand letters, directives, claims, Liens, investigations, proceedings or notices of noncompliance or violation (in each case in writing) by any Person, alleging noncompliance, violation or potential liability (including potential responsibility or liability for costs of enforcement, investigation, cleanup, governmental response, removal or remediation, for natural resources damages, property damage, personal injuries or penalties or for contribution, indemnification, cost recovery, compensation or injunctive relief) arising out of, or related to (x) the presence, release or threatened release of any Hazardous Materials, or (y) circumstances forming the basis of any violation or alleged violation of, or liability under, any Environmental Law or Environmental Permit.
Section 1.23.Environmental Laws.
“Environmental Laws” shall mean any Law, rule, ordinance, code, policy, rule of common Law and regulations relating to pollution or protection of human health (excluding OSHA) or the environment (including, without limitation, ambient air, surface water, ground water, land surface or subsurface strata), including, without limitation, Laws and regulations relating to environmental releases or threatened environmental releases of Hazardous Materials, or otherwise relating to the manufacture, processing, distribution, use, treatment, storage, disposal, transport or handling of Hazardous Materials.
3
Table of Contents
Section 1.24.ERISA.
“ERISA” shall mean the Employee Retirement Income Security Act of 1974, as amended.
Section 1.25.Exchange Act.
“Exchange Act” shall have the meaning given inSection 4.5 hereof.
Section 1.26.FDIC.
“FDIC” shall have the meaning given inSection 4.1(a) hereof.
Section 1.27.GAAP.
“GAAP” shall mean generally accepted accounting principles as in effect in the United States of America at the time of the preparation of the subject financial statement.
Section 1.28.Governmental Authority.
“Governmental Authority” shall mean any federal, state, provincial, municipal or other governmental department, commission, board, bureau, agency or instrumentality, or any court, in each case whether of the United States, any of its possessions or territories, or of any foreign nation.
Section 1.29.Hazardous Materials.
“Hazardous Materials” shall mean: (i) any petroleum or petroleum products, radioactive materials, asbestos in any form that is friable, urea formaldehyde foam insulation, and transformers or other equipment that contain dielectric fluid containing polychlorinated biphenyls (“PCBs”) above regulated levels and radon gas; and (ii) any chemicals, materials or substances which are now defined as or included in the definition of “hazardous substances,” “hazardous wastes,” “hazardous materials,” “extremely hazardous wastes,” “restricted hazardous wastes,” “toxic substances,” “toxic pollutants,” or words of similar import, under any Environmental Law; and (iii) any other chemical, material, substance or waste, exposure to which is now prohibited, limited or regulated by any Governmental Authority.
Section 1.30.Knowledge of the Company.
“Knowledge of the Company” shall mean the actual knowledge, after reasonable inquiry, of the senior executive officers of the Company and its Subsidiary.
Section 1.31.Knowledge of the Purchaser.
“Knowledge of the Purchaser” shall mean the actual knowledge, after reasonable inquiry, of the senior executive officers of the Purchaser and its Subsidiaries.
4
Table of Contents
Section 1.32.Law.
“Law” shall mean any federal, state, foreign, supranational, provincial, local or other law or treaty or governmental requirement of any kind, and the rules, regulations and orders promulgated thereunder.
Section 1.33.Leased Real Property.
“Leased Real Property” shall have the meaning given it inSection 5.12(b) hereof.
Section 1.34.Letter of Transmittal.
“Letter of Transmittal” shall have the meaning given inSection 3.2(a) hereof.
Section 1.35.Liens.
“Liens” shall mean all liens, pledges, security interests and transfer restrictions or other encumbrances.
Section 1.36.Material Adverse Effect.
“Material Adverse Effect” shall mean any effect or change that would be (or could reasonably be expected to be) materially adverse to the business, assets, condition (financial or otherwise), operating results, operations, or business prospects of the Company and its Subsidiaries, taken as a whole, or to the ability of the Company to consummate timely the transactions contemplated hereby (regardless of whether or not such adverse effect or change can be or has been cured at any time or whether the Purchaser has knowledge of such effect or change on the date hereof), excluding any adverse change, event, development, or effect arising from or relating to (a) general business or economic conditions, (b) national or international political or social conditions, including the engagement by the United States in hostilities, whether or not pursuant to the declaration of a national emergency or war, or the occurrence of any military or terrorist attack upon the United States, or any of its territories, possessions, or diplomatic or consular offices or upon any military installation, equipment or personnel of the United States, (c) financial, banking, or securities markets, (d) changes in GAAP, (e) changes in Laws or other binding directives issued by any Governmental Entity, and (f) the taking of any action contemplated by this Agreement and the other agreements contemplated hereby, other than to the extent that any adverse change, event, development, or effect referred to in each of clauses (a) through (f) has had or would reasonably be expected to have a disproportionately adverse effect on the Company and its Subsidiaries as generally compared to other participants in the industries in which Company and its Subsidiaries conduct business.
Section 1.37.Merger.
“Merger” shall mean the merger of the Company with and into the Purchaser, to be effective at the Effective Time.
5
Table of Contents
Section 1.38.Merger Consideration.
“Merger Consideration” shall have the meaning given inSection 3.1(a) hereof.
Section 1.39.OREO.
“OREO” shall have the meaning given inSection 4.17(b) hereof.
Section 1.40.Other Assets.
“Other Assets” shall mean the book value calculated in accordance with GAAP as of December 31, 2007 of all of the assets of the Company except for the Owned Real Property of the Company.
Section 1.41.Owned Real Property.
“Owned Real Property” shall have the meaning given inSection 5.12(a) hereof.
Section 1.42.Permits.
“Permits” shall mean permits, licenses and governmental authorizations, registrations and approvals.
Section 1.43.Permitted Liens.
“Permitted Liens” shall mean Liens specifically disclosed on the balance sheet referenced inSection 5.5; Liens for Taxes not yet due or being contested in good faith (and, with respect to those being contested, for which adequate accruals or reserves have been established on the balance sheet referenced inSection 5.5); or Liens that do not materially detract from the value or materially interfere with any present or intended use of such property or assets.
Section 1.44.Person.
“Person” shall mean an individual, corporation, partnership, joint venture, association, trust, unincorporated organization or other entity.
Section 1.45.Proxy Statement.
“Proxy Statement” shall mean the proxy statement/offering circular of the Company and the Purchaser distributed to the stockholders of the Company in connection with the Special Meeting.
Section 1.46.Purchaser.
“Purchaser” shall mean Carter Bank & Trust, a Virginia banking corporation.
6
Table of Contents
Section 1.47.Purchaser Common Stock.
“Purchaser Common Stock” shall mean the common stock, $1.00 par value per share, of the Purchaser.
Section 1.48.Purchaser Financial Advisor.
“Purchaser Financial Advisor” shall mean Boxwood Partners, LLC, financial advisor to the Purchaser.
Section 1.49.Purchaser Intellectual Property.
“Purchaser Intellectual Property” shall have the meaning given inSection 4.22 hereof.
Section 1.50.Real Property Lease.
“Real Property Lease” shall have the meaning given inSection 5.12(b) hereof.
Section 1.51.Representatives.
“Representatives” shall have the meaning given inSection 6.7(a) hereof.
Section 1.52.Restraints.
“Restraints” shall have the meaning given inSection 7.1(b) hereof.
Section 1.53.SCC.
“SCC” shall have the meaning given inSection 2.3 hereof.
Section 1.54.SEC.
“SEC” shall have the meaning given inSection 5.4 hereof.
Section 1.55.Securities Act.
“Securities Act” shall have the meaning given inSection 4.20(a)(i) hereof.
Section 1.56.Securities Law Documents.
“Securities Law Documents” shall have the meaning given inSection 4.5 hereof.
Section 1.57.Shares.
“Shares” shall mean shares of Company Common Stock.
Section 1.58.Special Meeting.
“Special Meeting” shall have the meaning given inSection 6.3(a) hereof.
7
Table of Contents
Section 1.59.Subsidiary; Subsidiaries.
“Subsidiary” shall mean, with respect to any Person, any corporation, limited liability company, partnership, association, or other business entity of which (i) if a corporation, a majority of the total voting power of shares of stock entitled (without regard to the occurrence of any contingency) to vote in the election of directors, managers, or trustees thereof is at the time owned or controlled, directly or indirectly, by that Person or one or more of the other Subsidiaries of that Person or a combination thereof or (ii) if a limited liability company, partnership, association, or other business entity (other than a corporation), a majority of the partnership or other similar ownership interests thereof is at the time owned or controlled, directly or indirectly, by that Person or one or more Subsidiaries of that Person or a combination thereof and for this purpose, a Person or Persons owns a majority ownership interest in such a business entity (other than a corporation) if such Person or Persons shall be allocated a majority of such business entity’s gains or losses or shall be or control any managing director or general partner of such business entity (other than a corporation). The term “Subsidiary” shall include all Subsidiaries of such Subsidiary (collectively, “Subsidiaries”).
Section 1.60.Tax Returns.
“Tax Returns” shall mean any report, return, information statement, payee statement or other information required to be provided to any federal, state, local or foreign Governmental Authority, or otherwise retained, with respect to Taxes.
Section 1.61.Taxes.
“Taxes” shall mean any and all taxes, levies, imposts, duties, assessments, charges and withholdings imposed or required to be collected by or paid over to any federal, state, local or foreign Governmental Authority or any political subdivision thereof, including, without limitation, income, gross receipts, ad valorem, value added, minimum tax, franchise, sales, use, excise, license, real or personal property, unemployment, disability, stock transfer, mortgage recording, estimated, withholding or other tax, governmental fee or other like assessment or charge of any kind whatsoever, whether disputed or not, together with any interest, penalties, fines, assessments or additions to tax imposed in respect of the foregoing, or in respect of any failure to comply with any requirement regarding Tax Returns and including any obligation to indemnify or otherwise assume or succeed to the tax liability of any other Person.
Section 1.62.Termination Fee.
“Termination Fee” shall have the meaning given inSection 8.3(a) hereof.
Section 1.63.Total Liabilities.
“Total Liabilities” shall mean the carrying amount of all of the liabilities of the Company as calculated in accordance with GAAP as of December 31, 2007.
Section 1.64.Transfer Agent.
“Transfer Agent” shall mean the Purchaser.
8
Table of Contents
Section 1.65.VSCA.
“VSCA” shall mean the Virginia Stock Corporation Act.
Section 1.66.Walk-Away Date.
“Walk-Away Date” shall have the meaning given inSection 8.1(b)(i) hereof.
ARTICLE II
THE MERGER
Section 2.1.The Merger.
Upon the terms and subject to the conditions set forth in this Agreement, and in accordance with the VSCA, the Company shall be merged with and into the Purchaser at the Effective Time. At the Effective Time, the separate corporate existence of the Company shall cease, and the Purchaser shall continue as the surviving corporation (the Purchaser is sometimes hereinafter referred to as a “Constituent Corporation” and, as the context requires, the Purchaser is sometimes hereinafter referred to as the “Surviving Corporation”) and shall continue under the name “Carter Bank & Trust.”
Section 2.2.Closing.
Unless this Agreement shall have been terminated and the transactions herein contemplated shall have been abandoned pursuant toSection 8.1 hereof, the closing of the Merger (the “Closing”) shall take place at 10:00 a.m., local time, on the third business day following satisfaction or waiver of the conditions set forth inArticle VII (other than those conditions that by their nature are to be satisfied at the Closing, but subject to the satisfaction or waiver of those conditions at such time) (the “Closing Date”), at the offices of Troutman Sanders, LLP, 1001 Haxall Point, Richmond, Virginia 23219, unless another date, time or place is agreed to in writing by the parties hereto.
Section 2.3.Effective Time of the Merger.
Subject to the provisions of this Agreement, the parties hereto shall cause the Merger to be consummated by filing properly executed articles of merger together with the related plan of merger meeting the requirements of Section 13.1-716 of the VSCA (the “Articles of Merger”) with the State Corporation Commission of Virginia (the “SCC”), in accordance with the provisions of the VSCA, as soon as practicable on or after the Closing Date. The Merger shall become effective at the time a certificate of merger is issued by the SCC, or at such later date or time as the Purchaser and the Company shall agree and as specified in the Articles of Merger (the “Effective Time”).
Section 2.4.Effects of the Merger.
(a) The Merger shall have the effects as set in this Agreement and Section 13.1-721 of the VSCA.
9
Table of Contents
(b) The Articles of Incorporation of the Purchaser immediately prior to the Effective Time shall be, from and after the Effective Time, the Articles of Incorporation of the Surviving Corporation, until thereafter duly amended in accordance with the terms thereof and the VSCA.
(c) The Bylaws of the Purchaser immediately prior to the Effective Time shall be, from and after the Effective Time, the Bylaws of the Surviving Corporation until thereafter duly amended in accordance with the terms thereof, the Articles of Incorporation and the VSCA.
(d) The directors and the officers of the Purchaser immediately prior to the Effective Time shall be, from and after the Effective Time, the directors and officers of the Surviving Corporation until their respective successors have been duly elected or appointed and qualified, or until their earlier death, resignation or removal in accordance with the Surviving Corporation’s Articles of Incorporation and Bylaws.
ARTICLE III
EFFECT OF THE MERGER ON THE CAPITAL STOCK OF
THE CONSTITUENT CORPORATIONS; EXCHANGE OF CERTIFICATES;
COMPANY STOCK OPTIONS
Section 3.1.Effect on Capital Stock.
At the Effective Time, by virtue of the Merger and without any action on the part of the Purchaser, the Company or the holder of any Shares or the holder of any capital stock of the Purchaser:
(a)Capital Stock of the Company. Each Share of the capital stock of the Company issued and outstanding immediately prior to the Effective Time shall be converted into and become that number of validly issued, fully paid and nonassessable shares of common stock, par value $1.00 per share, of the Surviving Corporation, equal to the greater of (i) 2.255 or (ii) the number that is derived by taking the Appraised Valueplus Other Assetsless Total Liabilitiesless two-thirds of the Deferred Tax Amount and dividing the resulting number by 398,244 and then dividing the per share result by $9.25 (the “Merger Consideration”).
(b)Cancellation of Shares. Each Share of Company Common Stock and all other shares of capital stock of the Company that are owned, directly or indirectly, by the Company or any wholly owned Subsidiary of the Company (except for Shares owned on behalf of third parties) and all Shares of Company Common Stock and all other shares of capital stock of the Company that are owned, directly or indirectly, by the Purchaser or any other wholly owned Subsidiary of the Purchaser (except for Shares owned on behalf of third parties) shall be automatically canceled and retired and shall cease to exist and no consideration shall be delivered or deliverable in exchange therefor.
(c)Capital Stock of the Purchaser. Each share of the capital stock of the Purchaser issued and outstanding immediately prior to the Effective Time shall remain a validly issued, fully paid and nonassessable share of common stock of the Surviving Corporation.
(d) All Shares of Company Common Stock, when converted as provided inSection 3.1(a), no longer shall be outstanding and automatically shall be canceled and retired and shall
10
Table of Contents
cease to exist, and each Certificate previously evidencing such Shares shall thereafter represent only the right to receive the Merger Consideration and shall be deemed for all purposes to evidence ownership of and to represent the number of shares of Surviving Corporation Common Stock into which such Shares shall have been converted.
(e) The holders of Certificates previously evidencing Shares outstanding immediately prior to the Effective Time shall cease to have any rights with respect to Company Common Stock except as otherwise provided herein or by Law and, upon the surrender of Certificates in accordance with the provisions ofSection 3.2, such Certificates shall represent only the right to receive the Merger Consideration to be exchanged in consideration therefore and shall be deemed for all purposes to evidence ownership of and to represent the number of shares of Surviving Corporation Common Stock into which such Shares shall have been converted.
(f)Fractional Shares. No certificates or scrip representing fractional shares of the Purchaser Common Stock shall be issued, and no holder of shares of Company Common Stock shall be entitled to any voting rights, rights to receive any dividends or distributions or other rights as a stockholder of the Purchaser that would otherwise be issued as fractional shares to such stockholder. In lieu of any fractional shares of stock that would otherwise be issued, each stockholder that would have been entitled to receive a fractional share of the Purchaser Common Stock shall, upon proper surrender of such person’s Certificates, receive a cash payment equal to such fraction multiplied by $9.25.
Section 3.2.Notices to Stockholders; Payment for Shares.
(a)Notices to Stockholders. As promptly as practicable after the Effective Time, the Surviving Corporation shall, or shall cause the Transfer Agent to, mail to each holder of record of Common Stock prior to the Effective Time (i) a letter of transmittal specifying that delivery shall be effected, and risk of loss of the Certificates shall pass, only upon proper delivery of the Certificates to the Transfer Agent, and which letter shall be in customary form and have such other provisions as the Purchaser may reasonably specify (the “Letter of Transmittal”), and (ii) instructions for effecting the surrender of such Certificates for exchange.
(b)Exchange. Upon surrender of a Certificate for cancellation to the Transfer Agent together with such letter of transmittal, duly completed and validly executed in accordance with the instructions (and such other customary documents as may reasonably be required by the Transfer Agent) the holder of such Certificate shall be entitled to receive in respect thereof the Merger Consideration, and the Certificate so surrendered shall forthwith be canceled.
(c)Lost, Stolen or Destroyed Certificates. In the event any Certificate shall have been lost, stolen or destroyed, upon the making of an affidavit of that fact by the Person claiming such Certificate to be lost, stolen or destroyed and, if required by the Purchaser, the posting by such Person of a bond, in such reasonable amount as the Purchaser may direct, as indemnity against any claim that may be made against it with respect to such Certificate, the Transfer Agent will pay, in exchange for such lost, stolen, or destroyed Certificate, the Merger Consideration pursuant to thisSection 3.2.
11
Table of Contents
(d)Withholding. Each of the Transfer Agent and the Purchaser will be entitled to deduct and withhold from the Merger Consideration otherwise payable pursuant to this Agreement to any holder of shares of Company Common Stock such amounts as it is required to deduct and withhold with respect to the making of such payment under the Code, or any other applicable state, local or foreign Law related to Taxes. To the extent that amounts are so withheld by the Transfer Agent or Purchaser, as the case may be, such withheld amounts (i) will be remitted by the Transfer Agent or the Purchaser, as the case may be, to the applicable Governmental Authority, and (ii) will be treated for all purposes of this Agreement as having been paid to the holder of the shares of Company Common Stock in respect of which such deduction and withholding was made by the Purchaser.
Section 3.3.Stock Transfer Books.
At the Effective Time, the stock transfer books of the Company shall be closed and there shall be no further registration of transfers of Shares of Company Common Stock thereafter on the records of the Surviving Corporation.
Section 3.4.Adjustments.
Notwithstanding any provision of thisArticle III to the contrary, during the period between the date of this Agreement and the Effective Time, any change in the number of outstanding Shares of Company Common Stock shall occur by reason of any reclassification, recapitalization, stock split or combination, exchange or readjustment of Shares, or stock dividend thereon with a record date during such period (or the occurrence of any similar events), the Merger Consideration shall be appropriately adjusted to reflect such reclassification, recapitalization, stock split or combination, exchange or readjustment of Shares, or stock dividend thereon or similar event.
Section 3.5.Appraisal Rights.
Notwithstanding any other provision of this Agreement to the contrary, each Share of Company Common Stock issued and outstanding immediately prior to the Effective Time that is held by stockholders who shall have not voted in favor of the Merger or consented thereto in writing and who shall have demanded properly in writing appraisal for such Shares in accordance with Section 13.1-730 of the VSCA (collectively, the “Dissenting Shares”) shall not be converted into or represent the right to receive the Merger Consideration. Such Shares instead shall, from and after the Effective Time, be canceled and shall cease to exist and shall represent only the right to receive payment of the appraised value of such Shares of Company Common Stock held by them in accordance with the provisions of such Section 13.1-730 (less any amounts as are required to be deducted and withheld with respect to the making of such payment under the Code, or any provision of any other Tax Law), except that all Dissenting Shares held by stockholders who shall have failed to perfect or who effectively shall have withdrawn or lost their rights to appraisal of such Shares of Company Common Stock under such Section 13.1-730 shall thereupon be deemed to have been converted into and to have become exchangeable, as of the Effective Time, for the right to receive, without any interest thereon, the Merger Consideration upon surrender, in the manner provided inArticle III hereof, of the Certificate or Certificates that, immediately prior to the Effective Time, evidenced such Shares of Company Common Stock.
12
Table of Contents
ARTICLE IV
REPRESENTATIONS AND WARRANTIES OF THE PURCHASER
The Purchaser represents and warrants to the Company as follows:
Section 4.1.Organization.
(a) The Purchaser is a Virginia banking corporation, duly organized, validly existing and in good standing under the Laws of the Commonwealth of Virginia, is in compliance in all material respects with all rules and regulations promulgated by the Federal Deposit Insurance Corporation (the “FDIC”), has all requisite corporate power any authority to carry on its business as now being conducted and to own and operate all of its assets, properties and business, is an “insured bank” as defined in the Federal Insurance Deposit Act and applicable regulations thereunder and its deposits are insured to the fullest extent allowed by Law by the Deposit Insurance Fund of the FDIC.
(b)Schedule 4.1 constitutes a true and complete list of all of the Subsidiaries of the Purchaser. Each of the Purchaser’s Subsidiaries is a Virginia corporation, duly organized, validly existing and in good standing under the Laws of the Commonwealth of Virginia its jurisdiction of organization.
(c) The Purchaser and each of its Subsidiaries has full corporate or other entity power to carry on their respective business as it is now being conducted and to own, operate and hold under lease their assets and properties as, and in the places where, such properties and assets now are owned, operated or held. The Purchaser and each of its Subsidiaries is duly licensed or qualified to do business and is in good standing in each jurisdiction where the failure to be so licensed, qualified or in good standing would have or could reasonably be expected to have a Material Adverse Effect.
Section 4.2.Authority Relative to this Agreement.
The execution, delivery and performance of this Agreement and of all of the other documents and instruments required hereby by the Purchaser are within the corporate power of the Purchaser. The execution and delivery of this Agreement and the consummation of the transactions contemplated hereby have been duly authorized by the Board of Directors of the Purchaser, and no other corporate or stockholder proceedings on the part of the Purchaser are necessary to authorize this Agreement or to consummate the transactions contemplated herein. This Agreement has been duly executed and delivered by the Purchaser and (assuming the due authorization, execution and delivery hereof by the Company) constitutes a valid and binding agreement of the Purchaser, enforceable against it in accordance with its terms.
Section 4.3.Capitalization.
(a) As of December 31, 2007, the authorized capital stock of the Purchaser consists of (a) 100,000,000 shares of common stock, par value $1.00 per share (“Purchaser Common
13
Table of Contents
Stock”), of which there were 24,996,572 shares issued and outstanding. The Purchaser has not issued any options, warrants, conversion privileges, or other rights to purchase or otherwise acquire any authorized but unissued shares of the Purchaser Common Stock or other proprietary interests. All issued and outstanding shares of the Purchaser Common Stock or other equity interests of the Purchaser have been duly authorized and validly issued and are, fully paid, nonassessable and free of preemptive and similar rights in favor of third parties and have not been and shall not be issued in violation of any federal or state securities Laws. The shares of the Purchaser Common Stock to be issued and delivered as part of the Merger Consideration shall be, at the time of issuance and delivery, duly authorized, fully paid, nonassessable and free of preemptive and similar rights in favor of third parties and shall not be issued in violation of any federal or state securities Laws.
(b) All of the outstanding equity interests of the Purchaser’s Subsidiaries are owned by the Purchaser, directly or indirectly, free and clear of all Liens, claims, charges or encumbrances. Except as set forth in the Purchaser’s Securities Law Documents, there are no outstanding securities, options, warrants, calls, subscriptions, rights or Contracts to which the Purchaser or any of its Subsidiaries is a party or by which the Purchaser or any of its Subsidiaries is bound, granting to any third party the right to purchase or acquire any capital stock of or any equity interests in the Purchaser or any of its Subsidiaries, and there are no put rights or Contracts pursuant to which the Purchaser any of its Subsidiaries is bound to repurchase any shares of its capital stock or equity interests. Except as set forth in the Purchaser’s Securities Law Documents, the Purchaser does not own any equity interest in any entity other than its Subsidiaries.
Section 4.4.Consents and Approvals; No Violations.
(a) No material Permit, authorization, consents or approvals of, or filings with or registrations with any court, administrative agency or commission or other Governmental Authority or instrumentality or with any third party are required to be made or obtained by the Purchaser in connection with the execution, delivery and performance by the Purchaser of this Agreement or to consummate the Merger except for (i) filings of applications or notices with the Virginia Bureau of Financial Institutions for the Merger and (ii) the filings or Articles of Merger with the Virginia State Corporation Commission pursuant to the Virginia Stock Corporation Act, (iii) the filing of the Proxy Statement with the FDIC, (iv) such filings as are required to be made or approvals as are required to be obtained under the securities or “Blue Sky” Laws of certain states in connection with the issuance of the Purchaser Common Stock in the Merger, and (v) receipt of any other consents or approvals that would be obtained by the Purchaser prior to the Effective Time.
(b) Assuming that all filings, registrations, Permits, authorizations, consents and approvals contemplated by the immediately preceding sentence have been duly made or obtained, neither the execution, delivery and performance of this Agreement nor the consummation of the transactions contemplated hereby by the Purchaser will (x) conflict with or result in any breach of any provision of the Articles of Incorporation, Bylaws, partnership or joint venture agreements or other organizational documents of the Purchaser or any of its Subsidiaries, (y) result in a violation or breach of, or constitute (with or without due notice or lapse of time or both) a default (or give rise to any right of termination, cancellation or
14
Table of Contents
acceleration) under, or otherwise result in any diminution of any of the rights of the Purchaser with respect to, any of the terms, conditions or provisions of any note, bond, mortgage, indenture, license, Contract or other instrument or obligation to which the Purchaser or any of its Subsidiaries is a party or by which it or any of them or any of their properties or assets may be bound or (z) violate any order, writ, injunction, decree, statute, rule or regulation applicable to the Purchaser or any of its Subsidiaries or any of their properties or assets except, in the case of subsections (y) and (z) above, for violations, breaches or defaults that will not prevent or materially delay the consummation of the transactions contemplated hereby.
Section 4.5.Financial Statements.
The Purchaser, which is a reporting bank under applicable Law, represents and warrants to the Company that its annual report on Form 10-K for the fiscal year ended December 31, 2006, and all other reports, proxy statements or information statements filed or furnished or to be filed or furnished by it subsequent to December 31, 2006 under Sections 13(a), 13(c) or 15(d) of the Securities Exchange Act of 1934 (the “Exchange Act”) or other applicable Law, in the form filed or furnished or to be filed or furnished (collectively, the Purchaser’s “Securities Law Documents”) with the FDIC, as of the date filed or furnished, (i) complied or will comply in all material respects as to form with the applicable requirements under the Exchange Act, as the case may be, and (ii) did not and will not contain any untrue statement of a material fact or omit to state a material fact required to be stated therein or necessary to make the statements therein, in light of the circumstances under which they were made, not misleading, and each of the statements of financial condition contained in or incorporated by reference into any such Securities Law Documents (including the related notes and schedules thereto) fairly presents, or will fairly present, the financial position of the Purchaser filing such Securities Law Documents as of its date, and each of the statements of income and change in stockholders’ equity and cashflows or equivalent statements in such Securities Law Documents (including any related notes and schedules thereto) fairly presents, or will fairly present, the results of operations, change in stockholders’ equity and changes in cashflows, as the case may be, of the Purchaser filing such Securities Law Documents for the periods to which they relate, in each case in accordance with GAAP consistently applied during the period involved, except in each case as may be noted therein, subject to normal year-end audit adjustments in the case of unaudited statements.
Section 4.6.Absence of Undisclosed Liabilities.
The Purchaser and its Subsidiaries have not incurred any liabilities or obligations that would be required to be reflected or reserved against in a consolidated balance sheet of the Purchaser and its consolidated Subsidiaries prepared in accordance with GAAP in a manner consistent with the Financial Statements except (i) as reflected in the Financial Statements and (ii) for liabilities and obligations incurred in the ordinary course of business since September 30, 2007, none of which is individually or in the aggregate reasonably likely to be material to the Purchaser and its Subsidiaries, taken as a whole.
15
Table of Contents
Section 4.7.Events Subsequent to Latest Financial Statements.
(a) Since September 30, 2007, through the date hereof, there have not been any events, changes, conditions, developments or occurrences that, individually or in the aggregate, have had or would be reasonably be expected to have a Material Adverse Effect and, other than as expressly required by this Agreement, the Purchaser and its Subsidiaries have conducted their business in the ordinary course, in substantially the same manner in which it has been previously conducted, none of the Purchaser or any of its Subsidiaries has:
(i) amended its Organizational Documents;
(ii) purchased, redeemed, retired or otherwise acquired any shares of any of its capital stock;
(iii) issued any capital stock or any security convertible into capital stock; granted any registration rights; or declared or paid any dividend or other distribution in respect of shares of its capital stock;
(iv) except as required by GAAP or required by a change in applicable Law, statute, rule or regulation, (i) made any change in its accounting principles or the methods by which such principles are applied for financial accounting purposes or (ii) revalued any of its assets;
(v) granted any stock options or rights to purchase shares of its capital stock (except for routine employee stock option grants in the ordinary course of business consistent with past practice);
(vi) accelerated, amended or changed the period of vesting or exercisability of stock options or other rights;
(vii) merged or consolidated with, purchased substantially all of the assets of, or otherwise acquired any business or any Person;
(viii) declared or paid dividends on any of its capital stock except intercompany dividends and distributions in the ordinary course of business consistent with past practice; or
(ix) entered into any agreement, whether oral or written, to do any of the foregoing.
Section 4.8.Regulatory Matters.
(a) Neither the Purchaser nor any of its properties is a party to or is subject to any cease and desist order, decree, agreement, memorandum of understanding or similar arrangement with, or a commitment letter or similar submission to, or extraordinary supervisory letter from, any Governmental Authority charged with the supervision or regulation of financial institutions or issuers of securities or engaged in the insurance of deposits (including, without limitation, the FDIC).
16
Table of Contents
(b) The Purchaser has not been advised by any Governmental Authority that such Governmental Authority is contemplating issuing or requesting (or is considering the appropriateness of issuing or requesting) any such order, decree, agreement, memorandum or understanding, commitment letter, supervisory letter of similar submission.
(c) With the exception of routine investigation of consumer complaints, the Purchaser has not been advised by any Governmental Authority that it is or may be in violation of the Equal Credit Opportunity Act or the Fair Housing Act or any similar federal or state statute.
Section 4.9.Legal Proceedings; Compliance with Laws.
There are no actions, suits or proceedings instituted or pending or, to the Knowledge of the Purchaser, threatened or probable of assertion against the Purchaser, or against any property, asset, interest or right of the Purchaser, that are reasonably expected to have, either individually or in the aggregate, a Material Adverse Effect on the financial condition of the Purchaser or that are reasonably expected to threaten or impede the consummation of the Merger. The Purchaser is not a party to any agreement or instrument or subject to any judgment, order, writ, injunction, decree or rule that might reasonably be expected to have a Material Adverse Effect on the Purchaser. To the Knowledge of the Purchaser, the Purchaser has complied in all material respects with all Laws, ordinances, requirements, regulations or orders applicable to its business (including environmental Laws, ordinances, requirements, regulations or orders).
Section 4.10.Reports.
Since December 31, 2006, the Purchaser has filed all reports and statements, together with any amendments required to be made with respect thereto, that were required to be filed with a Governmental Authority, and, to the Knowledge of the Purchaser, any other governmental or regulatory authority or agency having jurisdiction over its operations.
Section 4.11.Labor Relations.
The Purchaser is not a party to or bound by any collective bargaining agreement, contract or other agreement or understanding with a labor union or labor organization, nor is it the subject of a proceeding asserting that it has committed an unfair labor practice (within the meaning of the National Labor Relations Act) or seeking to compel it to bargain with any labor organization as to wages and conditions of employment, nor is there any strike or other labor dispute involving it, pending or, to the Knowledge of the Purchaser, threatened, nor is it aware of any activity involving its employees seeking to certify a collective bargaining unit or engaging in any other organizational activity.
Section 4.12.Tax Matters.
The Purchaser has filed all federal, state and local Tax Returns and reports required to be filed, and all Taxes shown by such returns to be due and payable have been paid or are reflected as a liability in the Financial Statements for the Purchaser. Except to the extent that liabilities therefor are specifically reflected in the Financial Statements for the Purchaser, there are no federal, state or local Tax liabilities of the Purchaser other than liabilities that have arisen since the date of such financial statements, all of which have been properly accrued or otherwise
17
Table of Contents
provided for on the books and records of the Purchaser. No Tax Return or report of the Purchaser is under examination by any Taxing authority or the subject of any administrative or judicial proceeding, and no unpaid Tax deficiency has been asserted against the Purchaser by any Taxing authority, which in each case might reasonably be expected to have a material adverse effect on the Purchaser.
Section 4.13.Property.
Except as disclosed or reserved against in the Financial Statements for the Purchaser, the Purchaser has good and marketable title, free and clear of all material Liens, encumbrances, charges, defaults or equities of whatever character to all of the material properties and assets, tangible or intangible, reflected in the Financial Statements for the Purchaser as being owned by the Purchaser as of the dates thereof. To the Knowledge of the Purchaser, all buildings, and all fixtures, equipment, and other property and assets which are material to its business on a consolidated basis, held under leases or subleases by the Purchaser are held under valid instruments enforceable in accordance with their respective terms, subject to bankruptcy, insolvency, reorganization, moratorium and similar Laws. The buildings, structures, and appurtenances owned, leased, or occupied by the Purchaser are in good operating condition and in a state of good maintenance and repair, and to the Knowledge of the Purchaser (i) comply in all material respects with applicable zoning and other municipal Laws and regulations, and (ii) there are no latent defects therein.
Section 4.14.Employee Benefit Plans.
(a) The Purchaser has made available true and complete copies of all material pension, retirement (including supplemental retirement), profit-sharing, deferred compensation, stock option, bonus, vacation or other material incentive plans or agreements, all material medical, dental or other health plans or agreements, all life insurance plans or agreements and all other material employee benefit or fringe benefit plans or agreements, including, without limitation, all “employee benefit plans” as that term is defined in Section 3(3) of ERISA, currently or within the last five years adopted, maintained by, sponsored in whole or in part by, or contributed to by the Purchaser or any of its affiliates for the benefit of employees, directors, retirees or other beneficiaries eligible to participate (collectively, the “Benefit Plans”). Any of the Benefit Plans which is an “employee pension benefit plan,” as that term is defined in Section 3(2) of ERISA, is referred to herein as a “ERISA Plan.” No Benefit Plan is or has been a multi-employer plan within the meaning of Section 3(37) of ERISA.
(b) All Benefit Plans are in compliance in all material respects with the applicable terms of ERISA and the Code and any other applicable Laws, rules and regulations (including, without limitation, applicable Tax qualification, reporting and disclosure, funding, fiduciary responsibility, and COBRA health care continuation coverage requirements) the breach or violation of which could result in a material liability to the Purchaser or any of its affiliates on a consolidated basis.
(c) No ERISA Plan is a defined benefit pension plan subject to Part IV of Title I of ERISA or Code Section 412.
18
Table of Contents
(d) Neither the execution nor delivery of this Agreement nor the consummation of the transactions or events contemplated hereby will (a) result in any payment or the provision of any benefit (including, without limitation, an increase in, acceleration of payment of or an acceleration of vesting of any compensation, benefit or other right under any Benefit Plan) to any current or former employee, director or agent of the Purchaser or any of its affiliates or (b) result in the making by the Purchaser or any of its affiliates of, or the imposition of any excise Tax under Code Section 4999 on, any excess parachute payment (as defined in Code Section 280G).
Section 4.15.Investment Securities.
Except for pledges to secure public deposits, none of the investment securities reflected in the Financial Statements for the Purchaser is subject to any restriction, contractual, statutory, or otherwise, which would impair materially the ability of the holder of such investment to dispose freely of any such investment at any time except as their disposal may be affected by GAAP applicable to the classification of securities.
Section 4.16.Insurance.
A complete list of all policies or binders of fire, liability, product liability, workmen’s compensation, vehicular and other insurance held by or on behalf of the Purchaser and its Subsidiaries has been provided to the Company. All such policies or binders are valid and enforceable in accordance with their terms, are in full force and effect, and insure against risks and liabilities to the extent and in the manner customary for the industry and are deemed appropriate and sufficient by the Purchaser and its Subsidiaries. The Purchaser and its Subsidiaries are not in default with respect to any provision contained in any such policy or binder and have not failed to give any notice or present any claim under any such policy or binder in due and timely fashion. The Purchaser and its Subsidiaries have not received notice of cancellation or nonrenewal of any such policy or binder. To the Knowledge of the Purchaser, there is no inaccuracy in any application for such policies or binders, failure to pay premiums when due or any similar state of facts or the occurrence of any event that is reasonably likely to form the basis for any material claim against it not fully covered (except to the extent of any applicable deductible) by the policies or binders referred to above. The Purchaser and its Subsidiaries have not received notice from any of its insurance carriers that any insurance premiums will be increased materially in the future or that any such insurance coverage will not be available in the future on substantially the same terms as now in effect.
Section 4.17.Loans, OREO, and Allowance for Loan Losses.
(a) Except for matters which individually or in the aggregate do not materially adversely affect the financial condition of the Purchaser or its Subsidiaries, to the Knowledge of the Purchaser each loan reflected as an asset in the financial statements for the Purchaser or its Subsidiaries (A) is evidenced by notes, agreements, or other evidences of indebtedness which are true, genuine and what they purport to be, (B) to the extent secured, has been secured by valid Liens and security interests which have been perfected, and (C) is the legal, valid and binding obligation of the obligor named therein, enforceable in accordance with its terms, subject to bankruptcy, insolvency, and other Laws of general applicability relating to or affecting creditors’ rights and to general equity principles.
19
Table of Contents
(b) The classification on the books and records of the Purchaser or its Subsidiaries of loans and/or non-performing assets as nonaccrual, troubled debt restructuring, other real estate owned (“OREO”) or other similar classification, complies in all material respects with GAAP and applicable regulatory accounting principles.
(c) Except for Liens, security interests, claims, charges, or such other encumbrances as have been appropriately reserved for in the Financial Statements for the Purchaser or its Subsidiaries or are not material, title to the OREO is good and marketable, and there are no adverse claims or encumbrances on the OREO. All title, hazard and other insurance claims and mortgage guaranty claims with respect to the OREO have been timely filed and the Purchaser has not received any notice of denial of any such claim.
(d) The Purchaser and its Subsidiaries are in possession of all of the OREO. No legal proceeding or quasi-legal proceeding is pending or, to the Knowledge of the Purchaser, threatened concerning any OREO or any servicing activity or omission to provide a servicing activity with respect to any of the OREO.
(e) All loans made by the Purchaser or its Subsidiaries to facilitate the disposition of OREO are performing in accordance with their terms.
(f) The allowance for possible loan losses shown on the Financial Statements for the Purchaser was, and the allowance for possible loan losses shown on the financial statements of the Purchaser as of dates subsequent to the execution of this Agreement will be, in each case as of the dates thereof, adequate in all material respects to provide for possible losses, net of recoveries relating to loans previously charged off, on loans outstanding (including accrued interest receivable) of the Purchaser and its Subsidiaries and other extensions of credit (including letters of credit and commitments to make loans or extend credit) by the Purchaser and its Subsidiaries.
Section 4.18.Environmental Matters.
(a) The Purchaser and its Subsidiaries are in material compliance with all Environmental Laws. The Purchaser or any of its Subsidiaries has not received any communication alleging that the Purchaser or any of its Subsidiaries is not in such compliance and, to the best Knowledge of the Purchaser, without the duty to conduct any additional investigation, there are not present circumstances that would prevent or interfere with the continuation of such compliance.
(b) The Purchaser and its Subsidiaries have not received notice of pending, and are not aware of any threatened, legal, administrative, arbitral or other proceedings, asserting Environmental Claims or other claims, causes of action or governmental investigations of any nature, seeking to impose, or that could result in the imposition of, any material liability arising under any Environmental Laws upon (i) the Purchaser or any of its Subsidiaries, (ii) any Person or entity whose liability for any Environmental Claim the Purchaser or any of its Subsidiaries has or may have retained either contractually or by operation of Law, (iii) any real or personal property owned or leased by the Purchaser or any of its Subsidiaries, or any real or personal property which the Purchaser or any of its Subsidiaries has been, or is, judged to have managed
20
Table of Contents
or to have supervised or to have participated in the management of, or (iv) any real or personal property in which the Purchaser or any of its Subsidiaries holds a security interest securing a loan recorded on the books of the Purchaser. The Purchaser or any of its Subsidiaries is not subject to any agreement, order, judgment, decree or memorandum by or with any court, Governmental Authority, regulatory agency or third party imposing any such liability.
(c) With respect to all real and personal property owned or leased by the Purchaser or any of its Subsidiaries, or all real and personal property which the Purchaser has been, or is, judged to have managed or to have supervised or to have participated in the management of, the Purchaser will promptly provide access to copies of any environmental audits, analyses and surveys that have been prepared relating to such properties. To the Knowledge of the Purchaser, the Purchaser and its Subsidiaries are in compliance in all material respects with all recommendations contained in any such environmental audits, analyses and surveys.
(d) To the Knowledge of the Purchaser, there are no past or present actions, activities, circumstances, conditions, events or incidents that could reasonably form the basis of any Environmental Claim or other claim or action or governmental investigation that could result in the imposition of any liability arising under any Environmental Laws against the Purchaser or any of its Subsidiaries or against any Person or entity whose liability for any Environmental Claim the Purchaser or any of its Subsidiaries has or may have retained or assumed either contractually or by operation of Law.
Section 4.19.Fees and Expenses of Brokers and Others.
Neither the Purchaser nor any of its Subsidiaries (i) has had any dealings, negotiations or communications with any broker or other intermediary in connection with the transactions contemplated by this Agreement, (ii) is committed to any liability for any brokers’ or finders’ fees or any similar fees in connection with the transactions contemplated by this Agreement or (iii) has retained any broker or other intermediary to act on its behalf in connection with the transactions contemplated by this Agreement, except in each case that the Purchaser has engaged the Purchaser Financial Advisor to represent it in connection with such transactions and shall pay all of the Purchaser Financial Advisor’s fees and expenses in connection with such engagement.
Section 4.20.Proxy Statement.
(a) At the time the Proxy Statement is mailed to the stockholders of the Company for the solicitation of proxies for the Company Stockholder Approval and at all times subsequent to such mailings up to and including the times of such approvals, such Proxy Statement (including any supplements thereto), with respect to all information set forth therein relating to the Purchaser, this Agreement, the Merger and all other transactions contemplated hereby that has been furnished in writing by the Purchaser expressly for inclusion therein, will:
(i) comply in all material respects with applicable provisions of the Securities Act of 1933 (the “Securities Act”), the Exchange Act and the rules and regulations under such Acts, to the extent such Laws, rules and regulations, or any of them are applicable; and
(ii) not contain any statement which, at the time and in light of the circumstances under which it is made, is false or misleading with respect to any material fact or
21
Table of Contents
omit to state any material fact required to be stated therein or necessary in order to make the statements therein not false or misleading, or necessary to correct any statement in an earlier communication with respect to the solicitation of a proxy for the same meeting or subject matter which has become false or misleading.
Section 4.21.Material Contracts.
Each of the Contracts required by applicable Law to be filed as an exhibit to the Purchaser’s Securities Law Documents has been so filed, is valid and binding on the Purchaser or any of its Subsidiaries, as the case may be, and, to the Knowledge of the Purchaser, on each counterparty and is in full force and effect, and neither the Purchaser nor any of its Subsidiaries, nor, to the Knowledge of the Purchaser, any other party thereto, is in breach of, or default under, any such Contract, and no event has occurred that with notice or lapse of time or both would constitute such a breach or default thereunder by the Purchaser or any of its Subsidiaries, or, to the Knowledge of the Purchaser, any other party thereto, except for such failures to be valid, binding or in full force and effect and such breaches and defaults that, individually or in the aggregate, have not had and would not reasonably be expected to have a Material Adverse Effect.
Section 4.22.Intellectual Property.
Except for those matters which, individually or in the aggregate, have not had and would not reasonably be expected to have a Material Adverse Effect, the Purchaser or one of its Subsidiaries exclusively owns, without restrictions, or is licensed to use, the rights to all patents, trademarks, trade names, service marks, copyrights together with any registrations and applications therefor, Internet domain names, inventories, technology, trade secrets, source codes, know-how, computer software programs or applications including, without limitation, all object and source codes and tangible or intangible proprietary information or material that are used in the business of the Purchaser or any of its Subsidiaries as currently conducted (the “Purchaser Intellectual Property”). Neither the Purchaser nor any of its Subsidiaries is, or as a result of the execution, delivery or performance of the Purchaser’s obligations hereunder will be, in material violation of, or lose any material rights pursuant to, any the Purchaser Intellectual Property. All granted and issued patents and all registered trademarks and service marks and all copyrights held by the Purchaser or any of its Subsidiaries are valid, enforceable and subsisting. To the Knowledge of the Purchaser, there has not been and there is not any unauthorized use, infringement or misappropriation of any of the Purchaser Intellectual Property by any third Person, including, without limitation, any employee or former employee.
Section 4.23.State Takeover Statutes.
The Board of Directors of the Purchaser has approved the Merger and this Agreement and such approval is sufficient to render inapplicable to the Merger, this Agreement and the transactions contemplated hereby the provisions of Article 14 and Article 14.1 of the VSCA. To the Knowledge of the Purchaser, no other state takeover, “moratorium,” “fair price,” “affiliate transaction” or similar statute or regulation under any Law is applicable to this Agreement and the transactions contemplated hereby.
22
Table of Contents
Section 4.24.Books and Records.
The stock record books and minute book of the Purchaser and its Subsidiaries which have been made available to the Company are complete and correct in all material respects.
Section 4.25.Affiliate Transactions.
Except as disclosed in the Purchaser’s Securities Law Documents, neither the Company nor its Subsidiary is a party to any agreement with any Affiliate or any stockholder of the Company.
ARTICLE V
REPRESENTATIONS AND WARRANTIES OF THE COMPANY
The Company represents and warrants to the Purchaser as follows:
Section 5.1.Organization, Standing and Corporate Power.
(a) The Company is a Virginia corporation, duly organized, validly existing and in good standing under the Laws of the Commonwealth of Virginia. The Company’s subsidiary Blackstone Properties L.L.C., is a duly formed limited liability company, validly existing and in good standing under the Laws of the Commonwealth of Virginia. True, complete and correct copies of the Articles of Incorporation and Bylaws of the Company and true, complete and correct copies of the Articles of Organization and the Operating Agreement of the Company’s Subsidiary, have been made available to the Purchaser.
(b) The Company and its Subsidiary have full corporate or other entity power to carry on their respective business as it is now being conducted and to own, operate and hold under lease their assets and properties as, and in the places where, such properties and assets now are owned, operated or held. The Company and its Subsidiary are duly licensed or qualified to do business and is in good standing in each jurisdiction where the failure to be so licensed, qualified or in good standing would have or could reasonably be expected to have a Material Adverse Effect.
Section 5.2.Authority Relative to this Agreement.
(a) The execution, delivery and performance of this Agreement and of all of the other documents and instruments required hereby by the Company are within the corporate power of the Company. The execution and delivery of this Agreement and the consummation of the transactions contemplated hereby have been duly authorized by the Board of Directors of the Company, and no other corporate or stockholder proceedings on the part of the Company are necessary to authorize this Agreement or to consummate the transactions contemplated herein (other than, with respect to the Merger, the Company Stockholder Approval). This Agreement has been executed and delivered by the Company and (assuming the due authorization, execution and delivery hereof by the Purchaser) constitutes a valid and binding agreement of the Company, enforceable against the Company in accordance with its terms.
23
Table of Contents
(b) The Company’s Board of Directors at a meeting duly called and held, has unanimously (i) approved and adopted this Agreement and approved the transactions contemplated hereby, including the Merger, (ii) determined that the Merger is advisable and fair to and in the best interests of, the stockholders of the Company, and (iii) resolved to submit this Agreement to the stockholders of the Company for approval and recommend that the stockholders of the Company approve this Agreement.
Section 5.3.Capitalization.
(a) As of December 31, 2007, the authorized capital stock of the Company consists of (a) 400,000 shares of common stock, no par value per share (“Company Common Stock”), of which there were 398,244 shares issued and outstanding. The Purchaser has not issued any options, warrants, conversion privileges, or other rights to purchase or otherwise acquire any authorized but unissued shares of the Purchaser Common Stock or other proprietary interests. All outstanding Shares of Company Common Stock and all outstanding shares of Company Common Stock or other equity interests of the Company or any of its Subsidiaries have been duly authorized and validly issued and are fully paid, nonassessable and free of preemptive and similar rights in favor of third parties and have not been issued in violation of any federal or state securities Laws. The Company has never declared or paid any dividend on any of the Company Common Stock.
(b) All of the outstanding membership interests and other equity interests in the Company’s Subsidiary are owned by the Company, directly or indirectly, free and clear of all Liens, claims, charges or encumbrances. There are no outstanding securities, options, warrants, calls, subscriptions, rights or Contracts to which the Company or its Subsidiary is a party or by which the Company or its Subsidiary is bound, granting to any third party the right to purchase or acquire any capital stock of or any equity interests in the Company or its Subsidiary, and there are no put rights or Contracts pursuant to which the Company or its Subsidiary is bound to repurchase any shares of its capital stock or equity interests. The Company does not own any equity interest in any entity other than its Subsidiary.
Section 5.4.Consents and Approvals; No Violations.
(a) No material Permit, authorization, consents or approvals of, or filings with or registrations with any court, administrative agency or commission or other Governmental Authority or instrumentality or with any third party are required to be made or obtained by the Company in connection with the execution, delivery and performance by the Company of this Agreement or to consummate the Merger except for (i) filings of applications or notices with the Virginia Bureau of Financial Institutions for the Merger and (ii) the filings or Articles of Merger with the Virginia State Corporation Commission pursuant to the Virginia Stock Corporation Act, (iii) the filing of the Proxy Statement with the Securities and Exchange Commission (the “SEC”), (iv) such filings as are required to be made or approvals as are required to be obtained under the securities or “Blue Sky” Laws of certain states in connection with the issuance of the Company Common Stock in the Merger, and (v) receipt of any other consents or approvals that would be obtained by the Company prior to the Effective Time.
24
Table of Contents
(b) Assuming that all filings, registrations, Permits, authorizations, consents and approvals contemplated by the immediately preceding sentence have been duly made or obtained, neither the execution, delivery and performance of this Agreement nor the consummation of the transactions contemplated hereby by the Company will (x) conflict with or result in any breach of any provision of the Articles of Incorporation, Bylaws, partnership or joint venture agreements or other organizational documents of the Company or its Subsidiary, (y) result in a violation or breach of, or constitute (with or without due notice or lapse of time or both) a default (or give rise to any right of termination, cancellation or acceleration) under, or otherwise result in any diminution of any of the rights of the Company or its Subsidiary with respect to, any of the terms, conditions or provisions of any note, bond, mortgage, indenture, license, Contract or other instrument or obligation to which the Company or its Subsidiary is a party or by which either of them or any of their properties or assets may be bound or (z) violate any order, writ, injunction, decree, statute, rule or regulation applicable to the Company or its Subsidiary or any of their properties or assets except, in the case of subsections (y) and (z) above, for violations, breaches or defaults that will not prevent or materially delay the consummation of the transactions contemplated hereby.
Section 5.5.Financial Statements.
The Company represents and warrants to the Purchaser that its annual report on Form 10-KSB for the fiscal year ended December 31, 2006, and all of its other Securities Law Documents in the form filed or furnished with the SEC, as of the date filed or furnished, (i) complied or will comply in all material respects as to form with the applicable requirements under the Exchange Act, as the case may be, and (ii) did not and will not contain any untrue statement of a material fact or omit to state a material fact required to be stated therein or necessary to make the statements therein, in light of the circumstances under which they were made, not misleading, and each of the statements of financial condition contained in or incorporated by reference into any such Securities Law Documents (including the related notes and schedules thereto) fairly presents, or will fairly present, the financial position of the Company filing such Securities Law Documents as of its date, and each of the statements of income and change in stockholders’ equity and cashflows or equivalent statements in such Securities Law Documents (including any related notes and schedules thereto) fairly presents, or will fairly present, the results of operations, change in stockholders’ equity and changes in cashflows, as the case may be, of the Company’s filing such Securities Law Documents for the periods to which they relate, in each case in accordance with GAAP consistently applied during the period involved, except in each case as may be noted therein, subject to normal year-end audit adjustments in the case of unaudited statements.
Section 5.6.Absence of Undisclosed Liabilities.
The Company and its Subsidiary have not incurred any liabilities or obligations that would be required to be reflected or reserved against in a consolidated balance sheet of the Company and its consolidated Subsidiary prepared in accordance with GAAP in a manner consistent with the Financial Statements except (i) as reflected in the Financial Statements and (ii) for liabilities and obligations incurred in the ordinary course of business since September 30, 2007, none of which is individually or in the aggregate reasonably likely to be material to the Company and its Subsidiary, taken as a whole.
25
Table of Contents
Section 5.7.Events Subsequent to Latest Financial Statements.
Since September 30, 2007, through the date hereof, there have not been any events, changes, conditions, developments or occurrences that, individually or in the aggregate, have had or would be reasonably be expected to have a Material Adverse Effect and, other than as expressly required by this Agreement, the Company and its Subsidiary have conducted their business in the ordinary course, in substantially the same manner in which they have been previously conducted, neither the Company or its Subsidiary has:
(a) amended its Organizational Documents;
(b) purchased, redeemed, retired or otherwise acquired any shares of any of its capital stock;
(c) issued any capital stock or any security convertible into capital stock; granted any registration rights; or declared or paid any dividend or other distribution in respect of shares of its capital stock;
(d) incurred any Debt, other than Debt incurred in the ordinary course of business;
(e) mortgaged, pledged or subjected to any Lien any of its properties or assets, except for Permitted Liens;
(f) except as required by GAAP or required by a change in applicable Law, statute, rule or regulation, (i) made any change in its accounting principles or the methods by which such principles are applied for financial accounting purposes or (ii) revalued any of its assets;
(g) granted any stock options or rights to purchase shares of its capital stock (except for routine employee stock option grants in the ordinary course of business consistent with past practice);
(h) sold, leased or disposed or agreed to sell, lease or dispose of any properties or assets (other than inventory in the ordinary course of business);
(i) merged or consolidated with, purchased substantially all of the assets of, or otherwise acquired any business or any Person;
(j) incurred any damage to or destruction or loss of any assets, not covered by insurance, adversely affecting its properties, assets, business, financial condition or prospects;
(k) declared or paid dividends on any of its capital stock except intercompany dividends and distributions in the ordinary course of business consistent with past practice; or
(l) entered into any agreement, whether oral or written, to do any of the foregoing.
26
Table of Contents
Section 5.8.Regulatory Matters.
(a) Neither the Company, its Subsidiary nor any of its properties is a party to or is subject to any cease and desist order, decree, agreement, memorandum of understanding or similar arrangement with, or a commitment letter or similar submission to, or extraordinary supervisory letter from, any Governmental Authority charged with the supervision or regulation of issuers of securities (including, without limitation, the SEC).
(b) The Company has not been advised by any Governmental Authority that such Governmental Authority is contemplating issuing or requesting (or is considering the appropriateness of issuing or requesting) any such order, decree, agreement, memorandum or understanding, commitment letter, supervisory letter of similar submission.
(c) The Company has not been advised by any Governmental Authority that it is or may be in violation of any similar federal or state statute.
Section 5.9.Legal Proceedings; Compliance with Laws.
There are no actions, suits or proceedings instituted or pending or, to the Knowledge of the Company, threatened or probable of assertion against the Company or its Subsidiary, or against any property, asset, interest or right of the Company or its Subsidiary, that are reasonably expected to have, either individually or in the aggregate, a Material Adverse Effect on the financial condition of the Company or its Subsidiary or that are reasonably expected to threaten or impede the consummation of the Merger. The Company or its Subsidiary is not a party to any agreement or instrument or subject to any judgment, order, writ, injunction, decree or rule that might reasonably be expected to have a Material Adverse Effect on the Company. To the Knowledge of the Company, the Company and its Subsidiary have complied in all material respects with all Laws, ordinances, requirements, regulations or orders applicable to their business (including environmental Laws, ordinances, requirements, regulations or orders).
Section 5.10.Labor Relations.
The Company is not a party to or bound by any collective bargaining agreement, contract or other agreement or understanding with a labor union or labor organization, nor is it the subject of a proceeding asserting that it has committed an unfair labor practice (within the meaning of the National Labor Relations Act) or seeking to compel it to bargain with any labor organization as to wages and conditions of employment, nor is there any strike or other labor dispute involving it, pending or, to the Knowledge of the Company, threatened, nor is it aware of any activity involving its employees seeking to certify a collective bargaining unit or engaging in any other organizational activity.
Section 5.11.Tax Matters.
The Company has filed all federal, state and local Tax Returns and reports required to be filed, and all Taxes shown by such returns to be due and payable have been paid or are reflected as a liability in the Financial Statements for the Company. Except to the extent that liabilities therefor are specifically reflected in the Financial Statements for the Company, there are no federal, state or local Tax liabilities of the Company other than liabilities that have arisen since
27
Table of Contents
the date of such financial statements, all of which have been properly accrued or otherwise provided for on the books and records of the Company. No Tax Return or report of the Company is under examination by any Taxing authority or the subject of any administrative or judicial proceeding, and no unpaid Tax deficiency has been asserted against the Company by any Taxing authority.
Section 5.12.Properties.
(a)Schedule 5.12(a) contains a true and complete list of (i) all real property owned by the Company or its Subsidiary and (collectively, the “Owned Real Property”) and for each parcel of Owned Real Property, identifies the correct street address and current use (including business unit, if applicable) of such Owned Real Property. Neither the Company nor its Subsidiary have received any notice of any, and to the Knowledge of the Company there is no, material default under any restrictive covenants, restrictions and conditions affecting the Owned Real Property and there has not occurred any event that with the lapse of time or the giving of notice or both would constitute such a default under any such restrictive covenants, restrictions or conditions, except as, individually or in the aggregate.
(b)Schedule 5.12(b) contains a true and complete list of all Owned Real Property that has been leased, subleased, licensed or is otherwise used or occupied (whether as a landlord, tenant, subtenant or pursuant to other occupancy arrangements) by the Company or its Subsidiary or which the Company or its Subsidiary has the right to use or occupy (collectively, including the improvements thereon, the “Leased Real Property”), and for each piece of Leased Real Property, identifies the correct street address and current use (including business unit, if applicable) of such Leased Real Property. True and complete copies of all agreements (including all written modifications, amendments, supplements, waivers and side letters thereto) under which the Company or its Subsidiary is the landlord, sublandlord, tenant, subtenant, or occupant of the Leased Real Property (each a “Real Property Lease”) that have not been terminated or expired as of the date of this Agreement have been made available to the Purchaser prior to the Effective Time.
(c) The Company and/or its Subsidiaries have good and marketable fee simple title to all Owned Real Property and valid leasehold estates in all Leased Real Property free and clear, in each case, of all Liens other than Permitted Liens.
(d) Other than the Real Property Leases, none of the Owned Real Property or the Leased Real Property is subject to any lease, sublease, license or other agreement granting to any other Person any right to the use, occupancy or enjoyment of such Owned Real Property or Leased Real Property or any part thereof.
(e) Each Real Property Lease is in full force and effect and constitutes the valid and legally binding obligation of the Company or its Subsidiary enforceable in accordance with its terms, except as such enforceability may be limited by bankruptcy, insolvency, reorganization, moratorium and similar Laws relating to or affecting creditors generally, by general equitable principles (regardless of whether such enforceability is considered in a proceeding in equity or at Law) or by an implied covenant of good faith and fair dealing, and there is no default under any Real Property Lease either by the Company or its Subsidiary party thereto or, to the Knowledge of the Company, by any other party thereto that have had or would be reasonably expected to have a Material Adverse Effect.
28
Table of Contents
(f) There do not exist any violations of building codes or pending condemnation or eminent domain proceedings that affect any Owned Real Property or, to the Knowledge of the Company, any such proceedings that affect any Leased Real Property or, to the Knowledge of the Company, any threatened condemnation or eminent domain proceedings that affect any Owned Real Property or Leased Real Property, and neither the Company nor any of its Subsidiary has received any written notice of the intention of any Governmental Authority or other Person to take or use any Owned Real Property or Leased Real Property.
(g) The buildings and improvements on the Owned Real Property and the Leased Real Property are in good condition and in a state of good and working maintenance and repair, ordinary wear and tear excepted.
Section 5.13.Employees.
Each of the Company and its Subsidiary have no paid employees and does not provide benefits to any of its employees.
Section 5.14.Insurance.
A complete list of all policies or binders of fire, liability, product liability, workmen’s compensation, vehicular and other insurance held by or on behalf of the Company and its Subsidiary has been provided to the Purchaser. All such policies or binders are valid and enforceable in accordance with their terms, are in full force and effect, and insure against risks and liabilities to the extent and in the manner customary for the industry and are deemed appropriate and sufficient by the Company and its Subsidiary. The Company and its Subsidiary are not in default with respect to any provision contained in any such policy or binder and have not failed to give any notice or present any claim under any such policy or binder in due and timely fashion. The Company and its Subsidiary have not received notice of cancellation or nonrenewal of any such policy or binder. To the Knowledge of the Company there is no inaccuracy in any application for such policies or binders, failure to pay premiums when due or any similar state of facts or the occurrence of any event that is reasonably likely to form the basis for any material claim against them not fully covered (except to the extent of any applicable deductible) by the policies or binders referred to above. The Company and its Subsidiary have not received notice from any of its insurance carriers that any insurance premiums will be increased materially in the future or that any such insurance coverage will not be available in the future on substantially the same terms as now in effect.
Section 5.15.Environmental Matters.
(a) The Company and its Subsidiary are in material compliance with all Environmental Laws. The Company or its Subsidiary has not received any communication alleging that the Company or its Subsidiary is not in such compliance and, to the best Knowledge of the Company, without the duty to conduct any additional investigation, there are not present circumstances that would prevent or interfere with the continuation of such compliance.
29
Table of Contents
(b) The Company and its Subsidiary have not received notice of pending, and are not aware of any threatened, legal, administrative, arbitral or other proceedings, asserting Environmental Claims or other claims, causes of action or governmental investigations of any nature, seeking to impose, or that could result in the imposition of, any material liability arising under any Environmental Laws upon (i) the Company or its Subsidiary, (ii) any Person or entity whose liability for any Environmental Claim the Company or its Subsidiary has or may have retained either contractually or by operation of Law, (iii) any real or personal property owned or leased by the Company or its Subsidiary, or any real or personal property which the Company or its Subsidiary has been, or is, judged to have managed or to have supervised or to have participated in the management of, or (iv) any real or personal property in which the Company or its Subsidiary holds a security interest securing a loan recorded on the books of the Company or its Subsidiary. The Company or its Subsidiary is not subject to any agreement, order, judgment, decree or memorandum by or with any court, Governmental Authority, regulatory agency or third party imposing any such liability.
(c) With respect to all real and personal property owned or leased by the Company or its Subsidiary, or all real and personal property which the Company or its Subsidiary has been, or is, judged to have managed or to have supervised or to have participated in the management of, the Company will promptly provide access to copies of any environmental audits, analyses and surveys that have been prepared relating to such properties. To the Knowledge of the Company, the Company and its Subsidiary are in compliance in all material respects with all recommendations contained in any such environmental audits, analyses and surveys.
(d) To the Knowledge of the Company, there are no past or present actions, activities, circumstances, conditions, events or incidents that could reasonably form the basis of any Environmental Claim or other claim or action or governmental investigation that could result in the imposition of any liability arising under any Environmental Laws against the Company or its Subsidiary or against any Person or entity whose liability for any Environmental Claim the Company or its Subsidiary has or may have retained or assumed either contractually or by operation of Law.
Section 5.16.Fees and Expenses of Brokers and Others.
Neither Company nor its Subsidiary (i) has had any dealings, negotiations or communications with any broker or other intermediary in connection with the transactions contemplated by this Agreement, (ii) is committed to any liability for any brokers’ or finders’ fees or any similar fees in connection with the transactions contemplated by this Agreement or (iii) has retained any broker or other intermediary to act on its behalf in connection with the transactions contemplated by this Agreement, except in each case that Company has engaged the Company Financial Advisor to represent it in connection with such transactions and shall pay all of the Company Financial Advisor’s fees and expenses in connection with such engagement.
Section 5.17.Proxy Statement.
(a) At the time the Proxy Statement is mailed to the stockholders of the Company for the solicitation of proxies for the Company Stockholder Approval and at all times subsequent to such mailings up to and including the times of such approvals, such Proxy Statement (including
30
Table of Contents
any supplements thereto), with respect to all information set forth therein relating to the Company, this Agreement, the Merger and all other transactions contemplated hereby that has been furnished in writing by the Company expressly for inclusion therein, will:
(i) comply in all material respects with applicable provisions of the Securities Act, the Exchange Act and the rules and regulations under such Acts, to the extent such Laws, rules and regulations, or any of them are applicable; and
(ii) not contain any statement which, at the time and in light of the circumstances under which it is made, is false or misleading with respect to any material fact or omit to state any material fact required to be stated therein or necessary in order to make the statements therein not false or misleading, or necessary to correct any statement in an earlier communication with respect to the solicitation of a proxy for the same meeting or subject matter which has become false or misleading.
Section 5.18.Material Contracts.
Each of the Contracts required by applicable Law to be filed as an exhibit to the Company’s Securities Law Documents has been so filed, is valid and binding on the Company or its Subsidiary, as the case may be, and, to the Knowledge of the Company, on each counterparty and is in full force and effect, and neither the Company nor its Subsidiary, nor, to the Knowledge of the Company, any other party thereto, is in breach of, or default under, any such Contract, and no event has occurred that with notice or lapse of time or both would constitute such a breach or default thereunder by the Company or its Subsidiary, or, to the Knowledge of the Company, any other party thereto, except for such failures to be valid, binding or in full force and effect and such breaches and defaults that, individually or in the aggregate, have not had and would not reasonably be expected to have a Material Adverse Effect.
Section 5.19.Intellectual Property.
Except for those matters which, individually or in the aggregate, have not had and would not reasonably be expected to have a Material Adverse Effect the Company or its Subsidiary exclusively owns, without restrictions, or is licensed to use, the rights to all patents, trademarks, trade names, service marks, copyrights together with any registrations and applications therefor, Internet domain names, inventories, technology, trade secrets, source codes, know-how, computer software programs or applications including, without limitation, all object and source codes and tangible or intangible proprietary information or material that are used in the business of the Company or its Subsidiary as currently conducted (the “Company Intellectual Property”). Neither the Company nor its Subsidiary is, or as a result of the execution, delivery or performance of the Company’s obligations hereunder will be, in material violation of, or lose any material rights pursuant to, any Company Intellectual Property. All granted and issued patents and all registered trademarks and service marks and all copyrights held by the Company or its Subsidiary are valid, enforceable and subsisting. To the Knowledge of the Company, there has not been and there is not any unauthorized use, infringement or misappropriation of any of the Company Intellectual Property by any third Person, including, without limitation, any employee or former employee.
31
Table of Contents
Section 5.20.State Takeover Statutes.
The Board of Directors of the Company has approved the Merger and this Agreement and such approval is sufficient to render inapplicable to the Merger, this Agreement and the transactions contemplated hereby the provisions of Article 14 and Article 14.1 of the VSCA. To the Knowledge of the Company, no other state takeover, “moratorium,” “fair price,” “affiliate transaction” or similar statute or regulation under any Law is applicable to this Agreement and the transactions contemplated hereby.
Section 5.21.Vote Required.
The Company Stockholder Consent is the only vote or approval of the holders of any class or series of capital stock of the Company necessary to approve and adopt this Agreement and the transactions contemplated hereby.
Section 5.22.Books and Records.
The stock record books and minute book of the Company and its Subsidiary which have been made available to the Purchaser are complete and correct in all material respects.
Section 5.23.Affiliate Transactions.
Except as disclosed in the Company’s Securities Law Documents, neither the Company nor its Subsidiary is a party to any agreement with any Affiliate or any stockholder of the Company.
ARTICLE VI
COVENANTS
Section 6.1.Conduct of the Business of the Company.
(a) The Company agrees that from the date hereof to the Effective Date it will operate its business substantially as presently operated and only in the ordinary course, and, consistent with such operation, it will use its best efforts to preserve intact its relationships with Persons having business dealings with it. Without limiting the generality of the foregoing, each agrees that it will not, without the prior written consent of the others:
(i) Make any change in its authorized capital stock, or issue or sell any additional shares of, securities convertible into or exchangeable for, or options, warrants or rights to purchase, its capital stock, nor shall it purchase, redeem or otherwise acquire any of its outstanding shares of capital stock;
(ii) Voluntarily make any changes in the composition of its officers, directors or other key management personnel;
(iii) Make any change in the compensation or title of any officer, director or key management employee or make any change in the compensation or title of any other employee;
32
Table of Contents
(iv) Enter into any bonus, incentive compensation, stock option, deferred compensation, profit sharing, thrift, retirement, pension, group insurance or other benefit plan or any employment, retention, change in control or consulting agreement;
(v) Incur any obligation or liability (whether absolute or contingent, excluding suits instituted against it), make any pledge, or encumber any of its assets, nor dispose of any its assets in any other manner, except in the ordinary course of its business and for adequate value, or as otherwise specifically permitted in this Agreement;
(vi) Knowingly waive any right to substantial value;
(vii) Enter into material transactions otherwise than in the ordinary course of its business;
(viii) Alter, amend or repeal its Articles of Incorporation or Bylaws;
(ix) Propose or take any other action which would make any of its representations or warranties inArticle V of this Agreement untrue.
Section 6.2.Appraisal.
The parties agree that as soon as possible, but in any event within 45 days after the date of this Agreement, the parties will obtain appraisals (the “Appraisals”) for all of the Company’s Owned Real Property by disinterested real estate appraisers who shall be members of the Appraisal Institute or appraisers licensed under applicable state Laws and who shall be mutually acceptable to the Purchaser and the Company. Each of the Purchaser and the Company shall have the right, which may not be unreasonably withheld, to approve the appraiser or appraisers who are selected to determine the Appraised Value. The Purchaser and the Company agree that all of the Appraisals shall be made without reference or regard to the terms and conditions of this Agreement. Copies of the Appraisals when complete will be delivered to each of the Purchaser and the Company. The appraiser for each Appraisal shall determine the fair market value of the respective parcel of the Company’s Owned Real Property. The Purchaser’s Financial Advisor and the Company’s Financial Advisor shall calculate the Appraised Value based on the aggregate fair market value determined by the Appraisals for each parcel of the Company’s Owned Real Property, which calculation shall be conclusive.
Section 6.3.Stockholders’ Meeting.
(a) The Company shall, in accordance with applicable Law and the Company’s Articles of Incorporation and Bylaws, duly call, give notice of, convene and hold a special meeting of its stockholders (the “Special Meeting”) as soon as practicable following execution of this Agreement for the purpose of considering and taking action upon this Agreement. The Company shall, through its Board of Directors, recommend to its stockholders adoption of this Agreement and include such recommendation in the Proxy Statement. Notwithstanding anything to the contrary contained in this Agreement, the Company shall be required to hold the Special Meeting unless this Agreement is terminated in accordance withSection 7.1.
33
Table of Contents
(b) The Purchaser and the Company shall prepare the Proxy Statement as promptly as practicable. The Company shall cause the Proxy Statement to be mailed to its stockholders and shall take all reasonably required action to solicit proxies in favor of the approval and adoption of this Agreement and approval of the Merger.
(c) The Purchaser shall, upon request by the Company, furnish the Company with all information concerning the Purchaser, its Subsidiaries, directors, officers and stockholders and such other matters as may be reasonably necessary or advisable in connection with the Proxy Statement or any other statement, filing, notice or application made by or on behalf of the Company or any of its respective Subsidiaries to any third party and/or any Governmental Entity in connection with the Merger and the transactions contemplated by this Agreement. If at any time prior to the Effective Time, the Purchaser should become aware of any event relating to the Purchaser or any of its Subsidiaries that is required under applicable Law to be disclosed in an amendment or supplement to the Proxy Statement, the Purchaser shall promptly so inform the Company and will furnish to the Company all information relating to such event that is required under applicable Law to be disclosed in an amendment or supplement to the Proxy Statement.
(d) The Purchaser agrees that it will vote, or cause to be voted, all of the Shares then owned by it or any of its other Subsidiaries in favor of the approval of the Merger and this Agreement.
Section 6.4.Filings; Approvals and Consents; Cooperation.
(a) Upon the terms and subject to the conditions set forth in this Agreement, each of the parties agrees to use its commercially reasonable efforts to take, or cause to be taken, all actions, and to do, or cause to be done, and to assist and cooperate with the other parties in doing, all things necessary, proper, or advisable to consummate and make effective, in the most expeditious manner reasonably practicable, the Merger and the other transactions contemplated by this Agreement, including (i) the obtaining of all necessary actions or nonactions, waivers, consents and approvals from Governmental Authorities and the making of all necessary registrations and filings (including filings with Governmental Authorities) and the taking of all reasonable steps as may be necessary to obtain an approval or waiver from, or to avoid an action or proceeding by, any Governmental Authority, (ii) the obtaining of all necessary consents, approvals or waivers from third parties, (iii) the defending of any lawsuits or other legal proceedings, whether judicial or administrative, investigating or challenging this Agreement or the consummation of any of the transactions contemplated by this Agreement, including seeking to have any stay or temporary restraining order entered by any court or other Governmental Authority vacated or reversed and (iv) the execution and delivery of any additional instruments necessary to consummate the transactions contemplated by, and to fully carry out the purposes of, this Agreement.
(b) The Company and the Purchaser each shall, upon request by the other, furnish the other with all information concerning itself, its Subsidiaries, directors, officers and stockholders and such other matters as may be reasonably necessary or advisable in connection with any statement, filing, notice or application made by or on behalf of the Purchaser, the Company or any of their respective Subsidiaries to any third party and/or any Governmental Authority in connection with the Merger and the transactions contemplated by this Agreement.
34
Table of Contents
(c) The Company and the Purchaser shall keep the other apprised of the status of matters relating to completion of the transactions contemplated hereby, including promptly furnishing the other with copies of material notices or other material communications received by the Purchaser or the Company, as the case may be, or any of their respective Subsidiaries, from any third party and/or any Governmental Authority with respect to the Merger and the other transactions contemplated by this Agreement.
Section 6.5.Access to Information; Confidentiality Agreements.
Between the date of this Agreement and the Effective Time, the Company shall (i) afford to the Purchaser reasonable access during normal business hours to the Company’s properties, books, Contracts, records (including Tax Returns) and employees (subject to reasonable procedures, including appointment of a management representative to coordinate and supervise such access to such employees), (ii) use reasonable best efforts to cause the Company’s consultants and independent public accountants to provide access to their work papers and such other information as the Purchaser may reasonably request and (iii) furnish promptly to the Purchaser (A) a copy of each report, schedule and other document filed by it pursuant to the requirements of Federal or state securities Laws, (B) each written update provided to its Board of Directors on the financial performance and projections for the Company or any of its Subsidiaries and (C) other information concerning its business and properties as the Purchaser may reasonably request. Until the Effective Time, all such information shall be kept confidential by the Purchaser.
Section 6.6.Anti-takeover Statutes.
If any anti-takeover or similar statue or regulation is or may become applicable to the Merger or the other transactions contemplated by this Agreement, each of the Purchaser and the Company and their respective boards of directors shall grant such approvals and take such actions as are necessary so that such transactions may be consummated as promptly as practicable on the terms contemplated by this Agreement or by the Merger and otherwise act to eliminate or minimize the effects of such statute or regulation on such transactions.
Section 6.7.No Solicitation.
(a) The Company shall not, nor shall it authorize or permit its Subsidiary, any of their respective directors, officers or employees or any investment banker, financial advisor, attorney, accountant or other advisor, agent or representative retained by the Company or its Subsidiary in connection with the Transactions (collectively, “Representatives”) to, directly or indirectly through another Person, (i) solicit, initiate, or knowingly encourage or facilitate, any inquiries or the making of any proposal that constitutes or is reasonably likely to lead to a Takeover Proposal (as defined herein) or (ii) other than solely informing Persons of the provisions contained in thisSection 6.7, participate in any discussions or negotiations regarding any Takeover Proposal, or furnish to any Person any information in connection with, or in furtherance, of any Takeover Proposal. The Company shall, and shall cause its Subsidiary and instruct its Representatives to, immediately cease and cause to be terminated all existing discussions or negotiations with any Person previously conducted with respect to any Takeover Proposal. Notwithstanding the foregoing, at any time prior to obtaining the Company Stockholder Approval, in response to an
35
Table of Contents
unsolicited bona fide written Takeover Proposal made after the date hereof that the Company’s Board of Directors determines in good faith (after receiving the advice of a recognized financial advisor with experience in bank and banking property transactions) constitutes or is reasonably likely to result in a Superior Proposal (as defined herein), the Company may, if the Company’s Board of Directors determines in good faith (after receiving the advice of its outside counsel) that there is a reasonable probability that failure to take such action would be inconsistent with its fiduciary duties to the stockholders of the Company under applicable Law, and after giving the Purchaser prompt written notice of such determination, (A) furnish information with respect to the Company and its Subsidiaries to the Person making such Takeover Proposal (and its Representatives) pursuant to a confidentiality agreement not less restrictive on such Person than the Mutual Non-Disclosure Agreement, effective as of November 28, 2007, between the Purchaser and the Company (as it may be amended from time to time, the “Confidentiality Agreement”),provided that all such information (to the extent that such written information that has not been previously provided or made available to the Purchaser) is provided or made available to the Purchaser, as the case may be, prior to or substantially concurrent with the time it is provided or made available to such Person, as the case may be, and (B) participate in discussions or negotiations with the Person making such Takeover Proposal (and its Representatives) regarding such Takeover Proposal.
(b) Except as expressly permitted by thisSection 6.7(b), the Board of Directors of the Company shall not (i)(A) withdraw or modify, in a manner adverse to the Purchaser, the recommendation by such Board of Directors that stockholders of the Company approve this Agreement (the “Company Board Recommendation”) or (B) publicly recommend to the stockholders of the Company a Takeover Proposal (any action described in this clause (i) being referred to as a “Company Adverse Recommendation Change”) (it being understood and agreed that any “stop, look and listen” communication by the Board of Directors to the stockholders of the Company pursuant to Rule 14d-9(f) under the Exchange Act, or any similar communication to the stockholders shall not constitute a Company Adverse Recommendation Change) or (ii) authorize the Company or any of its Subsidiaries to enter into any merger, acquisition or similar agreement with respect to any Takeover Proposal (other than a confidentiality agreement) (each, a “Company Acquisition Agreement”). Notwithstanding the foregoing, at any time prior to obtaining the Company Stockholder Approval, in response to a Superior Proposal, the Board of Directors of the Company may, if it determines in good faith (after receiving the advice of its outside counsel) that there is a reasonable probability that failure to take such action would be inconsistent with its fiduciary duties to the stockholders of the Company under applicable Law, withdraw or modify the Company Board Recommendation, recommend such Superior Proposal and/or terminate this Agreement (and concurrently with or after such termination, if it so chooses, cause the Company to enter into any Company Acquisition Agreement with respect to any Superior Proposal), but only after the third business day following the Purchaser’s receipt of written notice from the Company (an “Alternative Transaction Notice”) containing a description of the material terms of such Superior Proposal, and provided that the Board of Directors of the Company continues to believe, following such third business day that such Takeover Proposal still constitutes a Superior Proposal after taking into account any changes to the terms of this Agreement proposed by the Purchaser in response to an Alternative Transaction Notice.
36
Table of Contents
(c) For purposes of this Agreement:
“Takeover Proposal” means any inquiry, proposal or offer from any Person (other than the Purchaser and its Subsidiaries) relating to any (A) acquisition of assets of the Company and its Subsidiaries (including securities of Subsidiaries of the Company, but excluding sales of assets in the ordinary course of business) equal to 20% or more of the Company’s consolidated assets or to which 20% or more of the Company’s revenues or earnings on a consolidated basis are attributable, (B) acquisition of 20% or more of the outstanding Company Common Stock, (C) tender offer or exchange offer that if consummated would result in any Person beneficially owning 20% or more of the outstanding Company Common Stock or (D) merger, consolidation, share exchange, business combination, recapitalization, liquidation, dissolution or similar transaction involving the Company; in each case, other than the Transactions.
“Superior Proposal” means a proposal or offer to acquire, directly or indirectly, for consideration consisting of cash and/or securities, more than 50% of the issued and outstanding Company Common Stock, or all or substantially all of the assets of the Company and its Subsidiaries on a consolidated basis, made by a third party, and which is otherwise on terms and conditions which the Board of Directors of the Company determines in its good faith and reasonable judgment (after consultation with a recognized financial advisor with experience in bank and banking property transactions and in light of all relevant circumstances, including all the terms and conditions of such proposal and this Agreement) to be more favorable to the Company’s stockholders than the Merger and the other Transactions.
(d) Nothing in thisSection 6.7 shall prohibit the Board of Directors of the Company from taking and disclosing to the Company’s stockholders a position contemplated by Rule 14e-2(a), Rule 14d-9 or Item 1012(a) of Regulation M-A promulgated under the Exchange Act, or other applicable Law, if such Board determines, after consultation with outside counsel, that failure to so disclose such position could constitute a violation of applicable Law. In addition, it is understood and agreed that, for purposes of this Agreement, a factually accurate public statement by the Company that describes the Company’s receipt of a Takeover Proposal and the operation of this Agreement with respect thereto shall not be deemed a withdrawal or modification, or proposal by the Board of Directors of the Company to withdraw or modify, the Company Board Recommendation, or an approval or recommendation with respect to such Takeover Proposal.
Section 6.8.Tax-Free Reorganization.
(a) This Agreement is a “plan of reorganization” within the meaning of Section 1.368-2(g) of the Treasury regulations promulgated under the Code. From and after the date of this Agreement and until the Effective Time, each party hereto shall use all commercially reasonable efforts to cause the Merger to qualify as a reorganization under the provisions of Section 368(a) of the Code. Following the Effective Time, neither the Purchaser nor the Company or any of their affiliates shall knowingly take any action that could cause the Merger to fail to qualify as a reorganization under Section 368(a) of the Code.
(b) Officers of the Company shall execute and deliver to Troutman Sanders LLP, at the time the Proxy Statement or any amendment thereto is distributed and on or about the Closing Date, certificates substantially in compliance with IRS published advance ruling guidelines, with customary exceptions and modifications thereto, to enable such firms to deliver
37
Table of Contents
any Tax opinion with respect to the qualification of the Merger as a reorganization within the meaning of Section 368(a) of the Code. The Company does not know of any reason why the Company will not be able to deliver such certificates.
(c) Officers of Purchaser shall execute and deliver to each of Company’s and Purchaser’s counsel at the time the Proxy Statement or any amendment thereto is distributed and on or about the Closing Date, certificates substantially in compliance with IRS published advance ruling guidelines, with customary exceptions and modifications thereto, to enable Troutman Sanders LLP to deliver any Tax opinion with respect to the qualification of the Merger as a reorganization within the meaning of Section 368(a) of the Code. The Purchaser does not know of any reason why Purchaser will not be able to deliver such certificates.
Section 6.9.Restructuring.
The parties agree that the transactions contemplated by this Agreement may be restructured as necessary in order for the Purchaser to comply with any applicable rules or regulations of any Governmental Authority, including without limitation, any banking or corporate requirements; provided that any such restructuring will not alter in any way the Merger Consideration to be issued in the Merger.
ARTICLE VII
CONDITIONS PRECEDENT TO CONSUMMATION OF THE MERGER
Section 7.1.Conditions Precedent to Each Party’s Obligation to Effect the Merger.
The respective obligations of each party hereto to consummate the Merger shall be subject to the satisfaction (or waiver, if permissible under applicable Law) at or prior to the Effective Time of the following conditions precedent:
(a)Stockholder Approval. The Company Stockholder Approval shall have been obtained.
(b)No Injunction or Restraint. No Law, injunction, judgment or ruling enacted, promulgated, issued, entered, amended or enforced by any Governmental Authority (collectively, “Restraints”) shall be in effect enjoining, restraining, preventing or prohibiting consummation of the Merger or making the consummation of the Merger illegal.
(c)Tax Opinion. The Purchaser and the Company shall have received a written opinion of Troutman Sanders LLP, special counsel to the Purchaser, dated as of the Effective Time, in form and substance reasonably satisfactory to the Purchaser and the Company, substantially to the effect that, on the basis of the facts, representations and assumptions set forth in such opinion, all of which are consistent with the state of facts existing as of the Effective Time, to the effect that (A) the Merger will qualify as a reorganization within the meaning of Section 368 of the Code and (B) the Company and the Purchaser will each be a “party to the reorganization” within the meaning of Section 368 of the Code. In rendering such opinion, Troutman Sanders LLP may require and rely upon representations and covenants including those contained in certificates of officers of the Purchaser and the Company. The issuance of such Tax opinion shall be conditioned upon receipt by Troutman Sanders LLP of representation letters from each of the Purchaser and the Company reasonably satisfactory in form and substance to Troutman Sanders LLP.
38
Table of Contents
Section 7.2.Conditions Precedent to the Purchaser’s Obligation to Effect the Merger.
The obligations of the Purchaser to consummate the Merger shall be further subject to the satisfaction (or waiver, if permissible under applicable Law) at or prior to the Effective Time of the following conditions precedent:
(a)Representations and Warranties of the Company. The representations and warranties made by the Company inArticle V hereof shall be true and correct (i) in all respects at and as of the Effective Time (as to representations and warranties qualified or limited by the term “Material Adverse Effect,” the word “material” and phrases of like import), and (ii) in all material respects at and as of the Effective Time (as to representations and warranties not qualified or limited by the term “Material Adverse Effect,” the word “material” and phrases of like import), in each case with the same force and effect as though made at and as of the Effective Time (except to the extent they relate to a specific date).
(b)Obligations and Covenants of the Company. The Company shall have performed and complied with, in all material respects, all obligations and covenants to be performed or complied with by it under this Agreement on or before the Effective Time.
(c)No Material Adverse Change. During the period from the date of this Agreement to the Closing Date, there shall not have occurred any Material Adverse Effect that continues to exist on the Closing Date and as of the Effective Time.
(d)Officers’ Certificate. The Purchaser shall have received at the Effective Time a certificate of the Chief Executive Officer and Chief Financial Officer of the Company certifying fulfillment of the conditions set forth inSections 7.2(a),(b) and(c) hereof.
(e)No Pending Governmental Authority Action. No Governmental Authority shall have instituted an action or proceeding that remains pending seeking to enjoin, restrain, prevent or prohibit consummation of the Merger.
(f)Reasonable Documentation. All proceedings, corporate or other, to be taken by the Company in connection with the transactions contemplated by this Agreement, and all documents incident thereto, shall be reasonably satisfactory in form and substance to the Purchaser and Merger Subsidiary and counsel for the Purchaser and Merger Subsidiary, and the Company shall have made available to the Purchaser and Merger Subsidiary for examination the originals or true and correct copies of all documents that the Purchaser and Merger Subsidiary may reasonably request in connection with the transactions contemplated by this Agreement.
Section 7.3.Conditions Precedent to the Company’s Obligation to Effect the Merger.
The obligations of the Company to consummate the Merger shall be further subject to the satisfaction (or waiver, if permissible under applicable Law) at or prior to the Effective Time of the following conditions precedent:
(a)Representations and Warranties of the Purchaser. The representations and warranties made by the Purchaser inArticle IV hereof shall be true and correct (i) in all respects at and as of the Effective Time (as to representations and warranties qualified or limited by the term “material adverse effect,” the word “material” and phrases of like import), and (ii) in all material respects at and as of the Effective Time (as to representations and warranties not qualified or limited by the term “material adverse effect,” the word “material” and phrases of like import), in each case with the same force and effect as though made at and as of the Effective Time (except to the extent they relate to a specific date).
39
Table of Contents
(b)Obligations and Covenants of the Purchaser. The Purchaser shall have performed and complied with, in all material respects, all obligations and covenants to be performed or complied with by it under this Agreement on or before the Effective Time.
(c)Officers’ Certificate. The Company shall have received at the Effective Time a certificate of the Chief Executive Officer and Chief Financial Officer of the Purchaser certifying fulfillment of the conditions set forth inSections 7.3(a) and(b) hereof.
ARTICLE VIII
TERMINATION
Section 8.1.Termination.
This Agreement may be terminated and the transactions contemplated hereby may be abandoned at any time prior to the Effective Time, whether before or after receipt of the Company Stockholder Approval:
(a) by mutual written consent of the Company and the Purchaser duly authorized by each of their respective Boards of Directors; or
(b) by the Company or the Purchaser:
(i) if the Merger shall not have been consummated on or before June 30, 2008 (the “Walk-Away Date”);provided, however, that the right to terminate this Agreement under thisSection 8.1(b)(i) shall not be available to a party if the failure of the Merger to have been consummated on or before the Walk-Away Date was primarily due to the failure of such party to perform any of its obligations under this Agreement; andprovided, further, that the right to terminate this Agreement under thisSection 8.1(b)(i) shall not be available to the Company if a vote on the adoption and approval of this Agreement and the Merger shall not yet have occurred at a duly convened Special Meeting;
(ii) if the Company Stockholder Approval shall not have been obtained at the Special Meeting duly convened therefor or at any adjournment or postponement thereof;
(c) by the Company:
(i) if the Purchaser shall have breached or failed to perform any of its representations, warranties, covenants or agreements set forth in this Agreement, which breach or failure to perform (x) would give rise to the failure of a condition set forth inSection 7.3(a) or(b) and (y) cannot be cured by the Purchaser by the Walk-Away Date or, if curable, is not cured within 30 days after the Purchaser receives written notice from the Company of such breach;
40
Table of Contents
(ii) if pursuant toSection 6.7(b) the Board of Directors of the Company withdraws, modifies or changes its recommendation that the stockholders of the Company approve this Agreement in a manner adverse to the Purchaser and its stockholders;
(d) by the Purchaser:
(i) if the Company shall have breached or failed to perform any of its representations, warranties, covenants or agreements set forth in this Agreement, which breach or failure to perform (x) would give rise to the failure of a condition set forth inSection 7.2 and (y) cannot be cured by the Company by the Walk-Away Date or, if curable, is not cured within 30 days after the Company receives written notice from the Purchaser of such breach;
(ii) if the Board of Directors of the Company withdraws, modifies or changes its recommendation that the stockholders of the Company approve this Agreement in a manner adverse to the Purchaser and its stockholders, unless such withdrawal, modification or change is as a result of a breach by the Purchaser that would entitle the Company to terminate this Agreement or as a result of a Material Adverse Effect on the Purchaser; or
(iii) if the Appraised Value is less than 97% of the aggregate of the sum of the tax assessed values of the Owned Real Property as of December 31, 2007.
Section 8.2.Rights on Termination.
In the event of termination and abandonment of the Merger by any party pursuant toSection 8.1 hereof, written notice thereof shall forthwith be given to the other party or parties, specifying the provisions hereof pursuant to which such termination is made, and this Agreement shall terminate and the Merger and the other transactions contemplated hereby shall be abandoned, without further action by any of the parties hereto. If this Agreement is terminated and the transactions contemplated hereby are not consummated pursuant toSection 8.1 of this Agreement, this Agreement shall become void and of no further force and effect, except (i) for the provisions ofSection 8.2,Section 8.4 andArticle IX, and (ii) that no such termination shall relieve any party of liability for any fraud or any willful breach of this Agreement.
Section 8.3.Termination Fees.
(a) In the event that this Agreement is terminated by the Company pursuant toSection 8.1(c)(ii), then the Company shall pay by wire transfer of same-day funds to the Purchaser a termination fee of $500,000 (the “Termination Fee”). The Purchaser’s acceptance of the Termination Fee shall constitute conclusive evidence that this Agreement has been validly terminated.
(b) In the event that the Purchaser shall terminate this Agreement pursuant toSection 8.1(d)(ii), and a definitive agreement is entered into by the Company with respect to the Takeover Proposal that gave rise to the Company Adverse Recommendation Change within six months after such termination of this Agreement, then the Company shall, on the date such
41
Table of Contents
Takeover Proposal is consummated, pay by wire transfer of same-day funds to the Purchaser an amount equal to the Termination Fee;provided,however, that for the purpose of thisSection 8.3(b), all references in the definition of Takeover Proposal to “20%” shall instead be deemed to refer to “a majority.”
(c) In the event that (i)(A) the Purchaser validly terminates this Agreement pursuant toSection 8.1(d)(i) due to a willful breach by the Company of any covenant or agreement contained in this Agreement or pursuant toSection 8.1(b)(i) or (B) either the Purchaser or the Company terminates this Agreement pursuant toSection 8.1(b)(ii), (ii) prior to the time of such termination abona fide Takeover Proposal has been publicly made or otherwise made known to the Company’s stockholders and not withdrawn or rejected by the Company’s Board of Directors prior to such termination, and (iii) a definitive agreement is entered into by the Company with respect to such Takeover Proposal within six months after such termination of this Agreement, the Company shall, on the date such Takeover Proposal is consummated, pay by wire transfer of same-day funds the Termination Fee to the Purchaser;provided,however, that for the purpose of thisSection 8.3, all references in the definition of Takeover Proposal to “20%” shall instead be deemed to refer to “a majority.”
(d) The Company acknowledges that the agreements contained in thisSection 8.3 are an integral part of the Transactions. In the event that the Company shall fail to pay the Termination Fee when due, the Company shall reimburse the Purchaser for all reasonable costs and expenses actually incurred or accrued by the Purchaser (including reasonable fees and expenses of counsel) in connection with the Purchaser’s enforcement of thisSection 8.3.
Section 8.4.Remedies.
Except as otherwise provided in this Agreement, any and all remedies expressly conferred upon a party to this Agreement shall be cumulative with, and not exclusive of, any other remedy contained in this Agreement, at Law or in equity. The exercise by a party to this Agreement of any one remedy shall not preclude the exercise by it of any other remedy.
ARTICLE IX
MISCELLANEOUS
Section 9.1.Survival of Representations and Warranties.
The representations, warranties and agreements in this Agreement shall terminate at the Effective Time or, except as otherwise provided inSection 8.2, upon the termination of this Agreement pursuant toSection 7.1, as the case may be, except that the agreements set forth inArticle III andSection 6.4 and any other agreement in this Agreement which contemplates performance after the Effective Time shall survive the Effective Time indefinitely and those set forth inSections 8.2 and 8.4 and thisArticle IX shall survive termination indefinitely.
Section 9.2.Amendment.
At any time prior to the Effective Time, this Agreement may be amended or supplemented in any and all respects, whether before or after receipt of the Company Stockholder Approval, by written agreement of the parties hereto, by action taken or authorized
42
Table of Contents
by their respective Boards of Directors;provided,however, that following receipt of the Company Stockholder Approval, there shall be no amendment or change to the provisions hereof which by Law would require further approval by the stockholders of the Company without such approval.
Section 9.3.Extension; Waiver.
At any time prior to the Effective Time, any party may, subject to applicable Law, (i) extend the time for the performance of any of the obligations or other acts of the other party hereto, (ii) waive any inaccuracies in the representations and warranties contained herein or in any document, certificate or writing delivered pursuant hereto by the other party hereto or (iii) waive compliance with any of the agreements or conditions contained herein by the other party hereto. Notwithstanding the foregoing, no failure or delay by the Company or the Purchaser in exercising any right hereunder shall operate as a waiver thereof nor shall any single or partial exercise thereof preclude any other or further exercise thereof or the exercise of any other right hereunder. Any agreement on the part of any party to any such extension or waiver shall be valid only if set forth in an instrument in writing signed on behalf of such party.
Section 9.4.Entire Agreement; Assignment.
This Agreement (i) constitutes the entire agreement among the parties with respect to the subject matter hereof and supersedes all other prior agreements and understandings, both written and oral, between the parties or any of them with respect to the subject matter hereof and (ii) shall not be assigned by operation of Law or otherwise.
Section 9.5.Notices.
All notices, requests, claims, demands and other communications hereunder shall be in writing and shall be given (and shall be deemed to have been duly given upon receipt) by delivery in Person, by cable, telecopy, telegram or telex, by nationally recognized overnight delivery service, or by registered or certified mail (postage prepaid, return receipt requested) to the respective parties as follows:
if to the Purchaser :
1300 Kings Mountain Road
Martinsville, Virginia 24112
Attention: Phyllis Q. Karavatakis
Telephone: (276) 656-1776
Telecopy: (276) 656-6766
with a copy to:
Jacob A. Lutz, III, Esquire
Troutman Sanders LLP
1001 Haxall Point
Richmond, Virginia 23219
Telephone: (804) 697-1200
Telecopy: (804) 697-1339
43
Table of Contents
if to the Company:
1300 Kings Mountain Road
Martinsville, Virginia 24112
Attention: Worth Harris Carter, Jr.
Telephone: (276) 656-1776
Telecopy: (276) 656-6766
with a copy to:
John L. Gregory, III, Esquire
Young, Haskins, Mann, Gregory,
McGarry & Wall P.C.
400 Starling Avenue
P.O. Box 72
Martinsville, Virginia 24114-0072
Telephone: (276) 638-2367
Telecopy: (276) 638-1214
or to such other address as the Person to whom notice is given may have previously furnished to the others in writing in the manner set forth above.
Section 9.6.Governing Law; Consent to Jurisdiction; Waiver of Jury Trial.
(a) This Agreement shall be governed by and construed in accordance with the Laws of the Commonwealth of Virginia regardless of the Laws that might otherwise govern under applicable principles of conflicts of Laws thereof. Each of the parties hereto (i) consents to submit itself to the personal jurisdiction of any federal court located in the Western District of the Commonwealth of Virginia or any Virginia state court sitting in Henry County, Virginia in the event any dispute arises out of this Agreement or any of the transactions contemplated by this Agreement, and, in connection with any such matter, to service of process by notice as otherwise provided herein, (ii) agrees that it will not attempt to deny or defeat such personal jurisdiction by motion or other request for leave from any such court and (iii) agrees that it will not bring any action relating to this Agreement or any of the transactions contemplated by this Agreement in any court other than a federal court sitting in the Commonwealth of Virginia or a Virginia state court.
(b) Each of the parties hereto irrevocably waives any and all rights to trial by jury in any legal proceeding arising out of or related to this Agreement.
Section 9.7.Descriptive Headings.
The descriptive headings herein are inserted for convenience of reference only and are not intended to be part of or to affect the meaning or interpretation of this Agreement.
44
Table of Contents
Section 9.8.Parties in Interest.
This Agreement shall be binding upon and inure solely to the benefit of each party hereto, and nothing in this Agreement, express or implied, is intended to or shall confer upon any other Person any rights, benefits or remedies of any nature whatsoever under or by reason of this Agreement.
Section 9.9.Counterparts.
This Agreement may be executed in two or more counterparts, each of which shall be deemed to be an original, but all of which shall constitute one and the same agreement.
Section 9.10.Specific Performance.
The parties hereto agree that irreparable damage would occur in the event any of the provisions of this Agreement were not performed in accordance with the terms hereof and that the parties shall be entitled to specific performance of the terms hereof, in addition to any other remedy at Law or equity.
Section 9.11.Fees and Expenses.
The costs and expenses incurred in connection with this Agreement and the transactions contemplated hereby shall be paid by the party incurring such expenses, whether or not the Merger is consummated.
Section 9.12.Severability.
If any term or other provision of this Agreement is invalid, illegal or incapable of being enforced by any rule of Law or public policy, all other conditions and provisions of this Agreement shall nevertheless remain in full force and effect so long as the economic or legal substance of the transactions contemplated hereby is not affected in any manner adverse to either party. Upon such determination that any term or other provision is invalid, illegal or incapable of being enforced, the parties hereto shall negotiate in good faith to modify this Agreement so as to effect the original intent of the parties as closely as possible in an acceptable manner, to the end that the transactions contemplated hereby are fulfilled to the extent possible.
Section 9.13.Joint Participation.
The parties hereto have participated jointly in the negotiation and drafting of this Agreement and, in the event an ambiguity or question of intent or interpretation arises, this Agreement shall be construed as jointly drafted by the parties hereto and no presumption or burden of proof shall arise favoring or disfavoring any party by virtue of the authorship of any provision of this Agreement.
45
Table of Contents
IN WITNESS WHEREOF, each of the parties hereto has caused this Agreement to be duly executed on its behalf by its officer thereunto duly authorized, all as of the day and year first above written.
CARTER BANK & TRUST | ||
By: | /s/ Phyllis Q. Karavatakis | |
| Phyllis Q. Karavatakis | ||
| Senior Vice President and Cashier | ||
BANK BUILDING CORPORATION | ||
By: | /s/ Worth Harris Carter, Jr. | |
| Worth Harris Carter, Jr. | ||
| Chairman of the Board and President | ||
46
Table of Contents
Exhibit A
PLAN OF MERGER
merging
BANK BUILDING CORPORATION,
a Virginia corporation
with and into
CARTER BANK & TRUST,
a Virginia corporation
1.Merger. Bank Building Corporation, a Virginia corporation (the “Company”), shall, upon the effective time and date set forth in the Articles of Merger (the “Articles of Merger”) to be filed with the State Corporation Commission (the “SCC”) of the Commonwealth of Virginia (such time being referred to herein as the “Effective Time”), be merged (the “Merger”) with and into Carter Bank & Trust, a Virginia corporation (the “Purchaser”). As a result of the Merger, the separate corporate existence of the Company shall cease and the Purchaser shall continue as the surviving corporation following the Merger (the “Surviving Corporation”). The corporate existence of the Purchaser, with all its rights, privileges, immunities, powers and franchises, shall continue unaffected and unimpaired by the Merger.
2.Effects of the Merger. At the Effective Time, the Merger shall have the effects set forth in Section 13.1-721 of the Virginia Stock Corporation Act (the “VSCA”). Without limiting the generality of the foregoing, and subject thereto, at the Effective Time all the rights, privileges, immunities, powers and franchises of the Purchaser and the Company shall vest in the Surviving Corporation, and all debts, liabilities, obligations, restrictions, disabilities and duties of the Purchaser and the Company shall become the debts, liabilities, obligations, restrictions, disabilities and duties of the Surviving Corporation.
3.Articles of Incorporation. At the Effective Time, the Articles of Incorporation of the Purchaser in effect immediately prior to the Effective Time shall continue and shall be the articles of incorporation of the Surviving Corporation, until the same shall thereafter be altered, amended or repealed in accordance with the VSCA or the articles of incorporation of the Surviving Corporation.
4.Bylaws. At the Effective Time, the Bylaws of the Purchaser in effect immediately prior to the Effective Time shall continue and shall be the Bylaws of the Surviving Corporation, until the same shall thereafter be altered, amended or repealed in accordance with the VSCA, the articles of incorporation of the Surviving Corporation or the bylaws of the Surviving Corporation.
5.Board of Directors. The directors of the Purchaser immediately prior to the Effective Time shall be the directors of the Surviving Corporation until their respective successors are duly elected or appointed and qualified or until their earlier death, resignation or removal in accordance with the articles of incorporation and bylaws of the Surviving Corporation.
1
Table of Contents
6.Officers. The officers of Purchaser immediately prior to the Effective Time shall be the officers of the Surviving Corporation until their respective successors are duly appointed and qualified or until their earlier death, resignation or removal in accordance with the articles of incorporation and bylaws of the Surviving Corporation.
7.Manner and Basis of Converting Shares of Purchaser Common Stock. At the Effective Time, by virtue of the Merger and without any action on the part of the Purchaser, the Company or the holder of any Shares or the holder of any capital stock of the Purchaser:
(a)Capital Stock of the Company. Each Share of the capital stock of the Company issued and outstanding immediately prior to the Effective Time shall be converted into and become that number of validly issued, fully paid and nonassessable shares of common stock, par value $1.00 per share, of the Surviving Corporation, equal to the greater of (i) 2.255 or (ii) the number that is derived by taking the Appraised Value plus Other Assets less Total Liabilities less two-thirds of the Deferred Tax Amount and dividing the resulting number by 398,244 and then dividing the per share result by $9.25 (the “Merger Consideration”).
(b)Cancellation of Shares. Each Share of Company Common Stock and all other shares of capital stock of the Company that are owned, directly or indirectly, by the Company or any wholly owned Subsidiary of the Company (except for Shares owned on behalf of third parties) and all Shares of Company Common Stock and all other shares of capital stock of the Company that are owned, directly or indirectly, by the Purchaser or any other wholly owned Subsidiary of the Purchaser (except for Shares owned on behalf of third parties) shall be automatically canceled and retired and shall cease to exist and no consideration shall be delivered or deliverable in exchange therefor.
(c)Capital Stock of the Purchaser. Each share of the capital stock of the Purchaser issued and outstanding immediately prior to the Effective Time shall remain a validly issued, fully paid and nonassessable share of common stock of the Surviving Corporation.
(d) All Shares of Company Common Stock, when converted as provided in Section 7(a), no longer shall be outstanding and automatically shall be canceled and retired and shall cease to exist, and each Certificate previously evidencing such Shares shall thereafter represent only the right to receive the Merger Consideration and shall be deemed for all purposes to evidence ownership of and to represent the number of shares of Surviving Corporation Common Stock into which such Shares shall have been converted.
(e) The holders of Certificates previously evidencing Shares outstanding immediately prior to the Effective Time shall cease to have any rights with respect to Company Common Stock except as otherwise provided herein or by Law and, upon the surrender of Certificates in accordance with the provisions of Section 8, such Certificates shall represent only the right to receive the Merger Consideration to be exchanged in consideration therefore and shall be deemed for all purposes to evidence ownership of and to represent the number of shares of Purchaser Common Stock into which such Shares shall have been converted.
2
Table of Contents
(f)Fractional Shares. No certificates or scrip representing fractional shares of the Purchaser Common Stock shall be issued, and no holder of shares of Company Common Stock shall be entitled to any voting rights, rights to receive any dividends or distributions or other rights as a stockholder of the Purchaser that would otherwise be issued as fractional shares to such stockholder. In lieu of any fractional shares of stock that would otherwise be issued, each stockholder that would have been entitled to receive a fractional share of the Purchaser Common Stock shall, upon proper surrender of such person’s Certificates, receive a cash payment equal to such fraction multiplied by $9.25.
8.Notices to Stockholders; Payment for Shares.
(a)Notices to Stockholders. As promptly as practicable after the Effective Time, the Surviving Corporation shall, or shall cause the Transfer Agent to, mail to each holder of record of Common Stock prior to the Effective Time (i) a letter of transmittal specifying that delivery shall be effected, and risk of loss of the Certificates shall pass, only upon proper delivery of the Certificates to the Transfer Agent, and which letter shall be in customary form and have such other provisions as the Purchaser may reasonably specify (the “Letter of Transmittal”), and (ii) instructions for effecting the surrender of such Certificates for exchange.
(b)Exchange. Upon surrender of a Certificate for cancellation to the Transfer Agent together with such letter of transmittal, duly completed and validly executed in accordance with the instructions (and such other customary documents as may reasonably be required by the Transfer Agent) the holder of such Certificate shall be entitled to receive in respect thereof the Merger Consideration, and the Certificate so surrendered shall forthwith be canceled.
(c)Lost, Stolen or Destroyed Certificates. In the event any Certificate shall have been lost, stolen or destroyed, upon the making of an affidavit of that fact by the Person claiming such Certificate to be lost, stolen or destroyed and, if required by the Purchaser, the posting by such Person of a bond, in such reasonable amount as the Purchaser may direct, as indemnity against any claim that may be made against it with respect to such Certificate, the Transfer Agent will pay, in exchange for such lost, stolen, or destroyed Certificate, the Merger Consideration pursuant to this Section 8.
(d)Withholding. Each of the Transfer Agent and the Purchaser will be entitled to deduct and withhold from the Merger Consideration otherwise payable pursuant to this Agreement to any holder of shares of Company Common Stock such amounts as it is required to deduct and withhold with respect to the making of such payment under the Code, or any other applicable state, local or foreign Law related to Taxes. To the extent that amounts are so withheld by the Transfer Agent or Purchaser, as the case may be, such withheld amounts (i) will be remitted by the Transfer Agent or the Purchaser, as the case may be, to the applicable Governmental Authority, and (ii) will be treated for all purposes of this Agreement as having been paid to the holder of the shares of Company Common Stock in respect of which such deduction and withholding was made by the Purchaser.
9.Stock Transfer Books. At the Effective Time, the stock transfer books of the Company shall be closed and there shall be no further registration of transfers of Shares of Company Common Stock thereafter on the records of the Surviving Corporation.
3
Table of Contents
10.Appraisal Rights. Notwithstanding any other provision of this Plan of Merger to the contrary, each Share of Company Common Stock issued and outstanding immediately prior to the Effective Time that is held by stockholders who shall have not voted in favor of the Merger or consented thereto in writing and who shall have demanded properly in writing appraisal for such Shares in accordance with Section 13.1-730 of the VSCA (collectively, the “Dissenting Shares”) shall not be converted into or represent the right to receive the Merger Consideration. Such Shares instead shall, from and after the Effective Time, be canceled and shall cease to exist and shall represent only the right to receive payment of the appraised value of such Shares of Company Common Stock held by them in accordance with the provisions of such Section 13.1-730 (less any amounts as are required to be deducted and withheld with respect to the making of such payment under the Code, or any provision of any other Tax Law), except that all Dissenting Shares held by stockholders who shall have failed to perfect or who effectively shall have withdrawn or lost their rights to appraisal of such Shares of Company Common Stock under such Section 13.1-730 shall thereupon be deemed to have been converted into and to have become exchangeable, as of the Effective Time, for the right to receive, without any interest thereon, the Merger Consideration upon surrender, in the manner provided in this Plan of Merger, of the Certificate or Certificates that, immediately prior to the Effective Time, evidenced such Shares of Company Common Stock.
11.Amendment. At any time prior to the Effective Time, this Plan of Merger may be amended or supplemented in any and all respects, whether before or after receipt of the Company Stockholder Approval, by written agreement of the parties hereto, by action taken or authorized by Boards of Directors of the Company or the Purchaser;provided,however, that following receipt of the Company Stockholder Approval, there shall be no amendment or change to the provisions hereof which by Law would require further approval by the stockholders of the Company without such approval.
12.Defined Terms. As used in this Plan of Merger, the following terms shall have the meanings set forth below:
(a) “Appraised Value” shall mean 97% of the fair market value of the Owned Real Property of the Company as determined by certified appraisals by disinterested real estate appraisers who shall be members of the Appraisal Institute or appraisers licensed under applicable state Laws.
(b) “Certificates” shall mean the certificate or certificates which, immediately prior to the Effective Time, represented outstanding shares of Company Common Stock.
(c) “Code” shall mean, as appropriate, the Internal Revenue Code of 1986, as amended and the rules and regulations promulgated thereunder.
(d) “Company Common Stock” shall mean the common stock, no par value per share, of the Company.
(e) “Company Stockholder Approval” shall mean the affirmative vote (in person or by proxy) of the holders of at least 662/3% of the outstanding shares of Company Common Stock at the Special Meeting, or any adjournment or postponement thereof, in favor of the adoption of this Agreement.
4
Table of Contents
(f) “Deferred Tax Amount” shall mean 35% of the amount by which the Appraised Value exceeds the Tax basis of the Owned Real Property of the Company as of December 31, 2007.
(g) “GAAP” shall mean generally accepted accounting principles as in effect in the United States of America at the time of the preparation of the subject financial statement.
(h) “Governmental Authority” shall mean any federal, state, provincial, municipal or other governmental department, commission, board, bureau, agency or instrumentality, or any court, in each case whether of the United States, any of its possessions or territories, or of any foreign nation.
(i) “Law” shall mean any federal, state, foreign, supranational, provincial, local or other law or treaty or governmental requirement of any kind, and the rules, regulations and orders promulgated thereunder.
(j) “Other Assets” shall mean the book value calculated in accordance with GAAP as of December 31, 2007 of all of the assets of the Company except for the Owned Real Property of the Company.
(k) ��Owned Real Property” shall mean all real property owned by the Company or its Subsidiary.
(l) “Person” shall mean an individual, corporation, partnership, joint venture, association, trust, unincorporated organization or other entity.
(m) “Purchaser Common Stock” shall mean the common stock, $1.00 par value per share, of the Purchaser.
(n) “Shares” shall mean shares of Company Common Stock.
(o) “Special Meeting” shall mean a special meeting of the stockholders of the Company, duly called, noticed, convened and held, in accordance with applicable Law and the Company’s Articles of Incorporation and Bylaws, for the purpose of considering and taking action upon the Merger.
(p) “Subsidiary” shall mean, with respect to any Person, any corporation, limited liability company, partnership, association, or other business entity of which (i) if a corporation, a majority of the total voting power of shares of stock entitled (without regard to the occurrence of any contingency) to vote in the election of directors, managers, or trustees thereof is at the time owned or controlled, directly or indirectly, by that Person or one or more of the other Subsidiaries of that Person or a combination thereof or (ii) if a limited liability company, partnership, association, or other business entity (other than a corporation), a majority of the partnership or other similar ownership interests thereof is at the time owned or controlled, directly or indirectly, by that Person or one or more Subsidiaries of that Person or a combination
5
Table of Contents
thereof and for this purpose, a Person or Persons owns a majority ownership interest in such a business entity (other than a corporation) if such Person or Persons shall be allocated a majority of such business entity’s gains or losses or shall be or control any managing director or general partner of such business entity (other than a corporation). The term “Subsidiary” shall include all Subsidiaries of such Subsidiary (collectively, “Subsidiaries”).
(q) “Tax Returns” shall mean any report, return, information statement, payee statement or other information required to be provided to any federal, state, local or foreign Governmental Authority, or otherwise retained, with respect to Taxes.
(r) “Taxes” shall mean any and all taxes, levies, imposts, duties, assessments, charges and withholdings imposed or required to be collected by or paid over to any federal, state, local or foreign Governmental Authority or any political subdivision thereof, including, without limitation, income, gross receipts, ad valorem, value added, minimum tax, franchise, sales, use, excise, license, real or personal property, unemployment, disability, stock transfer, mortgage recording, estimated, withholding or other tax, governmental fee or other like assessment or charge of any kind whatsoever, whether disputed or not, together with any interest, penalties, fines, assessments or additions to tax imposed in respect of the foregoing, or in respect of any failure to comply with any requirement regarding Tax Returns and including any obligation to indemnify or otherwise assume or succeed to the tax liability of any other Person.
(s) “Total Liabilities” shall mean the carrying amount of all of the liabilities of the Company as calculated in accordance with GAAP as of December 31, 2007.
(t) “Transfer Agent” shall mean the Purchaser.
6
Table of Contents
ANNEX B

January 8, 2008
Private and Confidential
Mr. Worth Harris Carter, Jr.
Chairman of the Board and President
Bank Building Corporation
1300 Kings Mountain Road
Martinsville, Virginia 24112
Members of the Board:
You have requested our opinion as investment bankers as to the fairness, from a financial point of view, to the shareholders of Bank Building Corporation (“BBC”) of the Merger Consideration (as defined below) per share to be received by the BBC shareholders in the proposed merger (the “Merger”) of BBC with and into Carter Bank & Trust (“CB&T”) pursuant to the Agreement and Plan of Merger dated January 4, 2008 (the “Agreement”). As is more specifically set forth in the Agreement, upon consummation of the Merger, each share of the capital stock of BBC will be converted into that number of shares of CB&T common stock, par value $1.00 per share, equal to the greater of (i) 2.255 or (ii) the number that is derived by taking the Appraised Valueplus Other Assetsless Total Liabilitiesless two-thirds of the Deferred Tax Amount and dividing the resulting number by 398,244 and then dividing the per share result by $9.25 (the “Merger Consideration”), as such terms are defined in the Agreement.
Davenport & Company LLC, as part of its investment banking business is regularly engaged in the valuation of businesses and securities in connection with mergers, acquisitions, underwritings, sales and distributions of listed and unlisted securities, private placements and valuations for estate, corporate and other purposes. Davenport was selected by BBC’s Board of Directors to act as its financial advisor because of Davenport’s expertise in valuing and advising financial institutions and other businesses in merger and acquisition transactions and because Davenport was familiar with CB&T and BBC and their respective businesses. Davenport has acted as financial advisor to BBC in connection with the Transaction and will receive a fee for its services, a portion of which is payable in connection with rendering this opinion and a portion of which is payable upon consummation of the Merger. Davenport will not receive any other significant payment or compensation contingent upon the successful completion of the Merger. BBC has also agreed to reimburse our expenses and indemnify us against certain liabilities arising out of our engagement. In the past two years, Davenport has had no material relationship with BBC unrelated to the Merger. However, in the past two years, Davenport has provided financial advisory services to the predecessors of CB&T unrelated to the Merger, for which Davenport received compensation. In the ordinary course of its business as a broker-dealer, Davenport may, from time to time, purchase securities from, and sell securities to, CB&T.
In arriving at our opinion, we have, among other things:
| 1. | Reviewed the Agreement; |
Davenport & Company LLC Member: New York Stock Exchange · SIPC (804) 780-2000 www.investdavenport.com
Post Office Box 85678 Richmond VA 23285-5678 901 East Cary Street Suite 1100 Richmond VA 23219-4037
Table of Contents
Mr. Worth Harris Carter, Jr.
Chairman of the Board and President
Bank Building Corporation
January 8, 2008
Page 2
| 2. | Reviewed certain business, financial, and other information regarding BBC and its prospects that was furnished to us by the management of BBC and that we have discussed with the management of BBC. |
| 3. | Reviewed certain business, financial, and other information regarding CB&T and its prospects that was furnished to us by the management of CB&T and that we have discussed with the management of CB&T. |
| 4. | Reviewed the publicly reported historical price and trading activity for CB&T’s common stock. |
| 5. | Compared the business, financial, and other information regarding CB&T with similar information regarding certain other publicly traded companies that we deemed to be relevant. |
| 6. | Reviewed the pro forma financial impact of the Merger on BBC and CB&T, based on assumptions relating to purchase accounting adjustments and cost savings determined by the senior management of BBC and CB&T. |
| 7. | Considered other information such as financial studies, analyses, and investigations as well as financial and economic and market criteria that we deemed relevant. |
In conducting our review and arriving at our opinion, we have relied upon and assumed the accuracy, completeness and fairness of all of the foregoing financial and other information that was available to us from public sources, that was provided to us by BBC and CB&T or their representatives, or that was otherwise reviewed by us, and we have not assumed any responsibility for independently verifying the accuracy or completeness of any such information. We are not experts in the evaluation of loan portfolios for the purpose of assessing the adequacy of the allowance for losses, and assumed that such allowances for CB&T, are in the aggregate, adequate to cover such losses. We did not review any individual credit files for CB&T nor make any independent evaluation, appraisal or physical inspection of the assets, liabilities or properties of BBC and CB&T, nor were we furnished with such evaluation or appraisal.
With respect to the financial forecast information furnished to or discussed with us by BBC and CB&T, we assumed that such financial forecast information had been reasonably prepared and reflected the best currently available estimates and judgment of BBC’s and CB&T’s management as to the expected future financial performance of BBC and CB&T, respectively. We assumed no responsibility for and expressed no view as to any such forecasts or estimates or the assumptions upon which they were based. We have also assumed that the Merger will be completed substantially in accordance with the terms set forth in the Agreement and that the Merger will be accounted for as a purchase under generally accepted accounting principles. Our opinion is necessarily based upon economic, market, financial and other conditions as they exist and can be evaluated on the date hereof and the information made available to us through the date hereof.
Our opinion expressed herein was prepared solely for the Board of Directors of BBC in connection with and for the purposes of its evaluation of the Merger. This opinion does not address the relative merits of the Merger as compared to any alternative business strategies that might exist for BBC,
Table of Contents
Mr. Worth Harris Carter, Jr.
Chairman of the Board and President
Bank Building Corporation
January 8, 2008
Page 3
does not address the effect of any other business combination in which BBC might engage and does not constitute a recommendation to any shareholder of BBC as to how such shareholder should vote with respect to the Merger. We are not expressing any opinion herein as to the prices at which CB&T’s common stock will trade following the announcement or consummation of the Merger. This opinion does not express any opinion about the fairness of the amount or nature of the compensation to BBC’s officers, directors, employees or class of such persons, relative to compensation to the public shareholders of BBC, as no such compensation is included in the Merger Agreement. In accordance with internal procedures adopted pursuant to FINRA rules and regulations, this opinion is not subject to review by our fairness opinion committee and is directed to the Board of Directors of the Company in connection with its consideration of the Transaction.
Based upon and subject to certain limitations and assumptions set forth above and elsewhere in this presentation, our experience as investment bankers, our work described in this presentation, and other factors we deem relevant, it is our opinion that, as of the date hereof, the Merger Consideration to be received by the shareholders of BBC pursuant to the Agreement is fair, from a financial point of view, to the shareholders of BBC. Although subsequent developments may affect this opinion, it is understood that we do not have any obligation to update, revise or reaffirm this opinion.
| Sincerely, |
| DAVENPORT & COMPANY LLC |
 |
Robert F. Mizell Executive Vice President |
Table of Contents
Annex C
Real Estate Appraisals of Bank Building Corporation
[To Be Filed By Amendment]
Table of Contents
Annex D
CODE OF VIRGINIA
TITLE 13.1. CORPORATIONS
CHAPTER 9. VIRGINIA STOCK CORPORATION ACT
ARTICLE 15. APPRAISAL RIGHTS AND OTHER REMEDIES.
§ 13.1-730. Right to appraisal
A. A shareholder is entitled to appraisal rights, and to obtain payment of the fair value of that shareholder’s shares, in the event of any of the following corporate actions:
1. Consummation of a merger to which the corporation is a party (i) if shareholder approval is required for the merger by § 13.1-718 and the shareholder is entitled to vote on the merger, except that appraisal rights shall not be available to any shareholder of the corporation with respect to shares of any class or series that remain outstanding after consummation of the merger, or (ii) if the corporation is a subsidiary and the merger is governed by § 13.1-719;
2. Consummation of a share exchange to which the corporation is a party as the corporation whose shares will be acquired if the shareholder is entitled to vote on the exchange, except that appraisal rights shall not be available to any shareholder of the corporation with respect to any class or series of shares of the corporation that is not exchanged;
3. Consummation of a disposition of assets pursuant to § 13.1-724 if the shareholder is entitled to vote on the disposition;
4. An amendment of the articles of incorporation with respect to a class or series of shares that reduces the number of shares of a class or series owned by the shareholder to a fraction of a share if the corporation has the obligation or right to repurchase the fractional share so created; or
5. Any other amendment to the articles of incorporation, merger, share exchange or disposition of assets to the extent provided by the articles of incorporation, bylaws or a resolution of the board of directors.
B. Notwithstanding subsection A, the availability of appraisal rights under subdivisions A 1 through A 4 shall be limited in accordance with the following provisions:
1. Appraisal rights shall not be available for the holders of shares of any class or series of shares that is:
a. A covered security under § 18(b)(1)(A) or (B) of the federal Securities Act of 1933, as amended;
b. Traded in an organized market and has at least 2,000 shareholders and a market value of at least $ 20 million, exclusive of the value of such shares held by the corporation’s subsidiaries, senior executives, directors and beneficial shareholders owning more than 10 percent of such shares; or
c. Issued by an open end management investment company registered with the Securities and Exchange Commission under the Investment Company Act of 1940 and may be redeemed at the option of the holder at net asset value.
2. The applicability of subdivision 1 of this subsection shall be determined as of:
a. The record date fixed to determine the shareholders entitled to receive notice of, and to vote at, the meeting of shareholders to act upon the corporate action requiring appraisal rights; or
b. The day before the effective date of such corporate action if there is no meeting of shareholders.
3. Subdivision 1 of this subsection shall not be applicable and appraisal rights shall be available pursuant to subsection A for the holders of any class or series of shares who are required by the terms of the corporate action requiring appraisal rights to accept for such shares anything other than cash or shares of any class or any series of shares of any corporation, or any other proprietary interest of any other entity, that satisfies the standards set forth in subdivision 1 of this subsection at the time the corporate action becomes effective.
Table of Contents
4. Subdivision 1 of this subsection shall not be applicable and appraisal rights shall be available pursuant to subsection A for the holders of any class or series of shares where the corporate action is an interested transaction.
C. Notwithstanding any other provision of this section, the articles of incorporation as originally filed or any amendment thereto may limit or eliminate appraisal rights for any class or series of preferred shares, but any such limitation or elimination contained in an amendment to the articles of incorporation that limits or eliminates appraisal rights for any of such shares that are outstanding immediately prior to the effective date of such amendment or that the corporation is or may be required to issue or sell thereafter pursuant to any conversion, exchange or other right existing immediately before the effective date of such amendment shall not apply to any corporate action that becomes effective within one year of that date if such action would otherwise afford appraisal rights.
HISTORY: Code 1950, §§ 13-85, 13.1-75, 13.1-78; 1956, c. 428; 1968, c. 733; 1972, c. 425; 1975, c. 500; 1984, c. 613; 1985, c. 522; 1986, c. 540; 1988, c. 442; 1990, c. 229; 1992, c. 575; 1996, c. 246; 1999, c. 288; 2005, c. 765; 2007, c. 165.
Table of Contents
FINANCIAL STATEMENTS OF BANK BUILDING CORPORATION
Bank Building Corporation annual report on Form 10-KSB for the year ended December 31, 2006
Bank Building Corporation quarterly report on Form 10-QSB for the quarter ended September 30, 2007
Table of Contents
UNITED STATES
SECURITIES AND EXCHANGE COMMISSION
WASHINGTON, D.C. 20549
FORM 10-KSB
| x | ANNUAL REPORT UNDER SECTION 13 OR 15(d) OF THE SECURITIES EXCHANGE ACT OF 1934 |
For the fiscal year ended December 31, 2006
| ¨ | TRANSITION REPORT UNDER SECTION 13 OR 15(d) OF THE SECURITIES EXCHANGE ACT OF 1934 |
For the transition period from to
Commission File Number: 33-64520
BANK BUILDING CORPORATION
(Name of small business issuer in its charter)
| Virginia | 54-1714800 | |
(State or other jurisdiction of incorporation or organization) | (I.R.S. Employer Identification No.) | |
1300 Kings Mountain Road Martinsville, VA | 24112 | |
| (Address of principal executive offices) | (Zip Code) | |
Issuer’s telephone number: (276) 656-1776
Securities registered under Section 12(b) of the Exchange Act: None
Securities registered under Section 12(g) of the Exchange Act: common stock, no par value per share
Check whether the issuer (1) filed all reports required to be filed by Section 13 or 15(d) of the Exchange Act during the past 12 months (or for such shorter period that the registrant was required to file such reports), and (2) has been subject to such filing requirements for the past 90 days. Yes x No ¨
Check if there is no disclosure of delinquent filers in response to Item 405 of Regulation S-B contained in this form, and no disclosure will be contained, to the best of registrant’s knowledge, in definitive proxy or information statements incorporated by reference in Part III of this Form 10-KSB or any amendment to this Form 10-KSB. x
Indicate by check mark whether the registrant is a shell company (as defined in Rule 12b-2 of the Exchange Act). Yes ¨ No x
The issuer’s revenues for the fiscal year ended December 31, 2006 were $3,921,103.
As of March 27, 2007, there were issued and outstanding 398,244 shares of the issuer’s common stock. These shares are not believed to have any current market value.
Portions of the 2006 Annual Report to Shareholders, which is attached hereto as Exhibit 13, are incorporated by reference in Part II of this report.
Transitional Small Business Disclosure Format: Yes ¨ No x
Table of Contents
BANK BUILDING CORPORATION
2007 ANNUAL REPORT ON FORM 10-KSB
2
Table of Contents
FORWARD–LOOKING STATEMENTS
This report contains statements concerning the Corporation’s expectations, plans, objectives, future financial performance and other statements that are not historical facts. These statements may constitute “forward-looking statements” as defined by federal securities laws. In some cases, readers can identify the forward-looking statements by the use of words such as “may,” “ will,” “should,” “could,” “expect,” “plan,” “intend,” “anticipate,” “believe,” “estimate,” “predict,” “potential” or “continue” or the negative or other variations of these words, or other comparable words or phrases. These statements may address issues that involve estimates and assumptions made by management, risks and uncertainties, and actual results could differ materially from historical results or those anticipated by such statements. Factors that could have a material adverse effect on the Corporation’s operations and future prospects include, but are not limited to: desired business strategies, general economic conditions, interest rates, developments in local and national markets, and other matters, which, by their nature, are subject to significant uncertainties. These risks and uncertainties should be considered in evaluating the forward-looking statements contained herein, and readers are cautioned not to place undue reliance on such statements, which speak only as of the date of this report.
ITEM 1. DESCRIPTION OF BUSINESS.
Bank Building Corporation was incorporated under Virginia law in 1988. Bank Building Corporation is located at 1300 Kings Mountain Road, Martinsville, Virginia 24112.
The primary purpose of Bank Building Corporation (the Corporation) is to acquire and develop property for lease as bank offices to Carter Bank & Trust (the Bank). Carter Bank & Trust commenced business on December 29, 2006, with the concurrent merging of the following ten Banks (the Merger): Blue Ridge Bank, National Association, Floyd, Virginia; Central National Bank, Lynchburg, Virginia; Community National Bank, South Boston, Virginia; First National Bank, Rocky Mount, Virginia; First National Exchange Bank, Roanoke, Virginia; Mountain National Bank, Galax, Virginia; Patrick Henry National Bank, Bassett, Virginia; Patriot Bank, National Association, Fredericksburg, Virginia; Peoples National Bank, Danville, Virginia; and Shenandoah National Bank, Staunton, Virginia (collectively, the Merged Banks). The Corporation also acquires funds for site acquisition and development from banks other than the Bank.
Prior to the Merger, the primary purpose of the Corporation was to acquire and develop property for lease as bank offices to the Merged Banks. The Corporation intends to continue conducting its business in substantially the same manner as it did prior to the Merger.
The selection of sites and construction of the offices is performed by the Bank to insure the needs of the Bank are met. Should the Corporation decide to participate in the particular project, the site is titled in the name of the Corporation and all loans in connection with the site are made to the Corporation. There are, however, no commitments on the part of the Bank to present prospective office properties to the Corporation, nor are there any commitments on the part of the Corporation to accept any prospective office properties offered by the Bank.
Following construction of a bank branch, the property is leased to the Bank under a triple net operating lease. The Bank is responsible for all property taxes, insurance and maintenance costs on that office. It is anticipated that the lease payments and other costs approximate the cost which would have been experienced by the Bank had the office been developed by the Bank or leased from a third party. The lease payments cover all acquisition and loan costs and other costs associated with the site (just as though the Bank had acquired the site itself) plus a small additional fee to cover the accounting and processing costs.
In order to obtain the most desirable branch locations it is often necessary to acquire more property than will be required for an individual office. Currently, banking regulations restrict the ability of banks to acquire such property if it is not used for banking purposes. The Corporation is not subject to such restrictions and can acquire the most desirable property and either sell any excess property or develop it for subsequent sale or lease to other parties.
Regardless of the size of any given property purchased by the Corporation, the lease with the Bank includes only the portion of the property utilized for the branch. The allocation of costs between the branch site and other property is based on the relative size and market value of each segment. Any property other than that used for the branch will be developed, leased or sold by the Corporation. Any buildings or other developments on this property will be compatible with the design of the bank office and consistent with the conduct of the business of banking.
3
Table of Contents
Both interest and depreciation expenses are incurred on each office as well as other, minimal operating costs. These expenses will result in net operating losses during the initial years of each project although adequate cash flow from rental payments is expected to be available to meet all cash needs. During the initial lease term, all leases will be structured for the adjustments to the monthly lease payments to track adjustments in the payments required by the underlying mortgage. After the initial period of the lease, terms will be renegotiated. Such terms could provide for lease payments in excess of or less than payments required by the underlying mortgage and operating expenses. Additionally, the Bank may determine not to renew its lease on a particular branch. Under these circumstances, such branch could be sold or leased to another tenant. Such sale or lease could be profitable, although there can be no assurance that this will occur.
While it is anticipated that renewed leases with the Bank will produce sufficient rental payments to cover mortgage payments and other costs, there can be no assurance that this will, in fact, be accomplished. Failure to obtain renewal lease payments sufficient to cover these costs may result in a forced sale or foreclosure of the particular branch at a loss.
The Corporation does not have any paid employees or directors. All of its accounting, other professional services, record keeping and other operational needs will be met by other organizations on a fee-for-service basis. It is contemplated that such fees will be based on time expended plus reimbursable expenses. It is anticipated that such costs and expenses will be covered by the lease payments from the lease of the bank branches. At the present time, Bank Services of Virginia, Inc. provides these services. Bank Services of Virginia, Inc. is a bank service corporation owned by the Bank that currently provides various bookkeeping and related services to the Bank. Bank Services of Virginia, Inc. is a subsidiary of The Mortgage Company of Virginia, which is the wholly-owned subsidiary of Carter Bank & Trust.
ITEM 2. DESCRIPTION OF PROPERTY.
As of December 31, 2006, the Corporation owned the following offices which are leased to the Bank under triple net operating leases:
Address | ||
105 King Street, Blacksburg, VA 24060 | ||
325 Spring Street, Wytheville, VA 24382 | ||
370 Arbor Drive, Christiansburg, VA 24073 | ||
3008 Waterlick Road, Lynchburg, VA 24502 | ||
2018 Tate Springs Road, Lynchburg, VA 24501 | ||
1728 Graves Mill Road, Lynchburg, VA 24502 | ||
1002 Virginia Avenue, Clarksville, VA 23927 | ||
749 East 2nd Street, Chase City, VA 23924 | ||
222 Main Street, South Boston, VA 24592 | ||
300 Dabney Drive Ext., Henderson, NC 27536 | ||
205 South Bickett Street, Louisburg, NC 27549 | ||
823 North Main Street, Roxboro, NC 27573 | ||
302 E. Atlantic Street, South Hill, VA 23970 | ||
4251 North Roxboro Road, Durham, NC 27704 | ||
550 Blue Ridge Avenue, Bedford, VA 24523 | ||
135 Scruggs Road, Moneta, VA 24121 | ||
9440 Franklin Street, Ferrum, VA 24088 | ||
301 Carbon City Road, Morganton, NC 28655 | ||
821 4th Street Drive, SW, Hickory, NC 28602 | ||
704 Oak Street, Forest City, NC 28043 | ||
721 Blue Ridge Boulevard, Roanoke, VA 24012 | ||
3132 Electric Road, Roanoke, VA 24018 | ||
8334 Moneta Road, Bedford, VA 24523 |
4
Table of Contents
| 2728 Lee Highway South, Troutville, VA 24175 |
| 4143 Franklin Road, SW, Roanoke, VA 24014 |
| 507 Willow Street, Mt. Airy, NC 27030 |
| 345 North Bridge Street, Jonesville, NC 28642 |
| 1606 Curtis Bridge Road, Wilkesboro, NC 28697 |
| 630 Fagg Drive, Eden, NC 27288 |
| 900 Washington Street, Eden, NC 27288 |
| 100 Turner Drive, Reidsville, NC 27320 |
| 305 South Main Street, Reidsville, NC 27320 |
| 4004 West Wendover Avenue, Greensboro, NC 27407 |
| 5715 High Point Road, Greensboro, NC 27407 |
| 70 Chatham Heights Road, Fredericksburg, VA 22405 |
| 55 Worth Avenue, Stafford, VA 22554 |
| 8402 Sudley Road, Manassas, VA 20109 |
| 903 South Main Street, Danville, VA 24541 |
| 5406 U. S. Highway 29 North, Danville, VA 24527 |
| 697 Country Club Drive, Fayetteville, NC 28301 |
| 2803 Ward Boulevard, Wilson, NC 27893 |
| 123 Rowan Street, Fayetteville, NC 28301 |
| 1001 South Horner Road, Sanford, NC 27330 |
| 2100 West Arlington Boulevard, Greenville, NC 27834 |
| 75 North Mason Street, Harrisonburg, VA 22802 |
| 2782 Stuarts Draft Highway, Stuarts Draft, VA 24477 |
The Bank is responsible for all property taxes, insurance and maintenance costs on each leased office. The Corporation incurs interest and depreciation expenses related to each office as well as other, minimal operating costs.
In addition to the bank offices, as of December 31, 2006, the Corporation also owned the following properties which it leases to third parties:
Description | Location | |||
| Golden Corral Restaurant | Raleigh, NC | |||
| Westlake Corner Shopping Center | Moneta, VA | |||
| Blackstone Shopping Center | Blackstone, VA | |||
| Executive Office Park | Roanoke, VA |
As of December 31, 2006, management considered all of the Corporation’s properties to be in good condition, and maintained adequate insurance on each of these properties.
As of March 27, 2007, there were no material pending legal proceedings to which the Corporation was a party or to which the property of the Corporation was subject.
ITEM 4. SUBMISSION OF MATTERS TO A VOTE OF SECURITY HOLDERS.
Bank Building Corporation’s annual meeting was held on Thursday, December 28, 2006. A total of 262,197 shares, or 65.84% of the 398,244 outstanding shares, were voted either in person or by proxy.
5
Table of Contents
The following matters were acted on at the meeting:
Item | Votes For | Votes Against | Abstain | |||
1. Set the number of Directors to be elected at five. | 261,690 | 176 | 331 | |||
2. Election of the following directors: | ||||||
Worth Harris Carter, Jr. | 262,121 | 2,145 | ||||
Robert W. Conner | 262,121 | 2,234 | ||||
Charles E. Hall | 262,121 | 2,145 | ||||
Haller G. Prillaman | 262,121 | 2,145 | ||||
R. E. Williams | 262,121 | 2,160 | ||||
ITEM 5. MARKET FOR COMMON EQUITY AND RELATED STOCKHOLDER MATTERS.
The Corporation is authorized to issue 400,000 shares of common stock, with no par value. On February 28, 1995, the Corporation distributed 398,244 shares of its common stock to approximately 3,000 shareholders for no consideration. As of December 31, 2006, the Corporation had approximately 2,650 shareholders of record and 398,244 shares outstanding.
The Corporation is not aware of any brokerage firms making a market in the Corporation’s common stock or any securities professionals following the Corporation, and no public trading market for the stock has developed. Management believes that the consideration for any shares of stock that may have been traded in recent years has been minimal.
The Corporation has not paid dividends since its incorporation and no dividends are anticipated in the foreseeable future.
ITEM 6. MANAGEMENT’S DISCUSSION AND ANALYSIS OR PLAN OF OPERATION.
The following discussion should be read in conjunction with our Description of Business and our audited financial statements and accompanying notes included elsewhere in this report.
Overview
The primary purpose of the Corporation is to acquire and develop property for lease as bank offices to Carter Bank & Trust. As discussed in Item 1, Carter Bank & Trust commenced business on December 29, 2006 with the concurrent merging of the ten Merged Banks.
Prior to the Merger, the primary purpose of the Corporation was to acquire and develop property for lease as bank offices to the Merged Banks. The Corporation intends to continue conducting its business in substantially the same manner as it did prior to the Merger.
The selection of sites and construction of the offices is done by the Bank to insure the needs of the Bank are met. There are, however, no commitments on the part of the Bank to present prospective office properties to the Corporation nor are there any commitments on the part of the Corporation to accept any prospective office properties offered by the Bank.
The initial lease terms for a bank office are set to cover all carrying costs of the particular site plus a small amount for the accounting and record keeping costs of the Corporation. Subsequent lease terms are negotiated between the Bank and the Corporation based on the conditions in the relevant market at that time.
Regardless of the size of any given property purchased by the Corporation, the lease with the Bank includes only the portion of the property utilized for the branch. The allocation of costs between the branch site and other property is based on the relative size and
6
Table of Contents
market value of each segment. Any property other than that used for the branch will be developed, leased or sold by the Corporation. Any buildings or other developments on this property will be compatible with the design of the bank office and consistent with the conduct of the business of banking.
Critical Accounting Policies
The preparation of financial statements in conformity with generally accepted accounting principles requires management to make estimates and assumptions that affect the reported amounts of assets and liabilities at the dates of the financial statements and the reported amounts of revenues and expenses during the reporting periods. Critical accounting policies are defined as those that require management to make estimates, judgments and assumptions, giving due consideration to materiality, in certain circumstances that affect amounts reported in the financial statements, and potentially result in materially different results under different conditions and assumptions. The Corporation considers the following accounting policies to be critical policies which involve various estimation processes: accounting for the acquisition and classification of real estate assets, and accounting for the disposition and impairment of real estate assets.
Acquisition and Classification of Real Estate Assets
The majority (80%) of the Corporation’s properties are acquired from the Bank at carrying value. Each acquisition from the Bank is evaluated under SFAS No. 98, “Accounting for Leases; Sale-Leaseback Transactions Involving Real Estate; Sales-Type Leases of Real Estate; Definition of the Lease Term; Initial Direct Costs of Direct Financing Lease,” to determine whether the transfer qualifies as an accounting sale from and leaseback to the Bank. Once management determines that sale leaseback accounting is appropriate, directly owned and leased assets are classified as real estate held and leased under the operating method, or as net investment in financing leases at the inception of a lease, for financial reporting purposes. This classification is based on several criteria, including financing leases, but not limited to, estimates of the remaining economic life of the leased assets and the calculation of the present value of future minimum rents. The classification criteria are intended to indicate whether the risks and rewards of ownership are retained by the lessor or substantially transferred to the lessee.
Dispositions and Impairment of Real Estate
Gains and losses on dispositions of real estate are recognized upon sale of the underlying project in accordance with Statement of Financial Accounting Standards No. 66, “Accounting for Sales of Real Estate.” The Corporation evaluates each real estate sale transaction to determine if it qualifies for gain recognition under the full accrual method. If the transaction does not meet the criteria for the full accrual method of profit recognition based on the Corporation’s assessment, the Corporation accounts for a sale based on an appropriate deferral method determined by the nature and extent of the buyer’s investment and the Corporation’s continuing involvement.
FASB Statement No. 144 “Accounting for Impairment of Disposal of Long-Lived Assets,” requires that long-lived assets held and used by an entity be reviewed for impairment, whenever events or changes in circumstances indicate that the carrying amount of an asset may not be recoverable. This Statement also specifies criteria for reclassification and measurement for long-lived assets held for sale.
Properties
The Corporation did not acquire additional properties during 2006. As of December 31, 2006, the Corporation owned 46 offices that were leased to the Bank under triple net operating leases. The Bank is responsible for all property taxes, insurance and maintenance costs on each leased office. The Corporation incurs interest and depreciation expenses related to each office as well as other, minimal operating costs.
The Corporation also owns the Westlake Corner Shopping Center near Smith Mountain Lake. This center consists of 50,000 square feet of space on 29 acres. The anchor tenants for the center are Food Lion, Revco, and Family Dollar Store. First National Bank (one of the Merged Banks), Rocky Mount, Virginia opened an office on a 10 acre tract of this property, on June 5, 1998; this office is now a branch of Carter Bank & Trust.
The Corporation also owns Blackstone Properties L.L.C, a wholly-owned subsidiary. Blackstone Properties owns two properties: Blackstone Shopping Center, Virginia and Executive Office Park, an office complex located in Roanoke, Virginia. The shopping
7
Table of Contents
center maintains various retail tenants. Executive Office Park is an office complex consisting of six separate buildings containing approximately 54,000 square feet of space divided into 28 suites. The Corporation also owns a Golden Corral Restaurant in Raleigh, North Carolina, which it leases to a third party.
Long-term mortgages payable by the Corporation as of December 31, 2006 and 2005 consisted of the following:
| 2006 | 2005 | |||||||
| Mortgage loan secured by real estate (Lake Shopping Center) and related leases. Monthly payments are $19,403, including principal and interest at 8.25% at December 31, 2006, with the final payment due in 2012. | $ | 976,720 | $ | 1,122,386 | ||||
| Mortgage loan secured by real estate (Westlake Shopping Center) and related leases. Monthly payments are $8,418, including principal and interest at 7.00% as of December 31, 2006, with the final payment in 2011. | 413,209 | 482,638 | ||||||
| Mortgage loan secured by real estate (Blackstone Shopping Center) and related leases. Monthly payments are $18,175, including principal and interest at 8.38% as of December 31, 2006, with the final payment due in 2018. | 1,738,602 | 1,830,305 | ||||||
| Mortgage loan secured by real estate (Golden Corral Restaurant) and related lease. Monthly payments are $16,302, including principal and interest at 6.0% as of December 31, 2006, with the final payment due in 2013. | 1,147,225 | 1,269,984 | ||||||
| Mortgage loan secured by real estate (Executive Office Park) and related leases. Monthly payments are $17,444 at December 31, 2006, including principal and interest at 7.00%, with the final payment due in 2021. | 1,928,492 | 2,000,085 | ||||||
| Mortgage loans secured by real estate (branch bank facilities) and related leases. Monthly payments at December 31, 2006 are $212,379, including principal and interest, with the final payments due from 2017 to 2024. Interest rates range from 6.00% to 8.75% at December 31, 2006, and are subject to adjustments at various times. | 23,561,434 | 24,174,414 | ||||||
| 29,765,682 | 30,879,812 | |||||||
| Less current portion | (1,619,268 | ) | (3,373,848 | ) | ||||
| $ | 28,146,414 | $ | 27,505,964 | |||||
Operating Results
Net Income.The Corporation generated net income in 2006 of $225,452, or $0.57 per share, compared to net income in 2005 of $321,603, or $.81 per share, and net income in 2004 of $272,564, or $0.68 per share. The decrease of $96,151, from 2005 to 2006 is primarily due to the increase of legal and professional fees and several other operating expenses while the increase of $49,039 from 2004 to 2005 is attributable to the decrease in several operating expenses, interest expense being the largest decrease. This decrease was due to lower interest payments on variable rate mortgages. Lease income, which has historically been the Corporation’s principal source of revenue, was $3,909,676 in 2006, an increase of 2.5% from lease income in 2005 of $3,813,319. In comparison, the lease income in 2004 decreased 2% to $3,813,319 from $3,906,992 in 2004. Lease income accounted for 99.7% of total income in 2006, 98.8% in 2005 and 98.5% in 2004.
Operating Expenses. Operating expenses for 2006 were $3,549,161 compared to $3,348,284 for 2005. This increase of $200,877, or 6%, is due mainly to a increases in legal and professional fees and several other operating expenses. Repairs and depreciation decreased. In comparison, operating expenses for 2004 of $3,500,123 decreased to $3,348,284 in 2005, mainly due to the decrease in interest expense.
8
Table of Contents
Interest expense increased to $2,372,893 in 2006 from $2,253,235 in 2005, an increase of $119,658 or 5.3%. Interest expense for 2005, when compared to 2004, decreased $170,424, or 7%.
Depreciation decreased from $672,690 in 2005 to $667,713 in 2006 and increased from $663,930 in 2004 to $672,690 in 2005. The increase of $8,760 from 2004 to 2005 was the result of the capitalization of property improvements for the year.
Operating expenses, other than depreciation and interest, consist largely of amortization, real estate taxes and insurance, repairs and the cost of corporate functions, including legal and accounting fees. These expenses increased to $508,555 in 2006 from $422,359 in 2005, for a increase of $86,196 or 20.4%. The increase in professional fees were principally attributable to additional professional services rendered in connection with the review of multiple delinquent periodic reports. All other categories also increased from 2005 to 2006 with the exception of repairs which decreased slightly. In comparison, these other operating expenses rose to $422,359 in 2005 from $412,534 in 2004, for an increase of $9,825, or 2.4%. Expenses for taxes, insurance and professional fees rose from 2004 to 2005, while repair and other expenses decreased.
The effective income tax rate was 39.4% in 2006, 37.1% in 2005, and 41.5% in 2004. The changes each year were due to changes in components of income, primary tax on regular income, capital gains on sales of property and investments and the effect of these items on deferred tax.
Analysis of Financial Condition, Liquidity and Capital Resources
Liquidity describes the ability of a company to generate sufficient cash flows to meet the cash requirements of business operations. The Corporation’s main source of liquidity is lease income. Lease income was $3,909,676 in 2006, $3,813,319 in 2005, and $3,906,992 in 2004. Cash outflows consist of payments for operating expenses, interest expense, income taxes, and mortgage borrowings. The Corporation’s cash flow from operations was $609,851 for 2006 compared to $1,171,323 for 2005, and $764,469 for 2004.
As of December 31, 2006, the Corporation’s other sources of liquidity consist of $88,277 in cash and potential sales proceeds from real estate having an aggregate book value of approximately $31,656,245 at December 31, 2006. Management believes that its cash flow from operations and these other potential sources of cash will be sufficient to finance current and projected operations.
The Corporation has not paid dividends to its shareholders.
Off-Balance Sheet Arrangements
The Corporation does not have any off-balance sheet arrangements.
Recent Accounting Pronouncements
The following paragraphs outline several accounting pronouncements that will become effective in future years.
In May 2005, the FASB issued Statement No. 154, “Accounting Changes and Error Corrections – a replacement of APB Opinion No. 20 and FASB Statement No. 3.” This Statement requires retrospective application to prior period financial statements of changes in accounting principle, unless it is impracticable to determine either the period-specific effects or the cumulative effect of the change. When it is impracticable to determine the period-specific effects of an accounting change on one or more individual prior periods presented, this Statement requires that the new accounting principle be applied to the balance of assets and liabilities as of the beginning of the earliest period for which retrospective application is practicable and that a corresponding adjustment be made to the opening balance of retained earnings. This Statement improves financial reporting because its requirement to report voluntary changes in accounting principles via retrospective application, unless impracticable, enhances the consistency of the financial information between periods. This Statement is effective for accounting changes and corrections of errors made in fiscal years beginning after December 15, 2005.
9
Table of Contents
Adoption of this statement had no material impact on the Corporation’s financial condition or results of operations or cash flows.
In February 2006, the FASB issued SFAS No. 155, “Accounting for Certain Hybrid Financial Instruments – an amendment of FASB Statements No. 133 and 140.” This statement amends Statements No. 133 and 140 by: permitting fair value remeasurement for any hybrid financial instrument with an embedded derivative that otherwise would require bifurcation; clarifying which interest-only strips and principal-only strips are not subject to the requirements of Statement No. 133; establishing a requirement to evaluate interests in securitized financial assets to identify interest that are freestanding derivatives or that are hybrid financial instruments that contain an embedded derivative requiring bifurcation; clarifying that concentrations of credit risk in the form of subordination are not embedded derivatives; and amending Statement No. 140 to eliminate the prohibition on a qualifying special-purpose entity from holding a derivative financial instrument that pertains to a beneficial interest other than another derivative financial instrument. The statement is effective for fiscal years beginning after September 15, 2006. The adoption of this standard is not anticipated to have a material impact on financial condition , result of operations or cash flows.
In July 2006, the FASB issued FASB Interpretation No. 48 (FIN 48), “Accounting for Uncertainty in Income Taxes – an interpretation of FASB Statement 109,” which provides guidance on the measurement, recognition, and disclosure of tax positions taken or expected to be taken in a tax return. The interpretation also provides guidance on derecognition, classification, interest and penalties, and disclosure, FIN 48 prescribes that a tax position should only be recognized if it is more-likely-than-not that the position will be sustained upon examination by the appropriate taxing authority. A tax position that meets this threshold is measured as the largest amount of benefit that is more-likely-than-not (greater than 50 percent) realized upon ultimate settlement. The cumulative effect of applying FIN 48 is to be reported as an adjustment to the beginning balance of retained earnings in the period of adoption. FIN 48 is effective for fiscal years beginning after December 15, 2006. The Corporation is assessing the impact, if any, that adoption may have on its financial statements.
In September 2006, the FASB issued SFAS No. 157, “Fair Value Measurements,” SFAS 157 establishes a framework for measuring fair value in generally accepted accounting principles (“GAAP”), and expands disclosures about fair value measurements. While the Statement applies under other accounting prouncements that require or permit fair value measurements, it does not require any new fair valuemeasurements. SFAS No. 157 defines fair value as the price that would be received to sell an asset or paid to transfer a liability (an exit price) in an orderly transaction between market participants at the measurement date. In addition, the Statement establishes a fair value hierarchy, which prioritizes the inputs to valuation techniques used to measure fair value into three broad levels. Lastly, SFAS No. 157 requires additional disclosures for each interim and annual period separately for each major category of assets and liabilities. The Statement is effective for financial statements issued for fiscal years beginning after November 15, 2007, and interim periods within those fiscal years. Managements does not expect the adoption of this Statement to have a material impact on the Corporation’s financial statements.
In September 2006, the Securities and Exchange Commission (the “SEC”) released Staff Accounting Bulletin No. 108 (“SAB 108”), which provides detail in the quantification and correction of financial statement misstatements. SAB 108 specifies that companies should apply a combination of the “rollover” and “iron curtain” methodologies when making determinations of materiality. The rollover method quantifies a misstatement based on the amount of the error originating in the current year income statement. The iron curtain approach quantifies misstatements based on the effects of correcting the misstatement existing in the balance sheet at the end of the current year, regardless of the year(s) of origination SAB 108 instructs companies ot quanitify the misstatements under both methodologies and if either method results in the determination of a material error, then the company must adjust its financial statements to correct the error. SAB 108 also reminds preparers that a change from an accounting principle that is not generally accepted to a principle that is generally accepted is a correction of an error. The Bulletin is effective for annual financial statements covering the first fiscal year ending after November 15, 2006. Management does not expect the adoption of this Bulleting to have a material impact on the Corporation’s consolidated financial statements.
The report of the independent registered public accounting firm and audited financial statements of the Corporation and accompanying notes required by this Item are included in the Corporation’s Annual Report, which is attached hereto as Exhibit 13 and is incorporated herein by reference.
10
Table of Contents
ITEM 8. CHANGES IN AND DISAGREEMENTS WITH ACCOUNTANTS ON ACCOUNTING AND FINANCIAL DISCLOSURE.
None.
ITEM 8A. CONTROLS AND PROCEDURES.
The Corporation maintains a system of disclosure controls and procedures that is designed to ensure that material information is accumulated and communicated to management, including the Corporation’s president (who is currently the Corporation’s principal executive officer and principal financial officer), as appropriate to allow timely decisions regarding required disclosure. As required, during the preparation of this report, management, with the participation of the Corporation’s president, evaluated the effectiveness of the design and operation of the Corporation’s disclosure controls and procedures.
Based on this evaluation, the Corporation’s president concluded that the Corporation’s disclosure controls and procedures were operating effectively as of the end of the period covered by this report.
Because of the inherent limitations in all control systems, no evaluation of controls can provide absolute assurance that the Corporation’s disclosure controls and procedures will detect or uncover every situation involving the failure of persons within the Corporation to disclose material information otherwise required to be set forth in the Corporation’s periodic reports.
The Corporation’s management is also responsible for establishing and maintaining adequate internal control over financial reporting to provide reasonable assurance regarding the reliability of financial reporting and the preparation of financial statements for external purposes in accordance with generally accepted accounting principles.
There were no changes in the Corporation’s internal control over financial reporting during the fourth quarter of 2006 that materially affected, or are reasonably likely to materially affect, the Corporation’s internal control over financial reporting.
None.
ITEM 9. DIRECTORS, EXECUTIVE OFFICERS, PROMOTERS, CONTROL PERSONS, AND CORPORATE GOVERNANCE; COMPLIANCE WITH SECTION 16(a) OF THE EXCHANGE ACT.
The following information is provided as of March 29, 2007.
Directors Until Next Annual Meeting
Name (Age) | Director Since | Principal Occupation During Past Five Years | ||
| Worth Harris Carter, Jr. (69) | 1988 | Chairman of the Board and President
Worth Harris Carter, Jr. is also a director and officer of the following companies:
Chairman of the Board and President of Carter Bank & Trust since 2006; |
11
Table of Contents
Chairman of the Board and President of The
Chairman of the Board and President of Bank
Chairman of the Board and President of Coresoft, Inc.
Chairman of the Board and President of Bank
Manager of Blackstone Properties, L.L.C. since 1998.
Worth Harris Carter, Jr. was also a director and
Chairman of the Board of First National Bank since
Chairman of the Board and President of First
Chairman of the Board and President of Patrick
Chairman of the Board of Peoples National Bank
Chairman of the Board of Blue Ridge Bank since
Chairman of the Board and President of Community
Chairman of the Board and President of Central
Chairman of the Board and President of Mountain
Chairman of the Board and President of Shenandoah
Chairman of the Board and President of Patriot Bank | ||||
| Conner, Robert W. (67) | 1995 | Robert W. Conner is and has been Clerk of the Circuit Court of Halifax County for more than five years. He currently serves on the Board of Directors of Carter Bank & Trust. Prior to the Merger, he served on the Board of Directors of Community National Bank, South Boston, Virginia since 1985. He has served on the Boards of Directors of both Bank Services of Virginia and The Mortgage Company of Virginia. | ||
12
Table of Contents
| Hall, Charles E. (65) | 1995 | Charles E. Hall is and has been a Farmer for more than five years. He currently serves on the Board of Directors of Carter Bank & Trust. Prior to the Merger, he served on the Board of Directors for Blue Ridge Bank, N.A., Floyd, Virginia since 1978. He has served on the Boards of Directors of both Bank Services of Virginia and The Mortgage Company of Virginia. | ||
| Prillaman, Haller G. (73) | 1995 | Haller G. Prillaman has been President of Prillaman Brothers, Inc., Martinsville, Virginia for more than five years. Prior to the Merger, he served on the Board of Directors for Patrick Henry National Bank, Bassett, Virginia, since 1976 and Mountain National Bank, Galax, Virginia, since 1996. He has served on the Boards of Directors of both Bank Services of Virginia and The Mortgage Company of Virginia. | ||
| Williams, R. E. (72) | 1995 | R. E. Williams is retired. Previously he was President of Dry Fork Milling Company, Inc., Danville, Virginia for more than five years. He currently serves on the Board of Directors of Carter Bank and Trust. Prior to the Merger, he served as a Director of Central National Bank, Lynchburg, Virginia, since 1996 and of Patriot Bank, National Association since 1996. He has served on the Boards of Directors of both Bank Services of Virginia and The Mortgage Company of Virginia. | ||
Executive Officers
Mr. Carter is Chairman of the Board and President and is discussed above.
Jane Ann Davis (44) has served as Secretary Treasurer of the Corporation since 1995. Mrs. Davis also serves as an officer and director of both Bank Services of Virginia, Inc. and The Mortgage Company of Virginia.
There are no family relationships between any director or executive officer of the Corporation; nor is the Board of Directors aware of any involvement in legal proceedings that would be material to an evaluation of the ability or integrity of any director or executive officer.
Code of Ethics
The Corporation has not adopted a Code of Ethics for its directors, executives and employees, primarily because management of the Corporation believes and understands that our officers and directors adhere to and follow ethical standards without the necessity of a written policy. The Corporation’s Board of Directors will revisit this issue in the future to determine if adoption of a code of ethics is appropriate. In the meantime, the Corporation’s management requires and promotes honest and ethical conduct, full and fair disclosure in its reports to the SEC, and compliance with applicable governmental laws and regulations.
Section 16(a) Beneficial Ownership Reporting Compliance
Section 16(a) of the Securities Exchange Act of 1934 requires the Corporation’s directors and certain of its officers to file reports with the Securities and Exchange Commission indicating their holdings of, or transactions in, the Corporation’s equity securities. Based on a review of these reports and written representations furnished to the Corporation, the Corporation believes that, during fiscal year 2006, its directors and officers complied with all Section 16(a) filing requirements.
13
Table of Contents
Audit Committee
The entire Board of Directors functions as the Corporation’s Audit Committee. All of the Corporation’s directors, with the exception of Chairman of the Board and President Carter, are “independent” for the purposes of the NASDAQ listing standards. The Board has not adopted a written charter setting forth the responsibilities and authority of the Board in its capacity as the Audit Committee. Although Mr. Carter is not independent under the NASDAQ listing standards, the Board has determined that Mr. Carter possesses the knowledge and experience required to be considered an audit committee financial expert. The Board of Directors believes that all of the Corporation’s directors possess the financial knowledge and expertise necessary to protect the Corporation’s shareholders in performing the functions of the Audit Committee.
Shareholder Recommendations of Director Nominees
There have been no material changes to the process by which shareholders may submit director recommendations to the Board of Directors since the Corporation’s proxy statement for its 2006 annual meeting of shareholders.
ITEM 10. EXECUTIVE COMPENSATION.
The following information is provided as of December 31, 2006.
Executive Compensation
The Corporation does not have any paid employees or directors. All of its accounting, other professional services, record keeping and other operational needs will be met by other organizations on a fee-for-service basis. It is contemplated that such fees will be based on time expended plus reimbursable expenses. It is anticipated that such costs and expenses will be covered by the lease payments from the lease of the Bank branches. At the present time, Bank Services of Virginia, Inc., provides these services. Bank Services of Virginia, Inc. is a bank service corporation owned by the Bank that currently provides various bookkeeping and related services to the Bank. Bank Services of Virginia, Inc. is a subsidiary of The Mortgage Company of Virginia, which is the wholly-owned subsidiary of Carter Bank & Trust.
The Corporation does not have any equity compensation plans or employment or change in control agreements.
Mr. Worth Harris Carter, Jr., Chairman of the Board and President, serves as the principal executive, principal financial and principal accounting officer of the Corporation.
Director Compensation
The Directors receive no compensation for Board service or for committee meetings attended.
ITEM 11. SECURITY OWNERSHIP OF CERTAIN BENEFICIAL OWNERS AND MANAGEMENT AND RELATED STOCKHOLDER MATTERS.
The following table shows, as of December 31, 2006, the beneficial ownership of the Corporation’s common stock of each director, the executive officer identified above under the caption “Executive Compensation” and the Corporation’s directors and executive officers as a group. To the Corporation’s knowledge, Mr. Carter is the Corporation’s only shareholder beneficially holding more than 5% of the Corporation’s outstanding common stock. As of December 31, 2006, the Corporation’s directors and executive officers as a group, beneficially owned 52,077 shares or 13.08% of the Corporation’s outstanding common stock.
14
Table of Contents
| Amount and Nature of Beneficial Ownership (1)(2)(3) | Percent of Common Stock Outstanding | |||||
Worth Harris Carter, Jr. | 46,428 | (4) | 11.66 | % | ||
Robert W. Conner | 900 | (5) | 0.23 | % | ||
Charles E. Hall | 123 | (6) | 0.03 | % | ||
Haller G. Prillaman | 3,470 | 0.87 | % | |||
R.E. Williams | 1,156 | 0.29 | % | |||
All Directors and Executive Officer as a Group (6 persons) (7) | 52,077 | 13.08 | % |
| (1) | For purposes of this table, beneficial ownership has been determined in accordance with the provisions of Rule 13d-3 of the Securities Exchange Act of 1934 under which, in general, a person is deemed to be the beneficial owner of a security if he has or shares the power to vote or direct the voting of the security or the power to dispose of or direct the disposition of the security, or if he has the right to acquire beneficial ownership of the security within sixty days. |
| (2) | Includes shares held by affiliated corporations, spouses, minor or dependent children, relatives sharing the individual’s home, and shares held as custodian or trustee. |
| (3) | Unless otherwise indicated, the shares listed in the table represent sole voting and investment power. |
| (4) | Includes the following shares with respect to which Mr. Carter is deemed to be the beneficial owner: 4,714 shares held by Mr. Carter as custodian for his children and grandchildren, 363 shares held in Qualified Profit-Sharing Plan, and 538 shares held by C & C Realty, Inc., of which Mr. Carter is President and a 50% owner. |
| (5) | Includes 839 shares with respect to which Mr. Conner shares voting and investment power. |
| (6) | Includes 41 shares with respect to which Mr. Hall shares voting and investment power. |
| (7) | Includes share held by Jane Ann Davis, Secretary and Treasurer of the Company. |
The Corporation knows of no arrangements, including any pledge by any person of securities of the Corporation, which may at a subsequent date result in a change in control of the Corporation.
Equity Compensation Plans.No disclosure regarding equity compensation plans has been provided because the Corporation does not have any outstanding equity compensation plans or arrangements that would be covered by Item 201(d) of Regulation S-B.
ITEM 12. CERTAIN RELATIONSHIPS AND RELATED TRANSACTIONS, AND DIRECTOR INDEPENDENCE.
The information provided in Note 7 of the financial statements accompanying this report is incorporated herein by reference.
All of the Corporation’s directors, with the exception of Chairman of the Board and President Carter, are “independent” for the purposes of both board and audit committee membership under the NASDAQ listing standards.
15
Table of Contents
The following exhibits are filed as part of this Form 10-KSB:
Exhibits:
| 3.1 | Articles of Incorporation (incorporated by reference to Exhibit 3.1 to Form SB-2 filed with the SEC on June 16, 1993) | |
| 3.2 | Bylaws (incorporated by reference to Exhibit 3.2 to Form SB-2 filed with the SEC on June 16, 1993) | |
| 13 | Portion of 2006 Annual Report to Shareholders | |
| 21 | Subsidiaries (incorporated by reference to Exhibit 21 to Form 10-KSB, for the period ended December 31, 2000, filed with the SEC on May 5, 2006) | |
| 31 | Certification by principal executive officer and principal financial officer pursuant to Rule 13a-14(a) | |
| 32 | Certification of principal executive officer and principal financial officer pursuant to 18 U.S.C. § 1350 | |
ITEM 14. PRINCIPAL ACCOUNTANT FEES AND SERVICES.
The following table presents the fees for professional audit services rendered by Goodman & Company, L.L.P. for the audit of the Corporation’s annual financial statements for the years ended December 31, 2006 and December 31, 2005 and fees billed for other services rendered by Goodman & Company during those periods. All services reflected in the following fee table for 2006 and 2005 were pre-approved, respectively, in accordance with the policy of the Board of Directors.
| Year Ended December 31, | ||||||
| 2006 | 2005 | |||||
Audit fees1 | $ | 14,480 | $ | 40,190 | ||
Audit-related fees | — | — | ||||
Tax fees2 | 1,875 | 1,710 | ||||
All other fees | — | — | ||||
Total Fees | $ | 16,355 | $ | 41,900 | ||
1 | Audit fees consist of audit and review services, consents and review of documents to be filed with the SEC. The decrease in audit fees billed to the Corporation from 2005 to 2006 was principally attributable to additional professional services rendered in connection with the review during 2005 of multiple delinquent periodic reports that were subsequently filed in the second quarter of 2006. |
2 | Tax fees consist of preparation of federal and state tax returns and consultation concerning tax compliance issues. |
In its capacity as the Audit Committee, the Board of Directors considered the compatibility of the non-audit-related services performed by and fees paid to Goodman & Company in 2006 and 2005, and proposed non-audit-related services and proposed fees for 2007, and determined that such services and fees are compatible with the independence of Goodman & Company as the Corporation’s independent auditors.
Also in its capacity as the Audit Committee, the Board of Directors pre-approves all audit (including audit-related) and permitted non-audit services to be performed by the independent auditors. The Board of Directors annually approves the scope and fee estimates for the year-end audit to be performed by the Corporation’s independent auditors for the fiscal year. With respect to other permitted services, the Board of Directors pre-approves specific engagements, projects and categories of services on a fiscal year basis, subject to individual project and annual maximums.
16
Table of Contents
SIGNATURES
In accordance with Section 13 or 15(d) of the Exchange Act, the registrant caused this report to be signed on its behalf by the undersigned, thereunto duly authorized.
| BANK BUILDING CORPORATION | ||
| Date: March 29, 2007 | /s/ Worth Harris Carter, Jr. | |
| Worth Harris Carter, Jr. | ||
| Chairman of the Board and President | ||
In accordance with the Exchange Act, this report has been signed below by the following persons on behalf of the registrant and in the capacities and on the dates indicated.
Signature | Capacity | Date | ||
/s/ Worth Harris Carter, Jr. | Chairman of the Board and President | March 29, 2007 | ||
| Worth Harris Carter, Jr. | (principal executive, principal financial | |||
| and principal accounting officer) | ||||
/s/ Robert W. Conner | Director | March 29, 2007 | ||
| Robert W. Conner | ||||
/s/ Charles E. Hall | Director | March 29, 2007 | ||
| Charles E. Hall | ||||
/s/ Haller G. Prillaman | Director | March 29, 2007 | ||
| Haller G. Prillaman | ||||
/s/ R. E. Willliams | Director | March 29, 2007 | ||
| R.E. Williams | ||||
17
Table of Contents
Exhibit 13
REPORT OF INDEPENDENT AUDITORS
Board of Directors
Bank Building Corporation
We have audited the accompanying consolidated balance sheets of Bank Building Corporation and Subsidiary as of December 31, 2006 and 2005, and the related consolidated statements of income, changes in equity and cash flows for each of the three years in the period ended December 31, 2006. These financial statements are the responsibility of the Corporation’s management. Our responsibility is to express an opinion on these financial statements based on our audits.
We conducted our audits in accordance with the standards of the Public Company Accounting Oversight Board (United States). Those standards require that we plan and perform the audit to obtain reasonable assurance about whether the financial statements are free of material misstatement. An audit includes examining, on a test basis, evidence supporting the amounts and disclosures in the financial statements. An audit also includes assessing the accounting principles used and significant estimates made by management, as well as evaluating the overall financial statement presentation. We believe that our audits provide a reasonable basis for our opinion.
In our opinion, the financial statements referred to above present fairly, in all material respects, the consolidated financial position of Bank Building Corporation and Subsidiary as of December 31, 2006 and 2005, and the consolidated results of their operations and their cash flows for each of the three years in the period ended December 31, 2006, in conformity with accounting principles generally accepted in the United States of America.
| /s/ Goodman & Company, L. L. P. |
| Goodman & Company, L. L. P. |
| Danville, Virginia |
| March 27, 2007 |
19
Table of Contents
Bank Building Corporation
Consolidated Balance Sheets
December 31, 2006 and 2005
| 2006 | 2005 | |||||
Assets | ||||||
Current assets | ||||||
Cash | $ | 88,277 | $ | 110,119 | ||
Accounts receivable | 54,242 | — | ||||
Total current assets | 142,519 | 110,119 | ||||
Property – net | 31,656,245 | 32,266,395 | ||||
Other assets | 179,806 | 194,709 | ||||
| $ | 31,978,570 | $ | 32,571,223 | |||
Liabilities and Stockholders’ Equity | ||||||
Current liabilities | ||||||
Accounts payable | 1,820 | 58,048 | ||||
Accrued interest | 196,452 | 195,492 | ||||
Income taxes payable | — | 184,839 | ||||
Current portion of long-term debt | 1,619,268 | 3,373,848 | ||||
Notes payable | 565,000 | 25,000 | ||||
Total current liabilities | 2,382,540 | 3,837,227 | ||||
Long-term liabilities | ||||||
Long-term debt - net of current portion | 28,146,414 | 27,505,964 | ||||
Deferred income taxes | 62,445 | 66,313 | ||||
Total long-term liabilities | 28,208,859 | 27,572,277 | ||||
Total liabilities | 30,591,399 | 31,409,504 | ||||
Stockholders’ equity | ||||||
Common Stock, no par value, 400,000 shares authorized; 398,244 shares issued and outstanding | — | — | ||||
Retained earnings | 1,387,171 | 1,161,719 | ||||
Total stockholders’ equity | 1,387,171 | 1,161,719 | ||||
| $ | 31,978,570 | $ | 32,571,223 | |||
The accompanying notes are an integral part of these consolidated financial statements.
20
Table of Contents
Consolidated Statements of Income
Years ended December 31, | 2006 | 2005 | 2004 | ||||||
Operating Revenues | |||||||||
Lease income | $ | 3,909,676 | $ | 3,813,319 | $ | 3,906,992 | |||
Gain on sale of property | — | 46,494 | 58,847 | ||||||
Other income | 11,427 | 17 | — | ||||||
Total income | 3,921,103 | 3,859,830 | 3,965,839 | ||||||
Operating Expenses | |||||||||
Interest | 2,372,893 | 2,253,235 | 2,423,659 | ||||||
Depreciation | 667,713 | 672,690 | 663,930 | ||||||
Amortization | 16,914 | 16,914 | 16,914 | ||||||
Taxes and insurance | 92,066 | 85,828 | 84,806 | ||||||
Repairs | 124,590 | 136,332 | 157,347 | ||||||
Professional fees | 104,559 | 71,594 | 31,556 | ||||||
Other | 170,426 | 111,691 | 121,911 | ||||||
Total operating expenses | 3,549,161 | 3,348,284 | 3,500,123 | ||||||
Income before income taxes | 371,942 | 511,546 | 465,716 | ||||||
Income taxes | 146,490 | 189,943 | 193,152 | ||||||
Net income | $ | 225,452 | $ | 321,603 | $ | 272,564 | |||
Basic and diluted earnings per share | $ | 0.57 | $ | 0.81 | $ | 0.68 | |||
Weighted average shares outstanding | 398,244 | 398,244 | 398,244 | ||||||
The accompanying notes are an integral part of these consolidated financial statements.
21
Table of Contents
Consolidated Statements of Cash Flows
Years Ended December 31, | 2006 | 2005 | 2004 | |||||||||
Cash flows from operating activities | ||||||||||||
Net income | $ | 225,452 | $ | 321,603 | $ | 272,564 | ||||||
Adjustments to reconcile net income to net cash from operating activities: | ||||||||||||
Depreciation | 667,713 | 672,690 | 663,930 | |||||||||
Amortization | 16,914 | 16,914 | 16,914 | |||||||||
Gain on sale of property | — | (46,494 | ) | (58,847 | ) | |||||||
Deferred income taxes | (3,868 | ) | (12,667 | ) | (1,052 | ) | ||||||
Change in: | ||||||||||||
Accounts receivable | — | 158,035 | (158,035 | ) | ||||||||
Income taxes receivable | (54,242 | ) | — | — | ||||||||
Other assets | (2,011 | ) | 95 | (1,738 | ) | |||||||
Accounts payable | (56,228 | ) | 56,228 | (250 | ) | |||||||
Income taxes payable | (184,839 | ) | (9,365 | ) | 58,990 | |||||||
Accrued interest | 960 | 15,284 | (28,007 | ) | ||||||||
Net cash from operating activities | 609,851 | 1,172,323 | 764,469 | |||||||||
Cash flows from investing activities | ||||||||||||
Purchase of property | (57,563 | ) | (207,358 | ) | (91,348 | ) | ||||||
Proceeds from sale of property | — | 224,692 | 298,012 | |||||||||
Net cash from investing activities | (57,563 | ) | 17,334 | 206,664 | ||||||||
Cash flows from financing activities | ||||||||||||
Repayment of long-term debt | (1,114,130 | ) | (1,100,760 | ) | (993,980 | ) | ||||||
Proceeds from notes payable | 940,000 | 25,000 | — | |||||||||
Repayment of notes payable | (400,000 | ) | — | (60,000 | ) | |||||||
Net cash from financing activities | (574,130 | ) | (1,075,760 | ) | (1,053,980 | ) | ||||||
Net change in cash | (21,842 | ) | 113,897 | (82,847 | ) | |||||||
Cash at beginning of year | 110,119 | (3,778 | ) | 79,069 | ||||||||
Cash (overdraft) at end of year | $ | 88,277 | $ | 110,119 | $ | (3,778 | ) | |||||
| Supplemental disclosures of cash flow information | ||||||||||||
Cash Paid for interest | $ | 2,371,933 | $ | 2,237,952 | $ | 2,451,668 | ||||||
Cash paid for income taxes | $ | 389,439 | $ | 207,550 | $ | 145,767 | ||||||
The accompanying notes are an integral part of these consolidated financial statements.
22
Table of Contents
Consolidated Statements of Changes in Equity
Years Ended December 31, 2006, 2005 and 2004
| Capital | Paid-in Capital | Retained Earnings | Total | |||||||||
Balance - December 31, 2003 | $ | — | $ | — | $ | 567,552 | $ | 567,552 | ||||
Net Income | — | — | 272,564 | 272,564 | ||||||||
Balance - December 31, 2004 | — | — | 840,116 | 840,116 | ||||||||
Net Income | — | — | 321,603 | 321,603 | ||||||||
Balance - December 31, 2005 | $ | — | $ | — | $ | 1,161,719 | $ | 1,161,719 | ||||
Net Income | — | — | 225,452 | 225,452 | ||||||||
Balance - December 31, 2006 | $ | — | $ | — | $ | 1,387,171 | $ | 1,387,171 | ||||
The accompanying notes are an integral part of these consolidated financial statements.
23
Table of Contents
Notes to Consolidated Financial Statements
December 31, 2006, 2005, and 2004
Note 1 - ORGANIZATION AND NATURE OF BUSINESS
Bank Building Corporation (the Corporation) conducts its business from its office located in Martinsville, Virginia. The principal business activity of the Corporation is to acquire and develop property for lease as bank offices to Carter Bank & Trust. Carter Bank & Trust consists of ten banks that merged December 29, 2006. These banks were Blue Ridge Bank, National Association, Floyd, Virginia; Central National Bank, Lynchburg, Virginia; Community National Bank, South Boston, Virginia; First National Bank, Rocky Mount, Virginia; First National Exchange Bank, Roanoke, Virginia; Mountain National Bank, Galax, Virginia; Patrick Henry National Bank, Bassett, Virginia; Patriot Bank, National Association, Fredericksburg, Virginia; Peoples National Bank, Danville, Virginia; and Shenandoah National Bank, Staunton, Virginia. The Corporation also acquires funds for site acquisition and development from banks other than Carter Bank & Trust. The Corporation and its subsidiary Blackstone Properties, LLC (Blackstone) also own and lease two shopping centers, a restaurant and an office park.
The Corporation does not have any paid employees or directors. All of its accounting, other professional services, record keeping and other operational needs will be met by other organizations on a fee-for-service basis. It is contemplated that such fees will be based on time expended plus reimbursable expenses. It is anticipated that such costs and expenses will be covered by the lease payments from the lease of the bank branches. At the present time, Bank Services of Virginia, Inc. provides these services. Bank Services also currently provides various bookkeeping and related services for Carter Bank & Trust.
Note 2 - SUMMARY OF SIGNIFICANT ACCOUNTING POLICIES
Basis of Presentation and Consolidation
All intercompany transactions between the Corporation and Blackstone have been eliminated in these consolidated financial statements.
Cash and Cash Equivalents
The Corporation considers all highly liquid investments with a purchased maturity of three months or less to be cash and cash equivalents.
Leases and Other Income
The Corporation leases its properties under noncancellable operating leases. Lease income is recognized ratably over the lease term. Other income represents fees charged to tenants for maintenance, insurance, and taxes as incurred.
Accounts Receivable and Bad Debts
Receivables are charged to bad debt expense when they are determined to be uncollectible, based upon a periodic review of the accounts by management.
Other Assets
Other assets represent loan origination fees being ratably amortized over the life of the loan and are included in other assets. Accumulated amortization of loan fees amounted to $117,233 and $100,319 at December 31, 2006 and 2005, respectively.
Property
Property is stated at cost and is depreciated using the straight-line method over the estimated useful lives (40 years) of the assets.
24
Table of Contents
In accordance with FASB Statement No. 144 “Accounting for Impairment of Disposal of Long-Lived Assets” the Corporation reviews long-lived assets held and used by it for impairment whenever events or changes in circumstances indicate that the carrying amount of an asset may not be recoverable.
Estimates
The preparation of financial statements in conformity with accounting principles generally accepted in the United States of America requires management to make estimates and assumptions that affect the reported amounts of assets and liabilities and the disclosure of contingent assets and liabilities at the date of the financial statements. Such estimates also affect the reported amounts of revenues and expenses during the reporting period. Actual results could vary from these estimates.
Income Taxes
Deferred taxes are provided on the asset and liability method. Deferred tax assets are recognized for deductible temporary differences and operating loss and tax credit carryforwards, and deferred tax liabilities are recognized for taxable temporary differences. Temporary differences are the differences between the reported amounts of assets and liabilities and their tax return bases. Deferred tax assets are reduced by a valuation allowance when, in the opinion of management, it is more likely than not that some portion or all of the deferred tax assets will not be realized. Deferred tax assets and liabilities are adjusted for the effects of changes in tax laws and rates on the date of enactment. The only significant timing differences consists of loan origination fees, that are expensed, for income tax purposes, when incurred, but amortized over the life of the related loan for financial reporting purposes.
Earnings Per Share
Basic earnings per share (EPS) excludes dilution and is computed by dividing income available to common shareholders by the weighted average number of shares outstanding for the period. Diluted EPS reflects the potential dilution that could occur if securities or other contracts to issue common stock were issued, converted into common stock or resulted in the issuance of common stock that then shared in the earnings of the entity. The Corporation had no common stock equivalents during the periods ended December 31, 2006, 2005, and 2004; therefore, diluted earnings per share equals basic earnings per share.
Acquisition and Classification of Real Estate Assets
The majority (80%) of the Corporation’s properties are acquired from Carter Bank & Trust at carrying value. Each acquisition from Carter Bank & Trust is evaluated under SFAS No. 98, “Accounting for Leases; Sale-Leaseback Transactions Involving Real Estate; Sales-Type Leases of Real Estate; Definition of the Lease Term; Initial Direct Costs of Direct Financing Lease,” to determine whether the transfer qualifies as an accounting sale from and leaseback to the Participating Bank. Once Management determines that sale leaseback accounting is appropriate, directly owned and leased assets are classified as real estate held and leased under the operating method, or as net investment in at the inception of a lease, for financial reporting purposes. This classification is based on several criteria, including, but not limited to, estimates of the remaining economic life of the leased assets and the calculation of the present value of future minimum rents. The classification criteria are intended to indicate whether the risks and rewards of ownership are retained by the lessor or substantially transferred to the lessee. As Management has determined that the criteria for classification as an operating lease are met, and that the Corporation retains the risks and rewards of ownership, all of the Corporation’s leases are currently classified as operating leases.
Dispositions and Impairment of Real Estate
Gains and losses on dispositions of real estate are recognized upon sale of the underlying project in accordance with Statement of Financial Accounting Standards No. 66, “Accounting for Sales of Real Estate.” The Corporation evaluates each real estate sale transaction to determine if it qualifies for gain recognition under the full accrual method. If the transaction does not meet the criteria for the full accrual method of profit recognition based on the Corporation’s assessment, the Corporation accounts for a sale based on an appropriate deferral method determined by the nature and extent of the buyer’s investment and the Corporation’s continuing involvement. All of the Corporation’s sales are recorded under the full accrual method.
25
Table of Contents
Recent Accounting Pronouncements
In May 2005, the FASB issued Statement No. 154, “Accounting Changes and Error Corrections – a replacement of APB Opinion No. 20 and FASB Statement No. 3.” This Statement requires retrospective application to prior period financial statements of changes in accounting principle, unless it is impracticable to determine either the period-specific effects or the cumulative effect of the change. When it is impracticable to determine the period-specific effects of an accounting change on one or more individual prior periods presented, this Statement requires that the new accounting principle be applied to the balance of assets and liabilities as of the beginning of the earliest period for which retrospective application is practicable and that a corresponding adjustment be made to the opening balance of retained earnings. This Statement improves financial reporting because its requirement to report voluntary changes in accounting principles via retrospective application, unless impracticable, enhances the consistency of the financial information between periods. This Statement is effective for accounting changes and corrections of errors made in fiscal years beginning after December 15, 2005. Adoption of this statement had no material impact on the Corporation’s financial condition or results of operations or cash flows.
In February 2006, the FASB issued SFAS No. 155, “Accounting for Certain Hybrid Financial Instruments – an amendment of FASB Statements No. 133 and 140.” This statement amends Statements No. 133 and 140 by: permitting fair value remeasurement for any hybrid financial instrument with an embedded derivative that otherwise would require bifurcation; clarifying which interest-only strips and principal-only strips are not subject to the requirements of Statement No. 133; establishing a requirement to evaluate interests in securitized financial assets to identify interest that are freestanding derivatives or that are hybrid financial instruments that contain an embedded derivative requiring bifurcation; clarifying that concentrations of credit risk in the form of subordination are not embedded derivatives; and amending Statement No. 140 to eliminate the prohibition on a qualifying special-purpose entity from holding a derivative financial instrument that pertains to a beneficial interest other than another derivative financial instrument. The statement is effective for fiscal years beginning after September 15, 2006. The adoption of this standard is not anticipated to have a material impact on financial condition, result of operations or cash flows.
In July 2006, the FASB issued FASB Interpretation No. 48 (FIN 48), “Accounting for Uncertainty in Income Taxes – an interpretation of FASB Statement 109,” which provides guidance on the measurement, recognition, and disclosure of tax positions taken or expected to be taken in a tax return. The interpretation also provides guidance on derecognition, classification, interest and penalties, and disclosure, FIN 48 prescribes that a tax position should only be recognized if it is more-likely-than-not that the position will be sustained upon examination by the appropriate taxing authority. A tax position that meets this threshold is measured as the largest amount of benefit that is more-likely-than-not (greater than 50 percent) realized upon ultimate settlement. The cumulative effect of applying FIN 48 is to be reported as an adjustment to the beginning balance of retained earnings in the period of adoption. FIN 48 is effective for fiscal years beginning after December 15, 2006. The Corporation is assessing the impact, if any, that adoption may have on its financial statements.
In September 2006, the FASB issued SFAS No. 157, “Fair Value Measurements,” SFAS 157 establishes a framework for measuring fair value in generally accepted accounting principles (“GAAP”), and expands disclosures about fair value measurements. While the Statement applies under other accounting prouncements that require or permit fair value measurements, it does not require any new fair value measurements. SFAS No. 157 defines fair value as the price that would be received to sell an asset or paid to transfer a liability (an exit price) in an orderly transaction between market participants at the measurement date. In addition, the Statement establishes a fair value hierarchy, which prioritizes the inputs to valuation techniques used to measure fair value into three broad levels. Lastly, SFAS No. 157 requires additional disclosures for each interim and annual period separately for each major category of assets and liabilities. The Statement is effective for financial statements issued for fiscal years beginning after November 15, 2007, and interim periods within those fiscal years. Managements does not expect the adoption of this Statement to have a material impact on the Corporation’s financial statements.
In September 2006, the Securities and Exchange Commission (the “SEC”) released Staff Accounting Bulletin No. 108 (“SAB 108”), which provides detail in the quantification and correction of financial statement misstatements. SAB 108 specifies that companies should apply a combination of the “rollover” and “iron curtain” methodologies when making determinations of materiality. The rollover method quantifies a misstatement based on the amount of the error originating in the current year income statement. The iron curtain approach quantifies misstatements based on the effects of correcting the misstatement existing in the balance sheet at the end of the current year, regardless of the year (s) of origination. SAB 108 instructs companies to quantify the misstatement under both
26
Table of Contents
methodologies and if either method results in the determination of a material error, then the company must adjust its financial statements to correct the error. SAB 108 also reminds preparers that a change from an accounting principle that is not generally accepted to a principle that is generally accepted is a correction of an error. The Bulletin is effective for annual financial statements covering the first fiscal year ending after November 15, 2006. Management does not expect the adoption of this Bulletin to have a material impact on the Corporation’s consolidated financial statements.
NOTE 3 - PROPERTY AND EQUIPMENT
Property and equipment consists of the following at December 31:
| 2006 | 2005 | |||||||
Land | $ | 10,133,050 | $ | 10,130,519 | ||||
Buildings | 26,596,568 | 26,541,536 | ||||||
| 36,729,618 | 36,672,055 | |||||||
Less – accumulated depreciation | (5,073,373 | ) | (4,405,660 | ) | ||||
| $ | 31,656,245 | $ | 32,266,395 | |||||
NOTE 4 - LEASES
The primary purpose of the Corporation is to acquire and develop property for lease as bank offices to Carter Bank & Trust. The selection of sites and construction of the offices is performed by Carter Bank & Trust to ensure the needs of the Bank are met. There are, however, no commitments on the part of Carter Bank & Trust to present prospective office properties to the Corporation, nor are there any commitments on the part of the Corporation to accept any prospective office properties offered by Carter Bank & Trust.
At December 31, 2006, the Corporation owned 46 offices that are leased to Carter Bank and Trust under triple net operating leases. The Bank is responsible for all property taxes, insurance and maintenance costs on each leased office. The Corporation incurs both interest and depreciation expense related to each office as well as other, minimal operating costs. In addition, the Corporation and its subsidiary own several non-bank commercial properties.
The Corporation leases substantially all of its property under noncancellable long-term operating leases. Future minimum payments due under existing leases were as follows at December 31, 2006:
2007 | 3,716,304 | ||
2008 | 3,771,102 | ||
2009 | 3,774,765 | ||
2010 | 3,778,464 | ||
2011 | 3,782,201 | ||
Thereafter | 14,428,838 | ||
| $ | 33,251,674 | ||
A number of tenants leasing the Corporation’s non-bank commercial properties have leases that expire over the next five years. Most of these have renewal options that may be exercised. If this occurs, the lease payments over the next five years will be higher than the amounts listed above.
27
Table of Contents
NOTE 5 - LONG-TERM DEBT
Long-term debt consists of the following at December 31:
| 2006 | 2005 | |||||||
| Mortgage loan secured by real estate (shopping center) and related leases. Monthly payments are $19,403, including principal and interest at 8.25%, with the final payment due in 2012. | $ | 976,720 | $ | 1,122,386 | ||||
| Mortgage loan secured by real estate (shopping center) and related leases. Monthly payments are $8,418, including principal and interest at 7.00%, with the final payment in 2011. | 413,209 | 482,638 | ||||||
| Mortgage loan secured by real estate (shopping center) and related leases. Monthly payments are $18,175, including principal and interest at 8.38%, with the final payment due in 2018. | 1,738,602 | 1,830,305 | ||||||
| Mortgage loan secured by real estate and lease for a Golden Corral restaurant. Monthly payments are $16,302, including principal and interest at 6.0%, with the final payment due in 2013. | 1,147,225 | 1,269,984 | ||||||
| Mortgage loan secured by real estate (office park) and related leases. Monthly payments are $17,444, including principal and interest at 7.00%, with the final payment due in 2021. | 1,928,492 | 2,000,085 | ||||||
| Mortgage loans secured by real estate (branch bank facilities) and related leases. Monthly payments at December 31, 2006 are $212,379, including principal and interest, with the final payments due from 2017 to 2024. Interest rates range from 6.00% to 8.75% at December 31, 2006, and are subject to adjustments at various times. | 23,561,434 | 24,174,414 | ||||||
| 29,765,682 | 30,879,812 | |||||||
| Less current portion | (1,619,268 | ) | (3,373,848 | ) | ||||
| $ | 28,146,414 | $ | 27,505,964 | |||||
Maturities of long-term debt at December 31, 2006 are as follows:
2007 | 1,619,268 | ||
2008 | 1,752,639 | ||
2009 | 1,897,122 | ||
2010 | 2,053,651 | ||
2011 | 2,197,465 | ||
Thereafter | 20,245,537 | ||
| $ | 29,765,682 | ||
NOTE 6 - INCOME TAXES
The income tax expense consists of the following:
| 2006 | 2005 | 2004 | ||||||||||
Current | $ | 150,358 | $ | 202,620 | $ | 194,204 | ||||||
Deferred | (3,868 | ) | (12,677 | ) | (1,052 | ) | ||||||
| $ | 146,490 | $ | 189,943 | $ | 193,152 | |||||||
28
Table of Contents
Income tax expense differs from the amount of income tax determined by applying the U.S. federal income tax rate to pretax income due to the following:
| 2006 | 2005 | 2004 | |||||||
Tax expense computed by applying federal statutory rates to income before income taxes | $ | 125,504 | $ | 159,277 | $ | 160,928 | |||
State income taxes | 21,436 | 30,666 | 32,224 | ||||||
| $ | 146,940 | $ | 189,943 | $ | 193,152 | ||||
There were no significant deferred tax assets or liabilities at December 31, 2006 or 2005.
NOTE 7 - RELATED PARTY TRANSACTIONS
The Chairman of the Board and President of the Corporation serves in a similar capacity for Carter Bank & Trust.
At December 31, 2006 and 2005, the Corporation had outstanding mortgage loans with the Banks totaling $28,788,961 and $29,757,426, respectively. The largest aggregate amount outstanding under mortgage loans with the Bank for 2006 and 2005 was $29,757,426 and $30,724,017, respectively. The Corporation is directly obligated on these loans. No mortgage loans were obtained from the Bank in 2006; principal payments on these loans were $968,464 for 2006, and $985,132 for 2005. The Corporation also leases branch-banking locations to the Bank. Lease income received from the Bank was $2,761,592 in 2006, and $2,641,855 in 2005.
At December 31, 2006, the Corporation had accrued interest to the Bank of $196,452 and $187,773 at December 31, 2005. Total interest expense paid to the Bank was $2,275,686 for 2006, and $2,139,285 for 2005.
Information regarding the interest rates payable on these mortgage loans is contained under the caption “Properties” in Item 6 hereof and such information is incorporated herein by reference.
At December 31, 2006, the Corporation had a demand note payable to Carter Bank & Trust for $475,000 at 8% interest entered into on December 29, 2006 and a note for $90,000 payable to the Mortgage Company of Virginia’s non-qualified plan for the benefit of the President at 8% entered into on November 29, 2006. Interest paid on these loans for the year ended December 31, 2006 amounted to $839. The Corporation had a demand note payable to the President at December 31, 2005 of $25,000 at 6% interest entered into on December 19, 2005 paid in full on September 15, 2006 and a demand note payable entered into on September 15, 2006 for $300,000 at 8% interest paid in full on December 28, 2006. Interest on the two notes paid in full during 2006 was $8,014. The Corporation entered into a demand note payable to Patrick Henry National Bank (merged into Carter Bank & Trust-see Note 1) on September 29, 2006 for $75,000 at 8% interest paid in full on November 17, 2006. The interest paid on this note for the year ended December 31, 2006 was $1,183. These funds were used for operations.
NOTE 8 - FAIR VALUE OF FINANCIAL INSTRUMENTS
Statement of Financial Accounting Standards No. 107,Disclosures about Fair Values of Financial Instruments, requires the Corporation to disclose the estimated fair values of its financial assets and liabilities. The estimated fair values were determined using the following assumptions:
Cash: The carrying value of cash approximates fair value.
Notes Payable: The carrying value of the notes payable approximates fair value.
Long-term Debt: The fair value of long-term debt is estimated by discounting the anticipated cash flows using estimated market rates for similar loans available in the Corporation’s market area.
29
Table of Contents
| 2006 | 2005 | |||||||||||
| Carrying Value | Fair Value | Carrying Value | Fair Value | |||||||||
Financial assets | ||||||||||||
Cash | $ | 88,277 | $ | 88,277 | $ | $110,119 | $ | 110,119 | ||||
Financial liabilities | ||||||||||||
Notes payable | $ | 565,000 | $ | 565,000 | $ | 25,000 | $ | 25,000 | ||||
Long-term debt | 29,765,682 | 28,969,100 | 30,879,812 | 31,584,017 | ||||||||
| $ | 30,330,682 | $ | 29,534,100 | $ | 30,904,812 | $ | 31,609,017 | |||||
30
Table of Contents
Exhibit 31
CERTIFICATION
I, Worth Harris Carter, Jr., certify that:
| 1. | I have reviewed this annual report on Form 10-KSB of Bank Building Corporation; |
| 2. | Based on my knowledge, this report does not contain any untrue statement of a material fact or omit to state a material fact necessary to make the statements made, in light of the circumstances under which such statements were made, not misleading with respect to the period covered by this report; |
| 3. | Based on my knowledge, the financial statements, and other financial information included in this report, fairly present in all material respects the financial condition, results of operations and cash flows of the small business issuer as of, and for, the periods presented in this report; |
| 4. | I am responsible for establishing and maintaining disclosure controls and procedures (as defined in Exchange Act Rules 13a-15(e) and 15d-15(e)) for the small business issuer and have: |
| (a) | Designed such disclosure controls and procedures, or caused such disclosure controls and procedures to be designed under my supervision, to ensure that material information relating to the small business issuer, including its consolidated subsidiaries, is made known to me by others within those entities, particularly during the period in which this report is being prepared; |
| (b) | Evaluated the effectiveness of the small business issuer’s disclosure controls and procedures and presented in this report my conclusions about the effectiveness of the disclosure controls and procedures, as of the end of the period covered by this report based on such evaluation; and |
| (c) | Disclosed in this report any change in the small business issuer’s internal control over financial reporting that occurred during the small business issuer’s most recent fiscal quarter (the small business issuer’s fourth fiscal quarter in the case of an annual report) that has materially affected, or is reasonably likely to materially affect, the small business issuer’s internal control over financial reporting; and |
| 5. | I have disclosed, based on my most recent evaluation of internal control over financial reporting, to the small business issuer’s auditors and the audit committee of the small business issuer’s board of directors (or persons performing the equivalent functions): |
| (a) | All significant deficiencies and material weaknesses in the design or operation of internal control over financial reporting which are reasonably likely to adversely affect the small business issuer’s ability to record, process, summarize and report financial information; and |
| (b) | Any fraud, whether or not material, that involves management or other employees who have a significant role in the small business issuer’s internal control over financial reporting. |
| Date: March 29, 2007 | /s/ Worth Harris Carter, Jr. | |
| Worth Harris Carter, Jr. | ||
| Chairman of the Board and President | ||
| (principal executive, principal financial and principal accounting officer) |
31
Table of Contents
EXHIBIT 32
Certification Pursuant to § 906 of the
Sarbanes-Oxley Act of 2002 (18 U.S.C.§ 1350)
The undersigned, as the Chairman of the Board and President of Bank Building Corporation, certifies that to the best of his knowledge and belief the Annual Report on Form 10-KSB for the period ended December 31, 2006, which accompanies this certification, fully complies with the requirements of Section 13(a) or 15(d), as applicable, of the Securities Exchange Act of 1934, and the information contained in the periodic report fairly presents, in all material respects, the financial condition and results of operations of Bank Building Corporation at the dates and for the periods indicated. The foregoing certification is made pursuant to § 906 of the Sarbanes-Oxley Act of 2002 (18 U.S.C. § 1350) and shall not be relied upon for any other purpose. The undersigned expressly disclaims any obligation to update the foregoing certification except as required by law.
| Date: March 29, 2007 | /s/ Worth Harris Carter, Jr. | |
| Worth Harris Carter, Jr. | ||
| Chairman of the Board and President | ||
| (principal executive, principal financial,and principal accounting officer) |
32
Table of Contents
UNITED STATES
SECURITIES AND EXCHANGE COMMISSION
Washington, D.C. 20549
FORM 10-QSB
| x | QUARTERLY REPORT UNDER SECTION 13 OR 15(d) OF THE SECURITIES EXCHANGE ACT OF 1934 |
For the quarterly period ended September 30, 2007
| ¨ | TRANSITION REPORT UNDER SECTION 13 OR 15(d) OF THE EXCHANGE ACT |
For the transition period from to
Commission file number 33-64520
BANK BUILDING CORPORATION
(Exact name of small business issuer as specified in its charter)
| Virginia | 54-1714800 | |
(State or other jurisdiction of incorporation or organization) | (IRS Employer Identification No.) |
1300 Kings Mountain Road, Martinsville, Virginia 24112
(Address of principal executive offices)
(276) 656-1776
(Issuer’s telephone number)
(Former name, former address and former fiscal year, if changed since last report)
Check whether the issuer (1) filed all reports required to be filed by Section 13 or 15(d) of the Exchange Act during the past 12 months (or for such shorter period that the registrant was required to file such reports), and (2) has been subject to such filing requirements for the past 90 days. Yes x No ¨
Indicate by check mark whether the registrant is a shell company (as defined in Rule 12b-2 of the Exchange Act). Yes ¨ No x
There are 398,244 shares of the issuer’s common stock outstanding as of November 13, 2007.
Transitional Small Business Disclosure Format (Check one): Yes ¨ No x
Table of Contents
2
Table of Contents
Part I - Financial Information
Item 1 - Financial Statements.
Consolidated Statements of Financial Condition
| September 30 2007 | December 31 2006 | |||||
| (Unaudited) | ||||||
| Assets | ||||||
Current assets | ||||||
Cash | $ | 104,044 | $ | 88,277 | ||
Accounts receivable | — | 54,242 | ||||
Property – net | 31,378,182 | 31,656,245 | ||||
Income taxes receivable | 14,167 | — | ||||
Other assets | 190,175 | 179,806 | ||||
Total assets | 31,686,568 | 31,978,570 | ||||
Liabilities and Stockholders’ Equity | ||||||
Current liabilities | ||||||
Accounts payable | — | 1,820 | ||||
Accrued interest | 237,741 | 196,452 | ||||
Current portion of long-term debt | 1,733,290 | 1,619,268 | ||||
Notes payable | 907,000 | 565,000 | ||||
Total current liabilities | 2,878,030 | 2,382,540 | ||||
Long-term liabilities | ||||||
Long-term debt—net of current portion | 27,161,133 | 28,146,414 | ||||
Deferred income taxes | 62,445 | 62,445 | ||||
Total long-term liabilities | 27,223,578 | 28,208,859 | ||||
Total liabilities | 30,101,608 | 30,591,399 | ||||
| Stockholders’ equity | ||||||
Common Stock, no par value, 400,000 shares authorized; 398,244 shares issued and outstanding | ||||||
Retained earnings | 1,584,960 | 1,387,171 | ||||
Total stockholders’ equity | 1,584,960 | 1,387,171 | ||||
Total liabilities and stockholders’ equity | $ | 31,686,568 | $ | 31,978,570 | ||
The accompanying notes are an integral part of these consolidated financial statements.
3
Table of Contents
Consolidated Statements of Income
(Unaudited)
| Nine Months Ended September 30 | Three Months Ended September 30 | |||||||||||
| 2007 | 2006 | 2007 | 2006 | |||||||||
| (Unaudited) | (Unaudited) | |||||||||||
Income | ||||||||||||
Lease income | $ | 3,022,218 | $ | 2,930,620 | $ | 1,007,967 | $ | 993,531 | ||||
Gain on sale of property | — | — | — | — | ||||||||
Total income | 3,022,218 | 2,930,620 | 1,007,967 | 993,531 | ||||||||
Operating Expenses | ||||||||||||
Interest | 1,852,046 | 1,779,395 | 615,097 | 592,843 | ||||||||
Depreciation | 500,784 | 504,518 | 166,928 | 168,173 | ||||||||
Amortization | 12,685 | — | 4,228 | — | ||||||||
Taxes and insurance | 18,494 | 30,157 | — | 30,157 | ||||||||
Repairs | 164,719 | 137,772 | 35,016 | 36,226 | ||||||||
Professional fees | 65,288 | 42,849 | 1,980 | 8,768 | ||||||||
Other | 108,522 | 94,336 | 31,303 | 1,047 | ||||||||
Total operating expenses | 2,722,538 | 2,589,027 | 854,553 | 837,214 | ||||||||
Income before income taxes | 299,680 | 341,593 | 153,414 | 156,317 | ||||||||
Income taxes | 101,891 | 116,142 | 52,161 | 50,938 | ||||||||
Net income | $ | 197,789 | $ | 225,451 | 101,253 | $ | 105,379 | |||||
Retained earnings, beginning of period | 1,387,171 | 1,161,719 | — | — | ||||||||
Retained earnings, end of period | 1,584,960 | 1,387,170 | 101,253 | $ | 105,379 | |||||||
Basic and diluted earnings per share | $ | 0.50 | $ | 0.57 | $ | 0.25 | $ | 0.26 | ||||
The accompanying notes are an integral part of these consolidated financial statements.
4
Table of Contents
Consolidated Statements of Cash Flows
| Nine Months ended September 30, | ||||||||
| 2007 | 2006 | |||||||
| (Unaudited) | ||||||||
Cash flows from operating activities | ||||||||
Net Income | $ | 197,789 | $ | 225,451 | ||||
Adjustments to reconcile to net cash from operating activities: | ||||||||
Depreciation | 500,784 | 504,518 | ||||||
Change in: | ||||||||
Accounts Receivable | 54,242 | — | ||||||
Income taxes receivable | (14,167 | ) | — | |||||
Other assets | (10,369 | ) | (90,304 | ) | ||||
Accounts payable | (1,820 | ) | (27,328 | ) | ||||
Accrued interest | 41,289 | 2,194 | ||||||
Income taxes payable | — | (171,515 | ) | |||||
Net cash from operating activities | 767,748 | 443,016 | ||||||
Cash flows from investing activities | ||||||||
Purchase of property | (222,722 | ) | (1,892 | ) | ||||
Net cash from investing activities | (222,722 | ) | (1,892 | ) | ||||
Cash flows from financing activities | ||||||||
Repayment of long-term debt | (871,259 | ) | (828,947 | ) | ||||
Proceeds from notes payable | 342,000 | 350,000 | ||||||
Net cash from financing activities | (529,259 | ) | (478,947 | ) | ||||
Net change in cash | 15,767 | (37,823 | ) | |||||
Cash—beginning of period | 88,277 | 110,119 | ||||||
Cash—end of period | $ | 104,044 | $ | 72,296 | ||||
Supplemental disclosures of cash flow information | ||||||||
Cash paid for interest | $ | 1,810,758 | $ | 1,777,201 | ||||
Cash paid for income taxes | $ | 61,816 | $ | 300,253 | ||||
The accompanying notes are an integral part of these consolidated financial statements.
5
Table of Contents
Notes to Consolidated Financial Statements
1. Presentation of Statements
In the opinion of management, the accompanying unaudited consolidated financial statements contain all adjustments (all of which were normal recurring accruals) considered necessary for a fair presentation of financial position, results of operations and cash flows for the interim periods.
The accompanying financial statements include the Corporation’s wholly-owned subsidiary, Blackstone Properties, LLC. All intercompany transactions between the Corporation and Blackstone Properties have been eliminated in these statements. Blackstone Properties owns a shopping center in southside Virginia and an office park in Roanoke, Virginia, and leases space to a number of retail tenants.
The results of operations for the interim period ended September 30, 2007 are not necessarily indicative of the results which may be expected for the full year ending December 31, 2007. These unaudited financial statements should be read in conjunction with the financial statements and footnotes thereto and accounting policies included in the Corporation’s 2006 Form 10-KSB filed with the Securities and Exchange Commission (SEC).
The preparation of financial statements in conformity with generally accepted accounting principles requires management to make estimates and assumptions that affect the reported amounts of assets and liabilities and income and expenses during the reporting period. Actual results could differ from those estimates.
Item 2 - Management’s Discussion and Analysis or Plan of Operation.
This report contains statements concerning the Corporation’s expectations, plans, objectives, future financial performance and other statements that are not historical facts. These statements may constitute “forward-looking statements” as defined by federal securities laws. In some cases, readers can identify the forward-looking statements by the use of words such as “may,” “ will,” “should,” “could,” “expect,” “plan,” “intend,” “anticipate,” “believe,” “estimate,” “predict,” “potential” or “continue” or the negative or other variations of these words, or other comparable words or phrases. These statements may address issues that involve estimates and assumptions made by management, risks and uncertainties, and actual results could differ materially from historical results or those anticipated by such statements. Factors that could have a material adverse effect on the Corporation’s operations and future prospects include, but are not limited to: desired business strategies, general economic conditions, interest rates, developments in local and national markets, and other matters, which, by their nature, are subject to significant uncertainties. These risks and uncertainties should be considered in evaluating the forward-looking statements contained herein, and readers are cautioned not to place undue reliance on such statements, which speak only as of the date of this report.
General
The primary purpose of Bank Building Corporation (the Corporation) is to acquire and develop property for lease as bank offices to Carter Bank & Trust (the Bank). Carter Bank & Trust commenced business on December 29, 2006, with the concurrent merging of the following ten Banks (the Merger): Blue Ridge Bank, National Association, Floyd, Virginia; Central National Bank, Lynchburg, Virginia; Community National Bank, South Boston, Virginia; First National Bank, Rocky Mount, Virginia; First National Exchange Bank, Roanoke, Virginia; Mountain National Bank, Galax, Virginia; Patrick Henry National Bank, Bassett, Virginia; Patriot Bank, National Association, Fredericksburg, Virginia; Peoples National Bank, Danville, Virginia; and Shenandoah National Bank, Staunton, Virginia (collectively, the Merged Banks). The Corporation also acquires funds for site acquisition and development from banks other than the Bank.
6
Table of Contents
Prior to the Merger, the primary purpose of the Corporation was to acquire and develop property for lease as bank offices to the Merged Banks. The Corporation intends to continue conducting its business in substantially the same manner as it did prior to the Merger.
The selection of sites and construction of the offices is performed by the Bank to insure the needs of the Bank are met. Should the Corporation decide to participate in the particular project, the site is titled in the name of the Corporation and all loans in connection with the site are made to the Corporation. There are, however, no commitments on the part of the Bank to present prospective office properties to the Corporation, nor are there any commitments on the part of the Corporation to accept any prospective office properties offered by the Bank.
Following construction of a bank branch, the property is leased to the Bank under a triple net operating lease. The Bank is responsible for all property taxes, insurance and maintenance costs on that office. It is anticipated that the lease payments and other costs approximate the cost which would have been experienced by the Bank had the office been developed by the Bank or leased from a third party. The lease payments cover all acquisition and loan costs and other costs associated with the site (just as though the Bank had acquired the site itself) plus a small additional fee to cover the accounting and processing costs.
In order to obtain the most desirable branch locations it is often necessary to acquire more property than will be required for an individual office. Currently, banking regulations restrict the ability of banks to acquire such property if it is not used for banking purposes. The Corporation is not subject to such restrictions and can acquire the most desirable property and either sell any excess property or develop it for subsequent sale or lease to other parties.
Regardless of the size of any given property purchased by the Corporation, the lease with the Bank includes only the portion of the property utilized for the branch. The allocation of costs between the branch site and other property is based on the relative size and market value of each segment. Any property other than that used for the branch will be developed, leased or sold by the Corporation. Any buildings or other developments on this property will be compatible with the design of the bank office and consistent with the conduct of the business of banking.
Both interest and depreciation expenses are incurred on each office as well as other, minimal operating costs. These expenses will result in net operating losses during the initial years of each project although adequate cash flow from rental payments is expected to be available to meet all cash needs. During the initial lease term, all leases will be structured for the adjustments to the monthly lease payments to track adjustments in the payments required by the underlying mortgage. After the initial period of the lease, terms will be renegotiated. Such terms could provide for lease payments in excess of or less than payments required by the underlying mortgage and operating expenses. Additionally, the Bank may determine not to renew its lease on a particular branch. Under these circumstances, such branch could be sold or leased to another tenant. Such sale or lease could be profitable, although there can be no assurance that this will occur.
While it is anticipated that renewed leases with the Bank will produce sufficient rental payments to cover mortgage payments and other costs, there can be no assurance that this will, in fact, be accomplished. Failure to obtain renewal lease payments sufficient to cover these costs may result in a forced sale or foreclosure of the particular branch at a loss.
The Corporation does not have any paid employees or directors. All of its accounting, other professional services, record keeping and other operational needs will be met by other organizations on a fee-for-service basis. It is contemplated that such fees will be based on time expended plus reimbursable expenses. It is anticipated that such costs and expenses will be covered by the lease payments from the lease of the bank branches. At the present time, Bank Services of Virginia, Inc. provides these services. Bank Services of Virginia, Inc. is a bank service corporation owned by the Bank that currently provides various bookkeeping and related services to the Bank. Bank Services of Virginia, Inc. is a subsidiary of The Mortgage Company of Virginia, which is the wholly-owned subsidiary of Carter Bank & Trust.
Critical Accounting Policies
As of September 30, 2007, there have been no significant changes with regard to the application of critical accounting policies and estimates disclosed in “Management’s Discussion and Analysis” in the Corporation’s annual
7
Table of Contents
report on Form 10-KSB for the fiscal year ended December 31, 2006. The policies disclosed included: Accounting for the Acquisition and Classification of Real Estate Assets and Accounting for Dispositions and Impairment of Real Estate.
Properties
As of September 30, 2007, the Corporation owned 46 offices that are leased to the Bank under triple net operating leases. The Bank is responsible for all property taxes, insurance and maintenance costs on each leased office. The Corporation incurs interest and depreciation expenses related to each office as well as other, minimal operating costs.
The Corporation also owns the Westlake Corner Shopping Center near Smith Mountain Lake. This center consists of 50,000 square feet of space on 29 acres. The anchor tenants for the center are Food Lion, Revco, and Family Dollar Store. First National Bank, Rocky Mount (one of the merged banks), Virginia opened an office on a portion of this property on June 5, 1998; this office is now a branch of Carter Bank & Trust.
The Corporation also owns Blackstone Properties, LLC, a wholly owned subsidiary. Blackstone Properties owns two properties: a shopping center in southside Virginia and Executive Office Park, an office complex located in Roanoke, Virginia. The shopping center maintains various retail tenants. Executive Office Park is an office complex consisting of six separate buildings containing approximately 54,000 square feet of space divided into 28 suites. The Corporation also owns a Golden Corral Restaurant in Raleigh, North Carolina, which is leased to a third party.
Operating Results
Net Income.For the first nine months of 2007, the Corporation generated net income of $197,789 compared to $225,451 for the same period of the previous year, for a decrease of $27,662 or 12%. The decrease in net income is primarily attributable to the increase in all operating expenses with the exception of taxes and insurance and depreciation. The increase in the repair expense is mainly due to work done on the shopping centers and Executive Park Office. Lease income was 100% of total income for the first nine months of 2007 and 2006. Lease income has historically been the Corporation’s principal source of revenue.
Operating Expenses. Operating expenses for the first nine months of 2007 were $2,722,538 as compared to $2,589,027 for the same period of 2006. This increase of $133,511 or 5%, is due to increases in all categories with the exception of depreciation and taxes and insurance which decreased. Depreciation and interest expense have historically been the Corporation’s principal operating expenses.
Interest expense increased to $1,852,046 for the first nine months of 2007 from $1,779,395 in the same period of 2006, for an increase of $72,651 or 4%. The increase in interest expense was due to an increase in interest rates under certain variable rate mortgages which repriced in the first quarter of 2007 and notes payable issued to the Mortgage Company of Virginia’s non-qualified plan for the benefit of the President and to C & C Realty.
Depreciation expense decreased slightly to $500,784 in the first nine months of 2007 from $504,518 in the same period of 2006, for a decrease of $3,734 or less than 1%.
Other operating expenses increased to $357,023 for the first nine months of 2007 from $305,114 in the same period of 2006, for an increase of $51,909 or 17%. All categories of the other operating expenses increased, with the exception of the category of taxes and insurance which decreased . Other expense consists largely of operational utilities and management fees for the shopping center.
Financial Condition, Liquidity and Capital Resources
Liquidity describes the ability of a company to generate sufficient cash flows to meet the cash requirements of business operations. The Corporation’s main source of liquidity is lease income. Cash outflows consist of payments for operating expenses, interest expense, income taxes, and repayment of mortgage borrowings. The Corporation’s cash flow from operations was $767,748 for the first nine months of 2007 compared to $443,016 for the same period of 2006.
8
Table of Contents
As of September 30, 2007, the Corporation’s main source of liquidity consisted of $104,044 cash. In addition, the Corporation owns real estate having an aggregate book value of approximately $31,378,182. Management believes that its cash flow from operations and these other potential sources of cash will be sufficient to finance current and projected operations.
The Corporation has not paid dividends to its shareholders.
Off-Balance Sheet Arrangements
The Corporation does not have any off-balance sheet arrangements.
Recent Accounting Pronouncements
In February 2006, The FASB issued SFAS No. 155, “Accounting for Certain Hybrid Financial Instruments – an amendment of FASB Statements No. 133 and 140.” This statement amends Statements No. 133 and 140 by: permitting fair value re-measurement for any hybrid financial instrument with an embedded derivative that otherwise would require bifurcation; clarifying which interest-only strips and principal-only strips are not subject to the requirements of Statement No. 133; establishing a requirement to evaluate interests in securitized financial assets to identify interest that are freestanding derivatives or that are hybrid financial instruments that contain an embedded derivative requiring bifurcation; clarifying that concentrations of credit risk in the form of subordination are not embedded derivatives; and amending Statement No. 140 to eliminate the prohibition on a qualifying special-purpose entity from holding a derivative financial instrument that pertains to a beneficial interest other than another derivative financial instrument. The statement is effective for fiscal years beginning after September 15, 2006. The adoption of this standard is not anticipated to have a material impact on financial condition, result of operations or cash flows.
In July 2006, the FASB issued FASB Interpretation No. 48 (FIN 48), “Accounting for Uncertainty in Income Taxes—an interpretation of FASB Statement 109,” which provides guidance on the measurement, recognition, and disclosure of tax positions taken or expected to be taken in a tax return. The interpretation also provides guidance on de-recognition, classification, interest and penalties, and disclosure, FIN 48 prescribes that a tax position should only be recognized if it is more-likely-than-not that the position will be sustained upon examination by the appropriate taxing authority. A tax position that meets this threshold is measured as the largest amount of benefit that is more likely than not (greater than 50 percent) realized upon ultimate settlement. The cumulative effect of applying FIN 48 is to be reported as an adjustment to the beginning balance of retained earnings in the period of adoption. FIN 48 is effective for fiscal years beginning after December 15, 2007. The Corporation is assessing the impact, if any, that adoption may have on its financial statements.
In September 2006, the FASB issued SFAS No. 157, “Fair Value Measurements,” SFAS 157 establishes a framework for measuring fair value in generally accepted accounting principles (“GAAP”), and expands disclosures about fair value measurements. While the Statement applies under other accounting pronouncements that require or permit fair value measurements, it does not require any new fair value measurements. SFAS No. 157 defines fair value as the price that would be received to sell an asset or paid to transfer a liability (an exit price) in an orderly transaction between market participants at the measurement date. In addition, the Statement establishes a fair value hierarchy, which prioritizes the inputs to valuation techniques used to measure fair value into three broad levels. Lastly, SFAS No. 157 requires additional disclosures for each interim and annual period separately for each major category of assets and liabilities. The Statement is effective for financial statements issued for fiscal years beginning after November 15, 2007, and interim periods within those fiscal years. Management does not expect the adoption of this Statement to have a material impact on the Corporation’s financial statements.
In September 2006, the Securities and Exchange Commission (the “SEC”) released Staff Accounting Bulletin No. 108 (“SAB 108”), which provides detail in the quantification and correction of financial statement misstatements. SAB 108 specifies that companies should apply a combination of the “rollover” and “iron curtain”
9
Table of Contents
methodologies when making determinations of materiality. The rollover method quantifies a misstatement based on the amount of the error originating in the current year income statement. The iron curtain approach quantifies misstatements based on the effects of correcting the misstatement existing in the balance sheet at the end of the current year, regardless of the year(s) of origination. SAB 108 instructs companies to quantify the misstatement under both methodologies and if either method results in the determination of a material error, then the Bank must adjust its financial statements to correct the error. SAB 108 also reminds preparers that a change from an accounting principle that is not generally accepted to a principle that is generally accepted is a correction of an error. The Bulletin is effective for annual financial statements covering the first fiscal year ending after November 15, 2006. Management does not expect the adoption of this Bulletin to have a material impact on the Corporation’s consolidated financial statements.
Item 3 - Controls and Procedures.
The Corporation maintains a system of disclosure controls and procedures that is designed to ensure that material information is accumulated and communicated to management, including the Corporation’s president and secretary and treasurer (who are currently the Corporation’s principal executive officer and principal financial officer, respectively), as appropriate to allow timely decisions regarding required disclosure. As required, during the preparation of this report, management, with the participation of the Corporation’s president and secretary and treasurer, evaluated the effectiveness of the design and operation of the Corporation’s disclosure controls and procedures.
Based on this evaluation, the Corporation’s president and secretary and treasurer concluded that the Corporation’s disclosure controls and procedures were operating effectively as of the end of the period covered by this report.
Because of the inherent limitations in all control systems, no evaluation of controls can provide absolute assurance that the Corporation’s disclosure controls and procedures will detect or uncover every situation involving the failure of persons within the Corporation to disclose material information otherwise required to be set forth in the Corporation’s periodic reports.
The Corporation’s management is also responsible for establishing and maintaining adequate internal control over financial reporting to provide reasonable assurance regarding the reliability of financial reporting and the preparation of financial statements for external purposes in accordance with generally accepted accounting principles.
There were no changes in the Corporation’s internal control over financial reporting during the second quarter of 2007 that materially affected, or are reasonably likely to materially affect, the Corporation’s internal control over financial reporting.
There are no material pending legal proceedings to which the Corporation is a party or to which any of the Corporation’s property is subject.
Item 2 - Unregistered Sales of Equity Securities and Use of Proceeds.
The Corporation did not sell or repurchase any of its equity securities during the period covered by this report.
10
Table of Contents
Item 3 - Defaults Upon Senior Securities.
There have been no defaults on any securities.
Item 4 - Submission of Matters to a Vote of Security Holders.
There were no matters presented to a vote of security holders during the period covered by this report.
None.
Exhibits.
| 3.1 | Articles of Incorporation (incorporated by reference to Exhibit 3.1 to Form SB-2 filed with the SEC on June 16, 1993) | |
| 3.2 | Bylaws (incorporated by reference to Exhibit 3.2 to Form SB-2 filed with the SEC on June 16, 1993) | |
| 31.1 | Certification by principal executive officer pursuant to Rule 13a-14(a) | |
| 31.2 | Certification by principal financial officer pursuant to Rule 13a-14(a) | |
| 32 | Certification of principal executive officer and principal financial officer pursuant to 18 U.S.C. § 1350 | |
11
Table of Contents
SIGNATURES
In accordance with the requirements of the Exchange Act, the registrant caused this report to be signed on its behalf by the undersigned, thereunto duly authorized.
| BANK BUILDING CORPORATION | ||||
| DATE: November 13, 2007 | BY: | /s/ Worth Harris Carter, Jr. | ||
| Worth Harris Carter, Jr. | ||||
| Chairman of the Board and President | ||||
| (principal executive officer) | ||||
| DATE: November 13, 2007 | BY: | /s/ Jane Ann Davis | ||
| Jane Ann Davis | ||||
| Secretary and Treasurer | ||||
| (principal financial and accounting officer) | ||||
12
Table of Contents
Exhibit 31.1
CERTIFICATION
I, Worth Harris Carter, Jr., certify that:
| 1. | I have reviewed this quarterly report on Form 10-QSB of Bank Building Corporation; |
| 2. | Based on my knowledge, this report does not contain any untrue statement of a material fact or omit to state a material fact necessary to make the statements made, in light of the circumstances under which such statements were made, not misleading with respect to the period covered by this report; |
| 3. | Based on my knowledge, the financial statements, and other financial information included in this report, fairly present in all material respects the financial condition, results of operations and cash flows of the small business issuer as of, and for, the periods presented in this report; |
| 4. | The small business issuer’s other certifying officer and I are responsible for establishing and maintaining disclosure controls and procedures (as defined in Exchange Act Rules 13a-15(e) and 15d-15(e)) for the small business issuer and have: |
| (a) | Designed such disclosure controls and procedures, or caused such disclosure controls and procedures to be designed under our supervision, to ensure that material information relating to the small business issuer, including its consolidated subsidiaries, is made known to us by others within those entities, particularly during the period in which this report is being prepared; |
| (b) | Evaluated the effectiveness of the small business issuer’s disclosure controls and procedures and presented in this report our conclusions about the effectiveness of the disclosure controls and procedures, as of the end of the period covered by this report based on such evaluation; and |
| (c) | Disclosed in this report any change in the small business issuer’s internal control over financial reporting that occurred during the small business issuer’s most recent fiscal quarter (the small business issuer’s fourth fiscal quarter in the case of an annual report) that has materially affected, or is reasonably likely to materially affect, the small business issuer’s internal control over financial reporting; and |
| 5. | The small business issuer’s other certifying officer and I have disclosed, based on our most recent evaluation of internal control over financial reporting, to the small business issuer’s auditors and the audit committee of the small business issuer’s board of directors (or persons performing the equivalent functions): |
| (a) | All significant deficiencies and material weaknesses in the design or operation of internal control over financial reporting which are reasonably likely to adversely affect the small business issuer’s ability to record, process, summarize and report financial information; and |
| (b) | Any fraud, whether or not material, that involves management or other employees who have a significant role in the small business issuer’s internal control over financial reporting. |
| DATE: November 13, 2007 | /s/ Worth Harris Carter, Jr. | |
| Worth Harris Carter, Jr. | ||
| Chairman of the Board and President | ||
| (principal executive officer) |
Table of Contents
Exhibit 31.2
CERTIFICATION
I, Jane Ann Davis, certify that:
| 1. | I have reviewed this quarterly report on Form 10-QSB of Bank Building Corporation; |
| 2. | Based on my knowledge, this report does not contain any untrue statement of a material fact or omit to state a material fact necessary to make the statements made, in light of the circumstances under which such statements were made, not misleading with respect to the period covered by this report; |
| 3. | Based on my knowledge, the financial statements, and other financial information included in this report, fairly present in all material respects the financial condition, results of operations and cash flows of the small business issuer as of, and for, the periods presented in this report; |
| 4. | The small business issuer’s other certifying officer and I am responsible for establishing and maintaining disclosure controls and procedures (as defined in Exchange Act Rules 13a-15(e) and 15d-15(e)) for the small business issuer and have: |
| (a) | Designed such disclosure controls and procedures, or caused such disclosure controls and procedures to be designed under our supervision, to ensure that material information relating to the small business issuer, including its consolidated subsidiaries, is made known to us by others within those entities, particularly during the period in which this report is being prepared; |
| (b) | Evaluated the effectiveness of the small business issuer’s disclosure controls and procedures and presented in this report our conclusions about the effectiveness of the disclosure controls and procedures, as of the end of the period covered by this report based on such evaluation; and |
| (c) | Disclosed in this report any change in the small business issuer’s internal control over financial reporting that occurred during the small business issuer’s most recent fiscal quarter (the small business issuer’s fourth fiscal quarter in the case of an annual report) that has materially affected, or is reasonably likely to materially affect, the small business issuer’s internal control over financial reporting; and |
| 5. | The small business issuer’s other certifying officer and I have disclosed, based on our most recent evaluation of internal control over financial reporting, to the small business issuer’s auditors and the audit committee of the small business issuer’s board of directors (or persons performing the equivalent functions): |
| (a) | All significant deficiencies and material weaknesses in the design or operation of internal control over financial reporting which are reasonably likely to adversely affect the small business issuer’s ability to record, process, summarize and report financial information; and |
| (b) | Any fraud, whether or not material, that involves management or other employees who have a significant role in the small business issuer’s internal control over financial reporting. |
| DATE: November 13, 2007 | /s/ Jane Ann Davis | |
| Jane Ann Davis | ||
| Secretary and Treasurer | ||
| (principal financial officer) |
Table of Contents
Exhibit 32
Certification Pursuant to § 906 of the
Sarbanes-Oxley Act of 2002 (18 U.S.C. § 1350)
The undersigned, as the Chairman of the Board and President and the Secretary and Tresurer of Bank Building Corporation, respectively, certify that, to the best of their knowledge and belief, the Quarterly Report on Form 10-QSB for the period ended September 30, 2007, which accompanies this certification fully complies with the requirements of Section 13(a) or 15(d), as applicable, of the Securities Exchange Act of 1934 and the information contained in the periodic report fairly presents, in all material respects, the financial condition and results of operations of Bank Building Corporation at the dates and for the periods indicated. The foregoing certification is made pursuant to § 906 of the Sarbanes-Oxley Act of 2002 (18 U.S.C. § 1350) and shall not be relied upon for any other purpose. The undersigned expressly disclaim any obligation to update the foregoing certification except as required by law.
| DATE: November 13, 2007 | /s/ Worth Harris Carter, Jr. | |
| Worth Harris Carter, Jr. | ||
| Chairman of the Board and President | ||
| (principal executive officer) | ||
| DATE: November 13, 2007 | /s/ Jane Ann Davis | |
| Jane Ann Davis | ||
| Secretary and Treasurer | ||
| (principal financial officer) | ||
Table of Contents
FINANCIAL STATEMENTS OF CARTER BANK & TRUST
Carter Bank & Trust annual report on Form 10-K for the year ended December 31, 2006
Carter Bank & Trust quarterly report on Form 10-Q for the quarter ended September 30, 2007
Selected Financial Data for Carter Bank & Trust excerpted from the joint proxy statement/offering circular for Blue Ridge Bank, N.A., Central National Bank, Community National Bank, First National Bank, First National Exchange Bank, Mountain National Bank, Patrick Henry National Bank, Patriot Bank, N.A., Peoples National Bank and Shenandoah National Bank on Schedule 14A dated September 27, 2006
Pro Forma Unaudited Combined Consolidated Financial Information for Carter Bank & Trust excerpted from the joint proxy statement/offering circular for Blue Ridge Bank, N.A., Central National Bank, Community National Bank, First National Bank, First National Exchange Bank, Mountain National Bank, Patrick Henry National Bank, Patriot Bank, N.A., Peoples National Bank and Shenandoah National Bank on Schedule 14A dated September 27, 2006
Table of Contents
FEDERAL DEPOSIT INSURANCE CORPORATION
Washington, D.C. 20429
FORM 10-K
(Mark One)
| x | ANNUAL REPORT PURSUANT TO SECTION 13 OR 15(d) OF THE SECURITIES EXCHANGE ACT OF 1934 |
For the fiscal year ended December 31, 2006
or
| ¨ | TRANSITION REPORT PURSUANT TO SECTION 13 OR 15(d) OF THE SECURITIES EXCHANGE ACT OF 1934 |
For the transition period from to
Commission file number: n/a
CARTER BANK & TRUST
(Exact name of registrant as specified in its charter)
| Virginia | 20-5539935 | |
(State or other jurisdiction of incorporation or organization) | (I.R.S. Employer Identification No.) |
| 1300 Kings Mountain Road, Martinsville, Virginia | 24112 | |
| (Address of principal executive offices) | (Zip Code) |
Registrant’s telephone number, including area code: (276) 656-1776
Securities registered pursuant to Section 12(b) of the Act:
| Title of each class | Name of each exchange on which registered | |
| n/a | n/a |
Securities registered pursuant to Section 12(g) of the Act:
Common stock, $1.00 par value per share
Indicate by check mark if the registrant is a well-known seasoned issuer, as defined in Rule 405 of the Securities Act. Yes ¨ No x
Indicate by check mark if the registrant is not required to file reports pursuant to Section 13 or Section 15(d) of the Act. Yes ¨ No x
Indicate by check mark whether the registrant (1) has filed all reports required to be filed by Section 13 or 15(d) of the Securities Exchange Act of 1934 during the preceding 12 months (or for such shorter period that the registrant was required to file such reports), and (2) has been subject to such filing requirements for the past 90 days. Yes x No ¨
Indicate by check mark if disclosure of delinquent filers pursuant to Item 405 of Regulation S-K (§ 229.405 of this chapter) is not contained herein, and will not be contained, to the best of registrant’s knowledge, in definitive proxy or information statements incorporated by reference in Part III of this Form 10-K or any amendment to this Form 10-K. x
Indicate by check mark whether the registrant is a large accelerated filer, an accelerated filer, or a non-accelerated filer. See definition of “accelerated filer and large accelerated filer” in Rule 12b-2 of the Exchange Act. (Check one):
Large accelerated filer ¨ Accelerated filer ¨ Non-accelerated filer x
Indicate by check mark whether the registrant is a shell company (as defined in Rule 12b-2 of the Act). Yes ¨ No x
The aggregate market value of Carter Bank & Trust’s common stock held by non-affiliates, computed by reference to the price at which the common stock was last sold, or the average bid and asked price of such common stock, as of July 6, 2007, was $12.50.
There were 24,996,572 shares of common stock of Carter Bank & Trust outstanding as of March 31, 2007.
Table of Contents
TABLE OF CONTENTS
| Page | ||||
| PART I | ||||
| Item 1. | Business. | 3 | ||
| Item 1A. | Risk Factors. | 11 | ||
| Item 1B. | Unresolved Staff Comments. | 14 | ||
| Item 2. | Properties. | 14 | ||
| Item 3. | Legal Proceedings. | 16 | ||
| Item 4. | Submission of Matters to a Vote of Security Holders. | 16 | ||
| PART II | ||||
| Item 5. | Market for Registrant’s Common Equity, Related Stockholder Matters and Issuer Purchases of Equity Securities. | 17 | ||
| Item 6. | Selected Financial Data. | 19 | ||
| Item 7. | Management’s Discussion and Analysis of Financial Condition and Results of Operation. | 19 | ||
| Item 7A. | Quantitative and Qualitative Disclosures About Market Risk. | 26 | ||
| Item 8. | Financial Statements and Supplementary Data. | 28 | ||
| Item 9. | Changes in and Disagreements With Accountants on Accounting and Financial Disclosure. | 28 | ||
| Item 9A. | Controls and Procedures. | 28 | ||
| Item 9B. | Other Information. | 29 | ||
| PART III | ||||
| Item 10. | Directors, Executive Officers and Corporate Governance. | 29 | ||
| Item 11. | Executive Compensation. | 34 | ||
| Item 12. | Security Ownership of Certain Beneficial Owners and Management and Related Stockholder Matters. | 40 | ||
| Item 13. | Certain Relationships and Related Transactions, and Director Independence. | 43 | ||
| Item 14. | Principal Accountant Fees and Services. | 45 | ||
| PART IV | ||||
| Item 15. | Exhibits and Financial Statement Schedules. | 46 | ||
2
Table of Contents
PART I
ITEM 1. BUSINESS
Overview
Carter Bank & Trust (“Carter Bank & Trust” or sometimes the “Bank”) is a newly-organized banking institution, incorporated under Virginia law. It is not a member of the Federal Reserve System. Effective December 29, 2006, ten banking institutions, each of which had been in business for a number of years, were merged into Carter Bank & Trust concurrently (the “Merger”). The ten merged banks (each a “Merged Bank” and collectively, the “Merged Banks”), and their respective main office locations, were:
Blue Ridge Bank, N.A.—Floyd, Virginia
Central National Bank—Lynchburg, Virginia
Community National Bank—South Boston, Virginia
First National Bank—Rocky Mount, Virginia
First National Exchange Bank—Roanoke, Virginia
Mountain National Bank—Galax, Virginia
Patrick Henry National Bank—Martinsville, Virginia
Patriot Bank, N.A.—Fredericksburg, Virginia
Peoples National Bank—Danville, Virginia
Shenandoah National Bank—Staunton, Virginia
The main office of Carter Bank & Trust is Martinsville, Virginia. All officers and employees of the Merged Banks have continued as officers and employees of Carter Bank & Trust. Worth Harris Carter, Jr., who served as Chairman of the Board and President of each of the Merged Banks, serves as Chairman of the Board and President of Carter Bank & Trust.
By virtue of the Merger, Carter Bank & Trust, with total assets at December 31, 2006 in excess of $2.6 billion, is now the largest state chartered commercial bank headquartered in Virginia, operating 126 branches in Virginia and North Carolina.
As a result of the Merger, Carter Bank & Trust owns 100% of the capital stock of The Mortgage Company of Virginia, Inc. (“MCOV”). MCOV, in turn, owns 100% of the capital stock of Bank Services of Virginia, Inc. (“BSVA”) and 100% of the capital stock of Bank Services Insurance, Inc. and 50% of the capital stock of Coresoft, Inc. The historical financial information on Carter Bank & Trust as of December 31, 2006, and the combined financial statement of condition on Carter Bank & Trust for the 12 months ended December 31, 2006 is presented on a consolidated basis and includes MCOV and its subsidiaries as of and for the periods then ended.
Senior management of Carter Bank & Trust also serve as senior management of Bank Building Corporation (“BBC”), a publicly-owned, non-banking corporation, and its wholly-owned subsidiary, Blackstone Properties, LLC. BBC leases 46 branch banking offices to Carter Bank & Trust. See Item 13, “Certain Relationships and Related Transactions and Director Independence” for additional information concerning this relationship.
3
Table of Contents
Background of the Merger
The Merged Banks had a common heritage involving a number of overlapping board memberships, management, and operations, as well as other similar characteristics and joint activities. Each Merged Bank was founded by a group of organizers headed by Worth Harris Carter, Jr., and Mr. Carter served as the Chairman of the Board and President of each of the Merged Banks. Five of the Merged Banks were separately organized (First National Bank in 1974, Patrick Henry National Bank in 1976, Peoples National Bank in 1976, Blue Ridge Bank, N.A. in 1978 and Community National Bank in 1985). Five of the Merged Banks were created by spinning them off from existing Banks (Patriot Bank, N.A. and Central National Bank were created by spinoff from Peoples National Bank in 1996; Mountain National Bank and Shenandoah National Bank were created by spinoff from Patrick Henry National Bank in 1996; and First National Exchange Bank was created by spinoff from First National Bank in 1998). From the inception of each Merged Bank, the Merged Banks shared common senior management, operations (including investment management, interest rate risk management, lending and loan administration, check processing, information technology, and mortgage operations, as well as other areas), and certain of the Merged Banks had overlapping boards of directors.
The original purpose behind each of the Merged Banks was to create local, community sponsored banking organizations which would be responsive to the needs of each of the local communities. Indeed, each of the Merged Banks was very successful in meeting the lending and other needs of the communities that they serve. However, beginning in 2005, the boards of directors of each of the Merged Banks began consideration of a consolidation of the Merged Banks because of changes in the banking business and regulatory environment.
The changes and other factors that caused the boards of directors to consider consolidation included:
| • | the opportunity to put a single, “brand name” on the business of the Merged Banks, and to realize the economies from the use of a single name for the organization; |
| • | the consolidation of the banking industry generally and the greater economic power and resources of larger banks; |
| • | the increasingly burdensome regulatory environment involving additional recordkeeping and reporting which could be reduced on a consolidated reporting basis by a combined bank; |
| • | the multiple securities reporting requirements such as the filing of Forms 10-K and 10-KSB, Forms 10-Q and 10-QSB, Form 8-K, annual reports, and other filings made under the Securities Exchange Act of 1934 by eight of the Merged Banks with the Office of the Comptroller of the Currency and the fact that consolidating the Merged Banks into one charter would reduce the filing burden collectively by approximately 85%; |
| • | expected efficiencies from consolidation of many operations and procedures involving the Merged Banks; and |
| • | the larger, expanded branching network that would result from consolidation, with increasing convenience to customers of the Merged Banks. |
4
Table of Contents
In view of these considerations, the boards of directors of the respective Merged Banks, facilitated by Mr. Carter, began discussing the advantages and merger synergies that would be created by combining all of the Merged Banks into a single bank.
During the third quarter of 2005, an investment banking advisor, Davenport & Company LLC, was engaged to advise the Merged Banks regarding financial considerations involving the merger. Davenport commenced work on the engagement but did not complete its work because the boards of directors of the Merged Banks determined to suspend discussion of the transaction until 2006 based upon a variety of factors including the anticipated difficulty of closing the transaction during the 2005 calendar year.
During the first quarter of 2006, the boards of directors of each of the Merged Banks determined to again focus on the possibility of combining all of the Merged Banks through a merger. Substantial due diligence was conducted by each of the Merged Banks regarding the other Merged Banks involved in the merger. In addition, Davenport was again engaged to be the financial advisor for all ten Merged Banks for the purposes of providing financial advice and information regarding the fairness of the transaction to each of the Merged Banks. Also during the second quarter of 2006, the Merged Banks, working through management and the boards of directors and their advisors and representatives, negotiated the terms of a draft agreement and plan of merger.
During the period of July 5-7, 2006, the boards of directors of each of the Merged Banks met and unanimously approved the Merger. The agreement and plan of merger was signed on behalf of each of the Merged Banks on July 28, 2006.
The agreement and plan of merger was approved by the shareholders of each of the Merged Banks at special meetings of shareholders called for that purpose and held November 9-14, 2006. See Item 4, “Submission of Matters to a Vote of Security Holders.” The Merger became effective December 29, 2006.
Accounting Treatment of the Merger
Generally accepted accounting standards require that all business combinations be accounted for by the “purchase” method of accounting; therefore, the Merger is being accounted for in this manner. Under the purchase method of accounting, the assets and liabilities of the “acquired” entity or entities are recorded at their fair values and the excess of purchase price over the fair value of net assets is allocated to goodwill. Accordingly, the assets and liabilities of the nine Merged Banks that were deemed to be “acquired” in the Merger, as of the completion of the Merger, were recorded at their fair values and the excess of purchase price over the fair value of net assets of those nine Merged Banks was allocated to goodwill. Commonly, the “acquiring” entity in a business combination transaction is the larger entity; therefore, Peoples National Bank, the largest of the ten Merged Banks, was deemed to be the “acquirer” of each of the other nine Merged Banks for the purpose of applying the purchase method of accounting to the Merger. For this reason, the assets and liabilities of Peoples National Bank were not recorded at fair value in connection with the Merger.
Financial statements of Carter Bank & Trust issued after the consummation of the Merger will reflect values as described above and will not be restated retroactively to reflect the historical position or results of operations of each of the Merged Banks. The operating results of each of the Merged Banks will be reflected in Carter Bank & Trust’s financial statements from and after the date the Merger was consummated. For further information concerning the financial statements included in this report, see “Management’s Discussion and Analysis-Accounting Treatment of the Merger” and “-Financial Statement Presentation” in Item 7 below.
5
Table of Contents
General
Market Area.Carter Bank & Trust conducts a general commercial banking business in its two-state service area of Virginia and North Carolina, and focuses on serving the banking needs of small-to-medium sized businesses, professional concerns and individuals.
Goals and Strategy.The Bank’s goal is to be a leading financial institution in its market area by opening new offices and providing a full array of banking services. Management believes that the on-going consolidation of the banking industry has created an opportunity for community-based lenders like the Bank that emphasize retail lending and superior customer service. The Bank’s business strategy is to target individuals, businesses and professionals in its service area for loans, deposits, and other financial services and to explore selected opportunities to establish branches in areas that demographically compliment the Bank’s existing customer base.
Deposits and Loan Products.The Bank offers a full range of deposit services including LIFETIME FREE CHECKING, NOW accounts, savings accounts, retirement accounts and other deposit accounts of various types, ranging from money market accounts to longer-term certificates of deposit. The transaction accounts and time certificates are tailored to each of the Bank’s principal markets at competitive rates. All deposit accounts are insured by the Federal Deposit Insurance Corporation (“FDIC”) up to the maximum amount allowed by law (generally $100,000 per depositor subject to aggregation rules). The Bank solicits these accounts from individuals, businesses, associations, organizations, and governmental entities.
The Bank also offers a full range of commercial and personal loans. Commercial loans include both secured and unsecured loans. Consumer loans include secured and unsecured loans for financing automobiles, home improvements, education and personal investments. The Bank also makes real estate construction and acquisition loans and originates and holds fixed and variable rate mortgage loans.
The Bank’s lending activities are subject to a variety of lending limits imposed by federal law. While differing limits apply in certain circumstances based on the type of loan or the nature of the borrower (including the borrower’s relationship to the Bank), in general the Bank is subject to a loan-to-one borrower limit of an amount equal to 15% of the Bank’s unimpaired capital and surplus. The Bank may not make loans to any director, officer, employee or 10% shareholder of the Bank unless the loan is approved by the Board of Directors and is made on terms not more favorable than are made available to a person not affiliated with the Bank.
Other bank services include safe deposit boxes, travelers checks, direct deposit of payroll and social security checks, and automated drafts for various accounts. The Bank has no current plans to exercise trust powers.
Bank Lending Practices.The Bank’s lending efforts are directed to making loans to individuals and businesses in its market area. The Bank has both purchased and sold participation loans with other banks in the past and may do so in the future. The Bank believes that its lending and credit policies are conservative.
6
Table of Contents
The Bank’s primary lending program has been the origination of loans secured by real estate. The Bank evaluates both the borrower’s ability to make principal and interest payments and the value of the property that will secure the loan.
Residential mortgage loans generally are made on the basis of the borrower’s ability to make repayment from employment and other income and are secured by real estate that can be readily valued. The Bank offers both adjustable-rate and fixed-rate loans.
In contrast, commercial real estate loans typically are made on the basis of the borrower’s ability to make repayment from cash flow from its business and are secured by business properties. The Bank’s primary non-residential real estate loan products have rates that are fixed for three to five years and then become adjustable. Commercial loans typically involve larger loan balances concentrated with single borrowers or groups of related borrowers.
The Bank also makes consumer loans, including unsecured personal loans, automobile loans, deposit account loans, installment loans and time loans. The Bank’s primary consideration when making such consumer loans is the customer’s ability to repay the loan. Consumer loans generally warrant higher interest rates and fees, but such loans, particularly unsecured consumer loans, also may entail greater risk than residential mortgage loans. Even when a loan is secured, repossessed collateral for a defaulted consumer loan may not provide an adequate source of repayment. Consumer loan collections are dependent on the borrower’s continuing financial stability, and are more likely to be affected adversely by job loss, divorce, illness, or personal bankruptcy. Various federal and state laws, including bankruptcy and insolvency laws, may limit the amount that can be recovered on such loans and such loans may give rise to claims and defenses by a consumer loan borrower.
The Bank also makes commercial loans to qualified small businesses in its market area. Commercial business loans generally have a higher degree of risk than mortgage loans, but have commensurately higher yields. To manage these risks, the Bank generally secures appropriate collateral and carefully monitors the financial condition of its business borrowers.
Business of The Mortgage Corporation of Virginia, Inc.As a result of the Merger, the assets of MCOV have been transferred to Carter Bank & Trust, the business operations of MCOV have been entirely absorbed by Carter Bank & Trust and MCOV has no employees and no separate business of its own.
Business of Bank Services of Virginia, Inc.As a result of the Merger, all the business operations of BSVA, other than its courier services, have been absorbed by Carter Bank & Trust. The only employees of BSVA are those persons working in the courier operations.
Business of Bank Services Insurance, Inc.Bank Services Insurance, Inc. is a fully operational, licensed general insurance agency which provides insurance agency services to bank customers and other third-parties.
Competition
The Bank experiences significant competition in attracting depositors and borrowers. Competition in lending activities comes principally from other commercial banks, savings associations, insurance companies, governmental agencies, credit unions, and brokerage firms. Competition for deposits comes from other commercial banks, savings associations, money market and mutual funds, credit unions, insurance companies and brokerage firms. Some of the
7
Table of Contents
financial organizations competing with the Bank have greater financial resources than the Bank. Certain of these financial organizations also have greater geographic coverage and some offer bank and bank-related services which the Bank does not offer.
The Bank primarily focuses on providing products and services to customers in non-major metropolitan markets. Management believes the Bank has developed a niche and a certain level of expertise in serving these communities.
Supervision and Regulation
General.Financial institutions are extensively regulated under federal and state law. Consequently, the growth and earnings performance of the Bank can be affected not only by management decisions and general economic conditions, but also by the statutes administered by, and the regulations and policies of, various governmental regulatory authorities including, but not limited to, the Federal Reserve Board (“FRB”), the FDIC, the Office of the Comptroller of the Currency (“OCC”), the Internal Revenue Service, federal and state taxing authorities, and the Securities and Exchange Commission (“SEC”). The effect of such statutes, regulations and policies can be significant, and cannot be predicted with a high degree of certainty.
Federal and state laws and regulations generally applicable to financial institutions regulate, among other things, the scope of business, investments, reserves against deposits, capital levels relative to operations, the nature and amount of collateral for loans, the establishment of branches, mergers, consolidations and dividends. The system of supervision and regulation applicable to the Bank establishes a comprehensive framework for its operations and is intended primarily for the protection of the FDIC’s deposit insurance funds and the depositors, rather than the shareholders, of the Bank.
Finally, the Bank is subject to the periodic reporting requirements of the Securities Exchange Act of 1934, as amended, including but not limited to, filing annual, quarterly and other current reports with the FDIC.
The following references to material statutes and regulations affecting the Bank are brief summaries thereof and do not purport to be complete, and are qualified in their entirety by reference to such statutes and regulations. Any change in applicable law or regulations may have a material effect on the business of the Bank.
Regulatory Capital Requirements.All financial institutions are required to maintain minimum levels of regulatory capital. The FDIC has established risk-based and leveraged capital standards for the financial institutions they regulate. The FDIC also may impose capital requirements in excess of these standards on a case-by-case basis for various reasons, including financial condition or actual or anticipated growth. Under the risk-based capital requirements, the Bank is required to maintain a minimum ratio of total capital to risk-weighted assets of at least 8%. At least half of the total capital is required to be “Tier 1 capital,” which consists principally of common and certain qualifying preferred shareholders’ equity, less certain intangibles and other adjustments. The remainder, “Tier 2 capital,” consists of a limited amount of subordinated and other qualifying debt (including certain hybrid capital instruments) and a limited amount of the general loan loss reserve.
In addition, the federal regulatory agencies have established a minimum leveraged capital ratio (Tier 1 capital to period end total assets). These guidelines provide for a minimum leverage capital ratio of 4%. The guidelines also provide that banking organizations experiencing internal growth or making acquisitions will be expected to maintain strong capital positions substantially above the minimum supervisory levels, without significant reliance on intangible assets.
8
Table of Contents
As of September 30, 2006, each of the Merged Banks qualified as a “well-capitalized” institution, and as of December 31, 2006, Carter Bank & Trust qualified as a “well capitalized” institution (see Note 19 of the Notes to Consolidated Financial Statements filed herewith).
Insurance of Accounts, Assessments and Regulation by the FDIC.Carter Bank & Trust is a member of the Deposit Insurance Fund (“DIF”) of the FDIC. As a DIF-insured institution, the Bank is subject to FDIC rules and regulations as administrator of the DIF. The Bank’s deposits are insured up to at least $100,000 per insured depositor, as defined by law and regulation. As insurer, the FDIC is authorized to conduct examinations of and to require reporting by DIF institutions. The actual assessment to be paid by each DIF member is based on the institution’s assessment risk classification and whether the institution is considered by its supervisory agency to be financially sound or to have supervisory concerns.
Under the FDIC’s risk-based insurance system, DIF-insured institutions are currently assessed premiums of between five and forty-three cents per $100 of eligible deposits, depending on the institution’s capital position and other supervisory facts. Congress has enacted legislation that, among other things, provides for assessments against DIF-insured institutions that will be used to pay certain Financing Corporation (“FICO”) obligations.
The FDIC is authorized to prohibit any DIF-insured institution from engaging in any activity that the FDIC determines by regulation or order to pose a serious threat to the insurance fund. Also, the FDIC may initiate enforcement actions against banks after first giving the institution’s primary regulatory authority an opportunity to take such action. The FDIC may terminate the deposit insurance of any depository institution, including the Bank, if it determines, after a hearing, that the institution has engaged or is engaging in unsafe or unsound practices, is in an unsafe or unsound condition to continue operations, or has violated any applicable law, regulation, order or any condition imposed in writing by the FDIC. It also may suspend deposit insurance temporarily during the hearing process for the permanent termination of insurance, if the institution has no tangible capital. If deposit insurance is terminated, the deposits at the institution at the time of termination, less subsequent withdrawals, shall continue to be insured for a period from six months to two years, as determined by the FDIC. Management is aware of no existing circumstances that could result in termination of the Bank’s deposit insurance.
The Bank is not a member of the Federal Reserve System and is required to maintain certain levels of its cash and due from bank balances as reserves based on regulatory requirements. At December 31, 2006 and 2005, this reserve requirement was approximately $1,600,000.
Other Safety and Soundness Regulations.The federal banking agencies have broad powers under current federal law to take prompt corrective action to resolve problems of insured depository institutions. The extent of these powers depends upon whether the institutions in question are “well capitalized,” “adequately capitalized,” “undercapitalized,” “significantly undercapitalized” or “critically undercapitalized,” as such terms are defined under uniform regulations issued by each of the federal banking agencies.
Community Reinvestment.The requirements of the Community Reinvestment Act (“CRA”) affect the Bank. The CRA imposes on financial institutions an affirmative obligation to
9
Table of Contents
help meet the credit needs of their local communities, including low- and moderate-income neighborhoods, consistent with the safe and sound operation of those institutions. Each financial institution’s efforts in helping meet community credit needs currently are evaluated as part of the examination process pursuant to a regulation recently adopted by the banking regulatory agencies. Under the regulation a financial institution’s efforts in helping meet its community’s credit needs are evaluated, based on the particular institution’s total assets, according to a lending test, a community development test in addition to the lending test, or the three-pronged (lending, investment and service) test, all which replace the twelve assessment factors used previously. The grade received by a bank is considered in evaluating mergers, acquisitions and applications to open a branch or facility. The Bank has not yet undergone a CRA examination. To the best knowledge of the Bank, it is meeting its obligations under the CRA. Each of the Merged Banks received a rating of “satisfactory” or “outstanding” in their most recent CRA examinations.
Effect of Governmental Monetary Policies.As with other financial institutions, the earnings of the Bank are affected by general economic conditions as well as by the monetary policies of the FRB. Such policies, which include regulating the national supply of bank reserves and bank credit, can have a major effect upon the source and cost of funds and the rates of return earned on loans and investments. The Federal Reserve System exerts a substantial influence on interest rates and credit conditions, primarily through establishing target rates for federal funds, open market operations in U.S. Government securities, varying the discount rate on member bank borrowings and setting cash reserve requirements against deposits. Changes in monetary policy, including changes in interest rates, will influence the origination of loans, the purchase of investments, the generation of deposits, and rates received on loans and investment securities and paid on deposits. Fluctuations in the FRB’s monetary policies have had a significant impact on the operating results of the Bank and all financial institutions in the past and are expected to continue to do so in the future.
Dividend Limitations. The amount of dividends permitted to be paid by the Bank will depend upon its earnings and capital position, and is limited by federal and state law, regulations and policy. Virginia law imposes restrictions on the ability of all banks chartered under Virginia law to pay dividends. Under Virginia law, no dividend may be declared or paid that would impair a bank’s paid-in capital and payments must be made from retained earnings. State and federal regulators have the general authority to limit dividends paid by the Bank if it is, or after making the distribution it would become, “undercapitalized” (as that term is defined in federal law). The FDIC has issued policy statements that provide that insured banks generally should pay dividends only from their current operating earnings, and, under the Federal Deposit Insurance Act, no dividend may be paid by an insured bank while it is in default on any assessment due the FDIC. Our payment of dividends also could be affected or limited by other factors, such as events or circumstances which lead the FDIC to require that we maintain capital in excess of regulatory guidelines.
Employees
As of March 31, 2007, Carter Bank & Trust and its subsidiaries had approximately 1,072 full-time and 104 part-time employees. The Bank believes that its relationship with its employees is good, and no employees are represented by a labor union.
Where You Can Find More Information
Carter Bank & Trust files quarterly, annual and other reports, proxy statements and other information with the FDIC (rather than the SEC). You may (i) obtain copies of the documents
10
Table of Contents
Carter Bank & Trust files with the FDIC by directing a request by telephone or mail to Worth Harris Carter, Jr., Carter Bank & Trust, 1300 Kings Mountain Road, Martinsville, Virginia 24112; telephone number: (276) 656-1776, or (ii) obtain copies of these documents by contacting the FDIC by facsimile at (703) 562-2296 or by mail at 3501 North Fairfax Drive, Room E-1002, Arlington, Virginia 22226. Carter Bank & Trust does not make copies of the documents it files available via the Internet because it does not have an Internet website.
Until December 29, 2006, each of the Merged Banks, except for Blue Ridge Bank, N.A. and Community National Bank, filed annual, quarterly and current reports, proxy statements and other information with the OCC (rather than the SEC). You may (i) obtain copies of the documents the Merged Banks filed with the OCC by directing a request by telephone or mail to Worth Harris Carter, Jr., Carter Bank & Trust, 1300 Kings Mountain Road, Martinsville, Virginia 24112; telephone number: (276) 656-1776, or (ii) obtain up to 50 free pages of these documents by contacting the OCC by facsimile at (202) 874-4448 or by mail at the Office of the Comptroller of the Currency, Communications Division, 250 E Street, S.W., Washington, D.C. 20219.
ITEM 1A. RISK FACTORS
You should carefully read and consider the following risk factors concerning Carter Bank & Trust.
The integration of the operations of the Merged Banks may be more difficult than anticipated.
The success of the Merger will depend on the ability of Carter Bank & Trust to integrate successfully the operations of the Merged Banks. A successful integration will depend on a number of factors, including (but not limited to) Carter Bank & Trust’s ability to timely and successfully integrate the information technology systems and other support systems of the Merged Banks; maintain existing relationships between the Merged Banks and their depositors to minimize withdrawals of deposits from Carter Bank & Trust subsequent to the Merger; maintain and enhance existing relationships between the Merged Banks and their borrowers to limit unanticipated declines in loans to current customers of the Merged Banks; control the incremental non-interest expense from the Merger of each of the Merged Banks to maintain overall operating efficiencies; retain and attract qualified personnel; and compete effectively in the communities served by the Merged Banks and in nearby communities. Carter Bank & Trust may not be able to integrate successfully the operations of the Merged Banks or manage effectively its growth resulting from the Merger.
Carter Bank & Trust’s business is subject to interest rate risk and fluctuations in interest rates may adversely affect its earnings and capital levels.
The majority of Carter Bank & Trust’s assets are monetary in nature and, as a result, Carter Bank & Trust will be subject to significant risk from changes in interest rates. Changes in interest rates can impact Carter Bank & Trust’s net interest income as well as the valuation of its assets and liabilities. Also, Carter Bank & Trust’s earnings are significantly dependent on its net interest income, which is the difference between interest income on interest-earning assets, such as loans and securities, and interest expense on interest-bearing liabilities, such as deposits and borrowings. Carter Bank & Trust expects that it will periodically experience “gaps” in the interest rate sensitivities of its assets and liabilities, meaning that either its interest-bearing liabilities will be more sensitive to changes in market interest rates than its interest-earning assets, or vice versa. In either event, if market interest rates should move contrary to Carter Bank & Trust’s position, this “gap” will work against it and its earnings may be negatively affected.
11
Table of Contents
An increase in the general level of interest rates may also, among other things, reduce the demand for loans and Carter Bank & Trust’s ability to originate loans or increase the rate of default on existing loans. Conversely, a decrease in the general level of interest rates may, among other things, lead to an increase in prepayments on loan and increased competition for deposits. Accordingly, changes in the general level of market interest rates may affect net yield on interest-earning assets, loan origination volume, loan portfolios and Carter Bank & Trust’s overall results.
Although Carter Bank & Trust’s asset-liability management strategy is designed to control its risk from changes in the general level of market interest rates, market interest rates will be affected by many factors outside of its control, including inflation, recession, changes in unemployment, money supply and international disorder and instability in domestic and foreign financial markets. It is possible that significant or unexpected changes in interest rates may take place in the future, and Carter Bank & Trust cannot always accurately predict the nature or magnitude of such changes or how such changes may affect its business.
Carter Bank & Trust’s profitability depends significantly on local economic conditions.
Carter Bank & Trust’s success will depend primarily on the general economic conditions of the geographic markets in which it operates. The local economic conditions in the areas where it operates will have a significant impact on its commercial, real estate and construction loans, the ability of its borrowers to repay their loans and the value of the collateral securing these loans. A significant decline in general economic conditions, caused by inflation, recession, acts of terrorism, outbreak of hostilities or other international or domestic calamities, unemployment or other factors could impact these local economic conditions and negatively affect Carter Bank & Trust’s financial results.
Carter Bank & Trust faces strong competition from financial services companies and other companies that offer banking services which could negatively affect its business.
Carter Bank & Trust conducts its banking operations primarily in Virginia and North Carolina, including Roanoke, Lynchburg, Danville, Fredericksburg, Northern Virginia, Greensboro, Durham, Wilson and Fayetteville. Increased competition in these markets may result in reduced loans and deposits. Ultimately, Carter Bank & Trust may not be able to compete successfully against current and future competitors. Many competitors offer the same banking services that Carter Bank & Trust offers in its service area. These competitors include national banks, regional banks and other community banks. Carter Bank & Trust also faces competition from many other types of financial institutions, including without limitation, savings and loan institutions, finance companies, brokerage firms, insurance companies, credit unions, mortgage banks and other financial intermediaries. In particular, Carter Bank & Trust’s competitors include several major financial companies whose greater resources may afford them a marketplace advantage by enabling them to maintain numerous banking locations and ATMs and conduct extensive promotional and advertising campaigns.
Additionally, banks and other financial institutions with larger capitalization and financial intermediaries not subject to bank regulatory restrictions have larger lending limits and are thereby able to serve the credit needs of larger customers. Areas of competition include interest rates for loans and deposits, efforts to obtain deposits, and range and quality of products and services provided, including new technology-driven products and services. Technological
12
Table of Contents
innovation continues to contribute to greater competition in domestic and international financial services markets as technological advances enable more companies to provide financial services. Carter Bank & Trust also faces competition from out-of-state financial intermediaries that have opened low-end production offices or that solicit deposits in its market areas. If Carter Bank & Trust is unable to attract and retain banking customers, it may be unable to continue to grow its loan and deposit portfolios and its results of operations and financial condition may otherwise be adversely affected.
A large percentage of Carter Bank & Trust’s loans are secured by real estate, and an adverse change in the real estate market may result in losses and adversely affect Carter Bank & Trust’s profitability.
Approximately 90% of Carter Bank & Trust’s loan portfolio as of December 31, 2006, was comprised of loans secured by real estate, exclusive of municipal loans. An adverse change in the economy affecting values of real estate generally or in the market areas served by Carter Bank & Trust specifically could impair the value of Carter Bank & Trust’s collateral and its ability to sell the collateral upon foreclosure. In the event of a default with respect to any of these loans, the amounts Carter Bank & Trust receives upon sale of the collateral may be insufficient to recover outstanding principal and interest on the loan. As a result, Carter Bank & Trust’s profitability and financial condition could be negatively impacted by an adverse change in the real estate market.
Carter Bank & Trust is dependent on its management team, and the loss of its senior executive officers or other key employees could impair its relationship with its customers and adversely affect its business and financial results.
The success of Carter Bank & Trust will be dependent upon the continued service and skills of Worth Harris Carter, Jr. and other senior officers. The unexpected loss of services of one or more of these key personnel could have an adverse impact on the business of Carter Bank & Trust because of their skills, knowledge of the market, years of industry experience and the difficulty of promptly finding qualified replacement personnel.
An interruption in or breach in security of Carter Bank & Trust’s information systems may result in a loss of customer business and negatively affect our results of operation and financial condition.
Carter Bank & Trust relies heavily on communications and information systems to conduct its business. Any failure or interruption or breach in security of these systems could result in failures or disruptions in customer relationship management, general ledger, deposits, servicing or loan origination systems. Carter Bank & Trust cannot assure you that such failures or interruptions will not occur or, if they do occur, that they will be adequately addressed by the bank. The occurrence of any failures or interruptions could result in a loss of customer business, costs to us or damages to others and have a negative effect on Carter Bank & Trust’s results of operations and financial condition.
Carter Bank & Trust operates in a highly regulated environment and, as a result, is subject to extensive regulation and supervision that could adversely affect its financial performance.
Carter Bank & Trust is subject to extensive regulation, supervision and examination by federal and state banking authorities. Any change in applicable regulations or federal or state
13
Table of Contents
legislation could have a substantial impact on Carter Bank & Trust, its subsidiaries, and its operations. Additional legislation and regulations may be enacted or adopted in the future that could significantly affect Carter Bank & Trust’s powers, authority and operations, which could have a material adverse effect on Carter Bank & Trust’s financial condition and results of operations. Further, regulators have significant discretion and power to prevent or remedy unsafe or unsound practices or violations of laws by banks in the performance of their supervisory and enforcement duties. The exercise of this regulatory discretion and power may have a negative impact on Carter Bank & Trust and could limit growth and the return to investors by restricting activities such as the payment of dividends, mergers with, or acquisitions of or by, other institutions, investments, loans and interest rates, interest rates paid on deposits and the creation of branch offices. Although these regulations impose costs upon Carter Bank & Trust, they are intended to protect depositors and you should not assume that they protect your interests as a shareholder.
The trading volume in Carter Bank & Trust’s common stock may be low following the Merger.
Carter Bank & Trust is a new bank that is establishing its identity and credibility in the markets. There is currently no established trading market for Carter Bank & Trust’s common stock and our common stock in not listed or traded on any national securities exchange or included in any automatic quotation system. Although Carter Bank & Trust intends to apply to have its common stock listed for trading on a national securities exchange such as the New York Stock Exchange, American Stock Exchange or the NASDAQ Stock Market, no assurance can be given that such application will be approved. A public trading market having the desired characteristics of depth, liquidity and orderliness depends on the presence in the market place of willing buyers and sellers of Carter Bank & Trust’s common stock at any given time. This presence depends on the individual decisions of investors and general economic and market conditions over which Carter Bank & Trust has no control. Accordingly, it is uncertain at what price the shares of Carter Bank & Trust will trade upon listing, if any, on a national securities exchange. Given the absence of an established public market, significant sales of its common stock by shareholders, or the expectation of these sales, could adversely affect Carter Bank & Trust’s stock price and increase its volatility.
ITEM 1B. UNRESOLVED STAFF COMMENTS
Not applicable.
ITEM 2. PROPERTIES
Carter Bank & Trust’s main office is located at 4 East Commonwealth Boulevard, Martinsville, Virginia. As of March 31, 2007, the Bank also operated 125 additional offices, 89 of which are located in Virginia and 36 located in North Carolina. The Bank owns 71 of the offices free and clear of encumbrances, while the other 55 are held under operating leases. The leases are described in Note 21 of the Notes to Consolidated Financial Statements.
14
Table of Contents
Our banking offices are located in the following communities:
| Locations that are Open in Virginia | ||||
| Ararat | Fieldale | Nokesville | ||
| Abingdon (2 locations) | Floyd | Oaklevel | ||
| Amherst | Fredericksburg (3 locations) | Pulaski | ||
| Bassett | Galax (2 locations) | Radford | ||
| Bedford (2 locations) | Garrisonville | Roanoke (7 locations) | ||
| Blacksburg | Gretna | Rocky Mount | ||
| Blairs | Harrisonburg (2 locations) | St. Paul | ||
| Boones Mill | Hillsville | Salem | ||
| Bridgewater | Horsepasture | South Boston (2 locations) | ||
| Bristol | Hot Springs | South Hill | ||
| Cedar Bluff | Independence | Stafford Courthouse | ||
| Charlottesville (2 locations) | Ivey | Staunton | ||
| Chase City | Lake Ridge | Stuart | ||
| Chatham | Laurel Park | Stuarts Draft | ||
| Christiansburg (2 locations) | Lebanon | Tazewell | ||
| Clarksville | Lexington | Troutville | ||
| Collinsville | Lynchburg (4 locations) | Vinton | ||
| Culpepper | Madison Heights | Waynesboro | ||
| Danville (5 locations) | Manassas (2 locations) | West Lake | ||
| Emporia | Martinsville (2 locations) | Woolwine | ||
| Falmouth | Moneta | Wyers Cave | ||
| Ferrum | New Castle | Wytheville | ||
| Locations that are Open in North Carolina | ||||
| Asheboro | Henderson | Mt. Olive | ||
| Bethel | Hickory | N. Wilkesboro | ||
| Bostic | Jonesville | Reidsville (2 locations) | ||
| Burlington (2 locations) | Lenoir | Roxboro | ||
| Durham | Lincolnton | Sanford | ||
| Eden (2 locations) | Louisburg | Shelby | ||
| Fayetteville (2 locations) | Lumberton (2 locations) | Siler City | ||
| Forest City | Mooresville | Stoneville | ||
| Greensboro (2 locations) | Morganton | Wilson (2 locations) | ||
| Greenville | Mt. Airy | |||
| Properties Purchased or Leased for Possible Future Locations | ||||
Virginia | North Carolina | South Carolina | ||
| Ashland | Durham | Chesnee | ||
| Chester (leased) | Gastonia (2 locations) | |||
| Franklin (2 locations) | Graham | |||
| Henrico (4 locations) | Lillington | |||
| Mt. Jackson | Rocky Mount (2 locations) | |||
| Orange | Smithfield | |||
| Stephens City | Southern Pines | |||
| Winchester | Wilson | |||
| Woodstock | ||||
| Yellow Branch | ||||
15
Table of Contents
Prior to the Merger, the Merged Banks acquired 25 separate properties for future expansion. The locations of these facilities are listed above. These facilities are, in most cases, former banking facilities that were purchased by the Bank at very competitive prices and are being held for future expansion. They are all in markets the Bank believes to be attractive and consistent with the Bank’s general geographic coverage. Before opening and operating any of these facilities as branch offices of the Bank, the Bank must first seek and obtain the approval of the Virginia Bureau of Financial Institutions and the FDIC. The Bank does not have a specific schedule regarding when any such approvals will be sought or when any of these facilities will be opened for business.
Management considers these existing properties to be in good condition. Adequate insurance is maintained on each of these properties.
The Bank has acquired title to other parcels of real estate through the normal course of its lending activities. The book value of these properties was $10,248,479 as of December 31, 2006.
ITEM 3. LEGAL PROCEEDINGS
As of December 31, 2006, no material legal proceedings were pending or threatened against Carter Bank & Trust or any of the Merged Banks.
ITEM 4. SUBMISSION OF MATTERS TO A VOTE OF SECURITY HOLDERS
No matters were submitted to a vote of security holders of Carter Bank & Trust during the fourth quarter of the fiscal year covered by this report, except that the organizing shareholders of Carter Bank & Trust did unanimously approve by written consent the Agreement and Plan of Merger by which each of the Merged Banks was merged into Carter Bank & Trust effective December 29, 2006.
Each of the Merged Banks held a special meeting of shareholders during the fourth quarter of the fiscal year covered by this report for the purpose of approving the Agreement and Plan of Merger by which each of the Merged Banks was merged into Carter Bank & Trust effective December 29, 2006. The dates of each such meeting and vote tabulations for each such meeting were as follows:
Bank | Date of Meeting | Shares Outstanding and Entitled to Vote | Vote | |||||
| Blue Ridge Bank, N.A. | November 10, 2006 | 1,022,628 | For: | 873,094 | ||||
| Against: | 4,350 | |||||||
| Abstain: | 1,710 | |||||||
| Central National Bank | November 13, 2006 | 236,439 | For: | 204,708 | ||||
| Against: | 18 | |||||||
| Abstain: | 718 | |||||||
| Community National Bank | November 9, 2006 | 707,482 | For: | 630,147 | ||||
| Against: | 196 | |||||||
| Abstain: | 80 | |||||||
16
Table of Contents
Bank | Date of Meeting | Shares Outstanding and Entitled to Vote | Vote | |||||
| First National Bank | November 10, 2006 | 1,503,106 | For: | 1,356,843 | ||||
| Against: | 1,139 | |||||||
| Abstain: | 2,215 | |||||||
| First National Exchange Bank | November 10, 2006 | 492,329 | For: | 434,066 | ||||
| Against: | 2,309 | |||||||
| Abstain: | 582 | |||||||
| Mountain National Bank | November 14, 2006 | 507,865 | For: | 403,600 | ||||
| Against: | 351 | |||||||
| Abstain: | 138 | |||||||
| Patrick Henry National Bank | November 14, 2006 | 2,800,122 | For: | 2,235,495 | ||||
| Against: | 3,515 | |||||||
| Abstain: | 765 | |||||||
| Patriot Bank, N.A. | November 13, 2006 | 474,132 | For: | 404,390 | ||||
| Against: | 37 | |||||||
| Abstain: | 1,304 | |||||||
| Peoples National Bank | November 13, 2006 | 2,375,683 | For: | 2,037,335 | ||||
| Against: | 555 | |||||||
| Abstain: | 4,732 | |||||||
| Shenandoah National Bank | November 14, 2006 | 277,588 | For: | 219,914 | ||||
| Against: | 371 | |||||||
| Abstain: | 77 | |||||||
PART II
ITEM 5. MARKET FOR REGISTRANT’S COMMON EQUITY, RELATED STOCKHOLDER MATTERS AND ISSUER PURCHASES OF EQUITY SECURITIES
Common Stock
Carter Bank & Trust is authorized to issue 100,000,000 shares of common stock. This is the only class of authorized stock. As a result of the Merger that became effective December 29, 2006, the Bank had 24,996,572 shares of common stock issued and outstanding on December 31, 2006.
Holders of shares of common stock are entitled to receive dividends when and as declared by the board of directors out of funds legally available therefore. In the event of any liquidation, dissolution or winding up of Carter Bank & Trust, the holders of common stock (and the holders of any class or series of stock entitled to participate with the common stock in the distribution of assets that may be authorized by the board of directors in the future) will be entitled to receive, in cash or in kind, the assets of Carter Bank & Trust available for distribution remaining after payment or provision for payment of Carter Bank & Trust’s debts and liabilities.
17
Table of Contents
Holders of common stock are entitled to one vote per share on all matters submitted to shareholders. There are no cumulative voting rights in the election of directors. Carter Bank & Trust’s shareholders do not have preemptive rights to purchase additional shares of its capital stock. Holders of common stock have no conversion or redemption rights. The common stock issued in connection with the Merger was, when issued, fully paid and nonassessable.
As of March 31, 2007, Carter Bank &Trust had approximately 3,300 shareholders of record.
Market for Common Stock
The Bank’s common stock is not currently listed for trading on any established market, but may be quoted from time to time in the Pink Sheets or on the Over-the-Counter Bulletin Board (“OTCBB”). There are no known market makers in the Bank’s common stock. The Bank does contemplate seeking a listing for its common stock on one of the national securities exchanges, such as the New York Stock Exchange, the American Stock Exchange or the NASDAQ Stock Market, at some future date.
Carter Bank & Trust common stock did not trade during 2005 or 2006. The per share high and low price of the common stock of Carter Bank & Trust, based on transactions known to the Bank, during the first quarter of 2007 (through March 31, 2007), were:
High | Low | |
$14.20 | $13.51 |
The Bank’s common stock traded at $12.50 on July 6, 2007, the most recent transaction known to the Bank.
Dividends
The Bank declared a dividend of $.10 per share payable on January 31, 2007, to holders of record on December 31, 2006. That is the only dividend declared to date, but the Bank anticipates a practice of declaring dividends on a regular quarterly basis. Payment of dividends is at the discretion of the Bank’s Board of Directors and is subject to various federal and state regulatory limitations. See Item 1, “Supervision and Regulation-Dividend Limitations.”
Recent Sales of Unregistered Securities
The Bank’s issuance of unregistered common stock in connection with the Merger was reported on a Form 8-K filed with the FDIC on February 23, 2007.
Repurchases of Shares of Common Stock
Carter Bank & Trust did not repurchase any shares of its common stock during the fourth quarter of 2006.
18
Table of Contents
ITEM 6. SELECTED FINANCIAL DATA
Carter Bank & Trust did not commence business until December 29, 2006, when each of the ten Merged Banks were merged into Carter Bank & Trust.
The information required by this Item with respect to each of the Merged Banks individually for the years 2005, 2004, 2003, 2002 and 2001, and the six months ended June 30, 2006, and June 30, 2005, is included at pages 21-31 of the Joint Proxy Statement filed as Exhibit 99.1 to the Bank’s report on Form 8-K filed with the FDIC on February 23, 2007, and is incorporated herein by reference. Certain additional information with respect to Carter Bank & Trust, presented on a pro forma basis for the year ended December 31, 2005, and the six months ended June 30, 2006, is included at pages 32-33 of the Joint Proxy Statement filed as Exhibit 99.1 to the Bank’s report on Form 8-K filed with the FDIC on February 23, 2007, and is incorporated herein by reference.
ITEM 7. MANAGEMENT’S DISCUSSION AND ANALYSIS OF FINANCIAL CONDITION AND RESULTS OF OPERATION
Explanatory Note
As noted throughout this report, Carter Bank & Trust did not commence business until December 29, 2006, when each of the ten Merged Banks were merged into Carter Bank & Trust
The information required by this Item with respect to each of the Merged Banks individually is contained in the annual reports on Forms 10-K or 10-KSB for the year 2005 for each of the Merged Banks that was a “reporting bank” under the Securities Exchange Act of 1934 prior to the Merger, contained in the exhibits to the Joint Proxy Statement filed as Exhibit 99.1 to the Bank’s report on Form 8-K filed with the FDIC February 23, 2007, and to the Forms 10-Q or 10-QSB for those reporting banks for the nine months ended September 30, 2006, filed as Exhibit 99.3 to Carter Bank & Trust’s report on Form 8-K filed with the FDIC February 23, 2007, and incorporated by reference herein.
Management’s Discussion and Analysis of Financial Condition and Results of Operation
Except for the historical information contained in this report, the matters set forth herein include Forward-Looking Statements within the meaning of the “safe harbor” provisions of the Private Securities Litigation Reform Act of 1995. These Forward-Looking Statements include, among other things, statements of goals, plans, intentions and expectations, regarding or based upon desired business strategies, general economic conditions, interest rates, developments in local and national markets, and other matters, which, by their nature, are subject to significant uncertainties. Because of these uncertainties and the assumptions upon which this report is based, actual future developments with respect to the business of the Bank may differ materially from those contemplated by such statements.
Critical Accounting Policies.The accounting and reporting policies of the Bank conform to generally accepted accounting principles (“GAAP”) in the United States of America and to general practices within the banking industry. The preparation of the financial statements in conformity with GAAP requires management to make estimates and assumptions that affect the amounts reported in the consolidated financial statements and accompanying notes. We believe the most significant of these estimates involves the allowance for loan losses because of
19
Table of Contents
its potential impact on our overall performance. We have described our policies in this area below. A summary of the Bank’s significant accounting policies can be found in the Notes to Consolidated Financial Statements.
In general, determining the amount of the allowance for loan losses requires significant judgment and the use of estimates by management. The Bank maintains an allowance for loan losses to absorb probable losses in the loan portfolio based on a quarterly analysis of the portfolio and expected future losses. This analysis determines an appropriate level of the allowance for loan losses by considering factors affecting loan losses, including specific losses, levels and trends in impaired and non-performing loans, historical loan loss experience, current economic conditions, volume, growth and composition of the portfolio, and other relevant factors. The Bank records a provision for loan losses to maintain the allowance at an adequate level. The provision expense could increase or decrease each quarter based upon the results of management’s formal analysis.
The amount of the allowance represents management’s estimate of expected losses from existing loans based upon specific allocations for individual lending relationships and historical loss experience. The allowance for loan losses related to impaired loans is based on discounted cash flows using the loan’s initial effective interest rate or the fair value of the collateral for certain collateral dependent loans. This evaluation requires management to make estimates of the amounts and timing of future cash flows on impaired loans, which consists primarily of nonaccrual and restructured loans. Actual losses for these loans can vary significantly from these estimates.
Accounting Treatment of the Merger.Under GAAP, the Merger was required to be treated as a “purchase” transaction for accounting purposes. (See Item 1, “Business-Accounting Treatment of the Merger” above.) Thus, for accounting purposes, the Merger was required to be treated as if one of the Merged Banks was the “acquiring” bank that acquired the other Merged Banks. For this purpose, Peoples National Bank, which was the largest of the Merged Banks in terms of shareholders’ equity, was designated as the “acquiring” bank in the Merger for accounting purposes. As a result, under GAAP, purchase accounting adjustments were required to be made with respect to each of the Merged Banks other than Peoples National Bank. Also, under GAAP, the financial statements presented elsewhere in this annual report on Form 10-K are required to include financial statements of Peoples National Bank for 2005 and 2006 (until December 29, 2006) and to reflect the operations of Carter Bank & Trust for the two-day period December 30-31, 2006.
Financial Statement Presentation. It is important that readers of this Management’s Discussion and Analysis understand that the financial information presented herein and in the financial statements is not simply an arithmetic combination of accounts of the respective Merged Banks as of and for the periods indicated. There are two important differences.
First, the prior financial statements of each of the Merged Banks did not consolidate financial statements of The Mortgage Corporation of Virginia, Inc. and its subsidiaries, BSVA and Bank Services Insurance, Inc., because each of the respective Merged Banks owned only a 10% interest in MCOV.
Secondly, the financial statements for 2006 reflect purchase accounting adjustments required by the application of GAAP as a result of the Merger. The nature of these adjustments are explained in detail in Note 24 of the Notes to Consolidated Financial Statements, and you are urged to review that information carefully.
As discussed previously, Peoples National Bank, the largest of the ten Merged Banks, was deemed to be the “acquirer” of each of the other nine Merged Banks. The statement of financial condition contains information for Carter Bank & Trust for December 31, 2006, and
20
Table of Contents
information for Peoples National Bank for December 31, 2005. The statement of income for 2006, the statement of cash flows for 2006, and the statement of equity for 2006, include information for Peoples National Bank through December 29, 2006, plus two days of information for Carter Bank & Trust. The remaining data for 2005 and 2004 is of Peoples National Bank. The historical data for 2006 cannot be compared reasonably to the prior period data due to the uniqueness of the merger transaction.
Summary of Operations.Net income for 2006 was $1,891,000 or $0.76 per share. Net income for Peoples National Bank for 2005 was $2,091,000 or $0.83 per share, compared to $2,836,000 or $1.14 per share in 2004. This represents a return on average assets of 0.47% and return on average equity of 4.53% for 2005 compared to 0.77% and 7.59%, respectively, for 2004.
Carter Bank & Trust’s total deposits were $2.4 billion at December 31, 2006, while Peoples National Bank’s total deposits were $318 million at December 31, 2005.
Net Interest Income. Net interest income is our largest source of revenue and has been impacted by the low interest rates for the last two years. The Federal Reserve began to lower the target fed funds rate from 6.50% on May 16, 2000 to 1.00% on June 25, 2003. The 1.00% rate continued until June 30, 2004, when the Federal Reserve began a series of one-quarter percent increases on 17 different occasions with the latest increase in June, 2006 to 5.25%, where the rate remains today.
Net interest income was $10.7 million for the period ending December 31, 2006. Net interest income for Peoples National Bank for year ended December 31, 2005 was $10.1 million compared to $10.8 million for 2004. With interest rates at a higher level, we anticipate our existing loans will increase in yield at a faster pace than the net increase in the costs of deposits. We anticipate a significant improvement in net interest income during 2007.
The following table shows the changes in interest income and interest expense resulting from changes in volume and changes in rates for each category of interest-earning assets and interest-bearing liabilities for 2006/2005 and 2005/2004:
| (Dollars in thousands) | 2006 vs 2005 | 2005 vs 2004 | ||||||
| Increase | Increase | |||||||
Asset/Liability | (Decrease) | (Decrease) | ||||||
Real Estate Loans | $ | 1,533 | $ | (207 | ) | |||
Installment Loans | 15 | (4 | ) | |||||
Commercial Loans | 369 | 176 | ||||||
Total Loans | 1,917 | (35 | ) | |||||
Interest-Bearing Deposits in Other Financial Institutions | 175 | 327 | ||||||
Investment Securities | 368 | (706 | ) | |||||
Federal Funds Sold | 653 | 37 | ||||||
Total Earning Assets | 3,113 | (377 | ) | |||||
Interest-Bearing Transaction Accounts | 440 | (27 | ) | |||||
Savings/MMA Accounts | (93 | ) | (56 | ) | ||||
21
Table of Contents
| (Dollars in thousands) | 2006 vs 2005 | 2005 vs 2004 | ||||
Asset/Liability | Increase (Decrease) | Increase (Decrease) | ||||
Certificates of Deposit Over $100,000 | 645 | 153 | ||||
Other Certificates of Deposit | 1,351 | 348 | ||||
Total Deposits | 2,343 | 418 | ||||
Federal Funds Purchased | (7 | ) | 3 | |||
Notes issued to the U. S. Treasury | 7 | 1 | ||||
Total Interest-Bearing Liabilities | 2,343 | 422 | ||||
Net Interest Income | 770 | (799 | ) | |||
The following table details the average balances and cost and yield data for the earning assets and interest-bearing liabilities:
| (Dollars in thousands) | |||||||||||||||||||||||||||
| 2006 | 2005 | 2004 | |||||||||||||||||||||||||
Asset/Liability | Average Balance | Yield/ Cost | Average Balance | Yield/ Cost | Average Balance | Interest | Yield/ Cost | ||||||||||||||||||||
Real Estate Loans | $ | 163,380 | $ | 11,397 | 6.98 | % | $ | 208,503 | $ | 9,864 | 4.73 | % | $ | 158,091 | $ | 10,071 | 6.37 | % | |||||||||
Installment Loans | 14,251 | 1,242 | 8.72 | % | 13,826 | 1,227 | 8.87 | % | 12,589 | 1,231 | 9.78 | % | |||||||||||||||
Commercial Loans | 35,425 | 2,287 | 6.46 | % | 36,829 | 1,918 | 5.21 | % | 27,341 | 1,742 | 6.37 | % | |||||||||||||||
Total Loans | 213,056 | 14,926 | 7.01 | % | 259,158 | 13,009 | 5.02 | % | 198,021 | 13,044 | 6.59 | % | |||||||||||||||
Interest-Bearing Deposits in Other Financial Institutions | 19,132 | 959 | 5.01 | % | 23,031 | 784 | 3.40 | % | 19,827 | 457 | 2.30 | % | |||||||||||||||
Investment Securities | 79,171 | 3,665 | 4.63 | % | 89,861 | 3,297 | 3.67 | % | 105,500 | 4,003 | 3.79 | % | |||||||||||||||
Federal Funds Sold | 15,058 | 927 | 6.16 | % | 18,226 | 274 | 1.50 | % | 20,143 | 237 | 1.18 | % | |||||||||||||||
Total Earning Assets | 326,417 | 20,477 | 6.27 | % | 390,276 | 17,364 | 4.45 | % | 343,491 | 17,741 | 5.16 | % | |||||||||||||||
Interest-Bearing Transaction Accounts | 24,081 | 551 | 2.29 | % | 22,631 | 111 | 0.49 | % | 25,903 | 138 | 0.53 | % | |||||||||||||||
Savings/MMA Accounts | 62,763 | 1,156 | 1.84 | % | 81,148 | 1,249 | 1.54 | % | 90,235 | 1,305 | 1.45 | % | |||||||||||||||
Certificates of Deposit Over $100,000 | 36,637 | 1,714 | 4.68 | % | 28,805 | 1,069 | 3.71 | % | 37,654 | 916 | 2.43 | % | |||||||||||||||
Other Certificates of Deposit | 158,918 | 6,296 | 3.96 | % | 143,353 | 4,945 | 3.45 | % | 149,934 | 4,597 | 3.07 | % | |||||||||||||||
Total Deposits | 282,399 | 9,717 | 3.44 | % | 275,937 | 7,374 | 2.67 | % | 303,726 | 6,956 | 2.29 | % | |||||||||||||||
Federal Funds Purchased | 471 | 2 | 0.42 | % | 565 | 9 | 1.59 | % | 1,031 | 6 | 0.58 | % | |||||||||||||||
Notes issued to the U. S. Treasury | 1,545 | 9 | 0.58 | % | 202 | 2 | 0.99 | % | 182 | 1 | 0.55 | % | |||||||||||||||
Total Interest-Bearing Liabilities | $ | 284,415 | $ | 9,728 | 3.42 | % | $ | 276,704 | $ | 7,385 | 2.67 | % | $ | 304,939 | $ | 6,963 | 2.28 | % | |||||||||
Net Interest Income | $ | 10,749 | $ | 9,979 | $ | 10,778 | |||||||||||||||||||||
Net Yield on Earning Assets | 3.29 | % | 2.56 | % | 3.14 | % | |||||||||||||||||||||
22
Table of Contents
Loans.Total net loans for Carter Bank & Trust at December 31, 2006 equaled $1.4 billion. Net loans for Peoples National Bank totaled $204,632,000 at December 31, 2005.
Our loan portfolio continues to remain concentrated in loans secured by real estate and remains flexible in the maturity of the loan portfolio. Half of the loans have adjustable interest rates as of year-end 2006. In addition, the combination of adjustable-rate and fixed rate loans that adjust or mature within one year equals 32% of the total portfolio at year end 2006.
Allowance and Provision for Loan Losses.The Allowance for Loan Losses represents management’s estimation of the amount necessary to absorb future losses in the loan portfolio. On the Statement of Condition, the Allowance for Loan Losses is deducted from Total Loans so that the net amount shown represents the estimated realizable total loans. The Provision for Loan Losses is the amount charged to expense to maintain the Allowance at an adequate level.
Based on management’s analysis of the loan portfolio, including nonacccrual and impaired loans, the Provision for Loan Losses, for Peoples National Bank, was $120,000 for 2006, 2005 and 2004. All three years contain information for Peoples National Bank.
| (Dollars in thousands) | December 31, | |||||||||||
| 2006 | 2005 | 2004 | ||||||||||
Balance Beginning of Year | $ | 2,367 | $ | 2,412 | $ | 2,387 | ||||||
Provision for Loan Losses | 120 | 120 | 120 | |||||||||
Net Loan Losses: | ||||||||||||
Real Estate Loans | 415 | 88 | 22 | |||||||||
Installment Loans | 41 | 75 | 73 | |||||||||
Commercial Loans | — | 2 | — | |||||||||
Total Net Loan Losses | 456 | 165 | 95 | |||||||||
Adjustment from Merger | 10,806 | — | — | |||||||||
Balance End of Year | $ | 12,837 | $ | 2,367 | $ | 2,412 | ||||||
Net loan losses to average loans | 0.00 | % | 0.05 | % | 0.05 | % | ||||||
Allowance for Loan Losses to Year-end loans | 0.91 | % | 1.14 | % | 1.15 | % | ||||||
Nonaccrual loans are those loans contractually past due 90 days or more on which no interest is being accrued. Other real estate owned consists of real estate acquired through foreclosure. These properties are reviewed quarterly and reduced to an estimated realizable value at that time.
23
Table of Contents
Information concerning nonaccrual loans and other real estate owned is presented in the following table.
| (Dollars in thousands) | December 31, | |||||||||||
| 2006 | 2005 | 2004 | ||||||||||
Nonaccrual Loans | ||||||||||||
Real Estate Loans | $ | 21,691 | $ | 5,144 | $ | 1,903 | ||||||
Installment Loans | 129 | 16 | 2 | |||||||||
Commercial Loans | 125 | 5 | 5 | |||||||||
Total Nonaccrual Loans | 21,945 | 5,165 | 1,910 | |||||||||
Real Estate Owned Other Than Bank Premises | 12,156 | 257 | 128 | |||||||||
Total Nonperforming Assets | $ | 34,101 | $ | 5,422 | $ | 2,038 | ||||||
Allowance for Loan Losses to total nonperforming assets | 38 | % | 44 | % | 118 | % | ||||||
The following table presents the volume of loans contractually past due for 90 days or more on which interest continues to be accrued. These loans are believed to be well collateralized and present little or no likelihood of loss of principal.
| (Dollars in thousands) | December 31, | ||||||||
| 2006 | 2005 | 2004 | |||||||
Loans 90 Days or More Past Due | |||||||||
Real Estate Loans | $ | 146 | $ | 196 | $ | 1,085 | |||
Installment Loans | 48 | 62 | 43 | ||||||
Commercial Loans | — | — | — | ||||||
Total Loans 90 Days or More Past Due | $ | 194 | $ | 258 | $ | 1,128 | |||
Non-Interest Income and Expense.Non-interest income equaled $1.0 million for 2006, $1.1 million for 2005 and $1.3 million for 2004. The principal component of non-interest income is service charges, commissions and fees, which equaled $851,000 for 2006, $995,000 and $1.1 million for 2004. Non-interest expense equaled $9.0 million for 2006, $8.3 million for 2005 and $7.8 million for 2004. Salaries and employee benefits, which is the largest of these expenses, equaled $4.6 million for 2006 and 2005 and $4.5 million for 2004.
Investments.The total investment portfolio for Carter Bank & Trust at December 31, 2006 was $452 million. The total investment portfolio for Peoples National Bank at December 31, 2005 was $96 million.
Deposits.Total deposits for Carter Bank & Trust for 2006 equaled $2.4 billion. Total deposits for Peoples National Bank for 2005 equaled $318 million. There was a shift in deposits as customers moved funds from shorter term categories into Certificates of Deposit.
Contractual Obligations.The Bank leased facilities under non-cancelable operating leases during 2006, 2005, and 2004. The Bank leases forty-six offices from Bank Building Corporation. These leases required the Bank to pay maintenance, insurance and property taxes and do not have renewal options. Rental expense under these leases was $324,000 in 2006, $314,000 in 2005 and $329,000 in 2004. The Bank also leases offices from non-related parties under various terms. Rental expenses for these leases was $27,000 in 2006 and 2005 and $9,000 in 2004.
24
Table of Contents
Future minimum rental payments under these are as follows:
(Dollars in thousands)
| Payments due by period | |||||||||||||||
Contractual Obligations | Total | Less Than 1 Year | 1-3 Years | 3-5 Years | More than 5 years | ||||||||||
Operating Leases | $ | 20,302 | $ | 1,747 | $ | 4,153 | $ | 5,980 | $ | 8,422 | |||||
Total | $ | 20,302 | $ | 1,747 | $ | 4,153 | $ | 5,980 | $ | 8,422 | |||||
Off-Balance Sheet Arrangements.The Bank enters into certain off-balance sheet arrangements in the normal course of business to meet the financing needs of customers. These off-balance sheet arrangements include commitments to extend credit and standby letters of credit. Commitments to extend credit, which amounted to approximately $48,359,000 and $5,079,000 at December 31, 2006 and 2005, respectively, represent agreements to lend to customers with fixed expiration dates or other termination clauses. Since many of the commitments are expected to expire without being funded, the total commitment amounts do not necessarily represent future liquidity requirements. Standby letters of credit are conditional commitments issued by the Bank guaranteeing the performance of a customer to a third party. Those guarantees are primarily issued to support public and private borrowing arrangements. The Bank had outstanding letters of credit in the amount of $5,312,000 at December 31, 2006 and $711,000 at December 31, 2005.
Capital.The federal regulatory agencies use risk-based capital ratios to analyze the adequacy of a bank’s capital. These ratios weigh bank assets from 0% to 100% depending upon the risks inherent in each type of asset. The Bank continues to meet all requirements for a well-capitalized bank as defined by the regulatory agencies. The following table presents the key risk-based capital ratios for Peoples National Bank for 2006 and 2005. Additional details regarding capital may be found in the Notes to Consolidated Financial Statements.
| 2006 | 2005 | |||||
Tier 1 Ratio | 12.29 | % | 15.88 | % | ||
Total Risk-Based Capital Ratio | 13.12 | % | 16.88 | % | ||
Leverage Ratio | 7.86 | % | 10.70 | % |
Liquidity.Liquidity is our ability to fund both loans and investments in the normal course of business and to provide adequate protection for unexpected deposit withdrawals or other demands for funds without incurring a significant negative impact on profitability. Our primary source of day-to-day liquidity lies in the combination of cash, deposit balances, checks in process of collection, deposit growth and federal funds sold. Federal funds are excess funds that are sold to other banks, generally on a one-day basis. Normal funds from the repayment of loans and investments augment these funds.
Our secondary source of liquidity lies in our investments and deposits in other financial institutions. While our investments are categorized as held-to-maturity, they consist of short-term U. S. Government Agencies that are readily marketable. As reflected in the previous Interest Sensitivity Analysis, the majority of our investment securities mature in five years or less. Interest-bearing deposits in other financial institutions generally mature in one year. The total of these deposits at December 31, 2006 was $173 million.
25
Table of Contents
Effects of Inflation.The effect of changing prices is typically different for financial institutions than for other entities because a financial institution’s assets and liabilities are monetary in nature. Interest rates are significantly impacted by inflation, but neither the timing nor the magnitude of the changes is directly related to price-level indices. The consolidated financial statements reflect the impacts of inflation on interest rates, loan demands and deposits.
MANAGEMENT’S RESPONSIBILITY FOR FINANCIAL REPORTING
The management of Carter Bank & Trust has prepared and is responsible for the accompanying financial statements, together with the financial data and other information presented in this annual report. Management believes that the financial statements have been prepared in conformity with accounting principles generally accepted in the United States appropriate under the circumstances and include amounts that are based on management’s best estimates and judgments.
Management maintains and depends upon an internal accounting control system designed to provide reasonable assurance that transactions are executed in accordance with management’s authorization, that financial records are reliable as the basis for preparation of all financial statements, and that the Bank’s assets are safeguarded. The design and implementation of all systems of internal control are based on judgments required to evaluate the costs of control in relation to the expected benefits and to determine the appropriate balance between these costs and benefits. The Bank maintains a professional internal audit staff to monitor compliance with the system of internal control. Operational and special audits are conducted, and audit reports are submitted to appropriate management.
The Audit Committee of the Board of Directors meets periodically with the independent public accountants, Goodman & Company, management and internal auditors to review accounting, auditing and internal reporting matters. The independent public accountants and internal auditors have free access to the Audit Committee to discuss the results of their audit work and their evaluations of internal controls and the quality of financial reporting.
The responsibility of Goodman & Company is limited to an expression of their opinion as to the fairness of the financial statements. Their opinion is based on an audit conducted in accordance with Standards of the Public Company Accounting Oversight Board (United States), as described in their report included with the Consolidated Financial Statements herein.
Worth Harris Carter, Jr. | Jane Ann Davis | |
Chairman of the Board and President | Vice President |
ITEM 7A. QUANTITATIVE AND QUALITATIVE DISCLOSURES ABOUT MARKET RISK
Interest Sensitivity Analysis
The frequency with which interest rates on earning assets and interest bearing liabilities change has a significant impact on net interest income. The following table presents the
26
Table of Contents
anticipated changes based on the contractual maturity of each instrument. Expected maturities may differ from contractual maturities as both borrowers and depositors may have the right to call or prepay obligations with or without call or prepayment penalties.
The following table shows information for Carter Bank & Trust as of December 31, 2006:
(Dollars in thousands) Uses of Funds | Within One Year | One to Five Years | Over Five Years | Total | ||||||||||
Interest-Bearing Deposits in Other Financial Institutions | $ | 160,308 | $ | 12,870 | $ | — | $ | 173,178 | ||||||
Investment Securities | 112,930 | 339,251 | — | 452,181 | ||||||||||
Federal Funds Sold | — | — | — | — | ||||||||||
Loans (Net of Nonacccrual Loans) | 429,099 | 550,750 | 410,157 | 1,390,006 | ||||||||||
Total Earning Assets | $ | 702,337 | $ | 902,871 | $ | 410,157 | $ | 2,015,365 | ||||||
Deposits | ||||||||||||||
Interest-Bearing Demand | $ | 254,663 | $ | — | $ | — | $ | 254,663 | ||||||
Savings (Including MM’s) | 306,071 | — | — | 306,071 | ||||||||||
Time Deposits | ||||||||||||||
Certificates of Deposit Over $100,000 | 205,847 | 125,604 | — | 331,451 | ||||||||||
Other | 689,820 | 414,726 | — | 1,104,546 | ||||||||||
Total Interest-Bearing Deposits | 1,456,401 | 540,330 | — | 1,996,731 | ||||||||||
Federal Funds Purchased | — | — | — | — | ||||||||||
Notes issued to the U. S. Treasury | 4,054 | — | — | 4,054 | ||||||||||
Total Interest-Bearing Liabilities | $ | 1,460,455 | $ | 540,330 | $ | — | $ | 2,000,785 | ||||||
Maturity/Rate Sensitivity Gap Per Period | $ | (758,118 | ) | $ | 362,541 | $ | 410,157 | $ | 14,580 | |||||
Cumulative Maturity/Rate Sensitivity Gap | $ | (758,118 | ) | $ | (395,577 | ) | $ | 14,580 | ||||||
The Bank is not a party to any derivative financial instruments.
27
Table of Contents
ITEM 8. FINANCIAL STATEMENTS AND SUPPLEMENTARY DATA
The report of the independent registered public accounting firm, the audited balance sheet of Carter Bank & Trust at December 31, 2006, and the audited financial statements of Peoples National Bank (which, in the case of the statement of income for 2006, the statement of cash flows for 2006, and the statement of equity for 2006, include information for Peoples National Bank through December 29, 2006, plus two days of information for Carter Bank & Trust), and the accompanying notes and supplementary data required by this Item are contained in the 2006 Annual Report to Shareholders, portions of which are included as Exhibit 13 to this report and are incorporated herein by reference. See “Management’s Discussion and Analysis” in Item 7 above, under the caption “Accounting Treatment of the Merger” for an explanation of the financial statement presentation included elsewhere herein.
ITEM 9. CHANGES IN AND DISAGREEMENTS WITH ACCOUNTANTS ON ACCOUNTING AND FINANCIAL DISCLOSURE
None.
ITEM 9A. CONTROLS AND PROCEDURES
Disclosure Controls and Procedures
The Bank maintains a system of disclosure controls and procedures that is designed to ensure that material information is accumulated and communicated to management, including the Bank’s president (who is the Bank’s principal executive officer) and principal financial officer, as appropriate to allow timely decisions regarding required disclosure. As required, management, with the participation of the Bank’s president and principal financial officer, evaluated the effectiveness of the design and operation of the Bank’s disclosure controls and procedures as of the end of the period covered by this report. Based on this evaluation, the Bank’s president and principal financial officer concluded that the Bank’s disclosure controls and procedures were operating effectively to ensure that information required to be disclosed by the Bank in reports that it files or submits under the Securities Exchange Act of 1934, as amended, is recorded, processed, summarized, and reported within the time periods specified in the rules and forms of the SEC as such rules and forms have been adopted by the FDIC.
Because of the inherent limitations in all control systems, no evaluation of controls can provide absolute assurance that the Bank’s disclosure controls and procedures will detect or uncover every situation involving the failure of persons within the Bank to disclose material information otherwise required to be set forth in the Bank’s periodic reports.
Changes in Internal Control Over Financial Reporting
The Bank’s management is also responsible for establishing and maintaining adequate internal control over financial reporting to provide reasonable assurance regarding the reliability of financial reporting and the preparation of financial statements for external purposes in accordance with generally accepted accounting principles. There were no changes in the Bank’s internal control over financial reporting during the quarter ended December 31, 2006 that have materially affected, or are reasonably likely to materially affect, the Bank’s internal control over financial reporting.
28
Table of Contents
ITEM 9B. OTHER INFORMATION
None.
PART III
ITEM 10. DIRECTORS, EXECUTIVE OFFICERS AND CORPORATE GOVERNANCE
The following individuals are directors and executive officers of Carter Bank & Trust in each case, since December 29, 2006, the effective date of the Merger. Ages are given as of March 31, 2007:
| Directors | ||||||
Name | Age | Position | Business Experience During Past Five Years | |||
| Worth Harris Carter, Jr. | 69 | Chairman of the Board and President | Chairman of the Board of First National Bank from 1976 until the Merger, President from 1986 until the Merger.
Chairman of the Board and President of Patrick Henry National Bank from 1977 until the Merger.
Chairman of the Board Peoples National Bank from 1976 until the Merger, President from 1981 until the Merger.
Chairman of the Board of Blue Ridge Bank, N.A. from 1982 until the Merger, President from 2004 until the Merger.
Chairman of the Board and President of Community National Bank from 1985 until the Merger.
Chairman of the Board and President of Mountain National Bank from 1996 until the Merger.
Chairman of the Board and President of Shenandoah National Bank from 1996 until the Merger.
Chairman of Board and President of Central National Bank from 1996 until the Merger.
Chairman of the Board and President of Patriot Bank, N.A. from 1996 until the Merger.
Chairman of the Board and President of First National Exchange Bank from 1998 until the Merger.
Chairman of the Board and President of Mortgage Company of Virginia since 1984.
Chairman of the Board and President of BSVA since 1984.
Chairman of the Board and President of Bank Building Corporation since 1988.
Chairman of the Board and President of Coresoft, Inc. since 2004.
Chairman of the Board and President of Bank Services Insurance, Inc. since 2003.
Manager of Blackstone Properties LLC since 1998. | |||
29
Table of Contents
Name | Age | Position | Business Experience During Past Five Years | |||
George B. Buchanan, Jr. | 71 | Director | Chairman of the Board of Patricia Grand Hotels, Inc. Previously he was President of Danville Plywood Corporation, Danville, Virginia for more than five years. He also served as a director of Central National Bank from 1996 until the Merger and Peoples National Bank from 1978 until the Merger. | |||
Joseph L. Chandler | 74 | Director | Retired. Formerly, Manufacturing Manager, Small Power Division, ABB Power T & D Company, South Boston, Virginia for more than five years. He also served as a director of Community National Bank from 1985 until the Merger. | |||
Robert W. Conner | 67 | Director | Clerk of the Circuit Court of Halifax County for more than five years. He also has served as a director of Community National Bank from 1985 until the Merger and Bank Building Corporation since 1995. | |||
W. Lynwood Craig | 77 | Director | President and Treasurer of Bassett Oil & Equipment Company, Inc., Virginia for more than five years. He also served as a director of Patrick Henry National Bank from 1976 until the Merger and Shenandoah National Bank from 1996 until the Merger. | |||
Chester A. Gallimore | 70 | Director | President of Wills Ridge Supply for more than five years. He also served as a director of Blue Ridge Bank, N.A. from 1978 until the Merger. | |||
Charles E. Hall | 65 | Director | Farmer for more than five years. He also has served as a director of Blue Ridge Bank, N.A. from 1978 until the Merger and Bank Building Corporation since 1995. | |||
James W. Haskins | 66 | Director | Attorney and principal in the law firm of Young, Haskins, Mann & Gregory, Ltd., Martinsville, Virginia for more than five years. He also served as a director of Mountain National Bank from 1996 until the Merger and Patrick Henry National Bank from 1982 until the Merger. | |||
Walter P. Kingery | 75 | Director | Retired. Formerly dairy farmer in Franklin County, Virginia for more than five years. He also served as a director of First National Bank from 1974 until the Merger and First National Exchange Bank from 1998 until the Merger. | |||
Lanny A. Kyle, O.D. | 53 | Director | Currently practicing optometry in North Carolina. He formerly was Owner and President of Piedmont Optometric Association for more than five years. He also served as a director of Mountain National Bank from 2003 until the Merger. | |||
George W. Lester, II | 67 | Director | Chairman and Chief Executive Officer of the Lester Group, Inc., a Forest Products Company of Martinsville, Virginia for more than five years. He also served as a director of Patrick Henry National Bank from 1976 until the Merger and Shenandoah National Bank from 1996 until the Merger. | |||
Harry L. Mapp, Jr. | 76 | Director | Retired. Formerly attorney for more than five years. He also served as a director of Community National Bank from 1985 until the Merger. | |||
30
Table of Contents
Name | Age | Position | Business Experience During Past Five Years | |||
Sidney D. Mason | 79 | Director | Retired. Formerly Chairman of the Board of Virginia Apparel Corporation, Rocky Mount, Virginia for more than five years. He also served as a director of First National Bank from 1974 until the Merger and First National Exchange Bank from 1998 until the Merger. | |||
E. Warren Matthews | 66 | Director | Attorney in the firm of Harris, Matthews & Osborne, PC for more than five years. He also served as a director of Community National Bank from 1998 until the Merger. | |||
H. Marvin Midkiff, DDS | 82 | Director | Retired. Formerly Doctor of Dental Surgery and principal in H.M. Midkiff, DDS, Ltd., Martinsville, Virginia for more than five years. He also served as a director of Mountain National Bank from 1996 until the Merger and Patrick Henry National Bank from 1976 until the Merger. | |||
James C. Moses | 75 | Director | Retired. Formerly President of Moses Insurance Agency, Inc. He also served as a director of Central National Bank from 1996 until the Merger, Peoples National Bank from 1977 until the Merger and of Patriot Bank, N.A. from 1996 until the Merger. | |||
Joseph E. Pigg | 71 | Director | President of Millard’s Machinery, Inc., an industrial and logging equipment sales and service business for more than five years. He also served as a director of Patrick Henry National Bank from 1976 until the Merger and Shenandoah National Bank from 1996 until the Merger. | |||
Haller G. Prillaman | 73 | Director | President of Prillaman Brothers, Inc., Martinsville, Virginia. He was President of Prillaman Chemical Corp., Martinsville, Virginia and Daly Herring Company, Kingston, North Carolina for more than five years until 1987; Director, Ellis & Everard, PLC, Bradford, United Kingdom from August 1984 to July 1988; President and Director, Ellis & Everard (HOLDINGS), Inc., Atlanta, Georgia from October 1985 to July 1988. He also has served as a director of Mountain National Bank from 1996 until the Merger, Patrick Henry National Bank from 1976 until the Merger and Bank Building Corporation since 1995. | |||
Mary A. Ramsey | 82 | Director | Retired. Formerly operator of Chief Tassel Beauty Shoppe in Martinsville, Virginia for more than five years. She also served as a director of First National Bank from 1987 until the Merger and First National Exchange Bank from 1998 until the Merger. | |||
Larry N. Roach | 68 | Director | President of Larry Roach & Associates, Insurance Services, Inc. for more than five years. He also served as a director of Mountain National Bank from 1996 until the Merger and Patrick Henry National Bank from 1976 until the Merger. | |||
Leo H. Scott | 74 | Director | President of Leo H. Scott Cabinets, Inc., Ferrum, Virginia for more than five years. He also served as a director of First National Bank from 1974 until the Merger and First National Exchange Bank from 1998 until the Merger. | |||
Simon C. Spencer | 71 | Director | Retired. Formerly Assistant Principal of Fieldale-Collinsville High School for more than five years and Lt. Colonel, U.S. Army. He also served as a director of Patrick Henry National Bank from 1976 until the Merger and Shenandoah National Bank from 1996 until the Merger. | |||
31
Table of Contents
Name | Age | Position | Business Experience During Past Five Years | |||
William B. Sumner | 65 | Director | Retired. Formerly owner of Floyd Press, Inc. for more than five years. He also served as a director of Blue Ridge Bank, N.A. from 1978 until the Merger. | |||
James M. Thomasson | 76 | Director | Retired. Formerly Executive Vice President and Cashier of Patrick Henry National Bank for more than five years. He also served as a director of Patrick Henry National Bank from 1978 until the Merger and Shenandoah National Bank from 1996 until the Merger. | |||
W.C. Trent, Jr. | 63 | Director | Investor. He was Vice President and Treasurer of Trent Furniture Corp., Bassett, Virginia for more than five years. He also served as a director of Patrick Henry National Bank from 1977 until the Merger and Shenandoah National Bank from 1996 until the Merger. | |||
Betty A. Williams | 71 | Director | Retired. Formerly Advertising Director of Floyd Press, Inc. for more than five years. She also served as a director of Blue Ridge Bank, N.A. from 1978 until the Merger. | |||
R.E. Williams | 72 | Director | Retired. Formerly President of Dry Fork Milling Company, Inc., Danville, Virginia for more than five years. He also has served as a director of Central National Bank from 1996 until the Merger, Patriot Bank, N.A. from 1996 until the Merger, Peoples National Bank from 1977 until the Merger and Bank Building Corporation since 1995. | |||
| Executive Officers | ||||||
Name | Age | Position | Business Experience During Past Five Years | |||
Worth Harris Carter, Jr. | 69 | Chairman of the Board and President | See above under “Directors.” | |||
Carol Ann Bondurant | 63 | Senior Vice President | Senior Vice President Operations, BSVA and has been for more than five years. | |||
Jane Ann Davis | 44 | Vice President | Assistant Comptroller, BSVA and has been for more than five years. | |||
Robert L. Dye, III | 49 | Vice President | Vice President, Blue Ridge Bank, N.A. and has been for more than five years. | |||
Wright L. Garrett | 65 | Senior Vice President | Senior Vice President, Peoples National Bank and has been for more than five years. He also served as a director of Patriot Bank, N.A. from 2005 until the Merger. | |||
Dianne S. Hall | 61 | Senior Vice President | Senior Vice President and Cashier, First National Bank and has been for more than five years. | |||
Phyllis Q. Karavatakis | 51 | Senior Vice President & Cashier | Senior Vice President and Cashier, Patrick Henry National Bank, and Senior Vice President Loan Origination, BSVA, and has been employed more than five years. She also served as a director of Central National Bank from 2005 until the Merger. | |||
32
Table of Contents
Name | Age | Position | Business Experience During Past Five Years | |||
Brenda A. Kendrick | 58 | Senior Vice President | Senior Vice President Operations, Peoples National Bank and has been for more than five years. She also served as a director of Peoples National Bank from 2005 until the Merger. | |||
Bradford M. Kendrick | 50 | Vice President | Vice President Data Processing Manager, BSVA and has been for more than five years. | |||
Steven M. Moses, Jr. | 61 | Vice President | Vice President Loan Administration, BSVA and has been for more than five years. | |||
William E. Oeters | 57 | Senior Vice President | Senior Vice President and Cashier, Patriot Bank, N.A. and has been for more than five years. He also served as a director of Patriot Bank, N.A. from 2003 until the Merger. | |||
William Wells | 60 | Senior Vice President | Senior Vice President, First National Bank and has been for more than five years. | |||
Directors serve one-year terms until their successors are elected and qualified. Executive officers are appointed by the Board of Directors and serve at the discretion of the Board of Directors.
The Board of Directors is not aware of any family relationship between any director or executive officer; nor is the Board of Directors aware of any involvement in legal proceedings that would be material to an evaluation of the ability or integrity of any director, executive officer or person serving as a director.
AUDIT COMMITTEE
Prior to the Merger, the full board of directors of each of the Merged Banks functioned as the audit committee for each respective Merged Bank. Carter Bank & Trust has created and designated a separate committee of its Board of Directors as the Audit Committee. Current members of the Bank’s Audit Committee are Messrs. Joseph L. Chandler, W. Lynwood Craig, Chester A. Gallimore, Walter P. Kingery, Joseph E. Pigg, James M. Thomasson and W. C. Trent, Jr., each of whom is “independent” for this purpose according to NASDAQ listing standards and the regulations of the SEC. The Audit Committee engages the Bank’s independent registered public accounting firm, approves the scope of the independent registered public accounting firm’s audit, reviews the reports of examination by the applicable Bank regulatory agencies and the independent registered public accountant, and the internal auditor, and will report to the Board of Directors periodically. The Audit Committee is expected to meet four times during 2007.
The Board of Directors has determined that Mr. James M. Thomasson qualifies as an “audit committee financial expert” within the meaning of applicable regulations of the SEC, promulgated pursuant to the Sarbanes-Oxley Act of 2002.
Section 16(a) Beneficial Ownership Reporting Compliance
Section 16(a) of the Securities Exchange Act of 1934 requires that directors and executive officers, and persons who beneficially owns more than 10% of the Bank’s equity securities, file reports of ownership and reports of changes in ownership of the Bank’s outstanding equity securities. No such filings were required to be filed in 2006 with respect to the Bank. Prior to consummation of the Merger, all such filings with respect to the ownership of the Merged Banks’ then-outstanding equity securities had been filed timely in 2006.
33
Table of Contents
Code of Ethics
The Bank has adopted a Code of Ethics that applies to its directors, executive officers and employees. The Code of Ethics is filed herewith as Exhibit 14.
Shareholder Director Recommendation Process
The entire Board of Directors performs the functions of a Nominating Committee for the Bank. As a result of the Merger, Carter Bank & Trust has a larger board of directors than did any of the Merged Banks. The Board of Directors will continue to assess the need for a nominating committee as it gains additional experience working together as a single board. The Board has no prescribed minimum qualifications for nominees and will consider recommendations to the Board from shareholders as appropriate, as did the boards of each of the Merged Banks.
ITEM 11. EXECUTIVE COMPENSATION
Compensation Discussion & Analysis
The Bank’s compensation program is substantially similar to that of each of the Merged Banks prior to the Merger. The Bank’s compensation program is designed to offer competitive compensation to employees based on each individual’s contribution to the Bank’s overall success. As such, the program provides a competitive compensation package to attract and retain capable employees.
The compensation and benefits program consists of salary, a profit sharing plan, and life, health and disability insurance. The compensation and benefits program for officers parallels that of all other employees. The Bank offers no stock options or other forms of equity compensation, bonuses, employment contracts, country club memberships or other perquisites to officers or employees.
The entire Board of Directors performs the functions of a Salary Committee for the Bank. The Board has the responsibility for administering the Bank’s overall compensation program and for setting the salaries for the Bank’s officers. In setting the compensation of the Bank’s officers, including the compensation of the Bank’s Chairman and President, the Board will generally rely on the recommendations of the Chairman and President and the Board members’ own significant personal knowledge of the compensation provided to other, similarly situated, executives in banking and other industries in the local area. Neither the Bank nor the Board has engaged any compensation consultant in connection with its consideration of compensation matters. The Board also will review each individual’s performance and contribution to the overall Bank goals in determining the level of salary for the coming year. The Board of Directors has not adopted a charter relating to its consideration of compensation matters in its capacity as a Salary Committee.
As of March 31, 2007, compensation levels for Bank employees generally remained at the level paid to each employee by the Merged Bank or Bank affiliate for which such employee worked prior to the Merger. As appropriate and in keeping with the principles described above, the Board will take into account any additional, ongoing responsibilities assumed by employees upon consummation of the Merger in setting future compensation.
34
Table of Contents
Summary Compensation Table
Fiscal 2006
Because the Merger was consummated on December 29, 2006, the table below reflects compensation received by each named executive officer in 2006 from either a Merged Bank or other Bank affiliate, as further explained in the footnotes to the table.
Name and Principal Position with Carter Bank & Trust | Year | Salary ($) | Bonus (6) ($) | Stock Awards (6) ($) | Option Awards (6) ($) | Non-equity Incentive Plan Compensation (6) ($) | Change in Pension Value and Non-Qualified Deferred Compensation Earnings ($) | All Other Compensation(7)(8) ($) | Total ($) | |||||||||||||
Worth Harris Carter, Jr. Chairman of the Board and President (1) | 2006 | $ | 575,000 | N/A | N/A | N/A | N/A | $ | 49,470 | $ | 30,873 | $ | 655,343 | |||||||||
Phyllis Q. Karavatakis Senior Vice President and Cashier(2) | 2006 | $ | 150,600 | N/A | N/A | N/A | N/A | N/A | $ | 15,353 | $ | 165,953 | ||||||||||
Carol Ann Bondurant Senior Vice President(3) | 2006 | $ | 147,900 | N/A | N/A | N/A | N/A | N/A | $ | 16,527 | $ | 164,427 | ||||||||||
William E. Oeters Senior Vice President(4) | 2006 | $ | 147,900 | N/A | N/A | N/A | N/A | N/A | $ | 15,176 | $ | 163,076 | ||||||||||
Bradford M. Kendrick Vice President (5) | 2006 | $ | 120,000 | N/A | N/A | N/A | N/A | N/A | $ | 11,254 | $ | 131,254 | ||||||||||
| (1) | Compensation for Mr. Carter’s services as Chairman of the Board and President of all of the Merged Banks for 2006 was paid by BSVA, an affiliate of the Merged Banks. The Salary Committee of the board of directors of one of the Merged Banks (Patrick Henry National Bank) actually set Mr. Carter’s annual salary for 2006. The cost of Mr. Carter’s compensation, which consisted of his salary plus an amount equal to twenty-nine percent of his salary to cover payroll taxes and all other benefits, was shared by the Merged Banks on the basis of average deposits of each Merged Bank relative to total average deposits of all of the Merged Banks. Prior to the Merger, Mr. Carter also served as Chairman of the Board and President of MCOV, BSVA, Bank Services Insurance, Inc., and Bank Building Corporation, each of which was an affiliate of each of the Merged Banks. Mr. Carter continues to serve as Chairman of the Board and President of each of these entities, which are now direct or indirect wholly-owned subsidiaries of the Bank, except for Bank Building Corporation, which is an affiliate of the Bank. Mr. Carter did not receive compensation for his services to any such entities in 2006. |
| (2) | Compensation for 2006 was paid by BSVA, for whom Mrs. Karavatakis served as Senior Vice President prior to the Merger. |
| (3) | Compensation for 2006 was paid by BSVA, for whom Mrs. Bondurant served as Senior Vice President prior to the Merger. |
35
Table of Contents
| (4) | Compensation for 2006 was paid by Patriot Bank, NA, for whom Mr. Oeters served as Senior Vice President prior to the Merger. |
| (5) | Compensation for 2006 was paid by Bank Services of Virginia, Inc. for whom Mr. Kendrick served as Vice President prior to the Merger. |
| (6) | Neither Carter Bank & Trust nor any of the Merged Banks has or had any bonus compensation plan or arrangement, or any stock award plans, stock option plans, or other equity compensation plans or arrangements, or any non-equity incentive compensation plan or arrangement or any defined benefit or actuarial pension plans. For this reason, Carter Bank & Trust has not included in this annual report the tabular information that would otherwise be required under applicable rules and regulations for Grants of Plan-Based Awards, Outstanding Equity Awards at 2006 Fiscal Year End, Option Exercises and Stock Vested, or Pension Benefits. |
| (7) | The amount of compensation in the form of perquisites and other personal benefits properly categorized in this column did not exceed $10,000 for any named executive officer for 2006. |
| (8) | “All Other Compensation” consists of amounts contributed for 2006 for Mr. Carter under the Qualified Profit Sharing Plan of MCOV and life insurance premiums. For 2006, these amounts consisted of $23,943 contributed to the qualified plan and life insurance premiums of $6,930. “All Other Compensation” for Msses. Karavatakis and Bondurant, Messrs. Oeters and Kendrick consists of the contributions of $14,784, $14,585, $13,886, and $10,685 respectively, to the integrated profit sharing plan of each Merged Bank for whom a named executive officer worked on behalf of the indicated named executive officer and life insurance premiums of $569, $1,941, $1,290 and $569, respectively. All such named executive officers had more than five years of credited service under their respective Merged Bank’s profit sharing plans, and consequently have more than five years credit service under the Carter Bank & Trust profit sharing plan. Credited years of service is based on actual years of service. |
36
Table of Contents
Profit Sharing Plan
Carter Bank & Trust has adopted a profit sharing plan that was created by the merging of the ten merged bank’s plans and the Mortgage Company of Virginia plan into Peoples National Bank. The plan was renamed as the Carter Bank & Trust profit sharing plan. The plan covers all full time employees that have been employed for six (6) months and have reached the age of 20- 1/2 as of the first day of the plan year. Persons who have reached the age of 62 are fully vested regardless of length of service. For eligibility and vesting purposes, employees receive credit for previous employment with any of the Merged Banks, BSVA or other affiliates of the Bank. The regular vesting schedule is as follows:
Years of Service | Vested Percentage | Forfeitable Percentage | ||||
Less than 5 | 0 | % | 100 | % | ||
5 or more | 100 | % | 0 | % |
Each year the Board of Directors of the Bank will determine what amount, if any, is to be allocated to the plan out of accumulated or current earnings of the Bank. The combined contribution of the Merged Banks to their similar integrated profit sharing plans was $1,575,442 in 2006, $1,553,168 in 2005, and $1,550,385 in 2004.
Although Mr. Carter will participate in the qualified profit sharing plan of the Bank on and after January 1, 2007, prior to the Merger he participated in only two of the profit sharing plans. He participated in the plans of the MCOV and Patrick Henry National Bank. Mr. Carter also participated in the MCOV nonqualified plan for highly paid executives whose contribution to the qualified plan is limited due to IRS regulations. The contribution to the MCOV non-qualified plan is the difference between the amount that would have been allocated to Mr. Carter, in the banks qualified plan, if there was no IRS limitation and the actual amount allocated in the plan after applying the IRS limitation. Mr. Carter will continue to participate in these plans, both of which have become plans of Carter Bank & Trust. Contributions to the latter plan on behalf of Mr. Carter are intended to equal the amount that would have been contributed to the MCOV qualified profit sharing plan if contributions to that plan on behalf of Mr. Carter were not limited by law with respect to the allocation of the Company’s discretionary profit sharing contribution. The combined contributions of the Merged Banks to these MCOV plans on Mr. Carter’s behalf for 2006 is detailed in the Summary Compensation Table above. The Bank will continue to make contributions to these plans on Mr. Carter’s behalf on the same basis described above.
37
Table of Contents
Nonqualified Deferred Compensation
Fiscal 2006
As discussed above, prior to the Merger, MCOV offered a nonqualified profit sharing plan for highly paid executives to Mr. Carter. Information regarding Mr. Carter’s participation in the plan during 2006 is reflected in the following table.
NON-QUALIFIED DEFERRED COMPENSATION
Name | Executive Contributions In Last Fiscal Year ($) | Registrant Contributions In Last Fiscal Year ($) | Aggregate Earnings in Last FY ($) | Aggregate Withdrawals/ Distributions ($) | Aggregate Balance at Last FYE ($) | ||||||||
Worth Harris Carter, Jr. | N/A | $ | 49,470 | $ | 23,985 | N/A | $ | 756,587 | |||||
Health Plans
In addition, until December 29, 2006, there was a single health insurance plan for all officers and full-time employees of all the Merged Banks who met the eligibility requirements. There was also a group life insurance plan and short-term disability plan for officers and full-time employees, including those of BSVA. The plans have been continued by Carter Bank & Trust.
Potential Payments Upon Termination or Change in Control
Neither Carter Bank & Trust nor any of the Merged Banks prior to the Merger has or had any employment or change in control agreements with the executive officers, or any stock award plans, stock option plans, or other equity compensation plans or arrangements. For this reason, Carter Bank & Trust has no potential payments upon termination or change in control to report.
Director Compensation
Prior to the Merger, the Salary Committee of Patrick Henry National Bank determined the fees to be paid to non-employee directors of Patrick Henry National Bank based on the recommendation of Mr. Carter, which was based on a review of director fees paid by comparable community banks in Patrick Henry National Bank’s trade area. The Board of Directors of each of the other Merged Banks would then determine the fees to be paid to its non-employee directors based on the recommendation of Mr. Carter, which was similarly based on a review of director fees paid by comparable community banks in Merged Banks’ trade areas.
Prior to the Merger, non-employee directors of the Merged Banks received between $75 and $450 for each Board meeting attended, but did not receive annual retainers.
38
Table of Contents
Director Compensation Table
Fiscal 2006
The following table provides compensation information for the year ended December 31, 2006 for each non-employee member of the Merged Banks’ Boards of Directors.
Name (1) | Fees Earned or Paid in Cash ($) (2) | Stock Awards ($) | Option Awards ($) | Non-Equity Incentive Plan Compensation ($) | Change in Pension Value and Nonqualified Deferred Compensation Earnings ($) | All Other Compensation ($) | Total ($) | |||||||||
George B. Buchanan, Jr. | $ | 800 | — | — | — | — | — | $ | 800 | |||||||
Joseph L. Chandler | $ | 5,850 | — | — | — | — | — | $ | 5,850 | |||||||
Robert W. Conner | $ | 5,850 | — | — | — | — | — | $ | 5,850 | |||||||
W. Lynwood Craig | $ | 9,600 | — | — | — | — | — | $ | 9,600 | |||||||
Chester A. Gallimore | $ | 5,200 | — | — | — | — | — | $ | 5,200 | |||||||
Charles E. Hall | $ | 5,200 | — | — | — | — | — | $ | 5,200 | |||||||
James W. Haskins | $ | 9,600 | — | — | — | — | — | $ | 9,600 | |||||||
Walter P. Kingery | $ | 4,600 | — | — | — | — | — | $ | 4,600 | |||||||
Lanny A. Kyle, O.D. | $ | 4,550 | — | — | — | — | — | $ | 4,550 | |||||||
George W. Lester, II | $ | 8,800 | — | — | — | — | — | $ | 8,800 | |||||||
Harry L. Mapp, Jr. | $ | 5,850 | — | — | — | — | — | $ | 5,850 | |||||||
Sidney D. Mason | $ | 5,000 | — | — | — | — | — | $ | 5,000 | |||||||
E. Warren Matthews | $ | 4,950 | — | — | — | — | — | $ | 4,950 | |||||||
H. Marvin Midkiff, DDS | $ | 10,400 | — | — | — | — | — | $ | 10,400 | |||||||
James C. Moses | $ | 4,800 | — | — | — | — | — | $ | 4,800 | |||||||
Joseph E. Pigg | $ | 10,400 | — | — | — | — | — | $ | 10,400 | |||||||
Haller G. Prillaman | $ | 9,600 | — | — | — | — | — | $ | 9,600 | |||||||
Mary A. Ramsey | $ | 5,000 | — | — | — | — | — | $ | 5,000 | |||||||
Larry N. Roach | $ | 9,600 | — | — | — | — | — | $ | 9,600 | |||||||
Leo H. Scott | $ | 5,000 | — | — | — | — | — | $ | 5,000 | |||||||
Simon C. Spencer | $ | 10,400 | — | — | — | — | — | $ | 10,400 | |||||||
William B. Sumner | $ | 3,200 | — | — | — | — | — | $ | 3,200 | |||||||
James M. Thomasson | $ | 10,400 | — | — | — | — | — | $ | 10,400 | |||||||
W. C. Trent, Jr. | $ | 10,400 | — | — | — | — | — | $ | 10,400 | |||||||
Betty A. Williams | $ | 5,200 | — | — | — | — | — | $ | 5,200 | |||||||
R. E. Williams | $ | 5,200 | — | — | — | — | — | $ | 5,200 | |||||||
| (1) | Worth Harris Carter, Jr., the Bank’s Chairman of the Board and President, is not included in this table because he is an officer of the Bank and was an officer of each of the Merged Banks and receives no separate compensation for service as a director. The compensation received by Mr. Carter as an officer of the Bank and the Merged Banks is included in the Summary Compensation Table on page 35. |
| (2) | All fees reported were paid by the Merged Bank(s) on whose board the director served. |
The Carter Bank & Trust Board of Directors determines the fees to be paid to non-employee directors based on the recommendation of Mr. Carter, which is based on a review of director fees paid by comparable community banks in Carter Bank & Trust’s trade area. Each director of Carter Bank & Trust (who is not also an executive officer of the Bank) currently receives $600 for each Board meeting attended and $300 for each committee meeting attended. Carter Bank & Trust does not pay its directors an annual retainer.
39
Table of Contents
SALARY COMMITTEE REPORT
The Salary Committee of the Board of Directors has reviewed and discussed with management the Compensation Discussion & Analysis included above. Based upon such review, the related discussions and such other matters deemed relevant and appropriate by the Committee, the Committee has recommended to the Board of Directors the inclusion of the Compensation Discussion & Analysis in this annual report on Form 10-K.
Salary Committee Interlocks and Insider Participation
All of the members of the Board of Directors, except Mr. Carter, are independent non-management directors. None of the members of the Board of Directors has served as an officer or employee of Carter Bank & Trust except Mr. Carter, and none of the executive officers of Carter Bank & Trust has served as a member of a compensation committee or board of directors of any other entity which has an executive officer serving as a member of the Bank’s Board of Directors. A description of Mr. Carter’s relationships with the Bank, required to be described under Regulation S-K, Item 404, is provided in Part II, Item 13 of this report and is incorporated herein by reference.
ITEM 12. SECURITY OWNERSHIP OF CERTAIN BENEFICIAL OWNERS AND MANAGEMENT AND RELATED STOCKHOLDER MATTERS
Beneficial Ownership of 5% or Greater Shareholders and of Directors and Executive Officers
The following table shows as of February 23, 2007, the beneficial ownership of the Bank’s common stock of each director, the executive officers identified in the Summary Compensation Table and the Bank’s directors and executive officers as a group. To the Bank’s knowledge, Worth Harris Carter, Jr., Chairman of the Board and President of the Bank, is the Bank’s only shareholder beneficially holding 5% or more of the Bank’s outstanding common stock. As of February 23, 2007, the Bank’s directors and executive officers as a group, beneficially owned 8,103,568 shares (or 32.42%) of the Bank’s outstanding common stock.
Name | Amount and Nature of Beneficial Ownership (1) (2) | Ownership as a Percentage of Common Stock Outstanding | ||||
Bondurant, Carol Ann | 77,642 | (3) | * | |||
Buchanan, George B., Jr. | 314,385 | (4) | 1.26 | % | ||
Carter, Worth Harris, Jr. | 3,070,815 | (5) | 12.28 | % | ||
Chandler, Joseph L. | 27,243 | (6) | * | |||
40
Table of Contents
Name | Amount and Nature of Beneficial Ownership (1) (2) | Ownership as a Percentage of Common Stock Outstanding | ||||
Conner, Robert W. | 64,013 | (7) | * | |||
Craig, W. Lynwood | 492,118 | (8) | 1.97 | % | ||
Gallimore, Charles A. | 99,858 | * | ||||
Hall, Charles E. | 30,179 | (9) | * | |||
Haskins, James W. | 109,709 | (10) | * | |||
Karavatakis, Phyllis Q. | 16,638 | (11) | * | |||
Kendrick, Bradford M. | 72,857 | * | ||||
Kingery, Walter P. | 192,777 | (12) | * | |||
Kyle, Lanny A., O.D | 59,428 | * | ||||
Lester, George W., II | 999,151 | (13) | 4.00 | % | ||
Mapp, Harry L., Jr. | 48,145 | * | ||||
Mason, Sidney D. | 584,592 | (14) | 2.34 | % | ||
Matthews, E. Warren | 1,157 | * | ||||
Midkiff, H. Marvin, DDS | 61,053 | (15) | * | |||
Moses, James C. | 16,223 | (16) | * | |||
Oeters, William E. | 6,796 | * | ||||
Pigg, Joseph E. | 278,202 | (17) | 1.11 | % | ||
Prillaman, Haller G. | 186,837 | * | ||||
Ramsey, Mary A. | 376,168 | 1.50 | % | |||
Roach, Larry N. | 12,792 | (18) | * | |||
Scott, Leo H. | 370,587 | (19) | 1.48 | % | ||
Spencer, Simon C. | 10,417 | (20) | * | |||
Sumner, William B. | 30,924 | (21) | * | |||
Thomasson, James M. | 135,199 | (22) | * | |||
41
Table of Contents
Name | Amount and Nature of Beneficial Ownership (1) (2) | Ownership as a Percentage of Common Stock Outstanding | ||||
Trent, W.C., Jr. | 100,812 | (23) | * | |||
Williams, Betty A. | 48,050 | * | ||||
Williams, R. E. | 66,124 | * | ||||
All Directors and Executive Officers as a Group (38 Persons) (24) | 8,103,568 | 32.42 | % | |||
| * | less than 1% |
| (1) | For purposes of this table, beneficial ownership has been determined in accordance with the provisions of Rule 13d-3 of the Securities Exchange Act of 1934 under which, in general, a person is deemed to be the beneficial owner of a security if he/she has or shares the power to vote or direct the voting of the security or the power to dispose of or direct the disposition of the security, or if he/she has the right to acquire beneficial ownership of the security within sixty days. |
| (2) | Unless otherwise indicated, the shares listed in the table represent sole voting and investment power. |
| (3) | Includes 2,498 held as custodian for child and 75,144 held jointly with Mrs. Bondurant’s husband. |
| (4) | Includes 239,385 shares held jointly with Mr. Buchanan’s wife. |
| (5) | Includes 114,865 shares held by Mr. Carter as executor for his wife’s estate; 452,682 shares held by Mr. Carter as custodian for his children and grandchildren; 47,284 shares held for Mr. Carter’s account in the Nonqualified Profit Sharing Plan of Carter Bank & Trust; and 127,462 shares held by C&C Realty, Inc., of which Mr. Carter is president and a 50% owner. |
| (6) | Includes 526 shares held as custodian for grandchild. |
| (7) | Includes 59,672 shares held jointly with Mr. Conner’s wife. |
| (8) | Includes 19,606 shares held by Bassett Oil & Equipment Co., Inc., of which Mr. Craig is president, and 173,158 shares held by Mr. Craig’s wife. |
| (9) | Includes 27,352 shares held jointly with Mr. Hall’s wife. |
| (10) | Includes 1,656 shares held by Mr. Haskins’ wife. |
| (11) | Includes 7,736 shares held jointly with Mrs. Karavatakis’ husband and 4,726 held by Mrs. Karavatakis as custodian for her daughter. |
| (12) | Includes 3,382 shares held by Mr. Kingery’s wife. |
| (13) | Includes 152,451 shares held by the Lester Group, Inc., of which Mr. Lester is president; 1,043 shares held by Beaver Hills Dev. Corp., of which Mr. Lester is president; 4,269 shares held by Carriage Square, LTD, of which Mr. Lester is president; 25,691 shares held by Lester Group PS, of which Mr. Lester is trustee; 317,333 shares held by EASG, LLC, of which Mr. Lester is manager; 79,082 shares held by Mr. Lester as trustee for the benefit of his children. |
| (14) | Includes 453,940 shares held by the Sidney D. Mason Revocable Trust, of which Mr. Mason is trustee, and 130,652 shares held by the Dale W. Mason Revocable Trust, of which Mr. Mason’s wife is trustee. |
| (15) | Includes 6,776 shares held by Mr. Midkiff’s wife. |
42
Table of Contents
| (16) | Includes 11,241 shares held by the James C. Moses, Sr. & Nancy Wells Moses Revocable Living Trust, of which Mr. Moses and his wife are co-trustees. |
| (17) | Includes 163 shares held by Mr. Pigg’s wife, and 34,156 held by Millards Machinery, a company owned by Mr. Pigg. |
| (18) | Includes 5,623 shares held jointly with Mr. Roach’s wife; 2,240 shares held jointly with Mr. Roach’s mother, and 2,582 shares held by Mr. Roach’s wife. |
| (19) | Includes 183,605 shares held by the Leo H. Scott Revocable Trust, of which Mr. Scott is trustee, and 186,982 shares held by the Geraldine N. Scott Revocable Trust, of which Mr. Scott’s wife is trustee. |
| (20) | Includes 3,804 shares held jointly with Mr. Spencer’s wife and 243 shares held by Mr. Spencer’s wife. |
| (21) | Includes 21,343 shares held jointly with Mr. Sumner’s wife. |
| (22) | Includes 86,663 shares held by Mr. Thomasson’s wife. |
| (23) | Includes 21,938 shares held by Mr. Trent as custodian for his children and 2,248 shares held by Mr. Trent’s wife. |
| (24) | Includes shares held by Jane Ann Davis, Vice President, Robert L. Dye, III, Vice President, Wright L. Garrett, Senior Vice President, Dianne S. Hall, Senior Vice President, Brenda A. Kendrick, Senior Vice President, Steven M. Moses, Jr., Vice President and Williams Wells, Senior Vice President. |
The Bank knows of no arrangements, including any pledge by any person of securities of the Bank, which may at a subsequent date result in a change in control of the Bank.
Securities Authorized for Issuance Under Equity Compensation Plans
No tabular disclosure regarding equity compensation plans has been provided because the Bank does not have any outstanding equity compensation plans or arrangements that would be covered by Item 201(d) of Regulation S-K.
ITEM 13. CERTAIN RELATIONSHIPS AND RELATED TRANSACTIONS AND DIRECTOR INDEPENDENCE
Prior to the Merger, Mr. Carter, who now serves as Chairman of the Board and President of Carter Bank & Trust, served as chairman of the board and president of each of the Merged Banks.
Prior to the Merger, certain of the Merged Banks maintained a correspondent bank account with one or more of the other Merged Banks. In 2006 and 2005, the average daily balance in these accounts was considered a normal operating balance to facilitate general business transactions. Certain of the Merged Banks also participated in loan transactions with other of the Merged Banks. These transactions were at carrying value and did not involve more than the normal risk of collectibility or present other unfavorable features. As a result of the Merger, these interbank accounts and loan participations have been eliminated.
Prior to the Merger, each of the Merged Banks owned 10% of the outstanding common stock of MCOV. As a result of the Merger, Carter Bank & Trust now owns 100% of the common stock of MCOV. MCOV owns 100% of BSVA. Prior to the Merger, the business of both of these companies was to provide operational support services to the ten Merged Banks, who were charged for their respective share of these services. The cost of this expense was shared by the Merged Banks on the basis of average deposits of each bank related to total average deposits of all the Merged Banks. As a result of the Merger, the business of both these companies, except for courier services, has been absorbed by Carter Bank & Trust.
43
Table of Contents
MCOV also owns 100% of Bank Services Insurance, Inc. Bank Services Insurance, Inc. provided insurance products to the Merged Banks and customers in the service area of the ten Merged Banks, and now provides these products to Carter Bank & Trust in its two-state service area. The aggregate premiums paid to Bank Services Insurance, Inc. by Peoples National Bank during 2006 were $59,796.
MCOV also owns 50% of Coresoft, Inc., as a result of an initial $1,000 investment during 2004. Coresoft, Inc. is in the process of developing a core software package that the Bank will use. At December 31, 2006, Coresoft, Inc. had an outstanding note payable to MCOV of $1,400,000.
The Chairman of the Board and President of the Bank also serves as chairman of the board and president of Bank Building Corporation, a Virginia corporation that is publicly-held by approximately 2,800 shareholders, and is the manager of Blackstone Properties, LLC, its wholly owned subsidiary. Messrs. Robert W. Conner, Charles E. Hall, Haller G. Prillaman and R. E. Williams, who are directors of Carter Bank & Trust, also serve as directors of Bank Building Corporation. Bank Building Corporation does not have any paid employees or directors. All of its accounting, record keeping and other operational needs are currently provided by BSVA on a fee for services basis. Bank Building Corporation leased branches to certain of the Merged Banks prior to the Merger and now leases 46 such branches to Carter Bank & Trust. Aggregate rental expense under these leases was $324,000 in 2006 and $314,000 in 2005. The Bank also leases offices from non-related parties under various terms. Aggregate rental expense for these leases was $27,000 in 2006 and 2005. Future minimum lease payments to Bank Building Corporation and to non-related parties, from Carter Bank & Trust, will be approximately $3.7 million per year through 2010 and thereafter totaling $33.2 billion (may vary based on changing interest rates). As of December 31, 2006, Mr. Carter beneficially owned 46,166 shares of common stock (11.6%) of Bank Building Corporation.
Certain of the Merged Banks also had made various mortgage loans to Bank Building Corporation secured by real estate consisting of branch bank facilities and related leases. As of December 29, 2006, these loans became loans from Carter Bank & Trust. At December 31, 2006, these loans aggregated $28,788,961 principal amount, with interest rates ranging from 6% to 8.75%, subject to adjustment at various times, with final payments due from 2017 to 2024. Monthly payments of principal and interest on these loans to Carter Bank & Trust at December 31, 2006, aggregated $3,235,446. The loan transactions with Bank Building Corporation were made on terms substantially the same as those prevailing at the time for comparable loans with other persons and did not involve more than normal risk of collectibility or present other unfavorable features.
In the ordinary course of business, each of the Merged Banks’ directors and executive officers and their related interests were customers of, and had transactions with the respective Merged Banks. Loan transactions with directors and officers, principal security holders and associates were made on substantially the same terms as those prevailing at the time for comparable loans to other persons and did not involve more than normal risk of collectibility or present other unfavorable features. As of December 29, 2006, these became loans from Carter Bank & Trust. These maximum amount of these extensions of credit during 2006 equaled $16,280,000, or 8% of the equity capital of the Merged Banks, as of September 30, 2006. These extensions of credit equaled $14,911,255, or 5% of the equity capital of Carter Bank & Trust as of December 31, 2006.
44
Table of Contents
Procedures for Approving Related Party Transactions
The Bank has in place formal procedures for the extension of credit to directors and executive officers and their related interests, in accordance with applicable banking regulations. In addition, pursuant to the Bank’s Code of Ethics, all directors and executive officers are expected to make reasoned and impartial decisions in the workplace. The Merged Banks had only minimal related party transactions in the past that did not relate to extensions of credit. Therefore, the Bank does not currently have a formal procedure for reviewing and approving related party transactions that do not relate to extensions of credit. However, approval of any related party transaction other than extensions of credit would be denied by the Board of Directors if the Board of Directors believed that the director’s or executive officer’s interest in such transaction could influence decisions relative to the Bank’s business, or have the potential to adversely affect the Bank’s business or the objective performance of the director’s function or executive officer’s work.
Director Independence
All directors, other than the Chairman and President, Mr. Carter, satisfy the director independence requirements of the NASDAQ listing standards.
The Board of Directors as a whole serves as the Nominating Committee and Salary Committee. All directors, other than the Chairman and President, Mr. Carter, also satisfy the Nominating Committee and Salary Committee member independence requirements of the NASDAQ listing standards.
ITEM 14. PRINCIPAL ACCOUNTANT FEES AND SERVICES
Goodman & Company, LLP served as the independent public auditors for each of the Merged Banks and Carter Bank & Trust for the year ended December 31, 2006, and has been selected by the Board to act as independent public auditors for Carter Bank & Trust for the year ending December 31, 2007.
The following table presents the aggregate fees for all of the Merged Banks and for MCOV, BSVA and Bank Services Insurance, Inc., for professional audit services rendered by Goodman & Company for the audit of the annual financial statements for the years ended December 31, 2006, and December 31, 2005, and fees billed for other services rendered by Goodman & Company during those periods.
| Year Ended December 31, | ||||||
| 2006 | 2005 | |||||
Audit fees¹ | $ | 105,000 | $ | 16,300 | ||
Audit-related fees² | 23,500 | — | ||||
Tax fees3 | 31,500 | 3,265 | ||||
All other fees4 | 25,000 | — | ||||
Total Fees | $ | 185,000 | $ | 19,565 | ||
45
Table of Contents
1 | Audit fees consist of audit and review services, consents and review of documents filed with the OCC for 2005 and with the OCC and FDIC for 2006. |
2 | Audit-related fees consist of fees related to the Merger required by purchase accounting. |
3 | Tax fees consist of preparation of income tax returns for the Merged Banks for 2005 and ten final income tax returns for the Merged Banks and an income tax return for Carter Bank & Trust for 2006. |
4 | All other fees consist of fees for tax preparation and related schedules for wholly-owned subsidiary. |
In their capacities as the audit committee for their respective Merged Banks, the boards of directors of each of the Merged Banks considered the compatibility of the non-audit-related services performed by and fees paid to Goodman & Company in 2006 and 2005, and the Audit Committee of the Board of Directors of Carter Bank & Trust has considered the proposed non-audit-related services and proposed fees of Goodman & Company for 2007 and determined that such services and fees are compatible with the independence of Goodman & Company as the Bank’s independent auditors.
Also, the Audit Committee of the Board of Directors of the Bank will pre-approve all audit (including audit-related) and permitted non-audit services to be performed by the independent auditors. With respect to other permitted services, the Audit Committee pre-approves specific engagements, projects and categories of services on a fiscal year basis.
PART IV
ITEM 15. EXHIBITS AND FINANCIAL STATEMENT SCHEDULES
Exhibits:
| 3.1 | Articles of Incorporation (incorporated by reference to Exhibit 3.1 to the Bank’s Form 8-A filed with the FDIC February 23, 2007) | |
| 3.2 | Bylaws (incorporated by reference to Exhibit 3.2 to the Bank’s Form 8-A filed with the FDIC February 23, 2007) | |
| 10.1* | Qualified Profit Sharing Plan of Carter Bank & Trust (formerly the Qualified Profit Sharing Plan of each of the Merged Banks and MCOV) | |
| 10.2* | Nonqualified Profit Sharing Plan of Carter Bank & Trust (formerly the Nonqualified Profit Sharing Plan of MCOV) | |
| 13 | Excerpt from 2006 Annual Report to Shareholders | |
| 14 | Code of Ethics | |
| 31.1 | Certification by principal executive officer pursuant to Rule 13a-14(a) | |
| 31.2 | Certification by principal financial officer pursuant to Rule 13a-14(a) | |
| 32.1 | Certification by principal executive officer pursuant to Rule 18 U.S.C. §1350 | |
| 32.2 | Certification by principal financial officer pursuant to Rule 18 U.S.C. §1350 | |
| * | Denotes management contract. |
46
Table of Contents
Financial Statement Schedules:
None.
47
Table of Contents
SIGNATURES
Pursuant to the requirements of Section 13 or 15(d) of the Securities Exchange Act of 1934, the registrant has duly caused this report to be signed on its behalf by the undersigned, thereunto duly authorized.
CARTER BANK & TRUST | ||
(Registrant) | ||
| By: | /s/ Worth Harris Carter, Jr. | |
| Name: | Worth Harris Carter, Jr. | |
| Title: | Chairman of the Board and President | |
| Date: | July 6, 2007 | |
Pursuant to the requirements of the Securities Exchange Act of 1934, this report has been signed below by the following persons on behalf of the registrant and in the capacities and on the dates indicated.
| By: |
| By: |
| |||||
| Name: | Worth Harris Carter, Jr. | Name: | E. Warren Matthews | |||||
| Title: | Chairman of the Board and President (Principal Executive Officer) | Title: | Director | |||||
| Date: | Date: | |||||||
| By: |
| By: |
| |||||
| Name: | Jane Ann Davis | Name: | H. Marvin Midkiff, DDS | |||||
| Title: | Vice President (Principal Financial Officer) | Title: | Director | |||||
| Date: | Date: | |||||||
| By: |
| By: |
| |||||
| Name: | George B. Buchanan, Jr. | Name: | James C. Moses | |||||
| Title: | Director | Title: | Director | |||||
| Date: | Date: | |||||||
| By: |
| By: |
| |||||
| Name: | Joseph L. Chandler | Name: | Joseph E. Pigg | |||||
| Title: | Director | Title: | Director | |||||
| Date: | Date: | |||||||
48
Table of Contents
| By: |
| By: |
| |||||
| Name: | Robert W. Conner | Name: | Haller G. Prillaman | |||||
| Title: | Director | Title: | Director | |||||
| Date: | Date: | |||||||
| By: |
| By: |
| |||||
| Name: | W. Lynwood Craig | Name: | Mary A. Ramsey | |||||
| Title: | Director | Title: | Director | |||||
| Date: | Date: | |||||||
| By: |
| By: |
| |||||
| Name: | Chester A. Gallimore | Name: | Larry N. Roach | |||||
| Title: | Director | Title: | Director | |||||
| Date: | Date: | |||||||
| By: |
| By: |
| |||||
| Name: | Charles E. Hall | Name: | Leo H. Scott | |||||
| Title: | Director | Title: | Director | |||||
| Date: | Date: | |||||||
| By: |
| By: |
| |||||
| Name: | James W. Haskins | Name: | Simon C. Spencer | |||||
| Title: | Director | Title: | Director | |||||
| Date: | Date: | |||||||
| By: |
| By: |
| |||||
| Name: | Walter P. Kingery | Name: | William B. Sumner | |||||
| Title: | Director | Title: | Director | |||||
| Date: | Date: | |||||||
| By: |
| By: |
| |||||
| Name: | Lanny A. Kyle, O.D. | Name: | James M. Thomasson | |||||
| Title: | Director | Title: | Director | |||||
| Date: | Date: | |||||||
| By: |
| By: |
| |||||
| Name: | George W. Lester, II | Name: | W.C. Trent, Jr. | |||||
| Title: | Director | Title: | Director | |||||
| Date | Date: | |||||||
49
Table of Contents
| By: |
| By: |
| |||||
| Name: | Harry L. Mapp, Jr. | Name: | Betty A. Williams | |||||
| Title: | Director | Title: | Director | |||||
| Date: | Date: | |||||||
| By: |
| By: |
| |||||
| Name: | Sidney D. Mason | Name: | R.E. Williams | |||||
| Title: | Director | Title: | Director | |||||
| Date: | Date: | |||||||
50
Table of Contents
Exhibit 13
Excerpt from 2006 Annual Report to Shareholders
Table of Contents
| Financial Statement | ||||
| Years Ended | ||||
| December 31, 2006 and 2005 |
Carter Bank & Trust and Subsidiary
Table of Contents
Carter Bank & Trust and Subsidiary
Contents
| Page | ||
Report of Independent Auditors | 1 | |
Financial Statements | ||
Consolidated Statements of Financial Condition | 2 | |
Consolidated Statements of Income | 3 | |
Consolidated Statements of Changes in Shareholders ‘ Equity | 4 | |
Consolidated Statements of Cash Flows | 5 | |
Consolidated Statement of Income for Merged Banks For the Year Ended December 29, 2006 | 6 | |
Notes to Consolidated Financial Statements | 7-28 | |
Table of Contents
Report of Independent Auditors
Board of Directors
Carter Bank & Trust and Subsidiary
We have audited fie accompanying consolidated balance sheets ofCarter Bank & Trust and Subsidiary,as of December 31, 2006 and 2005, and the related consolidated statements of income, changes in equity and cash flows for each of the three years in the period ended December 31, 2006 and the consolidated statement of income for merged banks for the year ended December 29, 2006. These financial statements are the responsibility of the Corporation’s management. Our responsibility is to express an opinion on these financial statements based on our audits.
We conducted our audits in accordance with the standards of the Public Company Accounting Oversight Board (United States). Those standards require that we plan and perform the audit to obtain reasonable assurance about whether the financial statements are free of material misstatement. The Bank is not required to have, nor were we engaged to perform, an audit of its internal control over financial reporting. Our audit included consideration of internal control over financial reporting as a basis for designing audit procedures that are appropriate in the circumstances, but not for the purpose of expressing an opinion on the effectiveness of the Bank’s internal control over financial reporting. Accordingly, we express no such opinion. An audit also includes examining, on a test basis, evidence supporting the amounts and disclosures in the financial statements, assessing the accounting principles used and significant estimates made by management, as well as evaluating the overall financial statement presentation. We believe that our audits provide a reasonable basis for our opinion.
In our opinion, the financial statements referred to above present fairly, in all material respects, the consolidated financial positionofCarter Bank & Trust and Subsidiary,as of December 31, 2006 and 2005, and the consolidated results of their operations and their cash flows for each of the three years in the period ended December 31, 2006, in conformity with accounting principles generally accepted in the United States of America.
 |
Danville, Virginia |
July 6, 2007 |
1
Table of Contents
Carter Bank & Trust
Consolidated Statements of Financial Condition
(Dollars in Thousands)
December 31, | 2006 | 2005 | ||||||
ASSETS | ||||||||
Interest-bearing deposits in other financial institutions | $ | 173,178 | $ | 22,465 | ||||
Investment Securities (Fair Value $451,410 in 2006, $94,497 in 2005) | 452,181 | 95,665 | ||||||
Federal Funds Sold | 340,500 | — | ||||||
Loans (Net of Unearned Income) | 1,408,153 | 206,930 | ||||||
Less: Allowance for Loan Losses | (12,837 | ) | (2,367 | ) | ||||
Net Loans | 1,395,316 | 204,563 | ||||||
Earning assets | 2,361,175 | 322,693 | ||||||
Cash and Due from Banks | 83,365 | 10,367 | ||||||
Bank premises and equipment-net | 82,874 | 18,188 | ||||||
Real Estate Owned Other Than Bank Premises | 12,156 | 257 | ||||||
Investment in Associated Company | — | 769 | ||||||
Other assets | 28,422 | 4,970 | ||||||
Core Deposit Intangible | 61,763 | — | ||||||
Goodwill | 60,423 | — | ||||||
TOTAL ASSETS | $ | 2,690,178 | $ | 357,244 | ||||
LIABILITIES | ||||||||
Deposits: | ||||||||
LIFETIME FREE CHECKING | $ | 374,819 | $ | 44,862 | ||||
Interest-Bearing Demand | 254,663 | 26,781 | ||||||
Regular Passbook Savings | 306,071 | 67,738 | ||||||
Time Deposits: | ||||||||
Certificates of Deposit $100,000 and Over | 331,451 | 30,912 | ||||||
Other | 1,104,546 | 148,525 | ||||||
Total Deposits | 2,371,550 | 318,818 | ||||||
Notes issued to the U.S. Treasury | 4,054 | 72 | ||||||
Other liabilities | 25,282 | 534 | ||||||
TOTAL LIABILITIES | 2,400,886 | 319,424 | ||||||
SHAREHOLDERS’ EQUITY | ||||||||
Common stock (par value $1), authorized 100,000,000 shares, 24,996,552 shares outstanding in 2006, 2,500,000 shares authorized; 2,375,683 shares outstanding in 2005 | 24,996 | 2,376 | ||||||
Surplus | 131,831 | 28,935 | ||||||
Undivided profits | 132,465 | 6,509 | ||||||
TOTAL SHAREHOLDERS’ EQUITY | 289,292 | 37,820 | ||||||
TOTAL LIABILITIES AND SHAREHOLDERS’ EQUITY | $ | 2,690,178 | $ | 357,244 | ||||
The accompanying notes are an integral part of these consolidated financial statements.
2
Table of Contents
Carter Bank & Trust
Consolidated Statements of Income
(Dollars in Thousands)
Years Ended December 31, | 2006 | 2005 | 2004 | ||||||
INTEREST INCOME: | |||||||||
Interest and fees on loans: | |||||||||
Taxable | $ | 14,519 | $ | 12,647 | $ | 12,745 | |||
Non-Taxable | 407 | 362 | 299 | ||||||
Interest on Deposits in Other Financial Institutions | 959 | 784 | 457 | ||||||
Interest on Federal Funds Sold | 927 | 274 | 237 | ||||||
Interest and Dividends on Securities: | |||||||||
U.S. Agency Securities and Other | 3,665 | 3,274 | 3,884 | ||||||
States and Political Subdivisions | — | 23 | 119 | ||||||
TOTAL INTEREST INCOME | 20,477 | 17,364 | 17,741 | ||||||
INTEREST EXPENSE: | |||||||||
Interest on Time Deposits $100,000 and over | 1,714 | 1,069 | 916 | ||||||
Interest on Other Deposits | 8,003 | 6,305 | 6,040 | ||||||
Interest on Federal Funds Purchased | 2 | 9 | 6 | ||||||
Interest on Notes to the U.S . Treasury | 9 | 2 | 1 | ||||||
TOTAL INTEREST EXPENSE | 9,728 | 7,385 | 6,963 | ||||||
NET INTEREST INCOME | 10,749 | 9,979 | 10,778 | ||||||
Provision for Loan Losses | 120 | 120 | 120 | ||||||
NET INTEREST INCOME AFTER | |||||||||
PROVISION FOR LOAN LOSSES | 10,629 | 9,859 | 10,658 | ||||||
NON-INTEREST INCOME: | |||||||||
Service Charges, Commission and Fees | 851 | 995 | 1,075 | ||||||
Other Non-Interest Income | 166 | 124 | 219 | ||||||
TOTAL NON-INTEREST INCOME | 1,017 | 1,119 | 1,294 | ||||||
NON-INTEREST EXPENSE: | |||||||||
Salaries and Employee Benefits | 4,652 | 4,651 | 4,463 | ||||||
Occupancy Expense | 1,548 | 1,329 | 1,102 | ||||||
Operations center expense | 1,756 | 1,524 | 1,433 | ||||||
FDIC Assessment | — | 43 | 49 | ||||||
Other non-interest expense | 1,017 | 752 | 794 | ||||||
TOTAL NON-INTEREST EXPENSE | 8,973 | 8,299 | 7,841 | ||||||
INCOME BEFORE INCOME TAXES | 2,673 | 2,679 | 4,111 | ||||||
Income tax expense | 782 | 660 | 1,275 | ||||||
NET INCOME | $ | 1,891 | $ | 2,019 | $ | 2,836 | |||
NET INCOME PER COMMON SHARE: | |||||||||
Basic and diluted | $ | 0.76 | $ | 0.81 | $ | 1.13 | |||
Average common shares outstanding: | |||||||||
Basic, and diluted | 2,499,633 | 2,499,633 | 2,499,633 | ||||||
The accompanying notes are an integral part of these consolidated financial statements.
3
Table of Contents
Carter Bank & Trust
Consolidated Statements of Changes in Shareholders’ Equity
(Dollars in Thousands)
Years Ended December 31, 2006, 2005 and 2004
| Shares | Common Stock | Surplus | Undivided Profits | Total Shareholders’ Equity | ||||||||||||||
Balance, December 31, 2004 | 2,375,683 | $ | 2,376 | $ | 28,935 | $ | 5,455 | $ | 36,766 | |||||||||
Net income | — | — | — | 2,836 | 2,836 | |||||||||||||
Cash dividends declared and paid ($.80 per share) | — | — | — | (1,901 | ) | (1,901 | ) | |||||||||||
Balance, December 31, 2005 | 2,375,683 | 2,376 | 28,935 | 6,390 | 37,701 | |||||||||||||
Net income | — | — | — | 2,019 | 2,019 | |||||||||||||
Cash dividends declared and paid ($.80 per share) | — | — | — | (1,900 | ) | (1,900 | ) | |||||||||||
Balance, December 31, 2005 | 2,375,683 | 2,376 | 28,935 | 6,509 | 37,820 | |||||||||||||
Net income | — | — | — | 1,891 | 1,891 | |||||||||||||
Cash dividends declared and paid ($.80 per share) | — | — | — | (1,901 | ) | (1,901 | ) | |||||||||||
Contributed capital from merger | — | — | 102,896 | 125,966 | 228,862 | |||||||||||||
Cancellation of stock due to merger | (2,375,683 | ) | (2,376 | ) | — | — | (2,376 | ) | ||||||||||
Issuance of common stock in merger | 24,996,552 | 24,996 | — | — | 24,996 | |||||||||||||
Balance, December 31, 2006 | 24,996,552 | $ | 24,996 | $ | 131,831 | $ | 132,465 | $ | 289,292 | |||||||||
The accompanying notes are an integral part of these consolidated financial statements.
4
Table of Contents
Carter Bank & Trust
Consolidated Statements of Cash Flows
(Dollars in Thousands)
Years Ended December 31 | 2006 | 2005 | 2004 | |||||||||
Cash flows from operating activities | ||||||||||||
Net income | $ | 1,891 | $ | 2,019 | $ | 2,836 | ||||||
Adjustments to reconcile to net cash from operating activities: | ||||||||||||
Provision for loan losses | 120 | 120 | 120 | |||||||||
Depreciation of premises and equipment | 413 | 396 | 298 | |||||||||
Equity in undistributed income from associated company | (6 | ) | (1 | ) | (11 | ) | ||||||
Provision (benefit) for deferred income taxes | (97 | ) | 206 | 154 | ||||||||
(Decrease) in unearned Income | (133 | ) | (94 | ) | (96 | ) | ||||||
(Increase) decrease in other assets | 1,606 | (1,441 | ) | 495 | ||||||||
Increase (decrease) in other liabilities | 157 | 10 | (2 | ) | ||||||||
Net cash from operating activities | 3,951 | 1,215 | 3,794 | |||||||||
Cash flows from investing activities | ||||||||||||
Maturity of interest-bearing deposits | 17,525 | 20,007 | 15,046 | |||||||||
Purchase of interest-bearing deposits | (16,336 | ) | (17,531 | ) | (25,140 | ) | ||||||
Purchase of investment securities | (13,500 | ) | (34,089 | ) | (30,000 | ) | ||||||
Proceeds from maturities, calls and redemptions of investment securities | 38,154 | 14,037 | 72,637 | |||||||||
Purchase of Bank premises and equipment | (1,261 | ) | (1,194 | ) | (9,133 | ) | ||||||
Net (Increase) decrease in short-term loans outstanding, net | (12,202 | ) | 904 | (26,028 | ) | |||||||
Longer-term loans originated or purchase | (44,993 | ) | (39,178 | ) | (39,945 | ) | ||||||
Principal collected on longer-term loans | 49,005 | 40374 | 54,913 | |||||||||
Sale (purchase) of other real estate | (226 | ) | (129 | ) | 4 | |||||||
Investment in associated company | — | (150 | ) | — | ||||||||
Net cash from investing activities | 16,166 | (16,949 | ) | 12,354 | ||||||||
Cash flows from financing activities | ||||||||||||
Cash contributed from merger | 372,384 | — | — | |||||||||
Net increase (decrease) in demand and savings accounts | 1,553 | (12,177 | ) | (6,662 | ) | |||||||
Proceeds from sale of time deposits | 97,501 | 100,283 | 94,128 | |||||||||
Payments on matured time deposits | (76,230 | ) | (87,998 | ) | (102,093 | ) | ||||||
Cash dividends | (1,901 | ) | (1,900 | ) | (1,901 | ) | ||||||
Net Increase (decrease) in notes to U.S. Treasury | 74 | 15 | (527 | ) | ||||||||
Net cash from financing activities | 393,381 | (1,777 | ) | (17,055 | ) | |||||||
Net change in cash and cash equivalents | 413,498 | (17,511 | ) | (907 | ) | |||||||
Cash and cash equivalents - beginning of year | 10,367 | 27,878 | 28,785 | |||||||||
Cash and cash equivalents - end of year | $ | 423,865 | $ | 10367 | $ | 27,878 | ||||||
Supplemental disclosures of cash flow information | ||||||||||||
Interest paid | $ | 9,223 | $ | 7,338 | $ | 7,031 | ||||||
Income taxes paid | $ | 782 | $ | 660 | $ | 1,275 | ||||||
Transfer of loans to foreclosed assets | $ | — | $ | 282 | $ | — | ||||||
Transactions related to the merger: | ||||||||||||
Increase in assets and liabilities | ||||||||||||
Interest-bearing deposits in other financial institutions | $ | 151,902 | ||||||||||
Securities | 381,170 | |||||||||||
Loans - net | 212,919 | |||||||||||
Bank premises and equipment - net | 63,838 | |||||||||||
Other assets | 35,969 | |||||||||||
Goodwill | 60,423 | |||||||||||
Core deposit intangible | 61,763 | |||||||||||
Deposits | 1,877,448 | |||||||||||
Notes issued to U.S. Treasury | 3,908 | |||||||||||
Other liabilities | 24,591 | |||||||||||
Issuance of common stock | 24,996,552 | |||||||||||
The accompanying notes are an integral part of these consolidated financial statements.
5
Table of Contents
Carter Bank & Trust
Consolidated Statement of Income for Ten Merged Banks
For the Year Ended December 29, 2006
| Total | |||
INTEREST INCOME: | |||
Interest and fees on loans: | |||
Taxable | $ | 86,511 | |
Non-Taxable | 7,057 | ||
Interest on Deposits in Other Financial Institutions | 6,635 | ||
Interest on Federal Funds Sold | 7,328 | ||
Interest and Dividends on Securities: | |||
U.S. Agency Securities and Other | 21,738 | ||
TOTAL INTEREST INCOME | 129,319 | ||
INTEREST EXPENSE: | |||
Interest on Time Deposits $100,000 and over | 14,473 | ||
Interest on Other Deposits | 49,553 | ||
Interest on Federal Funds Purchased | 77 | ||
Interest on Notes to the U.S. Treasury | 62 | ||
TOTAL INTEREST EXPENSE | 64,165 | ||
Net Interest Income | 65,154 | ||
Provision for Loan Losses | 864 | ||
NET INTEREST INCOME AFTER PROVISION FOR LOAN LOSSES | 64,290 | ||
NON-INTEREST INCOME: | |||
Service Charges, Commissions and Fees | 6,393 | ||
Other Non-Interest Income | 1,534 | ||
TOTAL NON-INTEREST INCOME | 7,927 | ||
NON-INTEREST EXPENSE: | |||
Salaries and Employee Benefits | 29,603 | ||
Occupancy Expense | 8,487 | ||
Operations Center Expense | 12,081 | ||
Other Non-Interest Expense | 6,709 | ||
TOTAL NON-INTEREST EXPENSE | 56,880 | ||
INCOME BEFORE INCOME TAXES | 15,337 | ||
Income Tax Expense | 3,122 | ||
NET INCOME | $ | 12,215 | |
6
Table of Contents
Carter Bank & Trust and Subsidiary
Notes to Consolidated Financial Statements
December 31, 2006 and 2005
| 1. | Organization and Nature of Business |
Carter Bank & Trust and Subsidiary (the Bank) is a newly-organized banking institution, incorporated under Virginia law. The main office is located in Martinsville, Virginia. The Bank is a non-member state bank, regulated by the FDIC and State Bureau of Financial Institutions.
The Bank conducts a general commercial banking business in its two-state service area of Virginia and North Carolina, and focuses on serving the banking needs of small-to-medium sized businesses, professional concerns and individuals.
Effective December 29, 2006, ten banking institutions, each of which had been in business for a number of years, were merged into Carter Bank & Trust. The ten merged banks (merged banks) .and their respective main office locations were:
Blue Ridge Bank, N.A. – Floyd, Virginia
Central National Bank – Lynchtburg, Virginia
Community National Bank – South Boston, Virginia
First National Bank – Rocky Mount, Virginia
First National Exchange Bank – Roanoke, Virginia
Mountain National Bank – Galax, Virginia
Patrick Henry National Bank – Martinsville, Virginia
Patriot Bank, N.A. – Fredericksburg, Virginia
Peoples National Bank – Danville, Virginia
Shenandoah National Bank – Staunton, Virginia
This merger was accounted for under FASB 141, “Business Combinations” which required one of the banks to be identified as the purchaser and therefore, Peoples National Bank, was deemed the “acquirer” for accounting purposes (since it was the largest of the ten banks). The other nine banks were merged into Peoples National Bank creating Carter Bank & Trust. The historical data that appears elsewhere in this report is the historical data for Peoples National Bank up until the date of the merger. Under FASB No. 141, the nine banks merged in were recorded at their fair value at the date of merger.
As a result of the merger, on December 29, 2006 the Bank owned 100% of the common stock of The Mortgage Company of Virginia, Inc. (MCOV) and MCOV in turn owns 100% of the common stock of Bank Services of Virginia,. Inc. (BSVA) and Bank Services Insurance, Inc. (BSI).
All officers and employees of the merged banks have continued as officers and employees ofCarter Bank & Trust.
7
Table of Contents
| 2. | Summary of Significant Accounting Policies |
Basis of Presentation and Consolidation
The consolidated financial statements include the accounts and results of operations of the Bank and MCOV. All significant interBank transactions and balances are eliminated in the consolidation. Under FASB No. 141, the 2006 balance sheet includes MCOV and the 2005 and 2004 include only Peoples National Bank’s share of its investment in MCOV. The statement of income for all three years includes Peoples National Bank’s portion of the net income of MCOV.
Use of Estimates
The preparation of financial statements in conformity with accounting principles generally accepted in the Untied States of America requires management to make estimates and assumptions that affect the reported amounts of assets and liabilities and disclosure of contingent assets and liabilities at the date of the financial statements, and the reported amounts of revenue and expenses during the reporting period. Actual results could differ from those estimates. Material estimates that are particularly susceptible to significant change in the near term relate to the determination of the allowance for loan losses, and fair value of other real estate owned.
Cash and Cash Equivalents
The Bank considers all cash on hand, amounts due from banks, and federal funds sold as cash equivalents for purposes of the consolidated statement of cash flows. Federal funds are customarily sold for one-day periods.
Investment Securities
The Bank classifies its securities as held to maturity. These investment securities are stated at cost or unpaid principal adjusted for amortization of premiums and accretion of discounts using the interest method. The carrying value of these assets is not adjusted for temporary declines in value since the Bank has the ability and intent to hold them, to maturity. Gains or losses realized from sales are recognized by use of the specific identification method. The Bank has the positive intent and ability to hold these securities until maturity.
Loans and Allowance for Loan Losses
Loans are recorded at the amount of the loan disbursed to borrowers plus the applicable amount, if any, of unearned income and other charges, less payments received. Income earned on loans is recognized by methods which generally result in level rates of return on principal amounts outstanding. The net amount of nonrefundable loan origination fees approximates the direct costs associated with the lending process.
The allowance for loan losses is an estimate of losses inherent in the loan portfolio as determined by management taking into consideration historical loan loss experience, diversification of the loan portfolio, amounts of secured and unsecured loans, banking industry standards and averages, and general economic conditions. Ultimate losses may vary from current estimates. These estimates are reviewed periodically and as adjustments become necessary, they are reported in earnings in the periods in which they become reasonably estimable.
Management determines loan impairment using guidelines established by Statement of Financial Accounting ‘Standards No. 114 (SFAS 114), “Accounting by Creditors for Impairment of a Loan (as amended by SFAS No. 113, Accounting by Creditors for Impairment of a Loan – Income Recognition and Disclosures”). Under this accounting standard, a loan is considered to be impaired when it is probable that the Bank will be unable to collect all principal and interest amounts according to the contractual terms of the loan agreement. A performing loan may be considered impaired. The allowance for loan losses related to loans identified as
8
Table of Contents
impaired is primarily based on the excess of the loan’s current outstanding principal balance over the estimated fair value of the related collateral. For a loan that is not collateral-dependent, the allowance is recorded at the amount by which the outstanding principal balance exceeds the current best estimate of the future cash flows on the loan discounted at the loan’s original effective interest rate. Interest on impaired loans is recognized when cash is received.
Bank Premises and Equipment
Bank premises and equipment acquired are stated at cost, less accumulated depreciation. Depreciation is charged to operating expenses over the estimated useful life of the assets by the accelerated and straight-line methods.
For bank premises and equipment merged into CB&T from the nine banks, premises were recorded at appraised values, as required by the purchase accounting method. Equipment was merged into CB&T at the net book values, as carried by each of the nine banks, since management felt this approximated fair value at the date of merger.
Cost of maintenance or repairs are charged to expense as incurred and improvements are capitalized. Upon retirement or disposal of an asset, the asset and related allowance account are eliminated. Any gain or loss on such transactions is included in current operations. Depreciation has been included under Occupancy Expense in the Statements of Income in the amount of $413,000 in 2006, $396,000 in 2005, and $298,000 in 2004.
Other Real Estate Owned
Real estate properties acquired through or in lieu of loan foreclosure are initially recorded at the lower of the Bank’s carrying amount or fair value less estimated selling cost at the date of foreclosure. Any write-downs based on the asset’s fair value at the date of acquisition are charged to the allowance for loan losses. After foreclosure, these assets are carried at the lower of their new cost basis or fair value less cost to sell. Costs of significant property improvements are capitalized, whereas costs relating to holding property are expensed. Valuations are periodically performed by management, and any write-downs are recorded as a charge to operations, if necessary, to reduce the carrying value of a property to the lower of its carrying value or fair value less cost to sell.
Income Taxes
Deferred tax are provided on a liability method whereby deferred tax assets are recognized for deductible temporary differences and operating loss and tax credit carryforwards and deferred tax liabilities are recognized for taxable temporary differences. Temporary differences are the differences between the reported amounts of assets and liabilities and their tax bases. Deferred tax assets are reduced by a valuation allowance when, in the opinion of management, it is more likely than not that some portion or all of the deferred tax assets will not be realized. Deferred tax assets and liabilities are adjusted for the effects of changes in tax laws and rates on the date of enactment.
Retirement Benefits
The Bank has established an Employee Benefit Plan as described in footnote 8. The Bank does not provide any other post-retirement benefits that would be accrued under Statement of Financial Accounting Standards No. 106, “Employers' Accounting for Post Retirement Benefits Other Than Pensions”.
9
Table of Contents
Loans or Debt Securities Acquired in a Transfer
In January 2005, Statement of Position (SOP) 03-3,Accounting for Certain Loans or Debt Securities Acquired in a Transfer,was adopted for loan acquisitions. SOP 03-3 required loans to be recorded at fair value and prohibits carrying over valuation allowances in the initial accounting for acquired impaired loans. Loans carried at fair value, mortgage loans held for sale and loans to borrowers in good standing under revolving credit agreements are excluded for the scope of SOP 03-3. SOP 03-3 limits the yield that may be accreted to the excess of the undiscounted expected cash flows over the investor’s initial investment in the loan. The excess of the contractual cash flows expected to be collected are recognized prospectively through an adjustment of the loan’s yield over its remaining life. Decreases in expected cash flows are recognized as impairments. Refer to Note 6 for disclosures required under SOP 03-3.
Goodwill and Intangible Assets
The Bank follows Statement of Financial Accounting Standard (“SFAS”) 142,Goodwill and Other Intangible Assets.Accordingly, goodwill is subject to at least an annual assessment for impairment by applying a fair market value based test. Additionally, under SFAS 142, acquired intangible assets (such as core deposits intangibles) are separately recognized if the benefit of the assets can be sold, transferred, licensed, rented, or exchanged, and amortized over their useful lives. Branch acquisition transactions were outside the scope of SFAS 142 and, accordingly, intangible assets related to such transactions continues to amortize upon the adoption of SFAS 142. The cost of purchased deposit relationships and other intangible assets, based on independent valuation, are being amortized over their estimated lives of 8.33 years.
| 3. | Investment Securities |
The carrying value of securities pledged to secure public deposits was $450,673,000 and $93,652,000 as of December 31, 2006 and 2005, respectively. The amortized cost and estimated fair value of investment securities as of December 31, 2006 and 2005 are as follows:
| (Dollars in thousands) | 2006 | ||||||||||||
| Gross Amortized Cost | Gross Unrealized Gains | Gross Unrealized Losses | Fair Value | ||||||||||
U.S. Agency Securities | $ | 450,673 | $ | 14 | $ | (785 | ) | $ | 449,902 | ||||
Mortgage-Backed Securities | 1,508 | — | — | 1,508 | |||||||||
Total | $ | 452,181 | $ | 14 | $ | (785 | ) | $ | 451,410 | ||||
| (Dollars in thousands) | 2005 | ||||||||||||
| Gross Amortized Cost | Gross Unrealized Gains | Gross Unrealized Losses | Fair Value | ||||||||||
U.S. Agency Securities | $ | 93,652 | $ | 21 | $ | (1,189 | ) | $ | 92,484 | ||||
Mortgage-Backed Securities | 2,013 | — | — | 2,013 | |||||||||
Total | $ | 95,665 | $ | 21 | $ | (1,189 | ) | $ | 94,497 | ||||
10
Table of Contents
The table below shows gross unrealized losses and fair value, aggregated by investment category and length of time that individual securities have been in a continuous unrealized loss position at December 31, 2006 and 2005.
| (Dollars in thousands) | 2006 | ||||||||
| Securities Description | Fair Value | Unrealized Losses Less than 12 months | More than 12 Months | ||||||
U.S. Agency Securities | $ | 410,822 | $ | 138 | $ | — | |||
U.S. Agency Securities | 39,851 | — | 647 | ||||||
Total | $ | 450,673 | $ | 138 | $ | 647 | |||
| (Dollars in thousands) | 2005 | ||||||||
| Securities Description | Fair Value | Unrealized Losses Less than 12 months | More than 12 Months | ||||||
U.S. Agency Securities | $ | 45,133 | $ | 226 | $ | — | |||
U.S. Agency Securities | 50,532 | — | 963 | ||||||
Total | $ | 95,665 | $ | 226 | $ | 963 | |||
The unrealized losses on the Bank’s investments in obligations of U. S. Government Agencies were caused by interest rate increases. The contractual terms of those investments do not permit the issuer to settle the securities at a price less than the amortized cost of the investment. Because the Bank has the ability and intent to hold those investments until a recovery of fair value, which may be maturity, the Bank does not consider those investments to be other-than-temporarily impaired at December 31, 2006.
The amortized cost and estimated fair value of investments in debt securities at December 31, 2006 and 2005, by contractual maturity, are shown below. Expected maturities will differ from contractual maturities because issuers may have the right to call or prepay obligations with or without call or prepayment penalties.
| (Dollars in thousands) | 2006 | 2005 | ||||||||||
| Amortized Cost | Estimated Fair Value | Amortized Cost | Estimated Fair Value | |||||||||
Due in one year or less | $ | 112,930 | $ | 112,729 | $ | 34,644 | $ | 34,429 | ||||
Due after five years through ten years | 337,743 | 337,173 | 59,011 | 58,058 | ||||||||
Mortgage-Backed Securities | 1,508 | 1,508 | 2,010 | 2,010 | ||||||||
Total Securities | $ | 452,181 | $ | 451,410 | $ | 95,665 | $ | 94,497 | ||||
There were no sales of securities during 2006, 2005, or 2004.
11
Table of Contents
| 4. | Composition of Loans |
Loans outstanding at December 31 are summarized as follows:
| (Dollars in thousands) | 2006 | 2005 | ||||||
Real Estate | $ | 1,048,161 | $ | 158,906 | ||||
Loans to Other Commercial Banks | — | 1,500 | ||||||
Consumer | 92,495 | 13,748 | ||||||
Commercial, Industrial and Agricultural | 111,791 | 24,316 | ||||||
All other | 159,504 | 9,174 | ||||||
Gross Loans | 1,411,951 | 207,644 | ||||||
Less: Unearned Income | (3,798 | ) | (714 | ) | ||||
Allowance for loan losses | (12,837 | ) | (2,367 | ) | ||||
Total loans, net | $ | 1,395,316 | $ | 204,563 | ||||
Maturities or repricing frequency of loans at December 31 follows:
| (Dollars in thousands) | 2006 | 2005 | ||||
| Maturity Distribution | ||||||
Variable | ||||||
Less than one year | $ | 165,705 | $ | 23,327 | ||
One to five years | 456,318 | 61,086 | ||||
Over five years | 81,721 | 26,967 | ||||
Subtotal | 703,744 | 111,380 | ||||
Fixed | ||||||
Less than one year | 285,339 | 44,948 | ||||
One to five years | 94,432 | 16,694 | ||||
Over five years | 328,436 | 34,622 | ||||
Subtotal | 708,207 | 96,264 | ||||
Total | $ | 1,411,951 | $ | 207,644 | ||
| 5. | Accounting for Certain Loans Acquired in a Transfer |
The Bank acquired loans pursuant to the acquisition of the individual banks. In accordance with American Institute of Certified Public Accountants (“AICPA”) Statement of Position 03-3 (“SOP 03-3”), at acquisition, the Bank reviews each loan to determine whether there is evidence of deterioration of credit quality since origination and if it is probable that it will be unable to collect all amounts due according to the loan’s contractual terms. When both conditions exist, the Bank accounts for each loan individually, considers expected prepayments, and estimates the amount and timing of undiscounted expected principal, interest, and other cash flows (expected at acquisition) for each loan. The Bank determines the excess of the loan’s scheduled-contractual principal and contractual interest payments over all cash flows expected at acquisition as an amount that should not be accreted into interest income (nonaccretable difference). The remaining amount, representing the excess of the loan’s cash, flows expected to be collected over the amount paid, is accreted into interest income over the remaining life of the loan (accretable yield). Over the life of the loan, the Bank continues to estimate cash flows expected to be collected. The Bank evaluates at the balance sheet date whether the present value of its loans determined using the effective interest rates has decreased and it so, establishes a loan loss allowance for the loan. The Bank’s valuation
12
Table of Contents
allowances for all acquired loans subject to SOP 03-3 reflect only those losses incurred after acquisition – that is, the present value of cash flows expected at acquisition that are not expected to be collected. Valuation allowances are established only subsequent to acquisition of the loans. For loans that are not accounted for as debt securities, the present value of any subsequent increase in the loan’s or pool’s actual cash flows or cash flows expected to be collected is used first to reverse any existing valuation, allowance for that loan. For any remaining increases in cash flows expected to be collected, the Bank adjusts the amount of accretable yield recognized on a prospective basis over the loan’s remaining life. The Bank does not have any such loans that were accounted for as debt securities.
Information regarding loans that were acquired in the acquisition, for which there was, at acquisition, evidence of deterioration of credit quality since origination and for which it was probable, at acquisition, that all contractually required payments would not be made, is summarized below:
| (Dollars in thousands) | As of December 31, 2006 | ||
Outstanding Balance - Real Estate Service - Construction | $ | 19,400 | |
Carrying amount | $ | 13,200 | |
| 6. | Allowance for Loan Losses |
In the view of management, the Allowance for Loan Losses is adequate to meet the loss contingency based on experience factors and a review of the loan portfolio.
The Allowance for Loan Losses, for the years ending December 31, 2006, 2005 and 2004 is summarized as follows:
| (Dollars in thousands) | 2006 | 2005 | 2004 | |||||||||
Balance at beginning of year | $ | 2,367 | $ | 2,412 | $ | 2,387 | ||||||
Recoveries credited during year | 51 | 58 | 34 | |||||||||
Provision for loan losses | 120 | 120 | 120 | |||||||||
Losses charged to allowance | (507 | ) | (223 | ) | (129 | ) | ||||||
Adjustments from merger | 10,806 | — | — | |||||||||
Balance at end of year | $ | 12,837 | $ | 2,367 | $ | 2,412 | ||||||
13
Table of Contents
The following is a summary of information pertaining to impaired and non-accrual loans:
| (Dollars in Thousands) | 2006 | 2005 | ||||
Impaired loans without a valuation allowance | $ | — | $ | — | ||
Impaired loans with a valuation allowance | — | 1,759 | ||||
Total impaired loans | $ | — | $ | 1,759 | ||
Valuation allowance related to impaired loans | $ | — | $ | 701 | ||
Nonaccrual Loans (impaired) | $ | — | $ | 1,759 | ||
Nonaccrual loans (non-impaired) | $ | 21,945 | $ | 3,406 | ||
Total loans past due ninety days or more and still accruing | $ | 194 | $ | 258 | ||
| (Dollars in thousands) | 2006 | 2005 | 2004 | ||||||
Average investment in impaired loans | $ | — | $ | 1,759 | $ | 1,759 | |||
Interest income recognized on impaired loans | $ | — | $ | — | $ | 219 | |||
Interest income recognized on a cash basis on impaired loans | $ | — | $ | — | $ | 196 | |||
Impaired loans were adjusted to estimated value on the date of merger.
| 7. | Stock Options and Employee Benefit Plans |
There were no stock options or stock option plans in effect for 2006, 2005 or 2004.
Prior to the merger, each bank and MCOV maintained separate profit-sharing/401K plans. Subsequently, the Bank merged the profit sharing Plans and Trusts of the merged banks and MCOV into the Peoples National Bank Profit-sharing Plan and Trust.
Employees participate in the profit sharing plan following completion of six (6) months of service and upon reaching the age of twenty years and six months as of January 1. Vesting includes years of service to the Bank prior to the effective date of the plan. This plan gives 0% vesting to anyone who has less than five (5) years of service except that persons who have reached the age of 62 are fully vested regardless of length of service. Each participant in the plan (who has not reached age 62) becomes 100% vested after five (5) years of service. The .contribution to the plan is determined each year by the Board of Directors and thus may fluctuate in amount from year to year. The contribution by the Bank was $196,000 in 2006, $186,000 in 2005 and $185,000 in 2004 and these amounts are included in salaries and employee benefits in the Statements of Income.
14
Table of Contents
| 8. | Federal and State Income Taxes |
Net deferred tax assets consist of the following components as of December 31:
(Dollars in thousands) Deferred Tax Assets | 2006 | 2005 | ||||
Allowance for Loan Losses | $ | 5,705 | $ | 625 | ||
Dividend Exclusion | 137 | 86 | ||||
Other | 1,165 | 297 | ||||
Total Deferred Tax Assets | $ | 7,007 | $ | 1,008 | ||
| Deferred Tax Liabilities | 2006 | 2005 | ||||
Bank Premises | $ | 3,570 | $ | 498 | ||
Accrued vacation | 236 | 101 | ||||
Amortization | 293 | — | ||||
Total Deferred Tax Liabilities | 4,099 | 599 | ||||
Net Deferred Taxes | $ | 2,908 | $ | 409 | ||
The provisions for income taxes charged to operations for the years ended December 31 consist of the following:
| (Dollars in thousands) | 2006 | 2005 | 2004 | |||||||
Currently payable | $ | 873 | $ | 430 | $ | 1,112 | ||||
Currently payable - North Carolina | 6 | 8 | 9 | |||||||
Deferred | (97 | ) | 206 | 154 | ||||||
Other | — | 16 | — | |||||||
Net Provision | $ | 782 | $ | 660 | $ | 1,275 | ||||
The income tax provision differs from the amount of income tax determined by applying the U.S. federal income tax rate to pretax income for the years ended December 31 due to the following:
| (Dollars in thousands) | 2006 | 2005 | 2004 | |||||||||
Tax provisions computed by applying federal rates to income before income taxes | $ | 908 | $ | 911 | $ | 1,398 | ||||||
Tax exempt interest | (112 | ) | (131 | ) | (142 | ) | ||||||
Tax credits | — | (106 | ) | — | ||||||||
Other | (14 | ) | (14 | ) | 19 | |||||||
Net Provision | $ | 782 | $ | 660 | $ | 1,275 | ||||||
15
Table of Contents
| 9. | Related Party Transactions |
The Chairman of the Board and President of the Bank also serves as Chairman of the Board and President of Bank Building Corporation and Manager of Blackstone Properties, LLC, its wholly owned subsidiary (the “companies”). The companies leased branches to the Bank. At December 31, 2006, the Bank leased forty-six offices from the companies. Rental expense and future lease payments under these leases are disclosed in a footnote below. As of December 31, 2006 and 2005, the Bank had loans totaling $28,788,961 and $5,959,000, respectively, to the companies. These loans were made to purchase bank branches leased to the Bank and other investment property. The loans are secured by these branches and the related leases and other investment property, and have repayment terms similar to other loan customers of the Bank.
In the ordinary course of business, directors and their related interests were customers of, and had transactions with the Bank. Loan transactions with directors and officers, principal security holders and associates were made on substantially the same terms of those prevailing at the time of comparable loans to other persons and did not involve more than normal risk of collectibility or present other unfavorable features. A summary of these transactions is presented below.
| (Dollars in thousands) | 2006 | 2005 | ||||||
Beginning Balance | $ | 8 | $ | 21 | ||||
Transfer of loans from merger | 10,288 | — | ||||||
New Loans | 10,093 | 7 | ||||||
Repayments | (5,478 | ) | (20 | ) | ||||
Ending Balance | $ | 14,911 | $ | 8 | ||||
| 10. | Contingencies |
The Bank is not aware of any legal matters of financial significance pending at December 31, 2006 or 2005.
| 11. | Earnings Per Common Share |
The bank follows Statement of Financial Accounting Standards (SFAS) No. 128, “Earnings Per Share”. This statement requires the dual presentation of basic and diluted earnings per share. The weighted average number of shares used to compute earnings per share was 2,499,633.
16
Table of Contents
| 12. | Bank Premises and Equipment |
Premises and equipment are stated at cost less accumulated depreciation as follows:
| (Dollars in thousands) | Cost | Accumulated Depreciation and Amortization | Net Remaining Cost | |||||||
December 31,2006 | ||||||||||
Bank Premises (including land of $19,725) | $ | 78,949 | $ | (7,448 | ) | $ | 71,501 | |||
Equipment | 18,009 | (7,281 | ) | 10,728 | ||||||
Leasehold improvements | 1,031 | (386 | ) | 645 | ||||||
Total | $ | 97,989 | $ | (15,115 | ) | $ | 82,874 | |||
December 31,2005 | ||||||||||
Bank Premises (including land of $1,394) | $ | 16,974 | $ | (1,047 | ) | $ | 15,927 | |||
Equipment | 3,129 | (868 | ) | 2,261 | ||||||
Total | $ | 20,103 | $ | (1,915 | ) | $ | 18,188 | |||
| 13. | Goodwill and Other Intangible Assets |
In January 2003, the Bank adopted SFAS 142,Goodwill and Other Intangible Assets.Accordingly, goodwill is no longer subject to amortization, but is subject to at least an annual assessment for impairment by applying a fair value test.
The changes in the carrying amount of goodwill for the year ended December 31, 2006, are as follows:
| (Dollars in thousands) | |||
Balance as of January 1, 2006 | $ | — | |
Goodwill recorded during year | 60,423 | ||
Impairment losses | — | ||
Balance as of December 31, 2006 | $ | 60,423 | |
Approximately $1.4 million of the goodwill will be deductible for income taxes in future years.
Core deposits intangibles resulting from the acquisitions were $61,762,766 and are being amortized over 100 months.
17
Table of Contents
The following reflects the carrying amount, accumulated amortization, and amortization expense for amortized intangibles, and the estimated amortization expense for each of the five succeeding fiscal years.
| As of December 31, | ||||||||||||
| 2006 | 2005 | |||||||||||
| (Dollars in thousands) | Gross Carrying Amount | Accumulated Amortization | Gross Carrying Amount | Accumulated Amortization | ||||||||
Amortized Intangible Assets: | ||||||||||||
Core deposits intangibles | $ | 61,763 | $ | — | $ | — | $ | — | ||||
Aggregate Amortization Expense: | ||||||||||||
For year ended December 31, 2006 | — | |||||||||||
Estimated Amortization Expense: | ||||||||||||
For year ending December 31, 2007 | 7,414 | |||||||||||
For year ending December 31, 2008 | 7,414 | |||||||||||
For year ending December 31, 2009 | 7,414 | |||||||||||
For year ending December 31, 2010 | 7,414 | |||||||||||
For year ending December 31, 2011 | 7,414 | |||||||||||
Thereafter | 24,693 | |||||||||||
| 14. | Foreclosed Assets |
Expenses applicable to foreclosed assets include the following:
(Dollars in thousands) Years Ended December 31 | 2006 | 2005 | 2004 | ||||||
Net loss (gain) on sales of real estate | $ | — | $ | — | $ | — | |||
Provision for losses | — | — | — | ||||||
Operating expenses | 14 | 13 | 1 | ||||||
| 15. | Cash and Cash Equivalents |
Cash and cash equivalents as of December 31 are detailed below:
| (Dollars in thousands) | 2006 | 2005 | 2004 | ||||||
Cash and due from banks | $ | 83,365 | $ | 10,367 | $ | 9,393 | |||
Federal funds sold | 340,500 | — | 18,485 | ||||||
Total cash and cash equivalents | $ | 423,865 | $ | 10,367 | $ | 27,878 | |||
18
Table of Contents
| 16. | Deposits |
Certificates of Deposit maturing as of December 31:
| (Dollars in thousands) | 2006 | 2005 | ||||
1 Year | $ | 895,667 | $ | 77,730 | ||
2 Years | 227,763 | 27,007 | ||||
3 Years | 77,739 | 20,697 | ||||
4 Years | 143,268 | 17,479 | ||||
5 Years and thereafter | 91,560 | 36,524 | ||||
Total | $ | 1,435,997 | $ | 179,437 | ||
| 17. | Concentration of Credit Risk |
The majority of the Bank’s loans, commitments and lines of credit have been granted to customers in the Bank’s market area. The concentrations of credit by loan classification are set forth in an above footnote. The Bank does not extend credit to any individual borrowers in excess of its lending limit of $45,319,000 and $6,037,000, respectively, as of December 31, 2006 and 2005.
The largest category of Real Estate Loans consisted of loans to the commercial industry. These loans approximated $403,750,000 at December 31, 2006 and $55,973,000 at December 31, 2005.
| 18. | Fair Value of financial Instruments |
Statement of Financial Accounting Standards No. 107, “Disclosures about Fair Value of Financial Instruments”, requires the Bank to disclose the estimated fair values of its financial assets and liabilities. The estimated fair values were determined using the following assumptions:
| a. | The carrying value of Cash and Due From Banks, Federal Funds Sold, and Interest-Bearing Deposits in Other Financial Institutions are believed to approximate the fair value of these items. |
| b. | The fair value of actively traded investment securities are determined according to quotes available in the financial press. The fair value of instruments which are not actively traded are determined using values of other instruments with similar characteristics or obtained from outside sources believed to be reliable. |
| c. | The fair value loans are estimated by discounting the anticipated cash flows using estimated rates for similar loans available in the Bank’s market area. Estimates of maturities are based on both experience and contractual maturities although prepayments are permitted on the loans. |
| d. | The fair value of short-term demand and savings deposits are believed to equal carrying value. The fair value of certificates of deposit is based upon the contractual maturity of the instruments and rates currently offered for similar deposits. |
| e. | The fair value of Notes Payable to the U.S. Treasury and Subordinated Notes are-estimated at carrying value. |
| f. | The fair value of Accrued Interest Receivable and Accrued Interest Payable are estimated at carrying value. |
19
Table of Contents
| (Dollars in thousands) | 2006 | 2005 | ||||||||||
Financial Assets: | Carrying Value | Fair Value | Carrying Value | Fair Value | ||||||||
Interest-Bearing Deposits in Other Financial Institutions | $ | 173,178 | $ | 173,178 | $ | 22,465 | $ | 22,465 | ||||
Investment Securities | 452,181 | 451,410 | 95,665 | 94,497 | ||||||||
Federal Funds Sold | 340,500 | 340,500 | — | — | ||||||||
Loans (Net of Unearned Income) | 1,408,153 | 1,405,493 | 206,930 | 210,980 | ||||||||
Cash and Due From Banks | 83,365 | 83,365 | 10,367 | 10,367 | ||||||||
Accrued Interest Receivable | 14,098 | 14,098 | 2,003 | 2,003 | ||||||||
Total | $ | 2,471,475 | $ | 2,468,044 | $ | 337,430 | $ | 340,312 | ||||
Financial Liabilities: | ||||||||||||
Deposits | ||||||||||||
LIFETIME FREE CHECKING | $ | 374,819 | $ | 374,819 | $ | 44,862 | $ | 44,862 | ||||
Interest-Bearing Demand | 254,663 | 254,663 | 26,781 | 26,781 | ||||||||
Regular Passbook Savings | 306,071 | 306,071 | 67,738 | 67,738 | ||||||||
Time Deposits: | ||||||||||||
Certificates of Deposit $100,000 and Over | 331,451 | 331,451 | 30,912 | 30,819 | ||||||||
Other | 1,104,546 | 1,104,546 | 148,525 | 148,051 | ||||||||
Accrued Interest Payable | 4,073 | 4,073 | 275 | 275 | ||||||||
Total Deposits | $ | 2375,623 | $ | 2,375,623 | S319,093 | $ | 318,526 | |||||
Notes issued to the U.S. Treasury | 4,054 | 4,054 | 72 | 72 | ||||||||
Total | $ | 2379,677 | $ | 2,379,677 | $ | 319,165 | S318,598 | |||||
| 19. | Capital Adequacy |
The Bank is subject to various regulatory capital requirements. Under the regulatory capital guidelines and the regulator framework for Prompt Corrective Action (PCA), the Bank must meet specific capital guidelines involving the quantitative measures of the Bank’s assets, liabilities, and certain off-balance-sheet items as calculated under regulatory accounting practices. The Bank’s capital amount and classification are also subject to qualitative judgments by the regulators about components, risk weightings and other factors.
Quantitative measures established by regulation to ensure capital adequacy require the Bank to maintain minimum ratios (set forth in the table below) of total and Tier 1 (as defined in the regulations) to risk-weighted asses (as defined) and of Tier 1 capital to average assets (as defined).
| Minimum Ratio For Capital Adequacy Purposes | Minimum Ratio To Be Considered Well Capitalized | |||||
Tier 1 Capital to Risk Weighted Assets | 4 | % | 6 | % | ||
Total Capital to Risk, weighted Assets | 8 | % | 10 | % | ||
Tier 1 Capital to Average Assets | 4 | % | 5 | % |
20
Table of Contents
As of December 31, 2006, the most recent notification from the Federal Deposit Insurance Corporation categorized the Bank as well capitalized under the regulatory framework for prompt corrective action. To be categorized as well capitalized, an institution must maintain minimum total risk-based, Tier 1 risk-based and Tier 1 leverage ratios as set forth in the above table. There are no conditions or events since the notification that management believes have changed the Bank’s category. The Bank’s actual capital amounts and ratios as of December 31, 2006 and 2005 are presented in the following table. Management believes, as of December 31, 2006 and 2005, that the Bank meets all capital adequacy requirements to which it is subject.
| (Dollars in Thousands) | Minimum Capita! For Capital Adequacy Purposes | Minimum Capital To Be Considered Well Capitalized | Actual Capital | Actual Ratio | ||||||||
2006 | ||||||||||||
Tier 1 Capital to Risk Weighted Assets | $ | 62,006 | $ | 93,009 | $ | 289,292 | 1229 | % | ||||
Total Capital to Risk Weighted Assets | 124,012 | 155,015 | 302,129 | 13.12 | % | |||||||
Tier 1 Capital to Average Assets | 96,992 | 121,241 | 289,292 | 7.86 | % | |||||||
2005 | Minimum Capital For Capital Adequacy Purposes | Minimum Capital To Be Considered Well Capitalized | Actual Capital | Actual Ratio | ||||||||
Tier 1 Capital to Risk Weighted Assets | $ | 9,525 | $ | 14,288 | $ | 37,820 | 15.88 | % | ||||
Total Capital to Risk Weighted Assets | 19,050 | 23,813 | 40,249 | 16.88 | % | |||||||
Tier 1 Capital to Average Assets | 14,135 | 17,669 | 37,820 | 10.70 | % | |||||||
| 20. | Quarterly Financial Data (Unaudited) |
The following summarizes the quarterly results of operations for the years ended December 31:
| (Dollars in thousands) | First Quarter | Second Quarter | Third Quarter | Fourth Quarter | ||||||||
2006 | ||||||||||||
Total Interest Income | $ | 4,841 | $ | 4,859 | $ | 4,954 | $ | 5,823 | ||||
Total Interest Expense | 2,152 | 2,240 | 2,373 | 2,963 | ||||||||
Net Interest Income | 2,689 | 2,619 | 2,581 | 2,860 | ||||||||
Provision for Loan Losses | 30 | 30 | 30 | 30 | ||||||||
Net Interest Income After Provision for Loan Losses | 2,659 | 2,589 | 2,551 | 2,830 | ||||||||
Total Non-Interest Income | 251 | 200 | 253 | 313 | ||||||||
Total Non-Interest Expense | 2,103 | 2,157 | 2,063 | 2,650 | ||||||||
Income Before Income Taxes | 807 | 632 | 741 | 493 | ||||||||
Income Tax Expense | 240 | 210 | 195 | 137 | ||||||||
Net Income | $ | 567 | $ | 422 | $ | 546 | $ | 356 | ||||
21
Table of Contents
(Dollars in thousands) 2005 | First Quarter | Second Quarter | Third Quarter | Fourth Quarter | ||||||||
Total Interest Income | $ | 4,329 | $ | 4,264 | $ | 4,355 | $ | 4,416 | ||||
Total Interest Expense | 1,716 | 1,792 | 1,935 | 1,942 | ||||||||
Net Interest Income | 2,613 | 2,472 | 2,420 | 2,474 | ||||||||
Provision for Loan Losses | 30 | 30 | 30 | 30 | ||||||||
Net Interest Income After Provision for Loan Losses | 2,583 | 2,442 | 2,390 | 2,444 | ||||||||
Total Non-Interest Income | 292 | 236 | 255 | 336 | ||||||||
Total Non-Interest Expense | 2,045 | 2,035 | 2,035 | 2,184 | ||||||||
Income Before Income Taxes | 830 | 643 | 610 | 596 | ||||||||
Income Tax Expense | 245 | 181 | 171 | 63 | ||||||||
Net Income | $ | 585 | $ | 462 | $ | 439 | $ | 533 | ||||
| 21. | Leases and Rent Expense |
The Bank leased facilities under non-cancelable operating leases during 2006, 2005 and 2004. As noted above, the Bank leases forty-six offices from Bank Building Corporation. These leases required the Bank to pay maintenance, insurance and property taxes and do not have renewal options. Rental expense under these leases was $324,000 in 2006, $314,000 in 2005 and $329,000 in 2004. The Bank also leases offices from non-related parties under various terms. Rental expense for these leases was $27,000 in 2006 and 2005 and $9,000 for 2004.
Future minimum rental payments under these are as follows:
| (Dollars in thousands) | |||||
Year Ending December 31, | 2007 | $ | 2,483 | ||
| 2008 | 2,483 | ||||
| 2009 | 2,483 | ||||
| 2010 | 2,483 | ||||
| 2011 | 2,483 | ||||
| Thereafter | 7,887 | ||||
Total Minimum Lease Payments | $ | 20,302 | |||
| 22. | Off Balance Sheet Activities and Commitments |
Commitments to extend credit, which amounted to approximately $48,359,000 and $5,079,000 at December 31, 2006 and 2005 respectively, represent agreements to lend to customers with fixed expiration dates or other termination clauses. Since many of the commitments are expected to expire without being funded, the total commitment amounts do not necessarily represent future liquidity requirements. Standby letters of credit are conditional commitments issued by the Bank guaranteeing the performance of a customer to a third party. Those guarantees are primarily issued to support public and private borrowing arrangements. The Bank had outstanding letters of credit in the amount of $5,312,000 in 2006 and $711,000 in 2005.
The Bank is a not a member of the Federal Reserve System and is required to maintain certain levels of its cash and due from bank balances as reserves based on regulatory requirements. At December 31, 2006 and 2005, this reserve requirement was approximately $1,600,000.
22
Table of Contents
Federal banking regulations place certain restrictions on dividends paid by the Bank. The total amount of dividends which maybe paid at any date is generally limited to the retained earnings of the Bank. In addition, dividends paid by the Bank would be prohibited if the effect thereof would cause the Bank’s capital to be reduced below applicable minimum capital requirements,
| 23. | Consolidated Subsidiary |
As of the date of the merger described in Note 1, the Mortgage Company of Virginia, Inc. (MCOV) became a wholly-owned subsidiary of the Corporation. Prior to the merger, each bank owned 10% of the outstanding common stock. MCOV owns 100% of Bank Services of Virginia, Inc. The business of both of these companies is to provide operational support services to the Bank. These services consist of mortgage loan servicing, data processing, bookkeeping, check clearing, accounting, investment management, bank couriers, advertising programs, central purchasing and other management services. The Bank is charged for its share of these services, which is recorded as Operation Center Expense in the Statements of Income.
Prior to the merger, the merged banks recorded their investments in the common stock of The Mortgage Company of Virginia, Inc. under the equity method of accounting due to the influence the merged banks had over the Company. The merged banks invested an additional $150,000 in 2005 increasing the value of the investment to $769,000 from $618,000 at December 31, 2004. The merged banks share of earnings of the Bank recorded prior to the merger equaled $5,500 for 2006, $1,000 for 2005, and $11,000 for 2004 and is included in the Statements of Income under Other Non-interest Income.
The Mortgage Company of Virginia, Inc. owns 100% of Bank Services Insurance, Inc. Bank Services Insurance, Inc. provides insurance products to the Bank and customers in the Danville area. The premiums paid to Bank Services Insurance, Inc. prior to the merger equaled $60,813 for 2006, $58,000 for 2005, and $56,000 for 2004.
The following condensed statements summarize the financial position and results of operations of MCOV for the year ended December 31, 2006:
Balance Sheets | |||
| (Dollars in thousands) | December 31, 2006 | ||
Assets | |||
Cash | $ | 908 | |
Other current assets | 8,059 | ||
Other assets | 1,585 | ||
| $ | 10,552 | ||
Liabilities and Stockholder’s Equity | |||
Current liabilities | $ | 1,658 | |
Other liabilities | 1,150 | ||
Capital stock | 3,376 | ||
Retained earnings | 4,368 | ||
| $ | 10,552 | ||
23
Table of Contents
Income Statements | ||||
| Year Ended December 31, 2006 | ||||
Operating revenue | $ | 13,611 | ||
Operating expenses | (13,540 | ) | ||
| 71 | ||||
Provision for tax expense | (16 | ) | ||
Net income | $ | 55 | ||
Statements of Cash Flows | ||||
| Year Ended December 31, 2006 | ||||
Cash used in operations | $ | (154 | ) | |
Cash—beginning of year | 1,062 | |||
Cash—end of year | $ | 908 | ||
| 24. | Merger |
At the close of business on December 29, 2006, ten banks named in Note 1 of the Notes to Consolidated Financial Statements merged into Carter Bank & Trust (CB&T). The merged banks had a common heritage and shared management, operations (including investment management, interest rate risk management, lending and loan administration, check processing, information technology, and mortgage operations as well as other areas), and certain of the Merged Banks have had overlapping boards of directors. In 2005, the boards of directors of each of the Merged Banks began consideration of a consolidation because of changes in the banking business and regulatory environment. The merger would reduce examination fees by banking regulatory agencies, reduce the filing burden collectively by approximately 85%, reduce recordkeeping and reporting duties by merging the banks, as well as other advantages and merger synergies that would be created by combining all the banks merging into a single bank.
The merger was accounted for under the purchase accounting method of accounting principles generally accepted in the United States of America. Under this method, one bank must be chosen as the “deemed” acquirer for accounting purposes. Peoples National Bank was deemed the acquirer. The other nine banks’ assets and liabilities as of the date of the merger were recorded at their respective fair values and added to those of Peoples National Bank and all ten merged into the newly-chartered CB&T. The Balance Sheet at December 31, 2006 represents the combined assets of the Merged Banks, including the wholly-owned subsidiary. The Statement of Income for the year ended December 31, 2006 represents the results of operations for Peoples National Bank through the date of the merger (January 1 through December 29) and the results of operations of CB&T for the remainder of the year (December 30-31).
24
Table of Contents
These ten banks each owned 10% of The Mortgage Company of Virginia, Inc (MCOV) before the merger, CB&T now owns 100% of this stock and accounts for MCOV as a wholly-owned subsidiary. For the purposes of this footnote, all discussions of CB&T include the consolidation of MCOV, All significant related party transactions have been eliminated.
Under this method, a purchase price was determined based on an exchange ratio determined by an independent valuation. Shareholders of the ten banks received shares of common stock in the newly formed CB&T based upon the exchange ratio shown below.
Merged Bank | Exchange Ratio | |
Blue Ridge Bank | 2.474 | |
Central National Bank | 5.470 | |
Community National Bank | 4.350 | |
First National Bank | 1.613 | |
First National Exchange Bank | 4.509 | |
Mountain National Bank | 3.981 | |
Patrick Henry National Bank | 1.112 | |
Patriot Bank N.A. | 5.775 | |
Peoples National Bank | 1.945 | |
Shenandoah National Bank | 3.461 |
The aggregate purchase price was $87,959,676 which was based on the trading price of Peoples National Bank’s common stock at the close of business on December 29, 2006. This resulted in an issuance of 24,996,552 common shares of CB&T based on a closing price per common share of Peoples National Bank of $12.34 a share. No fractional shares were issued. Fractional shares were paid out to shareholders based on the $12.34 per share price.
The difference between the purchase price of the Merged Banks and the fair value of the identifiable net assets acquired was recorded as goodwill. In accordance with FASB Statement No. 142, “Goodwill and Other Intangible Assets (“FASB Statement No. 142”), issued in July 2001, the goodwill resulting from the merger will not be amortized to expense, but instead will be reviewed for impairment at least annually and to the extent goodwill is impaired, its carrying value will be written down to its implied fair value and a charge will be made to earnings. Core deposit, intangibles with definite useful lives recorded by CB&T in connection with the merger will be amortized to expense in accordance with FASB Statement No. 142.
25
Table of Contents
The purchase accounting adjustments and their estimated amortization/accretion periods are as follows:
| (Dollars in thousands) | AMOUNT | Amortization/ Accretion | ||||
ASSETS | ||||||
Bank Premises | $ | 15,366 | 39 years | |||
Land | 11,244 | — | ||||
Core deposit intangibles | 61,763 | 8.33 years | ||||
Other assets | 3,323 | — | ||||
Loans—discount | (38,962 | ) | 2 - 14 years | |||
Investments—discount | (4,344 | ) | 3.38 years | |||
Deferred taxes | (18,388 | ) | — | |||
TOTAL | 30,002 | |||||
Purchase price—above | (87,960 | ) | ||||
Merger costs incurred | (880 | ) | ||||
Total assigned to goodwill for merger | (58,838 | ) | ||||
Goodwill before acquisition | (1,585 | ) | ||||
Total goodwill at 12/31/06 | $ | (60,423 | ) | |||
The following condensed balance sheet of CB&T discloses the amounts assigned to each major asset and liability caption at the acquisition date:
| December 31, 2006 | |||
| (Dollars in thousands) | |||
Assets | |||
Cash and cash equivalents | $ | 524,286 | |
Investment securities | 381,170 | ||
Loans, net | 1,182,559 | ||
Premises and equipment, net | 63,838 | ||
Goodwill | 60,423 | ||
Core deposit intangible | 61,763 | ||
Other assets | 35,211 | ||
Total assets acquired | $ | 2,309,250 | |
Liabilities | |||
Total deposits | $ | 2,029,908 | |
Notes issued to U.S. Treasury | 3,908 | ||
Other liabilities | 24,064 | ||
Total liabilities assumed | 2,057,880 | ||
Net assets acquired | $ | 251,370 | |
26
Table of Contents
The following table presents the pro forma results of operations for the years ended December 31, 2006, 2005 and 2004 as though the ten banks had combined at the beginning of 2004. The condensed pro forma financial results do not necessarily reflect the results of operations that would have occurred had all ten banks constituted a single entity during all three periods.
| Years Ended December 31, | 2006 | 2005 | 2004 | |||||||||
Interest income | $ | 130,706 | $ | 115,625 | $ | 113,281 | ||||||
Interest expense | (65,455 | ) | (51,535 | ) | (47,184 | ) | ||||||
Total interest income | 65,251 | 64,090 | 66,097 | |||||||||
Non-interest income | 7,926 | 8,349 | 9,693 | |||||||||
Non-interest expense | (57,274 | ) | (53,770 | ) | (50,073 | ) | ||||||
Total non-interest income (expense) | (49,348 | ) | (45,421 | ) | (40,380 | ) | ||||||
Income before income taxes | 15,903 | 18,669 | 25,717 | |||||||||
Income tax expense | 4,494 | 5,435 | 7,831 | |||||||||
Net income | $ | 11,409 | $ | 13,235 | $ | 17,886 | ||||||
| 25. | New Accounting Pronouncements |
In May, 2005, the FASB issued Statement No. 154, “Accounting Changes and Error Corrections—a replacement of APB Opinion No. 20 and FASB Statement No. 3.” This Statement requires retrospective application to prior period financial statements of changes in accounting principle, unless it is impracticable to determine either the period-specific effects or the cumulative effect of the change. When it is impracticable to determine the period-specific effects of an accounting change on one or more individual prior periods presented, this Statement requires that the new accounting principle be applied to the balances of assets and liabilities as of the beginning of the earliest period for which retrospective application is practicable and that a corresponding adjustment be made to the opening balance of retained earnings. This Statement improves financial reporting because its requirement to report voluntary changes in accounting principles via retrospective application, unless impracticable enhances the consistency of financial information between periods. This statement is effective for accounting changes and corrections of errors made in fiscal years beginning after December 15, 2005. Adoption of this statement had no material impact on the Corporation’s financial condition or results of operations or cash flows.
In February 2006, The FASB issued SFAS No. 155, “Accounting for Certain Hybrid Financial Instruments -an amendment of FASB Statements No. 133 and 140.” This statement amends Statements No. 133 and 140 by: permitting fair value re-measurement for any hybrid financial instrument with an embedded derivative that otherwise would require bifurcation; clarifying which interest-only strips and principal-only strips are not subject to the requirements of Statement No. 133; establishing a requirement to evaluate interests in securitized financial assets to identify interest that are freestanding derivatives or that are hybrid financial instruments that contain an embedded derivative requiring bifurcation; clarifying that concentrations of credit risk in the form of subordination are not embedded derivatives; and amending Statement No. 140 to eliminate the prohibition on a qualifying special-purpose entity from holding a derivative financial instrument that pertains to a beneficial interest other than another derivative financial instrument. The statement is effective for fiscal years beginning after September 15, 2006. The adoption of this standard is not anticipated to have a material impact on financial condition, result of operations or cash flows.
27
Table of Contents
In July 2006, the FASB issued FASB Interpretation No. 48 (FIN 48), “Accounting for Uncertainty in Income Taxes—an interpretation of FASB Statement 109,” which provides guidance on the measurement, recognition, and disclosure of tax positions taken or expected to be taken in a tax return. The interpretation also provides guidance on de-recognition, classification, interest and penalties, and disclosure, FIN 48 prescribes that a tax position should only be recognized if it is more-likely-than-not that the position will be sustained upon examination by the appropriate taxing authority. A tax position that meets this threshold is measured as the largest amount of benefit that is more likely than not (greater than 50 percent) realized upon ultimate settlement. The cumulative effect of applying FIN 48 is to be reported as an adjustment to the beginning balance of retained earnings in the period of adoption. FIN 48 is effective for fiscal years beginning after December 15, 2006. The Corporation is assessing the impact, if any, that adoption may have on its financial statements.
In September 2006, the FASB issued SFAS No. 157, “Fair Value Measurements,” SFAS 157 establishes a framework for measuring fair value in generally accepted accounting principles (“GAAP”), and expands disclosures about fair value measurements. While the Statement applies under other accounting pronouncements that require or permit fair value measurements, it does not require any new fair value measurements. SFAS No. 157 defines fair value as the price that would be received to sell an asset or paid to transfer a liability (an exit price) in an orderly transaction between market participants at the measurement date. In addition, the Statement establishes a fair value hierarchy, which prioritizes the inputs to valuation techniques used to measure fair value into three broad levels. Lastly, SFAS No. 157 requires additional disclosures for each interim and annual period separately for each major category of assets and liabilities. The Statement is effective for financial statements issued for fiscal years beginning after November 15, 2007, and interim periods within those fiscal years. Management does not expect the adoption of this Statement to have a material impact on the Corporation’s financial statements.
In September 2006, the Securities and Exchange Commission (the “SEC”) released Staff Accounting Bulletin No. 108 (“SAB 108”), which provides detail in the quantification and correction of financial statement misstatements. SAB 108 specifies that companies should apply a combination of the “rollover” and “iron curtain” methodologies when making determinations of materiality. The rollover method quantifies a misstatement based on the amount of the error originating in the current year income statement. The iron curtain approach quantifies misstatements based on the effects of correcting the misstatement existing in the balance sheet at the end of the current year, regardless of the year(s) of origination. SAB 108 instructs companies to quantify the misstatement under both methodologies and if either method results in the determination of a material error, then the Bank must adjust its financial statements to correct the error. SAB 108 also reminds preparers that a change from an accounting principle that is not generally accepted to a principle that is generally accepted is a correction of an error. The Bulletin is effective for annual financial statements covering the first fiscal year ending after November 15, 2006. Management does not expect the adoption of this Bulletin to have a material impact on the Corporation’s consolidated financial statements.
* * *
28
Table of Contents
Exhibit 31.1
CERTIFICATIONS
I, Worth Harris Carter, Jr., certify that:
1. I have reviewed this annual report on Form 10-K of Carter Bank & Trust;
2. Based on my knowledge, this report does not contain any untrue statement of a material fact or omit to state a material fact necessary to make the statements made, in light of the circumstances under which such statements were made, not misleading with respect to the period covered by this report;
3. Based on my knowledge, the financial statements, and other financial information included in this report, fairly present in all material respects the financial condition, results of operations and cash flows of the registrant as of, and for, the periods presented in this report;
4. The registrant’s other certifying officer and I are responsible for establishing and maintaining disclosure controls and procedures (as defined in Exchange Act Rules 13a-15(e) and 15d-15(e)) for the registrant and have:
a) Designed such disclosure controls and procedures, or caused such disclosure controls and procedures to be designed under our supervision, to ensure that material information relating to the registrant, including its consolidated subsidiaries, is made known to us by others within those entities, particularly during the period in which this report is being prepared;
b) Evaluated the effectiveness of the registrant’s disclosure controls and procedures and presented in this report our conclusions about the effectiveness of the disclosure controls and procedures, as of the end of the period covered by this report based on such evaluation; and
c) Disclosed in this report any change in the registrant’s internal control over financial reporting that occurred during the registrant’s most recent fiscal quarter (the registrant’s fourth fiscal quarter in the case of an annual report) that has materially affected, or is reasonably likely to materially affect, the registrant’s internal control over financial reporting; and
5. The registrant’s other certifying officer and I have disclosed, based on our most recent evaluation of internal control over financial reporting, to the registrant’s auditors and the audit committee of the registrant’s board of directors (or persons performing the equivalent functions):
a) All significant deficiencies and material weaknesses in the design or operation of internal control over financial reporting which are reasonably likely to adversely affect the registrant’s ability to record, process, summarize and report financial information; and
b) Any fraud, whether or not material, that involves management or other employees who have a significant role in the registrant’s internal control over financial reporting.
Dated: July 6, 2007 |
| |||
| Worth Harris Carter, Jr. | ||||
| Chairman of the Board and President | ||||
| (Principal Executive Officer) |
Table of Contents
Exhibit 31.2
I, Jane Ann Davis, certify that:
1. I have reviewed this annual report on Form 10-K of Carter Bank & Trust;
2. Based on my knowledge, this report does not contain any untrue statement of a material fact or omit to state a material fact necessary to make the statements made, in light of the circumstances under which such statements were made, not misleading with respect to the period covered by this report;
3. Based on my knowledge, the financial statements, and other financial information included in this report, fairly present in all material respects the financial condition, results of operations and cash flows of the registrant as of, and for, the periods presented in this report;
4. The registrant’s other certifying officer and I are responsible for establishing and maintaining disclosure controls and procedures (as defined in Exchange Act Rules 13a-15(e) and 15d-15(e)) for the registrant and have:
a) Designed such disclosure controls and procedures, or caused such disclosure controls and procedures to be designed under our supervision, to ensure that material information relating to the registrant, including its consolidated subsidiaries, is made known to us by others within those entities, particularly during the period in which this report is being prepared;
b) Evaluated the effectiveness of the registrant’s disclosure controls and procedures and presented in this report our conclusions about the effectiveness of the disclosure controls and procedures, as of the end of the period covered by this report based on such evaluation; and
c) Disclosed in this report any change in the registrant’s internal control over financial reporting that occurred during the registrant’s most recent fiscal quarter (the registrant’s fourth fiscal quarter in the case of an annual report) that has materially affected, or is reasonably likely to materially affect, the registrant’s internal control over financial reporting; and
5. The registrant’s other certifying officer and I have disclosed, based on our most recent evaluation of internal control over financial reporting, to the registrant’s auditors and the audit committee of the registrant’s board of directors (or persons performing the equivalent functions):
a) All significant deficiencies and material weaknesses in the design or operation of internal control over financial reporting which are reasonably likely to adversely affect the registrant’s ability to record, process, summarize and report financial information; and
b) Any fraud, whether or not material, that involves management or other employees who have a significant role in the registrant’s internal control over financial reporting.
Dated: July 6, 2007 |
| |||
| Jane Ann Davis | ||||
| Vice President | ||||
| (Principal Financial Officer) |
Table of Contents
Exhibit 32.1
CERTIFICATION OF PRINCIPAL EXECUTIVE OFFICER
PURSUANT TO § 906 OF THE SARBANES-OXLEY ACT OF 2002 (18 U.S.C. § 1350)
Pursuant to § 906 of the Sarbanes-Oxley Act of 2002 (18 U.S.C. § 1350) I, Worth Harris Carter, Jr., as Chairman of the Board and President of Carter Bank & Trust, certify that, to the best of my knowledge and belief, the Annual Report on Form 10-K for the period ended December 31, 2006, which accompanies this certification fully complies with the requirements of Section 13(a) of the Securities Exchange Act of 1934, as amended, and the information contained in the periodic report fairly presents, in all material respects, the financial condition and results of operations of Carter Bank & Trust at the dates and for the periods indicated. The foregoing certification is made pursuant to § 906 of the Sarbanes-Oxley Act of 2002 (18 U.S.C. § 1350) and shall not be relied upon for any other purpose. The undersigned expressly disclaims any obligation to update the foregoing certification except as required by law.
Dated: July 6, 2007 | /s/ Worth Harris Carter, Jr. | |||
| Worth Harris Carter, Jr. | ||||
| Chairman of the Board and President | ||||
| (Principal Executive Officer) |
Table of Contents
Exhibit 32.2
CERTIFICATION OF PRINCIPAL FINANCIAL OFFICER
PURSUANT TO § 906 OF THE SARBANES-OXLEY ACT OF 2002 (18 U.S.C. § 1350)
Pursuant to § 906 of the Sarbanes-Oxley Act of 2002 (18 U.S.C. § 1350) I, Jane Ann Davis, as Vice President of Carter Bank & Trust, certify that, to the best of my knowledge and belief, the Annual Report on Form 10-K for the period ended December 31, 2006, which accompanies this certification fully complies with the requirements of Section 13(a) of the Securities Exchange Act of 1934, as amended, and the information contained in the periodic report fairly presents, in all material respects, the financial condition and results of operations of Carter Bank & Trust at the dates and for the periods indicated. The foregoing certification is made pursuant to § 906 of the Sarbanes-Oxley Act of 2002 (18 U.S.C. § 1350) and shall not be relied upon for any other purpose. The undersigned expressly disclaims any obligation to update the foregoing certification except as required by law.
Dated: July 6, 2007 | /s/ Jane Ann Davis | |||
| Jane Ann Davis | ||||
| Vice President | ||||
| (Principal Financial Officer) |
Table of Contents
FEDERAL DEPOSIT INSURANCE CORPORATION
Washington, D.C. 20429
FORM 10-Q
| x | QUARTERLY REPORT PURSUANT TO SECTION 13 OR 15(d) OF THE SECURITIES EXCHANGE ACT OF 1934 |
For the quarterly period ended September 30, 2007
OR
| ¨ | TRANSITION REPORT PURSUANT TO SECTION 13 OR 15(d) OF THE SECURITIES EXCHANGE ACT OF 1934 |
For the transition period from to
Commission File Number: n/a
CARTER BANK & TRUST
(Name of registrant as specified in its charter)
| Virginia | 20-5539935 | |
(State or other jurisdiction of incorporation or organization) | (I.R.S. Employer Identification No.) | |
| 1300 Kings Mountain Road, Martinsville, Virginia | 24112 | |
| (Address of principal executive offices) | (Zip Code) | |
(276) 656-1776
(Registrant’s telephone number, including area code)
n/a
(Former name, former address and former fiscal year, if changed since last report)
Indicate by check mark whether the registrant (1) has filed all reports required to be filed by Section 13 or 15(d) of the Securities Exchange Act of 1934 during the preceding 12 months (or for such shorter period that the registrant was required to file such reports), and (2) has been subject to such filing requirements for the past 90 days. Yes x No ¨
Indicate by check mark whether the registrant is a large accelerated filer, an accelerated filer, or a non-accelerated filer. See definition of “accelerated filer and large accelerated filer” in Rule 12b-2 of the Exchange Act.
Large accelerated filer ¨ Accelerated filer ¨ Non-accelerated filer x
Indicate by check mark whether the registrant is a shell company (as defined in Rule 12b-2 of the Exchange Act). Yes ¨ No x
As of November 13 , 2007 there were issued and outstanding 24,996,572 shares of the registrant’s common stock.
Table of Contents
| PART I – FINANCIAL INFORMATION | 4 | |||
| ITEM 1 - | FINANCIAL STATEMENTS | 4 | ||
| STATEMENTS OF CONDITION | 4 | |||
| STATEMENTS OF INCOME | 5 | |||
| STATEMENTS OF CASH FLOWS | 6 | |||
| STATEMENTS OF CHANGES IN SHAREHOLDERS’ EQUITY | 7 | |||
| NOTES TO UNAUDITED FINANCIAL STATEMENTS | 7 | |||
| ITEM 2 - | MANAGEMENT’S DISCUSSION AND ANALYSIS OF FINANCIAL CONDITION AND RESULTS OF OPERATIONS | 9 | ||
| ITEM 3 - | QUANTITATIVE AND QUALITATIVE DISCLOSURES ABOUT MARKET RISK | 15 | ||
| ITEM 4 - | CONTROLS AND PROCEDURES | 16 | ||
| PART II – OTHER INFORMATION | 16 | |||
| ITEM 1 - | LEGAL PROCEEDINGS. | 16 | ||
| ITEM 1A - | RISK FACTORS | 16 | ||
| ITEM 2 - | UNREGISTERED SALES OF EQUITY SECURITIES AND USE OF PROCEEDS. | 17 | ||
| ITEM 3 - | DEFAULTS UPON SENIOR SECURITIES. | 17 | ||
| ITEM 4 - | SUBMISSION OF MATTERS TO A VOTE OF SECURITY HOLDERS. | 18 | ||
| ITEM 5 - | OTHER INFORMATION | 18 | ||
| ITEM 6 - | EXHIBITS | 18 | ||
2
Table of Contents
FORWARD–LOOKING STATEMENTS
This report contains statements concerning Carter Bank & Trust (the “Bank”) expectations, plans, objectives, future financial performance and other statements that are not historical facts. These statements may constitute “forward-looking statements” as defined by federal securities laws. In some cases, readers can identify the forward-looking statements by the use of words such as “may,” “will,” “should,” “could,” “expect,” “plan,” “intend,” “anticipate,” “believe,” “estimate,” “predict,” “potential” or “continue” or the negative or other variations of these words, or other comparable words or phrases. These statements may address issues that involve estimates and assumptions made by management, risks and uncertainties, and actual results could differ materially from historical results or those anticipated by such statements. Factors that could have a material adverse effect on the Bank’s operations and future prospects include, but are not limited to, changes in: interest rates; general and local economic conditions; the legislative/regulatory climate; monetary and fiscal policies of the U.S. government, including policies of the U.S. Treasury; the quality or composition of loan or investment portfolios; demand for loan products; deposit flows; competition; demand for financial services in our market area and accounting principles, policies and guidelines. These risks and uncertainties should be considered in evaluating the forward-looking statements contained herein, and readers are cautioned not to place undue reliance on such statements, which speak only as of the date of this report.
3
Table of Contents
PART I – FINANCIAL INFORMATION
STATEMENTS OF CONDITION
| (in 000’s) | ||||||||
| (Dollars in Thousands) | September 30, 2007 (Unaudited) | December 31, 2006 | ||||||
ASSETS | ||||||||
Interest-Bearing Deposits in Other Financial Institutions | $ | 81,972 | $ | 173,178 | ||||
Investment Securities | ||||||||
U. S. Agency Securities | 552,880 | 452,181 | ||||||
Federal Funds Sold | 220,350 | 340,500 | ||||||
Loans | 1,415,704 | 1,411,951 | ||||||
Less: Unearned | (3,394 | ) | (3,798 | ) | ||||
Allowance for Loan Losses | (13,391 | ) | (12,837 | ) | ||||
Net Loans | 1,398,919 | 1,395,316 | ||||||
Earning Assets | 2,254,121 | 2,361,175 | ||||||
Cash and Due From Banks | 73,180 | 83,365 | ||||||
Bank Premises and Equipment | 83,613 | 82,874 | ||||||
Real Estate Owned Other Than Bank Premises | 9,827 | 12,156 | ||||||
Goodwill | 60,737 | 60,423 | ||||||
Other Intangible Assets | 56,202 | 61,763 | ||||||
Other Assets | 31,120 | 28,422 | ||||||
TOTAL ASSETS | $ | 2,568,800 | $ | 2,690,178 | ||||
LIABILITIES | ||||||||
Deposits | ||||||||
LIFETIME FREE CHECKING | $ | 355,809 | $ | 374,819 | ||||
Interest-Bearing Demand | 224,383 | 254,663 | ||||||
Regular Passbook Savings | 306,870 | 306,071 | ||||||
Time Deposits | ||||||||
Certificates of Deposit $100,000 or More | 306,184 | 331,451 | ||||||
Other | 1,051,373 | 1,104,546 | ||||||
Total Deposits | 2,244,619 | 2,371,550 | ||||||
Notes issued to the U. S. Treasury | 5,270 | 4,054 | ||||||
Other Liabilities | 26,735 | 25,282 | ||||||
TOTAL LIABILITIES | 2,276,624 | 2,400,886 | ||||||
SHAREHOLDERS’ EQUITY | ||||||||
Common Stock, Par Value $1 Per Share, Authorized 100,000,000 | ||||||||
Shares; 24,996,572 Outstanding | 24,996 | 24,996 | ||||||
Surplus | 131,786 | 131,831 | ||||||
Undivided Profits | 135,394 | 132,465 | ||||||
TOTAL SHAREHOLDERS’ EQUITY | 292,176 | 289,292 | ||||||
TOTAL LIABILITIES AND SHAREHOLDERS’ EQUITY | $ | 2,568,800 | $ | 2,690,178 | ||||
See accompanying notes to unaudited financial statements.
4
Table of Contents
STATEMENTS OF INCOME
| Nine Months Ended September 30, | Three Months Ended September 30, | |||||||||||
| 2007 | 2006 | 2007 | 2006 | |||||||||
| (Dollars in thousands) | (Unaudited) | (Unaudited) | ||||||||||
INTEREST INCOME | ||||||||||||
Interest and Fees on Loans | ||||||||||||
Taxable | $ | 69,475 | $ | 10,509 | $ | 23,620 | $ | 3,560 | ||||
Non-Taxable | 5,326 | 275 | 1,851 | 108 | ||||||||
Interest on Deposits in Other Financial Institutions | 5,019 | 671 | 1,337 | 228 | ||||||||
Interest on Federal Funds Sold | 14,093 | 484 | 2,986 | 115 | ||||||||
Interest and Dividends on Securities | ||||||||||||
U. S. Agency Securities | 16,970 | 2,715 | 7,294 | 943 | ||||||||
TOTAL INTEREST INCOME | 110,883 | 14,654 | 37,088 | 4,954 | ||||||||
INTEREST EXPENSE | ||||||||||||
Interest on Time Deposits $100,000 or More | 11,716 | 1,079 | 3,744 | 420 | ||||||||
Interest on Other Deposits | 44,910 | 5,681 | 14,979 | 1,950 | ||||||||
Interest on Federal Funds Purchased | — | 2 | — | 2 | ||||||||
Interest on Notes Issued to the U. S. Treasury | 69 | 3 | 19 | 1 | ||||||||
TOTAL INTEREST EXPENSE | 56,695 | 6,765 | 18,742 | 2,373 | ||||||||
NET INTEREST INCOME | 54,188 | 7,889 | 18,346 | 2,581 | ||||||||
Provision for Loan Losses | 648 | 90 | 216 | 30 | ||||||||
NET INTEREST INCOME AFTER PROVISION FOR LOAN LOSSES | 53,540 | 7,799 | 18,130 | 2,551 | ||||||||
NON-INTEREST INCOME | ||||||||||||
Service Charges, Commissions and Fees | 5,061 | 598 | 1,439 | 204 | ||||||||
Other Non-Interest Income | 1,874 | 106 | 1,148 | 49 | ||||||||
TOTAL NON-INTEREST INCOME | 6,935 | 704 | 2,587 | 253 | ||||||||
NON-INTEREST EXPENSE | ||||||||||||
Salaries and Employee Benefits | 27,627 | 3,481 | 9,218 | 1,129 | ||||||||
Occupancy Expense (Net) | 7,715 | 1,032 | 2,550 | 344 | ||||||||
Operations Center Expense | — | 1,195 | — | 398 | ||||||||
Other Non-Interest Expense | 12,077 | 615 | 4,472 | 192 | ||||||||
TOTAL NON-INTEREST EXPENSE | 47,419 | 6,323 | 16,240 | 2,063 | ||||||||
INCOME BEFORE INCOME TAXES | 13,056 | 2,180 | 4,477 | 741 | ||||||||
Income Tax Expense | 2,627 | 645 | 891 | 195 | ||||||||
NET INCOME | $ | 10,429 | $ | 1,535 | $ | 3,586 | $ | 546 | ||||
EARNINGS PER COMMON SHARE: | ||||||||||||
Basic and Diluted | $ | 0.42 | $ | 0.65 | $ | 0.14 | $ | 0.23 | ||||
Weighted Average Shares Outstanding | 24,996,572 | 2,375,683 | 24,996,572 | 2,375,683 | ||||||||
Cash Dividends Per Common Share | $ | 0.30 | $ | 0.60 | $ | 0.10 | $ | 0.20 | ||||
See accompanying notes to unaudited financial statements.
5
Table of Contents
STATEMENTS OF CASH FLOWS
| Nine Months Ended September 30, | ||||||||
| 2007 | 2006 | |||||||
| (Dollars in Thousands) | (Unaudited) | |||||||
Cash Flows From Operating Activities | ||||||||
Net Income | $ | 10,429 | $ | 1,535 | ||||
Adjustments to reconcile net income to net cash provided by operating activities | ||||||||
Provision for Loan Losses | 648 | 90 | ||||||
Depreciation of Bank Premises and Equipment | 2,329 | 304 | ||||||
Amortization of Core Deposit Intangible and Goodwill | 5,561 | — | ||||||
Increase in Goodwill | (314 | ) | — | |||||
Increase (Decrease) in Unearned Income | (404 | ) | (89 | ) | ||||
(Decrease) Increase in Other Assets | (2,698 | ) | 464 | |||||
Increase (Decrease) in Other Liabilities | 1,453 | 2,121 | ||||||
Net Cash From Operating Activities | 17,004 | 4,425 | ||||||
Cash Flows From Investing Activities | ||||||||
Proceeds from Maturity of Interest Bearing Balances | 376,206 | 14,394 | ||||||
Purchase of Interest Bearing Balances | (285,000 | ) | (10,792 | ) | ||||
Payments on Investment Securities | (100,699 | ) | 20,314 | |||||
Purchase of Investment Securities | — | (13,500 | ) | |||||
Purchase of Bank Premises and Equipment | (3,068 | ) | (1,239 | ) | ||||
Net (Increase) Decrease in Short-Term Loans Outstanding, Net | (33,211 | ) | (1,235 | ) | ||||
Longer-Term Loans Originated or Purchased | (456,355 | ) | (36,140 | ) | ||||
Principal Collected on Longer-Term Loans | 485,719 | (6,839 | ) | |||||
(Increase) in Other Real Estate | 2,329 | (188 | ) | |||||
Net Cash From Investing Activities | (14,079 | ) | (35,225 | ) | ||||
Cash Flows from Financing Activities | ||||||||
Decrease in Demand and Savings Accounts | (48,491 | ) | (8,767 | ) | ||||
Proceeds from Sale of Time Deposits | 162,780 | 106,900 | ||||||
Payments for Matured Time Deposits | (241,220 | ) | (57,119 | ) | ||||
Fractional Shares | (45 | ) | — | |||||
Cash Dividends | (7,500 | ) | (1,426 | ) | ||||
Net Change in Notes issued to the U. S. Treasury | 1,216 | 151 | ||||||
Net Cash From Financing Activities | (133,260 | ) | 39,739 | |||||
Net Increase (Decrease) in Cash and Cash Equivalents | (130,335 | ) | 8,939 | |||||
Cash and Cash Equivalents at Beginning of Year | 423,865 | 10,367 | ||||||
Cash and Cash Equivalents at End of Period | $ | 293,530 | $ | 19,306 | ||||
Cash and Cash Equivalents Include: | ||||||||
Cash and Due From Banks | $ | 73,180 | $ | 9,506 | ||||
Federal Funds Sold | 220,350 | 9,800 | ||||||
Total Cash and Cash Equivalents at Period End | $ | 293,530 | $ | 19,306 | ||||
Supplementary Data: | ||||||||
Cash Interest Paid | $ | 53,063 | $ | 7,294 | ||||
Cash Paid for Taxes | $ | 2,627 | $ | 645 | ||||
See accompanying notes to unaudited financial statements.
6
Table of Contents
STATEMENTS OF CHANGES IN SHAREHOLDERS’ EQUITY
| Common Stock | Undivided | ||||||||||||
| (Dollars in thousands) | Shares | Par Value | Surplus | Profits | |||||||||
Balances, December 31, 2006 | 24,996,572 | $ | 24,996 | $ | 131,831 | $ | 132,465 | ||||||
Net Income | — | — | — | 10,429 | |||||||||
Fractional Shares | — | — | (45 | ) | — | ||||||||
Cash Dividends | — | — | — | (7,500 | ) | ||||||||
Balances, September 30, 2007 (Unaudited) | 24,996,572 | $ | 24,996 | $ | 131,786 | $ | 135,394 | ||||||
Notes To Unaudited Financial Statements
The unaudited interim financial statements of the Bank are prepared in conformity with accounting principles generally accepted in the United States of America and the instructions to the Securities and Exchange Commission’s Form 10-Q. In the opinion of management, all adjustments (consisting only of normal recurring adjustments) necessary for a fair presentation of the financial position and results of operations for the periods presented have been included. The results for the nine months ended September 30, 2007 are not necessarily indicative of the results for the entire fiscal year ending December 31, 2007.
The Merger was accounted for under the purchase accounting method of accounting principles generally accepted in the United States of America. Under this method, one bank must be chosen as the “deemed” acquirer for accounting purposes. Peoples National Bank was deemed the acquirer. The other nine banks’ assets and liabilities as of the date of the merger were recorded at their respective fair values and added to those of Peoples National Bank and all ten merged into the newly-chartered Carter Bank & Trust. The Balance Sheet at September 30, 2007 and December 31, 2006 represents the combined assets of the Merged Banks, including the wholly-owned subsidiary. The Statement of Income represents Carter Bank & Trust for the September 30, 2007 period and Peoples National Bank for the June 30, 2006 period.
Certain reclassifications have been made to the prior year financial statements to conform to the 2007 presentation. These reclassifications had no effect on previously reported net income.
NOTE 1 - INVESTMENT SECURITIES
The Bank has the ability and intent to carry the investments noted with an unrealized loss to the final maturity of the instrument and considers these investments not other-than-temporarily impaired.
The following table sets forth a summary of the investment securities portfolio as of the periods indicated:
| (Dollars in thousands) | Amortized Cost | Gross Unrealized Gains | Gross Unrealized Losses | Estimated Market Value | ||||||||
September 30, 2007 (Unaudited) | ||||||||||||
U. S. Agency Securities | $ | 551,543 | $ | 726 | $ | 5,195 | $ | 547,074 | ||||
Mortgage-backed securities | 1,337 | — | — | 1,337 | ||||||||
Total | $ | 552,880 | $ | 726 | $ | 5,195 | $ | 548,411 | ||||
December 31, 2006 | ||||||||||||
U. S. Agency Securities | $ | 450,673 | $ | 14 | $ | 785 | $ | 449,902 | ||||
Mortgage-backed securities | 1,508 | — | — | 1,508 | ||||||||
Total | $ | 452,181 | $ | 14 | $ | 785 | $ | 451,410 | ||||
7
Table of Contents
NOTE 2 - LOANS
The composition of the loan portfolio by dollar amount is shown in the table below:
| (Dollars in thousands) | September 30, 2007 (Unaudited) | December 31, 2006 | ||||||
Secured by real estate | ||||||||
Construction Loans | $ | 47,973 | $ | 70,129 | ||||
Secured by farmland (including farm residential and other improvements) | 22,402 | 23,658 | ||||||
Secured by 1-4 family residential properties | 184,527 | 187,602 | ||||||
Secured by multi-family residential properties | 54,879 | 57,182 | ||||||
Secured by non-farm residential property | 661,432 | 709,590 | ||||||
Loans to other Depository Institutions | — | — | ||||||
Loans to finance agricultural production and other loans to farmers | 5,775 | 4,764 | ||||||
Commercial and industrial loans | 128,542 | 107,027 | ||||||
Loans to individuals for household, family and other personal expenditures | 103,814 | 92,495 | ||||||
Obligations (other than securities) of states and political subdivisions | 206,360 | 159,504 | ||||||
Less: Unearned Income | (3,394 | ) | (3,798 | ) | ||||
Total loans and leases | $ | 1,412,310 | $ | 1,408,153 | ||||
NOTE 3 - ALLOWANCE FOR LOAN LOSSES
The allowance for loan losses is an estimate of losses inherent in the loan portfolio as determined by management taking into consideration historical loan loss experience, diversification of the loan portfolio, amounts of secured and unsecured loans, banking industry standards and averages, and general economic conditions. Ultimate losses may vary from current estimates. These estimates are reviewed periodically and as adjustments become necessary, they are reported in earnings in the periods which they become reasonably estimable.
The following table summarizes the activity in the allowance for loan losses in the periods presented:
| (Dollars in thousands) | September 30, 2007 (Unaudited) | December 31, 2006 | ||||
Balance Beginning of Period | $ | 12,837 | $ | — | ||
Adjustment from Merger | — | 12,837 | ||||
Provision for Loan Losses | 648 | — | ||||
Charge-Offs, Net of (Recoveries): | ||||||
Real Estate Loans | 9 | — | ||||
Installment Loans | 74 | — | ||||
Commercial Loans | 11 | — | ||||
Total Net Loan Losses | 94 | — | ||||
Balance | $ | 13,391 | $ | 12,837 | ||
NOTE 4 - NONPERFORMING ASSETS AND DELINQUENT LOANS
| (Dollars in thousands) | September 30, 2007 (Unaudited) | December 31, 2006 | ||||
Nonaccrual Loans | ||||||
Real Estate | $ | 19,589 | $ | 21,691 | ||
Installment | 104 | 129 | ||||
Commercial | 862 | 125 | ||||
Total Nonaccrual Loans | 20,555 | 21,945 | ||||
Foreclosed Properties | 9,827 | 12,156 | ||||
Total Nonperforming Assets | $ | 30,382 | $ | 34,101 | ||
Loans 90 Days or More Past Due and Still Accruing | ||||||
Real Estate | $ | 849 | $ | 146 | ||
Installment | 60 | 48 | ||||
Commercial | — | — | ||||
Total Loans 90 Days or More Past Due | $ | 909 | $ | 194 | ||
8
Table of Contents
Item 2 - MANAGEMENT’S DISCUSSION AND ANALYSIS OF FINANCIAL CONDITION AND RESULTS OF OPERATIONS
The Bank
Carter Bank & Trust (“Carter Bank & Trust” or sometimes the “Bank”) is a newly-organized banking institution, incorporated under Virginia law. It is not a member of the Federal Reserve System. Effective December 29, 2006, ten banking institutions, each of which had been in business for a number of years, were merged into Carter Bank & Trust concurrently (the “Merger”). The ten merged banks (each a “Merged Bank” and collectively, the “Merged Banks”), and their respective main office locations, were:
Blue Ridge Bank, N.A. - Floyd, Virginia
Central National Bank - Lynchburg, Virginia
Community National Bank - South Boston, Virginia
First National Bank - Rocky Mount, Virginia
First National Exchange Bank - Roanoke, Virginia
Mountain National Bank - Galax, Virginia
Patrick Henry National Bank - Martinsville, Virginia
Patriot Bank, N.A. - Fredericksburg, Virginia
Peoples National Bank - Danville, Virginia
Shenandoah National Bank - Staunton, Virginia
The main office of Carter Bank & Trust is located in Martinsville, Virginia. All officers and employees of the Merged Banks have continued as officers and employees of Carter Bank & Trust. Worth Harris Carter, Jr., who served as Chairman of the Board and President of each of the Merged Banks, serves as Chairman of the Board and President of Carter Bank & Trust.
By virtue of the Merger, Carter Bank & Trust, with total assets at December 31, 2006 in excess of $2.6 billion, is now the largest state chartered commercial bank headquartered in Virginia, operating 126 branches in Virginia and North Carolina. At September 30, 2007, the Bank had $2.6 billion in assets, $1.4 billion in net loans, $2.2 billion in deposits and $292 million in total shareholders’ equity.
As a result of the Merger, Carter Bank & Trust owns 100% of the capital stock of The Mortgage Company of Virginia, Inc. The Mortgage Company of Virginia, Inc., in turn, owns 100% of the capital stock of Bank Services of Virginia, Inc. and 100% of the capital stock of Bank Services Insurance, Inc. and 50% of the capital stock of Coresoft, Inc.
Critical Accounting Policies
Basis of Presentation and Consolidation
The consolidated financial statements include the accounts and results of operations of the Bank and the Mortgage Company of Virginia (“MCOV”). All significant interbank transactions and balances are eliminated in the consolidation. The December 31, 2006 balance sheet and the September 30, 2007 balance sheets include MCOV. The income statement for September 30, 2007 includes MCOV and the September 30, 2006 income statement includes People National Bank’s portion of the net income of MCOV.
9
Table of Contents
Use of Estimates
The preparation of financial statements in conformity with accounting principles generally accepted in the United States of America requires management to make estimates and assumptions that affect the reported amounts of assets and liabilities and disclosure of contingent assets and liabilities at the date of the financial statements, and the reported amounts of revenue and expenses during the reporting period. Actual results could differ from those estimates. Material estimates that are particularly susceptible to significant change in the near term relate to the determination of the allowance for loan losses, and fair value of other real estate owned.
Cash and Cash Equivalents
The Bank considers all cash on hand, amounts due from banks, and federal funds sold as cash equivalents for purposes of the consolidated statement of cash flows. Federal funds are customarily sold for one-day periods.
Investment Securities
The Bank classifies its securities as held to maturity. These investment securities are stated at cost or unpaid principal adjusted for amortization of premiums and accretion of discounts using the interest method. The carrying value of these assets is not adjusted for temporary declines in value since the Bank has the ability and intent to hold them to maturity. Gains or losses realized from sales are recognized by use of the specific identification method. The Bank has the positive intent and ability to hold these securities until maturity.
Loans and Allowance for Loan Losses
Loans are recorded at the amount of the loan disbursed to borrowers plus the applicable amount, if any, of unearned income and other charges, less payments received. Income earned on loans is recognized by methods which generally result in level rates of return on principal amounts outstanding. The net amount of nonrefundable loan origination fees approximates the direct costs associated with the lending process.
The allowance for loan losses is an estimate of losses inherent in the loan portfolio as determined by management taking into consideration historical loan loss experience, diversification of the loan portfolio, amounts of secured and unsecured loans, banking industry standards and averages, and general economic conditions. Ultimate losses may vary from current estimates. These estimates are reviewed periodically and as adjustments are necessary, they are reported in earnings in the periods which they become reasonably estimable.
Management determines loan impairment using guidelines established by Statement of Financial Accounting Standards No. 114 (SFAS 114), “Accounting by Creditors for Impairment of a Loan – Income Recognition and Disclosures”). Under this accounting standard, a loan is considered to be impaired when it is probable that the Bank will be unable to collect all principal and interest amounts according to the contractual terms of the loan agreement. A performing loan may be considered impaired. The allowance for loan losses related to loans identified as impaired is primarily based on the excess of the loan’s current outstanding principal balance over the estimated fair value of the related collateral. For a loan that is not collateral-dependent, the allowance is recorded at the amount by which the outstanding principal balance exceeds the current best estimate of the future cash lows on the loan discounted at the loan’s original effective interest rate. Interest on impaired loans is recognized when cash is received.
Bank Premises and Equipment
Bank premises and equipment acquired are stated at cost, less accumulated depreciation. Depreciation is charged to operating expenses over the estimated useful life of the assets by the accelerated and straight-line methods.
Bank premises and equipment were merged into Carter Bank & Trust from the nine banks and premises were recorded at appraised values, as required by the purchase accounting method. Equipment was merged into Carter Bank & Trust at the net book values, as carried by each of the nine banks, since management felt this approximated fair value at the date of merger.
10
Table of Contents
Cost of maintenance or repairs are charged to expense as incurred and improvements are capitalized. Upon retirement or disposal of an asset, the asset and related allowance account are eliminated. Any gain or loss on such transactions is included in current operations. Depreciation has been included under Occupancy Expense in the Statements of Income.
Other Real Estate Owned
Real estate properties acquired through or in lieu of loan foreclosure are initially recorded at the lower of the Bank’s carrying amount or fair value less estimated selling cost of the date of foreclosure. Any write-downs based on the asset’s fair value at the date of acquisition are charged to the allowance for loan losses. After foreclosure, the assets are carried at the lower of their new cost basis or fair value less cost to sell. Costs of significant property improvements are capitalized, whereas costs relating to holding property are expensed. Valuations are periodically performed by management, and any write-downs are recorded as a charge to operations, if necessary, to reduce the carrying value of a property to the lower of its carrying value or fair value less cost to sell.
Income Taxes
Deferred tax are provided on a liability method whereby deferred tax assets are recognized for deductible temporary differences and operating loss and tax credit carry forwards and deferred tax liabilities are recognized for taxable temporary differences. Temporary differences are the differences between the reported amounts of assets and liabilities and their tax bases. Deferred tax assets are reduced by a valuation allowance when, in the opinion of management, it is more likely than not that some portion or all of the deferred tax assets will not be realized. Deferred tax assets and liabilities are adjusted for the effects of changes in tax laws and rates on the date of enactment.
Loans or Debt Securities Acquired in a Transfer
In January 2005, Statement of Position (SOP) 03-3, Accounting for Certain Loans or Debt Securities Acquired in a Transfer, was adopted for loan acquisitions. SOP 03-3 required loans to be recorded at fair value and prohibits carrying over valuation allowances in the initial accounting for acquired impaired loans. Loans carried at fair value, mortgage loans held for sale and loans to borrowers in good standing under revolving credit agreements are excluded for the scope of SOP 03-3. SOP 03-3 limits the yield that may be accreted to the excess of the undiscounted expected cash flows over the investor’s initial investment in the loan. The excess of the contractual cash flows expected to be collected are recognized prospectively through an adjustment of the loan’s yield over its remaining life. Decreases in expected cash flows are recognized as impairments.
Goodwill and Intangible Assets
The Bank follows Statement of Financial Accounting Standard (“SFAS”) 142, Goodwill and Other Intangible Assets. Accordingly, goodwill is subject to at least an annual assessment for impairment by applying a fair market value based test. Additionally, under SFAS 142, acquired intangible assets (such as core deposit intangibles) are separately recognized if the benefit of the assets can be sold, transferred, licensed, rented, or exchanged, and amortized over their useful lives. Branch acquisition transactions were outside the scope of SFAS 142 and , accordingly, intangible assets related to such transactions continues to amortize upon the adoption of SFAS 142. The cost of purchased deposit relationships and other intangible assets, based on independent valuation, are being amortized over their estimated lives of 8.33 years.
Overview
The Merger was accounted for under the purchase accounting method of accounting principles generally accepted in the United States of America. Under this method, one bank must be chosen as the “deemed” acquirer for accounting purposes. Peoples National Bank was deemed the acquirer. The other nine banks’ assets and liabilities as of the date of the merger were recorded at their respective fair values and added to those of Peoples National Bank and all ten merged into the newly-chartered Carter Bank & Trust. The Balance Sheet at September 30, 2007 and December 31, 2006 represents the combined assets of the Merged Banks, including the wholly-owned subsidiary. The Statement of Income represents Carter Bank & Trust for the September 30, 2007 period and Peoples National Bank for the September 30, 2006 period.
11
Table of Contents
Net income for C B & T for the first nine months of 2007 equaled $10,429,000, or $0.42 per share, compared to Peoples National Banks’ net income for the nine months ended September 30, 2006 of $1,535,000, or $0.65 per share.
Investments in interest-bearing deposits decreased to $81,972,000 at September 30, 2007 compared to $173,178,000 at December 31, 2006. This was a decrease of $91,206,000 or 53%. Federal Funds Sold decreased to $220,350,000 from $340,500,000 at year end, a decrease of $120,150,000 or 35%. Loans increased by $3,603,000. All categories of deposits decreased with the exception of regular passbook savings, which increased. The shift in the deposits was due to the decline in interest rates and customers putting money into accounts more readily available with shorter terms.
Total Liabilities at September 30, 2007 were $2,276,624,000, down from $2,400,886,000 at December 31, 2006.
Total Shareholders’ Equity at September 30, 2007 was $292,176,000. At December 31, 2006, total Shareholders’ Equity was $289,292,000.
Results of Operations
Net Interest Income.Net Interest Income is our largest source of revenue.
The following table details the average balances and cost and yield data for the earning assets and interest-bearing liabilities:
| For the Nine Months Ended | ||||||||||||||||||||||
| September 30, 2007 | September 30, 2006 | |||||||||||||||||||||
| (Dollars in thousands) | (Unaudited) | |||||||||||||||||||||
Asset/Liability | Average Balance | Income/ Expense | Yield/ Cost | Average Balance | Income/ Expense | Yield/ Cost | Increase (Decrease) | |||||||||||||||
Real Estate Loans | $ | 1,005,355 | $ | 52,188 | 6.92 | % | $ | 169,200 | $ | 8,381 | 6.60 | % | $ | 43,807 | ||||||||
Installment Loans | 100,431 | 6,809 | 9.04 | % | 13,422 | 884 | 8.78 | % | 5,925 | |||||||||||||
Commercial Loans | 323,243 | 15,804 | 6.52 | % | 30,831 | 1,519 | 6.57 | % | 14,285 | |||||||||||||
Total Loans - Net of Unearned Income | 1,429,029 | 74,801 | 6.98 | % | 213,453 | 10,784 | 6.74 | % | 64,017 | |||||||||||||
Interest-Bearing Deposits in Other Financial Institutions | 99,844 | 5,019 | 6.70 | % | 20,225 | 671 | 4.42 | % | 4,348 | |||||||||||||
Investment Securities | 564,928 | 16,970 | 4.01 | % | 87,313 | 2,715 | 4.15 | % | 14,255 | |||||||||||||
Federal Funds Sold | 516,799 | 14,093 | 3.64 | % | 19,558 | 484 | 3.30 | % | 13,609 | |||||||||||||
Total Earning Assets | $ | 2,610,600 | $ | 110,883 | 5.66 | % | $ | 340,549 | $ | 14,654 | 5.74 | % | 96,229 | |||||||||
Interest-Bearing Transaction Accounts | $ | 200,490 | $ | 2,138 | 1.42 | % | $ | 34,690 | $ | 467 | 1.79 | % | $ | 1,671 | ||||||||
Savings Deposits(Including MMA) | 348,364 | 5,394 | 2.06 | % | 70,728 | 883 | 1.66 | % | 4,511 | |||||||||||||
Certificates of Deposit Over $100,000. | 308,165 | 11,716 | 5.07 | % | 32,558 | 1,079 | 4.42 | % | 10,637 | |||||||||||||
Other Certificates of Deposits | 1,054,910 | 37,378 | 4.72 | % | 147,242 | 4,331 | 3.92 | % | 33,047 | |||||||||||||
Total Deposits | 1,911,929 | 56,626 | 3.95 | % | 285,218 | 6,760 | 3.16 | % | 49,866 | |||||||||||||
Notes issued to the U. S. Treasury | 1,733 | 69 | 5.31 | % | 100 | 3 | 4.00 | % | 66 | |||||||||||||
Federal Funds Purchased | — | — | — | 238 | 2 | 1.12 | % | (2 | ) | |||||||||||||
Total Interest-Bearing Liabilities | $ | 1,913,662 | $ | 56,695 | 3.95 | % | $ | 285,556 | $ | 6,765 | 3.16 | % | $ | 49,930 | ||||||||
Net Interest Income | $ | 54,188 | 2.77 | % | $ | 7,889 | 3.09 | % | $ | 46,299 | ||||||||||||
12
Table of Contents
Allowance and Provision for Loan Losses.The Allowance for Loan Losses represents management’s estimation of the amount necessary to absorb future losses in the loan portfolio. On the Statement of Condition, the Allowance for Loan Losses is deducted from Total Loans so that the net amount shown represents the estimated realizable total loans. The Provision for Loan Losses is the amount charged to expense to maintain the Allowance at an adequate level.
The Allowance for Loan Losses was $13,391,000, or less than 1% of total loans outstanding, at September 30, 2007. In the view of management, the Allowance for Loan Losses is adequate to meet the loss contingency based on experience factors and a review of the loan portfolio.
The Provision for Loan Loss was $648,000 for the nine months ended September 30, 2007 for Carter Bank & Trust and $90,000 for Peoples National Bank at September 30, 2006. See Note 3 – Allowance for Loan Losses – and Note 4 – Nonperforming Assets and Delinquent Loans - to the financial statements for additional information.
Non-Interest Income.Non-Interest Income equaled $6,935,000, for Carter Bank & Trust for the nine month period ended September 30, 2007, compared to Peoples National Bank for the same period of 2006, which equaled $704,000. The largest source of non-interest income is Service Charges, Commissions and Fees, which was $5,061,000 for Carter Bank & Trust for September 30, 2007, compared to Peoples National Bank for the same period of 2006, which equaled $598,000.
Non-Interest Expense.Non-Interest Expense was $47,419,000 for Carter Bank & Trust for the period ending September 30, 2007 compared to $6,323,000 for the same period, for Peoples National Bank.
Income Taxes.Income tax expense equaled $2,627,000 in the third quarter of 2007, as compared to $645,000 in 2006 for Peoples National Bank.
Analysis of Financial Condition
Investments.U. S. Agency Securities investments have increased $100,699,000, or 18%, compared to December 31, 2006. The decrease in Federal Funds Sold was used to purchase additional U. S. Agency Securities.
Loans. Loans increased $3,603,000 compared to December 31, 2006. The increases took place in all categories with the exception of the real estate categories, which decreased slightly.
Non-Performing Assets Impaired Loans.Non-performing assets, which consist of nonaccrual loans and foreclosed properties, were $30,382,000 at September 30, 2007 and $34,101,000 at December 31, 2006. Nonaccrual Loans equaled $20,555,000 at September 30, 2007 and $21,945,000 at December 31, 2006. Foreclosed Properties equaled $9,827,000 at September 30, 2007 and $12,156,000 at December 31, 2006. The decrease in foreclosed properties was due to the sale of commercial real estate property and several single family dwellings.
Nonaccrual loans are those loans contractually past due 90 days or more on which no interest is being accrued. Other real estate owned consists of real estate acquired through foreclosure. These properties are reviewed quarterly and reduced to an estimated realizable value at that time.
Deposits.Total deposits decreased $126,931,000 or 5% compared to December 31, 2006. All categories decreased with the exception of regular passbook savings which increased.
Capital.The federal regulatory agencies use risk-based capital ratios to analyze the adequacy of a bank’s capital. These ratios weigh bank assets from 0% to 100%, depending upon the risks inherent in each type of asset. The Bank continues to meet all requirements for a well-capitalized bank as defined by the regulatory agencies.
13
Table of Contents
The following table presents the key risk-based capital ratios for the periods indicated:
| September 30, 2007 | December 31, 2006 | |||||
Tier 1 Ratio | 13.01 | % | 12.29 | % | ||
Total Risk-Based Capital Ratio | 13.90 | % | 13.12 | % | ||
Leverage Ratio | 7.87 | % | 7.86 | % |
Shareholders’ Equity was $292,176,000 at September 30, 2007 compared to $289,292,000 at December 31, 2006.
Liquidity.Liquidity is our ability to fund both loans and investments in the normal course of business and to provide adequate protection for unexpected deposit withdrawals or other demands for funds without incurring a significant negative impact on profitability. Our primary source of day-to-day liquidity lies in the combination of cash, deposit balances, checks in process of collection, deposit growth and federal funds sold. Federal funds are excess funds that are sold to other banks, generally on a one-day basis. Normal funds from the repayment of loans and investments augment these funds.
Our secondary source of liquidity lies in our investments and deposits in other financial institutions. While our investments are categorized as held-to-maturity, they consist primarily of short-term U. S. Agency Securities that are readily marketable. The majority of our investment securities mature in five years or less. Interest-bearing deposits in other financial institutions generally mature in one year and the volume of this investment decreased for the first nine months.
Off-Balance Sheet Arrangements. Commitments to extend credit, which amounted to $70,382,000 at September 30, 2007 and $48,359,000 at December 31, 2006, respectively, represent agreements to lend to customers with fixed expiration dates or other termination clauses. Since many of the commitments are expected to expire without being funded, the total commitment amounts do not necessarily represent future liquidity requirements. Standby letters of credit are conditional commitments issued by the Bank guaranteeing the performance of a customer to a third party. Those guarantees are primarily issued to support public and private borrowing arrangements. The Bank had outstanding letters of credit in the amount of $6,609,000 at September 30, 2007 and $5,312,000 at December 31, 2006.
Recent Accounting Pronouncements.
In February 2006, The FASB issued SFAS No. 155, “Accounting for Certain Hybrid Financial Instruments—an amendment of FASB Statements No. 133 and 140.” This statement amends Statements No. 133 and 140 by: permitting fair value re-measurement for any hybrid financial instrument with an embedded derivative that otherwise would require bifurcation; clarifying which interest-only strips and principal-only strips are not subject to the requirements of Statement No. 133; establishing a requirement to evaluate interests in securitized financial assets to identify interest that are freestanding derivatives or that are hybrid financial instruments that contain an embedded derivative requiring bifurcation; clarifying that concentrations of credit risk in the form of subordination are not embedded derivatives; and amending Statement No. 140 to eliminate the prohibition on a qualifying special-purpose entity from holding a derivative financial instrument that pertains to a beneficial interest other than another derivative financial instrument. The statement is effective for fiscal years beginning after September 15, 2006. The adoption of this standard is not anticipated to have a material impact on financial condition, result of operations or cash flows.
In July 2006, the FASB issued FASB Interpretation No. 48 (FIN 48), “Accounting for Uncertainty in Income Taxes—an interpretation of FASB Statement 109,” which provides guidance on the measurement, recognition, and disclosure of tax positions taken or expected to be taken in a tax return. The interpretation also provides guidance on de-recognition, classification, interest and penalties, and disclosure, FIN 48 prescribes that a tax position should only be recognized if it is more-likely-than-not that the position will be sustained upon examination by the appropriate taxing authority. A tax position that meets this threshold is measured as the largest amount of benefit that is more likely than not (greater than 50 percent) realized upon ultimate settlement. The cumulative effect of applying FIN 48 is to be reported as an adjustment to the beginning balance of retained earnings in the period of adoption. FIN 48 is effective for fiscal years beginning after December 15, 2007. The Corporation is assessing the impact, if any, that adoption may have on its financial statements.
14
Table of Contents
In September 2006, the FASB issued SFAS No. 157, “Fair Value Measurements,” SFAS 157 establishes a framework for measuring fair value in generally accepted accounting principles (“GAAP”), and expands disclosures about fair value measurements. While the Statement applies under other accounting pronouncements that require or permit fair value measurements, it does not require any new fair value measurements. SFAS No. 157 defines fair value as the price that would be received to sell an asset or paid to transfer a liability (an exit price) in an orderly transaction between market participants at the measurement date. In addition, the Statement establishes a fair value hierarchy, which prioritizes the inputs to valuation techniques used to measure fair value into three broad levels. Lastly, SFAS No. 157 requires additional disclosures for each interim and annual period separately for each major category of assets and liabilities. The Statement is effective for financial statements issued for fiscal years beginning after November 15, 2007, and interim periods within those fiscal years. Management does not expect the adoption of this Statement to have a material impact on the Corporation’s financial statements.
In September 2006, the Securities and Exchange Commission (the “SEC”) released Staff Accounting Bulletin No. 108 (“SAB 108”), which provides detail in the quantification and correction of financial statement misstatements. SAB 108 specifies that companies should apply a combination of the “rollover” and “iron curtain” methodologies when making determinations of materiality. The rollover method quantifies a misstatement based on the amount of the error originating in the current year income statement. The iron curtain approach quantifies misstatements based on the effects of correcting the misstatement existing in the balance sheet at the end of the current year, regardless of the year(s) of origination. SAB 108 instructs companies to quantify the misstatement under both methodologies and if either method results in the determination of a material error, then the Bank must adjust its financial statements to correct the error. SAB 108 also reminds preparers that a change from an accounting principle that is not generally accepted to a principle that is generally accepted is a correction of an error. The Bulletin is effective for annual financial statements covering the first fiscal year ending after November 15, 2006. Management does not expect the adoption of this Bulletin to have a material impact on the Corporation’s consolidated financial statements.
Item 3 - QUANTITATIVE AND QUALITATIVE DISCLOSURES ABOUT MARKET RISK
Interest Sensitivity Analysis. The frequency with which interest rates on earning assets and interest bearing liabilities change has a significant impact on net interest income. The following table presents the anticipated changes based on the contractual maturity of each instrument. Expected maturities may differ from contractual maturities as both borrowers and depositors may have the right to call or prepay obligations with or without call or prepayment penalties.
(Dollars in thousands) Uses of Funds | Within One Year | One to Five Years | Over Five Years | Total | ||||||||||
Interest-Bearing Deposits in Other Financial Institutions | $ | 81,972 | $ | — | $ | — | $ | 81,972 | ||||||
Investment Securities | 104,354 | 268,326 | 180,200 | 552,880 | ||||||||||
Federal Funds Sold | 220,350 | — | — | 220,350 | ||||||||||
Loans (Net of Non-accrual Loans) | 452,422 | 458,186 | 484,541 | 1,395,149 | ||||||||||
Total Earning Assets | 859,098 | 726,512 | 664,741 | 2,250,351 | ||||||||||
Deposits | ||||||||||||||
Interest-Bearing Demand | 224,383 | — | — | 224,383 | ||||||||||
Regular Passbook Savings | 306,870 | — | — | 306,870 | ||||||||||
Time Deposits | ||||||||||||||
Certificates of Deposit Over $100,000 | 202,236 | 103,948 | — | 306,184 | ||||||||||
Other | 692,370 | 359,003 | — | 1,051,373 | ||||||||||
Total Deposits | 1,425,859 | 462,951 | — | 1,888,810 | ||||||||||
Notes issued to the U. S. Treasury | 5,270 | — | — | 5,270 | ||||||||||
Total Interest-Bearing Liabilities | 1,431,129 | 462,951 | — | 1,894,080 | ||||||||||
Maturity/Rate Sensitivity Gap Per Period | $ | (572,031 | ) | $ | 263,561 | $ | 664,741 | $ | 356,271 | |||||
Cummulative Maturity/Rate Sensitivity Gap | $ | (572,031 | ) | $ | (308,470 | ) | $ | 356,271 | ||||||
15
Table of Contents
Item 4 - CONTROLS AND PROCEDURES
The Bank maintains a system of disclosure controls and procedures that is designed to ensure that material information is accumulated and communicated to management, including the Bank’s president (who is the Bank’s principal executive officer) and the principal financial and accounting officer, as appropriate to allow timely decisions regarding required disclosure. As required, management, with the participation of the Bank’s president and the principal financial and accounting officer, evaluated the effectiveness of the design and operation of the Bank’s disclosure controls and procedures as of the end of the period covered by this report. Based on this evaluation, the Bank’s president and the principal financial and accounting officer, concluded that the Bank’s disclosure controls and procedures were operating effectively to ensure that information required to be disclosed by the Bank in reports that it files or submits under the Securities Exchange Act of 1934, as amended, is recorded, processed, summarized, and reported within the time periods specified in the rules and forms of the SEC.
Because of the inherent limitations in all control systems, no evaluation of controls can provide absolute assurance that the Bank’s disclosure controls and procedures will detect or uncover every situation involving the failure of persons within the Bank to disclose material information otherwise required to be set forth in the Bank’s periodic reports.
The Bank’s management is also responsible for establishing and maintaining adequate internal control over financial reporting to provide reasonable assurance regarding the reliability of financial reporting and the preparation of financial statements for external purposes in accordance with generally accepted accounting principles. There were no changes in the Bank’s internal control over financial reporting during the Bank’s quarter ended September 30, 2007 that have materially affected, or are reasonably likely to materially affect, the Bank’s internal control over financial reporting.
As of September 30, 2007, no material legal proceedings were pending or threatened against Carter Bank & Trust or any of the Merged Banks.
Business Risk.Carter Bank & Trust’s business is based primarily upon providing basic banking products and services to small, localized markets in Virginia and North Carolina, delivered through our branch network. Carter Bank & Trust’s business is subject to a range of banking competition, from other community banking institutions to large, diversified, multi-national financial services providers. Risks associated with our business include:
| • | Timely development of competitive products and services and the acceptance of these products and services by new and existing customers; |
| • | The willingness of customers to substitute competitors’ products and services for our products and services and vice versa; |
| • | The impact of changes in financial services’ laws and regulations, specifically laws concerning the business of banking; |
| • | A downturn in the real estate market could negatively affect the bank’s business because a significant portion (approximately 69% as of September 30, 2007) of our loans are secured by real estate, exclusive of municipal loans; |
| • | Technological changes; and |
| • | Changes in consumer spending and saving habits. |
Credit Risk.As a lending institution, the credit quality of Carter Bank & Trust’s loan portfolio can have a significant impact on our earnings. Credit risk is the risk of loss due to adverse changes in a borrower’s ability to meet its financial obligations under agreed upon terms. Risks associated with our credit quality include:
| • | The strength of the United States economy in general and the strength of the local economies in which we conduct operations may be different than expected resulting in, among other things, a deterioration in credit quality or a reduced demand for credit, including the resultant effect on Carter Bank & Trust’s loan portfolio and allowance for loan losses; and |
16
Table of Contents
| • | Adverse changes in the financial performance and/or condition of Carter Bank & Trust’s borrowers that could impact repayment of such borrowers’ outstanding loans. |
Market Risk. Carter Bank & Trust’s business is subject to market risk. The components of market risk are interest rate risk inherent in our balance sheet, price risk in our principal investing portfolio. Risks associated with managing market risk include:
| • | The effects of, and changes in, trade, monetary and fiscal policies and laws, including interest rate policies of the FRB; and |
| • | Inflation, interest rate, market and monetary fluctuations. |
Operational Risk. Operational risk is the risk of loss from inadequate or failed internal processes, people and systems or from external events. Risks associated with operational risk include:
| • | Unanticipated judicial proceedings or rulings; |
| • | Matters impacting our business or ethical reputation; |
| • | The impact of changes in accounting principles; and |
| • | The impact of criminal activity committed against the Bank including, but not limited to, robbery or embezzlement. |
Expansion of Branch Locations.We plan to open a number of new branch locations, which is consistent with our overall business strategy of providing convenient locations to market our products and services. These new locations will allow us to expand core business opportunities within our markets. There are risks involved in this strategy that include:
| • | The risk that core business opportunities not develop as projected in the planning phase of branch network expansion; |
| • | The risk that expenses associated with staffing and opening new offices will have a short term negative impact on the net earnings of the bank; and |
| • | The risk that expected revenue from new locations not be fully realized, or realized within expected time frames. |
Item 2 - UNREGISTERED SALES OF EQUITY SECURITIES AND USE OF PROCEEDS.
None.
Item 3 - DEFAULTS UPON SENIOR SECURITIES.
None.
17
Table of Contents
Item 4 - SUBMISSION OF MATTERS TO A VOTE OF SECURITY HOLDERS.
None.
None.
Exhibits:
| 3.1 | Articles of Incorporation (incorporated by reference to Exhibit 3.1 to the Bank’s Form 8-A filed with the FDIC February 23, 2007) | |
| 3.2 | Bylaws (incorporated by reference to Exhibit 3.2 to the Bank’s Form 8-A filed with the FDIC February 23, 2007) | |
| 31.1 | Certification by principal executive officer pursuant to Rule 13a-14(a) | |
| 31.2 | Certification by principal financial officer pursuant to Rule 13a-14(a) | |
| 32 | Certification of principal executive officer and principal financial officer pursuant to 18 U.S.C. § 1350 | |
SIGNATURES
Pursuant to the requirements of the Securities Exchange Act of 1934, the registrant has duly caused this report to be signed on its behalf by the undersigned thereunto duly authorized.
| CARTER BANK & TRUST | ||||
| (Registrant) | ||||
| Date: November 13, 2007 |
| |||
| Worth Harris Carter, Jr. | ||||
| Chairman of the Board and President | ||||
| (Principal Executive Officer) | ||||
| Date: November 13, 2007 |
| |||
| Jane Ann Davis | ||||
| Vice President | ||||
| (Principal Financial Officer) |
18
Table of Contents
Exhibit 31.1
CERTIFICATIONS
I, Worth Harris Carter, Jr., certify that:
| 1. | I have reviewed this quarterly report on Form 10-Q of Carter Bank & Trust; |
| 2. | Based on my knowledge, this report does not contain any untrue statement of a material fact or omit to state a material fact necessary to make the statements made, in light of the circumstances under which such statements were made, not misleading with respect to the period covered by this report; |
| 3. | Based on my knowledge, the financial statements, and other financial information included in this report, fairly present in all material respects the financial condition, results of operations and cash flows of the registrant as of, and for, the periods presented in this report; |
| 4. | The registrant’s other certifying officer and I are responsible for establishing and maintaining disclosure controls and procedures (as defined in Exchange Act Rules 13a-15(e) and 15d-15(e)) for the registrant and have: |
| (a) | Designed such disclosure controls and procedures, or caused such disclosure controls and procedures to be designed under our supervision, to ensure that material information relating to the registrant, including its consolidated subsidiaries, is made known to us by others within those entities, particularly during the period in which this report is being prepared; |
| (b) | Evaluated the effectiveness of the registrant’s disclosure controls and procedures and presented in this report our conclusions about the effectiveness of the disclosure controls and procedures, as of the end of the period covered by this report based on such evaluation; and |
| (c) | Disclosed in this report any change in the registrant’s internal control over financial reporting that occurred during the registrant’s most recent fiscal quarter (the registrant’s fourth fiscal quarter in the case of an annual report) that has materially affected, or is reasonably likely to materially affect, the registrant’s internal control over financial reporting; and |
| 5. | The registrant’s other certifying officer and I have disclosed, based on our most recent evaluation of internal control over financial reporting, to the registrant’s auditors and the audit committee of the registrant’s board of directors (or persons performing the equivalent functions): |
| (a) | All significant deficiencies and material weaknesses in the design or operation of internal control over financial reporting which are reasonably likely to adversely affect the registrant’s ability to record, process, summarize and report financial information; and |
| (b) | Any fraud, whether or not material, that involves management or other employees who have a significant role in the registrant’s internal control over financial reporting. |
| Date: November 13, 2007 |
| |||
| Worth Harris Carter, Jr. | ||||
| Chairman of the Board and President | ||||
| (Principal Executive Officer) |
19
Table of Contents
Exhibit 31.2
I, Jane Ann Davis, certify that:
| 1. | I have reviewed this quarterly report on Form 10-Q of Carter Bank & Trust; |
| 2. | Based on my knowledge, this report does not contain any untrue statement of a material fact or omit to state a material fact necessary to make the statements made, in light of the circumstances under which such statements were made, not misleading with respect to the period covered by this report; |
| 3. | Based on my knowledge, the financial statements, and other financial information included in this report, fairly present in all material respects the financial condition, results of operations and cash flows of the registrant as of, and for, the periods presented in this report; |
| 4. | The registrant’s other certifying officer and I are responsible for establishing and maintaining disclosure controls and procedures (as defined in Exchange Act Rules 13a-15(e) and 15d-15(e)) for the registrant and have: |
| (a) | Designed such disclosure controls and procedures, or caused such disclosure controls and procedures to be designed under our supervision, to ensure that material information relating to the registrant, including its consolidated subsidiaries, is made known to us by others within those entities, particularly during the period in which this report is being prepared; |
| (b) | Evaluated the effectiveness of the registrant’s disclosure controls and procedures and presented in this report our conclusions about the effectiveness of the disclosure controls and procedures, as of the end of the period covered by this report based on such evaluation; and |
| (c) | Disclosed in this report any change in the registrant’s internal control over financial reporting that occurred during the registrant’s most recent fiscal quarter (the registrant’s fourth fiscal quarter in the case of an annual report) that has materially affected, or is reasonably likely to materially affect, the registrant’s internal control over financial reporting; and |
| 5. | The registrant’s other certifying officer and I have disclosed, based on our most recent evaluation of internal control over financial reporting, to the registrant’s auditors and the audit committee of the registrant’s board of directors (or persons performing the equivalent functions): |
| (a) | All significant deficiencies and material weaknesses in the design or operation of internal control over financial reporting which are reasonably likely to adversely affect the registrant’s ability to record, process, summarize and report financial information; and |
| (b) | Any fraud, whether or not material, that involves management or other employees who have a significant role in the registrant’s internal control over financial reporting. |
| Date: November 13, 2007 |
| |||
| Jane Ann Davis | ||||
| Vice President | ||||
| (Principal Financial Officer) |
20
Table of Contents
Exhibit 32
CERTIFICATION OF
PRINCIPAL EXECUTIVE OFFICER AND PRINCIPAL FINANCIAL OFFICER
Pursuant to § 906 of the Sarbanes-Oxley Act of 2002 (18 U.S.C. § 1350)
The undersigned, as the principal executive officer and principal financial officer of Carter Bank & Trust, respectively, certify that, to the best of their knowledge and belief, the Quarterly Report on Form 10-Q for the period ended September 30, 2007, which accompanies this certification fully complies with the requirements of Section 13(a) of the Securities Exchange Act of 1934 and the information contained in the report fairly presents, in all material respects, the financial condition and results of operations of Carter Bank & Trust at the dates and for the periods indicated. The foregoing certification is made pursuant to § 906 of the Sarbanes-Oxley Act of 2002 (18 U.S.C. § 1350) and shall not be relied upon for any other purpose. The undersigned expressly disclaim any obligation to update the foregoing certification except as required by law.
| Date: November 13, 2007 |
| |||
| Worth Harris Carter, Jr. | ||||
| Chairman of the Board and President | ||||
| (Principal Executive Officer) | ||||
| Date: November 13, 2007 |
| |||
| Jane Ann Davis | ||||
| Vice President | ||||
| (Principal Financial Officer) |
21
Table of Contents
SUMMARY SELECTED FINANCIAL DATA
The following table sets forth certain summary historical financial information for each of the Banks. The balance sheet data and income statement data of Central National Bank, First National Bank, First National Exchange Bank, Mountain National Bank, Patrick Henry National Bank, Patriot Bank, N.A., Peoples National Bank and Shenandoah National Bank (the “Reporting Banks”) as of and for the five years in the period ended December 31, 2005 are taken from the audited financial statements of each of the Reporting Banks, respectively. The balance sheet data and income statement data of Blue Ridge Bank, N.A. and Community National Bank (the “Non-Reporting Banks”) as of and for the five years in the period ended December 31, 2005 are taken from their unaudited financial statements, respectively. The balance sheet data and income statement data of each of the Banks as of and for the six months ended June 30, 2006 and 2005, are taken from the unaudited financial statements of each of the Banks as of and for the six months ended June 30, 2006 and 2005, respectively. Results for the six months ended June 30, 2006 do not necessarily indicate results for the entire year. The following information should be read in conjunction with the audited financial statements of each of the Banks, and the related notes, included in this joint proxy statement/offering circular, in documents incorporated by reference, and in conjunction with the unaudited pro forma combined financial information, including the notes, appearing elsewhere in this joint proxy statement/offering circular.
Table of Contents
BLUE RIDGE BANK, N.A.
Summary Financial Data
(Unaudited)
(Dollars in thousands except per share data)
| As of and for the Six Months Ended June 30, | As of and for the Years Ended December 31, | |||||||||||||||||||||||||||
| 2006 | 2005 | 2005 | 2004 | 2003 | 2002 | 2001 | ||||||||||||||||||||||
Income Statement Data | ||||||||||||||||||||||||||||
Interest income | $ | 6,355 | $ | 5,687 | $ | 11,808 | $ | 12,012 | $ | 14,567 | $ | 17,309 | $ | 17,459 | ||||||||||||||
Interest expense | 3,121 | 2,581 | 6,267 | 5,205 | 6,290 | 8,358 | 11,680 | |||||||||||||||||||||
Net interest income | 3,234 | 3,106 | 5,541 | 6,807 | 8,277 | 8,951 | 5,779 | |||||||||||||||||||||
Provision for loan losses | 42 | 90 | 120 | 180 | 1,127 | 360 | 120 | |||||||||||||||||||||
Net interest income after provision for loan losses | 3,192 | 3,016 | 6,147 | 6,627 | 7,150 | 8,591 | 5,659 | |||||||||||||||||||||
Non-interest income | 454 | 420 | 949 | 1,012 | 983 | 908 | 770 | |||||||||||||||||||||
Non-interest expense | 2,852 | 2,683 | 5,567 | 5,045 | 4,531 | 4,641 | 4,351 | |||||||||||||||||||||
Income (loss) before income taxes | 794 | 753 | 1,529 | 2,594 | 3,602 | 4,858 | 2,078 | |||||||||||||||||||||
Income tax expense | 81 | 117 | 211 | 558 | 1,049 | 1,558 | 598 | |||||||||||||||||||||
Net income | $ | 713 | $ | 636 | $ | 1,318 | $ | 2,036 | $ | 2,553 | $ | 3,300 | $ | 1,480 | ||||||||||||||
Per Share Data | ||||||||||||||||||||||||||||
Net income - basic and diluted (1) | $ | 0.70 | $ | 0.63 | $ | 1.29 | $ | 1.99 | $ | 2.50 | $ | 3.23 | $ | 1.45 | ||||||||||||||
Cash dividends declared | 0.50 | 0.50 | 1.00 | 1.00 | 1.00 | 1.00 | 1.00 | |||||||||||||||||||||
Book value per share (1) | 19.83 | 19.46 | 19.63 | 19.34 | 18.35 | 16.35 | 13.46 | |||||||||||||||||||||
Balance Sheet Data | ||||||||||||||||||||||||||||
Assets | $ | 250,374 | $ | 253,306 | $ | 253,370 | $ | 244,928 | $ | 264,696 | $ | 265,017 | $ | 277,739 | ||||||||||||||
Loans, net | 149,578 | 156,365 | 154,024 | 141,942 | 152,250 | 151,447 | 153,385 | |||||||||||||||||||||
Investment securities | 53,770 | 53,053 | 56,762 | 42,409 | 66,151 | 62,626 | 66,286 | |||||||||||||||||||||
Deposits | 229,858 | 233,021 | 232,998 | 224,807 | 243,624 | 245,649 | 261,491 | |||||||||||||||||||||
Stockholders’ equity | 20,275 | 19,904 | 20,074 | 19,779 | 18,766 | 16,725 | 13,761 | |||||||||||||||||||||
Shares outstanding | 1,022,628 | 1,022,628 | 1,022,628 | 1,022,628 | 1,022,628 | 340,876 | 310,020 | |||||||||||||||||||||
Performance Ratios | ||||||||||||||||||||||||||||
Return on average assets (2) | 0.57 | % | 0.52 | % | 0.53 | % | 0.79 | % | 0.95 | % | 1.21 | % | 0.58 | % | ||||||||||||||
Return on average stockholders’ equity (2) | 7.11 | % | 6.43 | % | 6.65 | % | 10.54 | % | 14.13 | % | 21.50 | % | 11.32 | % | ||||||||||||||
Average equity to average assets | 8.10 | % | 7.86 | % | 7.92 | % | 8.08 | % | 7.09 | % | 6.31 | % | 4.95 | % | ||||||||||||||
Net interest margin (2) | 2.84 | % | 2.64 | % | 2.71 | % | 3.01 | % | 3.33 | % | 3.59 | % | 2.18 | % | ||||||||||||||
Efficiency ratio (3) | 77.33 | % | 76.09 | % | 77.15 | % | 64.52 | % | 48.93 | % | 47.07 | % | 66.44 | % | ||||||||||||||
Allowance for loan losses to loans | 1.39 | % | 1.30 | % | 1.28 | % | 1.33 | % | 1.25 | % | 0.85 | % | 0.71 | % | ||||||||||||||
Asset Quality Ratios | ||||||||||||||||||||||||||||
Net charge-offs to average loans outstanding | -0.04 | % | -0.03 | % | 0.02 | % | 0.14 | % | 0.33 | % | 0.09 | % | 0.03 | % | ||||||||||||||
Non-performing loans to period-end loans | 3.58 | % | 2.61 | % | 2.51 | % | 3.45 | % | 1.76 | % | 0.20 | % | 0.13 | % | ||||||||||||||
Non-performing assets to total assets | 3.30 | % | 2.69 | % | 2.60 | % | 3.12 | % | 2.05 | % | 0.36 | % | 0.07 | % | ||||||||||||||
Allowance for loan losses to non-performing loans | 39.37 | % | 50.43 | % | 51.81 | % | 39.29 | % | 72.24 | % | 441.41 | % | 538.73 | % | ||||||||||||||
Liquidity and Capital Ratios | ||||||||||||||||||||||||||||
Risk-based: | ||||||||||||||||||||||||||||
Tier 1 capital | 13.04 | % | 12.26 | % | 12.52 | % | 12.87 | % | 11.39 | % | 10.11 | % | 8.28 | % | ||||||||||||||
Total capital | 14.29 | % | 13.51 | % | 13.77 | % | 14.12 | % | 13.78 | % | 12.11 | % | 10.15 | % | ||||||||||||||
Average loans to average deposits | 65.50 | % | 63.88 | % | 63.36 | % | 63.36 | % | 62.81 | % | 68.07 | % | 53.65 | % | ||||||||||||||
Average shares outstanding | ||||||||||||||||||||||||||||
Basic and diluted | 1,022,628 | 1,022,628 | 1,022,628 | 1,022,628 | 1,022,628 | 340,876 | 310,020 | |||||||||||||||||||||
| (1) | Net income per share and book value per share have been retroactively adjusted to reflect current outstanding shares. |
| (2) | On an annualized basis. |
| (3) | The efficiency ratio equals non-interest expense divided by the sum of taxable equivalent net interest income plus non-interest income. |
2
Table of Contents
CENTRAL NATIONAL BANK
Summary Financial Data
(Dollars in thousands except per share data)
| As of and for the Six Months Ended June 30, | As of and for the Years Ended December 31, | |||||||||||||||||||||||||||
| 2006 | 2005 | 2005 | 2004 | 2003 | 2002 | 2001 | ||||||||||||||||||||||
| (Unaudited) | ||||||||||||||||||||||||||||
Income Statement Data | ||||||||||||||||||||||||||||
Interest income | $ | 3,145 | $ | 2,639 | $ | 5,476 | $ | 5,456 | $ | 6,690 | $ | 6,929 | $ | 6,684 | ||||||||||||||
Interest expense | 1,412 | 997 | 2,155 | 2,033 | 2,458 | 3,351 | 4,084 | |||||||||||||||||||||
Net interest income | 1,733 | 1,642 | 3,321 | 3,423 | 4,232 | 3,578 | 2,600 | |||||||||||||||||||||
Provision for loan losses | 30 | 42 | 84 | 84 | 513 | 84 | 60 | |||||||||||||||||||||
Net interest income after provision for loan losses | 1,703 | 1,600 | 3,237 | 3,339 | 3,719 | 3,494 | 2,540 | |||||||||||||||||||||
Non-interest income | 174 | 190 | 423 | 459 | 430 | 414 | 314 | |||||||||||||||||||||
Non-interest expense | 1,362 | 1,272 | 2,612 | 2,501 | 2,299 | 2,168 | 1,782 | |||||||||||||||||||||
Income (loss) before income taxes | 515 | 518 | 1,048 | 1,297 | 1,850 | 1,740 | 1,072 | |||||||||||||||||||||
Income tax expense | 144 | 159 | 317 | 354 | 538 | 544 | 328 | |||||||||||||||||||||
Net income | $ | 371 | $ | 359 | $ | 731 | $ | 943 | $ | 1,312 | $ | 1,196 | $ | 744 | ||||||||||||||
Per Share Data | ||||||||||||||||||||||||||||
Net income – basic and diluted (1) | $ | 1.57 | $ | 1.52 | $ | 3.09 | $ | 3.99 | $ | 5.55 | $ | 5.06 | $ | 3.15 | ||||||||||||||
Cash dividends declared | — | — | — | — | — | — | — | |||||||||||||||||||||
Book value per share (1) | 44.72 | 41.58 | 43.15 | 40.06 | 36.07 | 30.57 | 25.56 | |||||||||||||||||||||
Balance Sheet Data | ||||||||||||||||||||||||||||
Assets | $ | 117,425 | $ | 111,973 | $ | 108,783 | $ | 103,665 | $ | 112,003 | $ | 110,298 | $ | 104,620 | ||||||||||||||
Loans, net | 70,701 | 64,780 | 68,266 | 64,994 | 72,885 | 65,398 | 62,903 | |||||||||||||||||||||
Investment securities | 19,899 | 14,544 | 16,396 | 12,186 | 17,552 | 26,570 | 24,649 | |||||||||||||||||||||
Deposits | 106,637 | 101,810 | 98,113 | 93,464 | 101,630 | 100,656 | 96,525 | |||||||||||||||||||||
Stockholders’ equity | 10,574 | 9,831 | 10,203 | 9,472 | 8,529 | 7,228 | 6,044 | |||||||||||||||||||||
Shares outstanding | 236,439 | 236,439 | 236,439 | 236,439 | 236,439 | 215,173 | 195,845 | |||||||||||||||||||||
Performance Ratios | ||||||||||||||||||||||||||||
Return on average assets (2) | 0.62 | % | 0.65 | % | 0.65 | % | 0.80 | % | 1.10 | % | 1.05 | % | 0.81 | % | ||||||||||||||
Return on average stockholders’ equity (2) | 7.13 | % | 7.40 | % | 7.41 | % | 10.36 | % | 16.43 | % | 17.95 | % | 13.33 | % | ||||||||||||||
Average equity to average assets | 9.00 | % | 8.78 | % | 9.39 | % | 9.14 | % | 7.61 | % | 6.55 | % | 5.78 | % | ||||||||||||||
Net interest margin (2) | 3.21 | % | 3.31 | % | 3.46 | % | 3.65 | % | 4.11 | % | 3.52 | % | 2.67 | % | ||||||||||||||
Efficiency ratio (3) | 71.42 | % | 69.43 | % | 69.76 | % | 64.43 | % | 49.31 | % | 54.31 | % | 61.15 | % | ||||||||||||||
Allowance for loan losses to loans | 1.50 | % | 1.63 | % | 1.46 | % | 1.57 | % | 1.33 | % | 0.79 | % | 0.70 | % | ||||||||||||||
Asset Quality Ratios | ||||||||||||||||||||||||||||
Net charge-offs to average loans outstanding | -0.06 | % | 0.00 | % | 0.17 | % | 0.04 | % | 0.07 | % | 0.01 | % | 0.01 | % | ||||||||||||||
Non-performing loans to period-end loans | 4.29 | % | 2.49 | % | 4.47 | % | 1.65 | % | 1.48 | % | 0.00 | % | 0.00 | % | ||||||||||||||
Non-performing assets to total assets | 3.24 | % | 2.13 | % | 3.51 | % | 1.93 | % | 1.22 | % | 0.37 | % | 0.11 | % | ||||||||||||||
Allowance for loan losses to non-performing loans | 35.55 | % | 66.79 | % | 33.08 | % | 96.56 | % | 91.18 | % | 0.00 | % | 14800.00 | % | ||||||||||||||
Liquidity and Capital Ratios | ||||||||||||||||||||||||||||
Risk-based: | ||||||||||||||||||||||||||||
Tier 1 capital | 13.50 | % | 12.76 | % | 13.39 | % | 12.52 | % | 10.82 | % | 10.08 | % | 8.75 | % | ||||||||||||||
Total capital | 14.75 | % | 14.02 | % | 14.64 | % | 13.77 | % | 13.97 | % | 12.90 | % | 11.57 | % | ||||||||||||||
Average loans to average deposits | 64.60 | % | 65.60 | % | 67.46 | % | 75.02 | % | 72.27 | % | 65.91 | % | 64.82 | % | ||||||||||||||
Average shares outstanding | ||||||||||||||||||||||||||||
Basic and diluted | 236,439 | 236,439 | 236,439 | 236,439 | 236,439 | 215,173 | 195,845 | |||||||||||||||||||||
| (1) | Net income per share and book value per share have been retroactively adjusted to reflect current outstanding shares. |
| (2) | On an annualized basis. |
| (3) | The efficiency ratio equals non-interest expense divided by the sum of taxable equivalent net interest income plus non-interest income. |
3
Table of Contents
COMMUNITY NATIONAL BANK
Summary Financial Data
(Unaudited)
(Dollars in thousands except per share data)
| As of and for the Six Months Ended June 30, | As of and for the Years Ended December 31, | |||||||||||||||||||||||||||
| 2006 | 2005 | 2005 | 2004 | 2003 | 2002 | 2001 | ||||||||||||||||||||||
Income Statement Data | ||||||||||||||||||||||||||||
Interest income | $ | 6,270 | $ | 5,665 | $ | 11,705 | $ | 10,884 | $ | 11,627 | $ | 12,731 | $ | 13,394 | ||||||||||||||
Interest expense | 2,834 | 2,388 | 5,029 | 4,602 | 5,333 | 6,123 | 7,601 | |||||||||||||||||||||
Net interest income | 3,436 | 3,277 | 6,676 | 6,282 | 6,294 | 6,608 | 5,793 | |||||||||||||||||||||
Provision for loan losses | 36 | 36 | 72 | 72 | 583 | 72 | 72 | |||||||||||||||||||||
Net interest income after provision for loan losses | 3,400 | 3,241 | 6,604 | 6,210 | 5,711 | 6,536 | 5,721 | |||||||||||||||||||||
Non-interest income | 524 | 557 | 1,179 | 1,358 | 1,334 | 1,232 | 976 | |||||||||||||||||||||
Non-interest expense | 2,574 | 2,400 | 4,936 | 4,846 | 4,475 | 4,323 | 4,137 | |||||||||||||||||||||
Income (loss) before income taxes | 1,350 | 1,398 | 2,847 | 2,722 | 2,570 | 3,445 | 2,560 | |||||||||||||||||||||
Income tax expense | 263 | 304 | 555 | 682 | 714 | 1,070 | 778 | |||||||||||||||||||||
Net income | $ | 1,087 | $ | 1,094 | $ | 2,292 | $ | 2,040 | $ | 1,856 | $ | 2,375 | $ | 1,782 | ||||||||||||||
Per Share Data | ||||||||||||||||||||||||||||
Net income - basic and diluted (1) | $ | 1.54 | $ | 1.55 | $ | 3.24 | $ | 2.88 | $ | 2.62 | $ | 3.36 | $ | 2.52 | ||||||||||||||
Cash dividends declared | 1.10 | 1.00 | 1.00 | 0.90 | 0.90 | 0.75 | 0.75 | |||||||||||||||||||||
Book value per share (1) | 32.79 | 30.66 | 32.35 | 30.12 | 28.13 | 26.34 | 23.66 | |||||||||||||||||||||
Balance Sheet Data | ||||||||||||||||||||||||||||
Assets | $ | 246,970 | $ | 246,801 | $ | 245,250 | $ | 245,688 | $ | 242,912 | $ | 228,989 | $ | 213,121 | ||||||||||||||
Loans, net | 151,459 | 158,617 | 152,154 | 145,046 | 124,837 | 106,436 | 107,908 | |||||||||||||||||||||
Investment securities | 53,785 | 53,068 | 56,777 | 42,209 | 65,691 | 63,646 | 64,673 | |||||||||||||||||||||
Deposits | 223,542 | 224,648 | 222,042 | 223,985 | 222,729 | 209,602 | 195,952 | |||||||||||||||||||||
Stockholders’ equity | 23,199 | 21,693 | 22,890 | 21,306 | 19,903 | 18,635 | 16,742 | |||||||||||||||||||||
Shares outstanding | 707,482 | 707,482 | 707,482 | 707,482 | 707,482 | 643,312 | 643,312 | |||||||||||||||||||||
Performance Ratios | ||||||||||||||||||||||||||||
Return on average assets (2) | 0.88 | % | 0.90 | % | 0.93 | % | 0.83 | % | 0.77 | % | 1.06 | % | 0.89 | % | ||||||||||||||
Return on average stockholders’ equity (2) | 10.11 | % | 9.49 | % | 10.48 | % | 10.01 | % | 9.65 | % | 13.56 | % | 11.34 | % | ||||||||||||||
Average equity to average assets | 9.39 | % | 8.79 | % | 9.33 | % | 8.67 | % | 8.19 | % | 8.14 | % | 7.86 | % | ||||||||||||||
Net interest margin (2) | 2.99 | % | 2.87 | % | 2.96 | % | 2.72 | % | 2.75 | % | 3.11 | % | 2.90 | % | ||||||||||||||
Efficiency ratio (3) | 65.00 | % | 62.60 | % | 62.84 | % | 63.43 | % | 58.67 | % | 55.14 | % | 61.12 | % | ||||||||||||||
Allowance for loan losses to loans | 1.11 | % | 1.01 | % | 1.07 | % | 1.08 | % | 1.23 | % | 0.97 | % | 0.92 | % | ||||||||||||||
Asset Quality Ratios | ||||||||||||||||||||||||||||
Net charge-offs to average loans outstanding | -0.01 | % | 0.00 | % | 0.00 | % | 0.03 | % | 0.06 | % | 0.03 | % | 0.05 | % | ||||||||||||||
Non-performing loans to period-end loans | 1.60 | % | 1.58 | % | 1.62 | % | 1.32 | % | 1.03 | % | 0.00 | % | 0.02 | % | ||||||||||||||
Non-performing assets to total assets | 1.32 | % | 1.35 | % | 1.45 | % | 1.11 | % | 0.86 | % | 0.37 | % | 0.01 | % | ||||||||||||||
Allowance for loan losses to non-performing loans | 70.14 | % | 64.76 | % | 67.24 | % | 83.06 | % | 121.70 | % | 52150.00 | % | 4369.57 | % | ||||||||||||||
Liquidity and Capital Ratios | ||||||||||||||||||||||||||||
Risk-based: | ||||||||||||||||||||||||||||
Tier 1 capital | 14.74 | % | 14.05 | % | 14.84 | % | 14.45 | % | 14.54 | % | 14.95 | % | 14.36 | % | ||||||||||||||
Total capital | 15.82 | % | 15.10 | % | 15.92 | % | 15.53 | % | 15.68 | % | 15.78 | % | 15.23 | % | ||||||||||||||
Average loans to average deposits | 71.28 | % | 68.46 | % | 70.35 | % | 62.03 | % | 52.44 | % | 52.44 | % | 51.21 | % | ||||||||||||||
Average shares outstanding | ||||||||||||||||||||||||||||
Basic and diluted | 707,482 | 707,482 | 707,482 | 707,482 | 707,482 | 643,312 | 643,312 | |||||||||||||||||||||
| (1) | Net income per share and book value per share have been retroactively adjusted to reflect current outstanding shares. |
| (2) | On an annualized basis. |
| (3) | The efficiency ratio equals non-interest expense divided by the sum of taxable equivalent net interest income plus non-interest income. |
4
Table of Contents
FIRST NATIONAL BANK
Summary Financial Data
(Dollars in thousands except per share data)
| As of and for the Six Months Ended June 30, | As of and for the Years Ended December 31, | |||||||||||||||||||||||||||
| 2006 | 2005 | 2005 | 2004 | 2003 | 2002 | 2001 | ||||||||||||||||||||||
| (Unaudited) | ||||||||||||||||||||||||||||
Income Statement Data | ||||||||||||||||||||||||||||
Interest income | $ | 7,149 | $ | 6,427 | $ | 12,906 | $ | 12,253 | $ | 12,306 | $ | 13,408 | $ | 14,266 | ||||||||||||||
Interest expense | 3,653 | 3,089 | 6,188 | 5,332 | 5,159 | 5,751 | 8,361 | |||||||||||||||||||||
Net interest income | 3,496 | 3,338 | 6,718 | 6,921 | 7,147 | 7,657 | 5,905 | |||||||||||||||||||||
Provision for loan losses | 48 | 36 | 120 | 72 | 1,009 | 72 | 72 | |||||||||||||||||||||
Net interest income after provision for loan losses | 3,448 | 3,302 | 6,598 | 6,849 | 6,138 | 7,585 | 5,833 | |||||||||||||||||||||
Non-interest income | 340 | 353 | 787 | 887 | 822 | 766 | 494 | |||||||||||||||||||||
Non-interest expense | 2,760 | 2,642 | 5,479 | 4,828 | 4,519 | 4,378 | 3,690 | |||||||||||||||||||||
Income (loss) before income taxes | 1,028 | 1,013 | 1,906 | 2,908 | 2,441 | 3,973 | 2,637 | |||||||||||||||||||||
Income tax expense | 215 | 240 | 421 | 815 | 706 | 1,253 | 804 | |||||||||||||||||||||
Net income | $ | 813 | $ | 773 | $ | 1,485 | $ | 2,093 | $ | 1,735 | $ | 2,720 | $ | 1,833 | ||||||||||||||
Per Share Data | ||||||||||||||||||||||||||||
Net income - basic and diluted (1) | $ | 0.54 | $ | 0.51 | $ | 0.99 | $ | 1.39 | $ | 1.15 | $ | 1.81 | $ | 1.22 | ||||||||||||||
Cash dividends declared | 0.42 | 0.42 | 0.84 | 0.84 | 0.84 | 0.84 | 0.84 | |||||||||||||||||||||
Book value per share (1) | 12.48 | 12.31 | 12.36 | 12.22 | 11.66 | 11.30 | 10.22 | |||||||||||||||||||||
Balance Sheet Data | ||||||||||||||||||||||||||||
Assets | $ | 277,586 | $ | 279,659 | $ | 276,216 | $ | 304,551 | $ | 272,160 | $ | 241,253 | $ | 227,171 | ||||||||||||||
Loans, net | 173,962 | 161,983 | 165,803 | 156,415 | 131,671 | 115,994 | 115,189 | |||||||||||||||||||||
Investment securities | 57,270 | 56,553 | 60,262 | 42,624 | 67,301 | 68,220 | 74,105 | |||||||||||||||||||||
Deposits | 257,538 | 260,261 | 254,886 | 285,363 | 253,943 | 221,979 | 210,718 | |||||||||||||||||||||
Stockholders’ equity | 18,765 | 18,502 | 18,583 | 18,361 | 17,531 | 16,980 | 15,364 | |||||||||||||||||||||
Shares outstanding | 1,503,106 | 1,503,106 | 1,503,106 | 1,503,106 | 1,503,106 | 1,366,829 | 1,242,896 | |||||||||||||||||||||
Performance Ratios | ||||||||||||||||||||||||||||
Return on average assets (2) | 0.59 | % | 0.54 | % | 0.54 | % | 0.75 | % | 0.69 | % | 1.21 | % | 0.86 | % | ||||||||||||||
Return on average stockholders’ equity (2) | 8.78 | % | 8.42 | % | 8.07 | % | 11.56 | % | 9.92 | % | 16.80 | % | 12.32 | % | ||||||||||||||
Average equity to average assets | 6.76 | % | 6.62 | % | 6.73 | % | 6.03 | % | 6.44 | % | 7.04 | % | 6.76 | % | ||||||||||||||
Net interest margin (2) | 2.70 | % | 2.56 | % | 2.60 | % | 2.40 | % | 2.79 | % | 3.37 | % | 2.74 | % | ||||||||||||||
Efficiency ratio (3) | 71.95 | % | 71.58 | % | 73.00 | % | 61.83 | % | 56.71 | % | 51.98 | % | 57.67 | % | ||||||||||||||
Allowance for loan losses to loans | 1.07 | % | 1.17 | % | 1.09 | % | 1.26 | % | 1.50 | % | 0.93 | % | 0.95 | % | ||||||||||||||
Asset Quality Ratios | ||||||||||||||||||||||||||||
Net charge-offs to average loans outstanding | -0.01 | % | 0.07 | % | 0.18 | % | 0.06 | % | 0.08 | % | 0.07 | % | 0.01 | % | ||||||||||||||
Non-performing loans to period-end loans | 2.49 | % | 1.50 | % | 2.62 | % | 2.67 | % | 1.91 | % | 0.12 | % | 0.13 | % | ||||||||||||||
Non-performing assets to total assets | 2.32 | % | 1.56 | % | 2.27 | % | 2.06 | % | 1.20 | % | 0.38 | % | 0.07 | % | ||||||||||||||
Allowance for loan losses to non-performing loans | 43.62 | % | 78.79 | % | 42.15 | % | 47.82 | % | 79.60 | % | 761.11 | % | 744.59 | % | ||||||||||||||
Liquidity and Capital Ratios | ||||||||||||||||||||||||||||
Risk-based: | ||||||||||||||||||||||||||||
Tier 1 capital | 10.56 | % | 11.23 | % | 10.80 | % | 10.59 | % | 11.61 | % | 12.82 | % | 12.22 | % | ||||||||||||||
Total capital | 11.63 | % | 12.32 | % | 11.76 | % | 11.74 | % | 12.86 | % | 13.65 | % | 13.10 | % | ||||||||||||||
Average loans to average deposits | �� | 67.58 | % | 61.41 | % | 62.97 | % | 52.18 | % | 49.02 | % | 52.05 | % | 53.37 | % | |||||||||||||
Average shares outstanding | ||||||||||||||||||||||||||||
Basic and diluted | 1,503,106 | 1,503,106 | 1,503,106 | 1,503,106 | 1,503,106 | 1,366,829 | 1,242,896 | |||||||||||||||||||||
| (1) | Net income per share and book value per share have been retroactively adjusted to reflect current outstanding shares. |
| (2) | On an annualized basis. |
| (3) | The efficiency ratio equals non-interest expense divided by the sum of taxable equivalent net interest income plus non-interest income. |
5
Table of Contents
FIRST NATIONAL EXCHANGE BANK
Summary Financial Data
(Dollars in thousands except per share data)
| As of and for the Six Months Ended June 30, | As of and for the Years Ended December 31, | |||||||||||||||||||||||||||
| 2006 | 2005 | 2005 | 2004 | 2003 | 2002 | 2001 | ||||||||||||||||||||||
| (Unaudited) | ||||||||||||||||||||||||||||
Income Statement Data | ||||||||||||||||||||||||||||
Interest income | $ | 5,236 | $ | 5,285 | $ | 10,650 | $ | 11,649 | $ | 14,222 | $ | 16,651 | $ | 16,930 | ||||||||||||||
Interest expense | 2,604 | 2,406 | 4,984 | 4,936 | 6,510 | 8,790 | 12,349 | |||||||||||||||||||||
Net interest income | 2,632 | 2,879 | 5,666 | 6,713 | 7,712 | 7,861 | 4,581 | |||||||||||||||||||||
Provision for loan losses | 30 | 60 | 120 | 120 | 898 | 120 | 72 | |||||||||||||||||||||
Net interest income after provision for loan losses | 2,602 | 2,819 | 5,546 | 6,593 | 6,814 | 7,741 | 4,509 | |||||||||||||||||||||
Non-interest income | 330 | 328 | 703 | 790 | 819 | 776 | 587 | |||||||||||||||||||||
Non-interest expense | 2,659 | 2,589 | 5,285 | 5,018 | 5,021 | 5,148 | 4,387 | |||||||||||||||||||||
Income (loss) before income taxes | 273 | 558 | 964 | 2,365 | 2,612 | 3,369 | 709 | |||||||||||||||||||||
Income tax expense | (10 | ) | 100 | 148 | 538 | 750 | 1,033 | 130 | ||||||||||||||||||||
Net income | $ | 283 | $ | 458 | $ | 816 | $ | 1,827 | $ | 1,862 | $ | 2,336 | $ | 579 | ||||||||||||||
Per Share Data | ||||||||||||||||||||||||||||
Net income - basic and diluted (1) | $ | 0.57 | $ | 0.93 | $ | 1.66 | $ | 3.71 | $ | 3.78 | $ | 4.74 | $ | 1.18 | ||||||||||||||
Cash dividends declared | — | — | — | — | — | — | — | |||||||||||||||||||||
Book value per share (1) | 40.32 | 39.02 | 39.75 | 38.09 | 34.38 | 30.63 | 25.92 | |||||||||||||||||||||
Balance Sheet Data | ||||||||||||||||||||||||||||
Assets | $ | 209,744 | $ | 229,472 | $ | 209,881 | $ | 228,312 | $ | 252,088 | $ | 275,555 | $ | 302,727 | ||||||||||||||
Loans, net | 126,468 | 137,761 | 123,383 | 139,998 | 153,788 | 122,802 | 124,858 | |||||||||||||||||||||
Investment securities | 53,770 | 53,054 | 56,762 | 42,179 | 65,399 | 62,988 | 71,475 | |||||||||||||||||||||
Deposits | 189,399 | 208,419 | 189,557 | 208,571 | 234,126 | 257,230 | 284,857 | |||||||||||||||||||||
Stockholders’ equity | 19,851 | 19,210 | 19,568 | 18,752 | 16,925 | 15,079 | 12,760 | |||||||||||||||||||||
Shares outstanding | 492,329 | 492,329 | 492,329 | 492,329 | 492,329 | 447,900 | 407,524 | |||||||||||||||||||||
Performance Ratios | ||||||||||||||||||||||||||||
Return on average assets (2) | 0.27 | % | 0.41 | % | 0.37 | % | 0.75 | % | 0.69 | % | 0.92 | % | 0.23 | % | ||||||||||||||
Return on average stockholders’ equity (2) | 2.88 | % | 4.83 | % | 4.26 | % | 10.19 | % | 11.53 | % | 16.62 | % | 4.72 | % | ||||||||||||||
Average equity to average assets | 9.46 | % | 8.37 | % | 9.32 | % | 8.21 | % | 6.71 | % | 5.47 | % | 4.22 | % | ||||||||||||||
Net interest margin (2) | 2.69 | % | 2.67 | % | 2.89 | % | 3.14 | % | 3.23 | % | 3.01 | % | 1.58 | % | ||||||||||||||
Efficiency ratio (3) | 89.77 | % | 80.73 | % | 82.98 | % | 66.88 | % | 58.86 | % | 59.60 | % | 84.89 | % | ||||||||||||||
Allowance for loan losses to loans | 1.51 | % | 1.39 | % | 1.49 | % | 1.30 | % | 1.16 | % | 0.79 | % | 0.70 | % | ||||||||||||||
Asset Quality Ratios | ||||||||||||||||||||||||||||
Net charge-offs to average loans outstanding | -0.03 | % | -0.03 | % | 0.07 | % | 0.05 | % | 0.05 | % | 0.01 | % | 0.01 | % | ||||||||||||||
Non-performing loans to period-end loans | 2.86 | % | 1.46 | % | 2.93 | % | 2.89 | % | 1.27 | % | 0.00 | % | 0.00 | % | ||||||||||||||
Non-performing assets to total assets | 1.96 | % | 1.10 | % | 1.96 | % | 2.01 | % | 0.98 | % | 0.19 | % | 0.00 | % | ||||||||||||||
Allowance for loan losses to non-performing loans | 53.83 | % | 96.67 | % | 51.93 | % | 45.58 | % | 92.51 | % | 49250.00 | % | 29233.33 | % | ||||||||||||||
Liquidity and Capital Ratios | ||||||||||||||||||||||||||||
Risk-based: | ||||||||||||||||||||||||||||
Tier 1 capital | 14.43 | % | 13.39 | % | 14.40 | % | 12.56 | % | 10.45 | % | 9.79 | % | 7.89 | % | ||||||||||||||
Total capital | 15.68 | % | 14.64 | % | 15.65 | % | 13.81 | % | 11.57 | % | 10.42 | % | 10.48 | % | ||||||||||||||
Average loans to average deposits | 67.57 | % | 67.20 | % | 73.20 | % | 70.62 | % | 63.88 | % | 60.55 | % | 48.95 | % | ||||||||||||||
Average shares outstanding | ||||||||||||||||||||||||||||
Basic and diluted | 492,329 | 492,329 | 492,329 | 492,329 | 492,329 | 447,900 | 407,524 | |||||||||||||||||||||
| (1) | Net income per share and book value per share have been retroactively adjusted to reflect current outstanding shares. |
| (2) | On an annualized basis. |
| (3) | The efficiency ratio equals non-interest expense divided by the sum of taxable equivalent net interest income plus non-interest income. |
6
Table of Contents
MOUNTAIN NATIONAL BANK
Summary Financial Data
(Dollars in thousands except per share data)
| As of and for the Six Months Ended June 30, | As of and for the Years Ended December 31, | |||||||||||||||||||||||||||
| 2006 | 2005 | 2005 | 2004 | 2003 | 2002 | 2001 | ||||||||||||||||||||||
| (Unaudited) | ||||||||||||||||||||||||||||
Income Statement Data | ||||||||||||||||||||||||||||
Interest income | $ | 5,853 | $ | 4,869 | $ | 10,215 | $ | 9,516 | $ | 10,349 | $ | 12,493 | $ | 13,141 | ||||||||||||||
Interest expense | 3,105 | 2,317 | 5,116 | 4,328 | 5,163 | 6,388 | 8,383 | |||||||||||||||||||||
Net interest income | 2,748 | 2,552 | 5,099 | 5,188 | 5,186 | 6,105 | 4,758 | |||||||||||||||||||||
Provision for loan losses | 36 | 36 | 72 | 72 | 860 | 72 | 72 | |||||||||||||||||||||
Net interest income after provision for loan losses | 2,712 | 2,516 | 5,027 | 5,116 | 4,326 | 6,033 | 4,686 | |||||||||||||||||||||
Non-interest income | 308 | 293 | 593 | 754 | 670 | 572 | 483 | |||||||||||||||||||||
Non-interest expense | 1,974 | 1,893 | 3,877 | 3,653 | 3,344 | 3,288 | 2,806 | |||||||||||||||||||||
Income (loss) before income taxes | 1,046 | 916 | 1,743 | 2,217 | 1,652 | 3,317 | 2,363 | |||||||||||||||||||||
Income tax expense | 217 | 203 | 387 | 620 | 501 | 1,086 | 764 | |||||||||||||||||||||
Net income | $ | 829 | $ | 713 | $ | 1,356 | $ | 1,597 | $ | 1,151 | $ | 2,231 | $ | 1,599 | ||||||||||||||
Per Share Data | ||||||||||||||||||||||||||||
Net income - basic and diluted (1) | $ | 1.63 | $ | 1.40 | $ | 2.67 | $ | 3.14 | $ | 2.27 | $ | 4.39 | $ | 3.15 | ||||||||||||||
Cash dividends declared | 0.90 | 0.90 | 1.80 | 1.80 | 1.80 | 1.80 | 1.80 | |||||||||||||||||||||
Book value per share (1) | 31.60 | 30.50 | 30.87 | 30.00 | 28.66 | 28.19 | 25.56 | |||||||||||||||||||||
Balance Sheet Data | ||||||||||||||||||||||||||||
Assets | $ | 233,960 | $ | 229,825 | $ | 232,293 | $ | 223,557 | $ | 223,646 | $ | 212,239 | $ | 209,265 | ||||||||||||||
Loans, net | 132,789 | 115,480 | 126,045 | 107,623 | 100,361 | 95,185 | 102,219 | |||||||||||||||||||||
Investment securities | 53,785 | 53,068 | 56,777 | 42,109 | 65,359 | 62,215 | 67,750 | |||||||||||||||||||||
Deposits | 217,468 | 213,839 | 216,171 | 207,924 | 208,713 | 197,227 | 195,615 | |||||||||||||||||||||
Stockholders’ equity | 16,049 | 15,492 | 15,678 | 15,236 | 14,553 | 14,317 | 12,982 | |||||||||||||||||||||
Shares outstanding | 507,865 | 507,865 | 507,865 | 507,865 | 507,865 | 507,865 | 462,117 | |||||||||||||||||||||
Performance Ratios | ||||||||||||||||||||||||||||
Return on average assets (2) | 0.72 | % | 0.63 | % | 0.59 | % | 0.71 | % | 0.52 | % | 1.04 | % | 0.81 | % | ||||||||||||||
Return on average stockholders’ equity (2) | 10.53 | % | 9.35 | % | 8.81 | % | 10.76 | % | 7.93 | % | 16.37 | % | 12.73 | % | ||||||||||||||
Average equity to average assets | 6.86 | % | 6.74 | % | 6.75 | % | 6.82 | % | 6.51 | % | 6.75 | % | 6.20 | % | ||||||||||||||
Net interest margin (2) | 2.50 | % | 2.35 | % | 2.34 | % | 2.46 | % | 2.43 | % | 3.03 | % | 2.37 | % | ||||||||||||||
Efficiency ratio (3) | 64.56 | % | 66.54 | % | 68.11 | % | 61.48 | % | 57.10 | % | 49.24 | % | 53.54 | % | ||||||||||||||
Allowance for loan losses to loans | 1.26 | % | 1.42 | % | 1.31 | % | 1.51 | % | 1.60 | % | 0.90 | % | 0.77 | % | ||||||||||||||
Asset Quality Ratios | ||||||||||||||||||||||||||||
Net charge-offs to average loans outstanding | 0.01 | % | 0.02 | % | 0.04 | % | 0.05 | % | 0.10 | % | 0.00 | % | 0.12 | % | ||||||||||||||
Non-performing loans to period-end loans | 2.30 | % | 2.74 | % | 2.46 | % | 1.85 | % | 1.97 | % | 0.01 | % | 0.00 | % | ||||||||||||||
Non-performing assets to total assets | 2.02 | % | 2.15 | % | 2.05 | % | 1.84 | % | 1.09 | % | 0.23 | % | 0.00 | % | ||||||||||||||
Allowance for loan losses to non-performing loans | 55.66 | % | 52.67 | % | 54.14 | % | 83.24 | % | 82.78 | % | 12471.43 | % | 20050.00 | % | ||||||||||||||
Liquidity and Capital Ratios | ||||||||||||||||||||||||||||
Risk-based: | ||||||||||||||||||||||||||||
Tier 1 capital | 11.96 | % | 12.66 | % | 12.00 | % | 12.76 | % | 12.38 | % | 12.89 | % | 11.53 | % | ||||||||||||||
Total capital | 13.21 | % | 13.91 | % | 13.25 | % | 14.01 | % | 13.63 | % | 13.68 | % | 12.25 | % | ||||||||||||||
Average loans to average deposits | 60.62 | % | 53.26 | % | 54.30 | % | 51.25 | % | 45.89 | % | 53.04 | % | 49.91 | % | ||||||||||||||
Average shares outstanding | ||||||||||||||||||||||||||||
Basic and diluted | 507,865 | 507,865 | 507,865 | 507,865 | 507,865 | 507,865 | 462,117 | |||||||||||||||||||||
| (1) | Net income per share and book value per share have been retroactively adjusted to reflect current outstanding shares. |
| (2) | On an annualized basis. |
| (3) | The efficiency ratio equals non-interest expense divided by the sum of taxable equivalent net interest income plus non-interest income. |
7
Table of Contents
PATRICK HENRY NATIONAL BANK
Summary Financial Data
(Dollars in thousands except per share data)
| As of and for the Six Months Ended June 30, | As of and for the Years Ended December 31, | |||||||||||||||||||||||||||
| 2006 | 2005 | 2005 | 2004 | 2003 | 2002 | 2001 | ||||||||||||||||||||||
| (Unaudited) | ||||||||||||||||||||||||||||
Income Statement Data | ||||||||||||||||||||||||||||
Interest income | $ | 9,895 | $ | 8,704 | $ | 17,769 | $ | 16,974 | $ | 18,258 | $ | 20,171 | $ | 21,881 | ||||||||||||||
Interest expense | 4,891 | 3,906 | 8,307 | 7,614 | 8,440 | 10,247 | 12,676 | |||||||||||||||||||||
Net interest income | 5,004 | 4,798 | 9,462 | 9,360 | 9,818 | 9,924 | 9,205 | |||||||||||||||||||||
Provision for loan losses | 90 | 120 | 240 | 240 | 1,327 | 180 | 180 | |||||||||||||||||||||
Net interest income after provision for loan losses | 4,914 | 4,678 | 9,222 | 9,120 | 8,491 | 9,744 | 9,025 | |||||||||||||||||||||
Non-interest income | 550 | 595 | 1,270 | 1,492 | 1,374 | 1,372 | 1,234 | |||||||||||||||||||||
Non-interest expense | 4,064 | 3,889 | 8,023 | 7,704 | 6,919 | 6,643 | 6,219 | |||||||||||||||||||||
Income (loss) before income taxes | 1,400 | 1,384 | 2,469 | 2,908 | 2,946 | 4,473 | 4,040 | |||||||||||||||||||||
Income tax expense | 270 | 330 | 542 | 806 | 896 | 1,409 | 1,234 | |||||||||||||||||||||
Net income | $ | 1,130 | $ | 1,054 | $ | 1,927 | $ | 2,102 | $ | 2,050 | $ | 3,064 | $ | 2,806 | ||||||||||||||
Per Share Data | ||||||||||||||||||||||||||||
Net income - basic and diluted (1) | $ | 0.40 | $ | 0.38 | $ | 0.69 | $ | 0.75 | $ | 0.73 | $ | 1.09 | $ | 1.00 | ||||||||||||||
Cash dividends declared | 0.22 | 0.22 | 0.44 | 0.44 | 0.44 | 0.44 | 0.44 | |||||||||||||||||||||
Book value per share (1) | 8.70 | 8.42 | 8.52 | 8.27 | 7.96 | 7.64 | 6.93 | |||||||||||||||||||||
Balance Sheet Data | ||||||||||||||||||||||||||||
Assets | $ | 388,920 | $ | 379,231 | $ | 397,523 | $ | 380,220 | $ | 377,290 | $ | 355,826 | $ | 338,780 | ||||||||||||||
Loans, net | 234,545 | 209,859 | 229,260 | 201,869 | 178,350 | 175,952 | 176,188 | |||||||||||||||||||||
Investment securities | 84,167 | 88,088 | 93,652 | 72,011 | 112,938 | 97,845 | 105,450 | |||||||||||||||||||||
Deposits | 363,375 | 354,145 | 371,886 | 355,503 | 353,643 | 329,541 | 317,733 | |||||||||||||||||||||
Stockholders’ equity | 24,363 | 23,592 | 23,850 | 23,155 | 22,284 | 21,392 | 19,404 | |||||||||||||||||||||
Shares outstanding | 2,800,122 | 2,800,122 | 2,800,122 | 2,800,122 | 2,800,122 | 2,546,169 | 2,315,164 | |||||||||||||||||||||
Performance Ratios | ||||||||||||||||||||||||||||
Return on average assets (2) | 0.58 | % | 0.54 | % | 0.51 | % | 0.55 | % | 0.55 | % | 0.87 | % | 0.88 | % | ||||||||||||||
Return on average stockholders’ equity (2) | 9.44 | % | 8.80 | % | 8.23 | % | 9.27 | % | 9.18 | % | 15.07 | % | 15.17 | % | ||||||||||||||
Average equity to average assets | 6.26 | % | 6.22 | % | 6.00 | % | 6.09 | % | 5.91 | % | 6.01 | % | 5.73 | % | ||||||||||||||
Net interest margin (2) | 2.76 | % | 2.70 | % | 2.54 | % | 2.62 | % | 2.77 | % | 2.98 | % | 2.88 | % | ||||||||||||||
Efficiency ratio (3) | 73.17 | % | 72.11 | % | 74.76 | % | 70.99 | % | 61.82 | % | 58.81 | % | 59.57 | % | ||||||||||||||
Allowance for loan losses to loans | 1.07 | % | 1.20 | % | 1.06 | % | 1.17 | % | 1.35 | % | 0.70 | % | 0.67 | % | ||||||||||||||
Asset Quality Ratios | ||||||||||||||||||||||||||||
Net charge-offs to average loans outstanding | 0.01 | % | -0.01 | % | 0.08 | % | 0.14 | % | 0.08 | % | 0.08 | % | 0.07 | % | ||||||||||||||
Non-performing loans to period-end loans | 1.29 | % | 1.42 | % | 1.56 | % | 2.58 | % | 1.62 | % | 0.00 | % | 1.00 | % | ||||||||||||||
Non-performing assets to total assets | 1.48 | % | 1.38 | % | 1.47 | % | 1.98 | % | 0.87 | % | 0.17 | % | 4.00 | % | ||||||||||||||
Allowance for loan losses to non-performing loans | 83.94 | % | 85.96 | % | 69.25 | % | 46.24 | % | 84.26 | % | 20900.00 | % | 6005.00 | % | ||||||||||||||
Liquidity and Capital Ratios | ||||||||||||||||||||||||||||
Risk-based: | ||||||||||||||||||||||||||||
Tier 1 capital | 10.42 | % | 10.59 | % | 10.16 | % | 10.63 | % | 10.91 | % | 10.85 | % | 10.40 | % | ||||||||||||||
Total capital | 11.51 | % | 11.75 | % | 11.22 | % | 11.76 | % | 12.10 | % | 11.49 | % | 11.05 | % | ||||||||||||||
Average loans to average deposits | 63.42 | % | 59.42 | % | 57.41 | % | 54.87 | % | 51.32 | % | 50.57 | % | 55.51 | % | ||||||||||||||
Average shares outstanding | ||||||||||||||||||||||||||||
Basic and diluted | 2,800,122 | 2,800,122 | 2,800,122 | 2,800,122 | 2,800,122 | 2,546,169 | 2,315,164 | |||||||||||||||||||||
| (1) | Net income per share and book value per share have been retroactively adjusted to reflect current outstanding shares. |
| (2) | On an annualized basis. |
| (3) | The efficiency ratio equals non-interest expense divided by the sum of taxable equivalent net interest income plus non-interest income. |
8
Table of Contents
PATRIOT BANK, N.A.
Summary Financial Data
(Dollars in thousands except per share data)
| As of and for the Six Months Ended June 30, | As of and for the Years Ended December 31, | |||||||||||||||||||||||||||
| 2006 | 2005 | 2005 | 2004 | 2003 | 2002 | 2001 | ||||||||||||||||||||||
| (Unaudited) | ||||||||||||||||||||||||||||
Income Statement Data | ||||||||||||||||||||||||||||
Interest income | $ | 6,116 | $ | 5,559 | $ | 11,424 | $ | 10,370 | $ | 10,040 | $ | 10,919 | $ | 11,903 | ||||||||||||||
Interest expense | 1,826 | 1,417 | 3,099 | 2,537 | 2,909 | 3,653 | 5,222 | |||||||||||||||||||||
Net interest income | 4,290 | 4,142 | 8,325 | 7,833 | 7,131 | 7,266 | 6,681 | |||||||||||||||||||||
Provision for loan losses | 30 | 30 | 60 | 60 | 927 | 60 | 60 | |||||||||||||||||||||
Net interest income after provision for loan losses | 4,260 | 4,112 | 8,265 | 7,773 | 6,204 | 7,206 | 6,621 | |||||||||||||||||||||
Non-interest income | 385 | 462 | 954 | 1,253 | 1,215 | 1,333 | 1,277 | |||||||||||||||||||||
Non-interest expense | 3,303 | 3,079 | 6,462 | 5,811 | 5,288 | 5,268 | 4,847 | |||||||||||||||||||||
Income (loss) before income taxes | 1,342 | 1,495 | 2,757 | 3,215 | 2,131 | 3,271 | 3,051 | |||||||||||||||||||||
Income tax expense | 310 | 395 | 686 | 879 | 609 | 1,053 | 986 | |||||||||||||||||||||
Net income | $ | 1,032 | $ | 1,100 | $ | 2,071 | $ | 2,336 | $ | 1,522 | $ | 2,218 | $ | 2,065 | ||||||||||||||
Per Share Data | ||||||||||||||||||||||||||||
Net income - basic and diluted (1) | $ | 2.18 | $ | 2.32 | $ | 4.37 | $ | 4.93 | $ | 3.21 | $ | 4.68 | $ | 4.36 | ||||||||||||||
Cash dividends declared | 0.80 | 0.80 | 1.60 | 1.60 | 1.60 | 1.60 | 1.60 | |||||||||||||||||||||
Book value per share (1) | 43.67 | 41.04 | 42.29 | 39.52 | 36.19 | 34.51 | 31.27 | |||||||||||||||||||||
Balance Sheet Data | ||||||||||||||||||||||||||||
Assets | $ | 247,674 | $ | 258,963 | $ | 253,659 | $ | 243,642 | $ | 225,064 | $ | 208,434 | $ | 198,632 | ||||||||||||||
Loans, net | 153,656 | 144,407 | 158,223 | 139,686 | 113,692 | 89,813 | 93,850 | |||||||||||||||||||||
Investment securities | 53,785 | 53,068 | 56,777 | 41,778 | 63,899 | 58,891 | 58,326 | |||||||||||||||||||||
Deposits | 226,408 | 238,757 | 232,975 | 224,060 | 207,491 | 190,441 | 182,877 | |||||||||||||||||||||
Stockholders’ equity | 20,705 | 19,460 | 20,051 | 18,739 | 17,161 | 16,364 | 14,824 | |||||||||||||||||||||
Shares outstanding | 474,132 | 474,132 | 474,132 | 474,132 | 474,132 | 431,262 | 392,297 | |||||||||||||||||||||
Performance Ratios | ||||||||||||||||||||||||||||
Return on average assets (2) | 0.83 | % | 0.88 | % | 0.83 | % | 1.00 | % | 0.70 | % | 1.09 | % | 1.12 | % | ||||||||||||||
Return on average stockholders’ equity (2) | 10.13 | % | 10.80 | % | 10.83 | % | 12.99 | % | 8.98 | % | 14.09 | % | 14.54 | % | ||||||||||||||
Average equity to average assets | 8.36 | % | 7.51 | % | 7.90 | % | 7.69 | % | 7.62 | % | 7.85 | % | 7.46 | % | ||||||||||||||
Net interest margin (2) | 3.84 | % | 3.48 | % | 3.60 | % | 3.47 | % | 3.44 | % | 3.83 | % | 3.65 | % | ||||||||||||||
Efficiency ratio (3) | 70.65 | % | 66.88 | % | 69.64 | % | 63.96 | % | 63.36 | % | 61.26 | % | 60.91 | % | ||||||||||||||
Allowance for loan losses to loans | 1.18 | % | 1.22 | % | 1.13 | % | 1.20 | % | 1.51 | % | 1.02 | % | 0.93 | % | ||||||||||||||
Asset Quality Ratios | ||||||||||||||||||||||||||||
Net charge-offs to average loans outstanding | 0.00 | % | -0.05 | % | -0.04 | % | 0.09 | % | 0.11 | % | 0.01 | % | 0.01 | % | ||||||||||||||
Non-performing loans to period-end loans | 1.42 | % | 1.51 | % | 1.37 | % | 3.08 | % | 1.92 | % | 0.02 | % | 0.00 | % | ||||||||||||||
Non-performing assets to total assets | 0.88 | % | 0.84 | % | 0.86 | % | 1.76 | % | 0.97 | % | 0.01 | % | 0.00 | % | ||||||||||||||
Allowance for loan losses to non-performing loans | 84.14 | % | 82.30 | % | 83.08 | % | 39.38 | % | 80.21 | % | 5166.67 | % | 0.00 | % | ||||||||||||||
Liquidity and Capital Ratios | ||||||||||||||||||||||||||||
Risk-based: | ||||||||||||||||||||||||||||
Tier 1 capital | 12.86 | % | 12.74 | % | 12.41 | % | 12.62 | % | 13.75 | % | 14.67 | % | 14.15 | % | ||||||||||||||
Total capital | 14.00 | % | 13.90 | % | 13.53 | % | 13.81 | % | 15.00 | % | 15.50 | % | 14.99 | % | ||||||||||||||
Average loans to average deposits | 69.71 | % | 60.55 | % | 62.73 | % | 56.56 | % | 47.52 | % | 44.77 | % | 51.16 | % | ||||||||||||||
Average shares outstanding | ||||||||||||||||||||||||||||
Basic and diluted | 474,132 | 474,132 | 474,132 | 474,132 | 474,132 | 431,262 | 392,297 | |||||||||||||||||||||
| (1) | Net income per share and book value per share have been retroactively adjusted to reflect current outstanding shares. |
| (2) | On an annualized basis. |
| (3) | The efficiency ratio equals non-interest expense divided by the sum of taxable equivalent net interest income plus non-interest income. |
9
Table of Contents
PEOPLES NATIONAL BANK
Summary Financial Data
(Dollars in thousands except per share data)
| As of and for the Six Months Ended June 30, | As of and for the Years Ended December 31, | |||||||||||||||||||||||||||
| 2006 | 2005 | 2005 | 2004 | 2003 | 2002 | 2001 | ||||||||||||||||||||||
| (Unaudited) | ||||||||||||||||||||||||||||
Income Statement Data | ||||||||||||||||||||||||||||
Interest income | $ | 9,745 | $ | 8,593 | $ | 17,364 | $ | 17,741 | $ | 18,982 | $ | 20,766 | $ | 22,969 | ||||||||||||||
Interest expense | 4,392 | 3,508 | 7,385 | 6,963 | 7,935 | 10,223 | 13,363 | |||||||||||||||||||||
Net interest income | 5,353 | 5,085 | 9,979 | 10,778 | 11,047 | 10,543 | 9,606 | |||||||||||||||||||||
Provision for loan losses | 60 | 60 | 120 | 120 | 821 | 120 | 60 | |||||||||||||||||||||
Net interest income after provision for loan losses | 5,293 | 5,025 | 9,859 | 10,658 | 10,226 | 10,423 | 9,546 | |||||||||||||||||||||
Non-interest income | 451 | 528 | 1,119 | 1,294 | 1,118 | 1,110 | 991 | |||||||||||||||||||||
Non-interest expense | 4,260 | 4,080 | 8,299 | 7,841 | 7,001 | 6,573 | 5,511 | |||||||||||||||||||||
Income (loss) before income taxes | 1,484 | 1,473 | 2,679 | 4,111 | 4,343 | 4,960 | 5,026 | |||||||||||||||||||||
Income tax expense | 444 | 426 | 660 | 1,275 | 1,374 | 1,600 | 1,549 | |||||||||||||||||||||
Net income | $ | 1,040 | $ | 1,047 | $ | 2,019 | $ | 2,836 | $ | 2,969 | $ | 3,360 | $ | 3,477 | ||||||||||||||
Per Share Data | ||||||||||||||||||||||||||||
Net income - basic and diluted (1) | $ | 0.44 | $ | 0.44 | $ | 0.85 | $ | 1.19 | $ | 1.25 | $ | 1.41 | $ | 1.46 | ||||||||||||||
Cash dividends declared | 0.40 | 0.40 | 0.80 | 0.80 | 0.80 | 0.80 | 0.80 | |||||||||||||||||||||
Book value per share (1) | 15.96 | 15.91 | 15.92 | 15.87 | 15.48 | 14.98 | 14.26 | |||||||||||||||||||||
Balance Sheet Data | ||||||||||||||||||||||||||||
Assets | $ | 368,001 | $ | 359,794 | $ | 357,244 | $ | 356,992 | $ | 371,213 | $ | 359,641 | $ | 367,934 | ||||||||||||||
Loans, net | 213,221 | 201,600 | 204,563 | 206,689 | 195,653 | 213,674 | 179,066 | |||||||||||||||||||||
Investment securities | 86,063 | 90,781 | 95,665 | 75,613 | 118,250 | 105,952 | 105,792 | |||||||||||||||||||||
Deposits | 328,162 | 320,312 | 318,818 | 318,710 | 333,337 | 321,543 | 332,378 | |||||||||||||||||||||
Stockholders’ equity | 37,909 | 37,798 | 37,820 | 37,701 | 36,766 | 35,577 | 33,876 | |||||||||||||||||||||
Shares outstanding | 2,375,683 | 2,375,683 | 2,375,683 | 2,375,683 | 2,375,683 | 2,159,985 | 1,963,895 | |||||||||||||||||||||
Performance Ratios | ||||||||||||||||||||||||||||
Return on average assets (2) | 0.58 | % | 0.58 | % | 0.56 | % | 0.77 | % | 0.80 | % | 0.91 | % | 1.02 | % | ||||||||||||||
Return on average stockholders’ equity (2) | 5.51 | % | 5.55 | % | 5.43 | % | 7.59 | % | 8.16 | % | 9.74 | % | 10.55 | % | ||||||||||||||
Average equity to average assets | 10.30 | % | 10.51 | % | 10.59 | % | 10.56 | % | 9.90 | % | 9.89 | % | 9.21 | % | ||||||||||||||
Net interest margin (2) | 3.23 | % | 3.15 | % | 3.09 | % | 3.31 | % | 3.20 | % | 3.11 | % | 2.76 | % | ||||||||||||||
Efficiency ratio (3) | 73.40 | % | 72.69 | % | 74.78 | % | 64.95 | % | 57.55 | % | 56.41 | % | 52.01 | % | ||||||||||||||
Allowance for loan losses to loans | 1.11 | % | 1.20 | % | 1.14 | % | 1.15 | % | 1.20 | % | 0.79 | % | 93.00 | % | ||||||||||||||
Asset Quality Ratios | ||||||||||||||||||||||||||||
Net charge-offs to average loans outstanding | 0.01 | % | 0.01 | % | 0.08 | % | 0.05 | % | 0.07 | % | 7.00 | % | 0.04 | % | ||||||||||||||
Non-performing loans to period-end loans | 2.39 | % | 2.18 | % | 2.52 | % | 0.92 | % | 0.90 | % | 0.00 | % | 0.02 | % | ||||||||||||||
Non-performing assets to total assets | 1.46 | % | 1.31 | % | 1.52 | % | 0.57 | % | 0.51 | % | 0.06 | % | 0.03 | % | ||||||||||||||
Allowance for loan losses to non-performing loans | 47.14 | % | 55.94 | % | 45.83 | % | 126.28 | % | 135.47 | % | 24328.57 | % | 5487.10 | % | ||||||||||||||
Liquidity and Capital Ratios | ||||||||||||||||||||||||||||
Risk-based: | ||||||||||||||||||||||||||||
Tier 1 capital | 15.44 | % | 16.29 | % | 15.88 | % | 16.37 | % | 16.70 | % | 16.82 | % | 17.41 | % | ||||||||||||||
Total capital | 16.42 | % | 17.35 | % | 16.88 | % | 17.41 | % | 17.79 | % | 17.63 | % | 18.28 | % | ||||||||||||||
Average loans to average deposits | 65.05 | % | 65.61 | % | 65.40 | % | 62.13 | % | 56.68 | % | 55.19 | % | 55.13 | % | ||||||||||||||
Average shares outstanding | ||||||||||||||||||||||||||||
Basic and diluted | 2,375,683 | 2,375,683 | 2,375,683 | 2,375,683 | 2,375,683 | 2,159,985 | 1,963,895 | |||||||||||||||||||||
| (1) | Net income per share and book value per share have been retroactively adjusted to reflect current outstanding shares. |
| (2) | On an annualized basis. |
| (3) | The efficiency ratio equals non-interest expense divided by the sum of taxable equivalent net interest income plus non-interest income. |
10
Table of Contents
SHENANDOAH NATIONAL BANK
Summary Financial Data
(Dollars in thousands except per share data)
| As of and for the Six Months Ended June 30, | As of and for the Years Ended December 31, | |||||||||||||||||||||||||||
| 2006 | 2005 | 2005 | 2004 | 2003 | 2002 | 2001 | ||||||||||||||||||||||
| (Unaudited) | ||||||||||||||||||||||||||||
Income Statement Data | ||||||||||||||||||||||||||||
Interest income | $ | 3,066 | $ | 2,737 | $ | 5,670 | $ | 5,788 | $ | 6,690 | $ | 6,724 | $ | 7,059 | ||||||||||||||
Interest expense | 1,425 | 1,275 | 2,651 | 2,542 | 2,914 | 3,378 | 4,479 | |||||||||||||||||||||
Net interest income | 1,641 | 1,462 | 3,019 | 3,246 | 3,776 | 3,346 | 2,580 | |||||||||||||||||||||
Provision for loan losses | 30 | 36 | 72 | 72 | 441 | 60 | 48 | |||||||||||||||||||||
Net interest income after provision for loan losses | 1,611 | 1,426 | 2,947 | 3,174 | 3,335 | 3,286 | 2,532 | |||||||||||||||||||||
Non-interest income | 158 | 161 | 372 | 394 | 409 | 427 | 381 | |||||||||||||||||||||
Non-interest expense | 1,465 | 1,344 | 2,836 | 2,432 | 2,329 | 2,362 | 2,162 | |||||||||||||||||||||
Income (loss) before income taxes | 304 | 243 | 483 | 1,136 | 1,415 | 1,351 | 751 | |||||||||||||||||||||
Income tax expense | 84 | 59 | 112 | 338 | 445 | 444 | 237 | |||||||||||||||||||||
Net income | $ | 220 | $ | 184 | $ | 371 | $ | 798 | $ | 970 | $ | 907 | $ | 514 | ||||||||||||||
Per Share Data | ||||||||||||||||||||||||||||
Net income - basic and diluted (1) | $ | 0.79 | $ | 0.66 | $ | 1.34 | $ | 2.87 | $ | 3.49 | $ | 3.27 | $ | 1.85 | ||||||||||||||
Cash dividends declared | — | — | — | — | — | — | — | |||||||||||||||||||||
Book value per share (1) | 29.19 | 27.73 | 28.40 | 27.07 | 24.19 | 20.78 | 17.58 | |||||||||||||||||||||
Balance Sheet Data | ||||||||||||||||||||||||||||
Assets | $ | 113,281 | $ | 116,496 | $ | 117,160 | $ | 117,446 | $ | 119,638 | $ | 109,788 | $ | 105,242 | ||||||||||||||
Loans, net | 69,884 | 70,459 | 73,927 | 67,362 | 77,384 | 61,914 | 59,894 | |||||||||||||||||||||
Investment securities | 23,384 | 18,029 | 19,882 | 12,172 | 17,537 | 27,806 | 26,274 | |||||||||||||||||||||
Deposits | 103,446 | 106,942 | 107,409 | 108,091 | 111,089 | 101,775 | 98,402 | |||||||||||||||||||||
Stockholders’ equity | 8,104 | 7,697 | 7,884 | 7,513 | 6,715 | 5,767 | 4,880 | |||||||||||||||||||||
Shares outstanding | 277,588 | 277,588 | 277,588 | 277,588 | 277,588 | 252,856 | 230,331 | |||||||||||||||||||||
Performance Ratios | ||||||||||||||||||||||||||||
Return on average assets (2) | 0.39 | % | 0.32 | % | 0.32 | % | 0.67 | % | 0.84 | % | 0.85 | % | 0.52 | % | ||||||||||||||
Return on average stockholders’ equity (2) | 5.50 | % | 4.60 | % | 4.83 | % | 11.04 | % | 15.25 | % | 16.69 | % | 11.30 | % | ||||||||||||||
Average equity to average assets | 7.15 | % | 6.61 | % | 6.73 | % | 6.40 | % | 5.61 | % | 5.25 | % | 4.64 | % | ||||||||||||||
Net interest margin (2) | 3.17 | % | 2.73 | % | 2.82 | % | 3.01 | % | 3.35 | % | 3.23 | % | 2.58 | % | ||||||||||||||
Efficiency ratio (3) | 81.44 | % | 82.81 | % | 83.63 | % | 66.81 | % | 55.65 | % | 62.60 | % | 73.02 | % | ||||||||||||||
Allowance for loan losses to loans | 1.40 | % | 1.38 | % | 1.24 | % | 1.37 | % | 1.14 | % | 0.80 | % | 0.74 | % | ||||||||||||||
Asset Quality Ratios | ||||||||||||||||||||||||||||
Net charge-offs to average loans outstanding | -0.05 | % | -0.02 | % | 0.11 | % | 0.05 | % | 0.06 | % | 0.01 | % | 0.04 | % | ||||||||||||||
Non-performing loans to period-end loans | 3.79 | % | 1.98 | % | 3.56 | % | 2.13 | % | 1.20 | % | 0.00 | % | 0.00 | % | ||||||||||||||
Non-performing assets to total assets | 2.77 | % | 1.19 | % | 2.66 | % | 1.67 | % | 0.85 | % | 0.15 | % | 0.34 | % | ||||||||||||||
Allowance for loan losses to non-performing loans | 37.63 | % | 70.91 | % | 35.31 | % | 65.36 | % | 96.77 | % | 0.00 | % | 0.00 | % | ||||||||||||||
Liquidity and Capital Ratios | ||||||||||||||||||||||||||||
Risk-based: | ||||||||||||||||||||||||||||
Tier 1 capital | 10.77 | % | 10.33 | % | 10.17 | % | 9.92 | % | 8.48 | % | 8.45 | % | 7.30 | % | ||||||||||||||
Total capital | 14.02 | % | 13.60 | % | 13.31 | % | 13.13 | % | 11.50 | % | 11.38 | % | 10.22 | % | ||||||||||||||
Average loans to average deposits | 71.09 | % | 65.74 | % | 66.72 | % | 68.88 | % | 65.90 | % | 59.93 | % | 61.07 | % | ||||||||||||||
Average shares outstanding | ||||||||||||||||||||||||||||
Basic and diluted | 277,588 | 277,588 | 277,588 | 277,588 | 277,588 | 252,856 | 230,331 | |||||||||||||||||||||
| (1) | Net income per share and book value per share have been retroactively adjusted to reflect current outstanding shares. |
| (2) | On an annualized basis. |
| (3) | The efficiency ratio equals non-interest expense divided by the sum of taxable equivalent net interest income plus non-interest income. |
11
Table of Contents
PRO FORMA UNAUDITED COMBINED CONSOLIDATED FINANCIAL INFORMATION
The following is the unaudited pro forma combined consolidated financial information for each of the Banks and Carter Bank & Trust giving effect to the merger. The balance sheet information presented gives effect to the merger as if it occurred on December 31, 2005. The income statement information presented gives effect to the merger as if it occurred on the first day of each period presented.
We expect that we will incur merger and integration charges as a result of the merger. We also anticipate that the merger will provide the combined company with financial benefits that may include reduced operating expenses. The pro forma combined consolidated financial information, while helpful in illustrating the financial characteristics of the combined company under one set of assumptions, may not reflect all of these anticipated financial expenses and does not attempt to predict or suggest future results. It also does not necessarily reflect what the historical results of the combined company would have been had our companies been combined during the periods presented.
Generally accepted accounting standards require that all business combinations be accounted for by the “purchase” method of accounting; therefore, the merger will be accounted for in this manner. Under the purchase method of accounting, the assets and liabilities of nine of the Banks, as of the completion of the merger, will be recorded at their fair values and the excess of purchase price over the fair value of net assets will be allocated to goodwill. Commonly, the acquiring entity is the larger entity; therefore, the assets and liabilities of Peoples National Bank will not be recorded at fair value as this Bank will be deemed to be the “acquirer” for the purpose of effecting the merger transaction. Peoples National Bank has the largest stockholder’s equity and will have the greatest number of voting shares after the consummation of the merger. Financial statements of Carter Bank & Trust issued after the consummation of the merger will reflect such values and will not be restated retroactively to reflect the historical position or results of operations of each of the Banks. The operating results of each of the Banks will be reflected in Carter Bank & Trust’s financial statements from and after the date the merger is consummated.
The final allocation of the purchase price will be determined after the merger is completed and after completion of thorough analyses to determine the fair values of each of the Bank’s tangible and identifiable intangible assets and liabilities as of the date the merger is completed. In addition, estimates of merger-related charges are subject to final decisions related to combining the companies. Any change in the fair value of the net assets of the Banks will change the amount of the purchase price allocable to goodwill. Additionally, changes to each Bank’s stockholders’ equity, including net income and changes in the market value of each Bank’s common stock through the date the merger is completed, will also change the amount of goodwill recorded. As a result, the final adjustments may be materially different from the unaudited pro forma adjustments used in preparing the unaudited pro forma combined consolidated financial information presented herein. The exchange ratios are fixed, however, and will not change as a result of such fair market analysis as of the effective date. The unaudited pro forma adjustments used in preparing the unaudited pro forma combined consolidated financial information are described in greater detail in the notes thereto.
The unaudited pro forma combined consolidated financial information is based on, and should be read together with, the historical information that we have included in this joint proxy statement/offering circular or presented in the Banks’ prior filings with the OCC, which are incorporated into this joint proxy statement/offering circular by reference.
1
Table of Contents
UNAUDITED PRO FORMA COMBINED CONSOLIDATED BALANCE SHEET
AS OF JUNE 30, 2006
(Dollars in thousands)
| Blue Ridge Bank, N.A. | Central National Bank | Community National Bank | First National Bank | First National Exchange Bank | Mountain National Bank | Patrick Henry National Bank | Patriot Bank, N.A. | |||||||||||||||||||||||||
Assets | ||||||||||||||||||||||||||||||||
Interest-bearing deposits in other financial institutions | $ | 15,931 | $ | 7,921 | $ | 12,169 | $ | 15,931 | $ | 12,070 | $ | 12,169 | $ | 19,495 | $ | 12,169 | ||||||||||||||||
Investment securities U.S. agency securities | 53,770 | 19,899 | 53,785 | 57,270 | 53,770 | 53,785 | 84,167 | 53,785 | ||||||||||||||||||||||||
Federal funds sold | 8,180 | 9,460 | 12,155 | 11,630 | 3,620 | 20,900 | 24,180 | 3,780 | ||||||||||||||||||||||||
Loans | 152,332 | 72,092 | 153,452 | 176,323 | 128,581 | 134,954 | 237,883 | 155,646 | ||||||||||||||||||||||||
Less: Income collected-not Earned | (644 | ) | (313 | ) | (292 | ) | (468 | ) | (167 | ) | (463 | ) | (793 | ) | (160 | ) | ||||||||||||||||
Allowance for loan Losses | (2,110 | ) | (1,078 | ) | (1,701 | ) | (1,893 | ) | (1,946 | ) | (1,702 | ) | (2,545 | ) | (1,830 | ) | ||||||||||||||||
Net loans | 149,578 | 70,701 | 151,459 | 173,962 | 126,468 | 132,789 | 234,545 | 153,656 | ||||||||||||||||||||||||
Earning assets | 227,459 | 107,981 | 229,568 | 258,793 | 195,928 | 219,643 | 362,387 | 223,390 | ||||||||||||||||||||||||
Cash and due from banks | 11,509 | 4,126 | 9,852 | 8,718 | 6,239 | 7,010 | 13,989 | 14,542 | ||||||||||||||||||||||||
Bank premises and equipment | 4,846 | 2,297 | 2,657 | 4,333 | 3,450 | 2,413 | 4,808 | 6,355 | ||||||||||||||||||||||||
Real estate owned other than bank premises | 2,902 | 777 | 831 | 2,105 | 504 | 1,670 | 2,713 | 0 | ||||||||||||||||||||||||
Investment in associated companies | 769 | 769 | 769 | 769 | 769 | 769 | 769 | 769 | ||||||||||||||||||||||||
Goodwill net of amortization | ||||||||||||||||||||||||||||||||
Core deposit intangible | ||||||||||||||||||||||||||||||||
Other assets | 2,889 | 1,475 | 3,293 | 2,868 | 2,854 | 2,455 | 4,306 | 2,618 | ||||||||||||||||||||||||
Total Assets | $ | 250,374 | $ | 117,425 | $ | 246,970 | $ | 277,586 | $ | 209,744 | $ | 233,960 | $ | 388,972 | $ | 247,674 | ||||||||||||||||
Liabilities | ||||||||||||||||||||||||||||||||
Deposits | ||||||||||||||||||||||||||||||||
Lifetime free checking | 32,428 | 25,300 | 39,658 | 38,174 | 24,382 | 28,085 | 60,409 | 79,399 | ||||||||||||||||||||||||
Interest-bearing demand | 21,985 | 9,479 | 26,274 | 26,846 | 19,916 | 20,144 | 48,633 | 29,396 | ||||||||||||||||||||||||
Regular passbook savings | 27,847 | 10,225 | 31,240 | 41,984 | 21,253 | 26,429 | 59,161 | 44,133 | ||||||||||||||||||||||||
Time deposits: | ||||||||||||||||||||||||||||||||
Certificates of deposit $100,000 or more | 27,667 | 20,291 | 21,698 | 35,901 | 20,120 | 31,249 | 44,111 | 21,989 | ||||||||||||||||||||||||
Other | 119,931 | 41,342 | 104,672 | 114,633 | 103,728 | 111,561 | 151,061 | 51,491 | ||||||||||||||||||||||||
Total Deposits | 229,858 | 106,637 | 223,542 | 257,538 | 189,399 | 217,468 | 363,375 | 226,408 | ||||||||||||||||||||||||
Notes issued in the U.S. Treasury | 9 | 6 | 9 | 231 | 0 | 11 | 627 | 27 | ||||||||||||||||||||||||
Other liabilities for borrowed money | 0 | 0 | 0 | 0 | 0 | 0 | 0 | 0 | ||||||||||||||||||||||||
Other liabilities | 232 | 208 | 220 | 1,052 | 494 | 432 | 607 | 534 | ||||||||||||||||||||||||
Subordinated notes | 0 | 0 | 0 | 0 | 0 | 0 | 0 | 0 | ||||||||||||||||||||||||
Total Liabilities | 230,099 | 106,851 | 223,771 | 258,821 | 189,893 | 217,911 | 364,557 | 226,969 | ||||||||||||||||||||||||
Common stock | 8,692 | 1,182 | 3,537 | 1,879 | 2,462 | 2,539 | 3,500 | 2,371 | ||||||||||||||||||||||||
Paid in capital | ||||||||||||||||||||||||||||||||
Surplus | 9,153 | 5,651 | 15,825 | 11,327 | 13,344 | 10,206 | 13,879 | 14,021 | ||||||||||||||||||||||||
Undivided profits | 2,430 | 3,741 | 3,837 | 5,559 | 4,045 | 3,304 | 6,984 | 4,313 | ||||||||||||||||||||||||
Total Shareholders’ Equity | 20,275 | 10,574 | 23,199 | 18,765 | 19,851 | 16,049 | 24,363 | 20,705 | ||||||||||||||||||||||||
Total Liabilities and Shareholders’ Equity | $ | 250,374 | $ | 117,425 | $ | 246,970 | $ | 277,586 | $ | 209,744 | $ | 233,960 | $ | 388,972 | $ | 247,674 | ||||||||||||||||
2
Table of Contents
| Peoples National Bank | Shenandoah National Bank | MCOV | Eliminations | Purchase Accounting Adjustments | Purchase Accounting Adjustments | Purchase Accounting Adjustments | Pro Forma Combined Consolidated | |||||||||||||||||||||
Assets | ||||||||||||||||||||||||||||
Interest-bearing deposits in other financial institutions | $ | 19,495 | $ | 7,921 | $ | 0 | $ | 135,271 | ||||||||||||||||||||
Investment securities U.S. agency securities | 86,063 | 23,384 | 0 | 539,678 | ||||||||||||||||||||||||
Federal funds sold | 12,600 | 2,260 | 0 | 108,765 | ||||||||||||||||||||||||
Loans | 216,348 | 71,105 | 0 | -3,762 | (2) | 1,494,954 | ||||||||||||||||||||||
Less: Income collected-not Earned | (724 | ) | (225 | ) | 0 | -4,249 | ||||||||||||||||||||||
Allowance for loan Losses | (2,403 | ) | (996 | ) | 0 | -18,204 | ||||||||||||||||||||||
Net loans | 213,221 | 69,884 | 0 | -3,762 | 1,472,501 | |||||||||||||||||||||||
Earning assets | 331,379 | 103,449 | 0 | 2,256,215 | ||||||||||||||||||||||||
Cash and due from banks | 11,430 | 4,147 | 1,978 | -1,978 | (3) | 91,562 | ||||||||||||||||||||||
Bank premises and equipment | 19,213 | 3,144 | 3,724 | 21,436 | (1) | -138 | 78,538 | |||||||||||||||||||||
Real estate owned other than bank premises | 281 | 494 | 0 | 12,277 | ||||||||||||||||||||||||
Investment in associated companies | 769 | 769 | -7,690 | (4) | 0 | |||||||||||||||||||||||
Goodwill net of amortization | 1,617 | 18,977 | (1) | 20,594 | ||||||||||||||||||||||||
Core deposit intangible | 41,273 | (1) | -2,064 | 39,209 | ||||||||||||||||||||||||
Other assets | 4,929 | 1,278 | 4,637 | 948 | 34,550 | |||||||||||||||||||||||
Total Assets | $ | 368,001 | $ | 113,281 | $ | 11,956 | -$ | 13,430 | $ | 81,686 | -$ | 1,254 | (5) | $ | 2,532,945 | |||||||||||||
Liabilities | ||||||||||||||||||||||||||||
Deposits | ||||||||||||||||||||||||||||
Lifetime free checking | 44,922 | 17,666 | 0 | -1,978 | (3) | 388,445 | ||||||||||||||||||||||
Interest-bearing demand | 35,355 | 10,634 | 0 | 248,662 | ||||||||||||||||||||||||
Regular passbook savings | 63,438 | 11,019 | 0 | 336,729 | ||||||||||||||||||||||||
Time deposits: | ||||||||||||||||||||||||||||
Certificates of deposit $100,000 or more | 35,158 | 13,682 | 0 | 271,866 | ||||||||||||||||||||||||
Other | 149,289 | 50,445 | 0 | 998,153 | ||||||||||||||||||||||||
Total Deposits | 328,162 | 103,446 | 0 | -1,978 | 2,243,855 | |||||||||||||||||||||||
Notes issued in the U.S. Treasury | 9 | 10 | 0 | 939 | ||||||||||||||||||||||||
Other liabilities for borrowed money | 0 | 0 | 2,262 | -2,262 | (2) | 0 | ||||||||||||||||||||||
Other liabilities | 1,921 | 221 | 2,642 | 21,321 | (1) | -426 | 29,458 | |||||||||||||||||||||
Subordinated notes | 0 | 1,500 | 0 | -1,500 | (2) | 0 | ||||||||||||||||||||||
Total Liabilities | 330,092 | 105,177 | 4,904 | -5,740 | 21,321 | -426 | 2,274,252 | |||||||||||||||||||||
Common stock | 2,376 | 1,388 | 0 | 29,926 | ||||||||||||||||||||||||
Paid in capital | 5,985 | -5,985 | 0 | |||||||||||||||||||||||||
Surplus | 28,935 | 4,558 | 0 | 126,899 | ||||||||||||||||||||||||
Undivided profits | 6,598 | 2,158 | 1,067 | -1,705 | 60,365 | (1) | -828 | 101,868 | ||||||||||||||||||||
Total Shareholders’ Equity | 37,909 | 8,104 | 7,052 | -7,690 | (4) | 60,365 | -828 | 258,693 | ||||||||||||||||||||
Total Liabilities and Shareholders’ Equity | $ | 368,001 | $ | 113,281 | $ | 11,956 | -$ | 13,430 | $ | 81,686 | -$ | 1,254 | (5) | $ | 2,532,945 | |||||||||||||
The following notes are an integral part of the unaudited pro forma combined consolidated financial information:
| (1) | To record the deemed purchase, based on last trade price of Peoples National Bank (PNB) of $21.00 and the following fair value adjustments: |
$41,273 - The core deposit intangible (CDI) adjustment reflects the value of the base of core deposits acquired in the proposed transaction (excluding PNB). This amount was estimated based upon an independent appraiser’s comparison of similar transactions, effective yields and estimated lives of each category of deposits. This amount will be adjusted as of the merger date.
$18,977 - Adjusted to reflect the excess of the purchase price over identified tangible and intangible net assets acquired.
$21,436 - Adjusted to reflect the estimated current fair market value of the real property at June 30, 2006 (excluding PNB). Management allocated 50% of the adjustment to land and 50% to bank premises. This amount will be adjusted as of the merger date.
$21,321 - A deferred tax liability was recorded at the statutory rate of 34% for the CDI and fair value adjustment of bank premises (excluding PNB).
$60,365 - Adjusted for the effects of the purchase price and the adjustments to fair value of the assets and liabilities.
| (2) | Eliminating loans made by one of the combining banks (Patrick Henry National Bank (PHNB)) to the Mortgage Company of Virginia, Inc. (MCOV), the wholly-owned subsidiary of the combined banks. |
| (3) | Eliminating cash deposits from the wholly-owned subsidiary held by one of the combining banks (PHNB). |
| (4) | The wholly-owned subsidiary (MCOV) is consolidated with the ten banks for this pro forma and, therefore, adjustment was made to eliminate the asset on the individual banks for their equity investment in the subsidiary. |
| (5) | Adjustments reflect accumulated amortization of the CDI and the accumulated depreciation for the fair value adjustment of bank premises. |
3
Table of Contents
UNAUDITED PRO FORMA COMBINED CONSOLIDATED STATEMENT OF INCOME
FOR THE YEAR ENDED DECEMBER 31, 2005
(Dollars in thousands, except for share amounts)
| Blue Ridge Bank, N.A. | Central National Bank | Community National Bank | First National Bank | First National Exchange Bank | Mountain National Bank | Patrick Henry National Bank | Patriot Bank, N.A. | |||||||||||||||||
INTEREST INCOME | ||||||||||||||||||||||||
Interest and fees on loans: | ||||||||||||||||||||||||
Taxable | $ | 7,954 | $ | 4,079 | $ | 7,921 | $ | 8,783 | $ | 7,566 | $ | 6,141 | $ | 11,842 | $ | 7,698 | ||||||||
Non-taxable | 926 | 59 | 1,102 | 649 | 513 | 612 | 887 | 719 | ||||||||||||||||
Interest on deposits in other financial institutions | 683 | 422 | 575 | 683 | 556 | 559 | 783 | 559 | ||||||||||||||||
Interest on federal funds sold | 280 | 296 | 137 | 709 | 57 | 950 | 1,097 | 493 | ||||||||||||||||
Interest and dividends on securities: | ||||||||||||||||||||||||
U.S. government and other | 1,950 | 613 | 1,955 | 2,067 | 1,943 | 1,938 | 3,137 | 1,941 | ||||||||||||||||
State and political subdivisions | 15 | 7 | 15 | 15 | 15 | 15 | 23 | 14 | ||||||||||||||||
Total Interest Income | 11,808 | 5,476 | 11,705 | 12,906 | 10,650 | 10,215 | 17,769 | 11,424 | ||||||||||||||||
INTEREST EXPENSE | ||||||||||||||||||||||||
Interest on time deposits $100,000 or more | 991 | 627 | 736 | 1,175 | 746 | 897 | 1,616 | 517 | ||||||||||||||||
Interest on other deposits | 4,546 | 1,500 | 4,275 | 5,005 | 4,191 | 4,217 | 6,680 | 2,574 | ||||||||||||||||
Interest on federal funds purchased | 1 | 26 | 14 | 0 | 42 | 0 | 0 | 0 | ||||||||||||||||
Interest on notes payable | ||||||||||||||||||||||||
Interest on notes issued to the U.S. Treasury | 3 | 2 | 4 | 8 | 5 | 2 | 11 | 8 | ||||||||||||||||
Interest on notes subordinated to deposits | 0 | 0 | 0 | 0 | 0 | 0 | 0 | 0 | ||||||||||||||||
Total Interest Expense | 5,541 | 2,155 | 5,029 | 6,188 | 4,984 | 5,116 | 8,307 | 3,099 | ||||||||||||||||
Net Interest Income | 6,267 | 3,321 | 6,676 | 6,718 | 5,666 | 5,099 | 9,462 | 8,325 | ||||||||||||||||
Provision for loan losses | 120 | 84 | 72 | 120 | 120 | 72 | 240 | 60 | ||||||||||||||||
Net Interest Income after | 6,147 | 3,237 | 6,604 | 6,598 | 5,546 | 5,027 | 9,222 | 8,265 | ||||||||||||||||
NON-INTEREST INCOME | ||||||||||||||||||||||||
Service charges, commissions and fees | 767 | 339 | 940 | 586 | 559 | 430 | 1,100 | 838 | ||||||||||||||||
Other non-interest income | 182 | 84 | 239 | 201 | 144 | 163 | 170 | 116 | ||||||||||||||||
Total Non-Interest Income | 949 | 423 | 1,179 | 787 | 703 | 593 | 1,270 | 954 | ||||||||||||||||
NON-INTEREST EXPENSE | ||||||||||||||||||||||||
Salaries and employee benefits | 3,135 | 1,429 | 2,483 | 2,981 | 2,972 | 1,928 | 4,397 | 3,699 | ||||||||||||||||
Occupancy expense (net) | 670 | 428 | 826 | 666 | 843 | 490 | 1,087 | 992 | ||||||||||||||||
Operations center expense | 1,086 | 472 | 1,069 | 1,264 | 975 | 1,007 | 1,700 | 1,093 | ||||||||||||||||
Other non-interest expense | 676 | 283 | 558 | 568 | 495 | 452 | 839 | 678 | ||||||||||||||||
Total Non-Interest Expense | 5,567 | 2,612 | 4,936 | 5,479 | 5,285 | 3,877 | 8,023 | 6,462 | ||||||||||||||||
Income Before Income Taxes | 1,529 | 1,048 | 2,847 | 1,906 | 964 | 1,743 | 2,469 | 2,757 | ||||||||||||||||
Income Tax Expense | 211 | 317 | 555 | 421 | 148 | 387 | 542 | 686 | ||||||||||||||||
NET INCOME | $ | 1,318 | $ | 731 | $ | 2,292 | $ | 1,485 | $ | 816 | $ | 1,356 | $ | 1,927 | $ | 2,071 | ||||||||
Per Share | ||||||||||||||||||||||||
Basic and diluted earnings per share | $ | 1.29 | $ | 3.09 | $ | 3.24 | $ | 0.99 | $ | 1.66 | $ | 2.67 | $ | 0.69 | $ | 4.37 | ||||||||
Weighted average shares-basic and diluted | $ | 1.29 | $ | 3.09 | $ | 3.24 | $ | 0.99 | $ | 1.66 | $ | 2.67 | $ | 0.69 | $ | 4.37 | ||||||||
4
Table of Contents
| | Peoples National Bank | | Shenandoah National Bank | MCOV | Eliminations | | Purchase Accounting Adjustments (1) |
| Purchase Accounting Adjustments (2) |
| Purchase Accounting Adjustments (3) | | Pro Forma Combined Consolidated | ||||||||||||
INTEREST INCOME | |||||||||||||||||||||||||
Interest and fees on loans: | |||||||||||||||||||||||||
Taxable | $ | 12,647 | $ | 4,253 | $ | 80 | -$ | 65 | (6) | $ | 78,899 | ||||||||||||||
Non-taxable | 362 | 112 | 0 | 5,941 | |||||||||||||||||||||
Interest on deposits in other financial institutions | 784 | 421 | 0 | 6,025 | |||||||||||||||||||||
Interest on federal funds sold | 274 | 144 | 0 | 4,437 | |||||||||||||||||||||
Interest and dividends on securities: | 0 | ||||||||||||||||||||||||
U.S. government and other | 3,274 | 733 | 0 | 19,551 | |||||||||||||||||||||
State and political subdivisions | 23 | 7 | 0 | 149 | |||||||||||||||||||||
Total Interest Income | 17,364 | 5,670 | 80 | -65 | 115,002 | ||||||||||||||||||||
INTEREST EXPENSE | |||||||||||||||||||||||||
Interest on time deposits $100,000 or more | 1,069 | 547 | 0 | 8,921 | |||||||||||||||||||||
Interest on other deposits | 6,305 | 2,008 | 0 | 41,301 | |||||||||||||||||||||
Interest on federal funds purchased | 9 | 2 | 0 | 94 | |||||||||||||||||||||
Interest on notes payable | 65 | -65 | (6) | 0 | |||||||||||||||||||||
Interest on notes issued to the U.S. Treasury | 2 | 3 | 0 | 48 | |||||||||||||||||||||
Interest on notes subordinated to deposits | 0 | 91 | 0 | 91 | |||||||||||||||||||||
Total Interest Expense | 7,385 | 2,651 | 65 | -65 | 50,455 | ||||||||||||||||||||
Net Interest Income | 9,979 | 3,019 | 15 | 0 | 64,547 | ||||||||||||||||||||
Provision for loan losses | 120 | 72 | 0 | 1,080 | |||||||||||||||||||||
Net Interest Income after | 9,859 | 2,947 | 15 | 63,467 | |||||||||||||||||||||
NON-INTEREST INCOME | |||||||||||||||||||||||||
Service charges, commissions and fees | 995 | 334 | 11,927 | -10,699 | (5) | 8,116 | |||||||||||||||||||
Other non-interest income | 124 | 38 | 52 | 1,513 | |||||||||||||||||||||
Total Non-Interest Income | 1,119 | 372 | 11,979 | -10,699 | 9,629 | ||||||||||||||||||||
NON-INTEREST EXPENSE | |||||||||||||||||||||||||
Salaries and employee benefits | 4,651 | 1,454 | 7,395 | 36,524 | |||||||||||||||||||||
Occupancy expense (net) | 1,329 | 545 | 4,451 | 12,327 | |||||||||||||||||||||
Operations center expense | 1,524 | 509 | 0 | -10,699 | (5) | 0 | |||||||||||||||||||
Other non-interest expense | 795 | 328 | 256 | 4,435 | 192 | -1,894 | 8,661 | ||||||||||||||||||
Total Non-Interest Expense | 8,299 | 2,836 | 12,102 | -10,699 | 4,435 | 192 | -1,894 | 57,512 | |||||||||||||||||
Income Before Income Taxes | 2,679 | 483 | -108 | -4,435 | -192 | 1,894 | 15,584 | ||||||||||||||||||
Income Tax Expense | 660 | 112 | -24 | -1,507 | -127 | 644 | 3,025 | ||||||||||||||||||
NET INCOME | $ | 2,019 | $ | 371 | -84 | -$ | 2,928 | -$ | 65 | $ | 1,250 | $ | 12,559 | ||||||||||||
Per Share | |||||||||||||||||||||||||
Basic and diluted earnings per share | $ | 0.85 | $ | 1.34 | |||||||||||||||||||||
Weighted average shares-basic and diluted | $ | 0.85 | $ | 1.34 |
The following notes are an integral part of the unaudited pro forma combined consolidated financial information:
| (1) | Adjusted for the amortization expense for CDI over 10 years and the associated income taxes at 34%. |
| (2) | Adjusted for the additional depreciation expense on the fair value adjustment of bank premises based on estimated useful life of 39 years. |
| (3) | Adjusted for post-merger synergies of $1.25 million, after tax, consisting of anticipated savings from lower aggregate examination fees, lower costs of regulatory filings and compliance resulting from banking, securities and related filings on behalf of one combined bank as opposed to 10 separate banks, and operational savings in numerous areas from stationary costs to integration of accounting and related functions. The amount of post-merger synergies is based on management’s estimates, which in management’s opinion are conservative, and may actually be more or less over the relevant period. |
| (4) | Goodwill is not amortized, but is tested annually for impairment. |
| (5) | Eliminating operations center expense paid by the combining banks to Bank Services of Virginia, Inc. (BSOV), a wholly-owned subsidiary of MCOV. |
| (6) | Eliminating interest payable by MCOV to one of the combining banks (PHNB). |
5
Table of Contents
UNAUDITED PRO FORMA COMBINED CONSOLIDATED STATEMENT OF INCOME
FOR THE SIX MONTHS ENDED JUNE 30, 2006
(Dollars in thousands, except for share amounts)
| Blue Ridge Bank, N.A. | Central National Bank | Community National Bank | First National Bank | First National Exchange Bank | Mountain National Bank | Patrick Henry National Bank | Patriot Bank, N.A. | ||||||||||||||||||
INTEREST INCOME | |||||||||||||||||||||||||
Interest and fees on loans: | |||||||||||||||||||||||||
Taxable | $ | 4,139 | $ | 2,215 | $ | 4,236 | $ | 4,989 | $ | 3,538 | $ | 3,618 | $ | 6,595 | $ | 4,268 | |||||||||
Non-taxable | 543 | 82 | 562 | 387 | 289 | 393 | 595 | 427 | |||||||||||||||||
Interest on deposits in other financial institutions | 367 | 188 | 282 | 368 | 278 | 281 | 444 | 281 | |||||||||||||||||
Interest on federal funds sold | 221 | 292 | 104 | 245 | 48 | 481 | 557 | 56 | |||||||||||||||||
Interest and dividends on securities: | |||||||||||||||||||||||||
U.S. government and other | 1,085 | 368 | 1,086 | 1,160 | 1,083 | 1,080 | 1,704 | 1,084 | |||||||||||||||||
State and political subdivisions | 0 | 0 | 0 | 0 | 0 | 0 | 0 | 0 | |||||||||||||||||
Total Interest Income | 6,355 | 3,145 | 6,270 | 7,149 | 5,236 | 5,853 | 9,895 | 6,116 | |||||||||||||||||
INTEREST EXPENSE | |||||||||||||||||||||||||
Interest on time deposits $100,000 or more | 636 | 480 | 416 | 701 | 390 | 628 | 970 | 411 | |||||||||||||||||
Interest on other deposits | 2,483 | 930 | 2,412 | 2,947 | 2,210 | 2,475 | 3,913 | 1,389 | |||||||||||||||||
Interest on federal funds purchased | 0 | 0 | 3 | 0 | 2 | 0 | 0 | 20 | |||||||||||||||||
Interest on notes payable | 0 | 0 | 0 | 0 | 0 | 0 | 0 | 0 | |||||||||||||||||
Interest on notes issued to the U.S. Treasury | 2 | 2 | 3 | 5 | 2 | 2 | 8 | 6 | |||||||||||||||||
Interest on notes subordinated to deposits | 0 | 0 | 0 | 0 | 0 | 0 | 0 | 0 | |||||||||||||||||
Total Interest Expense | 3,121 | 1,412 | 2,834 | 3,653 | 2,604 | 3,105 | 4,891 | 1,826 | |||||||||||||||||
Net Interest Income | 3,234 | 1,733 | 3,436 | 3,496 | 2,632 | 2,748 | 5,004 | 4,290 | |||||||||||||||||
Provision for loan losses | 42 | 30 | 36 | 48 | 30 | 36 | 90 | 30 | |||||||||||||||||
Net Interest Income after Provision for Loan Losses | 3,192 | 1,703 | 3,400 | 3,448 | 2,602 | 2,712 | 4,914 | 4,260 | |||||||||||||||||
NON-INTEREST INCOME | |||||||||||||||||||||||||
Service charges, commissions and fees | 371 | 138 | 409 | 247 | 269 | 240 | 472 | 333 | |||||||||||||||||
Other non-interest income | 83 | 36 | 115 | 93 | 61 | 68 | 78 | 52 | |||||||||||||||||
Total Non-Interest Income | 454 | 174 | 524 | 340 | 330 | 308 | 550 | 385 | |||||||||||||||||
NON-INTEREST EXPENSE | |||||||||||||||||||||||||
Salaries and employee benefits | 1,598 | 705 | 1,283 | 1,436 | 1,493 | 927 | 2,140 | 1,870 | |||||||||||||||||
Occupancy expense (net) | 345 | 217 | 428 | 365 | 419 | 244 | 549 | 488 | |||||||||||||||||
Operations center expense | 555 | 261 | 532 | 613 | 453 | 520 | 867 | 549 | |||||||||||||||||
Other non-interest expense | 354 | 179 | 331 | 346 | 294 | 283 | 508 | 396 | |||||||||||||||||
Total Non-Interest Expense | 2,852 | 1,362 | 2,574 | 2,760 | 2,659 | 1,974 | 4,064 | 3,303 | |||||||||||||||||
Income Before Income Taxes | 794 | 515 | 1,350 | 1,028 | 273 | 1,046 | 1,400 | 1,342 | |||||||||||||||||
Income Tax Expense | 81 | 144 | 263 | 215 | (10 | ) | 217 | 270 | 310 | ||||||||||||||||
NET INCOME | $ | 713 | $ | 371 | $ | 1,087 | $ | 813 | $ | 283 | $ | 829 | $ | 1,130 | $ | 1,032 | |||||||||
Per Share | |||||||||||||||||||||||||
Basic and diluted earnings per share | $ | 0.70 | $ | 1.57 | $ | 1.54 | $ | 0.54 | $ | 0.57 | $ | 1.63 | $ | 0.40 | $ | 2.18 | |||||||||
Weighted average shares-basic and diluted | $ | 0.70 | $ | 1.57 | $ | 1.54 | $ | 0.54 | $ | 0.57 | $ | 1.63 | $ | 0.40 | $ | 2.18 | |||||||||
6
Table of Contents
| Peoples National Bank | Shenandoah National Bank | MCOV | Eliminations | Purchase Accounting Adjustments (1) | Purchase Accounting Adjustments (2) | Purchase Accounting Adjustments (3) | Pro Forma Combined Consolidated | |||||||||||||||||||||
INTEREST INCOME | ||||||||||||||||||||||||||||
Interest and fees on loans: | ||||||||||||||||||||||||||||
Taxable | $ | 6,979 | $ | 2,342 | $ | 152 | -$ | 103 | (6) | $ | 42,968 | |||||||||||||||||
Non-taxable | 182 | 46 | 0 | 3,506 | ||||||||||||||||||||||||
Interest on deposits in other financial institutions | 443 | 182 | 0 | 3,114 | ||||||||||||||||||||||||
Interest on federal funds sold | 369 | 42 | 0 | 2,415 | ||||||||||||||||||||||||
Interest and dividends on securities: | 0 | |||||||||||||||||||||||||||
U.S. government and other | 1,772 | 454 | 0 | 10,876 | ||||||||||||||||||||||||
State and political subdivisions | 0 | 0 | ||||||||||||||||||||||||||
Total Interest Income | 9,745 | 3,066 | 152 | -103 | 62,879 | |||||||||||||||||||||||
INTEREST EXPENSE | ||||||||||||||||||||||||||||
Interest on time deposits $100,000 or more | 659 | 289 | 0 | 5,580 | ||||||||||||||||||||||||
Interest on other deposits | 3,731 | 1,083 | 0 | 23,573 | ||||||||||||||||||||||||
Interest on federal funds purchased | 0 | 7 | 0 | 32 | ||||||||||||||||||||||||
Interest on notes payable | 0 | 0 | 103 | -103 | (6) | 0 | ||||||||||||||||||||||
Interest on notes issued to the U.S. Treasury | 2 | 1 | 0 | 33 | ||||||||||||||||||||||||
Interest on notes subordinated to deposits | 0 | 45 | 0 | 45 | ||||||||||||||||||||||||
Total Interest Expense | 4,392 | 1,425 | 103 | -103 | 29,263 | |||||||||||||||||||||||
Net Interest Income | 5,353 | 1,641 | 49 | 33,616 | ||||||||||||||||||||||||
Provision for loan losses | 60 | 30 | 0 | 432 | ||||||||||||||||||||||||
Net Interest Income after Provision for Loan Losses | 5,293 | 1,611 | 49 | 33,184 | ||||||||||||||||||||||||
NON-INTEREST INCOME | ||||||||||||||||||||||||||||
Service charges, commissions and fees | 394 | 139 | 6,187 | -5,442 | (5) | 3,757 | ||||||||||||||||||||||
Other non-interest income | 57 | 19 | 0 | -3 | (7) | 659 | ||||||||||||||||||||||
Total Non-Interest Income | 451 | 158 | 6,187 | -5,445 | 4,416 | |||||||||||||||||||||||
NON-INTEREST EXPENSE | ||||||||||||||||||||||||||||
Salaries and employee benefits | 2,352 | 751 | 3,662 | 18,217 | ||||||||||||||||||||||||
Occupancy expense (net) | 688 | 292 | 762 | 4,797 | ||||||||||||||||||||||||
Operations center expense | 797 | 253 | 0 | -5,399 | (5) | 1 | ||||||||||||||||||||||
Other non-interest expense | 423 | 169 | 2,450 | -46 | (7) | 2,064 | (1) | 138 | (2) | -948 | (3) | 6,941 | ||||||||||||||||
Total Non-Interest Expense | 4,260 | 1,465 | 6,874 | -5,445 | 2,064 | 138 | -948 | 29,956 | ||||||||||||||||||||
Income Before Income Taxes | 1,484 | 304 | -638 | -2,064 | -138 | 948 | 7,644 | |||||||||||||||||||||
Income Tax Expense | 444 | 84 | 0 | -702 | (1) | -46 | (2) | 322 | 1,592 | |||||||||||||||||||
NET INCOME | $ | 1,040 | $ | 220 | -$ | 638 | $ | 0 | -$ | 1,362 | -$ | 92 | $ | 626 | $ | 6,052 | ||||||||||||
Per Share | ||||||||||||||||||||||||||||
Basic and diluted earnings per share | $ | 0.44 | $ | 0.79 | ||||||||||||||||||||||||
Weighted average shares-basic and diluted | $ | 0.44 | $ | 0.79 | ||||||||||||||||||||||||
The following notes are an integral part of the unaudited pro forma combined consolidated financial information:
| (1) | Adjusted for the amortization expense for CDI over 10 years and the associated income taxes at 34%. |
| (2) | Adjusted for the additional depreciation expense on the fair value adjustment of bank premises based on estimated useful life of 39 years. |
| (3) | Adjusted for post-merger synergies of $1.25 million, after tax, consisting of anticipated savings from lower aggregate examination fees, lower costs of regulatory filings and compliance resulting from banking, securities and related filings on behalf of one combined bank as opposed to 10 separate banks, and operational savings in numerous areas from stationary costs to integration of accounting and related functions. The amount of post-merger synergies is based on management’s estimates, which in management’s opinion are conservative, and may actually be more or less over the relevant period. |
| (4) | Goodwill is not amortized, but is tested annually for impairment. |
| (5) | Eliminating operations center expense paid by the combining banks to Bank Services of Virginia, Inc. (BSOV), a wholly-owned subsidiary of MCOV. |
| (6) | Eliminating interest payable by MCOV to one of the combining banks (PHNB). |
| (7) | Eliminating management fees ($2,600) paid to one of the combining banks (PHNB) by BSOV and commissions ($43,000) paid by the combining banks, BSOV and MCOV to Bank Services Insurance , a wholly-owned subsidiary of MCOV. |
7
Table of Contents
FINANCIAL STATEMENTS OF MERGED BANKS
Blue Ridge Bank, N.A. annual report for the year ended December 31, 2005
Blue Ridge Bank, N.A. quarterly report for the quarter ended September 30, 2006
Central National Bank annual report on Form 10-KSB/A for the year ended December 31, 2005
Central National Bank quarterly report on Form 10-QSB for the quarter ended September 30, 2006
Community National Bank annual report for the year ended December 31, 2005
Community National Bank quarterly report for the quarter ended September 30, 2006
First National Bank annual report on Form 10-KSB for the year ended December 31, 2005
First National Bank quarterly report on Form 10-QSB for the quarter ended September 30, 2006
First National Exchange Bank annual report on Form 10-KSB for the year ended December 31, 2005
First National Exchange Bank quarterly report on Form 10-QSB for the quarter ended September 30, 2006
Mountain National Bank annual report on Form 10-KSB/A for the year ended December 31, 2005
Mountain National Bank quarterly report on Form 10-QSB for the quarter ended September 30, 2006
Patrick Henry National Bank annual report on Form 10-K for the year ended December 31, 2005
Patrick Henry National Bank quarterly report on Form 10-Q for the quarter ended September 30, 2006
Patriot Bank, N.A. annual report on Form 10-KSB for the year ended December 31, 2005
Patriot Bank, N.A. quarterly report on Form 10-QSB for the quarter ended September 30, 2006
Peoples National Bank annual report on Form 10-K/A for the year ended December 31, 2005
Peoples National Bank quarterly report on Form 10-Q for the quarter ended September 30, 2006
Shenandoah National Bank annual report on Form 10-KSB/A for the year ended December 31, 2005
Shenandoah National Bank quarterly report on Form 10-QSB for the quarter ended September 30, 2006
Table of Contents
2005 Annual Report

Member FDIC
Table of Contents
Management’s Discussion and Analysis of Financial Condition and Results of Operation
Except for the historical information contained in this report, the matters set forth herein include Forward-Looking Statements within the meaning of the “safe harbor” provisions of the Private Securities Litigation Reform Act of 1995. These Forward-Looking Statements included, among other things, statements of goals, plans, intentions and expectations, regarding or based upon desired business strategies, general economic conditions, interest rates, developments in local and national markets, and other matters, which, by their nature, are subject to significant uncertainties. Because of these uncertainties and the assumptions upon which this report is based, actual future developments with respect to the business of the Bank may differ materially from those contemplated by such statements.
Critical Accounting Policies.The accounting and reporting policies of the Bank conform to generally accepted accounting principles (GAAP) in the United States of America and to general practices within the banking industry. The preparation of the financial statements in conformity with GAAP requires management to make estimates and assumptions that affect the amounts reported in the financial statements and accompanying notes. We believe the most significant of these estimates involves the allowance for loan losses because of its potential impact on our overall performance. We have described our policies in this area below. A summary of the Bank’s significant accounting policies can be found in the Notes to the Financial Statements.
In general, determining the amount of the allowance for loan losses requires significant judgment and the use of estimates by management. The Bank maintains an allowance for loan losses to absorb probable losses in the loan portfolio based on a quarterly analysis of the portfolio and expected future losses. This analysis determines an appropriate level of the allowance for loan losses by considering factors affecting loan losses, including specific losses, levels and trends in impaired and non-performing loans, historical loan loss experience, current economic conditions, volume, growth and composition of the portfolio, and other relevant factors. The Bank records a provision for loan losses to maintain the allowance at an adequate level. The provision expense could increase or decrease each quarter based upon the results of management’s formal analysis.
The amount of the allowance represents management’s estimate of expected losses from existing loans based upon specific allocations for individual lending relationships and historical loss experience. The allowance for loan losses related to impaired loans is based on discounted cash flows using the loan’s initial effective interest rate or the fair value of the collateral for certain collateral dependent loans. This evaluation requires management to make estimates of the amounts and timing of future cash flows on impaired loans, which consists primarily of non-accrual and restructured loans. Actual losses for these loans can vary significantly from these estimates.
Summary of Operations.Net income for 2005 equaled $1,318,000 or $1.29 per share, compared to $2,036,000 or $1.99 per share, for 2004. This represents a return on average assets of 0.53% and return on average equity of 7% compared to 0.79% and 11%, respectively, for last year.
Total deposits increased $8 million compared to last year. In addition, there has been a shift in the composition of our deposits as customers have moved their funds from shorter-term accounts into longer term Certificates of Deposit. Time deposits and LIFETIME FREE CHECKING increased while all other deposit categories decreased. Loans increase $12 million during the year.
During 2005, the Bank opened its second office in Abingdon at Camp Comfort and offices in Cedar Bluff and Tazewell.
Net interest income.Net interest income is our largest source of revenue and has been impacted by the very low level of interest rates for the last two years. The Federal Reserve lowered the target rate for federal funds from six and one half percent in 2001 to one percent in 2003. The one percent rate continued until June 30, 2004 when the Fed began a series of one quarter percent increases on 14 different occasions over the last year and a half to the latest increase in January 2006, which places the target fed funds rate at 4.50%. The Fed is expected to continue increasing the rate several more times before pausing.
While the Bank increased loans and investments, the increase in the costs of deposits occurred more rapidly than the increase in interest income and as a result, net interest income declined $540,000 over the prior year. This was a significant improvement from the $1,470 million decline in net interest income in 2004. With interest rates at a higher level the Bank anticipates existing loans, many which will reprice annually, will increase in yield at a faster pace than the net increase in the costs of deposits. The Bank anticipates a significant improvement in net interest income during the coming year.
The following table shows a summary of the changes in interest income and interest expense resulting from changes in volume and changes in rates for each category of interest-earning assets and interest-bearing liabilities for 2005/2004 and 2004/2003:
(Dollars in thousands) Increase Asset/Liability | 2005 vs 2004 Increase (Decrease) (Revised) | 2004 vs 2003 Increase (Decrease) | ||||
Real Estate Loans | (461 | ) | (2,553 | ) | ||
Installment Loans | 145 | (96 | ) | |||
Commercial Loans | 160 | 497 | ||||
Total Loans | (156 | ) | (2,152 | ) | ||
Interest-Bearing Deposits in Other Financial Institutions | 240 | 86 | ||||
Investment Securities | (370 | ) | (320 | ) | ||
Federal Funds Sold | 82 | (169 | ) | |||
Total Earning Assets | (204 | ) | (2,555 | ) | ||
Interest-Bearing Transactions Accounts | (9 | ) | (60 | ) | ||
Savings Accounts (Includes MMDA’s) | (48 | ) | (34 | ) | ||
Certificates of Deposit $100,000 and Over | 235 | (116 | ) | |||
Other Certificates of Deposit | 275 | (873 | ) | |||
Total Deposits | 453 | (1,083 | ) | |||
Subordinated Notes | (119 | ) | (3 | ) | ||
Notes Issued to the U.S. Treasury | 1 | 1 | ||||
Federal Funds Purchased | 1 | — | ||||
Total Interest-Bearing Liabilities | 336 | (1,085 | ) | |||
Change in Net Interest Income | (540 | ) | (1,470 | ) | ||
2
Table of Contents
The following table details the average balances and cost and yield data for the earning assets and interest-bearing liabilities:
| (Dollars in thousands) | 2005 | 2004 | 2003 | ||||||||||||||||||||||||
| (Revised) | |||||||||||||||||||||||||||
Asset/Liability | Average Balance | Interest | Yield/ Cost | Average Balance | Interest | Yield/ Cost | Average Balance | Interest | Yield/ Cost | ||||||||||||||||||
Real Estate Loans | $ | 110,640 | $ | 6,533 | 5.90 | % | $ | 111,519 | $ | 6,994 | 6.27 | % | $ | 128,977 | $ | 9,547 | 7.40 | % | |||||||||
Installment Loans | 9,486 | 836 | 8.81 | % | 8,544 | 691 | 8.09 | % | 8,972 | 787 | 8.77 | % | |||||||||||||||
Commercial Loans | 30,334 | 1,511 | 4.98 | % | 25,970 | 1,351 | 5.20 | % | 15,074 | 854 | 5.67 | % | |||||||||||||||
Total Loans | 150,460 | 8,880 | 5.90 | % | 146,033 | 9,036 | 6.19 | % | 153,023 | 11,188 | 7.31 | % | |||||||||||||||
Interest-Bearing Deposits in | |||||||||||||||||||||||||||
Other Financial Institutions | 18,420 | 683 | 3.71 | % | 19,835 | 443 | 2.23 | % | 14,967 | 357 | 2.39 | % | |||||||||||||||
Investment Securities | 52,342 | 1,965 | 3.75 | % | 42,723 | 2,335 | 5.47 | % | 54,425 | 2,655 | 4.88 | % | |||||||||||||||
Federal Funds Sold | 9,139 | 280 | 3.06 | % | 21,524 | 198 | 0.92 | % | 36,379 | 367 | 1.01 | % | |||||||||||||||
Total Earning Assets | 230,361 | 11,808 | 5.13 | % | 230,115 | 12,012 | 5.22 | % | 258,794 | 14,567 | 5.63 | % | |||||||||||||||
Interest-Bearing Transaction Accounts | 17,470 | 98 | 0.56 | % | 17,931 | 107 | 0.60 | % | 19,072 | 167 | 0.88 | % | |||||||||||||||
Savings Accounts (Includes MMDA’s) | 40,958 | 626 | 1.53 | % | 45,835 | 674 | 1.47 | % | 41,999 | 708 | 1.69 | % | |||||||||||||||
Certificates of Deposit | |||||||||||||||||||||||||||
$100,000 or More | 25,945 | 991 | 3.82 | % | 20,499 | 756 | 3.69 | % | 25,463 | 872 | 3.42 | % | |||||||||||||||
Other Certificates of Deposit | 113,174 | 3,822 | 3.38 | % | 113,443 | 3,547 | 3.13 | % | 133,804 | 4,420 | 3.30 | % | |||||||||||||||
Total Deposits | 197,547 | 5,537 | 2.80 | % | 197,708 | 5,084 | 2.57 | % | 220,338 | 6,167 | 2.80 | % | |||||||||||||||
Subordinated Notes | — | — | — | 1,829 | 119 | 6.51 | % | 2,000 | 122 | 6.10 | % | ||||||||||||||||
Notes Issued to the U.S. Treasury | 154 | 3 | 1.95 | % | 212 | 2 | 0.94 | % | 97 | 1 | 1.03 | % | |||||||||||||||
Federal Funds Purchased | 371 | 1 | 0.27 | % | — | — | — | — | — | — | |||||||||||||||||
Total Interest-Bearing Liabilities | $ | 198,072 | $ | 5,541 | 2.80 | % | $ | 199,749 | $ | 5,205 | 2.61 | % | $ | 222,435 | $ | 6,290 | 2.83 | % | |||||||||
Net Interest Income | $ | 6,267 | $ | 6,807 | $ | 8,277 | |||||||||||||||||||||
Net Yield on Earning Assets | 2.72 | % | 2.96 | % | 3.20 | % | |||||||||||||||||||||
Loans.Loans increased from $144 million at year-end 2004 to $156 million at year-end 2005. The composition of the portfolio remained consistent with prior years as real estate loans made up 71% of loans and is indicative of the overall lending philosophy of the Bank.
The Bank also continues to maintain flexibility in the maturity of the loan portfolio. Over half of the Bank’s loans have adjustable interest rates as of year-end 2005 and 2004. In addition, the combination of adjustable rate and fixed rate loans that adjust or mature within one year equals 31% of the total portfolio for 2005 and 66% for 2004.
Allowance and Provision for Loan Losses.As discussed previously, the Allowance for Loan Losses represents management’s estimation of the amount necessary to absorb future losses in the loan portfolio. On the Statement of Condition, the Allowance for Loan Losses is deducted from Total Loans so that the net amount shown represents the estimated realizable total loans. The Provision for Loan Losses is the amount charged to expense to maintain the Allowance at an adequate level.
Based on management’s analysis of the loan portfolio, including non-accrual and impaired loans, the Provision for Loan Losses equaled $120,000 for 2005 and $180,000 for 2004.
| (Dollars in Thousands) | December 31 | |||||||||||||||||||
| 2005 | 2004 | 2003 | 2002 | 2001 | ||||||||||||||||
Balance Beginning of Year | $ | 1,924 | $ | 1,939 | $ | 1,311 | $ | 1,099 | $ | 1,015 | ||||||||||
Provision for Loan Losses | 120 | 180 | 1,127 | 360 | 120 | |||||||||||||||
Net Loan Losses | ||||||||||||||||||||
Real Estate Loans | 14 | 85 | 447 | 57 | — | |||||||||||||||
Installment Loans | 19 | 34 | 36 | 34 | 36 | |||||||||||||||
Commercial Loans | 4 | 76 | 16 | 57 | — | |||||||||||||||
Total Net Loan Losses | 37 | 195 | 499 | 148 | 36 | |||||||||||||||
Balance | $ | 2,007 | $ | 1,924 | $ | 1,939 | $ | 1,311 | $ | 1,099 | ||||||||||
Net Loan Losses to Average Loans | 0.02 | % | 0.13 | % | 0.33 | % | 0.09 | % | 0.03 | % | ||||||||||
Allowance for Loan Losses to Year-End Loans | 1.30 | % | 1.38 | % | 1.26 | % | 0.85 | % | 0.71 | % | ||||||||||
3
Table of Contents
Nonaccrual loans are those loans contractually past due 90 days or more on which no interest is being accrued. Other real estate owned consists of real estate acquired through foreclosure. These properties are reviewed quarterly and reduced to an estimated realizable value at that time.
Information concerning nonaccrual loans and other real estate owned is presented in the following table:
| (Dollars in Thousands) | December 31 | |||||||||||||||||||
| 2005 | 2004 | 2003 | 2002 | 2001 | ||||||||||||||||
| Nonaccrual Loans | (Revised) | |||||||||||||||||||
Real Estate | $ | 5,421 | $ | 4,773 | $ | 2,464 | $ | 100 | $ | — | ||||||||||
Installment | 2 | 30 | 35 | 2 | 9 | |||||||||||||||
Commercial | 40 | 94 | 185 | 195 | 195 | |||||||||||||||
Total Nonaccrual Loans | 5,463 | 4,897 | 2,684 | 297 | 204 | |||||||||||||||
Real Estate Owned Other Than Bank Premises | 2,721 | 2,735 | 2,732 | 648 | — | |||||||||||||||
Total Non-Performing Assets | $ | 8,184 | $ | 7,632 | $ | 5,416 | $ | 945 | $ | 204 | ||||||||||
Allowance for Loan Losses to Non-Performing Assets | 24.52 | % | 25.21 | % | 35.80 | % | 138.73 | % | 539 | % | ||||||||||
The following table presents the volume of loans contractually past due for 90 days or more on which interest continues to be accrued. These loans are believed to be well collateralized and present little or no likelihood of loss of principal.
(Dollars in Thousands) Loans 90 Days or More Past Due | 2005 | 2004 | 2003 | 2002 | 2001 | ||||||||||
Real Estate | $ | 142 | $ | 90 | $ | 1,245 | $ | 1,992 | $ | 135 | |||||
Installment | 1 | 28 | — | 31 | 5 | ||||||||||
Commercial | — | — | — | — | — | ||||||||||
Total Loans 90 Days or More Past Due | $ | 143 | $ | 118 | $ | 1,245 | $ | 2,023 | $ | 140 | |||||
Non-Interest Income.Non-interest income was $949,000 for 2005 compared to $1,012,000 for 2004. The principal component of non-interest income is service charges on deposit accounts, which equaled $767,000 for 2005 compared to $738,000 for 2004.
Non-Interest Expense.Non-interest expenses increased $522,000 during the year. Salaries and Employee Benefits, which are the largest of these expenses, increased $340,000 during the year, primarily due to the opening of three new branches.
Investments.The total investment securities increased from $42 million at year end 2004 to $57 million at year end 2005. With rates at levels never seen before in recent times, the Bank increased loans and investments in U. S. Agency Securities, while reducing Federal Funds Sold and Interest Bearing Deposits in Other Financial Institutions.
Deposits.Total deposits increased $8 million, or 4% during the year. There has been a slight shift in the composition of our deposits as customers have moved their funds from shorter term accounts into longer term Certificates of Deposit. Time deposits and LIFETIME FREE CHECKING increased while all other categories decreased during the year.
Interest Sensitivity Analysis.The frequency with which interest rates on earning assets and interest bearing liabilities change has a significant impact on net interest income. The following table presents the anticipated changes based on the contractual maturity of each instrument. Expected maturities may differ from contractual maturities as both borrowers and depositors may have the right to call or prepay obligations with or without call or prepayment penalties.
4
Table of Contents
(Dollars in Thousands) (Revised) Use of Funds | Within One Year | One to Five Years | Over Five Years | Total | ||||||||||
Interest-Bearing Deposits in Other Financial Institutions | $ | 19,396 | $ | — | $ | — | $ | 19,396 | ||||||
Investment Securities | 18,256 | 38,506 | — | 56,762 | ||||||||||
Federal Funds Sold | 1,130 | — | — | 1,130 | ||||||||||
Loans | 52,404 | 52,597 | 51,479 | 156,480 | ||||||||||
Total Earning Assets | $ | 91,186 | $ | 91,103 | $ | 51,479 | $ | 233,768 | ||||||
Deposits | ||||||||||||||
Interest-Bearing Demand | $ | 24,600 | $ | — | $ | — | $ | 24,600 | ||||||
Regular Passbook Savings | 28,384 | — | — | 28,384 | ||||||||||
Time Deposits | ||||||||||||||
Certificates of Deposit $100,000 and Over | 17,584 | 15,134 | — | 32,718 | ||||||||||
Other | 48,336 | 67,129 | — | 115,465 | ||||||||||
Total Interest-Bearing Deposits | 118,904 | 82,263 | — | 201,167 | ||||||||||
Subordinated Notes | — | — | — | — | ||||||||||
Notes issued to the U.S. Treasury | 79 | — | — | 79 | ||||||||||
Total Interest-Bearing Liabilities | $ | 118,983 | $ | 82,263 | $ | — | $ | 201,246 | ||||||
Maturity/Rate Sensitivity Gap Per Period | $ | (27,797 | ) | $ | 8,840 | $ | 51,479 | $ | 32,522 | |||||
Cumulative Maturity/Rate Sensitivity Gap | $ | (27,797 | ) | $ | (18,957 | ) | $ | 32,522 | ||||||
Capital.The federal regulatory agencies use risk-based capital ratios to analyze the adequacy of a bank’s capital. These ratios weight bank assets from 0% to 100% depending upon the risk inherent in each type of asset. The Bank continues to meet all requirements for a well-capitalized bank as defined in the regulatory agencies. The following table presents the key risk-based capital ratios for December 31, 2005 and 2004. Additional details regarding capital may be found in the footnotes of the Financial Statements.
| 2005 (Revised) | 2004 | |||||
Tier 1 Ratio | 12.52 | % | 12.87 | % | ||
Total Risk-Based Capital Ratio | 13.77 | % | 14.12 | % | ||
Leverage Ratio | 7.94 | % | 7.91 | % |
Liquidity.Liquidity is our ability to fund both loans and investments in the normal course of business and to provide adequate protection for unexpected deposit withdrawals or other demands for funds without incurring a significant negative impact on profitability. Our primary source of day-to-day liquidity lies in the combination of cash, deposit balances, checks in the process of collection, deposit growth and in federal funds sold. Federal funds are excess funds that are sold to other banks, and are generally made on a one-day basis. Normal funds from the repayment of loans and investments augment these funds.
Our secondary sources of liquidity are in our investments and deposits in other financial institutions. While our investments are categorized as held-to-maturity, they consist primarily of short-term United States Government Agencies that are readily marketable. As reflected in the previous Interest Sensitivity Analysis, the majority of our investment securities mature in five years or less. Interest-bearing deposits in other financial institutions generally mature in two years or less and the volume of these investments decreased $3.7 million during the year.
5
Table of Contents
Management’s Responsibility for Financial Reporting
The management of Blue Ridge Bank has prepared and is responsible for the accompanying financial statements, together with the financial data and other information presented in this annual report. Management believes that the financial statements have been prepared in conformity with accounting principles generally accepted in the United States of America appropriate under the circumstances. The financial statements include amounts that are based on management’s best estimates and judgments.
Management maintains and depends upon an internal accounting control system designed to provide reasonable assurance that transactions are executed in accordance with management’s authorization, that financial records are reliable as the basis for preparation of all financial statements, and that the Bank’s assets are safeguarded. The design and implementation of all systems of internal control are based on judgments required to evaluate the costs of control in relation to the expected benefits and to determine the appropriate balance between these costs and benefits. The Bank maintains a professional internal audit staff to monitor compliance with the system of internal control. Operational and special audits are conducted, and audit reports are submitted to appropriate management.
The Board of Directors meets periodically with management and internal auditors to review accounting, auditing and internal reporting matters. The internal auditors have free access to the Board, without management present, to discuss the results of their audit work and their evaluations of internal controls and the quality of financial reporting.
Worth Harris Carter, Jr.
Chairman of the Board, President
and Chief Financial Officer
6
Table of Contents
Statements of Financial Condition
(Dollars in Thousands)
| December 31 | ||||||||
| 2005 (Revised) | 2004 | |||||||
ASSETS: | ||||||||
Interest-Bearing Deposits in Other Financial Institutions | $ | 19,396 | $ | 23,061 | ||||
Investment Securities (Fair Value $ 56,034 in 2005, $ 42,368 in 2004) | 56,762 | 42,409 | ||||||
Federal Funds Sold | 1,130 | 18,565 | ||||||
Loans (Net of Unearned Income) | 156,031 | 143,866 | ||||||
Less: Allowance for Loan Losses | (2,007 | ) | (1,924 | ) | ||||
Net Loans | 154,024 | 141,942 | ||||||
Earning Assets | 231,312 | 225,977 | ||||||
Cash and Due from Banks | 10,772 | 7,105 | ||||||
Bank Premises and Equipment | 4,914 | 5,035 | ||||||
Real Estate Owned Other Than Bank Premises | 2,721 | 2,735 | ||||||
Investment in Associated Company | 769 | 618 | ||||||
Other Assets | 2,882 | 3,458 | ||||||
TOTAL ASSETS | $ | 253,370 | $ | 244,928 | ||||
LIABILITIES: | ||||||||
Deposits: | ||||||||
LIFETIME FREE CHECKING | $ | 31,831 | $ | 30,715 | ||||
Interest-Bearing Demand | 24,600 | 30,173 | ||||||
Regular Passbook Savings | 28,384 | 32,117 | ||||||
Time Deposits: | ||||||||
Certificates of Deposit $ 100,000 and Over | 32,718 | 19,441 | ||||||
Other | 115,465 | 112,361 | ||||||
TOTAL DEPOSITS | 232,998 | 224,807 | ||||||
Notes Issued to the U.S. Treasury | 79 | 91 | ||||||
Other Liabilities | 219 | 251 | ||||||
TOTAL LIABILITIES | 233,296 | 225,149 | ||||||
SHAREHOLDERS’ EQUITY: | ||||||||
Common Stock Par Value $8.50; 2,500,000 shares authorized; 1,022,628 shares outstanding in 2005 and 2004 | 8,692 | 8,692 | ||||||
Surplus | 9,153 | 9,153 | ||||||
Undivided Profits | 2,229 | 1,934 | ||||||
TOTAL SHAREHOLDERS’ EQUITY | 20,074 | 19,779 | ||||||
TOTAL LIABILITIES AND SHAREHOLDERS’ EQUITY | $ | 253,370 | $ | 244,928 | ||||
The accompanying notes are an integral part of these financial statements.
7
Table of Contents
Statements of Income
(Dollars in Thousands Except Per Share Data)
| Years Ended December 31 | |||||||||
| 2005 (Revised) | 2004 | 2003 | |||||||
INTEREST INCOME: | |||||||||
Interest and Fees on Loans: | |||||||||
Taxable | $ | 7,954 | $ | 8,344 | $ | 10,744 | |||
Non-Taxable | 926 | 692 | 444 | ||||||
Interest on Deposits in Other Financial Institutions | 683 | 443 | 357 | ||||||
Interest on Federal Funds Sold | 280 | 198 | 367 | ||||||
Interest and Dividends on Securities: | |||||||||
U.S. Agency Securities | 1,950 | 2,257 | 2,544 | ||||||
Obligations of States and Political Subdivisions | 15 | 78 | 111 | ||||||
TOTAL INTEREST INCOME | 11,808 | 12,012 | 14,567 | ||||||
INTEREST EXPENSE: | |||||||||
Interest on Time Deposits $100,000 and Over | 991 | �� | 756 | 872 | |||||
Interest on Other Deposits | 4,546 | 4,328 | 5,295 | ||||||
Interest on Notes Issued to the U.S. Treasury | 1 | 2 | 1 | ||||||
Interest on Subordinated Notes | 3 | 119 | 122 | ||||||
TOTAL INTEREST EXPENSE | 5,541 | 5,205 | 6,290 | ||||||
NET INTEREST INCOME | 6,267 | 6,807 | 8,277 | ||||||
Provision for Loan Losses | 120 | 180 | 1,127 | ||||||
NET INTEREST INCOME AFTER | |||||||||
PROVISION FOR LOAN LOSSES | 6,147 | 6,627 | 7,150 | ||||||
NON-INTEREST INCOME: | |||||||||
Service Charges, Commission and Fees | 767 | 738 | 771 | ||||||
Other Non-Interest Income | 182 | 274 | 212 | ||||||
TOTAL NON-INTEREST INCOME | 949 | 1,012 | 983 | ||||||
NON-INTEREST EXPENSE: | |||||||||
Salaries and Employee Benefits | 3,135 | 2,795 | 2,474 | ||||||
Occupancy Expense | 670 | 578 | 511 | ||||||
Operations Center Expense | 1,086 | 1,027 | 1,065 | ||||||
FDIC Assessment | 30 | 35 | 39 | ||||||
Other Non-Interest Expense | 646 | 610 | 442 | ||||||
TOTAL NON-INTEREST EXPENSE | 5,567 | 5,045 | 4,531 | ||||||
INCOME BEFORE INCOME TAXES | 1,529 | 2,594 | 3,602 | ||||||
Income Tax Expense | 211 | 558 | 1,049 | ||||||
NET INCOME | $ | 1,318 | $ | 2,036 | $ | 2,553 | |||
NET INCOME PER SHARE*: | |||||||||
Basic and Diluted | $ | 1.29 | $ | 1.99 | $ | 2.50 | |||
| * | Net income per share has been retroactively adjusted to reflect the stock dividend in 2003. |
The accompanying notes are an integral part of these financial statements.
8
Table of Contents
Statements of Cash Flows
(Dollars in Thousands)
| Years Ended December 31 | ||||||||||||
| 2005 (Revised) | 2004 | 2003 | ||||||||||
Cash Flows From Operating Activities: | ||||||||||||
Net Income | $ | 1,318 | $ | 2,036 | $ | 2,553 | ||||||
Adjustments to reconcile to net cash from operating activities: | ||||||||||||
Provision for Loan Losses | 120 | 180 | 1,127 | |||||||||
Depreciation of Premises and Equipment | 253 | 182 | 157 | |||||||||
Provision for Deferred Income Taxes | — | (86 | ) | 93 | ||||||||
Equity in Undistributed Income From Associated Company | (1 | ) | (11 | ) | (10 | ) | ||||||
Increase (Decrease) in Unearned Income | (54 | ) | 14 | (164 | ) | |||||||
(Increase) Decrease in Other Assets | 576 | (339 | ) | 72 | ||||||||
Increase (Decrease) in Other Liabilities | (32 | ) | (15 | ) | (34 | ) | ||||||
Net Cash from Operating Activities | 2,180 | 1,961 | 3,608 | |||||||||
Cash Flows From Investing Activities: | ||||||||||||
Maturity of Interest-Bearing Deposits | 17,913 | 46,902 | 12,766 | |||||||||
Purchase of Interest-Bearing Deposits | (14,248 | ) | (23,160 | ) | (13,953 | ) | ||||||
Proceeds From Maturities, Calls, and Redemptions of Investment Securities | 8,647 | 13,786 | 23,475 | |||||||||
Purchase of Investment Securities | (23,000 | ) | (22,000 | ) | (27,000 | ) | ||||||
Purchase of Bank Premises and Equipment | (132 | ) | (1,826 | ) | (1,001 | ) | ||||||
Net Increase in Short-Term Loans Outstanding, Net | (16,872 | ) | 2,634 | (10,366 | ) | |||||||
Longer-Term Loans Originated or Purchased | (20,207 | ) | (18,032 | ) | (32,503 | ) | ||||||
Principal Collected on Longer-Term Loans | 24,931 | 25,568 | 41,103 | |||||||||
Sale (Purchase) of Other Real Estate | 14 | (3 | ) | (2,084 | ) | |||||||
Investment in Associated Company | (150 | ) | — | (199 | ) | |||||||
Net Cash from Investing Activities | (23,104 | ) | 23,869 | (9,762 | ) | |||||||
Cash Flows From Financing Activities: | ||||||||||||
Net Increase (Decrease) in Demand and Savings Accounts | (8,190 | ) | (2,999 | ) | 16,503 | |||||||
Proceeds from Sale of Time Deposits | 76,171 | 63,481 | 101,408 | |||||||||
Payments on Matured Time Deposits | (59,790 | ) | (79,299 | ) | (119,936 | ) | ||||||
Net Increase (Decrease) in Notes Issued to U.S. Treasury | (12 | ) | 51 | (303 | ) | |||||||
Subordinated Note | — | (2,000 | ) | — | ||||||||
Cash Dividends | (1,023 | ) | (1,023 | ) | (512 | ) | ||||||
Net Cash from Financing Activities | 7,156 | (21,789 | ) | (2,840 | ) | |||||||
Net Change in Cash and Equivalents | (13,768 | ) | 4,041 | (8,994 | ) | |||||||
Cash and Equivalents at Beginning of Year | 25,670 | 21,629 | 30,623 | |||||||||
Cash and Equivalents at End of Year | $ | 11,902 | $ | 25,670 | $ | 21,629 | ||||||
Supplementary Data: | ||||||||||||
Cash Paid for Interest | $ | 7,399 | $ | 5,241 | $ | 6,298 | ||||||
Cash Paid for Income Taxes | 211 | 558 | 1,049 | |||||||||
Transfer of Loans to Foreclosed Assets | — | — | 1,902 | |||||||||
The accompanying notes are an integral part of these financial statements.
9
Table of Contents
Statements of Changes in Shareholders’ Equity
(Dollars in Thousands)
| COMMON STOCK | SURPLUS | UNDIVIDED PROFITS | ||||||||||
| SHARES | AMOUNT | |||||||||||
Year Ended December 31, 2003 | ||||||||||||
Balance at Beginning of Year | 340,876 | $ | 2,897 | $ | 9,153 | $ | 4,675 | |||||
Net Income | — | — | — | 2,553 | ||||||||
Stock Dividends (100%) | 681,752 | 5,795 | — | (5,795 | ) | |||||||
Cash Dividends, $0.50 per share | — | — | — | (512 | ) | |||||||
Total | 1,022,628 | $ | 8,692 | $ | 9,153 | $ | 921 | |||||
Year Ended December 31, 2004 | ||||||||||||
Balance at Beginning of Year | 1,022,628 | $ | 8,692 | $ | 9,153 | $ | 921 | |||||
Net Income | — | — | — | 2,036 | ||||||||
Cash Dividends, $1.00 per share | — | — | — | (1,023 | ) | |||||||
Total | 1,022,628 | $ | 8,692 | $ | 9,153 | $ | 1,934 | |||||
Year Ended December 31, 2005 (Revised) | ||||||||||||
Balance at Beginning of Year | 1,022,628 | $ | 8,692 | $ | 9,153 | $ | 1,934 | |||||
Net Income | — | — | — | 1,318 | ||||||||
Cash Dividends, $1.00 per share | — | — | — | (1,023 | ) | |||||||
Total | 1,022,628 | $ | 8,692 | $ | 9,153 | $ | 2,229 | |||||
The accompanying notes are an integral part of these financial statements.
10
Table of Contents
Notes to Financial Statements
(Dollars in Thousands in Charts Except Per Share Data)
1. SUMMARY OF SIGNIFICANT ACCOUNTING POLICIES
The accounting and reporting policies of Blue Ridge Bank are in accordance with accounting principles generally accepted in the United States of America and general practices within the banking industry which are consistent with reports filed with regulatory agencies.
NATURE OF OPERATIONS
The Bank generates commercial (including agricultural), mortgage and consumer loans and receives deposits from customers located primarily in the areas surrounding the Bank’s offices. The Bank operates under a national charter and provides full banking services. As a national bank, the Bank is subject to regulation by the Comptroller of the Currency, Federal Deposit Insurance Corporation, and the Board of Governors of the Federal Reserve System.
USE OF ESTIMATES
The preparation of financial statements in conformity with accounting principles generally accepted in the United States of America requires management to make estimates and assumptions that affect the reported amounts of assets and liabilities and disclosure of contingent assets and liabilities at the date of the financial statements and the reported amounts of revenue and expenses during the reporting period. Actual results could differ from those estimates. Material estimates that are particularly susceptible to significant change in the near term relate to the determination of the allowance for loan losses and fair value of other real estate owned.
CASH AND CASH EQUIVALENTS
For purposes of cash flows, cash and cash equivalents include cash on hand, demand balances due from banks and federal funds transactions. Generally, federal funds are purchased and sold for one-day periods.
SECURITIES
Investment securities are stated at cost, adjusted for amortization of premiums and accretion of discounts, and computed by the interest method. The Bank has the positive intent and ability to hold these securities until maturity. Gains and losses on sales, if any, of securities are based upon the adjusted cost of the specific securities sold.
LOANS
Loans are recorded at the amount of the loan disbursed to borrowers plus the applicable amount, if any, of unearned income and other charges, less payments received. Income earned on loans is recognized by methods which generally result in level rates of return on principal amounts outstanding. The net amount of non-refundable loan origination fees approximates the direct costs associated with the lending process.
The allowance for loan losses is an estimate of losses inherent in the loan portfolio as determined by management taking into consideration historical loan loss experience, diversification of the loan portfolio, amounts of secured and unsecured loans, banking industry standards and averages, and general economic conditions. Ultimate losses may vary from current estimates. These estimates are reviewed periodically and as adjustments become necessary, they are reported in earnings in the periods in which they become reasonably estimable.
Management determines loan impairment using guidelines established by Statement of Financial Accounting Standards No. 114 (SFAS 114), “Accounting by Creditors for Impairment of a Loan (as amended by SFAS No. 118, Accounting by Creditors for Impairment of a Loan - Income Recognition and Disclosures)”. Under this accounting standard, a loan is considered to be impaired when it is probable that the Bank will be unable to collect all principal and interest amounts according to the contractual terms of the loan agreement. A performing loan may be considered impaired. The allowance for loan losses related to loans identified as impaired is primarily based on the excess of the loan’s current outstanding principal balance over the estimated fair value of the related collateral. For a loan that is not collateral-dependent, the allowance is recorded at the amount by which the outstanding principal balance exceeds the current best estimate of the future cash flows on the loan discounted at the loan’s original effective interest rate. Interest on impaired loans is recognized when the cash is received.
BANK PREMISES AND EQUIPMENT
Premises and equipment are stated at cost, less accumulated depreciation. Depreciation is charged to operating expenses over the estimated useful life of the assets by the accelerated and straight-line methods. Costs of maintenance or repairs are charged to expense as incurred and improvements are capitalized. Upon retirement or disposal of an asset, the asset and related allowance account are eliminated. Any gain or loss on such transactions is included in current operations. Depreciation has been included under Occupancy Expense in the Statements of Income in the amount of $253,000 in 2005, $182,000 in 2004 and $157,000 in 2003.
OTHER REAL ESTATE OWNED
Real estate properties acquired through or in lieu of loan foreclosure are initially recorded at the lower of the Bank’s carrying amount or fair value less estimated selling cost at the date of foreclosure. Any write-downs based on the asset’s fair value at the date of acquisition are charged to the allowance for loan losses. After foreclosure, these assets are carried at the lower of their new cost basis or fair value less cost to sell. Costs of significant property improvements are capitalized, whereas costs relating to holding property are expensed. Valuations are periodically performed by management, and any write-downs are recorded as a charge to operations, if necessary, to reduce the carrying value of a property to the lower of its cost or fair value less cost to sell.
INCOME TAXES
Deferred taxes are provided on a liability method whereby deferred tax assets are recognized for deductible temporary differences and operating loss and tax credit carryforwards and deferred tax liabilities are recognized for taxable temporary differences. Temporary differences are the differences between the reported amounts of assets and liabilities and their tax bases. Deferred tax assets are reduced by a valuation allowance when, in the opinion of management, it is more likely than not that some portion or all of the deferred tax assets will not be realized. Deferred tax assets and liabilities are adjusted for the effects of changes in tax laws and rates on the date of enactment.
RETIREMENT BENEFITS
The Bank has established Employee Benefit Plans as described in footnote 5. The Bank does not provide any other post-retirement benefits that would be accrued under Statement of Financial Accounting Standards No. 106, “Employers’ Accounting for Post Retirement Benefits Other Than Pensions”.
2. INVESTMENT SECURITIES
The carrying value of securities pledged to secure public deposits was $56,762,000 and $41,944,000, respectively, at December 31, 2005 and 2004. The amortized cost and estimated fair value of investment securities as of December 31, 2005 and 2004 were as follows:
| Amortized Cost | Gross Unrealized Gains | Gross Unrealized Losses | Estimated Fair Value | |||||||||
| December 31, 2005 | ||||||||||||
U. S. Agency Securities | $ | 56,762 | $ | 14 | $ | 742 | $ | 56,034 | ||||
| December 31, 2004 | ||||||||||||
U. S. Agency Securities | $ | 41,944 | $ | 207 | $ | 261 | $ | 41,890 | ||||
Obligations of States and Political Subdivisions | 465 | 13 | — | 478 | ||||||||
Total | $ | 42,409 | $ | 220 | $ | 261 | $ | 42,368 | ||||
The table below shows gross unrealized losses and fair value, aggregated by investment category and length of time that individual securities have been in a continuous unrealized loss position at December 31, 2005 and 2004.
| Fair Value | Less Than 12 Months | More Than 12 Months | |||||||
2005 Securities Description | |||||||||
U. S. Agency Securities | $ | 14,381 | $ | 113 | $ | — | |||
U. S. Agency Securities | 47,249 | — | 629 | ||||||
Total | $ | 61,630 | $ | 113 | $ | 629 | |||
2004 | |||||||||
U. S. Agency Securities | $ | 28,946 | $ | — | $ | 261 | |||
Total | $ | 28,946 | $ | — | $ | 261 | |||
The unrealized losses on the Bank’s investments in obligations of U. S. Government Agencies were caused by interest rate increases. The contractual terms of those investments do not permit the issuer to settle the securities at a price less than the amortized cost of the investment. Because the Bank has the ability and intent to hold those investments until a recovery of fair value, which may be maturity, the Bank does not consider those investments to be other-than-temporarily impaired at December 31, 2005.
The amortized cost and estimated fair value of investments in debt securities at December 31, 2005 and 2004, by contractual maturity, are shown
11
Table of Contents
below. Expected maturities will differ from contractual maturities because issuers may have the right to call or prepay obligations with or without call or prepayment penalties.
| December 31, 2005 Estimated | December 31, 2004 Estimated | |||||||||||
| Amortized Cost | Fair Value | Amortized Cost | Fair Value | |||||||||
Due in One Year or Less | $ | 18,256 | $ | 18,151 | $ | 2,199 | $ | 2,218 | ||||
Due after One Year Through Five Years | 38,506 | 37,883 | 40,210 | 40,150 | ||||||||
Due After Five Years Through Ten Years | — | — | — | — | ||||||||
Due After Ten Years | — | — | — | — | ||||||||
Total | $ | 56,762 | $ | 56,034 | $ | 42,409 | $ | 42,368 | ||||
There were no sales of securities during 2005, 2004, or 2003.
3. COMPOSITION OF LOANS
| December 31 | ||||||||
| 2005 (Revised) | 2004 | |||||||
Real Estate | $ | 111,713 | $ | 111,070 | ||||
Consumer | 11,671 | 8,716 | ||||||
Commercial, Industrial and Agricultural | 7,955 | 4,778 | ||||||
All Other | 25,141 | 19,805 | ||||||
Gross Loans | 156,480 | 144,369 | ||||||
Less: Unearned Income | (449 | ) | (503 | ) | ||||
Allowance for Loan Losses | (2,007 | ) | (1,924 | ) | ||||
Total Loans, Net | $ | 154,024 | $ | 141,942 | ||||
Maturity Distribution Variable | 2005 (Revised) | 2004 | ||||||
Less Than One Year | $ | 24,802 | $ | 78,520 | ||||
One to Five Years | 40,382 | 3,433 | ||||||
Over Five Years | 12,618 | 3,421 | ||||||
Subtotal | 77,802 | 85,374 | ||||||
| Fixed | ||||||||
Less Than One Year | 24,211 | 16,376 | ||||||
One to Five Years | 11,730 | 23,964 | ||||||
Over Five Years | 42,737 | 18,655 | ||||||
Subtotal | 77,089 | 58,995 | ||||||
Total | $ | 156,480 | $ | 144,369 | ||||
4. ALLOWANCE FOR LOAN LOSSES
In the view of management, the Allowance for Loan Losses is adequate to meet the loss contingency based on experience factors and a review of the loan portfolio.
The Allowance for Loan Losses for the years ending December 31, 2005, 2004 and 2003 is summarized as follows:
| 2005 | 2004 | |||||||
Balance at beginning of year | $ | 1,924 | $ | 1,939 | ||||
Recoveries credited during year | 90 | 2 | ||||||
Provision for loan losses | 120 | 180 | ||||||
Losses charged to allowance | (127 | ) | (197 | ) | ||||
Balance at end of year | $ | 2,007 | $ | 1,924 | ||||
The following is a summary of information pertaining to impaired and non-accrual loans:
| December 31 | ||||||
| 2005 (Revised) | 2004 | |||||
Impaired loans without a valuation allowance | $ | — | $ | — | ||
Impaired loans with a valuation allowance | 2,375 | 2,375 | ||||
Total impaired loans | $ | 2,375 | $ | 2,375 | ||
Valuation allowance related to impaired loans | $ | 947 | $ | 947 | ||
Non-accrual loans (impaired) | $ | 2,375 | $ | 2,375 | ||
Non-accrual loans (non-impaired) | $ | 3,088 | $ | 2,522 | ||
Total loans past due ninety days or more and still accruing | $ | 143 | $ | 118 | ||
| Years Ended December 31 | |||||||||
| 2005 | 2004 | 2003 | |||||||
Average investment in impaired loans | $ | 2,375 | $ | 2,375 | $ | 1,153 | |||
Interest income recognized on impaired loans | $ | — | $ | 361 | $ | 23 | |||
Interest income recognized on a cash basis on impaired loans | $ | — | $ | 307 | $ | — | |||
5. STOCK OPTIONS AND EMPLOYEE BENEFIT PLANS
There were no stock options or stock option plans in effect for 2003, 2004 and 2005.
The Bank has adopted an integrated profit sharing plan. Employees participate in the profit sharing plan following completion of six (6) months of service and upon reaching the age of twenty years and six months as of January 1. Vesting includes years of service to the Bank prior to the effective date of the plan. The plan gives 0% vesting to anyone who has less than five (5) years of service except that persons who have reached the age of 62 are fully vested regardless of length of service. Each participant in the plan (who has not reached age 62) becomes 100% vested after five (5) years of service. The contribution to the plan is determined each year by the Board of Directors and thus may fluctuate in amount from year to year. The contribution by the Bank was $113,000 in 2005, $115,000 in 2004, and $99,000 in 2003 and is included in Salaries and Employee Benefits in the Statements of Income
6. FEDERAL INCOME TAXES
Net deferred tax assets consist of the following components as of December 31, 2005 and 2004:
| 2005 | 2004 | |||||
Deferred Tax Assets | ||||||
Allowance for Loan Losses | $ | 690 | $ | 640 | ||
Dividend Exclusion | 86 | 85 | ||||
Other | 31 | — | ||||
Total Deferred Tax Assets | 807 | $ | 725 | |||
Deferred Tax Liabilities | ||||||
Bank Premises | $ | 268 | $ | 231 | ||
Investment in Associated Companies | 101 | 100 | ||||
Total Deferred Tax Liabilities | 369 | $ | 331 | |||
Net Deferred Taxes | $ | 438 | $ | 394 | ||
The provisions for income taxes charged to operations for the years ended December 31, 2005, 2004 and 2003 consist of the following:
| 2005 (Revised) | 2004 | 2003 | ||||||||
Currently payable | $ | 211 | $ | 557 | $ | 1,143 | ||||
Deferred | — | 1 | (94 | ) | ||||||
Net Provision | $ | 211 | $ | 558 | $ | 1,049 | ||||
The income tax provision differs from the amount of income tax determined by applying the U. S. federal income tax rate to pretax income for the years ended December 31, 2005, 2004 and 2003 due to the following:
| 2005 (Revised) | 2004 | 2003 | ||||||||||
Tax provision computed by applying federal rate to income before income taxes | $ | 519 | $ | 882 | $ | 1,125 | ||||||
Tax exempt interest | (320 | ) | (262 | ) | (189 | ) | ||||||
Other | 12 | (62 | ) | 113 | ||||||||
Net Provision | $ | 211 | $ | 558 | $ | 1,049 | ||||||
7. RELATED PARTY TRANSACTIONS
The Chairman of the Board of Blue Ridge Bank, N.A. also serves as Chairman of the Board of Central National Bank, Community National Bank, First National Bank, First National Exchange Bank, Mountain National Bank, Patrick Henry National Bank, Peoples National Bank, Patriot Bank, N.A., and Shenandoah National Bank.
The Bank maintains correspondent bank accounts with two of these banks. In 2005 and 2004 the average daily balances in these accounts were considered normal operating balances to facilitate general business transactions.
The Bank also participates in loan transactions with these banks. These transactions are at carrying value and do not involve more than the normal risk of collectibility or present other unfavorable features.
The Bank owns ten percent of the outstanding common stock of The Mortgage Company of Virginia, Inc. The remaining common stock is equally owned by the Banks listed above. The Mortgage Company of Virginia owns 100% of Bank Services of Virginia, Inc. The business of both of these companies is to provide operational support services to the ten banks. These services consist of mortgage loan servicing, data processing, bookkeeping, check clearing, accounting, investment management, bank couriers, advertising programs, central purchasing and other management services. The Bank is charged for its share of these services, which is recorded as Operations Center Expense in the Statements of Income. The cost of this expense is shared by the ten banks on the basis of average deposits of each bank related to total average deposits of all the banks.
The Mortgage Company of Virginia, Inc. also owns 100% of Bank Services Insurance, Inc. Bank Services Insurance Inc. provides insurance products to the banks and customers in the Danville area. The premiums paid to Bank Services Insurance, Inc. equaled $25,000 at December 31, 2005.
12
Table of Contents
The Mortgage Company of Virginia, Inc. also owns 50% of Coresoft, Inc. represented by an initial $1,000 investment during 2004. Coresoft, Inc. is in the process of developing a core software package the banks listed above will use. At December 31, 2005, Coresoft, Inc. had an outstanding note payable to the Mortgage Company of $1,400,000.
The Bank records its investment in the common stock of The Mortgage Company of Virginia, Inc. under the equity method of accounting due to the influence the Bank has over the company. The Bank invested an additional $150,000 in 2005 increasing the value of the investment to $769,000 from $618,000 at December 31, 2004. The Bank’s share of earnings of the company equaled $1,000 for 2005, $11,000 for 2004 and $10,000 for 2003 and is shown in the Statements of Income under Other Non-interest Income.
The Chairman of the Board of the Bank also serves as Chairman of the Board and President of Bank Building Corporation and Manager of Blackstone Properties, LLC, its wholly owned subsidiary (the “companies”). The companies lease branches to certain of the Banks listed above. At December 31, 2005 the Bank leased three offices from the companies. Rental expense and future lease payments under these leases are disclosed in a footnote below. As of December 31, 2005 and 2004, the Bank had loans totaling $4,033,000 and $4,201,000, respectively, to the companies. These loans were made to purchase bank branches leased to affiliated banks and other investment property. The loans are secured by these branches and the related leases and other investment property, and have repayment terms similar to other loan customers of the Bank.
In the ordinary course of business, directors, and their related interests were customers of, and had transactions with the Bank. Loan transactions with directors and officers, principal security holders and associates were made on substantially the same terms as those prevailing at the time for comparable loans to other persons and did not involve more than normal risk of collectiblity or present other unfavorable features. A summary of these transactions is presented below:
| 2005 | 2004 | |||||||
Beginning Balance | $ | 39 | $ | 27 | ||||
New Loans | 15 | 16 | ||||||
Repayments | (12 | ) | (4 | ) | ||||
Ending Balance | $ | 42 | $ | 39 | ||||
8. CONTINGENCIES
The Bank did not have any legal matters of financial significance pending at December 31, 2005 or 2004.
9. EARNINGS PER COMMON SHARE
The Bank follows Statement of Financial Accounting Standards (SFAS) No. 128, Earnings Per Share. This statement requires the dual presentation of basic and diluted earnings per share. The weighted average number of shares used to compute earnings per share was 1,022,628.
The Bank issued a 200% stock dividend in 2003 and none in 2004 and 2005. No fractional shares were issued in this stock dividend. Stock dividends and fractional shares were settled based on known prices for recent trades of the stock and other factors deemed relevant at the time.
10. BANK PREMISES AND EQUIPMENT
Premises and equipment are stated at cost less accumulated depreciation as follows:
December 31, 2005 | Cost | Accumulated Depreciation and Amortization | Net Remaining Cost | ||||||
Bank Premises (Including | |||||||||
Land of $ 936,000) | $ | 4,609 | $ | 639 | $ | 3,970 | |||
Equipment | 1,653 | 709 | 944 | ||||||
Total | $ | 6,262 | $ | 1,348 | $ | 4,914 | |||
December 31, 2004 | |||||||||
Bank Premises (Including | |||||||||
Land of $ 827,000) | $ | 4,542 | $ | 549 | $ | 3,993 | |||
Equipment | 1,589 | 547 | 1,042 | ||||||
Total | $ | 6,131 | $ | 1,096 | $ | 5,035 | |||
11. FORECLOSED ASSETS
Expenses applicable to foreclosed assets include the following:
| Years Ended December 31 | |||||||||
| 2005 | 2004 | 2003 | |||||||
Net loss (gain) on sales of real estate | $ | — | $ | — | $ | — | |||
Provision for losses | — | — | — | ||||||
Operating Expenses | 180 | 165 | 16 | ||||||
12. CASH AND CASH EQUIVALENTS
Cash and cash equivalents as of December 31, 2005, 2004 and 2003 are detailed below:
| 2005 | 2004 | 2003 | |||||||
Cash and Due From Banks | $ | 10,772 | $ | 7,105 | $ | 6,469 | |||
Federal Funds Sold | 1,130 | 18,565 | 15,160 | ||||||
Total Cash and Cash Equivalents | $ | 11,902 | $ | 25,670 | $ | 21,629 | |||
13. DEPOSITS
Certificates of Deposit maturing as of December 31:
| 2005 | 2004 | |||||
1 Year | $ | 66,036 | $ | 57,225 | ||
2 Years | 27,106 | 16,492 | ||||
3 Years | 22,001 | 19,233 | ||||
4 Years | 12,812 | 24,623 | ||||
5 Years and Thereafter | 20,228 | 14,229 | ||||
Total | $ | 148,183 | $ | 131,802 | ||
14. CONCENTRATION OF CREDIT RISK
The majority of the Bank’s loans, have been granted to customers in the Bank’s market area. The concentrations of credit by loan classification are set forth in a footnote above. The Bank does not extend credit to any individual borrower in excess of its lending limit of $3,318,000 as of year-end 2005 and $3,264,000 as of year-end2004.The largest category of Real Estate Loans consisted of Commercial Loans. These loans approximated $32,834,000 at December 31, 2005 and $27,296,000 at December 31, 2004.
15. FAIR VALUE OF FINANCIAL INSTRUMENTS
Statement of Financial Accounting Standards No. 107, Disclosures about Fair Value of Financial Instruments, requires the Bank to disclose the estimated fair values of its financial assets and liabilities. The estimated fair values were determined using the following assumptions:
| a. | The carrying value of Cash and Due From Banks, Federal Funds Sold, and Interest-Bearing Deposits in Other Financial Institutions are believed to approximate the fair value of these items. |
| b. | The fair value of actively traded investment securities are determined according to quotes available in the financial press. The fair value of instruments which are not actively traded are determined using values of other instruments with similar characteristics or obtained from outside sources believed to be reliable. |
| c. | The fair value of loans are estimated by discounting the anticipated cash flows using estimated rates for similar loans available in the Bank’s market area. Estimates of maturities are based on both experience and contractual maturities although prepayments are permitted on the loans. |
| d. | The fair value of short-term demand and savings deposits are believed to equal carrying value. The fair value of certificates of deposit are based upon the contractual maturity of the instruments and rates currently offered for similar deposits. |
| e. | The fair value of Notes Payable to the U. S. Treasury and Subordinated Notes are estimated at carrying value. |
| f. | The fair value of Accrued Interest Receivable and Accrued Interest Payable are estimated at carrying value. |
| 2005 (Revised) | 2004 | |||||||||||
Financial Assets: | Carrying Value | Fair Value | Carrying Value | Fair Value | ||||||||
Interest-Bearing Deposits in Other Financial Institutions | $ | 19,396 | $ | 19,396 | $ | 23,061 | $ | 23,061 | ||||
Investment Securities | 56,762 | 56,034 | $ | 42,409 | 42,368 | |||||||
Federal Funds Sold | 1,130 | 1,130 | 18,565 | 18,565 | ||||||||
Loans (Net of Unearned Income) | 156,031 | 157,638 | 143,866 | 143,283 | ||||||||
Cash and Due From Banks | 10,772 | 10,772 | 7,105 | 7,105 | ||||||||
Accrued Interest Receivable | 1,445 | 1,445 | 1,124 | 1,124 | ||||||||
Total | $ | 245,536 | $ | 246,415 | $ | 236,130 | $ | 235,506 | ||||
13
Table of Contents
| 2005 | 2004 | |||||||||||
Financial Liabilities: | Carrying Value | Fair Value | Carrying Value | Fair Value | ||||||||
Deposits | ||||||||||||
LIFETIME FREE CHECKING | $ | 31,831 | $ | 31,831 | $ | 30,715 | $ | 30,715 | ||||
Interest-Bearing Demand | 24,600 | 24,600 | 30,173 | 30,173 | ||||||||
Regular Passbook Savings | 28,384 | 28,384 | 32,117 | 32,117 | ||||||||
Time Deposits: | ||||||||||||
Certificates of Deposit $100,000 and Over | 32,718 | 32,917 | 19,441 | 19,767 | ||||||||
Other | 115,465 | 115,764 | 112,361 | 113,807 | ||||||||
Total Deposits | 232,998 | 233,496 | 224,807 | 226,579 | ||||||||
Subordinated Notes | — | — | — | — | ||||||||
Notes issued to the U.S. Treasury | 79 | 79 | 91 | 91 | ||||||||
Accrued Interest Payable | 18 | 18 | 109 | 109 | ||||||||
Total | $ | 233,095 | $ | 233,593 | $ | 225,007 | $ | 226,779 | ||||
16. CAPITAL ADEQUACY
The Bank is subject to various regulatory capital requirements. Under the regulatory capital guidelines and the regulatory framework for Prompt Corrective Action (PCA), the Bank must meet specific capital guidelines involving the quantitative measures of the Bank’s assets, liabilities, and certain off-balance-sheet items as calculated under regulatory accounting practices. The Bank’s capital amount and classification are also subject to qualitative judgments by the regulators about components, risk weightings and other factors.
Quantitative measures established by regulation to ensure capital adequacy require the Bank to maintain minimum ratios (set forth in the table below) of total and Tier 1 capital (as defined in the regulations) to risk-weighted assets (as defined) and of Tier 1 capital to average assets (as defined).
| Minimum Ratio For Capital Adequacy Purposes | Minimum Ratio To Be Considered Well Capitalized Under PCA Provisions | |||||
Tier 1 Capital to Risk Weighted Assets | 4 | % | 6 | % | ||
Total Capital to Risk Weighted Assets | 8 | % | 10 | % | ||
Tier 1 Capital to Average Assets | 4 | % | 5 | % |
As of December 31, 2005, the most recent notification from the Federal Deposit Insurance Corporation categorized the Bank as well capitalized under the regulatory framework for prompt corrective action. To be categorized as well capitalized, an institution must maintain minimum total risk-based, Tier 1 risk-based and Tier 1 leverage ratios as set forth in the table above. There are no conditions or events since the notification that management believes have changed the Bank’s category. The Bank’s actual capital amounts and ratios as of December 31, 2005 and 2004 are presented in the following table. Management believes, as of December 31, 2005 and 2004, that the Bank meets all capital adequacy requirements to which it is subject.
| Minimum Capital For Capital Adequacy Purposes | Minimum Capital To Be Considered Well Capitalized Under PCA Provisions | Actual Capital | Actual Ratio | |||||||||
December 31, 2005 (Revised) | ||||||||||||
Tier 1 Capital to Risk Weighted Assets | $ | 6,412 | $ | 9,618 | $ | 20,074 | 12.52 | % | ||||
Total Capital to Risk Weighted Assets | 12,825 | 16,031 | 22,078 | 13.77 | % | |||||||
Tier 1 Capital to Average Assets | 10,118 | 12,648 | 20,074 | 7.94 | % | |||||||
| December 31, 2004 | ||||||||||||
Tier 1 Capital to Risk Weighted Assets | $ | 6,149 | $ | 9,224 | $ | 19,779 | 12.87 | % | ||||
Total Capital to Risk Weighted Assets | 12,298 | 15,373 | 21,703 | 14.12 | % | |||||||
Tier 1 Capital to- Average Assets | 10,001 | 12,501 | 19,779 | 7.91 | % | |||||||
17. QUARTERLY FINANCIAL DATA (Unaudited)
The following summarizes the quarterly results of operations for the years ended
December 31, 2005 and 2004:
| 2005 (Revised) | First Quarter | Second Quarter | Third Quarter | Fourth Quarter | |||||||||
Total Interest Income | $ | 2,773 | $ | 2,914 | $ | 3,026 | $ | 3,095 | |||||
Total Interest Expense | 1,231 | 1,350 | 1,465 | 1,495 | |||||||||
Net Interest Income | 1,542 | 1,564 | 1,561 | 1,600 | |||||||||
Provision For Loan Losses | 45 | 45 | 45 | (15 | ) | ||||||||
Net Interest Income After Provision for Loan Losses | 1,497 | 1,519 | 1,516 | 1,615 | |||||||||
Total Non-Interest Income | 202 | 218 | 203 | 326 | |||||||||
Total Non-Interest Expense | 1,320 | 1,363 | 1,404 | 1,480 | |||||||||
Income Before Income Taxes | 379 | 374 | 315 | 461 | |||||||||
Income Tax Expense | 60 | 57 | 21 | 73 | |||||||||
Net Income | $ | 319 | $ | 317 | $ | 294 | $ | 388 | |||||
Basic and Diluted Net Income Per Share | $ | 0.31 | $ | 0.31 | $ | 0.29 | $ | 0.38 | |||||
| 2004 | First Quarter | Second Quarter | Third Quarter | Fourth Quarter | |||||||||
Total Interest Income$ | $ | 3,117 | $ | 3,048 | $ | 3,033 | $ | 2,814 | |||||
Total Interest Expense | 1,339 | 1,298 | 1,292 | 1,276 | |||||||||
Net Interest Income | 1,778 | 1,750 | 1,741 | 1,538 | |||||||||
Provision For Loan Losses | 45 | 45 | 45 | 45 | |||||||||
Net Interest Income After Provision for Loan Losses | 1,733 | 1,705 | 1,696 | 1,493 | |||||||||
Total Non-Interest Income | 236 | 225 | 226 | 325 | |||||||||
Total Non-Interest Expense | 1,169 | 1,180 | 1,322 | 1,374 | |||||||||
Income Before Income Taxes | 800 | 750 | 600 | 444 | |||||||||
Income Tax Expense | 200 | 195 | 135 | 28 | |||||||||
Net Income | $ | 600 | $ | 555 | $ | 465 | $ | 416 | |||||
Basic and Diluted Net Income Per Share | $ | 0.59 | $ | 0.54 | $ | 0.45 | $ | 0.41 | |||||
18. LEASES AND RENT EXPENSES
The Bank leased facilities under non-cancelable operating leases during 2005, 2004, and 2003. As noted above, the Bank leases two branches from Bank Building Corporation and one branch from Blackstone, LLC. These leases required the Bank to pay maintenance, insurance and property taxes and do not have renewal options. Rental expense under these leases totaled $181,000 in 2005, $185,000 in 2004, and $187,000 in 2003. Future minimum rental payments under these leases are as follows:
Year ending December 31, | 2006 | $ | 181 | ||
| 2007 | 181 | ||||
| 2008 | 181 | ||||
| 2009 | 181 | ||||
| 2010 | 181 | ||||
| Thereafter | 848 | ||||
Total minimum lease payments | $ | 1,753 | |||
19. OFF BALANCE SHEET ACTIVITIES AND COMMITMENTS
Commitments to extend credit, which amounted to $4,780,000 and $6,206,000 at December 31, 2005 and 2004 respectively, represent agreements to lend to customers with fixed expiration dates or other termination clauses. Since many of the commitments are expected to expire without being funded, the total commitment amounts do not necessarily represent future liquidity requirements. Standby letters of credit are conditional commitments issued by the Bank guaranteeing the performance of a customer to a third party. Those guarantees are primarily issued to support public and private borrowing arrangements. At December 31, 2005 and 2004 respectively, the Bank had $37,000 and $407,000 in outstanding standby letters of credit.
The Bank is a member of the Federal Reserve System and is required to maintain certain levels of its cash and due from bank balances as reserves based on regulatory requirements. At December 31, 2005 and 2004, this reserve requirement was approximately $1,172,000 and $1,116,000, respectively.
14
Table of Contents
Federal banking regulations place certain restrictions on dividends paid by the Bank. The total amount of dividends may be paid at any date and is generally limited to the retained earnings of the Bank. In addition, dividends paid by the Bank would be prohibited if the effect thereof would cause the Bank’s capital to be reduced below applicable minimum capital requirements.
20. RECENT ACCOUNTING PRONOUNCEMENTS AND ACCOUNTING CHANGES
In November 2002, the FASB issued FASB Interpretation No. 45, “Guarantor’s Accounting and Disclosure Requirements for Guarantees, including Indirect Guarantees of Indebtedness of Others” (FIN 45). The interpretation elaborates on the disclosures to be made by a guarantor in its financial statements under certain guarantees that it has issued. It also clarifies that a guarantor is required to recognize, at the inception of a guarantee, a liability for the fair value of the obligation undertaken in issuing the guarantee. The interpretation requires disclosure of the nature of the guarantee, the maximum potential amount of future payments that the guarantor could be required to make under the guarantee, and the current amount of the liability, if any, for the guarantor’s obligations under the guarantee. The recognition requirements of the Interpretation were effective beginning January 1, 2003.
The FASB also revised FASB Interpretation 46, “Consolidation of Variable Interest Entities, an interpretation of ARB No. 51 (FIN 46)”. The interpretation provides a framework for identifying variable interest entities (VIEs), and determining when a company should include the assets, liabilities, noncontrolling interests and results of activities of a VIE in its consolidated financial statements. As revised, FIN 46 is effective beginning in the first quarter of 2004 for all VIEs (other than what is commonly referred to as special purpose entities, VIEs of small business issuers, and VIEs of nonpublic entities). The Bank does not currently utilize VIEs or so called special purpose entities.
In November 2003, the FASB’s Emerging Issues Task Force (EITF) reached consensus on new disclosure requirements related to unrealized losses on investment securities. The new disclosure requirements apply to marketable equity and debt securities accounted for under Financial Accounting Board Statement No. 115, “Accounting for Certain Investments in Debt and Equity Securities,” and are required for inclusion in annual reports with fiscal years ended after December 15, 2003.
In November 2003, the FASB issued FASB Staff Position (FSP) 144-1, “Determination of Cost Basis for Foreclosed Assets under FASB Statement No. 15”, “Accounting by Debtors and Creditors for Troubled Debt Restructurings,” and the Measurement of Cumulative Losses Previously Recognized under Paragraph 37 of FASB Statement No. 144, “Accounting for the Impairment or Disposal of Long-Lived Assets.” Under FSP 144-1, the lender is required to measure the foreclosure on a long-lived asset (e.g. real estate) at fair value less cost to sell on the foreclosure date, which establishes a new cost basis such that any loan valuation allowance is not retained. Thereafter, the lender would follow the impairment guidance in Statement No. 144, and could not reflect any recovery in value of the property beyond the cost basis established upon foreclosure of the loan. This guidance was effective upon posting of the FSP to the FASB web-site in November 2003.
In April 2003, the Financial Accounting Standards Board issued Statement No. 149, “Amendment of Statement 133 on Derivative Instruments and Hedging Activities”. This statement amends and clarifies financial accounting and reporting for derivative instruments, including certain derivative instruments embedded in other contracts (collectively referred to as derivatives) and for hedging activities under FASB Statement No. 133,” Accounting for Derivative Instruments and Hedging Activities”.
In May 2003, the Financial Accounting Standards Board issued Statement No. 150, “Accounting for Certain Financial Instruments with Characteristics of both Liabilities and Equity”. This statement establishes standards for how an issuer classifies and measures certain financial instruments with characteristics of both liabilities and equity. It requires that an issuer classify a financial instrument that is within its scope as a liability (or an asset in some circumstances). Many of those instruments were previously classified as equity. This statement is effective for financial instruments entered into or modified after May 31, 2003, and otherwise is effective at the beginning of the first interim period beginning after June 15, 2003
In December 2004, the FASB issued Statement No. 123 (revised 2004), which is a revision of Statement 123 “Accounting for Stock-Based Compensation”. This Statement establishes standards for the accounting for transactions in which an entity exchanges its equity instruments for goods or services. It also addresses transactions in which an entity incurs liabilities in exchange for goods or services that are based on the fair value of the entity’s equity instruments or that may be settled by the issuance of those equity instruments. This Statement focuses primarily on accounting for transactions in which an entity obtains employee services in share-based payment transactions. This Statement is effective for public entities as of the beginning of the first interim or annual reporting period that begins after June 15, 2005.
In December 2004, the FASB issued Statement No. 153, “Exchanges of Nonmonetary Assets”, an amendment of APB Opinion No. 29, Accounting for Nonmonetary Transactions”. This Statement eliminates the exception to fair value for exchanges of similar productive assets and replaces it with a general exception for exchange transactions that do not have commercial substance-that is, transactions that are not expected to result in significant changes in the cash flows of the reporting entity. This Statement is effective for nonmonetary asset exchanges occurring in fiscal periods beginning after June 15, 2005.
In May 2005, the FASB issued Statement No. 154, “Accounting Changes and Error Corrections - a replacement of APB Opinion No. 20 and FASB Statement No. 3”. This Statement requires retrospective application to prior periods’ financial statements of changes in accounting principle, unless it is impracticable to determine either the period-specific effects or the cumulative effect of the change. When it is impracticable to determine the period-specific effects of an accounting change on one or more individual prior periods presented, this Statement requires that the new accounting principle be applied to the balances of assets and liabilities as of the beginning of the earliest period for which retrospective application is practicable and that a corresponding adjustment be made to the opening balance of retained earnings. This Statement improves financial reporting because its requirement to report voluntary changes in accounting principles via retrospective application, unless impracticable, enhances the consistency of financial information between periods. This statement is effective for accounting changes and corrections of errors made in fiscal years beginning after December 15, 2005.
During November 2005, the FASB issued FASB Staff Position (FSP) FAS 115-1 and 124-1, “The Meaning of Other-Than-Temporary Impairment and Its Application to Certain Investments.” The guidance in this FSP addresses the determination of when an investment is considered impaired, whether that impairment is other than temporary, and the measurement of an impairment loss. The FSP also includes accounting considerations subsequent to the recognition of an other-than temporary impairment and requires certain disclosures about unrealized losses that have not been recognized as other-than-temporary impairments. The guidance in this FSP is required to be applied to reporting periods beginning after December 15, 2005. Earlier application is permitted. Management is determining what effect, if any, that this will have on financial condition and results of operation on adoption and thereafter.
The FASB has issued FASB Statement No. 155, “Accounting for Certain Hybrid Instruments.” This standard amends the guidance in FASB Statements No. 133, “Accounting for Derivative Instruments and Hedging Activities”, and No. 140, “Accounting for Transfers and Servicing of Financial Assets and Extinguishments of Liabilities.” Statement 155 allows financial instruments that have embedded derivatives to be accounted for as a whole (eliminating the need to bifurcate the derivative from its host) if the holder elects to account for the whole instrument on a fair value basis. Statement 155 is effective for all financial instruments acquired or issued after the beginning of an entity’s first fiscal year that begins after September 15, 2006. Earlier adoption is permitted as of the beginning of an entity’s fiscal year, provided the entity has not yet issued financial statements, including financial statements for any interim period for that fiscal year. Provisions of this Statement may be applied to instruments that an entity holds at the date of adoption on an instrument-by-instrument basis. The financial statement effect of the change in accounting, if any, should be recognized as a cumulative-effect adjustment to beginning retained earnings. Prior periods should not be restated.
Management does not expect these accounting pronouncements to have a material impact on the financial statements.
21. SUBORDINATED NOTE
On December 12, 2000, a subordinated capital note was executed in the principal amount of $2,000,000. Interest is payable on the note quarterly during the term of the note based on the base commercial lending rate of the holder. Annual principal payments in the amount of $400,000 begin January 1, 2007 with the final payment due January 1, 2011. Anticipation is allowed with the approval of regulatory authorities. Under the terms of the agreement, the note is subordinated to depositors and other creditors and is unsecured and ineligible as collateral by the holder. The note is callable in the event the terms of the agreement are not met. The note is considered part of the Bank’s Tier 2 capital under regulatory capital guidelines discussed in an above footnote.
This note was paid in full in December 2004.
15
Table of Contents
22. REVISION TO FINANCIAL STATEMENTS
Subsequent to the issuance of the Bank’s 2005 financial statements, the OCC issued a directive that the Bank’s Call Report be revised and re-filed. The revision dealt with the OCC’s determination that certain loans be reclassified from accruing to non-accrual loan status. As the result of the Bank having to revise its Call Report, the Bank was also required by the OCC to revise its annual financial statements.The effects of the revision on the Bank’s financial statements, as of and for the year ended December 31, 2005, are as follows:
| As Originally Presented | Changes | As Revised | ||||||||||
Statements of Financial Condition: | ||||||||||||
Loans | $ | 154,104 | $ | (81 | ) | $ | 154,023 | |||||
Other Assets | 2,844 | 38 | 2,882 | |||||||||
Statements of Income: | ||||||||||||
Interest income | 11,872 | (64 | ) | 11,808 | ||||||||
Income taxes | 233 | (22 | ) | 211 | ||||||||
Net income | 1,360 | (42 | ) | 1,318 | ||||||||
Statements of Cash Flows: | ||||||||||||
Net cash from operating activities | 2,260 | (80 | ) | 2,180 | ||||||||
Net cash from investing activities | (23,184 | ) | 80 | (23,104 | ) | |||||||
Statements of Changes in Shareholders Equity: | ||||||||||||
Undivided profits | 20,116 | (42 | ) | 20,074 | ||||||||
16
Table of Contents
Summary of Operations
(Dollars in Thousands Except Per Share Data)
FOR THE YEAR: | 2005 (Revised) | 2004 | 2003 | 2002 | 2001 | ||||||||||||||
Total Interest Income | $ | 11,808 | $ | 12,012 | $ | 14,567 | $ | 17,309 | $ | 17,459 | |||||||||
Total Interest Expense | 5,541 | 5,205 | 6,290 | 8,358 | 11,680 | ||||||||||||||
Net Interest Income | 6,267 | 6,807 | 8,277 | 8,951 | 5,779 | ||||||||||||||
Provision for Loan Losses | 120 | 180 | 1,127 | 360 | 120 | ||||||||||||||
Net Interest Income After Provision for Loan Losses | 6,147 | 6,627 | 7,150 | 8,591 | 5,659 | ||||||||||||||
Non-Interest Income | 949 | 1,012 | 983 | 908 | 770 | ||||||||||||||
Non-Interest Expense | 5,567 | 5,045 | 4,531 | 4,641 | 4,351 | ||||||||||||||
Net Income Before Taxes | 1,529 | 2,594 | 3,602 | 4,858 | 2,078 | ||||||||||||||
Applicable Income Taxes: | |||||||||||||||||||
Current | 211 | 643 | 1,143 | 1,629 | 620 | ||||||||||||||
Deferred | — | (85 | ) | (94 | ) | (71 | ) | (22 | ) | ||||||||||
Net Income (Loss) | $ | 1,318 | $ | 2,036 | $ | 2,553 | $ | 3,300 | $ | 1,480 | |||||||||
Basic and Diluted Net Income Per Share* | $ | 1.29 | $ | 1.99 | $ | 2.50 | $ | 3.23 | $ | 1.45 | |||||||||
* Net Income per share has been retroactively adjusted to reflect the stock dividend in 2003.
|
| ||||||||||||||||||
AT YEAR END: | 2005 (Revised) | 2004 | 2003 | 2002 | 2001 | ||||||||||||||
Interest-Bearing Deposits in Other Financial Institutions | $ | 19,396 | $ | 23,061 | $ | 14,847 | $ | 13,660 | $ | 11,880 | |||||||||
Federal Funds Sold | 1,130 | 18,565 | 15,160 | 21,350 | 33,530 | ||||||||||||||
Investment Securities | 56,762 | 42,409 | 66,151 | 62,626 | 66,286 | ||||||||||||||
Loans (Net) | 154,024 | 141,942 | 152,250 | 151,447 | 153,385 | ||||||||||||||
Deposits | 232,998 | 224,807 | 243,624 | 245,649 | 261,491 | ||||||||||||||
Demand | 31,831 | 30,715 | 30,518 | 25,695 | 24,703 | ||||||||||||||
Interest-Bearing Demand | 24,600 | 30,173 | 34,737 | 30,165 | 24,471 | ||||||||||||||
Savings | 28,384 | 32,117 | 30,749 | 23,641 | 19,280 | ||||||||||||||
Time | 148,183 | 131,802 | 147,620 | 166,148 | 193,037 | ||||||||||||||
Capital Accounts | 20,074 | 19,779 | 18,766 | 16,725 | 13,761 | ||||||||||||||
Total Resources | 253,370 | 244,928 | 264,696 | 265,017 | 277,739 | ||||||||||||||
Carrying Value Per Share | $ | 19.63 | $ | 19.34 | $ | 18.35 | $ | 16.35 | $ | 13.46 | |||||||||
DAILY AVERAGES FOR THE YEAR: | 2005 | 2004 | 2003 | 2002 | 2001 | ||||||||||||||
Interest-Bearing Deposits in Other Financial Institutions | $ | 18,420 | $ | 19,835 | $ | 14,967 | $ | 12,392 | $ | 10,907 | |||||||||
Federal Funds Sold | 9,139 | 21,524 | 36,379 | 9,374 | 35,272 | ||||||||||||||
Investment Securities | 52,342 | 42,723 | 54,425 | 69,898 | 56,739 | ||||||||||||||
Loans | 150,460 | 146,033 | 153,023 | 167,212 | 140,277 | ||||||||||||||
Deposits | 230,509 | 288,468 | 250,113 | 251,525 | 238,993 | ||||||||||||||
Demand | 32,962 | 30,760 | 29,775 | 25,108 | 22,295 | ||||||||||||||
Interest-Bearing Demand | 17,470 | 17,931 | 19,072 | 18,175 | 14,791 | ||||||||||||||
Savings (Includes MMDA’s) | 40,958 | 45,835 | 41,999 | 33,379 | 23,977 | ||||||||||||||
Time | 139,119 | 133,942 | 159,267 | 174,863 | 177,930 | ||||||||||||||
Capital Accounts | 19,826 | 19,320 | 18,065 | 14,057 | 13,074 | ||||||||||||||
Total Resources | $ | 249,860 | $ | 256,735 | $ | 269,035 | $ | 272,047 | $ | 255,558 | |||||||||
17
Table of Contents
Officers
Worth Harris Carter, Jr.
Chairman of the Board and President
| Robert L. Dye III | Clinton C. Ison | |
| Vice President and Managing Officer — | Assistant Vice President and Managing Officer — Wytheville | |
| Market Place | ||
| W. Thomas Leonard | ||
| Jack B. Johnson | Assistant Vice President and Managing | |
| Vice President | Officer — Main Street | |
| David R. Sheaves | Ronald M. Vaught | |
| Vice President and Managing Officer — Tazewell | Assistant Vice President and Managing Officer — | |
| Midway | ||
| Clyde H. Smythers, Jr. | ||
| Vice President | Sandy B. Venable | |
| Assistant Vice President and Managing Officer — | ||
| Eugene D. Stewart | Camp Comfort | |
| Vice President | ||
| Steven C. Leist | ||
| Ralph E. Stewart | Assistant Cashier and Managing Officer — Blacksburg | |
| Vice President and Managing Officer — Radford | ||
| Hazel Boyd | ||
| Sandra S. Clontz | Branch Manager — Cedar Bluff | |
| Operations Officer and Cashier | ||
| Diane B. Helbert | ||
| Mark S. Buckland | Branch Manager — Lebanon | |
| Assistant Vice President and Managing Officer — | ||
| Memorial Drive | Barbara J. Trent | |
| Branch Manager — St. Paul | ||
| Blendia H. Cole | ||
| Assistant Vice President and Managing Officer — | ||
| Christiansburg |
Directors
| Worth Harris Carter, Jr. | William B. Sumner | |||||
| Chairman of the Board and | Retired | |||||
| President | ||||||
| Betty A. Williams | ||||||
| Chester A. Gallimore | Retired | |||||
| President | ||||||
| Wills Ridge Supply, Inc. | ||||||
| Charles E. Hall | ||||||
| Farmer |
![]()
P.O. Box 139
Floyd, Virginia 24091
(540) 745-2011
Member FDIC
Table of Contents
![]()
P.O. Box 139
Floyd, Virginia 24091
(540) 745-2011
Member FDIC
Table of Contents
Financial
Statement
September 30, 2006


Member FDIC
Table of Contents
Statement of Condition
As of September 30
| (In 000’s) | ||||||||
| 2006 | 2005 | |||||||
ASSETS: | ||||||||
Interest-Bearing Deposits in Other Financial Institutions | $ | 15,633 | $ | 20,089 | ||||
Investment Securities: | ||||||||
U.S. Agency Securities | 55,775 | 52,758 | ||||||
Federal Funds Sold | 3,800 | 11,700 | ||||||
Loans | 157,820 | 153,702 | ||||||
Less: Income Collected - Not Earned | (535 | ) | (475 | ) | ||||
Allowance for Loan Losses | (2,183 | ) | (2,100 | ) | ||||
Net Loans | 155,102 | 151,127 | ||||||
Earning Assets | 230,310 | 235,674 | ||||||
Cash and Due From Banks | 6,622 | 6,465 | ||||||
Bank Premises and Equipment | 4,795 | 4,988 | ||||||
Real Estate Other Than Bank Premises | 2,899 | 2,725 | ||||||
Investment In Associated Companies | 769 | 618 | ||||||
Other Assets | 2,896 | 2,818 | ||||||
TOTAL ASSETS | $ | 248,291 | $ | 253,288 | ||||
LIABILITIES: | ||||||||
Deposits | ||||||||
LIFETIME FREE CHECKING | $ | 30,499 | $ | 32,536 | ||||
Interest-Bearing Demand | 18,683 | 25,989 | ||||||
Regular Passbook Savings | 26,414 | 29,714 | ||||||
Time Deposits: | ||||||||
Certificates or Deposit $100,000 or More | 28,654 | 29,197 | ||||||
Other | 123,189 | 115,501 | ||||||
Total Deposits | 227,439 | 232,937 | ||||||
Notes Issued to the U.S. Treasury | 165 | 193 | ||||||
Other Liabilities | 245 | 191 | ||||||
TOTAL LIABILITIES | 227,869 | 233,321 | ||||||
SHAREHOLDERS’ EQUITY: | ||||||||
Common Stock, Par Value $8.50 Per Share Authorized 2,500,000 Shares; 1,022,628 Outstanding in 2006 and 2005 | 8,692 | 8,692 | ||||||
Surplus | 9,153 | 9,153 | ||||||
Undivided Profits | 2,577 | 2,122 | ||||||
TOTAL SHAREHOLDERS’ EQUITY | 20,422 | 19,967 | ||||||
TOTAL LIABILITIES AND SHAREHOLDERS’ EQUITY | $ | 248,291 | $ | 253,288 | ||||
Table of Contents
Statement of income
Nine Months ended September 30
| (in 000’s except for per share data) | ||||||
| 2006 | 2005 | |||||
INTEREST INCOME: | ||||||
Interest and Fees on Loans: | ||||||
Taxable | $ | 6,288 | $ | 5,974 | ||
Non-Taxable | 848 | 643 | ||||
Interest on Deposits in Other Financial Institutions | 553 | 499 | ||||
Interest on Federal Funds Sold | 301 | 177 | ||||
Interest and Dividends on Securities: | ||||||
U.S. Agency Securities | 1,677 | 1,441 | ||||
Obligations of States and Political Subdivisions | — | 15 | ||||
TOTAL INTEREST INCOME | 9,667 | 8,749 | ||||
INTEREST EXPENSE: | ||||||
interest on Time Deposits $100,000 or More | 956 | 694 | ||||
Interest on Other Deposits | 3,866 | 3,349 | ||||
Interest on Federal Funds Purchased | — | 1 | ||||
interest on Notes Issued to the U. S. Treasury | 3 | 2 | ||||
TOTAL INTEREST EXPENSE | 4,825 | 4,046 | ||||
NET INTEREST INCOME | 4,842 | 4,703 | ||||
Provision for Loan Losses | 63 | 135 | ||||
NET INTEREST INCOME AFTER PROVISION FOR LOAN LOSSES | 4,779 | 4,568 | ||||
NON-INTEREST INCOME: | ||||||
Service Charges, Commissions and Fees | 546 | 500 | ||||
Other Non-Interest Income | 125 | 123 | ||||
TOTAL NON-INTEREST INCOME | 671 | 623 | ||||
NON-INTEREST EXPENSE: | ||||||
Salaries and Employee Benefits | 2,379 | 2,295 | ||||
Occupancy Expense | 519 | 483 | ||||
Operations Center Expense | 831 | 783 | ||||
Other Non-Interest Expense | 533 | 526 | ||||
TOTAL NON-INTEREST EXPENSE | 4,262 | 4,087 | ||||
INCOME BEFORE INCOME TAXES | 1,188 | 1,104 | ||||
Income Tax Expense | 116 | 150 | ||||
NET INCOME | $ | 1,073 | $ | 954 | ||
EARNINGS PER SHARE: | ||||||
Basic and Diluted | $ | 1.05 | $ | 0.93 | ||
Table of Contents

October 31, 2006
Dear Stockholder:
Your Board of Directors has declared the regular cash dividend of $0.25 per share payable to stockholders of record September 29, 2006. A check representing this dividend is enclosed.
These are very exciting times for your bank. With the last quarterly mailing, I enclosed a news release and letter to stockholders setting forth Information regarding the proposed merger of your bank with nine other banks into one Virginia state charter under the name of Carter Bank & Trust. By now, you should have received the proxy statement/offering circular and proxy for your review and opportunity to vote regarding the proposed merger. The various stockholder meetings regarding the merger will take place on November 9, 10, 13 and 14. While we have received a very large number of proxies so far, there are some of you who have not returned your proxy. I encourage everyone who has not mailed your proxy by the time you receive this letter to please take the time to review the proxy statement/offering circular and return your proxy so your shares will be voted.
I urge each stockholder to read the proxy statement/offering circular and any other relevant documents filed with the OCC or the FDIC in connection with the proposed merger, because they contain important information about the banks, Carter Bank & Trust and the proposed merger. You may (i) obtain free copies of the proxy statement/offering circular or these other documents by directing a request by telephone or mail to Worth Harris Carter, Jr., Bank Services of Virginia, Inc., 1300 Kings Mountain Road, Martinsville, Virginia 24112; telephone number: (276)656-1776, or (ii) obtain up to 50 free pages of these documents by contacting the Office of the Comptroller of the Currency by facsimile at (202) 874-4448 or by mail at the Office of the Comptroller of the Currency, Communications Division, 250 E Street, S,W., Washington, D.C. 20219.
We have filed the appropriate applications with the Bureau of Financial Institutions of the State of Virginia and the FDIC and anticipate receiving favorable responses by the end of November. The directors, officers and employees are working diligently to accomplish the merger in a way that will be beneficial to our customers and stockholders. We appreciate your support.
| Very truly yours, |
 |
| Worth Harris Carter, Jr |
| Chairman of the Board and President |
Table of Contents
Officers
Worth Harris Carter, Jr
Chairman of the Board and President
Robert L. Dye, III
Vice President
Jack B. Johnson
Vice President
David R. Sheaves
Vice President and Managing Officer—Tazewell
Clyde H. Smythers, Jr.
Vice President
Eugene D. Stewart
Vice President
Ralph E. Stewart
Vice President and Managing Officer—Redford
Sandra S. Clontz
Operations Officer and Cashier
Mark S. Buckland
Assistant Vice President and Managing Officer—Memorial Drive
Blendia H. Cole
Assistant Vice President and Managing Officer—Christiansburg
Clinton C. Ison
Assistant Vice President and Managing Officer—Wytheville
Cathy N. Miller
Assistant Vice President and Managing Officer—Market Place
Ronald M. Vaught
Assistant Vice President and Managing Officer—Midway
Sandy B. Venable
Assistant Vice President and Managing Officer—Main Street
Steven C. Leist
Assistant Cashier and Managing Officer—Blacksburg
Hazel Boyd
Branch Manager—Cedar Bluff
Jill B. Coakley
Branch Manager—Camp Comfort
Diane B. Helbert
Branch Manager—Lebanon
Barbara J. Trent
Branch Manager—St. Paul
Directors
Worth Harris Carter, Jr.
Chairman of the Board and President
Chester A. Gallimore
President, Wills Ridge Supply, Inc.
Charles E. Hall
Farmer
William B. Sumner
Retired
Betty A. Williams
Retired

P.O. Box 139
Floyd, Virginia 24091
(540) 745-2011
Member FDIC
Table of Contents
OFFICE OF THE COMPTROLLER OF THE CURRENCY
WASHINGTON, D.C. 20552
FORM 10-KSB/A
AMENDMENT NO. 1
| x | ANNUAL REPORT UNDER SECTION 13 OR 15(d) OF THE SECURITIES EXCHANGE ACT OF 1934 |
For the fiscal year ended December 31, 2005
OR
| ¨ | TRANSITION REPORT UNDER SECTION 13 OR 15(d) OF THE SECURITIES EXCHANGE ACT OF 1934 |
For the transition period from to
Commission file number: n/a
CENTRAL NATIONAL BANK
(Name of small business issuer in its charter)
| National Bank | 54-1801535 | |
(State or other jurisdiction of incorporation or organization) | (I.R.S. Employer Identification No.) |
2018 Tate Springs Road Lynchburg, VA | 24501 | |
| (Address of principal executive offices) | (Zip Code) |
Issuer’s telephone number: (804)845-0816
Securities registered under Section 12(b) of the Exchange Act: None
Securities registered under Section 12(g) of the Exchange Act: None
Check whether the issuer is not required to file reports pursuant to Section 13 or 15(d) of the Exchange Act. Yes ¨ No x
Check whether the issuer (1) filed all reports required to be filed by Section 13 or 15(d) of the Exchange Act during the past 12 months (or for such shorter period that the registrant was required to file such reports), and (2) has been subject to such filing requirements for the past 90 days. Yes x No ¨
Check if there is no disclosure of delinquent filers in response to Item 405 of Regulation S-B contained in this form, and no disclosure will be contained, to the best of registrant’s knowledge, in definitive proxy or information statements incorporated by reference in Part III of this Form 10-KSB or any amendment to this Form 10-KSB. x
Indicate by check mark whether the registrant is a shell company (as defined in Rule 12b-2 of the Exchange Act). Yes ¨ No x
The issuer’s revenues for the fiscal year ended December 31, 2005 were $5,899,000
The aggregate market value of the issuer’s common stock held by nonaffiliates as of March 16, 2006 was $4,529,000.
As of March 16, 2006, there were issued and outstanding 236,439 shares of the issuer’s common stock.
DOCUMENTS INCORPORATED BY REFERENCE
Portions of the 2005 Annual Report to Shareholders, as revised, are incorporated by reference in Part II of this report, which is attached hereto as Exhibit 13
Transitional Small Business Disclosure Format: Yes ¨ No x
Table of Contents
Central National Bank
2005 ANNUAL REPORT ON FORM 10-KSB/A
TABLE OF CONTENTS
| Page | ||||
EXPLANATORY NOTE | ||||
| PART I | 6 | |||
ITEM 1. | DESCRIPTION OF BUSINESS | 6 | ||
ITEM 2. | DESCRIPTION OF PROPERTY | 9 | ||
ITEM 3. | LEGAL PROCEEDINGS | 10 | ||
ITEM 4. | SUBMISSION OF MATTERS TO A VOTE OF SECURITY HOLDERS | 10 | ||
| PART II | 11 | |||
ITEM 5. | MARKET FOR COMMON EQUITY AND RELATED STOCKHOLDER MATTERS | 11 | ||
ITEM 6. | MANAGEMENT’S DISCUSSION AND ANALYSIS OR PLAN OF OPERATION | 11 | ||
ITEM 7. | FINANCIAL STATEMENTS | 11 | ||
ITEM 8. | CHANGES IN AND DISAGREEMENTS WITH ACCOUNTANTS ON ACCOUNTING AND FINANCIAL DISCLOSURE. | 12 | ||
ITEM 8A. | CONTROLS AND PROCEDURES | 12 | ||
ITEM 8B. | OTHER INFORMATION | 12 | ||
| PART III | 12 | |||
ITEM 9. | DIRECTORS, EXECUTIVE OFFICERS, PROMOTERS AND CONTROL PERSONS; COMPLIANCE WITH SECTION 16(a) OF THE EXCHANGE ACT | 12 | ||
ITEM 10. | EXECUTIVE COMPENSATION | 14 | ||
ITEM 11. | SECURITY OWNERSHIP OF CERTAIN BENEFICIAL OWNERS AND MANAGEMENT AND RELATED STOCKHOLDER MATTERS | 17 | ||
ITEM 13. | EXHIBITS | 18 | ||
ITEM 14. | PRINCIPAL ACCOUNTANT FEES AND SERVICES | 19 | ||
3
Table of Contents
EXPLANATORY NOTE
Central National Bank (the “Bank”) is simultaneously submitting the following amended filings: (i) Form 10-KSB/A for the year ended December 31, 2005 and (ii) Form 10-QSB/A for the quarter ended June 30, 2006. These amended filings update the Bank’s reported financial information for the year ended December 31, 2005 and for the affected quarters of 2005 and 2006.
This amendment amends the Annual Report on Form 10-KSB filed by the Bank on March 31, 2006 (the “Original Filing”). The purpose of this amendment is to change the Bank’s financial statements and related footnote disclosures and related MD&A discussion for the periods covered by this Form 10-KSB/A to match the amended Consolidated Reports of Condition and Income (“Call Reports”) the Bank filed in June 2006 at the direction of the Office of the Comptroller of the Currency (“OCC”) to place on nonaccrual one loan to a borrower group secured by a first deed of trust on a hotel property in North Carolina.
The amendments to the financial statements consist of the following:
(Dollars in thousands) | ||||||||||||
| As Originally Presented | Changes | As Revised | ||||||||||
Statements of Financial Condition: | ||||||||||||
Loans | $ | 68,290 | $ | (24 | ) | $ | 68,266 | |||||
Other Assets | 1,314 | 11 | 1,325 | |||||||||
Statements of Income: | ||||||||||||
Interest Income | 5,497 | (21 | ) | 5,476 | ||||||||
Income Taxes | 325 | (8 | ) | 317 | ||||||||
Net Income | 744 | (13 | ) | 731 | ||||||||
Statements of Cash Flows: | ||||||||||||
Net cash from operating activities | 856 | 36 | 892 | |||||||||
Net cash from investing activities | (2,402 | ) | (36 | ) | (2,438 | ) | ||||||
Statements of Changes in Shareholders’ Equity: | ||||||||||||
Undivided profits | 3,383 | (13 | ) | 3,370 | ||||||||
The Bank’s accountants previously advised the Bank that the financial statements included in the Original Filing were prepared in accordance with Generally Accepted Accounting Principles and that the amounts involved in the amendment of the Call Reports were not material. However, the OCC has advised the Bank that the financial statements in this Annual Report must be identical with the Bank’s Call Reports, as amended, to comply with OCC policy.
This Form 10-KSB/A does not change any of the information contained in Items 1-5 or 8-14 of the Original Filing which is repeated in this amended filing. Except for the changes noted above, references throughout this Form 10-KSB/A are accurate as of the date this Annual Report was originally filed and have not been updated to reflect events occurring subsequent to the original filing date.
Importantly, as of the date of this amended filing, the collateral securing the loan at issue has been liquidated as part of the Bank’s collection process and the loan has been paid in full. Therefore, all interest income adjusted in this Form 10-KSB/A will be reported by the Bank as income earned in the third quarter of 2006.
4
Table of Contents
FORWARD–LOOKING STATEMENTS
This report contains statements concerning the Bank’s expectations, plans, objectives, future financial performance and other statements that are not historical facts. These statements may constitute “forward-looking statements” as defined by federal securities laws. In some cases, readers can identify the forward-looking statements by the use of words such as “may,” “ will,” “should,” “could,” “expect,” “plan,” “intend,” “anticipate,” “believe,” “estimate,” “predict,” “potential” or “continue” or the negative or other variations of these words, or other comparable words or phrases. These statements may address issues that involve estimates and assumptions made by management, risks and uncertainties, and actual results could differ materially from historical results or those anticipated by such statements. Factors that could have a material adverse effect on the Bank’s operations and future prospects include, but are not limited to, changes in: interest rates; general and local economic conditions; the legislative/regulatory climate; monetary and fiscal policies of the U.S. government, including policies of the U.S. Treasury and the Federal Reserve Board; the quality or composition of loan or investment portfolios; demand for loan products; deposit flows; competition; demand for financial services in our market area and accounting principles, policies and guidelines. These risks and uncertainties should be considered in evaluating the forward-looking statements contained herein, and readers are cautioned not to place undue reliance on such statements, which speak only as of the date of this report.
5
Table of Contents
PART I
| ITEM 1. | DESCRIPTION OF BUSINESS. |
The Bank opened for business as a National Banking Association on July 1, 1996 and was created through the spin –off of the assets, liabilities and related capital of offices from Peoples National Bank, Danville, Virginia. The Bank’s main office is located at 2018 Tate Springs Road, Lynchburg, Virginia.
The Bank is a full service community bank that provides an array of financial products and services to its customers, including a variety of interest-bearing and non-interest bearing demand deposit accounts; savings and money market accounts; certificates of deposit; commercial, installment, and real estate mortgage loans (commercial and residential); and safe deposit rental facilities. The Bank also sells travelers checks, money orders and cashier’s checks.
At December 31, 2005 the Bank had 44 full-time employees and 1 part-time employee, $108 million in assets, $68 million in net loans, $98 million in deposits and $10 million in total shareholders’ equity.
Market Area
The Bank’s primary service area currently consists of the City of Lynchburg and Amherst and Campbell Counties in Virginia. The Bank conducts a general commercial banking business in its service area, and focuses on serving the banking needs of small-to-medium sized businesses, professional concerns and individuals.
Goals and Strategy
The Bank’s goal is to become a leading financial institution in its market area by opening new offices and providing a full array of banking services. Management believes that the on-going consolidation of the banking industry has created an opportunity for community-based lenders like the Bank which emphasize retail lending and superior customer service. The Bank’s business strategy is to target individuals, businesses and professionals in the area for loans, deposits, and other financial services and to explore selected opportunities to establish branches in areas that demographically compliment the Bank’s existing customer base.
Deposits and Loan Products
The Bank offers a full range of deposit services including LIFETIME FREE CHECKING, NOW accounts, savings accounts, retirement accounts and other deposits of various types, ranging from money market accounts to longer-term certificates of deposit. The transaction accounts and time certificates are tailored to the Bank’s principal market at competitive rates. All deposit accounts are insured by the FDIC up to the maximum amount allowed by law (generally $100,000 per depositor subject to aggregation rules). The Bank solicits these accounts from individuals, businesses, associations, organizations, and governmental entities.
The Bank also offers a full range of commercial and personal loans. Commercial loans include both secured and unsecured loans. Consumer loans include secured and unsecured loans for financing automobiles, home improvements, education and personal investments. The Bank also makes real estate construction and acquisition loans and originates and holds fixed- and variable-rate mortgage loans.
The Bank’s lending activities are subject to a variety of limits imposed by federal law. While differing limits apply in certain circumstances based on the type of loan or the nature of the borrower (including the borrower’s relationship to the Bank), in general the Bank is subject to a loan-to-one borrower limit of an amount equal to 15% of the Bank’s unimpaired capital and surplus, or 25% of the unimpaired capital and surplus. The Bank may not make loans to any director, officer, employee or 10% shareholder of the Bank unless the loan is approved by the Board of Directors and is made on terms not more favorable than are made available to a person not affiliated with the Bank.
6
Table of Contents
Other bank services include travelers checks, direct deposit of payroll and social security checks, and automated drafts for various accounts. The Bank has no current plans to exercise trust powers.
Bank Lending Practices
The Bank’s lending efforts are directed to making loans to individuals and businesses in its market area. The Bank has both purchased and sold participation loans with other banks in the past and may do so in the future. The Bank believes that its lending and credit policies are conservative.
The Bank’s primary lending program has been the origination of loans secured by real estate. The Bank evaluates both the borrower’s ability to make principal and interest payments and the value of the property that will secure the loan.
Residential mortgage loans generally are made on the basis of the borrower’s ability to make repayment from employment and other income and are secured by real estate that can be readily valued. The Bank offers both adjustable-rate and fixed-rate mortgages.
In contrast, commercial real estate loans typically are made on the basis of the borrower’s ability to make repayment from cash flow from its business and are secured by business properties. The Bank’s primary non-residential real estate loan products have rates which are fixed for three to five years and then become adjustable. Commercial loans typically involve larger loan balances concentrated with single borrowers or groups of related borrowers.
The Bank also makes consumer loans, including unsecured personal loans, automobile loans, deposit account loans, installment loans and time loans. The Bank’s primary consideration when making such consumer loans is the customer’s ability to repay the loan. Consumer loans generally warrant higher interest rates and fees, but such loans, particularly unsecured consumer loans, also may entail greater risk than residential mortgage loans. Even when a loan is secured, repossessed collateral for a defaulted consumer loan may not provide an adequate source of repayment. Consumer loan collections are dependent on the borrower’s continuing financial stability, and are more likely to be affected adversely by job loss, divorce, illness, or personal bankruptcy. Various federal and state laws, including bankruptcy and insolvency laws, may limit the amount which can be recovered on such loans and such loans may give rise to claims and defenses by a consumer loan borrower.
The Bank also makes commercial loans to qualified small businesses in its market area. Commercial business loans generally have a higher degree of risk than mortgage loans, but have commensurately higher yields. To manage these risks, the Bank generally secures appropriate collateral and carefully monitors the financial condition of its business borrowers.
Competition
Federal and state legislative changes have significantly increased competition among financial institutions, and current trends towards additional deregulation may be expected to increase competition even further. In its market area, the Bank competes with nationwide, statewide and local banking institutions, credit unions, thrift institutions, money market funds, consumer finance companies, and other financial service organizations. Many of the financial organizations competing with the Bank have greater financial resources than the Bank. Many of these financial organizations also have greater geographic coverage and some offer bank and bank-related services which the Bank does not offer.
Supervision and Regulation
Financial institutions are extensively regulated under federal and state law. Consequently, the growth and earnings performance of the Bank can be affected not only by management decisions and general economic conditions, but also by the statutes administered by, and the regulations and policies of, various governmental regulatory authorities including, but not limited to, the OCC, the Federal Reserve Board (“FRB”), the FDIC, the Internal Revenue Service, federal and state taxing authorities, and the Securities Exchange Commission. The effect of such statutes, regulations and policies can be significant, and cannot be predicted with a high degree of certainty.
7
Table of Contents
Federal and state laws and regulations generally applicable to financial institutions regulate, among other things, the scope of business, investments, reserves against deposits, capital levels relative to operations, the nature and amount of collateral for loans, the establishment of branches, mergers, consolidations and dividends. The system of supervision and regulation applicable to the Bank establishes a comprehensive framework for their respective operations and is intended primarily for the protection of the FDIC’s deposit insurance funds and the depositors, rather than the shareholders of the Bank.
The following references to material statutes and regulations affecting the Bank are brief summaries thereof and do not purport to be complete, and are qualified in their entirety by reference to such statutes and regulations. Any change in applicable law or regulations may have a material effect on the business of the Bank.
Finally, the Bank is subject to the periodic reporting requirements of the Securities Exchange Act of 1934, as amended, including but not limited to, filing annual, quarterly and other current reports with the Comptroller of the Currency.
Regulatory Capital Requirements
All financial institutions are required to maintain minimum levels of regulatory capital. The OCC has established risk-based and leveraged capital standards for the financial institutions they regulate. The OCC also may impose capital requirements in excess of these standards on a case-by-case basis for various reasons, including financial condition or actual or anticipated growth. Under the risk-based capital requirements, the Bank is required to maintain a minimum ratio of total capital to risk-weighted assets of at least 8%. At least half of the total capital is required to be “Tier 1 capital,” which consists principally of common and certain qualifying preferred shareholders’ equity, less certain intangibles and other adjustments. The remainder, “Tier 2 capital,” consists of a limited amount of subordinated and other qualifying debt (including certain hybrid capital instruments) and a limited amount of the general loan loss reserve.
In addition, the federal regulatory agencies have established a minimum leveraged capital ratio (Tier 1 capital to period end total assets). These guidelines provide for a minimum leveraged capital ratio of 4%. The guidelines also provide that banking organizations experiencing internal growth or making acquisitions will be expected to maintain strong capital positions substantially above the minimum supervisory levels, without significant reliance on intangible assets.
On December 12, 2000, the Bank issued a subordinated capital note in the amount of $1.5 million. This note is described in Footnote 21 of the Financial Statements in Part II, Item 7 filed herewith.
As of December 31, 2005 and 2004, the Bank qualified as “well-capitalized” institution (see Note 16 to the Financial Statements).
Insurance of Accounts, Assessments and Regulation by the FDIC
The Bank is a member of the Bank Insurance Fund (“BIF”) of the FDIC. As a BIF insured institution, the Bank is subject to FDIC rules and regulations as administrator of the BIF. The Bank’s deposits are insured up to $100,000 per insured depositor, as defined by law and regulation. As insurer, the FDIC is authorized to conduct examinations of and to require reporting by BIF institutions. The actual assessment to be paid by each BIF member is based on the institution’s assessment risk classification and whether the institution is considered by its supervisory agency to be financially sound or to have supervisory concerns.
Under the FDIC’s risk-based insurance system, BIF-insured institutions are currently assessed premiums of between zero and twenty seven cents per $100 of eligible deposits, depending on the institution’s capital position and other supervisory facts. Congress has enacted legislation that, among other things, provides for assessments against BIF-insured institutions that will be used to pay certain Financing Corporation (“FICO”) obligations.
8
Table of Contents
The FDIC is authorized to prohibit any BIF-insured institution from engaging in any activity that the FDIC determines by regulation or order to pose a serious threat to the insurance fund. Also, the FDIC may initiate enforcement actions against banks after first giving the institution’s primary regulatory authority an opportunity to take such action. The FDIC may terminate the deposit insurance of any depository institution, including the Bank, if it determines, after a hearing, that the institution has engaged or is engaging in unsafe or unsound practices, is in an unsafe or unsound condition to continue operations, or has violated any applicable law, regulation, order or any condition imposed in writing by the FDIC. It also may suspend deposit insurance temporarily during the hearing process for the permanent termination of insurance, if the institution has no tangible capital. If deposit insurance is terminated, the deposits at the institution at the time of termination, less subsequent withdrawals, shall continue to be insured for a period from six months to two years, as determined by the FDIC. Management is aware of no existing circumstances that could result in termination of the Bank’s deposit insurance.
Other Safety and Soundness Regulations
The federal banking agencies have broad powers under current federal law to take prompt corrective action to resolve problems of insured depository institutions. The extent of these powers depends upon whether the institutions in question are “well capitalized,” “adequately capitalized,” “undercapitalized,” “significantly undercapitalized” or “critically undercapitalized,” as such terms are defined under uniform regulations issued by each of the federal banking agencies.
Community Reinvestment
The requirements of the Community Reinvestment Act (“CRA”) affect the Bank. The CRA imposes on financial institutions an affirmative obligation to help meet the credit needs of their local communities, including low- and moderate-income neighborhoods, consistent with the safe and sound operation of those institutions. Each financial institution’s efforts in helping meet community credit needs currently is evaluated as part of the examination process pursuant to a new regulation recently adopted by the banking regulatory agencies. Under the new regulation a financial institution’s efforts in helping meet its community’s credit needs are evaluated, based on the particular institution’s Total Assets, according to a lending test, a community development test in addition to the lending test, or the three-pronged (lending, investment and service) test, all of which replace the twelve assessment factors used previously. The grade received by a bank is considered in evaluating mergers, acquisitions and applications to open a branch or facility. To the best knowledge of the Bank, it is meeting its obligations under the CRA.
Effect of Governmental Monetary Policies
As with other financial institutions, the earnings of the Bank are affected by general economic conditions as well as by the monetary policies of the Federal Reserve Board. Such policies, which include regulating the national supply of bank reserves and bank credit, can have a major effect upon the source and cost of funds and the rates of return earned on loans and investments. The Federal Reserve System exerts a substantial influence on interest rates and credit conditions, primarily through establishing target rates for federal funds, open market operations in U.S. Government securities, varying the discount rate on member bank borrowings and setting cash reserve requirements against deposits. Changes in monetary policy, including changes in interest rates, will influence the origination of loans, the purchase of investments, the generation of deposits, and rates received on loans and investment securities and paid on deposits. Fluctuations in the Federal Reserve Board’s monetary policies have had a significant impact on the operating results of the Bank and all financial institutions in the past and are expected to continue to do so in the future.
Employees
The Bank employees a total of 44 full-time employees and 1 part-time employees as of December 31, 2005. The Bank believes that its relationship with its employees is good, and no employees are represented by a labor union.
| ITEM 2. | DESCRIPTION OF PROPERTY. |
The Bank’s main office is located in a one and half story building at 2018 Tate Springs Road, Lynchburg, Virginia. The Bank also operates five additional offices, all which are located in Virginia. The Main Office, Waterlick and Campbell Avenue and the Amherst offices are held under non-cancellable operating leases as described in Footnotes 7 and 18 in the Financial Statements.
9
Table of Contents
As of December 31, 2005, the Bank operated the offices listed in the table below.
Office | Location | Owned/Leased | ||||
| Langhorne Road Office | 2018 Tate Springs Road | Lynchburg, VA 24501 | Leased | |||
| Waterlick Office | 3008 Waterlick Road | Lynchburg, VA 24502 | Leased | |||
| Graves Mill Road Office | 1728 Graves Mill Road | Lynchburg, VA 24502 | Leased | |||
| Campbell Avenue Office | 3515 Campbell Avenue | Lynchburg, VA 24501 | Owned | |||
| Madison Heights | 4498 South Amherst Highway | Madison Heights, VA 24572 | Owned | |||
| Amherst Office | Rt. 29 Business | Amherst, VA 24521 | Leased | |||
The Bank owns two lots for property for future bank locations. One is on Highway 29 South in Campbell County and the other is on Odd Fellows Road in the City of Lynchburg.
The Bank periodically acquires title to other parcels of real estate through the normal course of its lending activities. Other Real Estate held equaled $772,000 December 31, 2005 and $927,000 at December 31, 2004.
Management considers these properties to be in good condition. Adequate insurance is maintained on each of these properties.
| ITEM 3. | LEGAL PROCEEDINGS. |
There are no material pending legal proceedings to which the Bank is a party or to which the property of the Bank is subject.
| ITEM 4. | SUBMISSION OF MATTERS TO A VOTE OF SECURITY HOLDERS. |
No matters were submitted to a vote of security holders during the fourth quarter of the fiscal year covered by this report.
EXECUTIVE OFFICERS OF THE REGISTRANT
Name (Age) | Officer Since | Principal Occupation During Past Five Years | ||
Worth Harris Carter, Jr. (68) | 1976 | Chairman of the Board of First National Bank since 1976, President since 1986 | ||
| Chairman of the Board and President of Patrick Henry National Bank since 1977 | ||||
| Chairman of the Board of Peoples National Bank since 1976, President since 1981 | ||||
| Chairman of the Board of Blue Ridge Bank since 1982 | ||||
| Chairman of the Board and President of Community National Bank since 1985 | ||||
| Chairman of the Board and President of Mountain National Bank since 1996 | ||||
| Chairman of the Board and President of Shenandoah National Bank since 1996 | ||||
| Chairman of the Board and President of Central National Bank since 1996 | ||||
| Chairman of the Board and President of Patriot Bank since 1996 | ||||
| Chairman of the Board and President of First National Exchange Bank since 1998 | ||||
| Chairman of the Board and President of Mortgage Company of Virginia since 1984 | ||||
Chairman of the Board and President of Bank Services of Virginia since 1984 | ||||
Chairman of the Board and President of Bank Building Corporation since 1994 | ||||
Chairman of the Board and President of Bank Services Insurance, Inc. since 2003 | ||||
Manager of Blackstone Properties LLC Since 1998 | ||||
10
Table of Contents
PART II
| ITEM 5. | MARKET FOR COMMON EQUITY AND RELATED STOCKHOLDER MATTERS. |
The Bank is authorized to issue 2.5 million shares with a par value of $5. This stock has full voting rights and full preemptive rights. There were 236,439 shares outstanding as of December 31, 2005 and 2004. This is the only class of authorized stock.
The Bank’s common stock is traded locally with no established trading market and no known market-makers.
The quarterly high and low prices and quarterly dividends for the common stock are presented below:
| 2005 | 2004 | |||||||||||
| High | Low | High | Low | |||||||||
First Quarter | $ | 25 | $ | 25 | $ | 30 | $ | 25 | ||||
Second Quarter | 25 | 25 | 25 | 25 | ||||||||
Third Quarter | 25 | 25 | 25 | 25 | ||||||||
Fourth Quarter | 38 | 25 | 25 | 25 | ||||||||
Holders. As of March 16, 2006, there are approximately 565 holders of record of the Bank’s outstanding common stock.
Dividends. The amount of dividends that may be paid by the Bank will depend on the Bank’s earnings and capital position and is limited by federal law, regulations and policies. A national bank may not pay dividends from its capital; all dividends must be paid out of undivided profits then on hand, after deducting expenses, including reserves for losses and bad debts. In addition, the approval of the OCC is required if the total of all dividends declared by a national bank in any calendar year exceeds the total of its net profits for that year combined with its retained net profits for the preceding two years, less any required transfers to surplus. The Bank may not pay a dividend if, after giving effect to the dividend, the Bank would be undercapitalized.
Future cash dividends are dependent upon the Banks future performance and other factors including the capital position and anticipated growth.
| ITEM 6. | MANAGEMENT’S DISCUSSION AND ANALYSIS OR PLAN OF OPERATION. |
The information required by this Item is included in the Bank’s annual report to shareholders for the year ended December 31, 2005, as revised, (the “Annual Report”), which is attached hereto as Exhibit 13 and is incorporated herein by reference. The information appears in the Annual Report under the caption “Management’s Discussion and Analysis of Financial Condition and Results of Operation.”
| ITEM 7. | FINANCIAL STATEMENTS. |
The report of the independent registered public accounting firm and audited financial statements of the Bank and accompanying notes required by this Item are included in the Bank’s Annual Report, which is attached hereto as Exhibit 13 and is incorporated herein by reference.
11
Table of Contents
| ITEM 8. | CHANGES IN AND DISAGREEMENTS WITH ACCOUNTANTS ON ACCOUNTING AND FINANCIAL DISCLOSURE. |
None.
| ITEM 8A. | CONTROLS AND PROCEDURES. |
The Bank maintains a system of disclosure controls and procedures that is designed to ensure that material information is accumulated and communicated to management, including the Bank’s president (who is the Bank’s principal executive officer and principal financial officer), as appropriate to allow timely decisions regarding required disclosure. As required, management, with the participation of the Bank’s president, evaluated the effectiveness of the design and operation of the Bank’s disclosure controls and procedures as of the end of the period covered by this report. Based on this evaluation, the Bank’s president concluded that the Bank’s disclosure controls and procedures were operating effectively to ensure that information required to be disclosed by the Bank in reports that it files or submits under the Securities Exchange Act of 1934, as amended, is recorded, processed, summarized, and reported within the time periods specified in the rules and forms of the SEC.
Because of the inherent limitations in all control systems, no evaluation of controls can provide absolute assurance that the Bank’s disclosure controls and procedures will detect or uncover every situation involving the failure of persons within the Bank to disclose material information otherwise required to be set forth in the Bank’s periodic reports.
The Bank’s management is also responsible for establishing and maintaining adequate internal control over financial reporting to provide reasonable assurance regarding the reliability of financial reporting and the preparation of financial statements for external purposes in accordance with generally accepted accounting principles. There were no changes in the Bank’s internal control over financial reporting during the Bank’s fourth quarter ended December 31, 2005 that have materially affected, or are reasonably likely to materially affect, the Bank’s internal control over financial reporting.
| ITEM 8B. | OTHER INFORMATION. |
None.
PART III
| ITEM 9. | DIRECTORS, EXECUTIVE OFFICERS, PROMOTERS AND CONTROL PERSONS; COMPLIANCE WITH SECTION 16(A) OF THE EXCHANGE ACT. |
The information regarding the Bank’s executive officer is contained in Part I of this Report on Form 10-KSB/A.
Name and Business Experience | Age | Director Since | ||
Buchanan, George B., Jr. | 70 | 4/96 | ||
George B. Buchanan, Jr. is President of Danville Plywood Corporation | ||||
Danville, Virginia and has been for more than five years. He also has served as a director of Peoples National Bank since 1978. |
12
Table of Contents
Name and Business Experience | Age | Director Since | ||
Carter, Worth Harris, Jr. | 68 | 4/96 | ||
Chairman of the Board and President | ||||
Worth Harris Carter, Jr. is a director and officer of the following companies: | ||||
Chairman of the Board of First National Bank since 1976, President since 1986 | ||||
Chairman of the Board and President of Patrick Henry National Bank since 1977 | ||||
Chairman of the Board of Peoples National Bank since 1976, President since 1981 | ||||
Chairman of the Board of Blue Ridge Bank since 1982, President since 2004 | ||||
Chairman of the Board and President of Community National Bank since 1985 | ||||
Chairman of the Board and President of Mountain National Bank since 1996 | ||||
Chairman of the Board and President of Shenandoah National Bank since 1996 | ||||
Chairman of the Board and President of Patriot Bank since 1996 | ||||
Chairman of the Board and President of First National Exchange Bank since 1998 | ||||
Chairman of the Board and President of Mortgage Company of Virginia since 1984 | ||||
Chairman of the Board and President of Bank Services of Virginia, Inc. since 1984 | ||||
Chairman of the Board and President of Bank Services Insurance, Inc. since 2003 | ||||
Chairman of the Board and President of Coresoft, Inc. since 2004 | ||||
Chairman of the Board and President of Bank Building Corporation since 1988 Manager of Blackstone Properties LLC since 1998 | ||||
Karavatakis, Phyllis Q. | 51 | 2/05 | ||
Phyllis Q. Karavatakis is a Senior Vice President for Patrick Henry National Bank and has been for more than five years. | ||||
Moses, James C. | 74 | 4/96 | ||
James C. Moses is President of Moses Insurance Agency, Inc. and has been for more than five years. He also has served as a director of Peoples National Bank since 1977 and of Patriot Bank, National Association since 1996. | ||||
Williams, R. E. | 71 | 4/96 | ||
R. E. Williams is retired. Previously he was President of Dry Fork Milling Company Inc., Danville, Virginia for more than five years. He also has served as director of Peoples National Bank since 1977, Patriot Bank, National Association since 1996 and of Bank Building Corporation since 1995. | ||||
AUDIT COMMITTEE REPORT OF THE BOARD OF DIRECTORS
The entire Board of Directors functions as the Bank’s Audit Committee and in this capacity met four times in 2005. The functions of the Board in the audit area are focused on three areas:
| • | the adequacy of the Bank’s internal controls and financial reporting process and the reliability the financial statements; |
| • | the independence and performance of the Bank’s internal auditors and independent auditors; |
| • | the Bank’s compliance with legal and regulatory requirements. |
We meet with management periodically to consider the adequacy of the Bank’s internal controls and the objectivity of its financial reporting. We discuss these matters with the Bank’s independent auditors and with appropriate financial personnel and internal auditors.
We also periodically review the performance of the independent auditors and their independence from management.
All of the Directors who serve as the Bank’s Audit Committee, with the exception of Chairman of the Board and President Carter, are “independent” for the purposes of the Nasdaq Stock Market listing standards.
The Board has not adopted a written charter setting forth the responsibilities and authority of the Board in its capacity as the Audit Committee. Although Mr. Carter is not independent under the Nasdaq Stock Market or SEC standards for audit committee membership, the Board of Directors has determined that Mr. Carter possesses the knowledge and experience
13
Table of Contents
required to be considered an audit committee financial expert. In addition, the Board of Directors believes that all of the Bank’s Directors possess the financial knowledge and expertise necessary to protect the Bank’s shareholders in performing the functions of an audit committee. The Board of Directors is not aware of any family relationship between any Director, executive officer or person nominated by the Bank to become a Director; nor is the Board of Directors aware of any involvement in legal proceedings that would be material to an evaluation of the ability or integrity of any Director, executive officer or person nominated to become a Director.
Management has primary responsibility for the Bank’s financial statements and the overall reporting process, including the Bank’s system of internal controls.
The independent auditors audit the annual financial statements prepared by management, express an opinion as to whether those statements fairly present the financial position, results of operations and cash flows of the Bank in conformity with generally accepted accounting principles and discuss with us any issues they believe should be raised with us.
This year, we reviewed the Bank’s audited financial statements and met with both management and Goodman & Company, LLP, the Bank’s independent auditors, to discuss those financial statements. Management has represented to us that the financial statements were prepared in accordance with generally accepted accounting principles.
We have received from and discussed with Goodman & Company the written disclosure and the letter required by Independence Standards Board Statement No. 1 (Independence Discussions with Audit Committees) relating to that firm’s independence from the Bank. We also discussed with Goodman & Company the matters required to be discussed by Statement on Auditing Standard No. 61 (Communication with Audit Committees).
Based on these reviews and discussions, we recommended to the Board that the Bank’s audited financial statements be included in the Bank’s Annual Report on Form 10-KSB for the fiscal year ended December 31, 2005 for filing with the Office of the Comptroller of the Currency (“OCC”).
Directors
George B. Buchanan, Jr.
Worth Harris Carter, Jr
Phyllis Q. Karavatakis
James C. Moses R. E. Williams
SECTION 16(a) BENEFICIAL OWNERSHIP REPORTING COMPLIANCE
Section 16(a) of the Securities Exchange Act of 1934 requires that Directors and executive officers, and persons who control more than 10% of the Bank’s equity securities, file reports of ownership and reports of changes in ownership of the Bank’s outstanding equity securities. All such filings have been filed timely during 2005.
The Bank has not adopted a Code of Ethics for its directors, executives and employees, primarily because management of the Bank believes and understands that our officers and directors adhere to and follow ethical standards without the necessity of a written policy. The Bank’s Board of Directors will revisit this issue in the future to determine if adoption of a code of ethics is appropriate. In the meantime, the Bank’s management requires and promotes honest and ethical conduct, full and fair disclosure in its reports to the OCC, and compliance with applicable governmental laws and regulations.
| ITEM 10. | EXECUTIVE COMPENSATION. |
The Bank’s compensation program is designed to offer competitive compensation to employees based on each individual’s contribution to the Bank’s overall success. As such, the program provides a competitive compensation package to attract and retain capable employees.
14
Table of Contents
The compensation and benefits program consists of salary, a profit sharing plan, and life, health and disability insurance. The compensation and benefits program for officers parallels that of all other employees. The Bank offers no stock options or other forms of equity compensation, bonuses, employment contracts, country club memberships or other perquisites to officers or employees.
The entire Board of Directors performs the functions of a Salary Committee for the Bank. The Board has the responsibility for administering the Bank’s overall compensation program and for setting the salaries for the Bank’s officers. In setting the compensation of the Bank’s officers, the Board generally relies on the recommendations of the Chairman and President and the Board members’ own significant personal knowledge of the compensation provided to other, similarly situated, executives in banking and other industries in the local area. The Board also reviews each individual’s performance and contribution to the overall Bank goals in determining the level of salary for the coming year.
Mr. Worth Harris Carter, Jr., Chairman of the Board and President, serves as the Chief Executive Officer of Central National Bank. As noted below under “Certain Relationships and Related Transactions,” Mr. Carter also serves as Chairman and President of nine other banks. The Salary Committee of the Board of Directors of (Patrick Henry National Bank) actually sets Mr. Carter’s annual salary each year. The cost of Mr. Carter’s compensation, which consists of his salary plus an amount equal to twenty-nine percent of his salary to cover payroll taxes and all other benefits, is shared by the ten banks on the basis of average deposits of each bank related to total average deposits of all the banks that he serves. Mr. Carter’s total compensation, which is paid through Bank Services of Virginia, Inc. (“Bank Services”), is reflected below in two charts. The first chart reflects Mr. Carter’s total compensation as paid by Bank Services. The second chart reflects only the portion of Mr. Carter’s total compensation that is allocated to Central National Bank. During 2005, no other executive officer of the Bank received compensation in excess of $100,000.
Summary Compensation Tables
Bank Services of Virginia, Inc.
Annual Compensation
Name and Principal Position | Year | Salary | Other Annual Compensation² | All Other Compensation³ | ||||||
Worth Harris Carter, Jr. | 2005 | $ | 575,000 | — | $ | 80,000 | ||||
Chairman of the Board and | 2004 | $ | 575,000 | — | $ | 78,000 | ||||
President | 2003 | $ | 530,000 | — | $ | 67,000 | ||||
| (1) | This table shows the total cash compensation paid to Mr. Carter by Bank Services of Virginia, Inc. during 2005, 2004 and 2003 for his services as Chairman of the Board and President of all ten banks. |
| (2) | The amount of compensation in the form of perquisites and other personal benefits properly categorized in this column did not exceed the lesser of $50,000 or 10% of Mr. Carter’s annual salary for any of the three years reported. |
| (3) | “All Other Compensation” consists of amounts contributed for Mr. Carter under Bank Services’ qualified profit sharing plan and amounts contributed for Mr. Carter under Bank Services’ non-qualified profit sharing plan for highly paid executives. For 2005, these amounts consisted of $27,000 contributed to the qualified profit sharing plan and $53,000 contributed to the non-qualified profit sharing plan. |
15
Table of Contents
Central National Bank
Annual Compensation
Name and Principal Position | Year | Salary | Other Annual Compensation² | All Other Compensation³ | ||||||
Worth Harris Carter, Jr. | 2005 | $ | 25,000 | — | $ | 3,000 | ||||
Chairman of the Board and President | 2004 | $ | 27,000 | — | $ | 4,000 | ||||
| 2003 | $ | 26,000 | — | $ | 3,000 | |||||
| (1) | This table shows the portion of Mr. Carter’s total cash compensation during 2005, 2004 and 2003 allocated to Central National Bank. |
| (2) | The amount of compensation in the form of perquisites and other personal benefits properly categorized in this column did not exceed the lesser of $50,000 or 10% of Mr. Carter’s annual salary for any of the three years reported. |
| (3) | “All Other Compensation” consists of the portion allocated to Central National Bank for contributions on Mr. Carter’s behalf to Bank Services’ qualified profit sharing plan and non-qualified profit sharing plan for highly paid executives. For 2005, the portion allocated to Central National Bank consisted of $1,000 for the qualified profit sharing plan and $2,000 for the non-qualified profit sharing plan. |
Profit Sharing Plan
The Bank has adopted an integrated profit sharing plan. The plan covers all full time employees that have been employed for six (6) months and have reached the age of 20-1/2 as of the first day of the plan year. Persons who have reached the age of 62 are fully vested regardless of length of service. The regular vesting schedule is as follows:
Years of Service | Vested Percentage | Forfeitable Percentage | ||
Less than 5 | 0 | 100 | ||
5 or more | 100 | 0 |
Each year the Board of Directors determines what amount, if any, is to be allocated to the plan out of accumulated or current earnings of the Bank. The Bank’s contribution to the plan was $68,000 in 2005, $65,000 in 2004, and $54,000 in 2003.
Chairman of the Board and President Carter does not participate in the profit sharing plan of Central National Bank or any of the other nine banks. Instead, Mr. Carter participates in the two profit sharing plans of Bank Services of Virginia, Inc., a qualified profit sharing plan and a nonqualified plan for highly paid executives whose contribution to the qualified plan is limited due to IRS regulations. The Bank’s annual contributions to these plans on Mr. Carter’s behalf are detailed in the two Summary Compensation Tables above.
DIRECTOR COMPENSATION
Each outside Director (not also an officer of the Bank) currently receives $75 for each Board meeting attended.
16
Table of Contents
| ITEM 11. | SECURITY OWNERSHIP OF CERTAIN BENEFICIAL OWNERS AND MANAGEMENT AND RELATED STOCKHOLDER MATTERS. |
The following table shows as of March 16, 2006, the beneficial ownership of the Bank’s common stock of each Director, the executive officers identified in the Summary Compensation Table and the Bank’s Directors and executive officers as a group. As of March 16, 2006, the Bank’s Directors and executive officers as a group, beneficially owned 55,297 shares (or 23.0%) of the Bank’s outstanding common stock.
Name | Amount and Nature of Beneficial Ownership (1)(2) | Ownership as a Percentage of Common Stock Outstanding | ||||
Buchanan, George B., Jr. | 11,838 | (3) | 5.01 | % | ||
Carter, Worth Harris, Jr. | 40,339 | (4) | 17.06 | % | ||
Karavatakis, Phyllis Q. | 265 | (5) | 0.1 | % | ||
Moses, James C. | 880 | (6) | 0.4 | % | ||
Williams, R. E. | 1,975 | 0.8 | % | |||
All Directors and Executive | 55,297 | 23 | % | |||
Officers as a Group (5 persons) |
| (1) | For purposes of this table, beneficial ownership has been determined in accordance with the provisions of Rule 13d-3 of the Securities Exchange Act of 1934 under which, in general, a person is deemed to be the beneficial owner of a security if he has or shares the power to vote or direct the voting of the security or the power to dispose of or direct the disposition of the security, or if he has the right to acquire beneficial ownership of the security within sixty days. |
| (2) | Unless otherwise indicated, the shares listed in the table represent sole voting and investment power. |
| (3) | Includes 11,678 shares held jointly with Mr. Buchanan’s wife. |
| (4) | Includes 3,950 shares held by Mr. Carter as custodian for his children and grandchildren; 150 shares held by Mr. Carter’s son, Ernest Linwood Carter, II, who resides in Mr. Carter’s household; 980 shares held for Mr. Carter’s account in the Mortgage Company of Virginia, Inc./Bank Services of Virginia, Inc. Non-Qualified Profit-Sharing Plan; 4,400 shares held by C&C Realty, Inc.,of which Mr. Carter is president and a 50% owner; 370 shares held by Mr. Carter’s brother, Ernest L. Carter; and 289 shares held as executor of his wife’s estate. |
| (5) | Includes 3 shares held jointly with Mrs. Karavatakis’ husband and 162 shares held by Mrs. Karavatakis as custodian for her daughter. |
| (6) | Includes 588 shares held by the James C. Moses & Nancy Wells Moses Revocable Living Trust, of which Mr. Moses and his wife are co-trustees |
Equity Compensation Plans.No disclosure regarding equity compensation plans has been provided because the Bank does not have any outstanding equity compensation plans or arrangements that would be covered by Item 201(d) of Regulation S-B.
| ITEM 12. | CERTAIN RELATIONSHIPS AND RELATED TRANSACTIONS. |
Mr. Carter, Chairman of the Board and President of Central National Bank also serves as Chairman of the Board and President of Patrick Henry National Bank, Blue Ridge Bank, N.A., Mountain National Bank, Community National Bank, First National Bank, First National Exchange Bank, Peoples National Bank, Patriot Bank, N.A., and Shenandoah National Bank.
17
Table of Contents
The Bank maintains a correspondent bank account with one of these banks. In 2005 and 2004, the average daily balance in this account was considered a normal operating balance to facilitate general business transactions. The Bank also participates in loan transactions with these banks. These transactions are at carrying value and do not involve more than the normal risk of collectibility or present other unfavorable features.
The Bank owns 10% of the outstanding common stock of The Mortgage Company of Virginia, Inc. The remaining common stock is equally owned by the banks listed above. The Mortgage Company of Virginia owns 100% of Bank Services of Virginia, Inc. The business of both of these companies is to provide operational support services to the ten banks. The Bank is charged for its share of these services. The cost of this expense is shared by the ten banks on the basis of average deposits of each bank related to total average deposits of all the banks.
The Mortgage Company of Virginia, Inc. also owns 100% of Bank Services Insurance, Inc. Bank Services Insurance, Inc. provides insurance products to the banks and customers in the Danville area. The premiums paid to Bank Services Insurance, Inc. equaled $9,000 at December 31, 2005.
The Mortgage Company of Virginia, Inc. also owns 50% of Coresoft, Inc. represented by an initial $1,000 investment during 2004. Coresoft, Inc. is in the process of developing a core software package the banks listed above will use. At December 31, 2005, Coresoft, Inc. had an outstanding note payable to the Mortgage Company of $1,400,000.
The Chairman of the Board and President of the Bank also serves as Chairman of the Board and President of Bank Building Corporation and Manager of Blackstone Properties, LLC, it’s wholly owned subsidiary (the “companies”). The companies lease branches to certain of the banks listed above. At December 31, 2005, the Bank leased three offices from the companies. Rental expense under these leases was $ 158,000 in 2005, $208,000 in 2004 and $174,000 in 2003. The Bank also leases offices from non-related parties under various terms. Rental expense under that lease was $37,000 for 2005 and 2004 and $29,000 for 2003. Future minimum lease payments will be $213,000 per year through 2010, and thereafter (may vary based on changing interest rates). As of December 31, 2005 and 2004, the Bank had loans totaling $1,040,000 and $1,064,000, respectively, to Bank Building Corporation. These loans were made to purchase bank branches leased to affiliated banks. The loans are secured by these branches and the related leases, and have repayment terms similar to other loan customers of the Bank.
In the ordinary course of business, the Bank’s Directors and executive officers and their related interests were customers of, and had transactions with the Bank. Loan transactions with Directors and officers, principal security holders and associates were made on substantially the same terms as those prevailing at the time for comparable loans to other persons and did not involve more than normal risk of collectibility or present other unfavorable features. There was no such loan activity during 2005 or 2004.
| ITEM 13. | EXHIBITS. |
Exhibits: | ||
| 3.1 | Articles of Association (filed with the Office of the Comptroller of the Currency prior to the opening of the Bank) | |
| 3.2 | Amended and Restated Bylaws (as amended and restated through February 17, 2005) (incorporated by reference to Exhibit 3.2 to Form 8-K filed with the Office of the Comptroller of the Currency on February 17, 2005) | |
| 13 | 2005 Annual Report to Shareholders, as revised | |
| 31 | Certification by principal executive officer and principal financial officer pursuant to Rule 13a-14(a) | |
| 32 | Certification of principal executive officer and principal financial officer pursuant to 18 U.S.C. § 1350 | |
18
Table of Contents
| ITEM 14. | PRINCIPAL ACCOUNTANT FEES AND SERVICES. |
Goodman & Company, LLP served as the Bank’s independent public auditors for the year ended December 31, 2005, and has been selected by the Board to act as the Bank’s independent public auditors for the year ending December 31, 2006. A representative of Goodman & Company will be present at the Annual Meeting and will be given the opportunity to make a statement and respond to appropriate questions from shareholders.
The following table presents the fees for professional audit services rendered by Goodman & Company for the audit of the Bank’s annual financial statements for the years ended December 31, 2005 and 2004, and fees billed for other services rendered by Goodman & Company during those periods.
Year Ended December 31,
| 2005 | 2004 | |||||
Audit fees¹ | $ | 3,350 | $ | 3,130 | ||
Audit-related fees | — | — | ||||
Tax fees² | 3,265 | 3,100 | ||||
All other fees | — | — | ||||
Total Fees | $ | 6,615 | $ | 6,230 | ||
| 1 | Audit fees consist of audit and review services, consents and review of documents filed with the OCC. |
| 2 | Tax fees consist of preparation of federal and state tax returns and consultation concerning tax compliance issues. |
In its capacity as the Audit Committee, the Board of Directors considered the compatibility of the non-audit-related services performed by and fees paid to Goodman & Company in 2005 and 2004 and the proposed non-audit-related services and proposed fees for 2006 and determined that such services and fees are compatible with the independence of Goodman & Company as the Bank’s independent auditors.
Also in its capacity as the Audit Committee, the Board of Directors pre-approves all audit (including audit-related) and permitted non-audit services to be performed by the independent auditors. The Board of Directors annually approves the year-end audit to be performed by the Bank’s independent auditors for the fiscal year. With respect to other permitted services, the Board of Directors pre-approves specific engagements, projects and categories of services on a fiscal year basis.
19
Table of Contents
SIGNATURES
In accordance with Section 13 or 15(d) of the Exchange Act, the registrant has caused this report to be signed on its behalf by the undersigned, thereunto duly authorized.
| CENTRAL NATIONAL BANK | ||||
Date: September 8, 2006 | /s/ Worth Harris Carter, Jr. | |||
| Worth Harris Carter, Jr. | ||||
| Chairman of the Board and President | ||||
In accordance with the Exchange Act, this report has been signed below by the following persons on behalf of the registrant and in the capacities and on the dates indicated.
Signature | Capacity | Date | ||
/s/ Worth Harris Cater, Jr. | ||||
Worth Harris Carter, Jr. | Chairman of the Board and President (principal executive, principal financial and principal accounting officer) | September 8, 2006 | ||
/s/ George B. Buchanan, Jr. | ||||
George B. Buchanan, Jr. | Director | September 8, 2006 | ||
/s/ Phyllis Q. Karavatakis | ||||
Phyllis Q. Karavatakis | Director | September 8, 2006 | ||
| ||||
James C. Moses | Director | September , 2006 | ||
/s/ R. E. Williams | ||||
R. E. Williams | Director | September 8, 2006 | ||
20
Table of Contents
Exhibit 31
CERTIFICATION
I, Worth Harris Carter, Jr., certify that:
| 1. | I have reviewed this annual report on Form 10-KSB/A of Central National Bank; |
| 2. | Based on my knowledge, this report does not contain any untrue statement of a material fact or omit to state a material fact necessary to make the statements made, in light of the circumstances under which such statements were made, not misleading with respect to the period covered by this report; and |
| 3. | Based on my knowledge, the financial statements, and other financial information included in this report, fairly present in all material respects the financial condition, results of operations and cash flows of the small business issuer as of, and for, the periods presented in this report. |
| Date: September 8, 2006 | /s/ Worth Harris Carter, Jr. | |||
| Worth Harris Carter, Jr. | ||||
| Chairman of the Board and President | ||||
| (principal executive officer and principal financial officer) |
21
Table of Contents
Exhibit 32
CERTIFICATION OF
PRINCIPAL EXECUTIVE OFFICER AND PRINCIPAL FINANCIAL OFFICER
Pursuant to Section 906 of the Sarbanes-Oxley Act of 2002 (18 U.S.C. Section 1350)
The undersigned, as the principal executive officer and principal financial officer of Central National Bank, certifies that, to the best of his knowledge and belief, the Annual Report on Form 10-KSB/A for the fiscal year ended December 31, 2005 which accompanies this certification fully complies with the requirements of Section 13(a) or 15(d) of the Securities Exchange Act of 1934 and the information contained in the report fairly presents, in all material respects, the financial condition and results of operations of Central National Bank at the dates and for the periods indicated. The foregoing certification is made pursuant to Section 906 of the Sarbanes-Oxley Act of 2002 (18 U.S.C. Section 1350) and shall not be relied upon for any other purpose. The undersigned expressly disclaims any obligation to update the foregoing certification except as required by law.
| Date: September 8, 2006 | /s/ Worth Harris Carter, Jr. | |||
| Worth Harris Carter, Jr. | ||||
| Chairman of the Board and President | ||||
| (principal executive officer and principal financial officer) |
22
Table of Contents
Exhibit 13
2005
Annual Report

Central National Bank
Member FDIC
Table of Contents
Management’s Discussion and Analysis of Financial Condition and Results of Operation
Except for the historical information contained in this report, the matters set forth herein include Forward-Looking Statements within the meaning of the “safe harbor” provisions of the Private Securities Litigation Reform Act of 1995. These Forward-Looking Statements included, among other things, statements of goals, plans, intentions, and expectations, regarding or based upon desired business strategies, general economic conditions, interest rates, developments in local and national markets, and other matters, which, by their nature, are subject to significant uncertainties. Because of these uncertainties and the assumptions upon which this report is based, actual future developments with respect to the business of the Bank may differ materially from those contemplated by such statements.
Critical Accounting Policies.The accounting and reporting policies of the Bank conform to generally accepted accounting principles in the United States of America (GAAP) and to general practices within the banking industry. The preparation of the financial statements in conformity with GAAP requires management to make estimates and assumptions that affect the amounts reported in the financial statements and accompanying notes. We believe the most significant of these estimates involves the allowance for loan losses because of its potential impact on our overall performance. We have described our policies in this area below. A summary of the Bank’s significant accounting policies can be found in the Notes to the Financial Statements.
In general, determining the amount of the allowance for loan losses requires significant judgment and the use of estimates by management. The Bank maintains an allowance for loan losses to absorb probable losses in the loan portfolio based on a quarterly analysis of the portfolio and expected future losses. This analysis determines an appropriate level of the allowance for loan losses by considering factors affecting loan losses, including specific losses, levels and trends in impaired and non-performing loans, historical loan loss experience, current economic conditions, volume, growth and composition of the portfolio, and other relevant factors. The Bank records a provision for loan losses to maintain the allowance at an adequate level. The provision expense could increase or decrease each quarter based upon the results of management’s formal analysis.
The amount of the allowance represents management’s estimate of expected losses from existing loans based upon specific allocations for individual lending relationships and historical loss experience. The allowance for loan losses related to impaired loans is based on discounted cash flows using the loan’s initial effective interest rate or the fair value of the collateral for certain collateral dependent loans. This evaluation requires management to make estimates of the amounts and timing of future cash flows on impaired loans, which consists primarily of nonaccrual and restructured loans. Actual losses for these loans can vary significantly from these estimates.
Summary of Operations.Net income for 2005 equaled $731,000, or $3.09 per share, compared to $943,000, or $3.99 per share, for 2004. This represents a return on average assets of 0.65% and return on average equity of 7% compared to 0.80% and 10%, respectively, for last year.
Total deposits increased $4.6 million during the year. There has been a slight shift in the composition of our deposits as customers have moved their funds from shorter-term accounts into Certificates of Deposit. LIFETIME FREE CHECKING and time deposits increased while all other categories decreased.
Net Interest Income.Net interest income is our largest source of revenue and has been impacted by the very low level of interest rates for the last two years. Since 2001, the Federal Reserve has reduced the target rate for federal funds, which is a major factor in the level of most short-term interest rates, from 6.50% to 1.00%. The 1.00% rate continued until June 2004 when the Federal Reserve began a series of one-quarter percent increases on 14 different occasions over the last year and a half, to the latest increase in January 2006 at 4.50%. The Fed is expected to increase rates one or two times before pausing.
While we increased loans and investments, the increase in our costs of deposits occurred more rapidly than our increase in interest income and, as a result, net interest income declined $102,000 over the prior year. This was a significant improvement over the $809,000 decline in net interest income from 2003 to 2004. With interest rates at a higher level we anticipate our existing loans will increase in yield at a faster pace than the net increase in the costs of deposits.
The following table shows a summary of the changes in interest income and interest expense resulting from changes in volume and changes in rates (in thousands) for each category of interest-earning assets and interest-bearing liabilities for 2005/2004 and 2004/2003.
(Dollars in Thousands) | ||||||||
Asset/Liability | 2005 vs 2004 Increase (Decrease) (Revised) | 2004 vs 2003 Increase (Decrease) | ||||||
Real Estate Loans | $ | 26 | $ | (1,132 | ) | |||
Installment Loans | 91 | (63 | ) | |||||
Commercial Loans | (258 | ) | 163 | |||||
Total Loans | (141 | ) | (1,032 | ) | ||||
Interest-Bearing Deposits in Other Financial Institutions | 71 | 72 | ||||||
Investment Securities | (146 | ) | (291 | ) | ||||
Federal Funds Sold | 236 | 17 | ||||||
Total Earning Assets | 20 | (1,234 | ) | |||||
Interest-Bearing Transactions Accounts | 60 | (16 | ) | |||||
Savings Accounts (Includes MMDAs) | (18 | ) | (53 | ) | ||||
Certificates of Deposit $100,000 and Over | 78 | 66 | ||||||
Other Certificates of Deposit | 77 | (430 | ) | |||||
Total Deposits | 197 | (433 | ) | |||||
Subordinated Notes | 14 | (1 | ) | |||||
Federal Funds Purchased | (90 | ) | 9 | |||||
Notes Issued to the U. S. Treasury | 1 | — | ||||||
Total Interest-Bearing Liabilities | 122 | (425 | ) | |||||
Change in Net Interest Income | $ | 102 | $ | 809 | ||||
2
Table of Contents
The following table details the average balances and cost and yield data for the earning assets and interest-bearing liabilities:
(Dollars in Thousands)
| 2005 (Revised) | 2004 | 2003 | |||||||||||||||||||||||||
Asset/Liability | Average Balance | Interest | Yield/ Cost | Average Balance | Interest | Yield/ Cost | Average Balance | Interest | Yield/ Cost | ||||||||||||||||||
Real Estate Loans | $ | 51,738 | $ | 3,141 | 6.07 | % | $ | 50,442 | $ | 3,115 | 6.18 | % | $ | 57,662 | $ | 4,247 | 7.37 | % | |||||||||
Installment Loans | 2,652 | 241 | 9.09 | % | 2,559 | 150 | 5.86 | % | 2,445 | 213 | 8.71 | % | |||||||||||||||
Commercial Loans | 11,796 | 756 | 6.41 | % | 17,119 | 1,014 | 5.92 | % | 13,346 | 851 | 6.38 | % | |||||||||||||||
Total Loans | 66,186 | 4,138 | 6.25 | % | 70,120 | 4,279 | 6.10 | % | 73,453 | 5,311 | 7.23 | % | |||||||||||||||
Interest-Bearing Deposits in Other Financial Institutions | 11,148 | 422 | 3.79 | % | 15,447 | 351 | 2.27 | % | 11,629 | 279 | 2.40 | % | |||||||||||||||
Investment Securities | 15,339 | 620 | 4.04 | % | 16,461 | 766 | 4.65 | % | 21,808 | 1,057 | 4.85 | % | |||||||||||||||
Federal Funds Sold | 7,536 | 296 | 3.93 | % | 5,867 | 60 | 1.02 | % | 4,307 | 43 | 1.00 | % | |||||||||||||||
Total Earning Assets | 100,209 | 5,476 | 5.46 | % | 107,895 | 5,456 | 5.06 | % | 111,197 | 6,690 | 6.02 | % | |||||||||||||||
Interest-Bearing Transaction Accounts | 7,129 | 88 | 1.23 | % | 5,649 | 28 | 0.50 | % | 5,280 | 44 | 0.83 | % | |||||||||||||||
Savings Accounts (Includes MMDAs) | 17,481 | 231 | 1.32 | % | 21,095 | 249 | 1.18 | % | 18,218 | 302 | 1.66 | % | |||||||||||||||
Certificates of Deposit $100,000 and Over | 16,370 | 627 | 3.83 | % | 18,895 | 549 | 2.91 | % | 19,036 | 483 | 2.54 | % | |||||||||||||||
Other Certificates of Deposit | 38,863 | 1,181 | 3.04 | % | 41,571 | 1,104 | 2.66 | % | 50,096 | 1,534 | 3.06 | % | |||||||||||||||
Total Deposit | 79,843 | 2,127 | 2.66 | % | 87,210 | 1,930 | 2.21 | % | 92,630 | 2,363 | 2.55 | % | |||||||||||||||
Subordinated Notes | — | — | — | 1,500 | 90 | 6.00 | % | 1,500 | 91 | 6.07 | % | ||||||||||||||||
Federal Funds Purchased | 1,656 | 26 | 1.57 | % | 1,051 | 12 | 1.14 | % | — | 3 | — | ||||||||||||||||
Notes Issued to the U.S. Treasury | 74 | 2 | — | 82 | 1 | 1.22 | % | — | 1 | — | |||||||||||||||||
Total Interest-Bearing Liabilities | $ | 81,573 | $ | 2,155 | 2.64 | % | $ | 89,843 | $ | 2,033 | 2.26 | % | $ | 94,130 | $ | 2,458 | 2.61 | % | |||||||||
Net Interest Income | $ | 3,321 | $ | 3,423 | $ | 4,232 | |||||||||||||||||||||
Net Yield on Earning Assets | 3.31 | % | 3.17 | % | 3.81 | % | |||||||||||||||||||||
Loans.Loans increased from $66 million at year-end 2004 to $69 million at year-end 2005, a increase of $3.3 million, or 5%. This increase occurred primarily in the Real-Estate secured loan segment of the portfolio.
The portfolio remains concentrated in real estate loans with real estate loans making up approximately 78% of total loans at year-end 2005 compared to 73% in 2004.
The Bank also continues to maintain flexibility in the maturity of the loan portfolio. Approximately 71% of the loans have adjustable interest rates as of year-end 2005 compared to 61% at year-end 2004. In addition, the combination of adjustable rate and fixed rate loans that adjust or mature within one year equals 36% of the total portfolio at year-end 2005 compared to 88% last year.
Allowance and Provision for Loan Losses. As discussed previously, the Allowance for Loan Losses represents management’s estimation of the amount necessary to absorb future losses in the loan portfolio. On the Statement of Condition, the Allowance for Loan Losses is deducted from Total Loans so that the net amount shown represents the estimated realizable total loans. The Provision for Loan Losses is the amount charged to expense to maintain the Allowance at an adequate level.
Based on managements analysis of the loan portfolio including nonaccrual and impaired loans, the Provision for Loan Losses remained consistent at $84,000 for 2005 and 2004.
(Dollars in thousands)
| December 31 | ||||||||||||||||||||
| 2005 | 2004 | 2003 | 2002 | 2001 | ||||||||||||||||
Balance Beginning of Year | $ | 1,038 | $ | 982 | $ | 520 | $ | 444 | $ | 389 | ||||||||||
Provision for Loan Losses | 84 | 84 | 513 | 84 | 60 | |||||||||||||||
Net Loan Losses | ||||||||||||||||||||
Real Estate Loans | 103 | 13 | 42 | — | — | |||||||||||||||
Installment Loans | 10 | 15 | 9 | 8 | 5 | |||||||||||||||
Commercial Loans | — | — | — | — | — | |||||||||||||||
Total Net Loan Losses | 113 | 28 | 51 | 8 | 5 | |||||||||||||||
Balance | $ | 1,009 | $ | 1,038 | $ | 982 | $ | 520 | $ | 444 | ||||||||||
Net loan Losses to Average Loans | 0.17 | % | 0.04 | % | 0.07 | % | 0.01 | % | 0.01 | % | ||||||||||
Allowance for Loan Losses to Period-End Loans | 1.46 | % | 1.57 | % | 1.33 | % | 0.79 | % | 0.70 | % | ||||||||||
Nonaccrual loans are those loans contractually past due 90 days or more on which no interest is being accrued.
Other real estate owned consists of real estate acquired through foreclosure. These properties are reviewed quarterly and reduced to an estimated realizable value at that time.
3
Table of Contents
Information concerning nonaccrual loans and other real estate owned is presented in the following table:
(Dollars in thousands) | ||||||||||||||||||||
| December 31 | ||||||||||||||||||||
| 2005 (Revised) | 2004 | 2003 | 2002 | 2001 | ||||||||||||||||
Nonaccrual Loans | ||||||||||||||||||||
Real Estate | $ | 3,050 | $ | 1,075 | $ | 1,077 | $ | — | $ | — | ||||||||||
Installment | — | — | — | — | 3 | |||||||||||||||
Commercial | — | — | — | — | — | |||||||||||||||
Total Nonaccrual Loans | 3,050 | 1,075 | 1,077 | — | 3 | |||||||||||||||
Real Estate Owned Other Than Bank Premises | 772 | 927 | 285 | 403 | 111 | |||||||||||||||
Total Non-Performing Assets | $ | 3,822 | $ | 2,002 | $ | 1,362 | $ | 403 | $ | 114 | ||||||||||
Allowance for Loan Losses to Non-Performing Assets | 263 | % | 518 | % | 72 | % | 129 | % | 389 | % | ||||||||||
The following table presents the volume of loans contractually past due for 90 days or more on which interest continues to be accrued. These loans are believed to be well collateralized and present little or no likelihood of loss of principal.
(Dollars in thousands) | |||||||||||||||
| December 31 | |||||||||||||||
Loans 90 Days or More Past Due | 2005 | 2004 | 2003 | 2002 | 2001 | ||||||||||
Real Estate | $ | — | $ | 1,700 | $ | 1,191 | $ | — | $ | 1,218 | |||||
Installment | — | — | — | — | — | ||||||||||
Commercial | — | — | — | — | — | ||||||||||
Total Loans 90 Days or More Past Due | $ | — | $ | 1,700 | $ | 1,191 | $ | — | $ | 1,218 | |||||
Non-Interest Income and Expense. Non-interest Income equaled $423,000 for 2005 compared to $459,000 for 2004. The principal component of non-interest income is service charges on deposit accounts, which equaled $339,000 for 2004 and 2005. Non-interest expenses increased from $2.5 million in 2004 to $2.6 million in 2005. All categories of non-interest expense increased.
Investments. The total investment securities increased $4.2 million, or 35% With interest rates at levels never seen in recent times we increased investments in U. S. Agency Securities, where higher yields were available, while reducing interest bearing deposits in other financial institutions.
Deposits. Total deposits increased $4.6 million compared to last year. Time deposits and Lifetime Free Checking increased while all other deposit categories decreased. There was a shift in deposits as customers began moving their funds from shorter-term accounts into Certificate of Deposits.
Interest Sensitivity Analysis. The frequency with which interest rates on earning assets and interest bearing liabilities change has a significant impact on net interest income. The following table presents the anticipated changes based on the contractual maturity of each instrument. Expected maturities may differ from contractual maturities as both borrowers and depositors may have the right to call or prepay obligations with or without call or prepayment penalties.
(Dollars in thousands) | |||||||||||||
(Revised) Use of Funds | Within One Year | One to Five Years | Over Five Years | Total | |||||||||
Interest-Bearing Deposits in Other Financial Institutions | $ | 10,099 | $ | 1,287 | $ | — | $ | 11,386 | |||||
Investment Securities | 1,893 | 14,503 | — | 16,396 | |||||||||
Loans | 24,907 | 28,410 | 16,205 | 69,522 | |||||||||
Total Earning Assets | $ | 36,899 | $ | 44,200 | $ | 16,205 | $ | 97,304 | |||||
Deposits | |||||||||||||
Interest-Bearing Demand | $ | 8,450 | $ | — | $ | — | $ | 8,450 | |||||
Regular Passbook Savings | 10,064 | — | — | 10,064 | |||||||||
Time Deposits | |||||||||||||
Certificates of Deposit $100,000 and Over | 4,134 | 13,082 | — | 17,216 | |||||||||
Other | 20,813 | 18,797 | — | 39,610 | |||||||||
Total Deposits | 43,461 | 31,879 | — | 75,340 | |||||||||
Federal Funds Purchased | — | — | — | — | |||||||||
Subordinated Notes | — | — | — | — | |||||||||
Notes issued to the U. S. Treasury | 264 | — | — | 264 | |||||||||
Total Interest-Bearing Liabilities | $ | 43,725 | $ | 31,879 | $ | — | $ | 75,604 | |||||
Maturity/Rate Sensitivity Gap Per Period | $ | (6,826 | ) | $ | 12,322 | $ | 16,205 | $ | 21,700 | ||||
Cumulative Maturity/Rate Sensitivity Gap | $ | (6,826 | ) | $ | 5,495 | $ | 21,700 | ||||||
4
Table of Contents
Capital.The federal regulatory agencies use risk-based capital ratios to analyze the adequacy of a bank’s capital. These ratios weigh bank assets from 0% to 100% depending upon the risk inherent in each type of asset. The Bank continues to meet all requirements for a well capitalized bank as defined by the regulatory agencies. The following table presents the key risk-based capital ratios for December 31, 2005 and 2004. Additional details regarding capital may be found in the footnotes of the Financial Statements.
| 2005 (Revised) | 2004 | |||||
Tier 1 Ratio | 13.39 | % | 12.52 | % | ||
Total Risk-Based Capital Ratio | 14.64 | % | 13.77 | % | ||
Leverage Ratio | 8.90 | % | 8.90 | % |
Liquidity. Liquidity is our ability to fund both loans and investments in the normal course of business and to provide adequate protection for unexpected deposit withdrawals or other demands for funds without incurring a significant negative impact on profitability. Our primary source of day-to-day liquidity lies in the combination of cash, deposit balances, checks in the process of collection, deposit growth and federal funds sold. Federal funds are excess funds that are sold to other banks, generally on a one-day basis. Normal funds from the repayment of loans and investments augment these funds.
Our secondary source of liquidity lies in our investments and deposits in other financial institutions. While our investments are categorized as held-to-maturity, they consist of short-term U. S. Agency Securities that are readily marketable. As reflected in the previous Interest Sensitivity Analysis, the majority of our investment securities mature in five years or less. Interest-bearing deposits in other financial institutions generally mature in two years or less and the volume of this investment decreased $5.2 million during the year.
Management’s Responsibility for Financial Reporting
The management of Central National Bank has prepared and is responsible for the accompanying financial statements, together with the financial data and other information presented in this annual report. Management believes that the financial statements have been prepared in conformity with accounting principles generally accepted in the United States of America appropriate under the circumstances and include amounts that are based on management’s best estimates and judgments.
Management maintains and depends upon an internal accounting control system designed to provide reasonable assurance that transactions are executed in accordance with management’s authorization, that financial records are reliable as the basis for preparation of all financial statements, and that the Bank’s assets are safeguarded. The design and implementation of all systems of internal control are based on judgments required to evaluate the costs of control in relation to the expected benefits and to determine the appropriate balance between these costs and benefits. The Bank maintains a professional internal audit staff to monitor compliance with the system of internal control. Operational and special audits are conducted, and audit reports are submitted to appropriate management.
The Board of Directors functions as the audit committee and meets periodically with the independent public accountants, Goodman & Company, management and internal auditors to review accounting, auditing and internal reporting matters. The independent public accountants and internal auditors have free access to the Board to discuss the results of their audit work and their evaluations of internal controls and the quality of financial reporting.
The responsibility of Goodman & Company is limited to an expression of their opinion as to the fairness of the financial statements. Their opinion is based on an audit conducted in accordance with Standards of the Public Company Accounting Oversight Board (United States), as described in their report.
Worth Harris Carter, Jr.
Chairman of the Board, President and Chief Financial Officer
5
Table of Contents

Certified Public Accountants
Specialized Services
Business Solutions
Report of Independent Registered Public Accounting Firm
Board of Directors and Shareholders
Central National Bank
We have audited the accompanying statements of financial condition ofCentral National Bank (Bank) as of December 31, 2005 and 2004, and the related statements of income, shareholders’ equity and cash flows for each of the years in the three-year period ended December 31, 2005. These financial statements are the responsibility of the Bank’s management. Our responsibility is to express an opinion on these financial statements based on our audits.
We conducted our audits in accordance with the standards of the Public Company Accounting Oversight Board (United States). Those standards require that we plan and perform the audits to obtain reasonable assurance about whether the financial statements are free of material misstatement. An audit includes examining, on a test basis, evidence supporting the amounts and disclosures in the financial statements. An audit also includes assessing the accounting principles used and significant estimates made by management, as well as evaluating the overall financial statement presentation. We believe that our audits provide a reasonable basis for our opinion.
In our opinion, the financial statements referred to above present fairly, in all material respects, the financial position ofCentral National Bank as of December 31, 2005 and 2004, and the results of its operations and its cash flows for each of the years in the three-year period ended December 31, 2005, in conformity with accounting principles generally accepted in the United States of America.
As further discussed in Note 22 to the financial statements, the statements of financial condition as of December 31, 2005, and the related statements of operations, shareholders’ equity and cash flows for the year ended December 31, 2005, have been revised.

Danville, Virginia
March 1, 2006
110 Exchange Street, Suite G
Danville, VA 24541
ph: 434.792.5334
fax: 434.791.6061
www.goodmanco.com
6
Table of Contents
Statements of Financial Condition
(Dollars in Thousands)
| December 31 | ||||||||
| 2005 (Revised) | 2004 | |||||||
ASSETS: | ||||||||
Interest-Bearing Deposits in Other Financial Institutions | $ | 11,386 | $ | 16,635 | ||||
Investment Securities (Fair Value $16,132 in 2005, $12,222 in 2004) | 16,396 | 12,186 | ||||||
Loans (Net of Unearned Income) | 69,275 | 66,032 | ||||||
Less: Allowance for Loan Losses | (1,009 | ) | (1,038 | ) | ||||
Net Loans | 68,266 | 64,994 | ||||||
Earning Assets | 96,048 | 93,815 | ||||||
Cash and Due from Banks | 7,541 | 4,724 | ||||||
Bank Premises and Equipment | 2,328 | 2,398 | ||||||
Real Estate Owned Other Than Bank Premises | 772 | 927 | ||||||
Investment in Associated Company | 769 | 618 | ||||||
Other Assets | 1,325 | 1,183 | ||||||
TOTAL ASSETS | $ | 108,783 | $ | 103,665 | ||||
LIABILITIES: | ||||||||
Deposits: | ||||||||
LIFETIME FREE CHECKING | $ | 22,773 | $ | 18,333 | ||||
Interest-Bearing Demand | 8,450 | 11,436 | ||||||
Regular Passbook Savings | 10,064 | 10,781 | ||||||
Time Deposits: | ||||||||
Certificates of Deposit $100,000 and Over | 17,216 | 15,219 | ||||||
Other | 39,610 | 37,695 | ||||||
TOTAL DEPOSITS | 98,113 | 93,464 | ||||||
Federal Funds Purchased | — | 500 | ||||||
Notes Issued to the U.S. Treasury | 264 | 50 | ||||||
Other Liabilities | 203 | 179 | ||||||
TOTAL LIABILITIES | 98,580 | 94,193 | ||||||
SHAREHOLDERS’ EQUITY: | ||||||||
Common Stock, Par Value Per Share $5.00; 2,500,000 shares authorized; 236,439 shares outstanding in 2005 and 2004 | 1,182 | 1,182 | ||||||
Surplus | 5,651 | 5,651 | ||||||
Undivided Profits | 3,370 | 2,639 | ||||||
TOTAL SHAREHOLDERS’ EQUITY | 10,203 | 9,472 | ||||||
TOTAL LIABILITIES AND SHAREHOLDERS’ EQUITY | $ | 108,783 | $ | 103,665 | ||||
The accompanying notes are an integral part of these financial statements.
7
Table of Contents
Statements of Income
(Dollars in Thousands Except Per Share Data)
| Years Ended December 31 | |||||||||
| 2005 (Revised) | 2004 | 2003 | |||||||
INTEREST INCOME: | |||||||||
Interest and Fees on Loans: | |||||||||
Taxable | $ | 4,079 | $ | 4,055 | $ | 5,074 | |||
Non-Taxable | 59 | 224 | 237 | ||||||
Interest on Deposits in Other Financial Institutions | 422 | 351 | 279 | ||||||
Interest on Federal Funds Sold | 296 | 60 | 43 | ||||||
Interest and Dividends on Securities: | |||||||||
U.S. Agency Securities and Other | 613 | 721 | 1,021 | ||||||
States and Political Subdivisions | 7 | 45 | 36 | ||||||
TOTAL INTEREST INCOME | 5,476 | 5,456 | 6,690 | ||||||
INTEREST EXPENSE: | |||||||||
Interest on Time Deposits $100,000 and Over | 627 | 549 | 483 | ||||||
Interest on Other Deposits | 1,500 | 1,381 | 1,880 | ||||||
Interest on Subordinated Notes | — | 90 | 91 | ||||||
Interest on Federal Funds Purchased | 26 | 12 | 3 | ||||||
Interest on Notes to the U.S. Treasury | 2 | 1 | 1 | ||||||
TOTAL INTEREST EXPENSE | 2,155 | 2,033 | 2,458 | ||||||
NET INTEREST INCOME | 3,321 | 3,423 | 4,232 | ||||||
Provision for Loan Losses | 84 | 84 | 513 | ||||||
NET INTEREST INCOME AFTER PROVISION FOR LOAN LOSSES | 3,237 | 3,339 | 3,719 | ||||||
NON-INTEREST INCOME: | |||||||||
Service Charges, Commission and Fees | 339 | 339 | 331 | ||||||
Other Non-Interest Income | 84 | 120 | 99 | ||||||
TOTAL NON-INTEREST INCOME | 423 | 459 | 430 | ||||||
NON-INTEREST EXPENSE: | |||||||||
Salaries and Employee Benefits | 1,429 | 1,366 | 1,201 | ||||||
Occupancy Expense | 428 | 401 | 381 | ||||||
Operations Center Expense | 472 | 463 | 467 | ||||||
Other Non-Interest Expense | 283 | 271 | 250 | ||||||
TOTAL NON-INTEREST EXPENSE | 2,612 | 2,501 | 2,299 | ||||||
INCOME BEFORE INCOME TAXES | 1,048 | 1,297 | 1,850 | ||||||
Income Tax Expense | 317 | 354 | 538 | ||||||
NET INCOME | $ | 731 | $ | 943 | $ | 1,312 | |||
NET INCOME PER SHARE:* | |||||||||
Basic and Diluted | $ | 3.09 | $ | 3.99 | $ | 5.55 | |||
| * | Net income per share has been retroactively adjusted to reflect the stock dividend in 2003. |
The accompanying notes are an integral part of these financial statements.
8
Table of Contents
Statements of Cash Flows
(Dollars in Thousands)
| Years Ended December 31 | ||||||||||||
| 2005 (Revised) | 2004 | 2003 | ||||||||||
Cash Flows From Operating Activities: | ||||||||||||
Net Income | $ | 731 | $ | 943 | $ | 1,312 | ||||||
Adjustments to reconcile to net cash from operating activities: | ||||||||||||
Provision for Loan Losses | 84 | 84 | 513 | |||||||||
Depreciation of Premises and Equipment | 98 | 70 | 68 | |||||||||
Provision for Deferred Income Taxes | 30 | 39 | (149 | ) | ||||||||
Equity in Undistributed Income from Associated Company | (1 | ) | (11 | ) | (10 | ) | ||||||
(Decrease) in Unearned Income | 38 | 20 | (17 | ) | ||||||||
(Increase) Decrease in Other Assets | (142 | ) | 160 | 31 | ||||||||
Increase (Decrease) in Other Liabilities | 54 | (11 | ) | (373 | ) | |||||||
Net Cash from Operating Activities | 892 | 1,294 | 1,375 | |||||||||
Cash Flows From Investing Activities: | ||||||||||||
Maturity of Interest-Bearing Deposits | 12,081 | 12,678 | 8,918 | |||||||||
Purchase of Interest-Bearing Deposits | (6,832 | ) | (16,734 | ) | (11,688 | ) | ||||||
Purchase of Investment Securities | (8,000 | ) | (10,000 | ) | (880 | ) | ||||||
Proceeds from maturities, calls and redemptions of Investment Securities | 3,790 | 15,366 | 9,898 | |||||||||
Purchase of Bank Premises and Equipment | (28 | ) | (271 | ) | (48 | ) | ||||||
Net Increase (Decrease) in Short-Term Loans Outstanding, Net | 401 | 3,787 | 6,225 | |||||||||
Longer-Term Loans Originated or Purchased | (13,020 | ) | (9,136 | ) | (21,826 | ) | ||||||
Principal Collected on Longer-Term Loans | 9,165 | 12,494 | 7,618 | |||||||||
Sale (Purchase) of Other Real Estate | 155 | — | 118 | |||||||||
Investment in Associated Company | (150 | ) | — | (199 | ) | |||||||
Net Cash from Investing Activities | (2,438 | ) | 8,184 | (1,864 | ) | |||||||
Cash Flows From Financing Activities: | ||||||||||||
Net Increase in Demand and Savings Accounts | 737 | (88 | ) | 11,196 | ||||||||
Proceeds from Sale of Time Deposits | 27,380 | 32,158 | 46,241 | |||||||||
Payments on Matured Time Deposits | (23,468 | ) | (40,236 | ) | (56,463 | ) | ||||||
Stock Dividends | — | — | (11 | ) | ||||||||
Subordinated Note | — | (1,500 | ) | — | ||||||||
Increase (Decrease) in Notes Issued to U.S. Treasury | 214 | (4 | ) | (297 | ) | |||||||
Net Cash from Financing Activities | 4,863 | (9,670 | ) | 666 | ||||||||
Net Change in Cash and Equivalents | 3,317 | (192 | ) | 177 | ||||||||
Cash and Equivalents at Beginning of Year | 4,224 | 4,416 | 4,239 | |||||||||
Cash and Equivalents at End of Year | $ | 7,541 | $ | 4,224 | $ | 4,416 | ||||||
Supplementary Data: | ||||||||||||
Cash Paid for Interest | $ | 2,136 | $ | 2,064 | $ | 2,530 | ||||||
Cash Paid for Income Taxes | 317 | 354 | 538 | |||||||||
Loans Transferred to Foreclosed Assets | — | 641 | — | |||||||||
The accompanying notes are an integral part of these financial statements.
9
Table of Contents
Statements of Changes in Shareholders’ Equity
(Dollars in Thousands)
| COMMON STOCK | SURPLUS | UNDIVIDED PROFITS | ||||||||||
| SHARES | AMOUNT | |||||||||||
Year Ended December 31, 2003 | ||||||||||||
Balance at Beginning of Year | 215,173 | $ | 1,076 | $ | 4,801 | $ | 1,351 | |||||
Net Income | — | — | — | 1,312 | ||||||||
Stock Dividends (10%) | 21,266 | 106 | 850 | (967 | ) | |||||||
Total | 236,439 | $ | 1,182 | $ | 5,651 | $ | 1,696 | |||||
Year Ended December 31, 2004 | ||||||||||||
Balance at Beginning of Year | 236,439 | $ | 1,182 | $ | 5,651 | $ | 1,696 | |||||
Net Income | — | — | — | 943 | ||||||||
Total | 236,439 | $ | 1,182 | $ | 5,651 | $ | 2,639 | |||||
Year Ended December 31, 2005 (Revised) | ||||||||||||
Balance at Beginning of Year | 236,439 | $ | 1,182 | $ | 5,651 | $ | 2,639 | |||||
Net Income | — | — | — | 731 | ||||||||
Total | 236,439 | $ | 1,182 | $ | 5,651 | $ | 3,370 | |||||
The accompanying notes are an integral part of these financial statements.
10
Table of Contents
Notes to Financial Statements
(Dollars in Thousands in Charts, Except Per Share Data)
1. SUMMARY OF SIGNIFICANT ACCOUNTING POLICIES
The accounting and reporting policies of Central National Bank are in accordance with accounting principles generally accepted in the United States of America, and general practices within the banking industry that are consistent with reports filed with regulatory agencies.
NATURE OF OPERATIONS
The Bank generates commercial (including agricultural), mortgage and consumer loans and receives deposits from customers located primarily in the City of Lynchburg and Amherst and Campbell counties in Virginia and the surrounding areas. The Bank operates under a national charter and provides full banking services. As a national bank, the Bank is subject to regulation by the Comptroller of the Currency, Federal Deposit Insurance Corporation, and the Board of Governors of the Federal Reserve System.
USE OF ESTIMATES
The preparation of financial statements in conformity with accounting principles generally accepted in the United States of America requires management to make estimates and assumptions that affect the reported amounts of assets and liabilities and disclosure of contingent assets and liabilities at the date of the financial statements, and the reported amounts of revenue and expenses during the reporting period. Actual results could differ from those estimates. Material estimates that are particularly susceptible to significant change in the near term relate to the determination of the allowance for loan losses, and other real estate owned.
CASH AND CASH EQUIVALENTS
For purposes of cash flows, cash and cash equivalents include cash on hand, demand balances due from banks and federal funds transactions. Generally, federal funds are purchased and sold for one-day periods.
SECURITIES
Investment securities are stated at cost, adjusted for amortization of premiums and accretion of discounts, and computed by the interest method. The Bank has the positive intent and ability to hold these securities until maturity. Gains and losses on sales, if any, of securities are based upon the adjusted cost of the specific securities sold.
LOANS
Loans are recorded at the amount of the loan disbursed to borrowers plus the applicable amount, if any, of unearned income and other charges, less payments received. Income earned on loans is recognized by methods which generally result in level rates of return on principal amounts outstanding. The net amount of nonrefundable loan origination fees approximates the direct costs associated with the lending process.
The allowance for loan losses is an estimate of losses inherent in the loan portfolio as determined by management taking into consideration historical loan loss experience, diversification of the loan portfolio, amounts of secured and unsecured loans, banking industry standards and averages, and general economic conditions. Ultimate losses may vary from current estimates. These estimates are reviewed periodically and as adjustments become necessary, they are reported in earnings in the periods in which they become reasonably estimable.
Management determines loan impairment using guidelines established by Statement of Financial Accounting Standards No. 114 (SFAS 114),“Accounting by Creditors for Impairment of a Loan (as amended by SFAS No. 118, Accounting by Creditors for Impairment of a Loan - Income Recognition and Disclosures)”. Under this accounting standard, a loan is considered to be impaired when it is probable that the Bank will be unable to collect all principal and interest amounts according to the contractual terms of the loan agreement. A performing loan may be considered impaired. The allowance for loan losses related to loans identified as impaired is primarily based on the excess of the loan’s current outstanding principal balances over the estimated fair value of the related collateral. For a loan that is not collateral-dependent, the allowance is recorded at the amount by which the outstanding principal balance exceeds the current best estimate of the future cash flows on the loan discounted at the loan’s original effective interest rate. Interest on impaired loans is recognized when cash is received.
BANK PREMISES AND EQUIPMENT
Premises and equipment are stated at cost, less accumulated depreciation. Depreciation is charged to operating expenses over the estimated useful life of the assets by accelerated and straight-line methods. Costs of maintenance or repairs are charged to expense as incurred and improvements are capitalized. Upon retirement or disposal of an asset, the asset and related allowance account are eliminated. Any gain or loss on such transactions is included in current operations. Depreciation has been included under Occupancy Expense in the Statements of Income in the amount of $98,000 in 2005, $70,000 in 2004, and $68,000 in 2003.
OTHER REAL ESTATE OWNED
Real estate properties acquired through or in lieu of loan foreclosure are initially recorded at the lower of the Bank’s carrying amount or fair value less estimated selling cost at the date of foreclosure. Any write-downs based on the asset’s fair value at the date of acquisition are charged to the allowance for loan losses. After foreclosure, these assets are carried at the lower of their new cost basis or fair value less cost to sell. Costs of significant property improvements are capitalized, whereas costs relating to holding property are expensed. Valuations are periodically performed by management, and any write-downs are recorded as a charge to operations, if necessary, to reduce the carrying value of a property to the lower of its carrying value or fair value less cost to sell.
INCOME TAXES
Deferred taxes are provided on a liability method whereby deferred tax assets are recognized for deductible temporary differences and operating loss and tax credit carryforwards and deferred tax liabilities are recognized for taxable temporary differences. Temporary differences are the differences between the reported amounts of assets and liabilities and their tax bases. Deferred tax assets are reduced by a valuation allowance when, in the opinion of management, it is more likely than not that some portion or all of the deferred tax assets will not be realized. Deferred tax assets and liabilities are adjusted for the effects of changes in tax laws and rates on the date of enactment.
RETIREMENT BENEFITS
The Bank has established Employee Benefit Plans as described in footnote 5. The Bank does not provide any other post-retirement benefits that would be accrued under Statement of Financial Accounting Standards No. 106, “Employers’ Accounting for Post Retirement Benefits Other Than Pensions”.
2. INVESTMENT SECURITIES
The carrying value of securities pledged to secure public deposits was $16,396,000 and $11,991,000, respectively, at December 31, 2005 and 2004. The amortized cost and estimated fair value of investment securities as of December 31, 2005 and 2004 were as follows:
| Gross | Gross | Estimated | ||||||||||
| Amortized | Unrealized | Unrealized | Fair | |||||||||
December 31, 2005 | Cost | Gains | Losses | Value | ||||||||
U. S. Agency Securities | $ | 16,396 | $ | 7 | $ | 271 | $ | 16,132 | ||||
December 31, 2004 | ||||||||||||
U. S. Agency Securities | $ | 11,991 | $ | 100 | $ | 6 | $ | 12,022 | ||||
Obligations of States and Political Subdivisions | 195 | 5 | — | 200 | ||||||||
Total | $ | 12,186 | $ | 105 | $ | 69 | $ | 12,222 | ||||
The table below shows gross unrealized losses and fair value, aggregated by investment category and length of time that individual securities have been in a continuous unrealized loss position at December 31, 2005 and 2004.
| Unrealized Loss | |||||||||
| 2005 | Fair | Less than | More than | ||||||
Securities Description | Value | 12 Months | 12 Months | ||||||
U. S. Agency Securities | $ | 11,727 | $ | — | $ | 271 | |||
| 2004 | |||||||||
Securities Description | |||||||||
U. S. Agency Securities | $ | 5,929 | $ | 69 | $ | — | |||
The unrealized losses on the Bank’s investments in obligations of U. S. government agencies were caused by interest rate increases. The contractual terms of those investments do not permit the issuer to settle the securities at a price less than the amortized cost of the investment. Because the Bank has the ability and intent to hold those investments until a recovery of fair value, which may be maturity, the Bank does not consider those investments to be other-than-temporarily impaired at December 31, 2005.
The amortized cost and estimated fair value of investments in debt securities at December 31, 2005 and 2004, by contractual maturity, are shown on the preceding page. Expected maturities will differ from contractual maturities because issuers may have the right to call or prepay obligations with or without call or prepayment penalties.
| December 31, 2005 | December 31, 2004 | |||||||||||
| Estimated | Estimated | |||||||||||
| Amortized | Fair | Amortized | Fair | |||||||||
| Cost | Value | Cost | Value | |||||||||
Due in One Year or Less | $ | 1,893 | $ | 1,897 | $ | 645 | $ | 605 | ||||
After One Year Through Five Years | 14,503 | 14,235 | 11,541 | 11,617 | ||||||||
Due After Five Years Through Ten Years | — | — | — | — | ||||||||
Due After Ten Years | — | — | — | — | ||||||||
Total | $ | 16,396 | $ | 16,132 | $ | 12,186 | $ | 12,222 | ||||
There were no sales of securities during 2005, 2004, or 2003.
3. COMPOSITION OF LOANS
December 31 | 2005 (Revised) | 2004 | ||||||
Real Estate | $ | 53,470 | $ | 48,443 | ||||
Consumer | 2,958 | 2,886 | ||||||
Commercial, Industrial and Agricultural | 10,480 | 13,358 | ||||||
All Other | 2,614 | 1,554 | ||||||
Gross Loans | 69,522 | 66,241 | ||||||
Less: Unearned Income | (247 | ) | (209 | ) | ||||
Allowance for Loan Losses | (1,009 | ) | (1,038 | ) | ||||
Total Loans, Net | $ | 68,266 | $ | 64,994 | ||||
| Maturity Distribution | 2005 (Revised) | 2004 | ||||||
Variable | ||||||||
Less Than One Year | $ | 9,869 | $ | 40,873 | ||||
One to Five Years | 25,935 | — | ||||||
Over Five Years | 6,406 | 2,052 | ||||||
Subtotal | 42,210 | 42,925 | ||||||
Fixed | ||||||||
Less Than One Year | 15,035 | 17,405 | ||||||
One to Five Years | 2,478 | 1,869 | ||||||
Over Five Years | 9,799 | 4,042 | ||||||
Subtotal | 27,312 | 23,316 | ||||||
Total | $ | 69,522 | $ | 66,241 | ||||
4. ALLOWANCE FOR LOAN LOSSES
In the view of management, the Allowance for Loan Losses is adequate to meet the loss contingency based on experience factors and a review of the loan portfolio.
The Allowance for Loan Losses for the years ending December 31, 2005, 2004 and 2003 is summarized as follows:
| 2005 | 2004 | 2003 | ||||||||||
Balance at beginning of year | $ | 1,038 | $ | 982 | $ | 520 | ||||||
Recoveries credited during year | 9 | 1 | 11 | |||||||||
Provision for loan losses | 84 | 84 | 513 | |||||||||
Losses charged to allowance | (122 | ) | (29 | ) | (62 | ) | ||||||
Balance at end of year | $ | 1,009 | $ | 1,038 | $ | 982 | ||||||
11
Table of Contents
The following is a summary of information pertaining to impaired and non-accrual loans:
| December 31 | ||||||
| 2005 (Revised) | 2004 | |||||
Impaired loans without a valuation allowance | $ | — | $ | — | ||
Impaired loans with a valuation allowance | 1,075 | 1,075 | ||||
Total Impaired loans | $ | 1,075 | $ | 1,075 | ||
Valuation allowance related to impaired loans | $ | 429 | $ | 429 | ||
Non-accrual loans (impaired) | $ | 1,075 | $ | 1,075 | ||
Non-accrual loans (non-impaired) | $ | 1,975 | $ | — | ||
Total loans past due ninety days or more and still accruing | $ | 216 | $ | 1,700 | ||
| Years Ended December 31 | |||||||||
| 2005 | 2004 | 2003 | |||||||
Average investment in impaired loans | $ | 1,075 | $ | 1,075 | $ | 522 | |||
Interest income recognized on impaired loans | $ | — | $ | 241 | $ | 9 | |||
Interest income recognized on a cash basis on impaired loans | $ | — | $ | 114 | $ | — | |||
5. STOCK OPTIONS AND EMPLOYEE BENEFIT PLANS
There were no stock options or stock option plans in effect for 2003, 2004 and 2005.
The Bank has adopted an integrated profit sharing plan. Employees participate in the profit sharing plan following completion of six (6) months of service and upon reaching the age of twenty years and six months as of January 1. Vesting includes years of service to the Bank prior to the effective date of the plan. The plan gives 0% vesting to anyone who has less than five (5) years of service except that persons who have reached the age of 62 are fully vested regardless of length of service. Each participant in the plan (who has not reached age 62) becomes 100% vested after five (5) years of service. The contribution to the plan is determined each year by the Board of Directors and thus may fluctuate in amount from year to year. The contribution by the Bank was $68,000 in 2005, $65,000 in 2004, and $54,000 in 2003 and is included in Salaries and Employee Benefits in the Statements of Income.
6. FEDERAL INCOME TAXES
Net deferred tax assets consist of the following components as of December 31, 2005 and 2004:
Deferred Tax Assets | 2005 | 2004 | ||||
Allowance for Loan Losses | $ | 351 | $ | 341 | ||
Dividend Exclusion | 13 | 13 | ||||
Other | 20 | — | ||||
Total Deferred Tax Assets | $ | 384 | $ | 354 | ||
Deferred Tax Liabilities | ||||||
Bank Premises | $ | 124 | $ | 124 | ||
Investment in Associated Companies | 15 | 15 | ||||
Total Deferred Tax Liabilities | $ | 139 | $ | 139 | ||
Net Deferred Taxes | $ | 245 | $ | 215 | ||
The provisions for income taxes charged to operations for the years ended December 31, 2005, 2004 and 2003 consist of the following:
| 2005 | 2004 | 2003 | |||||||||
| (Revised) | |||||||||||
Currently payable | $ | 347 | $ | 315 | $ | 687 | |||||
Deferred | (30 | ) | 39 | (149 | ) | ||||||
Net Provision | $ | 317 | $ | 354 | $ | 538 | |||||
The income tax provision differs from the amount of income tax determined by applying the U.S. federal income tax rate to pretax income for the years ended December 31, 2005, 2004 and 2003 due to the following:
| 2005 | 2004 | 2003 | ||||||||||
| (Revised) | ||||||||||||
Tax provisions computed by applying federal rates to income before income taxes | $ | 355 | $ | 441 | $ | 629 | ||||||
Tax exempt interest | (22 | ) | (87 | ) | (93 | ) | ||||||
Other | (16 | ) | — | 2 | ||||||||
Net Provision | $ | 317 | $ | 354 | $ | 538 | ||||||
7. RELATED PARTY TRANSACTIONS
The Chairman of the Board of Central National Bank also serves as Chairman of the Board of Blue Ridge Bank, N. A., Community National Bank, First National Bank, First National Exchange Bank, Mountain National Bank, Patrick Henry National Bank, Patriot Bank, N. A., Peoples National Bank, and Shenandoah National Bank.
The Bank maintains correspondent bank accounts with one of these banks. In 2005 and 2004 the average daily balances in these accounts were considered normal operating balances to facilitate general business transactions.
The Bank also participates in loan transactions with these banks. These transactions are at carrying value and do not involve more than the normal risk of collectibility or present other unfavorable features.
The Bank owns ten percent of the outstanding common stock of The Mortgage Company of Virginia, Inc. The remaining common stock is equally owned by the banks listed above. The Mortgage Company of Virginia owns 100% of Bank Services of Virginia, Inc. The business of both of these companies is to provide operational support services to the ten banks. These services consist of mortgage loan servicing, data processing, bookkeeping, check clearing, accounting, investment management, bank couriers, advertising programs, central purchasing and other management services. The Bank is charged for its share of these services, which is recorded as Operations Center Expense in the Statements of Income. The cost of this expense is shared by the ten banks on the basis of average deposits of each bank related to total average deposits of all the banks.
The Mortgage Company of Virginia, Inc. also owns 100% of Bank Services Insurance, Inc. Bank Services Insurance, Inc. provides insurance products to the banks and customers in the Danville area. The premiums paid to Bank Services Insurance, Inc. equaled $9,000 in 2005.
The Mortgage Company of Virginia, Inc. also owns 50% of Coresoft, Inc. represented by an initial $1,000 investment during 2004. Coresoft, Inc. is in the process of developing a core software package the banks listed above will use. At December 31, 2005, Coresoft, Inc. had an outstanding note payable to the Mortgage Company of $1,400,000.
The Bank records its investment in the common stock of The Mortgage Company of Virginia, Inc. under the equity method of accounting due to the influence the Bank has over the company. The Bank invested an additional $150,000 in 2005 increasing the value of the investment to $769,000 from $618,000 at December 31, 2004. The Bank’s share of earnings of the company equaled $1,000 for 2005, $11,000 for 2004 and $10,000 for 2003 and is shown in the Statements of Income under Other Non-interest Income.
The Chairman of the Board and President of the Bank also serves as Chairman of the Board and President of Bank Building Corporation and Manager of Blackstone Properties, LLC, its wholly owned subsidiary (the “companies”). The companies lease branches to certain of the Banks listed above. At December 31, 2005, the Bank leased three offices from the companies. Rental expense and future lease payments under these leases are disclosed in a footnote below. As of December 31, 2005 and 2004, the Bank had loans totaling $1,040,000 and $1,064,000, respectively, to Bank Building Corporation. These loans were made to purchase bank branches leased to affiliated banks. In the ordinary course of business, directors and their related interests were customers of, and had transactions with the Bank. Loan transactions with directors, principal security holders and associates were made on substantially the same terms as those prevailing at the time for comparable loans to other persons and did not involve more than normal risk of collectibility or present other unfavorable features. There was no such loan activity during 2005 and 2004.
8. CONTINGENCIES
The Bank did not have any legal matters of financial significance pending at December 31, 2005 or 2004.
9. EARNINGS PER COMMON SHARE
The Bank follows Statement of Financial Accounting Standards (SFAS) No. 128, “Earnings Per Share”. This statement requires the dual presentation of basic and diluted earnings per share. The weighted average number of shares used to compute earnings per share was 236,439 and diluted earnings per share compute earnings per share was 236,439 and diluted earnings per share.
The Bank issued a 10% stock dividend in 2003 and none in 2004 or 2005. No fractional shares were issued in this stock dividend. Stock dividends and fractional shares were settled based on known prices for recent trades of the stock and other factors deemed relevant at the time.
10. BANK PREMISES AND EQUIPMENT
Premises and equipment are stated at cost less accumulated depreciation as follows:
| Accumulated | |||||||||
| Depreciation | Net | ||||||||
| and | Remaining | ||||||||
December 31, 2005 | Cost | Amortization | Cost | ||||||
Bank Premises (Including Land of $289,000) | $ | 1,928 | $ | 74 | $ | 1,854 | |||
Equipment | 775 | 327 | 448 | ||||||
Leasehold Improvements | 27 | 1 | 26 | ||||||
Total | $ | 2,730 | $ | 402 | $ | 2,328 | |||
December 31, 2004 | |||||||||
Bank Premises (Including Land of $289,000) | $ | 1,928 | $ | 53 | $ | 1,875 | |||
Equipment | 747 | 250 | 497 | ||||||
Leasehold Improvements | 27 | 1 | 26 | ||||||
Total | $ | 2,702 | $ | 304 | $ | 2,398 | |||
11. FORECLOSED ASSETS
Expenses applicable to foreclosed assets include the following:
| Years Ended December 31, | |||||||||
| 2005 | 2004 | 2003 | |||||||
Net loss (gain) on sales of real estate | $ | — | $ | — | $ | — | |||
Provision for losses | — | — | — | ||||||
Operating expenses | 7 | 7 | 3 | ||||||
12. CASH AND CASH EQUIVALENTS
Cash and cash equivalents as of December 31, 2005, 2004 and 2003 are detailed below:
| 2005 | 2004 | 2003 | |||||||||
Cash and Due From Banks | $ | 7,541 | $ | 4,724 | $ | 4,516 | |||||
Federal Funds Sold | — | — | — | ||||||||
Federal Funds Purchased | — | (500 | ) | (100 | ) | ||||||
Total | $ | 7,541 | $ | 4,224 | $ | 4,416 | |||||
13. DEPOSITS
Certificates of Deposit maturing as of December 31: | 2005 | 2004 | ||||
1 Year | $ | 24,948 | $ | 25,557 | ||
2 Years | 6,881 | 6,455 | ||||
3 Years | 5,400 | 3,892 | ||||
4 Years | 4,116 | 6,013 | ||||
5 Years and Thereafter | 15,481 | 10,997 | ||||
Total | $ | 56,826 | $ | 52,914 | ||
12
Table of Contents
14. CONCENTRATION OF CREDIT RISK
The majority of the Bank’s loans, commitments and lines of credit have been granted to customers in the Bank’s market area. The concentrations of credit by loan classification are set forth in a footnote above. The Bank does not extend credit to any individual borrowers in excess of its lending limit of $1,684,000 and $1,577,000 as of December 31, 2005 and 2004.
The largest category of Real Estate Loans consisted of loans to the motel/hotel industry. These loans approximated $17,109,000 at December 31, 2005 and $15,726,000 as of December 31, 2004.
15. FAIR VALUE OF FINANCIAL INSTRUMENTS
Statement of Financial Accounting Standards No. 107, “Disclosures about Fair Value of Financial Instruments”, requires the Bank to disclose the estimated fair values of its financial assets and liabilities. The estimated fair values were determined using the following assumptions:
| a. | The carrying value of Cash and Due From Banks, Federal Funds Sold, and Interest-Bearing Deposits in Other Financial Institutions are believed to approximate the fair value of these items. |
| b. | The fair value of actively traded investment securities are determined according to quotes available in the financial press. The fair value of instruments which are not actively traded are determined using values of other instruments with similar characteristics or obtained from outside sources believed to be reliable. |
| c. | The fair value of loans are estimated by discounting the anticipated cash flows using estimated rates for similar loans available in the Bank’s market area. Estimates of maturities are based on both experience and contractual maturities although prepayments are permitted on the loans. |
| d. | The fair value of short-term demand and savings deposits are believed to equal carrying value. The fair value of certificates of deposit are based upon the contractual maturity of the instruments and rates currently offered for similar deposits. |
| e. | The fair value of Notes Payable to the U. S. Treasury and Subordinated Notes are estimated at carrying value. |
| f. | The fair value of Accrued Interest Receivable and Accrued Interest Payable are estimated at carrying value. |
| 2005 (Revised) | 2004 | |||||||||||
Financial Assets: | Carrying Value | Fair Value | Carrying Value | Fair Value | ||||||||
Interest-Bearing Deposits in Other Financial Institutions | $ | 11,386 | $ | 11,386 | $ | 16,635 | $ | 16,635 | ||||
Investment Securities | 16,396 | 16,132 | 12,186 | 12,222 | ||||||||
Loans (Net of Unearned Income) | 69,275 | 69,394 | 66,032 | 74,972 | ||||||||
Cash and Due From Banks | 7,541 | 7,541 | 4,724 | 4,724 | ||||||||
Accrued Interest Receivable | 565 | 565 | 442 | 442 | ||||||||
Total | $ | 105,163 | $ | 105,018 | $ | 100,019 | $ | 108,995 | ||||
Financial Liabilities: | ||||||||||||
Deposits | ||||||||||||
LIFETIME FREE CHECKING | $ | 22,773 | $ | 22,773 | $ | 18,333 | $ | 18,333 | ||||
Interest-Bearing Demand | 8,450 | 8,450 | 11,436 | 11,436 | ||||||||
Regular Passbook Savings | 10,064 | 10,064 | 10,781 | 10,781 | ||||||||
Time Deposits: | ||||||||||||
Certificates of Deposit $100,000 and Over | 17,216 | 17,222 | 15,219 | 15,273 | ||||||||
Other | 39,610 | 39,595 | 37,695 | 38,082 | ||||||||
TOTAL DEPOSITS | 98,113 | 98,104 | 93,464 | 93,905 | ||||||||
Federal Funds Purchased | — | — | 500 | 500 | ||||||||
Notes issued to the U. S. Treasury | 264 | 264 | 50 | 50 | ||||||||
Accrued Interest Payable | 114 | 114 | 102 | 102 | ||||||||
Total | $ | 98,491 | $ | 98,482 | $ | 94,116 | $ | 94,557 | ||||
16. CAPITAL ADEQUACY
The Bank is subject to various regulatory capital requirements. Under the regulatory capital guidelines and the regulatory framework for Prompt Corrective Action (“PCA”), the Bank must meet specific capital guidelines involving the quantitative measures of the Bank’s assets, liabilities, and certain off-balance-sheet items as calculated under regulatory accounting practices. The Bank’s capital amount and classification are also subject to qualitative judgments by the regulators about components, risk weightings and other factors.
Quantitative measures established by regulation to ensure capital adequacy require the Bank to maintain minimum ratios (set forth in the table below) of total and Tier 1 capital (as defined in the regulations) to risk-weighted assets (as defined) and of Tier 1 capital to average assets (as defined).
| Minimum Ratio For Capital Adequacy Purposes | Minimum Ratio To Be Considered Well Capitalized Under PCA Provisions | |||||
Tier 1 Capital to Risk Weighted Assets | 4 | % | 6 | % | ||
Total Capital to Risk Weighted Assets | 8 | % | 10 | % | ||
Tier 1 Capital to Average Assets | 4 | % | 5 | % |
As of December 31, 2005, the most recent notification from the Federal Deposit Insurance Corporation categorized the Bank as well capitalized under the regulatory framework for prompt corrective action. To be categorized as well capitalized, an institution must maintain minimum total risk-based, Tier 1 risk-based and Tier 1 leverage ratios as set forth in the above table. There were no conditions or events since the notification that management believes have changed the Bank’s category. The Bank’s actual capital amounts and ratios as of December 31, 2005 and 2004 are presented in the following table. Management believes, as of December 31, 2005 and 2004, that the Bank meets all capital adequacy requirements to which it is subject.
As of December 31, 2005 (Revised) | Minimum Capital For Capital Adequacy Purposes | Minimum Capital To Be Considered Well Capitalized Under PCA Provisions | Actual Amount | Actual Ratio | ||||||||
Tier 1 Capital to Risk Weighted Assets | $ | 3,050 | $ | 4,575 | $ | 10,203 | 13.39 | % | ||||
Total Capital to Risk Weighted Assets | 6,100 | 7,625 | 11,156 | 14.64 | % | |||||||
Tier 1 Capital to Average Assets | 4,588 | 5,735 | 10,203 | 8.90 | % | |||||||
As of December 31, 2004 | ||||||||||||
Tier 1 Capital to Risk Weighted Assets | $ | 3,025 | $ | 4,538 | $ | 9,472 | 12.52 | % | ||||
Total Capital to Risk Weighted Assets | 6,050 | 7,563 | 10,417 | 13.77 | % | |||||||
Tier 1 Capital to Average Assets | 4,257 | 5,322 | 9,472 | 8.90 | % | |||||||
17. QUARTERLY FINANCIAL DATA (Unaudited)
The following summarizes the quarterly results of operations for the years ended December 31, 2005 and 2004:
2005 (Revised) | First Quarter | Second Quarter | Third Quarter | Fourth Quarter | ||||||||
Total Interest Income | $ | 1,318 | $ | 1,321 | $ | 1,383 | $ | 1454 | ||||
Total Interest Expense | 479 | 518 | 551 | 607 | ||||||||
Net Interest Income | 839 | 803 | 832 | 847 | ||||||||
Provision For Loan Losses | 21 | 21 | 21 | 21 | ||||||||
Net Interest Income After Provision for Loan Losses | 818 | 782 | 811 | 826 | ||||||||
Total Non-Interest Income | 93 | 97 | 92 | 141 | ||||||||
Total Non-Interest Expense | 631 | 641 | 649 | 691 | ||||||||
Income Before Income Taxes | 280 | 238 | 254 | 276 | ||||||||
Income Tax Expense | 85 | 74 | 82 | 76 | ||||||||
Net Income | $ | 195 | $ | 164 | $ | 172 | $ | 200 | ||||
Basic and Diluted Net Income Per Share | $ | 0.82 | $ | 0.69 | $ | 0.73 | $ | 0.85 | ||||
2004 | First Quarter | Second Quarter | Third Quarter | Fourth Quarter | ||||||||
Total Interest Income | $ | 1,408 | $ | 1,454 | $ | 1,310 | $ | 1,284 | ||||
Total Interest Expense | 536 | 529 | 497 | 471 | ||||||||
Net Interest Income | 872 | 925 | 813 | 813 | ||||||||
Provision For Loan Losses | 21 | 21 | 21 | 21 | ||||||||
Net Interest Income After Provision for Loan Losses | 851 | 904 | 792 | 792 | ||||||||
Total Non-Interest Income | 98 | 97 | 96 | 168 | ||||||||
Total Non-Interest Expense | 610 | 617 | 618 | 656 | ||||||||
Income Before Income Taxes | 339 | 384 | 270 | 304 | ||||||||
Income Tax Expense | 80 | 100 | 75 | 99 | ||||||||
Net Income | $ | 259 | $ | 284 | $ | 195 | $ | 205 | ||||
Basic and Diluted Net Income Per Share | $ | 1.10 | $ | 1.20 | $ | 0.82 | $ | 0.87 | ||||
18. LEASES AND RENT EXPENSE
The Bank leased facilities under non-cancelable operating leases during 2005, 2004 and 2003. As noted above, the Bank leases three offices from Bank Building Corporation. These leases required the Bank to pay maintenance, insurance and property taxes and do not have renewal options. Rental expense under these leases was $158,000 in 2005, $208,000 in 2004 and $174,000 in 2003. The Bank also leases an office from a non-related party under various terms. Rental expense under this lease was $37,000 for 2005 and 2004, and $29,000 for 2003. Future minimum rental payments under these leases are as follows:
Year Ending December 31: | 2006 | $ | 213 | ||
| 2007 | 213 | ||||
| 2008 | 213 | ||||
| 2009 | 213 | ||||
| 2010 | 213 | ||||
| Thereafter | 1,001 | ||||
Total Minimum Lease Payments | $ | 2,066 | |||
13
Table of Contents
19. OFF BALANCE SHEET ACTIVITIES AND COMMITMENTS
Commitments to extend credit, which amounted to $3,815,000 and $4,786,000 at December 31, 2005 and 2004 respectively, represent agreements to lend to customers with fixed expiration dates or other termination clauses. Since many of the commitments are expected to expire without being funded, the total commitment amounts do not necessarily represent future liquidity requirements. Standby letters of credit are conditional commitments issued by the Bank guaranteeing the performance of a customer to a third party. Those guarantees are primarily issued to support public and private borrowing arrangements. At December 31, 2005 the Bank had $639,000, and $717,000 in 2004, in outstanding standby letters of credit.
The Bank is a member of the Federal Reserve System and is required to maintain certain levels of its cash and due from bank balances as reserves based on regulatory requirements. At December 31, 2005 and 2004 this reserve requirement was approximately $556,000 and $353,000, respectively.
Federal banking regulations place certain restrictions on dividends paid by the Bank. The total amount of dividends which may be paid at any date is generally limited to the retained earnings of the Bank. In addition, dividends paid by the Bank would be prohibited if the effect thereof would cause the Bank’s capital to be reduced below applicable minimum capital requirements.
20. RECENT ACCOUNTING PRONOUNCEMENTS AND ACCOUNTING CHANGES
In November 2002, the FASB issued FASB Interpretation No. 45, “Guarantor’s Accounting and Disclosure Requirements for Guarantees, including Indirect Guarantees of Indebtedness of Others” (FIN 45). The interpretation elaborates on the disclosures to be made by a guarantor in its financial statements under certain guarantees that it has issued. It also clarifies that a guarantor is required to recognize, at the inception of a guarantee, a liability for the fair value of the obligation undertaken in issuing the guarantee. The interpretation requires disclosure of the nature of the guarantee, the maximum potential amount of future payments that the guarantor could be required to make under the guarantee, and the current amount of the liability, if any, for the guarantor’s obligations under the guarantee. The recognition requirements of the Interpretation were effective beginning January 1, 2003.
The FASB also revised FASB Interpretation 46, “Consolidation of Variable Interest Entities, an interpretation of ARB No. 51” (FIN 46). The interpretation provides a framework for identifying variable interest entities (VIEs), and determining when a company should include the assets, liabilities, noncontrolling interests and results of activities of a VIE in its consolidated financial statements. As revised, FIN 46 is effective beginning in the first quarter of 2004 for all VIEs (other than what is commonly referred to as special purpose entities, VIEs of small business issuers, and VIEs of nonpublic entities). The Bank does not currently utilize VIEs or so called special purpose entities.
In November 2003, the FASB’s Emerging Issues Task Force (EITF) reached consensus on new disclosure requirements related to unrealized losses on investment securities. The new disclosure requirements apply to marketable equity and debt securities accounted for under Financial Accounting Board Statement No 115, “Accounting for Certain Investments in Debt and Equity Securities,” and are required for inclusion in annual reports with fiscal years ended after December 15, 2003.
In November 2003, the FASB issued FASB Staff Position (FSP) 144-1, “Determination of Cost Basis for Foreclosed Assets under FASB Statement No. 15”, “Accounting by Debtors and Creditors for Troubled Debt Restructurings,” and the Measurement of Cumulative Losses Previously Recognized under Paragraph 37 of FASB Statement No. 144, “Accounting for the Impairment or Disposal of Long-Lived Assets.” Under FSP 144-1, the lender is required to measure the foreclosure on a long-lived asset (e.g. real estate) at fair value less cost to sell on the foreclosure date, which establishes a new cost basis such that any loan valuation allowance is not retained. Thereafter, the lender would follow the impairment guidance in Statement No. 144, and should not reflect any recovery in value of the property beyond the cost basis established upon foreclosure of the loan. This guidance was effective upon posting of the FSP to the FASB website in November 2003.
In April 2003, the Financial Accounting Standards Board issued Statement No. 149, “Amendment of Statement 133 on Derivative Instruments and Hedging Activities”. This statement amends and clarifies financial accounting and reporting for derivative instruments, including certain derivative instruments embedded in other contracts (collectively referred to as derivatives) and for hedging activities under FASB Statement No. 133,” Accounting for Derivative Instruments and Hedging Activities.”
In May 2003, the Financial Accounting Standards Board issued Statement No. 150, “Accounting for Certain Financial Instruments with Characteristics of both Liabilities and Equity”. This statement establishes standards for how an issuer classifies and measures certain financial instruments with characteristics of both liabilities and equity. It requires that an issuer classify a financial instrument that is within its scope as a liability (or an asset in some circumstances). Many of those instruments were previously classified as equity. This statement is effective for financial instruments entered into or modified after May 31, 2003, and otherwise is effective at the beginning of the first interim period beginning after June 15, 2003.
In December 2004, the FASB issued Statement No. 123 (revised 2004), which is a revision of Statement 123 “Accounting for Stock-Based Compensation”. This Statement establishes standards for the accounting for transactions in which an entity exchanges its equity instruments for goods or services. It also addresses transactions in which an entity incurs liabilities in exchange for goods or services that are based on the fair value of the entity’s equity instruments or that may be settled by the issuance of those equity instruments. This Statement focuses primarily on accounting for transactions in which an entity obtains employee services in share-based payment transactions. This Statement is effective for public entities as of the beginning of the first interim or annual reporting period that begins after June 15, 2005.
In December 2004, the FASB issued Statement No. 153, “Exchanges of Nonmonetary Assets”, an amendment of APB Opinion No. 29, Accounting for Nonmonetary Transactions”. This Statement eliminates the exception to fair value for exchanges of similar productive assets and replaces it with a general exception for exchange transactions that do not have commercial substance-that is, transactions that are not expected to result in significant changes in the cash flows of the reporting entity. This Statement is effective for nonmonetary asset exchanges occurring in fiscal periods beginning after June 15, 2005.
In May 2005, the FASB issued Statement No. 154, “Accounting Changes and Error Corrections—a replacement of APB Opinion No. 20 and FASB Statement No. 3”. This Statement requires retrospective application to prior periods’ financial statements of changes in accounting principle, unless it is impracticable to determine either the period-specific effects or the cumulative effect of the change. When it is impracticable to determine the period-specific effects of an accounting change on one or more individual prior periods presented, this Statement requires that the new accounting principle be applied to the balances of assets and liabilities as of the beginning of the earliest period for which retrospective application is practicable and that a corresponding adjustment be made to the opening balance of retained earnings. This Statement improves financial reporting because its requirement to report voluntary changes in accounting principles via retrospective application, unless impracticable, enhances the consistency of financial information between periods. This statement is effective for accounting changes and corrections of errors made in fiscal years beginning after December 15, 2005.
During November 2005, the FASB issued FASB Staff Position (FSP) FAS 115-1 and 124-1, “The Meaning of Other-Than-Temporary Impairment and Its Application to Certain Investments.” The guidance in this FSP addresses the determination of when an investment is considered impaired, whether that impairment is other than temporary, and the measurement of an impairment loss. The FSP also includes accounting considerations subsequent to the recognition of an other-than-temporary impairment and requires certain disclosures about unrealized losses that have not been recognized as other-than-temporary impairments. The guidance in this FSP is required to be applied to reporting periods beginning after December 15, 2005. Earlier application is permitted.
The FASB has issued FASB Statement No. 155, “Accounting for Certain Hybrid Instruments.” This standard amends the guidance in FASB Statements No. 133, “Accounting for Derivative Instruments and Hedging Activities”, and No. 140, “Accounting for Transfers and Servicing of Financial Assets and Extinguishments of Liabilities.” Statement 155 allows financial instruments that have embedded derivatives to be accounted for as a whole (eliminating the need to bifurcate the derivative from its host) if the holder elects to account for the whole instrument on a fair value basis. Statement 155 is effective for all financial instruments acquired or issued after the beginning of an entity’s first fiscal year that begins after September 15, 2006. Earlier adoption is permitted as of the beginning of an entity’s fiscal year, provided the entity has not yet issued financial statements, including financial statements for any interim period for that fiscal year. Provisions of this Statement may be applied to instruments that an entity holds at the date of adoption on an instrument-by-instrument basis. The financial statement effect of the change in accounting, if any, should be recognized as a cumulative-effect adjustment to beginning retained earnings. Prior periods should not be restated.
Management does not expect these accounting pronouncements to have a material impact on the financial statements.
21. SUBORDINATED NOTE
On December 12, 2000, a subordinated capital note was executed in the principal amount of $1,500,000. Interest payable on the note quarterly during the term of the note based on the base commercial lending rate of the holder. Annual principal payments in the amount of $300,000 begin January 1, 2007 with the final payment due January 1, 2011. Anticipation is allowed with the approval of regulatory authorities. Under the terms the agreement, the note is subordinated to depositors and other creditors and is unsecured and ineligible as collateral by the holder. The note is callable in the event the terms of the agreement are not met. The note is considered part of the Bank’s Tier 2 capital under regulatory capital guidelines discussed in a footnote above.
This subordinated note was paid in full in 2004.
22. REVISION TO FINANCIAL STATEMENTS
Subsequent to the issuance of the Bank’s 2005 financial statements, the OCC issued a directive that the Bank’s Call Report be revised and re-filed. The revision dealt with the OCC’s determination that certain loans be reclassified from accruing to non-accrual loan status. As the result of the Bank having to revise its Call Report, the Bank was also required by the OCC to revise its annual financial statements.
The effects of the revision on the Bank’s financial statements, as of and for the year ended December 31, 2005, are as follows:
(Dollars in thousands) | As Originally Presented | Changes | As Revised | ||||||||
Statements of Financial Condition: | |||||||||||
Loans | $ | 68,290 | (24 | ) | $ | 68,266 | |||||
Other Assets | 1,314 | 11 | 1,325 | ||||||||
Statements of Income: | |||||||||||
Interest income | 5,497 | (21 | ) | $ | 5,476 | ||||||
Income taxes | 325 | (8 | ) | 317 | |||||||
Net income | 744 | (13 | ) | 731 | |||||||
Statements of Cash Flows: | |||||||||||
Net cash from operating activities | 856 | 36 | 892 | ||||||||
Net cash from investing activities | (2,402 | ) | (36 | ) | (2,438 | ) | |||||
Statements of Changes in Shareholders Equity: | |||||||||||
Undivided profits | 3,383 | (13 | ) | 3,370 | |||||||
14
Table of Contents
Summary of Operations
(Dollars in Thousands Except Per Share Data)
| DECEMBER | |||||||||||||||||||
FOR THE YEAR: | 2005 (Revised) | 2004 | 2003 | 2002 | 2001 | ||||||||||||||
Total Interest Income | $ | 5,476 | $ | 5,456 | $ | 6,690 | $ | 6,929 | $ | 6,684 | |||||||||
Total Interest Expense | 2,155 | 2,033 | 2,458 | 3,351 | 4,084 | ||||||||||||||
Net Interest Income | 3,321 | 3,423 | 4,232 | 3,578 | 2,600 | ||||||||||||||
Provision for Loan Losses | 84 | 84 | 513 | 84 | 60 | ||||||||||||||
Net Interest Income After Provision for Loan Losses | 3,237 | 3,339 | 3,719 | 3,494 | 2,540 | ||||||||||||||
Non-Interest Income | 423 | 459 | 430 | 414 | 314 | ||||||||||||||
Non-Interest Expense | 2,612 | 2,501 | 2,299 | 2,168 | 1,782 | ||||||||||||||
Net Income Before Taxes | 1,048 | 1,297 | 1,850 | 1,740 | 1,072 | ||||||||||||||
Applicable Income Taxes: | |||||||||||||||||||
Current | 347 | 315 | 687 | 553 | 340 | ||||||||||||||
Deferred | (30 | ) | 39 | (149 | ) | (9 | ) | (12 | ) | ||||||||||
Net Income | $ | 731 | $ | 943 | $ | 1,312 | $ | 1,196 | $ | 744 | |||||||||
Basic and Diluted Net Income Per Share* | $ | 3.09 | $ | 3.99 | $ | 5.55 | $ | 5.06 | $ | 3.15 | |||||||||
| * | Net Income per share has been retroactively adjusted to reflect the stock dividend for 2003. |
AT YEAR END: | 2005 (Revised) | 2004 | 2003 | 2002 | 2001 | ||||||||||
Interest-Bearing Deposits in Other Financial Institutions | $ | 11,386 | $ | 16,635 | $ | 12,579 | $ | 9,809 | $ | 9,514 | |||||
Federal Funds Sold | — | — | — | — | 265 | ||||||||||
Investments | 16,396 | 12,186 | 17,552 | 26,570 | 24,649 | ||||||||||
Loans | 68,266 | 64,994 | 72,885 | 65,398 | 62,903 | ||||||||||
Deposits | 98,113 | 93,464 | 101,630 | 100,656 | 96,525 | ||||||||||
Demand | 22,773 | 18,333 | 17,696 | 14,285 | 12,725 | ||||||||||
Interest-Bearing Demand | 8,450 | 11,436 | 13,713 | 7,741 | 7,017 | ||||||||||
Savings | 10,064 | 10,781 | 9,229 | 7,416 | 5,797 | ||||||||||
Time | 56,826 | 52,914 | 60,992 | 71,214 | 70,986 | ||||||||||
Capital Accounts | 10,203 | 9,472 | 8,529 | 7,228 | 6,044 | ||||||||||
Total Resources | 108,783 | 103,665 | 112,003 | 110,298 | 104,620 | ||||||||||
Carrying Value Per Share | 43.15 | 40.06 | 36.07 | 30.57 | 25.56 | ||||||||||
DAILY AVERAGES FOR THE YEAR: | 2005 | 2004 | 2003 | 2002 | 2001 | ||||||||||
Interest-Bearing Deposits in Other Financial Institutions | $ | 11,148 | $ | 15,447 | $ | 11,629 | $ | 9,299 | $ | 8,504 | |||||
Federal Funds Sold | 7,536 | 5,867 | 4,307 | 1,883 | 2,445 | ||||||||||
Investment Securities | 15,339 | 16,461 | 21,808 | 28,703 | 17,261 | ||||||||||
Loans (Net) | 66,186 | 70,120 | 73,453 | 66,340 | 62,568 | ||||||||||
Deposits | 102,448 | 105,751 | 109,429 | 103,924 | 84,682 | ||||||||||
Demand | 22,605 | 18,541 | 16,799 | 13,562 | 11,005 | ||||||||||
Interest-Bearing Demand | 7,129 | 5,649 | 5,280 | 4,610 | 3,354 | ||||||||||
Savings | 17,481 | 21,095 | 18,218 | 10,596 | 6,728 | ||||||||||
Time | 55,233 | 60,466 | 69,132 | 75,156 | 63,595 | ||||||||||
Capital Accounts | 9,865 | 9,101 | 7,987 | 6,663 | 5,583 | ||||||||||
Total Resources | 112,839 | 117,246 | 118,992 | 113,965 | 92,169 | ||||||||||
15
Table of Contents
Price Range of Common Stock
| 2005 | 2004 | Dividends Per Share | ||||||||||||||||
| High | Low | High | Low | 2005 | 2004 | |||||||||||||
First Quarter | $ | 25 | $ | 25 | $ | 30 | $ | 25 | $ | — | $ | — | ||||||
Second Quarter | 25 | 25 | 25 | 25 | — | — | ||||||||||||
Third Quarter | 25 | 25 | 25 | 25 | — | — | ||||||||||||
Fourth Quarter | 38 | 25 | 25 | 25 | — | — | ||||||||||||
Officers
| Worth Harris Carter, Jr. | ||||
| Chairman of the Board and President | ||||
| John G. Nance | ||||
| Vice President—Commercial Loans | ||||
| Randall L. Sayre | ||||
| Vice President, Cashier and Managing Officer—Waterlick Road | ||||
| John E. Tanner | ||||
| Vice President and Managing Officer—Graves Mill Road | ||||
| Delores G. Overstreet | ||||
| Assistant Vice President and Managing Officer—Langhorne Road | ||||
| Norvin Rockwell | ||||
| Assistant Vice President and Managing Officer—Madison Heights | ||||
| Jackie Hodges | ||||
| Assistant Cashier and Managing Officer—Amherst | ||||
| Pamela McCullough | ||||
| Assistant Cashier and Managing Officer—Campbell Avenue | ||||
Directors
| George B. Buchanan, Jr. | ||||
| Chairman, Patricia Grand Hotels, Inc. | ||||
| Worth Harris Carter, Jr. | ||||
| Chairman of the Board and President | ||||
| Phyllis Q. Karavatakis | ||||
| Senior Vice President, Patrick Henry National Bank | ||||
| James C. Moses Retired | ||||
| R. E. Williams Retired | ||||

Central National Bank
2018 Tate Springs Road
Lynchburg, Virginia 24501
(434) 845-0816
Member FDIC
Table of Contents

Central National Bank
2018 Tate Springs Road
Lynchburg, Virginia 24501
(434) 845-0816
For Additional Information Contact:
Central National Bank
2018 Tate Springs Road
Lynchburg, Virginia 24501
Telephone: (434) 845-0816
Table of Contents
OFFICE OF THE COMPTROLLER OF THE CURRENCY
WASHINGTON, D.C. 20219
FORM 10-QSB
| x | QUARTERLY REPORT UNDER SECTION 13 OR 15(d) OF THE SECURITIES EXCHANGE ACT OF 1934 |
For the quarterly period ended September 30, 2006
OR
| ¨ | TRANSITION REPORT UNDER SECTION 13 OR 15(d) OF THE EXCHANGE ACT |
For the transition period from to
Commission file number: n/a
CENTRAL NATIONAL BANK
(Name of small business issuer as specified in its charter)
| National Bank | 54-1801535 | |
(State or other jurisdiction of incorporation or organization) | (I.R.S. Employer Identification No.) | |
| 2018 Tate Springs Road | ||
| Lynchburg, VA | 24501 | |
| (Address of principal executive offices) | (Zip Code) | |
(434) 845-0816
Issuer’s telephone number
n/a
(Former name, former address and former fiscal year, if changed since last report)
Check whether the issuer (1) filed all reports required to be filed by Section 13 or 15(d) of the Exchange Act during the past 12 months (or for such shorter period that the registrant was required to file such reports), and (2) has been subject to such filing requirements for the past 90 days. Yes x No ¨
Indicate by check mark whether the registrant is a shell company (as defined in Rule 12b-2 of the Exchange Act). Yes ¨ No x
As of November 13, 2006, there were issued and outstanding 236,439 shares of the issuer’s common stock.
Transitional Small Business Disclosure Format: Yes ¨ No x
1
Table of Contents
INDEX
| PART I—FINANCIAL INFORMATION | 4 | |
ITEM 1—FINANCIAL STATEMENTS | 4 | |
STATEMENTS OF CONDITION | 4 | |
STATEMENTS OF INCOME | 5 | |
STATEMENTS OF CASH FLOWS | 6 | |
STATEMENTS OF CHANGES IN SHAREHOLDERS’ EQUITY | 7 | |
Notes To Unaudited Financial Statements | 7 | |
ITEM 2—MANAGEMENT’S DISCUSSION AND ANALYSIS | 9 | |
ITEM 3— CONTROLS AND PROCEDURES | 13 | |
| PART II—OTHER INFORMATION | 14 | |
ITEM 1—LEGAL PROCEEDINGS. | 14 | |
ITEM 2—UNREGISTERED SALES OF EQUITY SECURITIES AND USE OF PROCEEDS. | 14 | |
ITEM 3—DEFAULTS UPON SENIOR SECURITIES. | 14 | |
ITEM 4—SUBMISSION OF MATTERS TO A VOTE OF SECURITY HOLDERS. | 14 | |
ITEM 5—OTHER INFORMATION | 14 | |
ITEM 6—EXHIBITS | 14 | |
2
Table of Contents
FORWARD–LOOKING STATEMENTS
This report contains statements concerning the Bank’s expectations, plans, objectives, future financial performance and other statements that are not historical facts. These statements may constitute “forward-looking statements” as defined by federal securities laws. In some cases, readers can identify the forward-looking statements by the use of words such as “may,” “will,” “should,” “could,” “expect,” “plan,” “intend,” “anticipate,” “believe,” “estimate,” “predict,” “potential” or “continue” or the negative or other variations of these words, or other comparable words or phrases. These statements may address issues that involve estimates and assumptions made by management, risks and uncertainties, and actual results could differ materially from historical results or those anticipated by such statements. Factors that could have a material adverse effect on the Bank’s operations and future prospects include, but are not limited to, changes in: interest rates; general and local economic conditions; the legislative/regulatory climate; monetary and fiscal policies of the U.S. government, including policies of the U.S. Treasury and the Federal Reserve Board; the quality or composition of loan or investment portfolios; demand for loan products; deposit flows; competition; demand for financial services in our market area and accounting principles, policies and guidelines. These risks and uncertainties should be considered in evaluating the forward-looking statements contained herein, and readers are cautioned not to place undue reliance on such statements, which speak only as of the date of this report.
3
Table of Contents
PART I—FINANCIAL INFORMATION
Item 1—FINANCIAL STATEMENTS
CENTRAL NATIONAL BANK
STATEMENTS OF CONDITION
| September 30, 2006 (Unaudited) | December 31, 2005 | |||||||
ASSETS | ||||||||
Interest-Bearing Deposits in Other Financial Institutions | $ | 8,514 | $ | 11,386 | ||||
Investment Securities | ||||||||
U. S. Agency Securities | 20,901 | 16,396 | ||||||
Federal Funds Sold | 7,300 | — | ||||||
Loans | 73,818 | 69,522 | ||||||
Less: Unearned Income | (266 | ) | (247 | ) | ||||
Allowance for Loan Losses | (1,111 | ) | (1,009 | ) | ||||
Net Loans | 72,441 | 68,266 | ||||||
Earning Assets | 109,156 | 96,048 | ||||||
Cash and Due From Banks | 12,768 | 7,541 | ||||||
Bank Premises and Equipment | 2,274 | 2,328 | ||||||
Real Estate Owned Other Than Bank Premises | 750 | 772 | ||||||
Investment in Associated Companies | 769 | 769 | ||||||
Other Assets | 1,569 | 1,325 | ||||||
TOTAL ASSETS | $ | 127,286 | $ | 108,783 | ||||
LIABILITIES | ||||||||
Deposits | ||||||||
LIFETIME FREE CHECKING | 21,994 | 22,773 | ||||||
Interest-Bearing Demand | 17,154 | 8,450 | ||||||
Regular Passbook Savings | 10,066 | 10,064 | ||||||
Time Deposits | ||||||||
Certificates of Deposit $100,000 or More | 23,146 | 17,216 | ||||||
Other | 43,799 | 39,610 | ||||||
Total Deposits | 116,159 | 98,113 | ||||||
Notes issued to the U. S. Treasury | 162 | 264 | ||||||
Other Liabilities | 260 | 203 | ||||||
TOTAL LIABILITIES | 116,581 | 98,580 | ||||||
SHAREHOLDERS’ EQUITY | ||||||||
Common Stock, Par Value $5.00 Per Share, Authorized 2,500,000 Shares; 236,439 Outstanding in 2006 and 2005 | 1,182 | 1,182 | ||||||
Surplus | 5,651 | 5,651 | ||||||
Undivided Profits | 3,872 | 3,370 | ||||||
TOTAL SHAREHOLDERS’ EQUITY | 10,705 | 10,203 | ||||||
TOTAL LIABILITIES AND SHAREHOLDERS’ EQUITY | $ | 127,286 | $ | 108,783 | ||||
See accompanying notes to unaudited financial statements.
4
Table of Contents
CENTRAL NATIONAL BANK
STATEMENTS OF INCOME
| Nine Months Ended September 30, | Three Months Ended September 30, | |||||||||||
| 2006 | 2005 | 2006 | 2005 | |||||||||
| (Unaudited) | ||||||||||||
INTEREST INCOME | ||||||||||||
Interest and Fees on Loans | ||||||||||||
Taxable | $ | 3,371 | $ | 2,994 | $ | 1,165 | $ | 972 | ||||
Non-Taxable | 132 | 47 | 50 | 6 | ||||||||
Interest on Deposits in Other Financial Institutions | 279 | 321 | 91 | 101 | ||||||||
Interest on Federal Funds Sold | 367 | 195 | 75 | 157 | ||||||||
Interest and Dividends on Securities | ||||||||||||
U. S. Agency Securities | 594 | 449 | 226 | 142 | ||||||||
Obligations of States and Political Subdivisions | — | 16 | — | 3 | ||||||||
TOTAL INTEREST INCOME | 4,743 | 4,022 | 1,607 | 1,381 | ||||||||
INTEREST EXPENSE | ||||||||||||
Interest on Time Deposits $100,000 or More | 757 | 443 | 277 | 168 | ||||||||
Interest on Other Deposits | 1,469 | 1,077 | 539 | 382 | ||||||||
Interest on Federal Funds Purchased | 15 | 26 | 15 | — | ||||||||
Interest on Notes Issued to the U. S. Treasury | 3 | 2 | 1 | 1 | ||||||||
TOTAL INTEREST EXPENSE | 2,244 | 1,548 | 832 | 551 | ||||||||
NET INTEREST INCOME | 2,499 | 2,474 | 775 | 830 | ||||||||
Provision for Loan Losses | 45 | 63 | 15 | 21 | ||||||||
NET INTEREST INCOME AFTER PROVISION FOR LOAN LOSSES | 2,454 | 2,411 | 760 | 809 | ||||||||
NON-INTEREST INCOME | ||||||||||||
Service Charges, Commissions and Fees | 219 | 225 | 81 | 74 | ||||||||
Other Non-Interest Income | 54 | 57 | 18 | 18 | ||||||||
TOTAL NON-INTEREST INCOME | 273 | 282 | 99 | 92 | ||||||||
NON-INTEREST EXPENSE | ||||||||||||
Salaries and Employee Benefits | 1,058 | 1,048 | 353 | 352 | ||||||||
Occupancy Expense (Net) | 327 | 325 | 110 | 109 | ||||||||
Operations Center Expense | 388 | 338 | 127 | 117 | ||||||||
Other Non-Interest Expense | 267 | 210 | 88 | 71 | ||||||||
TOTAL NON-INTEREST EXPENSE | 2,040 | 1,921 | 678 | 649 | ||||||||
INCOME BEFORE INCOME TAXES | 687 | 772 | 181 | 252 | ||||||||
Income Tax Expense | 185 | 241 | 40 | 81 | ||||||||
NET INCOME | $ | 502 | $ | 531 | $ | 141 | $ | 171 | ||||
EARNINGS PER COMMON SHARE: | ||||||||||||
Basic and Diluted | $ | 2.12 | $ | 2.25 | $ | 0.60 | $ | 0.72 | ||||
Weighted Average Shares Outstanding | 236,439 | 236,439 | 236,439 | 236,439 | ||||||||
Cash Dividends Per Common Share | $ | — | $ | — | $ | — | $ | — | ||||
See accompanying notes to unaudited financial statements.
5
Table of Contents
CENTRAL NATIONAL BANK
STATEMENTS OF CASH FLOWS
(Dollars in Thousands)
| Nine Months Ended September 30, | ||||||||
| 2006 | 2005 | |||||||
| (Unaudited) | ||||||||
Cash Flows From Operating Activities | ||||||||
Net Income | $ | 502 | $ | 531 | ||||
Adjustments to reconcile net income to net cash provided by operating activities | ||||||||
Provision for Loan Losses | 45 | 63 | ||||||
Depreciation of Bank Premises and Equipment | 75 | 73 | ||||||
Increase (Decrease) in Unearned Income | 19 | 28 | ||||||
(Increase) Decrease in Other Assets | (244 | ) | (58 | ) | ||||
Increase (Decrease) in Other Liabilities | 57 | 13 | ||||||
Net Cash From Operating Activities | 454 | 650 | ||||||
Cash Flows From Investing Activities | ||||||||
Proceeds from Maturity of Interest Bearing Balances | 7,129 | 10,596 | ||||||
Purchase of Interest Bearing Balances | (4,257 | ) | (5,545 | ) | ||||
Payments on Investment Securities | (5 | ) | 3,790 | |||||
Purchase of Investment Securities | (4,500 | ) | (6,000 | ) | ||||
Purchase of Bank Premises and Equipment | (21 | ) | (27 | ) | ||||
Net (Increase) Decrease in Short-Term Loans Outstanding, Net | (4,447 | ) | 3,702 | |||||
Longer-Term Loans Originated or Purchased | (5,791 | ) | (10,599 | ) | ||||
Principal Collected on Longer-Term Loans | 5,999 | 5,515 | ||||||
(Increase) Decrease in Other Real Estate | 22 | 159 | ||||||
Net Cash From Investing Activities | (5,871 | ) | 1,591 | |||||
Cash Flows from Financing Activities | ||||||||
Increase in Demand and Savings Accounts | 7,927 | 12,868 | ||||||
Proceeds from Sale of Time Deposits | 24,997 | 21,620 | ||||||
Payments for Matured Time Deposits | (14,878 | ) | (17,956 | ) | ||||
Net Increase (Decrease) in Notes issued to the U. S. Treasury | (102 | ) | 317 | |||||
Net Cash From Financing Activities | 17,944 | 16,849 | ||||||
Net Increase (Decrease) in Cash and Cash Equivalents | 12,527 | 19,090 | ||||||
Cash and Cash Equivalents at Beginning of Year | 7,541 | 4,224 | ||||||
Cash and Cash Equivalents at End of Period | $ | 20,068 | $ | 23,314 | ||||
Cash and Cash Equivalents Include: | ||||||||
Cash and Due From Banks | $ | 12,768 | $ | 4,974 | ||||
Federal Funds Sold | 7,300 | 18,340 | ||||||
Total Cash and Cash Equivalents at Period End | $ | 20,068 | $ | 23,314 | ||||
Supplementary Data: | ||||||||
Cash Paid for Interest | $ | 2,147 | $ | 1,493 | ||||
Cash Paid for Taxes | 185 | 245 | ||||||
See accompanying notes to unaudited financial statements.
6
Table of Contents
CENTRAL NATIONAL BANK
STATEMENTS OF CHANGES IN SHAREHOLDERS’ EQUITY
(Dollars in Thousands)
| Common Stock | Surplus | Undivided Profits | |||||||||
| Shares | Par Value | ||||||||||
Balances, December 31, 2005 | 236,439 | $ | 1,182 | $ | 5,651 | $ | 3,370 | ||||
Net Income | — | — | 502 | ||||||||
Balances, September 30, 2006 (Unaudited) | 236,439 | $ | 1,182 | $ | 5,651 | $ | 3,872 | ||||
Notes To Unaudited Financial Statements
The unaudited interim financial statements of the Bank are prepared in the conformity with accounting principles generally accepted in the United States of America and the instructions to Securities and Exchange Commission’s Form 10-QSB. In the opinion of management, all adjustments (consisting only of normal recurring adjustments) necessary for a fair presentation of the financial position and results of operations for the periods presented have been included. The financial statements should be read in conjunction with the financial statements and notes contained in the Bank’s Annual Report on Form 10-KSB for the year ended December 31, 2005. The results for the nine months ended September 30, 2006 are not necessarily indicative of the results for the entire fiscal year ending December 31, 2006.
Certain reclassifications have been made to the prior year financial statements to conform to the 2006 presentation. These reclassifications had no effect on previously reported net income.
NOTE 1—INVESTMENT SECURITIES
(Dollars in Thousands)
The Bank has the ability and intent to carry the investments noted with an unrealized loss to the final maturity of the instrument and considers these investments not other-than-temporarily impaired.
The following table sets forth a summary of the investment securities portfolio as of the periods indicated:
| Amortized Cost | Gross Unrealized Gains | Gross Unrealized Losses | Estimated Market Value | |||||||||
September 30, 2006 (Unaudited) | ||||||||||||
U. S. Treasury Securities | $ | — | $ | — | $ | — | $ | — | ||||
U. S. Agency Securities | 20,901 | 8 | 245 | 20,664 | ||||||||
Obligations of States and Political Subdivisions | — | — | — | |||||||||
Total Securities | $ | 20,901 | $ | 8 | $ | 245 | $ | 20,664 | ||||
December 31, 2005 | ||||||||||||
U. S. Treasury Securities | $ | — | $ | — | $ | — | $ | — | ||||
U. S. Agency Securities | 16,396 | 7 | 271 | 16,132 | ||||||||
Obligations of States and Political Subdivisions | — | — | — | — | ||||||||
Total Securities | $ | 16,396 | $ | 7 | $ | 271 | $ | 16,132 | ||||
7
Table of Contents
NOTE 2—LOANS
(Dollars in Thousands)
The composition of the loan portfolio by dollar amount is shown in the table below:
| September 30, 2006 (Unaudited) | December 31, 2005 | |||||||
Secured by real estate | ||||||||
Construction Loans | $ | 1,218 | $ | 1,192 | ||||
Secured by farmland | 1,519 | 1,561 | ||||||
Secured by 1-4 family residential properties | 8,643 | 7,085 | ||||||
Secured by multi-family residential properties | 1,869 | 3,222 | ||||||
Secured by non-farm residential property | 38,977 | 40,410 | ||||||
Loans to finance agricultural production and other loans to farmers | 3 | 4 | ||||||
Commercial and industrial loans | 12,768 | 10,480 | ||||||
Loans to individuals for household, family and other personal expenditures | 3,410 | 2,958 | ||||||
Obligations (other than securities) of states and political subdivisions | 5,411 | 2,610 | ||||||
Less: Unearned Income | (266 | ) | (247 | ) | ||||
Total loans and leases | $ | 73,552 | $ | 69,275 | ||||
NOTE 3—ALLOWANCE FOR LOAN LOSSES
(Dollars in Thousands)
The allowance for loan losses is an estimate of losses inherent in the loan portfolio as determined by management taking into consideration historical loan loss experience, diversification of the loan portfolio, amounts of secured and unsecured loans, banking industry standards and averages, and general economic conditions. Ultimate losses may vary from current estimates. These estimates are reviewed periodically and as adjustments become necessary, they are reported in earnings in the periods which they become reasonably estimable.
The following table summarizes the activity in the allowance for loan losses in the periods presented:
| September 30, 2006 (Unaudited) | December 31, 2005 | ||||||
Balance Beginning of Period | $ | 1,009 | $ | 1,038 | |||
Provision for Loan Losses | 45 | 84 | |||||
Charge-Offs, Net of (Recoveries): | |||||||
Real Estate Loans | (65 | ) | 103 | ||||
Installment Loans | 8 | 10 | |||||
Commercial Loans | — | — | |||||
Total Net Loan Losses | (57 | ) | 113 | ||||
Balance End of Period | $ | 1,111 | $ | 1,009 | |||
NOTE 4—NONPERFORMING ASSETS AND DELINQUENT LOANS
(Dollars in Thousands)
| September 30, 2006 (Unaudited) | December 31, 2005 | |||||
Nonaccrual Loans | ||||||
Real Estate | $ | 2,554 | $ | 3,050 | ||
Installment | 41 | — | ||||
Commercial | — | — | ||||
Total Nonaccrual Loans | 2,595 | 3,050 | ||||
Foreclosed Properties | 750 | 772 | ||||
Total Nonperforming Assets | $ | 3,345 | $ | 3,822 | ||
Loans 90 Days or More Past Due and Still Accruing | ||||||
Real Estate | $ | — | $ | 216 | ||
Installment | — | — | ||||
Commercial | — | — | ||||
Total Loans 90 Days or More Past Due | $ | — | $ | 216 | ||
8
Table of Contents
Item 2—MANAGEMENT’S DISCUSSION AND ANALYSIS
The Bank
The Bank opened for business as a National Banking Association on July 1, 1996 and was created through the spinoff of the assets, liabilities and related capital of offices from Peoples National Bank, Danville, Virginia. The Bank operates under a national charter and provides full banking services. As a national bank, the Bank is subject to regulation by the Comptroller of the Currency, the Federal Deposit Insurance Corporation and the Board of Governors of the Federal Reserve System. The Bank generates commercial (including agricultural), mortgage and consumer loans and receives deposits from customers located primarily in the areas surrounding the Bank’s offices, which are located in the City of Lynchburg and Amherst and Campbell Counties in Virginia. At September 30, 2006, the Bank had $127 million in assets, $72 million in net loans, $116 million in deposits and $11 million in total shareholders’ equity.
Proposed Reorganization and Merger
On July 28, 2006, the Bank entered into an Agreement and Plan of Merger (the “Merger Agreement”) with Blue Ridge Bank, N.A., Community National Bank, First National Bank, First National Exchange Bank, Mountain National Bank, Patrick Henry National Bank, Patriot Bank, National Association, Peoples National Bank, Shenandoah National Bank (together with the Bank, the “Banks”) and Carter Bank & Trust, a new Virginia chartered bank that will be headquartered in Martinsville, Virginia. The Merger Agreement sets forth the terms and conditions pursuant to which the Banks will reorganize by merging into Carter Bank & Trust (the “Merger”).
All officers and employees of the existing Banks will remain unchanged as a result of the Merger. Worth Harris Carter, Jr. is currently Chairman of the Board and President of each of the Banks and will serve as Chairman of the Board and President of Carter Bank & Trust. Under the terms of the Merger Agreement, shareholders of each of the Banks will receive a certain number of shares in Carter Bank & Trust in exchange for each share held in the existing Banks as follows: each share of Blue Ridge Bank: 2.474 shares; each share of Central National Bank: 5.470 shares; each share of Community National Bank: 4.350 shares; each share of First National Bank: 1.613 shares; each share of First National Exchange Bank: 4.509 shares; each share of Mountain National Bank: 3.981 shares; each share of Patrick Henry National Bank: 1.112 shares; each share of Patriot Bank: 5.775 shares; each share of Peoples National Bank: 1.945 shares; and each share of Shenandoah National Bank: 3.461 shares.
Consummation of the Merger is subject to a number of customary conditions including (i) the approval of the Merger by the shareholders of each of the Banks and Carter Bank & Trust and (ii) the receipt of all required regulatory approvals, including approval by the Virginia State Corporation Commission and the Federal Deposit Insurance Corporation. The Merger is expected to be completed in the fourth quarter of 2006 and will be accounted for using the purchase method of accounting.
Critical Accounting Policies
The accounting and reporting policies of the Bank conform to generally accepted accounting principles (GAAP) in the United States of America and to general practices within the banking industry. The preparation of the financial statements in conformity with GAAP requires management to make estimates and assumptions that affect the amounts reported in the financial statements and accompanying notes. We believe the most significant of these estimates involves the allowance for loan losses because of its potential impact on our overall performance. We have described our policies in this area below. A summary of the Bank’s significant accounting policies can be found in the Notes to Financial Statements included in the Bank’s 2005 Annual Report on Form 10-KSB.
9
Table of Contents
In general, determining the amount of the allowance for loan losses requires significant judgment and the use of estimates by management allowing for losses inherent to the loan portfolio. The Bank maintains an allowance for loan losses to absorb probable losses in the loan portfolio based on a quarterly analysis of the portfolio. This analysis determines an appropriate level of the allowance for loan losses by considering factors affecting loan losses, including specific losses, levels and trends in impaired and non-performing loans, historical loan loss experience, current economic conditions, volume, growth and composition of the portfolio, and other relevant factors. The Bank records a provision for loan losses to maintain the allowance at an adequate level. The provision expense could increase or decrease each quarter based upon the results of management’s formal analysis.
The amount of the allowance represents management’s estimate of expected losses from existing loans based upon specific allocations for individual lending relationships and historical loss experience. The allowance for loan losses related to impaired loans is based on discounted cash flows using the loan’s initial effective interest rate or the fair value of the collateral for certain collateral dependent loans. This evaluation requires management to make estimates of the amounts and timing of future cash flows on impaired loans, which consists primarily of non-accrual and restructured loans. Actual losses for these loans can vary significantly from these estimates.
Investment securities are stated at cost, adjusted for amortization of premiums and accretion of discounts, and computed by the interest method. The Bank has positive intent and ability to hold these securities until maturity. Gains and losses on sales, if any, of securities are based upon the adjusted cost of the specific securities sold. If any of the securities are not held to maturity, the classification of the entire portfolio could change to available for sale. This could require fair value accounting for not just the tainted securities but the entire portfolio, and possibly, the recognition of unrealized losses as other than temporary in the income statement.
Real estate properties acquired through or in lieu of loan foreclosure are initially recorded at the lower of the Bank’s carrying amount or fair value less estimated selling cost at the date of foreclosure. Any write-downs based on the asset’s fair value at the date of acquisition are charged to the allowance for loan losses. After foreclosure, these assets are carried at the lower of their new cost basis or fair value less cost to sell. Costs of significant property improvements are capitalized, whereas costs relating to holding property are expensed. The portion of interest costs relating to development of real estate is capitalized. Valuations are periodically performed by management, and any write-downs are recorded as a charge to operations, if necessary, to reduce the carrying value of a property to the lower of its carrying value or fair value less cost to sell. The fair value of other real estate owned, including related selling costs, is an estimate that may change in the near term. If estimates change that decrease the expected fair value of the property, the recognition of this loss is reflected in the income statement for the period the estimate changes.
Overview
Net income for the first nine months of 2006 equaled $502,000, or $2.12 per share, compared to $531,000, or $2.25 per share, for 2005. On an annualized basis, this represents a return on average assets of 0.56% and return on average equity of 6% compared to 0.64% and 7%, respectively, for last year
Deposits have increased $18 million since year-end with the increases occurring in all categories, except LIFETIME FREE CHECKING. These funds were used to increase fed funds sold and loans and invest in additional U. S. Agency Securities.
Total Liabilities at September 30, 2006 were $116,581,000, up from $98,580,000 at December 31, 2005.
Total Shareholders’ Equity at September 30, 2006 was $10,705,000. At December 31, 2005, total Shareholders’ Equity was $10,203,000.
The Bank’s net interest income increased $25,000 over the same period last year. Total non-interest expenses increased $119,000 and, as a result, net income decreased $29,000. As we move funds into loans and U. S. Agency Securities, we expect our net interest margins to expand and earnings will increase.
10
Table of Contents
Results of Operations
Net Interest Income.Net Interest Income is our largest source of revenue and continues to be impacted by low interest rates.
The following table details the average balances and cost and yield data for the earning assets and interest-bearing liabilities:
| For the Nine Months Ended | ||||||||||||||||||||||
| September 30, 2006 | September 30, 2005 | |||||||||||||||||||||
| (Unaudited) | ||||||||||||||||||||||
Asset/Liability | Average Balance | Income/ Expense | Yield/ Cost | Average Balance | Income/ Expense | Yield/ Cost | Increase (Decrease) | |||||||||||||||
Real Estate Loans | $ | 53,869 | $ | 2,515 | 6.22 | % | $ | 51,094 | $ | 2,285 | 5.96 | % | $ | 230 | ||||||||
Installment Loans | 3,137 | 210 | 8.93 | % | 2,555 | 181 | 9.45 | % | 29 | |||||||||||||
Commercial Loans | 17,352 | 778 | 5.98 | % | 10,234 | 575 | 7.49 | % | 203 | |||||||||||||
Total Loans - Net of Unearned Income | 74,358 | 3,503 | 6.28 | % | 63,883 | 3,041 | 6.35 | % | 462 | |||||||||||||
Interest-Bearing Deposits in Other Financial Institutions | 7,703 | 270 | 4.67 | % | 12,124 | 321 | 3.53 | % | (51 | ) | ||||||||||||
Investment Securities | 20,701 | 603 | 3.88 | % | 14,517 | 465 | 4.27 | % | 138 | |||||||||||||
Federal Funds Sold | 5,789 | 367 | 8.45 | % | 16,691 | 195 | 1.56 | % | 172 | |||||||||||||
Total Earning Assets | $ | 108,551 | $ | 4,743 | 5.83 | % | $ | 107,215 | $ | 4,022 | 5.00 | % | $ | 721 | ||||||||
Interest-Bearing Transaction Accounts | $ | 10,412 | $ | 67 | 0.86 | % | $ | 9,121 | $ | 66 | 0.96 | % | $ | 1 | ||||||||
Savings Accounts (Includes MMDAs) | 11,404 | 232 | 2.71 | % | 17,043 | 176 | 1.38 | % | 56 | |||||||||||||
Certificates of Deposit Over $100,000. | 23,128 | 757 | 4.36 | % | 16,110 | 443 | 3.67 | % | 314 | |||||||||||||
Other Certificates of Deposits | 39,955 | 1,170 | 3.90 | % | 40,673 | 835 | 2.74 | % | 335 | |||||||||||||
Total Deposits | 84,899 | 2,226 | 3.50 | % | 82,947 | 1,520 | 2.44 | % | 706 | |||||||||||||
Notes issued to the U. S. Treasury | 73 | 3 | 5.48 | % | 101 | 2 | 2.64 | % | 1 | |||||||||||||
Federal Funds Purchased | 1,094 | 15 | 1.83 | % | 25 | 26 | 138.67 | % | (11 | ) | ||||||||||||
Total Interest-Bearing Liabilities | $ | 86,066 | $ | 2,244 | 3.48 | % | $ | 83,073 | $ | 1,548 | 2.48 | % | $ | 696 | ||||||||
Net Interest Income | $ | 2,499 | 3.07 | % | $ | 2,474 | 3.08 | % | $ | 25 | ||||||||||||
Allowance and Provision for Loan Losses.The Allowance for Loan Losses represents management’s estimation of the amount necessary to absorb future losses in the loan portfolio. On the Statement of Condition, the Allowance for Loan Losses is deducted from Total Loans so that the net amount shown represents the estimated realizable total loans. The Provision for Loan Losses is the amount charged to expense to maintain the Allowance at an adequate level.
11
Table of Contents
The Allowance for Loan Losses was $1,111,000 or 1.5% of total loans outstanding, at September 30, 2006. In the view of management, the Allowance for Loan Losses is adequate to meet the loss contingency based on experience factors and a review of the loan portfolio.
The Provision for Loan Loss was $45,000 for the nine months ended September 30, 2006 and $ 63,000 for 2005. See Note 3—Allowance For Loan Losses—and Nonperforming Assets and Delinquent Loans—to the financial statements, for additional information.
Non-Interest Income.Non-Interest Income decreased $9,000, or 3%, for the nine-month period ended September 30, 2006, compared to the same period of 2005.
Non-Interest Expense.Non-Interest Expense increased $119,000, or 6%, for the nine month period ended September 30, 2006, compared to the same period of 2005. All categories of non-interest expense increased during this period.
Income Taxes.Income tax expense was $185,000 for the first nine months of 2006, as compared to $241,000 in 2005. The effective income tax rate declined between the periods, due to a higher percentage of tax exempt income to pretax accounting income in the current period.
Analysis of Financial Condition
Investments U. S. Agency Securities investments have increased $4.5 million, or 27% compared to December 31, 2005. Funds from the increase in deposits will be invested in additional U. S. Agency Securities.
Loans. Loans increased from $69,522,000 at December 31, 2005 to $73,818,000 at September 30, 2006. Loans secured by real estate make up 71% of total loans and continue to be the largest portion of the bank’s loan portfolio.
Non-Performing Assets and Impaired Loans.Non-performing assets, which consist of nonaccrual loans and foreclosed properties, were $3,345,000 at September 30, 2006 and $3,822,000 at December 31, 2005. Nonaccrual Loans equaled $2,595,000 at September 30, 2006 and $3,050,000 at December 31, 2005. Foreclosed Properties equaled $750,000 at September 30, 2006 and $772,000 at December 31, 2005.
Nonaccrual loans are those loans contractually past due 90 days or more on which no interest is being accrued. Other real estate owned consists of real estate acquired through foreclosure. These properties are reviewed quarterly and reduced to an estimated realizable value at that time.
Deposits.Total deposits have increased $18 million, or 18%, compared to December 31, 2005. Increases occurred in all categories.
Capital.The federal regulatory agencies use risk-based capital ratios to analyze the adequacy of a bank’s capital. These ratios weigh bank assets from 0% to 100%, depending upon the risks inherent in each type of asset. The Bank continues to meet all requirements for a well-capitalized bank as defined by the regulatory agencies.
The following table presents the key risk-based capital ratios for the periods indicated:
| September 30, 2006 | December 31, 2005 | |||||
Tier 1 Ratio | 13.16 | % | 13.39 | % | ||
Total Risk-Based Capital Ratio | 14.41 | % | 14.64 | % | ||
Leverage Ratio | 9.00 | % | 8.90 | % |
Shareholders’ Equity was $10,705,000 at September 30, 2006 compared to $10,203,000 at December 31, 2005.
12
Table of Contents
Liquidity.Liquidity is our ability to fund both loans and investments in the normal course of business and to provide adequate protection for unexpected deposit withdrawals or other demands for funds without incurring a significant negative impact on profitability. Our primary source of day-to-day liquidity lies in the combination of cash, deposit balances, checks in process of collection, deposit growth and federal funds sold. Federal funds are excess funds that are sold to other banks, generally on a one-day basis. Normal funds from the repayment of loans and investments augment these funds.
Our secondary source of liquidity lies in our investments and deposits in other financial institutions. While our investments are categorized as held-to-maturity, they consist primarily of short-term U S government agencies that are readily marketable. The majority of our investment securities mature in five years or less. Interest-bearing deposits in other financial institutions generally mature in two years or less and the volume of this investment decreased for the first nine months.
Off-Balance Sheet Arrangements.Commitments to extend credit, which amounted to $2,000,000 at September 30, 2006 and $3,815,000 at December 31, 2005, respectively, represent agreements to lend to customers with fixed expiration dates or other termination clauses. Since many of the commitments are expected to expire without being funded, the total commitment amounts do not necessarily represent future liquidity requirements. Standby letters of credit are conditional commitments issued by the Bank guaranteeing the performance of a customer to a third party. Those guarantees are primarily issued to support public and private borrowing arrangements. The Bank had outstanding letters of credit in the amount of $1,156,000 at September 30, 2006 and $639,000 at December 31, 2005.
Recent Accounting Pronouncements.In June 2005, the FASB issued Statement No. 154, “Accounting Changes and Error Corrections”, which replaces APB Opinion No. 20, “Accounting Changes” and FASB Statement No. 3, “Reporting Accounting Changes in Interim Financial Statements.” Statement No., 154 requires that a voluntary change in accounting principle be applied retrospectively with all prior period financial statements presented on the new accounting principle. Statement No. 154 also requires that a change in method of depreciating or amortizing a long-lived non-financial asset be accounted for prospectively as a change in estimate, and correction of errors in previously issued financial statements should be termed a “restatement.” Statement No. 154 is effective for accounting changes and correction of errors made in fiscal years beginning after December 15, 2005. Management does not expect this accounting pronouncement to have a material impact on the financial statements.
Item 3—CONTROLS AND PROCEDURES
The Bank maintains a system of disclosure controls and procedures that is designed to ensure that material information is accumulated and communicated to management, including the Bank’s president (who is the Bank’s principal executive officer and principal financial officer), as appropriate to allow timely decisions regarding required disclosure. As required, management, with the participation of the Bank’s president, evaluated the effectiveness of the design and operation of the Bank’s disclosure controls and procedures as of the end of the period covered by this report. Based on this evaluation, the Bank’s president concluded that the Bank’s disclosure controls and procedures were operating effectively to ensure that information required to be disclosed by the Bank in reports that it files or submits under the Securities Exchange Act of 1934, as amended, is recorded, processed, summarized, and reported within the time periods specified in the rules and forms of the SEC.
Because of the inherent limitations in all control systems, no evaluation of controls can provide absolute assurance that the Bank’s disclosure controls and procedures will detect or uncover every situation involving the failure of persons within the Bank to disclose material information otherwise required to be set forth in the Bank’s periodic reports.
The Bank’s management is also responsible for establishing and maintaining adequate internal control over financial reporting to provide reasonable assurance regarding the reliability of financial reporting and the preparation of financial statements for external purposes in accordance with generally accepted accounting principles. There were no changes in the Bank’s internal control over financial reporting during the Bank’s quarter ended September 30, 2006 that have materially affected, or are reasonably likely to materially affect, the Bank’s internal control over financial reporting.
13
Table of Contents
PART II—OTHER INFORMATION
Item 1—LEGAL PROCEEDINGS.
There are no material pending legal proceedings to which the Bank is a party or to which the property of the Bank is subject.
Item 2—UNREGISTERED SALES OF EQUITY SECURITIES AND USE OF PROCEEDS.
None.
Item 3—DEFAULTS UPON SENIOR SECURITIES.
None.
Item 4—SUBMISSION OF MATTERS TO A VOTE OF SECURITY HOLDERS.
None.
Item 5—OTHER INFORMATION
None.
Item 6—EXHIBITS
Exhibits:
| 2.1 | Agreement and Plan of Merger, dated as of July 28, 2006, by and among Blue Ridge Bank, N.A., Central National Bank, Community National Bank, First National Bank, First National Exchange Bank, Mountain National Bank, Patrick Henry National Bank, Patriot Bank, National Association, Peoples National Bank, Shenandoah National Bank and Carter Bank & Trust (incorporated by reference to Exhibit 2.1 to Form 8-K filed with the Office of the Comptroller of the Currency on July 31, 2006). | |
| 3.1 | Articles of Association (filed with the Office of the Comptroller of the Currency prior to the opening of the Bank) | |
| 3.2 | Amended and Restated Bylaws (as amended and restated through February 17, 2005) (incorporated by reference to Exhibit 3.2 to Form 8-K filed with the Office of the Comptroller of the Currency on February 17, 2005) | |
| 31 | Certification by principal executive officer and principal financial officer pursuant to Rule 13a-14(a) | |
| 32 | Certification of principal executive officer and principal financial officer pursuant to 18 U.S.C. § 1350 | |
14
Table of Contents
SIGNATURES
In accordance with the requirements of the Exchange Act, the registrant caused this report to be signed on its behalf by the undersigned, thereunto duly authorized.
| CENTRAL NATIONAL BANK | ||
| Date:November 13, 2006 |
| |
| Worth Harris Carter, Jr. | ||
| Chairman of the Board and President | ||
| (Signing on behalf of the registrant and as principal executive and financial officer of the registrant) | ||
15
Table of Contents
Exhibit 31
CERTIFICATION
I, Worth Harris Carter, Jr., certify that:
| 1. | I have reviewed this quarterly report on Form 10-QSB of Central National Bank; |
| 2. | Based on my knowledge, this report does not contain any untrue statement of a material fact or omit to state a material fact necessary to make the statements made, in light of the circumstances under which such statements were made, not misleading with respect to the period covered by this report; and |
| 3. | Based on my knowledge, the financial statements, and other financial information included in this report, fairly present in all material respects the financial condition, results of operations and cash flows of the small business issuer as of, and for, the periods presented in this report. |
| Date:November 13, 2006 |
| |
| Worth Harris Carter, Jr. | ||
| Chairman of the Board and President | ||
| (principal executive officer and principal financial officer) |
16
Table of Contents
Exhibit 32
CERTIFICATION OF
PRINCIPAL EXECUTIVE OFFICER AND PRINCIPAL FINANCIAL OFFICER
Pursuant to Section 906 of the Sarbanes-Oxley Act of 2002 (18 U.S.C. Section 1350)
The undersigned, as the principal executive officer and principal financial officer of Central National Bank, certifies that, to the best of his knowledge and belief, the Quarterly Report on Form 10-QSB for the period ended September 30, 2006 which accompanies this certification fully complies with the requirements of Section 13(a) or 15(d) of the Securities Exchange Act of 1934 and the information contained in the report fairly presents, in all material respects, the financial condition and results of operations of Central National Bank at the dates and for the periods indicated. The foregoing certification is made pursuant to Section 906 of the Sarbanes-Oxley Act of 2002 (18 U.S.C. Section 1350) and shall not be relied upon for any other purpose. The undersigned expressly disclaims any obligation to update the foregoing certification except as required by law.
| Date:November 13, 2006 |
| |
| Worth Harris Carter, Jr. | ||
| Chairman of the Board and President | ||
| (principal executive officer and principal financial officer) |
17
Table of Contents

2005 Annual Report

Community National Bank
SOUTH BOSTON VIRGINIA 24592
Member FDIC
Table of Contents
Management’s Discussion and Analysis of Financial Condition and Results of Operation
Except for the historical information contained in this report, the matters set forth herein include Forward-Looking Statements within the meaning of the “safe harbor” provisions of the Private Securities Litigation Reform Act of 1995. These Forward-Looking Statements included, among other things, statements of goals, plans, intentions and expectations, regarding or based upon desired business strategies, general economic conditions, interest rates, developments in local and national markets, and other matters, which, by their nature, are subject to significant uncertainties. Because of these uncertainties and the assumptions upon which this report is based, actual future developments with respect to the business of the Bank may differ materially from those contemplated by such statements.
Critical Accounting Policies.The accounting and reporting policies of the Bank conform to generally accepted accounting principles (GAAP) in the United States of America and to general practices within the banking industry. The preparation of the financial statements in conformity with GAAP requires management to make estimates and assumptions that affect the amounts reported in the financial statements and accompanying notes. We believe the most significant of these estimates involves the allowance for loan losses because of its potential impact on our overall performance. We have described our policies in this area below. A summary of the Bank’s significant accounting policies can be found in the Notes to the Financial Statements.
In general, determining the amount of the allowance for loan losses requires significant judgment and the use of estimates by management. The Bank maintains an allowance for loan losses to absorb probable losses in the loan portfolio based on a quarterly analysis of the portfolio and expected future losses. This analysis determines an appropriate level of the allowance for loan losses by considering factors affecting loan losses, including specific losses, levels and trends in impaired and non-performing loans, historical loan loss experience, current economic conditions, volume, growth and composition of the portfolio, and other relevant factors. The Bank records a provision for loan losses to maintain the allowance at an adequate level. The provision expense could increase or decrease each quarter based upon the results of management’s formal analysis.
The amount of the allowance represents management’s estimate of expected losses from existing loans based upon specific allocations for individual lending relationships and historical loss experience. The allowance for loan losses related to impaired loans is based on discounted cash flows using the loan’s initial effective interest rate or the fair value of the collateral for certain collateral dependent loans. This evaluation requires management to make estimates of the amounts and timing of future cash flows on impaired loans, which consists primarily of non-accrual and restructured loans. Actual losses for these loans can vary significantly from these estimates.
Summary of Operations.Net income for 2005 equaled $2,292,000 or $3.24 per share, compared to $2,040,000 or $2.88 per share, for 2004. This represents a return on average assets of 0.93% and return on average equity of 10% compared to 0.83% and 10%, respectively, for last year.
Our total deposits have decreased $1.9 million compared to last year. Time deposits and LIFETIME FREE CHECKING increased while all other categories decreased. Loans increased $7 million, or 5% during the year.
The Bank opened an office in Emporia, VA in 2004. We anticipate opening a second office in Durham, NC and two offices in Franklin, VA during 2006.
Net Interest Income.Net interest income is our largest source of revenue and continues to be impacted by the very low level of interest rates. Since 2001, the Federal Reserve has reduced the target rate for federal funds, which is a major factor in the level of most short-term interest rates, from 6.50% to 1.00%. The Federal Reserve began increasing the rate from 1.00% in June 2004 and has continued over the last year and a half to the latest increase bringing the rate to 4.50% The economy appears strong, and while inflation has been contained, there are signs inflation could increase and the Fed is expected to increase rates one or two more times before pausing.
With interest rates at levels never seen before in recent times, the Bank has increased loans and investments in U.S Agency Securities while reducing its Federal Funds Sold position and Interest Bearing Deposits in other Financial Institutions. The Bank allowed some high cost Certificates of Deposit to run off although, in the second half of the year, Certificates of Deposit increased as funds moved from shorter-term categories into Certificates of Deposit.
As a result of increasing loans and investments, our net interest income increased $394,000 over the prior year. With interest rates at a higher level we anticipate existing loans, many of which will reprice annually, will increase yields at a faster pace than the net increase in the cost of deposits.
The following table shows a summary of the changes in interest income and interest expense resulting from changes in volume and changes in rates for each category of interest-earning assets and interest-bearing liabilities for 2005/2004 and 2004/2003:
(Dollars in Thousands) Increase Asset/Liability | 2005 vs 2004 (Revised) Increase (Decrease) | 2004 vs 2003 (Decrease) | ||||
Real Estate Loans | 717 | (969 | ) | |||
Installment Loans | (80 | ) | 268 | |||
Commercial Loans | 456 | 472 | ||||
Total Loans | 1,093 | (229 | ) | |||
Interest-Bearing Deposits in Other Financial Institutions | 159 | 99 | ||||
Investment Securities | (348 | ) | (360 | ) | ||
Federal Funds Sold | (83 | ) | (253 | ) | ||
Total Earning Assets | 821 | (743 | ) | |||
Interest-Bearing Transactions Accounts | 13 | (51 | ) | |||
Savings Accounts (Includes MMDA’s) | (13 | ) | (32 | ) | ||
Certificates of Deposit $100,000 and Over | (2 | ) | 74 | |||
Other Certificates of Deposit | 413 | (723 | ) | |||
Total Interest-Bearing Deposits | 411 | (732 | ) | |||
Notes Issued to the U.S. Treasury | 2 | 1 | ||||
Federal Funds Purchased | 14 | — | ||||
Total Interest-Bearing Liabilities | 427 | (731 | ) | |||
Change in Net Interest Income | 394 | (12 | ) | |||
2
Table of Contents
The following table details the average balances and cost and yield data for the earning assets and interest-bearing liabilities:
(Dollars in Thousands) Asset/Liability | 2005 (Revised) | 2004 | 2003 | ||||||||||||||||||||||||
| Average Balance | Interest | Yield/ Cost | Average Balance | Interest | Yield/ Cost | Average Balance | Interest | Yield/ Cost | |||||||||||||||||||
Real Estate Loans | $ | 105,777 | $ | 6,485 | 6.13 | % | $ | 97,119 | $ | 5,768 | 5.94 | % | $ | 92,567 | $ | 6,737 | 7.28 | % | |||||||||
Installment Loans | 13,370 | 957 | 7.16 | % | 11,946 | 1,037 | 8.68 | % | 9,008 | 769 | 8.54 | % | |||||||||||||||
Commercial Loans | 37,060 | 1,581 | 4.27 | % | 29,865 | 1,125 | 3.77 | % | 15,219 | 653 | 4.29 | % | |||||||||||||||
Total Loans | 156,207 | 9,023 | 5.78 | % | 138,930 | 7,930 | 5.71 | % | 116,794 | 8,159 | 6.99 | % | |||||||||||||||
Interest-Bearing Deposits in Other Financial Institutions | 15,594 | 575 | 3.69 | % | 18,174 | 416 | 2.29 | % | 13,326 | 317 | 2.38 | % | |||||||||||||||
Investment Securities | 52,294 | 1,970 | 3.77 | % | 59,349 | 2,318 | 3.91 | % | 53,704 | 2,678 | 4.99 | % | |||||||||||||||
Federal Funds Sold | 6,610 | 137 | 2.07 | % | 17,189 | 220 | 1.28 | % | 45,760 | 473 | 1.03 | % | |||||||||||||||
Total Earning Assets | $ | 230,705 | $ | 11,705 | 5.07 | % | 233,642 | 10,884 | 4.66 | % | 229,584 | 11,627 | 5.06 | % | |||||||||||||
Interest-Bearing Transaction Accounts | 21,947 | 143 | 0.65 | % | 23,032 | 130 | 0.56 | % | 21,360 | 181 | 0.85 | % | |||||||||||||||
Savings Accounts (Includes MMDA’s) | 46,916 | 646 | 1.38 | % | 49,319 | 659 | 1.34 | % | 42,900 | 691 | 1.61 | % | |||||||||||||||
Certificates of Deposit | |||||||||||||||||||||||||||
$100,000 and Over | 18,752 | 736 | 3.92 | % | 16,570 | 738 | 4.45 | % | 16,175 | 664 | 4.11 | % | |||||||||||||||
Other Certificates of Deposit | 98,419 | 3,486 | 3.54 | % | 101,616 | 3,073 | 3.02 | % | 107,553 | 3,796 | 3.53 | % | |||||||||||||||
Total Deposits | 186,034 | 5,011 | 2.69 | % | 190,537 | 4,600 | 2.41 | % | 187,988 | 5,332 | 2.84 | % | |||||||||||||||
Notes Issued to the U.S. Treasury | 127 | 4 | 3.15 | % | 194 | 2 | 1.03 | % | 147 | 1 | 0.68 | % | |||||||||||||||
Federal Funds Purchased | 355 | 14 | 3.94 | % | — | — | — | — | — | — | |||||||||||||||||
Total Interest-Bearing Liabilities | $ | 186,516 | $ | 5,029 | 2.70 | % | $ | 190,731 | $ | 4,602 | 2.41 | % | $ | 188,135 | $ | 5,333 | 2.83 | % | |||||||||
Net Interest Income | $ | 6,676 | $ | 6,282 | $ | 6,294 | |||||||||||||||||||||
Net Yield on Earning Assets | 2.89 | % | 2.69 | % | 2.74 | % | |||||||||||||||||||||
Loans.Loans increased from $147 million at year end 2004 to $154 million at year end 2005. The composition of the portfolio remained consistent with prior years as real estate loans made up 69% of net loans and is indicative of the overall lending philosophy of the Bank.
The Bank also continues to maintain flexibility in the maturity of the loan portfolio. Almost half of the Bank’s loans have adjustable interest rates as of year-end 2005 and 2004. In addition, the combination of adjustable-rate and fixed rate loans that adjust or mature within one year equals nearly 32% of the total portfolio for 2005, compared to 62% for 2004.
Allowance and Provision for Loan Losses.As discussed previously, the Allowance for Loan Losses represents management’s estimation of the amount necessary to absorb future losses in the loan portfolio. On the Statement of Condition, the Allowance for Loan Losses is deducted from Total Loans so that the net amount shown represents the estimated realizable total loans. The Provision for Loan Losses is the amount charged to expense to maintain the allowance at an adequate level.
The Provision for Loan Losses equaled $72,000 at year end 2005 and 2004.
(Dollars in Thousands) | December 31 | |||||||||||||||||||
| 2005 | 2004 | 2003 | 2002 | 2001 | ||||||||||||||||
Balance Beginning of Year | $ | 1,589 | $ | 1,559 | $ | 1,043 | $ | 1,005 | $ | 986 | ||||||||||
Provision for Loan Losses | 72 | 72 | 583 | 72 | 72 | |||||||||||||||
Net Loan Losses | ||||||||||||||||||||
Real Estate Loans | 5 | 26 | 49 | — | — | |||||||||||||||
Installment Loans | — | 16 | 15 | 34 | 51 | |||||||||||||||
Commercial Loans | — | — | 3 | — | 2 | |||||||||||||||
Total Net Loan Losses | 5 | 42 | 67 | 34 | 53 | |||||||||||||||
Balance | $ | 1,656 | $ | 1,589 | $ | 1,559 | $ | 1,043 | $ | 1,005 | ||||||||||
Allowance for Loan Losses to Period-End Loans | 1.08 | % | 1.08 | % | 1.23 | % | 0.97 | % | 0.92 | % | ||||||||||
Net Loan Losses to Average Loans | 0.00 | % | 0.03 | % | 0.06 | % | 0.03 | % | 0.05 | % | ||||||||||
Nonaccrual loans are those loans contractually past due 90 days or more on which no interest is being accrued. Other real estate owned consists of real estate acquired through foreclosure. These properties are reviewed quarterly and reduced to an estimated realizable value at that time.
3
Table of Contents
Information concerning nonaccrual loans and other real estate owned is presented in the following table:
(Dollars in Thousands) Nonaccrual Loans | December 31 | ||||||||||||||
| 2005 (Revised) | 2004 | 2003 | 2002 | 2001 | |||||||||||
Real Estate | $ | 2,457 | $ | 1,913 | $ | 1,281 | $ | — | $ | — | |||||
Installment | 6 | — | — | 2 | 20 | ||||||||||
Commercial | — | — | — | — | 3 | ||||||||||
Total Nonaccrual Loans | 2,463 | 1,913 | 1,281 | 2 | 23 | ||||||||||
Real Estate Owned Other Than Bank Premises | 1,086 | 818 | 815 | 836 | — | ||||||||||
Total Non-Performing Assets | $ | 3,549 | $ | 2,731 | $ | 2,096 | $ | 838 | $ | 23 | |||||
The following table presents the volume of loans contractually past due for 90 days or more on which interest continues to be accrued. These loans are believed to be well collateralized and present little or no likelihood of loss of principal.
(Dollars in Thousands) Loans 90 Days or More Past Due | |||||||||||||||
| 2005 | 2004 | 2003 | 2002 | 2001 | |||||||||||
Real Estate | $ | 50 | $ | — | $ | — | $ | 27 | $ | 1,888 | |||||
Installment | — | — | — | — | — | ||||||||||
Commercial | — | — | 489 | — | — | ||||||||||
Total Loans 90 Days or More Past Due | $ | 50 | $ | — | $ | 489 | $ | 27 | $ | 1,888 | |||||
Non-Interest Income.Non-interest income equaled $1,179,000 for 2005 compared to $1,358,000 for 2004. The principal component of non-interest income is service charges on deposit accounts, which equaled $940,000 for 2005 compared to $999,000 for 2004.
Non-Interest Expense.Non-interest expense increased $90,000 during the year. Salaries and employee benefits, which is the largest of these expenses decreased $30,000 during the year. The Bank has been successful in controlling non-interest expenses while absorbing the costs of opening our Emporia office in 2004.
Investments.The total investment securities increased from $42 million at year-end 2004 to $57 million at year-end 2005. With interest rates at levels never seen before in recent times, the Bank increased loans and investments in U.S. Agency securities while reducing Federal Funds Sold.
Deposits.Total deposits decreased $1.9 million, or 0.9% during the year. In addition, there has been a shift in the composition of our deposits as customers have moved their funds from shorter-term accounts into Certificates of Deposit. As a result, our total time deposits increased $9.7 million during the year while all other deposit categories decreased with the exception of LIFETIME FREE CHECKING which increased.
Interest Sensitivity Analysis.The frequency with which interest rates on earning assets and interest bearing liabilities change has a significant impact on net interest income. The following table presents the anticipated changes based on the contractual maturity of each instrument. Expected maturities may differ from contractual maturities as both borrowers and depositors may have the right to call or prepay obligations with or without call or prepayment penalties.
| (Dollars in Thousands) | Within One Year | One to Five Years | Over Five Years | Total | |||||||||
| (Revised) | |||||||||||||
Use of Funds | |||||||||||||
Federal Funds Sold | $ | 200 | $ | — | $ | — | $ | 200 | |||||
Interest-Bearing Deposits in Other Financial Institutions | 14,743 | 1,287 | — | 16,030 | |||||||||
Investment Securities | 18,271 | 38,506 | — | 56,777 | |||||||||
Loans | 49,298 | 68,723 | 36,094 | 154,115 | |||||||||
Total Earning Assets | $ | 82,512 | $ | 108,516 | $ | 36,094 | $ | 227,122 | |||||
Deposits | |||||||||||||
Interest-Bearing Demand | $ | 28,553 | $ | — | $ | — | $ | 28,553 | |||||
Regular Passbook Savings | 31,054 | — | — | 31,054 | |||||||||
Time Deposits | |||||||||||||
Certificates of Deposit $100,000 and Over | 7,179 | 11,637 | — | 18,816 | |||||||||
Other | 44,424 | 59,238 | — | 103,662 | |||||||||
Total Interest-Bearing Deposits | 111,210 | 70,875 | — | 182,085 | |||||||||
Notes issued to the U.S. Treasury | 93 | — | — | 93 | |||||||||
Total Interest-Bearing Liabilities | 111,303 | $ | 70,875 | $ | — | $ | 182,178 | ||||||
Maturity/Rate Sensitivity Gap Per Period | $ | (28,791 | ) | $ | 37,641 | $ | 36,094 | $ | 44,944 | ||||
Cumulative Maturity/Rate Sensitivity Gap | $ | (28,791 | ) | $ | 8,850 | $ | 44,944 | ||||||
4
Table of Contents
Capital.The federal regulatory agencies use risk-based capital ratios to analyze the adequacy of a bank’s capital. These ratios weigh bank assets from 0% to 100% depending upon the risks inherent in each type of asset. The Bank continues to meet all requirements for a well-capitalized bank as defined by the regulatory agencies. The following table presents the key risk-based capital ratios for December 31, 2005 and 2004. Additional details regarding capital may be found in the footnotes of the Financial Statements.
| 2005 (Revised) | 2004 | |||||
Tier 1 Ratio | 14.84 | % | 14.45 | % | ||
Total Risk-Based Capital Ratio | 15.92 | % | 15.53 | % | ||
Leverage Ratio | 9.29 | % | 8.54 | % |
Liquidity.Liquidity is our ability to fund both loans and investments in the normal course of business and to provide adequate protection for unexpected deposit withdrawals or other demands for funds without incurring a significant negative impact on profitability. Our primary source of day-to-day liquidity lies in the combination of cash, deposit balances, checks in process of collection, deposit growth and federal funds sold. Federal funds are excess funds that are sold to other banks, generally on a one-day basis. Normal funds from the repayment of loans and investments augment these funds.
Our secondary source of liquidity lies in our investments and deposits in other financial institutions. While our investments are categorized as held-to-maturity, they consist primarily of short-term United States Government Agencies that are readily marketable. As reflected in the previous Interest Sensitivity Analysis, the majority of our investment securities mature in five years or less. Interest bearing deposits in other financial institutions generally mature in two years or less and the volume of this investment decreased during the year.
Management’s Responsibility for Financial Reporting
The management of Community National Bank has prepared and is responsible for the accompanying financial statements, together with the financial data and other information presented in this annual report. Management believes that the financial statements have been prepared in conformity with accounting principles generally accepted in the United States of America appropriate under the circumstances. The financial statements include amounts that are based on management’s best estimates and judgments.
Management maintains and depends upon an internal accounting control system designed to provide reasonable assurance that transactions are executed in accordance with management’s authorization, that financial records are reliable as the basis for preparation of all financial statements, and that the Bank’s assets are safeguarded. The design and implementation of all systems of internal control are based on judgments required to evaluate the costs of control in relation to the expected benefits and to determine the appropriate balance between these costs and benefits. The Bank maintains a professional internal audit staff to monitor compliance with the system of internal control. Operational and special audits are conducted, and audit reports are submitted to appropriate management.
The Board of Directors meets periodically with management and internal auditors to review accounting, auditing and internal reporting matters. The internal auditors have free access to the Board, without management present, to discuss the results of their audit work and their evaluations of internal controls and the quality of financial reporting.
Worth Harris Carter, Jr.
Chairman of the Board, President and
Chief Financial Officer
5
Table of Contents
Statements of Financial Condition
(Dollars in Thousands)
| December 31 | ||||||||
| 2005 (Revised) | 2004 | |||||||
ASSETS: | ||||||||
Interest-Bearing Deposits in Other Financial Institutions | $ | 16,030 | $ | 21,081 | ||||
Investment Securities (Fair Value $56,049 in 2005, $42,166 in 2004) | 56,777 | 42,209 | ||||||
Federal Funds Sold | 200 | 22,455 | ||||||
Loans (Net of Unearned Income) | 153,810 | 146,635 | ||||||
Less: Allowance for Loan Losses | (1,656 | ) | (1,589 | ) | ||||
Net Loans | 152,154 | 145,046 | ||||||
Earning Assets | 225,161 | 230,791 | ||||||
Cash and Due from Banks | 12,191 | 8,370 | ||||||
Bank Premises and Equipment | 2,684 | 2,588 | ||||||
Real Estate Owned Other Than Bank Premises | 1,086 | 818 | ||||||
Investment in Associated Company | 769 | 618 | ||||||
Other Assets | 3,359 | 2,503 | ||||||
TOTAL ASSETS | $ | 245,250 | $ | 245,688 | ||||
LIABILITIES: | ||||||||
Deposits: | ||||||||
LIFETIME FREE CHECKING | $ | 39,957 | $ | 36,261 | ||||
Interest-Bearing Demand | 28,553 | 42,239 | ||||||
Regular Passbook Savings | 31,054 | 32,702 | ||||||
Time Deposits: | ||||||||
Certificates of Deposit $100,000 and Over | 18,816 | 17,201 | ||||||
Other | 103,662 | 95,582 | ||||||
TOTAL DEPOSITS | 222,042 | 223,985 | ||||||
Notes Issued to the U. S. Treasury | 93 | 146 | ||||||
Other Liabilities | 225 | 251 | ||||||
TOTAL LIABILITIES | 222,360 | 224,382 | ||||||
SHAREHOLDERS’ EQUITY: | ||||||||
Common Stock Par Value $5.00; 2,500,000 shares authorized; 707,482 shares outstanding in 2005 and 2004 | 3,537 | 3,537 | ||||||
Surplus | 15,825 | 15,825 | ||||||
Undivided Profits | 3,528 | 1,944 | ||||||
TOTAL SHAREHOLDERS’ EQUITY | 22,890 | 21,306 | ||||||
TOTAL LIABILITIES AND SHAREHOLDERS’ EQUITY | $ | 245,250 | $ | 245,688 | ||||
The accompanying notes are an integral part of these financial statements.
6
Table of Contents
Statements of Income
(Dollars in Thousands Except Per Share Data)
| Years Ended December 31 | |||||||||
| 2005 (Revised) | 2004 | 2003 | |||||||
INTEREST INCOME: | |||||||||
Interest and Fees on Loans: | |||||||||
Taxable | $ | 7,921 | $ | 6,587 | $ | 7,749 | |||
Non-Taxable | 1,102 | 722 | 409 | ||||||
Interest on Deposits in Other Financial Institutions | 575 | 416 | 317 | ||||||
Interest on Federal Funds Sold | 137 | 220 | 473 | ||||||
Interest and Dividends on Securities: | |||||||||
U.S. Agency Securities | 1,955 | 2,827 | 2,570 | ||||||
Obligations of States and Political Subdivisions | 15 | 112 | 109 | ||||||
TOTAL INTEREST INCOME | 11,705 | 10,884 | 11,627 | ||||||
INTEREST EXPENSE: | |||||||||
Interest on Time Deposits $100,000 or More | 736 | 738 | 664 | ||||||
Interest on Other Deposits | 4,275 | 3,864 | 4,668 | ||||||
Interest on Federal Funds Purchased | 14 | — | — | ||||||
Interest on Notes Issued to the U. S. Treasury | 4 | — | 1 | ||||||
TOTAL INTEREST EXPENSE | 5,029 | 4,602 | 5,333 | ||||||
NET INTEREST INCOME | 6,676 | 6,282 | 6,294 | ||||||
Provision for Loan Losses | 72 | 72 | 583 | ||||||
NET INTEREST INCOME AFTER PROVISION FOR LOAN LOSSES | 6,604 | 6,210 | 5,711 | ||||||
NON-INTEREST INCOME: | |||||||||
Service Charges, Commission and Fees | 940 | 999 | 1,059 | ||||||
Other Non-Interest Income | 239 | 359 | 275 | ||||||
TOTAL NON-INTEREST INCOME | 1,179 | 1,358 | 1,334 | ||||||
NON-INTEREST EXPENSE: | |||||||||
Salaries and Employee Benefits | 2,483 | 2,513 | 2,266 | ||||||
Occupancy Expense | 826 | 784 | 721 | ||||||
Operations Center Expense | 1,069 | 972 | 947 | ||||||
FDIC Assessment | 30 | 33 | 33 | ||||||
Other Non-Interest Expense | 528 | 544 | 508 | ||||||
TOTAL NON-INTEREST EXPENSE | 4,936 | 4,846 | 4,475 | ||||||
INCOME BEFORE INCOME TAXES | 2,847 | 2,722 | 2,570 | ||||||
Income Tax Expense | 555 | 682 | 714 | ||||||
NET INCOME | $ | 2,292 | $ | 2,040 | $ | 1,856 | |||
NET INCOME PER SHARE*: | |||||||||
Basic and Diluted | $ | 3.24 | $ | 2.88 | $ | 2.62 | |||
| * | Net income per share has been retroactively adjusted to reflect the stock dividend in 2003. |
The accompanying notes are an integral part of these financial statements.
7
Table of Contents
Statements of Cash Flows
(Dollars in Thousands)
| Years Ended December 31 | ||||||||||||
| 2005 (Revised) | 2004 | 2003 | ||||||||||
Cash Flows From Operating Activities: | ||||||||||||
Net Income | $ | 2,292 | $ | 2,040 | $ | 1,856 | ||||||
Adjustments to reconcile net cash from operating activities: | ||||||||||||
Provision for Loan Losses | 72 | 72 | 583 | |||||||||
Depreciation of Premises and Equipment | 150 | 125 | 98 | |||||||||
Equity in Undistributed Income From Associated Company | (1 | ) | (11 | ) | (10 | ) | ||||||
Provision for Deferred Income Taxes | (24 | ) | 69 | (186 | ) | |||||||
Increase (Decrease) in Unearned Income | — | (99 | ) | (42 | ) | |||||||
(Increase) Decrease in Other Assets | (856 | ) | 332 | (40 | ) | |||||||
Increase (Decrease) in Other Liabilities | (2 | ) | (41 | ) | (20 | ) | ||||||
Net Cash from Operating Activities | 1,631 | 2,487 | 2,239 | |||||||||
Cash Flows From Investing Activities: | ||||||||||||
Maturity of Interest-Bearing Deposits | 23,032 | 13,956 | 11,383 | |||||||||
Purchase of Interest-Bearing Deposits | (17,981 | ) | (21,180 | ) | (13,857 | ) | ||||||
Proceeds from maturities, calls and redemptions of Investment Securities | 1,432 | 43,482 | 24,955 | |||||||||
Purchase of Investment Securities | (16,000 | ) | (20,000 | ) | (27,000 | ) | ||||||
Purchase of Bank Premises and Equipment | (246 | ) | (1,482 | ) | (387 | ) | ||||||
Net Increase in Short-Term Loans Outstanding, Net | 3,703 | (14,588 | ) | (16,493 | ) | |||||||
Longer-Term Loans Originated or Purchased | (44,281 | ) | (20,188 | ) | (30,081 | ) | ||||||
Principal Collected on Longer-Term Loans | 33,398 | 14,600 | 27,632 | |||||||||
Sale (Purchase) of Other Real Estate | (268 | ) | (3 | ) | 21 | |||||||
Investment in Associated Company | (150 | ) | — | (199 | ) | |||||||
Net Cash from Investing Activities | (17,361 | ) | (5,403 | ) | (24,026 | ) | ||||||
Cash Flows From Financing Activities: | ||||||||||||
Increase (Decrease) in Demand and Savings Accounts | (11,638 | ) | 8,167 | 14,715 | ||||||||
Proceeds from Sale of Time Deposits | 65,946 | 56,301 | 123,271 | |||||||||
Payments on Matured Time Deposits | (56,251 | ) | (63,212 | ) | (124,859 | ) | ||||||
Stock Dividends | — | — | (9 | ) | ||||||||
Cash Dividends | (708 | ) | (637 | ) | (579 | ) | ||||||
Increase (Decrease) in Notes Issued to U.S. Treasury | (53 | ) | 89 | (452 | ) | |||||||
Net Cash from Financing Activities | (2,704 | ) | 708 | 12,087 | ||||||||
Net Change in Cash and Equivalents | (18,434 | ) | (2,208 | ) | (9,700 | ) | ||||||
Cash and Equivalents at Beginning of Year | 30,825 | 33,033 | 42,733 | |||||||||
Cash and Equivalents at End of Year | $ | 12,391 | $ | 30,825 | $ | 33,033 | ||||||
Supplementary Data: | ||||||||||||
Cash Paid for Interest | $ | 5,004 | $ | 4,618 | $ | 5,371 | ||||||
Cash Paid for Income Taxes | 555 | 682 | 714 | |||||||||
Transfer of Loans to Foreclosed Assets | — | — | — | |||||||||
The accompanying notes are an integral part of these financial statements.
8
Table of Contents
Statements of Changes in Shareholders’ Equity
(Dollars in Thousands)
| COMMON STOCK | SURPLUS | UNDIVIDED PROFITS | ||||||||||
| SHARES | AMOUNT | |||||||||||
Year Ended December 31, 2003 | ||||||||||||
Balance at Beginning of Year | 643,312 | $ | 3,216 | $ | 12,617 | $ | 2,802 | |||||
Cash Dividends, $0.82 per share* | — | — | — | (579 | ) | |||||||
Stock Dividend (10%) | 64,170 | 321 | 3,208 | (3,538 | ) | |||||||
Net Income | — | — | — | 1,856 | ||||||||
Total | 707,482 | $ | 3,537 | $ | 15,825 | $ | 541 | |||||
Year Ended December 31, 2004 | ||||||||||||
Balance at Beginning of Year | 707,482 | $ | 3,537 | $ | 15,825 | $ | 541 | |||||
Cash Dividends, $0.90 per share* | — | — | — | (637 | ) | |||||||
Net Income | — | — | — | 2,040 | ||||||||
Total | 707,482 | $ | 3,537 | $ | 15,825 | $ | 1,944 | |||||
Year Ended December 31, 2005 (Revised) | ||||||||||||
Balance at Beginning of Year | 707,482 | $ | 3,537 | $ | 15,825 | $ | 1,944 | |||||
Cash Dividends, $1.00 per share* | — | — | — | (708 | ) | |||||||
Net Income | — | — | — | 2,292 | ||||||||
Total | 707,482 | $ | 3,537 | $ | 15,825 | $ | 3,528 | |||||
| * | Cash dividends per share have been retroactively restated to reflect the stock dividend in 2003. |
The accompanying notes are an integral part of these financial statements.
9
Table of Contents
Notes to Financial Statements
(Dollars in Thousands in Charts Except Per Share Data)
1. SUMMARY OF SIGNIFICANT ACCOUNTING POLICIES
The accounting and reporting policies of Community National Bank are in accordance with accounting principles generally accepted in the United States of America, and general practices within the banking industry which are consistent with reports filed with regulatory agencies.
NATURE OF OPERATIONS
The Bank generates commercial (including agricultural), mortgage and consumer loans and receives deposits from customers located primarily in South Boston, Halifax and Mecklenburg County, and the City of Emporia. The Bank operates under a national charter and provides full banking services. As a national bank, the Bank is subject to regulation by the Comptroller of the Currency, Federal Deposit Insurance Corporation, and the Board of Governors of the Federal Reserve System.
USE OF ESTIMATES
The preparation of financial statements in conformity with accounting principles generally accepted in the United States of America requires management to make estimates and assumptions that affect the reported amounts of assets and liabilities and disclosure of contingent assets and liabilities at the date of the financial statements and the reported amounts of revenue and expenses during the reporting period. Actual results could differ from those estimates. Material estimates that are particularly susceptible to significant change in the near term relate to the determination of the allowance for loan losses, and fair value of other real estate owned.
CASH AND CASH EQUIVALENTS
For purposes of cash flows, cash and cash equivalents include cash on hand, demand balances due from banks and federal funds transactions. Generally, federal funds are purchased and sold for one-day periods.
SECURITIES
Investment securities are stated at cost, adjusted for amortization of premiums and accretion of discounts, and computed by the interest method. The Bank has the positive intent and ability to hold these securities until maturity. Gains and losses on sales, if any, of securities are based upon the adjusted cost of the specific securities sold.
LOANS
Loans are recorded at the amount of the loan disbursed to borrowers plus the applicable amount, if any, of unearned income and other charges, less payments received. Income earned on loans is recognized by methods which generally result in level rates of return on principal amounts outstanding. The net amount of nonrefundable loan origination fees approximates the direct costs associated with the lending process.
The allowance for loan losses is an estimate of losses inherent in the loan portfolio as determined by management taking into consideration historical loan loss experience, diversification of the loan portfolio, amounts of secured and unsecured loans, banking industry standards and averages, and general economic conditions. Ultimate losses may vary from current estimates. These estimates are reviewed periodically and as adjustments become necessary, they are reported in earnings in the periods in which they become reasonably estimable.
Management determines loan impairment using guidelines established by Statement of Financial Accounting Standards No. 114 (SFAS 114), “Accounting by Creditors for Impairment of a Loan (as amended by SFAS No. 118, Accounting by Creditors for Impairment of a Loan - Income Recognition and Disclosures”).Under this accounting standard, a loan is considered to be impaired when it is probable that the Bank will be unable to collect all principal and interest amounts according to the contractual terms of the loan agreement. A performing loan may be considered impaired. The allowance for loan losses related to loans identified as impaired is primarily based on the excess of the loan’s current outstanding principal balance over the estimated fair value of the related collateral. For a loan that is not collateral-dependent, the allowance is recorded at the amount by which the outstanding principal balance exceeds the current best estimate of the future cash flows on the loan discounted at the loan’s original effective interest rate.Interest on impaired loans is recognized when cash is received.
BANK PREMISES AND EQUIPMENT
Premises and equipment are stated at cost, less accumulated depreciation. Depreciation is charged to operating expenses over the estimated useful life of the assets by the accelerated and straight-line methods. Costs of maintenance or repairs are charged to expense as incurred and improvements are capitalized. Upon retirement or disposal of an asset, the asset and related allowance account are eliminated. Any gain or loss on such transactions is included in current operations. Depreciation has been included under Occupancy Expenses in the Statements of Income in the amount of $150,000 in 2005, $125,000 in 2004, and $98,000 in 2003.
OTHER REAL ESTATE OWNED
Real estate properties acquired through or in lieu of loan foreclosure are initially recorded at the lower of the Bank’s carrying amount or fair value less estimated selling cost at the date of foreclosure. Any write-downs based on the asset’s fair value at the date of acquisition are charged to the allowance for loan losses. After foreclosure, these assets are carried at the lower of their new cost basis or fair value less cost to sell. Costs of significant property improvements are capitalized, whereas costs relating to holding property are expensed. Valuations are periodically performed by management, and any write-downs are recorded as a charge to operations, if necessary, to reduce the carrying value of a property to the lower of its cost or fair value less cost to sell.
INCOME TAXES
Deferred taxes are provided on a liability method whereby deferred tax assets are recognized for deductible temporary differences and operating loss and tax credit carryforwards and deferred tax liabilities are recognized for taxable temporary differences. Temporary differences are the differences between the reported amounts of assets and liabilities and their tax bases. Deferred tax assets are reduced by a valuation allowance when, in the opinion of management, it is more likely than not that some portion or all of the deferred tax assets will not be realized. Deferred tax assets and liabilities are adjusted for the effects of changes in tax laws and rates on the date of enactment.
RETIREMENT BENEFITS
The Bank has established Employee Benefit Plans as described in footnote 5. The Bank does not provide any other post-retirement benefits that would be accrued under Statement of Financial Accounting Standards No. 106, “Employers Accounting for Post Retirement Benefits Other Than Pensions”.
2. INVESTMENT SECURITIES
The carrying value of securities pledged to secure public deposits was $56,777,000 and $41,759,000, respectively, at December 31, 2005 and 2004. The amortized cost and estimated fair value of investment securities as of December 31, 2005 and 2004 were as follows:
December 31, 2005 | Amortized Cost | Gross Unrealized Gains | Gross Unrealized Losses | Estimated Fair Value | ||||||||
U. S. Agency Securities | $ | 56,777 | $ | 14 | $ | 742 | $ | 56,049 | ||||
December 31, 2004 | ||||||||||||
U. S. Agency Securities | $ | 41,759 | $ | 583 | $ | 639 | $ | 41,703 | ||||
Obligations of States and Political Subdivisions | 450 | 13 | — | 463 | ||||||||
Total | $ | 42,209 | $ | 596 | $ | 639 | $ | 42,166 | ||||
The table below shows gross unrealized losses and fair value, aggregated by investment category and length of time that individual securities have been in a continuous unrealized loss position at December 31, 2005 and 2004.
| Unrealized losses | |||||||||
2005 Securities Description | Fair Value | Less Than 12 Months | More Than 12 Months | ||||||
U. S. Agency Securities | $ | 14,381 | $ | 113 | $ | — | |||
U. S. Agency Securities | 32,867 | — | 629 | ||||||
Total | $ | 47,248 | $ | 113 | $ | 629 | |||
2004 | |||||||||
U. S. Agency Securities | $ | 28,723 | $ | — | $ | 639 | |||
Total | $ | 28,723 | $ | — | $ | 639 | |||
The unrealized losses on the Bank’s investments in obligations of U.S. Government Agencies were caused by interest rate increases. The contractual terms of those investments do not permit the issuer to settle the securities at a price less than the amortized cost of the investment. Because the Bank has the ability and intent to hold those investments until a recovery of fair value, which may be maturity, the Bank does not consider those investments to be other-than-temporarily impaired at December 31 2005.
10
Table of Contents
The amortized cost and estimated fair value of investments in debt securities at December 31, 2005 and 2004, by contractual maturity, are shown below. Expected maturities will differ from contractual maturities because issuers may have the right to call or prepay obligations with or without call or prepayment penalties.
| December 31, 2005 | December 31, 2004 | |||||||||||
| Amortized Cost | Estimated Fair Value | Amortized Cost | Estimated Fair Value | |||||||||
Due in One Year or Less | $ | 18,271 | $ | 18,166 | $ | 2,150 | $ | 2,016 | ||||
Due After One Year Through Five Years | 38,506 | 37,883 | 40,059 | 40,150 | ||||||||
Due After Five Years Through Ten Years | — | — | — | — | ||||||||
Due After Ten Years | — | — | — | — | ||||||||
Total | $ | 56,777 | $ | 56,049 | $ | 42,209 | $ | 42,166 | ||||
There were no sales of securities during 2005, 2004, or 2003.
3. COMPOSITION OF LOANS
| December 31 | ||||||||
| 2005 (Revised) | 2004 | |||||||
Real Estate | $ | 105,637 | $ | 97,685 | ||||
Consumer | 11,905 | 14,048 | ||||||
Loans to Other Commercial Banks | — | — | ||||||
Commercial, Industrial and Agricultural | 5,007 | 5,689 | ||||||
All Other | 31,566 | 29,518 | ||||||
Gross Loans | 154,115 | 146,940 | ||||||
Less: Unearned Income | (305 | ) | (305 | ) | ||||
Allowance for Loan Losses | (1,656 | ) | (1,589 | ) | ||||
Total Loans, Net | $ | 152,154 | $ | 145,046 | ||||
Maturity Distribution Variable | 2005 (Revised) | 2004 | ||||
Less Than One Year | $ | 14,314 | $ | 64,182 | ||
One to Five Years | 55,374 | 3,097 | ||||
Over Five Years | 11,116 | 4,204 | ||||
Subtotal | 80,804 | 71,483 | ||||
Fixed | ||||||
Less Than One Year | 34,983 | 26,404 | ||||
One to Five Years | 13,348 | 32,681 | ||||
Over Five Years | 24,980 | 16,372 | ||||
Subtotal | 73,311 | 75,457 | ||||
Total | $ | 154,115 | $ | 146,940 | ||
4. ALLOWANCE FOR LOAN LOSSES
In the view of management, the Allowance for Loan Losses is adequate to meet the loss contingency based on experience factors and a review of the loan portfolio.
The Allowance for Loan Losses for the years ending December 31, 2005, 2004 and 2003 is summarized as follows:
| 2005 | 2004 | 2003 | ||||||||||
Balance at beginning of year | $ | 1,589 | $ | 1,559 | $ | 1,043 | ||||||
Recoveries credited during year | 18 | 4 | 2 | |||||||||
Provision for loan losses | 72 | 72 | 583 | |||||||||
Loan losses charged to allowance | (23 | ) | (46 | ) | (69 | ) | ||||||
Balance at end of year | $ | 1,656 | $ | 1,589 | $ | 1,559 | ||||||
The following is a summary of information pertaining to impaired and non-accrual loans:
| December 31 | ||||||
| 2005 (Revised) | 2004 | |||||
Impaired loans without a valuation allowance | $ | — | $ | 280 | ||
Impaired loans with a valuation allowance | 1,363 | 1,363 | ||||
Total impaired loans | $ | 1,363 | $ | 1,643 | ||
Valuation allowance related to impaired loans | $ | 1,363 | $ | 1,363 | ||
Non-accrual loans (impaired) | $ | 1,363 | $ | 1,643 | ||
Non-accrual loans (non-impaired) | $ | 1,100 | $ | 270 | ||
Total loans past due ninety days or more and still accruing | $ | 50 | $ | — | ||
| Years Ended December 31 | |||||||||
| 2005 | 2004 | 2003 | |||||||
Average investment in impaired loans | $ | 1,363 | $ | 1,643 | $ | 534 | |||
Interest income recognized on impaired loans | $ | — | $ | 141 | $ | 5 | |||
Interest income recognized on a cash basis on impaired loans | $ | — | $ | 115 | $ | — | |||
5. STOCK OPTIONS AND EMPLOYEE BENEFIT PLANS
There were no stock options or stock option plans in effect for 2003, 2004 and 2005.
The Bank has adopted an integrated profit sharing plan. Employees participate in the profit sharing plan following completion of six (6) months of service and upon reaching the age of twenty years and six months as of January 1. Vesting includes years of service to the Bank prior to the effective date of the plan. The plan gives 0% vesting to anyone who has less than five (5) years of service except that persons who have reached the age of 62 are fully vested regardless of length of service. Each participant in the plan (who has not reached age 62) becomes 100% vested after five (5) years of service. The contribution to the plan is determined each year by the Board of Directors and thus may fluctuate in amount from year to year. The contribution by the Bank was $88,000 in 2005 and 2004, and $91,000 in 2003 and is included in Salaries and Employee Benefits in the Statements of Income.
6. FEDERAL INCOME TAXES
Net deferred tax assets consist of the following components as of December 31, 2005 and 2004:
Deferred Tax Assets | 2005 | 2004 | ||||
Allowance for Loan Losses | $ | 519 | $ | 498 | ||
Dividend Exclusion | 85 | 85 | ||||
Tax Credit Carryforward | 25 | — | ||||
Total Deferred Tax Assets | $ | 629 | $ | 583 | ||
Deferred Tax Liabilities | ||||||
Bank Premises | $ | 187 | $ | 166 | ||
Investment in Associated Companies | 101 | 100 | ||||
Total Deferred Tax Liabilities | $ | 288 | $ | 266 | ||
Net Deferred Taxes | $ | 341 | $ | 317 | ||
The provisions for income taxes charged to operations for the years ended December 31, 2005, 2004 and 2003 consist of the following:
| 2005 (Revised) | 2004 | 2003 | |||||||||
Currently payable | $ | 579 | $ | 613 | $ | 900 | |||||
Deferred | (24 | ) | 69 | (186 | ) | ||||||
Net Provision | $ | 555 | $ | 682 | $ | 714 | |||||
The Income tax provision differs from the amount of income tax determined by applying the U. S. federal income tax rate to pretax income for the years ended December 31, 2005, 2004 and 2003 due to the following:
| 2005 (Revised) | 2004 | 2003 | ||||||||||
Tax provision computed by applying federal rate to income before income taxes | $ | 968 | $ | 925 | $ | 874 | ||||||
Tax exempt interest | (380 | ) | (272 | ) | (176 | ) | ||||||
Tax credits | (56 | ) | — | — | ||||||||
Other | 23 | 29 | 16 | |||||||||
Net Provision | $ | 555 | $ | 682 | $ | 714 | ||||||
In 2005, the Bank purchased historic tax credits during the year of $568,000 at a discount of $56,000 that expire in 2014. A summary of the tax credits and their use is as follows:
Tax credits purchased | $ | 568 | ||
Taken in 2005 | (275 | ) | ||
Carryback taken in 2004 | (268 | ) | ||
Carryforward for 2006 | $ | 25 | ||
7. RELATED PARTY TRANSACTIONS
The Chairman of the Board of Community National Bank also serves as Chairman of the Board of Blue Ridge Bank, N. A., Central National Bank, First National Bank, First National Exchange Bank, Mountain National Bank, Patrick Henry National Bank, Patriot Bank, N.A., Peoples National Bank, and Shenandoah National Bank.
The Bank maintains correspondent bank accounts with two of these banks. In 2005 and 2004 the average daily balances in these accounts were considered normal operating balances to facilitate general business transactions.
The Bank also participates in loan transactions with these banks. These transactions are at carrying value and do not involve more than the normal risk of collectibility or present other unfavorable features.
The Bank owns ten percent of the outstanding common stock of The Mortgage Company of Virginia. The remaining common stock is owned equally by the banks listed above. The Mortgage Company of Virginia owns 100% of Bank Services of Virginia, Inc. The business of both of these companies is to provide operational support services to the ten banks. These services consist of mortgage loan servicing, data processing, bookkeeping,
11
Table of Contents
check clearing, accounting, investment management, bank couriers, advertising programs, central purchasing and other management services. The Bank is charged for its share of these services, which is recorded as Operation Center Expense in the Statements of Income. The cost of this expense is shared by the ten banks on the basis of average deposits of each bank related to total average deposits of all the banks.
The Mortgage Company of Virginia, Inc. also owns 100% of Bank Services Insurance, Inc. Bank Services Insurance, Inc. provides insurance products to the banks and customers in the Danville area. The premiums paid to Bank Services Insurance, Inc. equaled $21,000 in 2005.
The Mortgage Company of Virginia, Inc. also owns 50% of Coresoft, Inc. represented by an initial $1,000 investment during 2004. Coresoft, Inc. is in the process of developing a core software package the banks listed above will use. At December 31, 2005, Coresoft, Inc. had an outstanding note payable to the Mortgage Company of $1,400,000.
The Bank records its investment in the common stock of The Mortgage Company of Virginia, Inc. under the equity method of accounting due to the influence the Bank has over the company. The Bank invested an additional $150,000 in 2005 increasing the value of the investment to $769,000 from $618,000 at December 31, 2004. The Bank’s share of earnings of the company equaled $1,000 for 2005, $11,000 for 2004, and $10,000 for 2003 and is shown in the Statements of Income under Other Non-Interest Income.
The Chairman of the Board and President of the Bank also serves as Chairman of the Board and President of Bank Building Corporation and Manager of Blackstone Properties, LLC, its wholly owned subsidiary (the “companies”). The companies lease branches to certain of the banks listed above. At December 31, 2005, the Bank leased eight offices from the companies. Rental expense and future lease payments under these leases are disclosed in a footnote below. As of December 31, 2005 and 2004, the Bank had loans totaling $3,770,000 and $3,884,000, respectively, to the companies. These loans were made to purchase bank branches leased to affiliated banks and other investment property. The loans are secured by these branches and the related leases and other investment property, and have repayment terms similar to other loan customers of the Bank.
In the ordinary course of business, directors and their related interests were customers of, and had transactions with the Bank. Loan transactions with directors, principal security holders and associates were made on substantially the same terms as those prevailing at the time for comparable loans to other persons and did not involve more than normal risk of collectibility or present other unfavorable features. A summary of the transactions is presented below:
| 2005 | 2004 | ||||||
Beginning Balance | $ | — | $ | 3 | |||
New Loans | — | — | |||||
Repayments | — | (3 | ) | ||||
Ending Balance | $ | — | $ | — | |||
8. CONTINGENCIES
The Bank did not have any legal matters of financial significance pending at December 31, 2005 or 2004.
9. EARNINGS PER COMMON SHARE
The Bank follows Statement of Financial Accounting Standards (SFAS) No. 128, “Earnings Per Share”. This statement requires the dual presentation of basic and diluted earnings per share, which are equal for the Bank for all periods presented. The weighted average number of shares used to compute earnings per share was 707,482.
The Bank issued a 10% stock dividend in 2003 and none in 2004 and 2005. No fractional shares were issued in this stock dividend. Stock dividends and fractional shares were settled based on known prices for recent trades of the stock and other factors deemed relevant at that time.
10. BANK PREMISES AND EQUIPMENT
Premises and equipment are stated at cost less accumulated depreciation as follows:
December 31, 2005 | Cost | Accumulated Depreciation and Amortization | Net Remaining Cost | ||||||
Bank Premises (Including Land of $151,000) | $ | 2,137 | $ | 345 | $ | 1,792 | |||
Equipment | 1,331 | 499 | 832 | ||||||
Leasehold Improvements | 76 | 16 | 60 | ||||||
Total | $ | 3,544 | $ | 860 | $ | 2,684 | |||
December 31, 2004 | |||||||||
Bank Premises (Including Land of $151,000) | $ | 2,096 | $ | 348 | $ | 1,748 | |||
Equipment | 1,244 | 459 | 785 | ||||||
Leasehold Improvements | 69 | 14 | 55 | ||||||
Total | $ | 3,409 | $ | 821 | $ | 2,588 | |||
11. FORECLOSED ASSETS
Expenses applicable to foreclosed assets include the following:
| Years Ended December 31 | |||||||||
| 2005 | 2004 | 2003 | |||||||
Net loss (gain) on sales of real estate | $ | — | $ | — | $ | — | |||
Provision for losses | — | — | — | ||||||
Operating expenses | 21 | 21 | 21 | ||||||
12. CASH AND CASH EQUIVALENTS
Cash and cash equivalents as of December 31, 2005, 2004 and 2003 are detailed below:
| 2005 | 2004 | 2003 | |||||||
Cash and Due From Banks | $ | 12,191 | $ | 8,370 | $ | 8,773 | |||
Federal Funds Sold | 200 | 22,455 | 24,260 | ||||||
Federal Funds Purchased | — | — | — | ||||||
Total Cash and Cash Equivalents | $ | 12,391 | $ | 30,825 | $ | 33,033 | |||
13. DEPOSITS
Certificates of Deposit maturing as of December 31:
| 2005 | 2004 | |||||
1 Year | $ | 51,624 | $ | 55,493 | ||
2 Years | 19,773 | 14,324 | ||||
3 Years | 12,095 | 15,089 | ||||
4 Years | 11,197 | 14,519 | ||||
5 Years and Thereafter | 27,789 | 13,358 | ||||
Total | $ | 122,478 | $ | 112,783 | ||
14. CONCENTRATION OF CREDIT RISK
Substantially all of the Bank’s loans, commitments and lines of credit have been granted to customers in the Bank’s market area. The concentrations of credit by loan classification are set forth in a footnote above. The Bank does not extend credit to any individual borrower in excess of its lending limit of $3,685,000 as of year-end 2005 and $3,435,000 as of year-end 2004.
The largest category of Real Estate Loans consisted of Commercial Loans. These loans approximated $42,458,000 at December 31, 2005 and $32,248,000 at December 31, 2004.
15. FAIR VALUE OF FINANCIAL INSTRUMENTS
Statement of Financial Accounting Standards No. 107, “Disclosures about Fair Value of Financial Instruments”, requires the Bank to disclose the estimated fair values of its financial assets and liabilities. The estimated fair values were determined using the following assumptions:
| a. | The carrying value of Cash and Due From Banks, Federal Funds Sold, and Interest-Bearing Deposits in Other Financial Institutions are believed to approximate the fair value of these items. |
| b. | The fair value of actively traded investment securities are determined according to quotes available in the financial press. The fair value of instruments which are not actively traded are determined using values of other instruments with similar characteristics or obtained from outside sources believed to be reliable. |
| c. | The fair value of loans are estimated by discounting the anticipated cash flows using estimated rates for similar loans available in the Bank’s market area. Estimates of maturities are based on both experience and contractual maturities although prepayments are permitted on the loans. |
| d. | The fair value of short-term demand and savings deposits are believed to equal carrying value. The fair value of certificates of deposit are based upon the contractual maturity of the instruments and rates currently offered for similar deposits. |
| e. | The fair value of Notes Payable to the U. S. Treasury are estimated at carrying value. |
| f. | The fair value of Accrued Interest Receivable and Accrued Interest Payable are estimated at carrying value. |
| 2005 (Revised) | 2004 | |||||||||||
Financial Assets: | Carrying Value | Fair Value | Carrying Value | Fair Value | ||||||||
Interest-Bearing Deposits in Other Financial Institutions | $ | 16,030 | $ | 16,030 | $ | 21,081 | $ | 21,081 | ||||
Investment Securities | 56,777 | 56,049 | 42,209 | 42,166 | ||||||||
Federal Funds Sold | 200 | 200 | 22,455 | 22,455 | ||||||||
Loans (Net of Unearned Income) | 152,154 | 155,328 | 146,635 | 126,832 | ||||||||
Cash and Due From Banks | 12,191 | 12,191 | 8,370 | 8,370 | ||||||||
Accrued Interest Receivable | 1,456 | 1,456 | 1,123 | 1,123 | ||||||||
Total | $ | 238,808 | $ | 241,254 | $ | 241,873 | $ | 222,027 | ||||
12
Table of Contents
| 2005 | 2004 | |||||||||||
Financial Liabilities: | Carrying Value | Fair Value | Carrying Value | Fair Value | ||||||||
Deposits | ||||||||||||
LIFETIME FREE CHECKING | $ | 39,957 | $ | 39,957 | $ | 36,261 | $ | 36,261 | ||||
Interest-Bearing Demand | 28,553 | 28,553 | 42,239 | 42,239 | ||||||||
Regular Passbook Savings | 31,054 | 31,054 | 32,702 | 32,702 | ||||||||
Time Deposits: | ||||||||||||
Certificates of Deposit $100,000 and Over | 18,816 | 18,814 | 17,201 | 17,526 | ||||||||
Other | 103,662 | 103,495 | 95,582 | 96,915 | ||||||||
TOTAL DEPOSITS | 222,042 | 221,873 | 223,985 | 225,643 | ||||||||
Notes issued to the U.S. Treasury | 93 | 93 | 146 | 146 | ||||||||
Accrued Interest Payable | 225 | 225 | 111 | 111 | ||||||||
Total | $ | 222,360 | $ | 222,191 | $ | 224,242 | $ | 225,900 | ||||
16. CAPITAL ADEQUACY
The Bank is subject to various regulatory capital requirements. Under the regulatory capital guidelines and the regulatory framework for Prompt Corrective Action (PCA), the Bank must meet specific capital guidelines involving the quantitative measures of the Bank’s assets, liabilities, and certain off-balance-sheet items as calculated under regulatory accounting practices. The Bank’s capital amount and classification are also subject to qualitative judgments by the regulators about components, risk weightings and other factors.
Quantitative measures established by regulation to ensure capital adequacy require the Bank to maintain minimum ratios (set forth in the table below) of total and Tier 1 capital (as defined in the regulations) to risk-weighted assets (as defined) and of Tier 1 capital to average assets (as defined).
| Minimum Ratio For Capital Adequacy Purposes | Minimum Ratio To Be Considered Well Capitalized Under PCA Provisions | |||||
Tier 1 Capital to Risk Weighted Assets | 4 | % | 6 | % | ||
Total Capital to Risk Weighted Assets | 8 | % | 10 | % | ||
Tier 1 Capital to Average Assets | 4 | % | 5 | % |
As of December 31, 2005, the most recent notification from the Federal Deposit Insurance Corporation categorized the Bank as well capitalized under the regulatory framework for prompt corrective action. To be categorized as well capitalized, an institution must maintain minimum total risk-based, Tier 1 risk-based and Tier 1 leverage ratios as set forth in the table above. There are no conditions or events since the notification that management believes have changed the Bank’s category. The Bank’s actual capital amounts and ratios as of December 31, 2005 and 2004 are presented in the following table. Management believes, as of December 31, 2005 that the Bank meets all capital adequacy requirements to which it is subject.
December 31, 2005 (Revised) | Minimum Capital For Capital Adequacy Purposes | Minimum Capital to Be Considered Well Capitalized Under PCA Provision | Actual Capital | Actual Ratio | ||||||||
Tier 1 Capital to Risk Weighted Assets | $ | 6,169 | $ | 12,338 | $ | 22,890 | 14.84 | % | ||||
Total Capital to Risk Weighted Assets | 12,338 | 15,422 | 24,547 | 15.92 | % | |||||||
Tier 1 Capital to Average Assets | 9,853 | 12,316 | 22,890 | 9.29 | % | |||||||
December 31, 2004 | ||||||||||||
Tier 1 Capital to Risk Weighted Assets | $ | 5,898 | $ | 11,796 | $ | 21,306 | 14.45 | % | ||||
Total Capital to Risk Weighted Assets | 11,796 | 14,746 | 22,895 | 15.53 | % | |||||||
Tier 1 Capital to Average Assets | 9,980 | 12,476 | 21,306 | 8.54 | % | |||||||
17. QUARTERLY FINANCIAL DATA (Unaudited)
The following summarizes the quarterly results of operations for the years ended December 31, 2005 and 2004:
2005 (Revised) | First Quarter | Second Quarter | Third Quarter | Fourth Quarter | ||||||||
Total Interest Income | $ | 2,748 | $ | 2,917 | $ | 2,925 | $ | 3,115 | ||||
Total Interest Expense | 1,161 | 1,227 | 1,301 | 1,340 | ||||||||
Net Interest Income | 1,587 | 1,690 | 1,624 | 1,775 | ||||||||
Provision For Loan Losses | 18 | 18 | 18 | 18 | ||||||||
Net Interest Income After Provision for Loan Losses | 1,569 | 1,672 | 1,606 | 1,757 | ||||||||
Total Non-Interest Income | 274 | 283 | 270 | 352 | ||||||||
Total Non-Interest Expense | 1,188 | 1,212 | 1,226 | 1,310 | ||||||||
Income Before Income Taxes | 655 | 743 | 650 | 799 | ||||||||
Income Tax Expense | 140 | 164 | 130 | 121 | ||||||||
Net Income | $ | 515 | $ | 579 | $ | 520 | $ | 678 | ||||
Basic and Diluted Net Income Per Share | $ | 0.73 | $ | 0.82 | $ | 0.73 | $ | 0.96 | ||||
2004 | First Quarter | Second Quarter | Third Quarter | Fourth Quarter | ||||||||
Total Interest Income | $ | 2,632 | $ | 2,770 | $ | 2,746 | $ | 2,736 | ||||
Total Interest Expense | 1,166 | 1,129 | 1,143 | 1,164 | ||||||||
Net Interest Income | 1,466 | 1,641 | 1,603 | 1,572 | ||||||||
Provision For Loan Losses | 18 | 18 | 18 | 18 | ||||||||
Net Interest Income After Provision for Loan Losses | 1,448 | 1,623 | 1,585 | 1,554 | ||||||||
Total Non-Interest Income | 284 | 318 | 316 | 440 | ||||||||
Total Non-Interest Expense | 1,143 | 1,189 | 1,202 | 1,312 | ||||||||
Income Before Income Taxes | 589 | 752 | 699 | 682 | ||||||||
Income Tax Expense | 145 | 185 | 165 | 187 | ||||||||
Net Income | $ | 444 | $ | 567 | $ | 534 | $ | 495 | ||||
Basic and Diluted Net Income Per Share | $ | 0.63 | $ | 0.80 | $ | 0.75 | $ | 0.70 | ||||
18. LEASES AND RENT EXPENSE
The Bank leased facilities under non-cancelable operating leases during 2005, 2004 and 2003. As noted above, the Bank leases eight offices from the companies. These leases required the Bank to pay maintenance, insurance, and property taxes and do not have renewal options. Rental expense under these leases was $418,000 in 2005, $431,000 in 2004, and $438,000 in 2003. Future minimum rental payments under these leases are as follows:
Year Ending December 31, 2006 | $ | 451 | |
2007 | 451 | ||
2008 | 451 | ||
2009 | 451 | ||
2010 | 451 | ||
Thereafter | 1,300 | ||
Total minimum lease payments | $ | 3,555 | |
19. OFF BALANCE SHEET ACTIVITIES AND COMMITMENTS
Commitments to extend credit, which amounted to $623,000 and $4,984,000 at December 31, 2005 and 2004 respectively, represent agreements to lend to customers with fixed expiration dates or other termination clauses. Since many of the commitments are expected to expire without being funded, the total commitment amounts do not necessarily represent future liquidity requirements. Standby letters of credit are conditional commitments issued by the Bank guaranteeing the performance of a customer to a third party. Those guarantees are primarily issued to support public and private borrowing arrangements. At December 31, 2005, the Bank had outstanding letters of credit of $1,330,000, and $1,929,000 in 2004.
The Bank is a member of the Federal Reserve System and is required to maintain certain levels of its cash and due from bank balances as reserves based on regulatory requirements. At December 31, 2005 and 2004, this reserve requirement was approximately $1,983,000 and $1,989,000 respectively.
Federal banking regulations place certain restrictions on dividends paid by the Bank. The total amount of dividends which may be paid at any date and is generally limited to the retained earnings of the Bank. In addition, dividends paid by the Bank would be prohibited if the effect thereof would cause the Bank’s capital to be reduced below applicable minimum capital requirements.
13
Table of Contents
20. RECENT ACCOUNTING PRONOUNCEMENTS AND ACCOUNTING CHANGES
In November 2002, the FASB issued FASB Interpretation No. 45, “Guarantor’s Accounting and Disclosure Requirements for Guarantees, including Indirect Guarantees of Indebtedness of Others” (FIN 45). The interpretation elaborates on the disclosures to be made by a guarantor in its financial statements under certain guarantees that it has issued. It also clarifies that a guarantor is required to recognize, at the inception of a guarantee, a liability for the fair value of the obligation undertaken in issuing the guarantee. The interpretation requires disclosure of the nature of the guarantee, the maximum potential amount of future payments that the guarantor could be required to make under the guarantee, and the current amount of the liability, if any, for the guarantor’s obligations under the guarantee. The recognition requirements of the Interpretation were effective beginning January 1, 2003.
The FASB also revised FASB Interpretation 46,” Consolidation of Variable Interest Entities”, an interpretation of ARB No. 51 (FIN 46). The interpretation provides a framework for identifying variable interest entities (VIEs), and determining when a company should include the assets, liabilities, noncontrolling interests and results of activities of a VIE in its consolidated financial statements. As revised, FIN 46 is effective beginning in the first quarter of 2004 for all VIEs (other than what is commonly referred to as special purpose entities, VIEs of small business issuers, and VIEs of nonpublic entities). The Bank does not currently utilize VIEs or so called special purpose entities.
In November 2003, the FASB’s Emerging Issues Task Force (EITF) reached consensus on new disclosure requirements related to unrealized losses on investment securities. The new disclosure requirements apply to marketable equity and debt securities accounted for under Financial Accounting Board Statement No. 115, “Accounting for Certain Investments in Debt and Equity Securities,” and are required for inclusion in annual reports with fiscal years ended after December 15, 2003.
In November 2003, the FASB issued FASB Staff Position (FSP) 144-1, “Determination of Cost Basis for Foreclosed Assets under FASB Statement No. 15”, “Accounting by Debtors and Creditors for Troubled Debt Restructurings,” and the Measurement of Cumulative Losses Previously Recognized under Paragraph 37 of FASB Statement No. 144, “Accounting for the Impairment or Disposal of Long-Lived Assets.” Under FSP 144-1, the lender is required to measure the foreclosure on a long-lived asset (e.g. real estate) at fair value less cost to sell on the foreclosure date, which establishes a new cost basis such that any loan valuation allowance is not retained. Thereafter, the lender would follow the impairment guidance in Statement No. 144, and could not reflect any recovery in value of the property beyond the cost basis established upon foreclosure of the loan. This guidance was effective upon posting of the FSP to the FASB website in November 2003.
In April 2003, the Financial Accounting Standards Board issued Statement No. 149, “Amendment of Statement 133 on Derivative Instruments and Hedging Activities”. This statement amends and clarifies financial accounting and reporting for derivative instruments, including certain derivative instruments embedded in other contracts (collectively referred to as derivatives) and for hedging activities under FASB Statement No. 133, Accounting for Derivative Instruments and Hedging Activities. This statement is effective for contracts entered into or modified after June 30, 2003.
In May 2003, the Financial Accounting Standards Board issued Statement No. 150, “Accounting for Certain Financial Instruments with Characteristics of both Liabilities and Equity”. This statement establishes standards for how an issuer classifies and measures certain financial instruments with characteristics of both liabilities and equity. It requires that an issuer classify a financial instrument that is within its scope as a liability (or an asset in some circumstances). Many of those instruments were previously classified as equity. This statement is effective for financial instruments entered into or modified after May 31, 2003, and otherwise is effective at the beginning of the first interim period beginning after June 15, 2003.
In December 2004, the FASB issued Statement No. 123 (revised 2004), which is a revision of Statement 123 “Accounting for Stock-Based Compensation”. This Statement establishes standards for the accounting for transactions in which an entity exchanges its equity instruments for goods or services. It also addresses transactions in which an entity incurs liabilities in exchange for goods or services that are based on the fair value of the entity’s equity instruments or that may be settled by the issuance of those equity instruments. This Statement focuses primarily on accounting for transactions in which an entity obtains employee services in share-based payment transactions. This Statement is effective for public entities as of the beginning of the first interim or annual reporting period that begins after June 15, 2005.
In December 2004, the FASB issued Statement No. 153, “Exchanges of Nonmonetary Assets”, an amendment of APB Opinion No. 29, Accounting for Nonmonetary Transactions”. This Statement eliminates the exception to fair value for exchanges of similar productive assets and replaces it with a general exception for exchange transactions that do not have commercial substance - - that is, transactions that are not expected to result in significant changes in the cash flows of the reporting entity. This Statement is effective for nonmonetary asset exchanges occurring in fiscal periods beginning after June 15, 2005.
In May 2005, the FASB issued Statement No. 154, “Accounting Changes and Error Corrections - a replacement of APB Opinion No. 20 and FASB Statement No. 3”. This Statement requires retrospective application to prior periods’ financial statements of changes in accounting principle, unless it is impracticable to determine either the period-specific effects or the cumulative effect of the change. When it is impracticable to determine the period-specific effects of an accounting change on one or more individual prior periods presented, this Statement requires that the new accounting principle be applied to the balances of assets and liabilities as of the beginning of the earliest period for which retrospective application is practicable and that a corresponding adjustment be made to the opening balance of retained earnings. This Statement improves financial reporting because its requirement to report voluntary changes in accounting principles via retrospective application, unless impracticable, enhances the consistency of financial information between periods. This statement is effective for accounting changes and corrections of errors made in fiscal years beginning after December 15, 2005.
During November 2005, the FASB issued FASB Staff Position (FSP) FAS 115-1 and 124-1, “The Meaning of Other-Than-Temporary Impairment and Its Application to Certain Investments.” The guidance in this FSP addresses the determination of when an investment is considered impaired, whether that impairment is other than temporary, and the measurement of an impairment loss. The FSP also includes accounting considerations subsequent to the recognition of an other-than temporary impairment and requires certain disclosures about unrealized losses that have not been recognized as other-than-temporary impairments. The guidance in this FSP is required to be applied to reporting periods beginning after December 15, 2005. Earlier application is permitted. Management is determining what effect, if any, that this will have on financial condition and results of operation on adoption and thereafter.
The FASB has issued FASB Statement No. 155, “Accounting for Certain Hybrid Instruments.” This standard amends the guidance in FASB Statements No. 133, “Accounting for Derivative Instruments and Hedging Activities”, and No. 140, “Accounting for Transfers and Servicing of Financial Assets and Extinguishments of Liabilities.” Statement 155 allows financial instruments that have embedded derivatives to be accounted for as a whole (eliminating the need to bifurcate the derivative from its host) if the holder elects to account - for the whole instrument on a fair value basis. Statement 155 is effective for all financial instruments acquired or issued after the beginning of an entity’s first fiscal year that begins after September 15, 2006. Earlier adoption is permitted as of the beginning of an entity’s fiscal year, provided the entity has not yet issued financial statements, including financial statements for any interim period for that fiscal year. Provisions of this Statement may be applied to instruments that an entity holds at the date of adoption on an instrument-by-instrument basis. The financial statement effect of the change in accounting, if any, should be recognized as a cumulative-effect adjustment to beginning retained earnings. Prior periods should not be restated.
Management does not expect these accounting pronouncements to have a material impact on the financial statements.
14
Table of Contents
21. REVISION TO FINANCIAL STATEMENTS
Subsequent to the issuance of the Bank’s 2005 financial statements, the OCC issued a directive that the Bank’s Call Report be revised and re-filed. The revision dealt with the OCC’s determination that certain loans be reclassified from accruing to non-accrual loan status. As the result of the Bank having to revise its Call Report, the Bank was also required by the OCC to revise its annual financial statements.
The effects of the revision on the Bank’s financial statements, as of and for the year ended December 31, 2005, are as follows:
| As Originally Presented | Changes | As Revised | ||||||||||
Statements of Financial Condition: | ||||||||||||
Loans | $ | 152,193 | $ | (39 | ) | $ | 152,154 | |||||
Other Assets | 3,342 | 17 | 3,359 | |||||||||
Statements of Income: | ||||||||||||
Interest income | 11,738 | (33 | ) | 11,705 | ||||||||
Income taxes | 566 | (11 | ) | 555 | ||||||||
Net income | 2,314 | (22 | ) | 2,292 | ||||||||
Statements of Cash Flows: | ||||||||||||
Net cash from operating activities | 1,670 | (39 | ) | 1,631 | ||||||||
Net cash from investing activities | (17,400 | ) | 39 | (17,361 | ) | |||||||
Statements of Changes in Shareholders Equity: | ||||||||||||
Undivided profits | 22,912 | (22 | ) | 22,890 | ||||||||
15
Table of Contents
Summary of Operations
(Dollars in Thousands Except Per Share Data)
FOR THE YEAR: | 2005 (Revised) | 2004 | 2003 | 2002 | 2001 | ||||||||||||||
Total Interest Income | $ | 11,705 | $ | 10,884 | $ | 11,627 | $ | 12,731 | $ | 13,394 | |||||||||
Total Interest Expense | 5,029 | 4,602 | 5,333 | 6,123 | 7,601 | ||||||||||||||
Net Interest Income | 6,676 | 6,282 | 6,294 | 6,608 | 5,793 | ||||||||||||||
Provision for Loan Losses | 72 | 72 | 583 | 72 | 72 | ||||||||||||||
Net Interest Income After Provision for Loan Losses | 6,604 | 6,210 | 5,711 | 6,536 | 5,721 | ||||||||||||||
Non-Interest Income | 1,179 | 1,358 | 1,334 | 1,232 | 976 | ||||||||||||||
Non-Interest Expense | 4,936 | 4,846 | 4,475 | 4,323 | 4,137 | ||||||||||||||
Net Income Before Taxes | 2,847 | 2,722 | 2,570 | 3,445 | 2,560 | ||||||||||||||
Applicable Income Taxes: | |||||||||||||||||||
Current | 579 | 613 | 900 | 1,087 | 787 | ||||||||||||||
Deferred | (24 | ) | 69 | (186 | ) | (17 | ) | (9 | ) | ||||||||||
Net Income (Loss) | $ | 2,292 | $ | 2,040 | $ | 1,856 | $ | 2,375 | $ | 1,782 | |||||||||
Basic and Diluted | |||||||||||||||||||
Net Income Per Share* | $ | 3.24 | $ | 2.88 | $ | 2.62 | $ | 3.36 | $ | 2.52 | |||||||||
| * | Net Income per share has been retroactively adjusted to reflect the stock dividend in 2003. |
AT YEAR END: | 2005 (Revised) | 2004 | 2003 | 2002 | 2001 | ||||||||||
Interest-Bearing Deposits in Other Financial Institutions | $ | 16,030 | $ | 21,081 | $ | 13,857 | $ | 11,383 | $ | 10,692 | |||||
Federal Funds Sold | 200 | 22,455 | 24,260 | 31,200 | 16,360 | ||||||||||
Investment Securities | 56,777 | 42,209 | 65,691 | 63,646 | 64,673 | ||||||||||
Loans (Net) | 153,810 | 146,635 | 126,396 | 107,479 | 108,913 | ||||||||||
Deposits | 222,042 | 223,985 | 222,729 | 209,602 | 195,952 | ||||||||||
Demand | 39,957 | 36,261 | 33,839 | 32,476 | 30,280 | ||||||||||
Interest-Bearing Demand | 28,553 | 42,239 | 38,245 | 26,751 | 22,722 | ||||||||||
Savings | 31,054 | 32,702 | 30,951 | 29,093 | 24,601 | ||||||||||
Time | 122,478 | 112,783 | 119,694 | 121,282 | 118,349 | ||||||||||
Total Resources | 245,250 | 245,688 | 242,912 | 228,989 | 213,121 | ||||||||||
Capital Accounts | 22,890 | 21,306 | 19,903 | 18,635 | 16,742 | ||||||||||
Carrying Value Per Share | $ | 32.35 | $ | 30.12 | $ | 28.13 | $ | 26.34 | $ | 23.66 | |||||
DAILY AVERAGES AT YEAR END: | 2005 | 2004 | 2003 | 2002 | 2001 | ||||||||||
Interest-Bearing Deposits in Other Financial Institutions | $ | 15,594 | $ | 18,174 | $ | 13,326 | $ | 10,834 | $ | 10,138 | |||||
Federal Funds Sold | 6,610 | 17,189 | 45,760 | 27,935 | 19,772 | ||||||||||
Investment Securities | 52,294 | 59,349 | 53,704 | 67,447 | 55,021 | ||||||||||
Loans (Net) | 156,207 | 138,930 | 116,794 | 109,922 | 100,352 | ||||||||||
Deposits | 225,034 | 227,772 | 222,444 | 207,967 | 186,857 | ||||||||||
Demand | 39,000 | 37,235 | 34,456 | 32,739 | 27,891 | ||||||||||
Interest-Bearing Demand | 21,947 | 23,032 | 21,360 | 21,611 | 20,715 | ||||||||||
Savings | 46,916 | 49,319 | 42,900 | 34,386 | 25,146 | ||||||||||
Time | 117,171 | 118,186 | 123,728 | 119,231 | 113,105 | ||||||||||
Capital Accounts | 21,870 | 20,373 | 19,226 | 17,510 | 15,715 | ||||||||||
Total Resources | $ | 247,016 | $ | 245,622 | $ | 241,908 | $ | 223,450 | $ | 200,607 | |||||
16
Table of Contents
Officers
Worth Harris Carter, Jr.
Chairman of the Board and President
Luella B. Hubbard
Operations Officer and Cashier
Rosemary W. Champion
Assistant Vice President and Managing Officer - Louisburg
D. Elliott Collins
Assistant Vice President and Managing Officer - Emporia North Main Street
S. Wayne Harp
Assistant Vice President and Managing Officer - Henderson
Karen P. Puryear
Assistant Vice President and Managing Officer - Centerville
Karen C. Allen
Assistant Cashier
Kathy S. Comer
Assistant Cashier
Pamela Y. Conner
Assistant Cashier and Managing Officer - South Boston
Areca J. Duchene
Assistant Cashier and Managing Officer - South Hill
Carolyn T. Forlines
Assistant Cashier and Managing Officer - Clarksville
Tammy S. Pool
Assistant Cashier
Robert C. Seat, Jr.
Assistant Cashier and Managing Officer - Chase City
Eunice M. Wilkins
Assistant Cashier and Managing Officer - Roxboro
Directors
Worth Harris Carter, Jr.
Chairman of the Board and President
Joseph L. Chandler
Retired
Robert W. Conner
Clerk, Circuit Court of Halifax County
Harry L. Mapp, Jr.
Retired
E. Warren Matthews
Attorney, Harris, Matthews & Crowder, PC

Community National Bank
P.O. Box 817
South Boston, Virginia 24592
(434) 575-1200
Member FDIC
17
Table of Contents

Community National Bank
P.O. Box 817
South Boston, Virginia 24592
(434) 575-1200
Member FDIC
Table of Contents
Financial
Statement

September 30, 2006

Community National Bank
Member FDIC
Table of Contents
Statement of Condition
As of September 30
| (in 000’s) | ||||||||
| 2006 | 2005 | |||||||
ASSETS: | ||||||||
Interest-Bearing Deposits in Other Financial Institutions | $ | 12,465 | $ | 16,525 | ||||
Investment Securities: | ||||||||
U.S. Agency Securities | 55,790 | 52,773 | ||||||
Federal Funds Sold | 10,250 | 2,480 | ||||||
Loans | 151,627 | 162,495 | ||||||
Less: Income Collected — Not Earned | (230 | ) | (257 | ) | ||||
Allowance for Loan Losses | (1,718 | ) | (1,639 | ) | ||||
Net Loans | 149,679 | 160,599 | ||||||
Earning Assets | 228,184 | 232,377 | ||||||
Cash and Due From Banks | 9,318 | 10,284 | ||||||
Bank Premises and Equipment | 2,623 | 2,704 | ||||||
Real Estate Owned Other Than Bank Premises | 840 | 806 | ||||||
Investment In Associated Companies | 769 | 618 | ||||||
Other Assets | 3,501 | 2,761 | ||||||
TOTAL ASSETS | $ | 245,235 | $ | 249,550 | ||||
LIABILITIES: | ||||||||
Deposits | ||||||||
LIFETIME FREE CHECKING | $ | 37,027 | $ | 39,883 | ||||
Interest-Bearing Demand | 24,005 | 32,052 | ||||||
Regular Passbook Savings | 30,696 | 33,994 | ||||||
Time Deposits: | ||||||||
Certificates of Deposit $100,000 or More | 20,990 | 19,535 | ||||||
Other | 108,243 | 101,358 | ||||||
Total Deposits | 220,961 | 226,822 | ||||||
Notes Issued to the U.S. Treasury | 251 | 309 | ||||||
Other Liabilities | 262 | 194 | ||||||
TOTAL LIABILITIES | 221,474 | 227,325 | ||||||
SHAREHOLDERS’ EQUITY: | ||||||||
Common Stock, Par Value $5 Per Share, Authorized 2,500,000 Shares; 707,482 Outstanding in 2006 and 2005 | 3,537 | 3,537 | ||||||
Surplus | 15,825 | 15,825 | ||||||
Undivided Profits | 4,399 | 2,863 | ||||||
TOTAL SHAREHOLDERS’ EQUITY | 23,761 | 22,225 | ||||||
TOTAL LIABILITIES AND SHAREHOLDERS’ EQUITY | $ | 245,235 | $ | 249,550 | ||||
Table of Contents
Statement of Income
Nine Months ended September 30
| (in 000’s except for per share data) | ||||||
| 2006 | 2005 | |||||
INTEREST INCOME: | ||||||
Interest and Fees on Loans: | ||||||
Taxable | $ | 6,376 | $ | 5,851 | ||
Non-Taxable | 846 | 748 | ||||
Interest on Deposits in Other Financial Institutions | 449 | 427 | ||||
Interest on Federal Funds Sold | 248 | 123 | ||||
Interest and Dividends on Securities: | ||||||
U.S. Security Agencies | 1,654 | 1,433 | ||||
Obligations of States and Political Subdivisions | — | 26 | ||||
TOTAL INTEREST INCOME | 9,573 | 8,608 | ||||
INTEREST EXPENSE: | ||||||
Interest on Time Deposits $100,000 or More | 688 | 551 | ||||
Interest on Other Deposits | 3,712 | 3,133 | ||||
Interest on Federal Funds Purchased | 3 | 2 | ||||
Interest on Notes Issued to the U. S. Treasury | 4 | 3 | ||||
TOTAL INTEREST EXPENSE | 4,407 | 3,689 | ||||
NET INTEREST INCOME | 5,166 | 4,919 | ||||
Provision for Loan Losses | 54 | 54 | ||||
NET INTEREST INCOME AFTER PROVISION FOR LOAN LOSSES | 5,112 | 4,865 | ||||
NON-INTEREST INCOME: | ||||||
Service Charges, Commissions and Fees | 649 | 663 | ||||
Other Non-Interest Income | 164 | 164 | ||||
TOTAL NON-INTEREST INCOME | 813 | 827 | ||||
NON-INTEREST EXPENSE: | ||||||
Salaries and Employee Benefits | 1,954 | 1,819 | ||||
Occupancy Expense | 645 | 615 | ||||
Operations Center Expense | 799 | 772 | ||||
Other Non-Interest Expense | 500 | 420 | ||||
TOTAL NON-INTEREST EXPENSE | 3,898 | 3,626 | ||||
INCOME BEFORE INCOME TAXES | 2,027 | 2,066 | ||||
Income Tax Expense | 400 | 440 | ||||
NET INCOME | $ | 1,627 | $ | 1,626 | ||
EARNINGS PER SHARE:’ | ||||||
Basic and Diluted | $ | 2.30 | $ | 2.30 | ||
Table of Contents
Community National Bank
SOUTH BOSTON VIRGINIA 24592
October 31, 2006
Dear Stockholder:
These are very exciting times for your bank. With the last quarterly mailing, I enclosed a news release and letter to stockholders setting forth information regarding the proposed merger of your bank with nine other banks into one Virginia state charter under the name of Carter Bank & Trust. By now, you should have received the proxy statement/offering circular and proxy for your review and opportunity to vote regarding the proposed merger. The various stockholder meetings regarding the merger will take place on November 9, 10, 13 and 14. While we have received a very large number of proxies so far, there are some of you who have not returned your proxy. I encourage everyone who has not mailed your proxy by the time you receive this letter to please take the time to review the proxy statement/offering circular and return your proxy so your shares will be voted.
I urge each stockholder to read the proxy statement/offering circular and any other relevant documents filed with the OCC or the FDIC in connection with the proposed merger, because they contain important information about the banks, Carter Bank & Trust and the proposed merger. You may (i) obtain free copies of the proxy statement/offering circular or these other documents by directing a request by telephone or mail to Worth Harris Carter, Jr., Bank Services of Virginia, Inc., 1300 Kings Mountain Road, Martinsville, Virginia 24112; telephone number: (276) 656-1776, or (ii) obtain up to 50 free pages of these documents by contacting the Office of the Comptroller of the Currency by facsimile at (202) 874-4448 or by mail at the Office of the Comptroller of the Currency, Communications Division, 250 E Street, S.W., Washington, D.C. 20219.
We have filed the appropriate applications with the Bureau of Financial Institutions of the State of Virginia and the FDIC and anticipate receiving favorable responses by the end of November. The directors, officers and employees are working diligently to accomplish the merger in a way that will be beneficial to our customers and stockholders. We appreciate your support.
| Very truly yours, |
 |
| Worth Harris Carter, Jr. |
| Chairman of the Board and President |
Table of Contents
Officers
Worth Harris Carter, Jr.
Chairman of the Board and President
Luella B. Hubbard
Operations Officer and Cashier
Rosemary W. Champion
Assistant Vice President and Managing Officer — Louisburg
D. Elliott Collins
Assistant Vice President and Managing Officer — Emporia North Main Street
S. Wayne Harp
Assistant Vice President and Managing Officer — Henderson
Karen P. Puryear
Assistant Vice President and Managing Officer — Centerville
Karen C. Allen
Assistant Cashier
Kathy S. Comer
Assistant Cashier
Pamela Y. Conner
Assistant Cashier and Managing Officer — South Boston
Areca J. Duchene
Assistant Cashier and Managing Officer — South Hill
Carolyn T. Forlines
Assistant Cashier and Managing Officer — Clarksville
Darla W. Hobgood
Assistant Cashier and Managing Officer — Durham
Tammy S. Pool
Assistant Cashier
Robert C. Seat, Jr.
Assistant Cashier and Managing Officer — Chase City
Eunice M. Wilkins
Assistant Cashier and Managing Officer — Roxboro
Directors
Worth Harris Carter, Jr.
Chairman of the Board and President
Joseph L. Chandler
Retired
Robert W. Conner
Clerk, Circuit Court of Halifax County
Harry L. Mapp, Jr.
Retired
E. Warren Matthews
Attorney, Harris, Matthews & Crowder, PC
| Community National Bank | |||||
| P.O. Box 817 | ||||||
| South Boston, Virginia 24592 | ||||||
| (434) 575-1200 | ||||||
| Member FDIC | ||||||
Table of Contents
OFFICE OF THE COMPTROLLER OF THE CURRENCY
WASHINGTON, D.C. 20552
FORM 10-KSB
| x | ANNUAL REPORT UNDER SECTION 13 OR 15(d) OF THE SECURITIES EXCHANGE ACT OF 1934 |
For the fiscal year ended December 31, 2005
OR
| ¨ | TRANSITION REPORT UNDER SECTION 13 OR 15(d) OF THE SECURITIES EXCHANGE ACT OF 1934 |
For the transition period from to
Commission File Number: n/a
FIRST NATIONAL BANK
(Name of small business issuer in its charter)
| National Bank | 54-0962185 | |
(State or other jurisdiction of incorporation or organization) | (I.R.S. Employer Identification No.) | |
400 Franklin Street Rocky Mount, VA | 24151 | |
| (Address of principal executive offices) | (Zip Code) | |
Issuer’s telephone number: (540) 483-0204
Securities registered under Section 12(b) of the Exchange Act: None
Securities registered under Section 12(g) of the Exchange Act: None
Check whether the issuer is not required to file reports pursuant to Section 13 or 15(d) of the Exchange Act. Yes ¨ No x
Check whether the issuer (1) filed all reports required to be filed by Section 13 or 15(d) of the Exchange Act during the past 12 months (or for such shorter period that the registrant was required to file such reports), and (2) has been subject to such filing requirements for the past 90 days. Yes x No ¨
Check if there is no disclosure of delinquent filers in response to Item 405 of Regulation S-B contained in this form, and no disclosure will be contained, to the best of registrant’s knowledge, in definitive proxy or information statements incorporated by reference in Part III of this Form 10-KSB or any amendment to this Form 10-KSB. x
Indicate by check mark whether the registrant is a shell company (as defined in Rule 12b-2 of the Exchange Act). Yes ¨ No x
The issuer’s revenues for the fiscal year ended December 31, 2005 were $13,693,000
The aggregate market value of the issuer’s common stock held by nonaffiliates as of March 22, 2006 was $17,358,000.
As of March 22, 2006, there were 1,503,106 issued and outstanding shares of the issuer’s common stock.
DOCUMENTS INCORPORATED BY REFERENCE
Portions of the 2005 Annual Report to Shareholders are incorporated by reference in Part II of this report, which is attached hereto as Exhibit 13.
Transitional Small Business Disclosure Format: Yes ¨ No x
Table of Contents
FIRST NATIONAL BANK
2005 ANNUAL REPORT ON FORM 10-KSB
TABLE OF CONTENTS
| Page | ||||
| PART I | 3 | |||
ITEM 1. | DESCRIPTION OF BUSINESS | 3 | ||
ITEM 2. | DESCRIPTION OF PROPERTY | 7 | ||
ITEM 3. | LEGAL PROCEEDINGS | 7 | ||
ITEM 4. | SUBMISSION OF MATTERS TO A VOTE OF SECURITY HOLDERS | 8 | ||
| PART II | 9 | |||
ITEM 5. | MARKET FOR COMMON EQUITY AND RELATED STOCKHOLDER MATTERS | 9 | ||
ITEM 6. | MANAGEMENT’S DISCUSSION AND ANALYSIS OR PLAN OF OPERATION | 9 | ||
ITEM 7. | FINANCIAL STATEMENTS | 9 | ||
ITEM 8. | CHANGES IN AND DISAGREEMENTS WITH ACCOUNTANTS ON ACCOUNTING COMPLIANCE WITH SECTION 16(A) OF THE EXCHANGE ACT | 10 | ||
ITEM 8A. | CONTROLS AND PROCEDURES | 10 | ||
ITEM 8B. | OTHER INFORMATION | 10 | ||
| PART III | 10 | |||
ITEM 9. | DIRECTORS, EXECUTIVE OFFICERS, PROMOTERS AND CONTROL PERSONS; COMPLIANCE WITH SECTION 16(A) OF THE EXCHANGE ACT | 10 | ||
ITEM 10. | EXECUTIVE COMPENSATION | 12 | ||
ITEM 11. | SECURITY OWNERSHIP OF CERTAIN BENEFICIAL OWNERS AND MANAGEMENT AND RELATED STOCKHOLDER MATTERS | 14 | ||
ITEM 13. | EXHIBITS | 16 | ||
ITEM 14. | PRINCIPAL ACCOUNTANT FEES AND SERVICES | 16 | ||
2
Table of Contents
FORWARD–LOOKING STATEMENTS
This report contains statements concerning the Bank’s expectations, plans, objectives, future financial performance and other statements that are not historical facts. These statements may constitute “forward-looking statements” as defined by federal securities laws. In some cases, readers can identify the forward-looking statements by the use of words such as “may,” “ will,” “should,” “could,” “expect,” “plan,” “intend,” “anticipate,” “believe,” “estimate,” “predict,” “potential” or “continue” or the negative or other variations of these words, or other comparable words or phrases. These statements may address issues that involve estimates and assumptions made by management, risks and uncertainties, and actual results could differ materially from historical results or those anticipated by such statements. Factors that could have a material adverse effect on the Bank’s operations and future prospects include, but are not limited to, changes in: interest rates; general and local economic conditions; the legislative/regulatory climate; monetary and fiscal policies of the U.S. government, including policies of the U.S. Treasury and the Federal Reserve Board; the quality or composition of loan or investment portfolios; demand for loan products; deposit flows; competition; demand for financial services in our market area and accounting principles, policies and guidelines. These risks and uncertainties should be considered in evaluating the forward-looking statements contained herein, and readers are cautioned not to place undue reliance on such statements, which speak only as of the date of this report.
PART I
ITEM 1. DESCRIPTION OF BUSINESS.
General
The Bank opened for business as a National Banking Association in 1974 in Rocky Mount, Virginia.
The Bank is a full service community bank that provides an array of financial products and services to its customers, including a variety of interest-bearing and non-interest bearing demand deposit accounts; savings and money market accounts; certificates of deposit; commercial, installment, and real estate mortgage loans (commercial and residential); and safe deposit rental facilities. The Bank also sells travelers checks, money orders and cashier’s checks.
At December 31, 2005, the Bank had 93 full-time and 5 part time employees, $276 million in assets, $166 million in net loans, $255 million in deposits and $18.5 million in total shareholders’ equity.
Market Area
The Bank’s primary service area currently consists of Franklin County and the northern portion of Pittsylvania County in Virginia and Burke, Caldwell, Catawba, Cleveland and Rutherford Counties in North Carolina. The Bank conducts a general commercial banking business in its service area, and focuses on serving the banking needs of small-to-medium sized businesses, professional concerns and individuals.
For competitive reasons, First National Bank offices in Bostic, Forest City, Shelby and Lincolnton, as well as two offices in Gastonia that are being prepared to open, operate under the name “Carolina National Bank” with an indication that the offices are branches of First National Bank. These offices are fully consolidated in all of the comments, schedules and other date contained in this report.
Goals and Strategy
The Bank’s goal is to become a leading financial institution in its market area by opening new offices and providing a full array of banking services. Management believes that the on-going consolidation of the banking industry has created an opportunity for community-based lenders like the Bank that emphasize retail lending and superior customer service. The Bank’s business strategy is to target individuals, businesses and professionals in the area for loans, deposits, and other financial services and to explore selected opportunities to establish branches in areas that demographically compliment the Bank’s existing customer base.
3
Table of Contents
Deposits and Loan Products
The Bank offers a full range of deposit services including LIFETIME FREE CHECKING, NOW accounts, savings accounts, retirement accounts and other deposits of various types, ranging from money market accounts to longer-term certificates of deposit. The transaction accounts and time certificates are tailored to the Bank’s principal market at competitive rates. All deposit accounts are insured by the FDIC up to the maximum amount allowed by law (generally $100,000 per depositor subject to aggregation rules). The Bank solicits these accounts from individuals, businesses, associations, organizations, and governmental entities.
The Bank also offers a full range of commercial and personal loans. Commercial loans include both secured and unsecured loans. Consumer loans include secured and unsecured loans for financing automobiles, home improvements, education and personal investments. The Bank also makes real estate construction and acquisition loans and originates and holds fixed and variable rate mortgage loans.
The Bank’s lending activities are subject to a variety of lending limits imposed by federal law. While differing limits apply in certain circumstances based on the type of loan or the nature of the borrower (including the borrower’s relationship to the Bank), in general the Bank is subject to a loan-to-one borrower limit of an amount equal to 15% of the Bank’s unimpaired capital and surplus. The Bank may not make loans to any director, officer, employee or 10% shareholder of the Bank unless the loan is approved by the Board of Directors and is made on terms not more favorable than are made available to a person not affiliated with the Bank.
Other bank services include travelers checks, direct deposit of payroll and social security checks, and automated drafts for various accounts. The Bank has no current plans to exercise trust powers.
Bank Lending Practices
The Bank’s lending efforts are directed to making loans to individuals and businesses in its market area. The Bank has both purchased and sold participation loans with other banks in the past and may do so in the future. The Bank believes that its lending and credit policies are conservative.
The Bank’s primary lending program has been the origination of loans secured by real estate. The Bank evaluates both the borrower’s ability to make principal and interest payments and the value of the property that will secure the loan.
Residential mortgage loans generally are made on the basis of the borrower’s ability to make repayment from employment and other income and are secured by real estate that can be readily valued. The Bank offers both adjustable-rate and fixed-rate loans.
In contrast, commercial real estate loans typically are made on the basis of the borrower’s ability to make repayment from cash flow from its business and are secured by business properties. The Bank’s primary non-residential real estate loan products have rates that are fixed for three to five years and then become adjustable. Commercial loans typically involve larger loan balances concentrated with single borrowers or groups of related borrowers.
The Bank also makes consumer loans, including unsecured personal loans, automobile loans, deposit account loans, installment loans and time loans. The Bank’s primary consideration when making such consumer loans is the customer’s ability to repay the loan. Consumer loans generally warrant higher interest rates and fees, but such loans, particularly unsecured consumer loans, also may entail greater risk than residential mortgage loans. Even when a loan is secured, repossessed collateral for a defaulted consumer loan may not provide an adequate source of repayment. Consumer loan collections are dependent on the borrower’s continuing financial stability, and are more likely to be affected adversely by job loss, divorce, illness, or personal bankruptcy. Various federal and state laws, including bankruptcy and insolvency laws, may limit the amount that can be recovered on such loans and such loans may give rise to claims and defenses by a consumer loan borrower.
4
Table of Contents
The Bank also makes commercial loans to qualified small businesses in its market area. Commercial business loans generally have a higher degree of risk than mortgage loans, but have commensurately higher yields. To manage these risks, the Bank generally secures appropriate collateral and carefully monitors the financial condition of its business borrowers.
Competition
Federal and state legislative changes have significantly increased competition among financial institutions, and current trends towards additional deregulation may be expected to increase competition even further. In its market area, the Bank competes with nationwide, statewide and local banking institutions, credit unions, thrift institutions, money market funds, consumer finance companies, and other financial service organizations. Many of the financial organizations competing with the Bank have greater financial resources than the Bank. Many of these financial organizations also have greater geographic coverage and some offer bank and bank-related services that the Bank does not offer.
Supervision and Regulation
Financial institutions are extensively regulated under federal and state law. Consequently, the growth and earnings performance of the Bank can be affected not only by management decisions and general economic conditions, but also by the statutes administered by, and the regulations and policies of, various governmental regulatory authorities including, but not limited to, the OCC, the Federal Reserve Board (“FRB”), the FDIC, the Internal Revenue Service, federal and state taxing authorities, and the Securities Exchange Commission. The effect of such statutes, regulations and policies can be significant, and cannot be predicted with a high degree of certainty.
Federal and state laws and regulations generally applicable to financial institutions regulate, among other things, the scope of business, investments, reserves against deposits, capital levels relative to operations, the nature and amount of collateral for loans, the establishment of branches, mergers, consolidations and dividends. The system of supervision and regulation applicable to the Bank establishes a comprehensive framework for their respective operations and is intended primarily for the protection of the FDIC’s deposit insurance funds and the depositors, rather than the shareholders, of the Bank.
The following references to material statutes and regulations affecting the Bank are brief summaries thereof and do not purport to be complete, and are qualified in their entirety by reference to such statutes and regulations. Any change in applicable law or regulations may have a material effect on the business of the Bank.
Finally, the Bank is subject to the periodic reporting requirements of the Securities Exchange Act of 1934, as amended, including but not limited to, filing annual, quarterly and other current reports with the Comptroller of the Currency.
Regulatory Capital Requirements
All financial institutions are required to maintain minimum levels of regulatory capital. The OCC has established risk-based and leveraged capital standards for the financial institutions they regulate. The OCC also may impose capital requirements in excess of these standards on a case-by-case basis for various reasons, including financial condition or actual or anticipated growth. Under the risk-based capital requirements, the Bank is required to maintain a minimum ratio of total capital to risk-weighted assets of at least 8%. At least half of the total capital is required to be “Tier 1 capital,” which consists principally of common and certain qualifying preferred shareholders’ equity, less certain intangibles and other adjustments. The remainder, “Tier 2 capital,” consists of a limited amount of subordinated and other qualifying debt (including certain hybrid capital instruments) and a limited amount of the general loan loss reserve.
In addition, the federal regulatory agencies have established a minimum leveraged capital ratio (Tier 1 capital to period end total assets). These guidelines provide for a minimum leveraged capital ratio of 4%. The guidelines also provide that banking organizations experiencing internal growth or making acquisitions will be expected to maintain strong capital positions substantially above the minimum supervisory levels, without significant reliance on intangible assets.
5
Table of Contents
As of December 31, 2005 and 2004, the Bank qualified as a “well-capitalized” institution (see Note 16 to the Financial Statements).
Insurance of Accounts, Assessments and Regulation by the FD1C
The Bank is a member of the Bank Insurance Fund (“BIF”) of the FDIC. As a BIF insured institution, the Bank is subject to FDIC rules and regulations as administrator of the BIF. The Bank’s deposits are insured up to $100,000 per insured depositor, as defined by law and regulation. As insurer, the FDIC is authorized to conduct examinations of and to require reporting by BIF institutions. The actual assessment to be paid by each BIF member is based on the institution’s assessment risk classification and whether the institution is considered by its supervisory agency to be financially sound or to have supervisory concerns.
Under the FDIC’s risk-based insurance system, BIF-insured institutions are currently assessed premiums of between zero and twenty seven cents per $100 of eligible deposits, depending on the institution’s capital position and other supervisory facts. Congress has enacted legislation that, among other things, provides for assessments against BIF-insured institutions that will be used to pay certain Financing Corporation (“FICO”) obligations.
The FDIC is authorized to prohibit any BIF-insured institution from engaging in any activity that the FDIC determines by regulation or order to pose a serious threat to the insurance fund. Also, the FDIC may initiate enforcement actions against banks after first giving the institution’s primary regulatory authority an opportunity to take such action. The FDIC may terminate the deposit insurance of any depository institution, including the Bank, if it determines, after a hearing, that the institution has engaged or is engaging in unsafe or unsound practices, is in an unsafe or unsound condition to continue operations, or has violated any applicable law, regulation, order or any condition imposed in writing by the FDIC. It also may suspend deposit insurance temporarily during the hearing process for the permanent termination of insurance, if the institution has no tangible capital. If deposit insurance is terminated, the deposits at the institution at the time of termination, less subsequent withdrawals, shall continue to be insured for a period from six months to two years, as determined by the FDIC. Management is aware of no existing circumstances that could result in termination of the Bank’s deposit insurance.
Other Safety and Soundness Regulations
The federal banking agencies have broad powers under current federal law to take prompt corrective action to resolve problems of insured depository institutions. The extent of these powers depends upon whether the institutions in question are “well capitalized,” “adequately capitalized,” “undercapitalized,” “significantly undercapitalized” or “critically undercapitalized,” as such terms are defined under uniform regulations issued by each of the federal banking agencies.
Community Reinvestment
The requirements of the Community Reinvestment Act (“CRA”) affect the Bank. The CRA imposes on financial institutions an affirmative obligation to help meet the credit needs of their local communities, including low- and moderate-income neighborhoods, consistent with the safe and sound operation of those institutions. Each financial institution’s efforts in helping meet community credit needs currently are evaluated as part of the examination process pursuant to a new regulation recently adopted by the banking regulatory agencies. Under the new regulation a financial institution’s efforts in helping meet its community’s credit needs are evaluated, based on the particular institution’s Total Assets, according to a lending test, a community development test in addition to the lending test, or the three-pronged (lending, investment and service) test, all of which replace the twelve assessment factors used previously. The grade received by a bank is considered in evaluating mergers, acquisitions and applications to open a branch or facility. To the best knowledge of the Bank, it is meeting its obligations under the CRA.
Effect of Governmental Monetary Policies
As with other financial institutions, the earnings of the Bank are affected by general economic conditions as well as by the monetary policies of the Federal Reserve Board. Such policies, which include regulating the national supply
6
Table of Contents
of bank reserves and bank credit, can have a major effect upon the source and cost of funds and the rates of return earned on loans and investments. The Federal Reserve System exerts a substantial influence on interest rates and credit conditions, primarily through establishing target rates for federal funds, open market operations in U.S. Government securities, varying the discount rate on member bank borrowings and setting cash reserve requirements against deposits. Changes in monetary policy, including changes in interest rates, will influence the origination of loans, the purchase of investments, the generation of deposits, and rates received on loans and investment securities and paid on deposits. Fluctuations in the Federal Reserve Board’s monetary policies have had a significant impact on the operating results of the Bank and all financial institutions in the past and are expected to continue to do so in the future.
Employees
The Bank employed a total of 93 full-time and 5 part-time employees as of December 31, 2005. The Bank believes that its relationship with its employees is good, and no employees are represented by a labor union.
ITEM 2. DESCRIPTION OF PROPERTY.
The Bank’s main office is located in a two-story building located at 400 Franklin Street, Rocky Mount, Virginia. The Bank also operates five offices in Virginia and seven offices in North Carolina. The Bank owns seven of these offices and the other five are held under non-cancellable operating leases. Details regarding these leases are in Footnote 7 and 18 of the Financial Statements in Part II, Item 7 filed herewith.
As of December 31, 2005, the Bank operated the twelve offices listed in the table below:
Location | Address | Lease/Own | ||||
| Rocky Mount Office | 400 Franklin Street | Rocky Mount, VA 24151 | Own | |||
| Boones Mill Office | 50 Boones Mill Road | Boones Mill, VA 24065 | Own | |||
| Gretna Office | 307 South Main Street | Gretna, VA 24557 | Own | |||
| Ferrum Office | 9440 Franklin Street | Ferrum, VA 24088 | Lease | |||
| West Lake Office | 135 Scruggs Road | Moneta, VA 24121 | Lease | |||
| Morganton | 301 Carbon City Road | Morganton, NC 28655 | Lease | |||
| Hickory | 821 4th. Street Drive, SW | Hickory, NC 28601 | Lease | |||
| Forest City | 704 Oak Street | Forest City, NC 28043 | Lease | |||
| Shelby | 2001 East Dickson Boulevard | Shelby, NC 28152 | Own | |||
| Bostic | 176 North Main Street | Bostic, NC 28018 | Own | |||
| Lenoir | 127 Main Street | Lenoir, NC 28645 | Own | |||
| Lincolnton | 341 E. Main Street | Lincolnton, NC 28092 | Own | |||
The Bank also owns two offices in Gastonia, NC, which we are preparing to open.
The Bank periodically acquires title to other parcels of real estate through the normal course of its lending activities. Other Real Estate equaled $1,929,000 as of December 31, 2005 and $2,105,000 as of December 31, 2004.
Management considers these properties to be in good condition. Adequate insurance is maintained on each of these properties.
ITEM 3. LEGAL PROCEEDINGS.
There are no material pending legal proceedings to which the Bank is a party or to which the property of the Bank is subject.
7
Table of Contents
ITEM 4. SUBMISSION OF MATTERS TO A VOTE OF SECURITY HOLDERS.
No matters were submitted to a vote of security holders during the fourth quarter of the fiscal year covered by this report.
EXECUTIVE OFFICERS OF THE REGISTRANT
Name (Age) | Officer Since | Principal Occupation During Past Five Years | ||
Worth Harris Carter, Jr. (68) | 1976 | Chairman of the Board of First National Bank since 1976, President since 1986 | ||
| Chairman of the Board and President of Patrick Henry National Bank since 1977 | ||||
| Chairman of the Board of Peoples National Bank since 1976, President since 1981 | ||||
| Chairman of the Board of Blue Ridge Bank since 1982 | ||||
| Chairman of the Board and President of Community National Bank since 1985 | ||||
| Chairman of the Board and President of Mountain National Bank since 1996 | ||||
| Chairman of the Board and President of Shenandoah National Bank since 1996 | ||||
| Chairman of the Board and President of Central National Bank since 1996 | ||||
| Chairman of the Board and President of Patriot Bank since 1996 | ||||
| Chairman of the Board and President of First National Exchange Bank since 1998 | ||||
| Chairman of the Board and President of Mortgage Company of Virginia since 1984 | ||||
| Chairman of the Board and President of Bank Services of Virginia since 1984 | ||||
| Chairman of the Board and President of Bank Building Corporation since 1994 | ||||
| Chairman of the Board and President of Bank Services Insurance, Inc. since 2003 | ||||
| Manager of Blackstone Properties LLC Since 1998 | ||||
8
Table of Contents
PART II
ITEM 5. MARKET FOR COMMON EQUITY AND RELATED STOCKHOLDER MATTERS.
The Bank is authorized to issue 10 million shares of common stock with a par value of $1.25. This stock has full voting rights and full preemptive rights. There were 1,503,106 shares outstanding as of December 31, 2005 and 2004. This is the only class of authorized stock.
The Bank’s common stock is traded locally with no established trading market and no known market makers.
The quarterly high and low prices are based on transactions made known to the Bank and quarterly dividends for the common stock are presented below.
| 2005 | 2004 | Dividends Per Share | ||||||||||||||||
| High | Low | High | Low | 2005 | 2004 | |||||||||||||
First Quarter | $ | 20.00 | $ | 16.50 | $ | 22.50 | $ | 22.50 | $ | .21 | $ | 0.21 | ||||||
Second Quarter | 20.00 | 16.50 | 22.50 | 22.50 | 0.21 | 0.21 | ||||||||||||
Third Quarter | 20.00 | 16.50 | 21.00 | 21.00 | 0.21 | 0.21 | ||||||||||||
Fourth Quarter | 20.00 | 16.50 | 22.50 | 17.00 | 0.21 | 0.21 | ||||||||||||
Holders. As of March 22, 2006, there are approximately 801 holders of record of the Bank’s outstanding common stock.
Dividends. The amount of dividends that may be paid by the Bank will depend on the Bank’s earnings and capital position and is limited by federal law, regulations and policies. A national bank may not pay dividends from its capital; all dividends must be paid out of undivided profits then on hand, after deducting expenses, including reserves for losses and bad debts. In addition, the approval of the OCC is required if the total of all dividends declared by a national bank in any calendar year exceeds the total of its net profits for that year combined with its retained net profits for the preceding two years, less any required transfers to surplus. The Bank may not pay a dividend if, after giving effect to the dividend, the Bank would be undercapitalized.
The dividend payment history per quarter for the last two years is presented above. Future cash dividends are expected in the future and are dependent upon the Bank’s future performance and other factors.
ITEM 6. MANAGEMENT’S DISCUSSION AND ANALYSIS OR PLAN OF OPERATION.
The information required by this Item is included in the Bank’s annual report to shareholders for the year ended December 31, 2005 (the “Annual Report”), which is attached hereto as Exhibit 13 and is incorporated herein by reference. The information appears in the Annual Report under the caption “Management’s Discussion and Analysis of Financial Condition and Results of Operation.”
ITEM 7. FINANCIAL STATEMENTS.
The report of the independent registered public accounting firm and audited financial statements of the Bank and accompanying notes required by this Item are included in the Bank’s Annual Report, which is attached hereto as Exhibit 13 and is incorporated herein by reference.
9
Table of Contents
ITEM 8. CHANGES IN AND DISAGREEMENTS WITH ACCOUNTANTS ON ACCOUNTING AND FINANCIAL DISCLOSURE
None.
ITEM 8A. CONTROLS AND PROCEDURES.
The Bank maintains a system of disclosure controls and procedures that is designed to ensure that material information is accumulated and communicated to management, including the Bank’s president (who is the Bank’s principal executive officer and principal financial officer), as appropriate to allow timely decisions regarding required disclosure. As required, management, with the participation of the Bank’s president, evaluated the effectiveness of the design and operation of the Bank’s disclosure controls and procedures as of the end of the period covered by this report. Based on this evaluation, the Bank’s president concluded that the Bank’s disclosure controls and procedures were operating effectively to ensure that information required to be disclosed by the Bank in reports that it files or submits under the Securities Exchange Act of 1934, as amended, is recorded, processed, summarized, and reported within the time periods specified in the rules and forms of the SEC.
Because of the inherent limitations in all control systems, no evaluation of controls can provide absolute assurance that the Bank’s disclosure controls and procedures will detect or uncover every situation involving the failure of persons within the Bank to disclose material information otherwise required to be set forth in the Bank’s periodic reports.
The Bank’s management is also responsible for establishing and maintaining adequate internal control over financial reporting to provide reasonable assurance regarding the reliability of financial reporting and the preparation of financial statements for external purposes in accordance with generally accepted accounting principles. There were no changes in the Bank’s internal control over financial reporting during the Bank’s fourth quarter ended December 31, 2005 that have materially affected, or are reasonably likely to materially affect, the Bank’s internal control over financial reporting.
ITEM 8B. OTHER INFORMATION.
None.
PART III
ITEM 9. DIRECTORS, EXECUTIVE OFFICERS, PROMOTERS AND CONTROL PERSONS; COMPLIANCE WITH SECTION 16(A) OF THE EXCHANGE ACT.
The information regarding the Bank’s executive officer is contained in Part I of this Report on Form 10-KSB.
Name and Business Experience | Age | Director Since | ||
Carter, Worth Harris, Jr. | 68 | 2/76 | ||
Chairman of the Board and President | ||||
Worth Harris Carter, Jr. is a director and officer of the following companies: | ||||
Chairman of the Board and President of First National Exchange Bank since 1998 | ||||
Chairman of the Board and President of Patrick Henry National Bank since 1977 | ||||
Chairman of the Board of Peoples National Bank since 1976, President since 1981 | ||||
Chairman of the Board of Blue Ridge Bank since 1982, President since 2004 | ||||
Chairman of the Board and President of Community National Bank since 1985 | ||||
Chairman of the Board and President of Mountain National Bank since 1996 | ||||
Chairman of the Board and President of Shenandoah National Bank since 1996 | ||||
Chairman of the Board and President of Central National Bank since 1996 |
10
Table of Contents
Chairman of the Board and President of Patriot Bank since 1996 | ||||
Chairman of the Board and President of Mortgage Company of Virginia since 1984 | ||||
Chairman of the Board and President of Bank Services of Virginia, Inc. since 1984 | ||||
Chairman of the Board and President of Bank Services Insurance, Inc. since 2003 | ||||
Chairman of the Board and President of Coresoft, Inc. since 2004 | ||||
Chairman of the Board and President of Bank Building Corporation since 1988 | ||||
Manager of Blackstone Properties LLC since 1998 | ||||
| Kingery, Walter P. | 74 | 11/74 | ||
| Walter P. Kingery is retired. He was previously a dairy farmer in Franklin County, Virginia for more than five years. He has also served as a director of First National Exchange Bank in Roanoke, Virginia since 1998. | ||||
| Mason, Sidney D. | 78 | 11/74 | ||
| Sidney D. Mason is retired. He was previously Chairman of the Board of Virginia Apparel Corporation, Rocky Mount, Virginia for more than five years. He has also served as a director of First National Exchange Bank in Roanoke, Virginia since 1998. | ||||
| Ramsey, Mary Alice | 81 | 12/87 | ||
| Mary Alice Ramsey is retired She was previously the operator of Chief Tassel Beauty Shoppe in Martinsville, Virginia for more than five years. She has also served as a director of First National Exchange Bank in Roanoke, Virginia since 1998. | ||||
| Scott, Leo H. | 73 | 11/74 | ||
| Leo H. Scott is and has been President of Leo H. Scott Cabinets, Inc. Ferrum, Virginia for more than five years. He has also served as a director of First National Exchange Bank in Roanoke, Virginia since 1998. | ||||
The Board of Directors is not aware of any family relationship between any Director, executive officer or person nominated by the Bank to become a Director; nor is the Board of Directors aware of any involvement in legal proceedings that would be material to an evaluation of the ability or integrity of any Director, executive officer or person nominated to become a Director.
AUDIT COMMITTEE REPORT OF THE BOARD OF DIRECTORS
The entire Board of Directors functions as the Bank’s Audit Committee and in this capacity met four times in 2005. The functions of the Board in the audit area are focused on three areas.
| • | the adequacy of the Bank’s internal controls and financial reporting process and the reliability of the financial statements; |
| • | the independence and performance of the Bank’s internal auditors and independent auditors; and · |
| • | the Bank’s compliance with legal and regulatory requirements. |
We meet with management periodically to consider the adequacy of the Bank’s internal controls and the objectivity of its financial reporting. We discuss these matters with the Bank’s independent auditors and with appropriate financial personnel and internal auditors.
We also periodically review the performance of the independent auditors and their independence from management.
All of the Directors who serve as the Bank’s Audit Committee, with the exception of Chairman of the Board and President Carter, are “independent” for the purposes of the Nasdaq Stock Market listing standards.
The Board has not adopted a written charter setting forth the responsibilities and authority of the Board in its capacity as the Audit Committee. Although Mr. Carter is not independent under the Nasdaq Stock Market or SEC standards for audit committee membership, the Board of Directors has determined that Mr. Carter possesses the knowledge and experience
11
Table of Contents
required to be considered an audit committee financial expert. In addition, the Board of Directors believes that all of the Bank’s Directors possess the financial knowledge and expertise necessary to protect the Bank’s shareholders in performing the functions of an audit committee. Management has primary responsibility for the Bank’s financial statements and the overall reporting process, including the Bank’s system of internal controls.
The independent auditors audit the annual financial statements prepared by management, express an opinion as to whether those statements fairly present the financial position, results of operations and cash flows of the Bank in conformity with generally accepted accounting principles and discuss with us any issues they believe should be raised with us.
This year, we reviewed the Bank’s audited financial statements and met with both management and Goodman & Company, LLP, the Bank’s independent auditors, to discuss those financial statements. Management has represented to us that the financial statements were prepared in accordance with generally accepted accounting principles.
We have received from and discussed with Goodman & Company the written disclosure and the letter required by Independence Standards Board Statement No. 1 (Independence Discussions with Audit Committees) relating to that firm’s independence from the Bank. We also discussed with Goodman & Company the matters required to be discussed by Statement on Auditing Standard No. 61 (Communication with Audit Committees).
Based on these reviews and discussions, we recommended to the Board that the Bank’s audited financial statements be included in the Bank’s Annual Report on Form 10-KSB for the fiscal year ended December 31, 2005 for filing with the Office of the Comptroller of the Currency (“OCC”).
Directors
Worth Harris Carter, Jr.
Walter P. Kingery
Sidney D. Mason
Mary Alice Ramsey
Leo H. Scott
SECTION 16(a) BENEFICIAL OWNERSHIP REPORTING COMPLIANCE
Section 16(a) of the Securities Exchange Act of 1934 requires that Directors and executive officers, and persons who control more than 10% of the Bank’s equity securities, file reports of ownership and reports of changes in ownership of the Bank’s outstanding equity securities. All such filings were filed timely in 2005.
The Bank has not adopted a Code of Ethics for its directors, executives and employees, primarily because management of the Bank believes and understands that our officers and directors adhere to and follow ethical standards without the necessity of a written policy. The Bank’s Board of Directors will revisit this issue in the future to determine if adoption of a code of ethics is appropriate. In the meantime, the Bank’s management requires and promotes honest and ethical conduct, full and fair disclosure in its reports to the OCC, and compliance with applicable governmental laws and regulations.
ITEM 10. EXECUTIVE COMPENSATION.
The Bank’s compensation program is designed to offer competitive compensation to employees based on each individual’s contribution to the Bank’s overall success. As such, the program provides a competitive compensation package to attract and retain capable employees.
The compensation and benefits program consists of salary, a profit sharing plan, and life, health and disability insurance. The compensation and benefits program for officers parallels that of all other employees. The Bank offers no stock options or other forms of equity compensation, bonuses, employment contracts, country club memberships or other perquisites to officers or employees.
12
Table of Contents
The entire Board of Directors performs the functions of a Salary Committee for the Bank. The Board has the responsibility for administering the Bank’s overall compensation program and for setting the salaries for the Bank’s officers. In setting the compensation of the Bank’s officers, the Board generally relies on the recommendations of the Chairman and President and the Board members’ own significant personal knowledge of the compensation provided to other, similarly situated, executives in banking and other industries in the local area. The Board also reviews each individual’s performance and contribution to the overall Bank goals in determining the level of salary for the coming year.
Mr. Worth Harris Carter, Jr., Chairman of the Board and President, serves as the Chief Executive Officer of First National Bank. As noted below under “Certain Relationships and Related Transactions,” Mr. Carter also serves as Chairman and President of nine other banks. The Salary Committee of the Board of Directors of one of these other banks (Patrick Henry National Bank) actually sets Mr. Carter’s annual salary each year. The cost of Mr. Carter’s compensation, which consists of his salary plus an amount equal to twenty-nine percent of his salary to cover payroll taxes and all other benefits, is shared by the ten banks on the basis of average deposits of each bank related to total average deposits of all the banks that he serves. Mr. Carter’s total compensation, which is paid through Bank Services of Virginia, Inc. (“Bank Services”), is reflected below in two charts. The first chart reflects Mr. Carter’s total compensation as paid by Bank Services. The second chart reflects only the portion of Mr. Carter’s total compensation that is allocated to First National Bank. During 2005, no other executive officer of the Bank received compensation in excess of $100,000.
Summary Compensation Tables
Bank Services of Virginia, Inc.1
| Annual Compensation | ||||||||||
Name and Principal Position | Year | Salary | Other Annual Compensation² | All Other Compensation³ | ||||||
Worth Harris Carter, Jr. | 2005 | $ | 575,000 | — | $ | 80,000 | ||||
Chairman of the Board and | 2004 | $ | 575,000 | — | $ | 78,000 | ||||
| President | 2003 | $ | 530,000 | — | $ | 67,000 | ||||
| (1) | This table shows the total cash compensation paid to Mr. Carter by Bank Services of Virginia, Inc. during 2005, 2004 and 2003 for his services as Chairman of the Board and President of all ten banks. |
| (2) | The amount of compensation in the form of perquisites and other personal benefits properly categorized in this column did not exceed the lesser of $50,000 or 10% of Mr. Carter’s annual salary for any of the three years reported. |
| (3) | “All Other Compensation” consists of amounts contributed for Mr. Carter under Bank Services’ qualified profit sharing plan and amounts contributed for Mr. Carter under Bank Services’ non-qualified profit sharing plan for highly paid executives. For 2005, these amounts consisted of $27,000 contributed to the qualified profit sharing plan and $53,000 contributed to the non-qualified profit sharing plan. |
13
Table of Contents
First National Bank 1
Annual Compensation
| Annual Compensation | ||||||||||
Name and Principal Position | Year | Salary | Other Annual Compensation² | All Other Compensation³ | ||||||
Worth Harris Carter, Jr. | 2005 | $ | 68,000 | — | $ | 9,000 | ||||
Chairman of the Board and | 2004 | $ | 57,000 | — | $ | 8,000 | ||||
| President | 2003 | $ | 60,000 | — | $ | 8,000 | ||||
| (1) | This table shows the portion of Mr. Carter’s total cash compensation during 2005, 2004 and 2003 allocated to First National Bank. |
| (2) | The amount of compensation in the form of perquisites and other personal benefits properly categorized in this column did not exceed the lesser of $50,000 or 10% of Mr. Carter’s annual salary for any of the three years reported. |
| (3) | “All Other Compensation” consists of the portion allocated to First National Bank for contributions on Mr. Carter’s behalf to Bank Services’ qualified profit sharing plan and non-qualified profit sharing plan for highly paid executives. For 2005, the portion allocated to First National Bank consisted of $3,000 for the qualified profit sharing plan and $6,000 for the non-qualified profit sharing plan. |
Profit Sharing Plan
The Bank has adopted an integrated profit sharing plan. The plan covers all full time employees that have been employed for six (6) months and have reached the age of 20-1/2 as of the first day of the plan year. Persons who have reached the age of 62 are fully vested regardless of length of service. The regular vesting schedule is as follows:
Years of Service | Vested Percentage | Forfeitable Percentage | ||
| Less than 5 | 0 | 100 | ||
| 5 or more | 100 | 0 |
Each year the Board of Directors determines what amount, if any, is to be allocated to the plan out of accumulated or current earnings of the Bank. The Bank’s contribution to the plan was $125,000 in 2005, $127,000 in 2004, and $112,000 in 2003.
Chairman of the Board and President Carter does not participate in the profit sharing plan of First National Bank or any of the other nine banks. Instead, Mr. Carter participates in the two profit sharing plans of Bank Services of Virginia, Inc., a qualified profit sharing plan and a nonqualified plan for highly paid executives whose contribution to the qualified plan is limited due to IRS regulations. The Bank’s annual contributions to these plans on Mr. Carter’s behalf are detailed in the two Summary Compensation Tables above.
DIRECTOR COMPENSATION
Each outside Director (not also an officer of the Bank) currently receives $200 for each Board meeting attended.
ITEM 11. SECURITY OWNERSHIP OF CERTAIN BENEFICIAL OWNERS AND MANAGEMENT AND RELATED STOCKHOLDER MATTERS
The following table shows as of March 22, 2006, the beneficial ownership of the Bank’s common stock of each Director, the executive officer identified in the Summary Compensation Table and the Bank’s Directors and executive officers as a
14
Table of Contents
group. To the Bank’s knowledge, Directors Carter, Mason, Ramsey and Scott are the Bank’s only shareholders beneficially holding more than 5% of the Bank’s outstanding common stock. As of March 22, 2006, the Bank’s Directors and executive officers as a group, beneficially owned 551,971 shares (or 36.6%) of the Bank’s outstanding common stock.
Name | Amount and Nature of Beneficial Ownership (1)(2) | Ownership as a Percentage of Common Stock Outstanding | ||||
Carter, Worth Harris, Jr. | 196,020 | (3) | 13.0 | % | ||
Kingery, Walter P. | 56,078 | (4) | 3.7 | % | ||
Mason, Sidney D. | 98,960 | (5) | 6.6 | % | ||
Ramsey, Mary T. | 96,196 | 6.4 | % | |||
Scott, Leo H. | 104,717 | (6) | 7.0 | % | ||
All Directors and Executive Officers | 551,971 | 36.6 | % | |||
As a Group (5 persons) |
| 1) | For purposes of this table, beneficial ownership has been determined in accordance with the provisions of Rule 13d-3 of the Securities Exchange Act of 1934 under which, in general, a person s deemed to be the beneficial owner of a security if he/she has or shares the power to vote or direct the voting of the security or the power to dispose of or direct the disposition of the security, or if he/she has the right to acquire beneficial ownership of the security within sixty days. |
| (2) | Unless otherwise indicated, the shares listed in the table represent sole voting and investment power. |
| (3) | Includes 37,900 shares held by Mr. Carter as custodian for his children and grandchildren; 1,090 shares held by Mr. Carter’s son, Ernest Linwood Carter, II, who resides in Mr. Carter’s household; 1,500 shares held for Mr. Carter’s account in the Mortgage Company of Virginia, Inc./Bank Services of Virginia, Inc. Non-Qualified Profit-Sharing Plan; 500 shares held by C&C Realty, Inc., of which Mr. Carter is president and a 50% owner; and 4,820 shares held by Mr. Carter’s brother, Ernest L. Carter. |
| (4) | Includes 915 shares held by Mr. Kingery’s wife. |
| (5) | Includes 94,230 shares held by the Sidney D. Mason Revocable Trust, of which Mr. Mason is trustee, and 4,730 shares held by the Dale W. Mason Revocable Trust, of which Mr. Mason’s wife is trustee. |
| (6) | Includes 52,359 shares held by the Leo H. Scott Revocable Trust, of which Mr. Scott is trustee, and 52,358 shares held by the Geraldine N. Scott Revocable Trust, of which Mr. Scott’s wife is trustee. |
The Bank knows of no arrangements, including any pledge by any person of securities of the Bank, which may at a subsequent date result in a change in control of the Bank.
Equity Compensation Plans.No disclosure regarding equity compensation plans has been provided because the Bank does not have any outstanding equity compensation plans or arrangements that would be covered by Item 201(d) of Regulation S-B.
ITEM 12. CERTAIN RELATIONSHIPS AND RELATED TRANSACTIONS.
Mr. Carter, Chairman of the Board and President of First National Bank also serves as Chairman of the Board and President of Blue Ridge Bank, N.A., Central National Bank, Community National Bank, First National Exchange Bank, Mountain National Bank, Patrick Henry National Bank, Patriot Bank, N.A., Peoples National Bank and Shenandoah National Bank.
The Bank maintains correspondent bank accounts with three of these banks. In 2005 and 2004, the average daily balances in these accounts were considered normal operating balances to facilitate general business transactions. The Bank also participates in loan transactions with these banks. These transactions are at carrying value and do not involve more than the normal risk of collectibility or present other unfavorable features.
15
Table of Contents
The Bank owns 10% of the outstanding common stock of The Mortgage Company of Virginia, Inc. The remaining common stock is equally owned by the banks listed above. The Mortgage Company of Virginia owns 100% of Bank Services of Virginia, Inc. The business of both of these companies is to provide operational support services to the ten banks. The Bank is charged for its share of these services. The cost of this expense is shared by the ten banks on the basis of average deposits of each bank related to total average deposits of all the banks.
The Mortgage Company of Virginia, Inc. also owns 100% of Bank Services Insurance, Inc. Bank Services Insurance, Inc. provides insurance products to the banks and customers in the Danville area. The premiums paid to Bank Services Insurance, Inc. equaled $26,000 at December 31, 2005.
The Mortgage Company of Virginia, Inc. also owns 50% of Coresoft, Inc. represented by an initial $1,000 investment during 2004. Coresoft, Inc. is in the process of developing a core software package the banks listed above will use. At December 31, 2005, Coresoft, Inc. had an outstanding note payable to the Mortgage Company of $1,400,000.
The Chairman of the Board and President of the Bank also serves as Chairman of the Board and President of Bank Building Corporation and Manager of Blackstone Properties, LLC, it’s wholly owned subsidiary (the “companies”). The companies lease branches to certain of the banks listed above. At December 31, 2005, the Bank leased five offices from the companies. Rental expense under these leases was $186,000 in 2005, $198,000 in 2004 and 2003. Future minimum lease payments will be $195,000 per year through 2010, and thereafter (may vary based on changing interest rates). As of December 31, 2005 and 2004, the Bank had loans totaling $2,452,000 and $2,540,000, respectively, to the companies. These loans were made to purchase bank branches leased to affiliated banks. The loans are secured by these branches and the related leases, and have repayment terms similar to other loan customers of the Banks.
In the ordinary course of business, the Bank’s Directors and executive officers and their related interests were customers of, and had transactions with the Bank. Loan transactions with Directors and officers, principal security holders and associates were made on substantially the same terms as those prevailing at the time for comparable loans to other persons and did not involve more than normal risk of collectibility or present other unfavorable features. These extensions of credit equaled $105,000, or 0.5% of the Bank’s equity capital as of December 31, 2005.
ITEM 13. EXHIBITS.
Exhibits:
| 3.1 | Articles of Association (filed with the Office of the Comptroller of the Currency prior to the opening of the Bank) | |
| 3.2 | Amended and Restated Bylaws (as amended and restated through February 23, 2005) (incorporated by reference to Exhibit 3.2 to Form 8-K filed with the Office of the Comptroller of the Currency on February 23, 2005) | |
| 13 | 2005 Annual Report to Shareholders | |
| 31 | Certification by principal executive officer and principal financial officer pursuant to Rule 13a-14(a) | |
| 32 | Certification of principal executive officer and principal financial officer pursuant to 18 U.S.C. § 1350 | |
ITEM 14. PRINCIPAL ACCOUNTANT FEES AND SERVICES.
Goodman & Company, LLP served as the Bank’s independent public auditors for the year ended December 31, 2005, and has been selected by the Board to act as the Bank’s independent public auditors for the year ending December 31, 2006. A representative of Goodman & Company will be present at the Annual Meeting and will be given the opportunity to make a statement and respond to appropriate questions from shareholders.
16
Table of Contents
The following table presents the fees for professional audit services rendered by Goodman & Company for the audit of the Bank’s annual financial statements for the years ended December 31, 2005 and 2004, and fees billed for other services rendered by Goodman & Company during those periods.
| Years Ended December 31, | ||||||
| 2005 | 2004 | |||||
Audit fees¹ | $ | 12,500 | $ | 11,750 | ||
Audit-related fees | — | |||||
Tax fees² | 3,285 | 3,100 | ||||
All other fees | — | |||||
Total Fees | $ | 15,785 | $ | 14,850 | ||
| 1 | Audit fees consist of audit and review services, consents and review of documents filed with the OCC. |
| 2 | Tax fees consist of preparation of federal and state tax returns and consultation concerning tax compliance issues. |
In its capacity as the Audit Committee, the Board of Directors considered the compatibility of the non-audit-related services performed by and fees paid to Goodman & Company in 2005 and 2004 and the proposed non-audit-related services and proposed fees for 2006 and determined that such services and fees are compatible with the independence of Goodman & Company as the Bank’s independent auditors.
Also in its capacity as the Audit Committee, the Board of Directors pre-approves all audit (including audit-related) and permitted non-audit services to be performed by the independent auditors. The Board of Directors annually approves the year-end audit to be performed by the Bank’s independent auditors for the fiscal year. With respect to other permitted services, the Board of Directors pre-approves specific engagements, projects and categories of services on a fiscal year basis.
17
Table of Contents
EXHIBIT 31
CERTIFICATION
I, Worth Harris Carter, Jr., certify that:
1. I have reviewed this annual report on Form 10-KSB of First National Bank;
2. Based on my knowledge, this report does not contain any untrue statement of a material fact or omit to state a material fact necessary to make the statements made, in light of the circumstances under which such statements were made, not misleading with respect to the period covered by this report;
3. Based on my knowledge, the financial statements, and other financial information included in this report, fairly present in all material respects the financial condition, results of operations and cash flows of the small business issuer as of, and for, the periods presented in this report;
4. I am responsible for establishing and maintaining disclosure controls and procedures (as defined in Exchange Act Rules 13a-15(e) and 15d-15(e)) for the small business issuer and have:
(a) Designed such disclosure controls and procedures, or caused such disclosure controls and procedures to be designed under my supervision, to ensure that material information relating to the small business issuer, including its consolidated subsidiaries, is made known to me by others within those entities, particularly during the period in which this report is being prepared;
(b) Evaluated the effectiveness of the small business issuer’s disclosure controls and procedures and presented in this report my conclusions about the effectiveness of the disclosure controls and procedures, as of the end of the period covered by this report based on such evaluation; and
(c) Disclosed in this report any change in the small business issuer’s internal control over financial reporting that occurred during the small business issuer’s most recent fiscal quarter (the small business issuer’s fourth fiscal quarter in the case of an annual report) that has materially affected, or is reasonably likely to materially affect, the small business issuer’s internal control over financial reporting; and
5. I have disclosed, based on my most recent evaluation of internal control over financial reporting, to the small business issuer’s auditors and the audit committee of the small business issuer’s board of directors (or persons performing the equivalent functions):
(a) All significant deficiencies and material weaknesses in the design or operation of internal control over financial reporting which are reasonably likely to adversely affect the small business issuer’s ability to record, process, summarize and report financial information; and
(b) Any fraud, whether or not material, that involves management or other employees who have a significant role in the small business issuer’s internal control over financial reporting.
| Date: March 22, 2006 | /s/ Worth Harris Carter, Jr. | |
| Worth Harris Carter, Jr. | ||
Chairman of the Board and President (principal executive officer and principal financial officer) |
18
Table of Contents
EXHIBIT 32
CERTIFICATION OF
PRINCIPAL EXECUTIVE OFFICER AND PRINCIPAL FINANCIAL OFFICER
Pursuant to § 906 of the Sarbanes-Oxley Act of 2002 (18 U.S.C. § 1350)
The undersigned, as the principal executive officer and principal financial officer of FIRST NATIONAL BANK, certifies that, to the best of his knowledge and belief, the Annual Report on Form 10-KSB for the period ended December 31, 2005, which accompanies this certification fully complies with the requirements of Section 13(a) of the Securities Exchange Act of 1934 and the information contained in the report fairly presents, in all material respects, the financial condition and results of operations of FIRST NATIONAL BANK at the dates and for the periods indicated. The foregoing certification is made pursuant to § 906 of the Sarbanes-Oxley Act of 2002 (18 U.S.C. § 1350) and shall not be relied upon for any other purpose. The undersigned expressly disclaims any obligation to update the foregoing certification except as required by law.
| Date: March 22, 2006 | /s/ Worth Harris Carter, Jr. | |
| Worth Harris Carter, Jr. | ||
Chairman of the Board and President (principal executive officer and principal financial officer) |
19
Table of Contents
SIGNATURES
In accordance with the Exchange Act, this report has been signed below by the following persons on behalf of the registrant and in the capacities and on the dates indicated.
| FIRST NATIONAL BANK | ||||
| Date: March 22, 2006 | By: | /s/ Worth Harris Carter, Jr. | ||
| Worth Harris Carter, Jr. | ||||
Chairman of the Board, President, Chief Executive Officer and Chief Financial Officer | ||||
Signature | Title | Date | ||
/s/ Worth Harris Carter, Jr. Worth Harris Carter, Jr. | Chairman of the Board, President Chief Executive Officer and Chief Financial Officer | March 22, 2006 | ||
/s/ Walter P. Kingery | ||||
| Walter P. Kingery | Director | March 22, 2006 | ||
/s/ Sidney D. Mason | ||||
| Sidney D. Mason | Director | March 22, 2006 | ||
/s/ Mary A. Ramsey | ||||
| Mary A. Ramsey | Director | March 22, 2006 | ||
/s/ Leo H. Scott | ||||
| Leo H. Scott | Director | March 22, 2006 | ||
20
Table of Contents

Table of Contents
Management’s Discussion and Analysis of Financial Condition and Results of Operation
Except for the historical information contained in this report, the matters set forth herein include Forward-Looking Statements within the meaning of the “safe harbor” provisions of the Private Securities Litigation Reform Act of 1995. These Forward-Looking Statements included, among other things, statements of goals, plans, intentions and expectations, regarding or based upon desired business strategies, general economic conditions, interest rates, developments in local and national markets, and other matters, which, by their nature, are subject to significant uncertainities. Because of these uncertainties and the assumptions upon which this report is based, actual future developments with respect to the business of the Bank may differ materially from those contemplated by such statements.
Critical Accounting Policies.The accounting and reporting policies of the Bank conform to generally accepted accounting principles (GAAP) in the United States of America and to general practices within the banking industry. The preparation of the financial statements in conformity with GAAP requires management to make estimates and assumptions that affect the amounts reported in the financial statements and accompanying notes. We believe the most significant of these estimates involves the allowance for loan losses because of its potential impact on our overall performance. We have described our policies in this area below. A summary of the Bank’s significant accounting policies can be found in the Notes to the Financial Statements.
In general, determining the amount of the allowance for loan losses requires significant judgment and the use of estimates by management. The Bank maintains an allowance for loan losses to absorb probable losses in the loan portfolio based on a quarterly analysis of the portfolio and expected future losses. This analysis determines an appropriate level of the allowance for loan losses by considering factors affecting loan losses, including specific losses, levels and trends in impaired and non-performing loans, historical loan loss experience, current economic conditions, volume, growth and composition of the portfolio, and other relevant factors. The Bank records a provision for loan losses to maintain the allowance at an adequate level. The provision expense could increase or decrease each quarter based upon the results of management’s formal analysis.
The amount of the allowance represents management’s estimate of expected losses from existing loans based upon specific allocations for individual lending relationships and historical loss experience. The allowance for loan losses related to impaired loans is based on discounted cash flows using the loan’s initial effective interest rate or the fair value of the collateral for certain collateral dependent loans. This evaluation requires management to make estimates of the amounts and timing of future cash flows on impaired loans, which consists primarily of nonaccrual and restructured loans. Actual losses for these loans can vary significantly from these estimates.
Summary of Operations.Net income for 2005 equaled $1,485,000, or $0.99 per share, compared to $2,093,000, or $1.39 per share, for 2004. This represents a return on average assets of 0.54% and return on average equity of 8% compared to 0.75% and 12%, respectively, for last year.
Total deposits have decreased $30 million, or 12%, compared to last year. LIFETIME FREE CHECKING increased while all other deposit categories decreased. Loans increased $9 million, or 6%, during the year.
During 2004, the bank acquired three new offices—one in Lincolnton, NC, which opened in 2005, and two in Gastonia, NC, which are being prepared to open. While the aquisition and costs of opening these offices has a short-term negative impact on earnings, we feel these offices will enhance the long-term profitability of the Bank.
Net Interest Income.Net interest income is our largest source of revenue and continues to be impacted by low interest rates. The Federal Reserve decreased interest rates from 6.50% to 1.00 from May 2000 to June 2004. The Fed then began a series of one-quarter percent increases on 14 different occasions over the last year and a half to the latest increase in January 2006, which places the rate at 4.50%. The Fed is expected to make several more increases before pausing.
While we increased loans and investments, the increase in our costs of deposits occurred more rapidly than our increase in interest income, and as a result net interest income declined $203,000 over the prior year. With interest rates at a higher level, we anticipate our existing loans will increase in yield at a faster pace than the net increase in the costs of deposits. In addition, we anticipate an increase in loan volume and $10 million in U. S. Agency Securities will mature and will be reinvested at substantially higher yields. We anticipate a significant improvement in net interest income in the coming year.
The following table shows a summary of the changes in interest income and interest expense resulting from changes in volume and changes in rates for each category of interest-earning assets and interest-bearing liabilities for 2005/2004 and 2004/2003:
| 2005 vs 2004 | 2004 vs 2003 | |||||||
| (Dollars in thousands) | Increase | Increase | ||||||
Asset/Liability | (Decrease) | (Decrease) | ||||||
Real Estate Loans | $ | 138 | $ | (396 | ) | |||
Installment Loans | 79 | 121 | ||||||
Commercial Loans | 243 | 581 | ||||||
Total Loans | 460 | 306 | ||||||
Interest-Bearing Deposits in Other Financial Institutions | 255 | 109 | ||||||
Investment Securities | (278 | ) | (498 | ) | ||||
Federal Funds Sold | 216 | 30 | ||||||
Total Earning Assets | 653 | (53 | ) | |||||
Interest-Bearing Transactions Accounts | 131 | 101 | ||||||
Savings Accounts (Includes MMDAs) | 11 | (65 | ) | |||||
Certificates of Deposit $100,000 and Over | 174 | 182 | ||||||
Other Certificates of Deposit | 535 | (45 | ) | |||||
Total Deposits | 851 | 173 | ||||||
Federal Funds Purchased | — | — | ||||||
Notes Issued to the U.S. Treasury | 5 | — | ||||||
Total Interest-Bearing Liabilities | 856 | 173 | ||||||
Change in Net Interest Income | $ | (203 | ) | $ | (226 | ) | ||
2
Table of Contents
The following table details the average balances and cost and yield data for the earning assets and interest-bearing liabilities:
| 2005 | 2004 | 2003 | |||||||||||||||||||||||||
| (Dollars in thousands) | Average | Yield/ | Average | Yield/ | Average | Yield/ | |||||||||||||||||||||
Asset/Liability | Balance | Interest | Cost | Balance | Interest | Cost | Balance | Interest | Cost | ||||||||||||||||||
Real Estate Loans | $ | 123,605 | $ | 7,183 | 5.81 | % | $ | 118,682 | $ | 7,045 | 5.94 | % | $ | 105,506 | $ | 7,441 | 7.05 | % | |||||||||
Installment Loans | 6,557 | 637 | 9.71 | % | 5,647 | 558 | 9.88 | % | 4,819 | 437 | 9.07 | % | |||||||||||||||
Commercial Loans | 30,334 | 1,612 | 5.31 | % | 28,869 | 1,369 | 4.74 | % | 14,153 | 788 | 5.57 | % | |||||||||||||||
Total Loans | 160,496 | 9,432 | 5.88 | % | 153,198 | 8,972 | 5.86 | % | 124,478 | 8,666 | 6.96 | % | |||||||||||||||
Interest-Bearing Deposits in Other Financial Institutions | 18,404 | 683 | 3.71 | % | 18,597 | 428 | 2.30 | % | 13,416 | 319 | 2.38 | % | |||||||||||||||
Investment Securities | 54,598 | 2,082 | 3.81 | % | 60,134 | 2,360 | 3.92 | % | 57,136 | 2,858 | 5.00 | % | |||||||||||||||
Federal Funds Sold | 26,940 | 709 | 2.63 | % | 37,536 | 493 | 1.31 | % | 42,887 | 463 | 1.08 | % | |||||||||||||||
Total Earning Assets | 260,438 | 12,906 | 4.96 | % | 269,465 | 12,253 | 4.55 | % | 237,917 | 12,306 | 5.17 | % | |||||||||||||||
Interest-Bearing Transaction Accounts | 28,127 | 467 | 1.66 | % | 29,915 | 336 | 1.12 | % | 22,577 | 235 | 1.04 | % | |||||||||||||||
Savings Accounts (Includes MMDAs) | 51,860 | 891 | 1.72 | % | 54,565 | 880 | 1.61 | % | 52,467 | 945 | 1.80 | % | |||||||||||||||
Certificates of Deposit | |||||||||||||||||||||||||||
$100,000 and Over | 33,916 | 1,175 | 3.46 | % | 35,630 | 1,001 | 2.81 | % | 30,314 | 819 | 2.70 | % | |||||||||||||||
Other Certificates of Deposit | 120,611 | 3,647 | 3.02 | % | 105,445 | 3,112 | 2.95 | % | 96,240 | 3,157 | 3.28 | % | |||||||||||||||
Total Deposits | 234,514 | 6,180 | 2.64 | % | 225,555 | 5,329 | 2.36 | % | 201,598 | 5,156 | 2.56 | % | |||||||||||||||
Notes Issued to the U.S. Treasury | 323 | 8 | 2.48 | % | 261 | 3 | 1.15 | % | 242 | 3 | 1.24 | % | |||||||||||||||
Total Interest-Bearing Liabilities | $ | 234,837 | $ | 6,188 | 2.64 | % | $ | 225,816 | $ | 5,332 | 2.36 | % | $ | 201,840 | $ | 5,159 | 2.56 | % | |||||||||
Net Interest Income | $ | 6,718 | $ | 6,921 | $ | 7,147 | |||||||||||||||||||||
Net Yield on Earning Assets | 2.58 | % | 2.57 | % | 3.00 | % | |||||||||||||||||||||
Loans.Loans increased from $158 million at year-end 2004 to $168 million at year-end 2005, an increase of $10 million, or 6%. The increase took place in all categories of loans. Real estate secured loans made up approximately 76% of net loans in 2005 and 78% in 2004.
The Bank also continues to maintain flexibility in the maturity of the loan portfolio. Nearly half of the Bank’s loans have adjustable interest rates as of year-end 2005 and over half had adjustable rates in 2004. In addition, the combination of adjustable-rate and fixed rate loans that adjust or mature within one year equals 29% for 2005 compared to 65% for 2004.
Allowance and Provision for Loan Losses.As discussed previously, the Allowance for Loan Losses represents management’s estimation of the amount necessary to absorb future losses in the loan portfolio. On the Statement of Condition, the Allowance for Loan Losses is deducted from Total Loans so that the net amount shown represents the estimated realizable total loans. The Provision for Loan Losses is the amount charged to expense to maintain the Allowance at an adequate level.
Based on management’s analysis of the loan portfolio, including nonaccrual and impaired loans, the Provision for Loan Losses for 2005 equaled $120,000 compared to $72,000 for 2004.
| December 31 | ||||||||||||||||||||
(Dollars in thousands) | 2005 | 2004 | 2003 | 2002 | 2001 | |||||||||||||||
Balance Beginning of Year | $ | 1,994 | $ | 2,006 | $ | 1,096 | $ | 1,102 | $ | 1,040 | ||||||||||
Provision for Loan Losses | 120 | 72 | 1,009 | 72 | 72 | |||||||||||||||
Net Loan Losses | ||||||||||||||||||||
Real Estate Loans | 108 | 69 | 92 | — | — | |||||||||||||||
Installment Loans | 35 | 15 | 7 | 16 | 11 | |||||||||||||||
Commercial Loans | 142 | — | — | 62 | (1 | ) | ||||||||||||||
Total Net Loan Losses | 285 | 84 | 99 | 78 | 10 | |||||||||||||||
Balance | $ | 1,829 | $ | 1,994 | $ | 2,006 | $ | 1,096 | $ | 1,102 | ||||||||||
Net Loan Losses to Average Loans | 0.18 | % | 0.03 | % | 0.08 | % | 0.07 | % | 0.01 | % | ||||||||||
Allowance for Loan Losses to Year-End Loans | 1.09 | % | 1.28 | % | 1.50 | % | 0.94 | % | 0.95 | % | ||||||||||
Nonaccrual loans are those loans contractually past due 90 days or more on which no interest is being accrued. Other real estate owned consists of real estate acquired through foreclosure. These properties are reviewed quarterly and reduced to an estimated realizable value at that time.
Information concerning nonaccrual loans and other real estate owned is presented in the following table:
3
Table of Contents
Information concerning nonaccrual loans and other real estate owned is presented in the following table:
| December 31 | ||||||||||||||||||||
(Dollars in thousands) | 2005 | 2004 | 2003 | 2002 | 2001 | |||||||||||||||
Nonaccrual Loans | ||||||||||||||||||||
Real Estate | $ | 4,321 | $ | 2,547 | $ | 2,350 | $ | — | $ | — | ||||||||||
Installment | 18 | — | 170 | 142 | 148 | |||||||||||||||
Commercial | — | 13 | — | 2 | — | |||||||||||||||
Total Nonaccrual Loans | 4,339 | 2,560 | 2,520 | 144 | 148 | |||||||||||||||
Real Estate Owned Other Than Bank Premises | 1,929 | 2,105 | 755 | 774 | — | |||||||||||||||
Total Non-Performing Assets | $ | 6,268 | $ | 4,665 | $ | 3,275 | $ | 918 | $ | 148 | ||||||||||
Allowance for Loan Losses to Total Non-Performing Assets | 29 | % | 44 | % | 61 | % | 119 | % | 745 | % | ||||||||||
The following table presents the volume of loans contractually past due for 90 days or more on which interest continues to be accrued. These loans are believed to be well collateralized and present little or no likelihood of loss of principal.
| (Dollars in thousands) | December 31 | ||||||||||||||
Loans 90 Days or More Past Due | 2005 | 2004 | 2003 | 2002 | 2001 | ||||||||||
Real Estate | $ | 40 | $ | 3,583 | $ | 1,173 | $ | — | $ | 1,747 | |||||
Installment | 1 | 5 | — | — | 1 | ||||||||||
Commercial | 2 | — | — | — | — | ||||||||||
Total Loans 90 Days or More Past Due | $ | 43 | $ | 3,588 | $ | 1,173 | $ | — | $ | 1,748 | |||||
Non-interest Income.Non-interest Income equaled $787,000 for 2005 compared to $887,000 for 2004, a decrease of $100,000 or 11%. The principal component of non-interest income is service charges on deposit accounts, which equaled $586,000 for 2005 compared to $614,000 for 2004.
Non-interest Expense.Non-interest expense increased $651,000 during the year. All areas of non-interest expense increased with the exception of FDIC Assessments.
Investments.Total investment securities equaled $60 million at year-end 2005 compared to $43 million at year-end 2004. With interest rates at levels never before seen in recent times, the bank increased investments in U. S. Agency Securities, which are earning higher yields, while reducing interest-bearing deposits in other financial institutions.
Deposits.Total deposits fell $30 million, or 11%, during the year.
Interest Sensitivity Analysis.The frequency with which interest rates on earning assets and interest bearing liabilities change has a significant impact on net interest income. The following table presents the anticipated changes based on the contractual maturity of each instrument. Expected maturities may differ from contractual maturities as both borrowers and depositors may have the right to call or prepay obligations with or without call or prepayment penalties.
| (Dollars in thousands) | Within | One to | Over | |||||||||||
Use of Funds | One Year | Five Years | Five Years | Total | ||||||||||
Interest-Bearing Deposits in Other Financial Institutions | $ | 18,208 | $ | 1,287 | $ | — | $ | 19,495 | ||||||
Federal Funds Sold | 12,900 | — | — | 12,900 | ||||||||||
Investment Securities | 18,256 | 42,006 | — | 60,262 | ||||||||||
Loans | 49,492 | 62,795 | 55,781 | 168,068 | ||||||||||
Total Earning Assets | $ | 98,856 | $ | 106,088 | $ | 55,781 | $ | 260,725 | ||||||
Deposits | ||||||||||||||
Interest-Bearing Demand | $ | 42,702 | — | $ | — | $ | 42,702 | |||||||
Regular Passbook Savings | 43,746 | — | — | 43,746 | ||||||||||
Time Deposits | ||||||||||||||
Certificates of Deposit $100,000 and Over | 17,165 | 11,460 | — | 28,625 | ||||||||||
Other | 62,670 | 40,921 | — | 103,591 | ||||||||||
Total Interest-Bearing Deposits | 166,283 | 52,381 | — | 218,664 | ||||||||||
Notes issued to the U. S. Treasury | 2,102 | — | — | 2,102 | ||||||||||
Total Interest-Bearing Liabilities | $ | 168,385 | $ | 52,381 | $ | — | $ | 220,766 | ||||||
Maturity/Rate Sensitivity Gap Per Period | $ | (69,529 | ) | $ | 53,701 | $ | 55,781 | $ | 39,959 | |||||
Cummulative Maturity/Rate Sensitivity Gap | $ | (69,529 | ) | $ | (15,822 | ) | $ | 39,959 | ||||||
4
Table of Contents
Capital.The federal regulatory agencies use risk-based capital ratios to analyze the adequacy of a bank’s capital. These ratios weigh bank assets from 0% to 100% depending upon the risks inherent in each type of asset. The Bank continues to meet all requirements for a well-capitalized bank as defined by the regulatory agencies. The following table presents the key risk-based capital ratios for December 31, 2005 and 2004. Additional details regarding capital may be found in the footnotes of the Financial Statements.
| 2005 | 2004 | |||||
Tier 1 Ratio | 10.80 | % | 10.59 | % | ||
Total Risk-Based Capital Ratio | 11.86 | % | 11.76 | % | ||
Leverage Ratio | 7.04 | % | 6.29 | % |
Liquidity.Liquidity is our ability to fund both loans and investments in the normal course of business and to provide adequate protection for unexpected deposit withdrawals or other demands for funds without incurring a significant negative impact on profitability. Our primary source of day-to-day liquidity lies in the combination of cash, deposit balances, checks in process of collection, deposit growth and federal funds sold. Federal funds are excess funds that are sold to other banks, generally on a one-day basis. Normal funds from the repayment of loans and investments augment these funds.
Our secondary source of liquidity lies in our investments and deposits in other financial institutions. While our investments are categorized as held-to-maturity, they consist of short-term U.S. Government Agencies that are readily marketable. As reflected in the previous Interest Sensitivity Analysis, the majority of our investment securities mature in five years or less. Interest-bearing deposits in other financial institutions generally mature in two years or less and the volume of this investment decreased $3.4 million during the year.
Management’s Responsibility for Financial Reporting
The management of First National Bank has prepared and is responsible for the accompanying financial statements, together with the financial data and other information presented in this annual report. Management believes that the financial statements have been prepared in conformity with accounting principles generally accepted in the United States of America appropriate under the circumstances and include amounts that are based on management’s best estimates and judgments.
Management maintains and depends upon an internal accounting control system designed to provide reasonable assurance that transactions are executed in accordance with management’s authorization, that financial records are reliable as the basis for preparation of all financial statements, and that the Bank’s assets are safeguarded. The design and implementation of all systems of internal control are based on judgments required to evaluate the costs of control in relation to the expected benefits and to determine the appropriate balance between these costs and benefits. The Bank maintains a professional internal audit staff to monitor compliance with the system of internal control. Operational and special audits are conducted, and audit reports are submitted to appropriate management.
The Board of Directors functions as the audit committee and meets periodically with the independent public accountants, Goodman & Company, management and internal auditors to review accounting, auditing and internal reporting matters. The internal auditors have free access to the Board to discuss the results of their audit work and their evaluations of internal controls and the quality of financial reporting.
The responsibility of Goodman & Company is limited to an expression of their opinion as to the fairness of the financial statements. Their opinion is based on an audit conducted in accordance with Standards of the Public Company Accounting Oversight Board (United States), as described in their report.
Worth Harris Carter, Jr.
Chairman of the Board, President and
Chief Financial Officer
5
Table of Contents

Certified Public Accountants
Specialized Services
Business Solutions
Report of Independent Registered Public Accounting Firm
Board of Directors and Shareholders
First National Bank
We have audited the accompanying statements of financial condition ofFirst National Bank (Bank) as of December 31, 2005 and 2004, and the related statements of income, shareholders’ equity and cash flows for each of the years in the three-year period ended December 31, 2005. These financial statements are the responsibility of the Bank’s management. Our responsibility is to express an opinion on these financial statements based on our audits.
We conducted our audits in accordance with the standards of the Public Company Accounting Oversight Board (United States). Those standards require that we plan and perform the audits to obtain reasonable assurance about whether the financial statements are free of material misstatement. An audit includes examining, on a test basis, evidence supporting the amounts and disclosures in the financial statements. An audit also includes assessing the accounting principles used and significant estimates made by management, as well as evaluating the overall financial statement presentation. We believe that our audits provide a reasonable basis for our opinion.
In our opinion, the financial statements referred to above present fairly, in all material respects, the financial position ofFirst National Bank as of December 31, 2005 and 2004, and the results of its operations and its cash flows for each of the years in the three-year period ended December 31, 2005, in conformity with accounting principles generally accepted in the United States of America.
 |
Danville, Virginia |
March 1, 2006 |
110 Exchange Street, Suite G
Danville, VA 24541
ph: 434.792.5334
fax: 434.791.6061
www.goodmanco.com
6
Table of Contents
Statements of Financial Condition
(Dollars in Thousands)
| December 31 | ||||||||
| 2005 | 2004 | |||||||
ASSETS: | ||||||||
Interest-Bearing Deposits in Other Financial Institutions | $ | 19,495 | $ | 22,863 | ||||
Investment Securities (Fair Value $59,512 in 2005, $42,584 in 2004) | 60,262 | 42,624 | ||||||
Federal Funds Sold | 12,900 | 66,440 | ||||||
Loans (Net of Unearned Income) | 167,632 | 158,409 | ||||||
Less: Allowance for Loan Losses | (1,829 | ) | (1,994 | ) | ||||
Net Loans | 165,803 | 156,415 | ||||||
Earning Assets | 258,460 | 288,342 | ||||||
Cash and Due from Banks | 8,138 | 6,724 | ||||||
Bank Premises and Equipment | 4,146 | 4,091 | ||||||
Real Estate Owned Other Than Bank Premises | 1,929 | 2,105 | ||||||
Investment in Associated Company | 769 | 618 | ||||||
Other Assets | 2,774 | 2,671 | ||||||
TOTAL ASSETS | $ | 276,216 | $ | 304,551 | ||||
LIABILITIES: | ||||||||
Deposits: | ||||||||
LIFETIME FREE CHECKING | $ | 36,222 | $ | 34,186 | ||||
Interest-Bearing Demand | 42,702 | 51,626 | ||||||
Regular Passbook Savings | 43,746 | 44,103 | ||||||
Time Deposits: | ||||||||
Certificates of Deposit $100,000 and Over | 28,625 | 41,521 | ||||||
Other | 103,591 | 113,927 | ||||||
TOTAL DEPOSITS | 254,886 | 285,363 | ||||||
Notes Issued to the U.S. Treasury | 2,102 | 197 | ||||||
Other Liabilities | 645 | 630 | ||||||
TOTAL LIABILITIES | 257,633 | 286,190 | ||||||
SHAREHOLDERS’ EQUITY: | ||||||||
Common Stock, Par Value Per Share $1.25; 10,000,000 shares authorized; 1,503,106 shares outstanding in 2005 and 2004 | 1,879 | 1,879 | ||||||
Surplus | 11,327 | 11,327 | ||||||
Undivided Profits | 5,377 | 5,155 | ||||||
TOTAL SHAREHOLDERS’ EQUITY | 18,583 | 18,361 | ||||||
TOTAL LIABILITIES AND SHAREHOLDERS’ EQUITY | $ | 276,216 | $ | 304,551 | ||||
The accompanying notes are an integral part of these financial statements.
7
Table of Contents
Statements of Income
(Dollars in Thousands Except Per Share Data)
| Years Ended December 31 | |||||||||
| 2005 | 2004 | 2003 | |||||||
INTEREST INCOME: | |||||||||
Interest and Fees on Loans: | |||||||||
Taxable | $ | 8,783 | $ | 8,495 | $ | 8,368 | |||
Non-Taxable | 649 | 477 | 298 | ||||||
Interest on Deposits in Other Financial Institutions | 683 | 428 | 319 | ||||||
Interest on Federal Funds Sold | 709 | 493 | 463 | ||||||
Interest and Dividends on Securities: | |||||||||
U. S. Agency Securities and Other | 2,067 | 2,281 | 2,745 | ||||||
States and Political Subdivisions | 15 | 79 | 113 | ||||||
TOTAL INTEREST INCOME | 12,906 | 12,253 | 12,306 | ||||||
INTEREST EXPENSE: | |||||||||
Interest on Time Deposits $100,000 and Over | 1,175 | 1,001 | 819 | ||||||
Interest on Other Deposits | 5,005 | 4,328 | 4,337 | ||||||
Interest on Notes Issued to the U. S. Treasury | 8 | 3 | 3 | ||||||
TOTAL INTEREST EXPENSE | 6,188 | 5,332 | 5,159 | ||||||
NET INTEREST INCOME | 6,718 | 6,921 | 7,147 | ||||||
Provision for Loan Losses | 120 | 72 | 1,009 | ||||||
NET INTEREST INCOME AFTER PROVISION FOR LOAN LOSSES | 6,598 | 6,849 | 6,138 | ||||||
NON-INTEREST INCOME: | |||||||||
Service Charges, Commission and Fees | 586 | 614 | 595 | ||||||
Other Non-Interest Income | 201 | 273 | 227 | ||||||
TOTAL NON-INTEREST INCOME | 787 | 887 | 822 | ||||||
NON-INTEREST EXPENSE: | |||||||||
Salaries and Employee Benefits | 2,981 | 2,651 | 2,530 | ||||||
Occupancy Expense | 666 | 561 | 518 | ||||||
Operations Center Expense | 1,264 | 1,111 | 992 | ||||||
FDIC Assessment | 36 | 37 | 34 | ||||||
Other Non-Interest Expense | 532 | 468 | 445 | ||||||
TOTAL NON-INTEREST EXPENSE | 5,479 | 4,828 | 4,519 | ||||||
INCOME BEFORE INCOME TAXES | 1,906 | 2,908 | 2,441 | ||||||
Income Tax Expense | 421 | 815 | 706 | ||||||
NET INCOME | $ | 1,485 | $ | 2,093 | $ | 1,735 | |||
NET INCOME PER SHARE*: | |||||||||
Basic and Diluted | $ | 0.99 | $ | 1.39 | $ | 1.15 | |||
| * | Net income per share has been retroactively adjusted to reflect the stock dividend in 2003. |
The accompanying notes are an integral part of these financial statements.
8
Table of Contents
Statements of Cash Flows
(Dollars in Thousands)
| Years Ended December 31 | ||||||||||||
| 2005 | 2004 | 2003 | ||||||||||
Cash Flows From Operating Activities: | ||||||||||||
Net Income | $ | 1,485 | $ | 2,093 | $ | 1,735 | ||||||
Adjustments to reconcile to net cash from operating activities: | ||||||||||||
Provision for Loan Losses | 120 | 72 | 1,009 | |||||||||
Depreciation of Premises and Equipment | 217 | 169 | 150 | |||||||||
Equity in Undistributed Income From Associated Company | (1 | ) | (11 | ) | (10 | ) | ||||||
Provision for Deferred Income Taxes | 165 | 85 | (294 | ) | ||||||||
Increase (Decrease) in Unearned Income | (25 | ) | 29 | 26 | ||||||||
(Increase) Decrease in Other Assets | (103 | ) | (170 | ) | 237 | |||||||
Increase (Decrease) in Other Liabilities | (150 | ) | 77 | (118 | ) | |||||||
Net Cash from Operating Activities | 1,708 | 2,344 | 2,735 | |||||||||
Cash Flows From Investing Activities: | ||||||||||||
Maturity of Interest-Bearing Deposits | 17,715 | 13,956 | 11,581 | |||||||||
Purchase of Interest-Bearing Deposits | (14,347 | ) | (22,962 | ) | (13,857 | ) | ||||||
Purchase of Investment Securities | (26,500 | ) | (20,000 | ) | (27,000 | ) | ||||||
Proceeds from maturities, calls and redemptions of Investment Securities | 8,862 | 44,677 | 27,919 | |||||||||
Purchase of Bank Premises and Equipment | (272 | ) | (1,628 | ) | (298 | ) | ||||||
Net Increase in Short-Term Loans Outstanding, Net | (9,137 | ) | (13,880 | ) | (4,359 | ) | ||||||
Longer-Term Loans Originated or Purchased | (20,020 | ) | (39,470 | ) | (52,479 | ) | ||||||
Principal Collected on Longer-Term Loans | 19,674 | 27,194 | 40,126 | |||||||||
Sale of Other Real Estate | 176 | — | 19 | |||||||||
Investment in Associated Company | (150 | ) | — | (199 | ) | |||||||
Net Cash from Investing Activities | (23,999 | ) | (12,113 | ) | (18,547 | ) | ||||||
Cash Flows From Financing Activities: | ||||||||||||
Net Increase in Demand and Savings Accounts | (7,245 | ) | 11,243 | 13,787 | ||||||||
Proceeds from Sale of Time Deposits | 84,953 | 111,057 | 101,441 | |||||||||
Payments on Matured Time Deposits | (108,185 | ) | (90,880 | ) | (83,264 | ) | ||||||
Stock Dividends | — | — | (8 | ) | ||||||||
Cash Dividends | (1,263 | ) | (1,263 | ) | (1,176 | ) | ||||||
Net Increase (Decrease) in Notes Issued to U.S. Treasury | 1,905 | 64 | (1,490 | ) | ||||||||
Net Cash from Financing Activities | (29,835 | ) | 30,221 | 29,290 | ||||||||
Net Change in Cash and Equivalents | (52,126 | ) | 20,452 | 13,478 | ||||||||
Cash and Equivalents at Beginning of Year | 73,164 | 52,712 | 39,234 | |||||||||
Cash and Equivalents at End of Year | $ | 21,038 | $ | 73,164 | $ | 52,712 | ||||||
Supplementary Data: | ||||||||||||
Cash Paid for Interest | $ | 6,132 | $ | 5,297 | $ | 5,204 | ||||||
Cash Paid for Income Taxes | 421 | 815 | 706 | |||||||||
Transfer of Loans to Foreclosed Assets | 153 | 1,291 | — | |||||||||
The accompanying notes are an integral part of these financial statements.
9
Table of Contents
Statements of Changes in Shareholders’ Equity
(Dollars in Thousands)
| COMMON STOCK | UNDIVIDED | |||||||||||
| SHARES | AMOUNT | SURPLUS | PROFITS | |||||||||
Year Ended December 31, 2003 | ||||||||||||
Balance at Beginning of Year | 1,366,829 | $ | 1,708 | $ | 8,636 | $ | 6,636 | |||||
Net Income | — | — | — | 1,735 | ||||||||
Stock Dividends (10%) | 136,277 | 171 | 2,691 | (2,870 | ) | |||||||
Cash Dividends, $0.78 per share* | — | — | — | (1,176 | ) | |||||||
Total | 1,503,106 | $ | 1,879 | $ | 11,327 | $ | 4,325 | |||||
Year Ended December 31, 2004 | ||||||||||||
Balance at Beginning of Year | 1,503,106 | $ | 1,879 | $ | 11,327 | $ | 4,325 | |||||
Net Income | — | — | — | 2,093 | ||||||||
Cash Dividends, $0.84 per share* | — | — | — | (1,263 | ) | |||||||
Total | 1,503,106 | $ | 1,879 | $ | 11,327 | $ | 5,155 | |||||
Year Ended December 31, 2005 | ||||||||||||
Balance at Beginning of Year | 1,503,106 | $ | 1,879 | $ | 11,327 | $ | 5,155 | |||||
Net Income | — | — | — | 1,485 | ||||||||
Cash Dividends, $0.84 per share* | — | — | — | (1,263 | ) | |||||||
Total | 1,503,106 | $ | 1,879 | $ | 11,327 | $ | 5,377 | |||||
| * | Cash dividends per share have been retroactively restated to reflect the stock dividend in 2003. |
The accompanying notes are an integral part of these financial statements.
10
Table of Contents
Notes to Financial Statements
(Dollars in Thousands in Charts Except Per Share Data)
| 1. | SUMMARY OF SIGNIFICANT ACCOUNTING POLICIES |
The accounting and reporting policies of First National Bank are in accordance with accounting principles generally accepted in the United States of America, and general practices within the banking industry that are consistent with reports filed with regulatory agencies.
NATURE OF OPERATIONS
The Bank generates commercial (including agricultural), mortgage and consumer loans and receives deposits from customers located primarily in Franklin County and the northern portion of Pittsylvania County in Virginia and Burke, Caldwell, Catawba, Cleveland and Rutherford Counties in North Carolina. The Bank operates under a national charter and provides full banking services. As a national bank, the Bank is subject to regulation by the Comptroller of the Currency, Federal Deposit Insurance Corporation, and the Board of Governors of the Federal Reserve System.
USE OF ESTIMATES
The preparation of financial statements in conformity with accounting principles generally accepted in the United States of America requires management to make estimates and assumptions that affect the reported amounts of assets and liabilities and disclosure of contingent assets and liabilities at the date of the financial statements, and the reported amounts of revenue and expenses during the reporting period. Actual results could differ from those estimates. Material estimates that are particularly susceptible to significant change in the near term relate to the determination of the allowance for loan losses, and fair value of other real estate owned.
CASH AND CASH EQUIVALENTS
For purposes of cash flows, cash and cash equivalents include cash on hand, demand balances due from banks and federal funds transactions. Generally, federal funds are purchased and sold for one-day periods.
SECURITIES
Investment securities are stated at cost, adjusted for amortization of premiums and accretion of discounts, and computed by the interest method. The Bank has the positive intent and ability to hold these securities until maturity. Gains and losses on sales, if any, of securities are based upon the adjusted cost of the specific securities sold.
LOANS
Loans are recorded at the amount of the loan disbursed to borrowers plus the applicable amount, if any, of unearned income and other charges, less payments received. Income earned on loans is recognized by methods which generally result in level rates of return on principal amounts outstanding. The net amount of nonrefundable loan origination fees approximate the direct costs associated with the lending process.
The allowance for loan losses is an estimate of losses inherent in the loan portfolio as determined by management taking into consideration historical loan loss experience, diversification of the loan portfolio, amounts of secured and unsecured loans, banking industry standards and averages, and general economic conditions. Ultimate losses may vary from current estimates. These estimates are reviewed periodically and as adjustments become necessary, they are reported in earnings in the periods in which they become reasonably estimatable.
Management determines loan impairment using guidelines established by Statement of Financial Accounting Standards No. 114 (SFAS 114), “Accounting by Creditors for Impairment of a Loan (as amended by SFAS No. 118, Accounting by Creditors for Impairment of a Loan—Income Recognition and Disclosures)”. Under this accounting standard, a loan is considered to be impaired when it is probable that the Bank will be unable to collect all principal and interest amounts according to the contractual terms of the loan agreement. A performing loan may be considered impaired. The allowance for loan losses related to loans identified as impaired is primarily based on the excess of the loan’s current outstanding principal balance over the estimated fair value of the related collateral. For a loan that is not collateral-dependent, the allowance is recorded at the amount by which the outstanding principal balance exceeds the current best estimate of the future cash flows on the loan discounted at the loan’s original effective interest rate. Interest on impaired loans is recognized when cash is received.
BANK PREMISES AND EQUIPMENT
Premises and equipment are stated at cost, less accumulated depreciation. Depreciation is charged to operating expenses over the estimated useful life of the assets by the accelerated and straight-line methods. Costs of maintenance or repairs are charged to expense as incurred and improvements are capitalized. Upon retirement or disposal of an asset, the asset and related allowance account are eliminated. Any gain or loss on such transactions is included in current operations. Depreciation has been included under Occupancy Expense in the Statements of Income in the amount of $217,000 in 2005, $169,000 in 2004, and $150,000 in 2003.
OTHER REAL ESTATE OWNED
Real estate properties acquired through or in lieu of loan foreclosure are initially recorded at the lower of the Bank’s carrying amount or fair value less estimated selling cost at the date of foreclosure. Any write-downs based on the asset’s fair value at the date of acquisition are charged to the allowance for loan losses. After foreclosure, these assets are carried at the lower of their new cost basis or fair value less cost to sell. Costs of significant property improvements are capitalized, whereas costs relating to holding property are expensed. Valuations are periodically performed by management, and any write-downs are recorded as a charge to operations, if necessary, to reduce the carrying value of a property to the lower of its carrying or fair value less cost to sell.
INCOME TAXES
Deferred taxes are provided on a liability method whereby deferred tax assets are recognized for deductible temporary differences and operating loss and tax credit carryforwards and deferred tax liabilities are recognized for taxable temporary differences. Temporary differences are the differences between the reported amounts of assets and liabilities and their tax bases. Deferred tax assets are reduced by a valuation allowance when, in the opinion of management, it is more likely than not that some portion or all of the deferred tax assets will not be realized. Deferred tax assets and liabilities are adjusted for the effects of changes in tax laws and rates on the date of enactment.
RETIREMENT BENEFITS
The Bank has established an Employee Benefit Plan as described in footnote 5. The Bank does not provide any other post-retirement benefits that would be accrued under Statement of Financial Accounting Standards No. 106, “Employers’ Accounting for Post Retirement Benefits Other Than Pensions”.
| 2. | INVESTMENT SECURITIES |
The carrying value of securities pledged to secure public deposits was $60,262,000 and $42,144,000, respectively, at December 31, 2005 and 2004. The amortized cost and estimated fair value of investment securities as of December 31, 2005 and 2004 were as follows:
December 31, 2005 | Amortized Cost | Gross Unrealized Gains | Gross Unrealized Losses | Estimated Fair Value | ||||||||
U. S. Agency Securities | $ | 60,262 | $ | 14 | $ | 764 | $ | 59,512 | ||||
Total | $ | 60,262 | $ | 14 | $ | 764 | $ | 59,512 | ||||
December 31, 2004 | ||||||||||||
U. S. Agency Securities | $ | 42,144 | $ | 46 | $ | 99 | $ | 42,091 | ||||
Obligations of States and Political Subdivisions | 480 | 13 | — | 493 | ||||||||
Total | $ | 42,624 | $ | 59 | $ | 99 | $ | 42,584 | ||||
The table below shows gross unrealized losses and fair value, aggregated by investment category and length of time that individual securities have been in a continuous unrealized loss position at December 31, 2005 and 2004.
| Unrealized Losses | |||||||||
2005 Securities Description | Fair Value | Less Than 12 Months | More Than 12 Months | ||||||
U. S Agency Securities | $ | 14,381 | $ | 113 | $ | — | |||
U. S. Agency Securities | 36,346 | — | 651 | ||||||
Total | $ | 50,727 | $ | 113 | $ | 651 | |||
2004 Securities Description | |||||||||
U. S Agency Securities | $ | 29,485 | $ | 61 | $ | — | |||
U. S. Agency Securities | 4,962 | — | 38 | ||||||
Total | $ | 34,447 | $ | 61 | $ | 38 | |||
The unrealized losses on the Bank’s investments in obligations of U. S. government agencies were caused by interest rate increases. The contractual terms of those investments do not permit the issuer to settle the securities at a price less than the amortized cost of the investment. Because the Bank has the ability and intent to hold those investments until a recovery of fair value, which may be maturity, the Bank does not consider those investments to be other-than-temporarily impaired at December 31, 2005.
The amortized cost and estimated fair value of investments in debt securities at December 31, 2005 and 2004, by contractual maturity, are shown on the following page. Expected maturities will differ from contractual maturities because issuers may have the right to call or prepay obligations with or without call or prepayment penalties.
11
Table of Contents
| December 31, 2005 | December 31, 2004 | |||||||||||
| Estimated Amortized Cost | Fair Value | Estimated Amortized Cost | Fair Value | |||||||||
Due in One Year or Less | $ | 18,256 | $ | 18,151 | $ | 2,579 | $ | 2,419 | ||||
Due After One Year Through Five Years | 42,006 | 41,361 | 40,045 | 40,165 | ||||||||
Due After Five Years Through Ten Years | — | — | — | — | ||||||||
Due After Ten Years | — | — | — | — | ||||||||
Total | $ | 60,262 | $ | 59,512 | $ | 42,624 | $ | 42,584 | ||||
There were no sales of securities during 2005, 2004, or 2003
| 3. | COMPOSITION OF LOANS |
| December 31 | ||||||||
| 2005 | 2004 | |||||||
Real Estate | $ | 126,816 | $ | 124,359 | ||||
Consumer | 7,721 | 5,959 | ||||||
Commercial, Industrial and Agricultural | 13,805 | 10,315 | ||||||
All Other | 19,726 | 18,237 | ||||||
Gross Loans | 168,068 | 158,870 | ||||||
Less: Unearned Income | (436 | ) | (461 | ) | ||||
Allowance for Loan Losses | (1,829 | ) | (1,994 | ) | ||||
Total Loans, Net | $ | 165,803 | $ | 156,415 | ||||
Maturity Distribution | 2005 | 2004 | ||||||
Variable | ||||||||
Less Than One Year | $ | 15,050 | $ | 77,519 | ||||
One to Five Years | 53,009 | 3,669 | ||||||
Over Five Years | 11,825 | 2,372 | ||||||
Subtotal | 79,884 | 83,560 | ||||||
Fixed | ||||||||
Less Than One Year | 34,442 | 24,417 | ||||||
One to Five Years | 9,785 | 21,775 | ||||||
Over Five Years | 43,957 | 29,118 | ||||||
Subtotal | 88,184 | 75,310 | ||||||
Total | $ | 168,068 | $ | 158,870 | ||||
| 4. | ALLOWANCE FOR LOAN LOSSES |
In the view of management, the Allowance for Loan Losses is adequate to meet the loss contingency based on experience factors and a review of the loan portfolio.
The Allowance for Loan Losses for the years ending December 31, 2005, 2004 and 2003 is summarized as follows:
| 2005 | 2004 | 2003 | ||||||||||
Balance at beginning of year | $ | 1,994 | $ | 2,006 | $ | 1,096 | ||||||
Provision for loan losses | 120 | 72 | 1,009 | |||||||||
Losses charged to allowance | (375 | ) | (86 | ) | (101 | ) | ||||||
Recoveries credited during year | 90 | 2 | 2 | |||||||||
Balance at end of year | $ | 1,829 | $ | 1,994 | $ | 2,006 | ||||||
The following is a summary of information pertaining to impaired and non-accrual loans:
| December 31 | ||||||
| 2005 | 2004 | |||||
Impaired loans without a valuation allowance | $ | — | $ | — | ||
Impaired loans with a valuation allowance | 2,350 | 2,350 | ||||
Total impaired loans | $ | 2,350 | $ | 2,350 | ||
Valuation allowance related to impaired loans | $ | 937 | $ | 937 | ||
Nonaccrual loans (impaired) | $ | 2,350 | $ | 2,350 | ||
Nonaccrual loans (non-impaired) | $ | 1,989 | $ | 210 | ||
Total loans past due ninety days or more and still accruing | $ | 43 | $ | 3,588 | ||
| Years Ended December 31 | |||||||||
| 2005 | 2004 | 2003 | |||||||
Average investment in impaired loans | $ | 2,350 | $ | 2,350 | $ | 1,213 | |||
Interest income recognized on impaired loans | $ | — | $ | 466 | $ | 28 | |||
Interest income recognized on a cash basis on impaired loans . | $ | — | $ | 153 | $ | — | |||
| 5. | STOCK OPTIONS AND EMPLOYEE BENEFIT PLANS |
There were no stock options or stock option plans in effect for 2003, 2004 or 2005.
Effective January 1, 1997, the Bank has adopted an integrated profit sharing plan. Employees participate in the profit sharing plan following completion of six (6) months of service and upon reaching the age of twenty years and six months as of January 1. Vesting includes years of service to the Bank prior to the effective date of the plan. The plan gives 0% vesting to anyone who has less than five (5) years of service except that persons who have reached the age of 62 are fully vested regardless of length of service. Each participant in the plan (who has not reached age 62) becomes 100% vested after five (5) years of service. The contribution to the plan is determined each year by the Board of Directors and thus may fluctuate in amount from year to year. The contribution by the Bank was $125,000 in 2005, $127,000 in 2004, and $112,000 in 2003 and is included in Salaries and Employee Benefits in the Statements of Income.
| 6. | FEDERAL AND STATE INCOME TAXES |
Net deferred tax assets consist of the following components as of December 31, 2005 and 2004:
Deferred Tax Assets | 2005 | 2004 | ||||
Allowance for Loan Losses | $ | 545 | $ | 545 | ||
Dividend Exclusion | 86 | 85 | ||||
Other | 31 | — | ||||
Total Deferred Tax Assets | $ | 662 | $ | 700 | ||
Deferred Tax Liabilities | ||||||
Bank Premises | $ | 288 | $ | 250 | ||
Investment in Associated Companies | 101 | 100 | ||||
Total Deferred Tax Liabilities | $ | 389 | $ | 350 | ||
Net Deferred Taxes | $ | 273 | $ | 350 | ||
The provisions for income taxes charged to operations for the years ended December 31, 2005, 2004 and 2003 consist of the following:
| 2005 | 2004 | 2003 | ||||||||
Currently payable | $ | 341 | $ | 730 | $ | 990 | ||||
Currently payable-North Carolina | — | — | 10 | |||||||
Deferred | 80 | 85 | (294 | ) | ||||||
Net Provision | $ | 421 | $ | 815 | $ | 706 | ||||
The income tax provision differs from the amount of income tax determined by applying the U. S. federal income tax rate to pretax income for the years ended December 31, 2005, 2004, and 2003 due to the following:
| 2005 | 2004 | 2003 | ||||||||||
Tax provision computed by applying federal tax rates to income before income taxes | $ | 648 | $ | 989 | $ | 830 | ||||||
Tax exempt interest | (226 | ) | (189 | ) | (140 | ) | ||||||
Other | (1 | ) | 15 | 16 | ||||||||
Net Provision | $ | 421 | $ | 815 | $ | 706 | ||||||
| 7. | RELATED PARTY TRANSACTIONS |
The Chairman of the Board of First National Bank also serves as Chairman of the Board of Blue Ridge Bank, N. A., Central National Bank, Community National Bank, First National Exchange Bank, Mountain National Bank, Patrick Henry National Bank, Patriot Bank, N. A., Peoples National Bank and Shenandoah National Bank.
The Bank maintains correspondent bank accounts with three of these banks. In 2005 and 2004, the average daily balances in these accounts were considered normal operating balances to facilitate general business transactions.
The Bank also participates in loan transactions with these banks. These transactions are at carrying value and do not involve more than the normal risk of collectibility or present other unfavorable features.
The Bank owns ten percent of the outstanding common stock of The Mortgage Company of Virginia, Inc. The remaining common stock is equally owned by the banks listed above. The Mortgage Company of Virginia owns 100% of Bank Services of Virginia, Inc. The business of both of these companies is to provide operational support services to the ten banks. These services consist of mortgage loan servicing, data processing, bookkeeping, check clearing, accounting, investment management, bank couriers, advertising programs, central purchasing and other management services. The Bank is charged for its share of these services, which is recorded as Operation Center Expense in the Statements of Income. The cost of this expense is shared by the ten banks on the basis of average deposits of each bank related to total average deposits of all the banks.
The Mortgage Company of Virginia, Inc. also owns 100% of Bank Services Insurance, Inc. Bank Services Insurance, Inc. provides insurance products to the banks and customers in the Danville area. The premiums paid to Bank Services Insurance, Inc. equaled $26,000 at December 31, 2005.
The Mortgage Company of Virginia, Inc. also owns 50% of Coresoft, Inc. represented by an initial $1,000 investment during 2004. Coresoft, Inc. is
12
Table of Contents
in the process of developing a core software package the banks listed above will use. At December 31, 2005, Coresoft, Inc. had an outstanding note payable to the Mortgage Company of $1,400,000.
The Bank records its investment in the common stock of The Mortgage Company of Virginia, Inc. under the equity method of accounting due to the influence the Bank has over the company. The Bank invested an additional $150,000 in 2005 increasing the value of the investment to $769,000 from $618,000 at December 31, 2004. The Bank’s share of earnings of the company equaled $1,000 for 2005, $11,000 for 2004 and $10,000 for 2003 and is shown in the Statements of Income under Other Non-interest Income.
The Chairman of the Board and President of the Bank also serves as Chairman of the Board and President of Bank Building Corporation and Manager of Blackstone Properties, LLC, its wholly owned subsidiary (the “companies”). The companies lease branches to certain of the banks listed above. At December 31, 2005 the Bank leased five offices from the companies. Rental expense and future lease payments under these leases are disclosed in a footnote below. As of December 31, 2005 , the Bank had loans totaling $2,452,000 and $2,540,000 for 2004 respectively, to the companies. These loans were made to purchase bank branches leased to affiliated banks. The loans are secured by these branches and the related leases, and have repayment terms similar to other loan customers of the Banks.
In the ordinary course of business, directors, and their related interests were customers of, and had transactions with the Bank. Loan transactions with directors and officers, principal security holders and associates were made on substantially the same terms as those prevailing at the time for comparable loans to other persons and did not involve more than the normal risk of collectibility or present other unfavorable features. A summary of these transactions is presented below.
| 2005 | 2004 | |||||||
Beginning Balance | $ | 451 | $ | 316 | ||||
New Loans | 31 | 233 | ||||||
Repayments | (377 | ) | (98 | ) | ||||
Ending Balance | $ | 105 | $ | 451 | ||||
| 8. | CONTINGENCIES |
The Bank did not have any legal matters of financial significance pending at December 31, 2005 or 2004.
| 9. | EARNINGS PER COMMON SHARE |
The Bank follows Statement of Financial Accounting Standards (SFAS) No. 128, “Earnings Per Share”. This statement requires the dual presentation of basic and diluted earnings per share. The weighted average number of shares used to compute earnings per share was 1,503,106.
The Bank issued a 10% stock dividend in 2003, and none in 2005 or 2004. No fractional shares were issued in this stock dividend. Stock Dividends and fractional shares were settled based on known prices for recent trades of the stock and other factors deemed relevant at the time.
| 10. | BANK PREMISES AND EQUIPMENT |
Premises and equipment are stated at cost less accumulated depreciation as follows:
December 31, 2005 | Cost | Accumulated Depreciation and Amortization | Net Remaining Cost | ||||||
Bank Premises (Including Land of $504,000) | $ | 3,539 | $ | 580 | $ | 2,959 | |||
Equipment | 1,708 | 521 | 1,187 | ||||||
Total | $ | 5,247 | $ | 1,101 | $ | 4,146 | |||
December 31, 2004 | |||||||||
Bank Premises (Including Land of $427,000) | $ | 3,431 | $ | 534 | $ | 2,897 | |||
Equipment | 1,636 | 442 | 1,194 | ||||||
Total | $ | 5,067 | $ | 976 | $ | 4,091 | |||
| 11. | FORECLOSED ASSETS |
Expenses applicable to foreclosed assets include the following:
| Years Ended December 31 | |||||||||
| 2005 | 2004 | 2003 | |||||||
Net loss (gain) on sales of real estate | $ | — | $ | — | $ | — | |||
Provision for losses | — | — | — | ||||||
Operating expenses | 19 | 19 | 17 | ||||||
| 12. | CASH AND CASH EQUIVALENTS |
Cash and cash equivalents as of December 31, 2005, 2004 and 2003 are detailed below:
| 2005 | 2004 | 2003 | |||||||
Cash and Due From Banks | $ | 8,138 | $ | 6,724 | $ | 8,972 | |||
Federal Funds Sold | 12,900 | 66,440 | 43,740 | ||||||
Total Cash and Cash Equivalents | $ | 21,038 | $ | 73,164 | $ | 52,712 | |||
| 13. | DEPOSITS |
Certificates of Deposit maturing as of December 31:
| 2005 | 2004 | |||||
1 Year | $ | 79,854 | $ | 110,984 | ||
2 Years | 19,377 | 15,214 | ||||
3 Years | 9,676 | 11,823 | ||||
4 Years | 6,991 | 8,734 | ||||
5 Years and Thereafter | 16,318 | 8,693 | ||||
TOTAL | $ | 132,216 | $ | 155,448 | ||
| 14. | CONCENTRATION OF CREDIT RISK |
The majority of the Bank’s loans, commitments and lines of credit have been granted to customers in the Bank’s market area. The concentrations of credit by loan classification are set forth in an above footnote. The Bank does not extend credit to any individual borrowers in excess of its lending limit of $3,0621,000 and $3,059,000, respectively, as of December 31, 2005 and 2004.
The largest category of Real Estate Loans consisted of Commercial loans. These loans approximated $36,593,000 at December 31, 2005 and $21,190,000 at December 31, 2004.
| 15. | FAIR VALUE OF FINANCIAL INSTRUMENTS |
Statement of Financial Accounting Standards No. 107,” Disclosures about Fair Value of Financial Instruments”, requires the Bank to disclose the estimated fair values of its financial assets and liabilities. The estimated fair values were determined using the following assumptions:
| a. | The carrying value of Cash and Due From Banks, Federal Funds Sold, and Interest-Bearing Deposits in Other Financial Institutions are believed to approximate the fair value of these items. |
| b. | The fair value of actively traded investment securities are determined according to quotes available in the financial press. The fair value of instruments which are not actively traded are determined using values of other instruments with similar characteristics or obtained from outside sources believed to be reliable. |
| c. | The fair value of loans are estimated by discounting the anticipated cash flows using estimated rates for similar loans available in the Bank’s market area. Estimates of maturities are based on both experience and contractual maturities although prepayments are permitted on the loans. |
| d. | The fair value of short-term demand and savings deposits are believed to equal carrying value. The fair value of certificates of deposit are based upon the contractual maturity of the instruments and rates currently offered for similar deposits. |
| e. | The fair value of Notes Payable to the U. S. Treasury are estimated at carrying value. |
| f. | The fair value of Accrued Interest Receivable and Accrued Interest Payable are estimated at carrying value. |
| 2005 | 2004 | |||||||||||
Financial Assets: | Carrying Value | Fair Value | Carrying Value | Fair Value | ||||||||
Interest-Bearing Deposits in Other Financial | ||||||||||||
Institutions | $ | 19,495 | $ | 19,495 | $ | 22,863 | $ | 22,863 | ||||
Investment Securities | 60,262 | 59,512 | $ | 42,624 | 42,584 | |||||||
Federal Funds Sold | 12,900 | 12,900 | 66,440 | 66,440 | ||||||||
Loans (Net of Unearned Income) | 167,632 | 167,560 | 158,409 | 158,269 | ||||||||
Cash and Due From Banks | 8,138 | 8,138 | 6,724 | 6,724 | ||||||||
Accrued Interest Receivable | 1,730 | 1,730 | 1,210 | 1,210 | ||||||||
Total | $ | 270,157 | $ | 269,335 | $ | 298,270 | $ | 298,090 | ||||
13
Table of Contents
| 2005 | 2004 | |||||||||||
Financial Liabilities: | Carrying Value | Fair Value | Carrying Value | Fair Value | ||||||||
Deposits | ||||||||||||
LIFETIME FREE CHECKING | $ | 36,222 | $ | 36,222 | $ | 34,186 | $ | 34,186 | ||||
Interest-Bearing Demand | 42,702 | 42,702 | 51,626 | 51,626 | ||||||||
Regular Passbook Savings | 43,746 | 43,746 | 44,103 | 44,103 | ||||||||
Time Deposits: | ||||||||||||
Certificates of Deposit $100,000 and Over | 28,625 | 28,760 | 41,521 | 41,980 | ||||||||
Other | 103,591 | 103,659 | 113,927 | 115,267 | ||||||||
Total Deposits | 254,886 | 255,089 | 285,363 | 287,162 | ||||||||
Notes issued to the U. S. Treasury | 2,102 | 2,102 | 197 | 197 | ||||||||
Accrued Interest Payable | 477 | 477 | 474 | 474 | ||||||||
Total | $ | 257,465 | $ | 257,668 | $ | 286,034 | $ | 287,833 | ||||
| 16. | CAPITAL ADEQUACY |
The Bank is subject to various regulatory capital requirements. Under the regulatory capital guidelines and the regulatory framework for Prompt Corrective Action (PCA), the Bank must meet specific capital guidelines involving the quantitative measures of the Bank’s assets, liabilities, and certain off-balance-sheet items as calculated under regulatory accounting practices. The Bank’s capital amount and classification are also subject to qualitative judgments by the regulators about components, risk weightings and other factors.
Quantitative measures established by regulation to ensure capital adequacy require the Bank to maintain minimum ratios (set forth in the table below) of total and Tier 1 capital (as defined in the regulations) to risk-weighted assets (as defined) and of Tier 1 capital to average assets (as defined).
| Minimum Ratio For Capital Adequacy Purposes | Minimum Ratio To Be Considered Well Capitalized Under PCAP or visions | |||||
Tier 1 Capital to Risk Weighted Assets | 4 | % | 6 | % | ||
Total Capital to Risk Weighted Assets | 8 | % | 10 | % | ||
Tier 1 Capital to Average Assets | 4 | % | 5 | % |
As of December 31, 2005, the most recent notification from the Federal Deposit Insurance Corporation categorized the Bank as well capitalized under the regulatory framework for prompt corrective action. To be categorized as well capitalized, an institution must maintain minimum total risk-based, Tier 1 risk-based and Tier 1 leverage ratios as set forth in the above table. There are no conditions or events since the notification that management believes have changed the Bank’s category. The Bank’s actual capital amounts and ratios as of December 31, 2005 and 2004 are presented in the following table. Management believes, as of December 31, 2005 and 2004, that the Bank meets all capital adequacy requirements to which it is subject.
As of December 31, 2005 | Minimum Capital For Capital Adequacy Purposes | Minimum Capital to Be Considered Well Capitalized Under PCA Provisions | Actual Capital | Actual Ratio | ||||||||
Tier 1 Capital to Risk Weighted Assets | $ | 6,882 | $ | 10,323 | $ | 18,583 | 10.80 | % | ||||
Total Capital to Risk Weighted Assets | 13,763 | 17,204 | 20,412 | 11.86 | % | |||||||
Tier 1 Capital to Average Assets | 10,564 | 13,205 | 18,583 | 7.04 | % | |||||||
As of December 31, 2004 | ||||||||||||
Tier 1 Capital to Risk Weighted Assets | $ | 6,935 | $ | 10,402 | $ | 18,361 | 10.59 | % | ||||
Total Capital to Risk Weighted Assets | 13,870 | 17,337 | 20,355 | 11.76 | % | |||||||
Tier 1 Capital to Average Assets | 11,676 | 14,595 | 18,361 | 6.29 | % | |||||||
| 17. | QUARTERLY FINANCIAL DATA (Unaudited) |
The following summarizes the quarterly results of operations for the years ended December 31, 2005 and 2004:
2005 | First Quarter | Second Quarter | Third Quarter | Fourth Quarter | ||||||||
Total Interest Income | $ | 3,181 | $ | 3,246 | $ | 3,198 | $ | 3,281 | ||||
Total Interest Expense | 1,538 | 1,551 | 1,559 | 1,540 | ||||||||
Net Interest Income | 1,643 | 1,695 | 1,639 | 1,741 | ||||||||
Provision For Loan Losses | 18 | 18 | 18 | 66 | ||||||||
Net Interest Income After Provision for Loan Losses | 1,625 | 1,677 | 1,621 | 1,675 | ||||||||
Total Non-Interest Income | 180 | 173 | 180 | 254 | ||||||||
Total Non-Interest Expense | 1,302 | 1,340 | 1,358 | 1,479 | ||||||||
Income Before Income Taxes | 503 | 510 | 443 | 450 | ||||||||
Income Tax Expense | 120 | 120 | 100 | 81 | ||||||||
Net Income | $ | 383 | $ | 390 | $ | 343 | $ | 369 | ||||
Basic and Diluted Net Income Per Share | $ | 0.25 | $ | 0.26 | $ | 0.23 | $ | 0.25 | ||||
2004 | First Quarter | Second Quarter | Third Quarter | Fourth Quarter | ||||||||
Total Interest Income | $ | 2,934 | $ | 3,014 | $ | 3,213 | $ | 3,092 | ||||
Total Interest Expense | 1,243 | 1,226 | 1,335 | 1,528 | ||||||||
Net Interest Income | 1,691 | 1,788 | 1,878 | 1,564 | ||||||||
Provision For Loan Losses | 18 | 18 | 18 | 18 | ||||||||
Net Interest Income After Provision for Loan Losses | 1,673 | 1,770 | 1,860 | 1,546 | ||||||||
Total Non-Interest Income | 204 | 185 | 190 | 308 | ||||||||
Total Non-Interest Expense | 1,147 | 1,149 | 1,188 | 1,344 | ||||||||
Income Before Income Taxes | 730 | 806 | 862 | 510 | ||||||||
Income Tax Expense | 205 | 230 | 240 | 140 | ||||||||
Net Income | $ | 525 | $ | 576 | $ | 622 | $ | 370 | ||||
Basic and Diluted Net Income Per Share | $ | 0.35 | $ | 0.38 | $ | 0.41 | $ | 0.25 | ||||
| 18. | LEASES AND RENT EXPENSE |
The Bank leased facilities under non-cancelable operating leases during 2005, 2004 and 2003. As noted above, the Bank leases two offices from Bank Building Corporation and three offices from Blackstone Properties, LLC. These leases required the bank to pay maintenance, insurance and property taxes and do not have renewal options. Rental expense under these leases was $186,000 in 2005, $198,000 in 2004 and 2003. Future minimum rental payments under these leases are as follows:
Year Ending December 31, 2006 | $ | 195 | |||
2007 | 195 | ||||
2008 | 195 | ||||
2009 | 195 | ||||
2010 | 195 | ||||
Thereafter | 1,224 | ||||
Total minimum lease payments | $ | 2,199 | |||
| 19. | OFF BALANCE SHEET ACTIVITIES AND COMMITMENTS |
Commitments to extend credit, which amounted to $2,471,000 and $8,058,000 at December 31, 2005 and 2004, respectively, represent agreements to lend to customers with fixed expiration dates or other termination clauses. Since many of the commitments are expected to expire without being funded, the total commitment amounts do not necessarily represent future liquidity requirements. Standby letters of credit are conditional commitments issued by the Bank guaranteeing the performance of a customer to a third party. Those guarantees are primarily issued to support public and private borrowing arrangements. The Bank had outstanding letters of credit in the amount of $974,000 in 2005 and $1,148,000 in 2004.
The Bank is a member of the Federal Reserve System and is required to maintain certain levels of its cash and due from bank balances as reserves based on regulatory requirements. At December 31, 2005 and 2004, this reserve requirement was approximately $1,795,000 and $2,554,000, respectively.
Federal banking regulations place certain restrictions on dividends paid by the Bank. The total amount of dividends which may be paid at any date is generally limited to the retained earnings of the Bank. In addition, dividends paid by the Bank would be prohibited if the effect thereof would cause the Bank’s capital to be reduced below applicable minimum capital requirements.
14
Table of Contents
| 20. | RECENT ACCOUNTING PRONOUNCEMENTS AND ACCOUNTING CHANGES |
In November 2002, the FASB issued FASB Interpretation No. 45, “Guarantor’s Accounting and Disclosure Requirements for Guarantees, including Indirect Guarantees of Indebtedness of Others “(FIN 45). The interpretation elaborates on the disclosures to be made by a guarantor in its financial statements under certain guarantees that it has issued. It also clarifies that a guarantor is required to recognize, at the inception of a guarantee, a liability for the fair value of the obligation undertaken in issuing the guarantee. The interpretation requires disclosure of the nature of the guarantee, the maximum potential amount of future payments that the guarantor could be required to make under the guarantee, and the current amount of the liability, if any, for the guarantor’s obligations under the guarantee. The recognition requirements of the interpretation were effective beginning January 1, 2003.
The FASB also revised FASB Interpretation 46, “Consolidation of Variable Interest Entities, an interpretation of ARB No. 51” (FIN 46). The interpretation provides a framework for identifying variable interest entities (VIEs), and determining when a company should include the assets, liabilities, noncontrolling interests and results of activities of a VIE in its consolidated financial statements. As revised, FIN 46 is effective beginning in the first quarter of 2004 for all VIEs (other than what is commonly referred to as special purpose entities, VIEs of small business issuers, and VIEs of nonpublic entities). The Bank does not currently utilize VIEs or so called special purpose entities.
In November 2003, the FASB’s Emerging Issues Task Force (EITF) reached consensus on new disclosure requirements related to unrealized losses on investment securities. The new disclosure requirements apply to marketable equity and debt securities accounted for under Financial Accounting Board Statement No. 115, “Accounting for Certain Investments in Debt and Equity Securities,” and are required for inclusion in annual reports with fiscal years ended after December 15, 2003.
In November 2003, the FASB issued FASB Staff Position (FSP) 144-1, “Determination of Cost Basis for Foreclosed Assets under FASB Statement No. 15”, “Accounting by Debtors and Creditors for Troubled Debt Restructurings,” and the Measurement of Cumulative Losses Previously Recognized under Paragraph 37 of FASB Statement No. 144, “Accounting for the Impairment or Disposal of Long-Lived Assets.” Under FSP 144-1, the lender is required to measure the foreclosure on a long-lived asset (e.g. real estate) at fair value less cost to sell on the foreclosure date, which establishes a new cost basis such that any loan valuation allowance is not retained. Thereafter, the lender would follow the impairment guidance in Statement No 144, and should not reflect any recovery in value of the property beyond the cost basis established upon foreclosure of the loan. This guidance was effective upon posting of the FSP to the FASB website in November 2003.
In April 2003, the Financial Accounting Standards Board issued Statement No. 149, “Amendment of Statement 133 on Derivative Instruments and Hedging Activities”. This statement amends and clarifies financial accounting and reporting for derivative instruments, including certain derivative instruments embedded in other contracts (collectively referred to as derivatives) and for hedging activities under FASB Statement No. 133, Accounting for Derivative Instruments and Hedging Activities. This statement is effective for contracts entered into or modified after June 30, 2003.
In May 2003, the Financial Accounting Standards Board issued Statement No. 150, “Accounting for Certain Financial Instruments with Characteristics of both Liabilities and Equity”. This statement establishes standards for how an issuer classifies and measures certain financial instruments with characteristics of both liabilities and equity. It requires that an issuer classify a financial instrument that is within its scope as a liability (or an asset in some circumstances). Many of those instruments were previously classified as equity. This statement is effective for financial instruments entered into or modified after May 31, 2003, and otherwise is effective at the beginning of the first interim period beginning after June 15, 2003.
In December 2004, the FASB issued Statement No. 123 (revised 2004), which is a revision of Statement 123 “Accounting for Stock-Based Compensation”. This Statement establishes standards for the accounting for transactions in which an entity exchanges its equity instruments for goods or services. It also addresses transactions in which an entity incurs liabilities in exchange for goods or services that are based on the fair value of the entity’s equity instruments or that may be settled by the issuance of those equity instruments. This Statement focuses primarily on accounting for transactions in which an entity obtains employee services in share-based payment transactions. This Statement is effective for public entities as of the beginning of the first interim or annual reporting period that begins after June 15, 2005.
In December 2004, the FASB issued Statement No. 153, “Exchanges of Nonmonetary Assets”, an amendment of APB Opinion No. 29, Accounting for Nonmonetary Transactions”. This Statement eliminates the exception to fair value for exchanges of similar productive assets and replaces it with a general exception for exchange transactions that do not have commercial substance-that is, transactions that are not expected to result in significant changes in the cash flows of the reporting entity. This Statement is effective for nonmonetary asset exchanges occurring in fiscal periods beginning after June 15, 2005.
In May 2005, the FASB issued Statement No. 154, “Accounting Changes and Error Corrections—a replacement of APB Opinion No. 20 and FASB Statement No. 3”. This Statement requires retrospective application to prior periods’ financial statements of changes in accounting principle, unless it is impracticable to determine either the period-specific effects or the cumulative effect of the change. When it is impracticable to determine the period-specific effects of an accounting change on one or more individual prior periods presented, this Statement requires that the new accounting principle be applied to the balances of assets and liabilities as of the beginning of the earliest period for which retrospective application is practicable and that a corresponding adjustment be made to the opening balance of retained earnings. This Statement improves financial reporting because its requirement to report voluntary changes in accounting principles via retrospective application, unless impracticable, enhances the consistency of financial information between periods. This statement is effective for accounting changes and corrections of errors made in fiscal years beginning after December 15, 2005.
During November 2005, the FASB issued FASB Staff Position (FSP) FAS 115-1 and 124-1, “The Meaning of Other-Than-Temporary Impairment and Its Application to Certain Investments.” The guidance in this FSP addresses the determination of when an investment is considered impaired, whether that impairment is other than temporary, and the measurement of an impairment loss. The FSP also includes accounting considerations subsequent to the recognition of an other-than temporary impairment and requires certain disclosures about unrealized losses that have not been recognized as other-than-temporary impairments. The guidance in this FSP is required to be applied to reporting periods beginning after December 15, 2005. Earlier application is permitted.
The FASB has issued FASB Statement No. 155, “Accounting for Certain Hybrid Instruments.” This standard amends the guidance in FASB Statements No. 133, “Accounting for Derivative Instruments and Hedging Activities”, and No. 140, “Accounting for Transfers and Servicing of Financial Assets and Extinguishments of Liabilities.” Statement 155 allows financial instruments that have embedded derivatives to be accounted for as a whole (eliminating the need to bifurcate the derivative from its host) if the holder elects to account for the whole instrument on a fair value basis. Statement 155 is effective for all financial instruments acquired or issued after the beginning of an entity’s first fiscal year that begins after September 15, 2006. Earlier adoption is permitted as of the beginning of an entity’s fiscal year, provided the entity has not yet issued financial statements, including financial statements for any interim period for that fiscal year. Provisions of this Statement may be applied to instruments that an entity holds at the date of adoption on an instrument-by-instrument basis. The financial statement effect of the change in accounting, if any, should be recognized as a cumulative-effect adjustment to beginning retained earnings. Prior periods should not be restated.
Management does not expect these accounting pronouncements to have a material impact on the financial statements.
15
Table of Contents
Summary of Operations
(Dollars in Thousands Except Per Share Data)
FOR THE YEAR: | 2005 | 2004 | 2003 | 2002 | 2001 | ||||||||||||
Total Interest Income | $ | 12,906 | $ | 12,253 | $ | 12,306 | $ | 13,408 | $ | 14,266 | |||||||
Total Interest Expense | 6,188 | 5,332 | 5,159 | 5,751 | 8,361 | ||||||||||||
Net Interest Income | 6,718 | 6,921 | 7,147 | 7,657 | 5,905 | ||||||||||||
Provision for Loan Losses | 120 | 72 | 1,009 | 72 | 72 | ||||||||||||
Net Interest Income After Provision for Loan Losses | 6,598 | 6,849 | 6,138 | 7,585 | 5,833 | ||||||||||||
Non-Interest Income | 787 | 887 | 822 | 766 | 494 | ||||||||||||
Non-Interest Expense | 5,479 | 4,828 | 4,519 | 4,378 | 3,690 | ||||||||||||
Net Income Before Taxes | 1,906 | 2,908 | 2,441 | 3,973 | 2,637 | ||||||||||||
Applicable Income Taxes: | |||||||||||||||||
Current | 256 | 730 | 1,000 | 1,190 | 817 | ||||||||||||
Deferred | 165 | 85 | (294 | ) | 63 | (13 | ) | ||||||||||
Net Income (Loss) | $ | 1,485 | $ | 2,093 | $ | 1,735 | $ | 2,720 | $ | 1,833 | |||||||
Basic and Diluted Net Income Per Share* | $ | 0.99 | $ | 1.39 | $ | 1.15 | $ | 1.81 | $ | 1.22 | |||||||
| * | Net income per share has been retroactively adjusted to reflect the stock dividend in 2003. |
AT YEAR END: | 2005 | 2004 | 2003 | 2002 | 2001 | ||||||||||
Interest-Bearing Deposits in Other Financial Institutions | $ | 19,495 | $ | 22,863 | $ | 13,857 | $ | 11,581 | $ | 11,286 | |||||
Federal Funds Sold | 12,900 | 66,440 | 43,740 | 31,300 | 14,910 | ||||||||||
Investment Securities | 60,262 | 42,624 | 67,301 | 68,220 | 74,105 | ||||||||||
Loans (Net) | 165,803 | 156,415 | 131,671 | 115,994 | 115,189 | ||||||||||
Deposits | 254,886 | 285,363 | 253,943 | 221,979 | 210,718 | ||||||||||
Demand | 36,222 | 34,186 | 31,528 | 30,425 | 25,854 | ||||||||||
Interest-Bearing Demand | 42,702 | 51,626 | 44,335 | 35,905 | 24,735 | ||||||||||
Savings | 43,746 | 44,103 | 42,809 | 38,555 | 35,151 | ||||||||||
Time | 132,216 | 155,448 | 135,271 | 117,094 | 124,978 | ||||||||||
Capital Accounts | 18,583 | 18,361 | 17,531 | 16,980 | 15,364 | ||||||||||
Total Resources | 276,216 | 304,551 | 272,160 | 241,253 | 227,171 | ||||||||||
Carrying Value Per Share | $ | 12.36 | $ | 12.22 | $ | 11.66 | $ | 11.30 | $ | 10.22 | |||||
DAILY AVERAGES FOR THE YEAR: | 2005 | 2004 | 2003 | 2002 | 2001 | ||||||||||
Interest-Bearing Deposits in Other Financial Institutions | $ | 18,404 | $ | 18,597 | $ | 13,416 | $ | 11,443 | $ | 10,720 | |||||
Federal Funds Sold | 26,940 | 37,536 | 42,887 | 8,217 | 15,961 | ||||||||||
Investment Securities | 54,598 | 60,134 | 57,136 | 76,760 | 66,567 | ||||||||||
Loans | 160,496 | 153,198 | 124,478 | 115,529 | 112,466 | ||||||||||
Deposits | 270,160 | 260,409 | 232,984 | 205,130 | 196,461 | ||||||||||
Demand | 35,646 | 34,854 | 31,386 | 28,332 | 23,704 | ||||||||||
Interest-Bearing Demand | 28,127 | 29,915 | 22,577 | 18,434 | 16,664 | ||||||||||
Savings (Includes MMDA’s) | 51,860 | 54,565 | 52,467 | 44,453 | 36,397 | ||||||||||
Time | 154,527 | 141,075 | 126,554 | 113,911 | 119,696 | ||||||||||
Total Resources | $ | 277,456 | $ | 278,361 | $ | 251,982 | $ | 224,415 | $ | 212,667 | |||||
16
Table of Contents
Price Range of Common Stock
| 2005 | 2004 | Dividends Per Share | ||||||||||||||||
| HIGH | LOW | HIGH | LOW | 2005 | 2004 | |||||||||||||
First Quarter | $ | 20.00 | $ | 16.50 | $ | 22.50 | $ | 17.00 | $ | 0.21 | $ | 0.21 | ||||||
Second Quarter | 20.00 | 16.50 | 22.50 | 17.00 | 0.21 | 0.21 | ||||||||||||
Third Quarter | 20.00 | 16.50 | 21.00 | 17.00 | 0.21 | 0.21 | ||||||||||||
Fourth Quarter | 20.00 | 16.50 | 22.50 | 17.00 | 0.21 | 0.21 | ||||||||||||
| Officers | ||
| WORTH HARRIS CARTER, JR | GEORGE E. HUNT, JR. | |
| Chairman of the Board and President | Assistant Vice President and Managing Officer — Boones Mill | |
| DIANNE S. HALL | RHONDA T. JAMES | |
| Senior Vice President and Cashier | Assistant Vice President and Managing Officer — Rocky Mount | |
| WILLIAM WELLS | SHERRY G. YOUNG | |
| Senior Vice President | Assistant Vice President and Managing Officer — 4th Street | |
| DERWIN L. HALL | CHERYL A. ARGESE | |
| Vice President — Commercial Loans | Assistant Cashier and Managing Officer — Westlake | |
| RONALD HOLLAND | TERRY C. HENSON | |
Vice President and Managing Officer — Forest City | Branch Manager — Bostic | |
| DAN H. JOHNSON | SCOTTIE H. JENKINS | |
| Vice President — Commercial Loans | Branch Manager — Lincolnton | |
DOUGLAS E. WILLIAMS | SHARLENE P. ROBINSON | |
Vice President and Managing Officer — West Morganton | Branch Manager — Ferrum | |
L. V. HALEY Assistant Vice President and Managing Officer — Gretna | ||
Directors
WORTH HARRIS CARTER, JR.
Chairman of the Board and President
WALTER P. KINGERY
Retired
SIDNEY D. MASON
Retired
MARY ALICE RAMSEY
Retired
LEO H. SCOTT
President, Leo H. Scott, Inc.

P.O. Box 309
Rocky Mount, Virginia 24151
(540) 483-0204
Member FDIC
Table of Contents

MEMBER FDIC
For additional information contact:
First National Bank
P.O. Box 309
Rocky Mount, Virginia 24151
Telephone: (540) 483-0204
Table of Contents
OFFICE OF THE COMPTROLLER OF THE CURRENCY
WASHINGTON, D.C. 20219
FORM 10-QSB
| x | QUARTERLY REPORT UNDER SECTION 13 OR 15(d) OF THE SECURITIES EXCHANGE ACT OF 1934 |
For the quarterly period ended September 30, 2006
OR
| ¨ | TRANSITION REPORT UNDER SECTION 13 OR 15(d) OF THE SECURITIES EXCHANGE ACT OF 1934 |
For the transition period from to
Commission file number: n/a
FIRST NATIONAL BANK
(Name of registrant as specified in its charter)
| National Bank | 54-0962185 | |
(State or other jurisdiction of incorporation or organization) | (I.R.S. Employer Identification No.) | |
400 Franklin Street Rockv Mount, VA | 24151 | |
| (Address of principal executive offices) | (Zip Code) | |
(540) 483-0204
(Registrant’s telephone number, including area code)
n/a
(Former name, former address and former fiscal year, if changed since last report)
Check whether the issuer (1) filed all reports required to be filed by Section 13 or 15(d) of the Exchange Act during the past 12 months (or for such shorter period that the registrant was required to file such reports), and (2) has been subject to such filing requirements for the past 90 days. Yes x No ¨
Indicate by check mark whether the registrant is a shell company (as defined in Rule 12b-2 of the Exchange Act). Yes ¨ No x
As of November 13, 2006, there were issued and outstanding 1,503,106 shares of the registrant’s common stock.
Transitional Small Business Disclosure Format: Yes ¨ No x
1
Table of Contents
INDEX
| PART I - FINANCIAL INFORMATION | 4 | |||
ITEM 1 - | FINANCIAL STATEMENTS | 4 | ||
STATEMENTS OF CONDITION | 4 | |||
STATEMENTS OF INCOME | 5 | |||
STATEMENTS OF CASH FLOWS | 6 | |||
STATEMENTS OF CHANGES IN SHAREHOLDERS’ EQUITY | 7 | |||
NOTES TO UNAUDITED FINANCIAL STATEMENTS | 7 | |||
ITEM 2 - | MANAGEMENT’S DISCUSSION AND ANALYSIS | 9 | ||
ITEM 3 - | CONTROLS AND PROCEDURES | 13 | ||
| PART II - OTHER INFORMATION | 14 | |||
ITEM 1 - | LEGAL PROCEEDINGS | 14 | ||
ITEM 2 - | UNREGISTERED SALES OF EQUITY SECURITIES AND USE OF PROCEEDS | 14 | ||
ITEM 3 - | DEFAULTS UPON SENIOR SECURITIES | 14 | ||
ITEM 4 - | SUBMISSION OF MATTERS TO A VOTE OF SECURITY HOLDERS | 14 | ||
ITEM 5 - | OTHER INFORMATION | 14 | ||
ITEM 6 - | EXHIBITS AND REPORTS ON FORM 8-K | 14 | ||
2
Table of Contents
FORWARD-LOOKING STATEMENTS
This report contains statements concerning the Bank’s expectations, plans, objectives, future financial performance and other statements that are not historical facts. These statements may constitute “forward-looking statements” as defined by federal securities laws. In some cases, readers can identify the forward-looking statements by the use of words such as “may,” “ will,” “should,” “could,” “expect,” “plan,” “intend,” “anticipate,” “believe,” “estimate,” “predict,” “potential” or “continue” or the negative or other variations of these words, or other comparable words or phrases. These statements may address issues that involve estimates and assumptions made by management, risks and uncertainties, and actual results could differ materially from historical results or those anticipated by such statements. Factors that could have a material adverse effect on the Bank’s operations and future prospects include, but are not limited to, changes in: interest rates; general and local economic conditions; the legislative/regulatory climate; monetary and fiscal policies of the U.S. government, including policies of the U.S. Treasury and the Federal Reserve Board; the quality or composition of loan or investment portfolios; demand for loan products; deposit flows; competition; demand for financial services in our market area and accounting principles, policies and guidelines. These risks and uncertainties should be considered in evaluating the forward-looking statements contained herein, and readers are cautioned not to place undue reliance on such statements, which speak only as of the date of this report.
3
Table of Contents
PART I - FINANCIAL INFORMATION
STATEMENTS OF CONDITION
(Dollars in Thousands)
| September 30, 2006 (Unaudited) | December 31, 2005 | |||||||
ASSETS | ||||||||
Interest-Bearing Deposits in Other Financial Institutions | $ | 15,633 | $ | 19,495 | ||||
Investment Securities | ||||||||
U. S. Agency Securities | 59,275 | 60,262 | ||||||
Federal Funds Sold | 34,350 | 12,900 | ||||||
Loans | 176,018 | 168,068 | ||||||
Less: Unearned Income | (398 | ) | (436 | ) | ||||
Allowance for Loan Losses | (1,920 | ) | (1,829 | ) | ||||
Net Loans | 173,700 | 165,803 | ||||||
Earning Assets | 282,958 | 258,460 | ||||||
Cash and Due From Banks | 7,780 | 8,138 | ||||||
Bank Premises and Equipment | 4,276 | 4,146 | ||||||
Real Estate Owned Other Than Bank Premises | 2,045 | 1,929 | ||||||
Investment in Associated Companies | 769 | 769 | ||||||
Other Assets | 2,958 | 2,774 | ||||||
TOTAL ASSETS | $ | 300,786 | $ | 276,216 | ||||
LIABILITIES | ||||||||
Deposits | ||||||||
LIFETIME FREE CHECKING | $ | 36,707 | $ | 36,222 | ||||
Interest-Bearing Demand | 22,772 | 42,702 | ||||||
Regular Passbook Savings | 39,849 | 43,746 | ||||||
Time Deposits | ||||||||
Certificates of Deposit $100,000 or More | 51,664 | 28,625 | ||||||
Other | 129,036 | 103,591 | ||||||
Total Deposits | 280,028 | 254,886 | ||||||
Notes issued to the U. S. Treasury | 534 | 2,102 | ||||||
Other Liabilities | 1,435 | 645 | ||||||
TOTAL LIABILITIES | 281,997 | 257,633 | ||||||
SHAREHOLDERS’ EQUITY | ||||||||
Common Stock, Par Value $1.25 Per Share, Authorized 10,000,000 Shares, 1,503,106 Outstanding in 2006 and 2005 | 1,879 | 1,879 | ||||||
Surplus | 11,327 | 11,327 | ||||||
Undivided Profits | 5,583 | 5,377 | ||||||
TOTAL SHAREHOLDERS’ EQUITY | 18,789 | 18,583 | ||||||
TOTAL LIABILITIES AND SHAREHOLDERS EQUITY | $ | 300,786 | $ | 276,216 | ||||
See accompanying notes to unaudited financial statements.
4
Table of Contents
FIRST NATIONAL BANK
STATEMENTS OF INCOME
(Dollars in Thousands, except per share data)
| Nine Months Ended September 30, | Three Months Ended September 30, | ||||||||||||
| 2006 | 2005 | 2006 | 2005 | ||||||||||
| (Unaudited) | (Unaudited) | ||||||||||||
INTEREST INCOME | |||||||||||||
Interest and Fees on Loans | |||||||||||||
Taxable | $ | 7,514 | $ | 6,534 | $ | 2,525 | $ | 2,189 | |||||
Non-Taxable | 598 | 437 | 211 | 150 | |||||||||
Interest on Deposits in Other Financial Institutions | 554 | 498 | 186 | 165 | |||||||||
Interest on Federal Funds Sold | 509 | 621 | 264 | 198 | |||||||||
Interest and Dividends on Securities | |||||||||||||
U. S. Agency Securities | 1,791 | 1,519 | 631 | 539 | |||||||||
Obligations of States and Political Subdivisions | — | 16 | — | 5 | |||||||||
TOTAL INTEREST INCOME | 10,966 | 9,625 | 3,817 | 3,246 | |||||||||
INTEREST EXPENSE | |||||||||||||
Interest on Time Deposits $100,000 or More | 1,250 | 909 | 549 | 311 | |||||||||
Interest on Other Deposits | 4,585 | 3,739 | 1,638 | 1,241 | |||||||||
Interest on Notes Issued to the U. S. Treasury | 9 | — | 4 | (1 | ) | ||||||||
TOTAL INTEREST EXPENSE | 5,844 | 4,648 | 2,191 | 1,551 | |||||||||
NET INTEREST INCOME | 5,122 | 4,977 | 1,626 | 1,695 | |||||||||
Provision for Loan Losses | 72 | 54 | 24 | 18 | |||||||||
NET INTEREST INCOME AFTER | |||||||||||||
PROVISION FOR LOAN LOSSES | 5,050 | 4,923 | 1,602 | 1,677 | |||||||||
NON-INTEREST INCOME | |||||||||||||
Service Charges, Commissions and Fees | 355 | 397 | 108 | 128 | |||||||||
Other Non-Interest Income | 152 | 136 | 59 | 45 | |||||||||
TOTAL NON-INTEREST INCOME | 507 | 533 | 167 | 173 | |||||||||
NON-INTEREST EXPENSE | |||||||||||||
Salaries and Employee Benefits | 2,149 | 2,179 | 713 | 720 | |||||||||
Occupancy Expense (Net) | 552 | 499 | 187 | 170 | |||||||||
Operations Center Expense | 923 | 918 | 310 | 304 | |||||||||
Other Non-Interest Expense | 501 | 404 | 155 | 146 | |||||||||
TOTAL NON-INTEREST EXPENSE | 4,125 | 4,000 | 1,365 | 1,340 | |||||||||
INCOME BEFORE INCOME TAXES | 1,432 | 1,456 | 404 | 510 | |||||||||
Income Tax Expense | 280 | 340 | 65 | 120 | |||||||||
NET INCOME | $ | 1,152 | $ | 1,116 | $ | 339 | $ | 390 | |||||
EARNINGS PER COMMON SHARE: | |||||||||||||
Basic and Diluted | $ | 0.77 | $ | 0.74 | $ | 0.23 | $ | 0.26 | |||||
Weighted Average Shares Outstanding | 1,503,106 | 1,503,106 | 1,503,106 | 1,503,106 | |||||||||
Cash Dividends Per Common Shares | $ | 0.63 | $ | 0.63 | $ | 0.21 | $ | 0.21 | |||||
See accompanying notes to unaudited financial statements.
5
Table of Contents
FIRST NATIONAL BANK
STATEMENTS OF CASH FLOWS
(Dollars in Thousands)
| Nine Months Ended September 30, | ||||||||
| 2006 | 2005 | |||||||
| (Unaudited) | ||||||||
Cash Flows From Operating Activities | ||||||||
Net Income | $ | 1,152 | $ | 1,116 | ||||
Adjustments to reconcile net income to net cash provided by operating activities | ||||||||
Provision for Loan Losses | 72 | 54 | ||||||
Depreciation of Bank Premises and Equipment | 191 | 161 | ||||||
Increase (Decrease) in Unearned Income | (38 | ) | (23 | ) | ||||
(Increase) Decrease in Other Assets | (184 | ) | (68 | ) | ||||
Increase (Decrease) in Other Liabilities | 790 | 315 | ||||||
Net Cash From Operating Activities | 1,983 | 1,555 | ||||||
Cash Flows From Investing Activities | ||||||||
Proceeds from Maturity of Interest Bearing Balances | 13,060 | 13,854 | ||||||
Purchase of Interest Bearing Balances | (9,198 | ) | (11,080 | ) | ||||
Payments on Investment Securities | 9,987 | 8,866 | ||||||
Purchase of Investment Securities | (9,000 | ) | (22,500 | ) | ||||
Purchase of Bank Premises and Equipment | (321 | ) | (247 | ) | ||||
Net (Increase) Decrease in Short-Term Loans Outstanding, Net | (4,680 | ) | (7,145 | ) | ||||
Longer-Term Loans Originated or Purchased | (13,053 | ) | (14,010 | ) | ||||
Principal Collected on Longer-Term Loans | 9,802 | 19,762 | ||||||
(Increase) Decrease in Other Real Estate | (116 | ) | 182 | |||||
Net Cash From Investing Activities | (3,519 | ) | (12,318 | ) | ||||
Cash Flows from Financing Activities | ||||||||
Increase in Demand and Savings Accounts | (23,342 | ) | (23,411 | ) | ||||
Proceeds from Sale of Time Deposits | 106,329 | 64,952 | ||||||
Payments for Matured Time Deposits | (57,845 | ) | (82,581 | ) | ||||
Cash Dividends | (946 | ) | (947 | ) | ||||
Net Increase (Decrease) in Notes issued to the U. S. Treasury | (1,568 | ) | 343 | |||||
Net Cash From Financing Activities | 22,628 | (41,644 | ) | |||||
Net Decrease in Cash and Cash Equivalents | 21,092 | (52,407 | ) | |||||
Cash and Cash Equivalents at Beginning of Year | 21,038 | 73,164 | ||||||
Cash and Cash Equivalents at End of Period | $ | 42,130 | $ | 20,757 | ||||
Cash and Cash Equivalents Include: | ||||||||
Cash and Due From Banks | $ | 7,780 | $ | 8,157 | ||||
Federal Funds Sold | 34,350 | 12,600 | ||||||
Total Cash and Cash Equivalents at Period End | $ | 42,130 | $ | 20,757 | ||||
Supplementary Data: | ||||||||
Cash Interest Paid | $ | 5,014 | $ | 4,239 | ||||
Cash Paid for Taxes | 280 | 340 | ||||||
See accompanying notes to unaudited financial statements.
6
Table of Contents
FIRST NATIONAL BANK
STATEMENTS OF CHANGES IN SHAREHOLDERS’ EQUITY
(Dollars in Thousands)
| Common Stock | Surplus | Undivided Profits | ||||||||||
| Shares | Par Value | |||||||||||
Balances, December 31, 2005 | 1,503,106 | $ | 1,879 | $ | 11,327 | $ | 5,377 | |||||
Net Income | — | — | — | 1,152 | ||||||||
Cash Dividends | — | — | �� | — | (946 | ) | ||||||
Balances, September 30, 2006 (Unaudited) | 1,503,106 | $ | 1,879 | $ | 11,327 | $ | 5,583 | |||||
NOTES TO UNAUDITED FINANCIAL STATEMENTS
The unaudited interim financial statements of the Bank are prepared in conformity with accounting principles generally accepted in the United States of America and the instructions to Securities and Exchange Commission’s Form 10-QSB. In the opinion of management, all adjustments (consisting only of normal recurring adjustments) necessary for a fair presentation of the financial position and results of operations for the periods presented have been included. The financial statements should be read in conjunction with the financial statements and notes contained in the Bank’s Annual Report on Form 10-KSB for the year ended December 31, 2005. The results for the six months ended September 30, 2006 are not necessarily indicative of the results for the entire fiscal year ending December 31,2006.
Certain reclassifications have been made to the prior year financial statements to conform to the 2006 presentation. These reclassifications had no effect on previously reported net income.
Note 1 - INVESTMENT SECURITIES
(Dollars in Thousands)
The Bank has the ability and intent to carry the investments noted with an unrealized loss to the final maturity of the instrument and considers these investments not other-than-temporarily impaired.
The following table sets forth a summary of the investment securities portfolio as of the periods indicated:
| Amortized Cost | Gross Unrealized Gains | Gross Unrealized Losses | Estimated Market Value | |||||||||
September 30, 2006 (Unaudited) | ||||||||||||
U. S. Agency Securities | $ | 59,275 | $ | 15 | $ | 617 | $ | 58,673 | ||||
Total Securities | $ | 59,275 | $ | 15 | $ | 617 | $ | 58,673 | ||||
December 31, 2005 | ||||||||||||
U. S. Agency Securities | $ | 60,262 | $ | 14 | $ | 764 | $ | 59,512 | ||||
Total Securities | $ | 60,262 | $ | 14 | $ | 764 | $ | 59,512 | ||||
7
Table of Contents
Note 2 - LOANS
(Dollars in Thousands)
The composition of the loan portfolio by dollar amount is shown in the table below:
| September 30, 2006 (Unaudited) | December 31, 2005 | |||||||
Secured by real estate | ||||||||
Construction Loans | $ | 12,507 | $ | 10,763 | ||||
Secured by farmland (including farm residential and other improvements) | 3,597 | 3,729 | ||||||
Secured by 1-4 family residential properties | 28,750 | 25,255 | ||||||
Secured by multi-family residential properties | 9,365 | 9,216 | ||||||
Secured by non-farm residential property | 77,766 | 77,853 | ||||||
Loans to finance agricultural production and other loans to farmers | 580 | 508 | ||||||
Commercial and industrial loans | 14,815 | 13,805 | ||||||
Loans to individuals for household, family and other personal expenditures | 6,842 | 7,721 | ||||||
Obligations (other than securities) of states and political subdivisions | 21,796 | 19,218 | ||||||
Less: Unearned Income | (398 | ) | (436 | ) | ||||
Total loans and leases | $ | 175,620 | $ | 167,632 | ||||
Note 3 - ALLOWANCE FOR LOAN LOSSES
(Dollars in Thousands)
The allowance for loan losses is an estimate of losses inherent in the loan portfolio as determined by management taking into consideration historical loan loss experience, diversification of the loan portfolio, amounts of secured and unsecured loans, banking industry standards and averages, and general economic conditions. Ultimate losses may vary from current estimates. These estimates are reviewed periodically and as adjustments become necessary, they are reported in earnings in the periods which they become reasonably estimable.
The following table summarizes the activity in the allowance for loan losses in the periods presented:
| September 30, 2006 (Unaudited) | December 31, 2005 | ||||||
Balance Beginning of Period | $ | 1,829 | $ | 1,994 | |||
Provision for Loan Losses | 72 | 120 | |||||
Charge-Offs, Net of (Recoveries): | |||||||
Real Estate Loans | (80 | ) | 108 | ||||
Installment Loans | 29 | 35 | |||||
Commercial Loans | 32 | 142 | |||||
Total Net Loan Losses | (19 | ) | 285 | ||||
Balance End of Period | $ | 1,920 | $ | 1,829 | |||
8
Table of Contents
Note 4 - NONPERFORMING ASSETS AND DELINQUENT LOANS
(Dollars in Thousands)
| September 30, 2006 (Unaudited) | December 31, 2005 | |||||
Nonaccrual Loans | ||||||
Real Estate | $ | 4,322 | $ | 4,321 | ||
Installment | — | 18 | ||||
Commercial | — | — | ||||
Total Nonaccrual Loans | 4,322 | 4,339 | ||||
Foreclosed Properties | 2,045 | |||||
Total Nonperforming Assets | $ | 6,367 | $ | 4,339 | ||
Loans 90 Days or More Past Due and Still Accruing | ||||||
Real Estate | $ | — | $ | 40 | ||
Installment | 4 | 1 | ||||
Commercial | — | 2 | ||||
Total Loans 90 Days or More Past Due | $ | 4 | $ | 43 | ||
Item 2 - MANAGEMENT’S DISCUSSION AND ANALYSIS
The Bank
Incorporated in 1974 as a national banking association with its main office in Rocky Mount, Virginia, the Bank operates under a national charter and provides full banking services. As a national bank, the Bank is subject to regulation by the Comptroller of the Currency, the Federal Deposit Insurance Corporation and the Board of Governors of the Federal Reserve System. The Bank generates commercial (including agricultural), mortgage and consumer loans and receives deposits from customers located primarily in the areas surrounding the Bank’s offices, which are located in Franklin County and the northern portion of Pittsylvania County in Virginia under the name “First National Bank” and Burke, Caldwell, Catawba, Cleveland and Rutherford Counties in North Carolina under the “Carolina National Bank” name. At September 30, 2006, the Bank had $300 million in assets, $174 million in net loans, $280 million in deposits and $18.8 million in total shareholders’ equity.
Proposed Reorganization and Merger
On July 28, 2006, the Bank entered into an Agreement and Plan of Merger (the “Merger Agreement”) with Blue Ridge Bank, N.A., Central National Bank, Community National Bank, First National Exchange Bank, Mountain National Bank, Patrick Henry National Bank, Patriot Bank, National Association, Peoples National Bank, and Shenandoah National Bank (together with the Bank, the “Banks”) and Carter Bank & Trust, a new Virginia chartered bank that will be headquartered in Martinsville, Virginia. The Merger Agreement sets forth the terms and conditions pursuant to which the Banks will reorganize by merging into Carter Bank & Trust (the “Merger”).
All officers and employees of the existing Banks will remain unchanged as a result of the Merger. Worth Harris Carter, Jr. is currently Chairman of the Board and President of each of the Banks and will serve as Chairman of the Board and President of Carter Bank & Trust. Under the terms of the Merger Agreement, shareholders of each of the Banks will receive a certain number of shares in Carter Bank & Trust in exchange for each share held in the existing Banks as follows: each share of Blue Ridge Bank: 2.474 shares; each share of Central National Bank: 5.470 shares; each share of Community National Bank: 4.350 shares; each share of First National Bank: 1.613 shares; each share
9
Table of Contents
of First National Exchange Bank: 4.509 shares; each share of Mountain National Bank: 3.981 shares; each share of Patrick Henry National Bank: 1.112 shares; each share of Patriot Bank: 5.775 shares; each share of Peoples National Bank: 1.945 shares; and each share of Shenandoah National Bank: 3.461 shares.
Consummation of the Merger is subject to a number of customary conditions including (i) the approval of the Merger by the shareholders of each of the Banks and Carter Bank & Trust and (ii) the receipt of all required regulatory approvals, including approval by the Virginia State Corporation Commission and the Federal Deposit Insurance Corporation. The Merger is expected to be completed in the fourth quarter of 2006 and will be accounted for using the purchase method of accounting.
Critical Accounting Policies
The accounting and reporting policies of the Bank conform to generally accepted accounting principles (GAAP) in the United States of America and to general practices within the banking industry. The preparation of the financial statements in conformity with GAAP requires management to make estimates and assumptions that affect the amounts reported in the financial statements and accompanying notes. We believe the most significant of these estimates involves the allowance for loan losses because of its potential impact on our overall performance. We have described our policies in this area below. A summary of the Bank’s significant accounting policies can be found in the Notes to the Financial Statements included in the Bank’s 2005 Annual Report on Form 10KSB.
In general, determining the amount of the allowance for loan losses requires significant judgment and the use of estimates by management allowing for losses inherent to the loan portfolio. The Bank maintains an allowance for loan losses to absorb probable losses in the loan portfolio based on a quarterly analysis of the portfolio. This analysis determines an appropriate level of the allowance for loan losses by considering factors affecting loan losses, including specific losses, levels and trends in impaired and non-performing loans, historical loan loss experience, current economic conditions, volume, growth and composition of the portfolio, and other relevant factors. The Bank records a provision for loan losses to maintain the allowance at an adequate level. The provision expense could increase or decrease each quarter based upon the results of management’s formal analysis.
The amount of the allowance represents management’s estimate of expected losses from existing loans based upon specific allocations for individual lending relationships and historical loss experience. The allowance for loan losses related to impaired loans is based on discounted cash flows using the loan’s initial effective interest rate or the fair value of the collateral for certain collateral dependent loans. This evaluation requires management to make estimates of the amounts and timing of future cash flows on impaired loans, which consists primarily of nonaccrual and restructured loans. Actual losses for these loans can vary significantly from these estimates.
Investment securities are stated at cost, adjusted for amortization of premiums and accretion of discounts, and computed by the interest method. The Bank has positive intent and ability to hold these securities until maturity. Gains and losses on sales, if any, of securities are based upon the adjusted cost of the specific securities sold. If any of the securities are not held to maturity, the classification of the entire portfolio could change to available for sale. This could require fair value accounting for not just the tainted securities but the entire portfolio, and possibly, the recognition of unrealized losses as other than temporary in the income statement.
Real estate properties acquired through or in lieu of loan foreclosure are initially recorded at the lower of the Bank’s carrying amount or fair value less estimated selling cost at the date of foreclosure. Any write-downs based on the asset’s fair value at the date of acquisition are charged to the allowance for loan losses. After foreclosure, these assets are carried at the lower of their new cost basis or fair value less cost to sell. Costs of significant property improvements are capitalized, whereas costs relating to holding property are expensed. The portion of interest costs relating to development of real estate is capitalized. Valuations are periodically performed by management, and any write-downs are recorded as a charge to operations, if necessary, to reduce the carrying value of a property to the lower of its carrying value or fair value less cost to sell. The fair value of other real estate owned, including related selling costs, is an estimate that may change in the near term. If estimates change that decrease the expected fair value of the property, the recognition of this loss is reflected in the income statement for the period the estimate changes.
10
Table of Contents
Overview
Net income for the first nine months of 2006 equaled $1,152,000, or $0.77 per share, compared to $1,116,000, or $0.74 per share, for 2005. On an annualized basis, this represents a return on average assets of 0.55% and return on average equity of 8% compared to 0.53% and 8%, respectively, for last year.
Deposits have increased $25 million since the end of the year. LIFETIME FREE CHECKING and certificates of deposit increased, while all other categories decreased. The decrease in these categories was mainly due to funds being moved from short term accounts into longer term certificates of deposits.
The Bank has reduced short-term investments while increasing higher yielding loans $7.9 million. This had a positive impact on earnings as our net interest income increased $145,000. As a result net income was up $36,000 or 3%. As interest rates continue to increase, we expect our net interest margins to widen and our earnings are expected to increase.
Total Liabilities at September 30, 2006 were $281,997,000, up from $257,633,000 at December 31, 2005.
Total Shareholders’ Equity at September 30, 2006 was $18,789,000. At December 31, 2005, total Shareholders’ Equity was $18,583,000.
Results of Operations
Net Interest Income. Net Interest Income is our largest source of revenue. Net interest income increased $145,000 compared to the same period last year.
The following table details the average balances and cost and yield data for the earning assets and interest-bearing liabilities:
| For the Nine Months Ended | |||||||||||||||||||||||
| September 30, 2006 | September 30, 2006 | ||||||||||||||||||||||
| (Unaudited | |||||||||||||||||||||||
Asset/Liability | Average Balance | Income/ Expense | Yield/ Cost | Average Balance | Income/ Expense | Yield/ Cost | Increase (Decrease) | ||||||||||||||||
Real Estate Loans | $ | 130,029 | $ | 5,912 | 6.06 | % | $ | 123,323 | $ | 5,377 | 5.81 | % | $ | 535 | |||||||||
Installment Loans | 6,838 | 401 | 7.82 | % | 6,945 | 437 | 8.39 | % | (36 | ) | |||||||||||||
Commercial Loans | 37,865 | 1,799 | 6.33 | % | 32,658 | 1,157 | 4.72 | % | 642 | ||||||||||||||
Total Loans-Net of Unearned Income | 174,732 | 8,112 | 6.19 | % | 162,926 | 6,971 | 5.70 | % | 1,141 | ||||||||||||||
Interest-Bearing Deposits in Other Financial Institutions | 15,329 | 554 | 4.82 | % | 20,587 | 498 | 3.23 | % | 56 | ||||||||||||||
Investment Securities | 58,932 | 1,791 | 4.05 | % | 56,449 | 1,535 | 3.63 | % | 256 | ||||||||||||||
Federal Funds Sold | 19,899 | 509 | 3.41 | % | 17,045 | 621 | 4.86 | % | (112 | ) | |||||||||||||
Total Earning Assets | 268,892 | 10,966 | 5.44 | % | 257,007 | 9,625 | 4.99 | % | 1,341 | ||||||||||||||
Interest-Bearing Transaction Accounts | 19,173 | 514 | 3.57 | % | 21,872 | 323 | 1.97 | % | 191 | ||||||||||||||
Savings Deposits (Including MMDAs) | 44,504 | 636 | 1.91 | % | 51,641 | 677 | 1.75 | % | (41 | ) | |||||||||||||
Certificates of Deposit Over $100,000 | 42,722 | 1,250 | 3.90 | % | 31,996 | 909 | 3.79 | % | 341 | ||||||||||||||
Other Certificates of Deposits | 121,179 | 3,435 | 3.78 | % | 110,774 | 2,734 | 3.29 | % | 701 | ||||||||||||||
Total Deposits | 227,578 | 5,835 | 3.42 | % | 216,283 | 4,643 | 2.86 | % | 1,192 | ||||||||||||||
Notes issued to the U. S. Treasury | 260 | 9 | 4.62 | % | 271 | 5 | 2.46 | % | 4 | ||||||||||||||
Total Interest-Bearing Liabilities | $ | 227,838 | $ | 5,844 | 3.42 | % | $ | 216,554 | $ | 4,648 | 2.86 | % | $ | 1,196 | |||||||||
Net Interest Income | $ | 5,122 | 2.54 | % | $ | 4,977 | 2.58 | % | $ | 145 | |||||||||||||
11
Table of Contents
Allowance and Provision for Loan Losses. The Allowance for Loan Losses represents management’s estimation of the amount necessary to absorb future losses in the loan portfolio. On the Statement of Condition, the Allowance for Loan Losses is deducted from Total Loans so that the net amount shown represents the estimated realizable total loans. The Provision for Loan Losses is the amount charged to expense to maintain the Allowance at an adequate level.
The Allowance for Loan Losses was $1,920,000, or 1% of total loans outstanding, at September 30, 2006. In the view of management, the Allowance for Loan Losses is adequate to meet the loss contingency based on experience factors and a review of the loan portfolio.
The Provision for Loan Loss was $72,000 for the nine months ended September 30, 2006 and $54,000 for 2005. See Note 3 - Allowance for Loan Losses and Note 4 – Nonperforming Assets and Delinquent Loans – to the financial statements for additional information.
Non-Interest Income.Non-Interest Income decreased $26,000, or 5%, for the nine month period ended September 30, 2006, compared to the same period of 2005. The largest source of non-interest income is Service Charges, Commissions and Fees, which decreased from $397,000 at September 30, 2005 to $355,000 at September 30, 2006.
Non-Interest Expense.Non-Interest Expense increased $125,000 or 3%, for the nine month period ended September 30, 2006, compared to the same period of 2005.
Income Taxes.The Bank recorded $280,000 in income tax expense in the third quarter of 2006, as compared to $340,000 in 2005. The effective income tax rate declined between the periods, due to a higher percentage of tax exempt income to pretax accounting income in the current period.
Analysis of Financial Condition
Investments.U. S. Agency Securities investments have decreased $3.9 million compared to December 31, 2005. This decrease funded the increase in loans.
Loans.Loans increased $7.9 million, or 5%, compared to December 31, 2005. The increase took place primarily in the real estate segment of the portfolio. Real estate secured loans made up approximately 75% of total loans at September 30, 2006.
Non-Performing Assets and Impaired Loans. Non-performing assets, which consist of nonaccrual loans and foreclosed properties, were $6,367,000 at September 30, 2006 and $6,268,000 at December 31, 2005. Nonaccrual Loans equaled $4,322,000 at September 30, 2006 and $4,339,000 at December 31, 2005. The nonaccrual loans include a portion of loans considered to be impaired at quarter end, September 30, 2006 and year end, December 31, 2005. Foreclosed Properties equaled $2,045,000 at September 30, 2006 and $1,929,000 at December 31, 2005.
Nonaccrual loans are those loans contractually past due 90 days or more on which no interest is being accrued. Other real estate owned consists of real estate acquired through foreclosure. These properties are reviewed quarterly and reduced to an estimated realizable value at that time.
Deposits.Total deposits have increased $25 million, or 9%, compared to December 31, 2005. Increases occurred in LIFETIME FREE CHECKING and certificates of deposit. All other categories decreased.
Capital.The federal regulatory agencies use risk-based capital ratios to analyze the adequacy of a bank’s capital. These ratios weigh bank assets from 0% to 100%, depending upon the risks inherent in each type of asset. The Bank continues to meet all requirements for a well-capitalized bank as defined by the regulatory agencies.
12
Table of Contents
The Following table presents the key risk-based capital ratios for the periods indicated:
| September 30, 2006 | December 31, 2005 | |||||
Tier 1 Ratio | 10.39 | % | 10.80 | % | ||
Total Risk-Based Capital Ratio | 11.45 | % | 11.86 | % | ||
Leverage Ratio | 6.61 | % | 7.04 | % |
Shareholders’ Equity was $18,789,000 at September 30,2006 compared to $18,583,000 at December 31, 2005.
Liquidity.Liquidity is our ability to fund both loans and investments in the normal course of business and to provide adequate protection for unexpected deposit withdrawals or other demands for funds without incurring a significant negative impact on profitability. Our primary source of day-to-day liquidity lies in the combination of cash, deposit balances, checks in process of collection, deposit growth and federal funds sold. Federal funds are excess funds that are sold to other banks, generally on a one-day basis. Normal funds from the repayment of loans and investments augment these funds.
Our secondary source of liquidity lies in our investments and deposits in other financial institutions. While our investments are categorized as held-to-maturity, they consist primarily of short-term U. S. Agency Securities that are readily marketable. The majority of our investment securities mature in five years or less. Interest-bearing deposits in other financial institutions generally mature in two years or less and the volume of this investment decreased for the first nine months.
Off-Balance Sheet Arrangements.Commitments to extend credit, which amounted to $2,614,000 at September 30, 2006 and $2,471,000 at December 31,2005, respectively, represent agreements to lend to customers with fixed expiration dates or other termination clauses. Since many of the commitments are expected to expire without being funded, the total commitment amounts do not necessarily represent future liquidity requirements. Standby letters of credit are conditional commitments issued by the Bank guaranteeing the performance of a customer to a third party. Those guarantees are primarily issued to support public and private borrowing arrangements. The Bank had outstanding letters of credit in the amount of $1,534,000 at September 30, 2006 and $974,000 at December 31, 2005.
Recent Accounting Pronouncements.In June 2005, the FASB issued Statement No. 154, “Accounting Changes and Error Corrections”, which replaces APB Opinion No. 20, “Accounting Changes” and FASB Statement No. 3, “Reporting Accounting Changes in Interim Financial Statements.” Statement No., 154 requires that a voluntary change in accounting principle be applied retrospectively with all prior period financial statements presented on the new accounting principle. Statement No. 154 also requires that a change in method of depreciating or amortizing a long-lived non-financial asset be accounted for prospectively as a change in estimate, and correction of errors in previously issued financial statements should be termed a “restatement.” Statement No. 154 is effective for accounting changes and correction of errors made in fiscal years beginning after December 15, 2005. Management does not expect this accounting pronouncement to have a material impact on the financial statements.
Item 3 - CONTROLS AND PROCEDURES
The Bank maintains a system of disclosure controls and procedures that is designed to ensure that material information is accumulated and communicated to management, including the Bank’s president (who is the Bank’s principal executive officer and principal financial officer), as appropriate to allow timely decisions regarding required disclosure. As required, management, with the participation of the Bank’s president, evaluated the effectiveness of the design and operation of the Bank’s disclosure controls and procedures as of the end of the period covered by this report. Based on this evaluation, the Bank’s president concluded that the Bank’s disclosure controls and procedures were operating effectively to ensure that information required to be disclosed by the Bank in reports that it files or submits under the Securities Exchange Act of 1934, as amended, is recorded, processed, summarized, and reported within the time periods specified in the rules and forms of the SEC.
13
Table of Contents
Because of the inherent limitations in all control systems, no evaluation of controls can provide absolute assurance that the Bank’s disclosure controls and procedures will detect or uncover every situation involving the failure of persons within the Bank to disclose material information otherwise required to be set forth in the Bank’s periodic reports.
The Bank’s management is also responsible for establishing and maintaining adequate internal control over financial reporting to provide reasonable assurance regarding the reliability of financial reporting and the preparation of financial statements for external purposes in accordance with generally accepted accounting principles. There were no changes in the Bank’s internal control over financial reporting during the Bank’s quarter ended September 30, 2006 that have materially affected, or are reasonably likely to materially affect, the Bank’s internal control over financial reporting.
PART II - OTHER INFORMATION
Item 1 - LEGAL PROCEEDINGS.
There are no material pending legal proceedings to which the Bank is a party or to which the property of the Bank is subject.
Item 2 - UNREGISTERED SALES OF EQUITY SECURITIES AND USE OF PROCEEDS.
None.
Item 3 - DEFAULTS UPON SENIOR SECURITIES.
None.
Item 4 - SUBMISSION OF MATTERS TO A VOTE OF SECURITY HOLDERS.
None.
Item 5 - OTHER INFORMATION
None.
Item 6 - EXHIBITS AND REPORTS ON FORM 8-K
Exhibits:
| 2.1 | Agreement and Plan of Merger, dated as of July 28, 2006, by and among Blue Ridge Bank, N.A., Central National Bank, Community National Bank, First National Bank, First National Exchange Bank, Mountain National Bank, Patrick Henry National Bank, Patriot Bank, National Association, Peoples National Bank, Shenandoah National Bank and Carter Bank & Trust (incorporated by reference to Exhibit 2.1 to Form 8-K filed with the Office of the Comptroller of the Currency on July 3 1,2006). | |
| 3.1 | Articles of Association (filed with the Office of the Comptroller of the Currency prior to the opening of the Bank) | |
| 3.2 | Amended and Restated Bylaws (as amended and restated through February 23, 2005) (incorporated by reference to Exhibit 3.2 to Form 8-K filed with the Office of the Comptroller of the Currency on February 23, 2005) | |
| 31 | Certification by principal executive officer and principal financial officer pursuant to Rule 13a-14(a) | |
| 32 | Certification of principal executive officer and principal financial officer pursuant to 18 U.S.C. § 1350 | |
14
Table of Contents
SIGNATURES
In accordance with the requirements of the Exchange Act of 1934, the registrant caused this report to be signed on its behalf by the undersigned, thereunto duly authorized.
| FIRST NATIONAL BANK | ||
| Date:November 13, 2006 |
| |
| Worth Harris Carter, Jr. | ||
| Chairman of the Board and President | ||
| (principal executive officer and principal financial officer) | ||
15
Table of Contents
Exhibit 31
CERTIFICATION
I, Worth Harris Carter, Jr., certify that:
| 1. | I have reviewed this annual report on Form 10-QSB of First National Bank; |
| 2. | Based on my knowledge, this report does not contain any untrue statement of a material fact or omit to state a material fact necessary to make the statements made, in light of the circumstances under which such statements were made, not misleading with respect to the period covered by this report; |
| 3. | Based on my knowledge, the financial statements, and other financial information included in this report, fairly present in all material respects the financial condition, results of operations and cash flows of the registrant as of, and for, the periods presented in this report; |
| 4. | I am responsible for establishing and maintaining disclosure controls and procedures (as defined in Exchange Act Rules 13a-15(e) and 15d-15(e)) for the registrant and have: |
| (a) | Designed such disclosure controls and procedures, or caused such disclosure controls and procedures to be designed under my supervision, to ensure that material information relating to the registrant, including its consolidated subsidiaries, is made known to me by others within those entities, particularly during the period in which this report is being prepared; |
| (b) | Evaluated the effectiveness of the registrant’s disclosure controls and procedures and presented in this report my conclusions about the effectiveness of the disclosure controls and procedures, as of the end of the period covered by this report based on such evaluation; and |
| (c) | Disclosed in this report any change in the registrant’s internal control over financial reporting that occurred during the registrant’s most recent fiscal quarter (the registrant’s fourth fiscal quarter in the case of an annual report) that has materially affected, or is reasonably likely to materially affect, the registrant’s internal control over financial reporting; and |
| 5. | I have disclosed, based on my most recent evaluation of internal control over financial reporting, to the registrant’s auditors and the audit committee of the registrant’s board of directors (or persons performing the equivalent functions): |
| (a) | All significant deficiencies and material weaknesses in the design or operation of internal control over financial reporting which are reasonably likely to adversely affect the registrant’s ability to record, process, summarize and report financial information; and |
| (b) | Any fraud, whether or not material, that involves management or other employees who have a significant role in the registrant’s internal control over financial reporting. |
Date:November 13, 2006 |
| |||
| Worth Harris Carter, Jr. | ||||
| Chairman of the Board and President | ||||
| (principal executive officer and principal financial officer) |
16
Table of Contents
Exhibit 32
CERTIFICATION OF
PRINCIPAL EXECUTIVE OFFICER AND PRINCIPAL FINANCIAL OFFICER
Pursuant to Section 906 of the Sarbanes-Oxley Act of 2002 (18 U.S.C. Section 1350)
The undersigned, as the principal executive officer and principal financial officer of First National Bank, certifies that, to the best of his knowledge and belief, the Quarterly Report on Form 10-QSB for the period ended September 30, 2006 which accompanies this certification fully complies with the requirements of Section 13(a) or 15(d) of the Securities Exchange Act of 1934 and the information contained in the report fairly presents, in all material respects, the financial condition and results of operations of First National Bank at the dates and for the periods indicated. The foregoing certification is made pursuant to Section 906 of the Sarbanes-Oxley Act of 2002 (18 U.S.C. Section 1350) and shall not be relied upon for any other purpose. The undersigned expressly disclaims any obligation to update the foregoing certification except as required by law.
Date:November 13, 2006 |
| |
| Worth Harris Carter, Jr. | ||
| Chairman of the Board and President | ||
| (principal executive officer and principal financial officer) |
17
Table of Contents
OFFICE OF THE COMPTROLLER OF THE CURRENCY
WASHINGTON, D.C. 20552
FORM 10-KSB
| x | ANNUAL REPORT UNDER SECTION 13 OR 15(d) OF THE SECURITIES EXCHANGE ACT OF 1934 |
For the fiscal year ended December 31, 2005
OR
| ¨ | TRANSITION REPORT UNDER SECTION 13 OR 15(d) OF THE SECURITIES EXCHANGE ACT OF 1934 |
For the transition period from to
Commission File Number: n/a
FIRST NATIONAL EXCHANGE BANK
(Name of small business issuer in its charter)
| National Bank | 54-1888304 | |
(State or other jurisdiction of incorporation or organization) | (I.R.S. Employer Identification No.) | |
1722 Hershberger Road Roanoke, VA | 24012 | |
| (Address of principal executive offices) | (Zip Code) | |
Issuer’s telephone number: (540)563-0095
Securities registered under Section 12(b) of the Exchange Act: None
Securities registered under Section 12(g) of the Exchange Act: None
Check whether the issuer is not required to file reports pursuant to Section 13 or 15(d) of the Exchange Act. Yes ¨ No x
Check whether the issuer (1) filed all reports required to be filed by Section 13 or 15(d) of the Exchange Act during the past 12 months (or for such shorter period that the registrant was required to file such reports), and (2) has been subject to such filing requirements for the past 90 days. Yes x No ¨
Check if there is no disclosure of delinquent filers in response to Item 405 of Regulation S-B contained in this form, and no disclosure will be contained, to the best of registrant’s knowledge, in definitive proxy or information statements incorporated by reference in Part III of this Form 10-KSB or any amendment to this Form 10-KSB. x
Indicate by check mark whether the registrant is a shell company (as defined in Rule 12b-2 of the Exchange Act). Yes ¨ No x
The issuer’s revenues for the fiscal year ended December 31, 2005 were $ 11,353,000.
The aggregate market value of the issuer’s common stock held by nonaffiliates as of March 22, 2006 was $12,570,000.
As of March 22, 2006, there were issued and outstanding 492,329 shares of the issuer’s common stock.
DOCUMENTS INCORPORATED BY REFERENCE
Portions of the 2005 Annual Report to Shareholders are incorporated by reference in Part II of this report, which is attached hereto as Exhibit 13.
Transitional Small Business Disclosure Format: Yes ¨ No x
Table of Contents
First National Exchange Bank
2005 ANNUAL REPORT ON FORM 10-KSB
TABLE OF CONTENTS
| Page | ||||
| PART I | 4 | |||
ITEM 1. | DESCRIPTION OF BUSINESS | 4 | ||
ITEM 2. | DESCRIPTION OF PROPERTY. | 8 | ||
ITEM 3. | LEGAL PROCEEDINGS. | 8 | ||
ITEM 4. | SUBMISSION OF MATTERS TO A VOTE OF SECURITY HOLDERS. | 8 | ||
| PART II | 9 | |||
ITEM 5. | MARKET FOR COMMON EQUITY AND RELATED STOCKHOLDER MATTERS | 9 | ||
ITEM 6. | MANAGEMENT’S DISCUSSION AND ANALYSIS OR PLAN OF OPERATION | 10 | ||
ITEM 7. | FINANCIAL STATEMENTS. | 10 | ||
ITEM 8. | CHANGES IN AND DISAGREEMENTS WITH ACCOUNTANTS ON ACCOUNTING AND FINANCIAL DISCLOSURE | 10 | ||
ITEM 8A. | CONTROLS AND PROCEDURES. | 10 | ||
ITEM 8B. | OTHER INFORMATION | 11 | ||
| PART III | 11 | |||
ITEM 9. | DIRECTORS, EXECUTIVE OFFICERS, PROMOTERS AND CONTROL PERSONS; COMPLIANCE WITH SECTION 16(A) OF THE EXCHANGE ACT. | 11 | ||
ITEM 10. | EXECUTIVE COMPENSATION. | 13 | ||
ITEM 13. | EXHIBITS. | 17 | ||
ITEM 14. | PRINCIPAL ACCOUNTANT FEES AND SERVICES. | 17 |
2
Table of Contents
FORWARD–LOOKING STATEMENTS
This report contains statements concerning the Bank’s expectations, plans, objectives, future financial performance and other statements that are not historical facts. These statements may constitute “forward-looking statements” as defined by federal securities laws. In some cases, readers can identify the forward-looking statements by the use of words such as “may,” “ will,” “should,” “could,” “expect,” “plan,” “intend,” “anticipate,” “believe,” “estimate,” “predict,” “potential” or “continue” or the negative or other variations of these words, or other comparable words or phrases. These statements may address issues that involve estimates and assumptions made by management, risks and uncertainties, and actual results could differ materially from historical results or those anticipated by such statements. Factors that could have a material adverse effect on the Bank’s operations and future prospects include, but are not limited to, changes in: interest rates; general and local economic conditions; the legislative/regulatory climate; monetary and fiscal policies of the U.S. government, including policies of the U.S. Treasury and the Federal Reserve Board; the quality or composition of loan or investment portfolios; demand for loan products; deposit flows; competition; demand for financial services in our market area and accounting principles, policies and guidelines. These risks and uncertainties should be considered in evaluating the forward-looking statements contained herein, and readers are cautioned not to place undue reliance on such statements, which speak only as of the date of this report.
PART I
| ITEM 1. | DESCRIPTION OF BUSINESS. |
General
The Bank opened for business as a National Banking Association on May 1, 1998 in the Roanoke Valley and was created through the spin-off of the assets, liabilities and related capital from four offices of First National Bank in Rocky Mount, Virginia.
The Bank is a full service community bank that provides an array of financial products and services to its customers, including a variety of interest-bearing and non-interest bearing demand deposit accounts; savings and money market accounts; certificates of deposit; commercial, installment, and real estate mortgage loans (commercial and residential); and safe deposit rental facilities. The Bank also sells travelers checks, money orders and cashier’s checks.
At December 31, 2005, the Bank had 94 full-time and 5 part-time employees, $210 million in assets, $123 million in net loans, $190 million in deposits and $19.5 million in total shareholders’ equity.
Market Area
The Bank’s primary service area currently consists of Roanoke Valley, including the cities of Roanoke and Salem and the County of Roanoke, and Bedford, Botetourt, and Craig Counties in Virginia offices within this primary service area. The Bank expanded into Bath County in 2005 with the opening of a new office in Hot Springs, Virginia. The Bank conducts a general commercial banking business in its service area, and focuses on serving the banking needs of small-to-medium sized businesses, professional concerns and individuals.
Goals and Strategy
The Bank’s goal is to become a leading financial institution in its market area by opening new offices and providing a full array of banking services. Management believes that the on-going consolidation of the banking industry has created an opportunity for community-based lenders like the Bank that emphasize retail lending and superior customer service. The Bank’s business strategy is to target individuals, businesses and professionals in the area for loans, deposits, and other financial services and to explore selected opportunities to establish branches in areas that demographically compliment the Bank’s existing customer base.
3
Table of Contents
Deposits and Loan Products
The Bank offers a full range of deposit services including LIFETIME FREE CHECKING, NOW accounts, savings accounts, retirement accounts and other deposits of various types, ranging from money market accounts to longer-term certificates of deposit. The transaction accounts and time certificates are tailored to the Bank’s principal market at competitive rates. All deposit accounts are insured by the Federal Deposit Insurance Corporation (“FDIC”) up to the maximum amount allowed by law (generally $100,000 per depositor subject to aggregation rules). The Bank solicits these accounts from individuals, businesses, associations, organizations, and governmental entities.
The Bank also offers a full range of commercial and personal loans. Commercial loans include both secured and unsecured loans. Consumer loans include secured and unsecured loans for financing automobiles, home improvements, education and personal investments. The Bank also makes real estate construction and acquisition loans and originates and holds fixed and variable rate mortgage loans.
The Bank’s lending activities are subject to a variety of lending limits imposed by federal law. While differing limits apply in certain circumstances based on the type of loan or the nature of the borrower (including the borrower’s relationship to the Bank), in general the Bank is subject to a loan-to-one borrower limit of an amount equal to 15% of the Bank’s unimpaired capital and surplus. The Bank may not make loans to any director, officer, employee or 10% shareholder of the Bank unless the loan is approved by the Board of Directors and is made on terms not more favorable than are made available to a person not affiliated with the Bank.
Other bank services include travelers checks, direct deposit of payroll and social security checks, and automated drafts for various accounts. The Bank has no current plans to exercise trust powers.
Bank Lending Practices
The Bank’s lending efforts are directed to making loans to individuals and businesses in its market area. The Bank has both purchased and sold participation loans with other banks in the past and may do so in the future. The Bank believes that its lending and credit policies are conservative.
The Bank’s primary lending program has been the origination of loans secured by real estate. The Bank evaluates both the borrower’s ability to make principal and interest payments and the value of the property that will secure the loan.
Residential mortgage loans generally are made on the basis of the borrower’s ability to make repayment from employment and other income and are secured by real estate that can be readily valued. The Bank offers both adjustable-rate and fixed-rate loans.
In contrast, commercial real estate loans typically are made on the basis of the borrower’s ability to make repayment from cash flow from its business and are secured by business properties. The Bank’s primary non-residential real estate loan products have rates that are fixed for three to five years and then become adjustable. Commercial loans typically involve larger loan balances concentrated with single borrowers or groups of related borrowers.
The Bank also makes consumer loans, including unsecured personal loans, automobile loans, deposit account loans, installment loans and time loans. The Bank’s primary consideration when making such consumer loans is the customer’s ability to repay the loan. Consumer loans generally warrant higher interest rates and fees, but such loans, particularly unsecured consumer loans, also may entail greater risk than residential mortgage loans. Even when a loan is secured, repossessed collateral for a defaulted consumer loan may not provide an adequate source of repayment. Consumer loan collections are dependent on the borrower’s continuing financial stability, and are more likely to be affected adversely by job loss, divorce, illness, or personal bankruptcy. Various federal and state laws, including bankruptcy and insolvency laws, may limit the amount that can be recovered on such loans and such loans may give rise to claims and defenses by a consumer loan borrower.
4
Table of Contents
The Bank also makes commercial loans to qualified small businesses in its market area. Commercial business loans generally have a higher degree of risk than mortgage loans, but have commensurately higher yields. To manage these risks, the Bank generally secures appropriate collateral and carefully monitors the financial condition of its business borrowers.
Competition
Federal and state legislative changes have significantly increased competition among financial institutions, and current trends towards additional deregulation may be expected to increase competition even further. In its market area, the Bank competes with nationwide, statewide and local banking institutions, credit unions, thrift institutions, money market funds, consumer finance companies, and other financial service organizations. Many of the financial organizations competing with the Bank have greater financial resources than the Bank. Many of these financial organizations also have greater geographic coverage and some offer bank and bank-related services that the Bank does not offer.
Supervision and Regulation
Financial institutions are extensively regulated under federal and state law. Consequently, the growth and earnings performance of the Bank can be affected not only by management decisions and general economic conditions, but also by the statutes administered by, and the regulations and policies of, various governmental regulatory authorities including, but not limited to, the Office of the Comptroller of the Currency (“OCC”), the Federal Reserve Board (“FRB”), the FDIC, the Internal Revenue Service, federal and state taxing authorities, and the Securities and Exchange Commission. The effect of such statutes, regulations and policies can be significant, and cannot be predicted with a high degree of certainty.
Federal and state laws and regulations generally applicable to financial institutions regulate, among other things, the scope of business, investments, reserves against deposits, capital levels relative to operations, the nature and amount of collateral for loans, the establishment of branches, mergers, consolidations and dividends. The system of supervision and regulation applicable to the Bank establishes a comprehensive framework for their respective operations and is intended primarily for the protection of the FDIC’s deposit insurance funds and the depositors, rather than the shareholders, of the Bank.
The following references to material statutes and regulations affecting the Bank are brief summaries thereof and do not purport to be complete, and are qualified in their entirety by reference to such statutes and regulations. Any change in applicable law or regulations may have a material effect on the business of the Bank.
Finally, the Bank is subject to the periodic reporting requirements of the Securities Exchange Act of 1934, as amended, including but not limited to, filing annual, quarterly and other current reports with the OCC.
Regulatory Capital Requirements
All financial institutions are required to maintain minimum levels of regulatory capital. The OCC has established risk-based and leveraged capital standards for the financial institutions they regulate. The OCC also may impose capital requirements in excess of these standards on a case-by-case basis for various reasons, including financial condition or actual or anticipated growth. Under the risk-based capital requirements, the Bank is required to maintain a minimum ratio of total capital to risk-weighted assets of at least 8%. At least half of the total capital is required to be “Tier 1 capital,” which consists principally of common and certain qualifying preferred shareholders’ equity, less certain intangibles and other adjustments. The remainder, “Tier 2 capital,” consists of a limited amount of subordinated and other qualifying debt (including certain hybrid capital instruments) and a limited amount of the general loan loss reserve.
In addition, the federal regulatory agencies have established a minimum leveraged capital ratio (Tier 1 capital to period end total assets). These guidelines provide for a minimum leveraged capital ratio of 4%. The guidelines also provide that banking organizations experiencing internal growth or making acquisitions will be expected to maintain strong capital positions substantially above the minimum supervisory levels, without significant reliance on intangible assets.
5
Table of Contents
As of December 31, 2005 and 2004, the Bank qualified as a “well capitalized” institution (see Note 16 to the Financial Statements).
Insurance of Accounts, Assessments and Regulation by the FD1C
The Bank is a member of the Bank Insurance Fund (“BIF”) of the FDIC. As a BIF insured institution, the Bank is subject to FDIC rules and regulations as administrator of the BIF. The Bank’s deposits are insured up to $100,000 per insured depositor, as defined by law and regulation. As insurer, the FDIC is authorized to conduct examinations of and to require reporting by BIF institutions. The actual assessment to be paid by each BIF member is based on the institution’s assessment risk classification and whether the institution is considered by its supervisory agency to be financially sound or to have supervisory concerns.
Under the FDIC’s risk-based insurance system, BIF-insured institutions are currently assessed premiums of between zero and twenty seven cents per $100 of eligible deposits, depending on the institution’s capital position and other supervisory facts. Congress has enacted legislation that, among other things, provides for assessments against BIF-insured institutions that will be used to pay certain Financing Corporation (“FICO”) obligations.
The FDIC is authorized to prohibit any BIF-insured institution from engaging in any activity that the FDIC determines by regulation or order to pose a serious threat to the insurance fund. Also, the FDIC may initiate enforcement actions against banks after first giving the institution’s primary regulatory authority an opportunity to take such action. The FDIC may terminate the deposit insurance of any depository institution, including the Bank, if it determines, after a hearing, that the institution has engaged or is engaging in unsafe or unsound practices, is in an unsafe or unsound condition to continue operations, or has violated any applicable law, regulation, order or any condition imposed in writing by the FDIC. It also may suspend deposit insurance temporarily during the hearing process for the permanent termination of insurance, if the institution has no tangible capital. If deposit insurance is terminated, the deposits at the institution at the time of termination, less subsequent withdrawals, shall continue to be insured for a period from six months to two years, as determined by the FDIC. Management is aware of no existing circumstances that could result in termination of the Bank’s deposit insurance.
Other Safety and Soundness Regulations
The federal banking agencies have broad powers under current federal law to take prompt corrective action to resolve problems of insured depository institutions. The extent of these powers depends upon whether the institutions in question are “well capitalized,” “adequately capitalized,” “undercapitalized,” “significantly undercapitalized” or “critically undercapitalized,” as such terms are defined under uniform regulations issued by each of the federal banking agencies.
Community Reinvestment
The requirements of the Community Reinvestment Act (“CRA”) affect the Bank. The CRA imposes on financial institutions an affirmative obligation to help meet the credit needs of their local communities, including low- and moderate-income neighborhoods, consistent with the safe and sound operation of those institutions. Each financial institution’s efforts in helping meet community credit needs currently are evaluated as part of the examination process pursuant to a new regulation recently adopted by the banking regulatory agencies. Under the new regulation a financial institution’s efforts in helping meet its community’s credit needs are evaluated, based on the particular institution’s Total Assets, according to a lending test, a community development test in addition to the lending test, or the three-pronged (lending, investment and service) test, all of which replace the twelve assessment factors used previously. The grade received by a bank is considered in evaluating mergers, acquisitions and applications to open a branch or facility. To the best knowledge of the Bank, it is meeting its obligations under the CRA.
Effect of Governmental Monetary Policies
As with other financial institutions, the earnings of the Bank are affected by general economic conditions as well as by the monetary policies of the Federal Reserve Board. Such policies, which include regulating the national supply of bank
6
Table of Contents
reserves and bank credit, can have a major effect upon the source and cost of funds and the rates of return earned on loans and investments. The Federal Reserve System exerts a substantial influence on interest rates and credit conditions, primarily through establishing target rates for federal funds, open market operations in U.S. Government securities, varying the discount rate on member bank borrowings and setting cash reserve requirements against deposits. Changes in monetary policy, including changes in interest rates, will influence the origination of loans, the purchase of investments, the generation of deposits, and rates received on loans and investment securities and paid on deposits. Fluctuations in the Federal Reserve Board’s monetary policies have had a significant impact on the operating results of the Bank and all financial institutions in the past and are expected to continue to do so in the future.
Employees
The Bank employed 94 full-time employees and 5 part-time employees as of December 31, 2005. The Bank believes that its relationship with its employees is good, and no employees are represented by a labor union.
| ITEM 2. | DESCRIPTION OF PROPERTY. |
The Bank’s main office is located in a one and one half-story office located at 1722 Hershberger Road, Roanoke, Virginia that is owned by the Bank. The Bank also operates fourteen additional offices in Virginia. The Bank owns seven offices free and clear of encumbrances, while the other eight are held under non-cancellable operating leases. These leases are described in Footnotes 7 and 18 of the Financial Statements. The Bank’s offices are detailed in the table below:
Location | Address | Own/Lease | ||||
Roanoke | 1722 Hershberger Road | Roanoke, VA 24012 | Own | |||
New Castle | 300 Main Street | New Castle, VA 24127 | Own | |||
Bedford | 550 Blue Ridge Ave. | Bedford, VA 24523 | Lease | |||
Peter’s Creek | 2657 Peters Creek Road | Roanoke, VA 24017 | Own | |||
Cave Springs | 3132 Electric Road | Roanoke, VA 24018 | Lease | |||
Southeast | 616 9th Street | Roanoke, VA 24013 | Own | |||
Blue Ridge | 721 Blue Ridge Blvd. | Roanoke, VA 24012 | Lease | |||
Vinton | 901 Hardy Road | Vinton, VA 24179 | Lease | |||
Franklin Road | 4143 Franklin Road, SW | Roanoke, VA 24014 | Lease | |||
Electric Road | 1400 Electric Road | Salem, VA 24153 | Own | |||
Plantation Road | 4806 Hollins Road, NW | Roanoke, VA 24019 | Own | |||
Troutville | 2728 Lee Highway South | Troutville, VA 24175 | Lease | |||
Bedford-Forest Road | 1621 Forest Road | Bedford, VA 24523 | Lease | |||
Moneta | 8334 Moneta Road | Bedford, VA 24523 | Lease | |||
Hot Springs | Rt. 1 Box 543-E | Hot Springs, VA 24445 | Own | |||
The Bank has acquired title to other parcels of real estate through the normal course of its lending activities. The book values of these properties equaled $511,000 and $542,000 as of December 31, 2005 and 2004, respectively.
Management considers these properties to be in good condition. Adequate insurance is maintained on each of these properties.
| ITEM 3. | LEGAL PROCEEDINGS. |
There are no material pending legal proceedings to which the Bank is a party or to which the property of the Bank is subject.
| ITEM 4. | SUBMISSION OF MATTERS TO A VOTE OF SECURITY HOLDERS. |
No matters were submitted to a vote of security holders during the fourth quarter of the fiscal year covered by this report.
7
Table of Contents
EXECUTIVE OFFICERS OF THE REGISTRANT
Name (Age) | Officer Since | Principal Occupation During Past Five Years | ||
Worth Harris Carter, Jr. (68) | 1976 | Chairman of the Board of First National Bank since 1976, President since 1986 | ||
| Chairman of the Board and President of Patrick Henry National Bank since 1977 | ||||
| Chairman of the Board of Peoples National Bank since 1976, President since 1981 | ||||
| Chairman of the Board of Blue Ridge Bank since 1982 | ||||
| Chairman of the Board and President of Community National Bank since 1985 | ||||
| Chairman of the Board and President of Mountain National Bank since 1996 | ||||
| Chairman of the Board and President of Shenandoah National Bank since 1996 | ||||
| Chairman of the Board and President of Central National Bank since 1996 | ||||
| Chairman of the Board and President of Patriot Bank since 1996 | ||||
| Chairman of the Board and President of First National Exchange Bank since 1998 | ||||
| Chairman of the Board and President of Mortgage Company of Virginia since 1984 | ||||
| Chairman of the Board and President of Bank Services of Virginia since 1984 | ||||
| Chairman of the Board and President of Bank Building Corporation since 1994 | ||||
| Chairman of the Board and President of Bank Services Insurance, Inc. since 2003 | ||||
| Manager of Blackstone Properties LLC Since 1998 | ||||
PART II
| ITEM 5. | MARKET FOR COMMON EQUITY AND RELATED STOCKHOLDER MATTERS. |
The Bank is authorized to issue 2.5 million shares of common stock with a par value of $5. This stock has full voting rights and full preemptive rights. There were 492,329 shares outstanding as of December 31, 2005 and 2004. This is the only class of authorized stock.
The Bank’s common stock is traded locally with no established trading market and no known market makers.
The quarterly high and low prices for the common stock are presented below.
| 2005 | 2004 | |||||||||||
| High | Low | High | Low | |||||||||
First Quarter | $ | 45 | $ | 40 | $ | 45 | $ | 40 | ||||
Second Quarter | 45 | 40 | 45 | 40 | ||||||||
Third Quarter | 45 | 40 | 45 | 40 | ||||||||
Fourth Quarter | 45 | 40 | 45 | 40 | ||||||||
8
Table of Contents
Holders. As of March 22, 2006, there are approximately 763 holders of record of the Bank’s outstanding common stock.
Dividends. The amount of dividends that may be paid by the Bank will depend on the Bank’s earnings and capital position and is limited by federal law, regulations and policies. A national bank may not pay dividends from its capital; all dividends must be paid out of undivided profits then on hand, after deducting expenses, including reserves for losses and bad debts. In addition, the approval of the OCC is required if the total of all dividends declared by a national bank in any calendar year exceeds the total of its net profits for that year combined with its retained net profits for the preceding two years, less any required transfers to surplus. The Bank may not pay a dividend if, after giving effect to the dividend, the Bank would be undercapitalized.
The Bank has not paid any cash dividends for the last two years. Future cash dividends are dependent upon the Banks future performance and other factors including the capital position and anticipated growth.
| ITEM 6. | MANAGEMENT’S DISCUSSION AND ANALYSIS OR PLAN OF OPERATION. |
The information required by this Item is included in the Bank’s annual report to shareholders for the year ended December 31, 2005 (the “Annual Report”), which is attached hereto as Exhibit 13 and is incorporated herein by reference. The information appears in the Annual Report under the caption “Management’s Discussion and Analysis of Financial Condition and Results of Operation.”
| ITEM 7. | FINANCIAL STATEMENTS. |
The report of the independent registered public accounting firm and audited financial statements of the Bank and accompanying notes required by this Item are included in the Bank’s Annual Report, which is attached hereto as Exhibit 13 and is incorporated herein by reference.
| ITEM 8. | CHANGES IN AND DISAGREEMENTS WITH ACCOUNTANTS ON ACCOUNTING AND FINANCIAL DISCLOSURE |
None.
| ITEM 8A. | CONTROLS AND PROCEDURES. |
The Bank maintains a system of disclosure controls and procedures that is designed to ensure that material information is accumulated and communicated to management, including the Bank’s president (who is the Bank’s principal executive officer and principal financial officer), as appropriate to allow timely decisions regarding required disclosure. As required, management, with the participation of the Bank’s president, evaluated the effectiveness of the design and operation of the Bank’s disclosure controls and procedures as of the end of the period covered by this report. Based on this evaluation, the Bank’s president concluded that the Bank’s disclosure controls and procedures were operating effectively to ensure that information required to be disclosed by the Bank in reports that it files or submits under the Securities Exchange Act of 1934, as amended, is recorded, processed, summarized, and reported within the time periods specified in the rules and forms of the SEC.
Because of the inherent limitations in all control systems, no evaluation of controls can provide absolute assurance that the Bank’s disclosure controls and procedures will detect or uncover every situation involving the failure of persons within the Bank to disclose material information otherwise required to be set forth in the Bank’s periodic reports.
The Bank’s management is also responsible for establishing and maintaining adequate internal control over financial reporting to provide reasonable assurance regarding the reliability of financial reporting and the preparation of financial statements for external purposes in accordance with generally accepted accounting principles. There were no changes in the Bank’s internal control over financial reporting during the Bank’s fourth quarter ended December 31, 2005 that have materially affected, or are reasonably likely to materially affect, the Bank’s internal control over financial reporting.
9
Table of Contents
| ITEM 8B. | OTHER INFORMATION. |
None.
PART III
| ITEM 9. | DIRECTORS, EXECUTIVE OFFICERS, PROMOTERS AND CONTROL PERSONS; COMPLIANCE WITH SECTION 16(A) OF THE EXCHANGE ACT. |
The information regarding the Bank’s executive officer is contained in Part I of this Report on Form 10-KSB.
Name and Business Experience | Age | Director Since | ||
Carter, Worth Harris, Jr. | 68 | 5/98 | ||
Chairman of the Board and President | ||||
Worth Harris Carter, Jr. is a director and officer of the following companies: | ||||
Chairman of the Board of First National Bank since 1976 President since 1986 | ||||
Chairman of the Board and President of Patrick Henry National Bank since 1977 | ||||
Chairman of the Board of Peoples National Bank since 1976, President since 1981 | ||||
Chairman of the Board of Blue Ridge Bank since 1982, President since 2004 | ||||
Chairman of the Board and President of Community National Bank since 1985 | ||||
Chairman of the Board and President of Mountain National Bank since 1996 | ||||
Chairman of the Board and President of Shenandoah National Bank since 1996 | ||||
Chairman of the Board and President of Central National Bank since 1996 | ||||
Chairman of the Board and President of Patriot Bank since 1996 | ||||
Chairman of the Board and President of Mortgage Company of Virginia since 1984 | ||||
Chairman of the Board and President of Bank Services of Virginia, Inc. since 1984 | ||||
Chairman of the Board and President of Bank Services Insurance, Inc. since 2003 | ||||
Chairman of the Board and President of Coresoft, Inc. since 2004 | ||||
Chairman of the Board and President of Bank Building Corporation since 1988 | ||||
Manager of Blackstone Properties LLC since 1998 | ||||
| Kingery, Walter P. | 74 | 5/98 | ||
| Walter P. Kingery is retired. He was previously a dairy farmer in Franklin County, Virginia for more than five years. He also has served as a director of First National Bank in Rocky Mount, Virginia since 1974. | ||||
| Mason, Sidney D. | 78 | 5/98 | ||
| Sidney D. Mason is retired. He was previously Chairman of the Board of Virginia Apparel Corporation, Rocky Mount, Virginia for more than five years. He also has served as a director of First National Bank in Rocky Mount, Virginia since 1974. | ||||
| Ramsey, Mary Alice | 81 | 5/98 | ||
| Mary Alice Ramsey is retired She was previously the operator of Chief Tassel Beauty Shoppe in Martinsville, Virginia for more than five years. She also has served as a director of First National Bank in Rocky Mount, Virginia since 1987. | ||||
| Scott, Leo H. | 73 | 5/98 | ||
| Leo H. Scott is and has been President of Leo H. Scott Cabinets, Inc. Ferrum, Virginia for more than five years. He also has served as a director of First National Bank in Rocky Mount, Virginia since 1974 and of Bank Building Corporation since 1995. | ||||
10
Table of Contents
The Board of Directors is not aware of any family relationship between any Director, executive officer or person nominated by the Bank to become a Director; nor is the Board of Directors aware of any involvement in legal proceedings that would be material to an evaluation of the ability or integrity of any Director, executive officer or person nominated to become a Director.
AUDIT COMMITTEE REPORT OF THE BOARD OF DIRECTORS
The entire Board of Directors functions as the Bank’s Audit Committee and in this capacity met four times in 2005. The functions of the Board in the audit area are focused on three areas:
| • | the adequacy of the Bank’s internal controls and financial reporting process and the reliability of the financial statements; |
| • | the independence and performance of the Bank’s internal auditors and independent auditors; and |
| • | the Bank’s compliance with legal and regulatory requirements. |
We meet with management periodically to consider the adequacy of the Bank’s internal controls and the objectivity of its financial reporting. We discuss these matters with the Bank’s independent auditors and with appropriate financial personnel and internal auditors.
We also periodically review the performance of the independent auditors and their independence from management.
All of the Directors who serve as the Bank’s Audit Committee, with the exception of Chairman of the Board and President Carter, are “independent” for the purposes of the Nasdaq Stock Market listing standards.
The Board has not adopted a written charter setting forth the responsibilities and authority of the Board in its capacity as the Audit Committee. Although Mr. Carter is not independent under the Nasdaq Stock Market or SEC standards for audit committee membership, the Board of Directors has determined that Mr. Carter possesses the knowledge and experience required to be considered an audit committee financial expert. In addition, the Board of Directors believes that all of the Bank’s Directors possess the financial knowledge and expertise necessary to protect the Bank’s shareholders in performing the functions of an audit committee.
Management has primary responsibility for the Bank’s financial statements and the overall reporting process, including the Bank’s system of internal controls.
The independent auditors audit the annual financial statements prepared by management, express an opinion as to whether those statements fairly present the financial position, results of operations and cash flows of the Bank in conformity with generally accepted accounting principles and discuss with us any issues they believe should be raised with us.
This year, we reviewed the Bank’s audited financial statements and met with both management and Goodman & Company, LLP, the Bank’s independent auditors, to discuss those financial statements. Management has represented to us that the financial statements were prepared in accordance with generally accepted accounting principles.
We have received from and discussed with Goodman & Company the written disclosure and the letter required by Independence Standards Board Statement No. 1 (Independence Discussions with Audit Committees) relating to that firm’s independence from the Bank. We also discussed with Goodman & Company the matters required to be discussed by Statement on Auditing Standard No. 61 (Communication with Audit Committees).
Based on these reviews and discussions, we recommended to the Board that the Bank’s audited financial statements be included in the Bank’s Annual Report on Form 10-KSB for the fiscal year ended December 31, 2005 for filing with the Office of the Comptroller of the Currency (“OCC”).
11
Table of Contents
Directors
Worth Harris Carter, Jr.
Walter P. Kingery
Sidney D. Mason
Mary Alice Ramsey
Leo H. Scott
SECTION 16(a) BENEFICIAL OWNERSHIP REPORTING COMPLIANCE
Section 16(a) of the Securities Exchange Act of 1934 requires that Directors and executive officers, and persons who control more than 10% of the Bank’s equity securities, file reports of ownership and reports of changes in ownership of the Bank’s outstanding equity securities. All such filings were filed timely in 2005.
The Bank has not adopted a Code of Ethics for its directors, executives and employees, primarily because management of the Bank believes and understands that our officers and directors adhere to and follow ethical standards without the necessity of a written policy. The Bank’s Board of Directors will revisit this issue in the future to determine if adoption of a code of ethics is appropriate. In the meantime, the Bank’s management requires and promotes honest and ethical conduct, full and fair disclosure in its reports to the OCC, and compliance with applicable governmental laws and regulations.
| ITEM 10. | EXECUTIVE COMPENSATION. |
The Bank’s compensation program is designed to offer competitive compensation to employees based on each individual’s contribution to the Bank’s overall success. As such, the program provides a competitive compensation package to attract and retain capable employees.
The compensation and benefits program consists of salary, a profit sharing plan, and life, health and disability insurance. The compensation and benefits program for officers parallels that of all other employees. The Bank offers no stock options or other forms of equity compensation, bonuses, employment contracts, country club memberships or other perquisites to officers or employees.
The entire Board of Directors performs the functions of a Salary Committee for the Bank. The Board has the responsibility for administering the Bank’s overall compensation program and for setting the salaries for the Bank’s officers. In setting the compensation of the Bank’s officers, the Board generally relies on the recommendations of the Chairman and President and the Board members’ own significant personal knowledge of the compensation provided to other, similarly situated, executives in banking and other industries in the local area. The Board also reviews each individual’s performance and contribution to the overall Bank goals in determining the level of salary for the coming year.
Mr. Worth Harris Carter, Jr., Chairman of the Board and President, serves as the Chief Executive Officer of First National Exchange Bank. As noted below under “Certain Relationships and Related Transactions,” Mr. Carter also serves as Chairman and President of nine other banks. The Salary Committee of the Board of Directors of one of these other banks (Patrick Henry National Bank) actually sets Mr. Carter’s annual salary each year. The cost of Mr. Carter’s compensation, which consists of his salary plus an amount equal to twenty-nine percent of his salary to cover payroll taxes and all other benefits, is shared by the ten banks on the basis of average deposits of each bank related to total average deposits of all the banks that he serves. Mr. Carter’s total compensation, which is paid through Bank Services of Virginia, Inc. (“Bank Services”), is reflected below in two charts. The first chart reflects Mr. Carter’s total compensation as paid by Bank Services. The second chart reflects only the portion of Mr. Carter’s total compensation that is allocated to First National Exchange Bank. During 2005, no other executive officer of the Bank received compensation in excess of $100,000.
12
Table of Contents
Summary Compensation Tables
Bank Services of Virginia, Inc.
| Annual Compensation | ||||||||||
| Other Annual | All Other | |||||||||
Name and Principal Position | Year | Salary | Compensation² | Compensation³ | ||||||
Worth Harris Carter, Jr. | 2005 | $ | 575,000 | — | $ | 80,000 | ||||
Chairman of the Board and | 2004 | $ | 575,000 | — | $ | 78,000 | ||||
President | 2003 | $ | 530,000 | — | $ | 67,000 | ||||
| (1) | This table shows the total cash compensation paid to Mr. Carter by Bank Services of Virginia, Inc. during 2005, 2004 and 2003 for his services as Chairman of the Board and President of all ten banks. |
| (2) | The amount of compensation in the form of perquisites and other personal benefits properly categorized in this column did not exceed the lesser of $50,000 or 10% of Mr. Carter’s annual salary for any of the three years reported. |
| (3) | “All Other Compensation” consists of amounts contributed for Mr. Carter under Bank Services’ qualified profit sharing plan and amounts contributed for Mr. Carter under Bank Services’ non-qualified profit sharing plan for highly paid executives. For 2005, these amounts consisted of $27,000 contributed to the qualified profit sharing plan and $53,000 contributed to the non-qualified profit sharing plan. |
First National Exchange Bank
| Annual Compensation | ||||||||||
Name and Principal Position | Year | Salary | Other Annual Compensation² | All Other Compensation³ | ||||||
Worth Harris Carter, Jr. | 2005 | $ | 52,000 | — | $ | 7,000 | ||||
Chairman of the Board and | 2004 | $ | 57,000 | — | $ | 8,000 | ||||
President | 2003 | $ | 60,000 | — | $ | 8,000 | ||||
| (1) | This table shows the portion of Mr. Carter’s total cash compensation during 2005, 2004 and 2003 allocated to First National Exchange Bank. |
| (2) | The amount of compensation in the form of perquisites and other personal benefits properly categorized in this column did not exceed the lesser of $50,000 or 10% of Mr. Carter’s annual salary for any of the three years reported. |
| (3) | “All Other Compensation” consists of the portion allocated to First National Exchange Bank for contributions on Mr. Carter’s behalf to Bank Services’ qualified profit sharing plan and non-qualified profit sharing plan for highly paid executives. For 2005, the portion allocated to First National Bank consisted of $2,000 for the qualified profit sharing plan and $5,000 for the non-qualified profit sharing plan. |
Profit Sharing Plan
The Bank has adopted an integrated profit sharing plan. The plan covers all full time employees that have been employed for six (6) months and have reached the age of 20-1/2 as of the first day of the plan year. Persons who have reached the age of 62 are fully vested regardless of length of service. The regular vesting schedule is as follows
13
Table of Contents
Years of Service | Vested Percentage | Forfeitable Percentage | ||
Less than 5 | 0 | 100 | ||
5 or more | 100 | 0 |
Each year the Board of Directors determines what amount, if any, is to be allocated to the plan out of accumulated or current earnings of the Bank. The Bank’s contribution to the plan was $110,000 in 2005, $115,000 in 2004, and $101,000 in 2003.
Chairman of the Board and President Carter does not participate in the profit sharing plan of First National Exchange Bank or any of the other nine banks. Instead, Mr. Carter participates in the two profit sharing plans of Bank Services of Virginia, Inc., a qualified profit sharing plan and a nonqualified plan for highly paid executives whose contribution to the qualified plan is limited due to IRS regulations. The Bank’s annual contributions to these plans on Mr. Carter’s behalf are detailed in the two Summary Compensation Tables above.
DIRECTOR COMPENSATION
Each outside Director (not also an officer of the Bank) currently receives $200 for each Board meeting attended.
| ITEM 11. | SECURITY OWNERSHIP OF CERTAIN BENEFICIAL OWNERS AND MANAGEMENT. |
The following table shows as of March 22, 2006, the beneficial ownership of the Bank’s common stock of each Director, the executive officer identified in the Summary Compensation Table and the Bank’s Directors and executive officers as a group. To the Bank’s knowledge, Directors Carter, Mason, Ramsey and Scott are the Bank’s only shareholders beneficially holding more than 5% of the Bank’s outstanding common stock. As of March 22, 2006, the Bank’s Directors and executive officers as a group, beneficially owned 196,556 shares (or 39.9%) of the Bank’s outstanding common stock.
Name | Amount and Nature of Beneficial Ownership (1)(2) | Ownership as a Percentage of Common Stock Outstanding | ||||
Carter, Worth Harris, Jr. | 80,329 | (3) | 16.3 | % | ||
Kingery, Walter P. | 16,963 | (4) | 3.4 | % | ||
Mason, Sidney D. | 34,532 | (5) | 7.0 | % | ||
Ramsey, Mary T. | 33,129 | 6.7 | % | |||
Scott, Leo H. | 31,603 | (6) | 6.4 | % | ||
All Directors and Executive Officers | 196,556 | 39.9 | % | |||
As a Group (5 persons) |
| (1) | For purposes of this table, beneficial ownership has been determined in accordance with the provisions of Rule 13d-3 of the Securities Exchange Act of 1934 under which, in general, a person is deemed to be the beneficial owner of a security if he/she has or shares the power to vote or direct the voting of the security or the power to dispose of or direct the disposition of the security, or if he/she has the right to acquire beneficial ownership of the security within sixty days. |
| (2) | Unless otherwise indicated, the shares listed in the table represent sole voting and investment power. |
| (3) | Includes 15,550 shares held by Mr. Carter as custodian for his children and grandchildren; 350 shares held by Mr. Carter’s son, Ernest Linwood Carter, II, who resides in Mr. Carter’s household; 300 shares held for Mr. Carter’s account in the Mortgage Company of Virginia, Inc./Bank Services of Virginia, Inc. Non-Qualified Profit-Sharing Plan; 5,809 shares held by C&C Realty, Inc., of which Mr. Carter is president and a 50% owner; and 1,770 shares held by Mr. Carter’s brother, Ernest L. Carter. |
14
Table of Contents
| (4) | Includes 423 shares held by Mr. Kingery’s wife. |
| (5) | Includes 9,101 shares held by the Sidney D. Mason Revocable Trust, of which Mr. Mason is trustee, and 25,431 shares held by the Dale W. Mason Revocable Trust, of which Mr. Mason’s wife is trustee. |
| (6) | Includes 15,422 shares held by the Leo H. Scott Revocable Trust, of which Mr. Scott is trustee, and 16,181 shares held by the Geraldine N. Scott Revocable Trust, of which Mr. Scott’s wife is trustee. |
The Bank knows of no arrangements, including any pledge by any person of securities of the Bank, which may at a subsequent date result in a change in control of the Bank.
Equity Compensation Plans.No disclosure regarding equity compensation plans has been provided because the Bank does not have any outstanding equity compensation plans or arrangements that would be covered by Item 201(d) of Regulation S-B.
| ITEM 12. | CERTAIN RELATIONSHIPS AND RELATED TRANSACTIONS. |
Mr. Carter, Chairman of the Board and President of First National Exchange Bank also serves as Chairman of the Board and President of Blue Ridge Bank, N.A., Central National Bank, Community National Bank, First National Bank, Mountain National Bank, Patrick Henry National Bank, Patriot Bank, N.A., Peoples National Bank and Shenandoah National Bank.
The Bank maintains correspondent bank accounts with two of these banks. In 2005 and 2004, the average daily balances in these accounts were considered normal operating balances to facilitate general business transactions. The Bank also participates in loan transactions with these banks. These transactions are at carrying value and do not involve more than the normal risk of collectibility or present other unfavorable features.
The Bank owns 10% of the outstanding common stock of The Mortgage Company of Virginia, Inc. The remaining common stock is equally owned by the banks listed above. The Mortgage Company of Virginia owns 100% of Bank Services of Virginia, Inc. The business of both of these companies is to provide operational support services to the ten banks. The Bank is charged for its share of these services. The cost of this expense is shared by the ten banks on the basis of average deposits of each bank related to total average deposits of all the banks.
The Mortgage Company of Virginia, Inc. also owns 100% of Bank Services Insurance, Inc. Bank Services Insurance, Inc. provides insurance products to the banks and customers in the Danville area. The premiums paid to Bank Services Insurance, Inc. equaled $26,000 at December 31, 2005.
The Mortgage Company of Virginia, Inc. also owns 50% of Coresoft, Inc. represented by an initial $1,000 investment during 2004. Coresoft, Inc. is in the process of developing a core software package the banks listed above will use. At December 31, 2005, Coresoft, Inc. had an outstanding note payable to the Mortgage Company of $1,400,000.
The Chairman of the Board and President of the Bank also serves as Chairman of the Board and President of Bank Building Corporation and Manager of Blackstone Properties, LLC, it’s wholly owned subsidiary (the “companies”). The companies lease branches to certain of the banks listed above. At December 31, 2005, the Bank leased six offices from the companies. Rental expense under these leases was $285,000 in 2005, $267,000 in 2004 and $269,000 in 2003. The Bank also leases offices from non-related parties under various terms. Rental expense for these leases was $48,000 in 2005, 2004 and 2003. Future minimum lease payments will be $320,000 per year through 2010, and thereafter (may vary based on changing interest rates). As of December 31, 2005 and 2004, the Bank had loans totaling $2,730,000 and
15
Table of Contents
$2,796,000, respectively, to the companies. These loans were made to purchase bank branches leased to affiliated banks and other investment property. The loans are secured by these branches and the related leases and other investment property, and have repayment terms similar to other loan customers of the Banks.
In the ordinary course of business, the Bank’s Directors and executive officers and their related interests were customers of, and had transactions with the Bank. Loan transactions with Directors and officers, principal security holders and associates were made on substantially the same terms as those prevailing at the time for comparable loans to other persons and did not involve more than normal risk of collectibility or present other unfavorable features. There were no such extensions of credit in 2005 or 2004.
| ITEM 13. | EXHIBITS. |
Exhibits: | ||
3.1 | Articles of Association (filed with the Office of the Comptroller of the Currency prior to the opening of the Bank) | |
3.2 | Amended and Restated Bylaws (as amended and restated through February 23, 2005) (incorporated by reference to Exhibit 3.2 to Form 8-K filed with the Office of the Comptroller of the Currency on February 23, 2005) | |
13 | 2005 Annual Report to Shareholders | |
31 | Certification by principal executive officer and principal financial officer pursuant to Rule 13a-14(a) | |
32 | Certification of principal executive officer and principal financial officer pursuant to 18 U.S.C. § 1350 | |
| ITEM 14. | PRINCIPAL ACCOUNTANT FEES AND SERVICES. |
Goodman & Company, LLP served as the Bank’s independent public auditors for the year ended December 31, 2005, and has been selected by the Board to act as the Bank’s independent public auditors for the year ending December 31, 2006. A representative of Goodman & Company will be present at the Annual Meeting and will be given the opportunity to make a statement and respond to appropriate questions from shareholders.
The following table presents the fees for professional audit services rendered by Goodman & Company for the audit of the Bank’s annual financial statements for the years ended December 31, 2005 and 2004, and fees billed for other services rendered by Goodman & Company during those periods.
Year Ended December 31,
| 2005 | 2004 | |||||
Audit fees¹ | $ | 7,800 | $ | 7,330 | ||
Audit-related fees | — | — | ||||
Tax fees² | 3,265 | 3,100 | ||||
All other fees | — | — | ||||
Total Fees | $ | 11,065 | $ | 10,430 | ||
| 1 | Audit fees consist of audit and review services, consents and review of documents filed with the OCC. |
| 2 | Tax fees consist of preparation of federal and state tax returns and consultation concerning tax compliance issues. |
16
Table of Contents
In its capacity as the Audit Committee, the Board of Directors considered the compatibility of the non-audit-related services performed by and fees paid to Goodman & Company in 2005 and 2004 and the proposed non-audit-related services and proposed fees for 2006 and determined that such services and fees are compatible with the independence of Goodman & Company as the Bank’s independent auditors.
Also in its capacity as the Audit Committee, the Board of Directors pre-approves all audit (including audit-related) and permitted non-audit services to be performed by the independent auditors. The Board of Directors annually approves the year-end audit to be performed by the Bank’s independent auditors for the fiscal year. With respect to other permitted services, the Board of Directors pre-approves specific engagements, projects and categories of services on a fiscal year basis.
17
Table of Contents
Exhibit 31
CERTIFICATION
I, Worth Harris Carter, Jr., certify that:
1. I have reviewed this annual report on Form 10-KSB of First National Exchange Bank;
2. Based on my knowledge, this report does not contain any untrue statement of a material fact or omit to state a material fact necessary to make the statements made, in light of the circumstances under which such statements were made, not misleading with respect to the period covered by this report;
3. Based on my knowledge, the financial statements, and other financial information included in this report, fairly present in all material respects the financial condition, results of operations and cash flows of the small business issuer as of, and for, the periods presented in this report;
4. I am responsible for establishing and maintaining disclosure controls and procedures (as defined in Exchange Act Rules 13a-15(e) and 15d-15(e)) for the small business issuer and have:
(a) Designed such disclosure controls and procedures, or caused such disclosure controls and procedures to be designed under my supervision, to ensure that material information relating to the small business issuer, including its consolidated subsidiaries, is made known to me by others within those entities, particularly during the period in which this report is being prepared;
(b) Evaluated the effectiveness of the small business issuer’s disclosure controls and procedures and presented in this report my conclusions about the effectiveness of the disclosure controls and procedures, as of the end of the period covered by this report based on such evaluation; and
(c) Disclosed in this report any change in the small business issuer’s internal control over financial reporting that occurred during the small business issuer’s most recent fiscal quarter (the small business issuer’s fourth fiscal quarter in the case of an annual report) that has materially affected, or is reasonably likely to materially affect, the small business issuer’s internal control over financial reporting; and
5. I have disclosed, based on my most recent evaluation of internal control over financial reporting, to the small business issuer’s auditors and the audit committee of the small business issuer’s board of directors (or persons performing the equivalent functions):
(a) All significant deficiencies and material weaknesses in the design or operation of internal control over financial reporting which are reasonably likely to adversely affect the small business issuer’s ability to record, process, summarize and report financial information; and
(b) Any fraud, whether or not material, that involves management or other employees who have a significant role in the small business issuer’s internal control over financial reporting.
| Date: March 22, 2006 | /s/ Worth Harris Carter, Jr. | |
| Worth Harris Carter, Jr. | ||
| Chairman of the Board and President | ||
| (principal executive officer and principal financial officer) |
18
Table of Contents
EXHIBIT 32
CERTIFICATION OF
PRINCIPAL EXECUTIVE OFFICER AND PRINCIPAL FINANCIAL OFFICER
Pursuant to § 906 of the Sarbanes-Oxley Act of 2002 (18 U.S.C. § 1350)
The undersigned, as the principal executive officer and principal financial officer of FIRST NATIONAL EXCHANGE BANK, certifies that, to the best of his knowledge and belief, the Annual Report on Form 10-KSB for the period ended December 31, 2005, which accompanies this certification fully complies with the requirements of Section 13(a) of the Securities Exchange Act of 1934 and the information contained in the report fairly presents, in all material respects, the financial condition and results of operations of FIRST NATIONAL EXCHANGE BANK at the dates and for the periods indicated. The foregoing certification is made pursuant to § 906 of the Sarbanes-Oxley Act of 2002 (18 U.S.C. § 1350) and shall not be relied upon for any other purpose. The undersigned expressly disclaims any obligation to update the foregoing certification except as required by law.
| FIRST NATIONAL EXCHANGE BANK | ||||
| Date: March 22, 2006 | By: | /s/ Worth Harris Carter, Jr. | ||
| Worth Harris Carter, Jr. | ||||
| Chairman of the Board, President, | ||||
| Chief Executive Officer and Chief Financial Officer | ||||
19
Table of Contents
SIGNATURES
Pursuant to the requirements of the Securities Exchange Act of 1934, the Bank has caused this annual report to be signed on its behalf by the undersigned, thereunto duly authorized.
| FIRST NATIONAL EXCHANGE BANK | ||||
| Date: March 22, 2006 | By: | /s/ Worth Harris Carter, Jr. | ||
| Worth Harris Carter, Jr. | ||||
| Chairman of the Board, President, | ||||
| Chief Executive Officer and Chief Financial Officer | ||||
Signature | Title | Date | ||
/s/ Worth Harris Carter, Jr. | Chairman of the Board, President, | March 22, 2006 | ||
| Worth Harris Carter, Jr. | Chief Executive Officer and | |||
| Chief Financial Officer | ||||
/s/ Walter P. Kingery | ||||
| Walter P. Kingery | Director | March 22, 2006 | ||
/s/ Sidney D. Mason | ||||
| Sidney D. Mason | Director | March 22, 2006 | ||
/s/ Mary A. Ramsey | ||||
| Mary A. Ramsey | Director | March 22, 2006 | ||
/s/ Leo H. Scott | ||||
| Leo H. Scott | Director | March 22, 2006 | ||
20
Table of Contents
Exhibit 13
2005
Annual Report

First National
Exchange Bank
Member FDIC
Table of Contents
Management’s Discussion and Analysis of Financial Condition and Results of Operation
Except for the historical information contained in this report, the matters set forth herein include Forward-Looking Statements within the meaning of the “safe harbor” provisions of the Private Securities Litigation Reform Act of 1995. These Forward-Looking Statements included, among other things, statements of goals, plans, intentions and expectations, regarding or based upon desired business strategies, general economic conditions, interest rates, developments in local and national markets, and other matters, which, by their nature, are subject to significant uncertainities. Because of these uncertainties and the assumptions upon which this report is based, actual future developments with respect to the business of the Bank may differ materially from those contemplated by such statements.
Critical Accounting Policies.The accounting and reporting policies of the Bank conform to generally accepted accounting principles in the United States (“GAAP”) and to general practices within the banking industry. The preparation of the financial statements in conformity with GAAP requires management to make estimates and assumptions that affect the amounts reported in the financial statements and accompanying notes. We believe the most significant of these estimates involves the allowance for loan losses because of its potential impact on our overall performance. We have described our policies in this area below. A summary of the Bank’s significant accounting policies can be found in the Notes to the Financial Statements.
In general, determining the amount of the allowance for loan losses requires significant judgment and the use of estimates by management. The Bank maintains an allowance for loan losses to absorb probable losses in the loan portfolio based on a quarterly analysis of the portfolio and expected future losses. This analysis determines an appropriate level of the allowance for loan losses by considering factors affecting loan losses, including specific losses, levels and trends in impaired and non-performing loans, historical loan loss experience, current economic conditions, volume, growth and composition of the portfolio, and other relevant factors. The Bank records a provision for loan losses to maintain the allowance at an adequate level. The provision expense could increase or decrease each quarter based upon the results of management’s formal analysis.
The amount of the allowance represents management’s estimate of expected losses from existing loans based upon specific allocations for individual lending relationships and historical loss experience. The allowance for loan losses related to impaired loans is based on discounted cash flows using the loan’s initial effective interest rate or the fair value of the collateral for certain collateral dependent loans. This evaluation requires management to make estimates of the amounts and timing of future cash flows on impaired loans, which consists primarily of nonaccrual and restructured loans. Actual losses for these loans can vary significantly from these estimates.
Summary of Operations.Net income for 2005 equaled $816,000, or $1.66 per share, compared to $1,827,000 or $3.71 per share, for 2004. This represents a return on average assets of 0.37% and return on average equity of 4% compared to 0.75% and 10%, respectively, for last year.
Our total deposits fell $19 million during the year. A large portion of this decrease were deposits of municipalities, which fluctuate from time to time depending on interest rates. As a result, our time deposits and regular passbook savings fell while all other deposit categories increased. Loans decreased $16.5 million, or 12%, during the year.
Net Interest Income.Net interest income is our largest source of revenue and continues to be impacted by the very low level interest rates. Since 2001, the Federal Reserve has reduced the target rate for federal funds, which is a major factor in the level of most short-term interest rates, from 6.50% to a low of 1.00%. The 1.00% rate continued until June 2004, when the Fed began a series of one-quarter percent increases on 14 different occasions over the last year and a half to the latest increase in January 2006 at 4.50%. The Fed is expected to increase rates one or two more times before pausing.
While we increased investments, the increase in our costs of deposits occurred more rapidly than our increase in interest income and, as a result, net interest income declined $1,047,000 over the prior year. With interest rates at a higher level we anticipate our loans will increase in yield at a faster pace than the net increase in the costs of deposits. In addition, we anticipate an increase in loan volume as well as $10 million in U. S. Agency Securities, that mature, will be reinvested at substantially higher yields. We anticipate a significant improvement in net interest income during the coming year.
The following table shows a summary of the changes in interest income and interest expense resulting from changes in volume and changes in rates for each category of interest-earning assets and interest-bearing liabilities for 2005/2004 and 2004/2003:
| 2005 vs 2004 | 2004 vs 2003 | |||||||
(Dollars in thousands) Asset/Liability | Increase (Decrease) | Increase (Decrease) | ||||||
Real Estate Loans | $ | (952 | ) | $ | (1,878 | ) | ||
Installment Loans | 6 | (9 | ) | |||||
Commercial Loans | 214 | (138 | ) | |||||
Total Loans | (732 | ) | (2,025 | ) | ||||
Interest-Bearing Deposits in | ||||||||
Other Financial Institutions | 151 | 46 | ||||||
Investment Securities | (367 | ) | (299 | ) | ||||
Federal Funds Sold | (51 | ) | (295 | ) | ||||
Total Earning Assets | (999 | ) | (2,573 | ) | ||||
Interest-Bearing Transactions Accounts | 38 | (6 | ) | |||||
Savings Accounts (Includes MMDA’s) | (82 | ) | (87 | ) | ||||
Certificates of Deposit $100,000 and Over | 36 | (176 | ) | |||||
Other Certificates of Deposit | 29 | (1,322 | ) | |||||
Total Deposits | 21 | (1,591 | ) | |||||
Federal Funds Purchased | 26 | 13 | ||||||
Notes issued to the U.S. Treasury | 1 | 4 | ||||||
Total Interest-Bearing Liabilities | 48 | (1,574 | ) | |||||
Change in Net Interest Income | $ | (1,047 | ) | $ | (999 | ) | ||
2
Table of Contents
| 2005 | 2004 | 2003 | |||||||||||||||||||||||||
(Dollars in thousands) Asset/Liability | Average Balance | Interest | Yield/ Cost | Average Balance | Interest | Yield/ Cost | Average Balance | Interest | Yield Cost | ||||||||||||||||||
Real Estate Loans | $ | 108,070 | $ | 6,292 | 5.82 | % | $ | 120,405 | $ | 7,244 | 6.02 | % | $ | 127,048 | $ | 9,122 | 7.18 | % | |||||||||
Installment Loans | 1,686 | 180 | 10.68 | % | 1,722 | 174 | 10.10 | % | 2,187 | 183 | 8.37 | % | |||||||||||||||
Commercial Loans | 29,001 | 1,607 | 5.54 | % | 25,173 | 1,393 | 5.53 | % | 20,324 | 1,531 | 7.53 | % | |||||||||||||||
Total Loans | 138,757 | 8,079 | 5.82 | % | 147,300 | 8,811 | 5.98 | % | 149,559 | 10,836 | 7.25 | % | |||||||||||||||
Interest-Bearing Deposits in Other Financial Institutions | 14,822 | 556 | 3.75 | % | 17,789 | 405 | 2.28 | % | 15,040 | 359 | 2.39 | % | |||||||||||||||
Investment Securities | 52,260 | 1,958 | 3.75 | % | 59,372 | 2,325 | 3.92 | % | 53,039 | 2,624 | 4.95 | % | |||||||||||||||
Federal Funds Sold | 2,061 | �� | 57 | 2.77 | % | 6,649 | 108 | 1.62 | % | 37,142 | 403 | 1.09 | % | ||||||||||||||
Total Earning Assets | 207,900 | 10,650 | 5.12 | % | 231,110 | 11,649 | 5.04 | % | 254,780 | 14,222 | 5.58 | % | |||||||||||||||
Interest-Bearing Transaction Accounts | 17,210 | 179 | 1.04 | % | 18,479 | 141 | 0.76 | % | 16,641 | 147 | 0.88 | % | |||||||||||||||
Savings Accounts (Includes MMDA’s) | 35,515 | 509 | 1.43 | % | 43,035 | 591 | 1.37 | % | 41,351 | 678 | 1.64 | % | |||||||||||||||
Certificates of Deposit $100,000 and Over | 19,913 | 746 | 3.75 | % | 20,721 | 710 | 3.43 | % | 26,145 | 886 | 3.39 | % | |||||||||||||||
Other Certificates of Deposit | 105,007 | 3,503 | 3.34 | % | 115,594 | 3,474 | 3.01 | % | 147,209 | 4,796 | 3.26 | % | |||||||||||||||
Total Deposits | 177,645 | 4,937 | 2.78 | % | 197,829 | 4,916 | 2.48 | % | 231,346 | 6,507 | 2.81 | % | |||||||||||||||
Federal Funds Purchased | 1,269 | 42 | 3.31 | % | 1,754 | 16 | 0.91 | % | 194 | 3 | 1.55 | % | |||||||||||||||
Notes Issued to the U.S. Treasury | 156 | 5 | 3.21 | % | 266 | 4 | 1.50 | % | — | — | — | ||||||||||||||||
Total Interest-Bearing Liabilities | $ | 179,070 | $ | 4,984 | 2.78 | % | $ | 199,849 | $ | 4,936 | 2.47 | % | $ | 231,540 | $ | 6,510 | 2.81 | % | |||||||||
Net Interest Income | $ | 5,666 | $ | 6,713 | $ | 7,712 | |||||||||||||||||||||
Net Yield on Earning Assets | 2.73 | % | 2.90 | % | 3.03 | % | |||||||||||||||||||||
Loans.Loans decreased from $142 million at year-end 2004 to $125 million at year-end 2005, a decrease of $16.5 million, or 12%. The real estate loan portfolio actually declined by $14 million; however, Other Loans outstandings increased by $1.5 million. Real estate loans make up approximately 79% of this Bank’s total loans, therefore, it is not surprising to see that portfolio represents the major portion of the decline in outstandings.
The Bank also continues to maintain flexibility in the maturity of the loan portfolio. Approximately 62% of the Bank’s loans have adjustable interest rates as of year-end 2005 compared to 60% for 2004. In addition, the combination of adjustable rate and fixed rate loans that adjust or mature within one year equals nearly 39% for year-end 2005 compared to 70% for 2004.
Allowance and Provision for Loan Losses.As discussed previously, the Allowance for Loan Losses represents management’s estimation of the amount necessary to absorb future losses in the loan portfolio. On the Statement of Condition, the Allowance for Loan Losses is deducted from Total Loans so that the net amount shown represents the estimated realizable total loans. The Provision for Loan Losses is the amount charged to expense to maintain the Allowance at an adequate level.
Based on management’s analysis of the loan portfolio including non-accruing and impaired loans, the Provision for Loan Losses for 2005 and 2004 remained consistent at $120,000.
| December 31 | ||||||||||||||||||||
(Dollars in thousands) | 2005 | 2004 | 2003 | 2002 | 2001 | |||||||||||||||
Balance Beginning of Year | $ | 1,845 | $ | 1,804 | $ | 985 | $ | 877 | $ | 814 | ||||||||||
Provision for Loan Losses | 120 | 120 | 898 | 120 | 72 | |||||||||||||||
Net Loan Losses | ||||||||||||||||||||
Real Estate Loans | 76 | 72 | 76 | — | — | |||||||||||||||
Installment Loans | 15 | 7 | 3 | 9 | 9 | |||||||||||||||
Commercial Loans | — | — | — | 3 | — | |||||||||||||||
Total Net Loan Losses | 91 | 79 | 79 | 12 | 9 | |||||||||||||||
Balance | $ | 1,874 | $ | 1,845 | $ | 1,804 | $ | 985 | $ | 877 | ||||||||||
Net loan Losses to Average Loans | 0.06 | % | 0.05 | % | 0.05 | % | 0.01 | % | 0.01 | % | ||||||||||
Allowance for Loan Losses to Period-End Loans | 1.52 | % | 1.33 | % | 1.16 | % | 0.80 | % | 0.70 | % | ||||||||||
Nonaccrual loans are those loans contractually past due 90 days or more on which no interest is being accrued. Other real estate owned consists of real estate acquired through foreclosure. These properties are reviewed quarterly and reduced to an estimated realizable value at that time.
Information concerning nonaccrual loans and other real estate owned is presented in the following table:
| (Dollars in thousands) | December 31 | |||||||||||||||||||
Nonaccrual Loans | 2005 | 2004 | 2003 | 2002 | 2001 | |||||||||||||||
Real Estate | $ | 3,609 | $ | 4,044 | $ | 1,950 | $ | — | $ | — | ||||||||||
Installment | — | 4 | — | 2 | 3 | |||||||||||||||
Commercial | — | — | — | — | — | |||||||||||||||
Total Nonaccrual Loans | $ | 3,609 | 4,048 | 1,950 | 2 | 3 | ||||||||||||||
Real Estate Owned Other Than Bank Premises | 511 | 542 | 520 | 533 | — | |||||||||||||||
Total Nonperforming Assets | $ | 4,120 | $ | 4,590 | $ | 2,470 | $ | 535 | $ | 3 | ||||||||||
Allowance for Loan Losses to Non-performing Assets | 45 | % | 40 | % | 184 | % | 29,233 | % | 16,280 | % | ||||||||||
3
Table of Contents
The following table presents the volume of loans contractually past due for 90 days or more on which interest continues to be accrued. These loans are believed to be well collateralized and present little or no likelihood of loss of principal.
| (Dollars in thousands) | |||||||||||||||
Loans 90 Days or More Past Due | 2005 | 2004 | 2003 | 2002 | 2001 | ||||||||||
Real Estate | $ | — | $ | 1,659 | $ | — | $ | — | $ | 1,204 | |||||
Installment | — | — | — | 1 | — | ||||||||||
Commercial | — | — | — | — | — | ||||||||||
Total Loans 90 Days or More Past Due | $ | — | $ | 1,659 | $ | — | $ | 1 | $ | 1,204 | |||||
Non-interest Income.Non-interest Income equaled $703,000 for 2005 compared to $790,000 for 2004, a decrease of $87,000 or 12%. The principal component of non-interest income is service charges on deposit accounts, which equaled $559,000 for 2005 compared to $582,000 for 2004.
Non-interest Expense.Non-interest expenses increased $267,000, or 5% during the year. This increase was a result of opening a new office in Hot Springs during this period of low interest rates and declining net interest income.
Investments.The total investment securities equaled $57 million at year-end 2005 compared to $42 million at year-end 2004. With interest rates at a level never seen before in recent times, we increased investments in U. S. Agency Securities, where higher yields were available, while reducing our fed funds position and interest-bearing deposits in other financial institutions.
Deposits.Total deposits fell 19 million, or 9%, during the year. All categories of deposits decreased with the exception of Lifetime Free Checking which increased. A large portion of the decrease was deposits of municipalities which fluctuate from time to time depending on interest rates.
Interest Sensitivity Analysis.The frequency with which interest rates on earning assets and interest bearing liabilities change has a significant impact on net interest income. The following table presents the anticipated changes based on the contractual maturity of each instrument. Expected maturities may differ from contractual maturities as both borrowers and depositors may have the right to call or prepay obligations with or without call or prepayment penalties.
(Dollars in thousands) Use of Funds | Within One Year | One to Five Years | Over Five Years | Total | |||||||||
Interest-Bearing Deposits in Other Financial Institutions | $ | 14,347 | $ | 1,287 | $ | — | $ | 15,634 | |||||
Federal Funds Sold | — | — | — | — | |||||||||
Investment Securities | 18,256 | 38,506 | — | 56,762 | |||||||||
Loans | 48,488 | 57,182 | 19,735 | 125,405 | |||||||||
Total Earning Assets | $ | 81,091 | $ | 96,975 | $ | 19,735 | $ | 197,801 | |||||
Deposits | |||||||||||||
Interest-Bearing Demand | $ | 23,547 | $ | — | $ | — | $ | 23,547 | |||||
Regular Passbook Savings | 21,741 | — | — | 21,741 | |||||||||
Time Deposits | |||||||||||||
Certificates of Deposit $100,000 and Over | 6,221 | 12,468 | — | 18,689 | |||||||||
Other | 44,895 | 56,990 | — | 101,885 | |||||||||
Total Interest-Bearing Deposits | 96,404 | 69,458 | — | 165,862 | |||||||||
Notes issued to the U. S. Treasury | 273 | — | — | 273 | |||||||||
Total Interest-Bearing Liabilities | $ | 96,677 | $ | 69,458 | $ | — | $ | 166,135 | |||||
Maturity/Rate Sensitivity Gap Per Period | $ | (15,586 | ) | $ | 27,517 | $ | 19,735 | $ | 31,666 | ||||
Cumulative Maturity/Rate Sensitivity Gap | (15,586 | ) | 11,931 | 31,666 | |||||||||
Capital.The federal regulatory agencies use risk-based capital ratios to analyze the adequacy of a bank’s capital. These ratios weigh bank assets from 0% to 100% depending upon the risks inherent in each type of asset. The Bank continues to meet all requirements for a well-capitalized bank as defined by the regulatory agencies. The following table presents the key risk-based capital ratios for December 31, 2005 and 2004. Additional details regarding capital may be found in the footnotes of the Financial Statements.
| 2005 | 2004 | |||||
Tier 1 Ratio | 14.40 | % | 12.57 | % | ||
Total Risk-Based Capital Ratio | 15.65 | % | 13.80 | % | ||
Leverage Ratio | 9.16 | % | 8.04 | % |
Liquidity. Liquidity is our ability to fund both loans and investments in the normal course of business and to provide adequate protection for unexpected deposit withdrawals or other demands for funds without incurring a significant negative impact on profitability. Our primary source of day-to-day liquidity lies in the combination of cash, deposit balances, checks in process of collection, deposit growth and federal funds sold. Federal funds are excess funds that are sold to other banks, generally on a one-day basis. Normal funds from the repayment of loans and investments augment these funds.
Our secondary source of liquidity lies in our investments and deposits in other financial institutions. While our investments are categorized as held-to-maturity, they consist of short-term U.S. Government Securities that are readily marketable. As reflected in the previous Interest Sensitivity Analysis, the majority of our investment security mature in five years or less. Interest-bearing deposits in other financial institutions generally mature in two years or less and the volume of this investment decreased $3.9 million during the year.
4
Table of Contents
Management’s Responsibility for Financial Reporting
The management of First National Exchange Bank has prepared and is responsible for the accompanying financial statements, together with the financial data and other information presented in this annual report. Management believes that the financial statements have been prepared in conformity with accounting principles generally accepted in the United States of America appropriate under the circumstances and include amounts that are based on management’s best estimates and judgments.
Management maintains and depends upon an internal accounting control system designed to provide reasonable assurance that transactions are executed in accordance with management’s authorization, that financial records are reliable as the basis for preparation of all financial statements, and that the Bank’s assets are safeguarded. The design and implementation of all systems of internal control are based on judgments required to evaluate the costs of control in relation to the expected benefits and to determine the appropriate balance between these costs and benefits. The Bank maintains a professional internal audit staff to monitor compliance with the system of internal control. Operational and special audits are conducted, and audit reports are submitted to appropriate management.
The Board of Directors functions as the audit committee and meets periodically with the independent public accountants, Goodman & Company, management and internal auditors to review accounting, auditing and internal reporting matters. The independent public accountants and internal auditors have free access to the Board to discuss the results of their audit work and their evaluations of internal controls and the quality of financial reporting.
The responsibility of Goodman & Company is limited to an expression of their opinion as to the fairness of the financial statements. Their opinion is based on an audit conducted in accordance with Standards of the Public Company Accounting Oversight Board (United States), as described in their report.
Worth Harris Carter, Jr.
Chairman of the Board, President and
Chief Financial Officer
5
Table of Contents

Report of Independent Registered Public Accounting Firm
Board of Directors and Shareholders
First National Exchange Bank
We have audited the accompanying statements of financial condition ofFirst National Exchange Bank (Bank) as of December 31, 2005 and 2004, and the related statements of income, shareholders’ equity and cash flows for each of the years in the three-year period ended December 31, 2005. These financial statements are the responsibility of the Bank’s management. Our responsibility is to express an opinion on these financial statements based on our audits.
We conducted our audits in accordance with the standards of the Public Company Accounting Oversight Board (United States). Those standards require that we plan and perform the audits to obtain reasonable assurance about whether the financial statements are free of material misstatement. An audit includes examining, on a test basis, evidence supporting the amounts and disclosures in the financial statements. An audit also includes assessing the accounting principles used and significant estimates made by management, as well as evaluating the overall financial statement presentation. We believe that our audits provide a reasonable basis for our opinion.
In our opinion, the financial statements referred to above present fairly, in all material respects, the financial position ofFirst National Exchange Bank as of December 31, 2005 and 2004, and the results of its operations and its cash flows for each of the years in the three-year period ended December 31, 2005, in conformity with accounting principles generally accepted in the United States of America.

Danville, Virginia
March 1, 2006
110 Exchange Street, Suite G
Danville, VA 24541
ph: 434.792.5334
fax: 434.791.6061
www.goodmanco.com
6
Table of Contents
Statements of Financial Condition
(Dollars in Thousands)
| December 31 | ||||||||
| 2005 | 2004 | |||||||
ASSETS: | ||||||||
Interest-Bearing Deposits in Other Financial Institutions | $ | 15,634 | $ | 19,497 | ||||
Investment Securities (Fair Value $56,034 in 2005 and $42,135 in 2004) | 56,762 | 42,179 | ||||||
Federal Funds Sold | — | 12,455 | ||||||
Loans (Net of Unearned Income) | 125,257 | 141,843 | ||||||
Less: Allowance for Loan Losses | (1,874 | ) | (1,845 | ) | ||||
Net Loans | 123,383 | 139,998 | ||||||
Earning Assets | 195,779 | 214,129 | ||||||
Cash and Due from Banks | 6,707 | 5,992 | ||||||
Bank Premises and Equipment | 3,520 | 3,707 | ||||||
Real Estate Owned Other Than Bank Premises | 511 | 542 | ||||||
Investment in Associated Company | 769 | 618 | ||||||
Other Assets | 2,595 | 3,324 | ||||||
TOTAL ASSETS | $ | 209,881 | $ | 228,312 | ||||
LIABILITIES: | ||||||||
Deposits: | ||||||||
LIFETIME FREE CHECKING | $ | 23,695 | $ | 23,375 | ||||
Interest-Bearing Demand | 23,547 | 35,466 | ||||||
Regular Passbook Savings | 21,741 | 24,537 | ||||||
Time Deposits: | ||||||||
Certificates of Deposit $100,000 and Over | 18,689 | 18,947 | ||||||
Other | 101,885 | 106,246 | ||||||
TOTAL DEPOSITS | 189,557 | 208,571 | ||||||
Notes Issued to the U.S. Treasury | 273 | 504 | ||||||
Other Liabilities | 483 | 485 | ||||||
TOTAL LIABILITIES | 190,313 | 209,560 | ||||||
SHAREHOLDERS’ EQUITY: | ||||||||
Common Stock, Par Value Per Share $5.00; 2,500,000 shares authorized; 492,329 shares outstanding in 2004 and 2005 | 2,462 | 2,462 | ||||||
Surplus | 13,344 | 13,344 | ||||||
Undivided Profits | 3,762 | 2,946 | ||||||
TOTAL SHAREHOLDERS’ EQUITY | 19,568 | 18,752 | ||||||
TOTAL LIABILITIES AND SHAREHOLDERS’ EQUITY | $ | 209,881 | $ | 228,312 | ||||
The accompanying notes are an integral part of these financial statements.
7
Table of Contents
Statements of Income
(Dollars in Thousands Except Per Share Data)
| Years Ended December 31 | |||||||||
| 2005 | 2004 | 2003 | |||||||
INTEREST INCOME: | |||||||||
Interest and Fees on Loans: | |||||||||
Taxable | $ | 7,566 | $ | 8,300 | $ | 10,505 | |||
Non-Taxable | 513 | 511 | 331 | ||||||
Interest on Deposits in Other Financial Institutions | 556 | 405 | 359 | ||||||
Interest on Federal Funds Sold | 57 | 108 | 403 | ||||||
Interest and Dividends on Securities: | |||||||||
U. S. Agency Securities and Other | 1,943 | 2,249 | 2,517 | ||||||
States and Political Subdivisions | 15 | 76 | 107 | ||||||
TOTAL INTEREST INCOME | 10,650 | 11,649 | 14,222 | ||||||
INTEREST EXPENSE: | |||||||||
Interest on Time Deposits $100,000 and Over | 746 | 710 | 886 | ||||||
Interest on Other Deposits | 4,191 | 4,206 | 5,621 | ||||||
Interest on Federal Funds Purchased | 42 | 16 | 3 | ||||||
Interest on Notes to the U.S. Treasury | 5 | 4 | — | ||||||
TOTAL INTEREST EXPENSE | 4,984 | 4,936 | 6,510 | ||||||
NET INTEREST INCOME | 5,666 | 6,713 | 7,712 | ||||||
Provision for Loan Losses | 120 | 120 | 898 | ||||||
NET INTEREST INCOME AFTER | |||||||||
PROVISION FOR LOAN LOSSES | 5,546 | 6,593 | 6,814 | ||||||
NON-INTEREST INCOME: | |||||||||
Service Charges, Commission and Fees | 559 | 582 | 651 | ||||||
Other Non-Interest Income | 144 | 208 | 168 | ||||||
TOTAL NON-INTEREST INCOME | 703 | 790 | 819 | ||||||
NON-INTEREST EXPENSE: | |||||||||
Salaries and Employee Benefits | 2,972 | 2,810 | 2,733 | ||||||
Occupancy Expense | 843 | 763 | 764 | ||||||
Operations Center Expense | 975 | 976 | 1,084 | ||||||
FDIC Assessment | 28 | 35 | 40 | ||||||
Other Non-Interest Expense | 467 | 434 | 400 | ||||||
TOTAL NON-INTEREST EXPENSE | 5,285 | 5,018 | 5,021 | ||||||
INCOME BEFORE INCOME TAXES | 964 | 2,365 | 2,612 | ||||||
Income Tax Expense | 148 | 538 | 750 | ||||||
NET INCOME | $ | 816 | $ | 1,827 | $ | 1,862 | |||
NET INCOME PER SHARE*: | |||||||||
Basic and Diluted | $ | 1.66 | $ | 3.71 | $ | 3.78 | |||
| * | Net Income per share has been retroactively adjusted to reflect the stock dividend in 2003. |
The accompanying notes are an integral part of these financial statements.
8
Table of Contents
Statements of Cash Flows
(Dollars in Thousands)
| Years Ended December 31 | ||||||||||||
| 2005 | 2004 | 2003 | ||||||||||
Cash Flows From Operating Activities: | ||||||||||||
Net Income | $ | 816 | $ | 1,827 | $ | 1,862 | ||||||
Adjustments to reconcile to net cash from operating activities: | ||||||||||||
Provision for Loan Losses | 120 | 120 | 898 | |||||||||
Depreciation of Premises and Equipment | 258 | 190 | 211 | |||||||||
Equity in Undistributed Income from Associated Company | (1 | ) | (11 | ) | (10 | ) | ||||||
Provision for Deferred Income Taxes | 87 | (25 | ) | (283 | ) | |||||||
(Decrease) in Unearned Income | (2 | ) | (27 | ) | (18 | ) | ||||||
(Increase) Decrease in Other Assets | 642 | (602 | ) | 31 | ||||||||
Decrease in Other Liabilities | (2 | ) | (66 | ) | (1,143 | ) | ||||||
Net Cash from Operating Activities | 1,918 | 1,406 | 1,548 | |||||||||
Cash Flows From Investing Activities: | ||||||||||||
Maturity of Interest Bearing-Deposits | 15,151 | 14,946 | 13,660 | |||||||||
Purchase of Interest-Bearing Deposits | (11,288 | ) | (19,596 | ) | (14,847 | ) | ||||||
Purchase of Investment Securities | (20,792 | ) | (20,000 | ) | (27,000 | ) | ||||||
Proceeds from Maturities, Calls and Redemptions of Investment Securities | 6,209 | 43,220 | 24,589 | |||||||||
(Purchase) Sale of Bank Premises and Equipment | (71 | ) | (759 | ) | 13 | |||||||
Net Increase in Short-Term Loans Outstanding, | (2,009 | ) | (829 | ) | (5,224 | ) | ||||||
Longer-Term Loans Originated or Purchased | (14,549 | ) | (11,782 | ) | (46,827 | ) | ||||||
Principal Collected on Longer-Term Loans | 33,055 | 26,334 | 20,185 | |||||||||
Sale of Other Real Estate | 31 | — | 13 | |||||||||
Investment in Associated Company | (150 | ) | — | (199 | ) | |||||||
Net Cash from Investing Activities | 5,587 | 31,534 | (35,637 | ) | ||||||||
Cash Flows From Financing Activities: | ||||||||||||
Net Increase in Demand and Savings Accounts | (14,395 | ) | (811 | ) | 12,734 | |||||||
Proceeds from Sale of Time Deposits | 54,496 | 59,105 | 90,568 | |||||||||
Payments on Matured Time Deposits | (59,115 | ) | (83,849 | ) | (126,406 | ) | ||||||
Stock Dividends | — | — | (16 | ) | ||||||||
Net Increase (Decrease) in Notes issued to U. S. Treasury | (231 | ) | 43 | (1,066 | ) | |||||||
Net Cash from Financing Activities | (19,245 | ) | (25,512 | ) | (24,186 | ) | ||||||
Net Change in Cash and Equivalents | (11,740 | ) | 7,428 | (58,275 | ) | |||||||
Cash and Equivalents at Beginning of Year | 18,447 | 11,019 | 69,294 | |||||||||
Cash and Equivalents at End of Year | $ | 6,707 | $ | 18,447 | $ | 11,019 | ||||||
Supplementary Data: | ||||||||||||
Cash Paid for Interest | $ | 4,950 | $ | 5,054 | $ | 6,073 | ||||||
Cash Paid for Income Taxes | 148 | 538 | 750 | |||||||||
Transfer of Loans to Foreclosed Assets | — | 20 | — | |||||||||
The accompanying notes are an integral part of these financial statements.
9
Table of Contents
Statements of Changes in Shareholders’ Equity
(Dollars in Thousands)
| COMMON STOCK | UNDIVIDED | |||||||||||
| SHARES | AMOUNT | SURPLUS | PROFITS | |||||||||
Year Ended December 31, 2003 | ||||||||||||
Balance at Beginning of Year | 447,900 | $ | 2,240 | $ | 11,567 | $ | 1,272 | |||||
Net Income | — | — | — | 1,862 | ||||||||
Stock Dividends (10%) | 44,429 | 222 | 1,777 | (2,015 | ) | |||||||
Total | 492,329 | $ | 2,462 | $ | 13,344 | $ | 1,119 | |||||
Year Ended December 31, 2004 | ||||||||||||
Balance at Beginning of Year | 492,329 | $ | 2,462 | $ | 13,344 | $ | 1,119 | |||||
Net Income | — | — | — | 1,827 | ||||||||
Total | 492,329 | $ | 2,462 | $ | 13,344 | $ | 2,946 | |||||
Year Ended December 31, 2005 | ||||||||||||
Balance at Beginning of Year | 492,329 | $ | 2,462 | $ | 13,344 | $ | 2,946 | |||||
Net Income | — | — | — | 816 | ||||||||
Total | 492,329 | $ | 2,462 | $ | 13,344 | $ | 3,762 | |||||
The accompanying notes are an integral part of these financial statements.
10
Table of Contents
Notes to Financial Statements
(Dollars in Thousands in Charts Except Per Share Data)
| 1. | SUMMARY OF SIGNIFICANT ACCOUNTING POLICIES |
The accounting and reporting policies of First National Exchange Bank are in accordance with accounting principles generally accepted in the United States of America and general practices within the banking industry which are consistent with reports filed with regulatory agencies.
NATURE OF OPERATIONS
The Bank generates commercial (including agricultural), mortgage and consumer loans and receives deposits from customers located primarily in the Roanoke Valley, including the Cities of Roanoke and Salem and the County of Roanoke, and Bedford, Boutetourt, and Craig counties in Virginia. The Bank operates under a national charter and provides full banking services. As a national bank, the Bank is subject to regulation by the Comptroller of the Currency, Federal Deposit Insurance Corporation, and the Board of Governors of the Federal Reserve System.
USE OF ESTIMATES
The preparation of financial statements in conformity with accounting principles generally accepted in the United States of America requires management to make estimates and assumptions that affect the reported amounts of assets and liabilities and disclosure of contingent assets and liabilities at the date of the financial statements, and the reported amounts of revenue and expenses during the reporting period. Actual results could differ from those estimates. Material estimates that are particularly susceptible to significant change in the near term relate to the determination of the allowance for loan losses, and fair value of the real estate owned.
CASH AND CASH EQUIVALENTS
For purposes of cash flows, cash and cash equivalents include cash on hand, demand balances due from banks and federal funds transactions. Generally, federal funds are purchased and sold for one-day periods.
SECURITIES
Investment securities are stated at cost, adjusted for amortization of premiums and accretion of discounts, and computed by the interest method. The Bank has the positive intent and ability to hold these securities until maturity. Gains and losses on sales of securities, if any, are based upon the adjusted cost of the specific securities sold.
LOANS
Loans are recorded at the amount of the loan disbursed to borrowers plus the applicable amount, if any, of unearned income and other charges, less payments received. Income earned on loans is recognized by methods which generally result in level rates of return on principal amounts outstanding. The net amount of nonrefundable loan origination fees approximates the direct costs associated with the lending process.
The allowance for loan losses is an estimate of losses inherent in the loan portfolio as determined by management taking into consideration historical loan loss experience, diversification of the loan portfolio, amounts of secured and unsecured loans, banking industry standards and averages, and general economic conditions. Ultimate losses may vary from current estimates. These estimates are reviewed periodically and as adjustments become necessary, they are reported in earnings in the periods in which they become reasonably estimable.
Management determines loan impairment using guidelines established by Statement of Financial Accounting Standards No. 114 (SFAS 114), Accounting by Creditors for Impairment of a Loan (as amended by SFAS 118, “Accounting by Creditors for Impairment of a Loan - Income Recognition and Disclosures)”. Under this accounting standard, a loan is considered to be impaired when it is probable that the Bank will be unable to collect all principal and interest amounts according to the contractual terms of the loan agreement. A performing loan may be considered impaired. The allowance for loan losses related to loans identified as impaired is primarily based on the excess of the loan’s current outstanding principal balances over the estimated fair value of the related collateral. For a loan that is not collateral-dependent, the allowance is recorded at the amount by which the outstanding principal balance exceeds the current best estimate of the future cash flows on the loan discounted at the loan’s original effective interest rate. Interest on impaired loans is recognized when cash is received.
BANK PREMISES AND EQUIPMENT
Premises and equipment are stated at cost, less accumulated depreciation. Depreciation is charged to operating expenses over the estimated useful life of the assets by the accelerated and straight-line methods. Costs of maintenance or repairs are charged to expense as incurred and improvements are capitalized. Upon retirement or disposal of an asset, the asset and related allowance account are eliminated. Any gain or loss on such transactions is included in current operations. Depreciation has been included under Occupancy Expense in the Statements of Income in the amount of $258,000 in 2005, $190,000 in 2004 and $211,000 in 2003.
OTHER REAL ESTATE OWNED
Real estate properties acquired through or in lieu of loan foreclosure are initially recorded at the lower of the Bank’s carrying amount or fair value less estimated selling cost at the date of foreclosure. Any write-downs based on the asset’s fair value at the date of acquisition are charged to the allowance for loan losses. After foreclosure, these assets are carried at the lower of their new cost basis or fair value less cost to sell. Costs of significant property improvements are capitalized, whereas costs relating to holding property are expensed. Valuations are periodically performed by management, and any write-downs are recorded as a charge to operations, if necessary, to reduce the carrying value of a property to the lower of its carrying value or fair value less cost to sell.
INCOME TAXES
Deferred taxes are provided on a liability method whereby deferred tax assets are recognized for deductible temporary differences and operating loss and tax credit carryforwards and deferred tax liabilities are recognized for taxable temporary differences. Temporary differences are the differences between the reported amounts of assets and liabilities and their tax bases. Deferred tax assets are reduced by a valuation allowance when, in the opinion of management, it is more likely than not that some portion or all of the deferred tax assets will not be realized. Deferred tax assets and liabilities are adjusted for the effects of changes in tax laws and rates on the date of enactment.
RETIREMENT BENEFITS
Effective January 1, 1999, the Bank established Employee Benefit Plans as described in footnote 5. The Bank does not provide any other post-retirement benefits that would be accrued under Statement of Financial Accounting Standards No. 106, “Employers’ Accounting for Post Retirement Benefits Other Than Pensions”.
| 2. | INVESTMENT SECURITIES |
The carrying value of securities pledged to secure public deposits was $56,762,000 and $41,744,000 at December 31, 2005 and 2004. The amortized cost and estimated fair value of investment securities as of December 31, 2005 and 2004 were as follows:
| Gross Amortized Cost | Gross Unrealized Gains | Estimated Unrealized Losses | Fair Value | |||||||||
December 31, 2005 | ||||||||||||
U. S. Agency Securities | $ | 56,762 | $ | 14 | $ | 742 | $ | 56,034 | ||||
December 31, 2004 | ||||||||||||
U. S. Agency Securities | $ | 41,744 | $ | 205 | $ | 261 | $ | 41,688 | ||||
Obligations of States and Political Subdivisions | 435 | 12 | — | 447 | ||||||||
Total | $ | 42,179 | $ | 217 | $ | 261 | $ | 42,135 | ||||
The table below shows gross unrealized losses and fair value, aggregated by investment category and length of time that individual securities have been in a continuous unrealized loss position at December 31, 2005 and 2004.
| Unrealized Loss | |||||||||
2005 Securities Description | Fair Value | Less than 12 Months | More than 12 Months | ||||||
U. S. Agency Securities | $ | 14,381 | $ | 113 | $ | — | |||
U. S. Agency Securities | 32,868 | — | 629 | ||||||
Total | $ | 47,249 | $ | 113 | $ | 629 | |||
2004 | |||||||||
U. S. Agency Securities | $ | 23,761 | $ | 223 | $ | — | |||
U. S. Agency Securities | 4,962 | — | 38 | ||||||
Total | $ | 28,723 | $ | 223 | $ | 38 | |||
The unrealized losses on the Bank’s investments in obligations of U. S. government agencies were caused by interest rate increases. The contractual terms of those investments do not permit the issuer to settle the securities at a price less than the amortized cost of the investment. Because the Bank has the ability and intent to hold those investments until a recovery of fair value, which may be maturity, the Bank does not consider those investments to be other-than-temporarily impaired at December 31, 2005.
The amortized cost and estimated fair value of investments in debt securities at December 31, 2005 and 2004, by contractual maturity, are shown below. Expected maturities will differ from contractual maturities because issuers may have the right to call or prepay obligations with or without call or prepayment penalties.
| 2005 | 2004 | |||||||||||
| Estimated Amortized Cost | Fair Value | Estimated Amortized Cost | Fair Value | |||||||||
Due in One Year or Less | $ | 18,256 | $ | 18,151 | $ | 2,135 | $ | 2,016 | ||||
After One Year Through Five Years | 38,506 | 37,883 | 40,044 | 40,119 | ||||||||
Due After Five Years Through Ten Years | — | — | — | — | ||||||||
Due After Ten Years | — | — | — | — | ||||||||
Total | $ | 56,762 | $ | 56,034 | $ | 42,179 | $ | 42,135 | ||||
| 3. | COMPOSITION OF LOANS |
| December 31 | ||||||||
| 2005 | 2004 | |||||||
Real Estate | $ | 97,048 | $ | 111,412 | ||||
Consumer | 1,793 | 1,937 | ||||||
Commercial, Industrial and Agricultural | 9,539 | 13,078 | ||||||
All Other | 17,025 | 15,566 | ||||||
Gross Loans | 125,405 | 141,993 | ||||||
Less: Unearned Income | (148 | ) | (150 | ) | ||||
Allowance for Loan Losses | (1,874 | ) | (1,845 | ) | ||||
Total Loans, Net | $ | 123,383 | $ | 139,998 | ||||
Maturity Distribution |
| |||||||
Variable | 2005 | 2004 | ||||||
Less Than One Year | $ | 25,015 | $ | 78,625 | ||||
One to Five Years | 47,941 | 2,821 | ||||||
Over Five Years | 4,878 | 4,229 | ||||||
Subtotal | 77,834 | 85,675 | ||||||
Fixed | ||||||||
Less Than One Year | 23,472 | 20,287 | ||||||
One to Five Years | 9,242 | 17,180 | ||||||
Over Five Years | 14,857 | 18,851 | ||||||
Subtotal | 47,571 | 56,318 | ||||||
Total | $ | 125,405 | $ | 141,993 | ||||
| 4. | ALLOWANCE FOR LOAN LOSSES |
In the view of management, the Allowance for Loan Losses is adequate to meet the loss contingency based on experience factors and a review of the loan portfolio.
The Allowance for Loan Losses for the years ending December 31, 2005, 2004, and 2003 is summarized as follows:
| 2005 | 2004 | 2003 | ||||||||||
Balance at beginning of year | $ | 1,845 | $ | 1,804 | $ | 985 | ||||||
Recoveries credited during year | 89 | 1 | 2 | |||||||||
Provision for loan losses | 120 | 120 | 898 | |||||||||
Losses charged to allowance | (180 | ) | (80 | ) | (81 | ) | ||||||
Balance at end of year | $ | 1,874 | $ | 1,845 | $ | 1,804 | ||||||
11
Table of Contents
The following is a summary of information pertaining to impaired and non-accrual loans:
| December 31 | ||||||
| 2005 | 2004 | |||||
Impaired loans without a valuation allowance | $ | — | $ | — | ||
Impaired loans with a valuation allowance | 1,950 | 1,950 | ||||
Total impaired loans | $ | 1,950 | $ | 1,950 | ||
Valuation allowance related to impaired loans | $ | 778 | $ | 778 | ||
Non-accrual loans (impaired) | $ | 1,950 | $ | 1,950 | ||
Non-accrual loans (non-impaired) | $ | 1,659 | $ | 2,098 | ||
Total loans past due ninety days or more and still accruing | $ | — | $ | 1,659 | ||
| Years Ended December 31 | |||||||||
| 2005 | 2004 | 2003 | |||||||
Average investment in impaired loans | $ | 1,950 | $ | 1,950 | $ | 964 | |||
Interest income recognized on impaired loans— | $ | — | $ | 386 | $ | 18 | |||
Interest income recognized on a cash basis on impaired loans | $ | — | $ | — | $ | — | |||
| 5. | STOCK OPTIONS AND EMPLOYEE BENEFIT PLANS |
There were no stock options or stock option plans in effect for 2003, 2004 or 2005.
Effective January 1, 1999, the Bank adopted an integrated profit sharing plan. Employees participate in the profit sharing plan following completion of six (6) months of service and upon reaching the age of twenty years and six months as of January 1. Vesting includes years of service to the Bank prior to the effective date of the plan. The plan gives 0% vesting to anyone who has less than five (5) years of service except that persons who have reached the age of 62 are fully vested regardless of length of service. Each participant in the plan (who has not reached age 62) becomes 100% vested after five (5) years of service. The contribution to the plan is determined each year by the Board of Directors and thus may fluctuate in amount from year to year. The contribution by the Bank to the plan was $110,000 in 2005, $115,000 in 2004, and $101,000 in 2003 and is included in Salaries and Employee Benefits in the Statements of Income.
| 6. | FEDERAL INCOME TAXES |
Net deferred tax assets consist of the following components as of December 31, 2005 and 2004:
Deferred Tax Assets | 2005 | 2004 | ||||
Allowance for Loan Losses | 582 | 570 | ||||
Dividend Exclusion | 12 | 12 | ||||
NOL Carryforward to 2006 | 138 | 211 | ||||
Total Deferred Tax Assets | 732 | 793 | ||||
Deferred Tax Liabilities | ||||||
Bank Premises | 254 | 228 | ||||
Investment in Associated Companies | 14 | 14 | ||||
Total Deferred Tax Liabilities | 268 | 242 | ||||
Net Deferred Taxes | $ | 464 | $ | 551 | ||
The provisions for income taxes charged to operations for the years ended December 31, 2005, 2004 and 2003 consist of the following:
| 2005 | 2004 | 2003 | |||||||||
Currently payable | $ | 61 | $ | 563 | $ | 1,033 | |||||
Deferred | 87 | (25 | ) | (283 | ) | ||||||
Net Provision | $ | 148 | $ | 538 | $ | 750 | |||||
The income tax provision differs from the amount of income tax determined by applying the U.S. federal income tax rate to pretax income for the years ended December 31, 2005, 2004 and 2003 due to the following:
Tax provisions computed by applying federal rates to income before income taxes | $ | 302 | $ | 804 | $ | 888 | ||||||
Tax exempt interest | (179 | ) | (200 | ) | (149 | ) | ||||||
Tax credits | — | (84 | ) | — | ||||||||
Other | 25 | 18 | 11 | |||||||||
Net Provision | $ | 148 | $ | 538 | $ | 750 | ||||||
In 2004, the Bank purchased historic tax credits during the year of $846,000 at a discount of $84,000 that expire in 2013. A summary of the tax credits and their use is as follows:
Tax credits purchased | $ | 846 | ||
Taken in 2004 | (216 | ) | ||
Carryback taken in 2003 | (417 | ) | ||
Taken in 2005 | (75 | ) | ||
Carryforward for 2006 | $ | 138 | ||
| 7. | RELATED PARTY TRANSACTIONS |
The Chairman of the Board of First National Exchange Bank also serves as Chairman of the Board of Blue Ridge Bank, N.A., Central National Bank, Community National Bank, First National Bank, Mountain National Bank, Patrick Henry National Bank, Patriot Bank, N.A., Peoples National Bank and Shenandoah National Bank.
The Bank maintains correspondent bank accounts with two of these banks. In 2005 and 2004 the average daily balances in these accounts were considered normal operating balances to facilitate general business transactions.
The Bank also participates in loan transactions with these banks. These transactions are a carrying value and do not involve more than the normal risk of collectibility or present other unfavorable features.
The Bank owns ten percent of the outstanding common stock of The Mortgage Company of Virginia, Inc. The remaining common stock is equally owned by the banks listed above. The Mortgage Company of Virginia owns 100% of Bank Services of Virginia, Inc. The business of both of these companies is to provide operational support services to the ten banks. These services consist of mortgage loan servicing, data processing, bookkeeping, check clearing, accounting, investment management, bank couriers, advertising programs, central purchasing and other management services. The Bank is charged for its share of these services, which is recorded as Operation Center Expense in the Statements of Income. The cost of this expense is shared by the ten banks on the basis of average deposits of each bank related to total average deposits of all the banks.
The Mortgage Company of Virginia, Inc. also owns 100% of Bank Services Insurance, Inc. Bank Services Insurance, Inc. provides insurance products to the banks and customers in the Danville area. The premiums paid to Bank Services Insurance, Inc. equaled $26,000 in 2005.
The Mortgage Company of Virginia, Inc. also owns 50% of Coresoft, Inc. represented by an initial $1,000 investment during 2004. Coresoft, Inc. is in the process of developing a core software package the banks listed above will use. At December 31, 2005, Coresoft, Inc. had an outstanding note payable to the Mortgage Company of $1,400,000.
The Bank records its investment in the common stock of The Mortgage Company of Virginia, Inc. under the equity method of accounting due to the influence the Bank has over the company. The Bank invested an additional $150,000 in 2005 increasing the value of the investment to $769,000 from $618,000 at December 31, 2004. The Bank’s share of earnings of the company equaled $1,000 for 2005, $11,000 for 2004 and $10,000 for 2003 and is shown in the Statements of Income under Other Non-Interest Income.
The Chairman of the Board and President of the Bank also serves as Chairman of the Board and President of Bank Building Corporation and Manager of Blackstone Properties, LLC, its wholly owned subsidiary (the “companies”). The companies lease branches to certain of the Banks listed above. At December 31, 2005, the Bank leased six offices from the companies. Rental expense and future lease payments under these leases are disclosed in a footnote below. As of December 31, 2005 and 2004, the Bank had loans totaling $2,730,000 and $2,851,000, respectively, to Bank Building Corporation. These loans were made to purchase bank branches leased to affiliated banks. The loans are secured by these branches and the related leases, and have repayment terms similar to other loan customers of the Bank.
In the ordinary course of business, directors, and their related interests were customers of, and had transactions with the Bank. Loan transactions with directors and officers, principal security holders and associates were made on substantially the same terms as those prevailing at the time for comparable loans to other persons and did not involve more than normal risk of collectibility or present other unfavorable features. There was no such loan activity during 2005 or 2004.
| 8. | CONTINGENCIES |
The Bank did not have any legal matters of financial significance pending at December 31, 2005 and 2004.
| 9. | EARNINGS PER COMMON SHARE |
The Bank follows Statement of Financial Accounting Standards (SFAS) No. 128, “Earnings Per Share”.This statement requires the dual presentation of basic and diluted earnings per share The weighted average number of shares used to compute earnings per share was 492,329.
The Bank issued a 10% stock dividend in 2003 and none was issued in 2004 or 2005. No fractional shares were issued in this stock dividend. Stock dividends and fractional shares were settled based on known prices for recent trades of the stock and other factors deemed relevant at the time.
| 10. | BANK PREMISES AND EQUIPMENT |
Premises and equipment are stated at cost less accumulated depreciation as follows:
December 31, 2005 | Cost | Accumulated Depreciation and Amortization | Net Remaining Cost | ||||||
Bank Premises (Including Land of $823,000) | $ | 2,771 | $ | 464 | $ | 2,307 | |||
Leasehold Improvements | 146 | — | 146 | ||||||
Equipment | 1,948 | 881 | 1,067 | ||||||
Total | $ | 4,865 | $ | 1,345 | $ | 3,520 | |||
December 31, 2004 | |||||||||
Bank Premises (Including Land of $ 798,000) | $ | 2,767 | $ | 409 | $ | 2,358 | |||
Leasehold Improvements | 146 | — | 146 | ||||||
Equipment | 1,881 | 678 | 1,203 | ||||||
Total | $ | 4,794 | $ | 1,087 | $ | 3,707 | |||
| 11. | FORECLOSED ASSETS |
Expenses applicable to foreclosed assets include the following:
| Years Ended December 31 | |||||||||
| 2005 | 2004 | 2003 | |||||||
Net loss (gain) on sales of real estate | $ | — | $ | — | $ | — | |||
Provision for losses | — | — | — | ||||||
Operating expenses | 13 | 13 | 13 | ||||||
12
Table of Contents
| 12. | CASH AND CASH EQUIVALENTS |
Cash and cash equivalents as of December 31, 2005, 2004 and 2003 are detailed below:
| 2005 | 2004 | 2003 | |||||||
Cash and Due From Banks | $ | 6,707 | $ | 5,992 | $ | 6,374 | |||
Federal Funds Sold | — | 12,455 | 4,645 | ||||||
Total Cash and Cash Equivalents | $ | 6,707 | $ | 18,447 | $ | 11,019 | |||
| 13. | DEPOSITS |
Certificates of Deposit maturing as of December 31:
| 2005 | 2004 | |||||
1 Year | $ | 51,170 | $ | 57,800 | ||
2 Years | 25,855 | 17,669 | ||||
3 Years | 19,601 | 19,983 | ||||
4 Years | 10,027 | 18,980 | ||||
5 Years and Thereafter | 13,921 | 10,761 | ||||
Total | $ | 120,574 | $ | 125,193 | ||
| 14. | CONCENTRATION OF CREDIT RISK |
The majority of the Bank’s loans, commitments and lines of credit have been granted to customers in the Bank’s market area. The concentrations of credit by loan classification are set forth in a footnote above. The Bank does not extend credit to any individual borrowers in excess of its lending limit of $3,216,000 and $3,097,000, respectively, as of year-end 2005 and 2004.
The largest category of Real Estate Loans consisted of loans to the motel/hotel industry. These loans approximated $33,376,000 at December 31, 2005 and $29,190,000 at December 31, 2004.
| 15. | FAIR VALUE OF FINANCIAL INSTRUMENTS |
Statement of Financial Accounting Standards No. 107, “Disclosures about Fair Value of Financial Instruments”,requires the Bank to disclose the estimated fair values of its financial assets and liabilities. The estimated fair values were determined using the following assumptions:
| a. | The carrying value of Cash and Due From Banks, Federal Funds Sold, and Interest-Bearing Deposits in Other Financial Institutions are believed to approximate the fair value of these items. |
| b. | The fair value of actively traded investment securities are determined according to quotes available in the financial press. The fair value of instruments which are not actively traded are determined using values of other instruments with similar characteristics or obtained from outside sources believed to be reliable. |
| c. | The fair value of loans are estimated by discounting the anticipated cash flows using estimated rates for similar loans available in the Bank’s market area. Estimates of maturities are based on both experience and contractual maturities although prepayments are permitted on the loans. |
| d. | The fair value of short-term demand and savings deposits are believed to equal carrying value. The fair value of certificates of deposit are based upon the contractual maturity of the instruments and rates currently offered for similar deposits. |
| e. | The fair value of Notes Payable to the U. S. Treasury are estimated at carrying value. |
| f. | The fair value of Accrued Interest Receivable and Accrued Interest Payable are estimated at carrying value. |
| 2005 | 2004 | |||||||||||
Financial Assets: | Carrying Value | Fair Value | Carrying Value | Fair Value | ||||||||
Interest-Bearing Deposits in Other Financial Institutions | $ | 15,634 | $ | 15,634 | $ | 19,497 | $ | 19,497 | ||||
Investment Securities | 56,762 | 56,034 | 42,179 | 42,135 | ||||||||
Federal Funds Sold | — | — | 12,455 | 12,455 | ||||||||
Loans | ||||||||||||
(Net of Unearned Income) | 125,257 | 125,365 | 141,843 | 142,848 | ||||||||
Cash and Due From Banks | 6,707 | 6,707 | 5,992 | 5,992 | ||||||||
Accrued Interest Receivable | 1,131 | 1,131 | 1,073 | 1,073 | ||||||||
Total | $ | 205,491 | $ | 204,871 | $ | 223,039 | $ | 224,000 | ||||
Financial Liabilities: | ||||||||||||
Deposits | ||||||||||||
LIFETIME FREE CHECKING | $ | 23,695 | $ | 23,695 | $ | 23,375 | $ | 23,375 | ||||
Interest-Bearing Demand | 23,547 | 23,547 | 35,466 | 35,466 | ||||||||
Regular Passbook Saving | 21,741 | 21,741 | 24,537 | 24,537 | ||||||||
Time Deposits: | ||||||||||||
Certificates of Deposit $100,000 and Over | 18,689 | 18,616 | 18,947 | 19,275 | ||||||||
Other | 101,885 | 101,384 | 106,246 | 107,728 | ||||||||
TOTAL DEPOSITS | 189,557 | 188,983 | 208,571 | 210,381 | ||||||||
Notes issued to the U. S. Treasury | 273 | 273 | 504 | 504 | ||||||||
Accrued Interest Payable | 344 | 344 | 344 | 344 | ||||||||
Total | $ | 190,174 | $ | 189,600 | $ | 209,419 | $ | 211,229 | ||||
| 16. | CAPITAL ADEQUACY |
The Bank is subject to various regulatory capital requirements. Under the regulatory capital guidelines and the regulatory framework for Prompt Corrective Action (PCA), the Bank must meet specific capital guidelines involving the quantitative measures of the Bank’s assets, liabilities, and certain off-balance-sheet items as calculated under regulatory accounting practices. The Bank’s capital amount and classification are also subject to qualitative judgments by the regulators about components, risk weightings and other factors.
Quantitative measures established by regulation to ensure capital adequacy require the Bank to maintain minimum ratios (set forth in the table below) of total and Tier 1 capital (as defined in the regulations) to risk-weighted assets (as defined) and of Tier 1 capital to average assets (as defined).
| Minimum Ratio For Capital Adequacy Purposes | Minimum Ratio To Be Considered Well Capitalized Under PCA Provisions | |||||
Tier 1 Capital to Risk Weighted Assets | 4 | % | 6 | % | ||
Total Capital to Risk Weighted Assets | 8 | % | 10 | % | ||
Tier 1 Capital to Average Assets | 4 | % | 5 | % |
As of December 31, 2005, the most recent notification from the Federal Deposit Insurance Corporation categorized the Bank as well capitalized under the regulatory framework for prompt corrective action. To be categorized as well capitalized, an institution must maintain minimum total risk-based, Tier 1 risk-based and Tier 1 leverage ratios as set forth in the above table. There were no conditions or events since the notification that management believes have changed the Bank’s category. The Bank’s actual capital amounts and ratios as of December 31, 2005 and 2004 are presented in the following table. Management believes, as of December 31, 2005 and 2004, that the Bank meets all capital adequacy requirements to which it is subject.
As of December 31, 2005 | Minimum Capital For Capital Adequacy Purposes | Minimum Capital To Be Considered Well Capitalized Under PCA Provisions | Actual Capital | Actual Ratio | ||||||||
Tier 1 Capital to Risk Weighted Assets | $ | 5,436 | $ | 8,153 | $ | 19,568 | 14.40 | % | ||||
Total Capital to Risk Weighted Assets | 10,871 | 13,589 | 21,267 | 15.65 | % | |||||||
Tier 1 Capital to Average Assets | 9,545 | 6,795 | 19,568 | 9.16 | % | |||||||
As of December 31, 2004 | ||||||||||||
Tier 1 Capital to Risk Weighted Assets | $ | 5,971 | $ | 8,956 | $ | 18,752 | 12.57 | % | ||||
Total Capital to Risk Weighted Assets | 11,942 | 14,927 | 20,597 | 13.80 | % | |||||||
Tier 1 Capital to Average Assets | 9,330 | 11,662 | 18,752 | 8.04 | % | |||||||
| 17. | QUARTERLY FINANCIAL DATA (Unedited) |
The following summarizes the quarterly results of operations for the years ended December 31, 2005 and 2004:
2005 | First Quarter | Second Quarter | Third Quarter | Fourth Quarter | ||||||||
Total Interest Income | $ | 2,625 | $ | 2,660 | $ | 2,727 | $ | 2,638 | ||||
Total Interest Expense | 1,164 | 1,242 | 1,297 | 1,281 | ||||||||
Net Interest Income | 1,461 | 1,418 | 1,430 | 1,357 | ||||||||
Provision For Loan Losses | 30 | 30 | 30 | 30 | ||||||||
Net Interest Income After Provision for Loan Losses | 1,431 | 1,388 | 1,400 | 1,327 | ||||||||
Total Non-Interest Income | 177 | 151 | 138 | 237 | ||||||||
Total Non-Interest Expense | 1,290 | 1,299 | 1,305 | 1,391 | ||||||||
Income Before Income Taxes | 318 | 240 | 233 | 173 | ||||||||
Income Tax Expense | 60 | 40 | 35 | 13 | ||||||||
Net Income | $ | 258 | $ | 200 | $ | 198 | $ | 160 | ||||
Basic and Diluted Net Income Per Share | $ | 0.52 | $ | 0.41 | $ | 0.40 | $ | 0.33 | ||||
2004 | First Quarter | Second Quarter | Third Quarter | Fourth Quarter | ||||||||
Total Interest Income | $ | 3,089 | $ | 3,050 | $ | 2,851 | $ | 2,659 | ||||
Total Interest Expense | 1,280 | 1,238 | 1,216 | 1,202 | ||||||||
Net Interest Income | 1,809 | 1,812 | 1,635 | 1,457 | ||||||||
Provision For Loan Losses | 30 | 30 | 30 | 30 | ||||||||
Net Interest Income After Provision for Loan Losses | 1,779 | 1,782 | 1,605 | 1,427 | ||||||||
Total Non-Interest Income | 185 | 169 | 164 | 272 | ||||||||
Total Non-Interest Expense | 1,245 | 1,228 | 1,247 | 1,298 | ||||||||
Income Before Income Taxes | 719 | 723 | �� | 522 | 401 | |||||||
Income Tax Expense | 185 | 190 | 135 | 28 | ||||||||
Net Income | $ | 534 | $ | 533 | $ | 387 | $ | 373 | ||||
Basic and Diluted Net Income Per Share | $ | 1.08 | $ | 1.08 | $ | 0.79 | $ | 0.76 | ||||
13
Table of Contents
| 18. | LEASES AND RENT EXPENSE |
The Bank leases facilities under non-cancelable operating leases during 2005, 2004 and 2003. As noted above, the Bank leased six offices from the companies in 2005, 2004 and 2003 These leases required the Bank to pay maintenance, insurance and property taxes and do not have renewal options. Rental expense under these leases was $ 258,000 in 2005, $267,000 in 2004 and $269,000 in 2003. The Bank also leases offices from non-related parties under various terms. Rental expense under these leases was $48,000 in 2005, 2004 and 2003. Future minimum rental payments under these leases are as follows:
Year Ending December 31, 2006 | $ | 320 | |
2007 | 320 | ||
2008 | 320 | ||
2009 | 320 | ||
2010 | 320 | ||
Thereafter | 1,426 | ||
Total Minimum Lease Payments | $ | 3,0264 | |
| 19. | OFF BALANCE SHEET ACTIVITIES AND COMMITMENTS |
Commitments to extend credit, which amounted to $250,000 at December 31, 2005 and $1,560,000 at December 31, 2004, represent agreements to lend to customers with fixed expiration dates or other termination clauses. Since many of the commitments are expected to expire without being funded, the total commitment amounts do not necessarily represent future liquidity requirements. Standby letters of credit are conditional commitments issued by the Bank guaranteeing the performance of a customer to a third party. Those guarantees are primarily issued to support public and private borrowing arrangements. At December 31, 2005 the Bank had outstanding standby letters of credit of $492,000 and $425,000 on December 31, 2004.
The Bank is a member of the Federal Reserve System and is required to maintain certain levels of its cash and due from bank balances as reserves based on regulatory requirements. At December 31, 2005 and 2004, this reserve requirement was approximately $887,000 and $1,001,000, respectively.
Federal banking regulations place certain restrictions on dividends paid by the Bank. The total amount of dividends which may be paid at any date and is generally limited to the retained earnings of the Bank. In addition, dividends paid by the Bank would be prohibited if the effect thereof would cause the Bank’s capital to be reduced below applicable minimum capital requirements.
| 20. | RECENT ACCOUNTING PRONOUNCEMENTS AND ACCOUNTING CHANGES |
In November 2002, the FASB issued FASB Interpretation No. 45, “Guarantor’s Accounting and Disclosure Requirements for Guarantees, including Indirect Guarantees of Indebtedness of Others” (FIN 45).
The interpretation elaborates on the disclosures to be made by a guarantor in its financial statements under certain guarantees that it has issued. It also clarifies that a guarantor is required to recognize, at the inception of a guarantee, a liability for the fair value of the obligation undertaken in issuing the guarantee. The interpretation requires disclosure of the nature of the guarantee, the maximum potential amount of future payments that the guarantor could be required to make under the guarantee, and the current amount of the liability, if any, for the guarantor’s obligations under the guarantee. The recognition requirements of the Interpretation were effective beginning January 1, 2003.
The FASB also revised FASB Interpretation 46, “Consolidation of Variable Interest Entities, an interpretation of ARB No. 51” (FIN 46). The interpretation provides a framework for identifying variable interest entities (VIEs), and determining when a company should include the assets, liabilities, noncontrolling interests and results of activities of a VIE in its consolidated financial statements. As revised, FIN 46 is effective beginning in the first quarter of 2004 for all VIEs (other than what is commonly referred to as special purpose entities, VIEs of small business issuers, and VIEs of nonpublic entities). The Bank does not currently utilize VIEs or so called special purpose entities.
In November 2003, the FASB’s Emerging Issues Task Force (EITF) reached consensus on new disclosure requirements related to unrealized losses on investment securities. The new disclosure requirements apply to marketable equity and debt securities accounted for under Financial Accounting Board Statement No 115, “Accounting for Certain Investments in Debt and Equity Securities,” and are required for inclusion in annual reports with fiscal years ended after December 15, 2003.
In November 2003, the FASB issued FASB Staff Position (FSP) 144-1, “Determination of Cost Basis for Foreclosed Assets under FASB Statement No. 15”, “Accounting by Debtors and Creditors for Troubled Debt Restructurings,” and the Measurement of Cumulative Losses Previously Recognized under Paragraph 37 of FASB Statement No. 144, “Accounting for the Impairment or Disposal of Long-Lived Assets.” Under FSP 144-1, the lender is required to measure the foreclosure on a long-lived asset (e.g. real estate) at fair value less cost to sell on the foreclosure date, which establishes a new cost basis such that any loan valuation allowance is not retained. Thereafter, the lender would follow the impairment guidance in Statement No 144, and could not reflect any recovery in value of the property beyond the cost basis established upon foreclosure of the loan. This guidance was effective upon posting of the FSP to the FASB website in November 2003.
In April 2003, the Financial Accounting Standards Board issued Statement No. 149, “Amendment of Statement 133 on Derivative Instruments and Hedging Activities”. This statement amends and clarifies financial accounting and reporting for derivative instruments, including certain derivative instruments embedded in other contracts (collectively referred to as derivatives) and for hedging activities under FASB Statement No. 133,” Accounting for Derivative Instruments and Hedging Activities”.
In May 2003, the Financial Accounting Standards Board issued Statement No. 150, “Accounting for Certain Financial Instruments with Characteristics of both Liabilities and Equity”. This statement establishes standards for how an issuer classifies and measures certain financial instruments with characteristics of both liabilities and equity. It requires that an issuer classify a financial instrument that is within its scope as a liability (or an asset in some circumstances). Many of those instruments were previously classified as equity. This statement effective for financial instruments entered into or modified after May 31, 2003, and otherwise is effective at the beginning of the first interim period beginning after June 15, 2003.
In December 2004, the FASB issued Statement No. 123 (revised 2004), which is a revision of Statement 123 “Accounting for Stock-Based Compensation”. This Statement establishes standards for the accounting for transactions in which an entity exchanges its equity instruments for goods or services. It also addresses transactions in which an entity incurs liabilities in exchange for goods or services that are based on the fair value of the entity’s equity instruments or that may be settled by the issuance of those equity instruments. This Statement focuses primarily on accounting for transactions in which an entity obtains employee services in share-based payment transactions. This Statement is effective for public entities as of the beginning of the first interim or annual reporting period that begins after June 15, 2005.
In December 2004, the FASB issued Statement No. 153, “Exchanges of Nonmonetary Assets”, an amendment of APB Opinion No. 29, Accounting for Nonmonetary Transactions”. This Statement eliminates the exception to fair value for exchanges of similar productive assets and replaces it with a general exception for exchange transactions that do not have commercial substance-that is, transactions that are not expected to result in significant changes in the cash flows of the reporting entity. This Statement is effective for nonmonetary asset exchanges occurring in fiscal periods beginning after June 15, 2005.
In May 2005, the FASB issued Statement No. 154, “Accounting Changes and Error Corrections—a replacement of APB Opinion No. 20 and FASB Statement No. 3”. This Statement requires retrospective application to prior periods’ financial statements of changes in accounting principle, unless it is impracticable to determine either the period-specific effects or the cumulative effect of the change. When it is impracticable to determine the period-specific effects of an accounting change on one or more individual prior periods presented, this Statement requires that the new accounting principle be applied to the balances of assets and liabilities as of the beginning of the earliest period for which retrospective application is practicable and that a corresponding adjustment be made to the opening balance of retained earnings. This Statement improves financial reporting because its requirement to report voluntary changes in accounting principles via retrospective application, unless impracticable, enhances the consistency of financial information between periods. This statement is effective for accounting changes and corrections of errors made in fiscal years beginning after December 15, 2005.
During November 2005, the FASB issued FASB Staff Position (FSP) FAS 115-1 and 124-1, “The Meaning of Other-Than-Temporary Impairment and Its Application to Certain Investments.” The guidance in this FSP addresses the determination of when an investment is considered impaired, whether that impairment is other than temporary, and the measurement of an impairment loss. The FSP also includes accounting considerations subsequent to the recognition of an other-than temporary impairment and requires certain disclosures about unrealized losses that have not been recognized as other-than-temporary impairments. The guidance in this FSP is required to be applied to reporting periods beginning after December 15, 2005. Earlier application is permitted.
The FASB has issued FASB Statement No. 155, “Accounting for Certain Hybrid Instruments.” This standard amends the guidance in FASB Statements No. 133, “Accounting for Derivative Instruments and Hedging Activities”, and No. 140, “Accounting for Transfers and Servicing of Financial Assets and Extinguishments of Liabilities.” Statement 155 allows financial instruments that have embedded derivatives to be accounted for as a whole (eliminating the need to bifurcate the derivative from its host) if the holder elects to account for the whole instrument on a fair value basis. Statement 155 is effective for all financial instruments acquired or issued after the beginning of an entity’s first fiscal year that begins after September 15, 2006. Earlier adoption is permitted as of the beginning of an entity’s fiscal year, provided the entity has not yet issued financial statements, including financial statements for any interim period for that fiscal year. Provisions of this Statement may be applied to instruments that an entity holds at the date of adoption on an instrument-by-instrument basis. The financial statement effect of the change in accounting, if any, should be recognized as a cumulative-effect adjustment to beginning retained earnings. Prior periods should not be restated.
Management does not expect these accounting pronouncements to have a material impact on the financial statements.
14
Table of Contents
Summary of Operations
(Dollars in Thousands Except Per Share Data)
| 2005 | 2004 | 2003 | 2002 | 2001 | |||||||||||||
FOR THE YEAR: | |||||||||||||||||
Total Interest Income | $ | 10,650 | $ | 11,649 | $ | 14,222 | $ | 16,651 | $ | 16,930 | |||||||
Total Interest Expense | 4,984 | 4,936 | 6,510 | 8,790 | 12,349 | ||||||||||||
Net Interest Income | 5,666 | 6,713 | 7,712 | 7,861 | 4,581 | ||||||||||||
Provision for Loan Losses | 120 | 120 | 898 | 120 | 72 | ||||||||||||
Net Interest Income After Provision for Loan Losses | 5,546 | 6,593 | 6,814 | 7,741 | 4,509 | ||||||||||||
Non-Interest Income | 703 | 790 | 819 | 776 | 587 | ||||||||||||
Non-Interest Expense | 5,285 | 5,018 | 5,021 | 5,148 | 4,387 | ||||||||||||
Net Income Before Taxes | 964 | 2,365 | 2,612 | 3,369 | 709 | ||||||||||||
Applicable Income Taxes: | |||||||||||||||||
Current | 61 | 563 | 1,033 | 1,030 | 129 | ||||||||||||
Deferred | 87 | (25 | ) | (283 | ) | 3 | 1 | ||||||||||
Net Income | $ | 816 | $ | 1,827 | $ | 1,862 | $ | 2,336 | $ | 579 | |||||||
Basic and Diluted | |||||||||||||||||
Net Income Per Share* | $ | 1.66 | $ | 3.71 | $ | 3.78 | $ | 4.74 | $ | 1.18 | |||||||
* Net income per share has been retroactively adjusted to reflect the stock dividend in 2003. | |||||||||||||||||
| 2005 | 2004 | 2003 | 2002 | 2001 | |||||||||||||
AT YEAR END: | |||||||||||||||||
Interest-Bearing Deposits in Other Financial Institutions | $ | 15,634 | $ | 19,497 | $ | 14,847 | $ | 13,660 | $ | 12,177 | |||||||
Federal Funds Sold | — | 12,455 | 4,645 | 61,900 | 81,475 | ||||||||||||
Investment Securities | 56,762 | 42,179 | 65,399 | 62,988 | 71,475 | ||||||||||||
Loans (Net) | 123,383 | 139,998 | 153,788 | 122,802 | 124,858 | ||||||||||||
Deposits | 189,557 | 208,571 | 234,126 | 257,230 | 284,857 | ||||||||||||
Demand | 23,695 | 23,375 | 22,588 | 20,858 | 19,127 | ||||||||||||
Interest-Bearing Demand | 23,547 | 35,466 | 40,365 | 31,984 | 29,464 | ||||||||||||
Savings | 21,741 | 24,537 | 21,236 | 18,613 | 14,774 | ||||||||||||
Time | 120,574 | 125,193 | 149,937 | 185,775 | 221,492 | ||||||||||||
Capital Accounts | 19,568 | 18,752 | 16,925 | 15,079 | 12,760 | ||||||||||||
Total Resources | 209,881 | 228,312 | 252,088 | 275,555 | 302,727 | ||||||||||||
Carrying Value Per Share | $ | 39.75 | $ | 38.09 | $ | 34.38 | $ | 30.63 | $ | 25.92 | |||||||
| 2005 | 2004 | 2003 | 2002 | 2001 | |||||||||||||
DAILY AVERAGES FOR THE YEAR: | |||||||||||||||||
Interest-Bearing Deposits in Other Financial Institutions | $ | 14,822 | $ | 17,789 | $ | 15,040 | $ | 12,559 | $ | 11,475 | |||||||
Federal Funds Sold | 2,061 | 6,649 | 37,142 | 19,168 | 43,015 | ||||||||||||
Investment Securities | 52,260 | 59,372 | 53,039 | 75,071 | 61,129 | ||||||||||||
Loans | 138,757 | 147,300 | 149,559 | 155,744 | 139,449 | ||||||||||||
Deposits | 201,506 | 221,683 | 253,902 | 257,433 | 243,551 | ||||||||||||
Demand | 23,861 | 23,854 | 22,556 | 20,094 | 16,492 | ||||||||||||
Interest-Bearing Demand | 17,210 | 18,479 | 16,641 | 15,150 | 15,419 | ||||||||||||
Savings (Includes MMDA’s) | 35,515 | 43,035 | 41,351 | 26,533 | 17,591 | ||||||||||||
Time | 124,920 | 136,315 | 173,354 | 195,656 | 194,049 | ||||||||||||
Capital Accounts | 19,166 | 17,933 | 16,156 | 14,057 | 12,273 | ||||||||||||
Total Resources | $ | 221,209 | $ | 242,191 | $ | 269,591 | $ | 254,925 | $ | 256,976 | |||||||
15
Table of Contents
Price Range of Common Stock
| 2005 | 2004 | Dividends Per Share | ||||||||||||||
| High | Low | High | Low | 2005 | 2004 | |||||||||||
First Quarter | $ | 45 | $ | 40 | $ | 45 | $ | 40 | — | — | ||||||
Second Quarter | 45 | 40 | 45 | 40 | — | — | ||||||||||
Third Quarter | 45 | 40 | 45 | 40 | — | — | ||||||||||
Fourth Quarter | 45 | 40 | 45 | 40 | — | — | ||||||||||
Officers
Worth Harris Carter, Jr.
Chairman of the Board and President
| Michael R. Beavers | Wanda G. Burnette | |
| Vice President, Cashier and Managing Officer - Hershberger Road | Assistant Cashier and Managing Officer - Forest Road | |
| Bobby H. Lugar | Melissa Hudson | |
| Vice President and Managing Officer - New Castle | Assistant Cashier and Managing Officer - Electric Road | |
| Tracy Assaid | C. Patrick Harper | |
| Assistant Vice President and Managing Officer - Franklin Road | Branch Manager - Southeast | |
| J. Scott Carter | Jennifer T. King | |
| Assistant Vice President and Managing Officer - Bedford | Branch Manager - Peters Creek Road | |
| Donna R. Cole | Shellie D. Mellady | |
| Assistant Vice President and Managing Officer - Vinton | Branch Manager - Cave Springs | |
| Debra C. Simmons | Kischa Steele | |
| Assistant Vice President and Managing Officer - Moneta | Branch Manager - Hot Springs | |
| Mark A. Stevenson | Linda S. Turner | |
| Assistant Vice President - Commercial Loans | Branch Manager - Blue Ridge | |
| April Berger | ||
| Assistant Cashier and Managing Officer - Plantation | ||
Directors
Worth Harris Carter, Jr. | Mary Alice Ramsey | |
Chairman of the Board and President | Retired | |
Walter P. Kingery | Leo H. Scott | |
Retired | President, Leo H. Scott, Inc. | |
Sidney D. Mason | ||
Retired | ||

P.O. Box 21167
Roanoke, Virginia 24018-0536
(540) 563-0095
Member FDIC
Table of Contents
First National Exchange Bank
P.O. Box 21167
Roanoke, Virginia 24018-0536
(540) 563-0095
Table of Contents
OFFICE OF THE COMPTROLLER OF THE CURRENCY
WASHINGTON, D.C. 20219
FORM 10-QSB
| x | QUARTERLY REPORT UNDER SECTION 13 OR 15(d) OF THE SECURITIES EXCHANGE ACT OF 1934 |
For the quarterly period ended September 30, 2006
OR
| ¨ | TRANSITION REPORT UNDER SECTION 13 OR 15(d) OF THE SECURITIES EXCHANGE ACT OF 1934 |
For the transition period from to
Commission file number: n/a
FIRST NATIONAL EXCHANGE BANK
(Name of small business issuer as specified in its charter)
| National Bank | 54-1888304 | |
(State or other jurisdiction of incorporation or organization) | (I.R.S. Employer Identification No.) |
1722 Hershberger Road Roanoke, VA | 24012 | |
| (Address of principal executive offices) | (Zip Code) |
(540) 563-0095
Issuer’s telephone number
n/a
(Former name, former address and former fiscal year, if changed since last report)
Check whether the issuer (1) filed all reports required to be filed by Section 13 or 15(d) of the Exchange Act during the past 12 months (or for such shorter period that the registrant was required to file such reports), and (2) has been subject to such filing requirements for the past 90 days. Yes x No ¨
Indicate by check mark whether the registrant is a shell company (as defined in Rule 12b-2 of the Exchange Act). Yes ¨ No x
As of November 13, 2006, there were issued and outstanding 492,329 shares of the issuer’s common stock.
Transitional Small Business Disclosure Format: Yes ¨ No x
1
Table of Contents
INDEX
| PART I - FINANCIAL INFORMATION | 4 | |||
ITEM 1 - | FINANCIAL STATEMENTS | 4 | ||
STATEMENTS OF CONDITION | 4 | |||
STATEMENTS OF INCOME | 5 | |||
STATEMENTS OF CASH FLOWS | 6 | |||
STATEMENTS OF CHANGES IN SHAREHOLDERS’ EQUITY | 7 | |||
Notes To Unaudited Financial Statements | 7 | |||
ITEM 2 - | MANAGEMENT’S DISCUSSION AND ANALYSIS | 9 | ||
ITEM 3 - | CONTROLS AND PROCEDURES | 13 | ||
| PART II - OTHER INFORMATION | 14 | |||
ITEM 1 - | LEGAL PROCEEDINGS. | 14 | ||
ITEM 2 - | UNREGISTERED SALES OF EQUITY SECURITIES AND USE OF PROCEEDS. | 14 | ||
ITEM 3 - | DEFAULTS UPON SENIOR SECURITIES. | 14 | ||
ITEM 4 - | SUBMISSION OF MATTERS TO A VOTE OF SECURITY HOLDERS. | 14 | ||
ITEM 5 - | OTHER INFORMATION | 14 | ||
ITEM 6 - | EXHIBITS AND REPORTS ON FORM 8-K | 14 | ||
2
Table of Contents
FORWARD–LOOKING STATEMENTS
This report contains statements concerning the Bank’s expectations, plans, objectives, future financial performance and other statements that are not historical facts. These statements may constitute “forward-looking statements” as defined by federal securities laws. In some cases, readers can identify the forward-looking statements by the use of words such as “may,” “ will,” “should,” “could,” “expect,” “plan,” “intend,” “anticipate,” “believe,” “estimate,” “predict,” “potential” or “continue” or the negative or other variations of these words, or other comparable words or phrases. These statements may address issues that involve estimates and assumptions made by management, risks and uncertainties, and actual results could differ materially from historical results or those anticipated by such statements. Factors that could have a material adverse effect on the Bank’s operations and future prospects include, but are not limited to, changes in: interest rates; general and local economic conditions; the legislative/regulatory climate; monetary and fiscal policies of the U.S. government, including policies of the U.S. Treasury and the Federal Reserve Board; the quality or composition of loan or investment portfolios; demand for loan products; deposit flows; competition; demand for financial services in our market area and accounting principles, policies and guidelines. These risks and uncertainties should be considered in evaluating the forward-looking statements contained herein, and readers are cautioned not to place undue reliance on such statements, which speak only as of the date of this report.
3
Table of Contents
PART I - FINANCIAL INFORMATION
Item 1 - FINANCIAL STATEMENTS
FIRST NATIONAL EXCHANGE BANK
STATEMENTS OF CONDITION
(Dollars in Thousands)
| September 30, 2006 (Unaudited) | December 31, 2005 | |||||||
ASSETS | ||||||||
Interest-Bearing Deposits in Other Financial Institutions | $ | 12,366 | $ | 15,634 | ||||
Investment Securities | ||||||||
U.S. Agency Securities | 55,775 | 56,762 | ||||||
Federal Funds Sold | 5,000 | — | ||||||
Loans | 128,217 | 125,405 | ||||||
Less: Unearned Income | (137 | ) | (148 | ) | ||||
Allowance for Loan Losses | (1,981 | ) | (1,874 | ) | ||||
Net Loans | 126,099 | 123,383 | ||||||
Earning Assets | 199,240 | 195,779 | ||||||
Cash and Due From Banks | 6,390 | 6,707 | ||||||
Bank Premises and Equipment | 3,398 | 3,520 | ||||||
Real Estate Owned Other Than Bank Premises | 501 | 511 | ||||||
Investment in Associated Companies | 769 | 769 | ||||||
Other Assets | 2,934 | 2,595 | ||||||
TOTAL ASSETS | $ | 213,232 | $ | 209,881 | ||||
LIABILITIES | ||||||||
Deposits | ||||||||
LIFETIME FREE CHECKING | $ | 24,446 | $ | 23,695 | ||||
Interest-Bearing Demand | 18,277 | 23,547 | ||||||
Regular Passbook Savings | 20,960 | 21,741 | ||||||
Time Deposits | ||||||||
Certificates of Deposit $100,000 or More | 21,658 | 18,689 | ||||||
Other | 107,155 | 101,885 | ||||||
Total Deposits | 192,496 | 189,557 | ||||||
Notes issued to the U.S. Treasury | 195 | 273 | ||||||
Other Liabilities | 552 | 483 | ||||||
Subordinated Notes and Debentures | — | — | ||||||
TOTAL LIABILITIES | 193,243 | 190,313 | ||||||
SHAREHOLDERS’ EQUITY | ||||||||
Common Stock, Par Value $5.00 Per Share, Authorized 2,500,000 Shares, 492,329 Outstanding in 2006 and 2005 | 2,462 | 2,462 | ||||||
Surplus | 13,344 | 13,344 | ||||||
Undivided Profits | 4,183 | 3,762 | ||||||
TOTAL SHAREHOLDERS’ EQUITY | 19,989 | 19,568 | ||||||
TOTAL LIABILITIES AND SHAREHOLDERS EQUITY | $ | 213,232 | $ | 209,881 | ||||
See accompanying notes to unaudited financial statements.
4
Table of Contents
FIRST NATIONAL EXCHANGE BANK
STATEMENTS OF INCOME
| Nine Months Ended September 30, | Three Months Ended September 30, | ||||||||||||
| 2006 | 2005 | 2006 | 2005 | ||||||||||
| (Unaudited) | (Unaudited) | ||||||||||||
INTEREST INCOME | |||||||||||||
Interest and Fees on Loans | |||||||||||||
Taxable | $ | 5,404 | $ | 5,720 | $ | 1,866 | $ | 1,965 | |||||
Non-Taxable | 431 | 375 | 142 | 126 | |||||||||
Interest on Deposits in Other Financial Institutions | 418 | 411 | 140 | 140 | |||||||||
Interest on Federal Funds Sold | 89 | 57 | 41 | 11 | |||||||||
Interest and Dividends on Securities | |||||||||||||
U.S. Agency Securities | 1,674 | 1,434 | 591 | 481 | |||||||||
Obligations of States and Political Subdivisions | — | 15 | — | 4 | |||||||||
TOTAL INTEREST INCOME | 8,016 | 8,012 | 2,780 | 2,727 | |||||||||
INTEREST EXPENSE | |||||||||||||
Interest on Time Deposits $100,000 or More | 620 | 552 | 230 | 200 | |||||||||
Interest on Other Deposits | 3,423 | 3,131 | 1,213 | 1,087 | |||||||||
Interest on Federal Funds Purchased | 2 | 16 | — | 8 | |||||||||
Interest on Notes Issued to the U.S. Treasury | 3 | 4 | 1 | 2 | |||||||||
TOTAL INTEREST EXPENSE | 4,048 | 3,703 | 1,444 | 1,297 | |||||||||
NET INTEREST INCOME | 3,968 | 4,309 | 1,336 | 1,430 | |||||||||
Provision for Loan Losses | 45 | 90 | 15 | 30 | |||||||||
NET INTEREST INCOME AFTER | |||||||||||||
PROVISION FOR LOAN LOSSES | 3,923 | 4,219 | 1,321 | 1,400 | |||||||||
NON-INTEREST INCOME | |||||||||||||
Service Charges, Commissions and Fees | 392 | 368 | 123 | 107 | |||||||||
Other Non-Interest Income | 92 | 98 | 31 | 31 | |||||||||
TOTAL NON-INTEREST INCOME | 484 | 466 | 154 | 138 | |||||||||
NON-INTEREST EXPENSE | |||||||||||||
Salaries and Employee Benefits | 2,253 | 2,197 | 760 | 742 | |||||||||
Occupancy Expense (Net) | 631 | 631 | 212 | 209 | |||||||||
Operations Center Expense | 679 | 706 | 226 | 237 | |||||||||
Other Non-Interest Expense | 428 | 360 | 134 | 117 | |||||||||
TOTAL NON-INTEREST EXPENSE | 3,991 | 3,894 | 1,332 | 1,305 | |||||||||
INCOME BEFORE INCOME TAXES | 416 | 791 | 143 | 233 | |||||||||
Income Tax Expense | (5 | ) | 135 | 5 | 35 | ||||||||
NET INCOME | $ | 421 | $ | 656 | $ | 138 | $ | 198 | |||||
EARNINGS PER COMMON SHARE: | |||||||||||||
Basic and Diluted | $ | 0.86 | $ | 1.33 | $ | 0.28 | $ | 0.40 | |||||
Weighted Average Shares Outstanding | 492,329 | 492,329 | 492,329 | 492,329 | |||||||||
Cash Dividends Per Common Share | $ | — | $ | — | $ | — | $ | — | |||||
See accompanying notes to unaudited financial statements.
5
Table of Contents
FIRST NATIONAL EXCHANGE BANK
STATEMENTS OF CASH FLOWS
(Dollars in Thousands)
| Nine Months Ended “September 30, | ||||||||
| 2006 | 2005 | |||||||
| (Unaudited) | ||||||||
Cash Flows From Operating Activities | ||||||||
Net Income | $ | 421 | $ | 656 | ||||
Adjustments to reconcile net income to net cash provided by operating activities | ||||||||
Provision for Loan Losses | 45 | 90 | ||||||
Depreciation of Bank Premises and Equipment | 184 | 183 | ||||||
Increase (Decrease) in Unearned Income | (11 | ) | (1 | ) | ||||
(Increase) Decrease in Other Assets | (339 | ) | 593 | |||||
Increase (Decrease) in Other Liabilities | 69 | 24 | ||||||
Net Cash From Operating Activities | 369 | 1,545 | ||||||
Cash Flows From Investing Activities | ||||||||
Proceeds from Maturity of Interest Bearing Balances | 10,684 | 11,874 | ||||||
Purchase of Interest Bearing Balances | (7,416 | ) | (8,605 | ) | ||||
Payments on Investment Securities | 9,987 | 8,421 | ||||||
Purchase of Investment Securities | (9,000 | ) | (19,000 | ) | ||||
Purchase of Bank Premises and Equipment | 62 | (65 | ) | |||||
Net (Increase) Decrease in Short-Term Loans Outstanding, Net | (2,558 | ) | (6,903 | ) | ||||
Longer-Term Loans Originated or Purchased | (7,419 | ) | (12,040 | ) | ||||
Principal Collected on Longer-Term Loans | 7,103 | 24,589 | ||||||
(Increase) Decrease in Other Real Estate | 10 | 28 | ||||||
Net Cash From Investing Activities | 1,453 | (1,701 | ) | |||||
Cash Flows from Financing Activities | ||||||||
Increase in Demand and Savings accounts | (5,300 | ) | (11,166 | ) | ||||
Proceeds from Sale of Time Deposits | 44,385 | 41,403 | ||||||
Payments for Matured Time Deposits | (36,146 | ) | (41,232 | ) | ||||
Net Increase (Decrease) in Notes issued to the U.S. Treasury | (78 | ) | (295 | ) | ||||
Net Cash From Financing Activities | 2,861 | (11,290 | ) | |||||
Net (Decrease) Increase in Cash and Cash Equivalents | 4,683 | (11,446 | ) | |||||
Cash and Cash Equivalents at Beginning of Period | 6,707 | 18,447 | ||||||
Cash and Cash Equivalents at End of Period | $ | 11,390 | $ | 7,001 | ||||
Cash and Cash Equivalents Include: | ||||||||
Cash and Due From Banks | $ | 6,390 | $ | 5,861 | ||||
Federal Funds Sold | 5,000 | 1,140 | ||||||
Total Cash and Cash Equivalents at Period End | $ | 11,390 | $ | 7,001 | ||||
Supplementary Data: | ||||||||
Cash Paid for Interest | $ | 3,940 | $ | 3,606 | ||||
Cash Paid for Taxes | — | 135 | ||||||
See accompanying notes to unaudited financial statements.
6
Table of Contents
FIRST NATIONAL EXCHANGE BANK
STATEMENTS OF CHANGES IN SHAREHOLDERS’ EQUITY
(Dollars in Thousands)
| Common Stock | Undivided | ||||||||||
| Shares | Par Value | Surplus | Profits | ||||||||
Balances, December 31, 2005 | 492,329 | $ | 2,462 | $ | 13,344 | $ | 3,762 | ||||
Net Income | — | — | — | 421 | |||||||
Balances, September 30, 2006 (Unaudited) | 492,329 | $ | 2,462 | $ | 13,344 | $ | 4,183 | ||||
Notes To Unaudited Financial Statements
The unaudited interim financial statements of the Bank are prepared in sting only of normal recurring adjustments) necessary for a fair presentation of the financial position and results the conformity with accounting principles generally accepted in the United States of America and the instructions to Securities and Exchange Commission’s Form 10-QSB. In the opinion of management, all adjustments (consi of operations for the periods presented have been included. The financial statements should be read in conjunction with the financial statements and notes contained in the Bank’s Annual Report on Form 10-KSB for the year ended December 31, 2005. The results for the six months ended September 30, 2006 are not necessarily indicative of the results for the entire fiscal year ending December 31, 2006.
Certain reclassifications have been made to the prior year financial statements to conform to the 2006 presentation. These reclassifications had no effect on previously reported net income.
NOTE 1 - INVESTMENT SECURITIES
(Dollars in Thousands)
The Bank has the ability and intent to carry the investments noted with an unrealized loss to the final maturity of the instrument and considers these investments not other-than-temporarily impaired.
The following table sets forth a summary of the investment securities portfolio as of the periods indicated:
| Amortized Cost | Gross Unrealized Gains | Gross Unrealized Losses | Estimated Market Value | |||||||||
| September 30, 2006 (Unaudited) | ||||||||||||
U.S. Agency Securities | $ | 55,775 | $ | 15 | $ | 585 | $ | 55,205 | ||||
Total Securities | $ | 55,775 | $ | 15 | $ | 585 | $ | 55,205 | ||||
December 31, 2005 | ||||||||||||
U.S. Agency Securities | $ | 56,762 | $ | 14 | $ | 742 | $ | 56,034 | ||||
Total Securities | $ | 56,762 | $ | 14 | $ | 742 | $ | 56,034 | ||||
7
Table of Contents
NOTE 2 - LOANS
(Dollars in Thousands)
The composition of the loan portfolio by dollar amount is shown in the table below:
| September 30, 2006 (Unaudited) | December 31, 2005 | |||||||
Secured by real estate | ||||||||
Construction Loans | $ | 8,562 | $ | 7,706 | ||||
Secured by farmland (including farm residential and other improvements) | 3,421 | 3,517 | ||||||
Secured by 1-4 family residential properties | 7,257 | 3,386 | ||||||
Secured by multi-family residential properties | 3,174 | 3,307 | ||||||
Secured by non-farm residential property | 75,193 | 79,132 | ||||||
Loans to finance agricultural production and other loans to farmers | 325 | 251 | ||||||
Commercial and industrial loans | 11,643 | 9,539 | ||||||
Loans to individuals for household, family and other personal expenditures | 1,783 | 1,793 | ||||||
Obligations (other than securities) of states and political subdivisions | 16,859 | 16,774 | ||||||
Less: Unearned Income | (137 | ) | (148 | ) | ||||
Total loans and leases | $ | 128,080 | $ | 125,257 | ||||
NOTE 3 - ALLOWANCE FOR LOAN LOSSES
(Dollars in Thousands)
The allowance for loan losses is an estimate of losses inherent in the loan portfolio as determined by management taking into consideration historical loan loss experience, diversification of the loan portfolio, amounts of secured and unsecured loans, banking industry standards and averages, and general economic conditions. Ultimate losses may vary from current estimates. These estimates are reviewed periodically and as adjustments become necessary, they are reported in earnings in the periods which they become reasonably estimable.
The following table summarizes the activity in the allowance for loan losses in the periods presented:
| September 30, 2006 (Unaudited) | December 31, 2005 | ||||||
Balance at beginning of Period | $ | 1,874 | $ | 1,845 | |||
Provision for Loan Losses | 45 | 120 | |||||
Charge-Offs,Net Of (Recoveries): | |||||||
Real Estate Loans | (66 | ) | 76 | ||||
Installment Loans | 4 | 15 | |||||
Commercial Loans | — | — | |||||
Total Net Loan Losses | (62 | ) | 91 | ||||
Balance End of Period | $ | 1,981 | $ | 1,874 | |||
NOTE 4 - NONPERFORMING ASSETS AND DELINQUENT LOANS
(Dollars in Thousands)
| September 30, 2006 (Unaudited) | December 31, 2005 | |||||
Nonaccrual Loans | ||||||
Real Estate | $ | 3,609 | $ | 3,609 | ||
Installment | — | — | ||||
Commercial | — | — | ||||
Total Nonaccrual Loans | 3,609 | 3,609 | ||||
Foreclosed Properties | 501 | 511 | ||||
Total Nonperforming Assets | $ | 4,110 | $ | 4,120 | ||
Loans 90 Days or More Past Due and Still Accruing | ||||||
Real Estate | $ | 830 | $ | — | ||
Installment | — | — | ||||
Commercial | — | — | ||||
Total Loans 90 Days or More Past Due | $ | 830 | $ | — | ||
8
Table of Contents
Item 2 - MANAGEMENT’S DISCUSSION AND ANALYSIS
The Bank
Incorporated in 1998 as a national banking association with its main office in Roanoke, Virginia, the Bank operates under a national charter and provides full banking services. The Bank was created thru a spin-off of the assets, liabilities, and related capital from four offices of First National Bank in Rocky Mount, Virginia. As a national bank, the Bank is subject to regulation by the Comptroller of the Currency, the Federal Deposit Insurance Corporation and the Board of Governors of the Federal Reserve System. The Bank generates commercial (including agricultural), mortgage and consumer loans and receives deposits from customers located primarily in the areas surrounding the Bank’s offices in the Roanoke Valley, including the Cities of Roanoke and Salem and the Counties of Roanoke, Bedford and Craig; and as a result of a new office recently opened in Hot Springs, we now have a presence in Bath County. The Bank operates under the name “First National Exchange Bank” and all of its offices are located in Virginia. At September 30, 2006, the Bank had $213 million in assets, $126 million in net loans, $192 million in deposits and $19.9 million in total shareholders’ equity.
Proposed Reorganization and Merger
On July 28, 2006, the Bank entered into an Agreement and Plan of Merger (the “Merger Agreement”) with Blue Ridge Bank, N.A., Central National Bank, Community National Bank, First National Bank, Mountain National Bank, Patrick Henry National Bank, Patriot Bank, National Association, Peoples National Bank, Shenandoah National Bank (together with the Bank, the “Banks”) and Carter Bank & Trust, a new Virginia chartered bank that will be headquartered in Martinsville, Virginia. The Merger Agreement sets forth the terms and conditions pursuant to which the Banks will reorganize by merging into Carter Bank & Trust (the “Merger”).
All officers and employees of the existing Banks will remain unchanged as a result of the Merger. Worth Harris Carter, Jr. is currently Chairman of the Board and President of each of the Banks and will serve as Chairman of the Board and President of Carter Bank & Trust. Under the terms of the Merger Agreement, shareholders of each of the Banks will receive a certain number of shares in Carter Bank & Trust in exchange for each share held in the existing Banks as follows: each share of Blue Ridge Bank: 2.474 shares; each share of Central National Bank: 5.470 shares; each share of Community National Bank: 4.350 shares; each share of First National Bank: 1.613 shares; each share of First National Exchange Bank: 4.509 shares; each share of Mountain National Bank: 3.981 shares; each share of Patrick Henry National Bank: 1.112 shares; each share of Patriot Bank: 5.775 shares; each share of Peoples National Bank: 1.945 shares; and each share of Shenandoah National Bank: 3.461 shares.
Consummation of the Merger is subject to a number of customary conditions including (i) the approval of the Merger by the shareholders of each of the Banks and Carter Bank & Trust and (ii) the receipt of all required regulatory approvals, including approval by the Virginia State Corporation Commission and the Federal Deposit Insurance Corporation. The Merger is expected to be completed in the fourth quarter of 2006 and will be accounted for using the purchase method of accounting.
Critical Accounting Policies
The accounting and reporting policies of the Bank conform to generally accepted accounting principles (GAAP) in the United States of America and to general practices within the banking industry. The preparation of the financial statements in conformity with GAAP requires management to make estimates and assumptions that affect the
9
Table of Contents
amounts reported in the financial statements and accompanying notes. We believe the most significant of these estimates involves the allowance for loan losses because of its potential impact on our overall performance. We have described our policies in this area below. A summary of the Bank’s significant accounting policies can be found in the Notes to Financial Statements included in the Bank’s 2005 Annual Report on Form 10-KSB.
In general, determining the amount of the allowance for loan losses requires significant judgment and the use of estimates by management allowing for losses inherent to the loan portfolio. The Bank maintains an allowance for loan losses to absorb probable losses in the loan portfolio based on a quarterly analysis of the portfolio. This analysis determines an appropriate level of the allowance for loan losses by considering factors affecting loan losses, including specific losses, levels and trends in impaired and non-performing loans, historical loan loss experience, current economic conditions, volume, growth and composition of the portfolio, and other relevant factors. The Bank records a provision for loan losses to maintain the allowance at an adequate level. The provision expense could increase or decrease each quarter based upon the results of management’s formal analysis.
The amount of the allowance represents management’s estimate of expected losses from existing loans based upon specific allocations for individual lending relationships and historical loss experience. The allowance for loan losses related to impaired loans is based on discounted cash flows using the loan’s initial effective interest rate or the fair value of the collateral for certain collateral dependent loans. This evaluation requires management to make estimates of the amounts and timing of future cash flows on impaired loans, which consists primarily of non-accrual and restructured loans. Actual losses for these loans can vary significantly from these estimates.
Investment securities are stated at cost, adjusted for amortization of premiums and accretion of discounts, and computed by the interest method. The Bank has positive intent and ability to hold these securities until maturity. Gains and losses on sales, if any, of securities are based upon the adjusted cost of the specific securities sold. If any of the securities are not held to maturity, the classification of the entire portfolio could change to available for sale. This could require fair value accounting for not just the tainted securities but the entire portfolio, and possibly, the recognition of unrealized losses as other than temporary in the income statement.
Real estate properties acquired through or in lieu of loan foreclosure are initially recorded at the lower of the Bank’s carrying amount or fair value less estimated selling cost at the date of foreclosure. Any write-downs based on the asset’s fair value at the date of acquisition are charged to the allowance for loan losses. After foreclosure, these assets are carried at the lower of their new cost basis or fair value less cost to sell. Costs of significant property improvements are capitalized, whereas costs relating to holding property are expensed. The portion of interest costs relating to development of real estate is capitalized. Valuations are periodically performed by management, and any write-downs are recorded as a charge to operations, if necessary, to reduce the carrying value of a property to the lower of its carrying value or fair value less cost to sell. The fair value of other real estate owned, including related selling costs, is an estimate that may change in the near term. If estimates change that decrease the expected fair value of the property, the recognition of this loss is reflected in the income statement for the period the estimate changes.
Overview
Net income for the first nine months of 2006 equaled $421,000, or $0.86 per share, compared to $656,000, or $1.33 per share for 2005. On an annualized basis, this represents a return on average assets of 0.27% and return on average equity of 3% compared to 0.39% and 5%, respectively, for the same period last year.
Net interest income declined $341,000 or 8.67% compared to the prior year. Total non-interest expense reflected an increase of $97,000. The Bank’s net income declined to $421,000. Loans have increased $2.8 million. We anticipate increasing U.S. Agency Securities in the near future and expect our net interest margins to improve and earnings are expected to increase.
Total Liabilities at September 30, 2006 were $193,243,000, down from $190,313,000 at December 31, 2005.
Total Shareholders’ Equity at September 30, 2006 was $19,989,000. At December 31, 2005, total Shareholders’ Equity was $19,568,000.
10
Table of Contents
Results of Operations
Net Interest Income.Net Interest Income is our largest source of revenue. Net Interest Income declined $341,000 compared to the prior year. See Note 5 – Average Balances and Net Interest Income to the financial statements, for additional information in regard to Net Interest Income.
The following table details the average balances and cost and yield data for the earning assets and interest-bearing liabilities:
| For the Nine Months Ended | ||||||||||||||||||||||
| September 30, 2006 | September 30, 2005 | |||||||||||||||||||||
| (Unaudited) | ||||||||||||||||||||||
Asset/Liability | Average Balance | Income/ Expense | Yield/ Cost | Average Balance | Income/ Expense | Yield/ Cost | Increase (Decrease) | |||||||||||||||
Real Estate Loans | $ | 96,231 | $ | 4,379 | 6.07 | % | $ | 108,481 | $ | 4,732 | 5.82 | % | $ | (353 | ) | |||||||
Installment Loans | 1,739 | 131 | 10.04 | % | 1,865 | 134 | 9.58 | % | (3 | ) | ||||||||||||
Commercial Loans | 29,509 | 1,325 | 5.99 | % | 29,288 | 1,229 | 5.60 | % | 96 | |||||||||||||
Total Loans -Net of unearned income | 127,479 | 5,835 | 6.10 | % | 139,634 | 6,095 | 5.82 | % | (260 | ) | ||||||||||||
Interest-Bearing Deposits in Other Financial Institutions | 11,740 | 418 | 4.75 | % | 16,582 | 411 | 3.30 | % | 7 | |||||||||||||
Investment Securities | 55,432 | 1,674 | 4.03 | % | 52,966 | 1,449 | 3.65 | % | 225 | |||||||||||||
Federal Funds Sold | 3,061 | 89 | 3.88 | % | 1,368 | 57 | 5.56 | % | 32 | |||||||||||||
Total Earning Assets | 197,712 | 8,016 | 5.41 | % | 210,550 | 8,012 | 5.07 | % | 4 | |||||||||||||
Interest-Bearing Transaction Accounts | 12,573 | 114 | 1.21 | % | 16,271 | 144 | 1.18 | % | (30 | ) | ||||||||||||
Savings Accounts (Including MMDAs) | 26,289 | 332 | 1.68 | % | 33,626 | 395 | 1.57 | % | (63 | ) | ||||||||||||
Certificates of Deposit Over $100,000 | 20,195 | 620 | 4.09 | % | 20,847 | 552 | 3.53 | % | 68 | |||||||||||||
Other Certificates of Deposits | 104,966 | 2,977 | 3.78 | % | 105,820 | 2,592 | 3.27 | % | 385 | |||||||||||||
Total Deposits | 164,023 | 4,043 | 3.29 | % | 176,564 | 3,683 | 2.78 | % | 360 | |||||||||||||
Notes issued to the U. S. Treasury | 91 | 3 | 4.40 | % | 91 | 4 | 5.86 | % | (1 | ) | ||||||||||||
Federal Funds Purchased | 26 | 2 | 10.26 | % | 956 | 16 | 2.23 | % | (14 | ) | ||||||||||||
Total Interest-Bearing Liabilities | $ | 164,140 | $ | 4,048 | 3.29 | % | $ | 177,611 | $ | 3,703 | 2.78 | % | $ | 345 | ||||||||
Net Interest Income | $ | 3,968 | 2.68 | % | $ | 4,309 | 2.73 | % | $ | (341 | ) | |||||||||||
Allowance and Provision for Loan Losses.The Allowance for Loan Losses represents management’s estimation of the amount necessary to absorb future losses in the loan portfolio. On the Statement of Condition, the Allowance for Loan Losses is deducted from Total Loans so that the net amount shown represents the estimated realizable total loans. The Provision for Loan Losses is the amount charged to expense to maintain the Allowance at an adequate level.
The Allowance for Loan Losses was $1,981,000, or 1.5% of total loans outstanding, at September 30, 2006. In the view of management, the Allowance for Loan Losses is adequate to meet the loss contingency based on experience factors and a review of the loan portfolio.
The Provision for Loan Loss was $45,000 for the nine months ended September 30, 2006 and $90,000 for 2005. See Note 3 – Allowance for Loan Losses and Note 4 – Nonperforming Assets and Delinquent Loans to the financial statements, for additional information.
11
Table of Contents
Non-Interest Income.Non-Interest Income remained flat for the nine month period ended September 30, 2006, compared to the same period of 2005. The largest source of non-interest income is Services Charges, Commissions and Fees, which also remained flat at September 30, 2006 compared to the same period last year.
Non-Interest Expense.Non-Interest Expense increased $97,000, or 2.5%, for the nine month period ended September 30, 2006, compared to the same period of 2005.
Income Taxes.The Bank recorded a $5,000 credit in income tax expense during the first nine months of 2006, as compared to $135,000 expense in 2005. The effective income tax rate declined between the periods, due to a higher percentage of tax exempt income to pretax accounting income in the current period.
Analysis of Financial Condition
Investments.U. S. Agency Securities investments have decreased $987,000, or 1.8%, compared to December 31, 2005. As interest rates continue to increase, the Bank plans to increase U. S. Agency Securities.
Loans. Loans increased $2.8 million, or 2%, compared to December 31, 2005. The increase took place primarily in the commercial and industrial segment of the portfolio. Real estate secured loans made up approximately 76% of net loans at September 30, 2006.
Non-Performing Assets and Impaired Loans.Non-performing assets, which consist of nonaccrual loans and foreclosed properties, were $4,110,000 at September 30, 2006 and $3,609,000 at December 31, 2005. Nonaccrual Loans equaled $3,609,000 at September 30, 2006 and December 31, 2005. The nonaccrual loans include a portion of loans considered to be impaired at quarter end, September 30, 2006 and year end, December 31, 2005. Foreclosed Properties equaled $501,000 at September 30, 2006 and $511,000 at December 31, 2005.
Nonaccrual loans are those loans contractually past due 90 days or more on which no interest is being accrued. Other real estate owned consists of real estate acquired through foreclosure. These properties are reviewed quarterly and reduced to an estimated realizable value at that time.
Deposits.Total deposits have remained flat compared to December 31, 2005, due to low interest rates and the bank allowing higher cost deposits to decrease. The majority of the decline occurred prior to year end 2005, as deposits are basically the same at the end of the second quarter as they were at the end of the year.
Capital.The federal regulatory agencies use risk-based capital ratios to analyze the adequacy of a bank’s capital. These ratios weigh bank assets from 0% to 100%, depending upon the risks inherent in each type of asset. The Bank continues to meet all requirements for a well-capitalized bank as defined by the regulatory agencies.
The following table presents the key risk-based capital ratios for the periods indicated:
| September 30, 2006 | December 31, 2005 | |||||
Tier 1 Ratio | 14.57 | % | 14.40 | % | ||
Total Risk-Based Capital Ratio | 15.82 | % | 15.65 | % | ||
Leverage Ratio | 9.58 | % | 9.16 | % |
Shareholders’ Equity was $19,989,000 at September 30, 2006 compared to $19,568,000 at December 31, 2005.
Liquidity.Liquidity is our ability to fund both loans and investments in the normal course of business and to provide adequate protection for unexpected deposit withdrawals or other demands for funds without incurring a significant negative impact on profitability. Our primary source of day-to-day liquidity lies in the combination of cash, deposit balances, checks in process of collection, deposit growth and federal funds sold. Federal funds are excess funds that are sold to other banks, generally on a one-day basis. Normal funds from the repayment of loans and investments augment these funds.
12
Table of Contents
Our secondary source of liquidity lies in our investments and deposits in other financial institutions. While our investments are categorized as held-to-maturity, they consist primarily of short-term U S Agency Securities that are readily marketable. The majority of our investment securities mature in five years or less. Interest-bearing deposits in other financial institutions generally mature in two years or less and the volume of this investment decreased for the first nine months.
Off-Balance Sheet Arrangements.Commitments to extend credit, which amounted to $1,121,000 at September 30, 2006 and $250,000 at December 31, 2005, respectively, represent agreements to lend to customers with fixed expiration dates or other termination clauses. Since many of the commitments are expected to expire without being funded, the total commitment amounts do not necessarily represent future liquidity requirements. Standby letters of credit are conditional commitments issued by the Bank guaranteeing the performance of a customer to a third party. Those guarantees are primarily issued to support public and private borrowing arrangements. The Bank had outstanding letters of credit in the amount of $526,000 at September 30, 2006 and $492,000 at December 31, 2005.
Recent Accounting Pronouncements.In June 2005, the FASB issued Statement No. 154, “Accounting Changes and Error Corrections”, which replaces APB Opinion No. 20, “Accounting Changes” and FASB Statement No. 3, “Reporting Accounting Changes in Interim Financial Statements.” Statement No., 154 requires that a voluntary change in accounting principle be applied retrospectively with all prior period financial statements presented on the new accounting principle. Statement No. 154 also requires that a change in method of depreciating or amortizing a long-lived non-financial asset be accounted for prospectively as a change in estimate, and correction of errors in previously issued financial statements should be termed a “restatement.” Statement No. 154 is effective for accounting changes and correction of errors made in fiscal years beginning after December 15, 2005. Management does not expect this accounting pronouncement to have a material impact on the financial statements.
Item 3 - CONTROLS AND PROCEDURES
The Bank maintains a system of disclosure controls and procedures that is designed to ensure that material information is accumulated and communicated to management, including the Bank’s president (who is the Bank’s principal executive officer and principal financial officer), as appropriate to allow timely decisions regarding required disclosure. As required, management, with the participation of the Bank’s president, evaluated the effectiveness of the design and operation of the Bank’s disclosure controls and procedures as of the end of the period covered by this report. Based on this evaluation, the Bank’s president concluded that the Bank’s disclosure controls and procedures were operating effectively to ensure that information required to be disclosed by the Bank in reports that it files or submits under the Securities Exchange Act of 1934, as amended, is recorded, processed, summarized, and reported within the time periods specified in the rules and forms of the SEC.
Because of the inherent limitations in all control systems, no evaluation of controls can provide absolute assurance that the Bank’s disclosure controls and procedures will detect or uncover every situation involving the failure of persons within the Bank to disclose material information otherwise required to be set forth in the Bank’s periodic reports.
The Bank’s management is also responsible for establishing and maintaining adequate internal control over financial reporting to provide reasonable assurance regarding the reliability of financial reporting and the preparation of financial statements for external purposes in accordance with generally accepted accounting principles. There were no changes in the Bank’s internal control over financial reporting during the Bank’s quarter ended September 30, 2006 that have materially affected, or are reasonably likely to materially affect, the Bank’s internal control over financial reporting.
13
Table of Contents
PART II - OTHER INFORMATION
Item 1 - LEGAL PROCEEDINGS.
There are no material pending legal proceedings to which the Bank is a party or to which the property of the Bank is subject.
Item 2 – UNREGISTERED SALES OF EQUITY SECURITIES AND USE OF PROCEEDS.
None.
Item 3 - DEFAULTS UPON SENIOR SECURITIES.
None.
Item 4 - SUBMISSION OF MATTERS TO A VOTE OF SECURITY HOLDERS.
None.
Item 5 - OTHER INFORMATION
None.
Item 6 - EXHIBITS AND REPORTS ON FORM 8-K
Exhibits:
| 2.1 | Agreement and Plan of Merger, dated as of July 28, 2006, by and among Blue Ridge Bank, N.A., Central National Bank, Community National Bank, First National Bank, First National Exchange Bank, Mountain National Bank, Patrick Henry National Bank, Patriot Bank, National Association, Peoples National Bank, Shenandoah National Bank and Carter Bank & Trust (incorporated by reference to Exhibit 2.1 to Form 8-K filed with the Office of the Comptroller of the Currency on July 31, 2006). | |
| 3.1 | Articles of Association (filed with the Office of the Comptroller of the Currency prior to the opening of the Bank) | |
| 3.2 | Amended and Restated Bylaws (as amended and restated through February 23, 2005) (incorporated by reference to Exhibit 3.2 to Form 8-K filed with the Office of the Comptroller of the Currency on February 23, 2005) | |
| 31 | Certification by principal executive officer and principal financial officer pursuant to Rule 13a-14(a) | |
| 32 | Certification of principal executive officer and principal financial officer pursuant to 18 U.S.C. § 1350 | |
14
Table of Contents
SIGNATURES
In accordance with the requirements of the Exchange Act, the registrant caused this report to be signed on its behalf by the undersigned, thereunto duly authorized.
| FIRST NATIONAL EXCHANGE BANK | ||
| Date:November 13, 2006 |
| |
| Worth Harris Carter, Jr. | ||
Chairman of the Board and President (Principal executive officer and principal financial officer) | ||
15
Table of Contents
Exhibit 31
CERTIFICATION
I, Worth Harris Carter, Jr., certify that:
| 1. | I have reviewed this quarterly report on Form 10-QSB of First National Exchange Bank; |
| 2. | Based on my knowledge, this report does not contain any untrue statement of a material fact or omit to state a material fact necessary to make the statements made, in light of the circumstances under which such statements were made, not misleading with respect to the period covered by this report; |
| 3. | Based on my knowledge, the financial statements, and other financial information included in this report, fairly present in all material respects the financial condition, results of operations and cash flows of the small business issuer as of, and for, the periods presented in this report; |
| 4. | I am responsible for establishing and maintaining disclosure controls and procedures (as defined in Exchange Act Rules 13a-15(e) and 15d-15(e)) for the small business issuer and have: |
| (a) | Designed such disclosure controls and procedures, or caused such disclosure controls and procedures to be designed under my supervision, to ensure that material information relating to the small business issuer, including its consolidated subsidiaries, is made known to me by others within those entities, particularly during the period in which this report is being prepared; |
| (b) | Evaluated the effectiveness of the small business issuer’s disclosure controls and procedures and presented in this report my conclusions about the effectiveness of the disclosure controls and procedures, as of the end of the period covered by this report based on such evaluation; and |
| (c) | Disclosed in this report any change in the small business issuer’s internal control over financial reporting that occurred during the small business issuer’s most recent fiscal quarter (the small business issuer’s fourth fiscal quarter in the case of an annual report) that has materially affected, or is reasonably likely to materially affect, the small business issuer’s internal control over financial reporting; and |
| 5. | I have disclosed, based on my most recent evaluation of internal control over financial reporting, to the small business issuer’s auditors and the audit committee of the small business issuer’s board of directors (or persons performing the equivalent functions): |
| (a) | All significant deficiencies and material weaknesses in the design or operation of internal control over financial reporting which are reasonably likely to adversely affect the small business issuer’s ability to record, process, summarize and report financial information; and |
| (b) | Any fraud, whether or not material, that involves management or other employees who have a significant role in the small business issuer’s internal control over financial reporting. |
| Date:November 13, 2006 |
| |
| Worth Harris Carter, Jr. | ||
Chairman of the Board and President (principal executive officer and principal financial officer) |
16
Table of Contents
Exhibit 32
CERTIFICATION OF
PRINCIPAL EXECUTIVE OFFICER AND PRINCIPAL FINANCIAL OFFICER
Pursuant to Section 906 of the Sarbanes-Oxley Act of 2002 (18 U.S.C. Section 1350)
The undersigned, as the principal executive officer and principal financial officer of First National Exchange Bank, certifies that, to the best of his knowledge and belief, the Quarterly Report on Form 10-QSB for the period ended September 30, 2006 which accompanies this certification fully complies with the requirements of Section 13(a) or 15(d) of the Securities Exchange Act of 1934 and the information contained in the report fairly presents, in all material respects, the financial condition and results of operations of First National Exchange Bank at the dates and for the periods indicated. The foregoing certification is made pursuant to Section 906 of the Sarbanes-Oxley Act of 2002 (18 U.S.C. Section 1350) and shall not be relied upon for any other purpose. The undersigned expressly disclaims any obligation to update the foregoing certification except as required by law.
| Date:November 13, 2006 |
| |
| Worth Harris Carter, Jr. | ||
Chairman of the Board and President (principal executive officer and principal financial officer) |
17
Table of Contents
OFFICE OF THE COMPTROLLER OF THE CURRENCY
WASHINGTON, D.C. 20552
FORM 10-KSB/A
AMENDMENT NO. 1
| x | ANNUAL REPORT UNDER SECTION 13 OR 15 (d) OF THE SECURITIES EXCHANGE ACT OF 1934 |
For the fiscal year ended December 31, 2005
| ¨ | TRANSITION REPORT UNDER SECTION 13 OR 15 (d) OF THE SECURITIES EXCHANGE ACT OF 1934 |
For the transition period from to
Commission file number: n/a
MOUNTAIN NATIONAL BANK
(Name of small business issuer in its charter)
| National Bank | 54-1801531 | |
(State or other jurisdiction of incorporation or organization) | (I.R.S Employer Identification No.) | |
543 East Stuart Drive Galax, VA | 24333 | |
| (Address of principal executive offices) | (Zip Code) | |
Issuer’s telephone number: (276) 236-7107
Securities registered under Section 12(b) of the Exchange Act: None
Securities registered under Section 12(g) of the Exchange Act: None
Check whether the issuer is not required to file reports pursuant to Section 13 or 15(d) of the Exchange Act. Yes ¨ No x
Check whether the issuer (1) filed all reports required to be filed by Section 13 or 15(d) of the Exchange Act during the past 12 months (or for such shorter period that the registrant was required to file such reports), and (2) has been subject to such filing requirements for the past 90 days: Yes x No ¨
Check if there is no disclosure of delinquent filers in response to Item 405 of Regulation S-B contained in this form, and no disclosure will be contained, to the best of registrant’s knowledge, in definitive proxy or information statements incorporated by reference in Part III of this Form 10-KSB or any amendment to this Form 10-KSB. x
Indicate by check mark whether the registrant is a shell company (as defined in Rule 12b-2 of the Exchange Act). Yes ¨ No x
The issuer’s total revenues for the fiscal year ended December 31, 2005 were $10,808,000.
The aggregate market value of the issuer’s common stock held by nonaffiliates as of March 14, 2006 was $21,330,000.
As of March 14, 2006, there were issued and outstanding 507,865 shares of the issuer’s common stock.
DOCUMENTS INCORPORATED BY REFERENCE
Portions of the 2005 Annual Report to Shareholders, as revised, are incorporated by reference in Part II of this report, which is attached hereto as Exhibit 13.
Transitional Small Business Disclosure Format Yes ¨ No x
1
Table of Contents
Mountain National Bank
2005 ANNUAL REPORT ON FORM 10-KSB/A
TABLE OF CONTENTS
EXPLANATORY NOTE | ||
PART I | 5 | |
ITEM 1 - DESCRIPTION OF BUSINESS | 5 | |
ITEM 2 - DESCRIPTION OF PROPERTY | 8 | |
ITEM 3 - LEGAL PROCEEDINGS | 9 | |
ITEM 4 - SUBMISSION OF MATTERS TO A VOTE OF SECURITY HOLDERS | 9 | |
PART II | 10 | |
ITEM 5 - MARKET FOR COMMON EQUITY AND RELATED STOCKHOLDER MATTERS | 10 | |
ITEM 6 - MANAGEMENT’S DISCUSSION AND ANALYSIS OR PLAN OF OPERATION | 10 | |
ITEM 7 - FINANCIAL STATEMENTS | 11 | |
ITEM 8 - CHANGES IN AND DISAGREEMENTS WITH ACCOUNTANTS ON ACCOUNTING AND FINANCIAL DISCLOSURE | 11 | |
ITEM 8A - CONTROLS AND PROCEDURES | 11 | |
ITEM 8B - OTHER INFORMATION | 11 | |
PART III | 12 | |
ITEM 9 - DIRECTORS, EXECUTIVE OFFICERS, PROMOTERS AND CONTROL PERSONS; COMPLIANCE WITH SECTION 16(A) OF THE EXCHANGE ACT | 12 | |
ITEM 10 - EXECUTIVE COMPENSATION | 14 | |
ITEM 11 - SECURITY OWNERSHIP OF CERTAIN BENEFICIAL OWNERS AND MANAGEMENT | 16 | |
ITEM 12 - CERTAIN RELATIONSHIPS AND RELATED TRANSACTIONS | 17 | |
ITEM 13 - EXHIBITS | 18 | |
ITEM 14 - PRINCIPAL ACCOUNTANT FEES AND SERVICES | 18 | |
2
Table of Contents
EXPLANATORY NOTE
Mountain National Bank (the “Bank”) is simultaneously submitting the following amended filings:(i) Form 10-KSB/A for the year ended December 31, 2005 and (ii) Form 10-QSB/A for the quarter ended June 30, 2006. These amended filings update the Bank’s reported financial information for the year ended December 31, 2005 and for the affected quarters of 2005 and 2006.
This amendment amends the Annual Report on Form 10-KSB filed by the Bank on March 31, 2006 (the “Original Filing”). The purpose of this amendment is to change the Bank’s financial statements and related footnote disclosures and related MD&A discussion for the periods covered by this Form 10-KSB/A to match the amended Consolidated Reports of Condition and Income (“Call Reports”) the Bank filed in June 2006 at the direction of the Office of the Comptroller of the Currency (“OCC”) to place on nonaccrual one loan to a borrower group secured by a first deed of trust on a hotel property in North Carolina.
The amendments to the financial statements consist of the following:
| As Originally Presented | Changes | As Revised | ||||||||||
| (in thousands) | ||||||||||||
Statements of Financial Condition: | ||||||||||||
Loans | $ | 126,098 | $ | (53 | ) | $ | 126,045 | |||||
Other Assets | 2,286 | 23 | 2,309 | |||||||||
Statements of Income: | ||||||||||||
Interest Income | 10,261 | (46 | ) | 10,215 | ||||||||
Income Taxes | 403 | (16 | ) | 387 | ||||||||
Net Income | 1,386 | (30 | ) | 1,356 | ||||||||
Statements of Cash Flows: | ||||||||||||
Net cash from operating activities | 1,352 | (53 | ) | 1,299 | ||||||||
Net cash from investing activities | (29,176 | ) | 53 | (29,123 | ) | |||||||
Statements of Changes in Shareholders’ Equity: | ||||||||||||
Undivided profits | 2,963 | (30 | ) | 2,933 | ||||||||
The Bank’s accountants previously advised the Bank that the financial statements included in the Original Filing were prepared in accordance with Generally Accepted Accounting Principles and that the amounts involved in the amendment of the Call Reports were not material. However, the OCC has advised the Bank that the financial statements in this Annual Report must be identical with the Bank’s Call Reports, as amended, to comply with OCC policy.
This Form 10-KSB/A does not change any of the information contained in Items 1-5 or 8-14 of the Original Filing, (other than to add Item8B for which the response is “None”), and which is repeated in this amended filing. Except for the changes noted above, references throughout this Form 10-KSB/A are accurate as of the date this Annual Report was originally filed and have not been updated to reflect events occurring subsequent to the original filing date.
Importantly, as of the date of this amended filing, the collateral securing the loan at issue has been liquidated as part of the Bank’s collection process and the loan has been paid in full. Therefore, all interest income adjusted in this Form 10-KSB/A will be reported by the Bank as income earned in the third quarter of 2006.
3
Table of Contents
FORWARD–LOOKING STATEMENTS
This report contains statements concerning the Bank’s expectations, plans, objectives, future financial performance and other statements that are not historical facts. These statements may constitute “forward-looking statements” as defined by federal securities laws. In some cases, readers can identify the forward-looking statements by the use of words such as “may,” “ will,” “should,” “could,” “expect,” “plan,” “intend,” “anticipate,” “believe,” “estimate,” “predict,” “potential” or “continue” or the negative or other variations of these words, or other comparable words or phrases. These statements may address issues that involve estimates and assumptions made by management, risks and uncertainties, and actual results could differ materially from historical results or those anticipated by such statements. Factors that could have a material adverse effect on the Bank’s operations and future prospects include, but are not limited to, changes in: interest rates; general and local economic conditions; the legislative/regulatory climate; monetary and fiscal policies of the U.S. government, including policies of the U.S. Treasury and the Federal Reserve Board; the quality or composition of loan or investment portfolios; demand for loan products; deposit flows; competition; demand for financial services in our market area and accounting principles, policies and guidelines. These risks and uncertainties should be considered in evaluating the forward-looking statements contained herein, and readers are cautioned not to place undue reliance on such statements, which speak only as of the date of this report.
4
Table of Contents
PART I
Item 1 – DESCRIPTION OF BUSINESS
General
The Bank opened for business as a National Banking Association in 1996 in Galax, Virginia and was created through the spin off of the assets, liabilities, and related capital from offices of Patrick Henry National Bank, in Bassett, Virginia. At December 31, 2005, the Bank had had 62 full-time and 5 part-time employees, $232 million in assets, $126 million in net loans, $216 million in deposits and $16 million in total shareholders’ equity.
The Bank is a full service community bank that provides an array of financial products and services to its customers, including a variety of interest-bearing and non-interest bearing demand deposit accounts; savings and money market accounts; certificates of deposit; commercial, installment, and real estate mortgage loans (commercial and residential); and safe deposit rental facilities. The Bank also sells travelers checks, money orders and cashier’s checks.
Market Area
The Bank’s primary service area consists of Carroll and Grayson County and the City of Galax in Virginia and Iredell, Surry, Yadkin and Wilkes Counties in North Carolina. The Bank conducts a general commercial banking business in its service area, and focuses on serving the banking needs of small-to-medium sized businesses, professional concerns and individuals.
Goals and Strategy
The Bank’s goal is to become a leading financial institution in its market area by opening new offices and providing a full array of banking services. Management believes that the on-going consolidation of the banking industry has created an opportunity for community-based lenders like the Bank that emphasize retail lending and superior customer service. The Bank’s business strategy is to target individuals, businesses and professionals in the area for loans, deposits, and other financial services and to explore selected opportunities to establish branches in areas that demographically compliment the Bank’s existing customer base.
Deposits and Loan Products
The Bank offers a full range of deposit services including LIFETIME FREE CHECKING, NOW accounts, savings accounts, retirement accounts and other deposits of various types, ranging from money market accounts to longer-term certificates of deposit. The transaction accounts and time certificates are tailored to the Bank’s principal market at competitive rates. All deposit accounts are insured by the FDIC up to the maximum amount allowed by law (generally $100,000 per depositor subject to aggregation rules). The Bank solicits these accounts from individuals, businesses, associations, organizations, and governmental entities.
The Bank also offers a full range of commercial and personal loans. Commercial loans include both secured and unsecured loans. Consumer loans include secured and unsecured loans for financing automobiles, home improvements, education and personal investments. The Bank also makes real estate construction and acquisition loans and originates and holds fixed and variable rate mortgage loans.
The Bank’s lending activities are subject to a variety of lending limits imposed by federal law. While differing limits apply in certain circumstances based on the type of loan or the nature of the borrower (including the borrower’s relationship to the Bank), in general the Bank is subject to a loan-to-one borrower limit of an amount equal to 15% of the Bank’s unimpaired capital and surplus. The Bank may not make loans to any director, officer, employee or 10% shareholder of the Bank unless the loan is approved by the Board of Directors and is made on terms not more favorable than are made available to a person not affiliated with the Bank.
5
Table of Contents
Other bank services include travelers checks, direct deposit of payroll and social security checks, and automated drafts for various accounts. The Bank has no current plans to exercise trust powers.
Bank Lending Practices
The Bank’s lending efforts are directed to making loans to individuals and businesses in its market area. The Bank has both purchased and sold participation loans with other banks in the past and may do so in the future. The Bank believes that its lending and credit policies are conservative.
The Bank’s primary lending program has been the origination of loans secured by real estate. The Bank evaluates both the borrower’s ability to make principal and interest payments and the value of the property that will secure the loan.
Residential mortgage loans generally are made on the basis of the borrower’s ability to make repayment from employment and other income and are secured by real estate that can be readily valued. The Bank offers both adjustable-rate and fixed-rate loans.
In contrast, commercial real estate loans typically are made on the basis of the borrower’s ability to make repayment from cash flow from its business and are secured by business properties. The Bank’s primary non-residential real estate loan products have rates, which are fixed for three to five years and then become adjustable. Commercial loans typically involve larger loan balances concentrated with single borrowers or groups of related borrowers.
The Bank also makes consumer loans, including unsecured personal loans, automobile loans, deposit account loans, installment loans and time loans. The Bank’s primary consideration when making such consumer loans is the customer’s ability to repay the loan. Consumer loans generally warrant higher interest rates and fees, but such loans, particularly unsecured consumer loans, also may entail greater risk than residential mortgage loans. Even when a loan is secured, repossessed collateral for a defaulted consumer loan may not provide an adequate source of repayment. Consumer loan collections are dependent on the borrower’s continuing financial stability, and are more likely to be affected adversely by job loss, divorce, illness, or personal bankruptcy. Various federal and state laws, including bankruptcy and insolvency laws, may limit the amount that can be recovered on such loans and such loans may give rise to claims and defenses by a consumer loan borrower.
The Bank also makes commercial loans to qualified small businesses in its market area. Commercial business loans generally have a higher degree of risk than mortgage loans, but have commensurately higher yields. To manage these risks, the Bank generally secures appropriate collateral and carefully monitors the financial condition of its business borrowers.
Competition
Federal and state legislative changes have significantly increased competition among financial institutions, and current trends towards additional deregulation may be expected to increase competition even further. In its market area, the Bank competes with nationwide, statewide and local banking institutions, credit unions, thrift institutions, money market funds, consumer finance companies, and other financial service organizations. Many of the financial organizations competing with the Bank have greater financial resources than the Bank. Many of these financial organizations also have greater geographic coverage and some offer bank and bank-related services which the Bank does not offer.
Supervision and Regulation
Financial institutions are extensively regulated under federal and state law. Consequently, the growth and earnings performance of the Bank can be affected not only by management decisions and general economic conditions, but also by the statutes administered by, and the regulations and policies of, various governmental regulatory authorities including, but not limited to, the OCC, the Federal Reserve Board (“FRB”), the FDIC, the Internal Revenue Service, federal and state taxing authorities, and the Securities Exchange Commission. The effect of such statutes, regulations and policies can be significant, and cannot be predicted with a high degree of certainty.
Federal and state laws and regulations generally applicable to financial institutions regulate, among other things, the scope of business, investments, reserves against deposits, capital levels relative to operations, the nature and amount of collateral for loans, the establishment of branches, mergers, consolidations and dividends. The system of
6
Table of Contents
supervision and regulation applicable to the Bank establishes a comprehensive framework for their respective operations and is intended primarily for the protection of the FDIC’s deposit insurance funds and the depositors, rather than the shareholders, of the Bank.
The following references to material statutes and regulations affecting the Bank are brief summaries thereof and do not purport to be complete, and are qualified in their entirety by reference to such statutes and regulations. Any change in applicable law or regulations may have a material effect on the business of the Bank.
Finally, the Bank is subject to the periodic reporting requirements of the Securities Exchange Act of 1934, as amended, including but not limited to, filing annual, quarterly and other current reports with the Comptroller of the Currency.
Regulatory Capital Requirements
All financial institutions are required to maintain minimum levels of regulatory capital. The OCC has established risk-based and leveraged capital standards for the financial institutions they regulate. The OCC also may impose capital requirements in excess of these standards on a case-by-case basis for various reasons, including financial condition or actual or anticipated growth. Under the risk-based capital requirements, the Bank is required to maintain a minimum ratio of total capital to risk-weighted assets of at least 8%. At least half of the total capital is required to be “Tier 1 capital,” which consists principally of common and certain qualifying preferred shareholders’ equity, less certain intangibles and other adjustments. The remainder, “Tier 2 capital,” consists of a limited amount of subordinated and other qualifying debt (including certain hybrid capital instruments) and a limited amount of the general loan loss reserve.
In addition, the federal regulatory agencies have established a minimum leveraged capital ratio (Tier 1 capital to period end total assets). These guidelines provide for a minimum leveraged capital ratio of 4%. The guidelines also provide that banking organizations experiencing internal growth or making acquisitions will be expected to maintain strong capital positions substantially above the minimum supervisory levels, without significant reliance on intangible assets.
As of December 31, 2005 and 2004, the Bank qualified as “well-capitalized” institution (see Note 16 to the Financial Statements).
Insurance of Accounts, Assessments and Regulation by the FD1C
The Bank is a member of the Bank Insurance Fund (“BIF”) of the FDIC. As a BIF insured institution, the Bank is subject to FDIC rules and regulations as administrator of the BIF. The Bank’s deposits are insured up to $100,000 per insured depositor, as defined by law and regulation. As insurer, the FDIC is authorized to conduct examinations of and to require reporting by BIF institutions. The actual assessment to be paid by each BIF member is based on the institution’s assessment risk classification and whether the institution is considered by its supervisory agency to be financially sound or to have supervisory concerns.
Under the FDIC’s risk-based insurance system, BIF-insured institutions are currently assessed premiums of between zero and twenty seven cents per $100 of eligible deposits, depending on the institution’s capital position and other supervisory facts. Congress has enacted legislation that, among other things, provides for assessments against BIF-insured institutions that will be used to pay certain Financing Corporation (“FICO”) obligations.
The FDIC is authorized to prohibit any BIF-insured institution from engaging in any activity that the FDIC determines by regulation or order to pose a serious threat to the insurance fund. Also, the FDIC may initiate enforcement actions against banks after first giving the institution’s primary regulatory authority an opportunity to take such action. The FDIC may terminate the deposit insurance of any depository institution, including the Bank, if it determines, after a hearing, that the institution has engaged or is engaging in unsafe or unsound practices, is in an unsafe or unsound condition to continue operations, or has violated any applicable law, regulation, order or any condition imposed in writing by the FDIC. It also may suspend deposit insurance temporarily during the hearing process for the permanent termination of insurance, if the institution has no tangible capital. If deposit insurance is terminated, the deposits at the institution at the time of termination, less subsequent withdrawals, shall continue to be insured for a period from six months to two years, as determined by the FDIC. Management is aware of no existing circumstances that could result in termination of the Bank’s deposit insurance.
7
Table of Contents
Other Safety and Soundness Regulations
The federal banking agencies have broad powers under current federal law to take prompt corrective action to resolve problems of insured depository institutions. The extent of these powers depends upon whether the institutions in question are “well capitalized,” “adequately capitalized,” “undercapitalized,” “significantly undercapitalized” or “critically undercapitalized,” as such terms are defined under uniform regulations issued by each of the federal banking agencies.
Community Reinvestment
The requirements of the Community Reinvestment Act (“CRA”) affect the Bank. The CRA imposes on financial institutions an affirmative obligation to help meet the credit needs of their local communities, including low- and moderate-income neighborhoods, consistent with the safe and sound operation of those institutions. Each financial institution’s efforts in helping meet community credit needs currently is evaluated as part of the examination process pursuant to a new regulation recently adopted by the banking regulatory agencies. Under the new regulation a financial institution’s efforts in helping meet its community’s credit needs are evaluated, based on the particular institution’s Total Assets, according to a lending test, a community development test in addition to lending test or the three-pronged (lending, investment and service) test, all of which replace the twelve assessment factors used previously. The grade received by a bank is considered in evaluating mergers, acquisitions and applications to open a branch or facility. To the best knowledge of the Bank, it is meeting its obligations under the CRA.
Effect of Governmental Monetary Policies
As with other financial institutions, the earnings of the Bank are affected by general economic conditions as well as by the monetary policies of the Federal Reserve Board. Such policies, which include regulating the national supply of bank reserves and bank credit, can have a major effect upon the source and cost of funds and the rates of return earned on loans and investments. The Federal Reserve System exerts a substantial influence on interest rates and credit conditions, primarily through establishing target rates for federal funds, open market operations in U.S. Government securities, varying the discount rate on member bank borrowings and setting cash reserve requirements against deposits. Changes in monetary policy, including changes in interest rates, will influence the origination of loans, the purchase of investments, the generation of deposits, and rates received on loans and investment securities and paid on deposits. Fluctuations in the Federal Reserve Board’s monetary policies have had a significant impact on the operating results of the Bank and all financial institutions in the past and are expected to continue to do so in the future.
Employees
The Bank has 62 full-time employees and 5 part-time employees as of December 31, 2005. The Bank believes that its relationship with its employees is good, and no employees are represented by a labor union.
Item 2 – DESCRIPTION OF PROPERTY
The Bank’s main office is located in a one and one half story building at 543 East Stuart Drive, Galax, Virginia. The Bank also operates three additional offices in Virginia and four offices in North Carolina. The Bank owns five of the offices free and clear of encumbrances, while the other three are held under non-cancellable operating leases. These leases are described in Footnotes 7 and 18 of the Financial Statements.
As of December 31, 2005, the Bank operated the eight offices listed in the table below:
Location | Address | Own/Lease | ||||
City of Galax | 118 North Main Street | Galax, VA 24333 | Own | |||
City of Galax | 543 East Stuart Drive | Galax, VA 24333 | Own | |||
Hillsville | 220 Main Street | Hillsville, VA 24343 | Own | |||
Mt. Airy | 507 Willow Street | Mt. Airy, NC 27030 | Lease | |||
Jonesville | 345 North Bridge Street | Jonesville, NC 28642 | Lease | |||
Wilkesboro | 1606 Curtis Ridge Road | Wilkesboro, NC 25697 | Lease | |||
Independence | 449 East Main Street | Independence, VA 24348 | Own | |||
Plaza Drive | 231 East Plaza Drive | Mooresville, NC 28115 | Own | |||
8
Table of Contents
The Bank has acquired title to other parcels of real estate through the normal course of its lending activities. The book values of these properties equaled $1,655,000 and $2,131,000 as of December 31, 2005 and 2004, respectively.
Management considers these properties to be in good condition. Adequate insurance is maintained on each of these properties.
Item 3 – LEGAL PROCEEDINGS
There were no material pending legal proceedings to which the Bank is a party or to which the property of the Bank is subject.
Item 4 – SUBMISSION OF MATTERS TO A VOTE OF SECURITY HOLDERS
There were no matters submitted to a vote of security holders during the fourth quarter of the year covered by this report.
EXECUTIVE OFFICERS OF THE REGISTRANT
Name (Age) | Officer Since | Principal Occupation During Past Five Years | ||
Worth Harris Carter, Jr. (68) | 1976 | |||
| Chairman of the Board of First National Bank since 1976, President since 1986 | ||||
| Chairman of the Board and President of Patrick Henry National Bank since 1977 | ||||
| Chairman of the Board of Peoples National Bank since 1976, President since 1981 | ||||
| Chairman of the Board of Blue Ridge Bank since 1982 | ||||
| Chairman of the Board and President of Community National Bank since 1985 | ||||
| Chairman of the Board and President of Mountain National Bank since 1996 | ||||
| Chairman of the Board and President of Shenandoah National Bank since 1996 | ||||
| Chairman of the Board and President of Central National Bank since 1996 | ||||
| Chairman of the Board and President of Patriot Bank since 1996 | ||||
| Chairman of the Board and President of First National Exchange Bank since 1998 | ||||
| Chairman of the Board and President of Mortgage Company of Virginia since 1984 | ||||
| Chairman of the Board and President of Bank Services of Virginia since 1984 | ||||
| Chairman of the Board and President of Bank Building Corporation since 1994 | ||||
| Chairman of the Board and President of Bank Services Insurance, Inc. since 2003 | ||||
| Manager of Blackstone Properties LLC Since 1998 | ||||
9
Table of Contents
PART II
Item 5 – MARKET FOR COMMON EQUITY AND RELATED STOCKHOLDER MATTERS
The Bank is authorized to issue 2.5 million shares of common stock with a par value of $5. This stock has full voting rights full preemptive rights. There were 507,865 shares outstanding as of December 31, 2005 and 2004.
This is the only class of authorized stock.
The Bank’s common stock is traded locally with no known established trading market and no known market makers.
The quarterly high and low prices, based on transactions made known to the Bank, and quarterly dividends for 2005 and 2004 for the common stock are presented below:
| 2005 | 2004 | Dividends Per Share | ||||||||||||||||
| High | Low | High | Low | 2005 | 2004 | |||||||||||||
First Quarter | $ | 45 | $ | 44 | $ | 50 | $ | 45 | $ | 0.45 | $ | 0.45 | ||||||
Second Quarter | 43 | 43 | 50 | 45 | 0.45 | 0.45 | ||||||||||||
Third Quarter | 44 | 44 | 50 | 45 | 0.45 | 0.45 | ||||||||||||
Fourth Quarter | 39 | 38 | 50 | 45 | 0.45 | 0.45 | ||||||||||||
Holders. As of March 14, 2006, there are approximately 1,131 holders of record of the Bank’s outstanding common stock.
Dividends. The amount of dividends that may be paid by the Bank will depend on the Bank’s earnings and capital position and is limited by federal law, regulations and policies. A national bank may not pay dividends from its capital; all dividends must be paid out of undivided profits then on hand, after deducting expenses, including reserves for losses and bad debts. In addition, the approval of the OCC is required if the total of all dividends declared by a national bank in any calendar year exceeds the total of its net profits for that year combined with its retained net profits for the preceding two years, less any required transfers to surplus. The Bank may not pay a dividend if, after effect to the dividend, the Bank would be undercapitalized.
The dividend payment history for the last two years is presented above. Future cash dividends expected in the future and are dependent upon the Bank’s future performance and other factors.
Item 6 – MANAGEMENT’S DISCUSSION AND ANALYSIS OR PLAN OF OPERATION
The information required by this Item is included in the Bank’s annual report to shareholders for the year ended December 31, 2005, as revised, (the “Annual Report”), which is attached hereto as Exhibit 13 and is incorporated herein by reference. The information appears in the Annual Report under the caption “Management’s Discussion and Analysis of Financial Condition and Results of Operation.”
10
Table of Contents
Item 7 – FINANCIAL STATEMENTS
The report of the independent registered public accounting firm and audited financial statements of the Bank and accompanying notes required by this Item are included in the Bank’s Annual Report, which is attached hereto as Exhibit 13 and is incorporated herein by reference
Item 8 – CHANGES IN AND DISAGREEMENTS WITH ACCOUNTANTS ON ACCOUNTING AND FINANCIAL DISCLOSURE
None.
Item 8A – CONTROLS AND PROCEDURES
The Bank maintains a system of disclosure controls and procedures that is designed to ensure that material information is accumulated and communicated to management, including the Bank’s president (who is the Bank’s principal executive officer and principal financial officer), as appropriate to allow timely decisions regarding required disclosure. As required, management, with the participation of the Bank’s president, evaluated the effectiveness of the design and operation of the Bank’s disclosure controls and procedures as of the end of the period covered by this report. Based on this evaluation, the Bank’s president concluded that the Bank’s disclosure controls and procedures were operating effectively to ensure that information required to be disclosed by the Bank in reports that it files or submits under the Securities Exchange Act of 1934, as amended, is recorded, processed, summarized, and reported within the time periods specified in the rules and forms of the SEC.
Because of the inherent limitations in all control systems, no evaluation of controls can provide absolute assurance that the Bank’s disclosure controls and procedures will detect or uncover every situation involving the failure of persons within the Bank to disclose material information otherwise required to be set forth in the Bank’s periodic reports.
The Bank’s management is also responsible for establishing and maintaining adequate internal control over financial reporting to provide reasonable assurance regarding the reliability of financial reporting and the preparation of financial statements for external purposes in accordance with generally accepted accounting principles. There were no changes in the Bank’s internal control over financial reporting during the Bank’s fourth quarter ended December 31, 2005 that have materially affected, or are reasonably likely to materially affect, the Bank’s internal control over financial reporting.
Item 8B – OTHER INFORMATION
None.
11
Table of Contents
PART III
Item 9 – DIRECTORS, EXECUTIVE OFFICERS, PROMOTERS AND CONTROL PERSONS; COMPLIANCE WITH SECTION 16(a) OF THE EXCHANGE ACT
The information regarding the Bank’s executive officer is contained in Part I of this Report on Form 10-KSB/A.
Name and Business Experience | Age | Director Since | ||
Carter, Worth Harris, Jr. | 68 | 4/96 | ||
Chairman of the Board and President Worth Harris Carter, Jr. is a director and officer of the following companies: Chairman of the Board of First National Bank since 1976, President since 1986 Chairman of the Board and President of Patrick Henry National Bank since 1977 Chairman of the Board of Peoples National Bank since 1976, President since 1981 Chairman of the Board of Blue Ridge Bank since 1982, President since 2004 Chairman of the Board and President of Community National Bank since 1985 Chairman of the Board and President of Shenandoah National Bank since 1996 Chairman of the Board and President of Central National Bank since 1996 Chairman of the Board and President of Patriot Bank since 1996 Chairman of the Board and President of First National Exchange Bank since 1998 Chairman of the Board and President of Mortgage Company of Virginia since 1984 Chairman of the Board and President of Bank Services of Virginia, Inc. since 1984 Chairman of the Board and President of Bank Services Insurance, Inc. since 2003 Chairman of the Board and President of Coresoft, Inc. since 2004 Chairman of the Board and President of Bank Building Corporation since 1988 Manager of Blackstone Properties LLC since 1998 | ||||
| Haskins, James W. | 65 | 4/96 | ||
| James W. Haskins is and has been an attorney and a principal in the law firm of Young, Haskins, Mann & Gregory, Ltd., Martinsville, VA for more than five years. He also has served as a director of Patrick Henry National Bank, Bassett, VA, since 1976. | ||||
| Kyle, Lanny A., O.D. | 52 | 9/03 | ||
| Dr. Lanny A. Kyle is currently practicing optometry in North Carolina. He formerly was Owner and President of Piedmont Optometric Association for more than five years. | ||||
| Midkiff, H. Marvin, DDS | 80 | 4/96 | ||
| Dr. H. Marvin Midkiff is retired. Prior to retirement, he was previously a Doctor of Dental Surgery and principal in H. M. Midkiff, DDS, Ltd., Martinsville, VA for more than five years. He also has served as a director of Patrick Henry National Bank, Bassett, VA since 1976. | ||||
12
Table of Contents
Name and Business Experience | Age | Director Since | ||
| Prillaman, Haller G. | 72 | 4/96 | ||
| Haller G. Prillaman has been President of Prillaman Brothers, Inc., Martinsville, VA; he was President of Prillaman Chemical Corp., Martinsville, Virginia and Daly Herring Company, Kinston, NC for more than five years until 1987; Director, Ellis & Everard. PLC, Bradford, United Kingdom from August 1984 to July, 1988; President and Director, Ellis & Everard (HOLDINGS), Inc., Atlanta, GA from October 1985 to July 1988. He also has served as a director of Patrick Henry National Bank, Bassett, VA since 1976 and of Bank Building Corporation since 1995. | ||||
| Roach, N. Larry | 67 | 4/96 | ||
| N. Larry Roach is and has been President of Larry Roach & Associates, Insurance Services, Inc. for more than five years. He also has served as a director of Patrick Henry National Bank, Bassett, VA since 1976. | ||||
The Board of Directors is not aware of any family relationship between any Director, executive officer or person nominated by the Bank to become a Director; nor is the Board of Directors aware of any involvement in legal proceedings that would be material to an evaluation of the ability or integrity of any Director, executive officer or person nominated to become a Director.
AUDIT COMMITTEE REPORT OF THE BOARD OF DIRECTORS
The entire Board of Directors functions as the Bank’s Audit Committee and in this capacity met four times in 2005.
The functions of the Board in the audit area are focused on three areas.
| • | the adequacy of the Bank’s internal controls and financial reporting process and the reliability of the financial statements; |
| • | the independence and performance of the Bank’s internal auditors and independent auditors; and |
| • | the Bank’s compliance with legal and regulatory requirements. |
We meet with management periodically to consider the adequacy of the Bank’s internal controls and the objectivity of its financial reporting. We discuss these matters with the Bank’s independent auditors and with appropriate financial personnel and internal auditors.
We also periodically review the performance of the independent auditors and their independence from management.
All of the Directors who serve as the Bank’s Audit Committee, with the exception of Chairman of the Board and President Carter, are “independent” for the purposes of the Nasdaq Stock Market listing standards.
The Board has not adopted a written charter setting forth the responsibilities and authority of the Board in its capacity as the Audit Committee. Although Mr. Carter is not independent under the Nasdaq Stock Market or SEC standards for audit committee membership, the Board of Directors has determined that Mr. Carter possesses the knowledge and experience required to be considered an audit committee financial expert. In addition, the Board of Directors believes that all of the Bank’s Directors possess the financial knowledge and expertise necessary to protect the Bank’s shareholders in performing the functions of an audit committee.
Management has primary responsibility for the Bank’s financial statements and the overall reporting process, including the Bank’s system of internal controls.
The independent auditors audit the annual financial statements prepared by management, express an opinion as to whether those statements fairly present the financial position, results of operations and cash flows of the Bank in conformity with generally accepted accounting principles and discuss with us any issues they believe should be raised with us.
This year, we reviewed the Bank’s audited financial statements and met with both management and Goodman & Company, LLP, the Bank’s independent auditors, to discuss those financial statements. Management has represented to us that the financial statements were prepared in accordance with generally accepted accounting principles.
13
Table of Contents
We have received from and discussed with Goodman & Company the written disclosure and the letter required by Independence Standards Board Statement No. 1 (Independence Discussions with Audit Committees) relating to that firm’s independence from the Bank. We also discussed with Goodman & Company the matters required to be discussed by Statement on Auditing Standard No. 61 (Communication with Audit Committees).
Based on these reviews and discussions, we recommended to the Board that the Bank’s audited financial statements be included in the Bank’s Annual Report on Form 10-KSB for the fiscal year ended December 31, 2005 for filing with the Office of the Comptroller of the Currency (“OCC”).
Directors
Worth Harris Carter, Jr
James W. Haskins
Lanny A. Kyle, O.D.
H. Marvin Midkiff, D.D.S.
Haller G. Prillaman
N. Larry Roach
SECTION 16(a) BENEFICIAL OWNERSHIP REPORTING COMPLIANCE
Section 16(a) of the Securities Exchange Act of 1934 requires that Directors and executive officers, and persons who control more than 10% of the Bank’s equity securities, file reports of ownership and reports of changes in ownership of the Bank’s outstanding equity securities. All such filings have been filed timely in 2005.
The Bank has not adopted a Code of Ethics for its directors, executives and employees, primarily because management of the Bank believes and understands that our officers and directors adhere to and follow ethical standards without the necessity of a written policy. The Bank’s Board of Directors will revisit this issue in the future to determine if adoption of a code of ethics is appropriate. In the meantime, the Bank’s management requires and promotes honest and ethical conduct, full and fair disclosure in its reports to the OCC, and compliance with applicable governmental laws and regulations.
Item 10 – EXECUTIVE COMPENSATION
The Bank’s compensation program is designed to offer competitive compensation to employees based on each individual’s contribution to the Bank’s overall success. As such, the program provides a competitive compensation package to attract and retain capable employees.
The compensation and benefits program consists of salary, a profit sharing plan, and life, health and disability insurance. The compensation and benefits program for officers parallels that of all other employees. The Bank offers no stock options or other forms of equity compensation, bonuses, employment contracts, country club memberships or other perquisites to officers or employees.
The entire Board of Directors performs the functions of a Salary Committee for the Bank. The Board has the responsibility for administering the Bank’s overall compensation program and for setting the salaries for the Bank’s officers. In setting the compensation of the Bank’s officers, the Board generally relies on the recommendations of the Chairman and President and the Board members’ own significant personal knowledge of the compensation provided to other, similarly situated, executives in banking and other industries in the local area. The Board also reviews each individual’s performance and contribution to the overall Bank goals in determining the level of salary for the coming year.
Mr. Worth Harris Carter, Jr., Chairman of the Board and President, serves as the Chief Executive Officer of Mountain National Bank. As noted below under “Certain Relationships and Related Transactions,” Mr. Carter also serves as Chairman and President of nine other banks. The Salary Committee of the Board of Directors of (Patrick Henry National Bank) actually sets Mr. Carter’s annual salary each year. The cost of Mr. Carter’s compensation, which consists of his salary plus an amount equal to twenty-nine percent of his salary to cover payroll taxes and all other benefits, is shared by the ten banks on the basis of average deposits of each bank related to total average
14
Table of Contents
deposits of all the banks that he serves. Mr. Carter’s total compensation, which is paid through Bank Services of Virginia, Inc. (“Bank Services”), is reflected below in two charts. The first chart reflects Mr. Carter’s total compensation as paid by Bank Services. The second chart reflects only the portion of Mr. Carter’s total compensation that is allocated to Mountain National Bank. During 2005, no other executive officer of the Bank received compensation in excess of $100,000.
Summary Compensation Tables
Bank Services of Virginia, Inc.
| Annual Compensation | ||||||||||
Name and Principal Position | Year | Salary | Other Annual Compensation² | All Other Compensation³ | ||||||
Worth Harris Carter, Jr. | 2005 | $ | 575,000 | — | $ | 80,000 | ||||
Chairman of the Board and President | 2004 | 575,000 | — | 78,000 | ||||||
| 2003 | 530,000 | — | 67,000 | |||||||
| (1) | This table shows the total cash compensation paid to Mr. Carter by Bank Services of Virginia, Inc. during 2005, 2004 and 2003 for his services as Chairman of the Board and President of all ten banks. |
| (2) | The amount of compensation in the form of prerequisites and other personal benefits properly categorized in this column did not exceed the lesser of $50,000 or 10% of Mr. Carter’s annual salary for any of the three years reported. |
| (3) | “All Other Compensation” consists of amounts contributed for Mr. Carter under Bank Services’ qualified profit sharing plan and amounts contributed for Mr. Carter under Bank Services’ non-qualified profit sharing plan for highly paid executives. For 2005, these amounts consisted of $27,000 contributed to the qualified profit sharing plan and $53,000 contributed to the non-qualified profit sharing plan. |
Mountain National Bank
| Annual Compensation | ||||||||
Name and Principal Position | Year | Salary | Other Annual Compensation² | All Other Compensation³ | ||||
Worth Harris Carter, Jr. | 2005 | — | ||||||
Chairman of the Board and President | 2004 | 53,000 | — | 7,000 | ||||
| 2003 | 48,000 | — | 6,000 | |||||
| (1) | This table shows the portion of Mr. Carter’s total cash compensation during 2005, 2004 and 2003 allocated to Mountain National Bank. |
| (2) | The amount of compensation in the form of perquisites and other personal benefits properly categorized in this column did not exceed the lesser of $50,000 or 10% of Mr. Carter’s annual salary for any of the three years reported. |
| (3) | “All Other Compensation” consists of the portion allocated to Mountain National Bank for contributions on Mr. Carter’s behalf to Bank Services’ qualified profit sharing plan and non-qualified profit sharing plan for highly paid executives. For 2005, the portion allocated to Mountain National Bank consisted of $,000 for the qualified profit sharing plan and $,000 for the non-qualified profit sharing plan. |
Profit Sharing Plan
The Bank has adopted an integrated profit sharing plan. The plan covers all full time employees that have been employed for six (6) months and have reached the age of 20- 1/2 as of the first day of the plan year. Persons who have reached the age of 62 are fully vested regardless of length of service. The regular vesting schedule is as follows
Years of Service | Vested Percentage | Forfeitable Percentage | ||
Less than 5 | 0 | 100 | ||
5 or More | 100 | 0 |
Each year the Board of Directors determines what amount, if any, is to be allocated to the plan out of accumulated or current earnings of the Bank. The Bank’s contribution to the plan was $68,000 in 2005, $77,000 in 2004 and $64,000 in 2003.
15
Table of Contents
Chairman of the Board and President Carter does not participate in the profit sharing plan of Mountain National Bank or any of the other nine banks. Instead, Mr. Carter participates in the two profit sharing plans of Bank Services of Virginia, Inc., a qualified profit sharing plan and a nonqualified plan for highly paid executives whose contribution to the qualified plan is limited due to IRS regulations. The Bank’s annual contributions to these plans on Mr. Carter’s behalf are detailed in the two Summary Compensation Tables above.
DIRECTOR COMPENSATION
Each outside Director (not also an officer of the Bank) currently receives $250 for each Board meeting attended.
Item 11 – SECURITY OWNERSHIP OF CERTAIN BENEFICIAL OWNERS AND MANAGEMENT
The following table shows as of March 14, 2006, the beneficial ownership of the Bank’s common stock of each Director, the executive officer identified in the Summary Compensation Table and the Bank’s Directors and executive officers as a group. To the Bank’s knowledge, Director Carter was the Bank’s only shareholder beneficially holding more than 5% of the Bank’s outstanding common stock. As of March 14, 2006, the Bank’s Directors and executive officers as a group, beneficially owned 55,823 shares (or 11%) of the Bank’s outstanding common stock.
Name | Amount and Nature of Beneficial Ownership (1) (2) | Ownership as a Percentage of Common Stock Outstanding | ||||
Carter, Worth Harris, Jr. | 33,331 | (3) | 6.6 | % | ||
Haskins, James W. | 8,484 | (4) | 1.7 | % | ||
Lanny A. Kyle | 4,952 | 1.0 | % | |||
Midkiff, H. Marvin | 3,320 | 0.7 | % | |||
Prillaman, Haller G. | 4,714 | 0.9 | % | |||
Roach, N. Larry | 1,022 | (5) | 0.2 | % | ||
All Directors as a group | 55,823 | 11.0 | % | |||
| (1) | For purposes of this table, beneficial ownership has been determined in accordance with the provisions of Rule 13d-3 of the Securities Exchange Act of 1934 under which, in general, a person is deemed to be the beneficial owner of a security if he has or shares the power to vote or direct the voting of the security or the power to dispose of or direct the disposition of the security, or if he has the right to acquire beneficial ownership of the security within sixty days. |
| (2) | Unless otherwise indicated, the shares listed in the table represent sole voting and investment power. |
| (3) | Includes 6,603 shares held by Mr. Carter as custodian for his children and grandchildren; 181 shares held by Mr. Carter’s son, Ernest Linwood Carter, II, who resides in Mr. Carter’s household; 1,028 shares held by C&C Realty, Inc., of which Mr. Carter is president and a 50% owner; and 920 shares held by Mr. Carter’s brother, Ernest L. Carter. |
| (4) | Includes 138 shares held by Mr. Haskins’ wife. |
| (5) | Includes 5 shares held jointly with Mr. Roach’s wife, 187 shares held jointly with Mr. Roach’s mother and 20 shares held by Mr. Roach’s wife. |
The Bank knows of no arrangements, including any pledge by any person of securities of the Bank, which may at a subsequent date result in a change in control of the Bank.
16
Table of Contents
Item 12 – CERTAIN RELATIONSHIPS AND RELATED TRANSACTIONS
Mr. Carter, Chairman of the Board and President of Mountain National Bank also serves as Chairman of the Board and President of Patrick Henry National Bank, Blue Ridge Bank, N.A., Central National Bank, Community National Bank, First National Bank, First National Exchange Bank, Peoples National Bank, Patriot Bank, N.A., and Shenandoah National Bank.
The Bank maintains correspondent bank accounts with one of these banks. In 2005 and 2004, the average daily balances in these accounts were considered normal operating balances to facilitate general business transactions. The Bank also participates in loan transactions with these banks. These transactions are at carrying value and do not involve more than the normal risk of collectibility or present other unfavorable features.
The Bank owns 10% of the outstanding common stock of The Mortgage Company of Virginia, Inc. The remaining common stock is equally owned by the banks listed above. The Mortgage Company of Virginia owns 100% of Bank Services of Virginia, Inc. The business of both of these companies is to provide operational support services to the ten banks. The Bank is charged for its share of these services. The cost of this expense is shared by the ten banks on the basis of average deposits of each bank related to total average deposits of all the banks.
The Mortgage Company of Virginia, Inc. also owns 100% of Bank Services Insurance, Inc. Bank Services Insurance, Inc. provides insurance products to the banks and customers in the Danville area. The premiums paid to Bank Services Insurance, Inc. equaled $20,000 at December 31, 2005.
The Mortgage Company of Virginia, Inc. also owns 50% of Coresoft, Inc. represented by an initial $1,000 investment during 2004. Coresoft, Inc. is in the process of developing a core software package the banks listed above will use. At December 31, 2005, Coresoft, Inc. had an outstanding note payable to the Mortgage Company of $1,400,000.
The Chairman of the Board and President of the Bank also serves as Chairman of the Board and President of Bank Building Corporation and Manager of Blackstone Properties, LLC, it’s wholly owned subsidiary (the “companies”). The companies lease branches to certain of the banks listed above. At December 31, 2005, the Bank leased three offices from the companies. Rental expense under these leases was $155,000 in 2005, 2004, and 2003. Future minimum lease payments will be $155,000 per year through 2010, and thereafter (may vary based on changing interest rates). As of December 31, 2005 and 2004, the Bank had loans totaling $2,673,000 and $2,735,000, respectively, to the companies. These loans were made to purchase bank branches leased to affiliated banks. The loans are secured by these branches and the related leases, and have repayment terms similar to other loan customers of the Bank.
In the ordinary course of business, the Bank’s Directors and executive officers and their related interests were customers of, and had transactions with the Bank. Loan transactions with Directors and officers, principal security holders and associates were made on substantially the same terms as those prevailing at the time for comparable loans to other persons and did not involve more than normal risk of collectibility or present other unfavorable features. These extensions of credit equaled $324,000, or 2% of the Bank’s equity capital as of December 31, 2005.
17
Table of Contents
Item 13 – EXHIBITS
Exhibits:
3.1 | Articles of Association (filed with the Office of the Comptroller of the Currency prior to the opening of the Bank) | |
3.2 | Amended and Restated Bylaws (as amended and restated through February 15, 2005) (incorporated by reference to Exhibit 3.2 to Form 8-K filed with the Office of the Comptroller of the Currency on February 15, 2005) | |
13 | 2005 Annual Report to Shareholders, as revised | |
31 | Certification by principal executive officer and principal financial officer pursuant to Rule 13a-14(a) | |
32 | Certification of principal executive officer and principal financial officer pursuant to 18 U.S.C. § 1350 | |
Item 14 – PRINCIPAL ACCOUNTANT FEES AND SERVICES
Goodman & Company, LLP served as the Bank’s independent public auditors for the year ended December 31, 2005, and has been selected by the Board to act as the Bank’s independent public auditors for the year ending December 31, 2006. A representative of Goodman & Company will be present at the Annual Meeting and will be given the opportunity to make a statement and respond to appropriate questions from shareholders.
The following table presents the fees for professional audit services rendered by Goodman & Company for the audit of the Bank’s annual financial statements for the years ended December 31, 2005 and 2004, and fees billed for other services rendered by Goodman & Company during those periods.
| Year Ended December 31, | ||||||
| 2005 | 2004 | |||||
Audit fees¹ | $ | 3,800 | $ | 3,550 | ||
Audit-related fees | — | — | ||||
Tax fees² | 3,265 | 3,100 | ||||
All other fees | — | — | ||||
Total Fees | $ | 7,065 | $ | 6,650 | ||
1 Audit fees consist of audit and review services, consents and review of documents filed with the OCC. |
2 Tax fees consist of preparation of federal and state tax returns and consultation concerning tax compliance issues. |
In its capacity as the Audit Committee, the Board of Directors considered the compatibility of the non-audit-related services performed by and fees paid to Goodman & Company in 2005 and 2004 and the proposed non-audit-related services and proposed fees for 2006 and determined that such services and fees are compatible with the independence of Goodman & Company as the Bank’s independent auditors.
Also in its capacity as the Audit Committee, the Board of Directors pre-approves all audit (including audit-related) and permitted non-audit services to be performed by the independent auditors. The Board of Directors annually approves the year-end audit to be performed by the Bank’s independent auditors for the fiscal year. With respect to other permitted services, the Board of Directors pre-approves specific engagements, projects and categories of services on a fiscal year basis.
18
Table of Contents
SIGNATURES
In accordance with Section 13 or 15(d) of the Exchange Act, the registrant has caused this report to be signed on its behalf by the undersigned, thereunto duly authorized.
| MOUNTAIN NATIONAL BANK | ||||
| Date: September 8, 2006 | /s/ Worth Harris Carter, Jr. | |||
| Worth Harris Carter, Jr. | ||||
| Chairman of the Board and President | ||||
In accordance with the Exchange Act, this report has been signed below by the following persons on behalf of the registrant and in the capacities and on the dates indicated.
Signature | Capacity | Date | ||||||
/s/ Worth Harris Carter, Jr. | September 8, 2006 | |||||||
| Worth Harris Carter, Jr. | Chairman of the Board and President (principal executive, principal financial and principal accounting officer) | |||||||
/s/ James W. Haskins | ||||||||
| James W. Haskins | Director | September 8, 2006 | ||||||
| ||||||||
| Dr. Lanny A. Kyle | Director | September 8, 2006 | ||||||
/s/ Dr. H. Marvin Midkiff | ||||||||
| Dr. H. Marvin Midkiff | Director | September 8, 2006 | ||||||
/s/ Haller G. Prillaman | ||||||||
| Haller G. Prillaman | Director | September 8, 2006 | ||||||
/s/ N. Larry Roach | ||||||||
| N. Larry Roach | Director | September 8, 2006 | ||||||
19
Table of Contents
Exhibit 31
CERTIFICATION
I, Worth Harris Carter, Jr., certify that:
| 1. | I have reviewed this annual report on Form 10-KSB/A of Mountain National Bank; |
| 2. | Based on my knowledge, this report does not contain any untrue statement of a material fact or omit to state a material fact necessary to make the statements made, in light of the circumstances under which such statements were made, not misleading with respect to the period covered by this report; and |
| 3. | Based on my knowledge, the financial statements, and other financial information included in this report, fairly present in all material respects the financial condition, results of operations and cash flows of the small business issuer as of, and for, the periods presented in this report. |
Date: September 8, 2006 | /s/ Worth Harris Carter, Jr. | |||
| Worth Harris Carter, Jr. | ||||
| Chairman of the Board and President | ||||
| (principal executive officer and principal financial officer) |
20
Table of Contents
Exhibit 32
CERTIFICATION OF
PRINCIPAL EXECUTIVE OFFICER AND PRINCIPAL FINANCIAL OFFICER
Pursuant to Section 906 of the Sarbanes-Oxley Act of 2002 (18 U.S.C. Section 1350)
The undersigned, as the principal executive officer and principal financial officer of Mountain National Bank, certifies that, to the best of his knowledge and belief, the Annual Report on Form 10-KSB/A for the fiscal year ended December 31, 2005 which accompanies this certification fully complies with the requirements of Section 13(a) or 15(d) of the Securities Exchange Act of 1934 and the information contained in the report fairly presents, in all material respects, the financial condition and results of operations of Mountain National Bank at the dates and for the periods indicated. The foregoing certification is made pursuant to Section 906 of the Sarbanes-Oxley Act of 2002 (18 U.S.C. Section 1350) and shall not be relied upon for any other purpose. The undersigned expressly disclaims any obligation to update the foregoing certification except as required by law.
Date: September 8, 2006 | /s/ Worth Harris Carter, Jr. | |||
| Worth Harris Carter, Jr. | ||||
| Chairman of the Board and President | ||||
| (principal executive officer and principal financial officer) |
21
Table of Contents
Exhibit 13
2005
Annual Report

Table of Contents
Management’s Discussion and Analysis of Financial Condition and Results of Operation
Except for the historical information contained in this report, the matters set forth herein include Forward-Looking Statements within the meaning of the “safe harbor” provisions of the Private Securities Litigation Reform Act of 1995. These Forward-Looking Statements included, among other things, statements of goals, plans intentions and expectations, regarding or based upon desired business strategies, general economic conditions, interest rates, developments in local and national markets, and other matters, which, by their nature, are subject to significant uncertainties. Because of these uncertainties and the assumptions upon which this report is based, actual future developments with respect to the business of the Bank may differ materially from those contemplated by such statements.
Critical Accounting Policies.The accounting and reporting policies of the Bank conform to generally accepted accounting principles in the United States of America (GAAP) and to general practices within the banking industry. The preparation of the financial statements in conformity with GAAP requires management to make estimates and assumptions that affect the amounts reported in the financial statements and accompanying notes. We believe the most significant of these estimates involves the allowance for loan losses because of its potential impact on our overall performance. We have described our policies in this area below. A summary of the Bank’s significant accounting policies can be found in the Notes to the Financial Statements.
In general, determining the amount of the allowance for loan losses requires significant judgment and the use of estimates by management. The Bank maintains an allowance for loan losses to absorb probable losses in the loan portfolio based on a quarterly analysis of the portfolio and expected future losses. This analysis determines an appropriate level of the allowance for loan losses by considering factors affecting loan losses, including specific losses, levels and trends in impaired and non-performing loans, historical loan loss experience, current economic conditions, volume, growth and composition of the portfolio, and other relevant factors. The Bank records a provision for loan losses to maintain the allowance at an adequate level. The provision expense could increase or decrease each quarter based upon the results of management’s formal analysis.
The amount of the allowance represents management’s estimate of expected losses from existing loans based upon specific allocations for individual lending relationships and historical loss experience. The allowance for loan losses related to impaired loans is based on discounted cash flows using the loan’s initial effective interest rate or the fair value of the collateral for certain collateral dependent loans. This evaluation requires management to make estimates of the amounts and timing of future cash flows on impaired loans, which consists primarily of nonaccrual and restructured loans. Actual losses for these loans can vary significantly from these estimates.
Summary of Operations.Net Income for 2005 equaled $1,356,000 or $2.67 per share, compared to $1,597,000 or $3.14 per share, for 2004. this represents a return on average assets of 0.59% and return on average equity of 9% compared to 0.71% and 11% respectively, for last year.
Our total deposits increased $8.2 million, or 4%, during the year. Our core deposits actually decreased by $6.0 million while Certificates of Deposit rose by $14.2 million. This shift in deposits can be attributed to increasing interest rates on Certificates of Deposit. Our LIFETIME FREE CHECKING Accounts increases $1.0 million while Interest Bearing Demand and Passbook Savings Accounts decreased a combined $6.9 million. Loans increased $18.5 million during the year.
Net Interest Income.Net interest income is our largest source of revenue and continues to be impacted by the very low level of interest rates. Since 2000, the Federal Reserve decreased the target rate for federal funds from 6.50% to 1.00%. However, on June 30, 2004, the Fed began a series of one-quarter-percent increases on 14 different occasions over the last year and a half, placing the target federal funds rate at 4.50% at year end. These increases have improved the interest rates we earn on our earning assets in addition to increasing the cost of our interest-bearing deposits.
While we increased loans and investments, the increase in our costs of deposits continued to rise and, as a result, net interest income decreased $89,000 for the year. With interest rates at higher levels, we anticipate our existing loans will increase in yield at a faster pace than the net increase in the costs of deposits. We anticipate a significant improvement in net interest income during the coming year.
The following table shows a summary of the changes in interest income and interest expense resulting from changes in volume and changes in rates (in thousands) for each category of interest-earning assets and interest-bearing liabilities for 2005/2004 and 2004/2003:
Asset/Liability | 2005 vs 2004 Increase (Decrease) (Revised) | 2004 vs 2003 Increase (Decrease) | ||||||
Real Estate Loans | $ | (116 | ) | $ | (892 | ) | ||
Installment Loans | 131 | 77 | ||||||
Commercial Loans | 331 | 339 | ||||||
Total Loans | 346 | (476 | ) | |||||
Interest-Bearing Deposits in Other Financial Institutions | 169 | 69 | ||||||
Investment Securities | (338 | ) | (336 | ) | ||||
Federal Funds Sold | 522 | (90 | ) | |||||
Total Earning Assets | 699 | (833 | ) | |||||
Interest-Bearing Transactions Accounts | 5 | (19 | ) | |||||
Savings Accounts (Includes MMDA’s) | (77 | ) | (25 | ) | ||||
Certificates of Deposit $100,000 and Over | 275 | (120 | ) | |||||
Other Certificates of Deposit | 584 | (671 | ) | |||||
Total Deposits | 787 | (835 | ) | |||||
Notes Issued to the U.S. Treasury | 1 | — | ||||||
Total Interest-Bearing Liabilities | 788 | (835 | ) | |||||
Change in Net Interest Income | $ | (89 | ) | $ | 2 | |||
2
Table of Contents
The following table details the average balances and cost and yield data for the earning assets and interest-bearing liabilities:
| 2005 (Revised) | 2004 | 2003 | |||||||||||||||||||||||||
Asset/Liability | Average Balance | Interest | Yield/ Cost | Average Balance | Interest | Yield/ Cost | Average Balance | Interest | Yield/ Cost | ||||||||||||||||||
Real Estate Loans | $ | 86,820 | $ | 4,970 | 5.72 | % | $ | 84,772 | $ | 5,086 | 6.00 | % | $ | 82,314 | $ | 5,978 | 7.26 | % | |||||||||
Installment Loans | 9,234 | 819 | 8.87 | % | 8,152 | 688 | 8.44 | % | 7,873 | 611 | 7.76 | % | |||||||||||||||
Commercial Loans | 21,332 | 964 | 4.52 | % | 13,646 | 633 | 4.64 | % | 5,599 | 294 | 5.25 | % | |||||||||||||||
Total Loans | 117,386 | 6,753 | 5.75 | % | 106,570 | 6,407 | 6.01 | % | 95,786 | 6,883 | 7.19 | % | |||||||||||||||
Interest-Bearing Deposits in Other Financial Institutions | 14,893 | 559 | 3.75 | % | 17,064 | 390 | 2.29 | % | 13,482 | 321 | 2.38 | % | |||||||||||||||
Investment Securities | 52,277 | 1,953 | 3.74 | % | 59,118 | 2,291 | 3.88 | % | 52,900 | 2,627 | 4.97 | % | |||||||||||||||
Federal Funds Sold | 31,084 | 950 | 3.06 | % | 32,537 | 428 | 1.32 | % | 48,396 | 518 | 1.07 | % | |||||||||||||||
Total Earning Assets | $ | 215,640 | $ | 10,215 | 4.74 | % | $ | 215,289 | $ | 9,516 | 4.42 | % | $ | 210,564 | $ | 10,349 | 4.91 | % | |||||||||
Interest-Bearing Transaction Accounts | $ | 19,388 | $ | 176 | 0.91 | % | $ | 18,239 | $ | 171 | 0.94 | % | $ | 17,239 | $ | 190 | 1.10 | % | |||||||||
Savings Accounts (Includes MMDA’s) | 34,038 | 565 | 1.66 | % | 39,949 | 642 | 1.61 | % | 36,106 | 667 | 1.85 | % | |||||||||||||||
Certificates of Deposit $100,000 and Over | 25,901 | 897 | 3.46 | % | 22,411 | 622 | 2.78 | % | 22,877 | 742 | 3.24 | % | |||||||||||||||
Other Certificates of Deposit | 107,076 | 3,476 | 3.25 | % | 103,079 | 2,892 | 2.81 | % | 106,334 | 3,563 | 3.35 | % | |||||||||||||||
Total Deposits | 186,403 | 5,114 | 2.74 | % | 183,678 | 4,327 | 2.36 | % | 182,556 | 5,162 | 2.83 | % | |||||||||||||||
Notes issued to the U. S. Treasury | 65 | 2 | 3.08 | % | 110 | 1 | 0.91 | % | 88 | 1 | 1.14 | % | |||||||||||||||
Total Interest-Bearing Liabilities | $ | 186,468 | $ | 5,116 | 2.74 | % | $ | 183,788 | $ | 4,328 | 2.35 | % | $ | 182,644 | $ | 5,163 | 2.83 | % | |||||||||
Net Interest Income | $ | 5,099 | $ | 5,188 | $ | 5,186 | |||||||||||||||||||||
Net Yield on Average Earning Assets | 2.36 | % | 2.41 | % | 2.46 | % | |||||||||||||||||||||
Loans. Loans increased from $109 million at year-end 2004 to $128 million at year-end 2005. The composition of the portfolio remained consistent with prior years as real estate secured loans made up 77% of net loans in 2004 compared to 74% in 2005. This is indicative of the overall lending philosophy of the Bank.
The Bank also continues to maintain flexibility in the maturity of the loan portfolio. Over 50% of the loans have adjustable interest rates as of year-end 2005 and 2004. In addition, the combination of adjustable-rate and fixed rate loans that adjust or mature within one year equals 27% of the total portfolio in 2005 and 64% in 2004.
Allowance and Provision for Loan Losses. As discussed previously, the Allowance for Loan Losses represents management’s estimation of the amount necessary to absorb future losses in the loan portfolio. On the Statement of Condition, the Allowance for Loan Losses is deducted from Total Loans so that the net amount shown represents the estimated realizable total loans. The Provision for Loan Losses is the amount charged to expense to maintain the Allowance at an adequate level.
Based on management’s analysis of the loan portfolio, including non-accrual and impaired loans, the Provision for Loan Losses remained consistent at $72,000 in 2004 and 2005.
| December 31 | ||||||||||||||||||||
(Dollars in Thousands) | 2005 | 2004 | 2003 | 2002 | 2001 | |||||||||||||||
Balance Beginning of Year | $ | 1,659 | $ | 1,639 | $ | 873 | $ | 802 | $ | 848 | ||||||||||
Provision for Loan Losses | 72 | 72 | 860 | 72 | 72 | |||||||||||||||
Net Loan Losses | ||||||||||||||||||||
Real Estate Loans | 13 | 24 | 77 | — | 96 | |||||||||||||||
Installment Loans | 29 | 28 | 16 | 1 | 22 | |||||||||||||||
Commercial Loans | 8 | — | 1 | — | — | |||||||||||||||
Total Net Loan Losses | 50 | 52 | 94 | 1 | 118 | |||||||||||||||
Balance | $ | 1,681 | $ | 1,659 | $ | 1,639 | $ | 873 | $ | 802 | ||||||||||
Net Loan Losses to Average Loans | 0.04 | % | 0.05 | % | 0.10 | % | 0.00 | % | 0.78 | % | ||||||||||
Allowance for Loan Losses to Year-End Loans | 1.32 | % | 1.52 | % | 1.61 | % | 0.91 | % | 0.12 | % | ||||||||||
Nonaccrual loans are those loans contractually past due 90 days or more on which no interest is being accrued. Other real estate owned consists of real estate acquired through foreclosure. These properties are reviewed quarterly and reduced to an estimated realizable value at that time.
3
Table of Contents
Information concerning nonaccrual loans and other real estate owned is presented in the following table:
(Dollars in Thousands) | December 31 | |||||||||||||||||||
| 2005 (Revised) | 2004 | 2003 | 2002 | 2001 | ||||||||||||||||
Nonaccrual Loans | ||||||||||||||||||||
Real Estate | $ | 3,105 | $ | 1,975 | $ | 1,975 | $ | — | $ | — | ||||||||||
Installment | — | 18 | 5 | 7 | 4 | |||||||||||||||
Total Nonaccrual Loans | 3,105 | 1,993 | 1,980 | 7 | 4 | |||||||||||||||
Real Estate Owned Other Than Bank Premises | 1,655 | 2,131 | 459 | 471 | — | |||||||||||||||
Total Nonperforming Assets | $ | 4,760 | $ | 4,124 | $ | 2,439 | $ | 478 | $ | 4 | ||||||||||
Allowance for Loan Losses to Non-performing Assets | 0.35 | % | 0.40 | % | 0.67 | % | 183 | % | 2005 | % | ||||||||||
The following table presents the volume of loans contractually past due for 90 days or more on which interest continues to be accrued. These loans are believed to be well collateralized and present little or no likelihood of loss of principal.
| (Dollars in Thousands) | |||||||||||||||
Loans 90 Days or More Past Due | 2005 | 2004 | 2003 | 2002 | 2001 | ||||||||||
Real Estate | $ | — | $ | 118 | $ | 2,017 | $ | — | $ | 1,064 | |||||
Installment | — | — | — | — | — | ||||||||||
Total Loans 90 Days or More Past Due | $ | — | $ | 118 | $ | 2,017 | $ | — | $ | 1,064 | |||||
Non-Interest Income and Expense.Non-interest Income equaled $593,000 for 2005 compared to $754,000 for 2004, a decrease of $161,000, or 21%. The principal component of non-interest income is service charges on deposit accounts, which equaled $430,000 for 2005 compared to $526,000 for 2004. Non-interest expenses increased $224,000 during the year. Salaries and employee benefits, which is the largest of these expenses, increased $40,000 during the year.
Investments.The total investment securities increased from $42 million at year-end 2004 to $57 million at year-end 2005. With interest rates at levels never before seen in recent times, the Bank increased investments in U. S. Agency Securities, where higher yields were available, and reduced interest-bearing deposits in other financial institutions.
Deposits.Total deposits increased $8.2 million, or 4%, during the year. In addition, there has been a significant shift in the composition of our deposits as customers have moved their funds from shorter-term accounts into Certificate of Deposits. LIFETIME FREE CHECKING and time deposits increased while all other deposit categories decreased.
Interest Sensitivity Analysis.The frequency with which interest rates on earning assets and interest bearing liabilities change has a significant impact on net interest income. The following table presents the anticipated changes based on the contractual maturity of each instrument. Expected maturities may differ from contractual maturities as both borrowers and depositors may have the right to call or prepay obligations with or without call or prepayment penalties.
(Dollars in Thousands) (Revised) Use of Funds | Within One Year | One to Five Years | Over Five Years | Total | ||||||||||
Interest-Bearing Deposits in Other Financial Institutions | $ | 14,446 | $ | 1,287 | $ | — | $ | 15,733 | ||||||
Federal Funds Sold | 19,000 | — | — | 19,000 | ||||||||||
Investment Securities | 18,271 | 38,506 | — | 56,777 | ||||||||||
Loans | 34,778 | 41,886 | 51,480 | 128,144 | ||||||||||
Total Earning Assets | $ | 86,495 | $ | 81,679 | $ | 51,480 | $ | 219,654 | ||||||
Deposits | ||||||||||||||
Interest-Bearing Demand | $ | 27,200 | $ | — | $ | — | $ | 27,200 | ||||||
Regular Passbook Savings | 25,787 | — | — | 25,787 | ||||||||||
Time Deposits | ||||||||||||||
Certificates of Deposit $100,000 and Over | 16,653 | 12,434 | — | 29,087 | ||||||||||
Other | 62,328 | 48,163 | — | 110,491 | ||||||||||
Total Interest-Bearing Deposits | 131,968 | 60,597 | — | 192,565 | ||||||||||
Notes issued to the U. S. Treasury | 58 | — | — | 58 | ||||||||||
Total Interest-Bearing Liabilities | $ | 132,026 | $ | 60,597 | $ | — | $ | 192,623 | ||||||
Maturity/Rate Sensitivity Gap Per Period | $ | (45,531 | ) | $ | 21,082 | $ | 51,480 | $ | 27,031 | |||||
Cumulative Maturity/Rate Sensitivity Gap | (45,531 | ) | (24,449 | ) | 27,031 | |||||||||
4
Table of Contents
Capital.The federal regulatory agencies use risk-based capital ratios to analyze the adequacy of a bank’s capital. These ratios weigh bank assets from 0% to 100% depending upon the risks inherent in each type of asset. The Bank continues to meet all requirements for a well-capitalized bank as defined by the regulatory agencies.
| 2005 (Revised) | 2004 | |||||
Tier 1 Ratio | 12.00 | % | 12.76 | % | ||
Total Risk-Based Capital Ratio | 13.25 | % | 14.01 | % | ||
Leverage Ratio | 6.80 | % | 6.75 | % |
Liquidity. Liquidity is our ability to fund both loans and investments in the normal course of business and to provide adequate protection for unexpected deposit withdrawals or other demands for funds without incurring a significant negative impact on profitability. Our primary source of day-to-day liquidity lies in the combination of cash, deposit balances, checks in the process of collection, deposit growth and federal funds sold. Federal funds are excess funds that are sold to other banks, generally on a one-day basis. Normal funds from the repayment of loans and investments augment these funds.
Our secondary source of liquidity lies in our investments and deposits in other financial institutions. While our investments are categorized as held-to-maturity, they consist of short-term U. S. Government Agencies that are readily marketable. As reflected in the previous Interest Sensitivity Analysis, the majority of our investment securities mature in five years or less. Interest-bearing deposits in other financial institutions generally mature in two years or less and the volume of this investment decreased $3.8 million during the year.
Management’s Responsibility for Financial Reporting
The management of Mountain National Bank has prepared and is responsible for the accompanying financial statements, together with the financial data and other information presented in this annual report. Management believes that the financial statements have been prepared in conformity with accounting principles generally accepted in the United States of America appropriate under the circumstances and include amounts that are based on management’s best estimates and judgments.
Management maintains and depends upon an internal accounting control system designed to provide reasonable assurance that transactions are executed in accordance with management’s authorization, that financial records are reliable as the basis for preparation of all financial statements, and that the Bank’s assets are safeguarded. The design and implementation of all systems of internal control are based on judgments required to evaluate the costs of control in relation to the expected benefits and to determine the appropriate balance between these costs and benefits. The Bank maintains a professional internal audit staff to monitor compliance with the system of internal control. Operational and special audits are conducted, and audit reports are submitted to appropriate management.
The Board of Directors functions as the audit committee and meets periodically with the independent public accountants, Goodman & Company, management and internal auditors to review accounting, auditing and internal reporting matters. The independent public accountants and internal auditors have free access to the Board to discuss the results of their audit work and their evaluations of internal controls and the quality of financial reporting.
The responsibility of Goodman & Company is limited to an expression of their opinion as to the fairness of the financial statements. Their opinion is based on an audit conducted in accordance with Standards of the Public Company Accounting Oversight Board (United States), as described in their report.
| Worth Harris Carter, Jr. |
Chairman of the Board, President and Chief Financial Officer |
5
Table of Contents

Certified Public Accountants
Specialized Services
Business Solutions
Report of Independent Registered Public Accounting Firm
Board of Directors and Shareholders
Mountain National Bank
We have audited the accompanying statements of financial condition ofMountain National Bank (Bank) as of December 31, 2005 and 2004, and the related statements of income, shareholders’ equity and cash flows for each of the years in the three-year period ended December 31, 2005. These financial statements are the responsibility of the Bank’s management. Our responsibility is to express an opinion on these financial statements based on our audits.
We conducted our audits in accordance with the standards of the Public Company Accounting Oversight Board (United States). Those standards require that we plan and perform the audits to obtain reasonable assurance about whether the financial statements are free of material misstatement. An audit includes examining, on a test basis, evidence supporting the amounts and disclosures in the financial statements. An audit also includes assessing the accounting principles used and significant estimates made by management, as well as evaluating the overall financial statement presentation. We believe that our audits provide a reasonable basis for our opinion.
In our opinion, the financial statements referred to above present fairly, in all material respects, the financial position ofMountain National Bank as of December 31, 2005 and 2004, and the results of its operations and its cash flows for each of the years in the three-year period ended December 31, 2005, in conformity with accounting principles generally accepted in the United States of America.
As further discussed in Note 21 to the financial statements, the statements of financial condition as of December 31, 2005, and the related statements of operations, shareholders’ equity and cash flows for the year ended December 31, 2005, have been revised.
 |
| Danville, Virginia |
| March 1, 2006 |
110 Exchange Street, Suite G
Danville, VA 24541
ph: 434.792.5334
fax: 434.791.6061
www.goodmanco.com
6
Table of Contents
Statements of Financial Condition
(Dollars in Thousands)
| December 31 | ||||||||
| 2005 (Revised) | 2004 | |||||||
ASSETS: | ||||||||
Interest-Bearing Deposits in Other Financial Institutions | $ | 15,733 | $ | 19,497 | ||||
Investment Securities (Fair Value $56,049 in 2005, $42,065 in 2004) | 56,777 | 42,109 | ||||||
Federal Funds Sold | 19,000 | 41,380 | ||||||
Loans (Net of Unearned Income) | 127,726 | 109,282 | ||||||
Less: Allowance for Loan Losses | (1,681 | ) | (1,659 | ) | ||||
Net Loans | 126,045 | 107,623 | ||||||
Earning Assets | 217,555 | 210,609 | ||||||
Cash and Due from Banks | 7,547 | 5,654 | ||||||
Bank Premises and Equipment | 2,458 | 2,556 | ||||||
Real Estate Owned Other Than Bank Premises | 1,655 | 2,131 | ||||||
Investment in Associated Company | 769 | 618 | ||||||
Other Assets | 2,309 | 1,989 | ||||||
TOTAL ASSETS | $ | 232,293 | $ | 223,557 | ||||
LIABILITIES: | ||||||||
Deposits: | ||||||||
LIFETIME FREE CHECKING | $ | 27,200 | $ | 26,319 | ||||
Interest-Bearing Demand | 23,606 | 29,825 | ||||||
Regular Passbook Savings | 25,787 | 26,451 | ||||||
Time Deposits: | ||||||||
Certificates of Deposit $100,000 and Over | 29,087 | 22,898 | ||||||
Other | 110,491 | 102,431 | ||||||
TOTAL DEPOSITS | 216,171 | 207,924 | ||||||
Notes Issued to the U.S. Treasury | 58 | 54 | ||||||
Other Liabilities | 386 | 343 | ||||||
TOTAL LIABILITIES | 216,615 | 208,321 | ||||||
SHAREHOLDERS’ EQUITY: | ||||||||
Common Stock, Par Value Per Share $5.00; 2,500,000 shares authorized; 507,865 shares outstanding in 2005 and 2004 | 2,539 | 2,539 | ||||||
Surplus | 10,206 | 10,206 | ||||||
Undivided Profits | 2,933 | 2,491 | ||||||
TOTAL SHAREHOLDERS’ EQUITY | 15,678 | 15,236 | ||||||
TOTAL LIABILITIES AND SHAREHOLDERS’ EQUITY | $ | 232,293 | $ | 223,557 | ||||
The accompanying notes are an integral part of these financial statements.
7
Table of Contents
Statements of Income
(Dollars in Thousands Except Per Share Data)
| Years Ended December 31 | |||||||||
| 2005 (Revised) | 2004 | 2003 | |||||||
INTEREST INCOME: | |||||||||
Interest and Fees on Loans: | |||||||||
Taxable | $ | 6,141 | $ | 6,055 | $ | 6,777 | |||
Non-Taxable | 612 | 352 | 106 | ||||||
Interest on Deposits in Other Financial Institutions | 559 | 390 | 321 | ||||||
Interest on Federal Funds Sold | 950 | 428 | 518 | ||||||
Interest and Dividends on Securities | |||||||||
U. S. Agency Securities | 1,938 | 2,215 | 2,522 | ||||||
States and Political Subdivisions | 15 | 76 | 105 | ||||||
TOTAL INTEREST INCOME | 10,215 | 9,516 | 10,349 | ||||||
INTEREST EXPENSE: | |||||||||
Interest on Time Deposits $100,000 and Over | 897 | 622 | 742 | ||||||
Interest on Other Deposits | 4,217 | 3,705 | 4,420 | ||||||
Interest on Notes to the U. S. Treasury | 2 | 1 | 1 | ||||||
TOTAL INTEREST EXPENSE | 5,116 | 4,328 | 5,163 | ||||||
NET INTEREST INCOME | 5,099 | 5,188 | 5,186 | ||||||
Provision for Loan Losses | 72 | 72 | 860 | ||||||
NET INTEREST INCOME AFTER PROVISION FOR LOAN LOSSES | 5,027 | 5,116 | 4,326 | ||||||
NON-INTEREST INCOME: | |||||||||
Service Charges, Commission and Fees | 430 | 526 | 503 | ||||||
Other Non-Interest Income | 163 | 228 | 167 | ||||||
TOTAL NON-INTEREST INCOME | 593 | 754 | 670 | ||||||
NON-INTEREST EXPENSE: | |||||||||
Salaries and Employee Benefits | 1,928 | 1,888 | 1,673 | ||||||
Occupancy Expense | 490 | 432 | 374 | ||||||
Operations Center Expense | 1,007 | 908 | 880 | ||||||
Other Non-Interest Expense | 452 | 425 | 417 | ||||||
TOTAL NON-INTEREST EXPENSE | 3,877 | 3,653 | 3,344 | ||||||
INCOME BEFORE INCOME TAXES | 1,743 | 2,217 | 1,652 | ||||||
Income Tax Expense | 387 | 620 | 501 | ||||||
NET INCOME | $ | 1,356 | $ | 1,597 | $ | 1,151 | |||
NET INCOME PER SHARE: | |||||||||
Basic and Diluted | $ | 2.67 | $ | 3.14 | $ | 2.27 | |||
The accompanying notes are an integral part of these financial statements.
8
Table of Contents
Statements of Cash Flows
(Dollars in Thousands)
| Years Ended December 31 | ||||||||||||
| 2005 (Revised) | 2004 | 2003 | ||||||||||
Cash Flows From Operating Activities: | ||||||||||||
Net Income | $ | 1,356 | $ | 1,597 | $ | 1,151 | ||||||
Adjustments to reconcile to net cash from operating activities: | ||||||||||||
Provision for Loan Losses | 72 | 72 | 860 | |||||||||
Depreciation of Premises and Equipment | 161 | 125 | 80 | |||||||||
Equity in Undistributed Income from Associated Company | (1 | ) | (11 | ) | (10 | ) | ||||||
Provision for Deferred Income Taxes | (20 | ) | 70 | (253 | ) | |||||||
(Decrease) in Unearned Income | (12 | ) | (39 | ) | (29 | ) | ||||||
(Increase) Decrease in Other Assets | (320 | ) | 222 | 156 | ||||||||
Increase (Decrease) in Other Liabilities | 63 | 8 | (85 | ) | ||||||||
Net Cash from Operating Activities | 1,299 | 2,044 | 1,870 | |||||||||
Cash Flows From Investing Activities: | ||||||||||||
Maturity of Interest-Bearing Deposits | 14,854 | 14,055 | 11,581 | |||||||||
Purchase of Interest-Bearing Deposits | (11,090 | ) | (19,596 | ) | (13,956 | ) | ||||||
Purchase of Investment Securities | (22,891 | ) | (20,000 | ) | (27,000 | ) | ||||||
Proceeds from maturities, calls, and redemptions of Investment Securities | 8,223 | 43,250 | 23,856 | |||||||||
Purchase of Bank Premises and Equipment | (63 | ) | (468 | ) | (860 | ) | ||||||
Net Increase in Short-Term Loans Outstanding, Net | (6,588 | ) | (10,225 | ) | (5,176 | ) | ||||||
Longer-Term Loans Originated or Purchased | (21,278 | ) | (17,096 | ) | (25,121 | ) | ||||||
Principal Collected on Longer-Term Loans | 9,384 | 18,354 | 24,290 | |||||||||
Sale of Other Real Estate | 476 | — | 12 | |||||||||
Investment in Associated Company | (150 | ) | — | (199 | ) | |||||||
Net Cash from Investing Activities | (29,123 | ) | 8,274 | (12,573 | ) | |||||||
Cash Flows From Financing Activities: | ||||||||||||
Net Increase in Demand and Savings Accounts | (6,002 | ) | 2,234 | 12,876 | ||||||||
Proceeds from Sale of Time Deposits | 90,182 | 85,179 | 99,642 | |||||||||
Payments on Matured Time Deposits | (75,933 | ) | (88,202 | ) | (101,032 | ) | ||||||
Cash Dividends | (914 | ) | (914 | ) | (915 | ) | ||||||
Net Increase (Decrease) in Notes Issued to U.S. Treasury | 4 | 9 | (230 | ) | ||||||||
Net Cash from Financing Activities | 7,337 | (1,694 | ) | 10,341 | ||||||||
Net Change in Cash and Equivalents | (20,487 | ) | 8,624 | (362 | ) | |||||||
Cash and Equivalents at Beginning of Year | 47,034 | 38,410 | 38,772 | |||||||||
Cash and Equivalents at End of Year | $ | 26,547 | $ | 47,034 | $ | 38,410 | ||||||
Supplementary Data: | ||||||||||||
Cash Paid for Interest | $ | 5,046 | $ | 4,349 | $ | 5,233 | ||||||
Cash Paid for Income Taxes | 387 | 620 | 501 | |||||||||
Transfer of Loans to Foreclosed Assets | 203 | 1,538 | — | |||||||||
The accompanying notes are an integral part of these financial statements.
9
Table of Contents
Statements of Changes in Shareholders’ Equity
(Dollars in Thousands)
| COMMON STOCK | UNDIVIDED PROFITS | |||||||||||
| SHARES | AMOUNT | SURPLUS | ||||||||||
Year Ended December 31, 2003 | ||||||||||||
Balance at Beginning of Year | 507,865 | $ | 2,539 | $ | 10,206 | $ | 1,572 | |||||
Net Income | — | — | — | 1,151 | ||||||||
Cash Dividends, $1.80 per share | — | — | — | (915 | ) | |||||||
Total | 507,865 | $ | 2,539 | $ | 10,206 | $ | 1,808 | |||||
Year Ended December 31, 2004 | ||||||||||||
Balance at Beginning of Year | 507,865 | $ | 2,539 | $ | 10,206 | $ | 1,808 | |||||
Net Income | — | — | — | 1,597 | ||||||||
Cash Dividends, $1.80 per share | — | — | — | (914 | ) | |||||||
Total | 507,865 | $ | 2,539 | $ | 10,206 | $ | 2,491 | |||||
Year Ended December 31, 2005 (Revised) | ||||||||||||
Balance at Beginning of Year | 507,865 | $ | 2,539 | $ | 10,206 | $ | 2,491 | |||||
Net Income | — | — | — | 1,356 | ||||||||
Cash Dividends, $1.80 per share | — | — | — | (914 | ) | |||||||
Total | 507,865 | $ | 2,539 | $ | 10,206 | $ | 2,933 | |||||
The accompanying notes are an integral part of these financial statements.
10
Table of Contents
Notes to Financial Statements
(Dollars in Thousands Except Per Share Data)
1. SUMMARY OF SIGNIFICANT ACCOUNTING POLICIES
The accounting and reporting policies of Mountain National Bank are in accordance with accounting principles generally accepted in the United States of America, and general practices within the banking industry that are consistent with reports filed with regulatory agencies.
NATURE OF OPERATIONS
The Bank generates commercial (including agricultural), mortgage and consumer loans and receives deposits from customers located primarily in Carroll and Grayson Counties and the City of Galax in Virginia and Iredell, Surry, Yadkin and Wilkes Counties in North Carolina. The Bank operates under a national charter and provides full banking services. As a national bank, the Bank is subject to regulation by the Comptroller of the Currency, Federal Deposit Insurance Corporation, and the Board of Governors of the Federal Reserve System.
USE OF ESTIMATES
The preparation of financial statements in conformity with accounting principles generally accepted in the United States of America requires management to make estimates and assumptions that affect the reported amounts of assets and liabilities and disclosure of contingent assets and liabilities at the date of the financial statements, and the reported amounts of revenue and expenses during the reporting period. Actual results could differ from those estimates. Material estimates that are particularly susceptible to significant change in the near term relate to the determination of the allowance for loan losses, and fair value of other real estate owned.
CASH AND CASH EQUIVALENTS
For purposes of cash flows, cash and cash equivalents include cash on hand, demand balances due from banks and federal funds transactions. Generally, federal funds are purchased and sold for one-day periods.
SECURITIES
Investment securities are stated at cost, adjusted for amortization of premiums and accretion of discounts, and computed by the interest method. The Bank has the positive intent and ability to hold these securities until maturity. Gains and losses on sales, if any, of securities are based upon the adjusted cost of the specific securities sold.
LOANS
Loans are recorded at the amount of the loan disbursed to borrowers plus the applicable amount, if any, of unearned income and other charges, less payments received. Income earned on loans is recognized by methods which generally result in level rates of return on principal amounts outstanding. The net amount of nonrefundable loan origination fees approximates the direct costs associated with the lending process.
The allowance for loan losses is an estimate of losses inherent in the loan portfolio as determined by management taking into consideration historical loan loss experience, diversification of the loan portfolio, amounts of secured and unsecured loans, banking industry standards and averages, and general economic conditions. Ultimate losses may vary from current estimates. These estimates are reviewed periodically and as adjustments become necessary, they are reported in earnings in the periods in which they become reasonably estimable.
Management determines loan impairment using guidelines established by Statement of Financial Accounting Standards No. 114 (SFAS 114), “Accounting by Creditors for Impairment of a Loan (as amended by SFAS No. 118, Accounting by Creditors for Impairment of a Loan -Income Recognition and Disclosures”). Under this accounting standard, a loan is considered to be impaired when it is probable that the Bank will be unable to collect all principal and interest amounts according to the contractual terms of the loan agreement. A performing loan may be considered impaired . The allowance for loan losses related to loans identified as impaired is primarily based on the excess of the loan’s current outstanding principal balances over the estimated fair value of the related collateral. For a loan that is not collateral-dependent, the allowance is recorded at the amount by which the outstanding principal balance exceeds the current best estimate of the future cash flows on the loan discounted at the loan’s original effective interest rate. Interest on impaired loans is recognized when cash is received.
BANK PREMISES AND EQUIPMENT
Premises and equipment are stated at cost, less accumulated depreciation. Depreciation is charged to operating expenses over the estimated useful life of the assets by the accelerated and straight-line methods. Costs of maintenance or repairs are charged to expense as incurred and improvements are capitalized. Upon retirement or disposal of an asset, the asset and related allowance account are eliminated. Any gain or loss on such transactions is included in current operations. Depreciation has been included under Occupancy Expense in the Statements of Income in the amount of $161,000 in 2005, $125,000 in 2004 and $80,000 in 2003.
OTHER REAL ESTATE OWNED
Real estate properties acquired through or in lieu of loan foreclosure are initially recorded at the lower of the Bank’s carrying amount or fair value less estimated selling cost at the date of foreclosure. Any write-downs based on the asset’s fair value at the date of acquisition are charged to the allowance for loan losses. After foreclosure, these assets are carried at the lower of their new cost basis or fair value less cost to sell. Costs of significant property improvements are capitalized, whereas costs relating to holding property are expensed. Valuations are periodically performed by management, and any write-downs are recorded as a charge to operations, if necessary, to reduce the carrying value of a property to the lower of its carrying value or fair value less cost to sell.
INCOME TAXES
Deferred taxes are provided on a liability method whereby deferred tax assets are recognized for deductible temporary differences and operating loss and tax credit carryforwards and deferred tax liabilities are recognized for taxable temporary differences. Temporary differences are the differences between the reported amounts of assets and liabilities and their tax bases. Deferred tax assets are reduced by a valuation allowance when, in the opinion of management, it is more likely than not that some portion or all of the deferred tax assets will not be realized. Deferred tax assets and liabilities are adjusted for the effects of changes in tax laws and rates on the date of enactment.
RETIREMENT BENEFITS
The Bank has established an Employee Benefit Plan as described in footnote 5. The Bank does not provide any other post-retirement benefits that would be accrued under Statement of Financial Accounting Standards No. 106, “Employers” Accounting for Post Retirement Benefits Other Than Pensions”.
2. INVESTMENT SECURITIES
The carrying value of securities pledged to secure public deposits was $56,777,000 and $41,659,000, respectively, at December 31, 2005 and 2004. The amortized cost and estimated fair value of investment securities as of December 31, 2005 and 2004 were as follows:
December 31, 2005 | Amortized Cost | Gross Unrealized Gains | Gross Unrealized Losses | Estimated Fair Value | ||||||||
U. S. Agency Securities | $ | 56,777 | $ | 14 | $ | 742 | $ | 56,049 | ||||
December 31, 2004 | ||||||||||||
U. S. Agency Securities | $ | 41,659 | $ | 205 | $ | 261 | $ | 41,603 | ||||
Obligations of States and | ||||||||||||
Political Subdivisions | 450 | 12 | — | 462 | ||||||||
Total | $ | 42,109 | $ | 217 | $ | 261 | $ | 42,065 | ||||
The table below shows gross unrealized losses and fair value, aggregated by investment category and length of time that individual securities have been in a continuous unrealized loss position at December 31, 2005 and 2004.
2005 Securities Description | Fair Value | Unrealized Less than 12 Months | Losses More than 12 Months | ||||||
U. S. Agency Securities | $ | 14,381 | $ | 113 | $ | — | |||
U. S. Agency Securities | 32,868 | — | 629 | ||||||
Total | $ | 47,249 | $ | 113 | $ | 629 | |||
2004 | |||||||||
U. S. Agency Securities | $ | 27,743 | $ | 223 | $ | — | |||
U. S. Agency Securities | 4,998 | — | 38 | ||||||
Total | $ | 32,741 | $ | 223 | $ | 38 | |||
The unrealized losses on the Bank’s investments in obligations of U. S. government agencies were caused by interest rate increases. The contractual terms of those investments do not permit the issuer to settle the securities at a price less than the amortized cost of the investment. Because the Bank has the ability and intent to hold those investments until a recovery of fair value, which may be maturity, the Bank does not consider those investments to be other-than-temporarily impaired at December 31, 2005.
The amortized cost and estimated fair value of investments in debt securities at December 31, 2005 and 2004, by contractual maturity, are shown below. Expected maturities will differ from contractual maturities because issuers may have the right to call or prepay obligations with or without call or prepayment penalties.
| December 31, 2005 | December 31, 2004 | |||||||||||
| Amortized Cost | Estimated Fair Value | Amortized Cost | Estimated Fair Value | |||||||||
Due in one year or less | $ | 18,271 | $ | 18,166 | $ | 2,050 | $ | 1,916 | ||||
Due in one year through five years | 38,506 | 37,883 | 40,059 | 40,149 | ||||||||
Due in five years through ten year | — | — | — | — | ||||||||
Due after ten years | — | — | — | — | ||||||||
Total | $ | 56,777 | $ | 56,049 | $ | 42,109 | $ | 42,065 | ||||
There were no sales of securities during 2005, 2004 or 2003.
3. COMPOSITION OF LOANS
| December 31 | ||||||||
| 2005 (Revised) | 2004 | |||||||
Real Estate | $ | 94,509 | $ | 82,704 | ||||
Consumer | 10,533 | 8,792 | ||||||
Commercial, Industrial and Agricultural | 4,278 | 3,540 | ||||||
All Other | 18,824 | 14,676 | ||||||
Gross Loans | 128,144 | 109,712 | ||||||
Less: Unearned Income | (418 | ) | (430 | ) | ||||
Allowance for Loan Losses | (1,681 | ) | (1,659 | ) | ||||
Total Loans, Net | $ | 126,045 | $ | 107,623 | ||||
Maturity Distribution Variable | 2005 (Revised) | 2004 | ||||||
Less Than One Year | $ | 17,352 | $ | 55,414 | ||||
One to Five Years | 33,798 | 729 | ||||||
Over Five Years | 12,259 | 2,828 | ||||||
Subtotal | 63,409 | 58,971 | ||||||
Fixed | ||||||||
Less Than One Year | 17,427 | 14,565 | ||||||
One to Five Years | 8,085 | 18,830 | ||||||
Over Five Years | 39,223 | 17,346 | ||||||
Subtotal | 64,735 | 50,741 | ||||||
Total | $ | 128,144 | $ | 109,712 | ||||
4. ALLOWANCE FOR LOAN LOSSES
In the view of management, the Allowance for Loan Losses is adequate to meet the loss contingency based on experience factors and a review of the loan portfolio.
The Allowance for Loan Losses for the years ending December 31, 2005, 2004 and 2003 are summarized as follows:
| 2005 | 2004 | 2003 | ||||||||||
Balance at beginning of year | $ | 1,659 | $ | 1,639 | $ | 873 | ||||||
Recoveries credited during year | 57 | — | — | |||||||||
Provision for loan losses | 72 | 72 | 860 | |||||||||
Losses charged to allowance | (107 | ) | (52 | ) | (94 | ) | ||||||
Balance at end of year | $ | 1,681 | $ | 1,659 | $ | 1,639 | ||||||
11
Table of Contents
The following is a summary of information pertaining to impaired and non-accrual loans:
| December 31 2005 (Revised) | 2004 | |||||
Impaired loans without a valuation allowance | $ | — | $ | — | ||
Impaired loans with a valuation allowance | 1,975 | 1,975 | ||||
Total Impaired loans | $ | 1,975 | $ | 1,975 | ||
Valuation allowance related to impaired loans | $ | 788 | $ | 788 | ||
Nonaccrual loans (impaired) | $ | 1,975 | $ | 1,975 | ||
Nonaccrual loans (non-impaired) | $ | 1,130 | $ | 18 | ||
Total loans past due ninety days or more and still accruing | $ | — | $ | 118 | ||
Average investment in impaired loans | $ | 1,975 | $ | 1,975 | ||
Interest income recognized on impaired loans | $ | — | $ | 225 | ||
Interest income recognized on a cash basis on impaired loans | $ | — | $ | 177 | ||
5. STOCK OPTIONS AND EMPLOYEE BENEFIT PLANS
There were no stock options or stock option plans in effect for 2003, 2004, or 2005.
Effective January 1, 1997 the Bank adopted an integrated profit sharing plan. Employees participate in the profit sharing plan following completion of six (6) months of service and upon reaching the age of twenty years and six months as of January 1. Vesting includes years of service to the Bank prior to the effective date of the plan. The plan gives 0% vesting to anyone who has less than five (5) years of service except that persons who have reached the age of 62 are fully vested regardless of length of service. Each participant in the plan (who has not reached age 62) becomes 100% vested after five (5) years of service. The contribution to the plan is determined each year by the Board of Directors and thus may fluctuate in amount from year to year. The contribution by the Bank was $68,000 in 2005 $77,000 in 2004 and $64,000 in 2003, and is included in Salaries and Employee Benefits in the Statements of Income.
6. FEDERAL AND STATE INCOME TAXES
Net deferred tax assets consist of the following components as of December 31, 2005 and 2004:
Deferred Tax Assets | 2005 | 2004 | ||||
Allowance for Loan Losses | $ | 504 | $ | 493 | ||
Dividend Exclusion | 13 | 13 | ||||
Other | 20 | — | ||||
Total Deferred Tax Assets | $ | 537 | $ | 506 | ||
Deferred Tax Liabilities | ||||||
Bank Premises | $ | 206 | $ | 195 | ||
Investment in Associated Companies | 16 | 16 | ||||
Total Deferred Tax Liabilities | 222 | 211 | ||||
Net Deferred Taxes | $ | 315 | $ | 295 | ||
The provisions for income taxes charged to operations for the years ended December 31, 2005, 2004, and 2003 consist of the following:
| 2005 (Revised) | 2004 | 2003 | |||||||||
Currently payable - Federal | $ | 407 | $ | 550 | $ | 746 | |||||
Currently payable - North Carolina | — | — | 8 | ||||||||
Deferred | (20 | ) | 70 | (253 | ) | ||||||
Net Provision | $ | 387 | $ | 620 | $ | 501 | |||||
The income tax provision differs from the amount of income tax determined by applying the U. S. federal income tax rate to pretax income for the years ended December 31, 2005, 2004, and 2003 due to the following:
| 2005 (Revised) | 2004 | 2003 | ||||||||||
Tax provision computed by applying federal rates to income before income taxes | $ | 574 | $ | 754 | $ | 562 | ||||||
Tax exempt Interest | (213 | ) | (145 | ) | (72 | ) | ||||||
Other | 26 | 11 | 11 | |||||||||
Net Provision | $ | 387 | $ | 620 | $ | 501 | ||||||
7. RELATED PARTY TRANSACTIONS
The Chairman of the Board of Mountain National Bank also serves as Chairman of the Board of Blue Ridge Bank, N. A., Central National Bank, Community National Bank, First National Bank, First National Exchange Bank, Patrick Henry National Bank, Patriot Bank, N. A., Peoples National Bank, and Shenandoah National Bank.
The Bank maintains correspondent bank accounts with one of these banks. In 2005 and 2004 the average daily balances in these accounts were considered normal operating balances to facilitate general business transactions.
The Bank also participates in loan transactions with these banks. These transactions are at carrying value and do not involve more than the normal risk of collectibility or present other unfavorable features.
The Bank owns ten percent of the outstanding common stock of The Mortgage Company of Virginia, Inc. The remaining common stock is equally owned by the banks listed above. The Mortgage Company of Virginia owns 100% of Bank Services of Virginia, Inc. The business of both of these companies is to provide operational support services to the ten banks. These services consist of mortgage loan servicing, data processing, bookkeeping, check clearing, accounting, investment management, bank couriers, advertising programs, central purchasing and other management services. The Bank is charged for its share of these services, which is recorded as Operation Center Expense in the Statements of Income. The cost of this expense is shared by the ten banks on the basis of average deposits of each bank related to total average deposits of all the banks.
The Mortgage Company of Virginia, Inc. also owns 100% of Bank Services Insurance, Inc. Bank Services Insurance, Inc. provides insurance products to the banks and to customers in the Danville area. The premiums paid to Bank Services Insurance, Inc. equaled $20,000 for 2005.
The Mortgage Company of Virginia, Inc. also owns 50% of Coresoft, Inc. represented by an initial $1,000 investment during 2004. Coresoft, Inc. is in the process of developing a core software package the banks listed above will use. At December 31, 2005, Coresoft, Inc. had an outstanding note payable to the Mortgage Company of $1,400,000.
The Bank records its investment in the common stock of The Mortgage Company of Virginia, Inc. under the equity method of accounting due to the influence the Bank has over the company. The Bank invested an additional $150,000 in 2005 increasing the value of the investment to $769,000 from $618,000 at December 31, 2004. The Bank’s share of earnings of the company equaled $1,000 for 2005, $11,000 for 2004 and $10,000 for 2003 and is shown in the Statements of Income under Other Non-interest Income.
The Chairman of the Board and President of the Bank also serves as Chairman of the Board and President of Bank Building Corporation and Manager of Blackstone Properties, LLC, its wholly owned subsidiary (the “companies”). The companies lease branches to certain of the banks listed above. At December 31, 2005, the Bank leased three offices from the companies. Rental expense and future lease payments under these leases are disclosed in a footnote below. As of December 31, 2005 and 2004, the Bank had loans totaling $2,673,000 and $2,735,000, respectively, to the companies. These loans were made to purchase bank branches leased to affiliated banks. The loans are secured by these branches and the related leases, and have repayment terms similar to other loan customers of the Bank.
In the ordinary course of business, directors, and their related interests were customers of, and had transactions with the Bank. Loan transactions with directors, principal security holders, and associates were made on substantially the same terms as those prevailing at the time for comparable loans to other persons and did not involve more than normal risk of collectiblity or present other unfavorable features. A summary of these transactions is presented below:
| 2005 | 2004 | |||||||
Beginning Balance | $ | 355 | $ | 382 | ||||
New Loans | — | — | ||||||
Repayments | (31 | ) | (27 | ) | ||||
Ending Balance | $ | 324 | $ | 355 | ||||
8. CONTINGENCIES
The Bank did not have any legal matters of financial significance pending at December 31, 2005 or 2004.
9. EARNINGS PER COMMON SHARE
The Bank follows Statement of Financial Accounting Standards (SFAS) No. 128, “Earnings Per Share”. This statement requires the dual presentation of basic and diluted earnings per share. The weighted average number of shares used to compute earnings per share was 507,865.
The Bank issued a 10% stock dividend in 2003 and none in 2004 or 2005. No fractional shares were issued in this stock dividend. Stock dividends and fractional shares were settled based on known prices for recent trades of the stock and other factors deemed relevant at the time.
10. BANK PREMISES AND EQUIPMENT
Premises and equipment are stated at cost less accumulated depreciation as follows:
December 31, 2005 | Cost | Accumulated Depreciation and Amortization | Net Remaining Cost | ||||||
Bank Premises | |||||||||
(Including Land of $632,000) | $ | 2,330 | $ | 579 | $ | 1,751 | |||
Equipment | 1,004 | 297 | 707 | ||||||
Total | $ | 3,334 | $ | 876 | $ | 2,458 | |||
December 31, 2004 | |||||||||
Bank Premises | |||||||||
(Including Land of $244,000) | $ | 2,316 | $ | 528 | $ | 1,788 | |||
Equipment | 956 | 188 | 768 | ||||||
Total | $ | 3,272 | $ | 716 | $ | 2,556 | |||
11. FORECLOSED ASSETS
Expenses applicable to foreclosed assets include the following:
| Years Ending December 31, | |||||||||
| 2005 | 2004 | 2003 | |||||||
Net loss (gain) on sales of real estate | $ | — | $ | — | $ | — | |||
Provision for losses | — | — | — | ||||||
Operating expenses | 26 | 16 | 12 | ||||||
12. CASH AND CASH EQUIVALENTS
Cash and cash equivalents as of December 31, 2005, 2004, and 2003 are detailed below:
| 2005 | 2004 | 2003 | |||||||
Cash and Due From Banks | $ | 7,547 | $ | 5,654 | 5,095 | ||||
Federal Funds Sold | 19,000 | 41,380 | 33,315 | ||||||
Total Cash and Cash Equivalents | $ | 26,547 | $ | 47,034 | $ | 38,410 | |||
12
Table of Contents
13. DEPOSITS
Certificates of Deposit maturing as of December 31: | 2005 | 2004 | ||||
1 Year | $ | 78,984 | $ | 75,520 | ||
2 Years | 20,115 | 14,898 | ||||
3 Years | 10,935 | 12,967 | ||||
4 Years | 8,464 | 9,493 | ||||
5 Years and thereafter | 21,080 | 12,451 | ||||
Total | $ | 139,578 | $ | 125,329 | ||
14. CONCENTRATION OF CREDIT RISK
The majority of all the Bank’s loans, commitments and lines of credit have been granted to customers in the Bank’s market area. The concentrations of credit by loan classification are set forth in a footnote above. The Bank does not extend credit to any individual borrowers in excess of its lending limit of $2,608,000 as of year-end 2005 and $2,534,000 as of year-end 2004.
The largest category of Real Estate Loans consisted of Commercial loans. These loans approximated $27,120,000 at December 31, 2005 and $18,481,000 at December 31, 2004.
15. FAIR VALUE OF FINANCIAL INSTRUMENTS
Statement of Financial Accounting Standards No. 107,” Disclosures about Fair Value of Financial Instruments”, requires the Bank to disclose the estimated fair values of its financial assets and liabilities. The estimated fair values were determined using the following assumptions:
| a. | The carrying value of Cash and Due From Banks, Federal Funds Sold, and Interest-Bearing Deposits in Other Financial Institutions are believed to approximate the fair value of these items. |
| b. | The fair value of actively traded investment securities are determined according to quotes available in the financial press. The fair value of instruments which are not actively traded are determined using values of other instruments with similar characteristics or obtained from outside sources believed to be reliable. |
| c. | The fair value of loans are estimated by discounting the anticipated cash flows using estimated rates for similar loans available in the Bank’s market area. Estimates of maturities are based on both experience and contractual maturities although prepayments are permitted on the loans. |
| d. | The fair value of short-term demand and savings deposits are believed to equal carrying value. The fair value of certificates of deposit are based upon the contractual maturity of the instruments and rates currently offered for similar deposits. |
| e. | The fair value of Notes Payable to the U. S. Treasury are estimated at carrying value. |
| f. | The fair value of Accrued Interest Receivable and Accrued Interest Payable are estimated at carrying value. |
| 2005 (Revised) | 2004 | |||||||||||
Financial Assets: | Carrying Value | Fair Value | Carrying Value | Fair Value | ||||||||
Interest-Bearing Deposits in Other Financial Institutions | $ | 15,733 | $ | 15,733 | $ | 19,497 | $ | 19,497 | ||||
Investment Securities | 56,777 | 56,049 | 42,109 | 42,065 | ||||||||
Federal Funds Sold | 19,000 | 19,000 | 41,380 | 41,380 | ||||||||
Loans (Net of Unearned Income) | 127,726 | 127,328 | 109,282 | 109,132 | ||||||||
Cash and Due From Banks | 7,547 | 7,547 | 5,654 | 5,654 | ||||||||
Accrued Interest Receivable | 1,143 | 1,143 | 877 | 877 | ||||||||
Total | $ | 227,926 | $ | 226,800 | $ | 218,799 | $ | 218,605 | ||||
Financial Liabilities: | ||||||||||||
Deposits | ||||||||||||
LIFETIME FREE CHECKING | $ | 27,200 | $ | 27,200 | $ | 26,319 | $ | 26,319 | ||||
Interest-Bearing Demand | 23,606 | 23,606 | 29,825 | 29,825 | ||||||||
Regular Passbook Savings | 25,787 | 25,787 | 26,451 | 26,451 | ||||||||
Time Deposits: | ||||||||||||
Certificates of Deposit $100,000 and Over | 29,087 | 29,056 | 22,898 | 23,046 | ||||||||
Other | 110,491 | 110,284 | 102,431 | 102,994 | ||||||||
Total Deposits | 216,171 | 215,933 | 207,924 | 208,635 | ||||||||
Notes issued to the U. S. Treasury | 58 | 58 | 54 | 54 | ||||||||
Accrued Interest Payable | 310 | 310 | 242 | 242 | ||||||||
Total | $ | 216,539 | $ | 216,301 | $ | 208,220 | $ | 208,931 | ||||
16. CAPITAL ADEQUACY
The Bank is subject to various regulatory capital requirements. Under the regulatory capital guidelines and the regulatory framework for Prompt Corrective Action (PCA), the Bank must meet specific capital guidelines involving the quantitative measures of the Bank’s assets, liabilities, and certain off-balance-sheet items as calculated under regulatory accounting practices. The Bank’s capital amount and classification are also subject to qualitative judgments by the regulators about components, risk weightings and other factors.
Quantitive measures established by regulation to ensure capital adequacy require the Bank to maintain minimum ratios (set forth in the table below) of total and Tier 1 capital (as defined in the regulations) to resk-weighted assets (as defined) and of Tier 1 capital to average assets (as defined).
| Minimum Ratio For Capital Adequacy Purposes | Minimum Ratio To Be Considered Well Capitalized under PCA Provisions | |||||
Tier 1 Capital to Risk Weighted Assets | 4 | % | 6 | % | ||
Total Capital to Risk Weighted Assets | 8 | % | 10 | % | ||
Tier 1 Capital to Average Assets | 4 | % | 5 | % |
As of December 31, 2005, the most recent notification from the Federal Deposit Insurance Corporation categorized the Bank as well capitalized under the regulatory framework for prompt corrective action. To be categorized as well capitalized, an institution must maintain minimum total risk-based, Tier 1 risk-based and Tier 1 leverage ratios as set forth in the above table. There are no conditions or events since the notification that management believes have changed the Bank’s category. The Bank’s actual capital amounts and ratios as of December 31, 2005 and 2004 are presented in the following table. Management believes, as of December 31, 2005 and 2004, that the Bank meets all capital adequacy requirements to which it is subject.
December 31, 2005 (Revised) | Minimum Capital For Capital Adequacy Purposes | Minimum Capital To Be Considered Well Capitalized Under PCA Provisions | Actual Capital | Actual Ratio | ||||||||
Tier 1 Capital to Risk Weighted Assets | $ | 5,228 | $ | 7,842 | $ | 15,678 | 12.00 | % | ||||
Total Capital to Risk Weighted Assets | 10,456 | 13,070 | 17,312 | 13.25 | % | |||||||
Tier 1 Capital to Average Assets | 5,229 | 6,537 | 15,678 | 6.80 | % | |||||||
December 31, 2004 | ||||||||||||
Tier 1 Capital to Risk Weighted Assets | $ | 4,783 | $ | 7,174 | $ | 15,236 | 12.76 | % | ||||
Total Capital to Risk Weighted Assets | 9,566 | 11,957 | 16,731 | 14.01 | % | |||||||
Tier 1 Capital to Average Assets | 8,029 | 11,286 | 15,236 | 6.75 | % | |||||||
17. QUARTERLY FINANCIAL DATA (Unaudited)
The following summarizes the quarterly results of operations for the years ended December 31, 2005 and 2004:
2005 (Revised) | First Quarter | Second Quarter | Third Quarter | Fourth Quarter | ||||||||
Total Interest Income | $ | 2,368 | $ | 2,501 | $ | 2,646 | $ | 2,700 | ||||
Total Interest Expense | 1,111 | 1,206 | 1,373 | 1,426 | ||||||||
Net Interest Income | 1,257 | 1,295 | 1,273 | 1,294 | ||||||||
Provision For Loan Losses | 18 | 18 | 18 | 18 | ||||||||
Net Interest Income After Provision for Loan Losses | 1,239 | 1,277 | 1,255 | 1,256 | ||||||||
Total Non-Interest Income | 158 | 135 | 155 | 145 | ||||||||
Total Non-Interest Expense | 940 | 953 | 934 | 1,050 | ||||||||
Income Before Income Taxes | 457 | 459 | 476 | 351 | ||||||||
Income Tax Expense | 105 | 98 | 103 | 81 | ||||||||
Net Income | $ | 352 | $ | 361 | $ | 373 | $ | 270 | ||||
Basic and Diluted Net Income Per Share | $ | 0.69 | $ | 0.72 | $ | 0.73 | $ | 0.53 | ||||
2004 | First Quarter | Second Quarter | Third Quarter | Fourth Quarter | ||||||||
Total Interest Income | $ | 2,351 | $ | 2,379 | $ | 2,461 | $ | 2,325 | ||||
Total Interest Expense | 1,108 | 1,072 | 1,068 | 1,080 | ||||||||
Net Interest Income | 1,243 | 1,307 | 1,393 | 1,245 | ||||||||
Provision For Loan Losses | 18 | 18 | 18 | 18 | ||||||||
Net Interest Income After Provision for Loan Losses | 1,225 | 1,289 | 1,375 | 1,227 | ||||||||
Total Non-Interest Income | 167 | 173 | 167 | 247 | ||||||||
Total Non-Interest Expense | 851 | 882 | 912 | 1,008 | ||||||||
| �� | ||||||||||||
Income Before Income Taxes | 541 | 580 | 630 | 466 | ||||||||
Income Tax Expense | 155 | 165 | 175 | 125 | ||||||||
Net Income | $ | 386 | $ | 415 | $ | 455 | $ | 341 | ||||
Basic and Diluted Net Income Per Share | $ | 0.76 | $ | 0.82 | $ | 0.89 | $ | 0.67 | ||||
18. LEASES AND RENT EXPENSE
The Bank leased facilities under non-cancelable operating leases during 2005, 2004 and 2003. As noted above, the Bank leases two offices from Bank Building Corporation and one office from Blackstone, Inc. These leases required the Bank to pay maintenance, insurance and property taxes and do not have renewal options. Rental expense under these leases was $155,000 for 2005, 2004 and 2003. Future rental payments under all operating leases are as follows:
Year Ending December 31, | 2006 | $ | 155 | ||||
| 2007 | 155 | ||||||
| 2008 | 155 | ||||||
| 2009 | 155 | ||||||
| 2010 | 155 | ||||||
| Thereafter | 221 | ||||||
| Total Minimum Lease Payments | $ | 996 | |||||
19. OFF BALANCE SHEET ACTIVITIES AND COMMITMENTS
Commitments to extend credit, which amounted to $170,000 and $4,101,000 at December 31, 2005 and 2004 respectively, represent agreements to lend to customers with fixed expiration
13
Table of Contents
dates or other termination clauses. Since many of the commitments are expected to expire without being funded, the total commitment amounts do not necessarily represent future liquidity requirements. Standby letters of credit are conditional commitments issued by the Bank guaranteeing the performance of a customer to a third party. Those guarantees are primarily issued to support public and private borrowing arrangements. At December 31, 2005 the Bank had no outstanding standby letters of credit and $20,000 outstanding at December 31, 2004.
The Bank is a member of the Federal Reserve System and is required to maintain certain levels of its cash and due from bank balances as reserves based on regulatory requirements. At December 31, 2005 and 2004, this reserve requirement was approximately $1,103,000 and $1,084,000, respectively.
Federal banking regulations place certain restrictions on dividends paid by the Bank. The total amount of dividends which may be paid at any date and is generally limited to the retained earnings of the Bank. In addition, dividends paid by the Bank would be prohibited if the effect thereof would cause the Bank’s capital to be reduced below applicable minimum capital requirements.
20. RECENT ACCOUNTING PRONOUNCEMENTS AND ACCOUNTING CHANGES
In November 2002, the FASB issued FASB Interpretation No. 45, “Guarantor’s Accounting and Disclosure Requirements for Guarantees, including Indirect Guarantees of Indebtedness of Others” (FIN 45). The interpretation elaborates on the disclosures to be made by a guarantor in its financial statements under certain guarantees that it has issued. It also clarifies that a guarantor is required to recognize, at the inception of a guarantee, a liability for the fair value of the obligation undertaken in issuing the guarantee. The interpretation requires disclosure of the nature of the guarantee, the maximum potential amount of future payments that the guarantor could be required to make under the guarantee, and the current amount of the liability, if any, for the guarantor’s obligations under the guarantee. The recognition requirements of the Interpretation were effective beginning January 1, 2003.
The FASB also revised FASB Interpretation 46, “Consolidation of Variable Interest Entities, an interpretation of ARB No. 51” (FIN 46). The interpretation provides a framework for identifying variable interest entities (VIEs), and determining when a company should include the assets, liabilities, noncontrolling interests and results of activities of a VIE in its consolidated financial statements. As revised, FIN 46 is effective beginning in the first quarter of 2004 for all VIEs (other than what is commonly referred to as special purpose entities, VIEs of small business issuers, and VIEs of nonpublic entities). The Bank does not currently utilize VIEs or so called special purpose entities.
In November 2003, the FASB’s Emerging Issues Task Force (EITF) reached consensus on new disclosure requirements related to unrealized losses on investment securities. The new disclosure requirements apply to marketable equity and debt securities accounted for under Financial Accounting Board Statement No 115, “Accounting for Certain Investments in Debt and Equity Securities,” and are required for inclusion in annual reports with fiscal years ended after December 15, 2003.
In November 2003, the FASB issued FASB Staff Position (FSP) 144-1, “Determination of Cost Basis for Foreclosed Assets under FASB Statement No. 15”, “Accounting by Debtors and Creditors for Troubled Debt Restructurings,” and the Measurement of Cumulative Losses Previously Recognized under Paragraph 37 of FASB Statement No. 144, “Accounting for the Impairment or Disposal of Long-Lived Assets.” Under FSP 144-1, the lender is required to measure the foreclosure on a long-lived asset (e.g. real estate) at fair value less cost to sell on the foreclosure date, which establishes a new cost basis such that any loan valuation allowance is not retained. Thereafter, the lender would follow the impairment guidance in Statement No 144, and should not reflect any recovery in value of the property beyond the cost basis established upon foreclosure of the loan. This guidance was effective upon posting of the FSP to the FASB website in November 2003.
In April 2003, the Financial Accounting Standards Board issued Statement No. 149, “Amendment of Statement 133 on Derivative Instruments and Hedging Activities”. This statement amends and clarifies financial accounting and reporting for derivative instruments, including certain derivative instruments embedded in other contracts (collectively referred to as derivatives) and for hedging activities under FASB Statement No. 133,” Accounting for Derivative Instruments and Hedging Activities”.
In May 2003, the Financial Accounting Standards Board issued Statement No. 150, “Accounting for Certain Financial Instruments with Characteristics of both Liabilities and Equity”. This statement establishes standards for how an issuer classifies and measures certain financial instruments with characteristics of both liabilities and equity. It requires that an issuer classify a financial instrument that is within its scope as a liability (or an asset in some circumstances). Many of those instruments were previously classified as equity. This statement is effective for financial instruments entered into or modified after May 31, 2003, and otherwise is effective at the beginning of the first interim period beginning after June 15, 2003.
In December 2004, the FASB issued Statement No. 123 (revised 2004), which is a revision of Statement 123 “Accounting for Stock-Based Compensation”. This Statement establishes standards for the accounting for transactions in which an entity exchanges its equity instruments for good or services. It also addresses transactions in which an entity incurs liabilities in exchange for goods or services that are based on the fair value of the entity’s equity instruments or that may be settled by the issuance of those equity instruments. This Statement focuses primarily on accounting for transactions in which an entity obtains employee services in share based payment transactions. This Statement is effective for public entities as of the beginning of the first interim or annual reporting period that begins after June 15, 2005.
In December 2004, the FASB issued Statement No. 153, “Exchanges of Nonmonetary Assets”, an amendment of APB Opinion No. 29, Accounting for Nonmonetary Transactions”. This Statement eliminates the exception to fair value for exchanges of similar productive assets and replaces it with a general exception for exchange transactions that do not have commercial substance-that is, transactions that are not expected to result in significant changes in the cash flows of the reporting entity. This Statement is effective for nonmonetary asset exchanges occurring in fiscal periods beginning after June 15, 2005.
In May 2005, the FASB issued Statement No. 154, “Accounting Changes and Error Corrections—a replacement of APB Opinion No. 20 and FASB Statement No. 3”. This Statement requires retrospective application to prior periods’ financial statements of changes in accounting principle, unless it is impracticable to determine either the period-specific effects or the cumulative effect of the change. When it is impracticable to determine the period-specific effects of an accounting change on one or more individual prior periods presented, this Statement requires that the new accounting principle be applied to the balances of assets and liabilities as of the beginning of the earliest period for which retrospective application is practicable and that a corresponding adjustment be made to the opening balance of retained earnings. This Statement improves financial reporting because its requirement to report voluntary changes in accounting principles via retrospective application, unless impracticable, enhances the consistency of financial information between periods. This statement is effective for accounting changes and corrections of errors made in fiscal years beginning after December 15, 2005.
During November 2005, the FASB issued FASB Staff Position (FSP) FAS 115-1 and 124-1, “The Meaning of Other-Than-Temporary Impairment and Its Application to Certain Investments.” The guidance in this FSP address the determination of when an investment is considered impaired, whether that impairment is other-than- temporary, and the measurement of an impairment loss. The FSP also includes accounting considerations subsequent to the recognition of an other-than temporary impairment and requires certain disclosures about unrealized losses that have not been recognized as other-than-temporary impairments. The guidance in this FSP is required to be applied to reporting periods beginning after December 15, 2005. Earlier application is permitted.
The FASB has issued FASB Statement No. 155, “Accounting for Certain Hybrid Instruments.” This standard amends the guidance in FASB Statements No. 133, “Accounting for Derivative Instruments and Hedging Activities”, and No. 140, “Accounting for Transfers and Servicing of Financial Assets and Extinguishments of Liabilities.” Statement 155 allows financial instruments that have embedded derivatives to be accounted for as a whole (eliminating the need to bifurcate the derivative from its host) if the holder elects to account for the whole instrument on a fair value basis. Statement 155 is effective for all financial instruments acquired or issued after the beginning of an entity’s first fiscal year that begins after September 15, 2006. Earlier adoption is permitted as of the beginning of an entity’s fiscal year, provided the entity has not yet issued financial statements, including financial statements for any interim period for that fiscal year. Provisions of this Statement may be applied to instruments that an entity holds at the date of adoption on an instrument-by-instrument basis. The financial statement effect of the change in accounting, if any, should be recognized as a cumulative-effect adjustment to beginning retained earnings. Prior periods should not be restated.
Management does not expect these accounting pronouncements to have a material impact on the financial statements.
21. REVISION TO FINANCIAL STATEMENTS.
Subsequent to the issuance of the Bank’s 2005 financial statements, the OCC issued a directive that the Bank’s Call Report be revised and re-filed. The revision dealt with the OCC’s determination that certain loans be reclassified from accruing to non-accrual loan status. As the result of the Bank having to revise its Call Report, the Bank was also required by the OCC to revise its annual financial statements.
The effects of the revision on the Bank’s financial statements, as of and for the year ended December 31, 2005, are as follows:
| As Originally Presented | Changes | As Revised | ||||||||||
Statements of Financial Condition: | ||||||||||||
Loans | $ | 126,098 | $ | (53 | ) | $ | 126,045 | |||||
Other Assets | 2,286 | 23 | 2,309 | |||||||||
Statements of Income: | ||||||||||||
Interest income | 10,261 | (46 | ) | 10,215 | ||||||||
Income taxes | 403 | (16 | ) | 387 | ||||||||
Net income | 1,386 | (30 | ) | 1,356 | ||||||||
Statements of Cash Flows: | ||||||||||||
Net cash from operating activities | 1,352 | (53 | ) | 1,299 | ||||||||
Net cash from investing activities | (29,176 | ) | 53 | (29,123 | ) | |||||||
Statements of Changes in Shareholders Equity: | ||||||||||||
Undivided profits | 2,963 | (30 | ) | 2,933 | ||||||||
14
Table of Contents
Summary of Operations
(Dollars in Thousands Except Per Share Data)
FOR THE YEAR: | 2005 (Revised) 55 | 2004 | 2003 | 2002 | 2001 | ||||||||||||
Total Interest Income | $ | 10,215 | $ | 9,516 | $ | 10,349 | $ | 12,493 | $ | 13,141 | |||||||
Total Interest Expense | 5,116 | 4,328 | 5,163 | 6,388 | 8,383 | ||||||||||||
Net Interest Income | 5,099 | 5,188 | 5,186 | 6,105 | 4,758 | ||||||||||||
Provision for Loan Losses | 72 | 72 | 860 | 72 | 72 | ||||||||||||
Net Interest Income After Provision for Loan Losses | 5,027 | 5,116 | 4,326 | 6,033 | 4,686 | ||||||||||||
Non-Interest Income | 593 | 754 | 670 | 572 | 483 | ||||||||||||
Non-Interest Expense | 3,877 | 3,653 | 3,344 | 3,288 | 2,806 | ||||||||||||
Net Income Before Taxes | 1,743 | 2,217 | 1,652 | 3,317 | 2,363 | ||||||||||||
Applicable Income Taxes: | |||||||||||||||||
Current | 407 | 550 | 746 | 1,084 | 740 | ||||||||||||
Deferred | (20 | ) | 70 | (245 | ) | 2 | 24 | ||||||||||
Net Income | $ | 1,356 | $ | 1,597 | $ | 1,151 | $ | 2,231 | $ | 1,599 | |||||||
Basic and Diluted Net Income Per Share | $ | 2.67 | $ | 3.14 | $ | 2.27 | $ | 4.39 | $ | 3.15 | |||||||
AT YEAR END: | 2005 (Revised) | 2004 | 2003 | 2002 | 2001 | ||||||||||||
Interest-Bearing Deposits in Other Financial Institutions | $ | 15,733 | $ | 19,497 | $ | 13,956 | $ | 11,581 | $ | 10,989 | |||||||
Federal Funds Sold | 19,000 | 41,380 | 33,315 | 32,315 | 19,585 | ||||||||||||
Investment Securities | 56,777 | 42,109 | 65,359 | 62,215 | 67,750 | ||||||||||||
Loans (Net) | 126,045 | 107,623 | 100,361 | 95,185 | 102,219 | ||||||||||||
Deposits | 216,171 | 207,924 | 208,713 | 197,227 | 195,615 | ||||||||||||
Demand | 27,200 | 26,319 | 24,824 | 21,787 | 21,155 | ||||||||||||
Interest-Bearing Demand | 23,606 | 29,825 | 30,320 | 22,746 | 17,427 | ||||||||||||
Savings | 25,787 | 26,451 | 25,217 | 22,952 | 22,263 | ||||||||||||
Time | 139,578 | 125,329 | 128,352 | 129,742 | 134,770 | ||||||||||||
Capital Accounts | 15,678 | 15,236 | 14,553 | 14,317 | 12,982 | ||||||||||||
Total Resources | 232,293 | 223,557 | 223,646 | 212,239 | 209,265 | ||||||||||||
Carrying Value Per Share | 30.87 | 30.00 | 28.66 | 28.19 | 25.56 | ||||||||||||
DAILY AVERAGES FOR THE YEAR: | 2005 | 2004 | 2003 | 2002 | 2001 | ||||||||||||
Interest-Bearing Deposits in Other Financial Institutions | $ | 14,893 | $ | 17,064 | $ | 13,482 | $ | 10,871 | $ | 10,606 | |||||||
Federal Funds Sold | 31,084 | 32,537 | 48,396 | 17,208 | 21,173 | ||||||||||||
Investment Securities | 52,277 | 59,118 | 52,900 | 71,773 | 58,241 | ||||||||||||
Loans | 117,386 | 106,570 | 95,786 | 104,609 | 97,627 | ||||||||||||
Deposits | 458,151 | 450,562 | 442,062 | 199,110 | 183,356 | ||||||||||||
Demand | 27,550 | 27,177 | 24,570 | 21,516 | 18,820 | ||||||||||||
Interest-Bearing Demand | 19,388 | 18,239 | 17,239 | 16,359 | 14,410 | ||||||||||||
Savings (Includes MMDA’s) | 34,038 | 39,949 | 36,106 | 27,210 | 22,482 | ||||||||||||
Time | 132,977 | 125,490 | 129,211 | 134,025 | 127,644 | ||||||||||||
Capital Accounts | 15,385 | 14,839 | 14,521 | 13,629 | 12,563 | ||||||||||||
Total Resources | 228,81 | 224,868 | 220,415 | 214,664 | 196,321 | ||||||||||||
15
Table of Contents
Price Range of Common Stock
| 2005 | 2004 | Dividends Per Share | ||||||||||||||||
| High | Low | High | Low | 2005 | 2004 | |||||||||||||
First Quarter | $ | 45 | $ | 44 | $ | 50 | $ | 45 | $ | 0.45 | $ | 0.45 | ||||||
Second Quarter | 43 | 43 | 50 | 45 | 0.45 | 0.45 | ||||||||||||
Third Quarter | 44 | 44 | 50 | 45 | 0.45 | 0.45 | ||||||||||||
Fourth Quarter | 39 | 38 | 50 | 45 | 0.45 | 0.45 | ||||||||||||
| Officers | ||
| Worth Harris Carter, Jr. | Martha A. Bowers | |
| Chairman of the Board and President | Assistant Cashier | |
| Mary W. Gardner | Donna Eastridge | |
| Vice President and Cashier | Assistant Cashier and Managing Officer -Hillsville | |
| Brenda C. Scott | Theresa Hall | |
| Vice President - Commercial Loans | Assistant Cashier and Managing Officer -Independence | |
| Karon S. Beasley | Hank Testerman | |
| Assistant Vice President and Managing Officer -Jonesville | Assistant Cashier and Managing Officer -Downtown Galax | |
| Danny Beaver | Elaina Wyatt | |
| Assistant Vice President and Managing Officer -East Plaza Drive | Branch Manager - Wilkesboro | |
| J. Larry Boyer | ||
| Assistant Vice President and Managing Officer -East Galax | ||
| Darlene Akers | ||
| Assistant Cashier and Managing Officer -Mount Airy | ||
| Directors | ||
| Worth Harris Carter, Jr. | Dr. H. Marvin Midkiff | |
| Chairman of the Board and President | Retired | |
| James W. Haskins | Haller G. Prillaman | |
| Attorney, | President, | |
| Young, Haskins, Mann, Gregory, & Smith, Ltd. | Prillaman Brothers, Inc. | |
| Dr. Lanny A. Kyle, O.D. | N. Larry. Roach | |
| Optometrist | President, | |
| Larry Roach & Associates. Insurance, Inc. | ||

Mountain National Bank
P.O. Box 165
Galax, Virginia 24333-0165
(276) 238-1502
Table of Contents

Mountain National Bank
P.O. Box 165
Galax, Virginia 24333-0165
(276) 238-1502
Table of Contents
OFFICE OF THE COMPTROLLER OF THE CURRENCY
WASHINGTON, D.C. 20219
FORM 10-QSB
| x | QUARTERLY REPORT UNDER SECTION 13 OR 15(d) OF THE SECURITIES EXCHANGE ACT OF 1934 |
For the quarterly period ended September 30, 2006
OR
| ¨ | TRANSITION REPORT UNDER SECTION 13 OR 15(d) OF THE EXCHANGE ACT |
For the transition period from to
Commission file number: n/a
MOUNTAIN NATIONAL BANK
(Name of small business issuer as specified in its charter)
| National Bank | 54-1801531 | |
(State or other jurisdiction of incorporation or organization) | (I.R.S. Employer Identification No.) |
543 East Stuart Drive Galax , VA | 24333 | |
| (Address of principal executive offices) | (Zip Code) |
(276) 236-7107
Issuer’s telephone number
n/a
(Former name, former address and former fiscal year, if changed since last report)
Check whether the issuer (1) filed all reports required to be filed by Section 13 or 15(d) of the Exchange Act during the past 12 months (or for such shorter period that the registrant was required to file such reports), and (2) has been subject to such filing requirements for the past 90 days. Yes x No ¨
Indicate by check mark whether the registrant is a shell company (as defined in Rule 12b-2 of the Exchange Act). Yes ¨ No x
As of November 13, 2006, there were issued and outstanding 507,865 shares of the issuer’s common stock.
Transitional Small Business Disclosure Format: Yes ¨ No x
1
Table of Contents
INDEX
| PART I—FINANCIAL INFORMATION | 4 | |
ITEM 1—FINANCIAL STATEMENTS | 4 | |
STATEMENTS OF CONDITION | 4 | |
STATEMENTS OF INCOME | 5 | |
STATEMENTS OF CASH FLOWS | 6 | |
STATEMENTS OF CHANGES IN SHAREHOLDERS’ EQUITY | 7 | |
Notes To Unaudited Financial Statements | 7 | |
ITEM 2—MANAGEMENT’S DISCUSSION AND ANALYSIS | 9 | |
ITEM 3—CONTROLS AND PROCEDURES | 13 | |
| PART II —OTHER INFORMATION | 14 | |
ITEM 1—LEGAL PROCEEDINGS. | 14 | |
ITEM 2—UNREGISTERED SALES OF EQUITY SECURITIES AND USE OF PROCEEDS. | 14 | |
ITEM 3—DEFAULTS UPON SENIOR SECURITIES. | 14 | |
ITEM 4—SUBMISSION OF MATTERS TO A VOTE OF SECURITY HOLDERS. | 14 | |
ITEM 5—OTHER INFORMATION | 14 | |
ITEM 6—EXHIBITS | 14 | |
2
Table of Contents
FORWARD–LOOKING STATEMENTS
This report contains statements concerning the Bank’s expectations, plans, objectives, future financial performance and other statements that are not historical facts. These statements may constitute “forward-looking statements” as defined by federal securities laws. In some cases, readers can identify the forward-looking statements by the use of words such as “may,” “will,” “should,” “could,” “expect,” “plan,” “intend,” “anticipate,” “believe,” “estimate,” “predict,” “potential” or “continue” or the negative or other variations of these words, or other comparable words or phrases. These statements may address issues that involve estimates and assumptions made by management, risks and uncertainties, and actual results could differ materially from historical results or those anticipated by such statements. Factors that could have a material adverse effect on the Bank’s operations and future prospects include, but are not limited to, changes in: interest rates; general and local economic conditions; the legislative/regulatory climate; monetary and fiscal policies of the U.S. government, including policies of the U.S. Treasury and the Federal Reserve Board; the quality or composition of loan or investment portfolios; demand for loan products; deposit flows; competition; demand for financial services in our market area and accounting principles, policies and guidelines. These risks and uncertainties should be considered in evaluating the forward-looking statements contained herein, and readers are cautioned not to place undue reliance on such statements, which speak only as of the date of this report.
3
Table of Contents
PART I—FINANCIAL INFORMATION
Item 1—FINANCIAL STATEMENTS
MOUNTAIN NATIONAL BANK
STATEMENTS OF CONDITION
| September 30, 2006 (Unaudited) | December 31, 2005 | |||||||
ASSETS | ||||||||
Interest-Bearing Deposits in Other Financial Institutions | $ | 12,465 | $ | 15,733 | ||||
Investment Securities | ||||||||
U. S. Agency Securities | 55,790 | 56,777 | ||||||
Federal Funds Sold | 22,250 | 19,000 | ||||||
Loans | 139,182 | 128,144 | ||||||
Less: Unearned Income | (422 | ) | (418 | ) | ||||
Allowance for Loan Losses | (1,716 | ) | (1,681 | ) | ||||
Net Loans | 137,044 | 126,045 | ||||||
Earning Assets | 227,549 | 217,555 | ||||||
Cash and Due From Banks | 5,647 | 7,547 | ||||||
Bank Premises and Equipment | 2,372 | 2,458 | ||||||
Real Estate Owned Other Than Bank Premises | 1,608 | 1,655 | ||||||
Investment in Associated Companies | 769 | 769 | ||||||
Other Assets | 2,534 | 2,309 | ||||||
TOTAL ASSETS | $ | 240,479 | $ | 232,293 | ||||
LIABILITIES | ||||||||
Deposits | ||||||||
LIFETIME FREE CHECKING | $ | 28,138 | $ | 27,200 | ||||
Interest-Bearing Demand | 18,871 | 23,606 | ||||||
Regular Passbook Savings | 25,639 | 25,787 | ||||||
Time Deposits | ||||||||
Certificates of Deposit $100,000 or More | 34,179 | 29,087 | ||||||
Other | 116,873 | 110,491 | ||||||
Total Deposits | 223,700 | 216,171 | ||||||
Notes issued to the U. S. Treasury | 127 | 58 | ||||||
Other Liabilities | 443 | 386 | ||||||
TOTAL LIABILITIES | 224,270 | 216,615 | ||||||
SHAREHOLDERS’ EQUITY | ||||||||
Common Stock, Par Value $5.00 Per Share, Authorized 2,500,000 Shares; 507,865 Outstanding in 2006 and 2005 | 2,539 | 2,539 | ||||||
Surplus | 10,206 | 10,206 | ||||||
Undivided Profits | 3,464 | 2,933 | ||||||
TOTAL SHAREHOLDERS’ EQUITY | 16,209 | 15,678 | ||||||
TOTAL LIABILITIES AND SHAREHOLDERS’ EQUITY | $ | 240,479 | $ | 232,293 | ||||
See accompanying notes to unaudited financial statements.
4
Table of Contents
MOUNTAIN NATIONAL BANK
STATEMENTS OF INCOME
(Dollars in Thousands, except per share data)
| Nine Months Ended September 30, | Three Months Ended September 30, | |||||||||||
| 2006 | 2005 | 2006 | 2005 | |||||||||
| (Unaudited) | ||||||||||||
INTEREST INCOME | ||||||||||||
Interest and Fees on Loans | ||||||||||||
Taxable | $ | 5,498 | $ | 4,516 | $ | 1,903 | $ | 1,562 | ||||
Non-Taxable | 603 | 459 | 210 | 160 | ||||||||
Interest on Deposits in Other Financial Institutions | 422 | 412 | 141 | 139 | ||||||||
Interest on Federal Funds Sold | 765 | 682 | 284 | 279 | ||||||||
Interest and Dividends on Securities | ||||||||||||
U. S. Agency Securities | 1,671 | 1,431 | 591 | 497 | ||||||||
Obligations of States and Political Subdivisions | — | 15 | — | 4 | ||||||||
TOTAL INTEREST INCOME | 8,959 | 7,515 | 3,129 | 2,641 | ||||||||
INTEREST EXPENSE | ||||||||||||
Interest on Time Deposits $100,000 or More | 968 | 620 | 340 | 233 | ||||||||
Interest on Other Deposits | 3,896 | 3,069 | 1,421 | 1,139 | ||||||||
Interest on Notes Issued to the U. S. Treasury | 2 | 1 | — | 1 | ||||||||
TOTAL INTEREST EXPENSE | 4,866 | 3,690 | 1,761 | 1,373 | ||||||||
NET INTEREST INCOME | 4,093 | 3,825 | 1,368 | 1,268 | ||||||||
Provision for Loan Losses | 54 | 54 | 18 | 18 | ||||||||
NET INTEREST INCOME AFTER PROVISION FOR LOAN LOSSES | 4,039 | 3,771 | 1,350 | 1,250 | ||||||||
NON-INTEREST INCOME | ||||||||||||
Service Charges, Commissions and Fees | 367 | 332 | 127 | 121 | ||||||||
Other Non-Interest Income | 99 | 116 | 31 | 34 | ||||||||
TOTAL NON-INTEREST INCOME | 466 | 448 | 158 | 155 | ||||||||
NON-INTEREST EXPENSE | ||||||||||||
Salaries and Employee Benefits | 1,408 | 1,421 | 481 | 459 | ||||||||
Occupancy Expense (Net) | 367 | 357 | 123 | 119 | ||||||||
Operations Center Expense | 782 | 726 | 263 | 250 | ||||||||
Other Non-Interest Expense | 416 | 323 | 133 | 106 | ||||||||
TOTAL NON-INTEREST EXPENSE | 2,973 | 2,827 | 1,000 | 934 | ||||||||
INCOME BEFORE INCOME TAXES | 1,532 | 1,392 | 508 | 471 | ||||||||
Income Tax Expense | 315 | 306 | 95 | 101 | ||||||||
NET INCOME | $ | 1,217 | $ | 1,086 | $ | 413 | $ | 370 | ||||
EARNINGS PER COMMON SHARE: | ||||||||||||
Basic and Diluted | $ | 2.40 | $ | 2.14 | $ | 0.81 | $ | 0.73 | ||||
Weighted Average Shares Outstanding | 507,865 | 507,865 | 507,865 | 507,865 | ||||||||
Cash Dividends per Common Share | $ | 1.35 | $ | 1.35 | $ | 0.90 | $ | 0.90 | ||||
See accompanying notes to unaudited financial statements.
5
Table of Contents
MOUNTAIN NATIONAL BANK
STATEMENTS OF CASH FLOWS
(Dollars in Thousands)
| Nine Months Ended September 30, | ||||||||
| 2006 | 2005 | |||||||
| (Unaudited) | ||||||||
Cash Flows From Operating Activities | ||||||||
Net Income | $ | 1,217 | $ | 1,086 | ||||
Adjustments to reconcile net income to net cash provided by operating activities | ||||||||
Provision for Loan Losses | 54 | 54 | ||||||
Depreciation of Bank Premises and Equipment | 125 | 120 | ||||||
Increase (Decrease) in Unearned Income | 4 | (19 | ) | |||||
(Increase) Decrease in Other Assets | (225 | ) | (214 | ) | ||||
(Increase) Decrease in Other Liabilities | 57 | 4 | ||||||
Net Cash From Operating Activities | 1,232 | 1,031 | ||||||
Cash Flows From Investing Activities | ||||||||
Proceeds from Maturity of Interest Bearing Balances | 10,387 | 11,874 | ||||||
Purchase of Interest Bearing Balances | (7,119 | ) | (8,605 | ) | ||||
Payments on Investment Securities | 9,987 | 8,336 | ||||||
Purchase of Investment Securities | (9,000 | ) | (19,000 | ) | ||||
Purchase of Bank Premises and Equipment | (39 | ) | (60 | ) | ||||
Net (Increase) Decrease in Short-Term Loans Outstanding, Net | (5,051 | ) | (4,326 | ) | ||||
Longer-Term Loans Originated or Purchased | (12,094 | ) | (15,711 | ) | ||||
Principal Collected on Longer-Term Loans | 6,088 | 6,305 | ||||||
(Increase) Decrease in Other Real Estate | 47 | 348 | ||||||
Net Cash From Investing Activities | (6,794 | ) | (20,839 | ) | ||||
Cash Flows from Financing Activities | ||||||||
Increase in Demand and Savings Accounts | (3,945 | ) | (3,436 | ) | ||||
Proceeds from Sale of Time Deposits | 61,855 | 67,810 | ||||||
Payments for Matured Time Deposits | (50,381 | ) | (56,524 | ) | ||||
Payment of Cash Dividends | (686 | ) | (686 | ) | ||||
Net Increase (Decrease) in Notes issued to the U. S. Treasury | 69 | 81 | ||||||
Net Cash From Financing Activities | 6,912 | 7,245 | ||||||
Net Decrease in Cash and Cash Equivalents | 1,350 | (12,563 | ) | |||||
Cash and Cash Equivalents at Beginning of Year | 26,547 | 47,034 | ||||||
Cash and Cash Equivalents at End of Period | $ | 27,897 | $ | 34,471 | ||||
Cash and Cash Equivalents Include: | ||||||||
Cash and Due From Banks | $ | 5,647 | $ | 5,271 | ||||
Federal Funds Sold | 22,250 | 29,200 | ||||||
Total Cash and Cash Equivalents at Period End | $ | 27,897 | $ | 34,471 | ||||
Supplementary Data: | ||||||||
Cash Paid for Interest | $ | 4,774 | $ | 3,617 | ||||
Cash Paid for Taxes | 315 | 306 | ||||||
See accompanying notes to unaudited financial statements.
6
Table of Contents
MOUNTAIN NATIONAL BANK
STATEMENTS OF CHANGES IN SHAREHOLDERS’ EQUITY
(Dollars in Thousands)
| Common Stock | ||||||||||||
| Shares | Par Value | Surplus | Undivided Profits | |||||||||
Balances, December 31, 2005 | 507,865 | $ | 2,539 | $ | 10,206 | $ | 2,933 | |||||
Net Income | — | — | — | 1,217 | ||||||||
Cash Dividends | — | — | — | (686 | ) | |||||||
Balances, September 30, 2006 (Unaudited) | 507,865 | $ | 2,539 | $ | 10,206 | $ | 3,464 | |||||
Notes To Unaudited Financial Statements
The unaudited interim financial statements of the Bank are prepared in conformity with accounting principles generally accepted in the United States of America and the instructions to Securities and Exchange Commission’s Form 10-QSB. In the opinion of management, all adjustments (consisting only of normal recurring adjustments) necessary for a fair presentation of the financial position and results of operations for the periods presented have been included. The financial statements should be read in conjunction with the financial statements and notes contained in the Bank’s Annual Report on Form 10-KSB for the year ended December 31, 2005. The results for the nine months ended September 30, 2006 are not necessarily indicative of the results for the entire fiscal year ending December 31, 2006.
Certain reclassifications have been made to the prior year financial statements to conform to the 2006 presentation. These reclassifications had no effect on previously reported net income.
NOTE 1—INVESTMENT SECURITIES
(Dollars in Thousands)
The Bank has the ability and intent to carry the investments noted with an unrealized loss to the final maturity of the instrument and considers these investments not other-than-temporarily impaired.
The following table sets forth a summary of the investment securities portfolio as of the periods indicated:
| Amortized Cost | Gross Unrealized Gains | Gross Unrealized Losses | Estimated Market Value | |||||||||
September 30, 2006 (Unaudited) | ||||||||||||
U. S. Government Agencies | $ | 55,790 | $ | 13 | $ | 583 | $ | 55,220 | ||||
Total Securities | $ | 55,790 | $ | 13 | $ | 583 | $ | 55,220 | ||||
December 31, 2005 | ||||||||||||
U. S. Government Agencies | $ | 56,777 | $ | 14 | $ | 742 | $ | 56,049 | ||||
Total Securities | $ | 56,777 | $ | 14 | $ | 742 | $ | 56,049 | ||||
7
Table of Contents
Note 2—LOANS
(Dollars in Thousands)
The composition of the loan portfolio by dollar amount is shown in the table below:
| September 30, 2006 (Unaudited) | December 31, 2005 | |||||||
Secured by real estate | ||||||||
Construction Loans | $ | 3,240 | $ | 3,012 | ||||
Secured by farmland (including farm residential and other improvements) | 2,400 | 2,464 | ||||||
Secured by 1-4 family residential properties | 27,855 | 23,608 | ||||||
Secured by multi-family residential properties | 6,725 | 5,230 | ||||||
Secured by non-farm residential property | 60,059 | 60,195 | ||||||
Loans to finance agricultural production and other loans to farmers | 391 | 336 | ||||||
Commercial and industrial loans | 4,885 | 3,942 | ||||||
Loans to individuals for household, family and other personal expenditures | 12,201 | 10,533 | ||||||
Obligations (other than securities) of states and political subdivisions | 21,426 | 18,824 | ||||||
Less: Unearned Income | (422 | ) | (418 | ) | ||||
Total loans and leases | $ | 138,760 | $ | 127,726 | ||||
Note 3—ALLOWANCE FOR LOAN LOSSES
(Dollars in Thousands)
The allowance for loan losses is an estimate of losses inherent in the loan portfolio as determined by management taking into consideration historical loan loss experience, diversification of the loan portfolio, amounts of secured and unsecured loans, banking industry standards and averages, and general economic conditions. Ultimate losses may vary from current estimates. These estimates are reviewed periodically and as adjustments become necessary, they are reported in earnings in the periods which they become reasonably estimable.
The following table summarizes the activity in the allowance for loan losses in the periods presented:
| September 30, 2006 (Unaudited) | December 31, 2005 | |||||
Balance Beginning of Period | $ | 1,681 | $ | 659 | ||
Provision for Loan Losses | 54 | 72 | ||||
Charge-Offs, Net Of (Recoveries): | ||||||
Real Estate Loans | 10 | 13 | ||||
Installment Loans | 9 | 29 | ||||
Commercial Loans | — | 8 | ||||
Total Net Loan Losses | 19 | 50 | ||||
Balance End of Period | $ | 1,716 | $ | 1,681 | ||
8
Table of Contents
Note 4—NONPERFORMING ASSETS AND DELINQUENT LOANS
(Dollars in Thousands)
| September 30, 2006 (Unaudited) | December 31, 2005 | |||||
Nonaccrual Loans | ||||||
Real Estate | $ | 1,975 | $ | 3,105 | ||
Installment | — | — | ||||
Commercial | — | — | ||||
Total Nonaccrual Loans | 1,975 | 3,105 | ||||
Foreclosed Properties | 1,608 | 1,655 | ||||
Total Nonperforming Assets | $ | 3,583 | $ | 4,760 | ||
Loans 90 Days or More Past Due and Still Accruing | ||||||
Real Estate | $ | — | $ | — | ||
Installment | — | — | ||||
Commercial | — | — | ||||
Total Loans 90 Days or More Past Due | $ | — | $ | — | ||
Item 2—MANAGEMENT’S DISCUSSION AND ANALYSIS
The Bank
The Bank opened for business as a National Banking Association in 1996 in Galax, Virginia and was created through the spin-off of the assets, liabilities and related capital from offices of Patrick Henry National Bank, Bassett, Virginia. The Bank operates under a national charter and provides full banking services. As a national bank, the Bank is subject to regulation by the Comptroller of the Currency, the Federal Deposit Insurance Corporation and the Board of Governors of the Federal Reserve System. The Bank generates commercial (including agricultural), mortgage and consumer loans and receives deposits from customers located primarily in the areas surrounding the Bank’s offices, which are located in Carroll and Grayson County, and the City of Galax in Virginia and Iredell, Surry, Yadkin and Wilkes counties in North Carolina. At September 30, 2006, the Bank had $240 million in assets, $137 million in net loans, $224 million in deposits and $16 million in total shareholders’ equity.
Proposed Reorganization and Merger
On July 28, 2006, the Bank entered into an Agreement and Plan of Merger (the “Merger Agreement”) with Blue Ridge Bank, N.A., Central National Bank, Community National Bank, First National Bank, First National Exchange Bank, Patrick Henry National Bank, Patriot Bank, National Association, Peoples National Bank, Shenandoah National Bank (together with the Bank, the “Banks”) and Carter Bank & Trust, a new Virginia chartered bank that will be headquartered in Martinsville, Virginia. The Merger Agreement sets forth the terms and conditions pursuant to which the Banks will reorganize by merging into Carter Bank & Trust (the “Merger”).
All officers and employees of the existing Banks will remain unchanged as a result of the Merger. Worth Harris Carter, Jr. is currently Chairman of the Board and President of each of the Banks and will serve as Chairman of the Board and President of Carter Bank & Trust. Under the terms of the Merger Agreement, shareholders of each of the Banks will receive a certain number of shares in Carter Bank & Trust in exchange for each share held in the existing Banks as follows: each share of Blue Ridge Bank: 2.474 shares; each share of Central National Bank: 5.470 shares; each share of Community National Bank: 4.350 shares; each share of First National Bank: 1.613 shares; each share of First National Exchange Bank: 4.509 shares; each share of Mountain National Bank: 3.981 shares; each share of Patrick Henry National Bank: 1.112 shares; each share of Patriot Bank: 5.775 shares; each share of Peoples National Bank: 1.945 shares; and each share of Shenandoah National Bank: 3.461 shares.
9
Table of Contents
Consummation of the Merger is subject to a number of customary conditions including (i) the approval of the Merger by the shareholders of each of the Banks and Carter Bank & Trust and (ii) the receipt of all required regulatory approvals, including approval by the Virginia State Corporation Commission and the Federal Deposit Insurance Corporation. The Merger is expected to be completed in the fourth quarter of 2006 and will be accounted for using the purchase method of accounting.
Critical Accounting Policies
The accounting and reporting policies of the Bank conform to generally accepted accounting principles (GAAP) in the United States of America and to general practices within the banking industry. The preparation of the financial statements in conformity with GAAP requires management to make estimates and assumptions that affect the amounts reported in the financial statements and accompanying notes. We believe the most significant of these estimates involves the allowance for loan losses because of its potential impact on our overall performance. We have described our policies in this area below. A summary of the Bank’s significant accounting policies can be found in the Notes to Financial Statements included in the Bank’s 2005 Annual Report on Form 10-KSB.
In general, determining the amount of the allowance for loan losses requires significant judgment and the use of estimates by management allowing for losses inherent to the loan portfolio. The Bank maintains an allowance for loan losses to absorb probable losses in the loan portfolio based on a quarterly analysis of the portfolio. This analysis determines an appropriate level of the allowance for loan losses by considering factors affecting loan losses, including specific losses, levels and trends in impaired and non-performing loans, historical loan loss experience, current economic conditions, volume, growth and composition of the portfolio, and other relevant factors. The Bank records a provision for loan losses to maintain the allowance at an adequate level. The provision expense could increase or decrease each quarter based upon the results of management’s formal analysis.
The amount of the allowance represents management’s estimate of expected losses from existing loans based upon specific allocations for individual lending relationships and historical loss experience. The allowance for loan losses related to impaired loans is based on discounted cash flows using the loan’s initial effective interest rate or the fair value of the collateral for certain collateral dependent loans. This evaluation requires management to make estimates of the amounts and timing of future cash flows on impaired loans, which consists primarily of non-accrual and restructured loans. Actual losses for these loans can vary significantly from these estimates.
Investment securities are stated at cost, adjusted for amortization of premiums and accretion of discounts, and computed by the interest method. The Bank has positive intent and ability to hold these securities until maturity. Gains and losses on sales, if any, of securities are based upon the adjusted cost of the specific securities sold. If any of the securities are not held to maturity, the classification of the entire portfolio could change to available for sale. This could require fair value accounting for not just the tainted securities but the entire portfolio, and possibly, the recognition of unrealized losses as other than temporary in the income statement.
Real estate properties acquired through or in lieu of loan foreclosure are initially recorded at the lower of the Bank’s carrying amount or fair value less estimated selling cost at the date of foreclosure. Any write-downs based on the asset’s fair value at the date of acquisition are charged to the allowance for loan losses. After foreclosure, these assets are carried at the lower of their new cost basis or fair value less cost to sell. Costs of significant property improvements are capitalized, whereas costs relating to holding property are expensed. The portion of interest costs relating to development of real estate is capitalized. Valuations are periodically performed by management, and any write-downs are recorded as a charge to operations, if necessary, to reduce the carrying value of a property to the lower of its carrying value or fair value less cost to sell. The fair value of other real estate owned, including related selling costs, is an estimate that may change in the near term. If estimates change that decrease the expected fair value of the property, the recognition of this loss is reflected in the income statement for the period the estimate changes.
10
Table of Contents
Overview
Net income for the nine months of 2006 equaled $1,217,000, or $2.40 per share, compared to $1,086,000, or $2.14 per share, for 2005. On an annualized basis, this represents a return on average assets of 0.70% and return on average equity of 10% compared to 0.65% and 9.59%, respectively, for the same period last year.
Total Liabilities at September 30, 2006 were $224,270,000, up from $216,615,000 at December 31, 2005. This was mainly due to the increases in Time Deposits and LIFETIME FREE CHECKING.
Total Shareholders’ Equity at September 30, 2006 was $16,209,000. At December 31, 2005, total Shareholders’ Equity was $15,678,000.
With interest rates increasing, the Bank has reduced its investments in interest-bearing deposits and in U.S. Agency Securities while increasing loans $11 million. These changes in asset allocation have had a positive impact on earnings. As a result, the Bank has experienced an increase of $7.6 million in deposits when compared to December 31, 2005.
Because of these changes, the Bank has experienced an increase of net interest income of $268,000 or 7% when compared with the prior year. Non-interest income and expenses reflected modest increases and, as a result, net income increased $131,000 or 12% over the prior year. As interest rates continue to increase, we expect our net interest margins to widen and our earnings are expected to increase.
Results of Operations
Net Interest Income.Net Interest Income is our largest source of revenue. Net interest income increased $268,000 or 7% when compared with the prior year.
The following table details the average balances and cost and yield data for the earning assets and interest-bearing liabilities:
| For the Nine Months Ended | ||||||||||||||||||||||
| September 30, 2006 | September 30, 2005 | |||||||||||||||||||||
| (Unaudited) | ||||||||||||||||||||||
Asset/Liability | Average Balance | Income/ Expense | Yield/ Cost | Average Balance | Income/ Expense | Yield/ Cost | Increase (Decrease) | |||||||||||||||
Real Estate Loans | $ | 97,976 | $ | 4,418 | 6.01 | % | $ | 88,046 | $ | 3,743 | 5.67 | % | $ | 675 | ||||||||
Installment Loans | 11,777 | 722 | 8.17 | % | 9,606 | 548 | 7.61 | % | 174 | |||||||||||||
Commercial Loans | 26,652 | 961 | 4.81 | % | 22,772 | 684 | 4.00 | % | 277 | |||||||||||||
Total Loans—Net of Unearned Income | 136,405 | 6,101 | 5.96 | % | 120,424 | 4,975 | 5.51 | % | 1,126 | |||||||||||||
Interest-Bearing Deposits in Other Financial Institutions | 11,839 | 422 | 4.75 | % | 16,579 | 412 | 3.31 | % | 10 | |||||||||||||
Investment Securities | 55,447 | 1,671 | 4.02 | % | 52,981 | 1,446 | 3.64 | % | 225 | |||||||||||||
Federal Funds Sold | 21,153 | 765 | 4.82 | % | 32,345 | 682 | 2.81 | % | 83 | |||||||||||||
Total Earning Assets | $ | 224,844 | $ | 8,959 | 5.31 | % | $ | 222,329 | $ | 7,515 | 4.51 | % | $ | 1,444 | ||||||||
Interest-Bearing Transaction Accounts | $ | 16,263 | $ | 122 | 1.00 | % | $ | 19,512 | $ | 131 | 0.90 | % | $ | (9 | ) | |||||||
Savings Deposits (Including MMDAs) | 29,122 | 383 | 1.75 | % | 32,794 | 439 | 1.78 | % | (56 | ) | ||||||||||||
Certificates of Deposit Over $100,000. | 32,414 | 968 | 3.98 | % | 26,146 | 620 | 3.16 | % | 348 | |||||||||||||
Other Certificates of Deposits | 113,628 | 3,391 | 3.98 | % | 112,121 | 2,498 | 2.97 | % | 893 | |||||||||||||
Total Deposits | 191,427 | 4,864 | 3.39 | % | 190,573 | 3,688 | 2.58 | % | 1,176 | |||||||||||||
Notes issued to the U. S. Treasury | 56 | 2 | 4.76 | % | 79 | 2 | 3.38 | % | — | |||||||||||||
Total Interest-Bearing Liabilities | $ | 191,483 | $ | 4,866 | 5.08 | % | $ | 190,652 | $ | 3,690 | 2.58 | % | $ | 1,176 | ||||||||
Net Interest Income | $ | 4,093 | 2.43 | % | $ | 3,825 | 2.29 | % | $ | 268 | ||||||||||||
11
Table of Contents
Allowance and Provision for Loan Losses.The Allowance for Loan Losses represents management’s estimation of the amount necessary to absorb future losses in the loan portfolio. On the Statement of Condition, the Allowance for Loan Losses is deducted from Total Loans so that the net amount shown represents the estimated realizable total loans. The Provision for Loan Losses is the amount charged to expense to maintain the Allowance at an adequate level.
The Allowance for Loan Losses was $1,716,000, or 1.2% of total loans outstanding, at September 30, 2006. In the view of management, the Allowance for Loan Losses is adequate to meet the loss contingency based on experience factors and a review of the loan portfolio.
The Provision for Loan Loss was $54,000 for the nine months ended September 30, 2006 and 2005. See Note 3 – Allowance for Loan Losses and Note 4 – Nonperforming Assets and Delinquent Loans to the financial statements for additional information.
Non-Interest Income.Non-Interest Income increased $18,000, or 4% for the nine-month period ended September 30, 2006, compared to the same period of 2005. The largest source of non-interest income is Services Charges, Commissions and Fees, which increased from $332,000 at September 30, 2005 to $367,000 at September 30, 2006.
Non-Interest Expense.Non-Interest Expense increased $146,000 or 5%, for the nine-month period ended September 30, 2006, compared to the same period of 2005.
Income Taxes.The Bank recorded $315,000 in income tax expense in the third quarter of 2006, as compared to $306,000 in 2005. The income taxes increased due to the increase in income.
Analysis of Financial Condition
Investments.U. S. Agency Securities have decreased $987,000 compared to December 31, 2005. Funds from maturing U. S. Agency Securities have been used to increase loans $11 million compared to December 31, 2005.
Loans. Loans increased $11 million, or 9%, compared to December 31, 2005. Real estate secured loans made up approximately 73% of net loans at September 30, 2006.
Non-Performing Assets and Impaired Loans.Non-performing assets, which consist of nonaccrual loans and foreclosed properties, were $3,583,000 at September 30, 2006 and $4,760,000 at December 31, 2005. Nonaccrual Loans equaled $1,975,000 at September 30, 2006 and $3,105,000 December 31, 2005. Foreclosed Properties equaled $1,608,000 at September 30, 2006 and $1,655,000 December 31, 2005.
Nonaccrual loans are those loans contractually past due 90 days or more on which no interest is being accrued. Other real estate owned consists of real estate acquired through foreclosure. These properties are reviewed quarterly and reduced to an estimated realizable value at that time.
Deposits.Total deposits have increased $7.5 million, or 3%, compared to December 31, 2005. Increases occurred in all categories with the exception of interest bearing deposits and regular passbook savings, which decreased. Decreases in this category were due to funds moving from short-term deposits to longer-term certificates of deposits.
Capital.The federal regulatory agencies use risk-based capital ratios to analyze the adequacy of a bank’s capital. These ratios weigh bank assets from 0% to 100%, depending upon the risks inherent in each type of asset. The Bank continues to meet all requirements for a well-capitalized bank as defined by the regulatory agencies.
The Following table presents the key risk-based capital ratios for the periods indicated:
| September 30, 2006 | December 31, 2005 | |||||
Tier 1 Ratio | 11.73 | % | 12.00 | % | ||
Total Risk-Based Capital Ratio | 12.97 | % | 13.25 | % | ||
Leverage Ratio | 6.90 | % | 6.80 | % |
12
Table of Contents
Shareholders’ Equity was $16,209,000 at September 30, 2006 compared to $15,678,000 at December 31, 2005.
Liquidity.Liquidity is our ability to fund both loans and investments in the normal course of business and to provide adequate protection for unexpected deposit withdrawals or other demands for funds without incurring a significant negative impact on profitability. Our primary source of day-to-day liquidity lies in the combination of cash, deposit balances, checks in process of collection, deposit growth and federal funds sold. Federal funds are excess funds that are sold to other banks, generally on a one-day basis. Normal funds from the repayment of loans and investments augment these funds.
Our secondary source of liquidity lies in our investments and deposits in other financial institutions. While our investments are categorized as held-to-maturity, they consist primarily of short-term U S Agency Securities that are readily marketable. The majority of our investment securities mature in five years or less. Interest-bearing deposits in other financial institutions generally mature in two years or less and the volume of this investment decreased for the first nine months.
Off-Balance Sheet Arrangements.Commitments to extend credit, which amounted to $1,250,000 at September 30, 2006 and $170,000 at December 31, 2005, respectively, represent agreements to lend to customers with fixed expiration dates or other termination clauses. Since many of the commitments are expected to expire without being funded, the total commitment amounts do not necessarily represent future liquidity requirements. Standby letters of credit are conditional commitments issued by the Bank guaranteeing the performance of a customer to a third party. Those guarantees are primarily issued to support public and private borrowing arrangements. The Bank had no outstanding standby letters of credit at September 30, 2006 or December 31, 2005.
Recent Accounting Pronouncements.In June 2005, the FASB issued Statement No. 154, “Accounting Changes and Error Corrections”, which replaces APB Opinion No. 20, “Accounting Changes” and FASB Statement No. 3, “Reporting Accounting Changes in Interim Financial Statements.” Statement No., 154 requires that a voluntary change in accounting principle be applied retrospectively with all prior period financial statements presented on the new accounting principle. Statement No. 154 also requires that a change in method of depreciating or amortizing a long-lived non-financial asset be accounted for prospectively as a change in estimate, and correction of errors in previously issued financial statements should be termed a “restatement.” Statement No. 154 is effective for accounting changes and correction of errors made in fiscal years beginning after December 15, 2005. Management does not expect this accounting pronouncement to have a material impact on the financial statements.
Item 3—CONTROLS AND PROCEDURES
The Bank maintains a system of disclosure controls and procedures that is designed to ensure that material information is accumulated and communicated to management, including the Bank’s president (who is the Bank’s principal executive officer and principal financial officer), as appropriate to allow timely decisions regarding required disclosure. As required, management, with the participation of the Bank’s president, evaluated the effectiveness of the design and operation of the Bank’s disclosure controls and procedures as of the end of the period covered by this report. Based on this evaluation, the Bank’s president concluded that the Bank’s disclosure controls and procedures were operating effectively to ensure that information required to be disclosed by the Bank in reports that it files or submits under the Securities Exchange Act of 1934, as amended, is recorded, processed, summarized, and reported within the time periods specified in the rules and forms of the SEC.
Because of the inherent limitations in all control systems, no evaluation of controls can provide absolute assurance that the Bank’s disclosure controls and procedures will detect or uncover every situation involving the failure of persons within the Bank to disclose material information otherwise required to be set forth in the Bank’s periodic reports.
The Bank’s management is also responsible for establishing and maintaining adequate internal control over financial reporting to provide reasonable assurance regarding the reliability of financial reporting and the preparation of financial statements for external purposes in accordance with generally accepted accounting principles. There were
13
Table of Contents
no changes in the Bank’s internal control over financial reporting during the Bank’s quarter ended September 30, 2006 that have materially affected, or are reasonably likely to materially affect, the Bank’s internal control over financial reporting.
PART II—OTHER INFORMATION
Item 1—LEGAL PROCEEDINGS.
There are no material pending legal proceedings to which the Bank is a party or to which the property of the Bank is subject.
Item 2—UNREGISTERED SALES OF EQUITY SECURITIES AND USE OF PROCEEDS.
None.
Item 3—DEFAULTS UPON SENIOR SECURITIES.
None.
Item 4—SUBMISSION OF MATTERS TO A VOTE OF SECURITY HOLDERS.
None.
Item 5—OTHER INFORMATION
None.
Item 6—EXHIBITS
Exhibits:
| 2.1 | Agreement and Plan of Merger, dated as of July 28, 2006, by and among Blue Ridge Bank, N.A., Central National Bank, Community National Bank, First National Bank, First National Exchange Bank, Mountain National Bank, Patrick Henry National Bank, Patriot Bank, National Association, Peoples National Bank, Shenandoah National Bank and Carter Bank & Trust (incorporated by reference to Exhibit 2.1 to Form 8-K filed with the Office of the Comptroller of the Currency on July 31, 2006). | |
| 3.1 | Articles of Association (filed with the Office of the Comptroller of the Currency prior to the opening of the Bank) | |
| 3.2 | Amended and Restated Bylaws (as amended and restated through February 15, 2005) (incorporated by reference to Exhibit 3.2 to Form 8-K filed with the Office of the Comptroller of the Currency on February 15, 2005) | |
| 31 | Certification by principal executive officer and principal financial officer pursuant to Rule 13a-14(a) | |
| 32 | Certification of principal executive officer and principal financial officer pursuant to 18 U.S.C. § 1350 | |
14
Table of Contents
SIGNATURES
In accordance with the requirements of the Exchange Act, the registrant caused this report to be signed on its behalf by the undersigned, thereunto duly authorized.
| MOUNTAIN NATIONAL BANK | ||
| Date:November 13, 2006 |
| |
| Worth Harris Carter, Jr. | ||
Chairman of the Board and President (Signing on behalf of the registrant and as principal executive and financial officer of the registrant) | ||
15
Table of Contents
Exhibit 31
CERTIFICATION
I, Worth Harris Carter, Jr., certify that:
| 1. | I have reviewed this quarterly report on Form 10-QSB of Mountain National Bank; |
| 2. | Based on my knowledge, this report does not contain any untrue statement of a material fact or omit to state a material fact necessary to make the statements made, in light of the circumstances under which such statements were made, not misleading with respect to the period covered by this report; and |
| 3. | Based on my knowledge, the financial statements, and other financial information included in this report, fairly present in all material respects the financial condition, results of operations and cash flows of the small business issuer as of, and for, the periods presented in this report. |
| Date:November 13, 2006 |
| |
| Worth Harris Carter, Jr. | ||
Chairman of the Board and President (principal executive officer and principal financial officer) |
16
Table of Contents
Exhibit 32
CERTIFICATION OF
PRINCIPAL EXECUTIVE OFFICER AND PRINCIPAL FINANCIAL OFFICER
Pursuant to Section 906 of the Sarbanes-Oxley Act of 2002 (18 U.S.C. Section 1350)
The undersigned, as the principal executive officer and principal financial officer of Mountain National Bank, certifies that, to the best of his knowledge and belief, the Quarterly Report on Form 10-QSB for the period ended September 30, 2006 which accompanies this certification fully complies with the requirements of Section 13(a) or 15(d) of the Securities Exchange Act of 1934 and the information contained in the report fairly presents, in all material respects, the financial condition and results of operations of Mountain National Bank at the dates and for the periods indicated. The foregoing certification is made pursuant to Section 906 of the Sarbanes-Oxley Act of 2002 (18 U.S.C. Section 1350) and shall not be relied upon for any other purpose. The undersigned expressly disclaims any obligation to update the foregoing certification except as required by law.
Date:November 13, 2006 |
| |
| Worth Harris Carter, Jr. | ||
Chairman of the Board and President (principal executive officer and principal financial officer) |
17
Table of Contents
OFFICE OF THE COMPTROLLER OF THE CURRENCY
WASHINGTON, D.C. 20552
FORM 10-K
| x | ANNUAL REPORT PURSUANT TO SECTION 13 OR 15(d) OF THE SECURITIES EXCHANGE ACT OF 1934 |
For the fiscal year ended December 31, 2005
OR
| ¨ | TRANSITION REPORT PURSUANT TO SECTION 13 OR 15(d) OF THE SECURITIES EXCHANGE ACT OF 1934 |
For the transition period from to
Commission File Number: n/a
PATRICK HENRY NATIONAL BANK
(Exact name of registrant as specified in its charter)
| National Bank | 54-0993114 | |
(State or other jurisdiction of incorporation or organization) | (I.R.S. Employer Identification No.) |
2770 Riverside Drive Bassett, VA | 24055 | |
| (Address of principal executive offices) | (Zip Code) |
Registrant’s telephone number, including area code: (276) 629-1776
Securities registered under Section 12(b) of the Exchange Act: None
Securities registered under Section 12(g) of the Exchange Act: None
Indicate by check mark if the registrant is a well-known seasoned issuer, as defined in Rule 405 of the Securities Act. Yes ¨ No x
Indicate by check mark if the registrant is not required to file reports pursuant to Section 13 or Section 15(d) of the Act. Yes ¨ No x
Indicate by check mark whether the registrant (1) has filed all reports required to be filed by Section 13 or 15(d) of the Securities Exchange Act of 1934 during the preceding 12 months (or for such shorter period that the registrant was required to file such reports), and (2) has been subject to such filing requirements for the past 90 days. Yes x No ¨
Indicate by check mark if disclosure of delinquent filers in response to Item 405 of Regulation S-K is not contained herein, and will not be contained, to the best of registrant’s knowledge, in definitive proxy or information statements incorporated by reference in Part III of this Form 10-KS or any amendment to this Form 10-K. x
Indicate by check mark whether the registrant is a large accelerated filer, an accelerated filer, or a non-accelerated filer. See definition of “accelerated filer and large accelerated filer” in Rule 12b-2 of the Exchange Act.
Large accelerated filer ¨ Accelerated filer ¨ Non-accelerated filer x
Indicate by check mark whether the registrant is a shell company (as defined in Rule 12b-2 of the Act). Yes ¨ No x
The aggregate value of the registrant’s voting and non-voting common stock held by nonaffiliates as of March 14, 2006 was $22,628,000.
As of March 14, 2006, there were issued and outstanding 2,800,122 shares of the registrant’s common stock.
DOCUMENTS INCORPORATED BY REFERENCE
Portions of the 2005 Annual Report to Shareholders, which is attached hereto as Exhibit 13, are incorporated by reference in Part II of this report.
1
Table of Contents
PATRICK HENRY NATIONAL BANK
2005 ANNUAL REPORT ON FORM 10-KSB
TABLE OF CONTENTS
PART I | 3 | |||||
| ITEM 1. | DESCRIPTION OF BUSINESS | 3 | ||||
| ITEM 1A. | RISK FACTORS | 7 | ||||
| ITEM 1B. | UNRESOLVED STAFF COMMENTS | 7 | ||||
| ITEM 2. | DESCRIPTION OF PROPERTY | 8 | ||||
| ITEM 3. | LEGAL PROCEEDINGS | 8 | ||||
| ITEM 4. | SUBMISSION OF MATTERS TO A VOTE OF SECURITY HOLDERS | 8 | ||||
PART II | 9 | |||||
| ITEM 5. | MARKET FOR COMMON EQUITY AND RELATED STOCKHOLDER MATTERS | 9 | ||||
| ITEM 6. | SELECTED FINANCIAL DATA | 10 | ||||
| ITEM 7. | MANAGEMENT’S DISCUSSION AND ANALYSIS OF FINANCIAL CONDITION AND RESULTS OF OPERATIONS | 10 | ||||
| ITEM 7A. | QUANTITATIVE AND QUALITATIVE DISCLOSURES ABOUT MARKET RISK | 10 | ||||
| ITEM 8. | FINANCIAL STATEMENTS AND SUPPLEMENTARY DATA | 10 | ||||
| ITEM 9. | CHANGES IN AND DISAGREEMENTS WITH ACCOUNTANTS ON ACCOUNTING AND FINANCIAL DISCLOSURE | 10 | ||||
| ITEM 9A. | CONTROLS AND PROCEDURES | 10 | ||||
PART III | 11 | |||||
| ITEM 10. | DIRECTORS, EXECUTIVE OFFICERS, PROMOTERS AND CONTROL PERSONS; | 11 | ||||
| ITEM 11. | EXECUTIVE COMPENSATION | 13 | ||||
| ITEM 12. | SECURITY OWNERSHIP OF CERTAIN BENEFICIAL OWNERS AND MANAGEMENT, | 16 | ||||
| ITEM 13. | CERTAIN RELATIONSHIPS AND RELATED TRANSACTIONS | 18 | ||||
| ITEM 14. | PRINCIPAL ACCOUNTANT FEES AND SERVICES | 18 | ||||
PART IV | 19 | |||||
| ITEM 15. | EXHIBITS | 19 | ||||
2
Table of Contents
FORWARD–LOOKING STATEMENTS
This report contains statements concerning the Bank’s expectations, plans, objectives, future financial performance and other statements that are not historical facts. These statements may constitute “forward-looking statements” as defined by federal securities laws. In some cases, readers can identify the forward-looking statements by the use of words such as “may,” “ will,” “should,” “could,” “expect,” “plan,” “intend,” “anticipate,” “believe,” “estimate,” “predict,” “potential” or “continue” or the negative or other variations of these words, or other comparable words or phrases. These statements may address issues that involve estimates and assumptions made by management, risks and uncertainties, and actual results could differ materially from historical results or those anticipated by such statements. Factors that could have a material adverse effect on the Bank’s operations and future prospects include, but are not limited to, changes in: interest rates; general and local economic conditions; the legislative/regulatory climate; monetary and fiscal policies of the U.S. government, including policies of the U.S. Treasury and the Federal Reserve Board; the quality or composition of loan or investment portfolios; demand for loan products; deposit flows; competition; demand for financial services in our market area and accounting principles, policies and guidelines. These risks and uncertainties should be considered in evaluating the forward-looking statements contained herein, and readers are cautioned not to place undue reliance on such statements, which speak only as of the date of this report.
PART I
| ITEM 1. | DESCRIPTION OF BUSINESS |
General
The Bank opened for business as a National Banking Association in 1976 in Bassett, Virginia.
The Bank is a full service community bank that provides an array of financial products and services to its customers, including a variety of interest-bearing and non-interest bearing demand deposit accounts; savings and money market accounts; certificates of deposit; commercial, installment, and real estate mortgage loans (commercial and residential); and safe deposit rental facilities. The Bank also sells travelers checks, money orders and cashier’s checks.
At December 31, 2005, the Bank had 152 full-time and 12 part-time employees, total assets of $398 million, total net loans of $229 million, total deposits of $372 million, and total stockholders’ equity of $24 million.
Market Area
The Bank’s primary service area currently consists of Henry and Patrick Counties and the City of Martinsville in Virginia and Randolph County, Rockingham County and the City of Greensboro in North Carolina. The Bank conducts a general commercial banking business in its service area, and focuses on serving the banking needs of small-to-medium sized businesses, professional concerns and individuals.
Goals and Strategy
The Bank’s goal is to become a leading financial institution in its market area by opening new offices and providing a full array of banking services. Management believes that the on-going consolidation of the banking industry has created an opportunity for community-based lenders like the Bank, which emphasize retail lending and superior customer service. The Bank’s business strategy is to target individuals, businesses and professionals in the area for loans, deposits, and other financial services and to explore selected opportunities to establish branches in areas that demographically compliment the Bank’s existing customer base.
Deposits and Loan Products
The Bank offers a full range of deposit services including LIFETIME FREE CHECKING, NOW accounts, savings accounts, retirement accounts and other deposits of various types, ranging from money market accounts to longer-term certificates of deposit. The transaction accounts and time certificates are tailored to the Bank’s principal market at competitive rates. All deposit accounts are insured by the Federal Deposit Insurance Corporation
3
Table of Contents
(“FDIC”) up to the maximum amount allowed by law (generally $100,000 per depositor subject to aggregation rules). The Bank solicits these accounts from individuals, businesses, associations, organizations, and governmental entities.
The Bank also offers a full range of commercial and personal loans. Commercial loans include both secured and unsecured loans. Consumer loans include secured and unsecured loans for financing automobiles, home improvements, education and personal investments. The Bank also makes real estate, construction and acquisition loans and originates and holds fixed and variable rate mortgage loans.
The Bank’s lending activities are subject to a variety of lending limits imposed by federal law. While differing limits apply in certain circumstances based on the type of loan or the nature of the borrower (including the borrower’s relationship to the Bank), in general the Bank is subject to a loan-to-one borrower limit of an amount equal to 15% of the Bank’s unimpaired capital and surplus, or 25% of the unimpaired capital and surplus. The Bank may not make loans to any director, officer, employee or 10% shareholder of the Bank unless the loan is approved by the Board of Directors and is made on terms not more favorable than are made available to a person not affiliated with the Bank.
Other bank services include traveler’s checks, direct deposit of payroll and social security checks, and automated drafts for various accounts. The Bank has no current plans to exercise trust powers.
Bank Lending Practices
The Bank’s lending efforts are directed to making loans to individuals and businesses in its market area. The Bank has both purchased and sold participation loans with other banks in the past and may do so in the future. The Bank believes that its lending and credit policies are conservative.
The Bank’s primary lending program has been the origination of loans secured by real estate. The Bank evaluates both the borrower’s ability to make principal and interest payments and the value of the property that will secure the loan.
Residential mortgage loans generally are made on the basis of the borrower’s ability to make repayment from employment and other income and are secured by real estate that can be readily valued. The Bank offers both adjustable-rate and fixed-rate loans.
In contrast, commercial real estate loans typically are made on the basis of the borrower’s ability to make repayment from cash flow from its business and are secured by business properties. The Bank’s primary non-residential real estate loan products have rates that are fixed for three to five years and then become adjustable. Commercial loans typically involve larger loan balances concentrated with single borrowers or groups of related borrowers.
The Bank also makes consumer loans, including unsecured personal loans, automobile loans, deposit account loans, installment loans and time loans. The Bank’s primary consideration when making such consumer loans is the customer’s ability to repay the loan. Consumer loans generally warrant higher interest rates and fees, but such loans, particularly unsecured consumer loans, also may entail greater risk than residential mortgage loans. Even when a loan is secured, repossessed collateral for a defaulted consumer loan may not provide an adequate source of repayment. Consumer loan collections are dependent on the borrower’s continuing financial stability, and are more likely to be affected adversely by job loss, divorce, illness, or personal bankruptcy. Various federal and state laws, including bankruptcy and insolvency laws, may limit the amount that can be recovered on such loans and such loans may give rise to claims and defenses by a consumer loan borrower.
The Bank also makes commercial loans to qualified small businesses in its market area. Commercial business loans generally have a higher degree of risk than mortgage loans, but have commensurately higher yields. To manage these risks, the Bank generally secures appropriate collateral and carefully monitors the financial condition of its business borrowers.
Competition
The Bank experiences significant competition in attracting depositors and borrowers. Competition in lending activities comes principally from other commercial banks, savings associations, insurance companies, governmental agencies, credit unions, and brokerage firms. Competition for deposits comes from other commercial banks, savings associations, money market and mutual funds, credit unions, insurance companies and brokerage firms. Many of the financial organizations competing with the Bank have greater financial resources than the Bank. Many of these financial organizations also have greater geographic coverage and some offer bank and bank-related services that the Bank does not offer.
4
Table of Contents
The Bank primarily focuses on non-major metropolitan markets in which to provide products and services. Management believes the Bank has developed a niche and a certain level of expertise in serving these communities.
Supervision and Regulation
Financial institutions are extensively regulated under federal and state law. Consequently, the growth and earnings performance of the Bank can be affected not only by management decisions and general economic conditions, but also by the statutes administered by, and the regulations and policies of, various governmental regulatory authorities including, but not limited to, the Office of the Comptroller of the Currency (“OCC”), the Federal Reserve Board (“FRB”), the FDIC, the Internal Revenue Service, federal and state taxing authorities, and the Securities and Exchange Commission. The effect of such statutes, regulations and policies can be significant, and cannot be predicted with a high degree of certainty.
Federal and state laws and regulations generally applicable to financial institutions regulate, among other things, the scope of business, investments, reserves against deposits, capital levels relative to operations, the nature and amount of collateral for loans, the establishment of branches, mergers, consolidations and dividends. The system of supervision and regulation applicable to the Bank establishes a comprehensive framework for their respective operations and is intended primarily for the protection of the FDIC’s deposit insurance funds and the depositors, rather than the shareholders, of the Bank.
The following references to material statutes and regulations affecting the Bank are brief summaries thereof and do not purport to be complete, and are qualified in their entirety by reference to such statutes and regulations. Any change in applicable law or regulations may have a material effect on the business of the Bank.
Finally, the Bank is subject to the periodic reporting requirements of the Securities Exchange Act of 1934, as amended, including but not limited to, filing annual, quarterly and other current reports with the OCC.
Regulatory Capital Requirements
All financial institutions are required to maintain minimum levels of regulatory capital. The OCC has established risk-based and leveraged capital standards for the financial institutions they regulate. The OCC also may impose capital requirements in excess of these standards on a case-by-case basis for various reasons, including financial condition or actual or anticipated growth. Under the risk-based capital requirements, the Bank is required to maintain a minimum ratio of total capital to risk-weighted assets of at least 8%. At least half of the total capital is required to be “Tier 1 capital,” which consists principally of common and certain qualifying preferred shareholders’ equity, less certain intangibles and other adjustments. The remainder, “Tier 2 capital,” consists of a limited amount of subordinated and other qualifying debt (including certain hybrid capital instruments) and a limited amount of the general loan loss reserve.
In addition, the federal regulatory agencies have established a minimum leveraged capital ratio (Tier 1 capital to period end total assets). These guidelines provide for a minimum leveraged capital ratio of 4%. The guidelines also provide that banking organizations experiencing internal growth or making acquisitions will be expected to maintain strong capital positions substantially above the minimum supervisory levels, without significant reliance on intangible assets.
As of December 31, 2005 and 2004, the Bank qualified as “well-capitalized” institution (see Note 15 to the Financial Statements Part II, Item 8).
Insurance of Accounts, Assessments and Regulation by the FD1C
The Bank is a member of the Bank Insurance Fund (“BIF”) of the FDIC. As a BIF insured institution, the Bank is subject to FDIC rules and regulations as administrator of the BIF. The Bank’s deposits are insured up to $100,000 per insured depositor, as defined by law and regulation. As insurer, the FDIC is authorized to conduct examinations of and to require reporting by BIF institutions. The actual assessment to be paid by each BIF member is based on the institution’s assessment risk classification and whether the institution is considered by its supervisory agency to be financially sound or to have supervisory concerns.
5
Table of Contents
Under the FDIC’s risk-based insurance system, BIF-insured institutions are currently assessed premiums of between zero and twenty seven cents per $100 of eligible deposits, depending on the institution’s capital position and other supervisory facts. Congress has enacted legislation that, among other things, provides for assessments against BIF-insured institutions that will be used to pay certain Financing Corporation (“FICO”) obligations.
The FDIC is authorized to prohibit any BIF-insured institution from engaging in any activity that the FDIC determines by regulation or order to pose a serious threat to the insurance fund. Also, the FDIC may initiate enforcement actions against banks after first giving the institution’s primary regulatory authority an opportunity to take such action. The FDIC may terminate the deposit insurance of any depository institution, including the Bank, if it determines, after a hearing, that the institution has engaged or is engaging in unsafe or unsound practices, is in an unsafe or unsound condition to continue operations, or has violated any applicable law, regulation, order or any condition imposed in writing by the FDIC. It also may suspend deposit insurance temporarily during the hearing process for the permanent termination of insurance, if the institution has no tangible capital. If deposit insurance is terminated, the deposits at the institution at the time of termination, less subsequent withdrawals, shall continue to be insured for a period from six months to two years, as determined by the FDIC. Management is aware of no existing circumstances that could result in termination of the Bank’s deposit insurance.
Other Safety and Soundness Regulations
The federal banking agencies have broad powers under current federal law to take prompt corrective action to resolve problems of insured depository institutions. The extent of these powers depends upon whether the institutions in question are “well capitalized,” “adequately capitalized,” “undercapitalized,” “significantly undercapitalized” or “critically undercapitalized,” as such terms are defined under uniform regulations issued by each of the federal banking agencies.
Community Reinvestment
The requirements of the Community Reinvestment Act (“CRA”) affect the Bank. The CRA imposes on financial institutions an affirmative obligation to help meet the credit needs of their local communities, including low- and moderate-income neighborhoods, consistent with the safe and sound operation of those institutions. Each financial institution’s efforts in helping meet community credit needs currently is evaluated as part of the examination process pursuant to a new regulation recently adopted by the banking regulatory agencies. Under the new regulation a financial institution’s efforts in helping meet its community’s credit needs are evaluated, based on the particular institution’s Total Assets, according to a lending test, a community development test in addition to the lending test, or the three-pronged (lending, investment and service)test, all of which replace the twelve assessment factors used previously. The grade received by a bank is considered in evaluating mergers, acquisitions and applications to open a branch or facility. To the best knowledge of the Bank, it is meeting its obligations under the CRA.
Effect of Governmental Monetary Policies
As with other financial institutions, the earnings of the Bank are affected by general economic conditions as well as by the monetary policies of the Federal Reserve Board. Such policies, which include regulating the national supply of bank reserves and bank credit, can have a major effect upon the source and cost of funds and the rates of return earned on loans and investments. The Federal Reserve System exerts a substantial influence on interest rates and credit conditions, primarily through establishing target rates for federal funds, open market operations in U.S. Government securities, varying the discount rate on member bank borrowings and setting cash reserve requirements against deposits. Changes in monetary policy, including changes in interest rates, will influence the origination of loans, the purchase of investments, the generation of deposits, and rates received on loans and investment securities and paid on deposits. Fluctuations in the Federal Reserve Board’s monetary policies have had a significant impact on the operating results of the Bank and all financial institutions in the past and are expected to continue to do so in the future.
Employees
The Bank had 152 full-time and 12 part-time employees as of December 31, 2005. The Bank believes that its relationship with its employees is good, and no employees are represented by a labor union.
6
Table of Contents
| ITEM 1A. | RISK FACTORS |
An investment in Patrick Henry National Bank’s securities may involve risks due to the nature of the business we engage in and activities related to that business. The following are the most significant risks associated with the business or activities associated with conducting that business:
Business Risk.Patrick Henry National Bank’s business is based primarily upon providing basic banking products and services to small, localized markets in Virginia and North Carolina, delivered through our branch network. Patrick Henry National Bank’s business is subject to a range of banking competition, from other community banking institutions to large, diversified, multi-national financial services providers. Risks associated with our business include:
| • | Timely development of competitive products and services by Patrick Henry National Bank and the acceptance of these products and services by new and existing customers; |
| • | The willingness of customers to substitute competitors’ products and services for Patrick Henry National Bank’s products and services and vice versa; |
| • | The impact of changes in financial services’ laws and regulations, specifically laws concerning the business of banking; |
| • | A downturn in the real estate market could negatively affect the bank’s business because a significant portion (approximately 68% as of December 31, 2005) of its loans are secured by real estate; |
| • | Technological changes; and |
| • | Changes in consumer spending and saving habits. |
Credit Risk.As a lending institution, the credit quality of Patrick Henry National Bank’s loan portfolio can have a significant impact on our earnings. Credit risk is the risk of loss due to adverse changes in a borrower’s ability to meet its financial obligations under agreed upon terms. Risks associated with our credit quality include:
| • | The strength of the United States economy in general and the strength of the local economies in which Patrick Henry National Bank conducts operations may be different than expected resulting in, among other things, a deterioration in credit quality or a reduced demand for credit, including the resultant effect on Patrick Henry National Bank’s loan portfolio and allowance for loan losses; and |
| • | Adverse changes in the financial performance and/or condition of Patrick Henry National Bank’s borrowers that could impact repayment of such borrowers’ outstanding loans. |
Market Risk.Patrick Henry National Bank’s business is subject to market risk. The components of market risk are interest rate risk inherent in our balance sheet, price risk in our principal investing portfolio and market value risk in our trading portfolios. Risks associated with managing market risk include:
| • | The effects of, and changes in, trade, monetary and fiscal policies and laws, including interest rate policies of the Federal Reserve Board; and |
| • | Inflation, interest rate, market and monetary fluctuations. |
Operational Risk.Operational risk is the risk of loss from inadequate or failed internal processes, people and systems or from external events. Risks associated with operational risk include:
| • | Unanticipated judicial proceedings or rulings; |
| • | Matters impacting our business or ethical reputation; |
| • | The impact of changes in accounting principles; |
| • | The impact of criminal activity committed against the bank including, but not limited to, robbery or embezzlement. |
| ITEM 1B. | UNRESOLVED STAFF COMMENTS |
None.
7
Table of Contents
| ITEM 2. | DESCRIPTION OF PROPERTY |
The Bank’s main office is located in a one and one-half-story building located at 2770 Riverside Drive, Bassett, Virginia. The Bank also operates eighteen additional offices, ten of which are located in Virginia and eight of which are located in North Carolina. The Bank owns thirteen of the offices free and clear of encumbrances, while the other six are held under non-cancellable operating leases. These leases are described in Footnotes 7 and 17 in the Financial Statements in Part II, Item 8. The Bank’s offices are detailed in the table below:
Location | Address | Lease/Own | ||||
| Bassett Office | 2770 Riverside Drive | Bassett, VA 24055 | Own | |||
| Martinsville Office | 4 East Commonwealth Boulevard | Martinsville, VA 24112 | Own | |||
| Collinsville Office | 205 E. Paul Street | Collinsville, VA 24078 | Own | |||
| Stuart Office | 205 Blue Ridge Street | Stuart, VA 24171 | Own | |||
| 220 South Office | 141 Tensbury Drive | Martinsville, VA 24113 | Own | |||
| Laurel Park | 6142 A. L. Philpot Highway | Martinsville, VA 24112 | Own | |||
| Horsepasture Office | 166 Horsepasture Price Road | Martinsville, VA 24148 | Own | |||
| Eden Office | 630 Fagg Drive | Eden, NC 27288 | Lease | |||
| Reidsville - Turner Dr. Office | 100 Turner Drive | Reidsville, NC 27320 | Lease | |||
| Reidsville - Main Street Office | 305 South Main Street | Reidsville, NC 27320 | Lease | |||
| Washington Street Office | 900 Washington Street | Eden, NC 27288 | Lease | |||
| Stoneville Office | 170 South Henry Street | Stoneville, NC 27048 | Own | |||
| Adams Farm | 5715 High Point Road | Greensboro, NC 27407 | Lease | |||
| Wendover | 4004 West Wendover Avenue | Greensboro, NC 27407 | Lease | |||
| Oak Level | 11020 Virginia Avenue | Bassett, VA 24055 | Own | |||
| Woolwine | 9747 Woolwine Highway | Woolwine, VA 24185 | Own | |||
| Ararat | 4952 Ararat Highway | Ararat, VA 24053 | Own | |||
| Asheboro | 1425 North Fayetteville Street | Asheboro, NC 27203 | Own | |||
| Fieldale | 4259 Appalachian Drive | Fieldale, VA 24089 | Own | |||
The Bank has acquired title to other parcels of real estate through the normal course of its lending activities. The book values of these properties equaled $2,265,000 and $2,335,000 as of December 31, 2005 and 2004, respectively.
Management considers these properties to be in good condition. Adequate insurance is maintained on each of these properties.
| ITEM 3. | LEGAL PROCEEDINGS. |
There are no material pending legal proceedings to which the Bank is a party or to which the property of the Bank is subject.
| ITEM 4. | SUBMISSION OF MATTERS TO A VOTE OF SECURITY HOLDERS. |
There were no matters submitted to a vote of security holders during the fourth quarter of the fiscal year covered by this report.
8
Table of Contents
EXECUTIVE OFFICERS OF THE REGISTRANT
Name (Age) | Officer Since | Principal Occupation During Past Five Years | ||
Worth Harris Carter, Jr. (68) | 1976 | Chairman of the Board of First National Bank since 1976, President since 1986 | ||
| Chairman of the Board and President of Patrick Henry National Bank since 1977 | ||||
| Chairman of the Board of Peoples National Bank since 1976, President since 1981 | ||||
| Chairman of the Board of Blue Ridge Bank since 1982 | ||||
| Chairman of the Board and President of Community National Bank since 1985 | ||||
| Chairman of the Board and President of Mountain National Bank since 1996 | ||||
| Chairman of the Board and President of Shenandoah National Bank since 1996 | ||||
| Chairman of the Board and President of Central National Bank since 1996 | ||||
| Chairman of the Board and President of Patriot Bank since 1996 | ||||
| Chairman of the Board and President of First National Exchange Bank since 1998 | ||||
| Chairman of the Board and President of Mortgage Company of Virginia since 1984 | ||||
| Chairman of the Board and President of Bank Services of Virginia since 1984 | ||||
| Chairman of the Board and President of Bank Building Corporation since 1994 | ||||
| Chairman of the Board and President of Bank Services Insurance, Inc. since 2003 | ||||
| Manager of Blackstone Properties LLC Since 1998 | ||||
PART II
| ITEM 5. | MARKET FOR COMMON EQUITY AND RELATED STOCKHOLDER MATTERS. |
The Bank is authorized to issue 10 million shares of common stock with a par value of $1.25. This stock has full voting rights, and full preemptive rights. There were 2,800,122 shares outstanding as of December 31, 2005 and December 31, 2004. This is the only class of authorized stock.
The Bank’s common stock is traded locally with no established trading market and no known market makers.
The quarterly high and low prices, based on transactions made known to the Bank, and quarterly dividends for the common stock for 2005 and 2004 are presented below.
| 2005 | 2004 | Dividends Per Share | ||||||||||||||||
| High | Low | High | Low | 2005 | 2004 | |||||||||||||
First Quarter | $ | 12.00 | $ | 12.00 | $ | 16.00 | $ | 11.00 | $ | 0.11 | $ | 0.11 | ||||||
Second Quarter | 11.00 | 11.00 | 16.00 | 12.00 | 0.11 | 0.11 | ||||||||||||
Third Quarter | 11.00 | 11.00 | 14.00 | 12.00 | 0.11 | 0.11 | ||||||||||||
Fourth Quarter | 10.00 | 10.00 | 15.00 | 13.00 | 0.11 | 0.11 | ||||||||||||
9
Table of Contents
Holders. As of March 14, 2006, there are approximately 1,303 holders of record of the Bank’s outstanding common stock.
Dividends. The amount of dividends that may be paid by the Bank will depend on the Bank’s earnings and capital position and is limited by federal law, regulations and policies. A national bank may not pay dividends from its capital; all dividends must be paid out of undivided profits then on hand, after deducting expenses, including reserves for losses and bad debts. In addition, the approval of the OCC is required if the total of all dividends declared by a national bank in any calendar year exceeds the total of its net profits for that year combined with its retained net profits for the preceding two years, less any required transfers to surplus. The Bank may not pay a dividend if, after giving effect to the dividend, the Bank would be undercapitalized.
The dividend payment history per quarter for the last two years is presented above. Similar cash dividends are anticipated but are dependent upon the Bank’s future performance and other factors.
| ITEM 6. | SELECTED FINANCIAL DATA |
The information required by this Item is included in the Bank’s annual report to shareholders for the year ended December 31, 2005 (the “Annual Report”), which is attached hereto as Exhibit 13 and is incorporated herein by reference. The information appears in the Annual Report under the caption “Management’s Discussion and Analysis of Financial Condition and Results of Operation—Summary.”
| ITEM 7. | MANAGEMENT’S DISCUSSION AND ANALYSIS OF FINANCIAL CONDITION AND RESULTS OF OPERATIONS |
The information required by this Item is included in the Bank’s Annual Report, which is attached hereto as Exhibit 13 and is incorporated herein by reference. The information appears in the Annual Report under the caption “Management’s Discussion and Analysis of Financial Condition and Results of Operation.”
| ITEM 7A. | QUANTITATIVE AND QUALITATIVE DISCLOSURES ABOUT MARKET RISK. |
The information required by this Item is included in the Bank’s Annual Report, which is attached hereto as Exhibit 13 and is incorporated herein by reference. The information appears in the Annual Report under the caption ���Interest Sensitivity Analysis.”
| ITEM 8. | FINANCIAL STATEMENTS AND SUPPLEMENTARY DATA. |
The report of the independent registered public accounting firm, audited financial statements of the Bank and accompanying notes and supplementary data required by this Item are included in the Bank’s Annual Report, which is attached hereto as Exhibit 13 and is incorporated herein by reference.
| ITEM 9. | CHANGES IN AND DISAGREEMENTS WITH ACCOUNTANTS ON ACCOUNTING AND FINANCIAL DISCLOSURES. |
None.
| ITEM 9A. | CONTROLS AND PROCEDURES |
The Bank maintains a system of disclosure controls and procedures that is designed to ensure that material information is accumulated and communicated to management, including the Bank’s president (who is the Bank’s principal executive officer and principal financial officer), as appropriate to allow timely decisions regarding required disclosure. As required, management, with the participation of the Bank’s president, evaluated the effectiveness of the design and operation of the Bank’s disclosure controls and procedures as of the end of the period covered by this report. Based on this evaluation, the Bank’s president concluded that the Bank’s disclosure controls and procedures were operating effectively to ensure that information required to be disclosed by the Bank in reports that it files or submits under the Securities Exchange Act of 1934, as amended, is recorded, processed, summarized, and reported within the time periods specified in the rules and forms of the SEC.
10
Table of Contents
Because of the inherent limitations in all control systems, no evaluation of controls can provide absolute assurance that the Bank’s disclosure controls and procedures will detect or uncover every situation involving the failure of persons within the Bank to disclose material information otherwise required to be set forth in the Bank’s periodic reports.
The Bank’s management is also responsible for establishing and maintaining adequate internal control over financial reporting to provide reasonable assurance regarding the reliability of financial reporting and the preparation of financial statements for external purposes in accordance with generally accepted accounting principles. There were no changes in the Bank’s internal control over financial reporting during the Bank’s fourth quarter ended December 31, 2005 that have materially affected, or are reasonably likely to materially affect, the Bank’s internal control over financial reporting.
| ITEM 9B. | OTHER INFORMATION. |
None.
PART III
| ITEM 10. | DIRECTORS, EXECUTIVE OFFICERS, PROMOTERS AND CONTROL PERSONS; COMPLIANCE WITH SECTION 16(a) OF THE EXCHANGE ACT. |
The information regarding the Bank’s executive officer is contained in Part I of this Report on Form 10-KSB.
Name and Business Experience | Age | Director Since | ||
| Carter, Worth Harris, Jr. | 68 | 4/77 |
Chairman of the Board and President Worth Harris Carter, Jr. is a director and officer of the following companies: Chairman of the Board of First National Bank since 1976, President since 1986 Chairman of the Board of Peoples National Bank since 1976, President since 1981 Chairman of the Board of Blue Ridge Bank since 1982, President since 2004 Chairman of the Board and President of Community National Bank since 1985 Chairman of the Board and President of Mountain National Bank since 1996 Chairman of the Board and President of Shenandoah National Bank since 1996 Chairman of the Board and President of Central National Bank since 1996 Chairman of the Board and President of Patriot Bank since 1996 Chairman of the Board and President of First National Exchange Bank since 1998 Chairman of the Board and President of Mortgage Company of Virginia since 1984 Chairman of the Board and President of Bank Services of Virginia, Inc. since 1984 Chairman of the Board and President of Bank Services Insurance, Inc. since 2003 Chairman of the Board and President of Coresoft, Inc. since 2004 |
| Craig, W. Lynwood | 77 | 10/76 | ||
| Lynwood W. Craig is and has been President and Treasurer of Bassett Oil & Equipment Company, Inc. VA for more than five years. He also has served as a director of Shenandoah National Bank, Staunton, VA since 1996. | ||||
| Haskins, James W. | 65 | 1/82 | ||
| James W. Haskins is and has been an attorney and a principal in the law firm of Young, Haskins, Mann & Gregory, Ltd., Martinsville, VA for more than five years. He also has served as a director of Mountain National Bank, Galax, VA, since 1996. | ||||
| Lester, George W., II | 67 | 10/76 | ||
| George W. Lester, II is and has been Chairman and Chief Executive Officer of the Lester Group, Inc., a Forest Products Company of Martinsville, VA for more than five years. He also has served as a director of Shenandoah National Bank, Staunton, VA since 1996. | ||||
11
Table of Contents
| Midkiff, H. Marvin, DDS | 80 | 10/76 | ||
H. Marvin Midkiff is retired. Prior to retirement, he was previously a Doctor of Dental Surgery and principal in H. M. Midkiff, DDS, Ltd., Martinsville, VA for more than five years. He also has served as a director of Mountain National Bank, Galax, VA since 1996.
| Pigg, Joseph E. | 70 | 10/76 | ||
| Joseph E. Pigg is President of Millard’s Machinery, Inc., an industrial and logging equipment sales and service business for more than five years. He also has served as a director of Shenandoah National Bank since 1996. | ||||
Prillaman, Haller G. | 72 | 10/76 | ||
| Haller G. Prillaman has been President of Prillaman Brothers, Inc., Martinsville, VA; he was President of Prillaman Chemical Corp., Martinsville, Virginia and Daly Herring Company, Kinston, NC for more than five years until 1987; Director, Ellis & Everard. PLC, Bradford, United Kingdom from Ausust 1984 to July 1988; President and Director, Ellis & Everard (HOLDINGS), Inc., Atlanta, GA from October 1985 to July 1988. He also has served as a director of Mountain National Bank, Galax, VA since 1996 and of Bank Building Corporation since 1995. | ||||
Roach, N. Larry | 67 | 10/76 | ||
| N. Larry Roach is and has been President of Larry Roach & Associates, Insurance Services, Inc. for more than five years. He also has served as a director of Mountain National Bank, Galax, VA since 1996. | ||||
Spencer, Simon C. | 70 | 10/76 | ||
| Simon C. Spencer is retired. He was previously Assistant Principal of Fieldale-Collinsville High School for more than five years and a Lt. Colonel, U. S. Army. He also has served as a director of Shenandoah National Bank, Staunton, VA since 1996. | ||||
Thomasson, James M. | 75 | 8/78 | ||
| James M. Thomasson is retired. He was previously Executive Vice President and Cashier of Patrick Henry National Bank for more than five years. He also has served as a director of Shenandoah National Bank, Staunton, VA since 1996. | ||||
Trent, W. C., Jr. | 62 | 4/77 | ||
| W. C. Trent, Jr. is an investor. He was Vice President and Treasurer of Trent Furniture Corp., Bassett, VA for more than five years. He also has served as a director of Shenandoah National Bank, Staunton, VA since 1996. | ||||
The Board of Directors is not aware of any family relationship between any Director, executive officer or person nominated by the Bank to become a Director; nor is the Board of Directors aware of any involvement in legal proceedings that would be material to an evaluation of the ability or integrity of any Director, executive officer or person nominated to become a Director.
The Bank has not adopted a Code of Ethics for its directors, executives and employees, primarily because management of the Bank believes and understands that our officers and directors adhere to and follow ethical standards without the necessity of a written policy. The Bank’s Board of Directors will revisit this issue in the future to determine if adoption of a code of ethics is appropriate. In the meantime, the Bank’s management requires and promotes honest and ethical conduct, full and fair disclosure in its reports to the OCC, and compliance with applicable governmental laws and regulations.
AUDIT COMMITTEE REPORT OF THE BOARD OF DIRECTORS
The entire Board of Directors functions as the Bank’s Audit Committee and in this capacity met four times in 2005. The functions of the Board in the audit area are focused on three areas:
| • | the adequacy of the Bank’s internal controls and financial reporting process and the reliability of the financial statements; |
| • | the independence and performance of the Bank’s internal auditors and independent auditors; and |
| • | the Bank’s compliance with legal and regulatory requirements. |
We meet with management periodically to consider the adequacy of the Bank’s internal controls and the objectivity of its financial reporting. We discuss these matters with the Bank’s independent auditors and with appropriate financial personnel and internal auditors.
12
Table of Contents
We also periodically review the performance of the independent auditors and their independence from management.
All of the Directors who serve as the Bank’s Audit Committee, with the exception of Chairman of the Board and President Carter, are “independent” for the purposes of the Nasdaq Stock Market listing standards.
The Board has not adopted a written charter setting forth the responsibilities and authority of the Board in its capacity as the Audit Committee. Although Mr. Carter is not independent under the Nasdaq Stock Market or SEC standards for audit committee membership, the Board of Directors has determined that Mr. Carter possesses the knowledge and experience required to be considered an audit committee financial expert. In addition, the Board of Directors believes that all of the Bank’s Directors possess the financial knowledge and expertise necessary to protect the Bank’s shareholders in performing the functions of an audit committee.
Management has primary responsibility for the Bank’s financial statements and the overall reporting process, including the Bank’s system of internal controls.
The independent auditors audit the annual financial statements prepared by management, express an opinion as to whether those statements fairly present the financial position, results of operations and cash flows of the Bank in conformity with generally accepted accounting principles and discuss with us any issues they believe should be raised with us.
This year, we reviewed the Bank’s audited financial statements and met with both management and Goodman & Company, LLP, the Bank’s independent auditors, to discuss those financial statements. Management has represented to us that the financial statements were prepared in accordance with generally accepted accounting principles.
We have received from and discussed with Goodman & Company the written disclosure and the letter required by Independence Standards Board Statement No. 1 (Independence Discussions with Audit Committees) relating to that firm’s independence from the Bank. We also discussed with Goodman & Company the matters required to be discussed by Statement on Auditing Standard No. 61 (Communication with Audit Committees).
Based on these reviews and discussions, we recommended to the Board that the Bank’s audited financial statements be included in the Bank’s Annual Report on Form 10-KSB for the fiscal year ended December 31, 2005 for filing with the Office of the Comptroller of the Currency (“OCC”).
Directors
Worth Harris Carter, Jr.
W. Lynwood Craig
James W. Haskins
George W. Lester, II
Dr. H. Marvin Midkiff
Joseph E. Pigg
Haller G. Prillaman
N. Larry Roach
Simon C. Spencer
James M. Thomasson
W. C. Trent, Jr.
SECTION 16(a) BENEFICIAL OWNERSHIP REPORTING COMPLIANCE
Section 16(a) of the Securities Exchange Act of 1934 requires that Directors and executive officers, and persons who control more than 10% of the Bank’s equity securities, file reports of ownership and reports of changes in ownership of the Bank’s outstanding equity securities. All such filings required were filed timely in 2005.
| ITEM 11. | EXECUTIVE COMPENSATION. |
The Bank’s compensation program is designed to offer competitive compensation to employees based on each individual’s contribution to the Bank’s overall success. As such, the program provides a competitive compensation package to attract and retain capable employees.
13
Table of Contents
The compensation and benefits program consists of salary, a profit sharing plan, and life, health and disability insurance. The compensation and benefits program for officers parallels that of all other employees. The Bank offers no stock options or other forms of equity compensation, bonuses, employment contracts, country club memberships or other perquisites to officers or employees.
The entire Board of Directors performs the functions of a Salary Committee for the Bank. The Board has the responsibility for administering the Bank’s overall compensation program and for setting the salaries for the Bank’s officers. In setting the compensation of the Bank’s officers, the Board generally relies on the recommendations of the Chairman and President and the Board members’ own significant personal knowledge of the compensation provided to other, similarly situated, executives in banking and other industries in the local area. The Board also reviews each individual’s performance and contribution to the overall Bank goals in determining the level of salary for the coming year.
Mr. Worth Harris Carter, Jr., Chairman of the Board and President, serves as the Chief Executive Officer of Patrick Henry National Bank. As noted below under “Certain Relationships and Related Transactions,” Mr. Carter also serves as Chairman and President of nine other banks. The Salary Committee of the Board of directors of Patrick Henry National Bank actually sets Mr. Carter’s annual salary each year. The cost of Mr. Carter’s compensation, which consists of his salary plus an amount equal to twenty-nine percent of his salary to cover payroll taxes and all other benefits, is shared by the ten banks on the basis of average deposits of each bank related to total average deposits of all the banks that he serves. Mr. Carter’s total compensation, which is paid through Bank Services of Virginia, Inc. (“Bank Services”), is reflected below in two charts. The first chart reflects Mr. Carter’s total compensation as paid by Bank Services. The second chart reflects only the portion of Mr. Carter’s total compensation that is allocated to Patrick Henry National Bank.
Summary Compensation Tables
Bank Services of Virginia, Inc.
Annual Compensation
Name and Principal Position | Year | Salary | Other Annual Compensation² | All Other Compensation³ | |||||
Worth Harris Carter, Jr. Chairman of the Board and President | 2005 2004 2003 | $575,000 $575,000 $530,000 | — — — | $ $ $ | 80,000 78,000 67,000 | ||||
| (1) | This table shows the total cash compensation paid to Mr. Carter by Bank Services of Virginia, Inc. during 2005, 2004 and 2003 for his services as Chairman of the Board and President of all ten banks. |
| (2) | The amount of compensation in the form of perquisites and other personal benefits properly categorized in this column did not exceed the lesser of $50,000 or 10% of Mr. Carter’s annual salary for any of the three years reported. |
| (3) | “All Other Compensation” consists of amounts contributed for Mr. Carter under Bank Services’ qualified profit sharing plan and amounts contributed for Mr. Carter under Bank Services’ non-qualified profit sharing plan for highly paid executives. For 2005, these amounts consisted of $27,000 contributed to the qualified profit sharing plan and $53,000 contributed to the non-qualified profit sharing plan. |
Patrick Henry National Bank
Annual Compensation
Name and Principal Position | Year | Salary | Other Annual Compensation² | All Other Compensation³ | ||||||
Worth Harris Carter, Jr. Chairman of the Board and President | 2005 2004 2003 | $ $ $ | 91,000 91,000 82,000 | — — — | $ $ $ | 13,000 12,000 10,000 | ||||
Phyllis Q. Karavatakis Senior Vice President and Cashier | 2005 2004 2003 | $ $ $ | 144,000 135,000 127,200 | — — — | $ $ $ | 12,000 11,000 10,000 | ||||
14
Table of Contents
| (1) | This table shows the portion of Mr. Carter’s total cash compensation during 2005, 2004 and 2003 allocated to Patrick Henry National Bank. |
| (2) | The amount of compensation in the form of perquisites and other personal benefits properly categorized in this column did not exceed the lesser of $50,000 or 10% of Mr. Carter’s or Mrs. Karavatakis’ annual salary for any of the three years reported. |
| (3) | “All Other Compensation” for Mr. Carter consists of the portion allocated to the Bank for contributions on Mr. Carter’s behalf to Bank Services’ qualified profit sharing plan and non-qualified profit sharing plan for highly paid executives. For 2005, the portion of these contributions allocated to the Bank consisted of $4,000 for the qualified profit sharing plan and $9,000 for the non-qualified profit sharing plan. “All Other Compensation” for Mrs. Karavatakis consists of the Bank’s contribution to the Bank’s profit sharing plan on Mrs. Karavatakis’ behalf. |
PROFIT SHARING PLAN
The Bank has adopted an integrated profit sharing plan. The plan covers all full time employees that have been employed for six (6) months and have reached the age of 20-1/2 as of the first day of the plan year. Persons who have reached the age of 62 are fully vested regardless of length of service. The regular vesting schedule is as follows:
Years of Service | Vested Percentage | Forfeitable Percentage | ||
Less than 5 | 0 | 100 | ||
5 or more | 100 | 0 |
Each year the Board of Directors determines what amount, if any, is to be allocated to the plan out of accumulated or current earnings of the Bank. The Bank’s contribution to the plan was $163,000 in 2005, $151,000 in 2004, and $155,000 in 2003.
Chairman of the Board and President Carter does not participate in the profit sharing plan of Patrick Henry National Bank or any of the other nine banks. Instead, Mr. Carter participates in the two profit sharing plans of Bank Services of Virginia, Inc., a qualified profit sharing plan and a nonqualified plan for highly paid executives whose contribution to the qualified plan is limited due to IRS regulations. The Bank’s annual contributions to these plans on Mr. Carter’s behalf are detailed in the two Summary Compensation Tables above.
DIRECTOR COMPENSATION
Each outside Director (not also an officer of the Bank) currently receives $350 for each Board meeting attended.
PERFORMANCE GRAPH
The following graph compares the yearly cumulative total return of the Company’s common stock over a five-year period (beginning December 31, 2000 and ending December 31, 2005) to the returns over such period of the (i) Nasdaq Composite Index and (ii) a Custom Peer Group, which consists of thirty-eight commercial banks headquartered in Virginia and North Carolina with total assets between $200 million and $500 million.
15
Table of Contents
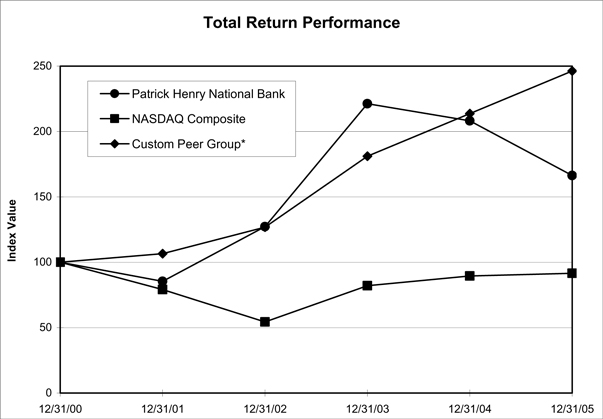
Index | Period Ending | |||||||||||
| 12/31/00 | 12/31/01 | 12/31/02 | 12/31/03 | 12/31/04 | 12/31/05 | |||||||
Patrick Henry National Bank | 100.00 | 85.39 | 127.22 | 221.33 | 208.13 | 166.37 | ||||||
NASDAQ Composite | 100.00 | 79.18 | 54.44 | 82.09 | 89.59 | 91.54 | ||||||
Custom Peer Group | 100.00 | 106.53 | 126.84 | 181.06 | 213.64 | 246.32 | ||||||
| ITEM 12. | SECURITY OWNERSHIP OF CERTAIN BENEFICIAL OWNERS AND MANAGEMENT, AND RELATED STOCKHOLDER MATTERS. |
The following table shows as of March 14, 2006, the beneficial ownership of the Bank’s common stock of each Director, the executive officers identified in the Summary Compensation Table and the Bank’s Directors and executive officers as a group. To the Bank’s knowledge, Director Carter is the Bank’s only shareholder beneficially holding more than 5% of the Bank’s outstanding common stock. As of March 14, 2006, the Bank’s Directors and executive officers as a group, beneficially owned 537,652 shares (or 19.1%) of the Bank’s outstanding common stock.
16
Table of Contents
Name | Amount and Nature of Beneficial Ownership (1)(2) | Ownership as a Percentage of Common Stock Outstanding | ||||
Carter, Worth Harris, Jr. | 200,371 | (3) | 7.2 | % | ||
Craig, W. Lynwood | 86,238 | (4) | 3.1 | % | ||
Haskins, James W. | 20,233 | (5) | 0.7 | % | ||
Karavatakis, Phyllis Q. | 2,780 | (6) | 0.09 | % | ||
Lester, George W., II | 85,018 | (7) | 3.0 | % | ||
Midkiff, H. Marvin | 18,271 | 0.7 | % | |||
Pigg, Joseph E., Sr. | 20,630 | (8) | 0.7 | % | ||
Prillaman, Haller G. | 25,934 | 0.9 | % | |||
Roach, N. Larry | 6,760 | (9) | 0.2 | % | ||
Spencer, Simon C. | 4,009 | (10) | 0.1 | % | ||
Thomasson, James M. | 33,722 | (11) | 1.2 | % | ||
Trent, W. C. Jr. | 33,736 | (12) | 1.2 | % | ||
All Directors and Executive Officers as a Group (11 persons) | 537,352 | 19.2 | % |
| (1) | For purposes of this table, beneficial ownership has been determined in accordance with the provisions of Rule 13d-3 of the Securities Exchange Act of 1934 under which, in general, a person is deemed to be the beneficial owner of a security if he has or shares the power to vote or direct the voting of the security or the power to dispose of or direct the disposition of the security, or if he has the right to acquire beneficial ownership of the security within sixty days. |
| (2) | Unless otherwise indicated, the shares listed in the table represent sole voting and investment power. |
| (3) | Includes 38,694 shares held by Mr. Carter as custodian for his children and grandchildren; 984 shares held by Mr. Carter’s son, Ernest Linwood Carter, II, who resides in Mr. Carter’s household; 7,518 shares held for Mr. Carter’s account in the Mortgage Company of Virginia, Inc./Bank Services of Virginia, Inc. Non-Qualified Profit-Sharing Plan; 8,179 shares held by C&C Realty, Inc., of which Mr. Carter is president and a 50% owner; and 5,010 shares held by Mr. Carter’s brother, Ernest L. Carter. |
| (4) | Includes 10,679 held by Bassett Oil & Equipment Co., Inc., of which Mr. Craig is president, and 3,212 shares held by Mr. Craig’s wife. |
| (5) | Includes 766 shares held by Mr. Haskins’ wife. |
| (6) | Includes 309 shares held jointly with Mrs. Karavatakis’ husband and 794 shares held as custodian for her child. |
| (7) | Includes 25,522 shares held by The Lester Group, Inc., of which Mr. Lester is president; 218 shares held by Beaver Hills Dev. Corp., of which Mr. Lester is president; 193 by Carriage Square, LTD, of which Mr. Lester is president; 7,169 shares held by Mr. Lester as custodian for his children; and 19 shares held by BB&T as trustee for Mr. Lester’s son. |
| (8) | Includes 13 shares held by Mr. Pigg’s wife. |
| (9) | Includes 36 shares held jointly with Mr. Roach’s wife; 1,032 shares held jointly with Mr. Roach’s mother; and 1,496 shares held by Mr. Roach’s wife. |
| (10) | Includes 1,691 shares held jointly with Mr. Spencer’s wife and 121 shares held by Mr. Spencer’s wife. |
| (11) | Includes 32,157 shares held by Mr. Thomasson’s wife. |
| (12) | Includes 8,805 shares held by Mr. Trent as custodian for his children and 2,150 shares held by Mr. Trent’s wife. |
The Bank knows of no arrangements, including any pledge by any person of securities of the Bank, which may at a subsequent date result in a change in control of the Bank.
Equity Compensation Plans.No disclosure regarding equity compensation plans has been provided because the Bank does not have any outstanding equity compensation plans or arrangements that would be covered by Item 201(d) of Regulation S-B.
17
Table of Contents
| ITEM 13. | CERTAIN RELATIONSHIPS AND RELATED TRANSACTIONS |
Mr. Carter, Chairman of the Board and President of Patrick Henry National Bank also serves as Chairman of the Board and President of Blue Ridge Bank, N.A., Central National Bank, Community National Bank, First National Bank, First National Exchange Bank, Mountain National Bank, Peoples National Bank, Patriot Bank, N.A., and Shenandoah National Bank.
The Bank participates in loan transactions with these banks. These transactions are at carrying value and do not involve more than the normal risk of collectibility or present other unfavorable features.
The Bank owns 10% of the outstanding common stock of The Mortgage Company of Virginia, Inc. The remaining common stock is equally owned by the banks listed above. The Mortgage Company of Virginia owns 100% of Bank Services of Virginia, Inc. The business of both of these companies is to provide operational support services to the ten banks. The Bank is charged for its share of these services. The cost of this expense is shared by the ten banks on the basis of average deposits of each bank related to total average deposits of all the banks.
The Mortgage Company of Virginia, Inc. also owns 100% of Bank Services Insurance, Inc. Bank Services Insurance, Inc. provides insurance products to the banks and customers in the Danville area. The premiums paid to Bank Services Insurance, Inc. equaled $42,000 at December 31, 2005.
The Mortgage Company of Virginia, Inc. also owns 50% of Coresoft, Inc. represented by an initial $1,000 investment during 2004. Coresoft, Inc. is in the process of developing a core software package the banks listed above will use. At December 31, 2005, Coresoft, Inc. had an outstanding note payable to the Mortgage Company of $1,400,000.
The Chairman of the Board and President of the Bank also serves as Chairman of the Board and President of Bank Building Corporation and Manager of Blackstone Properties, LLC, it’s wholly owned subsidiary (the “companies”). The companies lease branches to certain of the banks listed above. At December 31, 2005, the Bank leased six offices from the companies. Rental expense under these leases was $363,000 in 2005, and $394,000 in 2004 and 2003. Future minimum lease payments will be $386,000 per year through 2010, and thereafter (may vary based on changing interest rates). As of December 31, 2005 and 2004, the Bank had loans totaling $4,000,000 and $4,170,000, respectively, to the companies. These loans were made to purchase bank branches leased to affiliated banks and other investment property. The loans are secured by these branches and the related leases and other investment property, and have repayment terms similar to other loan customers of the Banks.
In the ordinary course of business, the Bank’s Directors and executive officers and their related interests were customers of, and had transactions with the Bank. Loan transactions with Directors and officers, principal security holders and associates were made on substantially the same terms as those prevailing at the time for comparable loans to other persons and did not involve more than normal risk of collectibility or present other unfavorable features. These extensions of credit equaled $9,685,000 or 41% of the Bank’s equity capital as of December 31, 2005.
| ITEM 14. | PRINCIPAL ACCOUNTANT FEES AND SERVICES. |
Goodman & Company, LLP served as the Bank’s independent public auditors for the year ended December 31, 2005, and has been selected by the Board to act as the Bank’s independent public auditors for the year ending December 31, 2006. A representative of Goodman & Company will be present at the Annual Meeting and will be given the opportunity to make a statement and respond to appropriate questions from shareholders.
The following table presents the fees for professional audit services rendered by Goodman & Company for the audit of the Bank’s annual financial statements for the years ended December 31, 2005 and 2004, and fees billed for other services rendered by Goodman & Company during those periods.
18
Table of Contents
Year Ended December 31,
| 2005 | 2004 | |||||
Audit fees¹ | $ | 12,485 | $ | 11,750 | ||
Audit-related fees | — | — | ||||
Tax fees² | 3,265 | 3,100 | ||||
All other fees | — | — | ||||
Total Fees | $ | 15,750 | $ | 14,850 | ||
| 1 | Audit fees consist of audit and review services, consents and review of documents filed with the OCC. |
| 2 | Tax fees consist of preparation of federal and state tax returns and consultation concerning tax compliance issues. |
In its capacity as the Audit Committee, the Board of Directors considered the compatibility of the non-audit-related services performed by and fees paid to Goodman & Company in 2005 and 2004 and the proposed non-audit-related services and proposed fees for 2006 and determined that such services and fees are compatible with the independence of Goodman & Company as the Bank’s independent auditors.
Also in its capacity as the Audit Committee, the Board of Directors pre-approves all audit (including audit-related) and permitted non-audit services to be performed by the independent auditors. The Board of Directors annually approves the year-end audit to be performed by the Bank’s independent auditors for the fiscal year. With respect to other permitted services, the Board of Directors pre-approves specific engagements, projects and categories of services on a fiscal year basis.
PART IV
| ITEM 15. | EXHIBITS |
Exhibits: | ||
| 3.1 | Articles of Association (filed with the Office of the Comptroller of the Currency prior to the opening of the Bank) | |
| 3.2 | Amended and Restated Bylaws (as amended and restated through February 15, 2005) (incorporated by reference to Exhibit 3.2 to Form 8-K filed with the Office of the Comptroller of the Currency on February 15, 2005) | |
| 13 | 2005 Annual Report to Shareholders | |
| 31 | Certification by principal executive officer and principal financial officer pursuant to Rule 13a-14(a) | |
| 32 | Certification of principal executive officer and principal financial officer pursuant to 18 U.S.C. § 1350 | |
19
Table of Contents
SIGNATURES
Pursuant to the requirements of Section 13 or 15(d) of the Securities Exchange Act of 1934, the registrant has duly caused this report to be signed on its behalf by the undersigned, thereunto duly authorized.
| PATRICK HENRY NATIONAL BANK | ||
| Date: April 14, 2006 | /s/ Worth Harris Carter, Jr. | |
| Worth Harris Carter, Jr. | ||
| Chairman of the Board and President | ||
Pursuant to the requirements of the Exchange Act of 1934, this report has been signed below by the following persons on behalf of the registrant and in the capacities and on the dates indicated.
Signature | Capacity | Date | ||
/s/ Worth Harris Carter, Jr. | Chairman of the Board | April 14, 2006 | ||
| Worth Harris Carter, Jr. | and President | |||
| (principal executive, principal financial | ||||
| and principal accounting officer) | ||||
| Director | April 14, 2006 | ||
| W. Lynwood Craig | ||||
/s/ James W. Haskins | Director | April 14, 2006 | ||
| James W. Haskins | ||||
/s/ George W. Lester, II | Director | April 14, 2006 | ||
| George W. Lester, II | ||||
/s/ Dr. H. Marvin Midkiff | Director | April 14, 2006 | ||
| Dr. H. Marvin Midkiff | ||||
/s/ Joseph E. Pigg | Director | April 14, 2006 | ||
| Joseph E. Pigg | ||||
/s/ Haller G. Prillaman | Director | April 14, 2006 | ||
| Haller G. Prillaman | ||||
/s/ Simon C. Spencer | Director | April 14, 2006 | ||
| Simon C. Spencer | ||||
/s/ James M. Thomasson | Director | April 14, 2006 | ||
| James M. Thomasson | ||||
/s/ W. C. Trent, Jr. | Director | April 14, 2006 | ||
| W. C. Trent, Jr. | ||||
20
Table of Contents
Exhibit 31
CERTIFICATION
I, Worth Harris Carter, Jr., certify that:
| 1. | I have reviewed this annual report on Form 10-K of Patrick Henry National Bank; |
| 2. | Based on my knowledge, this report does not contain any untrue statement of a material fact or omit to state a material fact necessary to make the statements made, in light of the circumstances under which such statements were made, not misleading with respect to the period covered by this report; |
| 3. | Based on my knowledge, the financial statements, and other financial information included in this report, fairly present in all material respects the financial condition, results of operations and cash flows of the registrant as of, and for, the periods presented in this report; |
| 4. | I am responsible for establishing and maintaining disclosure controls and procedures (as defined in Exchange Act Rules 13a-15(e) and 15d-15(e)) for the registrant and have: |
(a) Designed such disclosure controls and procedures, or caused such disclosure controls and procedures to be designed under my supervision, to ensure that material information relating to the registrant, including its consolidated subsidiaries, is made known to me by others within those entities, particularly during the period in which this report is being prepared;
(b) Evaluated the effectiveness of the registrant’s disclosure controls and procedures and presented in this report my conclusions about the effectiveness of the disclosure controls and procedures, as of the end of the period covered by this report based on such evaluation; and
(c) Disclosed in this report any change in the registrant’s internal control over financial reporting that occurred during the registrant’s most recent fiscal quarter (the registrant’s fourth fiscal quarter in the case of an annual report) that has materially affected, or is reasonably likely to materially affect, the registrant’s internal control over financial reporting; and
| 5. | I have disclosed, based on my most recent evaluation of internal control over financial reporting, to the registrant’s auditors and the audit committee of the registrant’s board of directors (or persons performing the equivalent functions): |
(a) All significant deficiencies and material weaknesses in the design or operation of internal control over financial reporting which are reasonably likely to adversely affect the registrant’s ability to record, process, summarize and report financial information; and
(b) Any fraud, whether or not material, that involves management or other employees who have a significant role in the registrant’s internal control over financial reporting.
| Date: April 14, 2006 | /s/ Worth Harris Carter, Jr. | |
| Worth Harris Carter, Jr. | ||
| Chairman of the Board and President | ||
| (principal executive officer and | ||
| principal financial officer) |
21
Table of Contents
Exhibit 32
CERTIFICATION OF
PRINCIPAL EXECUTIVE OFFICER AND PRINCIPAL FINANCIAL OFFICER
Pursuant to § 906 of the Sarbanes-Oxley Act of 2002 (18 U.S.C. § 1350)
The undersigned, as the principal executive officer and principal financial officer of Patrick Henry National Bank, certifies that, to the best of his knowledge and belief, the Annual Report on Form 10-K for the period ended December 31, 2005, which accompanies this certification fully complies with the requirements of Section 13(a) of the Securities Exchange Act of 1934 and the information contained in the report fairly presents, in all material respects, the financial condition and results of operations of Peoples National Bank at the dates and for the periods indicated. The foregoing certification is made pursuant to § 906 of the Sarbanes-Oxley Act of 2002 (18 U.S.C. § 1350) and shall not be relied upon for any other purpose. The undersigned expressly disclaims any obligation to update the foregoing certification except as required by law.
| Date: April 14, 2006 | /s/ Worth Harris Carter, Jr. | |
| Worth Harris Carter, Jr. | ||
| Chairman of the Board and President | ||
| (principal executive officer and | ||
| principal financial officer) |
22
Table of Contents
Table of Contents
Management’s Discussion and Analysis of Financial Condition and Results of Operation
Except for the historical information contained in this report, the matters set forth herein include Forward-Looking Statements within the meaning of the “safe harbor” provisions of the Private Securities Litigation Reform Act of 1995. These Forward-Looking Statements included, among other things, statements of goals, plans, intentions and expectations, regarding or based upon desired business strategies, general economic conditions, interest rates, developments in local and national markets, and other matters, which, by their nature, are subject to significant uncertainties. Because of these uncertainties and the assumptions upon which this report is based, actual future developments with respect to the business of the Bank may differ materially from those contemplated by such statements.
Critical Accounting Policies.The accounting and reporting policies of the Bank conform to generally accepted accounting principles (GAAP) in the United States of America and to general practices within the banking industry. The preparation of the financial statements in conformity with GAAP requires management to make estimates and assumptions that affect the amounts reported in the financial statements and accompanying notes. We believe the most significant of these estimates involves the allowance for loan losses because of its potential impact on our overall performance. We have described our policies in this area below. A summary of the Bank’s significant accounting policies can be found in the Notes to the Financial Statements.
In general, determining the amount of the allowance for loan losses requires significant judgment and the use of estimates by management. The Bank maintains an allowance for loan losses to absorb probable losses in the loan portfolio based on a quarterly analysis of the portfolio and expected future losses. This analysis determines an appropriate level of the allowance for loan losses by considering factors affecting loan losses, including specific losses, levels and trends in impaired and non-performing loans, historical loan loss experience, current economic conditions, volume, growth and composition of the portfolio, and other relevant factors. The Bank records a provision for loan losses to maintain the allowance at an adequate level. The provision expense could increase or decrease each quarter based upon the results of management’s formal analysis.
The amount of the allowance represents management’s estimate of expected losses from existing loans based upon specific allocations for individual lending relationships and historical loss experience. The allowance for loan losses related to impaired loans is based on discounted cash flows using the loan’s initial effective interest rate or the fair value of the collateral for certain collateral dependent loans. This evaluation requires management to make estimates of the amounts and timing of future cash flows on impaired loans, which consists primarily of nonaccrual and restructured loans. Actual losses for these loans can vary significantly from these estimates.
Summary of Operations.Net income for 2005 equaled $1,927,000 or $0.69 per share, compared to $2,102,000 or $0.75 per share, for 2004. This represents a return on average assets of 0.51% and return on average equity of 8% compared to 55% and 9%, respectively for the same period last year.
Our total deposits grew $16 million, or 5%, during the year. In addition, there has been a slight shift in the composition of our deposits as customers have moved their funds from shorter-term accounts into Certificate of Deposits. Total time deposits and Lifetime Free Checking increased while all other deposit categories decreased. Loans increased $27 million during the year.
We opened five new offices during 2004. The costs of opening these five offices increased our non-interest expense substantially. While the opening of these offices has a short-term negative impact on earnings, they will enhance the long-term profitability of the Bank. We have no plans of opening additional offices in the near future.
Net Interest Income.Net interest income is our largest source of revenue and has been impacted by the very low level of interest rates for the last two years. The Federal Reserve began to lower the target rate for federal funds from six and one half percent to one percent. The one percent rate continued until June 30, 2004 when the Fed began a series of one quarter percent increases on 14 different occasions over the last year and a half to the latest increase in January 2006, which places the target fed funds rate at 4.50%. The Fed is expected to continue increasing the rate several more times before pausing.
Net interest income increased $102,000, as earning assets increased by $14,201 during 2005. Interest expense increased slightly as some deposits have repriced at the higher rates sooner than earning assets have repriced at the higher rates.
The following table shows a summary of the changes in interest income and interest expense resulting from changes in volume and changes in rates for each category of interest-earning assets and interest-bearing liabilities for 2005/2004 and 2004/2003:
(Dollars in thousands) Asset/Liability | 2005 vs 2004 Increase (Decrease) | 2004 vs 2003 Increase (Decrease) | ||||||
Real Estate Loans | $ | 547 | $ | (2,018 | ) | |||
Installment Loans | 29 | (62 | ) | |||||
Commercial Loans | 62 | 1,231 | ||||||
Total Loans | 638 | (849 | ) | |||||
Interest-Bearing Deposits in Other Financial Institutions | 327 | 96 | ||||||
Investment Securities | (652 | ) | (371 | ) | ||||
Federal Funds Sold | 482 | (160 | ) | |||||
Total Earning Assets | 795 | (1,284 | ) | |||||
Interest-Bearing Transactions Accounts | 253 | (63 | ) | |||||
Savings Accounts (Includes MMDAs) | (160 | ) | (101 | ) | ||||
Certificates of Deposit $100,000 and Over | 316 | (56 | ) | |||||
Other Certificates of Deposit | 277 | (604 | ) | |||||
Total Deposits | 686 | (824 | ) | |||||
Notes Issued to the U.S. Treasury | 7 | (2 | ) | |||||
Total Interest-Bearing Liabilities | 693 | (826 | ) | |||||
Change in Net Interest Income | $ | 102 | $ | (458 | ) | |||
2
Table of Contents
The following table details the average balances and cost and yield data for the earning assets and interest-bearing liabilities:
(Dollars in thousands) Asset/Liability | 2005 | 2004 | 2003 | ||||||||||||||||||||||||
| Average Balance | Interest | Yield/ Cost | Average Balance | Interest | Yield/ Cost | Average Balance | Interest | Yield/ Cost | |||||||||||||||||||
Real Estate Loans | $ | 147,319 | $ | 8,697 | 5.90 | % | $ | 141,573 | $ | 8,150 | 5.76 | % | $ | 141,744 | $ | 10,168 | 7.17 | % | |||||||||
Installment Loans | 9,008 | 854 | 9.48 | % | 13,261 | 825 | 6.22 | % | 10,101 | 887 | 8.78 | % | |||||||||||||||
Commercial Loans | 57,172 | 3,178 | 5.56 | % | 40,236 | 3,116 | 7.74 | % | 29,657 | 1,885 | 6.36 | % | |||||||||||||||
Total Loans | 213,499 | 12,729 | 5.96 | % | 195,070 | 12,091 | 6.20 | % | 181,502 | 12,940 | 7.13 | % | |||||||||||||||
Interest-Bearing Deposits in Other Financial Institutions | 21,056 | 784 | 3.72 | % | 19,743 | 457 | 2.31 | % | 15,163 | 361 | 2.38 | % | |||||||||||||||
Investment Securities | 86,982 | 3,159 | 3.63 | % | 101,849 | 3,811 | 3.74 | % | 86,311 | 4,182 | 4.85 | % | |||||||||||||||
Federal Funds Sold | 36,416 | 1,097 | 3.01 | % | 47,935 | 615 | 1.28 | % | 74,617 | 775 | 1.04 | % | |||||||||||||||
Total Earning Assets | 357,953 | 17,769 | 4.96 | % | 364,597 | 16,974 | 4.66 | % | 357,593 | 18,258 | 5.11 | % | |||||||||||||||
Interest-Bearing Transaction Accounts | 38,891 | 493 | 1.27 | % | 35,319 | 240 | 0.68 | % | 31,563 | 303 | 0.96 | % | |||||||||||||||
Savings Accounts (Includes MMDAs) | 79,584 | 1,395 | 1.75 | % | 91,993 | 1,555 | 1.69 | % | 83,768 | 1,656 | 1.98 | % | |||||||||||||||
Certificates of Deposit $100,000 and Over | 36,422 | 1,616 | 4.44 | % | 33,036 | 1,300 | 3.94 | % | 34,100 | 1,356 | 3.98 | % | |||||||||||||||
Other Certificates of Deposit | 139,934 | 4,792 | 3.42 | % | 140,501 | 4,515 | 3.21 | % | 144,619 | 5,119 | 3.54 | % | |||||||||||||||
Total Deposits | 294,831 | 8,296 | 2.81 | % | 300,849 | 7,610 | 2.53 | % | 294,050 | 8,434 | 2.87 | % | |||||||||||||||
Notes Issued to the U.S. Treasury | 347 | 11 | 3.17 | % | 407 | 4 | 0.98 | % | 566 | 6 | 1.06 | % | |||||||||||||||
Total Interest-Bearing Liabilities | $ | 295,178 | $ | 8,307 | 2.81 | % | $ | 301,256 | $ | 7,614 | 2.53 | % | $ | 294,616 | $ | 8,440 | 2.86 | % | |||||||||
Net Interest Income | $ | 9,462 | $ | 9,360 | $ | 9,818 | |||||||||||||||||||||
Net Yield on Earning Assets | 2.64 | % | 2.57 | % | 2.75 | % | |||||||||||||||||||||
Loans.Loans increased from $204 million at year-end 2004 to $232 million at year-end 2005. The composition of the portfolio remained consistent with prior years as real estate secured loans made up 68% of net loans.
The Bank also continues to maintain flexibility in the maturity of the loan portfolio. Nearly half of the loans have adjustable interest rates as of year-end 2005, which is consistent with previous years. In addition, the combination of adjustable-rate and fixed rate loans that adjust or mature within one year equals 31% of the total portfolio, lower than previous years.
Allowance and Provision for Loan Losses.The Allowance for Loan Losses represents management’s estimation of the amount necessary to absorb future losses in the loan portfolio. On the Statement of Condition, the Allowance for Loan Losses is deducted from Total Loans so that the net amount shown represents the estimated realizable total loans. The Provision for Loan Losses is the amount charged to expense to maintain the Allowance at an adequate level.
Based on management’s analysis of the loan portfolio, including non-accruing and impaired loans, the Provision for Loan Losses remained consistent at $240,000 for 2005 and 2004.
(Dollars in thousands) | December 31 | |||||||||||||||||||
| 2005 | 2004 | 2003 | 2002 | 2001 | ||||||||||||||||
Balance Beginning of Year | $ | 2,404 | $ | 2,441 | $ | 1,254 | $ | 1,201 | $ | 1,150 | ||||||||||
Provision for Loan Losses | 240 | 240 | 1,327 | 180 | 180 | |||||||||||||||
Net Loan Losses | ||||||||||||||||||||
Real Estate Loans | (33 | ) | 113 | 112 | — | (16 | ) | |||||||||||||
Installment Loans | 57 | 77 | 15 | 104 | 142 | |||||||||||||||
Commercial Loans | 147 | 87 | 13 | 23 | 3 | |||||||||||||||
Total Net Loan Losses | 171 | 277 | 140 | 127 | 129 | |||||||||||||||
Balance | $ | 2,473 | $ | 2,404 | $ | 2,441 | $ | 1,254 | $ | 1,201 | ||||||||||
Net loan Losses to Average Loans | 0.08 | % | 0.14 | % | 0.08 | % | 0.08 | % | 0.07 | % | ||||||||||
Allowance for Loan Losses to Year-End Loans | 1.07 | % | 1.18 | % | 1.35 | % | 0.71 | % | 0.68 | % | ||||||||||
Nonaccrual loans are those loans contractually past due 90 days or more on which no interest is being accrued. Other real estate owned consists of real estate acquired through foreclosure. These properties are reviewed quarterly and reduced to an estimated realizable value at that time.
3
Table of Contents
Information concerning nonaccrual loans and other real estate owned is presented in the following table:
(Dollars in thousands) Nonaccrual Loans | December 31 | |||||||||||||||||||
| 2005 | 2004 | 2003 | 2002 | 2001 | ||||||||||||||||
Real Estate | $ | 2,875 | $ | 2,966 | $ | 2,875 | $ | — | — | |||||||||||
Installment | 38 | 18 | 22 | 6 | 20 | |||||||||||||||
Commercial | 658 | 488 | — | — | — | |||||||||||||||
Total Nonaccrual Loans | 3,571 | 3,472 | 2,897 | 6 | 20 | |||||||||||||||
Real Estate Owned Other Than Bank Premises | 2,265 | 2,335 | 399 | 613 | 114 | |||||||||||||||
Total Nonperforming Assets | $ | 5,836 | $ | 5,807 | $ | 3,296 | $ | 619 | $ | 134 | ||||||||||
Allowance for Loan Losses to Non-Performing Assets | 42 | % | 42 | % | 74 | % | 203 | % | 896 | % | ||||||||||
The following table presents the volume of loans contractually past due for 90 days or more on which interest continues to be accrued. These loans are believed to be well collateralized and present little or no likelihood of loss of principal:
(Dollars in thousands) Loans 90 Days or More Past Due | 2005 | 2004 | 2003 | 2002 | 2001 | ||||||||||
Real Estate | $ | — | $ | 9 | $ | — | $ | 232 | $ | 427 | |||||
Installment | 31 | 16 | 27 | 6 | 15 | ||||||||||
Commercial | — | — | — | — | 11 | ||||||||||
Total Loans 90 Days or More Past Due | $ | 31 | $ | 25 | $ | 27 | $ | 238 | $ | 453 | |||||
Non-interest Income.Non-interest Income equaled $1,270,000 for 2005, a decrease from $1,492,000 in 2004. The principal component of non-interest income is service charges on deposit accounts, which equaled $1,100,000 for 2005 compared to $1,207,000 for 2004.
Non-interest Expense.Non-interest expense increased slightly during the year. Salaries and employee benefits, which are the largest of these expenses, increased slightly during the year.
Investments.Total investment securities increased from $72 million at year-end 2004 to $94 million at year-end 2005. With interest rates at levels never seen before in recent times, the Bank increased investments in U. S. Agency securities, where higher yields were available, while reducing Interest-Bearing Deposits in Other Financial Institutions.
Deposits.Total deposits grew $16 million, or 5%, during the year. In addition, there has been a slight shift in the composition of our deposits as customers have moved their funds from shorter-term accounts into Certificate of Deposits. Total time deposits and Lifetime Free Checking increased during the year while all other deposit categories decreased.
Interest Sensitivity Analysis.The frequency with which interest rates on earning assets and interest bearing liabilities change has a significant impact on net interest income. The following table presents the anticipated changes based on the contractual maturity of each instrument. Expected maturities may differ from contractual maturities as both borrowers and depositors may have the right to call or prepay obligations with or without call or prepayment penalties.
(Dollars in thousands) Use of Funds | Within One Year | One to Five Years | Over Five Years | Total | ||||||||||
Interest-Bearing Deposits in Other Financial Institutions | $ | 21,178 | $ | 1,287 | $ | — | $ | 22,465 | ||||||
Investment Securities | 34,644 | 59,008 | — | 93,652 | ||||||||||
Federal Funds Sold | 26,600 | — | — | 26,600 | ||||||||||
Loans | 71,290 | 76,145 | 84,942 | 232,377 | ||||||||||
Total Earning Assets | $ | 153,712 | $ | 136,440 | $ | 84,942 | $ | 375,094 | ||||||
Deposits | ||||||||||||||
Interest-Bearing Demand | $ | 60,019 | $ | — | $ | — | $ | 60,019 | ||||||
Regular Passbook Savings | 58,031 | — | — | 58,031 | ||||||||||
Time Deposits | ||||||||||||||
Certificates of Deposit $100,000 and Over | 18,130 | 21,999 | — | 40,129 | ||||||||||
Other | 66,524 | 76,725 | — | 143,249 | ||||||||||
Total Interest-Bearing Deposits | 202,704 | 98,724 | — | 301 ,428 | ||||||||||
Notes issued to the U. S. Treasury | 948 | — | — | 948 | ||||||||||
Total Interest-Bearing Liabilities | $ | 203,652 | $ | 98,724 | — | $ | 302,376 | |||||||
Maturity/Rate Sensitivity Gap Per Period | $ | (49,940 | ) | $ | 37,716 | $ | 84,942 | $ | 72,718 | |||||
Cumulative Maturity/Rate Sensitivity Gap | $ | (49,940 | ) | $ | (12,224 | ) | $ | 72,718 | ||||||
4
Table of Contents
Capital.The federal regulatory agencies use risk-based capital ratios to analyze the adequacy of a bank’s capital. These ratios weigh bank assets from 0% to 100% depending upon the risks inherent in each type of asset. The Bank continues to meet all requirements for a well-capitalized bank as defined by the regulatory agencies. The following table presents the key risk-based capital ratios for December 31, 2005 and 2004. Additional details regarding capital may be found in the footnotes of the Financial Statements.
| 2005 | 2004 | |||||
Tier 1 Ratio | 10.16 | % | 10.63 | % | ||
Total Risk-Based Capital Ratio | 11.22 | % | 11.73 | % | ||
Leverage Ratio | 6.22 | % | 6.04 | % |
Liquidity.Liquidity is our ability to fund both loans and investments in the normal course of business and to provide adequate protection for unexpected deposit withdrawals or other demands for funds without incurring a significant negative impact on profitability. Our primary source of day-to-day liquidity lies in the combination of cash, deposit balances, checks in process of collection, deposit growth, and Federal Funds sold. Federal funds are excess funds that are sold to other banks, generally on a one-day basis. Normal funds from the repayment of loans and investments augment these funds.
Our secondary source of liquidity lies in our investments and deposits in other financial institutions. While our investments are categorized as held-to-maturity, they consist of short-term United States Government Agencies that are readily marketable. As reflected in the previous Interest Sensitivity Analysis, the majority of our investment securities mature in five years or less. Interest-bearing deposits in other financial institutions generally mature in two years or less and the volume of this investment decreased $2 million during the year.
Management’s Responsibility for Financial Reporting
The management of Patrick Henry National Bank has prepared and is responsible for the accompanying financial statements, together with the financial data and other information presented in this annual report. Management believes that the financial statements have been prepared in conformity with accounting principles generally accepted in the United States of America appropriate under the circumstances and include amounts that are based on management’s best estimates and judgments.
Management maintains and depends upon an internal accounting control system designed to provide reasonable assurance that transactions are executed in accordance with management’s authorization, that financial records are reliable as the basis for preparation of all financial statements, and that the Bank’s assets are safeguarded. The design and implementation of all systems of internal control are based on judgments required to evaluate the costs of control in relation to the expected benefits and to determine the appropriate balance between these costs and benefits. The Bank maintains a professional internal audit staff to monitor compliance with the system of internal control. Operational and special audits are conducted, and audit reports are submitted to appropriate management.
The Board of Directors functions as the audit committee and meets periodically with the independent public accountants, Goodman & Company, management and internal auditors to review accounting, auditing and internal reporting matters. The independent public accountants and internal auditors have free access to the Board, to discuss the results of their audit work and their evaluations of internal controls and the quality of financial reporting.
The responsibility of Goodman & Company is limited to an expression of their opinion as to the fairness of the financial statements. Their opinion is based on an audit conducted in accordance with Standards of the Public Company Accounting Oversight Board (United States), as described in their report.
Worth Harris Carter, Jr.
Chairman of the Board, President and
Chief Financial Officer
5
Table of Contents

Certified Public Accountants
Specialized Services
Business Solutions
Report of Independent Registered Public Accounting Firm
Board of Directors and Shareholders
Patrick Henry National Bank
We have audited the accompanying statements of financial condition ofPatrick Henry National Bank (Bank) as of December 31, 2005 and 2004, and the related statements of income, shareholders’ equity and cash flows for each of the years in the three-year period ended December 31, 2005. These financial statements are the responsibility of the Bank’s management. Our responsibility is to express an opinion on these financial statements based on our audits.
We conducted our audits in accordance with the standards of the Public Company Accounting Oversight Board (United States). Those standards require that we plan and perform the audits to obtain reasonable assurance about whether the financial statements are free of material misstatement. An audit includes examining, on a test basis, evidence supporting the amounts and disclosures in the financial statements. An audit also includes assessing the accounting principles used and significant estimates made by management, as well as evaluating the overall financial statement presentation. We believe that our audits provide a reasonable basis for our opinion.
In our opinion, the financial statements referred to above present fairly, in all material respects, the financial positionof Patrick Henry National Bankas of December 31, 2005 and 2004, and the results of its operations and its cash flows for each of the years in the three-year period ended December 31, 2005, in conformity with accounting principles generally accepted in the United States of America.
 |
| Danville, Virginia |
| March 1, 2006 |
110 Exchange Street, Suite G
Danville, VA 24541
ph: 434.792.5334
fax: 434.791.6061
www.goodmanco.com
6
Table of Contents
Statements of Financial Condition
(Dollars in Thousands)
| December 31 | ||||||||
| 2005 | 2004 | |||||||
ASSETS: | ||||||||
Interest-Bearing Deposits in Other Financial Institutions | $ | 22,465 | $ | 24,941 | ||||
Investment Securities (Fair Value $92,484 in 2005, $71,888 in 2004) | 93,652 | 72,011 | ||||||
Federal Funds Sold | 26,600 | 58,955 | ||||||
Loans (Net of Unearned Income) | 231,733 | 204,273 | ||||||
Less: Allowance for Loan Losses | (2,473 | ) | (2,404 | ) | ||||
Net Loans | 229,260 | 201,869 | ||||||
Earning Assets | 371,977 | 357,776 | ||||||
Cash and Due from Banks | 13,593 | 10,762 | ||||||
Bank Premises and Equipment | 4,899 | 5,104 | ||||||
Real Estate Owned Other Than Bank Premises | 2,265 | 2,335 | ||||||
Investment in Associated Company | 769 | 618 | ||||||
Other Assets | 4,020 | 3,625 | ||||||
TOTAL ASSETS | $ | 397,523 | $ | 380,220 | ||||
LIABILITIES: | ||||||||
Deposits: | ||||||||
LIFETIME FREE CHECKING | $ | 70,458 | $ | 62,528 | ||||
Interest-Bearing Demand | 60,019 | 62,082 | ||||||
Regular Passbook Savings | 58,031 | 59,621 | ||||||
Time Deposits: | ||||||||
Certificates of Deposit $100,000 and Over | 40,129 | 31,947 | ||||||
Other | 143,249 | 139,325 | ||||||
TOTAL DEPOSITS | 371,886 | 355,503 | ||||||
Notes Issued to the U.S. Treasury | 948 | 973 | ||||||
Other Liabilities | 839 | 589 | ||||||
TOTAL LIABILITIES | 373,673 | 357,065 | ||||||
SHAREHOLDERS’ EQUITY: | ||||||||
Common Stock, Par Value Per Share $1.25; 10,000,000 shares authorized; 2,800,122 shares outstanding in 2005 and 2004 | 3,500 | 3,500 | ||||||
Surplus | 13,879 | 13,879 | ||||||
Undivided Profits | 6,471 | 5,776 | ||||||
TOTAL SHAREHOLDERS’ EQUITY | 23,850 | 23,155 | ||||||
TOTAL LIABILITIES AND SHAREHOLDERS’ EQUITY | $ | 397,523 | $ | 380,220 | ||||
The accompanying notes are an integral part of these financial statements.
7
Table of Contents
Statements of Income
(Dollars in Thousands Except Per Share Data)
| Years Ended December 31 | |||||||||
| 2005 | 2004 | 2003 | |||||||
INTEREST INCOME: | |||||||||
Interest and Fees on Loans: | |||||||||
Taxable | $ | 11,842 | $ | 11,613 | $ | 12,728 | |||
Non-Taxable | 887 | 478 | 212 | ||||||
Interest on Deposits in Other Financial Institutions | 784 | 457 | 361 | ||||||
Interest on Federal Funds Sold | 1,097 | 615 | 775 | ||||||
Interest and Dividends on Securities: | |||||||||
U.S. Agency Securities and Other | 3,137 | 3,670 | 4,017 | ||||||
States and Political Subdivisions | 22 | 141 | 165 | ||||||
TOTAL INTEREST INCOME | 17,769 | 16,974 | 18,258 | ||||||
INTEREST EXPENSE: | |||||||||
Interest on Time Deposits $100,000 and Over | 1,616 | 1,300 | 1,356 | ||||||
Interest on Other Deposits | 6,680 | 6,310 | 7,078 | ||||||
Interest on Notes to the U.S. Treasury | 11 | 4 | 6 | ||||||
TOTAL INTEREST EXPENSE | 8,307 | 7,614 | 8,440 | ||||||
NET INTEREST INCOME | 9,462 | 9,360 | 9,818 | ||||||
Provision for Loan Losses | 240 | 240 | 1,327 | ||||||
NET INTEREST INCOME AFTER PROVISION FOR LOAN LOSSES | 9,222 | 9,120 | 8,491 | ||||||
NON-INTEREST INCOME: | |||||||||
Service Charges, Commission and Fees | 1,100 | 1,207 | 1,217 | ||||||
Other Non-Interest Income | 170 | 285 | 157 | ||||||
TOTAL NON-INTEREST INCOME | 1,270 | 1,492 | 1,374 | ||||||
NON-INTEREST EXPENSE: | |||||||||
Salaries and Employee Benefits | 4,397 | 4,352 | 3,806 | ||||||
Occupancy Expense | 1,087 | 1,012 | 886 | ||||||
Operations Center Expense | 1,700 | 1,562 | 1,498 | ||||||
FDIC Assessment | 48 | 52 | 53 | ||||||
Other Non-Interest Expense | 791 | 726 | 676 | ||||||
TOTAL NON-INTEREST EXPENSE | 8,023 | 7,704 | 6,919 | ||||||
INCOME BEFORE INCOME TAXES | 2,469 | 2,908 | 2,946 | ||||||
Income Tax Expense | 542 | 806 | 896 | ||||||
NET INCOME | $ | 1,927 | $ | 2,102 | $ | 2,050 | |||
NET INCOME PER SHARE*: | |||||||||
Basic and Diluted | $ | 0.69 | $ | 0.75 | $ | 0.73 | |||
| * | Net Income per share has been retroactively adjusted to reflect the stock dividend in 2003. |
The accompanying notes are an integral part of these financial statements.
8
Table of Contents
Statements of Cash Flows
(Dollars in Thousands)
| Years Ended December 31 | ||||||||||||
| 2005 | 2004 | 2003 | ||||||||||
Cash Flows From Operating Activities: | ||||||||||||
Net Income | $ | 1,927 | $ | 2,102 | $ | 2,050 | ||||||
Adjustments to reconcile to net cash from operating activities: | ||||||||||||
Provision for Loan Losses | 240 | 240 | 1,327 | |||||||||
Depreciation of Premises and Equipment | 350 | 276 | 199 | |||||||||
Provision for Deferred Income Taxes | (21 | ) | 155 | (388 | ) | |||||||
Equity in Undistributed Income from Associated Company | (1 | ) | (11 | ) | (10 | ) | ||||||
(Decrease) in Unearned Income | (9 | ) | (32 | ) | (157 | ) | ||||||
(Increase) Decrease in Other Assets | (395 | ) | (304 | ) | 198 | |||||||
Increase (Decrease) in Other Liabilities | 271 | 16 | (29 | ) | ||||||||
Net Cash From Operating Activities | 2,362 | 2,442 | 3,190 | |||||||||
Cash Flows From Investing Activities: | ||||||||||||
Maturity of Interest-Bearing Deposits | 20,006 | 15,046 | 13,957 | |||||||||
Purchase of Interest-Bearing Deposits | (17,530 | ) | (25,140 | ) | (14,847 | ) | ||||||
Purchase of Investment Securities | (34,089 | ) | (30,000 | ) | (54,012 | ) | ||||||
Proceeds from maturities, calls and redemptions of Investment Securities | 12,448 | 70,927 | 38,936 | |||||||||
Purchase of Bank Premises and Equipment | (145 | ) | (1,012 | ) | (1,316 | ) | ||||||
Net Increase in Short-Term Loans Outstanding, Net | (12,155 | ) | (18,767 | ) | (17,372 | ) | ||||||
Longer-Term Loans Originated or Purchased | (42,143 | ) | (39,525 | ) | (34,174 | ) | ||||||
Principal Collected on Longer-Term Loans | 26,676 | 32,690 | 47,961 | |||||||||
Sale of Other Real Estate | 70 | — | 214 | |||||||||
Investment in Associated Company | (150 | ) | — | (199 | ) | |||||||
Net Cash From Investing Activities | (47,012 | ) | 4,219 | (20,852 | ) | |||||||
Cash Flows From Financing Activities: | ||||||||||||
Net Increase in Demand and Savings Accounts | 4,277 | 5,382 | 28,431 | |||||||||
Proceeds from Sale of Time Deposits | 122,588 | 107,591 | 115,460 | |||||||||
Payments on Matured Time Deposits | (110,482 | ) | (111,113 | ) | (119,789 | ) | ||||||
Cash Dividends | (1,232 | ) | (1,231 | ) | (1,149 | ) | ||||||
Stock Dividends | — | — | (9 | ) | ||||||||
Net Increase (Decrease) in Notes Issued to U.S. Treasury | (25 | ) | 183 | (3,501 | ) | |||||||
Net Cash From Financing Activities | 15,126 | 812 | 19,443 | |||||||||
Net Change in Cash and Equivalents | (29,524 | ) | 7,473 | 1,781 | ||||||||
Cash and Equivalents at Beginning of Year | 69,717 | 62,244 | 60,463 | |||||||||
Cash and Equivalents at End of Year | $ | 40,193 | $ | 69,717 | $ | 62,244 | ||||||
Supplementary Data: | ||||||||||||
Cash Paid for Interest | $ | 8,052 | $ | 7,621 | $ | 8,494 | ||||||
Cash Paid for Income Taxes | 542 | 806 | 896 | |||||||||
Transfer of Loans to Foreclosed Assets | 120 | 1,934 | 17 | |||||||||
The accompanying notes are an integral part of these financial statements.
9
Table of Contents
Statements of Changes in Shareholders’ Equity
(Dollars in Thousands)
| COMMON STOCK | SURPLUS | UNDIVIDED PROFITS | ||||||||||
| SHARES | AMOUNT | |||||||||||
Year Ended December 31, 2003 | ||||||||||||
Balance at Beginning of Year | 2,546,169 | $ | 3,183 | $ | 10,641 | $ | 7,568 | |||||
Net Income | — | — | — | 2,050 | ||||||||
Stock Dividends (10%) | 253,953 | 317 | 3,238 | (3,564 | ) | |||||||
Cash Dividends $0.41 per share* | — | — | — | (1,149 | ) | |||||||
Total | 2,800,122 | $ | 3,500 | $ | 13,879 | $ | 4,905 | |||||
Year Ended December 31, 2004 | ||||||||||||
Balance at Beginning of Year | 2,800,122 | $ | 3,500 | $ | 13,879 | $ | 4,905 | |||||
Net Income | — | — | — | 2,102 | ||||||||
Cash Dividends $0.44 per share* | — | — | — | (1,231 | ) | |||||||
Total | 2,800,122 | $ | 3,500 | $ | 13,879 | $ | 5,776 | |||||
Year Ended December 31, 2005 | ||||||||||||
Balance at Beginning of Year | 2,800,122 | $ | 3,500 | $ | 13,879 | $ | 5,776 | |||||
Net Income | — | — | — | 1,927 | ||||||||
Cash Dividends $0.44 per share* | — | — | — | (1,232 | ) | |||||||
Total | 2,800,122 | $ | 3,500 | $ | 13,879 | $ | 6,471 | |||||
| * | Cash dividends per share have been retroactively restated to reflect the stock dividend in 2003. |
The accompanying notes are an integral part of these financial statements.
10
Table of Contents
Notes to Financial Statements
(Dollars in Thousands in Charts Except Per Share Data)
1. SUMMARY OF SIGNIFICANT ACCOUNTING POLICIES
The accounting and reporting policies of Patrick Henry National Bank are in accordance with accounting principles generally accepted in the United States of America and general practices within the banking industry that are consistent with reports filed with regulatory agencies.
NATURE OF OPERATIONS
The Bank generates commercial (including agricultural), mortgage and consumer loans and receives deposits from customers located primarily in Henry and Patrick counties and the City of Martinsville in Virgina and Randolph and Rockingham counties and the City of Greensboro in North Carolina. The Bank operates under a national charter and provides full banking services. As a national bank, the Bank is subject to regulation by the Comptroller of the Currency, Federal Deposit Insurance Corporation, and the Board of Governors of the Federal Reserve System.
USE OF ESTIMATES
The preparation of financial statements in conformity with accounting principles generally accepted in the United States of America requires management to make estimates and assumptions that affect the reported amounts of assets and liabilities and disclosure of contingent assets and liabilities at the date of the financial statements, and the reported amounts of revenue and expenses during the reporting period. Actual results could differ from those estimates. Material estimates that are particularly susceptible to significant change in the near term relate to the determination of the allowance for loan losses and fair value of other real estate owned.
CASH AND CASH EQUIVALENTS
For purposes of cash flows, cash and cash equivalents include cash on hand, demand balances due from banks and federal funds transactions. Generally, federal funds are purchased and sold for one-day periods.
SECURITIES
Investment securities are stated at cost, adjusted for amortization of premiums and accretion of discounts, and computed by the interest method. The Bank has the positive intent and ability to hold these securities until maturity. Gains and losses on sales, if any, of securities are based upon the adjusted cost of the specific securities sold.
LOANS
Loans are recorded at the amount of the loan disbursed to borrowers plus the applicable amount, if any, of unearned income and other charges, less payments received. Income earned on loans is recognized by methods which generally result in level rates of return on principal amounts outstanding. The net amount of nonrefundable loan origination fees approximates the direct costs associated with the lending process.
The allowance for loan losses is an estimate of losses inherent in the loan portfolio as determined by management taking into consideration historical loan loss experience, diversification of the loan portfolio, amounts of secured and unsecured loans, banking industry standards and averages, and general economic conditions. Ultimate losses may vary from current estimates. These estimates are reviewed periodically and as adjustments become necessary, they are reported in earnings in the periods in which they become reasonably estimable.
Management determines loan impairment using guidelines established by Statement of Financial Accounting Standards No. 114 (SFAS 114), “Accounting by Creditors for Impairment of a Loan (as amended by SFAS No. 118, Accounting by Creditors for Impairment of a Loan—Income Recognition and Disclosures)”. Under this accounting standard, a loan is considered to be impaired when it is probable that the Bank will be unable to collect all principal and interest amounts according to the contractural terms of the loan agreement. A performing loan may be considered impaired. The allowance for loan losses related to loans identified as impaired is primarily based on the excess of the loan’s current outstanding principal balance over the estimated fair value of the related collateral. For a loan that is not collateral-dependent, the allowance is recorded at the amount by which the outstanding principal balance exceeds the current best estimate of the future cash flows on the loan discounted at the loan’s original effective interest rate. Interest on impaired loans is recognized when cash is received.
BANK PREMISES AND EQUIPMENT
Premises and equipment are stated at cost, less accumulated depreciation. Depreciation is charged to operating expenses over the estimated useful life of the assets by the accelerated and straight-line methods. Costs of maintenance or repairs are charged to expense as incurred and improvements are capitalized. Upon retirement or disposal of an asset, the asset and related allowance account are eliminated. Any gain or loss on such transactions is included in current operations. Depreciation has been included under Occupancy Expense in the Statements of Income in the amount of $350,000 in 2005, $276,000 in 2004, and $199,000 in 2003.
OTHER REAL ESTATE OWNED
Real estate properties acquired through or in lieu of loan foreclosure are initially recorded at the lower of the Bank’s carrying amount or fair value less estimated selling cost at the date of foreclosure. Any write-downs based on the asset’s fair value at the date of acquisition are charged to the allowance for loan losses. After foreclosure, these assets are carried at the lower of their new cost basis or fair value less cost to sell. Costs of significant property improvements are capitalized, whereas costs relating to holding property are expensed. Valuations are periodically performed by management, and any write-downs are recorded as a charge to operations, if necessary, to reduce the carrying value of a property to the lower of its carrying value or fair value less cost to sell.
INCOME TAXES
Deferred taxes are provided on a liability method whereby deferred tax assets are recognized for deductible temporary differences and operating loss and tax credit carryforwards and deferred tax liabilities are recognized for taxable temporary differences. Temporary differences are the differences between the reported amounts of assets and liabilities and their tax bases. Deferred tax assets are reduced by a valuation allowance when, in the opinion of management, it is more likely than not that some portion or all of the deferred tax assets will not be realized. Deferred tax assets and liabilities are adjusted for the effects of changes in tax laws and rates on the date of enactment.
RETIREMENT BENEFITS
The Bank has established an Employee Benefit Plan as described in footnote 5. The Bank does not provide any other post-retirement benefits that would be accrued under Statement of Financial Accounting Standards No. 106, “Employers’ Accounting for Post Retirement Benefits Other Than Pensions”.
2. INVESTMENT SECURITIES
The carrying value of securities pledged to secure public deposits was $93,652,000 and $71,322,000, respectively, at December 31, 2005 and 2004. The amortized cost and estimated fair value of investment securities as of December 31, 2005 and 2004 were as follows:
December 31 , 2005 | Amortized Cost | Gross Unrealized Gains | Gross Unrealized Losses | Estimated Fair Value | ||||||||
U. S. Agency Securities | $ | 93,652 | $ | 21 | $ | 1,189 | $ | 92,484 | ||||
December 31 , 2004 | ||||||||||||
U. S. Agency Securities | $ | 71,322 | $ | 387 | $ | 530 | $ | 71,179 | ||||
Obligations of States and Political Subdivisions | 689 | 20 | — | 709 | ||||||||
Total | $ | 72,011 | $ | 407 | $ | 530 | $ | 71,888 | ||||
The table on the preceding page shows gross unrealized losses and fair value, aggregated by investment category and length of time that individual securities have been in a continuous unrealized loss position at December 31, 2005 and 2004.
11
Table of Contents
2005 Securities Description | Fair Value | Unrealized Loss | |||||||
| Less than 12 Months | More than 12 Months | ||||||||
U. S. Agency Securities | $ | 28,762 | $ | 226 | $ | — | |||
U. S. Agency Securities | 53,478 | — | 963 | ||||||
Total | $ | 82,240 | $ | 226 | $ | 963 | |||
2004 Securities Description | Fair Value | Less than 12 Months | More than 12 Months | ||||||
U. S. Agency Securities | $ | 41,592 | $ | 453 | $ | — | |||
U. S. Agency Securities | 9,923 | — | 77 | ||||||
Total | $ | 51,515 | $ | 453 | $ | 77 | |||
The unrealized losses on the Bank’s investments in obligations of U. S. Government Agencies were caused by interest rate increases. The contractual terms of those investments do not permit the issuer to settle the securities at a price less than the amortized cost of the investment. Because the Bank has the ability and intent to hold those investments until a recovery of fair value, which may be maturity, the Bank does not consider those investments to be other-than-temporarily impaired at December 31, 2005.
Amortized cost and estimated fair value of investments in debt securities at December 31, 2005 and 2004, by contractual maturity, are shown below. Expected maturities will differ from contractual maturities because issuers may have the right to call or prepay obligations with or without call or pre-payment penalties.
| December 31, 2005 | December 31, 2004 | |||||||||||
| Estimated Amortized Cost | Fair Value | Estimated Amortized Cost | Fair Value | |||||||||
Due in One Year or Less | $ | 34,644 | $ | 34,430 | $ | 3,199 | $ | 3,225 | ||||
Due After One Year Through Five Years | 59,008 | 58,054 | 68,812 | 68,663 | ||||||||
Due After Five Years Through Ten Years | — | — | — | — | ||||||||
Due After Ten Years | — | — | — | — | ||||||||
Total | $ | 93,652 | $ | 92,484 | $ | 72,011 | $ | 71,888 | ||||
There were no sales of securities during 2005, 2004, or 2003.
3. COMPOSITION OF LOANS
| December 31 | ||||||||
| 2005 | 2004 | |||||||
Real Estate | $ | 155,701 | $ | 141,844 | ||||
Consumer | 9,790 | 8,971 | ||||||
Commercial, Industrial and Agricultural | 32,173 | 31,634 | ||||||
All Other | 34,713 | 22,477 | ||||||
Gross Loans | 232,377 | 204,926 | ||||||
Less: Unearned Income | (644 | ) | (653 | ) | ||||
Allowance for Loan Losses | (2,473 | ) | (2,404 | ) | ||||
Total Loans, Net | $ | 229,260 | $ | 201,869 | ||||
Maturity Distribution | 2005 | 2004 | ||||||
Variable | ||||||||
Less Than One Year | $ | 19,454 | $ | 77,634 | ||||
One to Five Years | 54,192 | 3,756 | ||||||
Over Five Years | 22,496 | 4,015 | ||||||
Subtotal | 96,142 | 85,405 | ||||||
Fixed | ||||||||
Less Than One Year | 51,837 | 46,118 | ||||||
One to Five Years | 22,000 | 32,151 | ||||||
Over Five Years | 62,398 | 41 ,252 | ||||||
Subtotal | 136,235 | 119,521 | ||||||
Total | $ | 232,377 | $ | 204,926 | ||||
4. ALLOWANCE FOR LOAN LOSSES
In the view of management, the Allowance for Loan Losses is adequate to meet the loss contingency based on experience factors and a review of the loan portfolio.
The Allowance for Loan Losses for the years ending December 31, 2005, 2004 and 2003 is summarized below:
| 2005 | 2004 | 2003 | ||||||||||
Balance at beginning of year | $ | 2,404 | $ | 2,441 | $ | 1,254 | ||||||
Recoveries credited during year | 109 | 19 | 40 | |||||||||
Provision for loan losses | 240 | 240 | 1,327 | |||||||||
Losses charged to allowance | (280 | ) | (296 | ) | (180 | ) | ||||||
Balance at end of year | $ | 2,473 | $ | 2,404 | $ | 2,441 | ||||||
The following is a summary of information pertaining to impaired and non-accrual loans:
| December 31 | ||||||
| 2005 | 2004 | |||||
Impaired loans without a valuation allowance | $ | — | $ | 141 | ||
Impaired loans with a valuation allowance | 2,875 | 2,875 | ||||
Total impaired loans | $ | 2,875 | $ | 3,016 | ||
Valuation allowance related to impaired loans | $ | 1,147 | $ | 1,147 | ||
Nonaccrual loans (impaired) | 2,875 | 2,875 | ||||
Nonaccrual loans (non-impaired) | 696 | 597 | ||||
Total loans past due ninety days or more and still accruing | $ | 31 | $ | 25 | ||
| Years Ended December 31 | |||||||||
| 2005 | 2004 | 2003 | |||||||
Average investment in impaired loans | $ | 2,875 | $ | 6,417 | $ | 1,367 | |||
Interest income recognized on impaired loans | $ | — | $ | 289 | $ | — | |||
Interest income recognized on a cash basis on impaired loans | $ | — | $ | 212 | $ | — | |||
5. STOCK OPTIONS AND EMPLOYEE BENEFIT PLANS
There were no stock options or stock option plans in effect for 2003, 2004, or 2005.
The Bank has adopted an integrated profit sharing plan. Employees participate in the profit sharing plan following completion of six (6) months of service and upon reaching the age of twenty years and six months as of January 1. Vesting includes years of service to the Bank prior to the effective date of the plan. The plan gives 0% vesting to anyone who has less than five (5) years of service except that persons who have reached the age of 62 are fully vested regardless of length of service. Each participant in the plan (who has not reached age 62) becomes 100% vested after five (5) years of service. The contribution to the plan is determined each year by the Board of Directors and thus may fluctuate in amount from year to year. The contribution by the Bank was $163,000 in 2005, $151,000 in 2004, and $155,000 in 2003 and is included in Salaries and Employee Benefits in the Statements of Income.
6. FEDERAL AND STATE INCOME TAXES
Net deferred tax assets consist of the following components as of December 31, 2005 and 2004:
Deferred Tax Assets | 2005 | 2004 | ||||
Allowance for Loan Losses | $ | 739 | $ | 717 | ||
Dividend Exclusion | 86 | 85 | ||||
Other | 31 | — | ||||
Total Deferred Tax Assets | $ | 856 | $ | 802 | ||
Deferred Tax Liabilities | ||||||
Bank Premises | $ | 411 | $ | 337 | ||
Investment in Associated Companies | 101 | 100 | ||||
Total Deferred Tax Liabilities | $ | 512 | $ | 437 | ||
Net Deferred Taxes | $ | 344 | $ | 365 | ||
The provisions for income taxes charged to operations for the years ended December 31, 2005, 2004 and 2003 consist of the following:
| 2005 | 2004 | 2003 | |||||||||
Currently payable-Federal | $ | 553 | $ | 651 | $ | 1,266 | |||||
Currently payable-North Carolina | 10 | — | 18 | ||||||||
Deferred | (21 | ) | 155 | (388 | ) | ||||||
Net Provision | $ | 542 | $ | 806 | $ | 896 | |||||
The income tax provision differs from the amount of income tax determined by applying the U.S. federal income tax rate to pretax income for the years ended December 31, 2005, 2004 and 2003 due to the following:
| 2005 | 2004 | 2003 | ||||||||||
Tax provisions computed by applying federal rates to income before income taxes | $ | 839 | $ | 989 | $ | 1,002 | ||||||
North Carolina | — | — | 18 | |||||||||
Tax exempt interest | (309 | ) | (202 | ) | (129 | ) | ||||||
Other | 12 | 19 | 5 | |||||||||
Net Provision | $ | 542 | $ | 806 | $ | 896 | ||||||
7. RELATED PARTY TRANSACTIONS
The Chairman of the Board of Patrick Henry National Bank also serves as Chairman of the Board of Blue Ridge Bank, N. A., Central National Bank, Community National Bank, First National Bank, First National Exchange Bank, Mountain National Bank, Patriot Bank, N. A., Peoples National Bank, and Shenandoah National Bank.
The Bank participates in loan transactions with these banks. These transactions are at carrying value and do not involve more than the normal risk of collectibility or present other unfavorable features.
12
Table of Contents
The Bank owns ten percent of the outstanding common stock of The Mortgage Company of Virginia, Inc. The remaining common stock is equally owned by the banks listed above. The Mortgage Company of Virginia owns 100% of Bank Services of Virginia, Inc. The business of both of these companies is to provide operational support services to the ten banks. These services consist of mortgage loan servicing, data processing, bookkeeping, check clearing, accounting, investment management, bank couriers, advertising programs, central purchasing and other management services. The Bank is charged for its share of these services, which is recorded as Operation Center expense in the Statements of Income. The cost of this expense is shared by the ten banks on the basis of average deposits of each bank related to total average deposits of all the banks.
The Mortgage Company of Virginia, Inc. also owns 100% of Bank Services Insurance, Inc. Bank Services Insurance, Inc. provides insurance products to the banks and customers in the Danville area. The premiums paid to Bank Services Insurance, Inc. equaled $42,000 for 2005.
The Mortgage Company of Virginia, Inc. also owns 50% of Coresoft, Inc. represented by an initial $1,000 investment during 2004. Coresoft, Inc. is in the process of developing a core software package the banks listed above will use. At December 31, 2005, Coresoft, Inc. had an outstanding note payable to the Mortgage Company of $1,400,000.
The Bank records its investment in the common stock of The Mortgage Company of Virginia, Inc. under the equity method of accounting due to the influence the Bank has over the company. The Bank invested an additional $150,000 in 2005 increasing the value of the investment to $769,000 from $618,000 at December 31, 2004. The Bank’s share of earnings of the company equaled $1,000 for 2005, $11,000 in 2004, $10,000 for 2003 and is shown in the Statements of Income as Other Non-interest Income.
The Chairman of the Board and President of the Bank also serves as Chairman of the Board and President of Bank Building Corporation and Manager of Blackstone Properties, LLC, its wholly owned subsidiary (the “companies”). The companies lease branches to certain of the banks listed above. At December 31, 2005, the Bank leased six offices from the companies. Rental expense and future lease payments under these leases are disclosed in a footnote below. As of December 31, 2005 and 2004, the Bank had loans totaling $4,000,000 and $4,170,000, respectively, to the companies. These loans were made to purchase bank branches leased to affiliated banks and other investment property. The loans are secured by these branches and the related leases and other investment property, and have repayment terms similar to other loan customers of the Bank.
In the ordinary course of business, directors, and their related interests were customers of, and had transactions with the Bank. Loan transactions with directors and officers, principal security holders and associates were made on substantially the same terms as those prevailing at the time for comparable loans to other persons and did not involve more than normal risk of collectibility or present other unfavorable features. A summary of these transactions is presented below.
| 2005 | 2004 | |||||||
Beginning Balance | $ | 10,160 | $ | 7,116 | ||||
New Loans | 568 | 5,224 | ||||||
Repayments | (1,043 | ) | (2,180 | ) | ||||
Ending Balance | $ | 9,685 | 10,160 | |||||
8. CONTINGENCIES
The Bank did not have any legal matters of financial significance pending at December 31, 2005 or 2004.
9. EARNINGS PER COMMON SHARE
The Bank follows Statement of Financial Accounting Standards (SFAS) No. 128, “Earnings Per Share”. This statement requires the dual presentation of basic and diluted earnings per share. The weighted average number of shares used to compute earnings per share was 2,800,122.
The Bank issued a 10% stock dividend in 2003, and none in 2004 or 2005. No fractional shares were issued in this stock dividend. Stock dividends and fractional shares were settled based on known prices for recent trades of the stock and other factors deemed relevant at the time.
10. BANK PREMISES AND EQUIPMENT
Premises and equipment are stated at cost less accumulated depreciation as follows:
December 31. 2005 | Cost | Accumulated Depreciation and Amortization | Net Remaining Cost | ||||||
Bank Premises (Including Land of $840,000) | $ | 4,552 | $ | 1,043 | $ | 3,509 | |||
Equipment | 2,277 | 887 | 1,390 | ||||||
Total | $ | 6,829 | $ | 1,930 | $ | 4,899 | |||
December 31, 2004 | |||||||||
Bank Premises (Including Land of $840,000) | $ | 4,537 | $ | 940 | $ | 3,597 | |||
Equipment | 2,256 | 749 | 1,507 | ||||||
Total | $ | 6,793 | $ | 1,689 | $ | 5,104 | |||
11. FORECLOSED ASSETS
Expenses applicable to foreclosed assets include the following:
| Years Ended December 31 | |||||||||
| 2005 | 2004 | 2003 | |||||||
Net loss (gain) on sales of real estate | $ | — | $ | — | $ | — | |||
Provision for losses | — | — | — | ||||||
Operating expenses | 27 | 4 | 11 | ||||||
12. CASH AND CASH EQUIVALENTS
Cash and cash equivalents as of December 31, 2005, 2004 and 2003 are detailed below:
| 2005 | 2004 | 2003 | |||||||
Cash and Due From Banks | $ | 13,593 | $ | 10,762 | $ | 14,384 | |||
Federal Funds Sold | 26,600 | 58,955 | 47,860 | ||||||
Total Cash and Cash Equivalents | $ | 40,193 | $ | 69,717 | $ | 62,244 | |||
13. DEPOSITS
Certificates of Deposit maturing as of December 31:
| 2005 | 2004 | |||||
1 Year | $ | 84,655 | $ | 97,318 | ||
2 Years | 28,411 | 20,970 | ||||
3 Years | 15,399 | 20,747 | ||||
4 Years | 13,129 | 15,444 | ||||
5 Years and Thereafter | 41,784 | 16,793 | ||||
Total | $ | 183,378 | $ | 171,272 | ||
14. CONCENTRATION OF CREDIT RISK
The Majority of the Bank’s loans have been granted to customers in the Bank’s market area. The concentrations of credit by loan classification are set forth in an above footnote. The Bank does not extend credit to any individual borrowers in excess of its lending limit of $3,948,000 as of year-end 2005 and $3,843,000 as of year-end 2004.
The largest category of Real Estate Loans consisted of Commercial loans. These loans approximated $41,964,000 at December 31, 2005 and $35,933,000 at December 31, 2004.
15. FAIR VALUE OF FINANCIAL INSTRUMENTS
Statement of Financial Accounting Standards No. 107, “Disclosures about Fair Value of Financial Instruments,” requires the Bank to disclose the estimated fair values of its financial assets and liabilities. The estimated fair values were determined using the following assumptions:
| a. | The carrying value of Cash and Due From Banks, Federal Funds Sold, and Interest-Bearing Deposits in Other Financial Institutions are believed to approximate the fair value of these items. |
| b. | The fair value of actively traded investment securities are determined according to quotes available in the financial press. The fair value of instruments which are not actively traded are determined using values of other instruments with similar characteristics or obtained from outside sources believed to be reliable. |
| c. | The fair value of loans are estimated by discounting the anticipated cash flows using estimated rates for similar loans available in the Bank’s market area. Estimates of maturities are based on both experience and contractual maturities although prepayments are permitted on the loans. |
| d. | The fair value of short-term demand and savings deposits are believed to equal carrying value. The fair value of certificates of deposit are based upon the contractual maturity of the instruments and rates currently offered for similar deposits. |
| e. | The fair value of Notes Payable to the U. S. Treasury are estimated at carrying value. |
| f. | The fair value of Accrued Interest Receivable and Accrued Interest Payable are estimated at carrying value. |
Financial Assets: | 2005 | 2004 | ||||||||||
| Carrying Value | Fair Value | Carrying Value | Fair Value | |||||||||
Interest-Bearing Deposits in Other Financial Institutions | $ | 22,465 | $ | 22,465 | $ | 24,941 | $ | 24,941 | ||||
Investment Securities | 93,652 | 92,484 | 72,01 1 | 71,888 | ||||||||
Federal Funds Sold | 26,600 | 26,600 | 58,955 | 58,955 | ||||||||
Loans (Net of Unearned Income) | 231,733 | 234,945 | 204,273 | 183,234 | ||||||||
Cash and Due From Banks | 13,593 | 13,593 | 10,762 | 10,762 | ||||||||
Accrued Interest Receivable | 2,014 | 2,014 | 1,521 | 1,521 | ||||||||
Total | $ | 390,057 | $ | 392,101 | $ | 372,463 | $ | 351,301 | ||||
13
Table of Contents
Financial Liabilities: | 2005 | 2004 | ||||||||||
| Carrying Value | Fair Value | Carrying Value | Fair Value | |||||||||
Deposits | ||||||||||||
LIFETIME FREE CHECKING | $ | 70,458 | $ | 70,458 | $ | 62,528 | $ | 62,528 | ||||
Interest-Bearing Demand | 60,019 | 60,019 | 62,082 | 62,082 | ||||||||
Regular Passbook Savings | 58,031 | 58,031 | 59,621 | 59,621 | ||||||||
Time Deposits: | ||||||||||||
Certificates of Deposit $100,000 and Over | 40,129 | 41,139 | 31,947 | 32,442 | ||||||||
Other | 143,249 | 145,936 | 139,325 | 140,727 | ||||||||
TOTAL DEPOSITS | 371,886 | 375,583 | 355,503 | 357,400 | ||||||||
Notes issued to the U. S. Treasury | 948 | 948 | 973 | 973 | ||||||||
Accrued Interest Payable | 630 | 630 | 392 | 392 | ||||||||
Total | $ | 373,464 | $ | 377,161 | $ | 356,868 | $ | 358,765 | ||||
16. CAPITAL ADEQUACY
The Bank is subject to various regulatory capital requirements. Under the regulatory capital guidelines and the regulatory framework for Prompt Corrective Action (PCA), the Bank must meet specific capital guidelines involving the quantitative measures of the Banks assets, liabilities, and certain off-balance-sheet items as calculated under regulatory accounting practices. The Bank’s capital amount and classification are also subject to qualitative judgments by the regulators about components, risk weightings and other factors.
Quantitative measures established by regulation to ensure capital adequacy require the Bank to maintain minimum ratios (set forth in the table below) of total and Tier 1 capital (as defined in the regulations) to risk-weighted assets (as defined) and of Tier 1 capital to average assets (as defined).
| Minimum Ratio For Capital Adequacy Purposes | Minimum Ratio To Be Considered Well Capitalized Under PCA Provisions | |||||
Tier 1 Capital to Risk Weighted Assets | 4 | % | 6 | % | ||
Total Capital to Risk Weighted Assets | 8 | % | 10 | % | ||
Tier 1 Capital to Average Assets | 4 | % | 5 | % |
As of December 31, 2005, the most recent notification from the Federal Deposit Insurance Corporation categorized the Bank as well capitalized under the regulatory framework for prompt corrective action. To be categorized as well capitalized, an institution must maintain minimum total risk-based, Tier 1 risk-based and Tier 1 leverage ratios as set forth in the above table. There are no conditions or events since the notification that management believes have changed the Bank’s category. The Bank’s actual capital amounts and ratios as of December 31, 2005 and 2004 are presented in the following table. Management believes, as of December 31, 2005 and 2004, that the Bank meets all capital adequacy requirements to which it is subject.
As of December 31, 2005 | Minimum Capital For Capital Adequacy Purposes | Minimum Capital To Be Considered Well Capitalized Under PCA Provisions | Actual Capital | Actual Ratio | ||||||||
Tier 1 Capital to Risk Weighted Assets | $ | 9,387 | $ | 14,081 | $ | 23,850 | 10.16 | % | ||||
Total Capital to Risk Weighted Assets | 18,774 | 23,468 | 26,323 | 11.22 | % | |||||||
Tier 1 Capital to Average Assets | 15,252 | 19,065 | 23,850 | 6.22 | % | |||||||
As of December 31, 2004 | ||||||||||||
Tier 1 Capital to Risk Weighted Assets | $ | 8,716 | $ | 13,022 | $ | 23,155 | 10.63 | % | ||||
Total Capital to Risk Weighted Assets | 17,431 | 21,789 | 25,559 | 11.73 | % | |||||||
Tier 1 Capital to Average Assets | 15,330 | 19,163 | 23,155 | 6.04 | % | |||||||
17. QUARTERLY FINANCIAL DATA (Unaudited)
The following summarizes the quarterly results of operations for the years ended December 31, 2005 and 2004:
2005 | First Quarter | Second Quarter | Third Quarter | Fourth Quarter | ||||||||
Total Interest Income | $ | 4,279 | $ | 4,425 | $ | 4,457 | $ | 4,608 | ||||
Total Interest Expense | 1,874 | 2,032 | 2,172 | 2,229 | ||||||||
Net Interest Income | 2,405 | 2,393 | 2,285 | 2,379 | ||||||||
Provision For Loan Losses | 60 | 60 | 60 | 60 | ||||||||
Net Interest Income After Provision for Loan Losses | 2,345 | 2,333 | 2,225 | 2,319 | ||||||||
Total Non-Interest Income | 305 | 290 | 294 | 381 | ||||||||
Total Non-Interest Expense | 1,942 | 1,947 | 1,971 | 2,163 | ||||||||
Income Before Income Taxes | 708 | 676 | 548 | 537 | ||||||||
Income Tax Expense | 170 | 160 | 110 | 102 | ||||||||
Net Income | $ | 538 | $ | 516 | $ | 438 | $ | 435 | ||||
Basic and Diluted Net Income Per Share | $ | 0.19 | $ | 0.18 | $ | 0.16 | $ | 0.16 | ||||
2004 | First Quarter | Second Quarter | Third Quarter | Fourth Quarter | ||||||||
Total Interest Income | $ | 4,130 | $ | 4,259 | $ | 4,381 | $ | 4,204 | ||||
Total Interest Expense | 1,865 | 1,919 | 1,911 | 1,919 | ||||||||
Net Interest Income | 2,265 | 2,340 | 2,470 | 2,285 | ||||||||
Provision For Loan Losses | 45 | 45 | 45 | 105 | ||||||||
Net Interest Income After Provision for Loan Losses | 2,220 | 2,295 | 2,425 | 2,180 | ||||||||
Total Non-Interest Income | 358 | 336 | 338 | 460 | ||||||||
Total Non-Interest Expense | 1,832 | 1,875 | 1,902 | 2,095 | ||||||||
Income Before Income Taxes | 746 | 756 | 861 | 545 | ||||||||
Income Tax Expense | 210 | 225 | 230 | 141 | ||||||||
Net Income | $ | 536 | $ | 531 | $ | 631 | $ | 404 | ||||
Basic and Diluted Net Income Per Share | $ | 0.19 | $ | 0.19 | $ | 0.23 | $ | 0.14 | ||||
18. LEASES AND RENT EXPENSE
The Bank leased facilities under non-cancelable operating leases during 2005, 2004, and 2003. As noted above, the Bank leases six offices from Bank Building Corporation. These leases required the Bank to pay maintenance, insurance and property taxes and do not have renewal options. Rental expense under these leases was $363,000 in 2005 and $394,000 in 2004 and 2003. Future minimum rental payments under these leases are as follows:
Year Ending December 31 , 2006 | $ | 386 | |
2007 | 386 | ||
2008 | 386 | ||
2009 | 386 | ||
2010 | 386 | ||
Thereafter | 2,175 | ||
Total minimum lease payments | $ | 4,105 | |
19. OFF BALANCE SHEET ACTIVITIES AND COMMITMENTS
Commitments to extend credit, which amounted to $5,582,000 and $6,023,000 at December 31, 2005 and 2004 respectively, represent agreements to lend to customers with fixed expiration dates or other termination clauses. Since many of the commitments are expected to expire without being funded, the total commitment amounts do not necessarily represent future liquidity requirements. Standby letters of credit are conditional commitments issued by the Bank guaranteeing the performance of a customer to a third party. Those guarantees are primarily issued to support public and private borrowing arrangements. At December 31, 2005 the Bank had $560,000, and $1,217,000 in 2004, in outstanding standby letters of credit.
The Bank is a member of the Federal Reserve System and is required to maintain certain levels of its cash and due from bank balances as reserves based on regulatory requirements. At December 31, 2005 and 2004, this reserve requirement was approximately $6,058,000 and $5,191,000, respectively.
14
Table of Contents
Federal Banking regulations place certain restrictions on dividends paid by the Bank. The total amount of dividends which may be paid at any date is generally limited to the retained earnings of the Bank. In addition, dividends paid by the Bank would be prohibited if the effect thereof would cause the Bank’s capital to be reduced below applicable minimum capital requirements.
20. RECENT ACCOUNTING PRONOUNCEMENTS AND ACCOUNTING CHANGES
In November 2002, the FASB issued FASB Interpretation No. 45, “Guarantor’s Accounting and Disclosure Requirements for Guarantees, including Indirect Guarantees of Indebtedness of Others” (FIN 45). The interpretation elaborates on the disclosures to be made by a guarantor in its financial statements under certain guarantees that it has issued. It also clarifies that a guarantor is required to recognize, at the inception of a guarantee, a liability for the fair value of the obligation undertaken in issuing the guarantee. The interpretation requires disclosure of the nature of the guarantee, the maximum potential amount of future payments that the guarantor could be required to make under the guarantee, and the current amount of the liability, if any, for the guarantor’s obligations under the guarantee. The recognition requirements of the Interpretation were effective beginning January 1, 2003.
The FASB also revised FASB Interpretation 46, “Consolidation of Variable Interest Entities, an interpretation of ARB No. 51 (FIN 46)”. The interpretation provides a framework for identifying variable interest entities (VIEs), and determining when a company should include the assets, liabilities, noncontrolling interests and results of activities of a VIE in its consolidated financial statements. As revised, FIN 46 is effective beginning in the first quarter of 2004 for all VIEs (other than what is commonly referred to as special purpose entities, VIEs of small business issuers, and VIEs of nonpublic entities). The Bank does not currently utilize VIEs or so called special purpose entities.
In November 2003, the FASB’s Emerging Issues Task Force (EITF) reached consensus on new disclosure requirements related to unrealized losses on investment securities. The new disclosure requirements apply to marketable equity and debt securities accounted for under Financial Accounting Board Statement No. 115, “Accounting for Certain Investments in Debt and Equity Securities,” and are required for inclusion in annual reports with fiscal years ended after December 15, 2003.
In November 2003, the FASB issued FASB Staff Position (FSP) 144-1, “Determination of Cost Basis for Foreclosed Assets under FASB Statement No. 15”, “Accounting by Debtors and Creditors for Troubled Debt Restructurings,” and the Measurement of Cumulative Losses Previously Recognized under Paragraph 37 of FASB Statement No. 144, “Accounting for the Impairment or Disposal of Long-Lived Assets.” Under FSP 144-1, the lender is required to measure the foreclosure on a long-lived asset (e.g. real estate) at fair value less cost to sell on the foreclosure date, which establishes a new cost basis such that any loan valuation allowance is not retained. Thereafter, the lender would follow the impairment guidance in Statement No. 144, and could not reflect any recovery in value of the property beyond the cost basis established upon foreclosure of the loan. This guidance was effective upon posting of the FSP to the FASB website in November 2003.
In April 2003, the Financial Accounting Standards Board issued Statement No. 149, “Amendment of Statement 133 on Derivative Instruments and Hedging Activities”. This statement amends and clarifies financial accounting and reporting for derivative instruments, including certain derivative instruments embedded in other contracts (collectively referred to as derivatives) and for hedging activities under FASB Statement No. 133, “Accounting for Derivative Instruments and Hedging Activities”.
In May 2003, the Financial Accounting Standards Board issued Statement No. 150, “Accounting for Certain Financial Instruments with Characteristics of both Liabilities and Equity”. This statement establishes standards for how an issuer classifies and measures certain financial instruments with characteristics of both liabilities and equity. It requires that an issuer classify a financial instrument that is within its scope as a liability (or an asset in some circumstances). Many of those instruments were previously classified as equity. This statement is effective for financial instruments entered into or modified after May 31, 2003, and otherwise is effective at the beginning of the first interim period beginning after June 15, 2003.
In December 2004, the FASB issued Statement No. 123 (revised 2004), which is a revision of Statement 123 “Accounting for Stock-Based Compensation”. This Statement establishes standards for the accounting for transactions in which an entity exchanges its equity instruments for goods or services. It also addresses transactions in which an entity incurs liabilities in exchange for goods or services that are based on the fair value of the entity’s equity instruments or that may be settled by the issuance of those equity instruments. This Statement focuses primarily on accounting for transactions in which an entity obtains employee services in share-based payment transactions. This Statement is effective for public entities as of the beginning of the first interim or annual reporting period that begins after June 15, 2005.
In December 2004, the FASB issued Statement No. 153, “Exchanges of Nonmonetary Assets”, an amendment of APB Opinion No. 29, “Accounting for Nonmonetary Transactions”. This Statement eliminates the exception to fair value for exchanges of similar productive assets and replaces it with a general exception for exchange transactions that do not have commercial substance—that is, transactions that are not expected to result in significant changes in the cash flows of the reporting entity. This Statement is effective for nonmonetary asset exchanges occurring in fiscal periods beginning after June 15, 2005.
In May 2005, the FASB issued Statement No. 154, “Accounting Changes and Error Corrections—a replacement of APB Opinion No. 20 and FASB Statement No. 3”. This Statement requires retrospective application to prior periods’ financial statements of changes in accounting principle, unless it is impracticable to determine either the period-specific effects or the cumulative effect of the change. When it is impracticable to determine the period-specific effects of an accounting change on one or more individual prior periods presented, this Statement requires that the new accounting principle be applied to the balances of assets and liabilities as of the beginning of the earliest period for which retrospective application is practicable and that a corresponding adjustment be made to the opening balance of retained earnings. This Statement improves financial reporting because its requirement to report voluntary changes in accounting principles via retrospective application, unless impracticable, enhances the consistency of financial information between periods. This statement is effective for accounting changes and corrections of errors made in fiscal years beginning after December 15, 2005.
During November 2005, the FASB issued FASB Staff Position (FSP) FAS 115-1 and 124-1, “The Meaning of Other-Than-Temporary Impairment and Its Application to Certain Investments.” The guidance in this FSP addresses the determination of when an investment is considered impaired, whether that impairment is other than temporary, and the measurement of an impairment loss. The FSP also includes accounting considerations subsequent to the recognition of an other-than temporary impairment and requires certain disclosures about unrealized losses that have not been recognized as other-than-temporary impairments. The guidance in this FSP is required to be applied to reporting periods beginning after December 15, 2005. Earlier application is permitted. Management is determining what effect, if any, that this will have on financial condition and results of operation on adoption and thereafter.
The FASB has issued FASB Statement No. 155, “Accounting for Certain Hybrid Instruments.” This standard amends the guidance in FASB Statements No. 133, “Accounting for Derivative Instruments and Hedging Activities”, and No. 140, “Accounting for Transfers and Servicing of Financial Assets and Extinguishments of Liabilities.” Statement 155 allows financial instruments that have embedded derivatives to be accounted for as a whole (eliminating the need to bifurcate the derivative from its host) if the holder elects to account for the whole instrument on a fair value basis. Statement 155 is effective for all financial instruments acquired or issued after the beginning of an entity’s first fiscal year that begins after September 15, 2006. Earlier adoption is permitted as of the beginning of an entity’s fiscal year, provided the entity has not yet issued financial statements, including financial statements for any interim period for that fiscal year. Provisions of this Statement may be applied to instruments that an entity holds at the date of adoption on an instrument-by-instrument basis. The financial statement effect of the change in accounting, if any, should be recognized as a cumulative-effect adjustment to beginning retained earnings. Prior periods should not be restated.
Management does not expect these accounting pronouncements to have a material impact on the financial statements.
15
Table of Contents
Summary of Operations
(Dollars in Thousands Except Per Share Data)
FOR THE YEAR: | 2005 | 2004 | 2003 | 2002 | 2001 | |||||||||||||
Total Interest Income | $ | 17,769 | $ | 16,974 | $ | 18,258 | $ | 20,171 | $ | 21,881 | ||||||||
Total Interest Expense | 8,307 | 7,614 | 8,440 | 10,247 | 12,676 | |||||||||||||
Net Interest Income | 9,462 | 9,360 | 9,818 | 9,924 | 9,205 | |||||||||||||
Provision for Loan Losses | 240 | 240 | 1,327 | 180 | 180 | |||||||||||||
Net Interest Income After Provision for Loan Losses | 9,222 | 9,120 | 8,491 | 9,744 | 9,025 | |||||||||||||
Non-Interest Income | 1,270 | 1,492 | 1,374 | 1,372 | 1,234 | |||||||||||||
Non-Interest Expense | 8,023 | 7,704 | 6,919 | 6,643 | 6,219 | |||||||||||||
Net Income Before Taxes | 2,469 | 2,908 | 2,946 | 4,473 | 4,040 | |||||||||||||
Applicable Income Taxes: | ||||||||||||||||||
Current | 563 | 651 | 1,284 | 1,413 | 1,219 | |||||||||||||
Deferred | (21 | ) | 155 | (388 | ) | (4 | ) | 15 | ||||||||||
Net Income | $ | 1,927 | $ | 2,102 | $ | 2,050 | $ | 3,064 | $ | 2,806 | ||||||||
Basic and Diluted Net Income Per Share* | $ | 0.69 | $ | 0.75 | $ | 0.73 | $ | 1.09 | $ | 1.00 | ||||||||
| * | Net Income per share has been retroactively adjusted to reflect the stock dividend in 2003. |
AT YEAR END: | 2005 | 2004 | 2003 | 2002 | 2001 | ||||||||||
Interest-Bearing Deposits in Other Financial Institutions | $ | 22,465 | $ | 24,941 | $ | 14,847 | $ | 13,957 | $ | 12,672 | |||||
Federal Funds Sold | 26,600 | 58,955 | 47,860 | 45,710 | 25,587 | ||||||||||
Investment Securities | 93,652 | 72,011 | 112,938 | 97,845 | 105,450 | ||||||||||
Loans (Net) | 231,733 | 204,273 | 178,350 | 175,952 | 176,188 | ||||||||||
Deposits | 371,886 | 355,503 | 353,643 | 329,541 | 317,733 | ||||||||||
Demand | 70,458 | 62,528 | 56,541 | 52,535 | 46,757 | ||||||||||
Interest-Bearing Demand | 60,019 | 62,082 | 64,730 | 46,849 | 35,960 | ||||||||||
Savings | 58,031 | 59,621 | 57,578 | 51,034 | 45,033 | ||||||||||
Time | 183,378 | 171,272 | 174,794 | 179,123 | 189,983 | ||||||||||
Capital Accounts | 23,850 | 23,155 | 22,284 | 21,392 | 19,404 | ||||||||||
Total Resources | 397,523 | 380,220 | 377,290 | 355,826 | 338,780 | ||||||||||
Carrying Value Per Share | $ | 8.52 | $ | 8.27 | $ | 7.96 | $ | 7.64 | $ | 6.93 | |||||
DAILY AVERAGES FOR THE YEAR: | 2005 | 2004 | 2003 | 2002 | 2001 | ||||||||||
Interest-Bearing Deposits in Other Financial Institutions | $ | 21,056 | $ | 19,743 | $ | 15,163 | $ | 12,919 | $ | 11,898 | |||||
Federal Funds Sold | 36,416 | 47,935 | 74,617 | 41,852 | 27,489 | ||||||||||
Investment Securities | 86,982 | 101,849 | 86,311 | 110,972 | 91,403 | ||||||||||
Loans | 213,499 | 195,070 | 181,502 | 166,660 | 176,364 | ||||||||||
Deposits | 358,276 | 363,382 | 352,517 | 325,654 | 294,069 | ||||||||||
Demand | 63,445 | 62,533 | 58,467 | 51,017 | 46,408 | ||||||||||
Interest-Bearing Demand | 38,891 | 35,319 | 31,563 | 27,266 | 19,885 | ||||||||||
Savings (Includes MMDA’s) | 79,584 | 91,993 | 83,768 | 61,869 | 50,940 | ||||||||||
Time | 176,356 | 173,537 | 178,719 | 185,502 | 176,836 | ||||||||||
Capital Accounts | 23,405 | 22,679 | 22,337 | 20,330 | 18,503 | ||||||||||
Total Resources | $ | 381,302 | $ | 384,234 | $ | 375,035 | $ | 350,334 | $ | 317,204 | |||||
16
Table of Contents
Price Range of Common Stock
| 2005 | 2004 | Dividends Per Share | ||||||||||||||||
| HIGH | LOW | HIGH | LOW | 2005 | 2004 | |||||||||||||
First Quarter | $ | 12 | $ | 12 | $ | 16 | $ | 11 | $ | 0.11 | $ | 0.11 | ||||||
Second Quarter | 11 | 11 | 16 | 12 | 0.11 | 0.11 | ||||||||||||
Third Quarter | 11 | 11 | 14 | 12 | 0.11 | 0.11 | ||||||||||||
Fourth Quarter | 10 | 10 | 15 | 13 | 0.11 | 0.11 | ||||||||||||
Officers
Worth Harris Carter, Jr.
Chairman of the Board and President
| Phyllis Q. Karavatakis | Karen W. Pratt | |
| Senior Vice President and Cashier | Assistant Cashier | |
| Billy J. Adkins | Teresa Bateman | |
| Vice President - Commercial Loans | Branch Manager - 220 South | |
| Cliff Barbee | Julia Bryant | |
| Vice President - Commercial Loans | Branch Manager - Oak Level | |
| Donald W. Powell | John Barker | |
| Vice President and Managing Officer - Highway 14 | Branch Manager - Main Street - Reidsville | |
| Rosetta G. Jeffries | Regina Clifton | |
| Operations Officer | Branch Manager - Washington Street | |
| Glenn M. Dennis | Johanna Goodyear | |
| Assistant Vice President | Branch Manager - Asheboro | |
| Kathy S. Gravely | Jaclyn A. Hughes | |
| Assistant Vice President and Managing Officer - Stuart | Branch Manager - Horsepasture | |
| Phyllis Merricks | Tonya Jones | |
| Assistant Vice President and Managing Officer - Bassett | Branch Manager - Collinsville | |
| John L. Satterfield, III | Marla O. Lewis | |
| Assistant Vice President and Managing Officer - Turner Drive | Branch Manager - Woolwine | |
| Robert W. Maxey | Rebecca Nowlin | |
| Assistant Cashier and Managing Officer - Adams Farm | Branch Manager - Ararat | |
| W. Archie Moore | Laura Stanley | |
| Assistant Cashier and Managing Officer - Wendover | Branch Manager - Fieldale | |
| Misty G. Powell | Rolanda Stockton | |
| Assistant Cashier and Managing Officer - Martinsville | Branch Manager - Laurel Park | |
Directors
| Worth Harris Carter, Jr. | Joseph E. Pigg | |
| Chairman of the Board and President | President, Millard’s Machinery, Inc. | |
| W. Lynwood Craig | Haller G. Prillaman | |
| President, Bassett Oil & Equipment Co., Inc. | President, Prillaman Brothers, Inc. | |
| James W. Haskins | N. Larry Roach | |
| Attorney, Young, Haskins, Mann, Gregory & Smith, P.C. | President, Larry Roach & Associates Insurance Services, Inc. | |
| George W. Lester, II | Simon C. Spencer | |
Chairman and Chief Executive Officer The Lester Group, Inc. | Retired | |
| Dr. H. Marvin Midkiff | James M. Thomasson | |
| Retired | Retired | |
| W.C. Trent, Jr. | ||
| Investor | ||
 | P.O. Box 1776 Bassett, Virginia 24055-1776 (276) 632-2901 Member FDIC |
Table of Contents

| POST OFFICE BOX 1776 | BASSETT, VIRGINIA 24055 | (276) 629-1776 | MEMBER FDIC |
For Additional Information Contact:
Patrick Henry National Bank
Post Office Box 1776
Bassett, Virginia 24055
Telephone: (276) 629-1776
AND
4 East Commonwealth Blvd.
Martinsville, Virginia 24112
Telephone: (276) 632-2901
Table of Contents
OFFICE OF THE COMPTROLLER OF THE CURRENCY
WASHINGTON, D.C. 20219
FORM 10-Q
| x | QUARTERLY REPORT UNDER SECTION 13 OR 15(d) OF THE SECURITIES EXCHANGE ACT OF 1934 |
For the quarterly period ended September 30, 2006
OR
| ¨ | TRANSITION REPORT UNDER SECTION 13 OR 15(d) OF THE SECURITIES EXCHANGE ACT OF 1934 |
For the transition period from to
Commission file number: n/a
PATRICK HENRY NATIONAL BANK
(Name of registrant as specified in its charter)
| National Bank | 54-0993114 | |
(State or other jurisdiction of incorporation or organization) | (I.R.S. Employer Identification No.) | |
2770 Riverside Drive Bassett, VA | 24055 | |
| (Address of principal executive offices) | (Zip Code) | |
(276) 629-1776
(Registrant’s telephone number, including area code)
n/a
(Former name, former address and former fiscal year, if changed since last report)
Indicate by check mark whether the registrant (1) has filed all reports required to be filed by Section 13 or 15(d) of the Securities Exchange Act of 1934 during the preceding 12 months (or for such shorter period that the registrant was required to file such reports), and (2) has been subject to such filing requirements for the past 90 days. Yes x No ¨
Indicate by check mark whether the registrant is a large accelerated filer, an accelerated filer, or a non-accelerated filer. See definition of “accelerated filer and large accelerated filer” in Rule 12b-2 of the Exchange Act.
Large accelerated filer ¨ Accelerated filer ¨ Non-accelerated filer x
Indicate by check mark whether the registrant is a shell company (as defined in Rule 12b-2 of the Exchange Act). Yes ¨ No x
As of November 13, 2006, there were issued and outstanding 2,800,122 shares of the registrant’s common stock.
1
Table of Contents
INDEX
| PART I - FINANCIAL INFORMATION | 4 | |||
ITEM 1 - FINANCIAL STATEMENTS | 4 | |||
STATEMENTS OF CONDITION | 4 | |||
STATEMENTS OF INCOME | 5 | |||
STATEMENTS OF CASH FLOWS | 6 | |||
STATEMENTS OF CHANGES IN SHAREHOLDERS’ EQUITY | 7 | |||
NOTES TO UNAUDITED FINANCIAL STATEMENTS | 7 | |||
ITEM 2 - MANAGEMENT’S DISCUSSION AND ANALYSIS | 9 | |||
ITEM 3 - QUANTITATIVE AND QUALITATIVE DISCLOSURE ABOUT MARKET RISK | 13 | |||
ITEM 4 - CONTROLS AND PROCEDURES | 14 | |||
| PART II - OTHER INFORMATION | 14 | |||
ITEM 1 - LEGAL PROCEEDINGS. | 14 | |||
ITEM 1A- RISK FACTORS. | 14 | |||
ITEM 2 - UNREGISTERED SALES OF EQUITY SECURITIES AND USE OF PROCEEDS. | 14 | |||
ITEM 3 - DEFAULTS UPON SENIOR SECURITIES. | 14 | |||
ITEM 4 - SUBMISSION OF MATTERS TO A VOTE OF SECURITY HOLDERS. | 14 | |||
ITEM 5 - OTHER INFORMATION | 15 | |||
ITEM 6 - EXHIBITS AND REPORTS ON FORM 8-K | 15 | |||
2
Table of Contents
FORWARD–LOOKING STATEMENTS
This report contains statements concerning the Bank’s expectations, plans, objectives, future financial performance and other statements that are not historical facts. These statements may constitute “forward-looking statements” as defined by federal securities laws. In some cases, readers can identify the forward-looking statements by the use of words such as “may,” “ will,” “should,” “could,” “expect,” “plan,” “intend,” “anticipate,” “believe,” “estimate,” “predict,” “potential” or “continue” or the negative or other variations of these words, or other comparable words or phrases. These statements may address issues that involve estimates and assumptions made by management, risks and uncertainties, and actual results could differ materially from historical results or those anticipated by such statements. Factors that could have a material adverse effect on the Bank’s operations and future prospects include, but are not limited to, changes in: interest rates; general and local economic conditions; the legislative/regulatory climate; monetary and fiscal policies of the U.S. government, including policies of the U.S. Treasury and the Federal Reserve Board; the quality or composition of loan or investment portfolios; demand for loan products; deposit flows; competition; demand for financial services in our market area and accounting principles, policies and guidelines. These risks and uncertainties should be considered in evaluating the forward-looking statements contained herein, and readers are cautioned not to place undue reliance on such statements, which speak only as of the date of this report.
3
Table of Contents
PART I—FINANCIAL INFORMATION
Item 1—FINANCIAL STATEMENTS
PATRICK HENRY NATIONAL BANK
STATEMENTS OF CONDITION
(Dollars in Thousands)
| September 30, 2006 (Unaudited) | December 31, 2005 | |||||||
ASSETS | ||||||||
Interest-Bearing Deposits in Other Financial Institutions | $ | 18,801 | $ | 22,465 | ||||
Investment Securities | ||||||||
U. S. Agency Securities | 87,175 | 93,652 | ||||||
Federal Funds Sold | 25,000 | 26,600 | ||||||
Loans | 243,849 | 232,377 | ||||||
Less: Unearned Income | (719 | ) | (644 | ) | ||||
Allowance for Loan Losses | (2,578 | ) | (2,473 | ) | ||||
Net Loans | 240,552 | 229,260 | ||||||
Earning Assets | 371,528 | 371,977 | ||||||
Cash and Due From Banks | 11,869 | 13,593 | ||||||
Bank Premises and Equipment | 4,731 | 4,899 | ||||||
Real Estate Owned Other Than Bank Premises | 2,780 | 2,265 | ||||||
Investment in Associated Companies | 769 | 769 | ||||||
Other Assets | 4,602 | 4,020 | ||||||
TOTAL ASSETS | $ | 396,279 | $ | 397,523 | ||||
LIABILITIES | ||||||||
Deposits | ||||||||
LIFETIME FREE CHECKING | $ | 59,775 | $ | 70,458 | ||||
Interest-Bearing Demand | 43,835 | 60,019 | ||||||
Regular Passbook Savings | 57,687 | 58,031 | ||||||
Time Deposits | ||||||||
Certificates of Deposit $100,000 or More | 47,357 | 40,129 | ||||||
Other | 160,731 | 143,249 | ||||||
Total Deposits | 369,385 | 371,886 | ||||||
Notes issued to the U. S. Treasury | 1,541 | 948 | ||||||
Other Liabilities | 724 | 839 | ||||||
TOTAL LIABILITIES | 371,650 | 373,673 | ||||||
SHAREHOLDERS’ EQUITY | ||||||||
Common Stock, Par Value $1.25 Per Share, Authorized 10,000,000 Shares; 2,800,122 Outstanding in 2006 and 2005 | 3,500 | 3,500 | ||||||
Surplus | 13,879 | 13,879 | ||||||
Undivided Profits | 7,250 | 6,471 | ||||||
TOTAL SHAREHOLDERS’ EQUITY | 24,629 | 23,850 | ||||||
TOTAL LIABILITIES AND SHAREHOLDERS EQUITY | $ | 396,279 | $ | 397,523 | ||||
See accompanying notes to unaudited financial statements.
4
Table of Contents
PATRICK HENRY NATIONAL BANK
STATEMENTS OF INCOME
| Nine Months Ended September 30, | Three Months Ended September 30, | |||||||||||
| 2006 | 2005 | 2006 | 2005 | |||||||||
| (Unaudited) | (Unaudited) | |||||||||||
INTEREST INCOME | ||||||||||||
Interest and Fees on Loans | ||||||||||||
Taxable | $ | 10,065 | $ | 8,846 | $ | 3,470 | $ | 2,953 | ||||
Non-Taxable | 932 | 609 | 337 | 221 | ||||||||
Interest on Deposits in Other Financial Institutions | 671 | 567 | 227 | 206 | ||||||||
Interest on Federal Funds Sold | 871 | 797 | 314 | 295 | ||||||||
Interest and Dividends on Securities | ||||||||||||
U. S. Agency Securities | 2,616 | 2,320 | 912 | 777 | ||||||||
Obligations of States and Political Subdivisions | — | 22 | — | 5 | ||||||||
TOTAL INTEREST INCOME | 15,155 | 13,161 | 5,260 | 4,457 | ||||||||
| INTEREST EXPENSE | ||||||||||||
Interest on Time Deposits $100,000 or More | 1,535 | 1,186 | 565 | 452 | ||||||||
Interest on Other Deposits | 6,072 | 4,885 | 2,159 | 1,717 | ||||||||
Interest on Notes Issued to the U. S. Treasury | 14 | 7 | 6 | 3 | ||||||||
TOTAL INTEREST EXPENSE | 7,621 | 6,078 | 2,730 | 2,172 | ||||||||
NET INTEREST INCOME | 7,534 | 7,083 | 2,530 | 2,285 | ||||||||
Provision for Loan Losses | 135 | 180 | 45 | 60 | ||||||||
NET INTEREST INCOME AFTER PROVISION FOR LOAN LOSSES | 7,399 | 6,903 | 2,485 | 2,225 | ||||||||
NON-INTEREST INCOME | ||||||||||||
Service Charges, Commissions and Fees | 706 | 758 | 234 | 256 | ||||||||
Other Non-Interest Income | 167 | 131 | 89 | 38 | ||||||||
TOTAL NON-INTEREST INCOME | 873 | 889 | 323 | 294 | ||||||||
NON-INTEREST EXPENSE | ||||||||||||
Salaries and Employee Benefits | 3,252 | 3,237 | 1,112 | 1,087 | ||||||||
Occupancy Expense (Net) | 832 | 799 | 283 | 274 | ||||||||
Operations Center Expense | 1,306 | 1,226 | 439 | 415 | ||||||||
Other Non-Interest Expense | 788 | 598 | 280 | 195 | ||||||||
TOTAL NON-INTEREST EXPENSE | 6,178 | 5,860 | 2,114 | 1,971 | ||||||||
INCOME BEFORE INCOME TAXES | 2,094 | 1,932 | 694 | 548 | ||||||||
Income Tax Expense | 390 | 440 | 120 | 110 | ||||||||
NET INCOME | $ | 1,704 | $ | 1,492 | $ | 574 | $ | 438 | ||||
EARNINGS PER COMMON SHARE: | ||||||||||||
Basic and Diluted | $ | 0.61 | $ | 0.53 | $ | 0.20 | $ | 0.16 | ||||
Weighted Average Shares Outstanding | 2,800,122 | 2,800,122 | 2,800,122 | 2,800,122 | ||||||||
Cash Dividends Per Common Share | $ | 0.33 | $ | 0.33 | $ | 0.11 | $ | 0.11 | ||||
See accompanying notes to unaudited financial statements.
5
Table of Contents
PATRICK HENRY NATIONAL BANK
STATEMENTS OF CASH FLOWS
(Dollars in Thousands)
| Nine Months Ended September 30, | ||||||||
| 2006 | 2005 | |||||||
| (Unaudited) | ||||||||
Cash Flows From Operating Activities | ||||||||
Net Income | $ | 1,704 | $ | 1,492 | ||||
Adjustments to reconcile net income to net cash provided by operating activities | ||||||||
Provision for Loan Losses | 135 | 180 | ||||||
Depreciation of Bank Premises and Equipment | 260 | 257 | ||||||
Increase (Decrease) in Unearned Income | 75 | 5 | ||||||
(Increase) Decrease in Other Assets | (582 | ) | (204 | ) | ||||
Increase (Decrease) in Other Liabilities | (115 | ) | 196 | |||||
Net Cash From Operating Activities | 1,477 | 1,926 | ||||||
Cash Flows From Investing Activities | ||||||||
Proceeds from Maturity of Interest Bearing Balances | 15,347 | 14,744 | ||||||
Purchase of Interest Bearing Balances | (11,683 | ) | (13,060 | ) | ||||
Payments on Investment Securities | 19,977 | 12,865 | ||||||
Purchase of Investment Securities | (13,500 | ) | (28,500 | ) | ||||
Purchase of Bank Premises and Equipment | (92 | ) | (117 | ) | ||||
Net (Increase) Decrease in Short-Term Loans Outstanding, Net | (908 | ) | (6,283 | ) | ||||
Longer-Term Loans Originated or Purchased | (26,509 | ) | (30,723 | ) | ||||
Principal Collected on Longer-Term Loans | 15,915 | 22,474 | ||||||
(Increase) Decrease in Other Real Estate | (515 | ) | 107 | |||||
Net Cash From Investing Activities | (1,968 | ) | (28,493 | ) | ||||
Cash Flows from Financing Activities | ||||||||
Increase in Demand and Savings Accounts | (27,211 | ) | (6,294 | ) | ||||
Proceeds from Sale of Time Deposits | 92,085 | 95,122 | ||||||
Payments for Matured Time Deposits | (67,375 | ) | (83,615 | ) | ||||
Payment of Cash Dividends | (925 | ) | (924 | ) | ||||
Net Increase (Decrease) in Notes issued to the U. S. Treasury | 593 | 87 | ||||||
Net Cash From Financing Activities | (2,833 | ) | 4,376 | |||||
Net Decrease in Cash and Cash Equivalents | (3,324 | ) | (22,191 | ) | ||||
Cash and Cash Equivalents at Beginning of Year | 40,193 | 69,717 | ||||||
Cash and Cash Equivalents at End of Period | $ | 36,869 | $ | 47,526 | ||||
Cash and Cash Equivalents Include: | ||||||||
Cash and Due From Banks | $ | 11,869 | $ | 13,026 | ||||
Federal Funds Sold | 25,000 | 34,500 | ||||||
Total Cash and Cash Equivalents at Period End | $ | 36,869 | $ | 47,526 | ||||
Supplementary Data: | ||||||||
Cash Paid for Interest | $ | 4,856 | $ | 5,851 | ||||
Cash Paid for Taxes | 390 | 440 | ||||||
See accompanying notes to unaudited financial statements.
6
Table of Contents
PATRICK HENRY NATIONAL BANK
STATEMENTS OF CHANGES IN SHAREHOLDERS’ EQUITY
(Dollars in Thousands)
| Common Stock | Undivided Profits | |||||||||||
| Shares | Par Value | Surplus | ||||||||||
Balances, December 31, 2005 | 2,800,122 | $ | 3,500 | $ | 13,879 | $ | 6,471 | |||||
Net Income | — | — | — | 1,704 | ||||||||
Cash Dividends | — | — | — | (925 | ) | |||||||
Balances, September 30, 2006 (Unaudited) | 2,800,122 | $ | 3,500 | $ | 13,879 | $ | 7,250 | |||||
Notes To Unaudited Financial Statements
The unaudited interim financial statements of the Bank are prepared in conformity with accounting principles generally accepted in the United States of America and the instructions to Securities and Exchange Commission’s Form 10-Q. In the opinion of management, all adjustments (consisting only of normal recurring adjustments) necessary for a fair presentation of the financial position and results of operations for the periods presented have been included. The financial statements should be read in conjunction with the financial statements and notes contained in the Bank’s Annual Report on Form 10-KSB for the year ended December 31, 2005. The results for the six months ended September 30, 2006 are not necessarily indicative of the results for the entire fiscal year ending December 31, 2005.
Certain reclassifications have been made to the prior year financial statements to conform to the 2006 presentation. These reclassifications had no effect on previously reported net income.
NOTE 1—INVESTMENT SECURITIES
(Dollars in Thousands)
The Bank has the ability and intent to carry the investments noted with an unrealized loss to the final maturity of the instrument and considers these investments not other-than-temporarily impaired.
The following table sets forth a summary of the investment securities portfolio as of the periods indicated:
| September 30, 2006 (Unaudited) | Amortized Cost | Gross Unrealized Gains | Gross Unrealized Losses | Estimated Market Value | ||||||||
U S Agency Securities | $ | 87,175 | $ | 23 | $ | 894 | $ | 86,304 | ||||
Total Securities | $ | 87,175 | $ | 23 | $ | 894 | $ | 86,304 | ||||
| December 31, 2005 | ||||||||||||
U S Agency Securities | $ | 93,652 | $ | 21 | $ | 1,189 | $ | 92,484 | ||||
Total Securities | $ | 93,652 | $ | 21 | $ | 1,189 | $ | 92,484 | ||||
7
Table of Contents
Note 2—LOANS
(Dollars in Thousands)
The composition of the loan portfolio by dollar amount is shown in the table below:
| September 30, 2006 (Unaudited) | December 31, 2005 | |||||||
Secured by real estate | ||||||||
Construction Loans | $ | 8,720 | $ | 8,870 | ||||
Secured by farmland (including farm residential and other improvements) | 2,173 | 2,219 | ||||||
Secured by 1-4 family residential properties | 44,744 | 39,980 | ||||||
Secured by multi-family residential properties | 7,861 | 13,178 | ||||||
Secured by non-farm residential property | 100,663 | 91,454 | ||||||
Loans to finance agricultural production and other loans to farmers | 847 | 829 | ||||||
Commercial and industrial loans | 30,065 | 31,344 | ||||||
Loans to individuals for household, family and other personal expenditures | 9,331 | 9,790 | ||||||
Obligations (other than securities) of states and political subdivisions | 39,445 | 34,713 | ||||||
Less: Unearned Income | (719 | ) | (644 | ) | ||||
Total loans and leases | $ | 243,130 | $ | 231,733 | ||||
Note 3—ALLOWANCE FOR LOAN LOSSES
(Dollars in Thousands)
The allowance for loan losses is an estimate of losses inherent in the loan portfolio as determined by management taking into consideration historical loan loss experience, diversification of the loan portfolio, amounts of secured and unsecured loans, banking industry standards and averages, and general economic conditions. Ultimate losses may vary from current estimates. These estimates are reviewed periodically and as adjustments become necessary, they are reported in earnings in the periods which they become reasonably estimable.
The following table summarizes the activity in the allowance for loan losses in the periods presented:
| September 30, 2006 (Unaudited) | December 31, 2005 | ||||||
Balance Beginning of Period | $ | 2,473 | $ | 2,404 | |||
Provision for Loan Losses | 135 | 240 | |||||
Charge-Offs, Net Of (Recoveries): | |||||||
Real Estate Loans | 17 | (33 | ) | ||||
Installment Loans | 13 | 57 | |||||
Commercial Loans | — | 147 | |||||
Total Net Loan Losses | 30 | 171 | |||||
Balance | $ | 2,578 | $ | 2,473 | |||
Note 4—NONPERFORMING ASSETS AND DELINQUENT LOANS
(Dollars in Thousands)
| September 30, 2006 (Unaudited) | December 31, 2005 | |||||
Nonaccrual Loans | ||||||
Real Estate | $ | 2,982 | $ | 2,875 | ||
Installment | 3 | 38 | ||||
Commercial | — | 658 | ||||
Total Nonaccrual Loans | 2,985 | 3,571 | ||||
Foreclosed Properties | 2,780 | 2,265 | ||||
Total Nonperforming Assets | $ | 5,765 | $ | 5,836 | ||
Loans 90 Days or More Past Due and Still Accruing | ||||||
Real Estate | $ | — | $ | — | ||
Installment | 13 | — | ||||
Commercial | — | 31 | ||||
Total Loans 90 Days or More Past Due | $ | 13 | $ | 31 | ||
8
Table of Contents
Item 2—MANAGEMENT’S DISCUSSION AND ANALYSIS
The Bank
Incorporated in 1976 as a national banking association with its main office in Bassett, Virginia, the Bank operates under a national charter and provides full banking services. As a national bank, the Bank is subject to regulation by the Comptroller of the Currency, the Federal Deposit Insurance Corporation and the Board of Governors of the Federal Reserve System. The Bank generates commercial (including agricultural), mortgage and consumer loans and receives deposits from customers located primarily in Henry and Patrick Counties and the City of Martinsville in Virginia and Randolph County, Rockingham County an the City of Greensboro in North Carolina, with all offices operating under the name “Patrick Henry National Bank.” At September 30, 2006, the Bank had $396 million in assets, $241 million in net loans, $369 million in deposits and $25 million in total shareholders’ equity.
Proposed Reorganization and Merger
On July 28, 2006, the Bank entered into an Agreement and Plan of Merger (the “Merger Agreement”) with Blue Ridge Bank, N.A., Central National Bank, Community National Bank, First National Bank, First National Exchange Bank, Mountain National Bank, Patriot Bank, National Association, Peoples National Bank, Shenandoah National Bank (together with the Bank, the “Banks”) and Carter Bank & Trust, a new Virginia chartered bank that will be headquartered in Martinsville, Virginia. The Merger Agreement sets forth the terms and conditions pursuant to which the Banks will reorganize by merging into Carter Bank & Trust (the “Merger”).
All officers and employees of the existing Banks will remain unchanged as a result of the Merger. Worth Harris Carter, Jr. is currently Chairman of the Board and President of each of the Banks and will serve as Chairman of the Board and President of Carter Bank & Trust. Under the terms of the Merger Agreement, shareholders of each of the Banks will receive a certain number of shares in Carter Bank & Trust in exchange for each share held in the existing Banks as follows: each share of Blue Ridge Bank: 2.474 shares; each share of Central National Bank: 5.470 shares; each share of Community National Bank: 4.350 shares; each share of First National Bank: 1.613 shares; each share of First National Exchange Bank: 4.509 shares; each share of Mountain National Bank: 3.981 shares; each share of Patrick Henry National Bank: 1.112 shares; each share of Patriot Bank: 5.775 shares; each share of Peoples National Bank: 1.945 shares; and each share of Shenandoah National Bank: 3.461 shares.
Consummation of the Merger is subject to a number of customary conditions including (i) the approval of the Merger by the shareholders of each of the Banks and Carter Bank & Trust and (ii) the receipt of all required regulatory approvals, including approval by the Virginia State Corporation Commission and the Federal Deposit Insurance Corporation. The Merger is expected to be completed in the fourth quarter of 2006 and will be accounted for using the purchase method of accounting.
Critical Accounting Policies
The accounting and reporting policies of the Bank conform to generally accepted accounting principles (GAAP) in the United States of America and to general practices within the banking industry. The preparation of the financial statements in conformity with GAAP requires management to make estimates and assumptions that affect the amounts reported in the financial statements and accompanying notes. We believe the most significant of these estimates involves the allowance for loan losses because of its potential impact on our overall performance. We have described our policies in this area below. A summary of the Bank’s significant accounting policies can be found in the Notes to Financial Statements included in the Bank’s 2005 Annual Report on Form 10-K.
9
Table of Contents
In general, determining the amount of the allowance for loan losses requires significant judgment and the use of estimates by management allowing for losses inherent to the loan portfolio. The Bank maintains an allowance for loan losses to absorb probable losses in the loan portfolio based on a quarterly analysis of the portfolio. This analysis determines an appropriate level of the allowance for loan losses by considering factors affecting loan losses, including specific losses, levels and trends in impaired and non-performing loans, historical loan loss experience, current economic conditions, volume, growth and composition of the portfolio, and other relevant factors. The Bank records a provision for loan losses to maintain the allowance at an adequate level. The provision expense could increase or decrease each quarter based upon the results of management’s formal analysis.
The amount of the allowance represents management’s estimate of expected losses from existing loans based upon specific allocations for individual lending relationships and historical loss experience. The allowance for loan losses related to impaired loans is based on discounted cash flows using the loan’s initial effective interest rate or the fair value of the collateral for certain collateral dependent loans. This evaluation requires management to make estimates of the amounts and timing of future cash flows on impaired loans, which consists primarily of non-accrual and restructured loans. Actual losses for these loans can vary significantly from these estimates.
Investment securities are stated at cost, adjusted for amortization of premiums and accretion of discounts, and computed by the interest method. The Bank has positive intent and ability to hold these securities until maturity. Gains and losses on sales, if any, of securities are based upon the adjusted cost of the specific securities sold. If any of the securities are not held to maturity, the classification of the entire portfolio could change to available for sale. This could require fair value accounting for not just the tainted securities but the entire portfolio, and possibly, the recognition of unrealized losses as other than temporary in the income statement.
Real estate properties acquired through or in lieu of loan foreclosure are initially recorded at the lower of the Bank’s carrying amount or fair value less estimated selling cost at the date of foreclosure. Any write-downs based on the asset’s fair value at the date of acquisition are charged to the allowance for loan losses. After foreclosure, these assets are carried at the lower of their new cost basis or fair value less cost to sell. Costs of significant property improvements are capitalized, whereas costs relating to holding property are expensed. The portion of interest costs relating to development of real estate is capitalized. Valuations are periodically performed by management, and any write-downs are recorded as a charge to operations, if necessary, to reduce the carrying value of a property to the lower of its carrying value or fair value less cost to sell. The fair value of other real estate owned, including related selling costs, is an estimate that may change in the near term. If estimates change that decrease the expected fair value of the property, the recognition of this loss is reflected in the income statement for the period the estimate changes.
Overview
Net Income for the first nine months of 2006 equaled $1,704,000, or $0.61 per share, compared to $1,492,000, or $0.33 per share , for 2005. On an annualized basis, this represents a return on average assets of 0.58% and return on average equity of 9% compared to 0.52% and 9%, respectively, for the same period last year.
The Bank has reduced its investments in interest-bearing deposits, U. S. Agency Securities and Fed Funds sold. Loans increased $11.5 million when compared to December 31, 2005. The changes in asset allocation have had a positive impact on earnings. Because of these changes, the Bank has experienced an increase in net interest income of $751,000 or 11% when compared with the prior year. Net income increased $212,000 or 14% over the prior year. As interest rates continue to rise, the Bank expects net interest margins to widen and earnings to increase.
Total Liabilities at September 30, 2006 were $371,650,000, down from $373,673,000 at December 31, 2005. This was mainly due to a decrease in deposits.
Total Shareholders’ Equity at September 30, 2006 was $24,629,000. At December 31, 2005, total Shareholders’ Equity was $23,850,000.
10
Table of Contents
Results of Operations
Net Interest Income.Net Interest Income increased $751,000 or 11%, when compared to the same period last year. Net Interest Income is our largest source of revenue; however, it continues to be impacted by low interest rates. As interest rates continue to increase, we expect net interest margins to wide and earnings to increase.
The following table details the average balances and cost and yield data for the earning assets and interest-bearing liabilities:
| For the Nine Months Ended | ||||||||||||||||||||||
| September 30, 2006 | September 30, 2005 | |||||||||||||||||||||
| (Unaudited) | ||||||||||||||||||||||
Asset/Liability | Average Balance | Income/ Expense | Yield/ Cost | Average Balance | Income/ Expense | Yield/ Cost | Increase (Decrease) | |||||||||||||||
Real Estate Loans | $ | 163,485 | $ | 7,193 | 5.87 | % | $ | 149,355 | $ | 6,453 | 5.76 | % | $ | 740 | ||||||||
Installment Loans | 8,924 | 659 | 9.85 | % | 8,857 | 648 | 9.75 | % | 11 | |||||||||||||
Commercial Loans | 69,256 | 3,145 | 6.05 | % | 57,449 | 2,354 | 5.46 | % | 791 | |||||||||||||
Total Loans-Net of Unearned Income | 241,665 | 10,997 | 6.07 | % | 215,661 | 9,455 | 5.85 | % | 1,542 | |||||||||||||
Interest-Bearing Deposits in Other Financial Institutions | 18,653 | 671 | 4.80 | % | 23,898 | 567 | 3.16 | % | 104 | |||||||||||||
Investment Securities | 86,688 | 2,616 | 4.02 | % | 87,958 | 2,342 | 3.55 | % | 274 | |||||||||||||
Federal Funds Sold | 23,569 | 871 | 4.93 | % | 32,800 | 797 | 3.24 | % | 74 | |||||||||||||
Total Earning Assets | $ | 370,575 | $ | 15,155 | 5.45 | % | $ | 360,317 | $ | 13,161 | 4.87 | % | $ | 1,994 | ||||||||
Interest-Bearing Transaction Accounts | $ | 37,178 | $ | 579 | 2.08 | % | $ | 38,691 | $ | 328 | 1.13 | % | $ | 251 | ||||||||
Savings Deposits (Including MMDAs) | 67,027 | 958 | 1.91 | % | 76,758 | 1,072 | 1.86 | % | (114 | ) | ||||||||||||
Certificates of Deposit Over $100,000 | 45,779 | 1,535 | 4.47 | % | 38,259 | 1,186 | 4.13 | % | 349 | |||||||||||||
Other Certificates of Deposits | 155,005 | 4,535 | 3.90 | % | 142,564 | 3,485 | 3.26 | % | 1,050 | |||||||||||||
Total Deposits | 304,989 | 7,607 | 3.33 | % | 296,272 | 6,071 | 2.73 | % | 1,536 | |||||||||||||
Notes issued to the U. S. Treasury | 512 | 14 | 3.65 | % | 395 | 7 | 2.36 | % | 7 | |||||||||||||
Total Interest-Bearing Liabilities | $ | 305,501 | $ | 7,621 | 3.33 | % | $ | 296,667 | $ | 6,078 | 2.73 | % | $ | 1,543 | ||||||||
Net Interest Income | $ | 7,534 | 2.71 | % | $ | 7,083 | 2.62 | % | $ | 451 | ||||||||||||
Total Non-Interest Expense increased $318,000 or 5%. As a result net income increased $212,000 or 14%, when compared with the prior year.
Allowance and Provision for Loan Losses.The Allowance for Loan Losses represents management’s estimation of the amount necessary to absorb future losses in the loan portfolio. On the Statement of Condition, the Allowance for Loan Losses is deducted from Total Loans so that the net amount shown represents the estimated realizable total loans. The Provision for Loan Losses is the amount charged to expense to maintain the Allowance at an adequate level.
11
Table of Contents
The Allowance for Loan Losses was $2,578,000, or 1.06% of total loans outstanding, at September 30, 2006. In the view of management, the Allowance for Loan Losses is adequate to meet the loss contingency based on experience factors and a review of the loan portfolio.
The Provision for Loan Loss was $135,000 for the nine months ended September 30, 2006, and $180,000 for the same period in 2005. See Note 3—Allowance For Loan Losses—and Note 4—Nonperforming Assets and Delinquent Loans—to the financial statements for additional information.
Non-Interest Income.Non-Interest Income decreased $16,000 for the nine month period ended September 30, 2006, compared to the same period of 2005. The largest source of Non-Interest Income is Services Charges, Commissions and Fees, which decreased from $758,000 at September 30, 2005 to $706,000 at September 30, 2006.
Non-Interest Expense.Non-Interest Expense increased $318,000 at September 30, 2006, compared to the same period of 2005.
Income Taxes.Income tax expense was $390,000 in the third quarter of 2006, as compared to $440,000 in 2005. The effective income tax rate increased between the periods due to increased income.
Analysis of Financial Condition
Investments.U. S. Agency Securities investments have decreased $6.5 million compared to December 31, 2005. Funds from maturing U. S. Agency Securities and monies from Federal Funds Sold were invested in loans.
Loans. Loans increased $11.5 million, or 5%, compared to December 31, 2005. The increase took place primarily in the real estate segment of the portfolio. Real estate secured loans made up approximately 68% of net loans at September 30, 2006.
Non-Performing Assets and Impaired Loans.Non-performing assets, which consist of nonaccrual loans and foreclosed properties, were $5,765,000 at September 30, 2006 and $5,836,000 at December 31, 2005. Nonaccrual Loans equaled $2,985,000 at September 30, 2006 and $3,571,000 at December 31, 2005. Foreclosed Properties equaled $2,780,000 at September 30, 2006 and $2,265,000 at December 31, 2005.
Nonaccrual loans are those loans contractually past due 90 days or more on which no interest is being accrued. Other real estate owned consists of real estate acquired through foreclosure. These properties are reviewed quarterly and reduced to an estimated realizable value at that time.
Deposits.Total deposits have decreased $2.5 million, or 0.7%, compared to December 31, 2005. Increases occurred in Certificates of Deposit and decreases occurred in all other categories.
Capital.The federal regulatory agencies use risk-based capital ratios to analyze the adequacy of a bank’s capital. These ratios weigh bank assets from 0% to 100%, depending upon the risks inherent in each type of asset. The Bank continues to meet all requirements for a well-capitalized bank as defined by the regulatory agencies.
The Following table presents the key risk-based capital ratios for the periods indicated:
| September 30, 2006 | December 31, 2005 | |||||
Tier 1 Ratio | 10.30 | % | 10.16 | % | ||
Total Risk-Based Capital Ratio | 11.38 | % | 11.22 | % | ||
Leverage Ratio | 6.30 | % | 6.22 | % |
Shareholders’ Equity was $24,629,000 at September 30, 2006 compared to $23,850,000 at December 31, 2005.
Liquidity.Liquidity is our ability to fund both loans and investments in the normal course of business and to provide adequate protection for unexpected deposit withdrawals or other demands for funds without incurring a
12
Table of Contents
significant negative impact on profitability. Our primary source of day-to-day liquidity lies in the combination of cash, deposit balances, checks in process of collection, deposit growth and federal funds sold. Federal funds are excess funds that are sold to other banks, generally on a one-day basis. Normal funds from the repayment of loans and investments augment these funds.
Our secondary source of liquidity lies in our investments and deposits in other financial institutions. While our investments are categorized as held-to-maturity, they consist primarily of short-term U S Agency Securities that are readily marketable. The majority of our investment securities mature in five years or less. Interest-bearing deposits in other financial institutions generally mature in two years or less and the volume of this investment decreased for the first nine months.
Off-Balance Sheet Arrangements.Commitments to extend credit, which amounted to $2,782,000 at September 30, 2006 and $5,582,000 at December 31, 2005, respectively, represent agreements to lend to customers with fixed expiration dates or other termination clauses. Since many of the commitments are expected to expire without being funded, the total commitment amounts do not necessarily represent future liquidity requirements. Standby letters of credit are conditional commitments issued by the Bank guaranteeing the performance of a customer to a third party. Those guarantees are primarily issued to support public and private borrowing arrangements. The Bank had outstanding letters of credit in the amount of $97,000 at September 30, 2006 and $560,000 at December 31, 2005.
Recent Accounting Pronouncements.In June 2005, the FASB issued Statement No. 154, “Accounting Changes and Error Corrections”, which replaces APB Opinion No. 20, “Accounting Changes” and FASB Statement No. 3, “Reporting Accounting Changes in Interim Financial Statements.” Statement No., 154 requires that a voluntary change in accounting principle be applied retrospectively with all prior period financial statements presented on the new accounting principle. Statement No. 154 also requires that a change in method of depreciating or amortizing a long-lived non-financial asset be accounted for prospectively as a change in estimate, and correction of errors in previously issued financial statements should be termed a “restatement.” Statement No. 154 is effective for accounting changes and correction of errors made in fiscal years beginning after December 15, 2005. Management does not expect this accounting pronouncement to have a material impact on the financial statements.
Item 3—QUANTITATIVE AND QUALITATIVE DISCLOSURE ABOUT MARKET RISK
Interest Sensitivity Analysis. The frequency with which interest rates on earning assets and interest bearing liabilities change has a significant impact on net interest income. The following table presents the anticipated changes based on the contractual maturity of eachinstrument. Expected maturities may differ from contractual maturities as both borrowers and depositors may have the right to call or prepay obligations with or without call or prepayment penalties.
| (Dollars in thousands) | Within One Year | One to Five Years | Over Five Years | Total | ||||||||||
Uses of Funds | ||||||||||||||
Interest-Bearing Deposits in Other Financial Institutions | $ | 18,801 | $ | — | $ | — | $ | 18,801 | ||||||
Investment Securities | 30,178 | 56,997 | 87,175 | |||||||||||
Federal Funds Sold | 25,000 | 25,000 | ||||||||||||
Total Loans | 67,307 | 86,961 | 89,581 | 243,849 | ||||||||||
Total Earning Assets | 141,286 | 143,958 | 89,581 | 374,825 | ||||||||||
Deposits | ||||||||||||||
Interest-Bearing Demand | $ | 43,835 | $ | — | $ | — | $ | 43,835 | ||||||
Regular Passbook Savings | 57,687 | — | — | 57,687 | ||||||||||
Time Deposits | ||||||||||||||
Certificates of Deposit Over $100,000 | 26,317 | 21,040 | — | 47,357 | ||||||||||
Other | 90,836 | 69,895 | — | 160,731 | ||||||||||
Total Deposits | 218,675 | 90,935 | — | 309,610 | ||||||||||
Notes issued to the U. S. Treasury | 1,541 | — | — | 1,541 | ||||||||||
Total Interest-Bearing Liabilities | 220,216 | 90,935 | — | 311,151 | ||||||||||
Maturity/Rate Sensitivity Gap Per Period | $ | (78,930 | ) | $ | 53,023 | $ | 89,581 | $ | 63,674 | |||||
Cummulative Maturity/Rate Sensitivity Gap | $ | (78,930 | ) | $ | (25,907 | ) | $ | 63,674 | ||||||
13
Table of Contents
Item 4—CONTROLS AND PROCEDURES
The Bank maintains a system of disclosure controls and procedures that is designed to ensure that material information is accumulated and communicated to management, including the Bank’s president (who is the Bank’s principal executive officer and principal financial officer), as appropriate to allow timely decisions regarding required disclosure. As required, management, with the participation of the Bank’s president, evaluated the effectiveness of the design and operation of the Bank’s disclosure controls and procedures as of the end of the period covered by this report. Based on this evaluation, the Bank’s president concluded that the Bank’s disclosure controls and procedures were operating effectively to ensure that information required to be disclosed by the Bank in reports that it files or submits under the Securities Exchange Act of 1934, as amended, is recorded, processed, summarized, and reported within the time periods specified in the rules and forms of the SEC.
Because of the inherent limitations in all control systems, no evaluation of controls can provide absolute assurance that the Bank’s disclosure controls and procedures will detect or uncover every situation involving the failure of persons within the Bank to disclose material information otherwise required to be set forth in the Bank’s periodic reports.
The Bank’s management is also responsible for establishing and maintaining adequate internal control over financial reporting to provide reasonable assurance regarding the reliability of financial reporting and the preparation of financial statements for external purposes in accordance with generally accepted accounting principles. There were no changes in the Bank’s internal control over financial reporting during the Bank’s quarter ended September 30, 2006 that have materially affected, or are reasonably likely to materially affect, the Bank’s internal control over financial reporting.
PART II—OTHER INFORMATION
Item 1—LEGAL PROCEEDINGS.
There are no material pending legal proceedings to which the Bank is a party or to which the property of the Bank is subject.
Item 1A—RISK FACTORS.
There have been no material changes in the risk factors faced by Patrick Henry National Bank from those disclosed in Patrick Henry National Bank’s Annual Report to Shareholders for the year ended December 31, 2005.
Item 2—UNREGISTERED SALES OF EQUITY SECURITIES AND USE OF PROCEEDS.
None.
Item 3—DEFAULTS UPON SENIOR SECURITIES.
None.
Item 4—SUBMISSION OF MATTERS TO A VOTE OF SECURITY HOLDERS.
None.
14
Table of Contents
Item 5—OTHER INFORMATION
None.
Item 6—EXHIBITS AND REPORTS ON FORM 8-K
Exhibits:
| 2.1 | Agreement and Plan of Merger, dated as of July 28, 2006, by and among Blue Ridge Bank, N.A., Central National Bank, Community National Bank, First National Bank, First National Exchange Bank, Mountain National Bank, Patrick Henry National Bank, Patriot Bank, National Association, Peoples National Bank, Shenandoah National Bank and Carter Bank & Trust (incorporated by reference to Exhibit 2.1 to Form 8-K filed with the Office of the Comptroller of the Currency on July 31, 2006). | |
| 3.1 | Articles of Association (filed with the Office of the Comptroller of the Currency prior to the opening of the Bank) | |
| 3.2 | Amended and Restated Bylaws (as amended and restated through February 17, 2005) (incorporated by reference to Exhibit 3.2 to Form 8-K filed with the Office of the Comptroller of the Currency on February 23, 2005) | |
| 31 | Certification by principal executive officer and principal financial officer pursuant to Rule 13a-14(a) | |
| 32 | Certification of principal executive officer and principal financial officer pursuant to 18 U.S.C. § 1350 | |
15
Table of Contents
SIGNATURES
In accordance with the requirements of the Securities Exchange Act of 1934, the registrant caused this report to be signed on its behalf by the undersigned, thereunto duly authorized.
| PATRICK HENRY NATIONAL BANK | ||||
Date: November 13, 2006 |
| |||
| Worth Harris Carter, Jr. | ||||
| Chairman of the Board and President | ||||
| (principal executive officer, principal financial officer and principal accounting officer) | ||||
16
Table of Contents
Exhibit 31
CERTIFICATION
I, Worth Harris Carter, Jr., certify that:
| 1. | I have reviewed this annual report on Form 10-Q of Patrick Henry National Bank; |
| 2. | Based on my knowledge, this report does not contain any untrue statement of a material fact or omit to state a material fact necessary to make the statements made, in light of the circumstances under which such statements were made, not misleading with respect to the period covered by this report; |
| 3. | Based on my knowledge, the financial statements, and other financial information included in this report, fairly present in all material respects the financial condition, results of operations and cash flows of the registrant as of, and for, the periods presented in this report; |
| 4. | I am responsible for establishing and maintaining disclosure controls and procedures (as defined in Exchange Act Rules 13a-15(e) and 15d-15(e)) for the registrant and have: |
(a) Designed such disclosure controls and procedures, or caused such disclosure controls and procedures to be designed under my supervision, to ensure that material information relating to the registrant, including its consolidated subsidiaries, is made known to me by others within those entities, particularly during the period in which this report is being prepared;
(b) Evaluated the effectiveness of the registrant’s disclosure controls and procedures and presented in this report my conclusions about the effectiveness of the disclosure controls and procedures, as of the end of the period covered by this report based on such evaluation; and
(c) Disclosed in this report any change in the registrant’s internal control over financial reporting that occurred during the registrant’s most recent fiscal quarter (the registrant’s fourth fiscal quarter in the case of an annual report) that has materially affected, or is reasonably likely to materially affect, the registrant’s internal control over financial reporting; and
| 5. | I have disclosed, based on my most recent evaluation of internal control over financial reporting, to the registrant’s auditors and the audit committee of the registrant’s board of directors (or persons performing the equivalent functions): |
(a) All significant deficiencies and material weaknesses in the design or operation of internal control over financial reporting which are reasonably likely to adversely affect the registrant’s ability to record, process, summarize and report financial information; and
(b) Any fraud, whether or not material, that involves management or other employees who have a significant role in the registrant’s internal control over financial reporting.
| Date: November 13, 2006 | ||
| Worth Harris Carter, Jr. | ||
| Chairman of the Board and President | ||
| (principal executive officer, principal financial officer and principal accounting officer) |
17
Table of Contents
Exhibit 32
CERTIFICATION OF
PRINCIPAL EXECUTIVE OFFICER AND PRINCIPAL FINANCIAL OFFICER
Pursuant to § 906 of the Sarbanes-Oxley Act of 2002 (18 U.S.C. § 1350)
The undersigned, as the principal executive officer and principal financial officer of Patrick Henry National Bank, certifies that, to the best of his knowledge and belief, the Annual Report on Form 10-Q for the period ended September 30, 2006, which accompanies this certification fully complies with the requirements of Section 13(a) of the Securities Exchange Act of 1934 and the information contained in the report fairly presents, in all material respects, the financial condition and results of operations of Patrick Henry National Bank at the dates and for the periods indicated. The foregoing certification is made pursuant to § 906 of the Sarbanes-Oxley Act of 2002 (18 U.S.C. § 1350) and shall not be relied upon for any other purpose. The undersigned expressly disclaims any obligation to update the foregoing certification except as required by law.
| Date: November 13, 2006 | ||
| Worth Harris Carter, Jr. | ||
| Chairman of the Board and President | ||
| (principal executive officer, principal financial officer and principal accounting officer) |
18
Table of Contents
OFFICE OF THE COMPTROLLER OF THE CURRENCY
WASHINGTON, D.C. 20552
FORM 10-KSB
| x | ANNUAL REPORT UNDER SECTION 13 OR 15(d) OF THE SECURITIES EXCHANGE ACT OF 1934 |
For the fiscal year ended December 31, 2005
OR
| ¨ | TRANSITION REPORT UNDER SECTION 13 OR 15(d) OF THE SECURITIES EXCHANGE ACT OF 1934 |
Commission File Number: n/a
PATRIOT BANK, NATIONAL ASSOCIATION
(Name of small business issuer in its charter)
| National Bank | 54-1801538 | |
(State or other jurisdiction of incorporation or organization) | (I.R.S. Employer Identification No.) |
1204 Bragg Road Fredericksburg, VA | 22407 | |
| (Address of principal executive offices) | (Zip Code) |
Issuer’s telephone number: (540) 786-9815
Securities registered under Section 12(b) of the Exchange Act: None
Securities registered under Section 12(g) of the Exchange Act: None
Check whether the issuer is not required to file reports pursuant to Section 13 or 15(d) of the Exchange Act. Yes ¨ No x
Check whether the issuer (1) filed all reports required to be filed by Section 13 or 15(d) of the Exchange Act during the past 12 months (or for such shorter period that the registrant was required to file such reports), and (2) has been subject to such filing requirements for the past 90 days. Yes x No ¨
Check if there is no disclosure of delinquent filers in response to Item 405 of Regulation S-B contained in this form, and no disclosure will be contained, to the best of registrant’s knowledge, in definitive proxy or information statements incorporated by reference in Part III of this Form 10-KSB or any amendment to this Form 10-KSB. x
Indicate by check mark whether the registrant is a shell company (as defined in Rule 12b-2 of the Exchange Act). Yes ¨ No x
The issuer’s revenues for the fiscal year ended December 31, 2005 were $12,378,000.
The aggregate market value of the issuer’s common stock held by nonaffiliates as of March 16, 2006 was $19,916,000.
As of March 16, 2006, there were issued and outstanding 474,132 shares of the issuer’s common stock.
DOCUMENTS INCORPORATED BY REFERENCE
Portions of the 2005 Annual Report to Shareholders are incorporated by reference in Part II of this report, which is attached hereto as Exhibit 13.
Transitional Small Business Disclosure Format: Yes ¨ No x
1
Table of Contents
Patriot Bank, National Association
2005 ANNUAL REPORT ON FORM 10-KSB
TABLE OF CONTENTS
PART I | 3 | |||
| ITEM 1 - | DESCRIPTION OF BUSINESS | 3 | ||
| ITEM 2 - | DESCRIPTION OF PROPERTY | 6 | ||
| ITEM 3 - | LEGAL PROCEEDINGS | 7 | ||
| ITEM 4 - | SUBMISSION OF MATTERS TO A VOTE OF SECURITY HOLDERS | 7 | ||
PART II | 8 | |||
| ITEM 5 - | MARKET FOR COMMON EQUITY AND RELATED STOCKHOLDER MATTERS | 8 | ||
| ITEM 6 - | MANAGEMENT’S DISCUSSION AND ANALYSIS OR PLAN OF OPERATION | 9 | ||
| ITEM 7 - | FINANCIAL STATEMENTS | 9 | ||
| ITEM 8 - | CHANGES IN AND DISAGREEMENTS WITH ACCOUNTANTS ON ACCOUNTING AND FINANCIAL DISCLOSURE | 9 | ||
| ITEM 8A- | CONTROLS AND PROCEDURES | 9 | ||
ITEM 8B - OTHER INFORMATION | 10 | |||
PART III | 10 | |||
| ITEM 9 - | DIRECTORS, EXECUTIVE OFFICERS, PROMOTERS AND CONTROL PERSONS; COMPLIANCE WITH | |||
| SECTION 16(A) OF THE EXCHANGE ACT | 10 | |||
| ITEM 10 - | EXECUTIVE COMPENSATION | 12 | ||
| ITEM 11 - | SECURITY OWNERSHIP OF CERTAIN BENEFICIAL OWNERS AND MANAGEMENT, AND RELATED | |||
| STOCKHOLDER MATTERS | 14 | |||
| ITEM 12 - | CERTAIN RELATIONSHIPS AND RELATED TRANSACTIONS | 15 | ||
| ITEM 14 - | PRINCIPAL ACCOUNTANT FEES AND SERVICES | 16 | ||
2
Table of Contents
FORWARD–LOOKING STATEMENTS
This report contains statements concerning the Bank’s expectations, plans, objectives, future financial performance and other statements that are not historical facts. These statements may constitute “forward-looking statements” as defined by federal securities laws. In some cases, readers can identify the forward-looking statements by the use of words such as “may,” “ will,” “should,” “could,” “expect,” “plan,” “intend,” “anticipate,” “believe,” “estimate,” “predict,” “potential” or “continue” or the negative or other variations of these words, or other comparable words or phrases. These statements may address issues that involve estimates and assumptions made by management, risks and uncertainties, and actual results could differ materially from historical results or those anticipated by such statements. Factors that could have a material adverse effect on the Bank’s operations and future prospects include, but are not limited to, changes in: interest rates; general and local economic conditions; the legislative/regulatory climate; monetary and fiscal policies of the U.S. government, including policies of the U.S. Treasury and the Federal Reserve Board; the quality or composition of loan or investment portfolios; demand for loan products; deposit flows; competition; demand for financial services in our market area and accounting principles, policies and guidelines. These risks and uncertainties should be considered in evaluating the forward-looking statements contained herein, and readers are cautioned not to place undue reliance on such statements, which speak only as of the date of this report.
PART I
Item 1 - DESCRIPTION OF BUSINESS
General
The Bank opened for business as a National Banking Association on July 1, 1996 and was created through the spin-off of the assets, liabilities and related capital of four offices located in the Fredericksburg area from Peoples National Bank, Danville, Virginia. At December 31, 2005, the Bank had 115 full-time and 16 part-time employees, $254 million in assets, $158 million in net loans, $233 million in deposits and $20 million in total shareholders’ equity.
The Bank is a full service community bank that provides an array of financial products and services to its customers, including a variety of interest-bearing and non-interest bearing demand deposit accounts; savings and money market accounts; certificates of deposit; commercial, installment, and real estate mortgage loans (commercial and residential); and safe deposit rental facilities. The Bank also sells travelers checks, money orders and cashier’s checks.
Market Area
The Bank’s primary service area currently consists of Abemarle, Stafford, Spotsylvania, and Prince William Counties and the cities of Fredericksburg, Charlottesville and Manassas. The Bank expanded into Culpeper County with the opening of a new office in Culpeper, Virginia. The Bank conducts a general commercial banking business in its service area, and focuses on serving the banking needs of small-to-medium sized businesses, professional concerns and individuals.
Goals and Strategy
The Bank’s goal is to become a leading financial institution in its market area by opening new offices and providing a full array of banking services. Management believes that the on-going consolidation of the banking industry has created an opportunity for community-based lenders like the Bank that emphasize retail lending and superior customer service. The Bank’s business strategy is to target individuals, businesses and professionals in the area for loans, deposits, and other financial services and to explore selected opportunities to establish branches in areas that demographically compliment the Bank’s existing customer base.
Deposits and Loan Products
The Bank offers a full range of deposit services including LIFETIME FREE CHECKING, NOW accounts, savings accounts, retirement accounts and other deposits of various types, ranging from money market accounts to longer-term certificates of deposit. The transaction accounts and time certificates are tailored to the Bank’s principal market at competitive rates. All deposit accounts are insured by the Federal Deposit Insurance Corporation (“FDIC”) up to the maximum amount allowed by law (generally $100,000 per depositor subject to aggregation rules). The Bank solicits these accounts from individuals, businesses, associations, organizations, and governmental entities.
3
Table of Contents
The Bank also offers a full range of commercial and personal loans. Commercial loans include both secured and unsecured loans. Consumer loans include secured and unsecured loans for financing automobiles, home improvements, education and personal investments. The Bank also makes real estate construction and acquisition loans and originates and holds fixed and variable rate mortgage loans.
The Bank’s lending activities are subject to a variety of lending limits imposed by federal law. While differing limits apply in certain circumstances based on the type of loan or the nature of the borrower (including the borrower’s relationship to the Bank), in general the Bank is subject to a loan-to-one borrower limit of an amount equal to 15% of the Bank’s unimpaired capital and surplus. The Bank may not make loans to any director, officer, employee or 10% shareholder of the Bank unless the loan is approved by the Board of Directors and is made on terms not more favorable than are made available to a person not affiliated with the Bank.
Other bank services include travelers checks, direct deposit of payroll and social security checks, and automated drafts for various accounts. The Bank has no current plans to exercise trust powers.
Bank Lending Practices
The Bank’s lending efforts are directed to making loans to individuals and businesses in its market area. The Bank has both purchased and sold participation loans with other banks in the past and may do so in the future. The Bank believes that its lending and credit policies are conservative.
The Bank’s primary lending program has been the origination of loans secured by real estate. The Bank evaluates both the borrower’s ability to make principal and interest payments and the value of the property that will secure the loan.
Residential mortgage loans generally are made on the basis of the borrower’s ability to make repayment from employment and other income and are secured by real estate that can be readily valued. The Bank offers both adjustable-rate and fixed-rate loans.
In contrast, commercial real estate loans typically are made on the basis of the borrower’s ability to make repayment from cash flow from its business and are secured by business properties. The Bank’s primary non-residential real estate loan products have rates that are fixed for three to five years and then become adjustable. Commercial loans typically involve larger loan balances concentrated with single borrowers or groups of related borrowers.
The Bank also makes consumer loans, including unsecured personal loans, automobile loans, deposit account loans, installment loans and time loans. The Bank’s primary consideration when making such consumer loans is the customer’s ability to repay the loan. Consumer loans generally warrant higher interest rates and fees, but such loans, particularly unsecured consumer loans, also may entail greater risk than residential mortgage loans. Even when a loan is secured, repossessed collateral for a defaulted consumer loan may not provide an adequate source of repayment. Consumer loan collections are dependent on the borrower’s continuing financial stability, and are more likely to be affected adversely by job loss, divorce, illness, or personal bankruptcy. Various federal and state laws, including bankruptcy and insolvency laws, may limit the amount that can be recovered on such loans and such loans may give rise to claims and defenses by a consumer loan borrower.
The Bank also makes commercial loans to qualified small businesses in its market area. Commercial business loans generally have a higher degree of risk than mortgage loans, but have commensurately higher yields. To manage these risks, the Bank generally secures appropriate collateral and carefully monitors the financial condition of its business borrowers.
Competition
Federal and state legislative changes have significantly increased competition among financial institutions, and current trends toward additional deregulation may be expected to increase competition even further. In its market area, the Bank competes with nationwide, statewide and local banking institutions, credit unions, thrift institutions, money market funds, consumer finance companies, and other financial service organizations. Many of the financial organizations competing with the Bank have greater financial resources than the Bank. Many of these financial organizations also have greater geographic coverage and some offer bank and bank-related services that the Bank does not offer.
Supervision and Regulation
Financial institutions are extensively regulated under federal and state law. Consequently, the growth and earnings performance of the Bank can be affected not only by management decisions and general economic conditions, but also by the statutes administered
4
Table of Contents
by, and the regulations and policies of, various governmental regulatory authorities including, but not limited to, the Office of the Comptroller of the Currency (‘OCC”), the Federal Reserve Board (“FRB”), the FDIC, the Internal Revenue Service, federal and state taxing authorities, and the Securities and Exchange Commission. The effect of such statutes, regulations and policies can be significant, and cannot be predicted with a high degree of certainty.
Federal and state laws and regulations generally applicable to financial institutions regulate, among other things, the scope of business, investments, reserves against deposits, capital levels relative to operations, the nature and amount of collateral for loans, the establishment of branches, mergers, consolidations and dividends. The system of supervision and regulation applicable to the Bank establishes a comprehensive framework for their respective operations and is intended primarily for the protection of the FDIC’s deposit insurance funds and the depositors, rather than the shareholders, of the Bank.
The following references to material statutes and regulations affecting the Bank are brief summaries thereof and do not purport to be complete, and are qualified in their entirety by reference to such statutes and regulations. Any change in applicable law or regulations may have a material effect on the business of the Bank.
Finally, the Bank is subject to the periodic reporting requirements of the Securities Exchange Act of 1934, as amended, including but not limited to, filing annual, quarterly and other current reports with OCC.
Regulatory Capital Requirements
All financial institutions are required to maintain minimum levels of regulatory capital. The OCC has established risk-based and leveraged capital standards for the financial institutions they regulate. The OCC also may impose capital requirements in excess of these standards on a case-by-case basis for various reasons, including financial condition or actual or anticipated growth. Under the risk-based capital requirements, the Bank is required to maintain a minimum ratio of total capital to risk-weighted assets of at least 8%. At least half of the total capital is required to be “Tier 1 capital,” which consists principally of common and certain qualifying preferred shareholders’ equity, less certain intangibles and other adjustments. The remainder, “Tier 2 capital,” consists of a limited amount of subordinated and other qualifying debt (including certain hybrid capital instruments) and a limited amount of the general loan loss reserve.
In addition, the federal regulatory agencies have established a minimum leveraged capital ratio (Tier 1 capital to period end total assets). These guidelines provide for a minimum leveraged capital ratio of 4%. The guidelines also provide that banking organizations experiencing internal growth or making acquisitions will be expected to maintain strong capital positions substantially above the minimum supervisory levels, without significant reliance on intangible assets.
As of December 31, 2005 and 2004, the Bank qualified as a “well-capitalized” institution (see Note 16 to the Financial Statements filed herewith).
Insurance of Accounts, Assessments and Regulation by the FD1C
The Bank is a member of the Bank Insurance Fund (“BIF”) of the FDIC. As a BIF insured institution, the Bank is subject to FDIC rules and regulations as administrator of the BIF. The Bank’s deposits are insured up to $100,000 per insured depositor, as defined by law and regulation. As insurer, the FDIC is authorized to conduct examinations of and to require reporting by BIF institutions. The actual assessment to be paid by each BIF member is based on the institution’s assessment risk classification and whether the institution is considered by its supervisory agency to be financially sound or to have supervisory concerns.
Under the FDIC’s risk-based insurance system, BIF-insured institutions are currently assessed premiums of between zero and twenty seven cents per $100 of eligible deposits, depending on the institution’s capital position and other supervisory facts. Congress has enacted legislation that, among other things, provides for assessments against BIF-insured institutions that will be used to pay certain Financing Corporation (“FICO”) obligations.
The FDIC is authorized to prohibit any BIF-insured institution from engaging in any activity that the FDIC determines by regulation or order to pose a serious threat to the insurance fund. Also, the FDIC may initiate enforcement actions against banks after first giving the institution’s primary regulatory authority an opportunity to take such action. The FDIC may terminate the deposit insurance of any depository institution, including the Bank, if it determines, after a hearing, that the institution has engaged or is engaging in unsafe or unsound practices, is in an unsafe or unsound condition to continue operations, or has violated any applicable law, regulation, order or any condition imposed in writing by the FDIC. It also may suspend deposit insurance temporarily during the hearing process for the permanent termination of insurance, if the institution has no tangible capital. If deposit insurance is
5
Table of Contents
terminated, the deposits at the institution at the time of termination, less subsequent withdrawals, shall continue to be insured for a period from six months to two years, as determined by the FDIC. Management is aware of no existing circumstances that could result in termination of the Bank’s deposit insurance.
Other Safety and Soundness Regulations
The federal banking agencies have broad powers under current federal law to take prompt corrective action to resolve problems of insured depository institutions. The extent of these powers depends upon whether the institutions in question are “well capitalized,” “adequately capitalized,” “undercapitalized,” “significantly undercapitalized” or “critically undercapitalized,” as such terms are defined under uniform regulations issued by each of the federal banking agencies.
Community Reinvestment
The requirements of the Community Reinvestment Act (“CRA”) affect the Bank. The CRA imposes on financial institutions an affirmative obligation to help meet the credit needs of their local communities, including low- and moderate-income neighborhoods, consistent with the safe and sound operation of those institutions. Each financial institution’s efforts in helping meet community credit needs currently is evaluated as part of the examination process pursuant to a new regulation recently adopted by the banking regulatory agencies. Under the new regulation a financial institution’s efforts in helping meet its community’s credit needs are evaluated, based on the particular institution’s Total Assets, according to a lending test, a community development test in addition to the lending test, or the three-pronged (lending, investment and service) test, all of which replace the twelve assessment factors used previously. The grade received by a bank is considered in evaluating mergers, acquisitions and applications to open a branch or facility. To the best knowledge of the Bank, it is meeting its obligations under the CRA.
Effect of Governmental Monetary Policies
As with other financial institutions, the earnings of the Bank are affected by general economic conditions as well as by the monetary policies of the Federal Reserve Board. Such policies, which include regulating the national supply of bank reserves and bank credit, can have a major effect upon the source and cost of funds and the rates of return earned on loans and investments. The Federal Reserve System exerts a substantial influence on interest rates and credit conditions, primarily through establishing target rates for federal funds, open market operations in U.S. Government securities, varying the discount rate on member bank borrowings and setting cash reserve requirements against deposits. Changes in monetary policy, including changes in interest rates, will influence the origination of loans, the purchase of investments, the generation of deposits, and rates received on loans and investment securities and paid on deposits. Fluctuations in the Federal Reserve Board’s monetary policies have had a significant impact on the operating results of the Bank and all financial institutions in the past and are expected to continue to do so in the future.
Employees
The Bank employees a total of 115 full-time employees and 16 part-time employees as of December 31, 2005. The Bank believes that its relationship with its employees is good, and no employees are represented by a labor union.
Item 2 - DESCRIPTION OF PROPERTY
The Bank’s main office is located in a two-story building at 1204 Bragg Road, Fredericksburg, Virginia. The Bank also operates 12 additional offices, all of which are located in Virginia. The Bank owns nine offices free and clear of any encumbrances, while the remaining four are held under non-cancellable operating leases. Details regarding these leases are in Footnotes 7 and 17 of the Financial Statements.
6
Table of Contents
As of December 31, 2005, the Bank operated the offices listed in the table below.
Office | Location | Lease/Own | ||||
| Stafford Office | 2155 Jeff Davis Highway | Stafford, VA 22555 | Own | |||
| Falmouth Office | 175 Warrenton Rd. | Falmouth, VA 22401 | Own | |||
| Route 208 Office | 10407 Courthouse Rd. | Spotsylvania, VA 22553 | Own | |||
| Route 3 Office | 1204 Bragg Rd. | Fredericksburg, VA 22407 | Own | |||
| Lakeridge Office | 12791 Harbor Dr. | Lakeridge, VA 22192 | Own | |||
| Mathis Avenue Office | 9166 Mathis Avenue | Manassas, VA 22110 | Own | |||
| Route 610 Office | 55 Worth Avenue | Stafford, VA 22554 | Own | |||
| Sudley Road Office | 8402 Sudley Road | Manassas, VA 20109 | Lease | |||
| Nokesville Office | 12912 Fitzwater Road | Nokesville, VA 20182 | Own | |||
| Chatham Heights Office | 40 White Oak Road | Fredericksburg, VA 22405 | Lease | |||
| Gardens Blvd Office | 800 Gardens Blvd | Charlottesville, VA 22901 | Own | |||
| Ivy Office | 4430 Ivy Road | Charlottesville, VA 22902 | Own | |||
| 5th Street Office | 1113 5th Street | Charlottesville, VA 22903 | Own | |||
| Culpeper Office | 806 Nottingham St. | Culpeper, VA 22701 | Own | |||
In addition to these offices, the Bank has a large home in Orange, VA that will be remodeled into an office in the future.
The Bank periodically acquires title to other parcels of real estate through the normal course of its lending activities. No other real estate was held at December 31, 2005 or 2004.
Item 3 - LEGAL PROCEEDINGS
There are no pending material legal proceedings to which the Bank is a part or to which the property of the Bank is subject.
Item 4 - SUBMISSION OF MATTERS TO A VOTE OF SECURITY HOLDERS
No matters were submitted to a vote of security holders during the fourth quarter of the fiscal year covered by this report.
7
Table of Contents
EXECUTIVE OFFICERS OF THE REGISTRANT
Name (Age) | Officer Since | Principal Occupation During Past Five Years | ||
| Worth Harris Carter, Jr. (68) | 1976 | |||
| Chairman of the Board of First National Bank since 1976, President since 1986 | ||||
| Chairman of the Board and President of Patrick Henry National Bank since 1977 | ||||
| Chairman of the Board of Peoples National Bank since 1976, President since 1981 | ||||
| Chairman of the Board of Blue Ridge Bank since 1982 | ||||
| Chairman of the Board and President of Community National Bank since 1985 | ||||
| Chairman of the Board and President of Mountain National Bank since 1996 | ||||
| Chairman of the Board and President of Shenandoah National Bank since 1996 | ||||
| Chairman of the Board and President of Central National Bank since 1996 | ||||
| Chairman of the Board and President of Patriot Bank since 1996 | ||||
| Chairman of the Board and President of First National Exchange Bank since 1998 | ||||
| Chairman of the Board and President of Mortgage Company of Virginia since 1984 | ||||
| Chairman of the Board and President of Bank Services of Virginia since 1984 | ||||
| Chairman of the Board and President of Bank Building Corporation since 1994 | ||||
| Chairman of the Board and President of Bank Services Insurance, Inc. since 2003 | ||||
| Manager of Blackstone Properties LLC Since 1998 | ||||
PART II
Item 5 - MARKET FOR COMMON EQUITY AND RELATED STOCKHOLDER MATTERS
The Bank is authorized to issue 2.5 million shares with a par value of $5. This stock has full voting rights and full preemptive rights. There were 474,132 shares outstanding as of December 31, 2005 and 2004. This is the only class of authorized stock.
The Bank’s common stock is traded locally with established trading market and no known market makers.
The quarterly high and low prices, based on transactions made known to the Bank, and quarterly dividends for the common stock for 2005 and 2004 are presented below:
8
Table of Contents
| 2005 | 2004 | Dividends Per Share | ||||||||||||||||
| High | Low | High | Low | 2005 | 2004 | |||||||||||||
First Quarter | $ | 50 | $ | 50 | $ | 45 | $ | 45 | $ | 0.40 | $ | 0.40 | ||||||
Second Quarter | 50 | 50 | 55 | 37 | 0.40 | 0.40 | ||||||||||||
Third Quarter | 50 | 50 | 55 | 37 | 0.40 | 0.40 | ||||||||||||
Fourth Quarter | 50 | 50 | 55 | 40 | 0.40 | 0.40 | ||||||||||||
Holders. As of March 16, 2006 there are approximately 560 holders of record of the Bank’s outstanding common stock.
Dividends. The amount of dividends that may be paid by the Bank will depend on the Bank’s earnings and capital position and is limited by federal law, regulations and policies. A national bank may not pay dividends from its capital; all dividends must be paid out of undivided profits then on hand, after deducting expenses, including reserves for losses and bad debts. In addition, the approval of the OCC is required if the total of all dividends declared by a national bank in any calendar year exceeds the total of its net profits for that year combined with its retained net profits for the preceding two years, less any required transfers to surplus. The Bank may not pay a dividend if, after giving effect to the dividend, the Bank would be undercapitalized.
The dividend payment history per quarter for the last two years is presented above. Similar cash dividends are anticipated but are dependent upon the Bank’s future performance and other factors.
Item 6 - MANAGEMENT’S DISCUSSION AND ANALYSIS OR PLAN OF OPERATION
The information required by this Item is included in the Bank’s annual report to shareholders for the year ended December 31, 2005 (the “Annual Report”), which is attached hereto as Exhibit 13 and is incorporated herein by reference. The information appears in the Annual Report under the caption “Management’s Discussion and Analysis of Financial Condition and Results of Operation.”
Item 7 - FINANCIAL STATEMENTS
The report of the independent registered public accounting firm and audited financial statements of the Bank and accompanying notes required by this Item are included in the Bank’s Annual Report, which is attached hereto as Exhibit 13 and is incorporated herein by reference.
Item 8 - CHANGES IN AND DISAGREEMENTS WITH ACCOUNTANTS ON ACCOUNTING AND FINANCIAL DISCLOSURE
None.
Item 8A - CONTROLS AND PROCEDURES
The Bank maintains a system of disclosure controls and procedures that is designed to ensure that material information is accumulated and communicated to management, including the Bank’s president (who is the Bank’s principal executive officer and principal financial officer), as appropriate to allow timely decisions regarding required disclosure. As required, management, with the participation of the Bank’s president, evaluated the effectiveness of the design and operation of the Bank’s disclosure controls and procedures as of the end of the period covered by this report. Based on this evaluation, the Bank’s president concluded that the Bank’s disclosure controls and procedures were operating effectively to ensure that information required to be disclosed by the Bank in reports that it files or submits under the Securities Exchange Act of 1934, as amended, is recorded, processed, summarized, and reported within the time periods specified in the rules and forms of the SEC.
Because of the inherent limitations in all control systems, no evaluation of controls can provide absolute assurance that the Bank’s disclosure controls and procedures will detect or uncover every situation involving the failure of persons within the Bank to disclose material information otherwise required to be set forth in the Bank’s periodic reports.
9
Table of Contents
The Bank’s management is also responsible for establishing and maintaining adequate internal control over financial reporting to provide reasonable assurance regarding the reliability of financial reporting and the preparation of financial statements for external purposes in accordance with generally accepted accounting principles. There were no changes in the Bank’s internal control over financial reporting during the Bank’s fourth quarter ended December 31, 2005 that have materially affected, or are reasonably likely to materially affect, the Bank’s internal control over financial reporting.
Item 8B - OTHER INFORMATION
None.
PART III
Item 9 - DIRECTORS, EXECUTIVE OFFICERS, PROMOTERS AND CONTROL PERSONS; COMPLIANCE WITH SECTION 16(A) OF THE EXCHANGE ACT
The information regarding the Bank’s executive officer is contained in Part I of this Report on Form 10-KSB.
Name and Business Experience | Age | Director Since | ||
Carter, Worth Harris, Jr. | 68 | 4/96 | ||
Chairman of the Board and President | ||||
Worth Harris Carter, Jr. is a director and officer of the following companies: | ||||
Chairman of the Board of First National Bank since 1976, President since 1986 | ||||
Chairman of the Board and President of First National Exchange Bank since 1998 | ||||
Chairman of the Board and President of Patrick Henry National Bank since 1977 | ||||
Chairman of the Board of Peoples National Bank since 1976, President since 1981 | ||||
Chairman of the Board of Blue Ridge Bank since 1982, President since 2004 | ||||
Chairman of the Board and President of Community National Bank since 1985 | ||||
Chairman of the Board and President of Mountain National Bank since 1996 | ||||
Chairman of the Board and President of Shenandoah National Bank since 1996 | ||||
Chairman of the Board and President of Central National Bank since 1996 | ||||
Chairman of the Board and President of Mortgage Company of Virginia since 1984 | ||||
Chairman of the Board and President of Bank Services of Virginia, Inc. since 1984 | ||||
Chairman of the Board and President of Bank Services Insurance, Inc. since 2003 | ||||
Chairman of the Board and President of Coresoft, Inc. since 2004 | ||||
Chairman of the Board and President of Bank Building Corporation since 1988 | ||||
Manager of Blackstone Properties LLC since 1998 | ||||
Garrett, Wright L. | 64 | 2/05 | ||
| Wright L. Garrett is Senior Vice President for Peoples National Bank, Danville, Virginia and has been for more than five years. | ||||
Moses, James C. | 74 | 4/96 | ||
| James C. Moses is President of Moses Insurance Agency, Inc. of Danville, Virginia and has been for more than five years. He also has served as a director of Peoples National Bank, Danville, Virginia since 1977 and of Central National Bank since 1996. | ||||
Oeters, William E. | 56 | 12/03 | ||
| William E. Oeters is Senior Vice President of Patriot Bank, National Association and has been for more than five years. | ||||
Williams, R. E. | 71 | 4/96 | ||
| R. E. Williams is President of Dry Fork Milling Company, Inc., Dry Fork, Virginia and has been for more than five years. He also has served as a director of Peoples National Bank since 1977, Central National Bank since 1996 and of Bank Building Corporation since 1995. | ||||
10
Table of Contents
The Board of Directors is not aware of any family relationship between any Director, executive officer or person nominated by the Bank to become a Director; nor is the Board of Directors aware of any involvement in legal proceedings that would be material to an evaluation of the ability or integrity of any Director, executive officer or person nominated to become a Director.
AUDIT COMMITTEE REPORT OF THE BOARD OF DIRECTORS
The entire Board of Directors functions as the Bank’s Audit Committee and in this capacity met four times in 2005. The functions of the Board in the audit area are focused on three areas:
| • | the adequacy of the Bank’s internal controls and financial reporting process and the reliability of the financial statements; |
| • | the independence and performance of the Bank’s internal auditors and independent auditors; and |
| • | the Bank’s compliance with legal and regulatory requirements. |
We meet with management periodically to consider the adequacy of the Bank’s internal controls and the objectivity of its financial reporting. We discuss these matters with the Bank’s independent auditors and with appropriate financial personnel and internal auditors.
We also periodically review the performance of the independent auditors and their independence from management.
All of the Directors who serve as the Bank’s Audit Committee, with the exception of Chairman of the Board and President Carter, are “independent” for the purposes of the Nasdaq Stock Market listing standards.
The Board has not adopted a written charter setting forth the responsibilities and authority of the Board in its capacity as the Audit Committee. Although Mr. Carter is not independent under the Nasdaq Stock Market or SEC standards for audit committee membership, the Board of Directors has determined that Mr. Carter possesses the knowledge and experience required to be considered an audit committee financial expert. In addition, the Board of Directors believes that all of the Bank’s Directors possess the financial knowledge and expertise necessary to protect the Bank’s shareholders in performing the functions of an audit committee.
Management has primary responsibility for the Bank’s financial statements and the overall reporting process, including the Bank’s system of internal controls.
The independent auditors audit the annual financial statements prepared by management, express an opinion as to whether those statements fairly present the financial position, results of operations and cash flows of the Bank in conformity with generally accepted accounting principles and discuss with us any issues they believe should be raised with us.
This year, we reviewed the Bank’s audited financial statements and met with both management and Goodman & Company, LLP, the Bank’s independent auditors, to discuss those financial statements. Management has represented to us that the financial statements were prepared in accordance with generally accepted accounting principles.
We have received from and discussed with Goodman & Company the written disclosure and the letter required by Independence Standards Board Statement No. 1 (Independence Discussions with Audit Committees) relating to that firm’s independence from the Bank. We also discussed with Goodman & Company the matters required to be discussed by Statement on Auditing Standard No. 61 (Communication with Audit Committees).
Based on these reviews and discussions, we recommended to the Board that the Bank’s audited financial statements be included in the Bank’s Annual Report on Form 10-KSB for the fiscal year ended December 31, 2005 for filing with the Office of the Comptroller of the Currency (“OCC”).
11
Table of Contents
Directors
Worth Harris Carter, Jr.
Wright L. Garrett
James C. Moses
William E. Oeters
R. E. Williams
SECTION 16(a) BENEFICIAL OWNERSHIP REPORTING COMPLIANCE
Section 16(a) of the Securities Exchange Act of 1934 requires that Directors and executive officers, and persons who control more than 10% of the Bank’s equity securities, file reports of ownership and reports of changes in ownership of the Bank’s outstanding equity securities. All such filings were filed timely in 2005.
The Bank knows of no arrangements, including any pledge by any person of securities of the Bank, which may at a subsequent date result in a change in control of the Bank.
The Bank has not adopted a Code of Ethics for its directors, executives and employees, primarily because management of the Bank believes and understands that our officers and directors adhere to and follow ethical standards without the necessity of a written policy. The Bank’s Board of Directors will revisit this issue in the future to determine if adoption of a code of ethics is appropriate. In the meantime, the Bank’s management requires and promotes honest and ethical conduct, full and fair disclosure in its reports to the OCC, and compliance with applicable governmental laws and regulations.
Item 10 - EXECUTIVE COMPENSATION
EXECUTIVE COMPENSATION
The Bank’s compensation program is designed to offer competitive compensation to employees based on each individual’s contribution to the Bank’s overall success. As such, the program provides a competitive compensation package to attract and retain capable employees.
The compensation and benefits program consists of salary, a profit sharing plan, and life, health and disability insurance. The compensation and benefits program for officers parallels that of all other employees. The Bank offers no stock options or other forms of equity compensation, bonuses, employment contracts, country club memberships or other perquisites to officers or employees.
The entire Board of Directors performs the functions of a Salary Committee for the Bank. The Board has the responsibility for administering the Bank’s overall compensation program and for setting the salaries for the Bank’s officers. In setting the compensation of the Bank’s officers, the Board generally relies on the recommendations of the Chairman and President and the Board members’ own significant personal knowledge of the compensation provided to other, similarly situated, executives in banking and other industries in the local area. The Board also reviews each individual’s performance and contribution to the overall Bank goals in determining the level of salary for the coming year.
Mr. Worth Harris Carter, Jr., Chairman of the Board and President, serves as the Chief Executive Officer of Patriot Bank. As noted below under “Certain Relationships and Related Transactions,” Mr. Carter also serves as Chairman and President of nine other banks. The Salary Committee of the Board of Directors of one of these other banks (Patrick Henry National Bank) actually sets Mr. Carter’s annual salary each year. The cost of Mr. Carter’s compensation, which consists of his salary plus an amount equal to twenty-nine percent of his salary to cover payroll taxes and all other benefits, is shared by the ten banks on the basis of average deposits of each bank related to total average deposits of all the banks that he serves. Mr. Carter’s total compensation, which is paid through Bank Services of Virginia, Inc. (“Bank Services”), is reflected below in two charts. The first chart reflects Mr. Carter’s total compensation as paid by Bank Services. The second chart reflects only the portion of Mr. Carter’s total compensation that is allocated to Patriot Bank.
12
Table of Contents
Summary Compensation Tables
Bank Services of Virginia, Inc.
Name and Principal Position | Year | Salary | Other Annual Compensation² | All Other Compensation³ | ||||||
Worth Harris Carter, Jr. | 2005 | $ | 575,000 | — | $ | 80,000 | ||||
Chairman of the Board and | 2004 | $ | 575,000 | — | $ | 78,000 | ||||
President | 2003 | $ | 530,000 | — | $ | 67,000 | ||||
| (1) | This table shows the total cash compensation paid to Mr. Carter by Bank Services of Virginia, Inc. during 2005, 2004 and 2003 for his services as Chairman of the Board and President of all ten banks. |
| (2) | The amount of compensation in the form of perquisites and other personal benefits properly categorized in this column did not exceed the lesser of $50,000 or 10% of Mr. Carter’s annual salary for any of the three years reported. |
| (3) | “All Other Compensation” consists of amounts contributed for Mr. Carter under Bank Services’ qualified profit sharing plan and amounts contributed for Mr. Carter under Bank Services’ non-qualified profit sharing plan for highly paid executives. |
For 2005, these amounts consisted of $27,000 contributed to the qualified profit sharing plan and $53,000 contributed to the non-qualified profit sharing plan.
Patriot Bank, National Association
Annual Compensation
Name and Principal Position | Year | Salary | Other Annual Compensation² | All Other Compensation³ | ||||||
Worth Harris Carter, Jr. | 2005 | $ | 59,000 | — | $ | 8,000 | ||||
Chairman of the Board and | 2004 | $ | 54,000 | — | $ | 7,000 | ||||
President | 2003 | $ | 50,000 | — | $ | 6,000 | ||||
William E. Oeters | 2005 | $ | 142,200 | — | $ | 15,000 | ||||
Senior Vice President | 2004 | $ | 135,300 | — | $ | 14,000 | ||||
| 2003 | $ | 128,400 | — | $ | 12,000 | |||||
| (1) | This table shows the portion of Mr. Carter’s total cash compensation during 2005, 2004 and 2003 allocated to Patriot Bank, National Association. |
| (2) | The amount of compensation in the form of perquisites and other personal benefits properly categorized in this column did not exceed the lesser of $50,000 or 10% of Mr. Carter’s or Mr. Oeter’s annual salary for any of the three years reported. |
| (3) | “All Other Compensation” for Mr. Carter consists of the portion allocated to the Bank for contributions on Mr. Carter’s behalf to Bank Services’ qualified profit sharing plan and non-qualified profit sharing plan for highly paid executives. For 2004, the portion of these contributions allocated to the Bank consisted of $3,000 for the qualified profit sharing plan and $5,000 for the non-qualified profit sharing plan. “All Other Compensation” for Mr. Oeters consists of the Bank’s contribution to the Bank’s profit sharing plan on Mr. Oeters’ behalf. |
13
Table of Contents
Profit Sharing Plan
The Bank has adopted an integrated profit sharing plan. The plan covers all full time employees that have been employed for six (6) months and have reached the age of 20-1/2 as of the first day of the plan year. Persons who have reached the age of 62 are fully vested regardless of length of service. The regular vesting schedule is as follows:
Years of Service | Vested Percentage | Forfeitable Percentage | ||
Less than 5 | 0 | 100 | ||
5 or more | 100 | 0 |
Each year the Board of Directors determines what amount, if any, is to be allocated to the plan out of accumulated or current earnings of the Bank. The Bank’s contribution to the plan was $149,000 in 2005, $150,000 in 2004, and $135,000 in 2003.
Chairman of the Board and President Carter does not participate in the profit sharing plan of Patriot Bank, National Association or any of the other nine banks. Instead, Mr. Carter participates in the two profit sharing plans of Bank Services of Virginia, Inc., a qualified profit sharing plan and a nonqualified plan for highly paid executives whose contribution to the qualified plan is limited due to IRS regulations. The Bank’s annual contributions to these plans on Mr. Carter’s behalf are detailed in the two Summary Compensation Tables above.
DIRECTOR COMPENSATION
Each outside Director (not also an officer of the Bank) currently receives $125 for each Board meeting attended.
Item 11 - SECURITY OWNERSHIP OF CERTAIN BENEFICIAL OWNERS AND MANAGEMENT, AND RELATED STOCKHOLDER MATTERS
The following table shows as of March 16, 2006, the beneficial ownership of the Bank’s common stock of all persons known by the Bank to be the owners of more than five percent (5%) of the Bank’s common stock.
Name | Amount and Nature of Beneficial Ownership (1)(2) | Ownership as a Percentage of Common Stock Outstanding | ||||
Carter, Worth Harris, Jr. | 69,693 | (3) | 14.70 | % | ||
Lester, George W., II | 30,670 | (4) | 6.47 | % | ||
Martinsville, Virginia | ||||||
| (1) | For purposes of this table, beneficial ownership has been determined in accordance with the provisions of Rule 13d-3 of the Securities Exchange Act of 1934 under which, in general, a person is deemed to be the beneficial owner of a security if he has or shares the power to vote or direct the voting of the security or the power to dispose of or direct the disposition of the security, or if he has the right to acquire beneficial ownership of the security within sixty days. |
| (2) | Unless otherwise indicated, the shares listed in the table represent sole voting and investment power. |
| (3) | Includes 5,918 shares held by Mr. Carter as custodian for his children and grandchildren; 330 shares held by Mr. Carter’s son, Ernest Linwood Carter, II, who resides in Mr. Carter’s household; 1,100 shares held for Mr. Carter’s account in the Mortgage Company of Virginia, Inc./Bank Services of Virginia, Inc. Non-Qualified Profit-Sharing Plan; 1,980 shares held by C&C Realty, Inc., of which Mr. Carter is president and a 50% owner; and 704 shares held by Mr. Carter’s brother, Ernest L. Carter. |
| (4) | Includes 5,016 shares held by The Lester Group, Inc., of which Mr. Lester is president; 94 by Carriage Square, LTD, of which Mr. Lester is president; 2,678 shares held by Mr. Lester as trustee for the benefit of his children; and 392 shares held by his children. |
14
Table of Contents
The following table shows as of March 16, 2006, the beneficial ownership of the Bank’s common stock of each Director, the executive officers identified in the Summary Compensation Table and the Bank’s Directors and executive officers as a group. As of March 16, 2006, the Bank’s Directors and executive officers as a group, beneficially owned 75,804 shares (or 16.0%) of the Bank’s outstanding common stock.
Name | Amount and Nature of Beneficial Ownership (1)(2) | Ownership as a Percentage of Common Stock Outstanding | ||||
Carter, Worth Harris, Jr. | 69,693 | (3) | 14.7 | % | ||
Garrett, Wright L. | 100 | 0.02 | % | |||
Moses, James C. | 881 | (4) | 0.2 | % | ||
Oeters, William E. | 1,177 | 0.2 | % | |||
Williams, R. E. | 3,953 | 0.8 | % | |||
All Directors and Executive | 75,804 | 16.0 | % | |||
Officers as a Group (5 persons) |
| (1) | For purposes of this table, beneficial ownership has been determined in accordance with the provisions of Rule 13d-3 of the Securities Exchange Act of 1934 under which, in general, a person is deemed to be the beneficial owner of a security if he has or shares the power to vote or direct the voting of the security or the power to dispose of or direct the disposition of the security, or if he has the right to acquire beneficial ownership of the security within sixty days. |
| (2) | Unless otherwise indicated, the shares listed in the table represent sole voting and investment power. |
| (3) | Includes 5,918 shares held by Mr. Carter as custodian for his children and grandchildren; 330 shares held by Mr. Carter’s son, Ernest Linwood Carter, II, who resides in Mr. Carter’s household; 1,100 shares held for Mr. Carter’s account in the Mortgage Company of Virginia, Inc./Bank Services of Virginia, Inc. Non-Qualified Profit-Sharing Plan; 1,980 shares held by C&C Realty, Inc., of which Mr. Carter is president and a 50% owner; and 704 shares held by Mr. Carter’s brother, Ernest L. Carter. |
| (4) | Includes 431 shares held by the James C. Moses Revocable Living Trust, of which Mr. Moses is trustee. |
Equity Compensation Plans.No disclosure regarding equity compensation plans has been provided because the Bank does not have any outstanding equity compensation plans or arrangements that would be covered by Item 201(d) of Regulation S-B.
Item 12 - CERTAIN RELATIONSHIPS AND RELATED TRANSACTIONS
Mr. Carter, Chairman of the Board and President of Patriot Bank, National Association also serves as Chairman of the Board and President of Blue Ridge Bank, N.A., Central National Bank, Community National Bank, First National Bank, First National Exchange Bank, Mountain National Bank, Patrick Henry National Bank, Peoples National Bank and Shenandoah National Bank.
The Bank maintains a correspondent bank account with one of these banks. In 2005 and 2004, the average daily balance in this account was considered a normal operating balance to facilitate general business transactions. The Bank also participates in loan transactions with these banks. These transactions are at carrying value and do not involve more than the normal risk of collectibility or present other unfavorable features.
The Bank owns 10% of the outstanding common stock of The Mortgage Company of Virginia, Inc. The remaining common stock is equally owned by the banks listed above. The Mortgage Company of Virginia owns 100% of Bank Services of Virginia, Inc. The business of both of these companies is to provide operational support services to the ten banks. The Bank is charged for its share of these services. The cost of this expense is shared by the ten banks on the basis of average deposits of each bank related to total average deposits of all the banks.
15
Table of Contents
The Mortgage Company of Virginia, Inc. also owns 100% of Bank Services Insurance, Inc. Bank Services Insurance, Inc. provides insurance products to the banks and customers in the Danville area. The premiums paid to Bank Services Insurance, Inc. equaled $30,000 at December 31, 2005.
The Mortgage Company of Virginia, Inc. also owns 50% of Coresoft, Inc. represented by an initial $1,000 investment during 2004. Coresoft, Inc. is in the process of developing a core software package the banks listed above will use. At December 31, 2005, Coresoft, Inc. had an outstanding note payable to the Mortgage Company of $1,400,000.
The Chairman of the Board and President of the Bank also serves as Chairman of the Board and President of Bank Building Corporation and Manager of Blackstone Properties, LLC, it’s wholly owned subsidiary (the “companies”). The companies lease branches to certain of the banks listed above. At December 31, 2005, the Bank leased three offices from the companies. Rental expense under these leases was $304,000 in 2005, 2004 and 2003. The Bank also leases offices from non-related parties under various terms. Rental expense for these leases was $23,000 in 2005, 2004 and 2003. Future minimum lease payments will be $322,000 per year through 2010, and thereafter (may vary based on changing interest rates). As of December 31, 2005 and 2004, the Bank had loans totaling $1,828,000 and $1,922,000, respectively, to the companies. These loans were made to purchase bank branches leased to affiliated banks and other investment property. The loans are secured by these branches and the related leases and other investment property, and have repayment terms similar to other loan customers of the Banks.
In the ordinary course of business, the Bank’s Directors and executive officers and their related interests were customers of, and had transactions with the Bank. Loan transactions with Directors and officers, principal security holders and associates were made on substantially the same terms as those prevailing at the time for comparable loans to other persons and did not involve more than normal risk of collectibility or present other unfavorable features. There were no such loans as of December 31, 2005.
ITEM 13. EXHIBITS
Exhibits: | ||
| 3.1 | Articles of Association (filed with the Office of the Comptroller of the Currency prior to the opening of the Bank) | |
| 3.2 | Amended and Restated Bylaws (as amended and restated through February 17, 2005) (incorporated by reference to Exhibit 3.2 to Form 8-K filed with the Office of the Comptroller of the Currency on February 17, 2005) | |
| 13 | 2005 Annual Report to Shareholders | |
| 31 | Certification by principal executive officer and principal financial officer pursuant to Rule 13a-14(a) | |
| 32 | Certification of principal executive officer and principal financial officer pursuant to 18 U.S.C. § 1350 | |
ITEM 14. PRINCIPAL ACCOUNTANT FEES AND SERVICES
Goodman & Company, LLP served as the Bank’s independent public auditors for the year ended December 31, 2005, and has been selected by the Board to act as the Bank’s independent public auditors for the year ending December 31, 2006. A representative of Goodman & Company will be present at the Annual Meeting and will be given the opportunity to make a statement and respond to appropriate questions from shareholders.
The following table presents the fees for professional audit services rendered by Goodman & Company for the audit of the Bank’s annual financial statements for the years ended December 31, 2005 and 2004, and fees billed for other services rendered by Goodman & Company during those periods.
16
Table of Contents
| Year Ended December 31, | ||||||
| 2005 | 2004 | |||||
Audit fees¹ | $ | 7,800 | $ | 7,605 | ||
Audit-related fees | — | |||||
Tax fees² | 3,265 | 2,820 | ||||
All other fees | — | |||||
Total Fees | $ | 11,065 | $ | 10,425 | ||
| 1 | Audit fees consist of audit and review services, consents and review of documents filed with the OCC. |
| 2 | Tax fees consist of preparation of federal and state tax returns and consultation concerning tax compliance issues. |
In its capacity as the Audit Committee, the Board of Directors considered the compatibility of the non-audit-related services performed by and fees paid to Goodman & Company in 2005 and 2004 and the proposed non-audit-related services and proposed fees for 2006 and determined that such services and fees are compatible with the independence of Goodman & Company as the Bank’s independent auditors.
Also in its capacity as the Audit Committee, the Board of Directors pre-approves all audit (including audit-related) and permitted non-audit services to be performed by the independent auditors. The Board of Directors annually approves the year-end audit to be performed by the Bank’s independent auditors for the fiscal year. With respect to other permitted services, the Board of Directors pre-approves specific engagements, projects and categories of services on a fiscal year basis.
17
Table of Contents
Exhibit 31
CERTIFICATIONS
CERTIFICATION
I, Worth Harris Carter, Jr., certify that:
1. I have reviewed this annual report on Form 10-KSB of PATRIOT BANK, N.A.;
2. Based on my knowledge, this report does not contain any untrue statement of a material fact or omit to state a material fact necessary to make the statements made, in light of the circumstances under which such statements were made, not misleading with respect to the period covered by this report;
3. Based on my knowledge, the financial statements, and other financial information included in this report, fairly present in all material respects the financial condition, results of operations and cash flows of the small business issuer as of, and for, the periods presented in this report;
4. I am responsible for establishing and maintaining disclosure controls and procedures (as defined in Exchange Act Rules 13a-15(e) and 15d-15(e)) for the small business issuer and have:
(a) Designed such disclosure controls and procedures, or caused such disclosure controls and procedures to be designed under my supervision, to ensure that material information relating to the small business issuer, including its consolidated subsidiaries, is made known to me by others within those entities, particularly during the period in which this report is being prepared;
(b) Evaluated the effectiveness of the small business issuer’s disclosure controls and procedures and presented in this report my conclusions about the effectiveness of the disclosure controls and procedures, as of the end of the period covered by this report based on such evaluation; and
(c) Disclosed in this report any change in the small business issuer’s internal control over financial reporting that occurred during the small business issuer’s most recent fiscal quarter (the small business issuer’s fourth fiscal quarter in the case of an annual report) that has materially affected, or is reasonably likely to materially affect, the small business issuer’s internal control over financial reporting; and
5. I have disclosed, based on my most recent evaluation of internal control over financial reporting, to the small business issuer’s auditors and the audit committee of the small business issuer’s board of directors (or persons performing the equivalent functions):
(a) All significant deficiencies and material weaknesses in the design or operation of internal control over financial reporting which are reasonably likely to adversely affect the small business issuer’s ability to record, process, summarize and report financial information; and
(b) Any fraud, whether or not material, that involves management or other employees who have a significant role in the small business issuer’s internal control over financial reporting.
| Date: March 16, 2006 | /s/ Worth Harris Carter, Jr. | |
| Worth Harris Carter, Jr. | ||
| Chairman of the Board and President | ||
| (principal executive officer and | ||
| principal financial officer) |
18
Table of Contents
Exhibit 32
CERTIFICATION OF
PRINCIPAL EXECUTIVE OFFICER AND PRINCIPAL FINANCIAL OFFICER
Pursuant to § 906 of the Sarbanes-Oxley Act of 2002 (18 U.S.C. § 1350)
The undersigned, as the principal executive officer and principal financial officer of PATRIOT BANK, N.A, certifies that, to the best of his knowledge and belief, the Annual Report on Form 10-KSB for the period ended December 31, 2005, which accompanies this certification fully complies with the requirements of Section 13(a) of the Securities Exchange Act of 1934 and the information contained in the report fairly presents, in all material respects, the financial condition and results of operations of PATRIOT BANK, N.A at the dates and for the periods indicated. The foregoing certification is made pursuant to § 906 of the Sarbanes-Oxley Act of 2002 (18 U.S.C. § 1350) and shall not be relied upon for any other purpose. The undersigned expressly disclaims any obligation to update the foregoing certification except as required by law.
| Date: March 16, 2006 | /s/ Worth Harris Carter, Jr. | |||||
| Worth Harris Carter, Jr. | ||||||
| Chairman of the Board and President | ||||||
| (principal executive officer and | ||||||
| principal financial officer) |
19
Table of Contents
SIGNATURES
In accordance with the requirements of Section 13 or 15(d) of the Exchange Act, the registrant caused this report to be signed on its behalf by the undersigned, thereunto duly authorized.
| PATRIOT BANK, N.A | ||||||
| Date: March 16, 2006 | /s/ Worth Harris Carter, Jr. | |||||
| Worth Harris Carter, Jr. | ||||||
| Chairman of the Board and President | ||||||
In accordance with the Exchange Act, this report has been signed below by the following persons on behalf of the registrant and in the capacities and on the dates indicated.
Signature | Capacity | Date | ||
/s/ Worth Harris Carter, Jr. | Chairman of the Board | March 16, 2006 | ||
| Worth Harris Carter, Jr. | and President | |||
| (principal executive, principal financial | ||||
| and principal accounting officer) | ||||
/s/ Wright L. Garrett | ||||
| Wright L. Garrett | Director | March 16, 2006 | ||
/s/ James C. Moses | ||||
| James C. Moses | Director | March 16, 2006 | ||
/s/ William E. Oeters | ||||
| William E. Oeters | Director | March 16, 2006 | ||
/s/ R. E. Williams | ||||
| R. E. Williams | Director | March 16, 2006 | ||
20
Table of Contents
Table of Contents
Management’s Discussion and Analysis of Financial Condition and Results of Operation
Except for the historical information contained in this report, the matters set forth herein include Forward-Looking Statements within the meaning of the “safe harbor” provisions of the Private Securities Litigation Reform Act of 1995. These Forward-Looking Statements included, among other things, statements of goals, plans, intentions and expectations, regarding or based upon desired business strategies, general economic conditions, interest rates, developments in local and national markets, and other matters, which, by their nature, are subject to significant uncertainties. Because of these uncertainties and the assumptions upon which this report is based, actual future developments with respect to the business of the Bank may differ materially from those contemplated by such statements.
Critical Accounting Policies.The accounting and reporting policies of the Bank conform to generally accepted accounting principles in the United States (GAAP) and to general practices within the banking industry. The preparation of the financial statements in conformity with GAAP requires management to make estimates and assumptions that affect the amounts reported in the financial statements and accompanying notes. We believe the most significant of these estimates involves the allowance for loan losses because of its potential impact on our overall performance. We have described our policies in this area below. A summary of the Bank’s significant accounting policies can be found in the Notes to the Financial Statements.
In general, determining the amount of the allowance for loan losses requires significant judgment and the use of estimates by management. The Bank maintains an allowance for loan losses to absorb probable losses in the loan portfolio based on a quarterly analysis of the portfolio and expected future losses. This analysis determines an appropriate level of the allowance for loan losses by considering factors affecting loan losses, including specific losses, levels and trends in impaired and non-performing loans, historical loan loss experience, current economic conditions, volume, growth and composition of the portfolio, and other relevant factors. The Bank records a provision for loan losses to maintain the allowance at an adequate level. The provision expense could increase or decrease each quarter based upon the results of management’s formal analysis.
The amount of the allowance represents management’s estimate of expected losses from existing loans based upon specific allocations for individual lending relationships and historical loss experience. The allowance for loan losses related to impaired loans is based on discounted cash flows using the loan’s initial effective interest rate or the fair value of the collateral for certain collateral dependent loans. This evaluation requires management to make estimates of the amounts and timing of future cash flows on impaired loans, which consists primarily of nonaccrual and restructured loans. Actual losses for these loans can vary significantly from these estimates.
Summary of Operations.Net income for 2005 equaled $2,071,000, or $4.37 per share, compared to $2,336,000, or $4.93 per share, for 2004. This represents a return on average assets of 0.83% and return on average equity of 11% compared to 1.00% and 13%, respectively, for last year.
Total deposits increased $8.9 million, or 4%, compared to last year. In addition, there has been a shift in the composition of our deposits as customers have moved their funds from shorter-term accounts into Certificates of Deposit. LIFETIME FREE CHECKING and time deposits increased while all other deposit categories decreased. Loans increased by $19 million in 2005.
During 2004, the Bank opened three new offices in Charlottesville and an office in Culpeper in 2005. While opening these offices has a short-term negative impact on earnings, we believe these offices will enhance the long-term profit of the Bank.
Net Interest Income.Net interest income is our largest source of revenue and has been impacted by the very low level of interest rates for the last two years. Beginning in 2000, the Federal Reserve reduced the target rate for federal funds, which is a major factor in the level of most short-term interest rates, from 6.50% to a low of 1.00% until June 2004. The Federal Reserve began a series of one quarter percent increases on 14 different occasions over the last year and a half to the latest increase in January, 2006 placing the fed funds rate to 4.50%. The Fed is expected to increase rates one or two more times before pausing.
Net interest income increased $492,000 in 2005 due to increasing loans and investments. With interest rates at higher levels, we anticipate our existing loans to increase yields at a faster pace than the net increase in the cost of deposits.
The following table shows a summary of the changes in interest income and interest expense resulting from changes in volume and changes in rates for each category of interest-earning assets and interest-bearing liabilities for 2005/2004 and 2004/2003:
| 2005 vs 2004 | 2004 vs 2003 | |||||||
(Dollars in thousands) Asset/Liability | Increase (Decrease) | Increase (Decrease) | ||||||
Real Estate Loans | $ | 627 | $ | 117 | ||||
Installment Loans | 31 | (28 | ) | |||||
Commercial Loans | 221 | 595 | ||||||
Total Loans | 879 | 684 | ||||||
Interest-Bearing Deposits in Other Financial Institutions | 169 | 73 | ||||||
Investment Securities | (303 | ) | (209 | ) | ||||
Federal Funds Sold | 309 | (218 | ) | |||||
Total Earning Assets | 1,054 | 330 | ||||||
Interest-Bearing Transactions Accounts | 9 | (94 | ) | |||||
Savings Accounts (Includes MMDA’s) | (13 | ) | 34 | |||||
Certificates of Deposit $100,000 and Over | 251 | 5 | ||||||
Other Certificates of Deposit | 312 | (319 | ) | |||||
Total Deposits | 559 | (374 | ) | |||||
Federal Funds Purchased | 5 | — | ||||||
Notes Issued to the U.S. Treasury | (2 | ) | 2 | |||||
Total Interest-Bearing Liabilities | 562 | (372 | ) | |||||
Change in Net Interest Income | $ | 492 | $ | 702 | ||||
2
Table of Contents
The following table details the average balances and cost and yield data for the earning assets and interest-bearing liabilities:
| 2005 | 2004 | 2003 | |||||||||||||||||||||||||
(Dollars in thousands) Asset/Liability | Average Balance | Interest | Yield/ Cost | Average Balance | Interest | Yield Cost | Average Balance | Interest | Yield/ Cost | ||||||||||||||||||
Real Estate Loans | $ | 117,953 | $ | 6,890 | 5.84 | % | $ | 103,526 | $ | 6,263 | 6.05 | % | $ | 84,440 | $ | 6,146 | 7.28 | % | |||||||||
Installment Loans | 4,890 | 341 | 6.97 | % | 3,915 | 310 | 7.92 | % | 3,857 | 338 | 8.76 | % | |||||||||||||||
Commercial Loans | 23,313 | 1,186 | 5.09 | % | 19,283 | 965 | 5.00 | % | 10,298 | 370 | 3.59 | % | |||||||||||||||
Total Loans | 146,156 | 8,417 | 5.76 | % | 126,724 | 7,538 | 5.95 | % | 98,595 | 6,854 | 6.95 | % | |||||||||||||||
Interest-Bearing Deposits in Other Financial Institutions | 14,900 | 559 | 3.75 | % | 17,066 | 390 | 2.29 | % | 13,363 | 317 | 2.37 | % | |||||||||||||||
Investment Securities | 52,184 | 1,955 | 3.75 | % | 58,521 | 2,258 | 3.86 | % | 50,092 | 2,467 | 4.92 | % | |||||||||||||||
Federal Funds Sold | 15,400 | 493 | 3.20 | % | 14,207 | 184 | 1.30 | % | 39,342 | 402 | 1.02 | % | |||||||||||||||
Total Earning Assets | 228,640 | 11,424 | 5.00 | % | 216,518 | 10,370 | 4.79 | % | 201,392 | 10,040 | 4.99 | % | |||||||||||||||
Interest-Bearing Transaction Account | 25,197 | 121 | 0.48 | % | 22,832 | 112 | 0.49 | % | 21,067 | 206 | 0.98 | % | |||||||||||||||
Savings Accounts (Includes MMDA’s) | 64,897 | 895 | 1.38 | % | 67,933 | 908 | 1.34 | % | 57,049 | 874 | 1.53 | % | |||||||||||||||
Certificates of Deposit $100,000 and Over | 15,559 | 517 | 3.32 | % | 10,200 | 266 | 2.61 | % | 9,542 | 261 | 2.74 | % | |||||||||||||||
Other Certificates of Deposit | 47,648 | 1,558 | 3.27 | % | 44,851 | 1,246 | 2.78 | % | 50,185 | 1,565 | 3.12 | % | |||||||||||||||
Total Deposits | 153,301 | 3,091 | 2.02 | % | 145,816 | 2,532 | 1.74 | % | 137,843 | 2,906 | 2.11 | % | |||||||||||||||
Federal Funds Purchased | — | — | — | 352 | 2 | 0.57 | % | — | — | — | |||||||||||||||||
Notes issued to the U. S. Treasury | 240 | 8 | 3.33 | % | 282 | 3 | 1.06 | % | 313 | 3 | 0.96 | % | |||||||||||||||
Total Interest-Bearing Liabilities | $ | 153,541 | $ | 3,099 | 2.02 | % | $ | 146,450 | $ | 2,537 | 1.73 | % | $ | 138,156 | $ | 2,909 | 2.11 | % | |||||||||
Net Interest Income | $ | 8,325 | $ | 7,833 | $ | 7,131 | |||||||||||||||||||||
Net Yield on Average Earning Assets | 3.64 | % | 3.62 | % | 3.54 | % | |||||||||||||||||||||
Loans.Loans increased from $141 million at year-end 2004 to $160 million at year-end 2005, an increase of $19 million, or 13%, during the year. This gain occurred primarily in the real estate segment of the portfolio. The composition of the portfolio remained consistent with prior years as real estate secured loans made up 80% of loans.
The Bank also continues to maintain flexibility in the maturity of the loan portfolio. Adjustable rate loans remained at 50% of the total loan portfolio for 2004 and 2005. In addition, the combination of adjustable rate and fixed rate loans that adjust or mature within one year equals 21% of the total portfolio compared to 58% last year.
Allowance and Provision for Loan Losses. As discussed previously, the Allowance for Loan Losses represents management’s estimation of the amount necessary to absorb future losses in the loan portfolio. On the Statement of Condition, the Allowance for Loan Losses is deducted from Total Loans so that the net amount shown represents the estimated realizable total loans. The Provision for Loan Losses is the amount charged to expense to maintain the Allowance at an adequate level.
Based on management’s analysis of the loan portfolio, including non accruing and impaired loans, the Provision for Loan Losses remained at $60,000 for 2005 and 2004.
| December 31 | ||||||||||||||||||||
(Dollars in thousands) | 2005 | 2004 | 2003 | 2002 | 2001 | |||||||||||||||
Balance Beginning of Year | $ | 1,692 | $ | 1,747 | $ | 930 | $ | 881 | $ | 832 | ||||||||||
Provision for Loan Losses | 60 | 60 | 927 | 60 | 60 | |||||||||||||||
Net Loan Losses | ||||||||||||||||||||
Real Estate Loans | (61 | ) | 101 | 85 | — | — | ||||||||||||||
Installment Loans | 6 | 14 | 14 | 11 | 11 | |||||||||||||||
Commercial Loans | — | — | 11 | — | — | |||||||||||||||
Total Net Loan Losses | (55 | ) | 115 | 110 | 11 | 11 | ||||||||||||||
Balance | $ | 1,807 | $ | 1,692 | $ | 1,747 | $ | 930 | $ | 881 | ||||||||||
Net Loan Losses to Average Loans | (0.4 | )% | 0.03 | % | 0.11 | % | 0.01 | % | 0.01 | % | ||||||||||
Allowance for Loan Losses to Period-End Loans | 1.13 | % | 1.25 | % | 1.51 | % | 1.02 | % | 0.93 | % | ||||||||||
Nonaccrual loans are those loans contractually past due 90 days or more on which no interest is being accrued. Other real estate owned consists of real estate acquired through foreclosure. These properties are reviewed quarterly and reduced to an estimated realizable value at that time.
3
Table of Contents
Information concerning nonaccrual loans and other real estate owned is presented in the following table:
| December 31 | |||||||||||||||||||
(Dollars in thousands) | 2005 | 2004 | 2003 | 2002 | 2001 | ||||||||||||||
Nonaccrual Loans | |||||||||||||||||||
Real Estate | $ | 2,175 | $ | 4,297 | $ | 2,175 | $ | — | $ | — | |||||||||
Installment | — | — | 3 | 18 | — | ||||||||||||||
Commercial | — | — | — | — | — | ||||||||||||||
Total Nonaccrual Loans | 2,175 | 4,297 | 2,178 | 18 | — | ||||||||||||||
Real Estate Owned Other Than Bank Premises | — | — | — | — | — | ||||||||||||||
Total Non-Performing Assets | $ | 2,175 | $ | 4,297 | $ | 2,178 | $ | 18 | $ | — | |||||||||
Allowance for Loan Losses to Non-Performing Assets | 83 | % | 39 | % | 80 | % | 5,167 | % | N/A | ||||||||||
The following table presents the volume of loans contractually past due for 90 days or more on which interest continues to be accrued. These loans are believed to be well collateralized and present little or no likelihood of loss of principal:
(Dollars in thousands) Loans 90 Days or More Past Due | 2005 | 2004 | 2003 | 2002 | 2001 | ||||||||||
Real Estate | $ | — | $ | — | $ | — | $ | — | $ | — | |||||
Installment | — | — | — | — | — | ||||||||||
Commercial | — | — | — | — | — | ||||||||||
Total Loans 90 Days or More Past Due | $ | — | $ | — | $ | — | $ | — | $ | — | |||||
Non-Interest Income and Expense. Non-interest Income equaled $954,000 for 2005 compared to $1,253,000 for 2004. The principal component of non-interest income is service charges on deposit accounts, which equaled $838,000 for 2005 compared to $1,027,000 for 2004. Non-interest expenses increased $651,000 during the year. The largest increase occurred in Salaries and Employee Benefits and Operations Center Expense.
Investments. The total investment securities increased from $42 million at year-end 2004 to $57 million at year-end 2005. Investment in U. S. Agency Securities were increased, where higher yields were available, while reducing Interest-Bearing Deposits in Other Financial Institutions.
Deposits. Total deposits grew $8.9 million, or 4%, during the year. In addition, there has been a significant shift in the composition of our deposits as customers have moved their funds from shorter-term accounts into Certificate of Deposits. LIFETIME FREE CHECKING and time deposits increased as all other categories decreased.
Interest Sensitivity Analysis. The frequency with which interest rates on earning assets and interest bearing liabilities change has a significant impact on net interest income. The following table presents the anticipated changes based on the contractual maturity of each instrument. Expected maturities may differ from contractual maturities as both borrowers and depositors may have the right to call or prepay obligations with or without call or prepayment penalties:
(Dollars in thousands) Use of Funds | Within One Year | One to Five Years | Over Five Years | Total | |||||||||
Interest-Bearing Deposits in Other Financial Institutions | $ | 14,446 | $ | 1,287 | $ | — | $ | 15,733 | |||||
Federal Funds Sold | 775 | — | — | 775 | |||||||||
Investment Securities | 18,271 | 38,506 | — | 56,777 | |||||||||
Loans | 34,342 | 71,172 | 54,694 | 160,208 | |||||||||
Total Earning Assets | $ | 67,834 | $ | 110,965 | $ | 54,694 | $ | 233,493 | |||||
Deposits | |||||||||||||
Interest-Bearing Demand | $ | 37,860 | $ | — | $ | — | $ | 37,860 | |||||
Regular Passbook Savings | 46,154 | — | — | 46,154 | |||||||||
Time Deposits | |||||||||||||
Certificates of Deposit $100,000 and Over | 11,358 | 7,284 | — | 18,642 | |||||||||
Other | 28,080 | 21,820 | — | 49,900 | |||||||||
Total Interest-Bearing Deposits | 123,452 | 29,104 | — | 152,556 | |||||||||
Notes issued to the U. S. Treasury | 325 | — | — | 325 | |||||||||
Total Interest-Bearing Liabilities | $ | 123,777 | $ | 29,104 | $ | — | $ | 152,881 | |||||
Maturity/Rate Sensitivity Gap Per Period | $ | (55,943 | ) | $ | 81,861 | $ | 54,694 | $ | 80,612 | ||||
Cumulative Maturity/Rate Sensitivity Gap | (55,943 | ) | 25,918 | 80,612 | |||||||||
4
Table of Contents
Capital. The federal regulatory agencies use risk-based capital ratios to analyze the adequacy of a bank’s capital. These ratios weigh bank assets from 0% to 100% depending upon the risks inherent in each type of asset. The Bank continues to meet all requirements for a well-capitalized bank as defined by the regulatory agencies. The following table presents the key risk-based capital ratios for December 31, 2005 and 2004. Additional details regarding capital may be found in notes of the Financial Statements.
| 2005 | 2004 | |||||
Tier 1 Ratio | 12.41 | % | 12.63 | % | ||
Total Risk-Based Capital Ratio | 13.53 | % | 13.77 | % | ||
Leverage Ratio | 7.88 | % | 7.73 | % |
Liquidity. Liquidity is our ability to fund both loans and investments in the normal course of business and to provide adequate protection for unexpected deposit withdrawals or other demands for funds without incurring a significant negative impact on profitability. Our primary source of day-to-day liquidity lies in the combination of cash, deposit balances, checks in process of collection, deposit growth and Federal Funds sold. Federal Funds are excess funds that are sold to other banks, generally on a one-day basis. Normal funds from the repayment of loans and investments augment these funds.
Our secondary source of liquidity lies in our investments and deposits in other financial institutions. While our investments are categorized as held-to-maturity, they consist of short-term U. S. Government Agencies that are readily marketable. As reflected in the previous Interest Sensitivity Analysis, the majority of our investment security mature in five years or less. Interest-bearing deposits in other financial institutions generally mature in two years or less and the volume of this investment decreased $3.8 million during the year.
Management’s Responsibility for Financial Reporting
The management of Patriot Bank has prepared and is responsible for the accompanying financial statements, together with the financial data and other information presented in this annual report. Management believes that the financial statements have been prepared in conformity with accounting principles generally accepted in the United States of America appropriate under the circumstances and include amounts that are based on management’s best estimates and judgments.
Management maintains and depends upon an internal accounting control system designed to provide reasonable assurance that transactions are executed in accordance with management’s authorization, that financial records are reliable as the basis for preparation of all financial statements, and that the Bank’s assets are safeguarded. The design and implementation of all systems of internal control are based on judgments required to evaluate the costs of control in relation to the expected benefits and to determine the appropriate balance between these costs and benefits. The Bank maintains a professional internal audit staff to monitor compliance with the system of internal control. Operational and special audits are conducted, and audit reports are submitted to appropriate management.
The Board of Directors functions as the audit committee and meets periodically with the independent public accountants, Goodman & Company, management and internal auditors to review accounting, auditing and internal reporting matters. The independent public accountants and internal auditors have free access to the Board to discuss the results of their audit work and their evaluations of internal controls and the quality of financial reporting.
The responsibility of Goodman & Company is limited to an expression of their opinion as to the fairness of the financial statements. Their opinion is based on an audit conducted in accordance with Standards of the Public Company Accounting Oversight Board (United States), as described in their report.
| Worth Harris Carter, Jr. |
| Chairman of the Board, President and |
| Chief Financial Officer |
5
Table of Contents

Certified Public Accountants
Specialized Services
Business Solutions
Report of Independent Registered Public Accounting Firm
Board of Directors and Shareholders
Patriot Bank, N. A.
We have audited the accompanying statements of financial condition ofPatriot Bank, N. A. (Bank) as of December 31, 2005 and 2004, and the related statements of income, shareholders’ equity and cash flows for each of the years in the three-year period ended December 31, 2005. These financial statements are the responsibility of the Bank’s management. Our responsibility is to express an opinion on these financial statements based on our audits.
We conducted our audits in accordance with the standards of the Public Company Accounting Oversight Board (United States). Those standards require that we plan and perform the audits to obtain reasonable assurance about whether the financial statements are free of material misstatement. An audit includes examining, on a test basis, evidence supporting the amounts and disclosures in the financial statements. An audit also includes assessing the accounting principles used and significant estimates made by management, as well as evaluating the overall financial statement presentation. We believe that our audits provide a reasonable basis for our opinion.
In our opinion, the financial statements referred to above present fairly, in all material respects, the financial position ofPatriot Bank, N. A. as of December 31, 2005 and 2004, and the results of its operations and its cash flows for each of the years in the three-year period ended December 31, 2005, in conformity with accounting principles generally accepted in the United States of America.
 |
| Danville, Virginia |
| March 1, 2006 |
110 Exchange Street, Suite G
Danville, VA 24541
ph: 434.792.5334
fax: 434.791.6061
www.goodmanco.com
6
Table of Contents
Statements of Financial Condition
(Dollars in Thousands)
| December 31 | ||||||||
| 2005 | 2004 | |||||||
ASSETS: | ||||||||
Interest-Bearing Deposits in Other Financial Institutions | $ | 15,733 | $ | 19,497 | ||||
Investment Securities (Fair Value $56,049 in 2005, $41,731 in 2004) | 56,777 | 41,778 | ||||||
Federal Funds Sold | 775 | 24,470 | ||||||
Loans (Net of Unearned Income) | 160,030 | 141,378 | ||||||
Less: Allowance for Loan Losses | (1,807 | ) | (1,692 | ) | ||||
Net Loans | 158,223 | 139,686 | ||||||
Earning Assets | 231,508 | 225,431 | ||||||
Cash and Due from Banks | 12,236 | 8,702 | ||||||
Bank Premises and Equipment | 6,458 | 6,657 | ||||||
Investment in Associated Company | 769 | 618 | ||||||
Other Assets | 2,688 | 2,234 | ||||||
TOTAL ASSETS | $ | 253,659 | $ | 243,642 | ||||
LIABILITIES: | ||||||||
Deposits: | ||||||||
LIFETIME FREE CHECKING | $ | 80,419 | $ | 72,497 | ||||
Interest-Bearing Demand | 37,860 | 43,887 | ||||||
Regular Passbook Savings | 46,154 | 50,378 | ||||||
Time Deposits: | ||||||||
Certificates of Deposit $100,000 and Over | 18,642 | 11,762 | ||||||
Other | 49,900 | 45,536 | ||||||
TOTAL DEPOSITS | 232,975 | 224,060 | ||||||
Notes Issued to the U.S. Treasury | 325 | 410 | ||||||
Other Liabilities | 308 | 433 | ||||||
TOTAL LIABILITIES | 233,608 | 224,903 | ||||||
SHAREHOLDERS’ EQUITY: | ||||||||
Common Stock, Par Value Per Share $5.00; 2,500,000 shares authorized; 474,132 shares outstanding in 2005 and 2004 | 2,371 | 2,371 | ||||||
Surplus | 14,021 | 14,021 | ||||||
Undivided Profits | 3,659 | 2,347 | ||||||
TOTAL SHAREHOLDERS’ EQUITY | 20,051 | 18,739 | ||||||
TOTAL LIABILITIES AND SHAREHOLDERS’ EQUITY | $ | 253,659 | $ | 243,642 | ||||
The accompanying notes are an integral part of these financial statements.
7
Table of Contents
Statements of Income
(Dollars in Thousands Except Per Share Data)
| Years Ended December 31 | |||||||||
| 2005 | 2004 | 2003 | |||||||
INTEREST INCOME: | |||||||||
Interest and Fees on Loans: | |||||||||
Taxable | $ | 7,698 | $ | 6,953 | $ | 6,592 | |||
Non-Taxable | 719 | 585 | 262 | ||||||
Interest on Deposits in Other Financial Institutions | 559 | 390 | 317 | ||||||
Interest on Federal Funds Sold | 493 | 184 | 402 | ||||||
Interest and Dividends on Securities: | |||||||||
U. S. Agency Securities | 1,941 | 2,185 | 2,371 | ||||||
States and Political Subdivisions | 14 | 73 | 96 | ||||||
TOTAL INTEREST INCOME | $ | 11,424 | $ | 10,370 | $ | 10,040 | |||
INTEREST EXPENSE: | |||||||||
Interest on Time Deposits $100,000 and Over | 517 | 266 | 261 | ||||||
Interest on Other Deposits | 2,574 | 2,266 | 2,645 | ||||||
Interest on Federal Funds Purchased | — | 2 | — | ||||||
Interest on Notes Issued to the U. S. Treasury | 8 | 3 | 3 | ||||||
TOTAL INTEREST EXPENSE | 3,099 | 2,537 | 2,909 | ||||||
NET INTEREST INCOME | 8,325 | 7,833 | 7,131 | ||||||
Provision for Loan Losses | 60 | 60 | 927 | ||||||
NET INTEREST INCOME AFTER PROVISION FOR LOAN LOSSES | 8,265 | 7,773 | 6,204 | ||||||
NON-INTEREST INCOME: | |||||||||
Service Charges, Commission and Fees | 838 | 1,027 | 1,086 | ||||||
Other Non-Interest Income | 116 | 226 | 129 | ||||||
TOTAL NON-INTEREST INCOME | 954 | 1,253 | 1,215 | ||||||
NON-INTEREST EXPENSE: | |||||||||
Salaries and Employee Benefits | 3,699 | 3,501 | 3,174 | ||||||
Occupancy Expense | 992 | 869 | 782 | ||||||
Operations Center Expense | 1,093 | 927 | 849 | ||||||
Other Non-Interest Expense | 678 | 514 | 483 | ||||||
TOTAL NON-INTEREST EXPENSE | 6,462 | 5,811 | 5,288 | ||||||
INCOME BEFORE INCOME TAXES | 2,757 | 3,215 | 2,131 | ||||||
Income Tax Expense | 686 | 879 | 609 | ||||||
NET INCOME | $ | 2,071 | $ | 2,336 | $ | 1,522 | |||
Net Income per Share*: | |||||||||
Basic and Diluted | $ | 4.37 | $ | 4.93 | $ | 3.21 | |||
| * | Net income per share has been retroactively adjusted to reflect the stock dividend in 2003. |
The accompanying notes are an integral part of these financial statements.
8
Table of Contents
Statements of Cash Flows
(Dollars in Thousands)
| Years Ended December 31 | ||||||||||||
| 2005 | 2004 | 2003 | ||||||||||
Cash Flows From Operating Activities: | ||||||||||||
Net Income | $ | 2,071 | $ | 2,336 | $ | 1,522 | ||||||
Adjustments to reconcile to net cash from operating activities: | ||||||||||||
Provision for Loan Losses | 60 | 60 | 927 | |||||||||
Depreciation of Premises and Equipment | 287 | 196 | 144 | |||||||||
Provision for Deferred Income Taxes | 5 | (11 | ) | (285 | ) | |||||||
Equity in Undistributed Income from Associated Company | (1 | ) | 113 | (10 | ) | |||||||
Increase (Decrease) in Unearned Income | 10 | (25 | ) | (99 | ) | |||||||
(Increase) Decrease in Other Assets | (459 | ) | 37 | 311 | ||||||||
Increase (Decrease) in Other Liabilities | (125 | ) | 206 | (50 | ) | |||||||
Net Cash from Operating Activities | 1,848 | 2,912 | 2,460 | |||||||||
Cash Flows From Investing Activities: | ||||||||||||
Maturity of Interest-Bearing Deposits | 21,091 | 14,848 | 11,383 | |||||||||
Purchase of Interest-Bearing Deposits | (17,327 | ) | (20,389 | ) | (13,956 | ) | ||||||
Purchase of Investment Securities | (22,891 | ) | (20,000 | ) | (27,000 | ) | ||||||
Proceeds from Maturities, Calls and Redemptions of Investment Securities | 7,892 | 42,121 | 21,992 | |||||||||
Purchase of Bank Premises and Equipment | (88 | ) | (1,319 | ) | (2,339 | ) | ||||||
Net (Increase) in Short-Term Loans Outstanding, Net | (6,924 | ) | (11,366 | ) | (939 | ) | ||||||
Longer-Term Loans Originated or Purchased | (68,357 | ) | (83,125 | ) | (96,650 | ) | ||||||
Principal Collected on Longer-Term Loans | 56,674 | 68,536 | 72,882 | |||||||||
Investment in Associated Company | (150 | ) | — | (199 | ) | |||||||
Net Cash from Investing Activities | (30,080 | ) | (10,694 | ) | (34,826 | ) | ||||||
Cash Flows From Financing Activities: | ||||||||||||
Net Increase in Demand and Savings Accounts | (2,329 | ) | 15,524 | 20,999 | ||||||||
Proceeds from Sale of Time Deposits | 44,001 | 35,456 | 40,917 | |||||||||
Payments on Matured Time Deposits | (32,757 | ) | (34,411 | ) | (44,866 | ) | ||||||
Cash Dividends | (759 | ) | (758 | ) | (707 | ) | ||||||
Stock Dividends | — | — | (18 | ) | ||||||||
Net Increase (Decrease) in Notes Issued to U.S. Treasury | (85 | ) | 225 | (1,167 | ) | |||||||
Net Cash from Financing Activities | 8,071 | 16,036 | 15,158 | |||||||||
Net Change in Cash and Equivalents | (20,161 | ) | 8,254 | (17,208 | ) | |||||||
Cash and Equivalents at Beginning of Year | 33,172 | 24,918 | 42,126 | |||||||||
Cash and Equivalents at End of Year | $ | 13,011 | $ | 33,172 | $ | 24,918 | ||||||
Supplementary Data: | ||||||||||||
Cash Paid for Interest | $ | 3,125 | $ | 2,292 | $ | 3,634 | ||||||
Cash Paid for Income Taxes | 686 | 879 | 609 | |||||||||
Transfer of Loans to Foreclosed Assets | — | — | — | |||||||||
The accompanying notes are an integral part of these financial statements.
9
Table of Contents
Statements of Changes in Shareholders’ Equity
(Dollars in Thousands)
| COMMON STOCK | SURPLUS | UNDIVIDED PROFITS | ||||||||||
| SHARES | AMOUNT | |||||||||||
Year Ended December 31, 2003 | ||||||||||||
Balance at Beginning of Year | 431,262 | $ | 2,156 | $ | 11,235 | $ | 2,973 | |||||
Net Income | — | — | — | 1,522 | ||||||||
Stock Dividends (10%) | 42,870 | 215 | 2,786 | (3,019 | ) | |||||||
Cash Dividends, $1.49 per share* | — | — | — | (707 | ) | |||||||
Total | 474,132 | $ | 2,371 | $ | 14,021 | $ | 769 | |||||
Year Ended December 31, 2004 | ||||||||||||
Balance at Beginning of Year | 474,132 | $ | 2,371 | $ | 14,021 | $ | 769 | |||||
Net Income | — | — | — | 2,336 | ||||||||
Cash Dividends, $1.60 per share* | — | — | — | (758 | ) | |||||||
Total | 474,132 | $ | 2,371 | $ | 14,021 | $ | 2,347 | |||||
Year Ended December 31, 2005 | ||||||||||||
Balance at Beginning of Year | 474,132 | $ | 2,371 | $ | 14,021 | $ | 2,347 | |||||
Net Income | — | — | — | 2,071 | ||||||||
Cash Dividends, $1.60 per share* | — | — | — | (759 | ) | |||||||
Total | 474,132 | $ | 2,371 | $ | 14,021 | $ | 3,659 | |||||
| * | Cash dividends per share have been retroactively restated to reflect the stock dividend in 2003. |
The accompanying notes are an integral part of these financial statements.
10
Table of Contents
Notes to Financial Statements
(Dollars in Thousands in charts, Except Per Share Data)
1. SUMMARY OF SIGNIFICANT ACCOUNTING POLICIES
The accounting and reporting policies of Patriot Bank are in accordance with accounting principles generally accepted in the United States of America, and general practices within the banking industry that are consistent with reports filed with regulatory agencies.
NATURE OF OPERATIONS
The Bank generates commercial (including agricultural), mortgage and consumer loans and receives deposits from customers located primarily in Abemarle, Stafford, Spotsylvania, and Prince William counties and the Cities of Fredericksburg, Charlottesville and Manassas. The Bank operates under a national charter and provides full banking services. As a national bank, the Bank is subject to regulation by the Comptroller of the Currency, Federal Deposit Insurance Corporation, and the Board of Governors of the Federal Reserve System.
USE OF ESTIMATES
The preparation of financial statements in conformity with accounting principles generally accepted in the United States of America requires management to make estimates and assumptions that affect the reported amounts of assets and liabilities and disclosure of contingent assets and liabilities at the date of the financial statements, and the reported amounts of revenue and expenses during the reporting period. Actual results could differ from those estimates. Material estimates that are particularly susceptible to significant change in the near term relate to the determination of the allowance for loan losses, and fair value of Other Real Estate Owned.
CASH AND CASH EQUIVALENTS
For purposes of cash flows, cash and cash equivalents include cash on hand, demand balances due from banks and federal funds transactions. Generally, federal funds are purchased and sold for one-day periods.
SECURITIES
Investment securities are stated at cost, adjusted for amortization of premiums and accretion of discounts, and computed by the interest method. The Bank has the positive intent and ability to hold these securities until maturity. Gains and losses on sales, if any, of securities are based upon the adjusted cost of the specific securities sold.
LOANS
Loans are recorded at the amount of the loan disbursed to borrowers plus the applicable amount, if any, of unearned income and other charges, less payments received. Income earned on loans is recognized by methods which generally result in level rates of return on principal amounts outstanding. The net amount of nonrefundable loan origination fees approximate the direct costs associated with the lending process.
The allowance for loan losses is an estimate of losses inherent in the loan portfolio as determined by management taking into consideration historical loan loss experience, diversification of the loan portfolio, amounts of secured and unsecured loans, banking industry standards and averages, and general economic conditions. Ultimate losses may vary from current estimates. These estimates are reviewed periodically and as adjustments become necessary, they are reported in earnings in the periods in which they become reasonably estimable.
Management determines loan impairment using guidelines established by Statement of Financial Accounting Standards No. 114 (SFAS 114),”Accounting by Creditors for Impairment of a Loan (as amended by SFAS No. 118, Accounting by Creditors for Impairment of a Loan -Income Recognition and Disclosures)”. Under this accounting standard, a loan is considered to be impaired when it is probable that the Bank will be unable to collect all principal and interest amounts according to the contractual terms of the loan agreement. A performing loan may be considered impaired. The allowance for loan losses related to loans identified as impaired is primarily based on the excess of the loan’s current outstanding principal balances over the estimated fair value of the related collateral. For a loan that is not collateral-dependent, the allowance is recorded at the amount by which the outstanding principal balance exceeds the current best estimate of the future cash flows on the loan discounted at the loan’s original effective interest rate. Interest on impaired loans is recognized when cash is received.
BANK PREMISES AND EQUIPMENT
Premises and equipment are stated at cost, less accumulated depreciation. Depreciation is charged to operating expenses over the estimated useful life of the assets by the accelerated and straight-line methods. Costs of maintenance or repairs are charged to expense as incurred and improvements are capitalized. Upon retirement or disposal of an asset, the asset and related allowance account are eliminated. Any gain or loss on such transactions is included in current operations. Depreciation has been included under Occupancy Expense in the Statements of Income in the amount of $287,000 in 2005, $196,000 in 2004 and $144,000 in 2003.
OTHER REAL ESTATE OWNED
Real estate properties acquired through or in lieu of loan foreclosure are initially recorded at the lower of the Bank’s carrying amount or fair value less estimated selling cost at the date of foreclosure. Any write-downs based on the asset’s fair value at the date of acquisition are charged to the allowance for loan losses. After foreclosure, these assets are carried at the lower of their new cost basis or fair value less cost to sell. Costs of significant property improvements are capitalized, whereas costs relating to holding property are expensed. Valuations are periodically performed by management, and any write-downs are recorded as a charge to operations, if necessary, to reduce the carrying value of a property to the lower of its carrying value or fair value less cost to sell.
INCOME TAXES
Deferred taxes are provided on a liability method whereby deferred tax assets are recognized for deductible temporary differences and operating loss and tax credit carryforwards and deferred tax liabilities are recognized for taxable temporary differences. Temporary differences are the differences between the reported amounts of assets and liabilities and their tax bases. Deferred tax assets are reduced by a valuation allowance when, in the opinion of management, it is more likely than not that some portion or all of the deferred tax assets will not be realized. Deferred tax assets and liabilities are adjusted for the effects of changes in tax laws and rates on the date of enactment.
RETIREMENT BENEFITS
The Bank has established an Employee Benefit Plans as described in footnote 5. The Bank does not provide any other post-retirement benefits that would be accrued under Statement of Financial Accounting Standards No. 106, “Employers’Accounting for Post Retirement Benefits Other Than Pensions”.
2. INVESTMENT SECURITIES
The carrying value of securities pledged to secure public deposits was $56,777,000 and $41,359,000, respectively, at December 31, 2005 and 2004. The amortized cost and estimated fair value of investment securities as of December 31, 2005 and 2004 were as follows:
December 31, 2005 | Amortized Cost | Gross Unrealized Gains | Gross Unrealized Losses | Estimated Fair Value | ||||||||
U. S. Agency Securities | $ | 56,777 | $ | 14 | $ | 742 | $ | 56,049 | ||||
December 31, 2004 | ||||||||||||
U. S. Agency Securities | $ | 41,359 | $ | 202 | $ | 261 | $ | 41,300 | ||||
Obligations of States and Political Subdivisions | 419 | 12 | — | 431 | ||||||||
Total | $ | 41,778 | $ | 214 | $ | 261 | $ | 41,731 | ||||
The table below shows gross unrealized losses and fair value, aggregated by investment category and length of time that individual securities have been in a continuous unrealized loss position at December 31, 2005 and 2004.
| Unrealized Losses | |||||||||
2005 Securities Description | Fair Value | Less Than 12 Months | More than 12 Months | ||||||
U. S. Agency Securities | $ | 14,381 | $ | 113 | $ | — | |||
U. S. Agency Securities | 32,869 | — | 629 | ||||||
Total | $ | 47,250 | $ | 113 | $ | 629 | |||
2004 Securities Description | |||||||||
U. S. Agency Securities | $ | 23,761 | $ | 223 | $ | — | |||
U. S. Agency Securities | 4,962 | — | 38 | ||||||
Total | $ | 28,723 | $ | 223 | $ | 38 | |||
The unrealized losses on the Bank’s investments in obligations of U. S. Government Agencies were caused by interest rate increases. The contractual terms of those investments do not permit the issuer to settle the securities at a price less than the amortized cost of the investment. Because the Bank has the ability and intent to hold those investments until a recovery of fair value, which may be maturity, the Bank does not consider those investments to be other-than-temporarily impaired at December 31, 2005.
The amortized cost and estimated fair value of investments in debt securities at December 31, 2005 and 2004, by contractual maturity, are shown below. Expected maturities will differ from contractual maturities because issurers may have the right to call or prepay obligations with or without call or prepayment penalties.
| December 31, 2005 | December 31, 2004 | |||||||||||
| Amortized Cost | Estimated Fair Value | Amortized Cost | Estimated Fair Value | |||||||||
Due in One Year or Less | $ | 18,271 | $ | 18,166 | $ | 1,719 | $ | 1,613 | ||||
Due After One Year Through Five Years | 38,506 | 37,883 | 40,059 | 40,118 | ||||||||
Due After Five Years Through Ten Years | — | — | — | — | ||||||||
Due After Ten Years | — | — | — | — | ||||||||
Total | $ | 56,777 | $ | 56,049 | $ | 41,778 | $ | 41,731 | ||||
There were no sales of securities during 2005, 2004 or 2003.
3. COMPOSITION OF LOANS
| December 31 | ||||||||
| 2005 | 2004 | |||||||
Real Estate | $ | 127,655 | $ | 113,515 | ||||
Consumer | 4,862 | 4,977 | ||||||
Commercial, Industrial and Agricultural | 2,925 | 2,914 | ||||||
All Other | 24,766 | 20,140 | ||||||
Gross Loans | 160,208 | 141,546 | ||||||
Less: Unearned Income | (178 | ) | (168 | ) | ||||
Allowance for Loan Losses | (1,807 | ) | (1,766 | ) | ||||
Total Loans, Net | $ | 158,223 | $ | 139,612 | ||||
Maturity Distribution | 2005 | 2004 | ||||
Variable | ||||||
Less Than One Year | $ | 14,872 | $ | 68,113 | ||
One to Five Years | 58,294 | 108 | ||||
Over Five Years | 6,791 | 1,869 | ||||
Subtotal | $ | 79,957 | $ | 70,090 | ||
Fixed | ||||||
Less Than One Year | $ | 19,468 | $ | 13,746 | ||
One to Five Years | 12,880 | 22,862 | ||||
Over Five Years | 47,903 | 34,848 | ||||
Subtotal | 80,251 | 71,456 | ||||
Total | $ | 160,208 | $ | 141,546 | ||
11
Table of Contents
4. ALLOWANCE FOR LOAN LOSSES
In the view of management, the Allowance for Loan Losses is adequate to meet the loss contingency based on experience factors and a review of the loan portfolio.
The Allowance for Loan Losses for the years ending December 31, 2005, 2004, and 2003 is summarized as follows:
| 2005 | 2004 | 2003 | ||||||||||
Balance at beginning of year | $ | 1,692 | $ | 1,747 | $ | 930 | ||||||
Recoveries credited during year | 107 | 2 | — | |||||||||
Provision for loan losses | 60 | 60 | 927 | |||||||||
Losses charged to allowance | (52 | ) | (117 | ) | (110 | ) | ||||||
Balance at end of year | $ | 1,807 | $ | 1,692 | $ | 1,747 | ||||||
The following is a summary of information pertaining to impaired and non-accrual loans:
| December 31 | ||||||
| 2005 | 2004 | |||||
Impaired loans without a valuation allowance | $ | — | $ | — | ||
Impaired loans with a valuation allowance | 2,175 | 2,175 | ||||
Total Impaired loans | $ | 2,175 | $ | 2,175 | ||
Valuation allowance related to impaired loans | $ | 867 | $ | 867 | ||
Nonaccrual loans (impaired) | $ | 2,175 | $ | 2,175 | ||
Nonaccrual loans (non-impaired) | $ | — | $ | 2,122 | ||
Total loans past due ninety days or more and still accruing | $ | — | $ | — | ||
| Years Ended December 31 | |||||||||
| 2005 | 2004 | 2003 | |||||||
Average investment in impaired loans | $ | 2,175 | $ | 2,175 | $ | 970 | |||
Interest income recognized on impaired loans | — | 216 | — | ||||||
Interest income recognized on a cash basis on impaired loans | — | 192 | — | ||||||
5. STOCK OPTIONS AND EMPLOYEE BENEFIT PLANS
There were no stock options or stock option plans in effect for 2003, 2004 or 2005.
Effective January 1, 1997, the Bank adopted an integrated profit sharing plan. Employees participate in the profit sharing plan following completion of six (6) months of service and upon reaching the age of twenty years and six months as of January 1. Vesting includes years of service to the Bank prior to the effective date of the plan. The plan gives 0% vesting to anyone who has less than five (5) years of service except that persons who have reached the age of 62 are fully vested regardless of length of service. Each participant in the plan (who has not reached age 62) becomes 100% vested after five (5) years of service. The contribution to the plan is determined each year by the Board of Directors and thus may fluctuate in amount from year to year. The contribution by the Bank was $149,000 in 2005, $150,000 in 2004, $135,000 in 2003 and is included in Salaries and Employee Benefits in the Statements of Income.
6. FEDERAL INCOME TAXES
Net deferred tax assets consist of the following components as of December 31, 2005 and 2004:
Deferred Tax Assets | 2005 | 2004 | ||||
Allowance for Loan Losses | $ | 571 | $ | 554 | ||
Dividend Exclusion | 14 | 13 | ||||
Other | 20 | — | ||||
Total Deferred Tax Assets | $ | 605 | $ | 567 | ||
Deferred Tax Liabilities | ||||||
Bank Premises | $ | 270 | $ | 227 | ||
Investment in Associated Companies | 16 | 16 | ||||
Total Deferred Tax Liabilities | 286 | 243 | ||||
Net Deferred Taxes | $ | 319 | $ | 324 | ||
The provisions for income taxes charged to operations for the years ended December 31, 2005, 2004 and 2003 consist of the following:
| 2005 | 2004 | 2003 | ||||||||
Currently payable | $ | 681 | $ | 766 | $ | 894 | ||||
Deferred | 5 | 113 | (285 | ) | ||||||
Net Provision | $ | 686 | $ | 879 | $ | 609 | ||||
The income tax provision differs from the amount of income tax determined by applying the U.S. federal income tax rate to pretax income for the years ended December 31, 2005, 2004 and 2003 due to the following:
| 2005 | 2004 | 2003 | ||||||||||
Tax provision computed by applying federal rates to income before income taxes | $ | 937 | $ | 1,093 | $ | 725 | ||||||
Tax exempt interest | (249 | ) | (223 | ) | (118 | ) | ||||||
Other | (2 | ) | 9 | 2 | ||||||||
Net Provision | $ | 686 | $ | 879 | $ | 609 | ||||||
7. RELATED PARTY TRANSACTIONS
The Chairman of the Board of Patriot Bank also serves as Chairman of the Board of Blue Ridge Bank, N. A., Central National Bank, Community National Bank, First National Bank, First National Exchange Bank, Mountain National Bank, Patrick Henry National Bank, Peoples National Bank, and Shenandoah National Bank.
The Bank maintains a correspondent bank account with one of these banks. In 2005 and 2004 the average daily balance in this account was considered a normal operating balance to facilitate general business transactions.
The Bank also participates in loan transactions with these banks. These transactions are at carrying value and do not involve more than the normal risk of collectibility or present other unfavorable features.
The Bank owns ten percent of the outstanding common stock of The Mortgage Company of Virginia, Inc. The remaining common stock is equally owned by the banks listed above. The Mortgage Company of Virginia owns 100% of Bank Services of Virginia, Inc. The business of both of these companies is to provide operational support services to the ten banks. These services consist of mortgage loan servicing, data processing, bookkeeping, check clearing, accounting, investment management, bank couriers, advertising programs, central purchasing and other management services. The Bank is charged for its share of these services, which is recorded as Operation Center Expense in the Statements of Income. The cost of this expense is shared by the ten banks on the basis of average deposits of each bank to total average deposits of all the banks.
The Mortgage Company of Virginia, Inc. also owns 100% of Bank Services Insurance, Inc. Bank Services Insurance, Inc. provides insurance products to the banks and customers in the Danville area. The premiums paid to Bank Services Insurance, Inc. equaled $30,000 at December 31, 2005.
The Mortgage Company of Virginia, Inc. also owns 50% of Coresoft, Inc. represented by an initial $1,000 investment during 2004. Coresoft, Inc. is in the process of developing a core software package the banks listed above will use. At December 31, 2005, Coresoft, Inc. had an outstanding note payable to the Mortgage Company of $1,400,000.
The Bank records its investment in the common stock of The Mortgage Company of Virginia, Inc. under the equity method of accounting due to the influence the Bank has over the company. The Bank invested an additional $150,000 in 2005 increasing the value of the investment to $769,000 from $618,000 at December 31, 2004. The Bank’s share of earnings of the company equaled $1,000 for 2005, $11,000 for 2004 and $10,000 for 2003 and is shown in the Statements of Income under Other Non-interest Income.
The Chairman of the Board and President of the Bank also serves as Chairman of the Board and President of Bank Building Corporation and Manager of Blackstone Properties, LLC, its wholly owned subsidiary (the “companies”). The companies lease branches to certain of the Banks listed above. At December 31, 2005, the Bank leased three offices from the companies. Rental expense and future lease payments under these leases are disclosed in a footnote below. As of December 31, 2005 and 2004, the Bank had loans totaling $1,828,000 and $1,922,000, respectively, to the companies. These loans were made to purchase bank branches leased to affiliated banks and other investment property. The loans are secured by these branches and the related leases and other investment property, and have repayment terms similar to other loan customers of the Bank.
In the ordinary course of business, directors, and their related interests were customers of, and had transactions with the Bank. Loan transactions with directors, principal security holders and associates were made on substantially the same terms as those prevailing at the time for comparable loans to other persons and did not involve more than normal risk of collectibility or present other unfavor
8. COMMITMENTS AND CONTINGENCIES
The Bank did not have any legal matters of financial significance pending at December 31, 2005 or 2004.
9. EARNINGS PER COMMON SHARE
The Bank follows Statement of Financial Accounting Standards (SFAS) No. 128, “Earnings Per Share”. This statement requires the dual presentation of basic and diluted earnings per share. The weighted average number of shares used to compute earnings per share was 474,132.
The Bank issued a 10% stock dividend in 2003 and none in 2004 or 2005. No fractional shares were issued in this stock dividend. Stock dividends and fractional shares were settled based on known prices for recent trades of the stock and other factors deemed relevant at the time.
10. BANK PREMISES AND EQUIPMENT
Premises and equipment are stated at cost less accumulated depreciation as follows:
December 31, 2005 | Cost | Accumulated Depreciation and Amortization | Net Remaining Cost | ||||||
Bank Premises ( Including Land of $ 2,230,000) | $ | 6,383 | $ | 1,102 | $ | 5,281 | |||
Equipment | 1,664 | 598 | 1,066 | ||||||
Leasehold Improvements | 129 | 18 | 111 | ||||||
Total | $ | 8,176 | $ | 1,718 | $ | 6,458 | |||
December 31, 2004 | Cost | Accumulated Depreciation and Amortization | Net Remaining Cost | ||||||
Bank Premises ( Including Land of $ 2,065,000) | $ | 6,389 | $ | 994 | $ | 5,395 | |||
Equipment | 1,574 | 426 | 1,148 | ||||||
Leasehold Improvements | 129 | 15 | 114 | ||||||
Total | $ | 8,092 | $ | 1,435 | $ | 6,657 | |||
11. FORECLOSED ASSETS
Expenses applicable to foreclosed assets include the following:
| Years Ended December 31 | |||||||||
| 2005 | 2004 | 2003 | |||||||
Net loss (gain) on sales of real estate | $ | — | $ | — | $ | — | |||
Provision for losses | — | — | — | ||||||
Operating expenses | — | — | — | ||||||
12
Table of Contents
12. CASH AND CASH EQUIVALENTS
Cash and cash equivalents as of December 31, 2005, 2004 and 2003 are detailed below:
| 2005 | 2004 | 2003 | |||||||
Cash and Due From Banks | $ | 12,236 | $ | 8,702 | $ | 9,258 | |||
Federal Funds Sold | 775 | 24,470 | 15,660 | ||||||
Total Cash and Cash Equivalents | $ | 13,011 | $ | 33,172 | $ | 24,918 | |||
13. DEPOSITS
Certificates of Deposit maturing as of December 31:
| 2005 | 2004 | |||||
1 Year | $ | 39,448 | $ | 34,913 | ||
2 Years | 10,765 | 5,860 | ||||
3 Years | 6,507 | 6,357 | ||||
4 Years | 4,667 | 5,090 | ||||
5 Years and Thereafter | 7,155 | 5,078 | ||||
TOTAL | $ | 68,542 | $ | 57,298 | ||
14. CONCENTRATION OF CREDIT RISK
The majority of all the Bank’s loans have been granted to customers in the Bank’s market area. The concentrations of credit by loan classification are set forth in a footnote above. The Bank does not extend credit to any individual borrower in excess of its lending limit of $3,279,000 as of year-end 2005 and $3,076,000 as of year-end 2004.
The largest category of Real Estate Loans consisted of Commercial Loans. These loans approximated $50,181,000 at December 31, 2005 and $38,182,000 at December 31, 2004.
15. FAIR VALUE OF FINANCIAL INSTRUMENTS
Statement of Financial Accounting Standards No. 107, “Disclosures about Fair Value of Financial Instruments”, requires the Bank to disclose the estimated fair values of its financial assets and liabilities. The estimated fair values were determined using the following assumptions:
| a. | The carrying value of Cash and Due From Banks, Federal Funds Sold, and Interest-Bearing Deposits in Other Financial Institutions are believed to approximate the fair value of these items. |
| b. | The fair value of actively traded investment securities are determined according to quotes available in the financial press. The fair value of instruments which are not actively traded are determined using values of other instruments with similar characteristics or obtained from outside sources believed to be reliable. |
| c. | The fair value of loans are estimated by discounting the anticipated cash flows using estimated rates for similar loans available in the Bank’s market area. Estimates of maturities are based on both experience and contractual maturities although prepayments are permitted on the loans. |
| d. | The fair value of short-term demand and savings deposits are believed to equal carrying value. The fair value of certificates of deposit are based upon the contractual maturity of the instruments and rates currently offered for similar deposits. |
| e. | The fair value of Notes Payable to the U. S. Treasury are estimated at carrying value. |
| f. | The fair value of Accrued Interest Receivable and Accrued Interest Payable are estimated at carrying value. |
| 2005 | 2004 | |||||||||||
Financial Assets: | Carrying Value | Fair Value | Carrying Value | Fair Value | ||||||||
Interest-Bearing Deposits in Other Financial Institutions | $ | 15,733 | $ | 15,733 | $ | 19,497 | $ | 19,497 | ||||
Investment Securities | 56,777 | 56,049 | 41,778 | 41,731 | ||||||||
Federal Funds Sold | 775 | 775 | 24,470 | 24,470 | ||||||||
Loans (Net of Unearned Income) | 160,030 | 158,925 | 141,378 | 140,701 | ||||||||
Cash and Due From Banks | 12,236 | 12,236 | 8,702 | 8,702 | ||||||||
Accrued Interest Receivable | 1,354 | 1,354 | 1,043 | 1,043 | ||||||||
Total | $ | 246,905 | $ | 245,072 | $ | 236,868 | $ | 236,144 | ||||
Financial Liabilities: | ||||||||||||
Deposits | ||||||||||||
LIFETIME FREE CHECKING | $ | 80,419 | $ | 80,419 | $ | 72,497 | $ | 72,497 | ||||
Interest-Bearing Demand | 37,860 | 37,860 | 43,887 | 43,887 | ||||||||
Regular Passbook Savings | 46,154 | 46,154 | 50,378 | 50,378 | ||||||||
Time Deposits: | ||||||||||||
Certificates of Deposit $100,000 and Over | 18,642 | 18,654 | 11,762 | 11,852 | ||||||||
Other | 49,900 | 44,778 | 45,536 | 41,891 | ||||||||
TOTAL DEPOSITS | 232,975 | 227,865 | 224,060 | 220,505 | ||||||||
Notes issued to the U. S. Treasury | 325 | 325 | 410 | 410 | ||||||||
Accrued Interest Payable | 465 | 465 | 96 | 96 | ||||||||
Total | $ | 233,765 | $ | 228,655 | $ | 224,566 | $ | 221,011 | ||||
16. CAPITAL ADEQUACY
The Bank is subject to various regulatory capital requirements. Under the regulatory capital guidelines and the regulatory framework for Prompt Corrective Action (PCA), the Bank must meet specific capital guidelines involving the quantitative measures of the Bank’s assets, liabilities, and certain off-balance-sheet items as calculated under regulatory accounting practices. The Bank’s capital amount and classification are also subject to qualitative judgments by the regulators about components, risk weightings and other factors.
Quantitative measures established by regulation to ensure capital adequacy require the Bank to maintain minimum ratios (set forth in the table below) of total and Tier 1 capital (as defined in the regulations) to risk-weighted assets (as defined) and of Tier 1 capital to average assets (as defined)
| Minimum Ratio For Capital Adequacy Purposes | Minimum Ratio To Be Considered Well Capitalized Under PCA Provisions | |||||
Tier 1 Capital to Risk Weighted Assets | 4 | % | 6 | % | ||
Total Capital to Risk Weighted Assets | 8 | % | 10 | % | ||
Tier 1 Capital to Average Assets | 4 | % | 5 | % |
As of December 31, 2005, the most recent notification from the Federal Deposit Insurance Corporation categorized the Bank as well capitalized under the regulatory framework for prompt corrective action. To be categorized as well capitalized, an institution must maintain minimum total risk-based, Tier 1 risk-based and Tier 1 leverage ratios as set forth in the above table. There were no conditions or events since the notification that management believes have changed the Bank’s category. The Bank’s actual capital amounts and ratios as of December 31, 2005 and 2004 are presented in the following table. Management believes, as of December 31, 2005 and 2004, that the Bank meets all capital adequacy requirements to which it is subject.
As of December 31, 2005 | Minimum Capital For Capital Adequacy Purposes | Minimum Capital To Be Considered Well Capitalized Under PCA Provisions | Actual Capital | Actual Ratio | |||||
Tier 1 Capital to Risk Weighted Assets | 6,462 | 9,692 | 20,051 | 12.41 | % | ||||
Total Capital to Risk Weighted Assets | 12,923 | 16,154 | 21,858 | 13.53 | % | ||||
Tier 1 Capital to Average Assets | 10,174 | 12,718 | 20,051 | 7.88 | % | ||||
As of December 31, 2004 | |||||||||
Tier 1 Capital to Risk Weighted Assets | 5,938 | 8,907 | 18,739 | 12.63 | % | ||||
Total Capital to Risk Weighted Assets | 11,876 | 14,845 | 20,431 | 13.77 | % | ||||
Tier 1 Capital to Average Assets | 9,700 | 12,125 | 18,739 | 7.73 | % | ||||
17. Quarterly Financial Data (Unaudited)
The following summarizes the quarterly results of operations for the years ended December 31, 2005 and 2004:
2005 | First Quarter | Second Quarter | Third Quarter | Fourth Quarter | ||||||||
Total Interest Income | $ | 2,684 | $ | 2,875 | $ | 2,873 | $ | 2,992 | ||||
Total Interest Expense | 674 | 743 | 832 | 850 | ||||||||
Net Interest Income | 2,010 | 2,132 | 2,041 | 2,142 | ||||||||
Provision For Loan Losses | 15 | 15 | 15 | 15 | ||||||||
Net Interest Income After Provision for Loan Losses | 1,995 | 2,117 | 2,026 | 2,127 | ||||||||
Total Non-Interest Income | 236 | 226 | 242 | 250 | ||||||||
Total Non-Interest Expense | 1,502 | 1,577 | 1,582 | 1,801 | ||||||||
Income Before Income Taxes | 729 | 766 | 686 | 576 | ||||||||
Income Tax Expense | 190 | 205 | 170 | 121 | ||||||||
Net Income | $ | 539 | $ | 561 | $ | 516 | $ | 455 | ||||
Basic and Diluted Net Income Per Share | $ | 1.14 | $ | 1.18 | $ | 1.09 | $ | 0.96 | ||||
2004 | First Quarter | Second Quarter | Third Quarter | Fourth Quarter | ||||||||
Total Interest Income | $ | 2,394 | $ | 2,551 | $ | 2,776 | $ | 2,649 | ||||
Total Interest Expense | 616 | 623 | 636 | 662 | ||||||||
Net Interest Income | 1,778 | 1,928 | 2,140 | 1,987 | ||||||||
Provision For Loan Losses | 15 | 15 | 15 | 15 | ||||||||
Net Interest Income After Provision for Loan Losses | 1,763 | 1,913 | 2,125 | 1,972 | ||||||||
Total Non-Interest Income | 282 | 268 | 273 | 430 | ||||||||
Total Non-Interest Expense | 1,380 | 1,449 | 1,466 | 1,516 | ||||||||
Income Before Income Taxes | 665 | 732 | 932 | 886 | ||||||||
Income Tax Expense | 175 | 195 | 260 | 249 | ||||||||
Net Income | $ | 490 | $ | 537 | $ | 672 | $ | 637 | ||||
Basic and Diluted Net Income Per Share | $ | 1.03 | $ | 1.13 | $ | 1.42 | $ | 1.35 | ||||
13
Table of Contents
18. LEASES AND RENT EXPENSE
The Bank leased facilities under noncancelable operating leases during 2005, 2004 and 2003. As noted above, the Bank leases two branches from Bank Building Corporation, and one office from Blackstone Properties, L.L.C. These leases required the Bank to pay maintenance, insurance and property taxes and do not have renewal options. Rental expenses under these leases was $304,000 in 2005, 2004 and 2003. The Bank also leases offices from non-related parties under various terms. Rental expense under these leases was $23,000 in 2005, 2004 and 2003. Future minimum rental payments under these leases are as follows:
Year ending December 31, 2006 | $ | 322 | |
2007 | 322 | ||
2008 | 322 | ||
2009 | 322 | ||
2010 | 322 | ||
Thereafter | 1,259 | ||
Total Minimum Lease Payments | $ | 2,869 | |
19. OFF BALANCE SHEET ACTIVITIES AND COMMITMENTS
Commitments to extend credit, which amounted to $2,114,000 and $9,960,000 at December 31, 2005 and 2004 respectively, represent agreements to lend to customers with fixed expiration dates or other termination clauses. Since many of the commitments are expected to expire without being funded, the total commitment amounts do not necessarily represent future liquidity requirements. Standby letters of credit are conditional commitments issued by the Bank guaranteeing the performance of a customer to a third party. Those guarantees are primarily issued to support public and private borrowing arrangements. At December 31, 2005, and 2004, the Bank had $1,359,000 and $813,000, respectively, in outstanding standby letters of credit.
The Bank is a member of the Federal Reserve System and is required to maintain certain levels of its cash and due from bank balances as reserves based on regulatory requirements. At December 31, 2005 and 2004, this reserve requirement was approximately $6,295,000 and $5,807,000, respectively.
Federal banking regulations place certain restrictions on dividends paid by the Bank. The total amount of dividends which may be paid at any date and is generally limited to the retained earnings of the Bank. In addition, dividends paid by the Bank would be prohibited if the effect thereof would cause the Bank’s capital to be reduced below applicable minimum capital requirements.
20. RECENT ACCOUNTING PRONOUNCEMENTS AND ACCOUNTING CHANGES
In November 2002, the FASB issued FASB Interpretation No. 45, “Guarantor’s Accounting and Disclosure Requirements for Guarantees, including Indirect Guarantees of Indebtedness of Others” (FIN 45). The interpretation elaborates on the disclosures to be made by a guarantor in its financial statements under certain guarantees that it has issued. It also clarifies that a guarantor is required to recognize, at the inception of a guarantee, a liability for the fair value of the obligation undertaken in issuing the guarantee. The interpretation requires disclosure of the nature of the guarantee, the maximum potential amount of future payments that the guarantor could be required to make under the guarantee, and the current amount of the liability, if any, for the guarantor’s obligations under the guarantee. The recognition requirements of the Interpretation were effective beginning January 1, 2003.
The FASB also revised FASB Interpretation 46, “Consolidation of Variable Interest Entities, an interpretation of ARB No. 51 (FIN 46)”. The interpretation provides a framework for identifying variable interest entities (VIEs), and determining when a company should include the assets, liabilities, noncontrolling interests and results of activities of a VIE in its consolidated financial statements. As revised, FIN 46 is effective beginning in the first quarter of 2004 for all VIEs (other than what is commonly referred to as special purpose entities, VIEs of small business issuers, and VIEs of nonpublic entities). The Bank does not currently utilize VIEs or so called special purpose entities.
In November 2003, the FASB’s Emerging Issues Task Force (EITF) reached consensus on new disclosure requirements related to unrealized losses on investment securities. The new disclosure requirements apply to marketable equity and debt securities accounted for under Financial Accounting Board Statement No. 115, “Accounting for Certain Investments in Debt and Equity Securities,” and are required for inclusion in annual reports with fiscal years ended after December 15, 2003.
In November 2003, the FASB issued FASB Staff Position (FSP) 144-1, “Determination of Cost Basis for Foreclosed Assets under FASB Statement No. 15”, “Accounting by Debtors and Creditors for Troubled Debt Restructurings,” and the Measurement of Cumulative Losses Previously Recognized under Paragraph 37 of FASB Statement No. 144, “Accounting for the Impairment or Disposal of Long-Lived Assets.” Under FSP 144-1, the lender is required to measure the foreclosure on a long-lived asset (e.g. real estate) at fair value less cost to sell on the foreclosure date, which establishes a new cost basis such that any loan valuation allowance is not retained. Thereafter, the lender would follow the impairment guidance in Statement No. 144, and should not reflect any recovery in value of the property beyond the cost basis established upon foreclosure of the loan. This guidance was effective upon posting of the FSP to the FASB website in November 2003.
In April 2003, the Financial Accounting Standards Board issued Statement No. 149, “Amendment of Statement 133 on Derivative Instruments and Hedging Activities”. This statement amends and clarifies financial accounting and reporting for derivative instruments, including certain derivative instruments embedded in other contracts (collectively referred to as derivatives) and for hedging activities under FASB Statement No. 133,” Accounting for Derivative Instruments and Hedging Activities”.
In May 2003, the Financial Accounting Standards Board issued Statement No. 150, “Accounting for Certain Financial Instruments with Characteristics of both Liabilities and Equity”. This statement establishes standards for how an issuer classifies and measures certain financial instruments with characteristics of both liabilities and equity. It requires that an issuer classify a financial instrument that is within its scope as a liability (or an asset in some circumstances). Many of those instruments were previously classified as equity. This statement is effective for financial instruments entered into or modified after May 31, 2003, and otherwise is effective at the beginning of the first interim period beginning after June 15, 2003.
In December 2004, the FASB issued Statement No. 123 (revised 2004), which is a revision of Statement 123 “Accounting for Stock-Based Compensation”. This Statement establishes standards for the accounting for transactions in which an entity exchanges its equity instruments for goods or services. It also addresses transactions in which an entity incurs liabilities in exchange for goods or services that are based on the fair value of the entity’s equity instruments or that may be settled by the issuance of those equity instruments. This Statement focuses primarily on accounting for transactions in which an entity obtains employee services in share-based payment transactions. This Statement is effective for public entities as of the beginning of the first interim or annual reporting period that begins after June 15, 2005.
In December 2004, the FASB issued Statement No. 153, “Exchanges of Nonmonetary Assets”, an amendment of APB Opinion No. 29, Accounting for Nonmonetary Transactions”. This Statement eliminates the exception to fair value for exchanges of similar productive assets and replaces it with a general exception for exchange transactions that do not have commercial substance – that is, transactions that are not expected to result in significant changes in the cash flows of the reporting entity. This Statement is effective for nonmonetary asset exchanges occurring in fiscal periods beginning after June 15, 2005.
In May 2005, the FASB issued Statement No. 154, “Accounting Changes and Error Corrections – a replacement of APB Opinion No. 20 and FASB Statement No. 3”. This Statement requires retrospective application to prior periods’ financial statements of changes in accounting principle, unless it is impracticable to determine either the period-specific effects or the cumulative effect of the change. When it is impracticable to determine the period-specific effects of an accounting change on one or more individual prior periods presented, this Statement requires that the new accounting principle be applied to the balances of assets and liabilities as of the beginning of the earliest period for which retrospective application is practicable and that a corresponding adjustment be made to the opening balance of retained earnings. This Statement improves financial reporting because its requirement to report voluntary changes in accounting principles via retrospective application, unless impracticable, enhances the consistency of financial information between periods. This statement is effective for accounting changes and corrections of errors made in fiscal years beginning after December 15, 2005.
During November 2005, the FASB issued FASB Staff Position (FSP) FAS 115-1 and 124-1, “The Meaning of Other-Than-Temporary Impairment and Its Application to Certain Investments.” The guidance in this FSP addresses the determination of when an investment is considered impaired, whether that impairment is other than temporary, and the measurement of an impairment loss. The FSP also includes accounting considerations subsequent to the recognition of an other-than-temporary impairment and requires certain disclosures about unrealized losses that have not been recognized as other-than-temporary impairments. The guidance in this FSP is required to be applied to reporting periods beginning after December 15, 2005. Earlier application is permitted.
The FASB has issued FASB Statement No. 155, “Accounting for Certain Hybrid Instruments.” This standard amends the guidance in FASB Statements No. 133, “Accounting for Derivative Instruments and Hedging Activities”, and No. 140, “Accounting for Transfers and Servicing of Financial Assets and Extinguishments of Liabilities.” Statement 155 allows financial instruments that have embedded derivatives to be accounted for as a whole (eliminating the need to bifurcate the derivative from its host) if the holder elects to account for the whole instrument on a fair value basis. Statement 155 is effective for all financial instruments acquired or issued after the beginning of an entity’s first fiscal year that begins after September 15, 2006. Earlier adoption is permitted as of the beginning of an entity’s fiscal year, provided the entity has not yet issued financial statements, including financial statements for any interim period for that fiscal year. Provisions of this Statement may be applied to instruments that an entity holds at the date of adoption on an instrument-by-instrument basis. The financial statement effect of the change in accounting, if any, should be recognized as a cumulative-effect adjustment to beginning retained earnings. Prior periods should not be restated.
Management does not expect these accounting pronouncements to have a material impact on the financial statements.
14
Table of Contents
Summary of Operations
(Dollars in Thousands Except Per Share Data)
FOR THE YEAR: | 2005 | 2004 | 2003 | 2002 | 2001 | ||||||||||||
Total Interest Income | $ | 11,424 | $ | 10,370 | $ | 10,040 | $ | 10,919 | $ | 11,903 | |||||||
Total Interest Expense | 3,099 | 2,537 | 2,909 | 3,653 | 5,222 | ||||||||||||
Net Interest Income | 8,325 | 7,833 | 7,131 | 7,266 | 6,681 | ||||||||||||
Provision for Loan Losses | 60 | 60 | 927 | 60 | 60 | ||||||||||||
Net Interest Income After Provision for Loan Losses | 8,265 | 7,773 | 6,204 | 7,206 | 6,621 | ||||||||||||
Non-Interest Income | 954 | 1,253 | 1,215 | 1,333 | 1,277 | ||||||||||||
Non-Interest Expense | 6,462 | 5,811 | 5,288 | 5,268 | 4,847 | ||||||||||||
Net Income Before Taxes | 2,757 | 3,215 | 2,131 | 3,271 | 3,051 | ||||||||||||
Applicable Income Taxes: | |||||||||||||||||
Current | 681 | 766 | 894 | 1,061 | 982 | ||||||||||||
Deferred | 5 | 113 | (285 | ) | (8 | ) | 4 | ||||||||||
Net Income | $ | 2,071 | $ | 2,336 | $ | 1,522 | $ | 2,218 | $ | 2,065 | |||||||
Basic and Diluted Net Income Per Share*: | $ | 4.37 | $ | 4.93 | $ | 3.21 | $ | 4.68 | $ | 4.36 | |||||||
| * | Net income per share has been retroactively adjusted to reflect the stock dividend in 2003. |
AT YEAR END: | 2005 | 2004 | 2003 | 2002 | 2001 | ||||||||||
Interest-Bearing Deposits in Other Financial Institutions | $ | 15,733 | $ | 19,497 | $ | 13,956 | $ | 11,383 | $ | 10,593 | |||||
Federal Funds Sold | 775 | 24,470 | 15,660 | 29,610 | 20,100 | ||||||||||
Investments | 56,777 | 41,778 | 63,899 | 58,891 | 58,326 | ||||||||||
Loans (Net) | 158,223 | 139,612 | 113,692 | 89,813 | 93,850 | ||||||||||
Deposits | 232,975 | 224,060 | 207,491 | 190,441 | 182,877 | ||||||||||
Demand | 80,419 | 72,497 | 63,712 | 59,631 | 55,429 | ||||||||||
Interest-Bearing Demand | 37,860 | 43,887 | 41,355 | 32,413 | 25,913 | ||||||||||
Savings | 46,154 | 50,378 | 46,171 | 38,195 | 32,179 | ||||||||||
Time | 68,542 | 57,298 | 56,253 | 60,202 | 69,356 | ||||||||||
Capital Accounts | 20,051 | 18,739 | 17,161 | 16,364 | 14,824 | ||||||||||
Total Resources | 253,659 | 243,642 | 225,064 | 208,434 | 198,632 | ||||||||||
Carrying Value Per Share | 42.29 | 39.52 | 36.19 | 34.51 | 31.27 | ||||||||||
DAILY AVERAGES FOR THE YEAR: | 2005 | 2004 | 2003 | 2002 | 2001 | ||||||||||
Interest-Bearing Deposits in Other Financial Institutions | $ | 14,900 | $ | 17,066 | $ | 13,363 | $ | 10,596 | $ | 9,944 | |||||
Federal Funds Sold | 15,400 | 14,207 | 39,342 | 26,447 | 20,436 | ||||||||||
Investment Securities | 52,184 | 58,521 | 50,092 | 64,068 | 46,736 | ||||||||||
Loans | 146,156 | 126,724 | 98,595 | 85,268 | 93,557 | ||||||||||
Deposits | 234,215 | 220,404 | 202,780 | 184,398 | 167,163 | ||||||||||
Demand | 80,914 | 74,588 | 64,937 | 57,631 | 50,714 | ||||||||||
Interest-Bearing Demand | 25,197 | 22,832 | 21,067 | 19,499 | 15,694 | ||||||||||
Savings (Includes MMDA’s) | 64,897 | 67,933 | 57,049 | 45,534 | 33,852 | ||||||||||
Time | 63,207 | 55,051 | 59,727 | 61,734 | 66,903 | ||||||||||
Capital Accounts | 19,126 | 17,988 | 16,940 | 15,743 | 14,205 | ||||||||||
Total Resources | 250,174 | 234,559 | 218,035 | 203,493 | 184,455 | ||||||||||
15
Table of Contents
Price Range of Common Stock
| 2005 | 2004 | Dividends Per Share | ||||||||||||||||
| High | Low | High | Low | 2005 | 2004 | |||||||||||||
First Quarter | $ | 50 | $ | 50 | $ | 40 | $ | 40 | $ | 0.40 | $ | 0.40 | ||||||
Second Quarter | 50 | 50 | 55 | 37 | 0.40 | 0.40 | ||||||||||||
Third Quarter | 50 | 50 | 55 | 37 | 0.40 | 0.40 | ||||||||||||
Fourth Quarter | 50 | 50 | 55 | 40 | 0.40 | 0.40 | ||||||||||||
Officers
| Worth Harris Carter, Jr. | Stanley M. Keys | |
| Chairman of the Board and President | Assistant Vice President and Managing Officer - Nokesville | |
| William E. Oeters | Melody P. Layne | |
| Senior Vice President and Cashier | Assistant Vice President and Managing Officer - Lake Ridge | |
| Donna J. Burnopp | Patricia M. Melvin | |
| Assistant Vice President | Assistant Vice President and Managing Officer - Route 3 | |
| J. Howard Carpenter | Cathy N. Miller | |
| Assistant Vice President and Managing Officer - Culpeper | Assistant Vice President and Managing Officer - Stafford Courthouse | |
| Thomas L. R. Cole, III | Wanda C. Neal | |
| Assistant Vice President and Managing Officer - 5th Street | Assistant Vice President and Managing Officer - Route 610 | |
| Robert J. Collier | Jacquelyn C. Owens | |
| Assistant Vice President and Managing Officer - Ivy Road | Assistant Vice President and Managing Officer - Route 208 | |
| Theresa L. Deese | Karen Y. Tolson | |
| Assistant Vice President and Managing Officer - Gardens Blvd. | Assistant Vice President and Managing Officer - Chatham Heights | |
| Medford R. Fines, Sr. | Barbara Zaccagnino | |
| Assistant Vice President and Managing Officer - Falmouth | Assistant Vice President and Managing Officer - Sudley Road | |
| Ronald L. Freeman | ||
| Assistant Vice President | ||
| Directors | ||||
Worth Harris Carter, Jr. | ||||
| Chairman of the Board and President | ||||
Wright L. Garrett | ||||
| Senior Vice President - Commercial Loans, | ||||
| Peoples National Bank | ||||
James C. Moses | ||||
| Retired | ||||
William E. Oeters | ||||
| Senior Vice President and Cashier | ||||
R. E. Williams | ||||
| Retired | ||||

P.O. Box 610; Stafford, Virginia 22555-0610
(540) 373-0654
Member FDIC
Table of Contents

P.O. Box 610
Stafford, Virginia 22555-0610
(540) 373-0654
Table of Contents
OFFICE OF THE COMPTROLLER OF THE CURRENCY
WASHINGTON, D.C. 20219
FORM 10-QSB
| x | QUARTERLY REPORT UNDER SECTION 13 OR 15(d) OF THE SECURITIES EXCHANGE ACT OF 1934 |
For the quarterly period ended September 30, 2006
OR
| ¨ | TRANSITION REPORT UNDER SECTION 13 OR 15(d) OF THE SECURITIES EXCHANGE ACT OF 1934 |
For the transition period from to
Commission file number: n/a
PATRIOT BANK, NA
(Name of small business issuer as specified in its charter)
| National Bank | 54-1801538 | |
(State or other jurisdiction of incorporation or organization) | (I.R.S. Employer Identification No.) |
1204 Bragg Road Fredericksburg, VA | 22407 | |
| (Address of principal executive offices) | (Zip Code) |
(540) 786-9815
Issuer’s telephone number
n/a
(Former name, former address and former fiscal year, if changed since last report)
Check whether the issuer (1) filed all reports required to be filed by Section 13 or 15(d) of the Exchange Act during the past 12 months (or for such shorter period that the registrant was required to file such reports), and (2) has been subject to such filing requirements for the past 90 days. Yes x No ¨
Indicate by check mark whether the registrant is a shell company (as defined in Rule 12b-2 of the Exchange Act). Yes ¨ No x
As of November 13, 2006, there were issued and outstanding 474,132 shares of the issuer’s common stock.
Transitional Small Business Disclosure Format: Yes ¨ No x
1
Table of Contents
INDEX
| PART I - FINANCIAL INFORMATION | 4 | |||
ITEM 1 - FINANCIAL STATEMENTS | 4 | |||
STATEMENTS OF CONDITION | 4 | |||
STATEMENTS OF INCOME | 5 | |||
STATEMENTS OF CASH FLOWS | 6 | |||
STATEMENTS OF CHANGES IN SHAREHOLDERS’ EQUITY | 7 | |||
Notes To Unaudited Financial Statements | 7 | |||
ITEM 2 - MANAGEMENT’S DISCUSSION AND ANALYSIS | 9 | |||
ITEM 3 - CONTROLS AND PROCEDURES | 13 | |||
| PART II - OTHER INFORMATION | 14 | |||
ITEM 1 - LEGAL PROCEEDINGS. | 14 | |||
ITEM 2 - UNREGISTERED SALES OF EQUITY SECURITIES AND USE OF PROCEEDS. | 14 | |||
ITEM 3 - DEFAULTS UPON SENIOR SECURITIES. | 14 | |||
ITEM 4 - SUBMISSION OF MATTERS TO A VOTE OF SECURITY HOLDERS. | 14 | |||
ITEM 5 - OTHER INFORMATION | 14 | |||
ITEM 6 - EXHIBITS AND REPORTS ON FORM 8-K | 14 | |||
2
Table of Contents
FORWARD–LOOKING STATEMENTS
This report contains statements concerning the Bank’s expectations, plans, objectives, future financial performance and other statements that are not historical facts. These statements may constitute “forward-looking statements” as defined by federal securities laws. In some cases, readers can identify the forward-looking statements by the use of words such as “may,” “ will,” “should,” “could,” “expect,” “plan,” “intend,” “anticipate,” “believe,” “estimate,” “predict,” “potential” or “continue” or the negative or other variations of these words, or other comparable words or phrases. These statements may address issues that involve estimates and assumptions made by management, risks and uncertainties, and actual results could differ materially from historical results or those anticipated by such statements. Factors that could have a material adverse effect on the Bank’s operations and future prospects include, but are not limited to, changes in: interest rates; general and local economic conditions; the legislative/regulatory climate; monetary and fiscal policies of the U.S. government, including policies of the U.S. Treasury and the Federal Reserve Board; the quality or composition of loan or investment portfolios; demand for loan products; deposit flows; competition; demand for financial services in our market area and accounting principles, policies and guidelines. These risks and uncertainties should be considered in evaluating the forward-looking statements contained herein, and readers are cautioned not to place undue reliance on such statements, which speak only as of the date of this report.
3
Table of Contents
PART I - FINANCIAL INFORMATION
Item 1 - FINANCIAL STATEMENTS
PATRIOT BANK, NA
STATEMENTS OF CONDITION
(Dollars in Thousands)
| September 30, 2006 (Unaudited) | December 31, 2005 | |||||||
ASSETS | ||||||||
Interest-Bearing Deposits in Other Financial Institutions | $ | 12,465 | $ | 15,733 | ||||
Investment Securities | ||||||||
U. S. Agency Securities | 55,791 | 56,777 | ||||||
Federal Funds Sold | 5,600 | 775 | ||||||
Loans | 151,125 | 160,208 | ||||||
Less: Unearned | (143 | ) | (178 | ) | ||||
Allowance for Loan Losses | (1,843 | ) | (1,807 | ) | ||||
Net Loans | 149,139 | 158,223 | ||||||
Earning Assets | 222,995 | 231,508 | ||||||
Cash and Due From Banks | 10,161 | 12,236 | ||||||
Bank Premises and Equipment | 6,302 | 6,458 | ||||||
Investment in Associated Companies | 769 | 769 | ||||||
Other Assets | 2,774 | 2,688 | ||||||
TOTAL ASSETS | $ | 243,001 | $ | 253,659 | ||||
LIABILITIES | ||||||||
Deposits | ||||||||
LIFETIME FREE CHECKING | $ | 73,002 | $ | 80,419 | ||||
Interest-Bearing Demand | 28,274 | 37,860 | ||||||
Regular Passbook Savings | 40,661 | 46,154 | ||||||
Time Deposits | ||||||||
Certificates of Deposit $100,000 or More | 24,176 | 18,642 | ||||||
Other | 54,492 | 49,900 | ||||||
Total Deposits | 220,605 | 232,975 | ||||||
Notes issued to the U. S. Treasury | 558 | 325 | ||||||
Other Liabilities | 735 | 308 | ||||||
TOTAL LIABILITIES | 221,898 | 233,608 | ||||||
SHAREHOLDERS’ EQUITY | ||||||||
Common Stock, Par Value $5.00 Per Share, Authorized 2,500,000 Shares; 474,132 Outstanding in 2006 and 2005 | 2,371 | 2,371 | ||||||
Surplus | 14,021 | 14,021 | ||||||
Undivided Profits | 4,711 | 3,659 | ||||||
TOTAL SHAREHOLDERS’ EQUITY | 21,103 | 20,051 | ||||||
TOTAL LIABILITIES AND SHAREHOLDERS’ EQUITY | $ | 243,001 | $ | 253,659 | ||||
See accompanying notes to unaudited financial statements.
4
Table of Contents
PATRIOT BANK, NA
STATEMENTS OF INCOME
| Nine Months Ended September 30, | Three Months September 30, | |||||||||||
| 2006 | 2005 | 2006 | 2005 | |||||||||
| (Unaudited) | (Unaudited) | |||||||||||
INTEREST INCOME | ||||||||||||
Interest and Fees on Loans | ||||||||||||
Taxable | $ | 6,506 | $ | 5,731 | $ | 2,238 | $ | 1,908 | ||||
Non-Taxable | 637 | 491 | 210 | 167 | ||||||||
Interest on Deposits in Other Financial Institutions | 422 | 412 | 141 | 139 | ||||||||
Interest on Federal Funds Sold | 72 | 352 | 16 | 174 | ||||||||
Interest and Dividends on Securities | ||||||||||||
U. S. Agency Securities | 1,676 | 1,432 | 592 | 482 | ||||||||
Obligations of States and Political Subdivisions | — | 14 | — | 3 | ||||||||
TOTAL INTEREST INCOME | 9,313 | 8,432 | 3,197 | 2,873 | ||||||||
INTEREST EXPENSE | ||||||||||||
Interest on Time Deposits $100,000 or More | 603 | 353 | 192 | 145 | ||||||||
Interest on Other Deposits | 2,222 | 1,891 | 833 | 685 | ||||||||
Interest on Federal Funds Purchased | 47 | — | 27 | — | ||||||||
Interest on Notes Issued to the U. S. Treasury | 9 | 5 | 3 | 2 | ||||||||
TOTAL INTEREST EXPENSE | 2,881 | 2,249 | 1,055 | 832 | ||||||||
NET INTEREST INCOME | 6,432 | 6,183 | 2,142 | 2,041 | ||||||||
Provision for Loan Losses | 45 | 45 | 15 | 15 | ||||||||
NET INTEREST INCOME AFTER PROVISION FOR LOAN LOSSES | 6,387 | 6,138 | 2,127 | 2,026 | ||||||||
NON-INTEREST INCOME | ||||||||||||
Service Charges, Commissions and Fees | 508 | 615 | 175 | 215 | ||||||||
Other Non-Interest Income | 125 | 89 | 73 | 27 | ||||||||
TOTAL NON-INTEREST INCOME | 633 | 704 | 248 | 242 | ||||||||
NON-INTEREST EXPENSE | ||||||||||||
Salaries and Employee Benefits | 2,789 | 2,753 | 919 | 931 | ||||||||
Occupancy Expense (Net) | 729 | 739 | 241 | 246 | ||||||||
Operations Center Expense | 818 | 787 | 269 | 275 | ||||||||
Other Non-Interest Expense | 558 | 382 | 162 | 130 | ||||||||
TOTAL NON-INTEREST EXPENSE | 4,894 | 4,661 | 1,591 | 1,582 | ||||||||
INCOME BEFORE INCOME TAXES | 2,126 | 2,181 | 784 | 686 | ||||||||
Income Tax Expense | 505 | 565 | 195 | 170 | ||||||||
NET INCOME | $ | 1,621 | $ | 1,616 | $ | 589 | $ | 516 | ||||
EARNINGS PER COMMON SHARE: | $ | 3.42 | $ | 3.41 | $ | 1.24 | $ | 1.09 | ||||
Weighted Average Shares Outstanding | 474,132 | 474,132 | 474,132 | 474,132 | ||||||||
Cash Dividends Per Common Share | $ | 1.20 | $ | 1.20 | $ | 0.40 | 0.40 | |||||
See accompanying notes to unaudited financial statements.
5
Table of Contents
PATRIOT BANK, NA
STATEMENTS OF CASH FLOWS
(Dollars in Thousands)
| Nine Months Ended September 30, | ||||||||
| 2006 | 2005 | |||||||
| (Unaudited) | ||||||||
Cash Flows From Operating Activities | ||||||||
Net Income | $ | 1,621 | $ | 1,616 | ||||
Adjustments to reconcile net income to net cash provided by operating activities | ||||||||
Provision for Loan Losses | 45 | 45 | ||||||
Depreciation of Bank Premises and Equipment | 215 | 204 | ||||||
Increase (Decrease) in Unearned Income | (35 | ) | 62 | |||||
(Increase) Decrease in Other Assets | (86 | ) | (213 | ) | ||||
Increase (Decrease) in Other Liabilities | 427 | 191 | ||||||
Net Cash From Operating Activities | 2,187 | 1,905 | ||||||
Cash Flows From Investing Activities | ||||||||
Proceeds from Maturity of Interest Bearing Balances | 10,387 | 18,111 | ||||||
Purchase of Interest Bearing Balances | (7,119 | ) | (14,842 | ) | ||||
Payments on Investment Securities | 9,986 | 8,005 | ||||||
Purchase of Investment Securities | (9,000 | ) | (19,000 | ) | ||||
Purchase of Bank Premises and Equipment | (59 | ) | (85 | ) | ||||
Net (Increase) Decrease in Short-Term Loans Outstanding, Net | (3,200 | ) | 1,033 | |||||
Longer-Term Loans Originated or Purchased | (56,725 | ) | (49,909 | ) | ||||
Principal Collected on Longer-Term Loans | 68,999 | 42,021 | ||||||
Net Cash From Investing Activities | 13,269 | (14,666 | ) | |||||
Cash Flows from Financing Activities | ||||||||
Increase in Demand and Savings Accounts | (22,496 | ) | 3,854 | |||||
Proceeds from Sale of Time Deposits | 36,098 | 34,998 | ||||||
Payments for Matured Time Deposits | (25,972 | ) | (23,761 | ) | ||||
Payment of Cash Dividends | (569 | ) | (568 | ) | ||||
Net Increase (Decrease) in Notes issued to the U. S. Treasury | 233 | 217 | ||||||
Net Cash From Financing Activities | (12,706 | ) | 14,740 | |||||
Net Increase in Cash and Cash Equivalents | 2,750 | 1,979 | ||||||
Cash and Cash Equivalents at Beginning of Year | 13,011 | |||||||
Cash and Cash Equivalents at End of Period | $ | 15,761 | $ | 1,979 | ||||
Cash and Cash Equivalents Include: | ||||||||
Cash a Due From Banks | $ | 10,161 | $ | 10,651 | ||||
Federal Funds Sold | 5,600 | 24,500 | ||||||
Total Cash and Cash Equivalents at Period End | $ | 15,761 | $ | 35,151 | ||||
Supplementary Data: | ||||||||
Cash Interest Paid | $ | 2,202 | $ | 1,617 | ||||
Cash Paid for Taxes | 505 | 565 | ||||||
See accompanying notes to unaudited financial statements.
6
Table of Contents
PATRIOT BANK, NA
STATEMENTS OF CHANGES IN SHAREHOLDERS’ EQUITY
(Dollars in Thousands)
| Common Stock | Undivided Profits | |||||||||||
| Shares | Par Value | Surplus | ||||||||||
Balances, December 31, 2005 | 474,132 | $ | 2,371 | $ | 14,021 | $ | 3,659 | |||||
Net Income | — | — | — | 1,621 | ||||||||
Cash Dividends | — | — | — | (569 | ) | |||||||
Balances, September 30, 2006 (Unaudited) | 474,132 | $ | 2,371 | $ | 14,021 | $ | 4,711 | |||||
Notes To Unaudited Financial Statements
The unaudited interim financial statements of the Bank are prepared in the conformity with accounting principles generally accepted in the United States of America and the instructions to Securities and Exchange Commission’s Form 10-QSB. In the opinion of management, all adjustments (consisting only of normal recurring adjustments) necessary for a fair presentation of the financial position and results of operations for the periods presented have been included. The financial statements should be read in conjunction with the financial statements and notes contained in the Bank’s Annual Report on Form 10-KSB for the year ended December 31, 2005. The results for the six months ended September 30, 2006 are not necessarily indicative of the results for the entire fiscal year ending December 31, 2006.
Certain reclassifications have been made to the prior year financial statements to conform to the 2006 presentation. These reclassifications had no effect on previously reported net income.
NOTE 1 - INVESTMENT SECURITIES
(Dollars in Thousands)
The Bank has the ability and intent to carry the investments noted with an unrealized loss to the final maturity of the instrument and considers these investments not other-than-temporarily impaired.
The following table sets forth a summary of the investment securities portfolio as of the periods indicated:
| Amortized Cost | Gross Unrealized Gains | Gross Unrealized Losses | Estimated Market Value | |||||||||
| September 30, 2006 (Unaudited) | ||||||||||||
U. S. Agency Securities | $ | 55,791 | $ | 16 | $ | 605 | $ | 55,202 | ||||
Total Securities | $ | 55,791 | $ | 16 | $ | 605 | $ | 55,202 | ||||
December 31, 2005 | ||||||||||||
U. S. Agency Securities | $ | 56,777 | $ | 14 | $ | 742 | $ | 56,049 | ||||
Total Securities | $ | 56,777 | $ | 14 | $ | 742 | $ | 56,049 | ||||
7
Table of Contents
NOTE 2 - LOANS
(Dollars in Thousands)
The composition of the loan portfolio by dollar amount is shown in the table below:
| September 30, 2006 (Unaudited) | December 31, 2005 | |||||||
Secured by real estate | ||||||||
Construction Loans | $ | 10,675 | $ | 7,164 | ||||
Secured by farmland (including farm residential and other improvements) | 3,058 | 3,135 | ||||||
Secured by 1-4 family residential properties | 10,219 | 22,274 | ||||||
Secured by multi-family residential properties | 6,330 | 9,150 | ||||||
Secured by non-farm residential property | 85,474 | 85,932 | ||||||
Loans to finance agricultural production and other loans to farmers | 386 | 227 | ||||||
Commercial and industrial loans | 4,381 | 2,698 | ||||||
Loans to individuals for household, family and other personal expenditures | 6,824 | 4,862 | ||||||
Obligations (other than securities) of states and political subdivisions | 23,778 | 24,766 | ||||||
Less: Unearned Income | (143 | ) | (178 | ) | ||||
Total loans and leases | $ | 150,982 | $ | 160,030 | ||||
NOTE 3 - ALLOWANCE FOR LOAN LOSSES
(Dollars in Thousands)
The allowance for loan losses is an estimate of losses inherent in the loan portfolio as determined by management taking into consideration historical loan loss experience, diversification of the loan portfolio, amounts of secured and unsecured loans, banking industry standards and averages, and general economic conditions. Ultimate losses may vary from current estimates. These estimates are reviewed periodically and as adjustments become necessary, they are reported in earnings in the periods which they become reasonably estimable.
The following table summarizes the activity in the allowance for loan losses in the periods presented:
| September 30, 2006 (Unaudited) | December 31, 2005 | |||||||
Balance Beginning of Period | $ | 1,807 | $ | 1,692 | ||||
Provision for Loan Losses | 45 | 60 | ||||||
Charge-Offs, Net of (Recoveries): | ||||||||
Real Estate Loans | 12 | (61 | ) | |||||
Installment Loans | (3 | ) | 6 | |||||
Commercial Loans | — | — | ||||||
Total Net Loan Losses | 9 | (55 | ) | |||||
Balance End of Period | $ | 1,843 | $ | 1,807 | ||||
8
Table of Contents
NOTE 4 - NONPERFORMING ASSETS AND DELINQUENT LOANS
(Dollars in Thousands)
| September 30, 2006 (Unaudited) | December 31, 2005 | |||||
Nonaccrual Loans | ||||||
Real Estate | $ | 2,175 | $ | 2,175 | ||
Installment | — | — | ||||
Commercial | — | — | ||||
Total Nonaccrual Loans | 2,175 | 2,175 | ||||
Foreclosed Properties | — | — | ||||
Total Nonperforming Assets | $ | 2,175 | $ | 2,175 | ||
Loans 90 Days or More Past Due and Still Accruing | ||||||
Real Estate | $ | — | $ | — | ||
Installment | — | — | ||||
Commercial | — | — | ||||
Total Loans 90 Days or More Past Due | $ | — | $ | — | ||
Item 2 - MANAGEMENT’S DISCUSSION AND ANALYSIS
The Bank
The Bank opened for business on July 1, 1996, and was created through the spin-off of the assets, liabilities and related capital of four offices located in the Fredericksburg area from Peoples National Bank, Danville, Virginia. The Bank operates under a national charter and provides full banking services. As a national bank, the Bank is subject to regulation by the Comptroller of the Currency, the Federal Deposit Insurance Corporation and the Board of Governors of the Federal Reserve System. The Bank generates commercial (including agricultural), mortgage and consumer loans and receives deposits from customers located primarily in the areas surrounding the Bank’s offices, which are located in counties of Albemarle, Spotsylvania, Stafford, Prince William and the cities of Charlottesville, Fredericksburg, and Manassas. At September 30, 2006, the Bank had $243 million in assets, $149 million in net loans, $221 million in deposits and $21 million in total shareholders’ equity.
Proposed Reorganization and Merger
On July 28, 2006, the Bank entered into an Agreement and Plan of Merger (the “Merger Agreement”) with Blue Ridge Bank, N.A., Central National Bank, Community National Bank, First National Bank, First National Exchange Bank, Mountain National Bank, Patrick Henry National Bank, Peoples National Bank, Shenandoah National Bank (together with the Bank, the “Banks”) and Carter Bank & Trust, a new Virginia chartered bank that will be headquartered in Martinsville, Virginia. The Merger Agreement sets forth the terms and conditions pursuant to which the Banks will reorganize by merging into Carter Bank & Trust (the “Merger”).
All officers and employees of the existing Banks will remain unchanged as a result of the Merger. Worth Harris Carter, Jr. is currently Chairman of the Board and President of each of the Banks and will serve as Chairman of the Board and President of Carter Bank & Trust. Under the terms of the Merger Agreement, shareholders of each of the Banks will receive a certain number of shares in Carter Bank & Trust in exchange for each share held in the existing Banks as follows: each share of Blue Ridge Bank: 2.474 shares; each share of Central National Bank: 5.470 shares; each share of Community National Bank: 4.350 shares; each share of First National Bank: 1.613 shares; each share of First National Exchange Bank: 4.509 shares; each share of Mountain National Bank: 3.981 shares; each share of Patrick Henry National Bank: 1.112 shares; each share of Patriot Bank: 5.775 shares; each share of Peoples National Bank: 1.945 shares; and each share of Shenandoah National Bank: 3.461 shares.
9
Table of Contents
Consummation of the Merger is subject to a number of customary conditions including (i) the approval of the Merger by the shareholders of each of the Banks and Carter Bank & Trust and (ii) the receipt of all required regulatory approvals, including approval by the Virginia State Corporation Commission and the Federal Deposit Insurance Corporation. The Merger is expected to be completed in the fourth quarter of 2006 and will be accounted for using the purchase method of accounting
Critical Accounting Policies
The accounting and reporting policies of the Bank conform to generally accepted accounting principles (GAAP) in the United States of America and to general practices within the banking industry. The preparation of the financial statements in conformity with GAAP requires management to make estimates and assumptions that affect the amounts reported in the financial statements and accompanying notes. We believe the most significant of these estimates involves the allowance for loan losses because of its potential impact on our overall performance. We have described our policies in this area below. A summary of the Bank’s significant accounting policies can be found in the Notes to Financial Statements included in the Bank’s 2005 Annual Report on Form 10KSB.
In general, determining the amount of the allowance for loan losses requires significant judgment and the use of estimates by management allowing for losses inherent to the loan portfolio. The Bank maintains an allowance for loan losses to absorb probable losses in the loan portfolio based on a quarterly analysis of the portfolio. This analysis determines an appropriate level of the allowance for loan losses by considering factors affecting loan losses, including specific losses, levels and trends in impaired and non-performing loans, historical loan loss experience, current economic conditions, volume, growth and composition of the portfolio, and other relevant factors. The Bank records a provision for loan losses to maintain the allowance at an adequate level. The provision expense could increase or decrease each quarter based upon the results of management’s formal analysis.
The amount of the allowance represents management’s estimate of expected losses from existing loans based upon specific allocations for individual lending relationships and historical loss experience. The allowance for loan losses related to impaired loans is based on discounted cash flows using the loan’s initial effective interest rate or the fair value of the collateral for certain collateral dependent loans. This evaluation requires management to make estimates of the amounts and timing of future cash flows on impaired loans, which consists primarily of non-accrual and restructured loans. Actual losses for these loans can vary significantly from these estimates.
Investment securities are stated at cost, adjusted for amortization of premiums and accretion of discounts, and computed by the interest method. The Bank has positive intent and ability to hold these securities until maturity. Gains and losses on sales, if any, of securities are based upon the adjusted cost of the specific securities sold. If any of the securities are not held to maturity, the classification of the entire portfolio could change to available for sale. This could require fair value accounting for not just the tainted securities but the entire portfolio, and possibly, the recognition of unrealized losses as other than temporary in the income statement.
Real estate properties acquired through or in lieu of loan foreclosure are initially recorded at the lower of the Bank’s carrying amount or fair value less estimated selling cost at the date of foreclosure. Any write-downs based on the asset’s fair value at the date of acquisition are charged to the allowance for loan losses. After foreclosure, these assets are carried at the lower of their new cost basis or fair value less cost to sell. Costs of significant property improvements are capitalized, whereas costs relating to holding property are expensed. The portion of interest costs relating to development of real estate is capitalized. Valuations are periodically performed by management, and any write-downs are recorded as a charge to operations, if necessary, to reduce the carrying value of a property to the lower of its carrying value or fair value less cost to sell. The fair value of other real estate owned, including related selling costs, is an estimate that may change in the near term. If estimates change that decrease the expected fair value of the property, the recognition of this loss is reflected in the income statement for the period the estimate changes.
10
Table of Contents
Overview
Net Income for the first nine months of 2006 equaled $1,621,000, or $3.42 per share, compared to $1,616,000, or $3.41 per share for 2005. On an annualized basis, this represents a return on average assets of 0.88% and return on average equity of 10% compared to 0.87% and 11%, respectively, for last year.
The Bank has reduced its investments in interest-bearing deposits and U. S. Agency Securities while increasing Federal Funds Sold. These changes in asset allocation have had a positive impact on earnings. The Bank has experienced a decrease in deposits of $12.4 million or 6%, compared to December 31, 2005. All categories decreased with the exception of Certificates of Deposit, which increased.
Net interest income increased $249,000 and non-interest expense increased $233,000. Net income remained flat, increasing $5,000. We expect our net interest margins to expand, and as the new offices grow, our earnings are expected to increase.
Total liabilities at September 30, 2006 were $221,898,000, up from $233,608,000 at December 31, 2005. This was mainly due to the decrease in deposits.
Total Shareholders’ Equity at September 30, 2006 was $21,103,000. At December 31, 2005, total Shareholders’ Equity was $20,051,000.
Results of Operations
Net Interest Income.Net Interest Income is our largest source of revenue and continues to be impacted by low interest rates.
The following table details the average balances and cost and yield data for the earning assets and interest-bearing liabilities:
| For Nine Months Ended | ||||||||||||||||||||||
| September 30, 2006 | September 30, 2005 | |||||||||||||||||||||
| Average | Income/ | Yield/ | Average | Income/ | Yield/ | Increase | ||||||||||||||||
| (Unaudited) | ||||||||||||||||||||||
Asset/Liability | Balance | Expense | Cost | Balance | Expense | Cost | (Decrease) | |||||||||||||||
Real Estate Loans | $ | 121,323 | $ | 5,890 | 6.47 | % | $ | 118,758 | $ | 5,112 | 5.74 | % | $ | 778 | ||||||||
Installment Loans | 6,889 | 374 | 7.24 | % | 4,641 | 250 | 7.18 | % | 124 | |||||||||||||
Commercial Loans | 27,814 | 879 | 4.21 | % | 23,395 | 860 | 4.90 | % | 19 | |||||||||||||
Total Loans - Net of Unearned Income | 156,026 | 7,143 | 6.10 | % | 146,794 | 6,222 | 5.65 | % | 921 | |||||||||||||
Interest-Bearing Deposits in Other Financial Institutions | 11,840 | 422 | 4.75 | % | 16,579 | 412 | 3.31 | % | 10 | |||||||||||||
Investment Securities | 55,447 | 1,676 | 4.03 | % | 52,979 | 1,446 | 3.64 | % | 230 | |||||||||||||
Federal Funds Sold | 1,155 | 72 | 8.31 | % | 20,077 | 352 | 2.34 | % | (280 | ) | ||||||||||||
Total Earning Assets | $ | 224,468 | $ | 9,313 | 5.53 | % | $ | 236,429 | $ | 8,432 | 4.76 | % | $ | 881 | ||||||||
Interest-Bearing Transaction Accounts | $ | 19,614 | $ | 79 | 0.54 | % | $ | 25,052 | $ | 92 | 0.49 | % | $ | (13 | ) | |||||||
Savings Deposits (Including MMDAs) | 50,801 | 603 | 1.58 | % | 64,543 | 682 | 1.41 | % | (79 | ) | ||||||||||||
Certificates of Deposit Over $100,000 | 22,581 | 667 | 3.94 | % | 16,784 | 353 | 2.80 | % | 314 | |||||||||||||
Other Certificates of Deposits | 52,738 | 1,476 | 3.73 | % | 49,722 | 1,117 | 3.00 | % | 359 | |||||||||||||
Total Deposits | 145,734 | 2,825 | 2.58 | % | 156,101 | 2,244 | 1.92 | % | 581 | |||||||||||||
Notes issued to the U. S. Treasury | 217 | 9 | 5.53 | % | 283 | 5 | 2.36 | % | 4 | |||||||||||||
Federal Funds Purchased | 1,999 | 47 | 3.13 | % | — | — | — | 47 | ||||||||||||||
Total Interest-Bearing Liabilities | $ | 147,950 | $ | 2,881 | 2.60 | % | $ | 156,384 | $ | 2,249 | 1.92 | % | $ | 632 | ||||||||
Net Interest Income | $ | 6,432 | 3.82 | % | $ | 6,183 | 3.49 | % | $ | 249 | ||||||||||||
11
Table of Contents
As a result of the increase in earning assets, net interest income increased $249,000, or 4%, for the nine month period ended September 30, 2006 compared to the same period of 2005.
Allowance and Provision for Loan Losses.The Allowance for Loan Losses represents management’s estimation of the amount necessary to absorb future losses in the loan portfolio. On the Statement of Condition, the Allowance for Loan Losses is deducted from Total Loans so that the net amount shown represents the estimated realizable total loans. The Provision for Loan Losses is the amount charged to expense to maintain the Allowance at an adequate level.
The Allowance for Loan Losses was $1,843,000, or 1.2% of total loans outstanding, at September 30, 2006. In the view of management, the Allowance for Loan Losses is adequate to meet the loss contingency based on experience factors and a review of the loan portfolio.
The Provision for Loan Loss was $45,000 for the nine months ended September 30, 2006 and 2005. See Note 3 - Allowance For Loan Losses - and Note 4 - Average Balances and Net Interest Income - to the financial statements for additional information.
Non-Interest Income.Non-Interest Income decreased $71,000, or 11%, for the nine month period ended September 30, 2006, compared to the same period of 2005. The largest source of non-interest income is Services Charges, Commissions and Fees, which decreased from $615,000 at September 30, 2005 to $508,000 at September 30, 2006.
Non-Interest Expense.Non-Interest Expense increased $233,000 or 5%, for the nine month period ended September 30, 2006, compared to the same period of 2005.
Income Taxes. Income tax expense equaled $505,000 during the first nine months of 2006, as compared to $565,000 in 2005. The effective income tax rate declined between the periods, due to the decrease in income.
Net Income.Net Income after taxes increased slightly by $5,000, or 0.3%, from the prior year.
Analysis of Financial Condition
Investments.U. S. Agency Securities Investments have decreased $986,000 compared to December 31, 2005. Funds from maturing U. S. Agency Securities were invested in Federal Funds Sold.
Loans. Loans decreased $9 million, or 6%, compared to December 31, 2005. The decrease took place primarily in the real estate segment of the portfolio. Real estate secured loans made up approximately 77% of loans at September 30, 2006.
Non-Performing Assets and Impaired Loans.Non-performing assets, which consist of Nonaccrual loans and foreclosed properties, were $2,175,000 at September 30, 2006 and December 31, 2005. These totals consist entirely of Nonaccrual Loans, as the bank has no foreclosed properties.
Nonaccrual loans are those loans contractually past due 90 days or more on, which no interest is being accrued. Other real estate owned consists of real estate acquired through foreclosure. These properties are reviewed quarterly and reduced to an estimated realizable value at that time.
Deposits.Total deposits have decreased $12.4 million or 6%, compared to December 31, 2005. Increases occurred in Certificates of Deposit while all other categories decreased.
12
Table of Contents
Capital.The federal regulatory agencies use risk-based capital ratios to analyze the adequacy of a bank’s capital. These ratios weigh bank assets from 0% to 100%, depending upon the risks inherent in each type of asset. The Bank continues to meet all requirements for a well-capitalized bank as defined by the regulatory agencies.
The Following table presents the key risk-based capital ratios for the periods indicated:
| September 30, 2006 | December 31, 2005 | |||||
Tier 1 Ratio | 13.24 | % | 12.41 | % | ||
Total Risk-Based Capital Ratio | 14.40 | % | 13.53 | % | ||
Leverage Ratio | 8.75 | % | 7.88 | % |
Shareholders’ Equity was $21,103,000 at September 30, 2006 compared to $20,051,000 at December 31, 2005.
Liquidity.Liquidity is our ability to fund both loans and investments in the normal course of business and to provide adequate protection for unexpected deposit withdrawals or other demands for funds without incurring a significant negative impact on profitability. Our primary source of day-to-day liquidity lies in the combination of cash, deposit balances, checks in process of collection, deposit growth and federal funds sold. Federal funds are excess funds that are sold to other banks, generally on a one-day basis. Normal funds from the repayment of loans and investments augment these funds.
Our secondary source of liquidity lies in our investments and deposits in other financial institutions. While our investments are categorized as held-to-maturity, they consist primarily of short-term U S Agency Securities that are readily marketable. The majority of our investment securities mature in five years or less. Interest-bearing deposits in other financial institutions generally mature in two years or less and the volume of this investment decreased for the first nine months.
Off-Balance Sheet Arrangements.Commitments to extend credit, which amounted to $25,345,000 at September 30, 2006 and $2,114,000 at December 31, 2005, respectively, represent agreements to lend to customers with fixed expiration dates or other termination clauses. Since many of the commitments are expected to expire without being funded, the total commitment amounts do not necessarily represent future liquidity requirements. Standby letters of credit are conditional commitments issued by the Bank guaranteeing the performance of a customer to a third party. Those guarantees are primarily issued to support public and private borrowing arrangements. The Bank had outstanding letters of credit in the amount of $1,118,000 at September 30, 2006 and $1,359,000 at December 31, 2005.
Recent Accounting Pronouncements.In June 2005, the FASB issued Statement No. 154, “Accounting Changes and Error Corrections”, which replaces APB Opinion No. 20, “Accounting Changes” and FASB Statement No. 3, “Reporting Accounting Changes in Interim Financial Statements.” Statement No., 154 requires that a voluntary change in accounting principle be applied retrospectively with all prior period financial statements presented on the new accounting principle. Statement No. 154 also requires that a change in method of depreciating or amortizing a long-lived non-financial asset be accounted for prospectively as a change in estimate, and correction of errors in previously issued financial statements should be termed a “restatement.” Statement No. 154 is effective for accounting changes and correction of errors made in fiscal years beginning after December 15, 2005. Management does not expect this accounting pronouncement to have a material impact on the Bank’s financial statements.
Item 3 - CONTROLS AND PROCEDURES
The Bank maintains a system of disclosure controls and procedures that is designed to ensure that material information is accumulated and communicated to management, including the Bank’s president (who is the Bank’s principal executive officer and principal financial officer), as appropriate to allow timely decisions regarding required disclosure. As required, management, with the participation of the Bank’s president, evaluated the
13
Table of Contents
effectiveness of the design and operation of the Bank’s disclosure controls and procedures as of the end of the period covered by this report. Based on this evaluation, the Bank’s president concluded that the Bank’s disclosure controls and procedures were operating effectively to ensure that information required to be disclosed by the Bank in reports that it files or submits under the Securities Exchange Act of 1934, as amended, is recorded, processed, summarized, and reported within the time periods specified in the rules and forms of the SEC.
Because of the inherent limitations in all control systems, no evaluation of controls can provide absolute assurance that the Bank’s disclosure controls and procedures will detect or uncover every situation involving the failure of persons within the Bank to disclose material information otherwise required to be set forth in the Bank’s periodic reports.
The Bank’s management is also responsible for establishing and maintaining adequate internal control over financial reporting to provide reasonable assurance regarding the reliability of financial reporting and the preparation of financial statements for external purposes in accordance with generally accepted accounting principles. There were no changes in the Bank’s internal control over financial reporting during the Bank’s quarter ended September 30, 2006 that have materially affected, or are reasonably likely to materially affect, the Bank’s internal control over financial reporting.
PART II - OTHER INFORMATION
Item 1 - LEGAL PROCEEDINGS.
There are no materials pending legal proceedings to which the Bank is a party or to which the property of the Bank is subject.
Item 2 - UNREGISTERED SALES OF EQUITY SECURITIES AND USE OF PROCEEDS.
None.
Item 3 - DEFAULTS UPON SENIOR SECURITIES.
None.
Item 4 - SUBMISSION OF MATTERS TO A VOTE OF SECURITY HOLDERS.
None.
Item 5 - OTHER INFORMATION
None.
Item 6 - EXHIBITS AND REPORTS ON FORM 8-K
Exhibits:
| 2.1 | Agreement and Plan of Merger, dated as of July 28, 2006, by and among Blue Ridge Bank, N.A., Central National Bank, Community National Bank, First National Bank, First National Exchange Bank, Mountain National Bank, Patrick Henry National Bank, Patriot Bank, National Association, Peoples National Bank, Shenandoah National Bank and Carter Bank & Trust (incorporated by reference to Exhibit 2.1 to Form 8-K filed with the Office of the Comptroller of the Currency on July 31, 2006). | |
| 3.1 | Articles of Association (filed with the Office of the Comptroller of the Currency prior to the opening of the Bank) | |
14
Table of Contents
3.2 | Amended and Restated Bylaws (as amended and restated through February 17, 2005) (incorporated by reference to Exhibit 3.2 to Form 8-K filed with the Office of the Comptroller of the Currency on February 17, 2005) | |
31 | Certification by principal executive officer and principal financial officer pursuant to Rule 13a-14(a) | |
32 | Certification of principal executive officer and principal financial officer pursuant to 18 U.S.C. § 1350 | |
SIGNATURES
In accordance with the requirements of the Exchange Act, the registrant caused this report to be signed on its behalf by the undersigned, thereunto duly authorized.
| PATRIOT BANK, N.A. | ||
| Date:November 13, 2006 |
| |
| Worth Harris Carter, Jr. | ||
Chairman of the Board and President (Principal executive officer and principal financial officer) | ||
15
Table of Contents
Exhibit 31
CERTIFICATION
I, Worth Harris Carter, Jr., certify that:
| 1. | I have reviewed this quarterly report on Form 10-QSB of Patriot Bank, N.A.; |
| 2. | Based on my knowledge, this report does not contain any untrue statement of a material fact or omit to state a material fact necessary to make the statements made, in light of the circumstances under which such statements were made, not misleading with respect to the period covered by this report; |
| 3. | Based on my knowledge, the financial statements, and other financial information included in this report, fairly present in all material respects the financial condition, results of operations and cash flows of the small business issuer as of, and for, the periods presented in this report; |
| 4. | I am responsible for establishing and maintaining disclosure controls and procedures (as defined in Exchange Act Rules 13a-15(e) and 15d-15(e)) for the small business issuer and have: |
| (a) | Designed such disclosure controls and procedures, or caused such disclosure controls and procedures to be designed under my supervision, to ensure that material information relating to the small business issuer, including its consolidated subsidiaries, is made known to me by others within those entities, particularly during the period in which this report is being prepared; |
| (b) | Evaluated the effectiveness of the small business issuer’s disclosure controls and procedures and presented in this report my conclusions about the effectiveness of the disclosure controls and procedures, as of the end of the period covered by this report based on such evaluation; and |
| (c) | Disclosed in this report any change in the small business issuer’s internal control over financial reporting that occurred during the small business issuer’s most recent fiscal quarter (the small business issuer’s fourth fiscal quarter in the case of an annual report) that has materially affected, or is reasonably likely to materially affect, the small business issuer’s internal control over financial reporting; and |
| 5. | I have disclosed, based on my most recent evaluation of internal control over financial reporting, to the small business issuer’s auditors and the audit committee of the small business issuer’s board of directors (or persons performing the equivalent functions): |
| (a) | All significant deficiencies and material weaknesses in the design or operation of internal control over financial reporting which are reasonably likely to adversely affect the small business issuer’s ability to record, process, summarize and report financial information; and |
| (b) | Any fraud, whether or not material, that involves management or other employees who have a significant role in the small business issuer’s internal control over financial reporting. |
| Date:November 13, 2006 |
| |
| Worth Harris Carter, Jr. | ||
Chairman of the Board and President (principal executive officer and principal financial officer) |
16
Table of Contents
Exhibit 32
CERTIFICATION OF
PRINCIPAL EXECUTIVE OFFICER AND PRINCIPAL FINANCIAL OFFICER
Pursuant to Section 906 of the Sarbanes-Oxley Act of 2002 (18 U.S.C. Section 1350)
The undersigned, as the principal executive officer and principal financial officer of Patriot Bank, N.A., certifies that, to the best of his knowledge and belief, the Quarterly Report on Form 10-QSB for the period ended September 30, 2006 which accompanies this certification fully complies with the requirements of Section 13(a) or 15(d) of the Securities Exchange Act of 1934 and the information contained in the report fairly presents, in all material respects, the financial condition and results of operations of Patriot Bank, N.A. at the dates and for the periods indicated. The foregoing certification is made pursuant to Section 906 of the Sarbanes-Oxley Act of 2002 (18 U.S.C. Section 1350) and shall not be relied upon for any other purpose. The undersigned expressly disclaims any obligation to update the foregoing certification except as required by law.
| Date:November 13, 2006 |
| |
| Worth Harris Carter, Jr. | ||
Chairman of the Board and President (principal executive officer and principal financial officer) |
17
Table of Contents
OFFICE OF THE COMPTROLLER OF THE CURRENCY
WASHINGTON, D.C. 20552
FORM 10-K/A
AMENDMENT NO. 1
| x | ANNUAL REPORT PURSUANT TO SECTION 13 OR 15(d) OF THE SECURITIES EXCHANGE ACT OF 1934 |
For the fiscal year ended December 31, 2005
OR
| ¨ | TRANSITION REPORT PURSUANT TO SECTION 13 OR 15(d) OF THE SECURITIES EXCHANGE ACT OF 1934 |
For the transition period from to
Commission file number: n/a
PEOPLES NATIONAL BANK
(Exact name of registrant as specified in its charter)
| National Bank | 54-0500948 | |
(State or other jurisdiction of incorporation or organization) | (I.R.S. Employer Identification No.) | |
141 Westover Drive Danville, Virginia | 24541 | |
| (Address of principal executive offices) | (Zip Code) | |
Registrant’s telephone number, including area code: (434) 793-3321
Securities registered pursuant to Section 12(b) of the Exchange Act: None
Securities registered pursuant to Section 12(g) of the Exchange Act: None
Indicate by check mark if the registrant is a well-known seasoned issuer, as defined in Rule 405 of the Securities Act. Yes ¨ No x
Indicate by check mark if the registrant is not required to file reports pursuant to Section 13 or Section 15(d) of the Act. Yes ¨ No x
Indicate by check mark whether the registrant (1) has filed all reports required to be filed by Section 13 or 15(d) of the Securities Exchange Act of 1934 during the preceding 12 months (or for such shorter period that the registrant was required to file such reports), and (2) has been subject to such filing requirements for the past 90 days. Yes x No ¨
Indicate by check mark if disclosure of delinquent filers in response to Item 405 of Regulation S-K is not contained herein, and will not be contained, to the best of registrant’s knowledge, in definitive proxy or information statements incorporated by reference in Part III of this Form 10-K or any amendment to this Form 10-K. x
Indicate by check mark whether the registrant is a large accelerated filer, an accelerated filer, or a non-accelerated filer. See definition of “accelerated filer and large accelerated filer” in Rule 12b-2 of the Exchange Act.
Large accelerated filer ¨ Accelerated filer ¨ Non-accelerated filer x
Indicate by check mark whether the registrant is a shell company (as defined in Rule 12b-2 of the Act). Yes ¨ No x
The aggregate market value of the registrant’s voting and non-voting common stock held by nonaffiliates as of June 30, 2005 was $36,453,000.
As of March 16, 2006, there were issued and outstanding 2,375,683 shares of the registrant’s common stock.
DOCUMENTS INCORPORATED BY REFERENCE
Portions of the 2005 Annual Report to Shareholders, as revised, which is attached hereto as Exhibit 13, are incorporated by reference in Part II of this report.
Table of Contents
PEOPLES NATIONAL BANK
2005 ANNUAL REPORT ON FORM 10-K/A
TABLE OF CONTENTS
EXPLANATORY NOTE | ||||
PART I | 4 | |||
ITEM 1. | BUSINESS | 4 | ||
ITEM 1A. | RISK FACTORS | 8 | ||
ITEM 1B. | UNRESOLVED STAFF COMMENTS | 9 | ||
ITEM 3. | LEGAL PROCEEDINGS | 10 | ||
ITEM 4. | SUBMISSION OF MATTERS TO A VOTE OF SECURITY HOLDERS | 10 | ||
PART II | 11 | |||
ITEM 5. | MARKET FOR REGISTRANT’S COMMON EQUITY, RELATED STOCKHOLDER MATTERS AND ISSUER PURCHASES OF EQUITY SECURITIES | 11 | ||
ITEM 6. | SELECTED FINANCIAL DATA | 12 | ||
ITEM 7. | MANAGEMENT’S DISCUSSION AND ANALYSIS OF FINANCIAL CONDITION AND RESULTS OF OPERATION | 12 | ||
ITEM 7A. | QUANTITATIVE AND QUALITATIVE DISCLOSURES ABOUT MARKET RISK | 12 | ||
ITEM 8. | FINANCIAL STATEMENTS AND SUPPLEMENTARY DATA | 12 | ||
ITEM 9. | CHANGES IN AND DISAGREEMENTS WITH ACCOUNTANTS ON ACCOUNTING AND FINANCIAL DISCLOSURE | 13 | ||
ITEM 9A. | CONTROLS AND PROCEDURES | 13 | ||
ITEM 9B. | OTHER INFORMATION | 13 | ||
PART III | 13 | |||
ITEM 10. | DIRECTORS AND EXECUTIVE OFFICERS OF THE REGISTRANT | 13 | ||
ITEM 11. | EXECUTIVE COMPENSATION | 16 | ||
ITEM 12. | SECURITY OWNERSHIP OF CERTAIN BENEFICIAL OWNERS AND MANAGEMENT AND RELATED STOCKHOLDER MATTERS | 18 | ||
ITEM 13. | CERTAIN RELATIONSHIPS AND RELATED TRANSACTIONS | 20 | ||
ITEM 14. | PRINCIPAL ACCOUNTANT FEES AND SERVICES | 21 | ||
PART IV | 22 | |||
ITEM 15. | EXHIBITS, FINANCIAL STATEMENT SCHEDULES | 22 | ||
Table of Contents
EXPLANATORY NOTE
Peoples National Bank (the “Bank”) is simultaneously submitting the following amended filings: (i) Form 10-K/A for the year ended December 31, 2005, (ii) Form 10-Q/A for the quarter ended June 30, 2006. These amended filings update the Bank’s reported financial information for the year ended December 31, 2005 and for the affected quarters of 2005 and 2006.
This amendment amends the Annual Report on Form 10-K filed by the Bank on April 6, 2006 (the “Original Filing”). The purpose of this amendment is to change the Bank’s financial statements and related footnote disclosures, related selected financial data, and related MD&A discussion for the periods covered by this Form 10-K/A to match the amended Consolidated Reports of Condition and Income (“Call Reports”) the Bank filed in June 2006 at the direction of the Office of the Comptroller of the Currency (“OCC”) to place on nonaccrual one loan to a borrower group secured by a first deed of trust on a hotel property in Virginia.
The amendments to the financial statements consist of the following:
(Dollars in thousands)
| As Originally Presented | Changes | As Revised | ||||||||||
Statements of Financial Condition: | ||||||||||||
Net Loans | $ | 204,632 | $ | (69 | ) | $ | 204,563 | |||||
Other Assets | 4,963 | 7 | 4,970 | |||||||||
Statements of Income: | ||||||||||||
Interest Income | 17,458 | (94 | ) | 17,364 | ||||||||
Income Taxes | 692 | (32 | ) | 660 | ||||||||
Net Income | 2,081 | (62 | ) | 2,019 | ||||||||
Statements of Cash Flows: | ||||||||||||
Net cash from operating activities | 1,284 | (69 | ) | 1,215 | ||||||||
Net cash from investing activities | (17,018 | ) | 69 | (16,949 | ) | |||||||
Statements of Changes in Shareholders’ Equity: | ||||||||||||
Undivided profits | 6,571 | (62 | ) | 6,509 | ||||||||
The Bank’s accountants previously advised the Bank that the financial statements included in the Original Filing were prepared in accordance with Generally Accepted Accounting Principles and that the amounts involved in the amendment of the Call Reports were not material. However, the OCC has advised the Bank that the financial statements in this Annual Report must be identical with the Bank’s Call Reports, as amended, to comply with OCC policy.
This Form 10-K/A does not change any of the information contained in Items 1-5, 7A, or 9-15 of the Original Filing, and which is repeated in this amended filing. Except for the changes noted above, references throughout this Form 10-K/A are accurate as of the date this Annual Report was originally filed and have not been updated to reflect events occurring subsequent to the original filing date.
Importantly, as of the date of this amended filing, the collateral securing the loan at issue has been liquidated as part of the Bank’s collection process and the loan has been paid in full. Therefore, all interest income adjusted in this Form 10-K/A will be reported by the Bank as income earned in the third quarter of 2006.
2
Table of Contents
FORWARD–LOOKING STATEMENTS
This report contains statements concerning the Bank’s expectations, plans, objectives, future financial performance and other statements that are not historical facts. These statements may constitute “forward-looking statements” as defined by federal securities laws. In some cases, readers can identify the forward-looking statements by the use of words such as “may,” “will,” “should,” “could,” “expect,” “plan,” “intend,” “anticipate,” “believe,” “estimate,” “predict,” “potential” or “continue” or the negative or other variations of these words, or other comparable words or phrases. These statements may address issues that involve estimates and assumptions made by management, risks and uncertainties, and actual results could differ materially from historical results or those anticipated by such statements. Factors that could have a material adverse effect on the Bank’s operations and future prospects include, but are not limited to, changes in: interest rates; general and local economic conditions; the legislative/regulatory climate; monetary and fiscal policies of the U.S. government, including policies of the U.S. Treasury and the Federal Reserve Board; the quality or composition of loan or investment portfolios; demand for loan products; deposit flows; competition; demand for financial services in our market area and accounting principles, policies and guidelines. These risks and uncertainties should be considered in evaluating the forward-looking statements contained herein, and readers are cautioned not to place undue reliance on such statements, which speak only as of the date of this report.
3
Table of Contents
PART I
ITEM 1. BUSINESS.
General
The Bank converted to a national banking association in 1995. The Bank originally began business as a state-chartered bank in November 1976. The main office is at 141 Westover Drive, Danville, Virginia. At December 31, 2005, the Bank had 140 full-time and 7 part-time employees, $357 million in assets, $205 million in net loans, $319 million in deposits, and $38 million in total shareholders’ equity.
The Bank is a full service community bank that provides an array of financial products and services to its customers, including a variety of interest-bearing and non-interest bearing demand deposit accounts; savings and money market accounts; certificates of deposit; commercial, installment, and real estate mortgage loans (commercial and residential); and safe deposit rental facilities. The Bank also sells travelers checks, money orders and cashier’s checks.
Market Area
The Bank’s primary service area currently consists of the City of Danville and Pittsylvania County, Virginia and Alamance, Chatham, Cumberland, Lee, Pitt, Robeson, Wayne, and Wilson counties in North Carolina. The Bank conducts a general commercial banking business in its service area, and focuses on serving the banking needs of small-to-medium sized businesses, professional concerns and individuals.
Goals and Strategy
The Bank’s goal is to become a leading financial institution in its market area by opening new offices and providing a full array of banking services. Management believes that the on-going consolidation of the banking industry has created an opportunity for community-based lenders like the Bank that emphasize retail lending and superior customer service. The Bank’s business strategy is to target individuals, businesses and professionals in the area for loans, deposits, and other financial services and to explore selected opportunities to establish branches in areas that demographically compliment the Bank’s existing customer base.
Deposits and Loan Products
The Bank offers a full range of deposit services including LIFETIME FREE CHECKING, NOW accounts, savings accounts, retirement accounts and other deposit accounts of various types, ranging from money market accounts to longer-term certificates of deposit. The transaction accounts and time certificates are tailored to the Bank’s principal market at competitive rates. All deposit accounts are insured by the Federal Deposit Insurance Corporation (“FDIC”) up to the maximum amount allowed by law (generally $100,000 per depositor subject to aggregation rules). The Bank solicits these accounts from individuals, businesses, associations, organizations, and governmental entities.
The Bank also offers a full range of commercial and personal loans. Commercial loans include both secured and unsecured loans. Consumer loans include secured and unsecured loans for financing automobiles, home improvements, education and personal investments. The Bank also makes real estate construction and acquisition loans and originates and holds fixed and variable rate mortgage loans.
The Bank’s lending activities are subject to a variety of lending limits imposed by federal law. While differing limits apply in certain circumstances based on the type of loan or the nature of the borrower (including the borrower’s relationship to the Bank), in general the Bank is subject to a loan-to-one borrower limit of an amount equal to 15% of the Bank’s unimpaired capital and surplus. The Bank may not make loans to any director, officer, employee or 10% shareholder of the Bank unless the loan is approved by the Board of Directors and is made on terms not more favorable than are made available to a person not affiliated with the Bank.
4
Table of Contents
Other bank services include safe deposit boxes, travelers checks, direct deposit of payroll and social security checks, and automated drafts for various accounts. The Bank has no current plans to exercise trust powers.
Bank Lending Practices
The Bank’s lending efforts are directed to making loans to individuals and businesses in its market area. The Bank has both purchased and sold participation loans with other banks in the past and may do so in the future. The Bank believes that its lending and credit policies are conservative.
The Bank’s primary lending program has been the origination of loans secured by real estate. The Bank evaluates both the borrower’s ability to make principal and interest payments and the value of the property that will secure the loan.
Residential mortgage loans generally are made on the basis of the borrower’s ability to make repayment from employment and other income and are secured by real estate that can be readily valued. The Bank offers both adjustable-rate and fixed-rate loans.
In contrast, commercial real estate loans typically are made on the basis of the borrower’s ability to make repayment from cash flow from its business and are secured by business properties. The Bank’s primary non-residential real estate loan products have rates that are fixed for three to five years and then become adjustable. Commercial loans typically involve larger loan balances concentrated with single borrowers or groups of related borrowers.
The Bank also makes consumer loans, including unsecured personal loans, automobile loans, deposit account loans, installment loans and time loans. The Bank’s primary consideration when making such consumer loans is the customer’s ability to repay the loan. Consumer loans generally warrant higher interest rates and fees, but such loans, particularly unsecured consumer loans, also may entail greater risk than residential mortgage loans. Even when a loan is secured, repossessed collateral for a defaulted consumer loan may not provide an adequate source of repayment. Consumer loan collections are dependent on the borrower’s continuing financial stability, and are more likely to be affected adversely by job loss, divorce, illness, or personal bankruptcy. Various federal and state laws, including bankruptcy and insolvency laws, may limit the amount that can be recovered on such loans and such loans may give rise to claims and defenses by a consumer loan borrower.
The Bank also makes commercial loans to qualified small businesses in its market area. Commercial business loans generally have a higher degree of risk than mortgage loans, but have commensurately higher yields. To manage these risks, the Bank generally secures appropriate collateral and carefully monitors the financial condition of its business borrowers.
Competition
The Bank experiences significant competition in attracting depositors and borrowers. Competition in lending activities comes principally from other commercial banks, savings associations, insurance companies, governmental agencies, credit unions, and brokerage firms. Competition for deposits comes from other commercial banks, savings associations, money market and mutual funds, credit unions, insurance companies and brokerage firms. Many of the financial organizations competing with the Bank have greater financial resources than the Bank. Many of these financial organizations also have greater geographic coverage and some offer bank and bank-related services which the Bank does not offer.
The Bank primarily focuses on non-major metropolitan markets in which to provide products and services. Management believes the Bank has developed a niche and a certain level of expertise in serving these communities.
5
Table of Contents
Supervision and Regulation
Financial institutions are extensively regulated under federal and state law. Consequently, the growth and earnings performance of the Bank can be affected not only by management decisions and general economic conditions, but also by the statutes administered by, and the regulations and policies of, various governmental regulatory authorities including, but not limited to, the Office of the Comptroller of the Currency (“OCC”), the Federal Reserve Board (“FRB”), the FDIC, the Internal Revenue Service, federal and state taxing authorities, and the Securities and Exchange Commission. The effect of such statutes, regulations and policies can be significant, and cannot be predicted with a high degree of certainty.
Federal and state laws and regulations generally applicable to financial institutions regulate, among other things, the scope of business, investments, reserves against deposits, capital levels relative to operations, the nature and amount of collateral for loans, the establishment of branches, mergers, consolidations and dividends. The system of supervision and regulation applicable to the Bank establishes a comprehensive framework for their respective operations and is intended primarily for the protection of the FDIC’s deposit insurance funds and the depositors, rather than the shareholders, of the Bank.
The following references to material statutes and regulations affecting the Bank are brief summaries thereof and do not purport to be complete, and are qualified in their entirety by reference to such statutes and regulations. Any change in applicable law or regulations may have a material effect on the business of the Bank.
Finally, the Bank is subject to the periodic reporting requirements of the Securities Exchange Act of 1934, as amended, including but not limited to, filing annual, quarterly and other current reports with the OCC.
Regulatory Capital Requirements
All financial institutions are required to maintain minimum levels of regulatory capital. The OCC has established risk-based and leveraged capital standards for the financial institutions they regulate. The OCC also may impose capital requirements in excess of these standards on a case-by-case basis for various reasons, including financial condition or actual or anticipated growth. Under the risk-based capital requirements, the Bank is required to maintain a minimum ratio of total capital to risk-weighted assets of at least 8%. At least half of the total capital is required to be “Tier 1 capital,” which consists principally of common and certain qualifying preferred shareholders’ equity, less certain intangibles and other adjustments. The remainder, “Tier 2 capital,” consists of a limited amount of subordinated and other qualifying debt (including certain hybrid capital instruments) and a limited amount of the general loan loss reserve.
In addition, the federal regulatory agencies have established a minimum leveraged capital ratio (Tier 1 capital to period end total assets). These guidelines provide for a minimum leveraged capital ratio of 4%. The guidelines also provide that banking organizations experiencing internal growth or making acquisitions will be expected to maintain strong capital positions substantially above the minimum supervisory levels, without significant reliance on intangible assets.
As of December 31, 2005 and 2004, the Bank qualified as “well-capitalized” institution (see Note 16 to the Financial Statements filed herewith).
Insurance of Accounts, Assessments and Regulation by the FD1C
The Bank is a member of the Bank Insurance Fund (“BIF”) of the FDIC. As a BIF-insured institution, the Bank is subject to FDIC rules and regulations as administrator of the BIF. The Bank’s deposits are insured up to $100,000 per insured depositor, as defined by law and regulation. As insurer, the FDIC is authorized to conduct examinations of and to require reporting by BIF institutions. The actual assessment to be paid by each BIF member is based on the institution’s assessment risk classification and whether the institution is considered by its supervisory agency to be financially sound or to have supervisory concerns.
Under the FDIC’s risk-based insurance system, BIF-insured institutions are currently assessed premiums of between
6
Table of Contents
zero and twenty seven cents per $100 of eligible deposits, depending on the institution’s capital position and other supervisory facts. Congress has enacted legislation that, among other things, provides for assessments against BIF-insured institutions that will be used to pay certain Financing Corporation (“FICO”) obligations.
The FDIC is authorized to prohibit any BIF-insured institution from engaging in any activity that the FDIC determines by regulation or order to pose a serious threat to the insurance fund. Also, the FDIC may initiate enforcement actions against banks after first giving the institution’s primary regulatory authority an opportunity to take such action. The FDIC may terminate the deposit insurance of any depository institution, including the Bank, if it determines, after a hearing, that the institution has engaged or is engaging in unsafe or unsound practices, is in an unsafe or unsound condition to continue operations, or has violated any applicable law, regulation, order or any condition imposed in writing by the FDIC. It also may suspend deposit insurance temporarily during the hearing process for the permanent termination of insurance, if the institution has no tangible capital. If deposit insurance is terminated, the deposits at the institution at the time of termination, less subsequent withdrawals, shall continue to be insured for a period from six months to two years, as determined by the FDIC. Management is aware of no existing circumstances that could result in termination of the Bank’s deposit insurance.
Other Safety and Soundness Regulations
The federal banking agencies have broad powers under current federal law to take prompt corrective action to resolve problems of insured depository institutions. The extent of these powers depends upon whether the institutions in question are “well capitalized,” “adequately capitalized,” “undercapitalized,” “significantly undercapitalized” or “critically undercapitalized,” as such terms are defined under uniform regulations issued by each of the federal banking agencies.
Community Reinvestment
The requirements of the Community Reinvestment Act (“CRA”) affect the Bank. The CRA imposes on financial institutions an affirmative obligation to help meet the credit needs of their local communities, including low- and moderate-income neighborhoods, consistent with the safe and sound operation of those institutions. Each financial institution’s efforts in helping meet community credit needs currently are evaluated as part of the examination process pursuant to a new regulation recently adopted by the banking regulatory agencies. Under the new regulation a financial institution’s efforts in helping meet its community’s credit needs are evaluated, based on the particular institution’s Total Assets, according to a lending test, a community development test in addition to the lending test, or the three-pronged (lending, investment and service) test, all which replace the twelve assessment factors used previously. The grade received by a bank is considered in evaluating mergers, acquisitions and applications to open a branch or facility. To the best knowledge of the Bank, it is meeting its obligations under the CRA.
Effect of Governmental Monetary Policies
As with other financial institutions, the earnings of the Bank are affected by general economic conditions as well as by the monetary policies of the Federal Reserve Board. Such policies, which include regulating the national supply of bank reserves and bank credit, can have a major effect upon the source and cost of funds and the rates of return earned on loans and investments. The Federal Reserve System exerts a substantial influence on interest rates and credit conditions, primarily through establishing target rates for federal funds, open market operations in U.S. Government securities, varying the discount rate on member bank borrowings and setting cash reserve requirements against deposits. Changes in monetary policy, including changes in interest rates, will influence the origination of loans, the purchase of investments, the generation of deposits, and rates received on loans and investment securities and paid on deposits. Fluctuations in the Federal Reserve Board’s monetary policies have had a significant impact on the operating results of the Bank and all financial institutions in the past and are expected to continue to do so in the future.
Employees
The Bank had 140 full-time and 7 part-time employees as of December 31, 2005. The Bank believes that its relationship with its employees is good, and no employees are represented by a labor union.
7
Table of Contents
ITEM 1A. RISK FACTORS
An investment in Peoples National Bank’s securities may involve risks due to the nature of the business we engage in and activities related to that business. The following are the most significant risks associated with the business or activities associated with conducting that business:
Business Risk.Peoples National Bank’s business is based primarily upon providing basic banking products and services to small, localized markets in Virginia and North Carolina, delivered through our branch network. Peoples National Bank’s business is subject to a range of banking competition, from other community banking institutions to large, diversified, multi-national financial services providers. Risks associated with our business include:
| • | Timely development of competitive products and services by Peoples National Bank and the acceptance of these products and services by new and existing customers; |
| • | The willingness of customers to substitute competitors’ products and services for Peoples National Bank’s products and services and vice versa; |
| • | The impact of changes in financial services’ laws and regulations, specifically laws concerning the business of banking; |
| • | A downturn in the real estate market could negatively affect the bank’s business because a significant portion (approximately 77% as of December 31, 2005) of its loans are secured by real estate; |
| • | Technological changes; and |
| • | Changes in consumer spending and saving habits. |
Credit Risk.As a lending institution, the credit quality of Peoples National Bank’s loan portfolio can have a significant impact on our earnings. Credit risk is the risk of loss due to adverse changes in a borrower’s ability to meet its financial obligations under agreed upon terms. Risks associated with our credit quality include:
| • | The strength of the United States economy in general and the strength of the local economies in which Peoples National Bank conducts operations may be different than expected resulting in, among other things, a deterioration in credit quality or a reduced demand for credit, including the resultant effect on Peoples National Bank’s loan portfolio and allowance for loan losses; and |
| • | Adverse changes in the financial performance and/or condition of Peoples National Bank’s borrowers that could impact repayment of such borrowers’ outstanding loans. |
Market Risk.Peoples National Bank’s business is subject to market risk. The components of market risk are interest rate risk inherent in our balance sheet, price risk in our principal investing portfolio and market value risk in our trading portfolios. Risks associated with managing market risk include:
| • | The effects of, and changes in, trade, monetary and fiscal policies and laws, including interest rate policies of the Federal Reserve Board; and |
| • | Inflation, interest rate, market and monetary fluctuations. |
Operational Risk.Operational risk is the risk of loss from inadequate or failed internal processes, people and systems or from external events. Risks associated with operational risk include:
| • | Unanticipated judicial proceedings or rulings; |
| • | Matters impacting our business or ethical reputation; |
8
Table of Contents
| • | The impact of changes in accounting principles; |
| • | The impact of criminal activity committed against the bank including, but not limited to, robbery or embezzlement. |
Expansion of Branch Locations.We plan to open fourteen (14) additional branch locations, which is consistent with our overall business strategy of providing convenient locations to market our products and services. These new locations will allow us to expand core business opportunities within Peoples National Bank’s market.
| • | There are risks involved in this strategy that include: |
| • | The risk that core business opportunities not develop as projected in the planning phase of branch network expansion; |
| • | The risk that expenses associated with staffing and opening new offices will have a short term negative impact on the net earnings of the bank; |
| • | The risk that expected revenue from new locations not be fully realized, or realized within expected time frames. |
ITEM 1B. UNRESOLVED STAFF COMMENTS
None.
ITEM 2. PROPERTIES.
The Bank’s main office is located in a one and one half story office building located at 141 Westover Drive, Danville, Virginia. The Bank also operates nineteen additional offices, six of which are located in Virginia and thirteen are located in North Carolina. The Bank owns thirteen of the offices free and clear of encumbrances, while the other seven are held under operating leases. These leases are described in Footnotes 7 and 18 in the Financial Statements.
9
Table of Contents
The Bank’s offices are detailed in the table below:
Location | Address | Lease/Own | ||||
| Downtown Office | 110 S. Market Street | Danville, VA 24541 | Own | |||
| Westover Office | 141 Westover Drive | Danville, VA 24541 | Own | |||
| Chatham Office | 140 S. Main Street | Chatham, VA 24531 | Own | |||
| North Danville Office | 3060 N. Main Street | Danville, VA 24541 | Own | |||
| 58 East Office | 140 Kentuck Road | Danville, VA 24541 | Own | |||
| Blairs Office | 5406 US 29 North | Blairs, VA 24527 | Lease | |||
| South Main Office | 903 South Main Street | Danville, VA 24541 | Lease | |||
| North Church Street Office | 1534 North Church Street | Burlington, NC 27217 | Own | |||
| Country Club Road Office | 697 Country Club Road | Fayetteville, NC 28301 | Lease | |||
| Rowan Street Office | 123 Rowan Street | Fayetteville, NC 28301 | Lease | |||
| Nash Street Office | 208 West Nash Street | Wilson, NC 27893 | Own | |||
| Ward Boulevard Office | 2803 Ward Blvd. | Wilson, NC 27893 | Lease | |||
| Arlington Boulevard Office | 2100 West Arlington Blvd. | Greenville, NC 27834 | Lease | |||
| Siler City Office | 101 East Raleigh Road | Siler City, NC 27344 | Own | |||
| Lumberton Office | 604 North Chestnut Street | Lumberton, NC 28358 | Own | |||
| Bethel Office | James & Railroad Streets | Bethel, NC 27812 | Own | |||
| Horner Road Office | 1001 South Horner Road | Sanford, NC 27330 | Lease | |||
| Webb Avenue Office | 106 South Broad Street | Burlington, NC 27217 | Own | |||
| Mt. Olive Office | 215 N. Center Street | Mt. Olive, NC 28365 | Own | |||
| Fayetteville Road | 4601 Fayetteville Road | Lumberton, NC 28358 | Own | |||
We also have existing offices in Rocky Mount, Southern Pines, Graham and Smithfield, NC that we plan to open during 2006. Our present Wilson office on Ward Boulevard will be relocated to Forest Hills Road for better location and facilities. Eight additional offices have been acquired in Virginia; six are in the Richmond area – one each in Ashland and Chesterfield County and four in Henrico County. Two are in the Shenandoah Valley area – Stephens City and Winchester. We are currently preparing these offices to open.
The Bank has acquired title to other parcels of real estate through the normal course of its lending activities. The book values of these properties equaled $257,000 and $128,000 as of December 31, 2005 and 2004, respectively.
Management considers these properties to be in good condition. Adequate insurance is maintained on each of these properties.
ITEM 3. LEGAL PROCEEDINGS.
There are no material pending legal proceedings to which the Bank is a party or to which the property of the Bank is subject.
ITEM 4. SUBMISSION OF MATTERS TO A VOTE OF SECURITY HOLDERS.
No matters were submitted to a vote of security holders during the fourth quarter of the fiscal year covered by this report.
10
Table of Contents
EXECUTIVE OFFICER OF THE REGISTRANT
Name (Age) | Officer Since | Principal Occupation During Past Five Years | ||
| Worth Harris Carter, Jr. (68) | 1976 | Chairman of the Board of First National Bank since 1976, President since 1986 | ||
| Chairman of the Board and President of Patrick Henry National Bank since 1977 | ||||
| Chairman of the Board of Peoples National Bank since 1976, President since 1981 | ||||
| Chairman of the Board of Blue Ridge Bank since 1982, President since 2004 | ||||
| Chairman of the Board and President of Community National Bank since 1985 | ||||
| Chairman of the Board and President of Mountain National Bank since 1996 | ||||
| Chairman of the Board and President of Shenandoah National Bank since 1996 | ||||
| Chairman of the Board and President of Central National Bank since 1996 | ||||
| Chairman of the Board and President of Patriot Bank since 1996 | ||||
| Chairman of the Board and President of First National Exchange Bank since 1998 | ||||
| Chairman of the Board and President of Mortgage Company of Virginia since 1984 | ||||
| Chairman of the Board and President of Bank Services of Virginia, Inc. since 1984 | ||||
| Chairman of the Board and President of Bank Building Corporation since 1988 | ||||
| Chairman of the Board and President of Bank Services Insurance, Inc. since 2003 | ||||
| Chairman of the Board and President of Coresoft, Inc. since 2004 | ||||
| Manager of Blackstone Properties LLC since 1998 | ||||
PART II
ITEM 5. MARKET FOR REGISTRANT’S COMMON EQUITY, RELATED STOCKHOLDER MATTERS AND ISSUER PURCHASES OF EQUITY SECURITIES.
The Bank is authorized to issue 2.5 million shares of common stock with a par value of $1.00. This stock has full voting rights, and full preemptive rights. There were 2,375,683 shares outstanding as of December 31, 2005 and December 31, 2004. This is the only class of authorized stock.
The Bank’s common stock is traded locally with no established trading market and no known market makers.
11
Table of Contents
The quarterly high and low prices, based on transactions made known to the Bank, and quarterly dividends for the common stock for 2005 and 2004 are presented below:
| High | Low | High | Low | 2005 | 2004 | |||||||||||||
First Quarter | $ | 23 | $ | 22 | $ | 25 | $ | 22 | $ | 0.20 | $ | 0.20 | ||||||
Second Quarter | 23 | 20 | 25 | 22 | 0.20 | 0.20 | ||||||||||||
Third Quarter | 20 | 20 | 22 | 22 | 0.20 | 0.20 | ||||||||||||
Fourth Quarter | 20 | 19 | 22 | 21 | 0.20 | 0.20 | ||||||||||||
Holders. As of March 16, 2006, there are approximately 714 holders of record of the Bank’s outstanding common stock.
Dividends. The amount of dividends that may be paid by the Bank will depend on the Bank’s earnings and capital position and is limited by federal law, regulations and policies. A national bank may not pay dividends from its capital; all dividends must be paid out of undivided profits then on hand, after deducting expenses, including reserves for losses and bad debts. In addition, the approval of the OCC is required if the total of all dividends declared by a national bank in any calendar year exceeds the total of its net profits for that year combined with its retained net profits for the preceding two years, less any required transfers to surplus. The Bank may not pay a dividend if, after giving effect to the dividend, the Bank would be undercapitalized.
The dividend payment history per quarter for the last two years is presented above. The Bank’s ability to declare similar cash dividends in the future is dependent upon the Bank’s future performance and other factors.
ITEM 6. SELECTED FINANCIAL DATA.
The information required by this Item is included in the Bank’s annual report to shareholders for the year ended December 31, 2005, as revised (the “Annual Report”), which is attached hereto as Exhibit 13 and is incorporated herein by reference. The information appears in the Annual Report under the caption “Summary of Operations.”
ITEM 7. MANAGEMENT’S DISCUSSION AND ANALYSIS OF FINANCIAL CONDITION AND RESULTS OF OPERATION.
The information required by this Item is included in the Bank’s Annual Report, which is attached hereto as Exhibit 13 and is incorporated herein by reference. The information appears in the Annual Report under the caption “Management’s Discussion and Analysis of Financial Condition and Results of Operation.”
ITEM 7A. QUANTITATIVE AND QUALITATIVE DISCLOSURES ABOUT MARKET RISK.
The information required by this Item is included in the Bank’s Annual Report, which is attached hereto as Exhibit 13 and is incorporated herein by reference. The information appears in the Annual Report under the caption “Interest Sensitivity Analysis.”
ITEM 8. FINANCIAL STATEMENTS AND SUPPLEMENTARY DATA.
The report of the independent registered public accounting firm, audited financial statements of the Bank and accompanying notes and supplementary data required by this Item are included in the Bank’s Annual Report, which is attached hereto as Exhibit 13 and is incorporated herein by reference.
12
Table of Contents
ITEM 9. CHANGES IN AND DISAGREEMENTS WITH ACCOUNTANTS ON ACCOUNTING AND FINANCIAL DISCLOSURE.
None.
ITEM 9A. CONTROLS AND PROCEDURES.
The Bank maintains a system of disclosure controls and procedures that is designed to ensure that material information is accumulated and communicated to management, including the Bank’s president (who is the Bank’s principal executive officer and principal financial officer), as appropriate to allow timely decisions regarding required disclosure. As required, management, with the participation of the Bank’s president, evaluated the effectiveness of the design and operation of the Bank’s disclosure controls and procedures as of the end of the period covered by this report. Based on this evaluation, the Bank’s president concluded that the Bank’s disclosure controls and procedures were operating effectively to ensure that information required to be disclosed by the Bank in reports that it files or submits under the Securities Exchange Act of 1934, as amended, is recorded, processed, summarized, and reported within the time periods specified in the rules and forms of the SEC.
Because of the inherent limitations in all control systems, no evaluation of controls can provide absolute assurance that the Bank’s disclosure controls and procedures will detect or uncover every situation involving the failure of persons within the Bank to disclose material information otherwise required to be set forth in the Bank’s periodic reports.
The Bank’s management is also responsible for establishing and maintaining adequate internal control over financial reporting to provide reasonable assurance regarding the reliability of financial reporting and the preparation of financial statements for external purposes in accordance with generally accepted accounting principles. There were no changes in the Bank’s internal control over financial reporting during the Bank’s fourth quarter ended December 31, 2005 that have materially affected, or are reasonably likely to materially affect, the Bank’s internal control over financial reporting.
ITEM 9B. OTHER INFORMATION.
None.
PART III
ITEM 10. DIRECTORS AND EXECUTIVE OFFICERS OF THE REGISTRANT.
The information regarding the Bank’s executive officer is contained in Part I of this Report on Form 10-K/A.
Name and Business Experience | Age | Director Since | ||
Buchanan, George B., Jr. | 70 | 12/78 | ||
| George B. Buchanan is Chairman of the Board of Patricia Grand Hotels, Inc. He was previously President of Danville Plywood Corporation for more than five years. He also has served as a director of Central National Bank, Lynchburg, VA since 1996. | ||||
13
Table of Contents
Name and Business Experience | Age | Director Since | ||
Carter, Worth Harris, Jr. | 68 | 11/76 | ||
| Chairman of the Board and President | ||||
Worth Harris Carter, Jr. is a director and officer of the following companies: Chairman of the Board of First National Bank since 1976, President since 1986 Chairman of the Board and President of Patrick Henry National Bank since 1977 Chairman of the Board of Blue Ridge Bank since 1982, President since 2004 Chairman of the Board and President of Community National Bank since 1985 Chairman of the Board and President of Mountain National Bank since 1996 Chairman of the Board and President of Shenandoah National Bank since 1996 Chairman of the Board and President of Central National Bank since 1996 Chairman of the Board and President of Patriot Bank since 1996 Chairman of the Board and President of First National Exchange Bank since 1998 Chairman of the Board and President of Mortgage Company of Virginia since 1984 Chairman of the Board and President of Bank Services of Virginia, Inc. since 1984 Chairman of the Board and President of Bank Services Insurance, Inc. since 2003 Chairman of the Board and President of Coresoft, Inc. since 2004 Chairman of the Board and President of Bank Building Corporation since 1988 Manager of Blackstone Properties LLC since 1998 | ||||
Kendrick, Brenda A. | 57 | 2/05 | ||
| Brenda A. Kendrick is Senior Vice President of Peoples National Bank, Danville, VA and has been for more than 5 years. | ||||
Moses, James C. | 74 | 8/77 | ||
| James C. Moses is President of Moses Insurance Agency, Inc. and has been for more than five years. He also has served as a director of Central National Bank since 1996 and of Patriot Bank, National Association since 1996. | ||||
Williams, R. E. | 72 | 8/77 | ||
| R. E. Williams is retired. Previously he was President of Dry Fork Milling Company Inc., Danville, Virginia for more than five years. He also has served as director of Central National Bank since 1996, Patriot Bank, National Association since 1996 and of Bank Building Corporation since 1995. | ||||
The Board of Directors is not aware of any family relationship between any Director, executive officer or person nominated by the Bank to become a Director; nor is the Board of Directors aware of any involvement in legal proceedings that would be material to an evaluation of the ability or integrity of any Director, executive officer or person nominated to become a Director.
AUDIT COMMITTEE REPORT OF THE BOARD OF DIRECTORS
The entire Board of Directors functions as the Bank’s Audit Committee and in this capacity met four times in 2005. The functions of the Board in the audit area are focused on three areas:
| • | the adequacy of the Bank’s internal controls and financial reporting process and the reliability of the financial statements; |
| • | the independence and performance of the Bank’s internal auditors and independent auditors; and |
| • | the Bank’s compliance with legal and regulatory requirements. |
We meet with management periodically to consider the adequacy of the Bank’s internal controls and the objectivity of its financial reporting. We discuss these matters with the Bank’s independent auditors and with appropriate financial personnel and internal auditors.
We also periodically review the performance of the independent auditors and their independence from management.
14
Table of Contents
All of the Directors who serve as the Bank’s Audit Committee, with the exception of Chairman of the Board and President Carter, are “independent” for the purposes of the Nasdaq Stock Market listing standards.
The Board has not adopted a written charter setting forth the responsibilities and authority of the Board in its capacity as the Audit Committee. Although Mr. Carter is not independent under the Nasdaq Stock Market or SEC standards for audit committee membership, the Board of Directors has determined that Mr. Carter possesses the knowledge and experience required to be considered an audit committee financial expert. In addition, the Board of Directors believes that all of the Bank’s Directors possess the financial knowledge and expertise necessary to protect the Bank’s shareholders in performing the functions of an audit committee.
Management has primary responsibility for the Bank’s financial statements and the overall reporting process, including the Bank’s system of internal controls.
The independent auditors audit the annual financial statements prepared by management, express an opinion as to whether those statements fairly present the financial position, results of operations and cash flows of the Bank in conformity with generally accepted accounting principles and discuss with us any issues they believe should be raised with us.
This year, we reviewed the Bank’s audited financial statements and met with both management and Goodman & Company, LLP, the Bank’s independent auditors, to discuss those financial statements. Management has represented to us that the financial statements were prepared in accordance with generally accepted accounting principles.
We have received from and discussed with Goodman & Company the written disclosure and the letter required by Independence Standards Board Statement No. 1 (Independence Discussions with Audit Committees) relating to that firm’s independence from the Bank. We also discussed with Goodman & Company the matters required to be discussed by Statement on Auditing Standard No. 61 (Communication with Audit Committees).
Based on these reviews and discussions, we recommended to the Board that the Bank’s audited financial statements be included in the Bank’s Annual Report on Form 10-K for the fiscal year ended December 31, 2005 for filing with the Office of the Comptroller of the Currency (“OCC”).
Directors
George B. Buchanan, Jr.
Worth Harris Carter, Jr.
Brenda A. Kendrick
James C. Moses
R. E. Williams
SECTION 16(a) BENEFICIAL OWNERSHIP REPORTING COMPLIANCE
Section 16(a) of the Securities Exchange Act of 1934 requires that Directors and executive officers, and persons who control more than 10% of the Bank’s equity securities, file reports of ownership and reports of changes in ownership of the Bank’s outstanding equity securities. All such filings have been filed timely in 2005.
The Bank has not adopted a Code of Ethics for its directors, executives and employees, primarily because management of the Bank believes and understands that our officers and directors adhere to and follow ethical standards without the necessity of a written policy. The Bank’s Board of Directors will revisit this issue in the future to determine if adoption of a code of ethics is appropriate. In the meantime, the Bank’s management requires and promotes honest and ethical conduct, full and fair disclosure in its reports to the OCC, and compliance with applicable governmental laws and regulations.
15
Table of Contents
ITEM 11. EXECUTIVE COMPENSATION.
The Bank’s compensation program is designed to offer competitive compensation to employees based on each individual’s contribution to the Bank’s overall success. As such, the program provides a competitive compensation package to attract and retain capable employees.
The compensation and benefits program consists of salary, a profit sharing plan, and life, health and disability insurance. The compensation and benefits program for officers parallels that of all other employees. The Bank offers no stock options or other forms of equity compensation, bonuses, employment contracts, country club memberships or other perquisites to officers or employees.
The entire Board of Directors performs the functions of a Salary Committee for the Bank. The Board has the responsibility for administering the Bank’s overall compensation program and for setting the salaries for the Bank’s officers. In setting the compensation of the Bank’s officers, the Board generally relies on the recommendations of the Chairman and President and the Board members’ own significant personal knowledge of the compensation provided to other, similarly situated, executives in banking and other industries in the local area. The Board also reviews each individual’s performance and contribution to the overall Bank goals in determining the level of salary for the coming year.
Mr. Worth Harris Carter, Jr., Chairman of the Board and President, serves as the Chief Executive Officer of Peoples National Bank. As noted below under “Certain Relationships and Related Transactions,” Mr. Carter also serves as Chairman and President of nine other banks. The Salary Committee of the Board of Directors of one of these other banks (Patrick Henry National Bank) actually sets Mr. Carter’s annual salary each year. The cost of Mr. Carter’s compensation, which consists of his salary plus an amount equal to twenty-nine percent of his salary to cover payroll taxes and all other benefits, is shared by the ten banks on the basis of average deposits of each bank related to total average deposits of all the banks that he serves. Mr. Carter’s total compensation, which is paid through Bank Services of Virginia, Inc. (“Bank Services”), is reflected below in two charts. The first chart reflects Mr. Carter’s total compensation as paid by Bank Services. The second chart reflects only the portion of Mr. Carter’s total compensation that is allocated to Peoples National Bank.
Summary Compensation Tables¹
Bank Services of Virginia, Inc.
Annual Compensation
Name and Principal Position | Year | Salary | Other Annual Compensation² | All Other Compensation³ | ||||||
Worth Harris Carter, Jr. | 2005 | $ | 575,000 | — | $ | 80,000 | ||||
Chairman of the Board and President | 2004 | $ | 575,000 | — | $ | 78,000 | ||||
| 2003 | $ | 530.,000 | — | $ | 67,000 | |||||
| (1) | This table shows the total cash compensation paid to Mr. Carter by Bank Services of Virginia, Inc. during 2005, 2004 and 2003 for his services as Chairman of the Board and President of all ten banks. |
| (2) | The amount of compensation in the form of perquisites and other personal benefits properly categorized in this column did not exceed the lesser of $50,000 or 10% of Mr. Carter’s annual salary for any of the three years reported. |
| (3) | “All Other Compensation” consists of amounts contributed for Mr. Carter under Bank Services’ qualified profit sharing plan and amounts contributed for Mr. Carter under Bank Services’ non-qualified profit sharing plan for highly paid executives. For 2005, these amounts consisted of $27,000 contributed to the qualified profit sharing plan and $53,000 contributed to the non-qualified profit sharing plan. |
16
Table of Contents
Peoples National Bank¹
Annual Compensation
Name and Principal Position | Year | Salary | Other Annual Compensation² | All Other Compensation³ | ||||||
Worth Harris Carter, Jr. | 2005 | $ | 82,000 | — | $ | 11,000 | ||||
Chairman of the Board and President | 2004 | $ | 84,000 | — | $ | 11,000 | ||||
| 2003 | $ | 77,000 | — | $ | 10,000 | |||||
Brenda A. Kendrick | 2005 | $ | 108,300 | — | $ | 8,100 | ||||
Senior Vice President | 2004 | $ | 103,200 | — | $ | 8,500 | ||||
| 2003 | $ | 95,750 | — | $ | 7,500 | |||||
Wright L. Garrett | 2005 | $ | 108,300 | — | $ | 8,200 | ||||
Senior Vice President, Commercial Loans | 2004 | $ | 103,200 | — | $ | 8,600 | ||||
| 2003 | $ | 93,900 | — | $ | 7,300 | |||||
| (1) | This table shows the portion of Mr. Carter’s total cash compensation during 2005, 2004 and 2003 allocated to Peoples National Bank. |
| (2) | The amount of compensation in the form of perquisites and other personal benefits properly categorized in this column did not exceed the lesser of $50,000 or 10% of Mr. Carter’s, Mrs. Kendrick’s or Mr. Garrett’s annual salary for any of the three years reported. |
| (3) | “All Other Compensation” for Mr. Carter consists of the portion allocated to the Bank for contributions on Mr. Carter’s behalf to Bank Services’ qualified profit sharing plan and non-qualified profit sharing plan for highly paid executives. For 2005, the portion of these contributions allocated to the Bank consisted of $4,000 for the qualified profit sharing plan and $7,000 for the non-qualified profit sharing plan. “All Other Compensation” for Mrs. Kendrick and Mr. Garrett consists of the Bank’s contribution to the Bank’s profit sharing plan on their behalf. |
PROFIT SHARING PLAN
The Bank has adopted an integrated profit sharing plan. The plan covers all full time employees that have been employed for six (6) months and have reached the age of 20-1/2 as of the first day of the plan year. Persons who have reached the age of 62 are fully vested regardless of length of service. The regular vesting schedule is as follows
Years of Service | Vested Percentage | Forfeitable Percentage | ||
Less than 5 | 0 | 100 | ||
5 or more | 100 | 0 |
Each year the Board of Directors determines what amount, if any, is to be allocated to the plan out of accumulated or current earnings of the Bank. The Bank’s contribution to the plan was $186,000 in 2005, $185,000 in 2004, and $163,000 in 2003.
Chairman of the Board and President Carter does not participate in the profit sharing plan of Peoples National Bank or any of the other nine banks. Instead, Mr. Carter participates in the two profit sharing plans of Bank Services of Virginia, Inc., a qualified profit sharing plan and a nonqualified plan for highly paid executives whose contribution to the qualified plan is limited due to IRS regulations. The Bank’s annual contributions to these plans on Mr. Carter’s behalf are detailed in the two Summary Compensation Tables above.
DIRECTOR COMPENSATION
Each outside Director (not also an officer of the Bank) currently receives $200 for each Board meeting attended.
17
Table of Contents
PERFORMANCE GRAPH
The following graph compares the yearly cumulative total return of the Company’s common stock over a five-year period (beginning December 31, 2000 and ending December 31, 2005) to the returns over such period of the (i) Nasdaq Composite Index and (ii) a Custom Peer Group, which consists of thirty-eight commercial banks headquartered in Virginia and North Carolina with total assets between $200 million and $500 million.
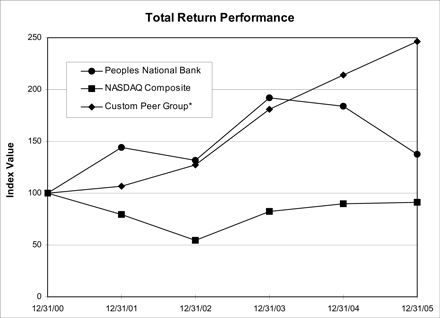
| Period Ending | ||||||||||||
Index | 12/31/00 | 12/31/01 | 12/31/02 | 12/31/03 | 12/31/04 | 12/31/05 | ||||||
Peoples National Bank | 100.00 | 144.10 | 131.78 | 192.11 | 183.76 | 137.61 | ||||||
NASDAQ Composite | 100.00 | 79.18 | 54.44 | 82.09 | 89.59 | 91.54 | ||||||
Custom Peer Group | 100.00 | 106.53 | 126.84 | 181.06 | 213.64 | 246.32 | ||||||
ITEM 12. SECURITY OWNERSHIP OF CERTAIN BENEFICIAL OWNERS AND MANAGEMENT AND RELATED STOCKHOLDER MATTERS.
The following table shows as of March 16, 2006, the beneficial ownership of the Bank’s common stock of all persons known by the Bank to be the owners of more than five percent (5%) of the Bank’s common stock.
18
Table of Contents
Name | Amount and Nature of Beneficial Ownership (1)(2) | Ownership as a Percentage of Common Stock Outstanding | ||||
Carter, Worth Harris, Jr. | 319,456 | (3) | 13.44 | % | ||
Lester, George W. | 157,734 | (4) | 6.64 | % | ||
Martinsville, VA |
| (1) | For purposes of this table, beneficial ownership has been determined in accordance with the provisions of Rule 13d-3 of the Securities Exchange Act of 1934 under which, in general, a person is deemed to be the beneficial owner of a security if he has or shares the power to vote or direct the voting of the security or the power to dispose of or direct the disposition of the security, or if he has the right to acquire beneficial ownership of the security within sixty days. |
| (2) | Unless otherwise indicated, the shares listed in the table represent sole voting and investment power. |
| (3) | Includes 52,217 shares held by Mr. Carter as executor for his wife’s estate; 47,740 shares held by Mr. Carter as custodian for his children and grandchildren; 1,430 shares held by Mr. Carter’s son, Ernest Linwood Carter, II, who resides in Mr. Carter’s household; 10,780 shares held for Mr. Carter’s account in the Mortgage Company of Virginia, Inc./Bank Services of Virginia, Inc. Non-Qualified Profit-Sharing Plan; 13,970 shares held by C&C Realty, Inc., of which Mr. Carter is president and a 50% owner; and 6,171 shares held by Mr. Carter’s brother, Ernest L. Carter. |
| (4) | Includes 31,234 shares held by The Lester Group, Inc., of which Mr. Lester is president; 807 by Carriage Square, LTD, of which Mr. Lester is president; 11,565 shares held by Mr. Lester as trustee for the benefit of his children; and 6,788 shares held by his children. |
The following table shows as of March 16, 2006, the beneficial ownership of the Bank’s common stock of each Director, the executive officers identified in the Summary Compensation Table and the Bank’s Directors and executive officers as a group. As of March 16, 2006, the Bank’s Directors and executive officers as a group, beneficially owned 458,623 shares (or 19.3%) of the Bank’s outstanding common stock. Ownership as a
Name | Amount and Nature of Beneficial Ownership (1)(2) | Ownership as a Percentage of Common Stock Outstanding | ||||
Buchanan, George B., Jr. | 91,449 | (3) | 3.8 | % | ||
Carter, Worth Harris, Jr. | 319,456 | (4) | 13.4 | % | ||
Kendrick, Brenda A. | 27,214 | (5) | 1.1 | % | ||
Moses, James E. | 4,464 | (6) | 0.2 | % | ||
Williams, R. E. | 1,040 | 0.7 | % | |||
All Directors and Executive Officers as a Group (5 Persons) | 458,623 | 19.3 | % |
| (1) | For purposes of this table, beneficial ownership has been determined in accordance with the provisions of Rule 13d-3 of the Securities Exchange Act of 1934 under which, in general, a person is deemed to be the beneficial owner of a security if he/she has or shares the power to vote or direct the voting of the security or the power to dispose of or direct the disposition of the security, or if he/she has the right to acquire beneficial ownership of the security within sixty days. |
19
Table of Contents
| (2) | Unless otherwise indicated, the shares listed in the table represent sole voting and investment power. |
| (3) | Includes 89,839 shares held jointly with Mr. Buchanan’s wife. |
| (4) | Includes 52,217 shares held by Mr. Carter as executor for his wife’s estate; 47,740 shares held by Mr. Carter as custodian for his children and grandchildren; 1,430 shares held by Mr. Carter’s son, Ernest Linwood Carter, II, who resides in Mr. Carter’s household; 10,780 shares held for Mr. Carter’s account in the Mortgage Company of Virginia, Inc./Bank Services of Virginia, Inc. Non-Qualified Profit-Sharing Plan; 13,970 shares held by C&C Realty, Inc., of which Mr. Carter is president and a 50% owner; and 6,171 shares held by Mr. Carter’s brother, Ernest L. Carter. |
| (5) | Includes 26,214 shares held jointly with Mrs. Kendrick’s husband. |
| (6) | Includes 4,059 shares held by the James C. Moses, Sr. & Nancy Wells Moses Revocable Living Trust, of which Mr. Moses and his wife are co-trustees. |
The Bank knows of no arrangements, including any pledge by any person of securities of the Bank, which may at a subsequent date result in a change in control of the Bank.
Equity Compensation Plans.No disclosure regarding equity compensation plans has been provided because the Bank does not have any outstanding equity compensation plans or arrangements that would be covered by Item 201(d) of Regulation S-K.
ITEM 13. CERTAIN RELATIONSHIPS AND RELATED TRANSACTIONS.
Mr. Carter, Chairman of the Board and President of Peoples National Bank also serves as Chairman of the Board and President of Blue Ridge Bank, N.A., Central National Bank, Community National Bank, First National Bank, First National Exchange Bank, Mountain National Bank, Patrick Henry National Bank, Patriot Bank, N.A., and Shenandoah National Bank.
The Bank maintains a correspondent bank account with one of these banks. In 2005 and 2004, the average daily balance in this account was considered a normal operating balance to facilitate general business transactions. The Bank also participates in loan transactions with these banks. These transactions are at carrying value and do not involve more than the normal risk of collectibility or present other unfavorable features.
The Bank owns 10% of the outstanding common stock of The Mortgage Company of Virginia, Inc. The remaining common stock is equally owned by the banks listed above. The Mortgage Company of Virginia owns 100% of Bank Services of Virginia, Inc. The business of both of these companies is to provide operational support services to the ten banks. The Bank is charged for its share of these services. The cost of this expense is shared by the ten banks on the basis of average deposits of each bank related to total average deposits of all the banks.
The Mortgage Company of Virginia, Inc. also owns 100% of Bank Services Insurance, Inc. Bank Services Insurance, Inc. provides insurance products to the banks and customers in the Danville area. The premiums paid to Bank Services Insurance, Inc. equaled $58,000 at December 31, 2005.
The Mortgage Company of Virginia, Inc. also owns 50% of Coresoft, Inc. represented by an initial $1,000 investment during 2004. Coresoft, Inc. is in the process of developing a core software package the banks listed above will use. At December 31, 2005, Coresoft, Inc. had an outstanding note payable to the Mortgage Company of $1,400,000.
The Chairman of the Board and President of the Bank also serves as Chairman of the Board and President of Bank Building Corporation and Manager of Blackstone Properties, LLC, it’s wholly owned subsidiary (the “companies”). The companies lease branches to certain of the banks listed above. At December 31, 2005, the Bank leased seven offices from the companies. Rental expense under these leases was $314,000 in 2005 and $329,000 in 2004 and 2003. The Bank also leases offices from non-related parties under various terms. Rental expense for these leases was $27,000 in 2005, $9,000 for 2004 and none for 2003. Future minimum lease payments will be $351,000 per year through 2010, and thereafter (may vary based on changing interest rates).
20
Table of Contents
In the ordinary course of business, the Bank’s Directors and executive officers and their related interests were customers of, and had transactions with the Bank. Loan transactions with Directors and officers, principal security holders and associates were made on substantially the same terms as those prevailing at the time for comparable loans to other persons and did not involve more than normal risk of collectibility or present other unfavorable features. These extensions of credit equaled $8,000, or .02% of the Bank’s equity capital as of December 31, 2005.
ITEM 14. PRINCIPAL ACCOUNTANT FEES AND SERVICES.
Goodman & Company, LLP served as the Bank’s independent public auditors for the year ended December 31, 2005, and has been selected by the Board to act as the Bank’s independent public auditors for the year ending December 31, 2006. A representative of Goodman & Company will be present at the Annual Meeting and will be given the opportunity to make a statement and respond to appropriate questions from shareholders.
The following table presents the fees for professional audit services rendered by Goodman & Company for the audit of the Bank’s annual financial statements for the years ended December 31, 2005 and 2004, and fees billed for other services rendered by Goodman & Company during those periods.
| Year Ended December 31, | ||||||
| 2005 | 2004 | |||||
Audit fees¹ | $ | 16,300 | $ | 15,350 | ||
Audit-related fees | — | — | ||||
Tax fees² | 3,265 | 3,100 | ||||
All other fees | — | — | ||||
Total Fees | $ | 19,565 | $ | 18,450 | ||
| 1 | Audit fees consist of audit and review services, consents and review of documents filed with the OCC. |
| 2 | Tax fees consist of preparation of federal and state tax returns and consultation concerning tax compliance issues. |
In its capacity as the Audit Committee, the Board of Directors considered the compatibility of the non-audit-related services performed by and fees paid to Goodman & Company in 2005 and 2004 and the proposed non-audit-related services and proposed fees for 2006 and determined that such services and fees are compatible with the independence of Goodman & Company as the Bank’s independent auditors.
Also in its capacity as the Audit Committee, the Board of Directors pre-approves all audit (including audit-related) and permitted non-audit services to be performed by the independent auditors. The Board of Directors annually approves the year-end audit to be performed by the Bank’s independent auditors for the fiscal year. With respect to other permitted services, the Board of Directors pre-approves specific engagements, projects and categories of services on a fiscal year basis.
21
Table of Contents
PART IV
ITEM 15. EXHIBITS, FINANCIAL STATEMENT SCHEDULES.
Exhibits:
| 3.1 | Articles of Incorporation (filed with the Office of the Comptroller of the Currency prior to the opening of the bank) | |
| 3.2 | Amended and Restated Bylaws (as amended and restated through February 17, 2005) (incorporated by reference to Exhibit 3.2 to Form 8-K filed with the Office of the Comptroller of the Currency on February 17, 2005) | |
| 13 | 2005 Annual Report to Shareholders, as revised | |
| 31 | Certification by principal executive officer and principal financial officer pursuant to Rule 13a-14(a) | |
| 32 | Certification of principal executive officer and principal financial officer pursuant to 18 U.S.C. § 1350 | |
22
Table of Contents
SIGNATURES
Pursuant to the requirements of Section 13 or 15(d) of the Securities Exchange Act of 1934, the registrant has duly caused this report to be signed on its behalf by the undersigned, thereunto duly authorized.
| PEOPLES NATIONAL BANK | ||
| Date: September 8, 2006 | /s/ Worth Harris Carter, Jr. | |
| Worth Harris Carter, Jr. | ||
| Chairman of the Board and President | ||
Pursuant to the requirements of the Securities Exchange Act of 1934, this report has been signed below by the following persons on behalf of the registrant and in the capacities and on the dates indicated.
Signature | Capacity | Date | ||
/s/ Worth Harris Carter, Jr. Worth Harris Carter, Jr. | Chairman of the Board and President (principal executive, principal financial and principal accounting officer) | September 8, 2006 | ||
/s/ George B. Buchanan, Jr. | Director | September 8, 2006 | ||
| George B. Buchanan, Jr. | ||||
/s/ Brenda A. Kendrick | Director | September 8, 2006 | ||
| Brenda A. Kendrick | ||||
| Director | September ,2006 | ||
| James C. Moses | ||||
/s/ R. E. Williams | Director | September 8, 2006 | ||
R.E. Williams | ||||
23
Table of Contents
Exhibit 31
CERTIFICATION
I, Worth Harris Carter, Jr., certify that:
| 1. | I have reviewed this annual report on Form 10-K/A of Peoples National Bank; |
| 2. | Based on my knowledge, this report does not contain any untrue statement of a material fact or omit to state a material fact necessary to make the statements made, in light of the circumstances under which such statements were made, not misleading with respect to the period covered by this report; and |
| 3. | Based on my knowledge, the financial statements, and other financial information included in this report, fairly present in all material respects the financial condition, results of operations and cash flows of the registrant as of, and for, the periods presented in this report. |
| Date: September 8, 2006 | /s/ Worth Harris Carter, Jr. | |
| Worth Harris Carter, Jr. | ||
| Chairman of the Board, President, | ||
| Chief Executive Officer and Chief Financial Officer |
24
Table of Contents
Exhibit 32
CERTIFICATION OF
CHIEF EXECUTIVE OFFICER AND CHIEF FINANCIAL OFFICER
Pursuant to Section 906 of the Sarbanes-Oxley Act of 2002 (18 U.S.C. Section 1350)
The undersigned, as the Chief Executive Officer and Chief Financial Officer of Peoples National Bank, certifies that, to the best of his knowledge and belief, the Annual Report on Form 10-K/A for the fiscal year ended December 31, 2005 which accompanies this certification fully complies with the requirements of Section 13(a) or 15(d) of the Securities Exchange Act of 1934 and the information contained in the report fairly presents, in all material respects, the financial condition and results of operations of Peoples National Bank at the dates and for the periods indicated. The foregoing certification is made pursuant to Section 906 of the Sarbanes-Oxley Act of 2002 (18 U.S.C. Section 1350) and shall not be relied upon for any other purpose. The undersigned expressly disclaims any obligation to update the foregoing certification except as required by law.
| Date: September 8, 2006 | /s/ Worth Harris Carter, Jr | |
| Worth Harris Carter, Jr. | ||
| Chairman of the Board, President, | ||
| Chief Executive Officer and Chief Financial Officer |
25
Table of Contents
Table of Contents
Management’s Discussion and Analysis of Financial Condition and Results of Operation
Except for the historical information contained in this report, the matters set forth herein include Forward-Looking Statements within the meaning of the “safe harbor” provisions of the Private Securities Litigation Reform Act of 1995. These Forward-Looking Statements included, among other things, statements of goals, plans, intentions and expectations, regarding or based upon desired business strategies, general economic conditions, interest rates, developments in local and national markets, and other matters, which, by their nature, are subject to significant uncertainties. Because of these uncertainties and the assumptions upon which this report is based, actual future developments with respect to the business of the Bank may differ materially from those contemplated by such statements.
Critical Accounting Policies.The accounting and reporting policies of the Bank conform to generally accepted accounting principles (GAAP) in the United States of America and to general practices within the banking industry. The preparation of the financial statements in conformity with GAAP requires management to make estimates and assumptions that affect the amounts reported in the financial statements and accompanying notes. We believe the most significant of these estimates involves the allowance for loan losses because of its potential impact on our overall performance. We have described our policies in this area below. A summary of the Bank’s significant accounting policies can be found in the Notes to the Financial Statements.
In general, determining the amount of the allowance for loan losses requires significant judgment and the use of estimates by management. The Bank maintains an allowance for loan losses to absorb probable losses in the loan portfolio based on a quarterly analysis of the portfolio and expected future losses. This analysis determines an appropriate level of the allowance for loan losses by considering factors affecting loan losses, including specific losses, levels and trends in impaired and non-performing loans, historical loan loss experience, current economic conditions, volume, growth and composition of the portfolio, and other relevant factors. The Bank records a provision for loan losses to maintain the allowance at an adequate level. The provision expense could increase or decrease each quarter based upon the results of management’s formal analysis.
The amount of the allowance represents management’s estimate of expected losses from existing loans based upon specific allocations for individual lending relationships and historical loss experience. The allowance for loan losses related to impaired loans is based on discounted cash flows using the loan’s initial effective interest rate or the fair value of the collateral for certain collateral dependent loans. This evaluation requires management to make estimates of the amounts and timing of future cash flows on impaired loans, which consists primarily of nonaccrual and restructured loans. Actual losses for these loans can vary significantly from these estimates.
Summary of Operations.Net income for 2005 equaled $2,019,000 or $0.85 per share, compared to $2,836,000 or $1.19 per share, for 2004. This represents a return on average assets of 0.56% and return on average equity of 5% compared to 0.77% and 8%, respectively, for last year.
Our total deposits increased $108,000, or 0.03%, during the year. LIFETIME FREE CHECKING and time deposits increased while all other deposit categories decreased.
During 2004, the Bank opened three new offices—our second office in both Burlington and Lumberton as well as an office in Mount Olive, North Carolina. We have acquired a number of offices in Virgina and North Carolina. We anticipate opening offices in Rocky Mount, Southern Pines, Graham and Smithfield, NC during this year. While the cost of acquiring and opening these offices has a short-term negative impact on earnings, we feel these offices will enhance the long-term profitability of the Bank.
Net Interest Income.Net interest income is our largest source of revenue and has been impacted by the low interest rates for the last two years. The Federal Reserve began to lower the target fed funds rate from 6.50% on May 16, 2000 to 1.00% on June 25, 2003. The 1.00% rate continued until June 30, 2004, when the fed began a series of one-quarter percent increases on 14 different occasions over the last year and a half to the latest increase January, 2006 to 4.50%. The Fed is expected to continue with several more increases before pausing.
Even with our increase in investments, the increase in our costs of deposits occurred more rapidly than our increase in interest income. As a result of this, our net interest income declined $799,000 from the prior year. With interest rates at a higher level, we anticipate our existing loans will increase in yield at a faster pace than the net increase in the costs of deposits. We anticipate a significant improvement in net interest income during the coming year.
The following table shows a summary of the changes in interest income and interest expense resulting from changes in volume and changes in rates for each category of interest-earning assets and interest-bearing liabilities for 2005/2004 and 2004/2003:
| 2005 vs 2004 (Revised) | 2004 vs 2003 | |||||||
| (Dollars in thousands) | Increase | Increase | ||||||
| Asset/Liability | (Decrease) | (Decrease) | ||||||
Real Estate Loans | $ | (3,419 | ) | $ | (1,042 | ) | ||
Installment Loans | (126 | ) | 108 | |||||
Commercial Loans | (427 | ) | 400 | |||||
Total Loans | (3,972 | ) | (534 | ) | ||||
Interest-Bearing Deposits in Other Financial Institutions | 253 | 96 | ||||||
Investment Securities | (108 | ) | (503 | ) | ||||
Federal Funds Sold | 58 | (300 | ) | |||||
Total Earning Assets | (3,769 | ) | (1,241 | ) | ||||
Interest-Bearing Transactions Accounts | (9 | ) | (112 | ) | ||||
Savings Accounts/MMA Accounts | 73 | (80 | ) | |||||
Certificates of Deposit Over $100,000 | 369 | 16 | ||||||
Other Certificates of Deposit | 545 | (800 | ) | |||||
Total Deposits | 978 | (976 | ) | |||||
Federal Funds Purchased | — | 6 | ||||||
Notes Issued to the U.S. Treasury | 1 | (2 | ) | |||||
Total Interest-Bearing Liabilities | 979 | (972 | ) | |||||
Change in Net Interest Income | $ | (4,748 | ) | $ | (269 | ) | ||
2
Table of Contents
The following table details the average balances and cost and yield data for the earning assets and interest-bearing liabilities:
| 2005 (Revised) | 2004 | 2003 | |||||||||||||||||||||||||
(Dollars in thousands) Asset/Liability | Average Balance | Interest | Yield/ Cost | Average Balance | Interest | Yield/ Cost | Average Balance | Interest | Yield/ Cost | ||||||||||||||||||
Real Estate Loans | $ | 208,503 | $ | 9,864 | 4.73 | % | $ | 158,091 | $ | 10,071 | 6.37 | % | $ | 156,936 | $ | 11,113 | 7.08 | % | |||||||||
Installment Loans | 13,826 | 1,227 | 8.87 | % | 12,589 | 1,231 | 9.78 | % | 11,812 | 1,123 | 9.51 | % | |||||||||||||||
Commercial Loans | 36,829 | 1,918 | 5.21 | % | 27,341 | 1,742 | 6.37 | % | 20,200 | 1,342 | 6.64 | % | |||||||||||||||
Total Loans | 259,158 | 13,009 | 5.02 | % | 198,021 | 13,044 | 6.59 | % | 188,948 | 13,578 | 7.19 | % | |||||||||||||||
Interest-Bearing Deposits in Other Financial Institutions | 23,031 | 784 | 3.40 | % | 19,827 | 457 | 2.30 | % | 15,166 | 361 | 2.38 | % | |||||||||||||||
Investment Securities | 89,861 | 3,297 | 3.67 | % | 105,500 | 4,003 | 3.79 | % | 93,343 | 4,506 | 4.83 | % | |||||||||||||||
Federal Funds Sold | 18,226 | 274 | 1.50 | % | 20,143 | 237 | 1.18 | % | 66,855 | 537 | 0.80 | % | |||||||||||||||
Total Earning Assets | 390,276 | 17,364 | 4.45 | % | 343,491 | 17,741 | 5.16 | % | 364,312 | 18,982 | 5.21 | % | |||||||||||||||
Interest-Bearing Transaction Accounts | 22,631 | 111 | 0.49 | % | 25,903 | 138 | 0.53 | % | 27,769 | 250 | 0.90 | % | |||||||||||||||
Savings/MMA Accounts | 81,148 | 1,249 | 1.54 | % | 90,235 | 1,305 | 1.45 | % | 83,033 | 1,385 | 1.67 | % | |||||||||||||||
Certificates of Deposit Over $100,000 | 28,805 | 1,069 | 3.71 | % | 37,654 | 916 | 2.43 | % | 26,585 | 900 | 3.39 | % | |||||||||||||||
Other Certificates of Deposit | 143,353 | 4,945 | 3.45 | % | 149,934 | 4,597 | 3.07 | % | 153,375 | 5,397 | 3.52 | % | |||||||||||||||
Total Deposits | 275,937 | 7,374 | 2.67 | % | 303,726 | 6,956 | 2.29 | % | 290,762 | 7,932 | 2.73 | % | |||||||||||||||
Federal Funds Purchased | 565 | 9 | 1.59 | % | 1,031 | 6 | 0.58 | % | — | — | — | ||||||||||||||||
Notes Issued to the U.S. Treasury | 202 | 2 | 0.99 | % | 182 | 1 | 0.55 | % | 333 | 3 | 0.90 | % | |||||||||||||||
Total Interest-Bearing Liabilities | $ | 276,704 | $ | 7,385 | 2.67 | % | $ | 304,939 | $ | 6,963 | 2.28 | % | $ | 291,095 | $ | 7,935 | 2.73 | % | |||||||||
Net Interest Income | $ | 9,979 | $ | 10,778 | $ | 11,047 | |||||||||||||||||||||
Net Yield on Earning Assets | 2.56 | % | 3.14 | % | 3.03 | % | |||||||||||||||||||||
Loans.Loans decreased from $209 million at year-end 2004 to $207 million at year-end 2005, a decrease of $2 million or .10%.
Our loan portfolio continues to remain concentrated in loans secured by real estate and remains flexible in the maturity of the loan portfolio. Over half of the loans have adjustable interest rates as of year-end 2005 compared to the same level in 2004. In addition, the combination of adjustable-rate and fixed rate loans that adjust or mature within one year equals 33% of the total portfolio at year-end 2005 compared to 63% last year.
Allowance and Provision for Loan Losses.The Allowance for Loan Losses represents management’s estimation of the amount necessary to absorb future losses in the loan portfolio. On the Statement of Condition, the Allowance for Loan Losses is deducted from Total Loans so that the net amount shown represents the estimated realizable total loans. The Provision for Loan Losses is the amount charged to expense to maintain the Allowance at an adequate level.
Based on management’s analysis of the loan portfolio, including non-acrrual and impaired loans, the Provision for Loan Losses remained consistent at year end 2005 and 2004 at $120,000.
| December 31 | ||||||||||||||||||||
(Dollars in thousands) | 2005 | 2004 | 2003 | 2002 | 2001 | |||||||||||||||
Balance Beginning of Year | $ | 2,412 | $ | 2,387 | $ | 1,703 | $ | 1,701 | $ | 1,709 | ||||||||||
Provision for Loan Losses | 120 | 120 | 821 | 120 | 60 | |||||||||||||||
Net Loan Losses | ||||||||||||||||||||
Real Estate Loans | 88 | 22 | 82 | — | — | |||||||||||||||
Installment Loans | 75 | 73 | 55 | 103 | 62 | |||||||||||||||
Commercial Loans | 2 | — | — | 15 | 6 | |||||||||||||||
Total Net Loan Losses | 165 | 95 | 137 | 118 | 68 | |||||||||||||||
Balance | $ | 2,367 | $ | 2,412 | $ | 2,387 | $ | 1,703 | $ | 1,701 | ||||||||||
Net Loan Losses to Average Loans | 0.05 | % | 0.05 | % | 0.07 | % | 0.07 | % | 0.04 | % | ||||||||||
Allowance for Loan Losses to Year-End Loans | 1.14 | % | 1.15 | % | 1.21 | % | 0.79 | % | 0.94 | % | ||||||||||
3
Table of Contents
Nonaccrual loans are those loans contractually past due 90 days or more on which no interest is being accrued. Other real estate owned consists of real estate acquired through foreclosure. These properties are reviewed quarterly and reduced to an estimated realizable value at that time.
Information concerning nonaccrual loans and other real estate owned is presented in the following table:
| December 31 | ||||||||||||||||||||
(Dollars in thousands) | 2005 (Revised) | 2004 | 2003 | 2002 | 200 | |||||||||||||||
Nonaccrual Loans | ||||||||||||||||||||
Real Estate | $ | 5,144 | $ | 1,903 | $ | 1,759 | $ | — | $ | — | ||||||||||
Installment | 16 | 2 | — | 7 | 31 | |||||||||||||||
Commercial | 5 | 5 | 3 | — | — | |||||||||||||||
Total Nonaccrual Loans | 5,165 | 1,910 | 1,762 | 7 | 31 | |||||||||||||||
Real Estate Owned Other Than Bank Premises | 257 | 128 | 132 | 209 | 73 | |||||||||||||||
Total Non-performing Assets | $ | 5,422 | $ | 2,038 | $ | 1,894 | $ | 216 | $ | 104 | ||||||||||
Allowance for Loan Losses to Nonperforming Assets | 44 | % | 118 | % | 126 | % | 788 | % | 1,636 | % | ||||||||||
The following table presents the volume of loans contractually past due for 90 days or more on which interest continues to be accrued. These loans are believed to be well collateralized and present little or no likelihood of loss of principal.
| (Dollars in thousands) | December 31 | ||||||||||||||
Loans 90 Days or More Past Due | 2005 | 2004 | 2003 | 2002 | 2001 | ||||||||||
Real Estate Loans | $ | 196 | $ | 1,085 | $ | 1,342 | $ | 1 | $ | 165 | |||||
Installment Loans | 62 | 43 | 2 | 5 | 32 | ||||||||||
Commercial Loans | — | — | — | — | — | ||||||||||
Total Loans 90 Days or More Past Due | $ | 258 | $ | 1,128 | $ | 1,344 | $ | 6 | $ | 197 | |||||
Non-Interest Income and Expense.Non-interest Income equaled $1,119,000 for 2005 compared to $1,294,000 for 2004. The principal component of non-interest income is service charges on deposit accounts, which equaled $995,000 for 2005 compared to $1,075,000 for 2004. Non-interest expense increased $458,000 during the year. Salaries and employee benefits, which is the largest of these expenses, increased $188,000 during the year and occupancy expense increased $227,000 during the year.
Investments.The total investment portfolio increased from $76 million at year-end 2004 to $96 million at year-end 2005. With interest rates at levels never seen before in recent times, we increased investments in U. S. Agency Securities $20 million and decreased investment in Interest-Bearing Deposits in Other Financial Institutions $2.5 million.
Deposits.Total deposits increased $108,000, or ..03%, during the year. There was a shift in deposits as customers moved funds from shorter term categories into Certificate of Deposits. Lifetime Free Checking and total time deposits increased while all other categories decreased.
Interest Sensitivity Analysis.The frequency with which interest rates on earning assets and interest bearing liabilities change has a significant impact on net interest income. The following table presents the anticipated changes based on the contractual maturity of each instrument. Expected maturities may differ from contractual maturities as both borrowers and depositors may have the right to call or prepay obligations with or without call or prepayment penalties.
(Dollars in thousands) (Revised) Use of Funds | Within One Year | One to Five Years | Over Five Years | Total | ||||||||||
Interest-Bearing Deposits in Other Financial Institutions | $ | 21,178 | $ | 1,287 | $ | — | $ | 22,465 | ||||||
Investment Securities | 34,644 | 59,011 | 2,010 | 95,665 | ||||||||||
Federal Funds Sold | — | — | — | — | ||||||||||
Loans | 68,275 | 77,781 | 61,588 | 207,644 | ||||||||||
Total Earning Assets | $ | 124,097 | $ | 138,079 | $ | 63,598 | $ | 325,774 | ||||||
Deposits | ||||||||||||||
Interest-Bearing Demand | $ | 26,781 | $ | — | $ | — | $ | 26,781 | ||||||
Savings | 67,738 | — | — | 67,738 | ||||||||||
Time Deposits | ||||||||||||||
Certificates of Deposit Over $100,000 | 12,003 | 18,909 | — | 30,912 | ||||||||||
Other | 65,593 | 82,932 | — | 148,525 | ||||||||||
Total Interest-Bearing Deposits | 172,115 | 101,841 | — | 273,956 | ||||||||||
Notes issued to the U. S. Treasury | 72 | — | — | 72 | ||||||||||
Total Interest-Bearing Liabilities | $ | 172,187 | $ | 101,841 | $ | — | $ | 274,028 | ||||||
Maturity/Rate Sensitivity Gap Per Period | $ | (48,090 | ) | $ | 36,238 | $ | 63,598 | $ | 51,746 | |||||
Cumulative Maturity/Rate Sensitivity Gap | $ | (48,090 | ) | $ | (11,852 | ) | $ | 51,746 | ||||||
4
Table of Contents
Capital.The federal regulatory agencies use risk-based capital ratios to analyze the adequacy of a bank’s capital. These ratios weigh bank assets from 0% to 100% depending upon the risks inherent in each type of asset. The Bank continues to meet all requirements for a well-capitalized bank as defined by the regulatory agencies. The following table presents the key risk-based capital ratios for December 31, 2005 and 2004. Additional details regarding capital may be found in the footnotes of the Financial Statements.
| 2005 (Revised) | 2004 | |||||
Tier 1 Ratio | 15.88 | % | 16.37 | % | ||
Total Risk-Based Capital Ratio | 16.88 | % | 17.41 | % | ||
Leverage Ratio | 10.70 | % | 10.44 | % |
Liquidity.Liquidity is our ability to fund both loans and investments in the normal course of business and to provide adequate protection for unexpected deposit withdrawals or other demands for funds without incurring a significant negative impact on profitability. Our primary source of day-to-day liquidity lies in the combination of cash, deposit balances, checks in process of collection, deposit growth and federal funds sold. Federal funds are excess funds that are sold to other banks, generally on a one-day basis. Normal funds from the repayment of loans and investments augment these funds.
Our secondary source of liquidity lies in our investments and deposits in other financial institutions. While our investments are categorized as held-to-maturity, they consist of short-term U. S. Government Agencies that are readily marketable. As reflected in the previous Interest Sensitivity Analysis, the majority of our investment securities mature in five years or less. Interest-bearing deposits in other financial institutions generally mature in two years or less and the volume of this investment decreased approximately $2.5 million this year.
Management’s Responsibility for Financial Reporting
The management of Peoples National Bank has prepared and is responsible for the accompanying financial statements, together with the financial data and other information presented in this annual report. Management believes that the financial statements have been prepared in conformity with accounting principles generally accepted in the United States appropriate under the circumstances and include amounts that are based on management’s best estimates and judgments.
Management maintains and depends upon an internal accounting control system designed to provide reasonable assurance that transactions are executed in accordance with management’s authorization, that financial records are reliable as the basis for preparation of all financial statements, and that the Bank’s assets are safeguarded. The design and implementation of all systems of internal control are based on judgments required to evaluate the costs of control in relation to the expected benefits and to determine the appropriate balance between these costs and benefits. The Bank maintains a professional internal audit staff to monitor compliance with the system of internal control. Operational and special audits are conducted, and audit reports are submitted to appropriate management.
The Board of Directors functions as the audit committee and meets periodically with the independent public accountants, Goodman & Company, management and internal auditors to review accounting, auditing and internal reporting matters. The independent public accountants and internal auditors have free access to the Board to discuss the results of their audit work and their evaluations of internal controls and the quality of financial reporting.
The responsibility of Goodman & Company is limited to an expression of their opinion as to the fairness of the financial statements. Their opinion is based on an audit conducted in accordance with Standards of the Public Company Accounting Oversight Board (United States), as described in their report.
Worth Harris Carter, Jr.
Chairman of the Board, President and
Chief Financial Officer
5
Table of Contents

Certified Public Accountants
Specialized Services
Business Solutions
Report of Independent Registered Public Accounting Firm
Board of Directors and Shareholders
Peoples National Bank
We have audited the accompanying statements of financial condition ofPeoples National Bank(Bank) as of December 31, 2005 and 2004, and the related statements of income, shareholders’ equity and cash flows for each of the years in the three-year period ended December 31, 2005. These financial statements are the responsibility of the Bank’s management. Our responsibility is to express an opinion on these financial statements based on our audits.
We conducted our audits in accordance with the standards of the Public Company Accounting Oversight Board (United States). Those standards require that we plan and perform the audits to obtain reasonable assurance about whether the financial statements are free of material misstatement. An audit includes examining, on a test basis, evidence supporting the amounts and disclosures in the financial statements. An audit also includes assessing the accounting principles used and significant estimates made by management, as well as evaluating the overall financial statement presentation. We believe that our audits provide a reasonable basis for our opinion.
In our opinion, the financial statements referred to above present fairly, in all material respects, the financial position ofPeoples National Bankas of December 31, 2005 and 2004, and the results of its operations and its cash flows for each of the years in the three-year period ended December 31, 2005, in conformity with accounting principles generally accepted in the United States of America.
As further discussed in Note 21 to the financial statements, the statements of financial condition as of December 31, 2005, and the related statements of operations, shareholders’ equity and cash flows for the year ended December 31, 2005, have been revised.

Danville, Virginia
March 1, 2006
110 Exchange Street, Suite G
Danville, VA 24541
ph: 434.792.5334
fax: 434.791.6061
www.goodmanco.com
6
Table of Contents
Statements of Financial Condition
(Dollars in Thousands)
| December 31 | ||||||||
| 2005 (Revised) | 2004 | |||||||
ASSETS: | ||||||||
Interest-Bearing Deposits in Other Financial Institutions | $ | 22,465 | $ | 24,941 | ||||
Investment Securities (Fair Value $94,497 in 2005, $75,492 in 2004) | 95,665 | 75,613 | ||||||
Federal Funds Sold | — | 18,485 | ||||||
Loans (Net of Unearned Income) | 206,930 | 209,101 | ||||||
Less: Allowance for Loan Losses | (2,367 | ) | (2,412 | ) | ||||
Net Loans | 204,563 | 206,689 | ||||||
Earning Assets | 322,693 | 325,728 | ||||||
Cash and Due from Banks | 10,367 | 9,393 | ||||||
Bank Premises and Equipment | 18,188 | 17,390 | ||||||
Real Estate Owned Other Than Bank Premises | 257 | 128 | ||||||
Investment in Associated Company | 769 | 618 | ||||||
Other Assets | 4,970 | 3,735 | ||||||
TOTAL ASSETS | $ | 357,244 | $ | 356,992 | ||||
LIABILITIES: | ||||||||
Deposits: | ||||||||
LIFETIME FREE CHECKING | $ | 44,862 | $ | 42,080 | ||||
Interest-Bearing Demand | 26,781 | 39,538 | ||||||
Regular Passbook Savings | 67,738 | 69,940 | ||||||
Time Deposits: | ||||||||
Certificates of Deposit $100,000 and Over | 30,912 | 26,912 | ||||||
Other | 148,525 | 140,240 | ||||||
TOTAL DEPOSITS | 318,818 | 318,710 | ||||||
Notes Issued to the U.S. Treasury | 72 | 57 | ||||||
Other Liabilities | 534 | 524 | ||||||
TOTAL LIABILITIES | 319,424 | 319,291 | ||||||
SHAREHOLDERS’ EQUITY: | ||||||||
Common Stock, Par Value Per Share $1.00; 2,500,000 shares authorized; 2,375,683 shares outstanding in 2005 and 2004 | 2,376 | 2,376 | ||||||
Surplus | 28,935 | 28,935 | ||||||
Undivided Profits | 6,509 | 6,390 | ||||||
TOTAL SHAREHOLDERS’ EQUITY | 37,820 | 37,701 | ||||||
TOTAL LIABILITIES AND SHAREHOLDERS’ EQUITY | $ | 357,244 | $ | 356,992 | ||||
The accompanying notes are an integral part of these financial statements.
7
Table of Contents
Statements of Income
(Dollars in Thousands Except Per Share Data)
| Years Ended December 31 | |||||||||
| 2005 (Revised) | 2004 | 2003 | |||||||
INTEREST INCOME: | |||||||||
Interest and Fees on Loans: | |||||||||
Taxable | $ | 12,647 | $ | 12,745 | $ | 13,450 | |||
Non-Taxable | 362 | 299 | 128 | ||||||
Interest on Deposits in Other Financial Institutions | 784 | 457 | 361 | ||||||
Interest on Federal Funds Sold | 274 | 237 | 537 | ||||||
Interest and Dividends on Securities: | |||||||||
U.S. Agency Securities and Other | 3,274 | 3,884 | 4,332 | ||||||
States and Political Subdivisions | 23 | 119 | 174 | ||||||
TOTAL INTEREST INCOME | 17,364 | 17,741 | 18,982 | ||||||
INTEREST EXPENSE: | |||||||||
Interest on Time Deposits $100,000 and Over | 1,069 | 916 | 900 | ||||||
Interest on Other Deposits | 6,305 | 6,040 | 7,032 | ||||||
Interest on Federal Funds Purchased | 9 | 6 | — | ||||||
Interest on Notes to the U.S. Treasury | 2 | 1 | 3 | ||||||
TOTAL INTEREST EXPENSE | 7,385 | 6,963 | 7,935 | ||||||
NET INTEREST INCOME | 9,979 | 10,778 | 11,047 | ||||||
Provision for Loan Losses | 120 | 120 | 821 | ||||||
NET INTEREST INCOME AFTER | |||||||||
PROVISION FOR LOAN LOSSES | 9,859 | 10,658 | 10,226 | ||||||
NON-INTEREST INCOME: | |||||||||
Service Charges, Commission and Fees | 995 | 1,075 | 998 | ||||||
Other Non-Interest Income | 124 | 219 | 120 | ||||||
TOTAL NON-INTEREST INCOME | 1,119 | 1,294 | 1,118 | ||||||
NON-INTEREST EXPENSE: | |||||||||
Salaries and Employee Benefits | 4,651 | 4,463 | 3,898 | ||||||
Occupancy Expense | 1,329 | 1,102 | 895 | ||||||
Operations Center Expense | 1,524 | 1,433 | 1,409 | ||||||
FDIC Assessment | 43 | 49 | 51 | ||||||
Other Non-Interest Expense | 752 | 794 | 748 | ||||||
TOTAL NON-INTEREST EXPENSE | 8,299 | 7,841 | 7,001 | ||||||
INCOME BEFORE INCOME TAXES | 2,679 | 4,111 | 4,343 | ||||||
Income Tax Expense | 660 | 1,275 | 1,374 | ||||||
NET INCOME | $ | 2,019 | $ | 2,836 | $ | 2,969 | |||
NET INCOME PER SHARE*: | |||||||||
Basic and Diluted | $ | 0.85 | $ | 1.19 | $ | 1.25 | |||
| * | Net income per share has been retroactively adjusted to reflect the stock dividend in 2003. |
The accompanying notes are an integral part of these financial statements.
8
Table of Contents
Statements of Cash Flows
(Dollars in Thousands)
| Years Ended December 31 | ||||||||||||
| 2005 (Revised) | 2004 | 2003 | ||||||||||
Cash Flows From Operating Activities: | ||||||||||||
Net Income | $ | 2,019 | $ | 2,836 | $ | 2,969 | ||||||
Adjustments to reconcile to net cash from operating activities: | ||||||||||||
Provision for Loan Losses | 120 | 120 | 821 | |||||||||
Depreciation of Premises and Equipment | 396 | 298 | 231 | |||||||||
Equity in Undistributed Income From Associated Company | (1 | ) | (11 | ) | (10 | ) | ||||||
Provision for Deferred Income Taxes | 206 | 154 | (166 | ) | ||||||||
(Decrease) in Unearned Income | (94 | ) | (96 | ) | (222 | ) | ||||||
(Increase) Decrease in Other Assets | (1,441 | ) | 495 | 386 | ||||||||
Increase (Decrease) in Other Liabilities | 10 | (2 | ) | (86 | ) | |||||||
Net Cash from Operating Activities | 1,215 | 3,794 | 3,923 | |||||||||
Cash Flows From Investing Activities: | ||||||||||||
Maturity of Interest-Bearing Deposits | 20,007 | 15,046 | 14,056 | |||||||||
Purchase of Interest-Bearing Deposits | (17,531 | ) | (25,140 | ) | (14,946 | ) | ||||||
Purchase of Investment Securities | (34,089 | ) | (30,000 | ) | (54,000 | ) | ||||||
Proceeds from maturities, calls and redemptions of | ||||||||||||
Investment Securities | 14,037 | 72,637 | 41,702 | |||||||||
Purchase of Bank Premises and Equipment | (1,194 | ) | (9,133 | ) | (3,909 | ) | ||||||
Net (Increase) Decrease in Short-Term Loans Outstanding, Net | 904 | (26,028 | ) | (6,324 | ) | |||||||
Longer-Term Loans Originated or Purchased | (39,178 | ) | (39,945 | ) | (54,433 | ) | ||||||
Principal Collected on Longer-Term Loans | 40,374 | 54,913 | 78,179 | |||||||||
Sale (Purchase) of Other Real Estate | (129 | ) | 4 | 77 | ||||||||
Investment in Associated Company | (150 | ) | — | (199 | ) | |||||||
Net Cash from Investing Activities | (16,949 | ) | 12,354 | 203 | ||||||||
Cash Flows From Financing Activities: | ||||||||||||
Net Increase in Demand and Savings Accounts | (12,177 | ) | (6,662 | ) | 23,516 | |||||||
Proceeds from Sale of Time Deposits | 100,283 | 94,128 | 118,183 | |||||||||
Payments on Matured Time Deposits | (87,998 | ) | (102,093 | ) | (129,905 | ) | ||||||
Stock Dividends | — | — | (9 | ) | ||||||||
Cash Dividends | (1,900 | ) | (1,901 | ) | (1,771 | ) | ||||||
Net Increase (Decrease) in Notes Issued to U.S. Treasury | 15 | (527 | ) | (1,325 | ) | |||||||
Net Cash from Financing Activities | (1,777 | ) | (17,055 | ) | 8,689 | |||||||
Net Change in Cash and Equivalents | (17,511 | ) | (907 | ) | 12,815 | |||||||
Cash and Equivalents at Beginning of Year | 27,878 | 28,785 | 15,970 | |||||||||
Cash and Equivalents at End of Year | $ | 10,367 | $ | 27,878 | $ | 28,785 | ||||||
Supplementary Data: | ||||||||||||
Cash Paid for Interest | $ | 7,338 | $ | 7,031 | $ | 8,049 | ||||||
Cash Paid for Income Taxes | 660 | 1,275 | 1,374 | |||||||||
Transfer of Loans to Foreclosed Assets | 282 | — | — | |||||||||
The accompanying notes are an integral part of these financial statements.
9
Table of Contents
Statements of Changes in Shareholders’ Equity
(Dollars in Thousands)
| COMMON STOCK | UNDIVIDED PROFITS | |||||||||||
| SHARES | AMOUNT | SURPLUS | ||||||||||
Year Ended December 31, 2003 | ||||||||||||
Balance at Beginning of Year | 2,159,985 | $ | 2,160 | $ | 22,679 | $ | 10,738 | |||||
Net Income | — | — | — | 2,969 | ||||||||
Stock Dividends (10%) | 215,698 | 216 | 6,256 | (6,481 | ) | |||||||
Cash Dividends, $ 0.75 per share* | — | — | — | (1,771 | ) | |||||||
Total | 2,375,683 | $ | 2,376 | $ | 28,935 | $ | 5,455 | |||||
Year Ended December 31, 2004 | ||||||||||||
Balance at Beginning of Year | 2,375,683 | $ | 2,376 | $ | 28,935 | $ | 5,455 | |||||
Net Income | — | — | — | 2,836 | ||||||||
Cash Dividends, $ 0.80 per share* | — | — | — | (1,901 | ) | |||||||
Total | 2,375,683 | $ | 2,376 | $ | 28,935 | $ | 6,390 | |||||
Year Ended December 31, 2005 (Revised) | ||||||||||||
Balance at Beginning of Year | 2,375,683 | $ | 2,376 | $ | 28,935 | $ | 6,390 | |||||
Net Income | — | — | — | 2,019 | ||||||||
Cash Dividends, $ 0.80 per share* | — | — | — | (1,900 | ) | |||||||
Total | 2,375,683 | $ | 2,376 | $ | 28,935 | $ | 6,509 | |||||
| * | Cash dividends per share have been retroactively restated to reflect the stock dividend in 2003. |
The accompanying notes are an integral part of these financial statements.
10
Table of Contents
Notes to Financial Statements
(Dollars in Thousands in Charts Except for Per Share Data)
1. SUMMARY OF SIGNIFICANT ACCOUNTING POLICIES
The accounting and reporting policies of Peoples National Bank are in accordance with accounting principles generally accepted in the United States of America, and general practices within the banking industry that are consistent with reports filed with regulatory agencies.
NATURE OF OPERATIONS
The Bank generates commercial (including agricultural), mortgage and consumer loans and receives deposits from customers located primarily in the City of Danville and Pittsylvania County, Virginia and Central and Eastern North Carolina. The Bank operates under a national charter and provides full banking services. As a national bank, the Bank is subject to regulation by the Comptroller of the Currency, Federal Deposit Insurance Corporation, and the Board of Governors of the Federal Reserve System.
USE OF ESTIMATES
The preparation of financial statements in conformity with accounting principles generally accepted in the United States of America requires management to make estimates and assumptions that affect the reported amounts of assets and liabilities and disclosure of contingent assets and liabilities at the date of the financial statements, and the reported amounts of revenue and expenses during the reporting period. Actual results could differ from those estimates. Material estimates that are particularly susceptible to significant change in the near term relate to the determination of the allowance for loan losses, and fair value of other real estate owned.
CASH AND CASH EQUIVALENTS
For purposes of cash flows, cash and cash equivalents include cash on hand, demand balances due from banks and federal funds transactions. Generally, federal funds are purchased and sold for one-day periods.
SECURITIES
Investment securities are stated at cost, adjusted for amortization of premiums and accretion of discounts, and computed by the interest method. The Bank has the positive intent and ability to hold these securities until maturity. Gains and losses on sales, if any, of securities are based on the adjusted costs of the specific securities sold.
LOANS
Loans are recorded at the amount of the loan disbursed to borrowers plus the applicable amount, if any, of unearned income and other charges, less payments received. Income earned on loans is recognized by methods which generally result in level rates of return on principal amounts outstanding. The net amount of nonrefundable loan origination fees approximates the direct costs associated with the lending process.
The allowance for loan losses is an estimate of losses inherent in the loan portfolio as determined by management taking into consideration historical loan loss experience, diversification of the loan portfolio, amounts of secured and unsecured loans, banking industry standards and averages, and general economic conditions. Ultimate losses may vary from current estimates. These estimates are reviewed periodically and as adjustments become necessary, they are reported in earnings in the periods in which they become reasonably estimable.
Management determines loan impairment using guidelines established by Statement of Financial Accounting Standards No. 114 (SFAS 114), “Accounting by Creditors for Impairment of a Loan (as amended by SFAS No. 118, Accounting by Creditors for Impairment of a Loan - Income Recognition and Disclosures”). Under this accounting standard, a loan is considered to be impaired when it is probable that the Bank will be unable to collect all principal and interest amounts according to the contractual terms of the loan agreement. A performing loan may be considered impaired. The allowance for loan losses related to loans identified as impaired is primarily based on the excess of the loan’s current outstanding principal balance over the estimated fair value of the related collateral. For a loan that is not collateral-dependent, the allowance is recorded at the amount by which the outstanding principal balance exceeds the current best estimate of the future cash flows on the loan discounted at the loan’s original effective interest rate. Interest on impaired loans is recognized when cash is received.
BANK PREMISES AND EQUIPMENT
Premises and equipment are stated at cost, less accumulated depreciation. Depreciation is charged to operating expenses over the estimated useful life of the assets by the accelerated and straight-line methods.
Costs of maintenance or repairs are charged to expense as incurred and improvements are capitalized. Upon retirement or disposal of an asset, the asset and related allowance account are eliminated. Any gain or loss on such transactions is included in current operations. Depreciation has been included under Occupancy Expense in the Statements of Income in the amount of $396,000 in 2005, $298,000 in 2004, and $231,000 in 2003.
OTHER REAL ESTATE OWNED
Real estate properties acquired through or in lieu of loan foreclosure are initially recorded at the lower of the Bank’s carrying amount or fair value less estimated selling cost at the date of foreclosure. Any write-downs based on the asset’s fair value at the date of acquisition are charged to the allowance for loan losses. After foreclosure, these assets are carried at the lower of their new cost basis or fair value less cost to sell. Costs of significant property improvements are capitalized, whereas costs relating to holding property are expensed. Valuations are periodically performed by management, and any write-downs are recorded as a charge to operations, if necessary, to reduce the carrying value of a property to the lower of its carrying value or fair value less cost to sell.
INCOME TAXES
Deferred taxes are provided on a liability method whereby deferred tax assets are recognized for deductible temporary differences and operating loss and tax credit carryforwards and deferred tax liabilities are recognized for taxable temporary differences. Temporary differences are the differences between the reported amounts of assets and liabilities and their tax bases. Deferred tax assets are reduced by a valuation allowance when, in the opinion of management, it is more likely than not that some portion or all of the deferred tax assets will not be realized. Deferred tax assets and liabilities are adjusted for the effects of changes in tax laws and rates on the date of enactment.
RETIREMENT BENEFITS
The Bank has established an Employee Benefit Plan as described in footnote 5. The Bank does not provide any other post-retirement benefits that would be accrued under Statement of Financial Accounting Standards No. 106, “Employers’ Accounting for Post Retirement Benefits Other Than Pensions”.
2. INVESTMENT SECURITIES
The carrying value of securities pledged to secure public deposits was $93,652,000 and $71,622,000 as of December 31, 2005 and 2004, respectively. The amortized cost and estimated fair value of investment securities as of December 31, 2005 and 2004 were as follows:
December 31, 2005 | Gross Amortized Cost | Gross Unrealized Gains | Estimated Unrealized Losses | Fair Value | ||||||||
U. S. Agency Securities | $ | 93,652 | $ | 21 | $ | 1,189 | $ | 92,484 | ||||
Mortgage-Backed Securities | 2,013 | — | — | 2,013 | ||||||||
Total | $ | 95,665 | $ | 21 | $ | 1,189 | $ | 94,497 | ||||
December 31, 2004 | ||||||||||||
U. S. Agency Securities | $ | 71,622 | $ | 313 | $ | 454 | $ | 71,481 | ||||
Obligations of State and Political Subdivisions | 719 | 20 | — | 739 | ||||||||
Mortgage-Backed Securities | 3,272 | — | — | 3,272 | ||||||||
Total | $ | 75,613 | $ | 333 | $ | 454 | $ | 75,492 | ||||
The table below shows gross unrealized losses and fair value, aggregated by investment category and length of time that individual securities have been in a continuous unrealized loss position at December 31, 2005 and 2004.
| Unrealized Losses | |||||||||
2005 Securities Description | Fair Value | Less than 12 Months | More than 12 Months | ||||||
U. S. Agency Securities | $ | 28,762 | $ | 226 | $ | — | |||
U. S. Agency Securities | 50,532 | — | 963 | ||||||
Total | $ | 79,294 | $ | 226 | $ | 963 | |||
2004 Securities Description | |||||||||
U. S. Agency Securities | $ | 41,969 | $ | 377 | $ | 2 | |||
U. S. Agency Securities | 10,000 | 75 | — | ||||||
Total | $ | 51,969 | $ | 452 | $ | 2 | |||
11
Table of Contents
The unrealized losses on the Bank’s investments in obligations of U. S. Government Agencies were caused by interest rate increases. The contractual terms of those investments do not permit the issuer to settle the securities at a price less than the amortized cost of the investment. Because the Bank has the ability and intent to hold those investments until a recovery of fair value, which may be maturity, the Bank does not consider those investments to be other-than-temporarily impaired at December 31, 2005
The amortized cost and estimated fair value of investments in debt securities at December 31, 2005 and 2004, by contractual maturity, are shown below. Expected maturities will differ from contractual maturities because issuers may have the right to call or prepay obligations with or without call or prepayment penalties.
| December 31, 2005 | December 31, 2004 | |||||||||||
| Amortized Cost | Estimated Fair Value | Amortized Cost | Estimated Fair Value | |||||||||
Due in one year or less | $ | 34,644 | $ | 34,429 | $ | 3,768 | $ | 3,528 | ||||
After one year through Five Years | 59,011 | 58,058 | 68,573 | 68,692 | ||||||||
Due after five years through ten years | — | — | — | — | ||||||||
Due after ten years | — | — | — | — | ||||||||
Mortgage-Backed Securities | 2,010 | 2,010 | 3,272 | 3,272 | ||||||||
Total Securities | $ | 95,665 | $ | 94,497 | $ | 75,613 | $ | 75,492 | ||||
There were no sales of securities during 2005, 2004, or 2003.
3. COMPOSITION OF LOANS
| December 31 | ||||||||
| 2005 (Revised) | 2004 | |||||||
Real Estate | $ | 158,906 | $ | 160,260 | ||||
Loans to Other Commercial Banks | 1,500 | 1,500 | ||||||
Consumer | 13,748 | 14,343 | ||||||
Commercial, Industrial and Agricultural | 24,316 | 21,945 | ||||||
All Other | 9,174 | 11,861 | ||||||
Gross Loans | 207,644 | 209,909 | ||||||
Less: Unearned Income | (714 | ) | (808 | ) | ||||
Allowance for Loan Losses | (2,367 | ) | (2,412 | ) | ||||
Total Loans, Net | $ | 204,563 | $ | 206,689 | ||||
Maturity Distribution | ||||||||
Variable | 2005 (Revised) | 2004 | ||||||
Less Than One Year | $ | 23,327 | $ | 91,833 | ||||
One to Five Years | 61,086 | 2,380 | ||||||
Over Five Years | 26,967 | 7,453 | ||||||
Subtotal | 111,380 | 101,666 | ||||||
Fixed | ||||||||
Less Than One Year | 44,948 | 41,367 | ||||||
One to Five Years | 16,694 | 23,071 | ||||||
Over Five Years | 34,622 | 43,805 | ||||||
Subtotal | 96,264 | 108,243 | ||||||
Total | $ | 207,644 | $ | 209,909 | ||||
4. ALLOWANCE FOR LOAN LOSSES
In the view of management, the Allowance for Loan Losses is adequate to meet the loss contingency based on experience factors and a review of the loan portfolio.
The Allowance for Loan Losses for the years ending December 31, 2005, 2004 and 2003 is summarized as follows:
| 2005 | 2004 | 2003 | ||||||||||
Balance at beginning of year | $ | 2,412 | $ | 2,387 | $ | 1,703 | ||||||
Recoveries credited during year | 58 | 34 | 17 | |||||||||
Provision for loan losses | 120 | 120 | 821 | |||||||||
Losses charged to allowance | (223 | ) | (129 | ) | (154 | ) | ||||||
Balance at end of year | $ | 2,367 | $ | 2,412 | $ | 2,387 | ||||||
The following is a summary of information pertaining to impaired and non-accrual loans:
| December 31 | ||||||
| 2005 (Revised) | 2004 | |||||
Impaired loans without a valuation allowance | $ | — | $ | — | ||
Impaired loans with a valuation allowance | 1,759 | 1,759 | ||||
Total impaired loans | $ | 1,759 | $ | 1,759 | ||
Valuation allowance related to impaired loans. | $ | 701 | $ | 701 | ||
| December 31, | ||||||
| 2005 (Revised) | 2004 | |||||
Nonaccrual loans (impaired) | $ | 1,759 | $ | 1,759 | ||
Nonaccrual loans (non-impaired) | $ | 3,406 | $ | 151 | ||
Total loans past due ninety days or more and. still accruing | $ | 258 | $ | 1,128 | ||
| Years Ended December 31 | |||||||||
| 2005 | 2004 | 2003 | |||||||
Average investment in impaired loans | $ | 1,759 | $ | 1,759 | $ | 1,025 | |||
Interest income recognized on impaired loans | $ | — | $ | 219 | $ | 29 | |||
Interest income recognized on a cash basis on impaired loans | $ | — | $ | 196 | $ | — | |||
5. STOCK OPTIONS AND EMPLOYEE BENEFIT PLANS
There were no stock options or stock option plans in effect for 2003, 2004, or 2005.
The Bank has adopted an integrated profit sharing plan. Employees participate in the profit sharing plan following completion of six (6) months of service and upon reaching the age of twenty years and six months as of January 1. Vesting includes years of service to the Bank prior to the effective date of the plan. The plan gives 0% vesting to anyone who has less than five (5) years of service except that persons who have reached the age of 62 are fully vested regardless of length of service. Each participant in the plan (who has not reached age 62) becomes 100% vested after five (5) years of service. The contribution to the plan is determined each year by the Board of Directors and thus may fluctuate in amount from year to year. The contribution by the Bank was $186,000 in 2005, $185,000 in 2004 and $163,000 in 2003 and these amounts are included in salaries and employee benefits in the Statements of Income.
6. FEDERAL AND STATE INCOME TAXES
Net deferred tax assets consist of the following components as of December 31, 2005 and 2004:
Deferred Tax Assets | 2005 | 2004 | ||||
Allowance for Loan Losses | $ | 625 | $ | 682 | ||
Dividend Exclusion | 86 | 85 | ||||
Other | 297 | — | ||||
Total Deferred Tax Assets | $ | 1,008 | $ | 767 | ||
Deferred Tax Liabilities | ||||||
Bank Premises | $ | 498 | $ | 464 | ||
Investment in Associated Companies | 101 | 100 | ||||
Total Deferred Tax Liabilities | 599 | 564 | ||||
Net Deferred Taxes | $ | 409 | $ | 203 | ||
The provisions for income taxes charged to operations for the years ended December 31, 2005, 2004 and 2003 consist of the following:
| 2005 (Revised) | 2004 | 2003 | ||||||||
Currently payable | $ | 430 | $ | 1,112 | $ | 1,544 | ||||
Currently payable - North Carolina | 8 | 9 | 18 | |||||||
Deferred | 206 | 154 | (188 | ) | ||||||
Other | 16 | — | — | |||||||
Net Provision | $ | 660 | $ | 1,275 | $ | 1,374 | ||||
The income tax provision differs from the amount of income tax determined by applying the U.S. federal income tax rate to pretax income for the years ended December 31, 2005, 2004 and 2003 due to the following:
| 2005 (Revised) | 2004 | 2003 | ||||||||||
Tax provisions computed by applying federal rates to income before income taxes | $ | 911 | $ | 1,398 | $ | 1,477 | ||||||
Tax exempt interest | (131 | ) | (142 | ) | (103 | ) | ||||||
Tax credits | (106 | ) | — | — | ||||||||
Other | (14 | ) | 19 | — | ||||||||
Net Provision | $ | 660 | $ | 1,275 | $ | 1,374 | ||||||
The Bank purchased historic tax credits during the year of $1,057,000 at a discount of $106,000 that will expire in 2014. A summary of the tax credits and their use follows:
Tax credits purchased | $ | 1,057 | ||
Credits taken in 2005 | (317 | ) | ||
Carryback taken to 2004 | (443 | ) | ||
Carryforward for 2006 | $ | 297 | ||
12
Table of Contents
7. RELATED PARTY TRANSACTIONS
The Chairman of the Board of Peoples National Bank also serves as Chairman of the Board of Blue Ridge Bank, N. A., Central National Bank, Community National Bank, First National Bank, First National Exchange Bank, Mountain National Bank, Patrick Henry National Bank, Patriot Bank, N. A., and Shenandoah National Bank.
The Bank maintains a correspondent bank account with one of these banks. In 2005 and 2004 the average daily balance in this account was considered a normal operating balance to facilitate general business transactions. The Bank also participates in loan transactions with these banks. These transactions are at carrying value and do not involve more than the normal risk of collectibility or present other unfavorable features.
The Bank owns 10% of the outstanding common stock of The Mortgage Company of Virginia, Inc. The remaining common stock is equally owned by the banks listed above. The Mortgage Company of Virginia owns 100% of Bank Services of Virginia, Inc. The business of both of these companies is to provide operational support services to the ten banks. These services consist of mortgage loan servicing, data processing, bookkeeping, check clearing, accounting, investment management, bank couriers, advertising programs, central purchasing and other management services. The Bank is charged for its share of these services, which is recorded as Operation Center Expense in the Statements of Income. The cost of this expense is shared by the ten banks on the basis of average deposits of each bank related to total average deposits of all the banks.
The Mortgage Company of Virginia, Inc. owns 100% of Bank Services Insurance, Inc. Bank Services Insurance, Inc. provides insurance products to the banks and customers in the Danville area. The premiums paid to Bank Services Insurance, Inc. equaled $58,000 for 2005.
The Mortgage Company of Virginia, Inc. also owns 50% of Coresoft, Inc. represented by an initial $1,000 investment during 2004. Coresoft, Inc. is developing a core software package the banks listed above will use. At December 31, 2005, Coresoft, Inc. had an outstanding note payable to the Mortgage Company of $1,400,000.
The Bank records its investment in the common stock of The Mortgage Company of Virginia, Inc. under the equity method of accounting due to the influence the Bank has over the company. The Bank invested an additional $150,000 in 2005 increasing the value of the investment to $769,000 from $618,000 at December 31, 2004. The Bank’s share of earnings of the company equaled $1,000 for 2005, $11,000 for 2004 and $10,000 for 2003 and is shown in the Statements of Income under Other Non-interest Income.
The Chairman of the Board and President of the Bank also serves as Chairman of the Board and President of Bank Building Corporation and Manager of Blackstone Properties, LLC, its wholly owned subsidiary (the “companies”). The companies lease branches to certain of the Banks listed above. At December 31, 2005, the Bank leased seven offices from the companies. Rental expense and future lease payments under these leases are disclosed in a footnote below. As of December 31, 2005 and 2004, the Bank had loans totaling $5,959,000 and $6,150,000, respectively, to the companies. These loans were made to purchase bank branches leased to affiliated banks and other investment property. The loans are secured by these branches and the related leases and other investment property, and have repayment terms similar to other loan customers of the Bank.
In the ordinary course of business, directors and their related interests were customers of, and had transactions with the Bank. Loan transactions with directors and officers, principal security holders and associates were made on substantially the same terms as those prevailing at the time for comparable loans to other persons and did not involve more than normal risk of collectibility or present other unfavorable features. A summary of these transactions is presented below.
| 2005 | 2004 | |||||||
Beginning Balance | $ | 21 | $ | 205 | ||||
New Loans | 7 | 25 | ||||||
Repayments | (20 | ) | (209 | ) | ||||
Ending Balance | $ | 8 | $ | 21 | ||||
8. CONTINGENCIES
The Bank did not have any legal matters of financial significance pending at December 31, 2005 or 2004.
9. EARNINGS PER COMMON SHARE
The Bank follows Statement of Financial Accounting Standards (SFAS) No. 128, “Earnings Per Share”. This statement requires the dual presentation of basic and diluted earnings per share. The weighted average number of shares used to compute earnings per share was 2,375,683.
The Bank issued a 10% stock dividend in 2003 and none in 2004 or 2005. No fractional shares were issued in this stock dividend. Stock dividends and fractional shares were settled based on known prices for recent trades of the stock and other factors deemed relevant at the time.
10. BANK PREMISES AND EQUIPMENT
Premises and equipment are stated at cost less accumulated depreciation as follows:
December 31, 2005 | Cost | Accumulated Depreciation and Amortization | Net Remaining Cost | ||||||
Bank Premises (Including Land of $1,394,000) | $ | 16,974 | $ | 1,047 | $ | 15,927 | |||
Equipment | 3,129 | 868 | 2,261 | ||||||
Total | $ | 20,103 | $ | 1,915 | $ | 18,188 | |||
December 31, 2004 | |||||||||
Bank Premises (Including Land of $1,394,000) | $ | 16,042 | $ | 929 | $ | 15,113 | |||
Equipment | 2,970 | 693 | 2,277 | ||||||
Total | $ | 19,012 | $ | 1,622 | $ | 17,390 | |||
11. FORECLOSED ASSETS
Expenses applicable to foreclosed assets include the following:
| Years Ended December 31 | |||||||||
| 2005 | 2004 | 2003 | |||||||
Net loss (gain) on sales of real estate | $ | — | $ | — | $ | — | |||
Provision for losses | — | — | — | ||||||
Operating expenses | 13 | 1 | 2 | ||||||
12. CASH AND CASH EQUIVALENTS
Cash and cash equivalents as of December 31, 2005, 2004, and 2003 are detailed below:
| 2004 | 2004 | 2003 | |||||||
Cash and Due From Banks | $ | 10,367 | $ | 9,393 | $ | 12,005 | |||
Federal Funds Sold | — | 18,485 | 16,780 | ||||||
Total Cash and Cash Equivalents | $ | 10,367 | $ | 27,878 | $ | 28,785 | |||
13. DEPOSITS
Certificates of Deposit maturing as of December 31:
| 2005 | 2004 | |||||
1 Year | $ | 77,730 | $ | 82,173 | ||
2 Years | 27,007 | 20,657 | ||||
3 Years | 20,697 | 20,734 | ||||
4 Years | 17,479 | 21,772 | ||||
5 Years and Thereafter | 36,524 | 21,816 | ||||
Total | $ | 179,437 | $ | 167,152 | ||
14. CONCENTRATION OF CREDIT RISK
The majority of the Bank’s loans, commitments and lines of credit have been granted to customers in the Bank’s market area. The concentrations of credit by loan classification are set forth in an above footnote. The Bank does not extend credit to any individual borrowers in excess of its lending limit of $6,037,000 and $6,017,000, respectively, as of December 31, 2005 and 2004.
The largest category of Real Estate Loans consisted of loans to the commercial industry. These loans approximated $55,973,000 at December 31, 2005 and $50,279,000 at December 31, 2004.
15. FAIR VALUE OF FINANCIAL INSTRUMENTS
Statement of Financial Accounting Standards No. 107, “Disclosures about Fair Value of Financial Instruments”, requires the Bank to disclose the estimated fair values of its financial assets and liabilities. The estimated fair values were determined using the following assumptions:
| a. | The carrying value of Cash and Due From Banks, Federal Funds Sold, and Interest-Bearing Deposits in Other Financial Institutions are believed to approximate the fair value of these items. |
13
Table of Contents
| b. | The fair value of actively traded investment securities are determined according to quotes available in the financial press. The fair value of instruments which are not actively traded are determined using values of other instruments with similar characteristics or obtained from outside sources believed to be reliable. |
| c. | The fair value of loans are estimated by discounting the anticipated cash flows using estimated rates for similar loans available in the Bank’s market area. Estimates of maturities are based on both experience and contractual maturities although prepayments are permitted on the loans. |
| d. | The fair value of short-term demand and savings deposits are believed to equal carrying value. The fair value of certificates of deposit are based upon the contractual maturity of the instruments and rates currently offered for similar deposits. |
| e. | The fair value of Notes Payable to the U. S. Treasury and Subordinated Notes are estimated at carrying value. |
| f. | The fair value of Accrued Interest Receivable and Accrued Interest Payable are estimated at carrying value. |
| 2005 (Revised) | 2004 | |||||||||||
Financial Assets: | Carrying Value | Fair Value | Carrying Value | Fair Value | ||||||||
Interest-Bearing Deposits in Other Financial Institutions | $ | 22,465 | $ | 22,465 | $ | 24,941 | $ | 24,941 | ||||
Investment Securities | 95,665 | 94,497 | 75,613 | 75,492 | ||||||||
Federal Funds Sold | — | — | 18,485 | 18,485 | ||||||||
Loans (Net of Unearned Income) | 206,930 | 210,980 | 209,101 | 211,273 | ||||||||
Cash and Due From Banks | 10,367 | 10,367 | 9,393 | 9,393 | ||||||||
Accured Interest Receivable | 2,003 | 2,003 | 1,673 | 1,673 | ||||||||
Total | $ | 337,499 | $ | 340,312 | $ | 339,206 | $ | 341,257 | ||||
Financial Liabilities: | ||||||||||||
Deposits | ||||||||||||
LIFETIME FREE CHECKING | $ | 44,862 | $ | 44,862 | $ | 42,080 | $ | 42,080 | ||||
Interest-Bearing Demand | 26,781 | 26,781 | 39,538 | 39,538 | ||||||||
Regular Passbook Savings | 67,738 | 67,738 | 69,940 | 69,940 | ||||||||
Time Deposits: | ||||||||||||
Certificates of Deposit $100,000 and Over | 30,912 | 30,819 | 26,912 | 27,272 | ||||||||
Other | 148,525 | 148,051 | 140,240 | 141,928 | ||||||||
Accrued Interest Payable | 275 | 275 | 300 | 300 | ||||||||
Total Deposits | 319,093 | 318,526 | 319,010 | 321,058 | ||||||||
Notes issued to the U. S. Treasury | 72 | 72 | 57 | 57 | ||||||||
Total | $ | 319,165 | $ | 318,598 | $ | 319,067 | $ | 321,115 | ||||
16. CAPITAL ADEQUACY
The Bank is subject to various regulatory capital requirements. Under the regulatory capital guidelines and the regulatory framework for Prompt Corrective Action (PCA), the Bank must meet specific capital guidelines involving the quantitative measures of the Bank’s assets, liabilities, and certain off-balance-sheet items as calculated under regulatory accounting practices. The Bank’s capital amount and classification are also subject to qualitative judgments by the regulators about components, risk weightings and other factors.
Quantitative measures established by regulation to ensure capital adequacy require the Bank to maintain minimum ratios (set forth in the table below) of total and Tier 1 capital (as defined in the regulations) to risk-weighted assets (as defined) and of Tier 1 capital to average assets (as defined).
| Minimum Ratio For Capital Adequacy Purposes | Minimum Ratio To Be Considered Well Capitalized Under PCA Provisions | |||||
Tier 1 Capital to Risk Weighted Assets | 4 | % | 6 | % | ||
Total Capital to Risk Weighted Assets | 8 | % | 10 | % | ||
Tier 1 Capital to Average Assets | 4 | % | 5 | % |
As of December 31, 2005, the most recent notification from the Federal Deposit Insurance Corporation categorized the Bank as well capitalized under the regulatory framework for prompt corrective action. To be categorized as well capitalized, an institution must maintain minimum total risk-based, Tier 1 risk-based and Tier 1 leverage ratios as set forth in the above table. There are no conditions or events since the notification that management believes have changed the Bank’s category. The Bank’s actual capital amounts and ratios as of December 31, 2005 and 2004 are presented in the following table. Management believes, as of December 31, 2005 and 2004, that the Bank meets all capital adequacy requirements to which it is subject.
| Minimum Capital For Capital Adequacy Purposes | Minimum Capital To Be Considered Well Capitalized Under PCA Provisions | Actual Capital | Actual Ratio | |||||||||
As of December 31, 2005 (Revised) | ||||||||||||
Tier 1 Capital to Risk Weighted Assets | $ | 9,525 | $ | 14,288 | $ | 37,820 | 15.88 | % | ||||
Total Capital to Risk Weighted Assets | 19,050 | 23,813 | 40,249 | 16.88 | % | |||||||
Tier 1 Capital to Average Assets | 14,135 | 17,669 | 37,820 | 10.70 | % | |||||||
As of December 31, 2004 | ||||||||||||
Tier 1 Capital to Risk Weighted Assets | $ | 9,215 | $ | 13,823 | $ | 37,701 | 16.37 | % | ||||
Total Capital to Risk Weighted Assets | 18,430 | 23,038 | 40,113 | 17.41 | % | |||||||
Tier 1 Capital to Average Assets | 14,442 | 18,053 | 37,701 | 10.44 | % | |||||||
17. QUARTERLY FINANCIAL DATA (Unaudited)
The following summarizes the quarterly results of operations for the years ended December 31, 2005 and 2004:
2005 (Revised) | First Quarter | Second Quarter | Third Quarter | Fourth Quarter | ||||||||
Total Interest Income | $ | 4,329 | $ | 4,264 | $ | 4,355 | $ | 4,416 | ||||
Total Interest Expense | 1,716 | 1,792 | 1,935 | 1,942 | ||||||||
Net Interest Income | 2,613 | 2,472 | 2,420 | 2,474 | ||||||||
Provision For Loan Losses | 30 | 30 | 30 | 30 | ||||||||
Net Interest Income After Provision for Loan Losses | 2,583 | 2,442 | 2,390 | 2,444 | ||||||||
Total Non-Interest Income | 292 | 236 | 255 | 336 | ||||||||
Total Non-Interest Expense | 2,045 | 2,035 | 2,035 | 2,184 | ||||||||
Income Before Income Taxes | 830 | 643 | 610 | 596 | ||||||||
Income Tax Expense | 245 | 181 | 171 | 63 | ||||||||
Net Income | $ | 585 | $ | 462 | $ | 439 | $ | 533 | ||||
Basic and Diluted Net Income Per Share | $ | 0.25 | $ | 0.20 | $ | 0.18 | $ | 0.22 | ||||
2004 | First Quarter | Second Quarter | Third Quarter | Fourth Quarter | ||||||||
Total Interest Income | $ | 4,393 | $ | 4,540 | $ | 4,471 | $ | 4,337 | ||||
Total Interest Expense | 1,760 | 1,719 | 1,734 | 1,750 | ||||||||
Net Interest Income | 2,633 | 2,821 | 2,737 | 2,587 | ||||||||
Provision For Loan Losses | 30 | 30 | 30 | 30 | ||||||||
Net Interest Income After Provision for Loan Losses | 2,603 | 2,791 | 2,707 | 2,557 | ||||||||
Total Non-Interest Income | 306 | 281 | 266 | 441 | ||||||||
Total Non-Interest Expense | 1,834 | 1,865 | 1,899 | 2,243 | ||||||||
Income Before Income Taxes | 1,075 | 1,207 | 1,074 | 755 | ||||||||
Income Tax Expense | 325 | 375 | 330 | 245 | ||||||||
Net Income | $ | 750 | $ | 832 | $ | 744 | $ | 510 | ||||
Basic and Diluted Net Income Per Share | $ | 0.32 | $ | 0.35 | $ | 0.31 | $ | 0.21 | ||||
14
Table of Contents
18. LEASES AND RENT EXPENSE
The Bank leased facilities under non-cancelable operating leases during 2005, 2004 and 2003. As noted above, the Bank leases five offices from Bank Building Corporation and two offices from Blackstone Properties, LLC. These leases required the Bank to pay maintenance, insurance and property taxes and do not have renewal options. Rental expense under these leases was $314,000 in 2005 and $329,000 in 2004 and 2003. The Bank also leases offices from non-related parties under various terms. Rental expense for these leases was $27,000 in 2005, $9,000 for 2004 and none for 2003. Future minimum rental payments under these are as follows:
Year Ending December 31, 2006 | $ | 351 | |
2007 | 351 | ||
2008 | 351 | ||
2009 | 351 | ||
2010 | 351 | ||
Thereafter | 1,807 | ||
Total Minimum Lease Payments | $ | 3,562 | |
19. OFF BALANCE SHEET ACTIVITIES AND COMMITMENTS
Commitments to extend credit, which amounted to $5,079,000 and $7,731,000 at December 31, 2005 and 2004 respectively, represent agreements to lend to customers with fixed expiration dates or other termination clauses. Since many of the commitments are expected to expire without being funded, the total commitment amounts do not necessarily represent future liquidity requirements. Standby letters of credit are conditional commitments issued by the Bank guaranteeing the performance of a customer to a third party. Those guarantees are primarily issued to support public and private borrowing arrangements. The Bank had outstanding letters of credit in the amount of $711,000 in 2005 and $61,000 in 2004.
The Bank is a member of the Federal Reserve System and is required to maintain certain levels of its cash and due from bank balances as reserves based on regulatory requirements. At December 31, 2005 and 2004, this reserve requirement was approximately $2,564,000.
Federal banking regulations place certain restrictions on dividends paid by the Bank. The total amount of dividends which may be paid at any date is generally limited to the retained earnings of the Bank. In addition, dividends paid by the Bank would be prohibited if the effect thereof would cause the Bank’s capital to be reduced below applicable minimum capital requirements.
20. RECENT ACCOUNTING PRONOUNCEMENTS AND ACCOUNTING CHANGES
In November 2002, the FASB issued FASB Interpretation No. 45, “Guarantor’s Accounting and Disclosure Requirements for Guarantees, including Indirect Guarantees of Indebtedness of Others” (FIN 45). The interpretation elaborates on the disclosures to be made by a guarantor in its financial statements under certain guarantees that it has issued. It also clarifies that a guarantor is required to recognize, at the inception of a guarantee, a liability for the fair value of the obligation undertaken in issuing the guarantee. The interpretation requires disclosure of the nature of the guarantee, the maximum potential amount of future payments that the guarantor could be required to make under the guarantee, and the current amount of the liability, if any, for the guarantor’s obligations under the guarantee. The recognition requirements of the interpretation were effective beginning January 1, 2003.
The FASB also revised FASB Interpretation 46, “Consolidation of Variable Interest Entities, an interpretation of ARB No. 51” (FIN 46). The interpretation provides a framework for identifying variable interest entities (VIEs), and determining when a company should include the assets, liabilities, noncontrolling interests and results of activities of a VIE in its consolidated financial statements. As revised, FIN 46 is effective beginning in the first quarter of 2004 for all VIEs (other than what is commonly referred to as special purpose entities, VIEs of small business issuers, and VIEs of nonpublic entities). The Bank does not currently utilize VIEs or so called special purpose entities.
In November 2003, the FASB’s Emerging Issues Task Force (EITF) reached consensus on new disclosure requirements related to unrealized losses on investment securities. The new disclosure requirements apply to marketable equity and debt securities accounted for under Financial Accounting Board Statement No 115, “Accounting for Certain Investments in Debt and Equity Securities,” and are required for inclusion in annual reports with fiscal years ended after December 15, 2003.
In November 2003, the FASB issued FASB Staff Position (FSP) 144-1, “Determination of Cost Basis for Foreclosed Assets under FASB Statement No. 15”, “Accounting by Debtors and Creditors for Troubled Debt Restructurings,” and the Measurement of Cumulative Losses Previously Recognized under Paragraph 37 of FASB Statement No. 144, “Accounting for the Impairment or Disposal of Long-Lived Assets.” Under FSP 144-1, the lender is required to measure the foreclosure on a long-lived asset (e.g. real estate) at fair value less cost to sell on the foreclosure date, which establishes a new cost basis such that any loan valuation allowance is not retained. Thereafter, the lender would follow the impairment guidance in Statement No 144, and should not reflect any recovery in value of the property beyond the cost basis established upon foreclosure of the loan. This guidance was effective upon posting of the FSP to the FASB website in November 2003.
In April 2003, the Financial Accounting Standards Board issued Statement No. 149, “Amendment of Statement 133 on Derivative Instruments and Hedging Activities”. This statement amends and clarifies financial accounting and reporting for derivative instruments, including certain derivative instruments embedded in other contracts (collectively referred to as derivatives) and for hedging activities under FASB Statement No. 133, Accounting for Derivative Instruments and Hedging Activities. This statement is effective for contracts entered into or modified after June 30, 2003.
In May 2003, the Financial Accounting Standards Board issued Statement No. 150, “Accounting for Certain Financial Instruments with Characteristics of both Liabilities and Equity”. This statement establishes standards for how an issuer classifies and measures certain financial instruments with characteristics of both liabilities and equity. It requires that an issuer classify a financial instrument that is within its scope as a liability (or an asset in some circumstances). Many of those instruments were previously classified as equity. This statement is effective for financial instruments entered into or modified after May 31, 2003, and otherwise is effective at the beginning of the first interim period beginning after June 15, 2003.
In December 2004, the FASB issued Statement No. 123 (revised 2004), which is a revision of Statement 123 “Accounting for Stock-Based Compensation”. This Statement establishes standards for the accounting for transactions in which an entity exchanges its equity instruments for goods or services. It also addresses transactions in which an entity incurs liabilities in exchange for goods or services that are based on the fair value of the entity’s equity instruments or that may be settled by the issuance of those equity instruments. This Statement focuses primarily on accounting for transactions in which an entity obtains employee services in share-based payment transactions. This Statement is effective for public entities as of the beginning of the first interim or annual reporting period that begins after June 15, 2005.
In December 2004, the FASB issued Statement No. 153, “Exchanges of Nonmonetary Assets”, an amendment of APB Opinion No. 29, Accounting for Nonmonetary Transactions”. This Statement eliminates the exception to fair value for exchanges of similar productive assets and replaces it with a general exception for exchange transactions that do not have commercial substance-that is, transactions that are not expected to result in significant changes in the cash flows of the reporting entity. This Statement is effective for nonmonetary asset exchanges occurring in fiscal periods beginning after June 15, 2005.
In May 2005, the FASB issued Statement No. 154, “Accounting Changes and Error Corrections - a replacement of APB Opinion No. 20 and FASB Statement No. 3”. This Statement requires retrospective application to prior periods’ financial statements of changes in accounting principle, unless it is impracticable to determine either the period-specific effects or the cumulative effect of the change. When it is impracticable to determine the period-specific effects of an accounting change on one or more individual prior periods presented, this Statement requires that the new accounting principle be applied to the balances of assets and liabilities as of the beginning of the earliest period for which retrospective application is practicable and that a corresponding adjustment be made to the opening balance of retained earnings. This Statement improves financial reporting because its requirement to report voluntary changes in accounting principles via retrospective application, unless impracticable, enhances the consistency of financial information between periods. This statement is effective for accounting changes and corrections of errors made in fiscal years beginning after December 15, 2005.
15
Table of Contents
During November 2005, the FASB issued FASB Staff Position (FSP) FAS 115-1 and 124-1, “The Meaning of Other-Than-Temporary Impairment and Its Application to Certain Investments.” The guidance in this FSP addresses the determination of when an investment is considered impaired, whether that impairment is other than temporary, and the measurement of an impairment loss. The FSP also includes accounting considerations subsequent to the recognition of an other-than temporary impairment and requires certain disclosures about unrealized losses that have not been recognized as other-than-temporary impairments. The guidance in this FSP is required to be applied to reporting periods beginning after December 15, 2005. Earlier application is permitted.
The FASB has issued FASB Statement No. 155, “Accounting for Certain Hybrid Instruments.” This standard amends the guidance in FASB Statements No. 133, “Accounting for Derivative Instruments and Hedging Activities”, and No. 140, “Accounting for Transfers and Servicing of Financial Assets and Extinguishments of Liabilities.” Statement 155 allows financial instruments that have embedded derivatives to be accounted for as a whole (eliminating the need to bifurcate the derivative from its host) if the holder elects to account for the whole instrument on a fair value basis. Statement 155 is effective for all financial instruments acquired or issued after the beginning of an entity’s first fiscal year that begins after September 15, 2006. Earlier adoption is permitted as of the beginning of an entity’s fiscal year, provided the entity has not yet issued financial statements, including financial statements for any interim period for that fiscal year. Provisions of this Statement may be applied to instruments that an entity holds at the date of adoption on an instrument-by-instrument basis. The financial statement effect of the change in accounting, if any, should be recognized as a cumulative-effect adjustment to beginning retained earnings. Prior periods should not be restated.
Management does not expect these accounting pronouncements to have a material impact on the financial statements.
21. REVISION TO FINANCIAL STATEMENTS.
Subsequent to the issuance of the Bank’s 2005 financial statements, the OCC issued a directive that the Bank’s Call Report be revised and re-filed. The revision dealt with the OCC’s determination that certain loans be reclassified from accruing to non-accrual loan status. As the result of the Bank having to revise its Call Report, the Bank was also required by the OCC to revise its annual financial statements.
The effects of the revision on the Bank’s financial statements, as of and for the year ended December 31, 2005, are as follows:
| As Originally Presented | Changes | As Revised | |||||||||
Statements of Financial Condition: | |||||||||||
Loans | $ | 204,632 | (69 | ) | $ | 204,563 | |||||
Other Assets | 4,963 | 7 | 4,970 | ||||||||
Statements of Income: | |||||||||||
Interest income | 17,458 | (94 | ) | 17,364 | |||||||
Income taxes | 692 | (32 | ) | 660 | |||||||
Net income | 2,081 | (62 | ) | 2,019 | |||||||
Statements of Cash Flows: | |||||||||||
Net cash from operating activities | 1,284 | (69 | ) | 1,215 | |||||||
Net cash from investing activities | (17,018 | ) | 69 | (16,949 | ) | ||||||
Statements of Changes in Shareholders Equity: | |||||||||||
Undivided profits | 6,571 | (62 | ) | 6,509 | |||||||
16
Table of Contents
Summary of Operations
(Dollars in Thousands Except Per Share Data)
FOR THE YEAR: | 2005 (Revised) | 2004 | 2003 | 2002 | 2001 | |||||||||||
Total Interest Income | $ | 17,364 | $ | 17,741 | $ | 18,982 | $ | 20,766 | $ | 22,969 | ||||||
Total Interest Expense | 7,385 | 6,963 | 7,935 | 10,223 | 13,363 | |||||||||||
Net Interest Income | 9,979 | 10,778 | 11,047 | 10,543 | 9,606 | |||||||||||
Provision for Loan Losses | 120 | 120 | 821 | 120 | 60 | |||||||||||
Net Interest Income After Provision for Loan Losses | 9,859 | 10,658 | 10,226 | 10,423 | 9,546 | |||||||||||
Non-Interest Income | 1,119 | 1,294 | 1,118 | 1,110 | 991 | |||||||||||
Non-Interest Expense | 8,299 | 7,841 | 7,001 | 6,573 | 5,511 | |||||||||||
Net Income Before Taxes | 2,679 | 4,111 | 4,343 | 4,960 | 5,026 | |||||||||||
Applicable Income Taxes: | ||||||||||||||||
Current | 454 | 1,112 | 1,544 | 1,531 | 1,525 | |||||||||||
Deferred | 206 | 163 | (170 | ) | 69 | 24 | ||||||||||
Net Income | $ | 2,019 | $ | 2,836 | $ | 2,969 | $ | 3,360 | $ | 3,477 | ||||||
Basic and Diluted | ||||||||||||||||
Net Income Per Share* | $ | 0.85 | $ | 1.19 | $ | 1.25 | $ | 1.41 | $ | 1.46 | ||||||
| * | Net Income per share has been retroactively adjusted to reflect the stock dividend in 2003. |
AT YEAR END: | 2005 (Revised) | 2004 | 2003 | 2002 | 2001 | ||||||||||
Interest-Bearing Deposits in Other Financial Institutions | $ | 22,465 | $ | 24,941 | $ | 14,847 | $ | 13,957 | $ | 12,672 | |||||
Federal Funds Sold | — | 18,485 | 16,780 | 5,215 | 50,798 | ||||||||||
Investment Securities | 95,665 | 75,613 | 118,250 | 105,952 | 105,792 | ||||||||||
Loans (Net) | 204,563 | 206,689 | 195,653 | 213,674 | 179,066 | ||||||||||
Deposits | 318,818 | 318,710 | 333,337 | 321,543 | 332,378 | ||||||||||
Demand | 44,862 | 42,080 | 40,367 | 36,782 | 36,064 | ||||||||||
Interest-Bearing Demand | 26,781 | 39,538 | 51,667 | 37,927 | 29,765 | ||||||||||
Savings | 67,738 | 69,940 | 66,186 | 59,995 | 53,592 | ||||||||||
Time | 179,437 | 167,152 | 175,117 | 186,839 | 212,957 | ||||||||||
Capital Accounts | 37,820 | 37,701 | 36,766 | 35,577 | 33,876 | ||||||||||
Total Resources | 357,244 | 356,992 | 371,213 | 359,641 | 367,934 | ||||||||||
Carrying Value Per Share | $ | 15.92 | $ | 15.87 | $ | 15.48 | $ | 14.98 | $ | 14.26 | |||||
DAILY AVERAGES FOR THE YEAR: | 2005 | 2004 | 2003 | 2002 | 2001 | ||||||||||
Interest-Bearing Deposits in Other Financial Institutions | $ | 23,031 | $ | 19,827 | $ | 15,166 | $ | 12,945 | $ | 11,900 | |||||
Federal Funds Sold | 18,226 | 20,143 | 66,855 | 40,877 | 29,011 | ||||||||||
Investment Securities | 89,861 | 105,500 | 93,343 | 110,794 | 94,548 | ||||||||||
Loans | 259,158 | 198,021 | 188,948 | 177,452 | 183,256 | ||||||||||
Deposits | 320,537 | 346,809 | 331,192 | 329,552 | 305,112 | ||||||||||
Demand | 44,600 | 43,083 | 40,430 | 35,939 | 32,789 | ||||||||||
Interest-Bearing Demand | 22,631 | 25,903 | 27,769 | 29,230 | 29,008 | ||||||||||
Savings | 81,148 | 90,235 | 83,033 | 64,862 | 55,292 | ||||||||||
Other Time | 172,158 | 187,588 | 179,960 | 199,521 | 188,023 | ||||||||||
Capital Accounts | 37,154 | 37,354 | 36,407 | 34,494 | 32,968 | ||||||||||
Total Resources | $ | 357,464 | $ | 367,316 | $ | 372,928 | $ | 369,163 | $ | 341,501 | |||||
17
Table of Contents
Price Range of Common Stock
| 2005 | 2004 | Dividends Per Share | ||||||||||||||||
| HIGH | LOW | HIGH | LOW | 2005 | 2004 | |||||||||||||
First Quarter | $ | 23 | $ | 22 | $ | 25 | $ | 22 | $ | 0.20 | $ | 0.20 | ||||||
Second Quarter | 23 | 20 | 25 | 22 | 0.20 | 0.20 | ||||||||||||
Third Quarter | 20 | 20 | 22 | 22 | 0.20 | 0.20 | ||||||||||||
Fourth Quarter | 20 | 19 | 22 | 21 | 0.20 | 0.20 | ||||||||||||
Officers
Worth Harris Carter, Jr.
Chairman of the Board and President
| Wright L. Garrett | Elaine Bovee | |
| Senior Vice President - Commercial Loans | Assistant Cashier and Managing Officer-Country Club Drive | |
| Brenda A. Kendrick | Karen S. Cifers | |
| Senior Vice President - Operations | Assistant Cashier and Managing Officer-Blairs | |
| Paul A. Shelton | Jean B. Parson | |
| Senior Vice President and Cashier | Assistant Cashier and Managing Officer-Horner Boulevard | |
| Robyn L. Brumfield | Lynn H. Powell | |
| Vice President and Managing Officer-Chatham | Assistant Cashier and Managing Officer-58 East | |
| Jerry R. Buckner | Glenda W. Spivey | |
| Vice President and Managing Officer-North Danville | Assistant Cashier and Managing Officer-Siler City | |
| Guy Dixon | Melody Crawford | |
| Vice President - Commercial Loans | Branch Manager-Webb Avenue | |
| Susanne M. Rea | Sita DeKlein | |
| Vice President and Managing Officer-South Main | Branch Manager-Rowan Street | |
| John G. Wales | Denise Elliott | |
| Vice President - Commercial Loans | Branch Manager - Ward Blvd. | |
| Kim B. Felts | Ronna Grady | |
| Operations Officer | Branch Manager - Mt. Olive | |
| Claudia E. Helton | Patricia R. Lovelace | |
| Assistant Vice President | Branch Manager - Downtown | |
| Ruth McDaniel | Terry L. Simmons | |
| Assistant Vice President and Managing Officer-Riverside | Branch Manager - Fayetteville Road | |
Directors
| George B. Buchanan, Jr. | James C. Moses | |
| Chairman,Patricia Grand Hotels, Inc. | Retired | |
| Worth Harris Carter, Jr. | R.E. Williams | |
| Chairman of the Board and President | Retired | |
| Brenda A. Kendrick | ||
| Senior Vice President -Operations | ||

P.O. Box 1658
Danville, Virginia 24543-1658
(434) 793-3321
Member FDIC
Table of Contents

Table of Contents
OFFICE OF THE COMPTROLLER OF THE CURRENCY
WASHINGTON, D.C. 20219
FORM 10-Q
| x | QUARTERLY REPORT PURSUANT SECTION 13 OR 15(d) OF THE SECURITIES EXCHANGE ACT OF 1934 |
For the quarterly period ended September 30, 2006
OR
| ¨ | TRANSITION REPORT PURSUANT TO SECTION 13 OR 15(d) OF THE SECURITIES EXCHANGE ACT OF 1934 |
For the transition period from to
Commission File Number: n/a
PEOPLES NATIONAL BANK
(Exact name of registrant as specified in its charter)
| National Bank | 54-0500948 | |
(State or other jurisdiction of incorporation or organization) | (I.R.S. Employer Identification No.) | |
141 Westover Drive Danville, VA | 24541 | |
| (Address of principal executive offices) | (Zip Code) | |
(434) 793-3321
(Registrant’s telephone number, including area code)
n/a
(Former name, former address and former fiscal year, if changed since last report)
Indicate by check mark whether the registrant (1) has filed all reports required to be filed by Section 13 or 15(d) of the Securities Exchange Act of 1934 during the preceding 12 months (or for such shorter period that the registrant was required to file such reports), and (2) has been subject to such filing requirements for the past 90 days. Yes x No ¨
Indicate by check mark whether the registrant is a large accelerated filer, an accelerated filer, or a non-accelerated filer. See definition of “accelerated filer and large accelerated filer” in Rule 12b-2 of the Exchange Act.
Large accelerated filer ¨ Accelerated filer ¨ Non-accelerated filer x
Indicate by check mark whether the registrant is a shell company (as defined in Rule 12b-2 of the Exchange Act). Yes ¨ No x
As of November 13, 2006, there were issued and outstanding 2,375,683 shares of the registrant’s common stock.
Table of Contents
INDEX
| PART I - FINANCIAL INFORMATION | 4 | |||||
| ITEM 1 - | FINANCIAL STATEMENTS | 4 | ||||
| STATEMENTS OF CONDITION | 4 | |||||
| STATEMENTS OF INCOME | 5 | |||||
| STATEMENTS OF CASH FLOWS | 6 | |||||
| STATEMENTS OF CHANGES IN SHAREHOLDERS’ EQUITY | 7 | |||||
| Notes To Unaudited Financial Statements | 7 | |||||
| ITEM 2 - MANAGEMENT’S DISCUSSION AND ANALYSIS | 9 | |||||
| ITEM 3 - QUANTITATIVE AND QUALITATIVE DISCLOSURES ABOUT MARKET RISK | 13 | |||||
| ITEM 4 - CONTROLS AND PROCEDURES | 14 | |||||
| PART II – OTHER INFORMATION | 15 | |||||
| ITEM 1 - LEGAL PROCEEDINGS | 15 | |||||
| ITEM 1A - RISK FACTORS | 15 | |||||
| ITEM 2 - UNREGISTERED SALES OF EQUITY SECURITIES AND USE OF PROCEEDS | 15 | |||||
| ITEM 3 - DEFAULTS UPON SENIOR SECURITIES | 15 | |||||
| ITEM 4 - SUBMISSION OF MATTERS TO A VOTE OF SECURITY HOLDERS | 15 | |||||
| ITEM 5 - OTHER INFORMATION | 15 | |||||
| ITEM 6 - EXHIBITS | 15 | |||||
2
Table of Contents
FORWARD–LOOKING STATEMENTS
This report contains statements concerning Peoples National Bank’s (the “Bank”) expectations, plans, objectives, future financial performance and other statements that are not historical facts. These statements may constitute “forward-looking statements” as defined by federal securities laws. In some cases, readers can identify the forward-looking statements by the use of words such as “may,” “will,” “should,” “could,” “expect,” “plan,” “intend,” “anticipate,” “believe,” “estimate,” “predict,” “potential” or “continue” or the negative or other variations of these words, or other comparable words or phrases. These statements may address issues that involve estimates and assumptions made by management, risks and uncertainties, and actual results could differ materially from historical results or those anticipated by such statements. Factors that could have a material adverse effect on the Bank’s operations and future prospects include, but are not limited to, changes in: interest rates; general and local economic conditions; the legislative/regulatory climate; monetary and fiscal policies of the U.S. government, including policies of the U.S. Treasury and the Federal Reserve Board; the quality or composition of loan or investment portfolios; demand for loan products; deposit flows; competition; demand for financial services in our market area and accounting principles, policies and guidelines. These risks and uncertainties should be considered in evaluating the forward-looking statements contained herein, and readers are cautioned not to place undue reliance on such statements, which speak only as of the date of this report.
3
Table of Contents
PART I—FINANCIAL INFORMATION
Item 1—FINANCIAL STATEMENTS
PEOPLES NATIONAL BANK
STATEMENTS OF CONDITION
(Dollars in Thousands)
| September 30, 2006 | December 31, 2005 | |||||||
| (Unaudited) | ||||||||
ASSETS | ||||||||
Interest-Bearing Deposits in Other Financial Institutions | $ | 18,801 | $ | 22,465 | ||||
Investment Securities | ||||||||
U. S. Agency Securities | 88,851 | 95,665 | ||||||
Federal Funds Sold | 9,800 | — | ||||||
Loans | 214,552 | 206,930 | ||||||
Less: Unearned | (625 | ) | (714 | ) | ||||
Allowance for Loan Losses | (2,451 | ) | (2,367 | ) | ||||
Net Loans | 211,476 | 204,563 | ||||||
Earning Assets | 328,928 | 322,693 | ||||||
Cash and Due From Banks | 9,506 | 10,367 | ||||||
Bank Premises and Equipment | 19,123 | 18,188 | ||||||
Real Estate Owned Other Than Bank Premises | 445 | 257 | ||||||
Investment in Associated Companies | 769 | 769 | ||||||
Other Assets | 4,499 | 4,970 | ||||||
TOTAL ASSETS | $ | 363,270 | $ | 357,244 | ||||
LIABILITIES | ||||||||
Deposits | ||||||||
LIFETIME FREE CHECKING | $ | 44,633 | $ | 44,862 | ||||
Interest-Bearing Demand | 24,573 | 26,781 | ||||||
Regular Passbook Savings | 61,408 | 67,738 | ||||||
Time Deposits | ||||||||
Certificates of Deposit $100,000 or More | 38,612 | 30,912 | ||||||
Other | 153,237 | 148,525 | ||||||
Total Deposits | 322,463 | 318,818 | ||||||
Notes issued to the U. S. Treasury | 223 | 72 | ||||||
Other Liabilities | 2,655 | 534 | ||||||
TOTAL LIABILITIES | 325,341 | 319,424 | ||||||
SHAREHOLDERS’ EQUITY | ||||||||
Common Stock, Par Value $1 Per Share, Authorized 2,500,000 Shares; 2,375,683 Outstanding in 2005 and 2004 | 2,376 | 2,376 | ||||||
Surplus | 28,935 | 28,935 | ||||||
Undivided Profits | 6,618 | 6,509 | ||||||
TOTAL SHAREHOLDERS’ EQUITY | 37,929 | 37,820 | ||||||
TOTAL LIABILITIES AND SHAREHOLDERS’ EQUITY | $ | 363,270 | $ | 357,244 | ||||
See accompanying notes to unaudited financial statements.
4
Table of Contents
PEOPLES NATIONAL BANK
STATEMENTS OF INCOME
| Nine Months Ended September 30, | Three Months Ended September 30, | |||||||||||
| 2006 | 2005 | 2006 | 2005 | |||||||||
| (Unaudited) | (Unaudited) | |||||||||||
INTEREST INCOME | ||||||||||||
Interest and Fees on Loans | ||||||||||||
Taxable | $ | 10,509 | $ | 9,436 | $ | 3,560 | $ | 3,098 | ||||
Non-Taxable | 275 | 288 | 108 | 92 | ||||||||
Interest on Deposits in Other Financial Institutions | 671 | 567 | 228 | 206 | ||||||||
Interest on Federal Funds Sold | 484 | 212 | 115 | 132 | ||||||||
Interest and Dividends on Securities | ||||||||||||
U. S. Agency Securities | 2,715 | 2,422 | 943 | 810 | ||||||||
Obligations of States and Political Subdivisions | — | 23 | — | 5 | ||||||||
TOTAL INTEREST INCOME | 14,654 | 12,948 | 4,954 | 4,343 | ||||||||
INTEREST EXPENSE | ||||||||||||
Interest on Time Deposits $100,000 or More | 1,079 | 781 | 420 | 287 | ||||||||
Interest on Other Deposits | 5,681 | 4,652 | 1,950 | 1,647 | ||||||||
Interest on Federal Funds Purchased | 2 | 8 | 2 | — | ||||||||
Interest on Notes Issued to the U. S. Treasury | 3 | 2 | 1 | 1 | ||||||||
TOTAL INTEREST EXPENSE | 6,765 | 5,443 | 2,373 | 1,935 | ||||||||
NET INTEREST INCOME | 7,889 | 7,505 | 2,581 | 2,408 | ||||||||
Provision for Loan Losses | 90 | 90 | 30 | 30 | ||||||||
NET INTEREST INCOME AFTER PROVISION FOR LOAN LOSSES | 7,799 | 7,415 | 2,551 | 2,378 | ||||||||
NON-INTEREST INCOME | ||||||||||||
Service Charges, Commissions and Fees | 598 | 688 | 204 | 226 | ||||||||
Other Non-Interest Income | 106 | 95 | 49 | 29 | ||||||||
TOTAL NON-INTEREST INCOME | 704 | 783 | 253 | 255 | ||||||||
NON-INTEREST EXPENSE | ||||||||||||
Salaries and Employee Benefits | 3,481 | 3,427 | 1,129 | 1,131 | ||||||||
Occupancy Expense (Net) | 1,032 | 958 | 344 | 323 | ||||||||
Operations Center Expense | 1,195 | 1,101 | 398 | 374 | ||||||||
Other Non-Interest Expense | 615 | 629 | 192 | 207 | ||||||||
TOTAL NON-INTEREST EXPENSE | 6,323 | 6,115 | 2,063 | 2,035 | ||||||||
INCOME BEFORE INCOME TAXES | 2,180 | 2,083 | 741 | 598 | ||||||||
Income Tax Expense | 645 | 597 | 195 | 167 | ||||||||
NET INCOME | $ | 1,535 | $ | 1,486 | $ | 546 | $ | 431 | ||||
EARNINGS PER COMMON SHARE: | ||||||||||||
Basic and Diluted | $ | 0.65 | $ | 0.63 | $ | 0.23 | $ | 0.18 | ||||
Weighted Average Shares Outstanding | 2,375,683 | 2,375,683 | 2,375,683 | 2,375,683 | ||||||||
Cash Dividends Per Common Share | $ | 0.60 | $ | 0.60 | $ | 0.20 | $ | 0.20 | ||||
See accompanying notes to unaudited financial statements.
5
Table of Contents
PEOPLES NATIONAL BANK
STATEMENTS OF CASH FLOWS
(Dollars in Thousands)
See accompanying notes to unaudited financial statements.
| Nine Months Ended September 30, | ||||||||
| 2006 | 2005 | |||||||
| (Unaudited) | ||||||||
Cash Flows From Operating Activities | ||||||||
Net Income | $ | 1,535 | $ | 1,486 | ||||
Adjustments to reconcile net income to net cash provided by operating activities | ||||||||
Provision for Loan Losses | 90 | 90 | ||||||
Depreciation of Bank Premises and Equipment | 304 | 297 | ||||||
Increase (Decrease) in Unearned Income | (89 | ) | (153 | ) | ||||
(Decrease) Increase in Other Assets | 464 | (66 | ) | |||||
Increase (Decrease) in Other Liabilities | 2,121 | 1,797 | ||||||
Net Cash From Operating Activities | 4,425 | 3,451 | ||||||
Cash Flows From Investing Activities | ||||||||
Proceeds from Maturity of Interest Bearing Balances | 14,394 | 14,745 | ||||||
Purchase of Interest Bearing Balances | (10,792 | ) | (13,061 | ) | ||||
Payments on Investment Securities | 20,314 | 14,086 | ||||||
Purchase of Investment Securities | (13,500 | ) | (28,500 | ) | ||||
Purchase of Bank Premises and Equipment | (1,239 | ) | (572 | ) | ||||
Net (Increase) Decrease in Short-Term Loans Outstanding, Net | (1,235 | ) | 29 | |||||
Longer-Term Loans Originated or Purchased | (36,140 | ) | (28,081 | ) | ||||
Principal Collected on Longer-Term Loans | (6,839 | ) | 29,844 | |||||
(Increase) in Other Real Estate | (188 | ) | (49 | ) | ||||
Net Cash From Investing Activities | (35,225 | ) | (11,559 | ) | ||||
Cash Flows from Financing Activities | ||||||||
Decrease in Demand and Savings Accounts | (8,767 | ) | (2,022 | ) | ||||
Proceeds from Sale of Time Deposits | 106,900 | 74,920 | ||||||
Payments for Matured Time Deposits | (57,119 | ) | (64,813 | ) | ||||
Cash Dividends | (1,426 | ) | (1,426 | ) | ||||
Net Change in Notes issued to the U. S. Treasury | 151 | 158 | ||||||
Net Cash From Financing Activities | 39,739 | 6,817 | ||||||
Net Increase (Decrease) in Cash and Cash Equivalents | 8,939 | (1,291 | ) | |||||
Cash and Cash Equivalents at Beginning of Year | 10,367 | 27,878 | ||||||
Cash and Cash Equivalents at End of Period | $ | 19,306 | $ | 26,587 | ||||
Cash and Cash Equivalents Include: | ||||||||
Cash and Due From Banks | $ | 9,506 | $ | 9,887 | ||||
Federal Funds Sold | 9,800 | 16,700 | ||||||
Total Cash and Cash Equivalents at Period End | $ | 19,306 | $ | 26,587 | ||||
Supplementary Data: | ||||||||
Cash Interest Paid | $ | 7,294 | $ | 3,442 | ||||
Cash Paid for Taxes | 645 | 597 | ||||||
6
Table of Contents
PEOPLES NATIONAL BANK
STATEMENTS OF CHANGES IN SHAREHOLDERS’ EQUITY
(Dollars in Thousands)
| Common Stock | Surplus | Undivided Profits | ||||||||||
| Shares | Par Value | |||||||||||
Balances, December 31, 2005 | 2,375,683 | $ | 2,376 | $ | 28,935 | $ | 6,509 | |||||
Net Income | — | — | — | 1,535 | ||||||||
Cash Dividends | — | — | — | (1,426 | ) | |||||||
Balances, September 30, 2006 (Unaudited) | 2,375,683 | $ | 2,376 | $ | 28,935 | $ | 6,618 | |||||
Notes To Unaudited Financial Statements
The unaudited interim financial statements of the Bank are prepared in conformity with accounting principles generally accepted in the United States of America and the instructions to the Securities and Exchange Commission’s Form 10-Q. In the opinion of management, all adjustments (consisting only of normal recurring adjustments) necessary for a fair presentation of the financial position and results of operations for the periods presented have been included. The financial statements should be read in conjunction with the financial statements and notes contained in the Bank’s Annual Report on Form 10-K, as amended, for the year ended December 31, 2005. The results for the nine months ended September 30, 2006 are not necessarily indicative of the results for the entire fiscal year ending December 31, 2006.
Certain reclassifications have been made to the prior year financial statements to conform to the 2006 presentation. These reclassifications had no effect on previously reported net income.
NOTE 1—INVESTMENT SECURITIES
(Dollars in Thousands)
The Bank has the ability and intent to carry the investments noted with an unrealized loss to the final maturity of the instrument and considers these investments not other-than-temporarily impaired.
The following table sets forth a summary of the investment securities portfolio as of the periods indicated:
| Amortized Cost | Gross Unrealized Gains | Gross Unrealized Losses | Estimated Market Value | |||||||||
September 30, 2006 (Unaudited) | ||||||||||||
U. S. Agency Securities | $ | 87,175 | $ | 23 | $ | 895 | $ | 86,303 | ||||
Mortgage-backed securities | 1,676 | — | — | 1,676 | ||||||||
Total | $ | 88,851 | $ | 23 | $ | 895 | $ | 87,979 | ||||
December 31, 2005 | ||||||||||||
U. S. Agency Securities | $ | 93,652 | $ | 21 | $ | 1,189 | $ | 92,484 | ||||
Mortgage-backed securities | 2,013 | — | — | 2,013 | ||||||||
Total | $ | 95,665 | $ | 21 | $ | 1,189 | $ | 94,497 | ||||
7
Table of Contents
NOTE 2—LOANS
(Dollars in Thousands)
The composition of the loan portfolio by dollar amount is shown in the table below:
| September 30, 2006 | December 31, 2005 | |||||||
| (Unaudited) | ||||||||
Secured by real estate | ||||||||
Construction Loans | $ | 10,861 | $ | 7,070 | ||||
Secured by farmland (including farm residential and other improvements) | 136 | 329 | ||||||
Secured by 1-4 family residential properties | 19,945 | 21,310 | ||||||
Secured by multi-family residential properties | 15,199 | 12,147 | ||||||
Secured by non-farm residential property | 122,271 | 118,119 | ||||||
Loans to other Depository Institutions | 1,500 | 1,500 | ||||||
Loans to finance agricultural production and other loans to farmers | 1,670 | 1,677 | ||||||
Commercial and industrial loans | 20,541 | 22,639 | ||||||
Loans to individuals for household, family and other personal expenditures | 12,706 | 13,748 | ||||||
Obligations (other than securities) of states and political subdivisions | 9,723 | 9,174 | ||||||
Less: Unearned Income | (625 | ) | (714 | ) | ||||
Total loans and leases | $ | 213,928 | $ | 206,999 | ||||
NOTE 3—ALLOWANCE FOR LOAN LOSSES
(Dollars in Thousands)
The allowance for loan losses is an estimate of losses inherent in the loan portfolio as determined by management taking into consideration historical loan loss experience, diversification of the loan portfolio, amounts of secured and unsecured loans, banking industry standards and averages, and general economic conditions. Ultimate losses may vary from current estimates. These estimates are reviewed periodically and as adjustments become necessary, they are reported in earnings in the periods which they become reasonably estimable.
The following table summarizes the activity in the allowance for loan losses in the periods presented:
| September 30, 2006 | December 31, 2005 | ||||||
| (Unaudited) | |||||||
Balance Beginning of Period | $ | 2,367 | $ | 2,412 | |||
Provision for Loan Losses | 90 | 120 | |||||
Charge-Offs, Net of (Recoveries): | |||||||
Real Estate Loans | (11 | ) | 88 | ||||
Installment Loans | 17 | 75 | |||||
Commercial Loans | — | 2 | |||||
Total Net Loan Losses | 6 | 165 | |||||
Balance | $ | 2,451 | $ | 2,367 | |||
8
Table of Contents
NOTE 4—NONPERFORMING ASSETS AND DELINQUENT LOANS
| September 30, 2006 | December 31, 2005 | |||||
| (Unaudited) | ||||||
Nonaccrual Loans | ||||||
Real Estate | $ | 2,495 | $ | 2,749 | ||
Installment | 24 | 16 | ||||
Commercial | — | 5 | ||||
Total Nonaccrual Loans | 2,519 | 2,770 | ||||
Foreclosed Properties | 445 | 257 | ||||
Total Nonperforming Assets | $ | 2,964 | $ | 3,027 | ||
Loans 90 Days or More Past Due and Still Accruing | ||||||
Real Estate | $ | — | $ | 196 | ||
Installment | 20 | 62 | ||||
Commercial | — | — | ||||
Total Loans 90 Days or More Past Due | $ | 20 | $ | 258 | ||
Item 2—MANAGEMENT’S DISCUSSION AND ANALYSIS
The Bank
Incorporated in 1976 as a state-chartered bank with its main office in Danville, Virginia. The Bank converted to a national banking association in 1995. The Bank operates under a national charter and provides full banking services. As a national bank, the Bank is subject to regulation by the Comptroller of the Currency, the Federal Deposit Insurance Corporation and the Board of Governors of the Federal Reserve System. The Bank generates commercial (including agricultural), mortgage and consumer loans and receives deposits from customers located primarily in the areas surrounding the Bank’s offices, which are located in the City of Danville and Pittsylvania County in Virginia and Alamance, Chatham, Cumberland, Lee, Pitt, Robeson, Wayne and Wilson Counties in North Carolina. At September 30, 2006, the Bank had $363 million in assets, $211 million in net loans, $322 million in deposits and $38 million in total shareholders’ equity.
Proposed Reorganization and Merger
On July 28, 2006, the Bank entered into an Agreement and Plan of Merger (the “Merger Agreement”) with Blue Ridge Bank, N.A., Central National Bank, Community National Bank, First National Bank, First National Exchange Bank, Mountain National Bank, Patrick Henry National Bank, Patriot Bank, National Association, Shenandoah National Bank (together with the Bank, the “Banks”) and Carter Bank & Trust, a new Virginia chartered bank that will be headquartered in Martinsville, Virginia. The Merger Agreement sets forth the terms and conditions pursuant to which the Banks will reorganize by merging into Carter Bank & Trust (the “Merger”).
All officers and employees of the existing Banks will remain unchanged as a result of the Merger. Worth Harris Carter, Jr. is currently Chairman of the Board and President of each of the Banks and will serve as Chairman of the Board and President of Carter Bank & Trust. Under the terms of the Merger Agreement, shareholders of each of the Banks will receive a certain number of shares in Carter Bank & Trust in exchange for each share held in the existing Banks as follows: each share of Blue Ridge Bank: 2.474 shares; each share of Central National Bank: 5.470 shares; each share of Community National Bank: 4.350 shares; each share of First National Bank: 1.613 shares; each share of First National Exchange Bank: 4.509 shares; each share of Mountain National Bank: 3.981 shares; each share of Patrick Henry National Bank: 1.112 shares; each share of Patriot Bank: 5.775 shares; each share of Peoples National Bank: 1.945 shares; and each share of Shenandoah National Bank: 3.461 shares.
9
Table of Contents
Consummation of the Merger is subject to a number of customary conditions including (i) the approval of the Merger by the shareholders of each of the Banks and Carter Bank & Trust and (ii) the receipt of all required regulatory approvals, including approval by the Virginia State Corporation Commission and the Federal Deposit Insurance Corporation. The Merger is expected to be completed in the fourth quarter of 2006 and will be accounted for using the purchase method of accounting
Critical Accounting Policies
The accounting and reporting policies of the Bank conform to generally accepted accounting principles (GAAP) in the United States of America and to general practices within the banking industry. The preparation of the financial statements in conformity with GAAP requires management to make estimates and assumptions that affect the amounts reported in the financial statements and accompanying notes. We believe the most significant of these estimates involves the allowance for loan losses because of its potential impact on our overall performance. We have described our policies in this area below. A summary of the Bank’s significant accounting policies can be found in the Notes to Financial Statements included in the Bank’s 2005 Annual Report on Form 10-K.
In general, determining the amount of the allowance for loan losses requires significant judgment and the use of estimates by management allowing for losses inherent to the loan portfolio. The Bank maintains an allowance for loan losses to absorb probable losses in the loan portfolio based on a quarterly analysis of the portfolio. This analysis determines an appropriate level of the allowance for loan losses by considering factors affecting loan losses, including specific losses, levels and trends in impaired and non-performing loans, historical loan loss experience, current economic conditions, volume, growth and composition of the portfolio, and other relevant factors. The Bank records a provision for loan losses to maintain the allowance at an adequate level. The provision expense could increase or decrease each quarter based upon the results of management’s formal analysis.
The amount of the allowance represents management’s estimate of expected losses from existing loans based upon specific allocations for individual lending relationships and historical loss experience. The allowance for loan losses related to impaired loans is based on discounted cash flows using the loan’s initial effective interest rate or the fair value of the collateral for certain collateral dependent loans. This evaluation requires management to make estimates of the amounts and timing of future cash flows on impaired loans, which consists primarily of non-accrual and restructured loans. Actual losses for these loans can vary significantly from these estimates.
Investment securities are stated at cost, adjusted for amortization of premiums and accretion of discounts, and computed by the interest method. The Bank has positive intent and ability to hold these securities until maturity. Gains and losses on sales, if any, of securities are based upon the adjusted cost of the specific securities sold. If any of the securities are not held to maturity, the classification of the entire portfolio could change to available for sale. This could require fair value accounting for not just the tainted securities but the entire portfolio, and possibly, the recognition of unrealized losses as other than temporary in the income statement.
Real estate properties acquired through or in lieu of loan foreclosure are initially recorded at the lower of the Bank’s carrying amount or fair value less estimated selling cost at the date of foreclosure. Any write-downs based on the asset’s fair value at the date of acquisition are charged to the allowance for loan losses. After foreclosure, these assets are carried at the lower of their new cost basis or fair value less cost to sell. Costs of significant property improvements are capitalized, whereas costs relating to holding property are expensed. The portion of interest costs relating to development of real estate is capitalized. Valuations are periodically performed by management, and any write-downs are recorded as a charge to operations, if necessary, to reduce the carrying value of a property to the lower of its carrying value or fair value less cost to sell. The fair value of other real estate owned, including related selling costs, is an estimate that may change in the near term. If estimates change that decrease the expected fair value of the property, the recognition of this loss is reflected in the income statement for the period the estimate changes.
10
Table of Contents
Overview
Net income for the first nine months of 2006 equaled $1,535,000, or $0.65 per share, compared to $1,486,000, or $0.63 per share, for the same quarter of 2005. This represents an annualized return on average assets of 0.56% and return on equity of 5% for both years.
The Bank’s earnings have been impacted by the historically low level of interest rates for the last three years. The Federal Reserve has continue to increase the Fed Funds rate with the rate currently at 5.25%.
With interest rates increasing, the Bank has reduced its investments in interest-bearing deposits and U. S. Agency Securities while increasing Federal Funds Sold and loans. These changes in asset allocation have had a positive impact on earnings. Total deposits increased 3.6 million or 1% compared to December 31, 2005. Time deposits increased while all other categories decreased. As a result, net income increased $49,000. As interest rates continue to increase the Bank expects net interest margins to widen and earnings to increase.
Total Liabilities at September 30, 2006 were $325,341,000, up from $319,424,000 at December 31, 2005.
Total Shareholders’ Equity at September 30, 2006 was $37,929,000. At December 31, 2005, total Shareholders’ Equity was $37,820,000.
Results of Operations
Net Interest Income.Net Interest Income is our largest source of revenue and continues to be impacted by low interest rates, however, net interest income increased $384,000 or 5% compared with the prior year.
The following table details the average balances and cost and yield data for the earning asets and interest-bearing liabilities:
| For the Nine Months Ended | ||||||||||||||||||||||
| September 30, 2006 | September 30, 2005 | |||||||||||||||||||||
| (Unaudited) | ||||||||||||||||||||||
Asset/Liability | Average Balance | Income/ Expense | Yield/ Cost | Average Balance | Income/ Expense | Yield/ Cost | Increase (Decrease) | |||||||||||||||
Real Estate Loans | $ | 169,200 | $ | 8,381 | 6.60 | % | $ | 152,642 | $ | 7,273 | 6.35 | % | $ | 1,108 | ||||||||
Installment Loans | 13,422 | 884 | 8.78 | % | 13,484 | 974 | 9.63 | % | (90 | ) | ||||||||||||
Commercial Loans | 30,831 | 1,519 | 6.57 | % | 37,049 | 1,477 | 5.32 | % | 42 | |||||||||||||
Total Loans—Net of Unearned Income | 213,453 | 10,784 | 6.74 | % | 203,175 | 9,724 | 6.38 | % | 1,060 | |||||||||||||
Interest-Bearing Deposits in Other Financial Institutions | 20,225 | 671 | 4.42 | % | 21,724 | 567 | 3.48 | % | 104 | |||||||||||||
Investment Securities | 87,313 | 2,715 | 4.15 | % | 90,457 | 2,445 | 3.60 | % | 270 | |||||||||||||
Federal Funds Sold | 19,558 | 484 | 3.30 | % | 33,607 | 212 | 0.84 | % | 272 | |||||||||||||
Total Earning Assets | $ | 340,549 | $ | 14,654 | 5.74 | % | $ | 348,963 | $ | 12,948 | 4.95 | % | $ | 1,706 | ||||||||
Interest-Bearing Transaction Accounts | $ | 34,690 | $ | 467 | 1.79 | % | $ | 22,454 | $ | 82 | 0.49 | % | $ | 385 | ||||||||
Savings Deposits(Including MMA) | 70,728 | 883 | 1.66 | % | 78,447 | 957 | 1.63 | % | (74 | ) | ||||||||||||
Certificates of Deposit Over $100,000 | 32,558 | 1,079 | 4.42 | % | 30,246 | 781 | 3.44 | % | 298 | |||||||||||||
Other Certificates of Deposits | 147,242 | 4,331 | 3.92 | % | 146,365 | 3,613 | 3.29 | % | 718 | |||||||||||||
Total Deposits | 285,218 | 6,760 | 3.16 | % | 277,512 | 5,433 | 2.61 | % | 1,327 | |||||||||||||
Notes issued to the U. S. Treasury | 100 | 3 | 4.00 | % | 97 | 2 | 2.75 | % | 1 | |||||||||||||
Federal Funds Purchased | 238 | 2 | 1.12 | % | 8 | 8 | 133.33 | % | (6 | ) | ||||||||||||
Total Interest-Bearing Liabilities | $ | 285,556 | $ | 6,765 | 3.16 | % | $ | 277,617 | $ | 5,443 | 2.61 | % | $ | 1,322 | ||||||||
Net Interest Income | $ | 7,889 | 3.09 | % | $ | 7,505 | 2.87 | % | $ | 384 | ||||||||||||
11
Table of Contents
Allowance and Provision for Loan Losses.The Allowance for Loan Losses represents management’s estimation of the amount necessary to absorb future losses in the loan portfolio. On the Statement of Condition, the Allowance for Loan Losses is deducted from Total Loans so that the net amount shown represents the estimated realizable total loans. The Provision for Loan Losses is the amount charged to expense to maintain the Allowance at an adequate level.
The Allowance for Loan Losses was $2,451,000, or 1.14% of total loans outstanding, at September 30, 2006. In the view of management, the Allowance for Loan Losses is adequate to meet the loss contingency based on experience factors and a review of the loan portfolio.
The Provision for Loan Loss was $90,000 for the nine months ended September 30, 2006 and 2005. See Note 3 – Allowance for Loan Losses – and Note 4 – Nonperforming Assets and Delinquent Loans— to the financial statements for additional information.
Non-Interest Income.Non-Interest Income decreased $79,000, or 11%, for the nine-month period ended September 30, 2006, compared to the same period of 2005. The largest source of non-interest income is Service Charges, Commissions and Fees, which decreased from $688,000 for the nine months ended September 30, 2005 to $598,000 at September 30, 2006.
Non-Interest Expense.Non-Interest Expense increased $208,000, or 3% during the same period, for the nine months ended September 30, 2006 as a result of the opening of several offices and the preparation of twelve offices for opening over the next twelve months.
Income Taxes.Income tax expense equaled $645,000 in the third quarter of 2006, as compared to $597,000 in 2005.
Analysis of Financial Condition
Investments.U. S. Agency Securities investments have decreased $6.8 million compared to December 31, 2005. U. S. Agency Securities were reduced while Federal Funds Sold and loans increased. These asset allocation changes have had a positive affect on earnings.
Loans. Loans increased $6.8 million, or 3%, compared to December 31, 2005. The increase took place primarily in the real estate segment of the portfolio. Real estate secured loans made up approximately 78% of total loans at September 30, 2006.
Non-Performing Assets Impaired Loans.Non-performing assets, which consist of nonaccrual loans and foreclosed properties, were $2,964,000 at September 30, 2006 and $5,422,000 at December 31, 2005. Nonaccrual Loans equaled $2,519,000 at September 30, 2006 and $5,165,000 at December 31, 2005. Foreclosed Properties equaled $445,000 at September 30, 2006 and $257,000 at December 31, 2005.
Nonaccrual loans are those loans contractually past due 90 days or more on which no interest is being accrued. Other real estate owned consists of real estate acquired through foreclosure. These properties are reviewed quarterly and reduced to an estimated realizable value at that time.
Deposits.Total deposits have increased $3.6 million, or 1%, compared to December 31, 2005. Increases occurred in time deposits, while all other categories decreased.
Capital.The federal regulatory agencies use risk-based capital ratios to analyze the adequacy of a bank’s capital. These ratios weigh bank assets from 0% to 100%, depending upon the risks inherent in each type of asset. The Bank continues to meet all requirements for a well-capitalized bank as defined by the regulatory agencies.
12
Table of Contents
The following table presents the key risk-based capital ratios for the periods indicated:
| September 30, 2006 | December 31, 2005 | |||||
Tier 1 Ratio | 15.46 | % | 15.88 | % | ||
Total Risk-Based Capital Ratio | 16.46 | % | 16.88 | % | ||
Leverage Ratio | 10.42 | % | 10.70 | % |
Shareholders’ Equity was $37,929,000 at September 30, 2006 compared to $37,820,000 at December 31, 2005.
Liquidity.Liquidity is our ability to fund both loans and investments in the normal course of business and to provide adequate protection for unexpected deposit withdrawals or other demands for funds without incurring a significant negative impact on profitability. Our primary source of day-to-day liquidity lies in the combination of cash, deposit balances, checks in process of collection, deposit growth and federal funds sold. Federal funds are excess funds that are sold to other banks, generally on a one-day basis. Normal funds from the repayment of loans and investments augment these funds.
Our secondary source of liquidity lies in our investments and deposits in other financial institutions. While our investments are categorized as held-to-maturity, they consist primarily of short-term U. S. Agency Securities that are readily marketable. The majority of our investment securities mature in five years or less. Interest-bearing deposits in other financial institutions generally mature in two years or less and the volume of this investment decreased for the first nine months.
Off-Balance Sheet Arrangements. Commitments to extend credit, which amounted to $4,859,000 at September 30, 2006 and $5,079,000 at December 31, 2005, respectively, represent agreements to lend to customers with fixed expiration dates or other termination clauses. Since many of the commitments are expected to expire without being funded, the total commitment amounts do not necessarily represent future liquidity requirements. Standby letters of credit are conditional commitments issued by the Bank guaranteeing the performance of a customer to a third party. Those guarantees are primarily issued to support public and private borrowing arrangements. The Bank had outstanding letters of credit in the amount of $701,000 at September 30, 2006 and $711,000 at December 31, 2005 .
Recent Accounting Pronouncements.In June 2005, the FASB issued Statement No. 154, “Accounting Changes and Error Corrections”, which replaces APB Opinion No. 20, “Accounting Changes” and FASB Statement No. 3, “Reporting Accounting Changes in Interim Financial Statements.” Statement No., 154 requires that a voluntary change in accounting principle be applied retrospectively with all prior period financial statements presented on the new accounting principle. Statement No. 154 also requires that a change in method of depreciating or amortizing a long-lived non-financial asset be accounted for prospectively as a change in estimate, and correction of errors in previously issued financial statements should be termed a “restatement.” Statement No. 154 is effective for accounting changes and correction of errors made in fiscal years beginning after December 15, 2005. Management does not expect this accounting pronouncement to have a material impact on the financial statements.
Item 3—QUANTITATIVE AND QUALITATIVE DISCLOSURES ABOUT MARKET RISK
Interest Sensitivity Analysis. The frequency with which interest rates on earning assets and interest bearing liabilities change has a significant impact on net interest income. The following table presents the anticipated changes based on the contractual maturity of each instrument. Expected maturities may differ from contractual maturities as both borrowers and depositors may have the right to call or prepay obligations with or without call or prepayment penalties.
13
Table of Contents
| (Unaudited) | Within One Year | One to Five Years | Over Five Years | Total | ||||||||||
Uses of Funds | ||||||||||||||
Interest-Bearing Deposits in Other Financial Institutions | $ | 18,801 | $ | — | $ | — | $ | 18,801 | ||||||
Investment Securities | 30,178 | 56,998 | 1,675 | 88,851 | ||||||||||
Federal Funds Sold | 9,800 | — | — | 9,800 | ||||||||||
Loans | 76,774 | 83,992 | 53,786 | 214,552 | ||||||||||
Total Earning Assets | 135,553 | 140,990 | 55,461 | 332,004 | ||||||||||
Deposits | ||||||||||||||
Interest-Bearing Demand | 24,573 | — | — | 24,573 | ||||||||||
Regular Passbook Savings | 61,408 | — | — | 61,408 | ||||||||||
Time Deposits | ||||||||||||||
Certificates of Deposit Over $100,000 | 20,465 | 18,147 | — | 38,612 | ||||||||||
Other | 83,227 | 70,010 | — | 153,237 | ||||||||||
Total Deposits | 189,673 | 88,157 | — | 277,830 | ||||||||||
Notes issued to the U. S. Treasury | 223 | — | — | 223 | ||||||||||
Total Interest-Bearing Liabilities | $ | 189,896 | $ | 88,157 | $ | — | $ | 278,053 | ||||||
Maturity/Rate Sensitivity Gap Per Period | $ | (54,343 | ) | $ | 52,833 | $ | 55,461 | $ | 53,951 | |||||
Cummulative Maturity/Rate Sensitivity Gap | $ | (54,343 | ) | $ | (1,510 | ) | $ | 53,951 | ||||||
Item 4—CONTROLS AND PROCEDURES
The Bank maintains a system of disclosure controls and procedures that is designed to ensure that material information is accumulated and communicated to management, including the Bank’s president (who is the Bank’s principal executive officer and principal financial officer), as appropriate to allow timely decisions regarding required disclosure. As required, management, with the participation of the Bank’s president, evaluated the effectiveness of the design and operation of the Bank’s disclosure controls and procedures as of the end of the period covered by this report. Based on this evaluation, the Bank’s president concluded that the Bank’s disclosure controls and procedures were operating effectively to ensure that information required to be disclosed by the Bank in reports that it files or submits under the Securities Exchange Act of 1934, as amended, is recorded, processed, summarized, and reported within the time periods specified in the rules and forms of the SEC.
Because of the inherent limitations in all control systems, no evaluation of controls can provide absolute assurance that the Bank’s disclosure controls and procedures will detect or uncover every situation involving the failure of persons within the Bank to disclose material information otherwise required to be set forth in the Bank’s periodic reports.
The Bank’s management is also responsible for establishing and maintaining adequate internal control over financial reporting to provide reasonable assurance regarding the reliability of financial reporting and the preparation of financial statements for external purposes in accordance with generally accepted accounting principles. There were no changes in the Bank’s internal control over financial reporting during the Bank’s quarter ended September 30, 2006 that have materially affected, or are reasonably likely to materially affect, the Bank’s internal control over financial reporting.
14
Table of Contents
PART II—OTHER INFORMATION
Item 1—LEGAL PROCEEDINGS.
There are no material pending legal proceedings to which the Bank is a party or to which the property of the Bank is subject.
Item 1A—RISK FACTORS.
There have been no material changes in the risk factors faced by Peoples National Bank from those disclosed in Peoples National Bank’s Annual Report to Shareholders for the year ended December 31, 2005.
Item 2—UNREGISTERED SALES OF EQUITY SECURITIES AND USE OF PROCEEDS.
None.
Item 3—DEFAULTS UPON SENIOR SECURITIES.
None.
Item 4—SUBMISSION OF MATTERS TO A VOTE OF SECURITY HOLDERS.
None.
Item 5—OTHER INFORMATION
None.
Item 6—EXHIBITS
Exhibits:
| 2.1 | Agreement and Plan of Merger, dated as of July 28, 2006, by and among Blue Ridge Bank, N.A., Central National Bank, Community National Bank, First National Bank, First National Exchange Bank, Mountain National Bank, Patrick Henry National Bank, Patriot Bank, National Association, Peoples National Bank, Shenandoah National Bank and Carter Bank & Trust (incorporated by reference to Exhibit 2.1 to Form 8-K filed with the Office of the Comptroller of the Currency on July 31, 2006). | |
| 3.1 | Articles of Association (filed with the Office of the Comptroller of the Currency prior to the opening of the Bank) | |
| 3.2 | Amended and Restated Bylaws (as amended and restated through February 17, 2005) (incorporated by reference to Exhibit 3.2 to Form 8-K filed with the Office of the Comptroller of the Currency on February 17, 2005) | |
| 31 | Certification by principal executive officer and principal financial officer pursuant to Rule 13a-14(a) | |
| 32 | Certification of principal executive officer and principal financial officer pursuant to 18 U.S.C. § 1350 | |
15
Table of Contents
SIGNATURES
Pursuant to the requirements of the Securities Exchange Act of 1934, the registrant has duly caused this report to be signed on its behalf by the undersigned thereunto duly authorized.
| PEOPLES NATIONAL BANK | ||||
| Date: November 13, 2006 |
| |||
| Worth Harris Carter, Jr. | ||||
| Chairman of the Board and President | ||||
| (Signing on behalf of the registrant and as principal executive and financial officer of the registrant) | ||||
16
Table of Contents
Exhibit 31
CERTIFICATION
I, Worth Harris Carter, Jr., certify that:
| 1. | I have reviewed this quarterly report on Form 10-Q of Peoples National Bank; |
| 2. | Based on my knowledge, this report does not contain any untrue statement of a material fact or omit to state a material fact necessary to make the statements made, in light of the circumstances under which such statements were made, not misleading with respect to the period covered by this report; and |
| 3. | Based on my knowledge, the financial statements, and other financial information included in this report, fairly present in all material respects the financial condition, results of operations and cash flows of the registrant as of, and for, the periods presented in this report. |
| Date: November 13, 2006 |
| |||
| Worth Harris Carter, Jr. | ||||
| Chairman of the Board, President, Chief Executive Officer and Chief Financial Officer |
17
Table of Contents
Exhibit 32
CERTIFICATION OF
CHIEF EXECUTIVE OFFICER AND CHIEF FINANCIAL OFFICER
Pursuant to Section 906 of the Sarbanes-Oxley Act of 2002 (18 U.S.C. Section 1350)
The undersigned, as the Chief Executive Officer and Chief Financial Officer of Peoples National Bank, certifies that, to the best of his knowledge and belief, the Quarterly Report on Form 10-Q for the period ended September 30, 2006 which accompanies this certification fully complies with the requirements of Section 13(a) or 15(d) of the Securities Exchange Act of 1934 and the information contained in the report fairly presents, in all material respects, the financial condition and results of operations of Peoples National Bank at the dates and for the periods indicated. The foregoing certification is made pursuant to Section 906 of the Sarbanes-Oxley Act of 2002 (18 U.S.C. Section 1350) and shall not be relied upon for any other purpose. The undersigned expressly disclaims any obligation to update the foregoing certification except as required by law.
| Date: November 13, 2006 |
| |||
| Worth Harris Carter, Jr. | ||||
| Chairman of the Board, President, Chief Executive Officer and Chief Financial Officer |
18
Table of Contents
OFFICE OF THE COMPTROLLER OF THE CURRENCY
WASHINGTON, D.C. 20552
FORM 10-KSB/A
AMENDMENT NO. 1
| x | ANNUAL REPORT UNDER SECTION 13 OR 15(d) OF THE SECURITIES EXCHANGE ACT OF 1934 |
For the fiscal year ended December 31, 2005
OR
| ¨ | TRANSITION REPORT UNDER SECTION 13 OR 15(d) OF THE SECURITIES EXCHANGE ACT OF 1934 |
Commission file number: n/a
SHENANDOAH NATIONAL BANK
(Name of small business issuer in its charter)
| National Bank | 54-1801533 | |
(State or other jurisdiction of incorporation or organization) | (I.R.S. Employer Identification No.) |
478 Frontier Drive Staunton, VA | 24401 | |
| (Address of principal executive offices) | (Zip Code) |
Issuer’s telephone number: (540) 885-1108
Securities registered under Section 12(b) of the Exchange Act: None
Securities registered under Section 12(g) of the Exchange Act: None
Check whether the issuer is not required to file reports pursuant to Section 13 or 15(d) of the Exchange Act. Yes ¨ No x
Check whether the issuer (1) filed all reports required to be filed by Section 13 or 15(d) of the Exchange Act during the past 12 months (or for such shorter period that the registrant was required to file such reports), and (2) has been subject to such filing requirements for the past 90 days. Yes x No ¨
Check if there is no disclosure of delinquent filers in response to Item 405 of Regulation S-B contained in this form, and no disclosure will be contained, to the best of registrant’s knowledge, in definitive proxy or information statements incorporated by reference in Part III of this Form 10-KSB or any amendment to this Form 10-KSB. x
Indicate by check mark whether the registrant is a shell company (as defined in Rule 12b-2 of the Exchange Act). Yes ¨ No x
The issuer’s revenues for the fiscal year ended December 31, 2005 were $6,042,000.
The aggregate market value of the issuer’s common stock held by nonaffiliates as of March 14, 2006 was $6,964,290.
As of March 14, 2006, there were issued and outstanding 277,588 shares of the issuer’s common stock.
DOCUMENTS INCORPORATED BY REFERENCE
Portions of the 2005 Annual Report to Shareholders, as revised, are incorporated by reference in Part II of this report, which is attached hereto as Exhibit 13.
Transitional Small Business Disclosure Format: Yes ¨ No x
Table of Contents
Shenandoah National Bank
2005 ANNUAL REPORT ON FORM 10-KSB/A
TABLE OF CONTENTS
��
| Page | ||||||
| EXPLANATORY NOTE | ||||||
| PART I | 5 | |||||
| ITEM 1. | DESCRIPTION OF BUSINESS | 5 | ||||
| ITEM 2. | DESCRIPTION OF PROPERTY | 9 | ||||
| ITEM 3. | LEGAL PROCEEDINGS | 9 | ||||
| ITEM 4. | SUBMISSION OF MATTERS TO A VOTE OF SECURITY HOLDERS | 9 | ||||
| PART II | 10 | |||||
| ITEM 5. | MARKET FOR COMMON EQUITY AND RELATED STOCKHOLDER MATTERS | 10 | ||||
| ITEM 6. | MANAGEMENT’S DISCUSSION AND ANALYSIS OR PLAN OF OPERATION | 11 | ||||
| ITEM 7. | FINANCIAL STATEMENTS | 11 | ||||
| ITEM 8. | CHANGES IN AND DISAGREEMENTS WITH ACCOUNTANTS ON ACCOUNTING AND FINANCIAL DISCLOSURE | 11 | ||||
| ITEM 8A. | CONTROLS AND PROCEDURES | 11 | ||||
| ITEM 8B. | OTHER INFORMATION | 11 | ||||
| PART III | 12 | |||||
| ITEM 9. | DIRECTORS, EXECUTIVE OFFICERS, PROMOTERS AND CONTROL PERSONS; COMPLIANCE WITH SECTION 16(a) OF THE EXCHANGE ACT | 12 | ||||
| ITEM 10. | EXECUTIVE COMPENSATION | 14 | ||||
| ITEM 11. | SECURITY OWNERSHIP OF CERTAIN BENEFICIAL OWNERS AND MANAGEMENT AND RELATED STOCKHOLDER MATTERS | 16 | ||||
| ITEM 13. | EXHIBITS | 18 | ||||
| ITEM 14. | PRINCIPAL ACCOUNTANT FEES AND SERVICES | 18 | ||||
2
Table of Contents
EXPLANATORY NOTE
Shenandoah National Bank (the “Bank”) is simultaneously submitting the following amended filings: (i) Form 10-KSB/A for the year ended December 31, 2005 and (ii) Form 10-QSB/A for the quarter ended June 30, 2006. These amended filings update the Bank’s reported financial information for the year ended December 31, 2005 and for the affected quarters of 2005 and 2006.
This amendment amends the Annual Report on Form 10-KSB filed by the Bank on March 31, 2006 (the “Original Filing”). The purpose of this amendment is to change the Bank’s financial statements and related footnote disclosures and related MD&A discussion for the periods covered by this Form 10-KSB/A to match the amended Consolidated Reports of Condition and Income (“Call Reports”) the Bank filed in June 2006 at the direction of the Office of the Comptroller of the Currency (“OCC”) to place on nonaccrual one loan to a borrower group secured by a first deed of trust on a hotel property in Virginia.
The amendments to the financial statements consist of the following:
(Dollars in thousands)
| As Originally Presented | Changes | As Revised | ||||||||||
Statements of Financial Condition: | ||||||||||||
Loans | $ | 73,939 | $ | (12 | ) | $ | 73,927 | |||||
Other Assets | 1,236 | 1 | 1,237 | |||||||||
Statements of Income: | ||||||||||||
Interest Income | 5,687 | (17 | ) | 5,670 | ||||||||
Income Taxes | 118 | (6 | ) | 112 | ||||||||
Net Income | 382 | (11 | ) | 371 | ||||||||
Statements of Cash Flows: | ||||||||||||
Net cash from operating activities | 564 | (12 | ) | 552 | ||||||||
Net cash from investing activities | (9,424 | ) | 12 | (9,412 | ) | |||||||
Statements of Changes in Shareholders’ | ||||||||||||
Equity: | ||||||||||||
Undivided profits | 1,949 | (11 | ) | 1,938 | ||||||||
The Bank’s accountants previously advised the Bank that the financial statements included in the Original Filing were prepared in accordance with Generally Accepted Accounting Principles and that the amounts involved in the amendment of the Call Reports were not material. However, the OCC has advised the Bank that the financial statements in this Annual Report must be identical with the Bank’s Call Reports, as amended, to comply with OCC policy.
This Form 10-KSB/A does not change any of the information contained in Items 1-5 or 8-14 of the Original Filing and which is repeated in this amended filing. Except for the changes noted above, references throughout this Form 10-KSB/A are accurate as of the date this Annual Report was originally filed and have not been updated to reflect events occurring subsequent to the original filing date.
Importantly, as of the date of this amended filing, the collateral securing the loan at issue has been liquidated as part of the Bank’s collection process and the loan has been paid in full. Therefore, all interest income adjusted in this Form 10-KSB/A will be reported by the Bank as income earned in the third quarter of 2006.
3
Table of Contents
FORWARD–LOOKING STATEMENTS
This report contains statements concerning the Bank’s expectations, plans, objectives, future financial performance and other statements that are not historical facts. These statements may constitute “forward-looking statements” as defined by federal securities laws. In some cases, readers can identify the forward-looking statements by the use of words such as “may,” “ will,” “should,” “could,” “expect,” “plan,” “intend,” “anticipate,” “believe,” “estimate,” “predict,” “potential” or “continue” or the negative or other variations of these words, or other comparable words or phrases. These statements may address issues that involve estimates and assumptions made by management, risks and uncertainties, and actual results could differ materially from historical results or those anticipated by such statements. Factors that could have a material adverse effect on the Bank’s operations and future prospects include, but are not limited to, changes in: interest rates; general and local economic conditions; the legislative/regulatory climate; monetary and fiscal policies of the U.S. government, including policies of the U.S. Treasury and the Federal Reserve Board; the quality or composition of loan or investment portfolios; demand for loan products; deposit flows; competition; demand for financial services in our market area and accounting principles, policies and guidelines. These risks and uncertainties should be considered in evaluating the forward-looking statements contained herein, and readers are cautioned not to place undue reliance on such statements, which speak only as of the date of this report.
4
Table of Contents
PART I
ITEM 1. DESCRIPTION OF BUSINESS.
General
The Bank opened for business as a National Banking Association on July 1, 1996 and was created through the spinoff of the assets, liabilities and related capital of three offices located in the Staunton area from Patrick Henry National Bank, Bassett, Virginia. At December 31, 2005, the Bank had 50 full-time and 2 part-time employee, $117 million in assets, $74 million in net loans, $107 million in deposits, and $8 million in total shareholders’ equity.
The Bank is a full service community bank that provides an array of financial products and services to its customers, including a variety of interest-bearing and non-interest bearing demand deposit accounts; savings and money market accounts; certificates of deposit; commercial, installment, and real estate mortgage loans (commercial and residential); and safe deposit rental facilities. The Bank also sells travelers checks, money orders, and cashier’s checks.
Market Area
The Bank’s primary service area currently consists of Augusta, Rockbridge and Rockingham counties in Virginia, including the cities of Buena Vista, Harrionsburg, Staunton and Waynesboro. The Bank conducts a general commercial banking business in its service area, and focuses on serving the banking needs of small-to-medium sized businesses, professional concerns and individuals.
Goals and Strategy
The Bank’s goal is to become a leading financial institution in its market area by opening new offices and providing a full array of banking services. Management believes that the on-going consolidation of the banking industry has created an opportunity for community-based lenders like the Bank, which emphasize retail lending and superior customer service. The Bank’s business strategy is to target individuals, businesses and professionals in the area for loans, deposits, and other financial services and to explore selected opportunities to establish branches in areas that demographically compliment the Bank’s existing customer base.
Deposits and Loan Products
The Bank offers a full range of deposit services including LIFETIME FREE CHECKING, NOW accounts, savings accounts, retirement accounts and other deposits of various types, ranging from money market accounts to longer-term certificates of deposit. The transaction accounts and time certificates are tailored to the Bank’s principal market at competitive rates. All deposit accounts are insured by the FDIC up to the maximum amount allowed by law (generally $100,000 per depositor subject to aggregation rules). The Bank solicits these accounts from individuals, businesses, associations, organizations, and governmental entities.
The Bank also offers a full range of commercial and personal loans. Commercial loans include both secured and unsecured loans. Consumer loans include secured and unsecured loans for financing automobiles, home improvements, education and personal investments. The Bank also makes real estate construction and acquisition loans and originates and holds fixed and variable rate mortgage loans.
The Bank’s lending activities are subject to a variety of lending limits imposed by federal law. While differing limits apply in certain circumstances based on the type of loan or the nature of the borrower (including the borrower’s relationship to the Bank), in general the Bank is subject to a loan-to-one borrower limit of an amount equal to 15% of the Bank’s unimpaired capital and surplus, or 25% of the unimpaired capital and surplus. The Bank may not make loans to any director, officer, employee or 10% shareholder of the Bank unless the loan is approved by the Board of Directors and is made on terms not more favorable than are made available to a person not affiliated with the Bank.
5
Table of Contents
Other bank services include traveler’s checks, direct deposit of payroll and social security checks, and automated drafts for various accounts. The Bank has no current plans to exercise trust powers.
Bank Lending Practices
The Bank’s lending efforts are directed to making loans to individuals and businesses in its market area. The Bank has both purchased and sold participation loans with other banks in the past and may do so in the future. The Bank believes that its lending and credit policies are conservative.
The Bank’s primary lending program has been the origination of loans secured by real estate. The Bank evaluates both the borrower’s ability to make principal and interest payments and the value of the property that will secure the loan.
Residential mortgage loans generally are made on the basis of the borrower’s ability to make repayment from employment and other income and are secured by real estate that can be readily valued. The Bank offers both adjustable-rate and fixed-rate loans.
In contrast, commercial real estate loans typically are made on the basis of the borrower’s ability to make repayment from cash flow from its business and are secured by business properties. The Bank’s primary non-residential real estate loan products have rates, which are fixed for three to five years and then become adjustable. Commercial loans typically involve larger loan balances concentrated with single borrowers or groups of related borrowers.
The Bank also makes consumer loans, including unsecured personal loans, automobile loans, deposit account loans, installment loans and time loans. The Bank’s primary consideration when making such consumer loans is the customer’s ability to repay the loan. Consumer loans generally warrant higher interest rates and fees, but such loans, particularly unsecured consumer loans, also may entail greater risk than residential mortgage loans. Even when a loan is secured, repossessed collateral for a defaulted consumer loan may not provide an adequate source of repayment. Consumer loan collections are dependent on the borrower’s continuing financial stability, and are more likely to be affected adversely by job loss, divorce, illness, or personal bankruptcy. Various federal and state laws, including bankruptcy and insolvency laws, may limit the amount that can be recovered on such loans and such loans may give rise to claims and defenses by a consumer loan borrower.
The Bank also makes commercial loans to qualified small businesses in its market area. Commercial business loans generally have a higher degree of risk than mortgage loans, but have commensurately higher yields. To manage these risks, the Bank generally secures appropriate collateral and carefully monitors the financial condition of its business borrowers.
Competition
Federal and state legislative changes have significantly increased competition among financial institutions, and current trends towards additional deregulation may be expected to increase competition even further. In its market area, the Bank competes with nationwide, statewide and local banking institutions, credit unions, thrift institutions, money market funds, consumer finance companies, and other financial service organizations. Many of the financial organizations competing with the Bank have greater financial resources than the Bank. Many of these financial organizations also have greater geographic coverage and some offer bank and bank-related services, which the Bank does not offer.
The Bank primarily focuses on non-major metropolitan markets in which to provide products and services. Management believes the Bank has developed a niche and a certain level of expertise in serving these communities.
Supervision and Regulation
Financial institutions are extensively regulated under federal and state law. Consequently, the growth and earnings performance of the Bank can be affected not only by management decisions and general economic conditions, but also by the statutes administered by, and the regulations and policies of, various governmental regulatory authorities including, but not limited to, the OCC, the Federal Reserve Board (“FRB”), the FDIC, the Internal Revenue Service, federal and state taxing authorities, and the Securities Exchange Commission. The effect of such statutes, regulations and policies can be significant, and cannot be predicted with a high degree of certainty.
6
Table of Contents
Federal and state laws and regulations generally applicable to financial institutions regulate, among other things, the scope of business, investments, reserves against deposits, capital levels relative to operations, the nature and amount of collateral for loans, the establishment of branches, mergers, consolidations and dividends. The system of supervision and regulation applicable to the Bank establishes a comprehensive framework for their respective operations and is intended primarily for the protection of the FDIC’s deposit insurance funds and the depositors, rather than the shareholders, of the Bank.
The following references to material statutes and regulations affecting the Bank are brief summaries thereof and do not purport to be complete, and are qualified in their entirety by reference to such statutes and regulations. Any change in applicable law or regulations may have a material effect on the business of the Bank.
Finally, the Bank is subject to the periodic reporting requirements of the Securities Exchange Act of 1934, as amended, including but not limited to, filing annual, quarterly and other current reports with the Comptroller of the Currency.
Regulatory Capital Requirements
All financial institutions are required to maintain minimum levels of regulatory capital. The OCC has established risk-based and leveraged capital standards for the financial institutions they regulate. The OCC also may impose capital requirements in excess of these standards on a case-by-case basis for various reasons, including financial condition or actual or anticipated growth. Under the risk-based capital requirements, the Bank is required to maintain a minimum ratio of total capital to risk-weighted assets of at least 8%. At least half of the total capital is required to be “Tier 1 capital,” which consists principally of common and certain qualifying preferred shareholders’ equity, less certain intangibles and other adjustments. The remainder, “Tier 2 capital,” consists of a limited amount of subordinated and other qualifying debt (including certain hybrid capital instruments) and a limited amount of the general loan loss reserve.
In addition, the federal regulatory agencies have established a minimum leveraged capital ratio (Tier 1 capital to period end total assets). These guidelines provide for a minimum leveraged capital ratio of 4%. The guidelines also provide that banking organizations experiencing internal growth or making acquisitions will be expected to maintain strong capital positions substantially above the minimum supervisory levels, without significant reliance on intangible assets.
On December 12, 2000, the Bank issued a subordinated capital note in the amount of $1.5 million. This note is described in Footnote 21 of the Financial Statements filed herewith.
The Bank qualified as “well-capitalized on December 31, 2005 and 2004. (See Note 16 to the Financial Statements Part II, Item 7 filed herewith).
Insurance of Accounts, Assessments and Regulation by the FD1C
The Bank is a member of the Bank Insurance Fund (“BIF”) of the FDIC. As a BIF insured institution, the Bank is subject to FDIC rules and regulations as administrator of the BIF. The Bank’s deposits are insured up to $100,000 per insured depositor, as defined by law and regulation. As insurer, the FDIC is authorized to conduct examinations of and to require reporting by BIF institutions. The actual assessment to be paid by each BIF member is based on the institution’s assessment risk classification and whether the institution is considered by its supervisory agency to be financially sound or to have supervisory concerns.
Under the FDIC’s risk-based insurance system, BIF-insured institutions are currently assessed premiums of between zero and twenty seven cents per $100 of eligible deposits, depending on the institution’s capital position and other supervisory facts. Congress has enacted legislation that, among other things, provides for assessments against BIF-insured institutions that will be used to pay certain Financing Corporation (“FICO”) obligations.
7
Table of Contents
The FDIC is authorized to prohibit any BIF-insured institution from engaging in any activity that the FDIC determines by regulation or order to pose a serious threat to the insurance fund. Also, the FDIC may initiate enforcement actions against banks after first giving the institution’s primary regulatory authority an opportunity to take such action. The FDIC may terminate the deposit insurance of any depository institution, including the Bank, if it determines, after a hearing, that the institution has engaged or is engaging in unsafe or unsound practices, is in an unsafe or unsound condition to continue operations, or has violated any applicable law, regulation, order or any condition imposed in writing by the FDIC. It also may suspend deposit insurance temporarily during the hearing process for the permanent termination of insurance, if the institution has no tangible capital. If deposit insurance is terminated, the deposits at the institution at the time of termination, less subsequent withdrawals, shall continue to be insured for a period from six months to two years, as determined by the FDIC. Management is aware of no existing circumstances that could result in termination of the Bank’s deposit insurance.
Other Safety and Soundness Regulations
The federal banking agencies have broad powers under current federal law to take prompt corrective action to resolve problems of insured depository institutions. The extent of these powers depends upon whether the institutions in question are “well capitalized,” “adequately capitalized,” “undercapitalized,” “significantly undercapitalized” or “critically undercapitalized,” as such terms are defined under uniform regulations issued by each of the federal banking agencies.
Community Reinvestment
The requirements of the Community Reinvestment Act (“CRA”) affect the Bank. The CRA imposes on financial institutions an affirmative obligation to help meet the credit needs of their local communities, including low- and moderate-income neighborhoods, consistent with the safe and sound operation of those institutions. Each financial institution’s efforts in helping meet community credit needs currently is evaluated as part of the examination process pursuant to a new regulation recently adopted by the banking regulatory agencies. Under the new regulation a financial institution’s efforts in helping meet its community’s credit needs are evaluated, based on the particular institution’s Total Assets, according to a lending test, a community development test in addition to the lending test, or the three-pronged (lending, investment and service) test, all of which replace the twelve assessment factors used previously. The grade received by a bank is considered in evaluating mergers, acquisitions and applications to open a branch or facility. To the best knowledge of the Bank, it is meeting its obligations under the CRA.
Effect of Governmental Monetary Policies
As with other financial institutions, the earnings of the Bank are affected by general economic conditions as well as by the monetary policies of the Federal Reserve Board. Such policies, which include regulating the national supply of bank reserves and bank credit, can have a major effect upon the source and cost of funds and the rates of return earned on loans and investments. The Federal Reserve System exerts a substantial influence on interest rates and credit conditions, primarily through establishing target rates for federal funds, open market operations in U.S. Government securities, varying the discount rate on member bank borrowings and setting cash reserve requirements against deposits. Changes in monetary policy, including changes in interest rates, will influence the origination of loans, the purchase of investments, the generation of deposits, and rates received on loans and investment securities and paid on deposits. Fluctuations in the Federal Reserve Board’s monetary policies have had a significant impact on the operating results of the Bank and all financial institutions in the past and are expected to continue to do so in the future.
Employees
The Bank had 50 full-time and 2 part-time employees as of December 31, 2005. The Bank believes that its relationship with its employees is good, and no employees are represented by a labor union.
8
Table of Contents
ITEM 2. DESCRIPTION OF PROPERTY.
The Bank’s main office is located in a one-story building at 478 Frontier Drive, Staunton, Virginia. The Bank also operates seven additional offices, all of which are located in Virginia. The Bank owns five of the offices free and clear of encumbrances, while the other three are held under non-cancellable operating leases. These leases are described in Footnotes 7 and 18 in the Financial Statements.
The Bank’s offices are listed in the table below:
Location | Address | Lease/Own | ||||
| Lexington Office | Stonewall Square | Lexington, VA 24451 | Own | |||
| Greenville Avenue Office | 478 Frontier Drive | Staunton, VA 24401 | Own | |||
| West Main Office | 2701 West Main Street | Waynesboro, VA 22980 | Own | |||
| North Mason Office | 75 North Mason Street | Harrisonburg, VA 22802 | Own | |||
| Stuarts Draft Office | 2782 Stuarts Draft Hwy. | Stuarts Draft, VA | Lease | |||
| Weyers Cave Office | 81 Franklin St. | Weyers Cave, VA 24486 | Lease | |||
| South Main | 2169 South Main Street | Harrisonburg, VA 22802 | Lease | |||
| Bridgewater Office | 317 North Main Street | Bridgewater, VA 22812 | Own | |||
The Bank has purchased a new office in Woodstock which we plan to open this year.
The Bank has acquired title to a parcel of real estate through the normal course of its lending activities. The book values of this property equaled $487,000 as of December 31, 2005 and $534,000 December 31, 2004.
Management considers these properties to be in good condition. Adequate insurance is maintainted on each of these properties.
ITEM 3. LEGAL PROCEEDINGS.
There are no material pending legal proceedings to which the Bank is a party or to which the property of the Bank is subject.
ITEM 4. SUBMISSION OF MATTERS TO A VOTE OF SECURITY HOLDERS.
No matters were submitted to a vote of security holders during the fourth quarter of the fiscal year covered by this report.
EXECUTIVE OFFICERS OF THE REGISTRANT
Name (Age) | Officer Since | Principal Occupation During Past Five Years | ||
| Worth Harris Carter, Jr. (68) | 1976 | Chairman of the Board of First National Bank since 1976, President since 1986 | ||
| Chairman of the Board and President of Patrick Henry National Bank since 1977 | ||||
| Chairman of the Board of Peoples National Bank since 1976, President since 1981 | ||||
| Chairman of the Board of Blue Ridge Bank since 1982 | ||||
| Chairman of the Board and President of Community National Bank since 1985 | ||||
9
Table of Contents
| Chairman of the Board and President of Mountain National Bank since 1996 | ||||
| Chairman of the Board and President of Shenandoah National Bank since 1996 | ||||
| Chairman of the Board and President of Central National Bank since 1996 | ||||
| Chairman of the Board and President of Patriot Bank since 1996 | ||||
| Chairman of the Board and President of First National Exchange Bank since 1998 | ||||
| Chairman of the Board and President of Mortgage Company of Virginia since 1984 | ||||
| Chairman of the Board and President of Bank Services of Virginia since 1984 | ||||
| Chairman of the Board and President of Bank Building Corporation since 1994 | ||||
| Chairman of the Board and President of Bank Services Insurance, Inc. since 2003 | ||||
| Manager of Blackstone Properties LLC Since 1998 | ||||
PART II
ITEM 5. MARKET FOR COMMON EQUITY AND RELATED STOCKHOLDER MATTERS.
The bank is authorized to issue 2.5 million shares of common stock with a par value of $5. This stock has full voting rights, and full preemptive rights. There were 277,588 shares outstanding as of December 31, 2005 and 2004. This is the only class of authorized stock.
The Bank’s common stock is traded locally with no established trading market and no known market makers.
The quarterly high and low prices, based on transactions made known to the Bank, for the common stock for 2005 and 2004 are presented below:
| 2005 | 2004 | |||||||||||
| High | Low | High | Low | |||||||||
First Quarter | $ | 33 | $ | 33 | $ | 40 | $ | 35 | ||||
Second Quarter | 31 | 31 | 40 | 35 | ||||||||
Third Quarter | 31 | 31 | 40 | 35 | ||||||||
Fourth Quarter | 30 | 30 | 50 | 40 | ||||||||
Holders. As of March 14, 2006, there are approximately 1,109 holders of record of the Bank’s outstanding common stock.
Dividends. The amount of dividends that may be paid by the Bank will depend on the Bank’s earnings and capital position and is limited by federal law, regulations and policies. A national bank may not pay dividends from its capital; all dividends must be paid out of undivided profits then on hand, after deducting expenses, including reserves for losses and bad debts. In addition, the approval of the OCC is required if the total of all dividends declared by a national bank in any calendar year exceeds the total of its net profits for that year combined with its retained net profits for the preceding two years, less any required transfers to surplus. The Bank may not pay a dividend if, after giving effect to the dividend, the Bank would be undercapitalized.
10
Table of Contents
No dividends have been paid. The Board of Directors will review the Bank’s performance and growth and make decisions regarding dividend payments in the future and are dependent upon the Bank’s future performance and other factors.
ITEM 6. MANAGEMENT’S DISCUSSION AND ANALYSIS OR PLAN OF OPERATION.
The information required by this Item is included in the Bank’s annual report to shareholders for the year ended December 31, 2005, as revised, (the “Annual Report”), which is attached hereto as Exhibit 13 and is incorporated herein by reference. The information appears in the Annual Report under the caption “Management’s Discussion and Analysis of Financial Condition and Results of Operation.”
ITEM 7. FINANCIAL STATEMENTS.
The report of the independent registered public accounting firm and audited financial statements of the Bank and accompanying notes required by this Item are included in the Bank’s Annual Report, which is attached hereto as Exhibit 13 and is incorporated herein by reference.
ITEM 8. CHANGES IN AND DISAGREEMENTS WITH ACCOUNTANTS ON ACCOUNTING AND FINANCIAL DISCLOSURE.
None.
ITEM 8A. CONTROLS AND PROCEDURES.
The Bank maintains a system of disclosure controls and procedures that is designed to ensure that material information is accumulated and communicated to management, including the Bank’s president (who is the Bank’s principal executive officer and principal financial officer), as appropriate to allow timely decisions regarding required disclosure. As required, management, with the participation of the Bank’s president, evaluated the effectiveness of the design and operation of the Bank’s disclosure controls and procedures as of the end of the period covered by this report. Based on this evaluation, the Bank’s president concluded that the Bank’s disclosure controls and procedures were operating effectively to ensure that information required to be disclosed by the Bank in reports that it files or submits under the Securities Exchange Act of 1934, as amended, is recorded, processed, summarized, and reported within the time periods specified in the rules and forms of the SEC.
Because of the inherent limitations in all control systems, no evaluation of controls can provide absolute assurance that the Bank’s disclosure controls and procedures will detect or uncover every situation involving the failure of persons within the Bank to disclose material information otherwise required to be set forth in the Bank’s periodic reports.
The Bank’s management is also responsible for establishing and maintaining adequate internal control over financial reporting to provide reasonable assurance regarding the reliability of financial reporting and the preparation of financial statements for external purposes in accordance with generally accepted accounting principles. There were no changes in the Bank’s internal control over financial reporting during the Bank’s fourth quarter ended December 31, 2005 that have materially affected, or are reasonably likely to materially affect, the Bank’s internal control over financial reporting.
ITEM 8B. OTHER INFORMATION.
None.
11
Table of Contents
PART III
ITEM 9. DIRECTORS, EXECUTIVE OFFICERS, PROMOTERS AND CONTROL PERSONS; COMPLIANCE WITH SECTION 16(A) OF THE EXCHANGE ACT.
The information regarding the Bank’s executive officer is contained in Part I of this Report on Form 10-KSB/A.
Name and Business Experience | Age | Director Since | ||
| Carter, Worth Harris, Jr. | 68 | 4/76 | ||
| Chairman of the Board and President | ||||
| Worth Harris Carter, Jr. is a director and officer of the following companies: | ||||
| Chairman of the Board of First National Bank since 1976, President since 1986 | ||||
| Chairman of the Board and President of Patrick Henry National Bank since 1977 | ||||
| Chairman of the Board of Peoples National Bank since 1976, President since 1981 | ||||
| Chairman of the Board of Blue Ridge Bank since 1982, President since 2004 | ||||
| Chairman of the Board and President of Community National Bank since 1985 | ||||
| Chairman of the Board and President of Mountain National Bank since 1996 | ||||
| Chairman of the Board and President of Central National Bank since 1996 | ||||
| Chairman of the Board and President of Patriot Bank since 1996 | ||||
| Chairman of the Board and President of First National Exchange Bank since 1998 | ||||
| Chairman of the Board and President of Mortgage Company of Virginia since 1984 | ||||
| Chairman of the Board and President of Bank Services of Virginia, Inc. since 1984 | ||||
| Chairman of the Board and President of Bank Services Insurance, Inc. since 2003 | ||||
| Chairman of the Board and President of Coresoft, Inc. since 2004 | ||||
| Chairman of the Board and President of Bank Building Corporation since 1988 | ||||
| Manager of Blackstone Properties LLC since 1998 | ||||
| Craig, W. Lynwood | 77 | 4/96 | ||
| W. Lynwood Craig is and has been President and Treasurer of Bassett Oil & Equipment Company, Inc., Bassett, VA for more than five years. He also has served as a director of Patrick Henry National Bank, Bassett, VA, since 1976. | ||||
| Lester, George W., II | 67 | 4/96 | ||
| George W. Lester, II is and has been Chairman and Chief Executive Officer of the Lester Group, Inc., a Forest Products Company of Martinsville, VA for more than five years. He also has served as a director of Patrick Henry National Bank, Bassett, VA since 1976. | ||||
| Pigg, Joseph E. | 70 | 4/96 | ||
| Joseph E. Pigg is President of Millard’s Machinery, Inc., an industrial and logging equipment sales and service business, and has been for more than five years. He also has served as a director of Patrick Henry National Bank, Bassett, VA since 1976. | ||||
| Spencer, Simon C. | 70 | 4/96 | ||
| Simon C. Spencer is retired. He was previously Assistant Principal of Fieldale-Collinsville High School for more than five years and a Lt. Colonel, U.S. Army. He has served as a director of Patrick Henry National Bank, Bassett, VA since 1976. | ||||
| Thomasson, James M. | 75 | 4/96 | ||
| James M. Thomasson is retired. He was previously Executive Vice President and Cashier of Patrick Henry National Bank for more than five years. He also has served as a director of Patrick Henry National Bank, Bassett, VA since 1978. | ||||
| Trent, W. C., Jr. | 62 | 4/96 | ||
| W. C. Trent, Jr. is an investor. He was Vice President & Treasurer of Trent Furniture Corp., Bassett, VA for more than five years. He has served as a director of Patrick Henry National Bank, Bassett, VA since 1977. | ||||
12
Table of Contents
The Board of Directors is not aware of any family relationship between any Director, executive officer or person nominated by the Bank to become a Director; nor is the Board of Directors aware of any involvement in legal proceedings that would be material to an evaluation of the ability or integrity of any Director, executive officer or person nominated to become a Director.
AUDIT COMMITTEE REPORT OF THE BOARD OF DIRECTORS
The entire Board of Directors functions as the Bank’s Audit Committee and in this capacity met four times in 2005. The functions of the Board in the audit area are focused on three areas:
| • | the adequacy of the Bank’s internal controls and financial reporting process and the reliability of the financial statements; |
| • | the independence and performance of the Bank’s internal auditors and independent auditors; and |
| • | the Bank’s compliance with legal and regulatory requirements. |
We meet with management periodically to consider the adequacy of the Bank’s internal controls and the objectivity of its financial reporting. We discuss these matters with the Bank’s independent auditors and with appropriate financial personnel and internal auditors.
We also periodically review the performance of the independent auditors and their independence from management. All of the Directors who serve as the Bank’s Audit Committee, with the exception of Chairman of the Board and President Carter, are “independent” for the purposes of the Nasdaq Stock Market listing standards.
The Board has not adopted a written charter setting forth the responsibilities and authority of the Board in its capacity as the Audit Committee. Although Mr. Carter is not independent under the Nasdaq Stock Market or SEC standards for audit committee membership, the Board of Directors has determined that Mr. Carter possesses the knowledge and experience required to be considered an audit committee financial expert. In addition, the Board of Directors believes that all of the Bank’s Directors possess the financial knowledge and expertise necessary to protect the Bank’s shareholders in performing the functions of an audit committee.
Management has primary responsibility for the Bank’s financial statements and the overall reporting process, including the Bank’s system of internal controls.
The independent auditors audit the annual financial statements prepared by management, express an opinion as to whether those statements fairly present the financial position, results of operations and cash flows of the Bank in conformity with generally accepted accounting principles and discuss with us any issues they believe should be raised with us.
This year, we reviewed the Bank’s audited financial statements and met with both management and Goodman & Company, LLP, the Bank’s independent auditors, to discuss those financial statements. Management has represented to us that the financial statements were prepared in accordance with generally accepted accounting principles.
We have received from and discussed with Goodman & Company the written disclosure and the letter required by Independence Standards Board Statement No. 1 (Independence Discussions with Audit Committees) relating to that firm’s independence from the Bank. We also discussed with Goodman & Company the matters required to be discussed by Statement on Auditing Standard No. 61 (Communication with Audit Committees).
Based on these reviews and discussions, we recommended to the Board that the Bank’s audited financial statements be included in the Bank’s Annual Report on Form 10-KSB for the fiscal year ended December 31, 2005 for filing with the Office of the Comptroller of the Currency (“OCC”).
13
Table of Contents
Directors
Worth Harris Carter, Jr
W. Lynwood Craig
George W. Lester, II
Joseph E. Pigg
Simon C. Spencer
James M. Thomasson
W. C. Trent, Jr.
SECTION 16(a) BENEFICIAL OWNERSHIP REPORTING COMPLIANCE
Section 16(a) of the Securities Exchange Act of 1934 requires that Directors and executive officers, and persons who control more than 10% of the Bank’s equity securities, file reports of ownership and reports of changes in ownership of the Bank’s outstanding equity securities. All such filings have been filed timely during 2005.
The Bank has not adopted a Code of Ethics for its directors, executives and employees, primarily because management of the Bank believes and understands that our officers and directors adhere to and follow ethical standards without the necessity of a written policy. The Bank’s Board of Directors will revisit this issue in the future to determine if adoption of a code of ethics is appropriate. In the meantime, the Bank’s management requires and promotes honest and ethical conduct, full and fair disclosure in its reports to the OCC, and compliance with applicable governmental laws and regulations.
ITEM 10. EXECUTIVE COMPENSATION.
The Bank’s compensation program is designed to offer competitive compensation to employees based on each individual’s contribution to the Bank’s overall success. As such, the program provides a competitive compensation package to attract and retain capable employees.
The compensation and benefits program consists of salary, a profit sharing plan, and life, health and disability insurance. The compensation and benefits program for officers parallels that of all other employees. The Bank offers no stock options or other forms of equity compensation, bonuses, employment contracts, country club memberships or other perquisites to officers or employees.
The entire Board of Directors performs the functions of a Salary Committee for the Bank. The Board has the responsibility for administering the Bank’s overall compensation program and for setting the salaries for the Bank’s officers. In setting the compensation of the Bank’s officers, the Board generally relies on the recommendations of the Chairman and President and the Board members’ own significant personal knowledge of the compensation provided to other, similarly situated, executives in banking and other industries in the local area. The Board also reviews each individual’s performance and contribution to the overall Bank goals in determining the level of salary for the coming year.
Mr. Worth Harris Carter, Jr., Chairman of the Board and President, serves as the Chief Executive Officer of Shenandoah National Bank. As noted below under “Certain Relationships and Related Transactions,” Mr. Carter also serves as Chairman and President of nine other banks. The Salary Committee of the Board of Directors of (Patrick Henry National Bank) actually sets Mr. Carter’s annual salary each year. The cost of Mr. Carter’s compensation, which consists of his salary plus an amount equal to twenty-nine percent of his salary to cover payroll taxes and all other benefits, is shared by the ten banks on the basis of average deposits of each bank related to total average deposits of all the banks that he serves. Mr. Carter’s total compensation, which is paid through Bank Services of Virginia, Inc. (“Bank Services”), is reflected below in two charts. The first chart reflects Mr. Carter’s total compensation as paid by Bank Services. The second chart reflects only the portion of Mr. Carter’s total compensation that is allocated to Shenandoah National Bank. During 2005, no other executive officer of the Bank received compensation in excess of $100,000.
14
Table of Contents
Summary Compensation Tables
Bank Services of Virginia, Inc.
| Annual Compensation | ||||||||||
Name and Principal Position | Year | Salary | Other Annual Compensation² | All Other Compensation³ | ||||||
Worth Harris Carter, Jr. | 2005 | $ | 575,000 | — | $ | 80,000 | ||||
Chairman of the Board and | 2004 | $ | 575,000 | — | $ | 78,000 | ||||
President | 2003 | $ | 530,000 | — | $ | 67,000 | ||||
| (1) | This table shows the total cash compensation paid to Mr. Carter by Bank Services of Virginia, Inc. during 2005, 2004 and 2003 for his services as Chairman of the Board and President of all ten banks. |
| (2) | The amount of compensation in the form of perquisites and other personal benefits properly categorized in this column did not exceed the lesser of $50,000 or 10% of Mr. Carter’s annual salary for any of the three years reported. |
| (3) | “All Other Compensation” consists of amounts contributed for Mr. Carter under Bank Services’ qualified profit sharing plan and amounts contributed for Mr. Carter under Bank Services’ non-qualified profit sharing plan for highly paid executives. For 2005, these amounts consisted of $27,000 contributed to the qualified profit sharing plan and $53,000 contributed to the non-qualified profit sharing. |
Shenandoah National Bank
Annual Compensation
| Annual Compensation | ||||||||||
Name and Principal Position | Year | Salary | Other Annual Compensation² | All Other Compensation³ | ||||||
Worth Harris Carter, Jr. | 2005 | $ | 27,000 | — | $ | 4,000 | ||||
Chairman of the Board and | 2004 | $ | 28,000 | — | $ | 4,000 | ||||
President | 2003 | $ | 25,000 | — | $ | 3,000 | ||||
| (1) | This table shows the portion of Mr. Carter’s total cash compensation during 2005, 2004 and 2003 allocated to Shenandoah National Bank. |
| (2) | The amount of compensation in the form of perquisites and other personal benefits properly categorized in this column did not exceed the lesser of $50,000 or 10% of Mr. Carter’s annual salary for any of the three years reported. |
| (3) | “All Other Compensation” consists of the portion allocated to Shenandoah National Bank for contributions on Mr. Carter’s behalf to Bank Services’ qualified profit sharing plan and non-qualified profit sharing plan for highly paid executives. For 2005, the portion allocated to Shenandoah National Bank consisted of $1,000 for the qualified profit sharing plan and $3,000 for the non-qualified profit sharing plan. |
Profit Sharing Plan
The Bank has adopted an integrated profit sharing plan. The plan covers all full time employees that have been employed for six (6) months and have reached the age of 20-1/2 as of the first day of the plan year. Persons who have reached the age of 62 are fully vested regardless of length of service. The regular vesting schedule is as follows
15
Table of Contents
Years of Service | Vested Percentage | Forfeitable Percentage | ||
Less than 5 | 0 | 100 | ||
5 or more | 100 | 0 |
Each year the Board of Directors determines what amount, if any, is to be allocated to the plan out of accumulated or current earnings of the Bank. The Bank’s contribution to the plan was $50,000 in 2005, $52,000 in 2004, and $51,000 in 2003.
Chairman of the Board and President Carter does not participate in the profit sharing plan of Shenandoah National Bank or any of the other nine banks. Instead, Mr. Carter participates in the two profit sharing plans of Bank Services of Virginia, Inc., a qualified profit sharing plan and a nonqualified plan for highly paid executives whose contribution to the qualified plan is limited due to IRS regulations. The Bank’s annual contributions to these plans on Mr. Carter’s behalf are detailed in the two Summary Compensation Tables above.
DIRECTOR COMPENSATION
Each outside Director (not also an officer of the Bank) currently receives $250 for each Board meeting attended.
ITEM 11. SECURITY OWNERSHIP OF CERTAIN BENEFICIAL OWNERS AND MANAGEMENT AND RELATED STOCKHOLDER MATTERS.
The following table shows as of March 14, 2006, the beneficial ownership of the Bank’s common stock of each Director, the executive officer identified in the Summary Compensation Table and the Bank’s Directors and executive officers as a group. To the Bank’s knowledge, Director Carter was the Bank’s only shareholder beneficially holding more than 5% of the Bank’s outstanding common stock. As of March 14, 2006, the Bank’s Directors and executive officers as a group, beneficially owned 45,445 shares (or 16%) of the Bank’s outstanding common stock.
Name | Amount and Nature of Beneficial Ownership (1)(2) | Ownership as a Percentage of Common Stock Outstanding | ||||
Carter, Worth Harris, Jr. | 19,535 | (3) | 7.0 | % | ||
Craig, W. Lynwood | 8,622 | (4) | 3.1 | % | ||
Lester, George W., II | 7,378 | (5) | 2.7 | % | ||
Pigg, Joseph E. | 2,986 | 1.1 | % | |||
Spencer, Simon C. | 445 | 0.2 | % | |||
Thomasson, James M. | 2,314 | (6) | 0.8 | % | ||
Trent , W. C., Jr. | 4,165 | (7) | 1.5 | % | ||
All Directors and Executive Officer as a Group (7 Persons) | 45,445 | 16 | % |
| (1) | For purposes of this table, beneficial ownership has been determined in accordance with the provisions of Rule 13d-3 of the Securities Exchange Act of 1934 under which, in general, a person is deemed to be the beneficial owner of a security if he has or shares the power to vote or direct the voting of the security or the power to dispose of or direct the disposition of the security, or if he has the right to acquire beneficial ownership of the security within sixty days. |
| (2) | Unless otherwise indicated, the shares listed in the table represent sole voting and investment power. |
| (3) | Includes 3,643 shares held by Mr. Carter as custodian for his children and grandchildren; 105 shares held by Mr. Carter’s son, Ernest Linwood Carter, II, who resides in Mr. Carter’s household; 572 shares held by C&C Realty, Inc., of which Mr. Carter is president and a 50% owner; and 512 shares held by Mr. Carter’s brother, Ernest L. Carter. |
16
Table of Contents
| (4) | Includes 7,965 shares held by Mr. Craig’s wife. |
| (5) | Includes 2,548 shares held by The Lester Group, Inc., of which Mr. Lester is president; 19 shares held by Beaver Hills Dev. Corp., of which Mr. Lester is president; 19 shares held by Carriage Square, LTD, of which Mr. Lester is president; 745 shares held by Mr. Lester as custodian for his children; and 2 shares held by BB&T as trustee for Mr. Lester’s son. 6) Includes 179 shares held jointly with Mr. Spencer’s wife and 8 shares held by Mr. Spencer’s wife. |
| (6) | Includes 944 shares held by Mr. Thomasson’s wife. |
| (7) | Includes 793 shares held by Mr. Trent as custodian for his children and 203 shares held by Mr. Trent’s wife. |
The Bank knows of no arrangements, including any pledge by any person of securities of the Bank, which may at a subsequent date result in a change in control of the Bank.
Equity Compensation Plans.No disclosure regarding equity compensation plans has been provided because the Bank does not have any outstanding equity compensation plans or arrangements that would be covered by Item 201(d) of Regulation S-B.
ITEM 12. CERTAIN RELATIONSHIPS AND RELATED TRANSACTIONS.
Mr. Carter, Chairman of the Board and President of Shenandoah National Bank also serves as Chairman of the Board and President of Patrick Henry National Bank, Blue Ridge Bank, N.A., Central National Bank, Community National Bank, First National Bank, First National Exchange Bank, Peoples National Bank, Patriot Bank, N.A., and Mountain National Bank.
The Bank maintains a correspondent bank account with one of these banks. In 2005 and 2004, the average daily balance in this account was considered a normal operating balance to facilitate general business transactions. The Bank also participates in loan transactions with these banks. These transactions are at carrying value and do not involve more than the normal risk of collectibility or present other unfavorable features.
The Bank owns ten percent of the outstanding common stock of The Mortgage Company of Virginia, Inc. The remaining common stock is equally owned by the banks listed above. The Mortgage Company of Virginia owns 100% of Bank Services of Virginia, Inc. The business of both of these companies is to provide operational support services to the ten banks. These services consist of mortgage loan servicing, data processing, bookkeeping, check clearing, accounting, investment management, band couriers, advertising programs, central purchasing and other management services. The Bank is charged for its share of these services, which is recorded as Operation Center Expense in the Statements of Income. The cost of this expense is shared by the ten banks on the basis of average deposits of each bank related to total average deposits of all the banks.
The Mortgage Company of Virginia, Inc. also owns 100% of Bank Services Insurance, Inc. Bank Services Insurance, Inc. provides insurance products to the banks and customers in the Danville area. The premiums paid to Bank Services Insurance, Inc. equaled $16,000 in 2005.
The Mortgage Company of Virginia, Inc. also owns 50% of Coresoft, Inc. represented by an initial $1,000 investment during 2004. Coresoft, Inc. is in the process of developing a core software package the banks listed above will use. At December 31, 2005, Coresoft, Inc. had an outstanding note payable to the Mortgage Company of $1,400,000.
The Chairman of the Board and President of the Bank also serves as Chairman of the Board and President of Bank Building Corporation and Manager of Blackstone Properties, LLC, it’s wholly owned subsidiary (the “companies”). The companies lease branches to certain of the banks listed above. At December 31, 2005, the Bank leased two offices from
17
Table of Contents
the companies. Rental expense under these leases was $104,000 in 2005, $114,000 in 2004 and 2003. The Bank also leases offices from non-related parties under various terms. Rental expense for these leases was $76,000 in 2005 and $74,000 in 2004 and 2003. Future minimum lease payments will be $181,000 per year through 2010, and thereafter (may vary based on changing interest rates). As of December 31, 2005 and 2004, the Bank had loans totaling $1,342,000 and $1,371,000, respectively, to the companies. These loans were made to purchase bank branches leased to affiliated banks and other investment property. The loans are secured by these branches and the related leases and other investment property, and have repayment terms similar to other loan customers of the Bank.
In the ordinary course of business, the Bank’s Directors and executive officers and their related interests were customers of, and had transactions with the Bank. Loan transactions with Directors and officers, principal security holders and associates were made on substantially the same terms as those prevailing at the time for comparable loans to other persons and did not involve more than normal risk of collectibility or present other unfavorable features. These extensions of credit equaled $132,000, or 2% of the Bank’s equity capital as of December 31, 2005.
ITEM 13. EXHIBITS.
| Exhibits: | ||
| 3.1 | Articles of Association (filed with the Office of the Comptroller of the Currency prior to the opening of the Bank) | |
3.2 | Amended and Restated Bylaws (as amended and restated through February 15, 2005) (incorporated by reference to Exhibit 3.2 to Form 8-K filed with the Office of the Comptroller of the Currency on February 15, 2005) | |
13 | 2005 Annual Report to Shareholders, as revised | |
31 | Certification by principal executive officer and principal financial officer pursuant to Rule 13a-14(a) | |
32 | Certification of principal executive officer and principal financial officer pursuant to 18 U.S.C. § 1350 | |
ITEM 14. PRINCIPAL ACCOUNTANT FEES AND SERVICES.
Goodman & Company, LLP served as the Bank’s independent public auditors for the year ended December 31, 2005, and has been selected by the Board to act as the Bank’s independent public auditors for the year ending December 31, 2006. A representative of Goodman & Company will be present at the Annual Meeting and will be given the opportunity to make a statement and respond to appropriate questions from shareholders.
The following table presents the fees for professional audit services rendered by Goodman & Company for the audit of the Bank’s annual financial statements for the years ended December 31, 2005 and 2004, and fees billed for other services rendered by Goodman & Company during those periods.
Year Ended December 31,
| 2005 | 2004 | |||||
Audit fees¹ | $ | 3,350 | $ | 3,130 | ||
Audit-related fees | — | — | ||||
Tax fees² | 3,265 | 3,100 | ||||
All other fees | — | — | ||||
Total Fees | $ | 6,615 | $ | 6,230 | ||
18
Table of Contents
| 1 | Audit fees consist of audit and review services, consents and review of documents filed with the OCC. |
| 2 | Tax fees consist of preparation of federal and state tax returns and consultation concerning tax compliance issues. |
In its capacity as the Audit Committee, the Board of Directors considered the compatibility of the non-audit-related services performed by and fees paid to Goodman & Company in 2005 and 2004 and the proposed non-audit-related services and proposed fees for 2006 and determined that such services and fees are compatible with the independence of Goodman & Company as the Bank’s independent auditors.
Also in its capacity as the Audit Committee, the Board of Directors pre-approves all audit (including audit-related) and permitted non-audit services to be performed by the independent auditors. The Board of Directors annually approves the year-end audit to be performed by the Bank’s independent auditors for the fiscal year. With respect to other permitted services, the Board of Directors pre-approves specific engagements, projects and categories of services on a fiscal year basis.
19
Table of Contents
SIGNATURES
In accordance with Section 13 or 15(d) of the Exchange Act, the registrant has caused this report to be signed on its behalf by the undersigned, thereunto duly authorized.
| SHENANDOAH NATIONAL BANK | ||||
| Date: September 8, 2006 | /s/ Worth Harris Carter, Jr. | |||
| Worth Harris Carter, Jr. | ||||
| Chairman of the Board and President | ||||
In accordance with the Exchange Act, this report has been signed below by the following persons on behalf of the registrant and in the capacities and on the dates indicated.
Signature | Capacity | Date | ||
/s/ Worth Harris Carter, Jr. | Chairman of the Board and President | September 8, 2006 | ||
| Worth Harris Carter, Jr. | (principal executive, principal financial | |||
| and principal accounting officer) | ||||
/s/ W. Lynwood Craig | Director | September 8, 2006 | ||
| W. Lynwood Craig | ||||
/s/ George W. Lester, II | Director | September 8, 2006 | ||
| George W. Lester, II | ||||
/s/ Joseph E. Pigg | Director | September 8, 2006 | ||
| Joseph E. Pigg | ||||
/s/ Simon C. Spencer | Director | September 8, 2006 | ||
| Simon C. Spencer | ||||
/s/ James M. Thomasson | Director | September 8, 2006 | ||
| James M. Thomasson | ||||
/s/ W. C. Trent, Jr. | Director | September 8, 2006 | ||
| W. C. Trent, Jr. | ||||
20
Table of Contents
Exhibit 31
CERTIFICATION
I, Worth Harris Carter, Jr., certify that:
| 1. | I have reviewed this annual report on Form 10-KSB/A of Shenandoah National Bank; |
| 2. | Based on my knowledge, this report does not contain any untrue statement of a material fact or omit to state a material fact necessary to make the statements made, in light of the circumstances under which such statements were made, not misleading with respect to the period covered by this report; and |
| 3. | Based on my knowledge, the financial statements, and other financial information included in this report, fairly present in all material respects the financial condition, results of operations and cash flows of the small business issuer as of, and for, the periods presented in this report. |
| Date: September 8, 2006 | /s/ Worth Harris Carter, Jr. | |||
| Worth Harris Carter, Jr. | ||||
| Chairman of the Board and President | ||||
| (principal executive officer and principal financial officer) |
21
Table of Contents
Exhibit 32
CERTIFICATION OF
PRINCIPAL EXECUTIVE OFFICER AND PRINCIPAL FINANCIAL OFFICER
Pursuant to Section 906 of the Sarbanes-Oxley Act of 2002 (18 U.S.C. Section 1350)
The undersigned, as the principal executive officer and principal financial officer of Shenandoah National Bank, certifies that, to the best of his knowledge and belief, the Annual Report on Form 10-KSB/A for the fiscal year ended December 31, 2005 which accompanies this certification fully complies with the requirements of Section 13(a) or 15(d) of the Securities Exchange Act of 1934 and the information contained in the report fairly presents, in all material respects, the financial condition and results of operations of Shenandoah National Bnak at the dates and for the periods indicated. The foregoing certification is made pursuant to Section 906 of the Sarbanes-Oxley Act of 2002 (18 U.S.C. Section 1350) and shall not be relied upon for any other purpose. The undersigned expressly disclaims any obligation to update the foregoing certification except as required by law.
| Date: September 8, 2006 | /s/ Worth Harris Carter, Jr. | |||
| Worth Harris Carter, Jr. | ||||
| Chairman of the Board and President | ||||
| (principal executive officer and principal financial officer) |
22
Table of Contents
| Exhibit 13 |
Annual
Report

Shenandoah National Bank
Member FDIC
Table of Contents
Management’s Discussion and Analysis of Financial Condition and Results of Operation
Except for the historical information contained in this report, the matters set forth herein include Forward-Looking Statements within the meaning of the “safe harbor” provisions of the Private Securities Litigation Reform Act of 1995. These Forward-Looking Statements included, among other things, statements of goals, plans, intentions and expectations, regarding or based upon desired business strategies, general economic conditions, interest rates, developments in local and national markets, and other matters, which, by their nature, are subject to significant uncertainties. Because of these uncertainties and the assumptions upon which this report is based, actual future developments with respect to the business of the Bank may differ materially from those contemplated by such statements.
Critical Accounting Policies.The accounting and reporting policies of the Bank conform to generally accepted accounting principles in the United States of America (GAAP) and to general practices within the banking industry. The preparation of the financial statements in conformity with GAAP requires management to make estimates and assumptions that affect the amounts reported in the financial statements and accompanying notes. We believe the most significant of these estimates involves the allowance for loan losses because of its potential impact on our overall performance. We have described our policies in this area below. A summary of the Bank’s significant accounting policies can be found in the Notes to the Financial Statements.
In general, determining the amount of the allowance for loan losses requires significant judgment and the use of estimates by management. The Bank maintains an allowance for loan losses to absorb probable losses in the loan portfolio based on a quarterly analysis of the portfolio and expected future losses. This analysis determines an appropriate level of the allowance for loan losses by considering factors affecting loan losses, including specific losses, levels and trends in impaired and non-performing loans, historical loan loss experience, current economic conditions, volume, growth and composition of the portfolio, and other relevant factors. The Bank records a provision for loan losses to maintain the allowance at an adequate level. The provision expense could increase or decrease each quarter based upon the results of management’s formal analysis.
The amount of the allowance represents management’s estimate of expected losses from existing loans based upon specific allocations for individual lending relationships and historical loss experience. The allowance for loan losses related to impaired loans is based on discounted cash flows using the loan’s initial effective interest rate or the fair value of the collateral for certain collateral dependent loans. This evaluation requires management to make estimates of the amounts and timing of future cash flows on impaired loans, which consists primarily of nonaccrual and restructured loans. Actual losses for these loans can vary significantly from these estimates.
Summary of Operations.Net income for 2005 equaled $371,000 or $1.34 per share, compared to $798,000 or $2.87 per share for 2004. This represents a return on average assets of 0.32% and return on average equity of 5% compared to 0.67% and 11%, respectively, for last year.
Our total deposits decreased by $682,000, or 0.63%, during the year. While total deposits remained relatively flat for the year, the composition of deposits changed. LIFETIME FREE CHECKING and Savings experienced increases, while Interest Bearing Demand and Time Deposits decreased. Loans increased $6.6 million, or 10%, during the year.
We opened an office in Harrisonburg during the fourth quarter of 2004 and an office in Bridgewater in 2005. Also slated to open in 2006 is a new office in Woodstock. While the acquisition and opening these offices has a short-term negative impact on earnings, we believe the offices will enhance the long-term profitability of the Bank.
Net Interest Income.Net interest income is our largest source of revenue and continues to be impacted by the very low level of interest rates. Since 2000, the Federal Reserve decreased the target rate for federal funds from 6.50% to 1.00%. However, on June 30, 2004, the Fed began a series of one-quarter-percent increased on 14 different occasions over the last year and a half, placing the target federal funds rate at 4.50% at year end. The Fed is expected to increase rates one or two more times before pausing.
While the Bank increased loans and investments, the increase in our costs of deposits occurred more rapidly than our increase in interest income and as a result, net interest income declined $227,000 over the prior year. This was a significant improvement from the $530,000 decline in net interest income in 2004. With interest rates at higher levels, we anticipate our existing loans will increase in yield at a faster pace than the net increase in the costs of deposits. We anticipate a significant improvement in net interest income in the coming year.
The following table shows a summary of the changes in interest income and interest expense resulting from changes in volume and changes in rates for each category of interest-earning assets and interest-bearing liabilities for 2005/2004 and 2004/2003:
(Dollars in Thousands) | 2005 vs 2004 Increase (Decrease) (Revised) | 2004 vs 2003 Increase (Decrease) | ||||||
Asset/Liability | ||||||||
Real Estate Loans | $ | (303 | ) | $ | (721 | ) | ||
Installment Loans | — | (47 | ) | |||||
Commercial Loans | 79 | 53 | ||||||
Total Loans | (224 | ) | (715 | ) | ||||
Interest-Bearing Deposits in Other Financial Institutions | 72 | 76 | ||||||
Investment Securities | (25 | ) | (316 | ) | ||||
Federal Funds Sold | 59 | 53 | ||||||
Total Earning Assets | (118 | ) | (902 | ) | ||||
Interest-Bearing Transaction Accounts | (3 | ) | (28 | ) | ||||
Savings Accounts (Includes MMDA’s) | (18 | ) | (30 | ) | ||||
Certificates of Deposit Over $ 100,000 | (12 | ) | (17 | ) | ||||
Other Certificates of Deposit | 143 | (303 | ) | |||||
Total Deposits | 110 | (378 | ) | |||||
Subordinated Notes | (1 | ) | 1 | |||||
Notes issued to the U. S. Treasury | (1 | ) | — | |||||
Federal Funds Purchased | 1 | 4 | ||||||
Total Interest-Bearing Liabilities | 109 | (373 | ) | |||||
Change in Net Interest Income | $ | (227 | ) | $ | (529 | ) | ||
2
Table of Contents
The following table details the average balances and cost and yield data for the earning assets and interest-bearing liabilities:
| (Dollars in thousands) | 2005 | 2004 | 2003 | ||||||||||||||||||||||||
Asset/Liability | Average Balance | (Revised) Income/ Expense | Yield/ Cost | Average Balance | Income/ Expense | Yield/ Cost | Average Balance | Income/ Expense | Yield/ Cost | ||||||||||||||||||
Real Estate Loans | $ | 63,182 | $ | 3,811 | 6.03 | % | $ | 65,716 | $ | 4,114 | 6.26 | % | $ | 65,530 | $ | 4,835 | 7.38 | % | |||||||||
Commercial Loans | 3,551 | 279 | 7.86 | % | 3,709 | 279 | 7.52 | % | 4,160 | 143 | 3.44 | % | |||||||||||||||
Installment Loans | 4,935 | 275 | 5.57 | % | 5,027 | 196 | 3.90 | % | 3,522 | 326 | 9.26 | % | |||||||||||||||
Total Loans | 71,668 | 4,365 | 6.09 | % | 74,452 | 4,589 | 6.16 | % | 73,212 | 5,304 | 7.24 | % | |||||||||||||||
Interest-Bearing Deposits in | |||||||||||||||||||||||||||
Other Financial Institutions | 11,122 | 421 | 3.79 | % | 15,372 | 349 | 2.27 | % | 11,462 | 273 | 2.38 | % | |||||||||||||||
Investment Securities | 17,532 | 740 | 4.22 | % | 16,558 | 765 | 4.62 | % | 22,346 | 1,081 | 4.84 | % | |||||||||||||||
Federal Funds Sold | 5,341 | 144 | 2.70 | % | 5,420 | 85 | 1.57 | % | 2,732 | 32 | 1.17 | % | |||||||||||||||
Total Earning Assets | $ | 105,663 | $ | 5,670 | 5.37 | % | $ | 111,802 | $ | 5,788 | 5.18 | % | $ | 109,752 | $ | 6,690 | 6.10 | % | |||||||||
Interest-Bearing Transaction Accounts | 10,710 | 53 | 0.49 | % | 11,249 | 56 | 0.50 | % | 10,093 | 84 | 0.83 | % | |||||||||||||||
Savings Accounts (Includes MMDA’s) | 15,764 | 220 | 1.40 | % | 17,238 | 238 | 1.38 | % | 15,014 | 267 | 1.79 | % | |||||||||||||||
Certificates of Deposit $100,000 and Over | 14,483 | 547 | 3.78 | % | 14,791 | 559 | 3.78 | % | 14,382 | 576 | 4.01 | % | |||||||||||||||
Other Certificates of Deposit | 50,983 | 1,735 | 3.40 | % | 50,731 | 1,592 | 3.14 | % | 55,242 | 1,895 | 3.43 | % | |||||||||||||||
Total Deposits | 91,940 | 2,555 | 2.78 | % | 94,009 | 2,445 | 2.60 | % | 94,731 | 2,822 | 2.98 | % | |||||||||||||||
Subordinated Notes | 1,500 | 91 | 6.07 | % | 1,500 | 92 | 6.13 | % | 1,500 | 91 | 6.07 | % | |||||||||||||||
Notes issued to the U. S. Treasury | 64 | 2 | 3.13 | % | 89 | 1 | 1.12 | % | 55 | — | — | ||||||||||||||||
Federal Funds Purchased | 161 | 3 | 1.86 | % | 512 | 4 | 0.78 | % | — | — | — | ||||||||||||||||
Total Interest-Bearing Liabilities | $ | 93,665 | $ | 2,651 | 2.83 | % | $ | 96,110 | $ | 2,542 | 2.64 | % | $ | 96,286 | $ | 2,914 | 3.03 | % | |||||||||
Net Interest Income | $ | 3,019 | $ | 3,246 | $ | 3,776 | |||||||||||||||||||||
Net Yield on Average Earning Assets | 2.86 | % | 2.90 | % | 3.44 | % | |||||||||||||||||||||
Loans. Loans increased from $68 million at year-end 2004 to $75 million at year-end 2005. The composition of the portfolio remained consistent with prior years as real estate secured loans made up 88% of net loans and is indicative of the overall lending philosophy of the Bank.
The Bank also continues to maintain flexibility in the maturity of the loan portfolio. Nearly 61% of the Bank’s loans have adjustable interest rates as of year-end 2005 compared to 71% for 2004. In addition, the combination of adjustable-rate loans that adjust or mature within one year equals 29% for 2005 compared to 74% in 2004.
Allowance and Provision for Loan Losses. As discussed previously, the Allowance for Loan Losses represents management’s estimation of the amount necessary to absorb future losses in the loan portfolio. On the Statement of Condition, the Allowance for Loan Losses is deducted from Total Loans so that the net amount shown represents the estimated realizable total loans. The Provision for Loan Losses is the amount charged to expense to maintain the Allowance at an adequate level.
Based on management’s analysis of the loan portfolio, including nonaccrual and impaired loans, the Provision for Loan Losses remained consistent at $72,000 for 2005 and 2004.
| December 31 | ||||||||||||||||||||
(Dollars in thousands) | 2005 | 2004 | 2003 | 2002 | 2001 | |||||||||||||||
Balance Beginning of Period | $ | 936 | $ | 898 | $ | 503 | $ | 452 | $ | 427 | ||||||||||
Provision for Loan Losses | 72 | 72 | 441 | 60 | 48 | |||||||||||||||
Net Loan Losses | ||||||||||||||||||||
Real Estate Loans | 73 | 24 | 36 | — | — | |||||||||||||||
Installment Loans | 6 | 10 | 9 | 7 | 23 | |||||||||||||||
Commercial Loans | — | — | 1 | 2 | — | |||||||||||||||
Total Net Loan Losses | 79 | 34 | 46 | 9 | 23 | |||||||||||||||
Balance End of Period | $ | 929 | $ | 936 | $ | 898 | $ | 503 | $ | 452 | ||||||||||
Net loan Losses to Average Loans | 0.11 | % | 0.04 | % | 0.06 | % | 0.01 | % | 0.04 | % | ||||||||||
Allowance for Loan Losses to Period-End Loans | 1.24 | % | 1.39 | % | 1.15 | % | 0.81 | % | 0.75 | % | ||||||||||
Nonaccrual loans are those loans contractually past due 90 days or more on which no interest is being accrued. Other real estate owned consists of real estate acquired through foreclosure. These properties are reviewed quarterly and reduced to an estimated realizable value at that time.
3
Table of Contents
Information concerning non-accrual loans and other real estate owned is presented in the following table:
(Dollars in thousands) | December 31 | |||||||||||||||||||
| 2005 (Revised) | 2004 | 2003 | 2002 | 2001 | ||||||||||||||||
Nonaccrual Loans | ||||||||||||||||||||
Real Estate | $ | 2,628 | $ | 1,431 | $ | 925 | $ | 925 | $ | — | ||||||||||
Installment | 2 | 1 | 3 | — | — | |||||||||||||||
Commercial | 1 | — | — | — | — | |||||||||||||||
Total Nonaccrual Loans | 2,631 | 1,432 | 928 | — | — | |||||||||||||||
Real Estate Owned Other Than Bank Premises | 487 | 534 | 90 | 160 | 355 | |||||||||||||||
Total Nonperforming Assets | $ | 3,118 | $ | 1,966 | $ | 1,018 | $ | 160 | $ | 355 | ||||||||||
Allowance for Loan Losses to Non-Performing Assets | 0.30 | % | 0.48 | % | 88 | % | 314 | % | 127 | % | ||||||||||
The following table presents the volume of loans contractually past due for 90 days or more on which interest continues to be accrued. These loans are believed to be well collateralized and present little or not likelihood of loss of principal:
| (Dollars in thousands) | |||||||||||||||
Loans 90 Days or More Past Due | |||||||||||||||
Real Estate | $ | 19 | $ | 1,350 | $ | — | $ | — | $ | 464 | |||||
Installment | 1 | — | — | — | — | ||||||||||
Commercial | — | 6 | — | — | — | ||||||||||
Total Loans 90 Days or More Past Due | $ | 20 | $ | 1,356 | $ | — | $ | — | $ | 464 | |||||
Non-Interest Income and Expense. Non-interest income equaled $372,000 for 2005 compared to $394,000 for 2004, a decrease of $22,000 or 6%. The principle component of non-interest income is service charges on deposit accounts, which equaled $334,000 for 2005 compared to $331,000 for 2004. Non-interest expenses increased $404,000 during the year. Salaries and employee benefits, which is the largest of these expenses, increased $180,000 during the year. Operations Center expense increased $34,000. Both occupancy and other expenses increased and accounted for $190,000 of the overall increase.
Investments.Total investment securities increased from $12 million at year-end 2004 to $20 million at year-end 2005. The funds derived from the reduction of Fed Funds Sold and Interest Bearing Deposits in other Financial Institutions were used, in part, to fund the increase in investments in U.S. Agency Securities, where greater yields are available.
Deposits. Total deposits decreased $682,000, or 0.63%, during the year. While the number of total deposits remained relatively flat, there has been a shift in the composition of our deposits as customers have moved their funds out of Interest Bearing Demand and Certificates of Deposit into LIFETIME FREE CHECKING and Savings Accounts. As a result, our total time deposits decreased during the year. LIFETIME FREE CHECKING increased $2.3 million or 15.6% over last year, while Interest Bearing Demand decreased $3.4 million or 20.1%. Passbook Savings increased $549,000 or 5%.
Interest Sensitivity Analysis. The frequency with which interest rates on earning assets and interest bearing liabilities change has a significant impact on net interest income. The following table presents the anticipated changes based on the contractual maturity of each instrument. Expected maturities may differ from contractual maturities as both borrowers and depositors may have the right to call or prepay obligations with or without call or prepayment penalties.
(Dollars in thousands) (Revised) Use of Funds | Within One Year | One to Five Years | Over Five Years | Total | ||||||||||
Interest-Bearing Deposits in Other Financial Institutions | $ | 10,099 | $ | 1,287 | $ | — | $ | 11,386 | ||||||
Federal Funds Sold | 1,800 | — | — | 1,800 | ||||||||||
Investment Securities | 1,879 | 18,003 | — | 19,882 | ||||||||||
Loans | 21,822 | 28,714 | 24,533 | 75,069 | ||||||||||
Total Earning Assets | $ | 35,600 | $ | 48,004 | $ | 24,533 | $ | 108,137 | ||||||
Deposits | ||||||||||||||
Interest-Bearing Demand | $ | 13,445 | $ | — | $ | — | $ | 13,445 | ||||||
Regular Passbook Savings | 11,587 | — | — | 11,587 | ||||||||||
Time Deposits | ||||||||||||||
Certificates of Deposit Over $ 100,000 | 6,225 | 7,542 | — | 13,767 | ||||||||||
Other | 24,323 | 27,236 | — | 51,559 | ||||||||||
Total Interest-Bearing Deposits | 55,580 | 34,778 | — | 90,358 | ||||||||||
Subordinated Notes | 1,500 | — | — | 1,500 | ||||||||||
Notes issued to the U. S. Treasury | 131 | — | — | 131 | ||||||||||
Total Interest-Bearing Liabilities | $ | 57,211 | $ | 34,778 | $ | — | $ | 91,989 | ||||||
Maturity/Rate Sensitivity Gap Per Period | $ | (21,611 | ) | $ | 13,226 | $ | 24,533 | $ | 16,148 | |||||
Cumulative Maturity/Rate Sensitivity Gap | (21,611 | ) | (8,385 | ) | 16,148 | |||||||||
4
Table of Contents
Capital. The federal regulatory agencies use risk-based capital ratios to analyze the adequacy of a bank’s capital. These ratios weigh bank assets from 0% to 100% depending upon the risks inherent in each type of asset. The Bank continues to meet all requirements for a well-capitalized bank as defined by the regulatory agencies. The following table presents the key risk-based capital ratios for December 31, 2005 and 2004. Additional details regarding capital may be found in the footnotes of the Financial Statements.
| 2005 (Revised) | 2004 | |||||
Tier 1 Ratio | 10.17 | % | 9.92 | % | ||
Total Risk-Based Capital Ratio | 13.31 | % | 13.13 | % | ||
Leverage Ratio | 6.76 | % | 6.37 | % |
Liquidity. Liquidity is our ability to fund both loans and investments in the normal course of business and to provide adequate protection for unexpected deposit withdrawals or other demands for funds without incurring a significant negative impact on profitability. Our primary source of day-to-day liquidity lies in the combination of cash, deposit balances, checks in process of collection, deposit growth and federal funds sold. Federal funds are excess funds that are sold to other banks, generally on a one-day basis. Normal funds from the repayment of loans and investments augment these funds.
Our secondary source of liquidity lies in our investments and deposits in other financial institutions. While our investments are categorized as held-to-maturity, they consist of short-term U.S. Government Agencies that are readily marketable. As reflected in the previous Interest Sensitivity Analysis, the majority of our investment securities mature in five years or less. Interest-bearing deposits in other financial institutions generally mature in two years or less and the volume of this investment decreased $5.2 million throughout the year.
Management’s Responsibility for Financial Reporting
The management of Shenandoah National Bank has prepared and is responsible for the accompanying financial statements, together with the financial data and other information presented in this annual report. Management believes that the financial statements have been prepared in conformity with accounting principles generally accepted in the United States of America appropriate under the circumstances and include amounts that are based on management’s best estimates and judgments.
Management maintains and depends upon an internal accounting control system designed to provide reasonable assurance that transactions are executed in accordance with management’s authorization, that financial records are reliable as the basis for preparation of all financial statements, and that the Bank’s assets are safeguarded. The design and implementation of all systems of internal control are based on judgments required to evaluate the costs of control in relation to the expected benefits and to determine the appropriate balance between these costs and benefits. The Bank maintains a professional internal audit staff to monitor compliance with the system of internal control. Operational and special audits are conducted, and audit reports are submitted to appropriate management.
The Board of Directors functions as the audit committee and meets periodically with the independent public accountants, Goodman & Company, management and internal auditors to review accounting, auditing and internal reporting matters. The independent public accountants and internal auditors have free access to the Board to discuss the results of their audit work and their evaluations of internal controls and the quality of financial reporting.
The responsibility of Goodman & Company is limited to an expression of their opinion as to the fairness of the financial statements. Their opinion is based on an audit conducted in accordance with Standards of the Public Company Accounting Oversight Board (United States), as described in their report.
Worth Harris Carter, Jr.
Chairman of the Board, President and
Chief Financial Officer
5
Table of Contents

Certified Public Accountants
Specialized Services
Business Solutions
Report of Independent Registered Public Accounting Firm
Board of Directors and Shareholders
Shenandoah National Bank
We have audited the accompanying statements of financial condition ofShenandoah National Bank (Bank) as of December 31, 2005 and 2004, and the related statements of income, shareholders’ equity and cash flows for each of the years in the three-year period ended December 31, 2005. These financial statements are the responsibility of the Bank’s management. Our responsibility is to express an opinion on these financial statements based on our audits.
We conducted our audits in accordance with the standards of the Public Company Accounting Oversight Board (United States). Those standards require that we plan and perform the audits to obtain reasonable assurance about whether the financial statements are free of material misstatement. An audit includes examining, on a test basis, evidence supporting the amounts and disclosures in the financial statements. An audit also includes assessing the accounting principles used and significant estimates made by management, as well as evaluating the overall financial statement presentation. We believe that our audits provide a reasonable basis for our opinion.
In our opinion, the financial statements referred to above present fairly, in all material respects, the financial position ofShenandoah National Bank as of December 31, 2005 and 2004, and the results of its operations and its cash flows for each of the years in the three-year period ended December 31, 2005, in conformity with accounting principles generally accepted in the United States of America.
As further discussed in Note 22 to the financial statements, the statements of financial condition as of December 31, 2005, and the related statements of operations, shareholders’ equity and cash flows for the year ended December 31, 2005, have been revised.

Danville, Virginia
March 1, 2006
110 Exchange Street, Suite G
Danville, VA 24541
ph: 434.792.5334
fax: 434.791.6061
www.goodmanco.com
6
Table of Contents
Statements of Financial Condition
(Dollars in Thousands)
| December 31 | ||||||||
| 2005 (Revised) | 2004 | |||||||
ASSETS: | ||||||||
Interest-Bearing Deposits in Other Financial Institutions | $ | 11,386 | $ | 16,635 | ||||
Investment Securities (Fair Value $19,595 in 2005, $12,206 in 2004) | 19,882 | 12,172 | ||||||
Federal Funds Sold | 1,800 | 11,700 | ||||||
Loans (Net of Unearned Income) | 74,856 | 68,298 | ||||||
Less: Allowance for Loan Losses | (929 | ) | (936 | ) | ||||
Net Loans | 73,927 | 67,362 | ||||||
Earning Assets | 106,995 | 107,869 | ||||||
Cash and Due from Banks | 4,469 | 4,068 | ||||||
Bank Premises and Equipment | 3,203 | 3,152 | ||||||
Real Estate Owned Other Than Bank Premises | 487 | 534 | ||||||
Investment in Associated Company | 769 | 618 | ||||||
Other Assets | 1,237 | 1,205 | ||||||
TOTAL ASSETS | $ | 117,160 | $ | 117,446 | ||||
LIABILITIES: | ||||||||
Deposits: | ||||||||
LIFETIME FREE CHECKING | $ | 17,051 | $ | 14,742 | ||||
Interest-Bearing Demand | 13,445 | 16,830 | ||||||
Regular Passbook Savings | 11,587 | 11,038 | ||||||
Time Deposits: | ||||||||
Certificates of Deposit $100,000 and Over | 13,767 | 15,155 | ||||||
Other | 51,559 | 50,326 | ||||||
TOTAL DEPOSITS | 107,409 | 108,091 | ||||||
Notes Issued to the U. S. Treasury | 131 | 88 | ||||||
Other Liabilities | 236 | 254 | ||||||
Subordinated Note | 1,500 | 1,500 | ||||||
TOTAL LIABILITIES | 109,276 | 109,933 | ||||||
SHAREHOLDERS’ EQUITY: | ||||||||
Common Stock, Par Value Per Share $5.00; 2,500,000 shares authorized; 277,588 shares outstanding in 2005 and 2004 | 1,388 | 1,388 | ||||||
Surplus | 4,558 | 4,558 | ||||||
Undivided Profits | 1,938 | 1,567 | ||||||
TOTAL SHAREHOLDERS’ EQUITY | 7,884 | 7,513 | ||||||
TOTAL LIABILITIES AND SHAREHOLDERS’ EQUITY | $ | 117,160 | $ | 117,446 | ||||
The accompanying notes are an integral part of these financial statements.
7
Table of Contents
Statements of Income
(Dollars in Thousands Except Per Share Data)
| Years Ended December 31 | |||||||||
| 2005 (Revised) | 2004 | 2003 | |||||||
INTEREST INCOME: | |||||||||
Interest and Fees on Loans: | |||||||||
Taxable | $ | 4,253 | $ | 4,473 | $ | 5,236 | |||
Non-Taxable | 112 | 116 | 68 | ||||||
Interest on Deposits in Other Financial Institutions | 421 | 349 | 273 | ||||||
Interest on Federal Funds Sold | 144 | 85 | 32 | ||||||
Interest and Dividends on Securities: | |||||||||
U. S. Agency Securities | 733 | 731 | 1,045 | ||||||
States and Political Subdivisions | 7 | 34 | 36 | ||||||
TOTAL INTEREST INCOME | 5,670 | 5,788 | 6,690 | ||||||
INTEREST EXPENSE: | |||||||||
Interest on Time Deposits $100,000 or More | 547 | 417 | 576 | ||||||
Interest on Other Deposits | 2,008 | 2,029 | 2,246 | ||||||
Interest on Subordinated Note | 91 | 91 | 91 | ||||||
Interest on Federal Funds Purchased | 3 | 4 | — | ||||||
Interest on Notes Issued to the U. S. Treasury | 2 | 1 | 1 | ||||||
TOTAL INTEREST EXPENSE | 2,651 | 2,542 | 2,914 | ||||||
NET INTEREST INCOME | 3,019 | 3,246 | 3,776 | ||||||
Provision for Loan Losses | 72 | 72 | 441 | ||||||
NET INTEREST INCOME AFTER | |||||||||
PROVISION FOR LOAN LOSSES | 2,947 | 3,174 | 3,335 | ||||||
NON-INTEREST INCOME: | |||||||||
Service Charges, Commission and Fees | 334 | 331 | 373 | ||||||
Other Non-Interest Income | 38 | 63 | 36 | ||||||
TOTAL NON-INTEREST INCOME | 372 | 394 | 409 | ||||||
NON-INTEREST EXPENSE: | |||||||||
Salaries and Employee Benefits | 1,454 | 1,274 | 1,278 | ||||||
Occupancy Expense | 545 | 444 | 379 | ||||||
Operations Center Expense | 509 | 475 | 458 | ||||||
Other Non-Interest Expense | 328 | 239 | 214 | ||||||
TOTAL NON-INTEREST EXPENSE | 2,836 | 2,432 | 2,329 | ||||||
INCOME BEFORE INCOME TAXES | 483 | 1,136 | 1,415 | ||||||
Income Tax Expense | 112 | 338 | 445 | ||||||
NET INCOME | $ | 371 | $ | 798 | $ | 970 | |||
Net Income Per Share*: | |||||||||
Basic and Diluted | $ | 1.34 | $ | 2.87 | $ | 3.49 | |||
| * | Net income per share has been retroactively adjusted to reflect the stock dividend in 2003. |
The accompanying notes are an integral part of these financial statements.
8
Table of Contents
Statements of Cash Flows
(Dollars in Thousands)
| Years Ended December 31 | ||||||||||||
| 2005 (Revised) | 2004 | 2003 | ||||||||||
Cash Flows From Operating Activities: | ||||||||||||
Net Income | $ | 371 | $ | 798 | $ | 970 | ||||||
Adjustments to reconcile to net cash from operating activities: | ||||||||||||
Provision for Loan Losses | 72 | 72 | 441 | |||||||||
Depreciation of Premises and Equipment | 144 | 82 | 75 | |||||||||
Equity in Undistributed Income From Associated Company | (1 | ) | (11 | ) | (10 | ) | ||||||
Provision for Deferred Income Taxes | 14 | 66 | (141 | ) | ||||||||
Increase (Decrease) in Unearned Income | 16 | (24 | ) | (92 | ) | |||||||
(Increase) Decrease in Other Assets | (46 | ) | 4 | 48 | ||||||||
Decrease in Other Liabilities | (18 | ) | (31 | ) | (244 | ) | ||||||
Net Cash from Operating Activities | 552 | 956 | 1,047 | |||||||||
Cash Flows From Investing Activities: | ||||||||||||
Maturity of Interest-Bearing Deposits | 11,987 | 12,579 | 9,611 | |||||||||
Purchase of Interest-Bearing Deposits | (6,738 | ) | (16,734 | ) | (12,480 | ) | ||||||
Purchase of Investment Securities | (11,594 | ) | (10,000 | ) | (11,586 | ) | ||||||
Proceeds from maturities, calls and redemptions of Investment Securities | 3,884 | 15,366 | 21,855 | |||||||||
Purchase of Bank Premises and Equipment | (195 | ) | (1,731 | ) | (677 | ) | ||||||
Net (Increase) Decrease in Short-Term Loans Outstanding, Net | (1,965 | ) | 1,156 | (5,101 | ) | |||||||
Longer-Term Loans Originated or Purchased | (10,065 | ) | (11,169 | ) | (20,482 | ) | ||||||
Principal Collected on Longer-Term Loans | 5,377 | 19,554 | 9,764 | |||||||||
Sale of Other Real Estate | 47 | — | 70 | |||||||||
Investment in Associated Company | (150 | ) | — | (199 | ) | |||||||
Net Cash from Investing Activities | (9,412 | ) | 9,021 | (9,225 | ) | |||||||
Cash Flows From Financing Activities: | ||||||||||||
Net Increase in Demand and Savings Accounts | (527 | ) | 155 | 8,562 | ||||||||
Proceeds from Sale of Time Deposits | 35,610 | 25,945 | 44,833 | |||||||||
Payments on Matured Time Deposits | (35,765 | ) | (29,098 | ) | (44,081 | ) | ||||||
Stock Dividends | — | — | (22 | ) | ||||||||
Net Increase (Decrease) in Notes Issued to U.S. Treasury | 43 | 39 | (168 | ) | ||||||||
Net Cash from Financing Activities | (639 | ) | (2,959 | ) | 9,124 | |||||||
Net Change in Cash and Equivalents | (9,499 | ) | 7,018 | 946 | ||||||||
Cash and Equivalents at Beginning of Year | 15,768 | 8,750 | 7,804 | |||||||||
Cash and Equivalents at End of Year | $ | 6,269 | $ | 15,768 | $ | 8,750 | ||||||
Supplementary Data: | ||||||||||||
Cash Paid for Interest | $ | 2,657 | $ | 2,559 | $ | 2,957 | ||||||
Cash Paid for Income Tax | 112 | 338 | 445 | |||||||||
Transfer of Loans to Foreclosed Assets | 78 | 512 | — | |||||||||
The accompanying notes are an integral part of these financial statements.
9
Table of Contents
Statements of Changes in Shareholders’ Equity
(Dollars in Thousands)
| COMMON STOCK | UNDIVIDED | |||||||||||
| SHARES | AMOUNT | SURPLUS | PROFITS | |||||||||
Year Ended December 31, 2003 | ||||||||||||
Balance at Beginning of Year | 252,856 | $ | 1,264 | $ | 3,692 | $ | 811 | |||||
Net Income | — | — | — | 970 | ||||||||
Stock Dividends (10%) | 24,732 | 124 | 866 | (1,012 | ) | |||||||
Total | 277,588 | $ | 1,388 | $ | 4,558 | $ | 769 | |||||
Year Ended December 31, 2004 | ||||||||||||
Balance at Beginning of Year | 277,588 | $ | 1,388 | $ | 4,558 | $ | 769 | |||||
Net Income | — | — | — | 798 | ||||||||
Total | 277,588 | $ | 1,388 | $ | 4,558 | $ | 1,567 | |||||
Year Ended December 31, 2005 (Revised) | ||||||||||||
Balance at Beginning of Year | 277,588 | $ | 1,388 | $ | 4,558 | $ | 1,567 | |||||
Net Income | — | — | — | 371 | ||||||||
Total | 277,588 | $ | 1,388 | $ | 4,558 | $ | 1,938 | |||||
The accompanying notes are an integral part of these financial statements.
10
Table of Contents
Notes to Financial Statements
(Dollars in Thousands Except Per Share Data)
1. SUMMARY OF SIGNIFICANT ACCOUNTING POLICIES
The accounting and reporting policies of Shenandoah National Bank are in accordance with accounting principles generally accepted in the United States of America and general practices within the banking industry that are consistent with reports filed with regulatory agencies.
NATURE OF OPERATIONS
The Bank generates commercial (including agricultural), mortgage and consumer loans and receives deposits from customers located primarily in Augusta, Rockbridge, and Rockingham Counties in Virginia, including the cities of Buena Vista, Harrisonburg, Staunton and Waynesboro. The Bank operates under a national charter and provides full banking services. As a national bank, the Bank is subject to regulation by the Comptroller of the Currency, Federal Deposit Insurance Corporation, and the Board of Governors of the Federal Reserve System.
USE OF ESTIMATES
The preparation of financial statements in conformity with accounting principles generally accepted in the United States of America requires management to make estimates and assumptions that affect the reported amounts of assets and liabilities and disclosure of contingent assets and liabilities at the date of the financial statements, and the reported amounts of revenue and expenses during the reporting period. Actual results could differ from those estimates. Material estimates that are particularly susceptible to significant change in the near term relate to the determination of the allowance for loan losses and fair value of other real estate owned.
CASH AND CASH EQUIVALENTS
For purposes of cash flows, cash and cash equivalents include cash on hand, demand balances due from banks and federal funds transactions. Generally, federal funds are purchased and sold for one-day periods.
SECURITIES
Investment securities are stated at cost, adjusted for amortization of premiums and accretion of discounts, and computed by the interest method. The Bank has the positive intent and ability to hold the securities until maturity. Gains and losses on sales, if any, of securities are based upon the adjusted cost of the specific securities sold.
LOANS
Loans are recorded at the amount of the loan disbursed to borrowers plus the applicable amount, if any, of unearned income and other charges, less payments received. Income earned on loans is recognized by methods which generally result in level rates of return on principal amounts outstanding. The net amount of nonrefundable loan originiation fees approximates the direct costs associated with the lending process.
The allowance for loan losses is an estimate of losses inherent in the loan portfolio as determined by management taking into consideration historical loan loss experience, diversification of the loan portfolio, amounts of secured and unsecured loans, banking industry standards and averages, and general economic conditions. Ultimate losses may vary from current estimates. These estimates are reviewed periodically and as adjustments become necessary, they are reported in earnings in the periods in which they become reasonably estimable.
Management determines loan impairment using guidelines established by Statement of Financial Accounting Standards No. 114 (SFAS 114),“Accounting by Creditors for Impairment of a Loan (as amended by SFAS No. 118, Accounting by Creditors for Impairment of a Loan - Income Recognition and Disclosures)”. Under this accounting standard, a loan is considered to be impaired when it is probable that the Bank will be unable to collect all principal and interest amounts according to the contractual terms of the loan agreement. A performing loan may be considered impaired. The allowance for loan losses related to loans identified as impaired is primarily based on the excess of the loan’s current outstanding principal balances over the estimated fair value of the related collateral. For a loan that is not collateral-dependent, the allowance is recorded at the amount by which the outstanding principal balance exceeds the current best estimate of the future cash flows on the loan discounted at the loan’s original effective interest rate. Interest on impaired loans is recognized when cash is received.
BANK PREMISES AND EQUIPMENT
Premises and equipment are stated at cost, less accumulated depreciation. Depreciation is charged to operating expenses over the estimated useful life of the assets by the accelerated and straight-line methods. Costs of maintenance or repairs are charged to expense as incurred and improvements are capitalized. Upon retirement or disposal of an asset, the asset and related allowance account are eliminated. Any gain or loss on such transactions is included in current operations. Depreciation has been included under Occupancy Expense in the Statements of Income in the amount of $144,000 in 2005, $82,000 in 2004 and $75,000 in 2003.
OTHER REAL ESTATE OWNED
Real estate properties acquired through or in lieu of loan foreclosure are initially recorded at the lower of the Bank’s carrying amount or fair value less estimated selling cost at the date of foreclosure. Any write-downs based on the asset’s fair value at the date of acquisition are charged to the allowance for loan losses. After foreclosure, these assets are carried at the lower of their new cost basis or fair value less cost to sell. Costs of significant property improvements are capitalized, whereas costs relating to holding property are expensed. Valuations are periodically performed by management, and any write-downs are recorded as a charge to operations, if necessary, to reduce the carrying value of a property to the lower of its carrying or fair value less cost to sell.
INCOME TAXES
Deferred taxes are provided on a liability method whereby deferred tax assets are recognized for deductible temporary differences and operating loss and tax credit carryforwards and deferred tax liabilities are recognized for taxable temporary differences. Temporary differences are the differences between the reported amounts of assets and liabilities and their tax bases. Deferred tax assets are reduced by a valuation allowance when, in the opinion of management, it is more likely than not that some portion or all of the deferred tax assets will not be realized. Deferred tax assets and liabilities are adjusted for the effects of changes in tax laws and rates on the date of enactment.
RETIREMENT BENEFITS
The Bank has established an Employee Benefit Plan as described in a footnote 5. The Bank does not provide any other post-retirement benefits that would be accrued under Statement of Financial Accounting Standards No. 106, “Employers’ Accounting for Post Retirement Benefits Other Than Pensions”.
2. INVESTMENT SECURITIES
The carrying value of securities pledged to secure public deposits was $19,882,000 and $11,977,000, respectively, at December 31, 2005 and 2004. The amortized cost and estimated fair value of investment securities as of December 31, 2005 and 2004 were as follows:
| Gross Amortized Cost | Gross Unrealized Gains | Estimated Unrealized Losses | Fair Value | |||||||||
December 31, 2005 | ||||||||||||
U. S. Agency Securities | $ | 19,882 | $ | 7 | $ | 294 | $ | 19,595 | ||||
December 31, 2004 | ||||||||||||
U. S. Agency Securities | $ | 11,977 | $ | 98 | $ | 69 | $ | 12,006 | ||||
Obligations of States and Political Subdivisions | 195 | 5 | $ | — | 200 | |||||||
Total | $ | 12,172 | $ | 103 | $ | 69 | $ | 12,206 | ||||
The table below shows gross unrealized losses and fair value, aggregated by investment category and length of time that individual securities have been in a continuous unrealized loss position at December 31, 2005 and 2004.
Securities Description | Fair Value | Unrealized Losses Less Than Twelve Months | More Than Twelve Months | ||||||
2005 | |||||||||
U. S. Agency Securities | $ | 15,205 | $ | — | $ | 294 | |||
2004 | |||||||||
U. S. Agency Securities | $ | 5,929 | $ | 69 | $ | — | |||
The unrealized losses on the Bank’s investments in obligations of U. S. Government Agencies were caused by interest rate increases. The contractual terms of those investments do not permit the issuer to settle the securities at a price less than the amortized cost of the investment. Because the Bank has the ability and intent to hold those investments until a recovery of fair value, which may be maturity, the Bank does not consider those investments to be other-than-temporarily impaired at December 31, 2005.
The amortized cost and estimated fair value of investments in debt securities at December 31, 2005 and 2004, by contractual maturity, are shown below. Expected maturities will differ from contractual maturities because issuers may have the right to call or prepay obligations with or without call or prepayment penalties.
| Estimated Amortized Cost | Fair Value | Estimated Amortized Cost | Fair Value | |||||||||
Due in one year or less | $ | 1,879 | $ | 1,882 | $ | 645 | $ | 605 | ||||
Due after one year through five years | 18,003 | 17,713 | 11,527 | 11,601 | ||||||||
Due after five years through ten years | — | — | — | — | ||||||||
Due after ten years | — | — | — | — | ||||||||
Mortgage-Backed Securities | — | — | — | — | ||||||||
Total | $ | 19,882 | $ | 19,595 | $ | 12,172 | $ | 2,206 | ||||
There were no sales of securities during 2005, 2004, and 2003.
3. COMPOSITION OF LOANS
December 31 | 2005 (Revised) | 2004 | ||||||
Real Estate | $ | 65,702 | $ | 60,911 | ||||
Consumer | 4,439 | 3,651 | ||||||
Commercial, Industrial and Agricultural | 2,055 | 1,304 | ||||||
All Other | 2,873 | 2,632 | ||||||
Gross Loans | 75,069 | 68,498 | ||||||
Less: Unearned Income | (213 | ) | (200 | ) | ||||
Allowance for Loan Losses | (929 | ) | (936 | ) | ||||
Total Loans, Net | $ | 73,927 | $ | 67,362 | ||||
Maturity Distribution | 2005 (Revised) | 2004 | ||||||
Variable | ||||||||
Less Than One Year | $ | 13,111 | $ | 44,781 | ||||
One to Five Years | 25,843 | 2,686 | ||||||
Over Five Years | 6,188 | 1,101 | ||||||
Subtotal | 45,142 | 48,568 | ||||||
Fixed | ||||||||
Less Than One Year | 8,712 | 5,838 | ||||||
One to Five Years | 2,870 | 4,655 | ||||||
Over Five Years | 18,345 | 9,437 | ||||||
Subtotal | 29,927 | 19,930 | ||||||
Total | $ | 75,069 | $ | 68,498 | ||||
11
Table of Contents
4. ALLOWANCE FOR LOAN LOSSES
In the view of management, the Allowance for Loan Losses is adequate to meet the loss contingency based on experience factors and a review of the loan portfolio.
The Allowance for Loan Losses for the years ending December 31, 2005, 2004 and 2003 is summarized as follows:
| 2005 | 2004 | 2003 | ||||||||||
Balance at beginning of year | $ | 936 | $ | 898 | $ | 503 | ||||||
Recoveries credited during year | 45 | 1 | 1 | |||||||||
Provision for loan losses | 72 | 72 | 441 | |||||||||
Losses charged to allowance | (124 | ) | (35 | ) | (47 | ) | ||||||
Balance at end of year | $ | 929 | $ | 936 | $ | 898 | ||||||
The following is a summary of information pertaining to impaired and non-accrual loans:
| December 31 | ||||||
| 2005 (Revised) | 2004 | |||||
Impaired loans without a valuation allowance | $ | — | $ | — | ||
Impaired loans with a valuation allowance | 925 | 925 | ||||
Total Impaired loans | $ | 925 | $ | 925 | ||
Valuation allowance related to impaired loans | $ | 369 | $ | 369 | ||
Nonaccrual loans (impaired) | $ | 925 | $ | 925 | ||
Nonaccrual loans (non-impaired) | $ | 1,706 | $ | 1 | ||
Total loans past due ninety days or more and still accruing | $ | 20 | $ | 1,356 | ||
| Years Ended December 31 | |||||||||
| 2005 | 2004 | 2003 | |||||||
Average investment in impaired loans | $ | 925 | $ | 925 | $ | 537 | |||
Interest income recognized on impaired loans | $ | — | $ | 312 | $ | 15 | |||
Interest income recognized on a cash basis on impaired loans | $ | — | $ | — | $ | — | |||
5. STOCK OPTIONS AND EMPLOYEE BENEFIT PLANS
There were no stock options or stock option plans in effect for 2003, 2004 and 2005. Effective January 1, 1997, the Bank adopted an integrated profit sharing plan.
Employees participate in the profit sharing plan following completion of six (6) months of service and upon reaching the age of twenty years and six months as of January 1. Vesting includes years of service to the bank prior to the effective date of the plan. The plan gives 0% vesting to anyone who has less than five (5) years of service except that persons who have reached the age of 62 are fully vested regardless of length of service. Each participant in the plan (who has not reached age 62) becomes 100% vested after five (5) years of service. The contribution to the plan is determined each year by the Board of Directors and thus may fluctuate in amount from year to year. The contribution by the Bank was $50,000 in 2005, $52,000 in 2004, and $51,000 in 2003 and is included in Salaries and Employee Benefits in the Statements of Income.
6. FEDERAL INCOME TAXES
Net deferred tax assets consist of the following components as of December 31, 2005 and 2004:
| 2005 | 2004 | |||||
Deferred Tax Assets | ||||||
Allowance for Loan Losses | $ | 294 | $ | 301 | ||
Dividend Exclusion | 13 | 15 | ||||
Other | 20 | — | ||||
Total Deferred Tax Assets | $ | 327 | $ | 316 | ||
Deferred Tax Liabilities | ||||||
Bank Premises | $ | 177 | $ | 154 | ||
Investment in Associated Companies | 15 | 13 | ||||
Total Deferred Tax Liabilities | $ | 192 | $ | 167 | ||
Net Deferred Taxes | $ | 135 | $ | 149 | ||
The provisions for income taxes charged to operations for the year ended December 31, 2005, 2004 and 2003 consist of the following:
| 2005 (Revised) | 2004 | 2003 | ||||||||
Currently payable | $ | 98 | $ | 272 | $ | 586 | ||||
Deferred | 14 | 66 | (141 | ) | ||||||
Net Provision | $ | 112 | $ | 338 | $ | 445 | ||||
The income tax provision differs from the amount of income tax determined by applying the U. S. federal income tax rate to pretax income for the year ended December 31, 2005, 2004 and 2003 due to the following:
| 2005 (Revised) | 2004 | 2003 | ||||||||||
Tax provision computed by applying federal rates to income before income taxes | $ | 164 | $ | 386 | $ | 481 | ||||||
Tax exempt interest | (41 | ) | (51 | ) | (35 | ) | ||||||
Other | (11 | ) | 3 | (1 | ) | |||||||
Net Provision | $ | 112 | $ | 338 | $ | 445 | ||||||
7. RELATED PARTY TRANSACTIONS
The Chairman of the Board of Shenandoah National Bank also serves as Chairman of the Board of Blue Ridge Bank, N. A., Central National Bank, Community National Bank, First National Bank, First National Exchange Bank, Mountain National Bank, Patrick Henry National Bank, Patriot Bank, N. A., and Peoples National Bank.
The Bank maintains correspondent bank accounts with one of these banks. In 2004 and 2003 the average daily balances in these accounts were considered normal operating balances to facilitate general business transactions.
The Bank also participates in loan transactions with these banks. These transactions are at carrying value and do not involve more than the normal risk of collectibility or present other unfavorable features.
The Chairman of the Board of Shenandoah National Bank also serves as Chairman of the Board of Blue Ridge Bank, N. A., Central National Bank, Community National Bank, First National Bank, First National Exchange Bank, Mountain National Bank, Patrick Henry National Bank, Patriot Bank, N. A., and Peoples National Bank.
The Bank maintains correspondent bank accounts with one of these banks. In 2005 and 2004 the average daily balances in these accounts were considered normal operating balances to facilitate general business transactions.
The Bank also participates in loan transactions with these banks. These transactions are at carrying value and do not involve more than the normal risk of collectibility or present other unfavorable features.
The Bank owns ten percent of the outstanding common stock of The Mortgage Company of Virginia, Inc. The remaining common stock is equally owned by the banks listed above. The Mortgage Company of Virginia owns 100% of Bank Services of Virginia, Inc. The business of both of these companies is to provide operational support services to the ten banks. These services consist of mortgage loan servicing, data processing, bookkeeping, check clearing, accounting, investment management, bank couriers, advertising programs, central purchasing and other management services. The Bank is charged for its share of these services, which is recorded as Operation Center Expense in the Statements of Income. The cost of this expense is shared by the ten banks on the basis of average deposits of each bank related to total average deposits of all the banks.
The Mortgage Company of Virginia, Inc also owns 100% of Bank Services Insurance, Inc. Bank Services Insurance, Inc. provides insurance products to the banks and customers in the Danville area. The premiums paid to Bank Services Insurance, Inc. equaled $16,000 in 2005.
The Mortgage Company of Virginia, Inc. also owns 50% of Coresoft, Inc. represented by an initial $1,000 investment during 2004. Coresoft, Inc. is in the process of developing a core software package the banks listed above will use. at December 31, 2005, Coresoft, Inc. had an outstanding note payable to the Mortgage Company of $1,400,000.
The Bank records its investment in the common stock of The Mortgage Company of Virginia, Inc. under the equity method of accounting due to the influence the Bank has over the company. The Bank invested an additional $150,000 in 2005 increasing the investment to $769,000 from $618,000 at December 31, 2004. The Bank’s share of earnings of the company equaled $1,000 for 2005, $11,000 for 2004 and $10,000 for 2003 and is shown in the Statements of Income under Other Non-interest Income.
The Chairman of the Board and President of the Bank also serves as Chairman of the Board and President of Bank Building Corporation and Manager of Blackstone Properties, LLC, its wholly oned subsidiary (the “companies”). The companies lease branches to certain of the banks listed above. At December 31, 2005, the Bank leased two offices from the companies. Rental expense and future lease payments under these leases are disclosed in a footnote below. As of December 31, 2005 and 2004, the Bank had loans totaling $1,308,000 and $1,342,000, respectively, to the companies. These loans were made to purchase bank branches leased to affiliated banks and other investment property. The loans are secured by these branches and the related leases and other investment property, and have repayment terms similar to other loan customers of the Bank.
In the ordinary course of business, directors, and their related interests were customers of, and had transactions with the Bank. Loan transactions with directors and officers, principal security holders and associates were made on substantially the same terms as those prevailing at the time for comparable loans to other persons and did not involve more than normal risk of collectiblity or present other unfavorable features. A summary of these transactions follows.
| 2005 | 2004 | |||||||
Beginning Balance | $ | 142 | $ | 151 | ||||
New Loans | — | — | ||||||
Repayments | (10 | ) | (9 | ) | ||||
Ending Balance | $ | 132 | $ | 142 | ||||
8. COMMITMENTS AND CONTINGENCIES
The Bank did not have any legal matters of financial significance pending at December 31, 2005 or 2004.
9. EARNINGS PER COMMON SHARE
The Bank follows Statement of Financial Accounting Standards (SFAS) No. 128, “Earnings per Share”. This statement requires the dual presentation of basic and diluted earnings per share which are equal for the Bank for all periods presented. The weighted average number of shares used to compute earnings per share was 277,588.
The Bank issued a 10% stock dividend in 2003. No stock dividend was issued in 2005 or 2004. No fractional shares were issued in this stock dividend. Stock Dividends and fractional shares were settled based on known prices for recent trades of the stock and other factors deemed relevant at the time.
12
Table of Contents
10. BANK PREMISES AND EQUIPMENT
Premises and equipment are stated at cost less accumulated depreciation as follows:
December 31, 2005 | |||||||||
Bank Premises (Including Land of $509,000) | $ | 2,322 | $ | 78 | $ | 2,244 | |||
Equipment | 944 | 324 | 620 | ||||||
Leasehold Improvements | 673 | 334 | 339 | ||||||
Total | $ | 3,939 | $ | 736 | $ | 3,203 | |||
December 31, 2004 | |||||||||
Bank Premises (Including Land of $329,000) | $ | 2,240 | $ | 57 | $ | 2,183 | |||
Equipment | 841 | 236 | 605 | ||||||
Leasehold Improvements | 666 | 302 | 364 | ||||||
Total | $ | 3,747 | $ | 595 | $ | 3,152 | |||
11. FORECLOSED ASSETS
Expenses applicable to foreclosed assets include the following:
| 2005 | 2004 | 2003 | |||||||
Net loss (gain) on sales of real estate | $ | — | $ | — | $ | — | |||
Provision for losses | — | — | — | ||||||
Operating expenses | — | 2 | 2 | ||||||
12. CASH AND CASH EQUIVALENTS
Cash and cash equivalents as of December 31, 2005, 2004 and 2003 are detailed below:
| 2005 | 2004 | 2003 | |||||||
Cash and Due From Banks | $ | 4,469 | $ | 4,068 | $ | 3,385 | |||
Federal Funds Sold | 1,800 | 11,700 | 5,365 | ||||||
Total Cash and Cash Equivalents | $ | 6,269 | $ | 15,768 | $ | 8,750 | |||
13. DEPOSITS
Certificates of Deposit maturing as of December 31: | 2005 | 2004 | ||||
1 Year | $ | 30,551 | $ | 38,700 | ||
2 Years | 9,818 | 8,924 | ||||
3 Years | 6,821 | 5,844 | ||||
4 Years | 4,614 | 6,624 | ||||
5 Years and Thereafter | 13,522 | 5,389 | ||||
Total | $ | 65,326 | $ | 65,481 | ||
14. CONCENTRATION OF CREDIT RISK
The majority of the Bank’s loans, commitments and lines of credit have been granted to customers in the Bank’s market area. The concentrations of credit by loan classification are set forth in a footnote above. The Bank does not extend credit to any individual borrower or related group of borrowers in excess of its lending limit of $1,549,000 as of year-end 2005 and $1,494,000 as of year-end 2004.
The largest category of Real Estate Loans consisted of Commercial loans. These loans approximated $19,558,000 at December 31, 2005 and $17,122,000 at December 31, 2004.
15. FAIR VALUE OF FINANCIAL INSTRUMENTS
Statement of Financial Accounting Standards No. 107, “Disclosures about Fair Value of Financial Instruments”, requires the Bank to disclose the estimated fair values of its financial assets and liabilities. The estimated fair values were determined using the following assumptions:
| a. | The carrying value of Cash and Due From Banks, Federal Funds Sold and Interest-Bearing Deposits in Other Financial Institutions are believed to approximate the fair value of these items. |
| b. | The fair value of actively traded investment securities are determined according to quotes available in the financial press. The fair value of instruments which are not actively traded are determined using values of other instruments with similar characteristics or obtained from outside sources believed to be reliable. |
| c. | The fair value of loans are estimated by discounting the anticipated cash flows using estimated rates for similar loans available in the Bank’s market area. Estimates of maturities are based on both experience and contractual maturities although prepayments are permitted on the loans. |
| d. | The fair value of short-term demand and savings deposits are believed to equal carrying value. The fair value of certificates of deposit are based upon the contractual maturity of the instruments and rates currently offered for similar deposits. |
| e. | The fair value of Notes Payable to the U. S. Treasury and Subordinated Notes are estimated at carrying value. |
| f. | The fair value of Accrued Interest Receivable and Accrued Interest Payable are estimated at carrying value. |
| 2005 (Revised) | 2004 | |||||||||||
Financial Assets: | Carrying Value | Fair Value | Carrying Value | Fair Value | ||||||||
Interest-Bearing Deposits in Other Financial Institutions | $ | 11,386 | $ | 11,386 | $ | 16,635 | $ | 16,635 | ||||
Investment Securities | 19,882 | 19,595 | 12,172 | 12,206 | ||||||||
Federal Funds Sold | 1,800 | 1,800 | 11,700 | 11,700 | ||||||||
Loans (Net of Unearned Income) | 74,856 | 74,658 | 68,298 | 69,202 | ||||||||
Cash and Due From Banks | 4,469 | 4,469 | 4,068 | 4,068 | ||||||||
Accrued Interest Receivable | 568 | 568 | 470 | 470 | ||||||||
Total | $ | 112,961 | $ | 112,476 | $ | 113,343 | $ | 114,281 | ||||
| 2005 (Revised) | 2004 | |||||||||||
Financial Liabilities: | Carrying Value | Fair Value | Carrying Value | Fair Value | ||||||||
Deposits | ||||||||||||
LIFETIME FREE CHECKING | $ | 17,051 | $ | 17,051 | $ | 14,742 | $ | 14,742 | ||||
Interest-Bearing Demand | 13,445 | 13,445 | 16,830 | 16,830 | ||||||||
Regular Passbook Savings | 11,587 | 11,587 | 11,038 | 11,038 | ||||||||
Time Deposits: | ||||||||||||
Certificates of Deposit $100,000 and Over | 13,767 | 13,764 | 15,155 | 15,346 | ||||||||
Other | 51,559 | 51,381 | 50,326 | 50,801 | ||||||||
TOTAL DEPOSITS | 107,409 | 107,228 | 108,091 | 108,757 | ||||||||
Subordinated Notes | 1,500 | 1,500 | 1,500 | 1,500 | ||||||||
Notes issued to the U. S. Treasury | 131 | 131 | 88 | 88 | ||||||||
Accrued Interest Payable | 182 | 182 | 190 | 190 | ||||||||
Total | $ | 109,222 | $ | 109,041 | $ | 109,869 | $ | 110,535 | ||||
16. CAPITAL ADEQUACY
The Bank is subject to various regulatory capital requirements. Under the regulatory capital guidelines and the regulatory framework for Prompt Corrective Action (PCA), the Bank must meet specific capital guidelines involving the quantitative measures of the Bank’s assets, liabilities, and certain off-balance-sheet items as calculated under regulatory accounting practices. The Bank’s capital amount and classification are also subject to qualitative judgments by the regulators about components, risk weightings and other factors.
Quantitative measures established by regulation to ensure capital adequacy require the Bank to maintain minimum ratios (set forth in the table below) of capital to average assets (as defined).
| Minimum Ratio For Capital Adequacy Purposes | Minimum Ratio To Be Considered Well Capitalized Under PCA Provisions | |||||
Tier 1 Capital to Risk Weighted Assets | 4 | % | 6 | % | ||
Total Capital to Risk Weighted Assets | 8 | % | 10 | % | ||
Tier 1 Capital to Average Assets | 4 | % | 5 | % |
As of December 31, 2005, the most recent notification from the Federal Deposit Insurance Corporation categorized the Bank as well capitalized under the regulatory framework for prompt corrective action. To be categorized as well capitalized, an institution must maintain minimum total risk-based, Tier 1 risk-based and Tier 1 leverage ratios as set forth in the above table. There are no conditions or events since the notification that management believes have changed the Bank’s category. The Bank’s actual capital amounts and ratios as of December 31, 2005 and 2004 are presented in the following table. Management believes, as of December 31, 2005, that the Bank meets all capital adequacy requirements to which it is subject.
| Minimum Capital For Capital Adequacy Purposes | Minimum Capital To Be Considered Well Capitalized Under PCA Provisions | Actual Capital | Actual Ratio | |||||||||
December 31, 2005 (Revised) | ||||||||||||
Tier 1 Capital to Risk Weighted Assets | $ | 3,100 | $ | 4,650 | $ | 7,884 | 10.17 | % | ||||
Total Capital to Risk Weighted Assets | 6,200 | 7,749 | 10,313 | 13.31 | % | |||||||
Tier 1 Capital to Average Assets | 4,661 | 5,827 | 7,884 | 6.76 | % | |||||||
December 31, 2004 | ||||||||||||
Tier 1 Capital to Risk Weighted Assets | $ | 3,031 | $ | 4,547 | $ | 7,513 | 9.92 | % | ||||
Total Capital to Risk Weighted Assets | 6,063 | 7,578 | 9,949 | 13.13 | % | |||||||
Tier 1 Capital to Average Assets | 4,716 | 5,895 | 7,513 | 6.37 | % | |||||||
13
Table of Contents
17. QUARTERLY FINANCIAL DATA (Unaudited)
The following summarizes the quarterly results of operations for the years ended December 31, 2005 and 2004:
| First Quarter | Second Quarte | Third Quarter | Fourth Quarter | |||||||||
2005 (Revised) | ||||||||||||
Total Interest Income | $ | 1,349 | $ | 1,388 | $ | 1,416 | $ | 1,517 | ||||
Total Interest Expense | 631 | 644 | 681 | 695 | ||||||||
Net Interest Income | 718 | 744 | 735 | 822 | ||||||||
Provision For Loan Losses | 18 | 18 | 18 | 18 | ||||||||
Net Interest Income After | ||||||||||||
Provision for Loan Losses | 700 | 726 | 717 | 804 | ||||||||
Total Non-Interest Income | 75 | 86 | 75 | 136 | ||||||||
Total Non-Interest Expense | 669 | 675 | 710 | 782 | ||||||||
Income Before | ||||||||||||
Income Taxes | 106 | 137 | 82 | 158 | ||||||||
Income Tax Expense | 25 | 34 | 17 | 36 | ||||||||
Net Income | $ | 81 | $ | 103 | $ | 65 | $ | 122 | ||||
Basic and Diluted | ||||||||||||
Net Income Per Share | $ | 0.29 | $ | 0.37 | $ | 0.24 | $ | 0.44 | ||||
2004 | ||||||||||||
Total Interest Income | $ | 1,535 | $ | 1,516 | $ | 1,400 | $ | 1,337 | ||||
Total Interest Expense | 647 | 634 | 631 | 630 | ||||||||
Net Interest Income | 888 | 882 | 769 | 707 | ||||||||
Provision For Loan Losses | 18 | 18 | 18 | 18 | ||||||||
Net Interest Income After | ||||||||||||
Provision for Loan Losses | 870 | 864 | 751 | 689 | ||||||||
Total Non-Interest Income | 95 | 92 | 73 | 134 | ||||||||
Total Non-Interest Expense | 577 | 594 | 604 | 657 | ||||||||
Income Before | ||||||||||||
Income Taxes | 388 | 362 | 220 | 166 | ||||||||
Income Tax Expense | 115 | 105 | 65 | 53 | ||||||||
Net Income | $ | 273 | $ | 257 | $ | 155 | $ | 113 | ||||
Basic and Diluted | ||||||||||||
Net Income Per Share | $ | 0.98 | $ | 0.92 | $ | 0.56 | $ | 0.41 | ||||
18. LEASES AND RENT EXPENSE
The Bank leased facilities under non-cancelable operating leases during 2005, 2004 and 2003. As noted above, the Bank leases two offices from the companies. These leases required the Bank to pay maintenance, insurance and property taxes and do not have renewal options. Rental expense under these leases was $104,00 in 2005 and $114,000 in 2004 and 2003. The Bank also leases offices from non-related parties under various terms. Rental expense for these leases was $76,000 in 2005 and $74,000 in 2004 and 2003. Future minimum rental payments under these leases are as follows:
Year Ending December 31, | 2006 | $ | 181 | ||
| 2007 | 181 | ||||
| 2008 | 181 | ||||
| 2009 | 181 | ||||
| 2010 | 181 | ||||
| Thereafter | 837 | ||||
| Total Minimum Lease Payments | $ | 1,742 | |||
19. OFF BALANCE SHEET ACTIVITIES AND COMMITMENTS
Commitments to extend credit, which amounted to $1,000,000 and $1,433,000 at December 31, 2005 and 2004 respectively, represent agreements to lend to customers with fixed expiration dates or other termination clauses. Since many of the commitments are expected to expire without being funded, the total commitment amounts do not necessarily represent future liquidity requirements. Standby letters of credit are conditional commitments issued by the Bank guaranteeing the performance of a customer to a third party. Those guarantees are primarily issued to support public and private borrowing arrangements. At December 31, 2005 , the Bank had outstanding letters of credit of $40,000, and $20,000, at December 31, 2004.
The Bank is a member of the Federal Reserve System and is required to maintain certain levels of its cash and due from bank balances as reserves based on regulatory requirements. At December 31, 2005 and 2004, this reserve requirement was approximately $503,000 and $505,000, respectively.
Federal banking regulations place certain restrictions on dividends paid by the Bank. The total amount of dividends which may be paid at any date is generally limited to the retained earnings of the Bank. In addition, dividends paid by the Bank would be prohibited if the effect thereof would cause the Banks’ capital to be reduced below applicable minimum capital requirements.
20. RECENT ACCOUNTING PRONOUNCEMENTS AND ACCOUNTING CHANGES
In November 2002, the FASB issued FASB Interpretation No. 45,” Guarantor’s Accounting and Disclosure Requirements for Guarantees, including Indirect Guarantees of Indebtedness of Others” (FIN 45). The interpretation elaborates on the disclosures to be made by a guarantor in its financial statements under certain guarantees that it has issued. It also clarifies that a guarantor is required to recognize, at the inception of a guarantee, a liability for the fair value of the obligation undertaken in issuing the guarantee. The interpretation requires disclosure of the nature of the guarantee, the maximum potential amount of future payments that the guarantor could be required to make under the guarantee, and the current amount of the liability, if any, for the guarantor’s obligations under the guarantee. The recognition requirements of the Interpretation were effective beginning January 1, 2003. The FASB also revised FASB Interpretation 46, “Consolidation of Variable Interest Entities, an interpretation of ARB No. 51” (FIN 46). The interpretation provides a framework for identifying variable interest entities (VIEs), and determining when a company should include the assets, liabilities, noncontrolling interests and results of activities of a VIE in its consolidated financial
In November 2003, the FASB’s Emerging Issues Task Force (EITF) reached consensus on new disclosure requirements related to unrealized losses on investment securities. The new disclosure requirements apply to marketable equity and debt securities accounted for under Financial Accounting Board Statement No. 115, “Accounting for Certain Investments in Debt and Equity Securities,” and are required for inclusion in annual reports with fiscal years ended after December 15, 2003.
In November 2003, the FASB issued FASB Staff Position (FSP) 144-1, “ Determination of Cost Basis for Foreclosed Assets FASB Statement No. 15”, “Accounting by Debtors and Creditors for Troubled Debt Restructurings, “ and the Measurement of Cumulative Losses Previously Recognized under Paragraph 37 of FASB Statement No. 144, “Accounting for the Imparirment or Disposal of Long-Lived Assets.” Under FSP 144-1, the lender is required to measure the foreclosure on a long-lived asset (e.g. real estate) at fair value less cost to sell on the foreclosure date, which establishes a new cost basis such that any loan valuation allowance is not retained. Thereafter, the lender would follow the impairment guidance in Statement No. 144, and could not reflect any recovery in value of the property beyond the cost basis established upon foreclosure of the loan. This guidance was effective upon posting of the FSP to the FASB website in November 2003. In April 2003, the Financial Accounting Standards Board issued Statement No. 149, “Amendment of Statement 133 on Derivative Instruments and Hedging Activities”. This statement amends and clarifies financial accounting and reporting for derivative instruments, including certain derivative instruments embedded in other contracts (collectively referred to as derivatives) and for hedging activities under FASB Statement No. 133,” Accounting for Derivative Instruments and Hedging Activities”.
In May 2003, the Financial Accounting Standards Board issued Statement No. 150, “Accounting for Certain Financial Instruments with Characteristics of both Liabilities and Equity”. This statement establishes standards for how an issuer classifies and measures certain financial instruments with characteristics of both liabilities and equity. It requires that an issuer classify a financial instrument that is within its scope as a liability (or an asset in some circumstances). Many of those instruments were previously classified as equity. This statement is effective for financial instruments entered into or modified after May 31, 2003, and otherwise is effective at the beginning of the first interim period beginning after June 15, 2003.
In December 2004, the FASB issued Statement No. 123 (revised 2004), which is a revision of Statement 123 “Accounting for Stock-Based Compensation”. This Statement establishes standards for the accounting for transactions in which an entity exchanges its equity instruments for goods or services. It also addresses transactions in which an entity incurs liabilities in exchange for goods or services that are based on the fair value of the entity’s equity instruments or that may be settled by the issuance of those equity instruments. This Statement focuses primarily on accounting for transactions in which an entity obtains employee services in share-based payment transactions. This Statement is effective for public entities as of the beginning of the first interim or annual reporting period that begins after June 15, 2005.
In December 2004, the FASB issued Statement No. 153, “Exchanges of Nonmonetary Assets”, an amendment of APB Opinion No. 29, Accounting for Nonmonetary Transactions”. This Statement eliminates the exception to fair value for exchanges of similar productive assets and replaces it with a general exception for exchange transactions that do not have commercial substance - that is, transactions that are not expected to result in significant changes in the cash flows of the reporting entity. This Statement is effective for nonmonetary asset exchanges occurring in fiscal periods beginning after June 15, 2005.
In May 2005, the FASB issued Statement No. 154, “Accounting Changes and Error Corrections - a replacement of APB Opinion No. 20 and FASB Statement No. 3”. This Statement requires retrospective application to prior periods’ financial statements of changes in accounting principle, unless it is impracticable to determine either the period-specific effects or the cumulative effect of the change. When it is impracticable to determine the period-specific effects of an accounting change on one or more individual prior periods presented, this Statement requires that the new accounting principle be applied to the balances of assets and liabilities as of the beginning of the earliest period for which retrospective application is practicable and that a corresponding adjustment be made to the opening balance of retained earnings. This Statement improves financial reporting because its requirement to report voluntary changes in accounting principles via retrospective application, unless impracticable, enhances the consistency of financial information between periods. This statement is effective for accounting changes and corrections of errors made in fiscal years beginning after December 15, 2005.
During November 2005, the FASB issued FASB Staff Position (FSP) FAS 115-1 and 124-1, “The Meaning of Other-Than-Temporary Impairment and Its Application to Certain Investments.” The guidance in this FSP addresses the determination of when an investment is considered impaired, whether that impairment is other than temporary, and the measurement of an impairment loss. The FSP also includes accounting considerations subsequent to the recognition of an other-than temporary impairment and requires certain disclosures about unrealized losses that have not been recognized as other-than-temporary impairments. The guidance in this FSP is required to be applied to reporting periods beginning after December 15, 2005. Earlier application is permitted.
The FASB has issued FASB Statement No. 155, “Accounting for Certain Hybrid Instruments.” This standard amends the guidance in FASB Statements No. 133, “Accounting for Derivative Instruments and Hedging Activities”, and No. 140, “Accounting for Transfers and Servicing of Financial Assets and Extinguishments of Liabilities.” Statement 155 allows financial instruments that have embedded derivatives to be accounted for as a whole (eliminating the need to bifurcate the derivative from its host) if the holder elects to account for the whole instrument on a fair value basis. Statement 155 is effective for all financial instruments acquired or issued after the beginning of an entity’s first fiscal year that begins after September 15, 2006. Earlier adoption is permitted as of the beginning of an entity’s fiscal year, provided the entity has not yet issued financial statements, including financial statements for any interim period for that fiscal year. Provisions of this Statement may be applied to instruments that an entity holds at the date of adoption on an instrument-by-instrument basis. The financial statement effect of the change in accounting, if any, should be recognized as a cumulative-effect adjustment to beginning retained earnings. Prior periods should not be restated.
Management does not expect these accounting pronouncements to have a material impact on the financial statements.
21. SUBORDINATED NOTE
On December 12, 2000, a subordinated capital note was executed in the principal amount of $1,500,000 with Peoples National Bank. Annual principal payments in the amount of $300,000 begin January 1, 2007 with the final payment due January 1, 2011. Anticipation is allowed with the approval of regulatory authorities. Under the terms of the agreement, the note is subordinated to depositors and other creditors and is unsecured and ineligible as collateral by the holder. The note is callable in the event the terms of the agreement are not met. The note is considered part of the Bank’s Tier 2 capital under regulatory capital guidelines discussed in a previous footnote.
22. REVISION TO FINANCIAL STATEMENTS
Subsequent to the issuance of the Bank’s 2005 financial statements, the OCC issued a directive that the Bank’s Call Report be revised and re-filed. The revision dealt with the OCC’s determination that certain loans be reclassified from accruing to non-accrual loan status. As the result of the Bank having to revise its Call Report, the Bank was also required by the OCC to revise its annual financial statements.
14
Table of Contents
The effects of the revision on the Bank’s financial statements, as of and for the year ended December 31, 2005, are as follows:
| As Originally Presented | Changes | As Revised | |||||||||
Statements of Financial Condition: | |||||||||||
Loans | $ | 73,939 | (12 | ) | $ | 73,927 | |||||
Other Assets | 1,236 | 1 | 1,237 | ||||||||
Statements of Income: | |||||||||||
Interest income | 5,687 | (17 | ) | 5,670 | |||||||
Income taxes | 118 | (6 | ) | 112 | |||||||
Net income | 382 | (11 | ) | 371 | |||||||
Statements of Cash Flows: | |||||||||||
Net cash from operating activities | 564 | (12 | ) | 552 | |||||||
Net cash from investing activities | (9,424 | ) | 12 | (9,412 | ) | ||||||
Statements of Changes in Shareholders Equity: | |||||||||||
Undivided profits | 1,949 | (11 | ) | 1,938 | |||||||
15
Table of Contents
Summary of Operations
(Dollars in Thousands Except Per Share Data)
FOR THE YEAR: | 2005 (Revised) | 2004 | 2003 | 2002 | 2001 | ||||||||||||
Total Interest Income | $ | 5,670 | $ | 5,788 | $ | 6,690 | $ | 6,724 | $ | 7,059 | |||||||
Total Interest Expense | 2,651 | 2,542 | 2,914 | 3,378 | 4,479 | ||||||||||||
Net Interest Income | 3,019 | 3,246 | 3,776 | 3,346 | 2,580 | ||||||||||||
Provision for Loan Losses | 72 | 72 | 441 | 60 | 48 | ||||||||||||
Net Interest Income After | |||||||||||||||||
Provision for Loan Losses | 2,947 | 3,174 | 3,335 | 3,286 | 2,532 | ||||||||||||
Non-Interest Income | 372 | 394 | 409 | 427 | 381 | ||||||||||||
Non-Interest Expense | 2,836 | 2,432 | 2,329 | 2,362 | 2,162 | ||||||||||||
Net Income Before Taxes | 483 | 1,136 | 1,415 | 1,351 | 751 | ||||||||||||
Applicable Income Taxes: | |||||||||||||||||
Current | 98 | 272 | 586 | 461 | 235 | ||||||||||||
Deferred | 14 | 66 | (141 | ) | (17 | ) | 2 | ||||||||||
Net Income | $ | 371 | $ | 798 | $ | 970 | $ | 907 | $ | 514 | |||||||
Basic and Diluted | |||||||||||||||||
Net Income Per Share* | $ | 1.34 | $ | 2.87 | $ | 3.49 | $ | 3.27 | $ | 1.85 | |||||||
| * | Net income per share has been retroactively adjusted to reflect the stock dividend in 2003. |
AT YEAR END: | 2005 (Revised) | 2004 | 2003 | 2002 | 2001 | ||||||||||
Interest-Bearing Deposits in Other Financial Institutions | $ | 11,386 | $ | 16,635 | $ | 12,480 | $ | 9,611 | $ | 9,019 | |||||
Federal Funds Sold | 1,800 | 11,700 | 5,365 | 4,180 | 4,660 | ||||||||||
Investment Securities | 19,882 | 12,172 | 17,537 | 27,806 | 26,274 | ||||||||||
Loans (Net) | 73,927 | 67,362 | 77,384 | 61,914 | 60,346 | ||||||||||
Deposits | 107,409 | 108,091 | 111,089 | 101,775 | 98,402 | ||||||||||
Demand | 17,051 | 14,742 | 13,831 | 12,575 | 10,554 | ||||||||||
Interest-Bearing Demand | 13,445 | 16,830 | 18,330 | 12,988 | 9,983 | ||||||||||
Savings | 11,587 | 11,038 | 10,294 | 8,330 | 7,091 | ||||||||||
Time | 65,326 | 65,481 | 68,634 | 67,882 | 70,774 | ||||||||||
Capital Accounts | 7,884 | 7,513 | 6,715 | 5,767 | 4,880 | ||||||||||
Total Resources | 117,160 | 117,446 | 119,638 | 109,788 | 105,242 | ||||||||||
Carrying Value Per Share | 28.40 | 27.07 | 24.19 | 20.78 | 17.58 | ||||||||||
DAILY AVERAGES FOR THE YEAR: | 2005 | 2004 | 2003 | 2002 | 2001 | ||||||||||
Interest-Bearing Deposits in Other Financial Institutions | $ | 11,122 | $ | 15,372 | $ | 11,462 | $ | 8,945 | $ | 8,050 | |||||
Federal Funds Sold | 5,341 | 5,420 | 2,732 | 1,186 | 7,125 | ||||||||||
Investment Securities | 17,532 | 16,558 | 22,346 | 30,138 | 18,915 | ||||||||||
Loans | 71,668 | 74,452 | 73,212 | 60,989 | 60,090 | ||||||||||
Deposits | 108,235 | 109,768 | 108,060 | 96,624 | 91,737 | ||||||||||
Demand | 16,295 | 14,375 | 13,329 | 11,604 | 9,268 | ||||||||||
Interest-Bearing Demand | 10,710 | 11,249 | 10,093 | 8,851 | 7,214 | ||||||||||
Savings (Includes MMDA’s) | 15,764 | 17,238 | 15,014 | 8,151 | 7,337 | ||||||||||
Time | 65,466 | 65,522 | 69,624 | 68,018 | 67,918 | ||||||||||
Capital Accounts | 7,682 | 7,231 | 6,359 | 5,433 | 4,549 | ||||||||||
Total Resources | 116,530 | 118,948 | 115,804 | 106,930 | 98,782 | ||||||||||
16
Table of Contents
Price Range of Common Stock
| 2005 | 2004 | Dividends Per Share | ||||||||||||||||
| High | Low | High | Low | 2005 | 2004 | |||||||||||||
First Quarter | $ | 33 | $ | 33 | $ | 40 | $ | 35 | $ | — | $ | — | ||||||
Second Quarter | 31 | 31 | 40 | 35 | — | — | ||||||||||||
Third Quarter | 31 | 31 | 40 | 35 | — | — | ||||||||||||
Fourth Quarter | 30 | 30 | 50 | 40 | — | — | ||||||||||||
Officers
Worth Harris Carter, Jr. Chairman of the Board and President | Dawn Powers Assistant Cashier and Managing Officer - South Main | |
Ronnie P. Craig Vice President and Managing Officer - West Main | Detra S. Smith Assistant Cashier and Managing Officer - Weyers Cave | |
Berlin Smiley Vice President and Managing Officer - Bridgewater | Justin Edris Branch Manager - Frontier Drive | |
Timothy K. Wines Vice President, Cashier and Managing Officer - North Mason Street | Jonathan Hamilton Branch Manager - Stuarts Draft | |
Kathy C. Cummins Assistant Vice President and Managing Officer - Lexington | ||
Directors
Worth Harris Carter, Jr. | Joseph E. Pigg | |
Chairman of The Board and President | President | |
Millard’s Machinery, Inc. | ||
W. Lynwood Craig | ||
President | Simon C. Spencer | |
Bassett Oil & Equipment Co., Inc. | Retired | |
George W. Lester, II | James M. Thomasson | |
Chairman and Chief Executive Officer | Retired | |
The Lester Group, Inc. | ||
W. C. Trent | ||
Investor |

Shenandoah National Bank
P.O. Box 450
Staunton, Virginia 24402-0450
(540) 885-1108
Table of Contents

Shenandoah National Bank
P.O. Box 450
Staunton, Virginia 24402-0450
(540) 885-1108
Table of Contents
OFFICE OF THE COMPTROLLER OF THE CURRENCY
WASHINGTON, D.C. 20219
FORM 10-QSB
| x | QUARTERLY REPORT UNDER SECTION 13 OR 15(d) OF THE SECURITIES EXCHANGE ACT OF 1934 |
For the quarterly period ended September 30, 2006
OR
| ¨ | TRANSITION REPORT UNDER SECTION 13 OR 15(d) OF THE EXCHANGE ACT |
For the transition period from to
Commission file number: n/a
SHENANDOAH NATIONAL BANK
(Name of small business issuer as specified in its charter)
| National Bank | 54-1801533 | |
(State or other jurisdiction of incorporation or organization) | (I.R.S. Employer Identification No.) | |
478 Frontier Drive Staunton, VA | 24401 | |
| (Address of principal executive offices) | (Zip Code) | |
(540) 885-1108
Issuer’s telephone number
n/a
(Former name, former address and former fiscal year, if changed since last report)
Check whether the issuer (1) filed all reports required to be filed by Section 13 or 15(d) of the Exchange Act during the past 12 months (or for such shorter period that the registrant was required to file such reports), and (2) has been subject to such filing requirements for the past 90 days. Yes x No ¨
Indicate by check mark whether the registrant is a shell company (as defined in Rule 12b-2 of the Exchange Act). Yes ¨ No x
As of November 13, 2006, there were issued and outstanding 277,588 shares of the issuer’s common stock.
Transitional Small Business Disclosure Format: Yes ¨ No x
1
Table of Contents
INDEX
PART I - FINANCIAL INFORMATION | 4 | |
ITEM 1 - FINANCIAL STATEMENTS | 4 | |
STATEMENTS OF CONDITION | 4 | |
STATEMENTS OF INCOME | 5 | |
STATEMENTS OF CASH FLOWS | 6 | |
STATEMENTS OF CHANGES IN SHAREHOLDERS’ EQUITY | 7 | |
Notes To Unaudited Financial Statements | 7 | |
ITEM 2 - MANAGEMENT’S DISCUSSION AND ANALYSIS | 9 | |
ITEM 3 - CONTROLS AND PROCEDURES | 13 | |
PART II - OTHER INFORMATION | 14 | |
ITEM 1 - LEGAL PROCEEDINGS. | 14 | |
ITEM 2 - UNREGISTERED SALES OF EQUITY SECURITIES AND USE OF PROCEEDS. | 14 | |
ITEM 3 - DEFAULTS UPON SENIOR SECURITIES. | 14 | |
ITEM 4 - SUBMISSION OF MATTERS TO A VOTE OF SECURITY HOLDERS. | 14 | |
ITEM 5 - OTHER INFORMATION | 14 | |
ITEM 6 - EXHIBITS | 14 | |
2
Table of Contents
FORWARD–LOOKING STATEMENTS
This report contains statements concerning the Bank’s expectations, plans, objectives, future financial performance and other statements that are not historical facts. These statements may constitute “forward-looking statements” as defined by federal securities laws. In some cases, readers can identify the forward-looking statements by the use of words such as “may,” “will,” “should,” “could,” “expect,” “plan,” “intend,” “anticipate,” “believe,” “estimate,” “predict,” “potential” or “continue” or the negative or other variations of these words, or other comparable words or phrases. These statements may address issues that involve estimates and assumptions made by management, risks and uncertainties, and actual results could differ materially from historical results or those anticipated by such statements. Factors that could have a material adverse effect on the Bank’s operations and future prospects include, but are not limited to, changes in: interest rates; general and local economic conditions; the legislative/regulatory climate; monetary and fiscal policies of the U.S. government, including policies of the U.S. Treasury and the Federal Reserve Board; the quality or composition of loan or investment portfolios; demand for loan products; deposit flows; competition; demand for financial services in our market area and accounting principles, policies and guidelines. These risks and uncertainties should be considered in evaluating the forward-looking statements contained herein, and readers are cautioned not to place undue reliance on such statements, which speak only as of the date of this report.
3
Table of Contents
PART I - FINANCIAL INFORMATION
Item 1 - FINANCIAL STATEMENTS
SHENANDOAH NATIONAL BANK
STATEMENTS OF CONDITION
| (in 000’s) | ||||||||
| September 30, 2006 (Unaudited) | December 31, 2005 | |||||||
ASSETS | ||||||||
Interest-Bearing Deposits in Other Financial Institutions | $ | 8,514 | $ | 11,386 | ||||
Investment Securities | ||||||||
U. S. Agency Securities | 24,386 | 19,882 | ||||||
Federal Funds Sold | 1,530 | 1,800 | ||||||
Loans | 74,391 | 75,072 | ||||||
Less: Unearned Income | (190 | ) | (216 | ) | ||||
Allowance for Loan Losses | (1,005 | ) | (929 | ) | ||||
Net Loans | 73,196 | 73,927 | ||||||
Earning Assets | 107,626 | 106,995 | ||||||
Cash and Due From Banks | 3,690 | 4,469 | ||||||
Bank Premises and Equipment | 3,110 | 3,203 | ||||||
Real Estate Owned Other Than Bank Premises | 396 | 487 | ||||||
Investment in Associated Companies | 769 | 769 | ||||||
Other Assets | 1,306 | 1,237 | ||||||
TOTAL ASSETS | $ | 116,897 | $ | 117,160 | ||||
LIABILITIES | ||||||||
Deposits | ||||||||
LIFETIME FREE CHECKING | $ | 17,091 | $ | 17,051 | ||||
Interest-Bearing Demand | 11,016 | 13,445 | ||||||
Regular Passbook Savings | 10,147 | 11,587 | ||||||
Time Deposits | ||||||||
Certificates of Deposit $100,000 or More | 16,137 | 13,767 | ||||||
Other | 52,406 | 51,559 | ||||||
Total Deposits | 106,797 | 107,409 | ||||||
Notes issued to the U. S. Treasury | 135 | 131 | ||||||
Other Liabilities | 257 | 236 | ||||||
Subordinated Notes | 1,500 | 1,500 | ||||||
TOTAL LIABILITIES | 108,689 | 109,276 | ||||||
SHAREHOLDERS’ EQUITY | ||||||||
Common Stock, Par Value $5.00 Per Share, Authorized 2,500,000 Shares; 277,588 Outstanding in 2006 and 2005 | 1,388 | 1,388 | ||||||
Surplus | 4,558 | 4,558 | ||||||
Undivided Profits | 2,262 | 1,938 | ||||||
TOTAL SHAREHOLDERS’ EQUITY | 8,208 | 7,884 | ||||||
TOTAL LIABILITIES AND SHAREHOLDERS’ EQUITY | $ | 116,897 | $ | 117,160 | ||||
See accompanying notes to unaudited financial statements.
4
Table of Contents
SHENANDOAH NATIONAL BANK
STATEMENTS OF INCOME
(Dollars in Thousands, except per share data)
| Nine Months Ended September 30, | Three Months Ended September 30, | |||||||||||
| 2006 | 2005 | 2006 | 2005 | |||||||||
| (Unaudited) | (Unaudited) | |||||||||||
INTEREST INCOME | ||||||||||||
Interest and Fees on Loans | ||||||||||||
Taxable | $ | 3,466 | $ | 3,081 | $ | 1,132 | $ | 1,042 | ||||
Non-Taxable | 76 | 79 | 30 | 27 | ||||||||
Interest on Deposits in Other Financial Institutions | 270 | 319 | 88 | 100 | ||||||||
Interest on Federal Funds Sold | 101 | 130 | 59 | 61 | ||||||||
Interest and Dividends on Securities | ||||||||||||
U. S. Agency Securities | 722 | 537 | 268 | 182 | ||||||||
Obligations of States and Political Subdivisions | — | 7 | — | 2 | ||||||||
TOTAL INTEREST INCOME | 4,635 | 4,153 | 1,577 | 1,414 | ||||||||
INTEREST EXPENSE | ||||||||||||
Interest on Time Deposits $100,000 or More | 478 | 411 | 189 | 136 | ||||||||
Interest on Other Deposits | 1,668 | 1,475 | 585 | 522 | ||||||||
Interest on Subordinated Notes | 68 | 68 | 23 | 23 | ||||||||
Interest on Federal Funds Purchased | 7 | 1 | — | — | ||||||||
Interest on Notes Issued to the U. S. Treasury | 2 | 1 | 1 | — | ||||||||
TOTAL INTEREST EXPENSE | 2,223 | 1,956 | 798 | 681 | ||||||||
NET INTEREST INCOME | 2,412 | 2,197 | 779 | 733 | ||||||||
Provision for Loan Losses | 45 | 54 | 15 | 18 | ||||||||
NET INTEREST INCOME AFTER | ||||||||||||
PROVISION FOR LOAN LOSSES | 2,367 | 2,143 | 764 | 715 | ||||||||
NON-INTEREST INCOME | ||||||||||||
Service Charges, Commissions and Fees | 202 | 208 | 62 | 66 | ||||||||
Other Non-Interest Income | 55 | 28 | 36 | 9 | ||||||||
TOTAL NON-INTEREST INCOME | 257 | 236 | 98 | 75 | ||||||||
NON-INTEREST EXPENSE | ||||||||||||
Salaries and Employee Benefits | 1,121 | 1,059 | 369 | 361 | ||||||||
Occupancy Expense (Net) | 431 | 401 | 139 | 140 | ||||||||
Operations Center Expense | 380 | 368 | 127 | 125 | ||||||||
Other Non-Interest Expense | 248 | 226 | 79 | 84 | ||||||||
TOTAL NON-INTEREST EXPENSE | 2,180 | 2,054 | 714 | 710 | ||||||||
INCOME BEFORE INCOME TAXES | 444 | 325 | 148 | 80 | ||||||||
Income Tax Expense | 120 | 76 | 35 | 16 | ||||||||
NET INCOME | $ | 324 | $ | 249 | $ | 113 | $ | 64 | ||||
EARNINGS PER COMMON SHARE: | ||||||||||||
Basic and Diluted | $ | 1.17 | $ | 0.90 | $ | 0.41 | $ | 0.23 | ||||
Weighted Average Shares Outstanding | 277,588 | 277,588 | 277,588 | 277,588 | ||||||||
Cash Dividends Per Common Share | $ | — | $ | — | $ | — | $ | — | ||||
See accompanying notes to unaudited financial statements.
5
Table of Contents
SHENANDOAH NATIONAL BANK
STATEMENTS OF CASH FLOWS
(Dollars in Thousands)
| Nine Months Ended September 30, | ||||||||
| 2006 | 2005 | |||||||
| (Unaudited) | ||||||||
Cash Flows From Operating Activities | ||||||||
Net Income | $ | 324 | $ | 254 | ||||
Adjustments to reconcile net income to net cash provided by operating activities | ||||||||
Provision for Loan Losses | 45 | 54 | ||||||
Depreciation of Bank Premises and Equipment | 117 | 100 | ||||||
Increase (Decrease) in Unearned Income | (26 | ) | 1 | |||||
(Increase) Decrease in Other Assets | (69 | ) | 23 | |||||
Increase (Decrease) in Other Liabilities | 21 | (31 | ) | |||||
Net Cash From Operating Activities | 412 | 401 | ||||||
Cash Flows From Investing Activities | ||||||||
Proceeds from Maturity of Interest Bearing Balances | 7,129 | 10,596 | ||||||
Purchase of Interest Bearing Balances | (4,257 | ) | (5,545 | ) | ||||
Payments on Investment Securities | (4 | ) | 3,791 | |||||
Purchase of Investment Securities | (4,500 | ) | (9,500 | ) | ||||
Purchase of Bank Premises and Equipment | (24 | ) | (179 | ) | ||||
Net (Increase) Decrease in Short-Term Loans Outstanding, Net | (3,557 | ) | (2,161 | ) | ||||
Longer-Term Loans Originated or Purchased | (9,548 | ) | (7,113 | ) | ||||
Principal Collected on Longer-Term Loans | 13,817 | 1,218 | ||||||
(Increase) Decrease in Other Real Estate | 91 | 51 | ||||||
Net Cash From Investing Activities | (853 | ) | (8,842 | ) | ||||
Cash Flows from Financing Activities | ||||||||
Increase in Demand and Savings Accounts | (3,829 | ) | (1,220 | ) | ||||
Proceeds from Sale of Time Deposits | 23,148 | 28,046 | ||||||
Payments for Matured Time Deposits | (19,931 | ) | (27,095 | ) | ||||
Net Increase (Decrease) in Notes issued to the U. S. Treasury | 4 | 73 | ||||||
Net Cash From Financing Activities | (608 | ) | (196 | ) | ||||
Net (Decrease) Increase in Cash and Cash Equivalents | (1,049 | ) | (8,637 | ) | ||||
Cash and Cash Equivalents at Beginning of Year | 6,269 | 15,768 | ||||||
Cash and Cash Equivalents at End of Period | $ | 5,220 | $ | 7,131 | ||||
Cash and Cash Equivalents Include: | ||||||||
Cash and Due From Banks | $ | 3,690 | $ | 4,256 | ||||
Federal Funds Sold | 1,530 | 2,875 | ||||||
Total Cash and Cash Equivalents at Period End | $ | 5,220 | $ | 7,131 | ||||
Supplementary Data: | ||||||||
Cash Interest Paid | $ | 2,187 | $ | 1,954 | ||||
Cash Paid for Taxes | 120 | 76 | ||||||
See accompanying notes to unaudited financial statements.
6
Table of Contents
SHENANDOAH NATIONAL BANK
STATEMENTS OF CHANGES IN SHAREHOLDERS’ EQUITY
(Dollars in Thousands)
| Common Stock | Surplus | Undivided Profits | |||||||||
| Shares | Par Value | ||||||||||
Balances, December 31, 2005 | 277,588 | $ | 1,388 | $ | 4,558 | $ | 1,938 | ||||
Net Income | — | — | 324 | ||||||||
Cash Dividends | — | — | — | ||||||||
Balances, September 30, 2006 (Unaudited) | 277,588 | $ | 1,388 | $ | 4,558 | $ | 2,262 | ||||
Notes To Unaudited Financial Statements
The unaudited interim financial statements of the Bank are prepared in the conformity with accounting principles generally accepted in the United States of America and the instructions to Securities and Exchange Commission’s Form 10-QSB. In the opinion of management, all adjustments (consisting only of normal recurring adjustments) necessary for a fair presentation of the financial position and results of operations for the periods presented have been included. The financial statements should be read in conjunction with the financial statements and notes contained in the Bank’s Annual Report on Form 10-KSB for the year ended December 31, 2005. The results for the six months ended September 30, 2006 are not necessarily indicative of the results for the entire fiscal year ending December 31, 2006.
Certain reclassifications have been made to the prior year financial statements to conform to the 2006 presentation. These reclassifications had no effect on previously reported net income.
NOTE 1 - INVESTMENT SECURITIES
(Dollars in Thousands)
The Bank has the ability and intent to carry the investments noted with an unrealized loss to the final maturity of the instrument and considers these investments not other-than-temporarily impaired.
The following table sets forth a summary of the investment securities portfolio as of the periods indicated:
| Amortized Cost | Gross Unrealized Gains | Gross Unrealized Losses | Estimated Market Value | |||||||||
September 30, 2006 (Unaudited) | ||||||||||||
U. S. Agency Securities | $ | 24,386 | $ | 8 | $ | 277 | $ | 24,117 | ||||
Total Securities | $ | 24,386 | $ | 8 | $ | 277 | $ | 24,117 | ||||
December 31, 2005 | ||||||||||||
U. S. Agency Securities | $ | 19,882 | $ | 7 | $ | 294 | $ | 19,595 | ||||
Total Securities | $ | 19,882 | $ | 7 | $ | 294 | $ | 19,595 | ||||
7
Table of Contents
NOTE 2 - LOANS
(Dollars in Thousands)
The composition of the loan portfolio by dollar amount is shown in the table below:
| September 30, 2006 (Unaudited) | December 31, 2005 | |||||||
Secured by real estate | ||||||||
Construction Loans | $ | 925 | $ | 925 | ||||
Secured by farmland (including farm residential and other improvements) | 2,118 | 1,629 | ||||||
Secured by 1-4 family residential properties | 12,555 | 14,388 | ||||||
Secured by multi-family residential properties | 5,783 | 5,647 | ||||||
Secured by non-farm residential property | 39,371 | 43,113 | ||||||
Loans to finance agricultural production and other loans to farmers | 165 | 97 | ||||||
Commercial and industrial loans | 3,166 | 1,958 | ||||||
Loans to individuals for household, family and other personal expenditures | 6,323 | 4,439 | ||||||
Obligations (other than securities) of states and political subdivisions | 3,986 | 2,873 | ||||||
Less: Unearned Income | (191 | ) | (213 | ) | ||||
Total loans and leases | $ | 74,201 | $ | 74,856 | ||||
NOTE 3 - ALLOWANCE FOR LOAN LOSSES
(Dollars in Thousands)
The allowance for loan losses is an estimate of losses inherent in the loan portfolio as determined by management taking into consideration historical loan loss experience, diversification of the loan portfolio, amounts of secured and unsecured loans, banking industry standards and averages, and general economic conditions. Ultimate losses may vary from current estimates. These estimates are reviewed periodically and as adjustments become necessary, they are reported in earnings in the periods which they become reasonably estimable.
The following table summarizes the activity in the allowance for loan losses in the periods presented:
| September 30, 2006 (Unaudited) | December 31, 2005 | ||||||
Balance Beginning of Period | $ | 929 | $ | 936 | |||
Provision for Loan Losses | 45 | 72 | |||||
Charge-Offs, Net Of (Recoveries): | |||||||
Real Estate Loans | (56 | ) | 73 | ||||
Installment Loans | 3 | 6 | |||||
Commercial Loans | 22 | — | |||||
Total Net Loan Losses | (31 | ) | 79 | ||||
Balance End of Period | $ | 1,005 | $ | 929 | |||
8
Table of Contents
NOTE 4 - NONPERFORMING ASSETS AND DELINQUENT LOANS
(Dollars in Thousands)
| September 30, 2006 (Unaudited) | December 31, 2005 | |||||
Nonaccrual Loans | ||||||
Real Estate | $ | 2,202 | $ | 2,628 | ||
Installment | — | 2 | ||||
Commercial | — | 1 | ||||
Total Nonaccrual Loans | 2,202 | 2,631 | ||||
Foreclosed Properties | 396 | 487 | ||||
Total Nonperforming Assets | $ | 2,598 | $ | 3,118 | ||
Loans 90 Days or More Past Due and Still Accruing | ||||||
Real Estate | $ | — | $ | 19 | ||
Installment | — | 1 | ||||
Commercial | — | — | ||||
Total Loans 90 Days or More Past Due | $ | — | $ | 20 | ||
Item 2 - MANAGEMENT’S DISCUSSION AND ANALYSIS
The Bank
The Bank opened for business as a National Banking Association on July 1, 1996, and was created through the spinoff of the assets, liabilities and related capital of three offices located in the Staunton area from Patrick Henry National Bank, Bassett, Virginia. The Bank operates under a national charter and provides full banking services. As a national bank, the Bank is subject to regulation by the Comptroller of the Currency, the Federal Deposit Insurance Corporation and the Board of Governors of the Federal Reserve System. The Bank generates commercial (including agricultural), mortgage and consumer loans and receives deposits from customers located primarily in the areas surrounding the Bank’s offices, which are located in Augusta, Rockbridge, and Rockingham Counties in Virginia, including the cities of Buena Vista, Harrisonburg, Staunton and Waynesboro. The Bank operates under the name “Shenandoah National Bank.” At September 30, 2006, the Bank had $117 million in assets, $73 million in net loans, $107 million in deposits and $8 million in total shareholders’ equity.
Proposed Reorganization and Merger
On July 28, 2006, the Bank entered into an Agreement and Plan of Merger (the “Merger Agreement”) with Blue Ridge Bank, N.A., Central National Bank, Community National Bank, First National Bank, First National Exchange Bank, Mountain National Bank, Patrick Henry National Bank, Patriot Bank, National Association, Peoples National Bank (together with the Bank, the “Banks”) and Carter Bank & Trust, a new Virginia chartered bank that will be headquartered in Martinsville, Virginia. The Merger Agreement sets forth the terms and conditions pursuant to which the Banks will reorganize by merging into Carter Bank & Trust (the “Merger”).
All officers and employees of the existing Banks will remain unchanged as a result of the Merger. Worth Harris Carter, Jr. is currently Chairman of the Board and President of each of the Banks and will serve as Chairman of the Board and President of Carter Bank & Trust. Under the terms of the Merger Agreement, shareholders of each of the Banks will receive a certain number of shares in Carter Bank & Trust in exchange for each share held in the existing Banks as follows: each share of Blue Ridge Bank: 2.474 shares; each share of Central National Bank: 5.470 shares; each share of Community National Bank: 4.350 shares; each share of First National Bank: 1.613 shares; each share
9
Table of Contents
of First National Exchange Bank: 4.509 shares; each share of Mountain National Bank: 3.981 shares; each share of Patrick Henry National Bank: 1.112 shares; each share of Patriot Bank: 5.775 shares; each share of Peoples National Bank: 1.945 shares; and each share of Shenandoah National Bank: 3.461 shares.
Consummation of the Merger is subject to a number of customary conditions including (i) the approval of the Merger by the shareholders of each of the Banks and Carter Bank & Trust and (ii) the receipt of all required regulatory approvals, including approval by the Virginia State Corporation Commission and the Federal Deposit Insurance Corporation. The Merger is expected to be completed in the fourth quarter of 2006 and will be accounted for using the purchase method of accounting.
Critical Accounting Policies
The accounting and reporting policies of the Bank conform to generally accepted accounting principles (GAAP) in the United States of America and to general practices within the banking industry. The preparation of the financial statements in conformity with GAAP requires management to make estimates and assumptions that affect the amounts reported in the financial statements and accompanying notes. We believe the most significant of these estimates involves the allowance for loan losses because of its potential impact on our overall performance. We have described our policies in this area below. A summary of the Bank’s significant accounting policies can be found in the Notes to Financial Statements included in the Bank’s 2005 Annual Report on Form 10KSB.
In general, determining the amount of the allowance for loan losses requires significant judgment and the use of estimates by management allowing for losses inherent to loan portfolio. The Bank maintains an allowance for loan losses to absorb probable losses in the loan portfolio based on a quarterly analysis of the portfolio. This analysis determines an appropriate level of the allowance for loan losses by considering factors affecting loan losses, including specific losses, levels and trends in impaired and non-performing loans, historical loan loss experience, current economic conditions, volume, growth and composition of the portfolio, and other relevant factors. The Bank records a provision for loan losses to maintain the allowance at an adequate level. The provision expense could increase or decrease each quarter based upon the results of management’s formal analysis.
The amount of the allowance represents management’s estimate of expected losses from existing loans based upon specific allocations for individual lending relationships and historical loss experience. The allowance for loan losses related to impaired loans is based on discounted cash flows using the loan’s initial effective interest rate or the fair value of the collateral for certain collateral dependent loans. This evaluation requires management to make estimates of the amounts and timing of future cash flows on impaired loans, which consists primarily of non-accrual and restructured loans. Actual losses for these loans can vary significantly from these estimates.
Investment securities are stated at cost, adjusted for amortization of premiums and accretion of discounts, and computed by the interest method. The Bank has positive intent and ability to hold these securities until maturity. Gains and losses on sales, if any, of securities are based upon the adjusted cost of the specific securities sold. If any of the securities are not held to maturity, the classification of the entire portfolio could change to available for sale. This could require fair value accounting for not just the tainted securities but the entire portfolio, and possibly, the recognition of unrealized losses as other than temporary in the income statement.
Real estate properties acquired through or in lieu of loan foreclosure are initially recorded at the lower of the Bank’s carrying amount or fair value less estimated selling cost at the date of foreclosure. Any write-downs based on the asset’s fair value at the date of acquisition are charged to the allowance for loan losses. After foreclosure, these assets are carried at the lower of their new cost basis or fair value less cost to sell. Costs of significant property improvements are capitalized, whereas costs relating to holding property are expensed. The portion of interest costs relating to development of real estate is capitalized. Valuations are periodically performed by management, and any write-downs are recorded as a charge to operations, if necessary, to reduce the carrying value of a property to the lower of its carrying value or fair value less cost to sell. The fair value of other real estate owned, including related selling costs, is an estimate that may change in the near term. If estimates change that decrease the expected fair value of the property, the recognition of this loss is reflected in the income statement for the period the estimate changes.
10
Table of Contents
Overview
Net income for the first nine months of 2006 equaled $324,000, or $1.17 per share, compared to $249,000, or $0.90 per share, for 2005. On an annualized basis, this represents a return on average assets of 0.38% and return on equity of 5% compared to 0.29% and 4%, respectively, for the same period last year.
The Bank has reduced its investment in interest-bearing deposits, while increasing U. S. Agency Securities. Net interest income increased $215,000 or 10%. Total non-interest expense increased $126,000. Net income increased $75,000 or 30% when compared with the prior year. We expect net interest margins to expand and, as the new offices grow, earnings are expected to rise.
Total Liabilities at September 30, 2006 were $108,689,000, down from $109,276,000 at December 31, 2005. This was due to the drop in deposits.
Total Shareholders’ Equity at September 30, 2006 was $8,208,000. At December 31, 2005, total Shareholders’ Equity was $7,884,000.
Results of Operations
Net Interest Income.Net Interest Income is our largest source of revenue and continues to be impacted by low interest rates. Net Interest Income increased $215,000 or 10%, compared to the same period last year. See Note 5 - Average Balances and Net Interest Income - to the financial statements for additional information regarding Net Interest Income.
The following table details the average balances and cost and yield data for the earning assets and interest-bearing liabilities:
| For the Nine Months Ended | ||||||||||||||||||||||
| September 30, 2006 | September 30, 2005 | |||||||||||||||||||||
| (Unaudited) | ||||||||||||||||||||||
Asset/Liability | Average Balance | Income/ Expense | Yield/ Cost | Average Balance | Income/ Expense | Yield/ Cost | Increase (Decrease) | |||||||||||||||
Real Estate Loans | $ | 59,861 | $ | 2,961 | 6.60 | % | $ | 62,904 | $ | 2,823 | 5.98 | % | $ | 138 | ||||||||
Installment Loans | 5,911 | 340 | 7.67 | % | 3,297 | 200 | 8.09 | % | 140 | |||||||||||||
Commercial Loans | 6,538 | 241 | 4.91 | % | 5,014 | 137 | 3.64 | % | 104 | |||||||||||||
Total Loans - Net of Unearned Income | 72,310 | 3,542 | 6.53 | % | 71,215 | 3,160 | 5.92 | % | 382 | |||||||||||||
Interest-Bearing Deposits in Other Financial Institutions | 7,703 | 270 | 4.67 | % | 12,106 | 319 | 3.51 | % | (49 | ) | ||||||||||||
Investment Securities | 24,186 | 722 | 3.98 | % | 17,983 | 544 | 4.03 | % | 178 | |||||||||||||
Federal Funds Sold | 4,369 | 101 | 3.08 | % | 6,931 | 130 | 2.50 | % | (29 | ) | ||||||||||||
Total Earning Assets | $ | 108,568 | $ | 4,635 | 5.69 | % | $ | 108,235 | $ | 4,153 | 5.12 | % | $ | 482 | ||||||||
Interest-Bearing Transaction Accounts | $ | 8,840 | $ | 36 | 0.54 | % | $ | 10,417 | $ | 40 | 0.51 | % | $ | (4 | ) | |||||||
Savings Deposits(Including MMA’s) | 14,342 | 153 | 1.42 | % | 15,331 | 169 | 1.47 | % | (16 | ) | ||||||||||||
Certificates of Deposit Over $100,000 | 16,038 | 478 | 3.97 | % | 14,255 | 411 | 3.84 | % | 67 | |||||||||||||
Other Certificates of Deposits | 50,491 | 1,479 | 3.91 | % | 51,852 | 1,266 | 3.26 | % | 213 | |||||||||||||
Total Deposits | 89,711 | 2,146 | 3.19 | % | 91,855 | 1,886 | 2.74 | % | 260 | |||||||||||||
Notes issued to the U. S. Treasury | 60 | 2 | 4.44 | % | 86 | 1 | 1.55 | % | 1 | |||||||||||||
Subordinated Notes | 1,500 | 68 | 6.04 | % | 1,500 | 68 | 6.04 | % | — | |||||||||||||
Federal Funds Purchased | 3 | 7 | 311.11 | % | 1 | 1 | 133.33 | % | 6 | |||||||||||||
Total Interest-Bearing Liabilities | $ | 91,274 | $ | 2,223 | 3.25 | % | $ | 93,442 | $ | 1,956 | 2.79 | % | $ | 267 | ||||||||
Net Interest Income | $ | 2,412 | 2.96 | % | $ | 2,197 | 2.71 | % | $ | 215 | ||||||||||||
11
Table of Contents
Allowance and Provision for Loan Losses.The Allowance for Loan Losses represents management’s estimation of the amount necessary to absorb future losses in the loan portfolio. On the Statement of Condition, the Allowance for Loan Losses is deducted from Total Loans so that the net amount shown represents the estimated realizable total loans. The Provision for Loan Losses is the amount charged to expense to maintain the Allowance at an adequate level.
The Allowance for Loan Losses was $1,005,000, or 1.3% of total loans outstanding, at September 30, 2006. In the view of management, the Allowance for Loan Losses is adequate to meet the loss contingency based on experience factors and a review of the loan portfolio.
The Provision for Loan Loss was $45,000 for the nine months ended September 30, 2006 and $54,000 for 2005. See Note 3 - Allowance for Loan Losses - and Note 4 - Nonperforming Assets and Delinquent Loans - to the financial statements for additional information.
Non-Interest Income.Non-Interest Income increased slightly for the nine month period ended September 30, 2006, compared to the same period of 2005. The largest source of non-interest income is Services Charges, Commissions and Fees, which was $202,000 at September 30, 2006 compared to $208,000 at September 30, 2005.
Non-Interest Expense.Non-Interest Expense increased $126,000 or 6%, for the nine month period ended September 30, 2006, compared to the same period of 2005.
Income Taxes.Income tax expense was $120,000 for the first nine months of 2006, as compared to $76,000 in 2005. The effective income tax rate increased between the periods, due to the increase in income in the current period.
Net Income.Net Income after taxes increased $75,000 from the same period last year. As rates continue to rise, so will net income.
Analysis of Financial Condition
Investments. U. S. Agency Securities investments have increased $4.5 million compared to December 31, 2005. Funds from the reduction in interest bearing deposits were invested in U. S. Agency Securities.
Loans. Loans decreased $678,000, or 0.9%, compared to December 31, 2005. The decrease took place primarily in the real estate segment of the portfolio. Real estate secured loans made up approximately 82% of loans at September 30, 2006.
Non-Performing Assets and Impaired Loans.Non-performing assets, which consist of nonaccrual loans and foreclosed properties, were $2,598,000 at September 30, 2006 and $3,118,000 at December 31, 2005. Nonaccrual Loans equaled $2,202,000 at September 30, 2006 and $2,631,000 at December 31, 2005. Foreclosed Properties equaled $396,000 at September 30, 2006 and $487,000 at December 31, 2005.
Nonaccrual loans are those loans contractually past due 90 days or more on which no interest is being accrued. Other real estate owned consists of real estate acquired through foreclosure. These properties are reviewed quarterly and reduced to an estimated realizable value at that time.
Deposits.Total deposits have decreased $612,000 or 0.6%, compared to December 31, 2005. Increases occurred in LIFETIME FREE CHECKING and time deposits, while interest bearing deposits and regular passbook savings decreased.
Capital. The federal regulatory agencies use risk-based capital ratios to analyze the adequacy of a bank’s capital. These ratios weigh bank assets from 0% to 100%, depending upon the risks inherent in each type of asset. The Bank continues to meet all requirements for a well-capitalized bank as defined by the regulatory agencies.
12
Table of Contents
The following table presents the key risk-based capital ratios for the periods indicated:
| September 30, 2006 | December 31, 2005 | |||||
Tier 1 Ratio | 10.62 | % | 10.17 | % | ||
Total Risk-Based Capital Ratio | 13.82 | % | 13.31 | % | ||
Leverage Ratio | 7.05 | % | 6.76 | % |
Shareholders’ Equity was $8,208,000 at September 30, 2006 compared to $7,884,000 at December 31, 2005.
Liquidity.Liquidity is our ability to fund both loans and investments in the normal course of business and to provide adequate protection for unexpected deposit withdrawals or other demands for funds without incurring a significant negative impact on profitability. Our primary source of day-to-day liquidity lies in the combination of cash, deposit balances, checks in process of collection, deposit growth and federal funds sold. Federal funds are excess funds that are sold to other banks, generally on a one-day basis. Normal funds from the repayment of loans and investments augment these funds.
Our secondary source of liquidity lies in our investments and deposits in other financial institutions. While our investments are categorized as held-to-maturity, they consist primarily of short-term U S Agency Securities that are readily marketable. The majority of our investment securities mature in five years or less. Interest-bearing deposits in other financial institutions generally mature in two years or less and the volume of this investment decreased for the first nine months.
Off-Balance Sheet Arrangements. Commitments to extend credit, which amounted to $1,000,000 at September 30, 2006 and December 31, 2005, respectively, represent agreements to lend to customers with fixed expiration dates or other termination clauses. Since many of the commitments are expected to expire without being funded, the total commitment amounts do not necessarily represent future liquidity requirements. Standby letters of credit are conditional commitments issued by the Bank guaranteeing the performance of a customer to a third party. Those guarantees are primarily issued to support public and private borrowing arrangements. The Bank had outstanding letters of credit in the amount of $20,000 at September 30, 2006 and December 31, 2005.
Recent Accounting Pronouncements.In June 2005, the FASB issued Statement No. 154, “Accounting Changes and Error Corrections”, which replaces APB Opinion No. 20, “Accounting Changes” and FASB Statement No. 3, “Reporting Accounting Changes in Interim Financial Statements.” Statement No., 154 requires that a voluntary change in accounting principle be applied retrospectively with all prior period financial statements presented on the new accounting principle. Statement No. 154 also requires that a change in method of depreciating or amortizing a long-lived non-financial asset be accounted for prospectively as a change in estimate, and correction of errors in previously issued financial statements should be termed a “restatement.” Statement No. 154 is effective for accounting changes and correction of errors made in fiscal years beginning after December 15, 2005. Management does not expect this accounting pronouncement to have a material impact on the financial statements.
Item 3 - CONTROLS AND PROCEDURES
The Bank maintains a system of disclosure controls and procedures that is designed to ensure that material information is accumulated and communicated to management, including the Bank’s president (who is the Bank’s principal executive officer and principal financial officer), as appropriate to allow timely decisions regarding required disclosure. As required, management, with the participation of the Bank’s president, evaluated the effectiveness of the design and operation of the Bank’s disclosure controls and procedures as of the end of the period covered by this report. Based on this evaluation, the Bank’s president concluded that the Bank’s disclosure controls and procedures were operating effectively to ensure that information required to be disclosed by the Bank in reports that it files or submits under the Securities Exchange Act of 1934, as amended, is recorded, processed, summarized, and reported within the time periods specified in the rules and forms of the SEC.
13
Table of Contents
Because of the inherent limitations in all control systems, no evaluation of controls can provide absolute assurance that the Bank’s disclosure controls and procedures will detect or uncover every situation involving the failure of persons within the Bank to disclose material information otherwise required to be set forth in the Bank’s periodic reports.
The Bank’s management is also responsible for establishing and maintaining adequate internal control over financial reporting to provide reasonable assurance regarding the reliability of financial reporting and the preparation of financial statements for external purposes in accordance with generally accepted accounting principles. There were no changes in the Bank’s internal control over financial reporting during the Bank’s quarter ended September 30, 2006 that have materially affected, or are reasonably likely to materially affect, the Bank’s internal control over financial reporting.
PART II - OTHER INFORMATION
Item 1 - LEGAL PROCEEDINGS.
There are no material pending legal proceedings to which the Bank is a party or to which the property of the Bank is subject.
Item 2 - UNREGISTERED SALES OF EQUITY SECURITIES AND USE OF PROCEEDS.
None.
Item 3 - DEFAULTS UPON SENIOR SECURITIES.
None.
Item 4 - SUBMISSION OF MATTERS TO A VOTE OF SECURITY HOLDERS.
None.
Item 5 - OTHER INFORMATION
None.
Item 6 - EXHIBITS
Exhibits:
2.1 | Agreement and Plan of Merger, dated as of July 28, 2006, by and among Blue Ridge Bank, N.A., Central National Bank, Community National Bank, First National Bank, First National Exchange Bank, Mountain National Bank, Patrick Henry National Bank, Patriot Bank, National Association, Peoples National Bank, Shenandoah National Bank and Carter Bank & Trust (incorporated by reference to Exhibit 2.1 to Form 8-K filed with the Office of the Comptroller of the Currency on July 31, 2006). | |
3.1 | Articles of Association (filed with the Office of the Comptroller of the Currency prior to the opening of the Bank) | |
3.2 | Amended and Restated Bylaws (as amended and restated through February 15, 2005) (incorporated by reference to Exhibit 3.2 to Form 8-K filed with the Office of the Comptroller of the Currency on February 15, 2005) | |
31 | Certification by principal executive officer and principal financial officer pursuant to Rule 13a-14(a) | |
32 | Certification of principal executive officer and principal financial officer pursuant to 18 U.S.C. § 1350 | |
14
Table of Contents
SIGNATURES
In accordance with the requirements of the Exchange Act, the registrant caused this report to be signed on its behalf by the undersigned, thereunto duly authorized.
| SHENANDOAH NATIONAL BANK | ||||
Date:November 13, 2006 |
| |||
| Worth Harris Carter, Jr. | ||||
| Chairman of the Board and President | ||||
(Signing on behalf of the registrant and as principal executive and financial officer of the registrant) | ||||
15
Table of Contents
Exhibit 31
CERTIFICATION
I, Worth Harris Carter, Jr., certify that:
| 1. | I have reviewed this quarterly report on Form 10-QSB of Shenandoah National Bank; |
| 2. | Based on my knowledge, this report does not contain any untrue statement of a material fact or omit to state a material fact necessary to make the statements made, in light of the circumstances under which such statements were made, not misleading with respect to the period covered by this report; and |
| 3. | Based on my knowledge, the financial statements, and other financial information included in this report, fairly present in all material respects the financial condition, results of operations and cash flows of the small business issuer as of, and for, the periods presented in this report. |
| Date:November 13, 2006 |
| |
| Worth Harris Carter, Jr. | ||
| Chairman of the Board and President | ||
| (principal executive officer and principal financial officer) |
16
Table of Contents
Exhibit 32
CERTIFICATION OF
PRINCIPAL EXECUTIVE OFFICER AND PRINCIPAL FINANCIAL OFFICER
Pursuant to Section 906 of the Sarbanes-Oxley Act of 2002 (18 U.S.C. Section 1350)
The undersigned, as the principal executive officer and principal financial officer of Shenandoah National Bank, certifies that, to the best of his knowledge and belief, the Quarterly Report on Form 10-QSB for the period ended September 30, 2006 which accompanies this certification fully complies with the requirements of Section 13(a) or 15(d) of the Securities Exchange Act of 1934 and the information contained in the report fairly presents, in all material respects, the financial condition and results of operations of Shenandoah National Bank at the dates and for the periods indicated. The foregoing certification is made pursuant to Section 906 of the Sarbanes-Oxley Act of 2002 (18 U.S.C. Section 1350) and shall not be relied upon for any other purpose. The undersigned expressly disclaims any obligation to update the foregoing certification except as required by law.
| Date:November 13, 2006 |
| |
| Worth Harris Carter, Jr. | ||
| Chairman of the Board and President | ||
| (principal executive officer and principal financial officer) |
17
Table of Contents
SPECIAL MEETING OF STOCKHOLDERS
to be held on [March 25], 2008
BANK BUILDING CORPORATION
1300 Kings Mountain Road
Martinsville, Virginia 24112
REVOCABLE PROXY
THIS PROXY IS SOLICITED BY AND ON BEHALF OF THE BOARD OF DIRECTORS OF
BANK BUILDING CORPORATION
The undersigned stockholder(s) of Bank Building Corporation, a Virginia Corporation (“Bank Building”), do hereby nominate and appoint Robert W. Conner, Charles E. Hall, Haller G. Prillaman and R. E. Williams, and each of them, with full power to act alone, as proxies, each with full power of substitution and revocation, to vote all shares of the common stock, having no par value per share, of Bank Building that the undersigned is entitled to vote at the special meeting of stockholders of Bank Building to be held on [March 25], 2008, at 1:00 p.m., local time, at the Bank Services of Virginia Operations Center, 320 College Drive, Martinsville, Virginia 24112 (the “Special Meeting”), and at any adjournments or postponements of the Special Meeting, with all powers the undersigned would possess if personally present at the Special Meeting. Except as otherwise indicated, the undersigned authorizes the proxy holders appointed hereby to vote all shares of stock of Bank Building standing in the name of the undersigned stockholder, on the following:
| 1. | A proposal to approve and adopt the agreement and plan of merger, dated January 8, 2008, between Carter Bank & Trust and Bank Building, the plan of merger attached to the agreement and plan of merger, and the transactions contemplated thereby. |
| ¨ FOR | ¨ AGAINST | ¨ ABSTAIN |
| 2. | A proposal to adjourn the meeting to a later date or dates, if necessary, to permit further solicitation of proxies in the event there are not sufficient votes at the time of the Special Meeting to approve the matters to be considered by the stockholders at the Special Meeting. |
| ¨ FOR | ¨ AGAINST | ¨ ABSTAIN |
The board of directors of Bank Building recommends a vote “FOR” each of the above items.
In their discretion, the proxy holders are authorized to vote upon any other business that may come before the meeting or any postponement or adjournment thereof.
This proxy may be revoked by the undersigned at any time before it is exercised by (1) written notice to Bank Building at the address listed above stating that you would like to revoke your proxy, (2) executing and delivering to Bank Building a later dated proxy prior to a vote being taken at the Special Meeting or (3) attending the Special Meeting and voting in person. Even if you expect to attend the Special Meeting in person, please return your signed proxy at once in the enclosed envelope.
The undersigned hereby acknowledges receipt of the notice of the Special Meeting and the proxy statement accompanying it. The undersigned hereby revokes all proxies given prior to this date for the Special Meeting.
THIS PROXY, WHEN PROPERLY EXECUTED, WILL BE VOTED AS SPECIFIED BY YOU ABOVE. IF NO DIRECTION IS MADE, THIS PROXY WILL BE VOTED “FOR” PROPOSALS 1 AND 2 AND ACCORDING TO THE DISCRETION OF THE PROXY HOLDERS ON ANY OTHER MATTER THAT MAY PROPERLY COME BEFORE THE SPECIAL MEETING AND ANY AND ALL ADJOURNMENTS OR POSTPONEMENTS THEREOF.
| Dated: , 2008 |
|
Signature |
|
Signature (if held jointly) |
Please sign exactly as your name appears hereon, date, fold, and mail the proxy in the envelope provided as soon as possible. When shares are held by joint tenants, both must sign. When signing as an attorney, executor, administrator, trustee or guardian, please give full title as such. If the signer is a corporation, please sign in full corporate name by the president or other authorized officer. If the signer is a partnership, please sign in partnership name by authorized person.