Exhibit 99(a)
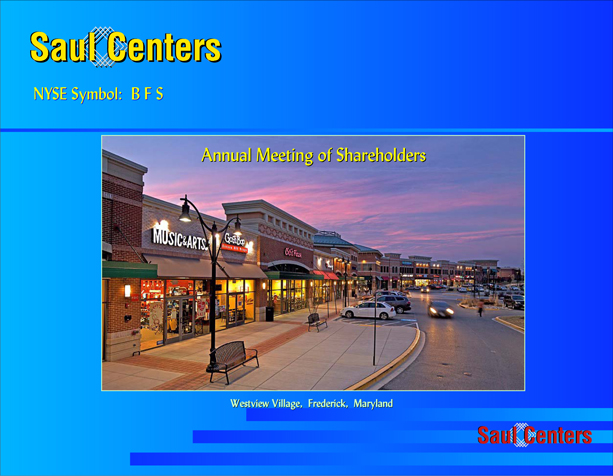
Saul Centers
Annual
Meeting of
Shareholders
Saul Centers
2011 ANNUAL REPORT TO SHAREHOLDERS
We have prepared a brief slide show to present highlights of 2011 including successful development and acquisition activity, and our core operating performance and financial results.
1
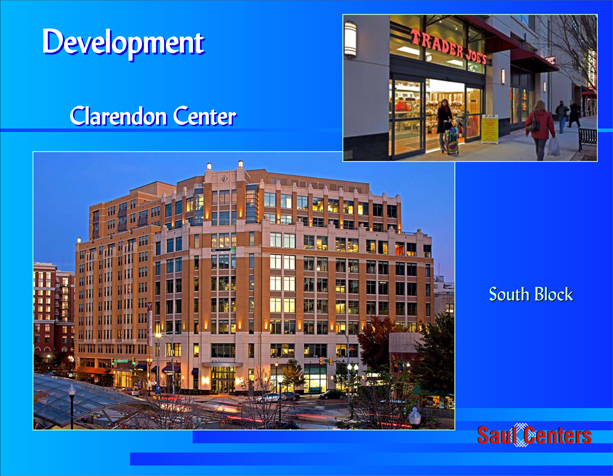
Development
Clarendon Center
South Block
Saul Centers
At year-end 2010, construction at our Clarendon Center development was substantially completed. The project includes a residential tower with 244 luxury apartment units, 42.000 square feet of street-level retail stores and 170,000 square feet of office space, all located on two blocks adjacent to the Clarendon Metro station in Arlington County, Virginia.
The first residential tenants for the 244 apartments took occupancy during the last week of December 2010, and by early May 2011, the apartments were over 95% leased and occupied.
Throughout the latter half of 2011 the apartments were fully leased, and remain so today.
All of the street level retail space is leased and occupied - Trader Joe’s opened in November 2011 and has been a very popular draw to the community.
2
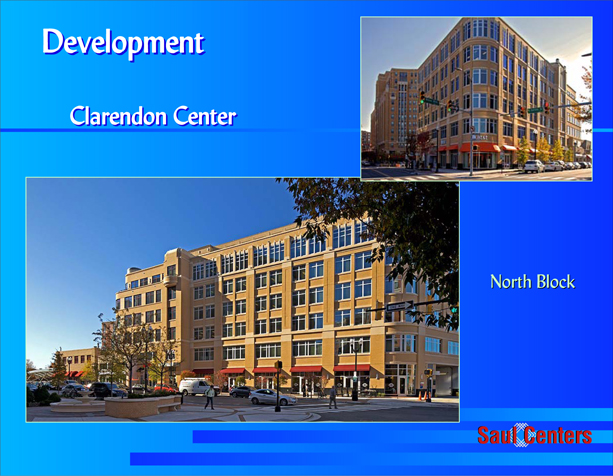
Development
Clarendon Center
North Block
Saul Centers
The North Block contains street level retail with 5 stories of office space above.
The 68,000 square foot Airline Reporting Corporation took occupancy as the anchor office tenant in March 2011.
16,000 square feet of office space in this project remains to be leased.
While the initial FFO contribution of Clarendon Center was negative during lease-up in 2011, 1st Quarter 2012 FFO was positive.
The commencement of rental income for 28,000 square feet of space recently leased should continue to drive property operating results through the balance of 2012.
3

Acquisitions
3 shopping centers
acquired in 2011 from
State of Maryland
Teachers Fund
Severna Park Marketplace, Severna Park, Maryland
Kentlands Square, Gaithersburg, Maryland
Cranberry Square, Westminster, Maryland
Saul Centers
A moment about acquisitions. There continue to be limited opportunities in the market to acquire grocery anchored shopping centers at prices that we consider to be attractive.
However, during late 2011, we were able to acquire three solid Giant Food anchored shopping centers in Maryland for $168.5 million.
4
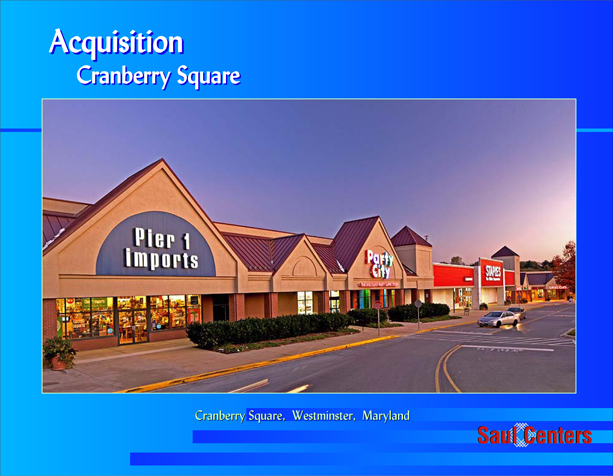
Acquisition
Cranberry Square
Cranberry Square, Westminster, Maryland
Saul Centers
We purchased Cranberry Square for $33 million.
Cranberry Square, the dominant grocery-anchored neighborhood shopping center in Westminster, MD contains 140,000 square feet.
The center was constructed in 1991, is 91.2% leased and is anchored by a 56,000 square foot Giant Food supermarket, Pier One, Party City and Staples.
5
Acquisition
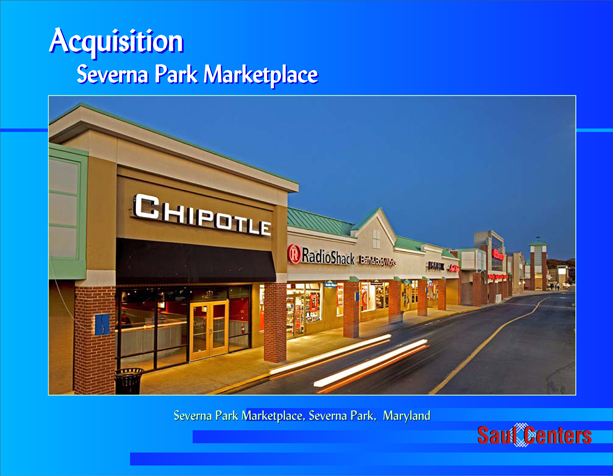
Severna Park Marketplace
Severna Park Marketplace, Severna Park, Maryland
Saul Centers
We purchased Severna Park Marketplace for $61 million.
Severna Park Marketplace is a 254,000 square foot shopping center located in Severna Park, Maryland, in Anne Arundel County.
More than 15,000 households with annual household incomes averaging over $112,000 are located within a three-mile radius of the center.
The center was constructed in 1974 and renovated in 2000, is 100% leased and is anchored by a 92,000 square foot Kohl’s and a 63,000 square foot Giant Food supermarket, which is the highest volume grocer in our portfolio, at over $50 million in sales.
6
Acquisition
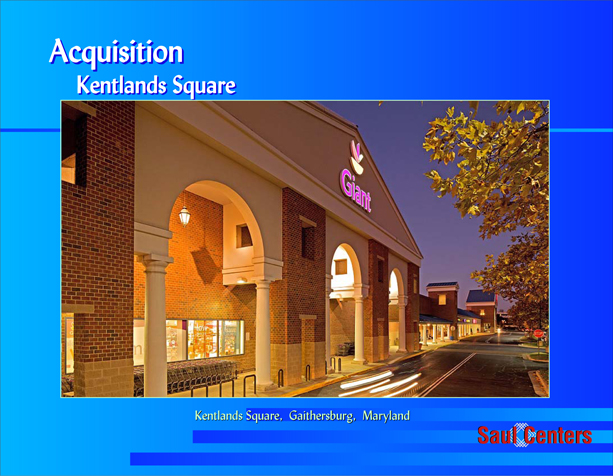
Kentlands Square
Kentlands Square, Gaithersburg, Gaithersburg, Maryland
Saul Centers
We purchased Kentlands Square for $74.5 million.
Kentlands Square is a 214,000 square foot community shopping center located in Gaithersburg, Maryland, in Montgomery County, adjacent to two of our existing retail properties.
More than 38,000 households, with annual household incomes averaging over $114,000, are located within a three-mile radius of the center.
The center was constructed in 1993, is 100% leased and is anchored by a 61,000 square foot Giant Food supermarket and a 104,000 square foot Kmart.
While providing an acceptable current cash flow yield, the real attraction of this property is its future development rights. The Gaithersburg master plan calls for mixed-use town-center development on this site. While the redevelopment of this property is many years away, this property has great potential for future value creation.
7
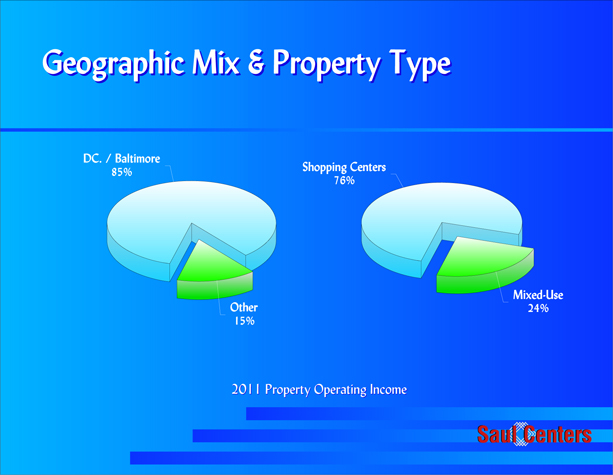
Geographic Mix & Property Type
DC. / Baltimore 85%
Other 15%
Shopping Centers 76%
Mixed-Use 24%
2011 Property Operating Income
Saul Centers
Looking at our overall portfolio, our geographic focus continues to be in the metropolitan Washington, DC market.
About 85% of our 2011 property operating income was generated in the metropolitan Washington, DC/Baltimore area. This focus continues to be our strength especially during these challenging economic times. Nationwide unemployment still hovers between 8 and 9%, while the Washington area jobless rate is below 6%.
The retail component of our portfolio’s income was 76%, with mixed-use producing 24%.
8
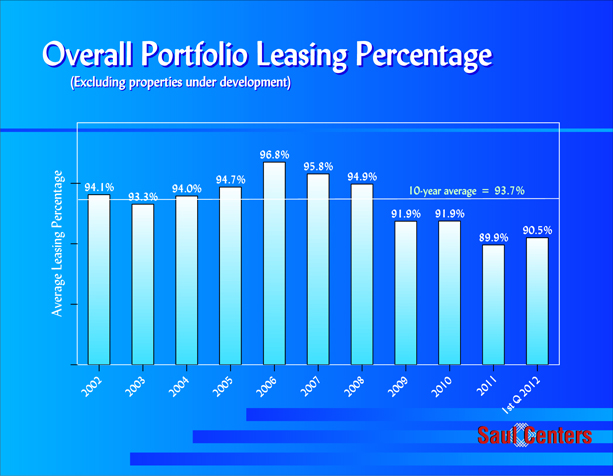
Overall Portfolio Leasing Percentage
(Excluding properties under development)
Average Leasing Percentage
94.1%
93.3%
94.0%
94.7%
96.8%
95.8%
94.9%
91.9%
91.9%
90.5%
89.9%
2002
2003
2004
2005
2006
2007
2008
2009
2010
2011
1st Q 2012
10-year average = 93.7%
Saul Centers
The economic challenges of the past few years continue to impact our portfolio’s operating performance, primarily as a result of decreased leasing percentage as shown here.
Our leasing percentage declined from a peak annual average of 96.8% during 2006, to 89.9% for 2011.
The 1st Quarter 2012 leasing percentage has improved to 90.5%.
9
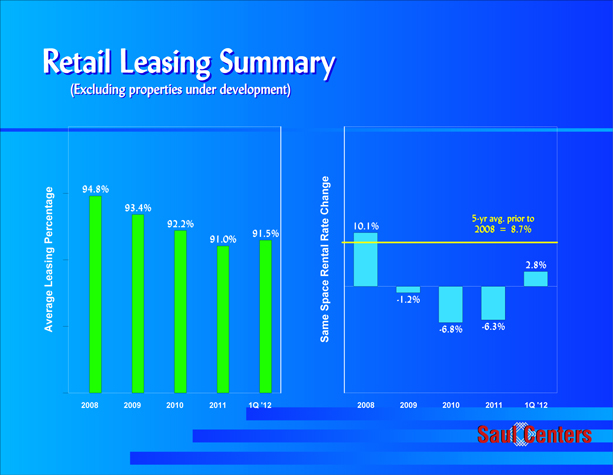
Retail Leasing Summary
(Excluding properties under development)
Average Leasing Percentage
94.8%
93.4%
92.2%
91.0%
91.5%
2008
2009
2010
2011
IQ ’12
Same Space Rental Rate Change
5-yr avg. prior to 2008 = 8.7%
10.1%
-1.2%
-6.8%
-6.3%
2.8%
2008
2009
2010
2011
IQ ’12
Saul Centers
After several challenging years in the financial and real estate markets, there have been recent signs of economic improvement. During the last several quarters, we have seen modestly improved retail sales and retail leasing activity, however, rents remain under pressure.
On a same space basis, retail rental rate increases over expiring rents averaged 8.7% for the 5 year period prior to 2008. The most recent year of increases was 2008, with very strong 10.1% increases in new and renewal rents. Retail rents decreased 1.2% in 2009, 6.8% in 2010, and 6.3% in 2011. For the first quarter of 2012, retail rental rates turned positive, at 2.8%.
10
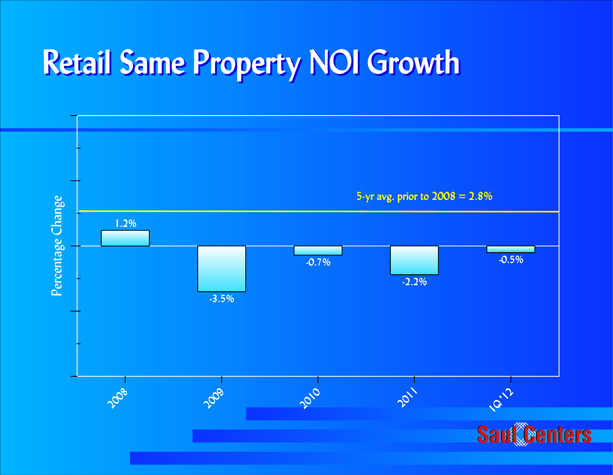
Retail Same Property NOI Growth
Percentage Change
5-yr avg. prior to 2008 = 2.8%
1.2%
-3.5%
-0.7%
-2.2%
-0.5%
2008
2009
2010
2011
IQ ‘12
Saul Centers
During the 5-years prior to 2008, on a same property basis, we achieved average annual retail net operating income growth of 2.8%.
Retail same property growth averaged 1.2% during 2008. Since then, same property operating income has declined, dropping 3.5% in 2009, 0.7% in 2010 and 2.2% in 2011. (The above figures exclude the impact of a $1.9 million collection in early 2010 of past due rents from a former anchor tenant).
Retail same property NOI for Q1 2012 decreased just 0.5%.
11
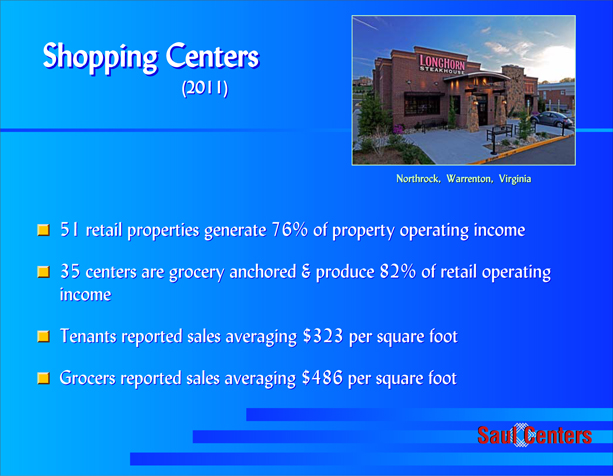
Shopping Centers
(2011)
Northrock, Warrenton, Virginia
51 retail properties generate 76% of property operating income
35 centers are grocery anchored & produce 82% of retail operating income
Tenants reported sales averaging $323 per square foot
Grocers reported sales averaging $486 per square foot
Saul Centers
During 2011, property operating income from our 51 retail properties produced 76% of overall operating income.
35 of our centers are anchored by a food store, and these grocery-anchored properties produced 82% of our retail operating income.
Total retail sales for the portfolio, from tenants who report sales, were $323 per square foot in 2011, a small increase from 2010, an improvement compared to a 1% decrease the prior year and 3.1% decrease a year earlier.
Grocery store sales are a key driver of customer traffic in neighborhood centers. The overall sales volume reported by our 28 national and regional grocery stores averaged $486 per square foot, a 1% increase over 2010.
12
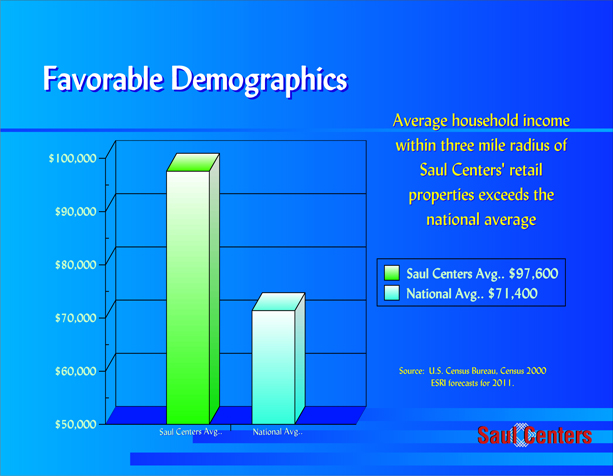
Favorable Demographics
$100,000
$90,000
$80,000
$70,000
$60,000
$50,000
Saul Centers Avg.
National Avg.
Average household income within three mile radius of Saul Centers’ retail properties exceeds the national average
Saul Centers Avg.. $97,600
National Avg.. $71,400
Source: U.S. Census Bureau, Census 2000
ESRI forecasts for 2011.
Saul Centers
The long-term success of our core portfolio hinges on prime infill locations.
Saul Centers’ demographics are well above the national averages.
Saul Centers’ properties 3-mile trade areas have average household incomes of $97,600 compared to the national average of $71,400.
Our 3 and 5 mile population counts average 94,000 and 224,000, respectively, which are representative of very strong infill locations.
13
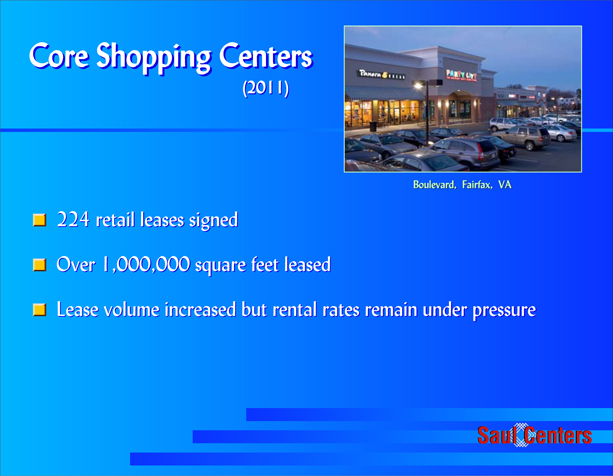
Core Shopping Centers
(2011)
Boulevard, Fairfax, VA
224 retail leases signed
Over 1,000,000 square feet leased
Lease volume increased but rental rates remain under pressure
Saul Centers
While anchor tenants provide stability and traffic to the centers, small shop leasing is a major driver of growth in our business.
During 2011, we executed 224 new and renewal leases, our single largest annual total, representing over 1,000,000 square feet of space.
While lease volumes have increased, rental rates declined during 2011. We expect continued rental rate pressure until market occupancy rates again reach pre-2008 levels.
14
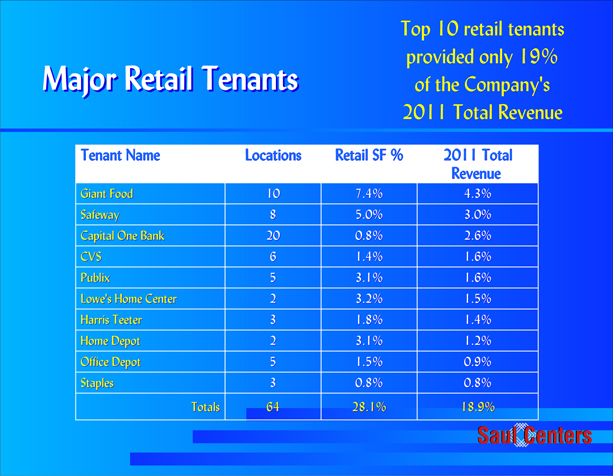
Major Retail Tenants
Top 10 retail tenants provided only 19% of the Company’s 2011 Total Revenue
Tenant Name Locations Retail SF % 2011 Total Revenue
Giant Food 10 7.4% 4.3%
Safeway 8 5.0% 3.0%
Capital One Bank 20 0.8% 2.6%
CVS 6 1.4% 1.6%
Publix 5 3.1% 1.6%
Lowe’s Home Center 2 3.2% 1.5%
Harris Teeter 3 1.8% 1.4%
Home Depot 2 3.1% 1.2%
Office Depot 5 1.5% 0.9%
Staples 3 0.8% 0.8%
Totals 64 28.1% 18.9%
Saul Centers
A diverse retail tenant base minimizes exposure to any one tenant’s credit.
Only Giant Food, at 4.3%, Safeway at 3.0% and Capital One Bank at 2.6% accounted for more than 2% of our total revenue in 2011.
Our top 10 retail tenants comprise only 19% of total revenue, with 58% of this revenue generated by supermarkets, a very stable source of income.
15
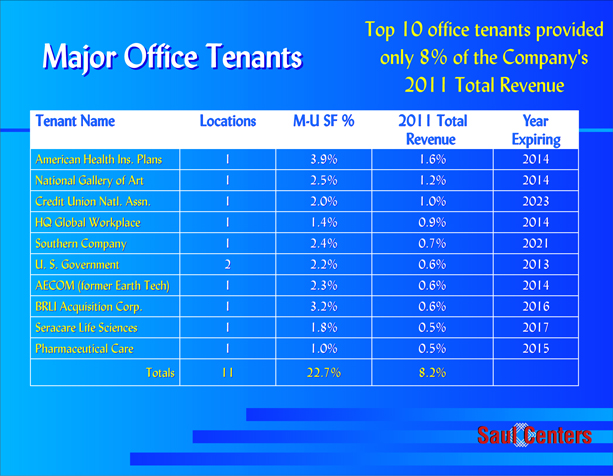
Major Office Tenants
Top 10 office tenants provided only 8% of the Company’s 2011 Total Revenue
Tenant Name Locations M-U SF % 2011 Total Year
Revenue Expiring
American Health Ins. Plans 1 3.9% 1.6% 2014
National Gallery of Art 1 2.5% 1.2% 2014
Credit Union Natl. Assn. 1 2.0% 1.0% 2023
HQ Global Workplace 1 1.4% 0.9% 2014
Southern Company 1 2.4% 0.7% 2021
U. S. Government 2 2.2% 0.6% 2013
AECOM (former Earth Tech) 1 2.3% 0.6% 2014
BRLI Acquisition Corp. 1 3.2% 0.6% 2016
Seracare Life Sciences 1 1.8% 0.5% 2017
Pharmaceutical Care 1 1.0% 0.5% 2015
Totals 11 22.7% 8.2%
Saul Centers
The lack of clarity on federal government spending continues to depress demand for office space throughout the Washington, DC area. Demand for space throughout our office portfolio has slowed dramatically during the past few quarters.
Our top 10 office tenants produced only 8.2% of our 2011 revenue, with no single tenant in more than 1 location in our portfolio, except the U.S. Government occupying 2 office spaces. Only the U.S. Government leases have lease expirations before 2014 - a positive in a currently slow office market.
Additionally only 75,000 square feet, or 5.3% of our total 1.4 million square foot commercial portfolio expires prior to the end of 2012.
16
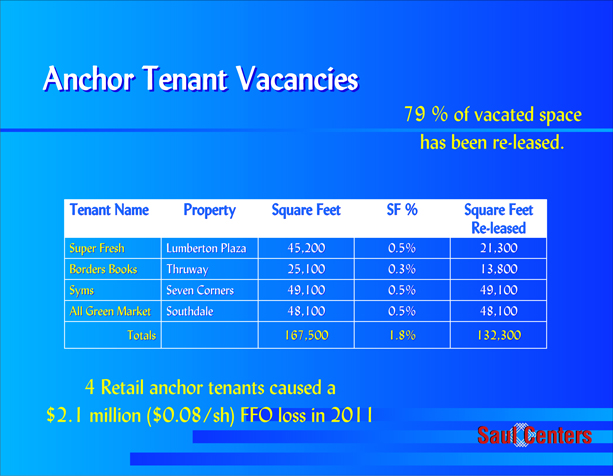
Anchor Tenant Vacancies
79 % of vacated space has been re-leased.
Tenant Name Property Square Feet SF % Square Feet
Re-leased Super Fresh Lumberton Plaza 45,200 0.5% 21,300
Borders Books Thruway 25,100 0.3% 13,800
Syms Seven Corners 49,100 0.5% 49,100
All Green Market Southdale 48,100 0.5% 48,100
Totals 167,500 1.8% 132,300
4 Retail anchor tenants caused a
$2.1 million ($0.08/sh) FFO loss in 2011
Saul Centers
During 2011, our retail portfolio occupancy and operating results were negatively impacted by anchor tenant bankruptcies and closings.
Three of our significant tenants were involved in bankruptcy proceedings. Within our shopping center portfolio, Border Books, Superfresh and Syms each closed a single store. Additionally, an independent grocer defaulted and vacated a store in our Southdale shopping center.
These store closings, totaling 168,000 square feet, reduced 2011 FFO by $0.08/share.
We have successfully signed leases for 132,000 square feet of this space, or 79% of the total anchor closings, with all of these new tenants projected to commence rent during the second half of 2012.
17
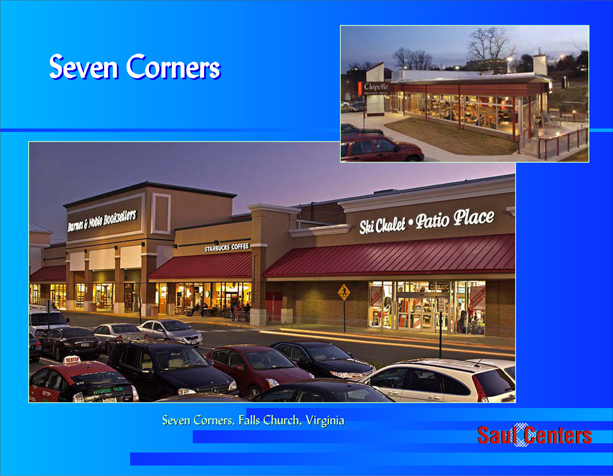
Seven Corners
Seven Corners, Falls Church, Virginia
Saul Centers
Seven Corners is a 568,000 square foot community shopping center in Falls Church, Virginia.
It is anchored by a Shoppers Food Warehouse and a Home Depot.
During 2011, Syms declared chapter 7 bankruptcy and terminated their lease early on December 31, 2011. We just re-leased the space to Burlington Coat Factory, projected to open in the fall of this year.
The center is our largest retail property as measured both by square footage and operating income, and is our top producing shopping center with over $170 million in annual sales reported by our tenants.
An indicator of the strength of this location, the leasing percentage of Seven Corners has remained above 98% during each of the last five years.
18
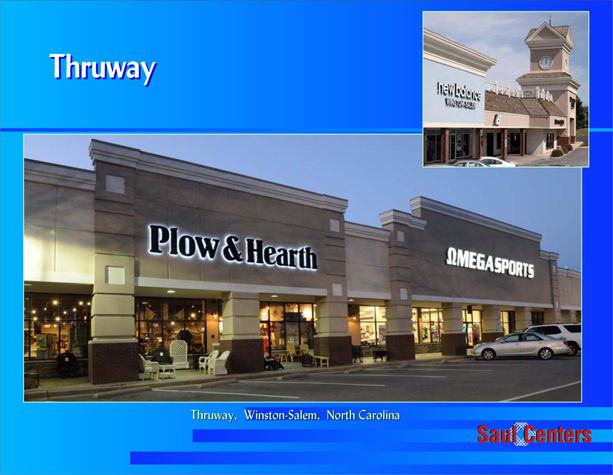
Thruway
Thruway, Winston-Salem, North Carolina
Saul Centers
Thruway is generally regarded as the leading community shopping center in Winston-Salem, North Carolina.
This 363,000 square foot shopping center is anchored by Harris Teeter and Stein Mart, and has a number of nationally recognized tenants such as Hanesbrands, Talbots, Chico’s, Joseph Banks, Ann Taylor, Plow & Hearth and Coldwater Creek.
During 2011 Borders Books returned their 25,000 square foot store to us. We leased half of this space to Trader Joe’s, which is expected to open for business this summer.
19
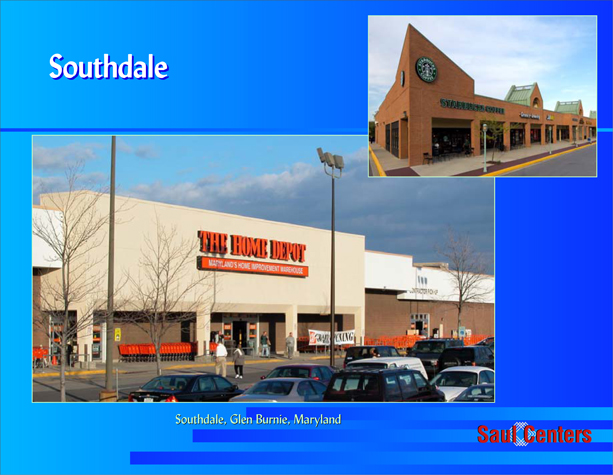
Southdale
Southdale, Glen Burnie, Maryland
Saul Centers
Southdale is a 484,000 square foot community shopping center located in Glen Burnie, MD, south of Baltimore.
The center is anchored by Home Depot, Marshall’s, and Value City Furniture.
In 2011, a 48,000 square foot tenant defaulted on their lease land left the center. We have since re-leased the space to Foodvalu, a local independent grocery store, which plans to open later this spring.
Southdale is currently 93% leased.
20
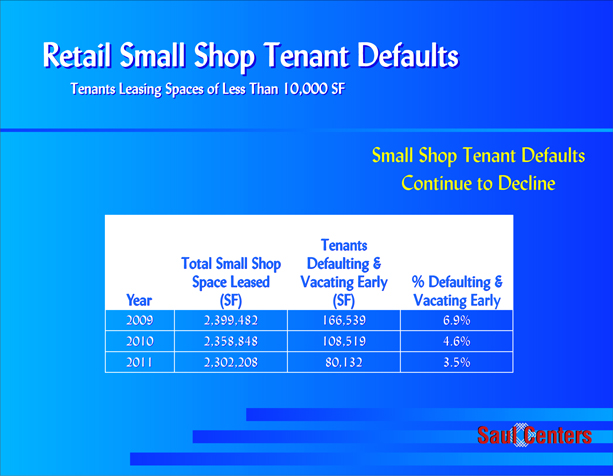
Retail Small Shop Tenant Defaults
Tenants Leasing Spaces of Less Than 10,000 SF
Small Shop Tenant Defaults Continue to Decline
Tenants
Total Small Shop Defaulting &
Space Leased Vacating Early % Defaulting &
Year (SF) (SF) Vacating Early
2009 2,399,482 166,539 6.9%
2010 2,358,848 108,519 4.6%
2011 2,302,208 80,132 3.5%
Saul Centers
The financial strength of our small shop tenants, (those leasing spaces smaller than 10,000 square feet) is showing signs of improvement.
Rent defaults by small shop tenants have decreased, with only 3.5% of these tenants vacating space prior to lease expiration in 2011, compared to an average of 5.8% per year in the prior two years.
21
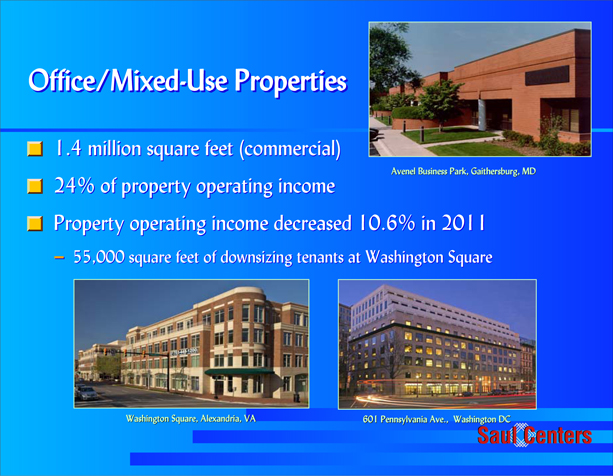
Office/Mixed-Use Properties
1.4 million square feet (commercial)
24% of property operating income
Property operating income decreased 10.6% in 2011
- 55,000 square feet of downsizing tenants at Washington Square
Avenel Business Park, Gaithersburg, MD
Washington Square, Alexandria, VA
601 Pennsylvania Ave., Washington DC
Saul Centers
Our office/mixed-use commercial space totals over 1.4 million square feet.
Operating income in the office/mixed-use portfolio was 24% of our total property operating income in 2011.
On a same property basis, the office property income decreased 10.6% over 2010 levels, primarily due to the default and early termination of a 40,000 square foot tenant at Van Ness Square and the downsizing of tenants totaling 55,000 square feet at Washington Square.
22
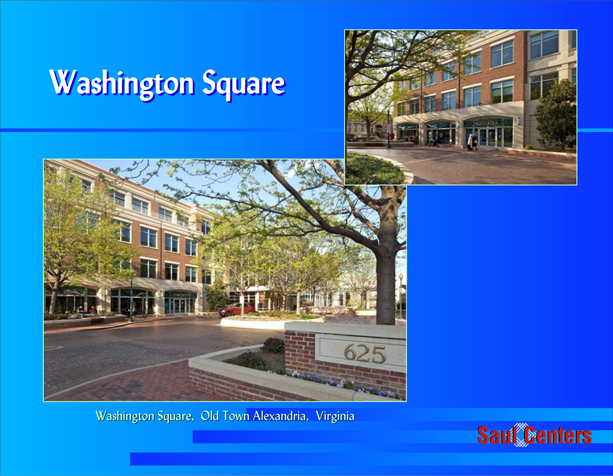
Washington Square
Washington Square, Old Town Alexandria, Virginia
Saul Centers
Tenants downsizing their spaces upon lease renewal gave back 55,000 square feet of vacant space at Washington Square in Alexandria, Virginia.
As of March 2011, Washington Square was 74% leased, but new leases signed during 2011 have increased the leasing percentage to 92%.
Despite depressed demand for office space throughout the Washington, DC area, the Saul Centers mixed-use portfolio reported a 5.3% improvement in same space operating performance for the 1st Quarter 2012.
23
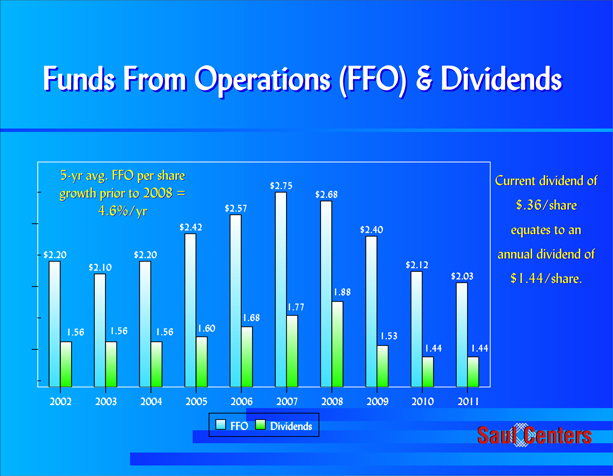
Funds From Operations (FFO) & Dividends
5-yr avg. FFO per share growth prior to 2008 = 4.6%/yr
$2.20
1.56
$2.10
1.56
$2.20
1.56
$2.42
1.60
$2.57
1.68
$2.75
1.77
$2.68
1.88
$2.40
1.53
$2.12
1.44
$2.03
1.44
2002
2003
2004
2005
2006
2007
2008
2009
2010
2011
FFO Dividends
Current dividend of $.36/share equates to an annual dividend of $1.44/share.
Saul Centers
FFO results for the past 10 years are highlighted here.
The 5-year average FFO/share growth prior to 2008 was 4.6%/year. Beginning in 2008, annual FFO has declined each year, due to the economic downturn’s impact on our portfolio and several nonrecurring events. However we reported 1st Quarter 2012 FFO of $0.58 per share, an increase over the 1st quarter 2011 of $0.53 per share.
After increasing the common stock dividend from 2005 to 2008, we reduced the January 2009 dividend by 17%, from a quarterly amount of $0.47 per share to $0.39 per share. In October 2009 we decreased the payout to the current quarterly rate of $0.36 per share.
24
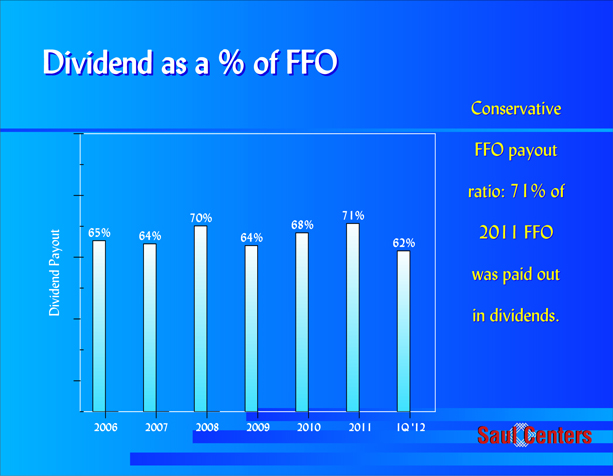
Dividend as a % of FFO
Dividend Payout
65%
64%
70%
64%
68%
71%
62%
2006
2007
2008
2009
2010
2011
IQ ‘12
Conservative FFO payout ratio: 71% of 2011 FFO was paid out in dividends.
Saul Centers
Over the past 5 years, we paid out an average of 66% of our FFO as dividends.
As you may know, REITs are required to pay out 90% of taxable income. We have historically followed a policy of setting the common stock dividend approximately equal to taxable income, to comply with these REIT regulations, and not pay federal corporate income tax. In this uncertain economic climate, this practice has allowed us to maintain the maximum amount of excess cash flow to fund development activities or to retire debt.
While taxable income declined during the past few years, the Board has maintained the current $1.44/share dividend. We paid dividends equal to 71% of our 2011 FFO, decreasing to 62% in the first quarter of 2012.
25
Debt Summary - 2011
2011 Maturities
- Clarendon construction loan
2011 New Loans
- Clarendon Center Mortgage
$125 million, 15-year term, 25-year amortization, 5.31% rate
- Acquisition Loans - 3 shopping centers
$101 million, 15-year term, 25-year amortization, 4.48% rate
Saul Centers
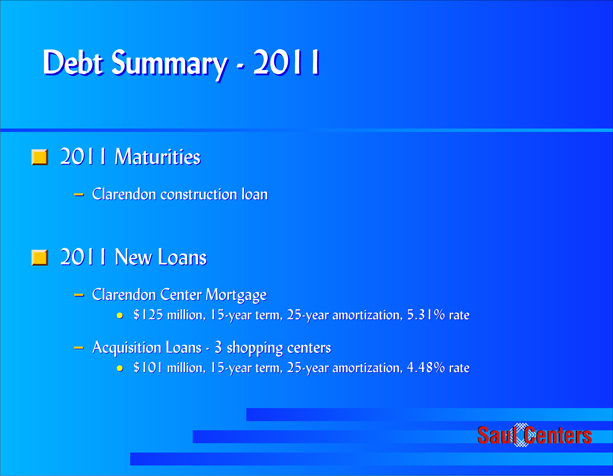
In light of the favorable long-term interest rate environment over the past year and the potential for future interest rate increases, during 2011 and early 2012, we focused on refinancing all of our near term debt maturities with long term mortgage debt.
We started 2011 with $601 million of fixed-rate mortgage debt, none of which was scheduled to mature in 2011, however our Clarendon Center construction loan was due to mature in late 2011.
During the 2011 1st quarter, we replaced the construction loan with long-term financing. The new 15-year, $125 million loan closed in March 2011, has a 5.31% interest rate, 25-year principal amortization.
Following the acquisition of three shopping centers in September 2011, we closed new non-recourse permanent financings secured by each of the centers. The loans, totaling $101 million, all had 15-year terms, 25-year principal amortization and a weighted average interest rate of 4.48%.
26
Debt Summary - 2012
2012 Maturities
- $63 million outstanding, due 10/2012, 10/20 secured by 7 shopping centers
2012 New Loans
- Seven Corners Mortgage
- $73 million, 15-year term, 25-year amortization, 5.84% rate
- Proceeds repaid all debt secured by the 7 shopping centers
- White Oak Mortgage
- $10.5 million new proceeds, 15-year term, 25-year amortization, 4.90% rate
Saul Centers
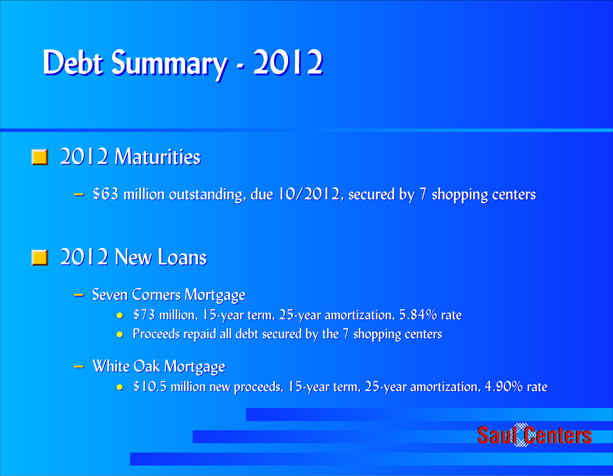
2012 maturities totaled $63 million - a pooled mortgage secured by 7 shopping centers, with an interest rate of 7.7% due to mature in October 2012.
On April 11, 2012, the Company closed on a $73 million mortgage loan secured by Seven Corners. Proceeds from this loan were used to pay-off the pooled mortgage and provide cash of $10 million. The new 15-year loan has a 5.84% interest rate and 25-year principal amortization.
On April 26, 2012, the Company substituted the White Oak shopping center for Van Ness Square as collateral for one of its existing mortgage loans which will allow the Company to analyze the feasibility of repositioning Van Ness Square. The terms of the original loan are unchanged, and in conjunction with the collateral substitution, the Company borrowed and additional $10.5 million. The new borrowing has a 4.90% interest rate and 25-year principal amortization, maturing in July 2024.
27
Mortgage Debt Maturities
May 1, 2012
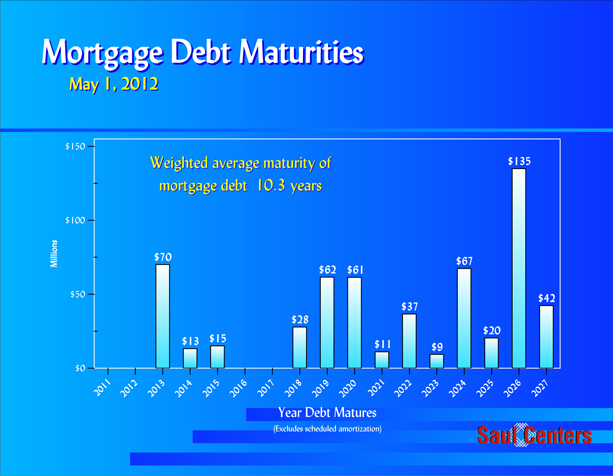
Weighted average maturity of mortgage debt 10.3 years
Millions
$150
$100
$50
$0
$70
$13
$15
$28
$62
$61
$11
$37
$9
$67
$20
$135
$42
2011
2012
2013
2014
2015
2016
2017
2018
2019
2020
2021
2022
2023
2024
2025
2026
2027
Year Debt Matures
(Excludes scheduled amortization)
Saul Centers
Our mortgage debt maturities are shown here.
Total maturities for the next six years are $98 million.
Five properties secure the loans maturing in 2013, the most significant of which is our flagship office building - 601 Pennsylvania Avenue. The 601 Pennsylvania Avenue loan has a balance of $23 million at maturity, and recent market comparables indicate a market value near $200 million.
As of May 2012, twenty of our 58 operating properties will be held free and clear of debt. In our view, we think these properties are worth somewhere between $375 and $400 million.
28
Debt Summary
May 1, 2012
- 98% fixed rate, nonrecourse debt
- Average mortgage debt interest rate is 6.0%
- Interest coverage = 2.6 times
- $150 million credit line, none drawn
- Over $30 million in cash balances
Saul Centers
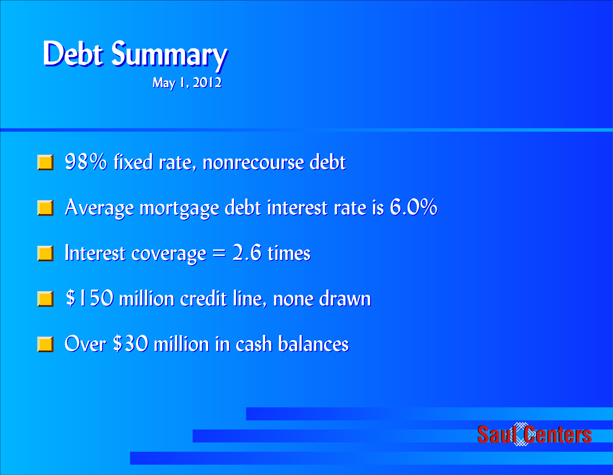
98% of our debt is now fixed rate, non-recourse property debt.
The weighted average interest rate is 6.0%.
Our property operating income provides an interest expense coverage of 2.6 times.
We have a $150 million revolving credit line which matures in June 2012, with a one-year extension to June 2013. There are no outstanding borrowings under the line. We are currently negotiating a new 4-year credit line, with more favorable market terms that we expect to announce later this quarter.
Currently, we have over $30 million in cash on hand.
29
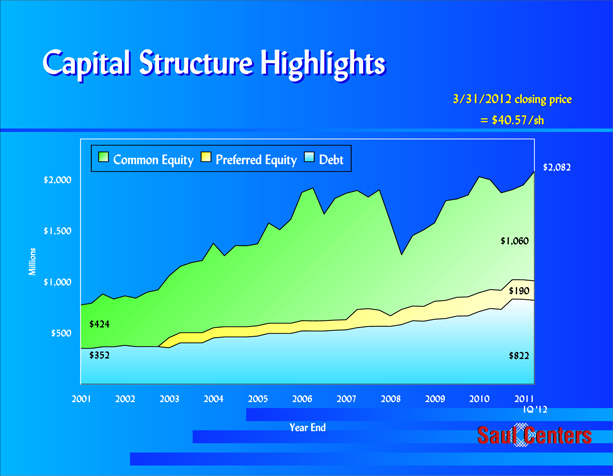
Capital Structure Highlights
3/31/2012 closing price = $40.57/sh
Common Equity
Preferred Equity
Debt
Millions
$2,000
$1,500
$1,000
$500
$424
$352
$2,082
$1,060
$190
$822
2001
2002
2003
2004
2005
2006
2007
2008
2009
2010
2011
IQ ‘12
Year End
Saul Centers
As of March 31, 2012, we had a total combined debt and equity capitalization of $2.1 billion, compared to $776 million 10 years ago.
Total debt is currently $822 million, represented here in blue.
Preferred stock of $190 million, show here in yellow, represents about 9% of our capital base. Both issues are perpetual and $100 million is currently callable by the Company, with the balance of $90 million callable beginning in March 2013.
Our capital structure now has a leverage ratio of approximately 39% debt to total capitalization.
30
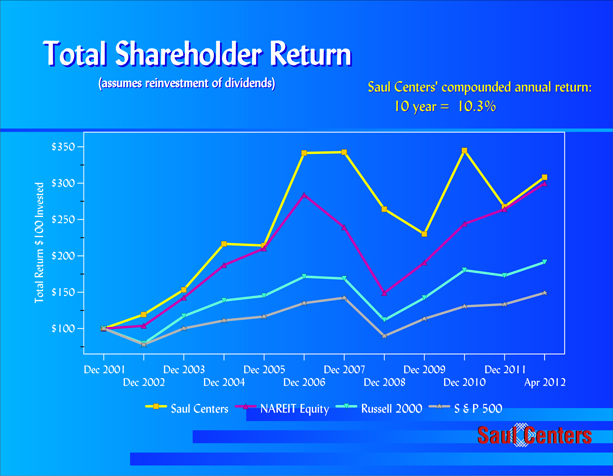
Total Shareholder Return
(assumes reinvestment of dividends)
Saul Centers’ compounded compounded annual return: 10 year = 10.3%
Total Return $100 Invested
$350
$300
$250
$200
$150
$100
Dec 2001
Dec 2003
Dec 2005
Dec 2007
Dec 2009
Dec 2011
Dec 2002
Dec 2004
Dec 2006
Dec 2008
Dec 2010
Apr 2012
Saul Centers
NAREIT Equity
Russell 2000
S & P 500
Saul Centers
At the end of 2011, our 10-year compounded total return averaged 10.3% per year as shown here in yellow. This exceeds the NAREIT Equity Index, the Russell 2000 Index and the S&P 500 Index total returns for the same period.
31
Saul Centers
NYSE Symbol: B F S
Annual Meeting of Shareholders
Westview Village, Frederick, Maryland
Saul Centers
We remain committed to, and confident in, the long-term performance of our core retail and mixed-use properties.
Our balance sheet is strong, and we are prepared to endure the challenges of the current economic recovery.
I now welcome any questions you may have.
(after questions)
Adjournment
32
Forward-looking Statements
This presentation contains forward-looking statements within the meaning of the federal securities laws. These statements are generally characterized by terms such as “believe,” “expect” and “may.”
Although we believe that the expectations reflected in such forward-looking statements are based upon reasonable assumptions, our actual results could differ materially from those given in the forward-looking statements as a result of changes in factors which include, among others, the following:
- continuing risks related to the challenging domestic and global credit markets and their effect on discretionary spending;
- risks related to our tenants’ ability to pay rent and our reliance on significant tenants;
- risks related to our substantial relationships with entities affiliated with our senior management;
- risks of financing, such as increases in interest rates, restrictions imposed by our debt, our ability to meet existing financial covenants and our ability to consummate planned and additional financings on acceptable terms;
- risks related to our development activities;
- risks that our growth will be limited if we cannot obtain additional capital;
- risks that planned and additional acquisitions or redevelopments may not be consummated, or if they are consummated, that they will not perform as expected;
- risks generally incident to the ownership of real property;
- risks related to our status as a REIT for federal income tax purposes; and
- such other risks as described in Part I, Item 1A of our Form 10-K for the year ended December 31, 2011.
Saul Centers
33