Exhibit 99.(a)
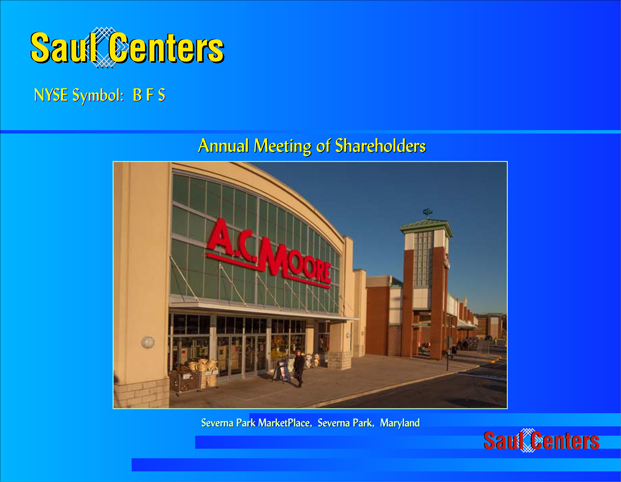
We have prepared a brief slide show to present balance sheet and operating performance highlights of 2012 and recent first quarter 2013 activity, and our current and future development plans.
1
During the past 15 months, we completed several equity and debt transactions which have improved our balance sheet and reduced our overall cost of capital.
We recently issued $140 million of perpetual preferred stock in order to redeem higher coupon issues, we completed $100 million of new long term financings to repay higher rate maturing debt, and we closed a new $175 million, 4-year line of credit.
2
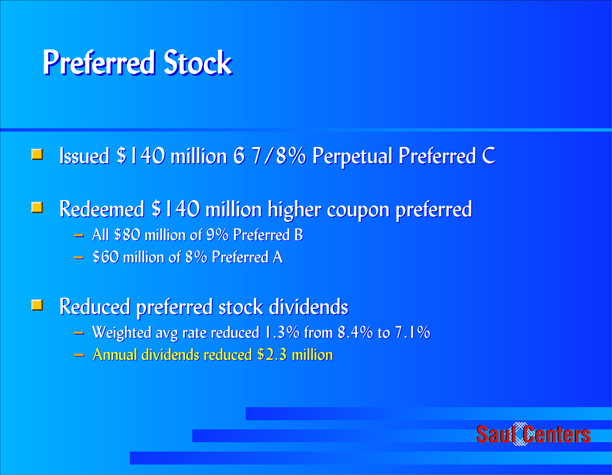
In February of this year, we issued $140 million of Series C perpetual preferred stock which has a coupon of 6 7/8%. The proceeds of this offering were used to redeem all $80 million of our 9% Series B and $60 million of our Series A preferred shares.
As a result of this offering, our weighted average cost of preferred equity was reduced from 8.4% to 7.1%.
Preferred dividends will be reduced by $2.3 million annually beginning this quarter.
3
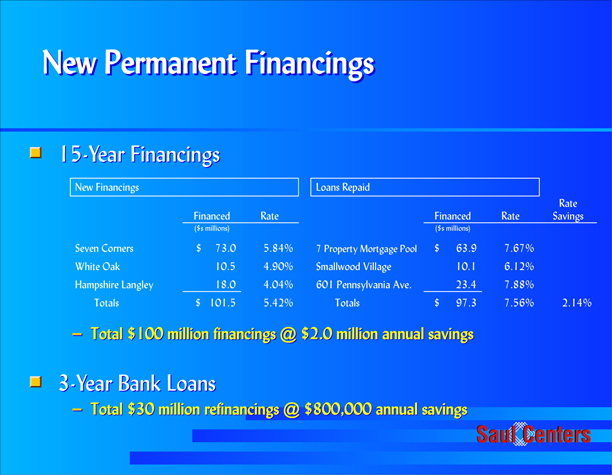
Entering 2012 near term loan maturities totaled just under $100 million - a pool of 7 shopping centers, with a rate of 7.67% maturing in October 2012 and loans at 601 Pennsylvania Avenue and Smallwood Village maturing in January 2013.
In April 2012, we closed on a $73 million mortgage loan secured by Seven Corners.
Also in April 2012, we substituted the White Oak shopping center as collateral for an existing loan at Van Ness Square which allows us to redevelop this building. The terms of the original loan remain unchanged, but we borrowed an additional $10.5 million at then market rates.
Then in March 2013, we closed an $18 million financing at Hampshire Langley.
These $100 million of financings were at rates 2.1% lower than debt repaid, resulting in $2.1 million in annual interest savings.
This March, we also refinanced two 3-year bank term loans, totaling $30 million, at lower interest spreads, resulting in $800,000 annual savings.
4
In May 2012, we completed a new 4-year, $175 million line of credit, which replaced an expiring $150 million line. The current 2.1% interest rate payable under this new credit line is 3.2% lower than the previous rate.
5
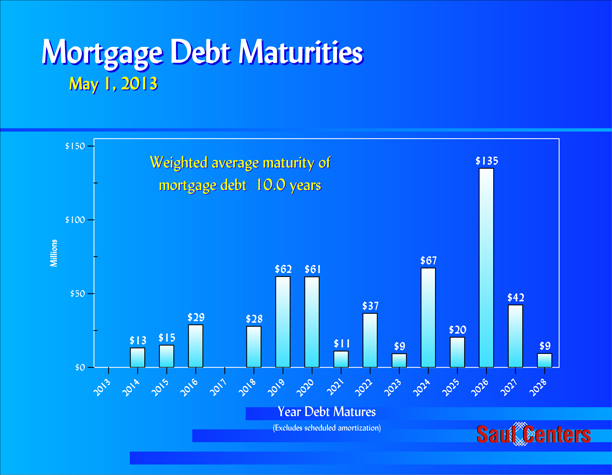
Our mortgage debt maturities are shown here.
Total maturities for the next five years through 2018 are $85 million.
6

92% of our total debt is fixed rate, nonrecourse debt. Throughout 2012, the favorable interest rate environment allowed us to lower our weighted average mortgage interest rate from 6.0% to the current 5.65%.
We have $140 million available under our $175 million line of credit, and have additional financial flexibility with one of our most valuable assets, 601 Pennsylvania Avenue, now held free and clear of debt.
As of May 2013, 22 of our 57 operating properties are held free and clear of debt. In our view, we think these properties which support line borrowings when combined with 601 Pennsylvania Avenue, are worth somewhere between $575 and $600 million.
7
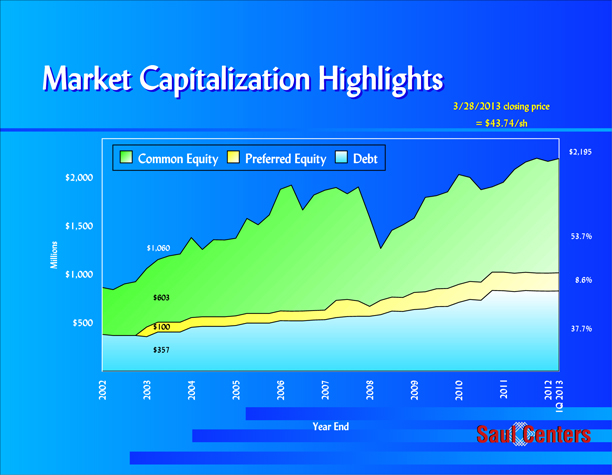
As of March 31, 2013, our total combined debt and equity capitalization was $2.2 billion, compared to $1.1 billion 10 years ago.
Total debt is currently $828 million.
Preferred stock represents about 9% of our capital base. All of our preferred stock is perpetual and $40 million is currently callable.
As you can see here, since late 2011, our debt level has remained flat, while our common equity value has grown. As a result, our capital structure’s leverage ratio of debt to total capitalization has improved to 38% from 44% in 2010.
8
Slowly improving economic conditions had a positive impact on our operating performance during 2012 and early 2013, after several difficult years following the downturn of 2008.
Our leasing percentage has trended upward, retail tenant sales have increased, and retail rental rates have improved. These positive factors have resulted in retail operating income growth in excess of 3.5% for the last 3 quarters, after being negative for the three years prior.
9
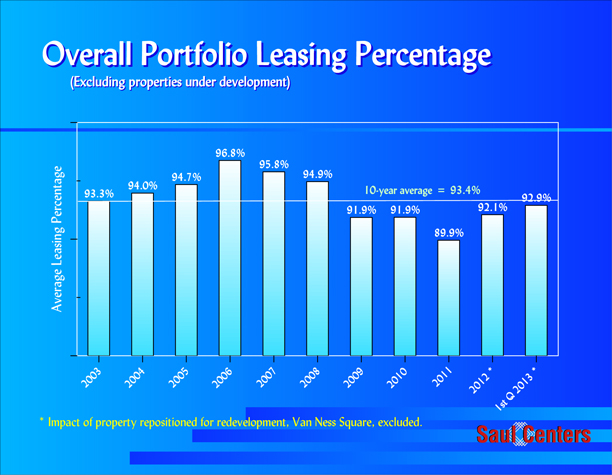
Overall leasing percentages improved during 2012, and averaged 92.9% during the first quarter 2013. This is an increase from a low of 89.9% during 2011, and is approaching our 10-year average of 93.4%.
10
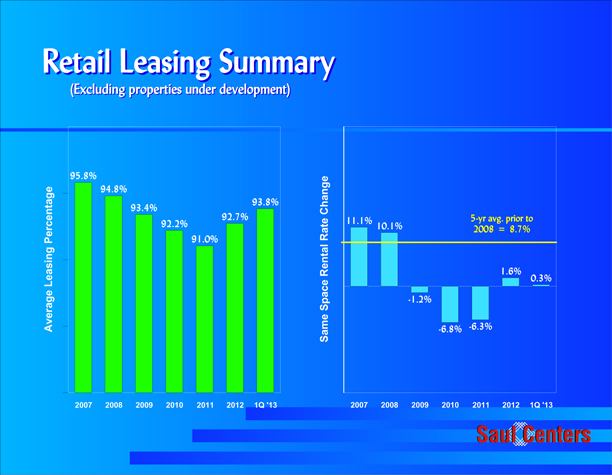
Our retail leasing percentage averaged 93.8% in the most recent quarter, up from a low of 91.0% but still 2.0% below 2007 levels.
On a same space basis, retail rental rate increases over expiring rents averaged 8.7% for the 5 year period prior to 2008. The most recent year of increases was 2008, with very strong 10.1% increases in new and renewal rents. Retail rents averaged a decrease of nearly 5% for the 3-year period from 2009 to 2011. During 2012, retail rental rates turned positive, at 1.6% and continued positive during early 2013.
11
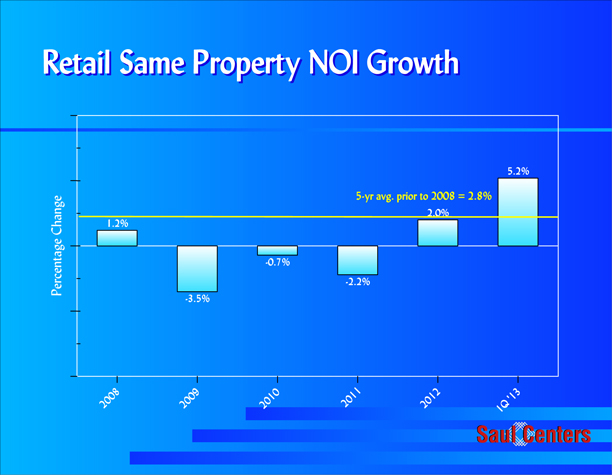
During the 5-years prior to 2008, on a same property basis, we achieved average annual retail net operating income growth of 2.8%.
Retail same property growth averaged 1.2% during 2008. During the period 2009 to 2011, retail property performance declined by an average of 2.1% per year. While modest, positive growth of 2.0% returned during 2012. The first quarter’s unusually high 5.2% rate largely reflects rental commencement from the anchor tenant leasing of space that was vacated in 2011.
12
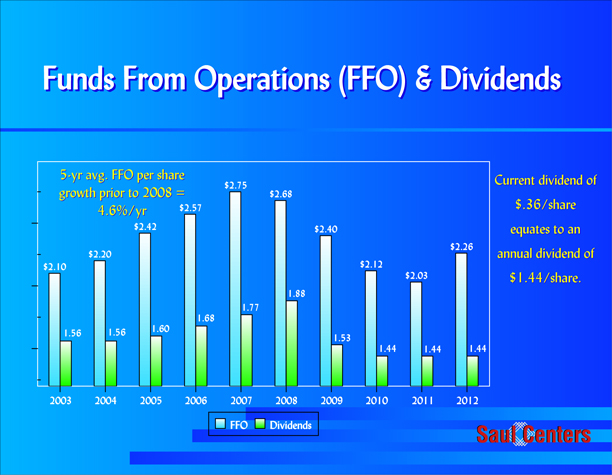
FFO results for the past 10 years are highlighted here.
The 5-year average FFO/share growth prior to 2008 was 4.6%/year. Beginning in 2008 and continuing through 2011, FFO declined each year, due to the economic downturn’s impact on our portfolio and several nonrecurring events. 2012 FFO of $2.26 per share was the first annual increase since 2007.
After increasing the common stock dividend to $1.88 per share from 2005 to 2008, we reduced the annual dividend rate to the current $1.44 per share during the downturn, allowing us to retain additional cash flow during this challenging period.
13
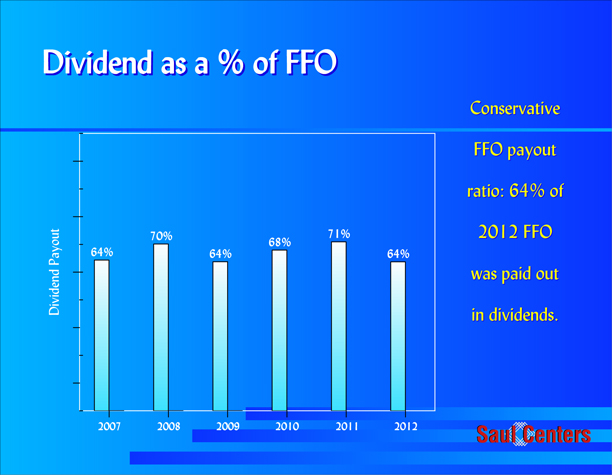
Over the past 5 years, we paid out an average of 66% of FFO as dividends. While the dividend payout increased from 2009 to 2011, the 2012 level returned to a historic low of 64%.
This conservative payout over the past 5 years allowed us to maintain excess cash flows to hedge against economic uncertainties, while also providing capital to fund acquisition and development activities and to retire debt.
14
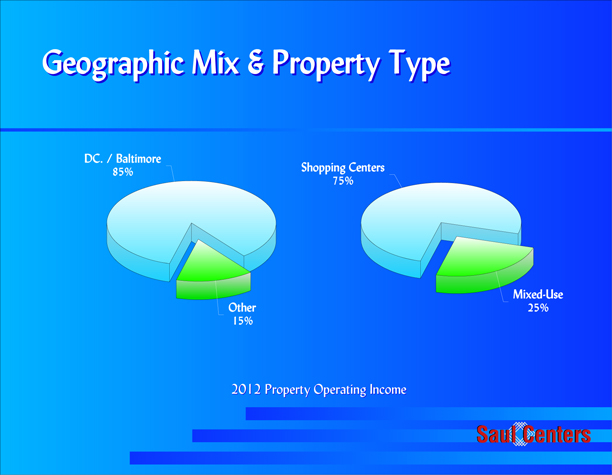
Our portfolio geographic focus continues to be in the metropolitan Washington, DC market.
About 85% of our 2012 property operating income was generated in the metropolitan Washington, DC/Baltimore area. This focus served us well during the challenging economic times.
The Washington jobless rate of 5.2% stayed well below national averages and that of most major metropolitan areas throughout this period. This helped minimize the magnitude of the property performance declines. Also, long-term debt capital continued to flow to Washington, DC area borrowers, while many other metropolitan areas and secondary markets found financing difficult.
15
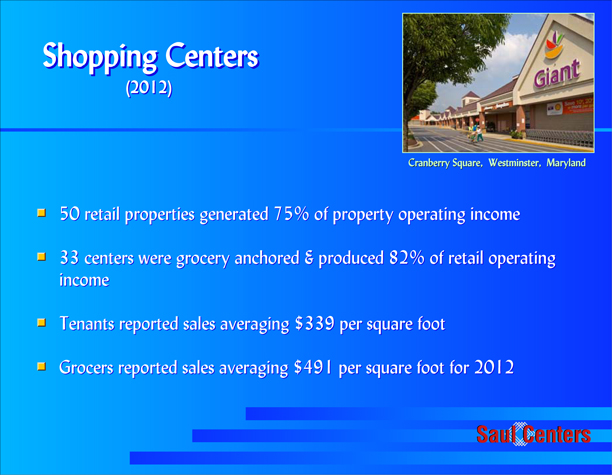
During 2012, property operating income from our 50 retail properties produced 75% of overall operating income.
33 of our centers are anchored by a grocery store, and these grocery-anchored properties produced 82% of our retail operating income.
Total retail sales for the portfolio, from tenants who report sales, were up to $339 per square foot in 2012 and $345 per square foot for the 2013 first quarter, a 5% increase over average sales reported between 2008 and 2011.
Grocery store sales are a key driver of customer traffic in neighborhood centers. The overall sales volume reported by our 28 national and regional grocery stores averaged $491 per square foot, a 1% increase over 2011.
16
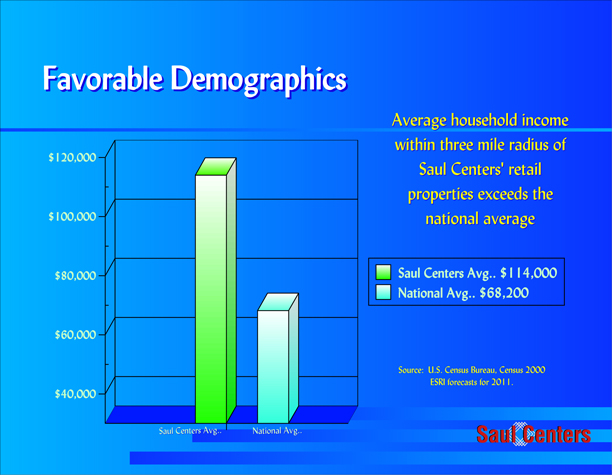
The long-term success of our core portfolio hinges largely on prime infill locations.
Saul Centers’ demographics are well above the national averages.
Saul Centers’ properties 3-mile trade areas have average household incomes of $114,000, compared to the national average of $68,200.
Our 3 and 5 mile population counts average 94,000, and 225,000, respectively, which are representative of very strong infill locations.
17
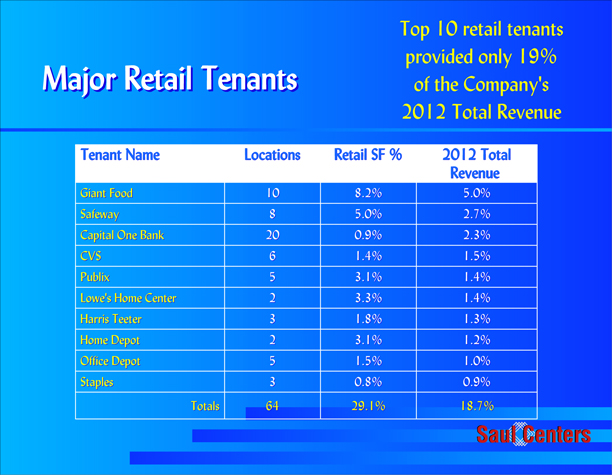
A diverse retail tenant base minimizes exposure to any one tenant’s credit.
Only Giant Food, at 5.0% and Safeway at 2.7% accounted for more than 2.5% of our total revenue in 2012.
Our top 10 retail tenants comprise only 19% of total revenue, with 56% of this revenue generated by major regional and national supermarkets, a very stable source of income.
18
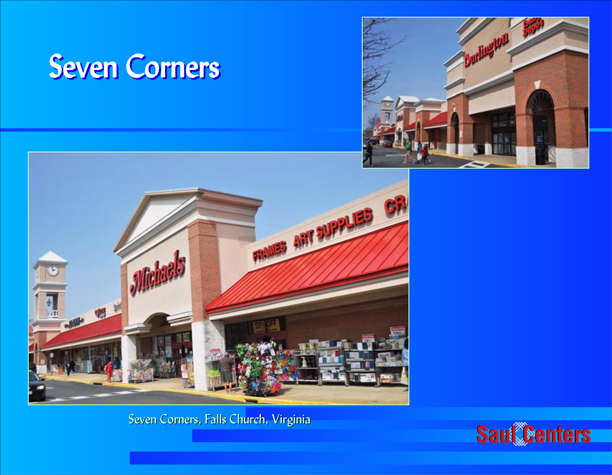
Seven Corners is a 570,000 square foot community shopping center in Falls Church, Virginia, anchored by Shoppers Food Warehouse, Home Depot and Burlington Coat.
During 2011, Syms declared chapter 7 bankruptcy and terminated their lease in December, 2011. We re-leased the space to Burlington Coat, which opened in October 2012.
The center is our largest retail property as measured both by square footage and operating income, and is our top producing shopping center with over $175 million in annual sales reported by the tenants.
An indicator of the strength of this location, the leasing percentage of Seven Corners has remained above 98% during each of the last five years.
19
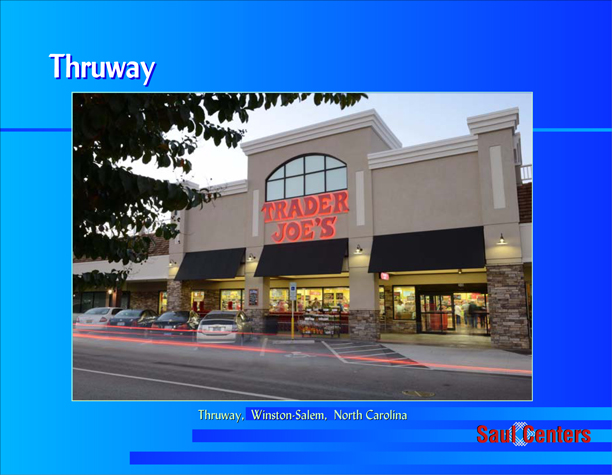
Thruway is generally regarded as the leading community shopping center in Winston-Salem, North Carolina.
This 363,000 square foot shopping center is anchored by Harris Teeter, Stein Mart and Trader Joe’s, and has many nationally recognized tenants such as Hanesbrands, Talbots, Chicos, Joseph Banks, Ann Taylor, Plow & Hearth and Coldwater Creek.
During 2011, Borders Books returned their 25,000 square foot store to us. We leased half of this space to Trader Joe’s, which opened in November 2012.
20
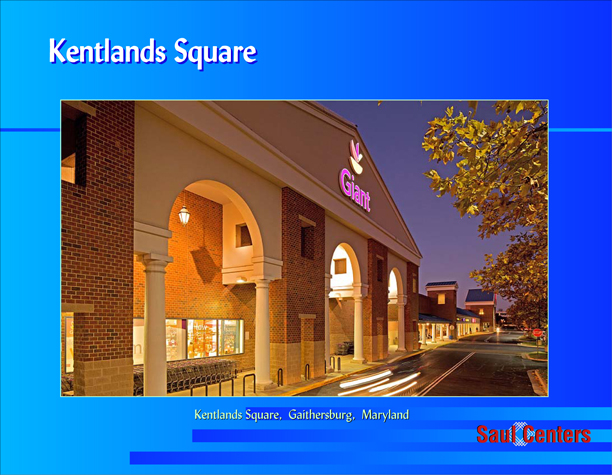
We own a total of 395,000 square feet of community shopping center space in the Kentlands area of Gaithersburg, Maryland, in Montgomery County.
More than 38,000 households, with annual household incomes averaging over $128,000, are located within a three-mile radius of the center.
We recently contracted for the acquisition of a 1.1 acre parcel containing a restaurant building at the main entrance. We just signed a lease with a successful Washington, DC area restaurant operator and plan to close on the acquisition later this year.
The Gaithersburg master plan calls for mixed-use town-center development on this site. While the redevelopment of this property is many years away, this property has great potential for future value creation.
21
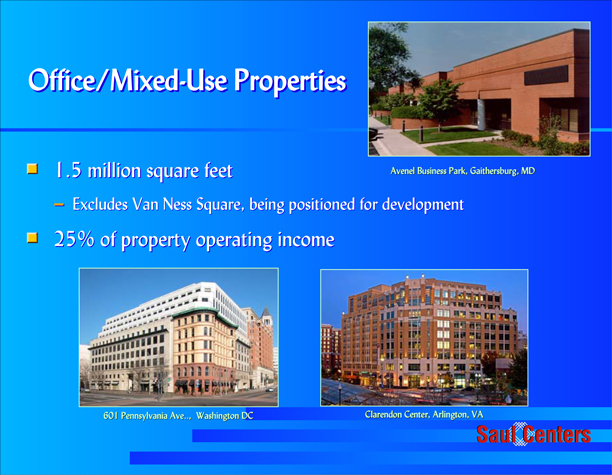
Our office/mixed-use space totals over 1.5 million square feet, representing 25% of our total property operating income.
The most significant of our office/mixed-use properties are 601 Pennsylvania Avenue and Clarendon Center, which produce almost 70% of the office/mixed-use cash flow.
22
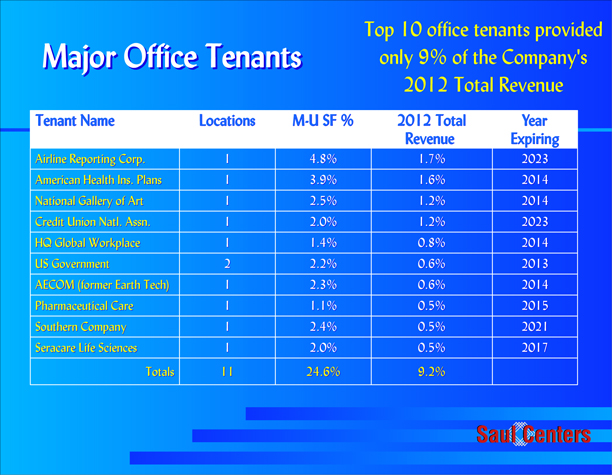
The lack of clarity on federal government spending continues to depress demand for office space throughout the Washington, DC area. Demand for space throughout our office portfolio continues to be very slow.
Our top 10 office tenants produce 9.2% of our revenue, with no single tenant in more than 1 location in our portfolio, except the U.S. Government occupying 2 spaces.
23
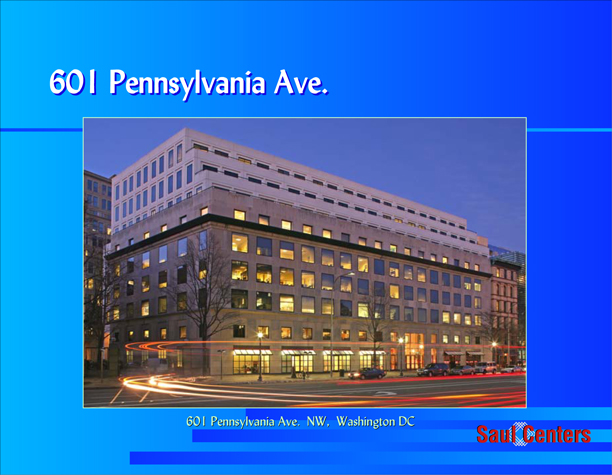
601 Pennsylvania Avenue is 95% leased.
Of the top four tenants shown on the previous Major Office Tenant schedule that represent more than 1.0% of our revenue, two are long-term leases expiring in 2023, and two expire next year. These two 2014 expirations are at 601 Pennsylvania Avenue, and we are currently in discussions with both of these tenants.
24
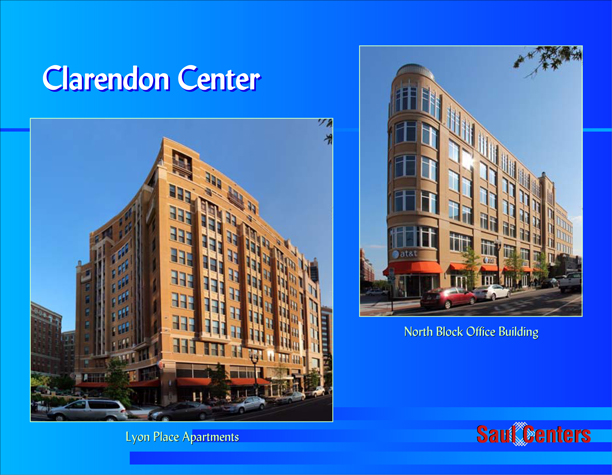
We completed construction at the Clarendon Center development at yearend 2010. The project includes Lyon Place, a residential tower with 244 luxury apartment units, 42,000 square feet of street-level retail and 170,000 square feet of office space, all located on two blocks adjacent to the Clarendon Metro station in Arlington County, Virginia.
The retail space is 100% leased and anchored by Trader Joe’s and the office space is 97% leased. The apartment units have remained leased at an average of 99% -100% every quarter since initial lease-up was completed in mid-2011, even as several new competitive buildings have been delivered in the Clarendon sub-market during the past year.
25
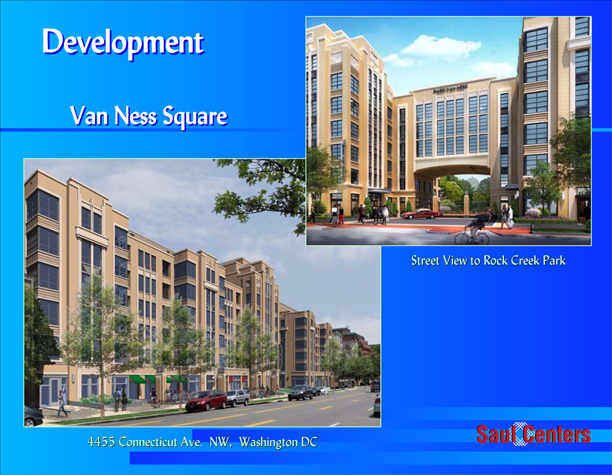
During 2012, we positioned our Van Ness Square office/retail property for redevelopment by not renewing expiring leases and entering into early lease termination agreements. As of last week, we successfully moved the final tenant out of the building.
We plan to construct a primarily residential apartment project with street level retail space as shown here in an architect’s rendering.
Construction documents and governmental approvals are in process, with a final development timetable dependent upon permit issuance.
26
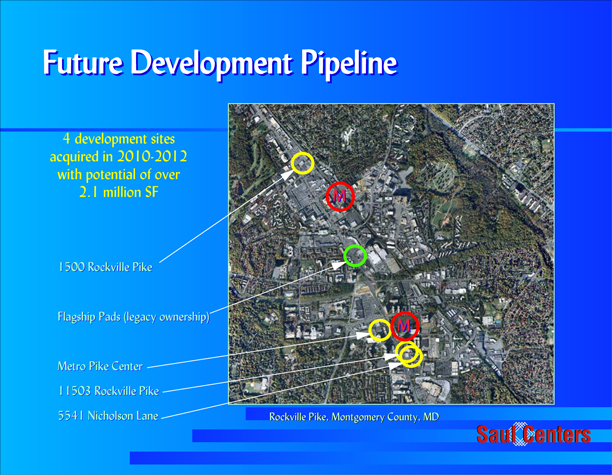
Looking beyond our development of Van Ness, we are currently focusing our future development pipeline along Rockville Pike near Metro Red Line stations, White Flint and Twinbrook.
Between 2010 and 2012, we acquired one and two-story retail properties in this area totaling 15 acres, and having zoning for development totaling over 2.1 million square feet of new residential and commercial space.
27
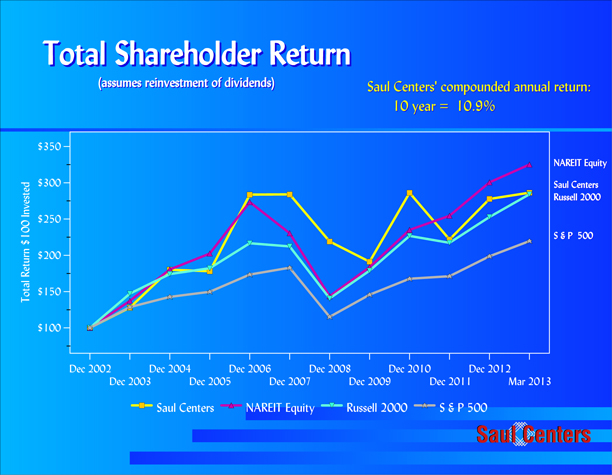
At the end of 2012, our 10-year compounded total return averaged 10.9% per year as shown here is yellow. While less than the NAREIT Equity Index, this equals the Russell 2000 Index and exceeds the S&P 500 Index total returns for the same period.
Saul Centers will cross the 20th anniversary of our initial public offering later this year. Our initial IPO investors have received an 11.3% compounded annual total return throughout our first 20 years.
28
We remain committed to, and confident in, the long-term performance of our core retail and mixed-use properties.
Our balance sheet is strong, and we are prepared for new challenges during this period of economic recovery.
I now welcome any questions you may have.
(after questions)
Adjournment
29
30