Quarterly Investor Update Fourth Quarter & Fiscal Year End 2019
Forward-Looking Statements The Company and MetaBank may from time to time make written or oral “forward-looking statements,” including statements contained in this investor update, the Company’s filings with the Securities and Exchange Commission (“SEC”), the Company’s reports to stockholders, and in other communications by the Company and MetaBank, which are made in good faith by the Company pursuant to the “safe harbor” provisions of the Private Securities Litigation Reform Act of 1995. You can identify forward-looking statements by words such as “may,” “hope,” “will,” “should,” “expect,” “plan,” “anticipate,” “intend,” “believe,” “estimate,” “predict,” “potential,” “continue,” “could,” “future,” or the negative of those terms, or other words of similar meaning or similar expressions. You should carefully read statements that contain these words because they discuss our future expectations or state other “forward-looking” information. These forward-looking statements are based on information currently available to us and assumptions about future events, and include statements with respect to the Company’s beliefs, expectations, estimates, and intentions, which are subject to significant risks and uncertainties, and are subject to change based on various factors, some of which are beyond the Company’s control. Such risks, uncertainties and other factors may cause our actual growth, results of operations, financial condition, cash flows, performance and business prospects and opportunities to differ materially from those expressed in, or implied by, these forward-looking statements. Such statements address, among others, the following subjects: future operating results; customer retention; loan and other product demand; important components of the Company's statements of financial condition and operations; growth and expansion; new products and services; credit quality and adequacy of reserves; technology; and the Company's employees. The following factors, among others, could cause the Company's financial performance and results of operations to differ materially from the expectations, estimates, and intentions expressed in such forward-looking statements: maintaining our executive management team; the expected growth opportunities, beneficial synergies and/or operating efficiencies from the Crestmark acquisition may not be fully realized or may take longer to realize than expected; customer losses and business disruption related to the Crestmark acquisition; unanticipated or unknown losses and liabilities may be incurred by the Company following the Crestmark acquisition; the costs, risks and effects on the Company of the ongoing federal investigation and bankruptcy proceedings involving DC Solar Solutions, Inc., DC Solar Distribution, Inc., and their affiliates, including the potential financial impact of those matters on the net book value of Company assets leased to DC Solar Distribution and the Company’s ability to recognize certain investment tax credits associated with such assets; factors relating to the Company’s share repurchase program; actual changes in interest rates and the Fed Funds rate; additional changes in tax laws; the strength of the United States' economy, in general, and the strength of the local economies in which the Company conducts operations; the effects of, and changes in, trade, monetary, and fiscal policies and laws, including interest rate policies of the Board of Governors of the Federal Reserve System (the “Federal Reserve”), as well as efforts of the United States Congress and the United States Treasury in conjunction with bank regulatory agencies to stimulate the economy and protect the financial system; inflation, market, and monetary fluctuations; the timely and efficient development of, and acceptance of, new products and services offered by the Company or its strategic partners, as well as risks (including reputational and litigation) attendant thereto, and the perceived overall value of these products and services by users; the risks of dealing with or utilizing third parties, including, in connection with the Company’s refund advance business, the risk of reduced volume of refund advance loans as a result of reduced customer demand for or acceptance of usage of Meta’s strategic partners’ refund advance products; any actions which may be initiated by our regulators in the future; the impact of changes in financial services laws and regulations, including, but not limited to, laws and regulations relating to the tax refund industry and the insurance premium finance industry; our relationship with our primary regulators, the Office of the Comptroller of the Currency and the Federal Reserve, as well as the Federal Deposit Insurance Corporation, which insures MetaBank’s deposit accounts up to applicable limits; technological changes, including, but not limited to, the protection of electronic files or databases; acquisitions; litigation risk, in general, including, but not limited to, those risks involving MetaBank's divisions; the growth of the Company’s business, as well as expenses related thereto; continued maintenance by MetaBank of its status as a well- capitalized institution, particularly in light of our growing deposit base, a portion of which has been characterized as “brokered;” changes in consumer spending and saving habits; and the success of the Company at maintaining its high quality asset level and managing and collecting assets of borrowers in default should problem assets increase. The foregoing list of factors is not exclusive. We caution you not to place undue reliance on these forward-looking statements. The forward-looking statements included herein speak only as of the date of this investor update. All subsequent written and oral forward-looking statements attributable to us or any person acting on our behalf are expressly qualified in their entirety by the cautionary statements contained or referred to in this cautionary note. Additional discussions of factors affecting the Company’s business and prospects are reflected under the caption “Risk Factors” and in other sections of the Company’s Annual Report on Form 10-K for the Company's fiscal year ended September 30, 2018 and in other filings made with the SEC. The Company expressly disclaims any intent or obligation to update any forward-looking statements, whether written or oral, that may be made from time to time by or on behalf of the Company or its subsidiaries, whether as a result of new information, changed circumstances or future events or for any other reason. 2 Fourth Quarter & Fiscal Year End 2019 | Nasdaq: CASH

Financial Highlights For the Applicable Period Ended September 30, 2019 Fourth Quarter Fiscal Year • Net income of $20.2 million, or $0.53 per diluted • Net income of $97.0 million, or $2.49 per diluted share, for the quarter. share, for the full fiscal year. • Net interest margin ("NIM") increased to 4.95% for • Earnings per diluted share increased 49% the fiscal 2019 fourth quarter, up 90 basis points compared to $1.67 per diluted share in the prior from the fiscal 2018 fourth quarter. year. • Total gross loans and leases increased by $25.5 • NIM increased to 4.91% for fiscal year 2019, up million, or 1%, compared to the immediately 177 basis points from fiscal year 2018. preceding linked-quarter in fiscal 2019. • Total gross loans and leases increased by • Average payments deposits grew $271.1 million, or $706.4 million, or 24%, compared to the prior 11%, compared to the prior fiscal year fourth year. quarter average. • Repurchased a total of 1,680,772 shares under the share repurchase program at an average price of $27.67 per share. 3 Fourth Quarter & Fiscal Year End 2019 | Nasdaq: CASH
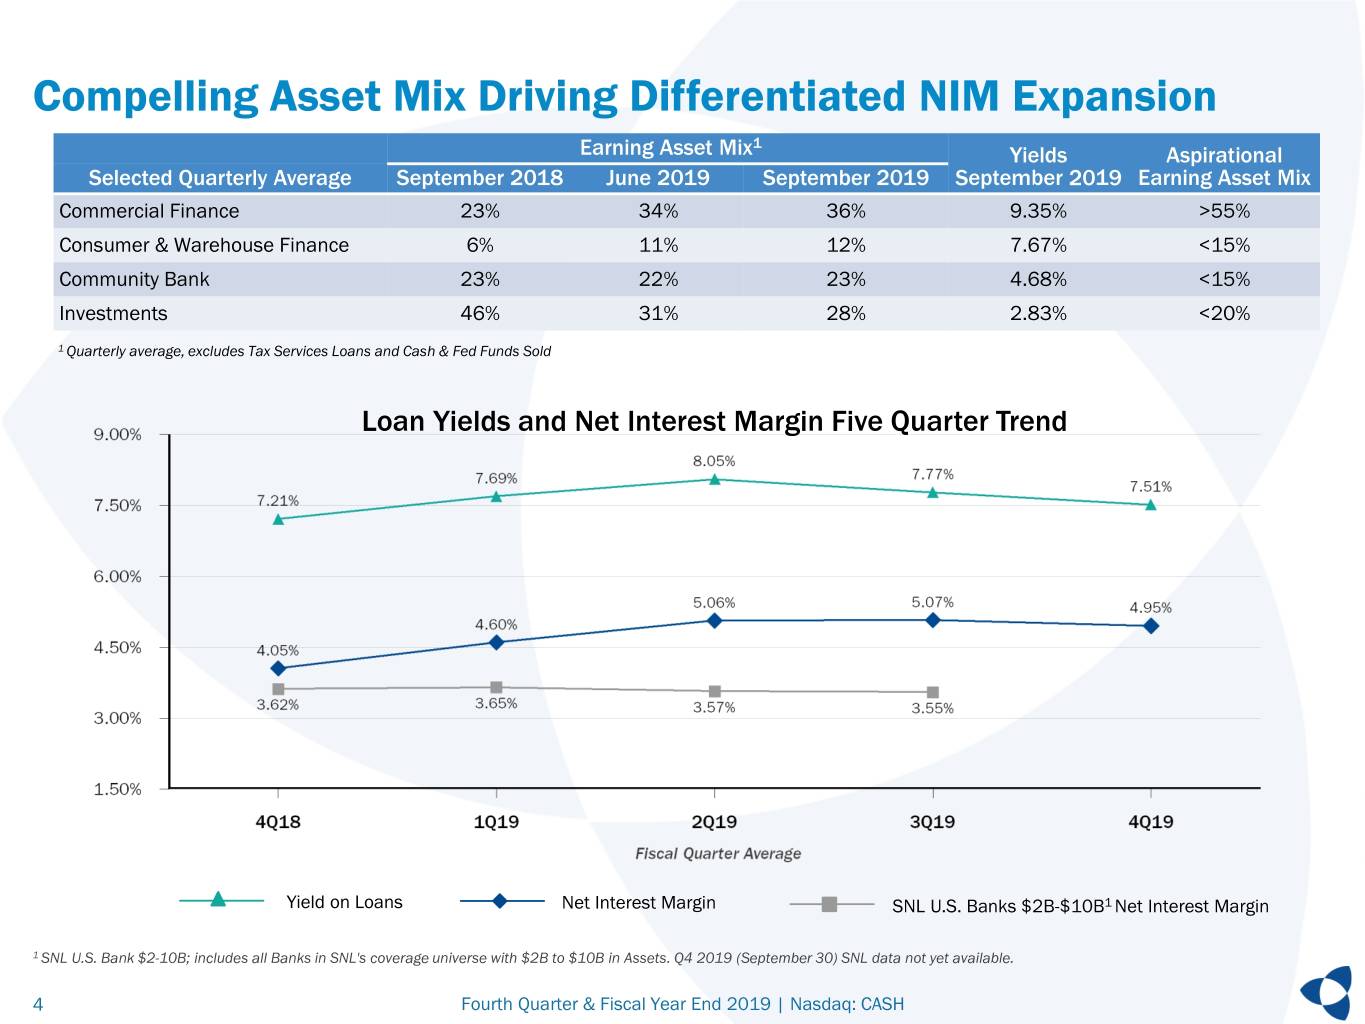
Compelling Asset Mix Driving Differentiated NIM Expansion 1 Earning Asset Mix Yields Aspirational Selected Quarterly Average September 2018 June 2019 September 2019 September 2019 Earning Asset Mix Commercial Finance 23% 34% 36% 9.35% >55% Consumer & Warehouse Finance 6% 11% 12% 7.67% <15% Community Bank 23% 22% 23% 4.68% <15% Investments 46% 31% 28% 2.83% <20% 1 Quarterly average, excludes Tax Services Loans and Cash & Fed Funds Sold Loan Yields and Net Interest Margin Five Quarter Trend Yield on Loans Net Interest Margin SNL U.S. Banks $2B-$10B1 Net Interest Margin 1 SNL U.S. Bank $2-10B; includes all Banks in SNL's coverage universe with $2B to $10B in Assets. Q4 2019 (September 30) SNL data not yet available. 4 Fourth Quarter & Fiscal Year End 2019 | Nasdaq: CASH

Diversified Loan Portfolio At the Quarter Ended September 30, 2019 June 30, 2019 March 31, 2019 December 31, 2018 September 30, 2018 4Q19 % Change From ($ in thousands) 4Q19 3Q19 2Q19 1Q19 4Q18 3Q19 4Q18 Commercial Finance 1,916,230 1,835,850 1,665,891 1,617,880 1,509,849 4.4% 26.9% Asset-based lending 688,520 615,309 572,210 554,072 477,917 11.9% 44.1% Factoring 296,507 320,344 287,955 284,912 284,221 (7.4)% 4.3% Lease financing 381,602 341,957 321,414 290,889 265,315 11.6% 43.8% Insurance premium finance 361,105 358,772 307,875 330,712 337,877 0.7% 6.9% SBA/USDA 88,831 99,791 77,481 67,893 59,374 (11.0)% 49.6% Other commercial finance 99,665 99,677 98,956 89,402 85,145 —% 17.1% Consumer Finance 268,198 320,266 310,441 278,654 270,361 (16.3)% (0.8)% National National Lending Consumer credit programs 106,794 155,539 139,617 96,144 80,605 (31.3)% 32.5% Other consumer finance 161,404 164,727 170,824 182,510 189,756 (2.0)% (14.9)% Tax Services 2,240 24,410 84,824 76,575 1,073 (90.8)% 108.8% Warehouse Finance 262,924 250,003 186,697 176,134 65,000 5.2% 304.5% Community Banking 1,201,821 1,195,434 1,187,163 1,179,065 1,098,706 0.5% 9.4% Commercial Real Estate & Op. 883,932 877,412 869,917 863,753 790,890 0.7% 11.8% 1-4 Family Real Estate & Other 259,425 256,853 257,079 256,341 247,318 1.0% 4.9% Agricultural loans 58,464 61,169 60,167 58,971 60,498 (4.4)% (3.4)% Total National Lending 2,449,592 2,430,529 2,247,853 2,149,243 1,846,283 0.8% 32.7% Total Community Banking 1,201,821 1,195,434 1,187,163 1,179,065 1,098,706 0.5% 9.4% Total Gross Loans & Leases 3,651,413 3,625,963 3,435,016 3,328,308 2,944,989 0.7% 24.0% 5 Fourth Quarter & Fiscal Year End 2019 | Nasdaq: CASH
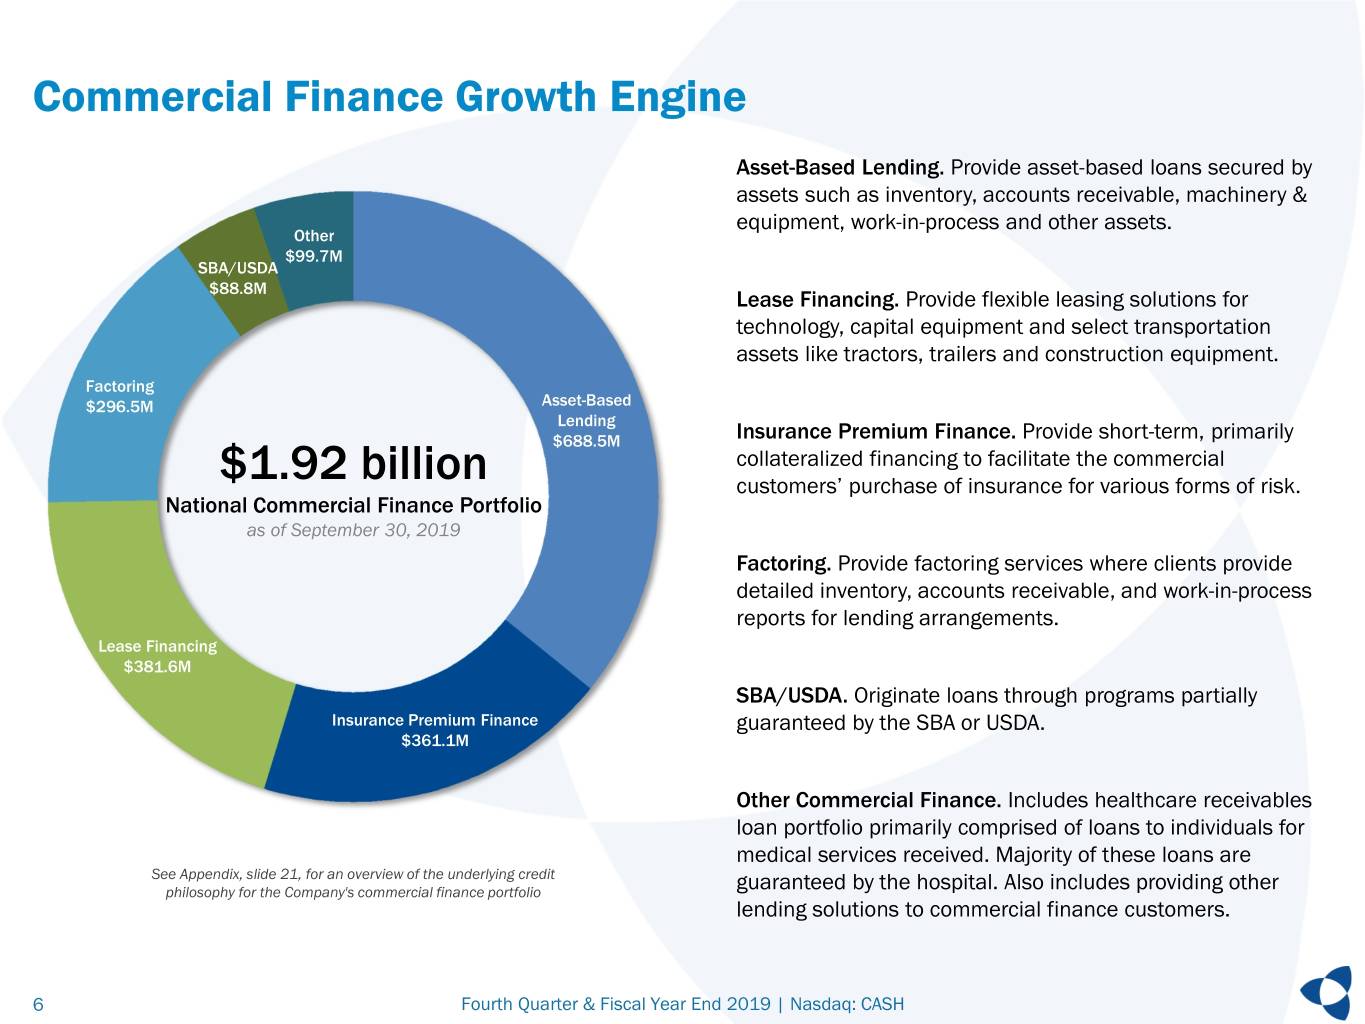
Commercial Finance Growth Engine Asset-Based Lending. Provide asset-based loans secured by assets such as inventory, accounts receivable, machinery & equipment, work-in-process and other assets. Other $99.7M SBA/USDA $88.8M Lease Financing. Provide flexible leasing solutions for technology, capital equipment and select transportation assets like tractors, trailers and construction equipment. Factoring $296.5M Asset-Based Lending $688.5M Insurance Premium Finance. Provide short-term, primarily collateralized financing to facilitate the commercial $1.92 billion customers’ purchase of insurance for various forms of risk. National Commercial Finance Portfolio as of September 30, 2019 Factoring. Provide factoring services where clients provide detailed inventory, accounts receivable, and work-in-process reports for lending arrangements. Lease Financing $381.6M SBA/USDA. Originate loans through programs partially Insurance Premium Finance guaranteed by the SBA or USDA. $361.1M Other Commercial Finance. Includes healthcare receivables loan portfolio primarily comprised of loans to individuals for medical services received. Majority of these loans are See Appendix, slide 21, for an overview of the underlying credit philosophy for the Company's commercial finance portfolio guaranteed by the hospital. Also includes providing other lending solutions to commercial finance customers. 6 Fourth Quarter & Fiscal Year End 2019 | Nasdaq: CASH
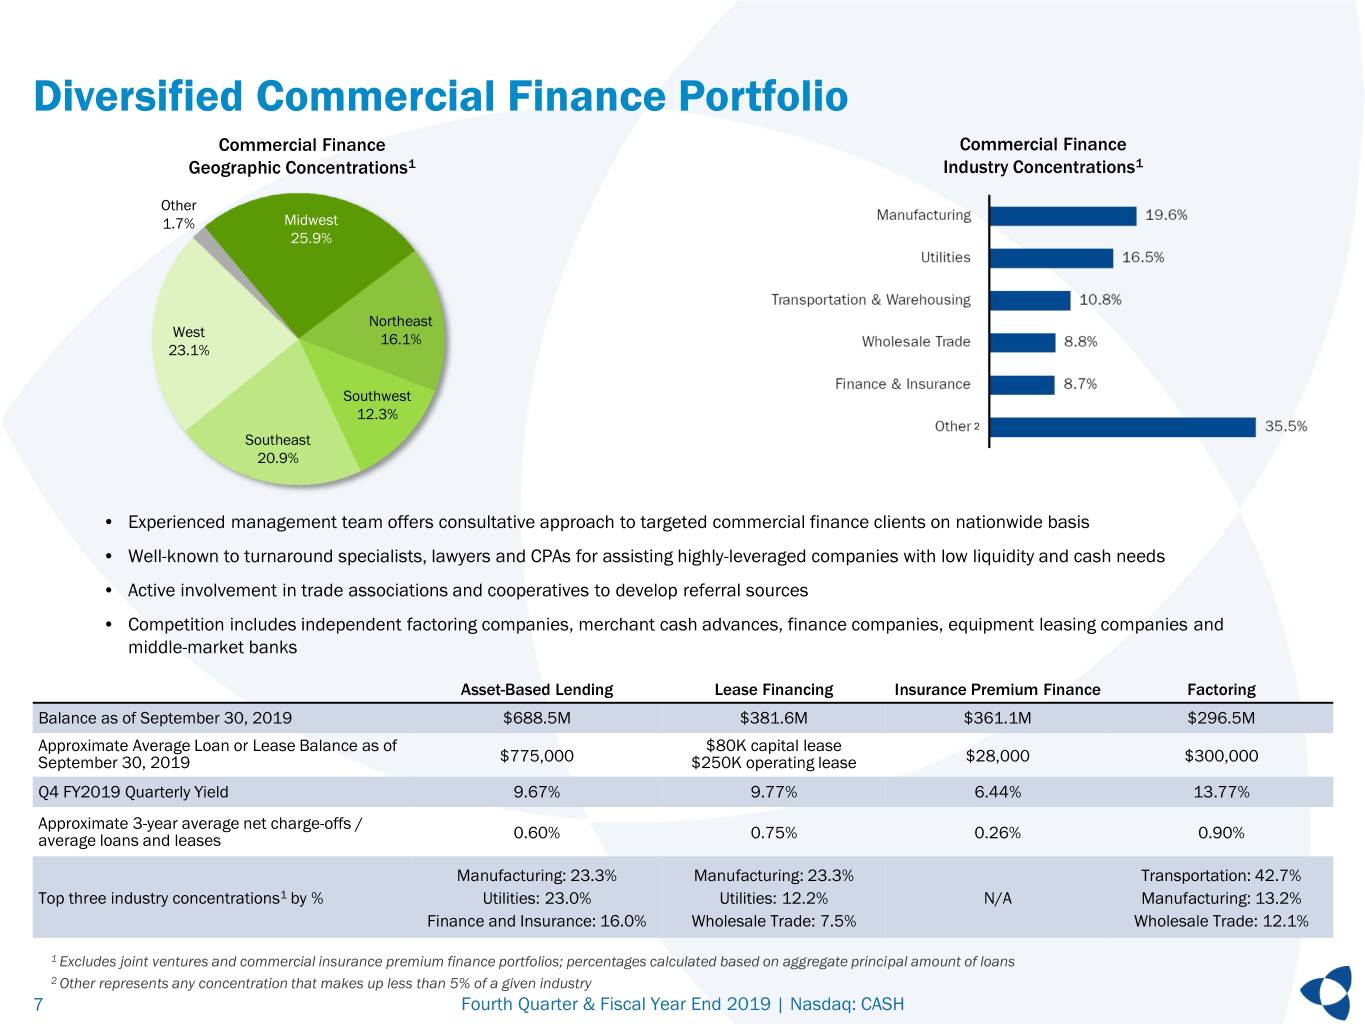
Diversified Commercial Finance Portfolio Commercial Finance Commercial Finance Geographic Concentrations1 Industry Concentrations1 Other 1.7% Midwest 25.9% Northeast West 16.1% 23.1% Southwest 12.3% 2 Southeast 20.9% • Experienced management team offers consultative approach to targeted commercial finance clients on nationwide basis • Well-known to turnaround specialists, lawyers and CPAs for assisting highly-leveraged companies with low liquidity and cash needs • Active involvement in trade associations and cooperatives to develop referral sources • Competition includes independent factoring companies, merchant cash advances, finance companies, equipment leasing companies and middle-market banks Asset-Based Lending Lease Financing Insurance Premium Finance Factoring Balance as of September 30, 2019 $688.5M $381.6M $361.1M $296.5M Approximate Average Loan or Lease Balance as of $80K capital lease September 30, 2019 $775,000 $250K operating lease $28,000 $300,000 Q4 FY2019 Quarterly Yield 9.67% 9.77% 6.44% 13.77% Approximate 3-year average net charge-offs / average loans and leases 0.60% 0.75% 0.26% 0.90% Manufacturing: 23.3% Manufacturing: 23.3% Transportation: 42.7% Top three industry concentrations1 by % Utilities: 23.0% Utilities: 12.2% N/A Manufacturing: 13.2% Finance and Insurance: 16.0% Wholesale Trade: 7.5% Wholesale Trade: 12.1% 1 Excludes joint ventures and commercial insurance premium finance portfolios; percentages calculated based on aggregate principal amount of loans 2 Other represents any concentration that makes up less than 5% of a given industry 7 Fourth Quarter & Fiscal Year End 2019 | Nasdaq: CASH

Disciplined Credit Culture Drives Strong Asset Quality 1 Excludes Tax Services NCOs and Related Seasonal Average Loans Tax Services NCOs and related seasonal average loans are excluded to adjust for the cyclicality of activity related to the overall economics of the tax services business line. Source: S&P Global Market Intelligence for data prior to acquisition on August 1, 2018 1Non-GAAP measures, see appendix for reconciliations. 8 Fourth Quarter & Fiscal Year End 2019 | Nasdaq: CASH

Ongoing Growth in Payments Deposits Driving Differentiated Funding Mix Fourth Quarter Fiscal 2019 Primary deposit source derived from Payments division, which generates low- cost deposits, including prepaid and demand deposit solutions Generated $89.1 million in card and deposit fee income in fiscal year 2019. $4.58 billion Quarterly Average Deposits Growth strategy includes gaining greater share of deposits from existing relationships and adding new strategic relationships. 0.95% Average Cost of Deposits See appendix for overview on MetaBank's Payments Solutions 14% CAGR 2015 - 2019 Payments: low-cost deposits including prepaid and demand deposit products Banking: traditional bank deposit products including demand deposits, savings, money market, and time deposits Corporate: wholesale deposits 9 Fourth Quarter & Fiscal Year End 2019 | Nasdaq: CASH

Interest Rate Risk Management September 30, 2019 12-Month Interest Rate Sensitivity from Base Net Interest Income 8% Net Interest Income modeled under an instantaneous, 6% parallel rate shock and a gradual parallel ramp. 4% 2% 0% Management also employs rigorous modeling techniques -2% under a variety of yield curve shapes, twists and ramps. -100 +100 +200 +300 Parallel Shock Ramp Earning Asset Pricing Attributes¹ Asset/Liability Gap Analysis $3,000 12% $2,500 31% $2,000 $1,500 $1,000 Volume ($MM) Volume $500 $0 57% -$500 Month 1-12 Month 13-36 Month 37-60 Month 61-180 Fixed Rate < 1 Year Fixed Rate > 1 Year Floating or Vairable Period Variance Total Assets Total Liabilities 1 Fixed rate securities, loans and leases are shown for contractual periods less than 12 months and greater than 12 months. 10 Fourth Quarter & Fiscal Year End 2019 | Nasdaq: CASH

Strategy Update 11 Fourth Quarter & Fiscal Year End 2019 | Nasdaq: CASH

Targeted Focus Areas Tailored solutions to facilitate money movement, enabling payments providers to Payments grow their businesses and build more profitable customer relationships by creating and delivering payment solutions Incorporated in 1993, is the holding company for its banking subsidiary, MetaBank. Provide customized national business capital Commercial solutions for small-and medium-sized businesses with innovative financial solutions Lending to niche markets; also provide traditional Founded in 1954, MetaBank has grown to operate in several different financial banking services within branch footprint sectors, including: payments, commercial finance, tax services, community banking and consumer lending. Consumer Focused on strategic relationships to build greater cross-sell opportunities, particularly with Lending our payments relationships 12 Fourth Quarter & Fiscal Year End 2019 | Nasdaq: CASH

Strategy to Drive Shareholder Value 1 2 3 KEY Increase Percentage of Optimize Interest-Earning Improve Operating Funding from Core Asset Mix Efficiencies INITIATIVES Deposits Expense discipline by improving collaboration Leverage payments division growth Replace lower-yielding loans and securities with and productivity between business lines opportunities higher-yielding and higher-return loans STRATEGY Concentrated focus on optimization and Explore and develop new niche deposit Expand net interest margin with focus on the utilization of existing business platforms opportunities commercial finance line of business Pause on material mergers and acquisitions During the fiscal year, sold securities and Grew fiscal year average payments deposits replaced with loans in an effort to further 11%, year-over-year optimize earning asset mix Analysis of organization resulted in organizational changes to better support 2019 Announced extended relationships with AAA and Changes from 4Q18 to 4Q19 include: strategic goals and efficiency opportunities NationalLink - Quarterly average commercial finance loans and PROGRESS leases increased from 23% to 36% of earning assets Improved efficiency ratio to 68.5% in fiscal Introduced the FasterPayments platform, an 2019, compared to 72.4% in fiscal 2018 additional service to deepen relationships - Quarterly average securities decreased from 46% to 28% of earning assets Gain greater share of deposits from existing relationships Driving 2x operating leverage in each business Continue to enhance interest-earning asset mix Develop additional products and services to line (i.e., growing revenue 2x the rate of expense FOCUS with focus on commercial finance business lines deepen relationships growth) Add new strategic relationships 13 Fourth Quarter & Fiscal Year End 2019 | Nasdaq: CASH

Long-Term Value Drivers Differentiated Model • Target niche commercial and consumer industries to provide opportunities for growth Low-Cost Funding Advantage • National payments business drives low-cost deposits • Re-focus on increasing percentage of funding from core deposits Scalable Lending Platforms • Crestmark acquisition provides scalable commercial finance platform, leveraged to optimize earning asset mix Cross-Selling Opportunities • Cross-selling expected to further enhance efficiencies with lower cost of customer acquisition, utilizing current product distribution channels Positioning in a shifting rate environment • Balance sheet well-positioned for a flat rate environment with emphasis of growing low-cost deposits and replacing lower-yielding assets with higher-yielding assets. Aspirational Target Qualitative Metrics • ROA > 2.0% • Efficiency ratio < 65% 14 Fourth Quarter & Fiscal Year End 2019 | Nasdaq: CASH

Appendix 15 Fourth Quarter & Fiscal Year End 2019 | Nasdaq: CASH
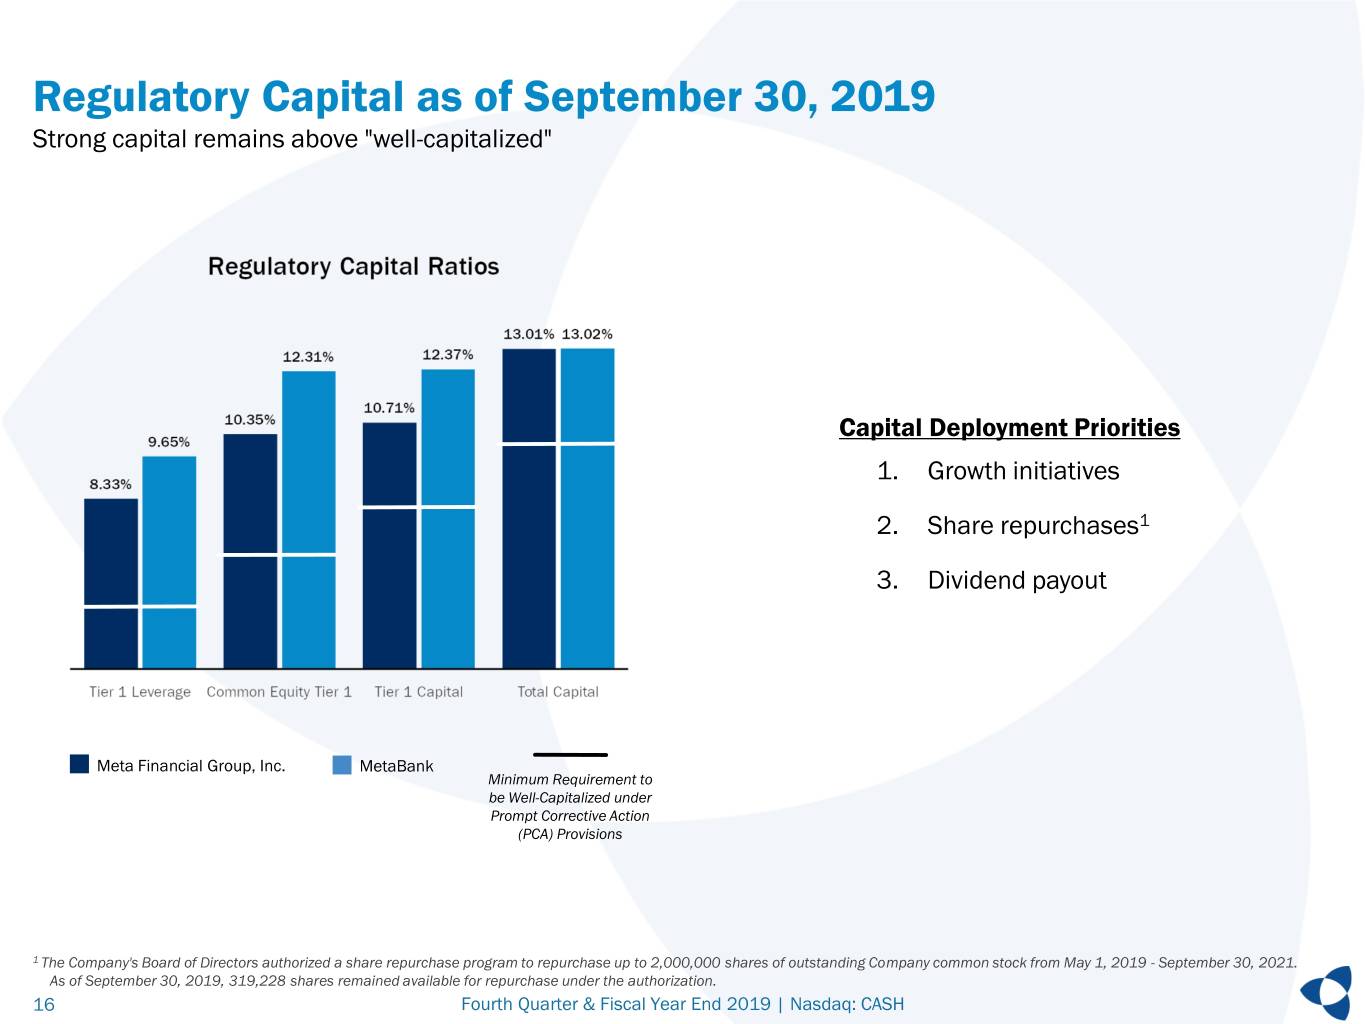
Regulatory Capital as of September 30, 2019 Strong capital remains above "well-capitalized" Capital Deployment Priorities 1. Growth initiatives 2. Share repurchases1 3. Dividend payout Meta Financial Group, Inc. MetaBank Minimum Requirement to be Well-Capitalized under Prompt Corrective Action (PCA) Provisions 1 The Company's Board of Directors authorized a share repurchase program to repurchase up to 2,000,000 shares of outstanding Company common stock from May 1, 2019 - September 30, 2021. As of September 30, 2019, 319,228 shares remained available for repurchase under the authorization. 16 Fourth Quarter & Fiscal Year End 2019 | Nasdaq: CASH

Quarterly Income Statement 4Q19 Change From ($ in millions, except per share data) 4Q19 3Q19 2Q19 1Q19 4Q18 3Q19 4Q18 $ % $ % Net Interest Income 65.6 67.0 71.4 60.3 48.5 (1.4) (2)% 17.1 35% Card & Deposit Fee Income 20.8 21.9 25.1 21.3 21.0 (1.1) (5)% (0.2) (1)% Refund Transfer Product Fee Income 0.6 6.7 31.6 0.3 0.5 (6.1) (91)% 0.1 20% Tax Advance Fee Income (0.1) — 33.0 1.7 — (0.1) NM (0.1) NM Rental Income 10.9 9.4 9.9 10.9 7.3 1.5 16% 3.6 49% Gain on Sale of Loans and Leases 1.4 1.9 1.1 0.9 0.4 (0.5) (26)% 1.0 250% Other Income 2.4 3.9 4.3 2.8 (4.6) (1.5) (38)% 7.0 (152)% Total Revenue $ 101.6 $ 110.8 $ 176.4 $ 98.0 $ 73.2 $ (9.2) (8)% $ 28.4 39% Compensation and Benefits 38.5 35.2 49.2 33.0 30.1 3.3 9% 8.4 28% Card Processing Expense 5.0 4.6 7.0 7.1 5.5 0.4 9% (0.5) (9)% Tax Product Expense — 0.7 9.4 0.5 0.2 (0.7) NM (0.2) NM Occupancy and Equipment 7.3 7.1 7.2 6.5 5.7 0.2 3% 1.6 28% Operating Lease Equipment Depreciation 7.9 6.0 4.5 7.8 5.4 1.9 32% 2.5 46% Intangible Amortization 3.4 4.4 5.6 4.4 3.6 (1.0) (23)% (0.2) (6)% All Other Expense 14.1 14.4 27.4 15.1 16.3 (0.3) (2)% (2.2) (13)% Total Expense $ 76.1 $ 72.5 $ 110.3 $ 74.3 $ 66.6 $ 3.6 5% $ 9.5 14% Provision for Loan and Lease Loss 4.1 9.1 33.3 9.1 4.7 (5.0) (55)% (0.6) (13)% Net Income Before Taxes 21.3 29.2 32.8 14.6 1.8 (7.9) (27)% 19.5 1,083% Income Tax Expense (Benefit) (0.1) (1.2) (0.4) (1.7) (7.6) 1.1 (92)% 7.5 (99)% Net Income before non-controlling interest 21.5 30.3 33.2 16.3 9.4 (8.8) (29)% 12.1 129% Net Income attributable to non-controlling 1.3 1.0 1.1 0.9 0.7 0.6 86% interest 0.3 30% Net Income attributable to parent $ 20.2 $ 29.3 $ 32.1 $ 15.4 $ 8.7 $ (9.1) (31)% $ 11.5 132% Earnings Per Share, Diluted $ 0.53 $ 0.75 $ 0.81 $ 0.39 $ 0.24 $ (0.22) (29)% $ 0.29 121% Average Diluted Shares 37,912,616 38,977,690 39,496,832 39,406,507 35,823,162 (1,065,074) (3)% 2,089,454 6% 17 Fourth Quarter & Fiscal Year End 2019 | Nasdaq: CASH
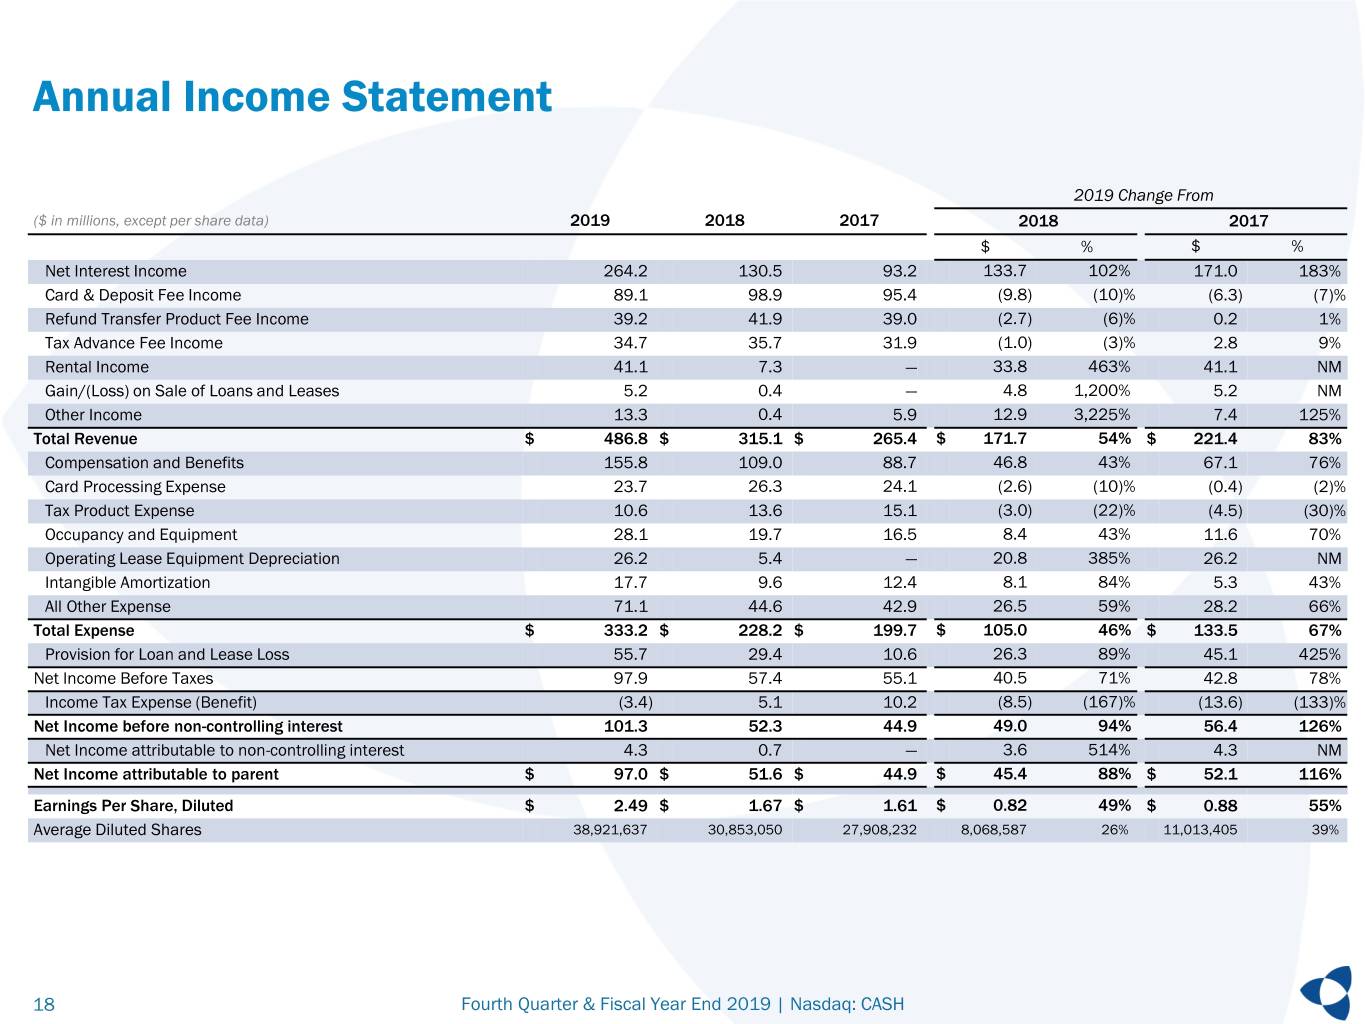
Annual Income Statement 2019 Change From ($ in millions, except per share data) 2019 2018 2017 2018 2017 $ % $ % Net Interest Income 264.2 130.5 93.2 133.7 102% 171.0 183% Card & Deposit Fee Income 89.1 98.9 95.4 (9.8) (10)% (6.3) (7)% Refund Transfer Product Fee Income 39.2 41.9 39.0 (2.7) (6)% 0.2 1% Tax Advance Fee Income 34.7 35.7 31.9 (1.0) (3)% 2.8 9% Rental Income 41.1 7.3 — 33.8 463% 41.1 NM Gain/(Loss) on Sale of Loans and Leases 5.2 0.4 — 4.8 1,200% 5.2 NM Other Income 13.3 0.4 5.9 12.9 3,225% 7.4 125% Total Revenue $ 486.8 $ 315.1 $ 265.4 $ 171.7 54% $ 221.4 83% Compensation and Benefits 155.8 109.0 88.7 46.8 43% 67.1 76% Card Processing Expense 23.7 26.3 24.1 (2.6) (10)% (0.4) (2)% Tax Product Expense 10.6 13.6 15.1 (3.0) (22)% (4.5) (30)% Occupancy and Equipment 28.1 19.7 16.5 8.4 43% 11.6 70% Operating Lease Equipment Depreciation 26.2 5.4 — 20.8 385% 26.2 NM Intangible Amortization 17.7 9.6 12.4 8.1 84% 5.3 43% All Other Expense 71.1 44.6 42.9 26.5 59% 28.2 66% Total Expense $ 333.2 $ 228.2 $ 199.7 $ 105.0 46% $ 133.5 67% Provision for Loan and Lease Loss 55.7 29.4 10.6 26.3 89% 45.1 425% Net Income Before Taxes 97.9 57.4 55.1 40.5 71% 42.8 78% Income Tax Expense (Benefit) (3.4) 5.1 10.2 (8.5) (167)% (13.6) (133)% Net Income before non-controlling interest 101.3 52.3 44.9 49.0 94% 56.4 126% Net Income attributable to non-controlling interest 4.3 0.7 — 3.6 514% 4.3 NM Net Income attributable to parent $ 97.0 $ 51.6 $ 44.9 $ 45.4 88% $ 52.1 116% Earnings Per Share, Diluted $ 2.49 $ 1.67 $ 1.61 $ 0.82 49% $ 0.88 55% Average Diluted Shares 38,921,637 30,853,050 27,908,232 8,068,587 26% 11,013,405 39% 18 Fourth Quarter & Fiscal Year End 2019 | Nasdaq: CASH
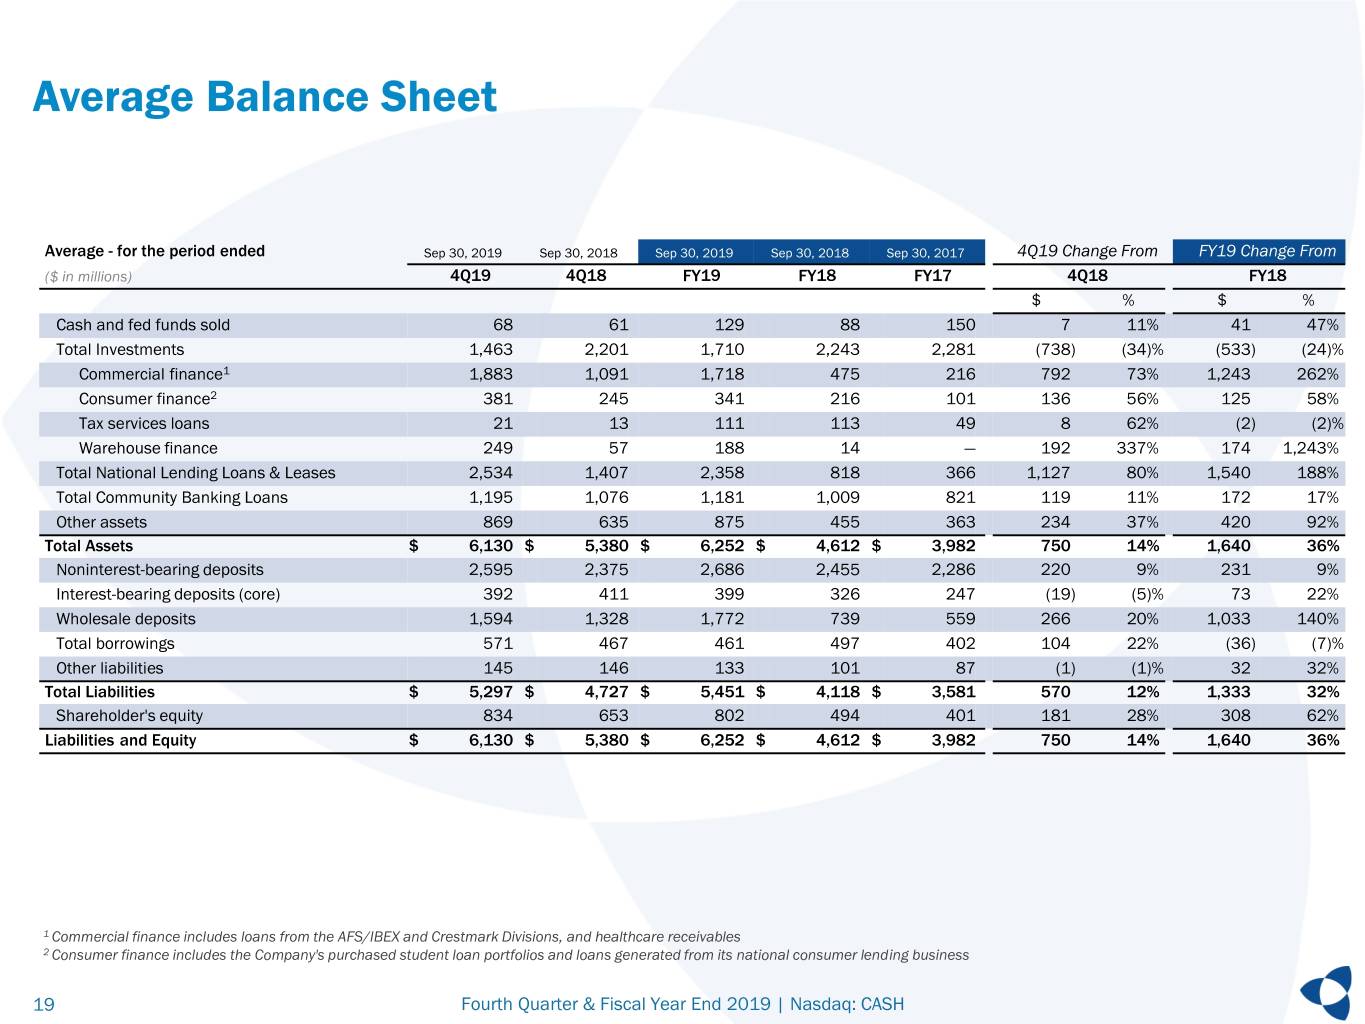
Average Balance Sheet Average - for the period ended Sep 30, 2019 Sep 30, 2018 Sep 30, 2019 Sep 30, 2018 Sep 30, 2017 4Q19 Change From FY19 Change From ($ in millions) 4Q19 4Q18 FY19 FY18 FY17 4Q18 FY18 $ % $ % Cash and fed funds sold 68 61 129 88 150 7 11% 41 47% Total Investments 1,463 2,201 1,710 2,243 2,281 (738) (34)% (533) (24)% Commercial finance1 1,883 1,091 1,718 475 216 792 73% 1,243 262% Consumer finance2 381 245 341 216 101 136 56% 125 58% Tax services loans 21 13 111 113 49 8 62% (2) (2)% Warehouse finance 249 57 188 14 — 192 337% 174 1,243% Total National Lending Loans & Leases 2,534 1,407 2,358 818 366 1,127 80% 1,540 188% Total Community Banking Loans 1,195 1,076 1,181 1,009 821 119 11% 172 17% Other assets 869 635 875 455 363 234 37% 420 92% Total Assets $ 6,130 $ 5,380 $ 6,252 $ 4,612 $ 3,982 750 14% 1,640 36% Noninterest-bearing deposits 2,595 2,375 2,686 2,455 2,286 220 9% 231 9% Interest-bearing deposits (core) 392 411 399 326 247 (19) (5)% 73 22% Wholesale deposits 1,594 1,328 1,772 739 559 266 20% 1,033 140% Total borrowings 571 467 461 497 402 104 22% (36) (7)% Other liabilities 145 146 133 101 87 (1) (1)% 32 32% Total Liabilities $ 5,297 $ 4,727 $ 5,451 $ 4,118 $ 3,581 570 12% 1,333 32% Shareholder's equity 834 653 802 494 401 181 28% 308 62% Liabilities and Equity $ 6,130 $ 5,380 $ 6,252 $ 4,612 $ 3,982 750 14% 1,640 36% 1 Commercial finance includes loans from the AFS/IBEX and Crestmark Divisions, and healthcare receivables 2 Consumer finance includes the Company's purchased student loan portfolios and loans generated from its national consumer lending business 19 Fourth Quarter & Fiscal Year End 2019 | Nasdaq: CASH

Financial Measure Reconciliations Efficiency Ratio For the last twelve months ended ($ in thousands) Sep 30, 2019 Jun 30, 2019 Mar 31, 2019 Dec 31, 2018 Sep 30, 2018 Noninterest Expense - GAAP 333,160 323,657 300,242 258,485 228,232 Net Interest Income 264,207 247,127 208,570 164,625 130,549 Noninterest Income 222,545 211,179 200,614 193,008 184,525 Total Revenue - GAAP 486,752 458,306 409,184 357,633 315,074 Efficiency Ratio, LTM 68.45% 70.62% 73.38% 72.28% 72.44% Non-GAAP Reconciliation Adjusted Annualized NCOs and Adjusted Average Loans and Leases For the quarter ended ($ in thousands) Sep 30, 2019 Jun 30, 2019 Mar 31, 2019 Dec 31, 2018 Sep 30, 2018 Net Charge-offs 18,476 14,279 5,936 848 13,616 Less: Tax services net charge-offs 15,416 9,592 (83) (50) 11,264 Adjusted Net Charge-offs $ 3,060 $ 4,687 $ 6,019 $ 898 $ 2,352 Quarterly Average Loans and Leases 3,729,545 3,599,138 3,709,820 3,120,374 2,482,888 Less: Quarterly Average Tax Services Loans 21,445 45,142 369,331 11,009 13,210 Adjusted Quarterly Loans and Leases $ 3,708,100 $ 3,553,996 $ 3,340,489 $ 3,109,365 $ 2,469,678 Annualized NCOs/Average Loans and Leases 1.98% 1.59% 0.65% 0.11% 2.18% Adjusted Annualized NCOs/Adjusted Average Loans and Leases1 0.33% 0.53% 0.73% 0.11% 0.38% 1 Tax Services NCOs and average loans are excluded to adjust for the cyclicality of activity related to the overall economics of the Company's tax services business line. 20 Fourth Quarter & Fiscal Year End 2019 | Nasdaq: CASH

Risk Management in Commercial Finance Underlying credit philosophy is fundamentally collateral-based lending with underwriting and monitoring focused on the risk management and administrative controls of the collateral borrowing base. Loans are underwritten to ensure that the Bank can recover the full loan exposure from the collateral in the event of a default or liquidation scenario. • Asset-Based Lending ("ABL") and Factoring - The Bank adjusts the advance rate, loan size and credit terms primarily based on an assessment of the collateral and the cash flow of the borrower. Typical advance rates of A/R are 70%-85% of eligible collateral. Advance rates for inventory are typically in the range of 40%-50%. – For most clients, through dominion of funds, all client funds are received through a Bank-controlled lockbox arrangement, whereby cash is applied directly to pay down the revolving loan balance, often on a daily basis. ABL products are "demand" products, and the Bank is under no obligation to make future advances. The Bank conducts regular client site visits in order to conduct field examinations of books, records and to substantiate collateral values. • Insurance Premium Finance loans are typically collateralized by unearned insurance premiums held at highly-rated insurance companies, with terms generally under 9- or 10-months. Candidates for lease financing and longer-term asset financing are analyzed similar to traditional bank underwriting methods where cash flow, liquidity, balance sheet strength and, to a lesser extent, collateral quality are the focus. • Direct financing leases are underwritten with and without residual exposure. For leases with residual exposure, the Bank estimates the residual value of the asset at the time of financing based on the cost of the asset, the term of the lease, the effective lease rate and the expected value of the leased asset at the end of the financing term. Finance leases without residuals are structured so that the Bank does not have financial asset value exposure at end of lease as the lessor retains the rights to the residual value. The Bank may structure leases with a large first payment that serves as an effective down payment to mitigate counterparty risk. • The Small Business Administration (the "SBA") guarantees 75% of a 7(a) loan, and this portion can be sold for a premium with funds then available for redeployment by the Bank. Completed submission packages with full underwriting are provided to the SBA for pre-approval. The USDA loan program, primarily utilized for alternative energy sector, leverages expertise in these industries where the Bank has generated significant tax credits, with guarantees up to 80% and other terms often more attractive than the SBA program. 21 Fourth Quarter & Fiscal Year End 2019 | Nasdaq: CASH

Payments Solutions Prepaid Demand Deposits ACH Meta is a leader in applying innovative How DDA delivers value for consumers Turnkey and flexible ACH payments prepaid solutions to address key consumer implementation and business payments needs. Promotes strong direct deposit relationship, acceptance with online and - Enables organizations to debit and credit digital funds transfer accounts using checking and routing numbers ISSUED Access to overdraft protection to - Affordable flexible multiple window processing MORE 1 BILLION support users during times of income with available Same Day Services THAN CARDS shortfalls - Leverage Meta’s expertise to design, Enables financial independence, better implement, and manage complex payment Consumer gifts money management and self-service systems with ease digital lifestyle Travel Cards - Partner-driven approach with ability to Provides digital bank account appeal for Commercial Prepaid support third-party service providers as well Gen Y/ Millennials, economic strivers as third-party senders and gig workers Payroll Of NACHA’s 2018 Top 50 Banks Receiving Employee or Consumer Incentives Key Product Features and Originating Payments, MetaBank ranked: Tax Refunds - Online account opening and real-time account 7.0% origination with online and mobile account access 25 Receiving volume Retail General Purpose Reloadable - Multiple ways to fund account including: ACH and Debits and Credits Y/Y direct deposit, mobile remote deposit capture, Corporate Refunds or Disbursements and even cash deposits at licensed money transmitters 6.0% - Use where major credit cards are accepted 34 Originating volume Prepaid offers several use cases to Debits and Credits Y/Y improve the electronic exchange of value - Live customer service agents to assist with chargebacks and disputes, error resolutions Source: https://www.nacha.org/system/files/2019-05/Nacha-Top-50-of-2018.pdf 22 Fourth Quarter & Fiscal Year End 2019 | Nasdaq: CASH


