Quarterly Investor Update First Quarter Fiscal Year 2020
Forward-Looking Statements The Company and MetaBank may from time to time make written or oral “forward-looking statements,” including statements contained in this investor update, the Company’s filings with the Securities and Exchange Commission (“SEC”), the Company’s reports to stockholders, and in other communications by the Company and MetaBank, which are made in good faith by the Company pursuant to the “safe harbor” provisions of the Private Securities Litigation Reform Act of 1995. You can identify forward-looking statements by words such as “may,” “hope,” “will,” “should,” “expect,” “plan,” “anticipate,” “intend,” “believe,” “estimate,” “predict,” “potential,” “continue,” “could,” “future,” or the negative of those terms, or other words of similar meaning or similar expressions. You should carefully read statements that contain these words because they discuss our future expectations or state other “forward-looking” information. These forward-looking statements are based on information currently available to us and assumptions about future events, and include statements with respect to the Company’s beliefs, expectations, estimates, and intentions, which are subject to significant risks and uncertainties, and are subject to change based on various factors, some of which are beyond the Company’s control. Such risks, uncertainties and other factors may cause our actual growth, results of operations, financial condition, cash flows, performance and business prospects and opportunities to differ materially from those expressed in, or implied by, these forward-looking statements. Such statements address, among others, the following subjects: future operating results; customer retention; loan and other product demand; important components of the Company's statements of financial condition and operations; growth and expansion; expectations concerning the Company's acquisitions and divestitures, including potential benefits of, and other expectations for the Company in connection with, such transactions; new products and services, such as those offered by MetaBank or the Company's Payments divisions (which include Meta Payment Systems, Refund Advantage, EPS Financial and Specialty Consumer Services); credit quality and adequacy of reserves; technology; and the Company's employees. The following factors, among others, could cause the Company's financial performance and results of operations to differ materially from the expectations, estimates, and intentions expressed in such forward-looking statements: maintaining our executive management team; expected growth opportunities may not be realized or may take longer to realize than expected; the risk that the transaction with Central Bank may not occur on a timely basis or at all; the parties ability to obtain third party and regulatory approvals, and otherwise satisfy the other conditions to closing the transaction with Central Bank, on a timely basis or at all; factors relating to the Company’s share repurchase program; actual changes in interest rates and the Fed Funds rate; additional changes in tax laws; the strength of the United States' economy, in general, and the strength of the local economies in which the Company conducts operations; the effects of, and changes in, trade, monetary, and fiscal policies and laws, including interest rate policies of the Board of Governors of the Federal Reserve System (the “Federal Reserve”), as well as efforts of the United States Congress and the United States Treasury in conjunction with bank regulatory agencies to stimulate the economy and protect the financial system; inflation, market, and monetary fluctuations; the timely and efficient development of, and acceptance of, new products and services offered by the Company or its strategic partners, as well as risks (including reputational and litigation) attendant thereto, and the perceived overall value of these products and services by users; the risks of dealing with or utilizing third parties, including, in connection with the Company’s refund advance business, the risk of reduced volume of refund advance loans as a result of reduced customer demand for or acceptance of usage of Meta’s strategic partners’ refund advance products; any actions which may be initiated by our regulators in the future; the impact of changes in financial services laws and regulations, including, but not limited to, laws and regulations relating to the tax refund industry and the insurance premium finance industry; our relationship with our primary regulators, the Office of the Comptroller of the Currency and the Federal Reserve, as well as the Federal Deposit Insurance Corporation, which insures MetaBank’s deposit accounts up to applicable limits; technological changes, including, but not limited to, the protection of electronic files or databases; acquisitions; litigation risk, in general, including, but not limited to, those risks involving MetaBank's divisions; the growth of the Company’s business, as well as expenses related thereto; continued maintenance by MetaBank of its status as a well-capitalized institution, particularly in light of our growing deposit base, a portion of which has been characterized as “brokered;” changes in consumer spending and saving habits; and the success of the Company at maintaining its high quality asset level and managing and collecting assets of borrowers in default should problem assets increase. The foregoing list of factors is not exclusive. We caution you not to place undue reliance on these forward-looking statements. The forward-looking statements included herein speak only as of the date of this investor update. All subsequent written and oral forward-looking statements attributable to us or any person acting on our behalf are expressly qualified in their entirety by the cautionary statements contained or referred to in this cautionary note. Additional discussions of factors affecting the Company’s business and prospects are reflected under the caption “Risk Factors” and in other sections of the Company’s Annual Report on Form 10-K for the Company's fiscal year ended September 30, 2019 and in other filings made with the SEC. The Company expressly disclaims any intent or obligation to update any forward-looking statements, whether written or oral, that may be made from time to time by or on behalf of the Company or its subsidiaries, whether as a result of new information, changed circumstances or future events or for any other reason. 2 First Quarter Fiscal Year 2020 | Nasdaq: CASH
Business Developments First Quarter Ended December 31, 2019 • On November 20, 2019, entered into a definitive agreement with Central Bank for the sale of the Community Bank division. – Sale includes all Community Bank deposits, branch locations, fixed assets and employees and a portion of the Community Bank’s loan portfolio. – The transaction is expected to close in the second fiscal quarter of 2020, subject to the satisfaction or waiver of certain conditions, the receipt of third party and regulatory approval and satisfaction of customary closing conditions. • Disposed of assets related to a previously disclosed Community Bank agricultural relationship that were held in other real estate owned, which represented 46 basis points of non-performing assets as of September 30, 2019. – The Company recognized a $5.0 million loss from the sale of foreclosed property, $1.1 million in deferred rental income and $0.2 million in other real estate owned expenses related to these foreclosed properties for a net loss of $4.1 million. • Joined KBW Nasdaq Financial Technology Index (Index Ticker: KFTX) effective after-market close on Friday, December 20, 2019 3 First Quarter Fiscal Year 2020 | Nasdaq: CASH
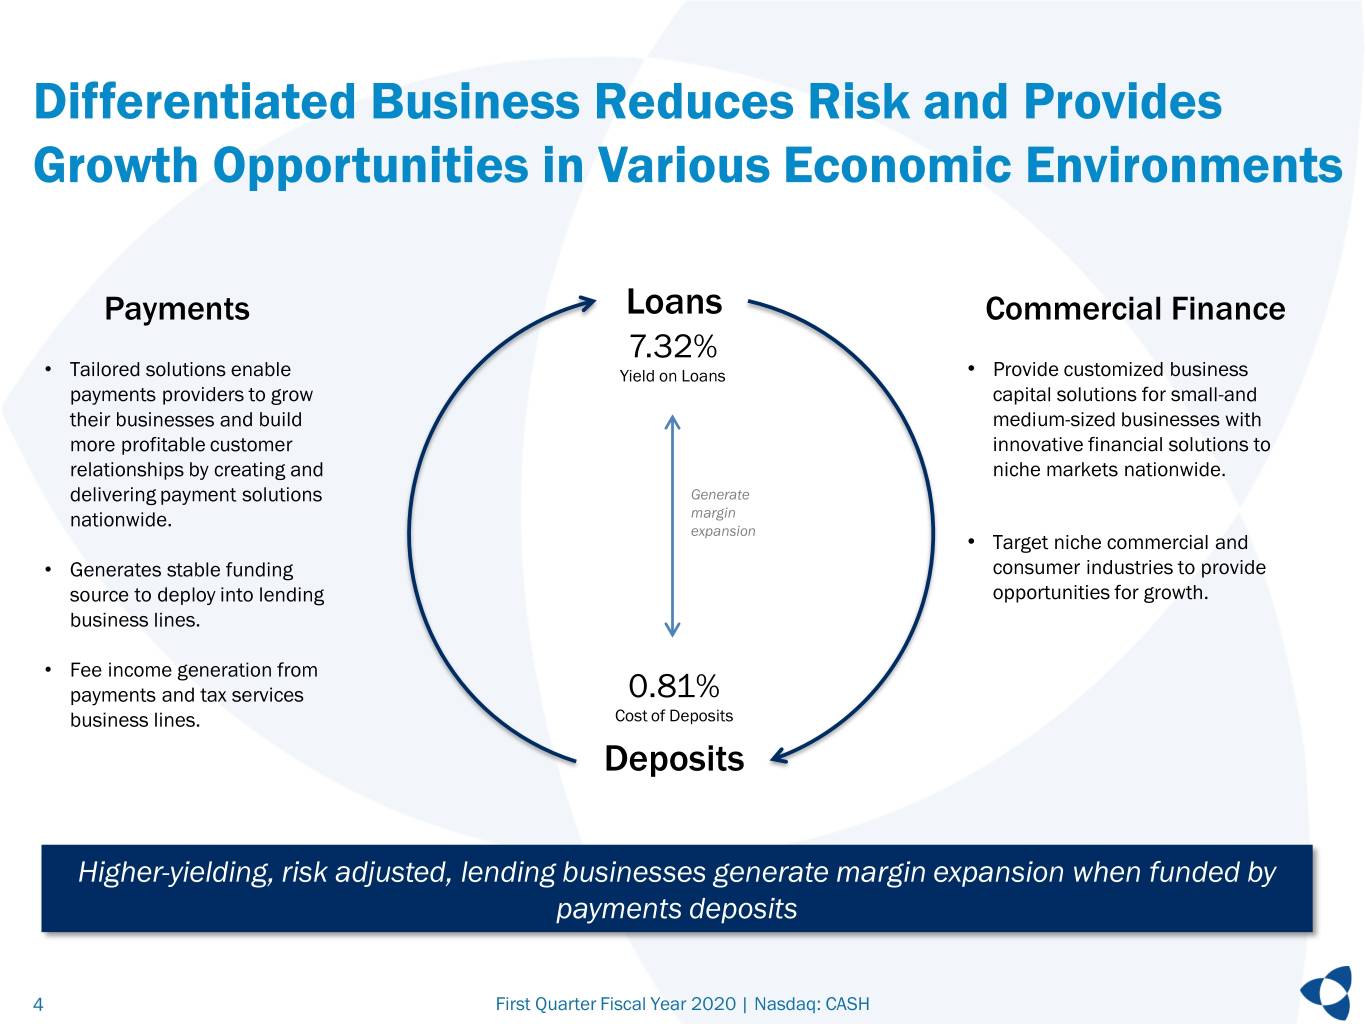
Differentiated Business Reduces Risk and Provides Growth Opportunities in Various Economic Environments Payments Loans Commercial Finance 7.32% • Tailored solutions enable Yield on Loans • Provide customized business payments providers to grow capital solutions for small-and their businesses and build medium-sized businesses with more profitable customer innovative financial solutions to relationships by creating and niche markets nationwide. delivering payment solutions Generate nationwide. margin expansion • Target niche commercial and • Generates stable funding consumer industries to provide source to deploy into lending opportunities for growth. business lines. • Fee income generation from payments and tax services 0.81% business lines. Cost of Deposits Deposits Higher-yielding, risk adjusted, lending businesses generate margin expansion when funded by payments deposits 4 First Quarter Fiscal Year 2020 | Nasdaq: CASH
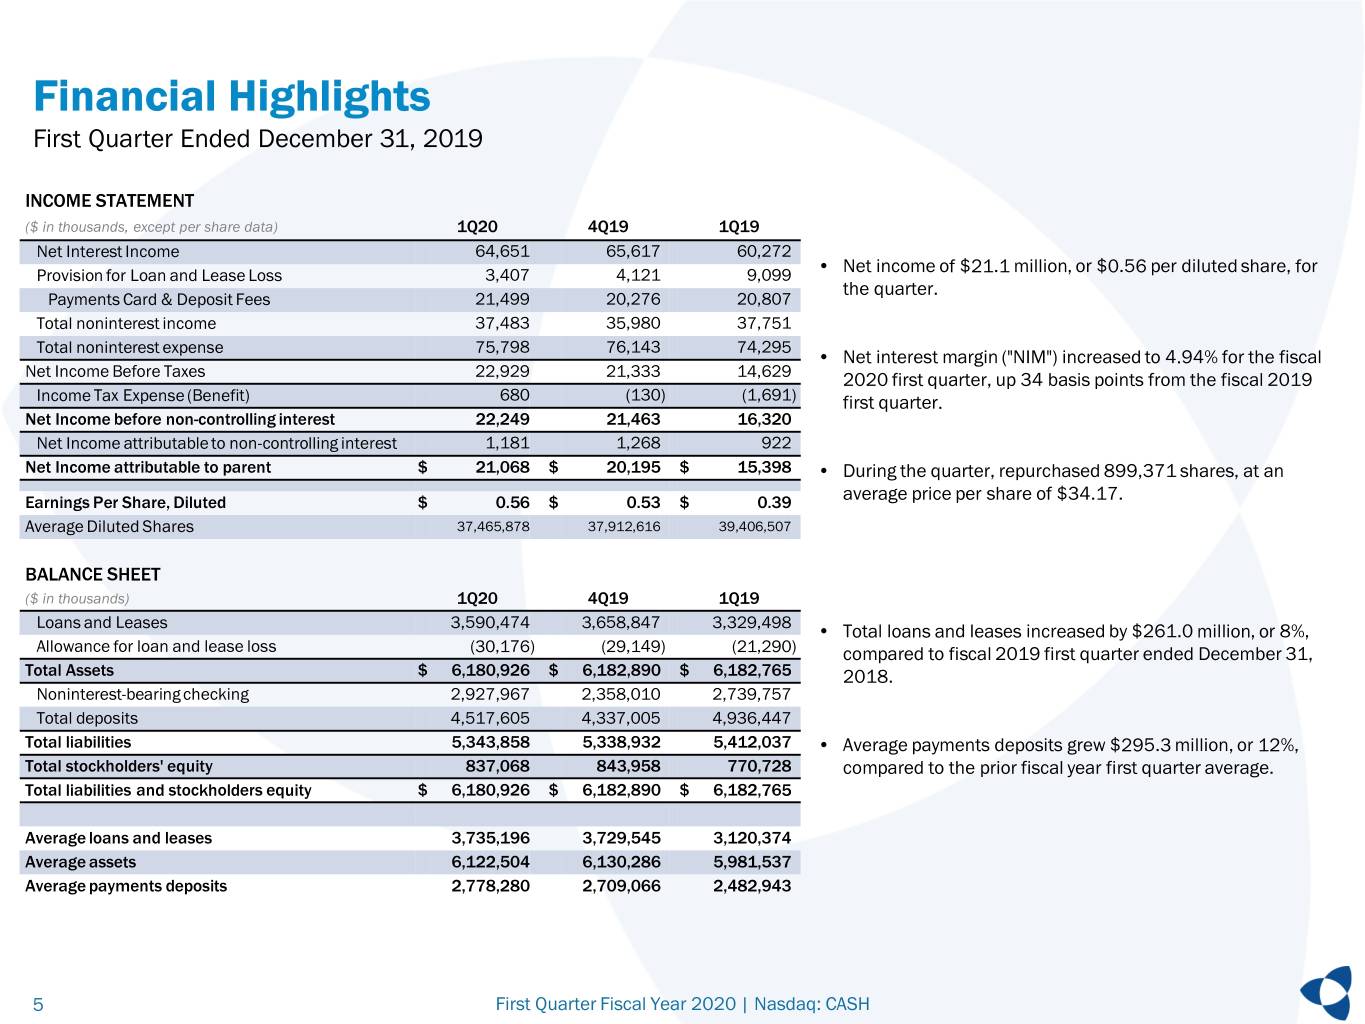
Financial Highlights First Quarter Ended December 31, 2019 INCOME STATEMENT ($ in thousands, except per share data) 1Q20 4Q19 1Q19 Net Interest Income 64,651 65,617 60,272 Provision for Loan and Lease Loss 3,407 4,121 9,099 • Net income of $21.1 million, or $0.56 per diluted share, for the quarter. Payments Card & Deposit Fees 21,499 20,276 20,807 Total noninterest income 37,483 35,980 37,751 Total noninterest expense 75,798 76,143 74,295 • Net interest margin ("NIM") increased to 4.94% for the fiscal Net Income Before Taxes 22,929 21,333 14,629 2020 first quarter, up 34 basis points from the fiscal 2019 Income Tax Expense (Benefit) 680 (130) (1,691) first quarter. Net Income before non-controlling interest 22,249 21,463 16,320 Net Income attributable to non-controlling interest 1,181 1,268 922 Net Income attributable to parent $ 21,068 $ 20,195 $ 15,398 • During the quarter, repurchased 899,371 shares, at an Earnings Per Share, Diluted $ 0.56 $ 0.53 $ 0.39 average price per share of $34.17. Average Diluted Shares 37,465,878 37,912,616 39,406,507 BALANCE SHEET ($ in thousands) 1Q20 4Q19 1Q19 Loans and Leases 3,590,474 3,658,847 3,329,498 • Total loans and leases increased by $261.0 million, or 8%, Allowance for loan and lease loss (30,176) (29,149) (21,290) compared to fiscal 2019 first quarter ended December 31, Total Assets $ 6,180,926 $ 6,182,890 $ 6,182,765 2018. Noninterest-bearing checking 2,927,967 2,358,010 2,739,757 Total deposits 4,517,605 4,337,005 4,936,447 Total liabilities 5,343,858 5,338,932 5,412,037 • Average payments deposits grew $295.3 million, or 12%, Total stockholders' equity 837,068 843,958 770,728 compared to the prior fiscal year first quarter average. Total liabilities and stockholders equity $ 6,180,926 $ 6,182,890 $ 6,182,765 Average loans and leases 3,735,196 3,729,545 3,120,374 Average assets 6,122,504 6,130,286 5,981,537 Average payments deposits 2,778,280 2,709,066 2,482,943 5 First Quarter Fiscal Year 2020 | Nasdaq: CASH
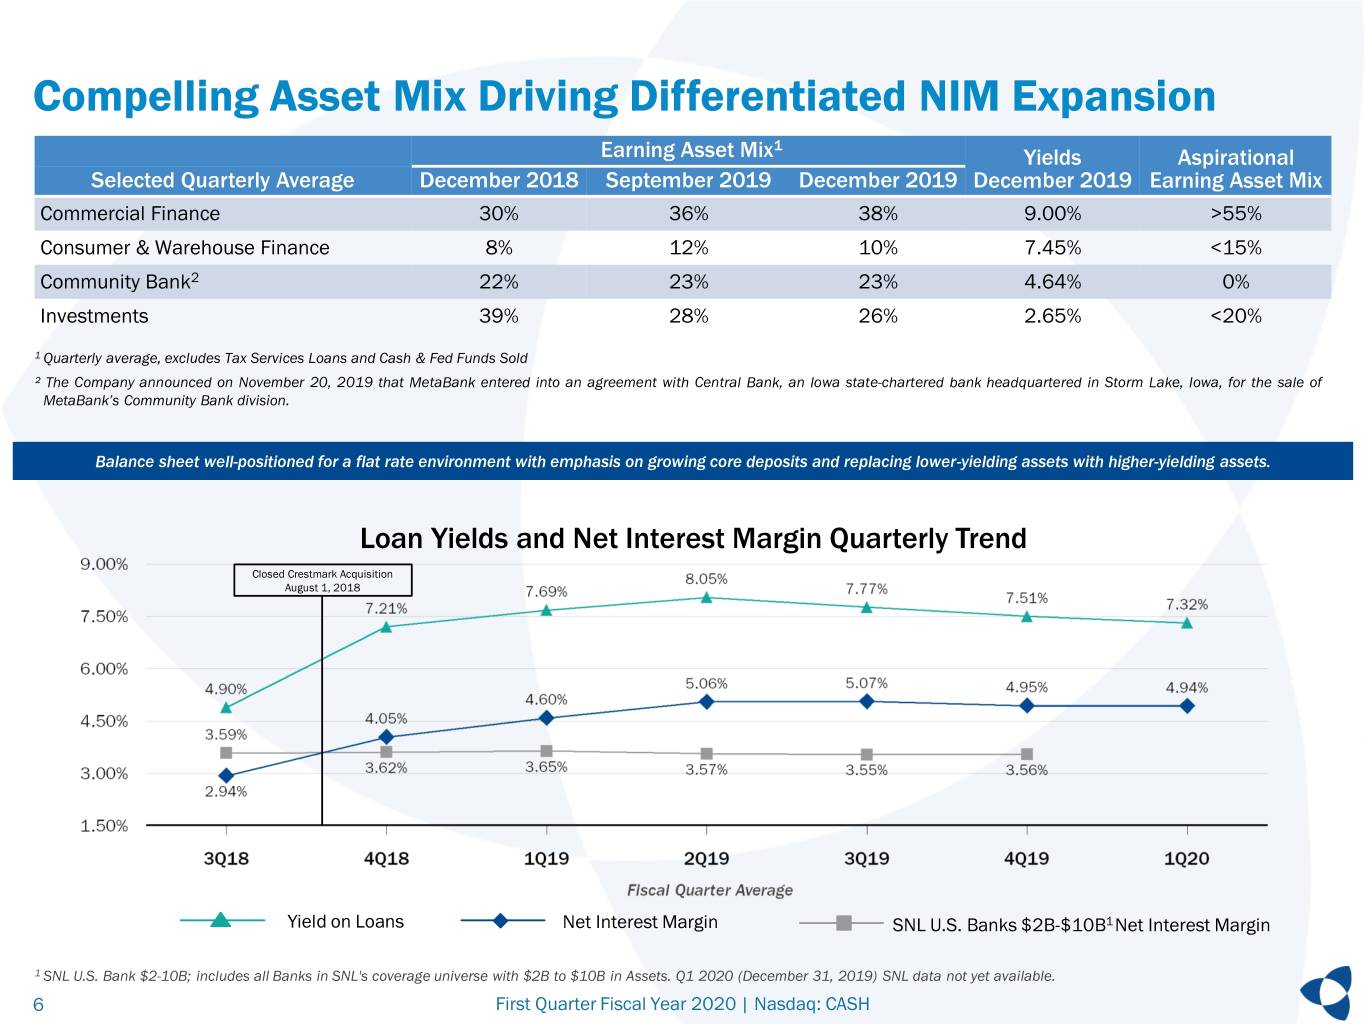
Compelling Asset Mix Driving Differentiated NIM Expansion 1 Earning Asset Mix Yields Aspirational Selected Quarterly Average December 2018 September 2019 December 2019 December 2019 Earning Asset Mix Commercial Finance 30% 36% 38% 9.00% >55% Consumer & Warehouse Finance 8% 12% 10% 7.45% <15% Community Bank2 22% 23% 23% 4.64% 0% Investments 39% 28% 26% 2.65% <20% 1 Quarterly average, excludes Tax Services Loans and Cash & Fed Funds Sold ² The Company announced on November 20, 2019 that MetaBank entered into an agreement with Central Bank, an Iowa state-chartered bank headquartered in Storm Lake, Iowa, for the sale of MetaBank’s Community Bank division. Balance sheet well-positioned for a flat rate environment with emphasis on growing core deposits and replacing lower-yielding assets with higher-yielding assets. Loan Yields and Net Interest Margin Quarterly Trend Closed Crestmark Acquisition August 1, 2018 Yield on Loans Net Interest Margin SNL U.S. Banks $2B-$10B1 Net Interest Margin 1 SNL U.S. Bank $2-10B; includes all Banks in SNL's coverage universe with $2B to $10B in Assets. Q1 2020 (December 31, 2019) SNL data not yet available. 6 First Quarter Fiscal Year 2020 | Nasdaq: CASH
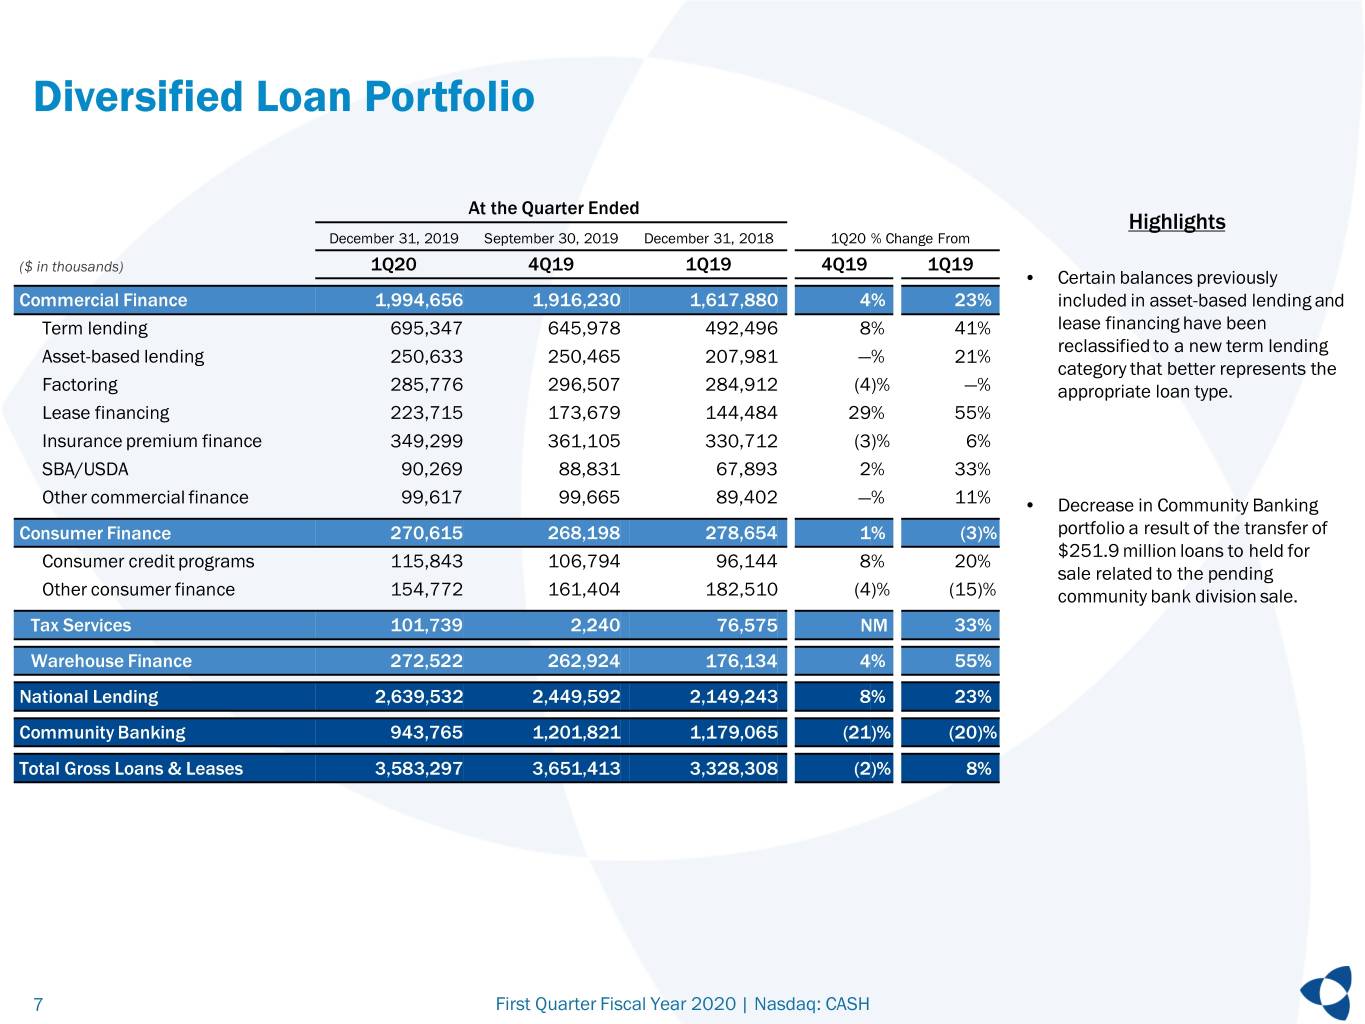
Diversified Loan Portfolio At the Quarter Ended Highlights December 31, 2019 September 30, 2019 December 31, 2018 1Q20 % Change From ($ in thousands) 1Q20 4Q19 1Q19 4Q19 1Q19 • Certain balances previously Commercial Finance 1,994,656 1,916,230 1,617,880 4% 23% included in asset-based lending and Term lending 695,347 645,978 492,496 8% 41% lease financing have been reclassified to a new term lending Asset-based lending 250,633 250,465 207,981 —% 21% category that better represents the Factoring 285,776 296,507 284,912 (4)% —% appropriate loan type. Lease financing 223,715 173,679 144,484 29% 55% Insurance premium finance 349,299 361,105 330,712 (3)% 6% SBA/USDA 90,269 88,831 67,893 2% 33% Other commercial finance 99,617 99,665 89,402 —% 11% • Decrease in Community Banking Consumer Finance 270,615 268,198 278,654 1% (3)% portfolio a result of the transfer of $251.9 million loans to held for Consumer credit programs 115,843 106,794 96,144 8% 20% sale related to the pending Other consumer finance 154,772 161,404 182,510 (4)% (15)% community bank division sale. Tax Services 101,739 2,240 76,575 NM 33% Warehouse Finance 272,522 262,924 176,134 4% 55% National Lending 2,639,532 2,449,592 2,149,243 8% 23% Community Banking 943,765 1,201,821 1,179,065 (21)% (20)% Total Gross Loans & Leases 3,583,297 3,651,413 3,328,308 (2)% 8% 7 First Quarter Fiscal Year 2020 | Nasdaq: CASH
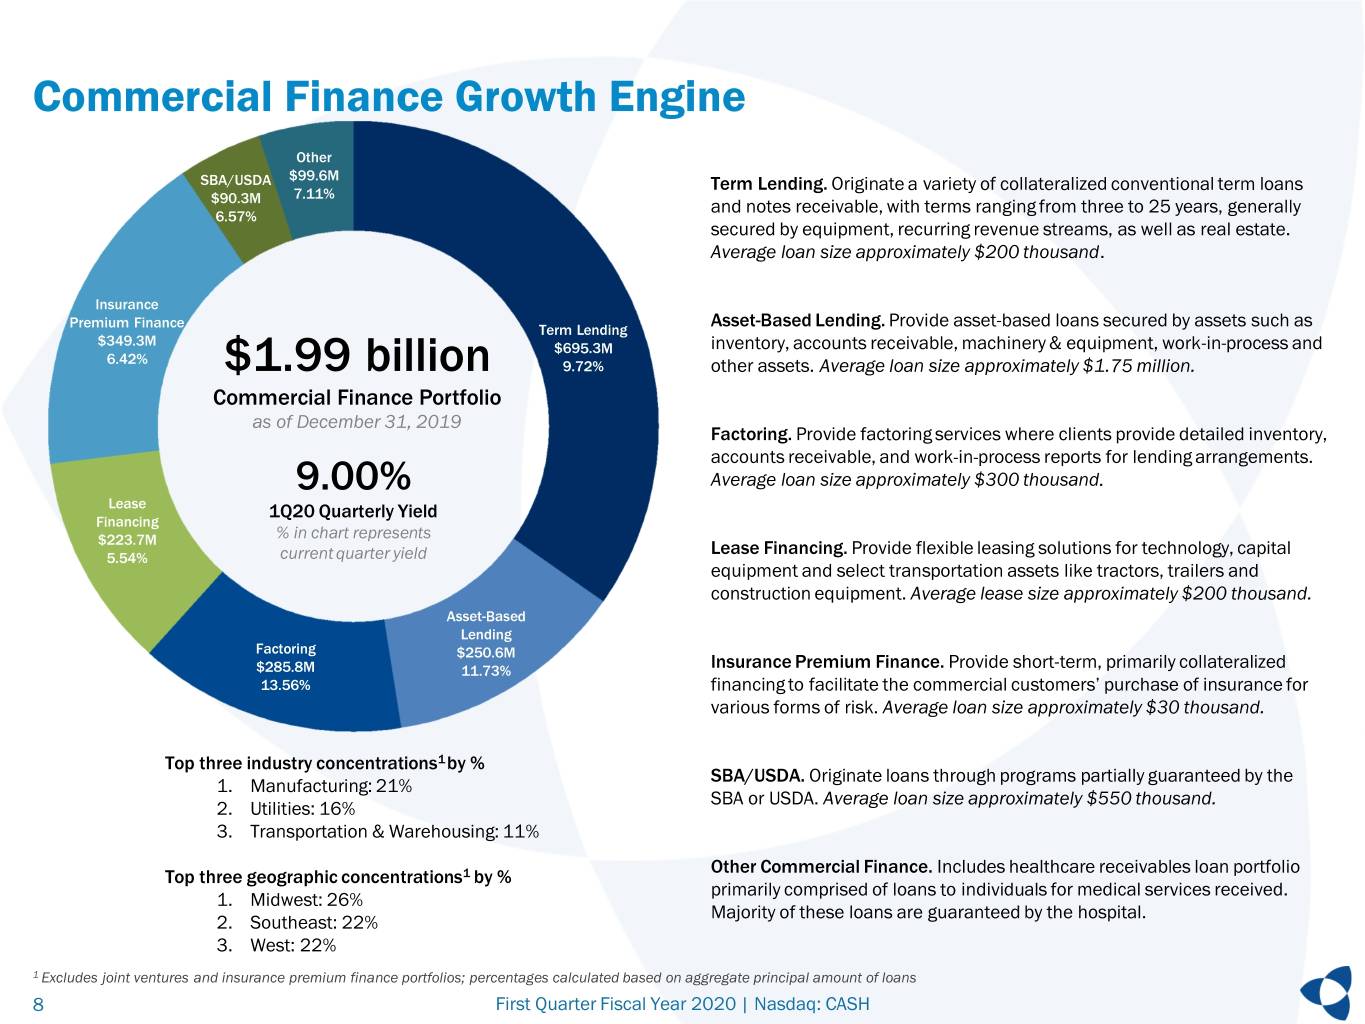
Commercial Finance Growth Engine Other SBA/USDA $99.6M Term Lending. Originate a variety of collateralized conventional term loans 7.11% $90.3M and notes receivable, with terms ranging from three to 25 years, generally 6.57% secured by equipment, recurring revenue streams, as well as real estate. Average loan size approximately $200 thousand. Insurance Asset-Based Lending. Provide asset-based loans secured by assets such as Premium Finance Term Lending $349.3M $695.3M inventory, accounts receivable, machinery & equipment, work-in-process and 6.42% $1.99 billion 9.72% other assets. Average loan size approximately $1.75 million. Commercial Finance Portfolio as of December 31, 2019 Factoring. Provide factoring services where clients provide detailed inventory, accounts receivable, and work-in-process reports for lending arrangements. 9.00% Average loan size approximately $300 thousand. Lease 1Q20 Quarterly Yield Financing % in chart represents $223.7M Lease Financing. Provide flexible leasing solutions for technology, capital 5.54% current quarter yield equipment and select transportation assets like tractors, trailers and construction equipment. Average lease size approximately $200 thousand. Asset-Based Lending Factoring $250.6M $285.8M 11.73% Insurance Premium Finance. Provide short-term, primarily collateralized 13.56% financing to facilitate the commercial customers’ purchase of insurance for various forms of risk. Average loan size approximately $30 thousand. Top three industry concentrations1 by % SBA/USDA. Originate loans through programs partially guaranteed by the 1. Manufacturing: 21% SBA or USDA. Average loan size approximately $550 thousand. 2. Utilities: 16% 3. Transportation & Warehousing: 11% Other Commercial Finance. Includes healthcare receivables loan portfolio Top three geographic concentrations1 by % primarily comprised of loans to individuals for medical services received. 1. Midwest: 26% Majority of these loans are guaranteed by the hospital. 2. Southeast: 22% 3. West: 22% 1 Excludes joint ventures and insurance premium finance portfolios; percentages calculated based on aggregate principal amount of loans 8 First Quarter Fiscal Year 2020 | Nasdaq: CASH
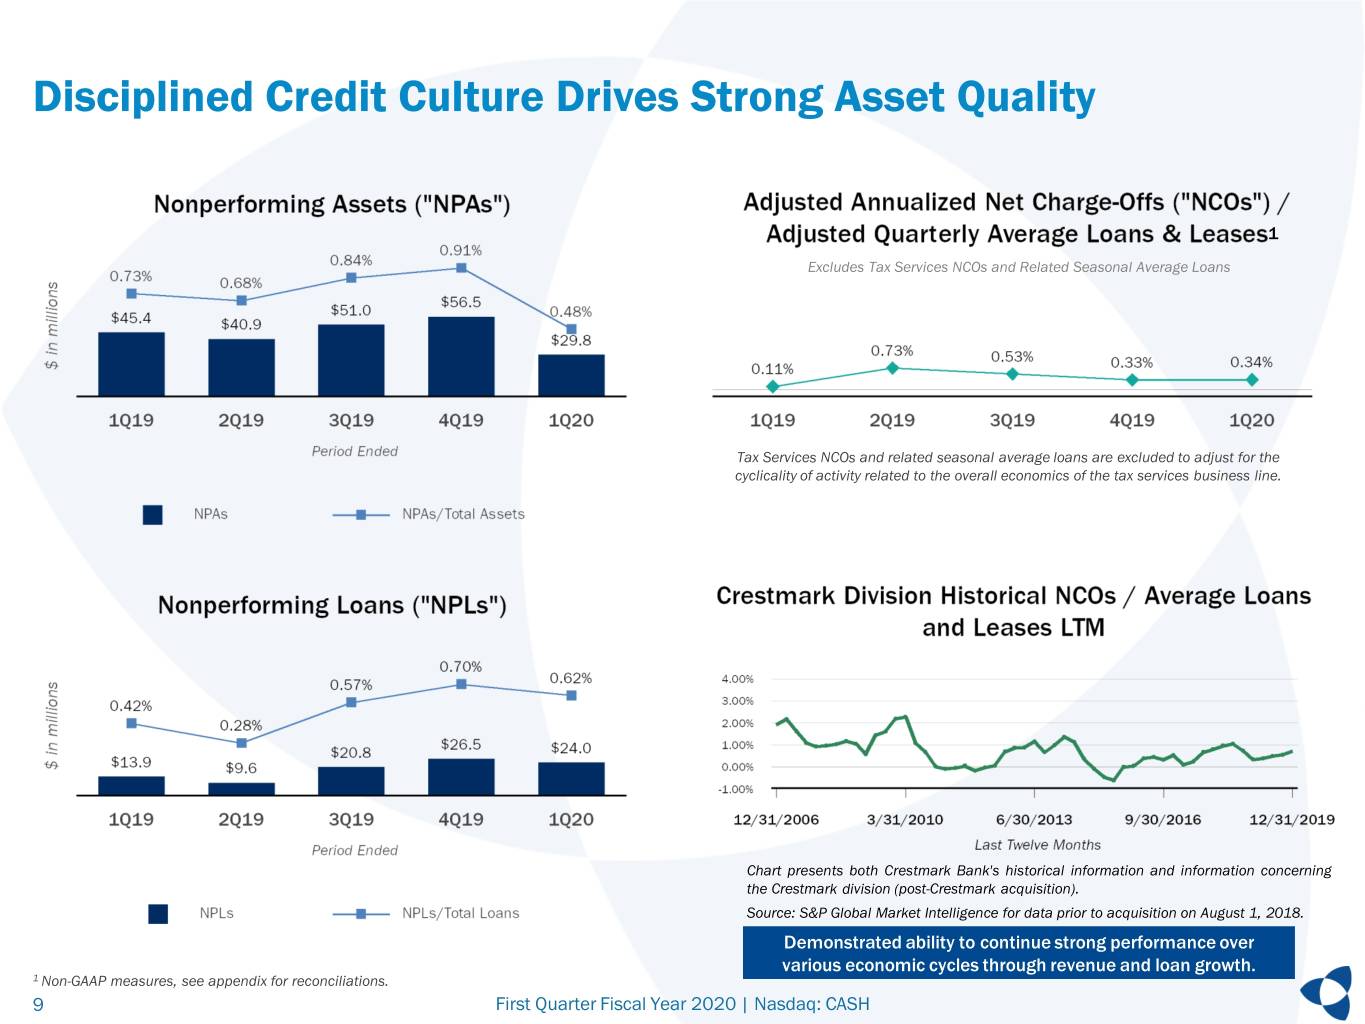
Disciplined Credit Culture Drives Strong Asset Quality 1 Excludes Tax Services NCOs and Related Seasonal Average Loans Tax Services NCOs and related seasonal average loans are excluded to adjust for the cyclicality of activity related to the overall economics of the tax services business line. Chart presents both Crestmark Bank's historical information and information concerning the Crestmark division (post-Crestmark acquisition). Source: S&P Global Market Intelligence for data prior to acquisition on August 1, 2018. Demonstrated ability to continue strong performance over various economic cycles through revenue and loan growth. 1 Non-GAAP measures, see appendix for reconciliations. 9 First Quarter Fiscal Year 2020 | Nasdaq: CASH
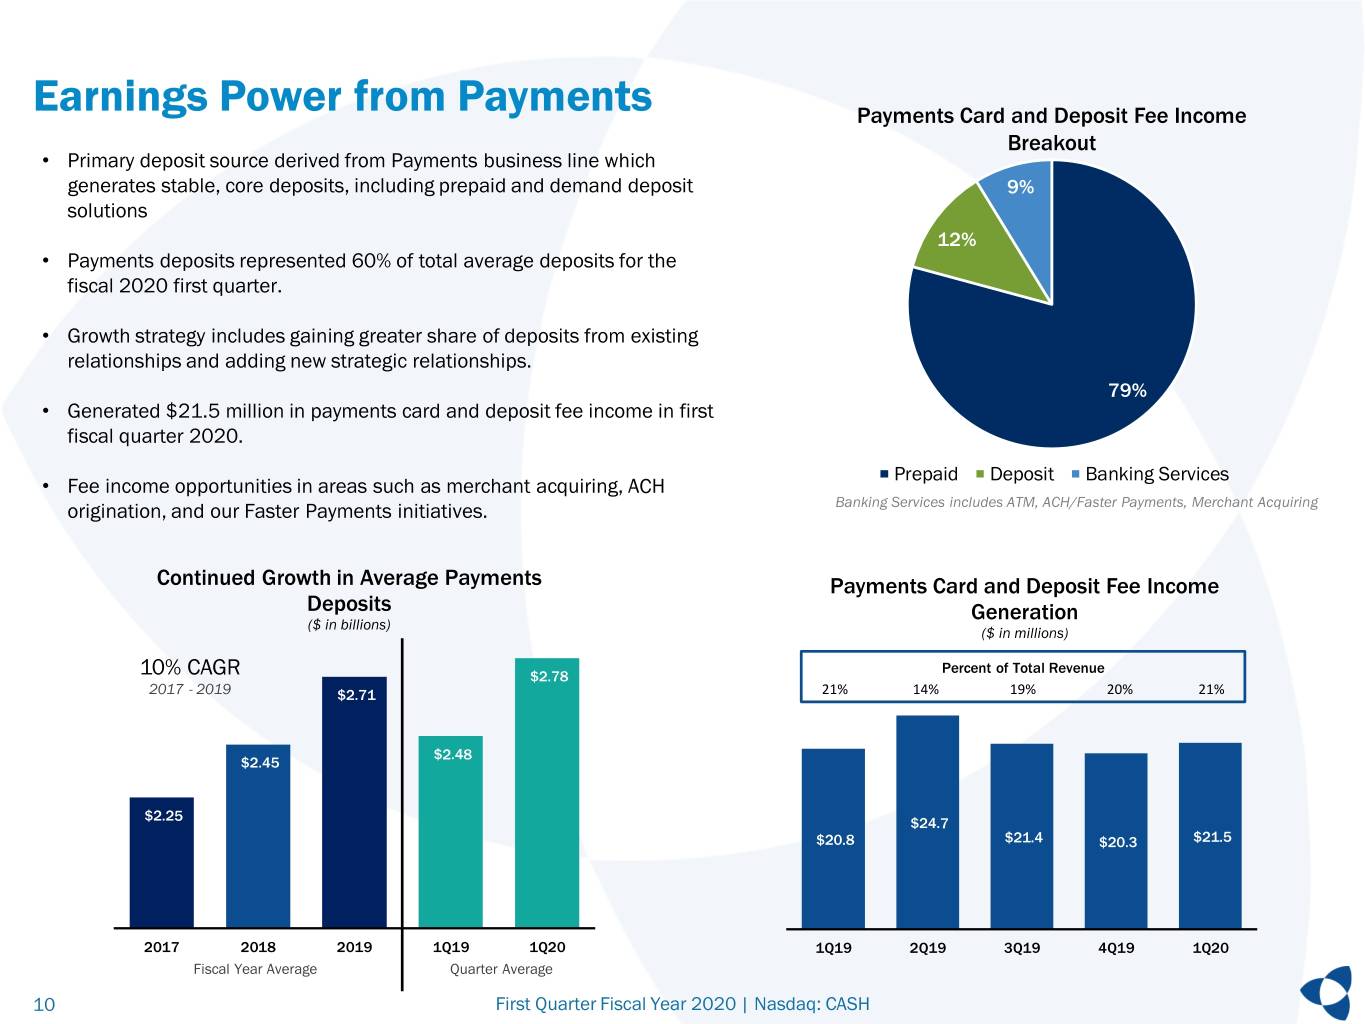
Earnings Power from Payments Payments Card and Deposit Fee Income Breakout • Primary deposit source derived from Payments business line which generates stable, core deposits, including prepaid and demand deposit 9% solutions 12% • Payments deposits represented 60% of total average deposits for the fiscal 2020 first quarter. • Growth strategy includes gaining greater share of deposits from existing relationships and adding new strategic relationships. 79% • Generated $21.5 million in payments card and deposit fee income in first fiscal quarter 2020. Prepaid Deposit Banking Services • Fee income opportunities in areas such as merchant acquiring, ACH origination, and our Faster Payments initiatives. Banking Services includes ATM, ACH/Faster Payments, Merchant Acquiring Continued Growth in Average Payments Payments Card and Deposit Fee Income Deposits Generation ($ in billions) ($ in millions) Percent of Total Revenue 10% CAGR $2.78 2017 - 2019 $2.71 21% 14% 19% 20% 21% $2.48 $2.45 $2.25 $24.7 $20.8 $21.4 $20.3 $21.5 2017 2018 2019 1Q19 1Q20 1Q19 2Q19 3Q19 4Q19 1Q20 Fiscal Year Average Quarter Average 10 First Quarter Fiscal Year 2020 | Nasdaq: CASH
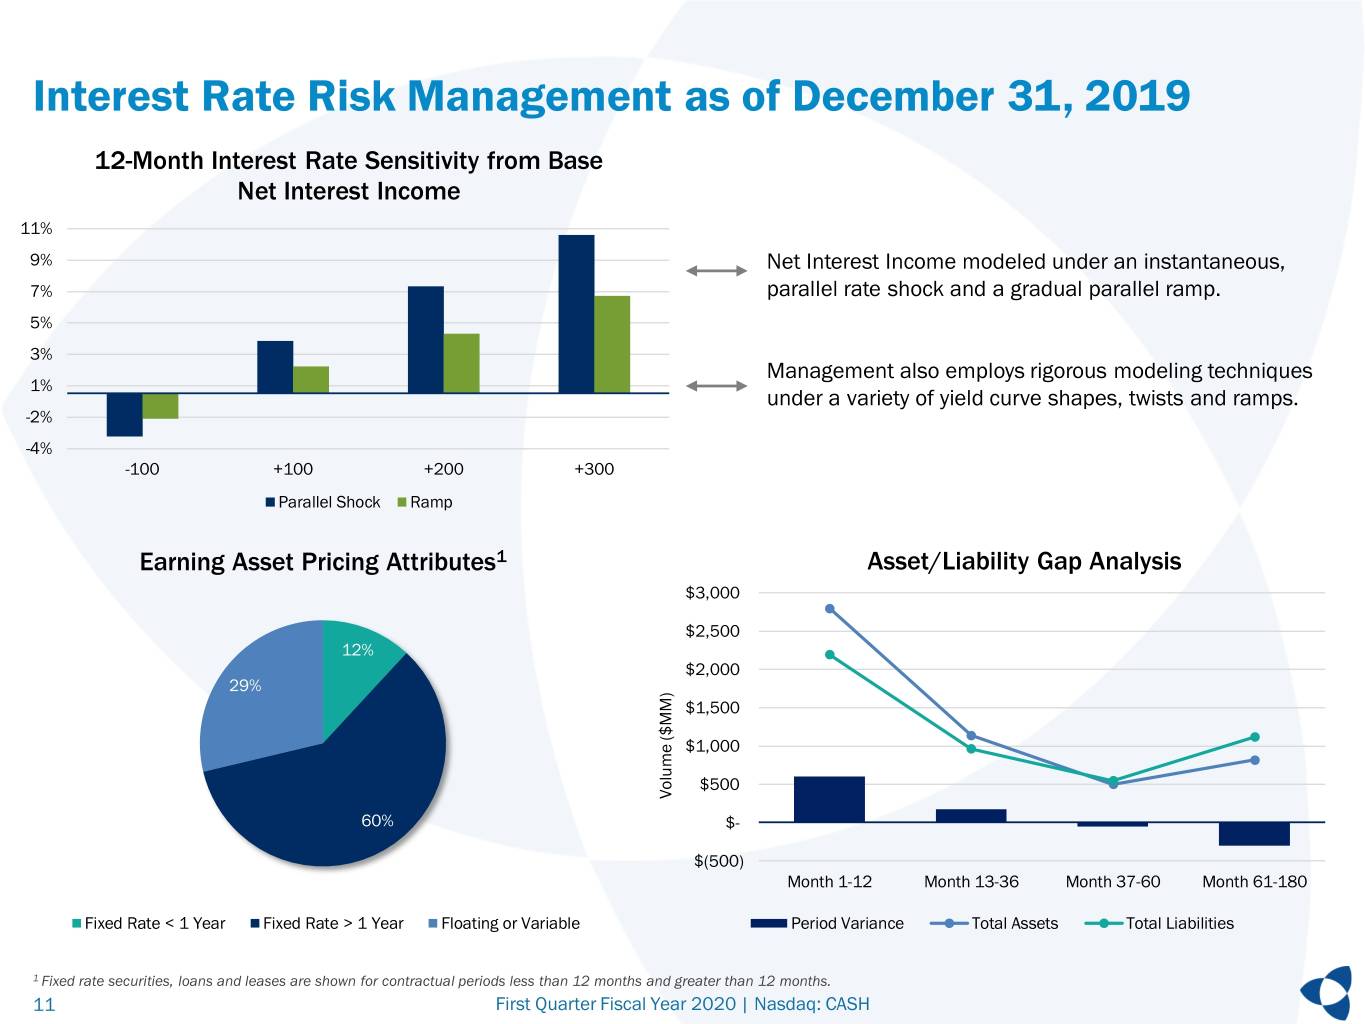
Interest Rate Risk Management as of December 31, 2019 12-Month Interest Rate Sensitivity from Base Net Interest Income 11% 9% Net Interest Income modeled under an instantaneous, 7% parallel rate shock and a gradual parallel ramp. 5% 3% Management also employs rigorous modeling techniques 1% under a variety of yield curve shapes, twists and ramps. -2% -4% -100 +100 +200 +300 Parallel Shock Ramp Earning Asset Pricing Attributes1 Asset/Liability Gap Analysis $3,000 $2,500 12% $2,000 29% $1,500 $1,000 $500 Volume ($MM) Volume 60% $- $(500) Month 1-12 Month 13-36 Month 37-60 Month 61-180 Fixed Rate < 1 Year Fixed Rate > 1 Year Floating or Variable Period Variance Total Assets Total Liabilities 1 Fixed rate securities, loans and leases are shown for contractual periods less than 12 months and greater than 12 months. 11 First Quarter Fiscal Year 2020 | Nasdaq: CASH
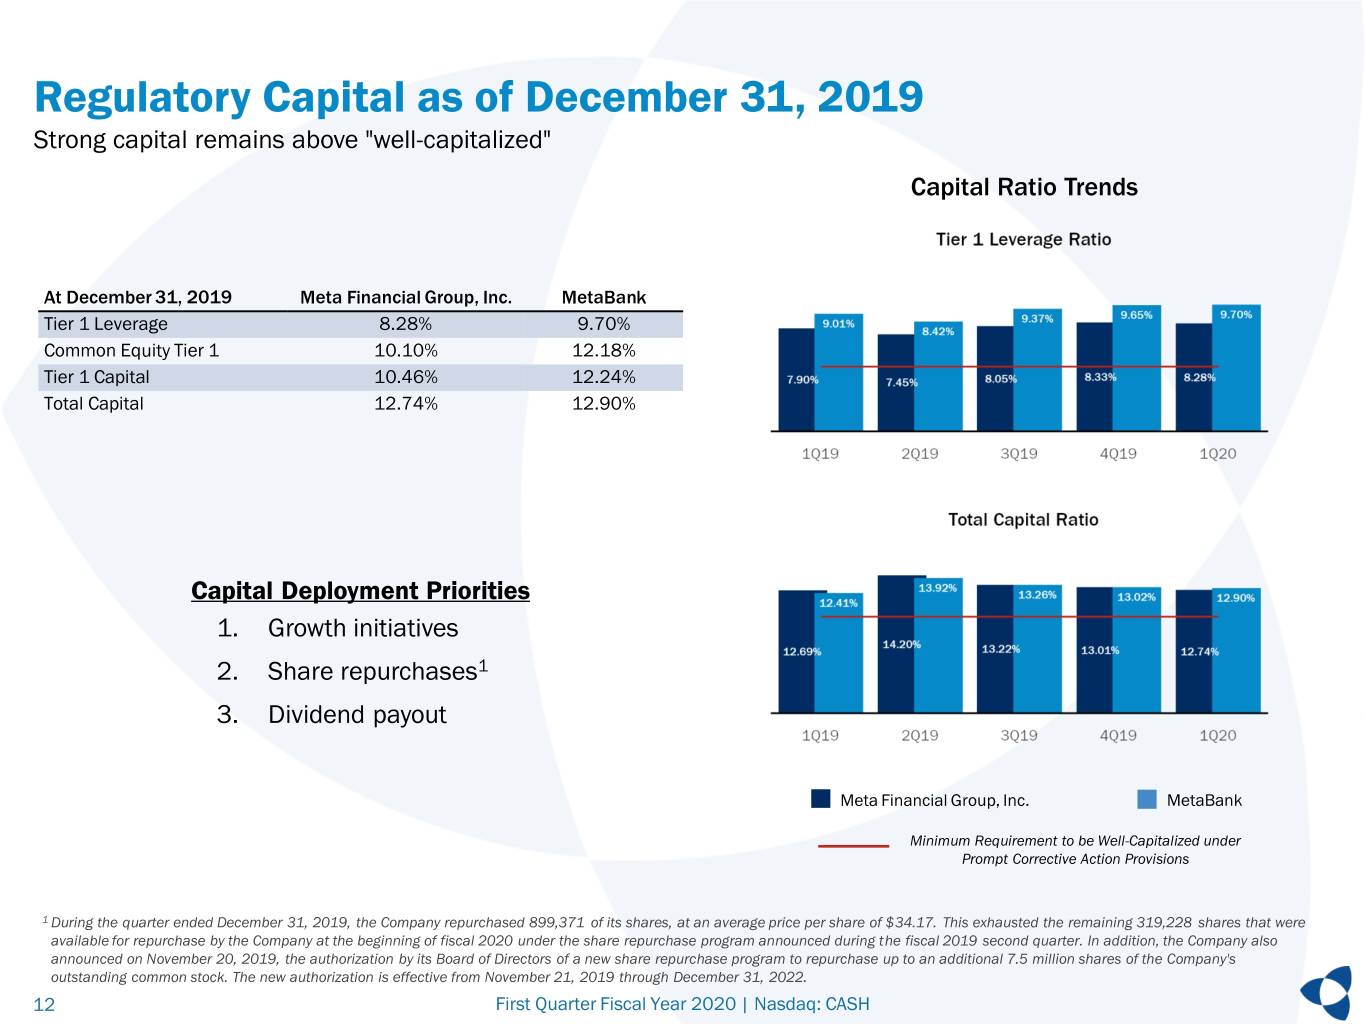
Regulatory Capital as of December 31, 2019 Strong capital remains above "well-capitalized" Capital Ratio Trends At December 31, 2019 Meta Financial Group, Inc. MetaBank Tier 1 Leverage 8.28% 9.70% Common Equity Tier 1 10.10% 12.18% Tier 1 Capital 10.46% 12.24% Total Capital 12.74% 12.90% Capital Deployment Priorities 1. Growth initiatives 2. Share repurchases1 3. Dividend payout Meta Financial Group, Inc. MetaBank Minimum Requirement to be Well-Capitalized under Prompt Corrective Action Provisions 1 During the quarter ended December 31, 2019, the Company repurchased 899,371 of its shares, at an average price per share of $34.17. This exhausted the remaining 319,228 shares that were available for repurchase by the Company at the beginning of fiscal 2020 under the share repurchase program announced during the fiscal 2019 second quarter. In addition, the Company also announced on November 20, 2019, the authorization by its Board of Directors of a new share repurchase program to repurchase up to an additional 7.5 million shares of the Company's outstanding common stock. The new authorization is effective from November 21, 2019 through December 31, 2022. 12 First Quarter Fiscal Year 2020 | Nasdaq: CASH
Strategy Update 13 First Quarter Fiscal Year 2020 | Nasdaq: CASH
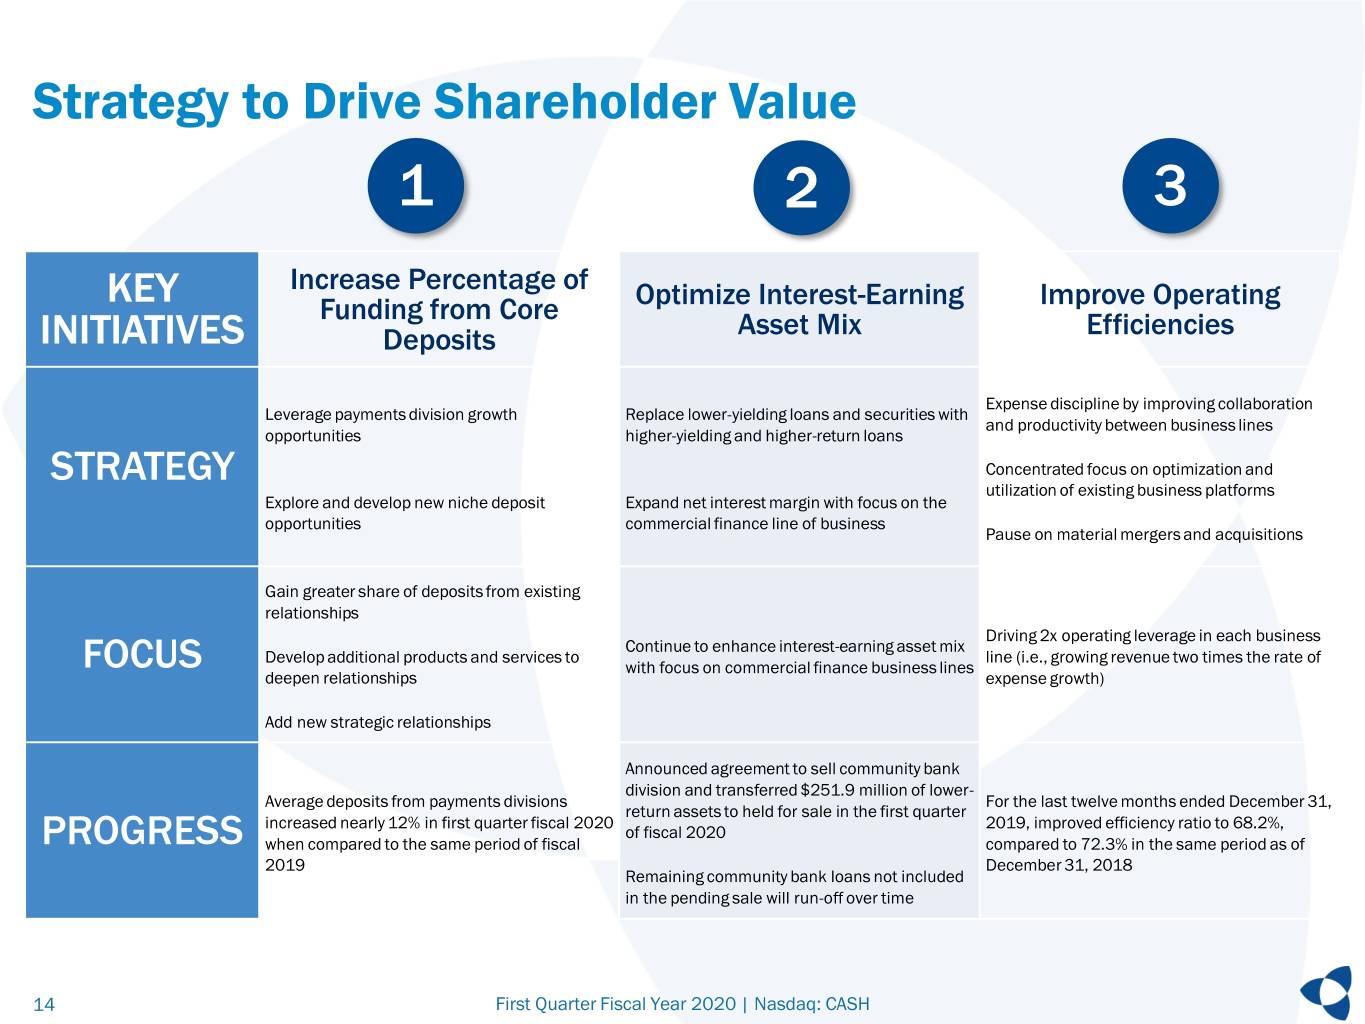
Strategy to Drive Shareholder Value 1 2 3 KEY Increase Percentage of Optimize Interest-Earning Improve Operating Funding from Core Asset Mix Efficiencies INITIATIVES Deposits Expense discipline by improving collaboration Leverage payments division growth Replace lower-yielding loans and securities with and productivity between business lines opportunities higher-yielding and higher-return loans STRATEGY Concentrated focus on optimization and utilization of existing business platforms Explore and develop new niche deposit Expand net interest margin with focus on the opportunities commercial finance line of business Pause on material mergers and acquisitions Gain greater share of deposits from existing relationships Driving 2x operating leverage in each business Continue to enhance interest-earning asset mix Develop additional products and services to line (i.e., growing revenue two times the rate of FOCUS with focus on commercial finance business lines deepen relationships expense growth) Add new strategic relationships Announced agreement to sell community bank division and transferred $251.9 million of lower- Average deposits from payments divisions For the last twelve months ended December 31, return assets to held for sale in the first quarter increased nearly 12% in first quarter fiscal 2020 2019, improved efficiency ratio to 68.2%, of fiscal 2020 PROGRESS when compared to the same period of fiscal compared to 72.3% in the same period as of 2019 December 31, 2018 Remaining community bank loans not included in the pending sale will run-off over time 14 First Quarter Fiscal Year 2020 | Nasdaq: CASH
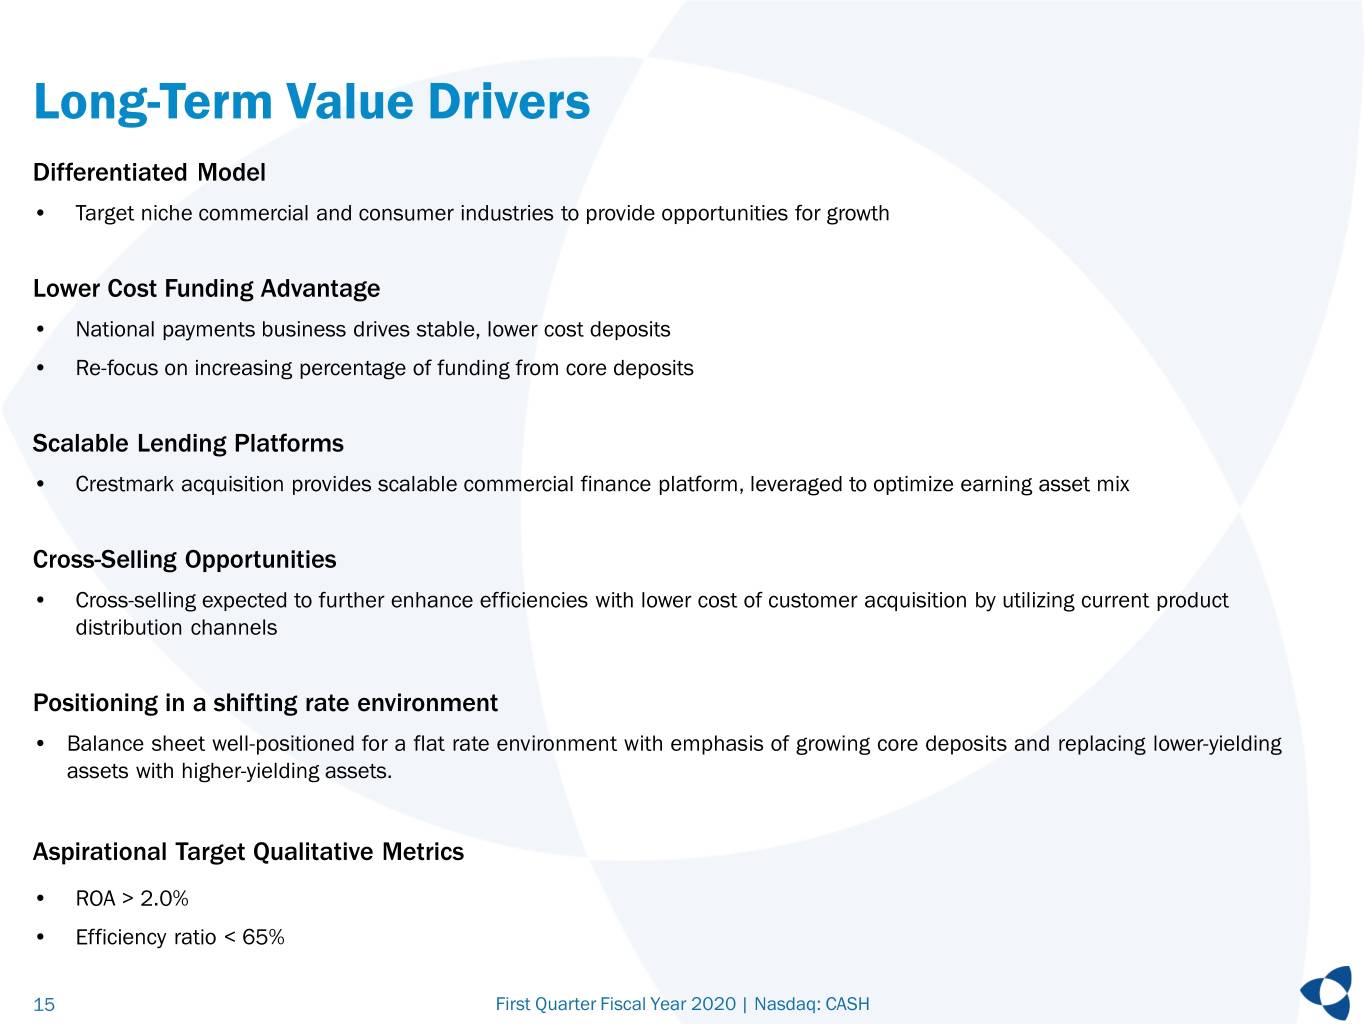
Long-Term Value Drivers Differentiated Model • Target niche commercial and consumer industries to provide opportunities for growth Lower Cost Funding Advantage • National payments business drives stable, lower cost deposits • Re-focus on increasing percentage of funding from core deposits Scalable Lending Platforms • Crestmark acquisition provides scalable commercial finance platform, leveraged to optimize earning asset mix Cross-Selling Opportunities • Cross-selling expected to further enhance efficiencies with lower cost of customer acquisition by utilizing current product distribution channels Positioning in a shifting rate environment • Balance sheet well-positioned for a flat rate environment with emphasis of growing core deposits and replacing lower-yielding assets with higher-yielding assets. Aspirational Target Qualitative Metrics • ROA > 2.0% • Efficiency ratio < 65% 15 First Quarter Fiscal Year 2020 | Nasdaq: CASH
Appendix 16 First Quarter Fiscal Year 2020 | Nasdaq: CASH
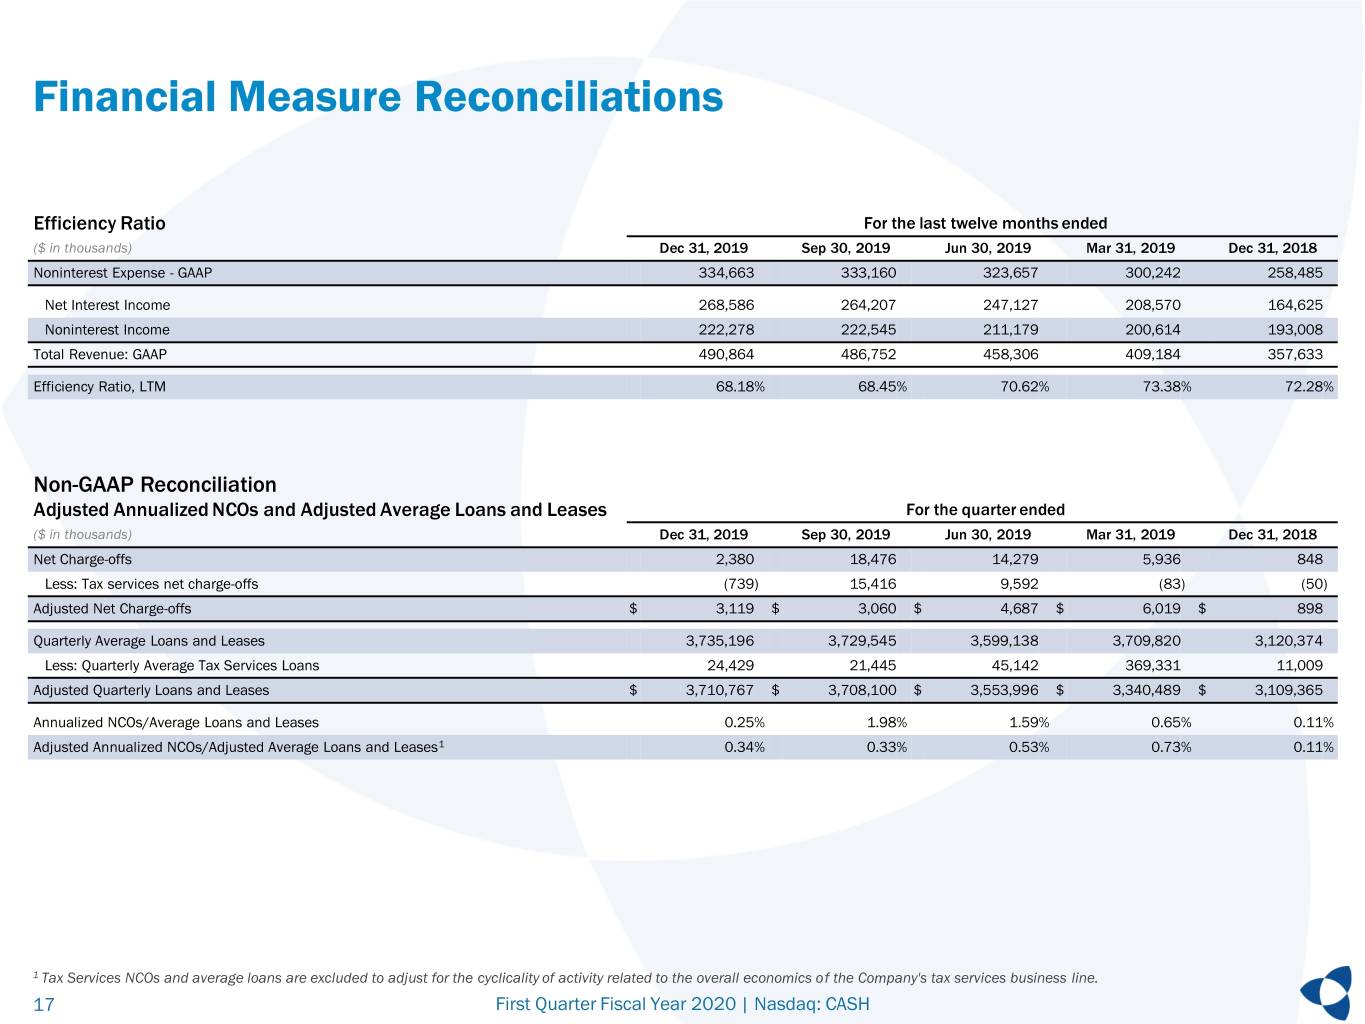
Financial Measure Reconciliations Efficiency Ratio For the last twelve months ended ($ in thousands) Dec 31, 2019 Sep 30, 2019 Jun 30, 2019 Mar 31, 2019 Dec 31, 2018 Noninterest Expense - GAAP 334,663 333,160 323,657 300,242 258,485 Net Interest Income 268,586 264,207 247,127 208,570 164,625 Noninterest Income 222,278 222,545 211,179 200,614 193,008 Total Revenue: GAAP 490,864 486,752 458,306 409,184 357,633 Efficiency Ratio, LTM 68.18% 68.45% 70.62% 73.38% 72.28% Non-GAAP Reconciliation Adjusted Annualized NCOs and Adjusted Average Loans and Leases For the quarter ended ($ in thousands) Dec 31, 2019 Sep 30, 2019 Jun 30, 2019 Mar 31, 2019 Dec 31, 2018 Net Charge-offs 2,380 18,476 14,279 5,936 848 Less: Tax services net charge-offs (739) 15,416 9,592 (83) (50) Adjusted Net Charge-offs $ 3,119 $ 3,060 $ 4,687 $ 6,019 $ 898 Quarterly Average Loans and Leases 3,735,196 3,729,545 3,599,138 3,709,820 3,120,374 Less: Quarterly Average Tax Services Loans 24,429 21,445 45,142 369,331 11,009 Adjusted Quarterly Loans and Leases $ 3,710,767 $ 3,708,100 $ 3,553,996 $ 3,340,489 $ 3,109,365 Annualized NCOs/Average Loans and Leases 0.25% 1.98% 1.59% 0.65% 0.11% Adjusted Annualized NCOs/Adjusted Average Loans and Leases1 0.34% 0.33% 0.53% 0.73% 0.11% 1 Tax Services NCOs and average loans are excluded to adjust for the cyclicality of activity related to the overall economics of the Company's tax services business line. 17 First Quarter Fiscal Year 2020 | Nasdaq: CASH


