Quarterly Investor Update Second Quarter Fiscal Year 2020
Forward-Looking Statements This investor update contains “forward-looking statements” which are made in good faith by the Company pursuant to the “safe harbor” provisions of the Private Securities Litigation Reform Act of 1995. You can identify forward-looking statements by words such as “may,” “hope,” “will,” “should,” “expect,” “plan,” “anticipate,” “intend,” “believe,” “estimate,” “predict,” “potential,” “continue,” “could,” “future,” or the negative of those terms, or other words of similar meaning or similar expressions. These forward-looking statements are based on information currently available to us and assumptions about future events, and include statements with respect to the Company’s beliefs, expectations, estimates, and intentions, which are subject to significant risks and uncertainties, and are subject to change based on various factors, some of which are beyond the Company’s control. Factors that could cause the Company's financial performance and results of operations to differ materially from the expectations, estimates, and intentions expressed in such forward-looking statements include, among others: maintaining our executive management team; expected growth opportunities may not be realized or may take longer to realize than expected; the potential adverse effects of the ongoing COVID-19 pandemic and any governmental or societal responses thereto, or other unusual and infrequently occurring events; factors relating to the Company’s share repurchase program; actual changes in interest rates and the Fed Funds rate; additional changes in tax laws; the strength of the United States' economy, in general, and the strength of the local economies in which the Company conducts operations; the effects of, and changes in, trade, monetary, and fiscal policies and laws, including interest rate policies of the Federal Reserve), as well as efforts of the United States Congress and the United States Treasury in conjunction with bank regulatory agencies to stimulate the economy and protect the financial system; inflation, market, and monetary fluctuations; the timely and efficient development of, and acceptance of, new products and services offered by the Company or its strategic partners, as well as risks (including reputational and litigation) attendant thereto, and the perceived overall value of these products and services by users; the risks of dealing with or utilizing third parties, including, in connection with the Company’s refund advance business, the risk of reduced volume of refund advance loans as a result of reduced customer demand for or acceptance of usage of the Company’s strategic partners’ refund advance products; any actions which may be initiated by our regulators in the future; the impact of changes in financial services laws and regulations, including, but not limited to, laws and regulations relating to the tax refund industry and the insurance premium finance industry and recent and potential changes in response to the COVID-19 pandemic such as the CARES Act and the rules and regulations that may be promulgated thereunder; our relationship with our primary regulators, the Office of the Comptroller of the Currency and the Federal Reserve, as well as the Federal Deposit Insurance Corporation, which insures MetaBank, National Association (“MetaBank”) deposit accounts up to applicable limits; technological changes, including, but not limited to, the protection of electronic files or databases; acquisitions and divestitures; litigation risk; the growth of the Company’s business, as well as expenses related thereto; continued maintenance by MetaBank of its status as a well-capitalized institution, particularly in light of our growing deposit base, a portion of which has been characterized as “brokered;” changes in consumer spending and saving habits; the success of the Company at maintaining its high quality asset level and managing and collecting assets of borrowers in default should problem assets increase; and the other factors described under the caption “Risk Factors” and in other sections of the Company’s Annual Report on Form 10-K for the Company's fiscal year ended September 30, 2019 and in other filings made by the Company with the Securities and Exchange Commission (“SEC”). The forward-looking statements included herein speak only as of the date of this investor update. The Company expressly disclaims any intent or obligation to update any forward-looking statements, whether written or oral, that may be made from time to time by or on behalf of the Company or its subsidiaries, whether as a result of new information, changed circumstances or future events or for any other reason. 2 Second Quarter Fiscal Year 2020 | Nasdaq: CASH
Business Developments Second Quarter Ended March 31, 2020 • Through April 20, 2020, authorized 502 applications totaling $189.5 million for the Paycheck Protection Program (“PPP”). • Expanded faster payments platform to include Visa Direct. • Converted MetaBank to a national bank charter from a federal thrift charter and Meta Financial Group to a bank holding company from a savings and loan holding company, which better reflects business model. • Closed sale of Community Bank division to Central Bank on February 29, 2020. - Sale included all of the community bank's deposits of $290.5 million, branch locations, fixed assets, employees, and a portion of the community bank’s loan portfolio totaling $268.8 million. The remaining community bank loans not sold to Central Bank, which totaled $896.2 million at March 31, 2020, have been retained by the Company under a servicing agreement with Central Bank. • Progress made towards long-term strategic plan through improved balance sheet mix and lower efficiency ratio. 3 Second Quarter Fiscal Year 2020 | Nasdaq: CASH
COVID-19 Pandemic Focus Second Quarter Ended March 31, 2020 Employee, Partner, and Customer Focus • COVID-19 Crisis Command Center monitors day-to-day operations and potential business interruptions • Remote work options and social distancing measures where available • Restrictions on non-essential business travel • Enhanced preventative cleaning at all office locations Credit Monitoring Focus • Tightening underwriting standards • Monitoring and placing limits on originations to higher risk industries and customers • Contacting customers in order to assess credit situations and needs • Offering flexible repayment options to current customers, when appropriate • Utilizing CARES Act, SBA and USDA programs and loan products • Increased allowance for loan and lease losses during the fiscal second quarter • As of April 19, 2020, completed short-term payment deferral modifications of $152.0 million and $62.4 million in other COVID-19 related modifications Capital Focus • Quarter-end Bank capital leverage ratio based on asset levels as of March 31, 2020 was 9.71%¹, better reflects the Company’s anticipated balance sheet going forward • Multiple capital options, including a flexible balance sheet including a highly-liquid $1.31 billion securities portfolio • Suspension of share repurchase program, representing the majority of our capital deployment plan 1 Non-GAAP measure, see appendix for reconciliations. 4 Second Quarter Fiscal Year 2020 | Nasdaq: CASH
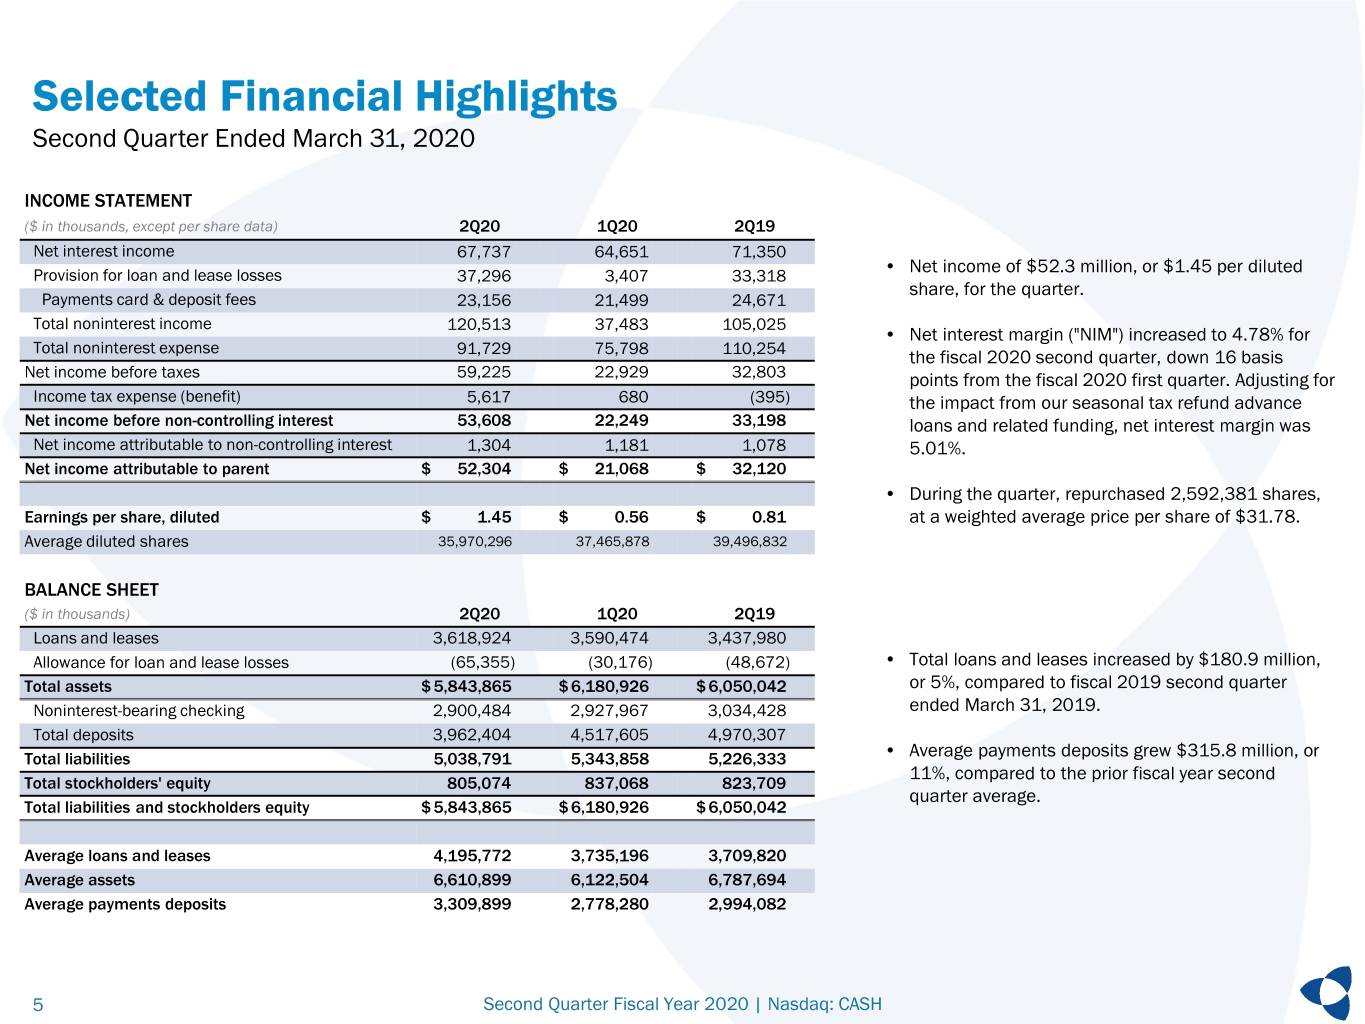
Selected Financial Highlights Second Quarter Ended March 31, 2020 INCOME STATEMENT ($ in thousands, except per share data) 2Q20 1Q20 2Q19 Net interest income 67,737 64,651 71,350 • Net income of $52.3 million, or $1.45 per diluted Provision for loan and lease losses 37,296 3,407 33,318 share, for the quarter. Payments card & deposit fees 23,156 21,499 24,671 Total noninterest income 120,513 37,483 105,025 • Net interest margin ("NIM") increased to 4.78% for Total noninterest expense 91,729 75,798 110,254 the fiscal 2020 second quarter, down 16 basis Net income before taxes 59,225 22,929 32,803 points from the fiscal 2020 first quarter. Adjusting for Income tax expense (benefit) 5,617 680 (395) the impact from our seasonal tax refund advance Net income before non-controlling interest 53,608 22,249 33,198 loans and related funding, net interest margin was Net income attributable to non-controlling interest 1,304 1,181 1,078 5.01%. Net income attributable to parent $ 52,304 $ 21,068 $ 32,120 • During the quarter, repurchased 2,592,381 shares, Earnings per share, diluted $ 1.45 $ 0.56 $ 0.81 at a weighted average price per share of $31.78. Average diluted shares 35,970,296 37,465,878 39,496,832 BALANCE SHEET ($ in thousands) 2Q20 1Q20 2Q19 Loans and leases 3,618,924 3,590,474 3,437,980 Allowance for loan and lease losses (65,355) (30,176) (48,672) • Total loans and leases increased by $180.9 million, Total assets $ 5,843,865 $ 6,180,926 $ 6,050,042 or 5%, compared to fiscal 2019 second quarter Noninterest-bearing checking 2,900,484 2,927,967 3,034,428 ended March 31, 2019. Total deposits 3,962,404 4,517,605 4,970,307 Total liabilities 5,038,791 5,343,858 5,226,333 • Average payments deposits grew $315.8 million, or 11%, compared to the prior fiscal year second Total stockholders' equity 805,074 837,068 823,709 quarter average. Total liabilities and stockholders equity $ 5,843,865 $ 6,180,926 $ 6,050,042 Average loans and leases 4,195,772 3,735,196 3,709,820 Average assets 6,610,899 6,122,504 6,787,694 Average payments deposits 3,309,899 2,778,280 2,994,082 5 Second Quarter Fiscal Year 2020 | Nasdaq: CASH
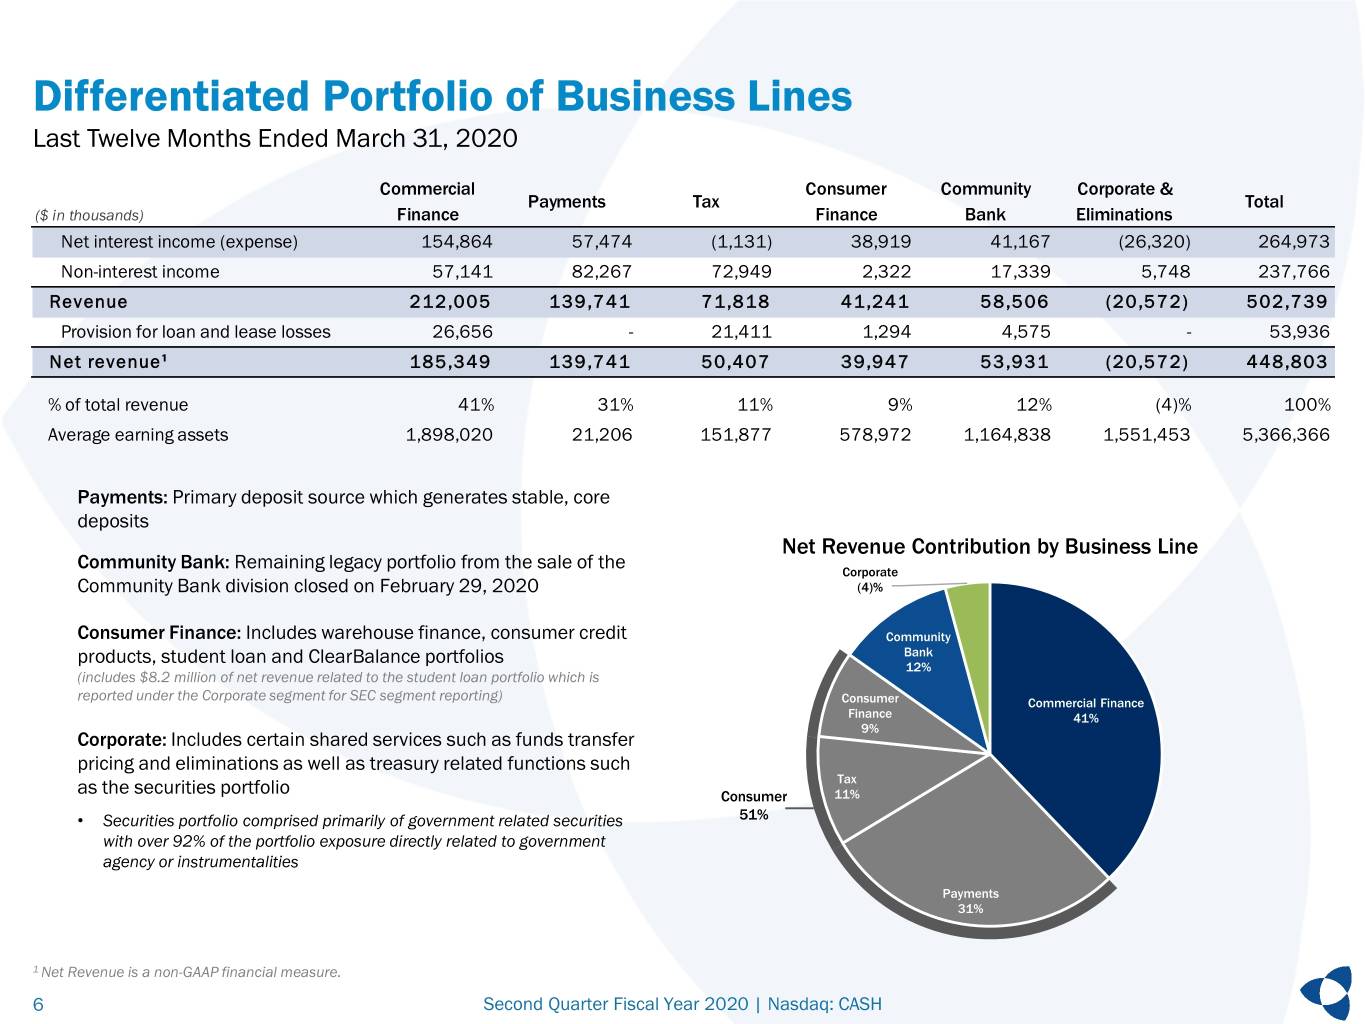
Differentiated Portfolio of Business Lines Last Twelve Months Ended March 31, 2020 Commercial Consumer Community Corporate & Payments Tax Total ($ in thousands) Finance Finance Bank Eliminations Net interest income (expense) 154,864 57,474 (1,131) 38,919 41,167 (26,320) 264,973 Non-interest income 57,141 82,267 72,949 2,322 17,339 5,748 237,766 Revenue 212,005 139,741 71,818 41,241 58,506 (20,572) 502,739 Provision for loan and lease losses 26,656 - 21,411 1,294 4,575 - 53,936 Net revenue¹ 185,349 139,741 50,407 39,947 53,931 (20,572) 448,803 % of total revenue 41% 31% 11% 9% 12% (4)% 100% Average earning assets 1,898,020 21,206 151,877 578,972 1,164,838 1,551,453 5,366,366 Payments: Primary deposit source which generates stable, core deposits Net Revenue Contribution by Business Line Community Bank: Remaining legacy portfolio from the sale of the Corporate Community Bank division closed on February 29, 2020 (4)% Consumer Finance: Includes warehouse finance, consumer credit Community products, student loan and ClearBalance portfolios Bank 12% (includes $8.2 million of net revenue related to the student loan portfolio which is reported under the Corporate segment for SEC segment reporting) Consumer Commercial Finance Finance 41% 9% Corporate: Includes certain shared services such as funds transfer pricing and eliminations as well as treasury related functions such Tax as the securities portfolio Consumer 11% • Securities portfolio comprised primarily of government related securities 51% with over 92% of the portfolio exposure directly related to government agency or instrumentalities Payments 31% 1 Net Revenue is a non-GAAP financial measure. 6 Second Quarter Fiscal Year 2020 | Nasdaq: CASH
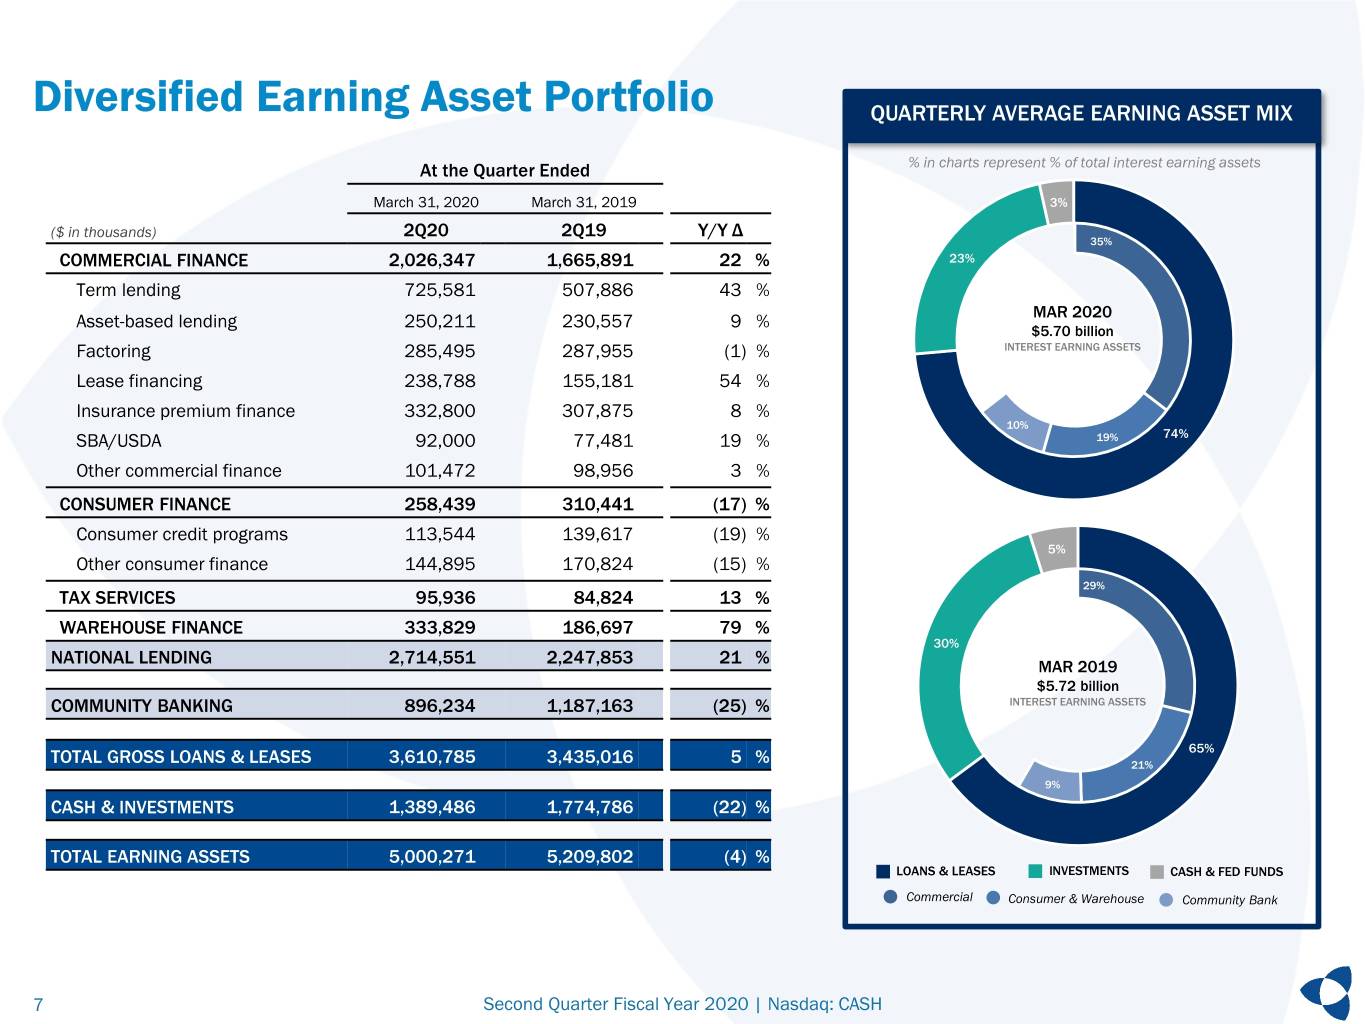
Diversified Earning Asset Portfolio QUARTERLY AVERAGE EARNING ASSET MIX At the Quarter Ended % in charts represent % of total interest earning assets March 31, 2020 March 31, 2019 3% ($ in thousands) 2Q20 2Q19 Y/Y Δ 35% COMMERCIAL FINANCE 2,026,347 1,665,891 22 % 23% Term lending 725,581 507,886 43 % Asset-based lending 250,211 230,557 9 % MAR 2020 $5.70 billion Factoring 285,495 287,955 (1) % INTEREST EARNING ASSETS Lease financing 238,788 155,181 54 % Insurance premium finance 332,800 307,875 8 % 10% SBA/USDA 92,000 77,481 19 % 19% 74% Other commercial finance 101,472 98,956 3 % CONSUMER FINANCE 258,439 310,441 (17) % Consumer credit programs 113,544 139,617 (19) % 5% Other consumer finance 144,895 170,824 (15) % 29% TAX SERVICES 95,936 84,824 13 % WAREHOUSE FINANCE 333,829 186,697 79 % 30% NATIONAL LENDING 2,714,551 2,247,853 21 % MAR 2019 $5.72 billion COMMUNITY BANKING 896,234 1,187,163 (25) % INTEREST EARNING ASSETS 65% TOTAL GROSS LOANS & LEASES 3,610,785 3,435,016 5 % 21% 9% CASH & INVESTMENTS 1,389,486 1,774,786 (22) % TOTAL EARNING ASSETS 5,000,271 5,209,802 (4) % LOANS & LEASES INVESTMENTS CASH & FED FUNDS Commercial Consumer & Warehouse Community Bank 7 Second Quarter Fiscal Year 2020 | Nasdaq: CASH
Commercial Finance & Community Bank Portfolios 8 Second Quarter Fiscal Year 2020 | Nasdaq: CASH
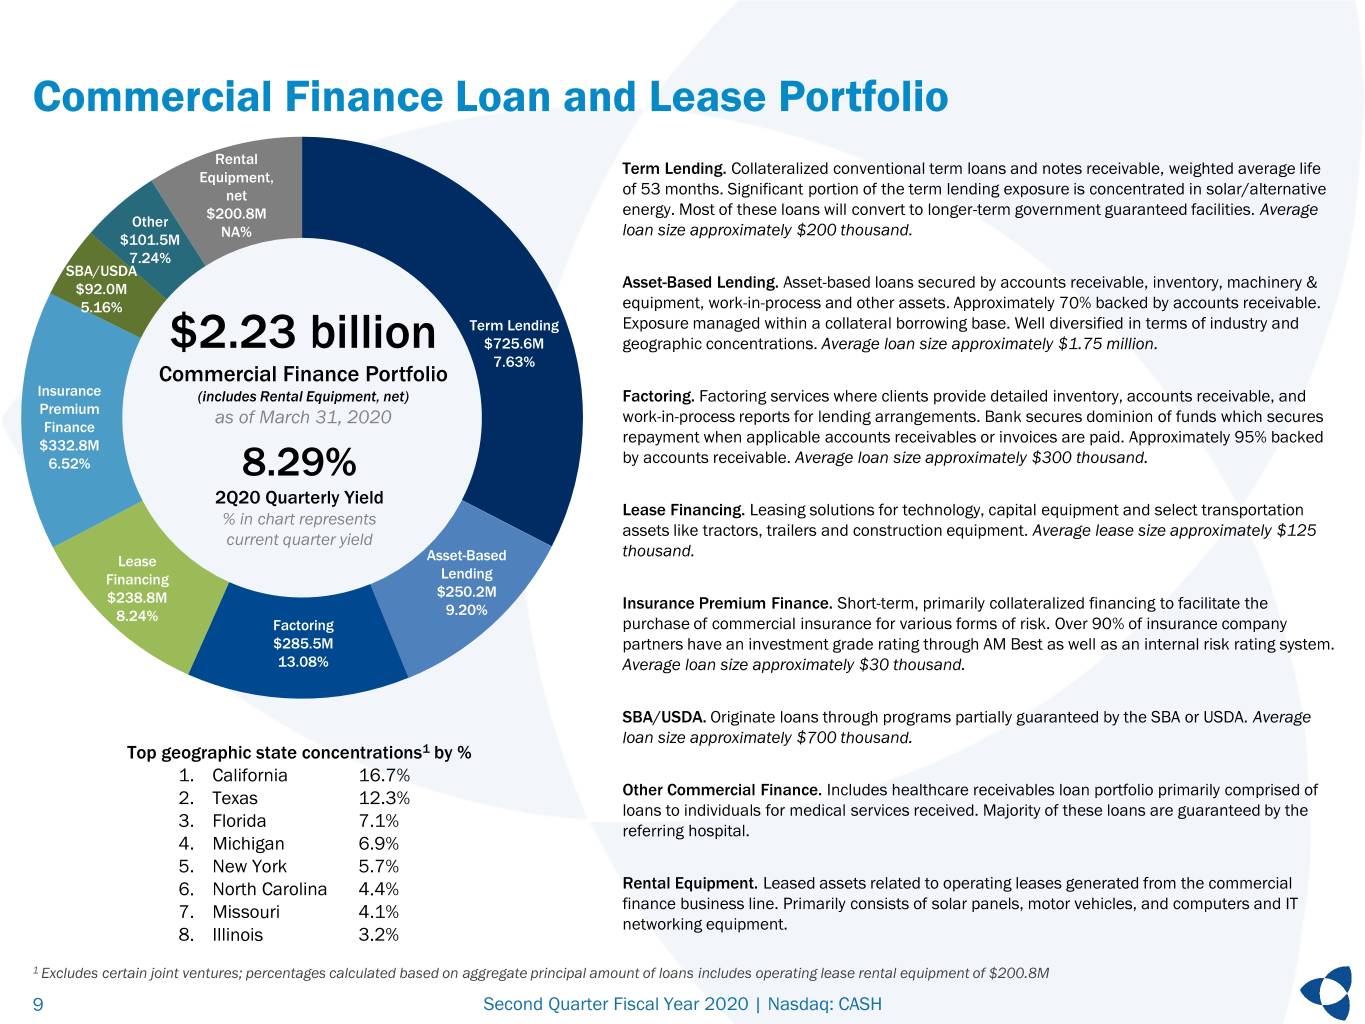
Commercial Finance Loan and Lease Portfolio Rental Term Lending. Collateralized conventional term loans and notes receivable, weighted average life Equipment, net of 53 months. Significant portion of the term lending exposure is concentrated in solar/alternative $200.8M energy. Most of these loans will convert to longer-term government guaranteed facilities. Average Other NA% loan size approximately $200 thousand. $101.5M 7.24% SBA/USDA $92.0M Asset-Based Lending. Asset-based loans secured by accounts receivable, inventory, machinery & 5.16% equipment, work-in-process and other assets. Approximately 70% backed by accounts receivable. Term Lending Exposure managed within a collateral borrowing base. Well diversified in terms of industry and $2.23 billion $725.6M geographic concentrations. Average loan size approximately $1.75 million. 7.63% Commercial Finance Portfolio Insurance (includes Rental Equipment, net) Factoring. Factoring services where clients provide detailed inventory, accounts receivable, and Premium as of March 31, 2020 work-in-process reports for lending arrangements. Bank secures dominion of funds which secures Finance $332.8M repayment when applicable accounts receivables or invoices are paid. Approximately 95% backed 6.52% 8.29% by accounts receivable. Average loan size approximately $300 thousand. 2Q20 Quarterly Yield Lease Financing. Leasing solutions for technology, capital equipment and select transportation % in chart represents assets like tractors, trailers and construction equipment. Average lease size approximately $125 current quarter yield thousand. Lease Asset-Based Financing Lending $250.2M $238.8M Insurance Premium Finance. Short-term, primarily collateralized financing to facilitate the 8.24% 9.20% Factoring purchase of commercial insurance for various forms of risk. Over 90% of insurance company $285.5M partners have an investment grade rating through AM Best as well as an internal risk rating system. 13.08% Average loan size approximately $30 thousand. SBA/USDA. Originate loans through programs partially guaranteed by the SBA or USDA. Average loan size approximately $700 thousand. Top geographic state concentrations1 by % 1. California 16.7% 2. Texas 12.3% Other Commercial Finance. Includes healthcare receivables loan portfolio primarily comprised of loans to individuals for medical services received. Majority of these loans are guaranteed by the 3. Florida 7.1% referring hospital. 4. Michigan 6.9% 5. New York 5.7% 6. North Carolina 4.4% Rental Equipment. Leased assets related to operating leases generated from the commercial 7. Missouri 4.1% finance business line. Primarily consists of solar panels, motor vehicles, and computers and IT networking equipment. 8. Illinois 3.2% 1 Excludes certain joint ventures; percentages calculated based on aggregate principal amount of loans includes operating lease rental equipment of $200.8M 9 Second Quarter Fiscal Year 2020 | Nasdaq: CASH
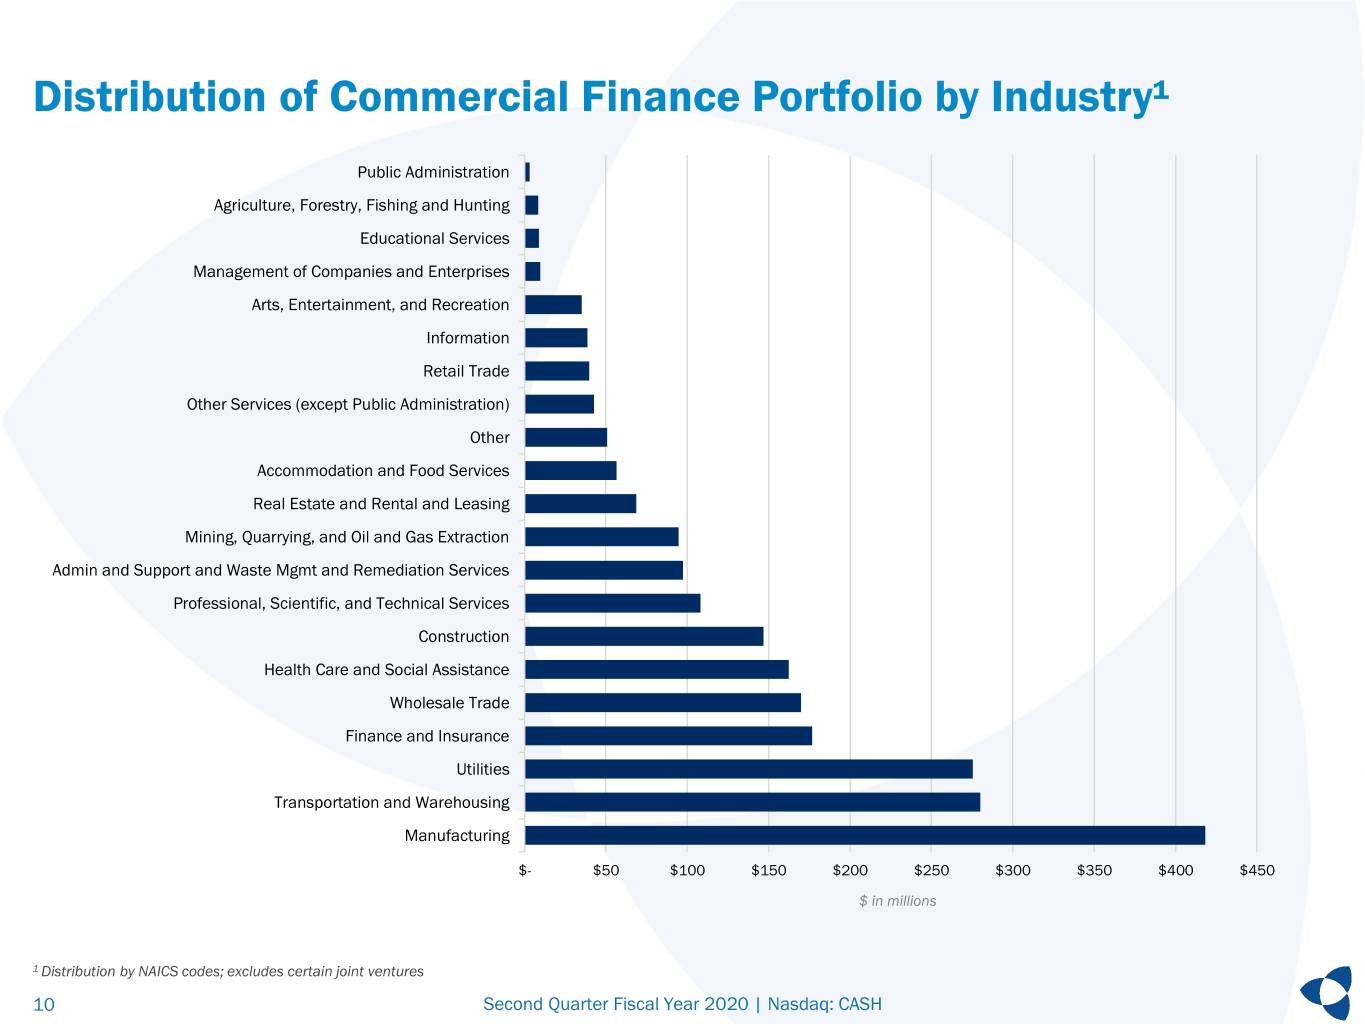
Distribution of Commercial Finance Portfolio by Industry¹ Public Administration Agriculture, Forestry, Fishing and Hunting Educational Services Management of Companies and Enterprises Arts, Entertainment, and Recreation Information Retail Trade Other Services (except Public Administration) Other Accommodation and Food Services Real Estate and Rental and Leasing Mining, Quarrying, and Oil and Gas Extraction Admin and Support and Waste Mgmt and Remediation Services Professional, Scientific, and Technical Services Construction Health Care and Social Assistance Wholesale Trade Finance and Insurance Utilities Transportation and Warehousing Manufacturing $- $50 $100 $150 $200 $250 $300 $350 $400 $450 $ in millions 1 Distribution by NAICS codes; excludes certain joint ventures 10 Second Quarter Fiscal Year 2020 | Nasdaq: CASH
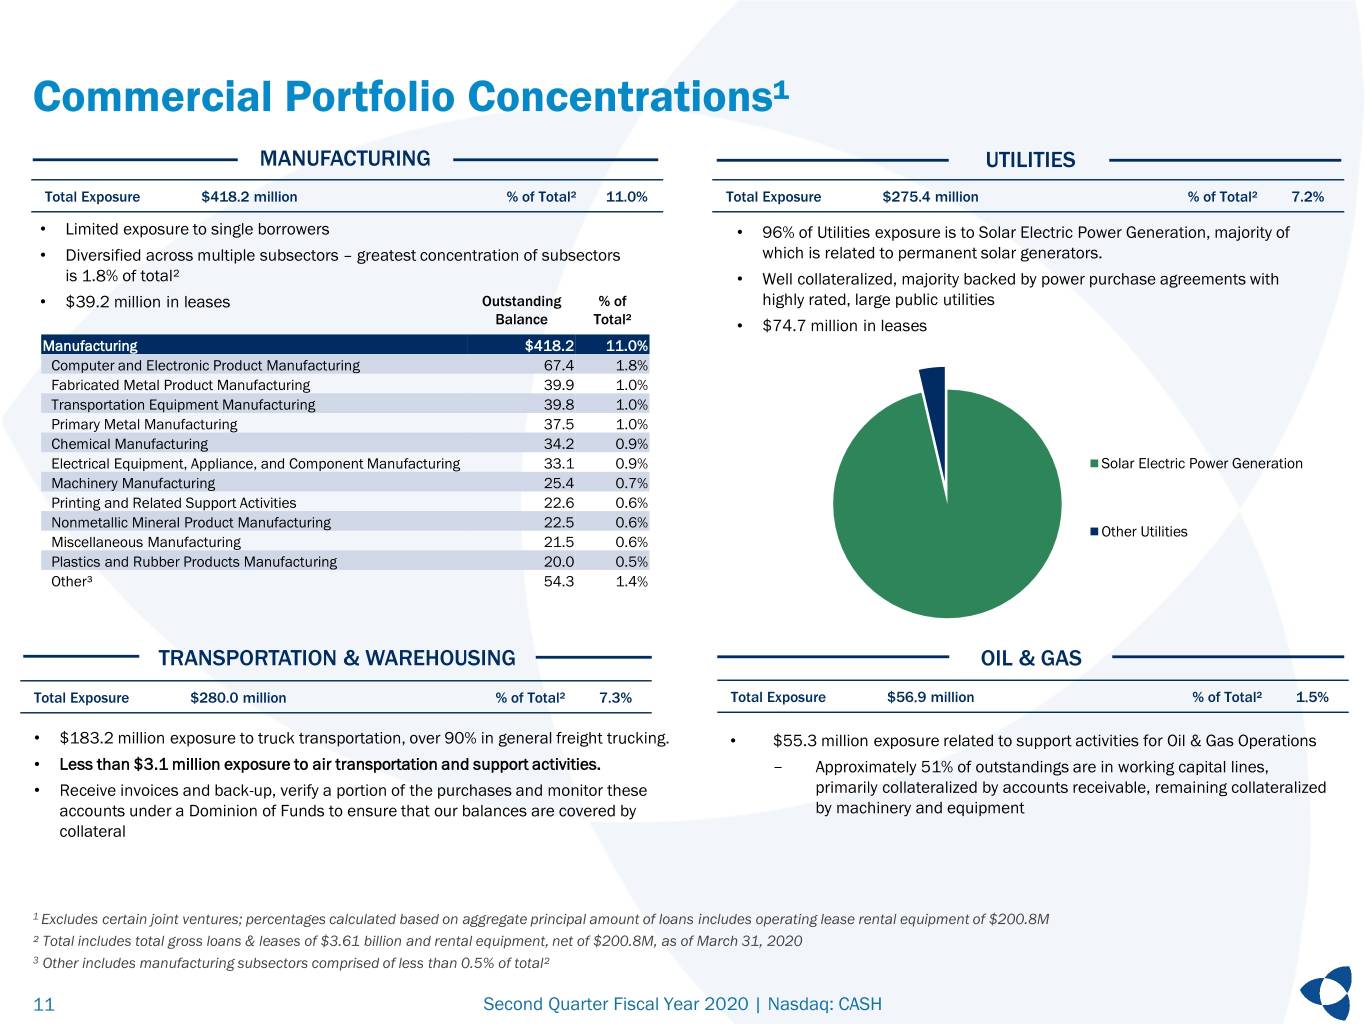
Commercial Portfolio Concentrations¹ MANUFACTURING UTILITIES Total Exposure $418.2 million % of Total² 11.0% Total Exposure $275.4 million % of Total² 7.2% • Limited exposure to single borrowers • 96% of Utilities exposure is to Solar Electric Power Generation, majority of • Diversified across multiple subsectors – greatest concentration of subsectors which is related to permanent solar generators. is 1.8% of total² • Well collateralized, majority backed by power purchase agreements with • $39.2 million in leases Outstanding % of highly rated, large public utilities Balance Total² • $74.7 million in leases Manufacturing $418.2 11.0% Computer and Electronic Product Manufacturing 67.4 1.8% Fabricated Metal Product Manufacturing 39.9 1.0% Transportation Equipment Manufacturing 39.8 1.0% Primary Metal Manufacturing 37.5 1.0% Chemical Manufacturing 34.2 0.9% Electrical Equipment, Appliance, and Component Manufacturing 33.1 0.9% Solar Electric Power Generation Machinery Manufacturing 25.4 0.7% Printing and Related Support Activities 22.6 0.6% Nonmetallic Mineral Product Manufacturing 22.5 0.6% Other Utilities Miscellaneous Manufacturing 21.5 0.6% Plastics and Rubber Products Manufacturing 20.0 0.5% Other³ 54.3 1.4% TRANSPORTATION & WAREHOUSING OIL & GAS Total Exposure $280.0 million % of Total² 7.3% Total Exposure $56.9 million % of Total² 1.5% • $183.2 million exposure to truck transportation, over 90% in general freight trucking. • $55.3 million exposure related to support activities for Oil & Gas Operations • Less than $3.1 million exposure to air transportation and support activities. - Approximately 51% of outstandings are in working capital lines, • Receive invoices and back-up, verify a portion of the purchases and monitor these primarily collateralized by accounts receivable, remaining collateralized accounts under a Dominion of Funds to ensure that our balances are covered by by machinery and equipment collateral 1 Excludes certain joint ventures; percentages calculated based on aggregate principal amount of loans includes operating lease rental equipment of $200.8M ² Total includes total gross loans & leases of $3.61 billion and rental equipment, net of $200.8M, as of March 31, 2020 3 Other includes manufacturing subsectors comprised of less than 0.5% of total² 11 Second Quarter Fiscal Year 2020 | Nasdaq: CASH
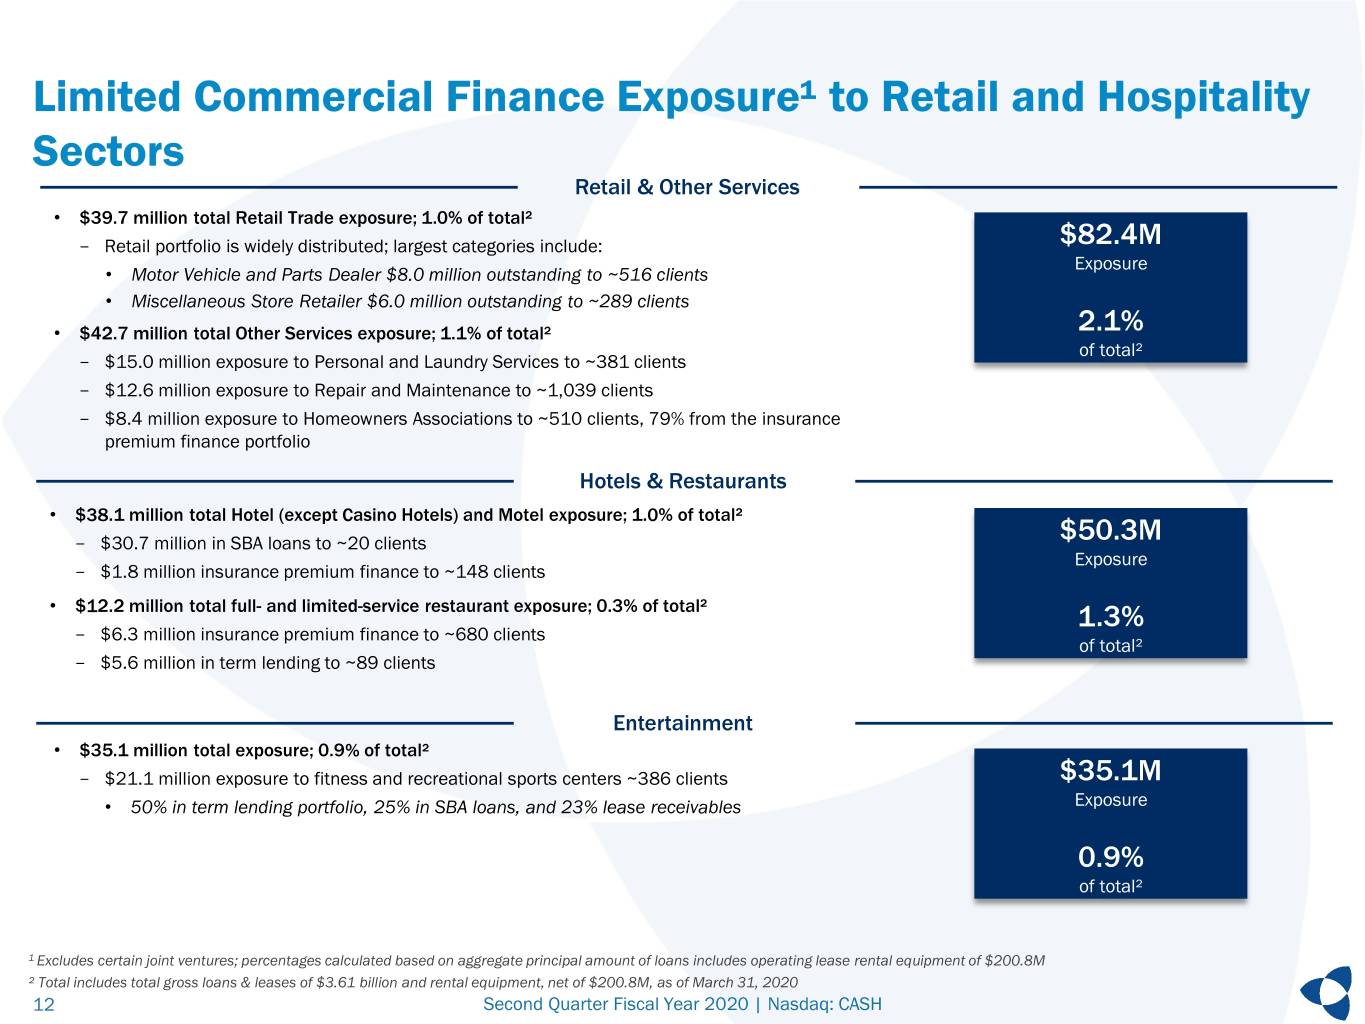
Limited Commercial Finance Exposure¹ to Retail and Hospitality Sectors Retail & Other Services • $39.7 million total Retail Trade exposure; 1.0% of total² - Retail portfolio is widely distributed; largest categories include: $82.4M Exposure • Motor Vehicle and Parts Dealer $8.0 million outstanding to ~516 clients • Miscellaneous Store Retailer $6.0 million outstanding to ~289 clients • $42.7 million total Other Services exposure; 1.1% of total² 2.1% of total² - $15.0 million exposure to Personal and Laundry Services to ~381 clients - $12.6 million exposure to Repair and Maintenance to ~1,039 clients - $8.4 million exposure to Homeowners Associations to ~510 clients, 79% from the insurance premium finance portfolio Hotels & Restaurants • $38.1 million total Hotel (except Casino Hotels) and Motel exposure; 1.0% of total² - $30.7 million in SBA loans to ~20 clients $50.3M Exposure - $1.8 million insurance premium finance to ~148 clients • $12.2 million total full- and limited-service restaurant exposure; 0.3% of total² 1.3% - $6.3 million insurance premium finance to ~680 clients of total² - $5.6 million in term lending to ~89 clients Entertainment • $35.1 million total exposure; 0.9% of total² - $21.1 million exposure to fitness and recreational sports centers ~386 clients $35.1M • 50% in term lending portfolio, 25% in SBA loans, and 23% lease receivables Exposure 0.9% of total² 1 Excludes certain joint ventures; percentages calculated based on aggregate principal amount of loans includes operating lease rental equipment of $200.8M ² Total includes total gross loans & leases of $3.61 billion and rental equipment, net of $200.8M, as of March 31, 2020 12 Second Quarter Fiscal Year 2020 | Nasdaq: CASH
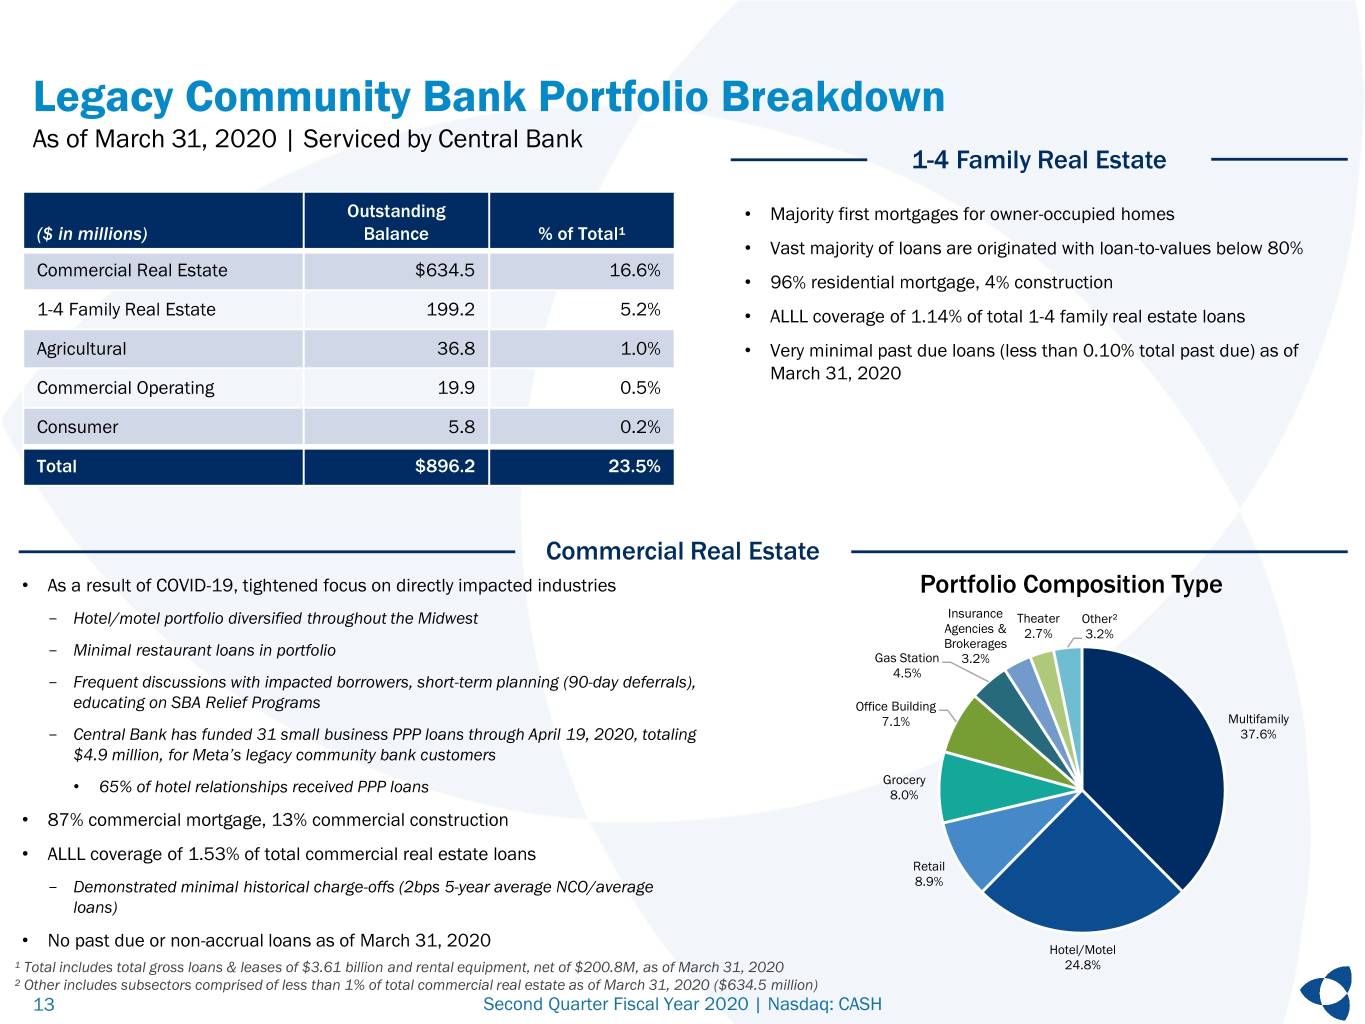
Legacy Community Bank Portfolio Breakdown As of March 31, 2020 | Serviced by Central Bank 1-4 Family Real Estate Outstanding • Majority first mortgages for owner-occupied homes ($ in millions) Balance % of Total¹ • Vast majority of loans are originated with loan-to-values below 80% Commercial Real Estate $634.5 16.6% • 96% residential mortgage, 4% construction 1-4 Family Real Estate 199.2 5.2% • ALLL coverage of 1.14% of total 1-4 family real estate loans Agricultural 36.8 1.0% • Very minimal past due loans (less than 0.10% total past due) as of March 31, 2020 Commercial Operating 19.9 0.5% Consumer 5.8 0.2% Total $896.2 23.5% Commercial Real Estate • As a result of COVID-19, tightened focus on directly impacted industries Portfolio Composition Type - Hotel/motel portfolio diversified throughout the Midwest Insurance Theater Other² Agencies & 2.7% 3.2% Brokerages - Minimal restaurant loans in portfolio Gas Station 3.2% 4.5% - Frequent discussions with impacted borrowers, short-term planning (90-day deferrals), educating on SBA Relief Programs Office Building 7.1% Multifamily - Central Bank has funded 31 small business PPP loans through April 19, 2020, totaling 37.6% $4.9 million, for Meta’s legacy community bank customers Grocery • 65% of hotel relationships received PPP loans 8.0% • 87% commercial mortgage, 13% commercial construction • ALLL coverage of 1.53% of total commercial real estate loans Retail - Demonstrated minimal historical charge-offs (2bps 5-year average NCO/average 8.9% loans) • No past due or non-accrual loans as of March 31, 2020 Hotel/Motel ¹ Total includes total gross loans & leases of $3.61 billion and rental equipment, net of $200.8M, as of March 31, 2020 24.8% ² Other includes subsectors comprised of less than 1% of total commercial real estate as of March 31, 2020 ($634.5 million) 13 Second Quarter Fiscal Year 2020 | Nasdaq: CASH

Consumer Lending, Tax Services, Payments 14 Second Quarter Fiscal Year 2020 | Nasdaq: CASH
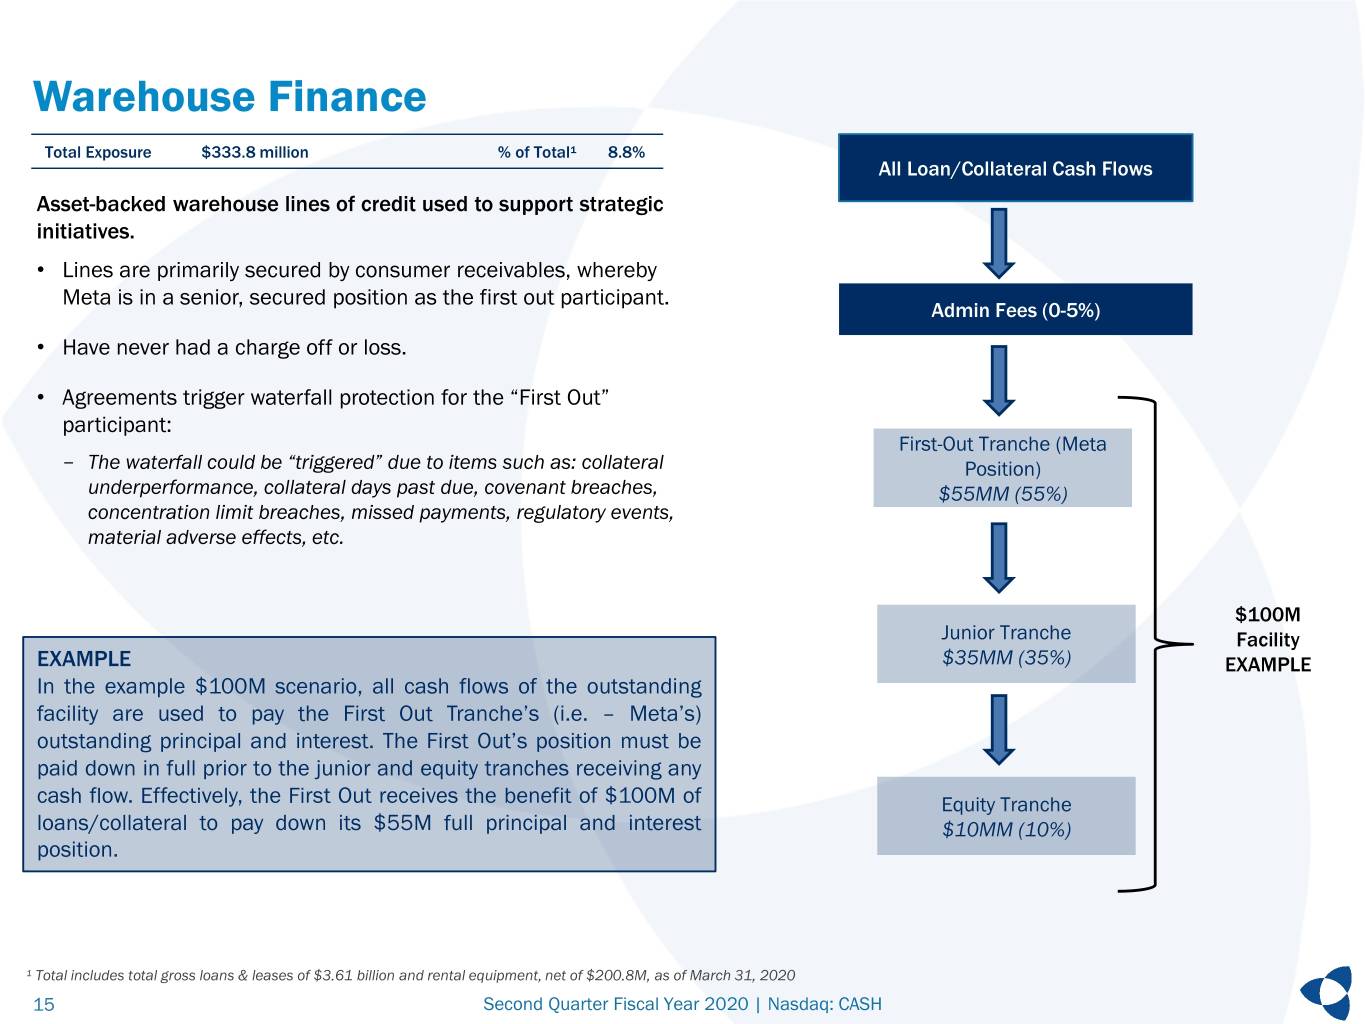
Warehouse Finance Total Exposure $333.8 million % of Total¹ 8.8% All Loan/Collateral Cash Flows Asset-backed warehouse lines of credit used to support strategic initiatives. • Lines are primarily secured by consumer receivables, whereby Meta is in a senior, secured position as the first out participant. Admin Fees (0-5%) • Have never had a charge off or loss. • Agreements trigger waterfall protection for the “First Out” participant: First-Out Tranche (Meta - The waterfall could be “triggered” due to items such as: collateral Position) underperformance, collateral days past due, covenant breaches, $55MM (55%) concentration limit breaches, missed payments, regulatory events, material adverse effects, etc. $100M Junior Tranche Facility EXAMPLE $35MM (35%) EXAMPLE In the example $100M scenario, all cash flows of the outstanding facility are used to pay the First Out Tranche’s (i.e. – Meta’s) outstanding principal and interest. The First Out’s position must be paid down in full prior to the junior and equity tranches receiving any cash flow. Effectively, the First Out receives the benefit of $100M of Equity Tranche loans/collateral to pay down its $55M full principal and interest $10MM (10%) position. ¹ Total includes total gross loans & leases of $3.61 billion and rental equipment, net of $200.8M, as of March 31, 2020 15 Second Quarter Fiscal Year 2020 | Nasdaq: CASH
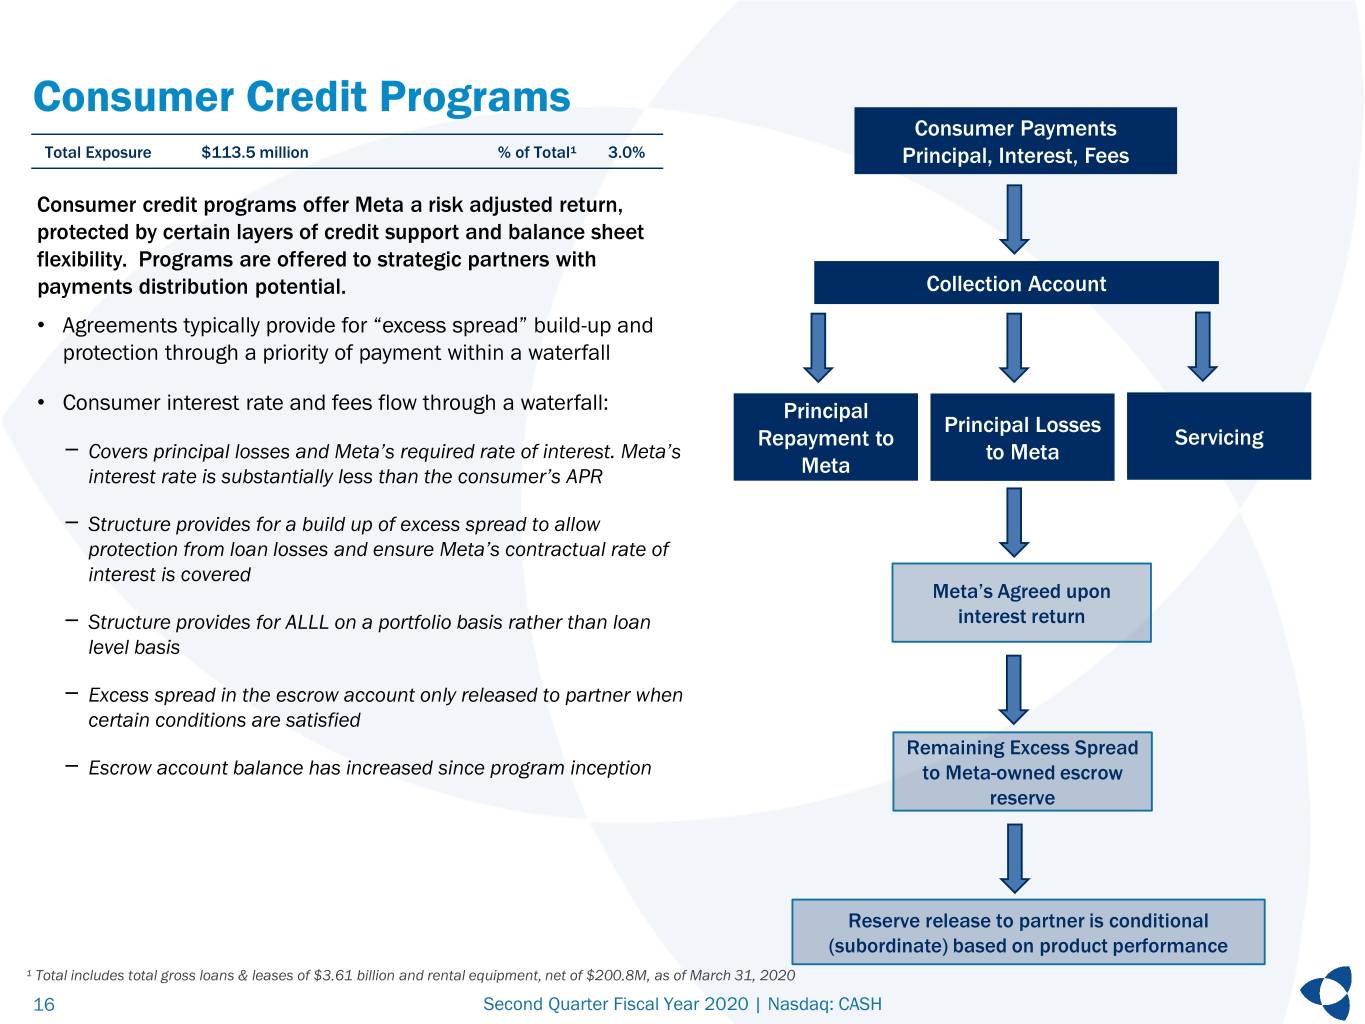
Consumer Credit Programs Consumer Payments Total Exposure $113.5 million % of Total¹ 3.0% Principal, Interest, Fees Consumer credit programs offer Meta a risk adjusted return, protected by certain layers of credit support and balance sheet flexibility. Programs are offered to strategic partners with payments distribution potential. Collection Account • Agreements typically provide for “excess spread” build-up and protection through a priority of payment within a waterfall • Consumer interest rate and fees flow through a waterfall: Principal Principal Losses Repayment to Servicing - Covers principal losses and Meta’s required rate of interest. Meta’s to Meta interest rate is substantially less than the consumer’s APR Meta - Structure provides for a build up of excess spread to allow protection from loan losses and ensure Meta’s contractual rate of interest is covered Meta’s Agreed upon - Structure provides for ALLL on a portfolio basis rather than loan interest return level basis - Excess spread in the escrow account only released to partner when certain conditions are satisfied Remaining Excess Spread - Escrow account balance has increased since program inception to Meta-owned escrow reserve Reserve release to partner is conditional (subordinate) based on product performance ¹ Total includes total gross loans & leases of $3.61 billion and rental equipment, net of $200.8M, as of March 31, 2020 16 Second Quarter Fiscal Year 2020 | Nasdaq: CASH
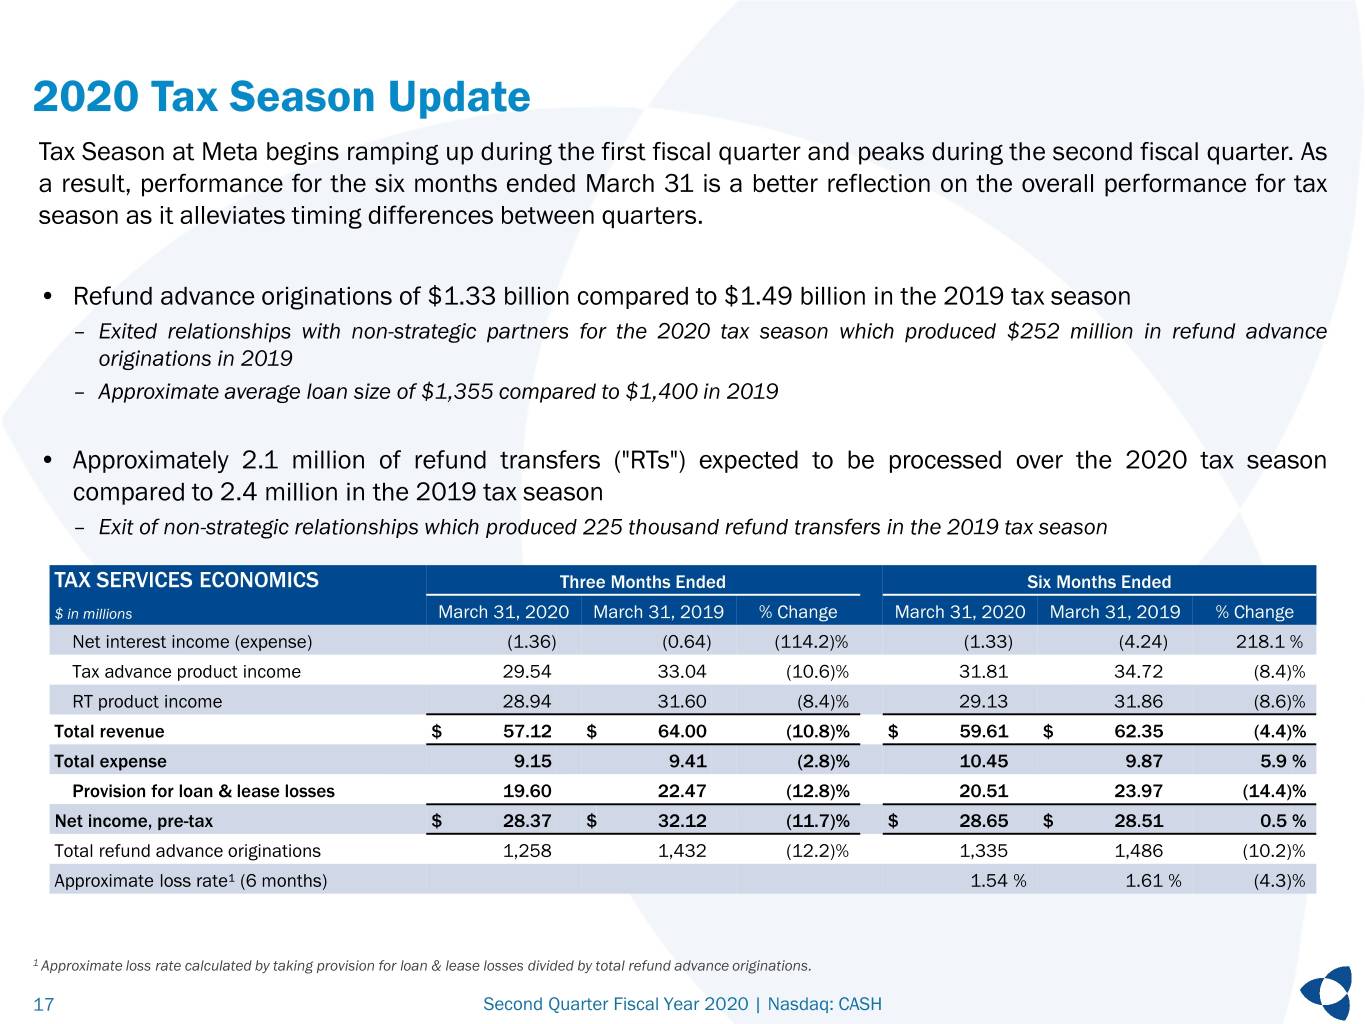
2020 Tax Season Update Tax Season at Meta begins ramping up during the first fiscal quarter and peaks during the second fiscal quarter. As a result, performance for the six months ended March 31 is a better reflection on the overall performance for tax season as it alleviates timing differences between quarters. • Refund advance originations of $1.33 billion compared to $1.49 billion in the 2019 tax season – Exited relationships with non-strategic partners for the 2020 tax season which produced $252 million in refund advance originations in 2019 – Approximate average loan size of $1,355 compared to $1,400 in 2019 • Approximately 2.1 million of refund transfers ("RTs") expected to be processed over the 2020 tax season compared to 2.4 million in the 2019 tax season – Exit of non-strategic relationships which produced 225 thousand refund transfers in the 2019 tax season TAX SERVICES ECONOMICS Three Months Ended Six Months Ended $ in millions March 31, 2020 March 31, 2019 % Change March 31, 2020 March 31, 2019 % Change Net interest income (expense) (1.36) (0.64) (114.2)% (1.33) (4.24) 218.1 % Tax advance product income 29.54 33.04 (10.6)% 31.81 34.72 (8.4)% RT product income 28.94 31.60 (8.4)% 29.13 31.86 (8.6)% Total revenue $ 57.12 $ 64.00 (10.8)% $ 59.61 $ 62.35 (4.4)% Total expense 9.15 9.41 (2.8)% 10.45 9.87 5.9 % Provision for loan & lease losses 19.60 22.47 (12.8)% 20.51 23.97 (14.4)% Net income, pre-tax $ 28.37 $ 32.12 (11.7)% $ 28.65 $ 28.51 0.5 % Total refund advance originations 1,258 1,432 (12.2)% 1,335 1,486 (10.2)% Approximate loss rate¹ (6 months) 1.54 % 1.61 % (4.3)% 1 Approximate loss rate calculated by taking provision for loan & lease losses divided by total refund advance originations. 17 Second Quarter Fiscal Year 2020 | Nasdaq: CASH
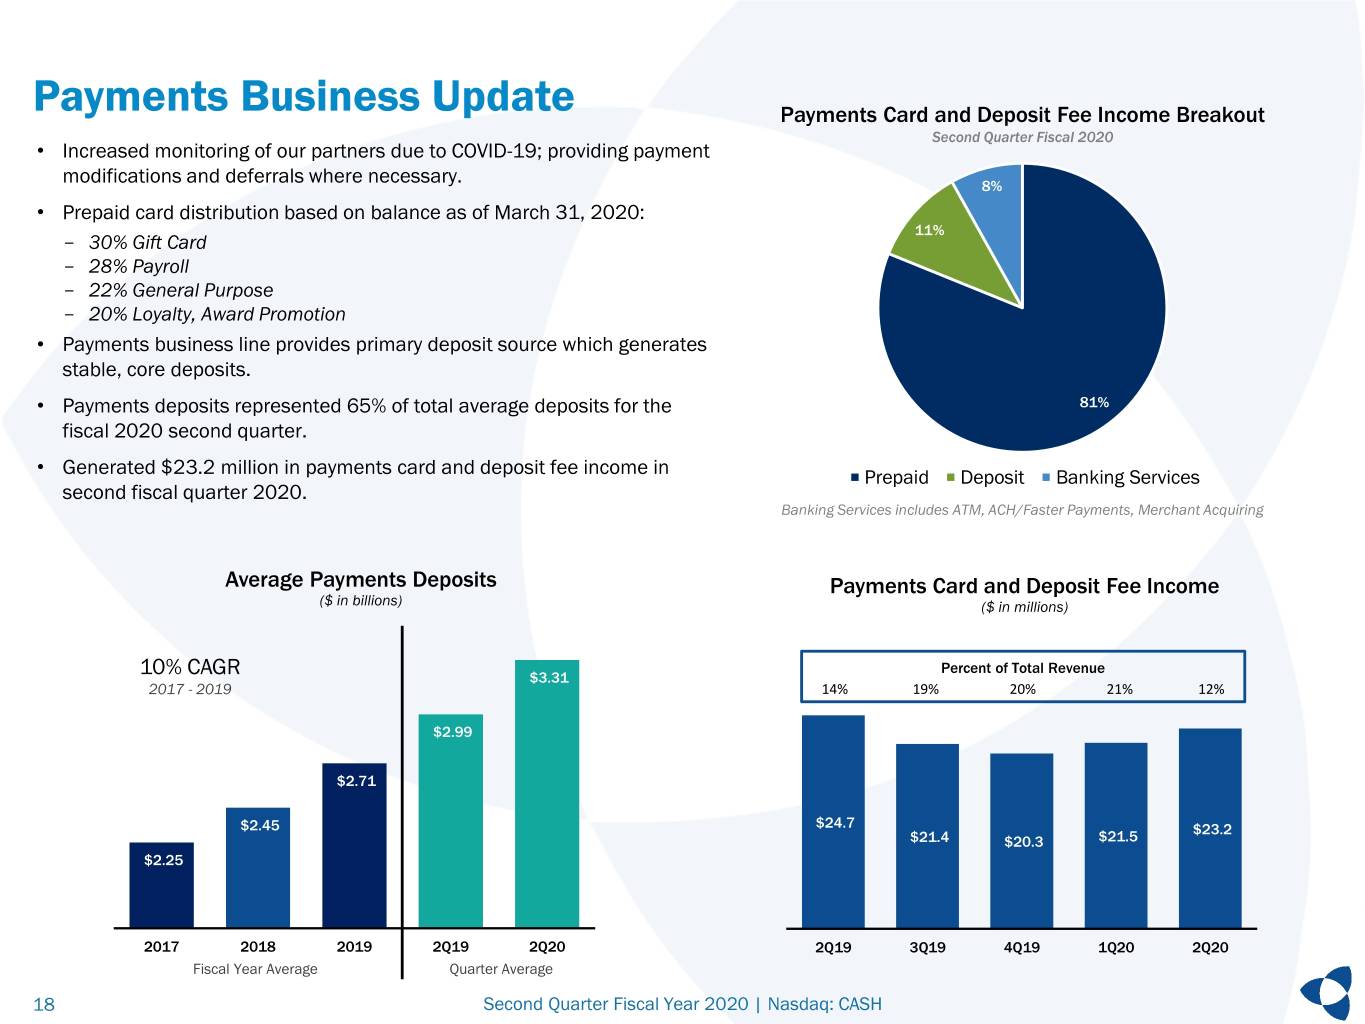
Payments Business Update Payments Card and Deposit Fee Income Breakout Second Quarter Fiscal 2020 • Increased monitoring of our partners due to COVID-19; providing payment modifications and deferrals where necessary. 8% • Prepaid card distribution based on balance as of March 31, 2020: 11% - 30% Gift Card - 28% Payroll - 22% General Purpose - 20% Loyalty, Award Promotion • Payments business line provides primary deposit source which generates stable, core deposits. • Payments deposits represented 65% of total average deposits for the 81% fiscal 2020 second quarter. • Generated $23.2 million in payments card and deposit fee income in Prepaid Deposit Banking Services second fiscal quarter 2020. Banking Services includes ATM, ACH/Faster Payments, Merchant Acquiring Average Payments Deposits Payments Card and Deposit Fee Income ($ in billions) ($ in millions) Percent of Total Revenue 10% CAGR $3.31 2017 - 2019 14% 19% 20% 21% 12% $2.99 $2.71 $2.45 $24.7 $23.2 $21.4 $20.3 $21.5 $2.25 2017 2018 2019 2Q19 2Q20 2Q19 3Q19 4Q19 1Q20 2Q20 Fiscal Year Average Quarter Average 18 Second Quarter Fiscal Year 2020 | Nasdaq: CASH
Asset Quality, Interest Rate Risk, Capital 19 Second Quarter Fiscal Year 2020 | Nasdaq: CASH
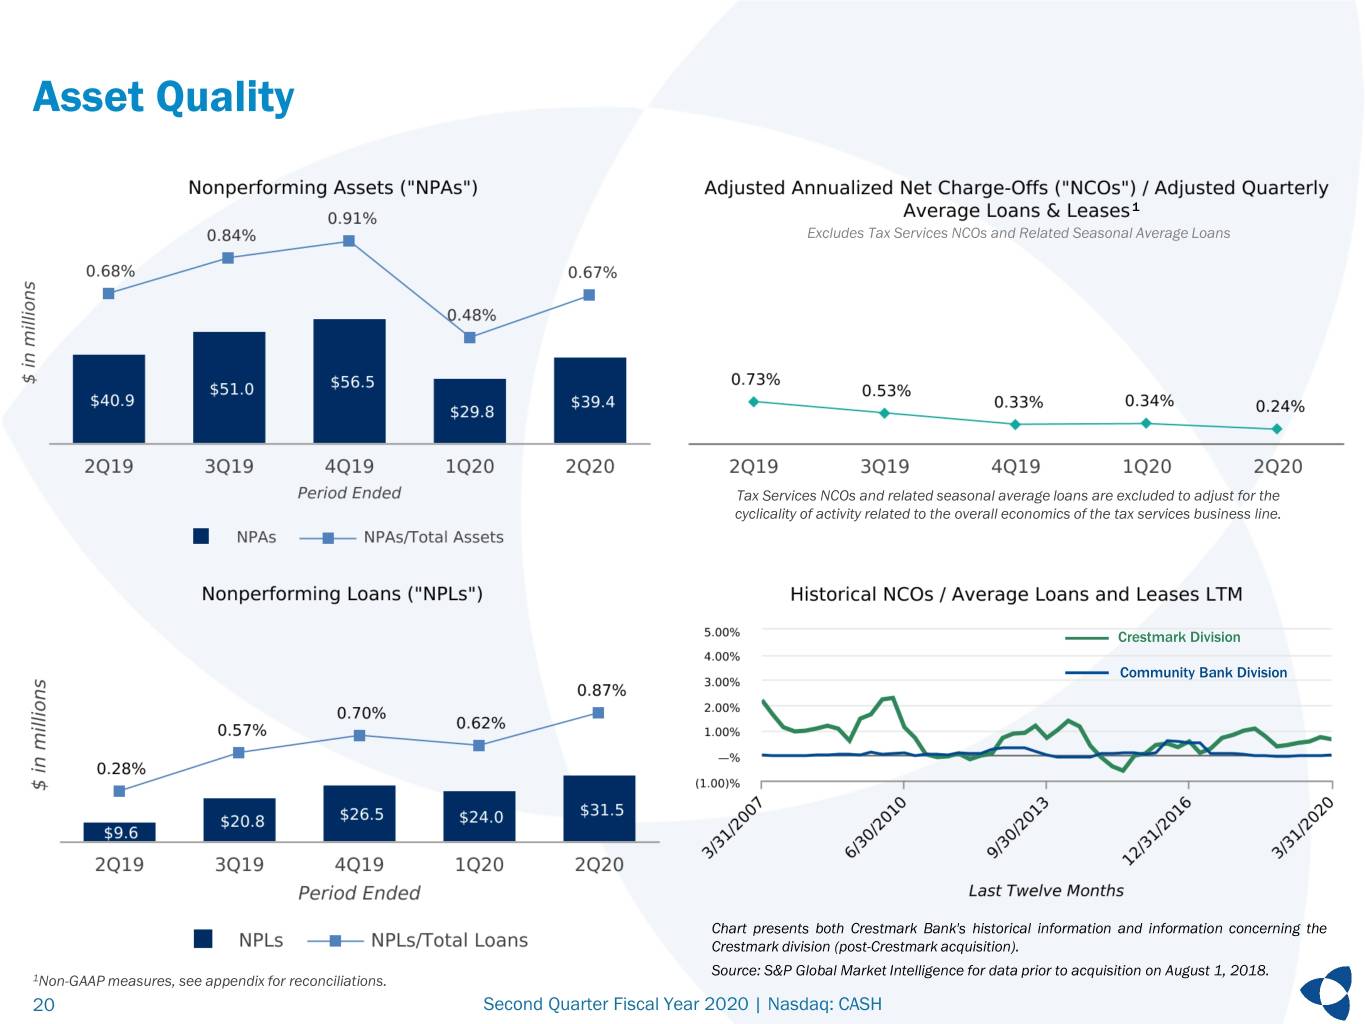
Asset Quality 1 Excludes Tax Services NCOs and Related Seasonal Average Loans Tax Services NCOs and related seasonal average loans are excluded to adjust for the cyclicality of activity related to the overall economics of the tax services business line. Crestmark Division Community Bank Division Chart presents both Crestmark Bank's historical information and information concerning the Crestmark division (post-Crestmark acquisition). Source: S&P Global Market Intelligence for data prior to acquisition on August 1, 2018. 1Non-GAAP measures, see appendix for reconciliations. 20 Second Quarter Fiscal Year 2020 | Nasdaq: CASH

Interest Rate Risk Management as of March 31, 2020 12-Month Interest Rate Sensitivity from Base Net Interest Income 11% • Net Interest Income modeled under an instantaneous, 9% parallel rate shock and a gradual parallel ramp. 7% 5% • Management also employs rigorous modeling 3% techniques under a variety of yield curve shapes, twists 1% and ramps. -2% • ALCO management focused on minimizing risk to -4% -100 +100 +200 +300 further decline in rates. Parallel Shock Ramp Earning Asset Pricing Attributes1 Asset/Liability Gap Analysis $3,500 $3,000 9% $2,500 $2,000 32% $1,500 $1,000 $500 Volume ($MM) Volume $- 59% $(500) $(1,000) Month 1-12 Month 13-36 Month 37-60 Month 61-180 Fixed Rate < 1 Year Fixed Rate > 1 Year Floating or Variable Period Variance Total Assets Total Liabilities 1 Fixed rate securities, loans and leases are shown for contractual periods less than 12 months and greater than 12 months. 21 Second Quarter Fiscal Year 2020 | Nasdaq: CASH
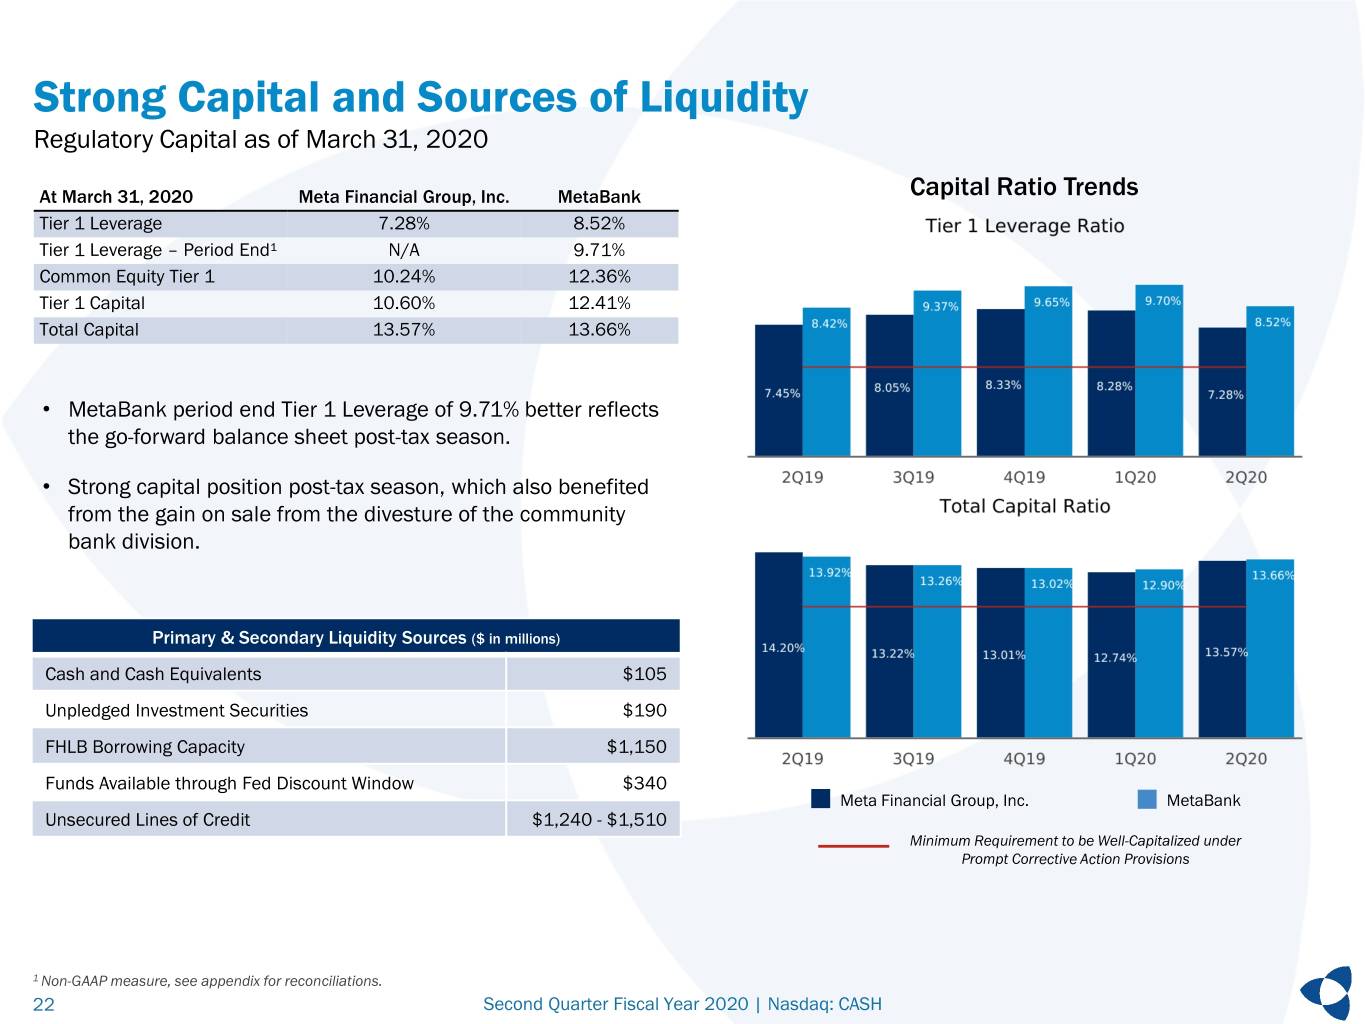
Strong Capital and Sources of Liquidity Regulatory Capital as of March 31, 2020 At March 31, 2020 Meta Financial Group, Inc. MetaBank Capital Ratio Trends Tier 1 Leverage 7.28% 8.52% Tier 1 Leverage – Period End¹ N/A 9.71% Common Equity Tier 1 10.24% 12.36% Tier 1 Capital 10.60% 12.41% Total Capital 13.57% 13.66% • MetaBank period end Tier 1 Leverage of 9.71% better reflects the go-forward balance sheet post-tax season. • Strong capital position post-tax season, which also benefited from the gain on sale from the divesture of the community bank division. Primary & Secondary Liquidity Sources ($ in millions) Cash and Cash Equivalents $105 Unpledged Investment Securities $190 FHLB Borrowing Capacity $1,150 Funds Available through Fed Discount Window $340 Meta Financial Group, Inc. MetaBank Unsecured Lines of Credit $1,240 - $1,510 Minimum Requirement to be Well-Capitalized under Prompt Corrective Action Provisions 1 Non-GAAP measure, see appendix for reconciliations. 22 Second Quarter Fiscal Year 2020 | Nasdaq: CASH
Appendix 23 Second Quarter Fiscal Year 2020 | Nasdaq: CASH
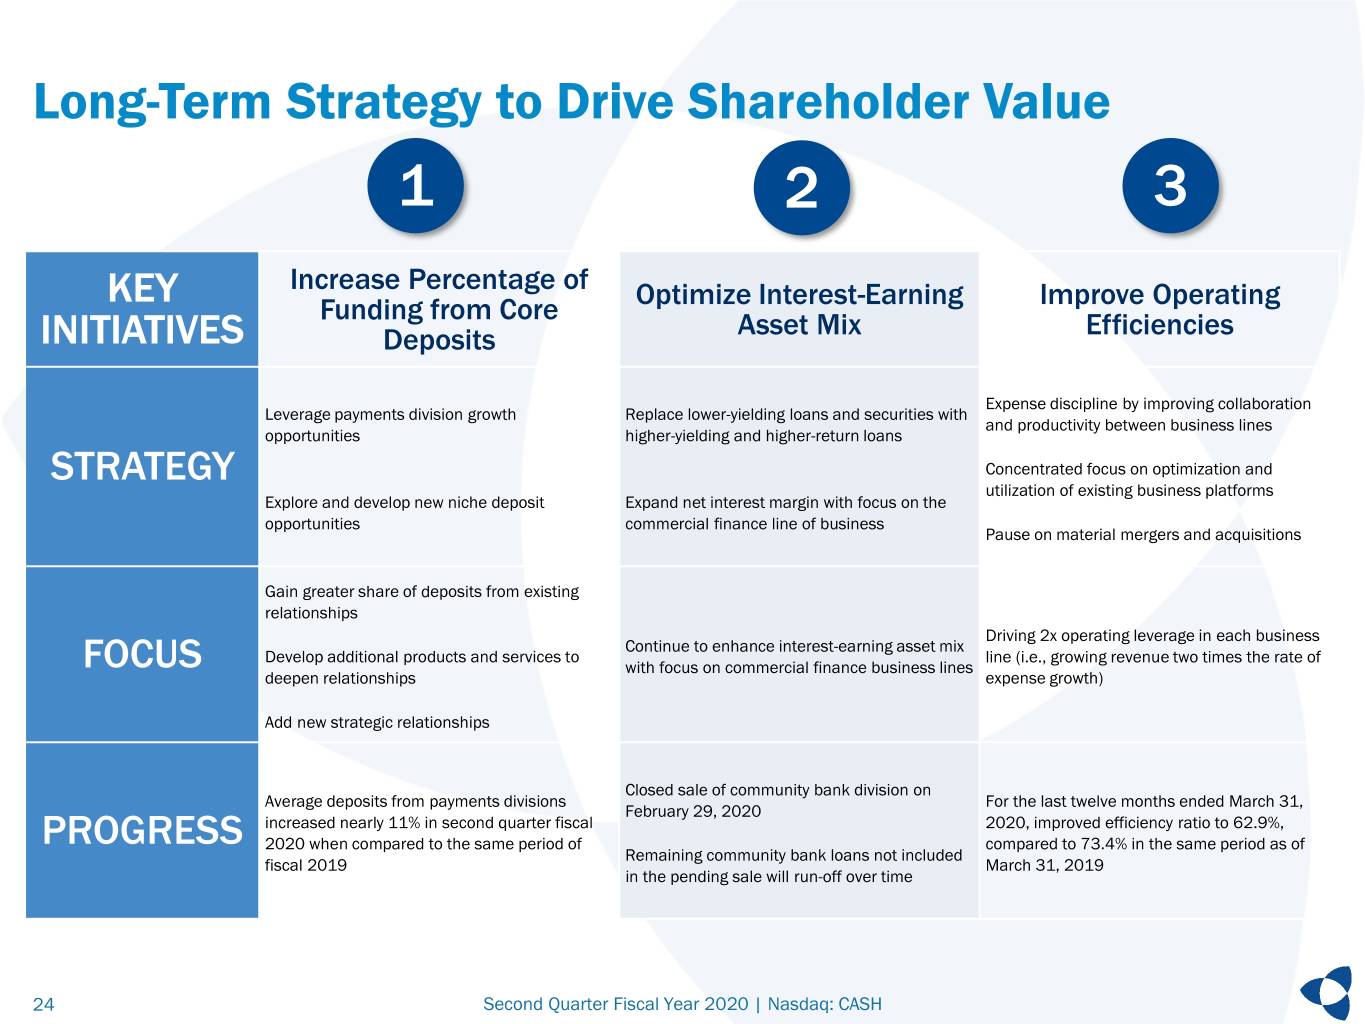
Long-Term Strategy to Drive Shareholder Value 1 2 3 KEY Increase Percentage of Optimize Interest-Earning Improve Operating Funding from Core Asset Mix Efficiencies INITIATIVES Deposits Expense discipline by improving collaboration Leverage payments division growth Replace lower-yielding loans and securities with and productivity between business lines opportunities higher-yielding and higher-return loans STRATEGY Concentrated focus on optimization and utilization of existing business platforms Explore and develop new niche deposit Expand net interest margin with focus on the opportunities commercial finance line of business Pause on material mergers and acquisitions Gain greater share of deposits from existing relationships Driving 2x operating leverage in each business Continue to enhance interest-earning asset mix Develop additional products and services to line (i.e., growing revenue two times the rate of FOCUS with focus on commercial finance business lines deepen relationships expense growth) Add new strategic relationships Closed sale of community bank division on Average deposits from payments divisions For the last twelve months ended March 31, February 29, 2020 increased nearly 11% in second quarter fiscal 2020, improved efficiency ratio to 62.9%, PROGRESS 2020 when compared to the same period of compared to 73.4% in the same period as of Remaining community bank loans not included fiscal 2019 March 31, 2019 in the pending sale will run-off over time 24 Second Quarter Fiscal Year 2020 | Nasdaq: CASH
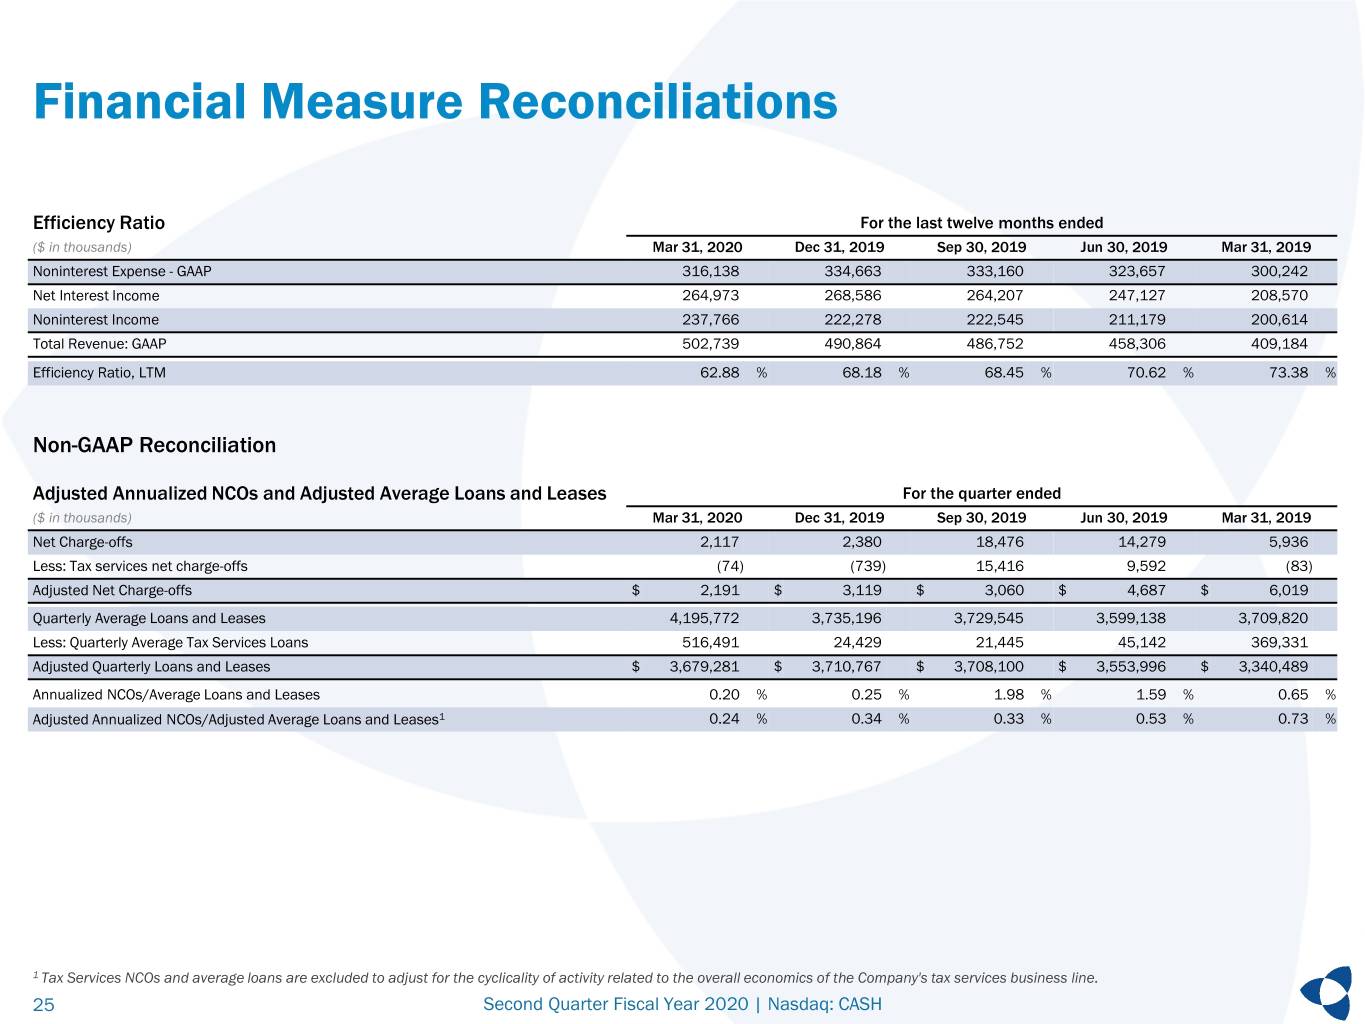
Financial Measure Reconciliations Efficiency Ratio For the last twelve months ended ($ in thousands) Mar 31, 2020 Dec 31, 2019 Sep 30, 2019 Jun 30, 2019 Mar 31, 2019 Noninterest Expense - GAAP 316,138 334,663 333,160 323,657 300,242 Net Interest Income 264,973 268,586 264,207 247,127 208,570 Noninterest Income 237,766 222,278 222,545 211,179 200,614 Total Revenue: GAAP 502,739 490,864 486,752 458,306 409,184 Efficiency Ratio, LTM 62.88 % 68.18 % 68.45 % 70.62 % 73.38 % Non-GAAP Reconciliation Adjusted Annualized NCOs and Adjusted Average Loans and Leases For the quarter ended ($ in thousands) Mar 31, 2020 Dec 31, 2019 Sep 30, 2019 Jun 30, 2019 Mar 31, 2019 Net Charge-offs 2,117 2,380 18,476 14,279 5,936 Less: Tax services net charge-offs (74) (739) 15,416 9,592 (83) Adjusted Net Charge-offs $ 2,191 $ 3,119 $ 3,060 $ 4,687 $ 6,019 Quarterly Average Loans and Leases 4,195,772 3,735,196 3,729,545 3,599,138 3,709,820 Less: Quarterly Average Tax Services Loans 516,491 24,429 21,445 45,142 369,331 Adjusted Quarterly Loans and Leases $ 3,679,281 $ 3,710,767 $ 3,708,100 $ 3,553,996 $ 3,340,489 Annualized NCOs/Average Loans and Leases 0.20 % 0.25 % 1.98 % 1.59 % 0.65 % Adjusted Annualized NCOs/Adjusted Average Loans and Leases1 0.24 % 0.34 % 0.33 % 0.53 % 0.73 % 1 Tax Services NCOs and average loans are excluded to adjust for the cyclicality of activity related to the overall economics of the Company's tax services business line. 25 Second Quarter Fiscal Year 2020 | Nasdaq: CASH
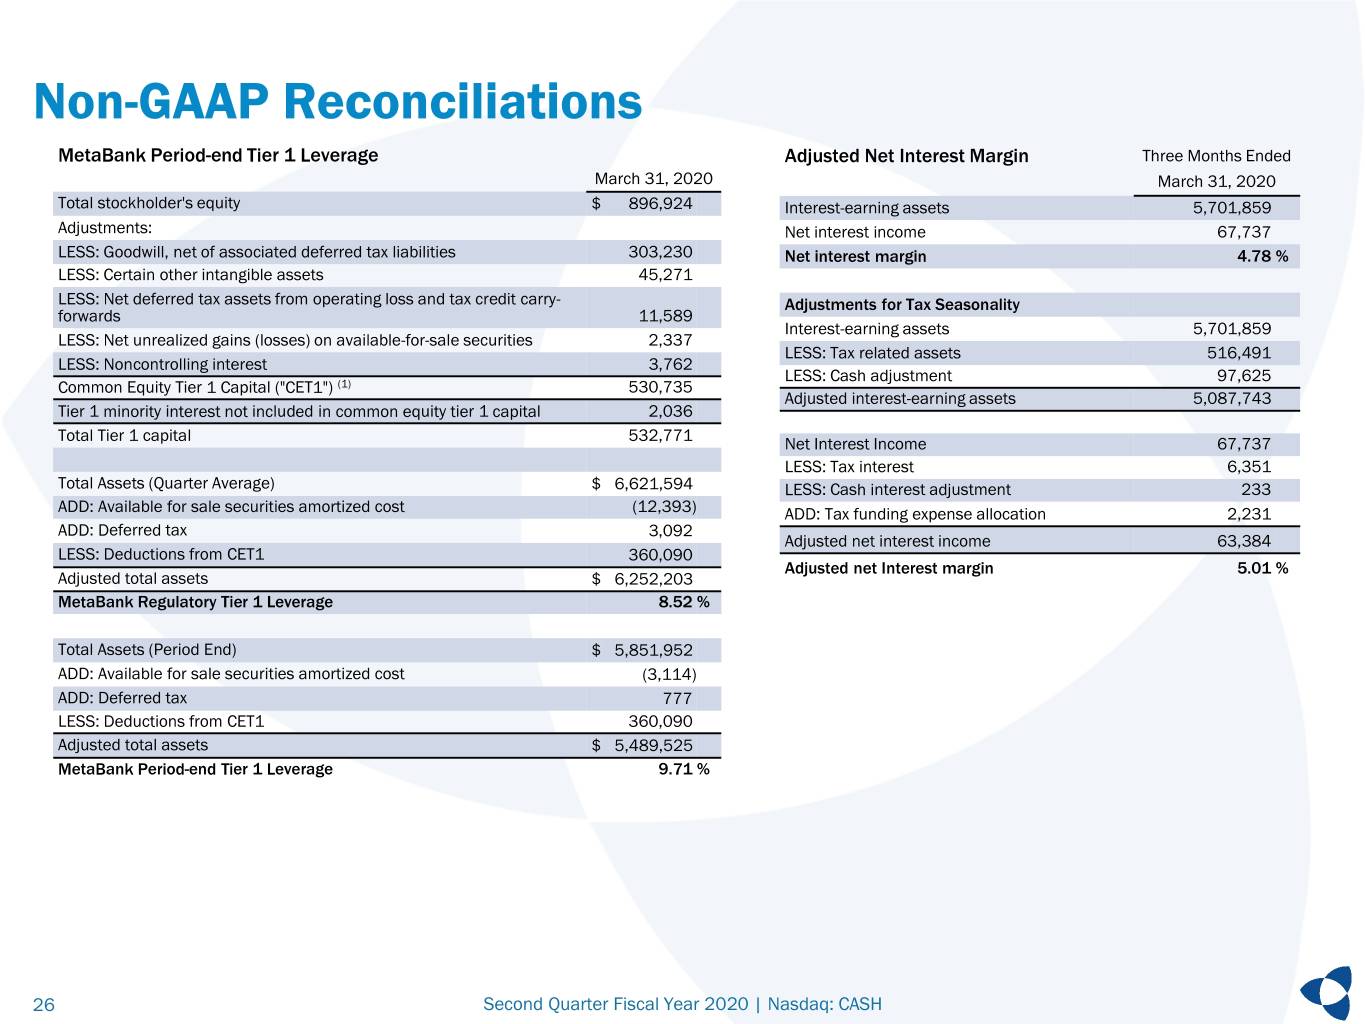
Non-GAAP Reconciliations MetaBank Period-end Tier 1 Leverage Adjusted Net Interest Margin Three Months Ended March 31, 2020 March 31, 2020 Total stockholder's equity $ 896,924 Interest-earning assets 5,701,859 Adjustments: Net interest income 67,737 LESS: Goodwill, net of associated deferred tax liabilities 303,230 Net interest margin 4.78 % LESS: Certain other intangible assets 45,271 LESS: Net deferred tax assets from operating loss and tax credit carry- Adjustments for Tax Seasonality forwards 11,589 Interest-earning assets 5,701,859 LESS: Net unrealized gains (losses) on available-for-sale securities 2,337 LESS: Tax related assets 516,491 LESS: Noncontrolling interest 3,762 LESS: Cash adjustment 97,625 Common Equity Tier 1 Capital ("CET1") (1) 530,735 Adjusted interest-earning assets 5,087,743 Tier 1 minority interest not included in common equity tier 1 capital 2,036 Total Tier 1 capital 532,771 Net Interest Income 67,737 LESS: Tax interest 6,351 Total Assets (Quarter Average) $ 6,621,594 LESS: Cash interest adjustment 233 ADD: Available for sale securities amortized cost (12,393) ADD: Tax funding expense allocation 2,231 ADD: Deferred tax 3,092 Adjusted net interest income 63,384 LESS: Deductions from CET1 360,090 Adjusted net Interest margin 5.01 % Adjusted total assets $ 6,252,203 MetaBank Regulatory Tier 1 Leverage 8.52 % Total Assets (Period End) $ 5,851,952 ADD: Available for sale securities amortized cost (3,114) ADD: Deferred tax 777 LESS: Deductions from CET1 360,090 Adjusted total assets $ 5,489,525 MetaBank Period-end Tier 1 Leverage 9.71 % 26 Second Quarter Fiscal Year 2020 | Nasdaq: CASH


