
QUARTERLY INVESTOR UPDATE FIRST QUARTER FISCAL YEAR 2022
FORWARD LOOKING STATEMENTS 2 This investor update contains “forward-looking statements” which are made in good faith by the Company pursuant to the “safe harbor” provisions of the Private Securities Litigation Reform Act of 1995. You can identify forward-looking statements by words such as “may,” “hope,” “will,” “should,” “expect,” “plan,” “anticipate,” “intend,” “believe,” “estimate,” “predict,” “potential,” “continue,” “could,” “future,” or the negative of those terms, or other words of similar meaning or similar expressions. These forward-looking statements are based on information currently available to us and assumptions about future events, and include statements with respect to the Company’s beliefs, expectations, estimates, and intentions, which are subject to significant risks and uncertainties, and are subject to change based on various factors, some of which are beyond the Company’s control. Such risks, uncertainties and other factors may cause our actual growth, results of operations, financial condition, cash flows, performance and business prospects and opportunities to differ materially from those expressed in, or implied by, these forward-looking statements. Such statements address, among others, the following subjects: future operating results; expectations in connection with the impact of the ongoing COVID-19 pandemic and related government actions on our business, our industry and the capital markets; customer retention; loan and other product demand; expectations concerning acquisitions and divestitures; new products and services, including those offered by Meta Payment Systems, Refund Advantage, EPS Financial and Specialty Consumer Services divisions; credit quality; the level of net charge-offs and the adequacy of the allowance for loan and lease losses; technology; and the Company's employees. The following factors, among others, could cause the Company's financial performance and results of operations to differ materially from the expectations, estimates, and intentions expressed in such forward-looking statements: maintaining our executive management team; expected growth opportunities may not be realized or may take longer to realize than expected; the potential adverse effects of the ongoing COVID-19 pandemic and any governmental or societal responses thereto, or other unusual and infrequently occurring events; actual changes in interest rates and the Fed Funds rate; additional changes in tax laws; the strength of the United States' economy, in general, and the strength of the local economies in which the Company operates; changes in, trade, monetary, and fiscal policies and laws, including interest rate policies of the Federal Reserve; inflation, market, and monetary fluctuations; the timely and efficient development of, and acceptance of, new products and services offered by the Company or its strategic partners, as well as risks (including reputational and litigation) attendant thereto, and the perceived overall value of these products and services by users; the risks of dealing with or utilizing third parties, including, in connection with the Company’s prepaid card and refund advance business, the risk of reduced volume of refund advance loans as a result of reduced customer demand for or usage of the Company’s strategic partners’ refund advance products; our relationship with, and any actions which may be initiated by, our regulators; the impact of changes in financial services laws and regulations, including, but not limited to, laws and regulations relating to the tax refund industry and the insurance premium finance industry; technological changes, including, but not limited to, the protection of our electronic systems and information; the impact of acquisitions and divestitures; litigation risk; the growth of the Company’s business, as well as expenses related thereto; continued maintenance by MetaBank of its status as a well- capitalized institution, changes in consumer spending and saving habits; losses from fraudulent or illegal activity, technological risks and developments and cyber threats, attacks or events; the success of the Company at maintaining its high quality asset level and managing and collecting assets of borrowers in default should problem assets increase; and the other factors described under the caption “Risk Factors” and in other sections of the Company’s Annual Report on Form 10-K for the Company's fiscal year ended September 30, 2021 and in other filings made by the Company with the Securities and Exchange Commission (“SEC”). The forward-looking statements included herein speak only as of the date of this investor update. The Company expressly disclaims any intent or obligation to update any forward-looking statements, whether written or oral, that may be made from time to time by or on behalf of the Company or its subsidiaries, whether as a result of new information, changed circumstances or future events or for any other reason. Meta Financial Group, Inc. (Nasdaq: CASH) | Quarterly Investor Presentation

3 WE STRIVE TO INCREASE FINANCIAL AVAILABILITY, CHOICE, AND OPPORTUNITY THROUGH FINANCIAL EMPOWERMENT. We work to disrupt traditional banking norms by developing partnerships with fintechs, affinity groups, government agencies, and other banks to make a range of quality financial products and services available to the communities we serve nationally. Our national bank charter, coordination with regulators, and deep understanding of risk mitigation and compliance allows us to guide our partners and deliver the financial products and services that meet the needs of those who need them most. We believe in financial inclusion for all®. Meta Financial Group, Inc. (Nasdaq: CASH) | Quarterly Investor Presentation
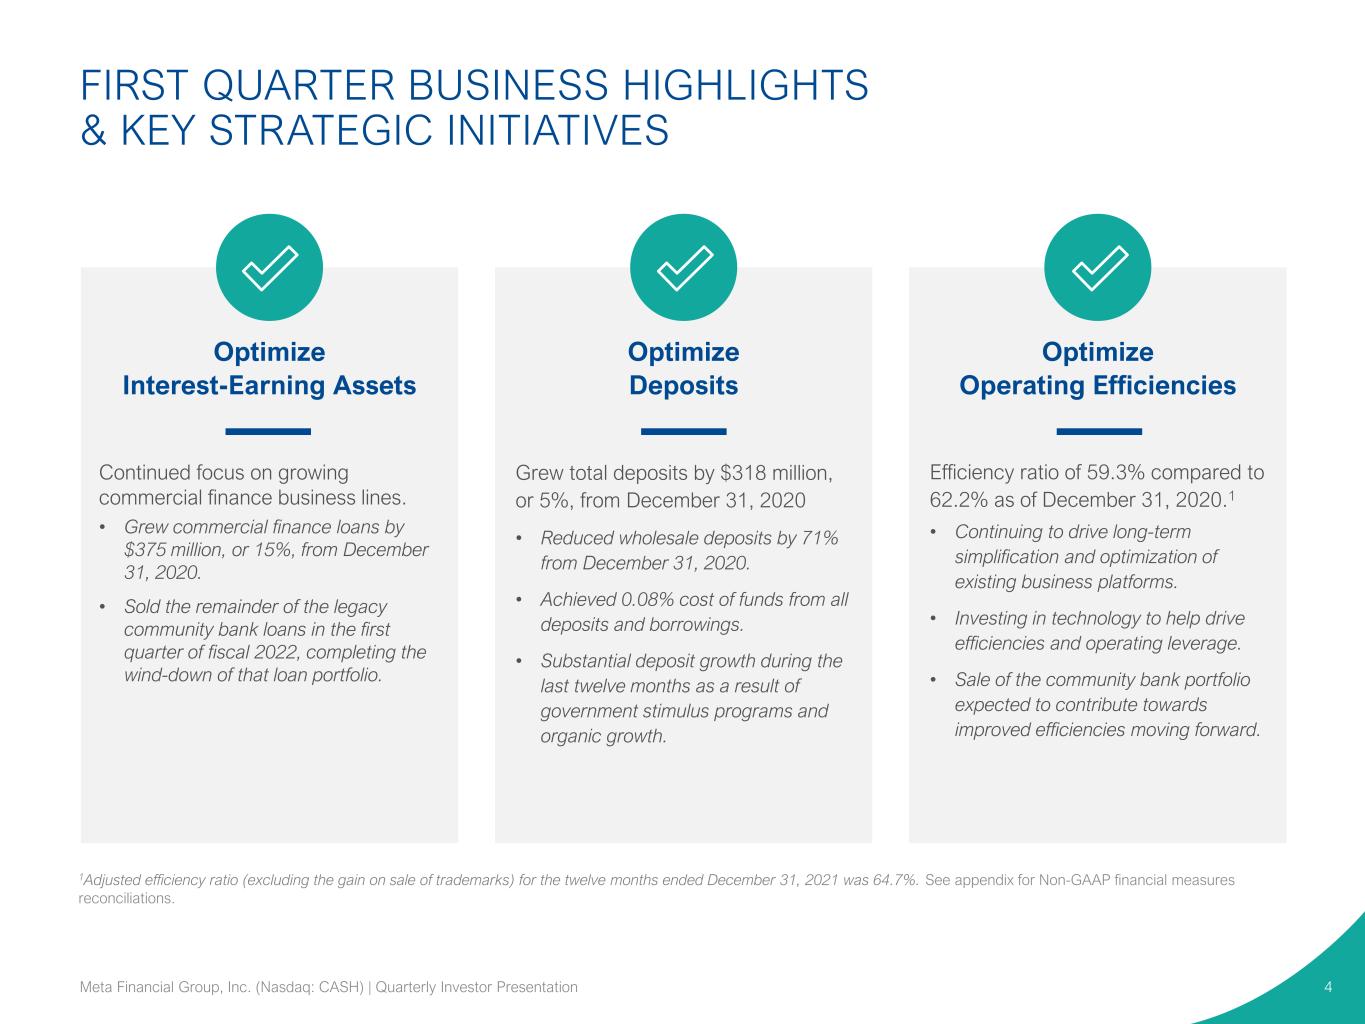
Optimize Interest-Earning Assets Optimize Deposits Optimize Operating Efficiencies Efficiency ratio of 59.3% compared to 62.2% as of December 31, 2020.1 • Continuing to drive long-term simplification and optimization of existing business platforms. • Investing in technology to help drive efficiencies and operating leverage. • Sale of the community bank portfolio expected to contribute towards improved efficiencies moving forward. Grew total deposits by $318 million, or 5%, from December 31, 2020 • Reduced wholesale deposits by 71% from December 31, 2020. • Achieved 0.08% cost of funds from all deposits and borrowings. • Substantial deposit growth during the last twelve months as a result of government stimulus programs and organic growth. Continued focus on growing commercial finance business lines. • Grew commercial finance loans by $375 million, or 15%, from December 31, 2020. • Sold the remainder of the legacy community bank loans in the first quarter of fiscal 2022, completing the wind-down of that loan portfolio. FIRST QUARTER BUSINESS HIGHLIGHTS & KEY STRATEGIC INITIATIVES 4Meta Financial Group, Inc. (Nasdaq: CASH) | Quarterly Investor Presentation 1Adjusted efficiency ratio (excluding the gain on sale of trademarks) for the twelve months ended December 31, 2021 was 64.7%. See appendix for Non-GAAP financial measures reconciliations.
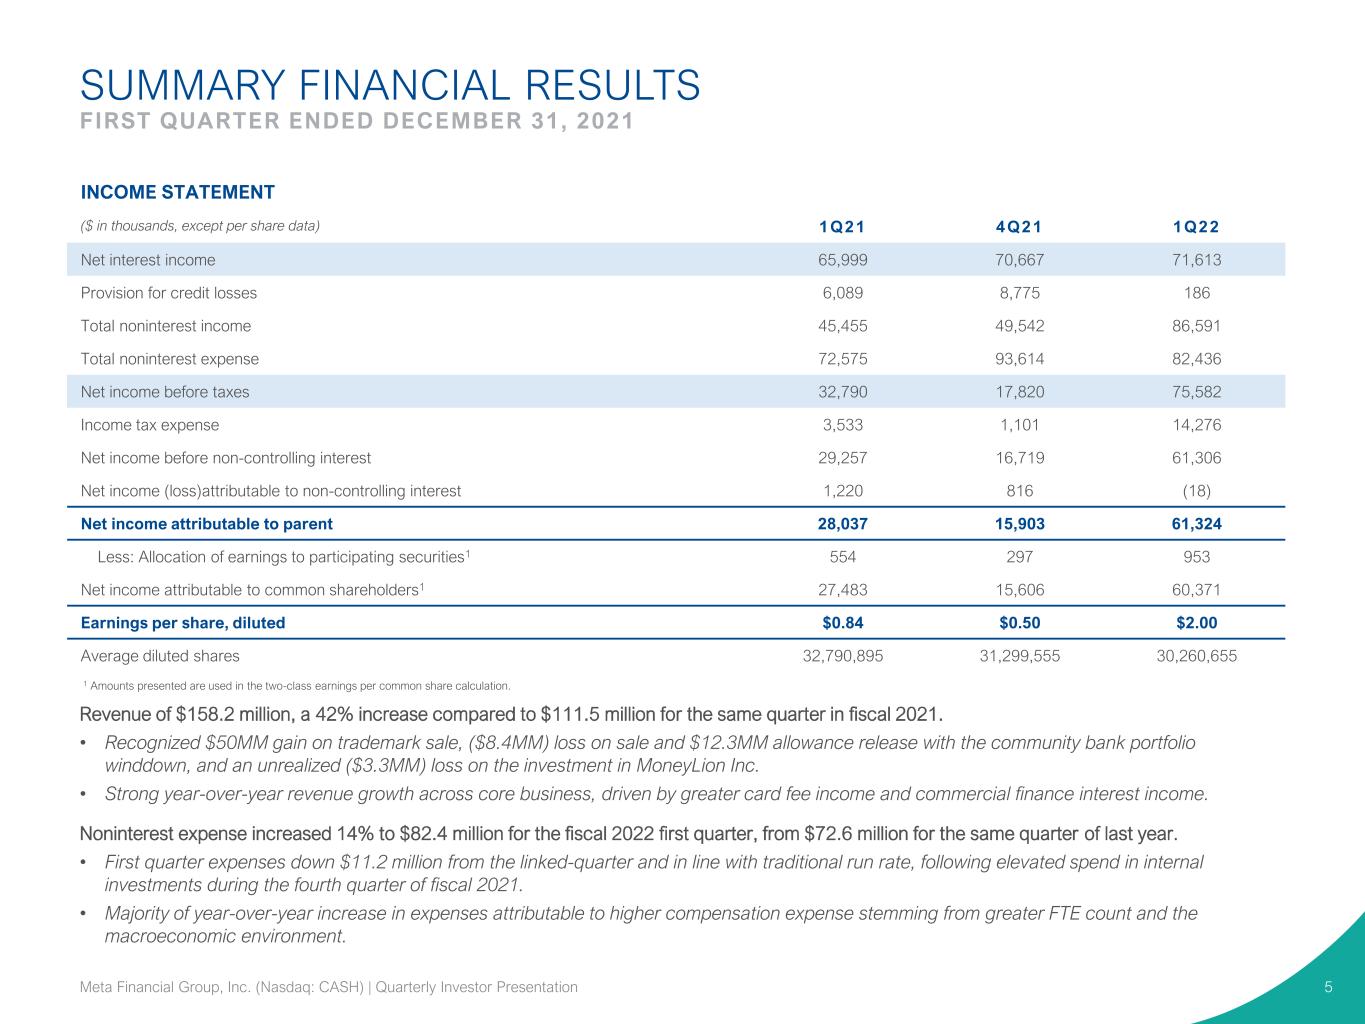
SUMMARY FINANCIAL RESULTS FIRST QUARTER ENDED DECEMBER 31, 2021 5 1 Amounts presented are used in the two-class earnings per common share calculation. INCOME STATEMENT ($ in thousands, except per share data) 1Q21 4Q21 1Q22 Net interest income 65,999 70,667 71,613 Provision for credit losses 6,089 8,775 186 Total noninterest income 45,455 49,542 86,591 Total noninterest expense 72,575 93,614 82,436 Net income before taxes 32,790 17,820 75,582 Income tax expense 3,533 1,101 14,276 Net income before non-controlling interest 29,257 16,719 61,306 Net income (loss)attributable to non-controlling interest 1,220 816 (18) Net income attributable to parent 28,037 15,903 61,324 Less: Allocation of earnings to participating securities1 554 297 953 Net income attributable to common shareholders1 27,483 15,606 60,371 Earnings per share, diluted $0.84 $0.50 $2.00 Average diluted shares 32,790,895 31,299,555 30,260,655 Revenue of $158.2 million, a 42% increase compared to $111.5 million for the same quarter in fiscal 2021. • Recognized $50MM gain on trademark sale, ($8.4MM) loss on sale and $12.3MM allowance release with the community bank portfolio winddown, and an unrealized ($3.3MM) loss on the investment in MoneyLion Inc. • Strong year-over-year revenue growth across core business, driven by greater card fee income and commercial finance interest income. Noninterest expense increased 14% to $82.4 million for the fiscal 2022 first quarter, from $72.6 million for the same quarter of last year. • First quarter expenses down $11.2 million from the linked-quarter and in line with traditional run rate, following elevated spend in internal investments during the fourth quarter of fiscal 2021. • Majority of year-over-year increase in expenses attributable to higher compensation expense stemming from greater FTE count and the macroeconomic environment. Meta Financial Group, Inc. (Nasdaq: CASH) | Quarterly Investor Presentation

$- $5.0 $10.0 $15.0 $20.0 $25.0 $30.0 $35.0 $40.0 1Q21 4Q21 1Q22 Payments Tax Services Consumer Lending BaaS CAPABILITIES GENERATE INCREASING LOW-COST DEPOSITS AND REVENUE 6 Growth in BaaS revenue Average Payments Deposits* ($ in billions) 27% 27% 22% % of Total Revenue % of Payments Revenue ($ in millions) $5.07 $5.89 $5.74 1Q21 4Q21 1Q22 *Deposit growth includes stimulus-related deposits as a result of Economic Impact Payments (“EIP”) disbursed in 2020 and 2021. **Banking Services includes ATM, ACH/Faster Payments, Merchant Acquiring Growth in BaaS deposits Banking Services** Checking Prepaid 12% 10% 78% Meta Financial Group, Inc. (Nasdaq: CASH) | Quarterly Investor Presentation 10% 11% 79% 11% 10% 79%
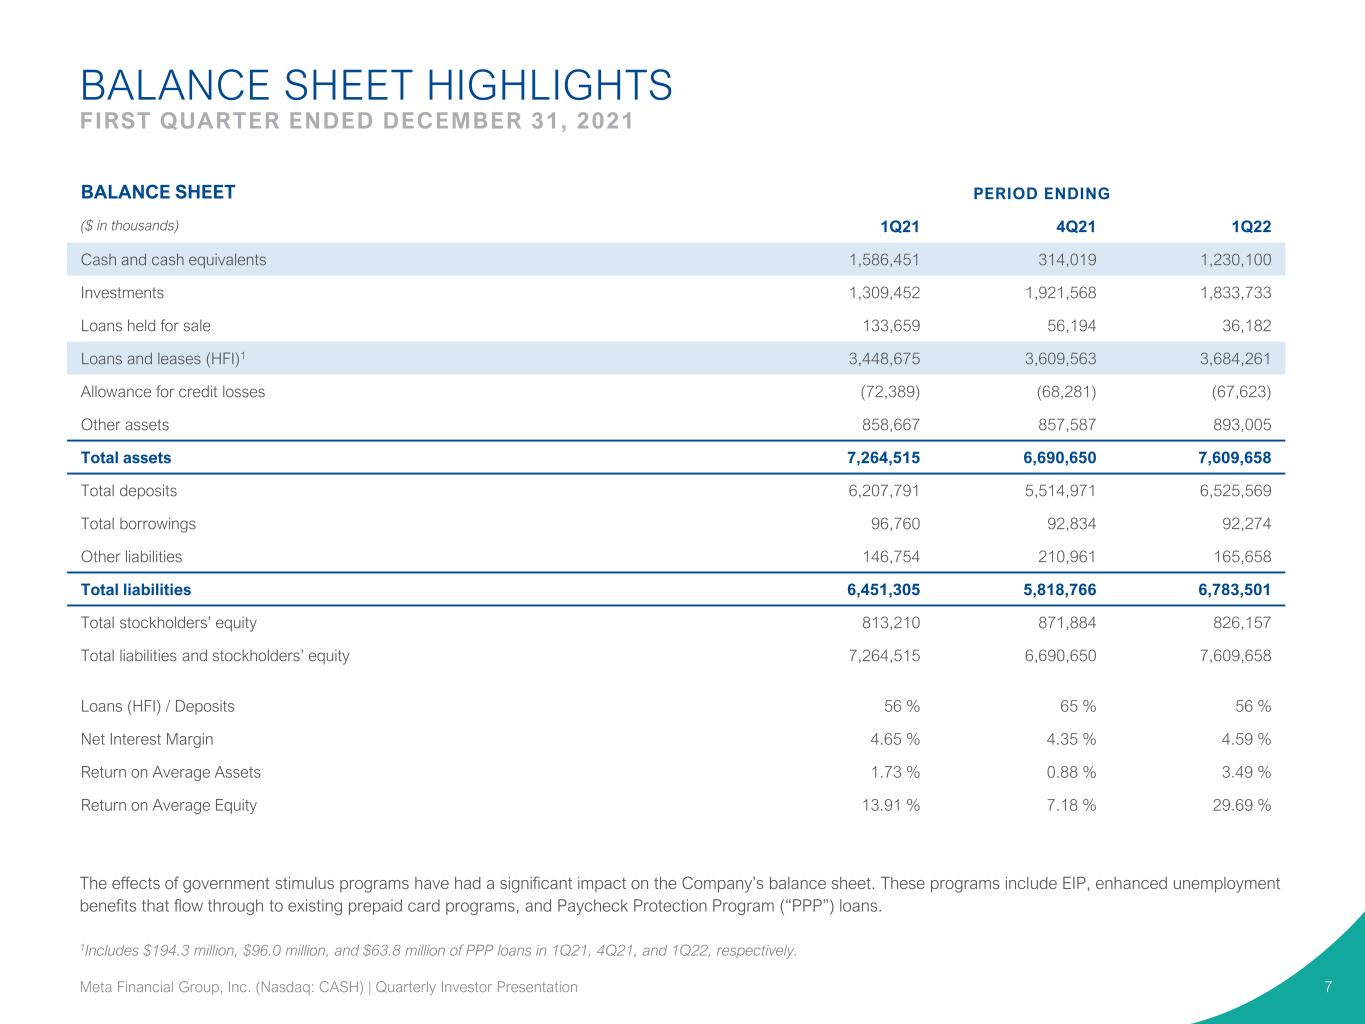
BALANCE SHEET HIGHLIGHTS FIRST QUARTER ENDED DECEMBER 31, 2021 7 BALANCE SHEET PERIOD ENDING ($ in thousands) 1Q21 4Q21 1Q22 Cash and cash equivalents 1,586,451 314,019 1,230,100 Investments 1,309,452 1,921,568 1,833,733 Loans held for sale 133,659 56,194 36,182 Loans and leases (HFI)1 3,448,675 3,609,563 3,684,261 Allowance for credit losses (72,389) (68,281) (67,623) Other assets 858,667 857,587 893,005 Total assets 7,264,515 6,690,650 7,609,658 Total deposits 6,207,791 5,514,971 6,525,569 Total borrowings 96,760 92,834 92,274 Other liabilities 146,754 210,961 165,658 Total liabilities 6,451,305 5,818,766 6,783,501 Total stockholders’ equity 813,210 871,884 826,157 Total liabilities and stockholders’ equity 7,264,515 6,690,650 7,609,658 Loans (HFI) / Deposits 56 % 65 % 56 % Net Interest Margin 4.65 % 4.35 % 4.59 % Return on Average Assets 1.73 % 0.88 % 3.49 % Return on Average Equity 13.91 % 7.18 % 29.69 % 1Includes $194.3 million, $96.0 million, and $63.8 million of PPP loans in 1Q21, 4Q21, and 1Q22, respectively. The effects of government stimulus programs have had a significant impact on the Company’s balance sheet. These programs include EIP, enhanced unemployment benefits that flow through to existing prepaid card programs, and Paycheck Protection Program (“PPP”) loans. Meta Financial Group, Inc. (Nasdaq: CASH) | Quarterly Investor Presentation
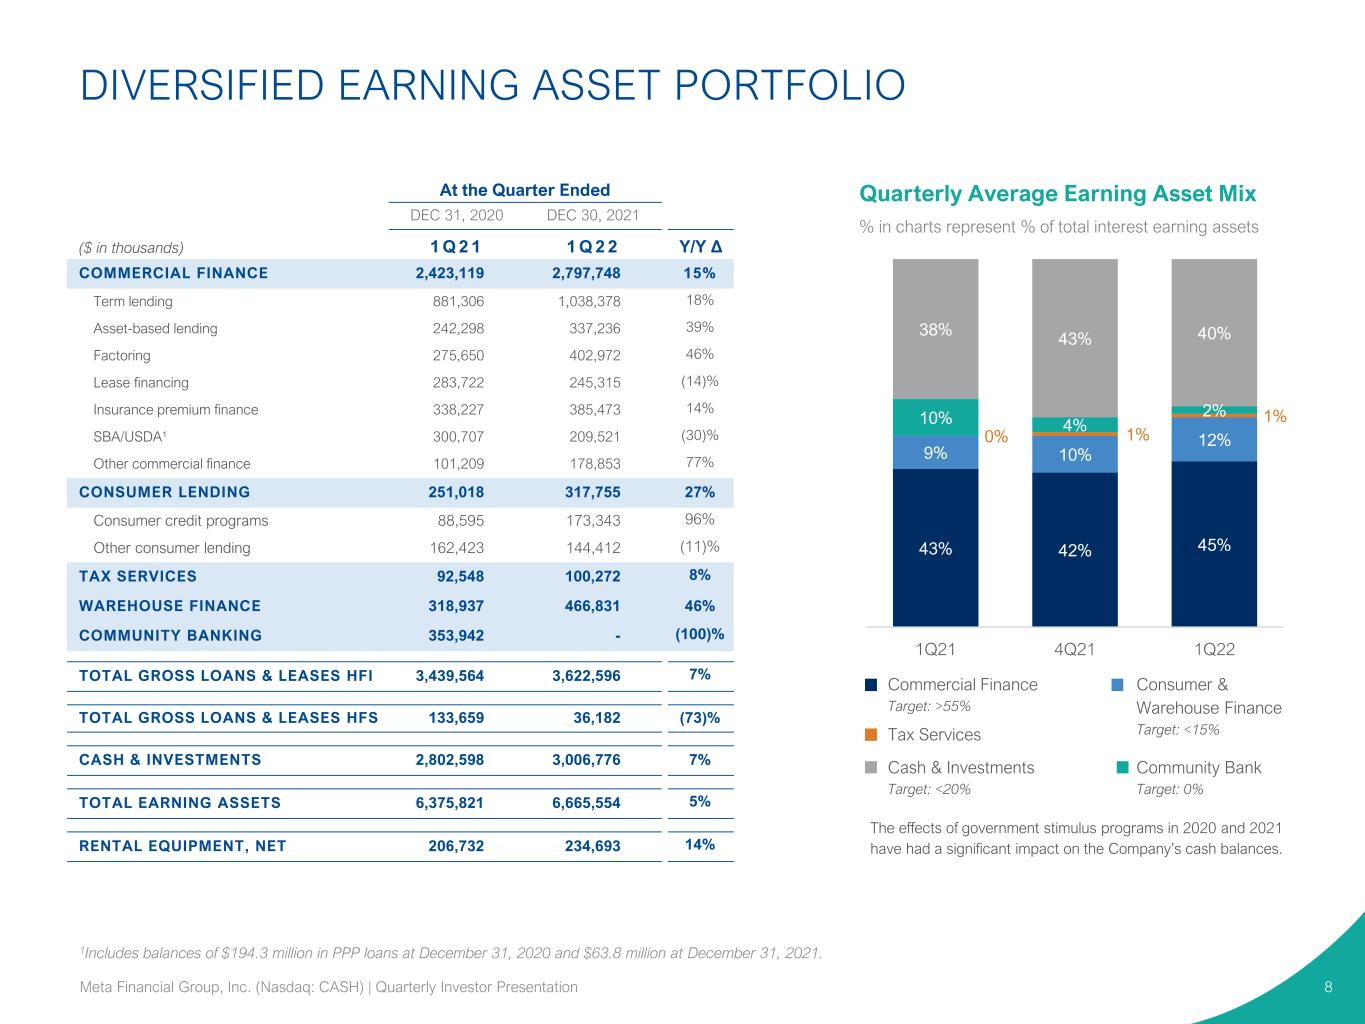
Quarterly Average Earning Asset Mix % in charts represent % of total interest earning assets At the Quarter Ended DEC 31, 2020 DEC 30, 2021 ($ in thousands) 1 Q 2 1 1 Q 2 2 Y/Y Δ COMMERCIAL FINANCE 2,423,119 2,797,748 15% Term lending 881,306 1,038,378 18% Asset-based lending 242,298 337,236 39% Factoring 275,650 402,972 46% Lease financing 283,722 245,315 (14)% Insurance premium finance 338,227 385,473 14% SBA/USDA¹ 300,707 209,521 (30)% Other commercial finance 101,209 178,853 77% CONSUMER LENDING 251,018 317,755 27% Consumer credit programs 88,595 173,343 96% Other consumer lending 162,423 144,412 (11)% TAX SERVICES 92,548 100,272 8% WAREHOUSE FINANCE 318,937 466,831 46% COMMUNITY BANKING 353,942 - (100)% TOTAL GROSS LOANS & LEASES HFI 3,439,564 3,622,596 7% TOTAL GROSS LOANS & LEASES HFS 133,659 36,182 (73)% CASH & INVESTMENTS 2,802,598 3,006,776 7% TOTAL EARNING ASSETS 6,375,821 6,665,554 5% RENTAL EQUIPMENT, NET 206,732 234,693 14% 1Includes balances of $194.3 million in PPP loans at December 31, 2020 and $63.8 million at December 31, 2021. DIVERSIFIED EARNING ASSET PORTFOLIO 8 43% 42% 45% 9% 10% 12%0% 1% 1%10% 4% 2% 38% 43% 40% 1Q21 4Q21 1Q22 Commercial Finance Target: >55% Consumer & Warehouse Finance Target: <15%Tax Services Community Bank Target: 0% Cash & Investments Target: <20% The effects of government stimulus programs in 2020 and 2021 have had a significant impact on the Company’s cash balances. Meta Financial Group, Inc. (Nasdaq: CASH) | Quarterly Investor Presentation
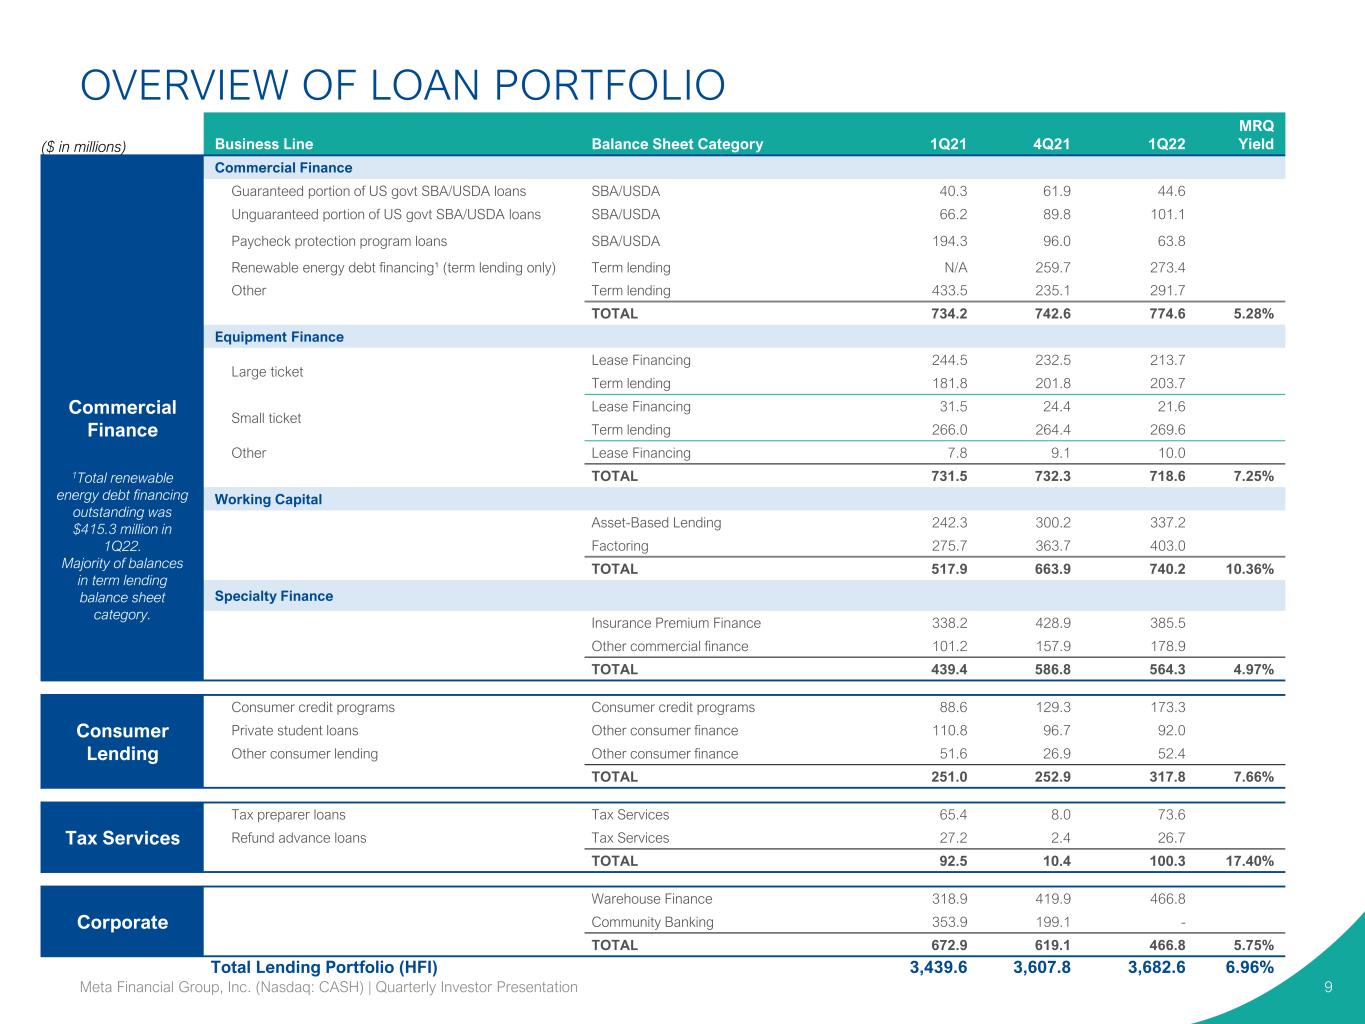
OVERVIEW OF LOAN PORTFOLIO 9 ($ in millions) Business Line Balance Sheet Category 1Q21 4Q21 1Q22 MRQ Yield Commercial Finance Commercial Finance Guaranteed portion of US govt SBA/USDA loans SBA/USDA 40.3 61.9 44.6 Unguaranteed portion of US govt SBA/USDA loans SBA/USDA 66.2 89.8 101.1 Paycheck protection program loans SBA/USDA 194.3 96.0 63.8 Renewable energy debt financing¹ (term lending only) Term lending N/A 259.7 273.4 Other Term lending 433.5 235.1 291.7 TOTAL 734.2 742.6 774.6 5.28% Equipment Finance Large ticket Lease Financing 244.5 232.5 213.7 Term lending 181.8 201.8 203.7 Small ticket Lease Financing 31.5 24.4 21.6 Term lending 266.0 264.4 269.6 Other Lease Financing 7.8 9.1 10.0 TOTAL 731.5 732.3 718.6 7.25% Working Capital Asset-Based Lending 242.3 300.2 337.2 Factoring 275.7 363.7 403.0 TOTAL 517.9 663.9 740.2 10.36% Specialty Finance Insurance Premium Finance 338.2 428.9 385.5 Other commercial finance 101.2 157.9 178.9 TOTAL 439.4 586.8 564.3 4.97% Consumer Lending Consumer credit programs Consumer credit programs 88.6 129.3 173.3 Private student loans Other consumer finance 110.8 96.7 92.0 Other consumer lending Other consumer finance 51.6 26.9 52.4 TOTAL 251.0 252.9 317.8 7.66% Tax Services Tax preparer loans Tax Services 65.4 8.0 73.6 Refund advance loans Tax Services 27.2 2.4 26.7 TOTAL 92.5 10.4 100.3 17.40% Corporate Warehouse Finance 318.9 419.9 466.8 Community Banking 353.9 199.1 - TOTAL 672.9 619.1 466.8 5.75% Total Lending Portfolio (HFI) 3,439.6 3,607.8 3,682.6 6.96% Meta Financial Group, Inc. (Nasdaq: CASH) | Quarterly Investor Presentation 1Total renewable energy debt financing outstanding was $415.3 million in 1Q22. Majority of balances in term lending balance sheet category.
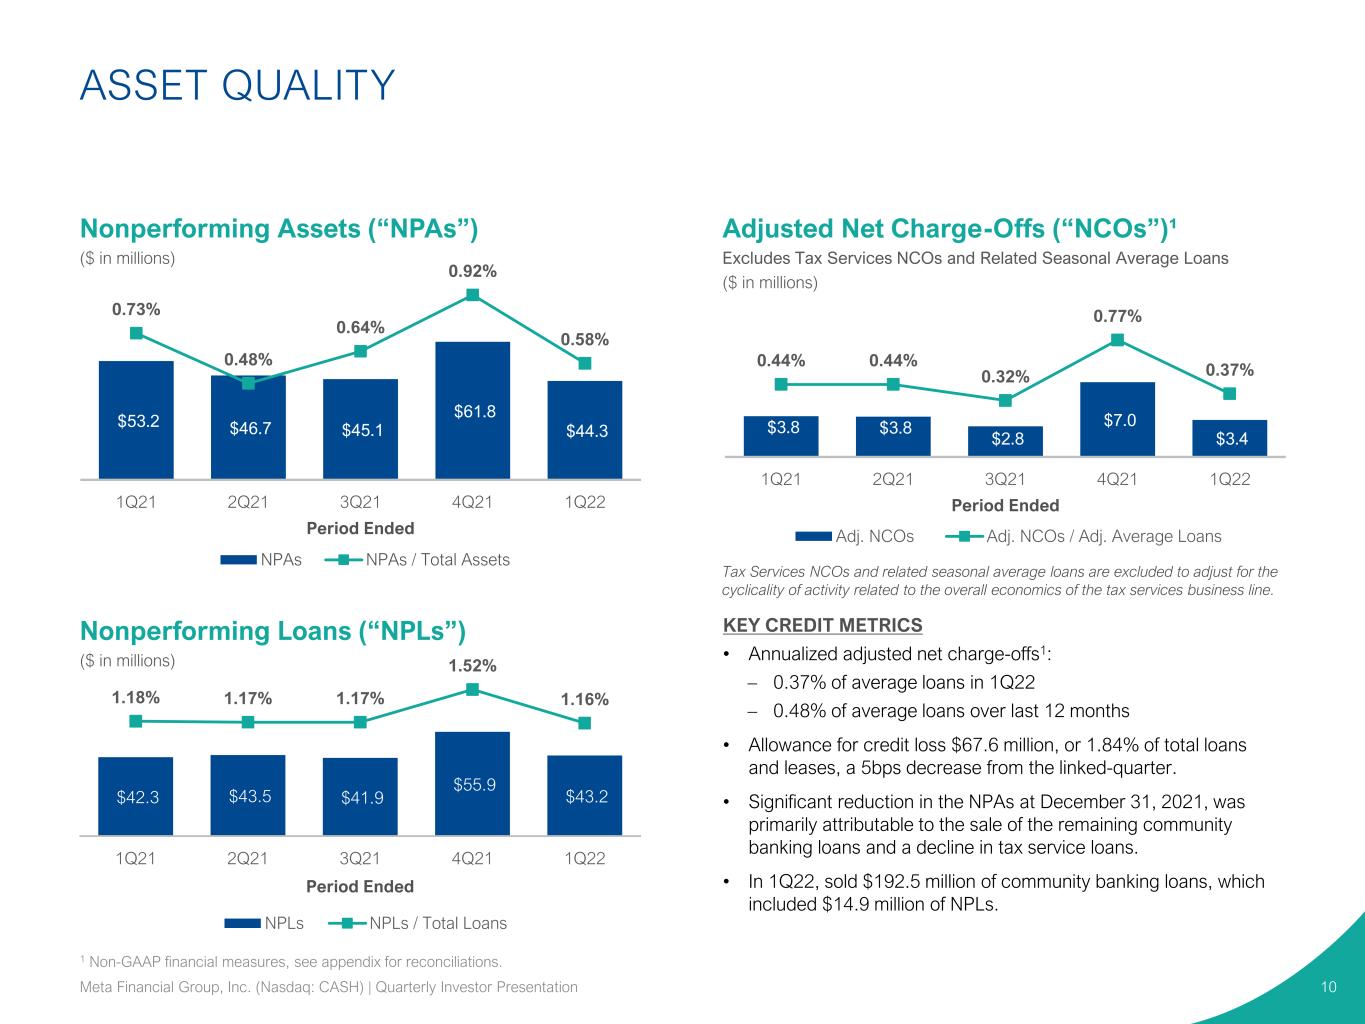
$3.8 $3.8 $2.8 $7.0 $3.4 0.44% 0.44% 0.32% 0.77% 0.37% 1Q21 2Q21 3Q21 4Q21 1Q22 Period Ended Adj. NCOs Adj. NCOs / Adj. Average Loans Adjusted Net Charge-Offs (“NCOs”)¹ Excludes Tax Services NCOs and Related Seasonal Average Loans ($ in millions) KEY CREDIT METRICS • Annualized adjusted net charge-offs1: – 0.37% of average loans in 1Q22 – 0.48% of average loans over last 12 months • Allowance for credit loss $67.6 million, or 1.84% of total loans and leases, a 5bps decrease from the linked-quarter. • Significant reduction in the NPAs at December 31, 2021, was primarily attributable to the sale of the remaining community banking loans and a decline in tax service loans. • In 1Q22, sold $192.5 million of community banking loans, which included $14.9 million of NPLs. $53.2 $46.7 $45.1 $61.8 $44.3 0.73% 0.48% 0.64% 0.92% 0.58% 1Q21 2Q21 3Q21 4Q21 1Q22 Period Ended NPAs NPAs / Total Assets ASSET QUALITY 10 1 Non-GAAP financial measures, see appendix for reconciliations. Tax Services NCOs and related seasonal average loans are excluded to adjust for the cyclicality of activity related to the overall economics of the tax services business line. $42.3 $43.5 $41.9 $55.9 $43.2 1.18% 1.17% 1.17% 1.52% 1.16% 1Q21 2Q21 3Q21 4Q21 1Q22 Period Ended NPLs NPLs / Total Loans Nonperforming Assets (“NPAs”) ($ in millions) Nonperforming Loans (“NPLs”) ($ in millions) Meta Financial Group, Inc. (Nasdaq: CASH) | Quarterly Investor Presentation
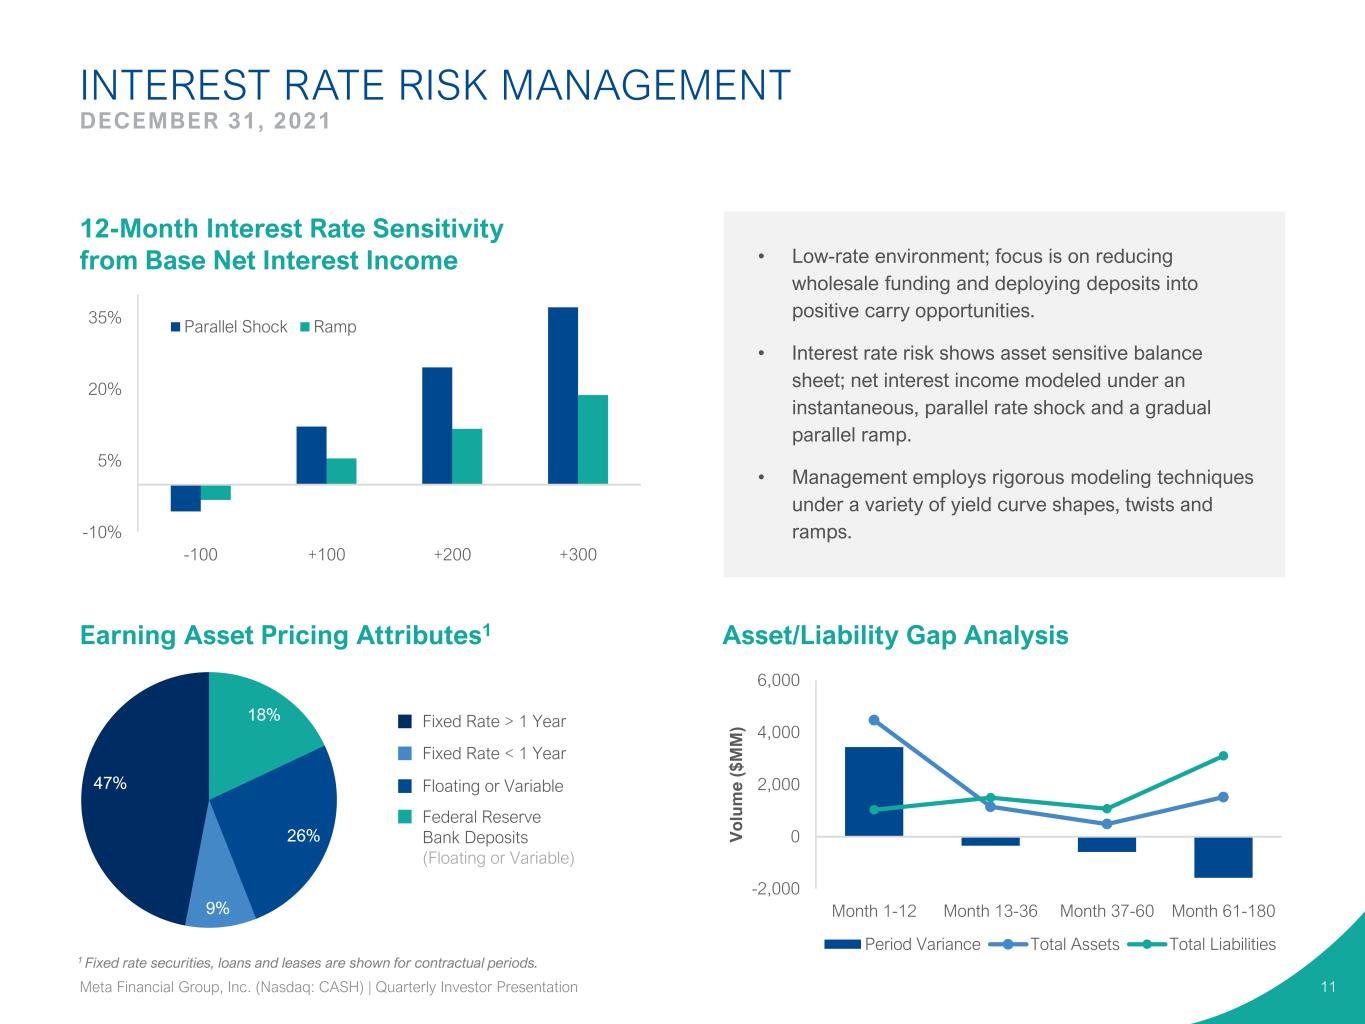
-10% 5% 20% 35% -100 +100 +200 +300 Parallel Shock Ramp 1 Fixed rate securities, loans and leases are shown for contractual periods. -2,000 0 2,000 4,000 6,000 Month 1-12 Month 13-36 Month 37-60 Month 61-180 V o lu m e ( $ M M ) Period Variance Total Assets Total Liabilities INTEREST RATE RISK MANAGEMENT DECEMBER 31, 2021 11 18% 26% 9% 47% • Low-rate environment; focus is on reducing wholesale funding and deploying deposits into positive carry opportunities. • Interest rate risk shows asset sensitive balance sheet; net interest income modeled under an instantaneous, parallel rate shock and a gradual parallel ramp. • Management employs rigorous modeling techniques under a variety of yield curve shapes, twists and ramps. Fixed Rate > 1 Year 12-Month Interest Rate Sensitivity from Base Net Interest Income Earning Asset Pricing Attributes1 Asset/Liability Gap Analysis Fixed Rate < 1 Year Floating or Variable Federal Reserve Bank Deposits (Floating or Variable) Meta Financial Group, Inc. (Nasdaq: CASH) | Quarterly Investor Presentation
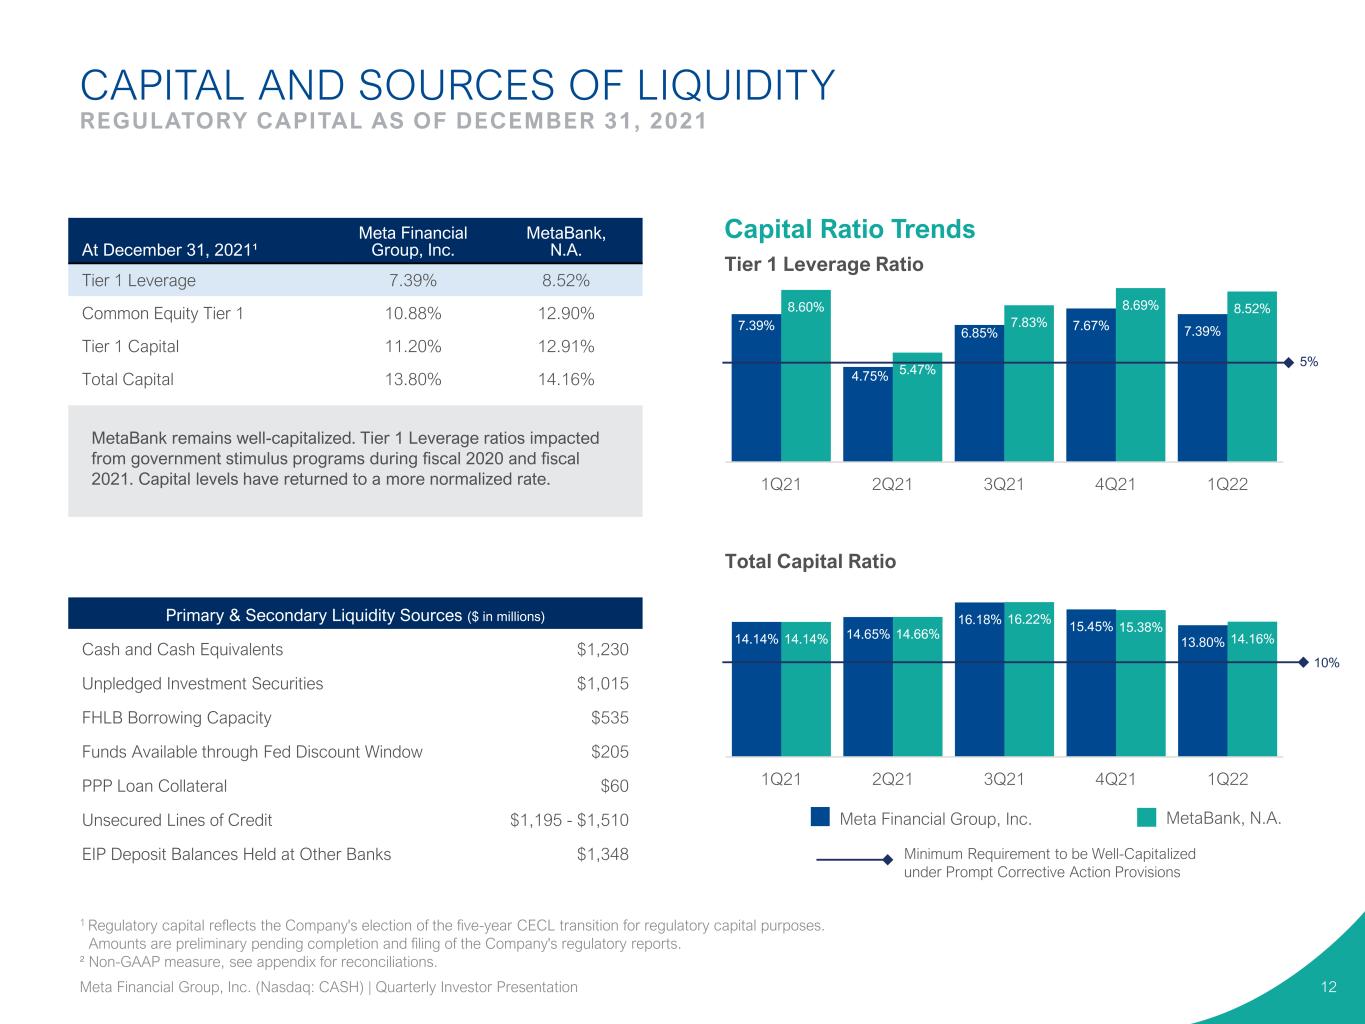
7.39% 4.75% 6.85% 7.67% 7.39% 8.60% 5.47% 7.83% 8.69% 8.52% 1Q21 2Q21 3Q21 4Q21 1Q22 CAPITAL AND SOURCES OF LIQUIDITY REGULATORY CAPITAL AS OF DECEMBER 31, 2021 Minimum Requirement to be Well-Capitalized under Prompt Corrective Action Provisions Meta Financial Group, Inc. MetaBank, N.A. Capital Ratio Trends At December 31, 2021¹ Meta Financial Group, Inc. MetaBank, N.A. Tier 1 Leverage 7.39% 8.52% Common Equity Tier 1 10.88% 12.90% Tier 1 Capital 11.20% 12.91% Total Capital 13.80% 14.16% MetaBank remains well-capitalized. Tier 1 Leverage ratios impacted from government stimulus programs during fiscal 2020 and fiscal 2021. Capital levels have returned to a more normalized rate. Primary & Secondary Liquidity Sources ($ in millions) Cash and Cash Equivalents $1,230 Unpledged Investment Securities $1,015 FHLB Borrowing Capacity $535 Funds Available through Fed Discount Window $205 PPP Loan Collateral $60 Unsecured Lines of Credit $1,195 - $1,510 EIP Deposit Balances Held at Other Banks $1,348 14.14% 14.65% 16.18% 15.45% 13.80%14.14% 14.66% 16.22% 15.38% 14.16% 1Q21 2Q21 3Q21 4Q21 1Q22 10% 5% 12 Total Capital Ratio Tier 1 Leverage Ratio 1 Regulatory capital reflects the Company's election of the five-year CECL transition for regulatory capital purposes. Amounts are preliminary pending completion and filing of the Company's regulatory reports. ² Non-GAAP measure, see appendix for reconciliations. Meta Financial Group, Inc. (Nasdaq: CASH) | Quarterly Investor Presentation
APPENDIX 13Meta Financial Group, Inc. (Nasdaq: CASH) | Quarterly Investor Presentation
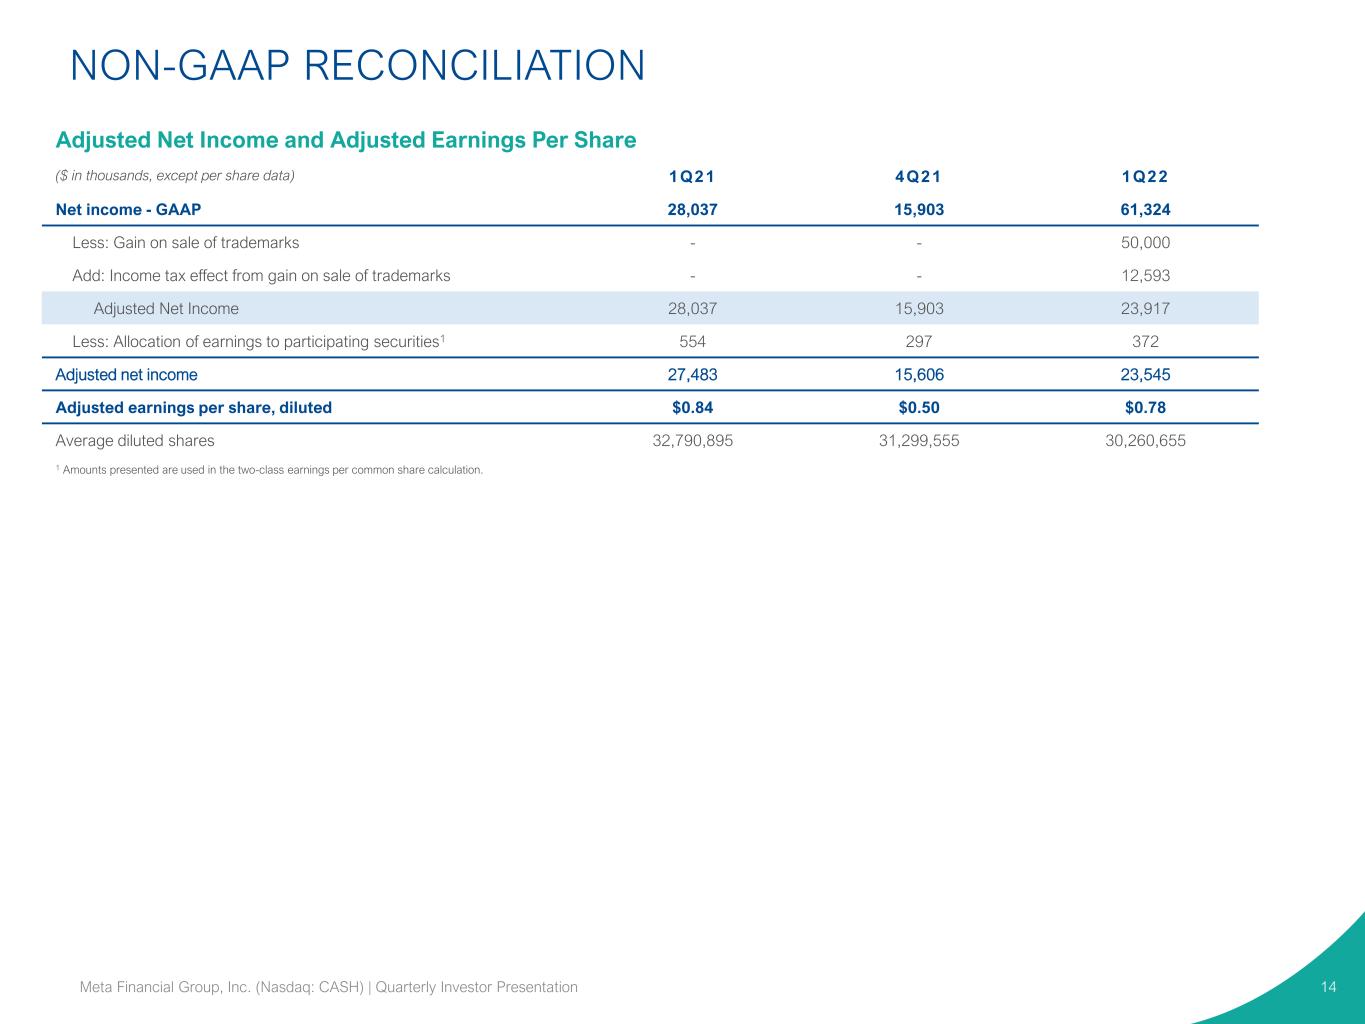
NON-GAAP RECONCILIATION 14Meta Financial Group, Inc. (Nasdaq: CASH) | Quarterly Investor Presentation Adjusted Net Income and Adjusted Earnings Per Share ($ in thousands, except per share data) 1Q21 4Q21 1Q22 Net income - GAAP 28,037 15,903 61,324 Less: Gain on sale of trademarks - - 50,000 Add: Income tax effect from gain on sale of trademarks - - 12,593 Adjusted Net Income 28,037 15,903 23,917 Less: Allocation of earnings to participating securities1 554 297 372 Adjusted net income 27,483 15,606 23,545 Adjusted earnings per share, diluted $0.84 $0.50 $0.78 Average diluted shares 32,790,895 31,299,555 30,260,655 1 Amounts presented are used in the two-class earnings per common share calculation.
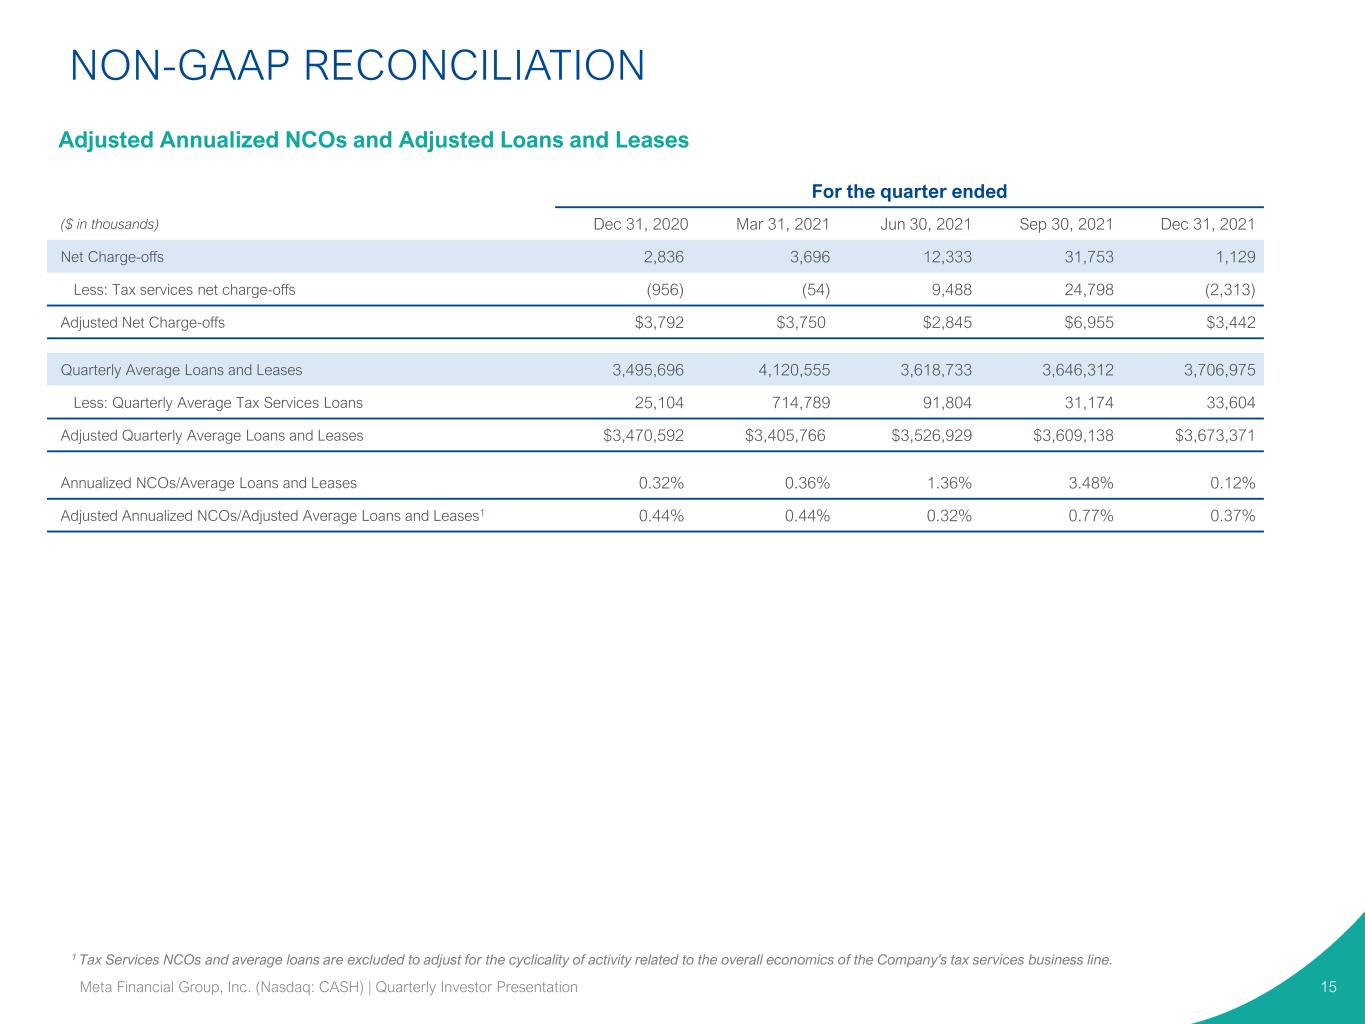
1 Tax Services NCOs and average loans are excluded to adjust for the cyclicality of activity related to the overall economics of the Company's tax services business line. 15 For the quarter ended ($ in thousands) Dec 31, 2020 Mar 31, 2021 Jun 30, 2021 Sep 30, 2021 Dec 31, 2021 Net Charge-offs 2,836 3,696 12,333 31,753 1,129 Less: Tax services net charge-offs (956) (54) 9,488 24,798 (2,313) Adjusted Net Charge-offs $3,792 $3,750 $2,845 $6,955 $3,442 Quarterly Average Loans and Leases 3,495,696 4,120,555 3,618,733 3,646,312 3,706,975 Less: Quarterly Average Tax Services Loans 25,104 714,789 91,804 31,174 33,604 Adjusted Quarterly Average Loans and Leases $3,470,592 $3,405,766 $3,526,929 $3,609,138 $3,673,371 Annualized NCOs/Average Loans and Leases 0.32% 0.36% 1.36% 3.48% 0.12% Adjusted Annualized NCOs/Adjusted Average Loans and Leases1 0.44% 0.44% 0.32% 0.77% 0.37% Meta Financial Group, Inc. (Nasdaq: CASH) | Quarterly Investor Presentation NON-GAAP RECONCILIATION Adjusted Annualized NCOs and Adjusted Loans and Leases

FINANCIAL MEASURE RECONCILIATIONS 16Meta Financial Group, Inc. (Nasdaq: CASH) | Quarterly Investor Presentation For the last twelve months ended ($ in thousands) Dec 31, 2020 Mar 31, 2021 Jun 30, 2021 Sep 30, 2021 Dec 31, 2021 Noninterest Expense - GAAP 315,828 320,070 330,352 343,683 353,544 Net Interest Income 260,368 266,499 272,837 278,991 284,605 Noninterest Income 247,766 240,706 262,111 270,903 312,039 Total Revenue: GAAP 508,152 507,205 534,948 549,894 596,644 Efficiency Ratio, LTM 62.15% 63.10% 61.75% 62.50% 59.26% For the last twelve months ended ($ in thousands) Dec 31, 2020 Mar 31, 2021 Jun 30, 2021 Sep 30, 2021 Dec 31, 2021 Noninterest Expense - GAAP 315,828 320,070 330,352 343,683 353,544 Net Interest Income 260,368 266,499 272,837 278,991 284,605 Noninterest Income 247,766 240,706 262,111 270,903 312,039 Less: Gain on sale of trademarks - - - - 50,000 Total Revenue: GAAP 508,152 507,205 534,948 549,894 546,644 Efficiency Ratio, LTM 62.15% 63.10% 61.75% 62.50% 64.68% Efficiency Ratio Adjusted Efficiency Ratio


