The following table presents for the periods indicated the total dollar amount of interest income from average interest-earning assets and the resultant yields, as well as the interest expense on average interest-bearing liabilities, expressed both in dollars and rates. No tax equivalent adjustments have been made. Non-accruing loans have been included in the table as loans carrying a zero yield.
Interest expense increased $3,443,000, or 18.7%, to $21,854,000 for the year ended September 30, 2005 from $18,411,000 for the 2004. Interest expense on deposits increased by $2,441,000, due primarily to an increase in the average rates paid on interest-bearing deposits during the period to 2.65% from 2.13%, and to a $1,801,000 increase in the average balance of interest-bearing deposits between the periods. The average balance of non-interest bearing deposits increased by $15,375,000 which resulted in an increase of $17,176,000 in the average balance of deposits. Interest expense on FHLB advances and other borrowings increased by $1,002,000 during the period, due to an increase in the average cost to 3.94% from 3.48%, which was partially offset by a decrease of $4,427,000 in the average balance outstanding during the period.
The provision for loan losses for the year ended September 30, 2005 was $5,482,000 compared to $489,000 for the same period in 2004. The primary reason for the significant increase in the provision for loan losses was the problem credits discussed earlier in “Corporate Developments in 2005”. Management believes that, based on a detailed review of the loan portfolio, historic loan losses, current economic conditions, growth of the loan portfolio, and other factors, the current level of provision for loan losses, and the resulting level of the allowance for loan losses, reflects an adequate allowance against probable losses from the loan portfolio at such date.
Economic conditions in the agricultural sector of the Company’s market areas are currently strong and stable. In 2005, above average yields offset modest deterioration in commodity prices. The agricultural economy is accustomed to commodity price fluctuations and is generally able to handle such fluctuations without significant problem. Higher petroleum prices had some dampening effect on 2005 profits and could cause more of a negative impact on profits in 2006 and beyond due to price increases in chemicals used in agricultural production. Increased interest rates will also be a negative factor for the agricultural sector. Should there be an extended period of low commodity prices, the Company’s agricultural loan portfolio could weaken and create a need for the Company to increase its allowance for loan losses through increased charges to provision for loan losses.
During recent years, the Company has increased its origination of multi-family, commercial real estate and commercial business loans. The Company anticipates activity in this type of lending to continue in future years. While generally carrying higher rates,
Meta Financial Group, Inc. and Subsidiaries
MANAGEMENT’S DISCUSSION AND ANALYSIS
this lending activity is considered to carry a higher level of risk due to the nature of the collateral and the size of individual loans.
Furthermore, although the Company maintains its allowance for loan losses at a level that it considers to be adequate, investors and others are cautioned that there can be no assurance that future losses will not exceed estimated amounts, or that additional provisions for loan losses will not be required in future periods. In addition, the Company’s determination of the allowance for loan losses is subject to review by its regulatory agencies, which can require the establishment of additional general or specific allowances.
NON-INTEREST INCOME
Non-interest income increased by $135,000, or 3.8%, to $3,731,000 for the year ended September 30, 2005 from $3,596,000 for the same period in 2004. The increase in non-interest income is primarily the result of an increase in other income of $1,408,000 and an increase in fees on deposits of $56,000. These increases were substantially offset by a non-recurring gain of $1,113,000 on the sale of a branch office during 2004, a decrease in the gain on sale of loans of $54,000, a decrease in the return on Bank Owned Life Insurance of $52,000 and a net loss of $19,000 on the sales of securities available for sale. The increase in other income was due to fee income generated by the Meta Payment Systems division of MetaBank, which totaled $1,591,000 for 2005, compared to $7,000 for 2004. The increase in deposit fees is primarily the result of an increase in transaction account balances in 2005 compared to 2004. The decrease in gain on the sale of loans reflects a lower volume of originations of 1-to-4 family, fixed rate loans during the year due to the slow down in the mortgage-refinancing market resulting from increased market rates. It is anticipated that fiscal 2006 will produce significant continued growth in fee income from Meta Payment Systems and an increase in deposit related service charges with continued growth in checking balances. Gains on the sale of loans will likely be flat due to current interest rate environment.
NON-INTEREST EXPENSE
Non-interest expense increased by $4,266,000, or 28.8%, to $19,097,000 for the year ended September 30, 2005 from $14,831,000 for the same period in 2004.The increase in non-interest expense primarily reflects the costs associated with the start-up of operations for Meta Payment Systems, costs related to the process of changing corporate names, costs associated with the liquidation of the repossessed assets and foreclosed real estate arising from the loans discussed in “Corporate Developments in 2005”, a full year of operations of the second Sioux Falls office ( which opened late in fiscal 2004), the opening of a third office and preparation for opening a fourth office in Sioux Falls, South Dakota, and additional staffing in the lending departments.
INCOME TAX EXPENSE
Due to the net loss for the year ended September 30, 2005, the Company recorded a benefit of $685,000, compared to an expense of $2,059,000 for the year ended September 30, 2004. The increase in income taxes is reflective of the change in operating result between the comparable periods.
COMPARISON OF OPERATING RESULTS FOR THE YEARS ENDED SEPTEMBER 30, 2004 AND SEPTEMBER 30, 2003
GENERAL
Net income for the year ended September 30, 2004 increased $590,000, or 17.4%, to $3,987,000, from $3,397,000 for the same period ended September 30, 2003. The increase in net income reflects an increase in net interest income and a small increase in non-interest income, which were partially offset by an increase in non-interest expense and a small increase in provision for loan losses.
NET INTEREST INCOME
Net interest income for the year ended September 30, 2004 increased by $2,041,000, or 13.0%, to $17,769,000 compared to $15,728,000 for the period ended September 30, 2003. The increase in net interest income reflects a $60.9 million increase in the average balance of interest-earning assets, and an increase in the net yield on average earning assets. The net yield on average earning assets increased to 2.40% for the period ended September 30, 2004 from 2.31% for the same period in 2003. The increase in net yield on average earning assets was due primarily to balance sheet growth during the year as the result of the growth in loans receivable. The average interest rate spread between loans and deposits increased to 4.35% for the fiscal year ended September 30, 2004 from 4.29% for the previous year. The increase in spread reflects a reduction in the average cost of deposits due to an increase in the level of lower cost transactional deposit accounts and an increased percentage of originated commercial loans at relatively higher yields during the period. Interest rates, particularly at the shorter end of the yield curve, increased during the last half of fiscal 2004.
INTEREST AND DIVIDEND INCOME
Interest and dividend income for the year ended September 30, 2004 increased $1,001,000, or 2.8%, to $36,180,000 from $35,179,000 for the same period in 2003. The increase was due primarily to an increase of $840,000 in interest and dividends on investments which was the result of an increase of $30,366,000 in the average balance of these assets during the period. Additionally, there was an increase of $161,000 in interest income from loans receivable which was the result of an increase of $30,571,000 in the average balance of loans receivable during the period. The yield on loans receivable decreased by .53% during the period, which partially offset the increase in income from the higher average balance.
INTEREST EXPENSE
Interest expense decreased $1,040,000, or 5.3%, to $18,411,000 for the year ended September 30, 2004 from $19,451,000 for the 2003. Interest expense on deposits decreased by $851,000 due primarily to a decrease in the average rates paid on deposits during the period from 2.72% to 2.13%, which was partially offset by a $67,804,000 increase in the average balance of deposits between the periods. Interest expense on FHLB advances and other borrowings decreased by $188,000 during the period, due to a decrease of $12,748,000 in the average balance outstanding during the period, which was partially offset by an increase in the average cost from 3.38% to 3.48%.
PROVISION FOR LOAN LOSSES
The provision for loan losses for the year ended September 30, 2004 was $489,000 compared to $350,000 for the same period in 2003. Management believes that, based on a detailed review of the loan portfolio, historic loan losses, current economic conditions, growth of the loan portfolio, and other factors, the current level of provision for loan losses, and the resulting level of the allowance for loan losses, reflects an adequate allowance against probable losses from the loan portfolio at such date.
NON-INTEREST INCOME
Non-interest income increased by $41,000, or 1.1%, to $3,596,000 for the year ended September 30, 2004 from $3,555,000 for the same period in 2003. The increase in non-interest income was the result of the sale of the Company’s branch office in Manson, Iowa, which resulted in a profit of $1,113,000. This profit was substantially offset by decreases in gain on the sale of loans, gain on sales of securities available for sale, deposit service charges and other income, which decreased by $661,000, $242,000, $49,000 and $57,000, respectively. The decrease in gain on the sale of loans reflects a lower volume of originations of 1-to-4 family, fixed rate loans during
7
Meta Financial Group, Inc. and Subsidiaries
MANAGEMENT’S DISCUSSION AND ANALYSIS
the year due to the slow down in the mortgage-refinancing market. The decrease in the gain on sale of securities available for sale is due to no security sales having taken place during the year. The decrease in other non-interest income was the result of a non-recurring gain of $177,000 during the previous fiscal year on the sale of a building formerly used as a drive up facility.
NON-INTEREST EXPENSE
Non-interest expense increased by $972,000, or 7.0%, to $14,831,000 for the year ended September 30, 2004 from $13,858,000 for the same period in 2003.The increase in non-interest expense primarily reflects the costs associated with the startup of operations for Meta Payment Systems, opening of the second banking office in Sioux Falls, South Dakota, and additional staffing in the lending departments. These increases were partially offset by $501,000 in prepayment fees associated with the early extinguishment of FHLB advances incurred in fiscal 2003, which did not recur in fiscal 2004.
INCOME TAX EXPENSE
Income tax expense increased by $380,000, or 22.7%, to $2,059,000 for the year ended September 30, 2004 from $1,678,000 for the same period in 2003. The increase in income tax expense reflects the increase in the level of taxable income between the comparable periods.
CRITICAL ACCOUNTING POLICY
The Company’s financial statements are prepared in accordance with accounting principles generally accepted in the United States of America. The financial information contained within these statements is, to a significant extent, financial information that is based on approximate measures of the financial effects of transactions and events that have already occurred. Based on its consideration of accounting policies that involve the most complex and subjective decisions and assessments, management has identified its most critical accounting policies to be those related to the allowance for loan losses and asset impairment judgments including the recoverability of goodwill.
The Company’s allowance for loan loss methodology incorporates a variety of risk considerations, both quantitative and qualitative in establishing an allowance for loan loss that management believes is appropriate at each reporting date. Quantitative factors include the Company’s historical loss experience, delinquency and charge-off trends, collateral values, changes in nonperforming loans, and other factors. Quantitative factors also incorporate known information about individual loans, including borrowers’ sensitivity to interest rate movements. Qualitative factors include the general economic environment in the Company’s markets, including economic conditions throughout the Midwest and in particular, the state of certain industries. Size and complexity of individual credits in relation to loan structure, existing loan policies and pace of portfolio growth are other qualitative factors that are considered in the methodology. As the Company adds new products and increases the complexity of its loan portfolio, it will consider enhancing its methodology accordingly. Management may report a materially different amount for the provision for loan losses in the statement of operations to change the allowance for loan losses if its assessment of the above factors changes. This discussion and analysis should be read in conjunction with the Company’s financial statements and the accompanying notes presented elsewhere herein, as well as the portion of this Management’s Discussion and Analysis section entitled “Asset Quality.” Although management believes the levels of the allowance as of both September 30, 2005 and September 30, 2004 were adequate to absorb probable losses inherent in the loan portfolio, a decline in local economic conditions or other factors, could result in increasing losses. (See Notes 1 and 5 of Notes to Consolidated Financial Statements.)
Goodwill represents the excess of acquisition costs over the fair value of the net assets acquired in a purchase acquisition. Goodwill is tested annually for impairment.
ASSET/LIABILITY MANAGEMENT AND MARKET RISK
QUALITATIVE ASPECTS OF MARKET RISK
As stated above, the Company derives its income primarily from the excess of interest collected over interest paid. The rates of interest the Company earns on assets and pays on liabilities generally are established contractually for a period of time. Market interest rates change over time. Accordingly, the Company’s results of operations, like those of most financial institution holding companies and financial institutions, are impacted by changes in interest rates and the interest rate sensitivity of its assets and liabilities. The risk associated with changes in interest rates and the Company’s ability to adapt to these changes is known as interest rate risk and is the Company’s only significant “market” risk.
QUANTITATIVE ASPECTS OF MARKET RISK
In an attempt to manage the Company’s exposure to changes in interest rates and comply with applicable regulations, we monitor the Company’s interest rate risk. In monitoring interest rate risk, we analyze and manage assets and liabilities based on their payment streams and interest rates, the timing of their maturities, and their sensitivity to actual or potential changes in market interest rates.
An asset or liability is interest rate sensitive within a specific time period if it will mature or reprice within that time period. If the Company’s assets mature or reprice more rapidly or to a greater extent than its liabilities, then net portfolio value and net interest income would tend to increase during periods of rising rates and decrease during periods of falling interest rates. Conversely, if the Company’s assets mature or reprice more slowly or to a lesser extent than its liabilities, then net portfolio value and net interest income would tend to decrease during periods of rising interest rates and increase during periods of falling interest rates.
The Company currently focuses lending efforts toward originating and purchasing competitively priced adjustable-rate and fixed-rate loan products with short to intermediate terms to maturity, generally 5 years or less. This theoretically allows the Company to maintain a portfolio of loans that will have relatively little sensitivity to changes in the level of interest rates while providing a reasonable spread to the cost of liabilities used to fund the loans.
The Company’s primary objective for its investment portfolio is to provide the liquidity necessary to meet the funding needs of the loan portfolio. The investment portfolio is also used in the ongoing management of changes to the Company’s asset/liability mix, while contributing to profitability through earnings flow. The investment policy generally calls for funds to be invested among various categories of security types and maturities based upon the Company’s need for liquidity, desire to achieve a proper balance between minimizing risk while maximizing yield, the need to provide collateral for borrowings, and to fulfill the Company’s asset/liability management goals.
The Company’s cost of funds responds to changes in interest rates due to the relatively short-term nature of its deposit portfolio, and due to the relatively short-term nature of a portion of its borrowed funds. Consequently, the results of operations are generally influenced by the level of short-term interest rates. The Company offers a range of maturities on its deposit products at competitive rates and monitors the maturities on an ongoing basis. The Company uses borrowed funds for both the purchase of investment securities and for day-to-day cash management.
The Company emphasizes and promotes its savings, money market, demand and NOW accounts and, subject to market conditions, certificates of deposit with maturities of three months through five years, principally in its primary market area. The savings and NOW accounts tend to be less susceptible to rapid changes in interest rates.
In managing its asset/liability mix, the Company, at times, depending on the relationship between long-term and short-term interest rates, market conditions, and consumer preference, may place somewhat greater emphasis on maximizing its net interest margin than on strictly matching the interest rate sensitivity of its assets and liabilities. Management believes the increased net income that may result from an acceptable
8
Meta Financial Group, Inc. and Subsidiaries
MANAGEMENT’S DISCUSSION AND ANALYSIS
mismatch in the actual maturity or repricing of its asset and liability portfolios can, at times, provide sufficient returns to justify the increased exposure to sudden and unexpected increases in interest rates that may result from such a mismatch. The Company has established limits, which may change from time to time, on the level of acceptable interest rate risk. There can be no assurance, however, that in the event of an adverse change in interest rates, the Company’s efforts to limit interest rate risk will be successful.
NET PORTFOLIO VALUE
The Company uses a net portfolio value (“NPV”) approach to the quantification of interest rate risk. This approach calculates the difference between the present value of expected cash flows from assets and the present value of expected cash flows from liabilities, as well as cash flows from off-balance-sheet contracts. Management of the Company’s assets and liabilities is performed within the context of the marketplace, but also within limits established by the Board of Directors on the amount of change in NPV that is acceptable given certain interest rate changes.
Presented below, as of September 30, 2005 and 2004, is an analysis of the Company’s interest rate risk as measured by changes in NPV for an instantaneous and sustained parallel shift in the yield curve, in 100 basis point increments, up and down 200 basis points. As illustrated in the table, the Company’s NPV at September 30, 2005 was more sensitive to decreasing interest rates than to rising interest rates. This reflects management’s efforts to maintain the Company’s interest rate sensitivity in light of the events since June 2004. During this period the Federal Open Market Committee began to increase short-term interest rates, in twenty-five (25) basis point increments, to a more normal level, from historically low levels. Through November 1, 2005, there have been twelve (12) such increases. As this happened, longer term rates moderated creating a flattening in the yield curve. This action is indicative of limited concern about long-term inflation at this time. While management does not anticipate a significant shift in market interest rates in the near future, it does believe that there is less risk from declining interest rates than from rising interest rates, and interest rate risk management has reflected this belief.
Certain shortcomings are inherent in the method of analysis presented in the table. For example, although certain assets and liabilities may have similar maturities or periods to repricing, they may react in different degrees to changes in market interest rates. Also, the interest rates on certain types of assets and liabilities may fluctuate in advance of changes in market interest rates, while interest rates on other types may lag behind changes in market rates. Additionally, certain assets such as adjustable-rate mortgage loans have features that restrict changes in interest rates on a short-term basis and over the life of the asset. Further, in the event of a change in interest rates, prepayments and early withdrawal levels would likely deviate from those assumed in calculating the table. Finally, the ability of some borrowers to service their debt may decrease in the event of an interest rate increase. The Company considers all of these factors in monitoring its exposure to interest rate risk.
Management reviews the OTS measurements and related peer reports on NPV and interest rate risk on a quarterly basis. In addition to monitoring selected measures of NPV, management also monitors the effects on net interest income resulting from increases or decreases in interest rates. This measure is used in conjunction with NPV measures to identify excessive interest rate risk.
ASSET QUALITY
It is management’s belief, based on information available at fiscal year end, that the Company’s current asset quality is satisfactory. At September 30, 2005, non-performing assets, consisting of non-accruing loans, accruing loans delinquent 90 days or more, restructured loans, foreclosed real estate, and repossessed consumer property, totaled $5,389,000, or 0.69% of total assets, compared to $729,000, or 0.09% of total assets, for the fiscal year ended 2004.
Non-accruing loans at September 30, 2005 include, among others, a commercial loan in the amount of $206,000 secured by a building and an agricultural loan in the amount of $218,000 secured by agricultural land.
Foreclosed real estate and repossessed assets at September 30, 2005 totaled $4,706,000, all of which related to the loans discussed earlier in “Corporate Developments in Fiscal 2005”. Real estate owned amounted to $1,898,000 and repossessed assets, consisting primarily of new and used vehicles, totaled $2,808,000.
The Company maintains an allowance for loan losses because of the potential that some loans may not be repaid in full. (See Note 1 of Notes to Consolidated Financial Statements.) At September 30, 2005, the Company had an allowance for loan losses in the amount of $7,222,000 as compared to $5,371,000 at September 30, 2004. Management’s periodic review of the adequacy of the allowance for loan losses is based on various subjective and objective factors including the Company’s past loss experience, known and inherent risks in the portfolio, adverse situations that may affect the borrower’s ability to repay, the estimated value of any underlying collateral, and current economic conditions. While management may allocate portions of the allowance for specifically identified problem loan situations, the majority of the allowance is based on judgmental factors related to the overall loan portfolio and is available for any loan charge-offs that may occur.
In determining the allowance for loan losses, the Company specifically identifies loans that it considers to have potential collectibility problems. Based on criteria established by Statement of Financial Accounting Standards (SFAS) No. 114, some of these loans are considered to be “impaired” while others are not considered to be impaired, but possess weaknesses that the Company believes merit additional analysis in establishing the allowance for loan losses. All other loans are evaluated by applying estimated loss ratios to various pools of loans. The Company then analyzes other factors (such as economic conditions) in determining the aggregate amount of the allowance needed.
At September 30, 2005, $251,000 of the allowance for loan losses was allocated to impaired loans (See Note 5 of Notes to Consolidated Financial Statements), $2,448,000 was allocated to identified problem loan situations, and $4,523,000 was allocated an allowance against losses from the overall loan portfolio based on historical loss experience and general economic conditions. At September 30, 2004, $197,000 of the allowance for loan losses was allocated to impaired loans, $1,256,000 was allocated to identified problem loan situations, and $3,918,000 was allocated against losses from the overall loan portfolio based on historical loss experience and general economic conditions.
The September 30, 2005 allowance for loan losses that was allocated to impaired loans was $251,000, which is 37.1% of impaired loans as of that date. The September 30, 2004 allowance allocated to impaired loans was $197,000, which is 30.2% of impaired loans at that date. The increase in the dollar amount and percentage of the
| | | | | | | | | | | | | | | | | | | | | | | | | |
| Change in Interest Rate | | Board Limit | | At September 30, 2005 | | At September 30, 2004 |
| (Basis Points) | | % Change | | $ Change | | % Change | | $ Change | | %Change |
|
|
|
|
|
|
|
|
|
|
|
|
| Dollars In Thousands | | | | | | | | | | | | | | | |
| | | | | | | | | | | | | | | | |
| +200 | bp | | | (40 | )% | | $ | (1,904 | ) | | | | (3 | )% | | | $ | (5,473 | ) | | | | (12 | )% |
| +100 | bp | | | (25 | ) | | | (411 | ) | | | | (1 | ) | | | | (1,580 | ) | | | | (3 | ) |
| 0 | | | | — | | | | — | | | | | — | | | | | — | | | | | — | |
| - 100 | bp | | | (25 | ) | | | (2,773 | ) | | | | (5 | ) | | | | (3,130 | ) | | | | (7 | ) |
| - 200 | bp | | | (40 | ) | | | (9,183 | ) | | | | (16 | ) | | | | (5,631 | ) | | | | (12 | ) |
9
Meta Financial Group, Inc. and Subsidiaries
MANAGEMENT’S DISCUSSION AND ANALYSIS
allocated allowance is a result of the specific analysis performed on a loan-by-loan basis as described above.
The September 30, 2005 allowance allocated to other identified problem loan situations was $2,448,000 as compared to $1,256,000 at September 30, 2004, an increase of $1,192,000. The increase in the dollar amount of the allocated allowance is due to a relative increase in identified problem loan situations between the periods and is the result of a specific analysis performed on a loan-by-loan basis as described above.
The portion of the September 30, 2005 allowance that was not specifically allocated to individual loans was $4,523,000 as compared to $3,918,000 at September 30, 2004, an increase of $609,000. The increase primarily reflects overall growth in the loan portfolio and a change in the composition of the loan portfolio. In excess of 95 percent of the total portfolio growth was in commercial, multi-family and agricultural real estate loans and commercial and agricultural operating loans.
LIQUIDITY AND CAPITAL RESOURCES
The Company’s primary sources of funds are deposits, borrowings, principal and interest payments on loans and mortgage-backed securities, and maturing investment securities. While scheduled loan repayments and maturing investments are relatively predictable, deposit flows and early loan repayments are influenced by the level of interest rates, general economic conditions, and competition.
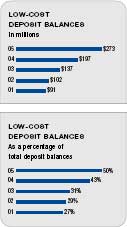
The Company relies on competitive pricing policies, advertising and customer service to attract and retain its deposits and only solicits these deposits from its primary market area. Based on its experience, the Company believes that its passbook savings, money market savings accounts, NOW and regular checking accounts are relatively stable sources of deposits. The Company’s ability to attract and retain time deposits has been, and will continue to be, significantly affected by market conditions. However, the Company does not foresee significant funding issues resulting from disintermediation of its portfolio of time deposits. In addition, the Meta Payment Systems division of MetaBank has become a significant source of low-cost deposits for the Company, and it is anticipated that it will continue to grow in this regard.
MetaBank and MetaBank WC are required by regulation to maintain sufficient liquidity to assure their safe and sound operation. In the opinion of management, both MetaBank and MetaBank WC are in compliance with this requirement.
Liquidity management is both a daily and long-term function of the Company’s management strategy. The Company adjusts its investments in liquid assets based upon management’s assessment of (i) expected loan demand, (ii) the projected availability of purchased loan products, (iii) expected deposit flows, (iv) yields available on interest-bearing deposits, and (v) the objectives of its asset/liability management program. Excess liquidity is generally invested in interest-earning overnight deposits and other short-term government agency obligations. If the Company requires funds beyond its ability to generate them internally, it has additional borrowing capacity with the FHLB and has collateral eligible for use with reverse repurchase agreements. The Company is not aware of any significant trends in the Company’s liquidity or its ability to borrow additional funds if needed.
The primary investing activities of the Company are the origination and purchase of loans and the purchase of securities. During the years ended September 30, 2005, 2004 and 2003, the Company originated loans totaling $382.5 million, $295.5 million and $324.7 million, respectively. Purchases of loans totaled $39.7 million, $39.5 million and $26.2 million during the years ended September 30, 2005, 2004 and 2003, respectively. During both fiscal 2005 and fiscal 2004, the mix of loans outstanding changed, with commercial and multi-family real estate loans, commercial business loans, agricultural loans and consumer loans increasing while one-to-four family residential mortgage loans ended fiscal 2005 slightly higher than at the end of fiscal 2004, but lower than at the end of fiscal 2003. (See Note 5 of Notes to Consolidated Financial Statements.) During the years ended September 30, 2005, 2004 and 2003, the Company purchased mortgage-backed securities and other securities available for sale in the amount of $55.1 million, $46.2 million and $431.7 million, respectively. (See Note 4 of Notes to Consolidated Financial Statements.)
At September 30, 2005, the Company had outstanding commitments to originate and purchase loans of $69.7 million. (See Note 15 of Notes to Consolidated Financial Statements.) Certificates of deposit scheduled to mature in one year or less from September 30, 2005 totaled $170.3 million. Based on its historical experience, management believes that a significant portion of such deposits will remain with the Company, however, there can be no assurance that the Company can retain all such deposits. Management believes that loan repayment and other sources of funds will be adequate to meet the Company’s foreseeable short- and long-term liquidity needs.
The following table summarizes the Company’s significant contractual obligations at September 30, 2005 (in thousands):
| | | | | | | | | | | | | | | | |
Contractual Obligations | | Total | | Less than 1 year | | 1 to 3 years | | 3 to 5 years | | More than 5 years | |
|
|
|
|
|
|
|
|
|
|
|
|
|
|
|
|
|
| | | | | | | | | | | | | | | | |
Time deposits | | $ | 268,122 | | $ | 170,305 | | $ | 79,359 | | $ | 18,173 | | $ | 285 | |
Long-term debt | | | 180,212 | | | 47,647 | | | 65,265 | | | 50,000 | | | 17,300 | |
Operating leases | | | 614 | | | 99 | | | 199 | | | 155 | | | 161 | |
Subordinated debentures | | | | | | | | | | | | | | | | |
Issued to capital trust | | | 10,310 | | | — | | | — | | | — | | | 10,310 | |
Data processing services | | | 2,172 | | | 576 | | | 1,152 | | | 444 | | | — | |
| |
|
| |
|
| |
|
| |
|
| |
|
| |
Total | | $ | 461,430 | | $ | 218,627 | | $ | 145,975 | | $ | 68,772 | | $ | 28,056 | |
| |
|
| |
|
| |
|
| |
|
| |
|
| |
During July 2001, the Company’s unconsolidated trust subsidiary, First Midwest Financial Capital Trust I, sold $10 million in floating rate cumulative preferred securities. Proceeds from the sale were used to purchase subordinated debentures of Meta Financial Group, which mature in the year 2031, and are redeemable at any time after five years. The Company used the proceeds for general corporate purposes.
On September 20, 1993, the Bank converted from a federally chartered mutual savings and loan association to a federally chartered stock savings bank. At that time, a liquidation account was established for the benefit of eligible account holders who continue to maintain their account with the Bank after the conversion. The liquidation account is reduced annually to the extent that eligible account holders have reduced their qualifying deposits. At September 30, 2005, the remaining liquidation account balance was approximately $1.9 million, compared to $2.2 million one year earlier.
The Company, MetaBank and MetaBank WC are in compliance with their capital requirements and are considered “well capitalized” under current regulatory guidelines. (See Note 14 of Notes to Consolidated Financial Statements.) The Company does not anticipate any significant changes to its capital structure.
On August 23, 2004, the Company announced that the Board of Directors had authorized the Company’s ESOP to purchase up to 40,000 shares of the Company’s stock through open market and privately negotiated transactions. The ESOP stock purchase was completed on April 18, 2005 at a total cost of $897,000. A portion of the
10
Meta Financial Group, Inc. and Subsidiaries
MANAGEMENT’S DISCUSSION AND ANALYSIS
stock, 3,188 shares, was used to fund part of the fiscal 2005 distribution to ESOP participants. The remaining 36,712 shares will be used in future distributions to participants in the Company’s ESOP.
On April 26, 2005, the Company announced that the Board of Directors had authorized the repurchase, at management’s discretion, of up to 100,000 shares of the Company’s stock through open market and privately negotiated transactions. This repurchase authorization expires on April 30, 2006. No shares have been repurchased under this authorization.
The payment of dividends and repurchase of shares has the effect of reducing stockholders’ equity. Prior to authorizing such transactions, the Board of Directors considers the effect the dividend or repurchase of shares would have on liquidity and capital ratios. The Banks and the Company may declare dividends if certain tolerance limits are observed and which include, in the case of MetaBank, consideration of the liquidation balance. (See Note 13 of Notes to Consolidated Financial Stateemnts.)
IMPACT OF INFLATION AND CHANGING PRICES
The Consolidated Financial Statements and Notes thereto presented herein have been prepared in accordance with generally accepted accounting principles, which require the measurement of financial position and operating results in terms of historical dollars without considering the change in the relative purchasing power of money over time due to inflation. The primary impact of inflation is reflected in the increased cost of the Company’s operations. Unlike most industrial companies, virtually all the assets and liabilities of the Company are monetary in nature. As a result, interest rates generally have a more significant impact on a financial institution’s performance than do the effects of general levels of inflation. Interest rates do not necessarily move in the same direction, or to the same extent, as the prices of goods and services.
IMPACT OF NEW ACCOUNTING STANDARDS
In May 2005, the Financial Accounting Standards Board issued Statement of Financial Accounting Standard (SFAS) No. 154,Accounting Changes and Error Corrections. This Statement replaces APB Opinion No. 20,Accounting Changes, and FASB Statement No.3,Reporting Accounting Changes in Interim Financial Statements. SFAS 154 carries forward the guidance contained in Opinion 20 for reporting the correction of an error in previously issued financial statements and a change in accounting estimate. However, SFAS 154 changes the requirements for the accounting for and reporting of a change in accounting principle. Under this Statement, every voluntary change in accounting principle requires retrospective application to prior periods’ financial statements, unless it is impracticable. It also applies to changes required by an accounting pronouncement in the unusual instance that the pronouncement does not include specific transition provisions. When a pronouncement includes specific transition provisions, those provisions should be followed. This Statement is effective for accounting changes and corrections of errors made in fiscal years beginning after December 15, 2005, although earlier application is permitted for changes and corrections made in fiscal years beginning after June 1, 2005. The Company expects no significant effect on its financial statements as a result of the adoption of this statement.
In December 2004, the Financial Accounting Standards Board (FASB) issued Statement of Financial Accounting Standard No. 123R, Share-Base Payment. This Statement revises SFAS Statement No. 123, Accounting for Stock-Based Compensation, amends SFAS Statement No. 95, Statement of Cash Flows, and supersedes APB Opinion No. 125, Accounting for Stock Issued to Employees. It requires that all stock-based compensation now be measured at fair value and recognized as expense in the income statement. This Statement also clarifies and expands guidance on measuring fair value of stock compensation, requires estimation of forfeitures when determining expense, and requires that excess tax benefits be shown as financing cash inflows versus a reduction of taxes paid in the statement of cash flows. Various other changes are also required. This Statement is effective beginning January 1, 2006, for public companies as a result of recent SEC actions. Management believes the impact on the financial statements will be similar to the disclosures made by footnote to the financial statements, showing the effect on earnings and earnings per share of expensing the value of stock options granted.
In November 2005, the FASB issued FASB Staff Position (FSP) FAS 115-1 and 124-1, “The Meaning of Other-Than-Temporary Impairment and Its Application to Certain Investments.” The FSP addresses the determination of when an investment is considered impaired, whether that impairment is other than temporary, and the measurement of an impairment loss. The FSP also includes accounting considerations subsequent to the recognition of an other-than-temporary impairment and requires certain disclosures about unrealized losses that have not been recognized as other-than-temporary impairments. The FSP amends FASB Statement No. 115,Accounting for Certain Investments in Debt and Equity Securities,and FASB Statement No. 124,Accounting for Certain Investments Held by Not-for-Profit Organizations,and APB Opinion No. 18,The Equity Method of Accounting for Investments in Common Stock. The FSP nullifies certain requirements of EITF Issue No. 03-1, “The Meaning of Other-Than-Temporary Impairment and Its Application to Certain Investments,” and supersedesEITF Abstracts,Topic D-44, “Recognition of Other-Than-Temporary Impairment upon the Planned Sale of a Security Whose Cost Exceeds Fair Value.” The FSP is required to be applied to reporting periods beginning after December 15, 2005. The Company does not expect adoption to have a material impact on the consolidated financial statements.
FORWARD LOOKING STATEMENTS
The Company, and its wholly-owned subsidiaries, MetaBank and MetaBank WC, may from time to time make written or oral “forward-looking statements,” including statements contained in its filings with the Securities and Exchange Commission, in its reports to shareholders, and in other communications by the Company, which are made in good faith by the Company pursuant to the “safe harbor” provisions of the Private Securities Litigation Reform Act of 1995.
These forward-looking statements include statements with respect to the Company’s beliefs, expectations, estimates and intentions that are subject to significant risks and uncertainties, and are subject to change based on various factors, some of which are beyond the Company’s control. Such statements address the following subjects: future operating results; customer growth and retention; loan and other product demand; net interest income; earnings growth and expectations; new products and services, such as those offered by the Meta Payment Systems Division; credit quality and adequacy of reserves; technology; and our employees. The following factors, among others, could cause the Company’s financial performance to differ materially from the expectations, estimates, and intentions expressed in such forward-looking statements: the strength of the United States economy in general and the strength of the local economies in which the Company conducts operations; the effects of, and changes in, trade, monetary, and fiscal policies and laws, including interest rate policies of the Federal Reserve Board; inflation, interest rate, market, and monetary fluctuations; the timely development of and acceptance of new products and services of the Company and the perceived overall value of these products and services by users; the impact of changes in financial services’ laws and regulations; technological changes; acquisitions; changes in consumer spending and saving habits; and the success of the Company at managing and collecting assets of borrowers in default and managing the risks involved in the foregoing.
The foregoing list of factors is not exclusive. Additional discussion of factors affecting the Company’s business and prospects is contained in the Company’s periodic filings with the SEC. The Company does not undertake, and expressly disclaims any intent or obligation, to update any forward-looking statement, whether written or oral, that may be made from time to time by or on behalf of the Company.
11
Meta Financial Group, Inc. and Subsidiaries
REPORT OF INDEPENDENT REGISTERED PUBLIC ACCOUNTING FIRM
TO THE BOARD OF DIRECTORS
META FINANCIAL GROUP, INC. AND SUBSIDIARIES
STORM LAKE, IOWA
We have audited the accompanying consolidated balance sheets of Meta Financial Group, Inc. and Subsidiaries as of September 30, 2005 and 2004, and the related consolidated statements of operations, changes in shareholders’ equity and cash flows for each of the three years in the period ended September 30, 2005. These financial statements are the responsibility of the Company’s management. Our responsibility is to express an opinion on these financial statements based on our audits.
We conducted our audits in accordance with the standards of the Public Company Accounting Oversight Board (United States). Those standards require that we plan and perform the audit to obtain reasonable assurance about whether the financial statements are free of material misstatement. An audit includes examining, on a test basis, evidence supporting the amounts and disclosures in the financial statements. An audit also includes assessing the accounting principles used and significant estimates made by management, as well as evaluating the overall financial statement presentation. We believe that our audits provide a reasonable basis for our opinion.
In our opinion, the consolidated financial statements referred to above present fair, in all material respects, the financial position of Meta Financial Group, Inc. and Subsidiaries as of September 30, 2005 and 2004, and the results of their operations and their cash flows for each of the three years in the period ended September 30, 2005. In conformity with U.S. generally accepted accounting principles.

Des Moines, Iowa
October 21, 2005
12
Meta Financial Group, Inc. and Subsidiaries
CONSOLIDATED BALANCE SHEETS
SEPTEMBER 30, 2005 AND 2004
| | | | | | | |
| | 2005 | | 2004 | |
|
|
|
|
|
|
ASSETS | | | | | | | |
Cash and due from banks | | $ | 5,390,455 | | $ | 1,591,982 | |
Interest-bearing deposits in other financial institutions | | | 8,979,299 | | | 7,344,587 | |
|
|
|
|
|
|
|
|
Total cash and cash equivalents | | | 14,369,754 | | | 8,936,569 | |
Securities purchased under agreements to resell | | | 37,513,348 | | | — | |
Securities available for sale | | | 230,892,565 | | | 322,523,577 | |
Loans receivable, net of allowance for loan losses of $7,222,404 in 2005 and $5,370,994 in 2004 | | | 440,190,245 | | | 404,051,379 | |
Loans held for sale | | | 306,000 | | | 270,000 | |
Federal Home Loan Bank (FHLB) stock, at cost | | | 8,161,000 | | | 11,052,700 | |
Accrued interest receivable | | | 4,240,694 | | | 3,849,215 | |
Premises and equipment, net | | | 15,126,069 | | | 11,690,437 | |
Foreclosed real estate and repossessed assets | | | 4,706,414 | | | — | |
Bank owned life insurance | | | 12,332,337 | | | 11,847,420 | |
Goodwill | | | 3,403,019 | | | 3,403,019 | |
Other assets | | | 5,107,497 | | | 3,174,208 | |
|
|
|
|
|
|
|
|
| | | | | | | |
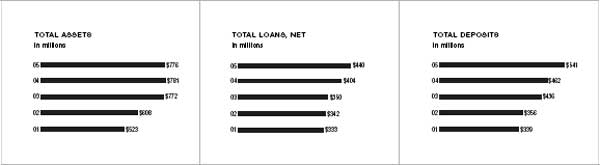
Total assets | | $ | 776,348,942 | | $ | 780,798,524 | |
|
|
|
|
|
|
|
|
| | | | | | | |
LIABILITIES AND SHAREHOLDERS’ EQUITY | | | | | | | |
| | | | | | | |
LIABILITIES | | | | | | | |
Noninterest-bearing demand deposits | | $ | 102,164,156 | | $ | 19,537,370 | |
Savings, NOW and money market demand deposits | | | 170,484,053 | | | 177,287,972 | |
Time certificates of deposit | | | 268,122,096 | | | 264,755,535 | |
|
|
|
|
|
|
|
|
Total deposits | | | 540,770,305 | | | 461,580,877 | |
Advances from FHLB | | | 159,705,000 | | | 226,250,000 | |
Securities sold under agreements to repurchase | | | 20,507,051 | | | 32,549,377 | |
Subordinated debentures | | | 10,310,000 | | | 10,310,000 | |
Advances from borrowers for taxes and insurance | | | 271,273 | | | 216,331 | |
Accrued interest payable | | | 941,935 | | | 473,426 | |
Accrued expenses and other liabilities | | | 884,688 | | | 2,144,248 | |
|
|
|
|
|
|
|
|
Total liabilities | | | 733,390,252 | | | 733,524,259 | |
|
|
|
|
|
|
|
|
| | | | | | | |
COMMITMENTS AND CONTINGENCIES (NOTE 15) | | | | | | | |
| | | | | | | |
SHAREHOLDERS’ EQUITY | | | | | | | |
Preferred stock, 800,000 shares authorized; none issued | | | — | | | — | |
Common stock,$.01 par value; 5,200,000 shares authorized; 2,957,999 shares issued and 2,503,655 shares outstanding at September 30, 2005; 2,957,999 shares issued and 2,491,025 shares outstanding at September 30, 2004 | | | 29,580 | | | 29,580 | |
Additional paid-in capital | | | 20,646,513 | | | 20,678,644 | |
Retained earnings, substantially restricted | | | 34,557,258 | | | 36,758,258 | |
Accumulated other comprehensive (loss) | | | (3,180,607 | ) | | (1,240,338 | ) |
Unearned Employee Stock Ownership Plan shares | | | (825,057 | ) | | (394,766 | ) |
Treasury stock, 454,344 and 466,974 common shares, at cost, at September 30, 2005 and 2004, respectively | | | (8,268,997 | ) | | (8,557,113 | ) |
|
|
|
|
|
|
|
|
Total shareholders’ equity | | | 42,958,690 | | | 47,274,265 | |
|
|
|
|
|
|
|
|
| | | | | | | |
Total liabilities and shareholders’ equity | | $ | 776,348,942 | | $ | 780,798,524 | |
|
|
|
|
|
|
|
|
See Notes to Consolidated Financial Statements.
13
Meta Financial Group, Inc. and Subsidiaries
CONSOLIDATED STATEMENTS OF OPERATIONS
YEARS ENDED SEPTEMBER 30, 2005, 2004 AND 2003
| | | | | | | | | | |
| | 2005 | | 2004 | | 2003 | |
|
|
|
|
|
|
|
|
| | | | | | | | | | |
Interest and dividend income: | | | | | | | | | | |
Loans receivable, including fees | | $ | 29,831,923 | | $ | 24,259,727 | | $ | 24,098,700 | |
Securities available for sale | | | 10,962,756 | | | 11,698,933 | | | 10,794,142 | |
Dividends on FHLB stock | | | 298,629 | | | 221,596 | | | 286,311 | |
|
|
|
|
|
|
|
|
|
|
|
| | | 41,093,308 | | | 36,180,256 | | | 35,179,153 | |
|
|
|
|
|
|
|
|
|
|
|
| | | | | | | | | | |
Interest expense: | | | | | | | | | | |
Deposits | | | 12,080,046 | | | 9,639,441 | | | 10,490,920 | |
FHLB advances and other borrowings | | | 9,773,747 | | | 8,771,744 | | | 8,959,831 | |
|
|
|
|
|
|
|
|
|
|
|
| | | 21,853,793 | | | 18,411,185 | | | 19,450,751 | |
|
|
|
|
|
|
|
|
|
|
|
| | | | | | | | | | |
Net interest income | | | 19,239,515 | | | 17,769,071 | | | 15,728,402 | |
| | | | | | | | | | |
Provision for loan losses | | | 5,482,000 | | | 488,500 | | | 350,000 | |
|
|
|
|
|
|
|
|
|
|
|
Net interest income after provision for loan losses | | | 13,757,515 | | | 17,280,571 | | | 15,378,402 | |
|
|
|
|
|
|
|
|
|
|
|
| | | | | | | | | | |
Noninterest income: | | | | | | | | | | |
Deposit service charges and other fees | | | 1,330,750 | | | 1,275,452 | | | 1,324,769 | |
Gain on sales of loans, net | | | 240,428 | | | 293,994 | | | 955,469 | |
Bank owned life insurance | | | 543,578 | | | 596,018 | | | 628,957 | |
Gain (loss) on sales of securities available for sale, net | | | (19,334 | ) | | — | | | 242,562 | |
Gain on sale of branch office | | | — | | | 1,113,230 | | | — | |
(Loss) on sales of foreclosed real estate, net | | | — | | | (8,752 | ) | | (5,372 | ) |
Brokerage commissions | | | — | | | 98,466 | | | 125,374 | |
Payment systems revenue | | | 1,403,554 | | | 6,414 | | | — | |
Other income | | | 231,631 | | | 220,947 | | | 283,297 | |
|
|
|
|
|
|
|
|
|
|
|
| | | 3,730,607 | | | 3,595,769 | | | 3,555,056 | |
|
|
|
|
|
|
|
|
|
|
|
| | | | | | | | | | |
Noninterest expense: | | | | | | | | | | |
Employee compensation and benefits | | | 11,398,887 | | | 9,473,684 | | | 8,400,501 | |
Occupancy and equipment expense | | | 3,455,630 | | | 2,369,623 | | | 2,154,355 | |
Deposit insurance premium | | | 70,296 | | | 66,480 | | | 61,950 | |
Data processing expense | | | 740,677 | | | 723,568 | | | 634,098 | |
Prepayment fee on FHLB advances | | | — | | | — | | | 500,674 | |
Advertising expense | | | 828,802 | | | 437,461 | | | 298,074 | |
Other expense | | | 2,602,766 | | | 1,759,776 | | | 1,808,516 | |
|
|
|
|
|
|
|
|
|
|
|
| | | 19,097,058 | | | 14,830,592 | | | 13,858,168 | |
|
|
|
|
|
|
|
|
|
|
|
| | | | | | | | | | |
Net income (loss) before income tax expense (benefit) | | | (1,608,936 | ) | | 6,045,748 | | | 5,075,290 | |
| | | | | | | | | | |
Income tax expense (benefit) | | | (684,685 | ) | | 2,058,698 | | | 1,678,286 | |
|
|
|
|
|
|
|
|
|
|
|
| | | | | | | | | | |
Net income (loss) | | $ | (924,251 | ) | $ | 3,987,050 | | $ | 3,397,004 | |
|
|
|
|
|
|
|
|
|
|
|
| | | | | | | | | | |
Earnings per common and common equivalent share: | | | | | | | | | | |
Basic earnings (loss) per common share | | $ | (0.38 | ) | $ | 1.61 | | $ | 1.37 | |
Diluted earnings (loss) per common share | | | (0.38 | ) | | 1.57 | | | 1.36 | |
See Notes to Consolidated Financial Statements.
14
Meta Financial Group, Inc. and Subsidiaries
CONSOLIDATED STATEMENTS OF CHANGES IN SHAREHOLDERS’ EQUITY
YEARS ENDED SEPTEMBER 30, 2005, 2004 AND 2003
| | | | | | | | | | | | | | | | | | | | | | |
| | | | | | | | | | Unearned | | | | | |
| | | | | | | | Accumulated | | Employee | | | | | |
| | | | Additional | | | | Other | | Stock | | | | Total | |
| | Common | | Paid-in | | Retained | | Comprehensive | | Ownership | | Treasury | | Sharehholders’ | |
| | Stock | | Capital | | Earnings | | Income (Loss) | | Plan Shares | | Stock | | Equity | |
|
|
|
|
|
|
|
|
|
|
|
|
|
|
|
|
| | | | | | | | | | | | | | | |
Balance, September 30, 2002 | | $ | 29,580 | | $ | 20,593,768 | | $ | 31,940,648 | | $ | 494,834 | | $ | (46,142 | ) | $ | (8,424,922 | ) | $ | 44,587,766 | |
Comprehensive income: | | | | | | | | | | | | | | | | | | | | | | |
Net income for the year ended September 30, 2003 | | | — | | | — | | | 3,397,004 | | | — | | | — | | | — | | | 3,397,004 | |
Net change in net unrealized gains and losses on securities available for sale, net of reclassification adjustments and tax effects | | | — | | | — | | | — | | | (3,523,596 | ) | | — | | | — | | | (3,523,596 | ) |
| | | | | | | | | | | | | | | | | | | |
|
|
|
Total comprehensive (loss) | | | | | | | | | | | | | | | | | | | | | (126,592 | ) |
Purchase of 10,147 common shares of treasury stock | | | — | | | — | | | — | | | — | | | — | | | (165,092 | ) | | (165,092 | ) |
Purchase of 35,574 common shares for ESOP | | | — | | | — | | | — | | | — | | | (608,584 | ) | | — | | | (608,584 | ) |
15,000 common shares committed to be released under the ESOP | | | — | | | 10,005 | | | — | | | — | | | 253,050 | | | — | | | 263,055 | |
Issuance of 35,292 common shares from treasury stock due to exercise of stock options | | | — | | | (189,770 | ) | | — | | | — | | | — | | | 425,051 | | | 235,281 | |
Tax benefit from exercise of stock options | | | — | | | 124,876 | | | — | | | — | | | — | | | — | | | 124,876 | |
Cash dividends declared on common stock ($.52 per share) | | | — | | | — | | | (1,279,911 | ) | | — | | | — | | | — | | | (1,279,911 | ) |
|
|
|
|
|
|
|
|
|
|
|
|
|
|
|
|
|
|
|
|
|
|
|
Balance, September 30, 2003 | | $ | 29,580 | | $ | 20,538,879 | | $ | 34,057,741 | | $ | (3,028,762 | ) | $ | (401,676 | ) | $ | (8,164,963 | ) | $ | 43,030,799 | |
|
|
|
|
|
|
|
|
|
|
|
|
|
|
|
|
|
|
|
|
|
|
|
| | | | | | | | | | | | | | | | | | | | | | |
Balance, September 30, 2003 | | $ | 29,580 | | $ | 20,538,879 | | $ | 34,057,741 | | $ | (3,028,762 | ) | $ | (401,676 | ) | $ | (8,164,963 | ) | $ | 43,030,799 | |
Comprehensive income: | | | | | | | | | | | | | | | | | | | | | | |
Net income for the year ended September 30, 2004 | | | — | | | — | | | 3,987,050 | | | — | | | — | | | — | | | 3,987,050 | |
Net change in net unrealized gains and losses on securities available for sale, net of reclassification adjustments and tax effects | | | — | | | — | | | — | | | 1,788,424 | | | — | | | — | | | 1,788,424 | |
| | | | | | | | | | | | | | | | | | | |
|
|
|
Total comprehensive income | | | | | | | | | | | | | | | | | | | | | 5,775,474 | |
Purchase of 39,470 common shares of treasury stock | | | — | | | — | | | — | | | — | | | — | | | (906,650 | ) | | (906,650 | ) |
Purchase of 10,000 common shares for ESOP | | | — | | | — | | | — | | | — | | | (212,400 | ) | | — | | | (212,400 | ) |
13,000 common shares committed to be released under the ESOP | | | — | | | 71,708 | | | — | | | — | | | 219,310 | | | — | | | 291,018 | |
Issuance of 36,546 common shares from treasury stock due to exercise of stock options | | | — | | | 68,057 | | | — | | | — | | | — | | | 514,500 | | | 582,557 | |
Cash dividends declared on common stock ($.52 per share) | | | — | | | — | | | (1,286,533 | ) | | — | | | — | | | — | | | (1,286,533 | ) |
|
|
|
|
|
|
|
|
|
|
|
|
|
|
|
|
|
|
|
|
|
|
|
Balance, September 30, 2004 | | $ | 29,580 | | $ | 20,678,644 | | $ | 36,758,258 | | $ | (1,240,338 | ) | $ | (394,766 | ) | $ | (8,557,113 | ) | $ | 47,274,265 | |
|
|
|
|
|
|
|
|
|
|
|
|
|
|
|
|
|
|
|
|
|
|
|
| | | | | | | | | | | | | | | | | | | | | | |
Balance, September 30, 2004 | | $ | 29,580 | | $ | 20,678,644 | | $ | 36,758,258 | | $ | (1,240,338 | ) | $ | (394,766 | ) | $ | (8,557,113 | ) | $ | 47,274,265 | |
Comprehensive (loss): | | | | | | | | | | | | | | | | | | | | | | |
Net (loss) for the year ended September 30, 2005 | | | — | | | — | | | (924,251 | ) | | — | | | — | | | — | | | (924,251 | ) |
Net change in net unrealized gains and losses on securities available for sale, net of reclassification adjustments and tax effects | | | — | | | — | | | — | | | (1,940,269 | ) | | — | | | — | | | (1,940,269 | ) |
| | | | | | | | | | | | | | | | | | | |
|
|
|
Total comprehensive (loss) | | | | | | | | | | | | | | | | | | | | | (2,864,520 | ) |
Purchase of 1,000 common shares of treasury stock | | | — | | | — | | | — | | | — | | | — | | | (25,655 | ) | | (25,655 | ) |
Purchase of 30,000 common shares for ESOP | | | — | | | — | | | — | | | — | | | (684,133 | ) | | — | | | (684,133 | ) |
14,000 common shares committed to be released under the ESOP | | | — | | | 51,226 | | | — | | | — | | | 253,842 | | | — | | | 305,068 | |
Issuance of 13,630 common shares from treasury stock due to exercise of stock options | | | — | | | (83,357 | ) | | — | | | — | | | — | | | 313,771 | | | 230,414 | |
Cash dividends declared on common stock ($.52 per share) | | | — | | | — | | | (1,276,749 | ) | | — | | | — | | | — | | | (1,276,749 | ) |
|
|
|
|
|
|
|
|
|
|
|
|
|
|
|
|
|
|
|
|
|
|
|
Balance, September 30, 2005 | | $ | 29,580 | | $ | 20,646,513 | | $ | 34,557,258 | | $ | (3,180,607 | ) | $ | (825,057 | ) | $ | (8,268,997 | ) | $ | 42,958,690 | |
|
|
|
|
|
|
|
|
|
|
|
|
|
|
|
|
|
|
|
|
|
|
|
See Notes to Consolidated Financial Statements.
15
Meta Financial Group, Inc. and Subsidiaries
CONSOLIDATED STATEMENTS OF CASH FLOWS
| | | | | | | | | | |
YEARS ENDED SEPTEMBER 30, 2005, 2004 AND 2003 | | 2005 | | 2004 | | 2003 | |
|
|
|
|
|
|
|
|
|
CASH FLOWS FROM OPERATING ACTIVITIES | | | | | | | | | | |
Net income (loss) | | $ | (924,251 | ) | $ | 3,987,050 | | $ | 3,397,004 | |
Adjustments to reconcile net income (loss) to net cash provided by operating activities: | | | | | | | | | | |
Effect of contrubution to employee stock ownership plan | | | 305,068 | | | 291,018 | | | 263,055 | |
Depreciation, amortization and accretion, net | | | 3,276,520 | | | 4,365,294 | | | 3,117,158 | |
Provision for loan losses | | | 5,482,000 | | | 488,500 | | | 350,000 | |
Prepayment fee on FHLB advances | | | — | | | — | | | 500,674 | |
(Gain) loss on sales of securities available for sale, net | | | 19,334 | | | — | | | (242,562 | ) |
(Gain) on sale of branch office | | | — | | | (1,113,230 | ) | | — | |
(Gain) on sales of office property, net | | | — | | | — | | | (134,700 | ) |
Proceeds from sales of loans held for sale | | | 16,272,543 | | | 18,043,207 | | | 76,465,663 | |
Originations of loans held for sale | | | (16,068,115 | ) | | (16,892,903 | ) | | (75,381,542 | ) |
(Gain) on sales of loans, net | | | (240,428 | ) | | (293,994 | ) | | (955,469 | ) |
Loss on sales of foreclosed real estate, net | | | — | | | 8,752 | | | 5,372 | |
Net change in: | | | | | | | | | | |
Accrued interest receivable | | | (391,479 | ) | | 77,343 | | | 388,438 | |
Other assets | | | (1,268,382 | ) | | (864,592 | ) | | (809,716 | ) |
Accrued interest payable | | | 468,509 | | | (33,435 | ) | | (164,172 | ) |
Accrued expenses and other liabilities | | | (1,259,560 | ) | | 710,759 | | | 451,818 | |
|
|
|
|
|
|
|
|
|
|
|
Net cash provided by operating activities | | | 5,671,759 | | | 8,773,769 | | | 7,251,021 | |
|
|
|
|
|
|
|
|
|
|
|
| | | | | | | | | | |
CASH FLOWS FROM INVESTING ACTIVITIES | | | | | | | | | | |
Purchase of securities available for sale | | | (17,628,374 | ) | | (46,204,355 | ) | | (431,711,574 | ) |
Net change in securities purchased under agreement to resell | | | (37,513,348 | ) | | — | | | — | |
Proceeds from sales of securities available for sale | | | 25,842,710 | | | — | | | 90,473,567 | |
Proceeds from maturities and principal repayments of securities available for sale | | | 78,086,047 | | | 89,167,761 | | | 185,761,348 | |
Loans purchased | | | (39,697,273 | ) | | (39,542,108 | ) | | (26,162,845 | ) |
Net change in loans | | | (6,708,447 | ) | | (16,106,777 | ) | | 17,696,050 | |
Proceeds from sales of foreclosed real estate | | | 22,028 | | | 1,158,935 | | | 631,156 | |
Proceeds from sale of office building | | | — | | | — | | | 197,169 | |
Cash transferred to buyer on sale of branch | | | — | | | (14,154,359 | ) | | — | |
Purchase of FHLB stock | | | (5,113,000 | ) | | (7,879,200 | ) | | (7,786,600 | ) |
Proceeds from redemption of FHLB stock | | | 8,004,700 | | | 7,756,800 | | | 3,698,900 | |
Purchase of premises and equipment | | | (4,434,538 | ) | | (1,364,922 | ) | | (1,254,819 | ) |
|
|
|
|
|
|
|
|
|
|
|
Net cash provided by (used in) investing activities | | | 860,505 | | | (27,168,225 | ) | | (168,457,648 | ) |
|
|
|
|
|
|
|
|
|
|
|
| | | | | | | | | | |
CASH FLOWS FROM FINANCING ACTIVITIES | | | | | | | | | | |
Net change in noninterest-bearing demand, savings, NOW and money market demand deposits | | | 75,822,867 | | | 66,183,859 | | | 34,607,349 | |
Net change in time deposits | | | 3,366,561 | | | (24,052,970 | ) | | 45,165,640 | |
Proceeds from advances from FHLB | | | 3,028,725,000 | | | 2,414,190,000 | | | 1,219,200,000 | |
Repayments of advances from FHLB | | | (3,095,270,000 | ) | | (2,411,724,394 | ) | | (1,121,006,279 | ) |
Net change in securities sold under agreements to repurchase | | | (12,042,326 | ) | | (25,152,657 | ) | | (12,474,194 | ) |
Net change in advances from borrowers for taxes and insurance | | | 54,942 | | | (46,602 | ) | | (87,202 | ) |
Purchase of shares by ESOP | | | (684,133 | ) | | (212,400 | ) | | (608,584 | ) |
Cash dividends paid | | | (1,276,749 | ) | | (1,286,533 | ) | | (1,279,911 | ) |
Proceeds from exercise of stock options | | | 230,414 | | | 582,557 | | | 235,281 | |
Purchase of treasury stock | | | (25,655 | ) | | (906,650 | ) | | (165,092 | ) |
|
|
|
|
|
|
|
|
|
|
|
Net cash provided by (used in) financing activities | | | (1,099,079 | ) | | 17,574,210 | | | 163,587,008 | |
|
|
|
|
|
|
|
|
|
|
|
| | | | | | | | | | |
Net change in cash and cash equivalents | | | 5,433,185 | | | (820,246 | ) | | 2,380,381 | |
| | | | | | | | | | |
CASH AND CASH EQUIVALENTS | | | | | | | | | | |
Beginning of year | | | 8,936,569 | | | 9,756,815 | | | 7,376,434 | |
|
|
|
|
|
|
|
|
|
|
|
End of year | | $ | 14,369,754 | | $ | 8,936,569 | | $ | 9,756,815 | |
|
|
|
|
|
|
|
|
|
|
|
| | | | | | | | | | |
SUPPLEMENTAL DISCLOSURE OF CASH FLOW INFORMATION | | | | | | | | | | |
Cash paid during the year for: | | | | | | | | | | |
Interest | | $ | 21,385,284 | | $ | 18,444,620 | | $ | 19,614,923 | |
Income taxes | | | 605,911 | | | 2,213,428 | | | 1,757,440 | |
| | | | | | | | | | |
SUPPLEMENTAL SCHEDULE OF NONCASH INVESTING ACTIVITIES | | | | | | | | | | |
Loans transferred to foreclosed real estate and repossessed assets | | $ | 4,728,442 | | $ | 58,349 | | $ | 418,064 | |
| | | | | | | | | | |
SALE OF BRANCH | | | | | | | | | | |
Assets disposed: | | | | | | | | | | |
Loans | | | | | $ | (730,704 | ) | | | |
Accrued interest receivable | | | | | | (5,518 | ) | | | |
Premises and equipment | | | | | | (110,818 | ) | | | |
Liabilities assumed by buyer: | | | | | | | | | | |
Noninterest bearing demand, savings, NOW and money market demand accounts | | | | | | 6,314,066 | | | | |
Time deposits | | | | | | 9,788,688 | | | | |
Advances from borrowers for taxes and insurance | | | | | | 5,749 | | | | |
Other liabilities | | | | | | 6,126 | | | | |
Gain on sale of office property, net | | | | | | (1,113,230 | ) | | | |
| | | | |
|
| | | | |
Cash paid | | | | | $ | 14,154,359 | | | | |
| | | | |
|
| | | | |
See Notes to Consolidated Financial Statements.
16
Meta Financial Group, Inc. and Subsidiaries
NOTES TO CONSOLIDATED FINANCIAL STATEMENTS
NOTE 1. SUMMARY OF SIGNIFICANT ACCOUNTING POLICIES
PRINCIPLES OF CONSOLIDATION
The consolidated financial statements include the accounts of Meta Financial Group, Inc. (the Company) (formerly First Midwest Financial, Inc.) a bank holding company located in Storm Lake, Iowa, and its wholly owned subsidiaries which include MetaBank (the Bank) (formerly First Federal Savings Bank of the Midwest), a federally chartered savings bank whose primary regulator is the Office of Thrift Supervision, MetaBank West Central (MBWC) (formerly Security State Bank), a state chartered commercial bank whose primary regulator is the Federal Reserve, First Services Financial Limited and Brookings Service Corporation, which offer noninsured investment products, Meta Trust Company (formerly First Securities Trust Company), which offers various trust services, and, for 2003, First Midwest Financial Capital Trust I, which was capitalized in July 2001, for the purpose of issuing trust preferred securities. All significant intercompany balances and transactions have been eliminated.
NATURE OF BUSINESS AND INDUSTRY SEGMENT INFORMATION
The primary source of income for the Company is interest from the purchase or origination of consumer, commercial, agricultural, commercial real estate, and residential real estate loans. See Note 5 for a discussion of concentrations of credit risk. The Company accepts deposits from customers in the normal course of business primarily in northwest and central Iowa and eastern South Dakota. The Company operates primarily in the banking industry which accounts for more than 90% of its revenues, operating income and assets, with the remaining operations consisting of payment processing services. The Company uses the “management approach” for reporting information about segments in annual and interim financial statements. The management approach is based on the way the chief operating decision-maker organizes segments within a company for making operating decisions and assessing performance. Reportable segments are based on products and services, geography, legal structure, management structure and any other manner in which management disaggregates a company. Based on the “management approach” model, the Company has determined that its business is comprised of two reporting segments.
Assets held in trust or fiduciary capacity are not assets of the Company and, accordingly, are not included in the accompanying consolidated financial statements.
USE OF ESTIMATES IN PREPARING FINANCIAL STATEMENTS
The preparation of financial statements requires management to make estimates and assumptions that affect the reported amounts of assets, liabilities and disclosure of contingent assets and liabilities at the date of the financial statements and the reported amounts of revenue and expenses during the reporting period. Actual results could differ from those estimates; Certain Significant Estimates: The allowance for loan losses and fair values of securities and other financial instruments involve certain significant estimates made by management. These estimates are reviewed by management regularly however they are particularly susceptible to significant changes in the future.
CASH AND CASH EQUIVALENTS
For purposes of reporting cash flows, cash and cash equivalents is defined to include the Company’s cash on hand and due from financial institutions and short-term interest-bearing deposits in other financial institutions. The Company reports net cash flows for securities purchased under agreements to resell, customer loan transactions, deposit transactions, and securities sold under agreements to repurchase.
The Bank is required to maintain reserve balances in cash or on deposit with the Federal Reserve Bank, based on a percentage of deposits. The total of those reserve balances was approximately $3,565,000 and $1,055,000 at September 30, 2005 and 2004, respectively.
SECURITIES PURCHASED UNDER AGREEMENT TO RESELL
Securities purchased under agreement to resell mature within one week and are carried at cost.
SECURITIES
The Company classifies all securities as available for sale. Available for sale securities are those the Company may decide to sell if needed for liquidity, asset-liability management or other reasons. Available for sale securities are reported at fair value, with net unrealized gains and losses reported as other comprehensive income or loss and as a separate component of shareholders’ equity, net of tax.
Gains and losses on the sale of securities are determined using the specific identification method based on amortized cost and are reflected in results of operations at the time of sale. Interest and dividend income, adjusted by amortization of purchase premium or discount over the estimated life of the security using the level yield method, is included in income as earned.
Declines in the fair value of held-to-maturity and available-for-sale securities below their cost that are deemed to be other-than-temporary are reflected in earnings as realized losses. In estimating other-then-temporary impairment losses, management considers (1) the length of time and the extent to which the fair value has been less than cost, (2) the financial condition and near-term prospects of the issuer, and (3) the intent and ability of the Company to retain its investment in the issuer for a period of time sufficient to allow for any anticipated recovery in fair value.
LOANS HELD FOR SALE
Mortgage loans originated and intended for sale in the secondary market are carried at the lower of cost or estimated market value in the aggregate. Net unrealized losses are recognized in a valuation allowance by charges to income. As assets specifically acquired for resale, the origination of, disposition of, and gain/loss on these loans are classified as operating activities in the statement of cash flows.
LOANS RECEIVABLE
Loans receivable that management has the intent and ability to hold for the foreseeable future or until maturity or pay-off are reported at their outstanding principal balances reduced by the allowance for loan losses and any deferred fees or costs on originated loans.
Premiums or discounts on purchased loans are amortized to income using the level yield method over the remaining period to contractual maturity, adjusted for anticipated prepayments.
Interest income on loans is accrued over the term of the loans based upon the amount of principal outstanding except when serious doubt exists as to the collectibility of a loan, in which case the accrual of interest is discontinued. Interest income is subsequently recognized only to the extent that cash payments are received until, in management’s judgment, the borrower has the ability to make contractual interest and principal payments, in which case the loan is returned to accrual status.
LOAN ORIGINATION FEES, COMMITMENT FEES, AND RELATED COSTS
Loan fees and certain direct loan origination costs are deferred, and the net fee or cost is recognized as an adjustment to interest income using the interest method.
ALLOWANCE FOR LOAN LOSSES
Because some loans may not be repaid in full, an allowance for loan losses is recorded. The allowance for loan losses is increased by a provision for loan losses charged to expense and decreased by charge-offs (net of recoveries). Estimating the risk of loss and the amount of loss on any loan is necessarily subjective. Management’s periodic evaluation of the adequacy of the allowance is based on the Company’s past loan loss experience, known and inherent risks in the portfolio, adverse situations that may affect the borrower’s ability to repay, the estimated value of any underlying collateral, and current economic conditions. While management may periodically allocate portions of the allowance for specific problem loan situations, the entire allowance is available for any loan charge-offs that occur.
17
Meta Financial Group, Inc. and Subsidiaries
NOTES TO CONSOLIDATED FINANCIAL STATEMENTS
Loans are considered impaired if full principal or interest payments are not anticipated in accordance with the contractual loan terms. Impaired loans are carried at the present value of expected future cash flows discounted at the loan’s effective interest rate or at the fair value of the collateral if the loan is collateral dependent. A portion of the allowance for loan losses is allocated to impaired loans if the value of such loans is deemed to be less than the unpaid balance. If these allocations cause the allowance for loan losses to require an increase, such increase is reported as a component of the provision for loan losses.
The allowance consists of specific, general and unallocated components. The specific component relates to loans that are classified either as doubtful, substandard or special mention. For such loans that are also classified as impaired, an allowance is established when the discounted cash flows (or collateral value or observable market price) of the impaired loan is lower than the carrying value of that loan. The general component covers non-classified loans and is based on historical loss experience adjusted for qualitative factors. An unallocated component is maintained to cover uncertainties that could affect management’s estimate of probable losses. The unallocated component of the allowance reflects the margin of imprecision inherent in the underlying assumptions used in the methodologies for estimating specific and general losses in the portfolio.
Smaller-balance homogeneous loans are evaluated for impairment in total. Such loans include residential first mortgage loans secured by one-to-four family residences, residential construction loans, and automobile, manufactured homes, home equity and second mortgage loans. Commercial and agricultural loans and mortgage loans secured by other properties are evaluated individually for impairment. When analysis of borrower operating results and financial condition indicates that underlying cash flows of the borrower’s business are not adequate to meet its debt service requirements, the loan is evaluated for impairment. Often this is associated with a delay or shortfall in payments of 90 days or more. Nonaccrual loans are often also considered impaired. Impaired loans, or portions thereof, are charged off when deemed uncollectible.
FORECLOSED REAL ESTATE AND REPOSSESSED ASSETS
Real estate properties and repossessed assets acquired through, or in lieu of, loan foreclosure are initially recorded at the lower of cost or fair value, less selling costs at the date of foreclosure, establishing a new cost basis. Any reduction to fair value from the carrying value of the related loan at the time of acquisition is accounted for as a loan loss and charged against the allowance for loan losses. Valuations are periodically performed by management and valuation allowances are adjusted through a charge to income for changes in fair value or estimated selling costs.
INCOME TAXES
The Company records income tax expense based on the amount of taxes due on its tax return plus deferred taxes computed based on the expected future tax consequences of temporary differences between the carrying amounts and tax bases of assets and liabilities, using enacted tax rates. A valuation allowance, if needed, reduces deferred tax assets to the amount expected to be realized.
PREMISES AND EQUIPMENT
Land is carried at cost. Buildings, furniture, fixtures and equipment are carried at cost, less accumulated depreciation and amortization computed principally by using the straight-line method over the estimated useful lives of the assets, which range from 15 to 39 years for buildings and 3 to 7 years for furniture, fixtures and equipment. These assets are reviewed for impairment when events indicate the carrying amount may not be recoverable.
TRANSFERS OF FINANCIAL ASSETS
Transfers of financial assets are accounted for as sales, when control over the assets has been surrendered. Control over transferred assets is deemed to be surrendered when (1) the assets have been isolated from the Company, (2) the transferee obtains the right (free of conditions that constrain it from taking advantage of that right) to pledge or exchange the transferred costs, and (3) the Company does not maintain effective control over the transferred assets through an agreement to repurchase them before their maturity.
BANK OWNED LIFE INSURANCE
Bank owned life insurance consists of investments in life insurance contracts. Earnings on the contracts are based on the earnings on the cash surrender value, less mortality costs.
EMPLOYEE STOCK OWNERSHIP PLAN
The Company accounts for its employee stock ownership plan (ESOP) in accordance with AICPA Statement of Position (SOP) 93-6. Under SOP 93-6, the cost of shares issued to the ESOP, but not yet allocated to participants, are presented in the consolidated balance sheets as a reduction of shareholders’ equity. Compensation expense is recorded based on the market price of the shares as they are committed to be released for allocation to participant accounts. The difference between the market price and the cost of shares committed to be released is recorded as an adjustment to additional paid-in capital. Dividends on allocated ESOP shares are recorded as a reduction of retained earnings. Dividends on unearned shares are used to reduce the accrued interest and principal amount of the ESOP’s loan payable to the Company.
FINANCIAL INSTRUMENTS WITH OFF-BALANCE-SHEET RISK
The Company, in the normal course of business, makes commitments to make loans which are not reflected in the consolidated financial statements. A summary of these commitments is disclosed in Note 15.
GOODWILL
Goodwill is not amortized but is subject to an impairment test at least annually, or more often if conditions indicate a possible impairment.
SECURITIES SOLD UNDER AGREEMENTS TO REPURCHASE
The Company enters into sales of securities under agreements to repurchase with primary dealers only, which provide for the repurchase of the same security. Securities sold under agreements to purchase identical securities are collateralized by assets which are held in safekeeping in the name of the Bank or security by the dealers who arranged the transaction. Securities sold under agreements to repurchase are treated as financings and the obligations to repurchase such securities are reflected as a liability. The securities underlying the agreements remain in the asset accounts of the Company.
EARNINGS PER COMMON SHARE
Basic earnings per common share is based on the net income divided by the weighted average number of common shares outstanding during the period. Allocated ESOP shares are considered outstanding for earnings per common share calculations as they are committed to be released; unearned ESOP shares are not considered outstanding. Diluted earnings per common share shows the dilutive effect of additional potential common shares issuable under stock options.
18
Meta Financial Group, Inc. and Subsidiaries
NOTES TO CONSOLIDATED FINANCIAL STATEMENTS
COMPREHENSIVE INCOME
Comprehensive income consists of net income and other comprehensive income. Other comprehensive income includes the net change in net unrealized gains and losses on securities available for sale, net of reclassification adjustments and tax effects, and is also recognized as a separate component of shareholders’ equity.
STOCK COMPENSATION
Expense for employee compensation under stock option plans is based on Accounting Principles Board (APB) Opinion 25, with expense reported only if options are granted below market price at grant date.
SFAS No. 123,Accounting for Stock Based Compensation, requires proforma disclosures for companies that do not adopt its fair value accounting method for stock-based employee compensation for awards granted. Accordingly, the following proforma information presents net income and earnings per share had the fair value method been used to measure compensation cost for stock option plans. The exercise price of options granted is equivalent to the market value of underlying stock at the grant date. Accordingly, no compensation cost was actually recognized for stock options during 2005, 2004 and 2003.
The fair value of options granted during 2005, 2004 and 2003 is estimated using the following weighted-average information: risk-free interest rate of 4.23%, 4.12% and 3.53%, expected life of 7 years, expected dividends of 2.79%, 2.31% and 2.41% per year and expected stock price volatility of 20.63%, 21.94% and 22.54% per year, respectively.
| | | | | | | | | | |
| | 2005 | | 2004 | | 2003 | |
|
|
|
|
|
|
|
|
|
|
|
| | | | | | | | | | |
Net income (loss) as reported | | $ | (924,251 | ) | $ | 3,987,050 | | $ | 3,397,004 | |
Proforma net income (loss) | | | (1,078,377 | ) | | 3,757,083 | | | 3,253,603 | |
| | | | | | | | | | |
Reported earnings (loss) per common and common equivalent share: | | | | | | | | | | |
Basic | | $ | (0.38 | ) | $ | 1.61 | | $ | 1.37 | |
Diluted | | | (0.38 | ) | | 1.57 | | | 1.36 | |
| | | | | | | | | | |
Proforma earnings (loss) per common and common equivalent share: | | | | | | | | | | |
Basic | | $ | (0.44 | ) | $ | 1.51 | | $ | 1.32 | |
Diluted | | | (0.44 | ) | | 1.48 | | | 1.30 | |
NEW ACCOUNTING PRONOUNCEMENTS
In May 2005, the Financial Accounting Standards Board issued Statement of Financial Accounting Standard (SFAS) No. 154,Accounting Changes and Error Corrections. This Statement replaces APB Opinion No. 20,Accounting Changes, and FASB Statement No. 3,Reporting Accounting Changes in Interim Financial Statements. SFAS 154 carries forward the guidance contained in Opinion 20 for reporting the correction of an error in previously issued financial statements and a change in accounting estimate. However, SFAS 154 changes the requirements for the accounting for and reporting of a change in accounting principle. Under this Statement, every voluntary change in accounting principle requires retrospective application to prior periods’ financial statements, unless it is impracticable. It also applies to changes required by an accounting pronouncement in the unusual instance that the pronouncement does not include specific transition provisions. When a pronouncement includes specific transition provisions, those provisions should be followed. This Statement is effective for accounting changes and corrections of errors made in fiscal years beginning after December 15, 2005, although earlier application is permitted for changes and corrections made in fiscal years beginning after June 1, 2005. The Company expects no significant effect on its financial statements as a result of the adoption of this statement.
In December 2004, the Financial Accounting Standards Board (FASB) issued Statement of Financial Accounting Standard No. 123R,Share-Base Payment. This Statement revises SFAS Statement No. 123,Accounting for Stock-Based Compensation, amends SFAS Statement No. 95,Statement of Cash Flows, and supersedes APB Opinion No. 125, Accounting for Stock Issued to Employees. It requires that all stock-based compensation now be measured at fair value and recognized as expense in the income statement. This Statement also clarifies and expands guidance on measuring fair value of stock compensation, requires estimation of forfeitures when determining expense, and requires that excess tax benefits be shown as financing cash inflows versus a reduction of taxes paid in the statement of cash flows. Various other changes are also required. This Statement is effective beginning October 1, 2005, for the Company as a result of recent SEC actions. Management believes the impact on the financial statements will be similar to the disclosures made by footnote to the financial statements, showing the effect on earnings and earnings per share of expensing the value of stock options granted.
In November 2005, the FASB issued FASB Staff Position (FSP) FAS 115-1 and 124-1,The Meaning of Other-Than-Temporary Impairment and Its Application to Certain Investments. The FASB addresses the determination of when an investment is considered impaired, whether that impairment is other than temporary, and the measurement of an impairment loss. The FSP also includes accounting considerations subsequent to the recognition of an other-than-temporary impairment and requires certain disclosures about unrealized losses that have not been recognized as other-than-temporary impairments. The FSP amends FASB Statement No. 115,Accounting for Certain Investments in Debt and Equity Securities, FASB Statement No. 124,Accounting for Certain Investments Held by Not-for-Profit Organizationsand APB Opinion No. 18,The Equity Method of Accounting for Investments in Common Stock. The FSP nullifies certain requirements of EITF Issue No. 03-1,The Meaning of Other-Than-Temporary Impairment and Its Application to Certain Investmentsand supersedes EITF Abstracts, Topics D-44,Recognition of Other-Than-Temporary Impairment upon the Planned Sale of a Security Whose Cost Exceeds Fair Value. The FSP is required to be applied to reporting periods beginning after December 15, 2005. The Company does not expect adoption to have a material impact on the consolidate financial statements.
19
Meta Financial Group, Inc. and Subsidiaries
NOTES TO CONSOLIDATED FINANCIAL STATEMENTS
NOTE 2. EARNINGS PER COMMON SHARE
A reconciliation of the numerators and denominators used in the computation of basic earnings per common share and diluted earnings per common share is presented below:
| | | | | | | | | | |
| | 2005 | | 2004 | | 2003 | |
|
|
|
|
|
|
|
|
|
|
|
| | | | | | | | | | |
Basic earnings (loss) per common share: | | | | | | | | | | |
Numerator, net income (loss) | | $ | (924,251 | ) | $ | 3,987,050 | | $ | 3,397,004 | |
|
|
|
|
|
|
|
|
|
|
|
| | | | | | | | | | |
Denominator, weighted average common shares outstanding | | | 2,497,954 | | | 2,498,403 | | | 2,485,088 | |
Less weighted average unallocated ESOP shares | | | (37,063 | ) | | (16,724 | ) | | (13,797 | ) |
|
|
|
|
|
|
|
|
|
|
|
| | | | | | | | | | |
Weighted average common shares outstanding | | $ | 2,460,891 | | $ | 2,481,679 | | $ | 2,471,291 | |
|
|
|
|
|
|
|
|
|
|
|
| | | | | | | | | | |
Basic earnings (loss) per common share | | $ | (0.38 | ) | $ | 1.61 | | $ | 1.37 | |
|
|
|
|
|
|
|
|
|
|
|
| | | | | | | | | | |
Diluted earnings (loss) per common share: | | | | | | | | | | |
Numerator, net income (loss) | | $ | (924,251 | ) | $ | 3,987,050 | | $ | 3,397,004 | |
|
|
|
|
|
|
|
|
|
|
|
| | | | | | | | | | |
Denominator, weighted average common shares outstanding for basic earnings per common share | | | 2,460,891 | | | 2,481,679 | | | 2,471,291 | |
Add dilutive effects of assumed exercises of stock options, net of tax benefits | | | — | | | 52,744 | | | 33,654 | |
|
|
|
|
|
|
|
|
|
|
|
| | | | | | | | | | |
Weighted average common and dilutive potential common shares outstanding | | $ | 2,460,891 | | $ | 2,534,423 | | $ | 2,504,945 | |
|
|
|
|
|
|
|
|
|
|
|
| | | | | | | | | | |
Diluted earnings (loss) per common share | | $ | (0.38 | ) | $ | 1.57 | | $ | 1.36 | |
|
|
|
|
|
|
|
|
|
|
|
The calculation of the diluted loss per share for the year ended September 30, 2005 do not reflect the effect of the assumed exercise of stock options of 46,624 because the effect would have been anti-dilutive due to the net loss for the period. Stock options totaling 60,315, 91,315 and 58,566 shares were not considered in computing diluted earnings per common share for the years ended September 30, 2005, 2004 and 2003, respectively, because they were not dilutive.
NOTE 3. SECURITIES PURCHASED UNDER AGREEMENTS TO RESELL
In September 2005, Meta Payment Systems entered into a contract to assume the processing of a gift card portfolio. As part of the contract, the funds supporting the outstanding balances of the portfolio were invested in securities purchased under an agreement to resell through Bank of America. The contract provides for a fixed rate of return of 3.49% during its term. The investment in securities purchased under an agreement to resell matures weekly and the identical security is sold. Prior to reinvestment the balance is reduced by an estimate of the amount that will be needed to cover gift card settlements the following week. The estimated amount, along with the previous week’s interest, is wired to the Company. The securities purchased under this agreement are comprised of U.S. Government agency securities.
20
Meta Financial Group, Inc. and Subsidiaries
NOTES TO CONSOLIDATED FINANCIAL STATEMENTS
NOTE 4. SECURITIES
Year end securities available for sale were as follows:
| | | | | | | | | | | | | |
2005 | | AMORTIZED
COST | | GROSS
UNREALIZED GAINS | | GROSS
UNREALIZED LOSSES | | FAIR
VALUE | |
|
|
|
|
|
|
|
|
|
|
|
|
|
|
| | | | | | | | | | | | | |
Debt securities: | | | | | | | | | | | | | |
Trust preferred securities | | $ | 26,262,643 | | $ | 109,645 | | $ | (735,248 | ) | $ | 25,637,040 | |
Obligations of states and political subdivisions | | | 443,129 | | | 349 | | | (2,609 | ) | | 440,869 | |
Mortgage-backed securities | | | 207,652,399 | | | 31,615 | | | (4,762,913 | ) | | 202,921,101 | |
Other | | | 999,090 | | | 14,320 | | | — | | | 1,013,410 | |
|
|
|
|
|
|
|
|
|
|
|
|
|
|
| | | 235,357,261 | | | 155,929 | | | (5,500,770 | ) | | 230,012,420 | |
Marketable equity securities | | | 602,331 | | | 277,814 | | | — | | | 880,145 | |
|
|
|
|
|
|
|
|
|
|
|
|
|
|
| | $ | 235,959,592 | | $ | 433,743 | | $ | (5,500,770 | ) | $ | 230,892,565 | |
|
|
|
|
|
|
|
|
|
|
|
|
|
|
| | | | | | | | | | | | | |
2004 | | AMORTIZED
COST | | GROSS
UNREALIZED GAINS | | GROSS
UNREALIZED LOSSES | | FAIR
VALUE | |
|
|
|
|
|
|
|
|
|
|
|
|
|
|
| | | | | | | | | | | | | |
Debt securities: | | | | | | | | | | | | | |
Trust preferred securities | | $ | 26,751,966 | | $ | 112,275 | | $ | (872,231 | ) | $ | 25,992,010 | |
Obligations of states and political subdivisions | | | 475,502 | | | 6,432 | | | — | | | 481,934 | |
Mortgage-backed securities | | | 295,672,052 | | | 761,354 | | | (2,341,122 | ) | | 294,092,284 | |
Other | | | 998,659 | | | 54,141 | | | — | | | 1,052,800 | |
|
|
|
|
|
|
|
|
|
|
|
|
|
|
| | | 323,898,179 | | | 934,202 | | | (3,213,353 | ) | | 321,619,028 | |
Marketable equity securities | | | 602,331 | | | 302,218 | | | — | | | 904,549 | |
|
|
|
|
|
|
|
|
|
|
|
|
|
|
| | $ | 324,500,510 | | $ | 1,236,420 | | $ | (3,213,353 | ) | $ | 322,523,577 | |
|
|
|
|
|
|
|
|
|
|
|
|
|
|
Gross unrealized losses and fair value, aggregated by investment category and length of time that individual securities have been in continuous unrealized loss position at September 30, 2005 and 2004 are as follows:
| | | | | | | | | | | | | | | | | | | |
2005 | | LESS THAN 12 MONTHS | | OVER 12 MONTHS | | TOTAL | |
|
|
|
|
|
|
|
|
|
|
|
|
|
|
|
|
|
|
|
|
| | Fair
Value | | Unrealized
Losses | | Fair
Value | | Unrealized
Losses | | Fair
Value | | Unrealized
Losses | |
|
|
|
|
|
|
|
|
|
|
|
|
|
|
|
|
|
|
|
|
| | | | | | | | | | | | | | | | | | | |
Debt securities: | | | | | | | | | | | | | | | | | | | |
Trust preferred securities | | $ | — | | $ | — | | $ | 24,027,396 | | $ | (735,248 | ) | $ | 24,027,396 | | $ | (735,248 | ) |
Obligations of states and political subdivisions | | | 290,520 | | | (2,609 | ) | | — | | | — | | | 290,520 | | | (2,609 | ) |
Mortgage-backed securities | | | 43,671,997 | | | (699,413 | ) | | 157,847,666 | | | (4,063,500 | ) | | 201,519,663 | | | (4,762,913 | ) |
|
|
|
|
|
|
|
|
|
|
|
|
|
|
|
|
|
|
|
|
| | $ | 43,962,517 | | $ | (702,022 | ) | $ | 181,875,062 | | $ | (4,798,748 | ) | $ | 225,837,579 | | $ | (5,500,770 | ) |
|
|
|
|
|
|
|
|
|
|
|
|
|
|
|
|
|
|
|
|
| | | | | | | | | | | | | | | | | | | |
2004 | | LESS THAN 12 MONTHS | | OVER 12 MONTHS | | TOTAL | |
|
|
|
|
|
|
|
|
| | Fair
Value | | Unrealized
Losses | | Fair
Value | | Unrealized
Losses | | Fair
Value | | Unrealized
Losses | |
|
|
|
|
|
|
|
|
|
|
|
|
|
|
|
|
|
|
|
|
| | | | | | | | | | | | | | | | | | | |
Debt securities: | | | | | | | | | | | | | | | | | | | |
Trust preferred securities | | $ | — | | $ | — | | $ | 23,879,735 | | $ | (872,231 | ) | $ | 23,879,735 | | $ | (872,231 | ) |
Mortgage-backed securities | | | 34,755,362 | | | (204,451 | ) | | 196,459,639 | | | (2,136,671 | ) | | 231,215,001 | | | (2,341,122 | ) |
|
|
|
|
|
|
|
|
|
|
|
|
|
|
|
|
|
|
|
|
| | $ | 34,755,362 | | $ | (204,451 | ) | $ | 220,339,374 | | $ | (3,008,902 | ) | $ | 255,094,736 | | $ | (3,213,353 | ) |
|
|
|
|
|
|
|
|
|
|
|
|
|
|
|
|
|
|
|
|
As of September 30, 2005, the investment portfolio included securities with current unrealized losses which have existed for longer than one year. All of these securities are considered to be acceptable credit risks. Because the declines in fair value were due to changes in market interest rates, not in estimated cash flows, no other-than-temporary impairment was recorded at September 30, 2005. In addition, the Company has the intent and ability to hold these investment securities for a period of time sufficient to allow for an anticipated recovery.
The amortized cost and fair value of debt securities by contractual maturity are shown below. Certain securities have call features which allow the issuer to call the security prior to maturity. Expected maturities may differ from contractual maturities in mortgage-backed securities because borrowers may have the right to call or prepay obligations with or without call or prepayment penalties. Therefore these securities are not included in the maturity categories in the following maturity summary. Marketable equitable securities are not included in the following maturity summary.
21
Meta Financial Group, Inc. and Subsidiaries
NOTES TO CONSOLIDATED FINANCIAL STATEMENTS
| | | | | | | |
| | Amortized | | Fair | |
| | Cost | | Value | |
|
|
|
|
|
|
|
|
| | | | | | | |
Due in one year or less | | $ | 296,110 | | $ | 295,363 | |
Due after one year through five years | | | 1,146,109 | | | 1,158,916 | |
Due after ten years | | | 26,262,643 | | | 25,637,040 | |
|
|
|
|
|
|
|
|
| | | 27,704,862 | | | 27,091,319 | |
Mortgage-backed securities | | | 207,652,399 | | | 202,921,101 | |
|
|
|
|
|
|
|
|
| | $ | 235,357,261 | | $ | 230,012,420 | |
|
|
|
|
|
|
|
|
Activities related to the sale of securities available for sale are summarized below.
| | | | | | | | | | |
| | 2005 | | 2004 | | 2003 | |
|
|
|
|
|
|
|
|
|
|
|
| | | | | | | | | | |
Proceeds from sales | | $ | 25,842,710 | | $ | — | | $ | 90,473,567 | |
Gross gains on sales | | | 221,868 | | | — | | | 342,871 | |
Gross (losses) on sales | | | (241,202 | ) | | — | | | (100,309 | ) |
NOTE 5. LOANS RECEIVABLE, NET
Year-end loans receivable were as follows:
| | | | | | | |
| | 2005 | | 2004 | |
|
|
|
|
|
|
| | | | | | | |
One to four family residential mortgage loans | | $ | 47,568,014 | | $ | 45,631,796 | |
Construction loans | | | 22,597,205 | | | 29,732,204 | |
Commercial and multi-family real estate loans | | | 214,048,999 | | | 196,773,919 | |
Agricultural real estate loans | | | 15,245,600 | | | 12,879,821 | |
Commercial business loans | | | 101,772,452 | | | 80,515,547 | |
Agricultural business loans | | | 24,528,747 | | | 21,147,748 | |
Consumer loans | | | 31,663,259 | | | 30,355,326 | |
|
|
|
|
|
|
|
|
| | | 457,424,276 | | | 417,036,361 | |
Less: | | | | | | | |
Allowance for loan losses | | | (7,222,404 | ) | | (5,370,994 | ) |
Undistributed portion of loans in process | | | (9,732,776 | ) | | (7,342,268 | ) |
Net deferred loan origination fees | | | (278,851 | ) | | (271,720 | ) |
|
|
|
|
|
|
|
|
| | $ | 440,190,245 | | $ | 404,051,379 | |
|
|
|
|
|
|
|
|
Activity in the allowance for loan losses for the years ended September 30 was as follows:
| | | | | | | | | | |
| | 2005 | | 2004 | | 2003 | |
|
|
|
|
|
|
|
|
| | | | | | | | | | |
Beginning balance | | $ | 5,370,994 | | $ | 4,961,777 | | $ | 4,692,988 | |
Provision for loan losses | | | 5,482,000 | | | 488,500 | | | 350,000 | |
Recoveries | | | 146,820 | | | 29,210 | | | 32,148 | |
Charge-offs | | | (3,777,410 | ) | | (108,493 | ) | | (113,359 | ) |
|
|
|
|
|
|
|
|
|
|
|
Ending balance | | $ | 7,222,404 | | $ | 5,370,994 | | $ | 4,961,777 | |
|
|
|
|
|
|
|
|
|
|
|
Virtually all of the Company’s originated loans are to Iowa and South Dakota-based individuals and organizations. The Company’s purchased loans totaled approximately $60,968,000 at September 30, 2005, and were secured by properties located, as a percentage of total loans, as follows: 1% in Washington, 1% in Colorado, 2% in Minnesota, 3% in Iowa, 2% in Arizona, 1% in Missouri and the remaining 3% in 12 other states. The Company’s purchased loans totaled approximately $91,713,000 at September 30, 2004, and were secured by properties located, as a percentage of total loans, as follows: 6% in Washington, 1% in Colorado, 2% in Minnesota, 2% in Iowa, 1% in Wisconsin, 1% in South Dakota, 2% in Arizona, 1% in Missouri and the remaining 6% in 12 other states.
The Company originates and purchases commercial real estate loans. These loans are considered by management to be of somewhat greater risk of uncollectibility due to the dependency on income production. The Company’s commercial real estate loans include approximately $33,554,000 of loans secured by hotel properties and $45,566,000 of multi-family at September 30, 2005. The Company’s commercial real estate loans includes approximately $39,409,000 of loans secured by hotel properties and $39,362,000 of loans secured by multi-family at September 30, 2004.The remainder of the commercial real estate portfolio is diversified by industry. The Company’s policy for requiring collateral and guarantees varies with the creditworthiness of each borrower.
22
Meta Financial Group, Inc. and Subsidiaries
NOTES TO CONSOLIDATED FINANCIAL STATEMENTS
Impaired loans were as follows:
| | | | | | | |
| | 2005 | | 2004 | |
|
|
|
|
|
|
| | | | | |
Year-end impaired loans with no allowance for loan losses allocated | | $ | — | | $ | — | |
Year-end impaired loans with allowance for loan losses allocated | | | 664,056 | | | 652,834 | |
Amount of the allowance allocated to impaired loans | | | 250,803 | | | 197,265 | |
Average of impaired loans during the year | | | 1,701,941 | | | 775,047 | |
Interest income and cash interest collected on impaired loans was not material during the years ended September 30, 2005, 2004, and 2003.
NOTE 6. LOAN SERVICING
Loans serviced for others are not reported as assets. The unpaid principal balances of these loans at year end were as follows:
| | | | | | | |
| | 2005 | | 2004 | |
|
|
|
|
|
|
|
|
| | | | | | | |
Mortgage loan portfolios serviced for FNMA | | $ | 25,241,000 | | $ | 25,804,000 | |
Other | | | 26,039,000 | | | 27,460,000 | |
|
|
|
|
|
|
|
|
| | $ | 51,280,000 | | $ | 53,264,000 | |
|
|
|
|
|
|
|
|
Custodial escrow balances maintained in connection with the foregoing loan servicing were approximately $128,000 and $100,000 at September 30, 2005 and 2004, respectively.
NOTE 7. PREMISES AND EQUIPMENT, NET
Year end premises and equipment were as follows:
| | | | | | | |
| | 2005 | | 2004 | |
|
|
|
|
|
|
|
|
| | | | | | | |
Land | | $ | 2,858,410 | | $ | 2,108,388 | |
Buildings | | | 12,484,587 | | | 9,577,962 | |
Furniture, fixtures and equipment | | | 6,021,614 | | | 5,243,724 | |
|
|
|
|
|
|
|
|
| | | 21,364,611 | | | 16,930,074 | |
Less accumulated depreciation | | | (6,238,542 | ) | | (5,239,637 | ) |
|
|
|
|
|
|
|
|
| | $ | 15,126,069 | | $ | 11,690,437 | |
|
|
|
|
|
|
|
|
Depreciation of premises and equipment included in occupancy and equipment expense was approximately $999,000, $917,000 and $893,000 for the years ended September 30, 2005, 2004 and 2003, respectively.
NOTE 8. DEPOSITS
Certificates of deposit in denominations of $100,000 or more were approximately $128,175,000 and $84,862,000 at September 30, 2005 and 2004, respectively.
At September 30, 2005, the scheduled maturities of certificates of deposit were as follows for the years ending September 30:
| | | | |
2006 | | $ | 170,304,440 | |
2007 | | | 60,216,568 | |
2008 | | | 19,142,377 | |
2009 | | | 9,221,728 | |
2010 | | | 8,951,641 | |
Thereafter | | | 285,342 | |
|
|
|
|
|
| | $ | 268,122,096 | |
|
|
|
|
|
NOTE 9. ADVANCES FROM FEDERAL HOME LOAN BANK
At September 30, 2005 advances from the FHLB of Des Moines had fixed and variable rates ranging from 2.15% to 7.19% (weighted-average rate of 4.56%) are required to be repaid in the year ending September 30 as presented below. Advances totaling $49,700,000 contain call features which allow the FHLB to call for the prepayment of the borrowing prior to maturity.
| | | | |
2006 | | $ | 42,140,000 | |
2007 | | | 25,265,000 | |
2008 | | | 25,000,000 | |
2009 | | | 30,000,000 | |
2010 | | | 20,000,000 | |
Thereafter | | | 17,300,000 | |
|
|
|
|
|
| | $ | 159,705,000 | |
|
|
|
|
|
Borrowed funds at September 30, 2004 included borrowings from the FHLB of $226,250,000. Such borrowings carried a weighted-average interest rate of 3.62% with maturities ranging from 2005 through 2019.
MetaBank and MBWC have executed blanket pledge agreements whereby MetaBank and MBWC assign, transfer and pledge to the FHLB and grant to the FHLB a security interest in all mortgage collateral and securities collateral. However, MetaBank
23
Meta Financial Group, Inc. and Subsidiaries
NOTES TO CONSOLIDATED FINANCIAL STATEMENTS
and MBWC have the right to use, commingle and dispose of the collateral they have assigned to the FHLB. Under the agreements, MetaBank and MBWC must maintain “eligible collateral” that has a “lending value” at least equal to the “required collateral amount,” all as defined by the agreements.
At year end 2005 and 2004, MetaBank and MBWC collectively pledged securities with amortized costs of $105,947,000 and $169,159,000, respectively, and fair values of approximately $103,397,000 and $167,922,000, respectively, against specific FHLB advances. In addition, qualifying mortgage loans of approximately $89,815,000 and $119,731,000 were pledged as collateral at September 30, 2005 and 2004, respectively.
NOTE 10. SECURITIES SOLD UNDER AGREEMENTS TO REPURCHASE
Securities sold under agreements to repurchase totaled $20,507,051 and $32,549,377 at September 30, 2005 and 2004, respectively.
An analysis of securities sold under agreements to repurchase is as follows:
| | | | | | | |
| | 2005 | | 2004 | |
|
|
|
|
|
|
| | | | | |
Highest month-end balance | | $ | 33,077,141 | | $ | 58,500,000 | |
Average balance | | | 28,066,924 | | | 38,977,080 | |
Weighted average interest rate during the period | | | 2.78 | % | | 1.71 | % |
Weighted average interest rate at end of period | | | 2.89 | % | | 2.49 | % |
At year-end 2005, securities sold under agreements to repurchase had a weighted average maturity of less than 13 months.
The Company pledged securities with amortized costs of approximately $22,312,000 and $35,702,000 and fair values of approximately $21,931,000 and $36,022,000, respectively, at year-end 2005 and 2004 as collateral for securities sold under agreements to repurchase.
NOTE 11. JUNIOR SUBORDINATED DEBENTURES AND TRUST PREFERRED SECURITIES
Subordinated debentures are due to First Midwest Financial Capital Trust I, a 100% owned non-consolidated subsidiary of the Company. The debentures were issued in 2001 in conjunction with the Trust’s issuance of 10,000 shares of Company Obligated Mandatory Redeemable Trust Preferred Securities. The debentures bear the same interest rate and terms as the trust preferred securities, detailed following. The debentures are included on the balance sheet as liabilities.
The Company issued all of the 10,000 authorized shares of trust preferred securities of First Midwest Financial Capital Trust I holding solely subordinated debt securities. Distributions are paid semi-annually. Cumulative cash distributions are calculated at a variable rate of LIBOR (as defined) plus 3.75% (7.67% at September 30, 2005 and 5.74% at September 30, 2004), not to exceed 12.5%. The Company may, at one or more times, defer interest payments on the capital securities for up to 10 consecutive semi-annual periods, but not beyond July 25, 2031. At the end of any deferral period, all accumulated and unpaid distributions are required to be paid. The capital securities are required to be redeemed on July 25, 2031; however, the Company has the option to shorten the maturity date to a date not earlier than July 25, 2006. The redemption price is $1,000 per capital security plus any accrued and unpaid distributions to the date of redemption plus, if redeemed prior to July 25, 2011, a redemption premium as defined in the Indenture agreement.
Holders of the capital securities have no voting rights, are unsecured and rank junior in priority of payment to all of the Company’s indebtedness and senior to the Company’s common stock.
Although the securities issued by the Trusts are not included as a component of stockholders’ equity, the securities are treated as capital for regulatory purposes, subject to certain limitations.
NOTE 12. EMPLOYEE BENEFITS
EMPLOYEE STOCK OWNERSHIP PLAN (ESOP)
The Company maintains an ESOP for eligible employees who have 1,000 hours of employment with the Bank, have worked one year at the Bank and who have attained age 21. In 2001, the ESOP borrowed $360,000 from the Company to purchase 30,000 shares of the Company’s common stock. Final payment of this loan was received during the year ended September 30, 2005. In 2003, the ESOP borrowed $608,584 from the Company to purchase 35,574 shares of the Company’s common stock. In 2004, the ESOP borrowed $212,400 from the Company to purchase 10,000 shares of the Company’s common stock. In 2005, the ESOP borrowed $684,133 from the Company to purchase 30,000 shares of the Company’s common stock. Shares purchased by the ESOP are held in suspense for allocation among participants as the loan is repaid. ESOP expense of $305,068, $291,018 and $263,055 was recorded for the years ended September 30, 2005, 2004 and 2003, respectively. Contributions of $253,842, $219,310 and $253,050 were made to the ESOP during the years ended September 30, 2005, 2004 and 2003, respectively.
Contributions to the ESOP and shares released from suspense in an amount proportional to the repayment of the ESOP loan are allocated among ESOP participants on the basis of compensation in the year of allocation. Benefits generally become 100% vested after seven years of credited service. Prior to the completion of seven years of credited service, a participant who terminates employment for reasons other than death or disability receives a reduced benefit based on the ESOP’s vesting schedule. Forfeitures are reallocated among remaining participating employees, in the same proportion as contributions. Benefits are payable in the form of stock upon termination of employment. The Company’s contributions to the ESOP are not fixed, so benefits payable under the ESOP cannot be estimated.
For the years ended September 30, 2005, 2004 and 2003, 14,000, 13,000 and 15,000 shares with an average fair value of $21.79, $22.37 and $17.54 per share, respectively, were committed to be released. Also for the years ended September 30, 2005, 2004 and 2003, allocated shares and total ESOP shares reflect 45,042, 15,056 and 4,865 shares, respectively, withdrawn from the ESOP by participants who are no longer with the Company or by participants diversifying their holdings and 5,152, 5,426 and 6,569 shares, respectively, purchased for dividend reinvestment.
24
Meta Financial Group, Inc. and Subsidiaries
NOTES TO CONSOLIDATED FINANCIAL STATEMENTS
Year-end ESOP shares are as follows:
| | | | | | | | | | |
| | 2005 | | 2004 | | 2003 | |
|
|
|
|
|
|
|
|
|
Allocated shares | | | 229,928 | | | 255,818 | | | 252,448 | |
Unearned shares | | | 36,812 | | | 20,812 | | | 23,812 | |
|
|
|
|
|
|
|
|
|
|
|
Total ESOP shares | | | 266,740 | | | 276,630 | | | 276,260 | |
|
|
|
|
|
|
|
|
|
|
|
|
Fair value of unearned shares | | $ | 686,912 | | $ | 462,859 | | $ | 525,055 | |
|
|
|
|
|
|
|
|
|
|
|
STOCK OPTIONS AND INCENTIVE PLANS
Certain officers and directors of the Company have been granted options to purchase common stock of the Company pursuant to stock option plans. Stock option plans are used to reward directors, officers and employees and provide them with an additional equity interest. Options are issued for 10 year periods, with 100% vesting generally occurring either at grant date or 48 months after grant date. At September 30, 2005, 91,862 shares were authorized for future grants. Information about option grants follows:
| | | | | | | | | | | |
| | Number of
Options | | Weighted-
Average
Exercise Price | |
|
|
|
|
|
|
|
|
|
|
|
|
| | | | | | | | | | | |
Outstanding, September 30, 2002 | | | | 251,173 | | | | $ | 13.88 | | |
Granted | | | | 36,708 | | | | | 21.45 | | |
Exercised | | | | (35,292 | ) | | | | 6.67 | | |
Forfeited | | | | — | | | | | — | | |
|
|
|
|
|
| | | | | | |
Outstanding, September 30, 2003 | | | | 252,589 | | | | | 15.99 | | |
Granted | | | | 93,315 | | | | | 22.46 | | |
Exercised | | | | (36,546 | ) | | | | 15.94 | | |
Forfeited | | | | (2,000 | ) | | | | 15.92 | | |
|
|
|
|
|
| | | | | | |
Outstanding, September 30, 2004 | | | | 307,358 | | | | | 17.96 | | |
Granted | | | | 21,600 | | | | | 18.87 | | |
Exercised | | | | (13,630 | ) | | | | 16.01 | | |
Forfeited | | | | (4,000 | ) | | | | 17.88 | | |
|
|
|
|
|
| | | | | | |
Outstanding, September 30, 2005 | | | | 311,328 | | | | $ | 18.11 | | |
|
|
|
|
|
| | | | | | |
The weighted-average fair value per option for options granted in 2005, 2004 and 2003 was $3.96, $5.37 and $4.81, respectively. At September 30, 2005, options outstanding were as follows:
| | | | | | | | | | | | | | | | | | | |
Exercise
Price | | Weighted-Average
Exercise Price | | Weighted-Average
Remaining Life
(Years) | | Number
of Options | |
|
|
|
|
|
|
|
|
| $ | 9.63 - | $ | 9.99 | | | | $ | 9.63 | | | | | 5.00 | | | | 20,324 | |
| $ | 10.00 - | $ | 14.99 | | | | | 13.69 | | | | | 5.79 | | | | 62,474 | |
| $ | 15.00 - | $ | 19.99 | | | | | 17.26 | | | | | 3.28 | | | | 97,717 | |
| $ | 20.00 - | $ | 23.81 | | | | | 22.17 | | | | | 8.25 | | | | 130,813 | |
| | | | | | | | | | | | | | | | |
|
| |
| | | | | | | | | 18.11 | | | | | 5.99 | | | | 311,328 | |
| | | | | | | | | | | | | | | | |
|
| |
Options exercisable at year end are as follows:
| | | | | | | | | |
| | Number of
Options | | Weighted-
Average
Exercise Price | |
|
|
|
|
|
|
| | | | | | | | | |
2003 | | | 236,464 | | | $ | 15.99 | | |
2004 | | | 250,483 | | | | 17.04 | | |
2005 | | | 260,453 | | | | 17.32 | | |
PROFIT SHARING PLAN
The Company has a profit sharing plan covering substantially all full-time employees. Contribution expense for the years ended September 30, 2005, 2004 and 2003, was $233,453, $276,923 and $283,212, respectively.
25
Meta Financial Group, Inc. and Subsidiaries
NOTES TO CONSOLIDATED FINANCIAL STATEMENTS
NOTE 13. INCOME TAXES
The Company, the Bank and its subsidiaries and MBWC file a consolidated federal income tax return on a fiscal year basis.
The provision for income taxes consists of:
| | | | | | | | | | |
| | 2005 | | 2004 | | 2003 | |
|
|
|
|
|
|
|
|
Federal: | | | | | | | | | | |
Current | | $ | 115,151 | | $ | 2,120,464 | | $ | 1,430,109 | |
Deferred | | | (670,140 | ) | | (333,905 | ) | | (23,962 | ) |
|
|
|
|
|
|
|
|
|
|
|
| | | (554,989 | ) | | 1,786,559 | | | 1,406,147 | |
|
|
|
|
|
|
|
|
|
|
|
State: | | | | | | | | | | |
Current | | | (46,076 | ) | | 288,092 | | | 278,015 | |
Deferred | | | (83,620 | ) | | (15,953 | ) | | (5,876 | ) |
|
|
|
|
|
|
|
|
|
|
|
| | | (129,696 | ) | | 272,139 | | | 272,139 | |
|
|
|
|
|
|
|
|
|
|
|
| | | | | | | | | | |
Income tax expense (benefit) | | $ | (684,685 | ) | $ | 2,058,698 | | $ | 1,678,286 | |
|
|
|
|
|
|
|
|
|
|
|
Total income tax expense (benefit) differs from the statutory federal income tax rate as follows:
| | | | | | | | | | |
| | | 2005 | | | 2004 | | | 2003 | |
|
|
|
|
|
|
|
|
| | | | | | | | | | |
Income taxes (benefit) at 35% federal tax rate | | $ | (563,000 | ) | $ | 2,116,000 | | $ | 1,776,000 | |
Increase (decrease) resulting from: | | | | | | | | | | |
State income taxes - net of federal benefit | | | (26,000 | ) | | 191,000 | | | 141,000 | |
Nontaxable buildup in cash surrender value | | | (165,000 | ) | | (186,000 | ) | | (190,000 | ) |
Other, net | | | 69,315 | | | (62,302 | ) | | (48,714 | ) |
|
|
|
|
|
|
|
|
|
|
|
Total income tax expense (benefit) | | $ | (684,685 | ) | $ | 2,058,698 | | $ | 1,678,286 | |
|
|
|
|
|
|
|
|
|
|
|
Year-end deferred tax assets and liabilities consist of:
| | | | | | | |
| | 2005 | | 2004 | |
|
|
|
|
|
|
| | | | | |
Deferred tax assets: | | | | | | | |
Bad debts | | $ | 2,694,000 | | $ | 1,885,000 | |
Net unrealized losses on securities available for sale | | | 1,886,420 | | | 735,629 | |
Other | | | 75,589 | | | 146,829 | |
|
|
|
|
|
|
|
|
| | | 4,656,009 | | | 2,767,458 | |
|
|
|
|
|
|
|
|
| | | | | | | |
Deferred tax liabilities: | | | | | | | |
Federal Home Loan Bank stock dividend | | | (452,000 | ) | | (452,000 | ) |
Premises and equipment | | | (463,000 | ) | | (461,000 | ) |
Deferred loan fees | | | (150,000 | ) | | (168,000 | ) |
|
|
|
|
|
|
|
|
| | | (1,065,000 | ) | | (1,081,000 | ) |
|
|
|
|
|
|
|
|
| | | | | | | |
Net deferred tax assets | | $ | 3,591,009 | | $ | 1,686,458 | |
|
|
|
|
|
|
|
|
Federal income tax laws provided savings banks with additional bad debt deductions through September 30, 1987, totaling $6,744,000 for the Bank. Accounting standards do not require a deferred tax liability to be recorded on this amount, which liability otherwise would total approximately $2,300,000 at September 30, 2005 and 2004. If the Bank were liquidated or otherwise ceases to be a bank or if tax laws were to change, the $2,300,000 would be recorded as expense.
NOTE 14. CAPITAL REQUIREMENTS AND RESTRICTIONS ON RETAINED EARNINGS
The Company has two primary subsidiaries, MetaBank and MBWC. MetaBank and MBWC are subject to various regulatory capital requirements. Failure to meet minimum capital requirements can initiate certain mandatory or discretionary actions by regulators that, if undertaken, could have a direct material effect on the financial statements. Under capital adequacy guidelines and the regulatory framework for prompt corrective action, MetaBank and MBWC must meet specific quantitative capital guidelines using their assets, liabilities and certain off-balance-sheet items as calculated under regulatory accounting practices. The requirements are also subject to qualitative judgments by the regulators about components, risk weightings and other factors.
Quantitative measures established by regulation to ensure capital adequacy require MetaBank and MBWC to maintain minimum amounts and ratios (set forth in the table below) of total risk-based capital and Tier I capital (as defined in the regulations) to risk-weighted assets (as defined), and a leverage ratio consisting of Tier I capital (as defined) to average assets (as defined). Management believes, as of September 30, 2005, that MetaBank and MBWC meet the capital adequacy requirements.
26
Meta Financial Group, Inc. and Subsidiaries
NOTES TO CONSOLIDATED FINANCIAL STATEMENTS
MetaBank’s and MBWCs’s actual capital and required capital amounts and ratios are presented below:
| | | | | | | | | | | | | | | | | | | |
| | ACTUAL | | CAPITAL ADEQUACY
PURPOSES | | MINIMUM TO BE WELL
CAPITALIZED FOR
PROMPT CORRECTIVE
ACTION PROVISIONS | |
| |
|
|
|
|
|
|
| | Amount | | Ratio | Amount | | Ratio | Amount | | Ratio |
|
|
|
|
|
|
|
|
|
|
|
|
|
|
(Dollars in thousands) | | | | | | | | | | | | | | | | | | | |
| | | | | | | | | | | | | | | | | | | |
AS OF SEPTEMBER 30, 2005: | | | | | | | | | | | | | | | | | | | |
Total capital (to risk-weighted assets): | | | | | | | | | | | | | | | | | | | |
MetaBank | | $ | 52,857 | | | 10.3 | % | $ | 40,944 | | | 8.0 | % | $ | 51,180 | | | 10.0 | % |
MetaBank West Central | | | 4,162 | | | 13.0 | | | 2,566 | | | 8.0 | | | 3,208 | | | 10.0 | |
Tier 1 (Core) capital (to risk-weighted assets): | | | | | | | | | | | | | | | | | | | |
MetaBank | | | 46,412 | | | 9.1 | | | 20,472 | | | 4.0 | | | 30,708 | | | 6.0 | |
MetaBank West Central | | | 3,762 | | | 11.8 | | | 1,277 | | | 4.0 | | | 1,915 | | | 6.0 | |
Tier 1 (Core) capital (to average total assets): | | | | | | | | | | | | | | | | | | | |
MetaBank | | | 46,412 | | | 6.5 | | | 28,405 | | | 4.0 | | | 35,507 | | | 5.0 | |
MetaBank West Central | | | 3,762 | | | 7.4 | | | 2,042 | | | 4.0 | | | 2,553 | | | 5.0 | |
Tier 1 (Core) capital (to total assets), | | | | | | | | | | | | | | | | | | | |
MetaBank | | | 46,412 | | | 6.4 | | | 29,065 | | | 4.0 | | | 36,332 | | | 5.0 | |
| | | | | | | | | | | | | | | | | | | |
AS OF SEPTEMBER 30, 2004: | | | | | | | | | | | | | | | | | | | |
Total capital (to risk-weighted assets): | | | | | | | | | | | | | | | | | | | |
First Federal | | $ | 53,716 | | | 11.2 | % | $ | 38,480 | | | 8.0 | % | $ | 48,099 | | | 10.0 | % |
Security | | | 4,646 | | | 14.5 | | | 2,570 | | | 8.0 | | | 3,213 | | | 10.0 | |
Tier 1 (Core) capital (to risk-weighted assets): | | | | | | | | | | | | | | | | | | | |
First Federal | | | 48,493 | | | 10.1 | | | 19,240 | | | 4.0 | | | 28,860 | | | 6.0 | |
Security | | | 4,419 | | | 13.8 | | | 1,285 | | | 4.0 | | | 1,928 | | | 6.0 | |
Tier 1 (Core) capital (to average total assets): | | | | | | | | | | | | | | | | | | | |
First Federal | | | 48,493 | | | 6.8 | | | 28,470 | | | 4.0 | | | 35,588 | | | 5.0 | |
Security | | | 4,419 | | | 7.1 | | | 2,485 | | | 4.0 | | | 3,106 | | | 5.0 | |
Tier 1 (Core) capital (to total assets), | | | | | | | | | | | | | | | | | | | |
First Federal | | | 48,493 | | | 6.8 | | | 28,655 | | | 4.0 | | | 35,819 | | | 5.0 | |
Regulations limit the amount of dividends and other capital distributions that may be paid by a financial institution without prior approval of its primary regulator. The regulatory restriction is based on a three-tiered system with the greatest flexibility being afforded to well-capitalized (Tier 1) institutions. MetaBank and MBWC are currently Tier 1 institutions. Accordingly, MetaBank and MBWC can make, without prior regulatory approval, distributions during a calendar year up to 100% of their retained net income for the calendar year-to-date plus retained net income for the previous two calendar years (less any dividends previously paid) as long as they remain well-capitalized, as defined in prompt corrective action regulations, following the proposed distribution. Accordingly, at September 30, 2005, approximately $4,052,000 of MetaBank’s retained earnings and none of MBWC’s retained earnings were potentially available for distribution to the Company.
NOTE 15. COMMITMENTS AND CONTINGENCIES
In the normal course of business, the Company’s subsidiary banks make various commitments to extend credit which are not reflected in the accompanying consolidated financial statements.
At September 30, 2005 and 2004, loan commitments approximated $69,648,000 and $60,244,000, respectively, excluding undisbursed portions of loans in process. Loan commitments at September 30, 2005 included commitments to originate fixed-rate loans with interest rates ranging from 5.38% to 7.0% totaling $2,833,000 and adjustable-rate loan commitments with interest rates ranging from 4.75% to 18% totaling $63,545,000. The Company also had commitments to purchase a fixed-rate loan of $2,000,000 with an interest rate of 7.5% and adjustable rate loans of $1,270,000 with an interest rate of 7.625%. Loan commitments at September 30, 2004 included commitments to originate fixed-rate loans with interest rates ranging from 4% to 9% totaling $8,150,000 and adjustable-rate loan commitments with interest rates ranging from 3.88% to 18% totaling $50,094,000. The Company also had commitments to purchase a fixed-rate loan of $2,000,000 with an interest rate of 6.5%. Commitments, which are disbursed subject to certain limitations, extend over various periods of time. Generally, unused commitments are canceled upon expiration of the commitment term as outlined in each individual contract.
The exposure to credit loss in the event of nonperformance by other parties to financial instruments for commitments to extend credit is represented by the contractual amount of those instruments. The same credit policies and collateral requirements are used in making commitments and conditional obligations as are used for on-balance-sheet instruments.
Since certain commitments to make loans and to fund lines of credit and loans in process expire without being used, the amount does not necessarily represent future cash commitments. In addition, commitments used to extend credit are agreements to lend to a customer as long as there is no violation of any condition established in the contract.
Securities with amortized costs of approximately $65,314,000 and $47,201,000 and fair values of approximately $63,313,000 and $46,098,000 at September 30, 2005 and 2004, respectively, were pledged as collateral for public funds on deposit. Securities with amortized costs of approximately $13,567,000 and $10,255,000 and fair values of approximately $13,400,000 and $10,296,000 at September 30, 2005 and 2004, respectively, were pledged as collateral for individual, trust and estate deposits.
Under employment agreements with certain executive officers, certain events leading to separation from the Company could result in cash payments totaling approximately $2,235,000 as of September 30, 2005.
The Company and its subsidiaries are subject to certain claims and legal actions arising in the ordinary course of business. In the opinion of management, after consultation with legal counsel, the ultimate disposition of these matters is not expected to have a material adverse effect on the consolidated financial position or results of operations of the Company.
27
Meta Financial Group, Inc. and Subsidiaries
NOTES TO CONSOLIDATED FINANCIAL STATEMENTS
NOTE 16. OTHER COMPREHENSIVE INCOME (LOSS)
Other comprehensive income (loss) components and related taxes were as follows:
| | | | | | | | | | |
| | 2005 | | 2004 | | 2003 | |
|
|
|
|
|
|
|
|
| | | | | | | | | | |
Net change in net unrealized gains and losses on securities available for sale: | | | | | | | | | | |
Unrealized gains (losses) arising during the year | | $ | (3,109,428 | ) | $ | 2,848,264 | | $ | (5,369,149 | ) |
Reclassification adjustment for (gains) losses included in net income | | | 19,334 | | | — | | | (242,562 | ) |
|
|
|
|
|
|
|
|
Net change in unrealized gains and losses on securities available for sale | | | (3,090,094 | ) | | 2,848,264 | | | (5,611,711 | ) |
Tax effects | | | 1,149,825 | | | (1,059,840 | ) | | 2,088,115 | |
|
|
|
|
|
|
|
|
| | | | | | | | | | |
Other comprehensive income (loss) | | $ | (1,940,269 | ) | $ | 1,788,424 | | $ | (3,523,596 | ) |
|
|
|
|
|
|
|
|
|
|
|
NOTE 17. LEASE COMMITMENT
The Company has leased property under various noncancelable operating lease agreements which expire at various times through October 2013, and require annual rentals ranging from $6,000 to $52,200 plus the payment of the property taxes, normal maintenance and insurance on the property.
The total minimum rental commitment at September 30, 2005, under the leases is as follows:
| | | | |
2006 | | $ | 99,140 | |
2007 | | | 99,580 | |
2008 | | | 99,015 | |
2009 | | | 92,800 | |
2010 | | | 62,350 | |
Thereafter | | | 160,950 | |
|
|
|
|
|
| | $ | 613,835 | |
|
|
|
|
|
NOTE 18. SEGMENT REPORTING
An operating segment is generally defined as a component of a business for which discrete financial information is available and whose results are reviewed by the chief operating decision-maker. The Company has determined that it has two reportable segments: The traditional banking segment consists of its two banking subsidiaries, MetaBank and MetaBank West Central, and Meta Payment Systems, a division of MetaBank. MetaBank and MetaBank West Central operate as traditional community banks providing deposit, loan and other related products to individuals and small businesses, primarily in the communities where their offices are located. Meta Payment Systems provides a number of products and services, primarily to third parties, including financial institutions and other businesses. These products and services include issuance of prepaid cards, issuance of credit cards, sponsorship of ATMs into the debit networks, ACH origination services and a gift card program. Other related programs are in the process of development. The remaining grouping under the caption “All Others” consists of the operations of the Meta Financial Group, Inc. and Meta Trust Company.
Transactions between affiliates, the resulting revenues of which are shown in the intersegment revenue category, are conducted at market prices, meaning prices that would be paid if the companies were not affiliates.
28
Meta Financial Group, Inc. and Subsidiaries
NOTES TO CONSOLIDATED FINANCIAL STATEMENTS
| | | | | | | | | | | | | |
| | TRADITIONAL | | PAYMENT | | | | | |
| | BANKING | | SYSTEMS | | ALL OTHERS | | TOTAL | |
|
|
|
|
|
|
|
|
|
|
| | | | | | | | | | | | | |
YEAR ENDED SEPTEMBER 30, 2005 | | | | | | | | | | | | | |
Revenues from external customers: | | | | | | | | | | | | | |
Interest income | | $ | 40,779,232 | | $ | 49,451 | | $ | 297,149 | | $ | 41,125,832 | |
Noninterest income | | | 2,002,364 | | | 1,591,031 | | | 104,688 | | | 3,698,083 | |
Inter-segment revenue | | | 262,843 | | | 358,947 | | | 6,606 | | | 628,396 | |
Interest expense | | | 21,229,473 | | | 5,224 | | | 761,799 | | | 21,996,496 | |
Provision for loan and lease losses | | | 5,482,000 | | | — | | | — | | | 5,482,000 | |
Depreciation expense | | | 961,710 | | | 37,196 | | | — | | | 998,906 | |
Other noninterest expense | | | 14,126,062 | | | 3,202,646 | | | 1,255,137 | | | 18,583,845 | |
Segment income (loss) from continuing operations before income taxes | | | 1,245,193 | | | (1,245,636 | ) | | (1,608,493 | ) | | (1,608,936 | ) |
Segment assets | | | 703,874,252 | | | 70,905,966 | | | 54,405,761 | | | 829,185,979 | |
| | | | | | | | | | | | | |
YEAR ENDED SEPTEMBER 30, 2004 | | | | | | | | | | | | | |
Revenues from external customers: | | | | | | | | | | | | | |
Interest income | | $ | 35,902,412 | | $ | 7 | | $ | 317,634 | | $ | 36,220,053 | |
Noninterest income | | | 3,448,192 | | | 6,747 | | | 101,033 | | | 3,555,972 | |
Inter-segment revenue | | | 549,957 | | | — | | | — | | | 549,957 | |
Interest expense | | | 17,892,050 | | | 3,200 | | | 634,084 | | | 18,529,334 | |
Provision for loan and lease losses | | | 488,500 | | | — | | | — | | | 488,500 | |
Depreciation expense | | | 907,894 | | | 9,139 | | | — | | | 917,033 | |
Other noninterest expense | | | 12,609,174 | | | 761,470 | | | 974,724 | | | 14,345,368 | |
Segment income (loss) from continuing operations before income taxes | | | 8,002,880 | | | (766,991 | ) | | (1,190,141 | ) | | 6,045,748 | |
Segment assets | | | 778,689,059 | | | 145,353 | | | 60,199,249 | | | 839,033,661 | |
| | | | | | | | | | | | | |
YEAR ENDED SEPTEMBER 30, 2003 | | | | | | | | | | | | | |
Revenues from external customers: | | | | | | | | | | | | | |
Interest income | | $ | 34,898,575 | | $ | — | | $ | 334,656 | | $ | 35,233,231 | |
Noninterest income | | | 3,405,052 | | | — | | | 95,926 | | | 3,500,978 | |
Inter-segment revenue | | | 521,472 | | | — | | | — | | | 521,472 | |
Interest expense | | | 18,919,805 | | | — | | | 644,385 | | | 19,564,190 | |
Provision for loan and lease losses | | | 350,000 | | | — | | | — | | | 350,000 | |
Depreciation expense | | | 893,228 | | | — | | | — | | | 893,228 | |
Other noninterest expense | | | 12,480,826 | | | — | | | 892,146 | | | 13,372,972 | |
Segment income (loss) from continuing operations before income taxes | | | 6,181,239 | | | — | | | (1,105,949 | ) | | 5,075,290 | |
Segment assets | | | 770,883,332 | | | — | | | 55,742,263 | | | 826,625,595 | |
29
Meta Financial Group, Inc. and Subsidiaries
NOTES TO CONSOLIDATED FINANCIAL STATEMENTS
| | | | | | | | | | |
| | 2005 | | 2004 | | 2003 | |
|
|
|
|
|
|
|
|
|
|
|
| | | | | | | | | | |
REVENUES FOR THE YEAR ENDED SEPTEMBER 30: | | | | | | | | | | |
Interest income for reportable segments | | $ | 40,828,683 | | $ | 35,902,419 | | $ | 34,898,575 | |
Noninterest income for reportable segments | | | 3,593,395 | | | 3,454,939 | | | 3,405,052 | |
Intersegment revenues for reportable segments | | | 621,790 | | | 549,957 | | | 521,472 | |
Other revenues | | | 408,443 | | | 418,667 | | | 430,582 | |
Elimination of intersegment revenues | | | (628,396 | ) | | (549,957 | ) | | (521,472 | ) |
|
|
|
|
|
|
|
|
|
|
|
Total consolidated revenues | | $ | 44,823,915 | | $ | 39,776,025 | | $ | 38,734,209 | |
|
|
|
|
|
|
|
|
|
|
|
| | | | | | | | | | |
INTEREST EXPENSE FOR THE YEAR ENDED SEPTEMBER 30: | | | | | | | | | | |
Interest expense for reportable segments | | $ | 21,234,697 | | $ | 17,895,250 | | $ | 18,919,805 | |
Other interest expense | | | 761,799 | | | 634,084 | | | 644,385 | |
Elimination of intersegment interest expense | | | (142,703 | ) | | (118,149 | ) | | (113,439 | ) |
|
|
|
|
|
|
|
|
|
|
|
| | $ | 21,853,793 | | $ | 18,411,185 | | $ | 19,450,751 | |
|
|
|
|
|
|
|
|
|
|
|
| | | | | | | | | | |
NONINTEREST EXPENSE FOR THE YEAR ENDED SEPTEMBER 30: | | | | | | | | | | |
Noninterest expense for reportable segments | | $ | 17,328,708 | | $ | 13,370,644 | | $ | 12,480,826 | |
Other noninterest expense | | | 1,255,137 | | | 974,724 | | | 892,146 | |
Depreciation expense | | | 998,906 | | | 917,033 | | | 893,228 | |
Elimination of intersegment interest expense | | | (485,693 | ) | | (431,809 | ) | | (408,032 | ) |
|
|
|
|
|
|
|
|
|
|
|
| | $ | 19,097,058 | | $ | 14,830,592 | | $ | 13,858,168 | |
|
|
|
|
|
|
|
|
|
|
|
| | | | | | | | | | |
INCOME (LOSS) BEFORE INCOME TAXES (BENEFIT) FOR YEAR ENDED SEPTEMER 30: | | | | | | | | | | |
Total income (loss) for reportable segments | | $ | (443 | ) | $ | 7,235,889 | | $ | 6,181,239 | |
Other loss | | | (1,608,493 | ) | | (1,190,141 | ) | | (1,105,949 | ) |
Elimination of intersegment profit (loss) | | | — | | | — | | | — | |
|
|
|
|
|
|
|
|
|
|
|
Income (loss) before income taxes | | $ | (1,608,936 | ) | $ | 6,045,748 | | $ | 5,075,290 | |
|
|
|
|
|
|
|
|
|
|
|
| | | | | | | | | | |
ASSETS AS OF SEPTEMBER 30: | | | | | | | | | | |
Total assets for reportable segments | | $ | 774,780,218 | | $ | 778,834,412 | | $ | 770,883,332 | |
Other assets | | | 54,405,761 | | | 60,199,249 | | | 55,742,263 | |
Elimination of intersegment receivables | | | (50,598,010 | ) | | (55,093,854 | ) | | (50,832,668 | ) |
Other intersegment eliminations | | | (2,239,027 | ) | | (3,141,283 | ) | | (3,507,800 | ) |
|
|
|
|
|
|
|
|
|
|
|
Total consolidated assets | | $ | 776,348,942 | | $ | 780,798,524 | | $ | 772,285,127 | |
|
|
|
|
|
|
|
|
|
|
|
30
Meta Financial Group, Inc. and Subsidiaries
NOTES TO CONSOLIDATED FINANCIAL STATEMENTS
NOTE 19. PARENT COMPANY FINANCIAL STATEMENTS
Presented below are condensed financial statements for the parent company, Meta Financial Group, Inc.:
CONDENSED BALANCE SHEETS
SEPTEMBER 30, 2005 AND 2004
| | | | | | | |
| | 2005 | | 2004 | |
|
|
|
|
|
|
|
|
| | | | | | | |
ASSETS | | | | | | | |
Cash and cash equivalents | | $ | 51,676 | | $ | 110,119 | |
Securities available for sale | | | 2,177,472 | | | 2,625,894 | |
Investment in subsidiaries | | | 50,598,010 | | | 55,093,854 | |
Loan receivable from ESOP | | | 825,057 | | | 394,766 | |
Loan receivable | | | — | | | 1,261,188 | |
Other assets | | | 1,224,682 | | | 856,789 | |
|
|
|
|
|
|
|
|
| | | | | | | |
Total assets | | $ | 54,876,897 | | $ | 60,342,610 | |
|
|
|
|
|
|
|
|
| | | | | | | |
LIABILITIES AND SHAREHOLDERS’ EQUITY | | | | | | | |
|
LIABILITIES | | | | | | | |
Loan payable to subsidiaries | | $ | 1,200,000 | | $ | 2,550,000 | |
Subordinated debentures | | | 10,310,000 | | | 10,310,000 | |
Accrued expenses and other liabilities | | | 408,207 | | | 208,345 | |
|
|
|
|
|
|
|
|
| | | | | | | |
Total liabilities | | | 11,918,207 | | | 13,068,345 | |
|
|
|
|
|
|
|
|
| | | | | | | |
SHAREHOLDERS’ EQUITY | | | | | | | |
Common stock | | | 29,580 | | | 29,580 | |
Additional paid-in capital | | | 20,646,513 | | | 20,678,644 | |
Retained earnings, substantially restricted | | | 34,557,258 | | | 36,758,258 | |
Accumulated other comprehensive (loss) | | | (3,180,607 | ) | | (1,240,338 | ) |
Unearned Employee Stock Ownership Plan shares | | | (825,057 | ) | | (394,766 | ) |
Treasury stock, at cost | | | (8,268,997 | ) | | (8,557,113 | ) |
|
|
|
|
|
|
|
|
| | | | | | | |
Total shareholders’ equity | | | 42,958,690 | | | 47,274,265 | |
|
|
|
|
|
|
|
|
| | | | | | | |
Total liabilities and shareholders’ equity | | $ | 54,876,897 | | $ | 60,342,610 | |
|
|
|
|
|
|
|
|
31
Meta Financial Group, Inc. and Subsidiaries
NOTES TO CONSOLIDATED FINANCIAL STATEMENTS
CONDENSED STATEMENTS OF OPERATIONS
YEARS ENDED SEPTEMBER 30, 2005, 2004 AND 2003
| | | | | | | | | | |
| | 2005 | | 2004 | | 2003 | |
|
|
|
|
|
|
|
|
| | | | | | | | | | |
Dividend income from subsidiaries | | $ | 2,510,000 | | $ | 2,300,000 | | $ | 1,250,000 | |
Interest income | | | 303,755 | | | 317,635 | | | 334,656 | |
Gain on sales of securities available for sale, net | | | — | | | — | | | 48,109 | |
|
|
|
|
|
|
|
|
|
|
|
| | | 2,813,755 | | | 2,617,635 | | | 1,632,765 | |
|
|
|
|
|
|
|
|
|
|
|
| | | | | | | | | | |
Interest expense | | | 761,799 | | | 634,083 | | | 644,385 | |
Operating expenses | | | 1,060,084 | | | 752,257 | | | 662,046 | |
|
|
|
|
|
|
|
|
|
|
|
| | | 1,821,883 | | | 1,386,340 | | | 1,306,431 | |
|
|
|
|
|
|
|
|
|
|
|
| | | | | | | | | | |
Income (loss) before income taxes and equity in undistributed net income of subsidiaries | | | 991,872 | | | 1,231,295 | | | 326,334 | |
| | | | | | | | | | |
Income tax (benefit) | | | (503,000 | ) | | (354,000 | ) | | (304,000 | ) |
|
|
|
|
|
|
|
|
|
|
|
| | | | | | | | | | |
Income (loss) before equity in undistributed net income of subsidiaries | | | 1,494,872 | | | 1,585,295 | | | 630,334 | |
| | | | | | | | | | |
Equity in undistributed net income (loss) of subsidiaries | | | (2,419,123 | ) | | 2,401,755 | | | 2,766,670 | |
| | | | | | | | | | |
|
|
|
|
|
|
|
|
|
|
|
Net income (loss) | | $ | (924,251 | ) | $ | 3,987,050 | | $ | 3,397,004 | |
|
|
|
|
|
|
|
|
|
|
|
CONDENSED STATEMENTS OF CASH FLOWS
YEARS ENDED SEPTEMBER 30, 2005, 2004 AND 2003
| | | | | | | | | | |
| | 2005 | | 2004 | | 2003 | |
|
|
|
|
|
|
|
|
|
|
|
| | | | | | | | | | |
CASH FLOWS FROM OPERATING ACTIVITIES | | | | | | | | | | |
Net income (loss) | | $ | (924,251 | ) | $ | 3,987,009 | | $ | 3,397,004 | |
Adjustments to reconcile net income (loss) to net cash provided by operating activities: | | | | | | | | | | |
Equity in undistributed net (income) loss of subsidiaries | | | 2,419,123 | | | (2,401,755 | ) | | (2,766,670 | ) |
(Loss) on sales of securities available for sale, net | | | — | | | — | | | (48,109 | ) |
Change in other assets | | | (367,893 | ) | | 365,401 | | | (465,296 | ) |
Change in accrued expenses and other liabilities | | | 180,671 | | | (70,908 | ) | | 233,718 | |
|
|
|
|
|
|
|
|
|
|
|
Net cash provided by operating activities | | | 1,307,650 | | | 1,879,747 | | | 350,647 | |
|
|
|
|
|
|
|
|
|
|
|
| | | | | | | | | | |
CASH FLOWS FROM INVESTING ACTIVITIES | | | | | | | | | | |
Investment in subsidiary | | | (275,000 | ) | | — | | | — | |
Maturity of securities | | | 500,000 | | | — | | | — | |
Purchase of securities available for sale | | | — | | | — | | | (48,325 | ) |
Proceeds from sales of securities available for sale | | | — | | | — | | | 156,016 | |
Loan to ESOP | | | (684,133 | ) | | (212,400 | ) | | (608,584 | ) |
Net change in loan receivable | | | 1,261,188 | | | 46,071 | | | 42,284 | |
Repayments on loan receivable from ESOP | | | 253,842 | | | 219,310 | | | 253,050 | |
|
|
|
|
|
|
|
|
|
|
|
Net cash provided by (used in) investment activities | | | 1,055,897 | | | 52,981 | | | (205,559 | ) |
|
|
|
|
|
|
|
|
|
|
|
| | | | | | | | | | |
CASH FLOWS FROM FINANCING ACTIVITIES | | | | | | | | | | |
Proceeds from loan payable to subsidiaries | | | — | | | 2,325,000 | | | 1,975,000 | |
Repayments on loan payable to subsidiaries | | | (1,350,000 | ) | | (2,675,000 | ) | | (830,000 | ) |
Cash dividends paid | | | (1,276,749 | ) | | (1,286,533 | ) | | (1,279,911 | ) |
Proceeds from exercise of stock options | | | 230,414 | | | 582,557 | | | 235,281 | |
Purchase of treasury stock | | | (25,655 | ) | | (906,650 | ) | | (165,092 | ) |
|
|
|
|
|
|
|
|
|
|
|
Net cash (used in) financing activities | | | (2,421,990 | ) | | (1,960,626 | ) | | (64,722 | ) |
|
|
|
|
|
|
|
|
|
|
|
| | | | | | | | | | |
Net change in cash and cash equivalents | | | (58,443 | ) | | (27,898 | ) | | 80,366 | |
| | | | | | | | | | |
CASH AND CASH EQUIVALENTS | | | | | | | | | | |
Beginning of year | | | 110,119 | | | 138,017 | | | 57,651 | |
|
|
|
|
|
|
|
|
|
|
|
End of year | | $ | 51,676 | | $ | 110,119 | | $ | 138,017 | |
|
|
|
|
|
|
|
|
|
|
|
The extent to which the Company may pay cash dividends to shareholders will depend on the cash currently available at the Company, as well as the ability of the subsidiary banks to pay dividends to the Company (see Note 14).
32
Meta Financial Group, Inc. and Subsidiaries
NOTES TO CONSOLIDATED FINANCIAL STATEMENTS
NOTE 20. SELECTED QUARTERLY FINANCIAL DATA (UNAUDITED)
| | | | | | | | | | | | | |
| | QUARTER ENDED | |
|
|
|
|
|
|
|
|
|
|
|
|
|
|
| | December 31 | | March 31 | | June 30 | | September 30 | |
|
|
|
|
|
|
|
|
|
|
|
|
|
|
| | | | | | | | | | | | | |
FISCAL YEAR 2005: | | | | | | | | | | | | | |
Total interest income | | $ | 9,784,691 | | $ | 10,372,608 | | $ | 10,812,675 | | $ | 10,123,334 | |
Total interest expense | | | 5,097,674 | | | 5,383,453 | | | 5,697,041 | | | 5,675,625 | |
Net interest income | | | 4,687,017 | | | 4,989,155 | | | 5,115,634 | | | 4,447,709 | |
Provision for loan losses | | | 177,000 | | | 257,500 | | | 4,956,000 | | | 91,500 | |
Net income (loss) | | | 441,942 | | | 399,374 | | | (2,311,994 | ) | | 546,427 | |
Earnings (loss) per common and common equivalent share: | | | | | | | | | | | | | |
Basic | | $ | 0.18 | | $ | 0.16 | | $ | (0.94 | ) | $ | 0.22 | |
Diluted | | | 0.18 | | | 0.16 | | | (0.94 | ) | | 0.22 | |
| | | | | | | | | | | | | |
FISCAL YEAR 2004: | | | | | | | | | | | | | |
Total interest income | | $ | 9,053,707 | | $ | 8,890,641 | | $ | 9,043,212 | | $ | 9,192,696 | |
Total interest expense | | | 4,585,909 | | | 4,475,826 | | | 4,523,366 | | | 4,826,084 | |
Net interest income | | | 4,467,798 | | | 4,414,815 | | | 4,519,846 | | | 4,366,612 | |
Provision for loan losses | | | 101,000 | | | 56,000 | | | 167,500 | | | 164,000 | |
Net income | | | 976,942 | | | 1,675,397 | | | 836,609 | | | 498,102 | |
Earnings (loss) per common and common equivalent share: | | | | | | | | | | | | | |
Basic | | $ | 0.39 | | $ | 0.67 | | $ | 0.34 | | $ | 0.20 | |
Diluted | | | 0.39 | | | 0.67 | | | 0.34 | | | 0.20 | |
| | | | | | | | | | | | | |
FISCAL YEAR 2003: | | | | | | | | | | | | | |
Total interest income | | $ | 8,952,749 | | $ | 9,001,683 | | $ | 8,773,197 | | $ | 8,451,524 | |
Total interest expense | | | 5,027,183 | | | 4,854,739 | | | 4,841,730 | | | 4,727,099 | |
Net interest income | | | 3,925,566 | | | 4,146,944 | | | 3,931,467 | | | 3,724,425 | |
Provision for loan losses | | | 175,000 | | | 108,000 | | | 67,000 | | | — | |
Net income | | | 844,256 | | | 915,186 | | | 892,407 | | | 745,155 | |
Earnings per common and common equivalent share: | | | | | | | | | | | | | |
Basic | | $ | 0.34 | | $ | 0.37 | | $ | 0.36 | | $ | 0.30 | |
Diluted | | | 0.34 | | | 0.37 | | | 0.36 | | | 0.30 | |
NOTE 21. FAIR VALUES OF FINANCIAL INSTRUMENTS
SFAS No. 107,Disclosures About Fair Value of Financial Instruments,requires that the Company disclose estimated fair value amounts of its financial instruments. It is management’s belief that the fair values presented below are reasonable based on the valuation techniques and data available to the Company as of September 30, 2005 and 2004, as more fully described below. The operations of the Company are managed from a going concern basis and not a liquidation basis. As a result, the ultimate value realized for the finan-cial instruments presented could be substantially different when actually recognized over time through the normal course of operations. Additionally, a substantial portion of the Company’s inherent value is the subsidiary banks’ capitalization and franchise value. Neither of these components have been given consideration in the presentation of fair values below.
The following presents the carrying amount and estimated fair value of the financial instruments held by the Company at September 30, 2005 and 2004. This information is presented solely for compliance with SFAS No. 107 and is subject to change over time based on a variety of factors.
| | 2005 | | 2004 | |
|
|
|
|
|
|
|
|
|
|
|
|
|
|
| | Carrying
Amount | | Estimated
Fair Value | | Carrying
Amount | | Estimated
Fair Value | |
|
|
|
|
|
|
|
|
|
|
|
|
|
|
| | | | | | | | | | | | | |
Financial assets: | | | | | | | | | | | | | |
Cash and cash equivalents | | $ | 14,369,754 | | $ | 14,370,000 | | $ | 8,936,569 | | $ | 8,937,000 | |
Securities purchased under agreements to resell | | | 37,513,348 | | | 37,513,000 | | | — | | | — | |
Securities available for sale | | | 230,892,565 | | | 230,893,000 | | | 322,523,577 | | | 322,524,000 | |
Loans receivable, net | | | 440,190,245 | | | 434,521,000 | | | 404,051,379 | | | 400,965,000 | |
Loans held for sale | | | 306,000 | | | 306,000 | | | 270,000 | | | 270,000 | |
FHLB stock | | | 8,161,000 | | | 8,161,000 | | | 11,052,700 | | | 11,053,000 | |
Accrued interest receivable | | | 4,240,694 | | | 4,241,000 | | | 3,849,215 | | | 3,849,000 | |
| | | | | | | | | | | | | |
Financial liabilities: | | | | | | | | | | | | | |
Noninterest bearing demand deposits | | | (102,164,156 | ) | | (102,164,000 | ) | | (19,537,370 | ) | | (19,537,000 | ) |
Savings, NOW and money market demand deposits | | | (170,484,053 | ) | | (170,484,000 | ) | | (177,287,972 | ) | | (177,288,000 | ) |
Other time certificates of deposit | | | (268,122,096 | ) | | (265,828,000 | ) | | (264,755,535 | ) | | (265,836,000 | ) |
|
|
|
|
|
|
|
|
|
|
|
|
|
|
Total deposits | | | (540,770,305 | ) | | (538,476,000 | ) | | (461,580,877 | ) | | (462,661,000 | ) |
| | | | | | | | | | | | | |
Advances from FHLB | | | (159,705,000 | ) | | (160,675,000 | ) | | (226,250,000 | ) | | (236,265,000 | ) |
Securities sold under agreements to repurchase | | | (20,507,051 | ) | | (20,340,000 | ) | | (32,549,377 | ) | | (33,074,000 | ) |
Subordinated debentures | | | (10,310,000 | ) | | (10,336,000 | ) | | (10,310,000 | ) | | (10,339,000 | ) |
Advances from borrowers for taxes and insurance | | | (271,273 | ) | | (271,000 | ) | | (216,331 | ) | | (216,000 | ) |
Accrued interest payable | | | (941,935 | ) | | (942,000 | ) | | (473,426 | ) | | (473,000 | ) |
| | | | | | | | | | | | | |
Off-balance-sheet instruments, loan commitments | | | — | | | — | | | — | | | — | |
33
Meta Financial Group, Inc. and Subsidiaries
NOTES TO CONSOLIDATED FINANCIAL STATEMENTS
The following sets forth the methods and assumptions used in determining the fair value estimates for the Company’s financial instruments at September 30, 2005 and 2004.
CASH AND CASH EQUIVALENTS
The carrying amount of cash and short-term investments is assumed to approximate the fair value.
SECURITIES PURCHASED UNDER AGREEMENT TO RESELL
The carrying amount of securities purchased under agreement to resell is assumed to approximate the fair value.
SECURITIES AVAILABLE FOR SALE
Quoted market prices or dealer quotes were used to determine the fair value of securities available for sale.
LOANS RECEIVABLE, NET
The fair value of loans was estimated by discounting the future cash flows using the current rates at which similar loans would be made to borrowers with similar credit ratings and for similar remaining maturities. When using the discounting method to determine fair value, loans were gathered by homogeneous groups with similar terms and conditions and discounted at a target rate at which similar loans would be made to borrowers as of September 30, 2005 and 2004. In addition, when computing the estimated fair value for all loans, allowances for loan losses have been subtracted from the calculated fair value for consideration of credit issues.
LOANS HELD FOR SALE
Fair values are based on quoted market prices of similar loans sold on the secondary market.
FHLB STOCK
The fair value of such stock approximates book value since the Company is able to redeem this stock with the Federal Home Loan Bank at par value.
ACCRUED INTEREST RECEIVABLE
The carrying amount of accrued interest receivable is assumed to approximate the fair value.
DEPOSITS
The fair value of deposits were determined as follows: (i) for noninterest bearing demand deposits, savings, NOW and money market demand deposits, since such deposits are immediately withdrawable, fair value is determined to approximate the carrying value (the amount payable on demand); (ii) for other time certificates of deposit, the fair value has been estimated by discounting expected future cash flows by the current rates offered as of September 30, 2005 and 2004, on certificates of deposit with similar remaining maturities. In accordance with SFAS No. 107. no value has been assigned to the Company’s long-term relationships with its deposit customers (core value of deposits intangible) since such intangible is not a financial instrument as defined under SFAS No. 107.
ADVANCES FROM FHLB
The fair value of such advances was estimated by discounting the expected future cash flows using current interest rates as of September 30, 2005 and 2004, for advances with similar terms and remaining maturities.
SECURITIES SOLD UNDER AGREEMENTS TO REPURCHASE AND SUBORDINATED DEBENTURES
The fair value of these instruments was estimated by discounting the expected future cash flows using derived interest rates approximating market as of September 30, 2005 and 2004, over the contractual maturity of such borrowings.
ADVANCES FROM BORROWERS FOR TAXES AND INSURANCE
The carrying amount of advances from borrowers for taxes and insurance is assumed to approximate the fair value.
ACCRUED INTEREST PAYABLE
The carrying amount of accrued interest payable is assumed to approximate the fair value.
LOAN COMMITMENTS
The commitments to originate and purchase loans have terms that are consistent with current market terms. Accordingly, the Company estimates that the fair values of these commitments are not significant.
LIMITATIONS
It must be noted that fair value estimates are made at a specific point in time, based on relevant market information about the financial instrument. Additionally, fair value estimates are based on existing on and off-balance-sheet financial instruments without attempting to estimate the value of anticipated future business, customer relationships and the value of assets and liabilities that are not considered financial instruments. These estimates do not reflect any premium or discount that could result from offering the Company’s entire holdings of a particular financial instrument for sale at one time. Furthermore, since no market exists for certain of the Company’s financial instruments, fair value estimates may be based on judgments regarding future expected loss experience, current economic conditions, risk characteristics of various financial instruments, and other factors. These estimates are subjective in nature and involve uncertainties and matters of significant judgment and therefore cannot be determined with a high level of precision. Changes in assumptions as well as tax considerations could significantly affect the estimates. Accordingly, based on the limitations described above, the aggregate fair value estimates are not intended to represent the underlying value of the Company, on either a going concern or a liquidation basis.
34
BOARD OF DIRECTORS
James S. Haahr
Chairman of the Board for Meta Financial Group, MetaBank, and MetaBank West Central
E. Wayne Cooley
Consultant Emeritus of the Iowa Girls’ High School Athletic Union
E. Thurman Gaskill
Iowa State Senator and Grain and Livestock Farming Operation Owner
J. Tyler Haahr
President and Chief Executive Officer for Meta Financial Group and MetaBank, Chief Executive Officer for MetaBank West Central, and President of Meta Trust
Brad C. Hanson
Executive Vice President for Meta Financial Group and MetaBank and President of Meta Payment Systems
G. Mark Mickelson
Partner with Mickelson & Newell, LLC
Rodney G. Muilenburg
Retired Dairy Specialist Manager for Purina Mills, Inc.; Consultant for TransOva Genetics Dairy Division; and Director of Sales and Marketing for TransOva Genetics
Jeanne Partlow
Retired Chairman of the Board and President of Iowa Savings Bank
SENIOR OFFICERS
James S. Haahr
Chairman of the Board for Meta Financial Group, MetaBank, and MetaBank West Central
J. Tyler Haahr
President and Chief Executive Officer for Meta Financial Group and MetaBank, Chief Executive Officer for MetaBank West Central, and President of Meta Trust
Troy Moore
Executive Vice President and Chief Operating Officer for Meta Financial Group and MetaBank
Brad C. Hanson
Executive Vice President for Meta Financial Group and MetaBank and President of Meta Payment Systems
Ronald J. Walters, CPA
Senior Vice President, Secretary, Treasurer and Chief Financial Officer for Meta Financial Group and MetaBank and Secretary for MetaBank West Central
Ellen E. Moore
Senior Vice President of Marketing and Sales for Meta Financial Group, MetaBank, and MetaBank West Central
Ben Guenther
President of MetaBank Northwest Iowa Market
Tim D. Harvey
President of MetaBank Brookings Market
Tony Trussell
President of MetaBank Sioux Empire Market
I. Eugene Richardson, Jr.
President of MetaBank Central Iowa Market and MetaBank West Central and Member of the MetaBank West Central Board of Directors
Charles B. Friederichs
Senior Vice President and Chief Information Officer
Jon C. Geistfeld
Senior Vice President and Chief Lending Officer
Sandra K. Hegland
Senior Vice President of Human Resources
Susan C. Jesse
Senior Vice President of Compliance and Operations
35
INVESTOR INFORMATION
Annual Meeting of Shareholders
The Annual Meeting of Shareholders will convene at 1:00 pm on Monday, January 23, 2006. The meeting will be held in the Board Room of MetaBank, 121 East Fifth Street, Storm Lake, Iowa. Further information with regard to this meeting can be found in the proxy statement.
General Counsel
Mack, Hansen, Gadd, Armstrong & Brown, P.C.
316 East Sixth Street
P.O. Box 278
Storm Lake, Iowa 50588
Special Counsel
Katten Muchin Rosenman LLP
1025 Thomas Jefferson Street NW
East Lobby, Suite 700
Washington, D.C. 20007-5201
Independent Auditors
McGladrey & Pullen LLP
400 Locust Street, Suite 640
Des Moines, Iowa 50309-2372
Shareholder Services and Investor Relations
Shareholders desiring to change the name, address, or ownership of stock; to report lost certificates; or to consolidate accounts, should contact the corporation’s transfer agent:
|
Registrar & Transfer Company |
10 Commerce Drive |
Cranford, New Jersey 07016 |
Telephone: 800.368.5948 |
Email: invrelations@rtco.com |
Website: www.rtco.com |
Form 10-K
Copies of the Company’s Annual Report on Form 10-K for the year ended September 30, 2005 (excluding exhibits thereto) may be obtained without charge by contacting:
|
Investor Relations |
Meta Financial Group |
121 East Fifth Street |
P.O. Box 1307 |
Storm Lake, Iowa 50588 |
Telephone: 712.732.4117 |
Email: invrelations@metacash.com |
Website: www.metacash.com |
DIVIDEND AND STOCK MARKET INFORMATION
Meta Financial Group’s common stock trades on the Nasdaq National Market under the symbol “CASH.” TheWall Street Journalpublishes daily trading information for the stock under the abbreviation, “MetaFnl,” in the National Market Listing. Quarterly dividends for 2004 and 2005 were $0.13. The price range of the common stock, as reported on the Nasdaq System, was as follows:
| | | | | | | | | | | | | |
| | FISCAL YEAR 2005 | | FISCAL YEAR 2004 | |
| | LOW | | HIGH | | LOW | | HIGH | |
|
|
|
|
|
|
|
|
|
|
|
|
|
|
| | | | | | | | | | | | | |
FIRST QUARTER | | $ | 22.50 | | $ | 26.00 | | $ | 21.50 | | $ | 23.75 | |
SECOND QUARTER | | | 22.25 | | | 24.49 | | | 21.40 | | | 23.90 | |
THIRD QUARTER | | | 18.15 | | | 24.09 | | | 21.97 | | | 24.75 | |
FOURTH QUARTER | | | 16.51 | | | 19.89 | | | 20.26 | | | 24.22 | |
Prices disclose inter-dealer quotations without retail mark-up, mark-down or commissions, and do not necessarily represent actual transactions.
Dividend payment decisions are made with consideration of a variety of factors including earnings, financial condition, market considerations, and regulatory restrictions. Restrictions on dividend payments are described in Note 13 of the Notes to Consolidated Financial Statements included in this Annual Report.
As of September 30, 2005, Meta Financial Group had 2,503,655 shares of common stock outstanding, which were held by 249 shareholders of record, and 311,328 shares subject to outstanding options. The shareholders of record number does not reflect approximately 500 persons or entities who hold their stock in nominee or “street” name.
The following securities firms indicated they were acting as market makers for Meta Financial Group stock as of September 30, 2005: Fig Partners, LLC; Friedman Billings Ramsey & Co.; FTN Midwest Securities.; Howe Barnes Investments, Inc.; Knight Equity Markets, L.P.; Sandler O’Neill & Partners; Schwab Capital Markets; and UBS Securities LLC.
36

METABANK
NORTHWEST IOWA MARKET
STORM LAKE MAIN OFFICE
121 East Fifth Street
P.O. Box 1307
Storm Lake, Iowa 50588
712.732.4117
800.792.6815
712.732.7105 fax
Storm Lake Plaza
1413 North Lake Avenue
Storm Lake, Iowa 50588
712.732.6655
712.732.7924 fax
Lake View
419 Main Street
P.O. Box 649
Lake View, Iowa 51450
712.657.2721
712.657.2896 fax
Laurens
104 North Third Street
Laurens, Iowa 50554
712.841.2588
712.841.2029 fax
Odebolt
219 South Main Street
P.O. Box 465
Odebolt, Iowa 51458
712.668.4881
712.668.4882 fax
Sac City
518 Audubon Street
P.O. Box 6
Sac City, Iowa 50583
712.662.7195
712.662.7196 fax
METABANK
BROOKINGS MARKET
BROOKINGS MAIN OFFICE
600 Main Avenue
P.O. Box 98
Brookings, South Dakota 57006
605.692.2314
800.842.7452
605.692.7059 fax
METABANK
CENTRAL IOWA MARKET
CENTRAL IOWA MAIN OFFICE
4848 86th Street
Urbandale, Iowa 50322
515.309.9800
515.309.9801 fax
Highland Park
3624 Sixth Avenue
Des Moines, Iowa 50313
515.288.4866
515.288.3104 fax
Ingersoll
3401 Ingersoll Avenue
Des Moines, Iowa 50312
515.274.9674
515.274.9675 fax
West Des Moines
3448 Westown Parkway
West Des Moines, Iowa 50266
515.226.8474
515.226.8475 fax
METABANK
SIOUX EMPIRE MARKET
SIOUX FALLS MAIN OFFICE
2500 South Minnesota Avenue
P.O. Box 520
Sioux Falls, South Dakota 57101
605.977.7500
605.977.7501 fax
North Minnesota
1600 North Minnesota Avenue
P.O. Box 520
Sioux Falls, South Dakota 57101
605.338.3470
605.338.3471 fax
West 12th Street
2104 West 12th Street
P.O. Box 520
Sioux Falls, South Dakota 57101
605.336.8900
605.336.8901 fax
Western Avenue
4900 South Western Avenue
P.O. Box 520
Sioux Falls, South Dakota 57101
605.338.0059
605.338.0155
METABANK
WEST CENTRAL
WEST CENTRAL MAIN OFFICE
615 South Division
P.O. Box 606
Stuart, Iowa 50250
515.523.2203
800.523.8003
515.523.2460 fax
Casey
101 East Logan
P.O. Box 97
Casey, Iowa 50048
641.746.3366
800.746.3367
641.746.2828 fax
Menlo
501 Sherman
P.O. Box 36
Menlo, Iowa 50164
641.524.4521

Meta Payment Systems
4900 South Western Avenue
P.O. Box 520
Sioux Falls, South Dakota 57101
605-275-9555
605-782-1701 fax
metapay.com
BILL MARKVE AND
ASSOCIATESAND META TRUST
Investment and trust services
available at bank locations.(1)
(1) Non-traditional bank products offered through Ameritas Investment Corporation are not FDIC insured, nor are they guaranteed by MetaBank or any affiliate. May lose value.

metabankonline.com
37

Invest in us. Bank with us.
See how easy money management can be.
|

|
|
MetaBank Building |
121 East Fifth Street |
P.O. Box 1307 |
Storm Lake, Iowa 50588 |
metacash.com |