Exhibit 13

2007 ANNUAL REPORT

Meta means change.
Change is not merely necessary to life — it is life.
ALVIN TOFFLER
LET’S FACE IT. LIFE CHANGES. AND SO DOES BUSINESS. THAT IS WHY META FINANCIAL GROUP IS DEDICATED TO CHANGE. CHANGING THE WAY PEOPLE PAY. CHANGING THE WAY BUSINESSES MANAGE MONEY. CHANGING THE WAY PEOPLE BANK. CHANGE FOR THE BETTER. THAT IS WHAT META IS ABOUT.
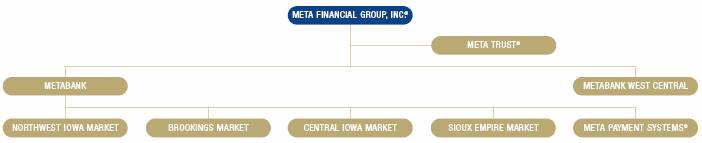
COMPANY STRUCTURE
COMPANY PROFILE
Headquartered in Storm Lake, Iowa, Meta Financial Group, Inc. (Meta) (trading symbol: “CASH”) is a $686 million bank holding company for MetaBank, MetaBank West Central, and Meta Trust Company. Its primary businesses are providing payment solutions nationally through its Meta Payment Systems (MPS) division and marketing deposits, loans and other financial services and products to meet the needs of its commercial, agricultural and retail customers in its bank markets. Meta shares are traded on the NASDAQ Global Market.SM
MPS is a recognized leader in the prepaid card industry and provides innovative payment solutions delivered nationally in collaboration with market-leading partners. MPS focuses on offering specific product solutions in the following areas: (i) prepaid cards, (ii) credit cards and lending solutions, and (iii) ATM sponsorship.
Meta operates its bank branches under a super-community banking philosophy with an emphasis on business banking that allows the Company to grow while maintaining its community bank roots, with local decision making and customer service. Administrative functions, transparent to the customer, are centralized to enhance the banks’ operational efficiencies and to improve customer service capabilities. MetaBank is a federally-chartered savings bank with four market areas: Brookings, Central Iowa, Northwest Iowa and Sioux Empire. MetaBank West Central is a state-chartered commercial bank located in West Central Iowa. Seventeen bank offices and two MPS/administrative offices support customers in Iowa, Nebraska, South Dakota and Tennessee and MPS clients across the country. Meta Trust provides professional trust services.
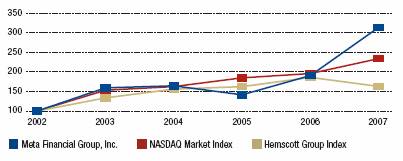
COMPARISON OF CUMULATIVE TOTAL RETURN OF CASH, INDUSTRY AND BROAD MARKET INDEXES
Banks are Members FDIC and Equal Housing Lenders. The Company and its subsidiaries exceed regulatory capital requirements.
CONTENTS | |
| |
Company Structure & Profile | i |
| |
Letter to Shareholders | ii-iii |
| |
Financials | 1-34 |
| |
Directors & Senior Officers | 35 |
| |
Investor Information | 36 |
| |
Locations | 37 |
i
To Fellow Shareholders

L TO R: J. TYLER HAAHR, JAMES S. HAAHR
ON BEHALF OF OUR LEADERSHIP TEAM AND META ASSOCIATES, WE ARE PLEASED TO SHARE ANOTHER YEAR OF PROGRESSION WITH YOU. META CONTINUES TO POSITION ITSELF AS A COMPANY THAT EMBRACES CHANGE—CHANGING THE WAY PEOPLE PAY, CHANGING THE WAY BUSINESSES MANAGE MONEY, AND CHANGING THE WAY PEOPLE BANK.
As a principal member of MasterCard,® Visa,® Discover® and the regional debit networks, Meta Payment Systems (MPS) expands the Company’s opportunity and reach in the growing payments industry. It serves banks, card processors, and third-party marketing companies nationwide. MPS focuses on offering specific product solutions in the following areas: (i) prepaid cards, (ii) credit cards and lending solutions, and (iii) ATM sponsorship.
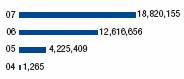
Annual consumer spending on prepaid cards is estimated to reach $260 billion by 2009.(1) As of fiscal year end, MPS supported clients by implementing more than 1,110 prepaid programs and issuing 35.7 million cards, up 94 percent and 49 percent from 2006 year end respectively. The success of its prepaid sponsorship program and launch of its new SimplexusTM prepaid card product suite has contributed to exponential growth since its inception in 2004. Additionally, MPS’s ATM Services unit now sponsors more than 44 percent of the white-label ATMs placed nationwide, up from 28 percent a year ago.
MPS FISCAL YEAR
CARDS ISSUED

MPS’s focus on leadership, innovation and change is evident by several noteworthy accomplishments in 2007:
· Founding member of the National Branded Prepaid Card Association (NBPCA) Board of Directors;
· Successful launch of SimplexusTM product suite;
· Market leader in ATM sponsorship;
· Rebate card programs issued for several Fortune 500 companies; and
· Successful pilot of contactless payment devices with MasterCard® and Visa.®
Meta understands the responsibility associated with being a recognized leader in the prepaid card industry. It respects its collaboration with market-leading partners in its efforts to deliver innovative payment solutions to improve the lives of its customers. Meta is bringing money to life.
FINANCIAL HIGHLIGHTS(2)
While Meta made strides in 2007, the Company’s constant emphasis on long-term, profitable growth over short-term gains is becoming increasingly important as Meta prepares for its next opportunities—in both payment solutions and traditional banking.
Meta reported net income of $1.2 million or $0.45 per diluted share for fiscal year 2007. This compares to net income of $3.7 million or $1.46 per diluted share for fiscal year 2006. Earnings for 2007 were impacted by a large provision for loan losses related primarily to an impairment on a commercial loan relationship offset, in part, by a gain on the sale of four Northwest Iowa bank branches. 2006 earnings were impacted by non-recurring fee income associated with a portfolio of purchased prepaid debit cards.
An important highlight for Meta is its growth in total revenues. Total revenue for fiscal year 2007 rose to a record $62.1 million, an increase of $7.8 million or 14 percent over fiscal year 2006. Total revenue from MPS, a separate reportable business unit of the
Company, was $26.3 million for fiscal 2007, up 90 percent or $12.5 million from fiscal 2006.
Net interest income for fiscal year 2007 was $21.7 million, up $2.1 million from fiscal year 2006. The 11 percent increase was driven by a higher net interest margin offset, in part, by a smaller earning asset base. Net interest margin continues its widening trend with a spread of 3.38 percent in fiscal year 2007, compared to 2.85 percent in 2006.
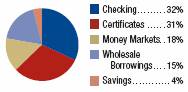
Contributing directly to Meta’s revenue and net interest income growth is a deliberate shift in its funding mix. Meta is replacing higher cost certificates of deposit, public funds deposits, and wholesale borrowings with low- and no-cost deposits that include checking, money market accounts and prepaid card product deposits.
FUNDING SOURCES 2007
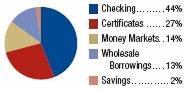
FUNDING SOURCES 2006
ii
Total low- and no-cost deposits rose 15 percent during fiscal year 2007 to $356 million at September 30, 2007.(3) As of September 30, 2007, these deposits represented 58 percent of total funding liabilities, compared to 50 percent one year earlier. A significant portion of this growth came from deposits generated by MPS. The Company used these deposit increases to pay down wholesale borrowing sources. Total wholesale borrowings at September 30, 2007 were $78.5 million, down 36 percent from $114.8 million at September 30, 2006.
LOW-COST
DEPOSIT BALANCES(3)
In millions
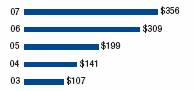
Low-cost deposits include checking and money market accounts.
Meta’s non-interest income also exhibited dramatic growth in fiscal year 2007, reaching a record $22.1 million. The $8.3 million or 61 percent increase from fiscal year 2006 can be attributed, in part, to MPS card fee income growth of $4.6 million, or 42 percent, over 2006 and increases in loan fee and deposit fee income totaling $150,000.
On the lending side, total loans, net of allowance for loan losses, fell $23.4 million or 6 percent during fiscal year 2007. This includes $2.2 million related to the branch sales. However, during the fourth quarter of fiscal 2007 there was an increase of $1.9 million. The Company believes
the pay downs and payoffs primarily in its originated and purchased commercial operating and commercial real estate portfolios are driven, in part, by a decrease in overall demand for credit and increased competition from secondary market investors.
Meta’s credit quality continues to exhibit positive trends. Non-performing loans at September 30, 2007 were 0.47 percent of total loans compared to 1.41 percent one year earlier. The Company’s underlying credit trends are very strong, and the Company continues to foster a conservative credit culture while it reduces its classified and nonperforming assets. Meta does not have any direct exposure to subprime mortgage loans.
Non-interest expense grew $10.2 million or 37 percent during fiscal 2007. The primary contributors, compensation and card processing expenses, rose as a result of MPS’s significant growth and Meta’s proactive efforts to support future growth and product development.
Meta has hired executive level management, client relations, compliance and operations support staff within MPS, as well as software developers, IT support staff, and other administrative support within the Company to secure the necessary infrastructure needed to support growth in the Company’s fast-growing MPS and its larger bank markets. For example, Meta’s information technology staff has grown from five to 35 full-time employees within two years in order to maintain Meta’s systems and support research and development initiatives.
Additionally, the Company invested in card processing settlement functions for value loading, card sales and other items to support new product development and anticipated growth of existing products. Meta’s occupancy and equipment expenses also rose during fiscal year 2007. The Company added administrative office space for MPS in Sioux Falls, SD and Omaha, NE and invested in computer hardware and software. Meta believes these investments will actively support growth at MPS.


Bank branch structure is also changing in the Company. In November 2007, Meta announced an agreement to sell its MetaBank West Central subsidiary with its three offices located in Stuart, Casey and Menlo, Iowa. The transaction will involve the sale of MetaBank West Central stock for approximately $8.3 million, which is dependent on the satisfaction of routine contractual terms by the date of the sale. The sale is anticipated to close on or before March 30, 2008.
Meta also sold four branches in Northwest Iowa for a $3.33 million gain recorded during the third quarter of fiscal 2007. The premium received from the sale of Meta’s seven branches has been and will be utilized for MPS and traditional banking expansion in markets with greater growth potential. MetaBank opened a new administrative office and retail branch in downtown Des Moines, Iowa this year and opened six new bank offices in Sioux Falls, South Dakota and the Des Moines metro area within the last five years. The Company believes that additional offices in higher-growth markets will lead to further loan and deposit growth. Its ATM network, online offerings and other technological services also support the distribution of Meta services.
CHANGE FOR THE FUTURE
The Company is committed to profitable growth for its customers, employees and shareholders. Meta associates are working to execute three key initiatives that we believe will enhance long-term performance and earnings:
· Actively pursue MPS growth,
· Build commercial banking business, and
· Manage infrastructure and risk to support growth.
Thank you for your interest and investment in our company

JAMES S. HAAHR, Chairman of the Board

(1) Mitchell, Richard. “Meeting the demand with rosy forecasts ahead, payment processors are tuned to servicing prepaid products,” www.intelecard.com, May 7, 2006.
(2) Information presented herein is qualified in its entirety by the Company’s audited financial statements presented elsewhere herein.
(3) 2007 low-cost deposit numbers exclude deposits from branches sold during the year and those related to the pending sale of MetaBank West Central.
iii
FINANCIAL HIGHLIGHTS
(Dollars in Thousands except Per Share Data) | | 2007 | | 2006 | | 2005 | | 2004 | | 2003 | |
| | | | (Restated) | | | | | | | |
AT SEPTEMBER 30 | | | | | | | | | | | |
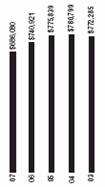
Total assets | | $ | 686,080 | | $ | 740,921 | | $ | 775,839 | | $ | 780,799 | | $ | 772,285 | |
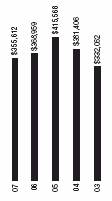
Total loans, net | | 355,612 | | 368,959 | | 415,568 | | 381,406 | | 332,062 | |
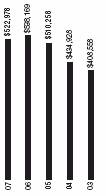
Total deposits | | 522,978 | | 538,169 | | 510,258 | | 433,928 | | 408,558 | |
Shareholder’s equity | | 48,098 | | 45,099 | | 42,959 | | 47,274 | | 43,031 | |
Book value per common share | | $ | 18.57 | | $ | 17.79 | | $ | 17.16 | | $ | 18.98 | | $ | 17.25 | |
Total equity to assets | | 7.01 | % | 6.09 | % | 5.54 | % | 6.05 | % | 5.57 | % |
| | | | | | | | | | | |
FOR THE FISCAL YEAR | | | | | | | | | | | |
Total interest income and non-interest income-continuing operations | | $ | 59,632 | | $ | 51,607 | | $ | 41,870 | | $ | 36,729 | | $ | 35,543 | |
Net interest income-continuing operations | | 20,807 | | 18,501 | | 18,063 | | 16,539 | | 14,647 | |
Income(loss)from continuing operations, net of tax | | 1,312 | | 3,379 | | (652 | ) | 3,662 | | 3,091 | |
Income (loss) from discontinued operations, net of tax | | (141 | ) | 309 | | (272 | ) | 325 | | 306 | |
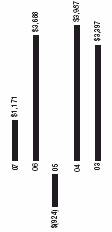
Net income(loss) | | 1,171 | | 3,688 | | (924 | ) | 3,987 | | 3,397 | |
| | | | | | | | | | | |
Diluted earnings (loss) per share: | | | | | | | | | | | |
Income (loss) from continuing operations | | $ | 0.50 | | $ | 1.34 | | $ | (0.27 | ) | $ | 1.44 | | $ | 1.24 | |
Income (loss) from discontinued operations | | (0.05 | ) | 0.12 | | (0.11 | ) | 0.13 | | 0.12 | |
Net income (loss) | | 0.45 | | 1.46 | | (0.38 | ) | 1.57 | | 1.36 | |
| | | | | | | | | | | |
Return on average assets | | 0.17 | % | 0.49 | % | -0.12 | % | 0.51 | % | 0.47 | % |
Return on average assets-continuing operations | | 0.19 | % | 0.45 | % | -0.08 | % | 0.47 | % | 0.43 | % |
Return on average equity | | 2.69 | % | 8.55 | % | -2.04 | % | 8.69 | % | 7.57 | % |
Return on average equity-continuing operations | | 3.01 | % | 7.83 | % | -1.44 | % | 7.98 | % | 6.89 | % |
Net yield on interest-earning assets-continuing operations | | 3.38 | % | 2.85 | % | 2.59 | % | 2.44 | % | 2.35 | % |
TOTAL ASSETS | | TOTAL LOANS, NET | | TOTAL DEPOSITS | | TOTAL REVENUES | | TOTAL NET INCOME |
In thousands | | In thousands | | In thousands | | In thousands | | n thousands |
| | | | | | | | |
| | 
| | 
| | 
| | 
|
FINANCIAL CONTENTS | | |
| | |
Financial Highlights | | 1 |
Selected Consolidated Financial Information | | 2 |
Management’s Discussion and Analysis | | 3 |
Report of Independent Registered Public Accounting Firm | | 11 |
Consolidated Statements of Financial Condition at September 30, 2007 and 2006 | | 12 |
Consolidated Statements of Operations for the Years Ended September 30, 2007, 2006 and 2005 | | 13 |
Consolidated Statements of Comprehensive Income (Loss) for the Years Ended September 30, 2007, 2006 and 2005 | | 14 |
Consolidated Statements of Changes in Shareholders’ Equity for the Years Ended September 30, 2007, 2006 and 2005 | | 14 |
Consolidated Statements of Cash Flows for the Years Ended September 30, 2007, 2006 and 2005. | | 15 |
Notes to Consolidated Financial Statements | | 16 |
1
Meta Financial Group, Inc. and Subsidiaries
SELECTED CONSOLIDATED FINANCIAL INFORMATION
SEPTEMBER 30, | | 2007 | | 2006 | | 2005 | | 2004 | | 2003 | |
| | | | (Restated) | | | | | | | |
SELECTED FINANCIAL CONDITION DATA
(In Thousands) | | | | | | | | | | | |
| | | | | | | | | | | |
Total assets | | $ | 686,080 | | $ | 740,921 | | $ | 775,839 | | $ | 780,799 | | $ | 772,285 | |
Loans receivable, net | | 355,612 | | 368,959 | | 415,568 | | 381,406 | | 332,062 | |
Securities available for sale | | 158,701 | | 172,444 | | 213,245 | | 290,186 | | 324,915 | |
Goodwill | | 1,508 | | 1,508 | | 1,508 | | 1,508 | | 1,508 | |
Deposits | | 522,978 | | 538,169 | | 510,258 | | 433,928 | | 408,558 | |
Total borrowings | | 78,534 | | 114,789 | | 176,857 | | 241,354 | | 258,082 | |
Shareholders’ equity | | 48,098 | | 45,099 | | 42,959 | | 47,274 | | 43,031 | |
| | | | | | | | | | | | | | | | |
YEAR ENDED SEPTEMBER 30, | | | | | | | | | | | |
| | | | | | | | | | | |
SELECTED OPERATIONS DATA | | | | | | | | | | | |
(In Thousands, Except Per Share Data) | | | | | | | | | | | |
| | | | | | | | | | | |
Total interest income | | $ | 37,774 | | 38,112 | | $ | 38,368 | | $ | 33,433 | | $ | 32,390 | |
Total interest expense | | 16,967 | | 19,611 | | 20,305 | | 16,894 | | 17,743 | |
Net interest income | | 20,807 | | 18,501 | | 18,063 | | 16,539 | | 14,647 | |
Provision for loan losses | | 3,168 | | 311 | | 4,713 | | 473 | | 381 | |
Net interest income after provision for loan losses | | 17,639 | | 18,190 | | 13,350 | | 16,066 | | 14,266 | |
Total non-interest income | | 21,858 | | 13,495 | | 3,502 | | 3,296 | | 3,153 | |
Total non-interest expense | | 36,958 | | 26,640 | | 17,995 | | 13,797 | | 12,778 | |
Income (loss) from continuing operations before income tax expense (benefit) | | 2,539 | | 5,045 | | (1,143 | ) | 5,565 | | 4,641 | |
Income tax expense (benefit) | | 1,227 | | 1,666 | | (491 | ) | 1,903 | | 1,550 | |
Income (loss) from continuing operations | | 1,312 | | 3,379 | | (652 | ) | 3,662 | | 3,091 | |
Income (loss) from discontinued operations, net of tax | | (141 | ) | 309 | | (272 | ) | 325 | | 306 | |
Net income (loss) | | 1,171 | | 3,688 | | (924 | ) | 3,987 | | 3,397 | |
| | | | | | | | | | | | | | | |
Basic earnings (loss) per common share: | | | | | | | | | | | |
Income (loss) from continuing operations | | $ | 0.52 | | $ | 1.36 | | $ | (0.27 | ) | $ | 1.48 | | $ | 1.25 | |
Income (loss) from discontinued operations | | (0.06 | ) | 0.12 | | (0.11 | ) | 0.13 | | 0.12 | |
Net income (loss) | | $ | 0.46 | | $ | 1.48 | | $ | (0.38 | ) | $ | 1.61 | | $ | 1.37 | |
| | | | | | | | | | | |
Diluted earnings (loss) per common share: | | | | | | | | | | | |
Income (loss) from continuing operations | | $ | 0.50 | | $ | 1.34 | | $ | (0.27 | ) | $ | 1.44 | | $ | 1.23 | |
Income (loss) from discontinued operations | | (0.05 | ) | 0.12 | | (0.11 | ) | 0.13 | | 0.12 | |
Net income (loss) | | $ | 0.45 | | $ | 1.46 | | $ | (0.38 | ) | $ | 1.57 | | $ | 1.36 | |
YEAR ENDED SEPTEMBER 30, | | | | | | | | | | | |
| | | | | | | | | | | |
SELECTED FINANCIAL RATIOS AND OTHER DATA PERFORMANCE RATIOS | | | | | | | | | | | |
Return on average assets | | 0.17 | % | 0.49 | % | -0.12 | % | 0.51 | % | 0.47 | % |
Return on average assets-continuing operations | | 0.19 | % | 0.45 | % | -0.08 | % | 0.47 | % | 0.43 | % |
Return on average equity | | 2.69 | % | 8.55 | % | -2.04 | % | 8.69 | % | 7.57 | % |
Return on average equity-continuing operations | | 3.01 | % | 7.83 | % | -1.44 | % | 7.98 | % | 6.89 | % |
Net interest margin-continuing operations | | 3.38 | % | 2.85 | % | 2.59 | % | 2.44 | % | 2.35 | % |
Operating expense to average assets-continuing operations | | 5.26 | % | 3.55 | % | 2.29 | % | 1.78 | % | 1.78 | % |
| | | | | | | | | | | |
QUALITY RATIOS—CONTINUING OPERATIONS | | | | | | | | | | | |
Non-performing assets to total assets at end of year | | 0.38 | % | 0.72 | % | 0.92 | % | 0.09 | % | 0.27 | % |
Allowance for loan losses to non-performing loans | | 196 | % | 121 | % | 280 | % | 706 | % | 475 | % |
| | | | | | | | | | | |
CAPITAL RATIOS | | | | | | | | | | | |
Shareholders’ equity to total assets at end of period | | 7.01 | % | 6.09 | % | 5.54 | % | 6.05 | % | 5.57 | % |
Average shareholders’ equity to average assets | | 6.20 | % | 5.76 | % | 5.77 | % | 5.91 | % | 6.25 | % |
| | | | | | | | | | | |
OTHER DATA | | | | | | | | | | | |
Book value per common share outstanding | | $ | 18.57 | | $ | 17.79 | | $ | 17.16 | | $ | 18.98 | | $ | 17.25 | |
Dividends declared per share | | 0.52 | | 0.52 | | 0.52 | | 0.52 | | 0.52 | |
Number of full-service offices | | 17 | | 19 | | 17 | | 16 | | 16 | |
| | | | | | | | | | | | | | | | |
2
Meta Financial Group, Inc. and Subsidiaries
MANAGEMENT’S DISCUSSION AND ANALYSIS
MANAGEMENT’S DISCUSSION AND ANALYSIS
GENERAL
Meta Financial Group, Inc.® (the “Company”) is a bank holding company whose primary subsidiaries are MetaBank (the “Bank”) and MetaBank West Central (“MetaBank WC”). The Company focuses on two core businesses, its regional retail banking business and a national payments business, conducted through its Meta Payment Systems® (“MPS”) division. The Company’s retail bank business is focused on establishing and maintaining long-term relationships with customers, and is committed to serving the financial service needs of the communities in its market area. The retail bank’s primary market area includes the following counties: Adair, Buena Vista, Dallas, Guthrie, and Polk located in central and northwestern Iowa, and Brookings, Lincoln, and Minnehaha located in east central South Dakota. The traditional bank segment attracts retail deposits from the general public and uses those deposits, together with other borrowed funds, to originate and purchase residential and commercial mortgage loans, and to originate consumer, agricultural and other commercial loans.
MPS, a division of the Bank, is an industry leader in the issuance of prepaid debit cards and is also a provider of a wide range of payment-related products and services, including prepaid debit cards, ATMs, credit cards and rebate cards. MPS pursues a strategy of working with industry-leading companies in a variety of industries to help them introduce new payment products to their customers. In addition, MPS partners with emerging companies to develop and introduce new payment products. MPS earns revenues from fees as well as being a significant provider of low- and no-cost demand deposits.
OVERVIEW OF CORPORATE DEVELOPMENTS
The Company continues to experience significant growth in its MPS division and is investing for further growth in this business unit. MPS continued to exhibit rapid growth during fiscal year 2007. On a business segment basis, its revenues (interest income plus non-interest income) grew by 58% over the previous year and now comprise 44% of the Company’s total revenue from continuing operations compared to 32% in the prior year. The division was created in May 2004 to take advantage of opportunities in the growing area of prepaid debit cards, ATM sponsorship, and other payment products and services. MPS is now recognized as an industry leader in a number of different areas within the payment systems industry including prepaid debit cards and ATMs.
The Bank continues to emphasize expansion in the growing metropolitan areas of Sioux Falls, South Dakota and Des Moines, Iowa. The Company focuses primarily on establishing lending and deposit relationships with commercial businesses and commercial real estate developers in these communities. In March 2007, the Company also opened an administrative support office in Omaha, Nebraska. During the third quarter of fiscal 2007, the Company divested four of its branches in rural Northwest Iowa. The Company also has signed a definitive agreement to sell MetaBank WC, which includes three branches in rural West-Central Iowa, with an expectation that the transaction will close in the second quarter of fiscal 2008. After the transaction closes the Company will be a unitary thrift holding company, subject to the jurisdiction of the Office of Thrift Supervision (“OTS”). These transactions allow the Company to increase its focus on higher growth markets and business lines. The Company now operates 17 branches: in Brookings (1) and Sioux Falls (4), South Dakota, in Des Moines (6), Northwest (2), and West-Central (3), Iowa, as well as a non-retail service branch in Memphis, Tennessee.
The Company discovered in September 2007 that maintenance fees charged to and collected from holders of prepaid gift cards, which were issued through the Company’s network of agent financial institutions, were not recognized as income in the appropriate periods. The impact to income from continuing operations before income tax expense for the fiscal year ended September 30, 2006 amounted to $322,000.
In addition, during the quarter ended December 31, 2006, the Company determined that a material impairment of its assets related to a certain loan had occurred and recorded an additional $690,000 provision for loan losses. The Company was subsequently informed by its independent accountants that, as a result of their consultation with their regulatory authorities, the additional provision should have been recorded in the quarter ended September 30, 2006 instead of the quarter ended December 31, 2006.
As a result of the above, the Company has restated its financial statements for the year ended September 30, 2006 to reflect an additional $322,000 of card fee revenue, an additional provision for loan losses of $690,000 and additional income tax benefit of $135,000, resulting in a decrease to net income of $233,000. The statement of financial condition for the year ending September 30, 2006 reflects a decrease in net loans of $690,000, a decrease to deposits of $322,000, a decrease to accrued expenses of $135,000, and a decrease to retained earnings of $233,000.
In November 2007, the Company also amended its Quarterly Reports on Form 10-Q for the quarterly periods ended December 31, 2006, March 31, 2007, and June 30, 2007 for the above restatements. Net income, as restated for the three months ended December 31, 2006, increased $550,000 due to additional prepaid card fee income of $178,000 and reduction in the provision for loan losses of $690,000. Net income, as restated for the three months ended March 31, 2007 and June 30, 2007, increased $132,000 and $152,000, respectively, due to additional prepaid card fee income.
The Company’s stock trades on the NASDAQ Global Market under the symbol “CASH.”
FINANCIAL CONDITION
The following discussion of the Company’s consolidated financial condition should be read in conjunction with the Selected Consolidated Financial Information and Consolidated Financial Statements and the related notes included in this Annual Report.
The Company’s total assets at September 30, 2007 were $686.1 million, a decrease of $54.8 million, or 7.4%, from $740.9 million at September 30, 2006. The decrease in assets of $54.8 million resulted primarily from decreases in the Company’s cash, securities, and loan portfolios.
Total cash and cash equivalents and federal funds sold were $86.3 million at September 30, 2007, a decrease of $21.2 million, or 19.7%, from $107.5 million at September 30, 2006. The decrease was primarily the result of the Company’s sale of four branches in northwest Iowa. Cash and short term investments were used to fund the assumption of deposit liabilities by the acquiring institutions.
In general, the Company maintains its cash investments in interest-bearing overnight deposits with various correspondent banks. Federal funds sold deposits are maintained at various large commercial banks.
The Company’s portfolio of securities purchased under agreements to resell and available for sale decreased $5.9 million, or 100%, to none at September 30, 2007. The Company’s portfolio of investment securities available for sale consists primarily of mortgage-backed securities, most with balloon maturities, which have relatively short expected average lives and limited maturity extension risk. During fiscal year 2007, the Company purchased securities for its available for sale portfolio totaling $13.2 million and sold securities available for sale in the amount of $1.1 million. See Note 5 to the Notes to Consolidated Financial Statements.
The Company’s portfolio of net loans receivable decreased by $13.4 million, or 3.6%, to $355.6 million at September 30, 2007 from $369.0 million at September 30, 2006. The decrease was mainly the result of pay offs and pay downs in the Company’s purchased loan participation portfolio, which is concentrated in commercial real estate and commercial operating credits. The Company experienced slight growth in its agricultural real estate and agricultural operating portfolios. See Note 6 to the Notes to Consolidated Financial Statements.
The Company owns stock in the Federal Home Loan Bank (“FHLB”) of Des Moines as well as in the Federal Reserve Bank due to its membership and participation in these banking systems. The Company’s investment in such stock decreased $1.1 million, or 20.5%, to $4.0 million at September 30, 2007 from $5.1 million at September 30, 2006. The decrease was due to a decrease in the level of borrowings from the FHLB, which require a calculated level of stock investment based on a formula determined by the FHLB.
Total deposits decreased by $15.2 million, or 2.8%, to $523.0 million at September 30, 2007 from $538.2 million at September 30, 2006. The majority of this net decrease was related to the sale of four branches in northwest Iowa. Additionally, however, the Company’s deposit mix shifted away from higher costing certificates of deposit and money market deposits toward low- and no-cost checking deposits. Most of the increase in checking deposits was the result of prepaid card deposit growth at the Bank’s MPS
3
Meta Financial Group, Inc. and Subsidiaries
MANAGEMENT’S DISCUSSION AND ANALYSIS
division. Total checking deposits increased by $64.0 million, or 30.4%, to $274.7 million at September 30, 2007 from $210.7 million at September 30, 2006. Total savings and certificates of deposit declined $61.8 million, or 27.0%, to $167.0 million at September 30, 2007 from $228.8 million at September 30, 2006. The decrease in savings and certificates resulted primarily from the sale of four branches and runoff of higher costing public funds deposits. Money market account balances also decreased during fiscal year 2007, decreasing $17.4 million, or 17.6%, to $81.3 million at September 30, 2007 from $98.7 million at September 30, 2006. Money market deposits decreased primarily due to the sale of branches and fluctuations in several large accounts.
The Company’s wholesale borrowings portfolio decreased $36.3 million, or 31.6%, to $78.5 million at September 30, 2007 from $114.8 million at September 30, 2006. The Company continues to de-emphasize these high cost funding sources in an effort to decrease overall liability costs and to de-lever the Company’s balance sheet. See Notes 10, 11, and 12 to the Notes to Consolidated Financial Statements.
Shareholders’ equity increased $3.0 million, or 6.6%, to $48.1 million at September 30, 2007 from $45.1 million at September 30, 2006. The increase was primarily the result of a favorable change in the accumulated other comprehensive loss on the Company’s securities available for sale portfolio and by the reported fiscal 2007 net income (see “Results of Operations” below) offset by the payment of dividends on common stock. At September 30, 2007, the Company and both of its banking subsidiaries, MetaBank and MetaBankWC, continue to meet regulatory requirements for classification as well capitalized institutions. See Note 16 to the Notes to Consolidated Financial Statements.
RESULTS OF OPERATIONS
The following discussion of the Company’s Results of Operations should be read in conjunction with the Selected Consolidated Financial Information and Consolidated Financial Statements and the related notes included in this Annual Report.
Of increasing importance, the Company’s Results of Operations are dependent on net interest income, non-interest income, non-interest expense, and income tax expense. Net interest income is the difference, or spread, between the average yield on interest earning assets and the average rate paid on interest-bearing liabilities. The interest rate spread is affected by regulatory, economic, and competitive factors that influence interest rates, loan demand, and deposit flows. The Company, like other financial institutions, is subject to interest rate risk to the extent that its interest-earning assets mature or reprice at different times, or on a different basis, than its interest-bearing liabilities.
The Company’s non-interest income is derived primarily from card and ATM fees attributable to MPS and fees charged on loans and transaction accounts. The Company’s fiscal year 2007 non-interest income was also impacted by a gain on sale of four branches in the amount of $3.3 million. This income is offset, in part, by expenses, such as compensation and occupancy expenses associated with additional personnel and office locations as well as card processing expenses attributable to MPS. To a lesser extent, non-interest income is derived from gains or losses on the sale of securities available for sale as well as the Company’s holdings of bank-owned life insurance. Additionally, non-interest income has been derived from the activities of Meta Trust Company® (“Meta Trust”), a wholly-owned subsidiary of Meta Financial Group, which provides a variety of professional trust services. Non-interest expense is also impacted by occupancy and equipment expenses and legal and consulting expenses.
COMPARISON OF OPERATING RESULTS FOR THE YEARS ENDED SEPTEMBER 30, 2007 AND SEPTEMBER 30, 2006
GENERAL
The Company’s income from continuing operations was $1.3 million, or $0.50 per diluted share, for the year ended September 30, 2007 compared to $3.4 million, or $1.34 per diluted share, for the year ended September 30, 2006. Net income was $1.2 million, or $0.45 per diluted share, for the year ended September 30, 2007 compared to $3.7 million, or $1.46 per diluted share, for the year ended September 30, 2006. Earnings in fiscal year 2007 were impacted by a large provision for loan losses related primarily to an impairment on a commercial loan relationship of $5.0 million related to fraud by the borrower and a gain on the sale of four branches in northwest Iowa of $3.3 million. Earnings in fiscal year 2006 were impacted by non-recurring fee income of $2.6 million associated with a portfolio of purchased prepaid debit cards.
NET INTEREST INCOME
Net interest income from continuing operations for the year ended September 30, 2007 increased by $2.3 million, or 12.5%, to $20.8 million from $18.5 million for the year ended September 30, 2006. The increase in net interest income reflects a higher net interest margin, offset in part by a smaller average earning asset base. Net interest margin increased 53 basis points to 3.38% in fiscal year 2007 from 2.85% in fiscal year 2006. The improvement resulted primarily from the shift in the Company’s funding mix attributable to growth in non-interest-bearing deposits and decreases in higher costing certificates, public funds deposits, and wholesale borrowings.
The Company’s average earning assets decreased $33.1 million, or 5.1%, to $616.3 million during fiscal year 2007 from $649.5 million during fiscal year 2006. The decrease is primarily the result of the decrease in the loan portfolio. The Company’s yield on earning assets rose 26 basis points to 6.13% during fiscal year 2007 from 5.87% during fiscal year 2006. The increase is the result primarily of increasing yields on the Company’s other investments.
The Company’s average total deposits and interest-bearing liabilities decreased $40.7 million, or 6.2%, to $616.7 million during fiscal year 2007 from $657.4 million during fiscal year 2006. The decrease resulted mainly from a decrease in the Company’s interest- bearing deposits and wholesale borrowings. Decreases in public funds deposits were more than offset by growth in non-interest bearing checking accounts. The Company’s cost of total deposits and interest-bearing liabilities decreased 23 basis points during fiscal year 2007 to 2.75% during fiscal year 2007 from 2.98% during fiscal year 2006. Despite an increasing interest rate environment in 2007, which drove the costs of certificates and money market deposits higher, the Company was able to limit the increase in its overall cost of funds by shifting its portfolio mix away from higher costing certificates, public funds deposits, and wholesale borrowings, into lower costing demand deposits.
PROVISION FOR LOAN LOSSES
In fiscal year 2007, the Company recorded a provision for loan losses of $3.2 million, compared to $311,000 for fiscal year 2006. The reduction in the provision in 2006 relates in part to the Company’s settlement agreement with one of several participants in an auto-dealership related lending relationship. Additionally, shrinkage in the Company’s loan portfolio during the year reduced the level of required loan loss allowances on the portfolio. The relatively large provision in fiscal year 2007 is the primary reason that net interest income after provision for loan losses decreased by $551,000, from $18.2 million in fiscal 2006 to $17.6 million in fiscal year 2007. For fiscal year 2007, the Company’s provision for loan losses of $3.2 million consisted of the impairment of a commercial lending relationship due to the fraud by the borrower partially offset by a decrease in loans, a decrease in impaired loans and a $500,000 recovery of a fidelity bond claim payment by the Company’s insurance carrier.
Management closely monitors economic developments both regionally and nationwide, and considers these factors when assessing the adequacy of its allowance for loan losses. While the Company has no direct exposure to sub-prime loans, management is concerned that recent developments in the sub-prime mortgage market may have a ripple effect on residential real estate prices. In addition, the potential for an economic slowdown and recent increase in energy prices may strain the financial condition of some borrowers. Management therefore believes that future losses in the residential portfolio may be somewhat higher than historical experience. Over the past six years, loss rates in the commercial and multi-family real estate market have remained moderate. Management recognizes that low charge-off rates over the past several years reflect the strong economic environment and are not indicative of likely losses over a full business cycle. This observation, as well as the aforementioned concerns regarding an economic slowdown, has led management to the conclusion that future losses in this portfolio may be somewhat higher than recent historical experience, excluding loan losses related to fraud by borrowers. On the other hand, current trends in agricultural
4
Meta Financial Group, Inc. and Subsidiaries
MANAGEMENT’S DISCUSSION AND ANALYSIS
AVERAGE BALANCES, INTEREST RATES AND YIELDS
The following table presents, for the periods indicated, the total dollar amount of interest income from average interest-earning assets and the resulting yields, as well as the interest expense on average interest-bearing liabilities, expressed both in dollars and rates. No tax equivalent adjustments have been made. Non-accruing loans have been included in the table as loans carrying a zero yield. Balances related to discontinued operations have been reclassified to non-interest earning assets and non-interest bearing liabilities for all periods presented.
YEAR ENDED SEPTEMBER 30,
| | | | 2007 | | | | | | 2006 | | | | | | 2005 | | | |
| | | | | | | | | | | | | | | | | | | |
| | Average | | Interest | | | | Average | | Interest | | | | Average | | Interest | | | |
| | Outstanding | | Earned | | Yield | | Outstanding | | Earned | | Yield | | Outstanding | | Earned | | Yield | |
(Dollars in Thousands) | | Balance | | /Paid | | /Rate | | Balance | | /Paid | | /Rate | | Balance | | /Paid | | /Rate | |
INTEREST-EARNING ASSETS | | | | | | | | | | | | | | | | | | | |
Interest-earning assets: | | | | | | | | | | | | | | | | | | | |
Loans receivable | | $ | 354,465 | | $ | 25,584 | | 7.22 | % | $ | 390,002 | | $ | 27,948 | | 7.17 | % | $ | 409,783 | | $ | 28,103 | | 6.86 | % |
Mortgage-backed securities | | 135,007 | | 5,500 | | 4.07 | % | 163,032 | | 6,185 | | 3.79 | % | 239,514 | | 8,688 | | 3.63 | % |
Other investments | | 126,853 | | 6,690 | | 5.27 | % | 96,416 | | 3,979 | | 4.13 | % | 47,730 | | 1,577 | | 3.30 | % |
Total interest-earning assets | | 616,325 | | $ | 37,774 | | 6.1 3 | % | 649,450 | | $ | 38,112 | | 5.87 | % | 697,027 | | $ | 38,368 | | 5.50 | % |
Non-interest-earning assets | | 86,502 | | | | | | 99,960 | | | | | | 89 ,171 | | | | | |
Total assets | | $ | 702,827 | | | | | | $ | 749,410 | | | | | | $ | 786,198 | | | | | |
| | | | | | | | | | | | | | | | | | | |
Non-interest bearing deposits | | $ | 230,930 | | $ | –– | | 0.00 | % | $ | 147,520 | | $ | –– | | 0.00 | % | $ | 31,896 | | $ | –– | | 0.00 | % |
INTEREST-BEARING LIABILITIES | | | | | | | | | | | | | | | | | | | |
Interest-bearing checking | | $ | 22,004 | | $ | 538 | | 2.45 | % | $ | 21,852 | | $ | 789 | | 3.61 | % | $ | 54,154 | | $ | 872 | | 1.61 | % |
Savings | | 17,586 | | 471 | | 2.68 | % | 46,822 | | 1,388 | | 2.96 | % | 55,541 | | 1,306 | | 2.35 | % |
Money markets | | 67,087 | | 2,301 | | 3.43 | % | 83,486 | | 2,354 | | 2.82 | % | 50,269 | | 895 | | 1.78 | % |
Time deposits | | 183,505 | | 8,355 | | 4.55 | % | 215,815 | | 8,225 | | 3.81 | % | 268,198 | | 8,427 | | 3.14 | % |
FHLB advances | | 77,433 | | 4,091 | | 5.28 | % | 115,102 | | 7,237 | | 4.77 | % | 194,960 | | 7,530 | | 3.86 | % |
Other borrowings | | 18,172 | | 1,211 | | 6.66 | % | 26,846 | | 1,367 | | 5.09 | % | 31,802 | | 1,275 | | 4.01 | % |
Total interest-bearing liabilities | | 385,787 | | 16,967 | | 4.4 0 | % | 509,923 | | 19,611 | | 3.85 | % | 654,924 | | 20,305 | | 3.10 | % |
Total deposits and interest-bearing liabilities | | 616,717 | | $ | 16,967 | | 2.7 5 | % | 657,443 | | $ | 19,611 | | 2.98 | % | 686,820 | | $ | 20,305 | | 2.96 | % |
Other non-interest bearing liabilities | | 42,557 | | | | | | 48,831 | | | | | | 54,027 | | | | | |
Total liabilities | | 659,274 | | | | | | 706,274 | | | | | | 740,847 | | | | | |
Shareholders’ equity | | 43,553 | | | | | | 43,136 | | | | | | 45,351 | | | | | |
Total liabilities and shareholders’ equity | | $ | 702,827 | | | | | | $ | 749,410 | | | | | | $ | 786,198 | | | | | |
Net interest income and net interest rate spread including non-interest bearing deposits | | | | $ | 20,807 | | 3.38 | % | | | $ | 18,501 | | 2.89 | % | | | $ | 18,063 | | 2.54 | % |
Net interest margin | | | | | | 3.38 | % | | | | | 2.85 | % | | | | | 2.59 | % |
markets are very favorable. Higher commodity prices as well as higher yields have created positive economic conditions for most farmers. Nonetheless, management still expects that future losses in this portfolio, which have been very low, could be higher than recent historical experience. Management believes that the aforementioned possibility for a slowdown in economic growth during the next fiscal year may also negatively impact consumers’ repayment capacities. Additionally, a sizable portion of the Company’s consumer loan portfolio is secured by residential real estate, as discussed above, is an area to be closely monitored by management in view of its stated concerns.
Management believes that, based on a detailed review of the loan portfolio, historic loan losses, current economic conditions, the size of the loan portfolio, and other factors, the current level of the allowance for loan losses at September 30, 2007 reflects an adequate allowance against probable losses from the loan portfolio. Although the Company maintains its allowance for loan losses at a level that it considers to be adequate, investors and others are cautioned that there can be no assurance that future losses will not exceed estimated amounts, or that additional provisions for loan losses will not be required in future periods. In addition, the Company’s determination of the allowance for loan losses is subject to review by its regulatory agencies, which can require the establishment of additional general or specific allowances.
NON-INTEREST INCOME
Non-interest income increased by $8.4 million, or 62.0%, to $21.9 million for the fiscal year 2007 from $13.5 million for fiscal year 2006. Non-interest income in fiscal year 2007 was impacted by a gain on the sale of four branches in northwest Iowa of $3.3 million. Non-interest income in the 2006 period was impacted by non-recurring pre-tax fee income of $2.6 million related to a purchased portfolio of prepaid debit cards. Adjusting for these non-recurring items, non-interest income for fiscal year 2007 rose $7.6 million, or 69.4%, over the same period in the prior fiscal year primarily due to an increase in card fee income. The majority of this growth is related to higher fee income earned on prepaid debit cards and other products and services offered by MPS.
Management performed an evaluation of whether the sale of the branches constituted discontinued operations, and concluded that the operations and cash flows of the branches sold were not discontinued operations. Revenue and expenses of the entity, including the gain on sale, are, therefore, included in the appropriate income statement line items for all periods presented.
NON-INTEREST EXPENSE
Non-interest expense increased by $10.4 million, or 38.7%, to $37.0 million for fiscal year 2007 from $26.6 million for fiscal year 2006. Several factors contributed to this increase. Compensation expense rose $5.4 million during the year, from $12.8 million in fiscal year 2006 to $18.2 million in fiscal year 2007. The increase represents the addition of executive level management, client relations, compliance and operations support staff within MPS, as well as software developers, Information Technology (“IT”) support staff, and other administrative support within the Company. Many of the new employees at MPS and in IT will be focused on developing new product lines and increasing market penetration of our payments systems products and services.
Costs associated with the processing of card-related products at MPS also increased during fiscal year 2007. Card processing expense rose $3.4 million from $3.0 million in fiscal year 2006 to $6.4 million in fiscal year 2007 as a result of the significant growth
in
5
Meta Financial Group, Inc. and Subsidiaries
MANAGEMENT’S DISCUSSION AND ANALYSIS
RATE/VOLUME ANALYSIS
The following schedule presents the dollar amount of changes in interest income and interest expense for major components of interest-earning assets and interest-bearing liabilities. It distinguishes between the increase related to higher outstanding balances and that due to the levels and volatility of interest rates. For each category of interest-earning assets and interest-bearing liabilities, information is provided on changes attributable to (i) changes in volume (i.e. changes in volume multiplied by old rate) and (ii) changes in rate (i.e. changes in rate multiplied by old volume). For purposes of this table, changes attributable to both rate and volume that cannot be segregated have been allocated proportionately to the change due to volume and the change due to rate.
YEAR ENDED SEPTEMBER 30,
| | 2007 VS. 2006 | | 2006 VS. 2005 | |
| | Increase | | Increase | | Total | | Increase | | Increase | | Total | |
| | (Decrease) | | (Decrease) | | Increase | | (Decrease) | | (Decrease) | | Increase | |
(in Thousands) | | Due to Volume | | Due to Rate | | (Decrease) | | Due to Volume | | Due to Rate | | (Decrease) | |
| | | | | | | | | | | | | |
INTEREST-EARNING ASSETS | | | | | | | | | | | | | |
Loans Receivable | | $ | (2,567 | ) | $ | 203 | | $ | (2,364 | ) | $ | (2,236 | ) | $ | 2,081 | | $ | (155 | ) |
Mortgage-backed securities | | (1,203 | ) | 518 | | (685 | ) | (2,921 | ) | 418 | | (2,503 | ) |
Other investments | | 1,444 | | 1,267 | | 2,711 | | 1,930 | | 472 | | 2,402 | |
Total interest - earning asset s | | $ | (2,326 | ) | $ | 1,988 | | $ | (338 | ) | $ | (3,227 | ) | $ | 2,971 | | (256 | ) |
| | | | | | | | | | | | | |
INTEREST-BEARING LIABILITIES | | | | | | | | | | | | | |
Interest-bearing checking | | $ | 6 | | $ | (257 | ) | $ | (251 | ) | $ | 76 | | $ | (159 | ) | $ | (83 | ) |
Savings | | (794 | ) | (123 | ) | (917 | ) | (124 | ) | 206 | | 82 | |
Money markets | | 521 | | (574 | ) | (53 | ) | 775 | | 684 | | 1,459 | |
Time deposits | | (433 | ) | 563 | | 130 | | 2,239 | | (2,441 | ) | (202 | ) |
FHLB advances | | (2,086 | ) | 689 | | (1,397 | ) | (4,776 | ) | 2,734 | | (2,042 | ) |
Other borrowings | | (3,510 | ) | 3,354 | | (156 | ) | (125 | ) | 217 | | 92 | |
Total interest-bearing liabilities | | $ | (6,296 | ) | $ | 3,652 | | $ | (2,644 | ) | $ | (1,935 | ) | $ | 1,241 | | $ | (694 | ) |
| | | | | | | | | | | | | |
Net effect on net interest income | | $ | 3,970 | | $ | (1,664 | ) | $ | 2,306 | | $ | (1,292 | ) | $ | 1,730 | | $ | 438 | |
the division’s product lines. These expenses stem primarily from MPS’ Simplexus® prepaid card product and other prepaid card programs managed by MPS. Other card processing expense increases are attributable to settlement functions for value loading, card sales and anticipated growth of existing products. Management expects that these costs will continue to increase as MPS issues more cards; however, it is anticipated that overall costs will increase less than revenues associated with these cards.
The Company’s occupancy and equipment expense also rose during fiscal year 2007, driven primarily by the addition of administrative office space in Sioux Falls and Omaha, as well as investment in computer hardware and software, primarily to support growth at MPS. Occupancy and equipment expense for fiscal year 2007 was $4.0 million compared to $2.9 million in fiscal year 2006.
INCOME TAX EXPENSE
Income tax expense from continuing operations for fiscal year 2007 was $1.2 million, or an effective tax rate of 48.3%, compared to $1.7 million, or an effective tax rate of 33.0%, in fiscal year 2006. The change is due primarily to the decrease in net income before income tax expense. The Company’s recorded income tax expense was also impacted primarily by permanent differences between book and taxable income.
DISCONTINUED OPERATIONS
Income (loss) from discontinued operations was a loss of $141,000 for fiscal year 2007 compared to income of $309,000 for fiscal year 2006. The decrease was primarily related to an increase in provision for loan losses in the amount of $703,000 as compared to the prior fiscal year. See Note 3 to the Notes to Consolidated Financial Statements for further discussion on discontinued operations.
COMPARISON OF OPERATING RESULTS FOR THE YEARS ENDED SEPTEMBER 30, 2006 AND SEPTEMBER 30, 2005
GENERAL
The Company’s income from continuing operations was $3.4 million, or $1.34 per diluted share, for the year ended September 30, 2006, compared to a net loss of $652,000, or $0.27 per diluted share, for the year ended September 30, 2005. Net income was $3.7 million, or $1.46 per diluted share, for the year ended September 30, 2006 compared to a net loss of $924,000, or $0.38 per diluted share, for the year ended September 30, 2005. Earnings in fiscal year 2006 were primarily impacted by card fees and non-recurring fee income, partially offset by higher compensation, occupancy, legal and consulting, and card processing expenses. Earnings in fiscal year 2005 were impacted by the provision for loan loss.
NET INTEREST INCOME
Net interest income from continuing operations for the year ended September 30, 2006 increased by $438,000, or 2.4%, to $18.5 million from $18.1 million for the year ended September 30, 2005. The increase in net interest income reflects a higher net interest margin, offset in part by a smaller average earning asset base. Net interest margin increased 26 basis points to 2.85% in fiscal year 2006 from 2.59% in fiscal year 2005. The improvement resulted primarily from the shift in the Company’s funding mix attributable to growth in non-interest-bearing and money market deposits and decreases in higher costing certificates, public funds deposits, and wholesale borrowings.
The Company’s average earning assets decreased $47.5 million, or 6.8%, to $649.5 million during fiscal year 2006 from $697.0 million during fiscal year 2005. The decrease is primarily the result of a smaller portfolio of mortgage-backed securities and loans. The Company’s yield on earning assets rose 37 basis points to 5.87% during fiscal year 2006 from 5.50% during fiscal year 2005. The increase is the result primarily of increasing yields on the Company’s adjustable rate loan portfolio due to an increasing interest rate environment during 2006.
The Company’s average total deposits and interest-bearing liabilities decreased $29.4 million, or 4.3%, to $657.4 million during fiscal year 2006 from $686.8 million during fiscal year 2005. The decrease resulted mainly from a decrease in the Company’s portfolio of advances from the FHLB and other wholesale borrowings. Decreases in public funds deposits were more than offset by growth in non-interest bearing checking accounts. The Company’s cost of total deposits and interest-bearing liabilities rose 2 basis points during fiscal year 2006 to 2.98% during fiscal year 2006 from 2.96%
6
Meta Financial Group, Inc. and Subsidiaries
MANAGEMENT’S DISCUSSION AND ANALYSIS
during fiscal year 2005. Despite an increasing interest rate environment in 2006, which drove the costs of certificates and money market deposits higher, the Company was able to limit the increase in its overall cost of funds by shifting its portfolio mix away from higher costing certificates, public funds deposits, and wholesale borrowings, into lower costing demand deposits.
PROVISION FOR LOAN LOSSES
In fiscal year 2006, the Company recorded a provision for loan losses of $311,000 compared to $4.7 million for fiscal year 2005. The provision in 2006 relates in part to the Company’s settlement agreement with one of several participants in an auto-dealership related lending relationship. Additionally, shrinkage in the Company’s loan portfolio during the year reduced the level of required loan loss allowances on the portfolio. The large provision for loan losses in fiscal year 2005 stemmed primarily from provisions related to losses in the aforementioned auto-dealership related loans. The relatively large provision in fiscal year 2005 and the provision in fiscal year 2006 is the primary reason that net interest income from continuing operations after provision for loan losses increased by $4.8 million, from $13.4 million in fiscal 2005 to $18.2 million in fiscal year 2006.
Management closely monitors economic developments both regionally and nationwide, and considers these factors when assessing the adequacy of its allowance for loan losses. Although current economic conditions are relatively strong, management is aware that many economists have forecasted a slowdown in economic growth during calendar year 2007. Additionally, management has monitored the disinflationary trend in residential and commercial real estate prices in recent quarters. Economic conditions in the agricultural sector of the Company’s market area are relatively strong. Recent rises in agricultural commodity prices will serve to offset more modest yields this year. The agricultural economy is accustomed to commodity price fluctuations and is generally able to handle such fluctuations without significant problems. The recent decrease in energy prices should also help to improve cash flows of consumers and businesses alike if the decrease persists during 2007.
Management believes that, based on a detailed review of the loan portfolio, historic loan losses, current economic conditions, the size of the loan portfolio, and other factors, the current level of the allowance for loan losses reflects an adequate allowance against probable losses from the loan portfolio. Although the Company maintains its allowance for loan losses at a level that it considers to be adequate, investors and others are cautioned that there can be no assurance that future losses will not exceed estimated amounts, or that additional provisions for loan losses will not be required in future periods. In addition, the Company’s determination of the allowance for loan losses is subject to review by its regulatory agencies, which can require the establishment of additional general or specific allowances.
NON-INTEREST INCOME
Non-interest income increased by $10.0 million, or 285.4%, to $13.5 million for the fiscal year 2006 from $3.5 million from fiscal year 2005. The majority of this growth is related to higher card fee income earned on prepaid debit cards and other products and services offered by MPS. The increase also includes $2.6 million of non-recurring fee income related to a purchased portfolio of prepaid debit cards.
NON-INTEREST EXPENSE
Non-interest expense increased by $8.6 million, or 48.0%, to $26.6 million for fiscal year 2006 from $18.0 million for fiscal year 2005. Several factors contributed to this increase. Compensation expense rose $1.9 million during the year, from $10.9 million in fiscal year 2005 to $12.8 million in fiscal year 2006. The increase stems primarily from staff acquisition costs related to growth at MPS and the staffing of two de novo branch facilities in the Sioux Falls market. The new branch in Des Moines did not significantly impact non-interest expense for the year, due to its opening late in the fiscal year.
Costs associated with the processing of card-related products at MPS also increased during fiscal year 2006. Card processing expense rose $2.6 million from $337,000 in fiscal year 2005 to $3.0 million in fiscal year 2006 as a result of the significant growth in the division’s product lines. These expenses stem primarily from fees charged by third party card and network transaction processors as well as costs associated with issuing MetaBank branded prepaid debit cards. Management expects that these costs will continue to rise as MPS issues more cards; however, it is anticipated that overall costs will rise less than revenues associated with these cards.
Legal and consulting expense increased $2.2 million in fiscal year 2006, from $815,000 in fiscal year 2005 to $3.0 million in fiscal year 2006. Several factors contributed to this increase. The Company incurred expenses related to the aforementioned auto dealership-related loans during the course of foreclosing on and liquidating the remaining assets of the borrowers. Additionally, the Company has been named in several lawsuits by banks that participated with MetaBank in these lending relationships. The Company has also incurred expenses related to its retention of an outside consulting firm to complete implementation work related to section 404 of the Sarbanes-Oxley Act. At this time, the Company does not anticipate that expenses associated with this implementation work will continue at present levels over the long term. Finally, the Company outsourced a significant portion of its internal audit work to an outside consulting firm during fiscal year 2006.
INCOME TAX EXPENSE
Income tax expense from continuing operations for fiscal year 2006 was $1.7 million, or an effective tax rate of 33.0%. In fiscal year 2005, the Company recorded an income tax benefit of $491,000, or an effective tax rate of 43.0%, due to the net loss recorded that year. The increase in income taxes is primarily the result of the positive change in operating results between the comparable periods.
DISCONTINUED OPERATIONS
Income from discontinued operations was $309,000 for fiscal year 2006 compared to a loss of $272,000 for fiscal year 2005. The increase was primarily related to a decrease in provision for loan losses in the amount of $845,000 as compared to the prior fiscal year. See Note 3 to the Notes to Consolidated Financial Statements for further discussion on discontinued operations.
CRITICAL ACCOUNTING POLICY
The Company’s financial statements are prepared in accordance with accounting principles generally accepted in the United States of America. The financial information contained within these statements is, to a significant extent, financial information that is based on approximate measures of the financial effects of transactions and events that have already occurred. Based on its consideration of accounting policies that involve the most complex and subjective decisions and assessments, management has identified its most critical accounting policies to be those related to the allowance for loan losses and asset impairment judgments including the recoverability of goodwill.
The Company’s allowance for loan loss methodology incorporates a variety of risk considerations, both quantitative and qualitative, in establishing an allowance for loan loss that management believes is appropriate at each reporting date. Quantitative factors include the Company’s historical loss experience, delinquency and charge-off trends, collateral values, changes in nonperforming loans, and other factors. Quantitative factors also incorporate known information about individual loans, including borrowers’ sensitivity to interest rate movements. Qualitative factors include the general economic environment in the Company’s markets, including economic conditions throughout the Midwest and, in particular, the state of certain industries. Size and complexity of individual credits in relation to loan structure, existing loan policies, and pace of portfolio growth are other qualitative factors that are considered in the methodology. As the Company adds new products and increases the complexity of its loan portfolio, it will enhance its methodology accordingly. Management may have reported a materially different amount for the provision for loan losses in the statement of operations to change the allowance for loan losses if its assessment of the above factors were different. This discussion and analysis should be read in conjunction with the Company’s financial statements and the accompanying notes presented in this Annual Report, as well as the portion of this
7
Meta Financial Group, Inc. and Subsidiaries
MANAGEMENT’S DISCUSSION AND ANALYSIS
Management’s Discussion and Analysis section entitled “Asset Quality.” Although management believes the levels of the allowance as of both September 30, 2007 and September 30, 2006 were adequate to absorb probable losses inherent in the loan portfolio, a decline in local economic conditions or other factors could result in increasing losses. See Notes 1 and 6 to the Notes to Consolidated Financial Statements.
Goodwill represents the excess of acquisition costs over the fair value of the net assets acquired in a purchase acquisition. Goodwill is tested annually for impairment.
ASSET/LIABILITY MANAGEMENT AND MARKET RISK
QUALITATIVE ASPECTS OF MARKET RISK
As stated above, the Company derives a portion of its income from the excess of interest collected over interest paid. The rates of interest the Company earns on assets and pays on liabilities generally are established contractually for a period of time. Market interest rates change over time. Accordingly, the Company’s results of operations, like those of most financial institutions, are impacted by changes in interest rates and the interest rate sensitivity of its assets and liabilities. The risk associated with changes in interest rates and the Company’s ability to adapt to these changes is known as interest rate risk and is the Company’s only significant “market” risk.
QUANTITATIVE ASPECTS OF MARKET RISK
The Company monitors and measures its exposure to changes in interest rates in order to comply with applicable government regulations and risk policies established by the Board of Directors, and in order to preserve shareholder value. In monitoring interest rate risk, the Company analyzes assets and liabilities based on characteristics including size, coupon rate, repricing frequency, maturity date, and likelihood of prepayment.
If the Company’s assets mature or reprice more rapidly or to a greater extent than its liabilities, then net portfolio value and net interest income would tend to increase during periods of rising rates and decrease during periods of falling interest rates. Conversely, if the Company’s assets mature or reprice more slowly or to a lesser extent than its liabilities, then net portfolio value and net interest income would tend to decrease during periods of rising interest rates and increase during periods of falling interest rates.
The Company currently focuses lending efforts toward originating and purchasing competitively priced adjustable-rate and fixed-rate loan products with short to intermediate terms to maturity, generally 5 years or less. This theoretically allows the Company to maintain a portfolio of loans that will have relatively little sensitivity to changes in the level of interest rates, while providing a reasonable spread to the cost of liabilities used to fund the loans.
The Company’s primary objective for its investment portfolio is to provide a source of liquidity for the Company. In addition, the investment portfolio may be used in the management of the Company’s interest rate risk profile. The investment policy generally calls for funds to be invested among various categories of security types and maturities based upon the Company’s need for liquidity, desire to achieve a proper balance between minimizing risk while maximizing yield, the need to provide collateral for borrowings, and to fulfill the Company’s asset/liability management goals.
The Company’s cost of funds responds to changes in interest rates due to the relatively short-term nature of its deposit portfolio, and due to the relatively short-term nature of its borrowed funds. The Company’s growing portfolio of low- or no-cost deposits provides a stable and profitable funding vehicle, but also subjects the Company to greater risk in a falling interest rate environment than it would otherwise have without this portfolio. This risk is due to the fact that, while asset yields may decrease in a falling interest rate environment, the Company cannot significantly reduce interest costs associated with these deposits, which thereby compresses the Company’s net interest margin. As a result of the Company’s new interest rate risk exposure in this regard, the Company has elected not to enter in to any new longer term wholesale borrowings, and generally has not emphasized longer term time deposit products.
The Board of Directors and relevant government regulations establish limits on the level of acceptable interest rate risk at the Company, to which management adheres. There can be no assurance, however, that in the event of an adverse change in interest rates, the Company’s efforts to limit interest rate risk will be successful.
NET PORTFOLIO VALUE
The Company uses a net portfolio value (“NPV”) approach to the quantification of interest rate risk. This approach calculates the difference between the present value of expected cash flows from assets and the present value of expected cash flows from liabilities, as well as cash flows from any off balance-sheet contracts. Management of the Company’s assets and liabilities is performed within the context of the marketplace, but also within limits established by the Board of Directors on the amount of change in NPV that is acceptable given certain interest rate changes.
Presented below (including discontinued operations), as of September 30, 2007 and 2006, is an analysis of the Company’s interest rate risk as measured by changes in NPV for an instantaneous and sustained parallel shift in the yield curve, in 100 basis point increments, up and down 200 basis points. As illustrated in the table below, the Company’s NPV at September 30, 2007 was relatively balanced. Growth in the Company’s portfolio of non-interest bearing deposits during fiscal year 2007 has contributed to a balance sheet that is slightly less asset sensitive, i.e. exhibits more favorable changes in a rising rate environment, as of September 30, 2007, than was the case at September 30, 2006.
Certain shortcomings are inherent in the method of analysis presented in the table. For example, although certain assets and liabilities may have similar maturities or periods to repricing, they may react in different degrees to changes in market interest rates. Also, the interest rates on certain types of assets and liabilities may fluctuate in advance of changes in market interest rates, while interest rates on other types may lag behind changes in market rates. Additionally, certain assets, such as adjustable rate mortgage loans, have features that restrict changes in interest rates on a short term basis and over the life of the asset. Furthermore, although management has estimated changes in the levels of prepayments and early withdrawal in these rate environments, such levels would likely deviate from those assumed in calculating the table. Finally, the ability of some borrowers to service their debt may decrease in the event of an interest rate increase.
In addition to the NPV approach, the Company also reviews gap reports, which measure the differences in assets and liabilities repricing in given time periods, and net income simulations to assess its interest rate risk profile. Management reviews its interest rate risk profile on a quarterly basis.
ASSET QUALITY
It is management’s belief, based on information available at fiscal year end, that the Company’s current asset quality is satisfactory. At September 30, 2007, nonperforming assets, consisting of impaired/non-accruing loans, accruing loans delinquent 90 days or more, restructured loans, foreclosed real estate, and repossessed consumer property,
Change in Interest Rate | | Board Limit | | | | At September 30, 2007 | | | | At September 30, 2006 | |
(Basis Points) | | % Change | | $ Change | | % Change | | $ Change | | % Change | |
Dollars In Thousands | | | | | | | | | | | | |
+200 bp | | (20 | )% | $ | 606 | | (1 | )% | $ | 548 | | 1 | % |
+100 bp | | (10 | ) | (221 | ) | (1 | ) | 562 | | 1 | |
0 | | — | | — | | — | | — | | — | |
-100 bp | | (10 | ) | (545 | ) | (1 | ) | (907 | ) | (1 | ) |
-200 bp | | (20 | ) | (3,226 | ) | (4 | ) | (4,139 | ) | (6 | ) |
| | | | | | | | | | | | | | |
8
Meta Financial Group, Inc. and Subsidiaries
MANAGEMENT’S DISCUSSION AND ANALYSIS
totaled $2.6 million, or 0.38% of total assets, compared to $5.3 million, or 0.72% of total assets, at September 30, 2006.
Impaired/non-accruing and restructured loans at September 30, 2007 totaled $1.7 million. Foreclosed real estate and repossessed assets at September 30, 2007 totaled $318,000.
The Company maintains an allowance for loan losses because of the potential that some loans may not be repaid in full. See Note 1 to the Notes to Consolidated Financial Statements. At September 30, 2007, the Company had an allowance for loan losses in the amount of $4.5 million as compared to $6.4 million at September 30, 2006. Management’s periodic review of the adequacy of the allowance for loan losses is based on various subjective and objective factors including the Company’s past loss experience, known and inherent risks in the portfolio, adverse situations that may affect the borrower’s ability to repay, the estimated value of any underlying collateral, and current economic conditions. While management may allocate portions of the allowance for specifically identified problem loan situations, the majority of the allowance is based on judgmental factors related to the overall loan portfolio and is available for any loan charge-offs that may occur. As stated previously, there can be no assurance that future losses will not exceed estimated amounts, or that additional provisions for loan losses will not be required in future periods. In addition, the Company’s banks are subject to review by banking regulatory bodies, which have the authority to require management to make changes to the allowance for loan losses.
In determining the allowance for loan losses, the Company specifically identifies loans that it considers to have potential collectibility problems. Based on criteria established by Statement of Financial Accounting Standards (SFAS) No. 114, some of these loans are considered to be “impaired” while others are not considered to be impaired, but possess weaknesses that the Company believes merit additional analysis in establishing the allowance for loan losses. All other loans are evaluated by applying estimated loss ratios to various pools of loans. The Company then analyzes other factors (such as economic conditions) in determining the aggregate amount of the allowance needed.
At September 30, 2007, $1.5 million of the allowance for loan losses was allocated to impaired loans, representing 65.1% of the related loan balances. See Note 6 to the Notes to Consolidated Financial Statements. $639,000 of the allowance was allocated to other identified problem loan situations, representing 3.0% of the related loan balances, and $2.4 million, representing 0.7% of the related loan balances, was allocated to the remaining overall loan portfolio based on historical loss experience and general economic conditions. At September 30, 2006, $2.7 million of the allowance for loan losses was allocated to impaired loans, representing 51.5% of the related loan balances. $1.1 million was allocated to other identified problem loan situations, and $2.5 million was allocated against losses from the overall loan portfolio based on historical loss experience and general economic conditions.
LIQUIDITY AND CAPITAL RESOURCES
The Company’s primary sources of funds are deposits, borrowings, principal and interest payments on loans and mortgage backed securities, and maturing investment securities. While scheduled loan repayments and maturing investments are relatively predictable, deposit flows and early loan repayments are influenced by the level of interest rates, general economic conditions, and competition.
The Company relies on advertising, quality customer service, convenient locations, and competitive pricing to attract and retain its deposits and only solicits these deposits from its primary market area. Based on its experience, the Company believes that its consumer checking, savings, and money market accounts are relatively stable sources of deposits. The Company’s ability to attract and retain time deposits has been, and will continue to be, affected by market conditions. However, the Company does not foresee any significant funding issues resulting from the sensitivity of time deposits to such market factors.
The Company is aware that, due to higher levels of concentration risk, the low- and no-cost checking deposits generated through MPS may carry a greater degree of liquidity risk than traditional consumer checking deposits. As a result, the Company closely monitors balances in these accounts, and maintains a portfolio of highly liquid assets to fund potential deposit outflows. To date, the Company has not experienced any inordinate or unusual outflows related to MPS, though no assurance can be given that this will continue to be the case.
MetaBank and MetaBank WC are required by regulation to maintain sufficient liquidity to assure their safe and sound operation. In the opinion of management, both MetaBank and MetaBank WC are in compliance with this requirement.
Liquidity management is both a daily and long term function of the Company’s management strategy. The Company adjusts its investments in liquid assets based upon management’s assessment of (i) expected loan demand, (ii) the projected availability of purchased loan products, (iii) expected deposit flows, (iv) yields available on interest bearing deposits, and (v) the objectives of its asset/liability management program. Excess liquidity is generally invested in interest earning overnight deposits and other short term government agency obligations. If the Company requires funds beyond its ability to generate them internally, it has additional borrowing capacity with the FHLB and other wholesale funding sources. The Company is not aware of any significant trends in the Company’s liquidity or its ability to borrow additional funds if needed.
The primary investing activities of the Company are the origination and purchase of loans and the purchase of securities. During the years ended September 30, 2007, 2006 and 2005, the Company originated loans totaling $274.5 million, $306.6 million, and $311.7 million, respectively. Purchases of loans totaled $44.9 million, $58.9 million, and $29.7 million during the years ended September 30, 2007, 2006 and 2005, respectively. During the years ended September 30, 2007, 2006 and 2005, the Company purchased mortgage-backed securities and other securities available for sale in the amount of $13.2 million, $109,000 and $17.6 million, respectively.
At September 30, 2007, the Company had unfunded loan commitments of $50.3 million. See Note 17 to the Notes to Consolidated Financial Statements. Certificates of deposit scheduled to mature in one year or less from September 30, 2007 totaled $107.3 million. Based on its historical experience, management believes that a significant portion of such deposits will remain with the Company; however, there can be no assurance that the Company can retain all such deposits. Management believes that loan repayment and other sources of funds will be adequate to meet the Company’s foreseeable short and long-term liquidity needs.
During July 2001, the Company’s unconsolidated trust subsidiary, First Midwest Financial Capital Trust I, sold $10.0 million in floating rate cumulative preferred securities. Proceeds from the sale were used to purchase subordinated debentures of Meta Financial
Group, which mature in the year 2031, and are redeemable at any time after five years. The capital securities are required to be redeemed on July 25, 2031; however, the Company has the option to shorten the maturity date to a date not earlier than July 25, 2007. The Company used the proceeds for general corporate purposes. See Note 12 to the Notes to Consolidated Financial Statements.
The Company and its banking subsidiaries, MetaBank and MetaBank WC, meet regulatory requirements for classification as well capitalized institutions. See Note 16 to the Notes to Consolidated Financial Statements. The Company does not anticipate any significant changes to its capital structure.
On August 23, 2004, the Company announced that the Board of Directors had authorized the Company’s ESOP to purchase up to 40,000 shares of the Company’s stock through open market and privately negotiated transactions. The ESOP stock purchase was completed on April 18, 2005 at a total cost of $897,000. At September 30, 2007, the ESOP held 16,562 unallocated shares, which will be used to fund future contributions to qualified employees.
The payment of dividends and repurchase of shares has the effect of reducing stockholders’ equity. Prior to authorizing such transactions, the Board of Directors considers the effect the dividend or repurchase of shares would have on liquidity and regulatory capital ratios.
IMPACT OF INFLATION AND CHANGING PRICES
The Consolidated Financial Statements and Notes thereto presented in this Annual Report have been prepared in accordance with generally accepted accounting principles,
9
Meta Financial Group, Inc. and Subsidiaries
MANAGEMENT’S DISCUSSION AND ANALYSIS
which require the measurement of financial position and operating results in terms of historical dollars without considering the change in the relative purchasing power of money over time due to inflation. The primary impact of inflation is reflected in the increased cost of the Company’s operations. Unlike most industrial companies, virtually all the assets and liabilities of the Company are monetary in nature. As a result, interest rates generally have a more significant impact on a financial institution’s performance than do the effects of general levels of inflation. Interest rates do not necessarily move in the same direction, or to the same extent, as the prices of goods and services.
IMPACT OF NEW ACCOUNTING STANDARDS
In June 2006, the FASB issued FASB Interpretation No. 48, (“FIN No. 48”), Accounting for Uncertainty in Income Taxes, an Interpretation of Statement No. 109, Accounting for Income Taxes. FIN No. 48 prescribes a recognition threshold and measurement attribute for the financial statement recognition and measurement of a tax position taken or expected to be taken in a tax return. FIN No. 48 is effective for fiscal years beginning after December 15, 2006, with earlier adoption permitted. The Company is currently assessing the financial statement impact of adopting FIN No. 48.
At its September 2006 meeting, the Emerging Issues Task Force (“EITF”) reached a final consensus on Issue No. 06-04, Accounting for Deferred Compensation and Postretirement Benefit Aspects of Endorsement Split-Dollar Life Insurance Arrangements. The consensus stipulates that an agreement by an employer to share a portion of the proceeds of a life insurance policy with an employee during the postretirement period is a postretirement benefit arrangement required to be accounted for under Statement No. 106 (“SFAS No. 106”) or Accounting Principles Board (“APB”) Opinion No. 12, Omnibus Opinion—1967. The consensus concludes that the purchase of a split-dollar life insurance policy does not constitute a settlement under SFAS No. 106 and, therefore, a liability for the postretirement obligation must be recognized under SFAS No. 106 if the benefit is offered under an arrangement that constitutes a plan or under APB No. 12 if it is not part of a plan. Issue 06-04 is effective for annual or interim reporting periods beginning after December 15, 2007. The Company has endorsement split-dollar life insurance policies and is currently assessing the financial statement impact of implementing EITF 06-04.
At its March 2007 meeting, the EITF reached a final consensus on Issue No. 06-10, Accounting for Collateral Assignment Split-Dollar Life Insurance Arrangements. A consensus was reached that an employer should recognize a liability for the postretirement benefit related to a collateral assignment split-dollar life insurance arrangement in accordance with either FASB Statement No. 106 or APB Opinion No. 12, as appropriate, if the employer has agreed to maintain a life insurance policy during the employee’s retirement or provide the employee with a death benefit based on the substantive agreement with the employee. A consensus also was reached that an employer should recognize and measure an asset based on the nature and substance of the collateral assignment split-dollar life insurance arrangement. The consensuses are effective for fiscal years beginning after December 15, 2007, including interim periods within those fiscal years, with early application permitted. The Company has endorsement split-dollar life insurance policies and is currently assessing the financial statement impact of implementing EITF 06-10.
In September 2006, the FASB issued Statement No. 157, (“SFAS No. 157”), Fair Value Measurements. SFAS No. 157 defines fair value, establishes a framework for measuring fair value, and expands disclosures about fair value measurements. It clarifies that fair value is the price that would be received to sell an asset or paid to transfer a liability in an orderly transaction between market participants in the market in which the reporting entity transacts. SFAS No. 157 does not require any new fair value measurements, but rather, it provides enhanced guidance to other pronouncements that require or permit assets or liabilities to be measured at fair value. SFAS No. 157 is effective for fiscal years beginning after November 15, 2007, with earlier adoption permitted. The Company does not expect that the adoption of SFAS No. 157 will have a material impact on its financial position, results of operation and cash flows.
FORWARD LOOKING STATEMENTS
The Company, and its wholly-owned subsidiaries, MetaBank, MetaBank WC, and Meta Trust, may from time to time make written or oral “forward-looking statements,” including statements contained in this Annual Report and in its filings with the Securities and Exchange Commission (“SEC”), in its reports to shareholders, and in other communications by the Company, which are made in good faith by the Company pursuant to the “safe harbor” provisions of the Private Securities Litigation Reform Act of 1995.
These forward-looking statements include statements with respect to the Company’s beliefs, expectations, estimates, and intentions that are subject to significant risks and uncertainties, and are subject to change based on various factors, some of which are beyond the Company’s control. Such statements address the following subjects: future operating results; customer retention; loan and other product demand; important components of the Company’s balance sheet and income statements; growth; new products and expansion and services, such as those offered by MPS or MetaBank; credit quality and adequacy of reserves; technology; and our employees. The following factors, among others, could cause the Company’s financial performance to differ materially from the expectations, estimates, and intentions expressed in such forward-looking statements: competition; the strength of the United States economy in general and the strength of the local economies in which the Company conducts operations; the effects of, and changes in, trade, monetary, and fiscal policies and laws, including interest rate policies of the Federal Reserve Board; inflation, interest rate, market, and monetary fluctuations; the timely development of and acceptance of new products and services offered by the Company as well as risks (including litigation) attendant thereto and the perceived overall value of these products and services by users; the impact of changes in financial services’ laws and regulations; technological changes; acquisitions; risk in general, including but not limited to those risks involving the MPS division; the growth of the Company’s business as well as expenses related thereto; changes in consumer spending and saving habits; and the success of the Company at managing and collecting assets of borrowers in default.
The foregoing list of factors is not exclusive. Additional discussions of factors affecting the Company’s business and prospects are contained in the Company’s periodic filings with the SEC. The Company expressly disclaims any intent or obligation to update any forward-looking statement, whether written or oral, that may be made from time to time by or on behalf of the Company or its subsidiaries.
The following table summarizes the Company’s significant contractual obligations at September 30, 2007 (Dollars in Thousands):
Contractual Obligations | | Total | | Less than 1 year | | 1 to 3 years | | 3 to 5 years | | More than 5 years | |
| | | | | | | | | | | |
Time deposits | | | $ | 156,723 | | | $ | 107,305 | | | $ | 42,679 | | | $ | 6,739 | | | $ | — | |
Long-term debt | | | | 68,224 | | | | 21,224 | | | | 30,000 | | | | 10,000 | | | | 7,000 | |
Operating leases | | | | 12,985 | | | | 1,251 | | | | 2,807 | | | | 2,987 | | | | 5,940 | |
Subordinate debentures Issued to capital trust | | | | 10,310 | | | | — | | | | — | | | | — | | | | 10,310 | |
Data processing services | | | | 667 | | | | 355 | | | | 312 | | | | — | | | | — | |
Total | | | $ | 248,909 | | | $ | 130,135 | | | $ | 75,798 | | | $ | 19,726 | | | $ | 23,250 | |
10
Meta Financial Group, Inc. and Subsidiaries
REPORT OF INDEPENDENT REGISTERED PUBLIC ACCOUNTING FIRM
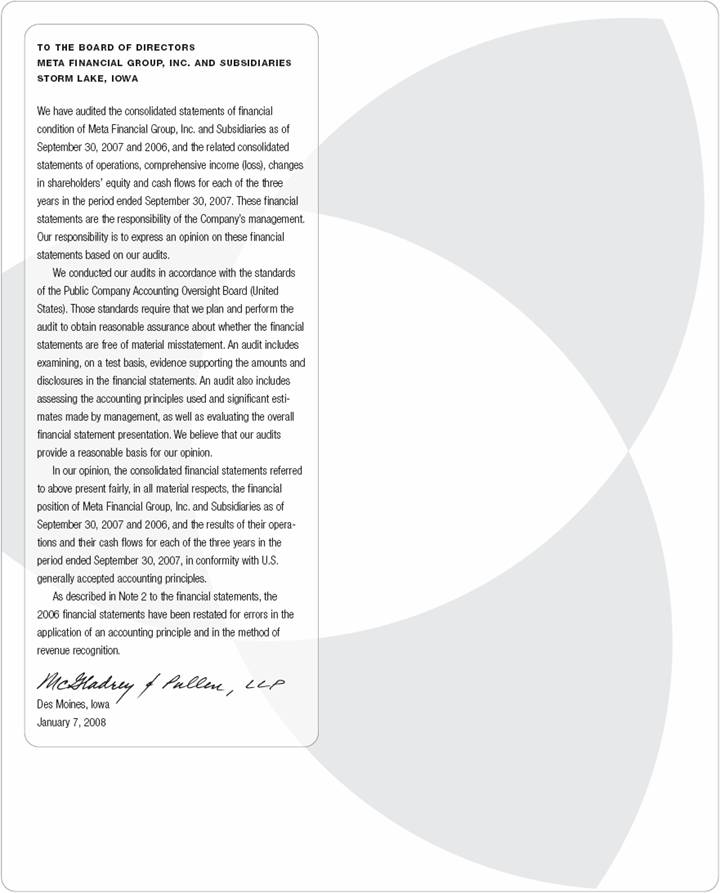
11
Meta Financial Group, Inc. and Subsidiaries
CONSOLIDATED STATEMENTS OF FINANCIAL CONDITION
Dollars in Thousands, Except Share and Per Share Data
SEPTEMBER 30, 2007 AND 2006
| | 2007 | | 2006 | |
| | | | (Restated) | |
ASSETS | | | | | |
Cash and due from banks | | $ | 1,210 | | $ | 7,228 | |
Interest-bearing deposits in other financial institutions | | 10,110 | | 100,243 | |
Total cash and cash equivalents | | 11,320 | | 107,471 | |
Federal funds sold | | 75,000 | | — | |
Securities purchased under agreements to resell | | — | | 5,891 | |
Investment securities available for sale | | 25,960 | | 27,424 | |
Mortgage-backed securities available for sale | | 132,741 | | 145,020 | |
Loans receivable—net of allowance for loan losses of $4,493 at September 30, 2007 and $6,391 at September 30, 2006 | | 355,612 | | 368,959 | |
Federal Home Loan Bank and Federal Reserve Bank stock, at cost | | 4,015 | | 5,053 | |
Accrued interest receivable | | 4,189 | | 4,076 | |
Premises and equipment, net | | 19,707 | | 16,886 | |
Bank-owned life insurance | | 12,261 | | 11,825 | |
Assets related to discontinued operations, held for sale | | 35,770 | | 40,298 | |
Goodwill | | 1,508 | | 1,508 | |
Other assets | | 7,997 | | 6,510 | |
| | | | | |
Total assets | | $ | 686,080 | | $ | 740,921 | |
| | | | | |
LIABILITIES AND SHAREHOLDERS’ EQUITY | | | | | |
LIABILITIES | | | | | |
Non-interest-bearing checking | | $ | 260,098 | | $ | 186,135 | |
Interest-bearing checking | | 14,600 | | 24,524 | |
Savings Deposits | | 10,265 | | 28,178 | |
Money Market Deposits | | 81,292 | | 98,697 | |
Time certificates of deposit | | 156,723 | | 200,635 | |
Total deposits | | 522,978 | | 538,169 | |
Advances from Federal Home Loan Bank | | 68,000 | | 89,300 | |
Securities sold under agreements to repurchase | | 224 | | 15,179 | |
Subordinated debentures | | 10,310 | | 10,310 | |
Accrued interest payable | | 842 | | 895 | |
Liabilities related to discontinued operations, held for sale | | 30,949 | | 37,747 | |
Accrued expenses and other liabilities | | 4,679 | | 4,222 | |
Total liabilities | | 637,982 | | 695,822 | |
| | | | | |
COMMITMENTS AND CONTINGENCIES (NOTES 17 AND 18) | | | | | |
SHAREHOLDERS’ EQUITY | | | | | |
Preferred stock, 800,000 shares authorized, no shares issued or outstanding | | — | | — | |
Common stock, $.01 par value; 5,200,000 shares authorized, 2,957,999 shares issued, 2,589,717 and 2,534,367 shares outstanding at September 30, 2007 and September 30, 2006, respectively | | 30 | | 30 | |
Additional paid-in capital | | 21,958 | | 20,969 | |
Retained earnings—substantially restricted | | 36,805 | | 36,953 | |
Accumulated other comprehensive (loss) | | (3,345 | ) | (4,548 | ) |
Unearned Employee Stock Ownership Plan shares | | (377 | ) | (509 | ) |
Treasury stock, 368,282 and 423,632 common shares, at cost, at September 30, 2007 and September 30, 2006, respectively | | (6,973 | ) | (7,796 | ) |
Total shareholders’ equity | | 48,098 | | 45,099 | |
| | | | | |
Total liabilities and shareholders’ equity | | $ | 686,080 | | $ | 740,921 | |
See Notes to Consolidated Financial Statements.
12
Meta Financial Group, Inc. and Subsidiaries
CONSOLIDATED STATEMENTS OF OPERATIONS
Dollars in Thousands, Except Share and Per Share Data
YEARS ENDED SEPTEMBER 30, 2007, 2006 AND 2005
| | 2007 | | 2006 | | 2005 | |
| | | | (Restated) | | | |
Interest and dividend income: | | | | | | | |
Loans receivable, including fees | | $ | 25,584 | | $ | 27,948 | | $ | 28,103 | |
Mortgage-backed securities | | 5,500 | | 6,185 | | 8,688 | |
Other investments | | 6,690 | | 3,979 | | 1,577 | |
| | 37,774 | | 38,112 | | 38,368 | |
| | | | | | | |
Interest expense: | | | | | | | |
Deposits | | 11,664 | | 12,756 | | 11,500 | |
FHLB advances and other borrowings | | 5,303 | | 6,855 | | 8,805 | |
| | 16,967 | | 19,611 | | 20,305 | |
| | | | | | | |
Net interest income | | 20,807 | | 18,501 | | 18,063 | |
| | | | | | | |
Provision for loan losses | | 3,168 | | 311 | | 4,713 | |
Net interest income after provision for loan losses | | 17,639 | | 18,190 | | 13,350 | |
| | | | | | | |
Non-interest income: | | | | | | | |
Card fees | | 15,375 | | 10,821 | | 1,240 | |
Gain on sale of branch office | | 3,331 | | — | | — | |
Deposit Fees | | 885 | | 852 | | 1,156 | |
Loan Fees | | 580 | | 446 | | 272 | |
Gain (loss) on sale of securities available for sale, net | | 496 | | — | | (8 | ) |
Bank-owned life insurance income | | 436 | | 555 | | 444 | |
Other income | | 755 | | 821 | | 398 | |
| | 21,858 | | 13,495 | | 3,502 | |
| | | | | | | |
Non-interest expense: | | | | | | | |
Compensation and benefits | | 18,248 | | 12,794 | | 10,922 | |
Card processing expense | | 6,377 | | 2,986 | | 337 | |
Occupancy and equipment expense | | 4,003 | | 2,932 | | 2,346 | |
Legal and consulting expense | | 2,965 | | 3,021 | | 815 | |
Data processing expense | | 911 | | 628 | | 579 | |
Marketing | | 797 | | 712 | | 745 | |
Other expense | | 3,657 | | 3,567 | | 2,251 | |
| | 36,958 | | 26,640 | | 17,995 | |
| | | | | | | |
Income (loss) from continuing operations before income tax expense (benefit) | | 2,539 | | 5,045 | | (1,143 | ) |
| | | | | | | |
Income tax expense (benefit) from continuing operations | | 1,227 | | 1,666 | | (491 | ) |
| | | | | | | |
Income (loss) from continuing operations | | 1,312 | | 3,379 | | (652 | ) |
Income (loss) from discontinued operations before taxes | | (394 | ) | 458 | | (466 | ) |
Income tax expense (benefit) from discontinued operations | | (253 | ) | 149 | | (194 | ) |
| | | | | | | |
Income (loss) from discontinued operations | | (141 | ) | 309 | | (272 | ) |
| | | | | | | |
Net income (loss) | | $ | 1,171 | | $ | 3,688 | | $ | (924 | ) |
| | | | | | | |
Basic earnings (loss) per common share: | | | | | | | |
Income (loss) from continuing operations | | $ | 0.52 | | $ | 1.36 | | $ | (0.27 | ) |
Income (loss) from discontinued operations | | (0.06 | ) | 0.12 | | (0.11 | ) |
Net income (loss) | | $ | 0.46 | | $ | 1.48 | | $ | (0.38 | ) |
| | | | | | | |
Diluted earnings (loss) per common share: | | | | | | | |
Income (loss) from continuing operations | | $ | 0.50 | | $ | 1.34 | | $ | (0.27 | ) |
Income (loss) from discontinued operations | | (0.05 | ) | 0.12 | | (0.11 | ) |
Net income (loss) | | $ | 0.45 | | $ | 1.46 | | $ | (0.38 | ) |
| | | | | | | |
Dividends declared per common share: | | $ | 0.52 | | $ | 0.52 | | $ | 0.52 | |
See Notes to Consolidated Financial Statements.
13
Meta Financial Group, Inc. and Subsidiaries
CONSOLIDATED STATEMENTS OF COMPREHENSIVE INCOME (LOSS)
Dollars in Thousands, Except Share and Per Share Data
YEARS ENDED SEPTEMBER 30, 2007, 2006 AND 2005
| | 2007 | | 2006 | | 2005 | |
| | | | (Restated) | | | |
Net income (loss) | | $ | 1,171 | | $ | 3,688 | | $ | (924 | ) |
Other comprehensive income (loss): | | | | | | | |
Change in net unrealized gain (loss) on securities available for sale | | 1,422 | | (2,186 | ) | (3,109 | ) |
Gains (losses) realized in net income | | 496 | | — | | (19 | ) |
| | 1,918 | | (2,186 | ) | (3,090 | ) |
Deferred income tax effect | | 715 | | (819 | ) | (1,149 | ) |
Total other comprehensive income (loss) | | 1,203 | | (1,367 | ) | (1,941 | ) |
Total comprehensive income (loss) | | $ | 2,374 | | $ | 2,321 | | $ | (2,865 | ) |
See Notes to Consolidated Financial Statements.
CONSOLIDATED STATEMENTS OF CHANGES IN SHAREHOLDERS’ EQUITY
Dollars in Thousands, Except Share and Per Share Data
YEARS ENDED SEPTEMBER 30, 2007, 2006 AND 2005
| | Common
Stock | | Additional
Paid-in
Capital | | Retained
Earnings | | Accumulated
Other
Comprehensive
(Loss) Net of Tax | | Unearned
Employee
Stock
Ownership
Plan Shares | | Treasury
Stock | | Total
Sharehholders’
Equity | |
| | | | | | | | | | | | | | | |
Balance, September 30, 2004 | | $ | 30 | | $ | 20,679 | | $ | 36,758 | | $ | (1,240 | ) | $ | (395 | ) | $ | (8,557 | ) | $ | 47,275 | |
Cash dividends declared on common stock ($.52 per share) | | — | | — | | (1,277 | ) | — | | — | | — | | (1,277 | ) |
Puchase of 1,000 common shares of treasury stock | | — | | — | | — | | — | | — | | (26 | ) | (26 | ) |
Issuance of 13,630 common shares from treasury stock due to exercise of stock options | | — | | (83 | ) | — | | — | | — | | 314 | | 231 | |
Purchase of 30,000 common shares for ESOP | | — | | — | | — | | — | | (684 | ) | — | | (684 | ) |
14,000 common shares committed to be released under the ESOP | | — | | 51 | | — | | — | | 254 | | — | | 305 | |
Change in net unrealized losses on securities available for sale, net | | — | | — | | — | | (1,941 | ) | — | | — | | (1,941 | ) |
Net (loss) for year ended September 30, 2005 | | — | | — | | (924 | ) | — | | — | | — | | (924 | ) |
Balance, September 30, 2005 | | $ | 30 | | $ | 20,647 | | $ | 34,557 | | $ | (3,181 | ) | $ | (825 | ) | $ | (8,269 | ) | $ | 42,959 | |
| | | | | | | | | | | | | | | |
Balance, September 30, 2005 | | $ | 30 | | $ | 20,647 | | $ | 34,557 | | $ | (3,181 | ) | $ | (825 | ) | $ | (8,269 | ) | $ | 42,959 | |
Cash dividends declared on common stock ($.52 per share) | | — | | — | | (1,292 | ) | — | | — | | — | | (1,292 | ) |
Issuance of 18,712 common shares from treasury stock due to exercise of stock options | | — | | (156 | ) | — | | — | | — | | 429 | | 273 | |
Issuance of 3,667 common shares from treasury stock due to issuance of nonvested shares | | — | | (44 | ) | — | | — | | — | | 44 | | — | |
Stock compensation | | — | | 481 | | — | | — | | — | | — | | 481 | |
14,500 common shares committed to be released under the ESOP | | — | | 41 | | — | | — | | 316 | | — | | 357 | |
Change in net unrealized losses on securities available for sale, net | | — | | — | | — | | (1,367 | ) | — | | — | | (1,367 | ) |
Net income for year ended September 30, 2006 (Restated) | | — | | — | | 3,688 | | — | | — | | — | | 3,688 | |
Balance, September 30, 2006 (Restated) | | 30 | | $ | 20,969 | | $ | 36,953 | | $ | (4,548 | ) | $ | (509 | ) | $ | (7,796 | ) | $ | 45,099 | |
| | | | | | | | | | | | | | | |
Balance, September 30, 2006 (Restated) | | $ | 30 | | $ | 20,969 | | $ | 36,953 | | $ | (4,548 | ) | $ | (509 | ) | $ | (7,796 | ) | $ | 45,099 | |
Cash dividends declared on common stock ($.52 per share) | | — | | — | | (1,319 | ) | — | | — | | — | | (1,319 | ) |
Issuance of 55,350 common shares from treasury stock due to exercise of stock options | | — | | (130 | ) | — | | — | | — | | 823 | | 693 | |
Stock compensation | | — | | 1,117 | | — | | — | | — | | — | | 1,117 | |
5,750 common shares committed to be released under the ESOP | | — | | 2 | | — | | — | | 132 | | — | | 134 | |
Change in net unrealized losses on securities available for sale, net | | — | | — | | — | | 1,203 | | — | | — | | 1,203 | |
Net income for year ended September 30, 2007 | | — | | — | | 1,171 | | — | | — | | — | | 1,171 | |
Balance, September 30, 2007 | | $ | 30 | | $ | 21,958 | | $ | 36,805 | | $ | (3,345 | ) | $ | (377 | ) | $ | (6,973 | ) | $ | 48,098 | |
See Notes to Consolidated Financial Statements.
14
Meta Financial Group, Inc. and Subsidiaries
CONSOLIDATED STATEMENTS OF CASH FLOWS
Dollars in Thousands, Except Share and Per Share Data
YEARS ENDED SEPTEMBER 30, 2007, 2006 AND 2005
| | 2007 | | 2006 | | 2005 | |
| | | | (Restated) | | | |
CASH FLOWS FROM OPERATING ACTIVITIES | | | | | | | |
Net income (loss) from continuing operations | | $ | 1,312 | | $ | 3,379 | | $ | (652 | ) |
Adjustments to reconcile net income (loss) to net cash from operating activities: | | | | | | | |
Effect of contribution to employee stock ownership plan | | 134 | | 357 | | 305 | |
Depreciation, amortization and accretion, net | | 2,580 | | 3,025 | | 3,012 | |
Provision for loan losses | | 3,168 | | 311 | | 4,713 | |
Stock compensation | | 1,117 | | 481 | | — | |
(Gain) on sale of branch office | | (3,331 | ) | — | | — | |
(Gain) on sale of other | | (71 | ) | (64 | ) | (48 | ) |
(Gain) loss on sale of investments, net | | (496 | ) | — | | 8 | |
Net change in accrued interest receivable | | (127 | ) | (176 | ) | (417 | ) |
Net change in other assets | | (2,410 | ) | (2,264 | ) | (649 | ) |
Net change in accrued interest payable | | (53 | ) | 31 | | 451 | |
Net change in accrued expenses and other liabilities | | 649 | | 3,295 | | (1,244 | ) |
Net cash provided by operating activities | | 2,472 | | 8,375 | | 5,479 | |
| | | | | | | |
CASH FLOWS FROM INVESTING ACTIVITIES | | | | | | | |
Purchase of securities available for sale | | (13,216 | ) | (109 | ) | (17,628 | ) |
Net change in Fed Funds sold | | (75,000 | ) | — | | — | |
Proceeds from sales of securities available for sale | | 1,098 | | — | | 19,470 | |
Net change in securities purchased under agreement to resell | | 5,891 | | 31,622 | | (25,108 | ) |
Proceeds from maturities and principal repayments of securities available for sale | | 27,089 | | 38,263 | | 70,317 | |
Loans purchased | | (44,912 | ) | (58,929 | ) | (29,730 | ) |
Net change in loans receivable | | 52,830 | | 107,707 | | (13,774 | ) |
Proceeds from sales of foreclosed real estate | | 318 | | 4,281 | | 22 | |
Cash transferred to buyer on sale of branch | | (33,665 | ) | — | | — | |
Net change in FHLB / FRB stock | | 1,038 | | 2,419 | | 2,768 | |
Proceeds from the sale of premises and equipment | | 18 | | — | | — | |
Purchase of premises and equipment | | (4,758 | ) | (3,762 | ) | (4,348 | ) |
Net cash provided by (used) in investing activities | | (83,269 | ) | 121,492 | | 1,989 | |
| | | | | | | |
CASH FLOWS FROM FINANCING ACTIVITIES | | | | | | | |
Net change in checking, savings, and money market deposits | | 37,562 | | 77,642 | | 75,255 | |
Net change in time deposits | | (15,882 | ) | (49,731 | ) | 858 | |
Net repayments of advances from Federal Home Loan Bank | | (21,300 | ) | (57,250 | ) | (64,350 | ) |
Net change in securities sold under agreements to repurchase | | (14,955 | ) | (5,328 | ) | (12,042 | ) |
Cash dividends paid | | (1,319 | ) | (1,291 | ) | (1,277 | ) |
Purchase of shares by ESOP | | — | | — | | (684 | ) |
Proceeds from exercise of stock options | | 540 | | 187 | | 230 | |
Purchase of treasury stock | | — | | — | | (26 | ) |
Other, net | | — | | — | | 385 | |
Net cash (used in) financing activities | | (15,354 | ) | (35,771 | ) | (1,651 | ) |
| | | | | | | |
Net change in cash and equivalents | | (96,151 | ) | 94,096 | | 5,817 | |
| | | | | | | |
Cash and cash equivalents at beginning of period | | 107,471 | | 13,375 | | 7,558 | |
Cash and cash equivalents at end of period | | $ | 11,320 | | $ | 107,471 | | $ | 13,375 | |
| | | | | | | |
SUPPLEMENTAL DISCLOSURE OF CASH FLOW INFORMATION | | | | | | | |
Cash paid during the period for: | | | | | | | |
Interest | | $ | 17,020 | | $ | 19,620 | | $ | 19,844 | |
Income taxes | | 570 | | 1,689 | | 606 | |
| | | | | | | |
SUPPLEMENTAL SCHEDULE OF NON-CASH INVESTING AND FINANCING ACTIVITIES: | | | | | | | |
Loans transferred to foreclosed real estate | | $ | 318 | | $ | 50 | | $ | 4,728 | |
| | | | | | | |
SALE OF BRANCH | | | | | | | |
Assets disposed: | | | | | | | |
Loans | | $ | (2,223 | ) | $ | — | | $ | — | |
Accrued interest receivable | | (14 | ) | — | | — | |
Premises and equipment | | (130 | ) | — | | — | |
Liabilities assumed by buyer: | | | | | | | |
Noninterest-bearing demand, savings, NOW and money market demand deposits | | 11,141 | | — | | — | |
Time deposits | | 28,030 | | — | | — | |
Other liabilities | | 192 | | — | | — | |
(Gain) on sale of office property, net | | (3,331 | ) | — | | — | |
Cash paid | | 33,665 | | — | | — | |
See Notes to Consolidated Financial Statements.
15
Meta Financial Group, Inc. and Subsidiaries
NOTES TO CONSOLIDATED FINANCIAL STATEMENTS
Dollars in Thousands, Except Share and Per Share Data
NOTE 1. SUMMARY OF SIGNIFICANT ACCOUNTING POLICIES
PRINCIPLES OF CONSOLIDATION
The consolidated financial statements include the accounts of Meta Financial Group, Inc. (the “Company”), a bank holding company located in Storm Lake, Iowa, and its wholly owned subsidiaries which include MetaBank (the “Bank”), a federally chartered savings bank whose primary regulator is the Office of Thrift Supervision, MetaBank West Central (“MBWC”), a state chartered commercial bank whose primary federal regulator is the Federal Reserve (together the “Banks”), First Services Financial Limited and Brookings Service Corporation, which offer noninsured investment products, and Meta Trust Company,® which offers various trust services. The Company also owns 100% of First Midwest Financial Capital Trust I (the “Trust”), which was formed in July 2001 for the purpose of issuing trust preferred securities. The Company presents the activity in the Trust under Financial Accounting Standards Board (“FASB”) Interpretation No. 46 (Revised), Consolidation of Variable Interest Entities, which requires the Company to use the equity method of accounting for this investment. All significant intercompany balances and transactions have been eliminated. The results of discontinued operations have been reported separately in the consolidated financial statements and the previously reported financial statements have been reclassified.
NATURE OF BUSINESS AND INDUSTRY SEGMENT INFORMATION
The primary source of income for the Company is interest from the purchase or origination of consumer, commercial, agricultural, commercial real estate, and residential real estate loans. Additionally, a significant source of income for the Company relates to payment processing services for prepaid debit cards, ATM sponsorship, and other money transfer systems and services. The Company accepts deposits from customers in the normal course of business primarily in northwest and central Iowa and eastern South Dakota. The Company operates in the banking industry, which accounts for the majority of its revenues and assets. The Company uses the “management approach” for reporting information about segments in annual and interim financial statements. The management approach is based on the way the chief operating decision-maker organizes segments within a company for making operating decisions and assessing performance. Reportable segments are based on products and services, geography, legal structure, management structure and any other manner in which management disaggregates a company. Based on the management approach model, the Company has determined that its business is comprised of two reporting segments.
Assets held in trust or fiduciary capacity are not assets of the Company and, accordingly, are not included in the accompanying consolidated financial statements.
USE OF ESTIMATES IN PREPARING FINANCIAL STATEMENTS
The preparation of financial statements in conformity with generally accepted accounting principles requires management to make estimates and assumptions that affect the reported amounts of assets, liabilities and disclosure of contingent assets and liabilities at the date of the financial statements and the reported amounts of revenue and expenses during the reporting period. Actual results could differ from those estimates. Certain significant estimates include the allowance for loan losses, the valuation of goodwill and the fair values of securities and other financial instruments. These estimates are reviewed by management regularly; however, they are particularly susceptible to significant changes in the future.
CASH AND CASH EQUIVALENTS AND FEDERAL FUNDS SOLD
For purposes of reporting cash flows, cash and cash equivalents is defined to include the Company’s cash on hand and due from financial institutions and short-term interest-bearing deposits in other financial institutions. The Company reports cash flows net for customer loan transactions, securities purchased under agreement to resell, deposit transactions, securities sold under agreements to repurchase, and Federal Home Loan Bank of Des Moines (“FHLB”) advances with terms less than 90 days. The Bank is required to maintain reserve balances in cash or on deposit with the Federal Reserve Bank, based on a percentage of deposits. The total of those reserve balances was none and approximately $5.95 million at September 30, 2007 and 2006, respectively. The Company at times maintains balances in excess of insured limits at various financial institutions including the FHLB, the Federal Reserve Bank, and other private institutions. At September 30, 2007 the Company had $10,000 of interest bearing deposits held at the FHLB. At September 30, 2007 the Company had $75,000 of federal funds sold at several private institutions. The Company does not believe these carry a significant risk of loss, but cannot provide assurances that no losses could occur if these institutions were to become insolvent.
SECURITIES PURCHASED UNDER AGREEMENT TO RESELL
Securities purchased under agreement to resell generally mature or reprice within one week and are carried at cost.
SECURITIES
The Company classifies all securities as available for sale. Available for sale securities are those the Company may decide to sell if needed for liquidity, asset-liability management or other reasons. Available for sale securities are reported at fair value, with net unrealized gains and losses reported as other comprehensive income or loss as a separate component of shareholders’ equity, net of tax.
Gains and losses on the sale of securities are determined using the specific identification method based on amortized cost and are reflected in results of operations at the time of sale. Interest and dividend income, adjusted by amortization of purchase premium or discount over the estimated life of the security using the level yield method, is included in income as earned.
Declines in the fair value of individual securities below their amortized cost that are deemed to be other-than-temporary are reflected in earnings as realized losses. In estimating other-than-temporary impairment losses, management considers (1) the length of time and the extent to which the fair value has been less than cost, (2) the financial condition and near-term prospects of the issuer, and (3) the intent and ability of the Company to retain its investment in the issuer, for a period of time sufficient to allow for any anticipated recovery in fair value.
LOANS RECEIVABLE
Loans receivable that management has the intent and ability to hold for the foreseeable future or until maturity or pay-off are reported at their outstanding principal balances reduced by the allowance for loan losses and any deferred fees or costs on originated loans.
Interest income on loans is accrued over the term of the loans based upon the amount of principal outstanding except when serious doubt exists as to the collectibility of a loan, in which case the accrual of interest is discontinued. Interest income is subsequently recognized only to the extent that cash payments are received until, in management’s judgment, the borrower has the ability to make contractual interest and principal payments, in which case the loan is returned to accrual status.
LOAN ORIGINATION FEES, COMMITMENT FEES AND RELATED COSTS
Loan fees and certain direct loan origination costs are deferred, and the net fee or cost is recognized as an adjustment to interest income using the interest method.
ALLOWANCE FOR LOAN LOSSES
Because some loans may not be repaid in full, an allowance for loan losses is recorded. The allowance for loan losses is increased by a provision for loan losses charged to expense and decreased by charge-offs (net of recoveries). Estimating the risk of loss and the amount of loss on any loan is necessarily subjective. Management’s periodic evaluation of the adequacy of the allowance is based on the Company’s past loan loss experience, known and inherent risks in the portfolio, adverse situations that may affect the
16
Meta Financial Group, Inc. and Subsidiaries
NOTES TO CONSOLIDATED FINANCIAL STATEMENTS
Dollars in Thousands, Except Share and Per Share Data
borrower’s ability to repay, the estimated value of any underlying collateral, and current economic conditions. While management may periodically allocate portions of the allowance for specific problem loan situations, the entire allowance is available for any loan charge-offs that occur.
Loans are considered impaired if full principal or interest payments are not anticipated in accordance with the contractual loan terms. Impaired loans are carried at the present value of expected future cash flows discounted at the loan’s effective interest rate or at the fair value of the collateral if the loan is collateral dependent. A portion of the allowance for loan losses is allocated to impaired loans if the value of such loans is deemed to be less than the unpaid balance. If these allocations cause the allowance for loan losses to require an increase, such increase is reported as a component of the provision for loan losses.
The allowance consists of specific, general, and unallocated components. The specific component relates to loans that are classified either as doubtful, substandard, or special mention. For such loans that are also classified as impaired, an allowance is established when the discounted cash flows (or collateral value or observable market price) of the impaired loan is lower than the carrying value of that loan. The general component covers loans not considered impaired and is based on historical loss experience adjusted for qualitative factors. An unallocated component is maintained to cover uncertainties that could affect management’s estimate of probable losses. The unallocated component of the allowance reflects the margin of imprecision inherent in the underlying assumptions used in the methodologies for estimating specific and general losses in the portfolio.
Smaller-balance homogeneous loans are evaluated for impairment in total. Such loans include residential first mortgage loans secured by one-to-four family residences, residential construction loans, and automobile, manufactured homes, home equity and second mortgage loans. Commercial and agricultural loans and mortgage loans secured by other properties are evaluated individually for impairment. When analysis of borrower operating results and financial condition indicates that underlying cash flows of the borrower’s business are not adequate to meet its debt service requirements, the loan is evaluated for impairment. Often this is associated with a delay or shortfall in payments of 90 days or more. Non-accrual loans are often also considered impaired. Impaired loans, or portions thereof, are charged off when deemed uncollectible.
FORECLOSED REAL ESTATE AND REPOSSESSED ASSETS
Real estate properties and repossessed assets acquired through, or in lieu of, loan foreclosure are initially recorded at the lower of cost or fair value less selling costs at the date of foreclosure, establishing a new cost basis. Any reduction to fair value from the carrying value of the related loan at the time of acquisition is accounted for as a loan loss and charged against the allowance for loan losses. Valuations are periodically performed by management and valuation allowances are increased through a charge to income for reductions in fair value or increases in estimated selling costs.
INCOME TAXES
The Company records income tax expense based on the amount of taxes due on its tax return plus deferred taxes computed based on the expected future tax consequences of temporary differences between the carrying amounts and tax bases of assets and liabilities, using enacted tax rates. Deferred tax assets are reduced by a valuation allowance when, in the opinion of management, it is more likely than not that some portion or all of the deferred tax assets will not be realized.
PREMISES AND EQUIPMENT
Land is carried at cost. Buildings, furniture, fixtures, leasehold improvements and equipment are carried at cost, less accumulated depreciation and amortization computed principally by using the straight-line method over the estimated useful lives of the assets, which range from 15 to 39 years for buildings, 5 to 20 years for leasehold improvements and 3 to 7 years for furniture, fixtures and equipment. These assets are reviewed for impairment when events indicate the carrying amount may not be recoverable.
TRANSFERS OF FINANCIAL ASSETS
Transfers of financial assets are accounted for as sales when control over the assets has been surrendered. Control over transferred assets is deemed to be surrendered when (1) the assets have been isolated from the Company, (2) the transferee obtains the right (free of conditions that constrain it from taking advantage of that right) to pledge or exchange the transferred assets, and (3) the Company does not maintain effective control over the transferred assets through an agreement to repurchase them before their maturity.
BANK-OWNED LIFE INSURANCE
Bank-owned life insurance represents the cash surrender value of investments in life insurance contracts. Earnings on the contracts are based on the earnings on the cash surrender value, less mortality costs.
EMPLOYEE STOCK OWNERSHIP PLAN
The Company accounts for its employee stock ownership plan (ESOP) in accordance with AICPA Statement of Position (SOP) 93-6. Under SOP 93-6, the cost of shares issued to the ESOP, but not yet allocated to participants, are presented in the consolidated balance sheets as a reduction of shareholders’ equity. Compensation expense is recorded based on the market price of the shares as they are committed to be released for allocation to participant accounts. The difference between the market price and the cost of shares committed to be released is recorded as an adjustment to additional paid-in capital. Dividends on allocated ESOP shares are recorded as a reduction of retained earnings. Dividends on unallocated shares are used to reduce the accrued interest and principal amount of the ESOP’s loan payable to the Company.
FINANCIAL INSTRUMENTS WITH OFF-BALANCE-SHEET RISK
The Company, in the normal course of business, makes commitments to make loans which are not reflected in the consolidated financial statements.
GOODWILL
Goodwill is not amortized but is subject to an impairment test at least annually or more often if conditions indicate a possible impairment.
ASSETS AND LIABILITIES RELATED TO DISCONTINUED OPERATIONS
Assets and liabilities related to discontinued operations are carried at the lower of cost or estimated market value in the aggregate.
SECURITIES SOLD UNDER AGREEMENTS TO REPURCHASE
The Company enters into sales of securities under agreements to repurchase with primary dealers only, which provide for the repurchase of the same security. Securities sold under agreements to repurchase identical securities are collateralized by assets which are held in safekeeping in the name of the Bank or by the dealers who arranged the transaction. Securities sold under agreements to repurchase are treated as financings, and the obligations to repurchase such securities are reflected as a liability. The securities underlying the agreements remain in the asset accounts of the Company.
REVENUE RECOGNITION
Interest revenue from loans and investments is recognized on the accrual basis of accounting as the interest is earned according to the terms of the particular loan or investment. Income from service and other customer charges in recognized as earned. Card fee revenue within the MPS division is recognized as services are performed and service charges are earned in accordance with the terms of the various programs.
17
Meta Financial Group, Inc. and Subsidiaries
NOTES TO CONSOLIDATED FINANCIAL STATEMENTS
Dollars in Thousands, Except Share and Per Share Data
EARNINGS PER COMMON SHARE (EPS)
Basic EPS is based on the net income divided by the weighted average number of common shares outstanding during the period. Allocated ESOP shares are considered outstanding for earnings per common share calculations, as they are committed to be released; unallocated ESOP shares are not considered outstanding. Diluted EPS shows the dilutive effect of additional potential common shares issuable under stock option plans. EPS, both basic and diluted, have been computed on a continuing and discontinued operations basis.
COMPREHENSIVE INCOME
Comprehensive income consists of net income and other comprehensive income. Other comprehensive income includes the net change in net unrealized gains and losses on securities available for sale, net of reclassification adjustments and tax effects, and is recognized as a separate component of shareholders’ equity.
STOCK COMPENSATION
Effective October 1, 2005, the Company adopted Statement of Financial Accounting Standards (“SFAS”) No. 123(R), Share-Based Payment, using a modified prospective application. Prior to that date, the Company accounted for stock option awards under APB Opinion No. 25, Accounting for Stock Issued to Employees. In accordance with SFAS No. 123(R), compensation expense for share based awards is recorded over the vesting period at the fair value of the award at the time of grant. The recording of such compensation expense began on October 1, 2005 for shares not yet vested as of that date and for all new grants subsequent to that date. Prior years’ results have not been restated. The exercise price of options or fair value of nonvested shares granted under the Company’s incentive plans is equal to the fair market value of the underlying stock at the grant date. The Company assumes no projected forfeitures on its stock based compensation, since actual historical forfeiture rates on its stock based incentive awards has been negligible.
RECLASSIFICATIONS
Certain 2006 amounts have been reclassified to conform to the 2007 presentation. 2006 and 2005 amounts have been reclassified for discontinued operations for comparative purposes.
NEW ACCOUNTING PRONOUNCEMENTS
In June 2006, the FASB issued FASB Interpretation No. 48, (“FIN No. 48”), Accounting for Uncertainty in Income Taxes, an Interpretation of Statement No. 109, Accounting for Income Taxes. FIN No. 48 prescribes a recognition threshold and measurement attribute for the financial statement recognition and measurement of a tax position taken or expected to be taken in a tax return. FIN No. 48 is effective for fiscal years beginning after December 15, 2006, with earlier adoption permitted. The Company is currently assessing the financial statement impact of adopting FIN No. 48.
At its September 2006 meeting, the Emerging Issues Task Force (“EITF”) reached a final consensus on Issue No. 06-04, Accounting for Deferred Compensation and Postretirement Benefit Aspects of Endorsement Split-Dollar Life Insurance Arrangements. The consensus stipulates that an agreement by an employer to share a portion of the proceeds of a life insurance policy with an employee during the postretirement period is a postretirement benefit arrangement required to be accounted for under Statement No. 106 (“SFAS No. 106”) or Accounting Principles Board (“APB”) Opinion No. 12, Omnibus Opinion—1967. The consensus concludes that the purchase of a split-dollar life insurance policy does not constitute a settlement under SFAS No. 106 and, therefore, a liability for the postretirement obligation must be recognized under SFAS No. 106 if the benefit is offered under an arrangement that constitutes a plan or under APB No. 12 if it is not part of a plan. Issue 06-04 is effective for annual or interim reporting periods beginning after December 15, 2007. The Company has endorsement split-dollar life insurance policies and is currently assessing the financial statement impact of implementing EITF 06-04.
At its March 2007 meeting, the EITF reached a final consensus on Issue No. 06-10, Accounting for Collateral Assignment Split-Dollar Life Insurance Arrangements. A consensus was reached that an employer should recognize a liability for the postretirement benefit related to a collateral assignment split-dollar life insurance arrangement in accordance with either FASB Statement No. 106 or APB Opinion No. 12, as appropriate, if the employer has agreed to maintain a life insurance policy during the employee’s retirement or provide the employee with a death benefit based on the substantive agreement with the employee. A consensus also was reached that an employer should recognize and measure an asset based on the nature and substance of the collateral assignment split-dollar life insurance arrangement. The consensuses are effective for fiscal years beginning after December 15, 2007, including interim periods within those fiscal years, with early application permitted. The Company has endorsement split-dollar life insurance policies and is currently assessing the financial statement impact of implementing EITF 06-10.
In September 2006, the FASB issued Statement No. 157, (“SFAS No. 157”), Fair Value Measurements. SFAS No. 157 defines fair value, establishes a framework for measuring fair value, and expands disclosures about fair value measurements. It clarifies that fair value is the price that would be received to sell an asset or paid to transfer a liability in an orderly transaction between market participants in the market in which the reporting entity transacts. SFAS No. 157 does not require any new fair value measurements, but rather, it provides enhanced guidance to other pronouncements that require or permit assets or liabilities to be measured at fair value. SFAS No. 157 is effective for fiscal years beginning after November 15, 2007, with earlier adoption permitted. The Company does not expect that the adoption of SFAS No. 157 will have a material impact on its financial position, results of operation and cash flows.
18
Meta Financial Group, Inc. and Subsidiaries
NOTES TO CONSOLIDATED FINANCIAL STATEMENTS
Dollars in Thousands, Except Share and Per Share Data
NOTE 2. RESTATEMENT OF FINANCIAL INFORMATION
The Company discovered in September 2007 that maintenance fees charged to and collected from holders of prepaid gift cards, which were issued through the Company’s network of agent financial institutions, were not recognized as income in the appropriate periods. The impact to income from continuing operations before income tax expense for the fiscal year ended September 30, 2006 amounted to $322.
In addition, during the quarter ended December 31, 2006, the Company determined that a material impairment of its assets related to a certain loan had occurred and recorded an additional $690 provision for loan losses. The Company was later informed by its independent accountants that as a result of their consultation with their regulatory authorities the additional provision should have been recorded in the quarter ended September 30, 2006 instead of the quarter ended December 31, 2006.
As a result of the above, the Company has restated its statements of operations for the year ended September 30, 2006 to reflect an additional $322 of card fee revenue, an additional provision for loan losses of $690 and additional income tax benefit of $135, resulting in a decrease to net income of $233. The statement of financial condition for the year ending September 30, 2006 reflects a decrease in net loans of $690, a decrease to deposits of $322, a decrease to accrued expenses of $135, and a decrease to retained earnings of $233. In addition, the Company has also corrected the interim periods of the year ended September 30, 2007 for these items.
NOTE 3. DISCONTINUED BANK OPERATIONS
SALE OF METABANK WEST CENTRAL
Subsequent to September 30, 2007, the Company has entered into an agreement to sell MBWC. MBWC has three branch offices in Stuart, Casey, and Menlo, Iowa. MBWC is a state chartered commercial bank whose primary federal regulator is the Federal Reserve Bank of Chicago. The transaction will involve the sale of the stock of MBWC for approximately $8.3 million and is anticipated to close on March 30, 2008, subject to various closing conditions, including regulatory approval. The Company expects to record a gain on sale of approximately $2.5 million upon the close of the transaction. The activity related to MBWC is accounted for as discontinued operations.
Activities related to discontinued bank operations have been recorded separately with current and prior period amounts reclassified as assets and liabilities related to discontinued operations on the consolidated statements of financial condition and as discontinued operations on the consolidated statements of operations and consolidated statement of cash flows. The notes to the consolidated financial statements have also been adjusted to eliminate the effect of discontinued bank operations.
Presented below are condensed financial statements for MBWC.
CONDENSED STATEMENTS OF FINANCIAL CONDITION — DISCONTINUED OPERATIONS
YEAR ENDED SEPTEMBER 30,
| | 2007 | | 2006 | |
| | | | | |
ASSETS | | | | | |
Cash and cash equivalents | | $ | 9,583 | | $ | 1,882 | |
Investments and mortgage-backed securities, available for sale | | 11,658 | | 13,732 | |
Loans receivable, net | | 9,599 | | 19,621 | |
Other assets | | 4,930 | | 5,064 | |
Total assets related to discontinued operations | | $ | 35,770 | | $ | 40,299 | |
| | | | | |
LIABILITIES AND SHAREHOLDERS’ EQUITY | | | | | |
LIABILITIES | | | | | |
Deposits | | $ | 24,610 | | $ | 27,220 | |
Other borrowings | | 6,300 | | 10,265 | |
Other liabilities | | 39 | | 262 | |
Total liabilities related to discontinued operations | | $ | 30,949 | | $ | 37,747 | |
CONDENSED STATEMENTS OF OPERATIONS — DISCONTINUED OPERATIONS
YEAR ENDED SEPTEMBER 30,
| | 2007 | | 2006 | | 2005 | |
| | | | | | | |
Interest income | | $ | 2,221 | | $ | 2,466 | | $ | 2,725 | |
Interest expense | | 1,305 | | 1,331 | | 1,549 | |
Net interest income | | 916 | | 1,135 | | 1,176 | |
Provision for loan losses | | 627 | | (76 | ) | 769 | |
Net interest income after provision for loan losses | | 289 | | 1,211 | | 407 | |
Noninterest income | | 216 | | 233 | | 229 | |
Noninterest expense | | 899 | | 986 | | 1,102 | |
Net income (loss) before income tax expense | | (394 | ) | 458 | | (466 | ) |
Income tax expense (benefit) | | (253 | ) | 149 | | (194 | ) |
Net income (loss) from discontinued operations | | $ | (141 | ) | $ | 309 | | $ | (272 | ) |
19
Meta Financial Group, Inc. and Subsidiaries
NOTES TO CONSOLIDATED FINANCIAL STATEMENTS
Dollars in Thousands, Except Share and Per Share Data
NOTE 4. EARNINGS PER COMMON SHARE (EPS)
A reconciliation of the income (loss) and common stock share amounts used in the computation of basic and diluted EPS for the fiscal years ended September 30, 2007, 2006 and 2005 is presented below:
| | 2007 | | 2006 | | 2005 | |
| | | | (Restated) | | | |
EARNINGS (LOSS) | | | | | | | |
Income (loss) from continuing operations | | $ | 1,312 | | $ | 3,379 | | $ | (652 | ) |
Discontinued operations, net of tax | | (141 | ) | 309 | | (272 | ) |
| | | | | | | |
Net income (loss) | | $ | 1,171 | | $ | 3,688 | | $ | (924 | ) |
| | | | | | | |
BASIC EPS | | | | | | | |
Weighted average common shares outstanding | | 2,550,193 | | 2,511,754 | | 2,497,954 | |
Less weighted average unallocated ESOP and nonvested shares | | (25,213 | ) | (27,949 | ) | (37,063 | ) |
Weighted average common shares outstanding | | 2,524,980 | | 2,483,805 | | 2,460,891 | |
| | | | | | | |
EARNINGS (LOSS) PER COMMON SHARE | | | | | | | |
Income (loss) from continuing operations | | $ | 0.52 | | $ | 1.36 | | $ | (0.27 | ) |
Discontinued operations, net of tax | | (0.06 | ) | 0.12 | | (0.11 | ) |
| | | | | | | |
Net income (loss) | | $ | 0.46 | | $ | 1.48 | | $ | (0.38 | ) |
| | | | | | | |
DILUTED EPS | | | | | | | |
Weighted average common shares outstanding for basis earnings per common share | | 2,524,980 | | 2,483,805 | | 2,460,891 | |
Add dilutive effect of assumed exercises of stock options, net of tax benefits | | 92,916 | | 38,052 | | — | |
Weighted average common and dilutive potential common shares outstanding | | 2,617,896 | | 2,521,857 | | 2,460,891 | |
| | | | | | | |
EARNINGS (LOSS) PER COMMON SHARE | | | | | | | |
Income (loss) from continuing operations | | $ | 0.50 | | $ | 1.34 | | $ | (0.27 | ) |
Discontinued operations, net of tax | | (0.05 | ) | 0.12 | | (0.11 | ) |
| | | | | | | |
Net income (loss) | | $ | 0.45 | | $ | 1.46 | | $ | (0.38 | ) |
The calculation of the diluted loss per share for the year ended September 30, 2005 does not reflect the assumed exercise of 46,624 stock options because the effect would have been anti-dilutive due to the net loss for the period. Stock options totaling 26,682, 99,355, and 60,315 were not considered in computing diluted earnings per common share for the years ended September 30, 2007, 2006, and 2005, respectively, because they were not dilutive.
NOTE 5. SECURITIES
Year end securities available for sale were as follows:
| | | | GROSS | | GROSS | | | |
| | AMORTIZED | | UNREALIZED | | UNREALIZED | | FAIR | |
2007 | | COST | | GAINS | | (LOSSES) | | VALUE | |
| | | | | | | | | |
Debt securities | | | | | | | | | |
Trust preferred and corporate securities | | $ | 26,784 | | $ | 172 | | $ | (2,546 | ) | $ | 24,410 | |
Obligations of states and political subdivisions | | 1,534 | | 17 | | (1 | ) | 1,550 | |
Mortgage-backed securities | | 135,432 | | 76 | | (2,767 | ) | 132,741 | |
Total debt securities | | $ | 163,750 | | $ | 265 | | $ | (5,314 | ) | $ | 158,701 | |
| | | | GROSS | | GROSS | | | |
| | AMORTIZED | | UNREALIZED | | UNREALIZED | | FAIR | |
2006 | | COST | | GAINS | | (LOSSES) | | VALUE | |
| | | | | | | | | |
Debt securities | | | | | | | | | |
Trust preferred and corporate securities | | $ | 26,773 | | $ | 114 | | $ | (608 | ) | $ | 26,279 | |
Obligations of states and political subdivisions | | 96 | | — | | (1 | ) | 95 | |
Mortgage-backed securities | | 151,417 | | 15 | | (6,412 | ) | 145,020 | |
Other | | 110 | | — | | (1 | ) | 109 | |
Total debt securities | | $ | 178,396 | | $ | 129 | | $ | (7,022 | ) | $ | 171,503 | |
20
Meta Financial Group, Inc. and Subsidiaries
NOTES TO CONSOLIDATED FINANCIAL STATEMENTS
Dollars in Thousands, Except Share and Per Share Data
Gross unrealized losses and fair value, aggregated by investment category and length of time that individual securities have been in continuous unrealized loss position at September 30, 2007 and 2006 are as follows:
2007 | | LESS THAN 12 MONTHS | | OVER 12 MONTHS | | TOTAL | |
| | Fair | | Unrealized | | Fair | | Unrealized | | Fair | | Unrealized | |
| | Value | | (Losses) | | Value | | (Losses) | | Value | | (Losses) | |
| | | | | | | | | | | | | |
Debt securities | | | | | | | | | | | | | |
Trust preferred and corporate securities | | $ | — | | $ | — | | $ | 22,238 | | $ | (2,546 | ) | $ | 22,238 | | $ | (2,546 | ) |
Obligations of states and political subdivisions | | 432 | | (1 | ) | — | | — | | 432 | | (1 | ) |
Mortgage-backed securities | | 4,082 | | (33 | ) | 121,102 | | (2,734 | ) | 125,184 | | (2,767 | ) |
Total debt securities | | $ | 4,514 | | $ | (34 | ) | $ | 143,340 | | $ | (5,280 | ) | $ | 147,854 | | $ | (5,314 | ) |
2006 | | LESS THAN 12 MONTHS | | OVER 12 MONTHS | | TOTAL | |
| | Fair | | Unrealized | | Fair | | Unrealized | | Fair | | Unrealized | |
| | Value | | (Losses) | | Value | | (Losses) | | Value | | (Losses) | |
| | | | | | | | | | | | | |
Debt securities | | | | | | | | | | | | | |
Trust preferred and corporate securities | | $ | — | | $ | — | | $ | 24,165 | | $ | (608 | ) | $ | 24,165 | | $ | (608 | ) |
Obligations of states and political subdivisions | | — | | — | | 95 | | (1 | ) | 95 | | (1 | ) |
Mortgage-backed securities | | 49 | | (1 | ) | 144,766 | | (6,411 | ) | 144,815 | | (6,412 | ) |
Other | | 110 | | (1 | ) | — | | — | | 110 | | (1 | ) |
Total debt securities | | $ | 159 | | $ | (2 | ) | $ | 169,026 | | $ | (7,020 | ) | $ | 169,185 | | $ | (7,022 | ) |
As of September 30, 2007, the investment portfolio included 33 securities with current unrealized losses which have existed for longer than one year. All of these securities are considered to be acceptable credit risks. Because the declines in fair value were due to changes in market interest rates, not in estimated cash flows, no other-than-temporary impairment was recorded at September 30, 2007. In addition, the Company has the intent and ability to hold these investment securities for a period of time sufficient to allow for an anticipated recovery.
The amortized cost and fair value of debt securities by contractual maturity are shown below. Certain securities have call features which allow the issuer to call the security prior to maturity. Expected maturities may differ from contractual maturities in mortgage-backed securities because borrowers may have the right to call or prepay obligations with or without call or prepayment penalties. Therefore, mortgage-backed securities are not included in the maturity categories in the following maturity summary.
SEPTEMBER 30, 2007
| | Amortized | | Fair | |
| | Cost | | Value | |
| | | | | |
Due in one year or less | | $ | 1,000 | | $ | 999 | |
Due after one year through five years | | 541 | | 548 | |
Due after five years through ten years | | 559 | | 569 | |
Due after ten years | | 26,218 | | 23,844 | |
| | 28,318 | | 25,960 | |
Mortgage-backed securities | | 135,432 | | 132,741 | |
Total debt securities | | $ | 163,750 | | $ | 158,701 | |
Activities related to the sale of securities available for sale are summarized below.
| | 2007 | | 2006 | | 2005 | |
| | | | | | | |
Proceeds from sales | | $ | 1,098 | | $ | — | | $ | 19,470 | |
Gross gains on sales | | 496 | | — | | 178 | |
Gross (losses) on sales | | — | | — | | (186 | ) |
| | | | | | | | | | |
21
Meta Financial Group, Inc. and Subsidiaries
NOTES TO CONSOLIDATED FINANCIAL STATEMENTS
Dollars in Thousands, Except Share and Per Share Data
NOTE 6. LOANS RECEIVABLE, NET
Year end loans receivable were as follows:
| | 2007 | | 2006 | |
| | | | (Restated) | |
One to four family residential mortgage loans | | $ | 45,407 | | $ | 58,165 | |
Commercial and multi-family real estate loans | | 169,877 | | 159,107 | |
Agricultural real estate loans | | 16,582 | | 14,098 | |
Consumer loans | | 36,763 | | 30,067 | |
Commercial business loans | | 58,705 | | 87,202 | |
Agricultural business loans | | 33,143 | | 28,661 | |
| | 360,477 | | 377,300 | |
Less: | | | | | |
Allowance for loan losses | | (4,493 | ) | (6,391 | ) |
Undisbursed portion of loans in process | | (254 | ) | (1,773 | ) |
Net deferred loan origination fees | | (117 | ) | (177 | ) |
| | $ | 355,612 | | $ | 368,959 | |
Annual activity in the allowance for loan losses was as follows:
| | 2007 | | 2006 | | 2005 | |
| | | | (Restated) | | | |
Beginning balance | | $ | 6,391 | | $ | 6,793 | | $ | 5,144 | |
Provision for loan losses | | 3,168 | | 311 | | 4,713 | |
Recoveries | | 549 | | 329 | | 147 | |
Charge offs | | (5,615 | ) | (1,042 | ) | (3,211 | ) |
Ending balance | | $ | 4,493 | | $ | 6,391 | | $ | 6,793 | |
Virtually all of the Company’s originated loans are to Iowa- and South Dakota-based individuals and organizations. The Company’s purchased loans totaled $44,100 at September 30, 2007, which were secured by properties located, as a percentage of total loans, as follows: 4% in Iowa, 3% in Washington, 2% in Minnesota, 1% each in South Dakota and Oregon, and the remaining 1% in eight other states. The Company’s purchased loans totaled approximately $49,000 at September 30, 2006, which were secured by properties located, as a percentage of total loans, as follows: 4% in Iowa, 2% in Arizona, 1% each in Minnesota, South Dakota, Illinois, Florida, California, and Washington, and the remaining 1% in eight other states.
The Company originates and purchases commercial real estate loans. These loans are considered by management to be of somewhat greater risk of uncollectibility due to the dependency on income production. The Company’s commercial real estate loans include $19,400 of loans secured by hotel properties and $21,800 of multi-family properties at September 30, 2007. The Company’s commercial real estate loans include $9,500 of loans secured by hotel properties and $29,400 of multi-family properties at September 30, 2006. The remainder of the commercial real estate portfolio is diversified by industry. The Company’s policy for requiring collateral and guarantees varies with the creditworthiness of each borrower.
Impaired loans, which include nonaccrual loans, were as follows:
| | 2007 | | 2006 | |
| | | | | |
Year-end impaired loans with no allowance for loan losses allocated | | $ | — | | $ | — | |
Year-end impaired loans with allowance for loan losses allocated | | 2,270 | | 5,251 | |
Amount of the allowance allocated to impaired loans | | 1,478 | | 2,705 | |
Average of impaired loans during the year | | 4,536 | | 5,540 | |
| | | | | | | |
Interest income and cash interest collected on impaired loans was not material during the years ended September 30, 2007, and 2006, and 2005.
NOTE 7. LOAN SERVICING
Loans serviced for others are not reported as assets. The unpaid principal balances of these loans at year end were as follows:
| | 2007 | | 2006 | |
| | | | | |
Mortgage loan portfolios serviced for FNMA | | $ | 20,422 | | $ | 22,900 | |
Other | | 9,192 | | 9,384 | |
| | $ | 29,614 | | $ | 32,284 | |
22
Meta Financial Group, Inc. and Subsidiaries
NOTES TO CONSOLIDATED FINANCIAL STATEMENTS
Dollars in Thousands, Except Share and Per Share Data
NOTE 8. PREMISES AND EQUIPMENT, NET
Year end premises and equipment were as follows:
| | 2006 | | 2005 | |
| | | | | |
Land | | $ | 2,751 | | $ | 2,761 | |
Buildings | | 14,384 | | 12,681 | |
Furniture, fixtures, and equipment | | 10,928 | | 8,373 | |
| | 28,063 | | 23,815 | |
Less accumulated depreciation | | (8,356 | ) | (6,929 | ) |
| | $ | 19,707 | | $ | 16,886 | |
Depreciation of premises and equipment included in occupancy and equipment expense was approximately $1,800, $1,200, and $930 for the years ended September 30, 2007, 2006, and 2005, respectively.
NOTE 9. DEPOSITS
Certificates of deposit in denominations of $100 or more were approximately $35,700 and $40,700 at September 30, 2007, and 2006, respectively.
At September 30, 2007, the scheduled maturities of certificates of deposit were as follows for the years ending September 30:
2008 | | $ | 107,305 | |
2009 | | 24,148 | |
2010 | | 18,531 | |
2011 | | 3,640 | |
2012 | | 3,099 | |
| | $ | 156,723 | |
NOTE 10. ADVANCES FROM THE FEDERAL HOME LOAN BANK
At September 30, 2007, the Company’s advances from the FHLB had fixed rates ranging from 3.24% to 7.02% with a weighted average rate of 5.43%. The scheduled maturities of FHLB advances were as follows for the years ending September 30:
2008 | | $ | 21,000 | |
2009 | | 11,000 | |
2010 | | 19,000 | |
2011 | | 10,000 | |
2012 | | — | |
Thereafter | | 7,000 | |
| | $ | 68,000 | |
Advances totaling $26,700, with a weighted average fixed rate of 5.75%, carry quarterly call provisions, whereby the FHLB can elect to accelerate the maturity of these borrowings. These advances are shown in the above table at their stated maturity dates, which range from 2008 to 2010.
As of September 30, 2006, the Company’s advances from the FHLB totaled $89,300 and carried a weighted average rate of 4.96%.
MetaBank has executed blanket pledge agreements whereby the Bank assigns, transfers, and pledges to the FHLB and grant to the FHLB a security interest in all mortgage collateral and securities collateral. The Bank has the right to use, commingle, and dispose of the collateral it has assigned to the FHLB. Under the agreement, the Bank must maintain “eligible collateral” that has a “lending value” at least equal to the “required collateral amount,” all as defined by the agreement.
At year end 2007, and 2006, the Bank pledged securities with fair values of approximately $46,600 and $44,200, respectively, against specific FHLB advances. In addition, qualifying mortgage loans of approximately $31,800, and $79,100 were pledged as collateral at September 30, 2007 and 2006, respectively.
NOTE 11. SECURITIES SOLD UNDER AGREEMENTS TO REPURCHASE
Securities sold under agreements to repurchase totaled approximately $224 and $15,200 at September 30, 2007 and 2006, respectively.
An analysis of securities sold under agreements to repurchase follows:
| | 2007 | | 2006 | |
| | | | | |
Highest month-end balance | | $ | 15,470 | | $ | 20,369 | |
Average balance | | 6,462 | | 16,616 | |
Weighted average interest rate during the period | | 3.37 | % | 3.01 | % |
Weighted average interest rate at end of period | | 5.16 | % | 3.13 | % |
| | | | | | | |
The Company pledged securities with fair values of approximately $20,500 at September 30, 2006, as collateral for securities sold under agreements to repurchase.
NOTE 12. SUBORDINATED DEBENTURES AND TRUST PREFERRED SECURITIES
Subordinated debentures are due to First Midwest Financial Capital Trust I, a 100%-owned unconsolidated subsidiary of the Company. The debentures were issued in 2001 in conjunction with the Trust’s issuance of 10,000 shares of Trust Preferred Securities. The debentures bear the same interest rate and terms as the trust preferred securities. The debentures are included on the balance sheet as liabilities.
The Company issued all of the 10,000 authorized shares of trust preferred securities of First Midwest Financial Capital Trust I holding solely subordinated debt securities. Distributions are paid semi-annually. Cumulative cash distributions are calculated at a variable rate of LIBOR (as defined) plus 3.75% (9.06% at September 30, 2007 and 9.30% at September 30, 2006), not to exceed 12.5%. The Company may, at one or more times, defer interest payments on the capital securities for up to 10 consecutive semi-annual periods, but not beyond July 25, 2031. At the end of any deferral period, all accumulated and unpaid distributions are required to be paid. The capital securities are required to be redeemed on July 25, 2031; however, the Company has the option to shorten the maturity date to a date not earlier than July 25, 2007. The redemption price is $1 per capital security plus any accrued and unpaid distributions to the date of redemption plus, if redeemed prior to July 25, 2011, a redemption premium as defined in the Indenture agreement.
Holders of the capital securities have no voting rights, are unsecured and rank junior in priority of payment to all of the Company’s indebtedness and senior to the Company’s common stock.
Although the securities issued by the trusts are not included as a component of shareholders’ equity, the securities are treated as capital for regulatory purposes, subject to certain limitations.
23
Meta Financial Group, Inc. and Subsidiaries
NOTES TO CONSOLIDATED FINANCIAL STATEMENTS
Dollars in Thousands, Except Share and Per Share Data
NOTE 13. EMPLOYEE STOCK OWNERSHIP AND PROFIT SHARING PLANS
The Company maintains an Employee Stock Ownership Plan (ESOP) for eligible employees who have 1,000 hours of employment with the Bank, have worked one year at the Bank and who have attained age 21. The ESOP has borrowed money from the Company to purchase shares of the Company’s common stock. Shares purchased by the ESOP are held in suspense for allocation among participants as the loan is repaid. ESOP expense of $134, $357 and $305 was recorded for the years ended September 30, 2007, 2006 and 2005, respectively. Contributions of $132, $316 and $254 were made to the ESOP during the years ended September 30, 2007, 2006 and 2005, respectively.
Contributions to the ESOP and shares released from suspense in an amount proportional to the repayment of the ESOP loan are allocated among ESOP participants on the basis of compensation in the year of allocation. Benefits generally become 100% vested after seven years of credited service. Prior to the completion of seven years of credited service, a participant who terminates employment for reasons other than death or disability receives a reduced benefit based on the ESOP’s vesting schedule. Forfeitures are reallocated among remaining participating employees in the same proportion as contributions. Benefits are payable in the form of stock upon termination of employment. The Company’s contributions to the ESOP are not fixed, so benefits payable under the ESOP cannot be estimated.
For the years ended September 30, 2007, 2006 and 2005, 5,750, 14,500 and 14,000 shares with a fair value of $23.30, $24.60 and $21.79 per share, respectively, were released. Also for the years ended September 30, 2007, 2006 and 2005, allocated shares and total ESOP shares reflect 26,440, 11,332, and 45,042 shares, respectively, withdrawn from the ESOP by participants who are no longer with the Company or by participants diversifying their holdings and 3,521, 5,358, and 5,152 shares, respectively, purchased for dividend reinvestment.
Year-end ESOP shares are as follows:
| | 2007 | | 2006 | | 2005 | |
| | | | | | | |
Allocated shares | | 221,283 | | 238,454 | | 229,928 | |
Unearned shares | | 16,562 | | 22,312 | | 36,812 | |
Total ESOP shares | | 237,845 | | 260,766 | | 266,740 | |
| | | | | | | |
Fair value of unearned shares | | $ | 660 | | $ | 549 | | $ | 687 | |
| | | | | | | | | | |
The Company also has a profit sharing plan covering substantially all full-time employees. Contribution expense to the profit sharing plan, included in compensation and benefits, for the years ended September 30, 2007, 2006, and 2005 was $311, $322, and $233, respectively.
NOTE 14. SHARE BASED COMPENSATION PLANS
The Company maintains the 2002 Omnibus Incentive Plan which, among other things, provides for the awarding of stock options and nonvested (restricted) shares to certain officers and directors of the Company. Awards are granted by the Stock Option Committee of the Board of Directors based on the performance of the award recipients or other relevant factors.
Effective October 1, 2005, the Company adopted SFAS No. 123(R), Share-Based Payment using a modified prospective application. Prior to adopting this standard, the Company accounted for stock options under APB Opinion No. 25, Accounting for Stock Issued to Employees. As a result of the adoption of SFAS No. 123 (R), the Company, during the year ended September 30, 2006, began recording expense associated with the awarding of stock options and restricted stock. Results for the year ended September 30, 2005 have not been restated to reflect the impact of this change. The following tables show the effect to income, net of tax benefits, of share-based expense recorded in the years ended September 30, 2007 and 2006, as well as the pro forma effect to income and earnings per share had the Company used the accounting methodology under SFAS No. 123(R) for fiscal year 2005.
YEAR ENDED SEPTEMBER 30,
| | 2007 | | 2006 | | 2005 | |
| | | | | | | |
Total employee stock-based compensation expense recognized in income, net of tax effects of $191 and $163, respectively | | $ | 926 | | $ | 318 | | $ | — | |
| | | | | | | | | | |
YEAR ENDED SEPTEMBER 30,
| | 2005 | |
| | | |
Net (loss) as reported | | $ | (924 | ) |
Deduct: Total employee stock-based compensation expense determined under fair value based method for all awards, net of tax effects | | (154 | ) |
Pro forma net (loss) | | $ | (1,078 | ) |
| | | |
(Loss) per common share — basic | | | |
As reported | | (0.38 | ) |
Pro forma | | (0.44 | ) |
| | | |
(Loss) per common share — diluted | | | |
As reported | | (0.38 | ) |
Pro forma | | (0.44 | ) |
As of September 30, 2007, stock based compensation expense not yet recognized in income totaled $906, which is expected to be recognized over a weighted average remaining period of 1.31 years.
24
Meta Financial Group, Inc. and Subsidiaries
NOTES TO CONSOLIDATED FINANCIAL STATEMENTS
Dollars in Thousands, Except Share and Per Share Data
At grant date, the fair value of options awarded to recipients is estimated using a Black-Scholes valuation model. The exercise price of stock options equals the fair market value of the underlying stock at the date of grant. The following table shows the key valuation assumptions used for options granted during the years ended September 30, 2007, 2006, and 2005, and other information. Options are issued for 10 year periods with 100% vesting generally occurring either at grant date or over a four year period.
YEAR ENDED SEPTEMBER 30,
| | 2007 | | 2006 | | 2005 | |
| | | | | | | |
Risk-free interest rate | | 4.46 -5.14 | % | 4.40 -5.09 | % | 4.30 | % |
Expected annual standard deviation | | | | | | | |
Range | | 19.52 -19.72 | % | 19.46 -20.60 | % | 20.60 | % |
Weighted average | | 19.62 | % | 19.93 | % | 20.60 | % |
Expected life (years) | | 7 | | 7 | | 7 | |
Expected dividend yield | | | | | | | |
Range | | 1.25 -1.77 | % | 2.13 -2.55 | % | 2.76 | % |
Weighted average | | 1.40 | % | 2.32 | % | 2.76 | % |
Weighted average fair value of options granted during period | | $ | 10.29 | | $ | 5.51 | | $ | 4.03 | |
Intrinsic value of options exercised during period | | $ | 1,486 | | $ | 218 | | $ | 98 | |
Although authorized under the Company’s 2002 Omnibus Incentive Plan, the Company had not, prior to fiscal year 2006, awarded nonvested (restricted) shares to employees or directors. The Company did award nonvested shares during the fiscal years ended 2007 and 2006. Nonvested shares vest immediately or over a period of four years. The following table shows the weighted average fair value of nonvested shares awarded and the total fair value of novested shares which vested during the fiscal years ended 2007 and 2006. The fair value is determined based on the fair market value of the Company’s stock on the grant date.
YEAR ENDED SEPTEMBER 30,
| | 2007 | | 2006 | | 2005 | |
| | | | | | | |
Weighted average fair value of nonvested shares granted during period | | $ | 39.84 | | $ | 24.43 | | n/a | |
Total fair value of nonvested shares vested during period | | $ | 162 | | $ | 90 | | n/a | |
In addition to the Company’s active 2002 Omnibus Incentive Plan, the Company also maintains the 1995 Stock Option and Incentive Plan, and the 1993 Stock Option and Incentive Plan. No new options were, or could have been, awarded under the 1995 plan during the year ended September 30, 2007; however, previously awarded but unexercised options were outstanding under these plans during the year.
The following tables shows the activity of options and nonvested shares granted, exercised, or forfeited under all of the Company’s option and incentive plans during the year ended September 30, 2007 and 2006.
| | NUMBER OF
SHARES | | WEIGHTED
AVERAGE
EXERCISE
PRICE | | WEIGHTED
AVERAGE
REMAINING
CONTRACTUAL
TERM (YRS) | | AGGREGATE
INTRINSIC
VALUE | |
| | | | | | | | | |
Options outstanding, September 30, 2006 | | 386,425 | | $ | 19.79 | | 6.65 | | $ | 1,793 | |
Granted | | 128,168 | | 37.62 | | | | | |
Exercised | | (88,824 | ) | 16.73 | | | | | |
Forfeited or expired | | (1,500 | ) | 23.26 | | | | | |
| | | | | | | | | |
Options outstanding, September 30, 2007 | | 424,269 | | $ | 25.81 | | 7.71 | | $ | 5,971 | |
| | | | | | | | | |
Options exercisable end of year | | 266,819 | | $ | 24.07 | | 7.14 | | $ | 4,207 | |
| | NUMBER OF
SHARES | | WEIGHTED
AVERAGE
EXERCISE
PRICE | | WEIGHTED
AVERAGE
REMAINING
CONTRACTUAL
TERM (YRS) | | AGGREGATE
INTRINSIC
VALUE | |
| | | | | | | | | |
Options outstanding, September 30, 2005 | | 311,328 | | $ | 18.11 | | 5.99 | | $ | 669 | |
Granted | | 114,903 | | 23.16 | | | | | |
Exercised | | (28,250 | ) | 14.57 | | | | | |
Forfeited or expired | | (11,556 | ) | 20.71 | | | | | |
| | | | | | | | | |
Options outstanding, September 30, 2006 | | 386,425 | | $ | 19.79 | | 6.65 | | $ | 1,793 | |
| | | | | | | | | |
Options exercisable end of year | | 276,925 | | $ | 18.74 | | 5.75 | | $ | 1,575 | |
25
Meta Financial Group, Inc. and Subsidiaries
NOTES TO CONSOLIDATED FINANCIAL STATEMENTS
Dollars in Thousands, Except Share and Per Share Data
| | | | WEIGHTED | |
| | NUMBER | | AVERAGE | |
| | OF | | FAIR MKT VAL | |
| | SHARES | | AT GRANT | |
| | | | | |
Nonvested shares outstanding, September 30, 2006 | | 8,333 | | $ | 24.43 | |
Granted | | 2,400 | | 39.84 | |
Vested | | (4,067 | ) | 33.52 | |
Forfeited or expired | | — | | — | |
| | | | | |
Nonvested shares outstanding, September 30, 2007 | | 6,666 | | $ | 24.43 | |
| | | | WEIGHTED | |
| | NUMBER | | AVERAGE | |
| | OF | | FAIR MKT VAL | |
| | SHARES | | AT GRANT | |
| | | | | |
Nonvested shares outstanding, September 30, 2005 | | — | | $ | — | |
Granted | | 12,000 | | 24.43 | |
Vested | | (3,667 | ) | 24.43 | |
Forfeited or expired | | — | | — | |
| | | | | |
Nonvested shares outstanding, September 30, 2006 | | 8,333 | | $ | 24.43 | |
NOTE 15. INCOME TAXES
The Company and its subsidiaries file a consolidated federal income tax return on a fiscal year basis.
The provision for income taxes from continuing operations consists of:
Years ended September 30,
| | 2007 | | 2006 | | 2005 | |
| | | | | | | |
Federal: | | | | | | | |
Current | | $ | 405 | | $ | 1,347 | | $ | 275 | |
Deferred | | 644 | | 20 | | (663 | ) |
| | 1,049 | | 1,367 | | (388 | ) |
| | | | | | | |
State: | | | | | | | |
Current | | 78 | | 293 | | (20 | ) |
Deferred | | 100 | | 6 | | (83 | ) |
| | 178 | | 299 | | (103 | ) |
| | | | | | | |
Income tax expense (benefit) | | $ | 1,227 | | $ | 1,666 | | $ | (491 | ) |
Total income tax expense (benefit) differs from the statutory federal income tax rate as follows:
Years ended September 30,
| | 2007 | | 2006 | | 2005 | |
| | | | | | | |
Income tax expense (benefit) at 35% federal tax rate | | $ | 889 | | $ | 1,766 | | $ | (401 | ) |
Increase (decrease) resulting from: | | | | | | | |
State income taxes net of federal benefit | | 89 | | 163 | | (9 | ) |
Nontaxable buildup in cash surrender value | | (153 | ) | (194 | ) | (151 | ) |
ISO expense | | 191 | | 61 | | — | |
Tax exempt income | | (5 | ) | (97 | ) | (5 | ) |
Nondeductible expenses | | 125 | | 25 | | 31 | |
Other, net | | 91 | | (58 | ) | 44 | |
| | | | | | | |
Total income tax expense (benefit) | | $ | 1,227 | | $ | 1,666 | | $ | (491 | ) |
26
Meta Financial Group, Inc. and Subsidiaries
NOTES TO CONSOLIDATED FINANCIAL STATEMENTS
Dollars in Thousands, Except Share and Per Share Data
Year-end deferred tax assets and liabilities included in other assets consist of:
September 30,
| | 2007 | | 2006 | |
| | | | | |
DEFERRED TAX ASSETS: | | | | | |
Bad debts | | $ | 1,688 | | $ | 2,379 | |
Stock based compensation | | 253 | | 91 | |
Net unrealized losses on securities available for sale | | 1,883 | | 2,444 | |
Other, net | | 101 | | 209 | |
| | 3,925 | | 5,123 | |
| | | | | |
DEFERRED TAX LIABILITIES: | | | | | |
FHLB stock dividend | | (452 | ) | (452 | ) |
Premises and equipment | | (588 | ) | (460 | ) |
Deferred loan fees | | (118 | ) | (140 | ) |
| | (1,158 | ) | (1,052 | ) |
| | | | | |
Net deferred tax assets | | $ | 2,767 | | $ | 4,072 | |
Federal income tax laws provided savings banks with additional bad debt deductions through September 30, 1987 totaling $6,700 for the Bank. Accounting standards do not require a deferred tax liability to be recorded on this amount, which liability otherwise would total approximately $2,300 at September 30, 2007, and 2006. If the Bank were to be liquidated or otherwise cease to be a bank, or if tax laws were to change, the $2,300 would be recorded as expense.
NOTE 16. CAPITAL REQUIREMENTS AND RESTRICTIONS ON RETAINED EARNINGS
The Company has two primary subsidiaries, MetaBank and MBWC. MetaBank and MBWC are subject to various regulatory capital requirements. Failure to meet minimum capital requirements can initiate certain mandatory or discretionary actions by regulators that, if undertaken, could have a direct material effect on the financial statements. Under capital adequacy guidelines and the regulatory framework for prompt corrective action, MetaBank and MBWC must meet specific quantitative capital guidelines using their assets, liabilities and certain off-balance-sheet items as calculated under regulatory accounting practices. The requirements are also subject to qualitative judgments by the regulators about components, risk weightings and other factors.
Quantitative measures established by regulation to ensure capital adequacy require MetaBank and MBWC to maintain minimum amounts and ratios (set forth in the table below) of total risk-based capital and Tier I capital (as defined in the regulations) to risk-weighted assets (as defined), and a leverage ratio consisting of Tier I capital (as defined) to average assets (as defined). As of September 30, 2007, MetaBank and MBWC met all capital adequacy requirements.
MetaBank’s and MBWC’s actual and required capital amounts and ratios are presented in the following table.
| | ACTUAL | | MINIMUM
REQUIREMENT FOR
CAPITAL ADEQUACY
PURPOSES | | MINIMUM REQUIREMENT
TO BE WELL CAPITALIZED
UNDER PROMPT CORRECTIVE
ACTION PROVISIONS | |
| | Amount | | Ratio | | Amount | | Ratio | | Amount | | Ratio | |
| | | | | | | | | | | | | |
SEPTEMBER 30, 2007: | | | | | | | | | | | | | |
MetaBank | | | | | | | | | | | | | |
Tangible capital (to tangible assets) | | $ | 49,475 | | 7.59 | % | $ | 9,773 | | 1.50 | % | $ | n/a | | n/a | |
Tier 1 (core) capital (to adjusted total assets) | | 49,475 | | 7.59 | % | 26,062 | | 4.00 | % | 32,577 | | 5.00 | % |
Tier 1 (core) capital (to risk-weighted assets) | | 49,475 | | 11.32 | % | 17,465 | | 4.00 | % | 26,198 | | 6.00 | % |
Total risk based capital (to risk weighted assets) | | 52,770 | | 12.08 | % | 34,931 | | 8.00 | % | 43,663 | | 10.00 | % |
MetaBank West Central | | | | | | | | | | | | | |
Tier 1 capital (to average assets) | | 3,930 | | 10.22 | | 1,539 | | 4.00 | | 1,923 | | 5.00 | |
Tier 1 risk based capital (to risk weighted assets) | | 3,930 | | 19.16 | | 820 | | 4.00 | | 1,230 | | 6.00 | |
Total risk based capital (to risk weighted assets) | | 4,077 | | 19.88 | | 1,641 | | 8.00 | | 2,051 | | 10.00 | |
| | | | | | | | | | | | | |
SEPTEMBER 30, 2006 (RESTATED): | | | | | | | | | | | | | |
MetaBank | | | | | | | | | | | | | |
Tangible capital (to tangible assets) | | $ | 48,376 | | 6.94 | % | $ | 10,452 | | 1.50 | % | $ | n/a | | n/a | |
Tier 1 (core) capital (to adjusted total assets) | | 48,376 | | 6.94 | % | 27,872 | | 4.00 | % | 34,840 | | 5.00 | % |
Tier 1 (core) capital (to risk-weighted assets) | | 48,376 | | 10.86 | % | 17,826 | | 4.00 | % | 26,739 | | 6.00 | % |
Total risk based capital (to risk weighted assets) | | 54,858 | | 12.31 | % | 35,652 | | 8.00 | % | 44,565 | | 10.00 | % |
MetaBank West Central | | | | | | | | | | | | | |
Tier 1 capital (to average assets) | | 4,071 | | 9.71 | | 1,677 | | 4.00 | | 2,097 | | 5.00 | |
Tier 1 risk based capital (to risk weighted assets) | | 4,071 | | 14.90 | | 1,093 | | 4.00 | | 1,640 | | 6.00 | |
Total risk based capital (to risk weighted assets) | | 4,338 | | 15.87 | | 2,186 | | 8.00 | | 2,733 | | 10.00 | |
Regulations limit the amount of dividends and other capital distributions that may be paid by a financial institution without prior approval of its primary regulator. The regulatory restriction is based on a three-tiered system with the greatest flexibility being afforded to well-capitalized (Tier 1) institutions. MetaBank and MBWC are currently Tier 1 institutions. Accordingly, MetaBank and MBWC can make, without prior regulatory approval, distributions during a calendar year up to 100% of their retained net income for the calendar year-to-date plus retained net income for the previous two calendar years (less any dividends previously paid) as long as they remain well-capitalized, as defined in prompt corrective action regulations, following the proposed distribution. Accordingly, at September 30, 2007, approximately $2,700 of MetaBank’s retained earnings were potentially available for distribution to the Company.
27
Meta Financial Group, Inc. and Subsidiaries
NOTES TO CONSOLIDATED FINANCIAL STATEMENTS
Dollars in Thousands, Except Share and Per Share Data
NOTE 17. COMMITMENTS AND CONTINGENCIES
In the normal course of business, the Company’s subsidiary banks make various commitments to extend credit which are not reflected in the accompanying consolidated financial statements.
At September 30, 2007 and 2006, unfunded loan commitments approximated $50,300 and $54,200 respectively, excluding undisbursed portions of loans in process. Unfunded loan commitments at September 30, 2007 and 2006 were principally for variable rate loans. Commitments, which are disbursed subject to certain limitations, extend over various periods of time. Generally, unused commitments are canceled upon expiration of the commitment term as outlined in each individual contract.
The exposure to credit loss in the event of nonperformance by other parties to financial instruments for commitments to extend credit is represented by the contractual amount of those instruments. The same credit policies and collateral requirements are used in making commitments and conditional obligations as are used for on-balance-sheet instruments.
Since certain commitments to make loans and to fund lines of credit and loans in process expire without being used, the amount does not necessarily represent future cash commitments. In addition, commitments used to extend credit are agreements to lend to a customer as long as there is no violation of any condition established in the contract.
Securities with fair values of approximately $24,100 and $26,400 at September 30, 2007 and 2006, respectively, were pledged as collateral for public funds on deposit. Securities with fair values of approximately $1,900 and $9,100 at September 30, 2007 and 2006, respectively, were pledged as collateral for individual, trust and estate deposits.
Under employment agreements with certain executive officers, certain events leading to separation from the Company could result in cash payments totaling approximately $3,000 as of September 30, 2007.
LEGAL PROCEEDINGS
MetaBank has been named in several lawsuits whose eventual outcome could have an adverse effect on the consolidated financial position or results of operations of the Company. Because the likelihood or amount of an adverse resolution to these matters cannot currently be reasonably estimated, the Company has not recorded a contingent liability related to these potential claims.
On June 11, 2004, the Sioux Falls School District filed suit in the Second Judicial Circuit Court alleging that MetaBank, a wholly-owned subsidiary of the Company, improperly allowed funds, which belonged to the school district, to be deposited into, and subsequently withdrawn from, a corporate account established by an employee of the school district. The school district is seeking in excess of $600. MetaBank has submitted the claim to its insurance carrier, and is working with counsel to vigorously contest the suit.
MetaBank, in conjunction with a roster of participating banks, had provided a series of loans and lines of credit to DNAG and SDAC. Plaintiffs allege that the MetaBank entities “participated in the fraudulent scheme” by virtue of providing these lines of credit and loans despite being aware of the predatory consumer practices of the Nelson companies, and that MetaBank profited by receiving undisclosed “special benefits” for providing these loans. DNAG, SDAC and Nelson have since filed for bankruptcy. Plaintiffs also allege that MetaBank did not vigorously pursue claims against Nelson and fellow DNAG executive Chris Tapken in their respective personal bankruptcies in order to allow these individuals to emerge with control over assets of their former companies. The claims against J. Tyler Haahr personally have now been dismissed. The MetaBank entities filed a motion to dismiss this complaint for failure to state a cause of action. This motion has been briefed and argued to the court, and a decision is pending. It would be premature to predict MetaBank’s likelihood of success or amount of exposure in this lawsuit. MetaBank intends to vigorously contest these claims. MetaBank’s liability insurer has already agreed to provide coverage to the MetaBank entities and J. Tyler Haahr for this claim, and has retained and is paying for counsel to defend this action.
Related to this matter, MetaBank was the lead lender and servicer of approximately $32,000 in loans to DNAG, SDAC, one other related auto dealership and their owners, including Nelson. Approximately $22,200 of the total had been sold to ten participating financial institutions. Each participation agreement with the ten participant banks provides that the participant bank shall own a specified percentage of the outstanding loan balance at any given time. Each agreement also recites a maximum dollar amount of participations for participants. MetaBank allocated to some participants an ownership in the outstanding loan balance in excess of the percentage specified in the participation agreement, but within the maximum amount authorized. MetaBank believes that in each instance this was done with the full knowledge and consent of the participant. Several participants have demanded that their participations be adjusted to match the percentage specified in the participant agreement. Based on the total loan recoveries projected as of September 30, 2007, MetaBank calculated that it would cost approximately $953 to adjust these participations as the participants would have them adjusted. A few participants have more recently asserted that MetaBank owes them additional monies based on additional legal theories. MetaBank denies any obligation to make the requested adjustments on these or related claims. Other than as disclosed below, MetaBank cannot predict at this time whether any of these claims will be the subject of litigation.
During the three months ended June 30, 2006 or shortly thereafter, three lawsuits were filed against the Company’s MetaBank subsidiary. Three of the complaints are related to the Company’s alleged actions in connection with its activities as lead lender to three companies involved in auto sales, service, and financing and their owner. An additional bank, North American Banking Company, joined the First Midwest Bank-Deerfield Branches case, and these three bank plaintiffs were then joined in the action brought by First Premiere Bank against MetaBank. All four of these banks are now plaintiffs in one consolidated federal lawsuit, as discussed below. In addition, Home Federal Bank has brought a separate action, discussed below, in state court. These actions are currently in discovery proceedings, and the amount of costs associated with these actions cannot be determined at this time. The Company intends, however, to vigorously defend its actions. Subject to a reservation of rights, the Company’s insurance carrier has agreed to cover the four claims described above and is currently paying for counsel to defend all four actions.
First Premier Bank, North American Banking Company, First Midwest Bank-Deerfield Branches and Mid-Country Bank v. MetaBank (Civ. No. 06-4114). On June 28, 2006, First Midwest Bank-Deerfield Branches and Mid-Country Bank filed suit against MetaBank in South Dakota’s Second Judicial Circuit Court, Minnehaha County, in the above titled action. These consolidated complaints allege that plaintiff banks, who were participating lenders with MetaBank on a series of loans made to DNAG and SDAC,
suffered damages exceeding $1,000 as a result of MetaBank’s placement and administration of the loans that were the subject of the loan participation agreements. The complaint sounds in breach of contract, negligence, gross negligence, negligent misrepresentation, fraud in the inducement, unjust enrichment and breach of fiduciary duty. On July 17, 2006, MetaBank removed the case from state court to the United States District Court for the District of South Dakota, where the action has been assigned case no. Civ. 06-4114. Plaintiff(s) moved to remand the case back to state court, but this motion was denied. As noted above, North American Banking Company has been allowed by the United States District Court to join this action with similar claims and allegations against MetaBank. A scheduling order was recently submitted to the United States District Court and discovery is continuing.
Home Federal Bank v. J. Tyler Haahr, Daniel A. Nelson and MetaBank (Civ. No. 06- 2230). On June 26, 2006, Home Federal Bank filed suit against MetaBank and two individuals, J. Tyler Haahr and Daniel A. Nelson, in South Dakota’s Second Judicial Circuit Court, Minnehaha County in the above titled action. The complaint alleges that Home Federal, a participating lender with MetaBank on a series of loans made to DNAG and SDAC, suffered damages exceeding $3,800 as a result of failure to make disclosures regarding an investigation of Nelson, DNAG and SDAC by the Iowa Attorney General at the time Home Federal agreed to an extension of the loan participation agreements. The complaint sounds in fraud, negligent misrepresentation, breach of fiduciary duty, conspiracy and breach of duty of good faith and fair dealing. Discovery in that matter is proceeding.
There are no other material pending legal proceedings to which the Company or its subsidiaries is a party other than ordinary routine litigation incidental to their respective businesses.
28
Meta Financial Group, Inc. and Subsidiaries
NOTES TO CONSOLIDATED FINANCIAL STATEMENTS
Dollars in Thousands, Except Share and Per Share Data
NOTE 18. LEASE COMMITMENTS
The Company has leased property under various noncancelable operating lease agreements which expire at various times through 2024, and require annual rentals ranging from $3 to $667 plus the payment of the property taxes, normal maintenance, and insurance on certain property.
The following table shows the total minimum rental commitment at September 30, 2007, under the leases.
2008 | | $ | 1,251 | |
2009 | | 1,409 | |
2010 | | 1,398 | |
2011 | | 1,492 | |
2012 | | 1,495 | |
Thereafter | | 5,940 | |
| | $ | 12,985 | |
NOTE 19. SEGMENT REPORTING
An operating segment is generally defined as a component of a business for which discrete financial information is available and whose results are reviewed by the chief operating decision-maker. The Company has determined that it has two reportable segments: The traditional banking segment consisting of its banking subsidiaries, MetaBank and MetaBank West Central, and Meta Payment Systems,® a division of MetaBank. MetaBank and MetaBank West Central operate as traditional community banks providing deposit, loan, and other related products to individuals and small businesses, primarily in the communities where their offices are located. Meta Payment Systems® provides a number of products and services, primarily to third parties, including financial institutions and other businesses. These products and services include issuance of prepaid debit cards, sponsorship of ATMs into the debit networks, ACH origination services, and a gift card program. Other related programs are in the process of development. The remaining grouping under the caption “All Others” consists of the operations of the Meta Financial Group, Inc. and Meta Trust Company.® MetaBank West Central is accounted for as discontinued bank operations. It was reported as part of the traditional banking segment, and has been separately classified to show the effect of continuing operations.
Fiscal year 2006 results for net interest income and non-interest expenses have been restated to be consistent with the fiscal year 2007 adoption of new deposit valuation and expense allocation methodologies between the Traditional Banking Segment, the Holding Company, and MPS.
The primary result of this change in allocation was to increase the earnings credit paid by the bank for deposits originated within the MPS division and also to allocate a higher portion of expenses to MPS based on growth in departments which provide administrative support to MPS.
Transactions between affiliates, the resulting revenues of which are shown in the intersegment revenue category, are conducted at market prices, meaning prices that would be paid if the companies were not affiliates.
| | TRADITIONAL | | META PAYMENT | | | | | |
| | BANKING | | SYSTEMS® | | ALL OTHERS | | TOTAL | |
| | | | | | | | | |
YEAR ENDED SEPTEMBER 30, 2007 | | | | | | | | | |
Net interest income (loss) | | $ | 10,967 | | $ | 10,748 | | $ | (908 | ) | $ | 20,807 | |
Provision for loan losses | | 3,168 | | — | | — | | $ | 3,168 | |
Non-interest income | | 5,956 | | 15,576 | | 326 | | $ | 21,858 | |
Non-interest expense | | 15,476 | | 21,128 | | 354 | | $ | 36,958 | |
Income (loss) from continuing operations before tax | | (1,721 | ) | 5,196 | | (936 | ) | $ | 2,539 | |
Income tax expense (benefit) | | (512 | ) | 1,862 | | (123 | ) | $ | 1,227 | |
Income (loss) from continuing operations | | $ | (1,209 | ) | $ | 3,334 | | $ | (813 | ) | $ | 1,312 | |
| | | | | | | | | |
Inter-segment revenue (expense) | | $ | (6,119 | ) | $ | 6,119 | | $ | — | | $ | — | |
Total assets | | 391,416 | | 254,643 | | 4,251 | | $ | 650,310 | |
Total deposits | | 280,076 | | 242,902 | | — | | $ | 522,978 | |
| | | | | | | | | |
DISCONTINUED OPERATIONS-TRADITIONAL BANKING | | | | | | | | | |
Net interest income | | $ | 916 | | | | | | | |
Provision for loan losses | | 627 | | | | | | | |
Non-interest income | | 216 | | | | | | | |
Non-interest expense | | 899 | | | | | | | |
(Loss) from discontinued operations before tax | | (394 | ) | | | | | | |
Income tax (benefit) | | (253 | ) | | | | | | |
(Loss) from discontinued operations | | (141 | ) | | | | | | |
| | | | | | | | | |
Total assets | | $ | 35,770 | | | | | | | |
Total deposits | | 24,610 | | | | | | | |
| | | | | | | | | |
YEAR ENDED SEPTEMBER 30, 2006 (RESTATED) | | | | | | | | | |
Net interest income (loss) | | $ | 13,082 | | $ | 5,673 | | $ | (254 | ) | $ | 18,501 | |
Provision for loan losses | | 311 | | — | | — | | $ | 311 | |
Non-interest income | | 2,326 | | 11,066 | | 103 | | $ | 13,495 | |
Non-interest expense | | 15,068 | | 11,234 | | 338 | | $ | 26,640 | |
Income (loss) from continuing operations before tax | | 29 | | 5,505 | | (489 | ) | $ | 5,045 | |
Income tax expense (benefit) | | (175 | ) | 1,958 | | (117 | ) | $ | 1,666 | |
Income (loss) from continuing operations | | $ | 204 | | $ | 3,547 | | $ | (372 | ) | $ | 3,379 | |
| | | | | | | | | |
Inter-segment revenue (expense) | | $ | (3,406 | ) | $ | 3,406 | | $ | — | | $ | — | |
Total assets | | 530,649 | | 166,883 | | 3,091 | | $ | 700,623 | |
Total deposits | | 375,377 | | 162,792 | | — | | $ | 538,169 | |
29
Meta Financial Group, Inc. and Subsidiaries
NOTES TO CONSOLIDATED FINANCIAL STATEMENTS
Dollars in Thousands, Except Share and Per Share Data
| | TRADITIONAL | | META PAYMENT | | | | | |
| | BANKING | | SYSTEMS® | | ALL OTHERS | | TOTAL | |
| | | | | | | | | |
DISCONTINUED OPERATIONS-TRADITIONAL BANKING | | | | | | | | | |
Net interest income | | $ | 1,135 | | | | | | | |
Provision for loan losses | | (76 | ) | | | | | | |
Non-interest income | | 233 | | | | | | | |
Non-interest expense | | 986 | | | | | | | |
Income from discontinued operations before tax | | 458 | | | | | | | |
Income tax expense | | 149 | | | | | | | |
Income from discontinued operations | | $ | 309 | | | | | | | |
| | | | | | | | | |
Total assets | | $ | 40,298 | | | | | | | |
Total deposits | | 27,220 | | | | | | | |
| | | | | | | | | |
YEAR ENDED SEPTEMBER 30, 2005 | | | | | | | | | |
Net interest income (loss) | | $ | 18,108 | | $ | 411 | | $ | (456 | ) | $ | 18,063 | |
Provision for loan losses | | 4,713 | | — | | — | | $ | 4,713 | |
Non-interest income | | 2,286 | | 1,591 | | (375 | ) | $ | 3,502 | |
Non-interest expense | | 13,969 | | 3,247 | | 779 | | $ | 17,995 | |
Income (loss) from continuing operations before tax | | 1,712 | | (1,245 | ) | (1,610 | ) | $ | (1,143 | ) |
Income tax expense (benefit) | | 481 | | (438 | ) | (534 | ) | $ | (491 | ) |
Income (loss) from continuing operations | | $ | 1,231 | | $ | (807 | ) | $ | (1,076 | ) | $ | (652 | ) |
| | | | | | | | | |
Inter-segment revenue (expense) | | $ | (365 | ) | $ | 365 | | | | $ | — | |
Total assets | | 654,565 | | 70,906 | | 1,016 | | $ | 726,487 | |
Total deposits | | 437,720 | | 72,537 | | — | | $ | 510,257 | |
| | | | | | | | | |
DISCONTINUED OPERATIONS-TRADITIONAL BANKING | | | | | | | | | |
Net interest income | | $ | 1,176 | | | | | | | |
Provision for loan losses | | 769 | | | | | | | |
Non-interest income | | 229 | | | | | | | |
Non-interest expense | | 1,102 | | | | | | | |
(Loss) from discontinued operations before tax | | (466 | ) | | | | | | |
Income tax (benefit) | | (194 | ) | | | | | | |
(Loss) from discontinued operations | | $ | (272 | ) | | | | | | |
| | | | | | | | | |
Total assets | | $ | 49,352 | | | | | | | |
Total deposits | | 30,784 | | | | | | | |
| | | | | | | | | | | | | | |
NOTE 20. PARENT COMPANY FINANCIAL STATEMENTS
Presented below are condensed financial statements for the parent company, Meta Financial Group, Inc.
CONDENSED STATEMENTS OF FINANCIAL CONDITION
SEPTEMBER 30,
| | 2007 | | 2006 | |
| | | | (Restated) | |
ASSETS | | | | | |
Cash and cash equivalents | | $ | 2,211 | | $ | 1,849 | |
Securities available for sale | | 1,173 | | 1,679 | |
Investment in subsidiaries | | 53,623 | | 51,518 | |
Loan receivable from ESOP | | 376 | | 509 | |
Other assets | | 2,224 | | 620 | |
Total assets | | $ | 59,607 | | $ | 56,175 | |
| | | | | |
LIABILITIES AND SHAREHOLDERS’ EQUITY | | | | | |
LIABILITIES | | | | | |
Loan payable to subsidiaries | | $ | 710 | | $ | 710 | |
Subordinated debentures | | 10,310 | | 10,310 | |
Other liabilities | | 489 | | 56 | |
Total liabilities | | $ | 11,509 | | $ | 11,076 | |
| | | | | |
SHAREHOLDERS’ EQUITY | | | | | |
Common stock | | 30 | | 30 | |
Additional paid-in capital | | 21,958 | | 20,969 | |
Retained earnings | | 36,805 | | 36,953 | |
Accumulated other comprehensive (loss) | | (3,345 | ) | (4,548 | ) |
Unearned Employee Stock Ownership Plan shares | | (377 | ) | (509 | ) |
Treasury stock, at cost | | (6,973 | ) | (7,796 | ) |
Total shareholders’ equity | | $ | 48,098 | | $ | 45,099 | |
Total liabilities and shareholders’ equity | | $ | 59,607 | | $ | 56,175 | |
30
Meta Financial Group, Inc. and Subsidiaries
NOTES TO CONSOLIDATED FINANCIAL STATEMENTS
Dollars in Thousands, Except Share and Per Share Data
CONDENSED STATEMENTS OF OPERATIONS
YEARS ENDED SEPTEMBER 30, 2007, 2006 AND 2005
| | 2007 | | 2006 | | 2005 | |
| | | | (Restated) | | | |
Dividend income from subsidiaries | | $ | 1,250 | | $ | 3,700 | | $ | 2,510 | |
Gain on sale of investments | | 225 | | — | | — | |
Other income | | 125 | | 191 | | 304 | |
Total income | | 1,600 | | 3,891 | | 2,814 | |
| | | | | | | |
Interest expense | | 1,033 | | 936 | | 762 | |
Other expense | | 146 | | 1,956 | | 1,060 | |
Total expense | | 1,179 | | 2,892 | | 1,822 | |
| | | | | | | |
Income before income taxes and equity in undistributed net income of subsidiaries | | 421 | | 998 | | 992 | |
| | | | | | | |
Income tax (benefit) | | (87 | ) | (835 | ) | (503 | ) |
| | | | | | | |
Income before equity in undistributed net income (loss of subsidiaries) | | 508 | | 1,833 | | 1,495 | |
| | | | | | | |
Equity in undistributed net income (loss) of subsidiaries | | 663 | | 1,855 | | (2,419 | ) |
| | | | | | | |
Net income (loss) | | $ | 1,171 | | $ | 3,688 | | $ | (924 | ) |
CONDENSED STATEMENTS OF CASH FLOWS
YEARS ENDED SEPTEMBER 30, 2007, 2006 AND 2005
| | 2007 | | 2006 | | 2005 | |
| | | | (Restated) | | | |
CASH FLOWS FROM OPERATING ACTIVITIES | | | | | | | |
Net income (loss) | | $ | 1,171 | | $ | 3,688 | | $ | (924 | ) |
Adjustments to reconcile net income (loss) to net cash provided by operating activites | | | | | | | |
Equity in undistributed net (income) loss of subsidiaries | | (663 | ) | (1,855 | ) | 2,419 | |
(Gain) on sale of securities available for sale | | (225 | ) | — | | — | |
Change in other assets | | (1,605 | ) | 574 | | (368 | ) |
Change in other liabilities | | 1,764 | | 244 | | 181 | |
Net cash provided by operating activities | | 442 | | 2,652 | | 1,308 | |
| | | | | | | |
CASH FLOWS FROM INVESTING ACTIVITIES | | | | | | | |
Investment in subsidiary | | (100 | ) | (75 | ) | (275 | ) |
Maturity of securities available for sale | | — | | 500 | | 500 | |
Proceeds from the sale of securities available for sale | | 727 | | — | | — | |
Loan to ESOP | | — | | — | | (684 | ) |
Net change in loan receivable | | — | | — | | 1,261 | |
Repayments on loan receivable from ESOP | | 133 | | 316 | | 254 | |
Net cash provided by investment activites | | 760 | | 741 | | 1,056 | |
| | | | | | | |
CASH FLOWS FROM FINANCING ACTIVITIES | | | | | | | |
Net change in loan payable to subsidiaries | | — | | (490 | ) | (1,350 | ) |
Cash dividends paid | | (1,319 | ) | (1,292 | ) | (1,277 | ) |
Proceeds from exercise of stock options | | 479 | | 187 | | 230 | |
Purchase of treasury stock | | — | | — | | (26 | ) |
Net cash (used in financing activities) | | (840 | ) | (1,595 | ) | (2,422 | ) |
| | | | | | | |
Net change in cash and cash equivalents | | $ | 362 | | $ | 1,798 | | $ | (58 | ) |
| | | | | | | |
CASH AND CASH EQUIVALENTS | | | | | | | |
Beginning of year | | $ | 1,849 | | $ | 52 | | $ | 110 | |
End of year | | 2,211 | | 1,849 | | 52 | |
The extent to which the Company may pay cash dividends to shareholders will depend on the cash currently available at the Company, as well as the ability of the subsidiary banks to pay dividends to the Company.
31
Meta Financial Group, Inc. and Subsidiaries
NOTES TO CONSOLIDATED FINANCIAL STATEMENTS
Dollars in Thousands, Except Share and Per Share Data
NOTE 21. SELECTED QUARTERLY FINANCIAL DATA (UNAUDITED)
| | QUARTER ENDED | |
| | December 31 | | March 31 | | June 30 | | September 30 | |
| | | | | | | | | |
FISCAL YEAR 2007 (AS RESTATED) | | | | | | | | | |
Interest income | | $ | 9,783 | | $ | 9,720 | | $ | 8,933 | | $ | 9,338 | |
Interest expense | | 4,792 | | 4,277 | | 4,058 | | 3,840 | |
Net interest income | | 4,991 | | 5,443 | | 4,875 | | 5,498 | |
Provision for loan losses | | 4,063 | | (225 | ) | (500 | ) | (170 | ) |
Net income (loss) from continuing operations | | (2,296 | ) | 620 | | 2,234 | | 754 | |
Income (loss) from discontinued operations | | (408 | ) | 115 | | 330 | | (178 | ) |
Net income (loss) | | (2,704 | ) | 735 | | 2,564 | | 576 | |
Earnings (loss) per common and common equivalent share—basic | | | | | | | | | |
Income (loss) from continuing operations | | $ | (0.92 | ) | $ | 0.25 | | $ | 0.88 | | $ | 0.29 | |
Income (loss) from discontinued operations | | (0.16 | ) | 0.04 | | 0.13 | | (0.07 | ) |
Net income (loss) | | (1.08 | ) | 0.29 | | 1.01 | | 0.22 | |
Earnings (loss) per common and common equivalent share —diluted | | | | | | | | | |
Income (loss) from continuing operations | | $ | (0.92 | ) | 0.24 | | 0.84 | | 0.28 | |
Income (loss) from discontinued operations | | (0.16 | ) | 0.04 | | 0.12 | | (0.07 | ) |
Net income (loss) | | (1.08 | ) | 0.28 | | 0.96 | | 0.21 | |
Dividend declared per share | | 0.13 | | 0.13 | | 0.13 | | 0.13 | |
| | | | | | | | | |
FISCAL YEAR 2006 (AS RESTATED) | | | | | | | | | |
Interest income | | $ | 9,550 | | $ | 9,569 | | $ | 9,439 | | $ | 9,554 | |
Interest expense | | 5,116 | | 4,873 | | 4,858 | | 4,764 | |
Net interest income | | 4,434 | | 4,696 | | 4,581 | | 4,790 | |
Provision for loan losses | | 58 | | (345 | ) | 28 | | 570 | |
Net income from continuing operations | | 401 | | 193 | | 2,135 | | 650 | |
Income (loss) from discontinued operations | | 114 | | 68 | | 348 | | (221 | ) |
Net income | | 515 | | 261 | | 2,483 | | 429 | |
Earnings (loss) per common and common equivalent share — basic | | | | | | | | | |
Income from continuing operations | | $ | 0.16 | | $ | 0.08 | | $ | 0.86 | | $ | 0.26 | |
Income (loss) from discontinued operations | | 0.05 | | 0.03 | | 0.14 | | (0.09 | ) |
Net income | | 0.21 | | 0.11 | | 1.00 | | 0.17 | |
Earnings (loss) per common and common equivalent share — diluted | | | | | | | | | |
Income from continuing operations | | 0.16 | | 0.07 | | 0.84 | | 0.26 | |
Income (loss) from discontinued operations | | 0.05 | | 0.03 | | 0.14 | | (0.09 | ) |
Net income | | 0.21 | | 0.10 | | 0.98 | | 0.17 | |
Dividend declared per share | | 0.13 | | 0.13 | | 0.13 | | 0.13 | |
| | | | | | | | | | | | | | | |
32
Meta Financial Group, Inc. and Subsidiaries
NOTES TO CONSOLIDATED FINANCIAL STATEMENTS
Dollars in Thousands, Except Share and Per Share Data
NOTE 22. FAIR VALUES OF FINANCIAL INSTRUMENTS
The following table discloses the Company’s estimated fair value amounts of its financial instruments. It is management’s belief that the fair values presented below are reasonable based on the valuation techniques and data available to the Company as of September 30, 2007 and 2006, as more fully described below. The operations of the Company are managed from a going concern basis and not a liquidation basis. As a result, the ultimate value realized for the financial instruments presented could be substantially different when actually recognized over time through the normal course of operations. Additionally, a substantial portion of the Company’s inherent value is the subsidiary banks’ capitalization and franchise value. Neither of these components have been given consideration in the presentation of fair values below.
The following presents the carrying amount and estimated fair value of the financial instruments held by the Company at September 30, 2007 and 2006. The information presented is subject to change over time based on a variety of factors.
Years ended September 30,
| | 2007 | | 2006 | |
| | Carrying | | Estimated | | Carrying | | Estimated | |
| | Amount | | Fair Value | | Amount | | Fair Value | |
| | | | | | (Restated) | |
FINANCIAL ASSETS | | | | | | | | | |
Cash and cash equivalents | | $ | 11,320 | | $ | 11,320 | | $ | 107,471 | | $ | 107,471 | |
Federal funds sold | | 75,000 | | 75,000 | | — | | — | |
Securities purchased under agreements to resell | | — | | — | | 5,891 | | 5,891 | |
Securities available for sale | | 158,701 | | 158,701 | | 172,444 | | 172,444 | |
Loans receivable, net | | 355,612 | | 354,489 | | 368,959 | | 366,421 | |
FHLB and FRB stock | | 4,015 | | 4,015 | | 5,053 | | 5,053 | |
Accrued interest receivable | | 4,189 | | 4,189 | | 4,076 | | 4,076 | |
| | | | | | | | | |
FINANCIAL LIABILITIES | | | | | | | | | |
Noninterest bearing demand deposits | | 260,098 | | 260,098 | | 186,135 | | 186,135 | |
Interest bearing demand deposits, savings, and money markets | | 106,157 | | 106,157 | | 151,399 | | 151,399 | |
Certificates of deposit | | 156,723 | | 156,980 | | 200,635 | | 199,307 | |
Total deposits | | 522,978 | | 523,235 | | 538,169 | | 536,841 | |
| | | | | | | | | |
Advances from FHLB | | 68,000 | | 69,873 | | 89,300 | | 90,757 | |
Securities sold under agreements to repurchase | | 224 | | 224 | | 15,179 | | 15,064 | |
Subordinated debentures | | 10,310 | | 12,574 | | 10,310 | | 10,524 | |
Accrued interest payable | | 842 | | 842 | | 895 | | 895 | |
| | | | | | | | | |
Off-balance-sheet instruments, loan commitments | | — | | — | | — | | — | |
| | | | | | | | | | | | | |
33
Meta Financial Group, Inc. and Subsidiaries
NOTES TO CONSOLIDATED FINANCIAL STATEMENTS
Dollars in Thousands, Except Share and Per Share Data
The following sets forth the methods and assumptions used in determining the fair value estimates for the Company’s financial instruments at September 30, 2007 and 2006.
CASH AND CASH EQUIVALENTS
The carrying amount of cash and short-term investments is assumed to approximate the fair value.
SECURITIES PURCHASED UNDER AGREEMENT TO RESELL
The carrying amount of securities purchased under agreement to resell is assumed to approximate the fair value.
SECURITIES AVAILABLE FOR SALE
To the extend available, quoted market prices or dealer quotes were used to determine the fair value of securities available for sale. For those securities which are thinly traded, or for which market data was not available, management estimated fair value using other available data. The amount of securities for which quoted market prices were not available is not material to the portfolio as a whole.
LOANS RECEIVABLE, NET
The fair value of loans was estimated by discounting the future cash flows using the current rates at which similar loans would be made to borrowers with similar credit ratings and for similar remaining maturities.When using the discounting method to determine fair value, loans were gathered by homogeneous groups with similar terms and conditions and discounted at a target rate at which similar loans would be made to borrowers as of September 30, 2007 and 2006. In addition, when computing the estimated fair value for all loans, allowances for loan losses have been subtracted from the calculated fair value for consideration of credit quality.
FHLB AND FEDERAL RESERVE STOCK
The fair value of such stock is assumed to approximate book value since the Company is generally able to redeem this stock at par value.
ACCRUED INTEREST RECEIVABLE
The carrying amount of accrued interest receivable is assumed to approximate the fair value.
DEPOSITS
The carrying values of non-interest bearing checking deposits, interest bearing checking deposits, savings, and money markets is assumed to approximate fair value, since such deposits are immediately withdrawable without penalty. The fair value of time certificates of deposit was estimated by discounting expected future cash flows by the current rates offered on certificates of deposit with similar remaining maturities.
In accordance with SFAS No. 107, no value has been assigned to the Company’s long-term relationships with its deposit customers (core value of deposits intangible) since such intangible is not a financial instrument as defined under SFAS No. 107.
ADVANCES FROM FHLB
The fair value of such advances was estimated by discounting the expected future cash flows using current interest rates as of September 30, 2007 and 2006 for advances with similar terms and remaining maturities.
SECURITIES SOLD UNDER AGREEMENTS TO REPURCHASE AND SUBORDINATED DEBENTURES
The fair value of these instruments was estimated by discounting the expected future cash flows using derived interest rates approximating market as of September 30, 2007 and 2006 over the contractual maturity of such borrowings.
ACCRUED INTEREST PAYABLE
The carrying amount of accrued interest payable is assumed to approximate the fair value.
LOAN COMMITMENTS
The commitments to originate and purchase loans have terms that are consistent with current market terms. Accordingly, the Company estimates that the fair values of these commitments are not significant.
LIMITATIONS
It must be noted that fair value estimates are made at a specific point in time, based on relevant market information about the financial instrument. Additionally, fair value estimates are based on existing on- and off-balance-sheet financial instruments without attempting to estimate the value of anticipated future business, customer relationships and the value of assets and liabilities that are not considered financial instruments. These estimates do not reflect any premium or discount that could result from offering the Company’s entire holdings of a particular financial instrument for sale at one time. Furthermore, since no market exists for certain of the Company’s financial instruments, fair value estimates may be based on judgments regarding future expected loss experience, current economic conditions, risk characteristics of various financial instruments and other factors. These estimates are subjective in nature and involve uncertainties and matters of significant judgment and therefore cannot be determined with a high level of precision. Changes in assumptions as well as tax considerations could significantly affect the estimates. Accordingly, based on the limitations described above, the aggregate fair value estimates are not intended to represent the underlying value of the Company, on either a going concern or a liquidation basis.
34
BOARD OF DIRECTORS
James S. Haahr
Chairman of the Board for Meta Financial Group, MetaBank, and MetaBank West Central
E. Wayne Cooley
Consultant Emeritus of the Iowa Girls’ High School Athletic Union
E. Thurman Gaskill
Iowa State Senator and Grain and Livestock Farming Operation Owner
J. Tyler Haahr
President and Chief Executive Officer for Meta Financial Group and MetaBank, Chief Executive Officer for MetaBank West Central, and President of Meta Trust
Brad C. Hanson
Executive Vice President for Meta Financial Group and MetaBank and President of Meta Payment Systems Division
Frederick V. Moore
President of Buena Vista University
Rodney G. Muilenburg
Retired Dairy Specialist Manager for Purina Mills, Inc.
Jeanne Partlow
Retired Chairman of the Board and President of Iowa Savings Bank
SENIOR OFFICERS
James S. Haahr
Chairman of the Board for Meta Financial Group, MetaBank, and MetaBank West Central
J. Tyler Haahr
President and Chief Executive Officer for Meta Financial Group and MetaBank, Chief Executive Officer for MetaBank West Central, and President of Meta Trust
Troy Moore
Executive Vice President and Chief Operating Officer for Meta Financial Group and MetaBank
Brad C. Hanson
Executive Vice President for Meta Financial Group and MetaBank and President of Meta Payment Systems Division
David W. Leedom
Acting Chief Financial Officer for Meta Financial Group, MetaBank, and MetaBank West Central
Brian R. Bond
Senior Vice President and Chief Lending Officer
Ron Butterfield
Senior Vice President for Meta Payment Systems Division
Michael Conlin
Senior Vice President Agent Products for Meta Payment Systems Division
Andrew Crowe
Senior Vice President of Product Development and Emerging Product Management for Meta Payment Systems Division
Merid Eshete
Senior Vice President and Chief Audit Executive
Scott Galit
Executive Vice President for Meta Payment Systems Division
Ben Guenther
President of MetaBank Northwest Iowa Market
John Hagy
Chief Risk Officer and General Counsel
Tim D. Harvey
President of MetaBank Brookings Market
Sandra K. Hegland
Senior Vice President of Human Resources
Eric Miller
Senior Vice President of Messaging for Meta Payment Systems Division
I. Eugene Richardson, Jr.
President of MetaBank Central Iowa Market and MetaBank West Central and Member of the MetaBank West Central Board of Directors
Grant Rogers
Senior Vice President of Prepaid for Meta Payment Systems Division
Trent Sorbe
Senior Vice President of Credit for Meta Payment Systems Division
Kathy M. Thorson
President of MetaBank Sioux Empire Market
35
INVESTOR INFORMATION
Annual Meeting of Shareholders
The Annual Meeting of Shareholders will convene at 1:00 pm on Tuesday, February 12, 2008. The meeting will be held in the Board Room of MetaBank, 121 East Fifth Street, Storm Lake, Iowa. Further information with regard to this meeting can be found in the proxy statement.
General Counsel
Mack, Hansen, Gadd, Armstrong & Brown, P.C.
316 East Sixth Street
P.O. Box 278
Storm Lake, Iowa 50588
Special Counsel
Katten Muchin Rosenman, LLP
1025 Thomas Jefferson Street NW
East Lobby, Suite 700
Washington, D.C. 20007-5201
Independent Auditors
McGladrey & Pullen LLP
400 Locust Street, Suite 640
Des Moines, Iowa 50309-2372
Shareholder Services and Investor Relations
Shareholders desiring to change the name, address, or ownership of stock; to report lost certificates; or to consolidate accounts, should contact the corporation’s transfer agent:
Registrar & Transfer Company
10 Commerce Drive
Cranford, New Jersey 07016
Telephone: 800.368.5948
Email: invrelations@rtco.com
Web site: www.rtco.com
Form 10-K
Copies of the Company’s Annual Report on Form 10-K for the year ended September 30, 2007 (excluding exhibits thereto) may be obtained without charge by contacting:
Investor Relations
Meta Financial Group
MetaBank Building
121 East Fifth Street
P.O. Box 1307
Storm Lake, Iowa 50588
Telephone: 712.732.4117
Email: invrelations@metacash.com
Web site: www.metacash.com
DIVIDEND AND STOCK MARKET INFORMATION
Meta Financial Group’s common stock trades on the NASDAQ Global MarketSM under the symbol “CASH.”
Quarterly dividends for 2006 and 2007 were $0.13. The price range of the common stock, as reported on the Nasdaq System, is as follows:
| | FISCAL YEAR 2007 | | FISCAL YEAR 2006 | |
| | LOW | | HIGH | | LOW | | HIGH | |
| | | | | | | | | |
FIRST QUARTER | | $ | 24.15 | | $ | 29.80 | | $ | 18.55 | | $ | 23.00 | |
SECOND QUARTER | | 27.32 | | 35.50 | | 19.04 | | 28.10 | |
THIRD QUARTER | | 31.00 | | 38.22 | | 21.01 | | 23.18 | |
FOURTH QUARTER | | 37.50 | | 42.00 | | 22.32 | | 25.73 | |
| | | | | | | | | | | | | |
Dividend payment decisions are made with consideration of a variety of factors including earnings, financial condition, market considerations, and regulatory restrictions. Restrictions on dividend payments are described in Note 17 of the Notes to Consolidated Financial Statements included in this Annual Report.
As of September 30, 2007, Meta had 2,589,717 shares of common stock outstanding, which were held by 221 shareholders of record, and 424,269 shares subject to outstanding options. The shareholders of record number does not reflect approximately 500 persons or entities who hold their stock in nominee or “street” name.
The following securities firms were acting as market makers for Meta stock during the year ended September 30, 2007: Automated Trading Desk; B-Trade Services LLC; Citadel Derivatives Group LLC; Credit Suisse Securities USA; Evolution Financial
Technologies; Howe Barnes Investments, Inc.; Knight Equity Markets, L.P.; Merriman Curhan Ford and Company; and UBS Securities LLC.
36

METABANK
NORTHWEST IOWA MARKET
STORM LAKE MAIN OFFICE
121 East Fifth Street
P.O. Box 1307
Storm Lake, Iowa 50588
712.732.4117
800.792.6815
712.732.8122 fax
Storm Lake Plaza
1413 North Lake Avenue
P.O. Box 1307
Storm Lake, Iowa 50588
712.732.6655
712.732.7924 fax
METABANK
WEST CENTRAL
WEST CENTRAL MAIN OFFICE
615 South Division
P.O. Box 606
Stuart, Iowa 50250
515.523.2203
800.523.8003
515.523.2460 fax
Casey
101 East Logan
P.O. Box 97
Casey, Iowa 50048
641.746.3366
800.746.3367
641.746.2828 fax
Menlo
501 Sherman
P.O. Box 36
Menlo, Iowa 50164
641.524.4521
METABANK
MEMPHIS MARKET
Cordova Main Office
7000 Goodlett Farms Parkway
Cordova, Tennessee 38106
901.380.8200
METABANK
CENTRAL IOWA MARKET
CENTRAL IOWA MAIN OFFICE
Downtown Des Moines
418 Sixth Avenue, Suite 205
Des Moines, IA 50309
515.243.0630
515.447.4242 fax
Highland Park
3624 Sixth Avenue
Des Moines, Iowa 50313
515.288.4866
515.288.3104 fax
Ingersoll
3401 Ingersoll Avenue
Des Moines, Iowa 50312
515.274.9674
515.274.9675 fax
Jordan Creek
270 South 68th Street
West Des Moines, Iowa 50266
515.223.0440
515.223.0439 fax
Urbandale
4848 86th Street
Urbandale, Iowa 50322
515.309.9800
515.309.9801 fax
West Des Moines
3448 Westown Parkway
West Des Moines, Iowa 50266
515.226.8474
515.226.8475 fax
METABANK
BROOKINGS MARKET
BROOKINGS MAIN OFFICE
600 Main Avenue
P.O. Box 98
Brookings, South Dakota 57006
605.692.2314
800.842.7452
605.692.7059 fax
METABANK
SIOUX EMPIRE MARKET
SIOUX FALLS MAIN OFFICE
4900 South Western Avenue
P.O. Box 520
Sioux Falls, South Dakota 57101
605.338.0059
605.338.0155 fax
North Minnesota
1600 North Minnesota Avenue
P.O. Box 520
Sioux Falls, South Dakota 57101
605.338.3470
605.338.3471 fax
South Minnesota
2500 South Minnesota Avenue
P.O. Box 520
Sioux Falls, South Dakota 57101
605.977.7500
605.977.7501 fax
West 12th Street
2104 West 12th Street
P.O. Box 520
Sioux Falls, South Dakota 57101
605.336.8900
605.336.8901 fax

META PAYMENT SYSTEMS AND
ADMINISTRATIVE OFFICES
Sioux Falls
5501 South Broadband Lane
Sioux Falls, South Dakota 57108
605.361.4347
866.550.6382
605.338.0596 fax
Omaha
4235 N 90th Street
Omaha, Nebraska 68134
402.573.0567
402.573.3360 fax

META TRUST
4900 South Western Avenue
Sioux Falls, South Dakota 57101
605.782.1780
605.338.0155 fax
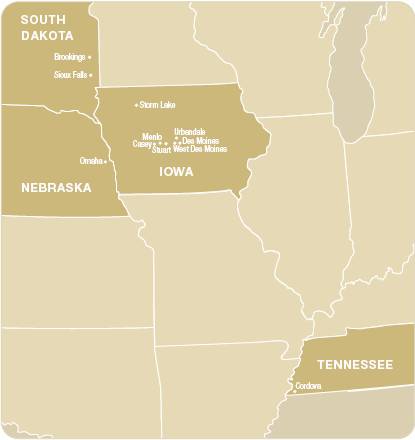
metapay.com
metabankonline.com
37

Change your thoughts
and you change your world.
NORMAN VINCENT PEALE

MetaBank Building
121 East Fifth Street
P.O. Box 1307
Storm Lake, Iowa 50588
metacash.com