APPRAISAL OF CERTAIN
PROPERTIES OWNED BY
FX Producing Company, Inc.
As of January 1, 2011
Prepared by:
Thomas K. Hohn, P.E.
Hohn Engineering, PLLC
2708 1st Avenue North, Suite 200
Billings, MT 59101
(406) 655-3381
| HOHN ENGINEERING, PLLC 2708 1st Avenue North, Suite 200 Billings, MT 59101 406-655-3381 Fax 406-655-3383 Email: hohneng@hohneng.com |
February 10, 2011
Mr. Clay Newton
Chief Executive Officer
FX Producing Company
3006 Highland Drive, Suite 206 Salt Lake City, Utah 84106
Re: Evaluation of oil and gas working interests owned by FX Producing Company located in various counties and states, as of January 1, 2011.
Dear Mr. Newton:
As you requested, I have evaluated the above referenced properties. The following summarizes my findings:
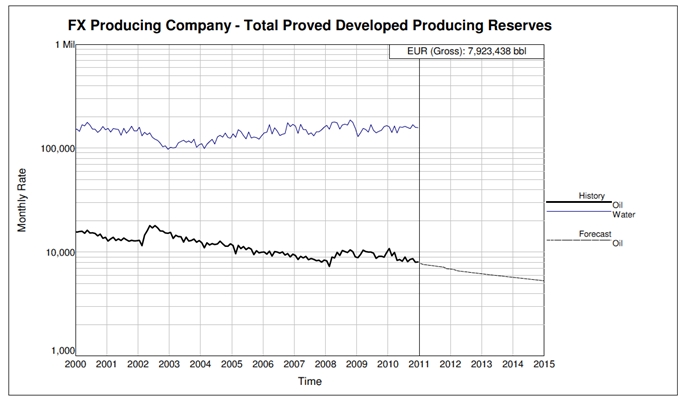
| FX Producing Company |
| Effective Date January 1, 2011 |
| | Proved Developed Producing Reserves |
| Net Oil Reserves, STB | 639,370 |
| Net Gas Reserves, MCF | 0 |
| Future Net Revenue, $ | 43,552,998 |
| Investment, $ | 0 |
| Future Net Cash Flow Undiscounted, $ | 16,790,935 |
| Future Net Cash Flow 10% Discount, $ | 9,668,546 |
All wells were producing at the effective date and have a long producing history. Reserves were estimated by production decline curve projection of the established producing trend. No other reserve classes were considered in the evaluation. I did not physically inspect the properties to determine the physical condition of the leases or the status of environmental compliance on the leases.
Ownership interests were supplied by FX Producing Company and accepted as presented. Historical operating costs and product prices were supplied by FX Producing Company and were considered reasonable. The prices used in the evaluation were based on the 2010 average of the first of month purchaser’s posted price, adjusted for transportation and deductions to a realized wellhead price for each lease. Both prices and costs were held constant for the life of the property, no escalations were applied.
Mr. Clay Newton
February 10, 2011
Page 2 of 2
Applicable production, severance and ad-valorem taxes were deducted. No federal or state income tax, salvage value or costs associated with abandonment were considered. In general, equipment salvage should cover abandonment and restoration costs. No major expenditures are anticipated for the properties and none were included in the forecasts.
All data used in preparing this report were provided by FX Producing Company or from public data sources and were accepted as true and correct. The reserve classifications used in this evaluation conform to the criteria as defined by the Society of Petroleum Engineers and included in Attachment A to this letter. These reserve estimates are predicated on the laws, regulations, taxes and policies in effect on the date of the evaluation, and no changes have been considered. All reserve estimates represent my best professional engineering judgment based on the data available to me at the time of the preparation of this report. It should be realized that the reserves actually recovered, the revenue generated from them and the actual costs incurred could be more or less than the estimated amounts.
If there are questions, or you need additional information, please advise. Thank you for the opportunity to perform this work for you.
Sincerely,
/s/ Thomas K. Hohn
Thomas K. Hohn
Registered Professional Petroleum Engineer
Montana 4303PE
FX PRODUCING CO.
TOTAL PROVED RESERVES
AS OF JANUARY 1, 2011
Summary Lease Report
| | Well | Gross Production | Net Production | Average Prices | Sales |
| Date | Count | Oil | Gas | Oil | Gas | Oil | Gas | Total |
| | | (Bbl) | (Mcf) | (Bbl) | (Mcf) | ($/Bbl) | ($/Mcf) | ($) |
| 12/2011 | 8 | 88,181 | 0 | 56,534 | 0 | 68.17 | 0.00 | 3,854,085 |
| 12/2012 | 6 | 77,883 | 0 | 51,690 | 0 | 68.27 | 0.00 | 3,528,925 |
| 12/2013 | 6 | 71,496 | 0 | 48,832 | 0 | 68.28 | 0.00 | 3,334,483 |
| 12/2014 | 6 | 66,138 | 0 | 46,212 | 0 | 68.29 | 0.00 | 3,155,660 |
| 12/2015 | 6 | 61,103 | 0 | 43,493 | 0 | 68.28 | 0.00 | 2,969,857 |
| 12/2016 | 5 | 54,660 | 0 | 40,488 | 0 | 68.27 | 0.00 | 2,764,313 |
| 12/2017 | 4 | 49,681 | 0 | 38,413 | 0 | 68.28 | 0.00 | 2,622,728 |
| 12/2018 | 4 | 47,092 | 0 | 36,457 | 0 | 68.28 | 0.00 | 2,489,254 |
| 12/2019 | 4 | 44,641 | 0 | 34,602 | 0 | 68.28 | 0.00 | 2,362,673 |
| 12/2020 | 4 | 42,320 | 0 | 32,842 | 0 | 68.28 | 0.00 | 2,242,625 |
| 12/2021 | 4 | 40,122 | 0 | 31,174 | 0 | 68.29 | 0.00 | 2,128,770 |
| 12/2022 | 4 | 38,041 | 0 | 29,592 | 0 | 68.29 | 0.00 | 2,020,784 |
| 12/2023 | 4 | 36,070 | 0 | 28,092 | 0 | 68.29 | 0.00 | 1,918,363 |
| 12/2024 | 3 | 33,414 | 0 | 26,360 | 0 | 68.38 | 0.00 | 1,802,578 |
| 12/2025 | 3 | 31,451 | 0 | 24,934 | 0 | 68.41 | 0.00 | 1,705,833 |
| Remainder: | | 103,405 | 0 | 69,656 | 0 | 66.79 | 0.00 | 4,652,065 |
| Grand Total: | | 885,698 | 0 | 639,370 | 0 | 68.12 | 0.00 | 43,552,998 |
| | Operating | | Operating | Other | Periodic | Cumulative | 10% |
| Date | Expenses | Taxes | Income | Costs | Cash Flow | Cash Flow | Cash Flow |
| | ($) | ($) | ($) | ($) | ($) | ($) | ($) |
| 12/2011 | 1,609,960 | 244,941 | 1,999,185 | 0 | 1,999,185 | 1,999,185 | 1,900,829 |
| 12/2012 | 1,497,988 | 224,712 | 1,806,225 | 0 | 1,806,225 | 3,805,410 | 1,561,239 |
| 12/2013 | 1,493,811 | 212,319 | 1,628,354 | 0 | 1,628,354 | 5,433,764 | 1,279,584 |
| 12/2014 | 1,493,811 | 200,836 | 1,461,013 | 0 | 1,461,013 | 6,894,776 | 1,043,757 |
| 12/2015 | 1,477,221 | 188,920 | 1,303,716 | 0 | 1,303,716 | 8,198,492 | 846,745 |
| 12/2016 | 1,426,966 | 175,851 | 1,161,496 | 0 | 1,161,496 | 9,359,989 | 685,799 |
| 12/2017 | 1,426,287 | 166,992 | 1,029,449 | 0 | 1,029,449 | 10,389,437 | 552,609 |
| 12/2018 | 1,426,287 | 158,598 | 904,369 | 0 | 904,369 | 11,293,807 | 441,367 |
| 12/2019 | 1,426,287 | 150,608 | 785,779 | 0 | 785,779 | 12,079,586 | 348,661 |
| 12/2020 | 1,426,287 | 143,005 | 673,333 | 0 | 673,333 | 12,752,919 | 271,641 |
| 12/2021 | 1,426,287 | 135,774 | 566,709 | 0 | 566,709 | 13,319,628 | 207,876 |
| 12/2022 | 1,426,287 | 128,909 | 465,589 | 0 | 465,589 | 13,785,216 | 155,292 |
| 12/2023 | 1,426,287 | 122,392 | 369,685 | 0 | 369,685 | 14,154,901 | 112,131 |
| 12/2024 | 1,407,491 | 115,862 | 279,225 | 0 | 279,225 | 14,434,126 | 77,030 |
| 12/2025 | 1,401,226 | 110,039 | 194,568 | 0 | 194,568 | 14,628,694 | 48,839 |
| Remainder: | 2,043,835 | 445,989 | 2,162,241 | 0 | 2,162,241 | 16,790,935 | 135,147 |
| Grand Total: | 23,836,317 | 2,925,747 | 16,790,935 | 0 | 16,790,935 | 16,790,935 | 9,668,546 |
| Discount Present Worth: | Economic Dates: | Economics Summary: | | |
| 0.00% | 16,790,935 | Effective Date | 01/2011 | | Bbl Oil | Mcf Gas |
| 10.00% | 9,668,546 | Calculated Limit | 12/2110 | Ultimate Gross | 7,923,438 | 102,346 |
| 20.00% | 7,041,599 | Economic Life | 1200 Months | Historic Gross | 7,037,740 | 102,346 |
| 30.00% | 5,587,093 | 100 Years 0 Months | Gross at Eff Date | 7,037,740 | 102,346 |
| 40.00% | 4,669,981 | Economics Information: | Remaining Gross | 885,698 | 0 |
| 50.00% | 4,041,692 | Net Payout Date: | 01/2011 | Remaining Net | 639,370 | 0 |
| 60.00% | 3,585,077 | Rate of Return: | >100% | | | |
| 70.00% | 3,238,274 | Return on Investment: | 0.00 | | | |
| 80.00% | 2,965,772 | Disc Return on Invest: | 0.00 | | | |
| 90.00% | 2,745,820 | | | | |
| 100.00% | 2,564,383 | | | | |
Last Twelve Months Historic Production Report
Summary Lease Report
| | Well | Days | Oil | Gas | Water | Injection |
| Date | Count | On | (bbl) | (mcf) | (bbl) | (bbl) |
| | | | | | | |
| Previous | | 1,259,806 | 6,932,526 | 101,626 | 56,511,796 | 30,051,660 |
| 01/2010 | 154 | 3,600 | 10,806 | 78 | 161,309 | 212,461 |
| 02/2010 | 154 | 3,119 | 9,234 | 51 | 141,821 | 184,257 |
| 03/2010 | 155 | 3,671 | 9,925 | 46 | 164,103 | 223,902 |
| 04/2010 | 157 | 3,523 | 8,337 | 10 | 140,593 | 188,688 |
| 05/2010 | 155 | 3,403 | 8,477 | 75 | 160,724 | 217,557 |
| 06/2010 | 153 | 3,452 | 8,178 | 67 | 159,111 | 215,448 |
| 07/2010 | 154 | 3,548 | 8,965 | 69 | 162,766 | 223,930 |
| 08/2010 | 154 | 3,578 | 8,099 | 63 | 158,388 | 224,787 |
| 09/2010 | 155 | 3,621 | 8,506 | 66 | 154,524 | 225,339 |
| 10/2010 | 156 | 3,709 | 8,646 | 65 | 168,264 | 237,500 |
| 11/2010 | 156 | 3,620 | 7,996 | 65 | 158,836 | 231,618 |
| 12/2010 | 156 | 3,627 | 8,045 | 65 | 157,999 | 225,902 |
| Total: | | 1,302,277 | 7,037,740 | 102,346 | 58,400,234 | 32,663,049 |
Oneline Cashflow Report
| ---GROSS PRODUCTION--- | --NET PRODUCTION-- | --SALES--- | ------------ EXPENSES------------ | -------NET CASH FLOW------ |
| | MCF | | MCF | | | | | | |
| BBL OIL | GAS | BBL OIL | GAS | TOTAL $ | ALL TAXES | TOT COSTS | CAPITAL | CUMULATIVE | 10 DISCNT |
| | | | | | | | | | |
| BACON FLAT FEDERAL (23-17A) | | | | | | | | | |
| 92,891 | 0 | 12,068 | 0 | 728,933 | 28,678 | 286,673 | 0 | 413,582 | 230,473 |
| BEARS DEN SWIFT SAND UNIT SUMMARY () | | | | | | | |
| 8,938 | 0 | 6,999 | 0 | 482,630 | 30,213 | 315,210 | 0 | 137,207 | 119,145 |
| MUNSON RANCH (13-1) | | | | | | | | | |
| 24,938 | 0 | 9,744 | 0 | 588,552 | 17,204 | 332,056 | 0 | 239,293 | 168,218 |
| MUNSON RANCH (13-45) | | | | | | | | | |
| 1,720 | 0 | 540 | 0 | 32,634 | 1,455 | 29,238 | 0 | 1,941 | 1,866 |
| MUNSON RANCH (13-46) | | | | | | | | | |
| 0 | 0 | 0 | 0 | 0 | 0 | 0 | 0 | 0 | 0 |
| MUNSON RANCH (14-33) | | | | | | | | | |
| 116 | 0 | 37 | 0 | 2,207 | 103 | 2,088 | 0 | 16 | 15 |
| MUNSON RANCH (14-49) | | | | | | | | | |
| 0 | 0 | 0 | 0 | 0 | 0 | 0 | 0 | 0 | 0 |
| MUNSON RANCH (14-49X) | | | | | | | | | |
| 0 | 0 | 0 | 0 | 0 | 0 | 0 | 0 | 0 | 0 |
| RIECKHOFF A () | | | | | | | | | |
| 1,780 | 0 | 1,451 | 0 | 96,915 | 6,067 | 89,000 | 0 | 1,848 | 1,794 |
| SWCBSU SUMMARY () | | | | | | | | | |
| 635,373 | 0 | 548,873 | 0 | 37,680,141 | 2,358,777 | 22,415,553 | 0 | 12,905,812 | 8,462,831 |
| TRAP SPRINGS - MUNSON RANCH (14-42) | | | | | | | | |
| 0 | 0 | 0 | 0 | 0 | 0 | 0 | 0 | 0 | 0 |
| TRIBAL (1186) | | | | | | | | | |
| 74,248 | 0 | 59,399 | 0 | 3,923,871 | 481,067 | 360,000 | 0 | 3,082,805 | 676,952 |
| TRIBAL 1466 () | | | | | | | | | |
| 0 | 0 | 0 | 0 | 0 | 0 | 0 | 0 | 0 | 0 |
| TYLER C WATERFLOOD () | | | | | | | | | |
| 45,694 | 0 | 259 | 0 | 17,115 | 2,184 | 6,500 | 0 | 8,431 | 7,252 |
| | | | | | | | | | |
| Grand Total: | | | | | | | | | |
| 885,698 | 0 | 639,370 | 0 | 43,552,998 | 2,925,748 | 23,836,318 | 0 | 16,790,935 | 9,668,546 |
Oneline Cashflow Report
| ---GROSS PRODUCTION--- | --NET PRODUCTION-- | --SALES--- | ------------ EXPENSES------------ | -------NET CASH FLOW------ |
| | MCF | | MCF | | | | | | |
| BBL OIL | GAS | BBL OIL | GAS | TOTAL $ | ALL TAXES | TOT COSTS | CAPITAL | CUMULATIVE | 10 DISCNT |
| | | | | | | | | | |
| Grand Total: | | | | | | | | | |
| 885,698 | 0 | 639,370 | 0 | 43,552,998 | 2,925,748 | 23,836,318 | 0 | 16,790,935 | 9,668,546 |
Annual CashFlow Report
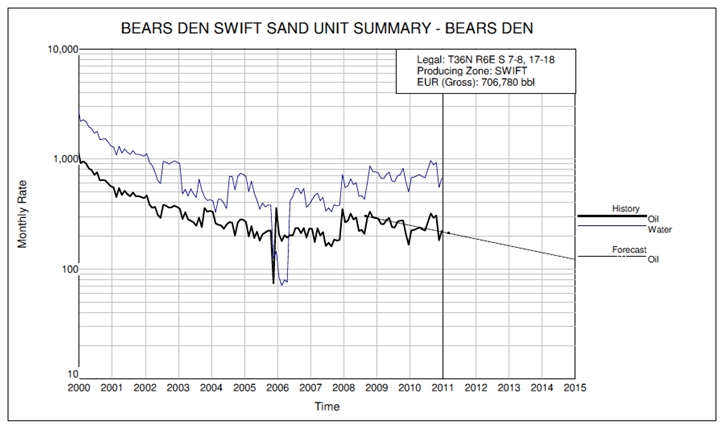
| Lease Name: BEARS DEN SWIFT SAND UNIT SUMMARY () | Operator: FX PRODUCING CO |
| County, ST: LIBERTY, MT | Field Name: BEARS DEN |
| Location: T36N R6E S 7-8, 17-18 | Reserve Type/Class: Proved/Developed, Producing |
| | Well | Gross Production | Net Production | Average Prices | Sales |
| Date | Count | Oil | Gas | Oil | Gas | Oil | Gas | Total |
| | | (Bbl) | (Mcf) | (Bbl) | (Mcf) | ($/Bbl) | ($/Mcf) | ($) |
| 12/2011 | 1 | 2,416 | 0 | 1,892 | 0 | 68.96 | 0.00 | 130,453 |
| 12/2012 | 1 | 2,094 | 0 | 1,640 | 0 | 68.96 | 0.00 | 113,065 |
| 12/2013 | 1 | 1,815 | 0 | 1,421 | 0 | 68.96 | 0.00 | 97,995 |
| 12/2014 | 1 | 1,573 | 0 | 1,232 | 0 | 68.96 | 0.00 | 84,933 |
| 09/2015 | 1 | 1,041 | 0 | 815 | 0 | 68.96 | 0.00 | 56,185 |
| Grand Total: | | 8,938 | 0 | 6,999 | 0 | 68.96 | 0.00 | 482,630 |
| | | | | | | | | |
| | Operating | | Operating | Other | Periodic | Cumulative | 10% |
| Date | Expenses | Taxes | Income | Costs | Cash Flow | Cash Flow | Cash Flow |
| | ($) | ($) | ($) | ($) | ($) | ($) | ($) |
| 12/2011 | 66,360 | 8,166 | 55,926 | 0 | 55,926 | 55,926 | 53,263 |
| 12/2012 | 66,360 | 7,078 | 39,627 | 0 | 39,627 | 95,553 | 34,328 |
| 12/2013 | 66,360 | 6,134 | 25,500 | 0 | 25,500 | 121,053 | 20,103 |
| 12/2014 | 66,360 | 5,317 | 13,256 | 0 | 13,256 | 134,310 | 9,526 |
| 09/2015 | 49,770 | 3,517 | 2,897 | 0 | 2,897 | 137,207 | 1,924 |
| Grand Total: | 315,210 | 30,213 | 137,207 | 0 | 137,207 | 137,207 | 119,145 |
| Discount Present Worth: | | Economic Dates: | | | Economics Summary: | | |
| 0.00% | 137,207 | Effective Date | 01/2011 | | | Bbl Oil | Mcf Gas |
| 10.00% | 119,145 | Calculated Limit | 09/2015 | | Ultimate Gross | 706,780 | 47,130 |
| 20.00% | 105,672 | Economic Life | 57 Months | | Historic Gross | 697,842 | 47,130 |
| 30.00% | 95,286 | 4 Years 9 Months | | Gross at Eff Date | 697,842 | 47,130 |
| 40.00% | 87,061 | Economics Information: | | Remaining Gross | 8,938 | 0 |
| 50.00% | 80,399 | Net Payout Date: | 01/2011 | | Remaining Net | 6,999 | 0 |
| 60.00% | 74,899 | Rate of Return: | >100% | | | | |
| 70.00% | 70,285 | Return on Investment: | 0.00 | | BTU Content: | 1.000 mmbtu/mcf | |
| 80.00% | 66,359 | Disc Return on Invest: | 0.00 | | Gravity: | Oil: 28.00 Gas: 0.800 | |
| 90.00% | 62,979 | Initial Division of Interest: | | | NRI | ORI |
| 100.00% | 60,038 | WI: | 100.000000 | | Oil: | 78.300000 | 0.000000 |
| | | | | | Gas: | 78.300000 | 0.000000 |
| | | Reversion Date: | None | | Injection: | 0.000000 | 0.000000 |
Last Twelve Months Historic Production Report
| Lease Name: BEARS DEN SWIFT SAND UNIT SUMMARY () | Operator: FX PRODUCING CO |
| County, ST: LIBERTY, MT | Field Name: BEARS DEN |
| Location: T36N R6E S 7-8, 17-18 | |
| | Well | Days | Oil | Gas | Water | Injection |
| Date | Count | On | (bbl) | (mcf) | (bbl) | (bbl) |
| | | | | | | |
| Previous | | 49,818 | 694,879 | 47,130 | 250,518 | 978,876 |
| 01/2010 | 6 | 155 | 224 | 0 | 675 | 2,609 |
| 02/2010 | 6 | 140 | 226 | 0 | 682 | 2,269 |
| 03/2010 | 6 | 155 | 233 | 0 | 703 | 4,263 |
| 04/2010 | 6 | 150 | 239 | 0 | 721 | 3,166 |
| 05/2010 | 6 | 155 | 228 | 0 | 688 | 3,353 |
| 06/2010 | 6 | 150 | 223 | 0 | 673 | 2,626 |
| 07/2010 | 6 | 155 | 270 | 0 | 814 | 3,030 |
| 08/2010 | 6 | 155 | 319 | 0 | 962 | 2,413 |
| 09/2010 | 6 | 150 | 292 | 0 | 881 | 3,020 |
| 10/2010 | 6 | 155 | 306 | 0 | 923 | 2,307 |
| 11/2010 | 6 | 155 | 182 | 0 | 549 | 1,701 |
| 12/2010 | 6 | 155 | 221 | 0 | 667 | 0 |
| | | | | | | |
| Total: | | 51,648 | 697,842 | 47,130 | 259,456 | 1,009,633 |
Annual CashFlow Report
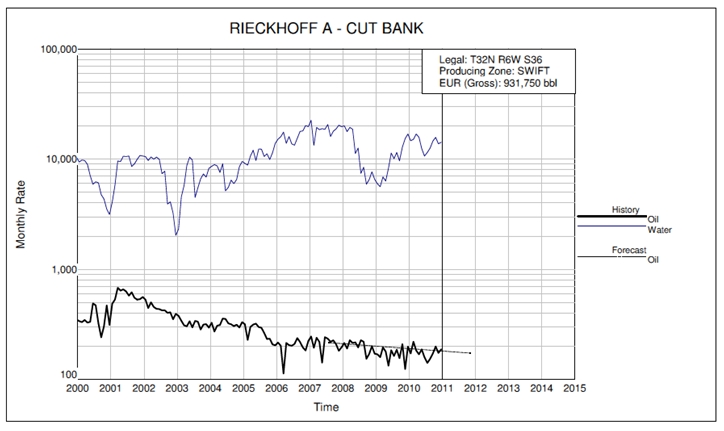
| Lease Name: RIECKHOFF A () | Operator: FX PRODUCING CO |
| County, ST: GLACIER, MT | Field Name: CUT BANK |
| Location: T32N R6W S36 | Reserve Type/Class: Proved/Developed, Producing |
| | Well | Gross Production | Net Production | Average Prices | Sales |
| Date | Count | Oil | Gas | Oil | Gas | Oil | Gas | Total |
| | | (Bbl) | (Mcf) | (Bbl) | (Mcf) | ($/Bbl) | ($/Mcf) | ($) |
| 10/2011 | 1 | 1,780 | 0 | 1,451 | 0 | 66.81 | 0.00 | 96,915 |
| Grand Total: | | 1,780 | 0 | 1,451 | 0 | 66.81 | 0.00 | 96,915 |
| | Operating | | Operating | Other | Periodic | Cumulative | 10% |
| Date | Expenses | Taxes | Income | Costs | Cash Flow | Cash Flow | Cash Flow |
| | ($) | ($) | ($) | ($) | ($) | ($) | ($) |
| 10/2011 | 89,000 | 6,067 | 1,848 | 0 | 1,848 | 1,848 | 1,794 |
| Grand Total: | 89,000 | 6,067 | 1,848 | 0 | 1,848 | 1,848 | 1,794 |
| Discount Present Worth: | | Economic Dates: | | | Economics Summary: | | |
| 0.00% | 1,848 | Effective Date | 01/2011 | | | Bbl Oil | Mcf Gas |
| 10.00% | 1,794 | Calculated Limit | 10/2011 | | Ultimate Gross | 931,750 | 328 |
| 20.00% | 1,746 | Economic Life | 10 Months | | Historic Gross | 929,970 | 328 |
| 30.00% | 1,704 | 0 Years 10 Months | | Gross at Eff Date | 929,970 | 328 |
| 40.00% | 1,666 | Economics Information: | | Remaining Gross | 1,780 | 0 |
| 50.00% | 1,632 | Net Payout Date: | 01/2011 | | Remaining Net | 1,451 | 0 |
| 60.00% | 1,600 | Rate of Return: | >100% | | | | |
| 70.00% | 1,572 | Return on Investment: | 0.00 | | BTU Content: | 1.000 mmbtu/mcf | |
| 80.00% | 1,546 | Disc Return on Invest: | 0.00 | | Gravity: | Oil: 28.00 Gas: 0.800 | |
| 90.00% | 1,521 | Initial Division of Interest: | | | NRI | ORI |
| 100.00% | 1,499 | WI: | 100.000000 | | Oil: | 81.500000 | 0.000000 |
| | | | | | Gas: | 81.500000 | 0.000000 |
| | | Reversion Date: | None | | Injection: | 0.000000 | 0.000000 |
Last Twelve Months Historic Production Report
| Lease Name: RIECKHOFF A () | Operator: FX PRODUCING CO |
| County, ST: GLACIER, MT | Field Name: CUT BANK |
| Location: T32N R6W S36 | |
| Date | Well Count | Days On | Oil (bbl) | Gas (mcf) | Water (bbl) | Injection (bbl) |
| | | | | | | |
| Previous | | 59,071 | 927,841 | 328 | 2,594,979 | 3,835,457 |
| 01/2010 | 10 | 119 | 173 | 0 | 14,666 | 28,387 |
| 02/2010 | 9 | 109 | 221 | 0 | 15,093 | 25,943 |
| 03/2010 | 9 | 117 | 184 | 0 | 16,919 | 36,982 |
| 04/2010 | 10 | 112 | 170 | 0 | 15,822 | 33,087 |
| 05/2010 | 9 | 124 | 188 | 0 | 12,495 | 34,655 |
| 06/2010 | 9 | 117 | 160 | 0 | 10,634 | 34,935 |
| 07/2010 | 9 | 120 | 142 | 0 | 11,535 | 36,901 |
| 08/2010 | 9 | 116 | 155 | 0 | 12,590 | 30,647 |
| 09/2010 | 10 | 147 | 173 | 0 | 14,600 | 35,600 |
| 10/2010 | 10 | 142 | 200 | 0 | 15,757 | 36,857 |
| 11/2010 | 10 | 142 | 175 | 0 | 13,787 | 30,742 |
| 12/2010 | 10 | 142 | 188 | 0 | 14,202 | 33,327 |
| | | | | | | |
| Total: | | 60,578 | 929,970 | 328 | 2,763,079 | 4,233,520 |
Annual CashFlow Report
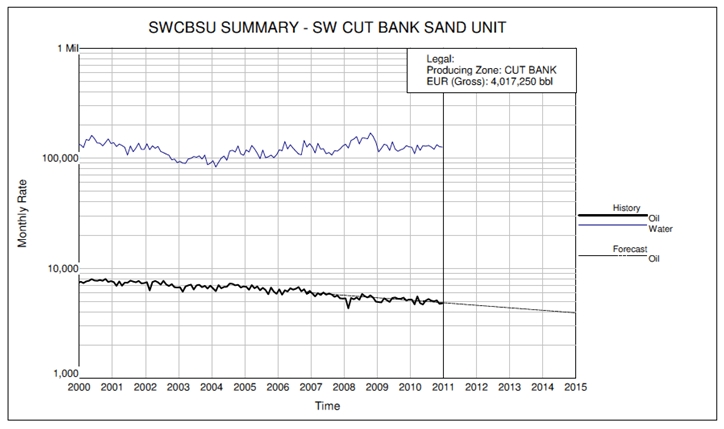
| Lease Name: SWCBSU SUMMARY () | Operator: FX PRODUCING CO |
| County, ST: GLACIER/PONDERA, MT | Field Name: SW CUT BANK SAND UNIT |
| Location: 0-0-0 | Reserve Type/Class: Proved/Developed, Producing |
| | | Gross Production | Net Production | Average Prices | Sales |
| | Well | Oil | Gas | Oil | Gas | Oil | Gas | Total |
| Date | Count | (Bbl) | (Mcf) | (Bbl) | (Mcf) | ($/Bbl) | ($/Mcf) | ($) |
| 12/2011 | 1 | 56,882 | 0 | 49,138 | 0 | 68.65 | 0.00 | 3,373,342 |
| 12/2012 | 1 | 53,962 | 0 | 46,616 | 0 | 68.65 | 0.00 | 3,200,155 |
| 12/2013 | 1 | 51,192 | 0 | 44,222 | 0 | 68.65 | 0.00 | 3,035,860 |
| 12/2014 | 1 | 48,563 | 0 | 41,952 | 0 | 68.65 | 0.00 | 2,880,000 |
| 12/2015 | 1 | 46,070 | 0 | 39,798 | 0 | 68.65 | 0.00 | 2,732,142 |
| 12/2016 | 1 | 43,705 | 0 | 37,755 | 0 | 68.65 | 0.00 | 2,591,875 |
| 12/2017 | 1 | 41,461 | 0 | 35,817 | 0 | 68.65 | 0.00 | 2,458,809 |
| 12/2018 | 1 | 39,333 | 0 | 33,978 | 0 | 68.65 | 0.00 | 2,332,575 |
| 12/2019 | 1 | 37,313 | 0 | 32,233 | 0 | 68.65 | 0.00 | 2,212,821 |
| 12/2020 | 1 | 35,398 | 0 | 30,579 | 0 | 68.65 | 0.00 | 2,099,216 |
| 12/2021 | 1 | 33,580 | 0 | 29,009 | 0 | 68.65 | 0.00 | 1,991,443 |
| 12/2022 | 1 | 31,856 | 0 | 27,519 | 0 | 68.65 | 0.00 | 1,889,203 |
| 12/2023 | 1 | 30,221 | 0 | 26,107 | 0 | 68.65 | 0.00 | 1,792,212 |
| 12/2024 | 1 | 28,669 | 0 | 24,766 | 0 | 68.65 | 0.00 | 1,700,200 |
| 12/2025 | 1 | 27,197 | 0 | 23,495 | 0 | 68.65 | 0.00 | 1,612,913 |
| Remainder: | | 29,971 | 0 | 25,890 | 0 | 68.65 | 0.00 | 1,777,375 |
| Grand Total: | | 635,373 | 0 | 548,873 | 0 | 68.65 | 0.00 | 37,680,141 |
| | Operating | | Operating | Other | Periodic | Cumulative | 10% |
| Date | Expenses | Taxes | Income | Costs | Cash Flow | Cash Flow | Cash Flow |
| | ($) | ($) | ($) | ($) | ($) | ($) | ($) |
| 12/2011 | 1,386,529 | 211,171 | 1,775,641 | 0 | 1,775,641 | 1,775,641 | 1,688,180 |
| 12/2012 | 1,386,529 | 200,330 | 1,613,297 | 0 | 1,613,297 | 3,388,938 | 1,394,438 |
| 12/2013 | 1,386,529 | 190,045 | 1,459,287 | 0 | 1,459,287 | 4,848,225 | 1,146,699 |
| 12/2014 | 1,386,529 | 180,288 | 1,313,183 | 0 | 1,313,183 | 6,161,408 | 938,125 |
| 12/2015 | 1,386,529 | 171,032 | 1,174,581 | 0 | 1,174,581 | 7,335,989 | 762,865 |
| 12/2016 | 1,386,529 | 162,251 | 1,043,095 | 0 | 1,043,095 | 8,379,084 | 615,918 |
| 12/2017 | 1,386,529 | 153,921 | 918,359 | 0 | 918,359 | 9,297,442 | 493,005 |
| 12/2018 | 1,386,529 | 146,019 | 800,027 | 0 | 800,027 | 10,097,469 | 390,473 |
| 12/2019 | 1,386,529 | 138,523 | 687,770 | 0 | 687,770 | 10,785,238 | 305,202 |
| 12/2020 | 1,386,529 | 131,411 | 581,276 | 0 | 581,276 | 11,366,514 | 234,531 |
| 12/2021 | 1,386,529 | 124,664 | 480,249 | 0 | 480,249 | 11,846,764 | 176,191 |
| 12/2022 | 1,386,529 | 118,264 | 384,410 | 0 | 384,410 | 12,231,173 | 128,247 |
| 12/2023 | 1,386,529 | 112,192 | 293,490 | 0 | 293,490 | 12,524,664 | 89,054 |
| 12/2024 | 1,386,529 | 106,433 | 207,239 | 0 | 207,239 | 12,731,902 | 57,213 |
| 12/2025 | 1,386,529 | 100,968 | 125,415 | 0 | 125,415 | 12,857,317 | 31,533 |
| Remainder: | 1,617,617 | 111,264 | 48,494 | 0 | 48,494 | 12,905,812 | 11,156 |
| Grand Total: | 22,415,553 | 2,358,777 | 12,905,812 | 0 | 12,905,812 | 12,905,812 | 8,462,831 |
| Discount Present Worth: | | | Economic Dates: | | | Economics Summary: | | |
| 0.00% | 12,905,812 | | Effective Date | 01/2011 | | | Bbl Oil | Mcf Gas |
| 10.00% | 8,462,831 | | Calculated Limit | 02/2027 | | Ultimate Gross | 4,017,250 | 8,444 |
| 20.00% | 6,249,482 | | Economic Life | 194 Months | | Historic Gross | 3,381,877 | 8,444 |
| 30.00% | 4,976,426 | | 16 Years 2 Months | | Gross at Eff Date | 3,381,877 | 8,444 |
| 40.00% | 4,163,931 | | Economics Information: | | Remaining Gross | 635,373 | 0 |
| 50.00% | 3,604,510 | | Net Payout Date: | 01/2011 | | Remaining Net | 548,873 | 0 |
| 60.00% | 3,197,001 | | Rate of Return: | >100% | | | | |
| 70.00% | 2,887,151 | | Return on Investment: | 0.00 | | BTU Content: | 1.000 mmbtu/mcf | |
| 80.00% | 2,643,561 | | Disc Return on Invest: | 0.00 | | Gravity: | Oil: 28.00 Gas: 0.800 | |
| 90.00% | 2,446,905 | | Initial Division of Interest: | | | NRI | ORI |
| 100.00% | 2,284,682 | | WI: | 99.606970 | | Oil: | 86.386000 | 0.000000 |
| | | | | | | Gas: | 86.386000 | 0.000000 |
| | | | Reversion Date: | Nonee | | Injection: | 0.000000 | 0.000000 |
Last Twelve Months Historic Production Report
| Lease Name: SWCBSU SUMMARY () | Operator: FX PRODUCING CO |
| County, ST: GLACIER/PONDERA, MT | Field Name: SW CUT BANK SAND UNIT |
| Location: 0-0-0 | |
| Date | Well Count | Days On | Oil (bbl) | Gas (mcf) | Water (bbl) | Injection (bbl) |
| | | | | | | |
| Previous | | 1,070,534 | 3,321,723 | 8,444 | 51,997,929 | 23,937,988 |
| 01/2010 | 124 | 3,041 | 5,213 | 0 | 125,440 | 165,715 |
| 02/2010 | 124 | 2,596 | 4,698 | 0 | 109,904 | 141,685 |
| 03/2010 | 125 | 3,104 | 5,575 | 0 | 131,702 | 169,727 |
| 04/2010 | 126 | 2,980 | 4,829 | 0 | 117,805 | 147,805 |
| 05/2010 | 125 | 2,821 | 4,693 | 0 | 129,973 | 163,479 |
| 06/2010 | 125 | 2,937 | 5,094 | 0 | 128,422 | 159,847 |
| 07/2010 | 125 | 2,989 | 5,280 | 0 | 130,482 | 165,769 |
| 08/2010 | 125 | 3,021 | 5,093 | 0 | 126,342 | 174,717 |
| 09/2010 | 124 | 3,007 | 5,009 | 0 | 120,394 | 169,569 |
| 10/2010 | 125 | 3,070 | 5,121 | 0 | 132,781 | 181,156 |
| 11/2010 | 125 | 3,000 | 4,746 | 0 | 127,170 | 181,995 |
| 12/2010 | 125 | 3,000 | 4,803 | 0 | 125,795 | 175,395 |
| | | | | | | |
| Total: | | 1,106,100 | 3,381,877 | 8,444 | 53,504,139 | 25,934,847 |
Annual CashFlow Report
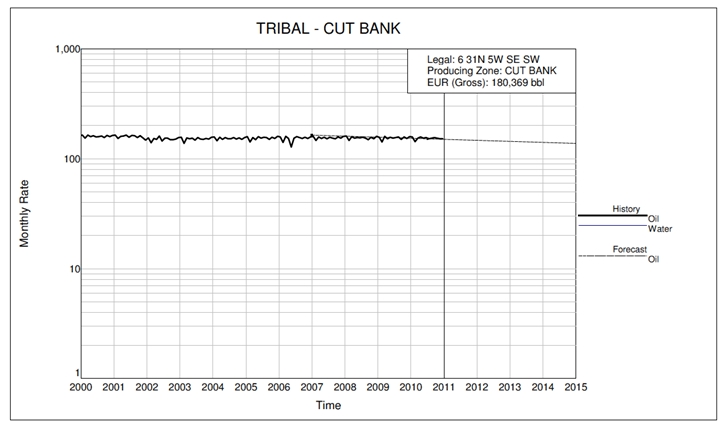
| Lease Name: TRIBAL (1186) | Operator: FX DRILLING COMPANY |
| County, ST: PONDERA, MT | Field Name: CUT BANK |
| Location: 6 31N 5W SE SW | Reserve Type/Class: Proved/Developed, Producing |
| | Well | Gross Production | Net Production | Average Prices | Sales |
| Date | Count | Oil | Gas | Oil | Gas | Oil | Gas | Total |
| | | (Bbl) | (Mcf) | (Bbl) | (Mcf) | ($/Bbl) | ($/Mcf) | ($) |
| 12/2011 | 1 | 1,788 | 0 | 1,431 | 0 | 66.06 | 0.00 | 94,501 |
| 12/2012 | 1 | 1,750 | 0 | 1,400 | 0 | 66.06 | 0.00 | 92,490 |
| 12/2013 | 1 | 1,713 | 0 | 1,370 | 0 | 66.06 | 0.00 | 90,522 |
| 12/2014 | 1 | 1,676 | 0 | 1,341 | 0 | 66.06 | 0.00 | 88,595 |
| 12/2015 | 1 | 1,641 | 0 | 1,313 | 0 | 66.06 | 0.00 | 86,710 |
| 12/2016 | 1 | 1,606 | 0 | 1,285 | 0 | 66.06 | 0.00 | 84,865 |
| 12/2017 | 1 | 1,572 | 0 | 1,257 | 0 | 66.06 | 0.00 | 83,059 |
| 12/2018 | 1 | 1,538 | 0 | 1,231 | 0 | 66.06 | 0.00 | 81,291 |
| 12/2019 | 1 | 1,505 | 0 | 1,204 | 0 | 66.06 | 0.00 | 79,561 |
| 12/2020 | 1 | 1,473 | 0 | 1,179 | 0 | 66.06 | 0.00 | 77,868 |
| 12/2021 | 1 | 1,442 | 0 | 1,154 | 0 | 66.06 | 0.00 | 76,211 |
| 12/2022 | 1 | 1,411 | 0 | 1,129 | 0 | 66.06 | 0.00 | 74,589 |
| 12/2023 | 1 | 1,381 | 0 | 1,105 | 0 | 66.06 | 0.00 | 73,001 |
| 12/2024 | 1 | 1,352 | 0 | 1,082 | 0 | 66.06 | 0.00 | 71,448 |
| 12/2025 | 1 | 1,323 | 0 | 1,059 | 0 | 66.06 | 0.00 | 69,927 |
| Remainder: | | 51,075 | 0 | 40,860 | 0 | 66.06 | 0.00 | 2,699,234 |
| Grand Total: | | 74,248 | 0 | 59,399 | 0 | 66.06 | 0.00 | 3,923,871 |
| | Operating | | Operating | Other | Periodic | Cumulative | 10% |
| | Expenses | Taxes | Income | Costs | Cash Flow | Cash Flow | Cash Flow |
| Date | ($) | ($) | ($) | ($) | ($) | ($) | ($) |
| | | | | | | | |
| 12/2011 | 3,600 | 11,586 | 79,315 | 0 | 79,315 | 79,315 | 75,366 |
| 12/2012 | 3,600 | 11,339 | 77,551 | 0 | 77,551 | 156,866 | 66,990 |
| 12/2013 | 3,600 | 11,098 | 75,824 | 0 | 75,824 | 232,690 | 59,544 |
| 12/2014 | 3,600 | 10,862 | 74,134 | 0 | 74,134 | 306,823 | 52,924 |
| 12/2015 | 3,600 | 10,631 | 72,479 | 0 | 72,479 | 379,303 | 47,039 |
| 12/2016 | 3,600 | 10,404 | 70,860 | 0 | 70,860 | 450,163 | 41,808 |
| 12/2017 | 3,600 | 10,183 | 69,276 | 0 | 69,276 | 519,438 | 37,157 |
| 12/2018 | 3,600 | 9,966 | 67,725 | 0 | 67,725 | 587,163 | 33,023 |
| 12/2019 | 3,600 | 9,754 | 66,207 | 0 | 66,207 | 653,370 | 29,348 |
| 12/2020 | 3,600 | 9,547 | 64,721 | 0 | 64,721 | 718,091 | 26,081 |
| 12/2021 | 3,600 | 9,343 | 63,267 | 0 | 63,267 | 781,358 | 23,178 |
| 12/2022 | 3,600 | 9,145 | 61,844 | 0 | 61,844 | 843,203 | 20,597 |
| 12/2023 | 3,600 | 8,950 | 60,451 | 0 | 60,451 | 903,654 | 18,303 |
| 12/2024 | 3,600 | 8,760 | 59,088 | 0 | 59,088 | 962,742 | 16,264 |
| 12/2025 | 3,600 | 8,573 | 57,754 | 0 | 57,754 | 1,020,497 | 14,451 |
| Remainder: | 306,000 | 330,926 | 2,062,308 | 0 | 2,062,308 | 3,082,805 | 114,878 |
| Grand Total: | 360,000 | 481,067 | 3,082,805 | 0 | 3,082,805 | 3,082,805 | 676,952 |
| Discount Present Worth: | Economic Dates: | Economics Summary: | |
| 0.00% | 3,082,805 | Effective Date | 01/2011 | Bbl Oil | Mcf Gas |
| 10.00% | 676,952 | Calculated Limit | 12/2110 | Ultimate Gross | 180,369 | 570 |
| 20.00% | 388,460 | Economic Life | 1200 Months | Historic Gross | 106,121 | 570 |
| 30.00% | 278,448 | 100 Years 0 Months | Gross at Eff Date | 106,121 | 570 |
| 40.00% | 220,300 | Economics Information: | Remaining Gross | 74,248 | 0 |
| 50.00% | 184,260 | Net Payout Date: | 01/2011 | Remaining Net | 59,399 | 0 |
| 60.00% | 159,685 | Rate of Return: | >100% | | |
| 70.00% | 141,824 | Return on Investment: | 0.00 | BTU Content: | 1.000 mmbtu/mcf | |
| 80.00% | 128,234 | Disc Return on Invest: | 0.00 | Gravity: | Oil: 25.00 Gas: 0.800 | |
| 90.00% | 117,531 | Initial Division of Interest: | NRI | ORI |
| 100.00% | 108,873 | WI: | 100.000000 | Oil: | 80.000000 | 0.000000 |
| | | | Gas: | 80.000000 | 0.000000 |
| | | Reversion Date: | None | Injection: | 0.000000 | 0.000000 |
Last Twelve Months Historic Production Report
| Lease Name: TRIBAL (1186) | Operator: FX DRILLING COMPANY |
| County, ST: PONDERA, MT | Field Name: CUT BANK |
| Location: 6 31N 5W SE SW | |
| Date | Well Count | Days On | Oil (bbl) | Gas (mcf) | Water (bbl) | Injection (bbl) |
| | | | | | | |
| Previous | | 9,758 | 104,278 | 570 | 0 | 0 |
| 01/2010 | 1 | 31 | 158 | 0 | 0 | 0 |
| 02/2010 | 1 | 27 | 143 | 0 | 0 | 0 |
| 03/2010 | 1 | 31 | 154 | 0 | 0 | 0 |
| 04/2010 | 1 | 29 | 158 | 0 | 0 | 0 |
| 05/2010 | 1 | 31 | 154 | 0 | 0 | 0 |
| 06/2010 | 1 | 30 | 156 | 0 | 0 | 0 |
| 07/2010 | 1 | 31 | 152 | 0 | 0 | 0 |
| 08/2010 | 1 | 31 | 154 | 0 | 0 | 0 |
| 09/2010 | 1 | 30 | 156 | 0 | 0 | 0 |
| 10/2010 | 1 | 31 | 154 | 0 | 0 | 0 |
| 11/2010 | 1 | 30 | 152 | 0 | 0 | 0 |
| 12/2010 | 1 | 31 | 152 | 0 | 0 | 0 |
| | | | | | | |
| Total: | | 10,121 | 106,121 | 570 | 0 | 0 |
Annual CashFlow Report
| Lease Name: TRIBAL 1466 () | Operator: FX PRODUCING CO |
| County, ST: GLACIER, MT | Field Name: CUT BANK |
| Location: T32N R6W S27 | Reserve Type/Class: Proved/Developed, Producing |
| | Well | Gross Production | Net Production | Average Prices | Sales |
| Date | Count | Oil | Gas | Oil | Gas | Oil | Gas | Total |
| | | (Bbl) | (Mcf) | (Bbl) | (Mcf) | ($/Bbl) | ($/Mcf) | ($) |
| Grand Total: | | | 0 | | 0 | 0.00 | 0.00 | |
| | Operating | | Operating | Other | Periodic | Cumulative | 10% |
| | Expenses | Taxes | Income | Costs | Cash Flow | Cash Flow | Cash Flow |
| Date | ($) | ($) | ($) | ($) | ($) | ($) | ($) |
| Grand Total: | 0 | 0 | 0 | 0 | 0 | 0 | 0 |
| Discount Present Worth: | | Economic Dates: | | Economics Summary: |
| 0.00% | 0 | Effective Date | 01/2011 | | | Bbl Oil | Mcf Gas |
| 10.00% | 0 | Calculated Limit | n/a | | Ultimate Gross | 183,841 | 2,330 |
| 20.00% | 0 | Economic Life | 0 Months | | Historic Gross | 183,841 | 2,330 |
| 30.00% | 0 | 0 Years 0 Months | | Gross at Eff Date | 183,841 | 2,330 |
| 40.00% | 0 | Economics Information: | | Remaining Gross | 0 | 0 |
| 50.00% | 0 | Net Payout Date: | n/a | | Remaining Net | 0 | 0 |
| 60.00% | 0 | Rate of Return: | n/a | | | | |
| 70.00% | 0 | Return on Investment: | 0.00 | | BTU Content: | 1.000 mmbtu/mcf | |
| 80.00% | 0 | Disc Return on Invest: | 0.00 | | Gravity: | Oil: 28.00 Gas: 0.800 | |
| 90.00% | 0 | Initial Division of Interest: | | | NRI | ORI |
| 100.00% | 0 | WI: | 100.000000 | | Oil: | 82.500000 | 0.000000 |
| | | | | | Gas: | 82.500000 | 0.000000 |
| | | Reversion Date: | None | | Injection: | 0.000000 | 0.000000 |
Last Twelve Months Historic Production Report
| Lease Name: TRIBAL 1466 () | Operator: FX PRODUCING CO |
| County, ST: GLACIER, MT | Field Name: CUT BANK |
| Location: T32N R6W S27 | |
| Date | Well Count | Days On | Oil (bbl) | Gas (mcf) | Water (bbl) | Injection (bbl) |
| | | | | | | |
| Previous | | 15,198 | 183,590 | 2,330 | 53,339 | 0 |
| 01/2010 | 1 | 4 | 1 | 0 | 25 | 0 |
| 02/2010 | 2 | 29 | 53 | 0 | 145 | 0 |
| 03/2010 | 2 | 32 | 25 | 0 | 72 | 0 |
| 04/2010 | 2 | 33 | 10 | 0 | 58 | 0 |
| 05/2010 | 2 | 33 | 7 | 0 | 65 | 0 |
| 06/2010 | 1 | 30 | 37 | 0 | 339 | 0 |
| 07/2010 | 2 | 33 | 45 | 0 | 559 | 0 |
| 08/2010 | 2 | 56 | 30 | 0 | 350 | 0 |
| 09/2010 | 2 | 45 | 8 | 0 | 240 | 0 |
| 10/2010 | 2 | 62 | 12 | 0 | 360 | 0 |
| 11/2010 | 2 | 62 | 12 | 0 | 0 | 0 |
| 12/2010 | 2 | 62 | 11 | 0 | 0 | 0 |
| | | | | | | |
| Total: | | 15,679 | 183,841 | 2,330 | 55,552 | 0 |
Annual CashFlow Report
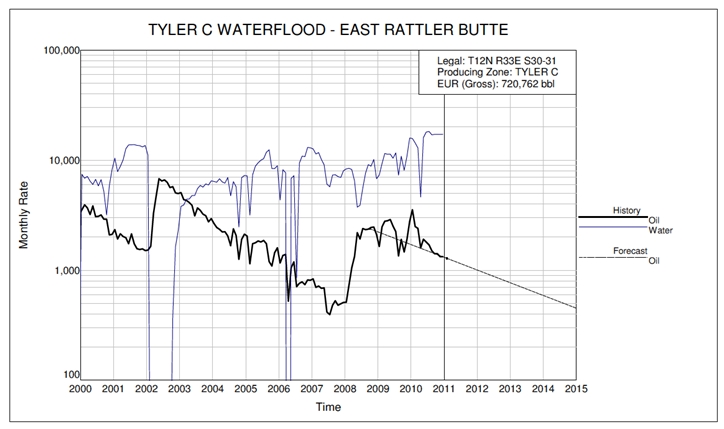
| Lease Name: TYLER C WATERFLOOD () | Operator: TYLER OIL CO |
| County, ST: ROSEBUD, MT | Field Name: EAST RATTLER BUTTE |
| Location: T12N R33E S30-31 | Reserve Type/Class: Proved/Developed, Producing |
| | Well | Gross Production | Net Production | Average Prices | Sales |
| Date | Count | Oil | Gas | Oil | Gas | Oil | Gas | Total |
| | | (Bbl) | (Mcf) | (Bbl) | (Mcf) | ($/Bbl) | ($/Mcf) | ($) |
| 12/2011 | 1 | 13,801 | 0 | 78 | 0 | 66.06 | 0.00 | 5,169 |
| 12/2012 | 1 | 10,576 | 0 | 60 | 0 | 66.06 | 0.00 | 3,961 |
| 12/2013 | 1 | 8,104 | 0 | 46 | 0 | 66.06 | 0.00 | 3,035 |
| 12/2014 | 1 | 6,210 | 0 | 35 | 0 | 66.06 | 0.00 | 2,326 |
| 12/2015 | 1 | 4,759 | 0 | 27 | 0 | 66.06 | 0.00 | 1,782 |
| 12/2016 | 1 | 2,244 | 0 | 13 | 0 | 66.06 | 0.00 | 841 |
| Grand Total: | | 45,694 | 0 | 259 | 0 | 66.06 | 0.00 | 17,115 |
| | Operating | | Operating | Other | Periodic | Cumulative | 10% |
| | Expenses | Taxes | Income | Costs | Cash Flow | Cash Flow | Cash Flow |
| Date | ($) | ($) | ($) | ($) | ($) | ($) | ($) |
| 12/2011 | 1,164 | 660 | 3,346 | 0 | 3,346 | 3,346 | 3,187 |
| 12/2012 | 1,164 | 505 | 2,292 | 0 | 2,292 | 5,637 | 1,985 |
| 12/2013 | 1,164 | 387 | 1,484 | 0 | 1,484 | 7,121 | 1,170 |
| 12/2014 | 1,164 | 297 | 865 | 0 | 865 | 7,986 | 621 |
| 12/2015 | 1,164 | 227 | 391 | 0 | 391 | 8,377 | 256 |
| 07/2016 | 679 | 107 | 54 | 0 | 54 | 8,431 | 33 |
| Grand Total: | 6,500 | 2,184 | 8,431 | 0 | 8,431 | 8,431 | 7,252 |
| Discount Present Worth: | | Economic Dates: | | Economics Summary: |
| 0.00% | 8,431 | Effective Date | 01/2011 | | | Bbl Oil | Mcf Gas |
| 10.00% | 7,252 | Calculated Limit | 07/2016 | | Ultimate Gross | 720,762 | 43,544 |
| 20.00% | 6,389 | Economic Life | 67 Months | | Historic Gross | 675,068 | 43,544 |
| 30.00% | 5,735 | 5 Years 7 Months | | Gross at Eff Date | 675,068 | 43,544 |
| 40.00% | 5,223 | Economics Information: | | Remaining Gross | 45,694 | 0 |
| 50.00% | 4,812 | Net Payout Date: | 01/2011 | | Remaining Net | 259 | 0 |
| 60.00% | 4,476 | Rate of Return: | >100% | | | | |
| 70.00% | 4,196 | Return on Investment: | 0.00 | | BTU Content: | 1.000 mmbtu/mcf | |
| 80.00% | 3,959 | Disc Return on Invest: | 0.00 | | Gravity: | Oil: 28.00 Gas: 0.800 | |
| 90.00% | 3,755 | Initial Division of Interest: | | | NRI | ORI |
| 100.00% | 3,579 | WI: | 0.682713 | | Oil: | 0.567000 | 0.000000 |
| | | | | | Gas: | 0.567000 | 0.000000 |
| | | Reversion Date: | None | | Injection: | 0.000000 | 0.000000 |
Last Twelve Months Historic Production Report
| Lease Name: TYLER C WATERFLOOD () | Operator: TYLER OIL CO |
| County, ST: ROSEBUD, MT | Field Name: EAST RATTLER BUTTE |
| Location: T12N R33E S30-31 | |
| Date | Well Count | Days On | Oil (bbl) | Gas (mcf) | Water (bbl) | Injection (bbl) |
| | | | | | | |
| Previous | | 11,257 | 652,642 | 42,824 | 901,312 | 1,299,339 |
| 01/2010 | 5 | 62 | 3,547 | 78 | 15,750 | 15,750 |
| 02/2010 | 5 | 49 | 2,498 | 51 | 14,360 | 14,360 |
| 03/2010 | 5 | 53 | 2,405 | 46 | 12,930 | 12,930 |
| 04/2010 | 5 | 36 | 1,592 | 10 | 4,630 | 4,630 |
| 05/2010 | 5 | 61 | 1,908 | 75 | 16,070 | 16,070 |
| 06/2010 | 5 | 59 | 1,802 | 67 | 18,040 | 18,040 |
| 07/2010 | 5 | 62 | 1,695 | 69 | 18,230 | 18,230 |
| 08/2010 | 5 | 60 | 1,501 | 63 | 17,010 | 17,010 |
| 09/2010 | 5 | 60 | 1,411 | 66 | 17,150 | 17,150 |
| 10/2010 | 5 | 62 | 1,415 | 65 | 17,180 | 17,180 |
| 11/2010 | 5 | 48 | 1,326 | 65 | 17,180 | 17,180 |
| 12/2010 | 5 | 48 | 1,326 | 65 | 17,180 | 17,180 |
| | | | | | | |
| Total: | | 11,917 | 675,068 | 43,544 | 1,087,022 | 1,485,049 |
Annual CashFlow Report
| Lease Name: BACON FLAT FEDERAL (23-17A) | Operator: DOUBLE D NEVADA |
| County, ST: NYE, NV | Field Name: BACON FLAT |
| Location: 17 7N 57E SW NE SW | Reserve Type/Class: Proved/Developed, Producing |
| | Well | Gross Production | Net Production | Average Prices | Sales |
| Date | Count | Oil | Gas | Oil | Gas | Oil | Gas | Total |
| | | (Bbl) | (Mcf) | (Bbl) | (Mcf) | ($/Bbl) | ($/Mcf) | ($) |
| 12/2011 | 1 | 7,020 | 0 | 912 | 0 | 60.40 | 0.00 | 55,089 |
| 12/2012 | 1 | 6,596 | 0 | 857 | 0 | 60.40 | 0.00 | 51,756 |
| 12/2013 | 1 | 6,196 | 0 | 805 | 0 | 60.40 | 0.00 | 48,625 |
| 12/2014 | 1 | 5,822 | 0 | 756 | 0 | 60.40 | 0.00 | 45,683 |
| 12/2015 | 1 | 5,469 | 0 | 711 | 0 | 60.40 | 0.00 | 42,919 |
| 12/2016 | 1 | 5,138 | 0 | 668 | 0 | 60.40 | 0.00 | 40,322 |
| 12/2017 | 1 | 4,828 | 0 | 627 | 0 | 60.40 | 0.00 | 37,883 |
| 12/2018 | 1 | 4,535 | 0 | 589 | 0 | 60.40 | 0.00 | 35,591 |
| 12/2019 | 1 | 4,261 | 0 | 554 | 0 | 60.40 | 0.00 | 33,437 |
| 12/2020 | 1 | 4,003 | 0 | 520 | 0 | 60.40 | 0.00 | 31,414 |
| 12/2021 | 1 | 3,761 | 0 | 489 | 0 | 60.40 | 0.00 | 29,514 |
| 12/2022 | 1 | 3,533 | 0 | 459 | 0 | 60.40 | 0.00 | 27,728 |
| 12/2023 | 1 | 3,320 | 0 | 431 | 0 | 60.40 | 0.00 | 26,050 |
| 12/2024 | 1 | 3,119 | 0 | 405 | 0 | 60.40 | 0.00 | 24,474 |
| 12/2025 | 1 | 2,930 | 0 | 381 | 0 | 60.40 | 0.00 | 22,993 |
| Remainder: | | 22,359 | 0 | 2,905 | 0 | 60.40 | 0.00 | 175,455 |
| Grand Total: | | 92,891 | 0 | 12,068 | 0 | 60.40 | 0.00 | 728,933 |
| Date | Operating Expenses ($) | Taxes ($) | Operating Income ($) | Other Costs ($) | Periodic Cash Flow ($) | Cumulative Cash Flow ($) | 10% Cash Flow ($) |
| 12/2011 | 11,097 | 2,846 | 41,147 | 0 | 41,147 | 41,147 | 39,115 |
| 12/2012 | 11,097 | 2,673 | 37,986 | 0 | 37,986 | 79,132 | 32,828 |
| 12/2013 | 11,097 | 2,512 | 35,016 | 0 | 35,016 | 114,148 | 27,511 |
| 12/2014 | 11,097 | 2,360 | 32,226 | 0 | 32,226 | 146,374 | 23,018 |
| 12/2015 | 11,097 | 2,217 | 29,605 | 0 | 29,605 | 175,979 | 19,223 |
| 12/2016 | 11,097 | 2,083 | 27,142 | 0 | 27,142 | 203,121 | 16,022 |
| 12/2017 | 11,097 | 1,957 | 24,829 | 0 | 24,829 | 227,950 | 13,324 |
| 12/2018 | 11,097 | 1,751 | 22,743 | 0 | 22,743 | 250,693 | 11,095 |
| 12/2019 | 11,097 | 1,533 | 20,807 | 0 | 20,807 | 271,500 | 9,228 |
| 12/2020 | 11,097 | 1,309 | 19,009 | 0 | 19,009 | 290,509 | 7,665 |
| 12/2021 | 11,097 | 1,082 | 17,335 | 0 | 17,335 | 307,843 | 6,355 |
| 12/2022 | 11,097 | 867 | 15,764 | 0 | 15,764 | 323,608 | 5,254 |
| 12/2023 | 11,097 | 663 | 14,291 | 0 | 14,291 | 337,898 | 4,329 |
| 12/2024 | 11,097 | 530 | 12,847 | 0 | 12,847 | 350,745 | 3,539 |
| 12/2025 | 11,097 | 498 | 11,398 | 0 | 11,398 | 362,144 | 2,854 |
| Remainder: | 120,218 | 3,800 | 51,438 | 0 | 51,438 | 413,582 | 9,113 |
| Grand Total: | 286,673 | 28,678 | 413,582 | 0 | 413,582 | 413,582 | 230,473 |
| Discount Present Worth: | Economic Dates: | Economics Summary: | | |
| 0.00% | 413,582 | Effective Date | 01/2011 | Bbl Oil | Mcf Gas |
| 10.00% | 230,473 | Calculated Limit | 10/2036 | Ultimate Gross | 536,078 | | 0 |
| 20.00% | 158,876 | Economic Life | 310 Months | Historic Gross | 443,187 | | 0 |
| 30.00% | 122,512 | 25 Years 10 Months | Gross at Eff Date | 443,187 | | 0 |
| 40.00% | 100,786 | Economics Information: | Remaining Gross | 92,891 | | 0 |
| 50.00% | 86,377 | Net Payout Date: | 01/2011 | Remaining Net | 12,068 | | 0 |
| 60.00% | 76,117 | Rate of Return: | >100% | | | |
| 70.00% | 68,433 | Return on Investment: | 0.00 | BTU Content: | 1.000 mmbtu/mcf | | |
| 80.00% | 62,454 | Disc Return on Invest: | 0.00 | Gravity: | Oil: 28.00 Gas: 0.800 | | |
| 90.00% | 57,663 | Initial Division of Interest: | NRI | ORI | |
| 100.00% | 53,734 | WI: | 16.875000 | Oil: | 12.992000 | 0.000000 | |
| | | | Gas: | 12.992000 | 0.000000 | |
| | | Reversion Date: | None | Injection: | 0.000000 | 0.000000 | |
Last Twelve Months Historic Production Report
| Lease Name: BACON FLAT FEDERAL (23-17A) | Operator: DOUBLE D NEVADA |
| County, ST: NYE, NV | Field Name: BACON FLAT |
| Location: 17 7N 57E SW NE SW | |
| Date | Well Count | Days On | Oil (bbl) | Gas (mcf) | Water (bbl) | Injection (bbl) |
| | | | | | | |
| Previous | | 5,580 | 437,018 | 0 | 421,690 | 0 |
| 01/2010 | 1 | 31 | 649 | 0 | 3,300 | 0 |
| 02/2010 | 1 | 28 | 700 | 0 | 316 | 0 |
| 03/2010 | 1 | 24 | 558 | 0 | 350 | 0 |
| 04/2010 | 1 | 30 | 588 | 0 | 150 | 0 |
| 05/2010 | 1 | 31 | 576 | 0 | 155 | 0 |
| 06/2010 | 0 | 0 | 0 | 0 | 0 | 0 |
| 07/2010 | 1 | 31 | 650 | 0 | 155 | 0 |
| 08/2010 | 0 | 0 | 0 | 0 | 0 | 0 |
| 09/2010 | 1 | 30 | 601 | 0 | 150 | 0 |
| 10/2010 | 1 | 29 | 633 | 0 | 145 | 0 |
| 11/2010 | 1 | 30 | 612 | 0 | 150 | 0 |
| 12/2010 | 1 | 31 | 602 | 0 | 155 | 0 |
| | | | | | | |
| Total: | | 5,875 | 443,187 | 0 | 426,716 | 0 |
Annual CashFlow Report
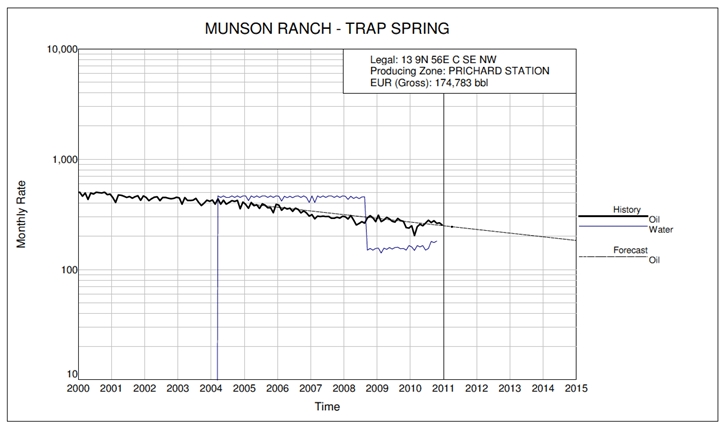
| Lease Name: MUNSON RANCH (13-1) | Operator: FRONTIER EXPLORATION INCORPORATED |
| County, ST: NYE, NV | Field Name: TRAP SPRING |
| Location: 13 9N 56E C SE NW | Reserve Type/Class: Proved/Developed, Producing |
| | Well | Gross Production | Net Production | Average Prices | Sales |
| Date | Count | Oil | Gas | Oil | Gas | Oil | Gas | Total |
| | | (Bbl) | (Mcf) | (Bbl) | (Mcf) | ($/Bbl) | ($/Mcf) | ($) |
| 12/2011 | 1 | 2,888 | 0 | 1,128 | 0 | 60.40 | 0.00 | 68,158 |
| 12/2012 | 1 | 2,674 | 0 | 1,045 | 0 | 60.40 | 0.00 | 63,115 |
| 12/2013 | 1 | 2,476 | 0 | 968 | 0 | 60.40 | 0.00 | 58,446 |
| 12/2014 | 1 | 2,293 | 0 | 896 | 0 | 60.40 | 0.00 | 54,122 |
| 12/2015 | 1 | 2,124 | 0 | 830 | 0 | 60.40 | 0.00 | 50,119 |
| 12/2016 | 1 | 1,967 | 0 | 768 | 0 | 60.40 | 0.00 | 46,411 |
| 12/2017 | 1 | 1,821 | 0 | 712 | 0 | 60.40 | 0.00 | 42,978 |
| 12/2018 | 1 | 1,686 | 0 | 659 | 0 | 60.40 | 0.00 | 39,798 |
| 12/2019 | 1 | 1,562 | 0 | 610 | 0 | 60.40 | 0.00 | 36,854 |
| 12/2020 | 1 | 1,446 | 0 | 565 | 0 | 60.40 | 0.00 | 34,128 |
| 12/2021 | 1 | 1,339 | 0 | 523 | 0 | 60.40 | 0.00 | 31,603 |
| 12/2022 | 1 | 1,240 | 0 | 485 | 0 | 60.40 | 0.00 | 29,265 |
| 12/2023 | 1 | 1,148 | 0 | 449 | 0 | 60.40 | 0.00 | 27,100 |
| 03/2024 | 1 | 274 | 0 | 107 | 0 | 60.40 | 0.00 | 6,456 |
| Grand Total: | | 24,938 | 0 | 9,744 | 0 | 60.40 | 0.00 | 588,552 |
Date | Operating Expenses ($) | Taxes ($) | Operating Income ($) | Other Costs ($) | Periodic Cash Flow ($) | Cumulative Cash Flow ($) | 10% Cash Flow ($) |
| 12/2011 | 25,061 | 3,069 | 40,028 | 0 | 40,028 | 40,028 | 38,062 |
| 12/2012 | 25,061 | 2,604 | 35,451 | 0 | 35,451 | 75,478 | 30,649 |
| 12/2013 | 25,061 | 2,142 | 31,243 | 0 | 31,243 | 106,721 | 24,558 |
| 12/2014 | 25,061 | 1,713 | 27,348 | 0 | 27,348 | 134,070 | 19,543 |
| 12/2015 | 25,061 | 1,296 | 23,762 | 0 | 23,762 | 157,832 | 15,437 |
| 12/2016 | 25,061 | 1,005 | 20,345 | 0 | 20,345 | 178,177 | 12,018 |
| 12/2017 | 25,061 | 931 | 16,986 | 0 | 16,986 | 195,163 | 9,123 |
| 12/2018 | 25,061 | 862 | 13,875 | 0 | 13,875 | 209,039 | 6,776 |
| 12/2019 | 25,061 | 798 | 10,995 | 0 | 10,995 | 220,034 | 4,883 |
| 12/2020 | 25,061 | 739 | 8,328 | 0 | 8,328 | 228,362 | 3,363 |
| 12/2021 | 25,061 | 684 | 5,858 | 0 | 5,858 | 234,219 | 2,152 |
| 12/2022 | 25,061 | 634 | 3,570 | 0 | 3,570 | 237,790 | 1,195 |
| 12/2023 | 25,061 | 587 | 1,452 | 0 | 1,452 | 239,242 | 444 |
| 03/2024 | 6,265 | 140 | 51 | 0 | 51 | 239,293 | 15 |
| Grand Total: | 332,056 | 17,204 | 239,293 | 0 | 239,293 | 239,293 | 168,218 |
| Discount Present Worth: | Economic Dates: | Economics Summary: | | |
| 0.00% | 239,293 | Effective Date | 01/2011 | Bbl Oil | Mcf Gas |
| 10.00% | 168,218 | Calculated Limit | 03/2024 | Ultimate Gross | 174,783 | | 0 |
| 20.00% | 129,158 | Economic Life | 159 Months | Historic Gross | 149,845 | | 0 |
| 30.00% | 105,223 | 13 Years 3 Months | Gross at Eff Date | 149,845 | | 0 |
| 40.00% | 89,304 | Economics Information: | Remaining Gross | 24,938 | | 0 |
| 50.00% | 78,038 | Net Payout Date: | 01/2011 | Remaining Net | 9,744 | | 0 |
| 60.00% | 69,674 | Rate of Return: | >100% | | | |
| 70.00% | 63,227 | Return on Investment: | 0.00 | BTU Content: | 1.000 mmbtu/mcf | | |
| 80.00% | 58,107 | Disc Return on Invest: | 0.00 | Gravity: | Oil: 28.00 Gas: 0.800 | | |
| 90.00% | 53,942 | Initial Division of Interest: | NRI | ORI | |
| 100.00% | 50,485 | WI: | 46.000000 | Oil: | 39.074000 | 0.000000 | |
| | | | Gas: | 39.074000 | 0.000000 | |
| | | Reversion Date: | None | Injection: | 0.000000 | 0.000000 | |
Last Twelve Months Historic Production Report
| Lease Name: MUNSON RANCH (13-1) | Operator: FRONTIER EXPLORATION INCORPORATED |
| County, ST: NYE, NV | Field Name: TRAP SPRING |
| Location: 13 9N 56E C SE NW | |
| Date | Well Count | Days On | Oil (bbl) | Gas (mcf) | Water (bbl) | Injection (bbl) |
| | | | | | | |
| Previous | | 7,830 | 146,769 | 0 | 31,332 | 0 |
| 01/2010 | 1 | 30 | 250 | 0 | 160 | 0 |
| 02/2010 | 1 | 28 | 203 | 0 | 149 | 0 |
| 03/2010 | 1 | 31 | 245 | 0 | 165 | 0 |
| 04/2010 | 1 | 30 | 258 | 0 | 160 | 0 |
| 05/2010 | 1 | 31 | 250 | 0 | 165 | 0 |
| 06/2010 | 1 | 30 | 264 | 0 | 150 | 0 |
| 07/2010 | 1 | 31 | 280 | 0 | 155 | 0 |
| 08/2010 | 1 | 31 | 267 | 0 | 180 | 0 |
| 09/2010 | 1 | 30 | 277 | 0 | 175 | 0 |
| 10/2010 | 1 | 31 | 263 | 0 | 181 | 0 |
| 11/2010 | 1 | 30 | 265 | 0 | 0 | 0 |
| 12/2010 | 1 | 31 | 254 | 0 | 0 | 0 |
| | | | | | | |
| Total: | | 8,194 | 149,845 | 0 | 32,972 | 0 |
Annual CashFlow Report
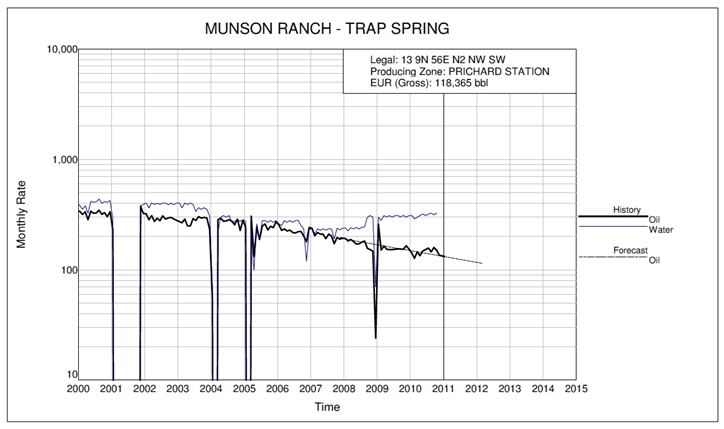
| Lease Name: MUNSON RANCH (13-45) | Operator: FRONTIER EXPLORATION INCORPORATED |
| County, ST: NYE, NV | Field Name: TRAP SPRING |
| Location: 13 9N 56E N2 NW SW | Reserve Type/Class: Proved/Developed, Producing |
| | Well | Gross Production | Net Production | Average Prices | Sales |
| Date | Count | Oil | Gas | Oil | Gas | Oil | Gas | Total |
| | | (Bbl) | (Mcf) | (Bbl) | (Mcf) | ($/Bbl) | ($/Mcf) | ($) |
| 12/2011 | 1 | 1,489 | 0 | 468 | 0 | 60.40 | 0.00 | 28,252 |
| 02/2012 | 1 | 231 | 0 | 73 | 0 | 60.40 | 0.00 | 4,382 |
| Grand Total: | | 1,720 | 0 | 540 | 0 | 60.40 | 0.00 | 32,634 |
| | | | | | | | | |
| | Operating | | Operating | Other | Periodic | Cumulative | 10% |
| Date | Expenses | Taxes | Income | Costs | Cash Flow | Cash Flow | Cash Flow |
| | ($) | ($) | ($) | ($) | ($) | ($) | ($) |
| 12/2011 | 25,061 | 1,273 | 1,918 | 0 | 1,918 | 1,918 | 1,846 |
| 02/2012 | 4,177 | 183 | 23 | 0 | 23 | 1,941 | 21 |
| Grand Total: | 29,238 | 1,455 | 1,941 | 0 | 1,941 | 1,941 | 1,866 |
| Discount Present Worth: | Economic Dates: | Economics Summary: | | |
| 0.00% | 1,941 | Effective Date | 01/2011 | Bbl Oil | Mcf Gas |
| 10.00% | 1,866 | Calculated Limit | 02/2012 | Ultimate Gross | 118,365 | | 0 |
| 20.00% | 1,801 | Economic Life | 14 Months | Historic Gross | 116,645 | | 0 |
| 30.00% | 1,745 | 1 Year 2 Months | Gross at Eff Date | 116,645 | | 0 |
| 40.00% | 1,694 | Economics Information: | Remaining Gross | 1,720 | | 0 |
| 50.00% | 1,649 | Net Payout Date: | 01/2011 | Remaining Net | 540 | | 0 |
| 60.00% | 1,609 | Rate of Return: | >100% | | | |
| 70.00% | 1,572 | Return on Investment: | 0.00 | BTU Content: | 1.000 mmbtu/mcf | | |
| 80.00% | 1,538 | Disc Return on Invest: | 0.00 | Gravity: | Oil: 28.00 Gas: 0.800 | | |
| 90.00% | 1,508 | Initial Division of Interest: | NRI | ORI | |
| 100.00% | 1,479 | WI: | 46.000000 | Oil: | 31.418000 | 0.000000 | |
| | | | Gas: | 31.418000 | 0.000000 | |
| | | Reversion Date: | None | Injection: | 0.000000 | 0.000000 | |
Last Twelve Months Historic Production Report
| Lease Name: MUNSON RANCH (13-45) | Operator: FRONTIER EXPLORATION INCORPORATED |
| County, ST: NYE, NV | Field Name: TRAP SPRING |
| Location: 13 9N 56E N2 NW SW | |
| Date | Well Count | Days On | Oil (bbl) | Gas (mcf) | Water (bbl) | Injection (bbl) |
| | | | | | | |
| Previous | | 6,529 | 114,917 | 0 | 50,129 | 0 |
| 01/2010 | 1 | 31 | 142 | 0 | 311 | 0 |
| 02/2010 | 1 | 28 | 127 | 0 | 290 | 0 |
| 03/2010 | 1 | 29 | 145 | 0 | 300 | 0 |
| 04/2010 | 1 | 30 | 134 | 0 | 310 | 0 |
| 05/2010 | 1 | 31 | 148 | 0 | 320 | 0 |
| 06/2010 | 1 | 30 | 152 | 0 | 310 | 0 |
| 07/2010 | 1 | 31 | 157 | 0 | 320 | 0 |
| 08/2010 | 1 | 31 | 145 | 0 | 325 | 0 |
| 09/2010 | 1 | 30 | 159 | 0 | 315 | 0 |
| 10/2010 | 1 | 31 | 150 | 0 | 326 | 0 |
| 11/2010 | 1 | 30 | 135 | 0 | 0 | 0 |
| 12/2010 | 1 | 31 | 134 | 0 | 0 | 0 |
| | | | | | | |
| Total: | | 6,892 | 116,645 | 0 | 53,256 | 0 |
Annual CashFlow Report
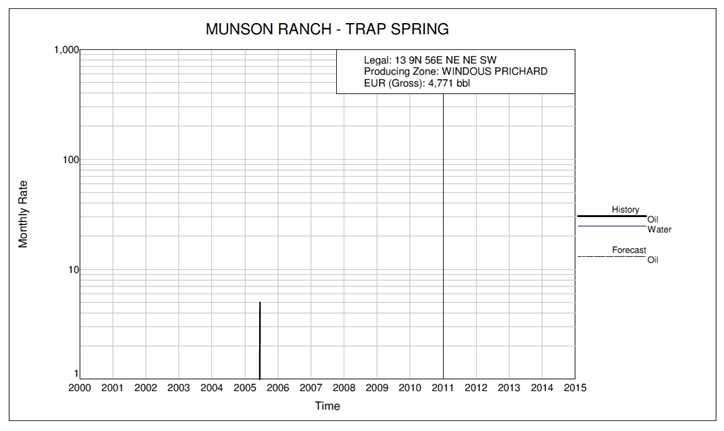
| Lease Name: MUNSON RANCH (13-46) | Operator: FRONTIER EXPLORATION INCORPORATED |
| County, ST: NYE, NV | Field Name: TRAP SPRING |
| Location: 13 9N 56E NE NE SW | Reserve Type/Class: Proved/Developed, Shutin |
| | Well | Gross Production | Net Production | Average Prices | Sales |
| Date | Count | Oil | Gas | Oil | Gas | Oil | Gas | Total |
| | | (Bbl) | (Mcf) | (Bbl) | (Mcf) | ($/Bbl) | ($/Mcf) | ($) |
| 01/2011 | 1 | 0 | 0 | 0 | 0 | 0.00 | 0.00 | 0 |
| Grand Total: | | 0 | 0 | 0 | 0 | 0.00 | 0.00 | 0 |
| | Operating | | Operating | Other | Periodic | Cumulative | 10% |
| Date | Expenses | Taxes | Income | Costs | Cash Flow | Cash Flow | Cash Flow |
| | ($) | ($) | ($) | ($) | ($) | ($) | ($) |
| 01/2011 | 0 | 0 | 0 | 0 | 0 | 0 | 0 |
| Grand Total: | 0 | 0 | 0 | 0 | 0 | 0 | 0 |
| Discount Present Worth: | Economic Dates: | Economics Summary: | | |
| 0.00% | 0 | Effective Date | 01/2011 | Bbl Oil | Mcf Gas |
| 10.00% | 0 | Calculated Limit | 01/2011 | Ultimate Gross | 4,771 | | 0 |
| 20.00% | 0 | Economic Life | 1 Month | Historic Gross | 4,771 | | 0 |
| 30.00% | 0 | 0 Year 1 Months | Gross at Eff Date | 4,771 | | 0 |
| 40.00% | 0 | Economics Information: | Remaining Gross | 0 | | 0 |
| 50.00% | 0 | Net Payout Date: | n/a | Remaining Net | 0 | | 0 |
| 60.00% | 0 | Rate of Return: | n/a | | | |
| 70.00% | 0 | Return on Investment: | 0.00 | BTU Content: | 1.000 mmbtu/mcf | | |
| 80.00% | 0 | Disc Return on Invest: | 0.00 | Gravity: | Oil: 28.00 Gas: 0.800 | | |
| 90.00% | 0 | Initial Division of Interest: | NRI | ORI | |
| 100.00% | 0 | WI: | 46.000000 | Oil: | 31.418000 | 0.000000 | |
| | | | Gas: | 31.418000 | 0.000000 | |
| | | Reversion Date: | None | Injection: | 0.000000 | 0.000000 | |
Last Twelve Months Historic Production Report
| Lease Name: MUNSON RANCH (13-46) | Operator: FRONTIER EXPLORATION INCORPORATED |
| County, ST: NYE, NV | Field Name: TRAP SPRING |
| Location: 13 9N 56E NE NE SW | |
| Date | Well Count | Days On | Oil (bbl) | Gas (mcf) | Water (bbl) | Injection (bbl) |
| | | | | | | |
| Previous | | 444 | 4,766 | 0 | 457 | 0 |
| 07/2004 | 0 | 0 | 0 | 0 | 0 | 0 |
| 08/2004 | 0 | 0 | 0 | 0 | 0 | 0 |
| 09/2004 | 0 | 0 | 0 | 0 | 0 | 0 |
| 10/2004 | 0 | 0 | 0 | 0 | 0 | 0 |
| 11/2004 | 0 | 0 | 0 | 0 | 0 | 0 |
| 12/2004 | 0 | 0 | 0 | 0 | 0 | 0 |
| 01/2005 | 0 | 0 | 0 | 0 | 0 | 0 |
| 02/2005 | 0 | 0 | 0 | 0 | 0 | 0 |
| 03/2005 | 0 | 0 | 0 | 0 | 0 | 0 |
| 04/2005 | 0 | 0 | 0 | 0 | 0 | 0 |
| 05/2005 | 0 | 0 | 0 | 0 | 0 | 0 |
| 06/2005 | 1 | 1 | 5 | 0 | 0 | 0 |
| | | | | | | |
| Total: | | 445 | 4,771 | 0 | 457 | 0 |
Annual CashFlow Report
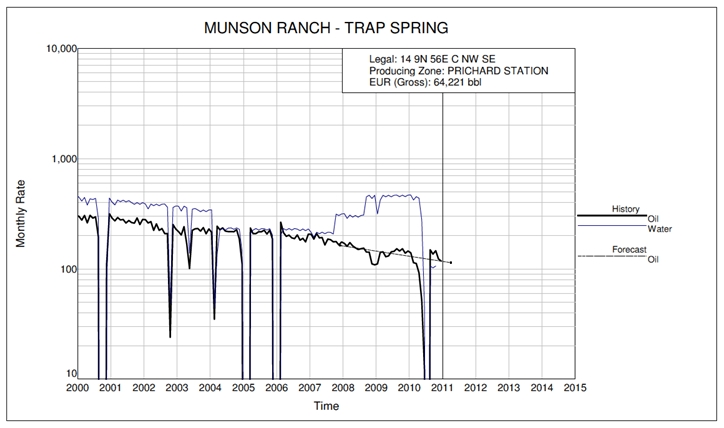
| Lease Name: MUNSON RANCH (14-33) | Operator: FRONTIER EXPLORATION INCORPORATED |
| County, ST: NYE, NV | Field Name: TRAP SPRING |
| Location: 14 9N 56E C NW SE | Reserve Type/Class: Proved/Developed, Producing |
| | Well | Gross Production | Net Production | Average Prices | Sales |
| Date | Count | Oil | Gas | Oil | Gas | Oil | Gas | Total |
| | | (Bbl) | (Mcf) | (Bbl) | (Mcf) | ($/Bbl) | ($/Mcf) | ($) |
| 01/2011 | 1 | 116 | 0 | 37 | 0 | 60.40 | 0.00 | 2,207 |
| Grand Total: | | 116 | 0 | 37 | 0 | 60.40 | 0.00 | 2,207 |
| | Operating | | Operating | Other | Periodic | Cumulative | 10% |
| Date | Expenses | Taxes | Income | Costs | Cash Flow | Cash Flow | Cash Flow |
| | ($) | ($) | ($) | ($) | ($) | ($) | ($) |
| 01/2011 | 2,088 | 103 | 16 | 0 | 16 | 16 | 15 |
| Grand Total: | 2,088 | 103 | 16 | 0 | 16 | 16 | 15 |
| Discount Present Worth: | Economic Dates: | Economics Summary: | | |
| 0.00% | 16 | Effective Date | 01/2011 | Bbl Oil | Mcf Gas |
| 10.00% | 15 | Calculated Limit | 01/2011 | Ultimate Gross | 64,221 | | 0 |
| 20.00% | 15 | Economic Life | 1 Month | Historic Gross | 64,105 | | 0 |
| 30.00% | 15 | 0 Years 1 Months | Gross at Eff Date | 64,105 | | 0 |
| 40.00% | 15 | Economics Information: | Remaining Gross | 116 | | 0 |
| 50.00% | 15 | Net Payout Date: | 01/2011 | Remaining Net | 37 | | 0 |
| 60.00% | 15 | Rate of Return: | >100% | | | |
| 70.00% | 15 | Return on Investment: | 0.00 | BTU Content: | 1.000 mmbtu/mcf | | |
| 80.00% | 15 | Disc Return on Invest: | 0.00 | Gravity: | Oil: 28.00 Gas: 0.800 | | |
| 90.00% | 15 | Initial Division of Interest: | NRI | ORI | |
| 100.00% | 15 | WI: | 46.000000 | Oil: | 31.418000 | 0.000000 | |
| | | | Gas: | 31.418000 | 0.000000 | |
| | | Reversion Date: | None | Injection: | 0.000000 | 0.000000 | |
Last Twelve Months Historic Production Report
| Lease Name: MUNSON RANCH (14-33) | Operator: FRONTIER EXPLORATION INCORPORATED |
| County, ST: NYE, NV | Field Name: TRAP SPRING |
| Location: 14 9N 56E C NW SE | |
| Date | Well Count | Days On | Oil (bbl) | Gas (mcf) | Water (bbl) | Injection (bbl) |
| | | | | | | |
| Previous | | 6,899 | 62,911 | 0 | 71,580 | 0 |
| 01/2010 | 1 | 31 | 140 | 0 | 468 | 0 |
| 02/2010 | 1 | 28 | 114 | 0 | 422 | 0 |
| 03/2010 | 1 | 30 | 112 | 0 | 452 | 0 |
| 04/2010 | 1 | 30 | 92 | 0 | 438 | 0 |
| 05/2010 | 1 | 19 | 52 | 0 | 277 | 0 |
| 06/2010 | 1 | 5 | 12 | 0 | 44 | 0 |
| 07/2010 | 0 | 0 | 0 | 0 | 0 | 0 |
| 08/2010 | 1 | 12 | 149 | 0 | 106 | 0 |
| 09/2010 | 1 | 30 | 136 | 0 | 102 | 0 |
| 10/2010 | 1 | 31 | 146 | 0 | 106 | 0 |
| 11/2010 | 1 | 30 | 123 | 0 | 0 | 0 |
| 12/2010 | 1 | 31 | 118 | 0 | 0 | 0 |
| | | | | | | |
| Total: | | 7,176 | 64,105 | 0 | 73,995 | 0 |
Annual CashFlow Report
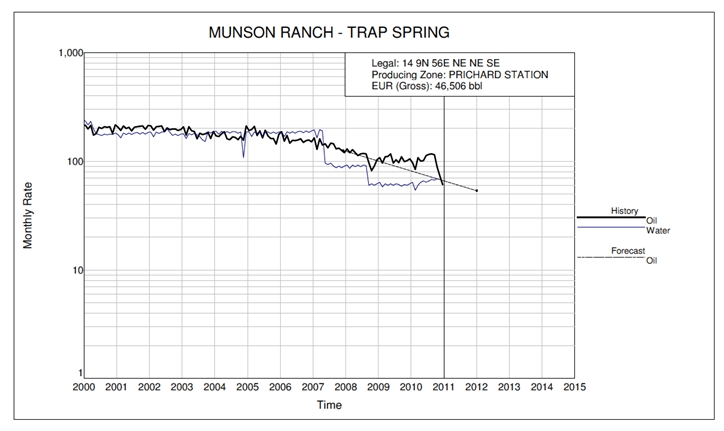
| Lease Name: MUNSON RANCH (14-49) | Operator: FRONTIER EXPLORATION INCORPORATED |
| County, ST: NYE, NV | Field Name: TRAP SPRING |
| Location: 14 9N 56E NE NE SE | Reserve Type/Class: Proved/Developed, Producing |
| | Well | Gross Production | Net Production | Average Prices | Sales |
| Date | Count | Oil | Gas | Oil | Gas | Oil | Gas | Total |
| | | (Bbl) | (Mcf) | (Bbl) | (Mcf) | ($/Bbl) | ($/Mcf) | ($) |
| Grand Total: | | 0 | 0 | 0 | 0 | 0.00 | 0.00 | 0 |
| | Operating | | Operating | Other | Periodic | Cumulative | 10% |
| Date | Expenses | Taxes | Income | Costs | Cash Flow | Cash Flow | Cash Flow |
| | ($) | ($) | ($) | ($) | ($) | ($) | ($) |
| Grand Total: | 0 | 0 | 0 | 0 | 0 | 0 | 0 |
| Discount Present Worth: | Economic Dates: | Economics Summary: | | |
| 0.00% | 0 | Effective Date | 01/2011 | Bbl Oil | Mcf Gas |
| 10.00% | 0 | Calculated Limit | n/a | Ultimate Gross | 46,506 | | 0 |
| 20.00% | 0 | Economic Life | 0 Months | Historic Gross | 46,506 | | 0 |
| 30.00% | 0 | 0 Years 0 Months | Gross at Eff Date | 46,506 | | 0 |
| 40.00% | 0 | Economics Information: | Remaining Gross | 0 | | 0 |
| 50.00% | 0 | Net Payout Date: | n/a | Remaining Net | 0 | | 0 |
| 60.00% | 0 | Rate of Return: | n/a | | | |
| 70.00% | 0 | Return on Investment: | 0.00 | BTU Content: | 1.000 mmbtu/mcf | | |
| 80.00% | 0 | Disc Return on Invest: | 0.00 | Gravity: | Oil: 28.00 Gas: 0.800 | | |
| 90.00% | 0 | Initial Division of Interest: | NRI | ORI | |
| 100.00% | 0 | WI: | 46.000000 | Oil: | 31.418000 | 0.000000 | |
| | | | Gas: | 31.418000 | 0.000000 | |
| | | Reversion Date: | None | Injection: | 0.000000 | 0.000000 | |
Last Twelve Months Historic Production Report
| Lease Name: MUNSON RANCH (14-49) | Operator: FRONTIER EXPLORATION INCORPORATED |
| County, ST: NYE, NV | Field Name: TRAP SPRING |
| Location: 14 9N 56E NE NE SE | |
| Date | Well Count | Days On | Oil (bbl) | Gas (mcf) | Water (bbl) | Injection (bbl) |
| | | | | | | |
| Previous | | 7,084 | 45,333 | 0 | 32,580 | 0 |
| 01/2010 | 1 | 31 | 97 | 0 | 64 | 0 |
| 02/2010 | 1 | 26 | 84 | 0 | 54 | 0 |
| 03/2010 | 1 | 31 | 108 | 0 | 60 | 0 |
| 04/2010 | 1 | 30 | 100 | 0 | 64 | 0 |
| 05/2010 | 1 | 31 | 101 | 0 | 66 | 0 |
| 06/2010 | 1 | 30 | 113 | 0 | 64 | 0 |
| 07/2010 | 1 | 31 | 116 | 0 | 66 | 0 |
| 08/2010 | 1 | 31 | 117 | 0 | 68 | 0 |
| 09/2010 | 1 | 30 | 115 | 0 | 67 | 0 |
| 10/2010 | 1 | 31 | 88 | 0 | 69 | 0 |
| 11/2010 | 1 | 30 | 73 | 0 | 0 | 0 |
| 12/2010 | 1 | 31 | 61 | 0 | 0 | 0 |
| | | | | | | |
| Total: | | 7,447 | 46,506 | 0 | 33,222 | 0 |
Annual CashFlow Report
| Lease Name: MUNSON RANCH (14-49X) | Operator: FRONTIER EXPLORATION INCORPORATED |
| County, ST: NYE, NV | Field Name: TRAP SPRING |
| Location: 14 9N 56E SE NE SE | Reserve Type/Class: Proved/Developed, Producing |
| | Well | Gross Production | Net Production | Average Prices | Sales |
| Date | Count | Oil | Gas | Oil | Gas | Oil | Gas | Total |
| | | (Bbl) | (Mcf) | (Bbl) | (Mcf) | ($/Bbl) | ($/Mcf) | ($) |
| Grand Total: | | 0 | 0 | 0 | 0 | 0.00 | 0.00 | 0 |
| | Operating | | Operating | Other | Periodic | Cumulative | 10% |
| Date | Expenses | Taxes | Income | Costs | Cash Flow | Cash Flow | Cash Flow |
| | ($) | ($) | ($) | ($) | ($) | ($) | ($) |
| Grand Total: | 0 | 0 | 0 | 0 | 0 | 0 | 0 |
| Discount Present Worth: | Economic Dates: | Economics Summary: | | |
| 0.00% | 0 | Effective Date | 01/2011 | Bbl Oil | Mcf Gas |
| 10.00% | 0 | Calculated Limit | n/a | Ultimate Gross | 19,598 | | 0 |
| 20.00% | 0 | Economic Life | 0 Months | Historic Gross | 19,598 | | 0 |
| 30.00% | 0 | 0 Years 0 Months | Gross at Eff Date | 19,598 | | 0 |
| 40.00% | 0 | Economics Information: | Remaining Gross | 0 | | 0 |
| 50.00% | 0 | Net Payout Date: | n/a | Remaining Net | 0 | | 0 |
| 60.00% | 0 | Rate of Return: | n/a | | | |
| 70.00% | 0 | Return on Investment: | 0.00 | BTU Content: | 1.000 mmbtu/mcf | | |
| 80.00% | 0 | Disc Return on Invest: | 0.00 | Gravity: | Oil: 28.00 Gas: 0.800 | | |
| 90.00% | 0 | Initial Division of Interest: | NRI | ORI | |
| 100.00% | 0 | WI: | 50.500000 | Oil: | 34.492000 | 0.000000 | |
| | | | Gas: | 34.492000 | 0.000000 | |
| | | Reversion Date: | None | Injection: | 0.000000 | 0.000000 | |
Last Twelve Months Historic Production Report
| Lease Name: MUNSON RANCH (14-49X) | Operator: FRONTIER EXPLORATION INCORPORATED |
| County, ST: NYE, NV | Field Name: TRAP SPRING |
| Location: 14 9N 56E SE NE SE | |
| Date | Well Count | Days On | Oil (bbl) | Gas (mcf) | Water (bbl) | Injection (bbl) |
| | | | | | | |
| Previous | | 2,203 | 19,247 | 0 | 1,167 | 0 |
| 01/2010 | 1 | 3 | 34 | 0 | 0 | 0 |
| 02/2010 | 1 | 3 | 27 | 0 | 0 | 0 |
| 03/2010 | 1 | 3 | 29 | 0 | 0 | 0 |
| 04/2010 | 1 | 3 | 30 | 0 | 0 | 0 |
| 05/2010 | 1 | 4 | 38 | 0 | 0 | 0 |
| 06/2010 | 1 | 4 | 39 | 0 | 0 | 0 |
| 07/2010 | 1 | 3 | 29 | 0 | 0 | 0 |
| 08/2010 | 1 | 3 | 29 | 0 | 0 | 0 |
| 09/2010 | 1 | 2 | 19 | 0 | 0 | 0 |
| 10/2010 | 1 | 3 | 29 | 0 | 0 | 0 |
| 11/2010 | 1 | 3 | 29 | 0 | 0 | 0 |
| 12/2010 | 1 | 3 | 19 | 0 | 0 | 0 |
| | | | | | | |
| Total: | | 2,240 | 19,598 | 0 | 1,167 | 0 |
Annual CashFlow Report
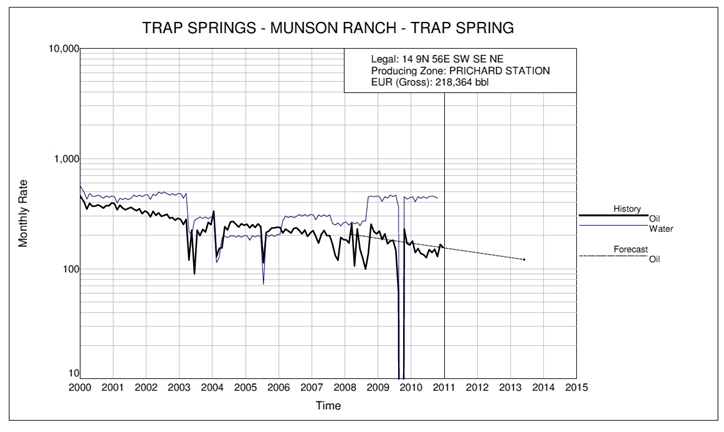
| Lease Name: TRAP SPRINGS - MUNSON RANCH (14-42) | Operator: FRONTIER EXPLORATION INCORPORATED |
| County, ST: NYE, NV | Field Name: TRAP SPRING |
| Location: 14 9N 56E SW SE NE | Reserve Type/Class: Proved/Developed, Producing |
| | Well | Gross Production | Net Production | Average Prices | Sales |
| Date | Count | Oil | Gas | Oil | Gas | Oil | Gas | Total |
| | | (Bbl) | (Mcf) | (Bbl) | (Mcf) | ($/Bbl) | ($/Mcf) | ($) |
| Grand Total: | | 0 | 0 | 0 | 0 | 0.00 | 0.00 | 0 |
| | Operating | | Operating | Other | Periodic | Cumulative | 10% |
| Date | Expenses | Taxes | Income | Costs | Cash Flow | Cash Flow | Cash Flow |
| | ($) | ($) | ($) | ($) | ($) | ($) | ($) |
| Grand Total: | 0 | 0 | 0 | 0 | 0 | 0 | 0 |
| Discount Present Worth: | Economic Dates: | Economics Summary: | | |
| 0.00% | 0 | Effective Date | 01/2011 | Bbl Oil | Mcf Gas |
| 10.00% | 0 | Calculated Limit | n/a | Ultimate Gross | 218,364 | | 0 |
| 20.00% | 0 | Economic Life | 0 Months | Historic Gross | 218,364 | | 0 |
| 30.00% | 0 | 0 Years 0 Months | Gross at Eff Date | 218,364 | | 0 |
| 40.00% | 0 | Economics Information: | Remaining Gross | 0 | | 0 |
| 50.00% | 0 | Net Payout Date: | n/a | Remaining Net | 0 | | 0 |
| 60.00% | 0 | Rate of Return: | n/a | | | |
| 70.00% | 0 | Return on Investment: | 0.00 | BTU Content: | 1.000 mmbtu/mcf | | |
| 80.00% | 0 | Disc Return on Invest: | 0.00 | Gravity: | Oil: 28.00 Gas: 0.800 | | |
| 90.00% | 0 | Initial Division of Interest: | NRI | ORI | |
| 100.00% | 0 | WI: | 21.600000 | Oil: | 18.900000 | 0.000000 | |
| | | | Gas: | 18.900000 | 0.000000 | |
| | | Reversion Date: | None | Injection: | 0.000000 | 0.000000 | |
Last Twelve Months Historic Production Report
| Lease Name: TRAP SPRINGS - MUNSON RANCH (14-42) | Operator: FRONTIER EXPLORATION INCORPORATED |
| County, ST: NYE, NV | Field Name: TRAP SPRING |
| Location: 14 9N 56E SW SE NE | |
| Date | Well Count | Days On | Oil (bbl) | Gas (mcf) | Water (bbl) | Injection (bbl) |
| | | | | | | |
| Previous | | 7,600 | 216,607 | 0 | 104,784 | 0 |
| 01/2010 | 1 | 31 | 178 | 0 | 450 | 0 |
| 02/2010 | 1 | 28 | 140 | 0 | 406 | 0 |
| 03/2010 | 1 | 31 | 152 | 0 | 450 | 0 |
| 04/2010 | 1 | 30 | 137 | 0 | 435 | 0 |
| 05/2010 | 1 | 31 | 134 | 0 | 450 | 0 |
| 06/2010 | 1 | 30 | 126 | 0 | 435 | 0 |
| 07/2010 | 1 | 31 | 149 | 0 | 450 | 0 |
| 08/2010 | 1 | 31 | 140 | 0 | 455 | 0 |
| 09/2010 | 1 | 30 | 150 | 0 | 450 | 0 |
| 10/2010 | 1 | 31 | 129 | 0 | 436 | 0 |
| 11/2010 | 1 | 30 | 166 | 0 | 0 | 0 |
| 12/2010 | 1 | 31 | 156 | 0 | 0 | 0 |
| | | | | | | |
| Total: | | 7,965 | 218,364 | 0 | 109,201 | 0 |
Attachment A
Petroleum Resources Management System 2007
Prepared by Society of Petroleum Engineers (SPE)
Resource and Reserve classifications -- excerpts
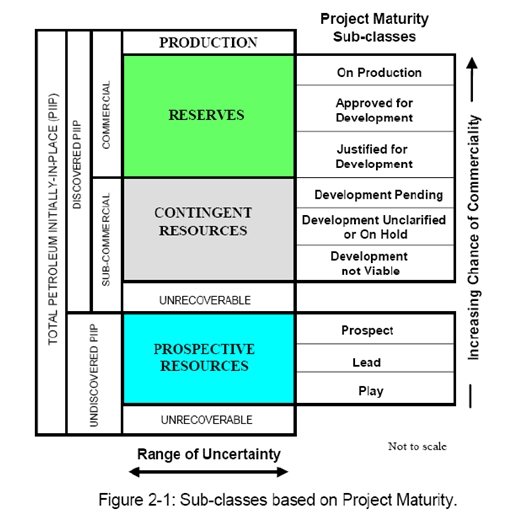
2.1.3.1 Project Maturity Sub-Classes
All illustrated in Figure 2-1, development projects (and their associated recoverable quantities) may be sub-classified according to project maturity levels and the associated actions (business decisions) required to move a project toward commercial production.
SPE Resource Classification
Page 1 of 7
Table 1: Recoverable Resources Classes and Sub-Classes
| | Class/Sub-Class | | Definition | | Guidelines |
| | Reserves | | Reserves are those quantities of petroleum anticipated to be commercially recoverable by application of development projects to known accumulations from a given date forward under defined conditions. | | Reserves must satisfy four criteria: they must be discovered, recoverable, commercial, and remaining based on the development project(s) applied. Reserves are further subdivided in accordance with the level of certainty associated with the estimates and may be sub-classified based on project maturity and/or characterized by their development and production status. To be included in the Reserves class, a project must be sufficiently defined to establish its commercial viability. There must be a reasonable expectation that all required internal and external approvals will be forthcoming, and there is evidence of firm intention to proceed with development within a reasonable time frame. A reasonable time frame for the initiation of development depends on the specific circumstances and varies according to the scope of the project. While 5 years is recommended as a benchmark, a longer time frame could be applied where, for example, development of economic projects are deferred at the option of the producer for, among other things, market-related reasons, or to meet contractual or strategic objectives. In all cases, the justification for classification as Reserves should be clearly documented. To be included in the Reserves class, there must be a high confidence in the commercial producibility of the reservoir as supported by actual production or formation tests. In certain cases, Reserves may be assigned on the basis of well logs and/or core analysis that indicate that the subject reservoir is hydrocarbon-bearing and is analogous to reservoirs in the same area that are producing or have demonstrated the ability to produce on formation tests. |
| | On Production | | The development project is currently producing and selling petroleum to market. | | The key criterion is that the project is receiving income from sales, rather than the approved development project necessarily being complete. This is the point at which the project “chance of commerciality” can be said to be 100%. The project “decision gate” is the decision to initiate commercial production from the project. |
| | Approved for Development | | All necessary approvals have been obtained, capital funds have been committed, and implementation of the development project is under way. | | At this point, it must be certain that the development project is going ahead. The project must not be subject to any contingencies such as outstanding regulatory approvals or sales contracts. Forecast capital expenditures should be included in the reporting entity’s current or following year’s approved budget. The project “decision gate” is the decision to start investing capital in the construction of production facilities and/or drilling development wells. |
SPE Resource Classification
Page 2 of 7
| | Class/Sub-Class | | Definition | | Guidelines |
| | Justified for Development | | Implementation of the development project is justified on the basis of reasonable forecast commercial conditions at the time of reporting, and there are reasonable expectations that all necessary approvals/contracts will be obtained. | | In order to move to this level of project maturity, and hence have reserves associated with it, the development project must be commercially viable at the time of reporting, based on the reporting entity’s assumptions of future prices, costs, etc. (“forecast case”) and the specific circumstances of the project. Evidence of a firm intention to proceed with development within a reasonable time frame will be sufficient to demonstrate commerciality. There should be a development plan in sufficient detail to support the assessment of commerciality and a reasonable expectation that any regulatory approvals or sales contracts required prior to project implementation will be forthcoming. Other than such approvals/contracts, there should be no known contingencies that could preclude the development from proceeding within a reasonable timeframe (see Reserves class). The project “decision gate” is the decision by the reporting entity and its partners, if any, that the project has reached a level of technical and commercial maturity sufficient to justify proceeding with development at that point in time. |
| | Contingent Resources | | Those quantities of petroleum estimated, as of a given date, to be potentially recoverable from known accumulations by application of development projects, but which are not currently considered to be commercially recoverable due to one or more contingencies. | | Contingent Resources may include, for example, projects for which there are currently no viable markets, or where commercial recovery is dependent on technology under development, or where evaluation of the accumulation is insufficient to clearly assess commerciality. Contingent Resources are further categorized in accordance with the level of certainty associated with the estimates and may be sub-classified based on project maturity and/or characterized by their economic status. |
| | Development Pending | | A discovered accumulation where project activities are ongoing to justify commercial development in the foreseeable future. | | The project is seen to have reasonable potential for eventual commercial development, to the extent that further data acquisition (e.g. drilling, seismic data) and/or evaluations are currently ongoing with a view to confirming that the project is commercially viable and providing the basis for selection of an appropriate development plan. The critical contingencies have been identified and are reasonably expected to be resolved within a reasonable time frame. Note that disappointing appraisal/evaluation results could lead to a re-classification of the project to “On Hold” or “Not Viable” status. The project “decision gate” is the decision to undertake further data acquisition and/or studies designed to move the project to a level of technical and commercial maturity at which a decision can be made to proceed with development and production. |
SPE Resource Classification
Page 3 of 7
| | Class/Sub-Class | | Definition | | Guidelines |
| | Development Unclarified or on Hold | | A discovered accumulation where project activities are on hold and/or where justification as a commercial development may be subject to significant delay. | | The project is seen to have potential for eventual commercial development, but further appraisal/evaluation activities are on hold pending the removal of significant contingencies external to the project, or substantial further appraisal/evaluation activities are required to clarify the potential for eventual commercial development. Development may be subject to a significant time delay. Note that a change in circumstances, such that there is no longer a reasonable expectation that a critical contingency can be removed in the foreseeable future, for example, could lead to a reclassification of the project to “Not Viable” status. The project “decision gate” is the decision to either proceed with additional evaluation designed to clarify the potential for eventual commercial development or to temporarily suspend or delay further activities pending resolution of external contingencies. |
| | Development Not Viable | | A discovered accumulation for which there are no current plans to develop or to acquire additional data at the time due to limited production potential. | | The project is not seen to have potential for eventual commercial development at the time of reporting, but the theoretically recoverable quantities are recorded so that the potential opportunity will be recognized in the event of a major change in technology or commercial conditions. The project “decision gate” is the decision not to undertake any further data acquisition or studies on the project for the foreseeable future. |
| | Prospective Resources | | Those quantities of petroleum which are estimated, as of a given date, to be potentially recoverable from undiscovered accumulations. | | Potential accumulations are evaluated according to their chance of discovery and, assuming a discovery, the estimated quantities that would be recoverable under defined development projects. It is recognized that the development programs will be of significantly less detail and depend more heavily on analog developments in the earlier phases of exploration. |
| | Prospect | | A project associated with a potential accumulation that is sufficiently well defined to represent a viable drilling target. | | Project activities are focused on assessing the chance of discovery and, assuming discovery, the range of potential recoverable quantities under a commercial development program. |
| | Lead | | A project associated with a potential accumulation that is currently poorly defined and requires more data acquisition and/or evaluation in order to be classified as a prospect. | | Project activities are focused on acquiring additional data and/or undertaking further evaluation designed to confirm whether or not the lead can be matured into a prospect. Such evaluation includes the assessment of the chance of discovery and, assuming discovery, the range of potential recovery under feasible development scenarios. |
| | Play | | A project associated with a prospective trend of potential prospects, but which requires more data acquisition and/or evaluation in order to define specific leads or prospects. | | Project activities are focused on acquiring additional data and/or undertaking further evaluation designed to define specific leads or prospects for more detailed analysis of their chance of discovery and, assuming discovery, the range of potential recovery under hypothetical development scenarios. |
SPE Resource Classification
Page 4 of 7
Table 2: Reserves Status Definitions and Guidelines
| | Status | | Definition | | Guidelines |
| | Developed Reserves | | Developed Reserves are expected quantities to be recovered from existing wells and facilities. | | Reserves are considered developed only after the necessary equipment has been installed, or when the costs to do so are relatively minor compared to the cost of a well. Where required facilities become unavailable, it may be necessary to reclassify Developed Reserves as Undeveloped. Developed Reserves may be further sub-classified as Producing or Non-Producing. |
| | Developed Producing Reserves | | Developed Producing Reserves are expected to be recovered from completion intervals that are open and producing at the time of the estimate. | | Improved recovery reserves are considered producing only after the improved recovery project is in operation. |
| | Developed Non- Producing Reserves | | Developed Non-Producing Reserves include shut-in and behind-pipe Reserves. | | Shut-in Reserves are expected to be recovered from (1) completion intervals which are open at the time of the estimate but which have not yet started producing, (2) wells which were shut-in for market conditions or pipeline connections, or (3) wells not capable of production for mechanical reasons. Behind-pipe Reserves are expected to be recovered from zones in existing wells which will require additional completion work or future re-completion prior to start of production. In all cases, production can be initiated or restored with relatively low expenditure compared to the cost of drilling a new well. |
| | Undeveloped Reserves | | Undeveloped Reserves are quantities expected to be recovered through future investments: | | (1) from new wells on undrilled acreage in known accumulations, (2) from deepening existing wells to a different (but known) reservoir, (3) from infill wells that will increase recovery, or (4) where a relatively large expenditure (e.g. when compared to the cost of drilling a new well) is required to (a) recomplete an existing well or (b) install production or transportation facilities for primary or improved recovery projects. |
SPE Resource Classification
Page 5 of 7
Table 3: Reserves Category Definitions and Guidelines
| | Category | | Definition | | Guidelines |
| | Proved Reserves | | Proved Reserves are those quantities of petroleum, which by analysis of geoscience and engineering data, can be estimated with reasonable certainty to be commercially recoverable, from a given date forward, from known reservoirs and under defined economic conditions, operating methods, and government regulations. | | If deterministic methods are used, the term reasonable certainty is intended to express a high degree of confidence that the quantities will be recovered. If probabilistic methods are used, there should be at least a 90% probability that the quantities actually recovered will equal or exceed the estimate. The area of the reservoir considered as Proved includes (1) the area delineated by drilling and defined by fluid contacts, if any, and (2) adjacent undrilled portions of the reservoir that can reasonably be judged as continuous with it and commercially productive on the basis of available geoscience and engineering data. In the absence of data on fluid contacts, Proved quantities in a reservoir are limited by the lowest known hydrocarbon (LKH) as seen in a well penetration unless otherwise indicated by definitive geoscience, engineering, or performance data. Such definitive information may include pressure gradient analysis and seismic indicators. Seismic data alone may not be sufficient to define fluid contacts for Proved reserves (see “2001 Supplemental Guidelines,” Chapter 8). Reserves in undeveloped locations may be classified as Proved provided that: · Th● The locations are in undrilled areas of the reservoir that can be judged with reasonable certainty
to be commercially productive. · Int● Interpretations of available geoscience and engineering data indicate with reasonable certainty
that the objective formation is laterally continuous with drilled Proved locations. For Proved Reserves, the recovery efficiency applied to these reservoirs should be defined based on a range of possibilities supported by analogs and sound engineering judgment considering the characteristics of the Proved area and the applied development program. |
| | Probable Reserves | | Probable Reserves are those additional Reserves which analysis of geoscience and engineering data indicate are less likely to be recovered than Proved Reserves but more certain to be recovered than Possible Reserves. | | It is equally likely that actual remaining quantities recovered will be greater than or less than the sum of the estimated Proved plus Probable Reserves (2P). In this context, when probabilistic methods are used, there should be at least a 50% probability that the actual quantities recovered will equal or exceed the 2P estimate. Probable Reserves may be assigned to areas of a reservoir adjacent to Proved where data control or interpretations of available data are less certain. The interpreted reservoir continuity may not meet the reasonable certainty criteria. Probable estimates also include incremental recoveries associated with project recovery efficiencies beyond that assumed for Proved. |
SPE Resource Classification
Page 6 of 7
| | Category | | Definition | | Guidelines |
| | Possible Reserves | | Possible Reserves are those additional reserves which analysis of geoscience and engineering data indicate are less likely to be recoverable than Probable Reserves. | | The total quantities ultimately recovered from the project have a low probability to exceed the sum of Proved plus Probable plus Possible (3P), which is equivalent to the high estimate scenario. When probabilistic methods are used, there should be at least a 10% probability that the actual quantities recovered will equal or exceed the 3P estimate. Possible Reserves may be assigned to areas of a reservoir adjacent to Probable where data control and interpretations of available data are progressively less certain. Frequently, this may be in areas where geoscience and engineering data are unable to clearly define the area and vertical reservoir limits of commercial production from the reservoir by a defined project. Possible estimates also include incremental quantities associated with project recovery efficiencies beyond that assumed for Probable. |
| | Probable and Possible Reserves | | (See above for separate criteria for Probable Reserves and Possible Reserves.) | | The 2P and 3P estimates may be based on reasonable alternative technical and commercial interpretations within the reservoir and/or subject project that are clearly documented, including comparisons to results in successful similar projects. In conventional accumulations, Probable and/or Possible Reserves may be assigned where geoscience and engineering data identify directly adjacent portions of a reservoir within the same accumulation that may be separated from Proved areas by minor faulting or other geological discontinuities and have not been penetrated by a wellbore but are interpreted to be in communication with the known (Proved) reservoir. Probable or Possible Reserves may be assigned to areas that are structurally higher than the Proved area. Possible (and in some cases, Probable) Reserves may be assigned to areas that are structurally lower than the adjacent Proved or 2P area. Caution should be exercised in assigning Reserves to adjacent reservoirs isolated by major, potentially sealing, faults until this reservoir is penetrated and evaluated as commercially productive. Justification for assigning Reserves in such cases should be clearly documented. Reserves should not be assigned to areas that are clearly separated from a known accumulation by non-productive reservoir (i.e., absence of reservoir, structurally low reservoir, or negative test results); such areas may contain Prospective Resources. In conventional accumulations, where drilling has defined a highest known oil (HKO) elevation and there exists the potential for an associated gas cap, Proved oil Reserves should only be assigned in the structurally higher portions of the reservoir if there is reasonable certainty that such portions are initially above bubble point pressure based on documented engineering analyses. Reservoir portions that do not meet this certainty may be assigned as Probable and Possible oil and/or gas based on reservoir fluid properties and pressure gradient interpretations. |
SPE Resource Classification Page 7 of 7 |