The Directors
FX Energy Inc
3006 Highland Drive 206
Salt Lake City,
Utah 84106
United States of America
The Royal Bank of Scotland Plc
135 Bishopsgate
London
EC2M 3UR
United Kingdom.
ING Bank N.V.
Bijlmerplein 888
1102 MG
Amsterdam
The Netherlands
KBC Bank N.V.
Dublin Branch
KBC House
4 George’s Dock
IFSC
Dublin 1
ECV1817
14th February 2012
Dear Sirs,
EVALUATION OF POLISH GAS ASSETS
RPS Energy (RPS) has completed an independent reserves evaluation of the Zaniemysl, Roszkow, Winna Gora, Sroda-Kromolice, Kromolice South, Grabowka and Lisewo Gas Fields in Poland (“the Properties”) currently owned by FX Energy Inc (“FX”). We have estimated Proved, Proved plus Probable and Proved plus Probable plus Possible reserves as at 1 January 2012, based on data and information available up to 31 December 2011.
The Proved, Proved plus Probable and Proved plus Probable plus Possible reserves estimates in this report comply with the reporting definitions set in the Article 210.4-10(a) of Regulations S-X (17 CFR 210) of United States Securities and Exchange Commission (“SEC”).
The work was undertaken by a team of professional petroleum engineers, geoscientists and economists and is based on data supplied by FX. Our approach has been to prepare independent estimates of developed reserves for all producing assets based on the field’s production performance. In fields where potential exists to further develop reserves through additional capital investment, we have reviewed the available data supplied by the Operator and estimated the likely range of incremental reserves that can be recovered.
In estimating reserves we have used standard petroleum engineering techniques. These techniques combine geological and production data with detailed information concerning fluid characteristics and reservoir pressure as well as pertinent production software that allowed to model the different wells as close as possible to what their interaction resembles in reality. We have estimated the degree of uncertainty inherent in the measurements and interpretation of the data and have calculated a range of recoverable reserves. We have taken the working interest that FX has in the Properties as presented by FX and we have not investigated nor do we make any warranty as to FX's interest in the fields.
Reserves
Gas Reserves attributable to the FX Energy Interest (MMscf), as of 1 January 2012
| Field | FX Energy Interest | FX Energy Gas Reserves (MMscf) |
| Developed | Undeveloped |
| Proved | Proved + Probable | Proved + Probable + Possible | Proved | Proved + Probable | Proved + Probable + Possible |
| | | | | | | | |
| Grabowka | 100.0% | 110 | 860 | 2,160 | 1,310 | 6,909 | 17,609 |
| Zaniemysl | 24.5% | 2,958 | 5,718 | 11,095 | | | |
| Roszkow | 49.0% | 6,165 | 15,475 | 26,919 | | | |
| Sroda-Kromolice | 49.0% | 18,339 | 31,514 | 49,593 | | | |
| Kromolice South | 49.0% | 4,414 | 7,450 | 12,029 | | | |
| Winna Gora | 49.0% | | | | 4,093 | 5,804 | 7,938 |
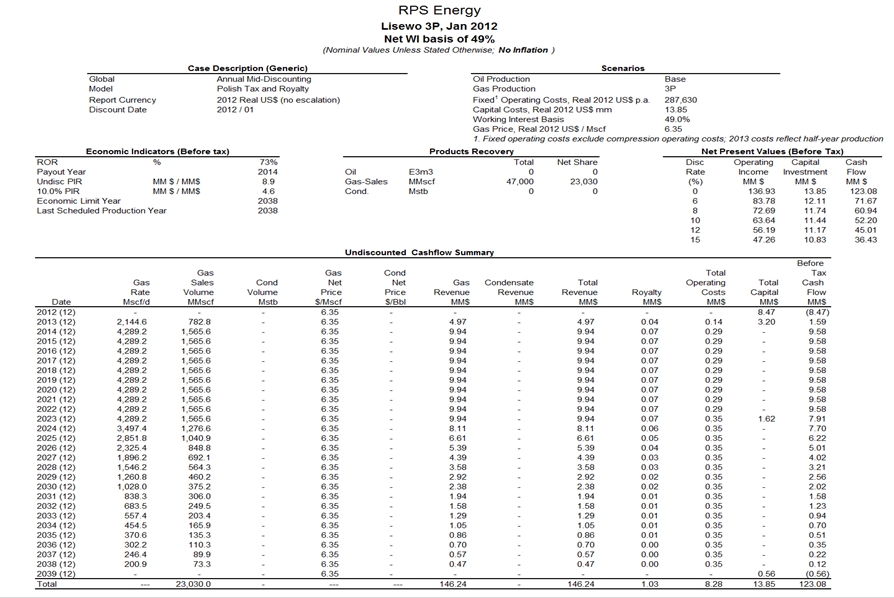
| Lisewo | 49.0% | | | | 12,245 | 16,941 | 23,030 |
| | | | | | | | |
| Total | | 31,987 | 61,017 | 101,797 | 17,649 | 29,654 | 48,577 |
Economic Evaluation
We have calculated the Net Present Value of the Properties based on our estimates of Reserves and on current firm development plans, as follows:
| Field | FX Energy Interest | NPV10 (Million US$) |
| Proved | Proved + Probable | Proved + Probable + Possible |
| Gross | Net | Gross | Net | Gross | Net |
| Zaniemysl | 24.5% | 47.8 | 11.7 | 79.4 | 19.5 | 119.4 | 29.2 |
| Sroda-Kromolice | 49.0% | 134.6 | 66.0 | 180.8 | 88.6 | 203.2 | 99.6 |
| Roszkow | 49.0% | 64.6 | 31.7 | 148.3 | 72.6 | 216.6 | 106.1 |
| Winna Gora | 49.0% | 31.1 | 15.3 | 40.8 | 20.0 | 50.9 | 24.9 |
| Kromolice South | 49.0% | 39.2 | 19.2 | 53.6 | 26.2 | 67.2 | 32.9 |
| Grabowka | 100.0% | 1.8 | 1.8 | 6.8 | 6.8 | 10.9 | 10.9 |
| Lisewo | 49.0% | 78.0 | 38.2 | 88.0 | 43.1 | 106.5 | 52.2 |
| | | | | | | | |
| Total | | 397.1 | 183.8 | 597.6 | 276.9 | 774.6 | 355.9 |
Qualifications
RPS is an independent consultancy specialising in petroleum reservoir evaluation and economic analysis. The provision of professional services has been solely on a fee basis. Mr Gordon Taylor, Director, Geoscience for RPS Energy, has supervised the evaluation. Mr Taylor is a Chartered Geologist and Chartered Engineer with over 30 years experience in upstream oil and gas.
Other RPS employees involved in this work hold at least a Masters degree in geology, geophysics, petroleum engineering or a related subject or have at least five years of relevant experience in the practice of geology, geophysics or petroleum engineering.
Basis of Opinion
The evaluation presented in this report reflects our informed judgement based on accepted standards of professional investigation, but is subject to generally recognised uncertainties associated with the interpretation of geological, geophysical and engineering data. The evaluation has been conducted within our understanding of petroleum legislation, taxation and other regulations that currently apply to these interests. However, RPS Energy is not in a position to attest to the property title, financial interest relationships or encumbrances related to the property.
It should be understood that any evaluation, particularly one involving exploration and future petroleum developments may be subject to significant variations over short periods of time as new information becomes available.
Yours faithfully,
RPS Energy
/s/ Gordon R. Taylor
Gordon R Taylor, CEng, CGeol
Director, Geoscience
| RPS Energy | FX Energy, Inc. Evaluation of Polish Gas Assets |
EVALUATION OF POLISH GAS ASSETS
Prepared for
FX Energy Incorporated
and
The Royal Bank of Scotland Plc, acting as Agent on behalf of the Finance Parties
RPS Energy
309 Reading Road, Henley-on-Thames, Oxon. RG9 1EL
T +44 (0)1491 415400 F +44 (0)1491 415415
E rpshen@rpsgroup.com
W www.rpsgroup.com
DOCUMENT REVISION RECORD
| Document Description | Date | Issued by | Checked by | Accepted by Client | Comment |
| Final | Feb 2012 | L. Reyes, B. Hodgson, K. Kasriel | G. Taylor /s/ G. Taylor | | |
| RPS Energy | FX Energy, Inc. Evaluation of Polish Gas Assets |
Table of Contents
| 1. | EXECUTIVE SUMMARY | 1 |
| | | |
| 2. | TECHNICAL EVALUATION | 3 |
| | | |
| | 2.1 | Fields Study | 3 |
| | | | |
| | 2.2 | Roszkow Field | 3 |
| | | | |
| | | 2.2.1 | Field Description | 3 |
| | | | | |
| | | 2.2.2 | Production History | 4 |
| | | | | |
| | | 2.2.3 | Gas Reserves Estimation | 4 |
| | | | | |
| | | 2.2.4 | Geological Review | 6 |
| | | | | |
| | 2.3 | Winna Gora Field | 7 |
| | | | | |
| | | 2.3.1 | New 3D seismic interpretation | 7 |
| | | | | |
| | | 2.3.2 | Gas Reserves Estimation | 11 |
| | | | |
| | 2.4 | Zaniemysl field | 12 |
| | | | |
| | | 2.4.1 | Field Description | 12 |
| | | | | |
| | | 2.4.2 | Production History | 12 |
| | | | | |
| | | 2.4.3 | Gas Reserves Estimation | 14 |
| | | | |
| | 2.5 | Kromolice-Sroda Field | 15 |
| | | | | |
| | | 2.5.1 | Field Description | 15 |
| | | | | |
| | | 2.5.2 | Production History | 15 |
| | | | | |
| | | 2.5.3 | Gas Reserves Estimation | 17 |
| | | | |
| | 2.6 | Kromolice-South Field | 21 |
| | | | |
| | | 2.6.1 | Field Description | 21 |
| | | | | |
| | | 2.6.2 | Production History | 22 |
| | | | | |
| | | 2.6.3 | Gas Reserves Estimation | 22 |
| | | | |
| | 2.7 | Grabowka | 23 |
| | | | |
| | | 2.7.1 | Field Description | 23 |
| | | | | |
| | | 2.7.2 | Production History | 24 |
| | | | | |
| | | 2.7.3 | Gas Reserves Estimation | 24 |
| | | | |
| | 2.8 | Lisewo | 27 |
| | | | |
| | | 2.8.1 | Field Description | 27 |
| | | | | |
| | | 2.8.2 | Seismic Data Review | 28 |
| | | | | |
| | | 2.8.3 | Gas Reserves Estimation | 30 |
| RPS Energy | FX Energy, Inc. Evaluation of Polish Gas Assets |
| 3. | ECONOMIC ANALYSIS | 32 |
| | | | |
| | 3.1 | Assumptions | 32 |
| | | | |
| | 3.2 | Costing | 32 |
| | | | |
| | 3.3 | Results | 33 |
| | | | |
| 4. | RESERVES EVOLUTION 2010-2011 | 35 |
| | | | |
| | 4.1 | Proved Gas Reserves | 35 |
| | | | |
| | 4.2 | Proved plus Probable Gas Reserves | 35 |
| | | | |
| | 4.3 | Proved plus Probable plus Possible Gas Reserves | 36 |
| | | | |
| 5. | REFERENCES | 37 |
| | | |
| APPENDIX 1: | PRODUCTION FORECASTS AND CASHFLOW ANALYSIS FOR THE ROSZKOW FIELD | 38 |
| | | |
| APPENDIX 2: | PRODUCTION FORECASTS AND CASHFLOW ANALYSIS FOR THE WINNA GORA FIELD | 45 |
| | | |
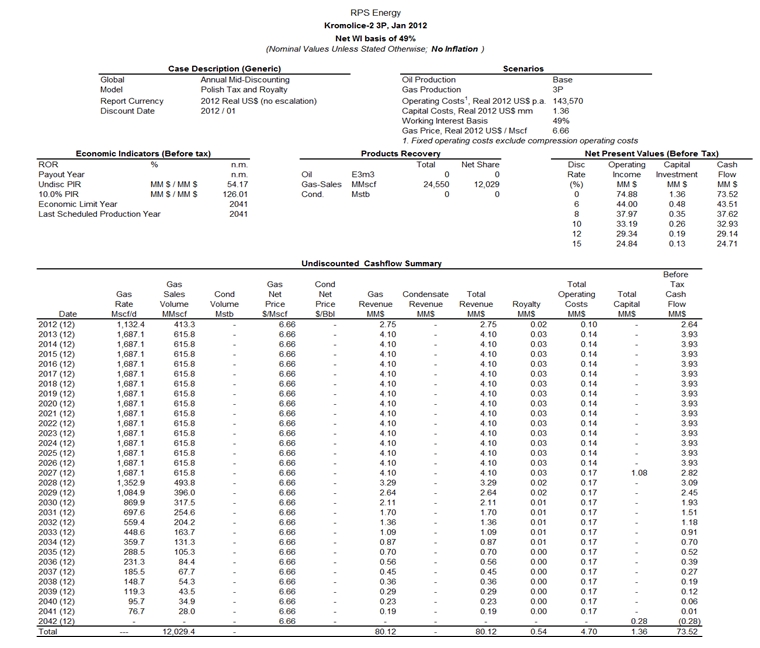
| APPENDIX 3: | PRODUCTION FORECASTS AND CASHFLOW ANALYSIS FOR THE KROMOLICE SOUTH FIELD | 52 |
| | | |
| APPENDIX 4: | PRODUCTION FORECASTS AND CASHFLOW ANALYSIS FOR ZANIEMYSL FIELD | 59 |
| | | |
| APPENDIX 5: | PRODUCTION FORECASTS AND CASHFLOW ANALYSIS FOR SRODA-KROMOLICE FIELD | 66 |
| | | |
| APPENDIX 6: | PRODUCTION FORECASTS AND CASHFLOW ANALYSIS FOR GRABOWKA | 73 |
| | | |
| APPENDIX 7: | PRODUCTION FORECASTS AND CASHFLOW ANALYSIS FOR LISEWO | 77 |
| RPS Energy | FX Energy, Inc. Evaluation of Polish Gas Assets |
| Figure 2-1: | Roszkow Field Top Structure Map | 3 |
| | | |
| Figure 2-2: | Roszkow Field Production History | 4 |
| | | |
| Figure 2-3: | Roszkow Field Material Balance | 5 |
| | | |
| Figure 2-4: | Roszkow FX Interpretation 2007 | 6 |
| | | |
| Figure 2-5: | Winna Gora Field Top Structure Map (2D Seismic Grid) | 8 |
| | | |
| Figure 2-6: | Winna Gora Field 3D Seismic Data Base | 8 |
| | | |
| Figure 2-7: | Winna Gora-1 Well Tie (In line 1280) | 9 |
| | | |
| Figure 2-8: | Winna Gora Base Zechstein Depth Structure | 10 |
| | | |
| Figure 2-9: | Zaniemysl Field Top Structure Map | 13 |
| | | |
| Figure 2-10: | Zaniemysl Field Production History | 13 |
| | | |
| Figure 2-11: | Zaniemysl Field Material Balance | 14 |
| | | |
| Figure 2-12: | Kromolice-Sroda Field Top Structure Map | 16 |
| | | |
| Figure 2-13: | Sroda Field Production History | 17 |
| | | |
| Figure 2-14: | Kromolice-1 Field Production History | 17 |
| | | |
| Figure 2-15: | WHP-Behaviour of Kromolice-1 and Sroda-4 | 18 |
| | | |
| Figure 2-16: | Sroda Field Material Balance | 19 |
| | | |
| Figure 2-17: | WHP versus Cumulative Gas (Sroda-4) | 19 |
| | | |
| Figure 2-18: | WHP versus Cumulative Gas (Kromolice-1) | 20 |
| | | |
| Figure 2-19: | Kromolice South Top Structure Map | 21 |
| | | |
| Figure 2-20: | Kromolice South Field Production History | 22 |
| | | |
| Figure 2-21: | Kromolice South: WHP versus Cumulative Gas | 22 |
| | | |
| Figure 2-22: | G-12 Well Production Performance (Grabowka-East) | 24 |
| | | |
| Figure 2-23: | G-12 performance with monthly averaged WGR | 25 |
| | | |
| Figure 2-24: | Grabowka-12 WHP vs Cum Gas | 25 |
| | | |
| Figure 2-25: | Grabowka 2P Production forecast | 27 |
| | | |
| Figure 2-26: | Lisewo-1 Well to Seismic Tie (Well Profile) | 28 |
| | | |
| Figure 2-27: | Lisewo-1 Well to Seismic Tie (VSP Corridor Stack) | 29 |
| | | |
| Figure 2-28: | Lisewo-1 Well Velocity Profile | 30 |
| | | |
| Figure 3-1: | Gas Price Sensitivity on NPV10 (Net to FX Energy) for the 2P Case | 34 |
| RPS Energy | FX Energy, Inc. Evaluation of Polish Gas Assets |
| Table 1-1: | Gas Reserves attributable to the FX Energy interest (MMscf), as of 31st December 2011 | 1 |
| | | |
| Table 1-2: | Total Gas Reserves, 100% Basis | 2 |
| | | |
| Table 1-3: | Total Gas Reserves, Net interest | 2 |
| | | |
| Table 2-1: | Reserves (MMscf) for the Roszkow Field at 31st December 2011, 100% Basis | 5 |
| | | |
| Table 2-2: | Winna Gora: Geofizyka Torun Velocity Model | 10 |
| | | |
| Table 2-3: | Winna Gora Petrophysical Summary (2007) | 11 |
| | | |
| Table 2-4: | Winna Gora GIIP Range | 12 |
| | | |
| Table 2-5: | Reserves (MMscf) for the Winna Gora Field at 31st December 2011 100% Basis | 12 |
| | | |
| Table 2-6: | Gas Reserves (MMscf) for the Zaniemysl Field at 31st December 2011, 100% Basis | 15 |
| | | |
| Table 2-7: | Gas Reserves (MMscf) for the Kromolice-Sroda Field at 31st December 2011 100% Basis | 20 |
| | | |
| Table 2-8: | Gas Reserves (MMscf) for the Kromolice South Field at 31st December (100% basis) | 23 |
| | | |
| Table 2-9: | Gas Reserves (MMscf) for the Grabowka Field at 31st December 2011 100% Basis | 26 |
| | | |
| Table 2-10: | Gas Composition of Lisewo-1 | 27 |
| | | |
| Table 2-11: | Gas Reserves (MMscf) for the Lisewo Field at 31st December 2011 100% Basis | 31 |
| | | |
| Table 3-1: | Gas Price, Royalty and OPEX Assumptions | 32 |
| | | |
| Table 3-2: | Total NPV10 and NPV10, attributable to FX Energy | 33 |
| | | |
| Table 3-3: | Effect of Gas Price Sensitivities on FX Net Reserves (MMscf) | 34 |
| | | |
| Table 3-4: | Effect of Gas Price Sensitivities on NPV10 (Net to FX Energy) in Million USD | 34 |
| | | |
| Table 4-1: | Gas Proved Reserves (MMscf) 100% Basis | 35 |
| | | |
| Table 4-2: | Gas Proved plus Probable Reserves (MMscf) 100% Basis | 35 |
| | | |
| Table 4-3: | Gas Proved plus Probable plus Possible Reserves (MMscf) 100% Basis | 36 |
| RPS Energy | FX Energy, Inc. Evaluation of Polish Gas Assets |
1. EXECUTIVE SUMMARY
RPS Energy has performed a technical and economic evaluation of FX Energy’s assets in Poland. This is an update of a similar evaluation performed by RPS Energy at the end of 2010 but accommodating changes that have occurred during 2011. Principally these include 12 months of production from the Zaniemysl, Roszkow, Kromolice-Sroda and Grabowka East fields. Pressure surveys in Zaniemysl and Roszkow shed some new light on the GIIP of these fields. The wells Kromolice-1 (Sroda-Kromolice field) and Kromolice-2 (Kromolice-South) entered production by the middle of 2011. Due to variable capacity in the export pipeline system, the two Kromolice wells and Sroda-4 only produced intermittently. The export pipeline capacity has being addressed and the full capacity was restored by January 2012.
The undeveloped discoveries of Winna Gora, and Lisewo were reviewed but largely left unchanged. Some delay is experienced in the Grabowka West field, which is expected to come on stream during 2012. Revised product prices and operating and development costs have been included in determining asset values as of 31st December 2011.
Our computation of Remaining Reserves at 31st December 2011 is given in Table 1-1.
| Field | FX Energy Interest | FX Energy Gas Reserves (MMscf) |
| | Developed | | Undeveloped |
| Proved | Proved + Probable | Proved + Probable + Possible | Proved | Proved + Probable | Proved + Probable + Possible |
| | | | | | | | |
| Grabowka | 100.0% | 110 | 860 | 2,160 | 1,310 | 6,909 | 17,609 |
| Zaniemysl | 24.5% | 2,958 | 5,718 | 11,095 | | | |
| Roszkow | 49.0% | 6,165 | 15,475 | 26,919 | | | |
| Sroda-Kromolice | 49.0% | 18,339 | 31,514 | 49,593 | | | |
| Kromolice South | 49.0% | 4,414 | 7,450 | 12,029 | | | |
| Winna Gora | 49.0% | | | | 4,093 | 5,804 | 7,938 |
| Lisewo | 49.0% | | | | 12,245 | 16,941 | 23,030 |
| | | | | | | | |
| Total | | 31,987 | 61,017 | 101,797 | 17,649 | 29,654 | 48,577 |
Table 1-1: Gas Reserves attributable to the FX Energy interest (MMscf), as of 31st December 2011
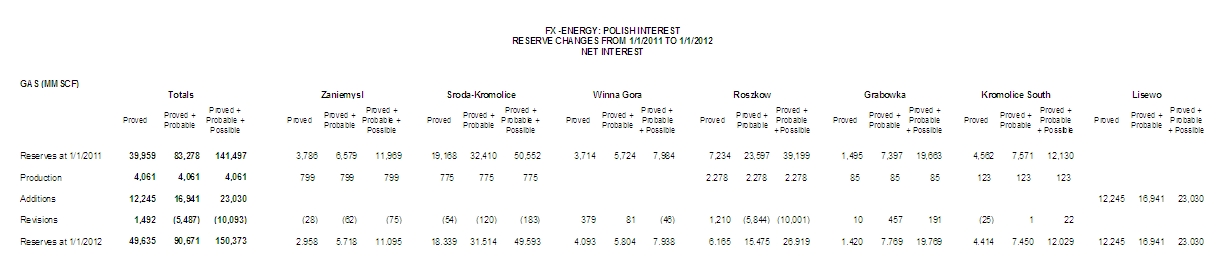
A summary of reserve changes during the past year, taking account of production, reserve additions and revisions are given in Table 1-2 (Gross Volumes) and Table 1-3 (FX Net volumes). Note that these contain developed and undeveloped fields.
In terms of reserves volumes, the most significant changes have been noted in the Proved plus Probable and Proved plus Probable plus Possible Reserves of Roszkow. These downward revisions are a result of acquisition of reservoir pressure data, which reduces the current GIIP estimates but which also indicates that the field is less likely influenced by aquifer influx.
The end year 2011 economic values are summarised in the report in Table 3-2. Note that the economical values were based on firm development plans.
| RPS Energy | FX Energy, Inc. Evaluation of Polish Gas Assets |
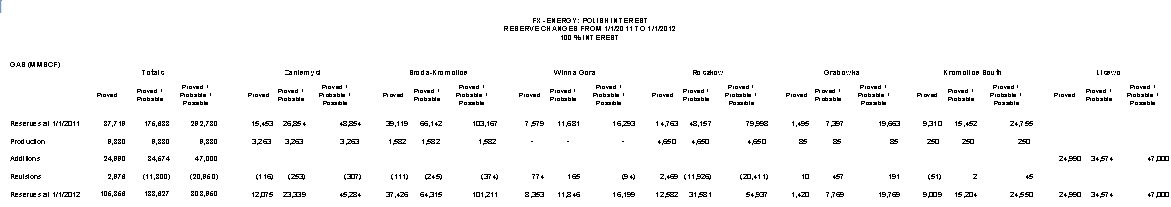
Table 1-2: Total Gas Reserves, 100% Basis
Table 1-3: Total Gas Reserves, Net interest
| RPS Energy | FX Energy, Inc. Evaluation of Polish Gas Assets |
2. TECHNICAL EVALUATION
2.1 Fields Study
RPS revised the historical and expected performance of each of the specified fields. It also determined FX Energy’s gas reserves of each of these fields. RPS based its estimations solely on the data provide by FX Energy. RPS did not detect any reluctance, on the part of FX Energy’s staff, to provide it with relevant data.
RPS used different methodologies to estimate reserves, ensuring that the SEC definitions are honoured for the proved, probable and possible reserves.
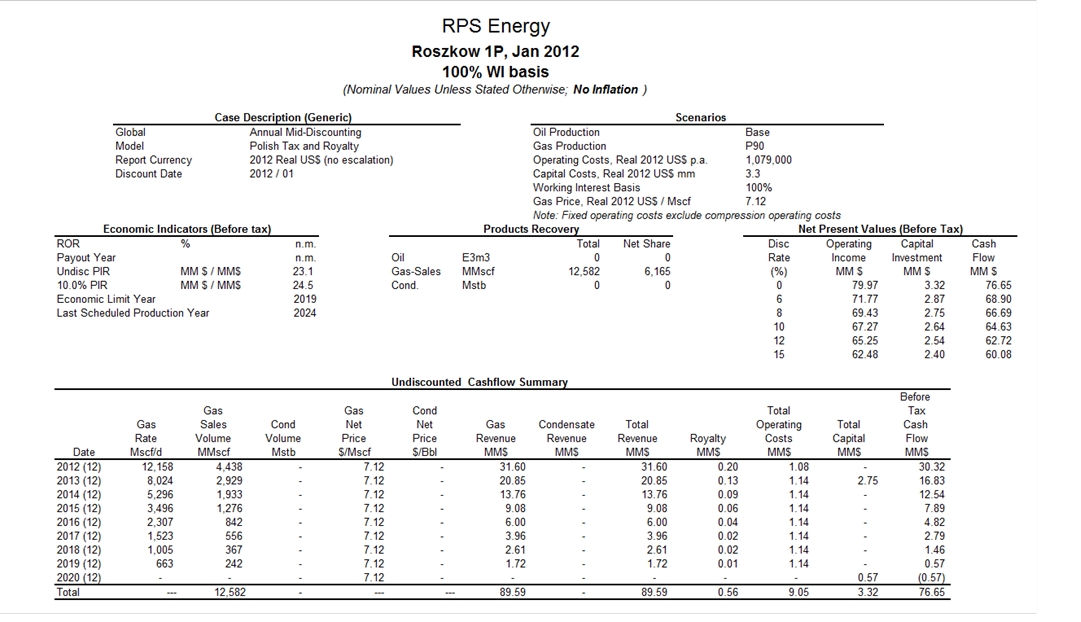
2.2 Roszkow Field
2.2.1 Field Description
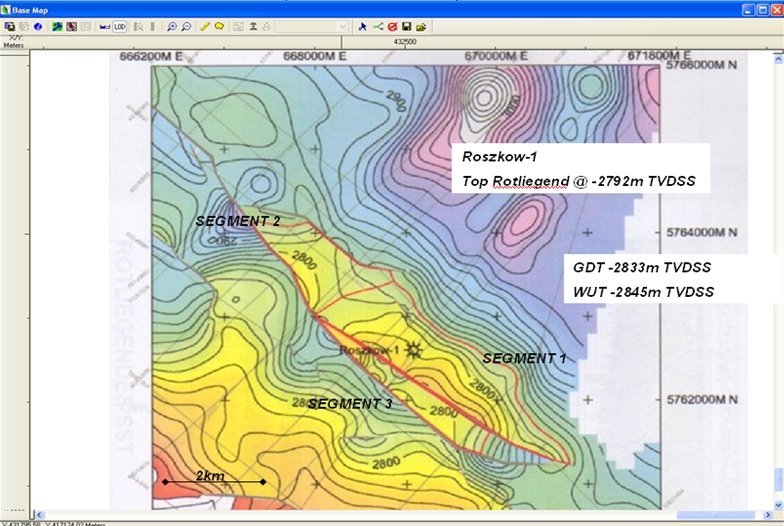
The Roszkow-1 discovery well was drilled on a NW-SE trending elongate structure with fault closure to the SW and dip closure to the NW, E and SE (up-thrown fault block), see Figure 2-1. The structure is well constrained in the dip direction but less so in the strike direction. The reservoir interval comprises a good porosity, clean sandstone with no interpreted shale. The gas water contact could be as deep as 2,965 meters MD (2,845 meters TVDSS), see reference 3.
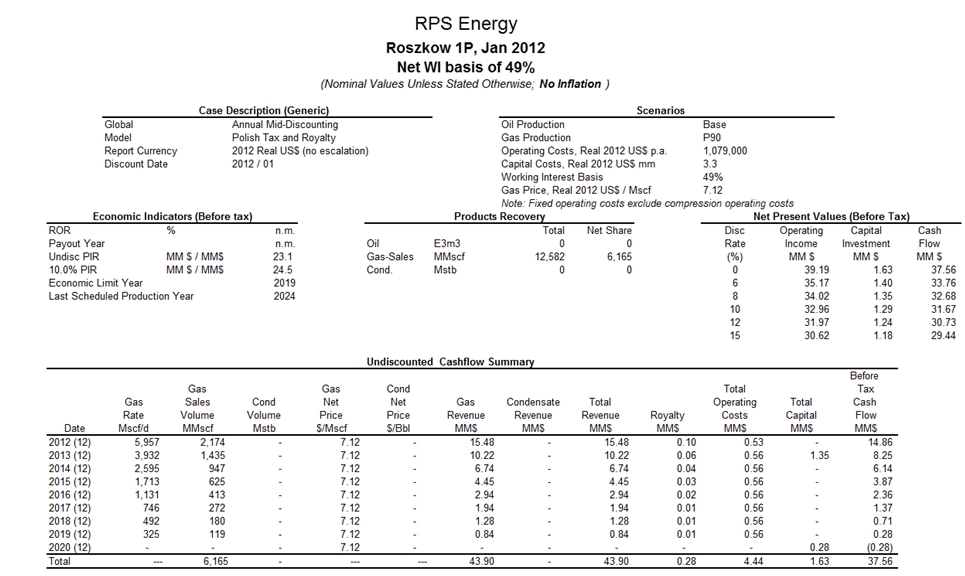
A deliverability test was carried out on Roszkow-1 in Sept 2009, from which an AOF potential of 144 MMscf/d could be calculated. FX Energy’s net working interest in this field is 49%.
Figure 2-1: Roszkow Field Top Structure Map
| RPS Energy | FX Energy, Inc. Evaluation of Polish Gas Assets |
2.2.2 Production History
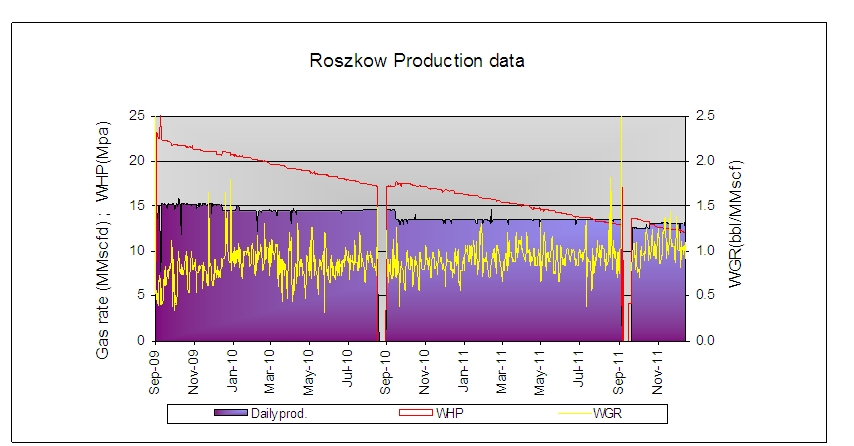
The field commenced production in September 2009. A plot showing the production data to the 31st of December 2011 is shown in Figure 2-2. The well is currently producing at a plateau rate around 13 MMscf/day and has a total gas cumulative production of 11,186 MMscf at 31st December 2011. Only condensed water has been produced in Roszkow to date.
Figure 2-2: Roszkow Field Production History
2.2.3 Gas Reserves Estimation
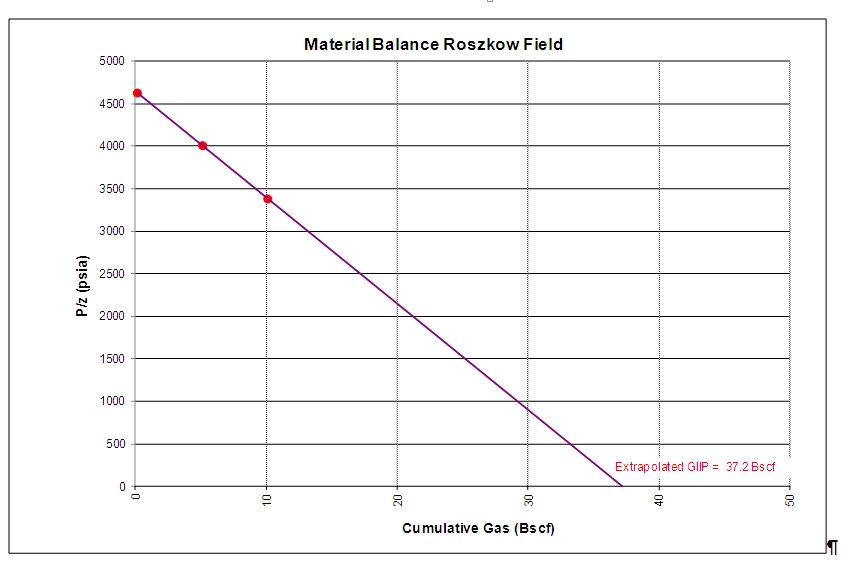
A new static pressure was carried out in the Roszkow-1 in September 2011. This pressure has been used to obtain a material balance estimate of the GIIP and the result is shown in Figure 2-3.
Despite the open access towards the NE, the p/z plot and the WGR behaviour do not suggest any influence of the aquifer. This could be explained by a poorly defined structural map (only based on 2D seismic).
The GIIP derived from the p/z plot amounts to 37.2 Bscf, and is substantially lower than the Proved+Probable volumetric estimate of 78.0 Bscf. It could be possible that the gas in the fault-blocks in the NW and SE of the structure may start to feed in only later, when enough pressure difference has built up over these faults. This threshold phenomenon has been observed in other Rotliegend fields.
The latest pressure point makes the volumetrically derived Proved+Probable GIIP less likely and RPS Energy is therefore recommending using the Proved+Probable Volumetric estimate as the current Proved+Probable+Possible estimate. For the Proved estimate the material balance estimate is maintained and as a Proved+Probable estimate the average of the material balance and Proved+Probable volumetrics is maintained for this year. This will be critically reviewed next year when more production performance and static pressure measurements become available.
| RPS Energy | FX Energy, Inc. Evaluation of Polish Gas Assets |
The latest Roszkow GIIP estimates are therefore:
| Proved | 37.2 Bscf |
| Proved plus Probable | 57.6 Bscf |
| Proved plus Probable plus Possible | 78.0 Bscf |
Figure 2-3: Roszkow Field Material Balance
Recovery factors have been increased slightly, based on the current apparent absence of aquifer influence to 65% (1P), 75% (2P) and up to 85% (3P) and have been used to estimate recoverable reserves.
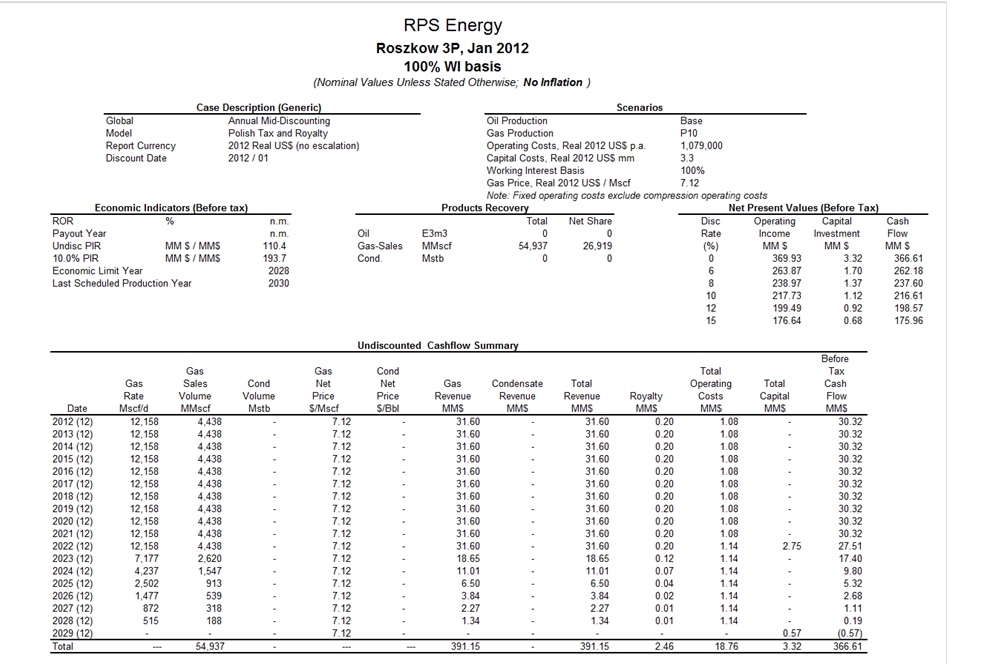
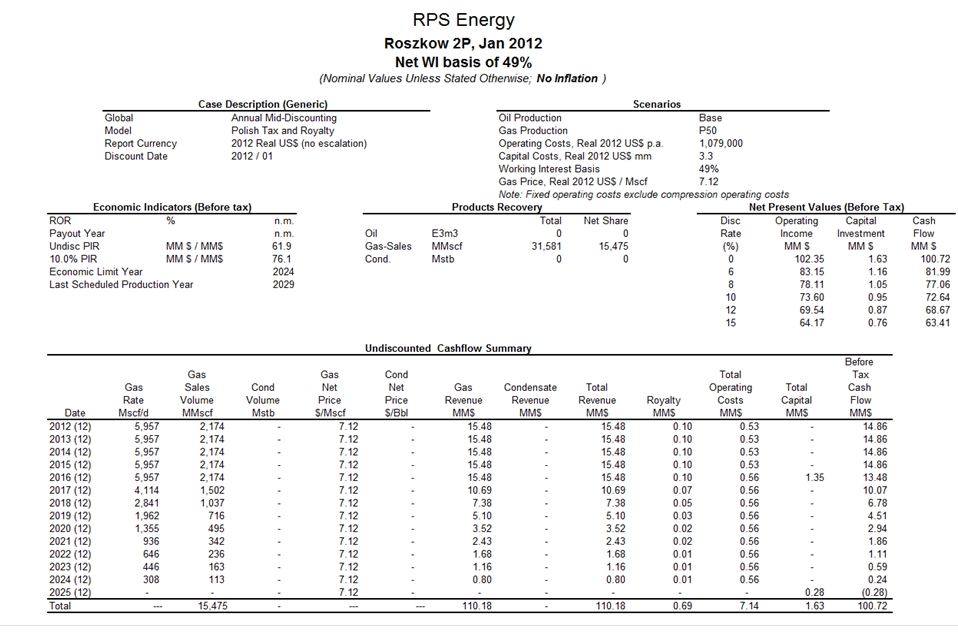
The remaining gas reserves as of 31st December 2011 for this field, based on the existing well are summarized in Table 2-1. The gas production forecasts are shown in the Appendix 1.
| | Roszkow | |
| | 2011 | 2012 |
| Remaining Reserves (MMscf) | Evaluation 1st Jan 2011 | Production
during 2011 | Remaining 31st Dec 2011 | Economic Limit in year | Evaluation 1st Jan 2012 |
| Proven | 14,763 | 4,650 | 10,113 | 2019 | 12,582 |
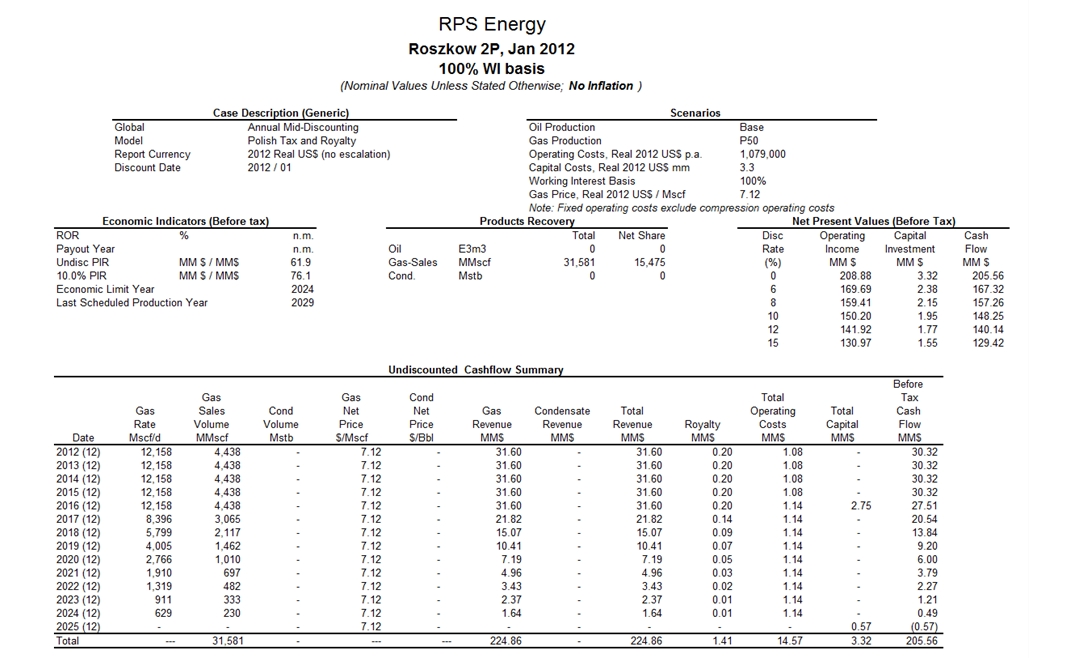
| Proven+Probable | 48,157 | 4,650 | 43,507 | 2024 | 31,581 |
| Proven+Probable+Possible | 79,998 | 4,650 | 75,348 | 2028 | 54,937 |
Table 2-1: Reserves (MMscf) for the Roszkow Field at 31st December 2011, 100% Basis
| RPS Energy | FX Energy, Inc. Evaluation of Polish Gas Assets |
A brief geological review of the Roszkow field was carried out in an attempt to reconcile the material balance and volumetrically derived GIIP values.
The structure is mapped as an elongate NW-SE fault-controlled anticline, with fault closure to the SW (Figure 2-1 and Figure 2-4), where an additional, downthrown fault block is also mapped. As noted in the 2007 RPS report (ref. 3), strike line control is poor, and a potential structural low may subdivide the field into north and south culminations.
Figure 2-4: Roszkow FX Interpretation 2007
For volumetric calculations, the GRV from Segment 1 (Figure 2-1) was used for the Proven (Deterministic) GIIP estimate, whereas for the 2P and 3P (Monte Carlo) case the combined GRV from Segments 1 and 2 was used. The GRV from Segment 3 was excluded from all volumetric estimates. A 4-layer reservoir model was used for GIIP estimates, with reservoir parameters derived from log and core analysis (see ref. 3).
From a review of the work, undertaken in 2007, the following points can be noted:
| | 1) | The Proven (deterministic) calculation has used the GRV only from Segment 1, and included three of the four reservoir layers, with a fixed GWC at 2833m TVDSS. The input parameters therefore appear reasonably conservative, and yield a GIIP of 49.2 Bscf (which still exceeds the 37 Bscf currently indicated by material balance). |
| RPS Energy | FX Energy, Inc. Evaluation of Polish Gas Assets |
| | 2) | For the 2P and 3P Monte Carlo calculation, Segments 1 and 2 have been used for GRV input, with an assumed areal uncertainty of +/-35%. A 4th reservoir layer is also included to allow for a potentially deeper GWC down to 2845m TVDSS. |
| | 3) | Input ranges for porosity and Sw for each layer in the Monte Carlo calculation are quite narrow: +/- 1 percentage points for porosity, and +/- 3 percentage points for Sw. |
No Kingdom project or other seismic data were available for Roszkow so it has not been possible to review the interpretation in any detail. However, alternative structural interpretations may be possible, given the structural style observed elsewhere in the basin, where fault offsets generate an en-echelon style of faulting which set up individual traps and control on structural spill points. Given the limited seismic coverage, the Roszkow-1 structure could be a small 3-way dip closure controlled by a single fault, but this possibility clearly cannot be evaluated without access to geophysical data.
Area-depth values were re-run and were found to be consistent with the 2007 input values to REP, so at present there is no obvious scope for significantly reducing GRV.
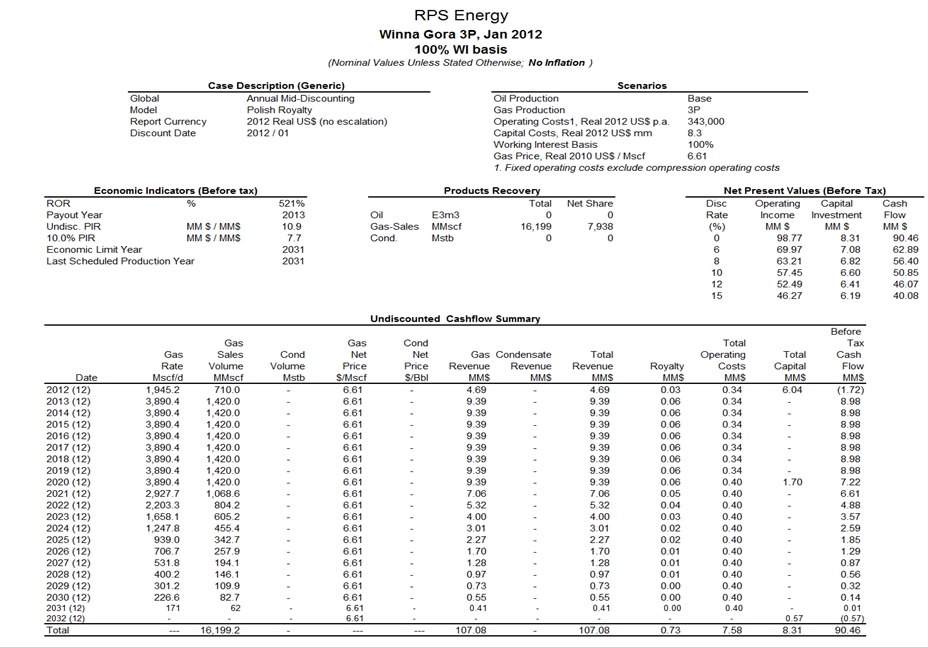
2.3 Winna Gora Field
2.3.1 New 3D seismic interpretation
Winna Gora-1 was drilled as a vertical well to test a footwall closure at Top Rotliegend against a NW-SE trending fault (Figure 2-5). The well encountered the Top Rotliegend sands at 3520m MD (-3448m TVDSS), and TD’d within the Rotliegend at 3652m MD (-3580m TVDSS). A clear GWC was identified at 3558m MD (-3485.8m TVDSS) from petrophysical analysis, giving a penetrated gas column of 38m.
Previous GIIP estimates on Winna Gora have been based on a GRV derived from mapping on a 2D seismic dataset (Figure 2-5). Given the uncertainties in interpretation and depth conversion, only the area within the blue polygon was included in the GRV calculation. The subsidiary closure to the northwest of the well was excluded from the GRV calculation, as was the small closure on the en echelon fault to the south, which was considered as untested.
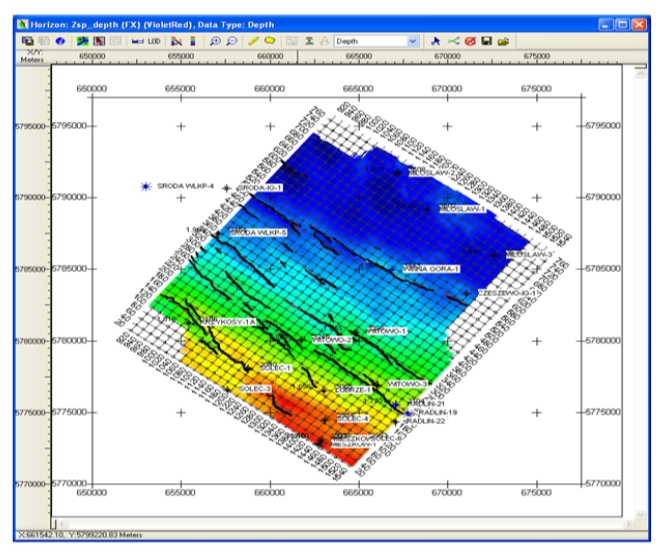
FX Energy provided a Kingdom project (Winna Gora 3D) containing a 3D seismic volume (Figure 2-6). The project contained mapped horizons in both time and depth, well data (locations, deviation profiles and velocity data), and formation tops. The project contained no grid data. Documentation on the velocity model was also provided by FX Energy.
| RPS Energy | FX Energy, Inc. Evaluation of Polish Gas Assets |
Figure 2-5: Winna Gora Field Top Structure Map (2D Seismic Grid)
Figure 2-6: Winna Gora Field 3D Seismic Data Base
| RPS Energy | FX Energy, Inc. Evaluation of Polish Gas Assets |
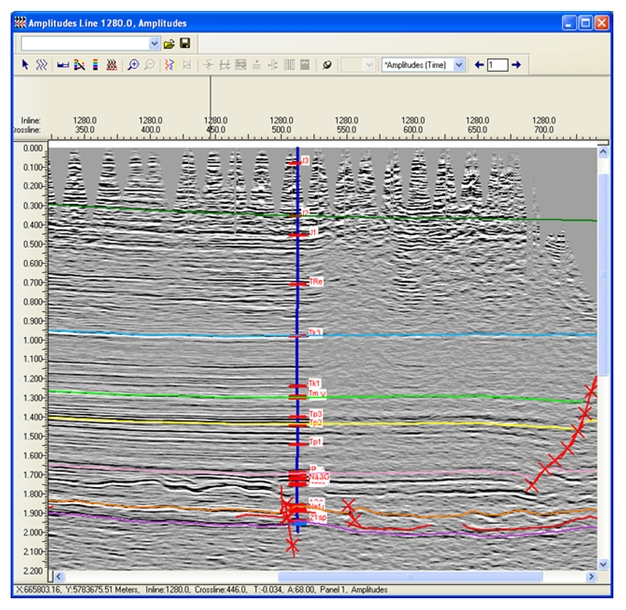
RPS has reviewed the seismic interpretation, and considers the main horizon and fault picks to be sound. A high degree of confidence in the regional mapped surfaces is confirmed by the Winna Gora-1 well tie, which is excellent (Figure 2-7). It was observed that a (bulk) time shift of 30ms (downwards) was required to align formation tops to equivalent surfaces picked on the seismic data. This has no effect on the depth conversion and GRV estimate.
Figure 2-7: Winna Gora-1 Well Tie (In line 1280)
The 3D interpretation confirms the Winna Gora structure to be a fault-controlled anticline with Winna Gora-1 having tested the southern culmination of the structure. The extent of closure appears to be controlled by a discontinuity in the main bounding fault to the south-east (Figure 2-8).
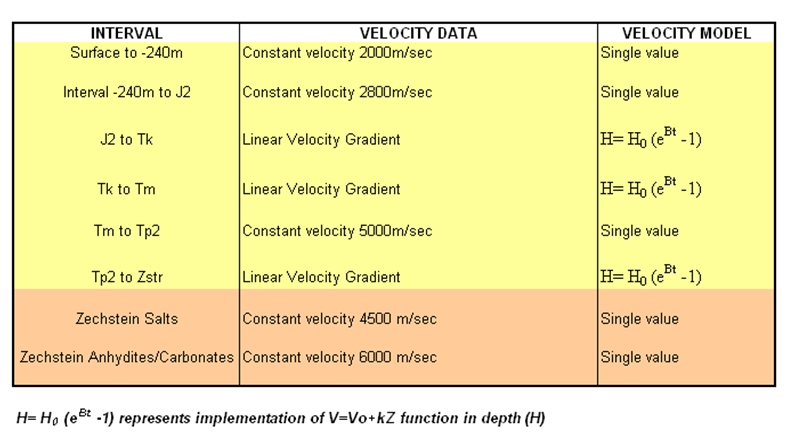
The velocity model of FX Energy (Table 2-2) is a layer-cake model compiled by Geofizyka Torun, and is a modification of a pre-existing model used for depth conversion in the Kornik-Sroda area. The model is also similar in principle to the layer cake model used for depth conversion in the Lisewo area further to the south east.
The model is composed of 6 layers from surface to Top Zechstein, with layers assigned either a constant interval velocity, or defined by a Vo-k function. Constant velocities are assigned to lithologic units within the Zechstein.
Below the 2-layer model of the near surface, the main difference from the Kornik-Sroda model is in the interval J2 –Tk, where the Vo-k parameters are modified to incorporate the velocity data from the Winna Gora-1 well.
| RPS Energy | FX Energy, Inc. Evaluation of Polish Gas Assets |
Figure 2-8: Winna Gora Base Zechstein Depth Structure
Table 2-2: Winna Gora: Geofizyka Torun Velocity Model
| RPS Energy | FX Energy, Inc. Evaluation of Polish Gas Assets |
FX Energy notes that the Vo-k model does generate misties that might be explained by spatial velocity gradients that cannot be easily be incorporated into the Vo-k model, and that depth corrections were applied during the time-depth transformation. Since the intermediate depth conversion steps are not included in the Kingdom project it has not been possible to fully evaluate this aspect of the depth conversion.
Given the well control and the relatively small dimensions of the structure, the velocity model is considered as quite reasonable. RPS generated a Base Zechstein grid (20m cell size) for depth mapping. It was observed that residual depth errors of up to 11m were present at some of the wells within the 3D volume at Base Zechstein (though the error was only 2.5m at Winna Gora-1), so a residual correction was applied. The resultant depth map (Figure 2-8) shows the GWC matching the spill point of the bounding fault, lending further support to the validity of the velocity/depth model and structural interpretation.
2.3.2 Gas Reserves Estimation
For input to REP and GIIP determination, an area-depth curve was compiled for the Winna Gora structure (Figure 2-8). A GRV uncertainty of +/-10% has also been applied. This is partly a subjective estimate, but is also a reflection of the robustness of the structural mapping compared with the 2D interpretation.
Petrophysical parameters, derived in the RPS 2007 report (ref. 3) were used as input values to REP (repeated in Table 2-3) and are based on a three-layer reservoir model. The 2007 REP input indicated narrow ranges for porosity and water saturation.
Comparison of zone averages
| | FX Energy | RPS |
| Zone | Porosity (%) | SW (%) | Porosity (%) | Sw (%) |
| | (arith. Av. Whole | Porosity-wtd arith av. | (arith. Av. Whole | Porosity-wtd arith av. |
| | sand) | Whole sand) | sand) | Whole sand) |
| 1 | 18 | 34 | 16 | 38 |
| 3520-3538mMD | (17.72) | (33.65) | (16.13) | (38.36) |
| 2 | 17 | 45 | 15 | 52 |
| 3538.3543mMD | (16.99) | (45.46) | (14.98) | (52.48) |
| 3 | 17 | 56 | 16 | 53 |
| 3543-3547 | (16.74) | (55.51) | (15.61) | (53.34) |
| Above GWC | 18 | 47 | 16 | 61 |
| 3520-3557.8mMD | (17.78) | (47.45) | (16.31) | (60.74) |
| Below GWC | 15 | 85 | 14 | 96 |
| 3557.8-3652mMD | (14.98) | (84.74) | (14.24) | (96.3) |
Table 2-3: Winna Gora Petrophysical Summary (2007)
| RPS Energy | FX Energy, Inc. Evaluation of Polish Gas Assets |
GIIP was calculated deterministically for the Proved case, and using Monte Carlo analysis for the 2P (P50) and 3P (P10) cases. The resulting GIIP distribution is shown in Table 2-4. An alternative Monte Carlo Case was run in which the input parameter ranges were expanded to include the values derived by FX Energy; the resulting GIIP figures are not significantly different. The wider GIIP range is preferred however and will be used in further calculations.
| Date | Proved GIIP (Bscf) | Monte Carlo GIIP (Bscf)
|
| | Deterministic | P90 | P50 | P10 |
| Oct ‘07 | 13.8 | 12.9 | 16.9 | 22.0 |
| Dec ‘11 (previous range) | | 14.9 | 17.3 | 19.9 |
| Dec ‘11 (wider range) | 14.0 | 14.4 | 17.0 | 20.2 |
Table 2-4: Winna Gora GIIP Range
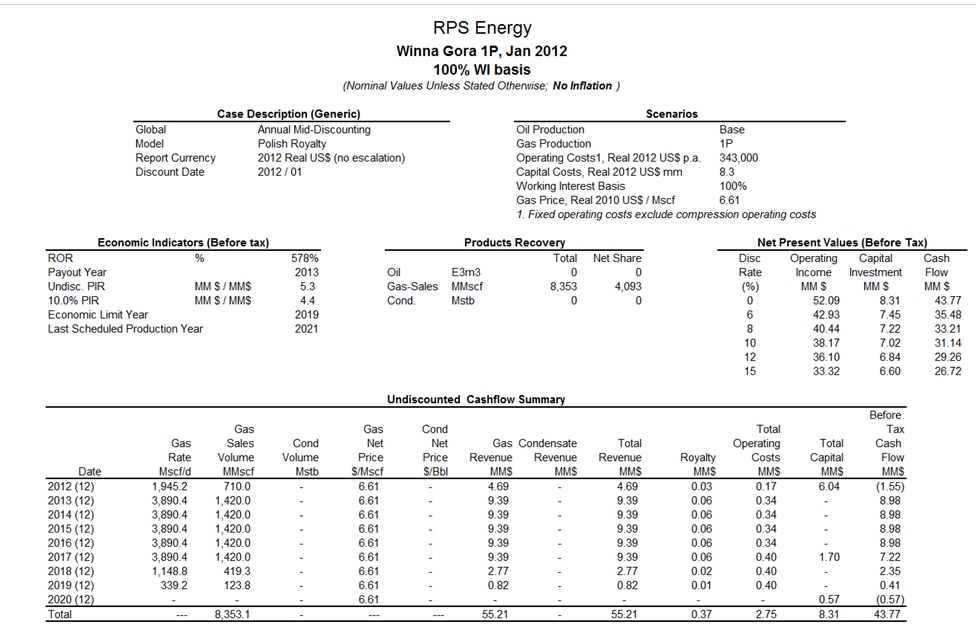
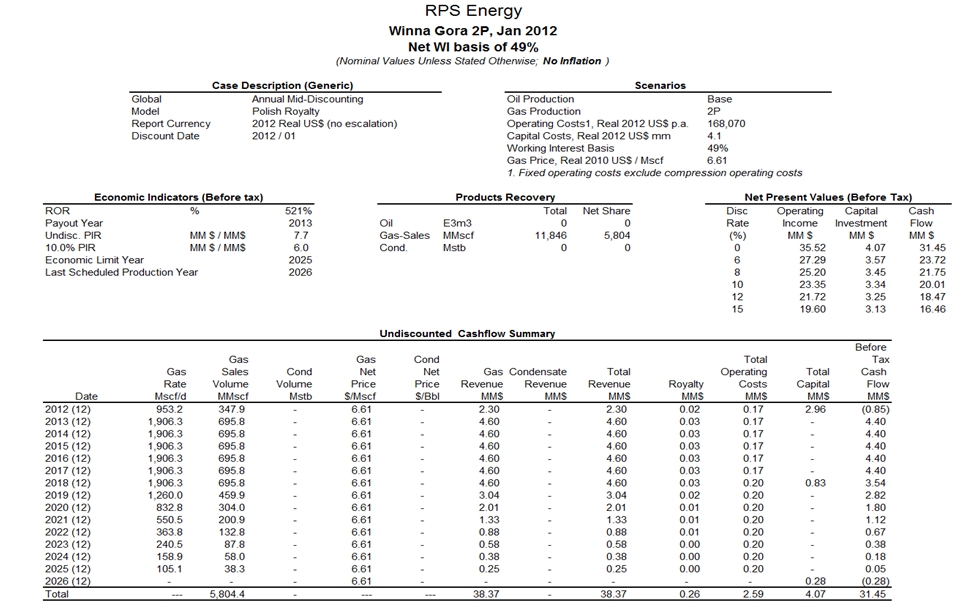
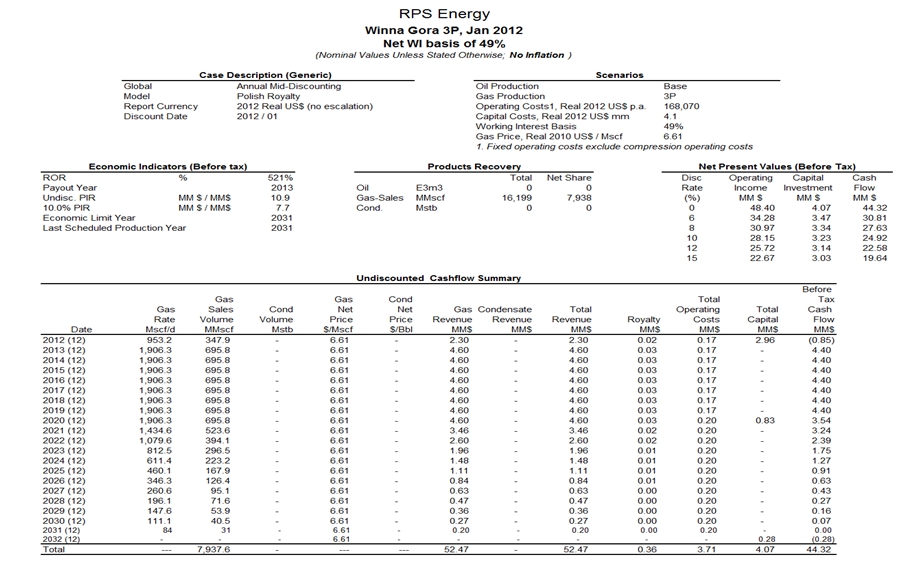
Reserves were calculated assuming recovery factor of 60% (P), 70% (P+P) and 80% (P+P+P). As instructed by FX Energy ten days of downtime has been included in the profiles. The remaining reserves of gas, at 31st December 2011 for this field are summarized in Table 2-5. The gas production forecasts are shown in the Appendix 2.
| Remaining Reserves (MMscf) | Remaining 31st Dec 2011 | Economic Limit in year | Evaluation 1st Jan 2012 |
| Proven | 7,579 | 2019 | 8,353 |
| Proven+Probable | 11,681 | 2025 | 11,846 |
| Proven+Probable+Possible | 16,293 | 2031 | 16,199 |
Table 2-5: Reserves (MMscf) for the Winna Gora Field at 31st December 2011 100% Basis
Development planning is well advanced and the production start date is estimated to be by mid 2012. FX Energy net working interest for this field is 49%.
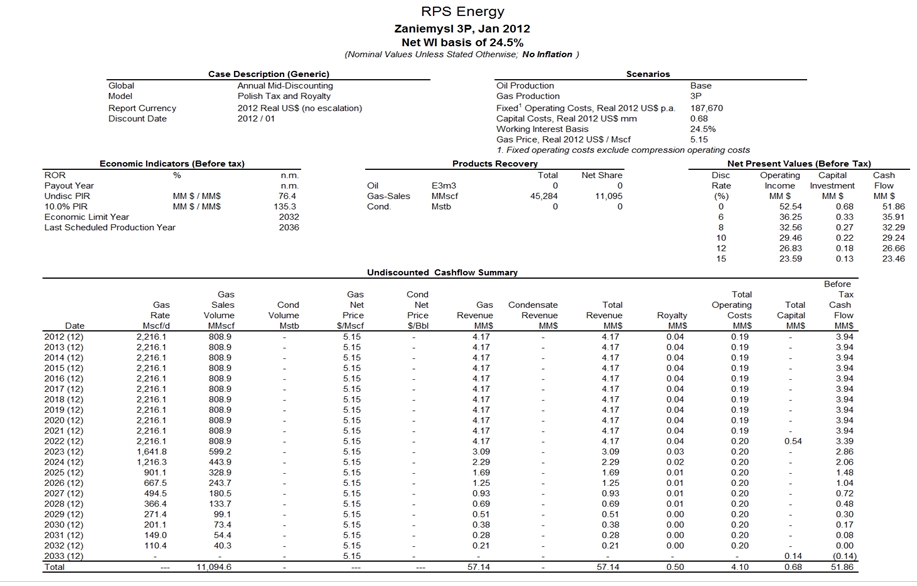
2.4 Zaniemysl field
2.4.1 Field Description
The Zaniemysl field is a fault and dip closed Rotliegend structure, with dip closure to the north, and fault closures in the SW and SE. The latest top structure map, supplied by the operator in early 2008, is shown in Figure 2-9.
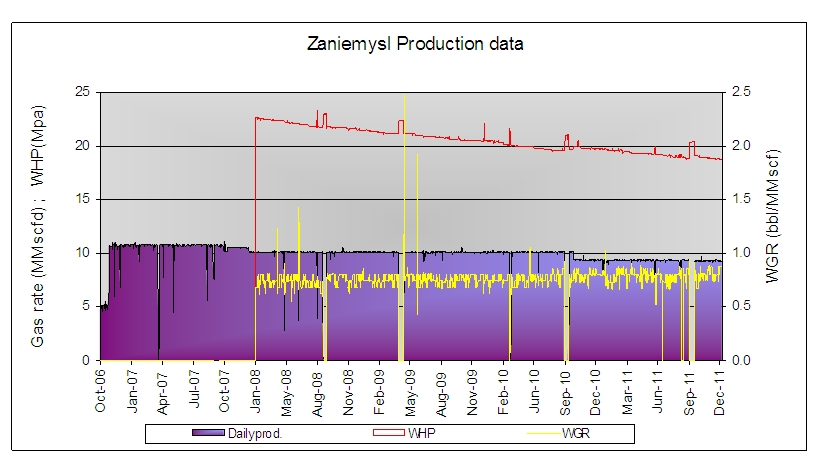
The Zaniemysl field was brought on stream on October 2006. The updated production history up to 31st December 2011 is shown in Figure 2-10.
2.4.2 Production History
The field has been produced at a plateau production rate around 9.3 MMscf/d, and has a total gas cumulative production of 18,387 MMscf at 31st December 2011. FX Energy net working interest in this field is 24.5%. The WGR remained at a condensed water background level.
| RPS Energy | FX Energy, Inc. Evaluation of Polish Gas Assets |
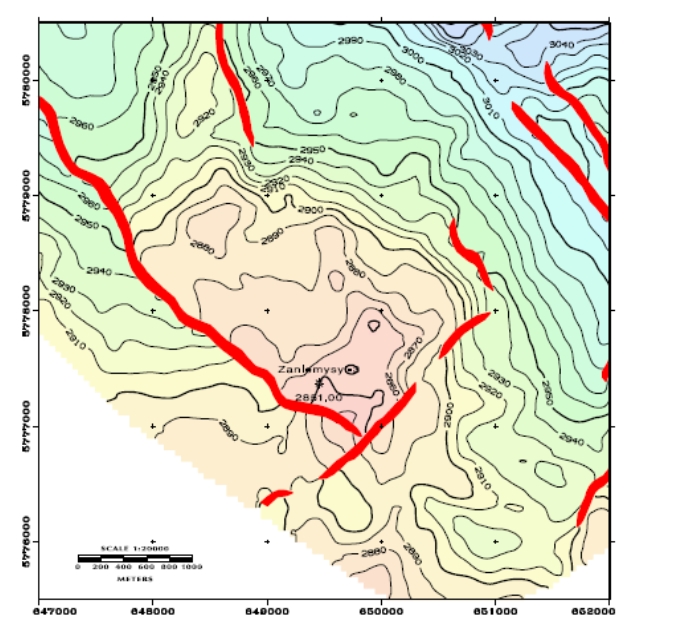
Figure 2-9: Zaniemysl Field Top Structure Map
Figure 2-10: Zaniemysl Field Production History
| RPS Energy | FX Energy, Inc. Evaluation of Polish Gas Assets |
2.4.3 Gas Reserves Estimation
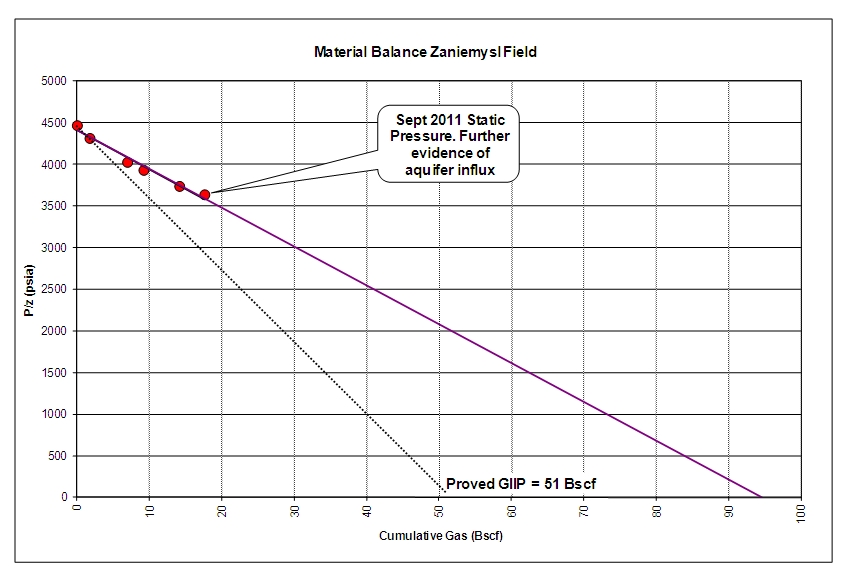
A static pressure survey was carried out in the single producing well Zaniemysl-3 in September 2011. This pressure has been incorporated in the material balance estimate and the results are shown in Figure 2-11. This additional pressure measurement supports the possibility of some delayed ingress of fluids into the field. On the top structure map there is no evidence of a major separate fault block nor do the Zaniemysl-3 logs show low permeability layers, which both might account for a deviation from straight line p/z behaviour. The most likely scenario for the observed pressure behaviour is therefore aquifer influx. A large aquifer is noted towards the North and Northwest of the gas accumulation. Due to the relatively high structural position of the Zaniemysl-3 well, no increased water production seems to have occurred as yet.
Figure 2-11: Zaniemysl Field Material Balance
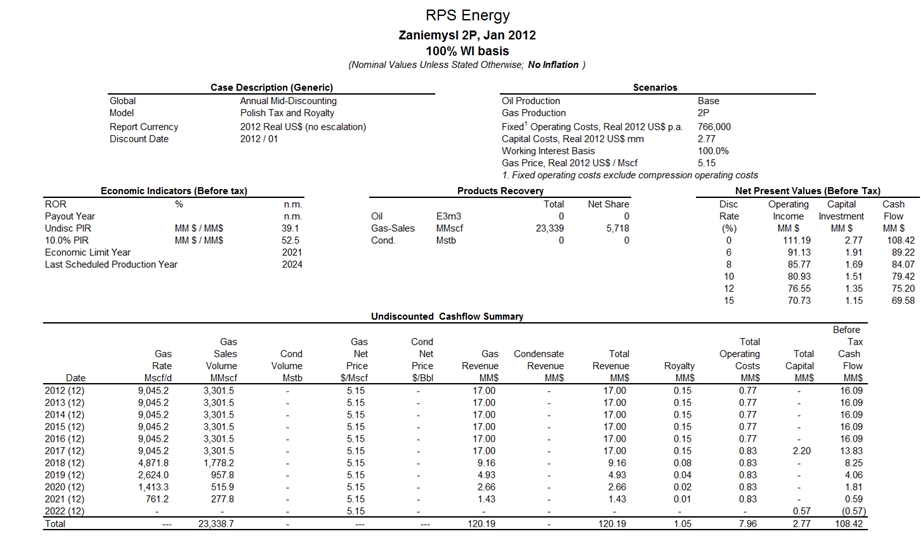
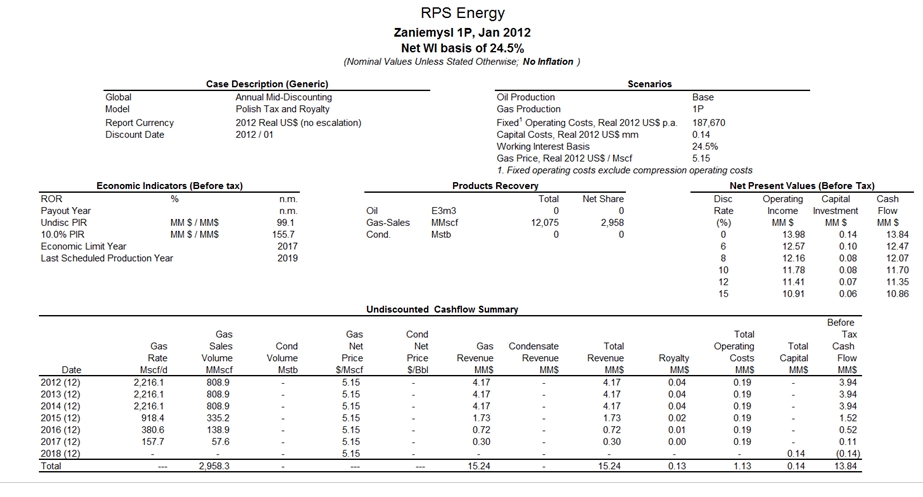
As for last year’s estimate, it is assumed for the Proved estimate of GIIP that the last 4 pressure points are influenced by water influx and that the pressure point measured in 2007 had not yet been influenced by aquifer support, because of aquifer inertia. Due to the likely influence of water, the Proved plus Probable and Proved + Probable+Possible GIIP estimates were maintained at the volumetric estimates of 60 Bscf and 80 Bscf respectively. The Zaniemysl GIIP estimates remain therefore unchanged compared to last year:
| Proved | 51 Bscf |
| Proved plus Probable | 60 Bscf |
| Proved plus Probable plus Possible | 80 Bscf |
| RPS Energy | FX Energy, Inc. Evaluation of Polish Gas Assets |
The Zaniemysl forecasts were produced by hand and cut-off at an assumed recovery factor range of 60-70-80%, unchanged from last year.
The profiles were prepared respecting the plateau rate and producing approximately 90% of the ultimate recovery in the plateau period, which is typical for a reservoir producing with substantial water influx. The tail was declined with a simple annualised decline to achieve the estimated EUR per case. A table showing the forecasts is included in Appendix 4.
As instructed by FX Energy ten days of downtime has been included in the profiles. The remaining reserves of gas, at 31st December 2011 for this field are summarized in Table 2-6.
| | Zaniemysl | |
| | 2011 | 2012 |
| Remaining Reserves (MMscf) | Evaluation 1st Jan 2011 | Production
during 2011 | Remaining 31st Dec 2011 | Economic Limit in year | Evaluation 1st Jan 2012 |
| Proven* | 15,453 | 3,263 | 12,190 | 2017 | 12,075 |
| Proven+Probable | 26,854 | 3,263 | 23,591 | 2021 | 23,339 |
| Proven+Probable+Possible | 48,854 | 3,263 | 45,591 | 2032 | 45,284 |
Table 2-6: Gas Reserves (MMscf) for the Zaniemysl Field at 31st December 2011, 100% Basis
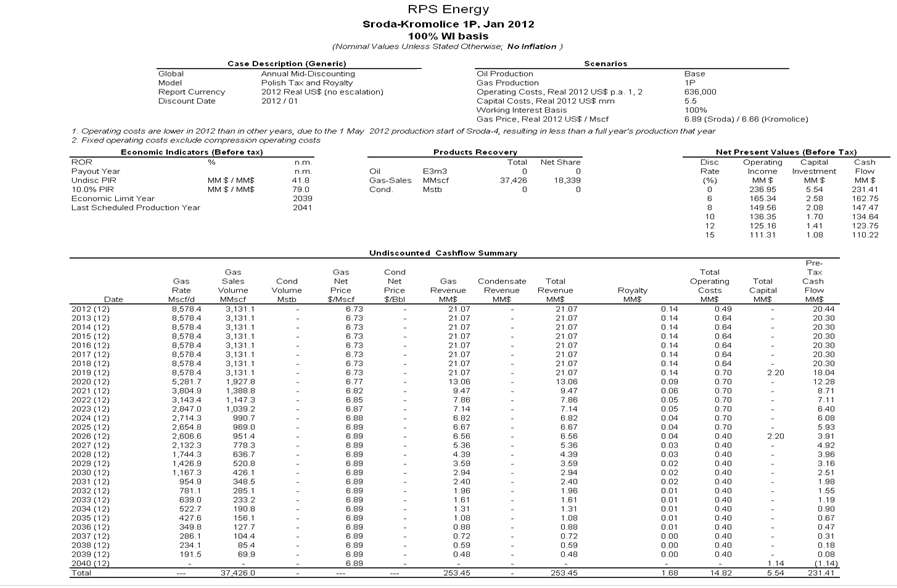
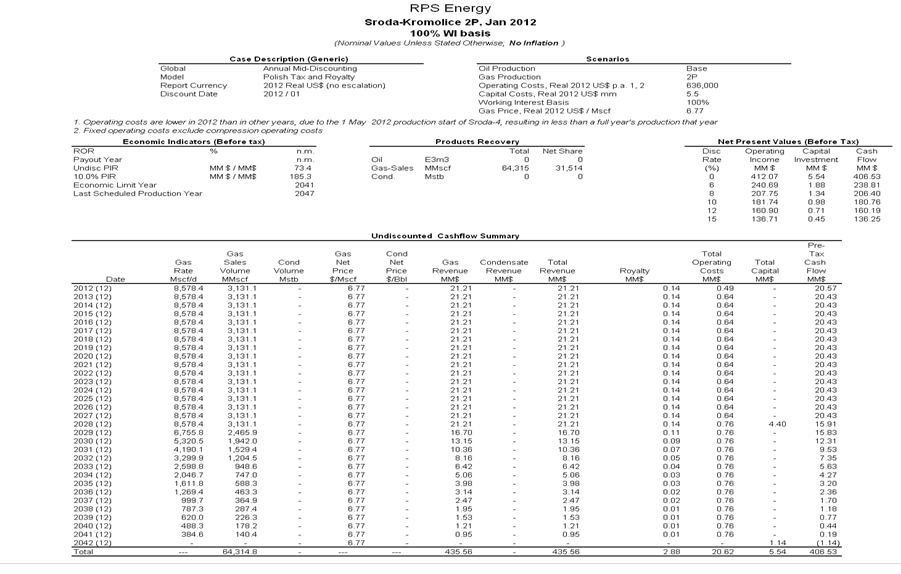
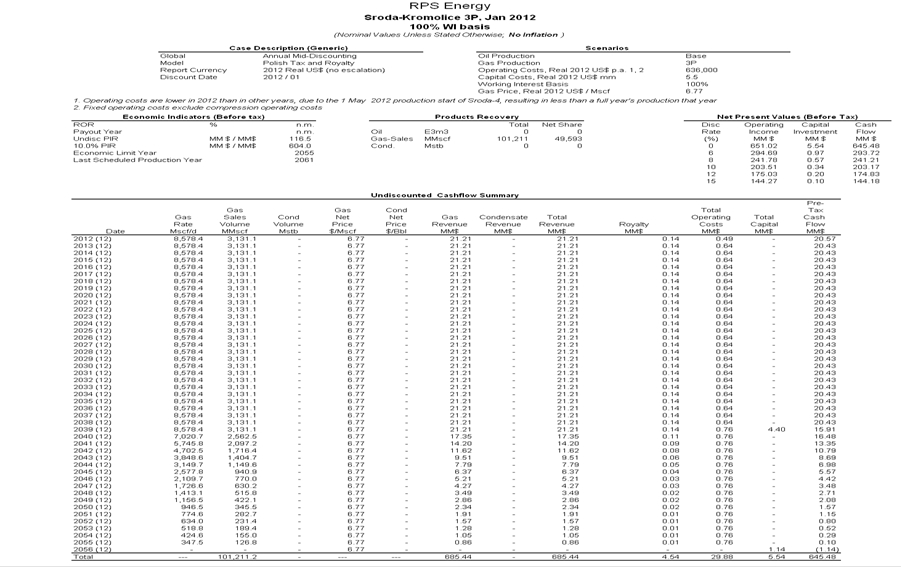
2.5 Kromolice-Sroda Field
2.5.1 Field Description
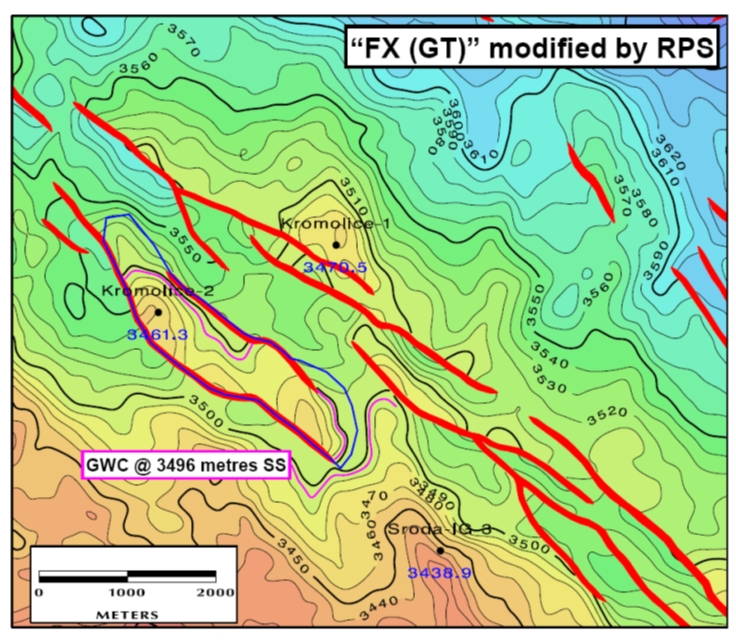
The Kromolice-Sroda structure has been documented in detail in Reference 4, but the map has been repeated in Figure 2-12.
The following GIIP-range was used from this Reference:
| Proved | 65.2 Bscf | * |
| Proved plus Probable | 94.7 Bscf | |
| Proved plus Probable plus Possible | 136.2 Bscf | |
*Note that in the Proved case, the Kromolice and Sroda structures were modelled as two separated tanks, since the map based on the FX Energy structural interpretation indicated almost separate structures, see also Figure 2-12.
2.5.2 Production History
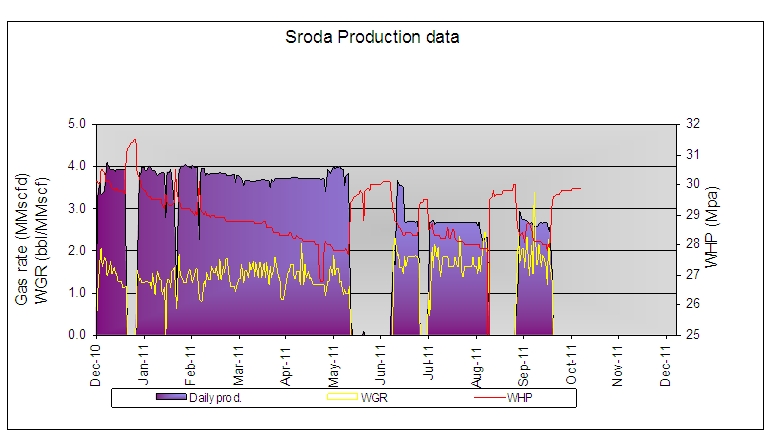
Sroda-4 came on production at the end of 2010, see Figure 2-13. It was initially produced at a rate of 3.8 MMscf/d but this was cut back in June/July 2011 because in May 2011 an increase in the chloride content of the produced water was measured. The chloride content in the produced water subsequently dropped back to previous levels. RPS Energy feels this response was relatively exaggerated (maximum recorded salinity only 2.5 g/l) and does not believe that any significant amount of formation water was being produced in Sroda-4.
| RPS Energy | FX Energy, Inc. Evaluation of Polish Gas Assets |
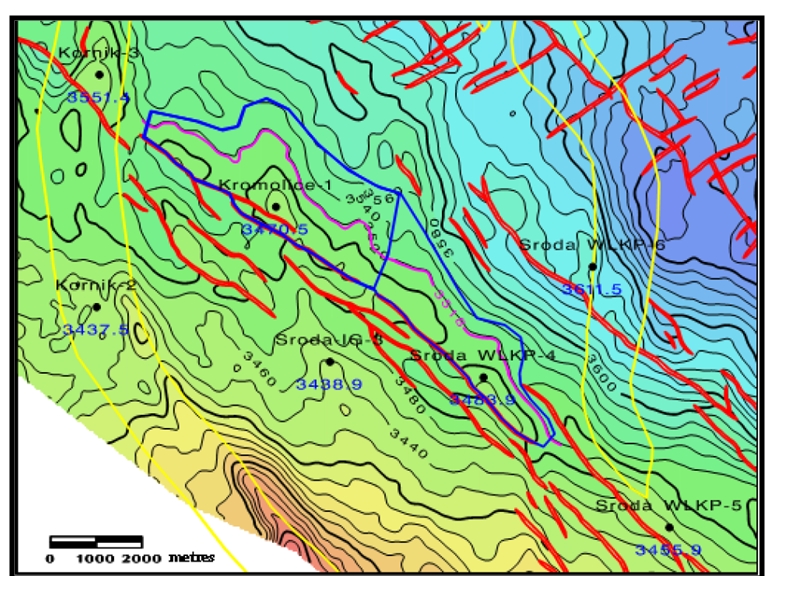
Figure 2-12: Kromolice-Sroda Field Top Structure Map
The reduced production level was maintained through to Oct 13th, the last day that the well was producing, due to a bottleneck in the evacuating pipeline. The well came back on production in January 2012 after an easing of pipeline capacity constraints. A static bottom hole pressure was measured in September 2011.
Figure 2-13: Sroda Field Production History
| RPS Energy | FX Energy, Inc. Evaluation of Polish Gas Assets |
Kromolice-1 came on production in June 2011, produced intermittently until October, and has been on continuous production since that time; see Figure 2-14. The variations in daily production rate were due to variable capacity in the export pipeline system and not due to any reservoir issues.
Figure 2-14: Kromolice-1 Field Production History
Observing the WHP behaviour of Kromolice-1 and Sroda-4 (Figure 2-15), which RPS believed to be in the same field (see reference 4), highlights the following findings:
| · | During periods of production of Sr-4, no reaction on the pressures of K-1 was observed. |
| · | The CIWHP of K-1 lags behind 400-500 psi from the FWHP’s of Sr-4, not all of which can be explained by Sr-4’s tubing friction losses. |
| · | Some CIWHP drops were observed in K-1 during year 2011, which could indicate a small form of communication or a result of temperature effects. |
| · | However Sroda-4 is experiencing slow pressure build-ups and even after 17-20 days of build-up, the pressure is still rising significantly. It is unlikely that this is caused by the influence of an aquifer and this suggests that some gas is being produced via a saddle connection from the Kromolice-1 area towards the NW (see Figure 2-12). |
2.5.3 Gas Reserves Estimation
A static bottomhole pressure was measured in Sroda-4 on 19th September 2011. No static pressure was carried out in Kromolice-1 during 2011.
With a possible separation of Sroda-4 and Kromolice-1, the p/z plot for Sr-4 was constructed, using production of Sr-4 only. This yielded an extrapolated GIIP of only 17 Bscf, see Figure 2-16, much smaller than the Proved Volumetric GIIP of 32 Bscf.
| RPS Energy | FX Energy, Inc. Evaluation of Polish Gas Assets |
Figure 2-15: WHP-Behaviour of Kromolice-1 and Sroda-4
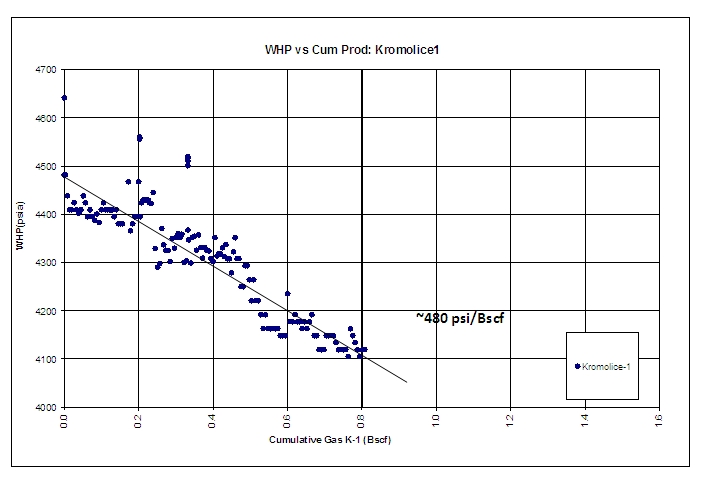
To verify connected volumes, separate plots of FWHP versus cumulative production were made for Sr-4 (Figure 2-17) and K-1 (Figure 2-18). They show steep pressure declines of ~600 psi/Bscf (Sr-4) and ~480 psi/Bscf (K-1), both indicating very small connected volumes. However when extrapolating the Closed-in WHP from Sr-4, a much flatter pressure decline of 140 psi/Bscf is observed.
No hard evidence can be deduced from the FWHP trends of Sroda-4 and Kromolice-1, whilst slow rising build-ups are observed in Sroda-4. The limited connected volumes from FWHP-extrapolation could be either a result of layering or from sub-seismic compartmentalisation. RPS Energy finds it therefore too premature to base the GIIP on material balance estimates. The GIIP estimates therefore remain at the values reported in section 2.5.1.
If feasible, RPS Energy would recommend carrying out interference testing between Sroda-4 and Kromolice-1 to improve understanding of the communication.
| RPS Energy | FX Energy, Inc. Evaluation of Polish Gas Assets |
Figure 2-16: Sroda Field Material Balance
Figure 2-17: WHP versus Cumulative Gas (Sroda-4)
| RPS Energy | FX Energy, Inc. Evaluation of Polish Gas Assets |
Figure 2-18: WHP versus Cumulative Gas (Kromolice-1)
For the Kromolice-Sroda structure the same range in recovery factor assumptions were maintained as made in the report presented in January 2009 (Reference 4): 60-70-75.8%.
The profiles were produced by hand but adjusted accordingly to achieve the agreed recoverable reserves in each case whilst complying with the plateau rate up to a total of approximately 60% of the ultimate recovery produced on plateau.
Forecasts for this field are included in Appendix 5.
The following forecast assumptions were used:
| · | A plateau rate of 6.14 MMscf/d for the Kromolice-1 well and 2.68 MMscf/d for the Sroda-4 well, as currently indicated by the Operator, POGC. |
| · | A re start-production date of January 2012 for Sroda-4 on the advice of FX Energy. |
| · | As instructed by FX Energy, ten days of downtime per well have been included in the profiles. |
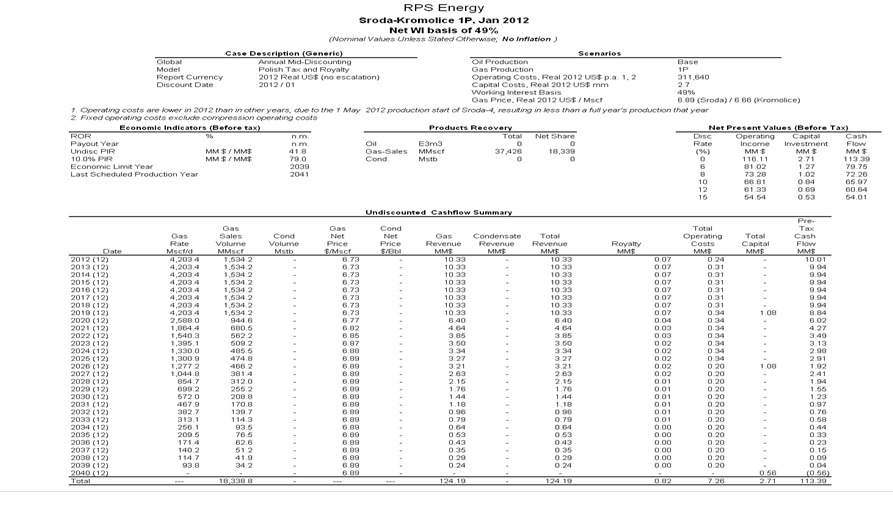
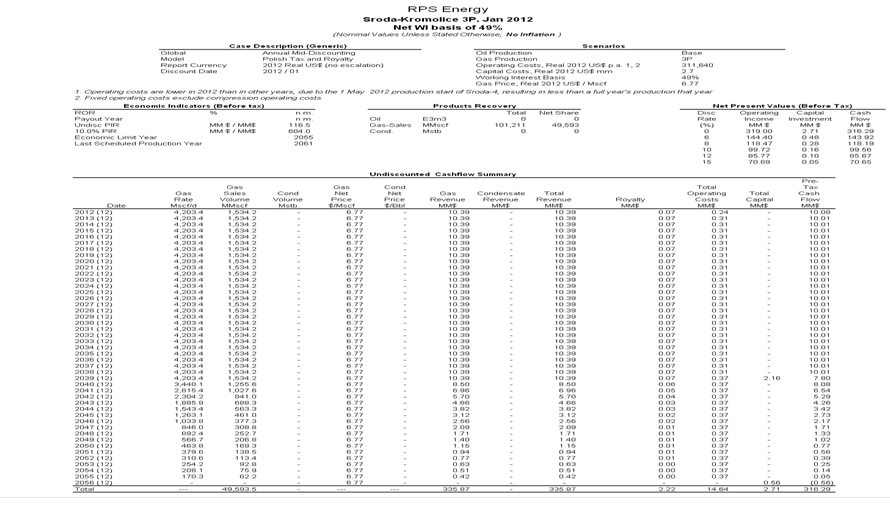
The remaining reserves of gas, at 31st December 2011 for this field are summarized in Table 2-7.
| Kromolice-Sroda |
| | 2011 | 2012 |
| Remaining Reserves (MMscf) | Evaluation 1st Jan 2011 | Production
during 2011 | Remaining 31st Dec 2011 | Economic Limit in year | Evaluation 1st Jan 2012 |
| Proven | 39,119 | 1,582 | 37,537 | 2039 | 37,426 |
| Proven+Probable | 66,142 | 1,582 | 64,560 | 2041 | 64,315 |
| Proven+Probable+Possible | 103,167 | 1,582 | 101,585 | 2055 | 101,211 |
Table 2-7: Gas Reserves (MMscf) for the Kromolice-Sroda Field at 31st December 2011 100% Basis
| RPS Energy | FX Energy, Inc. Evaluation of Polish Gas Assets |
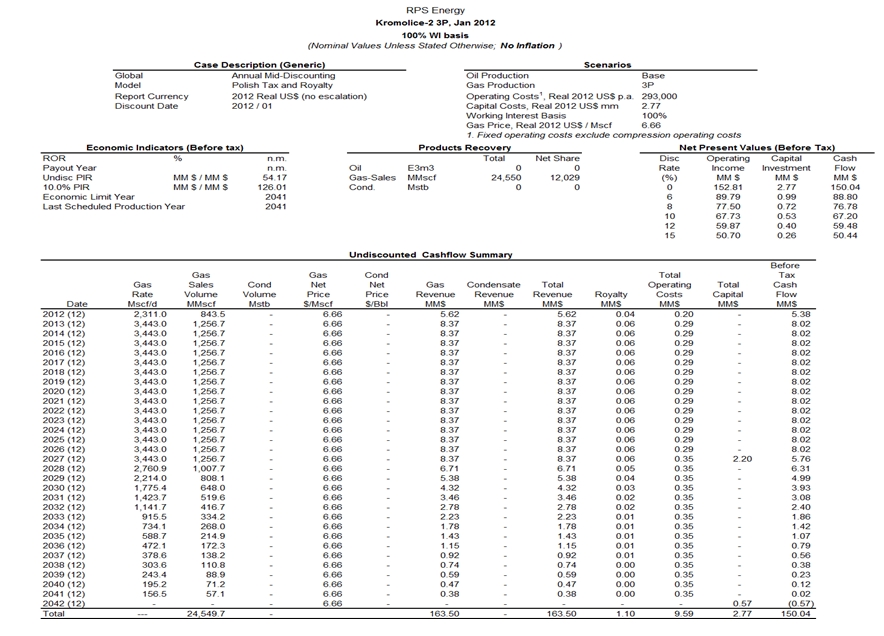
2.6 Kromolice-South Field
2.6.1 Field Description
The Volumetric Estimate of Kromolice South structure has been detailed in a separate report (Reference 6). The top structure map in Figure 2-19 is repeated from this reference.
The following GIIP-range was used from this Reference:
| Proved | 15.5 Bscf |
| Proved plus Probable | 22.2 Bscf |
| Proved plus Probable plus Possible | 31.5 Bscf |
Figure 2-19: Kromolice South Top Structure Map
| RPS Energy | FX Energy, Inc. Evaluation of Polish Gas Assets |
2.6.2 Production History
The Kromolice South field was brought on production on July 6th 2011 (Figure 2-20) and has not been produced at constant rates since that time. The variations in daily production rate were due to variable capacity in the export pipeline system and not due to any reservoir issues. At present, Kromolice-2 is not producing and this is likely to be the case till May 2012. The observed declining WGR trend is likely to be caused by cleaning up of packer fluid: Because of corrosion in the tubing an estimated 33 m3 of saline packer-fluid has penetrated the reservoir.
Figure 2-20: Kromolice South Field Production History
A plot of flowing WHP versus Cumulative Production for Kromolice-2 was made showing steep pressure declines (see Figure 2-21). It is noticed however that the accuracy of the gauge is not reliable; hence no further conclusions were based on this observation.
Figure 2-21: Kromolice South: WHP versus Cumulative Gas
| RPS Energy | FX Energy, Inc. Evaluation of Polish Gas Assets |
2.6.3 Gas Reserves Estimation
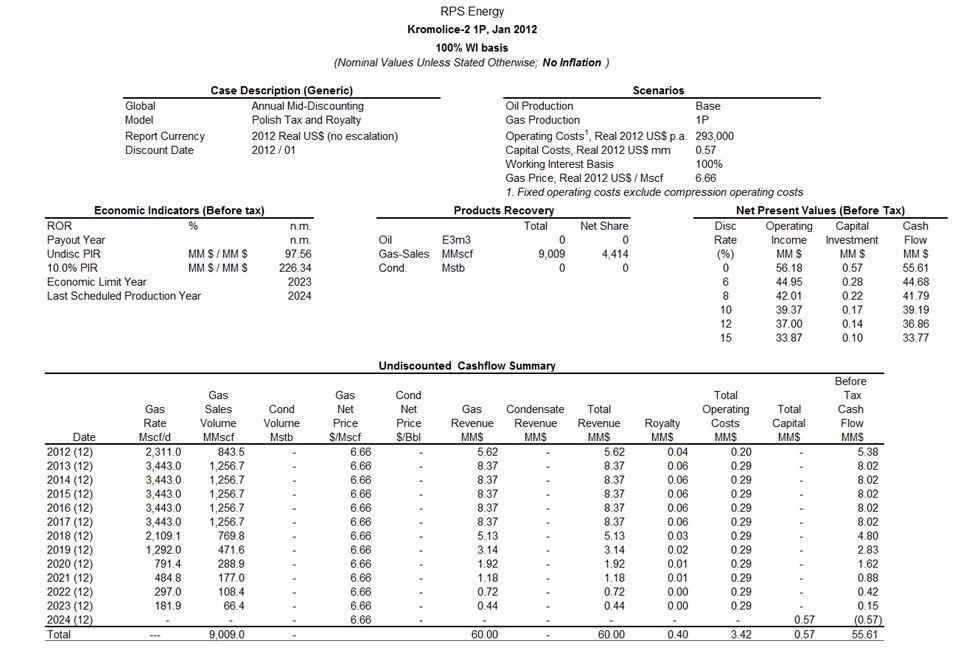
No reliable material balance could yet be derived for Kromolice South. Hence GIIP and EUR estimates were maintained from reference 6. The GIIP range is repeated in section 2.6.1, whilst the recovery factor range was maintained at 60-70-78.6% (see reference 6).
The following forecast assumptions were used:
| · | A plateau rate of 3.54 MMscf/d for Kromolice-2, as proposed by the operator POGC. |
| · | As instructed by FX Energy, ten days of downtime per well have been included in the profiles. |
To reflect reductions due to potential water influx, recovery factors were maintained as last year for the Proved (60%) and Proved Plus Probable (70%) and Proved Plus Probable Plus Possible (78.6%). The profiles were produced by hand but adjusted accordingly to achieve the agreed recoverable in each case whilst complying with the plateau rate acknowledged. Note that the reserves produced in the plateau period are high as a result of assumed water influx.
Forecasts for this field are included in Appendix 3. The remaining reserves of gas, at 31st December 2011 for this field are summarized in Table 2-8.
| Kromolice-South |
| | 2011 | 2012 |
| Remaining Reserves (MMscf) | Evaluation 1st Jan 2011 | Production
during 2011 | Remaining 31st Dec 2011 | Economic Limit in year | Evaluation 1st Jan 2012 |
| Proven | 9,310 | 250.3 | 9,060 | 2023 | 9,009 |
| Proven+Probable | 15,452 | 250.3 | 15,202 | 2030 | 15,204 |
| Proven+Probable+Possible | 24,755 | 250.3 | 24,505 | 2041 | 24,550 |
Table 2-8: Gas Reserves (MMscf) for the Kromolice South Field at 31st December (100% basis)
2.7 Grabowka
2.7.1 Field Description
From previous studies on Grabowka (Ref. 7), the following volumetric ranges in GIIP (Bscf) for the two structures amounted to:
| | Grabowka East | Grabowka West |
| | Spill 1550 m TVDSS | Spill 1565 m TVDSS |
| | | |
| P | 1.0 | 3.6 |
| P+P | 2.2 | 12.6 |
| P+P+P | 3.9 | 25.2 |
| RPS Energy | FX Energy, Inc. Evaluation of Polish Gas Assets |
2.7.2 Production History
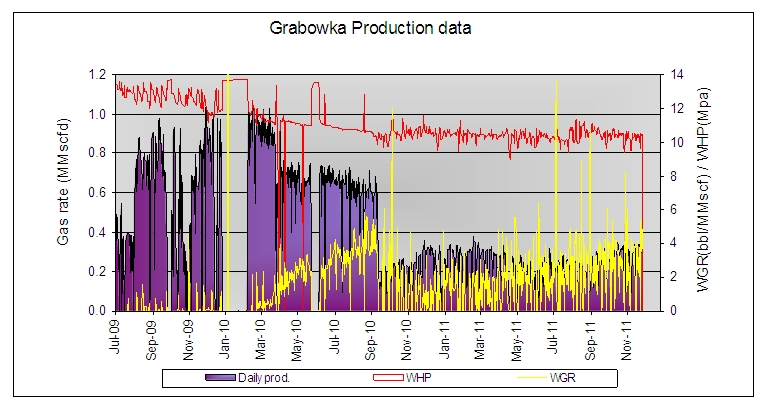
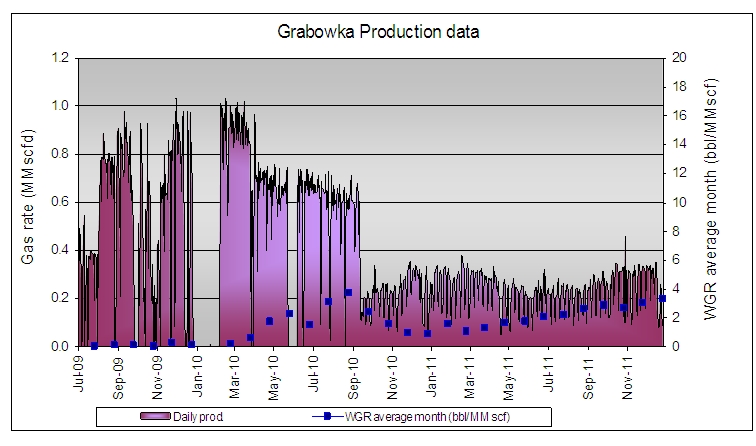
The Grabowka East field started production in July 2009 with well G-12. In Sept 2010 a new gas rate of 0.24 MMscf/d commenced as a result of a new gas buyer. From that moment the rate was kept relatively constant. The Grabowka East field has produced a total of 340 MMscf of gas to December 31st 2011. Due to the erratic nature of the daily data and the low gas rates (Figure 2-22), the WGR has been plotted using monthly average data (Figure 2-23).A slight increase in the WGR is noted. Figure 2-22 also shows that the WHFP does not really decline at these low off-take rates, suggesting a presence of an active aquifer.
A work-over of G-6 is planned in Grabowka West in February 2012 and it is estimated that the well should be available in April 2012. The expected off-take rate from the two wells will be 0.375 MMscf/d-meeting the demand of the gas buyer. The laying of a pipeline to the POGC trunk line has been assumed deferred till 2014.
2.7.3 Gas Reserves Estimation
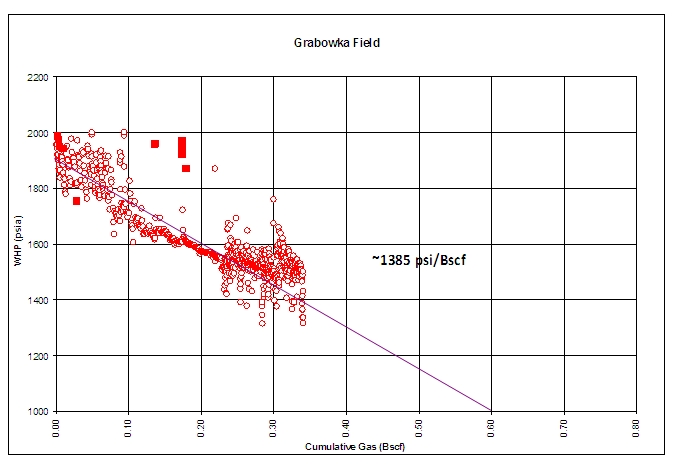
No static pressure surveys were recorded in G-12 hence no reliable material balance estimate can be supplied. The WHP versus Cumulative Production plot indicates an earlier decline of almost 1400 psi/Bscf (see Figure 2-24). Note the absence of any decline during the recent smaller off-takes. When using the same pressure decline in FWHP for the reservoir pressures, a material balance derived GIIP extrapolation of 1.7 Bscf resulted.
Figure 2-22: G-12 Well Production Performance (Grabowka-East)
| RPS Energy | FX Energy, Inc. Evaluation of Polish Gas Assets |
Figure 2-23: G-12 performance with monthly averaged WGR
This is within the range of the volumetric GIIP estimates, detailed in section 2.7.1. For that reason GIIP used for the Proved, Proved plus Probable and Proved plus Probable plus Possible cases have been left unchanged from the volumetric range in GIIP volumes, determined from Monte Carlo analysis.
Figure 2-24: Grabowka-12 WHP vs Cum Gas
| RPS Energy | FX Energy, Inc. Evaluation of Polish Gas Assets |
Although strong aquifer influence in Grabowka East is suspected (FWHP maintenance and slow WGR increase) and a restricted demand from the buyer (which is unfavourable for gas reservoirs with a strong aquifer), the P90 and P50 recovery factors for Grabowka East were increased slightly compared to last year’s estimates (Note that the 1P Recovery Factor was 35%, whilst at the end of 2011 already 34% of the 1P GIIP was produced):
| P90 (SEC): | 45% |
| P50: | 55% |
| P10: | 65% |
No production has yet taken place in Grabowka West (G-6 and G-8 wells) and therefore recovery factor estimates were kept the same as in last year’s report (ref. 7).
The following additional forecast assumptions were taken into account:
| · | The G-12 well was kept at the current average rate of 0.24 MMscf/d for all cases and declined to meet recovery factors of 45%, 55% and 65% of EUR for Grabowka East. |
| · | Start-up of Grabowka-West well G-6 as of April 2012. The production of G-6 and G-12 will be capped to 0.375 MMscf/d |
| · | Start-up of Grabowka-West well G-8 in January 2014. |
| · | Capping production of the three wells to 2.7 MMscf/d (contractual limit) as of January 2014. The three wells can then flow against a WHP of ~900 psi, when the main POGC pipeline would be operational. However, the G-6 and G-8 wells were capped at 1.0 MMscf/d each, due to productivity considerations (AOFP of G-6 was only 1.55 MMscf/d). |
| · | 10 days downtime for annual testing/shut in. |
| · | Inclusion of compression with a minimum WHFP of 200 psia at the end of the plateau for the three wells. |
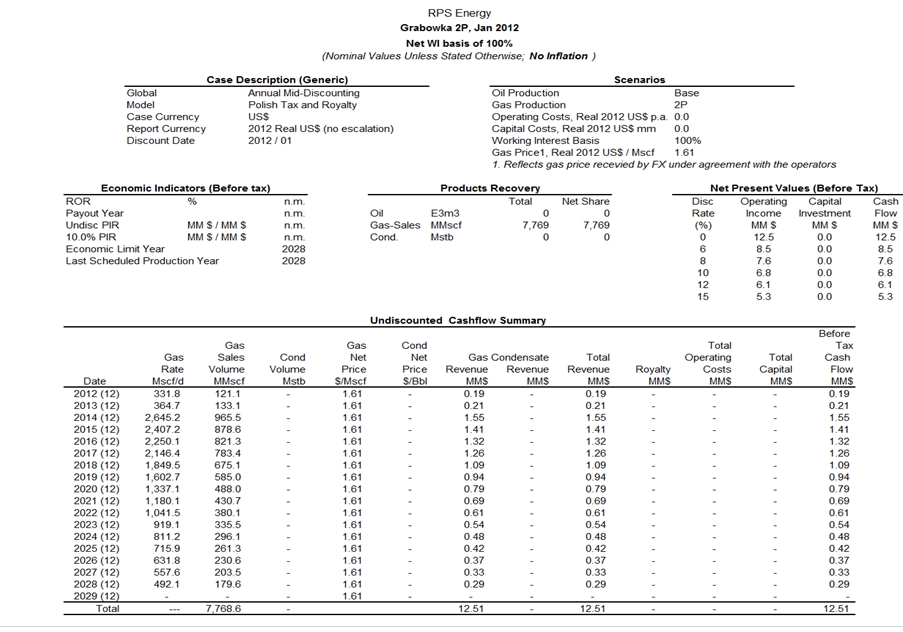
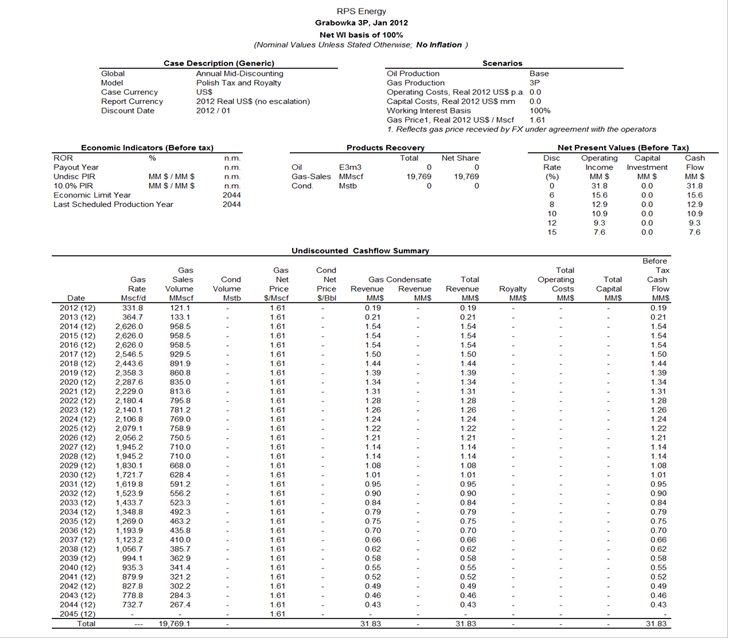
The resulting production forecast for the Proven+Probable case is shown in Figure 2-25, highlighting the importance of the Grabowka West volumes.
The total Grabowka Gas Reserves are summarised in Table 2-9.
| Grabowka |
| | 2011 | 2012 |
| Remaining Reserves (MMscf) | Evaluation 1st Jan 2011 | Production
during 2011 | Remaining 31st Dec 2011 | Economic Limit in year | Evaluation 1st Jan 2012 |
| Proven | 1,495 | 85.1 | 1,410 | 2016 | 1,420 |
| Proven+Probable | 7,397 | 85.1 | 7,312 | 2028 | 7,769 |
| Proven+Probable+Possible | 19,663 | 85.1 | 19,578 | 2044 | 19,769 |
Table 2-9: Gas Reserves (MMscf) for the Grabowka Field at 31st December 2011 100% Basis
| RPS Energy | FX Energy, Inc. Evaluation of Polish Gas Assets |
Figure 2-25: Grabowka 2P Production forecast
2.8 Lisewo
2.8.1 Field Description
The Lisewo field was discovered in 2011 by well Lisewo-1. Additional data from Lisewo-1 became available after the report date of ref. 8 (February 2011):
| · | Petrophysical SCAL data from the core revealed that the assumed porosity and saturation exponents (m=1.85, n=1.85) were considered reasonable. |
| · | A gas composition was made available, which was used to calculate an expansion factor range (previous range was based on an analogue composition). Based on a pressure and temperature estimate at datum (GWC or 3636.7 m TVDSS) of 5893 psia and 134 deg C respectively, a new expansion factor range of 251-252-253 was calculated. The corresponding gas composition is listed below in Table 2-10. |
| Component | Component | %mol |
| Methane | CH4 | 76.994 |
| Ethane | C2H6 | 0.185 |
| Propane | C3H8 | 0.005 |
| Carbon dioxide | CO2 | 1.196 |
| Helium | He | 0.115 |
| Nitrogen | N2 | 21.505 |
| Total | 100.00 |
Table 2-10: Gas Composition of Lisewo-1
| RPS Energy | FX Energy, Inc. Evaluation of Polish Gas Assets |
| · | A processed VSP-survey from well Lisewo-1 indicated that the applied time depth conversion in reference 8 was considered as reasonable, which is further discussed in the next section. |
2.8.2 Seismic Data Review
FX Energy provided digital VSP data (ASCII files and SEGY data) for Lisewo-1, and a 3rd party report on depth conversion (Zerkow-Pleszew 3D Depth Conversion and Structural Uncertainty Review, AA Geophysical Limited). The Base Zechstein depth grid generated by AA Geophysical was also provided.
The well-to-seismic tie is excellent, as shown by the well profile (Figure 2-26) and the VSP corridor stack (Figure 2-27).
Figure 2-26: Lisewo-1 Well to Seismic Tie (Well Profile)
| RPS Energy | FX Energy, Inc. Evaluation of Polish Gas Assets |
Figure 2-27: Lisewo-1 Well to Seismic Tie (VSP Corridor Stack)
Furthermore, an overlay of the actual velocity profile at the well (Figure 2-28) with the pre-drill velocity profile derived from the multi-layer velocity model (see reference 8 for details), shows very close agreement between modelled and actual velocities, with perhaps some minor differences in the shallow section (which has proved problematic in terms of velocity modelling). Based on these observations, RPS concludes that the incorporation of the Lisewo-1 velocity data in to the velocity model will have no significant impact on the depth conversion and GRV estimation of the Lisewo structure.
It was noted that a (bulk) time shift of -30msec (upwards) was required to align formation tops to equivalent surfaces picked on the seismic data. This has no effect on the depth conversion and GRV estimate.
RPS has undertaken a brief review of the recently completed Depth Conversion Study by AA Geophysical. This is a comprehensive attempt to analyse and improve on the layer-cake model used to date by FX Energy. The study has focussed on the shallow section where the velocity behaviour has proved difficult to model, using refraction statics data to help model the Malm “fast unit”, and seismic velocities for the overburden above Top Keuper. Alternative Vo-k functions have been derived for intervals down to Top Zechstein, with the intra-Zechstein model largely unchanged (gridded interval velocities for interval Zsp to Z2, as opposed to a constant velocity model).
A detailed analysis of this work is beyond the scope of this exercise, not least because a comparison would need to be made between the 8-layer models documented in the report, with the 11-layer model which was utilised last year.
| RPS Energy | FX Energy, Inc. Evaluation of Polish Gas Assets |
Figure 2-28: Lisewo-1 Well Velocity Profile
At this stage, the new model is certainly useful in helping to assess structural risk on undrilled prospects. However, the report’s claims that the depth prediction errors at Top Rotliegend are generally less than 10m should be treated with caution, since inspection of the AA depth grid at Lisewo-1 shows a prediction error of 20 m and not the 9 m error noted on Enclosure 6 of the report. By comparison, the pre-drill prediction at Top Rotliegend from the 11-layer model of last year was 6.5 m.
Until the AA model is further analysed, RPS can see no justification for changing the velocity model/depth conversion as applied to Lisewo. GRV estimates are therefore unchanged from last year.
2.8.3 Gas Reserves Estimation
Due to the small change in the gas expansion factor, the GIIP and EUR volumes, as documented in Reference 8 are slightly downgraded:
| | GIIP (Bscf) | RF | Technical Reserves (Bscf) |
| P90: | 41.8 | 60% | 25.1 |
| P50 | 49.7 | 70% | 34.8 |
| P10 | 58.8 | 80% | 47.0 |
An additional Lisewo well is scheduled for 2Q12 in the south-eastern compartment of the field and will accelerate the production forecast, starting as of July 2013.
| RPS Energy | FX Energy, Inc. Evaluation of Polish Gas Assets |
The following additional forecast assumptions were taken into account:
| · | A plateau rate 4.5 MMscf/d for each well |
| · | A flexible plateau duration to allow the reserves to be recovered |
| · | A start up date of 1 July 2013 for both wells on the advice of FX Energy |
| · | 10 days downtime for annual testing/shut in. |
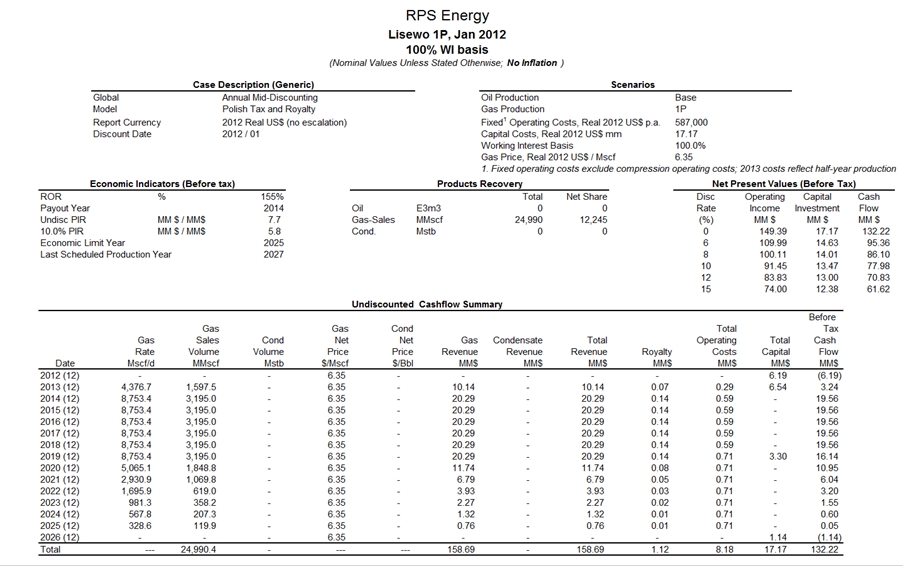
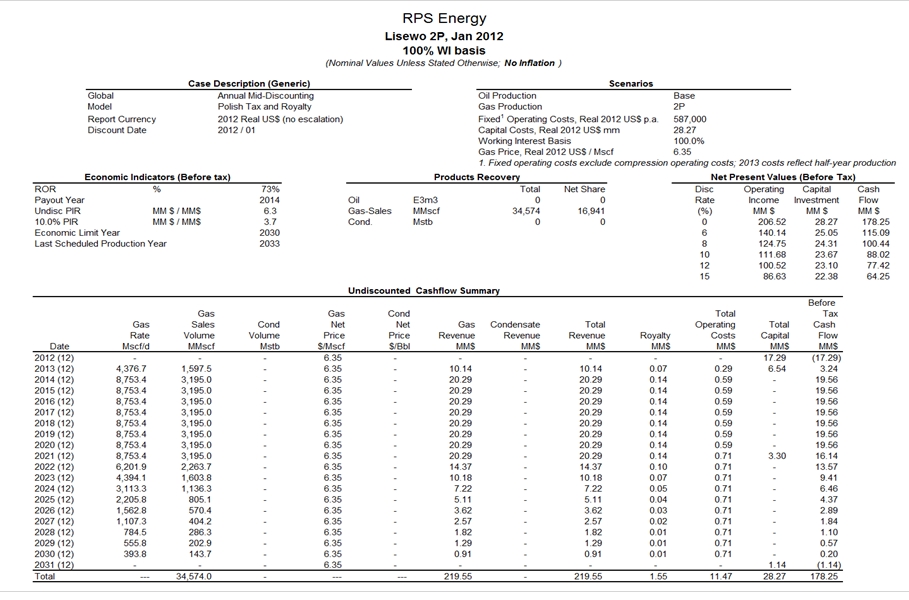
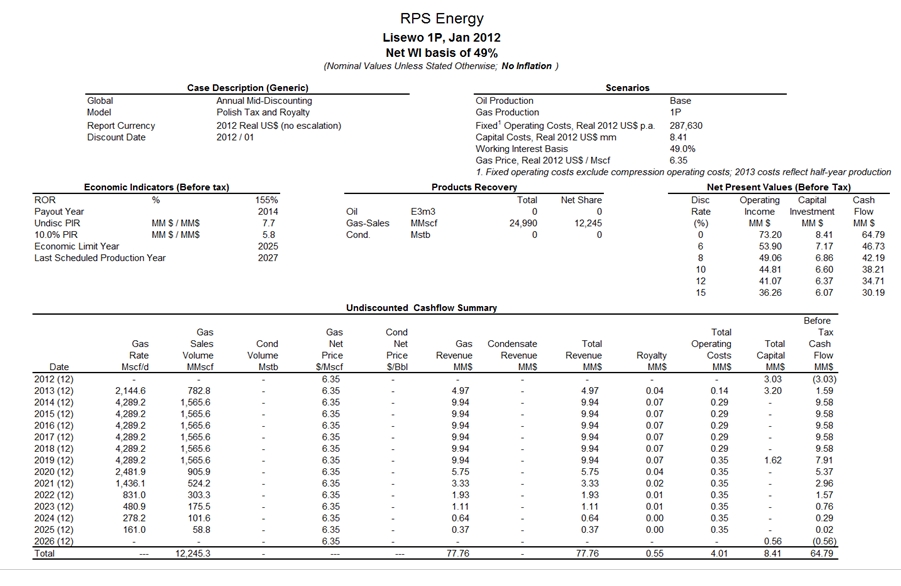
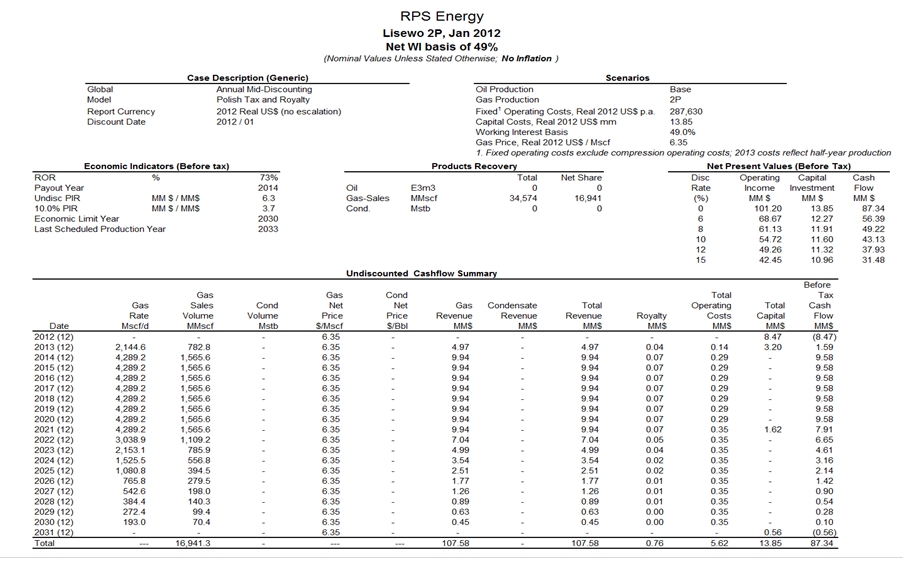
The total Lisewo Gas Reserves are summarised in Table 2-11.
| Lisewo |
| 2012 |
| Remaining Reserves (MMscf) | Evaluation 1st Jan 2011 | Economic Limit in year | Evaluation 1st Jan 2012 |
| Proven | 26,000 | 2025 | 24,990 |
| Proven+Probable | 36,200 | 2030 | 34,574 |
| Proven+Probable+Possible | 48,900 | 2038 | 47,000 |
Table 2-11: Gas Reserves (MMscf) for the Lisewo Field at 31st December 2011 100% Basis
| RPS Energy | FX Energy, Inc. Evaluation of Polish Gas Assets |
3. ECONOMIC ANALYSIS
3.1 Assumptions
An economic analysis of the Polish Assets of FX Energy was undertaken based on the following price and royalty assumptions (see Table 3-1). These data have been supplied by FX Energy in US Dollars and are based on Polish Zloty gas prices and exchange rates, taken as the average of the 1st day of the month values throughout 2011.
| | Gas Price $/Mscf | Royalty % | OPEX MM $ p.a. |
| | | | |
| Roszkow | 7.12 | 0.63 | 1.079 |
| Winna Gora | 6.61 | 0.68 | 0.343 |
| Zaniemysl | 5.15 | 0.87 | 0.766 |
| Kromolice-South | 6.66 | 0.67 | 0.293 |
| Kromolice-Sroda | 6.66/6.89 | 0.68/0.66 | 0.293/0.0.343 |
| Grabowka | 1.61 | N.A. | N.A. |
| Lisewo | 6.35 | 0.71 | 0.587 |
Table 3-1: Gas Price, Royalty and OPEX Assumptions
Note that due to contractual arrangements no CAPEX or OPEX is required by FX Energy for the Grabowka field.
3.2 Costing
Capital Expenditure
For the undeveloped fields and future compression costs for the developed fields, the Capital Expenditure programme shown below has been assumed based on information supplied by FX Energy. No inflation has been applied to these estimates.
| · | Roszkow –For the Proved, Proved plus Probable Cases and Proved plus Probable plus Possible Cases, Compression Costs of US $2.75 MM in 2013, 2016 and 2022 respectively. |
| · | Winna Gora – For all cases facility CAPEX and tie-in of the existing well at a cost of US $6.0 MM in 2012. Compression Costs of US $1.7 MM for the proved case in 2017, for the Proved plus Probable case in 2018 and for the Proved plus Probable plus Possible case in 2020. |
| · | Zaniemysl – Central compression costs of US $2.2 MM in MCHY have been allocated to Zaniemysl. For the Proved Case this happens in 2014, for the Proved plus Probable case in 2017 and in the Proved plus Probable plus Possible case in 2022. |
| · | Sroda-Kromolice – Central compression costs of US $4.4 MM in MCHY have been allocated to Sroda-Kromolice. This will happen in 2019 for the Proved case, in 2028 for the Proved plus Probable case and in 2039 in the Proved plus Probable plus Possible case. |
| RPS Energy | FX Energy, Inc. Evaluation of Polish Gas Assets |
| · | Kromolice-South - Central compression costs of US $2.2 MM in MCHY have been allocated to Kromolice-South. The Proved case is based on a strong aquifer influx and compression is not considered needed. For the Proved plus Probable case this is expected in 2021 and in 2027 in the Proved plus Probable plus Possible case. |
| · | Lisewo– For all cases facility CAPEX and tie-in of the existing well at a cost of US $6.19 MM in 2012 and $6.54 MM in 2013. Compression Costs of US $3.3 MM for the proved case in 2019, for the Proved plus Probable case in 2021 and for the Proved plus Probable plus Possible case in 2023. |
Operating and Abandonment Costs
Normal operating costs per well have been provided for all the fields and are tabulated in Table 3-1.
In addition to the normal operating costs, there is a $60,000/p.a additional compression OPEX per well, once compression is required. The dates for compression start-up are given above under the CAPEX requirements.
The Abandonment Costs have been provided by FX Energy and amount to 0.32 US $ MM per well and 0.25 US $MM per facility.
3.3 Results
The results of our analysis are shown below in Table 3-2. The Net Present Values are stated excluding Income Tax and are expressed in gross and net terms.
| | | NPV10 (Million US$) |
| | FX Energy | | | Proved + Probable + |
| Field | Interest | Proved | Proved + Probable | Possible |
| | | Gross | Net | Gross | Net | Gross | Net |
| Zaniemysl | 24.5% | 47.8 | 11.7 | 79.4 | 19.5 | 119.4 | 29.2 |
| Sroda-Kromolice | 49.0% | 134.6 | 66.0 | 180.8 | 88.6 | 203.2 | 99.6 |
| Roszkow | 49.0% | 64.6 | 31.7 | 148.3 | 72.6 | 216.6 | 106.1 |
| Winna Gora | 49.0% | 31.1 | 15.3 | 40.8 | 20.0 | 50.9 | 24.9 |
| Kromolice South | 49.0% | 39.2 | 19.2 | 53.6 | 26.2 | 67.2 | 32.9 |
| Grabowka | 100.0% | 1.8 | 1.8 | 6.8 | 6.8 | 10.9 | 10.9 |
| Lisewo | 49.0% | 78.0 | 38.2 | 88.0 | 43.1 | 106.5 | 52.2 |
| | | | | | | | |
| Total | | 397.1 | 183.8 | 597.6 | 276.9 | 774.6 | 355.9 |
Table 3-2: Total NPV10 and NPV10, attributable to FX Energy
It was requested by FX Energy to carry out +/- 10% sensitivities on the gas prices, mentioned in Table 3-1. The sensitivity to the gas price for the net reserves of the various assets is listed in Table 3-3. There is very little impact to the net reserves by varying the gas prices +/- 10%. The corresponding influence on the NPV10 (Net to FX Energy) of the gas price sensitivity is logically larger and is shown in Table 3-4 and graphically in Figure 3-1 for the Proven+Probable reserves only. The influence of gas price on NPV10 is more striking for the Roszkow and Sroda-Kromolice fields.
| RPS Energy | FX Energy, Inc. Evaluation of Polish Gas Assets |
| Fields | Net Reserves 90% Price | Net Reserves Base Price | Net Reserves 110% Price |
| | 1P | 2P | 3P | 1P | 2P | 3P | 1P | 2P | 3P |
| Roszkow | 6,165 | 15,475 | 26,919 | 6,165 | 15,475 | 26,919 | 6,244 | 15,552 | 26,919 |
| Winna Gora | 4,093 | 5,804 | 7,907 | 4,093 | 5,804 | 7,937.6 | 4,093 | 5,804 | 7,937.6 |
| Kromolice South | 4,414 | 7,450 | 12,001 | 4,414 | 7,450 | 12,029 | 4,434 | 7,450 | 12,029 |
| Zaniemysl | 2,958 | 5,718 | 11,054 | 2,958 | 5,718 | 11,095 | 2,958 | 5,755 | 11,095 |
| Kromolice Sroda | 18,339 | 31,514 | 49,594 | 18,339 | 31,514 | 49,594 | 18,367 | 31,568 | 49,644 |
| Grabowka | 1,420 | 7,769 | 19,769 | 1,420 | 7,769 | 19,769 | 1,420 | 7,769 | 19,769 |
| Lisewo | 12,186.5 | 16,941 | 23,030 | 12,245 | 16,941 | 23,030 | 12,245 | 16,941 | 23,030 |
| | | | | | | | | | |
| Total | 49,576 | 90,672 | 150,274 | 49,635 | 90,672 | 150,373 | 49,762 | 90,839 | 150,424 |
Table 3-3: Effect of Gas Price Sensitivities on FX Net Reserves (MMscf)
| | NPV10 90% Price | NPV10 Base Price | NPV10 110% Price |
| Fields | 1P | 2P | 3P | 1P | 2P | 3P | 1P | 2P | 3P |
| Roszkow | 28.06 | 64.88 | 95.02 | 31.67 | 72.64 | 106.14 | 35.31 | 80.43 | 117.26 |
| Winna Gora | 13.30 | 17.54 | 21.94 | 15.26 | 20.01 | 24.92 | 17.22 | 22.48 | 27.89 |
| Kromolice South | 17.18 | 23.44 | 29.47 | 19.21 | 26.24 | 32.93 | 21.24 | 29.04 | 36.39 |
| Zaniemysl | 10.44 | 17.35 | 26.12 | 11.70 | 19.46 | 29.24 | 12.96 | 21.57 | 32.36 |
| Kromolice Sroda | 59.01 | 79.36 | 89.26 | 65.97 | 88.57 | 99.56 | 72.94 | 97.80 | 109.85 |
| Grabowka | 1.60 | 6.10 | 9.80 | 1.80 | 6.80 | 10.90 | 1.90 | 7.50 | 11.90 |
| Lisewo | 33.52 | 37.43 | 45.58 | 38.21 | 43.13 | 52.20 | 42.89 | 48.83 | 58.82 |
| | | | | | | | | | |
| Total | 163.11 | 246.10 | 317.19 | 183.82 | 276.85 | 355.89 | 204.46 | 307.65 | 394.47 |
Table 3-4: Effect of Gas Price Sensitivities on NPV10 (Net to FX Energy) in Million USD
Figure 3-1: Gas Price Sensitivity on NPV10 (Net to FX Energy) for the 2P Case.
| RPS Energy | FX Energy, Inc. Evaluation of Polish Gas Assets |
4. RESERVES EVOLUTION 2010-2011
4.1 Proved Gas Reserves
| | 2011 | 2012 | Variation |
| Field | Evaluation | Production | Remaining | Evaluation | MMscf | (%) |
| | 01-Jan-11 | during 2011 | 31-Dec-11 | 01-Jan-12 | | |
| | | | | | | |
| Zaniemysl | 15,453 | 3,263 | 12,190 | 12,075 | -116 | -1% |
| Sroda-Kromolice | 39,119 | 1,582 | 37,537 | 37,426 | -111 | 0% |
| Roszkow | 14,763 | 4,650 | 10,113 | 12,582 | 2,469 | 24% |
| Winna Gora | 7,579 | 0 | 7,579 | 8,353 | 774 | 10% |
| Kromolice South | 9,310 | 250 | 9,060 | 9,009 | -51 | -1% |
| Grabowka | 1,495 | 85 | 1,410 | 1,420 | 10 | 1% |
| Lisewo | | | | 24,990 | | |
| | | | | | | |
| Total | 87,719 | 9,830 | 77,889 | 105,856 | 27,967 | 36% |
Table 4-1: Gas Proved Reserves (MMscf) 100% Basis
The change to the Proved Reserves in Roszkow is related to an increased recovery factor (less likely to be influenced by aquifer influx). The change in Winna Gora is related to the new 3D seismic interpretation. The remaining small variations are due to minor adjustments and slightly different economic cut-off dates.
4.2 Proved plus Probable Gas Reserves
| | 2011 | 2012 | Variation |
| Field | Evaluation | Production | Remaining | Evaluation | MMscf | (%) |
| | 01-Jan-11 | during 2011 | 31-Dec-11 | 01-Jan-12 | | |
| | | | | | | |
| Zaniemysl | 26,854 | 3,263 | 23,591 | 23,339 | -253 | -1% |
| Sroda-Kromolice | 66,142 | 1,582 | 64,560 | 64,315 | -245 | 0% |
| Roszkow | 48,157 | 4,650 | 43,507 | 31,581 | -11,926 | -27% |
| Winna Gora | 11,681 | 0 | 11,681 | 11,846 | 165 | 1% |
| Kromolice South | 15,452 | 250 | 15,202 | 15,204 | 2 | 0% |
| Grabowka | 7,397 | 85 | 7,312 | 7,769 | 457 | 6% |
| Lisewo | | | | 34,574 | | |
| | | | | | | |
| Total | 175,683 | 9,830 | 165,853 | 188,627 | 22,774 | 14% |
Table 4-2: Gas Proved plus Probable Reserves (MMscf) 100% Basis
The change in the Proved plus Probable Reserves for Roszkow is related to a less likely water influx (GIIP now more dependent on material balance estimate). The remaining small variations are due to minor adjustments and slightly different economic cut-off dates.
| RPS Energy | FX Energy, Inc. Evaluation of Polish Gas Assets |
4.3 Proved plus Probable plus Possible Gas Reserves
| | 2011 | 2012 | Variation |
| Field | Evaluation | Production | Remaining | Evaluation | MMscf | (%) |
| | 01-Jan-11 | during 2011 | 31-Dec-11 | 01-Jan-12 | | |
| | | | | | | |
| Zaniemysl | 48,854 | 3,263 | 45,591 | 45,284 | -307 | -1% |
| Sroda-Kromolice | 103,167 | 1,582 | 101,585 | 101,211 | -374 | 0% |
| Roszkow | 79,998 | 4,650 | 75,348 | 54,937 | -20,411 | -27% |
| Winna Gora | 16,293 | 2,031 | 14,262 | 16,199 | 1,937 | 14% |
| Kromolice South | 24,755 | 250 | 24,505 | 24,550 | 45 | 0% |
| Grabowka | 19,663 | 85.1 | 19,578 | 19,769 | 191 | 1% |
| Lisewo | | | | 47,000 | | |
| | | | | | | |
| Total | 292,730 | 11,861 | 280,869 | 308,950 | 28,081 | 10% |
Table 4-3: Gas Proved plus Probable plus Possible Reserves (MMscf) 100% Basis
The change in the Proved plus Probable plus Possible Reserves for Roszkow is related to a less likely water influx (GIIP now more dependent on material balance estimate). The change in Winna Gora is related to the new 3D seismic interpretation. The remaining small variations are due to minor adjustments and slightly different economic cut-off dates.
| RPS Energy | FX Energy, Inc. Evaluation of Polish Gas Assets |
5. REFERENCES
| 1. | Francis Boundy. Evaluation of Polish Gas Assets. RPS Energy, February 2007. |
| 2. | RPS Energy Report ECV1380. Evaluation of Polish Gas Assets, February 2008. |
| 3. | Francis Boundy. Evaluation of Winna Gora and Roszkow Gas fields. RPS Energy, August 2007. |
| 4. | RPS Energy Report ECV1475. Evaluation of the Kromolice-Sroda field, January 2009. |
| 5. | RPS Energy Report ECV1496. Evaluation of Polish Gas Assets, February 2009. |
| 6. | RPS Energy Report ECV1566a. Evaluation of the Kromolice-South and Grabowka Fields, January 2010. |
| 7. | RPS Energy Report ECV1566b. FX Energy, Inc. Evaluation of Polish Gas Assets, February 2010. |
| 8. | RPS Energy Report ECV1713b. Evaluation of the Lisewo Discovery, February 2011. |
| RPS Energy | FX Energy, Inc. Evaluation of Polish Gas Assets |
| APPENDIX 1: | PRODUCTION FORECASTS AND CASHFLOW ANALYSIS FOR THE ROSZKOW FIELD |
| | Proved | Proved+Probable | Proved +Probable+Possible |
| Year | Gas Rate (MMscfd) | Cumulative Production (Bscf) | Gas Rate (MMscfd) | Cumulative Production (Bscf) | Gas Rate (MMscfd) | Cumulative Production (Bscf) |
| 2012 | 12.16 | 15.62 | 12.16 | 15.62 | 12.16 | 15.62 |
| 2013 | 8.02 | 18.55 | 12.16 | 20.06 | 12.16 | 20.06 |
| 2014 | 5.30 | 20.49 | 12.16 | 24.50 | 12.16 | 24.50 |
| 2015 | 3.50 | 21.76 | 12.16 | 28.94 | 12.16 | 28.94 |
| 2016 | 2.31 | 22.60 | 12.16 | 33.37 | 12.16 | 33.37 |
| 2017 | 1.52 | 23.16 | 8.40 | 36.44 | 12.16 | 37.81 |
| 2018 | 1.01 | 23.53 | 5.80 | 38.55 | 12.16 | 42.25 |
| 2019 | 0.66 | 23.77 | 4.00 | 40.02 | 12.16 | 46.69 |
| 2020 | 0.44 | 23.93 | 2.77 | 41.03 | 12.16 | 51.12 |
| 2021 | 0.29 | 24.03 | 1.91 | 41.72 | 12.16 | 55.56 |
| 2022 | 0.19 | 24.10 | 1.32 | 42.20 | 12.16 | 60.00 |
| 2023 | 0.13 | 24.15 | 0.91 | 42.54 | 7.18 | 62.62 |
| 2024 | 0.08 | 24.18 | 0.63 | 42.77 | 4.24 | 64.16 |
| 2025 | | | 0.43 | 42.93 | 2.50 | 65.08 |
| 2026 | | | 0.30 | 43.04 | 1.48 | 65.62 |
| 2027 | | | 0.21 | 43.11 | 0.87 | 65.94 |
| 2028 | | | 0.14 | 43.16 | 0.51 | 66.12 |
| 2029 | | | 0.10 | 43.20 | 0.30 | 66.23 |
| 2030 | | | | | 0.18 | 66.30 |
Table A1.1: Gas Production Forecast for Roszkow Field
| RPS Energy | FX Energy, Inc. Evaluation of Polish Gas Assets |
| RPS Energy | FX Energy, Inc. Evaluation of Polish Gas Assets |
| RPS Energy | FX Energy, Inc. Evaluation of Polish Gas Assets |
| RPS Energy | FX Energy, Inc. Evaluation of Polish Gas Assets |
| RPS Energy | FX Energy, Inc. Evaluation of Polish Gas Assets |
| RPS Energy | FX Energy, Inc. Evaluation of Polish Gas Assets |
| RPS Energy | FX Energy, Inc. Evaluation of Polish Gas Assets |
| APPENDIX 2: | PRODUCTION FORECASTS AND CASHFLOW ANALYSIS FOR THE WINNA GORA FIELD |
| | Proved | Proved+Probable | Proved +Probable+Possible |
| Year | Gas Rate (MMscfd) | Cumulative Production (Bscf) | Gas Rate (MMscfd) | Cumulative Production (Bscf) | Gas Rate (MMscfd) | Cumulative Production (Bscf) |
| 2012 | 1.95 | 0.71 | 1.95 | 0.71 | 1.95 | 0.71 |
| 2013 | 3.89 | 2.13 | 3.89 | 2.13 | 3.89 | 2.13 |
| 2014 | 3.89 | 3.55 | 3.89 | 3.55 | 3.89 | 3.55 |
| 2015 | 3.89 | 4.97 | 3.89 | 4.97 | 3.89 | 4.97 |
| 2016 | 3.89 | 6.39 | 3.89 | 6.39 | 3.89 | 6.39 |
| 2017 | 3.89 | 7.81 | 3.89 | 7.81 | 3.89 | 7.81 |
| 2018 | 1.15 | 8.23 | 3.89 | 9.23 | 3.89 | 9.23 |
| 2019 | 0.34 | 8.35 | 2.57 | 10.17 | 3.89 | 10.65 |
| 2020 | 0.10 | 8.39 | 1.70 | 10.79 | 3.89 | 12.07 |
| 2021 | 0.03 | 8.40 | 1.12 | 11.20 | 2.93 | 13.14 |
| 2022 | | | 0.74 | 11.47 | 2.20 | 13.94 |
| 2023 | | | 0.49 | 11.65 | 1.66 | 14.55 |
| 2024 | | | 0.32 | 11.77 | 1.25 | 15.00 |
| 2025 | | | 0.21 | 11.85 | 0.94 | 15.35 |
| 2026 | | | 0.14 | 11.90 | 0.71 | 15.60 |
| 2027 | | | | | 0.53 | 15.80 |
| 2028 | | | | | 0.40 | 15.94 |
| 2029 | | | | | 0.30 | 16.05 |
| 2030 | | | | | 0.23 | 16.14 |
| 2031 | | | | | 0.17 | 16.20 |
Table A2.1: Gas Production Forecast for Winna Gora Field
| RPS Energy | FX Energy, Inc. Evaluation of Polish Gas Assets |
| RPS Energy | FX Energy, Inc. Evaluation of Polish Gas Assets |

| RPS Energy | FX Energy, Inc. Evaluation of Polish Gas Assets |
| RPS Energy | FX Energy, Inc. Evaluation of Polish Gas Assets |
| RPS Energy | FX Energy, Inc. Evaluation of Polish Gas Assets |
| RPS Energy | FX Energy, Inc. Evaluation of Polish Gas Assets |
| RPS Energy | FX Energy, Inc. Evaluation of Polish Gas Assets |
| APPENDIX 3: | PRODUCTION FORECASTS AND CASHFLOW ANALYSIS FOR THE KROMOLICE SOUTH FIELD |
| | Proved | Proved+Probable | Proved +Probable+Possible |
| | Gas Rate | Cumulative | Gas Rate | Cumulative | Gas Rate | Cumulative |
| Year | (MMscfd) | Production | (MMscfd) | Production | (MMscfd) | Production |
| | | (Bscf) | | (Bscf) | | (Bscf) |
| 2012 | 2.31 | 1.09 | 2.31 | 1.09 | 2.31 | 1.09 |
| 2013 | 3.44 | 2.35 | 3.44 | 2.35 | 3.44 | 2.35 |
| 2014 | 3.44 | 3.61 | 3.44 | 3.61 | 3.44 | 3.61 |
| 2015 | 3.44 | 4.86 | 3.44 | 4.86 | 3.44 | 4.86 |
| 2016 | 3.44 | 6.12 | 3.44 | 6.12 | 3.44 | 6.12 |
| 2017 | 3.44 | 7.38 | 3.44 | 7.38 | 3.44 | 7.38 |
| 2018 | 2.11 | 8.15 | 3.44 | 8.63 | 3.44 | 8.63 |
| 2019 | 1.29 | 8.62 | 3.44 | 9.89 | 3.44 | 9.89 |
| 2020 | 0.79 | 8.91 | 3.44 | 11.15 | 3.44 | 11.15 |
| 2021 | 0.48 | 9.08 | 3.44 | 12.40 | 3.44 | 12.40 |
| 2022 | 0.30 | 9.19 | 2.48 | 13.31 | 3.44 | 13.66 |
| 2023 | 0.18 | 9.26 | 1.78 | 13.96 | 3.44 | 14.92 |
| 2024 | 0.11 | 9.30 | 1.28 | 14.42 | 3.44 | 16.17 |
| 2025 | | | 0.92 | 14.76 | 3.44 | 17.43 |
| 2026 | | | 0.66 | 15.00 | 3.44 | 18.69 |
| 2027 | | | 0.48 | 15.18 | 3.44 | 19.94 |
| 2028 | | | 0.34 | 15.30 | 2.76 | 20.95 |
| 2029 | | | 0.25 | 15.39 | 2.21 | 21.76 |
| 2030 | | | 0.18 | 15.45 | 1.78 | 22.41 |
| 2031 | | | 0.13 | 15.50 | 1.42 | 22.93 |
| 2032 | | | | | 1.14 | 23.34 |
| 2033 | | | | | 0.92 | 23.68 |
| 2034 | | | | | 0.73 | 23.95 |
| 2035 | | | | | 0.59 | 24.16 |
| 2036 | | | | | 0.47 | 24.33 |
| 2037 | | | | | 0.38 | 24.47 |
| 2038 | | | | | 0.30 | 24.58 |
| 2039 | | | | | 0.24 | 24.67 |
| 2040 | | | | | 0.20 | 24.74 |
| 2041 | | | | | 0.16 | 24.80 |
Table A3.1: Gas Production Forecast for Kromolice South Field
| RPS Energy | FX Energy, Inc. Evaluation of Polish Gas Assets |
| RPS Energy | FX Energy, Inc. Evaluation of Polish Gas Assets |
| RPS Energy | FX Energy, Inc. Evaluation of Polish Gas Assets |
| RPS Energy | FX Energy, Inc. Evaluation of Polish Gas Assets |

| RPS Energy | FX Energy, Inc. Evaluation of Polish Gas Assets |
| RPS Energy | FX Energy, Inc. Evaluation of Polish Gas Assets |
| RPS Energy | FX Energy, Inc. Evaluation of Polish Gas Assets |
| APPENDIX 4: | PRODUCTION FORECASTS AND CASHFLOW ANALYSIS FOR ZANIEMYSL FIELD |
| | Proved | Proved+Probable | Proved +Probable+Possible |
| Year | Gas Rate (MMscfd) | Cumulative Production (Bscf) | Gas Rate (MMscfd) | Cumulative Production (Bscf) | Gas Rate (MMscfd) | Cumulative Production (Bscf) |
| 2012 | 9.05 | 21.69 | 9.05 | 21.69 | 9.05 | 21.69 |
| 2013 | 9.05 | 24.99 | 9.05 | 24.99 | 9.05 | 24.99 |
| 2014 | 9.05 | 28.29 | 9.05 | 28.29 | 9.05 | 28.29 |
| 2015 | 3.75 | 29.66 | 9.05 | 31.59 | 9.05 | 31.59 |
| 2016 | 1.55 | 30.23 | 9.05 | 34.89 | 9.05 | 34.89 |
| 2017 | 0.64 | 30.46 | 9.05 | 38.20 | 9.05 | 38.20 |
| 2018 | 0.27 | 30.56 | 4.87 | 39.97 | 9.05 | 41.50 |
| 2019 | 0.11 | 30.60 | 2.62 | 40.93 | 9.05 | 44.80 |
| 2020 | | | 1.41 | 41.45 | 9.05 | 48.10 |
| 2021 | | | 0.76 | 41.73 | 9.05 | 51.40 |
| 2022 | | | 0.41 | 41.88 | 9.05 | 54.70 |
| 2023 | | | 0.22 | 41.96 | 6.70 | 57.15 |
| 2024 | | | 0.12 | 42.00 | 4.96 | 58.96 |
| 2025 | | | | | 3.68 | 60.30 |
| 2026 | | | | | 2.72 | 61.30 |
| 2027 | | | | | 2.02 | 62.04 |
| 2028 | | | | | 1.50 | 62.58 |
| 2029 | | | | | 1.11 | 62.99 |
| 2030 | | | | | 0.82 | 63.29 |
| 2031 | | | | | 0.61 | 63.51 |
| 2032 | | | | | 0.45 | 63.67 |
| 2033 | | | | | 0.33 | 63.79 |
| 2034 | | | | | 0.25 | 63.88 |
| 2035 | | | | | 0.18 | 63.95 |
| 2036 | | | | | 0.14 | 64.00 |
Table A4.1: Gas Production Forecasts for the Zaniemysl Field
| RPS Energy | FX Energy, Inc. Evaluation of Polish Gas Assets |
| RPS Energy | FX Energy, Inc. Evaluation of Polish Gas Assets |
| RPS Energy | FX Energy, Inc. Evaluation of Polish Gas Assets |

| RPS Energy | FX Energy, Inc. Evaluation of Polish Gas Assets |
| RPS Energy | FX Energy, Inc. Evaluation of Polish Gas Assets |
| RPS Energy | FX Energy, Inc. Evaluation of Polish Gas Assets |
| RPS Energy | FX Energy, Inc. Evaluation of Polish Gas Assets |
| APPENDIX 5: | PRODUCTION FORECASTS AND CASHFLOW ANALYSIS FOR SRODA-KROMOLICE FIELD |
| | Proved Kromolice | Proved Sroda | Proved+Probable | Proved +Probable+Possible |
| Year | Gas Rate (MMscfd) | Cumulative Production (Bscf) | Gas Rate (MMscfd) | Cumulative Production (Bscf) | Gas Rate (MMscfd) | Cumulative Production (Bscf) | Gas Rate (MMscfd) | Cumulative Production (Bscf) |
| 2012 | 5.97 | 2.99 | 2.61 | 1.73 | 8.6 | 4.72 | 8.6 | 4.72 |
| 2013 | 5.97 | 5.17 | 2.61 | 2.68 | 8.6 | 7.85 | 8.6 | 7.85 |
| 2014 | 5.97 | 7.35 | 2.61 | 3.64 | 8.6 | 10.98 | 8.6 | 10.98 |
| 2015 | 5.97 | 9.53 | 2.61 | 4.59 | 8.6 | 14.11 | 8.6 | 14.11 |
| 2016 | 5.97 | 11.71 | 2.61 | 5.54 | 8.6 | 17.24 | 8.6 | 17.24 |
| 2017 | 5.97 | 13.89 | 2.61 | 6.49 | 8.6 | 20.38 | 8.6 | 20.38 |
| 2018 | 5.97 | 16.07 | 2.61 | 7.44 | 8.6 | 23.51 | 8.6 | 23.51 |
| 2019 | 5.97 | 18.25 | 2.61 | 8.39 | 8.6 | 26.64 | 8.6 | 26.64 |
| 2020 | 2.68 | 19.22 | 2.61 | 9.34 | 8.6 | 29.77 | 8.6 | 29.77 |
| 2021 | 1.20 | 19.66 | 2.61 | 10.30 | 8.6 | 32.90 | 8.6 | 32.90 |
| 2022 | 0.54 | 19.86 | 2.61 | 11.25 | 8.6 | 36.03 | 8.6 | 36.03 |
| 2023 | 0.24 | 19.94 | 2.61 | 12.20 | 8.6 | 39.16 | 8.6 | 39.16 |
| 2024 | 0.11 | 19.98 | 2.61 | 13.15 | 8.6 | 42.29 | 8.6 | 42.29 |
| 2025 | 0.05 | 20.00 | 2.61 | 14.10 | 8.6 | 45.42 | 8.6 | 45.42 |
| 2026 | | | 2.61 | 15.05 | 8.6 | 48.56 | 8.6 | 48.56 |
| 2027 | | | 2.13 | 15.83 | 8.6 | 51.69 | 8.6 | 51.69 |
| 2028 | | | 1.74 | 16.47 | 8.6 | 54.82 | 8.6 | 54.82 |
| 2029 | | | 1.43 | 16.99 | 6.8 | 57.28 | 8.6 | 57.95 |
| 2030 | | | 1.17 | 17.41 | 5.3 | 59.23 | 8.6 | 61.08 |
| 2031 | | | 0.95 | 17.76 | 4.2 | 60.76 | 8.6 | 64.21 |
| 2032 | | | 0.78 | 18.05 | 3.3 | 61.96 | 8.6 | 67.34 |
| 2033 | | | 0.64 | 18.28 | 2.6 | 62.91 | 8.6 | 70.47 |
| 2034 | | | 0.52 | 18.47 | 2.0 | 63.66 | 8.6 | 73.60 |
| 2035 | | | 0.43 | 18.63 | 1.6 | 64.24 | 8.6 | 76.74 |
| 2036 | | | 0.35 | 18.76 | 1.3 | 64.71 | 8.6 | 79.87 |
| 2037 | | | 0.29 | 18.86 | 1.0 | 65.07 | 8.6 | 83.00 |
| 2038 | | | 0.23 | 18.95 | 0.8 | 65.36 | 8.6 | 86.13 |
| 2039 | | | 0.19 | 19.02 | 0.6 | 65.59 | 8.6 | 89.26 |
| 2040 | | | 0.16 | 19.07 | 0.5 | 65.76 | 7.0 | 91.82 |
| 2041 | | | 0.13 | 19.12 | 0.4 | 65.90 | 5.7 | 93.92 |
| 2042 | | | | | 0.3 | 66.01 | 4.7 | 95.64 |
| 2043 | | | | | 0.2 | 66.10 | 3.8 | 97.04 |
| 2044 | | | | | 0.2 | 66.17 | 3.1 | 98.19 |
| 2045 | | | | | 0.15 | 66.22 | 2.6 | 99.13 |
| 2046 | | | | | 0.12 | 66.27 | 2.1 | 99.90 |
| 2047 | | | | | 0.09 | 66.30 | 1.7 | 100.53 |
| 2048 | | | | | | | 1.4 | 101.05 |
| 2049 | | | | | | | 1.2 | 101.47 |
| 2050 | | | | | | | 0.9 | 101.81 |
| 2051 | | | | | | | 0.8 | 102.10 |
| 2052 | | | | | | | 0.6 | 102.33 |
| 2053 | | | | | | | 0.5 | 102.52 |
| 2054 | | | | | | | 0.4 | 102.67 |
| 2055 | | | | | | | 0.3 | 102.80 |
| 2056 | | | | | | | 0.3 | 102.90 |
| 2057 | | | | | | | 0.2 | 102.99 |
| 2058 | | | | | | | 0.2 | 103.06 |
| 2059 | | | | | | | 0.16 | 103.12 |
| 2060 | | | | | | | 0.13 | 103.16 |
| 2061 | | | | | | | 0.10 | 103.20 |
Table A5.1: Gas Production Forecasts for Sroda-Kromolice
| RPS Energy | FX Energy, Inc. Evaluation of Polish Gas Assets |
| RPS Energy | FX Energy, Inc. Evaluation of Polish Gas Assets |
| RPS Energy | FX Energy, Inc. Evaluation of Polish Gas Assets |
| RPS Energy | FX Energy, Inc. Evaluation of Polish Gas Assets |
| RPS Energy | FX Energy, Inc. Evaluation of Polish Gas Assets |
| RPS Energy | FX Energy, Inc. Evaluation of Polish Gas Assets |
| RPS Energy | FX Energy, Inc. Evaluation of Polish Gas Assets |
| APPENDIX 6 | PRODUCTION FORECASTS AND CASHFLOW ANALYSIS FOR GRABOWKA |
| | Proved | Proved+Probable | Proved +Probable+Possible |
| Year | Gas Rate (MMscfd) | Cumulative Production (Bscf) | Gas Rate (MMscfd) | Cumulative Production (Bscf) | Gas Rate (MMscfd) | Cumulative Production (Bscf) |
| 2012 | 0.33 | 0.45 | 0.33 | 0.5 | 0.33 | 0.45 |
| 2013 | 0.36 | 0.59 | 0.36 | 0.6 | 0.36 | 0.59 |
| 2014 | 1.75 | 1.22 | 2.65 | 1.6 | 2.63 | 1.54 |
| 2015 | 0.94 | 1.57 | 2.41 | 2.4 | 2.63 | 2.50 |
| 2016 | 0.50 | 1.75 | 2.25 | 3.3 | 2.63 | 3.46 |
| 2017 | 0.27 | 1.85 | 2.15 | 4.0 | 2.55 | 4.39 |
| 2018 | | | 1.85 | 4.7 | 2.44 | 5.28 |
| 2019 | | | 1.60 | 5.3 | 2.36 | 6.14 |
| 2020 | | | 1.34 | 5.8 | 2.29 | 6.98 |
| 2021 | | | 1.18 | 6.2 | 2.23 | 7.79 |
| 2022 | | | 1.04 | 6.6 | 2.18 | 8.59 |
| 2023 | | | 0.92 | 6.9 | 2.14 | 9.37 |
| 2024 | | | 0.81 | 7.2 | 2.11 | 10.14 |
| 2025 | | | 0.72 | 7.5 | 2.08 | 10.90 |
| 2026 | | | 0.63 | 7.7 | 2.06 | 11.65 |
| 2027 | | | 0.56 | 7.9 | 1.95 | 12.36 |
| 2028 | | | 0.49 | 8.1 | 1.95 | 13.07 |
| 2029 | | | | | 1.83 | 13.74 |
| 2030 | | | | | 1.72 | 14.36 |
| 2031 | | | | | 1.62 | 14.95 |
| 2032 | | | | | 1.52 | 15.51 |
| 2033 | | | | | 1.43 | 16.03 |
| 2034 | | | | | 1.35 | 16.53 |
| 2035 | | | | | 1.27 | 16.99 |
| 2036 | | | | | 1.19 | 17.43 |
| 2037 | | | | | 1.12 | 17.84 |
| 2038 | | | | | 1.06 | 18.22 |
| 2039 | | | | | 0.99 | 18.58 |
| 2040 | | | | | 0.94 | 18.93 |
| 2041 | | | | | 0.88 | 19.25 |
| 2042 | | | | | 0.83 | 19.55 |
| 2043 | | | | | 0.78 | 19.83 |
| 2044 | | | | | 0.73 | 20.10 |
Table A6.1: Gas Production Forecasts for Grabowka
| RPS Energy | FX Energy, Inc. Evaluation of Polish Gas Assets |
| RPS Energy | FX Energy, Inc. Evaluation of Polish Gas Assets |
| RPS Energy | FX Energy, Inc. Evaluation of Polish Gas Assets |
| RPS Energy | FX Energy, Inc. Evaluation of Polish Gas Assets |
| APPENDIX 7 | PRODUCTION FORECASTS AND CASHFLOW ANALYSIS FOR LISEWO |
| | Proved | Proved+Probable | Proved +Probable+Possible |
| Year | Gas Rate (MMscfd) | Cumulative Production (Bscf) | Gas Rate (MMscfd) | Cumulative Production (Bscf) | Gas Rate (MMscfd) | Cumulative Production (Bscf) |
| 2013 | 4.38 | 1.6 | 4.38 | 1.60 | 4.38 | 1.60 |
| 2014 | 8.75 | 4.8 | 8.75 | 4.79 | 8.75 | 4.79 |
| 2015 | 8.75 | 8.0 | 8.75 | 7.99 | 8.75 | 7.99 |
| 2016 | 8.75 | 11.2 | 8.75 | 11.18 | 8.75 | 11.18 |
| 2017 | 8.75 | 14.4 | 8.75 | 14.38 | 8.75 | 14.38 |
| 2018 | 8.75 | 17.6 | 8.75 | 17.57 | 8.75 | 17.57 |
| 2019 | 8.75 | 20.8 | 8.75 | 20.77 | 8.75 | 20.77 |
| 2020 | 5.07 | 22.6 | 8.75 | 23.96 | 8.75 | 23.96 |
| 2021 | 2.93 | 23.7 | 8.75 | 27.16 | 8.75 | 27.16 |
| 2022 | 1.70 | 24.3 | 6.20 | 29.42 | 8.75 | 30.35 |
| 2023 | 0.98 | 24.7 | 4.39 | 31.03 | 8.75 | 33.55 |
| 2024 | 0.57 | 24.9 | 3.11 | 32.16 | 7.14 | 36.15 |
| 2025 | 0.33 | 25.0 | 2.21 | 32.97 | 5.82 | 38.28 |
| 2026 | 0.19 | 25.1 | 1.56 | 33.54 | 4.75 | 40.01 |
| 2027 | 0.11 | 25.1 | 1.11 | 33.94 | 3.87 | 41.42 |
| 2028 | | | 0.78 | 34.23 | 3.16 | 42.57 |
| 2029 | | | 0.56 | 34.43 | 2.57 | 43.51 |
| 2030 | | | 0.39 | 34.57 | 2.10 | 44.28 |
| 2031 | | | 0.28 | 34.68 | 1.71 | 44.90 |
| 2032 | | | 0.20 | 34.75 | 1.39 | 45.41 |
| 2033 | | | 0.14 | 34.80 | 1.14 | 45.83 |
| 2034 | | | | | 0.93 | 46.17 |
| 2035 | | | | | 0.76 | 46.44 |
| 2036 | | | | | 0.62 | 46.67 |
| 2037 | | | | | 0.50 | 46.85 |
| 2038 | | | | | 0.41 | 47.00 |
Table A6.2: Gas Production Forecasts for Lisewo
| RPS Energy | FX Energy, Inc. Evaluation of Polish Gas Assets |
| RPS Energy | FX Energy, Inc. Evaluation of Polish Gas Assets |
| RPS Energy | FX Energy, Inc. Evaluation of Polish Gas Assets |
| RPS Energy | FX Energy, Inc. Evaluation of Polish Gas Assets |
| RPS Energy | FX Energy, Inc. Evaluation of Polish Gas Assets |
| RPS Energy | FX Energy, Inc. Evaluation of Polish Gas Assets |