UNITED STATES
SECURITIES AND EXCHANGE COMMISSION
Washington, D.C. 20549
FORM N-CSR
CERTIFIED SHAREHOLDER REPORT OF REGISTERED
MANAGEMENT INVESTMENT COMPANIES
| Investment Company Act file number | 811-07820 | |||||||||||||||||||
| AMERICAN CENTURY CAPITAL PORTFOLIOS, INC. | ||||||||||||||||||||
| (Exact name of registrant as specified in charter) | ||||||||||||||||||||
| 4500 MAIN STREET, KANSAS CITY, MISSOURI | 64111 | |||||||||||||||||||
| (Address of principal executive offices) | (Zip Code) | |||||||||||||||||||
| JOHN PAK 4500 MAIN STREET, KANSAS CITY, MISSOURI 64111 | ||||||||||||||||||||
| (Name and address of agent for service) | ||||||||||||||||||||
| Registrant’s telephone number, including area code: | 816-531-5575 | |||||||||||||||||||
| Date of fiscal year end: | 03-31 | |||||||||||||||||||
| Date of reporting period: | 03-31-2022 | |||||||||||||||||||
ITEM 1. REPORTS TO STOCKHOLDERS.
(a) Provided under separate cover.

| Annual Report | |||||
| March 31, 2022 | |||||
| Equity Income Fund | |||||
| Investor Class (TWEIX) | |||||
| I Class (ACIIX) | |||||
| Y Class (AEIYX) | |||||
| A Class (TWEAX) | |||||
| C Class (AEYIX) | |||||
| R Class (AEURX) | |||||
| R5 Class (AEIUX) | |||||
| R6 Class (AEUDX) | |||||
| G Class (AEIMX) | |||||
| Table of Contents | ||
| President’s Letter | |||||
| Performance | |||||
| Portfolio Commentary | |||||
| Fund Characteristics | |||||
| Shareholder Fee Example | |||||
| Schedule of Investments | |||||
| Statement of Assets and Liabilities | |||||
| Statement of Operations | |||||
| Statement of Changes in Net Assets | |||||
| Notes to Financial Statements | |||||
| Financial Highlights | |||||
| Report of Independent Registered Public Accounting Firm | |||||
| Management | |||||
| Liquidity Risk Management Program | |||||
| Additional Information | |||||
Any opinions expressed in this report reflect those of the author as of the date of the report, and do not necessarily represent the opinions of American Century Investments® or any other person in the American Century Investments organization. Any such opinions are subject to change at any time based upon market or other conditions and American Century Investments disclaims any responsibility to update such opinions. These opinions may not be relied upon as investment advice and, because investment decisions made by American Century Investments funds are based on numerous factors, may not be relied upon as an indication of trading intent on behalf of any American Century Investments fund. Security examples are used for representational purposes only and are not intended as recommendations to purchase or sell securities. Performance information for comparative indices and securities is provided to American Century Investments by third party vendors. To the best of American Century Investments’ knowledge, such information is accurate at the time of printing.
| President’s Letter | ||
 Jonathan Thomas
Dear Investor:
Thank you for reviewing this annual report for the period ended March 31, 2022. Annual reports help convey important information about fund returns, including market factors that affected performance. For additional investment insights, please visit americancentury.com.
Soaring Inflation, Escalating Volatility Led to Mixed Results for Stocks and Bonds
Upbeat economic and earnings data and continued Federal Reserve (Fed) support generally buoyed stock returns for most of the reporting period. Despite periodic outbreaks of COVID-19, the worst of the virus appeared over in the U.S., and pre-pandemic activities gradually resumed. Bonds delivered solid gains in the first half of the period before a Fed policy pivot triggered a drastic sentiment shift in fixed-income markets.
Early in the period, inflation began a steady upward march. Initially, the Fed was unfazed, viewing the price hikes as a temporary economic consequence of recovering from the pandemic. But by late 2021, inflation was surging toward multidecade highs, prompting the Fed to adopt a more hawkish strategy.
Policymakers announced an abrupt end to bond buying followed by a March rate hike, the first since 2018. At period-end, market indicators reflected expectations for more aggressive Fed rate hikes along with balance sheet cuts to tame inflation.
In addition to an 8.5% annual inflation rate and a hawkish Fed, Russia’s invasion of Ukraine further rattled investors in early 2022. Stocks declined sharply amid the unrest, but strong performance earlier in the fiscal year left most U.S. indices with solid 12-month gains. For bonds, declines in the second half of the reporting period overwhelmed earlier gains, and most U.S. fixed-income indices retreated for the 12 months overall.
Staying Focused in Uncertain Times
We expect market volatility to linger amid elevated inflation and tighter Fed policy. In addition, Russia’s invasion of Ukraine has led to a devastating humanitarian crisis and further complicated a tense geopolitical backdrop. We will continue to monitor the evolving situation and its implications for our clients and our investment exposure.
We appreciate your confidence in us during these extraordinary times. Our firm has a long history of helping clients weather unpredictable and volatile markets, and we’re confident we will continue to meet prevailing challenges.
Sincerely,

Jonathan Thomas
President and Chief Executive Officer
American Century Investments
2
| Performance | ||
| Total Returns as of March 31, 2022 | ||||||||||||||||||||
| Average Annual Returns | ||||||||||||||||||||
| Ticker Symbol | 1 year | 5 years | 10 years | Since Inception | Inception Date | |||||||||||||||
| Investor Class | TWEIX | 11.74% | 8.95% | 10.47% | — | 8/1/94 | ||||||||||||||
| Russell 3000 Value Index | — | 11.10% | 10.16% | 11.60% | — | — | ||||||||||||||
| S&P 500 Index | — | 15.65% | 15.98% | 14.63% | — | — | ||||||||||||||
| I Class | ACIIX | 11.83% | 9.16% | 10.70% | — | 7/8/98 | ||||||||||||||
| Y Class | AEIYX | 12.10% | — | — | 9.36% | 4/10/17 | ||||||||||||||
| A Class | TWEAX | 3/7/97 | ||||||||||||||||||
| No sales charge | 11.46% | 8.69% | 10.20% | — | ||||||||||||||||
| With sales charge | 5.02% | 7.40% | 9.55% | — | ||||||||||||||||
| C Class | AEYIX | 10.63% | 7.88% | 9.38% | — | 7/13/01 | ||||||||||||||
| R Class | AEURX | 11.23% | 8.43% | 9.94% | — | 8/29/03 | ||||||||||||||
| R5 Class | AEIUX | 11.84% | — | — | 9.17% | 4/10/17 | ||||||||||||||
| R6 Class | AEUDX | 12.10% | 9.31% | — | 10.08% | 7/26/13 | ||||||||||||||
| G Class | AEIMX | 12.72% | — | — | 10.47% | 8/1/19 | ||||||||||||||
Average annual returns since inception are presented when ten years of performance history is not available.
G Class returns would have been lower if a portion of the fees had not been waived.
C Class shares will automatically convert to A Class shares after being held for approximately eight years. C Class average annual returns do not reflect this conversion.
Sales charges include initial sales charges and contingent deferred sales charges (CDSCs), as applicable. A Class shares have a 5.75% maximum initial sales charge and may be subject to a maximum CDSC of 1.00%. C Class shares redeemed within 12 months of purchase are subject to a maximum CDSC of 1.00%. The SEC requires that mutual funds provide performance information net of maximum sales charges in all cases where charges could be applied.
Data presented reflect past performance. Past performance is no guarantee of future results. Current performance may be higher or lower than the performance shown. Total returns for periods less than one year are not annualized. Investment return and principal value will fluctuate, and redemption value may be more or less than original cost. Data assumes reinvestment of dividends and capital gains, and none of the charts reflect the deduction of taxes that a shareholder would pay on fund distributions or the redemption of fund shares. To obtain performance data current to the most recent month end, please call 1-800-345-2021 or visit americancentury.com. For additional information about the fund, please consult the prospectus.
3
| Growth of $10,000 Over 10 Years | ||
| $10,000 investment made March 31, 2012 | ||
| Performance for other share classes will vary due to differences in fee structure. | ||
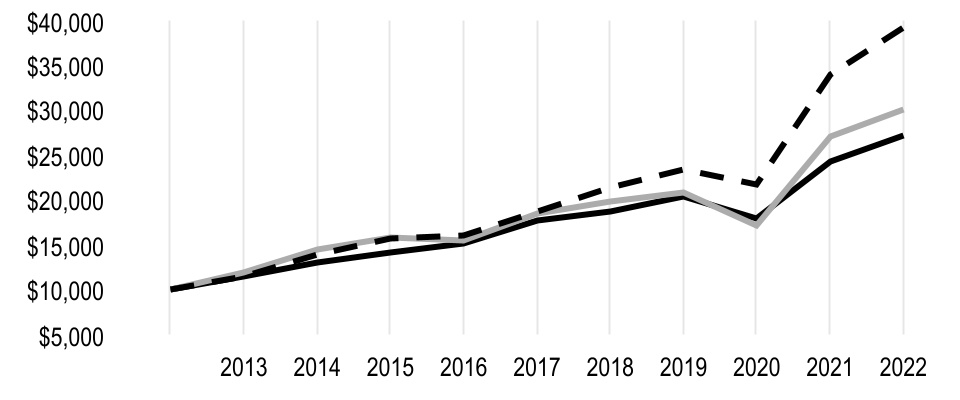
| Value on March 31, 2022 | |||||
| Investor Class — $27,092 | |||||
| Russell 3000 Value Index — $29,991 | |||||
S&P 500 Index — $39,197 | |||||
| Total Annual Fund Operating Expenses | ||||||||||||||||||||||||||
| Investor Class | I Class | Y Class | A Class | C Class | R Class | R5 Class | R6 Class | G Class | ||||||||||||||||||
| 0.92% | 0.72% | 0.57% | 1.17% | 1.92% | 1.42% | 0.72% | 0.57% | 0.57% | ||||||||||||||||||
The total annual fund operating expenses shown is as stated in the fund’s prospectus current as of the date of this report. The prospectus may vary from the expense ratio shown elsewhere in this report because it is based on a different time period, includes acquired fund fees and expenses, and, if applicable, does not include fee waivers or expense reimbursements.
Data presented reflect past performance. Past performance is no guarantee of future results. Current performance may be higher or lower than the performance shown. Total returns for periods less than one year are not annualized. Investment return and principal value will fluctuate, and redemption value may be more or less than original cost. Data assumes reinvestment of dividends and capital gains, and none of the charts reflect the deduction of taxes that a shareholder would pay on fund distributions or the redemption of fund shares. To obtain performance data current to the most recent month end, please call 1-800-345-2021 or visit americancentury.com. For additional information about the fund, please consult the prospectus.
4
| Portfolio Commentary | ||
Portfolio Managers: Phil Davidson, Brian Woglom, Paul Howanitz, Kevin Toney and Michael Liss
Effective February 2022, Paul Howanitz was promoted to portfolio manager.
Performance Summary
Equity Income returned 11.74%* for the fiscal year ended March 31, 2022, outperforming the Russell 3000 Value Index, which returned 11.10%. The fund’s return reflects operating expenses, while the index’s return does not.
The information technology sector contributed to performance relative to the benchmark due to security selection. Security selection and an underweight in industrials also boosted performance. In contrast, security selection in the energy and financials sectors detracted.
Stock Selection in Information Technology and Industrials Contributed
Stock selection in the information technology sector, in the software industry in particular, benefited performance. Microsoft was a key contributor. Our avoidance of several benchmark names also aided returns.
Security selection in the industrials sector contributed to relative performance. An underweight to the machinery and industrial conglomerates industries was also a notable contributor to relative performance. Avoiding The Boeing Co. and our overweight position in Raytheon Technologies contributed to relative performance. Our limited exposure to companies in the communication services sector also benefited relative performance.
Elsewhere, Marsh & McLennan Cos. was a notable contributor. Following a difficult start to 2022, shares of this insurance broker bounced back in March, partially aided by a $5 billion increase to the company’s share repurchase authorization.
Energy and Financials Detracted
Security selection in the energy sector detracted from relative returns. Most energy stocks turned in strong performance as oil and gas prices rose. Our underweight position in Exxon Mobil and lack of exposure to several of the more leveraged energy names detracted from performance.
Our conservative security selection in financials led to relative underperformance in the sector. Our underweight to the common stocks of mega-cap banks along with exposure to fixed-to-floating preferred stocks within the banking industry hindered performance. A lack of exposure to the common stock of Berkshire Hathaway was a notable detractor. Berkshire’s shares recently outperformed after the company announced the acquisition of Alleghany, which many investors viewed as a positive usage of Berkshire’s cash.
Our position in consumer goods company Unilever detracted from performance. Sharply rising commodity prices and concerns with the Russia-Ukraine conflict drove investors’ fears that Unilever’s profitability may be pressured due to inflation in the company’s input costs.
*All fund returns referenced in this commentary are for Investor Class shares. Performance for other share classes will vary due to differences in fee structure; when Investor Class performance exceeds that of the fund’s benchmark, other share classes may not. See page 3 for returns for all share classes.
5
Portfolio Positioning
The portfolio seeks to invest in companies where we believe the valuation and relative yield does not reflect the quality and normal earnings power of the company. This has historically resulted in a higher-yielding, less volatile portfolio versus the benchmark. Our process is based on individual security selection, but broad themes have emerged.
At the end of the period, consumer staples, utilities and financials were the large overweights relative to the benchmark. We held significant underweights in real estate, consumer discretionary and communication services.
We remain overweight in the consumer staples sector. Because consumers deem these products necessities, the companies that make them are less sensitive to economic cycles. Historically, many consumer staples companies have traded at a premium, but our analysis has led us to select companies in the sector that we believe are trading at a discount to the overall market.
Similarly, we like the utilities sector due to its defensive nature. Many utilities companies offer compelling quality characteristics, lower volatility and relatively attractive dividends. We are finding attractive utilities from both a valuation and relative return perspective, particularly in gas utilities. Rising gas prices pressured the stocks last year, but successful resolution of extreme gas costs associated with winter storm Uri and mergers and acquisitions activity have benefited valuations.
We have identified many higher-quality companies in the financials sector that meet our investment criteria, particularly in the insurance, banking and capital markets industries. The U.S. Federal Reserve has begun raising short-term interest rates to unwind its highly accommodative policy over the last three years. This could provide tailwinds to our interest rate-sensitive holdings.
Finally, we believe there is less value in real estate and consumer discretionary. The extended valuation of real estate stocks has led to a continued underweight in the sector. Meanwhile, we generally seek attractively valued, higher-quality companies with sustainable business models, and stocks in the consumer discretionary sector fit that profile less frequently.
6
| Fund Characteristics | ||
| MARCH 31, 2022 | |||||
| Types of Investments in Portfolio | % of net assets | ||||
| Common Stocks | 79.3% | ||||
| Preferred Stocks | 9.1% | ||||
| Convertible Bonds | 3.8% | ||||
| Exchange-Traded Funds | 2.9% | ||||
| Convertible Preferred Stocks | 1.8% | ||||
| Corporate Bonds | 0.2% | ||||
| Short-Term Investments | 3.7% | ||||
| Other Assets and Liabilities | (0.8)% | ||||
| Top Five Industries* | % of net assets | ||||
| Banks | 9.5% | ||||
| Pharmaceuticals | 7.2% | ||||
| Health Care Equipment and Supplies | 6.6% | ||||
| Insurance | 5.8% | ||||
| Oil, Gas and Consumable Fuels | 5.8% | ||||
*Exposure indicated excludes Exchange-Traded Funds. The Schedule of Investments provides additional information on the fund's portfolio holdings.
7
| Shareholder Fee Example | ||
Fund shareholders may incur two types of costs: (1) transaction costs, including sales charges (loads) on purchase payments and redemption/exchange fees; and (2) ongoing costs, including management fees; distribution and service (12b-1) fees; and other fund expenses. This example is intended to help you understand your ongoing costs (in dollars) of investing in your fund and to compare these costs with the ongoing cost of investing in other mutual funds.
The example is based on an investment of $1,000 made at the beginning of the period and held for the entire period from October 1, 2021 to March 31, 2022.
Actual Expenses
The table provides information about actual account values and actual expenses for each class. You may use the information, together with the amount you invested, to estimate the expenses that you paid over the period. First, identify the share class you own. Then simply divide your account value by $1,000 (for example, an $8,600 account value divided by $1,000 = 8.6), then multiply the result by the number under the heading “Expenses Paid During Period” to estimate the expenses you paid on your account during this period.
If you hold Investor Class shares of any American Century Investments fund, or I Class shares of the American Century Diversified Bond Fund, in an American Century Investments account (i.e., not through a financial intermediary or employer-sponsored retirement plan account), American Century Investments may charge you a $25.00 annual account maintenance fee if the value of those shares is less than $10,000. We will redeem shares automatically in one of your accounts to pay the $25.00 fee. In determining your total eligible investment amount, we will include your investments in all personal accounts (including American Century Investments brokerage accounts) registered under your Social Security number. Personal accounts include individual accounts, joint accounts, UGMA/UTMA accounts, personal trusts, Coverdell Education Savings Accounts and IRAs (including traditional, Roth, Rollover, SEP-, SARSEP- and SIMPLE-IRAs), and certain other retirement accounts. If you have only business, business retirement, employer-sponsored or American Century Investments brokerage accounts, you are currently not subject to this fee. If you are subject to the account maintenance fee, your account value could be reduced by the fee amount.
Hypothetical Example for Comparison Purposes
The table also provides information about hypothetical account values and hypothetical expenses based on the actual expense ratio of each class of your fund and an assumed rate of return of 5% per year before expenses, which is not the actual return of a fund’s share class. The hypothetical account values and expenses may not be used to estimate the actual ending account balance or expenses you paid for the period. You may use this information to compare the ongoing costs of investing in your fund and other funds. To do so, compare this 5% hypothetical example with the 5% hypothetical examples that appear in the shareholder reports of the other funds.
Please note that the expenses shown in the table are meant to highlight your ongoing costs only and do not reflect any transactional costs, such as sales charges (loads) or redemption/exchange fees. Therefore, the table is useful in comparing ongoing costs only, and will not help you determine the relative total costs of owning different funds. In addition, if these transactional costs were included, your costs would have been higher.
8
| Beginning Account Value 10/1/21 | Ending Account Value 3/31/22 | Expenses Paid During Period(1) 10/1/21 - 3/31/22 | Annualized Expense Ratio(1) | |||||||||||
| Actual | ||||||||||||||
| Investor Class | $1,000 | $1,073.80 | $4.96 | 0.96% | ||||||||||
| I Class | $1,000 | $1,074.80 | $3.93 | 0.76% | ||||||||||
| Y Class | $1,000 | $1,076.60 | $3.16 | 0.61% | ||||||||||
| A Class | $1,000 | $1,072.50 | $6.25 | 1.21% | ||||||||||
| C Class | $1,000 | $1,069.60 | $10.11 | 1.96% | ||||||||||
| R Class | $1,000 | $1,071.50 | $7.54 | 1.46% | ||||||||||
| R5 Class | $1,000 | $1,074.90 | $3.93 | 0.76% | ||||||||||
| R6 Class | $1,000 | $1,075.50 | $3.16 | 0.61% | ||||||||||
| G Class | $1,000 | $1,078.50 | $0.31 | 0.06% | ||||||||||
| Hypothetical | ||||||||||||||
| Investor Class | $1,000 | $1,020.15 | $4.84 | 0.96% | ||||||||||
| I Class | $1,000 | $1,021.14 | $3.83 | 0.76% | ||||||||||
| Y Class | $1,000 | $1,021.89 | $3.07 | 0.61% | ||||||||||
| A Class | $1,000 | $1,018.90 | $6.09 | 1.21% | ||||||||||
| C Class | $1,000 | $1,015.16 | $9.85 | 1.96% | ||||||||||
| R Class | $1,000 | $1,017.65 | $7.34 | 1.46% | ||||||||||
| R5 Class | $1,000 | $1,021.14 | $3.83 | 0.76% | ||||||||||
| R6 Class | $1,000 | $1,021.89 | $3.07 | 0.61% | ||||||||||
| G Class | $1,000 | $1,024.63 | $0.30 | 0.06% | ||||||||||
(1)Expenses are equal to the class's annualized expense ratio listed in the table above, multiplied by the average account value over the period, multiplied by 182, the number of days in the most recent fiscal half-year, divided by 365, to reflect the one-half year period. Annualized expense ratio reflects actual expenses, including any applicable fee waivers or expense reimbursements and excluding any acquired fund fees and expenses.
9
| Schedule of Investments | ||
MARCH 31, 2022
| Shares/ Principal Amount | Value | |||||||
| COMMON STOCKS — 79.3% | ||||||||
| Aerospace and Defense — 2.1% | ||||||||
| Raytheon Technologies Corp. | 2,498,927 | $ | 247,568,698 | |||||
| Air Freight and Logistics — 0.2% | ||||||||
| United Parcel Service, Inc., Class B | 118,564 | 25,427,235 | ||||||
| Auto Components — 0.3% | ||||||||
| Bridgestone Corp. | 998,000 | 38,738,136 | ||||||
| Automobiles — 0.2% | ||||||||
| Toyota Motor Corp. | 1,599,200 | 28,846,362 | ||||||
| Banks — 3.0% | ||||||||
| Commerce Bancshares, Inc. | 598,347 | 42,835,662 | ||||||
| JPMorgan Chase & Co. | 1,299,900 | 177,202,368 | ||||||
| PNC Financial Services Group, Inc. | 392,223 | 72,345,532 | ||||||
| U.S. Bancorp | 999,900 | 53,144,685 | ||||||
| 345,528,247 | ||||||||
| Beverages — 2.0% | ||||||||
| PepsiCo, Inc. | 1,399,693 | 234,280,614 | ||||||
| Capital Markets — 4.2% | ||||||||
| Ameriprise Financial, Inc. | 299,899 | 90,077,664 | ||||||
| Bank of New York Mellon Corp. | 2,998,408 | 148,810,989 | ||||||
| BlackRock, Inc. | 39,675 | 30,318,445 | ||||||
| Northern Trust Corp. | 1,098,032 | 127,865,826 | ||||||
| T. Rowe Price Group, Inc. | 599,387 | 90,621,320 | ||||||
| 487,694,244 | ||||||||
| Chemicals — 3.1% | ||||||||
| Akzo Nobel NV | 999,910 | 85,914,551 | ||||||
| Linde PLC | 851,631 | 272,036,490 | ||||||
| 357,951,041 | ||||||||
| Commercial Services and Supplies — 0.9% | ||||||||
| Republic Services, Inc. | 759,075 | 100,577,438 | ||||||
| Communications Equipment — 2.1% | ||||||||
| Cisco Systems, Inc. | 4,398,877 | 245,281,382 | ||||||
| Containers and Packaging — 1.3% | ||||||||
| Amcor PLC | 3,999,700 | 45,316,601 | ||||||
| Packaging Corp. of America | 699,221 | 109,155,390 | ||||||
| 154,471,991 | ||||||||
| Diversified Telecommunication Services — 2.9% | ||||||||
| Deutsche Telekom AG | 1,999,800 | 37,244,521 | ||||||
| Verizon Communications, Inc. | 5,999,155 | 305,596,956 | ||||||
| 342,841,477 | ||||||||
| Electric Utilities — 2.0% | ||||||||
| Duke Energy Corp. | 998,459 | 111,487,932 | ||||||
| Evergy, Inc. | 399,503 | 27,302,035 | ||||||
| Eversource Energy | 998,495 | 88,057,274 | ||||||
| 226,847,241 | ||||||||
| Electrical Equipment — 3.5% | ||||||||
| Emerson Electric Co. | 2,699,490 | 264,684,994 | ||||||
10
| Shares/ Principal Amount | Value | |||||||
| Hubbell, Inc. | 798,635 | $ | 146,765,154 | |||||
| 411,450,148 | ||||||||
| Electronic Equipment, Instruments and Components — 1.2% | ||||||||
| Corning, Inc. | 2,998,521 | 110,675,410 | ||||||
| TE Connectivity Ltd. | 207,800 | 27,217,644 | ||||||
| 137,893,054 | ||||||||
| Energy Equipment and Services — 0.3% | ||||||||
| Baker Hughes Co. | 999,992 | 36,409,709 | ||||||
| Equity Real Estate Investment Trusts (REITs) — 0.5% | ||||||||
| American Tower Corp. | 45,479 | 11,425,234 | ||||||
| Equinix, Inc. | 19,956 | 14,799,769 | ||||||
| Welltower, Inc. | 373,435 | 35,902,041 | ||||||
| 62,127,044 | ||||||||
| Food and Staples Retailing — 3.0% | ||||||||
| Koninklijke Ahold Delhaize NV | 2,999,509 | 96,480,692 | ||||||
| Walmart, Inc. | 1,688,995 | 251,525,135 | ||||||
| 348,005,827 | ||||||||
| Food Products — 3.8% | ||||||||
| Hershey Co. | 599,163 | 129,796,680 | ||||||
| Mondelez International, Inc., Class A | 2,299,296 | 144,349,803 | ||||||
| Nestle SA | 1,299,536 | 168,963,934 | ||||||
| 443,110,417 | ||||||||
| Gas Utilities — 5.3% | ||||||||
| Atmos Energy Corp. | 1,498,102 | 179,008,208 | ||||||
ONE Gas, Inc.(1) | 2,948,846 | 260,206,171 | ||||||
| Spire, Inc. | 2,499,896 | 179,392,537 | ||||||
| 618,606,916 | ||||||||
| Health Care Equipment and Supplies — 5.3% | ||||||||
| Becton Dickinson and Co. | 349,522 | 92,972,852 | ||||||
| Embecta Corp. | 26,215 | 873,759 | ||||||
| Medtronic PLC | 4,729,004 | 524,682,994 | ||||||
| 618,529,605 | ||||||||
| Health Care Providers and Services — 1.0% | ||||||||
| Cardinal Health, Inc. | 499,600 | 28,327,320 | ||||||
| Quest Diagnostics, Inc. | 245,217 | 33,560,399 | ||||||
| UnitedHealth Group, Inc. | 98,000 | 49,977,060 | ||||||
| 111,864,779 | ||||||||
| Household Products — 2.4% | ||||||||
| Colgate-Palmolive Co. | 1,898,835 | 143,988,658 | ||||||
| Henkel AG & Co. KGaA, Preference Shares | 599,600 | 40,132,243 | ||||||
| Procter & Gamble Co. | 619,320 | 94,632,096 | ||||||
| 278,752,997 | ||||||||
| Industrial Conglomerates — 0.1% | ||||||||
| Siemens AG | 99,900 | 13,832,879 | ||||||
| Insurance — 5.5% | ||||||||
| Aflac, Inc. | 1,299,148 | 83,652,140 | ||||||
| Allstate Corp. | 399,507 | 55,335,714 | ||||||
| Chubb Ltd. | 773,082 | 165,362,240 | ||||||
| Hartford Financial Services Group, Inc. | 199,665 | 14,337,944 | ||||||
| Marsh & McLennan Cos., Inc. | 1,663,841 | 283,551,783 | ||||||
| MetLife, Inc. | 498,700 | 35,048,636 | ||||||
| 637,288,457 | ||||||||
11
| Shares/ Principal Amount | Value | |||||||
| IT Services — 2.0% | ||||||||
| Automatic Data Processing, Inc. | 999,905 | $ | 227,518,384 | |||||
| Machinery — 0.1% | ||||||||
| PACCAR, Inc. | 148,338 | 13,064,128 | ||||||
| Media — 0.3% | ||||||||
| Comcast Corp., Class A | 698,700 | 32,713,134 | ||||||
| Oil, Gas and Consumable Fuels — 5.8% | ||||||||
| Chevron Corp. | 799,783 | 130,228,666 | ||||||
| Enterprise Products Partners LP | 8,999,756 | 232,283,702 | ||||||
| Exxon Mobil Corp. | 2,398,500 | 198,092,115 | ||||||
TotalEnergies SE(2) | 2,199,317 | 111,284,382 | ||||||
| 671,888,865 | ||||||||
| Personal Products — 1.6% | ||||||||
| Unilever PLC | 4,098,914 | 185,255,333 | ||||||
| Pharmaceuticals — 7.2% | ||||||||
| Johnson & Johnson | 2,999,739 | 531,643,743 | ||||||
| Merck & Co., Inc. | 498,300 | 40,885,515 | ||||||
| Roche Holding AG | 675,062 | 267,096,179 | ||||||
| 839,625,437 | ||||||||
| Road and Rail — 1.4% | ||||||||
| Norfolk Southern Corp. | 559,919 | 159,700,097 | ||||||
| Semiconductors and Semiconductor Equipment — 1.2% | ||||||||
| Texas Instruments, Inc. | 771,013 | 141,465,465 | ||||||
| Software — 2.8% | ||||||||
| Microsoft Corp. | 898,906 | 277,141,709 | ||||||
| Oracle Corp. (New York) | 627,745 | 51,933,344 | ||||||
| 329,075,053 | ||||||||
| Thrifts and Mortgage Finance — 0.7% | ||||||||
Capitol Federal Financial, Inc.(1) | 7,914,186 | 86,106,344 | ||||||
TOTAL COMMON STOCKS (Cost $6,499,078,342) | 9,240,338,178 | |||||||
| PREFERRED STOCKS — 9.1% | ||||||||
| Banks — 6.0% | ||||||||
| Bank of America Corp., 4.30% | 29,992,000 | 28,529,890 | ||||||
| Bank of America Corp., 5.875% | 102,202,000 | 103,331,332 | ||||||
Citigroup, Inc., 5.95%(2) | 68,062,000 | 68,953,612 | ||||||
| JPMorgan Chase & Co., 3.77% | 82,210,000 | 82,210,596 | ||||||
| JPMorgan Chase & Co., 4.60% | 89,013,000 | 86,008,811 | ||||||
| JPMorgan Chase & Co., 5.00% | 161,224,000 | 160,788,695 | ||||||
| U.S. Bancorp, 5.30% | 137,380,000 | 135,811,120 | ||||||
| Wells Fargo & Co., 3.90% | 39,511,000 | 37,897,964 | ||||||
| 703,532,020 | ||||||||
| Capital Markets — 1.3% | ||||||||
| Bank of New York Mellon Corp., 4.70% | 9,871,000 | 10,132,582 | ||||||
| Charles Schwab Corp., 5.00% | 6,681,000 | 6,460,527 | ||||||
| Charles Schwab Corp., 5.375% | 34,310,000 | 35,510,850 | ||||||
| Charles Schwab Corp., Series I, 4.00% | 99,959,000 | 95,835,691 | ||||||
| 147,939,650 | ||||||||
| Electric Utilities — 0.9% | ||||||||
| Duke Energy Corp., 4.875% | 102,852,000 | 104,202,448 | ||||||
| Insurance — 0.3% | ||||||||
| Progressive Corp., 5.375% | 40,146,000 | 39,363,153 | ||||||
12
| Shares/ Principal Amount | Value | |||||||
| Multi-Utilities — 0.6% | ||||||||
| Dominion Energy, Inc., 4.65% | 69,238,000 | $ | 68,891,810 | |||||
TOTAL PREFERRED STOCKS (Cost $1,082,106,667) | 1,063,929,081 | |||||||
| CONVERTIBLE BONDS — 3.8% | ||||||||
| Airlines — 0.1% | ||||||||
| Southwest Airlines Co., 1.25%, 5/1/25 | $ | 10,952,000 | 14,902,934 | |||||
| Diversified Financial Services — 1.5% | ||||||||
Credit Suisse AG, (convertible into Berkshire Hathaway, Inc., Class B), 1.15%, 6/28/22(3)(4) | 119,800 | 34,610,601 | ||||||
Goldman Sachs International, (convertible into Stanley Black & Decker, Inc), 8.50%, 9/30/22(3)(4) | 208,300 | 28,800,599 | ||||||
JPMorgan Chase Bank N.A., (convertible into Berkshire Hathaway, Inc., Class B), 0.21%, 5/24/22(3)(4) | 92,900 | 26,688,663 | ||||||
JPMorgan Chase Bank N.A., (convertible into Berkshire Hathaway, Inc., Class B), 0.90%, 7/19/22(3)(4) | 56,600 | 17,684,956 | ||||||
Royal Bank of Canada, (convertible into Berkshire Hathaway, Inc., Class B), 0.52%, 6/1/22(3)(4) | 79,800 | 23,124,398 | ||||||
UBS AG, (convertible into Berkshire Hathaway, Class B), 1.10%, 9/9/22(3)(4) | 122,200 | 38,998,329 | ||||||
| 169,907,546 | ||||||||
| Electrical Equipment — 0.2% | ||||||||
Royal Bank of Canada, (convertible into Emerson Electric Co.), 3.51%, 4/19/22(3)(4) | 275,000 | 25,917,108 | ||||||
| Hotels, Restaurants and Leisure — 0.6% | ||||||||
Cracker Barrel Old Country Store, Inc., 0.625%, 6/15/26(4) | 74,969,000 | 68,784,058 | ||||||
| Metals and Mining — 0.2% | ||||||||
Credit Suisse AG, (convertible into Freeport-McMoRan Inc.), 20.50%, 7/29/22(3)(4) | 655,800 | 26,408,289 | ||||||
| Semiconductors and Semiconductor Equipment — 0.9% | ||||||||
Microchip Technology, Inc., 0.125%, 11/15/24(2) | 89,993,000 | 102,552,248 | ||||||
| Specialty Retail — 0.3% | ||||||||
Merrill Lynch International & Co. CV, (convertible into Advanced Auto Parts, Inc.), 7.00%, 8/18/22(3)(4) | 175,000 | 37,750,655 | ||||||
TOTAL CONVERTIBLE BONDS (Cost $442,036,158) | 446,222,838 | |||||||
| EXCHANGE-TRADED FUNDS — 2.9% | ||||||||
iShares Russell 1000 Value ETF (Cost $307,630,373) | 1,998,848 | 331,768,791 | ||||||
| CONVERTIBLE PREFERRED STOCKS — 1.8% | ||||||||
| Banks — 0.5% | ||||||||
| Bank of America Corp., 7.25% | 44,900 | 59,034,520 | ||||||
| Health Care Equipment and Supplies — 1.3% | ||||||||
Becton Dickinson and Co., 6.00%, 6/1/23(2) | 2,799,928 | 147,892,197 | ||||||
TOTAL CONVERTIBLE PREFERRED STOCKS (Cost $208,951,801) | 206,926,717 | |||||||
| CORPORATE BONDS — 0.2% | ||||||||
| Electric Utilities — 0.2% | ||||||||
NextEra Energy Capital Holdings, Inc., VRN, 5.65%, 5/1/79 (Cost $19,805,875) | $ | 19,778,000 | 20,330,396 | |||||
| SHORT-TERM INVESTMENTS — 3.7% | ||||||||
| Discount Notes — 1.5% | ||||||||
Federal Home Loan Bank Discount Notes, 0.09%, 4/1/22(5) | 171,000,000 | 171,000,000 | ||||||
| Money Market Funds — 1.3% | ||||||||
| State Street Institutional U.S. Government Money Market Fund, Premier Class | 36,376,016 | 36,376,016 | ||||||
13
| Shares | Value | |||||||
State Street Navigator Securities Lending Government Money Market Portfolio(6) | 110,879,722 | $ | 110,879,722 | |||||
| 147,255,738 | ||||||||
| Repurchase Agreements — 0.9% | ||||||||
| BMO Capital Markets Corp., (collateralized by various U.S. Treasury obligations, 3.125% - 3.625%, 2/15/43 - 8/15/43, valued at $10,137,173), in a joint trading account at 0.26%, dated 3/31/22, due 4/1/22 (Delivery value $9,936,600) | 9,936,528 | |||||||
| Fixed Income Clearing Corp., (collateralized by various U.S. Treasury obligations, 2.375% - 3.125%, 11/15/41 - 2/15/42, valued at $ 101,356,552), at 0.25%, dated 3/31/21, due 4/1/22 (Delivery value $99,369,690) | 99,369,000 | |||||||
| 109,305,528 | ||||||||
TOTAL SHORT-TERM INVESTMENTS (Cost $427,561,266) | 427,561,266 | |||||||
TOTAL INVESTMENT SECURITIES — 100.8% (Cost $8,987,170,482) | 11,737,077,267 | |||||||
| OTHER ASSETS AND LIABILITIES — (0.8)% | (90,697,938) | |||||||
| TOTAL NET ASSETS — 100.0% | $ | 11,646,379,329 | ||||||
| WRITTEN OPTIONS CONTRACTS | |||||||||||||||||||||||
| Reference Entity | Contracts | Type | Exercise Price | Expiration Date | Underlying Notional Amount | Premiums Received | Value | ||||||||||||||||
| Kimberly-Clark Corp. | 807 | Put | $ | 115.00 | 4/14/22 | $ | 9,939,012 | $ | (60,856) | $ | (16,140) | ||||||||||||
| FORWARD FOREIGN CURRENCY EXCHANGE CONTRACTS | ||||||||||||||||||||
| Currency Purchased | Currency Sold | Counterparty | Settlement Date | Unrealized Appreciation (Depreciation) | ||||||||||||||||
| USD | 369,941,253 | CHF | 343,666,176 | Morgan Stanley | 6/30/22 | $ | (3,391,561) | |||||||||||||
| USD | 485,240,179 | EUR | 438,934,757 | JPMorgan Chase Bank N.A. | 6/30/22 | (2,009,795) | ||||||||||||||
| USD | 2,226,627 | JPY | 270,351,680 | Bank of America N.A. | 6/30/22 | 469 | ||||||||||||||
| USD | 1,821,063 | JPY | 220,966,340 | Bank of America N.A. | 6/30/22 | 1,559 | ||||||||||||||
| USD | 54,549,989 | JPY | 6,564,873,000 | Bank of America N.A. | 6/30/22 | 492,820 | ||||||||||||||
| $ | (4,906,508) | |||||||||||||||||||
14
| NOTES TO SCHEDULE OF INVESTMENTS | ||||||||
| CHF | - | Swiss Franc | ||||||
| EUR | - | Euro | ||||||
| JPY | - | Japanese Yen | ||||||
| USD | - | United States Dollar | ||||||
| VRN | - | Variable Rate Note. The rate adjusts periodically based upon the terms set forth in the security’s offering documents. The rate shown is effective at the period end and the reference rate and spread, if any, is indicated. The security's effective maturity date may be shorter than the final maturity date shown. | ||||||
(1)Affiliated Company: the fund’s holding represents ownership of 5% or more of the voting securities of the company; therefore, the company is affiliated as defined in the Investment Company Act of 1940.
(2)Security, or a portion thereof, is on loan. At the period end, the aggregate value of securities on loan was $110,403,358. The amount of securities on loan indicated may not correspond with the securities on loan identified because securities with pending sales are in the process of recall from the brokers.
(3)Equity-linked debt security. The aggregated value of these securities at the period end was $259,983,598, which represented 2.2% of total net assets.
(4)Security was purchased pursuant to Rule 144A or Section 4(2) under the Securities Act of 1933 and may be sold in transactions exempt from registration, normally to qualified institutional investors. The aggregate value of these securities at the period end was $328,767,656, which represented 2.8% of total net assets.
(5)The rate indicated is the yield to maturity at purchase.
(6)Investment of cash collateral from securities on loan. At the period end, the aggregate value of the collateral held by the fund was $113,340,658, which includes securities collateral of $2,460,936.
See Notes to Financial Statements.
15
| Statement of Assets and Liabilities | ||
| MARCH 31, 2022 | |||||
| Assets | |||||
| Investment securities - unaffiliated, at value (cost of $8,650,057,058) — including $110,403,358 of securities on loan | $ | 11,279,885,030 | |||
| Investment securities - affiliated, at value (cost of $226,233,702) | 346,312,515 | ||||
| Investment made with cash collateral received for securities on loan, at value (cost of $110,879,722) | 110,879,722 | ||||
| Total investment securities, at value (cost of $8,987,170,482) | 11,737,077,267 | ||||
| Deposits with broker for options contracts | 2,784,154 | ||||
| Receivable for investments sold | 3,947,340 | ||||
| Receivable for capital shares sold | 4,400,569 | ||||
| Unrealized appreciation on forward foreign currency exchange contracts | 494,848 | ||||
| Dividends and interest receivable | 32,592,516 | ||||
| Securities lending receivable | 43,795 | ||||
| 11,781,340,489 | |||||
| Liabilities | |||||
| Written options, at value (premiums received $60,856) | 16,140 | ||||
| Payable for collateral received for securities on loan | 110,879,722 | ||||
| Payable for investments purchased | 1,172,295 | ||||
| Payable for capital shares redeemed | 8,266,931 | ||||
| Unrealized depreciation on forward foreign currency exchange contracts | 5,401,356 | ||||
| Accrued management fees | 7,609,921 | ||||
| Distribution and service fees payable | 428,119 | ||||
| Accrued other expenses | 1,186,676 | ||||
| 134,961,160 | |||||
| Net Assets | $ | 11,646,379,329 | |||
| Net Assets Consist of: | |||||
| Capital (par value and paid-in surplus) | $ | 8,578,940,654 | |||
| Distributable earnings | 3,067,438,675 | ||||
| $ | 11,646,379,329 | ||||
| Net Assets | Shares Outstanding | Net Asset Value Per Share | |||||||||
| Investor Class, $0.01 Par Value | $4,191,544,325 | 425,095,112 | $9.86 | ||||||||
| I Class, $0.01 Par Value | $4,912,267,144 | 497,500,572 | $9.87 | ||||||||
| Y Class, $0.01 Par Value | $276,001,115 | 27,919,324 | $9.89 | ||||||||
| A Class, $0.01 Par Value | $858,437,399 | 87,068,829 | $9.86* | ||||||||
| C Class, $0.01 Par Value | $272,763,687 | 27,669,925 | $9.86 | ||||||||
| R Class, $0.01 Par Value | $47,838,788 | 4,873,470 | $9.82 | ||||||||
| R5 Class, $0.01 Par Value | $66,131,268 | 6,704,886 | $9.86 | ||||||||
| R6 Class, $0.01 Par Value | $1,021,389,083 | 103,333,184 | $9.88 | ||||||||
| G Class, $0.01 Par Value | $6,520 | 659 | $9.89 | ||||||||
*Maximum offering price $10.46 (net asset value divided by 0.9425).
See Notes to Financial Statements.
16
| Statement of Operations | ||
| YEAR ENDED MARCH 31, 2022 | |||||
| Investment Income (Loss) | |||||
| Income: | |||||
| Dividends (including $14,885,841 from affiliates and net of foreign taxes withheld of $3,971,633) | $ | 275,658,205 | |||
| Interest | 55,492,866 | ||||
| Securities lending, net | 329,819 | ||||
| 331,480,890 | |||||
| Expenses: | |||||
| Management fees | 93,398,800 | ||||
| Distribution and service fees: | |||||
| A Class | 2,199,862 | ||||
| C Class | 2,917,607 | ||||
| R Class | 259,268 | ||||
| Directors' fees and expenses | 289,214 | ||||
| Other expenses | 3,479,517 | ||||
| 102,544,268 | |||||
| Fees waived - G Class | (34) | ||||
| 102,544,234 | |||||
| Net investment income (loss) | 228,936,656 | ||||
| Realized and Unrealized Gain (Loss) | |||||
| Net realized gain (loss) on: | |||||
| Investment transactions (including $1,965,873 from affiliates) (Note 4) | 899,312,534 | ||||
| Forward foreign currency exchange contract transactions | 57,606,643 | ||||
| Written options contract transactions | 3,252,531 | ||||
| Foreign currency translation transactions | (105,069) | ||||
| 960,066,639 | |||||
| Change in net unrealized appreciation (depreciation) on: | |||||
| Investments (including $14,542,416 from affiliates) | 176,017,743 | ||||
| Forward foreign currency exchange contracts | (22,423,713) | ||||
| Written options contracts | (3,792) | ||||
| Translation of assets and liabilities in foreign currencies | (14,207) | ||||
| 153,576,031 | |||||
| Net realized and unrealized gain (loss) | 1,113,642,670 | ||||
| Net Increase (Decrease) in Net Assets Resulting from Operations | $ | 1,342,579,326 | |||
See Notes to Financial Statements.
17
| Statement of Changes in Net Assets | ||
| YEARS ENDED MARCH 31, 2022 AND MARCH 31, 2021 | ||||||||
| Increase (Decrease) in Net Assets | March 31, 2022 | March 31, 2021 | ||||||
| Operations | ||||||||
| Net investment income (loss) | $ | 228,936,656 | $ | 245,864,202 | ||||
| Net realized gain (loss) | 960,066,639 | 401,852,680 | ||||||
| Change in net unrealized appreciation (depreciation) | 153,576,031 | 2,734,453,371 | ||||||
| Net increase (decrease) in net assets resulting from operations | 1,342,579,326 | 3,382,170,253 | ||||||
| Distributions to Shareholders | ||||||||
| From earnings: | ||||||||
| Investor Class | (282,936,433) | (89,824,916) | ||||||
| I Class | (351,310,719) | (116,672,660) | ||||||
| Y Class | (19,904,820) | (6,594,058) | ||||||
| A Class | (56,093,134) | (14,576,470) | ||||||
| C Class | (16,328,252) | (4,417,051) | ||||||
| R Class | (3,104,626) | (1,002,485) | ||||||
| R5 Class | (4,527,186) | (1,336,997) | ||||||
| R6 Class | (73,621,920) | (24,137,281) | ||||||
| G Class | (476) | (160) | ||||||
| Decrease in net assets from distributions | (807,827,566) | (258,562,078) | ||||||
| Capital Share Transactions | ||||||||
| Net increase (decrease) in net assets from capital share transactions (Note 5) | (881,461,208) | (1,141,632,398) | ||||||
| Net increase (decrease) in net assets | (346,709,448) | 1,981,975,777 | ||||||
| Net Assets | ||||||||
| Beginning of period | 11,993,088,777 | 10,011,113,000 | ||||||
| End of period | $ | 11,646,379,329 | $ | 11,993,088,777 | ||||
See Notes to Financial Statements.
18
| Notes to Financial Statements | ||
MARCH 31, 2022
1. Organization
American Century Capital Portfolios, Inc. (the corporation) is registered under the Investment Company Act of 1940, as amended (the 1940 Act), as an open-end management investment company and is organized as a Maryland corporation. Equity Income Fund (the fund) is one fund in a series issued by the corporation. The fund’s investment objective is to seek current income. Capital appreciation is a secondary objective.
The fund offers the Investor Class, I Class, Y Class, A Class, C Class, R Class, R5 Class, R6 Class and G Class. The A Class may incur an initial sales charge. The A Class and C Class may be subject to a contingent deferred sales charge.
2. Significant Accounting Policies
The following is a summary of significant accounting policies consistently followed by the fund in preparation of its financial statements. The fund is an investment company and follows accounting and reporting guidance in accordance with accounting principles generally accepted in the United States of America. This may require management to make certain estimates and assumptions at the date of the financial statements. Actual results could differ from these estimates. Management evaluated the impact of events or transactions occurring through the date the financial statements were issued that would merit recognition or disclosure.
Investment Valuations — The fund determines the fair value of its investments and computes its net asset value (NAV) per share at the close of regular trading (usually 4 p.m. Eastern time) on the New York Stock Exchange (NYSE) on each day the NYSE is open. The Board of Directors has adopted valuation policies and procedures to guide the investment advisor in the fund’s investment valuation process and to provide methodologies for the oversight of the fund’s pricing function.
Equity securities that are listed or traded on a domestic securities exchange are valued at the last reported sales price or at the official closing price as provided by the exchange. Equity securities traded on foreign securities exchanges are generally valued at the closing price of such securities on the exchange where primarily traded or at the close of the NYSE, if that is earlier. If no last sales price is reported, or if local convention or regulation so provides, the mean of the latest bid and asked prices may be used. Securities traded over-the-counter are valued at the mean of the latest bid and asked prices, the last sales price, or the official closing price. Equity securities initially expressed in local currencies are translated into U.S. dollars at the mean of the appropriate currency exchange rate at the close of the NYSE as provided by an independent pricing service.
Fixed income securities are valued at the evaluated mean as provided by independent pricing services or at the mean of the most recent bid and asked prices as provided by investment dealers. Corporate bonds, U.S. Treasury and Government Agency securities and convertible bonds are valued using market models that consider trade data, quotations from dealers and active market makers, relevant yield curve and spread data, creditworthiness, trade data or market information on comparable securities, and other relevant security specific information.
Hybrid securities are valued at the evaluated mean as provided by independent pricing services or at the mean of the most recent bid and asked prices as provided by investment dealers. Preferred stocks and convertible preferred stocks with perpetual maturities are valued using market models that consider trade data, quotations from dealers and active market makers, relevant yield curve and spread data, creditworthiness, trade data or market information on comparable securities, and other relevant security specific information.
Open-end management investment companies are valued at the reported NAV per share. Exchange-traded options contracts are valued at a mean as provided by independent pricing services. Repurchase agreements are valued at cost, which approximates fair value. Forward foreign currency exchange contracts are valued at the mean of the appropriate forward exchange rate at the close of the NYSE as provided by an independent pricing service.
19
If the fund determines that the market price for an investment is not readily available or the valuation methods mentioned above do not reflect an investment’s fair value, such investment is valued as determined in good faith by the Board of Directors or its delegate, in accordance with policies and procedures adopted by the Board of Directors. In its determination of fair value, the fund may review several factors including, but not limited to, market information regarding the specific investment or comparable investments and correlation with other investment types, futures indices or general market indicators. Circumstances that may cause the fund to use these procedures to value an investment include, but are not limited to: an investment has been declared in default or is distressed; trading in a security has been suspended during the trading day or a security is not actively trading on its principal exchange; prices received from a regular pricing source are deemed unreliable; or there is a foreign market holiday and no trading occurred.
The fund monitors for significant events occurring after the close of an investment’s primary exchange but before the fund’s NAV per share is determined. Significant events may include, but are not limited to: corporate announcements and transactions; governmental action and political unrest that could impact a specific investment or an investment sector; or armed conflicts, natural disasters and similar events that could affect investments in a specific country or region. The fund also monitors for significant fluctuations between domestic and foreign markets, as evidenced by the U.S. market or such other indicators that the Board of Directors, or its delegate, deems appropriate. The fund may apply a model-derived factor to the closing price of equity securities traded on foreign securities exchanges. The factor is based on observable market data as provided by an independent pricing service.
Security Transactions — Security transactions are accounted for as of the trade date. Net realized gains and losses are determined on the identified cost basis, which is also used for federal income tax purposes.
Investment Income — Dividend income less foreign taxes withheld, if any, is recorded as of the ex-dividend date. Distributions received on securities that represent a return of capital or long-term capital gain are recorded as a reduction of cost of investments and/or as a realized gain. The fund may estimate the components of distributions received that may be considered nontaxable distributions or long-term capital gain distributions for income tax purposes. Interest income is recorded on the accrual basis and includes accretion of discounts and amortization of premiums. For convertible bonds, the premiums attributable only to the debt instrument are amortized. Securities lending income is net of fees and rebates earned by the lending agent for its services.
Equity-Linked Debt and Linked-Equity Securities — The fund may invest in hybrid equity securities, which usually convert into common stock at a date predetermined by the issuer. These securities generally offer a higher dividend yield than that of the common stock to which the security is linked. These instruments are issued by a company other than the one to which the security is linked and carry the credit of the issuer, not that of the underlying common stock. The securities’ appreciation is limited based on a predetermined final cap price at the date of the conversion. Risks of investing in these securities include, but are not limited to, a set time to capture the yield advantage, limited appreciation potential, decline in value of the underlying stock, and failure of the issuer to pay dividends or to deliver common stock at maturity.
Foreign Currency Translations — All assets and liabilities initially expressed in foreign currencies are translated into U.S. dollars at prevailing exchange rates at period end. The fund may enter into spot foreign currency exchange contracts to facilitate transactions denominated in a foreign currency. Purchases and sales of investment securities, dividend and interest income, spot foreign currency exchange contracts, and expenses are translated at the rates of exchange prevailing on the respective dates of such transactions. Net realized and unrealized foreign currency exchange gains or losses related to investment securities are a component of net realized gain (loss) on investment transactions and change in net unrealized appreciation (depreciation) on investments, respectively.
Repurchase Agreements — The fund may enter into repurchase agreements with institutions that American Century Investment Management, Inc. (ACIM) (the investment advisor) has determined are creditworthy pursuant to criteria adopted by the Board of Directors. The fund requires that the collateral, represented by securities, received in a repurchase transaction be transferred to the custodian in a manner sufficient to enable the fund to obtain those securities in the event of a default under the repurchase agreement. ACIM monitors, on a daily basis, the securities transferred to ensure the value, including accrued interest, of the securities under each repurchase agreement is equal to or greater than amounts owed to the fund under each repurchase agreement.
Joint Trading Account — Pursuant to an Exemptive Order issued by the Securities and Exchange Commission, the fund, along with certain other funds in the American Century Investments family of funds,
20
may transfer uninvested cash balances into a joint trading account. These balances are invested in one or more repurchase agreements that are collateralized by U.S. Treasury or Agency obligations.
Segregated Assets — In accordance with the 1940 Act, the fund segregates assets on its books and records to cover certain types of investment securities and other financial instruments. ACIM monitors, on a daily basis, the securities segregated to ensure the fund designates a sufficient amount of liquid assets, marked-to-market daily. The fund may also receive assets or be required to pledge assets at the custodian bank or with a broker for collateral requirements.
Income Tax Status — It is the fund’s policy to distribute substantially all net investment income and net realized gains to shareholders and to otherwise qualify as a regulated investment company under provisions of the Internal Revenue Code. Accordingly, no provision has been made for income taxes. The fund files U.S. federal, state, local and non-U.S. tax returns as applicable. The fund's tax returns are subject to examination by the relevant taxing authority until expiration of the applicable statute of limitations, which is generally three years from the date of filing but can be longer in certain jurisdictions. At this time, management believes there are no uncertain tax positions which, based on their technical merit, would not be sustained upon examination and for which it is reasonably possible that the total amounts of unrecognized tax benefits will significantly change in the next twelve months.
Multiple Class — All shares of the fund represent an equal pro rata interest in the net assets of the class to which such shares belong, and have identical voting, dividend, liquidation and other rights and the same terms and conditions, except for class specific expenses and exclusive rights to vote on matters affecting only individual classes. Income, non-class specific expenses, and realized and unrealized capital gains and losses of the fund are allocated to each class of shares based on their relative net assets.
Distributions to Shareholders — Distributions from net investment income, if any, are generally declared and paid quarterly. Distributions from net realized gains, if any, are generally declared and paid annually. The fund may elect to treat a portion of its payment to a redeeming shareholder, which represents the pro rata share of undistributed net investment income and net realized gains, as a distribution for federal income tax purposes (tax equalization).
Indemnifications — Under the corporation’s organizational documents, its officers and directors are indemnified against certain liabilities arising out of the performance of their duties to the fund. In addition, in the normal course of business, the fund enters into contracts that provide general indemnifications. The maximum exposure under these arrangements is unknown as this would involve future claims that may be made against a fund. The risk of material loss from such claims is considered by management to be remote.
Securities Lending — Securities are lent to qualified financial institutions and brokers. State Street Bank & Trust Co. serves as securities lending agent to the fund pursuant to a Securities Lending Agreement. The lending of securities exposes the fund to risks such as: the borrowers may fail to return the loaned securities, the borrowers may not be able to provide additional collateral, the fund may experience delays in recovery of the loaned securities or delays in access to collateral, or the fund may experience losses related to the investment collateral. To minimize certain risks, loan counterparties pledge collateral in the form of cash and/or securities. The lending agent has agreed to indemnify the fund in the case of default of any securities borrowed. Cash collateral received is invested in the State Street Navigator Securities Lending Government Money Market Portfolio, a money market mutual fund registered under the 1940 Act. The loans may also be secured by U.S. government securities in an amount at least equal to the market value of the securities loaned, plus accrued interest and dividends, determined on a daily basis and adjusted accordingly. By lending securities, the fund seeks to increase its net investment income through the receipt of interest and fees. Such income is reflected separately within the Statement of Operations. The value of loaned securities and related collateral outstanding at period end, if any, are shown on a gross basis within the Schedule of Investments and Statement of Assets and Liabilities.
21
The following table reflects a breakdown of transactions accounted for as secured borrowings, the gross obligation by the type of collateral pledged, and the remaining contractual maturity of those transactions as of March 31, 2022.
| Remaining Contractual Maturity of Agreements | |||||||||||||||||
| Overnight and Continuous | <30 days | Between 30 & 90 days | >90 days | Total | |||||||||||||
Securities Lending Transactions(1) | |||||||||||||||||
| Common Stocks | $ | 17,248,452 | — | — | — | $ | 17,248,452 | ||||||||||
| Convertible Bonds | 45,787,753 | — | — | — | 45,787,753 | ||||||||||||
| Convertible Preferred Stocks | 41,148,231 | — | — | — | 41,148,231 | ||||||||||||
| Preferred Stocks | 6,695,286 | — | — | — | 6,695,286 | ||||||||||||
| Total Borrowings | $ | 110,879,722 | — | — | — | $ | 110,879,722 | ||||||||||
| Gross amount of recognized liabilities for securities lending transactions | $ | 110,879,722 | |||||||||||||||
(1)Amount represents the payable for cash collateral received for securities on loan. This will generally be in the Overnight and Continuous column as the securities are typically callable on demand.
3. Fees and Transactions with Related Parties
Certain officers and directors of the corporation are also officers and/or directors of American Century Companies, Inc. (ACC). The corporation’s investment advisor, ACIM, the corporation's distributor, American Century Investment Services, Inc. (ACIS), and the corporation’s transfer agent, American Century Services, LLC, are wholly owned, directly or indirectly, by ACC.
Management Fees — The corporation has entered into a management agreement with ACIM, under which ACIM provides the fund with investment advisory and management services in exchange for a single, unified management fee (the fee) per class. The agreement provides that ACIM will pay all expenses of managing and operating the fund, except brokerage expenses, taxes, interest, fees and expenses of the independent directors (including legal counsel fees), extraordinary expenses, and expenses incurred in connection with the provision of shareholder services and distribution services under a plan adopted pursuant to Rule 12b-1 under the 1940 Act. The fee is computed and accrued daily based on each class's daily net assets and paid monthly in arrears. The difference in the fee among the classes is a result of their separate arrangements for non-Rule 12b-1 shareholder services. It is not the result of any difference in advisory or custodial fees or other expenses related to the management of the fund's assets, which do not vary by class. The rate of the fee is determined by applying a fee rate calculation formula. This formula takes into account the fund's assets as well as certain assets, if any, of other clients of the investment advisor outside the American Century Investments family of funds (such as subadvised funds and separate accounts) that use very similar investment teams and strategies (strategy assets). The investment advisor agreed to waive the G Class's management fee in its entirety. The investment advisor expects this waiver to remain in effect permanently and cannot terminate it without the approval of the Board of Directors.
The management fee schedule range and the effective annual management fee for each class for the period ended March 31, 2022 are as follows:
Management Fee Schedule Range | Effective Annual Management Fee | |||||||
| Investor Class | 0.80% to 1.00% | 0.90% | ||||||
| I Class | 0.60% to 0.80% | 0.70% | ||||||
| Y Class | 0.45% to 0.65% | 0.55% | ||||||
| A Class | 0.80% to 1.00% | 0.90% | ||||||
| C Class | 0.80% to 1.00% | 0.90% | ||||||
| R Class | 0.80% to 1.00% | 0.90% | ||||||
| R5 Class | 0.60% to 0.80% | 0.70% | ||||||
| R6 Class | 0.45% to 0.65% | 0.55% | ||||||
| G Class | 0.45% to 0.65% | 0.00%(1) | ||||||
(1)Effective annual management fee before waiver was 0.55%.
22
Distribution and Service Fees — The Board of Directors has adopted a separate Master Distribution and Individual Shareholder Services Plan for each of the A Class, C Class and R Class (collectively the plans), pursuant to Rule 12b-1 of the 1940 Act. The plans provide that the A Class will pay ACIS an annual distribution and service fee of 0.25%. The plans provide that the C Class will pay ACIS an annual distribution and service fee of 1.00%, of which 0.25% is paid for individual shareholder services and 0.75% is paid for distribution services. The plans provide that the R Class will pay ACIS an annual distribution and service fee of 0.50%. The fees are computed and accrued daily based on each class’s daily net assets and paid monthly in arrears. The fees are used to pay financial intermediaries for distribution and individual shareholder services. Fees incurred under the plans during the period ended March 31, 2022 are detailed in the Statement of Operations.
Directors' Fees and Expenses — The Board of Directors is responsible for overseeing the investment advisor’s management and operations of the fund. The directors receive detailed information about the fund and its investment advisor regularly throughout the year, and meet at least quarterly with management of the investment advisor to review reports about fund operations. The fund’s officers do not receive compensation from the fund.
Other Expenses — The fund’s other expenses may include interest charges, clearing exchange fees, proxy solicitation expenses, filing fees for foreign tax reclaims and other miscellaneous expenses. The impact of other expenses to the ratio of operating expenses to average net assets was 0.03% for the period ended March 31, 2022.
Interfund Transactions — The fund may enter into security transactions with other American Century Investments funds and other client accounts of the investment advisor, in accordance with the 1940 Act rules and procedures adopted by the Board of Directors. The rules and procedures require, among other things, that these transactions be effected at the independent current market price of the security. During the period, the interfund purchases and sales were $1,599,640 and $4,677,547, respectively. The effect of interfund transactions on the Statement of Operations was $794,278 in net realized gain (loss) on investment transactions.
4. Investment Transactions
Purchases and sales of investment securities, excluding short-term investments and in kind transactions, for the period ended March 31, 2022 were $2,741,770,557 and $3,927,450,435, respectively.
For the period ended March 31, 2022, the fund incurred net realized gains of $42,264,917 from redemptions in kind. A redemption in kind occurs when a fund delivers securities from its portfolio in lieu of cash as payment to a redeeming shareholder.
23
5. Capital Share Transactions
Transactions in shares of the fund were as follows:
| Year ended March 31, 2022 | Year ended March 31, 2021 | |||||||||||||
| Shares | Amount | Shares | Amount | |||||||||||
| Investor Class/Shares Authorized | 3,600,000,000 | 3,600,000,000 | ||||||||||||
| Sold | 33,470,395 | $ | 329,446,877 | 66,931,155 | $ | 558,165,028 | ||||||||
| Issued in reinvestment of distributions | 28,470,849 | 275,292,827 | 10,296,106 | 86,745,797 | ||||||||||
| Redeemed | (82,385,577) | (814,231,066) | (144,331,250) | (1,220,193,872) | ||||||||||
| (20,444,333) | (209,491,362) | (67,103,989) | (575,283,047) | |||||||||||
| I Class/Shares Authorized | 3,850,000,000 | 3,850,000,000 | ||||||||||||
| Sold | 83,497,773 | 824,814,991 | 161,889,860 | 1,356,311,143 | ||||||||||
| Issued in reinvestment of distributions | 34,687,065 | 335,831,117 | 13,122,030 | 110,995,416 | ||||||||||
| Redeemed | (166,604,042) | (1,645,207,735) | (210,474,171) | (1,780,200,380) | ||||||||||
| (48,419,204) | (484,561,627) | (35,462,281) | (312,893,821) | |||||||||||
| Y Class/Shares Authorized | 200,000,000 | 200,000,000 | ||||||||||||
| Sold | 3,006,421 | 29,772,413 | 6,952,418 | 58,596,972 | ||||||||||
| Issued in reinvestment of distributions | 1,970,619 | 19,101,347 | 748,529 | 6,345,832 | ||||||||||
| Redeemed | (6,777,802) | (66,943,223) | (9,109,803) | (76,780,263) | ||||||||||
| (1,800,762) | (18,069,463) | (1,408,856) | (11,837,459) | |||||||||||
| A Class/Shares Authorized | 720,000,000 | 720,000,000 | ||||||||||||
| Sold | 10,243,100 | 100,942,790 | 27,235,924 | 231,711,362 | ||||||||||
| Issued in reinvestment of distributions | 5,416,057 | 52,355,264 | 1,610,153 | 13,580,326 | ||||||||||
| Redeemed | (20,543,107) | (203,100,842) | (34,722,510) | (285,333,015) | ||||||||||
| (4,883,950) | (49,802,788) | (5,876,433) | (40,041,327) | |||||||||||
| C Class/Shares Authorized | 275,000,000 | 275,000,000 | ||||||||||||
| Sold | 2,059,118 | 20,283,318 | 3,214,897 | 26,939,727 | ||||||||||
| Issued in reinvestment of distributions | 1,614,770 | 15,594,055 | 494,459 | 4,109,198 | ||||||||||
| Redeemed | (8,087,187) | (79,697,877) | (26,853,941) | (228,095,966) | ||||||||||
| (4,413,299) | (43,820,504) | (23,144,585) | (197,047,041) | |||||||||||
| R Class/Shares Authorized | 70,000,000 | 70,000,000 | ||||||||||||
| Sold | 660,105 | 6,445,056 | 950,355 | 8,012,700 | ||||||||||
| Issued in reinvestment of distributions | 322,570 | 3,104,583 | 116,317 | 968,783 | ||||||||||
| Redeemed | (2,167,923) | (21,239,748) | (2,938,398) | (24,840,585) | ||||||||||
| (1,185,248) | (11,690,109) | (1,871,726) | (15,859,102) | |||||||||||
| R5 Class/Shares Authorized | 50,000,000 | 50,000,000 | ||||||||||||
| Sold | 922,859 | 9,138,075 | 7,141,230 | 57,602,916 | ||||||||||
| Issued in reinvestment of distributions | 468,144 | 4,527,186 | 157,987 | 1,336,997 | ||||||||||
| Redeemed | (1,307,541) | (12,993,195) | (805,398) | (6,991,331) | ||||||||||
| 83,462 | 672,066 | 6,493,819 | 51,948,582 | |||||||||||
| R6 Class/Shares Authorized | 800,000,000 | 800,000,000 | ||||||||||||
| Sold | 24,925,775 | 245,778,944 | 25,998,150 | 221,466,928 | ||||||||||
| Issued in reinvestment of distributions | 7,593,972 | 73,609,160 | 2,848,378 | 24,137,221 | ||||||||||
| Redeemed | (39,033,573) | (384,086,001) | (33,581,581) | (286,223,492) | ||||||||||
| (6,513,826) | (64,697,897) | (4,735,053) | (40,619,343) | |||||||||||
| G Class/Shares Authorized | 20,000,000 | 65,000,000 | ||||||||||||
| Issued in reinvestment of distributions | 49 | 476 | 19 | 160 | ||||||||||
| Net increase (decrease) | (87,577,111) | $ | (881,461,208) | (133,109,085) | $ | (1,141,632,398) | ||||||||
24
6. Affiliated Company Transactions
If a fund's holding represents ownership of 5% or more of the voting securities of a company, the company is affiliated as defined in the 1940 Act. A summary of transactions for each company which is or was an affiliate at or during the period ended March 31, 2022 follows (amounts in thousands):
| Company | Beginning Value | Purchase Cost | Sales Cost | Change in Net Unrealized Appreciation (Depreciation) | Ending Value | Ending Shares | Net Realized Gain (Loss) | Income | ||||||||||||||||||
| Capitol Federal Financial, Inc. | $ | 105,799 | — | $ | 737 | $ | (18,956) | $ | 86,106 | 7,914 | $ | 239 | $ | 7,598 | ||||||||||||
| ONE Gas, Inc. | 238,361 | $ | 2,687 | 14,340 | 33,498 | 260,206 | 2,949 | 1,727 | 7,288 | |||||||||||||||||
| $ | 344,160 | $ | 2,687 | $ | 15,077 | $ | 14,542 | $ | 346,312 | 10,863 | $ | 1,966 | $ | 14,886 | ||||||||||||
7. Fair Value Measurements
The fund’s investments valuation process is based on several considerations and may use multiple inputs to determine the fair value of the investments held by the fund. In conformity with accounting principles generally accepted in the United States of America, the inputs used to determine a valuation are classified into three broad levels.
•Level 1 valuation inputs consist of unadjusted quoted prices in an active market for identical investments.
•Level 2 valuation inputs consist of direct or indirect observable market data (including quoted prices for comparable investments, evaluations of subsequent market events, interest rates, prepayment speeds, credit risk, etc.). These inputs also consist of quoted prices for identical investments initially expressed in local currencies that are adjusted through translation into U.S. dollars.
•Level 3 valuation inputs consist of unobservable data (including a fund’s own assumptions).
The level classification is based on the lowest level input that is significant to the fair valuation measurement. The valuation inputs are not necessarily an indication of the risks associated with investing in these securities or other financial instruments.
25
The following is a summary of the level classifications as of period end. The Schedule of Investments provides additional information on the fund’s portfolio holdings.
| Level 1 | Level 2 | Level 3 | |||||||||
| Assets | |||||||||||
| Investment Securities | |||||||||||
| Common Stocks | |||||||||||
| Auto Components | — | $ | 38,738,136 | — | |||||||
| Automobiles | — | 28,846,362 | — | ||||||||
| Chemicals | $ | 272,036,490 | 85,914,551 | — | |||||||
| Diversified Telecommunication Services | 305,596,956 | 37,244,521 | — | ||||||||
| Food and Staples Retailing | 251,525,135 | 96,480,692 | — | ||||||||
| Food Products | 274,146,483 | 168,963,934 | — | ||||||||
| Household Products | 238,620,754 | 40,132,243 | — | ||||||||
| Industrial Conglomerates | — | 13,832,879 | — | ||||||||
| Oil, Gas and Consumable Fuels | 560,604,483 | 111,284,382 | — | ||||||||
| Personal Products | — | 185,255,333 | — | ||||||||
| Pharmaceuticals | 572,529,258 | 267,096,179 | — | ||||||||
| Other Industries | 5,691,489,407 | — | — | ||||||||
| Preferred Stocks | — | 1,063,929,081 | — | ||||||||
| Convertible Bonds | — | 446,222,838 | — | ||||||||
| Exchange-Traded Funds | 331,768,791 | — | — | ||||||||
| Convertible Preferred Stocks | 147,892,197 | 59,034,520 | — | ||||||||
| Corporate Bonds | — | 20,330,396 | — | ||||||||
| Short-Term Investments | 147,255,738 | 280,305,528 | — | ||||||||
| $ | 8,793,465,692 | $ | 2,943,611,575 | — | |||||||
| Other Financial Instruments | |||||||||||
| Forward Foreign Currency Exchange Contracts | — | $ | 494,848 | — | |||||||
| Liabilities | |||||||||||
| Other Financial Instruments | |||||||||||
| Forward Foreign Currency Exchange Contracts | — | $ | 5,401,356 | — | |||||||
| Written Options Contracts | $ | 16,140 | — | — | |||||||
| $ | 16,140 | $ | 5,401,356 | — | |||||||
26
8. Derivative Instruments
Equity Price Risk — The fund is subject to equity price risk in the normal course of pursuing its investment objectives. A fund may enter into options contracts based on an equity index or specific security in order to manage its exposure to changes in market conditions. The risks of entering into equity price risk derivative instruments include the possible lack of liquidity, failure of the counterparty to meet its obligations, and that there may be unfavorable changes in the underlying investments or instruments. A fund may purchase or write an option contract to protect against declines in market value on the underlying index or security. A purchased option contract provides the fund a right, but not an obligation, to buy (call) or sell (put) an equity-related asset at a specified exercise price within a certain period or on a specific date. A written option contract holds the corresponding obligation to sell (call writing) or buy (put writing) the underlying equity-related asset if the purchaser exercises the option contract. The buyer pays the seller an initial purchase price (premium) for this right. Option contracts purchased by a fund are accounted for in the same manner as marketable portfolio securities. The premium received by a fund for option contracts written is recorded as a liability and valued daily. The proceeds from securities sold through the exercise of option contracts are decreased by the premium paid to purchase the option contracts. A fund may recognize a realized gain or loss when the option contract is closed, exercised or expires. Net realized and unrealized gains or losses occurring during the holding period of purchased options contracts are a component of net realized gain (loss) on investment transactions and change in net unrealized appreciation (depreciation) on investments, respectively. Net realized and unrealized gains or losses occurring during the holding period of written options contracts are a component of net realized gain (loss) on written options contract transactions and change in net unrealized appreciation (depreciation) on written options contracts, respectively. The fund’s average exposure to equity price risk derivative instruments held during the period was 2,312 written options contracts.
Foreign Currency Risk — The fund is subject to foreign currency exchange rate risk in the normal course of pursuing its investment objectives. The value of foreign investments held by a fund may be significantly affected by changes in foreign currency exchange rates. The dollar value of a foreign security generally decreases when the value of the dollar rises against the foreign currency in which the security is denominated and tends to increase when the value of the dollar declines against such foreign currency. A fund may enter into forward foreign currency exchange contracts to reduce a fund's exposure to foreign currency exchange rate fluctuations. The net U.S. dollar value of foreign currency underlying all contractual commitments held by a fund and the resulting unrealized appreciation or depreciation are determined daily. Realized gain or loss is recorded upon settlement of the contract. Net realized and unrealized gains or losses occurring during the holding period of forward foreign currency exchange contracts are a component of net realized gain (loss) on forward foreign currency exchange contract transactions and change in net unrealized appreciation (depreciation) on forward foreign currency exchange contracts, respectively. A fund bears the risk of an unfavorable change in the foreign currency exchange rate underlying the forward contract. Additionally, losses, up to the fair value, may arise if the counterparties do not perform under the contract terms. The fund's average U.S. dollar exposure to foreign currency risk derivative instruments held during the period was $1,156,848,524.
Value of Derivative Instruments as of March 31, 2022
| Asset Derivatives | Liability Derivatives | |||||||||||||
| Type of Risk Exposure | Location on Statement of Assets and Liabilities | Value | Location on Statement of Assets and Liabilities | Value | ||||||||||
| Equity Price Risk | Written Options | — | Written Options | $ | 16,140 | |||||||||
| Foreign Currency Risk | Unrealized appreciation on forward foreign currency exchange contracts | $ | 494,848 | Unrealized depreciation on forward foreign currency exchange contracts | 5,401,356 | |||||||||
| $ | 494,848 | $ | 5,417,496 | |||||||||||
27
Effect of Derivative Instruments on the Statement of Operations for the Year Ended March 31, 2022
| Net Realized Gain (Loss) | Change in Net Unrealized Appreciation (Depreciation) | |||||||||||||
| Type of Risk Exposure | Location on Statement of Operations | Value | Location on Statement of Operations | Value | ||||||||||
| Equity Price Risk | Net realized gain (loss) on written options contract transactions | $ | 3,252,531 | Change in net unrealized appreciation (depreciation) on written options contracts | $ | (3,792) | ||||||||
| Foreign Currency Risk | Net realized gain (loss) on forward foreign currency exchange contract transactions | 57,606,643 | Change in net unrealized appreciation (depreciation) on forward foreign currency exchange contracts | (22,423,713) | ||||||||||
| $ | 60,859,174 | $ | (22,427,505) | |||||||||||
9. Risk Factors
The value of the fund’s shares will go up and down, sometimes rapidly or unpredictably, based on the performance of the securities owned by the fund and other factors generally affecting the securities market. Market risks, including political, regulatory, economic and social developments, can affect the value of the fund’s investments. Natural disasters, public health emergencies, war, terrorism and other unforeseeable events may lead to increased market volatility and may have adverse long-term effects on world economies and markets generally.
There are certain risks involved in investing in foreign securities. These risks include those resulting from political events (such as civil unrest, national elections and imposition of exchange controls), social and economic events (such as labor strikes and rising inflation), and natural disasters. Securities of foreign issuers may be less liquid and more volatile. Investing a significant portion of assets in one country or region may accentuate these risks.
10. Federal Tax Information
The tax character of distributions paid during the years ended March 31, 2022 and March 31, 2021 were as follows:
| 2022 | 2021 | |||||||
| Distributions Paid From | ||||||||
| Ordinary income | $ | 349,809,542 | $ | 258,562,078 | ||||
| Long-term capital gains | $ | 458,018,024 | — | |||||
The book-basis character of distributions made during the year from net investment income or net realized gains may differ from their ultimate characterization for federal income tax purposes. These differences reflect the differing character of certain income items and net realized gains and losses for financial statement and tax purposes, and may result in reclassification among certain capital accounts on the financial statements.
As of period end, the federal tax cost of investments and the components of distributable earnings on a tax-basis were as follows:
| Federal tax cost of investments | $ | 8,996,830,055 | |||
| Gross tax appreciation of investments | $ | 2,865,255,857 | |||
| Gross tax depreciation of investments | (125,008,645) | ||||
| Net tax appreciation (depreciation) of investments | 2,740,247,212 | ||||
| Net tax appreciation (depreciation) on derivatives and translation of assets and liabilities in foreign currencies | 187,016 | ||||
| Net tax appreciation (depreciation) | $ | 2,740,434,228 | |||
| Undistributed ordinary income | $ | 78,220,514 | |||
| Accumulated long-term gains | $ | 248,783,933 | |||
The difference between book-basis and tax-basis unrealized appreciation (depreciation) is attributable primarily to the tax deferral of losses on wash sales, the realization for tax purposes of unrealized gains (losses) on certain foreign currency exchange contracts and the timing and recognition of partnership income.
28
| Financial Highlights | ||
| For a Share Outstanding Throughout the Years Ended March 31 (except as noted) | |||||||||||||||||||||||||||||||||||||||||||||||
| Per-Share Data | Ratios and Supplemental Data | ||||||||||||||||||||||||||||||||||||||||||||||
| Income From Investment Operations: | Distributions From: | Ratio to Average Net Assets of: | |||||||||||||||||||||||||||||||||||||||||||||
| Net Asset Value, Beginning of Period | Net Investment Income (Loss)(1) | Net Realized and Unrealized Gain (Loss) | Total From Investment Operations | Net Investment Income | Net Realized Gains | Total Distributions | Net Asset Value, End of Period | Total Return(2) | Operating Expenses | Operating Expenses (before expense waiver) | Net Investment Income (Loss) | Net Investment Income (Loss) (before expense waiver) | Portfolio Turnover Rate | Net Assets, End of Period (in thousands) | |||||||||||||||||||||||||||||||||
| Investor Class | |||||||||||||||||||||||||||||||||||||||||||||||
| 2022 | $9.45 | 0.18 | 0.91 | 1.09 | (0.19) | (0.49) | (0.68) | $9.86 | 11.74% | 0.93% | 0.93% | 1.83% | 1.83% | 24% | $4,191,544 | ||||||||||||||||||||||||||||||||
| 2021 | $7.14 | 0.17 | 2.33 | 2.50 | (0.19) | — | (0.19) | $9.45 | 35.30% | 0.91% | 0.91% | 2.10% | 2.10% | 52% | $4,211,554 | ||||||||||||||||||||||||||||||||
| 2020 | $8.69 | 0.18 | (1.07) | (0.89) | (0.19) | (0.47) | (0.66) | $7.14 | (11.81)% | 0.91% | 0.91% | 2.07% | 2.07% | 85% | $3,660,808 | ||||||||||||||||||||||||||||||||
| 2019 | $8.60 | 0.18 | 0.56 | 0.74 | (0.18) | (0.47) | (0.65) | $8.69 | 9.07% | 0.91% | 0.91% | 2.13% | 2.13% | 80% | $6,081,355 | ||||||||||||||||||||||||||||||||
| 2018 | $9.13 | 0.17 | 0.37 | 0.54 | (0.17) | (0.90) | (1.07) | $8.60 | 5.61% | 0.91% | 0.91% | 1.86% | 1.86% | 75% | $6,496,269 | ||||||||||||||||||||||||||||||||
| I Class | |||||||||||||||||||||||||||||||||||||||||||||||
| 2022 | $9.47 | 0.20 | 0.90 | 1.10 | (0.21) | (0.49) | (0.70) | $9.87 | 11.83% | 0.73% | 0.73% | 2.03% | 2.03% | 24% | $4,912,267 | ||||||||||||||||||||||||||||||||
| 2021 | $7.15 | 0.20 | 2.32 | 2.52 | (0.20) | — | (0.20) | $9.47 | 35.67% | 0.71% | 0.71% | 2.30% | 2.30% | 52% | $5,167,202 | ||||||||||||||||||||||||||||||||
| 2020 | $8.70 | 0.21 | (1.08) | (0.87) | (0.21) | (0.47) | (0.68) | $7.15 | (11.62)% | 0.71% | 0.71% | 2.27% | 2.27% | 85% | $4,157,382 | ||||||||||||||||||||||||||||||||
| 2019 | $8.61 | 0.20 | 0.56 | 0.76 | (0.20) | (0.47) | (0.67) | $8.70 | 9.27% | 0.71% | 0.71% | 2.33% | 2.33% | 80% | $2,826,256 | ||||||||||||||||||||||||||||||||
| 2018 | $9.14 | 0.19 | 0.37 | 0.56 | (0.19) | (0.90) | (1.09) | $8.61 | 5.82% | 0.71% | 0.71% | 2.06% | 2.06% | 75% | $2,621,898 | ||||||||||||||||||||||||||||||||
| For a Share Outstanding Throughout the Years Ended March 31 (except as noted) | |||||||||||||||||||||||||||||||||||||||||||||||
| Per-Share Data | Ratios and Supplemental Data | ||||||||||||||||||||||||||||||||||||||||||||||
| Income From Investment Operations: | Distributions From: | Ratio to Average Net Assets of: | |||||||||||||||||||||||||||||||||||||||||||||
| Net Asset Value, Beginning of Period | Net Investment Income (Loss)(1) | Net Realized and Unrealized Gain (Loss) | Total From Investment Operations | Net Investment Income | Net Realized Gains | Total Distributions | Net Asset Value, End of Period | Total Return(2) | Operating Expenses | Operating Expenses (before expense waiver) | Net Investment Income (Loss) | Net Investment Income (Loss) (before expense waiver) | Portfolio Turnover Rate | Net Assets, End of Period (in thousands) | |||||||||||||||||||||||||||||||||
| Y Class | |||||||||||||||||||||||||||||||||||||||||||||||
| 2022 | $9.48 | 0.22 | 0.90 | 1.12 | (0.22) | (0.49) | (0.71) | $9.89 | 12.10% | 0.58% | 0.58% | 2.18% | 2.18% | 24% | $276,001 | ||||||||||||||||||||||||||||||||
| 2021 | $7.16 | 0.21 | 2.33 | 2.54 | (0.22) | — | (0.22) | $9.48 | 35.83% | 0.56% | 0.56% | 2.45% | 2.45% | 52% | $281,614 | ||||||||||||||||||||||||||||||||
| 2020 | $8.71 | 0.22 | (1.08) | (0.86) | (0.22) | (0.47) | (0.69) | $7.16 | (11.48)% | 0.56% | 0.56% | 2.42% | 2.42% | 85% | $222,844 | ||||||||||||||||||||||||||||||||
| 2019 | $8.62 | 0.22 | 0.55 | 0.77 | (0.21) | (0.47) | (0.68) | $8.71 | 9.43% | 0.56% | 0.56% | 2.48% | 2.48% | 80% | $230,773 | ||||||||||||||||||||||||||||||||
2018(3) | $9.16 | 0.20 | 0.36 | 0.56 | (0.20) | (0.90) | (1.10) | $8.62 | 5.83% | 0.56%(4) | 0.56%(4) | 2.25%(4) | 2.25%(4) | 75%(5) | $216,014 | ||||||||||||||||||||||||||||||||
| A Class | |||||||||||||||||||||||||||||||||||||||||||||||
| 2022 | $9.45 | 0.16 | 0.90 | 1.06 | (0.16) | (0.49) | (0.65) | $9.86 | 11.46% | 1.18% | 1.18% | 1.58% | 1.58% | 24% | $858,437 | ||||||||||||||||||||||||||||||||
| 2021 | $7.14 | 0.16 | 2.31 | 2.47 | (0.16) | — | (0.16) | $9.45 | 34.95% | 1.16% | 1.16% | 1.85% | 1.85% | 52% | $869,137 | ||||||||||||||||||||||||||||||||
| 2020 | $8.69 | 0.16 | (1.07) | (0.91) | (0.17) | (0.47) | (0.64) | $7.14 | (12.02)% | 1.16% | 1.16% | 1.82% | 1.82% | 85% | $698,473 | ||||||||||||||||||||||||||||||||
| 2019 | $8.60 | 0.16 | 0.56 | 0.72 | (0.16) | (0.47) | (0.63) | $8.69 | 8.80% | 1.16% | 1.16% | 1.88% | 1.88% | 80% | $850,117 | ||||||||||||||||||||||||||||||||
| 2018 | $9.13 | 0.14 | 0.38 | 0.52 | (0.15) | (0.90) | (1.05) | $8.60 | 5.36% | 1.16% | 1.16% | 1.61% | 1.61% | 75% | $931,567 | ||||||||||||||||||||||||||||||||
| C Class | |||||||||||||||||||||||||||||||||||||||||||||||
| 2022 | $9.45 | 0.08 | 0.91 | 0.99 | (0.09) | (0.49) | (0.58) | $9.86 | 10.63% | 1.93% | 1.93% | 0.83% | 0.83% | 24% | $272,764 | ||||||||||||||||||||||||||||||||
| 2021 | $7.14 | 0.09 | 2.32 | 2.41 | (0.10) | — | (0.10) | $9.45 | 33.90% | 1.91% | 1.91% | 1.10% | 1.10% | 52% | $303,205 | ||||||||||||||||||||||||||||||||
| 2020 | $8.69 | 0.10 | (1.08) | (0.98) | (0.10) | (0.47) | (0.57) | $7.14 | (12.66)% | 1.91% | 1.91% | 1.07% | 1.07% | 85% | $394,129 | ||||||||||||||||||||||||||||||||
| 2019 | $8.60 | 0.10 | 0.55 | 0.65 | (0.09) | (0.47) | (0.56) | $8.69 | 8.00% | 1.91% | 1.91% | 1.13% | 1.13% | 80% | $538,726 | ||||||||||||||||||||||||||||||||
| 2018 | $9.13 | 0.08 | 0.37 | 0.45 | (0.08) | (0.90) | (0.98) | $8.60 | 4.58% | 1.91% | 1.91% | 0.86% | 0.86% | 75% | $627,651 | ||||||||||||||||||||||||||||||||
| For a Share Outstanding Throughout the Years Ended March 31 (except as noted) | |||||||||||||||||||||||||||||||||||||||||||||||
| Per-Share Data | Ratios and Supplemental Data | ||||||||||||||||||||||||||||||||||||||||||||||
| Income From Investment Operations: | Distributions From: | Ratio to Average Net Assets of: | |||||||||||||||||||||||||||||||||||||||||||||
| Net Asset Value, Beginning of Period | Net Investment Income (Loss)(1) | Net Realized and Unrealized Gain (Loss) | Total From Investment Operations | Net Investment Income | Net Realized Gains | Total Distributions | Net Asset Value, End of Period | Total Return(2) | Operating Expenses | Operating Expenses (before expense waiver) | Net Investment Income (Loss) | Net Investment Income (Loss) (before expense waiver) | Portfolio Turnover Rate | Net Assets, End of Period (in thousands) | |||||||||||||||||||||||||||||||||
| R Class | |||||||||||||||||||||||||||||||||||||||||||||||
| 2022 | $9.41 | 0.13 | 0.91 | 1.04 | (0.14) | (0.49) | (0.63) | $9.82 | 11.23% | 1.43% | 1.43% | 1.33% | 1.33% | 24% | $47,839 | ||||||||||||||||||||||||||||||||
| 2021 | $7.11 | 0.14 | 2.30 | 2.44 | (0.14) | — | (0.14) | $9.41 | 34.60% | 1.41% | 1.41% | 1.60% | 1.60% | 52% | $57,032 | ||||||||||||||||||||||||||||||||
| 2020 | $8.66 | 0.14 | (1.07) | (0.93) | (0.15) | (0.47) | (0.62) | $7.11 | (12.28)% | 1.41% | 1.41% | 1.57% | 1.57% | 85% | $56,388 | ||||||||||||||||||||||||||||||||
| 2019 | $8.57 | 0.14 | 0.56 | 0.70 | (0.14) | (0.47) | (0.61) | $8.66 | 8.57% | 1.41% | 1.41% | 1.63% | 1.63% | 80% | $88,499 | ||||||||||||||||||||||||||||||||
| 2018 | $9.10 | 0.13 | 0.36 | 0.49 | (0.12) | (0.90) | (1.02) | $8.57 | 5.11% | 1.41% | 1.41% | 1.36% | 1.36% | 75% | $93,154 | ||||||||||||||||||||||||||||||||
| R5 Class | |||||||||||||||||||||||||||||||||||||||||||||||
| 2022 | $9.46 | 0.20 | 0.90 | 1.10 | (0.21) | (0.49) | (0.70) | $9.86 | 11.84% | 0.73% | 0.73% | 2.03% | 2.03% | 24% | $66,131 | ||||||||||||||||||||||||||||||||
| 2021 | $7.14 | 0.19 | 2.33 | 2.52 | (0.20) | — | (0.20) | $9.46 | 35.72% | 0.71% | 0.71% | 2.30% | 2.30% | 52% | $62,610 | ||||||||||||||||||||||||||||||||
| 2020 | $8.70 | 0.21 | (1.09) | (0.88) | (0.21) | (0.47) | (0.68) | $7.14 | (11.74)% | 0.71% | 0.71% | 2.27% | 2.27% | 85% | $912 | ||||||||||||||||||||||||||||||||
| 2019 | $8.60 | 0.20 | 0.57 | 0.77 | (0.20) | (0.47) | (0.67) | $8.70 | 9.41% | 0.71% | 0.71% | 2.33% | 2.33% | 80% | $892 | ||||||||||||||||||||||||||||||||
2018(3) | $9.15 | 0.21 | 0.33 | 0.54 | (0.19) | (0.90) | (1.09) | $8.60 | 5.57% | 0.71%(4) | 0.71%(4) | 2.51%(4) | 2.51%(4) | 75%(5) | $653 | ||||||||||||||||||||||||||||||||
| R6 Class | |||||||||||||||||||||||||||||||||||||||||||||||
| 2022 | $9.47 | 0.22 | 0.90 | 1.12 | (0.22) | (0.49) | (0.71) | $9.88 | 12.10% | 0.58% | 0.58% | 2.18% | 2.18% | 24% | $1,021,389 | ||||||||||||||||||||||||||||||||
| 2021 | $7.16 | 0.21 | 2.32 | 2.53 | (0.22) | — | (0.22) | $9.47 | 35.68% | 0.56% | 0.56% | 2.45% | 2.45% | 52% | $1,040,730 | ||||||||||||||||||||||||||||||||
| 2020 | $8.71 | 0.22 | (1.08) | (0.86) | (0.22) | (0.47) | (0.69) | $7.16 | (11.48)% | 0.56% | 0.56% | 2.42% | 2.42% | 85% | $820,173 | ||||||||||||||||||||||||||||||||
| 2019 | $8.62 | 0.22 | 0.55 | 0.77 | (0.21) | (0.47) | (0.68) | $8.71 | 9.43% | 0.56% | 0.56% | 2.48% | 2.48% | 80% | $796,417 | ||||||||||||||||||||||||||||||||
| 2018 | $9.15 | 0.21 | 0.36 | 0.57 | (0.20) | (0.90) | (1.10) | $8.62 | 5.97% | 0.56% | 0.56% | 2.21% | 2.21% | 75% | $691,393 | ||||||||||||||||||||||||||||||||
| For a Share Outstanding Throughout the Years Ended March 31 (except as noted) | |||||||||||||||||||||||||||||||||||||||||||||||
| Per-Share Data | Ratios and Supplemental Data | ||||||||||||||||||||||||||||||||||||||||||||||
| Income From Investment Operations: | Distributions From: | Ratio to Average Net Assets of: | |||||||||||||||||||||||||||||||||||||||||||||
| Net Asset Value, Beginning of Period | Net Investment Income (Loss)(1) | Net Realized and Unrealized Gain (Loss) | Total From Investment Operations | Net Investment Income | Net Realized Gains | Total Distributions | Net Asset Value, End of Period | Total Return(2) | Operating Expenses | Operating Expenses (before expense waiver) | Net Investment Income (Loss) | Net Investment Income (Loss) (before expense waiver) | Portfolio Turnover Rate | Net Assets, End of Period (in thousands) | |||||||||||||||||||||||||||||||||
| G Class | |||||||||||||||||||||||||||||||||||||||||||||||
| 2022 | $9.48 | 0.26 | 0.92 | 1.18 | (0.28) | (0.49) | (0.77) | $9.89 | 12.72% | 0.03% | 0.58% | 2.73% | 2.18% | 24% | $7 | ||||||||||||||||||||||||||||||||
| 2021 | $7.16 | 0.27 | 2.32 | 2.59 | (0.27) | — | (0.27) | $9.48 | 36.61% | 0.00%(6) | 0.56% | 3.01% | 2.45% | 52% | $6 | ||||||||||||||||||||||||||||||||
2020(7) | $9.06 | 0.18 | (1.43) | (1.25) | (0.18) | (0.47) | (0.65) | $7.16 | (15.32)% | 0.00%(4)(6) | 0.56%(4) | 3.02%(4) | 2.46%(4) | 85%(8) | $4 | ||||||||||||||||||||||||||||||||
| Notes to Financial Highlights | ||
(1)Computed using average shares outstanding throughout the period.
(2)Total returns are calculated based on the net asset value of the last business day and do not reflect applicable sales charges, if any. Total returns for periods less than one year are not annualized.
(3)April 10, 2017 (commencement of sale) through March 31, 2018.
(4)Annualized.
(5)Portfolio turnover is calculated at the fund level. Percentage indicated was calculated for the year ended March 31, 2018.
(6)Ratio was less than 0.005%.
(7)August 1, 2019 (commencement of sale) through March 31, 2020.
(8)Portfolio turnover is calculated at the fund level. Percentage indicated was calculated for the year ended March 31, 2020.
See Notes to Financial Statements.
| Report of Independent Registered Public Accounting Firm | ||
To the Shareholders and the Board of Directors of American Century Capital Portfolios, Inc.:
Opinion on the Financial Statements and Financial Highlights
We have audited the accompanying statement of assets and liabilities, including the schedule of investments, of Equity Income Fund (the “Fund”), one of the funds constituting the American Century Capital Portfolios, Inc., as of March 31, 2022, the related statement of operations for the year then ended, the statements of changes in net assets for each of the two years in the period then ended, the financial highlights for each of the five years in the period then ended, and the related notes. In our opinion, the financial statements and financial highlights present fairly, in all material respects, the financial position of Equity Income Fund of the American Century Capital Portfolios, Inc. as of March 31, 2022, and the results of its operations for the year then ended, the changes in its net assets for each of the two years in the period then ended, and the financial highlights for each of the five years in the period then ended, in conformity with accounting principles generally accepted in the United States of America.
Basis for Opinion
These financial statements and financial highlights are the responsibility of the Fund's management. Our responsibility is to express an opinion on the Fund’s financial statements and financial highlights based on our audits. We are a public accounting firm registered with the Public Company Accounting Oversight Board (United States) (PCAOB) and are required to be independent with respect to the Fund in accordance with the U.S. federal securities laws and the applicable rules and regulations of the Securities and Exchange Commission and the PCAOB.
We conducted our audits in accordance with the standards of the PCAOB. Those standards require that we plan and perform the audit to obtain reasonable assurance about whether the financial statements and financial highlights are free of material misstatement, whether due to error or fraud. The Fund is not required to have, nor were we engaged to perform, an audit of its internal control over financial reporting. As part of our audits, we are required to obtain an understanding of internal control over financial reporting but not for the purpose of expressing an opinion on the effectiveness of the Fund’s internal control over financial reporting. Accordingly, we express no such opinion.
Our audits included performing procedures to assess the risks of material misstatement of the financial statements and financial highlights, whether due to error or fraud, and performing procedures that respond to those risks. Such procedures included examining, on a test basis, evidence regarding the amounts and disclosures in the financial statements and financial highlights. Our audits also included evaluating the accounting principles used and significant estimates made by management, as well as evaluating the overall presentation of the financial statements and financial highlights. Our procedures included confirmation of securities owned as of March 31, 2022, by correspondence with the custodian and brokers; when replies were not received from brokers, we performed other auditing procedures. We believe that our audits provide a reasonable basis for our opinion.
/s/ Deloitte & Touche LLP
Kansas City, Missouri
May 16, 2022
We have served as the auditor of one or more American Century investment companies since 1997.
33
| Management | ||
The Board of Directors
The individuals listed below serve as directors of the funds. Each director will continue to serve in this capacity until death, retirement, resignation or removal from office. The board has adopted a mandatory retirement age for directors who are not “interested persons,” as that term is defined in the Investment Company Act (independent directors). Independent directors shall retire on December 31 of the year in which they reach their 75th birthday.
Jonathan S. Thomas is an “interested person” because he currently serves as President and Chief Executive Officer of American Century Companies, Inc. (ACC), the parent company of American Century Investment Management, Inc. (ACIM or the advisor). The other directors (more than three-fourths of the total number) are independent. They are not employees, directors or officers of, and have no financial interest in, ACC or any of its wholly owned, direct or indirect, subsidiaries, including ACIM, American Century Investment Services, Inc. (ACIS) and American Century Services, LLC (ACS), and they do not have any other affiliations, positions or relationships that would cause them to be considered “interested persons” under the Investment Company Act. The directors serve in this capacity for seven (in the case of Jonathan S. Thomas, 16; and Stephen E. Yates, 8) registered investment companies in the American Century Investments family of funds.
The following table presents additional information about the directors. The mailing address for each director is 4500 Main Street, Kansas City, Missouri 64111.
| Name (Year of Birth) | Position(s) Held with Funds | Length of Time Served | Principal Occupation(s) During Past 5 Years | Number of American Century Portfolios Overseen by Director | Other Directorships Held During Past 5 Years | ||||||||||||
| Independent Directors | |||||||||||||||||
| Thomas W. Bunn (1953) | Director | Since 2017 | Retired | 68 | None | ||||||||||||
| Chris H. Cheesman (1962) | Director | Since 2019 | Retired. Senior Vice President & Chief Audit Executive, AllianceBernstein (1999 to 2018) | 68 | Alleghany Corporation | ||||||||||||
| Barry Fink (1955) | Director | Since 2012 (independent since 2016) | Retired | 68 | None | ||||||||||||
| Rajesh K. Gupta (1960) | Director | Since 2019 | Partner Emeritus, SeaCrest Investment Management and SeaCrest Wealth Management (2019 to Present); Chief Executive Officer and Chief Investment Officer, SeaCrest Investment Management (2006 to 2019); Chief Executive Officer and Chief Investment Officer, SeaCrest Wealth Management (2008 to 2019) | 68 | None | ||||||||||||
34
| Name (Year of Birth) | Position(s) Held with Funds | Length of Time Served | Principal Occupation(s) During Past 5 Years | Number of American Century Portfolios Overseen by Director | Other Directorships Held During Past 5 Years | ||||||||||||
| Independent Directors | |||||||||||||||||
| Lynn Jenkins (1963) | Director | Since 2019 | Consultant, LJ Strategies (2019 to present); United States Representative, U.S. House of Representatives (2009 to 2018) | 68 | MGP Ingredients, Inc. (2019 to 2021) | ||||||||||||
| Jan M. Lewis (1957) | Director and Board Chair | Since 2011 (Board Chair since 2022) | Retired | 68 | None | ||||||||||||
| Stephen E. Yates (1948) | Director | Since 2012 | Retired | 108 | None | ||||||||||||
| Interested Director | |||||||||||||||||
| Jonathan S. Thomas (1963) | Director | Since 2007 | President and Chief Executive Officer, ACC (2007 to present). Also serves as Chief Executive Officer, ACS; Director, ACC and other ACC subsidiaries | 146 | None | ||||||||||||
The Statement of Additional Information has additional information about the fund's directors and is available without charge, upon request, by calling 1-800-345-2021.
35
Officers
The following table presents certain information about the executive officers of the funds. Each officer serves as an officer for 16 (in the case of Robert J. Leach, 15) investment companies in the American Century family of funds, unless otherwise noted. No officer is compensated for his or her service as an officer of the funds. The listed officers are interested persons of the funds and are appointed or re-appointed on an annual basis. The mailing address for each officer listed below is 4500 Main Street, Kansas City, Missouri 64111.
| Name (Year of Birth) | Offices with the Funds | Principal Occupation(s) During the Past Five Years | ||||||
| Patrick Bannigan (1965) | President since 2019 | Executive Vice President and Director, ACC (2012 to present); Chief Financial Officer, Chief Accounting Officer and Treasurer, ACC (2015 to present); Also serves as President, ACS; Vice President, ACIM; Chief Financial Officer, Chief Accounting Officer and/or Director, ACIM, ACS and other ACC subsidiaries | ||||||
| R. Wes Campbell (1974) | Chief Financial Officer and Treasurer since 2018 | Vice President, ACS (2020 to present); Investment Operations and Investment Accounting, ACS (2000 to present) | ||||||
| Amy D. Shelton (1964) | Chief Compliance Officer and Vice President since 2014 | Chief Compliance Officer, American Century funds, (2014 to present); Chief Compliance Officer, ACIM (2014 to present); Chief Compliance Officer, ACIS (2009 to present). Also serves as Vice President, ACIS | ||||||
| John Pak (1968) | General Counsel and Senior Vice President since 2021 | General Counsel and Senior Vice President, ACC (2021 to present); Also serves as General Counsel and Senior Vice President, ACIM, ACS and ACIS. Chief Legal Officer of Investment and Wealth Management, The Bank of New York Mellon (2014 to 2021) | ||||||
| C. Jean Wade (1964) | Vice President since 2012 | Senior Vice President, ACS (2017 to present); Vice President, ACS (2000 to 2017) | ||||||
| Robert J. Leach (1966) | Vice President since 2006 | Vice President, ACS (2000 to present) | ||||||
| David H. Reinmiller (1963) | Vice President since 2000 | Attorney, ACC (1994 to present). Also serves as Vice President, ACIM and ACS | ||||||
| Ward D. Stauffer (1960) | Secretary since 2005 | Attorney, ACC (2003 to present) | ||||||
36
| Liquidity Risk Management Program | ||
The Fund has adopted a liquidity risk management program (the “program”). The Fund’s Board of Directors (the "Board") has designated American Century Investment Management, Inc. (“ACIM”) as the administrator of the program. Personnel of ACIM or its affiliates conduct the day-to-day operation of the program pursuant to policies and procedures administered by the Program Administrator, including members of ACIM’s Investment Oversight Committee who are members of the ACIM’s Investment Management and Global Analytics departments.
Under the program, ACIM manages the Fund’s liquidity risk, which is the risk that the Fund could not meet shareholder redemption requests without significant dilution of remaining shareholders’ interests in the Fund. This risk is managed by monitoring the degree of liquidity of the Fund’s investments, limiting the amount of the Fund’s illiquid investments, and utilizing various risk management tools and facilities available to the Fund for meeting shareholder redemptions, among other means. ACIM’s process of determining the degree of liquidity of certain Fund’s investments is supported by a third-party liquidity assessment vendor.
The Board reviewed a report prepared by ACIM regarding the operation and effectiveness of the program for the period January 1, 2021 through December 31, 2021. No significant liquidity events impacting the Fund were noted in the report. In addition, ACIM provided its assessment that the program had been effective in managing the Fund’s liquidity risk.
37
| Additional Information | ||
Retirement Account Information
As required by law, distributions you receive from certain retirement accounts are subject to federal income tax withholding, unless you elect not to have withholding apply*. Tax will be withheld on the total amount withdrawn even though you may be receiving amounts that are not subject to withholding, such as nondeductible contributions. In such case, excess amounts of withholding could occur. You may adjust your withholding election so that a greater or lesser amount will be withheld.
If you don’t want us to withhold on this amount, you must notify us to not withhold the federal income tax. You may notify us in writing or in certain situations by telephone or through other electronic means. For systematic withdrawals, your withholding election will remain in effect until revoked or changed by filing a new election. You have the right to revoke your election at any time and change your withholding percentage for future distributions.
Remember, even if you elect not to have income tax withheld, you are liable for paying income tax on the taxable portion of your withdrawal. If you elect not to have income tax withheld or you don’t have enough income tax withheld, you may be responsible for payment of estimated tax. You may incur penalties under the estimated tax rules if your withholding and estimated tax payments are not sufficient. You can reduce or defer the income tax on a distribution by directly or indirectly rolling such distribution over to another IRA or eligible plan. You should consult your tax advisor for additional information.
State tax will be withheld if, at the time of your distribution, your address is within one of the mandatory withholding states and you have federal income tax withheld (or as otherwise required by state law). State taxes will be withheld from your distribution in accordance with the respective state rules.
*Some 403(b), 457 and qualified retirement plan distributions may be subject to 20% mandatory withholding, as they are subject to special tax and withholding rules. Your plan administrator or plan sponsor is required to provide you with a special tax notice explaining those rules at the time you request a distribution. If applicable, federal and/or state taxes may be withheld from your distribution amount.
Proxy Voting Policies
A description of the policies that the fund's investment advisor uses in exercising the voting rights associated with the securities purchased and/or held by the fund is available without charge, upon request, by calling 1-800-345-2021. It is also available on American Century Investments’ website at americancentury.com/proxy and on the Securities and Exchange Commission’s website at sec.gov. Information regarding how the investment advisor voted proxies relating to portfolio securities during the most recent 12-month period ended June 30 is available on americancentury.com/proxy. It is also available at sec.gov.
Quarterly Portfolio Disclosure
The fund files its complete schedule of portfolio holdings with the Securities and Exchange
Commission (SEC) for the first and third quarters of each fiscal year as an exhibit to its reports on
Form N-PORT. These portfolio holdings are available on the fund's website at
americancentury.com and, upon request, by calling 1-800-345-2021. The fund’s Form N-PORT
reports are available on the SEC’s website at sec.gov.
38
Other Tax Information
The following information is provided pursuant to provisions of the Internal Revenue Code.
The fund hereby designates up to the maximum amount allowable as qualified dividend income for the fiscal year ended March 31, 2022.
For corporate taxpayers, the fund hereby designates $202,940,182, or up to the maximum amount allowable, of ordinary income distributions paid during the fiscal year ended March 31, 2022 as qualified for the corporate dividends received deduction.
The fund hereby designates $122,631,497 as qualified short-term capital gain distributions for purposes of Internal Revenue Code Section 871 for the fiscal year ended March 31, 2022.
The fund hereby designates $483,213,591, or up to the maximum amount allowable, as long-term capital gain distributions (20% rate gain distributions) for the fiscal year ended March 31, 2022.
The fund utilized earnings and profits of $42,867,314 distributed to shareholders on redemption of shares as part of the dividends paid deduction (tax equalization).
39
| Notes | ||
40
| ||||||||
| Contact Us | americancentury.com | |||||||
| Automated Information Line | 1-800-345-8765 | |||||||
| Investor Services Representative | 1-800-345-2021 or 816-531-5575 | |||||||
| Investors Using Advisors | 1-800-378-9878 | |||||||
| Business, Not-For-Profit, Employer-Sponsored Retirement Plans | 1-800-345-3533 | |||||||
| Banks and Trust Companies, Broker-Dealers, Financial Professionals, Insurance Companies | 1-800-345-6488 | |||||||
| Telecommunications Relay Service for the Deaf | 711 | |||||||
| American Century Capital Portfolios, Inc. | ||||||||
Investment Advisor: American Century Investment Management, Inc. Kansas City, Missouri | ||||||||
| This report and the statements it contains are submitted for the general information of our shareholders. The report is not authorized for distribution to prospective investors unless preceded or accompanied by an effective prospectus. | ||||||||
| ©2022 American Century Proprietary Holdings, Inc. All rights reserved. CL-ANN-92268 2205 | ||||||||
| Annual Report | |||||
| March 31, 2022 | |||||
| Focused Large Cap Value Fund | |||||
| Investor Class (ALVIX) | |||||
| I Class (ALVSX) | |||||
| A Class (ALPAX) | |||||
| C Class (ALPCX) | |||||
| R Class (ALVRX) | |||||
| R5 Class (ALVGX) | |||||
| R6 Class (ALVDX) | |||||
| G Class (ACFLX) | |||||
| Table of Contents | ||
| President’s Letter | |||||
| Performance | |||||
| Portfolio Commentary | |||||
| Fund Characteristics | |||||
| Shareholder Fee Example | |||||
| Schedule of Investments | |||||
| Statement of Assets and Liabilities | |||||
| Statement of Operations | |||||
| Statement of Changes in Net Assets | |||||
| Notes to Financial Statements | |||||
| Financial Highlights | |||||
| Report of Independent Registered Public Accounting Firm | |||||
| Management | |||||
| Liquidity Risk Management Program | |||||
| Additional Information | |||||
Any opinions expressed in this report reflect those of the author as of the date of the report, and do not necessarily represent the opinions of American Century Investments® or any other person in the American Century Investments organization. Any such opinions are subject to change at any time based upon market or other conditions and American Century Investments disclaims any responsibility to update such opinions. These opinions may not be relied upon as investment advice and, because investment decisions made by American Century Investments funds are based on numerous factors, may not be relied upon as an indication of trading intent on behalf of any American Century Investments fund. Security examples are used for representational purposes only and are not intended as recommendations to purchase or sell securities. Performance information for comparative indices and securities is provided to American Century Investments by third party vendors. To the best of American Century Investments’ knowledge, such information is accurate at the time of printing.
| President’s Letter | ||
Jonathan ThomasDear Investor:
Thank you for reviewing this annual report for the period ended March 31, 2022. Annual reports help convey important information about fund returns, including market factors that affected performance. For additional investment insights, please visit americancentury.com.
Soaring Inflation, Escalating Volatility Led to Mixed Results for Stocks and Bonds
Upbeat economic and earnings data and continued Federal Reserve (Fed) support generally buoyed stock returns for most of the reporting period. Despite periodic outbreaks of COVID-19, the worst of the virus appeared over in the U.S., and pre-pandemic activities gradually resumed. Bonds delivered solid gains in the first half of the period before a Fed policy pivot triggered a drastic sentiment shift in fixed-income markets.
Early in the period, inflation began a steady upward march. Initially, the Fed was unfazed, viewing the price hikes as a temporary economic consequence of recovering from the pandemic. But by late 2021, inflation was surging toward multidecade highs, prompting the Fed to adopt a more hawkish strategy.
Policymakers announced an abrupt end to bond buying followed by a March rate hike, the first since 2018. At period-end, market indicators reflected expectations for more aggressive Fed rate hikes along with balance sheet cuts to tame inflation.
In addition to an 8.5% annual inflation rate and a hawkish Fed, Russia’s invasion of Ukraine further rattled investors in early 2022. Stocks declined sharply amid the unrest, but strong performance earlier in the fiscal year left most U.S. indices with solid 12-month gains. For bonds, declines in the second half of the reporting period overwhelmed earlier gains, and most U.S. fixed-income indices retreated for the 12 months overall.
Staying Focused in Uncertain Times
We expect market volatility to linger amid elevated inflation and tighter Fed policy. In addition, Russia’s invasion of Ukraine has led to a devastating humanitarian crisis and further complicated a tense geopolitical backdrop. We will continue to monitor the evolving situation and its implications for our clients and our investment exposure.
We appreciate your confidence in us during these extraordinary times. Our firm has a long history of helping clients weather unpredictable and volatile markets, and we’re confident we will continue to meet prevailing challenges.
Sincerely,
Jonathan Thomas
President and Chief Executive Officer
American Century Investments
2
| Performance | ||
| Total Returns as of March 31, 2022 | ||||||||||||||||||||
| Average Annual Returns | ||||||||||||||||||||
| Ticker Symbol | 1 year | 5 years | 10 years | Since Inception | Inception Date | |||||||||||||||
| Investor Class | ALVIX | 11.82% | 9.13% | 10.73% | — | 7/30/99 | ||||||||||||||
| Russell 1000 Value Index | — | 11.67% | 10.28% | 11.69% | — | — | ||||||||||||||
| S&P 500 Index | — | 15.65% | 15.98% | 14.63% | — | — | ||||||||||||||
| I Class | ALVSX | 12.03% | 9.34% | 10.94% | — | 8/10/01 | ||||||||||||||
| A Class | ALPAX | — | 10/26/00 | |||||||||||||||||
| No sales charge | 11.44% | 8.84% | 10.44% | — | ||||||||||||||||
| With sales charge | 5.03% | 7.57% | 9.79% | — | ||||||||||||||||
| C Class | ALPCX | 10.69% | 8.05% | 9.63% | — | 11/7/01 | ||||||||||||||
| R Class | ALVRX | 11.24% | 8.58% | 10.16% | — | 8/29/03 | ||||||||||||||
| R5 Class | ALVGX | 12.01% | — | — | 9.43% | 4/10/17 | ||||||||||||||
| R6 Class | ALVDX | 12.10% | 9.49% | — | 9.62% | 7/26/13 | ||||||||||||||
| G Class | ACFLX | — | — | — | 3.38% | 3/15/22 | ||||||||||||||
Average annual returns since inception are presented when ten years of performance history is not available.
G Class returns would have been lower if a portion of the fees had not been waived.
C Class shares will automatically convert to A Class shares after being held for approximately eight years. C Class average annual returns do not reflect this conversion.
Sales charges include initial sales charges and contingent deferred sales charges (CDSCs), as applicable. A Class shares have a 5.75% maximum initial sales charge and may be subject to a maximum CDSC of 1.00%. C Class shares redeemed within 12 months of purchase are subject to a maximum CDSC of 1.00%. The SEC requires that mutual funds provide performance information net of maximum sales charges in all cases where charges could be applied.
Data presented reflect past performance. Past performance is no guarantee of future results. Current performance may be higher or lower than the performance shown. Total returns for periods less than one year are not annualized. Investment return and principal value will fluctuate, and redemption value may be more or less than original cost. Data assumes reinvestment of dividends and capital gains, and none of the charts reflect the deduction of taxes that a shareholder would pay on fund distributions or the redemption of fund shares. To obtain performance data current to the most recent month end, please call 1-800-345-2021 or visit americancentury.com. For additional information about the fund, please consult the prospectus.
3
| Growth of $10,000 Over 10 Years | ||
| $10,000 investment made March 31, 2012 | ||
Performance for other share classes will vary due to differences in fee structure.
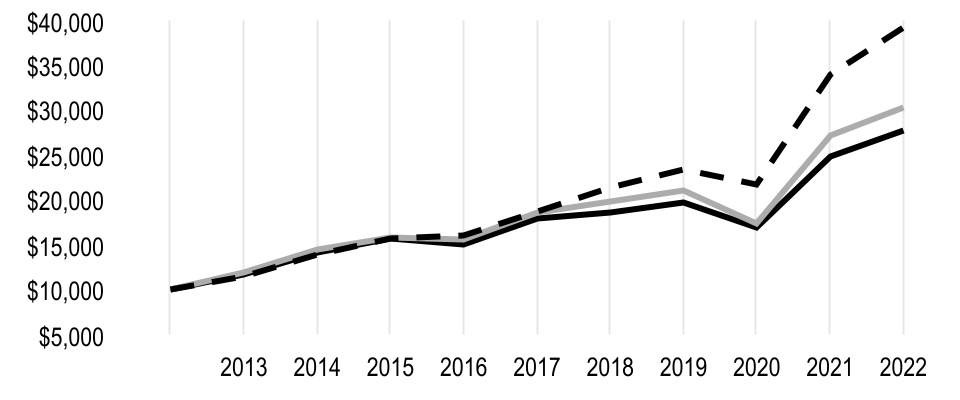
| Value on March 31, 2022 | |||||
| Investor Class — $27,718 | |||||
| Russell 1000 Value Index — $30,235 | |||||
S&P 500 Index — $39,197 | |||||
| Total Annual Fund Operating Expenses | |||||||||||||||||||||||
| Investor Class | I Class | A Class | C Class | R Class | R5 Class | R6 Class | G Class | ||||||||||||||||
| 0.83% | 0.63% | 1.08% | 1.83% | 1.33% | 0.63% | 0.48% | 0.48% | ||||||||||||||||
The total annual fund operating expenses shown is as stated in the fund’s prospectus current as of the date of this report. The prospectus may vary from the expense ratio shown elsewhere in this report because it is based on a different time period, includes acquired fund fees and expenses, and, if applicable, does not include fee waivers or expense reimbursements.
Data presented reflect past performance. Past performance is no guarantee of future results. Current performance may be higher or lower than the performance shown. Total returns for periods less than one year are not annualized. Investment return and principal value will fluctuate, and redemption value may be more or less than original cost. Data assumes reinvestment of dividends and capital gains, and none of the charts reflect the deduction of taxes that a shareholder would pay on fund distributions or the redemption of fund shares. To obtain performance data current to the most recent month end, please call 1-800-345-2021 or visit americancentury.com. For additional information about the fund, please consult the prospectus.
4
| Portfolio Commentary | ||
Portfolio Managers: Brian Woglom, Adam Krenn, Kevin Toney, Phil Davidson, Michael Liss and Philip Sundell
Performance Summary
Focused Large Cap Value returned 11.82%* for the fiscal year ended March 31, 2022, compared with the 11.67% return of its benchmark, the Russell 1000 Value Index.
After advancing for most of the fiscal year, broad U.S. equity markets encountered sharp volatility late in the period due to inflation concerns, rising interest rates and mounting geopolitical uncertainties. Focused Large Cap Value advanced during the fiscal year and outperformed its benchmark, the Russell 1000 Value Index. Stock selection in the information technology and industrials sectors contributed to relative performance. Selection in consumer staples and energy detracted from relative results.
Stock Selection in Information Technology and Industrials Contributed
Stock selection in the information technology sector benefited performance. Our avoidance of several benchmark names in the IT services and semiconductors and semiconductor equipment industries, along with a position in software company Oracle, contributed to returns. We exited our position in Oracle as the risk/reward profile became less attractive.
Stock selection in the industrials sector contributed to relative performance. A lack of exposure to the machinery industry and an overweight in the commercial services and supplies industry relative to the benchmark were also positive. Shares of Raytheon Technologies outperformed as the aerospace and defense conglomerate reported strong earnings across all segments.
Cerner contributed. Shares of this health care information technology stock climbed sharply in the fourth quarter of 2021 following an all-cash acquisition offer from Oracle. We have long thought Cerner was a high-quality asset and would make an attractive takeover for many of the large technology companies trying to further their penetration into the health care space. We exited our position on outperformance.
Stock Selection in Consumer Staples and Energy Detracted
Stock selection in the consumer staples sector weighed on relative performance. An overweight in the personal products industry also limited returns. Our position in Unilever detracted as shares of the consumer goods company were pressured by higher commodity prices and rising input costs.
Security selection in the energy sector negatively impacted performance. Most energy stocks turned in strong performance as oil and gas prices rose. Therefore, our underweight position in Exxon Mobil and lack of exposure to several of the benchmark’s energy names weighed on results.
Siemens detracted. Shares of this industrial conglomerate underperformed, due in part to supply chain disruptions and persistent inflationary cost pressures that we believe are transitory. According to our analysis, Siemens continues to offer strong fundamentals and an attractive risk/reward profile.
*All fund returns referenced in this commentary are for Investor Class shares. Performance for other share classes will vary due to differences in fee structure; when Investor Class performance exceeds that of the fund’s benchmark, other share classes may not. See page 3 for returns for all share classes.
5
Portfolio Positioning
The portfolio seeks to invest in companies where we believe the valuation does not reflect the quality and normal earnings power of the company. Our process is based on individual security selection, but broad themes have emerged.
The portfolio is overweight in the health care sector. We believe long-term demographic trends support demand for companies in the health care sector. Furthermore, through our bottom-up process, we have found companies that we think are higher-quality with attractive risk/reward profiles.
The portfolio remains overweight also in the consumer staples sector. We’re finding opportunities among companies that make the products consumers depend on every day, regardless of economic conditions or their personal financial situations. Businesses in this sector make and sell food, beverages and household products. Because consumers deem these products necessities, the companies that make them are less sensitive to economic cycles. Historically, many consumer staples companies have traded at a premium. However, our analysis has led us to select companies in the sector that we believe are trading at a discount to the overall market.
We ended the reporting period with limited exposure to the consumer discretionary and real estate sectors. It has been difficult for us to find consumer discretionary companies that we believe to be higher-quality and have sustainable business models. Within real estate, we believe many equities are overvalued. Furthermore, COVID-19 has elevated the risks in commercial real estate, and rising interest rates tend to decrease the value of properties and increase borrowing costs.
6
| Fund Characteristics | ||||||||
| MARCH 31, 2022 | |||||
| Types of Investments in Portfolio | % of net assets | ||||
| Common Stocks | 97.2% | ||||
| Short-Term Investments | 2.6% | ||||
| Other Assets and Liabilities | 0.2% | ||||
| Top Five Industries | % of net assets | ||||
| Health Care Equipment and Supplies | 10.7% | ||||
| Insurance | 9.9% | ||||
| Pharmaceuticals | 9.7% | ||||
| Oil, Gas and Consumable Fuels | 6.2% | ||||
| Banks | 5.3% | ||||
7
| Shareholder Fee Example | ||||||||||||||
Fund shareholders may incur two types of costs: (1) transaction costs, including sales charges (loads) on purchase payments and redemption/exchange fees; and (2) ongoing costs, including management fees; distribution and service (12b-1) fees; and other fund expenses. This example is intended to help you understand your ongoing costs (in dollars) of investing in your fund and to compare these costs with the ongoing cost of investing in other mutual funds.
The example is based on an investment of $1,000 made at the beginning of the period and held for the entire period from October 1, 2021 to March 31, 2022 (except as noted).
Actual Expenses
The table provides information about actual account values and actual expenses for each class. You may use the information, together with the amount you invested, to estimate the expenses that you paid over the period. First, identify the share class you own. Then simply divide your account value by $1,000 (for example, an $8,600 account value divided by $1,000 = 8.6), then multiply the result by the number under the heading “Expenses Paid During Period” to estimate the expenses you paid on your account during this period.
If you hold Investor Class shares of any American Century Investments fund, or I Class shares of the American Century Diversified Bond Fund, in an American Century Investments account (i.e., not through a financial intermediary or employer-sponsored retirement plan account), American Century Investments may charge you a $25.00 annual account maintenance fee if the value of those shares is less than $10,000. We will redeem shares automatically in one of your accounts to pay the $25.00 fee. In determining your total eligible investment amount, we will include your investments in all personal accounts (including American Century Investments brokerage accounts) registered under your Social Security number. Personal accounts include individual accounts, joint accounts, UGMA/UTMA accounts, personal trusts, Coverdell Education Savings Accounts and IRAs (including traditional, Roth, Rollover, SEP-, SARSEP- and SIMPLE-IRAs), and certain other retirement accounts. If you have only business, business retirement, employer-sponsored or American Century Investments brokerage accounts, you are currently not subject to this fee. If you are subject to the account maintenance fee, your account value could be reduced by the fee amount.
Hypothetical Example for Comparison Purposes
The table also provides information about hypothetical account values and hypothetical expenses based on the actual expense ratio of each class of your fund and an assumed rate of return of 5% per year before expenses, which is not the actual return of a fund’s share class. The hypothetical account values and expenses may not be used to estimate the actual ending account balance or expenses you paid for the period. You may use this information to compare the ongoing costs of investing in your fund and other funds. To do so, compare this 5% hypothetical example with the 5% hypothetical examples that appear in the shareholder reports of the other funds.
Please note that the expenses shown in the table are meant to highlight your ongoing costs only and do not reflect any transactional costs, such as sales charges (loads) or redemption/exchange fees. Therefore, the table is useful in comparing ongoing costs only, and will not help you determine the relative total costs of owning different funds. In addition, if these transactional costs were included, your costs would have been higher.
8
| Beginning Account Value 10/1/21 | Ending Account Value 3/31/22 | Expenses Paid During Period(1) 10/1/21 - 3/31/22 | Annualized Expense Ratio(1) | |||||||||||
| Actual | ||||||||||||||
| Investor Class | $1,000 | $1,079.00 | $4.30 | 0.83% | ||||||||||
| I Class | $1,000 | $1,080.00 | $3.27 | 0.63% | ||||||||||
| A Class | $1,000 | $1,076.60 | $5.59 | 1.08% | ||||||||||
| C Class | $1,000 | $1,073.50 | $9.46 | 1.83% | ||||||||||
| R Class | $1,000 | $1,076.10 | $6.88 | 1.33% | ||||||||||
| R5 Class | $1,000 | $1,078.90 | $3.27 | 0.63% | ||||||||||
| R6 Class | $1,000 | $1,079.80 | $2.49 | 0.48% | ||||||||||
| G Class | $1,000 | $1,033.80 | $0.00(2) | 0.00%(3) | ||||||||||
| Hypothetical | ||||||||||||||
| Investor Class | $1,000 | $1,020.79 | $4.18 | 0.83% | ||||||||||
| I Class | $1,000 | $1,021.79 | $3.18 | 0.63% | ||||||||||
| A Class | $1,000 | $1,019.55 | $5.44 | 1.08% | ||||||||||
| C Class | $1,000 | $1,015.81 | $9.20 | 1.83% | ||||||||||
| R Class | $1,000 | $1,018.30 | $6.69 | 1.33% | ||||||||||
| R5 Class | $1,000 | $1,021.79 | $3.18 | 0.63% | ||||||||||
| R6 Class | $1,000 | $1,022.54 | $2.42 | 0.48% | ||||||||||
| G Class | $1,000 | $1,024.93 | $0.00 | 0.00%(3) | ||||||||||
(1)Expenses are equal to the class's annualized expense ratio listed in the table above, multiplied by the average account value over the period, multiplied by 182, the number of days in the most recent fiscal half-year, divided by 365, to reflect the one-half year period. Annualized expense ratio reflects actual expenses, including any applicable fee waivers or expense reimbursements and excluding any acquired fund fees and expenses.
(2)Expenses are equal to the class's annualized expense ratio listed in the table above, multiplied by the average account value over the period, multiplied by 17, the number of days in the period from March 15, 2022 (commencement of sale) through March 31, 2022, divided by 365, to reflect the period. Had the class been available for the full period, the expenses paid during the period would have been higher.
(3)Other expenses, which include directors' fees and expenses, did not exceed 0.005%.
9
| Schedule of Investments | ||||||||||||||
MARCH 31, 2022
| Shares | Value | |||||||
| COMMON STOCKS — 97.2% | ||||||||
| Aerospace and Defense — 2.5% | ||||||||
| Raytheon Technologies Corp. | 917,625 | $ | 90,909,109 | |||||
| Airlines — 1.7% | ||||||||
Southwest Airlines Co.(1) | 1,314,732 | 60,214,726 | ||||||
| Banks — 5.3% | ||||||||
| JPMorgan Chase & Co. | 902,129 | 122,978,225 | ||||||
| Truist Financial Corp. | 1,230,304 | 69,758,237 | ||||||
| 192,736,462 | ||||||||
| Beverages — 1.2% | ||||||||
| PepsiCo, Inc. | 253,398 | 42,413,757 | ||||||
| Capital Markets — 3.7% | ||||||||
| Bank of New York Mellon Corp. | 1,834,731 | 91,057,699 | ||||||
| BlackRock, Inc. | 53,574 | 40,939,644 | ||||||
| 131,997,343 | ||||||||
| Communications Equipment — 4.9% | ||||||||
| Cisco Systems, Inc. | 1,996,769 | 111,339,840 | ||||||
F5, Inc.(1) | 317,792 | 66,402,638 | ||||||
| 177,742,478 | ||||||||
| Containers and Packaging — 1.6% | ||||||||
| Sonoco Products Co. | 923,485 | 57,773,222 | ||||||
| Diversified Financial Services — 2.5% | ||||||||
Berkshire Hathaway, Inc., Class B(1) | 256,406 | 90,488,241 | ||||||
| Diversified Telecommunication Services — 3.8% | ||||||||
| Verizon Communications, Inc. | 2,691,232 | 137,091,358 | ||||||
| Electric Utilities — 3.4% | ||||||||
| Duke Energy Corp. | 618,125 | 69,019,837 | ||||||
| Pinnacle West Capital Corp. | 703,549 | 54,947,177 | ||||||
| 123,967,014 | ||||||||
| Electrical Equipment — 2.0% | ||||||||
| Emerson Electric Co. | 735,723 | 72,137,640 | ||||||
| Equity Real Estate Investment Trusts (REITs) — 1.5% | ||||||||
| American Tower Corp. | 216,239 | 54,323,562 | ||||||
| Food and Staples Retailing — 1.7% | ||||||||
| Walmart, Inc. | 408,186 | 60,787,059 | ||||||
| Food Products — 4.1% | ||||||||
| Conagra Brands, Inc. | 2,505,562 | 84,111,716 | ||||||
| Mondelez International, Inc., Class A | 1,035,832 | 65,029,533 | ||||||
| 149,141,249 | ||||||||
| Gas Utilities — 2.9% | ||||||||
| Atmos Energy Corp. | 885,394 | 105,795,729 | ||||||
| Health Care Equipment and Supplies — 10.7% | ||||||||
| Becton Dickinson and Co. | 294,348 | 78,296,568 | ||||||
| Medtronic PLC | 1,677,148 | 186,079,570 | ||||||
| Zimmer Biomet Holdings, Inc. | 963,112 | 123,182,025 | ||||||
| 387,558,163 | ||||||||
| Health Care Providers and Services — 4.4% | ||||||||
Henry Schein, Inc.(1) | 672,250 | 58,613,478 | ||||||
| Humana, Inc. | 97,390 | 42,381,206 | ||||||
10
| Shares/Principal Amount | Value | |||||||
| UnitedHealth Group, Inc. | 116,870 | $ | 59,600,194 | |||||
| 160,594,878 | ||||||||
| Hotels, Restaurants and Leisure — 1.4% | ||||||||
| Sodexo SA | 620,341 | 50,480,806 | ||||||
| Household Products — 3.3% | ||||||||
| Colgate-Palmolive Co. | 559,689 | 42,441,217 | ||||||
| Kimberly-Clark Corp. | 623,874 | 76,836,322 | ||||||
| 119,277,539 | ||||||||
| Industrial Conglomerates — 1.8% | ||||||||
| Siemens AG | 481,889 | 66,725,846 | ||||||
| Insurance — 9.9% | ||||||||
| Aflac, Inc. | 683,852 | 44,033,230 | ||||||
| Allstate Corp. | 881,904 | 122,152,523 | ||||||
| Chubb Ltd. | 186,400 | 39,870,960 | ||||||
| Marsh & McLennan Cos., Inc. | 340,944 | 58,103,677 | ||||||
| Reinsurance Group of America, Inc. | 846,604 | 92,669,274 | ||||||
| 356,829,664 | ||||||||
| Oil, Gas and Consumable Fuels — 6.2% | ||||||||
| Chevron Corp. | 209,849 | 34,169,713 | ||||||
| Exxon Mobil Corp. | 963,930 | 79,610,979 | ||||||
| TotalEnergies SE, ADR | 2,149,038 | 108,612,380 | ||||||
| 222,393,072 | ||||||||
| Personal Products — 4.1% | ||||||||
| Unilever PLC, ADR | 3,248,194 | 148,020,201 | ||||||
| Pharmaceuticals — 9.7% | ||||||||
| Johnson & Johnson | 1,088,214 | 192,864,167 | ||||||
| Merck & Co., Inc. | 994,533 | 81,601,433 | ||||||
| Roche Holding AG | 190,673 | 75,442,003 | ||||||
| 349,907,603 | ||||||||
| Semiconductors and Semiconductor Equipment — 1.1% | ||||||||
| Texas Instruments, Inc. | 218,663 | 40,120,287 | ||||||
| Software — 1.8% | ||||||||
| Open Text Corp. | 1,506,694 | 63,883,826 | ||||||
TOTAL COMMON STOCKS (Cost $2,970,409,135) | 3,513,310,834 | |||||||
| SHORT-TERM INVESTMENTS — 2.6% | ||||||||
| Discount Notes — 0.8% | ||||||||
Federal Home Loan Bank Discount Notes, 0.10%, 4/1/22(2) | $ | 30,000,000 | 30,000,000 | |||||
| Money Market Funds — 0.4% | ||||||||
| State Street Institutional U.S. Government Money Market Fund, Premier Class | 15,651,905 | 15,651,905 | ||||||
| Repurchase Agreements — 1.4% | ||||||||
| BMO Capital Markets Corp., (collateralized by various U.S. Treasury obligations, 3.125% - 3.625%, 2/15/43 - 8/15/43, valued at $4,472,926), in a joint trading account at 0.26%, dated 3/31/22, due 4/1/22 (Delivery value $4,384,425) | 4,384,394 | |||||||
| Fixed Income Clearing Corp., (collateralized by various U.S. Treasury obligations, 2.375%, 2/15/42, valued at $44,721,960), at 0.25%, dated 3/31/22, due 4/1/22 (Delivery value $43,845,304) | 43,845,000 | |||||||
| 48,229,394 | ||||||||
TOTAL SHORT-TERM INVESTMENTS (Cost $93,881,299) | 93,881,299 | |||||||
TOTAL INVESTMENT SECURITIES — 99.8% (Cost $3,064,290,434) | 3,607,192,133 | |||||||
| OTHER ASSETS AND LIABILITIES — 0.2% | 7,143,050 | |||||||
| TOTAL NET ASSETS — 100.0% | $ | 3,614,335,183 | ||||||
11
| FORWARD FOREIGN CURRENCY EXCHANGE CONTRACTS | ||||||||||||||||||||
| Currency Purchased | Currency Sold | Counterparty | Settlement Date | Unrealized Appreciation (Depreciation) | ||||||||||||||||
| CHF | 729,361 | USD | 786,761 | Morgan Stanley | 6/30/22 | $ | 5,562 | |||||||||||||
| CHF | 1,764,237 | USD | 1,918,508 | Morgan Stanley | 6/30/22 | (1,976) | ||||||||||||||
| USD | 16,451,193 | CHF | 15,282,747 | Morgan Stanley | 6/30/22 | (150,822) | ||||||||||||||
| USD | 51,176,439 | CHF | 47,623,208 | Morgan Stanley | 6/30/22 | (557,795) | ||||||||||||||
| USD | 45,914,999 | EUR | 41,533,430 | JPMorgan Chase Bank N.A. | 6/30/22 | (190,173) | ||||||||||||||
| USD | 147,141,557 | EUR | 133,392,764 | JPMorgan Chase Bank N.A. | 6/30/22 | (934,256) | ||||||||||||||
| USD | 29,125,917 | GBP | 21,994,274 | Bank of America N.A. | 6/30/22 | 241,180 | ||||||||||||||
| USD | 94,200,987 | GBP | 71,988,008 | Bank of America N.A. | 6/30/22 | (339,743) | ||||||||||||||
| USD | 4,607,238 | GBP | 3,509,412 | Bank of America N.A. | 6/30/22 | (1,618) | ||||||||||||||
| $ | (1,929,641) | |||||||||||||||||||
| NOTES TO SCHEDULE OF INVESTMENTS | ||||||||
| ADR | - | American Depositary Receipt | ||||||
| CHF | - | Swiss Franc | ||||||
| EUR | - | Euro | ||||||
| GBP | - | British Pound | ||||||
| USD | - | United States Dollar | ||||||
(1)Non-income producing.
(2)The rate indicated is the yield to maturity at purchase.
See Notes to Financial Statements.
12
| Statement of Assets and Liabilities | ||||||||||||||
| MARCH 31, 2022 | |||||
| Assets | |||||
| Investment securities, at value (cost of $3,064,290,434) | $ | 3,607,192,133 | |||
| Cash | 667,176 | ||||
| Receivable for investments sold | 21,914,819 | ||||
| Receivable for capital shares sold | 117,321 | ||||
| Unrealized appreciation on forward foreign currency exchange contracts | 246,742 | ||||
| Dividends and interest receivable | 7,853,459 | ||||
| 3,637,991,650 | |||||
| Liabilities | |||||
| Payable for investments purchased | 11,007,981 | ||||
| Payable for capital shares redeemed | 9,926,259 | ||||
| Unrealized depreciation on forward foreign currency exchange contracts | 2,176,383 | ||||
| Accrued management fees | 535,786 | ||||
| Distribution and service fees payable | 10,058 | ||||
| 23,656,467 | |||||
| Net Assets | $ | 3,614,335,183 | |||
| Net Assets Consist of: | |||||
| Capital (par value and paid-in surplus) | $ | 3,096,086,315 | |||
| Distributable earnings | 518,248,868 | ||||
| $ | 3,614,335,183 | ||||
| Net Assets | Shares Outstanding | Net Asset Value Per Share | |||||||||
| Investor Class, $0.01 Par Value | $613,872,871 | 59,327,779 | $10.35 | ||||||||
| I Class, $0.01 Par Value | $38,603,907 | 3,726,830 | $10.36 | ||||||||
| A Class, $0.01 Par Value | $33,333,641 | 3,222,907 | $10.34* | ||||||||
| C Class, $0.01 Par Value | $974,118 | 94,117 | $10.35 | ||||||||
| R Class, $0.01 Par Value | $5,285,879 | 510,266 | $10.36 | ||||||||
| R5 Class, $0.01 Par Value | $7,831 | 756 | $10.36 | ||||||||
| R6 Class, $0.01 Par Value | $171,043,900 | 16,519,672 | $10.35 | ||||||||
| G Class, $0.01 Par Value | $2,751,213,036 | 265,478,039 | $10.36 | ||||||||
*Maximum offering price $10.97 (net asset value divided by 0.9425).
See Notes to Financial Statements.
13
| Statement of Operations | ||||||||||||||
| YEAR ENDED MARCH 31, 2022 | |||||
| Investment Income (Loss) | |||||
| Income: | |||||
| Dividends (net of foreign taxes withheld of $602,171) | $ | 23,321,430 | |||
| Interest | 7,131 | ||||
| 23,328,561 | |||||
| Expenses: | |||||
| Management fees | 7,054,409 | ||||
| Distribution and service fees: | |||||
| A Class | 86,275 | ||||
| C Class | 11,735 | ||||
| R Class | 23,219 | ||||
| Directors' fees and expenses | 22,452 | ||||
| Other expenses | 21,684 | ||||
| 7,219,774 | |||||
| Fees waived - G Class | (144,942) | ||||
| 7,074,832 | |||||
| Net investment income (loss) | 16,253,729 | ||||
| Realized and Unrealized Gain (Loss) | |||||
| Net realized gain (loss) on: | |||||
| Investment transactions | 103,371,746 | ||||
| Forward foreign currency exchange contract transactions | 5,841,682 | ||||
| Foreign currency translation transactions | 5,528 | ||||
| 109,218,956 | |||||
| Change in net unrealized appreciation (depreciation) on: | |||||
| Investments | (27,549,659) | ||||
| Forward foreign currency exchange contracts | (3,516,654) | ||||
| Translation of assets and liabilities in foreign currencies | 4,259 | ||||
| (31,062,054) | |||||
| Net realized and unrealized gain (loss) | 78,156,902 | ||||
| Net Increase (Decrease) in Net Assets Resulting from Operations | $ | 94,410,631 | |||
See Notes to Financial Statements.
14
| Statement of Changes in Net Assets | ||||||||||||||
| YEARS ENDED MARCH 31, 2022 AND MARCH 31, 2021 | ||||||||
| Increase (Decrease) in Net Assets | March 31, 2022 | March 31, 2021 | ||||||
| Operations | ||||||||
| Net investment income (loss) | $ | 16,253,729 | $ | 15,051,268 | ||||
| Net realized gain (loss) | 109,218,956 | 95,942,910 | ||||||
| Change in net unrealized appreciation (depreciation) | (31,062,054) | 178,303,179 | ||||||
| Net increase (decrease) in net assets resulting from operations | 94,410,631 | 289,297,357 | ||||||
| Distributions to Shareholders | ||||||||
| From earnings: | ||||||||
| Investor Class | (134,586,683) | (13,444,946) | ||||||
| I Class | (9,868,498) | (907,504) | ||||||
| A Class | (7,614,654) | (654,706) | ||||||
| C Class | (243,135) | (28,683) | ||||||
| R Class | (1,076,171) | (65,478) | ||||||
| R5 Class | (1,724) | (157) | ||||||
| R6 Class | (39,666,740) | (4,204,577) | ||||||
| G Class | (138) | — | ||||||
| Decrease in net assets from distributions | (193,057,743) | (19,306,051) | ||||||
| Capital Share Transactions | ||||||||
| Net increase (decrease) in net assets from capital share transactions (Note 5) | 2,789,145,881 | 26,038,913 | ||||||
| Net increase (decrease) in net assets | 2,690,498,769 | 296,030,219 | ||||||
| Net Assets | ||||||||
| Beginning of period | 923,836,414 | 627,806,195 | ||||||
| End of period | $ | 3,614,335,183 | $ | 923,836,414 | ||||
See Notes to Financial Statements.
15
| Notes to Financial Statements | ||
MARCH 31, 2022
1. Organization
American Century Capital Portfolios, Inc. (the corporation) is registered under the Investment Company Act of 1940, as amended (the 1940 Act), as an open-end management investment company and is organized as a Maryland corporation. Focused Large Cap Value Fund (the fund) is one fund in a series issued by the corporation. The fund’s investment objective is to seek long-term capital growth. Income is a secondary objective.
The fund offers the Investor Class, I Class, A Class, C Class, R Class, R5 Class, R6 Class and G Class. The A Class may incur an initial sales charge. The A Class and C Class may be subject to a contingent deferred sales charge. Sale of the G Class commenced on March 15, 2022.
2. Significant Accounting Policies
The following is a summary of significant accounting policies consistently followed by the fund in preparation of its financial statements. The fund is an investment company and follows accounting and reporting guidance in accordance with accounting principles generally accepted in the United States of America. This may require management to make certain estimates and assumptions at the date of the financial statements. Actual results could differ from these estimates. Management evaluated the impact of events or transactions occurring through the date the financial statements were issued that would merit recognition or disclosure.
Investment Valuations — The fund determines the fair value of its investments and computes its net asset value (NAV) per share at the close of regular trading (usually 4 p.m. Eastern time) on the New York Stock Exchange (NYSE) on each day the NYSE is open. The Board of Directors has adopted valuation policies and procedures to guide the investment advisor in the fund’s investment valuation process and to provide methodologies for the oversight of the fund’s pricing function.
Equity securities that are listed or traded on a domestic securities exchange are valued at the last reported sales price or at the official closing price as provided by the exchange. Equity securities traded on foreign securities exchanges are generally valued at the closing price of such securities on the exchange where primarily traded or at the close of the NYSE, if that is earlier. If no last sales price is reported, or if local convention or regulation so provides, the mean of the latest bid and asked prices may be used. Securities traded over-the-counter are valued at the mean of the latest bid and asked prices, the last sales price, or the official closing price. Equity securities initially expressed in local currencies are translated into U.S. dollars at the mean of the appropriate currency exchange rate at the close of the NYSE as provided by an independent pricing service.
Fixed income securities are valued at the evaluated mean as provided by independent pricing services or at the mean of the most recent bid and asked prices as provided by investment dealers. U.S. Treasury and Government Agency securities are valued using market models that consider trade data, quotations from dealers and active market makers, relevant yield curve and spread data, creditworthiness, trade data or market information on comparable securities, and other relevant security specific information.
Open-end management investment companies are valued at the reported NAV per share. Repurchase agreements are valued at cost, which approximates fair value. Forward foreign currency exchange contracts are valued at the mean of the appropriate forward exchange rate at the close of the NYSE as provided by an independent pricing service.
If the fund determines that the market price for an investment is not readily available or the valuation methods mentioned above do not reflect an investment’s fair value, such investment is valued as determined in good faith by the Board of Directors or its delegate, in accordance with policies and procedures adopted by the Board of Directors. In its determination of fair value, the fund may review several factors including, but not limited to, market information regarding the specific investment or comparable investments and correlation with other investment types, futures indices or general market indicators. Circumstances that may cause the fund to use these procedures to value an investment include, but are not limited to: an investment has been declared in default or is distressed; trading in a security has been suspended during the trading day or a security is not actively trading on its principal exchange; prices received from a regular pricing source are deemed unreliable; or there is a foreign market holiday and no trading occurred.
16
The fund monitors for significant events occurring after the close of an investment’s primary exchange but before the fund’s NAV per share is determined. Significant events may include, but are not limited to: corporate announcements and transactions; governmental action and political unrest that could impact a specific investment or an investment sector; or armed conflicts, natural disasters and similar events that could affect investments in a specific country or region. The fund also monitors for significant fluctuations between domestic and foreign markets, as evidenced by the U.S. market or such other indicators that the Board of Directors, or its delegate, deems appropriate. The fund may apply a model-derived factor to the closing price of equity securities traded on foreign securities exchanges. The factor is based on observable market data as provided by an independent pricing service.
Security Transactions — Security transactions are accounted for as of the trade date. Net realized gains and losses are determined on the identified cost basis, which is also used for federal income tax purposes.
Investment Income — Dividend income less foreign taxes withheld, if any, is recorded as of the ex-dividend date. Distributions received on securities that represent a return of capital or long-term capital gain are recorded as a reduction of cost of investments and/or as a realized gain. The fund may estimate the components of distributions received that may be considered nontaxable distributions or long-term capital gain distributions for income tax purposes. Interest income is recorded on the accrual basis and includes accretion of discounts and amortization of premiums.
Foreign Currency Translations — All assets and liabilities initially expressed in foreign currencies are translated into U.S. dollars at prevailing exchange rates at period end. The fund may enter into spot foreign currency exchange contracts to facilitate transactions denominated in a foreign currency. Purchases and sales of investment securities, dividend and interest income, spot foreign currency exchange contracts, and expenses are translated at the rates of exchange prevailing on the respective dates of such transactions. Net realized and unrealized foreign currency exchange gains or losses related to investment securities are a component of net realized gain (loss) on investment transactions and change in net unrealized appreciation (depreciation) on investments, respectively.
Repurchase Agreements — The fund may enter into repurchase agreements with institutions that American Century Investment Management, Inc. (ACIM) (the investment advisor) has determined are creditworthy pursuant to criteria adopted by the Board of Directors. The fund requires that the collateral, represented by securities, received in a repurchase transaction be transferred to the custodian in a manner sufficient to enable the fund to obtain those securities in the event of a default under the repurchase agreement. ACIM monitors, on a daily basis, the securities transferred to ensure the value, including accrued interest, of the securities under each repurchase agreement is equal to or greater than amounts owed to the fund under each repurchase agreement.
Joint Trading Account — Pursuant to an Exemptive Order issued by the Securities and Exchange Commission, the fund, along with certain other funds in the American Century Investments family of funds, may transfer uninvested cash balances into a joint trading account. These balances are invested in one or more repurchase agreements that are collateralized by U.S. Treasury or Agency obligations.
Income Tax Status — It is the fund’s policy to distribute substantially all net investment income and net realized gains to shareholders and to otherwise qualify as a regulated investment company under provisions of the Internal Revenue Code. Accordingly, no provision has been made for income taxes. The fund files U.S. federal, state, local and non-U.S. tax returns as applicable. The fund's tax returns are subject to examination by the relevant taxing authority until expiration of the applicable statute of limitations, which is generally three years from the date of filing but can be longer in certain jurisdictions. At this time, management believes there are no uncertain tax positions which, based on their technical merit, would not be sustained upon examination and for which it is reasonably possible that the total amounts of unrecognized tax benefits will significantly change in the next twelve months.
Multiple Class — All shares of the fund represent an equal pro rata interest in the net assets of the class to which such shares belong, and have identical voting, dividend, liquidation and other rights and the same terms and conditions, except for class specific expenses and exclusive rights to vote on matters affecting only individual classes. Income, non-class specific expenses, and realized and unrealized capital gains and losses of the fund are allocated to each class of shares based on their relative net assets.
Distributions to Shareholders — Distributions from net investment income, if any, are generally declared and paid quarterly. Distributions from net realized gains, if any, are generally declared and paid annually. The fund may elect to treat a portion of its payment to a redeeming shareholder, which represents the pro rata share of undistributed net investment income and net realized gains, as a distribution for federal income tax purposes (tax equalization).
17
Indemnifications — Under the corporation’s organizational documents, its officers and directors are indemnified against certain liabilities arising out of the performance of their duties to the fund. In addition, in the normal course of business, the fund enters into contracts that provide general indemnifications. The maximum exposure under these arrangements is unknown as this would involve future claims that may be made against a fund. The risk of material loss from such claims is considered by management to be remote.
3. Fees and Transactions with Related Parties
Certain officers and directors of the corporation are also officers and/or directors of American Century Companies, Inc. (ACC). The corporation’s investment advisor, ACIM, the corporation's distributor, American Century Investment Services, Inc. (ACIS), and the corporation’s transfer agent, American Century Services, LLC, are wholly owned, directly or indirectly, by ACC. Various funds issued by American Century Asset Allocation Portfolios, Inc. own, in aggregate, 53% of the shares of the fund. Related parties do not invest in the fund for the purpose of exercising management or control.
Management Fees — The corporation has entered into a management agreement with ACIM, under which ACIM provides the fund with investment advisory and management services in exchange for a single, unified management fee (the fee) per class. The agreement provides that ACIM will pay all expenses of managing and operating the fund, except brokerage expenses, taxes, interest, fees and expenses of the independent directors (including legal counsel fees), extraordinary expenses, and expenses incurred in connection with the provision of shareholder services and distribution services under a plan adopted pursuant to Rule 12b-1 under the 1940 Act. The fee is computed and accrued daily based on each class's daily net assets and paid monthly in arrears. The difference in the fee among the classes is a result of their separate arrangements for non-Rule 12b-1 shareholder services. It is not the result of any difference in advisory or custodial fees or other expenses related to the management of the fund's assets, which do not vary by class. The rate of the fee is determined by applying a fee rate calculation formula. This formula takes into account the fund's assets as well as certain assets, if any, of other clients of the investment advisor outside the American Century Investments family of funds (such as subadvised funds and separate accounts) that use very similar investment teams and strategies (strategy assets). Prior to the fund's acquisition of NT Focused Large Cap Value Fund, the strategy assets of the fund also included the assets of NT Focused Large Cap Value Fund. The investment advisor agreed to waive the G Class's management fee in its entirety. The investment advisor expects this waiver to remain in effect permanently and cannot terminate it without the approval of the Board of Directors.
The management fee schedule range and the effective annual management fee for each class for the period ended March 31, 2022 are as follows:
Management Fee Schedule Range | Effective Annual Management Fee | |||||||
| Investor Class | 0.70% to 0.90% | 0.82% | ||||||
| I Class | 0.50% to 0.70% | 0.62% | ||||||
| A Class | 0.70% to 0.90% | 0.82% | ||||||
| C Class | 0.70% to 0.90% | 0.82% | ||||||
| R Class | 0.70% to 0.90% | 0.82% | ||||||
| R5 Class | 0.50% to 0.70% | 0.62% | ||||||
| R6 Class | 0.35% to 0.55% | 0.47% | ||||||
| G Class | 0.35% to 0.55% | 0.00%(1) | ||||||
(1)Effective annual management fee before waiver was 0.47%.
Distribution and Service Fees — The Board of Directors has adopted a separate Master Distribution and Individual Shareholder Services Plan for each of the A Class, C Class and R Class (collectively the plans), pursuant to Rule 12b-1 of the 1940 Act. The plans provide that the A Class will pay ACIS an annual distribution and service fee of 0.25%. The plans provide that the C Class will pay ACIS an annual distribution and service fee of 1.00%, of which 0.25% is paid for individual shareholder services and 0.75% is paid for distribution services. The plans provide that the R Class will pay ACIS an annual distribution and service fee of 0.50%. The fees are computed and accrued daily based on each class’s daily net assets and paid monthly in arrears. The fees are used to pay financial intermediaries for distribution and individual shareholder services. Fees incurred under the plans during the period ended March 31, 2022 are detailed in the Statement of Operations.
18
Directors' Fees and Expenses — The Board of Directors is responsible for overseeing the investment advisor’s management and operations of the fund. The directors receive detailed information about the fund and its investment advisor regularly throughout the year, and meet at least quarterly with management of the investment advisor to review reports about fund operations. The fund’s officers do not receive compensation from the fund.
Interfund Transactions — The fund may enter into security transactions with other American Century Investments funds and other client accounts of the investment advisor, in accordance with the 1940 Act rules and procedures adopted by the Board of Directors. The rules and procedures require, among other things, that these transactions be effected at the independent current market price of the security. During the period, the interfund sales were $21,454,036 and there were no interfund purchases. The effect of interfund transactions on the Statement of Operations was $479,294 in net realized gain (loss) on investment transactions.
4. Investment Transactions
Purchases and sales of investment securities, excluding short-term investments, for the period ended March 31, 2022 were $460,934,974 and $593,684,996, respectively.
19
5. Capital Share Transactions
Transactions in shares of the fund were as follows:
Year ended March 31, 2022(1) | Year ended March 31, 2021 | |||||||||||||
| Shares | Amount | Shares | Amount | |||||||||||
| Investor Class/Shares Authorized | 450,000,000 | 450,000,000 | ||||||||||||
| Sold | 4,811,577 | $ | 56,167,255 | 6,869,368 | $ | 71,014,401 | ||||||||
| Issued in reinvestment of distributions | 12,635,341 | 132,775,626 | 1,275,533 | 13,275,397 | ||||||||||
| Redeemed | (12,814,037) | (155,539,000) | (8,864,404) | (89,779,524) | ||||||||||
| 4,632,881 | 33,403,881 | (719,503) | (5,489,726) | |||||||||||
| I Class/Shares Authorized | 40,000,000 | 50,000,000 | ||||||||||||
| Sold | 642,235 | 7,493,119 | 2,898,219 | 29,493,139 | ||||||||||
| Issued in reinvestment of distributions | 877,335 | 9,230,917 | 80,978 | 847,978 | ||||||||||
| Redeemed | (1,371,804) | (15,358,986) | (1,836,263) | (19,395,476) | ||||||||||
| 147,766 | 1,365,050 | 1,142,934 | 10,945,641 | |||||||||||
| A Class/Shares Authorized | 30,000,000 | 40,000,000 | ||||||||||||
| Sold | 299,823 | 3,423,386 | 391,949 | 4,039,777 | ||||||||||
| Issued in reinvestment of distributions | 651,652 | 6,837,534 | 56,411 | 586,532 | ||||||||||
| Redeemed | (679,073) | (7,905,565) | (698,072) | (7,022,228) | ||||||||||
| 272,402 | 2,355,355 | (249,712) | (2,395,919) | |||||||||||
| C Class/Shares Authorized | 20,000,000 | 25,000,000 | ||||||||||||
| Sold | 13,377 | 151,603 | 32,179 | 311,687 | ||||||||||
| Issued in reinvestment of distributions | 21,307 | 223,501 | 2,559 | 26,555 | ||||||||||
| Redeemed | (55,662) | (637,122) | (202,085) | (2,101,488) | ||||||||||
| (20,978) | (262,018) | (167,347) | (1,763,246) | |||||||||||
| R Class/Shares Authorized | 20,000,000 | 30,000,000 | ||||||||||||
| Sold | 132,998 | 1,540,553 | 104,335 | 1,050,787 | ||||||||||
| Issued in reinvestment of distributions | 97,783 | 1,026,225 | 5,625 | 58,475 | ||||||||||
| Redeemed | (59,660) | (695,773) | (106,016) | (1,064,369) | ||||||||||
| 171,121 | 1,871,005 | 3,944 | 44,893 | |||||||||||
| R5 Class/Shares Authorized | 20,000,000 | 25,000,000 | ||||||||||||
| Issued in reinvestment of distributions | 164 | 1,724 | 15 | 157 | ||||||||||
| R6 Class/Shares Authorized | 150,000,000 | 150,000,000 | ||||||||||||
| Sold | 1,695,134 | 19,418,913 | 7,361,106 | 75,369,267 | ||||||||||
| Issued in reinvestment of distributions | 3,755,823 | 39,527,794 | 399,917 | 4,192,187 | ||||||||||
| Redeemed | (5,524,232) | (65,868,809) | (5,719,918) | (54,864,341) | ||||||||||
| (73,275) | (6,922,102) | 2,041,105 | 24,697,113 | |||||||||||
| G Class/Shares Authorized | 1,800,000,000 | N/A | ||||||||||||
| Sold | 4,523,509 | 46,999,503 | ||||||||||||
| Issued in connection with reorganization (Note 10) | 262,828,937 | 2,729,819,489 | ||||||||||||
| Issued in reinvestment of distributions | 13 | 138 | ||||||||||||
| Redeemed | (1,874,420) | (19,486,144) | ||||||||||||
| 265,478,039 | 2,757,332,986 | |||||||||||||
| Net increase (decrease) | 270,608,120 | $ | 2,789,145,881 | 2,051,436 | $ | 26,038,913 | ||||||||
(1)March 15, 2022 (commencement of sale) through March 31, 2022 for the G Class.
20
6. Fair Value Measurements
The fund’s investments valuation process is based on several considerations and may use multiple inputs to determine the fair value of the investments held by the fund. In conformity with accounting principles generally accepted in the United States of America, the inputs used to determine a valuation are classified into three broad levels.
•Level 1 valuation inputs consist of unadjusted quoted prices in an active market for identical investments.
•Level 2 valuation inputs consist of direct or indirect observable market data (including quoted prices for comparable investments, evaluations of subsequent market events, interest rates, prepayment speeds, credit risk, etc.). These inputs also consist of quoted prices for identical investments initially expressed in local currencies that are adjusted through translation into U.S. dollars.
•Level 3 valuation inputs consist of unobservable data (including a fund’s own assumptions).
The level classification is based on the lowest level input that is significant to the fair valuation measurement. The valuation inputs are not necessarily an indication of the risks associated with investing in these securities or other financial instruments.
The following is a summary of the level classifications as of period end. The Schedule of Investments provides additional information on the fund’s portfolio holdings.
| Level 1 | Level 2 | Level 3 | |||||||||
| Assets | |||||||||||
| Investment Securities | |||||||||||
| Common Stocks | |||||||||||
| Hotels, Restaurants and Leisure | — | $ | 50,480,806 | — | |||||||
| Industrial Conglomerates | — | 66,725,846 | — | ||||||||
| Pharmaceuticals | $ | 274,465,600 | 75,442,003 | — | |||||||
| Other Industries | 3,046,196,579 | — | — | ||||||||
| Short-Term Investments | 15,651,905 | 78,229,394 | — | ||||||||
| $ | 3,336,314,084 | $ | 270,878,049 | — | |||||||
| Other Financial Instruments | |||||||||||
| Forward Foreign Currency Exchange Contracts | — | $ | 246,742 | — | |||||||
| Liabilities | |||||||||||
| Other Financial Instruments | |||||||||||
| Forward Foreign Currency Exchange Contracts | — | $ | 2,176,383 | — | |||||||
7. Derivative Instruments
Foreign Currency Risk — The fund is subject to foreign currency exchange rate risk in the normal course of pursuing its investment objectives. The value of foreign investments held by a fund may be significantly affected by changes in foreign currency exchange rates. The dollar value of a foreign security generally decreases when the value of the dollar rises against the foreign currency in which the security is denominated and tends to increase when the value of the dollar declines against such foreign currency. A fund may enter into forward foreign currency exchange contracts to reduce a fund's exposure to foreign currency exchange rate fluctuations. The net U.S. dollar value of foreign currency underlying all contractual commitments held by a fund and the resulting unrealized appreciation or depreciation are determined daily. Realized gain or loss is recorded upon settlement of the contract. Net realized and unrealized gains or losses occurring during the holding period of forward foreign currency exchange contracts are a component of net realized gain (loss) on forward foreign currency exchange contract transactions and change in net unrealized appreciation (depreciation) on forward foreign currency exchange contracts, respectively. A fund bears the risk of an unfavorable change in the foreign currency exchange rate underlying the forward contract. Additionally, losses, up to the fair value, may arise if the counterparties do not perform under the contract terms. The fund's average U.S. dollar exposure to foreign currency risk derivative instruments held during the period was $139,597,090.
21
The value of foreign currency risk derivative instruments as of March 31, 2022, is disclosed on the Statement of Assets and Liabilities as an asset of $246,742 in unrealized appreciation on forward foreign currency exchange contracts and a liability of $2,176,383 in unrealized depreciation on forward foreign currency exchange contracts. For the year ended March 31, 2022, the effect of foreign currency risk derivative instruments on the Statement of Operations was $5,841,682 in net realized gain (loss) on forward foreign currency exchange contract transactions and $(3,516,654) in change in net unrealized appreciation (depreciation) on forward foreign currency exchange contracts.
8. Risk Factors
The value of the fund’s shares will go up and down, sometimes rapidly or unpredictably, based on the performance of the securities owned by the fund and other factors generally affecting the securities market. Market risks, including political, regulatory, economic and social developments, can affect the value of the fund’s investments. Natural disasters, public health emergencies, war, terrorism and other unforeseeable events may lead to increased market volatility and may have adverse long-term effects on world economies and markets generally.
There are certain risks involved in investing in foreign securities. These risks include those resulting from political events (such as civil unrest, national elections and imposition of exchange controls), social and economic events (such as labor strikes and rising inflation), and natural disasters. Securities of foreign issuers may be less liquid and more volatile. Investing a significant portion of assets in one country or region may accentuate these risks.
9. Federal Tax Information
The tax character of distributions paid during the years ended March 31, 2022 and March 31, 2021 were as follows:
| 2022 | 2021 | |||||||
| Distributions Paid From | ||||||||
| Ordinary income | $ | 85,283,842 | $ | 14,593,775 | ||||
| Long-term capital gains | $ | 107,773,901 | $ | 4,712,276 | ||||
The book-basis character of distributions made during the year from net investment income or net realized gains may differ from their ultimate characterization for federal income tax purposes. These differences reflect the differing character of certain income items and net realized gains and losses for financial statement and tax purposes, and may result in reclassification among certain capital accounts on the financial statements.
As of period end, the federal tax cost of investments and the components of distributable earnings on a tax-basis were as follows:
| Federal tax cost of investments | $ | 3,099,443,139 | |||
| Gross tax appreciation of investments | $ | 566,823,563 | |||
| Gross tax depreciation of investments | (59,074,569) | ||||
| Net tax appreciation (depreciation) of investments | 507,748,994 | ||||
| Net tax appreciation (depreciation) on derivatives and translation of assets and liabilities in foreign currencies | (18,198) | ||||
| Net tax appreciation (depreciation) | $ | 507,730,796 | |||
| Undistributed ordinary income | $ | 1,247,658 | |||
| Accumulated long-term gains | $ | 9,270,414 | |||
The difference between book-basis and tax-basis unrealized appreciation (depreciation) is attributable primarily to the tax deferral of losses on wash sales.
22
10. Reorganization
On December 2, 2021, the Board of Directors approved an agreement and plan of reorganization (the reorganization), whereby the net assets of NT Focused Large Cap Value Fund, one fund in a series issued by the corporation, were transferred to Focused Large Cap Value Fund in exchange for shares of Focused Large Cap Value Fund. The purpose of the transaction was to combine two funds with substantially similar investment objectives and strategies. The financial statements and performance history of Focused Large Cap Value Fund survived after the reorganization. The reorganization was effective at the close of the NYSE on March 25, 2022.
The reorganization was accomplished by a tax-free exchange of shares. On March 25, 2022, NT Focused Large Cap Value Fund exchanged its shares for shares of Focused Large Cap Value Fund as follows:
| Original Fund/Class | Shares Exchanged | New Fund/Class | Shares Received | ||||||||
| NT Focused Large Cap Value Fund – G Class | 241,023,182 | Focused Large Cap Value Fund – G Class | 262,828,937 | ||||||||
The net assets of NT Focused Large Cap Value Fund and Focused Large Cap Value Fund immediately before the reorganization were $2,729,819,489 and $865,609,421, respectively. NT Focused Large Cap Value Fund's unrealized appreciation of $417,690,402 was combined with that of Focused Large Cap Value Fund. Immediately after the reorganization, the combined net assets were $3,595,428,910.
Assuming the reorganization had been completed on April 1, 2021, the beginning of the annual reporting period, the pro forma results of operations for the period ended March 31, 2022 are as follows:
| Net investment income (loss) | $ | 86,447,923 | |||
| Net realized and unrealized gain (loss) | 356,071,110 | ||||
| Net increase (decrease) in net assets resulting from operations | $ | 442,519,033 | |||
Because the combined investment portfolios have been managed as a single integrated portfolio since the reorganization was completed, it is not practicable to separate the amounts of revenue and earnings of NT Focused Large Cap Value Fund that have been included in the fund’s Statement of Operations since March 25, 2022.
23
| Financial Highlights | ||
| For a Share Outstanding Throughout the Years Ended March 31 (except as noted) | |||||||||||||||||||||||||||||||||||||||||||||||
| Per-Share Data | Ratios and Supplemental Data | ||||||||||||||||||||||||||||||||||||||||||||||
| Income From Investment Operations: | Distributions From: | Ratio to Average Net Assets of: | |||||||||||||||||||||||||||||||||||||||||||||
| Net Asset Value, Beginning of Period | Net Investment Income (Loss)(1) | Net Realized and Unrealized Gain (Loss) | Total From Investment Operations | Net Investment Income | Net Realized Gains | Total Distributions | Net Asset Value, End of Period | Total Return(2) | Operating Expenses | Operating Expenses (before expense waiver) | Net Investment Income (Loss) | Net Investment Income (Loss) (before expense waiver) | Portfolio Turnover Rate | Net Assets, End of Period (in thousands) | |||||||||||||||||||||||||||||||||
| Investor Class | |||||||||||||||||||||||||||||||||||||||||||||||
| 2022 | $11.80 | 0.19 | 1.11 | 1.30 | (0.20) | (2.55) | (2.75) | $10.35 | 11.82% | 0.83% | 0.83% | 1.59% | 1.59% | 42% | $613,873 | ||||||||||||||||||||||||||||||||
| 2021 | $8.24 | 0.19 | 3.62 | 3.81 | (0.19) | (0.06) | (0.25) | $11.80 | 46.64% | 0.83% | 0.83% | 1.90% | 1.90% | 112% | $645,489 | ||||||||||||||||||||||||||||||||
| 2020 | $9.85 | 0.18 | (1.52) | (1.34) | (0.18) | (0.09) | (0.27) | $8.24 | (14.21)% | 0.84% | 0.84% | 1.72% | 1.72% | 72% | $456,382 | ||||||||||||||||||||||||||||||||
| 2019 | $9.85 | 0.18 | 0.40 | 0.58 | (0.18) | (0.40) | (0.58) | $9.85 | 6.20% | 0.83% | 0.83% | 1.83% | 1.83% | 62% | $673,365 | ||||||||||||||||||||||||||||||||
| 2018 | $10.05 | 0.21 | 0.17 | 0.38 | (0.20) | (0.38) | (0.58) | $9.85 | 3.65% | 0.83% | 0.83% | 2.09% | 2.09% | 53% | $621,874 | ||||||||||||||||||||||||||||||||
| I Class | |||||||||||||||||||||||||||||||||||||||||||||||
| 2022 | $11.81 | 0.22 | 1.10 | 1.32 | (0.22) | (2.55) | (2.77) | $10.36 | 12.03% | 0.63% | 0.63% | 1.79% | 1.79% | 42% | $38,604 | ||||||||||||||||||||||||||||||||
| 2021 | $8.24 | 0.22 | 3.62 | 3.84 | (0.21) | (0.06) | (0.27) | $11.81 | 47.06% | 0.63% | 0.63% | 2.10% | 2.10% | 112% | $42,273 | ||||||||||||||||||||||||||||||||
| 2020 | $9.86 | 0.20 | (1.53) | (1.33) | (0.20) | (0.09) | (0.29) | $8.24 | (14.13)% | 0.64% | 0.64% | 1.92% | 1.92% | 72% | $20,080 | ||||||||||||||||||||||||||||||||
| 2019 | $9.86 | 0.20 | 0.40 | 0.60 | (0.20) | (0.40) | (0.60) | $9.86 | 6.41% | 0.63% | 0.63% | 2.03% | 2.03% | 62% | $18,196 | ||||||||||||||||||||||||||||||||
| 2018 | $10.06 | 0.22 | 0.18 | 0.40 | (0.22) | (0.38) | (0.60) | $9.86 | 3.85% | 0.63% | 0.63% | 2.29% | 2.29% | 53% | $20,213 | ||||||||||||||||||||||||||||||||
| For a Share Outstanding Throughout the Years Ended March 31 (except as noted) | |||||||||||||||||||||||||||||||||||||||||||||||
| Per-Share Data | Ratios and Supplemental Data | ||||||||||||||||||||||||||||||||||||||||||||||
| Income From Investment Operations: | Distributions From: | Ratio to Average Net Assets of: | |||||||||||||||||||||||||||||||||||||||||||||
| Net Asset Value, Beginning of Period | Net Investment Income (Loss)(1) | Net Realized and Unrealized Gain (Loss) | Total From Investment Operations | Net Investment Income | Net Realized Gains | Total Distributions | Net Asset Value, End of Period | Total Return(2) | Operating Expenses | Operating Expenses (before expense waiver) | Net Investment Income (Loss) | Net Investment Income (Loss) (before expense waiver) | Portfolio Turnover Rate | Net Assets, End of Period (in thousands) | |||||||||||||||||||||||||||||||||
| A Class | |||||||||||||||||||||||||||||||||||||||||||||||
| 2022 | $11.80 | 0.17 | 1.09 | 1.26 | (0.17) | (2.55) | (2.72) | $10.34 | 11.44% | 1.08% | 1.08% | 1.34% | 1.34% | 42% | $33,334 | ||||||||||||||||||||||||||||||||
| 2021 | $8.23 | 0.17 | 3.62 | 3.79 | (0.16) | (0.06) | (0.22) | $11.80 | 46.44% | 1.08% | 1.08% | 1.65% | 1.65% | 112% | $34,806 | ||||||||||||||||||||||||||||||||
| 2020 | $9.85 | 0.15 | (1.53) | (1.38) | (0.15) | (0.09) | (0.24) | $8.23 | (14.52)% | 1.09% | 1.09% | 1.47% | 1.47% | 72% | $26,342 | ||||||||||||||||||||||||||||||||
| 2019 | $9.85 | 0.16 | 0.40 | 0.56 | (0.16) | (0.40) | (0.56) | $9.85 | 5.94% | 1.08% | 1.08% | 1.58% | 1.58% | 62% | $34,603 | ||||||||||||||||||||||||||||||||
| 2018 | $10.05 | 0.18 | 0.17 | 0.35 | (0.17) | (0.38) | (0.55) | $9.85 | 3.39% | 1.08% | 1.08% | 1.84% | 1.84% | 53% | $40,192 | ||||||||||||||||||||||||||||||||
| C Class | |||||||||||||||||||||||||||||||||||||||||||||||
| 2022 | $11.80 | 0.07 | 1.11 | 1.18 | (0.08) | (2.55) | (2.63) | $10.35 | 10.69% | 1.83% | 1.83% | 0.59% | 0.59% | 42% | $974 | ||||||||||||||||||||||||||||||||
| 2021 | $8.23 | 0.09 | 3.62 | 3.71 | (0.08) | (0.06) | (0.14) | $11.80 | 45.31% | 1.83% | 1.83% | 0.90% | 0.90% | 112% | $1,358 | ||||||||||||||||||||||||||||||||
| 2020 | $9.85 | 0.07 | (1.52) | (1.45) | (0.08) | (0.09) | (0.17) | $8.23 | (15.14)% | 1.84% | 1.84% | 0.72% | 0.72% | 72% | $2,324 | ||||||||||||||||||||||||||||||||
| 2019 | $9.85 | 0.08 | 0.40 | 0.48 | (0.08) | (0.40) | (0.48) | $9.85 | 5.15% | 1.83% | 1.83% | 0.83% | 0.83% | 62% | $3,363 | ||||||||||||||||||||||||||||||||
| 2018 | $10.05 | 0.11 | 0.17 | 0.28 | (0.10) | (0.38) | (0.48) | $9.85 | 2.63% | 1.83% | 1.83% | 1.09% | 1.09% | 53% | $6,050 | ||||||||||||||||||||||||||||||||
| R Class | |||||||||||||||||||||||||||||||||||||||||||||||
| 2022 | $11.81 | 0.14 | 1.10 | 1.24 | (0.14) | (2.55) | (2.69) | $10.36 | 11.24% | 1.33% | 1.33% | 1.09% | 1.09% | 42% | $5,286 | ||||||||||||||||||||||||||||||||
| 2021 | $8.24 | 0.14 | 3.62 | 3.76 | (0.13) | (0.06) | (0.19) | $11.81 | 46.00% | 1.33% | 1.33% | 1.40% | 1.40% | 112% | $4,006 | ||||||||||||||||||||||||||||||||
| 2020 | $9.86 | 0.13 | (1.53) | (1.40) | (0.13) | (0.09) | (0.22) | $8.24 | (14.71)% | 1.34% | 1.34% | 1.22% | 1.22% | 72% | $2,762 | ||||||||||||||||||||||||||||||||
| 2019 | $9.86 | 0.13 | 0.40 | 0.53 | (0.13) | (0.40) | (0.53) | $9.86 | 5.67% | 1.33% | 1.33% | 1.33% | 1.33% | 62% | $3,389 | ||||||||||||||||||||||||||||||||
| 2018 | $10.06 | 0.16 | 0.17 | 0.33 | (0.15) | (0.38) | (0.53) | $9.86 | 3.13% | 1.33% | 1.33% | 1.59% | 1.59% | 53% | $4,291 | ||||||||||||||||||||||||||||||||
| For a Share Outstanding Throughout the Years Ended March 31 (except as noted) | |||||||||||||||||||||||||||||||||||||||||||||||
| Per-Share Data | Ratios and Supplemental Data | ||||||||||||||||||||||||||||||||||||||||||||||
| Income From Investment Operations: | Distributions From: | Ratio to Average Net Assets of: | |||||||||||||||||||||||||||||||||||||||||||||
| Net Asset Value, Beginning of Period | Net Investment Income (Loss)(1) | Net Realized and Unrealized Gain (Loss) | Total From Investment Operations | Net Investment Income | Net Realized Gains | Total Distributions | Net Asset Value, End of Period | Total Return(2) | Operating Expenses | Operating Expenses (before expense waiver) | Net Investment Income (Loss) | Net Investment Income (Loss) (before expense waiver) | Portfolio Turnover Rate | Net Assets, End of Period (in thousands) | |||||||||||||||||||||||||||||||||
| R5 Class | |||||||||||||||||||||||||||||||||||||||||||||||
| 2022 | $11.81 | 0.22 | 1.10 | 1.32 | (0.22) | (2.55) | (2.77) | $10.36 | 12.01% | 0.63% | 0.63% | 1.79% | 1.79% | 42% | $8 | ||||||||||||||||||||||||||||||||
| 2021 | $8.24 | 0.21 | 3.63 | 3.84 | (0.21) | (0.06) | (0.27) | $11.81 | 47.06% | 0.63% | 0.63% | 2.10% | 2.10% | 112% | $7 | ||||||||||||||||||||||||||||||||
| 2020 | $9.86 | 0.20 | (1.53) | (1.33) | (0.20) | (0.09) | (0.29) | $8.24 | (14.13)% | 0.64% | 0.64% | 1.92% | 1.92% | 72% | $5 | ||||||||||||||||||||||||||||||||
| 2019 | $9.86 | 0.20 | 0.40 | 0.60 | (0.20) | (0.40) | (0.60) | $9.86 | 6.40% | 0.63% | 0.63% | 2.03% | 2.03% | 62% | $6 | ||||||||||||||||||||||||||||||||
2018(3) | $10.04 | 0.23 | 0.19 | 0.42 | (0.22) | (0.38) | (0.60) | $9.86 | 4.05% | 0.63%(4) | 0.63%(4) | 2.28%(4) | 2.28%(4) | 53%(5) | $5 | ||||||||||||||||||||||||||||||||
| R6 Class | |||||||||||||||||||||||||||||||||||||||||||||||
| 2022 | $11.81 | 0.24 | 1.09 | 1.33 | (0.24) | (2.55) | (2.79) | $10.35 | 12.10% | 0.48% | 0.48% | 1.94% | 1.94% | 42% | $171,044 | ||||||||||||||||||||||||||||||||
| 2021 | $8.24 | 0.23 | 3.62 | 3.85 | (0.22) | (0.06) | (0.28) | $11.81 | 47.29% | 0.48% | 0.48% | 2.25% | 2.25% | 112% | $195,898 | ||||||||||||||||||||||||||||||||
| 2020 | $9.86 | 0.21 | (1.52) | (1.31) | (0.22) | (0.09) | (0.31) | $8.24 | (14.01)% | 0.49% | 0.49% | 2.07% | 2.07% | 72% | $119,911 | ||||||||||||||||||||||||||||||||
| 2019 | $9.86 | 0.22 | 0.40 | 0.62 | (0.22) | (0.40) | (0.62) | $9.86 | 6.57% | 0.48% | 0.48% | 2.18% | 2.18% | 62% | $152,534 | ||||||||||||||||||||||||||||||||
| 2018 | $10.06 | 0.25 | 0.16 | 0.41 | (0.23) | (0.38) | (0.61) | $9.86 | 4.01% | 0.48% | 0.48% | 2.44% | 2.44% | 53% | $121,935 | ||||||||||||||||||||||||||||||||
| G Class | |||||||||||||||||||||||||||||||||||||||||||||||
2022(6) | $10.59 | 0.01 | 0.34 | 0.35 | (0.03) | (0.55) | (0.58) | $10.36 | 3.38% | 0.00%(4)(7) | 0.47%(4) | 1.68%(4) | 1.21%(4) | 42%(8) | $2,751,213 | ||||||||||||||||||||||||||||||||
| Notes to Financial Highlights | ||
(1)Computed using average shares outstanding throughout the period.
(2)Total returns are calculated based on the net asset value of the last business day and do not reflect applicable sales charges, if any. Total returns for periods less than one year are not annualized.
(3)April 10, 2017 (commencement of sale) through March 31, 2018.
(4)Annualized.
(5)Portfolio turnover is calculated at the fund level. Percentage indicated was calculated for the year ended March 31, 2018.
(6)March 15, 2022 (commencement of sale) through March 31, 2022.
(7)Ratio was less than 0.005%.
(8)Portfolio turnover is calculated at the fund level. Percentage indicated was calculated for the year ended March 31, 2022.
See Notes to Financial Statements.
| Report of Independent Registered Public Accounting Firm | ||
To the Shareholders and the Board of Directors of American Century Capital Portfolios, Inc.:
Opinion on the Financial Statements and Financial Highlights
We have audited the accompanying statement of assets and liabilities, including the schedule of investments, of Focused Large Cap Value Fund (the “Fund”), one of the funds constituting the American Century Capital Portfolios, Inc., as of March 31, 2022, the related statement of operations for the year then ended, the statements of changes in net assets for each of the two years in the period then ended, the financial highlights for each of the five years in the period then ended, and the related notes. In our opinion, the financial statements and financial highlights present fairly, in all material respects, the financial position of Focused Large Cap Value Fund of the American Century Capital Portfolios, Inc. as of March 31, 2022, and the results of its operations for the year then ended, the changes in its net assets for each of the two years in the period then ended, and the financial highlights for each of the five years in the period then ended, in conformity with accounting principles generally accepted in the United States of America.
Basis for Opinion
These financial statements and financial highlights are the responsibility of the Fund's management. Our responsibility is to express an opinion on the Fund’s financial statements and financial highlights based on our audits. We are a public accounting firm registered with the Public Company Accounting Oversight Board (United States) (PCAOB) and are required to be independent with respect to the Fund in accordance with the U.S. federal securities laws and the applicable rules and regulations of the Securities and Exchange Commission and the PCAOB.
We conducted our audits in accordance with the standards of the PCAOB. Those standards require that we plan and perform the audit to obtain reasonable assurance about whether the financial statements and financial highlights are free of material misstatement, whether due to error or fraud. The Fund is not required to have, nor were we engaged to perform, an audit of its internal control over financial reporting. As part of our audits, we are required to obtain an understanding of internal control over financial reporting but not for the purpose of expressing an opinion on the effectiveness of the Fund’s internal control over financial reporting. Accordingly, we express no such opinion.
Our audits included performing procedures to assess the risks of material misstatement of the financial statements and financial highlights, whether due to error or fraud, and performing procedures that respond to those risks. Such procedures included examining, on a test basis, evidence regarding the amounts and disclosures in the financial statements and financial highlights. Our audits also included evaluating the accounting principles used and significant estimates made by management, as well as evaluating the overall presentation of the financial statements and financial highlights. Our procedures included confirmation of securities owned as of March 31, 2022, by correspondence with the custodian and brokers; when replies were not received from brokers, we performed other auditing procedures. We believe that our audits provide a reasonable basis for our opinion.
/s/ Deloitte & Touche LLP
Kansas City, Missouri
May 16, 2022
We have served as the auditor of one or more American Century investment companies since 1997.
28
| Management | ||
The Board of Directors
The individuals listed below serve as directors of the funds. Each director will continue to serve in this capacity until death, retirement, resignation or removal from office. The board has adopted a mandatory retirement age for directors who are not “interested persons,” as that term is defined in the Investment Company Act (independent directors). Independent directors shall retire on December 31 of the year in which they reach their 75th birthday.
Jonathan S. Thomas is an “interested person” because he currently serves as President and Chief Executive Officer of American Century Companies, Inc. (ACC), the parent company of American Century Investment Management, Inc. (ACIM or the advisor). The other directors (more than three-fourths of the total number) are independent. They are not employees, directors or officers of, and have no financial interest in, ACC or any of its wholly owned, direct or indirect, subsidiaries, including ACIM, American Century Investment Services, Inc. (ACIS) and American Century Services, LLC (ACS), and they do not have any other affiliations, positions or relationships that would cause them to be considered “interested persons” under the Investment Company Act. The directors serve in this capacity for seven (in the case of Jonathan S. Thomas, 16; and Stephen E. Yates, 8) registered investment companies in the American Century Investments family of funds.
The following table presents additional information about the directors. The mailing address for each director is 4500 Main Street, Kansas City, Missouri 64111.
| Name (Year of Birth) | Position(s) Held with Funds | Length of Time Served | Principal Occupation(s) During Past 5 Years | Number of American Century Portfolios Overseen by Director | Other Directorships Held During Past 5 Years | ||||||||||||
| Independent Directors | |||||||||||||||||
| Thomas W. Bunn (1953) | Director | Since 2017 | Retired | 68 | None | ||||||||||||
| Chris H. Cheesman (1962) | Director | Since 2019 | Retired. Senior Vice President & Chief Audit Executive, AllianceBernstein (1999 to 2018) | 68 | Alleghany Corporation | ||||||||||||
| Barry Fink (1955) | Director | Since 2012 (independent since 2016) | Retired | 68 | None | ||||||||||||
| Rajesh K. Gupta (1960) | Director | Since 2019 | Partner Emeritus, SeaCrest Investment Management and SeaCrest Wealth Management (2019 to Present); Chief Executive Officer and Chief Investment Officer, SeaCrest Investment Management (2006 to 2019); Chief Executive Officer and Chief Investment Officer, SeaCrest Wealth Management (2008 to 2019) | 68 | None | ||||||||||||
29
| Name (Year of Birth) | Position(s) Held with Funds | Length of Time Served | Principal Occupation(s) During Past 5 Years | Number of American Century Portfolios Overseen by Director | Other Directorships Held During Past 5 Years | ||||||||||||
| Independent Directors | |||||||||||||||||
| Lynn Jenkins (1963) | Director | Since 2019 | Consultant, LJ Strategies (2019 to present); United States Representative, U.S. House of Representatives (2009 to 2018) | 68 | MGP Ingredients, Inc. (2019 to 2021) | ||||||||||||
| Jan M. Lewis (1957) | Director and Board Chair | Since 2011 (Board Chair since 2022) | Retired | 68 | None | ||||||||||||
| Stephen E. Yates (1948) | Director | Since 2012 | Retired | 108 | None | ||||||||||||
| Interested Director | |||||||||||||||||
| Jonathan S. Thomas (1963) | Director | Since 2007 | President and Chief Executive Officer, ACC (2007 to present). Also serves as Chief Executive Officer, ACS; Director, ACC and other ACC subsidiaries | 146 | None | ||||||||||||
The Statement of Additional Information has additional information about the fund's directors and is available without charge, upon request, by calling 1-800-345-2021.
30
Officers
The following table presents certain information about the executive officers of the funds. Each officer serves as an officer for 16 (in the case of Robert J. Leach, 15) investment companies in the American Century family of funds, unless otherwise noted. No officer is compensated for his or her service as an officer of the funds. The listed officers are interested persons of the funds and are appointed or re-appointed on an annual basis. The mailing address for each officer listed below is 4500 Main Street, Kansas City, Missouri 64111.
| Name (Year of Birth) | Offices with the Funds | Principal Occupation(s) During the Past Five Years | ||||||
| Patrick Bannigan (1965) | President since 2019 | Executive Vice President and Director, ACC (2012 to present); Chief Financial Officer, Chief Accounting Officer and Treasurer, ACC (2015 to present); Also serves as President, ACS; Vice President, ACIM; Chief Financial Officer, Chief Accounting Officer and/or Director, ACIM, ACS and other ACC subsidiaries | ||||||
| R. Wes Campbell (1974) | Chief Financial Officer and Treasurer since 2018 | Vice President, ACS (2020 to present); Investment Operations and Investment Accounting, ACS (2000 to present) | ||||||
| Amy D. Shelton (1964) | Chief Compliance Officer and Vice President since 2014 | Chief Compliance Officer, American Century funds, (2014 to present); Chief Compliance Officer, ACIM (2014 to present); Chief Compliance Officer, ACIS (2009 to present). Also serves as Vice President, ACIS | ||||||
| John Pak (1968) | General Counsel and Senior Vice President since 2021 | General Counsel and Senior Vice President, ACC (2021 to present); Also serves as General Counsel and Senior Vice President, ACIM, ACS and ACIS. Chief Legal Officer of Investment and Wealth Management, The Bank of New York Mellon (2014 to 2021) | ||||||
| C. Jean Wade (1964) | Vice President since 2012 | Senior Vice President, ACS (2017 to present); Vice President, ACS (2000 to 2017) | ||||||
| Robert J. Leach (1966) | Vice President since 2006 | Vice President, ACS (2000 to present) | ||||||
| David H. Reinmiller (1963) | Vice President since 2000 | Attorney, ACC (1994 to present). Also serves as Vice President, ACIM and ACS | ||||||
| Ward D. Stauffer (1960) | Secretary since 2005 | Attorney, ACC (2003 to present) | ||||||
31
| Liquidity Risk Management Program | ||
The Fund has adopted a liquidity risk management program (the “program”). The Fund’s Board of Directors (the "Board") has designated American Century Investment Management, Inc. (“ACIM”) as the administrator of the program. Personnel of ACIM or its affiliates conduct the day-to-day operation of the program pursuant to policies and procedures administered by the Program Administrator, including members of ACIM’s Investment Oversight Committee who are members of the ACIM’s Investment Management and Global Analytics departments.
Under the program, ACIM manages the Fund’s liquidity risk, which is the risk that the Fund could not meet shareholder redemption requests without significant dilution of remaining shareholders’ interests in the Fund. This risk is managed by monitoring the degree of liquidity of the Fund’s investments, limiting the amount of the Fund’s illiquid investments, and utilizing various risk management tools and facilities available to the Fund for meeting shareholder redemptions, among other means. ACIM’s process of determining the degree of liquidity of certain Fund’s investments is supported by a third-party liquidity assessment vendor.
The Board reviewed a report prepared by ACIM regarding the operation and effectiveness of the program for the period January 1, 2021 through December 31, 2021. No significant liquidity events impacting the Fund were noted in the report. In addition, ACIM provided its assessment that the program had been effective in managing the Fund’s liquidity risk.
32
| Additional Information | ||
Retirement Account Information
As required by law, distributions you receive from certain retirement accounts are subject to federal income tax withholding, unless you elect not to have withholding apply*. Tax will be withheld on the total amount withdrawn even though you may be receiving amounts that are not subject to withholding, such as nondeductible contributions. In such case, excess amounts of withholding could occur. You may adjust your withholding election so that a greater or lesser amount will be withheld.
If you don’t want us to withhold on this amount, you must notify us to not withhold the federal income tax. You may notify us in writing or in certain situations by telephone or through other electronic means. For systematic withdrawals, your withholding election will remain in effect until revoked or changed by filing a new election. You have the right to revoke your election at any time and change your withholding percentage for future distributions.
Remember, even if you elect not to have income tax withheld, you are liable for paying income tax on the taxable portion of your withdrawal. If you elect not to have income tax withheld or you don’t have enough income tax withheld, you may be responsible for payment of estimated tax. You may incur penalties under the estimated tax rules if your withholding and estimated tax payments are not sufficient. You can reduce or defer the income tax on a distribution by directly or indirectly rolling such distribution over to another IRA or eligible plan. You should consult your tax advisor for additional information.
State tax will be withheld if, at the time of your distribution, your address is within one of the mandatory withholding states and you have federal income tax withheld (or as otherwise required by state law). State taxes will be withheld from your distribution in accordance with the respective state rules.
*Some 403(b), 457 and qualified retirement plan distributions may be subject to 20% mandatory withholding, as they are subject to special tax and withholding rules. Your plan administrator or plan sponsor is required to provide you with a special tax notice explaining those rules at the time you request a distribution. If applicable, federal and/or state taxes may be withheld from your distribution amount.
Proxy Voting Policies
A description of the policies that the fund's investment advisor uses in exercising the voting rights associated with the securities purchased and/or held by the fund is available without charge, upon request, by calling 1-800-345-2021. It is also available on American Century Investments’ website at americancentury.com/proxy and on the Securities and Exchange Commission’s website at sec.gov. Information regarding how the investment advisor voted proxies relating to portfolio securities during the most recent 12-month period ended June 30 is available on americancentury.com/proxy. It is also available at sec.gov.
Quarterly Portfolio Disclosure
The fund files its complete schedule of portfolio holdings with the Securities and Exchange
Commission (SEC) for the first and third quarters of each fiscal year as an exhibit to its reports on
Form N-PORT. These portfolio holdings are available on the fund's website at
americancentury.com and, upon request, by calling 1-800-345-2021. The fund’s Form N-PORT
reports are available on the SEC’s website at sec.gov.
33
Other Tax Information
The following information is provided pursuant to provisions of the Internal Revenue Code.
The fund hereby designates up to the maximum amount allowable as qualified dividend income for the fiscal year ended March 31, 2022.
For corporate taxpayers, the fund hereby designates $19,956,868, or up to the maximum amount allowable, of ordinary income distributions paid during the fiscal year ended March 31, 2022 as qualified for the corporate dividends received deduction.
The fund hereby designates $71,765,171 as qualified short-term capital gain distributions for purposes of Internal Revenue Code Section 871 for the fiscal year ended March 31, 2022.
The fund hereby designates $112,834,152, or up to the maximum amount allowable, as long-term capital gain distributions (20% rate gain distributions) for the fiscal year ended March 31, 2022.
The fund utilized earnings and profits of $7,944,527 distributed to shareholders on redemption of shares as part of the dividends paid deduction (tax equalization).
34
| Notes | ||
35
| Notes | ||
36
| ||||||||
| Contact Us | americancentury.com | |||||||
| Automated Information Line | 1-800-345-8765 | |||||||
| Investor Services Representative | 1-800-345-2021 or 816-531-5575 | |||||||
| Investors Using Advisors | 1-800-378-9878 | |||||||
| Business, Not-For-Profit, Employer-Sponsored Retirement Plans | 1-800-345-3533 | |||||||
| Banks and Trust Companies, Broker-Dealers, Financial Professionals, Insurance Companies | 1-800-345-6488 | |||||||
| Telecommunications Relay Service for the Deaf | 711 | |||||||
| American Century Capital Portfolios, Inc. | ||||||||
Investment Advisor: American Century Investment Management, Inc. Kansas City, Missouri | ||||||||
| This report and the statements it contains are submitted for the general information of our shareholders. The report is not authorized for distribution to prospective investors unless preceded or accompanied by an effective prospectus. | ||||||||
| ©2022 American Century Proprietary Holdings, Inc. All rights reserved. CL-ANN-92269 2205 | ||||||||
| Annual Report | |||||
| March 31, 2022 | |||||
| Mid Cap Value Fund | |||||
| Investor Class (ACMVX) | |||||
| I Class (AVUAX) | |||||
| Y Class (AMVYX) | |||||
| A Class (ACLAX) | |||||
| C Class (ACCLX) | |||||
| R Class (AMVRX) | |||||
| R5 Class (AMVGX) | |||||
| R6 Class (AMDVX) | |||||
| G Class (ACIPX) | |||||
| Table of Contents | ||
| President’s Letter | |||||
| Performance | |||||
| Portfolio Commentary | |||||
| Fund Characteristics | |||||
| Shareholder Fee Example | |||||
| Schedule of Investments | |||||
| Statement of Assets and Liabilities | |||||
| Statement of Operations | |||||
| Statement of Changes in Net Assets | |||||
| Notes to Financial Statements | |||||
| Financial Highlights | |||||
| Report of Independent Registered Public Accounting Firm | |||||
| Management | |||||
| Liquidity Risk Management Program | |||||
| Additional Information | |||||
Any opinions expressed in this report reflect those of the author as of the date of the report, and do not necessarily represent the opinions of American Century Investments® or any other person in the American Century Investments organization. Any such opinions are subject to change at any time based upon market or other conditions and American Century Investments disclaims any responsibility to update such opinions. These opinions may not be relied upon as investment advice and, because investment decisions made by American Century Investments funds are based on numerous factors, may not be relied upon as an indication of trading intent on behalf of any American Century Investments fund. Security examples are used for representational purposes only and are not intended as recommendations to purchase or sell securities. Performance information for comparative indices and securities is provided to American Century Investments by third party vendors. To the best of American Century Investments’ knowledge, such information is accurate at the time of printing.
| President’s Letter | ||
Jonathan ThomasDear Investor:
Thank you for reviewing this annual report for the period ended March 31, 2022. Annual reports help convey important information about fund returns, including market factors that affected performance. For additional investment insights, please visit americancentury.com.
Soaring Inflation, Escalating Volatility Led to Mixed Results for Stocks and Bonds
Upbeat economic and earnings data and continued Federal Reserve (Fed) support generally buoyed stock returns for most of the reporting period. Despite periodic outbreaks of COVID-19, the worst of the virus appeared over in the U.S., and pre-pandemic activities gradually resumed. Bonds delivered solid gains in the first half of the period before a Fed policy pivot triggered a drastic sentiment shift in fixed-income markets.
Early in the period, inflation began a steady upward march. Initially, the Fed was unfazed, viewing the price hikes as a temporary economic consequence of recovering from the pandemic. But by late 2021, inflation was surging toward multidecade highs, prompting the Fed to adopt a more hawkish strategy.
Policymakers announced an abrupt end to bond buying followed by a March rate hike, the first since 2018. At period-end, market indicators reflected expectations for more aggressive Fed rate hikes along with balance sheet cuts to tame inflation.
In addition to an 8.5% annual inflation rate and a hawkish Fed, Russia’s invasion of Ukraine further rattled investors in early 2022. Stocks declined sharply amid the unrest, but strong performance earlier in the fiscal year left most U.S. indices with solid 12-month gains. For bonds, declines in the second half of the reporting period overwhelmed earlier gains, and most U.S. fixed-income indices retreated for the 12 months overall.
Staying Focused in Uncertain Times
We expect market volatility to linger amid elevated inflation and tighter Fed policy. In addition, Russia’s invasion of Ukraine has led to a devastating humanitarian crisis and further complicated a tense geopolitical backdrop. We will continue to monitor the evolving situation and its implications for our clients and our investment exposure.
We appreciate your confidence in us during these extraordinary times. Our firm has a long history of helping clients weather unpredictable and volatile markets, and we’re confident we will continue to meet prevailing challenges.
Sincerely,
Jonathan Thomas
President and Chief Executive Officer
American Century Investments
2
| Performance | ||
| Total Returns as of March 31, 2022 | ||||||||||||||||||||
| Average Annual Returns | ||||||||||||||||||||
| Ticker Symbol | 1 year | 5 years | 10 years | Since Inception | Inception Date | |||||||||||||||
| Investor Class | ACMVX | 12.48% | 9.18% | 11.97% | — | 3/31/04 | ||||||||||||||
| Russell Midcap Value Index | — | 11.45% | 9.99% | 12.01% | — | — | ||||||||||||||
| I Class | AVUAX | 12.75% | 9.40% | 12.20% | — | 8/2/04 | ||||||||||||||
| Y Class | AMVYX | 12.91% | — | — | 9.63% | 4/10/17 | ||||||||||||||
| A Class | ACLAX | 1/13/05 | ||||||||||||||||||
| No sales charge | 12.23% | 8.91% | 11.70% | — | ||||||||||||||||
| With sales charge | 5.76% | 7.63% | 11.05% | — | ||||||||||||||||
| C Class | ACCLX | 11.37% | 8.08% | 10.86% | — | 3/1/10 | ||||||||||||||
| R Class | AMVRX | 11.92% | 8.63% | 11.41% | — | 7/29/05 | ||||||||||||||
| R5 Class | AMVGX | 12.68% | — | — | 9.46% | 4/10/17 | ||||||||||||||
| R6 Class | AMDVX | 12.92% | 9.56% | — | 11.13% | 7/26/13 | ||||||||||||||
| G Class | ACIPX | — | — | — | 3.55% | 3/15/22 | ||||||||||||||
Average annual returns since inception are presented when ten years of performance history is not available.
Fund returns would have been lower if a portion of the fees had not been waived.
C Class shares will automatically convert to A Class shares after being held for approximately eight years. C Class average annual returns do not reflect this conversion.
Sales charges include initial sales charges and contingent deferred sales charges (CDSCs), as applicable. A Class shares have a 5.75% maximum initial sales charge and may be subject to a maximum CDSC of 1.00%. C Class shares redeemed within 12 months of purchase are subject to a maximum CDSC of 1.00%. The SEC requires that mutual funds provide performance information net of maximum sales charges in all cases where charges could be applied.
Data presented reflect past performance. Past performance is no guarantee of future results. Current performance may be higher or lower than the performance shown. Total returns for periods less than one year are not annualized. Investment return and principal value will fluctuate, and redemption value may be more or less than original cost. Data assumes reinvestment of dividends and capital gains, and none of the charts reflect the deduction of taxes that a shareholder would pay on fund distributions or the redemption of fund shares. To obtain performance data current to the most recent month end, please call 1-800-345-2021 or visit americancentury.com. For additional information about the fund, please consult the prospectus.
3
| Growth of $10,000 Over 10 Years | ||
| $10,000 investment made March 31, 2012 | ||
| Performance for other share classes will vary due to differences in fee structure. | ||
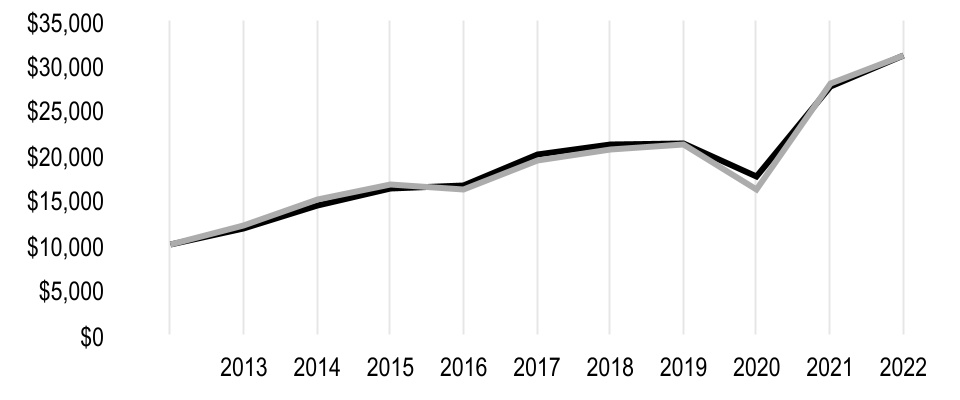
| Value on March 31, 2022 | |||||
| Investor Class — $31,001 | |||||
| Russell Midcap Value Index — $31,096 | |||||
Ending value of Investor Class would have been lower if a portion of the fees had not been waived.
| Total Annual Fund Operating Expenses | ||||||||||||||||||||||||||
| Investor Class | I Class | Y Class | A Class | C Class | R Class | R5 Class | R6 Class | G Class | ||||||||||||||||||
| 0.98% | 0.78% | 0.63% | 1.23% | 1.98% | 1.48% | 0.78% | 0.63% | 0.63% | ||||||||||||||||||
The total annual fund operating expenses shown is as stated in the fund’s prospectus current as of the date of this report. The prospectus may vary from the expense ratio shown elsewhere in this report because it is based on a different time period, includes acquired fund fees and expenses, and, if applicable, does not include fee waivers or expense reimbursements.
Data presented reflect past performance. Past performance is no guarantee of future results. Current performance may be higher or lower than the performance shown. Total returns for periods less than one year are not annualized. Investment return and principal value will fluctuate, and redemption value may be more or less than original cost. Data assumes reinvestment of dividends and capital gains, and none of the charts reflect the deduction of taxes that a shareholder would pay on fund distributions or the redemption of fund shares. To obtain performance data current to the most recent month end, please call 1-800-345-2021 or visit americancentury.com. For additional information about the fund, please consult the prospectus.
4
| Portfolio Commentary | ||
Portfolio Managers: Kevin Toney, Nathan Rawlins, Brian Woglom, Michael Liss and Phil Davidson
Effective February 2022, Nathan Rawlins was promoted to portfolio manager.
Performance Summary
Mid Cap Value returned 12.48%* for the fiscal year ended March 31, 2022, compared with the 11.45% return of its benchmark, the Russell Midcap Value Index. Fund returns reflect operating expenses, while index returns do not.
After advancing for most of the fiscal year, broad U.S. equity markets encountered sharp volatility late in the period due to inflation concerns, rising interest rates and mounting geopolitical uncertainties. Mid Cap Value advanced in the fiscal year and outperformed its benchmark, the Russell Midcap Value Index. Security selection in the consumer discretionary and industrials sectors contributed to relative performance. Our stock selection in materials and consumer staples limited returns.
Stock Selection in Consumer Discretionary and Industrials Contributed
Stock selection in the consumer discretionary sector positively impacted performance. An underweight in household durables companies also contributed. Standing out was Dollar Tree. This chain of discount variety stores outperformed as the company plans to move to price points above $1, which should drive earnings higher. Additionally, an activist investor took a sizable position in Dollar Tree and intends to add multiple board members to ensure better operational execution.
Industrials performed well. The aerospace and defense industry benefited from expanding defense budgets. Our security selection in select defense companies buoyed relative performance in the quarter. BAE Systems, a large U.K.-based defense company, was a top performer as countries took a sharper focus on security.
ConocoPhillips contributed. Shares of this oil and gas exploration and production company outperformed as commodity prices continued to rise amid a fundamentally tight market and geopolitical tensions. We exited our position as the shares appreciated and its risk/reward profile deteriorated.
Stock Selection in Materials and Consumer Staples Detracted
Stock selection in the materials sector and not owning several benchmark names in metals and mining detracted from relative performance. Holdings in the chemicals and paper and forest products industries also weighed on results. Mondi, a global packaging and paper products company, which generates approximately 20% of its operating profit in Russia, was a top detractor.
Security selection in the consumer staples sector detracted from performance. Selection in the food products industry, including not owning more commodity-focused benchmark names, also weighed on relative results.
*All fund returns referenced in this commentary are for Investor Class shares. Performance for other share classes will vary due to differences in fee structure; when Investor Class performance exceeds that of the fund’s benchmark, other share classes may not. See page 3 for returns for all share classes.
5
Zimmer Biomet Holdings detracted from performance. This medical device company has historically exhibited high returns on capital and holds leading market shares in orthopedics. The pandemic weighed on its shares as patients deferred elective procedures. As COVID-19 cases decline, we expect volumes to normalize.
Portfolio Positioning
The portfolio seeks to invest in companies where we believe the valuation does not reflect the quality and normal earnings power of the company. Our process is based on individual security selection, but broad themes have emerged.
We ended the reporting period with an overweight in health care. We believe long-term demographic trends support demand for companies in the health care sector. Through our bottom-up process, we are finding quality companies with attractive risk/reward profiles, particularly in the health care providers and services and health care equipment and supplies industries.
Our portfolio also remains overweight in the consumer staples sector. We’re finding opportunities among companies that make the products consumers depend on every day, regardless of economic conditions or their personal financial situations. Businesses in this sector make and sell food, beverages and household products. Because consumers deem these products necessities, the companies that make them are less sensitive to economic cycles. Historically, many consumer staples companies have traded at a premium, but our analysis has led us to select companies in the sector that we believe are trading at a discount to the overall market.
On the other hand, the portfolio is underweight in real estate and information technology. We continue to hold a limited number of real estate stocks due to valuations that we believe are extended. While we are underweight the information technology sector, we have found select stocks that meet our investment criteria.
6
| Fund Characteristics | ||
| MARCH 31, 2022 | |||||
| Types of Investments in Portfolio | % of net assets | ||||
| Common Stocks | 96.2% | ||||
| Exchange-Traded Funds | 2.0% | ||||
| Short-Term Investments | 2.0% | ||||
| Other Assets and Liabilities | (0.2)% | ||||
| Top Five Industries* | % of net assets | ||||
| Health Care Providers and Services | 8.1% | ||||
| Capital Markets | 7.0% | ||||
| Equity Real Estate Investment Trusts (REITs) | 6.7% | ||||
| Insurance | 6.0% | ||||
| Health Care Equipment and Supplies | 5.7% | ||||
*Exposure indicated excludes Exchange-Traded Funds. The Schedule of Investments provides additional information on the fund's portfolio holdings.
7
| Shareholder Fee Example | ||
Fund shareholders may incur two types of costs: (1) transaction costs, including sales charges (loads) on purchase payments and redemption/exchange fees; and (2) ongoing costs, including management fees; distribution and service (12b-1) fees; and other fund expenses. This example is intended to help you understand your ongoing costs (in dollars) of investing in your fund and to compare these costs with the ongoing cost of investing in other mutual funds.
The example is based on an investment of $1,000 made at the beginning of the period and held for the entire period from October 1, 2021 to March 31, 2022 (except as noted).
Actual Expenses
The table provides information about actual account values and actual expenses for each class. You may use the information, together with the amount you invested, to estimate the expenses that you paid over the period. First, identify the share class you own. Then simply divide your account value by $1,000 (for example, an $8,600 account value divided by $1,000 = 8.6), then multiply the result by the number under the heading “Expenses Paid During Period” to estimate the expenses you paid on your account during this period.
If you hold Investor Class shares of any American Century Investments fund, or I Class shares of the American Century Diversified Bond Fund, in an American Century Investments account (i.e., not through a financial intermediary or employer-sponsored retirement plan account), American Century Investments may charge you a $25.00 annual account maintenance fee if the value of those shares is less than $10,000. We will redeem shares automatically in one of your accounts to pay the $25.00 fee. In determining your total eligible investment amount, we will include your investments in all personal accounts (including American Century Investments brokerage accounts) registered under your Social Security number. Personal accounts include individual accounts, joint accounts, UGMA/UTMA accounts, personal trusts, Coverdell Education Savings Accounts and IRAs (including traditional, Roth, Rollover, SEP-, SARSEP- and SIMPLE-IRAs), and certain other retirement accounts. If you have only business, business retirement, employer-sponsored or American Century Investments brokerage accounts, you are currently not subject to this fee. If you are subject to the account maintenance fee, your account value could be reduced by the fee amount.
Hypothetical Example for Comparison Purposes
The table also provides information about hypothetical account values and hypothetical expenses based on the actual expense ratio of each class of your fund and an assumed rate of return of 5% per year before expenses, which is not the actual return of a fund’s share class. The hypothetical account values and expenses may not be used to estimate the actual ending account balance or expenses you paid for the period. You may use this information to compare the ongoing costs of investing in your fund and other funds. To do so, compare this 5% hypothetical example with the 5% hypothetical examples that appear in the shareholder reports of the other funds.
Please note that the expenses shown in the table are meant to highlight your ongoing costs only and do not reflect any transactional costs, such as sales charges (loads) or redemption/exchange fees. Therefore, the table is useful in comparing ongoing costs only, and will not help you determine the relative total costs of owning different funds. In addition, if these transactional costs were included, your costs would have been higher.
8
| Beginning Account Value 10/1/21 | Ending Account Value 3/31/22 | Expenses Paid During Period(1) 10/1/21 - 3/31/22 | Annualized Expense Ratio(1) | |||||||||||
| Actual | ||||||||||||||
| Investor Class | $1,000 | $1,098.10 | $5.07 | 0.97% | ||||||||||
| I Class | $1,000 | $1,099.20 | $4.03 | 0.77% | ||||||||||
| Y Class | $1,000 | $1,099.90 | $3.25 | 0.62% | ||||||||||
| A Class | $1,000 | $1,097.00 | $6.38 | 1.22% | ||||||||||
| C Class | $1,000 | $1,091.90 | $10.27 | 1.97% | ||||||||||
| R Class | $1,000 | $1,095.30 | $7.68 | 1.47% | ||||||||||
| R5 Class | $1,000 | $1,098.50 | $4.03 | 0.77% | ||||||||||
| R6 Class | $1,000 | $1,100.00 | $3.25 | 0.62% | ||||||||||
| G Class | $1,000 | $1,035.50 | $0.00(2) | 0.00%(3) | ||||||||||
| Hypothetical | ||||||||||||||
| Investor Class | $1,000 | $1,020.10 | $4.89 | 0.97% | ||||||||||
| I Class | $1,000 | $1,021.09 | $3.88 | 0.77% | ||||||||||
| Y Class | $1,000 | $1,021.84 | $3.13 | 0.62% | ||||||||||
| A Class | $1,000 | $1,018.85 | $6.14 | 1.22% | ||||||||||
| C Class | $1,000 | $1,015.11 | $9.90 | 1.97% | ||||||||||
| R Class | $1,000 | $1,017.60 | $7.39 | 1.47% | ||||||||||
| R5 Class | $1,000 | $1,021.09 | $3.88 | 0.77% | ||||||||||
| R6 Class | $1,000 | $1,021.84 | $3.13 | 0.62% | ||||||||||
| G Class | $1,000 | $1,024.93 | $0.00 | 0.00%(3) | ||||||||||
(1)Expenses are equal to the class's annualized expense ratio listed in the table above, multiplied by the average account value over the period, multiplied by 182, the number of days in the most recent fiscal half-year, divided by 365, to reflect the one-half year period. Annualized expense ratio reflects actual expenses, including any applicable fee waivers or expense reimbursements and excluding any acquired fund fees and expenses.
(2)Expenses are equal to the class's annualized expense ratio listed in the table above, multiplied by the average account value over the period, multiplied by 17, the number of days in the period from March 15, 2022 (commencement of sale) through March 31, 2022, divided by 365, to reflect the period. Had the class been available for the full period, the expenses paid during the period would have been higher.
(3)Other expenses, which include directors' fees and expenses, did not exceed 0.005%.
9
| Schedule of Investments | ||
MARCH 31, 2022
| Shares | Value | |||||||
| COMMON STOCKS — 96.2% | ||||||||
| Aerospace and Defense — 1.0% | ||||||||
| BAE Systems PLC | 5,399,263 | $ | 50,706,897 | |||||
| General Dynamics Corp. | 191,445 | 46,172,705 | ||||||
| 96,879,602 | ||||||||
| Airlines — 2.1% | ||||||||
Southwest Airlines Co.(1) | 4,563,026 | 208,986,591 | ||||||
| Auto Components — 2.0% | ||||||||
Aptiv PLC(1) | 80,865 | 9,680,349 | ||||||
| BorgWarner, Inc. | 3,602,897 | 140,152,694 | ||||||
| Bridgestone Corp. | 1,147,200 | 44,529,448 | ||||||
| 194,362,491 | ||||||||
| Banks — 5.1% | ||||||||
| Commerce Bancshares, Inc. | 229,213 | 16,409,359 | ||||||
| First Hawaiian, Inc. | 4,359,197 | 121,578,004 | ||||||
| M&T Bank Corp. | 198,774 | 33,692,193 | ||||||
| Prosperity Bancshares, Inc. | 1,899,230 | 131,768,577 | ||||||
| Truist Financial Corp. | 2,515,804 | 142,646,087 | ||||||
| Westamerica Bancorporation | 1,049,217 | 63,477,629 | ||||||
| 509,571,849 | ||||||||
| Building Products — 0.7% | ||||||||
| Cie de Saint-Gobain | 1,228,032 | 73,068,335 | ||||||
| Capital Markets — 7.0% | ||||||||
| Ameriprise Financial, Inc. | 197,738 | 59,392,586 | ||||||
| Bank of New York Mellon Corp. | 4,055,064 | 201,252,826 | ||||||
| Northern Trust Corp. | 2,051,655 | 238,915,225 | ||||||
| State Street Corp. | 538,352 | 46,901,226 | ||||||
| T. Rowe Price Group, Inc. | 1,005,269 | 151,986,620 | ||||||
| 698,448,483 | ||||||||
| Chemicals — 0.8% | ||||||||
Axalta Coating Systems Ltd.(1) | 3,409,330 | 83,801,331 | ||||||
| Commercial Services and Supplies — 0.5% | ||||||||
| Republic Services, Inc. | 351,825 | 46,616,813 | ||||||
| Communications Equipment — 1.4% | ||||||||
F5, Inc.(1) | 519,010 | 108,447,139 | ||||||
| Juniper Networks, Inc. | 745,298 | 27,695,274 | ||||||
| 136,142,413 | ||||||||
| Containers and Packaging — 3.3% | ||||||||
| Amcor PLC | 5,649,208 | 64,005,527 | ||||||
| Packaging Corp. of America | 726,361 | 113,392,216 | ||||||
| Sonoco Products Co. | 2,456,118 | 153,654,742 | ||||||
| 331,052,485 | ||||||||
| Electric Utilities — 4.3% | ||||||||
| Edison International | 2,650,465 | 185,797,596 | ||||||
| Evergy, Inc. | 677,805 | 46,321,194 | ||||||
| Eversource Energy | 613,277 | 54,084,899 | ||||||
| Pinnacle West Capital Corp. | 1,381,910 | 107,927,171 | ||||||
| Xcel Energy, Inc. | 482,578 | 34,827,654 | ||||||
| 428,958,514 | ||||||||
10
| Shares | Value | |||||||
| Electrical Equipment — 4.0% | ||||||||
| Emerson Electric Co. | 2,071,919 | $ | 203,151,658 | |||||
| Hubbell, Inc. | 227,858 | 41,873,464 | ||||||
| nVent Electric PLC | 4,397,333 | 152,939,242 | ||||||
| 397,964,364 | ||||||||
| Electronic Equipment, Instruments and Components — 0.4% | ||||||||
| TE Connectivity Ltd. | 330,302 | 43,262,956 | ||||||
| Energy Equipment and Services — 1.4% | ||||||||
| Baker Hughes Co. | 3,879,178 | 141,240,871 | ||||||
| Equity Real Estate Investment Trusts (REITs) — 6.7% | ||||||||
| Equinix, Inc. | 155,601 | 115,396,813 | ||||||
| Essex Property Trust, Inc. | 205,337 | 70,939,827 | ||||||
| Healthcare Trust of America, Inc., Class A | 1,687,612 | 52,889,760 | ||||||
| Healthpeak Properties, Inc. | 4,889,893 | 167,870,027 | ||||||
| MGM Growth Properties LLC, Class A | 2,596,791 | 100,495,812 | ||||||
| Regency Centers Corp. | 1,729,556 | 123,386,525 | ||||||
| Weyerhaeuser Co. | 1,050,466 | 39,812,661 | ||||||
| 670,791,425 | ||||||||
| Food and Staples Retailing — 2.2% | ||||||||
| Koninklijke Ahold Delhaize NV | 5,148,040 | 165,589,255 | ||||||
| Sysco Corp. | 670,226 | 54,723,953 | ||||||
| 220,313,208 | ||||||||
| Food Products — 4.6% | ||||||||
| Conagra Brands, Inc. | 5,799,398 | 194,685,791 | ||||||
| General Mills, Inc. | 1,031,411 | 69,847,153 | ||||||
| J.M. Smucker Co. | 510,499 | 69,126,670 | ||||||
| Kellogg Co. | 1,000,395 | 64,515,473 | ||||||
| Orkla ASA | 7,112,096 | 63,187,330 | ||||||
| 461,362,417 | ||||||||
| Gas Utilities — 1.4% | ||||||||
| Atmos Energy Corp. | 528,426 | 63,141,623 | ||||||
| Spire, Inc. | 1,106,070 | 79,371,583 | ||||||
| 142,513,206 | ||||||||
| Health Care Equipment and Supplies — 5.7% | ||||||||
| Becton Dickinson and Co. | 374,494 | 99,615,404 | ||||||
| DENTSPLY SIRONA, Inc. | 924,596 | 45,508,615 | ||||||
Envista Holdings Corp.(1) | 657,102 | 32,007,438 | ||||||
| Koninklijke Philips NV | 1,751,286 | 53,466,762 | ||||||
| Zimmer Biomet Holdings, Inc. | 2,607,432 | 333,490,553 | ||||||
Zimvie, Inc.(1) | 254,580 | 5,814,607 | ||||||
| 569,903,379 | ||||||||
| Health Care Providers and Services — 8.1% | ||||||||
| AmerisourceBergen Corp. | 486,646 | 75,289,003 | ||||||
| Cardinal Health, Inc. | 2,023,849 | 114,752,238 | ||||||
Henry Schein, Inc.(1) | 1,695,668 | 147,845,293 | ||||||
| Humana, Inc. | 69,252 | 30,136,393 | ||||||
| McKesson Corp. | 265,701 | 81,339,047 | ||||||
| Quest Diagnostics, Inc. | 1,304,462 | 178,528,670 | ||||||
| Universal Health Services, Inc., Class B | 1,265,534 | 183,439,153 | ||||||
| 811,329,797 | ||||||||
| Health Care Technology — 0.6% | ||||||||
| Cerner Corp. | 643,207 | 60,178,447 | ||||||
11
| Shares | Value | |||||||
| Hotels, Restaurants and Leisure — 1.5% | ||||||||
| Cracker Barrel Old Country Store, Inc. | 457,190 | $ | 54,282,169 | |||||
| Sodexo SA | 1,201,404 | 97,765,329 | ||||||
| 152,047,498 | ||||||||
| Household Products — 1.4% | ||||||||
| Kimberly-Clark Corp. | 1,146,312 | 141,179,786 | ||||||
| Insurance — 6.0% | ||||||||
| Aflac, Inc. | 1,964,931 | 126,521,907 | ||||||
| Allstate Corp. | 1,418,771 | 196,513,971 | ||||||
| Chubb Ltd. | 462,468 | 98,921,905 | ||||||
| Reinsurance Group of America, Inc. | 1,562,568 | 171,038,694 | ||||||
| 592,996,477 | ||||||||
| IT Services — 1.2% | ||||||||
| Amdocs Ltd. | 1,065,725 | 87,613,252 | ||||||
Euronet Worldwide, Inc.(1) | 238,860 | 31,087,629 | ||||||
| 118,700,881 | ||||||||
| Leisure Products — 0.8% | ||||||||
| Polaris, Inc. | 729,160 | 76,795,131 | ||||||
| Machinery — 2.9% | ||||||||
| Cummins, Inc. | 228,507 | 46,869,070 | ||||||
| IMI PLC | 1,374,121 | 24,464,882 | ||||||
| Oshkosh Corp. | 1,146,292 | 115,374,290 | ||||||
| PACCAR, Inc. | 813,470 | 71,642,303 | ||||||
| Stanley Black & Decker, Inc. | 227,063 | 31,741,137 | ||||||
| 290,091,682 | ||||||||
| Media — 1.5% | ||||||||
| Fox Corp., Class B | 4,074,400 | 147,819,232 | ||||||
| Multi-Utilities — 1.3% | ||||||||
| NorthWestern Corp. | 2,088,554 | 126,336,632 | ||||||
| Multiline Retail — 2.0% | ||||||||
Dollar Tree, Inc.(1) | 1,244,854 | 199,363,368 | ||||||
| Oil, Gas and Consumable Fuels — 4.4% | ||||||||
| Devon Energy Corp. | 2,918,756 | 172,586,042 | ||||||
| Enterprise Products Partners LP | 4,102,493 | 105,885,344 | ||||||
| Pioneer Natural Resources Co. | 643,451 | 160,882,054 | ||||||
| 439,353,440 | ||||||||
| Paper and Forest Products — 1.1% | ||||||||
| Mondi PLC | 5,778,503 | 112,321,545 | ||||||
| Road and Rail — 0.6% | ||||||||
Heartland Express, Inc.(2) | 4,103,800 | 57,740,466 | ||||||
| Software — 2.0% | ||||||||
| CDK Global, Inc. | 1,828,126 | 88,993,174 | ||||||
| Open Text Corp. | 2,478,824 | 105,102,137 | ||||||
| 194,095,311 | ||||||||
| Specialty Retail — 2.0% | ||||||||
| Advance Auto Parts, Inc. | 959,375 | 198,552,250 | ||||||
| Technology Hardware, Storage and Peripherals — 1.4% | ||||||||
| HP, Inc. | 3,922,424 | 142,383,991 | ||||||
| Thrifts and Mortgage Finance — 0.4% | ||||||||
| Capitol Federal Financial, Inc. | 3,703,281 | 40,291,697 | ||||||
12
| Shares/Principal Amount | Value | |||||||
| Trading Companies and Distributors — 2.4% | ||||||||
Beacon Roofing Supply, Inc.(1) | 1,219,906 | $ | 72,316,028 | |||||
| MSC Industrial Direct Co., Inc., Class A | 1,992,052 | 169,742,751 | ||||||
| 242,058,779 | ||||||||
TOTAL COMMON STOCKS (Cost $7,647,841,425) | 9,598,877,143 | |||||||
| EXCHANGE-TRADED FUNDS — 2.0% | ||||||||
iShares Russell Mid-Cap Value ETF (Cost $195,522,883) | 1,678,428 | 200,807,126 | ||||||
| SHORT-TERM INVESTMENTS — 2.0% | ||||||||
| Discount Notes — 1.7% | ||||||||
Federal Farm Credit Discount Notes, 0.10%, 4/1/22(3) | $ | 37,500,000 | 37,500,000 | |||||
Federal Home Loan Bank Discount Notes, 0.08%, 4/1/22(3) | 130,000,000 | 130,000,000 | ||||||
| 167,500,000 | ||||||||
| Money Market Funds — 0.1% | ||||||||
| State Street Institutional U.S. Government Money Market Fund, Premier Class | 9,409,715 | 9,409,715 | ||||||
| Repurchase Agreements — 0.2% | ||||||||
| BMO Capital Markets Corp., (collateralized by various U.S. Treasury obligations, 3.125% - 3.625%, 2/15/43 - 8/15/43, valued at $2,215,519), in a joint trading account at 0.26%, dated 3/31/22, due 4/1/22 (Delivery value $2,171,683) | 2,171,667 | |||||||
| Fixed Income Clearing Corp., (collateralized by various U.S. Treasury obligations, 3.125%, 8/15/44, valued at $22,151,387), at 0.25%, dated 3/31/22, due 4/1/22 (Delivery value $21,717,151) | 21,717,000 | |||||||
| 23,888,667 | ||||||||
TOTAL SHORT-TERM INVESTMENTS (Cost $200,798,382) | 200,798,382 | |||||||
TOTAL INVESTMENT SECURITIES — 100.2% (Cost $8,044,162,690) | 10,000,482,651 | |||||||
| OTHER ASSETS AND LIABILITIES — (0.2)% | (19,966,313) | |||||||
| TOTAL NET ASSETS — 100.0% | $ | 9,980,516,338 | ||||||
| FORWARD FOREIGN CURRENCY EXCHANGE CONTRACTS | ||||||||||||||||||||
| Currency Purchased | Currency Sold | Counterparty | Settlement Date | Unrealized Appreciation (Depreciation) | ||||||||||||||||
| USD | 280,191,234 | EUR | 253,453,190 | JPMorgan Chase Bank N.A. | 6/30/22 | $ | (1,160,512) | |||||||||||||
| USD | 52,776,919 | EUR | 47,845,485 | JPMorgan Chase Bank N.A. | 6/30/22 | (335,100) | ||||||||||||||
| USD | 9,018,455 | EUR | 8,059,965 | JPMorgan Chase Bank N.A. | 6/30/22 | 71,300 | ||||||||||||||
| GBP | 4,160,323 | USD | 5,477,730 | Bank of America N.A. | 6/30/22 | (14,043) | ||||||||||||||
| GBP | 3,518,654 | USD | 4,639,591 | Bank of America N.A. | 6/30/22 | (18,598) | ||||||||||||||
| GBP | 4,940,220 | USD | 6,489,590 | Bank of America N.A. | 6/30/22 | (1,677) | ||||||||||||||
| USD | 153,513,374 | GBP | 115,924,768 | Bank of America N.A. | 6/30/22 | 1,271,180 | ||||||||||||||
| USD | 29,674,471 | GBP | 22,677,109 | Bank of America N.A. | 6/30/22 | (107,023) | ||||||||||||||
| USD | 30,528,764 | JPY | 3,674,014,670 | Bank of America N.A. | 6/30/22 | 275,805 | ||||||||||||||
| USD | 867,446 | JPY | 105,274,965 | Bank of America N.A. | 6/30/22 | 580 | ||||||||||||||
| USD | 6,238,921 | JPY | 770,541,405 | Bank of America N.A. | 6/30/22 | (105,953) | ||||||||||||||
| USD | 948,685 | JPY | 115,123,320 | Bank of America N.A. | 6/30/22 | 725 | ||||||||||||||
| USD | 45,087,341 | NOK | 396,321,338 | UBS AG | 6/30/22 | 91,783 | ||||||||||||||
| USD | 9,695,146 | NOK | 84,605,907 | UBS AG | 6/30/22 | 89,582 | ||||||||||||||
| $ | 58,049 | |||||||||||||||||||
13
| NOTES TO SCHEDULE OF INVESTMENTS | ||||||||
| EUR | - | Euro | ||||||
| GBP | - | British Pound | ||||||
| JPY | - | Japanese Yen | ||||||
| NOK | - | Norwegian Krone | ||||||
| USD | - | United States Dollar | ||||||
(1)Non-income producing.
(2)Affiliated Company: the fund’s holding represents ownership of 5% or more of the voting securities of the company; therefore, the company is affiliated as defined in the Investment Company Act of 1940.
(3)The rate indicated is the yield to maturity at purchase.
See Notes to Financial Statements.
14
| Statement of Assets and Liabilities | ||
| MARCH 31, 2022 | |||||
| Assets | |||||
| Investment securities - unaffiliated, at value (cost of $7,968,163,996) | $ | 9,942,742,185 | |||
| Investment securities - affiliated, at value (cost of $75,998,694) | 57,740,466 | ||||
| Total investment securities, at value (cost of $8,044,162,690) | 10,000,482,651 | ||||
| Cash | 657,164 | ||||
| Receivable for investments sold | 126,551,598 | ||||
| Receivable for capital shares sold | 5,753,934 | ||||
| Unrealized appreciation on forward foreign currency exchange contracts | 1,800,955 | ||||
| Dividends and interest receivable | 17,699,146 | ||||
| 10,152,945,448 | |||||
| Liabilities | |||||
| Payable for investments purchased | 42,982,500 | ||||
| Payable for capital shares redeemed | 122,190,609 | ||||
| Unrealized depreciation on forward foreign currency exchange contracts | 1,742,906 | ||||
| Accrued management fees | 5,373,480 | ||||
| Distribution and service fees payable | 139,615 | ||||
| 172,429,110 | |||||
| Net Assets | $ | 9,980,516,338 | |||
| Net Assets Consist of: | |||||
| Capital (par value and paid-in surplus) | $ | 8,091,255,667 | |||
| Distributable earnings | 1,889,260,671 | ||||
| $ | 9,980,516,338 | ||||
| Net Assets | Shares Outstanding | Net Asset Value Per Share | |||||||||
| Investor Class, $0.01 Par Value | $2,325,956,696 | 134,448,055 | $17.30 | ||||||||
| I Class, $0.01 Par Value | $1,754,741,009 | 101,325,782 | $17.32 | ||||||||
| Y Class, $0.01 Par Value | $192,429,779 | 11,105,196 | $17.33 | ||||||||
| A Class, $0.01 Par Value | $303,260,497 | 17,574,972 | $17.26* | ||||||||
| C Class, $0.01 Par Value | $39,036,784 | 2,298,469 | $16.98 | ||||||||
| R Class, $0.01 Par Value | $97,310,786 | 5,660,887 | $17.19 | ||||||||
| R5 Class, $0.01 Par Value | $46,565,336 | 2,687,782 | $17.32 | ||||||||
| R6 Class, $0.01 Par Value | $3,591,179,978 | 207,402,170 | $17.32 | ||||||||
| G Class, $0.01 Par Value | $1,630,035,473 | 94,066,222 | $17.33 | ||||||||
*Maximum offering price $18.31 (net asset value divided by 0.9425).
See Notes to Financial Statements.
15
| Statement of Operations | ||
| YEAR ENDED MARCH 31, 2022 | |||||
| Investment Income (Loss) | |||||
| Income: | |||||
| Dividends (including $2,012,025 from affiliates and net of foreign taxes withheld of $2,284,491) | $ | 197,616,417 | |||
| Securities lending, net | 308,583 | ||||
| Interest | 71,100 | ||||
| 197,996,100 | |||||
| Expenses: | |||||
| Management fees | 66,164,616 | ||||
| Distribution and service fees: | |||||
| A Class | 789,062 | ||||
| C Class | 456,345 | ||||
| R Class | 498,940 | ||||
| Directors' fees and expenses | 206,632 | ||||
| Other expenses | 57,085 | ||||
| 68,172,680 | |||||
| Fees waived - G Class | (118,255) | ||||
| 68,054,425 | |||||
| Net investment income (loss) | 129,941,675 | ||||
| Realized and Unrealized Gain (Loss) | |||||
| Net realized gain (loss) on: | |||||
| Investment transactions (including $(68,889) from affiliates) (Note 4) | 1,377,303,555 | ||||
| Forward foreign currency exchange contract transactions | 41,481,148 | ||||
| Foreign currency translation transactions | (3,281) | ||||
| 1,418,781,422 | |||||
| Change in net unrealized appreciation (depreciation) on: | |||||
| Investments (including $(22,050,825) from affiliates) | (540,962,820) | ||||
| Forward foreign currency exchange contracts | (6,981,119) | ||||
| Translation of assets and liabilities in foreign currencies | (10,450) | ||||
| (547,954,389) | |||||
| Net realized and unrealized gain (loss) | 870,827,033 | ||||
| Net Increase (Decrease) in Net Assets Resulting from Operations | $ | 1,000,768,708 | |||
See Notes to Financial Statements.
16
| Statement of Changes in Net Assets | ||
| YEARS ENDED MARCH 31, 2022 AND MARCH 31, 2021 | ||||||||
| Increase (Decrease) in Net Assets | March 31, 2022 | March 31, 2021 | ||||||
| Operations | ||||||||
| Net investment income (loss) | $ | 129,941,675 | $ | 121,025,382 | ||||
| Net realized gain (loss) | 1,418,781,422 | 351,902,276 | ||||||
| Change in net unrealized appreciation (depreciation) | (547,954,389) | 2,923,709,175 | ||||||
| Net increase (decrease) in net assets resulting from operations | 1,000,768,708 | 3,396,636,833 | ||||||
| Distributions to Shareholders | ||||||||
| From earnings: | ||||||||
| Investor Class | (465,761,885) | (45,011,916) | ||||||
| I Class | (361,957,976) | (43,120,588) | ||||||
| Y Class | (40,681,870) | (3,320,505) | ||||||
| A Class | (61,620,484) | (4,854,461) | ||||||
| C Class | (8,077,770) | (601,904) | ||||||
| R Class | (19,500,726) | (1,283,728) | ||||||
| R5 Class | (10,442,981) | (1,144,444) | ||||||
| R6 Class | (724,687,721) | (68,481,912) | ||||||
| G Class | (156) | — | ||||||
| Decrease in net assets from distributions | (1,692,731,569) | (167,819,458) | ||||||
| Capital Share Transactions | ||||||||
| Net increase (decrease) in net assets from capital share transactions (Note 5) | 2,165,833,316 | (1,047,314,553) | ||||||
| Net increase (decrease) in net assets | 1,473,870,455 | 2,181,502,822 | ||||||
| Net Assets | ||||||||
| Beginning of period | 8,506,645,883 | 6,325,143,061 | ||||||
| End of period | $ | 9,980,516,338 | $ | 8,506,645,883 | ||||
See Notes to Financial Statements.
17
Notes to Financial Statements | ||
MARCH 31, 2022
1. Organization
American Century Capital Portfolios, Inc. (the corporation) is registered under the Investment Company Act of 1940, as amended (the 1940 Act), as an open-end management investment company and is organized as a Maryland corporation. Mid Cap Value Fund (the fund) is one fund in a series issued by the corporation. The fund’s investment objective is to seek long-term capital growth. Income is a secondary objective.
The fund offers the Investor Class, I Class, Y Class, A Class, C Class, R Class, R5 Class, R6 Class and G Class. The A Class may incur an initial sales charge. The A Class and C Class may be subject to a contingent deferred sales charge. Sale of the G Class commenced on March 15, 2022.
2. Significant Accounting Policies
The following is a summary of significant accounting policies consistently followed by the fund in preparation of its financial statements. The fund is an investment company and follows accounting and reporting guidance in accordance with accounting principles generally accepted in the United States of America. This may require management to make certain estimates and assumptions at the date of the financial statements. Actual results could differ from these estimates. Management evaluated the impact of events or transactions occurring through the date the financial statements were issued that would merit recognition or disclosure.
Investment Valuations — The fund determines the fair value of its investments and computes its net asset value (NAV) per share at the close of regular trading (usually 4 p.m. Eastern time) on the New York Stock Exchange (NYSE) on each day the NYSE is open. The Board of Directors has adopted valuation policies and procedures to guide the investment advisor in the fund’s investment valuation process and to provide methodologies for the oversight of the fund’s pricing function.
Equity securities that are listed or traded on a domestic securities exchange are valued at the last reported sales price or at the official closing price as provided by the exchange. Equity securities traded on foreign securities exchanges are generally valued at the closing price of such securities on the exchange where primarily traded or at the close of the NYSE, if that is earlier. If no last sales price is reported, or if local convention or regulation so provides, the mean of the latest bid and asked prices may be used. Securities traded over-the-counter are valued at the mean of the latest bid and asked prices, the last sales price, or the official closing price. Equity securities initially expressed in local currencies are translated into U.S. dollars at the mean of the appropriate currency exchange rate at the close of the NYSE as provided by an independent pricing service.
Fixed income securities are valued at the evaluated mean as provided by independent pricing services or at the mean of the most recent bid and asked prices as provided by investment dealers. U.S. Treasury and Government Agency securities are valued using market models that consider trade data, quotations from dealers and active market makers, relevant yield curve and spread data, creditworthiness, trade data or market information on comparable securities, and other relevant security specific information.
Open-end management investment companies are valued at the reported NAV per share. Repurchase agreements are valued at cost, which approximates fair value. Forward foreign currency exchange contracts are valued at the mean of the appropriate forward exchange rate at the close of the NYSE as provided by an independent pricing service.
If the fund determines that the market price for an investment is not readily available or the valuation methods mentioned above do not reflect an investment’s fair value, such investment is valued as determined in good faith by the Board of Directors or its delegate, in accordance with policies and procedures adopted by the Board of Directors. In its determination of fair value, the fund may review several factors including, but not limited to, market information regarding the specific investment or comparable investments and correlation with other investment types, futures indices or general market indicators. Circumstances that may cause the fund to use these procedures to value an investment include, but are not limited to: an investment has been declared in default or is distressed; trading in a security has been suspended during the trading day or a security is not actively trading on its principal exchange; prices received from a regular pricing source are deemed unreliable; or there is a foreign market holiday and no trading occurred.
18
The fund monitors for significant events occurring after the close of an investment’s primary exchange but before the fund’s NAV per share is determined. Significant events may include, but are not limited to: corporate announcements and transactions; governmental action and political unrest that could impact a specific investment or an investment sector; or armed conflicts, natural disasters and similar events that could affect investments in a specific country or region. The fund also monitors for significant fluctuations between domestic and foreign markets, as evidenced by the U.S. market or such other indicators that the Board of Directors, or its delegate, deems appropriate. The fund may apply a model-derived factor to the closing price of equity securities traded on foreign securities exchanges. The factor is based on observable market data as provided by an independent pricing service.
Security Transactions — Security transactions are accounted for as of the trade date. Net realized gains and losses are determined on the identified cost basis, which is also used for federal income tax purposes.
Investment Income — Dividend income less foreign taxes withheld, if any, is recorded as of the ex-dividend date. Distributions received on securities that represent a return of capital or long-term capital gain are recorded as a reduction of cost of investments and/or as a realized gain. The fund may estimate the components of distributions received that may be considered nontaxable distributions or long-term capital gain distributions for income tax purposes. Interest income is recorded on the accrual basis and includes accretion of discounts and amortization of premiums. Securities lending income is net of fees and rebates earned by the lending agent for its services.
Foreign Currency Translations — All assets and liabilities initially expressed in foreign currencies are translated into U.S. dollars at prevailing exchange rates at period end. The fund may enter into spot foreign currency exchange contracts to facilitate transactions denominated in a foreign currency. Purchases and sales of investment securities, dividend and interest income, spot foreign currency exchange contracts, and expenses are translated at the rates of exchange prevailing on the respective dates of such transactions. Net realized and unrealized foreign currency exchange gains or losses related to investment securities are a component of net realized gain (loss) on investment transactions and change in net unrealized appreciation (depreciation) on investments, respectively.
Repurchase Agreements — The fund may enter into repurchase agreements with institutions that American Century Investment Management, Inc. (ACIM) (the investment advisor) has determined are creditworthy pursuant to criteria adopted by the Board of Directors. The fund requires that the collateral, represented by securities, received in a repurchase transaction be transferred to the custodian in a manner sufficient to enable the fund to obtain those securities in the event of a default under the repurchase agreement. ACIM monitors, on a daily basis, the securities transferred to ensure the value, including accrued interest, of the securities under each repurchase agreement is equal to or greater than amounts owed to the fund under each repurchase agreement.
Joint Trading Account — Pursuant to an Exemptive Order issued by the Securities and Exchange Commission, the fund, along with certain other funds in the American Century Investments family of funds, may transfer uninvested cash balances into a joint trading account. These balances are invested in one or more repurchase agreements that are collateralized by U.S. Treasury or Agency obligations.
Segregated Assets — In accordance with the 1940 Act, the fund segregates assets on its books and records to cover certain types of investment securities and other financial instruments. ACIM monitors, on a daily basis, the securities segregated to ensure the fund designates a sufficient amount of liquid assets, marked-to-market daily. The fund may also receive assets or be required to pledge assets at the custodian bank or with a broker for collateral requirements.
Income Tax Status — It is the fund’s policy to distribute substantially all net investment income and net realized gains to shareholders and to otherwise qualify as a regulated investment company under provisions of the Internal Revenue Code. Accordingly, no provision has been made for income taxes. The fund files U.S. federal, state, local and non-U.S. tax returns as applicable. The fund's tax returns are subject to examination by the relevant taxing authority until expiration of the applicable statute of limitations, which is generally three years from the date of filing but can be longer in certain jurisdictions. At this time, management believes there are no uncertain tax positions which, based on their technical merit, would not be sustained upon examination and for which it is reasonably possible that the total amounts of unrecognized tax benefits will significantly change in the next twelve months.
19
Multiple Class — All shares of the fund represent an equal pro rata interest in the net assets of the class to which such shares belong, and have identical voting, dividend, liquidation and other rights and the same terms and conditions, except for class specific expenses and exclusive rights to vote on matters affecting only individual classes. Income, non-class specific expenses, and realized and unrealized capital gains and losses of the fund are allocated to each class of shares based on their relative net assets.
Distributions to Shareholders — Distributions from net investment income, if any, are generally declared and paid quarterly. Distributions from net realized gains, if any, are generally declared and paid annually. The fund may elect to treat a portion of its payment to a redeeming shareholder, which represents the pro rata share of undistributed net investment income and net realized gains, as a distribution for federal income tax purposes (tax equalization).
Indemnifications — Under the corporation’s organizational documents, its officers and directors are indemnified against certain liabilities arising out of the performance of their duties to the fund. In addition, in the normal course of business, the fund enters into contracts that provide general indemnifications. The maximum exposure under these arrangements is unknown as this would involve future claims that may be made against a fund. The risk of material loss from such claims is considered by management to be remote.
Securities Lending — Securities are lent to qualified financial institutions and brokers. State Street Bank & Trust Co. serves as securities lending agent to the fund pursuant to a Securities Lending Agreement. The lending of securities exposes the fund to risks such as: the borrowers may fail to return the loaned securities, the borrowers may not be able to provide additional collateral, the fund may experience delays in recovery of the loaned securities or delays in access to collateral, or the fund may experience losses related to the investment collateral. To minimize certain risks, loan counterparties pledge collateral in the form of cash and/or securities. The lending agent has agreed to indemnify the fund in the case of default of any securities borrowed. Cash collateral received is invested in the State Street Navigator Securities Lending Government Money Market Portfolio, a money market mutual fund registered under the 1940 Act. The loans may also be secured by U.S. government securities in an amount at least equal to the market value of the securities loaned, plus accrued interest and dividends, determined on a daily basis and adjusted accordingly. By lending securities, the fund seeks to increase its net investment income through the receipt of interest and fees. Such income is reflected separately within the Statement of Operations. The value of loaned securities and related collateral outstanding at period end, if any, are shown on a gross basis within the Schedule of Investments and Statement of Assets and Liabilities.
3. Fees and Transactions with Related Parties
Certain officers and directors of the corporation are also officers and/or directors of American Century Companies, Inc. (ACC). The corporation’s investment advisor, ACIM, the corporation's distributor, American Century Investment Services, Inc. (ACIS), and the corporation’s transfer agent, American Century Services, LLC, are wholly owned, directly or indirectly, by ACC. Various funds issued by American Century Asset Allocation Portfolios, Inc. own, in aggregate, 12% of the shares of the fund.
Management Fees — The corporation has entered into a management agreement with ACIM, under which ACIM provides the fund with investment advisory and management services in exchange for a single, unified management fee (the fee) per class. The agreement provides that ACIM will pay all expenses of managing and operating the fund, except brokerage expenses, taxes, interest, fees and expenses of the independent directors (including legal counsel fees), extraordinary expenses, and expenses incurred in connection with the provision of shareholder services and distribution services under a plan adopted pursuant to Rule 12b-1 under the 1940 Act. The fee is computed and accrued daily based on each class's daily net assets and paid monthly in arrears. The difference in the fee among the classes is a result of their separate arrangements for non-Rule 12b-1 shareholder services. It is not the result of any difference in advisory or custodial fees or other expenses related to the management of the fund's assets, which do not vary by class. The rate of the fee is determined by applying a fee rate calculation formula. This formula takes into account the fund's assets as well as certain assets, if any, of other clients of the investment advisor outside the American Century Investments family of funds (such as subadvised funds and separate accounts) that use very similar investment teams and strategies (strategy assets). Prior to the fund's acquisition of NT Mid Cap Value Fund, the strategy assets of the fund also included the assets of NT Mid Cap Value Fund. The investment advisor agreed to waive the G Class's management fee in its entirety. The investment advisor expects this waiver to remain in effect permanently and cannot terminate it without the approval of the Board of Directors.
20
The management fee schedule range and the effective annual management fee for each class for the period ended March 31, 2022 are as follows:
Management Fee Schedule Range | Effective Annual Management Fee | |||||||
| Investor Class | 0.95% to 0.97% | 0.97% | ||||||
| I Class | 0.75% to 0.77% | 0.77% | ||||||
| Y Class | 0.60% to 0.62% | 0.62% | ||||||
| A Class | 0.95% to 0.97% | 0.97% | ||||||
| C Class | 0.95% to 0.97% | 0.97% | ||||||
| R Class | 0.95% to 0.97% | 0.97% | ||||||
| R5 Class | 0.75% to 0.77% | 0.77% | ||||||
| R6 Class | 0.60% to 0.62% | 0.62% | ||||||
| G Class | 0.60% to 0.62% | 0.00%(1) | ||||||
(1)Effective annual management fee before waiver was 0.62%.
Distribution and Service Fees — The Board of Directors has adopted a separate Master Distribution and Individual Shareholder Services Plan for each of the A Class, C Class and R Class (collectively the plans), pursuant to Rule 12b-1 of the 1940 Act. The plans provide that the A Class will pay ACIS an annual distribution and service fee of 0.25%. The plans provide that the C Class will pay ACIS an annual distribution and service fee of 1.00%, of which 0.25% is paid for individual shareholder services and 0.75% is paid for distribution services. The plans provide that the R Class will pay ACIS an annual distribution and service fee of 0.50%. The fees are computed and accrued daily based on each class’s daily net assets and paid monthly in arrears. The fees are used to pay financial intermediaries for distribution and individual shareholder services. Fees incurred under the plans during the period ended March 31, 2022 are detailed in the Statement of Operations.
Directors' Fees and Expenses — The Board of Directors is responsible for overseeing the investment advisor’s management and operations of the fund. The directors receive detailed information about the fund and its investment advisor regularly throughout the year, and meet at least quarterly with management of the investment advisor to review reports about fund operations. The fund’s officers do not receive compensation from the fund.
Interfund Transactions — The fund may enter into security transactions with other American Century Investments funds and other client accounts of the investment advisor, in accordance with the 1940 Act rules and procedures adopted by the Board of Directors. The rules and procedures require, among other things, that these transactions be effected at the independent current market price of the security. During the period, the interfund purchases and sales were $1,608,538 and $10,318,559, respectively. The effect of interfund transactions on the Statement of Operations was $2,844,328 in net realized gain (loss) on investment transactions.
4. Investment Transactions
Purchases and sales of investment securities, excluding short-term investments and in kind transactions, for the period ended March 31, 2022 were $4,279,486,170 and $5,294,737,118, respectively.
For the period ended March 31, 2022, the fund incurred net realized gains of $30,440,356 from redemptions in kind. A redemption in kind occurs when a fund delivers securities from its portfolio in lieu of cash as payment to a redeeming shareholder.
21
5. Capital Share Transactions
Transactions in shares of the fund were as follows:
Year ended March 31, 2022(1) | Year ended March 31, 2021 | |||||||||||||
| Shares | Amount | Shares | Amount | |||||||||||
| Investor Class/Shares Authorized | 1,100,000,000 | 1,100,000,000 | ||||||||||||
| Sold | 18,108,052 | $ | 350,635,375 | 25,241,110 | $ | 398,413,156 | ||||||||
| Issued in reinvestment of distributions | 26,136,073 | 455,845,806 | 2,774,786 | 43,909,525 | ||||||||||
| Redeemed | (42,239,243) | (814,867,789) | (48,256,051) | (754,357,720) | ||||||||||
| 2,004,882 | (8,386,608) | (20,240,155) | (312,035,039) | |||||||||||
| I Class/Shares Authorized | 1,060,000,000 | 1,100,000,000 | ||||||||||||
| Sold | 16,228,589 | 311,159,957 | 28,384,245 | 438,667,055 | ||||||||||
| Issued in reinvestment of distributions | 19,530,997 | 340,984,702 | 2,592,121 | 40,950,019 | ||||||||||
| Redeemed | (27,853,235) | (528,757,255) | (88,577,519) | (1,392,791,909) | ||||||||||
| 7,906,351 | 123,387,404 | (57,601,153) | (913,174,835) | |||||||||||
| Y Class/Shares Authorized | 75,000,000 | 75,000,000 | ||||||||||||
| Sold | 1,529,090 | 29,487,698 | 2,955,674 | 46,276,623 | ||||||||||
| Issued in reinvestment of distributions | 2,318,448 | 40,505,206 | 206,142 | 3,292,573 | ||||||||||
| Redeemed | (2,238,973) | (40,980,409) | (1,553,679) | (24,778,108) | ||||||||||
| 1,608,565 | 29,012,495 | 1,608,137 | 24,791,088 | |||||||||||
| A Class/Shares Authorized | 170,000,000 | 180,000,000 | ||||||||||||
| Sold | 5,208,055 | 98,308,670 | 5,494,682 | 85,957,251 | ||||||||||
| Issued in reinvestment of distributions | 2,597,648 | 45,171,721 | 250,309 | 3,949,771 | ||||||||||
| Redeemed | (7,278,144) | (139,165,202) | (6,657,741) | (103,788,427) | ||||||||||
| 527,559 | 4,315,189 | (912,750) | (13,881,405) | |||||||||||
| C Class/Shares Authorized | 25,000,000 | 50,000,000 | ||||||||||||
| Sold | 115,107 | 2,158,890 | 52,946 | 834,704 | ||||||||||
| Issued in reinvestment of distributions | 467,742 | 8,003,740 | 37,293 | 579,058 | ||||||||||
| Redeemed | (1,033,684) | (19,475,968) | (2,171,393) | (34,037,700) | ||||||||||
| (450,835) | (9,313,338) | (2,081,154) | (32,623,938) | |||||||||||
| R Class/Shares Authorized | 50,000,000 | 60,000,000 | ||||||||||||
| Sold | 1,019,656 | 19,514,146 | 1,237,180 | 19,151,663 | ||||||||||
| Issued in reinvestment of distributions | 1,126,093 | 19,500,704 | 80,759 | 1,269,017 | ||||||||||
| Redeemed | (1,640,925) | (31,014,293) | (1,688,280) | (26,464,381) | ||||||||||
| 504,824 | 8,000,557 | (370,341) | (6,043,701) | |||||||||||
| R5 Class/Shares Authorized | 30,000,000 | 30,000,000 | ||||||||||||
| Sold | 475,463 | 9,105,307 | 1,653,554 | 26,031,948 | ||||||||||
| Issued in reinvestment of distributions | 595,277 | 10,406,295 | 72,918 | 1,144,443 | ||||||||||
| Redeemed | (1,487,369) | (28,280,353) | (3,456,564) | (53,275,869) | ||||||||||
| (416,629) | (8,768,751) | (1,730,092) | (26,099,478) | |||||||||||
| R6 Class/Shares Authorized | 1,300,000,000 | 1,300,000,000 | ||||||||||||
| Sold | 41,383,112 | 793,447,536 | 69,425,692 | 1,090,502,531 | ||||||||||
| Issued in reinvestment of distributions | 40,644,059 | 709,744,760 | 4,193,628 | 66,735,181 | ||||||||||
| Redeemed | (58,184,664) | (1,117,550,420) | (57,415,715) | (925,484,957) | ||||||||||
| 23,842,507 | 385,641,876 | 16,203,605�� | 231,752,755 | |||||||||||
| G Class/Shares Authorized | 850,000,000 | N/A | ||||||||||||
| Sold | 36,467 | 636,327 | ||||||||||||
| Issued in connection with reorganization (Note 11) | 99,974,219 | 1,744,376,569 | ||||||||||||
| Issued in reinvestment of distributions | 9 | 156 | ||||||||||||
| Redeemed | (5,944,473) | (103,068,560) | ||||||||||||
| 94,066,222 | 1,641,944,492 | |||||||||||||
| Net increase (decrease) | 129,593,446 | $ | 2,165,833,316 | (65,123,903) | $ | (1,047,314,553) | ||||||||
(1)March 15, 2022 (commencement of sale) through March 31, 2022 for the G Class.
22
6. Fair Value Measurements
The fund’s investments valuation process is based on several considerations and may use multiple inputs to determine the fair value of the investments held by the fund. In conformity with accounting principles generally accepted in the United States of America, the inputs used to determine a valuation are classified into three broad levels.
•Level 1 valuation inputs consist of unadjusted quoted prices in an active market for identical investments.
•Level 2 valuation inputs consist of direct or indirect observable market data (including quoted prices for comparable investments, evaluations of subsequent market events, interest rates, prepayment speeds, credit risk, etc.). These inputs also consist of quoted prices for identical investments initially expressed in local currencies that are adjusted through translation into U.S. dollars.
•Level 3 valuation inputs consist of unobservable data (including a fund’s own assumptions).
The level classification is based on the lowest level input that is significant to the fair valuation measurement. The valuation inputs are not necessarily an indication of the risks associated with investing in these securities or other financial instruments.
The following is a summary of the level classifications as of period end. The Schedule of Investments provides additional information on the fund’s portfolio holdings.
| Level 1 | Level 2 | Level 3 | |||||||||
| Assets | |||||||||||
| Investment Securities | |||||||||||
| Common Stocks | |||||||||||
| Aerospace and Defense | $ | 46,172,705 | $ | 50,706,897 | — | ||||||
| Auto Components | 149,833,043 | 44,529,448 | — | ||||||||
| Building Products | — | 73,068,335 | — | ||||||||
| Food and Staples Retailing | 54,723,953 | 165,589,255 | — | ||||||||
| Food Products | 398,175,087 | 63,187,330 | — | ||||||||
| Hotels, Restaurants and Leisure | 54,282,169 | 97,765,329 | — | ||||||||
| Machinery | 265,626,800 | 24,464,882 | — | ||||||||
| Paper and Forest Products | — | 112,321,545 | — | ||||||||
| Other Industries | 7,998,430,365 | — | — | ||||||||
| Exchange-Traded Funds | 200,807,126 | — | — | ||||||||
| Short-Term Investments | 9,409,715 | 191,388,667 | — | ||||||||
| $ | 9,177,460,963 | $ | 823,021,688 | — | |||||||
| Other Financial Instruments | |||||||||||
| Forward Foreign Currency Exchange Contracts | — | $ | 1,800,955 | — | |||||||
| Liabilities | |||||||||||
| Other Financial Instruments | |||||||||||
| Forward Foreign Currency Exchange Contracts | — | $ | 1,742,906 | — | |||||||
7. Affiliated Company Transactions
If a fund's holding represents ownership of 5% or more of the voting securities of a company, the company is affiliated as defined in the 1940 Act. A summary of transactions for each company which is or was an affiliate at or during the period ended March 31, 2022 follows (amounts in thousands):
| Company | Beginning Value | Purchase Cost | Sales Cost | Change in Net Unrealized Appreciation (Depreciation) | Ending Value | Ending Shares | Net Realized Gain (Loss) | Income | ||||||||||||||||||
| Heartland Express, Inc. | $ | 67,453 | $ | 12,930 | $ | 592 | $ | (22,051) | $ | 57,740 | 4,104 | $ | (69) | $ | 2,012 | |||||||||||
23
8. Derivative Instruments
Foreign Currency Risk — The fund is subject to foreign currency exchange rate risk in the normal course of pursuing its investment objectives. The value of foreign investments held by a fund may be significantly affected by changes in foreign currency exchange rates. The dollar value of a foreign security generally decreases when the value of the dollar rises against the foreign currency in which the security is denominated and tends to increase when the value of the dollar declines against such foreign currency. A fund may enter into forward foreign currency exchange contracts to reduce a fund's exposure to foreign currency exchange rate fluctuations. The net U.S. dollar value of foreign currency underlying all contractual commitments held by a fund and the resulting unrealized appreciation or depreciation are determined daily. Realized gain or loss is recorded upon settlement of the contract. Net realized and unrealized gains or losses occurring during the holding period of forward foreign currency exchange contracts are a component of net realized gain (loss) on forward foreign currency exchange contract transactions and change in net unrealized appreciation (depreciation) on forward foreign currency exchange contracts, respectively. A fund bears the risk of an unfavorable change in the foreign currency exchange rate underlying the forward contract. Additionally, losses, up to the fair value, may arise if the counterparties do not perform under the contract terms. The fund's average U.S. dollar exposure to foreign currency risk derivative instruments held during the period was $665,693,175.
The value of foreign currency risk derivative instruments as of March 31, 2022, is disclosed on the Statement of Assets and Liabilities as an asset of $1,800,955 in unrealized appreciation on forward foreign currency exchange contracts and a liability of $1,742,906 in unrealized depreciation on forward foreign currency exchange contracts. For the year ended March 31, 2022, the effect of foreign currency risk derivative instruments on the Statement of Operations was $41,481,148 in net realized gain (loss) on forward foreign currency exchange contract transactions and $(6,981,119) in change in net unrealized appreciation (depreciation) on forward foreign currency exchange contracts.
9. Risk Factors
The value of the fund’s shares will go up and down, sometimes rapidly or unpredictably, based on the performance of the securities owned by the fund and other factors generally affecting the securities market. Market risks, including political, regulatory, economic and social developments, can affect the value of the fund’s investments. Natural disasters, public health emergencies, war, terrorism and other unforeseeable events may lead to increased market volatility and may have adverse long-term effects on world economies and markets generally.
There are certain risks involved in investing in foreign securities. These risks include those resulting from political events (such as civil unrest, national elections and imposition of exchange controls), social and economic events (such as labor strikes and rising inflation), and natural disasters. Securities of foreign issuers may be less liquid and more volatile. Investing a significant portion of assets in one country or region may accentuate these risks.
10. Federal Tax Information
The tax character of distributions paid during the years ended March 31, 2022 and March 31, 2021 were as follows:
| 2022 | 2021 | |||||||
| Distributions Paid From | ||||||||
| Ordinary income | $ | 459,052,286 | $ | 126,596,525 | ||||
| Long-term capital gains | $ | 1,233,679,283 | $ | 41,222,933 | ||||
The book-basis character of distributions made during the year from net investment income or net realized gains may differ from their ultimate characterization for federal income tax purposes. These differences reflect the differing character of certain income items and net realized gains and losses for financial statement and tax purposes, and may result in reclassification among certain capital accounts on the financial statements.
The reclassifications, which are primarily due to tax equalization, were made to capital $144,253,498 and
distributable earnings $(144,253,498).
24
As of period end, the federal tax cost of investments and the components of distributable earnings on a tax-basis were as follows:
| Federal tax cost of investments | $ | 8,190,491,693 | |||
| Gross tax appreciation of investments | $ | 1,953,119,476 | |||
| Gross tax depreciation of investments | (143,128,518) | ||||
| Net tax appreciation (depreciation) of investments | 1,809,990,958 | ||||
| Net tax appreciation (depreciation) on derivatives and translation of assets and liabilities in foreign currencies | (338) | ||||
| Net tax appreciation (depreciation) | $ | 1,809,990,620 | |||
| Undistributed ordinary income | $ | 19,026,607 | |||
| Accumulated long-term gains | $ | 60,243,444 | |||
The difference between book-basis and tax-basis unrealized appreciation (depreciation) is attributable primarily to the tax deferral of losses on wash sales.
11. Reorganization
On December 2, 2021, the Board of Directors approved an agreement and plan of reorganization (the reorganization), whereby the net assets of NT Mid Cap Value Fund, one fund in a series issued by the corporation, were transferred to Mid Cap Value Fund in exchange for shares of Mid Cap Value Fund. The purpose of the transaction was to combine two funds with substantially similar investment objectives and strategies. The financial statements and performance history of Mid Cap Value Fund survived after the reorganization. The reorganization was effective at the close of the NYSE on March 25, 2022.
The reorganization was accomplished by a tax-free exchange of shares. On March 25, 2022, NT Mid Cap Value Fund exchanged its shares for shares of Mid Cap Value Fund as follows:
| Original Fund/Class | Shares Exchanged | New Fund/Class | Shares Received | ||||||||
| NT Mid Cap Value Fund – G Class | 131,763,604 | Mid Cap Value Fund – G Class | 99,974,219 | ||||||||
The net assets of NT Mid Cap Value Fund and Mid Cap Value Fund immediately before the reorganization were $1,744,376,569 and $8,436,268,301, respectively. NT Mid Cap Value Fund's unrealized appreciation of $341,168,071 was combined with that of Mid Cap Value Fund. Immediately after the reorganization, the combined net assets were $10,180,644,870.
Assuming the reorganization had been completed on April 1, 2021, the beginning of the annual reporting period, the pro forma results of operations for the period ended March 31, 2022 are as follows:
| Net investment income (loss) | $ | 168,573,861 | |||
| Net realized and unrealized gain (loss) | 1,061,829,759 | ||||
| Net increase (decrease) in net assets resulting from operations | $ | 1,230,403,620 | |||
Because the combined investment portfolios have been managed as a single integrated portfolio since the reorganization was completed, it is not practicable to separate the amounts of revenue and earnings of NT Mid Cap Value Fund that have been included in the fund’s Statement of Operations since March 25, 2022.
25
| Financial Highlights | ||
| For a Share Outstanding Throughout the Years Ended March 31 (except as noted) | |||||||||||||||||||||||||||||||||||||||||||||||
| Per-Share Data | Ratios and Supplemental Data | ||||||||||||||||||||||||||||||||||||||||||||||
| Income From Investment Operations: | Distributions From: | Ratio to Average Net Assets of: | |||||||||||||||||||||||||||||||||||||||||||||
| Net Asset Value, Beginning of Period | Net Investment Income (Loss)(1) | Net Realized and Unrealized Gain (Loss) | Total From Investment Operations | Net Investment Income | Net Realized Gains | Total Distributions | Net Asset Value, End of Period | Total Return(2) | Operating Expenses | Operating Expenses (before expense waiver) | Net Investment Income (Loss) | Net Investment Income (Loss) (before expense waiver) | Portfolio Turnover Rate | Net Assets, End of Period (in thousands) | |||||||||||||||||||||||||||||||||
| Investor Class | |||||||||||||||||||||||||||||||||||||||||||||||
| 2022 | $19.03 | 0.26 | 1.95 | 2.21 | (0.25) | (3.69) | (3.94) | $17.30 | 12.48% | 0.97% | 0.97% | 1.33% | 1.33% | 50% | $2,325,957 | ||||||||||||||||||||||||||||||||
| 2021 | $12.35 | 0.22 | 6.78 | 7.00 | (0.23) | (0.09) | (0.32) | $19.03 | 57.22% | 0.97% | 0.97% | 1.43% | 1.43% | 65% | $2,519,909 | ||||||||||||||||||||||||||||||||
| 2020 | $15.19 | 0.24 | (2.85) | (2.61) | (0.23) | — | (0.23) | $12.35 | (17.52)% | 0.98% | 0.99% | 1.56% | 1.55% | 55% | $1,885,286 | ||||||||||||||||||||||||||||||||
| 2019 | $17.09 | 0.23 | (0.21) | 0.02 | (0.21) | (1.71) | (1.92) | $15.19 | 0.81% | 0.96% | 1.00% | 1.38% | 1.34% | 53% | $3,514,131 | ||||||||||||||||||||||||||||||||
| 2018 | $17.76 | 0.28 | 0.71 | 0.99 | (0.27) | (1.39) | (1.66) | $17.09 | 5.51% | 0.96% | 1.00% | 1.57% | 1.53% | 47% | $4,223,276 | ||||||||||||||||||||||||||||||||
| I Class | |||||||||||||||||||||||||||||||||||||||||||||||
| 2022 | $19.04 | 0.29 | 1.96 | 2.25 | (0.28) | (3.69) | (3.97) | $17.32 | 12.75% | 0.77% | 0.77% | 1.53% | 1.53% | 50% | $1,754,741 | ||||||||||||||||||||||||||||||||
| 2021 | $12.36 | 0.25 | 6.79 | 7.04 | (0.27) | (0.09) | (0.36) | $19.04 | 57.50% | 0.77% | 0.77% | 1.63% | 1.63% | 65% | $1,778,956 | ||||||||||||||||||||||||||||||||
| 2020 | $15.21 | 0.28 | (2.87) | (2.59) | (0.26) | — | (0.26) | $12.36 | (17.40)% | 0.78% | 0.79% | 1.76% | 1.75% | 55% | $1,866,460 | ||||||||||||||||||||||||||||||||
| 2019 | $17.10 | 0.26 | (0.20) | 0.06 | (0.24) | (1.71) | (1.95) | $15.21 | 1.07% | 0.76% | 0.80% | 1.58% | 1.54% | 53% | $1,535,449 | ||||||||||||||||||||||||||||||||
| 2018 | $17.77 | 0.32 | 0.71 | 1.03 | (0.31) | (1.39) | (1.70) | $17.10 | 5.72% | 0.76% | 0.80% | 1.77% | 1.73% | 47% | $1,793,037 | ||||||||||||||||||||||||||||||||
| For a Share Outstanding Throughout the Years Ended March 31 (except as noted) | |||||||||||||||||||||||||||||||||||||||||||||||
| Per-Share Data | Ratios and Supplemental Data | ||||||||||||||||||||||||||||||||||||||||||||||
| Income From Investment Operations: | Distributions From: | Ratio to Average Net Assets of: | |||||||||||||||||||||||||||||||||||||||||||||
| Net Asset Value, Beginning of Period | Net Investment Income (Loss)(1) | Net Realized and Unrealized Gain (Loss) | Total From Investment Operations | Net Investment Income | Net Realized Gains | Total Distributions | Net Asset Value, End of Period | Total Return(2) | Operating Expenses | Operating Expenses (before expense waiver) | Net Investment Income (Loss) | Net Investment Income (Loss) (before expense waiver) | Portfolio Turnover Rate | Net Assets, End of Period (in thousands) | |||||||||||||||||||||||||||||||||
| Y Class | |||||||||||||||||||||||||||||||||||||||||||||||
| 2022 | $19.05 | 0.32 | 1.96 | 2.28 | (0.31) | (3.69) | (4.00) | $17.33 | 12.91% | 0.62% | 0.62% | 1.68% | 1.68% | 50% | $192,430 | ||||||||||||||||||||||||||||||||
| 2021 | $12.36 | 0.28 | 6.79 | 7.07 | (0.29) | (0.09) | (0.38) | $19.05 | 57.69% | 0.62% | 0.62% | 1.78% | 1.78% | 65% | $180,923 | ||||||||||||||||||||||||||||||||
| 2020 | $15.21 | 0.32 | (2.89) | (2.57) | (0.28) | — | (0.28) | $12.36 | (17.22)% | 0.63% | 0.64% | 1.91% | 1.90% | 55% | $97,541 | ||||||||||||||||||||||||||||||||
| 2019 | $17.11 | 0.31 | (0.24) | 0.07 | (0.26) | (1.71) | (1.97) | $15.21 | 1.16% | 0.61% | 0.65% | 1.73% | 1.69% | 53% | $16,061 | ||||||||||||||||||||||||||||||||
2018(3) | $17.76 | 0.32 | 0.75 | 1.07 | (0.33) | (1.39) | (1.72) | $17.11 | 5.97% | 0.61%(4) | 0.65%(4) | 1.89%(4) | 1.85%(4) | 47%(5) | $572 | ||||||||||||||||||||||||||||||||
| A Class | |||||||||||||||||||||||||||||||||||||||||||||||
| 2022 | $18.99 | 0.21 | 1.95 | 2.16 | (0.20) | (3.69) | (3.89) | $17.26 | 12.23% | 1.22% | 1.22% | 1.08% | 1.08% | 50% | $303,260 | ||||||||||||||||||||||||||||||||
| 2021 | $12.32 | 0.19 | 6.76 | 6.95 | (0.19) | (0.09) | (0.28) | $18.99 | 56.87% | 1.22% | 1.22% | 1.18% | 1.18% | 65% | $323,669 | ||||||||||||||||||||||||||||||||
| 2020 | $15.16 | 0.20 | (2.85) | (2.65) | (0.19) | — | (0.19) | $12.32 | (17.76)% | 1.23% | 1.24% | 1.31% | 1.30% | 55% | $221,284 | ||||||||||||||||||||||||||||||||
| 2019 | $17.06 | 0.18 | (0.20) | (0.02) | (0.17) | (1.71) | (1.88) | $15.16 | 0.57% | 1.21% | 1.25% | 1.13% | 1.09% | 53% | $358,500 | ||||||||||||||||||||||||||||||||
| 2018 | $17.73 | 0.22 | 0.73 | 0.95 | (0.23) | (1.39) | (1.62) | $17.06 | 5.26% | 1.21% | 1.25% | 1.32% | 1.28% | 47% | $540,108 | ||||||||||||||||||||||||||||||||
| C Class | |||||||||||||||||||||||||||||||||||||||||||||||
| 2022 | $18.75 | 0.06 | 1.93 | 1.99 | (0.07) | (3.69) | (3.76) | $16.98 | 11.37% | 1.97% | 1.97% | 0.33% | 0.33% | 50% | $39,037 | ||||||||||||||||||||||||||||||||
| 2021 | $12.17 | 0.07 | 6.67 | 6.74 | (0.07) | (0.09) | (0.16) | $18.75 | 55.65% | 1.97% | 1.97% | 0.43% | 0.43% | 65% | $51,558 | ||||||||||||||||||||||||||||||||
| 2020 | $14.98 | 0.08 | (2.81) | (2.73) | (0.08) | — | (0.08) | $12.17 | (18.37)% | 1.98% | 1.99% | 0.56% | 0.55% | 55% | $58,796 | ||||||||||||||||||||||||||||||||
| 2019 | $16.89 | 0.06 | (0.21) | (0.15) | (0.05) | (1.71) | (1.76) | $14.98 | (0.23)% | 1.96% | 2.00% | 0.38% | 0.34% | 53% | $94,910 | ||||||||||||||||||||||||||||||||
| 2018 | $17.58 | 0.10 | 0.71 | 0.81 | (0.11) | (1.39) | (1.50) | $16.89 | 4.48% | 1.96% | 2.00% | 0.57% | 0.53% | 47% | $135,133 | ||||||||||||||||||||||||||||||||
| For a Share Outstanding Throughout the Years Ended March 31 (except as noted) | |||||||||||||||||||||||||||||||||||||||||||||||
| Per-Share Data | Ratios and Supplemental Data | ||||||||||||||||||||||||||||||||||||||||||||||
| Income From Investment Operations: | Distributions From: | Ratio to Average Net Assets of: | |||||||||||||||||||||||||||||||||||||||||||||
| Net Asset Value, Beginning of Period | Net Investment Income (Loss)(1) | Net Realized and Unrealized Gain (Loss) | Total From Investment Operations | Net Investment Income | Net Realized Gains | Total Distributions | Net Asset Value, End of Period | Total Return(2) | Operating Expenses | Operating Expenses (before expense waiver) | Net Investment Income (Loss) | Net Investment Income (Loss) (before expense waiver) | Portfolio Turnover Rate | Net Assets, End of Period (in thousands) | |||||||||||||||||||||||||||||||||
| R Class | |||||||||||||||||||||||||||||||||||||||||||||||
| 2022 | $18.93 | 0.16 | 1.94 | 2.10 | (0.15) | (3.69) | (3.84) | $17.19 | 11.92% | 1.47% | 1.47% | 0.83% | 0.83% | 50% | $97,311 | ||||||||||||||||||||||||||||||||
| 2021 | $12.28 | 0.15 | 6.74 | 6.89 | (0.15) | (0.09) | (0.24) | $18.93 | 56.48% | 1.47% | 1.47% | 0.93% | 0.93% | 65% | $97,590 | ||||||||||||||||||||||||||||||||
| 2020 | $15.12 | 0.17 | (2.86) | (2.69) | (0.15) | — | (0.15) | $12.28 | (18.00)% | 1.48% | 1.49% | 1.06% | 1.05% | 55% | $67,874 | ||||||||||||||||||||||||||||||||
| 2019 | $17.02 | 0.14 | (0.20) | (0.06) | (0.13) | (1.71) | (1.84) | $15.12 | 0.33% | 1.46% | 1.50% | 0.88% | 0.84% | 53% | $96,701 | ||||||||||||||||||||||||||||||||
| 2018 | $17.69 | 0.19 | 0.71 | 0.90 | (0.18) | (1.39) | (1.57) | $17.02 | 5.02% | 1.46% | 1.50% | 1.07% | 1.03% | 47% | $120,024 | ||||||||||||||||||||||||||||||||
| R5 Class | |||||||||||||||||||||||||||||||||||||||||||||||
| 2022 | $19.05 | 0.29 | 1.95 | 2.24 | (0.28) | (3.69) | (3.97) | $17.32 | 12.68% | 0.77% | 0.77% | 1.53% | 1.53% | 50% | $46,565 | ||||||||||||||||||||||||||||||||
| 2021 | $12.36 | 0.25 | 6.80 | 7.05 | (0.27) | (0.09) | (0.36) | $19.05 | 57.58% | 0.77% | 0.77% | 1.63% | 1.63% | 65% | $59,132 | ||||||||||||||||||||||||||||||||
| 2020 | $15.21 | 0.28 | (2.87) | (2.59) | (0.26) | — | (0.26) | $12.36 | (17.40)% | 0.78% | 0.79% | 1.76% | 1.75% | 55% | $59,766 | ||||||||||||||||||||||||||||||||
| 2019 | $17.11 | 0.28 | (0.23) | 0.05 | (0.24) | (1.71) | (1.95) | $15.21 | 1.01% | 0.76% | 0.80% | 1.58% | 1.54% | 53% | $58,526 | ||||||||||||||||||||||||||||||||
2018(3) | $17.76 | 0.29 | 0.76 | 1.05 | (0.31) | (1.39) | (1.70) | $17.11 | 5.83% | 0.76%(4) | 0.80%(4) | 1.70%(4) | 1.66%(4) | 47%(5) | $313 | ||||||||||||||||||||||||||||||||
| R6 Class | |||||||||||||||||||||||||||||||||||||||||||||||
| 2022 | $19.04 | 0.32 | 1.96 | 2.28 | (0.31) | (3.69) | (4.00) | $17.32 | 12.92% | 0.62% | 0.62% | 1.68% | 1.68% | 50% | $3,591,180 | ||||||||||||||||||||||||||||||||
| 2021 | $12.36 | 0.28 | 6.78 | 7.06 | (0.29) | (0.09) | (0.38) | $19.04 | 57.74% | 0.62% | 0.62% | 1.78% | 1.78% | 65% | $3,494,909 | ||||||||||||||||||||||||||||||||
| 2020 | $15.20 | 0.31 | (2.87) | (2.56) | (0.28) | — | (0.28) | $12.36 | (17.23)% | 0.63% | 0.64% | 1.91% | 1.90% | 55% | $2,068,136 | ||||||||||||||||||||||||||||||||
| 2019 | $17.10 | 0.29 | (0.22) | 0.07 | (0.26) | (1.71) | (1.97) | $15.20 | 1.16% | 0.61% | 0.65% | 1.73% | 1.69% | 53% | $1,938,315 | ||||||||||||||||||||||||||||||||
| 2018 | $17.77 | 0.34 | 0.72 | 1.06 | (0.34) | (1.39) | (1.73) | $17.10 | 5.88% | 0.61% | 0.65% | 1.92% | 1.88% | 47% | $1,578,125 | ||||||||||||||||||||||||||||||||
| For a Share Outstanding Throughout the Years Ended March 31 (except as noted) | |||||||||||||||||||||||||||||||||||||||||||||||
| Per-Share Data | Ratios and Supplemental Data | ||||||||||||||||||||||||||||||||||||||||||||||
| Income From Investment Operations: | Distributions From: | Ratio to Average Net Assets of: | |||||||||||||||||||||||||||||||||||||||||||||
| Net Asset Value, Beginning of Period | Net Investment Income (Loss)(1) | Net Realized and Unrealized Gain (Loss) | Total From Investment Operations | Net Investment Income | Net Realized Gains | Total Distributions | Net Asset Value, End of Period | Total Return(2) | Operating Expenses | Operating Expenses (before expense waiver) | Net Investment Income (Loss) | Net Investment Income (Loss) (before expense waiver) | Portfolio Turnover Rate | Net Assets, End of Period (in thousands) | |||||||||||||||||||||||||||||||||
| G Class | |||||||||||||||||||||||||||||||||||||||||||||||
2022(6) | $17.81 | 0.02 | 0.61 | 0.63 | (0.03) | (1.08) | (1.11) | $17.33 | 3.55% | 0.00%(4)(7) | 0.62%(4) | 2.11%(4) | 1.49%(4) | 50%(8) | $1,630,035 | ||||||||||||||||||||||||||||||||
| Notes to Financial Highlights | ||||||||||||||
(1)Computed using average shares outstanding throughout the period.
(2)Total returns are calculated based on the net asset value of the last business day and do not reflect applicable sales charges, if any. Total returns for periods less than one year are not annualized.
(3)April 10, 2017 (commencement of sale) through March 31, 2018.
(4)Annualized.
(5)Portfolio turnover is calculated at the fund level. Percentage indicated was calculated for the year ended March 31, 2018.
(6)March 15, 2022 (commencement of sale) through March 31, 2022.
(7)Ratio was less than 0.005%.
(8)Portfolio turnover is calculated at the fund level. Percentage indicated was calculated for the year ended March 31, 2022.
See Notes to Financial Statements.
| Report of Independent Registered Public Accounting Firm | ||
To the Shareholders and the Board of Directors of American Century Capital Portfolios, Inc.:
Opinion on the Financial Statements and Financial Highlights
We have audited the accompanying statement of assets and liabilities, including the schedule of investments, of Mid Cap Value Fund (the “Fund”), one of the funds constituting the American Century Capital Portfolios, Inc., as of March 31, 2022, the related statement of operations for the year then ended, the statements of changes in net assets for each of the two years in the period then ended, the financial highlights for each of the five years in the period then ended, and the related notes. In our opinion, the financial statements and financial highlights present fairly, in all material respects, the financial position of Mid Cap Value Fund of the American Century Capital Portfolios, Inc. as of March 31, 2022, and the results of its operations for the year then ended, the changes in its net assets for each of the two years in the period then ended, and the financial highlights for each of the five years in the period then ended, in conformity with accounting principles generally accepted in the United States of America.
Basis for Opinion
These financial statements and financial highlights are the responsibility of the Fund's management. Our responsibility is to express an opinion on the Fund’s financial statements and financial highlights based on our audits. We are a public accounting firm registered with the Public Company Accounting Oversight Board (United States) (PCAOB) and are required to be independent with respect to the Fund in accordance with the U.S. federal securities laws and the applicable rules and regulations of the Securities and Exchange Commission and the PCAOB.
We conducted our audits in accordance with the standards of the PCAOB. Those standards require that we plan and perform the audit to obtain reasonable assurance about whether the financial statements and financial highlights are free of material misstatement, whether due to error or fraud. The Fund is not required to have, nor were we engaged to perform, an audit of its internal control over financial reporting. As part of our audits, we are required to obtain an understanding of internal control over financial reporting but not for the purpose of expressing an opinion on the effectiveness of the Fund’s internal control over financial reporting. Accordingly, we express no such opinion.
Our audits included performing procedures to assess the risks of material misstatement of the financial statements and financial highlights, whether due to error or fraud, and performing procedures that respond to those risks. Such procedures included examining, on a test basis, evidence regarding the amounts and disclosures in the financial statements and financial highlights. Our audits also included evaluating the accounting principles used and significant estimates made by management, as well as evaluating the overall presentation of the financial statements and financial highlights. Our procedures included confirmation of securities owned as of March 31, 2022, by correspondence with the custodian and brokers; when replies were not received from brokers, we performed other auditing procedures. We believe that our audits provide a reasonable basis for our opinion.
/s/ Deloitte & Touche LLP
Kansas City, Missouri
May 16, 2022
We have served as the auditor of one or more American Century investment companies since 1997.
30
| Management | ||
The Board of Directors
The individuals listed below serve as directors of the funds. Each director will continue to serve in this capacity until death, retirement, resignation or removal from office. The board has adopted a mandatory retirement age for directors who are not “interested persons,” as that term is defined in the Investment Company Act (independent directors). Independent directors shall retire on December 31 of the year in which they reach their 75th birthday.
Jonathan S. Thomas is an “interested person” because he currently serves as President and Chief Executive Officer of American Century Companies, Inc. (ACC), the parent company of American Century Investment Management, Inc. (ACIM or the advisor). The other directors (more than three-fourths of the total number) are independent. They are not employees, directors or officers of, and have no financial interest in, ACC or any of its wholly owned, direct or indirect, subsidiaries, including ACIM, American Century Investment Services, Inc. (ACIS) and American Century Services, LLC (ACS), and they do not have any other affiliations, positions or relationships that would cause them to be considered “interested persons” under the Investment Company Act. The directors serve in this capacity for seven (in the case of Jonathan S. Thomas, 16; and Stephen E. Yates, 8) registered investment companies in the American Century Investments family of funds.
The following table presents additional information about the directors. The mailing address for each director is 4500 Main Street, Kansas City, Missouri 64111.
| Name (Year of Birth) | Position(s) Held with Funds | Length of Time Served | Principal Occupation(s) During Past 5 Years | Number of American Century Portfolios Overseen by Director | Other Directorships Held During Past 5 Years | ||||||||||||
| Independent Directors | |||||||||||||||||
| Thomas W. Bunn (1953) | Director | Since 2017 | Retired | 68 | None | ||||||||||||
| Chris H. Cheesman (1962) | Director | Since 2019 | Retired. Senior Vice President & Chief Audit Executive, AllianceBernstein (1999 to 2018) | 68 | Alleghany Corporation | ||||||||||||
| Barry Fink (1955) | Director | Since 2012 (independent since 2016) | Retired | 68 | None | ||||||||||||
| Rajesh K. Gupta (1960) | Director | Since 2019 | Partner Emeritus, SeaCrest Investment Management and SeaCrest Wealth Management (2019 to Present); Chief Executive Officer and Chief Investment Officer, SeaCrest Investment Management (2006 to 2019); Chief Executive Officer and Chief Investment Officer, SeaCrest Wealth Management (2008 to 2019) | 68 | None | ||||||||||||
31
| Name (Year of Birth) | Position(s) Held with Funds | Length of Time Served | Principal Occupation(s) During Past 5 Years | Number of American Century Portfolios Overseen by Director | Other Directorships Held During Past 5 Years | ||||||||||||
| Independent Directors | |||||||||||||||||
| Lynn Jenkins (1963) | Director | Since 2019 | Consultant, LJ Strategies (2019 to present); United States Representative, U.S. House of Representatives (2009 to 2018) | 68 | MGP Ingredients, Inc. (2019 to 2021) | ||||||||||||
| Jan M. Lewis (1957) | Director and Board Chair | Since 2011 (Board Chair since 2022) | Retired | 68 | None | ||||||||||||
| Stephen E. Yates (1948) | Director | Since 2012 | Retired | 108 | None | ||||||||||||
| Interested Director | |||||||||||||||||
| Jonathan S. Thomas (1963) | Director | Since 2007 | President and Chief Executive Officer, ACC (2007 to present). Also serves as Chief Executive Officer, ACS; Director, ACC and other ACC subsidiaries | 146 | None | ||||||||||||
The Statement of Additional Information has additional information about the fund's directors and is available without charge, upon request, by calling 1-800-345-2021.
32
Officers
The following table presents certain information about the executive officers of the funds. Each officer serves as an officer for 16 (in the case of Robert J. Leach, 15) investment companies in the American Century family of funds, unless otherwise noted. No officer is compensated for his or her service as an officer of the funds. The listed officers are interested persons of the funds and are appointed or re-appointed on an annual basis. The mailing address for each officer listed below is 4500 Main Street, Kansas City, Missouri 64111.
| Name (Year of Birth) | Offices with the Funds | Principal Occupation(s) During the Past Five Years | ||||||
| Patrick Bannigan (1965) | President since 2019 | Executive Vice President and Director, ACC (2012 to present); Chief Financial Officer, Chief Accounting Officer and Treasurer, ACC (2015 to present); Also serves as President, ACS; Vice President, ACIM; Chief Financial Officer, Chief Accounting Officer and/or Director, ACIM, ACS and other ACC subsidiaries | ||||||
| R. Wes Campbell (1974) | Chief Financial Officer and Treasurer since 2018 | Vice President, ACS (2020 to present); Investment Operations and Investment Accounting, ACS (2000 to present) | ||||||
| Amy D. Shelton (1964) | Chief Compliance Officer and Vice President since 2014 | Chief Compliance Officer, American Century funds, (2014 to present); Chief Compliance Officer, ACIM (2014 to present); Chief Compliance Officer, ACIS (2009 to present). Also serves as Vice President, ACIS | ||||||
| John Pak (1968) | General Counsel and Senior Vice President since 2021 | General Counsel and Senior Vice President, ACC (2021 to present); Also serves as General Counsel and Senior Vice President, ACIM, ACS and ACIS. Chief Legal Officer of Investment and Wealth Management, The Bank of New York Mellon (2014 to 2021) | ||||||
| C. Jean Wade (1964) | Vice President since 2012 | Senior Vice President, ACS (2017 to present); Vice President, ACS (2000 to 2017) | ||||||
| Robert J. Leach (1966) | Vice President since 2006 | Vice President, ACS (2000 to present) | ||||||
| David H. Reinmiller (1963) | Vice President since 2000 | Attorney, ACC (1994 to present). Also serves as Vice President, ACIM and ACS | ||||||
| Ward D. Stauffer (1960) | Secretary since 2005 | Attorney, ACC (2003 to present) | ||||||
33
| Liquidity Risk Management Program | ||
The Fund has adopted a liquidity risk management program (the “program”). The Fund’s Board of Directors (the "Board") has designated American Century Investment Management, Inc. (“ACIM”) as the administrator of the program. Personnel of ACIM or its affiliates conduct the day-to-day operation of the program pursuant to policies and procedures administered by the Program Administrator, including members of ACIM’s Investment Oversight Committee who are members of the ACIM’s Investment Management and Global Analytics departments.
Under the program, ACIM manages the Fund’s liquidity risk, which is the risk that the Fund could not meet shareholder redemption requests without significant dilution of remaining shareholders’ interests in the Fund. This risk is managed by monitoring the degree of liquidity of the Fund’s investments, limiting the amount of the Fund’s illiquid investments, and utilizing various risk management tools and facilities available to the Fund for meeting shareholder redemptions, among other means. ACIM’s process of determining the degree of liquidity of certain Fund’s investments is supported by a third-party liquidity assessment vendor.
The Board reviewed a report prepared by ACIM regarding the operation and effectiveness of the program for the period January 1, 2021 through December 31, 2021. No significant liquidity events impacting the Fund were noted in the report. In addition, ACIM provided its assessment that the program had been effective in managing the Fund’s liquidity risk.
34
| Additional Information | ||
Retirement Account Information
As required by law, distributions you receive from certain retirement accounts are subject to federal income tax withholding, unless you elect not to have withholding apply*. Tax will be withheld on the total amount withdrawn even though you may be receiving amounts that are not subject to withholding, such as nondeductible contributions. In such case, excess amounts of withholding could occur. You may adjust your withholding election so that a greater or lesser amount will be withheld.
If you don’t want us to withhold on this amount, you must notify us to not withhold the federal income tax. You may notify us in writing or in certain situations by telephone or through other electronic means. For systematic withdrawals, your withholding election will remain in effect until revoked or changed by filing a new election. You have the right to revoke your election at any time and change your withholding percentage for future distributions.
Remember, even if you elect not to have income tax withheld, you are liable for paying income tax on the taxable portion of your withdrawal. If you elect not to have income tax withheld or you don’t have enough income tax withheld, you may be responsible for payment of estimated tax. You may incur penalties under the estimated tax rules if your withholding and estimated tax payments are not sufficient. You can reduce or defer the income tax on a distribution by directly or indirectly rolling such distribution over to another IRA or eligible plan. You should consult your tax advisor for additional information.
State tax will be withheld if, at the time of your distribution, your address is within one of the mandatory withholding states and you have federal income tax withheld (or as otherwise required by state law). State taxes will be withheld from your distribution in accordance with the respective state rules.
*Some 403(b), 457 and qualified retirement plan distributions may be subject to 20% mandatory withholding, as they are subject to special tax and withholding rules. Your plan administrator or plan sponsor is required to provide you with a special tax notice explaining those rules at the time you request a distribution. If applicable, federal and/or state taxes may be withheld from your distribution amount.
Proxy Voting Policies
A description of the policies that the fund's investment advisor uses in exercising the voting rights associated with the securities purchased and/or held by the fund is available without charge, upon request, by calling 1-800-345-2021. It is also available on American Century Investments’ website at americancentury.com/proxy and on the Securities and Exchange Commission’s website at sec.gov. Information regarding how the investment advisor voted proxies relating to portfolio securities during the most recent 12-month period ended June 30 is available on americancentury.com/proxy. It is also available at sec.gov.
Quarterly Portfolio Disclosure
The fund files its complete schedule of portfolio holdings with the Securities and Exchange
Commission (SEC) for the first and third quarters of each fiscal year as an exhibit to its reports on
Form N-PORT. These portfolio holdings are available on the fund's website at
americancentury.com and, upon request, by calling 1-800-345-2021. The fund’s Form N-PORT
reports are available on the SEC’s website at sec.gov.
35
Other Tax Information
The following information is provided pursuant to provisions of the Internal Revenue Code.
The fund hereby designates up to the maximum amount allowable as qualified dividend income for the fiscal year ended March 31, 2022.
For corporate taxpayers, the fund hereby designates $183,186,631, or up to the maximum amount allowable, of ordinary income distributions paid during the fiscal year ended March 31, 2022 as qualified for the corporate dividends received deduction.
The fund hereby designates $1,302,283,318, or up to the maximum amount allowable, as long-term capital gain distributions (20% rate gain distributions) for the fiscal year ended March 31, 2022.
The fund hereby designates $354,217,480 as qualified short-term capital gain distributions for purposes of Internal Revenue Code Section 871 for the fiscal year ended March 31, 2022.
The fund utilized earnings and profits of $92,913,840 distributed to shareholders on redemption of shares as part of the dividends paid deduction (tax equalization).
36
| ||||||||
| Contact Us | americancentury.com | |||||||
| Automated Information Line | 1-800-345-8765 | |||||||
| Investor Services Representative | 1-800-345-2021 or 816-531-5575 | |||||||
| Investors Using Advisors | 1-800-378-9878 | |||||||
| Business, Not-For-Profit, Employer-Sponsored Retirement Plans | 1-800-345-3533 | |||||||
| Banks and Trust Companies, Broker-Dealers, Financial Professionals, Insurance Companies | 1-800-345-6488 | |||||||
| Telecommunications Relay Service for the Deaf | 711 | |||||||
| American Century Capital Portfolios, Inc. | ||||||||
Investment Advisor: American Century Investment Management, Inc. Kansas City, Missouri | ||||||||
| This report and the statements it contains are submitted for the general information of our shareholders. The report is not authorized for distribution to prospective investors unless preceded or accompanied by an effective prospectus. | ||||||||
| ©2022 American Century Proprietary Holdings, Inc. All rights reserved. CL-ANN-92271 2205 | ||||||||
| Annual Report | |||||
| March 31, 2022 | |||||
| Small Cap Value Fund | |||||
| Investor Class (ASVIX) | |||||
| I Class (ACVIX) | |||||
| Y Class (ASVYX) | |||||
| A Class (ACSCX) | |||||
| C Class (ASVNX) | |||||
| R Class (ASVRX) | |||||
| R5 Class (ASVGX) | |||||
| R6 Class (ASVDX) | |||||
| G Class (ASVHX) | |||||
| Table of Contents | ||
| President’s Letter | |||||
| Performance | |||||
| Portfolio Commentary | |||||
| Fund Characteristics | |||||
| Shareholder Fee Example | |||||
| Schedule of Investments | |||||
| Statement of Assets and Liabilities | |||||
| Statement of Operations | |||||
| Statement of Changes in Net Assets | |||||
| Notes to Financial Statements | |||||
| Financial Highlights | |||||
| Report of Independent Registered Public Accounting Firm | |||||
| Management | |||||
| Liquidity Risk Management Program | |||||
| Additional Information | |||||
Any opinions expressed in this report reflect those of the author as of the date of the report, and do not necessarily represent the opinions of American Century Investments® or any other person in the American Century Investments organization. Any such opinions are subject to change at any time based upon market or other conditions and American Century Investments disclaims any responsibility to update such opinions. These opinions may not be relied upon as investment advice and, because investment decisions made by American Century Investments funds are based on numerous factors, may not be relied upon as an indication of trading intent on behalf of any American Century Investments fund. Security examples are used for representational purposes only and are not intended as recommendations to purchase or sell securities. Performance information for comparative indices and securities is provided to American Century Investments by third party vendors. To the best of American Century Investments’ knowledge, such information is accurate at the time of printing.
| President’s Letter | ||
Jonathan ThomasDear Investor:
Thank you for reviewing this annual report for the period ended March 31, 2022. Annual reports help convey important information about fund returns, including market factors that affected performance. For additional investment insights, please visit americancentury.com.
Soaring Inflation, Escalating Volatility Led to Mixed Results for Stocks and Bonds
Upbeat economic and earnings data and continued Federal Reserve (Fed) support generally buoyed stock returns for most of the reporting period. Despite periodic outbreaks of COVID-19, the worst of the virus appeared over in the U.S., and pre-pandemic activities gradually resumed. Bonds delivered solid gains in the first half of the period before a Fed policy pivot triggered a drastic sentiment shift in fixed-income markets.
Early in the period, inflation began a steady upward march. Initially, the Fed was unfazed, viewing the price hikes as a temporary economic consequence of recovering from the pandemic. But by late 2021, inflation was surging toward multidecade highs, prompting the Fed to adopt a more hawkish strategy.
Policymakers announced an abrupt end to bond buying followed by a March rate hike, the first since 2018. At period-end, market indicators reflected expectations for more aggressive Fed rate hikes along with balance sheet cuts to tame inflation.
In addition to an 8.5% annual inflation rate and a hawkish Fed, Russia’s invasion of Ukraine further rattled investors in early 2022. Stocks declined sharply amid the unrest, but strong performance earlier in the fiscal year left most U.S. indices with solid 12-month gains. For bonds, declines in the second half of the reporting period overwhelmed earlier gains, and most U.S. fixed-income indices retreated for the 12 months overall.
Staying Focused in Uncertain Times
We expect market volatility to linger amid elevated inflation and tighter Fed policy. In addition, Russia’s invasion of Ukraine has led to a devastating humanitarian crisis and further complicated a tense geopolitical backdrop. We will continue to monitor the evolving situation and its implications for our clients and our investment exposure.
We appreciate your confidence in us during these extraordinary times. Our firm has a long history of helping clients weather unpredictable and volatile markets, and we’re confident we will continue to meet prevailing challenges.
Sincerely,
Jonathan Thomas
President and Chief Executive Officer
American Century Investments
2
| Performance | ||
| Total Returns as of March 31, 2022 | ||||||||||||||||||||
| Average Annual Returns | ||||||||||||||||||||
| Ticker Symbol | 1 year | 5 years | 10 years | Since Inception | Inception Date | |||||||||||||||
| Investor Class | ASVIX | 4.45% | 10.83% | 12.11% | — | 7/31/98 | ||||||||||||||
| Russell 2000 Value Index | — | 3.32% | 8.57% | 10.53% | — | — | ||||||||||||||
| I Class | ACVIX | 4.70% | 11.05% | 12.34% | — | 10/26/98 | ||||||||||||||
| Y Class | ASVYX | 4.75% | — | — | 11.63% | 4/10/17 | ||||||||||||||
| A Class | ACSCX | 12/31/99 | ||||||||||||||||||
| No sales charge | 4.20% | 10.54% | 11.82% | — | ||||||||||||||||
| With sales charge | -1.82% | 9.24% | 11.17% | — | ||||||||||||||||
| C Class | ASVNX | 3.49% | 9.75% | 10.99% | — | 3/1/10 | ||||||||||||||
| R Class | ASVRX | 3.87% | 10.27% | 11.55% | — | 3/1/10 | ||||||||||||||
| R5 Class | ASVGX | 4.70% | — | — | 11.48% | 4/10/17 | ||||||||||||||
| R6 Class | ASVDX | 4.86% | 11.22% | — | 11.26% | 7/26/13 | ||||||||||||||
| G Class | ASVHX | 5.62% | — | — | 18.72% | 4/1/19 | ||||||||||||||
Average annual returns since inception are presented when ten years of performance history is not available.
G Class returns would have been lower if a portion of the fees had not been waived.
C Class shares will automatically convert to A Class shares after being held for approximately eight years. C Class average annual returns do not reflect this conversion.
Sales charges include initial sales charges and contingent deferred sales charges (CDSCs), as applicable. A Class shares have a 5.75% maximum initial sales charge and may be subject to a maximum CDSC of 1.00%. C Class shares redeemed within 12 months of purchase are subject to a maximum CDSC of 1.00%. The SEC requires that mutual funds provide performance information net of maximum sales charges in all cases where charges could be applied.
Data presented reflect past performance. Past performance is no guarantee of future results. Current performance may be higher or lower than the performance shown. Total returns for periods less than one year are not annualized. Investment return and principal value will fluctuate, and redemption value may be more or less than original cost. Data assumes reinvestment of dividends and capital gains, and none of the charts reflect the deduction of taxes that a shareholder would pay on fund distributions or the redemption of fund shares. To obtain performance data current to the most recent month end, please call 1-800-345-2021 or visit americancentury.com. For additional information about the fund, please consult the prospectus.
3
| Growth of $10,000 Over 10 Years | ||
| $10,000 investment made March 31, 2012 | ||
| Performance for other share classes will vary due to differences in fee structure. | ||
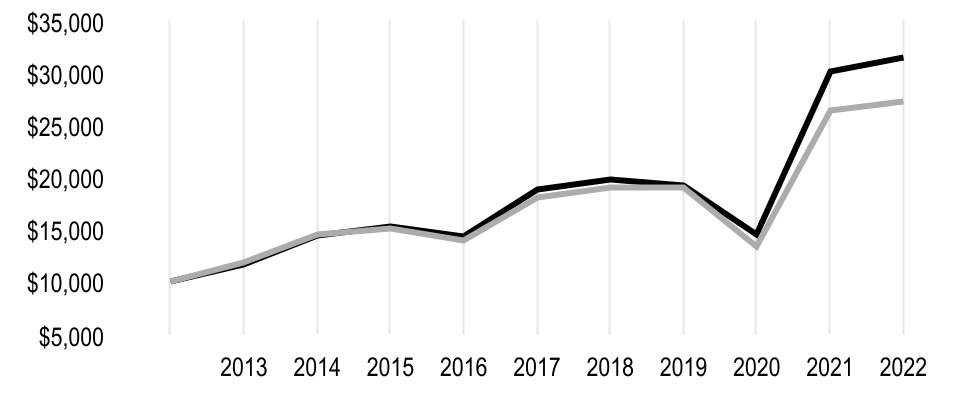
| Value on March 31, 2022 | |||||
| Investor Class — $31,383 | |||||
| Russell 2000 Value Index — $27,237 | |||||
| Total Annual Fund Operating Expenses | ||||||||||||||||||||||||||
| Investor Class | I Class | Y Class | A Class | C Class | R Class | R5 Class | R6 Class | G Class | ||||||||||||||||||
| 1.19% | 0.99% | 0.84% | 1.44% | 2.19% | 1.69% | 0.99% | 0.84% | 0.84% | ||||||||||||||||||
The total annual fund operating expenses shown is as stated in the fund’s prospectus current as of the date of this report. The prospectus may vary from the expense ratio shown elsewhere in this report because it is based on a different time period, includes acquired fund fees and expenses, and, if applicable, does not include fee waivers or expense reimbursements.
Data presented reflect past performance. Past performance is no guarantee of future results. Current performance may be higher or lower than the performance shown. Total returns for periods less than one year are not annualized. Investment return and principal value will fluctuate, and redemption value may be more or less than original cost. Data assumes reinvestment of dividends and capital gains, and none of the charts reflect the deduction of taxes that a shareholder would pay on fund distributions or the redemption of fund shares. To obtain performance data current to the most recent month end, please call 1-800-345-2021 or visit americancentury.com. For additional information about the fund, please consult the prospectus.
4
| Portfolio Commentary | ||
Portfolio Managers: Jeff John and Ryan Cope
Performance Summary
Small Cap Value rose 4.45%* for the 12-month period ended March 31, 2022. The fund’s benchmark, the Russell 2000 Value Index, rose 3.32% for the same time period. The fund’s return reflects operating expenses, while the index’s return does not.
Performance versus the benchmark was helped primarily by our underweight in the health care sector. In addition, strong security selection in the financials and information technology sectors buoyed relative results. On the other hand, underweight positions in the energy and real estate sectors hurt performance. Stock selection in the real estate and materials sectors also hindered returns.
Health Care, Financials and Information Technology Contributed
An underweight to the health care sector contributed to returns relative to the benchmark, especially in the biotechnology industry, which we avoided during the period. Favorable stock selections in the health care providers and services industry also contributed to returns. An overweight position in Apria, a home health care company, was advantageous, as the company was acquired at a 26% premium, eliminating our position. Our decision to avoid Invitae, a biotechnology company specializing in genomic testing, added to relative performance as well. A lack of exposure to the life sciences tools and services industry and to the pharmaceuticals industry also benefited returns.
In the financials sector, our selections were beneficial, especially in the diversified financial services, capital markets and insurance industries. In diversified financial services, a position in A-Mark Precious Metals, a precious metals trading company, performed well on strong demand and improved margins in the wholesale and direct-to-consumer business segments. In the capital markets industry, Donnelley Financial Solutions, a provider of risk and compliance solutions, was a notable contributor. This stock performed well as the pandemic waned and initial public offering and mergers and acquisitions activity rebounded, resulting in a dramatic improvement in sales and profits. In the insurance industry, Axis Capital Holdings also added to relative returns. This property/casualty and reinsurance underwriter showed improvement in premium growth and in its core loss ratios, resulting in strong returns on equity.
Information technology was another area of strength. Several holdings in the sector delivered strong performance. Teradata, a provider of data warehouse software, rose sharply on strong results for its cloud business, which resulted in expanded margins and improved free cash flows. The company also increased its 2022 growth guidance due to a robust deal pipeline and continued an aggressive share buyback program. Kulicke & Soffa Industries, a semiconductor equipment manufacturer, has benefited from accelerated purchases by semiconductor companies, particularly in response to the recent global semiconductor shortage. New product offerings have also supported financial results.
* All fund returns referenced in this commentary are for Investor Class shares. Performance for other share classes will vary due to differences in fee structure; when Investor Class performance exceeds that of the fund’s benchmark, other share classes may not. See page 3 for returns for all share classes.
5
Energy, Real Estate and Materials Detracted
In the energy sector, a large underweight was detrimental, especially in the oil, gas and consumable fuels industry. An underweight to the energy equipment and services industry, combined with a lack of exposure to two drilling companies, Patterson-UTI Energy and Helmerich & Payne, also hampered performance.
In the real estate sector, an underweight position weighed on relative returns, particularly in the equity real estate investment trusts (REITs) industry. In addition, the decision to avoid particular REITs in the residential segment, such as Independence Realty Trust, Preferred Apartment Communities and NexPoint Residential Trust, was detrimental. A lack of exposure to STAG Industrial and Terreno Realty in the industrial segment also detracted.
Positions in the materials sector also detracted. A lack of exposure to the metals and mining industry hampered performance, and while an overweight to the containers and packaging industry was beneficial, our position in Pactiv Evergreen detracted. This large producer of fresh food and beverage packaging underperformed due to higher costs and transitory challenges caused by the pandemic.
Portfolio Positioning
The portfolio seeks to invest in companies where we believe the valuation does not reflect the quality and normal earnings power of the company. Our process is based on individual security selection, but broad themes have emerged.
We ended the year overweight in information technology because we are finding a number of attractively valued opportunities, especially in the IT services and electronic equipment, instruments and components industries. We are also overweight the consumer discretionary sector, particularly in specialty retail, leisure products, household durables, and hotels, restaurants and leisure companies. With their attractive risk/reward profiles, we believe they will perform well as the economy continues to reopen. Our overweight in the industrials sector is driven by attractive stock-specific opportunities in the machinery and commercial services and supplies industries.
We remain underweight energy, but we do own a few companies in the sector that are perceived as higher-quality, including Enviva, a company that engages in the production and distribution of wood biomass to electric utility companies. This company has a quality balance sheet, is a high-dividend payer, suffered no ill effects from the pandemic lockdown and provides us with energy exposure. We are also underweight in the real estate sector despite adding some attractive names when pandemic lockdowns caused the sector to sell-off. We’ve also added to positions more recently. We viewed them as good values at relatively inexpensive prices.
6
| Fund Characteristics | ||
| MARCH 31, 2022 | |||||
| Types of Investments in Portfolio | % of net assets | ||||
| Common Stocks | 98.7% | ||||
| Short-Term Investments | 1.3% | ||||
| Other Assets and Liabilities | —* | ||||
| *Category is less than 0.05% of total net assets. | |||||
| Top Five Industries | % of net assets | ||||
| Banks | 20.1% | ||||
| Electronic Equipment, Instruments and Components | 7.7% | ||||
| Equity Real Estate Investment Trusts (REITs) | 6.0% | ||||
| Commercial Services and Supplies | 6.0% | ||||
| Machinery | 5.7% | ||||
7
| Shareholder Fee Example | ||
Fund shareholders may incur two types of costs: (1) transaction costs, including sales charges (loads) on purchase payments and redemption/exchange fees; and (2) ongoing costs, including management fees; distribution and service (12b-1) fees; and other fund expenses. This example is intended to help you understand your ongoing costs (in dollars) of investing in your fund and to compare these costs with the ongoing cost of investing in other mutual funds.
The example is based on an investment of $1,000 made at the beginning of the period and held for the entire period from October 1, 2021 to March 31, 2022.
Actual Expenses
The table provides information about actual account values and actual expenses for each class. You may use the information, together with the amount you invested, to estimate the expenses that you paid over the period. First, identify the share class you own. Then simply divide your account value by $1,000 (for example, an $8,600 account value divided by $1,000 = 8.6), then multiply the result by the number under the heading “Expenses Paid During Period” to estimate the expenses you paid on your account during this period.
If you hold Investor Class shares of any American Century Investments fund, or I Class shares of the American Century Diversified Bond Fund, in an American Century Investments account (i.e., not through a financial intermediary or employer-sponsored retirement plan account), American Century Investments may charge you a $25.00 annual account maintenance fee if the value of those shares is less than $10,000. We will redeem shares automatically in one of your accounts to pay the $25.00 fee. In determining your total eligible investment amount, we will include your investments in all personal accounts (including American Century Investments brokerage accounts) registered under your Social Security number. Personal accounts include individual accounts, joint accounts, UGMA/UTMA accounts, personal trusts, Coverdell Education Savings Accounts and IRAs (including traditional, Roth, Rollover, SEP-, SARSEP- and SIMPLE-IRAs), and certain other retirement accounts. If you have only business, business retirement, employer-sponsored or American Century Investments brokerage accounts, you are currently not subject to this fee. If you are subject to the account maintenance fee, your account value could be reduced by the fee amount.
Hypothetical Example for Comparison Purposes
The table also provides information about hypothetical account values and hypothetical expenses based on the actual expense ratio of each class of your fund and an assumed rate of return of 5% per year before expenses, which is not the actual return of a fund’s share class. The hypothetical account values and expenses may not be used to estimate the actual ending account balance or expenses you paid for the period. You may use this information to compare the ongoing costs of investing in your fund and other funds. To do so, compare this 5% hypothetical example with the 5% hypothetical examples that appear in the shareholder reports of the other funds.
Please note that the expenses shown in the table are meant to highlight your ongoing costs only and do not reflect any transactional costs, such as sales charges (loads) or redemption/exchange fees. Therefore, the table is useful in comparing ongoing costs only, and will not help you determine the relative total costs of owning different funds. In addition, if these transactional costs were included, your costs would have been higher.
8
| Beginning Account Value 10/1/21 | Ending Account Value 3/31/22 | Expenses Paid During Period(1) 10/1/21 - 3/31/22 | Annualized Expense Ratio(1) | |||||||||||
| Actual | ||||||||||||||
| Investor Class | $1,000 | $1,016.70 | $5.43 | 1.08% | ||||||||||
| I Class | $1,000 | $1,017.60 | $4.43 | 0.88% | ||||||||||
| Y Class | $1,000 | $1,017.30 | $3.67 | 0.73% | ||||||||||
| A Class | $1,000 | $1,014.80 | $6.68 | 1.33% | ||||||||||
| C Class | $1,000 | $1,011.40 | $10.43 | 2.08% | ||||||||||
| R Class | $1,000 | $1,013.70 | $7.93 | 1.58% | ||||||||||
| R5 Class | $1,000 | $1,017.50 | $4.43 | 0.88% | ||||||||||
| R6 Class | $1,000 | $1,018.30 | $3.67 | 0.73% | ||||||||||
| G Class | $1,000 | $1,022.10 | $0.00 | 0.00%(2) | ||||||||||
| Hypothetical | ||||||||||||||
| Investor Class | $1,000 | $1,019.55 | $5.44 | 1.08% | ||||||||||
| I Class | $1,000 | $1,020.54 | $4.43 | 0.88% | ||||||||||
| Y Class | $1,000 | $1,021.29 | $3.68 | 0.73% | ||||||||||
| A Class | $1,000 | $1,018.30 | $6.69 | 1.33% | ||||||||||
| C Class | $1,000 | $1,014.56 | $10.45 | 2.08% | ||||||||||
| R Class | $1,000 | $1,017.05 | $7.95 | 1.58% | ||||||||||
| R5 Class | $1,000 | $1,020.54 | $4.43 | 0.88% | ||||||||||
| R6 Class | $1,000 | $1,021.29 | $3.68 | 0.73% | ||||||||||
| G Class | $1,000 | $1,024.93 | $0.00 | 0.00%(2) | ||||||||||
(1)Expenses are equal to the class's annualized expense ratio listed in the table above, multiplied by the average account value over the period, multiplied by 182, the number of days in the most recent fiscal half-year, divided by 365, to reflect the one-half year period. Annualized expense ratio reflects actual expenses, including any applicable fee waivers or expense reimbursements and excluding any acquired fund fees and expenses.
(2)Other expenses, which include directors' fees and expenses, did not exceed 0.005%.
9
| Schedule of Investments | ||
MARCH 31, 2022
| Shares | Value | |||||||
| COMMON STOCKS — 98.7% | ||||||||
| Banks — 20.1% | ||||||||
| Ameris Bancorp | 1,641,775 | $ | 72,041,087 | |||||
| BankUnited, Inc. | 2,218,614 | 97,530,271 | ||||||
| ConnectOne Bancorp, Inc. | 882,516 | 28,249,337 | ||||||
| CVB Financial Corp. | 660,654 | 15,333,779 | ||||||
| F.N.B. Corp. | 8,065,895 | 100,420,393 | ||||||
| First BanCorp | 6,532,586 | 85,707,528 | ||||||
| First Hawaiian, Inc. | 137,669 | 3,839,588 | ||||||
| First Mid Bancshares, Inc. | 320,467 | 12,334,775 | ||||||
| Home BancShares, Inc. | 3,249,037 | 73,428,236 | ||||||
| Independent Bank Corp. (Massachusetts) | 517,677 | 42,289,034 | ||||||
| Independent Bank Group, Inc. | 818,423 | 58,238,981 | ||||||
| Old National Bancorp. | 5,995,188 | 98,201,180 | ||||||
| Origin Bancorp, Inc. | 655,724 | 27,730,568 | ||||||
| Pacific Premier Bancorp, Inc. | 2,174,242 | 76,859,455 | ||||||
| Premier Financial Corp. | 729,678 | 22,131,134 | ||||||
| QCR Holdings, Inc. | 300,746 | 17,019,216 | ||||||
| SouthState Corp. | 1,267,076 | 103,380,731 | ||||||
| Towne Bank | 912,097 | 27,308,184 | ||||||
| UMB Financial Corp. | 977,406 | 94,964,767 | ||||||
| Valley National Bancorp | 9,515,389 | 123,890,365 | ||||||
| Veritex Holdings, Inc. | 1,666,426 | 63,607,480 | ||||||
| 1,244,506,089 | ||||||||
| Building Products — 1.8% | ||||||||
Cornerstone Building Brands, Inc.(1) | 2,050,986 | 49,879,980 | ||||||
DIRTT Environmental Solutions(1)(2) | 3,909,691 | 5,317,180 | ||||||
| Tecnoglass, Inc. | 2,213,684 | 55,873,384 | ||||||
| 111,070,544 | ||||||||
| Capital Markets — 1.3% | ||||||||
Donnelley Financial Solutions, Inc.(1)(3) | 1,799,543 | 59,852,800 | ||||||
| Patria Investments Ltd., A Shares | 1,000,842 | 17,824,996 | ||||||
| 77,677,796 | ||||||||
| Chemicals — 1.0% | ||||||||
| Minerals Technologies, Inc. | 956,470 | 63,270,491 | ||||||
| Commercial Services and Supplies — 6.0% | ||||||||
| Brink's Co. | 1,898,148 | 129,074,064 | ||||||
CECO Environmental Corp.(1)(3) | 1,760,101 | 9,662,954 | ||||||
Charah Solutions, Inc.(1)(2)(3) | 1,925,932 | 9,610,401 | ||||||
Deluxe Corp.(3) | 2,287,638 | 69,178,173 | ||||||
| Healthcare Services Group, Inc. | 1,553,030 | 28,839,767 | ||||||
KAR Auction Services, Inc.(1) | 2,689,114 | 48,538,508 | ||||||
| Loomis AB | 1,666,426 | 45,454,792 | ||||||
| UniFirst Corp. | 155,449 | 28,646,142 | ||||||
| 369,004,801 | ||||||||
| Construction and Engineering — 1.6% | ||||||||
| Arcosa, Inc. | 320,467 | 18,346,736 | ||||||
Dycom Industries, Inc.(1) | 820,768 | 78,186,359 | ||||||
| 96,533,095 | ||||||||
10
| Shares | Value | |||||||
| Containers and Packaging — 2.8% | ||||||||
| Graphic Packaging Holding Co. | 6,172,677 | $ | 123,700,447 | |||||
| Pactiv Evergreen, Inc. | 4,986,916 | 50,168,375 | ||||||
| 173,868,822 | ||||||||
| Diversified Financial Services — 2.4% | ||||||||
| A-Mark Precious Metals, Inc. | 441,937 | 34,179,407 | ||||||
Compass Diversified Holdings(3) | 4,920,393 | 116,957,742 | ||||||
| 151,137,149 | ||||||||
| Electric Utilities — 0.3% | ||||||||
| PNM Resources, Inc. | 404,281 | 19,272,075 | ||||||
| Electronic Equipment, Instruments and Components — 7.7% | ||||||||
| Advanced Energy Industries, Inc. | 246,513 | 21,219,839 | ||||||
| Avnet, Inc. | 2,598,244 | 105,462,724 | ||||||
| Belden, Inc. | 946,609 | 52,442,139 | ||||||
Coherent, Inc.(1) | 310,606 | 84,907,256 | ||||||
II-VI, Inc.(1) | 2,198,893 | 159,397,753 | ||||||
| Vontier Corp. | 2,164,382 | 54,953,659 | ||||||
| 478,383,370 | ||||||||
| Energy Equipment and Services — 1.3% | ||||||||
ChampionX Corp.(1) | 3,096,199 | 75,794,952 | ||||||
NCS Multistage Holdings, Inc.(1) | 54,233 | 2,714,904 | ||||||
| 78,509,856 | ||||||||
| Equity Real Estate Investment Trusts (REITs) — 6.0% | ||||||||
| Brandywine Realty Trust | 4,205,506 | 59,465,855 | ||||||
| CareTrust REIT, Inc. | 2,031,265 | 39,203,414 | ||||||
| Cousins Properties, Inc. | 674,352 | 27,169,642 | ||||||
| Easterly Government Properties, Inc. | 1,230,033 | 26,002,898 | ||||||
| Four Corners Property Trust, Inc. | 1,883,357 | 50,925,973 | ||||||
| Getty Realty Corp. | 902,237 | 25,822,023 | ||||||
| Healthcare Realty Trust, Inc. | 325,397 | 8,941,910 | ||||||
| Highwoods Properties, Inc. | 576,840 | 26,384,662 | ||||||
| Kite Realty Group Trust | 1,124,098 | 25,595,711 | ||||||
| National Health Investors, Inc. | 591,631 | 34,912,145 | ||||||
| Physicians Realty Trust | 976,191 | 17,122,390 | ||||||
| Sabra Health Care REIT, Inc. | 1,099,447 | 16,370,766 | ||||||
Summit Hotel Properties, Inc.(1) | 1,597,402 | 15,910,124 | ||||||
| 373,827,513 | ||||||||
| Gas Utilities — 0.8% | ||||||||
| Northwest Natural Holding Co. | 244,585 | 12,649,936 | ||||||
| South Jersey Industries, Inc. | 542,328 | 18,737,433 | ||||||
| Southwest Gas Holdings, Inc. | 241,583 | 18,913,533 | ||||||
| 50,300,902 | ||||||||
| Health Care Equipment and Supplies — 0.7% | ||||||||
Varex Imaging Corp.(1) | 1,444,565 | 30,754,789 | ||||||
Zimvie, Inc.(1) | 571,910 | 13,062,424 | ||||||
| 43,817,213 | ||||||||
| Health Care Providers and Services — 2.3% | ||||||||
AMN Healthcare Services, Inc.(1) | 379,630 | 39,606,798 | ||||||
| National Healthcare Corp. | 332,928 | 23,381,533 | ||||||
| Patterson Cos., Inc. | 2,484,848 | 80,434,530 | ||||||
| 143,422,861 | ||||||||
| Hotels, Restaurants and Leisure — 3.1% | ||||||||
Accel Entertainment, Inc.(1) | 3,746,993 | 45,638,375 | ||||||
11
| Shares | Value | |||||||
| Boyd Gaming Corp. | 359,909 | $ | 23,674,814 | |||||
Dave & Buster's Entertainment, Inc.(1) | 1,451,043 | 71,246,211 | ||||||
Penn National Gaming, Inc.(1) | 566,980 | 24,051,291 | ||||||
Red Robin Gourmet Burgers, Inc.(1)(3) | 1,533,309 | 25,851,590 | ||||||
| 190,462,281 | ||||||||
| Household Durables — 2.0% | ||||||||
Mohawk Industries, Inc.(1) | 310,606 | 38,577,265 | ||||||
Skyline Champion Corp.(1) | 1,533,309 | 84,147,998 | ||||||
| 122,725,263 | ||||||||
| Household Products — 2.7% | ||||||||
| Spectrum Brands Holdings, Inc. | 1,863,636 | 165,341,786 | ||||||
| Insurance — 2.9% | ||||||||
| Axis Capital Holdings Ltd. | 2,065,777 | 124,917,535 | ||||||
| James River Group Holdings Ltd. | 527,538 | 13,051,290 | ||||||
| ProAssurance Corp. | 1,626,984 | 43,733,330 | ||||||
| 181,702,155 | ||||||||
| IT Services — 2.6% | ||||||||
Euronet Worldwide, Inc.(1) | 212,001 | 27,591,930 | ||||||
| EVERTEC, Inc. | 2,963,083 | 121,278,988 | ||||||
IBEX Holdings Ltd.(1)(3) | 912,648 | 14,547,609 | ||||||
| 163,418,527 | ||||||||
| Leisure Products — 2.9% | ||||||||
| Brunswick Corp. | 1,291,727 | 104,487,797 | ||||||
Malibu Boats, Inc., Class A(1) | 1,025,493 | 59,488,849 | ||||||
Solo Brands, Inc., Class A(1)(2) | 1,809,403 | 15,434,208 | ||||||
| 179,410,854 | ||||||||
| Machinery — 5.7% | ||||||||
| Albany International Corp., Class A | 59,016 | 4,976,229 | ||||||
Colfax Corp.(1) | 2,675,000 | 106,438,250 | ||||||
Gates Industrial Corp. PLC(1) | 5,171,836 | 77,887,850 | ||||||
Graham Corp.(3) | 730,505 | 5,632,194 | ||||||
| Luxfer Holdings PLC | 714,887 | 12,010,102 | ||||||
| Timken Co. | 2,445,406 | 148,436,144 | ||||||
| 355,380,769 | ||||||||
| Media — 1.0% | ||||||||
Entravision Communications Corp., Class A(3) | 7,853,894 | 50,343,461 | ||||||
Townsquare Media, Inc., Class A(1) | 796,960 | 10,193,118 | ||||||
| 60,536,579 | ||||||||
| Oil, Gas and Consumable Fuels — 1.0% | ||||||||
Earthstone Energy, Inc., Class A(1) | 892,376 | 11,270,709 | ||||||
| Enviva, Inc. | 616,282 | 48,778,720 | ||||||
| 60,049,429 | ||||||||
| Personal Products — 1.5% | ||||||||
| Edgewell Personal Care Co. | 2,622,895 | 96,181,560 | ||||||
| Professional Services — 2.5% | ||||||||
Barrett Business Services, Inc.(3) | 409,212 | 31,701,654 | ||||||
| KBR, Inc. | 458,514 | 25,094,471 | ||||||
| Korn Ferry | 1,493,867 | 97,011,723 | ||||||
| 153,807,848 | ||||||||
| Semiconductors and Semiconductor Equipment — 2.0% | ||||||||
Cohu, Inc.(1) | 793,771 | 23,495,622 | ||||||
| Kulicke & Soffa Industries, Inc. | 1,769,961 | 99,153,215 | ||||||
| 122,648,837 | ||||||||
12
| Shares/Principal Amount | Value | |||||||
| Software — 2.8% | ||||||||
Avaya Holdings Corp.(1)(3) | 4,915,463 | $ | 62,278,916 | |||||
Teradata Corp.(1) | 2,253,126 | 111,056,581 | ||||||
| 173,335,497 | ||||||||
| Specialty Retail — 3.9% | ||||||||
MarineMax, Inc.(1)(3) | 1,567,821 | 63,120,474 | ||||||
OneWater Marine, Inc., Class A(3) | 1,395,262 | 48,066,776 | ||||||
| Penske Automotive Group, Inc. | 1,376,270 | 128,984,024 | ||||||
| 240,171,274 | ||||||||
| Textiles, Apparel and Luxury Goods — 2.0% | ||||||||
| Tapestry, Inc. | 3,263,828 | 121,251,210 | ||||||
| Thrifts and Mortgage Finance — 0.8% | ||||||||
| Enact Holdings, Inc. | 1,079,726 | 24,023,903 | ||||||
| Provident Financial Services, Inc. | 1,193,122 | 27,919,055 | ||||||
| 51,942,958 | ||||||||
| Trading Companies and Distributors — 3.2% | ||||||||
Beacon Roofing Supply, Inc.(1) | 1,628,163 | 96,517,503 | ||||||
DXP Enterprises, Inc.(1)(3) | 1,178,331 | 31,920,987 | ||||||
GMS, Inc.(1) | 1,267,076 | 63,062,372 | ||||||
Karat Packaging, Inc.(1) | 373,624 | 7,416,436 | ||||||
| 198,917,298 | ||||||||
TOTAL COMMON STOCKS (Cost $5,234,926,422) | 6,111,886,702 | |||||||
| SHORT-TERM INVESTMENTS — 1.3% | ||||||||
| Discount Notes — 0.3% | ||||||||
Federal Farm Credit Discount Notes, 0.10%, 4/1/22(4) | $ | 20,000,000 | 20,000,000 | |||||
| Money Market Funds — 0.4% | ||||||||
| State Street Institutional U.S. Government Money Market Fund, Premier Class | 13,105,578 | 13,105,578 | ||||||
State Street Navigator Securities Lending Government Money Market Portfolio(5) | 8,263,030 | 8,263,030 | ||||||
| 21,368,608 | ||||||||
| Repurchase Agreements — 0.6% | ||||||||
| BMO Capital Markets Corp., (collateralized by various U.S. Treasury obligations, 3.125% - 3.625%, 2/15/43 - 8/15/43, valued at $3,651,837) in a joint trading account at 0.26%, dated 3/31/22, due 4/1/22 (Delivery value $3,579,582) | 3,579,556 | |||||||
| Fixed Income Clearing Corp., (collateralized by various U.S. Treasury obligations, 3.125%, 2/15/43, valued at $36,512,999) at 0.25%, dated 3/31/22, due 4/1/22 (Delivery value $35,797,249) | 35,797,000 | |||||||
| 39,376,556 | ||||||||
TOTAL SHORT-TERM INVESTMENTS (Cost $80,745,164) | 80,745,164 | |||||||
TOTAL INVESTMENT SECURITIES — 100.0% (Cost $5,315,671,586) | 6,192,631,866 | |||||||
OTHER ASSETS AND LIABILITIES† | (2,493,752) | |||||||
| TOTAL NET ASSETS — 100.0% | $ | 6,190,138,114 | ||||||
13
| FORWARD FOREIGN CURRENCY EXCHANGE CONTRACTS | ||||||||||||||||||||
| Currency Purchased | Currency Sold | Counterparty | Settlement Date | Unrealized Appreciation (Depreciation) | ||||||||||||||||
| SEK | 18,961,800 | USD | 2,018,335 | UBS AG | 6/30/22 | $ | 2,980 | |||||||||||||
| USD | 40,274,989 | SEK | 379,954,250 | UBS AG | 6/30/22 | (227,886) | ||||||||||||||
| USD | 963,946 | SEK | 8,906,300 | UBS AG | 6/30/22 | 14,540 | ||||||||||||||
| $ | (210,366) | |||||||||||||||||||
| NOTES TO SCHEDULE OF INVESTMENTS | ||||||||
| SEK | - | Swedish Krona | ||||||
| USD | - | United States Dollar | ||||||
†Category is less than 0.05% of total net assets.
(1)Non-income producing.
(2)Security, or a portion thereof, is on loan. At the period end, the aggregate value of securities on loan was $7,797,403. The amount of securities on loan indicated may not correspond with the securities on loan identified because securities with pending sales are in the process of recall from the brokers.
(3)Affiliated Company: the fund’s holding represents ownership of 5% or more of the voting securities of the company; therefore, the company is affiliated as defined in the Investment Company Act of 1940.
(4)The rate indicated is the yield to maturity at purchase.
(5)Investment of cash collateral from securities on loan. At the period end, the aggregate value of the collateral held by the fund was $8,270,772, which includes securities collateral of $7,742.
See Notes to Financial Statements.
14
| Statement of Assets and Liabilities | ||
| MARCH 31, 2022 | |||||
| Assets | |||||
| Investment securities - unaffiliated, at value (cost of $4,776,037,078) — including $7,756,829 of securities on loan | $ | 5,585,643,105 | |||
| Investment securities - affiliated, at value (cost of $531,371,478) — including $40,574 of securities on loan | 598,725,731 | ||||
| Investment made with cash collateral received for securities on loan, at value (cost of $8,263,030) | 8,263,030 | ||||
| Total investment securities, at value (cost of $5,315,671,586) | 6,192,631,866 | ||||
| Receivable for investments sold | 121,287,074 | ||||
| Receivable for capital shares sold | 10,947,601 | ||||
| Unrealized appreciation on forward foreign currency exchange contracts | 17,520 | ||||
| Dividends and interest receivable | 7,894,758 | ||||
| Securities lending receivable | 35,581 | ||||
| 6,332,814,400 | |||||
| Liabilities | |||||
| Payable for collateral received for securities on loan | 8,263,030 | ||||
| Payable for investments purchased | 37,309,763 | ||||
| Payable for capital shares redeemed | 92,458,537 | ||||
| Unrealized depreciation on forward foreign currency exchange contracts | 227,886 | ||||
| Accrued management fees | 4,366,918 | ||||
| Distribution and service fees payable | 50,152 | ||||
| 142,676,286 | |||||
| Net Assets | $ | 6,190,138,114 | |||
| Net Assets Consist of: | |||||
| Capital (par value and paid-in surplus) | $ | 5,273,156,253 | |||
| Distributable earnings | 916,981,861 | ||||
| $ | 6,190,138,114 | ||||
| Net Assets | Shares Outstanding | Net Asset Value Per Share | |||||||||
| Investor Class, $0.01 Par Value | $1,107,941,779 | 106,541,275 | $10.40 | ||||||||
| I Class, $0.01 Par Value | $2,691,382,609 | 255,654,472 | $10.53 | ||||||||
| Y Class, $0.01 Par Value | $106,556,883 | 10,105,407 | $10.54 | ||||||||
| A Class, $0.01 Par Value | $113,657,939 | 11,088,621 | $10.25* | ||||||||
| C Class, $0.01 Par Value | $26,317,400 | 2,777,512 | $9.48 | ||||||||
| R Class, $0.01 Par Value | $7,314,101 | 719,812 | $10.16 | ||||||||
| R5 Class, $0.01 Par Value | $14,646,228 | 1,390,006 | $10.54 | ||||||||
| R6 Class, $0.01 Par Value | $1,779,112,649 | 168,969,959 | $10.53 | ||||||||
| G Class, $0.01 Par Value | $343,208,526 | 32,518,335 | $10.55 | ||||||||
*Maximum offering price $10.88 (net asset value divided by 0.9425).
See Notes to Financial Statements.
15
| Statement of Operations | ||
| YEAR ENDED MARCH 31, 2022 | |||||
| Investment Income (Loss) | |||||
| Income: | |||||
| Dividends (including $14,412,679 from affiliates and net of foreign taxes withheld of $121,556) | $ | 84,222,958 | |||
| Securities lending, net | 144,984 | ||||
| Interest | 31,895 | ||||
| 84,399,837 | |||||
| Expenses: | |||||
| Management fees | 51,579,798 | ||||
| Distribution and service fees: | |||||
| A Class | 285,656 | ||||
| C Class | 239,161 | ||||
| R Class | 33,557 | ||||
| Directors' fees and expenses | 137,226 | ||||
| Other expenses | 331 | ||||
| 52,275,729 | |||||
| Fees waived - G Class | (2,933,350) | ||||
| 49,342,379 | |||||
| Net investment income (loss) | 35,057,458 | ||||
| Realized and Unrealized Gain (Loss) | |||||
| Net realized gain (loss) on: | |||||
| Investment transactions (including $50,626,489 from affiliates) (Note 4) | 422,710,674 | ||||
| Forward foreign currency exchange contract transactions | 5,198,162 | ||||
| Foreign currency translation transactions | 58,459 | ||||
| 427,967,295 | |||||
| Change in net unrealized appreciation (depreciation) on: | |||||
| Investments (including $(113,194,941) from affiliates) | (263,584,677) | ||||
| Forward foreign currency exchange contracts | (210,366) | ||||
| (263,795,043) | |||||
| Net realized and unrealized gain (loss) | 164,172,252 | ||||
| Net Increase (Decrease) in Net Assets Resulting from Operations | $ | 199,229,710 | |||
See Notes to Financial Statements.
16
| Statement of Changes in Net Assets | ||
| YEARS ENDED MARCH 31, 2022 AND MARCH 31, 2021 | ||||||||
| Increase (Decrease) in Net Assets | March 31, 2022 | March 31, 2021 | ||||||
| Operations | ||||||||
| Net investment income (loss) | $ | 35,057,458 | $ | 17,709,446 | ||||
| Net realized gain (loss) | 427,967,295 | 190,771,566 | ||||||
| Change in net unrealized appreciation (depreciation) | (263,795,043) | 1,587,349,837 | ||||||
| Net increase (decrease) in net assets resulting from operations | 199,229,710 | 1,795,830,849 | ||||||
| Distributions to Shareholders | ||||||||
| From earnings: | ||||||||
| Investor Class | (85,394,553) | (3,150,781) | ||||||
| I Class | (200,774,759) | (6,801,236) | ||||||
| Y Class | (6,566,926) | (339,676) | ||||||
| A Class | (8,624,080) | (153,102) | ||||||
| C Class | (1,964,123) | — | ||||||
| R Class | (504,032) | (1,916) | ||||||
| R5 Class | (1,031,885) | (45,434) | ||||||
| R6 Class | (116,741,559) | (4,992,095) | ||||||
| G Class | (33,912,858) | (5,290,956) | ||||||
| Decrease in net assets from distributions | (455,514,775) | (20,775,196) | ||||||
| Capital Share Transactions | ||||||||
| Net increase (decrease) in net assets from capital share transactions (Note 5) | 1,943,415,925 | 1,371,014,953 | ||||||
| Net increase (decrease) in net assets | 1,687,130,860 | 3,146,070,606 | ||||||
| Net Assets | ||||||||
| Beginning of period | 4,503,007,254 | 1,356,936,648 | ||||||
| End of period | $ | 6,190,138,114 | $ | 4,503,007,254 | ||||
See Notes to Financial Statements.
17
| Notes to Financial Statements | ||
MARCH 31, 2022
1. Organization
American Century Capital Portfolios, Inc. (the corporation) is registered under the Investment Company Act of 1940, as amended (the 1940 Act), as an open-end management investment company and is organized as a Maryland corporation. Small Cap Value Fund (the fund) is one fund in a series issued by the corporation. The fund’s investment objective is to seek long-term capital growth. Income is a secondary objective.
The fund offers the Investor Class, I Class, Y Class, A Class, C Class, R Class, R5 Class, R6 Class and G Class. The A Class may incur an initial sales charge. The A Class and C Class may be subject to a contingent deferred sales charge.
2. Significant Accounting Policies
The following is a summary of significant accounting policies consistently followed by the fund in preparation of its financial statements. The fund is an investment company and follows accounting and reporting guidance in accordance with accounting principles generally accepted in the United States of America. This may require management to make certain estimates and assumptions at the date of the financial statements. Actual results could differ from these estimates. Management evaluated the impact of events or transactions occurring through the date the financial statements were issued that would merit recognition or disclosure.
Investment Valuations — The fund determines the fair value of its investments and computes its net asset value (NAV) per share at the close of regular trading (usually 4 p.m. Eastern time) on the New York Stock Exchange (NYSE) on each day the NYSE is open. The Board of Directors has adopted valuation policies and procedures to guide the investment advisor in the fund’s investment valuation process and to provide methodologies for the oversight of the fund’s pricing function.
Equity securities that are listed or traded on a domestic securities exchange are valued at the last reported sales price or at the official closing price as provided by the exchange. Equity securities traded on foreign securities exchanges are generally valued at the closing price of such securities on the exchange where primarily traded or at the close of the NYSE, if that is earlier. If no last sales price is reported, or if local convention or regulation so provides, the mean of the latest bid and asked prices may be used. Securities traded over-the-counter are valued at the mean of the latest bid and asked prices, the last sales price, or the official closing price. Equity securities initially expressed in local currencies are translated into U.S. dollars at the mean of the appropriate currency exchange rate at the close of the NYSE as provided by an independent pricing service.
Fixed income securities are valued at the evaluated mean as provided by independent pricing services or at the mean of the most recent bid and asked prices as provided by investment dealers. U.S. Treasury and Government Agency securities are valued using market models that consider trade data, quotations from dealers and active market makers, relevant yield curve and spread data, creditworthiness, trade data or market information on comparable securities, and other relevant security specific information.
Open-end management investment companies are valued at the reported NAV per share. Repurchase agreements are valued at cost, which approximates fair value. Forward foreign currency exchange contracts are valued at the mean of the appropriate forward exchange rate at the close of the NYSE as provided by an independent pricing service.
If the fund determines that the market price for an investment is not readily available or the valuation methods mentioned above do not reflect an investment’s fair value, such investment is valued as determined in good faith by the Board of Directors or its delegate, in accordance with policies and procedures adopted by the Board of Directors. In its determination of fair value, the fund may review several factors including, but not limited to, market information regarding the specific investment or comparable investments and correlation with other investment types, futures indices or general market indicators. Circumstances that may cause the fund to use these procedures to value an investment include, but are not limited to: an investment has been declared in default or is distressed; trading in a security has been suspended during the trading day or a security is not actively trading on its principal exchange; prices received from a regular pricing source are deemed unreliable; or there is a foreign market holiday and no trading occurred.
18
The fund monitors for significant events occurring after the close of an investment’s primary exchange but before the fund’s NAV per share is determined. Significant events may include, but are not limited to: corporate announcements and transactions; governmental action and political unrest that could impact a specific investment or an investment sector; or armed conflicts, natural disasters and similar events that could affect investments in a specific country or region. The fund also monitors for significant fluctuations between domestic and foreign markets, as evidenced by the U.S. market or such other indicators that the Board of Directors, or its delegate, deems appropriate. The fund may apply a model-derived factor to the closing price of equity securities traded on foreign securities exchanges. The factor is based on observable market data as provided by an independent pricing service.
Security Transactions — Security transactions are accounted for as of the trade date. Net realized gains and losses are determined on the identified cost basis, which is also used for federal income tax purposes.
Investment Income — Dividend income less foreign taxes withheld, if any, is recorded as of the ex-dividend date. Distributions received on securities that represent a return of capital or long-term capital gain are recorded as a reduction of cost of investments and/or as a realized gain. The fund may estimate the components of distributions received that may be considered nontaxable distributions or long-term capital gain distributions for income tax purposes. Interest income is recorded on the accrual basis and includes accretion of discounts and amortization of premiums. Securities lending income is net of fees and rebates earned by the lending agent for its services.
Foreign Currency Translations — All assets and liabilities initially expressed in foreign currencies are translated into U.S. dollars at prevailing exchange rates at period end. The fund may enter into spot foreign currency exchange contracts to facilitate transactions denominated in a foreign currency. Purchases and sales of investment securities, dividend and interest income, spot foreign currency exchange contracts, and expenses are translated at the rates of exchange prevailing on the respective dates of such transactions. Net realized and unrealized foreign currency exchange gains or losses related to investment securities are a component of net realized gain (loss) on investment transactions and change in net unrealized appreciation (depreciation) on investments, respectively.
Repurchase Agreements — The fund may enter into repurchase agreements with institutions that American Century Investment Management, Inc. (ACIM) (the investment advisor) has determined are creditworthy pursuant to criteria adopted by the Board of Directors. The fund requires that the collateral, represented by securities, received in a repurchase transaction be transferred to the custodian in a manner sufficient to enable the fund to obtain those securities in the event of a default under the repurchase agreement. ACIM monitors, on a daily basis, the securities transferred to ensure the value, including accrued interest, of the securities under each repurchase agreement is equal to or greater than amounts owed to the fund under each repurchase agreement.
Joint Trading Account — Pursuant to an Exemptive Order issued by the Securities and Exchange Commission, the fund, along with certain other funds in the American Century Investments family of funds, may transfer uninvested cash balances into a joint trading account. These balances are invested in one or more repurchase agreements that are collateralized by U.S. Treasury or Agency obligations.
Segregated Assets — In accordance with the 1940 Act, the fund segregates assets on its books and records to cover certain types of investment securities and other financial instruments. ACIM monitors, on a daily basis, the securities segregated to ensure the fund designates a sufficient amount of liquid assets, marked-to-market daily. The fund may also receive assets or be required to pledge assets at the custodian bank or with a broker for collateral requirements.
Income Tax Status — It is the fund’s policy to distribute substantially all net investment income and net realized gains to shareholders and to otherwise qualify as a regulated investment company under provisions of the Internal Revenue Code. Accordingly, no provision has been made for income taxes. The fund files U.S. federal, state, local and non-U.S. tax returns as applicable. The fund's tax returns are subject to examination by the relevant taxing authority until expiration of the applicable statute of limitations, which is generally three years from the date of filing but can be longer in certain jurisdictions. At this time, management believes there are no uncertain tax positions which, based on their technical merit, would not be sustained upon examination and for which it is reasonably possible that the total amounts of unrecognized tax benefits will significantly change in the next twelve months.
19
Multiple Class — All shares of the fund represent an equal pro rata interest in the net assets of the class to which such shares belong, and have identical voting, dividend, liquidation and other rights and the same terms and conditions, except for class specific expenses and exclusive rights to vote on matters affecting only individual classes. Income, non-class specific expenses, and realized and unrealized capital gains and losses of the fund are allocated to each class of shares based on their relative net assets.
Distributions to Shareholders — Distributions from net investment income, if any, are generally declared and paid quarterly. Distributions from net realized gains, if any, are generally declared and paid annually. The fund may elect to treat a portion of its payment to a redeeming shareholder, which represents the pro rata share of undistributed net investment income and net realized gains, as a distribution for federal income tax purposes (tax equalization).
Indemnifications — Under the corporation’s organizational documents, its officers and directors are indemnified against certain liabilities arising out of the performance of their duties to the fund. In addition, in the normal course of business, the fund enters into contracts that provide general indemnifications. The maximum exposure under these arrangements is unknown as this would involve future claims that may be made against a fund. The risk of material loss from such claims is considered by management to be remote.
Securities Lending — Securities are lent to qualified financial institutions and brokers. State Street Bank & Trust Co. serves as securities lending agent to the fund pursuant to a Securities Lending Agreement. The lending of securities exposes the fund to risks such as: the borrowers may fail to return the loaned securities, the borrowers may not be able to provide additional collateral, the fund may experience delays in recovery of the loaned securities or delays in access to collateral, or the fund may experience losses related to the investment collateral. To minimize certain risks, loan counterparties pledge collateral in the form of cash and/or securities. The lending agent has agreed to indemnify the fund in the case of default of any securities borrowed. Cash collateral received is invested in the State Street Navigator Securities Lending Government Money Market Portfolio, a money market mutual fund registered under the 1940 Act. The loans may also be secured by U.S. government securities in an amount at least equal to the market value of the securities loaned, plus accrued interest and dividends, determined on a daily basis and adjusted accordingly. By lending securities, the fund seeks to increase its net investment income through the receipt of interest and fees. Such income is reflected separately within the Statement of Operations. The value of loaned securities and related collateral outstanding at period end, if any, are shown on a gross basis within the Schedule of Investments and Statement of Assets and Liabilities.
The following table reflects a breakdown of transactions accounted for as secured borrowings, the gross obligation by the type of collateral pledged, and the remaining contractual maturity of those transactions as of March 31, 2022.
| Remaining Contractual Maturity of Agreements | |||||||||||||||||
| Overnight and Continuous | <30 days | Between 30 & 90 days | >90 days | Total | |||||||||||||
Securities Lending Transactions(1) | |||||||||||||||||
| Common Stocks | $ | 8,263,030 | — | — | — | $ | 8,263,030 | ||||||||||
| Gross amount of recognized liabilities for securities lending transactions | $ | 8,263,030 | |||||||||||||||
(1)Amount represents the payable for cash collateral received for securities on loan. This will generally be in the Overnight and Continuous column as the securities are typically callable on demand.
20
3. Fees and Transactions with Related Parties
Certain officers and directors of the corporation are also officers and/or directors of American Century Companies, Inc. (ACC). The corporation’s investment advisor, ACIM, the corporation's distributor, American Century Investment Services, Inc. (ACIS), and the corporation’s transfer agent, American Century Services, LLC, are wholly owned, directly or indirectly, by ACC.
Management Fees — The corporation has entered into a management agreement with ACIM, under which ACIM provides the fund with investment advisory and management services in exchange for a single, unified management fee (the fee) per class. The agreement provides that ACIM will pay all expenses of managing and operating the fund, except brokerage expenses, taxes, interest, fees and expenses of the independent directors (including legal counsel fees), extraordinary expenses, and expenses incurred in connection with the provision of shareholder services and distribution services under a plan adopted pursuant to Rule 12b-1 under the 1940 Act. The fee is computed and accrued daily based on each class's daily net assets and paid monthly in arrears. The difference in the fee among the classes is a result of their separate arrangements for non-Rule 12b-1 shareholder services. It is not the result of any difference in advisory or custodial fees or other expenses related to the management of the fund's assets, which do not vary by class. The rate of the fee is determined by applying a fee rate calculation formula. This formula takes into account the fund's assets as well as certain assets, if any, of other clients of the investment advisor outside the American Century Investments family of funds (such as subadvised funds and separate accounts) that use very similar investment teams and strategies (strategy assets). The investment advisor agreed to waive the G Class's management fee in its entirety. The investment advisor expects this waiver to remain in effect permanently and cannot terminate it without the approval of the Board of Directors.
The management fee schedule range and the effective annual management fee for each class for the period ended March 31, 2022 are as follows:
Management Fee Schedule Range | Effective Annual Management Fee | |||||||
| Investor Class | 1.00% to 1.25% | 1.09% | ||||||
| I Class | 0.80% to 1.05% | 0.89% | ||||||
| Y Class | 0.65% to 0.90% | 0.74% | ||||||
| A Class | 1.00% to 1.25% | 1.09% | ||||||
| C Class | 1.00% to 1.25% | 1.09% | ||||||
| R Class | 1.00% to 1.25% | 1.09% | ||||||
| R5 Class | 0.80% to 1.05% | 0.89% | ||||||
| R6 Class | 0.65% to 0.90% | 0.74% | ||||||
| G Class | 0.65% to 0.90% | 0.00%(1) | ||||||
(1)Effective annual management fee before waiver was 0.74%.
Distribution and Service Fees — The Board of Directors has adopted a separate Master Distribution and Individual Shareholder Services Plan for each of the A Class, C Class and R Class (collectively the plans), pursuant to Rule 12b-1 of the 1940 Act. The plans provide that the A Class will pay ACIS an annual distribution and service fee of 0.25%. The plans provide that the C Class will pay ACIS an annual distribution and service fee of 1.00%, of which 0.25% is paid for individual shareholder services and 0.75% is paid for distribution services. The plans provide that the R Class will pay ACIS an annual distribution and service fee of 0.50%. The fees are computed and accrued daily based on each class’s daily net assets and paid monthly in arrears. The fees are used to pay financial intermediaries for distribution and individual shareholder services. Fees incurred under the plans during the period ended March 31, 2022 are detailed in the Statement of Operations.
21
Directors' Fees and Expenses — The Board of Directors is responsible for overseeing the investment advisor’s management and operations of the fund. The directors receive detailed information about the fund and its investment advisor regularly throughout the year, and meet at least quarterly with management of the investment advisor to review reports about fund operations. The fund’s officers do not receive compensation from the fund.
Interfund Transactions — The fund may enter into security transactions with other American Century Investments funds and other client accounts of the investment advisor, in accordance with the 1940 Act rules and procedures adopted by the Board of Directors. The rules and procedures require, among other things, that these transactions be effected at the independent current market price of the security. During the period, the interfund purchases were $4,489,112 and there were no interfund sales.
4. Investment Transactions
Purchases and sales of investment securities, excluding short-term investments and in kind transactions, for the period ended March 31, 2022 were $4,112,272,887 and $2,452,354,979, respectively.
For the period ended March 31, 2022, the fund incurred net realized gains of $38,830,076 from redemptions in kind. A redemption in kind occurs when a fund delivers securities from its portfolio in lieu of cash as payment to a redeeming shareholder.
22
5. Capital Share Transactions
Transactions in shares of the fund were as follows:
| Year ended March 31, 2022 | Year ended March 31, 2021 | |||||||||||||
| Shares | Amount | Shares | Amount | |||||||||||
| Investor Class/Shares Authorized | 700,000,000 | 700,000,000 | ||||||||||||
| Sold | 47,898,248 | $ | 535,098,036 | 40,326,653 | $ | 326,284,879 | ||||||||
| Issued in reinvestment of distributions | 7,868,332 | 83,518,740 | 430,711 | 3,039,149 | ||||||||||
| Redeemed | (38,471,805) | (427,162,341) | (35,943,298) | (261,463,817) | ||||||||||
| 17,294,775 | 191,454,435 | 4,814,066 | 67,860,211 | |||||||||||
| I Class/Shares Authorized | 1,500,000,000 | 800,000,000 | ||||||||||||
| Sold | 155,758,028 | 1,745,410,740 | 153,121,813 | 1,350,198,944 | ||||||||||
| Issued in reinvestment of distributions | 16,588,074 | 178,302,193 | 791,999 | 6,121,740 | ||||||||||
| Redeemed | (105,364,131) | (1,175,678,794) | (42,625,240) | (330,844,984) | ||||||||||
| 66,981,971 | 748,034,139 | 111,288,572 | 1,025,475,700 | |||||||||||
| Y Class/Shares Authorized | 60,000,000 | 60,000,000 | ||||||||||||
| Sold | 6,199,280 | 68,661,686 | 3,747,350 | 31,726,079 | ||||||||||
| Issued in reinvestment of distributions | 434,498 | 4,680,071 | 32,693 | 251,672 | ||||||||||
| Redeemed | (2,671,253) | (29,656,559) | (2,206,380) | (16,362,220) | ||||||||||
| 3,962,525 | 43,685,198 | 1,573,663 | 15,615,531 | |||||||||||
| A Class/Shares Authorized | 80,000,000 | 80,000,000 | ||||||||||||
| Sold | 4,942,951 | 54,328,984 | 3,384,280 | 27,106,052 | ||||||||||
| Issued in reinvestment of distributions | 774,979 | 8,107,973 | 23,213 | 149,558 | ||||||||||
| Redeemed | (3,545,343) | (38,455,376) | (3,895,324) | (30,777,886) | ||||||||||
| 2,172,587 | 23,981,581 | (487,831) | (3,522,276) | |||||||||||
| C Class/Shares Authorized | 25,000,000 | 25,000,000 | ||||||||||||
| Sold | 1,325,224 | 13,600,276 | 1,205,644 | 9,721,981 | ||||||||||
| Issued in reinvestment of distributions | 171,921 | 1,662,626 | — | — | ||||||||||
| Redeemed | (279,450) | (2,797,652) | (176,515) | (1,278,094) | ||||||||||
| 1,217,695 | 12,465,250 | 1,029,129 | 8,443,887 | |||||||||||
| R Class/Shares Authorized | 20,000,000 | 180,000,000 | ||||||||||||
| Sold | 414,495 | 4,529,516 | 184,334 | 1,574,021 | ||||||||||
| Issued in reinvestment of distributions | 48,597 | 504,032 | 306 | 1,915 | ||||||||||
| Redeemed | (229,674) | (2,479,922) | (149,094) | (1,179,377) | ||||||||||
| 233,418 | 2,553,626 | 35,546 | 396,559 | |||||||||||
| R5 Class/Shares Authorized | 20,000,000 | 40,000,000 | ||||||||||||
| Sold | 1,088,366 | 12,203,841 | 1,441,277 | 10,417,513 | ||||||||||
| Issued in reinvestment of distributions | 95,911 | 1,031,885 | 6,113 | 45,434 | ||||||||||
| Redeemed | (702,177) | (7,852,962) | (1,180,367) | (8,588,379) | ||||||||||
| 482,100 | 5,382,764 | 267,023 | 1,874,568 | |||||||||||
| R6 Class/Shares Authorized | 900,000,000 | 450,000,000 | ||||||||||||
| Sold | 105,191,783 | 1,180,480,567 | 56,027,727 | 446,342,135 | ||||||||||
| Issued in reinvestment of distributions | 10,500,337 | 112,884,267 | 652,567 | 4,948,292 | ||||||||||
| Redeemed | (33,550,767) | (376,237,451) | (25,033,289) | (199,977,832) | ||||||||||
| 82,141,353 | 917,127,383 | 31,647,005 | 251,312,595 | |||||||||||
| G Class/Shares Authorized | 300,000,000 | 300,000,000 | ||||||||||||
| Sold | 11,418,982 | 129,340,781 | 20,818,476 | 125,595,248 | ||||||||||
| Issued in reinvestment of distributions | 3,142,112 | 33,912,858 | 696,920 | 5,290,956 | ||||||||||
| Redeemed | (15,077,068) | (164,522,090) | (14,913,075) | (127,328,026) | ||||||||||
| (515,974) | (1,268,451) | 6,602,321 | 3,558,178 | |||||||||||
| Net increase (decrease) | 173,970,450 | $ | 1,943,415,925 | 156,769,494 | $ | 1,371,014,953 | ||||||||
23
6. Affiliated Company Transactions
If a fund's holding represents ownership of 5% or more of the voting securities of a company, the company is affiliated as defined in the 1940 Act. A summary of transactions for each company which is or was an affiliate at or during the period ended March 31, 2022 follows (amounts in thousands):
| Company | Beginning Value | Purchase Cost | Sales Cost | Change in Net Unrealized Appreciation (Depreciation) | Ending Value | Ending Shares | Net Realized Gain (Loss) | Income | ||||||||||||||||||
Avaya Holdings Corp.(1) | $ | 31,394 | $ | 82,226 | $ | 1,497 | $ | (49,844) | $ | 62,279 | 4,915 | $ | (39) | — | ||||||||||||
| Barrett Business Services, Inc. | 28,577 | 5,533 | 5,898 | 3,490 | 31,702 | 409 | 1,132 | $ | 500 | |||||||||||||||||
CECO Environmental Corp.(1) | 13,600 | 511 | 102 | (4,346) | 9,663 | 1,760 | 35 | — | ||||||||||||||||||
Charah Solutions, Inc.(1)(2) | 9,748 | 626 | 2,033 | 1,269 | 9,610 | 1,926 | (898) | — | ||||||||||||||||||
| Compass Diversified Holdings | 93,642 | 33,769 | 11,606 | 1,153 | 116,958 | 4,920 | 2,748 | 7,715 | ||||||||||||||||||
| Deluxe Corp. | 87,487 | 16,695 | 10,396 | (24,608) | 69,178 | 2,288 | (1,196) | 2,638 | ||||||||||||||||||
Donnelley Financial Solutions, Inc.(1) | 86,273 | 9,491 | 34,767 | (1,145) | 59,853 | 1,800 | 24,489 | — | ||||||||||||||||||
DXP Enterprises, Inc.(1) | 33,853 | 12,400 | 11,507 | (2,825) | 31,921 | 1,178 | 270 | — | ||||||||||||||||||
| Entravision Communications Corp., Class A | 33,027 | 6,988 | 4,949 | 15,277 | 50,343 | 7,854 | 5,618 | 768 | ||||||||||||||||||
| Graham Corp. | 10,550 | — | 110 | (4,808) | 5,632 | 731 | (30) | 244 | ||||||||||||||||||
IBEX Holdings Ltd.(1) | 16,280 | 3,151 | 129 | (4,754) | 14,548 | 913 | 77 | — | ||||||||||||||||||
MarineMax, Inc.(1) | 57,751 | 28,099 | 9,306 | (13,424) | 63,120 | 1,568 | (797) | — | ||||||||||||||||||
| OneWater Marine, Inc., Class A | 45,155 | 12,178 | 142 | (9,124) | 48,067 | 1,395 | 573 | 2,187 | ||||||||||||||||||
Red Robin Gourmet Burgers, Inc.(1) | 59,034 | 2,798 | 162 | (35,818) | 25,852 | 1,533 | 204 | — | ||||||||||||||||||
Tecnoglass,Inc.(3) | 26,504 | 33,668 | 20,611 | 16,312 | (3) | (3) | 18,440 | 361 | ||||||||||||||||||
| $ | 632,875 | $ | 248,133 | $ | 113,215 | $ | (113,195) | $ | 598,726 | 33,190 | $ | 50,626 | $ | 14,413 | ||||||||||||
(1)Non-income producing.
(2)Security, or a portion thereof, is on loan.
(3)Company was not an affiliate at March 31 2022.
24
7. Fair Value Measurements
The fund’s investments valuation process is based on several considerations and may use multiple inputs to determine the fair value of the investments held by the fund. In conformity with accounting principles generally accepted in the United States of America, the inputs used to determine a valuation are classified into three broad levels.
•Level 1 valuation inputs consist of unadjusted quoted prices in an active market for identical investments.
•Level 2 valuation inputs consist of direct or indirect observable market data (including quoted prices for comparable investments, evaluations of subsequent market events, interest rates, prepayment speeds, credit risk, etc.). These inputs also consist of quoted prices for identical investments initially expressed in local currencies that are adjusted through translation into U.S. dollars.
•Level 3 valuation inputs consist of unobservable data (including a fund���s own assumptions).
The level classification is based on the lowest level input that is significant to the fair valuation measurement. The valuation inputs are not necessarily an indication of the risks associated with investing in these securities or other financial instruments.
The following is a summary of the level classifications as of period end. The Schedule of Investments provides additional information on the fund’s portfolio holdings.
| Level 1 | Level 2 | Level 3 | |||||||||
| Assets | |||||||||||
| Investment Securities | |||||||||||
| Common Stocks | $ | 6,066,431,910 | $ | 45,454,792 | — | ||||||
| Short-Term Investments | 21,368,608 | 59,376,556 | — | ||||||||
| $ | 6,087,800,518 | $ | 104,831,348 | — | |||||||
| Other Financial Instruments | |||||||||||
| Forward Foreign Currency Exchange Contracts | — | $ | 17,520 | — | |||||||
| Liabilities | |||||||||||
| Other Financial Instruments | |||||||||||
| Forward Foreign Currency Exchange Contracts | — | $ | 227,886 | — | |||||||
8. Derivative Instruments
Foreign Currency Risk — The fund is subject to foreign currency exchange rate risk in the normal course of pursuing its investment objectives. The value of foreign investments held by a fund may be significantly affected by changes in foreign currency exchange rates. The dollar value of a foreign security generally decreases when the value of the dollar rises against the foreign currency in which the security is denominated and tends to increase when the value of the dollar declines against such foreign currency. A fund may enter into forward foreign currency exchange contracts to reduce a fund's exposure to foreign currency exchange rate fluctuations. The net U.S. dollar value of foreign currency underlying all contractual commitments held by a fund and the resulting unrealized appreciation or depreciation are determined daily. Realized gain or loss is recorded upon settlement of the contract. Net realized and unrealized gains or losses occurring during the holding period of forward foreign currency exchange contracts are a component of net realized gain (loss) on forward foreign currency exchange contract transactions and change in net unrealized appreciation (depreciation) on forward foreign currency exchange contracts, respectively. A fund bears the risk of an unfavorable change in the foreign currency exchange rate underlying the forward contract. Additionally, losses, up to the fair value, may arise if the counterparties do not perform under the contract terms. The fund's average U.S. dollar exposure to foreign currency risk derivative instruments held during the period was $44,558,197.
25
The value of foreign currency risk derivative instruments as of March 31, 2022, is disclosed on the Statement of Assets and Liabilities as an asset of $17,520 in unrealized appreciation on forward foreign currency exchange contracts and a liability of $227,886 in unrealized depreciation on forward foreign currency exchange contracts. For the year ended March 31, 2022, the effect of foreign currency risk derivative instruments on the Statement of Operations was $5,198,162 in net realized gain (loss) on forward foreign currency exchange contract transactions and $(210,366) in change in net unrealized appreciation (depreciation) on forward foreign currency exchange contracts.
9. Risk Factors
The value of the fund’s shares will go up and down, sometimes rapidly or unpredictably, based on the performance of the securities owned by the fund and other factors generally affecting the securities market. Market risks, including political, regulatory, economic and social developments, can affect the value of the fund’s investments. Natural disasters, public health emergencies, war, terrorism and other unforeseeable events may lead to increased market volatility and may have adverse long-term effects on world economies and markets generally.
The fund invests in common stocks of small companies. Because of this, the fund may be subject to greater risk and market fluctuations than a fund investing in larger, more established companies.
10. Federal Tax Information
The tax character of distributions paid during the years ended March 31, 2022 and March 31, 2021 were as follows:
| 2022 | 2021 | |||||||
| Distributions Paid From | ||||||||
| Ordinary income | $ | 300,112,544 | $ | 20,775,196 | ||||
| Long-term capital gains | $ | 155,402,231 | — | |||||
The book-basis character of distributions made during the year from net investment income or net realized gains may differ from their ultimate characterization for federal income tax purposes. These differences reflect the differing character of certain income items and net realized gains and losses for financial statement and tax purposes, and may result in reclassification among certain capital accounts on the financial statements.
As of period end, the federal tax cost of investments and the components of distributable earnings on a tax-basis were as follows:
| Federal tax cost of investments | $ | 5,417,400,264 | |||
| Gross tax appreciation of investments | $ | 1,000,717,036 | |||
| Gross tax depreciation of investments | (225,485,434) | ||||
| Net tax appreciation (depreciation) of investments | $ | 775,231,602 | |||
| Undistributed ordinary income | $ | 30,249,199 | |||
| Accumulated long-term gains | $ | 111,501,060 | |||
The difference between book-basis and tax-basis unrealized appreciation (depreciation) is attributable primarily to the tax deferral of losses on wash sales.
26
| Financial Highlights | ||
| For a Share Outstanding Throughout the Years Ended March 31 (except as noted) | |||||||||||||||||||||||||||||||||||||||||||||||
| Per-Share Data | Ratios and Supplemental Data | ||||||||||||||||||||||||||||||||||||||||||||||
| Income From Investment Operations: | Distributions From: | Ratio to Average Net Assets of: | |||||||||||||||||||||||||||||||||||||||||||||
| Net Asset Value, Beginning of Period | Net Investment Income (Loss)(1) | Net Realized and Unrealized Gain (Loss) | Total From Investment Operations | Net Investment Income | Net Realized Gains | Total Distributions | Net Asset Value, End of Period | Total Return(2) | Operating Expenses | Operating Expenses (before expense waiver) | Net Investment Income (Loss) | Net Investment Income (Loss) (before expense waiver) | Portfolio Turnover Rate | Net Assets, End of Period (in thousands) | |||||||||||||||||||||||||||||||||
| Investor Class | |||||||||||||||||||||||||||||||||||||||||||||||
| 2022 | $10.74 | 0.04 | 0.45 | 0.49 | (0.06) | (0.77) | (0.83) | $10.40 | 4.45% | 1.09% | 1.09% | 0.35% | 0.35% | 43% | $1,107,942 | ||||||||||||||||||||||||||||||||
| 2021 | $5.20 | 0.03 | 5.55 | 5.58 | (0.04) | — | (0.04) | $10.74 | 107.63% | 1.19% | 1.19% | 0.46% | 0.46% | 72% | $958,579 | ||||||||||||||||||||||||||||||||
| 2020 | $7.05 | 0.05 | (1.71) | (1.66) | (0.04) | (0.15) | (0.19) | $5.20 | (24.44)% | 1.25% | 1.25% | 0.71% | 0.71% | 71% | $439,030 | ||||||||||||||||||||||||||||||||
| 2019 | $8.64 | 0.06 | (0.44) | (0.38) | (0.05) | (1.16) | (1.21) | $7.05 | (3.15)% | 1.25% | 1.25% | 0.68% | 0.68% | 90% | $594,650 | ||||||||||||||||||||||||||||||||
| 2018 | $9.39 | 0.04 | 0.47 | 0.51 | (0.03) | (1.23) | (1.26) | $8.64 | 5.41% | 1.26% | 1.26% | 0.42% | 0.42% | 90% | $687,877 | ||||||||||||||||||||||||||||||||
| I Class | |||||||||||||||||||||||||||||||||||||||||||||||
| 2022 | $10.86 | 0.06 | 0.46 | 0.52 | (0.08) | (0.77) | (0.85) | $10.53 | 4.70% | 0.89% | 0.89% | 0.55% | 0.55% | 43% | $2,691,383 | ||||||||||||||||||||||||||||||||
| 2021 | $5.26 | 0.05 | 5.61 | 5.66 | (0.06) | — | (0.06) | $10.86 | 108.04% | 0.99% | 0.99% | 0.66% | 0.66% | 72% | $2,049,527 | ||||||||||||||||||||||||||||||||
| 2020 | $7.13 | 0.07 | (1.74) | (1.67) | (0.05) | (0.15) | (0.20) | $5.26 | (24.30)% | 1.05% | 1.05% | 0.91% | 0.91% | 71% | $407,147 | ||||||||||||||||||||||||||||||||
| 2019 | $8.72 | 0.07 | (0.44) | (0.37) | (0.06) | (1.16) | (1.22) | $7.13 | (2.95)% | 1.05% | 1.05% | 0.88% | 0.88% | 90% | $352,298 | ||||||||||||||||||||||||||||||||
| 2018 | $9.47 | 0.06 | 0.46 | 0.52 | (0.04) | (1.23) | (1.27) | $8.72 | 5.57% | 1.06% | 1.06% | 0.62% | 0.62% | 90% | $411,986 | ||||||||||||||||||||||||||||||||
| For a Share Outstanding Throughout the Years Ended March 31 (except as noted) | |||||||||||||||||||||||||||||||||||||||||||||||
| Per-Share Data | Ratios and Supplemental Data | ||||||||||||||||||||||||||||||||||||||||||||||
| Income From Investment Operations: | Distributions From: | Ratio to Average Net Assets of: | |||||||||||||||||||||||||||||||||||||||||||||
| Net Asset Value, Beginning of Period | Net Investment Income (Loss)(1) | Net Realized and Unrealized Gain (Loss) | Total From Investment Operations | Net Investment Income | Net Realized Gains | Total Distributions | Net Asset Value, End of Period | Total Return(2) | Operating Expenses | Operating Expenses (before expense waiver) | Net Investment Income (Loss) | Net Investment Income (Loss) (before expense waiver) | Portfolio Turnover Rate | Net Assets, End of Period (in thousands) | |||||||||||||||||||||||||||||||||
| Y Class | |||||||||||||||||||||||||||||||||||||||||||||||
| 2022 | $10.88 | 0.08 | 0.45 | 0.53 | (0.10) | (0.77) | (0.87) | $10.54 | 4.75% | 0.74% | 0.74% | 0.70% | 0.70% | 43% | $106,557 | ||||||||||||||||||||||||||||||||
| 2021 | $5.27 | 0.06 | 5.62 | 5.68 | (0.07) | — | (0.07) | $10.88 | 108.41% | 0.84% | 0.84% | 0.81% | 0.81% | 72% | $66,827 | ||||||||||||||||||||||||||||||||
| 2020 | $7.14 | 0.09 | (1.75) | (1.66) | (0.06) | (0.15) | (0.21) | $5.27 | (24.15)% | 0.90% | 0.90% | 1.06% | 1.06% | 71% | $24,079 | ||||||||||||||||||||||||||||||||
| 2019 | $8.73 | 0.10 | (0.45) | (0.35) | (0.08) | (1.16) | (1.24) | $7.14 | (2.80)% | 0.90% | 0.90% | 1.03% | 1.03% | 90% | $3,320 | ||||||||||||||||||||||||||||||||
2018(3) | $9.32 | 0.08 | 0.61 | 0.69 | (0.05) | (1.23) | (1.28) | $8.73 | 7.43% | 0.91%(4) | 0.91%(4) | 0.95%(4) | 0.95%(4) | 90%(5) | $131 | ||||||||||||||||||||||||||||||||
| A Class | |||||||||||||||||||||||||||||||||||||||||||||||
| 2022 | $10.60 | 0.01 | 0.45 | 0.46 | (0.04) | (0.77) | (0.81) | $10.25 | 4.20% | 1.34% | 1.34% | 0.10% | 0.10% | 43% | $113,658 | ||||||||||||||||||||||||||||||||
| 2021 | $5.13 | 0.02 | 5.47 | 5.49 | (0.02) | — | (0.02) | $10.60 | 107.16% | 1.44% | 1.44% | 0.21% | 0.21% | 72% | $94,533 | ||||||||||||||||||||||||||||||||
| 2020 | $6.96 | 0.03 | (1.69) | (1.66) | (0.02) | (0.15) | (0.17) | $5.13 | (24.66)% | 1.50% | 1.50% | 0.46% | 0.46% | 71% | $48,260 | ||||||||||||||||||||||||||||||||
| 2019 | $8.54 | 0.03 | (0.42) | (0.39) | (0.03) | (1.16) | (1.19) | $6.96 | (3.32)% | 1.50% | 1.50% | 0.43% | 0.43% | 90% | $82,755 | ||||||||||||||||||||||||||||||||
| 2018 | $9.31 | 0.01 | 0.46 | 0.47 | (0.01) | (1.23) | (1.24) | $8.54 | 5.02% | 1.51% | 1.51% | 0.17% | 0.17% | 90% | $116,763 | ||||||||||||||||||||||||||||||||
| C Class | |||||||||||||||||||||||||||||||||||||||||||||||
| 2022 | $9.90 | (0.06) | 0.42 | 0.36 | (0.01) | (0.77) | (0.78) | $9.48 | 3.49% | 2.09% | 2.09% | (0.65)% | (0.65)% | 43% | $26,317 | ||||||||||||||||||||||||||||||||
| 2021 | $4.82 | (0.04) | 5.12 | 5.08 | — | — | — | $9.90 | 105.39% | 2.19% | 2.19% | (0.54)% | (0.54)% | 72% | $15,448 | ||||||||||||||||||||||||||||||||
| 2020 | $6.57 | (0.02) | (1.58) | (1.60) | — | (0.15) | (0.15) | $4.82 | (25.11)% | 2.25% | 2.25% | (0.29)% | (0.29)% | 71% | $2,556 | ||||||||||||||||||||||||||||||||
| 2019 | $8.18 | (0.02) | (0.43) | (0.45) | — | (1.16) | (1.16) | $6.57 | (4.19)% | 2.25% | 2.25% | (0.32)% | (0.32)% | 90% | $2,536 | ||||||||||||||||||||||||||||||||
| 2018 | $9.01 | (0.05) | 0.45 | 0.40 | — | (1.23) | (1.23) | $8.18 | 4.41% | 2.26% | 2.26% | (0.58)% | (0.58)% | 90% | $2,688 | ||||||||||||||||||||||||||||||||
| For a Share Outstanding Throughout the Years Ended March 31 (except as noted) | |||||||||||||||||||||||||||||||||||||||||||||||
| Per-Share Data | Ratios and Supplemental Data | ||||||||||||||||||||||||||||||||||||||||||||||
| Income From Investment Operations: | Distributions From: | Ratio to Average Net Assets of: | |||||||||||||||||||||||||||||||||||||||||||||
| Net Asset Value, Beginning of Period | Net Investment Income (Loss)(1) | Net Realized and Unrealized Gain (Loss) | Total From Investment Operations | Net Investment Income | Net Realized Gains | Total Distributions | Net Asset Value, End of Period | Total Return(2) | Operating Expenses | Operating Expenses (before expense waiver) | Net Investment Income (Loss) | Net Investment Income (Loss) (before expense waiver) | Portfolio Turnover Rate | Net Assets, End of Period (in thousands) | |||||||||||||||||||||||||||||||||
| R Class | |||||||||||||||||||||||||||||||||||||||||||||||
| 2022 | $10.53 | (0.02) | 0.44 | 0.42 | (0.02) | (0.77) | (0.79) | $10.16 | 3.87% | 1.59% | 1.59% | (0.15)% | (0.15)% | 43% | $7,314 | ||||||||||||||||||||||||||||||||
| 2021 | $5.10 | —(6) | 5.43 | 5.43 | —(6) | — | —(6) | $10.53 | 106.61% | 1.69% | 1.69% | (0.04)% | (0.04)% | 72% | $5,120 | ||||||||||||||||||||||||||||||||
| 2020 | $6.92 | 0.01 | (1.68) | (1.67) | —(6) | (0.15) | (0.15) | $5.10 | (24.80)% | 1.75% | 1.75% | 0.21% | 0.21% | 71% | $2,299 | ||||||||||||||||||||||||||||||||
| 2019 | $8.50 | 0.02 | (0.43) | (0.41) | (0.01) | (1.16) | (1.17) | $6.92 | (3.58)% | 1.75% | 1.75% | 0.18% | 0.18% | 90% | $3,437 | ||||||||||||||||||||||||||||||||
| 2018 | $9.28 | (0.01) | 0.46 | 0.45 | — | (1.23) | (1.23) | $8.50 | 4.82% | 1.76% | 1.76% | (0.08)% | (0.08)% | 90% | $3,284 | ||||||||||||||||||||||||||||||||
| R5 Class | |||||||||||||||||||||||||||||||||||||||||||||||
| 2022 | $10.87 | 0.06 | 0.46 | 0.52 | (0.08) | (0.77) | (0.85) | $10.54 | 4.70% | 0.89% | 0.89% | 0.55% | 0.55% | 43% | $14,646 | ||||||||||||||||||||||||||||||||
| 2021 | $5.26 | 0.05 | 5.62 | 5.67 | (0.06) | — | (0.06) | $10.87 | 108.23% | 0.99% | 0.99% | 0.66% | 0.66% | 72% | $9,870 | ||||||||||||||||||||||||||||||||
| 2020 | $7.14 | 0.06 | (1.74) | (1.68) | (0.05) | (0.15) | (0.20) | $5.26 | (24.41)% | 1.05% | 1.05% | 0.91% | 0.91% | 71% | $3,373 | ||||||||||||||||||||||||||||||||
| 2019 | $8.73 | 0.11 | (0.48) | (0.37) | (0.06) | (1.16) | (1.22) | $7.14 | (2.92)% | 1.05% | 1.05% | 0.88% | 0.88% | 90% | $491 | ||||||||||||||||||||||||||||||||
2018(3) | $9.32 | 0.06 | 0.62 | 0.68 | (0.04) | (1.23) | (1.27) | $8.73 | 7.32% | 1.06%(4) | 1.06%(4) | 0.65%(4) | 0.65%(4) | 90%(5) | $5 | ||||||||||||||||||||||||||||||||
| R6 Class | |||||||||||||||||||||||||||||||||||||||||||||||
| 2022 | $10.86 | 0.08 | 0.46 | 0.54 | (0.10) | (0.77) | (0.87) | $10.53 | 4.86% | 0.74% | 0.74% | 0.70% | 0.70% | 43% | $1,779,113 | ||||||||||||||||||||||||||||||||
| 2021 | $5.26 | 0.06 | 5.61 | 5.67 | (0.07) | — | (0.07) | $10.86 | 108.42% | 0.84% | 0.84% | 0.81% | 0.81% | 72% | $943,344 | ||||||||||||||||||||||||||||||||
| 2020 | $7.13 | 0.08 | (1.74) | (1.66) | (0.06) | (0.15) | (0.21) | $5.26 | (24.19)% | 0.90% | 0.90% | 1.06% | 1.06% | 71% | $290,444 | ||||||||||||||||||||||||||||||||
| 2019 | $8.72 | 0.09 | (0.44) | (0.35) | (0.08) | (1.16) | (1.24) | $7.13 | (2.80)% | 0.90% | 0.90% | 1.03% | 1.03% | 90% | $316,502 | ||||||||||||||||||||||||||||||||
| 2018 | $9.47 | 0.07 | 0.47 | 0.54 | (0.06) | (1.23) | (1.29) | $8.72 | 5.73% | 0.91% | 0.91% | 0.77% | 0.77% | 90% | $278,351 | ||||||||||||||||||||||||||||||||
| For a Share Outstanding Throughout the Years Ended March 31 (except as noted) | |||||||||||||||||||||||||||||||||||||||||||||||
| Per-Share Data | Ratios and Supplemental Data | ||||||||||||||||||||||||||||||||||||||||||||||
| Income From Investment Operations: | Distributions From: | Ratio to Average Net Assets of: | |||||||||||||||||||||||||||||||||||||||||||||
| Net Asset Value, Beginning of Period | Net Investment Income (Loss)(1) | Net Realized and Unrealized Gain (Loss) | Total From Investment Operations | Net Investment Income | Net Realized Gains | Total Distributions | Net Asset Value, End of Period | Total Return(2) | Operating Expenses | Operating Expenses (before expense waiver) | Net Investment Income (Loss) | Net Investment Income (Loss) (before expense waiver) | Portfolio Turnover Rate | Net Assets, End of Period (in thousands) | |||||||||||||||||||||||||||||||||
| G Class | |||||||||||||||||||||||||||||||||||||||||||||||
| 2022 | $10.89 | 0.16 | 0.45 | 0.61 | (0.18) | (0.77) | (0.95) | $10.55 | 5.62% | 0.00%(7) | 0.74% | 1.44% | 0.70% | 43% | $343,209 | ||||||||||||||||||||||||||||||||
| 2021 | $5.29 | 0.12 | 5.63 | 5.75 | (0.15) | — | (0.15) | $10.89 | 110.06% | 0.00%(7) | 0.84% | 1.65% | 0.81% | 72% | $359,758 | ||||||||||||||||||||||||||||||||
| 2020 | $7.25 | 0.15 | (1.85) | (1.70) | (0.11) | (0.15) | (0.26) | $5.29 | (24.58)% | 0.00%(7) | 0.90% | 1.96% | 1.06% | 71% | $139,749 | ||||||||||||||||||||||||||||||||
| Notes to Financial Highlights | ||
(1)Computed using average shares outstanding throughout the period.
(2)Total returns are calculated based on the net asset value of the last business day and do not reflect applicable sales charges, if any. Total returns for periods less than one year are not annualized.
(3)April 10, 2017 (commencement of sale) through March 31, 2018.
(4)Annualized.
(5)Portfolio turnover is calculated at the fund level. Percentage indicated was calculated for the year ended March 31, 2018.
(6)Per-share amount was less than $0.005.
(7)Ratio was less than 0.005%.
See Notes to Financial Statements.
| Report of Independent Registered Public Accounting Firm | ||
To the Shareholders and the Board of Directors of American Century Capital Portfolios, Inc.:
Opinion on the Financial Statements and Financial Highlights
We have audited the accompanying statement of assets and liabilities, including the schedule of investments, of Small Cap Value Fund (the “Fund”), one of the funds constituting the American Century Capital Portfolios, Inc., as of March 31, 2022, the related statement of operations for the year then ended, the statements of changes in net assets for each of the two years in the period then ended, the financial highlights for each of the five years in the period then ended, and the related notes. In our opinion, the financial statements and financial highlights present fairly, in all material respects, the financial position of Small Cap Value Fund of the American Century Capital Portfolios, Inc. as of March 31, 2022, and the results of its operations for the year then ended, the changes in its net assets for each of the two years in the period then ended, and the financial highlights for each of the five years in the period then ended, in conformity with accounting principles generally accepted in the United States of America.
Basis for Opinion
These financial statements and financial highlights are the responsibility of the Fund's management. Our responsibility is to express an opinion on the Fund’s financial statements and financial highlights based on our audits. We are a public accounting firm registered with the Public Company Accounting Oversight Board (United States) (PCAOB) and are required to be independent with respect to the Fund in accordance with the U.S. federal securities laws and the applicable rules and regulations of the Securities and Exchange Commission and the PCAOB.
We conducted our audits in accordance with the standards of the PCAOB. Those standards require that we plan and perform the audit to obtain reasonable assurance about whether the financial statements and financial highlights are free of material misstatement, whether due to error or fraud. The Fund is not required to have, nor were we engaged to perform, an audit of its internal control over financial reporting. As part of our audits, we are required to obtain an understanding of internal control over financial reporting but not for the purpose of expressing an opinion on the effectiveness of the Fund’s internal control over financial reporting. Accordingly, we express no such opinion.
Our audits included performing procedures to assess the risks of material misstatement of the financial statements and financial highlights, whether due to error or fraud, and performing procedures that respond to those risks. Such procedures included examining, on a test basis, evidence regarding the amounts and disclosures in the financial statements and financial highlights. Our audits also included evaluating the accounting principles used and significant estimates made by management, as well as evaluating the overall presentation of the financial statements and financial highlights. Our procedures included confirmation of securities owned as of March 31, 2022, by correspondence with the custodian and brokers; when replies were not received from brokers, we performed other auditing procedures. We believe that our audits provide a reasonable basis for our opinion.
/s/ Deloitte & Touche LLP
Kansas City, Missouri
May 16, 2022
We have served as the auditor of one or more American Century investment companies since 1997.
31
| Management | ||
The Board of Directors
The individuals listed below serve as directors of the funds. Each director will continue to serve in this capacity until death, retirement, resignation or removal from office. The board has adopted a mandatory retirement age for directors who are not “interested persons,” as that term is defined in the Investment Company Act (independent directors). Independent directors shall retire on December 31 of the year in which they reach their 75th birthday.
Jonathan S. Thomas is an “interested person” because he currently serves as President and Chief Executive Officer of American Century Companies, Inc. (ACC), the parent company of American Century Investment Management, Inc. (ACIM or the advisor). The other directors (more than three-fourths of the total number) are independent. They are not employees, directors or officers of, and have no financial interest in, ACC or any of its wholly owned, direct or indirect, subsidiaries, including ACIM, American Century Investment Services, Inc. (ACIS) and American Century Services, LLC (ACS), and they do not have any other affiliations, positions or relationships that would cause them to be considered “interested persons” under the Investment Company Act. The directors serve in this capacity for seven (in the case of Jonathan S. Thomas, 16; and Stephen E. Yates, 8) registered investment companies in the American Century Investments family of funds.
The following table presents additional information about the directors. The mailing address for each director is 4500 Main Street, Kansas City, Missouri 64111.
| Name (Year of Birth) | Position(s) Held with Funds | Length of Time Served | Principal Occupation(s) During Past 5 Years | Number of American Century Portfolios Overseen by Director | Other Directorships Held During Past 5 Years | ||||||||||||
| Independent Directors | |||||||||||||||||
| Thomas W. Bunn (1953) | Director | Since 2017 | Retired | 68 | None | ||||||||||||
| Chris H. Cheesman (1962) | Director | Since 2019 | Retired. Senior Vice President & Chief Audit Executive, AllianceBernstein (1999 to 2018) | 68 | Alleghany Corporation | ||||||||||||
| Barry Fink (1955) | Director | Since 2012 (independent since 2016) | Retired | 68 | None | ||||||||||||
| Rajesh K. Gupta (1960) | Director | Since 2019 | Partner Emeritus, SeaCrest Investment Management and SeaCrest Wealth Management (2019 to Present); Chief Executive Officer and Chief Investment Officer, SeaCrest Investment Management (2006 to 2019); Chief Executive Officer and Chief Investment Officer, SeaCrest Wealth Management (2008 to 2019) | 68 | None | ||||||||||||
32
| Name (Year of Birth) | Position(s) Held with Funds | Length of Time Served | Principal Occupation(s) During Past 5 Years | Number of American Century Portfolios Overseen by Director | Other Directorships Held During Past 5 Years | ||||||||||||
| Independent Directors | |||||||||||||||||
| Lynn Jenkins (1963) | Director | Since 2019 | Consultant, LJ Strategies (2019 to present); United States Representative, U.S. House of Representatives (2009 to 2018) | 68 | MGP Ingredients, Inc. (2019 to 2021) | ||||||||||||
| Jan M. Lewis (1957) | Director and Board Chair | Since 2011 (Board Chair since 2022) | Retired | 68 | None | ||||||||||||
| Stephen E. Yates (1948) | Director | Since 2012 | Retired | 108 | None | ||||||||||||
| Interested Director | |||||||||||||||||
| Jonathan S. Thomas (1963) | Director | Since 2007 | President and Chief Executive Officer, ACC (2007 to present). Also serves as Chief Executive Officer, ACS; Director, ACC and other ACC subsidiaries | 146 | None | ||||||||||||
The Statement of Additional Information has additional information about the fund's directors and is available without charge, upon request, by calling 1-800-345-2021.
33
Officers
The following table presents certain information about the executive officers of the funds. Each officer serves as an officer for 16 (in the case of Robert J. Leach, 15) investment companies in the American Century family of funds, unless otherwise noted. No officer is compensated for his or her service as an officer of the funds. The listed officers are interested persons of the funds and are appointed or re-appointed on an annual basis. The mailing address for each officer listed below is 4500 Main Street, Kansas City, Missouri 64111.
| Name (Year of Birth) | Offices with the Funds | Principal Occupation(s) During the Past Five Years | ||||||
| Patrick Bannigan (1965) | President since 2019 | Executive Vice President and Director, ACC (2012 to present); Chief Financial Officer, Chief Accounting Officer and Treasurer, ACC (2015 to present); Also serves as President, ACS; Vice President, ACIM; Chief Financial Officer, Chief Accounting Officer and/or Director, ACIM, ACS and other ACC subsidiaries | ||||||
| R. Wes Campbell (1974) | Chief Financial Officer and Treasurer since 2018 | Vice President, ACS (2020 to present); Investment Operations and Investment Accounting, ACS (2000 to present) | ||||||
| Amy D. Shelton (1964) | Chief Compliance Officer and Vice President since 2014 | Chief Compliance Officer, American Century funds, (2014 to present); Chief Compliance Officer, ACIM (2014 to present); Chief Compliance Officer, ACIS (2009 to present). Also serves as Vice President, ACIS | ||||||
| John Pak (1968) | General Counsel and Senior Vice President since 2021 | General Counsel and Senior Vice President, ACC (2021 to present); Also serves as General Counsel and Senior Vice President, ACIM, ACS and ACIS. Chief Legal Officer of Investment and Wealth Management, The Bank of New York Mellon (2014 to 2021) | ||||||
| C. Jean Wade (1964) | Vice President since 2012 | Senior Vice President, ACS (2017 to present); Vice President, ACS (2000 to 2017) | ||||||
| Robert J. Leach (1966) | Vice President since 2006 | Vice President, ACS (2000 to present) | ||||||
| David H. Reinmiller (1963) | Vice President since 2000 | Attorney, ACC (1994 to present). Also serves as Vice President, ACIM and ACS | ||||||
| Ward D. Stauffer (1960) | Secretary since 2005 | Attorney, ACC (2003 to present) | ||||||
34
| Liquidity Risk Management Program | ||
The Fund has adopted a liquidity risk management program (the “program”). The Fund’s Board of Directors (the "Board") has designated American Century Investment Management, Inc. (“ACIM”) as the administrator of the program. Personnel of ACIM or its affiliates conduct the day-to-day operation of the program pursuant to policies and procedures administered by the Program Administrator, including members of ACIM’s Investment Oversight Committee who are members of the ACIM’s Investment Management and Global Analytics departments.
Under the program, ACIM manages the Fund’s liquidity risk, which is the risk that the Fund could not meet shareholder redemption requests without significant dilution of remaining shareholders’ interests in the Fund. This risk is managed by monitoring the degree of liquidity of the Fund’s investments, limiting the amount of the Fund’s illiquid investments, and utilizing various risk management tools and facilities available to the Fund for meeting shareholder redemptions, among other means. ACIM’s process of determining the degree of liquidity of certain Fund’s investments is supported by a third-party liquidity assessment vendor.
The Board reviewed a report prepared by ACIM regarding the operation and effectiveness of the program for the period January 1, 2021 through December 31, 2021. No significant liquidity events impacting the Fund were noted in the report. In addition, ACIM provided its assessment that the program had been effective in managing the Fund’s liquidity risk.
35
| Additional Information | ||
Retirement Account Information
As required by law, distributions you receive from certain retirement accounts are subject to federal income tax withholding, unless you elect not to have withholding apply*. Tax will be withheld on the total amount withdrawn even though you may be receiving amounts that are not subject to withholding, such as nondeductible contributions. In such case, excess amounts of withholding could occur. You may adjust your withholding election so that a greater or lesser amount will be withheld.
If you don’t want us to withhold on this amount, you must notify us to not withhold the federal income tax. You may notify us in writing or in certain situations by telephone or through other electronic means. For systematic withdrawals, your withholding election will remain in effect until revoked or changed by filing a new election. You have the right to revoke your election at any time and change your withholding percentage for future distributions.
Remember, even if you elect not to have income tax withheld, you are liable for paying income tax on the taxable portion of your withdrawal. If you elect not to have income tax withheld or you don’t have enough income tax withheld, you may be responsible for payment of estimated tax. You may incur penalties under the estimated tax rules if your withholding and estimated tax payments are not sufficient. You can reduce or defer the income tax on a distribution by directly or indirectly rolling such distribution over to another IRA or eligible plan. You should consult your tax advisor for additional information.
State tax will be withheld if, at the time of your distribution, your address is within one of the mandatory withholding states and you have federal income tax withheld (or as otherwise required by state law). State taxes will be withheld from your distribution in accordance with the respective state rules.
*Some 403(b), 457 and qualified retirement plan distributions may be subject to 20% mandatory withholding, as they are subject to special tax and withholding rules. Your plan administrator or plan sponsor is required to provide you with a special tax notice explaining those rules at the time you request a distribution. If applicable, federal and/or state taxes may be withheld from your distribution amount.
Proxy Voting Policies
A description of the policies that the fund's investment advisor uses in exercising the voting rights associated with the securities purchased and/or held by the fund is available without charge, upon request, by calling 1-800-345-2021. It is also available on American Century Investments’ website at americancentury.com/proxy and on the Securities and Exchange Commission’s website at sec.gov. Information regarding how the investment advisor voted proxies relating to portfolio securities during the most recent 12-month period ended June 30 is available on americancentury.com/proxy. It is also available at sec.gov.
Quarterly Portfolio Disclosure
The fund files its complete schedule of portfolio holdings with the Securities and Exchange
Commission (SEC) for the first and third quarters of each fiscal year as an exhibit to its reports on
Form N-PORT. These portfolio holdings are available on the fund's website at
americancentury.com and, upon request, by calling 1-800-345-2021. The fund’s Form N-PORT
reports are available on the SEC’s website at sec.gov.
36
Other Tax Information
The following information is provided pursuant to provisions of the Internal Revenue Code.
The fund hereby designates up to the maximum amount allowable as qualified dividend income for the fiscal year ended March 31, 2022.
For corporate taxpayers, the fund hereby designates $79,495,850, or up to the maximum amount allowable, of ordinary income distributions paid during the fiscal year ended March 31, 2022 as qualified for the corporate dividends received deduction.
The fund hereby designates $169,621,437, or up to the maximum amount allowable, as long-term capital gain distributions (20% rate gain distributions) for the fiscal year ended March 31, 2022.
The fund hereby designates $279,634,400 as qualified short-term capital gain distributions for purposes of Internal Revenue Code Section 871 for the fiscal year ended March 31, 2022.
The fund utilized earnings and profits of $25,053,995 distributed to shareholders on redemption of shares as part of the dividends paid deduction (tax equalization).
37
| Notes | ||||||||||||||
38
| Notes | ||||||||||||||
39
| Notes | ||||||||||||||
40
| ||||||||
| Contact Us | americancentury.com | |||||||
| Automated Information Line | 1-800-345-8765 | |||||||
| Investor Services Representative | 1-800-345-2021 or 816-531-5575 | |||||||
| Investors Using Advisors | 1-800-378-9878 | |||||||
| Business, Not-For-Profit, Employer-Sponsored Retirement Plans | 1-800-345-3533 | |||||||
| Banks and Trust Companies, Broker-Dealers, Financial Professionals, Insurance Companies | 1-800-345-6488 | |||||||
| Telecommunications Relay Service for the Deaf | 711 | |||||||
| American Century Capital Portfolios, Inc. | ||||||||
Investment Advisor: American Century Investment Management, Inc. Kansas City, Missouri | ||||||||
| This report and the statements it contains are submitted for the general information of our shareholders. The report is not authorized for distribution to prospective investors unless preceded or accompanied by an effective prospectus. | ||||||||
| ©2022 American Century Proprietary Holdings, Inc. All rights reserved. CL-ANN-92272 2205 | ||||||||
| Annual Report | |||||
| March 31, 2022 | |||||
| Value Fund | |||||
| Investor Class (TWVLX) | |||||
| I Class (AVLIX) | |||||
| Y Class (AVUYX) | |||||
| A Class (TWADX) | |||||
| C Class (ACLCX) | |||||
| R Class (AVURX) | |||||
| R5 Class (AVUGX) | |||||
| R6 Class (AVUDX) | |||||
| Table of Contents | ||
| President’s Letter | |||||
| Performance | |||||
| Portfolio Commentary | |||||
| Fund Characteristics | |||||
| Shareholder Fee Example | |||||
| Schedule of Investments | |||||
| Statement of Assets and Liabilities | |||||
| Statement of Operations | |||||
| Statement of Changes in Net Assets | |||||
| Notes to Financial Statements | |||||
| Financial Highlights | |||||
| Report of Independent Registered Public Accounting Firm | |||||
| Management | |||||
| Liquidity Risk Management Program | |||||
| Additional Information | |||||
Any opinions expressed in this report reflect those of the author as of the date of the report, and do not necessarily represent the opinions of American Century Investments® or any other person in the American Century Investments organization. Any such opinions are subject to change at any time based upon market or other conditions and American Century Investments disclaims any responsibility to update such opinions. These opinions may not be relied upon as investment advice and, because investment decisions made by American Century Investments funds are based on numerous factors, may not be relied upon as an indication of trading intent on behalf of any American Century Investments fund. Security examples are used for representational purposes only and are not intended as recommendations to purchase or sell securities. Performance information for comparative indices and securities is provided to American Century Investments by third party vendors. To the best of American Century Investments’ knowledge, such information is accurate at the time of printing.
| President’s Letter | ||
Jonathan ThomasDear Investor:
Thank you for reviewing this annual report for the period ended March 31, 2022. Annual reports help convey important information about fund returns, including market factors that affected performance. For additional investment insights, please visit americancentury.com.
Soaring Inflation, Escalating Volatility Led to Mixed Results for Stocks and Bonds
Upbeat economic and earnings data and continued Federal Reserve (Fed) support generally buoyed stock returns for most of the reporting period. Despite periodic outbreaks of COVID-19, the worst of the virus appeared over in the U.S., and pre-pandemic activities gradually resumed. Bonds delivered solid gains in the first half of the period before a Fed policy pivot triggered a drastic sentiment shift in fixed-income markets.
Early in the period, inflation began a steady upward march. Initially, the Fed was unfazed, viewing the price hikes as a temporary economic consequence of recovering from the pandemic. But by late 2021, inflation was surging toward multidecade highs, prompting the Fed to adopt a more hawkish strategy.
Policymakers announced an abrupt end to bond buying followed by a March rate hike, the first since 2018. At period-end, market indicators reflected expectations for more aggressive Fed rate hikes along with balance sheet cuts to tame inflation.
In addition to an 8.5% annual inflation rate and a hawkish Fed, Russia’s invasion of Ukraine further rattled investors in early 2022. Stocks declined sharply amid the unrest, but strong performance earlier in the fiscal year left most U.S. indices with solid 12-month gains. For bonds, declines in the second half of the reporting period overwhelmed earlier gains, and most U.S. fixed-income indices retreated for the 12 months overall.
Staying Focused in Uncertain Times
We expect market volatility to linger amid elevated inflation and tighter Fed policy. In addition, Russia’s invasion of Ukraine has led to a devastating humanitarian crisis and further complicated a tense geopolitical backdrop. We will continue to monitor the evolving situation and its implications for our clients and our investment exposure.
We appreciate your confidence in us during these extraordinary times. Our firm has a long history of helping clients weather unpredictable and volatile markets, and we’re confident we will continue to meet prevailing challenges.
Sincerely,
Jonathan Thomas
President and Chief Executive Officer
American Century Investments
2
| Performance | ||
| Total Returns as of March 31, 2022 | ||||||||||||||||||||
| Average Annual Returns | ||||||||||||||||||||
| Ticker Symbol | 1 year | 5 years | 10 years | Since Inception | Inception Date | |||||||||||||||
| Investor Class | TWVLX | 12.26% | 9.54% | 11.00% | — | 9/1/93 | ||||||||||||||
| Russell 1000 Value Index | — | 11.67% | 10.28% | 11.69% | — | — | ||||||||||||||
| S&P 500 Index | — | 15.65% | 15.98% | 14.63% | — | — | ||||||||||||||
| I Class | AVLIX | 12.44% | 9.73% | 11.21% | — | 7/31/97 | ||||||||||||||
| Y Class | AVUYX | 12.61% | — | — | 9.99% | 4/10/17 | ||||||||||||||
| A Class | TWADX | 10/2/96 | ||||||||||||||||||
| No sales charge | 12.00% | 9.25% | 10.72% | — | ||||||||||||||||
| With sales charge | 5.54% | 7.96% | 10.07% | — | ||||||||||||||||
| C Class | ACLCX | 11.15% | 8.45% | 9.90% | — | 6/4/01 | ||||||||||||||
| R Class | AVURX | 11.70% | 8.97% | 10.44% | — | 7/29/05 | ||||||||||||||
| R5 Class | AVUGX | 12.45% | — | — | 9.84% | 4/10/17 | ||||||||||||||
| R6 Class | AVUDX | 12.61% | 9.89% | — | 10.06% | 7/26/13 | ||||||||||||||
Average annual returns since inception are presented when ten years of performance history is not available.
C Class shares will automatically convert to A Class shares after being held for approximately eight years. C Class average annual returns do not reflect this conversion.
Sales charges include initial sales charges and contingent deferred sales charges (CDSCs), as applicable. A Class shares have a 5.75% maximum initial sales charge and may be subject to a maximum CDSC of 1.00%. C Class shares redeemed within 12 months of purchase are subject to a maximum CDSC of 1.00%. The SEC requires that mutual funds provide performance information net of maximum sales charges in all cases where charges could be applied.
Data presented reflect past performance. Past performance is no guarantee of future results. Current performance may be higher or lower than the performance shown. Total returns for periods less than one year are not annualized. Investment return and principal value will fluctuate, and redemption value may be more or less than original cost. Data assumes reinvestment of dividends and capital gains, and none of the charts reflect the deduction of taxes that a shareholder would pay on fund distributions or the redemption of fund shares. To obtain performance data current to the most recent month end, please call 1-800-345-2021 or visit americancentury.com. For additional information about the fund, please consult the prospectus.
3
| Growth of $10,000 Over 10 Years | ||
| $10,000 investment made March 31, 2012 | ||
| Performance for other share classes will vary due to differences in fee structure. | ||
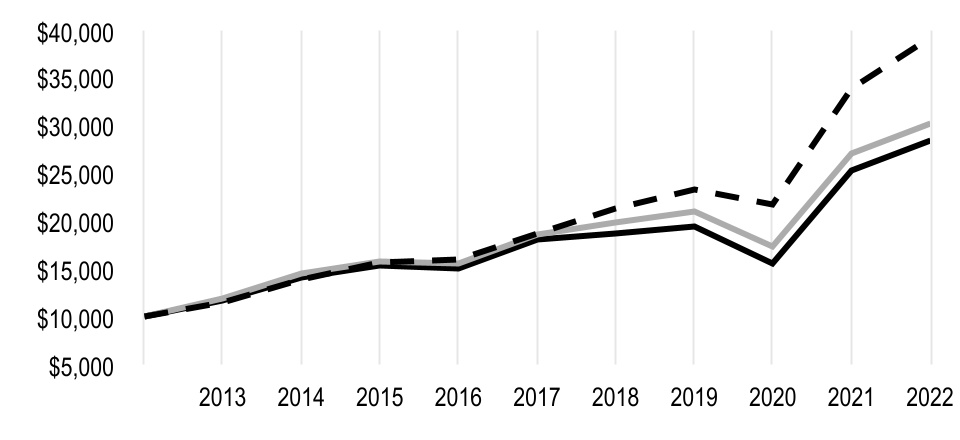
| Value on March 31, 2022 | |||||
| Investor Class — $28,418 | |||||
| Russell 1000 Value Index — $30,235 | |||||
S&P 500 Index — $39,197 | |||||
| Total Annual Fund Operating Expenses | |||||||||||||||||||||||
| Investor Class | I Class | Y Class | A Class | C Class | R Class | R5 Class | R6 Class | ||||||||||||||||
| 1.00% | 0.80% | 0.65% | 1.25% | 2.00% | 1.50% | 0.80% | 0.65% | ||||||||||||||||
The total annual fund operating expenses shown is as stated in the fund’s prospectus current as of the date of this report. The prospectus may vary from the expense ratio shown elsewhere in this report because it is based on a different time period, includes acquired fund fees and expenses, and, if applicable, does not include fee waivers or expense reimbursements.
Data presented reflect past performance. Past performance is no guarantee of future results. Current performance may be higher or lower than the performance shown. Total returns for periods less than one year are not annualized. Investment return and principal value will fluctuate, and redemption value may be more or less than original cost. Data assumes reinvestment of dividends and capital gains, and none of the charts reflect the deduction of taxes that a shareholder would pay on fund distributions or the redemption of fund shares. To obtain performance data current to the most recent month end, please call 1-800-345-2021 or visit americancentury.com. For additional information about the fund, please consult the prospectus.
4
| Portfolio Commentary | ||
Portfolio Managers: Michael Liss, David Byrns, Philip Sundell, Kevin Toney, Brian Woglom and Phil Davidson
Effective February 2022, David Byrns was promoted to portfolio manager.
Performance Summary
Value returned 12.26%* for the fiscal year ended March 31, 2022, compared with the 11.67% return of its benchmark, the Russell 1000 Value Index. The fund’s return reflects operating expenses, while the index’s return does not.
The fund’s outperformance relative to the benchmark was led by an overweight allocation and stock selection in the energy sector. Stock decisions and an underweight in the information technology sector also added value to relative performance. Stock selection in the consumer staples sector was a top detractor, while stock decisions and an underweight allocation in materials dampened performance.
Energy and Information Technology Contributed
Our overweights and stock selection in the energy sector benefited relative performance. As oil and natural gas prices rose, most energy stocks turned in strong performances. Devon Energy, Chevron and Baker Hughes were among the portfolio’s top individual contributors.
Stock selection and an underweight led to outperformance in the information technology sector. A lack of exposure to the IT services industry and other benchmark names supported relative performance. Stock selection in the consumer discretionary sector also contributed to returns.
Among individual top contributors was Comcast. Lack of exposure to this global media and technology company positively impacted relative results. The stock underperformed as investors had concerns over the potential for intense competition in broadband, high-speed internet service.
Consumer Staples and Materials Detracted
Our security selection in the consumer staples sector, the food products industry in particular, negatively impacted relative performance. Unilever, a top detractor, was pressured by higher commodity costs and the perception of disproportionate exposure to the war in Ukraine relative to its peers.
Stock selection and an underweight in the materials sector detracted from the portfolio’s performance. Mondi was a notable detractor. Shares of this U.K.-based global packaging and paper company underperformed due to uncertainty regarding the future of its paper mill in Russia. The company generates approximately 20% of its operating profit in Russia.
Elsewhere, AT&T detracted from performance. This communication services stock underperformed due to strategic decisions, such as spinning off its WarnerMedia division. The divestiture led to AT&T lowering its dividend, disappointing shareholders.
*All fund returns referenced in this commentary are for Investor Class shares. Performance for other share classes will vary due to differences in fee structure; when Investor Class performance exceeds that of the index, other share classes may not. See page 3 for returns for all share classes.
5
Portfolio Positioning
The portfolio seeks to invest in companies where we believe the valuation does not reflect the quality and normal earnings power of the company. Our process is based on individual security selection, but broad themes have emerged.
We continue to see value in energy. Our research has led us to energy companies that we believe are higher quality and offer solid assets, strong balance sheets and management teams focused on returns on capital and return of capital to shareholders. The portfolio is also overweight in financials. Banks represent the majority of our financials exposure, but we also hold select positions in diversified financial services, capital markets and insurance companies.
The portfolio remains overweight in the consumer staples sector. We’re finding opportunities among companies that make products consumers depend on every day, regardless of economic conditions or their personal financial situations. Businesses in this sector make and sell food, beverages and household products, as well as retail products. Because consumers deem these products necessities, the companies that make them are less sensitive to economic cycles.
Real estate continues to be a notable underweight due to valuations that we believe are extended. In addition, our portfolio remains underweight in utilities relative to the benchmark. However, we continue to look for opportunities in these sectors.
6
| Fund Characteristics | ||
| MARCH 31, 2022 | |||||
| Types of Investments in Portfolio | % of net assets | ||||
| Common Stocks | 97.9% | ||||
| Short-Term Investments | 2.3% | ||||
| Other Assets and Liabilities | (0.2)% | ||||
| Top Five Industries | % of net assets | ||||
| Banks | 11.0% | ||||
| Pharmaceuticals | 8.7% | ||||
| Oil, Gas and Consumable Fuels | 6.9% | ||||
| Health Care Providers and Services | 5.0% | ||||
| Diversified Telecommunication Services | 4.7% | ||||
7
| Shareholder Fee Example | ||
Fund shareholders may incur two types of costs: (1) transaction costs, including sales charges (loads) on purchase payments and redemption/exchange fees; and (2) ongoing costs, including management fees; distribution and service (12b-1) fees; and other fund expenses. This example is intended to help you understand your ongoing costs (in dollars) of investing in your fund and to compare these costs with the ongoing cost of investing in other mutual funds.
The example is based on an investment of $1,000 made at the beginning of the period and held for the entire period from October 1, 2021 to March 31, 2022.
Actual Expenses
The table provides information about actual account values and actual expenses for each class. You may use the information, together with the amount you invested, to estimate the expenses that you paid over the period. First, identify the share class you own. Then simply divide your account value by $1,000 (for example, an $8,600 account value divided by $1,000 = 8.6), then multiply the result by the number under the heading “Expenses Paid During Period” to estimate the expenses you paid on your account during this period.
If you hold Investor Class shares of any American Century Investments fund, or I Class shares of the American Century Diversified Bond Fund, in an American Century Investments account (i.e., not through a financial intermediary or employer-sponsored retirement plan account), American Century Investments may charge you a $25.00 annual account maintenance fee if the value of those shares is less than $10,000. We will redeem shares automatically in one of your accounts to pay the $25.00 fee. In determining your total eligible investment amount, we will include your investments in all personal accounts (including American Century Investments brokerage accounts) registered under your Social Security number. Personal accounts include individual accounts, joint accounts, UGMA/UTMA accounts, personal trusts, Coverdell Education Savings Accounts and IRAs (including traditional, Roth, Rollover, SEP-, SARSEP- and SIMPLE-IRAs), and certain other retirement accounts. If you have only business, business retirement, employer-sponsored or American Century Investments brokerage accounts, you are currently not subject to this fee. If you are subject to the account maintenance fee, your account value could be reduced by the fee amount.
Hypothetical Example for Comparison Purposes
The table also provides information about hypothetical account values and hypothetical expenses based on the actual expense ratio of each class of your fund and an assumed rate of return of 5% per year before expenses, which is not the actual return of a fund’s share class. The hypothetical account values and expenses may not be used to estimate the actual ending account balance or expenses you paid for the period. You may use this information to compare the ongoing costs of investing in your fund and other funds. To do so, compare this 5% hypothetical example with the 5% hypothetical examples that appear in the shareholder reports of the other funds.
Please note that the expenses shown in the table are meant to highlight your ongoing costs only and do not reflect any transactional costs, such as sales charges (loads) or redemption/exchange fees. Therefore, the table is useful in comparing ongoing costs only, and will not help you determine the relative total costs of owning different funds. In addition, if these transactional costs were included, your costs would have been higher.
8
| Beginning Account Value 10/1/21 | Ending Account Value 3/31/22 | Expenses Paid During Period(1) 10/1/21 - 3/31/22 | Annualized Expense Ratio(1) | |||||||||||
| Actual | ||||||||||||||
| Investor Class | $1,000 | $1,086.00 | $5.30 | 1.02% | ||||||||||
| I Class | $1,000 | $1,086.80 | $4.27 | 0.82% | ||||||||||
| Y Class | $1,000 | $1,087.60 | $3.49 | 0.67% | ||||||||||
| A Class | $1,000 | $1,084.80 | $6.60 | 1.27% | ||||||||||
| C Class | $1,000 | $1,080.00 | $10.48 | 2.02% | ||||||||||
| R Class | $1,000 | $1,082.10 | $7.89 | 1.52% | ||||||||||
| R5 Class | $1,000 | $1,086.90 | $4.27 | 0.82% | ||||||||||
| R6 Class | $1,000 | $1,086.40 | $3.49 | 0.67% | ||||||||||
| Hypothetical | ||||||||||||||
| Investor Class | $1,000 | $1,019.85 | $5.14 | 1.02% | ||||||||||
| I Class | $1,000 | $1,020.84 | $4.13 | 0.82% | ||||||||||
| Y Class | $1,000 | $1,021.59 | $3.38 | 0.67% | ||||||||||
| A Class | $1,000 | $1,018.60 | $6.39 | 1.27% | ||||||||||
| C Class | $1,000 | $1,014.86 | $10.15 | 2.02% | ||||||||||
| R Class | $1,000 | $1,017.35 | $7.64 | 1.52% | ||||||||||
| R5 Class | $1,000 | $1,020.84 | $4.13 | 0.82% | ||||||||||
| R6 Class | $1,000 | $1,021.59 | $3.38 | 0.67% | ||||||||||
(1)Expenses are equal to the class's annualized expense ratio listed in the table above, multiplied by the average account value over the period, multiplied by 182, the number of days in the most recent fiscal half-year, divided by 365, to reflect the one-half year period. Annualized expense ratio reflects actual expenses, including any applicable fee waivers or expense reimbursements and excluding any acquired fund fees and expenses.
9
| Schedule of Investments | ||
MARCH 31, 2022
| Shares | Value | |||||||
| COMMON STOCKS — 97.9% | ||||||||
| Aerospace and Defense — 1.9% | ||||||||
| BAE Systems PLC | 1,291,570 | $ | 12,129,712 | |||||
| Raytheon Technologies Corp. | 222,380 | 22,031,187 | ||||||
| Thales SA | 92,440 | 11,576,771 | ||||||
| 45,737,670 | ||||||||
| Airlines — 0.8% | ||||||||
Southwest Airlines Co.(1) | 407,300 | 18,654,340 | ||||||
| Auto Components — 0.9% | ||||||||
| BorgWarner, Inc. | 566,382 | 22,032,260 | ||||||
| Automobiles — 1.3% | ||||||||
General Motors Co.(1) | 460,384 | 20,137,196 | ||||||
| Honda Motor Co. Ltd. | 398,900 | 11,307,155 | ||||||
| 31,444,351 | ||||||||
| Banks — 11.0% | ||||||||
| Bank of America Corp. | 1,177,350 | 48,530,367 | ||||||
| Comerica, Inc. | 91,107 | 8,238,806 | ||||||
| JPMorgan Chase & Co. | 485,271 | 66,152,143 | ||||||
| Prosperity Bancshares, Inc. | 209,170 | 14,512,215 | ||||||
| Truist Financial Corp. | 425,185 | 24,107,989 | ||||||
| U.S. Bancorp | 1,147,607 | 60,995,312 | ||||||
| Wells Fargo & Co. | 870,668 | 42,192,571 | ||||||
| 264,729,403 | ||||||||
| Capital Markets — 4.0% | ||||||||
| Bank of New York Mellon Corp. | 800,410 | 39,724,348 | ||||||
| Invesco Ltd. | 883,436 | 20,372,034 | ||||||
| Northern Trust Corp. | 152,832 | 17,797,287 | ||||||
| State Street Corp. | 213,310 | 18,583,567 | ||||||
| 96,477,236 | ||||||||
| Chemicals — 0.3% | ||||||||
| Akzo Nobel NV | 84,750 | 7,281,914 | ||||||
| Communications Equipment — 3.4% | ||||||||
| Cisco Systems, Inc. | 1,184,634 | 66,055,192 | ||||||
F5, Inc.(1) | 78,297 | 16,360,158 | ||||||
| 82,415,350 | ||||||||
| Containers and Packaging — 0.8% | ||||||||
| Sonoco Products Co. | 301,669 | 18,872,413 | ||||||
| Diversified Financial Services — 4.5% | ||||||||
Berkshire Hathaway, Inc., Class A(1) | 129 | 68,230,809 | ||||||
Berkshire Hathaway, Inc., Class B(1) | 113,485 | 40,049,991 | ||||||
| 108,280,800 | ||||||||
| Diversified Telecommunication Services — 4.7% | ||||||||
| AT&T, Inc. | 2,560,430 | 60,502,961 | ||||||
| Verizon Communications, Inc. | 1,021,252 | 52,022,577 | ||||||
| 112,525,538 | ||||||||
| Electric Utilities — 1.4% | ||||||||
| Edison International | 258,270 | 18,104,727 | ||||||
| Pinnacle West Capital Corp. | 202,530 | 15,817,593 | ||||||
| 33,922,320 | ||||||||
10
| Shares | Value | |||||||
| Electrical Equipment — 2.7% | ||||||||
| Emerson Electric Co. | 187,773 | $ | 18,411,143 | |||||
| Hubbell, Inc. | 105,337 | 19,357,780 | ||||||
| nVent Electric PLC | 441,168 | 15,343,823 | ||||||
| Signify NV | 239,150 | 11,124,631 | ||||||
| 64,237,377 | ||||||||
| Electronic Equipment, Instruments and Components — 0.4% | ||||||||
| Anritsu Corp. | 663,400 | 8,400,505 | ||||||
| Energy Equipment and Services — 2.5% | ||||||||
| Baker Hughes Co. | 710,718 | 25,877,242 | ||||||
| Halliburton Co. | 281,500 | 10,660,405 | ||||||
| Schlumberger NV | 589,128 | 24,336,878 | ||||||
| 60,874,525 | ||||||||
| Entertainment — 1.3% | ||||||||
Walt Disney Co.(1) | 229,490 | 31,476,848 | ||||||
| Equity Real Estate Investment Trusts (REITs) — 1.7% | ||||||||
| Equinix, Inc. | 15,920 | 11,806,591 | ||||||
| Healthpeak Properties, Inc. | 458,410 | 15,737,215 | ||||||
| Weyerhaeuser Co. | 368,410 | 13,962,739 | ||||||
| 41,506,545 | ||||||||
| Food and Staples Retailing — 2.1% | ||||||||
| Koninklijke Ahold Delhaize NV | 887,165 | 28,536,101 | ||||||
| Walmart, Inc. | 149,181 | 22,216,035 | ||||||
| 50,752,136 | ||||||||
| Food Products — 4.5% | ||||||||
| Conagra Brands, Inc. | 1,057,928 | 35,514,643 | ||||||
| Danone SA | 329,440 | 18,199,239 | ||||||
| JDE Peet's NV | 330,748 | 9,470,457 | ||||||
| Kellogg Co. | 246,799 | 15,916,067 | ||||||
| Mondelez International, Inc., Class A | 291,651 | 18,309,850 | ||||||
| Orkla ASA | 1,133,730 | 10,072,610 | ||||||
| 107,482,866 | ||||||||
| Gas Utilities — 0.6% | ||||||||
| Atmos Energy Corp. | 117,994 | 14,099,103 | ||||||
| Health Care Equipment and Supplies — 4.7% | ||||||||
| Medtronic PLC | 510,990 | 56,694,341 | ||||||
| Zimmer Biomet Holdings, Inc. | 424,967 | 54,353,279 | ||||||
Zimvie, Inc.(1) | 41,894 | 956,859 | ||||||
| 112,004,479 | ||||||||
| Health Care Providers and Services — 5.0% | ||||||||
| Cardinal Health, Inc. | 714,895 | 40,534,546 | ||||||
| Cigna Corp. | 59,780 | 14,323,886 | ||||||
| CVS Health Corp. | 251,670 | 25,471,521 | ||||||
| McKesson Corp. | 55,020 | 16,843,272 | ||||||
| Quest Diagnostics, Inc. | 93,760 | 12,831,994 | ||||||
| Universal Health Services, Inc., Class B | 75,700 | 10,972,715 | ||||||
| 120,977,934 | ||||||||
| Hotels, Restaurants and Leisure — 0.6% | ||||||||
| Sodexo SA | 178,210 | 14,501,999 | ||||||
| Household Products — 1.2% | ||||||||
| Kimberly-Clark Corp. | 97,300 | 11,983,468 | ||||||
| Procter & Gamble Co. | 115,999 | 17,724,647 | ||||||
| 29,708,115 | ||||||||
11
| Shares | Value | |||||||
| Industrial Conglomerates — 3.3% | ||||||||
| General Electric Co. | 612,198 | $ | 56,016,117 | |||||
| Siemens AG | 165,530 | 22,920,485 | ||||||
| 78,936,602 | ||||||||
| Insurance — 2.6% | ||||||||
| Allstate Corp. | 112,320 | 15,557,443 | ||||||
| Chubb Ltd. | 115,933 | 24,798,069 | ||||||
| Reinsurance Group of America, Inc. | 209,666 | 22,950,040 | ||||||
| 63,305,552 | ||||||||
| Leisure Products — 0.5% | ||||||||
Mattel, Inc.(1) | 485,430 | 10,781,400 | ||||||
| Machinery — 0.4% | ||||||||
| IMI PLC | 544,726 | 9,698,314 | ||||||
| Metals and Mining — 0.8% | ||||||||
| BHP Group Ltd. | 516,775 | 19,920,378 | ||||||
| Multi-Utilities — 0.4% | ||||||||
| Engie SA | 711,620 | 9,355,666 | ||||||
| Multiline Retail — 1.0% | ||||||||
Dollar Tree, Inc.(1) | 156,260 | 25,025,039 | ||||||
| Oil, Gas and Consumable Fuels — 6.9% | ||||||||
| Chevron Corp. | 240,624 | 39,180,806 | ||||||
| ConocoPhillips | 204,183 | 20,418,300 | ||||||
| Devon Energy Corp. | 281,130 | 16,623,217 | ||||||
| EQT Corp. | 354,351 | 12,193,218 | ||||||
| Exxon Mobil Corp. | 397,230 | 32,807,226 | ||||||
| Shell PLC | 687,325 | 18,838,676 | ||||||
TotalEnergies SE(2) | 500,074 | 25,303,504 | ||||||
| 165,364,947 | ||||||||
| Paper and Forest Products — 0.8% | ||||||||
| Mondi PLC | 940,585 | 18,282,929 | ||||||
| Personal Products — 1.2% | ||||||||
| Unilever PLC | 640,550 | 28,950,425 | ||||||
| Pharmaceuticals — 8.7% | ||||||||
| Bristol-Myers Squibb Co. | 304,160 | 22,212,805 | ||||||
| Johnson & Johnson | 416,182 | 73,759,936 | ||||||
| Merck & Co., Inc. | 647,012 | 53,087,335 | ||||||
| Pfizer, Inc. | 606,433 | 31,395,036 | ||||||
| Roche Holding AG | 32,450 | 12,839,222 | ||||||
Teva Pharmaceutical Industries Ltd., ADR(1) | 1,539,747 | 14,458,224 | ||||||
| 207,752,558 | ||||||||
| Road and Rail — 1.0% | ||||||||
| Heartland Express, Inc. | 1,644,601 | 23,139,536 | ||||||
| Semiconductors and Semiconductor Equipment — 2.6% | ||||||||
| Intel Corp. | 897,682 | 44,489,120 | ||||||
| QUALCOMM, Inc. | 116,564 | 17,813,310 | ||||||
| 62,302,430 | ||||||||
| Software — 1.6% | ||||||||
| Open Text Corp. | 427,860 | 18,141,264 | ||||||
| Oracle Corp. (New York) | 249,229 | 20,618,715 | ||||||
| 38,759,979 | ||||||||
| Specialty Retail — 0.9% | ||||||||
| Advance Auto Parts, Inc. | 108,936 | 22,545,395 | ||||||
| Technology Hardware, Storage and Peripherals — 0.5% | ||||||||
| HP, Inc. | 341,575 | 12,399,173 | ||||||
12
| Shares | Value | |||||||
| Textiles, Apparel and Luxury Goods — 1.2% | ||||||||
| Ralph Lauren Corp. | 102,190 | $ | 11,592,434 | |||||
| Tapestry, Inc. | 476,662 | 17,707,993 | ||||||
| 29,300,427 | ||||||||
| Trading Companies and Distributors — 1.2% | ||||||||
| MSC Industrial Direct Co., Inc., Class A | 329,579 | 28,083,427 | ||||||
TOTAL COMMON STOCKS (Cost $1,575,642,692) | 2,352,300,204 | |||||||
| SHORT-TERM INVESTMENTS — 2.3% | ||||||||
| Money Market Funds — 0.8% | ||||||||
| State Street Institutional U.S. Government Money Market Fund, Premier Class | 12,359,759 | 12,359,759 | ||||||
State Street Navigator Securities Lending Government Money Market Portfolio(3) | 6,075,515 | 6,075,515 | ||||||
| 18,435,274 | ||||||||
| Repurchase Agreements — 1.5% | ||||||||
| BMO Capital Markets Corp., (collateralized by various U.S. Treasury obligations, 3.125% - 3.625%, 2/15/43 - 8/15/43, valued at $3,445,003), in a joint trading account at 0.26%, dated 3/31/22, due 4/1/22 (Delivery value $3,376,840) | 3,376,816 | |||||||
| Fixed Income Clearing Corp., (collateralized by various U.S. Treasury obligations, 2.875%, 5/15/43, valued at $34,444,386), at 0.25%, dated 3/31/22, due 4/1/22 (Delivery value $33,769,235) | 33,769,000 | |||||||
| 37,145,816 | ||||||||
TOTAL SHORT-TERM INVESTMENTS (Cost $55,581,090) | 55,581,090 | |||||||
TOTAL INVESTMENT SECURITIES — 100.2% (Cost $1,631,223,782) | 2,407,881,294 | |||||||
| OTHER ASSETS AND LIABILITIES — (0.2)% | (5,786,407) | |||||||
| TOTAL NET ASSETS — 100.0% | $ | 2,402,094,887 | ||||||
| FORWARD FOREIGN CURRENCY EXCHANGE CONTRACTS | ||||||||||||||||||||
| Currency Purchased | Currency Sold | Counterparty | Settlement Date | Unrealized Appreciation (Depreciation) | ||||||||||||||||
| USD | 13,408,481 | AUD | 18,003,149 | Bank of America N.A. | 6/30/22 | $ | (84,135) | |||||||||||||
| USD | 686,511 | AUD | 918,568 | Bank of America N.A. | 6/30/22 | (1,918) | ||||||||||||||
| USD | 611,940 | AUD | 813,921 | Bank of America N.A. | 6/30/22 | 1,940 | ||||||||||||||
| USD | 9,618,680 | CHF | 8,935,513 | Morgan Stanley | 6/30/22 | (88,183) | ||||||||||||||
| USD | 140,031,000 | EUR | 126,668,144 | JPMorgan Chase Bank N.A. | 6/30/22 | (579,988) | ||||||||||||||
| USD | 45,670,276 | GBP | 34,487,654 | Bank of America N.A. | 6/30/22 | 378,177 | ||||||||||||||
| USD | 14,637,727 | JPY | 1,761,591,900 | Bank of America N.A. | 6/30/22 | 132,241 | ||||||||||||||
| USD | 573,231 | JPY | 69,555,375 | Bank of America N.A. | 6/30/22 | 491 | ||||||||||||||
| USD | 7,595,535 | NOK | 66,765,360 | UBS AG | 6/30/22 | 15,462 | ||||||||||||||
| $ | (225,913) | |||||||||||||||||||
13
| NOTES TO SCHEDULE OF INVESTMENTS | ||||||||
| ADR | - | American Depositary Receipt | ||||||
| AUD | - | Australian Dollar | ||||||
| CHF | - | Swiss Franc | ||||||
| EUR | - | Euro | ||||||
| GBP | - | British Pound | ||||||
| JPY | - | Japanese Yen | ||||||
| NOK | - | Norwegian Krone | ||||||
| USD | - | United States Dollar | ||||||
(1)Non-income producing.
(2)Security, or a portion thereof, is on loan. At the period end, the aggregate value of securities on loan was $5,740,768. The amount of securities on loan indicated may not correspond with the securities on loan identified because securities with pending sales are in the process of recall from the brokers.
(3)Investment of cash collateral from securities on loan. At the period end, the aggregate value of the collateral held by the fund was $6,075,515.
See Notes to Financial Statements.
14
| Statement of Assets and Liabilities | ||
| MARCH 31, 2022 | |||||
| Assets | |||||
| Investment securities, at value (cost of $1,625,148,267) — including $5,740,768 of securities on loan | $ | 2,401,805,779 | |||
| Investment made with cash collateral received for securities on loan, at value (cost of $6,075,515) | 6,075,515 | ||||
| Total investment securities, at value (cost of $1,631,223,782) | 2,407,881,294 | ||||
| Receivable for investments sold | 5,871,119 | ||||
| Receivable for capital shares sold | 776,421 | ||||
| Unrealized appreciation on forward foreign currency exchange contracts | 528,311 | ||||
| Dividends and interest receivable | 4,890,014 | ||||
| Securities lending receivable | 3,388 | ||||
| 2,419,950,547 | |||||
| Liabilities | |||||
| Payable for collateral received for securities on loan | 6,075,515 | ||||
| Payable for investments purchased | 6,622,273 | ||||
| Payable for capital shares redeemed | 2,415,923 | ||||
| Unrealized depreciation on forward foreign currency exchange contracts | 754,224 | ||||
| Accrued management fees | 1,857,875 | ||||
| Distribution and service fees payable | 129,850 | ||||
| 17,855,660 | |||||
| Net Assets | $ | 2,402,094,887 | |||
| Net Assets Consist of: | |||||
| Capital (par value and paid-in surplus) | $ | 1,554,960,245 | |||
| Distributable earnings | 847,134,642 | ||||
| $ | 2,402,094,887 | ||||
| Net Assets | Shares Outstanding | Net Asset Value Per Share | |||||||||
| Investor Class, $0.01 Par Value | $1,309,198,129 | 142,952,015 | $9.16 | ||||||||
| I Class, $0.01 Par Value | $520,320,505 | 56,671,320 | $9.18 | ||||||||
| Y Class, $0.01 Par Value | $128,720,576 | 14,017,750 | $9.18 | ||||||||
| A Class, $0.01 Par Value | $69,880,466 | 7,640,535 | $9.15* | ||||||||
| C Class, $0.01 Par Value | $9,886,255 | 1,104,643 | $8.95 | ||||||||
| R Class, $0.01 Par Value | $254,460,488 | 27,796,948 | $9.15 | ||||||||
| R5 Class, $0.01 Par Value | $2,617,862 | 285,217 | $9.18 | ||||||||
| R6 Class, $0.01 Par Value | $107,010,606 | 11,651,265 | $9.18 | ||||||||
*Maximum offering price $9.71 (net asset value divided by 0.9425).
See Notes to Financial Statements.
15
| Statement of Operations | ||
| YEAR ENDED MARCH 31, 2022 | |||||
| Investment Income (Loss) | |||||
| Income: | |||||
| Dividends (net of foreign taxes withheld of $1,108,613) | $ | 61,844,774 | |||
| Interest | 120,489 | ||||
| Securities lending, net | 83,300 | ||||
| 62,048,563 | |||||
| Expenses: | |||||
| Management fees | 22,636,921 | ||||
| Distribution and service fees: | |||||
| A Class | 173,223 | ||||
| C Class | 98,442 | ||||
| R Class | 1,230,096 | ||||
| Directors' fees and expenses | 59,264 | ||||
| Other expenses | 258,300 | ||||
| 24,456,246 | |||||
| Net investment income (loss) | 37,592,317 | ||||
| Realized and Unrealized Gain (Loss) | |||||
| Net realized gain (loss) on: | |||||
| Investment transactions | 375,668,534 | ||||
| Forward foreign currency exchange contract transactions | 15,426,472 | ||||
| Foreign currency translation transactions | (105,001) | ||||
| 390,990,005 | |||||
| Change in net unrealized appreciation (depreciation) on: | |||||
| Investments | (133,618,575) | ||||
| Forward foreign currency exchange contracts | (3,408,886) | ||||
| Translation of assets and liabilities in foreign currencies | (21,752) | ||||
| (137,049,213) | |||||
| Net realized and unrealized gain (loss) | 253,940,792 | ||||
| Net Increase (Decrease) in Net Assets Resulting from Operations | $ | 291,533,109 | |||
See Notes to Financial Statements.
16
| Statement of Changes in Net Assets | ||
| YEARS ENDED MARCH 31, 2022 AND MARCH 31, 2021 | ||||||||
| Increase (Decrease) in Net Assets | March 31, 2022 | March 31, 2021 | ||||||
| Operations | ||||||||
| Net investment income (loss) | $ | 37,592,317 | $ | 42,081,542 | ||||
| Net realized gain (loss) | 390,990,005 | 110,465,919 | ||||||
| Change in net unrealized appreciation (depreciation) | (137,049,213) | 939,867,042 | ||||||
| Net increase (decrease) in net assets resulting from operations | 291,533,109 | 1,092,414,503 | ||||||
| Distributions to Shareholders | ||||||||
| From earnings: | ||||||||
| Investor Class | (161,082,877) | (47,389,449) | ||||||
| I Class | (67,705,351) | (18,043,626) | ||||||
| Y Class | (15,323,017) | (3,313,630) | ||||||
| A Class | (8,557,994) | (1,899,039) | ||||||
| C Class | (1,151,149) | (261,340) | ||||||
| R Class | (29,698,860) | (6,184,829) | ||||||
| R5 Class | (318,549) | (69,988) | ||||||
| R6 Class | (12,133,497) | (3,640,523) | ||||||
| Decrease in net assets from distributions | (295,971,294) | (80,802,424) | ||||||
| Capital Share Transactions | ||||||||
| Net increase (decrease) in net assets from capital share transactions (Note 5) | (203,075,147) | (300,990,460) | ||||||
| Net increase (decrease) in net assets | (207,513,332) | 710,621,619 | ||||||
| Net Assets | ||||||||
| Beginning of period | 2,609,608,219 | 1,898,986,600 | ||||||
| End of period | $ | 2,402,094,887 | $ | 2,609,608,219 | ||||
See Notes to Financial Statements.
17
| Notes to Financial Statements | ||
MARCH 31, 2022
1. Organization
American Century Capital Portfolios, Inc. (the corporation) is registered under the Investment Company Act of 1940, as amended (the 1940 Act), as an open-end management investment company and is organized as a Maryland corporation. Value Fund (the fund) is one fund in a series issued by the corporation. The fund’s investment objective is to seek long-term capital growth. Income is a secondary objective.
The fund offers the Investor Class, I Class, Y Class, A Class, C Class, R Class, R5 Class and R6 Class. The A Class may incur an initial sales charge. The A Class and C Class may be subject to a contingent deferred sales charge.
2. Significant Accounting Policies
The following is a summary of significant accounting policies consistently followed by the fund in preparation of its financial statements. The fund is an investment company and follows accounting and reporting guidance in accordance with accounting principles generally accepted in the United States of America. This may require management to make certain estimates and assumptions at the date of the financial statements. Actual results could differ from these estimates. Management evaluated the impact of events or transactions occurring through the date the financial statements were issued that would merit recognition or disclosure.
Investment Valuations — The fund determines the fair value of its investments and computes its net asset value (NAV) per share at the close of regular trading (usually 4 p.m. Eastern time) on the New York Stock Exchange (NYSE) on each day the NYSE is open. The Board of Directors has adopted valuation policies and procedures to guide the investment advisor in the fund’s investment valuation process and to provide methodologies for the oversight of the fund’s pricing function.
Equity securities that are listed or traded on a domestic securities exchange are valued at the last reported sales price or at the official closing price as provided by the exchange. Equity securities traded on foreign securities exchanges are generally valued at the closing price of such securities on the exchange where primarily traded or at the close of the NYSE, if that is earlier. If no last sales price is reported, or if local convention or regulation so provides, the mean of the latest bid and asked prices may be used. Securities traded over-the-counter are valued at the mean of the latest bid and asked prices, the last sales price, or the official closing price. Equity securities initially expressed in local currencies are translated into U.S. dollars at the mean of the appropriate currency exchange rate at the close of the NYSE as provided by an independent pricing service.
Open-end management investment companies are valued at the reported NAV per share. Repurchase agreements are valued at cost, which approximates fair value. Forward foreign currency exchange contracts are valued at the mean of the appropriate forward exchange rate at the close of the NYSE as provided by an independent pricing service.
If the fund determines that the market price for an investment is not readily available or the valuation methods mentioned above do not reflect an investment’s fair value, such investment is valued as determined in good faith by the Board of Directors or its delegate, in accordance with policies and procedures adopted by the Board of Directors. In its determination of fair value, the fund may review several factors including, but not limited to, market information regarding the specific investment or comparable investments and correlation with other investment types, futures indices or general market indicators. Circumstances that may cause the fund to use these procedures to value an investment include, but are not limited to: an investment has been declared in default or is distressed; trading in a security has been suspended during the trading day or a security is not actively trading on its principal exchange; prices received from a regular pricing source are deemed unreliable; or there is a foreign market holiday and no trading occurred.
18
The fund monitors for significant events occurring after the close of an investment’s primary exchange but before the fund’s NAV per share is determined. Significant events may include, but are not limited to: corporate announcements and transactions; governmental action and political unrest that could impact a specific investment or an investment sector; or armed conflicts, natural disasters and similar events that could affect investments in a specific country or region. The fund also monitors for significant fluctuations between domestic and foreign markets, as evidenced by the U.S. market or such other indicators that the Board of Directors, or its delegate, deems appropriate. The fund may apply a model-derived factor to the closing price of equity securities traded on foreign securities exchanges. The factor is based on observable market data as provided by an independent pricing service.
Security Transactions — Security transactions are accounted for as of the trade date. Net realized gains and losses are determined on the identified cost basis, which is also used for federal income tax purposes.
Investment Income — Dividend income less foreign taxes withheld, if any, is recorded as of the ex-dividend date. Distributions received on securities that represent a return of capital or long-term capital gain are recorded as a reduction of cost of investments and/or as a realized gain. The fund may estimate the components of distributions received that may be considered nontaxable distributions or long-term capital gain distributions for income tax purposes. Interest income is recorded on the accrual basis and includes accretion of discounts and amortization of premiums. Securities lending income is net of fees and rebates earned by the lending agent for its services.
Foreign Currency Translations — All assets and liabilities initially expressed in foreign currencies are translated into U.S. dollars at prevailing exchange rates at period end. The fund may enter into spot foreign currency exchange contracts to facilitate transactions denominated in a foreign currency. Purchases and sales of investment securities, dividend and interest income, spot foreign currency exchange contracts, and expenses are translated at the rates of exchange prevailing on the respective dates of such transactions. Net realized and unrealized foreign currency exchange gains or losses related to investment securities are a component of net realized gain (loss) on investment transactions and change in net unrealized appreciation (depreciation) on investments, respectively.
Repurchase Agreements — The fund may enter into repurchase agreements with institutions that American Century Investment Management, Inc. (ACIM) (the investment advisor) has determined are creditworthy pursuant to criteria adopted by the Board of Directors. The fund requires that the collateral, represented by securities, received in a repurchase transaction be transferred to the custodian in a manner sufficient to enable the fund to obtain those securities in the event of a default under the repurchase agreement. ACIM monitors, on a daily basis, the securities transferred to ensure the value, including accrued interest, of the securities under each repurchase agreement is equal to or greater than amounts owed to the fund under each repurchase agreement.
Joint Trading Account — Pursuant to an Exemptive Order issued by the Securities and Exchange Commission, the fund, along with certain other funds in the American Century Investments family of funds, may transfer uninvested cash balances into a joint trading account. These balances are invested in one or more repurchase agreements that are collateralized by U.S. Treasury or Agency obligations.
Segregated Assets — In accordance with the 1940 Act, the fund segregates assets on its books and records to cover certain types of investment securities and other financial instruments. ACIM monitors, on a daily basis, the securities segregated to ensure the fund designates a sufficient amount of liquid assets, marked-to-market daily. The fund may also receive assets or be required to pledge assets at the custodian bank or with a broker for collateral requirements.
Income Tax Status — It is the fund’s policy to distribute substantially all net investment income and net realized gains to shareholders and to otherwise qualify as a regulated investment company under provisions of the Internal Revenue Code. Accordingly, no provision has been made for income taxes. The fund files U.S. federal, state, local and non-U.S. tax returns as applicable. The fund's tax returns are subject to examination by the relevant taxing authority until expiration of the applicable statute of limitations, which is generally three years from the date of filing but can be longer in certain jurisdictions. At this time, management believes there are no uncertain tax positions which, based on their technical merit, would not be sustained upon examination and for which it is reasonably possible that the total amounts of unrecognized tax benefits will significantly change in the next twelve months.
19
Multiple Class — All shares of the fund represent an equal pro rata interest in the net assets of the class to which such shares belong, and have identical voting, dividend, liquidation and other rights and the same terms and conditions, except for class specific expenses and exclusive rights to vote on matters affecting only individual classes. Income, non-class specific expenses, and realized and unrealized capital gains and losses of the fund are allocated to each class of shares based on their relative net assets.
Distributions to Shareholders — Distributions from net investment income, if any, are generally declared and paid quarterly. Distributions from net realized gains, if any, are generally declared and paid annually. The fund may elect to treat a portion of its payment to a redeeming shareholder, which represents the pro rata share of undistributed net investment income and net realized gains, as a distribution for federal income tax purposes (tax equalization).
Indemnifications — Under the corporation’s organizational documents, its officers and directors are indemnified against certain liabilities arising out of the performance of their duties to the fund. In addition, in the normal course of business, the fund enters into contracts that provide general indemnifications. The maximum exposure under these arrangements is unknown as this would involve future claims that may be made against a fund. The risk of material loss from such claims is considered by management to be remote.
Securities Lending — Securities are lent to qualified financial institutions and brokers. State Street Bank & Trust Co. serves as securities lending agent to the fund pursuant to a Securities Lending Agreement. The lending of securities exposes the fund to risks such as: the borrowers may fail to return the loaned securities, the borrowers may not be able to provide additional collateral, the fund may experience delays in recovery of the loaned securities or delays in access to collateral, or the fund may experience losses related to the investment collateral. To minimize certain risks, loan counterparties pledge collateral in the form of cash and/or securities. The lending agent has agreed to indemnify the fund in the case of default of any securities borrowed. Cash collateral received is invested in the State Street Navigator Securities Lending Government Money Market Portfolio, a money market mutual fund registered under the 1940 Act. The loans may also be secured by U.S. government securities in an amount at least equal to the market value of the securities loaned, plus accrued interest and dividends, determined on a daily basis and adjusted accordingly. By lending securities, the fund seeks to increase its net investment income through the receipt of interest and fees. Such income is reflected separately within the Statement of Operations. The value of loaned securities and related collateral outstanding at period end, if any, are shown on a gross basis within the Schedule of Investments and Statement of Assets and Liabilities.
The following table reflects a breakdown of transactions accounted for as secured borrowings, the gross obligation by the type of collateral pledged, and the remaining contractual maturity of those transactions as of March 31, 2022.
| Remaining Contractual Maturity of Agreements | |||||||||||||||||
Overnight and Continuous | <30 days | Between 30 & 90 days | >90 days | Total | |||||||||||||
Securities Lending Transactions(1) | |||||||||||||||||
| Common Stocks | $ | 6,075,515 | — | — | — | $ | 6,075,515 | ||||||||||
| Gross amount of recognized liabilities for securities lending transactions | $ | 6,075,515 | |||||||||||||||
(1)Amount represents the payable for cash collateral received for securities on loan. This will generally be in the Overnight and Continuous column as the securities are typically callable on demand.
3. Fees and Transactions with Related Parties
Certain officers and directors of the corporation are also officers and/or directors of American Century Companies, Inc. (ACC). The corporation’s investment advisor, ACIM, the corporation's distributor, American Century Investment Services, Inc. (ACIS), and the corporation’s transfer agent, American Century Services, LLC, are wholly owned, directly or indirectly, by ACC.
20
Management Fees — The corporation has entered into a management agreement with ACIM, under which ACIM provides the fund with investment advisory and management services in exchange for a single, unified management fee (the fee) per class. The agreement provides that ACIM will pay all expenses of managing and operating the fund, except brokerage expenses, taxes, interest, fees and expenses of the independent directors (including legal counsel fees), extraordinary expenses, and expenses incurred in connection with the provision of shareholder services and distribution services under a plan adopted pursuant to Rule 12b-1 under the 1940 Act. The fee is computed and accrued daily based on each class's daily net assets and paid monthly in arrears. The difference in the fee among the classes is a result of their separate arrangements for non-Rule 12b-1 shareholder services. It is not the result of any difference in advisory or custodial fees or other expenses related to the management of the fund's assets, which do not vary by class. The rate of the fee is determined by applying a fee rate calculation formula. This formula takes into account the fund's assets as well as certain assets, if any, of other clients of the investment advisor outside the American Century Investments family of funds (such as subadvised funds and separate accounts) that use very similar investment teams and strategies (strategy assets).
The management fee schedule range and the effective annual management fee for each class for the period ended March 31, 2022 are as follows:
Management Fee Schedule Range | Effective Annual Management Fee | |||||||
| Investor Class | 0.85% to 1.00% | 1.00% | ||||||
| I Class | 0.65% to 0.80% | 0.80% | ||||||
| Y Class | 0.50% to 0.65% | 0.65% | ||||||
| A Class | 0.85% to 1.00% | 1.00% | ||||||
| C Class | 0.85% to 1.00% | 1.00% | ||||||
| R Class | 0.85% to 1.00% | 1.00% | ||||||
| R5 Class | 0.65% to 0.80% | 0.80% | ||||||
| R6 Class | 0.50% to 0.65% | 0.65% | ||||||
Distribution and Service Fees — The Board of Directors has adopted a separate Master Distribution and Individual Shareholder Services Plan for each of the A Class, C Class and R Class (collectively the plans), pursuant to Rule 12b-1 of the 1940 Act. The plans provide that the A Class will pay ACIS an annual distribution and service fee of 0.25%. The plans provide that the C Class will pay ACIS an annual distribution and service fee of 1.00%, of which 0.25% is paid for individual shareholder services and 0.75% is paid for distribution services. The plans provide that the R Class will pay ACIS an annual distribution and service fee of 0.50%. The fees are computed and accrued daily based on each class’s daily net assets and paid monthly in arrears. The fees are used to pay financial intermediaries for distribution and individual shareholder services. Fees incurred under the plans during the period ended March 31, 2022 are detailed in the Statement of Operations.
Directors' Fees and Expenses — The Board of Directors is responsible for overseeing the investment advisor’s management and operations of the fund. The directors receive detailed information about the fund and its investment advisor regularly throughout the year, and meet at least quarterly with management of the investment advisor to review reports about fund operations. The fund’s officers do not receive compensation from the fund.
Interfund Transactions — The fund may enter into security transactions with other American Century Investments funds and other client accounts of the investment advisor, in accordance with the 1940 Act rules and procedures adopted by the Board of Directors. The rules and procedures require, among other things, that these transactions be effected at the independent current market price of the security. During the period, the interfund purchases were $1,801,514 and there were no interfund sales.
4. Investment Transactions
Purchases and sales of investment securities, excluding short-term investments, for the period ended March 31, 2022 were $984,375,589 and $1,408,141,618, respectively.
21
5. Capital Share Transactions
Transactions in shares of the fund were as follows:
| Year ended March 31, 2022 | Year ended March 31, 2021 | |||||||||||||
| Shares | Amount | Shares | Amount | |||||||||||
| Investor Class/Shares Authorized | 1,350,000,000 | 1,350,000,000 | ||||||||||||
| Sold | 13,559,184 | $ | 128,574,461 | 20,891,001 | $ | 162,180,523 | ||||||||
| Issued in reinvestment of distributions | 17,680,147 | 155,206,819 | 5,782,191 | 45,104,856 | ||||||||||
| Redeemed | (54,760,353) | (529,042,949) | (91,975,737) | (668,759,186) | ||||||||||
| (23,521,022) | (245,261,669) | (65,302,545) | (461,473,807) | |||||||||||
| I Class/Shares Authorized | 400,000,000 | 400,000,000 | ||||||||||||
| Sold | 4,660,313 | 44,504,194 | 51,227,913 | 357,034,754 | ||||||||||
| Issued in reinvestment of distributions | 7,604,075 | 67,010,969 | 2,287,477 | 17,868,731 | ||||||||||
| Redeemed | (12,251,204) | (115,844,231) | (22,514,917) | (170,343,966) | ||||||||||
| 13,184 | (4,329,068) | 31,000,473 | 204,559,519 | |||||||||||
| Y Class/Shares Authorized | 130,000,000 | 130,000,000 | ||||||||||||
| Sold | 6,719,308 | 63,586,908 | 6,831,633 | 51,846,513 | ||||||||||
| Issued in reinvestment of distributions | 1,521,680 | 13,435,978 | 350,684 | 2,783,963 | ||||||||||
| Redeemed | (7,138,696) | (69,231,624) | (1,838,386) | (13,846,282) | ||||||||||
| 1,102,292 | 7,791,262 | 5,343,931 | 40,784,194 | |||||||||||
| A Class/Shares Authorized | 60,000,000 | 60,000,000 | ||||||||||||
| Sold | 1,631,731 | 15,351,982 | 1,553,173 | 12,101,266 | ||||||||||
| Issued in reinvestment of distributions | 880,127 | 7,709,724 | 219,542 | 1,712,093 | ||||||||||
| Redeemed | (2,031,837) | (19,138,683) | (2,976,521) | (22,195,383) | ||||||||||
| 480,021 | 3,923,023 | (1,203,806) | (8,382,024) | |||||||||||
| C Class/Shares Authorized | 20,000,000 | 25,000,000 | ||||||||||||
| Sold | 254,435 | 2,393,777 | 205,865 | 1,602,499 | ||||||||||
| Issued in reinvestment of distributions | 132,544 | 1,133,934 | 33,493 | 256,871 | ||||||||||
| Redeemed | (291,412) | (2,706,195) | (1,011,329) | (7,680,219) | ||||||||||
| 95,567 | 821,516 | (771,971) | (5,820,849) | |||||||||||
| R Class/Shares Authorized | 175,000,000 | 175,000,000 | ||||||||||||
| Sold | 1,486,468 | 14,108,754 | 2,127,440 | 15,336,461 | ||||||||||
| Issued in reinvestment of distributions | 3,389,739 | 29,698,860 | 788,342 | 6,184,619 | ||||||||||
| Redeemed | (2,539,300) | (24,001,845) | (2,259,988) | (18,088,339) | ||||||||||
| 2,336,907 | 19,805,769 | 655,794 | 3,432,741 | |||||||||||
| R5 Class/Shares Authorized | 20,000,000 | 30,000,000 | ||||||||||||
| Sold | 32,133 | 310,289 | 26,422 | 196,902 | ||||||||||
| Issued in reinvestment of distributions | 36,178 | 318,549 | 8,910 | 69,988 | ||||||||||
| Redeemed | (27,469) | (263,806) | (13,919) | (105,851) | ||||||||||
| 40,842 | 365,032 | 21,413 | 161,039 | |||||||||||
| R6 Class/Shares Authorized | 125,000,000 | 150,000,000 | ||||||||||||
| Sold | 3,922,544 | 36,833,008 | 6,460,861 | 49,366,293 | ||||||||||
| Issued in reinvestment of distributions | 1,366,401 | 12,049,360 | 445,647 | 3,462,825 | ||||||||||
| Redeemed | (3,671,920) | (35,073,380) | (17,181,917) | (127,080,391) | ||||||||||
| 1,617,025 | 13,808,988 | (10,275,409) | (74,251,273) | |||||||||||
| Net increase (decrease) | (17,835,184) | $ | (203,075,147) | (40,532,120) | $ | (300,990,460) | ||||||||
22
6. Fair Value Measurements
The fund’s investments valuation process is based on several considerations and may use multiple inputs to determine the fair value of the investments held by the fund. In conformity with accounting principles generally accepted in the United States of America, the inputs used to determine a valuation are classified into three broad levels.
•Level 1 valuation inputs consist of unadjusted quoted prices in an active market for identical investments.
•Level 2 valuation inputs consist of direct or indirect observable market data (including quoted prices for comparable investments, evaluations of subsequent market events, interest rates, prepayment speeds, credit risk, etc.). These inputs also consist of quoted prices for identical investments initially expressed in local currencies that are adjusted through translation into U.S. dollars.
•Level 3 valuation inputs consist of unobservable data (including a fund’s own assumptions).
The level classification is based on the lowest level input that is significant to the fair valuation measurement. The valuation inputs are not necessarily an indication of the risks associated with investing in these securities or other financial instruments.
The following is a summary of the level classifications as of period end. The Schedule of Investments provides additional information on the fund’s portfolio holdings.
| Level 1 | Level 2 | Level 3 | |||||||||
| Assets | |||||||||||
| Investment Securities | |||||||||||
| Common Stocks | |||||||||||
| Aerospace and Defense | $ | 22,031,187 | $ | 23,706,483 | — | ||||||
| Automobiles | 20,137,196 | 11,307,155 | — | ||||||||
| Chemicals | — | 7,281,914 | — | ||||||||
| Electrical Equipment | 53,112,746 | 11,124,631 | — | ||||||||
| Electronic Equipment, Instruments and Components | — | 8,400,505 | — | ||||||||
| Food and Staples Retailing | 22,216,035 | 28,536,101 | — | ||||||||
| Food Products | 69,740,560 | 37,742,306 | — | ||||||||
| Hotels, Restaurants and Leisure | — | 14,501,999 | — | ||||||||
| Industrial Conglomerates | 56,016,117 | 22,920,485 | — | ||||||||
| Machinery | — | 9,698,314 | — | ||||||||
| Metals and Mining | — | 19,920,378 | — | ||||||||
| Multi-Utilities | — | 9,355,666 | — | ||||||||
| Oil, Gas and Consumable Fuels | 121,222,767 | 44,142,180 | — | ||||||||
| Paper and Forest Products | — | 18,282,929 | — | ||||||||
| Personal Products | — | 28,950,425 | — | ||||||||
| Pharmaceuticals | 194,913,336 | 12,839,222 | — | ||||||||
| Other Industries | 1,484,199,567 | — | — | ||||||||
| Short-Term Investments | 18,435,274 | 37,145,816 | — | ||||||||
| $ | 2,062,024,785 | $ | 345,856,509 | — | |||||||
| Other Financial Instruments | |||||||||||
| Forward Foreign Currency Exchange Contracts | — | $ | 528,311 | — | |||||||
| Liabilities | |||||||||||
| Other Financial Instruments | |||||||||||
| Forward Foreign Currency Exchange Contracts | — | $ | 754,224 | — | |||||||
23
7. Derivative Instruments
Foreign Currency Risk — The fund is subject to foreign currency exchange rate risk in the normal course of pursuing its investment objectives. The value of foreign investments held by a fund may be significantly affected by changes in foreign currency exchange rates. The dollar value of a foreign security generally decreases when the value of the dollar rises against the foreign currency in which the security is denominated and tends to increase when the value of the dollar declines against such foreign currency. A fund may enter into forward foreign currency exchange contracts to reduce a fund's exposure to foreign currency exchange rate fluctuations. The net U.S. dollar value of foreign currency underlying all contractual commitments held by a fund and the resulting unrealized appreciation or depreciation are determined daily. Realized gain or loss is recorded upon settlement of the contract. Net realized and unrealized gains or losses occurring during the holding period of forward foreign currency exchange contracts are a component of net realized gain (loss) on forward foreign currency exchange contract transactions and change in net unrealized appreciation (depreciation) on forward foreign currency exchange contracts, respectively. A fund bears the risk of an unfavorable change in the foreign currency exchange rate underlying the forward contract. Additionally, losses, up to the fair value, may arise if the counterparties do not perform under the contract terms. The fund's average U.S. dollar exposure to foreign currency risk derivative instruments held during the period was $242,684,620.
The value of foreign currency risk derivative instruments as of March 31, 2022, is disclosed on the Statement of Assets and Liabilities as an asset of $528,311 in unrealized appreciation on forward foreign currency exchange contracts and a liability of $754,224 in unrealized depreciation on forward foreign currency exchange contracts. For the year ended March 31, 2022, the effect of foreign currency risk derivative instruments on the Statement of Operations was $15,426,472 in net realized gain (loss) on forward foreign currency exchange contract transactions and $(3,408,886) in change in net unrealized appreciation (depreciation) on forward foreign currency exchange contracts.
8. Risk Factors
The value of the fund’s shares will go up and down, sometimes rapidly or unpredictably, based on the performance of the securities owned by the fund and other factors generally affecting the securities market. Market risks, including political, regulatory, economic and social developments, can affect the value of the fund’s investments. Natural disasters, public health emergencies, war, terrorism and other unforeseeable events may lead to increased market volatility and may have adverse long-term effects on world economies and markets generally.
There are certain risks involved in investing in foreign securities. These risks include those resulting from political events (such as civil unrest, national elections and imposition of exchange controls), social and economic events (such as labor strikes and rising inflation), and natural disasters. Securities of foreign issuers may be less liquid and more volatile. Investing a significant portion of assets in one country or region may accentuate these risks.
9. Federal Tax Information
The tax character of distributions paid during the years ended March 31, 2022 and March 31, 2021 were as follows:
| 2022 | 2021 | |||||||
| Distributions Paid From | ||||||||
| Ordinary income | $ | 120,901,348 | $ | 53,037,015 | ||||
| Long-term capital gains | $ | 175,069,946 | $ | 27,765,409 | ||||
The book-basis character of distributions made during the year from net investment income or net realized gains may differ from their ultimate characterization for federal income tax purposes. These differences reflect the differing character of certain income items and net realized gains and losses for financial statement and tax purposes, and may result in reclassification among certain capital accounts on the financial statements.
24
As of period end, the federal tax cost of investments and the components of distributable earnings on a tax-basis were as follows:
| Federal tax cost of investments | $ | 1,694,498,252 | |||
| Gross tax appreciation of investments | $ | 755,121,716 | |||
| Gross tax depreciation of investments | (41,738,674) | ||||
| Net tax appreciation (depreciation) of investments | 713,383,042 | ||||
| Net tax appreciation (depreciation) on derivatives and translation of assets and liabilities in foreign currencies | (12,715) | ||||
| Net tax appreciation (depreciation) | $ | 713,370,327 | |||
| Undistributed ordinary income | $ | 21,601,322 | |||
| Accumulated long-term gains | $ | 112,162,993 | |||
The difference between book-basis and tax-basis unrealized appreciation (depreciation) is attributable primarily to the tax deferral of losses on wash sales.
25
| Financial Highlights | ||
| For a Share Outstanding Throughout the Years Ended March 31 (except as noted) | |||||||||||||||||||||||||||||||||||||||||
| Per-Share Data | Ratios and Supplemental Data | ||||||||||||||||||||||||||||||||||||||||
| Income From Investment Operations: | Distributions From: | Ratio to Average Net Assets of: | |||||||||||||||||||||||||||||||||||||||
| Net Asset Value, Beginning of Period | Net Investment Income (Loss)(1) | Net Realized and Unrealized Gain (Loss) | Total From Investment Operations | Net Investment Income | Net Realized Gains | Total Distributions | Net Asset Value, End of Period | Total Return(2) | Operating Expenses | Net Investment Income (Loss) | Portfolio Turnover Rate | Net Assets, End of Period (in thousands) | |||||||||||||||||||||||||||||
| Investor Class | |||||||||||||||||||||||||||||||||||||||||
| 2022 | $9.32 | 0.14 | 0.94 | 1.08 | (0.15) | (1.09) | (1.24) | $9.16 | 12.26% | 1.01% | 1.52% | 41% | $1,309,198 | ||||||||||||||||||||||||||||
| 2021 | $5.92 | 0.14 | 3.55 | 3.69 | (0.15) | (0.14) | (0.29) | $9.32 | 63.17% | 1.00% | 1.88% | 53% | $1,550,992 | ||||||||||||||||||||||||||||
| 2020 | $8.10 | 0.15 | (1.60) | (1.45) | (0.14) | (0.59) | (0.73) | $5.92 | (19.92)% | 1.00% | 1.90% | 46% | $1,373,039 | ||||||||||||||||||||||||||||
| 2019 | $8.65 | 0.15 | 0.15 | 0.30 | (0.14) | (0.71) | (0.85) | $8.10 | 4.01% | 0.98% | 1.70% | 48% | $1,845,967 | ||||||||||||||||||||||||||||
| 2018 | $8.98 | 0.14 | 0.17 | 0.31 | (0.13) | (0.51) | (0.64) | $8.65 | 3.38% | 0.98% | 1.59% | 35% | $2,043,212 | ||||||||||||||||||||||||||||
| I Class | |||||||||||||||||||||||||||||||||||||||||
| 2022 | $9.34 | 0.16 | 0.94 | 1.10 | (0.17) | (1.09) | (1.26) | $9.18 | 12.44% | 0.81% | 1.72% | 41% | $520,321 | ||||||||||||||||||||||||||||
| 2021 | $5.94 | 0.16 | 3.54 | 3.70 | (0.16) | (0.14) | (0.30) | $9.34 | 63.29% | 0.80% | 2.08% | 53% | $529,024 | ||||||||||||||||||||||||||||
| 2020 | $8.12 | 0.17 | (1.60) | (1.43) | (0.16) | (0.59) | (0.75) | $5.94 | (19.71)% | 0.80% | 2.10% | 46% | $152,349 | ||||||||||||||||||||||||||||
| 2019 | $8.67 | 0.16 | 0.15 | 0.31 | (0.15) | (0.71) | (0.86) | $8.12 | 4.21% | 0.78% | 1.90% | 48% | $313,183 | ||||||||||||||||||||||||||||
| 2018 | $9.00 | 0.16 | 0.17 | 0.33 | (0.15) | (0.51) | (0.66) | $8.67 | 3.58% | 0.78% | 1.79% | 35% | $648,241 | ||||||||||||||||||||||||||||
| Y Class | |||||||||||||||||||||||||||||||||||||||||
| 2022 | $9.34 | 0.18 | 0.93 | 1.11 | (0.18) | (1.09) | (1.27) | $9.18 | 12.61% | 0.66% | 1.87% | 41% | $128,721 | ||||||||||||||||||||||||||||
| 2021 | $5.94 | 0.17 | 3.55 | 3.72 | (0.18) | (0.14) | (0.32) | $9.34 | 63.54% | 0.65% | 2.23% | 53% | $120,607 | ||||||||||||||||||||||||||||
| 2020 | $8.12 | 0.18 | (1.60) | (1.42) | (0.17) | (0.59) | (0.76) | $5.94 | (19.60)% | 0.65% | 2.25% | 46% | $44,963 | ||||||||||||||||||||||||||||
| 2019 | $8.67 | 0.19 | 0.14 | 0.33 | (0.17) | (0.71) | (0.88) | $8.12 | 4.36% | 0.63% | 2.05% | 48% | $307,792 | ||||||||||||||||||||||||||||
2018(3) | $8.98 | 0.19 | 0.17 | 0.36 | (0.16) | (0.51) | (0.67) | $8.67 | 3.94% | 0.63%(4) | 2.15%(4) | 35%(5) | $1,038 | ||||||||||||||||||||||||||||
| For a Share Outstanding Throughout the Years Ended March 31 (except as noted) | |||||||||||||||||||||||||||||||||||||||||
| Per-Share Data | Ratios and Supplemental Data | ||||||||||||||||||||||||||||||||||||||||
| Income From Investment Operations: | Distributions From: | Ratio to Average Net Assets of: | |||||||||||||||||||||||||||||||||||||||
| Net Asset Value, Beginning of Period | Net Investment Income (Loss)(1) | Net Realized and Unrealized Gain (Loss) | Total From Investment Operations | Net Investment Income | Net Realized Gains | Total Distributions | Net Asset Value, End of Period | Total Return(2) | Operating Expenses | Net Investment Income (Loss) | Portfolio Turnover Rate | Net Assets, End of Period (in thousands) | |||||||||||||||||||||||||||||
| A Class | |||||||||||||||||||||||||||||||||||||||||
| 2022 | $9.31 | 0.12 | 0.93 | 1.05 | (0.12) | (1.09) | (1.21) | $9.15 | 12.00% | 1.26% | 1.27% | 41% | $69,880 | ||||||||||||||||||||||||||||
| 2021 | $5.92 | 0.12 | 3.54 | 3.66 | (0.13) | (0.14) | (0.27) | $9.31 | 62.58% | 1.25% | 1.63% | 53% | $66,639 | ||||||||||||||||||||||||||||
| 2020 | $8.09 | 0.13 | (1.59) | (1.46) | (0.12) | (0.59) | (0.71) | $5.92 | (20.01)% | 1.25% | 1.65% | 46% | $49,497 | ||||||||||||||||||||||||||||
| 2019 | $8.65 | 0.12 | 0.15 | 0.27 | (0.12) | (0.71) | (0.83) | $8.09 | 3.63% | 1.23% | 1.45% | 48% | $80,120 | ||||||||||||||||||||||||||||
| 2018 | $8.98 | 0.12 | 0.17 | 0.29 | (0.11) | (0.51) | (0.62) | $8.65 | 3.13% | 1.23% | 1.34% | 35% | $116,377 | ||||||||||||||||||||||||||||
| C Class | |||||||||||||||||||||||||||||||||||||||||
| 2022 | $9.13 | 0.05 | 0.91 | 0.96 | (0.05) | (1.09) | (1.14) | $8.95 | 11.15% | 2.01% | 0.52% | 41% | $9,886 | ||||||||||||||||||||||||||||
| 2021 | $5.81 | 0.07 | 3.46 | 3.53 | (0.07) | (0.14) | (0.21) | $9.13 | 61.27% | 2.00% | 0.88% | 53% | $9,212 | ||||||||||||||||||||||||||||
| 2020 | $7.95 | 0.07 | (1.56) | (1.49) | (0.06) | (0.59) | (0.65) | $5.81 | (20.58)% | 2.00% | 0.90% | 46% | $10,340 | ||||||||||||||||||||||||||||
| 2019 | $8.51 | 0.06 | 0.14 | 0.20 | (0.05) | (0.71) | (0.76) | $7.95 | 2.92% | 1.98% | 0.70% | 48% | $20,369 | ||||||||||||||||||||||||||||
| 2018 | $8.84 | 0.05 | 0.17 | 0.22 | (0.04) | (0.51) | (0.55) | $8.51 | 2.40% | 1.98% | 0.59% | 35% | $28,948 | ||||||||||||||||||||||||||||
| R Class | |||||||||||||||||||||||||||||||||||||||||
| 2022 | $9.31 | 0.10 | 0.93 | 1.03 | (0.10) | (1.09) | (1.19) | $9.15 | 11.70% | 1.51% | 1.02% | 41% | $254,460 | ||||||||||||||||||||||||||||
| 2021 | $5.92 | 0.10 | 3.54 | 3.64 | (0.11) | (0.14) | (0.25) | $9.31 | 62.15% | 1.50% | 1.38% | 53% | $237,129 | ||||||||||||||||||||||||||||
| 2020 | $8.10 | 0.11 | (1.60) | (1.49) | (0.10) | (0.59) | (0.69) | $5.92 | (20.31)% | 1.50% | 1.40% | 46% | $146,876 | ||||||||||||||||||||||||||||
| 2019 | $8.65 | 0.10 | 0.15 | 0.25 | (0.09) | (0.71) | (0.80) | $8.10 | 3.50% | 1.48% | 1.20% | 48% | $175,855 | ||||||||||||||||||||||||||||
| 2018 | $8.98 | 0.10 | 0.16 | 0.26 | (0.08) | (0.51) | (0.59) | $8.65 | 2.87% | 1.48% | 1.09% | 35% | $158,220 | ||||||||||||||||||||||||||||
| For a Share Outstanding Throughout the Years Ended March 31 (except as noted) | |||||||||||||||||||||||||||||||||||||||||
| Per-Share Data | Ratios and Supplemental Data | ||||||||||||||||||||||||||||||||||||||||
| Income From Investment Operations: | Distributions From: | Ratio to Average Net Assets of: | |||||||||||||||||||||||||||||||||||||||
| Net Asset Value, Beginning of Period | Net Investment Income (Loss)(1) | Net Realized and Unrealized Gain (Loss) | Total From Investment Operations | Net Investment Income | Net Realized Gains | Total Distributions | Net Asset Value, End of Period | Total Return(2) | Operating Expenses | Net Investment Income (Loss) | Portfolio Turnover Rate | Net Assets, End of Period (in thousands) | |||||||||||||||||||||||||||||
| R5 Class | |||||||||||||||||||||||||||||||||||||||||
| 2022 | $9.34 | 0.16 | 0.94 | 1.10 | (0.17) | (1.09) | (1.26) | $9.18 | 12.45% | 0.81% | 1.72% | 41% | $2,618 | ||||||||||||||||||||||||||||
| 2021 | $5.94 | 0.16 | 3.54 | 3.70 | (0.16) | (0.14) | (0.30) | $9.34 | 63.29% | 0.80% | 2.08% | 53% | $2,281 | ||||||||||||||||||||||||||||
| 2020 | $8.12 | 0.17 | (1.60) | (1.43) | (0.16) | (0.59) | (0.75) | $5.94 | (19.71)% | 0.80% | 2.10% | 46% | $1,324 | ||||||||||||||||||||||||||||
| 2019 | $8.67 | 0.18 | 0.13 | 0.31 | (0.15) | (0.71) | (0.86) | $8.12 | 4.21% | 0.78% | 1.90% | 48% | $1,692 | ||||||||||||||||||||||||||||
2018(3) | $8.98 | 0.16 | 0.19 | 0.35 | (0.15) | (0.51) | (0.66) | $8.67 | 3.80% | 0.78%(4) | 1.78%(4) | 35%(5) | $5 | ||||||||||||||||||||||||||||
| R6 Class | |||||||||||||||||||||||||||||||||||||||||
| 2022 | $9.34 | 0.18 | 0.93 | 1.11 | (0.18) | (1.09) | (1.27) | $9.18 | 12.61% | 0.66% | 1.87% | 41% | $107,011 | ||||||||||||||||||||||||||||
| 2021 | $5.94 | 0.17 | 3.55 | 3.72 | (0.18) | (0.14) | (0.32) | $9.34 | 63.54% | 0.65% | 2.23% | 53% | $93,724 | ||||||||||||||||||||||||||||
| 2020 | $8.12 | 0.18 | (1.60) | (1.42) | (0.17) | (0.59) | (0.76) | $5.94 | (19.59)% | 0.65% | 2.25% | 46% | $120,598 | ||||||||||||||||||||||||||||
| 2019 | $8.67 | 0.18 | 0.15 | 0.33 | (0.17) | (0.71) | (0.88) | $8.12 | 4.36% | 0.63% | 2.05% | 48% | $234,991 | ||||||||||||||||||||||||||||
| 2018 | $9.00 | 0.17 | 0.17 | 0.34 | (0.16) | (0.51) | (0.67) | $8.67 | 3.74% | 0.63% | 1.94% | 35% | $200,518 | ||||||||||||||||||||||||||||
| Notes to Financial Highlights | ||
(1)Computed using average shares outstanding throughout the period.
(2)Total returns are calculated based on the net asset value of the last business day and do not reflect applicable sales charges, if any. Total returns for periods less than one year are not annualized.
(3)April 10, 2017 (commencement of sale) through March 31, 2018.
(4)Annualized.
(5)Portfolio turnover is calculated at the fund level. Percentage indicated was calculated for the year ended March 31, 2018.
See Notes to Financial Statements.
| Report of Independent Registered Public Accounting Firm | ||
To the Shareholders and the Board of Directors of American Century Capital Portfolios, Inc.:
Opinion on the Financial Statements and Financial Highlights
We have audited the accompanying statement of assets and liabilities, including the schedule of investments, of Value Fund (the “Fund”), one of the funds constituting the American Century Capital Portfolios, Inc., as of March 31, 2022, the related statement of operations for the year then ended, the statements of changes in net assets for each of the two years in the period then ended, the financial highlights for each of the five years in the period then ended, and the related notes. In our opinion, the financial statements and financial highlights present fairly, in all material respects, the financial position of Value Fund of the American Century Capital Portfolios, Inc. as of March 31, 2022, and the results of its operations for the year then ended, the changes in its net assets for each of the two years in the period then ended, and the financial highlights for each of the five years in the period then ended, in conformity with accounting principles generally accepted in the United States of America.
Basis for Opinion
These financial statements and financial highlights are the responsibility of the Fund's management. Our responsibility is to express an opinion on the Fund’s financial statements and financial highlights based on our audits. We are a public accounting firm registered with the Public Company Accounting Oversight Board (United States) (PCAOB) and are required to be independent with respect to the Fund in accordance with the U.S. federal securities laws and the applicable rules and regulations of the Securities and Exchange Commission and the PCAOB.
We conducted our audits in accordance with the standards of the PCAOB. Those standards require that we plan and perform the audit to obtain reasonable assurance about whether the financial statements and financial highlights are free of material misstatement, whether due to error or fraud. The Fund is not required to have, nor were we engaged to perform, an audit of its internal control over financial reporting. As part of our audits, we are required to obtain an understanding of internal control over financial reporting but not for the purpose of expressing an opinion on the effectiveness of the Fund’s internal control over financial reporting. Accordingly, we express no such opinion.
Our audits included performing procedures to assess the risks of material misstatement of the financial statements and financial highlights, whether due to error or fraud, and performing procedures that respond to those risks. Such procedures included examining, on a test basis, evidence regarding the amounts and disclosures in the financial statements and financial highlights. Our audits also included evaluating the accounting principles used and significant estimates made by management, as well as evaluating the overall presentation of the financial statements and financial highlights. Our procedures included confirmation of securities owned as of March 31, 2022, by correspondence with the custodian and brokers; when replies were not received from brokers, we performed other auditing procedures. We believe that our audits provide a reasonable basis for our opinion.
/s/ Deloitte & Touche LLP
Kansas City, Missouri
May 16, 2022
We have served as the auditor of one or more American Century investment companies since 1997.
29
| Management | ||
The Board of Directors
The individuals listed below serve as directors of the funds. Each director will continue to serve in this capacity until death, retirement, resignation or removal from office. The board has adopted a mandatory retirement age for directors who are not “interested persons,” as that term is defined in the Investment Company Act (independent directors). Independent directors shall retire on December 31 of the year in which they reach their 75th birthday.
Jonathan S. Thomas is an “interested person” because he currently serves as President and Chief Executive Officer of American Century Companies, Inc. (ACC), the parent company of American Century Investment Management, Inc. (ACIM or the advisor). The other directors (more than three-fourths of the total number) are independent. They are not employees, directors or officers of, and have no financial interest in, ACC or any of its wholly owned, direct or indirect, subsidiaries, including ACIM, American Century Investment Services, Inc. (ACIS) and American Century Services, LLC (ACS), and they do not have any other affiliations, positions or relationships that would cause them to be considered “interested persons” under the Investment Company Act. The directors serve in this capacity for seven (in the case of Jonathan S. Thomas, 16; and Stephen E. Yates, 8) registered investment companies in the American Century Investments family of funds.
The following table presents additional information about the directors. The mailing address for each director is 4500 Main Street, Kansas City, Missouri 64111.
| Name (Year of Birth) | Position(s) Held with Funds | Length of Time Served | Principal Occupation(s) During Past 5 Years | Number of American Century Portfolios Overseen by Director | Other Directorships Held During Past 5 Years | ||||||||||||
| Independent Directors | |||||||||||||||||
| Thomas W. Bunn (1953) | Director | Since 2017 | Retired | 68 | None | ||||||||||||
| Chris H. Cheesman (1962) | Director | Since 2019 | Retired. Senior Vice President & Chief Audit Executive, AllianceBernstein (1999 to 2018) | 68 | Alleghany Corporation | ||||||||||||
| Barry Fink (1955) | Director | Since 2012 (independent since 2016) | Retired | 68 | None | ||||||||||||
| Rajesh K. Gupta (1960) | Director | Since 2019 | Partner Emeritus, SeaCrest Investment Management and SeaCrest Wealth Management (2019 to Present); Chief Executive Officer and Chief Investment Officer, SeaCrest Investment Management (2006 to 2019); Chief Executive Officer and Chief Investment Officer, SeaCrest Wealth Management (2008 to 2019) | 68 | None | ||||||||||||
30
| Name (Year of Birth) | Position(s) Held with Funds | Length of Time Served | Principal Occupation(s) During Past 5 Years | Number of American Century Portfolios Overseen by Director | Other Directorships Held During Past 5 Years | ||||||||||||
| Independent Directors | |||||||||||||||||
| Lynn Jenkins (1963) | Director | Since 2019 | Consultant, LJ Strategies (2019 to present); United States Representative, U.S. House of Representatives (2009 to 2018) | 68 | MGP Ingredients, Inc. (2019 to 2021) | ||||||||||||
| Jan M. Lewis (1957) | Director and Board Chair | Since 2011 (Board Chair since 2022) | Retired | 68 | None | ||||||||||||
| Stephen E. Yates (1948) | Director | Since 2012 | Retired | 108 | None | ||||||||||||
| Interested Director | |||||||||||||||||
| Jonathan S. Thomas (1963) | Director | Since 2007 | President and Chief Executive Officer, ACC (2007 to present). Also serves as Chief Executive Officer, ACS; Director, ACC and other ACC subsidiaries | 146 | None | ||||||||||||
The Statement of Additional Information has additional information about the fund's directors and is available without charge, upon request, by calling 1-800-345-2021.
31
Officers
The following table presents certain information about the executive officers of the funds. Each officer serves as an officer for 16 (in the case of Robert J. Leach, 15) investment companies in the American Century family of funds, unless otherwise noted. No officer is compensated for his or her service as an officer of the funds. The listed officers are interested persons of the funds and are appointed or re-appointed on an annual basis. The mailing address for each officer listed below is 4500 Main Street, Kansas City, Missouri 64111.
| Name (Year of Birth) | Offices with the Funds | Principal Occupation(s) During the Past Five Years | ||||||
| Patrick Bannigan (1965) | President since 2019 | Executive Vice President and Director, ACC (2012 to present); Chief Financial Officer, Chief Accounting Officer and Treasurer, ACC (2015 to present); Also serves as President, ACS; Vice President, ACIM; Chief Financial Officer, Chief Accounting Officer and/or Director, ACIM, ACS and other ACC subsidiaries | ||||||
| R. Wes Campbell (1974) | Chief Financial Officer and Treasurer since 2018 | Vice President, ACS (2020 to present); Investment Operations and Investment Accounting, ACS (2000 to present) | ||||||
| Amy D. Shelton (1964) | Chief Compliance Officer and Vice President since 2014 | Chief Compliance Officer, American Century funds, (2014 to present); Chief Compliance Officer, ACIM (2014 to present); Chief Compliance Officer, ACIS (2009 to present). Also serves as Vice President, ACIS | ||||||
| John Pak (1968) | General Counsel and Senior Vice President since 2021 | General Counsel and Senior Vice President, ACC (2021 to present); Also serves as General Counsel and Senior Vice President, ACIM, ACS and ACIS. Chief Legal Officer of Investment and Wealth Management, The Bank of New York Mellon (2014 to 2021) | ||||||
| C. Jean Wade (1964) | Vice President since 2012 | Senior Vice President, ACS (2017 to present); Vice President, ACS (2000 to 2017) | ||||||
| Robert J. Leach (1966) | Vice President since 2006 | Vice President, ACS (2000 to present) | ||||||
| David H. Reinmiller (1963) | Vice President since 2000 | Attorney, ACC (1994 to present). Also serves as Vice President, ACIM and ACS | ||||||
| Ward D. Stauffer (1960) | Secretary since 2005 | Attorney, ACC (2003 to present) | ||||||
32
| Liquidity Risk Management Program | ||
The Fund has adopted a liquidity risk management program (the “program”). The Fund’s Board of Directors (the "Board") has designated American Century Investment Management, Inc. (“ACIM”) as the administrator of the program. Personnel of ACIM or its affiliates conduct the day-to-day operation of the program pursuant to policies and procedures administered by the Program Administrator, including members of ACIM’s Investment Oversight Committee who are members of the ACIM’s Investment Management and Global Analytics departments.
Under the program, ACIM manages the Fund’s liquidity risk, which is the risk that the Fund could not meet shareholder redemption requests without significant dilution of remaining shareholders’ interests in the Fund. This risk is managed by monitoring the degree of liquidity of the Fund’s investments, limiting the amount of the Fund’s illiquid investments, and utilizing various risk management tools and facilities available to the Fund for meeting shareholder redemptions, among other means. ACIM’s process of determining the degree of liquidity of certain Fund’s investments is supported by a third-party liquidity assessment vendor.
The Board reviewed a report prepared by ACIM regarding the operation and effectiveness of the program for the period January 1, 2021 through December 31, 2021. No significant liquidity events impacting the Fund were noted in the report. In addition, ACIM provided its assessment that the program had been effective in managing the Fund’s liquidity risk.
33
| Additional Information | ||
Retirement Account Information
As required by law, distributions you receive from certain retirement accounts are subject to federal income tax withholding, unless you elect not to have withholding apply*. Tax will be withheld on the total amount withdrawn even though you may be receiving amounts that are not subject to withholding, such as nondeductible contributions. In such case, excess amounts of withholding could occur. You may adjust your withholding election so that a greater or lesser amount will be withheld.
If you don’t want us to withhold on this amount, you must notify us to not withhold the federal income tax. You may notify us in writing or in certain situations by telephone or through other electronic means. For systematic withdrawals, your withholding election will remain in effect until revoked or changed by filing a new election. You have the right to revoke your election at any time and change your withholding percentage for future distributions.
Remember, even if you elect not to have income tax withheld, you are liable for paying income tax on the taxable portion of your withdrawal. If you elect not to have income tax withheld or you don’t have enough income tax withheld, you may be responsible for payment of estimated tax. You may incur penalties under the estimated tax rules if your withholding and estimated tax payments are not sufficient. You can reduce or defer the income tax on a distribution by directly or indirectly rolling such distribution over to another IRA or eligible plan. You should consult your tax advisor for additional information.
State tax will be withheld if, at the time of your distribution, your address is within one of the mandatory withholding states and you have federal income tax withheld (or as otherwise required by state law). State taxes will be withheld from your distribution in accordance with the respective state rules.
*Some 403(b), 457 and qualified retirement plan distributions may be subject to 20% mandatory withholding, as they are subject to special tax and withholding rules. Your plan administrator or plan sponsor is required to provide you with a special tax notice explaining those rules at the time you request a distribution. If applicable, federal and/or state taxes may be withheld from your distribution amount.
Proxy Voting Policies
A description of the policies that the fund's investment advisor uses in exercising the voting rights associated with the securities purchased and/or held by the fund is available without charge, upon request, by calling 1-800-345-2021. It is also available on American Century Investments’ website at americancentury.com/proxy and on the Securities and Exchange Commission’s website at sec.gov. Information regarding how the investment advisor voted proxies relating to portfolio securities during the most recent 12-month period ended June 30 is available on americancentury.com/proxy. It is also available at sec.gov.
Quarterly Portfolio Disclosure
The fund files its complete schedule of portfolio holdings with the Securities and Exchange
Commission (SEC) for the first and third quarters of each fiscal year as an exhibit to its reports on
Form N-PORT. These portfolio holdings are available on the fund's website at
americancentury.com and, upon request, by calling 1-800-345-2021. The fund’s Form N-PORT
reports are available on the SEC’s website at sec.gov.
34
Other Tax Information
The following information is provided pursuant to provisions of the Internal Revenue Code.
The fund hereby designates up to the maximum amount allowable as qualified dividend income for the fiscal year ended March 31, 2022.
For corporate taxpayers, the fund hereby designates $55,689,251, or up to the maximum amount allowable, of ordinary income distributions paid during the fiscal year ended March 31, 2022 as qualified for the corporate dividends received deduction.
The fund hereby designates $85,941,125 as qualified short-term capital gain distributions for purposes of Internal Revenue Code Section 871 for the fiscal year ended March 31, 2022.
The fund hereby designates $186,137,450, or up to the maximum amount allowable, as long-term capital gain distributions (20% rate gain distributions) for the fiscal year ended March 31, 2022.
The fund utilized earnings and profits of $14,439,332 distributed to shareholders on redemption of shares as part of the dividends paid deduction (tax equalization).
35
| Notes | ||
36
| ||||||||
| Contact Us | americancentury.com | |||||||
| Automated Information Line | 1-800-345-8765 | |||||||
| Investor Services Representative | 1-800-345-2021 or 816-531-5575 | |||||||
| Investors Using Advisors | 1-800-378-9878 | |||||||
| Business, Not-For-Profit, Employer-Sponsored Retirement Plans | 1-800-345-3533 | |||||||
| Banks and Trust Companies, Broker-Dealers, Financial Professionals, Insurance Companies | 1-800-345-6488 | |||||||
| Telecommunications Relay Service for the Deaf | 711 | |||||||
| American Century Capital Portfolios, Inc. | ||||||||
Investment Advisor: American Century Investment Management, Inc. Kansas City, Missouri | ||||||||
| This report and the statements it contains are submitted for the general information of our shareholders. The report is not authorized for distribution to prospective investors unless preceded or accompanied by an effective prospectus. | ||||||||
| ©2022 American Century Proprietary Holdings, Inc. All rights reserved. CL-ANN-92273 2205 | ||||||||
(b) None.
ITEM 2. CODE OF ETHICS.
(a) The registrant has adopted a Code of Ethics for Senior Financial Officers that applies to the registrant’s principal executive officer, principal financial officer, principal accounting officer, and persons performing similar functions.
(b) No response required.
(c) None.
(d) None.
(e) Not applicable.
(f) The registrant’s Code of Ethics for Senior Financial Officers was filed as Exhibit 12 (a)(1) to American Century Asset Allocation Portfolios, Inc.’s Annual Certified Shareholder Report on Form N-CSR, File No. 811-21591, on September 29, 2005, and is incorporated herein by reference.
ITEM 3. AUDIT COMMITTEE FINANCIAL EXPERT.
(a)(1) The registrant’s board has determined that the registrant has at least one audit committee financial expert serving on its audit committee.
(a)(2) Chris H. Cheesman, Lynn M. Jenkins and Barry Fink are the registrant’s designated audit committee financial experts. They are “independent” as defined in Item 3 of Form N-CSR.
(a)(3) Not applicable.
(b) No response required.
(c) No response required.
(d) No response required.
ITEM 4. PRINCIPAL ACCOUNTANT FEES AND SERVICES.
(a) Audit Fees.
The aggregate fees billed for each of the last two fiscal years for professional services rendered by the principal accountant for the audit of the registrant’s annual financial statements or services that are normally provided by the accountant in connection with statutory and regulatory filings or engagements for those fiscal years were as follows:
FY 2021: $181,090
FY 2022: $117,220
(b) Audit-Related Fees.
The aggregate fees billed in each of the last two fiscal years for assurance and related services by the principal accountant that are reasonably related to the performance of the audit of the registrant’s financial statements and are not reported under paragraph (a) of this Item were as follows:
For services rendered to the registrant:
FY 2021: $0
FY 2022: $0
Fees required to be approved pursuant to paragraph (c)(7)(ii) of Rule 2-01 of Regulation S-X (relating to certain engagements for non-audit services with the registrant’s investment adviser and its affiliates):
FY 2021: $0
FY 2022: $0
(c) Tax Fees.
The aggregate fees billed in each of the last two fiscal years for professional services rendered by the principal accountant for tax compliance, tax advice, and tax planning were as follows:
For services rendered to the registrant:
FY 2021: $0
FY 2022: $0
Fees required to be approved pursuant to paragraph (c)(7)(ii) of Rule 2-01 of Regulation S-X (relating to certain engagements for non-audit services with the registrant’s investment adviser and its affiliates):
FY 2021: $0
FY 2022: $0
(d) All Other Fees.
The aggregate fees billed in each of the last two fiscal years for products and services provided by the principal accountant, other than the services reported in paragraphs (a) through (c) of this Item were as follows:
For services rendered to the registrant:
FY 2021: $0
FY 2022: $0
Fees required to be approved pursuant to paragraph (c)(7)(ii) of Rule 2-01 of Regulation S-X (relating to certain engagements for non-audit services with the registrant’s investment adviser and its affiliates):
FY 2021: $0
FY 2022: $0
(e)(1) In accordance with paragraph (c)(7)(i)(A) of Rule 2-01 of Regulation S-X, before the accountant is engaged by the registrant to render audit or non-audit services, the engagement is approved by the registrant’s audit committee. Pursuant to paragraph (c)(7)(ii) of Rule 2-01 of Regulation S-X, the registrant’s audit committee also pre-approves its accountant’s engagements for non-audit services with the registrant’s investment adviser, its parent company, and any entity controlled by, or under common control with the investment adviser that provides ongoing services to the registrant, if the engagement relates directly to the operations and financial reporting of the registrant.
(e)(2) All services described in each of paragraphs (b) through (d) of this Item were pre-approved before the engagement by the registrant’s audit committee pursuant to paragraph (c)(7)(i)(A) of Rule 2-01 of Regulation S-X. Consequently, none of such services were required to be approved by the audit committee pursuant to paragraph (c)(7)(i)(C).
(f) The percentage of hours expended on the principal accountant’s engagement to audit the registrant’s financial statements for the most recent fiscal year that were attributed to work performed by persons other than the principal accountant’s full-time, permanent employees was less than 50%.
(g) The aggregate non-audit fees billed by the registrant’s accountant for services rendered to the registrant, and rendered to the registrant’s investment adviser (not including any sub-adviser whose role is primarily portfolio management and is subcontracted with or overseen by another investment adviser), and any entity controlling, controlled by, or under common control with the adviser that provides ongoing services to the registrant for each of the last two fiscal years of the registrant were as follows:
FY 2021: $0
FY 2022: $2,832,126
(h) The registrant’s investment adviser and accountant have notified the registrant’s audit committee of all non-audit services that were rendered by the registrant’s accountant to the registrant’s investment adviser, its parent company, and any entity controlled by, or under common control with the investment adviser that provides services to the registrant, which services were not required to be pre-approved pursuant to paragraph (c)(7)(ii) of Rule 2-01 of Regulation S-X. The notification provided to the registrant’s audit committee included sufficient details regarding such services to allow the registrant’s audit committee to consider the continuing independence of its principal accountant.
ITEM 5. AUDIT COMMITTEE OF LISTED REGISTRANTS.
Not applicable.
ITEM 6. INVESTMENTS.
(a) The schedule of investments is included as part of the report to stockholders filed under Item 1 of this Form.
(b) Not applicable.
ITEM 7. DISCLOSURE OF PROXY VOTING POLICIES AND PROCEDURES FOR CLOSED-END MANAGEMENT INVESTMENT COMPANIES.
Not applicable.
ITEM 8. PORTFOLIO MANAGERS OF CLOSED-END MANAGEMENT INVESTMENT COMPANIES.
Not applicable.
ITEM 9. PURCHASES OF EQUITY SECURITIES BY CLOSED-END MANAGEMENT INVESTMENT COMPANY AND AFFILIATED PURCHASERS.
Not applicable.
ITEM 10. SUBMISSION OF MATTERS TO A VOTE OF SECURITY HOLDERS.
During the reporting period, there were no material changes to the procedures by which shareholders may recommend nominees to the registrant’s board.
ITEM 11. CONTROLS AND PROCEDURES.
(a) The registrant's principal executive officer and principal financial officer have concluded that the registrant's disclosure controls and procedures (as defined in Rule 30a-3(c) under the Investment Company Act of 1940) are effective based on their evaluation of these controls and procedures as of a date within 90 days of the filing date of this report.
(b) There were no changes in the registrant's internal control over financial reporting (as defined in Rule 30a-3(d) under the Investment Company Act of 1940) that occurred during the period covered by this report that have materially affected, or are reasonably likely to materially affect, the registrant's internal control over financial reporting.
ITEM 12. DISCLOSURE OF SECURITIES LENDING ACTIVITIES FOR CLOSED-END MANAGEMENT INVESTMENT COMPANIES.
Not applicable.
ITEM 13. EXHIBITS.
(a)(1) Registrant’s Code of Ethics for Senior Financial Officers, which is the subject of the disclosure required by Item 2 of Form N-CSR, was filed as Exhibit 12(a)(1) to American Century Asset Allocation Portfolios, Inc.’s Certified Shareholder Report on Form N-CSR, File No. 811-21591, on September 29, 2005.
(a)(2) Separate certifications by the registrant’s principal executive officer and principal financial officer, pursuant to Section 302 of the Sarbanes-Oxley Act of 2002 and Rule 30a-2(a) under the Investment Company Act of 1940, are filed and attached hereto as EX-99.CERT.
(a)(3) Not applicable.
(a)(4) Not applicable.
(b) A certification by the registrant’s chief executive officer and chief financial officer, pursuant to Section 906 of the Sarbanes-Oxley Act of 2002, is furnished and attached hereto as EX-99.906CERT.
SIGNATURES
Pursuant to the requirements of the Securities Exchange Act of 1934 and the Investment Company Act of 1940, the registrant has duly caused this report to be signed on its behalf by the undersigned, thereunto duly authorized.
| Registrant: | American Century Capital Portfolios, Inc. | ||||||||||
| By: | /s/ Patrick Bannigan | ||||||||||
| Name: | Patrick Bannigan | ||||||||||
| Title: | President | ||||||||||
| Date: | May 25, 2022 | ||||||||||
Pursuant to the requirements of the Securities Exchange Act of 1934 and the Investment Company Act of 1940, this report has been signed below by the following persons on behalf of the registrant and in the capacities and on the dates indicated.
| By: | /s/ Patrick Bannigan | |||||||
| Name: | Patrick Bannigan | |||||||
| Title: | President | |||||||
| (principal executive officer) | ||||||||
| Date: | May 25, 2022 | |||||||
| By: | /s/ R. Wes Campbell | |||||||
| Name: | R. Wes Campbell | |||||||
| Title: | Treasurer and | |||||||
| Chief Financial Officer | ||||||||
| (principal financial officer) | ||||||||
| Date: | May 25, 2022 | |||||||