[PIMCO LOGO] | | |
| | |
PIMCO COMMERCIAL MORTGAGE | | |
SECURITIES TRUST, INC. | | |
| | |
| | ANNUAL |
| | REPORT |
| | |
| | December 31, 2003 |
2003
[GRAPHIC]
A CLOSED-END FUND SPECIALIZING
IN INVESTMENTS IN COMMERCIAL
MORTGAGE-BACKED SECURITIES
Pacific Investment Management Company LLC (“PIMCO”), an investment adviser with more than $373 billion of assets under management as of December 31, 2003, is responsible for the management and administration of the PIMCO Commercial Mortgage Securities Trust, Inc. (the “Fund”). Founded in 1971, PIMCO manages assets on behalf of mutual fund and institutional clients located around the world. Renowned for its fixed income management expertise, PIMCO manages assets for many of the largest corporations, foundations, endowments, and governmental bodies in the United States and the world.
Contents
Chairman’s Letter
For the 12-month period ended December 31, 2003, the PIMCO Commercial Mortgage Securities Trust, Inc. returned 9.76% return based on its NYSE share price and 7.03% based on its net asset value. In comparison, the Lehman Brothers Aggregate Bond Index, the Fund’s benchmark and generally regarded as representative of the U.S. bond market as a whole, returned 4.10% for the same period. Longer-term performance has continued to be strong, as the Fund posted annualized returns of 11.13% based on its NYSE share price and 8.27% based on its net asset value for the five-year period ended December 31, 2003. The Fund outperformed the Lehman Index’s annualized return of 6.62% for the five-year period.
Most bonds posted positive returns in the fourth quarter 2003, which capped a year in which fixed income assets gained ground despite volatile interest rates. Although Treasury yields rose only 0.20% to 0.50% for the year, bond markets were far from calm. For instance, yields moved lower through the first half of the year as deflation risks dominated the news and the market’s view of future Federal Reserve policy. The Fed cut the federal funds rate to 1% in June and the 10-year Treasury yield plunged to a 45-year low near 3%. Rates then reversed course dramatically, increasing more than 1.3% during June and July, and ending July 0.89% higher.
This reversal was prompted by technical factors in the Treasury market, and also by investors’ growing confidence that growth would accelerate. Economic performance in the second half of 2003 met investors’ expectations. Business investment revived, while massive fiscal stimulus and the lagged impact of the mortgage refinancing boom sustained consumption. This led to an 8.2% annualized growth in the third quarter, which was the fastest pace in almost two decades. The 10-year Treasury yield finished the year at 4.25%, up 0.43% for the whole year. Commodity prices surged in 2003 as growth revived and the dollar plunged against most major currencies.
On the following pages you will find specific details as to the Fund’s portfolio and total return investment performance, including a discussion of those factors that affected performance.
We appreciate the trust you have placed in us, and welcome your questions and comments regarding the Fund and this annual report.
Sincerely,
/s/ Brent R. Harris | |
Brent R. Harris |
Chairman of the Board |
|
|
January 31, 2004 |
1
PIMCO Commercial Mortgage Securities Trust, Inc. Performance Summary
NYSE Symbol: | | Primary Investments: | | Fund Inception Date: | |
PCM | | Commercial mortgage-backed securities | | 9/02/1993 | |
| | | | | |
Objective: | | | | Total Net Assets: | |
The Fund’s primary investment objective is to achieve high current income, with capital gains from the disposition of investments as a secondary objective. | | | | $139.9 million
Portfolio Managers:
Bill Powers
Dan Ivascyn | |
INVESTMENT PERFORMANCE For the period ended December 31, 2003
| | 1 Year | | 5 Years* | | 10 Years* | | Since Inception* | |
| | | | | | | | | |
NYSE Market Value | | 9.76 | % | 11.13 | % | 10.49 | % | 10.07 | % |
| | | | | | | | | |
Net Asset Value | | 7.03 | % | 8.27 | % | 8.69 | % | 8.44 | % |
| | | | | | | | | |
Lehman Brothers Aggregate Bond Index | | 4.10 | % | 6.62 | % | 6.95 | % | — | |
* Annualized
All Fund returns are net of fees and expenses.
Portfolio Insights
• The PIMCO Commercial Mortgage Securities Trust, Inc. seeks to achieve its investment objective by investing under normal circumstances at least 80% of its assets in commercial mortgage-backed securities (CMBS).
• For the 12-month period ended December 31, 2003, the Fund returned 9.76% based on its NYSE market price and 7.03% based on its net asset value, outperforming the 4.10% return of the benchmark Lehman Brothers Aggregate Bond Index.
• For 2003, investment grade CMBS outperformed Treasuries, as spreads on CMBS tightened substantially. However, CMBS underperformed corporates, whose spreads rebounded from very wide levels.
• An emphasis on BBB rated bonds was positive, as this was the best performing category within CMBS.
• Overall, the Fund’s investments in investment grade bonds added to returns, as these securities performed well during the year.
• Generally speaking, prices of CMBS increased because of healthy demand and improved real estate credit.
• Leverage in the portfolio earned a positive spread, as the financing rate declined while long rates rose during the period.
• For most of the period, the Fund’s curve structure was positioned such that decrease in long-term yields would benefit the portfolio relative to its benchmark; however, the yield curve steepened which detracted from overall performance.
2
Cumulative Returns Through December 31, 2003
$10,000 invested at the inception date of the Fund
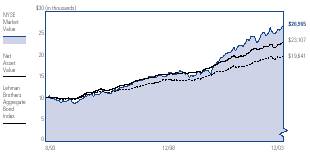
Past performance is no guarantee of future results. The line graph depicts the value of a net $10,000 investment made at the Fund’s inception on September 2,1993 and held through December 31, 2003, compared to the Lehman Brothers Aggregate Bond Index, an unmanaged market index. Investment performance assumes the reinvestment of dividends and capital gains distributions, if any. The Fund’s NYSE Market Value performance does not reflect the effect of sales loads or broker commissions. The performance data quoted represents past performance. Investment return and share value will fluctuate so that Fund shares, when sold may be worth more or less than their original cost. Returns shown do not reflect the deduction of taxes that a shareholder would pay (i) on Fund distributions or (ii) the sale of Fund shares.
The credit quality of the investments in the Fund’s portfolio does not apply to the stability or safety of the Fund. An investment in the Fund is not a deposit of a bank and is not guaranteed or insured by the Federal Deposit Insurance Corporation or any other government agency. In addition, it is possible to lose money on investments in the Fund.
3
Financial Highlights
Selected Per Share
Data for the Year Ended: | | 12/31/2003 | | 12/31/2002 | | 12/31/2001 | | 12/31/2000 | | 12/31/1999 | |
| | | | | | | | | | | |
Net Asset Value, Beginning of Period | | $ | 12.80 | | $ | 12.85 | | $ | 12.86 | | $ | 12.89 | | $ | 13.74 | |
| | | | | | | | | | | |
Net Investment Income | | 1.12 | | 1.22 | | 1.28 | | 1.39 | | 1.08 | |
| | | | | | | | | | | |
Net Realized and Unrealized Gain (Loss) on Investments | | (0.26 | ) | 0.14 | | 0.06 | | (0.10 | ) | (0.75 | ) |
| | | | | | | | | | | |
Total from Investment Operations | | 0.86 | | 1.36 | | 1.34 | | 1.29 | | 0.33 | |
| | | | | | | | | | | |
Less Dividends from Net Investment Income | | (1.13 | ) | (1.41 | ) | (1.35 | ) | (1.32 | ) | (1.18 | ) |
| | | | | | | | | | | |
Net Asset Value, End of Period | | $ | 12.53 | | $ | 12.80 | | $ | 12.85 | | $ | 12.86 | | $ | 12.89 | |
| | | | | | | | | | | |
Per Share Market Value, End of Period | | $ | 14.53 | | $ | 14.32 | | $ | 14.15 | | $ | 12.56 | | $ | 12.00 | |
| | | | | | | | | | | |
Total Investment Return Per Share Market Value (a) | | 9.76 | % | 11.59 | % | 24.20 | % | 16.60 | % | (4.42 | )% |
| | | | | | | | | | | |
Per Share Net Asset Value (b) | | 7.03 | % | 10.97 | % | 10.69 | % | 10.50 | % | 2.44 | % |
| | | | | | | | | | | |
Ratios To Average Net Assets | | | | | | | | | | | |
| | | | | | | | | | | |
Operating Expenses (Excluding Interest Expense) | | 1.05 | % | 1.08 | % | 1.12 | % | 1.01 | % | 1.01 | % |
| | | | | | | | | | | |
Total Operating Expenses | | 1.52 | % | 1.94 | % | 3.28 | % | 4.15 | % | 3.16 | % |
| | | | | | | | | | | |
Net Investment Income | | 8.86 | % | 9.34 | % | 9.67 | % | 10.79 | % | 7.97 | % |
| | | | | | | | | | | |
Supplemental Data | | | | | | | | | | | |
| | | | | | | | | | | |
Net Assets, End of Period (Amounts in Thousands) | | $ | 139,891 | | $ | 142,063 | | $ | 141,746 | | $ | 141,581 | | $ | 141,860 | |
| | | | | | | | | | | |
Amount of Borrowings Outstanding, End of Period (in Thousands) | | $ | 71,025 | | $ | 50,993 | | $ | 63,448 | | $ | 72,034 | | $ | 52,233 | |
| | | | | | | | | | | |
Portfolio Turnover Rate | | 39.58 | % | 41.62 | % | 59.90 | % | 104.73 | % | 1.86 | % |
(a) Total investment return on market value is the combination of reinvested dividend income, reinvested capital gains distributions, if any, and changes in market price per share. Total investment returns exclude the effects of sales loads.
(b) Total investment return on net asset value is the combination of reinvested dividend income, reinvested capital gains distributions, if any, and changes in net asset value per share.
See accompanying notes
4
Statement of Assets and Liabilities
December 31, 2003
Amounts in thousands, except per share amounts.
Assets: | | | |
Investments, at value | | $ | 209,833 | |
Receivable for investments sold | | 251 | |
Interest and dividends receivable | | 1,811 | |
Paydown receivable | | 45 | |
Swap premiums paid | | 43 | |
Unrealized appreciation on swap agreements | | 252 | |
Other assets | | 190 | |
| | 212,425 | |
| | | |
Liabilities: | | | |
Reverse repurchase agreement | | $ | 71,025 | |
Dividends payable | | 1,047 | |
Accrued investment advisory fee | | 257 | |
Accrued administration fee | | 35 | |
Accrued printing expense | | 27 | |
Accrued custodian expense | | 5 | |
Accrued audit fee | | 17 | |
Variation margin payable | | 4 | |
Swap premiums received | | 18 | |
Unrealized depreciation on swap agreements | | 35 | |
Other liabilities | | 64 | |
| | 72,534 | |
| | | |
Net Assets | | $ | 139,891 | |
| | | |
Net Assets Consist of: | | | |
Capital stock – authorized 300 million shares, $.001 par value; outstanding 11,168,727 shares | | $ | 11 | |
Paid in capital | | 154,208 | |
Undistributed net investment income | | 224 | |
Accumulated undistributed net realized (loss) | | (12,340 | ) |
Net unrealized (depreciation) | | (2,212 | ) |
| | $ | 139,891 | |
| | | |
Net Assets Value Per Share Outstanding | | $ | 12.53 | |
| | | |
Cost of Investments Owned | | $ | 212,457 | |
See accompanying notes
5
Statement of Operations
Amounts in thousands
| | Year Ended
December 31, 2003 | |
| | | |
Investment Income: | | | |
Interest | | $ | 14,318 | |
Miscellaneous income | | 336 | |
Total Income | | 14,654 | |
| | | |
Expenses: | | | |
Investment advisory fees | | 1,019 | |
Administration fees | | 141 | |
Transfer agent fees | | 31 | |
Directors’ fees | | 62 | |
Printing expense | | 60 | |
Proxy expense | | 27 | |
Legal fee | | 60 | |
Audit fee | | 22 | |
Custodian fees | | 28 | |
Interest expense | | 673 | |
Miscellaneous expense | | 34 | |
Total Expenses | | 2,157 | |
| | | |
Net Investment Income | | 12,497 | |
| | | |
Net Realized and Unrealized Gain (Loss): | | | |
Net realized (loss) on investments | | (2,780 | ) |
Net realized (loss) on futures contracts and swaps | | (357 | ) |
Net change in unrealized (depreciation) on investments | | (294 | ) |
Net change in unrealized appreciation on futures contracts and swaps | | 364 | |
Net (Loss) | | (3,067 | ) |
| | | |
Net Increase in Assets Resulting from Operations | | $ | 9,430 | |
See accompanying notes
6
Statements of Changes in Net Assets
Amounts in thousands
Increase (Decrease) in Net Assets from: | | Year Ended
December 31, 2003 | | Year Ended
December 31, 2002 | |
| | | | | |
Operations: | | | | | |
Net investment income | | $ | 12,497 | | $ | 13,523 | |
Net realized (loss) | | (3,137 | ) | (1,295 | ) |
Net change in unrealized appreciation | | 70 | | 2,725 | |
Net increase resulting from operations | | 9,430 | | 14,953 | |
| | | | | |
Distributions to Shareholders: | | | | | |
From net investment income | | (12,537 | ) | (15,589 | ) |
| | | | | |
Fund Share Transactions: | | | | | |
Issued as reinvestment of distributions (68,643 and 69,640 shares, respectively) | | 935 | | 953 | |
| | | | | |
Total Increase (Decrease) in Net Assets | | (2,172 | ) | 317 | |
| | | | | |
Net Assets: | | | | | |
Beginning of period | | 142,063 | | 141,746 | |
End of period * | | $ | 139,891 | | $ | 142,063 | |
| | | | | |
*Including (overdistributed) net investment income of: | | $ | 224 | | $ | (328 | ) |
See accompanying notes
7
Statement of Cash Flows
December 31, 2003
Amounts in thousands
Increase (Decrease) in Cash from: | | | |
| | | |
Financing Activities: | | | |
Sales of Fund shares | | $ | 0 | |
Redemptions of Fund shares | | 0 | |
Cash distributions paid | | (14,725 | ) |
Proceeds from financing transactions | | 18,644 | |
Net increase from financing activities | | 3,919 | |
| | | |
Operating Activities: | | | |
Purchases of long-term securities | | (141,495 | ) |
Proceeds from sales of long-term securities | | 116,424 | |
Purchases of short-term securities (net) | | 14,755 | |
Net investment income | | 12,497 | |
Change in other receivables/payables (net) | | (6,100 | ) |
Net (decrease) from operating activities | | (3,919 | ) |
| | | |
Net Increase in Cash | | 0 | |
| | | |
Cash: | | | |
Beginning of period | | 0 | |
End of period | | $ | 0 | |
See accompanying notes
8
Schedule of Investments
December 31, 2003
| | Principal
Amount
(000s) | | Value
(000s) | |
COMMERCIAL MORTGAGE-BACKED SECURITIES 133.5% | | | | | |
| | | | | |
Multi-Class 58.9% | | | | | |
Aetna Commercial Mortgage Trust | | | | | |
7.100% due 12/26/2030 | | $ | 327 | | $ | 329 | |
American Southwest Financial Securities Corp. | | | | | |
1.078% due 01/18/2009 (b)(d) | | 2,227 | | 74 | |
8.000% due 01/18/2009 | | 1,500 | | 1,647 | |
Asset Securitization Corp. | | | | | |
7.384% due 08/13/2029 | | 750 | | 850 | |
Carey Commercial Mortgage Trust | | | | | |
5.970% due 08/20/2032 (a) | | 1,463 | | 1,515 | |
Commercial Mortgage Acceptance Corp. | | | | | |
6.792% due 09/15/2030 (b) | | 1,500 | | 1,664 | |
Commercial Mortgage Asset Trust | | | | | |
7.546% due 01/17/2010 | | 210 | | 245 | |
6.640% due 09/17/2010 (c) | | 3,000 | | 3,384 | |
6.975% due 04/17/2013 (c) | | 2,500 | | 2,887 | |
Commercial Mortgage Pass-Through Certificates | | | | | |
1.442% due 05/15/2005 (a)(b)(c) | | 1,872 | | 1,872 | |
6.830% due 02/15/2034 | | 2,893 | | 3,055 | |
6.586% due 07/16/2034 (a) | | 1,000 | | 1,055 | |
6.936% due 07/16/2034 (a)(b) | | 1,500 | | 1,384 | |
Contimortgage Home Equity Trust | | | | | |
7.550% due 08/15/2028 | | 498 | | 310 | |
CS First Boston Mortgage Securities Corp. | | | | | |
7.170% due 05/17/2040 | | 3,000 | | 3,185 | |
Federal Housing Administration | | | | | |
8.360% due 01/01/2012 | | 591 | | 593 | |
7.380% due 04/01/2041 | | 2,454 | | 2,454 | |
FFCA Secured Lending Corp. | | | | | |
1.728% due 09/18/2020 (a)(b)(d) | | 17,308 | | 1,196 | |
First Chicago Lennar Trust | | | | | |
7.982% due 04/29/2006 (a)(b) | | 3,826 | | 3,917 | |
GMAC Commercial Mortgage Securities, Inc. | | | | | |
7.860% due 11/15/2006 (a) | | 500 | | 533 | |
6.500% due 03/15/2012 | | 20 | | 22 | |
3.912% due 02/15/2016 (a) | | 2,000 | | 2,000 | |
7.093% due 05/15/2030 (a)(b) | | 1,500 | | 884 | |
Green Tree Financial Corp. | | | | | |
7.510% due 07/15/2028 | | 4,000 | | 640 | |
GS Mortgage Securities Corp. | | | | | |
6.624% due 05/03/2018 (a)(b)(c) | | 2,000 | | 2,234 | |
6.044% due 08/15/2018 (a)(b) | | 331 | | 351 | |
6.526% due 08/15/2018 (a)(b) | | 2,000 | | 2,221 | |
GS Mortgage Securities Corp. II | | | | | |
6.615% due 02/16/2016 (a)(c) | | 3,500 | | 3,863 | |
7.643% due 08/05/2018 (a) | | 3,480 | | 3,724 | |
7.190% due 04/13/2031 | | 1,000 | | 1,100 | |
Hilton Hotel Pool Trust | | | | | |
0.622% due 10/01/2016 (a)(b)(d) | | 33,569 | | 1,319 | |
J.P. Morgan Commercial Mortgage Finance Corp. | | | | | |
8.525% due 11/25/2027 (a)(b) | | 2,284 | | 2,354 | |
6.465% due 11/15/2035 | | 3,000 | | 3,344 | |
J.P. Morgan Chase Commercial Mortgage Securities Corp. | | | | | |
1.760% due 02/17/2015 (d) | | $ | 213,624 | | $ | 613 | |
Keystone Owner Trust | | | | | |
8.500% due 01/25/2029 (a) | | 1,612 | | 1,616 | |
LTC Commercial Mortgage Pass-Through Certificates | | | | | |
6.029% due 05/28/2030 (a)(c) | | 2,451 | | 2,464 | |
Merrill Lynch Mortgage Investors, Inc. | | | | | |
7.511% due 06/15/2021 (b) | | 365 | | 393 | |
Morgan Stanley Capital I | | | | | |
6.850% due 02/15/2020 (a) | | 1,000 | | 1,021 | |
7.622% due 11/15/2028 (a) | | 2,992 | | 3,261 | |
7.695% due 10/03/2030 (a) | | 2,000 | | 1,288 | |
7.016% due 12/15/2031 | | 200 | | 224 | |
Mortgage Capital Funding, Inc. | | | | | |
7.531% due 04/20/2007 | | 1,000 | | 1,065 | |
Nationslink Funding Corp. | | | | | |
7.050% due 02/20/2008 (a) | | 2,000 | | 1,997 | |
7.105% due 01/20/2013 (a) | | 2,500 | | 2,304 | |
Nomura Asset Securities Corp. | | | | | |
10.536% due 09/11/2019 (b)(c) | | 3,000 | | 3,008 | |
Office Portfolio Trust | | | | | |
6.778% due 02/01/2016 (a) | | 1,000 | | 1,044 | |
Prudential Securities Secured Financing Corp. | | | | | |
6.755% due 08/15/2011 (a) | | 2,000 | | 1,852 | |
7.610% due 12/26/2022 | | 1,000 | | 1,055 | |
Salomon Brothers Mortgage Securities VII | | | | | |
7.500% due 05/25/2026 | | 65 | | 65 | |
Trizec Hahn Office Properties | | | | | |
7.604% due 05/15/2016 (a) | | 3,000 | | 2,934 | |
| | | | 82,409 | |
Multi-Family 51.7% | | | | | |
Bear Stearns Commercial Mortgage Securities, Inc. | | | | | |
5.060% due 11/15/2016 | | 23 | | 25 | |
Chase Commercial Mortgage Securities Corp. | | | | | |
6.900% due 11/19/2006 | | 1,500 | | 1,657 | |
6.275% due 02/12/2016 | | 2,000 | | 2,183 | |
6.900% due 11/19/2028 (a) | | 5,500 | | 5,593 | |
Fannie Mae | | | | | |
6.360% due 05/01/2008 (c) | | 2,354 | | 2,531 | |
8.000% due 07/01/2009 | | 850 | | 909 | |
8.000% due 10/01/2010 | | 56 | | 60 | |
6.250% due 07/01/2012 (c) | | 10,827 | | 11,862 | |
8.000% due 12/01/2012 | | 6 | | 6 | |
8.000% due 06/01/2015 | | 23 | | 25 | |
8.000% due 06/01/2015 | | 75 | | 81 | |
8.000% due 08/01/2015 | | 87 | | 93 | |
8.037% due 12/25/2015 (a) | | 697 | | 730 | |
8.111% due 12/25/2015 (a) | | 874 | | 931 | |
9.375% due 04/01/2016 | | 208 | | 201 | |
7.875% due 11/01/2018 | | 24 | | 23 | |
6.930% due 09/01/2021 (c) | | 7,524 | | 8,193 | |
6.110% due 04/01/2023 (c) | | 11,281 | | 12,265 | |
6.500% due 01/01/2032 (c) | | 7,579 | | 7,929 | |
See accompanying notes
9
| | Principal
Amount
(000s) | | Value
(000s) | |
7.000% due 10/01/2033 | | $ | 4,680 | | $ | 4,990 | |
7.000% due 11/01/2033 | | 4,655 | | 4,966 | |
Fort Lewis Communities LLC | | | | | |
6.971% due 05/10/2033 (a) | | 1,981 | | 1,909 | |
G-Wing Ltd. | | | | | |
3.770% due 05/06/2004 (a)(b) | | 1,439 | | 1,428 | |
Multi-Family Capital Access One, Inc. | | | | | |
7.400% due 01/15/2024 | | 1,492 | | 1,666 | |
NationsBanc Mortgage Capital Corp. | | | | | |
8.080% due 05/25/2028 (a) | | 1,388 | | 1,402 | |
TECO Energy, Inc. | | | | | |
7.500% due 06/15/2010 | | 700 | | 752 | |
| | | | 72,410 | |
Hospitality 10.2% | | | | | |
Host Marriot Pool Trust | | | | | |
8.310% due 08/03/2009 (a) | | 2,000 | | 2,022 | |
Nomura Asset Capital Corp. | | | | | |
7.500% due 07/15/2013 (a) | | 5,030 | | 5,198 | |
Starwood Commercial Mortgage Trust | | | | | |
6.920% due 02/03/2009 (a)(b)(c) | | 2,500 | | 2,819 | |
Times Square Hotel Trust | | | | | |
8.528% due 08/01/2026 (a) | | 3,876 | | 4,243 | |
| | | | 14,282 | |
Other Mortgage-Backed Securities 9.9% | | | | | |
Asset Securitization Corp. | | | | | |
10.115% due 02/14/2041 | | 1,861 | | 2,133 | |
Circus & Eldorado Joint Venture Silver Legacy Capital Corp. | | | | | |
10.125% due 03/01/2012 | | 700 | | 730 | |
First International Bank | | | | | |
4.119% due 04/15/2026 | | 1,856 | | 186 | |
First Sierra Receivables | | | | | |
11.510% due 01/18/2007 (a) | | 1,064 | | 1,097 | |
Fort James Corp. | | | | | |
9.500% due 05/15/2022 | | 700 | | 732 | |
GMAC Commercial Mortgage Securities, Inc. | | | | | |
6.420% due 05/15/2035 (c) | | 2,000 | | 2,226 | |
Golden State Tobacco Securitization Corp. Revenue Bonds, Series 2003 | | | | | |
6.750% due 06/01/2039 | | 1,000 | | 987 | |
LB Commercial Conduit Mortgage Trust | | | | | |
6.000% due 11/19/2035 (a) | | 5,000 | | 4,841 | |
Midwest Generation LLC | | | | | |
8.560% due 01/02/2016 | | 700 | | 733 | |
Next Card Credit Card Master Trust | | | | | |
7.278% due 12/15/2006 (a)(b) | | 1,000 | | 150 | |
| | | | 13,815 | |
Healthcare 2.8% | | | | | |
Red Mountain Funding Corp. | | | | | |
9.150% due 11/28/2027 (a) | | 3,200 | | 1,598 | |
RMF Commercial Mortgage Pass-Through Certificates | | | | | |
7.072% due 01/15/2019 (a) | | 2,000 | | 1,683 | |
7.471% due 01/15/2019 (a) | | 1,000 | | 329 | |
8.920% due 01/15/2019 (a) | | $ | 1,000 | | $ | 261 | |
| | | | 3,871 | |
Total Commercial Mortgage-Backed Securities (Cost $188,446) | | | | 186,787 | |
| | | | | |
CORPORATE BONDS & NOTES 0.1% | | | | | |
| | | | | |
Industrials 0.1% | | | | | |
U.S. Airways, Inc. | | | | | |
9.330% due 01/01/2006 (i) | | 640 | | 167 | |
| | | | | |
Total Corporate Bonds & Notes (Cost $647) | | | | 167 | |
| | | | | |
ASSET-BACKED SECURITIES 14.3% | | | | | |
Access Financial Manufactured Housing Contract Trust | | | | | |
7.650% due 05/15/2021 | | 2,500 | | 1,627 | |
Asset-Backed Funding Certificates | | | | | |
4.750% due 10/25/2004 (d) | | 16,786 | | 460 | |
Commercial Capital Access One, Inc. | | | | | |
7.688% due 11/15/2028 (a) | | 3,000 | | 3,175 | |
Freddie Mac | | | | | |
8.000% due 03/01/2005 | | 6 | | 7 | |
7.000% due 08/01/2007 | | 57 | | 60 | |
7.000% due 12/01/2007 | | 25 | | 27 | |
8.000% due 07/01/2010 | | 26 | | 27 | |
7.000% due 09/01/2010 | | 16 | | 17 | |
8.000% due 10/01/2010 | | 26 | | 28 | |
7.000% due 11/01/2010 (c) | | 608 | | 643 | |
7.000% due 02/01/2011 | | 50 | | 54 | |
8.000% due 06/01/2011 | | 21 | | 22 | |
8.000% due 01/01/2012 | | 13 | | 14 | |
8.000% due 05/01/2012 | | 15 | | 16 | |
8.000% due 06/01/2012 | | 20 | | 22 | |
7.000% due 07/01/2012 | | 72 | | 77 | |
7.000% due 07/01/2012 | | 11 | | 11 | |
7.000% due 07/01/2013 (c) | | 562 | | 599 | |
7.000% due 12/01/2014 | | 156 | | 167 | |
7.000% due 02/01/2015 | | 57 | | 61 | |
8.000% due 05/01/2015 | | 3 | | 3 | |
8.000% due 06/01/2015 | | 3 | | 4 | |
7.000% due 09/01/2015 | | 121 | | 129 | |
7.000% due 12/01/2015 | | 2 | | 2 | |
7.000% due 03/01/2016 | | 150 | | 160 | |
7.000% due 06/01/2016 | | 155 | | 166 | |
7.000% due 07/01/2016 | | 372 | | 398 | |
7.000% due 03/01/2031 | | 798 | | 844 | |
7.000% due 10/01/2031 | | 209 | | 221 | |
7.000% due 08/01/2032 (c) | | 3,046 | | 3,223 | |
Green Tree Financial Corp. | | | | | |
7.050% due 02/15/2027 | | 922 | | 471 | |
Impac Secured Assets CMN Owner Trust | | | | | |
8.950% due 07/25/2025 | | 215 | | 216 | |
7.000% due 10/25/2031 | | 3,080 | | 3,179 | |
See accompanying notes
10
| | Principal
Amount
(000s) | | Value
(000s) | |
Keystone Owner Trust | | | | | |
8.500% due 01/25/2029 (a) | | $ | 658 | | $ | 676 | |
Life Financial Home Loan Owner Trust | | | | | |
9.090% due 04/25/2024 | | 1,706 | | 1,765 | |
Mego Mortgage Home Loan Trust | | | | | |
8.010% due 08/25/2023 | | 305 | | 304 | |
Residential Funding Mortgage Securities I, Inc. | | | | | |
7.000% due 05/25/2011 | | 132 | | 134 | |
Wilshire Mortgage Loan Trust | | | | | |
8.990% due 05/25/2028 (a) | | 908 | | 908 | |
Total Asset-Backed Securities | | | | 19,917 | |
(Cost $20,402) | | | | | |
| | | | | |
SHORT-TERM INSTRUMENTS 2.1% | | | | | |
| | | | | |
Commercial Paper 1.0% | | | | | |
General Electric Capital Corp. | | | | | |
1.090% due 04/13/2004 | | 1,400 | | 1,396 | |
Repurchase Agreement 0.7% | | | | | |
State Street Bank | | | | | |
0.800% due 01/02/2004 | | 962 | | 962 | |
(Dated 12/31/2003. Collateralized by Federal Home Loan Bank 1.625% due 04/15/2005 valued at $984. Repurchase proceeds are $962.) | | | | | |
| | | | | |
U.S. Treasury Bills 0.4% | | | | | |
1.010% due 03/04/2004- 03/18/2004 (e)(f)(g) | | 605 | | 604 | |
| | | | | |
Total Short-Term Instruments | | | | 2,962 | |
(Cost $2,962) | | | | | |
| | | | | |
Total Investments 150.0% | | | | $ | 209,833 | |
(Cost $212,457) | | | | | |
| | | | | |
Other Assets and Liabilities (Net) (50.0%) | | | | (69,942 | ) |
| | | | | |
Net Assets 100.0% | | | | $ | 139,891 | |
| | | | | | | |
Notes to Schedule of Investments (amounts in thousands, except number of contracts):
(a) Securities purchased under Rule 144A of the 1933 Securities Act and, unless registered under the Act or exempt from registration, may only be sold to qualified institutional investors.
(b) Variable rate security. The rate listed is as of December 31, 2003.
(c) Security, or a portion thereof, pledged as collateral for reverse repurchase agreements.
(d) Interest only security.
(e) Securities are grouped by coupon or range of coupons and represent a range of maturities.
(f) Securities with an aggregate market value of $354 have been segregated with the custodian to cover margin requirements for the following open futures contracts at December 31, 2003:
Type | | # of
Contracts | | Unrealized
Appreciation | |
| | | | | |
U.S. Treasury 10-Year Note (03/2004) - Short | | 23 | | $ | 7 | |
| | | | | | |
(g) Security, or a portion thereof, has been pledged as collateral for swap contracts. The aggregate market value for all securities pledged as collateral was $250 as of December 31, 2003.
(h) Swap agreements outstanding at December 31, 2003:
Type | | Notional
Amount | | Unrealized
Appreciation/
(Depreciation) | |
| | | | | |
Receive total return on Lehman Brothers Commercial Mortgage Backed Securities Index and pay floating rate based on 1-month LIBOR less 0.650%. | | | | | |
Counterparty: J.P. Morgan Chase & Co. | | | | | |
Exp. 02/15/2004 | | $ | 10,000 | | $ | 252 | |
| | | | | |
Receive floating rate based on 3-month LIBOR and pay a fixed rate equal to 4.000%. | | | | | |
Counterparty: Merrill Lynch & Co., Inc. | | | | | |
Exp. 06/16/2009 | | 7,200 | | (29 | ) |
| | | | | |
Receive floating rate based on 3-month LIBOR and pay a fixed rate equal to 5.000%. | | | | | |
Counterparty: Goldman Sachs & Co. | | | | | |
Exp. 06/16/2014 | | 2,900 | | (6 | ) |
| | | | $ | 217 | |
| | | | | | | |
(i) Security is in default.
See accompanying notes
11
Notes to Financial Statements
December 31, 2003
1. General Information
The PIMCO Commercial Mortgage Securities Trust, Inc. (the “Fund”) commenced operations on September 2, 1993. The Fund is registered under the Investment Company Act of 1940 (the “Act”), as amended, as a closed-end, non-diversified, investment management company organized as a Maryland corporation. The stock exchange symbol of the Fund is PCM. Shares are traded on the New York Stock Exchange.
2. Significant Accounting Policies
The following is a summary of significant accounting policies consistently followed by the Fund in the preparation of its financial statements in conformity with accounting principles generally accepted in the United States of America. The preparation of financial statements in accordance with accounting principles generally accepted in the United States of America requires management to make estimates and assumptions that affect the reported amounts and disclosures in the financial statements. Actual results could differ from those estimates.
Security Valuation. Portfolio securities and other financial instruments for which market quotations are readily available are stated at market value. Portfolio securities and other financial instruments for which market quotes are not readily available are valued at fair value, as determined in good faith and pursuant to guidelines established by the Board of Directors, including certain fixed income securities which may be valued with reference to securities whose prices are more readily obtainable. Market value is determined on the basis of last reported sales prices, or if no sales are reported, as is the case for most securities traded over-the-counter, the mean between representative bid and asked quotations obtained from a quotation reporting system or from established market makers. The prices of certain portfolio securities or other financial instruments may be determined at a time prior to the close of regular trading on the New York Stock Exchange. Fair valuation may be used if significant events occur after the close of the relevant markets and prior to the close of regular trading on the New York Stock Exchange that materially affect the values of such securities or financial instruments. Net asset value per share is determined as of 4:15 p.m., Eastern Time, no less frequently than Thursday of each week (except where such Thursday is not a business day, then the first business day immediately succeeding such Thursday). Fixed income securities are normally valued on the basis of quotes obtained from brokers and dealers or pricing services. Certain fixed income securities purchased on a delayed delivery basis are marked to market daily until settlement at the forward settlement value. Short-term investments, which mature in 60 days or less are valued at amortized cost, which approximates market value. Exchange traded options, futures and options on futures are valued at the settlement price determined by the relevant exchange. Prices may be obtained from independent pricing services which use information provided by market makers or estimates of market values obtained from yield data relating to investments or securities with similar characteristics. The prices used by the Fund may differ from the value that would be realized if the securities were sold and the differences could be material to the financial statements.
Securities Transactions and Investment Income. Securities transactions are recorded as of the trade date. Securities purchased or sold on a when-issued or delayed-delivery basis may be settled a month or more after the trade date. Securities purchased on a when-issued basis are subject to market value fluctuations during this period. On the commitment date of such purchases, the Fund designates specific assets with a value at least equal to the commitment, to be utilized to settle the commitment. The proceeds to be received from delayed-delivery sales are included in the Fund’s net assets on the date the commitment is executed. Accordingly, any fluctuation in the value of such assets is excluded from the Fund’s net asset value while the commitment is in effect. Realized gains and losses from securities sold are recorded on the identified cost basis. Dividend income is recorded on the ex-dividend date, except certain dividends from foreign securities where the ex-dividend date may have passed, are recorded as soon as the Fund is informed of the ex-dividend date. Interest income, adjusted for the accretion of discounts and amortization of premiums, is recorded on the accrual basis. Paydown gains and losses on mortgage- and asset-backed securities are recorded as adjustments to interest income in the Statements of Operations.
Dividends and Distributions to Shareholders. The Fund intends to distribute all its net investment income monthly. Distributions, if any, of net realized short- or long-term capital gains will be distributed # PIMCO Commercial Mortgage Securities Trust, Inc. Annual Report | 12.31.03no less frequently than once each year. Income and capital gain distributions are determined in accordance with income tax regulations which may differ from accounting principles generally accepted in the United States of America. These differences are primarily due to differing treatments for such items as wash sales, foreign currency transactions, net operating losses and capital loss carryforwards.
12
Delayed Delivery Transactions. The Fund may purchase or sell securities on a when-issued or delayed delivery basis. These transactions involve a commitment by the Fund to purchase or sell securities for a predetermined price or yield, with payment and delivery taking place beyond the customary settlement period. When delayed delivery purchases are outstanding, the Fund will designate liquid assets in an amount sufficient to meet the purchase price. When purchasing a security on a delayed delivery basis, the Fund assumes the rights and risks of ownership of the security, including the risk of price and yield fluctuations, and takes such fluctuations into account when determining its net asset value. The Fund may dispose of or renegotiate a delayed delivery transaction after it is entered into, and may sell when-issued securities before they are delivered, which may result in a capital gain or loss. When the Fund has sold a security on a delayed delivery basis, the Fund does not participate in future gains and losses with respect to the security.
Federal Income Taxes. The Fund intends to qualify as a regulated investment company and distribute all of its taxable income and net realized gains, if applicable, to shareholders. Accordingly, no provision for Federal income taxes has been made.
Futures Contracts. The Fund is authorized to enter into futures contracts. A Fund may use futures contracts to manage its exposure to the securities markets or to movements in interest rates and currency values. The primary risks associated with the use of futures contracts are the imperfect correlation between the change in market value of the securities held by a Fund and the prices of futures contracts, the possibility of an illiquid market, and the inability of the counterparty to meet the terms of the contract. Futures contracts are valued based upon their quoted daily settlement prices. Upon entering into a futures contract, the Fund may be required to deposit with its custodian, in a segregated account in the name of the futures broker, an amount of cash or U.S. Government and Agency Obligations in accordance with the initial margin requirements of the broker or exchange. Futures contracts are marked to market daily and an appropriate payable or receivable for the change in value (“variation margin”) is recorded by the Fund. Gains or losses are recognized but not considered realized until the contracts expire or are closed. Futures contracts involve, to varying degrees, risk of loss in excess of the variation margin disclosed in the Statement of Assets and Liabilities.
Repurchase Agreements. The Fund may engage in repurchase transactions. Under the terms of a typical repurchase agreement, the Fund takes possession of an underlying debt obligation subject to an obligation of the seller to repurchase, and the Fund to resell, the obligation at an agreed-upon price and time. The market value of the collateral must be equal at all times to the total amount of the repurchase obligations, including interest. Generally, in the event of counterparty default, the Fund has the right to use the collateral to offset losses incurred.
Reverse Repurchase Agreements. Reverse repurchase agreements involve the sale of a portfolio-eligible security by the Fund, coupled with an agreement to repurchase the security at a specified date and price. Reverse repurchase agreements involve the risk that the market value of securities retained by the Fund may decline below the repurchase price of the securities sold by the Fund, which is obligated to repurchase. Reverse repurchase agreements are considered to be borrowing by the Fund. To the extent the Fund collateralizes it obligations under reverse repurchase agreements, such transactions will not be deemed subject to the 300% asset coverage requirements imposed by the Act of 1940. The Fund will segregate assets determined to be liquid by PIMCO or otherwise cover its obligations under reverse repurchase agreements.
Stripped Mortgage-Backed Securities (SMBS). SMBS represent a participation in, or are secured by and payable from, mortgage loans on real property, and may be structured in classes with rights to receive varying proportions of principal and interest. SMBS include interest-only securities (IOs), which receive all of the interest, and principal-only securities (POs), which receive all of the principal. If the underlying mortgage assets experience greater than anticipated payments of principal, a Fund may fail to recoup some or all of its initial investment in these securities. The market value of these securities is highly sensitive to changes in interest rates.
Swap Agreements. The Fund may invest in swap agreements. A swap is an agreement to exchange the return generated by one instrument for the return generated by another instrument. The Fund may enter into interest rate, total return, forward swap spread lock and credit default swap agreements to manage its exposure to interest rates and credit risk. In connection with these agreements, securities may be identified as collateral in accordance with the terms of the respective swap agreement. Interest rate swap agreements involve the exchange by the Fund with another party of their respective commitments to pay or receive interest, e.g., an exchange of floating rate payments for fixed rate payments with respect to a notional amount of principal. Total return swap agreements involve commitments to pay interest in exchange for a market-linked return, both based on notional amounts. To the
13
extent the total return of the security or index underlying the transaction exceeds or falls short of the offsetting interest rate obligation, the Fund will receive a payment from or make a payment to the counterparty. Forward spread lock swap agreements involve commitments to pay or receive a settlement amount calculated as the difference between the swap spread and a fixed spread, multiplied by the notional amount times the duration of the swap. The swap spread is the difference between the benchmark swap rate (market rate) and the specific Treasury rate. In a credit default swap, one party makes a stream of payments to another party in exchange for the right to receive a specified return in the event of a default by a third party, typically corporate issues or sovereign issues of an emerging country, on its obligation. The Fund may use credit default swaps to provide a measure of protection against defaults of issuers (i.e., to reduce risk where the Fund owns or has exposure to the issuer) or to take an active long or short position with respect to the likelihood of a particular issuer’s default. Swaps are marked to market daily based upon quotations from market makers and vendors and the change in value, if any, is recorded as unrealized gain or loss in the Statement of Operations. Payments received or made at the beginning of the measurement period are reflected as such on the Statement of Assets and Liabilities. A liquidation payment received or made at the termination of the swap is recorded as realized gain or loss in the Statement of Operations. Net periodic payments are included as part of miscellaneous income on the Statement of Operations. Entering into these agreements involves, to varying degrees, elements of credit, market and documentation risk in excess of the amounts recognized on the Statement of Assets and Liabilities. Such risks involve the possibility that there will be no liquid market for these agreements, that the counterparty to the agreements may default on its obligation to perform or disagree as to the meaning of contractual terms in the agreements, and that there may be unfavorable changes in interest rates.
U.S. Government Agencies Or Government-Sponsored Enterprises. Securities issued by U.S. Government agencies or government-sponsored enterprises may not be guaranteed by the U.S. Treasury. GNMA, a wholly owned U.S. Government corporation, is authorized to guarantee, with the full faith and credit of the U.S. Government, the timely payment of principal and interest on securities issued by institutions approved by GNMA and backed by pools of mortgages insured by the Federal Housing Administration or guaranteed by the Department of Veterans Affairs. Government-related guarantors (i.e., not backed by the full faith and credit of the U.S. Government) include the Federal National Mortgage Association (“FNMA”) and the Federal Home Loan Mortgage Corporation (“FHLMC”). Pass-through securities issued by FNMA are guaranteed as to timely payment of principal and interest by FNMA but are not backed by the full faith and credit of the U.S. Government. FHLMC guarantees the timely payment of interest and ultimate collection of principal, but its participation certificates are not backed by the full faith and credit of the U.S. Government.
3. Fees, Expenses, and Related Party Transactions
Investment Manager Fee. Pacific Investment Management Company LLC (PIMCO) is a majority owned subsidiary of Allianz Dresdner Asset Management of America L.P. and serves as investment manager (the “Manager”) to the Fund, pursuant to an investment advisory contract. The Manager receives a quarterly fee from the Fund at an annual rate of 0.725% based on average weekly net assets of the Fund.
Administration Fee. PIMCO serves as administrator (the “Administrator”), and provides administrative services to the Fund for which it receives from the Fund a quarterly administrative fee at an annual rate of 0.10% based on average weekly net assets of the Fund.
Expenses. The Fund is responsible for the following expenses: (i) salaries and other compensation of any of the Fund’s executive officers and employees who are not officers, directors, stockholders or employees of PIMCO or its subsidiaries or affiliates; (ii) taxes and governmental fees; (iii) brokerage fees and commissions and other portfolio transaction expenses; (iv) the costs of borrowing money, including interest expenses; (v) fees and expenses of the Directors who are not “interested persons” of PIMCO or the Fund, and any counsel retained exclusively for their benefit; (vi) printing expense; (vii) proxy expense; (viii) legal fees; (ix) audit fees; (x) custodian fees and (xi) extraordinary expenses, including costs of litigation and indemnification expenses. The ratio of expenses to average net assets, as disclosed in the Financial Highlights, may differ from the annual fund operating expenses as disclosed in the Prospectus for the reasons set forth above. Each unaffiliated Director receives an annual retainer of $6,000, plus $1,000 for each Board of Directors meeting attended in person and $500 for each meeting attended telephonically, plus reimbursement of related expenses. In addition, each committee chair receives an additional annual retainer of $500.
14
4. Purchases and Sales of Securities
The length of time a Fund has held a particular security is not generally a consideration in investment decisions. A change in the securities held by a Fund is known as “portfolio turnover.” The Fund may engage in frequent and active trading of portfolio securities to achieve its investment objective, particularly during periods of volatile market movements. High portfolio turnover (e.g., over 100%) involves correspondingly greater expenses to the Fund, including brokerage commissions or dealer mark-ups and other transaction costs on the sale of securities and reinvestments in other securities. Such sales may also result in realization of taxable capital gains, including short-term capital gains (which are generally taxed at ordinary income tax rates). The trading costs and tax effects associated with portfolio turnover may adversely affect the Fund’s performance.
Purchases and sales of securities (excluding short-term investments) for the period ended December 31, 2003, were as follows (amounts in thousands):
U.S Government/Agency | | All Other | |
Purchases | | Sales | | Purchases | | Sales | |
| | | | | | | |
$ | 70,233 | | $ | 40,930 | | $ | 69,263 | | $ | 33,071 | |
| | | | | | | | | | | |
5. Borrowings under Reverse Repurchase Agreements
The average amount of borrowings outstanding during the period ended December 31, 2003, was $54,352,016 at a weighted average interest rate of 1.23%. On December 31, 2003, securities valued at $74,224,007 were pledged as collateral for reverse repurchase agreements. The Fund is authorized to borrow funds and utilize leverage in amounts not exceeding thirty-three and one-third percent of its total assets. The Fund’s ability to leverage creates an opportunity for increased net income, but at the same time poses special risks. If the income from the securities purchased with borrowed funds is not sufficient to cover the cost of borrowing, the net income of the Fund will be less than if borrowing had not been used, reducing the amount available for distribution to shareholders.
6. Federal Income Tax Matters
As of December 31, 2003, the components of distributable taxable earnings were as follows (amounts in thousands):
Undistributed
Ordinary
Income | | Undistributed
Long-Term
Capital Gains | | Net Tax Basis
Appreciation
on Derivatives and
Foreign Currency
Denominated
Assets/Liabilities (1) | | Other
Book-to-Tax
Accounting
Differences | | Accumulated
Capital
Losses (2) | | Post-October
Deferral | |
| | | | | | | | | | | |
$ | 106 | | $ | 0 | | $ | 405 | | $ | 0 | | $ | (12,283 | ) | $ | 0 | |
| | | | | | | | | | | | | | | | | |
(1) Adjusted for accelerated recognition of unrealized gain/(loss) or deferral of realized losses for certain futures.
(2) Capital loss carryovers expire in varying amounts through December 31, 2011.
As of December 31, 2003, the aggregate cost and the net unrealized appreciation/(depreciation) of investments for federal income tax purposes are as follows (amounts in thousands):
Federal
Tax Cost | | Unrealized
Appreciation | | Unrealized
(Depreciation) | | Net Unrealized
(Depreciation) (3) | |
| | | | | | | |
$ | 212,389 | | $ | 9,960 | | $ | (12,516 | ) | $ | (2,556 | ) |
| | | | | | | | | | | |
(3) Primary differences, if any, between book and tax net unrealized (depreciation) are attributable to wash sale loss deferrals and interest only basis adjustment for federal income tax purposes.
15
As of fiscal year ended December 31, 2003, the Fund made the following tax basis distributions (amounts in thousands):
Ordinary Income
Distributions | | Long-Term
Capital Gains
Distributions | | Return of
Capital | |
| | | | | |
$ | 12,537 | | $ | 0 | | $ | 0 | |
| | | | | | | | |
The Fund did not distribute capital gains during the fiscal year due to accumulated capital losses. The Fund will resume capital gain distributions in the future to the extent gains are realized in excess of accumulated capital losses.
7. Subsequent Event
On February 17, 2004, the Attorney General of New Jersey filed a complaint against Allianz Dresdner Asset Management of America L.P. (“ADAM”); PIMCO Advisors Distributors LLC (“PAD”); PEA Capital LLC (formerly known as PIMCO Equity Advisors LLC) ((“PEA”); and Pacific Investment Management Company LLC (“PIMCO”) in connection with its investigation into market timing and late trading. The complaint contends that inappropriate trading by shareholders engaged in market timing activity took place in funds in the PIMCO Funds: Multi-Manager Series (“MMS Funds”) and the PIMCO Funds: Pacific Investment Management Series (“PIMS Funds”). On February 17, 2004, a class action lawsuit was filed in the United States District Court for the District of Connecticut on behalf of certain shareholders of the PIMCO Funds against ADAM, PEA, PIMCO, PIMS Funds, MMS Funds and certain other defendants, regarding use of brokerage commissions to pay for distribution. On February 20, 2004, a class action lawsuit was filed in the United States District Court for the District of New Jersey on behalf of certain shareholders of the PIMCO Funds against ADAM, PAD, PIMCO, PEA, PIMS Funds, MMS Funds, PIMCO Variable Insurance Trust, PIMCO Commercial Mortgage Securities Trust, Inc. and certain other defendants, alleging that inappropriate market timing activity by certain shareholders caused financial injury to the shareholders of the Funds. Both of the class action lawsuits seek unspecified compensatory damages. ADAM and the PIMCO-related entities are conducting a thorough internal investigation into the matters raised in the complaints. The New Jersey Attorney General’s complaint does not allege any market timing activity took place in the Fund, and the class action complaint filed in Connecticut does not name the Fund as a party.
These legal and regulatory developments do not relate to closed-end investment companies such as the Fund. Although PIMCO does not believe that the complaints will have a material adverse affect on the Fund, there can be no assurance that the ongoing adverse publicity and/or other developments resulting from regulatory investigations, litigation, or related developments will not result in a decrease of the current market premium in the per share market value in excess of net asset value or other adverse consequences to the Fund.
16
Report of Independent Auditors
To the Directors and Shareholders of PIMCO Commercial Mortgage Securities Trust, Inc.
In our opinion, the accompanying statement of assets and liabilities, including the schedule of investments, and the related statements of operations, of changes in net assets and of cash flows, and the financial highlights presents fairly, in all material respects, the financial position of PIMCO Commercial Mortgage Securities Trust, Inc. (hereafter referred to as the “Fund”) at December 31, 2003, and the results of its operations, the changes in its net assets and cash flows, and the financial highlights for the years ended December 31, 2003, December 31, 2002 and December 31, 2001, in conformity with accounting principles generally accepted in the United States of America. The financial highlights for the years ended December 31, 2000 and December 31, 1999 were audited by other independent accountants whose report dated February 12, 2001, expressed an unqualified opinion on those statements. These financial statements and financial highlights (hereafter referred to as “financial statements”) are the responsibility of the Fund’s management; our responsibility is to express an opinion on these financial statements based on our audit. We conducted our audits of these financial statements in accordance with auditing standards generally accepted in the United States of America, which require that we plan and perform the audit to obtain reasonable assurance about whether the financial statements are free of material misstatement. An audit includes examining, on a test basis, evidence supporting the amounts and disclosures in the financial statements, assessing the accounting principles used and significant estimates made by management, and evaluating the overall financial statement presentation. We believe that our audit, which included confirmation of securities at December 31, 2003 by correspondence with the custodian and counterparties, provides a reasonable basis for our opinion.
PricewaterhouseCoopers LLP |
Kansas City, Missouri |
February 23, 2004 |
17
Privacy Policy (Unaudited)
Our Commitment to You
We consider customer privacy to be a fundamental aspect of our relationship with clients. We are committed to maintaining the confidentiality, integrity, and security of our current, prospective and former clients’ personal information. We have developed policies designed to protect this confidentiality, while allowing client needs to be served.
Obtaining Personal Information
In the course of providing you with products and services, we may obtain non-public personal information about you. This information may come from sources such as account applications and other forms, from other written, electronic or verbal correspondence, from your transactions, from your brokerage or financial advisory firm, financial adviser or consultant, and/or from information captured on our internet web sites.
Respecting Your Privacy
We do not disclose any personal or account information provided by you or gathered by us to non-affiliated third parties, except as required or permitted by law. As is common in the industry, non-affiliated companies may from time to time provide certain services, such as preparing and mailing prospectuses, reports, account statements and other information, conducting research on client satisfaction, and gathering shareholder proxies. We may also retain non-affiliated companies to market our products and enter in joint marketing agreements with other companies. These companies may have access to your personal and account information, but are permitted to use the information solely to provide the specific service or as otherwise permitted by law. We may also provide your personal and account information to your brokerage or financial advisory firm and/or to your financial adviser or consultant.
Sharing Information with Third Parties
We do reserve the right to disclose or report personal information to non-affiliated third parties in limited circumstances where we believe in good faith that disclosure is required under law, to cooperate with regulators or law enforcement authorities, to protect our rights or property, or upon reasonable request by any mutual fund in which you have chosen to invest. In addition, we may disclose information about you or your accounts to a non-affiliated third party at your request or if you consent in writing to the disclosure.
Sharing Information with Affiliates
We may share client information with our affiliates in connection with servicing your account or to provide you with information about products and services that we believe may be of interest to you. The information we share may include, for example, your participation in our mutual funds or other investment programs, your ownership of certain types of accounts (such as IRAs), or other data about your accounts. Our affiliates, in turn, are not permitted to share your information with non-affiliated entities, except as required or permitted by law.
Implementation of Procedures
We take seriously the obligation to safeguard your non-public personal information. We have implemented procedures designed to restrict access to your non-public personal information to our personnel who need to know that information to provide products or services to you. To guard your non-public personal information, physical, electronic, and procedural safeguards are in place.
This Privacy Policy applies to the following entities: PIMCO Advisors Fund Management LLC, Pacific Investment Management Company LLC, PEA Capital LLC, Cadence Capital Management, NFJ Investment Group, PIMCO Advisors Distributors LLC, PIMCO Funds: Multi-Manager Series, PIMCO Funds: Pacific Investment Management Series, PIMCO Specialty Markets, PIMCO Commercial Mortgage Securities Trust, Inc., and PIMCO Strategic Global Government Fund, Inc.
18
Dividend Reinvestment Plan (Unaudited)
What is the Dividend Reinvestment Plan for PIMCO Commercial Mortgage Securities Trust, Inc.?
The Dividend Reinvestment Plan offers shareholders in the Fund an efficient and simple way to reinvest dividends and capital gains distributions, if any, in additional shares of the Fund. Each month the Fund will distribute to shareholders substantially all of its net investment income. The Fund expects to distribute at least annually any net realized long-term or short-term capital gains. EquiServe acts as Plan Agent for shareholders in administering the Plan.
Who can participate in the Plan?
All shareholders in the Fund may participate in the Plan by following the instructions for enrollment provided later in this section.
What does the Plan offer?
The Plan offers shareholders a simple and convenient means to reinvest dividends and capital gains distributions in additional shares of the Fund.
How is the reinvestment of income dividends and capital gains distributions accomplished?
If you are a participant in the Plan, your dividends and capital gains distributions will be reinvested automatically for you, increasing your holding in the Fund. If the Fund declares a dividend or capital gains distribution payable either in cash or in shares of the Fund, you will automatically receive shares of the Fund. If the market price of shares is equal to or exceeds the net asset value per share on the Valuation Date (as defined below), Plan participants will be issued shares valued at the net asset value most recently determined or, if net asset value is less than 95% of the then current market price, then at 95% of the market price.
If the market price is less than the net asset value on the Valuation Date, the Plan Agent will buy shares in the open market, on the New York Stock Exchange (“NYSE”) or elsewhere, for the participants’ accounts. If, following the commencement of the purchase and before the Plan Agent has completed its purchases, the market price exceeds the net asset value, the average per share purchase price paid by the Plan Agent may exceed the net asset value, resulting in the acquisition of fewer shares than if the dividend or capital gains distribution had been paid in shares issued by the Fund at net asset value. Additionally, if the market price exceeds the net asset value before the Plan Agent has completed its purchases, the Plan Agent is permitted to cease purchasing shares and the Fund may issue the remaining shares at a price equal to the greater of net asset value or 95% of the then current market price. In a case where the Plan Agent has terminated open market purchases and the Fund has issued the remaining shares, the number of shares received by the participant will be based on the weighted average of prices paid for shares purchased in the open market and the price at which the Fund issues the remaining shares. The Plan Agent will apply all cash received to purchase shares as soon as practicable after the payment date of the dividend or capital gains distribution, but in no event later than 30 days after that date, except when necessary to comply with applicable provisions of the federal securities laws.
The Valuation Date is the dividend or capital gains distribution payment date or, if that date is not a NYSE trading day, the immediately preceding trading day. All reinvestments are in full and fractional shares, carried to three decimal places.
Is there a cost to participate?
There is no direct charge to participants for reinvesting dividends and capital gains distributions, since the Plan Agent’s fees are paid by the Fund. There are no brokerage charges for shares issued directly by the Fund. Whenever shares are purchased on the NYSE or elsewhere in connection with the reinvestment of dividends or capital gains distributions, each participant will pay a pro rata portion of brokerage commissions. Brokerage charges for purchasing shares through the Plan are expected to be less than the usual brokerage charges for individual transactions, because the Plan Agent will purchase shares for all participants in blocks, resulting in lower commissions for each individual participant.
What are the tax implications for participants?
You will receive tax information annually for your personal records to help you prepare your federal income tax return. The automatic reinvestment of dividends and capital gains distributions does not affect the tax characterization of the dividends and capital gains. Other questions should be directed to your tax adviser.
19
How do participating shareholders benefit?
You will build holdings in the Fund easily and automatically at reduced costs.
You will receive a detailed account statement from the Plan Agent, showing total dividends and distributions, dates of investments, shares acquired and price per share, and total shares of record held by you and by the Plan Agent for you. The proxy you receive in connection with the Fund’s shareholder meetings will include shares purchased for you by the Plan Agent according to the Plan.
As long as you participate in the Plan, shares acquired through the Plan will be held for you in safekeeping in non-certificated form by State Street Bank & Trust Co., the Plan Agent. This convenience provides added protection against loss, theft or inadvertent destruction of certificates.
Whom should I contact for additional information?
If you hold shares in your own name, please address all notices, correspondence, questions or other communications regarding the Plan to:
PIMCO Commercial Mortgage Securities Trust, Inc.
EquiServe
150 Royall Street
Canton, MA 02021
Telephone: 800-213-3606
If your shares are not held in your name, you should contact your brokerage firm, bank or other nominee for more information.
How do I enroll in the Plan?
If you hold shares of the Fund in your own name, you are already enrolled in this Plan. Your reinvestments will begin with the first dividend after you purchase your shares. If your shares are held in the name of a brokerage firm, bank, or other nominee, you should contact your nominee to see if it will participate in the Plan on your behalf. If your nominee is unable to participate in the Plan on your behalf, you may want to request that your shares be registered in your name so that you can participate in the Plan.
Once enrolled in the Plan, may I withdraw from it?
You may withdraw from the Plan without penalty at any time by providing written notice to EquiServe. Elections to withdraw from the Plan will be effective for distributions with a Record Date of at least ten days after such elections are received by the Plan Agent.
If you withdraw, you will receive, without charge, a share certificate issued in your name for all full shares accumulated in your account from dividend and capital gains distributions, plus a check for any fractional shares based on market price.
Experience under the Plan may indicate that changes are desirable. Accordingly, either the Fund or the Plan Agent may amend or terminate the Plan. Participants will receive written notice at least 30 days before the effective date of any amendment. In the case of termination, participants will receive written notice at least 30 days before the record date of any dividend or capital gains distribution by the Fund.
20
Management of the Fund (Unaudited)
The chart below identifies the Directors and Officers of the Fund. Each “interested” Director as defined by the 1940 Act, is indicated by an asterisk (*). Unless otherwise indicated, the address of all persons below is 840 Newport Center Drive, Newport Beach, CA 92660.
Directors of the Fund
Name, Age and
Position Held with
Trust | | Term of
Office**
and
Length of
Time
Served | | Principal Occupation(s) During
Past 5 Years | | Number of
Funds in
Fund
Complex
Overseen
by Director | | Other
Directorships Held by Director | |
Interested Directors | | | | | | | | | |
| | | | | | | | | |
Brent R. Harris*
(44)
Chairman of the Board and Director | | 06/1993 to present | | Managing Director, PIMCO; Chairman and Trustee, PIMCO Funds: Pacific Investment Management Series; Chairman and Trustee, PIMCO Variable Insurance Trust; Chairman, Director and President, PIMCO Strategic Global Government Fund, Inc.; Director, PIMCO Luxembourg S.A.; and Board of Governors and Executive Committee, Investment Company Institute. | | 78 | | None | |
| | | | | | | | | |
R. Wesley Burns*
(44)
President and Director | | 11/1997 to present (since 02/1994 as President) | | Director, PIMCO; President and Trustee, PIMCO Funds: Pacific Investment Management Series; President and Trustee, PIMCO Variable Insurance Trust; Senior Vice President, PIMCO Strategic Global Government Fund, Inc.; Director, PIMCO Funds: Global Investors Series plc; and Director, PIMCO Global Advisors (Ireland) Limited. Formerly, Managing Director, PIMCO and Executive Vice President, PIMCO Funds: Multi-Manager Series. | | 77 | | None | |
| | | | | | | | | |
Independent Directors | | | | | | | | | |
| | | | | | | | | |
E. Philip Cannon
(63)
Director | | 03/2000 to present | | Proprietor, Cannon & Company, (a private equity investment firm); President, Houston Zoo; Trustee, PIMCO Funds: Pacific Investment Management Series; Trustee, PIMCO Variable Insurance Trust; and Trustee, PIMCO Funds: Multi-Manager Series. Formerly, Headmaster, St. John’s School, Houston, Texas. | | 116 | | None | |
| | | | | | | | | |
Vern O. Curtis
(69)
Director | | 02/1995 to present | | Private Investor; Trustee, PIMCO Funds: Pacific Investment Management Series; and Trustee, PIMCO Variable Insurance Trust. | | 77 | | Director, PS Business Parks, Inc., (a Real Estate Investment Trust); and Director, Fresh Choice, Inc. (restaurant company). | |
| | | | | | | | | |
J. Michael Hagan
(64)
Director | | 03/2000 to present | | Private Investor and Business Consultant; Trustee, PIMCO Funds: Pacific Investment Management Series; Trustee, PIMCO Variable Insurance Trust; Director, Freedom Communications; and Director, Remedy Temp (staffing). Formerly, Director, Saint Gobain Corporation (manufacturing); and Chairman and CEO, Furon Company (manufacturing). | | 77 | | Director, Ameron International (manufacturing); and Director, Fleetwood Enterprises (manufacturer of housing and recreational vehicles). | |
| | | | | | | | | |
William J. Popejoy (65)
Director | | 07/1993 to 02/1995 and 08/1995 to present | | Managing Director, Pacific Capital Investors; Trustee, PIMCO Funds: Pacific Investment Management Series; and Trustee, PIMCO Variable Insurance Trust. Formerly, Director, Commonwealth Energy Corporation. | | 77 | | Director, New Century Financial Corporation. | |
* Each of Mr. Harris and Mr. Burns is an “interested person” of the Fund (as the term is defined in the 1940 Act) because of his affiliations with PIMCO.
** Directors serve until their successors are duly elected and qualified.
21
Officers of the Fund
Name, Age and
Position Held with
Trust | | Term of
Office*** and
Length of
Time
Served | | Principal Occupation(s) During
Past 5 Years | |
| | | | | |
Mohan V. Phansalkar
(40)
Chief Legal Officer | | 08/2003 to present | | Executive Vice President, PIMCO. | |
| | | | | |
Daniel J. Ivascyn
(34)
Senior Vice President | | 11/2001 to present | | Senior Vice President, PIMCO. Formerly, Vice President, PIMCO. | |
| | | | | |
William C. Powers
(46)
Senior Vice President | | 07/1993 to present | | Managing Director, PIMCO. | |
| | | | | |
Jeffrey M. Sargent
(40)
Senior Vice President | | 06/1993 to present (since 02/1999 as Senior Vice President) | | Senior Vice President, PIMCO. Formerly, Vice President, PIMCO. | |
| | | | | |
William S. Thompson, Jr.
(58)
Senior Vice President | | 07/1993 to present | | Managing Director and Chief Executive Officer, PIMCO. | |
| | | | | |
Henrik P. Larsen
(33)
Vice President | | 02/1999 to present | | Vice President, PIMCO. Formerly, Manager, PIMCO. | |
| | | | | |
Michael J. Willemsen
(43)
Vice President | | 02/1995 to present (since 02/2002 as Vice President) | | Vice President, PIMCO. Formerly, Manager, PIMCO. | |
| | | | | |
Garlin G. Flynn
(57)
Secretary | | 08/1995 to present | | Specialist, PIMCO. | |
| | | | | |
John P. Hardaway
(46)
Treasurer | | 06/1993 to present | | Senior Vice President, PIMCO. Formerly, Vice President, PIMCO. | |
| | | | | |
Erik C. Brown
(36)
Assistant Treasurer | | 02/2001 to present | | Vice President, PIMCO. Formerly, Senior Tax Manager, Deloitte & Touche LLP and Tax Manager, PricewaterhouseCoopers LLP. | |
| | | | | |
Stacie D. Anctil
(34)
Assistant Treasurer | | 11/2003 to present | | Specialist, PIMCO. Formerly, Sales Associate, ESIS and Sales Manager, FT Interactive Data | |
*** The Officers of the Fund are re-appointed annually by the Board of Directors.
22
(This Page Intentionally Left Blank)
OTHER INFORMATION
Investment Manager and Administrator
Pacific Investment Management Company LLC
840 Newport Center Drive
Newport Beach, California 92660
Transfer Agent
EquiServe
150 Royall Street
Canton, Massachusetts 02021
Custodian
State Street Bank & Trust Co.
801 Pennsylvania
Kansas City, Missouri 64105
Legal Counsel
Dechert LLP
1775 I Street, N.W.
Washington, D.C. 20006-2401
Independent Auditors
PricewaterhouseCoopers LLP
1055 Broadway
Kansas City, Missouri 64105
PIMCO
COMMERCIAL MORTGAGE SECURITIES TRUST, INC.
This report, including the financial statements herein, is provided to the shareholders of PIMCO Commercial Mortgage Securities Trust, Inc. for their information. This is not a prospectus, circular or representation intended for use in the purchase of shares of the Fund or any securities mentioned in this report.
[GRAPHIC]
3674-AR-04