SECURITIES AND EXCHANGE COMMISSION
CERTIFIED SHAREHOLDER REPORT OF REGISTERED MANAGEMENT
Investment Company Act file number:
811-07816
(Exact name of registrant as specified in charter)
1633 Broadway, New York, NY 10019
(Address of principal executive offices)
Treasurer (Principal Financial & Accounting Officer)
(Name and address of agent for service)
Copies to:
Registrant’s telephone number, including area code: (844) 337-4626
Date of fiscal year end: June 30
Date of reporting period: December 31, 2023
Form N-CSR is to be used by management investment companies to file reports with the Commission not later than 10 days after the transmission to stockholders of any report that is required to be transmitted to stockholders under Rule 30e-1 under the Investment Company Act of 1940 (17 CFR 270.30e-1). The Commission may use the information provided on Form N-CSR in its regulatory, disclosure review, inspection, and policymaking roles.
A registrant is required to disclose the information specified by Form N-CSR, and the Commission will make this information public. A registrant is not required to respond to the collection of information contained in Form N-CSR unless the Form displays a currently valid Office of Management and Budget (“OMB”) control number. Please direct comments concerning the accuracy of the information collection burden estimate and any suggestions for reducing the burden to Secretary, Securities and Exchange Commission, 450 Fifth Street, NW, Washington, DC 20549-0609. The OMB has reviewed this collection of information under the clearance requirements of 44 U.S.C. § 3507.
The following is a copy of the report transmitted to shareholders pursuant to Rule 30e-1 under the Investment Company Act of 1940, as amended (the “1940 Act”) (17 CFR 270.30e-1).
Semiannual Report
December 31, 2023
PCM Fund, Inc. | PCM | NYSE
PIMCO Global StocksPLUS
& Income Fund | PGP | NYSE
PIMCO Strategic Income Fund, Inc. | RCS | NYSE
PIMCO Access Income Fund | PAXS | NYSE
PIMCO Dynamic Income Fund | PDI | NYSE
PIMCO Dynamic Income Opportunities Fund | PDO | NYSE
| | | | | | | | |
| | |
| | | | | | Page | |
| | | | | | | | |
| | |
| | | | | | | 2 | |
| | |
| | | | | | | 3 | |
| | |
| | | | | | | 13 | |
| | |
| | | | | | | 14 | |
| | |
| | | | | | | 16 | |
| | |
| | | | | | | 17 | |
| | |
| | | | | | | 18 | |
| | |
| | | | | | | 19 | |
| | |
| | | | | | | 20 | |
| | |
| | | | | | | 22 | |
| | |
| | | | | | | 24 | |
| | |
| | | | | | | 25 | |
| | |
| | | | | | | 103 | |
| | |
| | | | | | | 137 | |
| | |
| | | | | | | 138 | |
| | |
| | | | | | | 140 | |
| | | | | | | | |
| | |
| Fund | | Fund
Summary | | | Schedule of
Investments | |
| | | | | | | | |
| | |
| | | 7 | | | | 26 | |
| | |
| | | 8 | | | | 35 | |
| | |
| | | 9 | | | | 47 | |
| | |
| | | 10 | | | | 59 | |
| | |
| | | 11 | | | | 68 | |
| | |
| | | 12 | | | | 91 | |
| | | Consolidated Schedule of Investments |
Dear Shareholder,
This semiannual report covers the
six-month
reporting period ended December 31, 2023 (the “reporting period”). On the subsequent pages, you will find details regarding investment results and a discussion of certain factors that affected performance during the reporting period.
The global economy continued to grow despite inflation that remains elevated, interest rate increases, tighter credit conditions, and geopolitical concerns affecting many countries. This resilience was particularly evident in the United States (“U.S.”). Some European economies experienced slower growth and generally continued to expand over the reporting period.
Central banks slowed interest rate hikes
Inflation eased over the reporting period, and several bank officials suggested that central banks may slow aggressive interest-rate hikes. From March 2022 through July 2023, the U.S. Federal Reserve (the “Fed”) raised the federal funds rate a total of 5.25 percentage points. In September, November and December 2023, the Fed did not increase interest rates. In December 2023, Fed communications conveyed a belief that the policy rate may be likely at or near its peak for the tightening cycle. From July 2022 through September 2023, the European Central Bank (“ECB”) raised its deposit facility overnight rate a total of 4.50 percentage points and then held rates steady at its October and December 2023 meetings. Meanwhile, from December 2019 through July 2023, the Bank of England (“BoE”) raised its Bank Rate a total of 5.15 percentage points and then held rates steady in September, November and December 2023. Both the ECB and BoE acknowledged the possibility of rate cuts in 2024.
Mixed financial market returns
The yield on the benchmark
10-year
U.S. Treasury increased during the reporting period. In many other developed markets, yields on
10-year
government bonds fluctuated. Overall, the global bond market rallied toward the end of 2023, bolstered by central bank officials’ policy pronouncements signaling a possible end to monetary tightening. During the reporting period, lower-rated bonds generally outperformed their higher-rated counterparts. Global equities and commodities rose amid market volatility. The U.S. dollar weakened relative to the euro, British pound and Japanese yen.
We continue to work diligently to navigate dynamic global markets and manage the assets that you have entrusted with us. We encourage you to speak with your financial advisor about your goals and visit global.pimco.com for our latest insights.
Sincerely,
| | |
 | |  |
| |
 | |  |
| Deborah A. DeCotis | | Joshua D. Ratner |
| Chair of the Board of Trustees | | President |
| | |
| |
Total Returns of Certain Asset Classes for the
Period Ended December 31, 2023 |
| | |
| Asset Class (as measured by, currency) | | |
| | |
| U.S. large cap equities (S&P 500 Index, USD) | | 8.04% |
| | |
| Global equities (MSCI World Index, USD) | | 7.56% |
| | |
| European equities (MSCI Europe Index, EUR) | | 4.24% |
| | |
| Emerging market equities (MSCI Emerging Markets Index, EUR) | | 4.71% |
| | |
| Japanese equities (Nikkei 225 Index, JPY) | | 1.74% |
| | |
| Emerging market local bonds (JPMorgan Government Bond Index-Emerging Markets Global Diversified Index, USD Unhedged) | | 4.55% |
| | |
| Emerging market external debt (JPMorgan Emerging Markets Bond Index (EMBI) Global, USD Hedged) | | 6.40% |
| | |
| Below investment grade bonds (ICE BofAML Developed Markets High Yield Constrained Index, USD Hedged) | | 7.90% |
| | |
| Global investment grade credit bonds (Bloomberg Global Aggregate Credit Index, USD Hedged) | | 5.52% |
| | |
| Fixed-rate, local currency government debt of investment grade countries (Bloomberg Global Treasury Index, USD Hedged) | | 3.48% |
Past performance is no guarantee of future results. Unless otherwise noted, index returns reflect the reinvestment of income distributions and capital gains, if any, but do not reflect fees, brokerage commissions or other expenses of investing. It is not possible to invest directly in an unmanaged index.
Statements concerning financial market trends are based on current market conditions, which will fluctuate. There is no guarantee that these investment strategies will work under all market conditions or are appropriate for all investors and each investor should evaluate their ability to invest for the long-term, especially during periods of downturn in the market. Outlook and strategies are subject to change without notice.
| | | | |
Important Information About the Funds | | | | |
We believe that bond funds have an important role to play in a well-diversified investment portfolio. It is important to note, however, that in an environment where interest rates may trend upward, rising rates would negatively impact the performance of most bond funds, and fixed-income securities and other instruments held by a Fund are likely to decrease in value. A wide variety of factors can cause interest rates or yields of U.S. Treasury securities (or yields of other types of bonds) to rise (e.g., central bank monetary policies, inflation rates, general economic conditions, etc.). In addition, changes in interest rates can be sudden and unpredictable, and there is no guarantee that Fund management will anticipate such movement accurately. A Fund may lose money as a result of movements in interest rates.
As of the date of this report, interest rates in the United States and many parts of the world, including certain European countries, continue to increase. In efforts to combat inflation, the U.S. Federal Reserve raised interest rates multiple times in 2022 and 2023. Thus, bond funds currently face a heightened level of risk associated with rising interest rates and/or bond yields. This could be driven by a variety of factors, including but not limited to central bank monetary policies, changing inflation or real growth rates, general economic conditions, increasing bond issuances or reduced market demand for low yielding investments. Further, while bond markets have steadily grown over the past three decades, dealer inventories of corporate bonds are near historic lows in relation to market size. As a result, there has been a significant reduction in the ability of dealers to “make markets”.
Bond funds and individual bonds with a longer duration (a measure used to determine the sensitivity of a security’s price to changes in interest rates) tend to be more sensitive to changes in interest rates, usually making them more volatile than securities or funds with shorter durations. All of the factors mentioned above, individually or collectively, could lead to increased volatility and/or lower liquidity in the fixed income markets or negatively impact a Fund’s performance or cause a Fund to incur losses.
A Fund may enter into opposite sides of multiple interest rate swaps or other derivatives with respect to the same underlying reference instrument (e.g., a
10-year
U.S. treasury) that have different effective dates with respect to interest accrual time periods also for the principal purpose of generating distributable gains (characterized as ordinary income for tax purposes) that are not part of a Fund’s duration or yield curve management strategies. In such a “paired swap transaction”, a Fund would generally enter into one or more interest rate swap agreements whereby a Fund agrees to make regular payments starting at the time a Fund enters into the agreements equal to a floating interest rate in return for payments equal to a fixed interest rate (the “initial leg”). A Fund would also enter into one or more interest rate swap agreements on the same underlying instrument, but take the
opposite position (i.e., in this example, a Fund would make regular payments equal to a fixed interest rate in return for receiving payments equal to a floating interest rate) with respect to a contract whereby the payment obligations do not commence until a date following the commencement of the initial leg (the “forward leg”).
A Fund may engage in investment strategies, including those that employ the use of paired swaps transactions, the use of interest rate swaps to seek to capitalize on differences between short-term and long-term interest rates and other derivatives transactions, to, among other things, seek to generate current, distributable income, even if such strategies could potentially result in declines in the Fund’s net asset value (“NAV”). A Fund’s income and gain-generating strategies, including certain derivatives strategies, may generate current income and gains taxable as ordinary income sufficient to support monthly distributions even in situations when a Fund has experienced a decline in net assets due to, for example, adverse changes in the broad U.S. or non-U.S. equity markets or a Fund’s debt investments, or arising from its use of derivatives. For instance, a portion of a Fund’s monthly distributions may be sourced from paired swap transactions utilized to produce current distributable ordinary income for tax purposes on the initial leg, with a substantial possibility that a Fund will later realize a corresponding capital loss and potential decline in its NAV with respect to the forward leg (to the extent there are not corresponding offsetting capital gains being generated from other sources). Because some or all of these transactions may generate capital losses without corresponding offsetting capital gains, portions of a Fund’s distributions recognized as ordinary income for tax purposes (such as from paired swap transactions) may be economically similar to a taxable return of capital when considered together with such capital losses.
Classifications of the Funds’ portfolio holdings in this report are made according to financial reporting standards. The classification of a particular portfolio holding as shown in the Allocation Breakdown and Schedule of Investments or Consolidated Schedule of Investments, as applicable, sections of this report may differ from the classification used for the Funds’ compliance calculations, including those used in the Funds’ prospectus, investment objectives, regulatory, and other investment limitations and policies, which may be based on different asset class, sector or geographical classifications. Each Fund is separately monitored for compliance with respect to prospectus and regulatory requirements.
The geographical classification of foreign
(non-U.S.)
securities in this report, if any, are classified by the country of incorporation of a holding. In certain instances, a security’s country of incorporation may be different from its country of economic exposure.
| | | | |
Important Information About the Funds | | | | |
In February 2022, Russia launched an invasion of Ukraine. As a result, Russia and other countries, persons and entities that have provided material aid to Russia’s aggression against Ukraine, have been the subject of economic sanctions and import and export controls imposed by countries throughout the world, including the United States. Such measures have had and may continue to have an adverse effect on the Russian, Belarusian and other securities and economies, which may, in turn, negatively impact a Fund. The extent, duration and impact of Russia’s military action in Ukraine, related sanctions and retaliatory actions are difficult to ascertain, but could be significant and have severe adverse effects on the region, including significant adverse effects on the regional, European, and global economies and the markets for certain securities and commodities, such as oil and natural gas, as well as other sectors. Further, a Fund may have investments in securities and instruments that are economically tied to the region and may have been negatively impacted by the sanctions and counter-sanctions by Russia, including declines in value and reductions in liquidity. The sanctions may cause a Fund to sell portfolio holdings at a disadvantageous time or price or to continue to hold investments that a Fund may no longer seek to hold. PIMCO will continue to actively manage these positions in the best interests of a Fund and its shareholders.
The Funds may invest in certain instruments that rely in some fashion upon the London Interbank Offered Rate (“LIBOR”). LIBOR was traditionally an average interest rate, determined by the ICE Benchmark Administration, that banks charge one another for the use of short-term money. The United Kingdom’s Financial Conduct Authority, which regulates LIBOR, has announced plans to ultimately phase out the use of LIBOR. Although the transition process away from LIBOR for many instruments has been completed, some LIBOR use is continuing and there are potential effects related to the transition away from LIBOR or continued use of LIBOR on a Fund, or on certain instruments in which the Fund invests, which can be difficult to ascertain, and may vary depending on factors that include, but are not limited to: (i) existing fallback or termination provisions in individual contracts and (ii) whether, how, and when industry participants develop and adopt new reference rates and fallbacks for both legacy and new products and instruments. On March 15, 2022, the Adjustable Interest Rate (LIBOR) Act was signed into law. This law provides a statutory fallback mechanism on a nationwide basis to replace LIBOR with a benchmark rate that is selected by the Board of Governors of the Federal Reserve System based on the Secured Overnight Financing Rate (“SOFR”) for tough legacy contracts. On February 27, 2023, the Federal Reserve System’s final rule in connection with this law became effective, establishing benchmark replacements based on SOFR and Term SOFR (a forward-looking measurement of market expectations of SOFR implied from certain derivatives markets) for applicable tough legacy contracts governed by U.S. law. In addition, the FCA has announced
that it will require the publication of synthetic LIBOR for the one-month, three-month and six-month U.S. Dollar LIBOR settings after June 30, 2023 through at least September 30, 2024. The possible scope and effect of synthetic LIBOR for U.S. Dollar LIBOR contracts and the LIBOR transition is unknown at this time. Moreover, certain aspects of the transition from LIBOR will rely on the actions of third-party market participants, such as clearing houses, trustees, administrative agents, asset servicers and certain service providers; PIMCO cannot guarantee the performance of such market participants and any failure on the part of such market participants to manage their part of the LIBOR transition could impact a Fund. The transition of investments from LIBOR to a replacement rate as a result of amendment, application of existing fallbacks, statutory requirements or otherwise may also result in a reduction in the value of certain instruments held by a Fund or a reduction in the effectiveness of related Fund transactions such as hedges. In addition, an instrument’s transition to a replacement rate could result in variations in the reported yields of a Fund that holds such instrument. Any such effects of the transition away from LIBOR, as well as other unforeseen effects, could result in losses to a Fund.
The common shares of the Funds trade on the New York Stock Exchange. As with any stock, the price of a Fund’s common shares will fluctuate with market conditions and other factors. If you sell your common shares of a Fund, the price received may be more or less than your original investment. Shares of closed-end management investment companies, such as the Funds, frequently trade at a discount from their NAV and may trade at a price that is less than the initial offering price and/or the NAV of such shares. Further, if a Fund’s shares trade at a price that is more than the initial offering price and/or the NAV of such shares, including at a substantial premium and/or for an extended period of time, there is no assurance that any such premium will be sustained for any period of time and will not decrease, or that the shares will not trade at a discount to NAV thereafter.
U.S. and global markets recently have experienced increased volatility, including as a result of the recent failures of certain U.S. and non-U.S. banks, which could be harmful to the Funds and issuers in which they invest. For example, if a bank at which a Fund or issuer has an account fails, any cash or other assets in bank or custody accounts, which may be substantial in size, could be temporarily inaccessible or permanently lost by the Fund or issuer. If a bank that provides a subscription line credit facility, asset-based facility, other credit facility and/or other services to an issuer or to a fund fails, the issuer or fund could be unable to draw funds under its credit facilities or obtain replacement credit facilities or other services from other lending institutions with similar terms.
Issuers in which a Fund may invest can be affected by volatility in the banking sector. Even if banks used by issuers in which the Funds invest remain solvent, continued volatility in the banking sector could contribute to, cause or intensify an economic recession, increase the costs of capital and banking services or result in the issuers being unable to obtain or refinance indebtedness at all or on as favorable terms as could otherwise have been obtained. Conditions in the banking sector are evolving, and the scope of any potential impacts to the Funds and issuers, both from market conditions and also potential legislative or regulatory responses, are uncertain. Such conditions and responses, as well as a changing interest rate environment, can contribute to decreased market liquidity and erode the value of certain holdings, including those of U.S. and non-U.S. banks. Continued market volatility and uncertainty and/or a downturn in market and economic and financial conditions, as a result of developments in the banking sector or otherwise (including as a result of delayed access to cash or credit facilities), could have an adverse impact on the Funds and issuers in which they invest.
On each Fund Summary page in this Shareholder Report, the Average Annual Total Return table and Cumulative Returns chart measure performance assuming that any dividend and capital gain distributions were reinvested. Total return is calculated by determining the percentage change in NAV or market price (as applicable) in the specified period. Returns do not reflect the deduction of taxes that a shareholder would pay on Fund distributions. Total return for a period of more than one year represents the average annual total return. Performance at market price will differ from results at NAV. Although market price returns tend to reflect investment results over time, during shorter periods returns at market price can also be influenced by factors such as changing views about a Fund, market conditions, supply and demand for the Fund’s shares, or changes in the Fund’s dividends. Performance shown is net of fees and expenses. Historical NAV performance for a Fund may have been positively impacted by fee waivers or expense limitations in place during some or all of the periods shown, if applicable. Future performance (including total return or yield) and distributions may be negatively impacted by the expiration or reduction of any such fee waivers or expense limitations.
The dividend rate that a Fund pays on its common shares may vary as portfolio and market conditions change, and will depend on a number of factors, including without limit the amount of a Fund’s undistributed net investment income and net short-and long-term capital gains, as well as the costs of any leverage obtained by a Fund. As portfolio and market conditions change, the rate of distributions on the common shares and a Fund’s dividend policy could change. There can be no
assurance that a change in market conditions or other factors will not result in a change in a Fund’s distribution rate or that the rate will be sustainable in the future.
The following table discloses the Inception Date and diversification status of each Fund:
| | | | | | | | | | | | |
| | | |
| | | | | | | | | |
| PCM Fund, Inc. | | | | | | | 09/02/93 | | | | Diversified | |
PIMCO Global StocksPLUS & Income Fund | | | | | | | 05/31/05 | | | | Diversified | |
| PIMCO Strategic Income Fund, Inc. | | | | | | | 02/24/94 | | | | Diversified | |
| PIMCO Access Income Fund | | | | | | | 01/31/22 | | | | Non-Diversified | |
| PIMCO Dynamic Income Fund | | | | | | | 05/30/12 | | | | Diversified | |
| PIMCO Dynamic Income Opportunities Fund | | | | | | | 01/29/21 | | | | Non-Diversified | |
An investment in a Fund is not a bank deposit and is not guaranteed or insured by the Federal Deposit Insurance Corporation or any other government agency. It is possible to lose money on investments in a Fund.
The Trustees/Directors
1
are responsible generally for overseeing the management of the Funds. The Trustees authorize the Funds to enter into service agreements with Pacific Investment Management Company LLC (“PIMCO”) and other service providers in order to provide, and in some cases authorize service providers to procure through other parties, necessary or desirable services on behalf of the Funds. Shareholders are not parties to or third-party beneficiaries of such service agreements. Neither a Fund’s prospectus or Statement of Additional Information (“SAI”), any press release or shareholder report, any contracts filed as exhibits to a Fund’s registration statement, nor any other communications, disclosure documents or regulatory filings (including this report) from or on behalf of a Fund creates a contract between or among any shareholders of a Fund, on the one hand, and the Fund, a service provider to the Fund, and/or the Trustees or officers of the Fund, on the other hand.
The Trustees (or the Funds and their officers, service providers or other delegates acting under authority of the Trustees) may amend its most recent prospectus or use a new prospectus or SAI with respect to a Fund, adopt and disclose new or amended policies and other changes in press releases and shareholder reports and/or amend, file and/or issue any other communications, disclosure documents or regulatory filings, and may amend or enter into any contracts to which a Fund is a party, and interpret the investment objective(s), policies, restrictions and contractual provisions applicable to any Fund, without shareholder input or approval, except in circumstances in which shareholder approval is specifically required by law (such as changes to
| Hereinafter, the terms “Trustee” or “Trustees” used herein shall refer to a Director or Directors of applicable Funds. |
| | | | |
Important Information About the Funds | | | | |
fundamental investment policies) or where a shareholder approval requirement was specifically disclosed in a Fund’s then-current prospectus, SAI or shareholder report and is otherwise still in effect.
PIMCO has adopted written proxy voting policies and procedures (“Proxy Policy”) as required by Rule
206(4)-6
under the Investment Advisers Act of 1940, as amended. The Proxy Policy has been adopted by the Funds as the policies and procedures that PIMCO will use when voting proxies on behalf of the Funds. A description of the policies and procedures that PIMCO uses to vote proxies relating to portfolio securities of each Fund, and information about how each Fund voted proxies relating to portfolio securities held during the most recent twelve-month period ended June 30th, are available without charge, upon request, by calling the Funds at (844)
33-PIMCO,
on the Funds’ website at www.pimco.com, and on the Securities and Exchange Commission’s (“SEC”) website at www.sec.gov.
The Funds file their complete schedules of portfolio holdings with the SEC for the first and third quarters of each fiscal year as an exhibit to their reports on Form N-PORT. The Funds’ Form N-PORT reports are available to the public on the SEC’s website at www.sec.gov and on PIMCO’s website at www.pimco.com, and upon request by calling PIMCO at (844) 33-PIMCO.
SEC rules allow the Funds to fulfill their obligation to deliver shareholder reports to investors by providing access to such reports online free of charge and by mailing a notice that the report is electronically available. Investors may elect to receive all reports in paper free of charge by contacting their financial intermediary or, if invested directly with a Fund, investors can inform the Fund by calling (844) 33-PIMCO. Any election to receive reports in paper will apply to all funds held with the fund complex if invested directly with a Fund or to all funds held in the investor’s account if invested through a financial intermediary, such as a broker-dealer or bank.
In May 2022, the SEC proposed a framework that would require certain registered funds (such as the Funds) to disclose their environmental, social, and governance (“ESG”) investing practices. Among other things, the proposed requirements would mandate that funds meeting three pre-defined classifications (i.e., integrated, ESG focused and/or impact funds) provide prospectus and shareholder report disclosure related to the ESG factors, criteria and processes used in managing the fund. The proposal’s impact on the Funds will not be known unless and until any final rulemaking is adopted.
In October 2022, the SEC adopted changes to the mutual fund and exchange-traded fund (“ETF”) shareholder report and registration statement disclosure requirements and the registered fund advertising rules, which will impact the disclosures provided to shareholders. The rule amendments were effective as of January 2023, but the SEC is
providing an 18-month compliance period following the effective date for such amendments other than those addressing fee and expense information in advertisements that might be materially misleading.
In November 2022, the SEC adopted amendments to Form N-PX under the Act to improve the utility to investors of proxy voting information reported by mutual funds, ETFs and certain other funds. The rule amendments will expand the scope of funds’ Form N-PX reporting obligations, subject managers to Form N-PX reporting obligations for “Say on Pay” votes, enhance Form N-PX disclosures, permit joint reporting by funds, managers and affiliated managers on Form N-PX; and require website availability of fund proxy voting records. The amendments will become effective on July 1, 2024. Funds and managers will be required to file their first reports covering the period from July 1, 2023 to June 30, 2024 on amended Form N-PX by August 31, 2024.
In September 2023, the SEC adopted amendments to a current rule governing fund naming conventions. In general, the current rule requires funds with certain types of names to adopt a policy to invest at least 80% of their assets in the type of investment suggested by the name. The amendments expand the scope of the current rule in a number of ways that are expected to result in an increase in the types of fund names that would require the fund to adopt an 80% investment policy under the rule. Additionally, the amendments address deviations from a fund’s 80% investment policy and the use and valuation of derivatives instruments for purposes of the rule. The amendments are effective as of December 11, 2023, but the SEC is providing a 24-month compliance period following the effective date for fund groups with net assets of $1 billion or more (and a 30-month compliance period for fund groups with net assets of less than $1 billion).
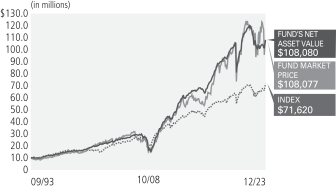
Cumulative Returns Through December 31, 2023
$10,000 invested at the end of the month when the Fund commenced operations.
Allocation Breakdown as of December 31, 2023
| | | | |
| Asset-Backed Securities | | | 31.5% | |
| |
Non-Agency Mortgage-Backed Securities | | | 25.9% | |
| |
| Corporate Bonds & Notes | | | 13.1% | |
| |
| Loan Participations and Assignments | | | 10.9% | |
| |
| | | 7.7% | |
| |
| Common Stocks | | | 6.5% | |
| |
| U.S. Government Agencies | | | 2.5% | |
| |
| Other | | | 1.9% | |
| | | % of Investments, at value. |
| | | Allocation Breakdown and % of investments exclude securities sold short and financial derivative instruments, if any. |
| | | Includes Central Funds Used for Cash Management Purposes. |
| | | | | | | | | | | | | | | | | | | | | | |
|
Average Annual Total Return (1) for the period ended December 31, 2023 | |
| | | | | | |
| | | | | 6 Month* | | | 1 Year | | | 5 Year | | | 10 Year | | | Commencement
of Operations
(09/02/93) | |
 | | Market Price | | | (12.23)% | | | | 13.38% | | | | 5.25% | | | | 6.59% | | | | 8.16% | |
 | | NAV | | | 3.86% | | | | 7.49% | | | | 3.23% | | | | 5.69% | | | | 8.16% | |
 | | ICE BofAML US High Yield Index | | | 7.63% | | | | 13.46% | | | | 5.21% | | | | 4.51% | | | | | |
All Fund returns are net of fees and expenses and include applicable fee waivers and/or expense limitations. Absent any applicable fee waivers and/or expense limitations, performance would have been lower and there can be no assurance that any such waivers or limitations will continue in the future.
Average Annual Return since 08/31/1993.
It is not possible to invest directly in an unmanaged index.
| Performance quoted represents past performance. Past performance is not a guarantee or a reliable indicator of future results. Current performance may be lower or higher than performance shown. Investment return and the principal value of an investment will fluctuate. Returns shown do not reflect the deduction of taxes that a shareholder would pay on Fund distributions or the sale of Fund shares. Total return, market price, NAV, market price distribution rate, and NAV distribution rate will fluctuate with changes in market conditions. The NAV presented may differ from the NAV reported for the same period in other Fund materials. Performance current to the most recent month-end is available at www.pimco.com or via (844) 33-PIMCO. Performance is calculated assuming all dividends and distributions are reinvested at prices obtained under the Fund’s dividend reinvestment plan. Performance does not reflect any brokerage commissions in connection with the purchase or sale of Fund shares. |
| | Performance of an index is shown in light of a requirement by the Securities and Exchange Commission that the performance of an appropriate broad-based securities market index be disclosed. However, the Fund is not managed to an index nor should the index be viewed as a “benchmark” for the Fund’s performance. The index is not intended to be indicative of the Fund’s investment strategies, portfolio components or past or future performance. Please see Additional Information Regarding the Funds for a description of the Fund’s principal investment strategies. |
| Distribution rates are not performance and are calculated by annualizing the most recent distribution per share and dividing by the NAV or Market Price, as applicable, as of the reported date. Distributions may be comprised of ordinary income, net capital gains, and/or a return of capital (ROC) of your investment in the Fund. Because the distribution rate may include a ROC, it should not be confused with yield or income. If the Fund estimates that a portion of its distribution may be comprised of amounts from sources other than net investment income in accordance with its policies and good accounting practices, the Fund will notify shareholders of the estimated composition of such distribution through a Section 19 Notice. Please refer to the most recent Section 19 Notice, if applicable, for additional information regarding the estimated composition of distributions. Please visit www.pimco.com for most recent Section 19 Notice, if applicable. Final determination of a distribution’s tax character will be provided to shareholders when such information is available. |
| Represents total effective leverage outstanding, as a percentage of total managed assets. Total effective leverage consists of preferred shares, reverse repurchase agreements and other borrowings, credit default swap notional and floating rate notes issued in tender option bond transactions, as applicable (collectively “Total Effective Leverage”). The Fund may engage in other transactions not included in Total Effective Leverage disclosed above that may give rise to a form of leverage, including certain derivative transactions. For the purpose of calculating Total Effective Leverage outstanding as a percentage of total managed assets, total managed assets refer to total assets (including assets attributable to Total Effective Leverage that may be outstanding) minus accrued liabilities (other than liabilities representing Total Effective Leverage). |
Fund Information (as of December 31, 2023)
(1)
| | | | |
| Market Price | | | $7.96 | |
| |
| NAV | | | $6.52 | |
| |
| Premium/(Discount) to NAV | | | 22.09% | |
| |
Market Price Distribution Rate (2) | | | 12.06% | |
| |
| | | 14.72% | |
| |
Total Effective Leverage (3) | | | 41.85% | |
Investment Objective and Strategy Overview
The Fund’s primary investment objective is to achieve high current income. Capital gain from the disposition of investments is a secondary objective of the Fund.
Fund Insights at NAV
The following affected performance (on a gross basis) during the reporting period:
| » | | Holdings related to corporate special situation investments, which include companies undergoing stress, distress, challenges or significant transition contributed to absolute performance, as select securities posted positive returns. |
| » | | Security selection within residential mortgage credit contributed to absolute performance, as select securities posted positive returns. |
| » | | Exposure to corporate credit, notably bank loans and high yield, contributed to performance, as the asset classes posted positive returns. |
| » | | The costs associated with one or more forms of leverage detracted from performance. The costs of leverage generally will reduce returns to the extent they exceed the rate of return on the additional investments purchased with such leverage. |
| » | | Security selection within asset backed securities detracted from performance, as select securities posted negative returns. |
| » | | Security selection within commercial mortgage credit detracted from performance, as select securities posted negative returns. |
PIMCO Global StocksPLUS
& Income Fund
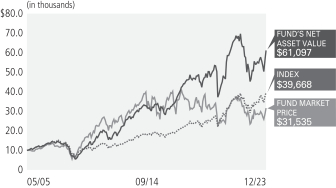
Cumulative Returns Through December 31, 2023
$10,000 invested at the end of the month when the Fund commenced operations.
Allocation Breakdown as of December 31, 2023
| | | | |
| U.S. Government Agencies | | | 30.2% | |
| |
| Corporate Bonds & Notes | | | 22.4% | |
| |
| Loan Participations and Assignments | | | 12.0% | |
| |
| | | 11.0% | |
| |
Non-Agency Mortgage-Backed Securities | | | 9.9% | |
| |
| Common Stocks | | | 5.7% | |
| |
| Asset-Backed Securities | | | 4.0% | |
| |
| Sovereign Issues | | | 2.2% | |
| |
| Preferred Securities | | | 1.4% | |
| |
| Other | | | 1.2% | |
| | | % of Investments, at value. |
| | | Allocation Breakdown and % of investments exclude securities sold short and financial derivative instruments, if any. |
| | | Includes Central Funds Used for Cash Management Purposes. |
| | | | | | | | | | | | | | | | | | | | | | |
|
Average Annual Total Return (1) for the period ended December 31, 2023 | |
| | | | | | |
| | | | | 6 Month* | | | 1 Year | | | 5 Year | | | 10 Year | | | Commencement
of Operations
(05/31/05) | |
| | Market Price | | | 10.54% | | | | 21.47% | | | | 1.38% | | | | (0.53)% | | | | 6.37% | |
| | NAV | | | 8.03% | | | | 21.12% | | | | 7.67% | | | | 7.20% | | | | 10.23% | |
| | MSCI World Index | | | 7.56% | | | | 23.79% | | | | 12.80% | | | | 8.60% | | | | 7.69% | |
All Fund returns are net of fees and expenses and include applicable fee waivers and/or expense limitations. Absent any applicable fee waivers and/or expense limitations, performance would have been lower and there can be no assurance that any such waivers or limitations will continue in the future.
It is not possible to invest directly in an unmanaged index.
| Performance quoted represents past performance. Past performance is not a guarantee or a reliable indicator of future results. Current performance may be lower or higher than performance shown. Investment return and the principal value of an investment will fluctuate. Returns shown do not reflect the deduction of taxes that a shareholder would pay on Fund distributions or the sale of Fund shares. Total return, market price, NAV, market price distribution rate, and NAV distribution rate will fluctuate with changes in market conditions. The NAV presented may differ from the NAV reported for the same period in other Fund materials. Performance current to the most recent month-end is available at www.pimco.com or via (844) 33-PIMCO. Performance is calculated assuming all dividends and distributions are reinvested at prices obtained under the Fund’s dividend reinvestment plan. Performance does not reflect any brokerage commissions in connection with the purchase or sale of Fund shares. |
| | Performance of an index is shown in light of a requirement by the Securities and Exchange Commission that the performance of an appropriate broad-based securities market index be disclosed. However, the Fund is not managed to an index nor should the index be viewed as a “benchmark” for the Fund’s performance. The index is not intended to be indicative of the Fund’s investment strategies, portfolio components or past or future performance. Please see Additional Information Regarding the Funds for a description of the Fund’s principal investment strategies. |
| Distribution rates are not performance and are calculated by annualizing the most recent distribution per share and dividing by the NAV or Market Price, as applicable, as of the reported date. Distributions may be comprised of ordinary income, net capital gains, and/or a return of capital (ROC) of your investment in the Fund. Because the distribution rate may include a ROC, it should not be confused with yield or income. If the Fund estimates that a portion of its distribution may be comprised of amounts from sources other than net investment income in accordance with its policies and good accounting practices, the Fund will notify shareholders of the estimated composition of such distribution through a Section 19 Notice. Please refer to the most recent Section 19 Notice, if applicable, for additional information regarding the estimated composition of distributions. Please visit www.pimco.com for most recent Section 19 Notice, if applicable. Final determination of a distribution’s tax character will be provided to shareholders when such information is available. |
| Represents total effective leverage outstanding, as a percentage of total managed assets. Total effective leverage consists of preferred shares, reverse repurchase agreements and other borrowings, credit default swap notional and floating rate notes issued in tender option bond transactions, as applicable (collectively “Total Effective Leverage”). The Fund may engage in other transactions not included in Total Effective Leverage disclosed above that may give rise to a form of leverage, including certain derivative transactions. For the purpose of calculating Total Effective Leverage outstanding as a percentage of total managed assets, total managed assets refer to total assets (including assets attributable to Total Effective Leverage that may be outstanding) minus accrued liabilities (other than liabilities representing Total Effective Leverage). |
Fund Information (as of December 31, 2023)
(1)
| | | | |
| Market Price | | | $7.50 | |
| |
| NAV | | | $7.45 | |
| |
| Premium/(Discount) to NAV | | | 0.67% | |
| |
Market Price Distribution Rate (2) | | | 11.04% | |
| |
| | | 11.11% | |
| |
Total Effective Leverage (3) | | | 20.09% | |
Investment Objective and Strategy Overview
PIMCO Global StocksPLUS
& Income Fund’s investment objective is to seek total return comprised of current income, current gains and long-term capital appreciation.
Fund Insights at NAV
The following affected performance (on a gross basis) during the reporting period:
| » | | Exposure to holdings related to corporate special situation investments, which include companies undergoing stress, distress, challenges or significant transition, contributed to absolute performance, as the securities posted positive returns. |
| » | | Exposure to the corporate credit sector contributed to absolute performance, as the sector posted positive performance. |
| » | | Exposure to equity index derivatives, linked to the MSCI EAFE Index, contributed to absolute performance, as the index posted positive performance. |
| » | | Short exposure to equity index derivatives linked to the S&P 500 Index detracted from absolute performance, as the index posted positive returns. |
| » | | The costs associated with one or more forms of leverage detracted from performance. The costs of leverage generally will reduce returns to the extent they exceed the rate of return on the additional investments purchased with such leverage. |
| » | | Exposure to holdings related to emerging market special situation investments, detracted from absolute performance, as the securities posted negative returns. |
PIMCO Strategic Income Fund, Inc.
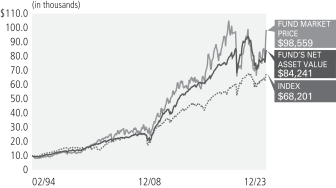
Cumulative Returns Through December 31, 2023
$10,000 invested at the end of the month when the Fund commenced operations.
Allocation Breakdown as of December 31, 2023
| | | | |
| U.S. Government Agencies | | | 55.8% | |
| |
| Corporate Bonds & Notes | | | 18.2% | |
| |
Non-Agency Mortgage-Backed Securities | | | 10.3% | |
| |
| Loan Participations and Assignments | | | 6.1% | |
| |
| Common Stocks | | | 3.5% | |
| |
| Asset-Backed Securities | | | 2.2% | |
| |
| | | 1.2% | |
| |
| Other | | | 2.7% | |
| | | % of Investments, at value. |
| | | Allocation Breakdown and % of investments exclude securities sold short and financial derivative instruments, if any. |
| | | Includes Central Funds Used for Cash Management Purposes. |
| | | | | | | | | | | | | | | | | | | | | | |
|
Average Annual Total Return (1) for the period ended December 31, 2023 | |
| | | | | | |
| | | | | 6 Month* | | | 1 Year | | | 5 Year | | | 10 Year | | | Commencement
of Operations
(02/24/94) | |
| | Market Price | | | 24.01% | | | | 38.53% | | | | 0.87% | | | | 5.64% | | | | 7.97% | |
| | NAV | | | 9.02% | | | | 15.19% | | | | 2.36% | | | | 4.34% | | | | 7.39% | |
| | ICE BofAML US High Yield Index | | | 7.63% | | | | 13.46% | | | | 5.21% | | | | 4.51% | | | | | |
All Fund returns are net of fees and expenses and include applicable fee waivers and/or expense limitations. Absent any applicable fee waivers and/or expense limitations, performance would have been lower and there can be no assurance that any such waivers or limitations will continue in the future.
Average Annual Return since 2/28/1994.
It is not possible to invest directly in an unmanaged index.
| Performance quoted represents past performance. Past performance is not a guarantee or a reliable indicator of future results. Current performance may be lower or higher than performance shown. Investment return and the principal value of an investment will fluctuate. Returns shown do not reflect the deduction of taxes that a shareholder would pay on Fund distributions or the sale of Fund shares. Total return, market price, NAV, market price distribution rate, and NAV distribution rate will fluctuate with changes in market conditions. Performance current to the most recent month-end is available at www.pimco.com or via (844) 33-PIMCO. Performance is calculated assuming all dividends and distributions are reinvested at prices obtained under the Fund’s dividend reinvestment plan. Performance does not reflect any brokerage commissions in connection with the purchase or sale of Fund shares. |
| | The performance information shown for the Fund includes historical performance information for the periods prior to February 8, 2002, during which the Fund had a different investment manager. As of February 8, 2002, PIMCO became the Fund’s investment manager. The Fund’s performance prior to that time may have been different if the Fund were advised by PIMCO. |
| | Performance of an index is shown in light of a requirement by the Securities and Exchange Commission that the performance of an appropriate broad-based securities market index be disclosed. However, the Fund is not managed to an index nor should the index be viewed as a “benchmark” for the Fund’s performance. The index is not intended to be indicative of the Fund’s investment strategies, portfolio components or past or future performance. Please see Additional Information Regarding the Funds for a description of the Fund’s principal investment strategies. |
| Distribution rates are not performance and are calculated by annualizing the most recent distribution per share and dividing by the NAV or Market Price, as applicable, as of the reported date. Distributions may be comprised of ordinary income, net capital gains, and/or a return of capital (ROC) of your investment in the Fund. Because the distribution rate may include a ROC, it should not be confused with yield or income. If the Fund estimates that a portion of its distribution may be comprised of amounts from sources other than net investment income in accordance with its policies and good accounting practices, the Fund will notify shareholders of the estimated composition of such distribution through a Section 19 Notice. Please refer to the most recent Section 19 Notice, if applicable, for additional information regarding the estimated composition of distributions. Please visit www.pimco.com for most recent Section 19 Notice, if applicable. Final determination of a distribution’s tax character will be provided to shareholders when such information is available. |
| Represents total effective leverage outstanding, as a percentage of total managed assets. Total effective leverage consists of preferred shares, reverse repurchase agreements and other borrowings, credit default swap notional and floating rate notes issued in tender option bond transactions, as applicable (collectively “Total Effective Leverage”). The Fund may engage in other transactions not included in Total Effective Leverage disclosed above that may give rise to a form of leverage, including certain derivative transactions. For the purpose of calculating Total Effective Leverage outstanding as a percentage of total managed assets, total managed assets refer to total assets (including assets attributable to Total Effective Leverage that may be outstanding) minus accrued liabilities (other than liabilities representing Total Effective Leverage). |
Fund Information (as of December 31, 2023)
(1)
| | | | |
| Market Price | | | $6.08 | |
| |
| NAV | | | $4.38 | |
| |
| Premium/(Discount) to NAV | | | 38.81% | |
| |
Market Price Distribution Rate (2) | | | 10.07% | |
| |
| | | 13.97% | |
| |
Total Effective Leverage (3) | | | 36.89% | |
Investment Objective and Strategy Overview
The Fund’s primary investment objective is to generate a level of income that is higher than that generated by high quality, intermediate-term U.S. debt securities. The Fund also seeks capital appreciation to the extent consistent with this objective.
Fund Insights at NAV
The following affected performance (on a gross basis) during the reporting period:
| » | | Exposure to holdings related to corporate special situation investments, which include companies undergoing stress, distress, challenges or significant transition, contributed to absolute performance, as the securities posted positive returns. |
| » | | Exposure to the corporate credit sector contributed to absolute performance, as the sector posted positive performance. |
| » | | Exposure to agency residential mortgage securities contributed to absolute performance, as the sector posted positive performance. |
| » | | The costs associated with one or more forms of leverage detracted from performance. The costs of leverage generally will reduce returns to the extent they exceed the rate of return on the additional investments purchased with such leverage. |
| » | | Short exposure to interest rate swaps detracted from performance, as rates declined. |
| » | | Exposure to holdings related to emerging market special situation investments detracted from absolute performance, as the securities posted negative returns. |
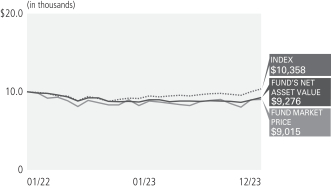
Cumulative Returns Through December 31, 2023
$10,000 invested at the end of the month when the Fund commenced operations.
Allocation Breakdown as of December 31, 2023
| | | | |
Non-Agency Mortgage-Backed Securities | | | 32.8% | |
| |
| Asset-Backed Securities | | | 19.1% | |
| |
| Corporate Bonds & Notes | | | 16.5% | |
| |
| Loan Participations and Assignments | | | 15.6% | |
| |
| | | 9.0% | |
| |
| Common Stocks | | | 4.4% | |
| |
| Municipal Bonds & Notes | | | 1.7% | |
| |
| Other | | | 0.9% | |
| | | % of Investments, at value. |
| | | Allocation Breakdown and % of investments exclude securities sold short and financial derivative instruments, if any. |
| | | Includes Central Funds Used for Cash Management Purposes. |
| | | | | | | | | | | | | | |
|
Average Annual Total Return (1) for the period ended December 31, 2023 | |
| | | | |
| | | | | 6 Month* | | | 1 Year | | | Commencement
of Operations
(01/31/22) | |
| | Market Price | | | 3.15% | | | | 9.19% | | | | (5.27)% | |
| | NAV | | | 5.80% | | | | 6.57% | | | | (3.85)% | |
| | ICE BofAML US High Yield Index | | | 7.63% | | | | 13.46% | | | | 1.85% | |
All Fund returns are net of fees and expenses and include applicable fee waivers and/or expense limitations. Absent any applicable fee waivers and/or expense limitations, performance would have been lower and there can be no assurance that any such waivers or limitations will continue in the future.
It is not possible to invest directly in an unmanaged index.
| Performance quoted represents past performance. Past performance is not a guarantee or a reliable indicator of future results. Current performance may be lower or higher than performance shown. Investment return and the principal value of an investment will fluctuate. Returns shown do not reflect the deduction of taxes that a shareholder would pay on Fund distributions or the sale of Fund shares. Total return, market price, NAV, market price distribution rate, and NAV distribution rate will fluctuate with changes in market conditions. Performance current to the most recent month-end is available at www.pimco.com or via (844) 33-PIMCO. Performance is calculated assuming all dividends and distributions are reinvested at prices obtained under the Fund’s dividend reinvestment plan. Performance does not reflect any brokerage commissions in connection with the purchase or sale of Fund shares. |
| | Performance of an index is shown in light of a requirement by the Securities and Exchange Commission that the performance of an appropriate broad-based securities market index be disclosed. However, the Fund is not managed to an index nor should the index be viewed as a “benchmark” for the Fund’s performance. The index is not intended to be indicative of the Fund’s investment strategies, portfolio components or past or future performance. Please see Additional Information Regarding the Funds for a description of the Fund’s principal investment strategies. |
| Distribution rates are not performance and are calculated by annualizing the most recent distribution per share and dividing by the NAV or Market Price, as applicable, as of the reported date. Distributions may be comprised of ordinary income, net capital gains, and/or a return of capital (ROC) of your investment in the Fund. Because the distribution rate may include a ROC, it should not be confused with yield or income. If the Fund estimates that a portion of its distribution may be comprised of amounts from sources other than net investment income in accordance with its policies and good accounting practices, the Fund will notify shareholders of the estimated composition of such distribution through a Section 19 Notice. Please refer to the most recent Section 19 Notice, if applicable, for additional information regarding the estimated composition of distributions. Please visit www.pimco.com for most recent Section 19 Notice, if applicable. Final determination of a distribution’s tax character will be provided to shareholders when such information is available. |
| Represents total effective leverage outstanding, as a percentage of total managed assets. Total effective leverage consists of preferred shares, reverse repurchase agreements and other borrowings, credit default swap notional and floating rate notes issued in tender option bond transactions, as applicable (collectively “Total Effective Leverage”). The Fund may engage in other transactions not included in Total Effective Leverage disclosed above that may give rise to a form of leverage, including certain derivative transactions. For the purpose of calculating Total Effective Leverage outstanding as a percentage of total managed assets, total managed assets refer to total assets (including assets attributable to Total Effective Leverage that may be outstanding) minus accrued liabilities (other than liabilities representing Total Effective Leverage). |
Fund Information (as of December 31, 2023)
(1)
| | | | |
| Market Price | | | $14.30 | |
| |
| NAV | | | $14.81 | |
| |
| Premium/(Discount) to NAV | | | (3.44)% | |
| |
Market Price Distribution Rate (2) | | | 12.54% | |
| |
| | | 12.11% | |
| |
Total Effective Leverage (3) | | | 43.03% | |
Investment Objective and Strategy Overview
PIMCO Access Income Fund’s investment objective is to seek current income as a primary objective and capital appreciation as a secondary objective.
Fund Insights at NAV
The following affected performance (on a gross basis) during the reporting period:
| » | | Holdings related to corporate special situation investments, which include companies undergoing stress, distress, challenges or significant transition contributed to absolute performance, as select securities posted positive returns. |
| » | | Security selection within residential mortgage credit contributed to performance, as select securities posted positive returns. |
| » | | Exposure to corporate credit, notably high yield and bank loans, contributed to absolute performance, as the asset classes posted positive returns. |
| » | | The costs associated with one or more forms of leverage detracted from performance. The costs of leverage generally will reduce returns to the extent they exceed the rate of return on the additional investments purchased with such leverage. |
| » | | Holdings related to emerging market special situation investments detracted from absolute performance, as select securities posted negative returns. |
| » | | Security selection within asset backed securities detracted from performance, as select securities posted negative returns. |
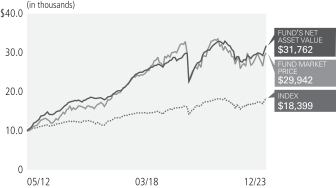
PIMCO Dynamic Income Fund
Cumulative Returns Through December 31, 2023
$10,000 invested at the end of the month when the Fund commenced operations.
Allocation Breakdown as of December 31, 2023
| | | | |
Non-Agency Mortgage-Backed Securities | | | 27.1% | |
| |
| Loan Participations and Assignments | | | 17.8% | |
| |
| Corporate Bonds & Notes | | | 17.7% | |
| |
| Asset-Backed Securities | | | 15.9% | |
| |
| | | 10.3% | |
| |
| Common Stocks | | | 6.1% | |
| |
| Municipal Bonds & Notes | | | 1.3% | |
| |
| Sovereign Issues | | | 1.2% | |
| |
| Other | | | 2.6% | |
| | | % of Investments, at value. |
| | | Allocation Breakdown and % of investments exclude securities sold short and financial derivative instruments, if any. |
| | | Includes Central Funds Used for Cash Management Purposes. |
| | | | | | | | | | | | | | | | | | | | | | |
|
Average Annual Total Return (1) for the period ended December 31, 2023 | |
| | | | | | |
| | | | | 6 Month* | | | 1 Year | | | 5 Year | | | 10 Year | | | Commencement
of Operations
(05/30/12) | |
| | Market Price | | | 3.41% | | | | 12.86% | | | | 2.75% | | | | 8.28% | | | | 10.14% | |
| | NAV | | | 7.49% | | | | 13.08% | | | | 3.76% | | | | 7.72% | | | | 10.51% | |
| | ICE BofAML US High Yield Index | | | 7.63% | | | | 13.46% | | | | 5.21% | | | | 4.51% | | | | 5.40% | |
All Fund returns are net of fees and expenses and include applicable fee waivers and/or expense limitations. Absent any applicable fee waivers and/or expense limitations, performance would have been lower and there can be no assurance that any such waivers or limitations will continue in the future.
It is not possible to invest directly in an unmanaged index.
| Performance quoted represents past performance. Past performance is not a guarantee or a reliable indicator of future results. Current performance may be lower or higher than performance shown. Investment return and the principal value of an investment will fluctuate. Returns shown do not reflect the deduction of taxes that a shareholder would pay on Fund distributions or the sale of Fund shares. Total return, market price, NAV, market price distribution rate, and NAV distribution rate will fluctuate with changes in market conditions. The NAV presented may differ from the NAV reported for the same period in other Fund materials. Performance current to the most recent month-end is available at www.pimco.com or via (844) 33-PIMCO. Performance is calculated assuming all dividends and distributions are reinvested at prices obtained under the Fund’s dividend reinvestment plan. Performance does not reflect any brokerage commissions in connection with the purchase or sale of Fund shares. |
| | Performance of an index is shown in light of a requirement by the Securities and Exchange Commission that the performance of an appropriate broad-based securities market index be disclosed. However, the Fund is not managed to an index nor should the index be viewed as a “benchmark” for the Fund’s performance. The index is not intended to be indicative of the Fund’s investment strategies, portfolio components or past or future performance. Please see Additional Information Regarding the Funds for a description of the Fund’s principal investment strategies. |
| Distribution rates are not performance and are calculated by annualizing the most recent distribution per share and dividing by the NAV or Market Price, as applicable, as of the reported date. Distributions may be comprised of ordinary income, net capital gains, and/or a return of capital (ROC) of your investment in the Fund. Because the distribution rate may include a ROC, it should not be confused with yield or income. If the Fund estimates that a portion of its distribution may be comprised of amounts from sources other than net investment income in accordance with its policies and good accounting practices, the Fund will notify shareholders of the estimated composition of such distribution through a Section 19 Notice. Please refer to the most recent Section 19 Notice, if applicable, for additional information regarding the estimated composition of distributions. Please visit www.pimco.com for most recent Section 19 Notice, if applicable. Final determination of a distribution’s tax character will be provided to shareholders when such information is available. |
| Represents total effective leverage outstanding, as a percentage of total managed assets. Total effective leverage consists of preferred shares, reverse repurchase agreements and other borrowings, credit default swap notional and floating rate notes issued in tender option bond transactions, as applicable (collectively “Total Effective Leverage”). The Fund may engage in other transactions not included in Total Effective Leverage disclosed above that may give rise to a form of leverage, including certain derivative transactions. For the purpose of calculating Total Effective Leverage outstanding as a percentage of total managed assets, total managed assets refer to total assets (including assets attributable to Total Effective Leverage that may be outstanding) minus accrued liabilities (other than liabilities representing Total Effective Leverage). |
Fund Information (as of December 31, 2023)
(1)
| | | | |
| Market Price | | | $17.95 | |
| |
| NAV | | | $17.18 | |
| |
| Premium/(Discount) to NAV | | | 4.48% | |
| |
Market Price Distribution Rate (2) | | | 14.74% | |
| |
| | | 15.40% | |
| |
Total Effective Leverage (3) | | | 40.53% | |
Investment Objective and Strategy Overview
PIMCO Dynamic Income Fund’s primary investment objective is to seek current income, and capital appreciation is a secondary objective.
Fund Insights at NAV
The following affected performance (on a gross basis) during the reporting period:
| » | | Holdings related to corporate special situation investments, which include companies undergoing stress, distress, challenges or significant transition contributed to absolute performance, as select securities posted positive returns. |
| » | | Exposure to corporate credit, notably bank loans and high yield contributed to absolute performance, as the asset classes posted positive returns. |
| » | | Security selection within mortgage credit contributed to performance, as select securities posted positive returns. |
| » | | The costs associated with one or more forms of leverage detracted from performance. The costs of leverage generally will reduce returns to the extent they exceed the rate of return on the additional investments purchased with such leverage. |
| » | | Holdings related to emerging market special situation investments detracted from absolute performance, as select securities posted negative returns. |
| » | | Security selection within municipal bonds detracted from performance, as a select taxable municipal security posted negative returns. |
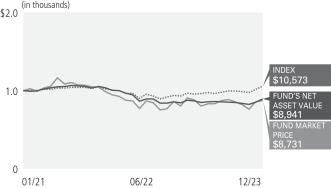
PIMCO Dynamic Income Opportunities Fund
Cumulative Returns Through December 31, 2023
$10,000 invested at the end of the month when the Fund commenced operations.
Allocation Breakdown as of December 31, 2023
| | | | |
| Non-Agency Mortgage-Backed Securities | | | 27.8% | |
| |
| Corporate Bonds & Notes | | | 22.7% | |
| |
| Loan Participations and Assignments | | | 16.7% | |
| |
| Asset-Backed Securities | | | 13.6% | |
| |
| | | 8.9% | |
| |
| Common Stocks | | | 5.2% | |
| |
| Real Estate Investment Trusts | | | 1.1% | |
| |
| Convertible Bonds & Notes | | | 1.1% | |
| |
| U.S. Government Agencies | | | 1.1% | |
| |
| Municipal Bonds & Notes | | | 1.1% | |
| |
| Other | | | 0.7% | |
| | | % of Investments, at value. |
| | | Allocation Breakdown and % of investments exclude securities sold short and financial derivative instruments, if any. |
| | | Includes Central Funds Used for Cash Management Purposes. |
| | | | | | | | | | | | | | |
|
Average Annual Total Return (1) for the period ended December 31, 2023 | |
| | | | |
| | | | | 6 Month* | | | 1 Year | | | Commencement
of Operations
(01/29/21) | |
| | Market Price | | | (0.19)% | | | | 8.23% | | | | (4.54)% | |
| | NAV | | | 4.08% | | | | 5.49% | | | | (3.76)% | |
| | ICE BofAML US High Yield Index | | | 7.63% | | | | 13.46% | | | | 1.93% | |
All Fund returns are net of fees and expenses and include applicable fee waivers and/or expense limitations. Absent any applicable fee waivers and/or expense limitations, performance would have been lower and there can be no assurance that any such waivers or limitations will continue in the future.
It is not possible to invest directly in an unmanaged index.
| Performance quoted represents past performance. Past performance is not a guarantee or a reliable indicator of future results. Current performance may be lower or higher than performance shown. Investment return and the principal value of an investment will fluctuate. Returns shown do not reflect the deduction of taxes that a shareholder would pay on Fund distributions or the sale of Fund shares. Total return, market price, NAV, market price distribution rate, and NAV distribution rate will fluctuate with changes in market conditions. The NAV presented may differ from the NAV reported for the same period in other Fund materials. Performance current to the most recent month-end is available at www.pimco.com or via (844) 33-PIMCO. Performance is calculated assuming all dividends and distributions are reinvested at prices obtained under the Fund’s dividend reinvestment plan. Performance does not reflect any brokerage commissions in connection with the purchase or sale of Fund shares. |
| | Performance of an index is shown in light of a requirement by the Securities and Exchange Commission that the performance of an appropriate broad-based securities market index be disclosed. However, the Fund is not managed to an index nor should the index be viewed as a “benchmark” for the Fund’s performance. The index is not intended to be indicative of the Fund’s investment strategies, portfolio components or past or future performance. Please see Additional Information Regarding the Funds for a description of the Fund’s principal investment strategies. |
| Distribution rates are not performance and are calculated by annualizing the most recent distribution per share and dividing by the NAV or Market Price, as applicable, as of the reported date. Distributions may be comprised of ordinary income, net capital gains, and/or a return of capital (ROC) of your investment in the Fund. Because the distribution rate may include a ROC, it should not be confused with yield or income. If the Fund estimates that a portion of its distribution may be comprised of amounts from sources other than net investment income in accordance with its policies and good accounting practices, the Fund will notify shareholders of the estimated composition of such distribution through a Section 19 Notice. Please refer to the most recent Section 19 Notice, if applicable, for additional information regarding the estimated composition of distributions. Please visit www.pimco.com for most recent Section 19 Notice, if applicable. Final determination of a distribution’s tax character will be provided to shareholders when such information is available. |
| Represents total effective leverage outstanding, as a percentage of total managed assets. Total effective leverage consists of preferred shares, reverse repurchase agreements and other borrowings, credit default swap notional and floating rate notes issued in tender option bond transactions, as applicable (collectively “Total Effective Leverage”). The Fund may engage in other transactions not included in Total Effective Leverage disclosed above that may give rise to a form of leverage, including certain derivative transactions. For the purpose of calculating Total Effective Leverage outstanding as a percentage of total managed assets, total managed assets refer to total assets (including assets attributable to Total Effective Leverage that may be outstanding) minus accrued liabilities (other than liabilities representing Total Effective Leverage). |
Fund Information (as of December 31, 2023)
(1)
| | | | |
| Market Price | | | $12.24 | |
| |
| NAV | | | $12.42 | |
| |
| Premium/(Discount) to NAV | | | (1.45)% | |
| |
Market Price Distribution Rate (2) | | | 12.54% | |
| |
| | | 12.36% | |
| |
Total Effective Leverage (3) | | | 42.30% | |
Investment Objective and Strategy Overview
PIMCO Dynamic Income Opportunities Fund’s investment objective is to seek current income as a primary objective and capital appreciation as a secondary objective.
Fund Insights at NAV
The following affected performance (on a gross basis) during the reporting period:
| » | | Holdings related to corporate special situation investments, which include companies undergoing stress, distress, challenges or significant transition, contributed to absolute performance, as select securities posted positive returns. |
| » | | Exposure to corporate credit, notably bank loans and high yield, contributed to absolute performance, as the asset classes posted positive returns. |
| » | | Security selection within residential mortgage credit contributed to performance, as select securities posted positive returns. |
| » | | The costs associated with one or more forms of leverage detracted from performance. The costs of leverage generally will reduce returns to the extent they exceed the rate of return on the additional investments purchased with such leverage. |
| » | | Security selection within commercial mortgage credit detracted from performance, as select securities posted negative returns. |
| » | | Holdings related to emerging market special situation investments detracted from absolute performance, as select securities posted negative returns. |
| | |
| | |
| |
| ICE BofAML U.S. High Yield Index | | ICE BofAML U.S. High Yield Index tracks the performance of below investment grade U.S. dollar-denominated corporate bonds publicly issued in the U.S. domestic market. Qualifying bonds must have at least one year remaining term to maturity, a fixed coupon schedule and a minimum amount outstanding of USD 100 million. Bonds must be rated below investment grade based on a composite of Moody’s and S&P. |
| |
| MSCI World Index | | The MSCI World Index is a free float-adjusted market capitalization weighted index that is designed to measure the equity market performance of developed markets. The MSCI World Index consists of 23 developed market country indices. |
* It is not possible to invest directly in an unmanaged index.
| | | | | | | | | | | | | | | | | | | | | | | | | | | | | | | | |
| | | | | | | | | | |
| | | | | | | | | | | | | | | | | | | | | | | | | |
| Selected Per Share Data for the Year or Period Ended | | Net Asset Value Beginning of Year or Period (a) | | | Net Investment Income (Loss) (b) | | | Net
Realized/
Unrealized
Gain (Loss) | | | | | | | | | From Net
Realized
Capital
Gains | | | Tax Basis
Return of
Capital | | | | |
| | | | | | | | |
| | | | | | | | | | | | | | | | | | | | | | | | | | | | | | | | |
| | | | | | | | |
| 07/01/2023 - 12/31/2023+ | | $ | 6.74 | | | $ | 0.28 | | | $ | (0.02 | ) | | $ | 0.26 | | | $ | (0.48 | ) | | $ | 0.00 | | | $ | 0.00 | | | $ | (0.48 | ) |
| | | | | | | | |
| 06/30/2023 | | | 7.69 | | | | 0.82 | | | | (0.81 | ) | | | 0.01 | | | | (0.73 | ) | | | 0.00 | | | | (0.23 | ) | | | (0.96 | ) |
| | | | | | | | |
| 06/30/2022 | | | 9.52 | | | | 0.79 | | | | (1.66 | ) | | | (0.87 | ) | | | (0.93 | ) | | | 0.00 | | | | (0.03 | ) | | | (0.96 | ) |
| | | | | | | | |
| 06/30/2021 | | | 8.47 | | | | 0.97 | | | | 1.04 | | | | 2.01 | | | | (0.96 | ) | | | 0.00 | | | | 0.00 | | | | (0.96 | ) |
| | | | | | | | |
| 06/30/2020 | | | 10.19 | | | | 0.86 | | | | (1.62 | ) | | | (0.76 | ) | | | (0.95 | ) | | | 0.00 | | | | (0.01 | ) | | | (0.96 | ) |
| | | | | | | | |
| 06/30/2019 | | | 10.23 | | | | 0.69 | | | | 0.23 | | | | 0.92 | | | | (0.96 | ) | | | 0.00 | | | | 0.00 | | | | (0.96 | ) |
| | | | | | | | |
PIMCO Global StocksPLUS & Income Fund | | | | | | | | | | | | | | | | | | | | | | | | | | | | | | | | |
| | | | | | | | |
| 07/01/2023 - 12/31/2023+ | | $ | 7.29 | | | $ | 0.33 | | | $ | 0.24 | | | $ | 0.57 | | | $ | (0.41 | ) | | $ | 0.00 | | | $ | 0.00 | | | $ | (0.41 | ) |
| | | | | | | | |
| 06/30/2023 | | | 7.27 | | | | 0.77 | | | | 0.08 | | | | 0.85 | | | | (0.83 | ) | | | 0.00 | | | | 0.00 | | | | (0.83 | ) |
| | | | | | | | |
| 06/30/2022 | | | 10.44 | | | | 0.87 | | | | (3.21 | ) | | | (2.34 | ) | | | (0.83 | ) | | | 0.00 | | | | 0.00 | | | | (0.83 | ) |
| | | | | | | | |
| 06/30/2021 | | | 7.47 | | | | 0.95 | | | | 2.85 | | | | 3.80 | | | | (0.83 | ) | | | 0.00 | | | | 0.00 | | | | (0.83 | ) |
| | | | | | | | |
| 06/30/2020 | | | 9.89 | | | | 1.10 | | | | (2.42 | ) | | | (1.32 | ) | | | (0.85 | ) | | | 0.00 | | | | (0.25 | ) | | | (1.10 | ) |
| | | | | | | | |
| 06/30/2019 | | | 10.50 | | | | 1.11 | | | | (0.34 | ) | | | 0.77 | | | | (1.20 | ) | | | 0.00 | | | | (0.18 | ) | | | (1.38 | ) |
| | | | | | | | |
PIMCO Strategic Income Fund, Inc. | | | | | | | | | | | | | | | | | | | | | | | | | | | | | | | | |
| | | | | | | | |
| 07/01/2023 - 12/31/2023+ | | $ | 4.32 | | | $ | 0.20 | | | $ | 0.17 | | | $ | 0.37 | | | $ | (0.31 | ) | | $ | 0.00 | | | $ | 0.00 | | | $ | (0.31 | ) |
| | | | | | | | |
| 06/30/2023 | | | 4.68 | | | | 0.39 | | | | (0.14 | ) | | | 0.25 | | | | (0.61 | ) | | | 0.00 | | | | 0.00 | | | | (0.61 | ) |
| | | | | | | | |
| 06/30/2022 | | | 6.55 | | | | 0.61 | | | | (1.87 | ) | | | (1.26 | ) | | | (0.60 | ) | | | 0.00 | | | | (0.01 | ) | | | (0.61 | ) |
| | | | | | | | |
| 06/30/2021 | | | 5.94 | | | | 0.58 | | | | 0.64 | | | | 1.22 | | | | (0.41 | ) | | | 0.00 | | | | (0.20 | ) | | | (0.61 | ) |
| | | | | | | | |
| 06/30/2020 | | | 7.12 | | | | 0.74 | | | | (1.20 | ) | | | (0.46 | ) | | | (0.49 | ) | | | 0.00 | | | | (0.23 | ) | | | (0.72 | ) |
| | | | | | | | |
| 06/30/2019 | | | 7.32 | | | | 0.60 | | | | 0.03 | | | | 0.63 | | | | (0.61 | ) | | | 0.00 | | | | (0.22 | ) | | | (0.83 | ) |
| | | | | | | | |
PIMCO Access Income Fund (Consolidated) | | | | | | | | | | | | | | | | | | | | | | | | | | | | | | | | |
| | | | | | | | |
| 07/01/2023 - 12/31/2023+ | | $ | 14.86 | | | $ | 0.74 | | | $ | 0.11 | | | $ | 0.85 | | | $ | (0.90 | ) | | $ | 0.00 | | | $ | 0.00 | | | $ | (0.90 | ) |
| | | | | | | | |
| 06/30/2023 | | | 17.20 | | | | 1.81 | | | | (1.90 | ) | | | (0.09 | ) | | | (2.25 | ) | | | 0.00 | | | | 0.00 | | | | (2.25 | ) |
| | | | | | | | |
| 01/31/2022 - 06/30/2022 | | | 20.00 | | | | 0.45 | | | | (2.78 | ) | | | (2.33 | ) | | | (0.47 | ) | | | 0.00 | | | | 0.00 | | | | (0.47 | ) |
| | | | | | | | |
PIMCO Dynamic Income Fund (Consolidated) | | | | | | | | | | | | | | | | | | | | | | | | | | | | | | | | |
| | | | | | | | |
| 07/01/2023 - 12/31/2023+ | | $ | 17.27 | | | $ | 0.88 | | | $ | 0.27 | | | $ | 1.15 | | | $ | (1.32 | ) | | $ | 0.00 | | | $ | 0.00 | | | $ | (1.32 | ) |
| | | | | | | | |
| 06/30/2023 | | | 19.72 | | | | 2.23 | | | | (1.56 | ) | | | 0.67 | | | | (3.30 | ) | | | 0.00 | | | | 0.00 | | | | (3.30 | ) |
| | | | | | | | |
| 06/30/2022 | | | 25.23 | | | | 2.84 | | | | (5.77 | ) | | | (2.93 | ) | | | (2.65 | ) | | | 0.00 | | | | 0.00 | | | | (2.65 | ) |
| | | | | | | | |
| 06/30/2021 | | | 22.59 | | | | 2.51 | | | | 2.57 | | | | 5.08 | | | | (2.52 | ) | | | 0.00 | | | | (0.13 | ) | | | (2.65 | ) |
| | | | | | | | |
| 06/30/2020 | | | 28.29 | | | | 2.92 | | | | (5.80 | ) | | | (2.88 | ) | | | (3.07 | ) | | | 0.00 | | | | 0.00 | | | | (3.07 | ) |
| | | | | | | | |
| 06/30/2019 | | | 28.98 | | | | 2.73 | | | | (0.37 | ) | | | 2.36 | | | | (3.15 | ) | | | 0.00 | | | | 0.00 | | | | (3.15 | ) |
| | | | | | | | |
PIMCO Dynamic Income Opportunities Fund (Consolidated) | | | | | | | | | | | | | | | | | | | | | | | | | | | | | | | | |
| | | | | | | | |
| 07/01/2023 - 12/31/2023+ | | $ | 12.69 | | | $ | 0.55 | | | $ | (0.05 | ) | | $ | 0.50 | | | $ | (0.77 | ) | | $ | 0.00 | | | $ | 0.00 | | | $ | (0.77 | ) |
| | | | | | | | |
| 06/30/2023 | | | 15.31 | | | | 1.50 | | | | (1.63 | ) | | | (0.13 | ) | | | (2.49 | ) | | | 0.00 | | | | 0.00 | | | | (2.49 | ) |
| | | | | | | | |
| 06/30/2022 | | | 20.50 | | | | 1.73 | | | | (5.01 | ) | | | (3.28 | ) | | | (1.79 | ) | | | (0.12 | ) | | | 0.00 | | | | (1.91 | ) |
| | | | | | | | |
| 01/29/2021 - 06/30/2021 | | | 20.00 | | | | 0.49 | | | | 0.47 | | | | 0.96 | | | | (0.47 | ) | | | 0.00 | | | | 0.00 | | | | (0.47 | ) |
| ^ | A zero balance may reflect actual amounts rounding to less than $0.01 or 0.01%. |
| * | Annualized, except for organizational expense, if any. |
| Includes adjustments required by U.S. GAAP and may differ from net asset values and performance reported elsewhere by the Funds. |
| Per share amounts based on average number of shares outstanding during the year or period. |
| The tax characterization of distributions is determined in accordance with Federal income tax regulations. The actual tax characterization of distributions paid is determined at the end of the fiscal year. See Note 2, Distributions — Common Shares, in the Notes to Financial Statements for more information |
| Total investment return is calculated assuming a purchase of a share at the market price on the first day and a sale of a share at the market price on the last day of each year reported. Dividends and distributions, if any, are assumed, for purposes of this calculation, to be reinvested at prices obtained under the Fund’s dividend reinvestment plan. Total investment return does not reflect brokerage commissions in connection with the purchase or sale of Fund shares. |
| Ratio includes interest expense which primarily relates to participation in borrowing and financing transactions. See Note 5, Borrowings and Other Financing Transactions, in the Notes to Financial Statements for more information. |
| Effective December 13, 2021, the Fund’s Investment advisory fee was decreased by 0.05% to an annual rate of 1.10%. |
| | | | | | | | | | | | | | | | | | | | | | | | | | | | | | | | | | | | | | | | | | | | | | |
| | | | | | | | | | | |
| | | | | | | | | | | | | | | | | | | Ratios to Average Net Assets | | | | |
Increase
resulting from
Common Share
Offering | | | Offering Cost
Charged to
Paid in Capital | | | Net Asset Value End of Year or Period (a) | | | Market Price
End of Year
or Period | | | | | | | | | | | | Expenses Excluding Waivers (e) | | | Expenses
Excluding
Interest
Expense | | | | | | Net
Investment
Income (Loss) | | | | |
| | | | | | | | | | | |
| | | | | | | | | | | | | | | | | | | | | | | | | | | | | | | | | | | | | | | | | | | | | | |
| | | | | | | | | | | |
| $ | N/A | | | $ | N/A | | | $ | 6.52 | | | $ | 7.96 | | | | (12.23 | )% | | $ | 78,089 | | | | 7.11 | %* | | | 7.11 | %* | | | 1.64 | %* | | | 1.64 | %* | | | 8.77 | %* | | | 4 | % |
| | | | | | | | | | | |
| | N/A | | | | N/A | | | | 6.74 | | | | 9.63 | | | | 16.30 | | | | 80,318 | | | | 5.68 | | | | 5.68 | | | | 1.68 | | | | 1.68 | | | | 11.29 | | | | 20 | |
| | | | | | | | | | | |
| | N/A | | | | N/A | | | | 7.69 | | | | 9.25 | | | | (14.44 | ) | | | 90,639 | | | | 2.30 | | | | 2.30 | | | | 1.63 | | | | 1.63 | | | | 8.71 | | | | 65 | |
| | | | | | | | | | | |
| | N/A | | | | N/A | | | | 9.52 | | | | 11.87 | | | | 38.25 | | | | 111,154 | | | | 2.49 | | | | 2.49 | | | | 1.60 | | | | 1.60 | | | | 10.56 | | | | 127 | |
| | | | | | | | | | | |
| | N/A | | | | N/A | | | | 8.47 | | | | 9.42 | | | | (8.33 | ) | | | 98,539 | | | | 3.39 | | | | 3.39 | | | | 1.54 | | | | 1.54 | | | | 9.09 | | | | 15 | |
| | | | | | | | | | | |
| | N/A | | | | N/A | | | | 10.19 | | | | 11.32 | | | | 8.26 | | | | 118,181 | | | | 3.35 | | | | 3.35 | | | | 1.41 | | | | 1.41 | | | | 6.89 | | | | 8 | |
| | | | | | | | | | | |
| | | | | | | | | | | | | | | | | | | | | | | | | | | | | | | | | | | | | | | | | | | | | | |
| | | | | | | | | | | |
| $ | N/A | | | $ | N/A | | | $ | 7.45 | | | $ | 7.50 | | | | 10.54 | % | | $ | 84,989 | | | | 3.80 | %* | | | 3.80 | %* | | | 1.45 | %* | | | 1.45 | %* | | | 9.45 | %* | | | 282 | % |
| | | | | | | | | | | |
| | N/A | | | | N/A | | | | 7.29 | | | | 7.20 | | | | 2.32 | | | | 82,667 | | | | 3.79 | | | | 3.79 | | | | 1.65 | | | | 1.65 | | | | 10.69 | | | | 483 | |
| | | | | | | | | | | |
| | N/A | | | | N/A | | | | 7.27 | | | | 7.89 | | | | (22.51 | ) | | | 81,353 | | | | 2.09 | | | | 2.09 | | | | 1.76 | | | | 1.76 | | | | 8.96 | | | | 373 | |
| | | | | | | | | | | |
| | N/A | | | | N/A | | | | 10.44 | | | | 11.10 | | | | 48.12 | | | | 115,748 | | | | 2.03 | | | | 2.03 | | | | 1.66 | | | | 1.66 | | | | 10.35 | | | | 503 | |
| | | | | | | | | | | |
| | N/A | | | | N/A | | | | 7.47 | | | | 8.19 | | | | (26.51 | ) | | | 82,109 | | | | 2.78 | | | | 2.78 | | | | 1.65 | | | | 1.65 | | | | 12.56 | | | | 395 | |
| | | | | | | | | | | |
| | N/A | | | | N/A | | | | 9.89 | | | | 12.47 | | | | (7.41 | ) | | | 107,562 | | | | 2.64 | | | | 2.64 | | | | 1.53 | | | | 1.53 | | | | 11.37 | | | | 381 | |
| | | | | | | | | | | |
| | | | | | | | | | | | | | | | | | | | | | | | | | | | | | | | | | | | | | | | | | | | | | |
| | | | | | | | | | | |
| $ | N/A | | | $ | N/A | | | $ | 4.38 | | | $ | 6.08 | | | | 24.01 | % | | $ | 200,907 | | | | 5.08 | %* | | | 5.08 | %* | | | 0.97 | %* | | | 0.97 | %* | | | 9.31 | %* | | | 436 | % |
| | | | | | | | | | | |
| | N/A | | | | N/A | | | | 4.32 | | | | 5.20 | | | | 14.43 | | | | 196,497 | | | | 3.87 | | | | 3.87 | | | | 0.97 | | | | 0.97 | | | | 8.73 | | | | 639 | |
| | | | | | | | | | | |
| | N/A | | | | N/A | | | | 4.68 | | | | 5.13 | | | | (25.44 | ) | | | 210,018 | | | | 1.44 | | | | 1.44 | | | | 0.98 | | | | 0.98 | | | | 10.29 | | | | 678 | |
| | | | | | | | | | | |
| | N/A | | | | N/A | | | | 6.55 | | | | 7.61 | | | | 30.90 | | | | 290,989 | | | | 1.36 | | | | 1.36 | | | | 0.96 | | | | 0.96 | | | | 8.97 | | | | 774 | |
| | | | | | | | | | | |
| | N/A | | | | N/A | | | | 5.94 | | | | 6.37 | | | | (27.94 | ) | | | 261,163 | | | | 2.61 | | | | 2.61 | | | | 0.98 | | | | 0.98 | | | | 11.28 | | | | 679 | |
| | | | | | | | | | | |
| | N/A | | | | N/A | | | | 7.12 | | | | 9.71 | | | | 9.57 | | | | 309,287 | | | | 3.20 | | | | 3.20 | | | | 0.97 | | | | 0.97 | | | | 8.52 | | | | 655 | |
| | | | | | | | | | | |
| | | | | | | | | | | | | | | | | | | | | | | | | | | | | | | | | | | | | | | | | | | | | | |
| | | | | | | | | | | |
| $ | N/A | | | $ | N/A | | | $ | 14.81 | | | $ | 14.30 | | | | 3.15 | % | | $ | 651,970 | | | | 7.25 | %* | | | 7.25 | %* | | | 2.21 | %* | | | 2.21 | %* | | | 10.16 | %* | | | 6 | % |
| | | | | | | | | | | |
| | N/A | | | | N/A | | | | 14.86 | | | | 14.75 | | | | 7.53 | | | | 653,891 | | | | 5.92 | | | | 5.92 | | | | 2.24 | | | | 2.24 | | | | 11.10 | | | | 28 | |
| | | | | | | | | | | |
| | N/A | | | | N/A | | | | 17.20 | | | | 15.83 | | | | (18.72 | ) | | | 756,653 | | | | 1.79 | * | | | 1.79 | * | | | 1.51 | * | | | 1.51 | * | | | 5.81 | * | | | 16 | |
| | | | | | | | | | | |
| | | | | | | | | | | | | | | | | | | | | | | | | | | | | | | | | | | | | | | | | | | | | | |
| | | | | | | | | | | |
| $ | 0.08 | | | $ | 0.00 | | | $ | 17.18 | | | $ | 17.95 | | | | 3.41 | % | | $ | 4,906,845 | | | | 6.50 | %* | | | 6.50 | %* | | | 1.90 | %* | | | 1.90 | %* | | | 10.45 | %* | | | 8 | % |
| | | | | | | | | | | |
| | 0.18 | | | | 0.00 | | | | 17.27 | | | | 18.75 | | | | 7.22 | | | | 4,578,482 | | | | 5.12 | | | | 5.12 | | | | 1.92 | | | | 1.92 | | | | 12.10 | | | | 20 | |
| | | | | | | | | | | |
| | 0.07 | | | | 0.00 | | | | 19.72 | | | | 20.87 | | | | (19.10 | ) | | | 4,466,886 | | | | 2.64 | (f) | | | 2.64 | (f) | | | 2.00 | (f) | | | 2.00 | (f) | | | 12.28 | | | | 27 | |
| | | | | | | | | | | |
| | 0.21 | | | | 0.00 | | | | 25.23 | | | | 28.81 | | | | 29.29 | | | | 1,781,435 | | | | 2.78 | | | | 2.78 | | | | 2.04 | | | | 2.04 | | | | 10.36 | | | | 38 | |
| | | | | | | | | | | |
| | 0.25 | | | | 0.00 | | | | 22.59 | | | | 24.72 | | | | (14.18 | ) | | | 1,375,107 | | | | 3.72 | | | | 3.72 | | | | 1.99 | | | | 1.99 | | | | 11.44 | | | | 21 | |
| | | | | | | | | | | |
| | 0.10 | | | | (0.00 | ) | | | 28.29 | | | | 32.15 | | | | 12.03 | | | | 1,603,368 | | | | 3.96 | | | | 3.96 | | | | 1.89 | | | | 1.89 | | | | 9.70 | | | | 12 | |
| | | | | | | | | | | |
| | | | | | | | | | | | | | | | | | | | | | | | | | | | | | | | | | | | | | | | | | | | | | |
| | | | | | | | | | | |
| $ | 0.00 | | | $ | 0.00 | | | $ | 12.42 | | | $ | 12.24 | | | | (0.19 | )% | | $ | 1,399,276 | | | | 6.83 | %* | | | 6.83 | % | | | 2.02 | %* | | | 2.02 | %* | | | 9.07 | %* | | | 8 | % |
| | | | | | | | | | | |
| | 0.00 | | | | 0.00 | | | | 12.69 | | | | 13.06 | | | | 13.17 | | | | 1,406,536 | | | | 5.75 | | | | 5.75 | | | | 2.11 | | | | 2.11 | | | | 10.67 | | | | 17 | |
| | | | | | | | | | | |
| | N/A | | | | N/A | | | | 15.31 | | | | 13.85 | | | | (33.77 | ) | | | 1,684,507 | | | | 2.79 | | | | 2.79 | | | | 2.12 | | | | 2.12 | | | | 9.11 | | | | 47 | |
| | | | | | | | | | | |
| | 0.01 | | | | N/A | | | | 20.50 | | | | 23.18 | | | | 16.70 | | | | 2,227,301 | | | | 2.10 | * | | | 2.10 | * | | | 1.78 | * | | | 1.78 | * | | | 5.93 | * | | | 49 | |
| | | | | | |
Statements of Assets and Liabilities | | | | | | December 31, 2023 (Unaudited) |
| | | | | | | | | | | | |
(Amounts in thousands , except per share amounts) | | | | | PIMCO Global StocksPLUS & Income Fund | | | PIMCO
Strategic
Income Fund,
Inc. | |
| | | |
| | | | | | | | | | | | |
| | | |
| | | | | | | | | | | | |
| Investments in securities* | | $ | 122,093 | | | $ | 124,513 | | | $ | 603,871 | |
| Investments in Affiliates | | | 9,566 | | | | 14,325 | | | | 4,761 | |
Financial Derivative Instruments | | | | | | | | | | | | |
| Exchange-traded or centrally cleared | | | 61 | | | | 205 | | | | 419 | |
| Over the counter | | | 0 | | | | 2,547 | | | | 62 | |
| Cash | | | 75 | | | | 54 | | | | 115 | |
| Deposits with counterparty | | | 1,818 | | | | 3,525 | | | | 8,489 | |
| Foreign currency, at value | | | 5 | | | | 0 | | | | 71 | |
| Receivable for investments sold | | | 216 | | | | 715 | | | | 2,530 | |
| Receivable for TBA investments sold | | | 0 | | | | 48,656 | | | | 263,452 | |
| Interest and/or dividends receivable | | | 884 | | | | 1,608 | | | | 3,286 | |
| Dividends receivable from Affiliates | | | 36 | | | | 51 | | | | 39 | |
| Other assets | | | 72 | | | | 66 | | | | 0 | |
| | | 134,826 | | | | 196,265 | | | | 887,095 | |
| | | |
| | | | | | | | | | | | |
| | | |
Borrowings & Other Financing Transactions | | | | | | | | | | | | |
| Payable for reverse repurchase agreements | | $ | 54,097 | | | $ | 19,520 | | | $ | 116,233 | |
| Payable for short sales | | | 0 | | | | 655 | | | | 3,509 | |
Financial Derivative Instruments | | | | | | | | | | | | |
| Exchange-traded or centrally cleared | | | 2 | | | | 887 | | | | 131 | |
| Over the counter | | | 160 | | | | 210 | | | | 416 | |
| Payable for investments purchased | | | 282 | | | | 288 | | | | 4,526 | |
| Payable for investments in Affiliates purchased | | | 41 | | | | 59 | | | | 41 | |
| Payable for TBA investments purchased | | | 0 | | | | 84,861 | | | | 553,143 | |
| Payable for unfunded loan commitments | | | 318 | | | | 116 | | | | 106 | |
| Deposits from counterparty | | | 774 | | | | 3,783 | | | | 5,570 | |
| Distributions payable to common shareholders | | | 959 | | | | 787 | | | | 2,339 | |
| Overdraft due to custodian | | | 0 | | | | 10 | | | | 0 | |
| Accrued management fees | | | 104 | | | | 98 | | | | 166 | |
| Foreign capital gains tax payable | | | 0 | | | | 2 | | | | 7 | |
| Other liabilities | | | 0 | | | | 0 | | | | 1 | |
| | | 56,737 | | | | 111,276 | | | | 686,188 | |
| | | |
Commitments and contingent liabilities^ | | | | | | | | | | | | |
| | | |
Net Assets Applicable to Common Shareholders | | $ | 78,089 | | | $ | 84,989 | | | $ | 200,907 | |
| | | |
Net Assets Applicable to Common Shareholders Consist of: | | | | | | | | | | | | |
| | | |
| | $ | 12 | | | $ | 0 | | | $ | 0 | |
| Paid in capital in excess of par | | | 111,528 | | | | 136,245 | | | | 346,157 | |
| Distributable earnings (accumulated loss) | | | (33,451 | ) | | | (51,256 | ) | | | (145,250 | ) |
| | | |
Net Assets Applicable to Common Shareholders | | $ | 78,089 | | | $ | 84,989 | | | $ | 200,907 | |
| | | |
Common Shares Outstanding | | | 11,985 | | | | 11,407 | | | | 45,861 | |
| | | |
Net Asset Value Per Common Share (a) | | $ | 6.52 | | | $ | 7.45 | | | $ | 4.38 | |
| | | |
| Cost of investments in securities | | $ | 140,665 | | | $ | 147,868 | | | $ | 663,958 | |
| Cost of investments in Affiliates | | $ | 9,564 | | | $ | 14,322 | | | $ | 4,760 | |
| Cost of foreign currency held | | $ | 4 | | | $ | 0 | | | $ | 0 | |
| Proceeds received on short sales | | $ | 0 | | | $ | 647 | | | $ | 3,347 | |
| Cost or premiums of financial derivative instruments, net | | $ | 1,088 | | | $ | 568 | | | $ | 9,529 | |
| | | |
| * Includes repurchase agreements of: | | $ | 355 | | | $ | 499 | | | $ | 1,482 | |
| A zero balance may reflect actual amounts rounding to less than one thousand. |
| See Note 9, Fees and Expenses, in the Notes to Financial Statements for more information. |
| ($0.001 per share), ($0.00001 per share), ($0.00001 per share). |
| Includes adjustments required by U.S. GAAP and may differ from net asset values and performance reported elsewhere by the Funds. |
| | | | | | |
Consolidated Statements of Assets and Liabilities | | | | December 31, 2023 | | (Unaudited) |
| | | | | | | | | | | | |
(Amounts in thousands , except per share amounts) | | | | | | | | PIMCO
Dynamic
Income
Opportunities
Fund | |
| | | |
| | | | | | | | | | | | |
| | | |
| | | | | | | | | | | | |
| Investments in securities* | | $ | 1,036,685 | | | $ | 7,175,518 | | | $ | 2,140,560 | |
| Investments in Affiliates | | | 91,888 | | | | 863,300 | | | | 154,334 | |
Financial Derivative Instruments | | | | | | | | | | | | |
| Exchange-traded or centrally cleared | | | 706 | | | | 5,016 | | | | 1,830 | |
| Over the counter | | | 1,020 | | | | 12,347 | | | | 7,289 | |
| Cash | | | 1,441 | | | | 0 | | | | 1,086 | |
| Deposits with counterparty | | | 15,046 | | | | 133,920 | | | | 55,349 | |
| Receivable for investments sold | | | 5,631 | | | | 99,529 | | | | 55,661 | |
| Receivable for Fund shares sold | | | 0 | | | | 1,641 | | | | 0 | |
| Interest and/or dividends receivable | | | 13,360 | | | | 88,817 | | | | 34,481 | |
| Dividends receivable from Affiliates | | | 298 | | | | 2,159 | | | | 575 | |
| Other assets | | | 68 | | | | 3,098 | | | | 457 | |
| | | 1,166,143 | | | | 8,385,345 | | | | 2,451,622 | |
| | | |
| | | | | | | | | | | | |
| | | |
Borrowings & Other Financing Transactions | | | | | | | | | | | | |
| Payable for reverse repurchase agreements | | $ | 491,631 | | | $ | 3,271,734 | | | $ | 1,005,997 | |
Financial Derivative Instruments | | | | | | | | | | | | |
| Exchange-traded or centrally cleared | | | 21 | | | | 702 | | | | 338 | |
| Over the counter | | | 840 | | | | 13,057 | | | | 3,011 | |
| Payable for investments purchased | | | 2,968 | | | | 57,941 | | | | 9,165 | |
| Payable for investments in Affiliates purchased | | | 343 | | | | 2,465 | | | | 662 | |
| Payable for unfunded loan commitments | | | 3,211 | | | | 18,811 | | | | 3,291 | |
| Deposits from counterparty | | | 6,906 | | | | 36,485 | | | | 12,729 | |
| Distributions payable to common shareholders | | | 6,578 | | | | 62,557 | | | | 14,409 | |
| Overdraft due to custodian | | | 441 | | | | 6,748 | | | | 385 | |
| Accrued management fees | | | 1,232 | | | | 7,707 | | | | 2,313 | |
| Foreign capital gains tax payable | | | 1 | | | | 107 | | | | 43 | |
| Other liabilities | | | 1 | | | | 186 | | | | 3 | |
| | | 514,173 | | | | 3,478,500 | | | | 1,052,346 | |
| | | |
Commitments and contingent liabilities^ | | | | | | | | | | | | |
| | | |
Net Assets Applicable to Common Shareholders | | $ | 651,970 | | | $ | 4,906,845 | | | $ | 1,399,276 | |
| | | |
Net Assets Applicable to Common Shareholders Consist of: | | | | | | | | | | | | |
| | | |
| | $ | 0 | | | $ | 3 | | | $ | 1 | |
| Paid in capital in excess of par | | | 880,383 | | | | 7,211,908 | | | | 2,235,017 | |
| Distributable earnings (accumulated loss) | | | (228,413 | ) | | | (2,305,066 | ) | | | (835,742 | ) |
| | | |
Net Assets Applicable to Common Shareholders | | $ | 651,970 | | | $ | 4,906,845 | | | $ | 1,399,276 | |
| | | |
Common Shares Outstanding | | | 44,030 | | | | 285,537 | | | | 112,658 | |
| | | |
Net Asset Value Per Common Share (a) : | | $ | 14.81 | | | $ | 17.18 | | | $ | 12.42 | |
| | | |
| Cost of investments in securities | | $ | 1,177,058 | | | $ | 8,398,525 | | | $ | 2,639,981 | |
| Cost of investments in Affiliates | | $ | 91,866 | | | $ | 766,445 | | | $ | 154,296 | |
| Cost or premiums of financial derivative instruments, net | | $ | 11,229 | | | $ | 27,997 | | | $ | 20,388 | |
| | | |
| * Includes repurchase agreements of: | | $ | 0 | | | $ | 154,274 | | | $ | 0 | |
| A zero balance may reflect actual amounts rounding to less than one thousand. |
| See Note 9, Fees and Expenses, in the Notes to Financial Statements for more information. |
| Includes adjustments required by U.S. GAAP and may differ from net asset values and performance reported elsewhere by the Funds. |
| | | | | | | | | | | | |
| Six Months Ended December 31, 2023 (Unaudited) | |
| | | | | | | | Strategic
Income Fund,
Inc. | |
| | | |
| | | | | | | | | | | | |
| | | |
| Interest, net of foreign taxes* | | $ | 6,031 | | | $ | 4,966 | | | $ | 13,705 | |
| Dividends | | | 56 | | | | 119 | | | | 99 | |
| Dividends from Investments in Affiliates | | | 59 | | | | 113 | | | | 56 | |
| Miscellaneous income | | | 0 | | | | 19 | | | | 0 | |
| Total Income | | | 6,146 | | | | 5,217 | | | | 13,860 | |
| | | |
| | | | | | | | | | | | |
| | | |
| Management fees | | | 628 | | | | 554 | | | | 919 | |
| Trustee fees and related expenses | | | 5 | | | | 17 | | | | 12 | |
| Interest expense | | | 2,115 | | | | 924 | | | | 3,958 | |
| Miscellaneous expense | | | 4 | | | | 0 | | | | 10 | |
| Total Expenses | | | 2,752 | | | | 1,495 | | | | 4,899 | |
| | | |
Net Investment Income (Loss) | | | 3,394 | | | | 3,722 | | | | 8,961 | |
| | | |
Net Realized Gain (Loss): | | | | | | | | | | | | |
| | | |
| Investments in securities | | | (1,860 | ) | | | (4,243 | ) | | | (11,794 | ) |
| Investments in Affiliates | | | 1 | | | | 0 | | | | 1 | |
| Exchange-traded or centrally cleared financial derivative instruments | | | (2,433 | ) | | | (3,329 | ) | | | 5,020 | |
| Over the counter financial derivative instruments | | | (31 | ) | | | 7,379 | | | | 44 | |
| Foreign currency | | | 0 | | | | (29 | ) | | | (843 | ) |
| | | |
| | | (4,323 | ) | | | (222 | ) | | | (7,572 | ) |
| | | |
Net Change in Unrealized Appreciation (Depreciation): | | | | | | | | | | | | |
| | | |
| Investments in securities | | | 696 | | | | 6,302 | | | | 20,802 | |
| Investments in Affiliates | | | 2 | | | | 3 | | | | 1 | |
| Exchange-traded or centrally cleared financial derivative instruments | | | 3,019 | | | | 2,759 | | | | (5,813 | ) |
| Over the counter financial derivative instruments | | | 128 | | | | (6,042 | ) | | | 278 | |
| Foreign currency assets and liabilities | | | 0 | | | | 28 | | | | 21 | |
| | | |
Net Change in Unrealized Appreciation (Depreciation) | | | 3,845 | | | | 3,050 | | | | 15,289 | |
| | | |
Net Increase (Decrease) in Net Assets Resulting from Operations | | $ | 2,916 | | | $ | 6,550 | | | $ | 16,678 | |
| | | |
| * Foreign tax withholdings | | $ | 0 | | | $ | 6 | | | $ | 15 | |
| A zero balance may reflect actual amounts rounding to less than one thousand. |
| | | | |
Consolidated Statements of Operations
| | | | |
| | | | | | | | | | | | |
| Six Months Ended December 31, 2023 (Unaudited) | |
| | | | | | | | PIMCO
Dynamic
Income
Opportunities
Fund | |
| | | |
| | | | | | | | | | | | |
| | | |
| Interest, net of foreign taxes* | | $ | 54,396 | | | $ | 387,305 | | | $ | 105,292 | |
| Dividends | | | 828 | | | | 2,379 | | | | 2,261 | |
| Dividends from Investments in Affiliates | | | 419 | | | | 3,180 | | | | 906 | |
| Total Income | | | 55,643 | | | | 392,864 | | | | 108,459 | |
| | | |
| | | | | | | | | | | | |
| | | |
| Management fees | | | 7,041 | | | | 43,787 | | | | 13,641 | |
| Trustee fees and related expenses | | | 40 | | | | 266 | | | | 90 | |
| Interest expense | | | 16,091 | | | | 106,593 | | | | 32,827 | |
| Miscellaneous expense | | | 6 | | | | 68 | | | | 18 | |
| Total Expenses | | | 23,178 | | | | 150,714 | | | | 46,576 | |
| | | |
Net Investment Income (Loss) | | | 32,465 | | | | 242,150 | | | | 61,883 | |
| | | |
Net Realized Gain (Loss): | | | | | | | | | | | | |
| | | |
| Investments in securities | | | (25,355 | ) | | | (127,893 | ) | | | (81,951 | ) |
| Investments in Affiliates | | | 3 | | | | 25 | | | | 3 | |
| Exchange-traded or centrally cleared financial derivative instruments | | | (4,863 | ) | | | (159,882 | ) | | | (41,689 | ) |
| Over the counter financial derivative instruments | | | 3,320 | | | | (4,241 | ) | | | 5,653 | |
| Foreign currency | | | (545 | ) | | | 4,526 | | | | (484 | ) |
| | | |
| | | (27,440 | ) | | | (287,465 | ) | | | (118,468 | ) |
| | | |
Net Change in Unrealized Appreciation (Depreciation): | | | | | | | | | | | | |
| | | |
| Investments in securities | | | 24,450 | | | | 133,881 | | | | 56,895 | |
| Investments in Affiliates | | | 22 | | | | 32,327 | | | | 38 | |
| Exchange-traded or centrally cleared financial derivative instruments | | | 10,066 | | | | 187,906 | | | | 53,725 | |
| Over the counter financial derivative instruments | | | (881 | ) | | | 22,398 | | | | 4,244 | |
| Foreign currency assets and liabilities | | | (1,579 | ) | | | (4,393 | ) | | | (2,032 | ) |
| | | |
Net Change in Unrealized Appreciation (Depreciation) | | | 32,078 | | | | 372,119 | | | | 112,870 | |
| | | |
Net Increase (Decrease) in Net Assets Resulting from Operations | | $ | 37,103 | | | $ | 326,804 | | | $ | 56,285 | |
| | | |
| * Foreign tax withholdings - Interest | | $ | 3 | | | $ | 150 | | | $ | 24 | |
| A zero balance may reflect actual amounts rounding to less than one thousand. |
| | | | |
Statements of Changes in Net Assets | | | | |
| | | | | | | | | | | | | | | | |
| | | | | | PIMCO Global StocksPLUS & Income Fund | |
| | | | |
| | Six Months Ended
December 31, 2023
(Unaudited) | | | | | | Six Months Ended
December 31, 2023
(Unaudited) | | | | |
| | | | |
Increase (Decrease) in Net Assets from: | | | | | | | | | | | | | | | | |
| | | | |
| | | | | | | | | | | | | | | | |
| | | | |
| Net investment income (loss) | | $ | 3,394 | | | $ | 9,680 | | | $ | 3,722 | | | $ | 8,679 | |
| Net realized gain (loss) | | | (4,323 | ) | | | (3,469 | ) | | | (222 | ) | | | (17,101 | ) |
| Net change in unrealized appreciation (depreciation) | | | 3,845 | | | | (6,281 | ) | | | 3,050 | | | | 18,061 | |
| | | | |
Net Increase (Decrease) in Net Assets Applicable to Common Shareholders Resulting from Operations | | | 2,916 | | | | (70 | ) | | | 6,550 | | | | 9,639 | |
| | | | |
Distributions to Common Shareholders: | | | | | | | | | | | | | | | | |
| | | | |
| From net investment income and/or net realized capital gains | | | (5,737 | ) | | | (8,675 | ) | | | (4,710 | ) | | | (9,334 | ) |
| Tax basis return of capital | | | 0 | | | | (2,703 | ) | | | 0 | | | | 0 | |
| | | | |
Total Distributions to Common Shareholders (a) | | | (5,737 | ) | | | (11,378 | ) | | | (4,710 | ) | | | (9,334 | ) |
| | | | |
Common Share Transactions*: | | | | | | | | | | | | | | | | |
| | | | |
| Issued as reinvestment of distributions | | | 592 | | | | 1,127 | | | | 482 | | | | 1,009 | |
| | | | |
Net Increase (decrease) resulting from common share transactions | | | 592 | | | | 1,127 | | | | 482 | | | | 1,009 | |
| | | | |
Total increase (decrease) in net assets applicable to common shareholders | | | (2,229 | ) | | | (10,321 | ) | | | 2,322 | | | | 1,314 | |
| | | | |
Net Assets Applicable to Common Shareholders: | | | | | | | | | | | | | | | | |
| | | | |
| Beginning of period | | | 80,318 | | | | 90,639 | | | | 82,667 | | | | 81,353 | |
| End of period | | $ | 78,089 | | | $ | 80,318 | | | $ | 84,989 | | | $ | 82,667 | |
| | | | |
*Common Share Transactions: | | | | | | | | | | | | | | | | |
| | | | |
| Shares issued as reinvestment of distributions | | | 72 | | | | 131 | | | | 70 | | | | 140 | |
| Net increase (decrease) in common shares outstanding | | | 72 | | | | 131 | | | | 70 | | | | 140 | |
| A zero balance may reflect actual amounts rounding to less than one thousand. |
| The tax characterization of distributions is determined in accordance with Federal income tax regulations. The actual tax characterization of distributions paid is determined at the end of the fiscal year. See Note 2, Distributions — Common Shares, in the Notes to Financial Statements for more information. |
| | | | | | |
PIMCO
Strategic Income Fund, Inc. | |
| |
Six Months Ended
December 31, 2023
(Unaudited) | | | | |
| |
| | | | | | |
| |
| | | | | | |
| |
| $ | 8,961 | | | $ | 17,754 | |
| | (7,572 | ) | | | (13,114 | ) |
| | 15,289 | | | | 6,292 | |
| |
|
16,678 |
| | | 10,932 | |
| |
| | | | | | |
| |
| | (13,990 | ) | | | (27,542 | ) |
| | 0 | | | | (135 | ) |
| |
| | (13,990 | ) | | | (27,677 | ) |
| |
| | | | | | |
| |
| | 1,722 | | | | 3,224 | |
| |
| | 1,722 | | | | 3,224 | |
| |
| | 4,410 | | | | (13,521 | ) |
| |
| | | | | | |
| |
| | 196,497 | | | | 210,018 | |
| $ | 200,907 | | | $ | 196,497 | |
| |
| | | | | | |
| |
| | 339 | | | | 644 | |
| | 339 | | | | 644 | |
| | | | |
Consolidated Statements of Changes in Net Assets | | | | |
| | | | | | | | | | | | | | | | |
| | | | | | | |
| | | | |
| | Six Months Ended
December 31, 2023
(Unaudited) | | | | | | Six Months Ended
December 31, 2023
(Unaudited) | | | | |
| | | | |
Increase (Decrease) in Net Assets from: | | | | | | | | | | | | | | | | |
| | | | |
| | | | | | | | | | | | | | | | |
| | | | |
| Net investment income (loss) | | $ | 32,465 | | | $ | 79,679 | | | $ | 242,150 | | | $ | 544,739 | |
| Net realized gain (loss) | | | (27,440 | ) | | | (50,054 | ) | | | (287,465 | ) | | | (215,286 | ) |
| Net change in unrealized appreciation (depreciation) | | | 32,078 | | | | (33,804 | ) | | | 372,119 | | | | (165,047 | ) |
| | | | |
Net Increase (Decrease) in Net Assets Applicable to Common Shareholders Resulting from Operations | | | 37,103 | | | | (4,179 | ) | | | 326,804 | | | | 164,406 | |
| | | | |
Distributions to Common Shareholders: | | | | | | | | | | | | | | | | |
| | | | |
| From net investment income and/or net realized capital gains | | | (39,453 | ) | | | (98,875 | ) | | | (364,408 | ) | | | (803,703 | ) |
| | | | |
Total Distributions to Common Shareholders (a) | | | (39,453 | ) | | | (98,875 | ) | | | (364,408 | ) | | | (803,703 | ) |
| | | | |
Common Share Transactions*: | | | | | | | | | | | | | | | | |
| | | | |
Net proceeds from offering | | | 0 | | | | 0 | | | | 324,907 | | | | 659,397 | |
| | | 0 | | | | 0 | | | | (416 | ) | | | 0 | |
| Issued as reinvestment of distributions | | | 429 | | | | 292 | | | | 41,476 | | | | 91,496 | |
| | | | |
Net increase (decrease) resulting from common share transactions | | | 429 | | | | 292 | | | | 365,967 | | | | 750,893 | |
| | | | |
Total increase (decrease) in net assets applicable to common shareholders | | | (1,921 | ) | | | (102,762 | ) | | | 328,363 | | | | 111,596 | |
| | | | |
Net Assets Applicable to Common Shareholders: | | | | | | | | | | | | | | | | |
| | | | |
| Beginning of period | | | 653,891 | | | | 756,653 | | | | 4,578,482 | | | | 4,466,886 | |
| End of period | | $ | 651,970 | | | $ | 653,891 | | | $ | 4,906,845 | | | $ | 4,578,482 | |
| | | | |
*Common Share Transactions: | | | | | | | | | | | | | | | | |
| | | | |
| Shares sold | | | 0 | | | | 0 | | | | 17,987 | | | | 33,641 | |
| Shares issued as reinvestment of distributions | | | 29 | | | | 18 | | | | 2,420 | | | | 4,931 | |
| Net increase (decrease) in common shares outstanding | | | 29 | | | | 18 | | | | 20,407 | | | | 38,572 | |
| A zero balance may reflect actual amounts rounding to less than one thousand. |
| The tax characterization of distributions is determined in accordance with Federal income tax regulations. The actual tax characterization of distributions paid is determined at the end of the fiscal year. See Note 2, Dividends and Distributions to Shareholders, in the Notes to Financial Statements for more information. |
| | | | | | |
PIMCO
Dynamic Income
Opportunities Fund | |
| |
Six Months Ended
December 31, 2023
(Unaudited) | | | | |
| |
| | | | | | |
| |
| | | | | | |
| |
| $ | 61,883 | | | $ | 165,765 | |
| | (118,468 | ) | | | (175,444 | ) |
| | 112,870 | | | | (4,391 | ) |
| |
|
56,285 |
| | | (14,070 | ) |
| |
| | | | | | |
| |
| | (86,091 | ) | | | (275,384 | ) |
| |
| | (86,091 | ) | | | (275,384 | ) |
| |
| | | | | | |
| | 13,784 | | | | 527 | |
| | (55 | ) | | | 0 | |
| | 8,817 | | | | 10,956 | |
| |
| | 22,546 | | | | 11,483 | |
| |
| | (7,260 | ) | | | (277,971 | ) |
| |
| | | | | | |
| | 1,406,536 | | | | 1,684,507 | |
| $ | 1,399,276 | | | $ | 1,406,536 | |
| |
| | | | | | |
| |
| | 1,066 | | | | 37 | |
| | 715 | | | | 787 | |
| | 1,781 | | | | 824 | |
| | | | | | | | | | | | |
| Six Months Ended December 31, 2023 (Unaudited) | | | | | | | | | |
| | | | | PIMCO Global StocksPLUS & Income Fund | | | PIMCO
Strategic
Income Fund,
Inc. | |
| | | |
Cash Flows Provided by (Used for) Operating Activities: | | | | | | | | | | | | |
| | | |
| Net increase (decrease) in net assets resulting from operations | | $ | 2,916 | | | $ | 6,550 | | | $ | 16,678 | |
| | | |
Adjustments to Reconcile Net Increase (Decrease) in Net Assets from Operations to Net Cash Provided by (Used for) Operating Activities: | | | | | | | | | | | | |
| Purchases of long-term securities | | | (6,566 | ) | | | (334,070 | ) | | | (2,447,853 | ) |
| Proceeds from sales of long-term securities | | | 23,596 | | | | 336,272 | | | | 2,386,532 | |
| (Purchases) Proceeds from sales of short-term portfolio investments, net | | | (2,339 | ) | | | 2,027 | | | | 6,173 | |
| (Increase) decrease in deposits with counterparty | | | (140 | ) | | | (358 | ) | | | 627 | |
| (Increase) decrease in receivable for investments sold | | | 337 | | | | (3,390 | ) | | | 157,107 | |
| (Increase) decrease in interest and/or dividends receivable | | | 461 | | | | 473 | | | | 260 | |
| (Increase) decrease in dividends receivable from Affiliates | | | (36 | ) | | | (51 | ) | | | (39 | ) |
| Proceeds from (Payments on) exchange-traded or centrally cleared financial derivative instruments | | | 430 | | | | (15 | ) | | | (1,307 | ) |
| Proceeds from (Payments on) over the counter financial derivative instruments | | | 68 | | | | 7,518 | | | | 83 | |
| (Increase) decrease in other assets | | | 0 | | | | (1 | ) | | | 0 | |
| Increase (decrease) in payable for investments purchased | | | (214 | ) | | | 1,931 | | | | (117,080 | ) |
| Increase (decrease) in payable for unfunded loan commitments | | | (880 | ) | | | (655 | ) | | | (1,597 | ) |
| Increase (decrease) in deposits from counterparty | | | 774 | | | | (4,790 | ) | | | 4,980 | |
| Increase (decrease) in accrued management fees | | | (13 | ) | | | (4 | ) | | | 0 | |
| Proceeds from (Payments on) short sales transactions, net | | | 0 | | | | (13 | ) | | | 969 | |
| Proceeds from (Payments on) foreign currency transactions | | | 0 | | | | 10 | | | | (849 | ) |
| Increase (decrease) in foreign capital gains tax payable | | | 0 | | | | (3 | ) | | | (5 | ) |
| | | | | | | | | | | | |
| Investments in securities | | | 1,860 | | | | 4,243 | | | | 11,794 | |
| Investments in Affiliates | | | (1 | ) | | | 0 | | | | (1 | ) |
| Exchange-traded or centrally cleared financial derivative instruments | | | 2,433 | | | | 3,329 | | | | (5,020 | ) |
| Over the counter financial derivative instruments | | | 31 | | | | (7,379 | ) | | | (44 | ) |
| Foreign currency | | | 0 | | | | 29 | | | | 843 | |
Net Change in Unrealized (Appreciation) Depreciation | | | | | | | | | | | | |
| Investments in securities | | | (696 | ) | | | (6,302 | ) | | | (20,802 | ) |
| Investments in Affiliates | | | (2 | ) | | | (3 | ) | | | (1 | ) |
| Exchange-traded or centrally cleared financial derivative instruments | | | (3,019 | ) | | | (2,759 | ) | | | 5,813 | |
| Over the counter financial derivative instruments | | | (128 | ) | | | 6,042 | | | | (278 | ) |
| Foreign currency assets and liabilities | | | 0 | | | | (28 | ) | | | (21 | ) |
| Net amortization (accretion) on investments | | | (471 | ) | | | (655 | ) | | | (1,190 | ) |
| | | |
Net Cash Provided by (Used for) Operating Activities | | | 18,401 | | | | 7,948 | | | | (4,228 | ) |
| | | |
Cash Flows Received from (Used for) Financing Activities: | | | | | | | | | | | | |
| | | |
| Increase (decrease) in overdraft due to custodian | | | 0 | | | | (28 | ) | | | (40 | ) |
| Cash distributions paid to common shareholders* | | | (5,139 | ) | | | (4,223 | ) | | | (12,251 | ) |
| Proceeds from reverse repurchase agreements | | | 155,459 | | | | 66,286 | | | | 325,633 | |
| Payments on reverse repurchase agreements | | | (168,653 | ) | | | (69,938 | ) | | | (308,928 | ) |
| | | |
Net Cash Received from (Used for) Financing Activities | | | (18,333 | ) | | | (7,903 | ) | | | 4,414 | |
| | | |
Net Increase (Decrease) in Cash and Foreign Currency | | | 68 | | | | 45 | | | | 186 | |
| | | |
Cash and Foreign Currency: | | | | | | | | | | | | |
| | | |
| Beginning of period | | | 12 | | | | 9 | | | | 0 | |
| End of period | | $ | 80 | | | $ | 54 | | | $ | 186 | |
| | | |
| * Reinvestment of distributions | | $ | 592 | | | $ | 482 | | | $ | 1,722 | |
| | | |
Supplemental Disclosure of Cash Flow Information: | | | | | | | | | | | | |
| | | |
| Interest expense paid during the period | | $ | 2,366 | | | $ | 1,030 | | | $ | 3,608 | |
| Non-Cash Payment In-Kind | | $ | 36 | | | $ | 175 | | | $ | 737 | |
| A zero balance may reflect actual amounts rounding to less than one thousand. |
A Statement of Cash Flows is presented when a Fund has a significant amount of borrowing during the period, based on the average total borrowing outstanding in relation to total assets or when substantially all of a Fund’s investments are not classified as Level 1 or 2 in the fair value hierarchy.
| | | | |
Consolidated Statements of Cash Flows | | | | |
| | | | | | | | | | | | |
| Six Months Ended December 31, 2023 (Unaudited) | | | | | | | | | |
| | | | | | | | PIMCO
Dynamic
Income
Opportunities
Fund | |
| | | |
Cash Flows Provided by (Used for) Operating Activities: | | | | | | | | | | | | |
| | | |
| Net increase (decrease) in net assets resulting from operations | | $ | 37,103 | | | $ | 326,804 | | | $ | 56,285 | |
| | | |
Adjustments to Reconcile Net Increase (Decrease) in Net Assets from Operations to Net Cash Provided by (Used for) Operating Activities: | | | | | | | | | | | | |
| | | |
| Purchases of long-term securities | | | (84,960 | ) | | | (592,124 | ) | | | (166,102 | ) |
| Proceeds from sales of long-term securities | | | 92,342 | | | | 1,001,813 | | | | 365,819 | |
| (Purchases) Proceeds from sales of short-term portfolio investments, net | | | 68,408 | | | | (361,129 | ) | | | (93,044 | ) |
| (Increase) decrease in deposits with counterparty | | | (922 | ) | | | (24,226 | ) | | | 4,428 | |
| (Increase) decrease in receivable for investments sold | | | 26,268 | | | | 227,232 | | | | 86,565 | |
| (Increase) decrease in interest and/or dividends receivable | | | 1,431 | | | | 22,526 | | | | 8,373 | |
| (Increase) decrease in dividends receivable from Affiliates | | | (298 | ) | | | (2,159 | ) | | | (575 | ) |
| Proceeds from (Payments on) exchange-traded or centrally cleared financial derivative instruments | | | 4,096 | | | | 22,340 | | | | 9,980 | |
| Proceeds from (Payments on) over the counter financial derivative instruments | | | 3,495 | | | | (2,923 | ) | | | 6,025 | |
| (Increase) decrease in other assets | | | (68 | ) | | | 300 | | | | (133 | ) |
| Increase (decrease) in payable for investments purchased | | | (83,062 | ) | | | (234,340 | ) | | | (8,753 | ) |
| Increase (decrease) in payable for unfunded loan commitments | | | 360 | | | | (21,789 | ) | | | (12,591 | ) |
| Increase (decrease) in deposits from counterparty | | | 4,582 | | | | 22,780 | | | | 4,289 | |
| Increase (decrease) in accrued management fees | | | (75 | ) | | | 198 | | | | (242 | ) |
| Increase (decrease) in foreign capital gains taxes payable | | | (1 | ) | | | (198 | ) | | | (119 | ) |
| Proceeds from (Payments on) foreign currency transactions | | | (837 | ) | | | 4,742 | | | | (1,644 | ) |
| Increase (decrease) in other liabilities | | | 1 | | | | (27 | ) | | | 1 | |
| | | | | | | | | | | | |
| Investments in securities | | | 25,355 | | | | 127,893 | | | | 81,951 | |
| Investments in Affiliates | | | (3 | ) | | | (25 | ) | | | (3 | ) |
| Exchange-traded or centrally cleared financial derivative instruments | | | 4,863 | | | | 159,882 | | | | 41,689 | |
| Over the counter financial derivative instruments | | | (3,320 | ) | | | 4,241 | | | | (5,653 | ) |
| Foreign currency | | | 545 | | | | (4,526 | ) | | | 484 | |
Net Change in Unrealized (Appreciation) Depreciation | | | | | | | | | | | | |
| Investments in securities | | | (24,450 | ) | | | (133,881 | ) | | | (56,895 | ) |
| Investments in Affiliates | | | (22 | ) | | | (32,327 | ) | | | (38 | ) |
| Exchange-traded or centrally cleared financial derivative instruments | | | (10,066 | ) | | | (187,906 | ) | | | (53,725 | ) |
| Over the counter financial derivative instruments | | | 881 | | | | (22,398 | ) | | | (4,244 | ) |
| Foreign currency assets and liabilities | | | 1,579 | | | | 4,393 | | | | 2,032 | |
| Net amortization (accretion) on investments | | | (8,158 | ) | | | (61,768 | ) | | | (14,165 | ) |
| | | |
Net Cash Provided by (Used for) Operating Activities | | | 55,067 | | | | 243,398 | | | | 249,995 | |
| | | |
Cash Flows Received from (Used for) Financing Activities: | | | | | | | | | | | | |
| Net proceeds from at-the-market offering | | | 0 | | | | 330,866 | | | | 13,784 | |
| Net at-the-market offering cost | | | 0 | | | | (416 | ) | | | (55 | ) |
| Increase (decrease) in overdraft due to custodian | | | (3,433 | ) | | | (619 | ) | | | 385 | |
| Cash distributions paid* | | | (39,020 | ) | | | (318,317 | ) | | | (77,046 | ) |
| Proceeds from reverse repurchase agreements | | | 1,636,879 | | | | 10,440,392 | | | | 2,721,899 | |
| Payments on reverse repurchase agreements | | | (1,654,922 | ) | | | (10,699,632 | ) | | | (2,912,748 | ) |
| | | |
Net Cash Received from (Used for) Financing Activities | | | (60,496 | ) | | | (247,726 | ) | | | (253,781 | ) |
| | | |
Net Increase (Decrease) in Cash and Foreign Currency | | | (5,429 | ) | | | (4,328 | ) | | | (3,786 | ) |
| | | |
Cash and Foreign Currency: | | | | | | | | | | | | |
| | | |
| Beginning of period | | | 6,870 | | | | 4,328 | | | | 4,872 | |
| End of period | | $ | 1,441 | | | $ | 0 | | | $ | 1,086 | |
| | | |
| * Reinvestment of distributions | | $ | 429 | | | $ | 41,476 | | | $ | 8,817 | |
| | | |
Supplemental Disclosure of Cash Flow Information: | | | | | | | | | | | | |
| | | |
| Interest expense paid during the period | | $ | 16,287 | | | $ | 111,384 | | | $ | 33,795 | |
| Non Cash Payment in Kind | | $ | 2,863 | | | $ | 12,650 | | | $ | 6,273 | |
| A zero balance may reflect actual amounts rounding to less than one thousand. |
A Statement of Cash Flows is presented when a Fund has a significant amount of borrowing during the period, based on the average total borrowing outstanding in relation to total assets or when substantially all of a Fund’s investments are not classified as Level 1 or 2 in the fair value hierarchy.
(Amounts in thousands*, except number of shares, contracts, units and ounces, if any)
| | | | | | | | | | | | |
| | | | | | | | | | | |
INVESTMENTS IN SECURITIES 156.3% | |
| |
LOAN PARTICIPATIONS AND ASSIGNMENTS 18.3% | |
|
| |
| | $ | | | 81 | | | $ | | | 81 | |
| | | | | 1,659 | | | | | | 1,659 | |
|
| |
TBD% - 15.420% due 05/25/2026 | | | | | 1,284 | | | | | | 973 | |
|
Encina Private Credit LLC | |
TBD% - 9.241% due 11/30/2025 «µ | | | | | 1,011 | | | | | | 990 | |
|
| |
| | | | | 924 | | | | | | 928 | |
|
| |
TBD% - 13.988% due 03/01/2024 « | | | | | 1,025 | | | | | | 1,087 | |
|
| |
| | | | | 1,659 | | | | | | 1,580 | |
|
| |
| | | | | 27 | | | | | | 19 | |
|
Lealand Finance Co. BV (6.431% Cash and 3.000% PIK) | |
9.431% due 06/30/2025 (b) | | | | | 204 | | | | | | 85 | |
|
| |
| | | | | 560 | | | | | | 559 | |
|
| |
| | | | | 688 | | | | | | 679 | |
| | | | | 280 | | | | | | 279 | |
|
| |
| | | | | 393 | | | | | | 317 | |
|
Rising Tide Holdings, Inc. | |
| | | | | 86 | | | | | | 83 | |
|
| |
| | | | | 564 | | | | | | 539 | |
|
| |
| | | | | 1,998 | | | | | | 1,767 | |
|
| |
| | | | | 2,070 | | | | | | 1,578 | |
|
| |
| | | | | 819 | | | | | | 683 | |
|
Westmoreland Mining Holdings LLC | |
| | | | | 355 | | | | | | 263 | |
|
| |
| | | | | 164 | | | | | | 156 | |
| | | | | | | | | | | | |
Total Loan Participations and Assignments
(Cost $14,402) | | | | | | | |
| | | | | | | | | | | | |
| |
CORPORATE BONDS & NOTES 22.2% | |
| |
| |
|
| |
5.950% due 08/15/2034 (j) | | | | | 1,100 | | | | | | 1,157 | |
|
| |
| | | | | 51 | | | | | | 48 | |
|
| |
1.800% due 02/02/2031 ^(c) | | | | | 284 | | | | | | 189 | |
4.345% due 04/29/2028 ^(c) | | | | | 100 | | | | | | 66 | |
4.570% due 04/29/2033 ^(c) | | | | | 200 | | | | | | 132 | |
|
| |
6.000% due 01/15/2030 (j) | | | | | 1,065 | | | | | | 745 | |
10.500% due 02/15/2028 (j) | | | | | 807 | | | | | | 819 | |
|
Voyager Aviation Holdings LLC | |
8.500% due 05/09/2026 ^«(c) | | | | | 2,205 | | | | | | 1,199 | |
| | | | | | | | | | | | |
| | | | | | | | | | | 4,355 | |
| | | | | | | | | | | | |
| |
| |
|
Carvana Co. (12.000% PIK) | |
12.000% due 12/01/2028 (b) | | | | | 183 | | | | | | 148 | |
|
Carvana Co. (13.000% PIK) | |
13.000% due 06/01/2030 (b) | | | | | 525 | | | | | | 419 | |
|
Carvana Co. (14.000% PIK) | |
14.000% due 06/01/2031 (b) | | | | | 458 | | | | | | 370 | |
|
| |
5.880% due 01/10/2028 (j) | | | | | 587 | | | | | | 581 | |
|
| |
| | | | | 200 | | | | | | 188 | |
| | | | | | | | | | | | |
| | | | | | | | | | | |
|
| |
5.250% due 12/01/2026 (j) | | $ | | | 660 | | | $ | | | 567 | |
5.750% due 12/01/2028 (j) | | | | | 400 | | | | | | 320 | |
|
| |
11.750% due 11/15/2027 (j) | | | | | 800 | | | | | | 836 | |
|
Exela Intermediate LLC (11.500% PIK) | |
11.500% due 04/15/2026 (b) | | | | | 14 | | | | | | 3 | |
|
| |
| | | | | 100 | | | | | | 98 | |
|
| |
| | | | | 100 | | | | | | 101 | |
| | | | | 500 | | | | | | 527 | |
|
Newfold Digital Holdings Group, Inc. | |
| | | | | 300 | | | | | | 323 | |
|
Raising Cane’s Restaurants LLC | |
| | | | | 100 | | | | | | 107 | |
|
| |
4.875% due 09/30/2039 (j) | | | | | 261 | | | | | | 241 | |
5.750% due 09/30/2039 (j) | | | | | 1,092 | | | | | | 1,087 | |
|
| |
| | | | | 400 | | | | | | 406 | |
|
| |
10.625% due 06/28/2028 (j) | | | | | 249 | | | | | | 191 | |
|
| |
| | | | | 100 | | | | | | 103 | |
|
| |
| | | | | 100 | | | | | | 101 | |
|
| |
7.500% due 09/01/2025 (j) | | | | | 650 | | | | | | 537 | |
|
Wesco Aircraft Holdings, Inc. (7.500% Cash and 3.000% PIK) | |
10.500% due 11/15/2026 ^(b)(c) | | | | | 4,180 | | | | | | 3,804 | |
|
| |
7.750% due 08/15/2028 (j) | | | | | 1,752 | | | | | | 1,536 | |
| | | | | | | | | | | | |
| | | | | | | | | | | 12,594 | |
| | | | | | | | | | | | |
| |
| |
|
Pacific Gas & Electric Co. | |
| | | | | 2 | | | | | | 1 | |
4.300% due 03/15/2045 (j) | | | | | 463 | | | | | | 364 | |
| | | | | | | | | | | | |
| | | | | | | | | | | 365 | |
| | | | | | | | | | | | |
Total Corporate Bonds & Notes (Cost $19,379) | | | | |
| | | | | | | | | | | | |
| |
CONVERTIBLE BONDS & NOTES 0.6% | |
| |
| |
|
Multiplan Corp. (6.000% Cash or 7.000% PIK) | |
6.000% due 10/15/2027 (b)(j) | | | | | 700 | | | | | | 465 | |
| | | | | | | | | | | | |
Total Convertible Bonds & Notes (Cost $690) | | | | |
| | | | | | | | | | | | |
| |
MUNICIPAL BONDS & NOTES 1.6% | |
| |
| |
|
Commonwealth of Puerto Rico Bonds, Series 2022 | |
| | | | | 1,328 | | | | | | 725 | |
| | | | | 1,188 | | | | | | 558 | |
| | | | | | | | | | | | |
Total Municipal Bonds & Notes (Cost $1,229) | | | | |
| | | | | | | | | | | | |
| |
U.S. GOVERNMENT AGENCIES 4.2% | |
|
| |
4.000% due 06/25/2050 (a)(j) | | | | | 2,857 | | | | | | 532 | |
|
| |
0.698% due 05/25/2050 •(a)(j) | | | | | 1,496 | | | | | | 207 | |
0.700% due 11/25/2055 ~(a) | | | | | 5,951 | | | | | | 356 | |
2.010% due 11/25/2045 ~(a) | | | | | 1,027 | | | | | | 71 | |
3.500% due 02/25/2041 (a)(j) | | | | | 1,703 | | | | | | 210 | |
4.000% due 07/25/2050 (a)(j) | | | | | 5,468 | | | | | | 1,206 | |
5.000% due 03/15/2040 (a)(j) | | | | | 178 | | | | | | 9 | |
10.602% due 10/25/2029 •(j) | | | | | 250 | | | | | | 273 | |
| | | | | 381 | | | | | | 401 | |
| | | | | | | | | | | | |
Total U.S. Government Agencies (Cost $3,410) | | | | |
| | | | | | | | | | | | |
| | | | | | | | | | | | |
| | | | | | | | | | | |
NON-AGENCY MORTGAGE-BACKED SECURITIES 43.6% | |
|
| |
3.657% due 06/05/2037 ~(j) | | $ | | | 1,065 | | | $ | | | 857 | |
|
Adjustable Rate Mortgage Trust | |
| | | | | 48 | | | | | | 43 | |
|
Ashford Hospitality Trust | |
6.934% due 04/15/2035 ~(j) | | | | | 900 | | | | | | 880 | |
|
Banc of America Alternative Loan Trust | |
| | | | | 62 | | | | | | 53 | |
|
Banc of America Funding Trust | |
| | | | | 33 | | | | | | 27 | |
| | | | | 183 | | | | | | 134 | |
| | | | | 34 | | | | | | 34 | |
| | | | | 318 | | | | | | 218 | |
|
Banc of America Mortgage Trust | |
| | | | | 37 | | | | | | 34 | |
| | | | | 108 | | | | | | 105 | |
|
Bancorp Commercial Mortgage Trust | |
9.193% due 08/15/2032 ~(j) | | | | | 190 | | | | | | 188 | |
|
Barclays Commercial Mortgage Securities Trust | |
3.688% due 02/15/2053 ~(j) | | | | | 1,000 | | | | | | 758 | |
8.484% due 10/15/2037 •(j) | | | | | 900 | | | | | | 859 | |
|
| |
| | | | | 50 | | | | | | 41 | |
|
| |
| | | | | 804 | | | | | | 729 | |
| | | | | 23 | | | | | | 16 | |
| | | | | 21 | | | | | | 9 | |
| | | | | 183 | | | | | | 93 | |
| | | | | 458 | | | | | | 239 | |
| | | | | 100 | | | | | | 72 | |
| | | | | 60 | | | | | | 56 | |
| | | | | 382 | | | | | | 335 | |
|
Bear Stearns Asset-Backed Securities Trust | |
| | | | | 22 | | | | | | 14 | |
|
Bear Stearns Commercial Mortgage Securities Trust | |
| | | | | 33 | | | | | | 31 | |
|
| |
8.347% due 08/15/2036 ~(j) | | | | | 588 | | | | | | 575 | |
|
CBA Commercial Small Balance Commercial Mortgage | |
| | | | | 92 | | | | | | 85 | |
|
| |
| | | | | 57 | | | | | | 52 | |
|
Chase Mortgage Finance Trust | |
| | | | | 156 | | | | | | 88 | |
|
Citigroup Commercial Mortgage Trust | |
| | | | | 224 | | | | | | 144 | |
|
Citigroup Mortgage Loan Trust | |
| | | | | 920 | | | | | | 752 | |
4.984% due 11/25/2035 ~(j) | | | | | 1,081 | | | | | | 600 | |
| | | | | 649 | | | | | | 297 | |
|
Citigroup Mortgage Loan Trust, Inc. Mortgage Pass-Through Certificates | |
| | | | | 58 | | | | | | 41 | |
|
Commercial Mortgage Lease-Backed Certificates | |
6.250% due 06/20/2031 ~(j) | | | | | 87 | | | | | | 86 | |
|
Commercial Mortgage Loan Trust | |
| | | | | 133 | | | | | | 15 | |
|
Connecticut Avenue Securities Trust | |
8.437% due 10/25/2041 •(j) | | | | | 800 | | | | | | 808 | |
|
Countrywide Alternative Loan Trust | |
| | | | | 372 | | | | | | 162 | |
| | | | | 158 | | | | | | 25 | |
6.000% due 04/25/2036 (j) | | | | | 2,129 | | | | | | 1,022 | |
6.012% due 12/25/2035 •(j) | | | | | 525 | | | | | | 435 | |
6.020% due 10/25/2037 •(j) | | | | | 3,435 | | | | | | 854 | |
| | | | | 118 | | | | | | 95 | |
| | | | | 361 | | | | | | 319 | |
|
Countrywide Home Loan Mortgage Pass-Through Trust | |
| | | | | 54 | | | | | | 47 | |
| | | | | 174 | | | | | | 153 | |
| | | | | 180 | | | | | | 82 | |
| | | | | 64 | | | | | | 55 | |
| | | | | 305 | | | | | | 199 | |
| | | | | 2 | | | | | | 2 | |
| | | | | | | | |
| | | | | | December 31, 2023 | | (Unaudited) |
| | | | | | | | | | | | |
| | | | | | | | | | | |
|
Credit Suisse First Boston Mortgage Securities Corp. | |
| | $ | | | 28 | | | $ | | | 28 | |
|
Credit Suisse Mortgage Capital Mortgage-Backed Trust | |
6.000% due 07/25/2036 (j) | | | | | 847 | | | | | | 417 | |
| | | | | 140 | | | | | | 74 | |
| | | | | 144 | | | | | | 56 | |
|
| |
0.194% due 10/15/2036 ~(a) | | | | | 147,870 | | | | | | 223 | |
7.509% due 06/15/2033 •(j) | | | | | 900 | | | | | | 582 | |
8.059% due 06/15/2033 •(j) | | | | | 200 | | | | | | 113 | |
|
Extended Stay America Trust | |
9.176% due 07/15/2038 ~(j) | | | | | 840 | | | | | | 824 | |
|
First Horizon Alternative Mortgage Securities Trust | |
| | | | | 1 | | | | | | 0 | |
|
| |
12.837% due 10/25/2041 •(j) | | | | | 1,100 | | | | | | 1,159 | |
13.137% due 11/25/2041 ~(j) | | | | | 1,100 | | | | | | 1,168 | |
|
GS Mortgage Securities Corp. Trust | |
4.591% due 10/10/2032 ~(j) | | | | | 800 | | | | | | 720 | |
| | | | | 100 | | | | | | 88 | |
|
GS Mortgage Securities Trust | |
0.448% due 08/10/2043 ~(a) | | | | | 1,772 | | | | | | 15 | |
|
| |
| | | | | 573 | | | | | | 367 | |
|
HarborView Mortgage Loan Trust | |
| | | | | 390 | | | | | | 236 | |
|
IndyMac INDA Mortgage Loan Trust | |
| | | | | 92 | | | | | | 70 | |
|
IndyMac INDX Mortgage Loan Trust | |
| | | | | 88 | | | | | | 47 | |
| | | | | 213 | | | | | | 189 | |
|
JP Morgan Alternative Loan Trust | |
6.500% due 03/25/2036 (j) | | | | | 740 | | | | | | 429 | |
|
JP Morgan Chase Commercial Mortgage Securities Trust | |
0.389% due 02/15/2046 «~(a)(j) | | | | | 52,385 | | | | | | 24 | |
| | | | | 26 | | | | | | 215 | |
7.085% due 07/05/2033 •(j) | | | | | 843 | | | | | | 725 | |
9.726% due 02/15/2035 •(j) | | | | | 786 | | | | | | 756 | |
11.866% due 11/15/2038 •(j) | | | | | 900 | | | | | | 819 | |
|
| |
| | | | | 7 | | | | | | 7 | |
|
| |
| | | | | 142 | | | | | | 91 | |
| | | | | 4 | | | | | | 4 | |
|
MASTR Adjustable Rate Mortgages Trust | |
| | | | | 181 | | | | | | 86 | |
|
MASTR Asset Securitization Trust | |
| | | | | 146 | | | | | | 90 | |
|
Merrill Lynch Mortgage Investors Trust | |
| | | | | 2 | | | | | | 2 | |
| | | | | 8 | | | | | | 7 | |
| | | | | 35 | | | | | | 34 | |
| | | | | 13 | | | | | | 11 | |
| | | | | 34 | | | | | | 31 | |
|
| |
4.191% due 08/25/2061 ~(j) | | | | | 1,000 | | | | | | 861 | |
4.260% due 12/25/2066 ~(j) | | | | | 1,000 | | | | | | 774 | |
|
Morgan Stanley Capital Trust | |
0.607% due 11/12/2049 ~(a) | | | | | 117 | | | | | | 0 | |
| | | | | 400 | | | | | | 371 | |
|
Morgan Stanley Mortgage Loan Trust | |
| | | | | 158 | | | | | | 126 | |
| | | | | 136 | | | | | | 50 | |
|
Morgan Stanley Re-REMIC Trust | |
4.203% due 03/26/2037 ~(j) | | | | | 1,716 | | | | | | 1,479 | |
|
Mortgage Equity Conversion Asset Trust | |
| | | | | 57 | | | | | | 52 | |
|
Natixis Commercial Mortgage Securities Trust | |
4.058% due 04/10/2037 ~(j) | | | | | 1,197 | | | | | | 610 | |
9.306% due 03/15/2035 •(j) | | | | | 279 | | | | | | 278 | |
10.555% due 03/15/2035 •(j) | | | | | 559 | | | | | | 555 | |
|
New Residential Mortgage Loan Trust | |
3.879% due 11/25/2059 ~(j) | | | | | 2,900 | | | | | | 1,443 | |
| | | | | | | | | | | | |
| | | | | | | | | | | |
|
Nomura Asset Acceptance Corp. Alternative Loan Trust | |
6.540% due 02/25/2035 •(j) | | $ | | | 174 | | | $ | | | 169 | |
|
| |
| | | | | 10 | | | | | | 9 | |
|
Residential Accredit Loans, Inc. Trust | |
| | | | | 163 | | | | | | 119 | |
| | | | | 112 | | | | | | 96 | |
| | | | | 61 | | | | | | 47 | |
| | | | | 112 | | | | | | 90 | |
|
Residential Asset Securitization Trust | |
| | | | | 181 | | | | | | 60 | |
|
Residential Funding Mortgage Securities, Inc. Trust | |
| | | | | 85 | | | | | | 69 | |
|
Structured Adjustable Rate Mortgage Loan Trust | |
| | | | | 146 | | | | | | 82 | |
| | | | | 171 | | | | | | 86 | |
| | | | | 17 | | | | | | 15 | |
|
Structured Asset Mortgage Investments Trust | |
5.890% due 08/25/2036 ~(j) | | | | | 297 | | | | | | 240 | |
|
TBW Mortgage-Backed Trust | |
| | | | | 102 | | | | | | 37 | |
|
Wachovia Bank Commercial Mortgage Trust | |
0.393% due 10/15/2041 ~(a) | | | | | 8 | | | | | | 0 | |
|
WaMu Mortgage Pass-Through Certificates Trust | |
3.918% due 12/25/2036 ~(j) | | | | | 151 | | | | | | 133 | |
6.370% due 10/25/2045 •(j) | | | | | 2,421 | | | | | | 2,021 | |
| | | | | 158 | | | | | | 142 | |
|
Washington Mutual Mortgage Pass-Through Certificates Trust | |
6.500% due 08/25/2036 (j) | | | | | 615 | | | | | | 504 | |
|
Wells Fargo Commercial Mortgage Trust | |
4.928% due 12/15/2039 ~(j) | | | | | 1,042 | | | | | | 870 | |
|
| |
| | | | | 2,400 | | | | | | 141 | |
| | | | | | | | | | | | |
Total Non-Agency Mortgage-Backed Securities (Cost $40,249) | | | | | | | |
| | | | | | | | | | | | |
| |
ASSET-BACKED SECURITIES 53.1% | |
|
AIM Aviation Finance Ltd. | |
6.213% due 02/15/2040 þ(j) | | | | | 823 | | | | | | 554 | |
|
Asset-Backed Securities Corp. Home Equity Loan Trust | |
6.565% due 02/25/2035 •(j) | | | | | 1,215 | | | | | | 1,247 | |
| | | | | 58 | | | | | | 57 | |
|
Bear Stearns Asset-Backed Securities Trust | |
| | | | | 19 | | | | | | 19 | |
5.653% due 04/25/2036 •(j) | | | | | 1,982 | | | | | | 2,779 | |
|
Bombardier Capital Mortgage Securitization Corp. | |
| | | | | 1,185 | | | | | | 143 | |
|
Citigroup Mortgage Loan Trust | |
5.790% due 12/25/2036 •(j) | | | | | 1,022 | | | | | | 571 | |
5.910% due 12/25/2036 •(j) | | | | | 632 | | | | | | 254 | |
6.170% due 11/25/2046 •(j) | | | | | 1,100 | | | | | | 864 | |
|
Conseco Finance Securitizations Corp. | |
| | | | | 324 | | | | | | 90 | |
| | | | | 747 | | | | | | 723 | |
|
Countrywide Asset-Backed Certificates Trust | |
5.870% due 06/25/2037 •(j) | | | | | 478 | | | | | | 481 | |
5.875% due 09/25/2046 •(j) | | | | | 4,167 | | | | | | 3,282 | |
5.950% due 05/25/2036 •(j) | | | | | 7,322 | | | | | | 6,091 | |
7.345% due 10/25/2035 •(j) | | | | | 2,225 | | | | | | 1,737 | |
|
| |
| | | | | 600 | | | | | | 366 | |
|
| |
| | | | | 87 | | | | | | 85 | |
| | | | | 184 | | | | | | 176 | |
|
Flagship Credit Auto Trust | |
0.000% due 06/15/2026 «(e) | | | | | 2 | | | | | | 71 | |
0.000% due 06/15/2029 «(e) | | | | | 14 | | | | | | 1,065 | |
|
GE Capital Mortgage Services, Inc. Trust | |
| | | | | 22 | | | | | | 19 | |
|
| |
7.270% due 06/25/2035 •(j) | | | | | 2,200 | | | | | | 2,069 | |
8.095% due 12/25/2034 ~(j) | | | | | 2,156 | | | | | | 1,689 | |
| | | | | | | | | | | | |
| | | | | | | | | | | |
|
Home Equity Mortgage Loan Asset-Backed Trust | |
5.710% due 04/25/2037 •(j) | | $ | | | 3,176 | | | $ | | | 2,054 | |
| | | | | 107 | | | | | | 105 | |
|
HSI Asset Securitization Corp. Trust | |
5.580% due 04/25/2037 •(j) | | | | | 2,756 | | | | | | 1,405 | |
5.810% due 12/25/2036 •(j) | | | | | 4,255 | | | | | | 1,121 | |
|
| |
| | | | | 714 | | | | | | 317 | |
|
| |
| | | | | 600 | | | | | | 396 | |
|
| |
0.000% due 07/16/2029 «(e) | | | | | 5 | | | | | | 113 | |
0.000% due 03/15/2030 «(e) | | | | | 8 | | | | | | 273 | |
|
MASTR Asset-Backed Securities Trust | |
5.690% due 08/25/2036 •(j) | | | | | 2,454 | | | | | | 946 | |
|
Morgan Stanley ABS Capital, Inc. Trust | |
5.610% due 10/25/2036 ~(j) | | | | | 7,863 | | | | | | 3,395 | |
| | | | | 91 | | | | | | 80 | |
|
Morgan Stanley Home Equity Loan Trust | |
6.535% due 05/25/2035 •(j) | | | | | 1,920 | | | | | | 1,699 | |
|
National Collegiate Commutation Trust | |
| | | | | 3,500 | | | | | | 931 | |
|
People’s Financial Realty Mortgage Securities Trust | |
5.600% due 09/25/2036 ~(j) | | | | | 5,696 | | | | | | 1,063 | |
|
Renaissance Home Equity Loan Trust | |
7.238% due 09/25/2037 þ(j) | | | | | 3,289 | | | | | | 1,402 | |
|
Securitized Asset-Backed Receivables LLC Trust | |
| | | | | 82 | | | | | | 79 | |
|
SMB Private Education Loan Trust | |
0.000% due 02/16/2055 «(e) | | | | | 0 | | | | | | 225 | |
|
SoFi Professional Loan Program LLC | |
0.000% due 05/25/2040 (e) | | | | | 1,000 | | | | | | 82 | |
0.000% due 09/25/2040 «(e) | | | | | 339 | | | | | | 41 | |
|
Soundview Home Loan Trust | |
6.420% due 10/25/2037 ~(j) | | | | | 1,586 | | | | | | 1,162 | |
|
Structured Asset Investment Loan Trust | |
| | | | | 68 | | | | | | 72 | |
|
UCFC Manufactured Housing Contract | |
| | | | | 50 | | | | | | 45 | |
| | | | | | | | | | | | |
Total Asset-Backed Securities (Cost $52,680) | | | | |
| | | | | | | | | | | | |
| |
| | | | | | | | | | | |
| |
| |
COMMUNICATION SERVICES 0.4% | |
| | | |
Clear Channel Outdoor Holdings, Inc. (d) | | | 108,013 | | | | | | 196 | |
| | | | |
iHeartMedia, Inc. ‘A’ (d) | | | | | 25,745 | | | | | | 69 | |
| | | | |
iHeartMedia, Inc. ‘B’ «(d) | | | | | 20,009 | | | | | | 48 | |
| | | | | | | | | | | | |
| | | | | | | | | | | 313 | |
| | | | | | | | | | | | |
| |
| |
| | | | |
Axis Energy Services ‘A’ «(h) | | | | | 3,344 | | | | | | 99 | |
| | | | | | | | | | | | |
| |
| |
| | | | |
| | | | | 81,058 | | | | | | 4,158 | |
| | | | | | | | | | | | |
| |
| |
| | | | |
Mcdermott International Ltd. (d) | | | | | 7,216 | | | | | | 1 | |
| | | |
Neiman Marcus Group Ltd. LLC «(d)(h) | | | 13,191 | | | | | | 1,977 | |
| | | | |
Syniverse Holdings, Inc. «(h) | | | | | 373,838 | | | | | | 327 | |
| | | |
Voyager Aviation Holdings LLC «(d) | | | 307 | | | | | | 0 | |
| | | |
Westmoreland Mining Holdings «(d)(h) | | | 9,154 | | | | | | 37 | |
| | | | |
Westmoreland Mining LLC «(d)(h) | | | | | 9,234 | | | | | | 32 | |
| | | | | | | | | | | | |
| | | | | | | | | | | 2,374 | |
| | | | | | | | | | | | |
| | | | | | | | | | | | |
| See Accompanying Notes | | | | | | | | | | DECEMBER 31, 2023 | | | |
| | | | | | | | | | | | |
| | | | | | | | | | | |
| |
| | | | |
| | | | | 9,914 | | | $ | | | 354 | |
| | | | |
| | | | | 2,750 | | | | | | 29 | |
| | | | |
| | | | | 43,518 | | | | | | 1,288 | |
| | | | | | | | | | | | |
| | | | | | | | | | | 1,671 | |
| | | | | | | | | | | | |
Total Common Stocks (Cost $7,088) | | | | | | | |
| | | | | | | | | | | | |
| |
| |
| |
| |
| | | | |
West Marine - Exp. 09/08/2028 « | | | | | 357 | | | | | | 0 | |
| | | | | | | | | | | | |
| | | | | | | | | | | | |
| | | | | | | | | | | | |
| |
PREFERRED SECURITIES 0.0% | |
| |
| |
|
| |
4.700% due 11/15/2031 ^(c)(g) | | | | | 11,000 | | | | | | 0 | |
| | | | | | | | | | | | |
| |
| |
|
Voyager Aviation Holdings LLC | |
| | | | | 1,842 | | | | | | 0 | |
| | | | | | | | | | | | |
Total Preferred Securities (Cost $605) | | | | | | | |
| | | | | | | | | | | | |
| | | | | | | | | | | | |
| | | | | | | | | | | |
REAL ESTATE INVESTMENT TRUSTS 0.9% | |
| |
| |
| | | |
CBL & Associates Properties, Inc. | | | 4,345 | | | $ | | | 106 | |
| | | | |
| | | | | 34,736 | | | | | | 201 | |
| | | | |
| | | | | 13,531 | | | | | | 431 | |
| | | | | | | | | | | | |
Total Real Estate Investment Trusts (Cost $317) | | | | |
| | | | | | | | | | | | |
| |
| | | | | | | | | | | |
SHORT-TERM INSTRUMENTS 0.8% | |
| |
REPURCHASE AGREEMENTS (i) 0.5% | |
| | | | | | | | | | | 355 | |
| | | | | | | | | | | | |
| |
| |
5.342% due 02/29/2024 (e)(f)(m) | | $ | | | 263 | | | | | | 261 | |
| | | | | | | | | | | | |
Total Short-Term Instruments | | | | | | | |
| | | | | | | | | | | | |
|
| |
Total Investments in Securities (Cost $140,665) | | | | |
| | | | | | | | | | | | |
| |
| | | | | | | | | | | | |
| | | | | | | | | | | |
INVESTMENTS IN AFFILIATES 12.3% | |
| |
SHORT-TERM INSTRUMENTS 12.3% | |
| |
CENTRAL FUNDS USED FOR CASH MANAGEMENT PURPOSES 12.3% | |
| | | | |
PIMCO Short-Term Floating NAV Portfolio III | | | | | 983,461 | | | $ | | | 9,566 | |
| | | | | | | | | | | | |
Total Short-Term Instruments (Cost $9,564) | | | | | | | | | | |
| | | | | | | | | | | | |
| | | | |
| | | | | | | | | | | | |
Total Investments in Affiliates (Cost $9,564) | | | | | | | |
| | | | |
| | | | | | | | | | | | |
Total Investments 168.6%
(Cost $150,229) | | | $ | | | | |
| |
Financial Derivative
Instruments (k)(l) (0.1)% (Cost or Premiums, net $1,088) | | | | | | | |
| |
Other Assets and Liabilities, net (68.5)% | | | | | | | |
| | | | | | | | | | | | |
| | | $ | | | | |
| | | | | | | | | | | | |
NOTES TO SCHEDULE OF INVESTMENTS:
| A zero balance may reflect actual amounts rounding to less than one thousand. |
| Security valued using significant unobservable inputs (Level 3). |
| All or a portion of this amount represents unfunded loan commitments. The interest rate for the unfunded portion will be determined at the time of funding. See Note 4, Securities and Other Investments, in the Notes to Financial Statements for more information regarding unfunded loan commitments. |
| Variable or Floating rate security. Rate shown is the rate in effect as of period end. Certain variable rate securities are not based on a published reference rate and spread, rather are determined by the issuer or agent and are based on current market conditions. Reference rate is as of reset date, which may vary by security. These securities may not indicate a reference rate and/or spread in their description. |
| Rate shown is the rate in effect as of period end. The rate may be based on a fixed rate, a capped rate or a floor rate and may convert to a variable or floating rate in the future. These securities do not indicate a reference rate and spread in their description. |
| Coupon represents a rate which changes periodically based on a predetermined schedule or event. Rate shown is the rate in effect as of period end. |
| Security is an Interest Only (“IO”) or IO Strip. |
| Security is not accruing income as of the date of this report. |
| Security did not produce income within the last twelve months. |
| Coupon represents a yield to maturity. |
| Perpetual maturity; date shown, if applicable, represents next contractual call date. |
(h) RESTRICTED SECURITIES:
| | | | | | | | | | | | | | | | |
| | | | | | | | | | | Market Value
as Percentage
of Net Assets | |
| | | | | | $ | 3,387 | | | $ | 4,158 | | | | 5.32 | % |
| | | 07/01/2021 | | | | 49 | | | | 99 | | | | 0.13 | |
Neiman Marcus Group Ltd. LLC | | | 09/25/2020 | | | | 425 | | | | 1,977 | | | | 2.53 | |
| | | 05/12/2022 - 11/30/2023 | | | | 367 | | | | 327 | | | | 0.42 | |
| | | 07/20/2018 | | | | 314 | | | | 354 | | | | 0.45 | |
| | | 09/12/2023 | | | | 40 | | | | 29 | | | | 0.04 | |
Westmoreland Mining Holdings | | | 12/08/2014 | | | | 267 | | | | 37 | | | | 0.05 | |
| | | 06/30/2023 | | | | 61 | | | | 32 | | | | 0.04 | |
| | | | | | | | | | | | | | | | |
| | | $ | 4,910 | | | $ | 7,013 | | | | 8.98 | % |
| | | | | | | | | | | | | |
| | | | | | | | |
| | | | | | December 31, 2023 | | (Unaudited) |
BORROWINGS AND OTHER FINANCING TRANSACTIONS
(i) REPURCHASE AGREEMENTS:
| | | | | | | | | | | | | | | | | | | | | | | | | | | | | | |
| | | | | | | | | | | | | | | | | | | Repurchase
Agreements,
at Value | | | Repurchase Agreement Proceeds to be Received (1) | |
| FICC | | | 2.600 | % | | | 12/29/2023 | | | | 01/02/2024 | | | $ | 355 | | | U.S. Treasury Notes 4.875% due 11/30/2025 | | $ | (362 | ) | | $ | 355 | | | $ | 355 | |
| | | | | | | | | | | | | | | | | | | | | | | | | | | | | | |
Total Repurchase Agreements | | | | | | | | | | | | | | | |
| | | | | | | | | | | | | | | |
REVERSE REPURCHASE AGREEMENTS:
| | | | | | | | | | | | | | | | | | | | |
| | | | | | | | | | | | | | Payable for
Reverse
Repurchase
Agreements | |
| | | 6.634 | % | | | 10/16/2023 | | | | 04/16/2024 | | | $ | (4,216 | ) | | $ | (4,277 | ) |
| | | 5.970 | | | | 10/10/2023 | | | | 01/08/2024 | | | | (263 | ) | | | (266 | ) |
| | | 6.650 | | | | 10/18/2023 | | | | 02/21/2024 | | | | (1,465 | ) | | | (1,485 | ) |
| | | 6.060 | | | | 07/14/2023 | | | | 01/10/2024 | | | | (667 | ) | | | (686 | ) |
| | | 6.120 | | | | 07/31/2023 | | | | 01/29/2024 | | | | (634 | ) | | | (651 | ) |
| | | 6.120 | | | | 10/02/2023 | | | | 01/29/2024 | | | | (210 | ) | | | (213 | ) |
| | | 6.650 | | | | 12/20/2023 | | | | 04/16/2024 | | | | (4,800 | ) | | | (4,811 | ) |
| | | 6.650 | | | | 12/20/2023 | | | | 05/15/2024 | | | | (280 | ) | | | (281 | ) |
| | | 6.690 | | | | 12/20/2023 | | | | 04/16/2024 | | | | (2,479 | ) | | | (2,485 | ) |
| | | 6.750 | | | | 12/20/2023 | | | | 05/15/2024 | | | | (632 | ) | | | (633 | ) |
| | | 6.950 | | | | 12/20/2023 | | | | 04/16/2024 | | | | (1,503 | ) | | | (1,507 | ) |
| | | 5.700 | | | | 07/28/2023 | | | | TBD | | | | (574 | ) | | | (589 | ) |
| | | 6.560 | | | | 12/22/2023 | | | | 04/22/2024 | | | | (233 | ) | | | (234 | ) |
| | | 6.700 | | | | 12/08/2023 | | | | 04/08/2024 | | | | (1,017 | ) | | | (1,022 | ) |
| | | 6.720 | | | | 08/10/2023 | | | | 02/06/2024 | | | | (1,238 | ) | | | (1,272 | ) |
| | | 6.820 | | | | 08/31/2023 | | | | 02/26/2024 | | | | (100 | ) | | | (102 | ) |
| | | 6.833 | | | | 08/07/2023 | | | | 01/30/2024 | | | | (501 | ) | | | (515 | ) |
| | | 6.850 | | | | 12/15/2023 | | | | 04/15/2024 | | | | (1,873 | ) | | | (1,879 | ) |
| | | 6.130 | | | | 10/10/2023 | | | | 04/08/2024 | | | | (805 | ) | | | (817 | ) |
| | | 6.020 | | | | 08/16/2023 | | | | 02/16/2024 | | | | (10 | ) | | | (10 | ) |
| | | 6.276 | | | | 12/28/2023 | | | | 09/27/2024 | | | | (632 | ) | | | (632 | ) |
| | | 6.326 | | | | 12/28/2023 | | | | 09/27/2024 | | | | (548 | ) | | | (549 | ) |
| | | 6.426 | | | | 12/28/2023 | | | | 09/27/2024 | | | | (1,153 | ) | | | (1,154 | ) |
| | | 6.670 | | | | 10/26/2023 | | | | 07/29/2024 | | | | (148 | ) | | | (150 | ) |
| | | 6.720 | | | | 10/26/2023 | | | | 07/29/2024 | | | | (516 | ) | | | (522 | ) |
| | | 6.050 | | | | 12/21/2023 | | | | 03/21/2024 | | | | (580 | ) | | | (581 | ) |
| | | 6.100 | | | | 12/21/2023 | | | | 03/21/2024 | | | | (1,920 | ) | | | (1,924 | ) |
| | | 6.510 | | | | 08/11/2023 | | | | 02/07/2024 | | | | (246 | ) | | | (252 | ) |
| | | 6.588 | | | | 11/01/2023 | | | | 02/01/2024 | | | | (428 | ) | | | (433 | ) |
| | | 6.550 | | | | 12/13/2023 | | | | 06/20/2024 | | | | (4,152 | ) | | | (4,167 | ) |
| | | 6.470 | | | | 12/18/2023 | | | | 04/18/2024 | | | | (651 | ) | | | (653 | ) |
| | | 6.020 | | | | 08/17/2023 | | | | 02/16/2024 | | | | (1,879 | ) | | | (1,922 | ) |
| | | 6.700 | | | | 10/06/2023 | | | | 01/05/2024 | | | | (1,781 | ) | | | (1,810 | ) |
| | | 6.740 | | | | 12/19/2023 | | | | 02/02/2024 | | | | (138 | ) | | | (138 | ) |
| | | 6.750 | | | | 01/02/2024 | | | | 02/16/2024 | | | | (141 | ) | | | (141 | ) |
| | | 5.830 | | | | 10/13/2023 | | | | 01/11/2024 | | | | (960 | ) | | | (973 | ) |
| | | 6.120 | | | | 10/10/2023 | | | | 04/10/2024 | | | | (654 | ) | | | (664 | ) |
| | | 6.120 | | | | 10/18/2023 | | | | 04/10/2024 | | | | (427 | ) | | | (433 | ) |
| | | 6.467 | | | | 11/20/2023 | | | | 02/20/2024 | | | | (602 | ) | | | (607 | ) |
| | | 5.500 | | | | 07/28/2023 | | | | TBD | | | | (607 | ) | | | (621 | ) |
| | | 6.100 | | | | 07/10/2023 | | | | 01/05/2024 | | | | (933 | ) | | | (961 | ) |
| | | 6.100 | | | | 10/19/2023 | | | | 04/16/2024 | | | | (125 | ) | | | (126 | ) |
| | | 6.610 | | | | 09/11/2023 | | | | 03/11/2024 | | | | (4,252 | ) | | | (4,340 | ) |
| | | 6.690 | | | | 07/10/2023 | | | | 01/10/2024 | | | | (851 | ) | | | (878 | ) |
| | | 6.720 | | | | 10/10/2023 | | | | 01/10/2024 | | | | (5,643 | ) | | | (5,731 | ) |
| | | | | | | | | | | | | | | | | | | | |
Total Reverse Repurchase Agreements | | | | | | | | | | | | | | | | | | | | |
| | | | | | | | | | | | | | | | | | | | |
| | | | | | | | | | | | |
| See Accompanying Notes | | | | | | | | | | DECEMBER 31, 2023 | | | |
BORROWINGS AND OTHER FINANCING TRANSACTIONS SUMMARY
The following is a summary by counterparty of the market value of Borrowings and Other Financing Transactions and collateral pledged/(received) as of December 31, 2023:
| | | | | | | | | | | | | | | | | | | | | | | | |
| | Repurchase Agreement Proceeds to be Received (1) | | | Payable for
Reverse
Repurchase
Agreements | | | Payable for Sale-Buyback Transactions | | | Total
Borrowings and
Other Financing
Transactions | | | Collateral
Pledged/(Received) | | | | |
Global/Master Repurchase Agreement | |
| | $ | 0 | | | $ | (4,277 | ) | | $ | 0 | | | $ | (4,277 | ) | | $ | 5,570 | | | $ | 1,293 | |
| | | 0 | | | | (1,751 | ) | | | 0 | | | | (1,751 | ) | | | 2,414 | | | | 663 | |
| | | 0 | | | | (11,267 | ) | | | 0 | | | | (11,267 | ) | | | 15,009 | | | | 3,742 | |
| | | 0 | | | | (5,613 | ) | | | 0 | | | | (5,613 | ) | | | 7,895 | | | | 2,282 | |
| | | 0 | | | | (817 | ) | | | 0 | | | | (817 | ) | | | 994 | | | | 177 | |
| | | 0 | | | | (10 | ) | | | 0 | | | | (10 | ) | | | 9 | | | | (1 | ) |
| | | 355 | | | | 0 | | | | 0 | | | | 355 | | | | (362 | ) | | | (7 | ) |
| | | 0 | | | | (3,007 | ) | | | 0 | | | | (3,007 | ) | | | 3,971 | | | | 964 | |
| | | 0 | | | | (2,505 | ) | | | 0 | | | | (2,505 | ) | | | 3,233 | | | | 728 | |
| | | 0 | | | | (685 | ) | | | 0 | | | | (685 | ) | | | 853 | | | | 168 | |
| | | 0 | | | | (4,167 | ) | | | 0 | | | | (4,167 | ) | | | 6,106 | | | | 1,939 | |
| | | 0 | | | | (653 | ) | | | 0 | | | | (653 | ) | | | 824 | | | | 171 | |
| | | 0 | | | | (1,922 | ) | | | 0 | | | | (1,922 | ) | | | 2,155 | | | | 233 | |
| | | 0 | | | | (2,089 | ) | | | 0 | | | | (2,089 | ) | | | 2,663 | | | | 574 | |
| | | 0 | | | | (2,677 | ) | | | 0 | | | | (2,677 | ) | | | 3,315 | | | | 638 | |
| | | 0 | | | | (621 | ) | | | 0 | | | | (621 | ) | | | 600 | | | | (21 | ) |
| | | 0 | | | | (12,036 | ) | | | 0 | | | | (12,036 | ) | | | 16,170 | | | | 4,134 | |
| | | | | | | | | | | | | | | | | | | | | | | | |
Total Borrowings and Other Financing Transactions | | | | | | | | | | | | | | | | | | | | | | | | |
| | | | | | | | | | | | | | | | | | | | | | | | |
CERTAIN TRANSFERS ACCOUNTED FOR AS SECURED BORROWINGS
Remaining Contractual Maturity of the Agreements
| | | | | | | | | | | | | | | | | | | | |
| | | | | | | | | | | | | | | | |
Reverse Repurchase Agreements | |
| | $ | 0 | | | $ | (3,347 | ) | | $ | (138 | ) | | $ | (3,250 | ) | | $ | (6,735 | ) |
Convertible Bonds & Notes | | | 0 | | | | (403 | ) | | | 0 | | | | 0 | | | | (403 | ) |
| | | 0 | | | | 0 | | | | (1,932 | ) | | | (192 | ) | | | (2,124 | ) |
Non-Agency Mortgage-Backed Securities | | | 0 | | | | (1,669 | ) | | | (5,171 | ) | | | (11,997 | ) | | | (18,837 | ) |
| | | 0 | | | | (7,265 | ) | | | (5,826 | ) | | | (12,766 | ) | | | (25,857 | ) |
| | | | | | | | | | | | | | | | | | | | |
| | | | | | | | | | | | | | | | | | | | |
| | | | | | | | | | | | | | | | | | | | |
Payable for reverse repurchase agreements (5) | | | | | |
| | | | | |
| Securities with an aggregate market value of $71,953 and cash of $379 have been pledged as collateral under the terms of the above master agreements as of December 31, 2023. |
| Includes accrued interest. |
| The average amount of borrowings outstanding during the period ended December 31, 2023 was $(61,583) at a weighted average interest rate of 6.319%. Average borrowings may include reverse repurchase agreements and sale-buyback transactions, if held during the period. |
| Open maturity reverse repurchase agreement. |
| Net Exposure represents the net receivable/(payable) that would be due from/to the counterparty in the event of default. Exposure from borrowings and other financing transactions can only be netted across transactions governed under the same master agreement with the same legal entity. See Note 8, Master Netting Arrangements, in the Notes to Financial Statements for more information. |
| Unsettled reverse repurchase agreements liability of $(141) is outstanding at period end. |
(k) FINANCIAL DERIVATIVE INSTRUMENTS: EXCHANGE-TRADED OR CENTRALLY CLEARED
| | | | | | | | | | | | | | | | | | | | | | | | |
| |
| | | | | |
| | | | | | | | | | | Unrealized
Appreciation/
(Depreciation) | | | | |
| | | | | | |
3-Month SOFR Active Contract December Futures | | | 03/2024 | | | | 5 | | | $ | (1,183 | ) | | $ | 34 | | | $ | 0 | | | $ | 0 | |
3-Month SOFR Active Contract December Futures | | | 03/2025 | | | | 1 | | | | (241 | ) | | | 4 | | | | 0 | | | | 0 | |
3-Month SOFR Active Contract December Futures | | | 03/2026 | | | | 1 | | | | (242 | ) | | | 2 | | | | 0 | | | | 0 | |
3-Month SOFR Active Contract June Futures | | | 09/2024 | | | | 2 | | | | (477 | ) | | | 11 | | | | 0 | | | | 0 | |
3-Month SOFR Active Contract June Futures | | | 09/2025 | | | | 2 | | | | (484 | ) | | | 5 | | | | 0 | | | | (1 | ) |
| | | | | | | | |
| | | | | | December 31, 2023 | | (Unaudited) |
| | | | | | | | | | | | | | | | | | | | | | | | |
| | | | | | | | | | | Unrealized
Appreciation/
(Depreciation) | | | | |
| | | | | | |
3-Month SOFR Active Contract March Futures | | | 06/2024 | | | | 4 | | | $ | (950 | ) | | $ | 24 | | | $ | 0 | | | $ | 0 | |
3-Month SOFR Active Contract March Futures | | | 06/2025 | | | | 2 | | | | (483 | ) | | | 6 | | | | 0 | | | | 0 | |
3-Month SOFR Active Contract March Futures | | | 06/2026 | | | | 1 | | | | (242 | ) | | | 2 | | | | 0 | | | | 0 | |
3-Month SOFR Active Contract September Futures | | | 12/2024 | | | | 2 | | | | (480 | ) | | | 9 | | | | 0 | | | | 0 | |
3-Month SOFR Active Contract September Futures | | | 12/2025 | | | | 1 | | | | (242 | ) | | | 3 | | | | 0 | | | | 0 | |
| | | | | | | | | | | | | | | | | | | | | | | | |
| | | | | | | | | | | | | |
| | | | | | | | | | | | | | | | | | | | | | | | |
| | | | | | | | | | | | | | | | | | | | | | | | | | | | | | | | | | | | | | | | |
| | | | | | | | | | | | | | | | | | Unrealized
Appreciation/
(Depreciation) | | | | | | | |
| | | | | | |
| | | | | 2.450 | % | | Annual | | | 12/20/2024 | | | $ | | | | | 3,800 | | | $ | 0 | | | $ | 89 | | | $ | 89 | | | $ | 1 | | | $ | 0 | |
| | | | | 2.350 | | | Annual | | | 01/17/2025 | | | | | | | | 1,900 | | | | 0 | | | | 43 | | | | 43 | | | | 0 | | | | 0 | |
| | | | | 2.300 | | | Annual | | | 01/17/2026 | | | | | | | | 300 | | | | 0 | | | | 10 | | | | 10 | | | | 0 | | | | 0 | |
| | | | | 1.250 | | | | | | 12/15/2026 | | | | | | | | 200 | | | | (1 | ) | | | (15 | ) | | | (16 | ) | | | 0 | | | | 0 | |
| | | | | 1.550 | | | | | | 01/20/2027 | | | | | | | | 1,900 | | | | (4 | ) | | | (139 | ) | | | (143 | ) | | | 0 | | | | (1 | ) |
| | | | | 0.500 | | | Semi-Annual | | | 06/16/2028 | | | | | | | | 140 | | | | (5 | ) | | | (14 | ) | | | (19 | ) | | | 0 | | | | 0 | |
| | | | | 3.750 | | | Annual | | | 12/20/2028 | | | | | | | | 4,900 | | | | 45 | | | | 1 | | | | 46 | | | | 2 | | | | 0 | |
| | | | | 1.700 | | | Semi-Annual | | | 01/12/2029 | | | | | | | | 2,000 | | | | (6 | ) | | | (195 | ) | | | (201 | ) | | | 0 | | | | 0 | |
| | | | | 4.250 | | | Annual | | | 06/19/2029 | | | | | | | | 7,800 | | | | (32 | ) | | | 342 | | | | 310 | | | | 3 | | | | 0 | |
| | | | | 4.500 | | | Annual | | | 06/17/2030 | | | | | | | | 10,300 | | | | 8 | | | | 621 | | | | 629 | | | | 1 | | | | 0 | |
| | | | | 1.370 | | | Semi-Annual | | | 07/19/2031 | | | | | | | | 100 | | | | 0 | | | | 16 | | | | 16 | | | | 0 | | | | 0 | |
| | | | | 1.360 | | | Semi-Annual | | | 07/20/2031 | | | | | | | | 100 | | | | 0 | | | | 16 | | | | 16 | | | | 0 | | | | 0 | |
| | | | | 3.500 | | | Annual | | | 12/20/2033 | | | | | | | | 1,800 | | | | 54 | | | | (58 | ) | | | (4 | ) | | | 1 | | | | 0 | |
| | | | | 3.000 | | | Semi-Annual | | | 12/19/2038 | | | | | | | | 5,200 | | | | 13 | | | | 457 | | | | 470 | | | | 11 | | | | 0 | |
| | | | | 2.000 | | | Semi-Annual | | | 01/15/2050 | | | | | | | | 100 | | | | (1 | ) | | | 29 | | | | 28 | | | | 0 | | | | 0 | |
| | | | | 1.625 | | | Semi-Annual | | | 01/16/2050 | | | | | | | | 400 | | | | 0 | | | | 140 | | | | 140 | | | | 1 | | | | 0 | |
| | | | | 1.750 | | | Semi-Annual | | | 01/22/2050 | | | | | | | | 700 | | | | (4 | ) | | | 232 | | | | 228 | | | | 2 | | | | 0 | |
| | | | | 1.625 | | | Semi-Annual | | | 02/03/2050 | | | | | | | | 400 | | | | (2 | ) | | | 141 | | | | 139 | | | | 1 | | | | 0 | |
| | | | | 1.450 | | | Semi-Annual | | | 04/07/2051 | | | | | | | | 1,300 | | | | (1 | ) | | | 514 | | | | 513 | | | | 5 | | | | 0 | |
| | | | | 1.750 | | | Annual | | | 06/15/2052 | | | | | | | | 5,700 | | | | 994 | | | | 749 | | | | 1,743 | | | | 22 | | | | 0 | |
| | | | | 1.750 | | | Annual | | | 12/21/2052 | | | | | | | | 2,800 | | | | 674 | | | | 129 | | | | 803 | | | | 11 | | | | 0 | |
| | | | | | | | | | | | | | | | | | | | | | | | | | | | | | | | | | | | | | | | |
| | | | | | | | | | | | | | | | | | | | | | | | | | | | | |
| | | | | | | | | | | | | | | | | | | | | | | | | | | | | | | | | | | | | | | | |
FINANCIAL DERIVATIVE INSTRUMENTS: EXCHANGE-TRADED OR CENTRALLY CLEARED SUMMARY
The following is a summary of the market value and variation margin of Exchange-Traded or Centrally Cleared Financial Derivative Instruments as of December 31, 2023:
| | | | | | | | | | | | | | | | | | | | | | | | | | | | | | | | | | | | |
| | | Financial Derivative Assets | | | | | | Financial Derivative Liabilities | |
| | | | | | | | | | | | | | | | | | Variation Margin
Liability | | | | |
| | | | | | | | | | | | | | | | | | | | | | | | | | | | |
Total Exchange-Traded or Centrally Cleared | | | | | | | | | | | | | | | | | | | | | | | | | | | | | | | | | | | | |
| | | | | | | | | | | | | | | | | | | | | | | | | | | | | | | | | | | | |
Cash of $1,114 has been pledged as collateral for exchange-traded and centrally cleared financial derivative instruments as of December 31, 2023. See Note 8, Master Netting Arrangements, in the Notes to Financial Statements for more information.
| This instrument has a forward starting effective date. See Note 2, Securities Transactions and Investment Income, in the Notes to Financial Statements for further information. |
(l) FINANCIAL DERIVATIVE INSTRUMENTS: OVER THE COUNTER
CREDIT DEFAULT SWAPS ON CREDIT INDICES - SELL PROTECTION
(1)
| | | | | | | | | | | | | | | | | | | | | | | | | | | | | | | | |
| | | | | | | | | | | | | | | | | | Unrealized
Appreciation/
(Depreciation) | | | Swap Agreements, at Value (3) | |
| | | | | | |
| GST | | | | | 0.320 | % | | Monthly | | | 07/25/2045 | | | $ | 1,587 | | | $ | (316 | ) | | $ | 197 | | | $ | 0 | | | $ | (119 | ) |
| | | | | 0.090 | | | Monthly | | | 08/25/2037 | | | | 513 | | | | (328 | ) | | | 287 | | | | 0 | | | | (41 | ) |
| | | | | | | | | | | | | | | | | | | | | | | | | | | | | | | | |
| | | | | | | | | | | | | | | | | |
| | | | | | | | | | | | | | | | | | | | | | | | | | | | | | | | |
| | | | | | | | | | | | |
| See Accompanying Notes | | | | | | | | | | DECEMBER 31, 2023 | | | |
FINANCIAL DERIVATIVE INSTRUMENTS: OVER THE COUNTER SUMMARY
The following is a summary by counterparty of the market value of OTC financial derivative instruments and collateral pledged/(received) as of December 31, 2023:
| | | | | | | | | | | | | | | | | | | | | | | | | | | | | | | | | | | | | | | | | | | | | | | | |
| | | Financial Derivative Assets | | | | | | Financial Derivative Liabilities | | | | | | | | | | |
| | Forward
Foreign
Currency
Contracts | | | | | | | | | | | | | | | Forward
Foreign
Currency
Contracts | | | | | | | | | | | | Net Market
Value of OTC
Derivatives | | | Collateral
Pledged/
(Received) | | | | |
| | $ | 0 | | | $ | 0 | | | $ | 0 | | | $ | 0 | | | | | | | $ | 0 | | | $ | 0 | | | $ | (160 | ) | | $ | (160 | ) | | $ | (160 | ) | | $ | 261 | | | $ | 101 | |
| | | | | | | | | | | | | | | | | | | | | | | | | | | | | | | | | | | | | | | | | | | | | | | | |
| Securities with an aggregate market value of $261 have been pledged as collateral for financial derivative instruments as governed by International Swaps and Derivatives Association, Inc. master agreements as of December 31, 2023. |
| If the Fund is a seller of protection and a credit event occurs, as defined under the terms of that particular swap agreement, the Fund will either (i) pay to the buyer of protection an amount equal to the notional amount of the swap and take delivery of the referenced obligation or underlying securities comprising the referenced index or (ii) pay a net settlement amount in the form of cash, securities or other deliverable obligations equal to the notional amount of the swap less the recovery value of the referenced obligation or underlying securities comprising the referenced index. |
| The maximum potential amount the Fund could be required to pay as a seller of credit protection or receive as a buyer of credit protection if a credit event occurs as defined under the terms of that particular swap agreement. |
| The prices and resulting values for credit default swap agreements serve as indicators of the current status of the payment/performance risk and represent the likelihood of an expected liability (or profit) for the credit derivative should the notional amount of the swap agreement be closed/sold as of the period end. Increasing market values, in absolute terms when compared to the notional amount of the swap, represent a deterioration of the underlying referenced instrument’s credit soundness and a greater likelihood or risk of default or other credit event occurring as defined under the terms of the agreement. |
| Net Exposure represents the net receivable/(payable) that would be due from/to the counterparty in the event of default. Exposure from OTC financial derivative instruments can only be netted across transactions governed under the same master agreement with the same legal entity. See Note 8, Master Netting Arrangements, in the Notes to Financial Statements for more information. |
FAIR VALUE OF FINANCIAL DERIVATIVE INSTRUMENTS
The following is a summary of the fair valuation of the Fund’s derivative instruments categorized by risk exposure. See Note 7, Principal and Other Risks, in the Notes to Financial Statements on risks of the Fund.
Fair Values of Financial Derivative Instruments on the Statements of Assets and Liabilities as of December 31, 2023:
| | | | | | | | | | | | | | | | | | | | | | | | |
| | | Derivatives not accounted for as hedging instruments | |
| | | | | | | | | | | | | | | | | | | |
Financial Derivative Instruments - Assets | |
Exchange-traded or centrally cleared | |
| | $ | 0 | | | $ | 0 | | | $ | 0 | | | $ | 0 | | | $ | 61 | | | $ | 61 | |
| | | | | | | | | | | | | | | | | | | | | | | | |
|
Financial Derivative Instruments - Liabilities | |
Exchange-traded or centrally cleared | |
| | $ | 0 | | | $ | 0 | | | $ | 0 | | | $ | 0 | | | $ | 1 | | | $ | 1 | |
| | | 0 | | | | 0 | | | | 0 | | | | 0 | | | | 1 | | | | 1 | |
| | | | | | | | | | | | | | | | | | | | | | | | |
| | $ | 0 | | | $ | 0 | | | $ | 0 | | | $ | 0 | | | $ | 2 | | | $ | 2 | |
| | | | | | | | | | | | | | | | | | | | | | | | |
| |
| | $ | 0 | | | $ | 160 | | | $ | 0 | | | $ | 0 | | | $ | 0 | | | $ | 160 | |
| | | | | | | | | | | | | | | | | | | | | | | | |
| | $ | 0 | | | $ | 160 | | | $ | 0 | | | $ | 0 | | | $ | 2 | | | $ | 162 | |
| | | | | | | | | | | | | | | | | | | | | | | | |
The effect of Financial Derivative Instruments on the Statements of Operations for the period ended December 31, 2023:
| | | | | | | | | | | | | | | | | | | | | | | | |
| | | Derivatives not accounted for as hedging instruments | |
| | | | | | | | | | | | | | | | | | | |
Net Realized Gain (Loss) on Financial Derivative Instruments | |
Exchange-traded or centrally cleared | |
| | $ | 0 | | | $ | 0 | | | $ | 0 | | | $ | 0 | | | $ | (2,433 | ) | | $ | (2,433 | ) |
| | | | | | | | | | | | | | | | | | | | | | | | |
| |
| | $ | 0 | | | $ | (31 | ) | | $ | 0 | | | $ | 0 | | | $ | 0 | | | $ | (31 | ) |
| | | | | | | | | | | | | | | | | | | | | | | | |
| | $ | 0 | | | $ | (31 | ) | | $ | 0 | | | $ | 0 | | | $ | (2,433 | ) | | $ | (2,464 | ) |
| | | | | | | | | | | | | | | | | | | | | | | | |
| | | | | | | | |
| | | | | | December 31, 2023 | | (Unaudited) |
| | | | | | | | | | | | | | | | | | | | | | | | |
| | | Derivatives not accounted for as hedging instruments | |
| | | | | | | | | | | | | | | | | | | |
Net Change in Unrealized Appreciation (Depreciation) on Financial Derivative Instruments | |
Exchange-traded or centrally cleared | |
| | $ | 0 | | | $ | 0 | | | $ | (111 | ) | | $ | 0 | | | $ | 99 | | | $ | (12 | ) |
| | | 0 | | | | 0 | | | | 0 | | | | 0 | | | | 3,031 | | | | 3,031 | |
| | | | | | | | | | | | | | | | | | | | | | | | |
| | $ | 0 | | | $ | 0 | | | $ | (111 | ) | | $ | 0 | | | $ | 3,130 | | | $ | 3,019 | |
| | | | | | | | | | | | | | | | | | | | | | | | |
| |
| | $ | 0 | | | $ | 128 | | | $ | 0 | | | $ | 0 | | | $ | 0 | | | $ | 128 | |
| | | | | | | | | | | | | | | | | | | | | | | | |
| | $ | 0 | | | $ | 128 | | | $ | (111 | ) | | $ | 0 | | | $ | 3,130 | | | $ | 3,147 | |
| | | | | | | | | | | | | | | | | | | | | | | | |
The following is a summary of the fair valuations according to the inputs used as of December 31, 2023 in valuing the Fund’s assets and
liabilities:
| | | | | | | | | | | | | | | | |
| | | | | | | | | | | | |
Investments in Securities, at Value | |
Loan Participations and Assignments | | $ | 0 | | | $ | 8,938 | | | $ | 5,367 | | | $ | 14,305 | |
| |
| | | 0 | | | | 3,156 | | | | 1,199 | | | | 4,355 | |
| | | 0 | | | | 12,594 | | | | 0 | | | | 12,594 | |
| | | 0 | | | | 365 | | | | 0 | | | | 365 | |
Convertible Bonds & Notes | |
| | | 0 | | | | 465 | | | | 0 | | | | 465 | |
| |
| | | 0 | | | | 1,283 | | | | 0 | | | | 1,283 | |
| | | 0 | | | | 3,265 | | | | 0 | | | | 3,265 | |
Non-Agency Mortgage-Backed Securities | | | 0 | | | | 32,862 | | | | 1,192 | | | | 34,054 | |
| | | 0 | | | | 39,063 | | | | 2,375 | | | | 41,438 | |
| |
| | | 265 | | | | 0 | | | | 48 | | | | 313 | |
| | | 0 | | | | 0 | | | | 99 | | | | 99 | |
| | | 0 | | | | 0 | | | | 4,158 | | | | 4,158 | |
| | | 1 | | | | 0 | | | | 2,373 | | | | 2,374 | |
| | | 0 | | | | 0 | | | | 1,671 | | | | 1,671 | |
Real Estate Investment Trusts | |
| | | 738 | | | | 0 | | | | 0 | | | | 738 | |
| |
| | | 0 | | | | 355 | | | | 0 | | | | 355 | |
| | | 0 | | | | 261 | | | | 0 | | | | 261 | |
| | | | | | | | | | | | | | | | |
| | $ | 1,004 | | | $ | 102,607 | | | $ | 18,482 | | | $ | 122,093 | |
| | | | | | | | | | | | | | | | |
| | | | | | | | | | | | | | | | |
| | | | | | | | | | | | |
Investments in Affiliates, at Value | |
| |
Central Funds Used for Cash Management Purposes | | $ | 9,566 | | | $ | 0 | | | $ | 0 | | | $ | 9,566 | |
| | | | | | | | | | | | | | | | |
| | | | |
| | $ | 10,570 | | | $ | 102,607 | | | $ | 18,482 | | | $ | 131,659 | |
| | | | | | | | | | | | | | | | |
|
Financial Derivative Instruments - Asset s | |
Exchange-traded or centrally cleared | | $ | 0 | | | $ | 61 | | | $ | 0 | | | $ | 61 | |
| | | | | | | | | | | | | | | | |
|
Financial Derivative Instruments - Liabilities | |
Exchange-traded or centrally cleared | | | 0 | | | | (2 | ) | | | 0 | | | | (2 | ) |
| | | 0 | | | | 0 | | | | (160 | ) | | | (160 | ) |
| | | | | | | | | | | | | | | | |
| | $ | 0 | | | $ | (2 | ) | | $ | (160 | ) | | $ | (162 | ) |
| | | | | | | | | | | | | | | | |
| | | | |
Total Financial Derivative Instruments | | $ | 0 | | | $ | 59 | | | $ | (160 | ) | | $ | (101 | ) |
| | | | | | | | | | | | | | | | |
| | | | |
| | $ | 10,570 | | | $ | 102,666 | | | $ | 18,322 | | | $ | 131,558 | |
| | | | | | | | | | | | | | | | |
The following is a reconciliation of the fair valuations using significant unobservable inputs (Level 3) for the Fund during the period ended December 31, 2023:
| | | | | | | | | | | | | | | | | | | | | | | | | | | | | | | | | | | | | | | | |
| | Beginning
Balance
at 06/30/2023 | | | | | | | | | Accrued
Discounts/
(Premiums) | | | | | | Net Change in Unrealized Appreciation/ (Depreciation) (2) | | | | | | | | | Ending
Balance
at 12/31/2023 | | | Net Change in Unrealized Appreciation/ (Depreciation) on Investments Held at 12/31/2023 (2) | |
Investments in Securities, at Value | |
Loan Participations and Assignments | | $ | 6,420 | | | $ | 2,516 | | | $ | (3,928 | ) | | $ | (40 | ) | | $ | (973 | ) | | $ | 1,651 | | | $ | 0 | | | $ | (279 | ) | | $ | 5,367 | | | $ | 161 | |
| |
| | | 0 | | | | 0 | | | | 0 | | | | 0 | | | | 0 | | | | 0 | | | | 1,199 | | | | 0 | | | | 1,199 | | | | 0 | |
Non-Agency Mortgage-Backed Securities | | | 1,320 | | | | 1 | | | | (80 | ) | | | (65 | ) | | | 0 | | | | 16 | | | | 0 | | | | 0 | | | | 1,192 | | | | 16 | |
| | | 3,874 | | | | 0 | | | | (38 | ) | | | 5 | | | | 5 | | | | (1,551 | ) | | | 80 | | | | 0 | | | | 2,375 | | | | (1,546 | ) |
| |
| | | 65 | | | | 0 | | | | 0 | | | | 0 | | | | 0 | | | | (17 | ) | | | 0 | | | | 0 | | | | 48 | | | | (17 | ) |
| | | 100 | | | | 0 | | | | 0 | | | | 0 | | | | 0 | | | | (1 | ) | | | 0 | | | | 0 | | | | 99 | | | | (1 | ) |
| | | 0 | | | | 3,387 | | | | 0 | | | | 0 | | | | 0 | | | | 771 | | | | 0 | | | | 0 | | | | 4,158 | | | | 771 | |
| | | 2,504 | | | | 22 | | | | 0 | | | | 0 | | | | 0 | | | | (153 | ) | | | 0 | | | | 0 | | | | 2,373 | | | | (80 | ) |
| | | 278 | | | | 356 | | | | 0 | | | | 0 | | | | 0 | | | | 1,037 | | | | 0 | | | | 0 | | | | 1,671 | | | | 1,037 | |
| | | | | | | | | | | | |
| See Accompanying Notes | | | | | | | | | | DECEMBER 31, 2023 | | | |
| | | | | | | | |
| | | | | | December 31, 2023 | | (Unaudited) |
| | | | | | | | | | | | | | | | | | | | | | | | | | | | | | | | | | | | | | | | |
| | Beginning
Balance
at 06/30/2023 | | | | | | | | | Accrued
Discounts/
(Premiums) | | | | | | Net Change in Unrealized Appreciation/ (Depreciation) (2) | | | | | | | | | Ending
Balance
at 12/31/2023 | | | Net Change in Unrealized Appreciation/ (Depreciation) on Investments Held at 12/31/2023 (2) | |
| |
| | $ | 666 | | | $ | 0 | | | $ | (316 | ) | | $ | 0 | | | $ | 0 | | | $ | (350 | ) | | $ | 0 | | | $ | 0 | | | $ | 0 | | | $ | 0 | |
| |
| | | 444 | | | | 0 | | | | 0 | | | | 0 | | | | 0 | | | | (444 | ) | | | 0 | | | | 0 | | | | 0 | | | | 0 | |
| | | | | | | | | | | | | | | | | | | | | | | | | | | | | | | | | | | | | | | | |
| | $ | 15,671 | | | $ | 6,282 | | | $ | (4,362 | ) | | $ | (100 | ) | | $ | (968 | ) | | $ | 959 | | | $ | 1,279 | | | $ | (279 | ) | | $ | 18,482 | | | $ | 341 | |
| | | | | | | | | | | | | | | | | | | | | | | | | | | | | | | | | | | | | | | | |
|
Financial Derivative Instruments - Liabilities | |
| | $ | (189 | ) | | $ | 143 | | | $ | (197 | ) | | $ | 0 | | | $ | (43 | ) | | $ | 126 | | | $ | 0 | | | $ | 0 | | | $ | (160 | ) | | $ | (45 | ) |
| | | | | | | | | | | | | | | | | | | | | | | | | | | | | | | | | | | | | | | | |
| | | | | | | | | | |
| | $ | 15,482 | | | $ | 6,425 | | | $ | (4,559 | ) | | $ | (100 | ) | | $ | (1,011 | ) | | $ | 1,085 | | | $ | 1,279 | | | $ | (279 | ) | | $ | 18,322 | | | $ | 296 | |
| | | | | | | | | | | | | | | | | | | | | | | | | | | | | | | | | | | | | | | | |
The following is a summary of significant unobservable inputs used in the fair valuations of assets and liabilities categorized within Level 3 of the fair value hierarchy:
| | | | | | | | | | | | | | | | | | | | |
| | Ending
Balance
at 12/31/2023 | | | | | | | | | | (% Unless Noted Otherwise) | |
| | | | | | |
Investments in Securities, at Value | |
Loan Participations and Assignments | | $ | 1,740 | | | | | | | | X | | | | 14.500 | | | | — | |
| | | 3,627 | | | | | | | | | | | | 6.020-26.490 | | | | 13.670 | |
| |
| | | 1,199 | | | | | | | | | | | | 54.375 | | | | — | |
Non-Agency Mortgage-Backed Securities | | | 24 | | | | | | | | | | | | 10.000 | | | | — | |
| | | 1,168 | | | Fair Valuation of Odd Lot Positions | | | | | | | | | 2.500 | | | | — | |
| | | 1,788 | | | | | | | | | | | | 12.000-17.000 | | | | 15.475 | |
| | | 587 | | | Fair Valuation of Odd Lot Positions | | | | | | | | | 2.500 | | | | — | |
| |
| | | 48 | | | | | Stock Price w/Liquidity Discount | | | | | | | 10.000 | | | | — | |
| | | 99 | | | | | | | | X | | | | 4.000 | | | | — | |
| | | 4,158 | | | | | | | | X | | | | 14.500 | | | | | |
| | | 1,977 | | | Comparable Companies/Discounted Cash Flow | | Revenue Multiple/EBITDA Multiple/Discount Rate | | | X/X/% | | | | 0.550/6.500/10.000 | | | | — | |
| | | 327 | | | | | | | | | | | | 17.280 | | | | — | |
| | | 69 | | | Indicative Market Quotation | | | | | $ | | | | 3.500-4.000 | | | | 3.766 | |
| | | 1,288 | | | | | | | | X | | | | 5.860 | | | | — | |
| | | 29 | | | Discounted Cash Flow/Comparable Companies | | Discount Rate/Revenue Multiple | | | %/X | | | | 17.250/0.550 | | | | — | |
| | | 354 | | | Indicative Market Quotation | | | | | $ | | | | 35.750 | | | | — | |
|
Financial Derivative Instruments - Liabilities | |
| | | (160 | ) | | Indicative Market Quotation | | | | | | | | | 92.000-92.500 | | | | 92.373 | |
| | | | | | | | | | | | | | | | | | | | |
| | $ | 18,322 | | | | | | | | | | | | | | | | | |
| | | | | | | | | | | | | | | | | | | | |
| Net Purchases and Settlements for Financial Derivative Instruments may include payments made or received upon entering into swap agreements to compensate for differences between the stated terms of the swap agreement and prevailing market conditions. | |
| Any difference between Net Change in Unrealized Appreciation/(Depreciation) and Net Change in Unrealized Appreciation/(Depreciation) on Investments Held at December 31, 2023 may be due to an investment no longer held or categorized as Level 3 at period end. | |
| | | | | | | | |
| | PIMCO Global StocksPLUS & Income Fund | | | | December 31, 2023 | | (Unaudited) |
(Amounts in thousands*, except number of shares, contracts, units and ounces, if any)
| | | | | | | | | | | | |
| | | | | | | | | | | |
INVESTMENTS IN SECURITIES 146.5% | |
| |
LOAN PARTICIPATIONS AND ASSIGNMENTS 19.6% | |
|
| |
| | $ | | | 226 | | | $ | | | 226 | |
| | | | | 1,857 | | | | | | 1,857 | |
|
| |
TBD% - 15.420% due 05/25/2026 | | | | | 1,293 | | | | | | 980 | |
|
Gateway Casinos & Entertainment Ltd. | |
| | | | | 1,097 | | | | | | 1,098 | |
13.588% (CDOR03M + 8.000%) due 10/18/2027 ~ | | CAD | | | 239 | | | | | | 181 | |
|
| |
TBD% - 13.988% due 03/01/2024 « | | $ | | | 1,086 | | | | | | 1,152 | |
|
| |
| | | | | 7 | | | | | | 5 | |
|
Lealand Finance Co. BV (6.431% Cash and 3.000% PIK) | |
9.431% due 06/30/2025 (b) | | | | | 67 | | | | | | 28 | |
|
| |
| | | | | 600 | | | | | | 599 | |
|
| |
10.042% (SONIA03M + 4.750%) due 11/04/2027 ~ | | GBP | | | 1,039 | | | | | | 1,285 | |
|
MPH Acquisition Holdings LLC | |
| | $ | | | 199 | | | | | | 192 | |
|
| |
TBD% - 14.000% due 09/07/2024 µ | | | 450 | | | | | | 450 | |
|
| |
9.175% (EUR003M + 5.250%) due 09/30/2028 ~ | | EUR | | | 1,000 | | | | | | 1,105 | |
|
Promotora de Informaciones SA | |
8.942% (EUR003M + 5.000%) due 06/30/2026 «~ | | | | | 1,800 | | | | | | 1,984 | |
|
| |
| | $ | | | 6 | | | | | | 6 | |
|
| |
| | | | | 635 | | | | | | 606 | |
|
Steenbok Lux Finco 2 SARL | |
| | EUR | | | 2,646 | | | | | | 1,222 | |
|
| |
| | $ | | | 2,071 | | | | | | 1,832 | |
|
| |
| | | | | 1,592 | | | | | | 1,214 | |
|
Westmoreland Mining Holdings LLC | |
| | | | | 509 | | | | | | 377 | |
|
| |
| | | | | 231 | | | | | | 220 | |
| | | | | | | | | | | | |
Total Loan Participations and Assignments (Cost $17,223) | | | | |
| | | | |
| |
CORPORATE BONDS & NOTES 36.7% | |
| |
| |
|
Adler Financing SARL (12.500% PIK) | |
12.500% due 06/30/2025 (b) | | EUR | | | 107 | | | | | | 125 | |
|
| |
| | | | | 1,300 | | | | | | 1,094 | |
|
| |
| | | | | 800 | | | | | | 313 | |
| | | | | 100 | | | | | | 37 | |
|
| |
5.100% due 12/31/2099 (h) | | $ | | | 13 | | | | | | 16 | |
|
Banca Monte dei Paschi di Siena SpA | |
2.625% due 04/28/2025 (k) | | EUR | | | 220 | | | | | | 237 | |
| | | | | 100 | | | | | | 111 | |
| | | | | 390 | | | | | | 434 | |
| | | | | 200 | | | | | | 223 | |
| | | | | 634 | | | | | | 770 | |
|
Banco de Credito del Peru SA | |
| | PEN | | | 100 | | | | | | 26 | |
|
| |
| | $ | | | 400 | | | | | | 417 | |
| | | | | | | | | | | | |
| | | | | | | | | | | |
|
| |
5.950% due 08/15/2034 (k) | | $ | | | 1,200 | | | $ | | | 1,262 | |
|
Corestate Capital Holding SA (8.000% Cash or 9.000% PIK) | |
8.000% due 12/31/2026 ^(b)(c) | | EUR | | | 130 | | | | | | 75 | |
| | | | |
Credit Suisse AG AT1 Claim | | $ | | | 200 | | | | | | 24 | |
|
| |
14.702% (T-BILL 1MO + 9.500%) due 04/22/2025 ~ | | | | | 250 | | | | | | 236 | |
|
| |
| | | | | 500 | | | | | | 533 | |
|
Kennedy Wilson Europe Real Estate Ltd. | |
| | EUR | | | 100 | | | | | | 100 | |
|
| |
| | $ | | | 700 | | | | | | 747 | |
|
| |
17.092% (T-BILL 3MO + 11.750%) due 04/09/2029 ~ | | | | | 250 | | | | | | 197 | |
|
| |
1.800% due 02/02/2031 ^(c) | | | | | 280 | | | | | | 186 | |
4.345% due 04/29/2028 ^(c) | | | | | 100 | | | | | | 66 | |
4.570% due 04/29/2033 ^(c) | | | | | 200 | | | | | | 132 | |
|
| |
6.000% due 01/15/2030 (k) | | | | | 1,127 | | | | | | 789 | |
| | | | | 440 | | | | | | 446 | |
|
Voyager Aviation Holdings LLC | |
8.500% due 05/09/2026 ^«(c) | | | | | 2,706 | | | | | | 1,471 | |
| | | | | | | | | | | | |
| | | | | | | | | | | 10,067 | |
| | | | | | | | | | | | |
| |
| |
|
Carvana Co. (12.000% PIK) | |
12.000% due 12/01/2028 (b) | | | | | 83 | | | | | | 67 | |
|
Carvana Co. (13.000% PIK) | |
13.000% due 06/01/2030 (b) | | | | | 905 | | | | | | 723 | |
|
Carvana Co. (14.000% PIK) | |
14.000% due 06/01/2031 (b) | | | | | 719 | | | | | | 581 | |
|
| |
7.750% due 04/01/2027 (k) | | EUR | | | 132 | | | | | | 135 | |
8.750% due 04/01/2027 (k) | | $ | | | 1,887 | | | | | | 1,721 | |
|
| |
| | | | | 200 | | | | | | 188 | |
|
| |
5.250% due 12/01/2026 (k) | | | | | 1,800 | | | | | | 1,545 | |
|
Exela Intermediate LLC (11.500% PIK) | |
11.500% due 04/15/2026 (b) | | | | | 14 | | | | | | 3 | |
|
| |
| | | | | 200 | | | | | | 195 | |
|
| |
7.500% due 11/15/2095 (k) | | | | | 300 | | | | | | 339 | |
|
Intelsat Jackson Holdings SA | |
6.500% due 03/15/2030 (k) | | | | | 2,525 | | | | | | 2,412 | |
|
Inter Media & Communication SpA | |
| | EUR | | | 200 | | | | | | 213 | |
|
| |
| | $ | | | 600 | | | | | | 633 | |
|
| |
| | EUR | | | 100 | | | | | | 99 | |
|
Newfold Digital Holdings Group, Inc. | |
| | $ | | | 370 | | | | | | 398 | |
|
| |
4.810% due 09/17/2030 (k) | | | | | 1,200 | | | | | | 1,123 | |
|
Odebrecht Oil & Gas Finance Ltd. | |
0.000% due 01/29/2024 (f)(h) | | | | | 322 | | | | | | 11 | |
|
| |
6.700% due 02/16/2032 (k) | | | | | 100 | | | | | | 83 | |
| | | | | 200 | | | | | | 174 | |
| | | | | 306 | | | | | | 298 | |
|
| |
4.875% due 09/30/2039 (k) | | | | | 143 | | | | | | 132 | |
5.750% due 09/30/2039 (k) | | | | | 882 | | | | | | 878 | |
| | | | | | | | | | | | |
| | | | | | | | | | | |
|
| |
| | $ | | | 400 | | | $ | | | 406 | |
|
| |
10.625% due 06/28/2028 (k) | | | | | 756 | | | | | | 580 | |
|
| |
| | | | | 102 | | | | | | 105 | |
|
| |
0.000% due 12/29/2049 ~(h) | | BRL | | | 20,000 | | | | | | 1,455 | |
|
Venture Global Calcasieu Pass LLC | |
| | $ | | | 200 | | | | | | 176 | |
|
Wesco Aircraft Holdings, Inc. (7.500% Cash and 3.000% PIK) | |
10.500% due 11/15/2026 ^(b)(c) | | | | | 4,431 | | | | | | 4,032 | |
| | | | | | | | | | | | |
| | | | | | | | | | | 18,705 | |
| | | | | | | | | | | | |
| |
| |
|
| |
| | | | | 239 | | | | | | 222 | |
|
| |
10.000% due 07/27/2025 ^(c) | | | | | 6,513 | | | | | | 326 | |
|
Pacific Gas & Electric Co. | |
4.300% due 03/15/2045 (k) | | | | | 827 | | | | | | 649 | |
| | | | | 380 | | | | | | 418 | |
|
| |
5.375% due 03/22/2030 (k) | | | | | 1,000 | | | | | | 828 | |
| | | | | | | | | | | | |
| | | | | | | | | | | 2,443 | |
| | | | | | | | | | | | |
Total Corporate Bonds & Notes (Cost $34,916) | | | | |
| | | | |
| |
CONVERTIBLE BONDS & NOTES 0.4% | |
| |
| |
|
Corestate Capital Holding SA (8.000% Cash or 9.000% PIK) | |
8.000% due 12/31/2026 ^(b)(c) | | EUR | | | 22 | | | | | | 12 | |
| | | | | | | | | | | | |
| |
| |
|
| |
| | $ | | | 600 | | | | | | 321 | |
| | | | | | | | | | | | |
Total Convertible Bonds & Notes (Cost $624) | | | | |
| | | | |
| |
MUNICIPAL BONDS & NOTES 1.3% | |
| |
| |
|
Commonwealth of Puerto Rico Bonds, Series 2022 | |
| | | | | 394 | | | | | | 215 | |
| | | | | 184 | | | | | | 75 | |
| | | | | | | | | | | | |
| | | | | | | | | | | 290 | |
| | | | | | | | | | | | |
| |
| |
|
Tobacco Settlement Finance Authority, West Virginia Revenue Bonds, Series 2007 | |
0.000% due 06/01/2047 (f) | | | | | 8,800 | | | | | | 780 | |
| | | | | | | | | | | | |
Total Municipal Bonds & Notes (Cost $1,314) | | | | |
| | | | |
| |
U.S. GOVERNMENT AGENCIES 49.3% | |
|
| |
| | | | | 224 | | | | | | 142 | |
0.548% due 11/25/2049 •(a) | | | | | 104 | | | | | | 15 | |
0.598% due 03/25/2037 •(a) | | | | | 107 | | | | | | 9 | |
0.698% due 11/25/2039 •(a) | | | | | 103 | | | | | | 9 | |
0.848% due 01/25/2038 •(a) | | | | | 151 | | | | | | 13 | |
0.928% due 03/25/2037 •(a) | | | | | 124 | | | | | | 10 | |
0.948% due 12/25/2037 ~(a) | | | | | 152 | | | | | | 11 | |
0.958% due 06/25/2037 •(a) | | | | | 59 | | | | | | 4 | |
0.998% due 04/25/2037 •(a) | | | | | 315 | | | | | | 31 | |
1.148% due 11/25/2035 •(a) | | | | | 20 | | | | | | 0 | |
1.348% due 11/25/2036 •(a) | | | | | 583 | | | | | | 64 | |
1.748% due 02/25/2037 •(a) | | | | | 104 | | | | | | 12 | |
3.000% due 04/25/2050 (a) | | | | | 11,345 | | | | | | 1,846 | |
| | | | | 27 | | | | | | 28 | |
| | | | | | | | | | | | |
| See Accompanying Notes | | | | | | | | | | DECEMBER 31, 2023 | | | |
| | | | | | | | |
| | PIMCO Global StocksPLUS & Income Fund | | | | | | |
| | | | | | | | | | | | |
| | | | | | | | | | | |
|
| |
0.698% due 05/25/2050 •(a) | | $ | | | 1,031 | | | $ | | | 143 | |
0.700% due 11/25/2055 ~(a) | | | | | 5,410 | | | | | | 323 | |
0.987% due 03/15/2037 •(a) | | | | | 265 | | | | | | 24 | |
1.117% due 09/15/2036 •(a) | | | | | 152 | | | | | | 13 | |
1.127% due 09/15/2036 •(a) | | | | | 318 | | | | | | 31 | |
10.602% due 10/25/2029 •(k) | | | | | 250 | | | | | | 273 | |
|
| |
0.628% due 12/20/2048 •(a) | | | | | 822 | | | | | | 79 | |
|
| |
| | | | | 3,300 | | | | | | 3,074 | |
| | | | | 1,700 | | | | | | 1,661 | |
|
Uniform Mortgage-Backed Security | |
3.500% due 03/01/2048 - 04/01/2048 | | | | | 353 | | | | | | 329 | |
|
Uniform Mortgage-Backed Security, TBA | |
| | | | | 150 | | | | | | 128 | |
| | | | | 1,550 | | | | | | 1,371 | |
| | | | | 18,900 | | | | | | 17,359 | |
| | | | | 1,650 | | | | | | 1,562 | |
| | | | | 1,700 | | | | | | 1,649 | |
| | | | | 100 | | | | | | 99 | |
| | | | | 5,900 | | | | | | 5,927 | |
| | | | | 4,400 | | | | | | 4,468 | |
| | | | | 1,200 | | | | | | 1,230 | |
| | | | | | | | | | | | |
Total U.S. Government Agencies (Cost $41,162) | | | | |
| | | | |
| |
NON-AGENCY MORTGAGE-BACKED SECURITIES 16.2% | |
|
Atrium Hotel Portfolio Trust | |
| | | | | 600 | | | | | | 551 | |
|
Banc of America Funding Trust | |
| | | | | 73 | | | | | | 65 | |
| | | | | 183 | | | | | | 134 | |
| | | | | 92 | | | | | | 80 | |
|
Banc of America Mortgage Trust | |
| | | | | 1 | | | | | | 1 | |
|
Bear Stearns Adjustable Rate Mortgage Trust | |
| | | | | 78 | | | | | | 69 | |
|
| |
| | | | | 76 | | | | | | 57 | |
| | | | | 50 | | | | | | 38 | |
| | | | | 61 | | | | | | 36 | |
|
Bear Stearns Asset-Backed Securities Trust | |
5.519% due 03/25/2036 ~(k) | | | | | 1,632 | | | | | | 552 | |
|
Bear Stearns Commercial Mortgage Securities Trust | |
| | | | | 123 | | | | | | 123 | |
|
Bear Stearns Structured Products, Inc. Trust | |
| | | | | 140 | | | | | | 106 | |
| | | | | 233 | | | | | | 172 | |
|
CBA Commercial Small Balance Commercial Mortgage | |
| | | | | 92 | | | | | | 85 | |
|
| |
| | | | | 61 | | | | | | 55 | |
|
Chevy Chase Funding LLC Mortgage-Backed Certificates | |
| | | | | 27 | | | | | | 25 | |
| | | | | 2 | | | | | | 2 | |
|
Citigroup Commercial Mortgage Trust | |
5.442% due 12/10/2049 ~(k) | | | | | 302 | | | | | | 195 | |
|
Citigroup Mortgage Loan Trust | |
| | | | | 50 | | | | | | 48 | |
4.984% due 11/25/2035 ~(k) | | | | | 1,029 | | | | | | 572 | |
|
Commercial Mortgage Loan Trust | |
| | | | | 266 | | | | | | 29 | |
|
Connecticut Avenue Securities Trust | |
8.437% due 10/25/2041 •(k) | | | | | 900 | | | | | | 909 | |
|
Countrywide Alternative Loan Trust | |
1.680% due 07/25/2036 •(a) | | | | | 729 | | | | | | 127 | |
| | | | | 74 | | | | | | 59 | |
| | | | | 58 | | | | | | 50 | |
4.756% due 07/25/2035 •(k) | | | | | 380 | | | | | | 355 | |
| | | | | 173 | | | | | | 163 | |
| | | | | 12 | | | | | | 7 | |
| | | | | | | | | | | | |
| | | | | | | | | | | |
5.750% due 05/25/2036 •(k) | | $ | | | 1,179 | | | $ | | | 379 | |
| | | | | 43 | | | | | | 29 | |
| | | | | 417 | | | | | | 293 | |
| | | | | 26 | | | | | | 25 | |
6.500% due 08/25/2036 (k) | | | | | 986 | | | | | | 321 | |
|
Countrywide Home Loan Mortgage Pass-Through Trust | |
| | | | | 214 | | | | | | 168 | |
| | | | | 8 | | | | | | 7 | |
| | | | | 62 | | | | | | 58 | |
| | | | | 24 | | | | | | 24 | |
| | | | | 11 | | | | | | 6 | |
| | | | | 95 | | | | | | 86 | |
| | | | | 47 | | | | | | 40 | |
|
Credit Suisse Mortgage Capital Mortgage-Backed Trust | |
| | | | | 89 | | | | | | 74 | |
|
Extended Stay America Trust | |
9.176% due 07/15/2038 ~(k) | | | | | 933 | | | | | | 916 | |
|
First Horizon Alternative Mortgage Securities Trust | |
| | | | | 137 | | | | | | 96 | |
|
First Horizon Mortgage Pass-Through Trust | |
| | | | | 168 | | | | | | 92 | |
|
| |
12.837% due 10/25/2041 •(k) | | | | | 1,200 | | | | | | 1,264 | |
|
| |
| | | | | 56 | | | | | | 50 | |
|
HarborView Mortgage Loan Trust | |
| | | | | 35 | | | | | | 26 | |
| | | | | 1 | | | | | | 1 | |
| | | | | 15 | | | | | | 4 | |
| | | | | 3 | | | | | | 3 | |
|
HSI Asset Loan Obligation Trust | |
| | | | | 101 | | | | | | 69 | |
|
ILPT Commercial Mortgage Trust | |
| | | | | 600 | | | | | | 578 | |
|
IndyMac INDX Mortgage Loan Trust | |
| | | | | 276 | | | | | | 235 | |
| | | | | 441 | | | | | | 520 | |
| | | | | 3 | | | | | | 3 | |
|
| |
| | | | | 150 | | | | | | 120 | |
| | | | | 25 | | | | | | 12 | |
|
MASTR Adjustable Rate Mortgages Trust | |
| | | | | 55 | | | | | | 49 | |
| | | | | 257 | | | | | | 123 | |
|
Merrill Lynch Alternative Note Asset Trust | |
| | | | | 613 | | | | | | 178 | |
|
Opteum Mortgage Acceptance Corp. Asset-Backed Pass-Through Certificates | |
| | | | | 165 | | | | | | 59 | |
|
RBSSP Resecuritization Trust | |
5.000% due 09/26/2036 ~(k) | | | | | 859 | | | | | | 620 | |
|
Residential Accredit Loans, Inc. Trust | |
| | | | | 61 | | | | | | 54 | |
| | | | | 335 | | | | | | 245 | |
| | | | | 255 | | | | | | 85 | |
| | | | | 100 | | | | | | 81 | |
|
Structured Adjustable Rate Mortgage Loan Trust | |
| | | | | 146 | | | | | | 82 | |
| | | | | 124 | | | | | | 86 | |
| | | | | 32 | | | | | | 19 | |
| | | | | 190 | | | | | | 96 | |
6.412% due 05/25/2035 •(k) | | | | | 710 | | | | | | 497 | |
|
Structured Asset Mortgage Investments Trust | |
5.930% due 02/25/2036 •(k) | | | | | 144 | | | | | | 112 | |
| | | | | 98 | | | | | | 80 | |
|
SunTrust Adjustable Rate Mortgage Loan Trust | |
| | | | | 31 | | | | | | 23 | |
|
WaMu Mortgage Pass-Through Certificates Trust | |
3.918% due 12/25/2036 ~(k) | | | | | 168 | | | | | | 149 | |
| | | | | 46 | | | | | | 38 | |
|
Wells Fargo Commercial Mortgage Trust | |
| | | | | 1,065 | | | | | | 889 | |
| | | | | | | | | | | | |
Total Non-Agency Mortgage-Backed Securities (Cost $15,930) | | | | |
| | | | |
| |
| | | | | | | | | | | | |
| | | | | | | | | | | |
ASSET-BACKED SECURITIES 6.6% | |
|
| |
| | EUR | | | 250 | | | $ | | | 87 | |
|
| |
| | | | | 1,000 | | | | | | 768 | |
|
Bear Stearns Asset-Backed Securities Trust | |
| | $ | | | 518 | | | | | | 184 | |
|
| |
| | | | | 34,966 | | | | | | 4 | |
|
Bombardier Capital Mortgage Securitization Corp. | |
| | | | | 1,421 | | | | | | 171 | |
|
Carlyle Global Market Strategies CLO Ltd. | |
| | | | | 1,700 | | | | | | 287 | |
|
Carlyle Global Market Strategies Euro CLO DAC | |
| | EUR | | | 900 | | | | | | 227 | |
| | | | | 300 | | | | | | 109 | |
|
| |
| | $ | | | 600 | | | | | | 183 | |
|
Carrington Mortgage Loan Trust | |
| | | | | 33 | | | | | | 32 | |
|
Citigroup Mortgage Loan Trust | |
| | | | | 124 | | | | | | 39 | |
|
Conseco Finance Securitizations Corp. | |
| | | | | 364 | | | | | | 101 | |
|
Countrywide Asset-Backed Certificates Trust | |
| | | | | 26 | | | | | | 24 | |
|
| |
| | | | | 21 | | | | | | 18 | |
|
| |
0.000% due 12/15/2028 «(f) | | | | | 2 | | | | | | 15 | |
0.000% due 04/16/2029 «(f) | | | | | 2 | | | | | | 16 | |
0.000% due 07/16/2029 «(f) | | | | | 2 | | | | | | 54 | |
|
Morgan Stanley ABS Capital, Inc. Trust | |
| | | | | 62 | | | | | | 52 | |
|
SMB Private Education Loan Trust | |
0.000% due 09/18/2046 «(f) | | | | | 1 | | | | | | 299 | |
0.000% due 10/15/2048 «(f) | | | | | 2 | | | | | | 444 | |
0.000% due 02/16/2055 «(f) | | | | | 0 | | | | | | 224 | |
|
Soundview Home Loan Trust | |
| | | | | 152 | | | | | | 46 | |
|
| |
| | | | | 393 | | | | | | 75 | |
0.454% due 01/06/2041 •(k) | | | | | 11,064 | | | | | | 2,121 | |
|
Washington Mutual Asset-Backed Certificates Trust | |
| | | | | 78 | | | | | | 28 | |
| | | | | | | | | | | | |
Total Asset-Backed Securities (Cost $17,916) | | | | |
| | | | |
| |
| |
|
Argentina Government International Bond | |
0.750% due 07/09/2030 þ(k) | | | | | 512 | | | | | | 197 | |
| | | | | 97 | | | | | | 39 | |
3.500% due 07/09/2041 þ(k) | | | | | 905 | | | | | | 309 | |
3.625% due 07/09/2035 þ(k) | | | | | 563 | | | | | | 186 | |
4.250% due 01/09/2038 þ(k) | | | | | 1,597 | | | | | | 635 | |
| | ARS | | | 8,480 | | | | | | 3 | |
|
Argentina Treasury Bond BONCER | |
| | | | | 47,222 | | | | | | 78 | |
|
Autonomous City of Buenos Aires | |
122.642% (BADLARPP + 3.750%) due 02/22/2028 ~ | | | | | 449 | | | | | | 0 | |
|
Provincia de Buenos Aires | |
| | | | | 79,631 | | | | | | 66 | |
|
Republic of Greece Government International Bond | |
| | EUR | | | 73 | | | | | | 80 | |
| | | | | 162 | | | | | | 191 | |
| | | | | 127 | | | | | | 148 | |
| | | | | 159 | | | | | | 188 | |
|
Romania Government International Bond | |
| | | | | 700 | | | | | | 796 | |
|
Russia Government International Bond | |
5.625% due 04/04/2042 ^(c) | | $ | | | 200 | | | | | | 134 | |
|
Ukraine Government International Bond | |
| | EUR | | | 89 | | | | | | 20 | |
| | | | | | | | |
| | | | | | December 31, 2023 | | (Unaudited) |
| | | | | | | | | | | | |
| | | | | | | | | | | |
|
Venezuela Government International Bond | |
8.250% due 10/13/2024 ^(c) | | $ | | | 4 | | | $ | | | 1 | |
9.250% due 09/15/2027 ^(c) | | | | | 62 | | | | | | 12 | |
| | | | | | | | | | | | |
Total Sovereign Issues (Cost $5,072) | | | | |
| | | | |
| |
| | | | | | | | | | | |
| |
| |
COMMUNICATION SERVICES 0.4% | |
| | | |
Clear Channel Outdoor Holdings, Inc. (d) | | | 97,913 | | | | | | 178 | |
| | | | |
iHeartMedia, Inc. ‘A’ (d) | | | | | 22,927 | | | | | | 61 | |
| | | | |
iHeartMedia, Inc. ‘B’ «(d) | | | | | 17,837 | | | | | | 43 | |
| | | | | | | | | | | | |
| | | | | | | | | | | 282 | |
| | | | | | | | | | | | |
| |
CONSUMER DISCRETIONARY 0.0% | |
| | | | |
Steinhoff International Holdings NV «(d)(i) | | | | | 4,155,239 | | | | | | 0 | |
| | | | | | | | | | | | |
| |
| |
| | | | |
Axis Energy Services ‘A’ «(i) | | | | | 514 | | | | | | 15 | |
| | | | | | | | | | | | |
| |
| |
| | | | |
| | | | | 1,206 | | | | | | 1 | |
| | | | |
Banca Monte dei Paschi di Siena SpA (d) | | | | | 123,500 | | | | | | 415 | |
| | | | |
Intelsat Emergence SA «(d)(i) | | | | | 34,354 | | | | | | 979 | |
| | | | | | | | | | | | |
| | | | | | | | | | | 1,395 | |
| | | | | | | | | | | | |
| |
| |
| | | | |
| | | | | 71,417 | | | | | | 3,663 | |
| | | | | | | | | | | | |
| |
| |
| | | | |
Drillco Holding Lux SA «(d) | | | | | 12,089 | | | | | | 300 | |
| | | | |
Drillco Holding Lux SA «(d)(i) | | | | | 5,770 | | | | | | 143 | |
| | | | |
| | | | | 1,342 | | | | | | 33 | |
| | | |
Neiman Marcus Group Ltd. LLC «(d)(i) | | | 516 | | | | | | 77 | |
| | | |
Sierra Hamilton Holder LLC «(d)(i) | | | 100,456 | | | | | | 0 | |
| | | | |
Syniverse Holdings, Inc. «(i) | | | | | 347,712 | | | | | | 305 | |
| | | |
Voyager Aviation Holdings LLC (d) | | | 377 | | | | | | 0 | |
| | | | | | | | | | | | |
| | | | | | | | | | | |
| | | |
Westmoreland Mining Holdings «(d)(i) | | | 13,114 | | | $ | | | 53 | |
| | | | |
Westmoreland Mining LLC «(d)(i) | | | | | 13,229 | | | | | | 46 | |
| | | | | | | | | | | | |
| | | | | | | | | | | 957 | |
| | | | | | | | | | | | |
| |
| |
| | | | |
| | | | | 2,671 | | | | | | 2 | |
| | | | | | | | | | | | |
| |
| |
| | | | |
| | | | | 52,536 | | | | | | 1,555 | |
| | | | | | | | | | | | |
Total Common Stocks (Cost $8,594) | | | | |
| | | | |
| |
| |
| |
| |
| | | | |
Intelsat Emergence SA - Exp. 02/17/2027 « | | | | | 236 | | | | | | 1 | |
| | | | | | | | | | | | |
Total Warrants (Cost $763) | | | | |
| | | | |
| |
PREFERRED SECURITIES 2.2% | |
| |
| |
|
| |
7.405% (US0003M + 1.750%) due 01/15/2067 ~(k) | | | | | 1,000,000 | | | | | | 509 | |
|
| |
0.000% due 04/26/2028 (f) | | | | | 1,400 | | | | | | 724 | |
| | |
Stichting AK Rabobank Certificaten | | | | | | | |
6.500% due 12/29/2049 þ(h)(k) | | | | | 587,000 | | | | | | 651 | |
|
| |
4.700% due 11/15/2031 ^(c)(h) | | | 11,000 | | | | | | 0 | |
| | | | | | | | | | | | |
| | | | | | | | | | | 1,884 | |
| | | | | | | | | | | | |
| |
| |
|
Voyager Aviation Holdings LLC | |
| | | | | 2,260 | | | | | | 0 | |
| | | | | | | | | | | | |
Total Preferred Securities (Cost $2,456) | | | | |
| | | | |
| |
REAL ESTATE INVESTMENT TRUSTS 0.3% | |
| |
| |
| | | | |
CBL & Associates Properties, Inc. | | | | | 2,842 | | | | | | 69 | |
| | | | |
| | | | | 32,667 | | | | | | 189 | |
| | | | | | | | | | | | |
Total Real Estate Investment Trusts (Cost $246) | | | | |
| | | | |
| | | | | | | | | | | | |
| | | | | | | | | | | |
SHORT-TERM INSTRUMENTS 1.0% | |
| |
REPURCHASE AGREEMENTS (j) 0.6% | |
| | | | | | | | $ | | | 499 | |
| | | | | | | | | | | | |
| |
| |
|
Argentina Treasury Bond BONCER | |
| | ARS | | | 31,243 | | | | | | 33 | |
| | | | | | | | | | | | |
| |
HUNGARY TREASURY BILLS 0.1% | |
10.900% due 01/04/2024 (f)(g) | | HUF | | | 35,000 | | | | | | 101 | |
| | | | | | | | | | | | |
| |
| |
5.390% due 01/25/2024 - 02/15/2024 (e)(f)(n) | | $ | | | 275 | | | | | | 274 | |
| | | | | | | | | | | | |
Total Short-Term Instruments | | | | |
| | | | |
|
| |
Total Investments in Securities (Cost $147,868) | | | | |
| | | | |
| |
| | | | | | | | | | | |
INVESTMENTS IN AFFILIATES 16.9% | |
| |
SHORT-TERM INSTRUMENTS 16.9% | |
| |
CENTRAL FUNDS USED FOR CASH MANAGEMENT PURPOSES 16.9% | |
| | | | |
PIMCO Short-Term Floating NAV Portfolio III | | | | | 1,472,655 | | | | | | 14,325 | |
| | | | | | | | | | | | |
Total Short-Term Instruments (Cost $14,322) | | | | | | | |
| | | | |
| | | | |
| | | | | | | | | | | | |
Total Investments in Affiliates (Cost $14,322) | | | | | | | |
| |
| | | | |
Total Investments 163.4% (Cost $162,190) | | | | | | $ | | | | |
| |
Financial Derivative
Instruments (l)(m) 1.9% (Cost or Premiums, net $568) | | | | |
| |
Other Assets and Liabilities, net (65.3)% | | | | |
| | | | |
| | | $ | | | | |
| | | | | | | |
NOTES TO SCHEDULE OF INVESTMENTS:
| A zero balance may reflect actual amounts rounding to less than one thousand. |
| Security valued using significant unobservable inputs (Level 3). |
| All or a portion of this amount represents unfunded loan commitments. The interest rate for the unfunded portion will be determined at the time of funding. See Note 4, Securities and Other Investments, in the Notes to Financial Statements for more information regarding unfunded loan commitments. |
| Variable or Floating rate security. Rate shown is the rate in effect as of period end. Certain variable rate securities are not based on a published reference rate and spread, rather are determined by the issuer or agent and are based on current market conditions. Reference rate is as of reset date, which may vary by security. These securities may not indicate a reference rate and/or spread in their description. |
| Rate shown is the rate in effect as of period end. The rate may be based on a fixed rate, a capped rate or a floor rate and may convert to a variable or floating rate in the future. These securities do not indicate a reference rate and spread in their description. |
| Coupon represents a rate which changes periodically based on a predetermined schedule or event. Rate shown is the rate in effect as of period end. |
| Security is an Interest Only (“IO”) or IO Strip. |
| Security is not accruing income as of the date of this report. |
| Security did not produce income within the last twelve months. |
| Coupon represents a weighted average yield to maturity. |
| | | | | | | | | | | | |
| See Accompanying Notes | | | | | | | | | | DECEMBER 31, 2023 | | | |
| | | | | | | | |
| | PIMCO Global StocksPLUS & Income Fund | | | | | | |
| Coupon represents a yield to maturity. |
| Perpetual maturity; date shown, if applicable, represents next contractual call date. |
(i) RESTRICTED SECURITIES:
| | | | | | | | | | | | | | | | |
| | | | | | | | | | | Market Value
as Percentage
of Net Assets | |
| | | | | | $ | 2,984 | | | $ | 3,663 | | | | 4.31 | % |
| | | 07/01/2021 | | | | 8 | | | | 15 | | | | 0.02 | |
| | | 06/08/2023 | | | | 115 | | | | 143 | | | | 0.17 | |
| | | | | | | 2,403 | | | | 979 | | | | 1.15 | |
Neiman Marcus Group Ltd. LLC | | | 09/25/2020 | | | | 0 | | | | 77 | | | | 0.09 | |
Sierra Hamilton Holder LLC | | | 07/31/2017 | | | | 25 | | | | 0 | | | | 0.00 | |
Steinhoff International Holdings NV | | | | | | | 0 | | | | 0 | | | | 0.00 | |
| | | | | | | 342 | | | | 305 | | | | 0.36 | |
Westmoreland Mining Holdings | | | 12/08/2014 - 08/05/2016 | | | | 367 | | | | 53 | | | | 0.06 | |
| | | 06/30/2023 | | | | 88 | | | | 46 | | | | 0.05 | |
| | | | | | | | | | | | | | | | |
| | | $ | 6,332 | | | $ | 5,281 | | | | 6.21 | % |
| | | | | | | | | | | | | |
BORROWINGS AND OTHER FINANCING TRANSACTIONS
(j) REPURCHASE AGREEMENTS:
| | | | | | | | | | | | | | | | | | | | | | | | | | | | | | |
| | | | | | | | | | | | | | | | | | | Repurchase
Agreements,
at Value | | | Repurchase Agreement Proceeds to be Received (1) | |
| FICC | | | 2.600 | % | | | 12/29/2023 | | | | 01/02/2024 | | | $ | 499 | | | U.S. Treasury Notes 4.875% due 11/30/2025 | | $ | (509 | ) | | $ | 499 | | | $ | 499 | |
| | | | | | | | | | | | | | | | | | | | | | | | | | | | | | |
Total Repurchase Agreements | | | | | | | | | | | | | | | |
| | | | | | | | | | | | | | | |
REVERSE REPURCHASE AGREEMENTS:
| | | | | | | | | | | | | | | | | | | | | | | | |
| | | | | | | | | | | | | | Payable for
Reverse
Repurchase
Agreements | |
| | | 6.060 | % | | | 07/14/2023 | | | | 01/10/2024 | | | | $ | | | | (2,030 | ) | | $ | (2,089 | ) |
| | | 6.120 | | | | 07/10/2023 | | | | 01/04/2024 | | | | | | | | (135 | ) | | | (139 | ) |
| | | 6.120 | | | | 07/31/2023 | | | | 01/29/2024 | | | | | | | | (404 | ) | | | (415 | ) |
| | | 6.650 | | | | 12/20/2023 | | | | 04/16/2024 | | | | | | | | (269 | ) | | | (270 | ) |
| | | 6.650 | | | | 12/20/2023 | | | | 05/15/2024 | | | | | | | | (206 | ) | | | (206 | ) |
| | | 6.750 | | | | 12/20/2023 | | | | 05/15/2024 | | | | | | | | (826 | ) | | | (828 | ) |
| | | 6.950 | | | | 12/20/2023 | | | | 04/16/2024 | | | | | | | | (819 | ) | | | (821 | ) |
| | | 4.350 | | | | 11/03/2023 | | | | 01/11/2024 | | | | EUR | | | | (432 | ) | | | (480 | ) |
| | | 5.700 | | | | 07/28/2023 | | | | TBD | | | | $ | | | | (608 | ) | | | (623 | ) |
| | | 6.440 | | | | 10/13/2023 | | | | 01/12/2024 | | | | | | | | (484 | ) | | | (491 | ) |
| | | 6.560 | | | | 12/22/2023 | | | | 04/22/2024 | | | | | | | | (151 | ) | | | (151 | ) |
| | | 6.840 | | | | 08/30/2023 | | | | 02/26/2024 | | | | | | | | (292 | ) | | | (299 | ) |
| | | 6.100 | | | | 11/20/2023 | | | | 05/20/2024 | | | | | | | | (227 | ) | | | (228 | ) |
| | | 6.130 | | | | 10/19/2023 | | | | 04/16/2024 | | | | | | | | (77 | ) | | | (78 | ) |
| | | 5.800 | | | | 12/29/2023 | | | | 04/29/2024 | | | | | | | | (326 | ) | | | (327 | ) |
| | | 6.100 | | | | 12/07/2023 | | | | 04/05/2024 | | | | | | | | (840 | ) | | | (844 | ) |
| | | 6.130 | | | | 11/15/2023 | | | | 01/24/2024 | | | | | | | | (714 | ) | | | (719 | ) |
| | | 4.130 | | | | 05/10/2023 | | | | TBD | | | | EUR | | | | (105 | ) | | | (119 | ) |
| | | 6.922 | | | | 12/08/2023 | | | | 02/02/2024 | | | | $ | | | | (1,445 | ) | | | (1,453 | ) |
| | | 6.226 | | | | 12/28/2023 | | | | 09/27/2024 | | | | | | | | (1,696 | ) | | | (1,698 | ) |
| | | 5.750 | | | | 12/15/2023 | | | | 02/02/2024 | | | | | | | | (1,101 | ) | | | (1,104 | ) |
| | | 6.470 | | | | 12/18/2023 | | | | 04/18/2024 | | | | | | | | (723 | ) | | | (725 | ) |
| | | 6.740 | | | | 12/19/2023 | | | | 02/02/2024 | | | | | | | | (418 | ) | | | (419 | ) |
| | | 6.750 | | | | 01/02/2024 | | | | 02/16/2024 | | | | | | | | (429 | ) | | | (429 | ) |
| | | 5.600 | | | | 12/05/2023 | | | | TBD | | | | | | | | (68 | ) | | | (68 | ) |
| | | 5.830 | | | | 10/13/2023 | | | | 01/11/2024 | | | | | | | | (1,048 | ) | | | (1,061 | ) |
| | | 5.650 | | | | 07/28/2023 | | | | TBD | | | | | | | | (1,006 | ) | | | (1,031 | ) |
| | | 5.710 | | | | 12/19/2023 | | | | 02/20/2024 | | | | | | | | (610 | ) | | | (611 | ) |
| | | 4.100 | | | | 11/10/2023 | | | | 06/06/2025 | | | | EUR | | | | (107 | ) | | | (119 | ) |
| | | 5.920 | | | | 10/03/2023 | | | | 01/02/2024 | | | | $ | | | | (889 | ) | | | (902 | ) |
| | | 6.100 | | | | 10/16/2023 | | | | 04/15/2024 | | | | | | | | (763 | ) | | | (773 | ) |
| | | | | | | | | | | | | | | | | | | | | | | | |
Total Reverse Repurchase Agreements | | | | | | | | | | | | | |
| | | | | | | | | | | | | | | | | | | | | | | | |
| | | | | | | | |
| | | | | | December 31, 2023 | | (Unaudited) |
| | | | | | | | | | | | | | | | | | | | |
| | | | | | | | | | | | | | | |
U.S. Government Agencies (0.8)% | |
Uniform Mortgage-Backed Security, TBA | | | 2.000% | | | | 02/01/2054 | | | $ | 800 | | | $ | (647 | ) | | $ | (655 | ) |
| | | | | | | | | | | | | | | | | | | | |
| | | | | | | | | | | | | | | | | | | | |
| | | | | | | | | | | | | | | | | | | | |
BORROWINGS AND OTHER FINANCING TRANSACTIONS SUMMARY
The following is a summary by counterparty of the market value of Borrowings and Other Financing Transactions and collateral pledged/(received) as of December 31, 2023:
| | | | | | | | | | | | | | | | | | | | | | | | |
| | Repurchase Agreement Proceeds to be Received (1) | | | Payable for
Reverse
Repurchase
Agreements | | | Payable for Sale-Buyback Transactions | | | Total
Borrowings and
Other Financing
Transactions | | | Collateral
Pledged/(Received) | | | | |
Global/Master Repurchase Agreement | |
| | $ | 0 | | | $ | (4,768 | ) | | $ | 0 | | | $ | (4,768 | ) | | $ | 6,162 | | | $ | 1,394 | |
| | | 0 | | | | (2,044 | ) | | | 0 | | | | (2,044 | ) | | | 2,633 | | | | 589 | |
| | | 0 | | | | (306 | ) | | | 0 | | | | (306 | ) | | | 380 | | | | 74 | |
| | | 0 | | | | (1,890 | ) | | | 0 | | | | (1,890 | ) | | | 2,166 | | | | 276 | |
| | | 0 | | | | 0 | | | | 0 | | | | 0 | | | | (10 | ) | | | (10 | ) |
| | | 0 | | | | (1,572 | ) | | | 0 | | | | (1,572 | ) | | | 2,254 | | | | 682 | |
| | | 499 | | | | 0 | | | | 0 | | | | 499 | | | | (509 | ) | | | (10 | ) |
| | | 0 | | | | (1,698 | ) | | | 0 | | | | (1,698 | ) | | | 1,943 | | | | 245 | |
| | | 0 | | | | (1,104 | ) | | | 0 | | | | (1,104 | ) | | | 1,337 | | | | 233 | |
| | | 0 | | | | (725 | ) | | | 0 | | | | (725 | ) | | | 916 | | | | 191 | |
| | | 0 | | | | (848 | ) | | | 0 | | | | (848 | ) | | | 580 | | | | (268 | ) |
| | | 0 | | | | (1,129 | ) | | | 0 | | | | (1,129 | ) | | | 1,345 | | | | 216 | |
| | | 0 | | | | (1,642 | ) | | | 0 | | | | (1,642 | ) | | | 1,772 | | | | 130 | |
| | | 0 | | | | (1,794 | ) | | | 0 | | | | (1,794 | ) | | | 2,076 | | | | 282 | |
| | | | | | | | | | | | | | | | | | | | | | | | |
Total Borrowings and Other Financing Transactions | | | | | | | | | | | | | | | | | | | | | | | | |
| | | | | | | | | | | | | | | | | | | | | | | | |
CERTAIN TRANSFERS ACCOUNTED FOR AS SECURED BORROWINGS
Remaining Contractual Maturity of the Agreements
| | | | | | | | | | | | | | | | | | | | |
| | | | | | | | | | | | | | | | |
Reverse Repurchase Agreements | |
| | $ | 0 | | | $ | (5,350 | ) | | $ | (1,030 | ) | | $ | (4,210 | ) | | $ | (10,590 | ) |
| | | 0 | | | | 0 | | | | 0 | | | | (191 | ) | | | (191 | ) |
Non-Agency Mortgage-Backed Securities | | | 0 | | | | (491 | ) | | | (299 | ) | | | (4,508 | ) | | | (5,298 | ) |
| | | 0 | | | | 0 | | | | (1,453 | ) | | | 0 | | | | (1,453 | ) |
| | | 0 | | | | 0 | | | | (1,104 | ) | | | 0 | | | | (1,104 | ) |
| | | 0 | | | | (455 | ) | | | 0 | | | | 0 | | | | (455 | ) |
| | | | | | | | | | | | | | | | | | | | |
| | | | | | | | | | | | | | | | | | | | |
| | | | | | | | | | | | | | | | | | | | |
Payable for reverse repurchase agreements (5) | | | | | |
| | | | | |
| Securities with an aggregate market value of $23,562 have been pledged as collateral under the terms of the above master agreements as of December 31, 2023. |
| Includes accrued interest. |
| The average amount of borrowings outstanding during the period ended December 31, 2023 was $(21,226) at a weighted average interest rate of 5.954%. Average borrowings may include reverse repurchase agreements and sale-buyback transactions, if held during the period. |
| Open maturity reverse repurchase agreement. |
| Net Exposure represents the net receivable/(payable) that would be due from/to the counterparty in the event of default. Exposure from borrowings and other financing transactions can only be netted across transactions governed under the same master agreement with the same legal entity. See Note 8, Master Netting Arrangements, in the Notes to Financial Statements for more information. |
| Unsettled reverse repurchase agreements liability of $(429) is outstanding at period end. |
| | | | | | | | | | | | |
| See Accompanying Notes | | | | | | | | | | DECEMBER 31, 2023 | | | |
| | | | | | | | |
| | PIMCO Global StocksPLUS & Income Fund | | | | | | |
(l) FINANCIAL DERIVATIVE INSTRUMENTS: EXCHANGE-TRADED OR CENTRALLY CLEARED
| | | | | | | | | | | | | | | | | | | | | | | | |
| | | | | | | | | | | | | | | | | | |
| | | 4,520.000 | | | | 01/19/2024 | | | | 168 | | | $ | 8 | | | $ | 91 | | | $ | 27 | |
| | | | | | | | | | | | | | | | | | | | | | | | |
| | | | | | | | | |
| | | | | | | | | | | | | | | | | | | | | | | | |
| | | | | | | | | | | | | | | | | | | | | | | | |
| | | | | | | | | | | | | | | | | | |
| | | 4,760.000 | | | | 01/19/2024 | | | | 168 | | | $ | 8 | | | $ | (534 | ) | | $ | (710 | ) |
| | | | | | | | | | | | | | | | | | | | | | | | |
| | | | | | | | | |
| | | | | | | | | | | | | | | | | | | | | | | | |
| | | | | | | | | | | | | | | | | | | | | | | | |
| | | | | | | | | | | Unrealized
Appreciation/
(Depreciation) | | | | |
| | | | | | |
E-Mini S&P 500 Index March Futures | | | 03/2024 | | | | 177 | | | | $ 42,657 | | | $ | 1,478 | | | $ | 0 | | | $ | (108 | ) |
| | | | | | | | | | | | | | | | | | | | | | | | |
| |
| | | | | |
| | | | | | | | | | | Unrealized
Appreciation/
(Depreciation) | | | | |
| | | | | | |
3-Month SOFR Active Contract December Futures | | | 03/2024 | | | | 5 | | | | $ (1,183 | ) | | $ | 34 | | | $ | 0 | | | $ | 0 | |
3-Month SOFR Active Contract December Futures | | | 03/2025 | | | | 1 | | | | (241 | ) | | | 4 | | | | 0 | | | | 0 | |
3-Month SOFR Active Contract December Futures | | | 03/2026 | | | | 1 | | | | (242 | ) | | | 2 | | | | 0 | | | | 0 | |
3-Month SOFR Active Contract June Futures | | | 09/2024 | | | | 2 | | | | (477 | ) | | | 11 | | | | 0 | | | | 0 | |
3-Month SOFR Active Contract June Futures | | | 09/2025 | | | | 2 | | | | (484 | ) | | | 5 | | | | 0 | | | | (1 | ) |
3-Month SOFR Active Contract March Futures | | | 06/2024 | | | | 4 | | | | (950 | ) | | | 24 | | | | 0 | | | | 0 | |
3-Month SOFR Active Contract March Futures | | | 06/2025 | | | | 2 | | | | (483 | ) | | | 6 | | | | 0 | | | | 0 | |
3-Month SOFR Active Contract March Futures | | | 06/2026 | | | | 1 | | | | (242 | ) | | | 2 | | | | 0 | | | | 0 | |
3-Month SOFR Active Contract September Futures | | | 12/2024 | | | | 2 | | | | (480 | ) | | | 9 | | | | 0 | | | | 0 | |
3-Month SOFR Active Contract September Futures | | | 12/2025 | | | | 1 | | | | (242 | ) | | | 3 | | | | 0 | | | | 0 | |
| | | | | | | | | | | | | | | | | | | | | | | | |
| | | | | | | | | | | | | | $ | 100 | | | $ | 0 | | | $ | (1 | ) |
| | | | | | | | | | | | | | | | | | | | | | | | |
| | | | | | | | | | | | | |
| | | | | | | | | | | | | |
| | | | | | | | | | | | | | | | | | | | | | | | | | | | | | | | | | | | | | | | |
| | | | | | | | | | | | | | | | | | Unrealized
Appreciation/
(Depreciation) | | | | | | | |
| | | | | | |
| | | | | 5.000 | % | | Annual | | | 03/20/2029 | | | | GBP | | | | 1,600 | | | $ | 157 | | | $ | 1 | | | $ | 158 | | | $ | 0 | | | $ | (5 | ) |
| | | | | 0.750 | | | Annual | | | 09/21/2052 | | | | | | | | 600 | | | | 123 | | | | 251 | | | | 374 | | | | 12 | | | | 0 | |
| | | | | 0.250 | | | | | | 06/16/2024 | | | | $ | | | | 3,000 | | | | 3 | | | | 76 | | | | 79 | | | | 2 | | | | 0 | |
| | | | | 3.000 | | | Semi-Annual | | | 06/19/2024 | | | | | | | | 4,400 | | | | (18 | ) | | | 75 | | | | 57 | | | | 2 | | | | 0 | |
| | | | | 2.450 | | | Annual | | | 12/20/2024 | | | | | | | | 3,700 | | | | 0 | | | | 86 | | | | 86 | | | | 1 | | | | 0 | |
| | | | | 2.350 | | | Annual | | | 01/17/2025 | | | | | | | | 1,900 | | | | 0 | | | | 43 | | | | 43 | | | | 0 | | | | 0 | |
| | | | | 2.300 | | | Annual | | | 01/17/2026 | | | | | | | | 300 | | | | 0 | | | | 10 | | | | 10 | | | | 0 | | | | 0 | |
| | | | | 4.250 | | | Annual | | | 06/15/2027 | | | | | | | | 26,000 | | | | (151 | ) | | | 704 | | | | 553 | | | | 15 | | | | 0 | |
| | | | | 1.500 | | | Semi-Annual | | | 12/15/2028 | | | | | | | | 1,250 | | | | (12 | ) | | | 144 | | | | 132 | | | | 0 | | | | 0 | |
| | | | | 1.750 | | | Annual | | | 06/15/2029 | | | | | | | | 340 | | | | (37 | ) | | | 1 | | | | (36 | ) | | | 0 | | | | 0 | |
| | | | | 3.750 | | | Annual | | | 06/20/2029 | | | | | | | | 1,200 | | | | (23 | ) | | | 0 | | | | (23 | ) | | | 0 | | | | (1 | ) |
| | | | | 1.750 | | | Semi-Annual | | | 01/15/2030 | | | | | | | | 600 | | | | (5 | ) | | | 73 | | | | 68 | | | | 0 | | | | 0 | |
| | | | | 2.000 | | | Semi-Annual | | | 02/12/2030 | | | | | | | | 4,400 | | | | (56 | ) | | | 480 | | | | 424 | | | | 1 | | | | 0 | |
| | | | | 2.000 | | | Semi-Annual | | | 03/10/2030 | | | | | | | | 500 | | | | 0 | | | | 47 | | | | 47 | | | | 0 | | | | 0 | |
| | | | | 1.000 | | | Semi-Annual | | | 12/16/2030 | | | | | | | | 400 | | | | (12 | ) | | | 80 | | | | 68 | | | | 0 | | | | 0 | |
| | | | | 0.750 | | | Semi-Annual | | | 06/16/2031 | | | | | | | | 2,229 | | | | (174 | ) | | | (264 | ) | | | (438 | ) | | | 0 | | | | (1 | ) |
| | | | | | | | |
| | | | | | December 31, 2023 | | (Unaudited) |
| | | | | | | | | | | | | | | | | | | | | | | | | | | | | | | | | | | | | | | | |
| | | | | | | | | | | | | | | | | | Unrealized
Appreciation/
(Depreciation) | | | | | | | |
| | | | | | |
| | | | | 1.750 | % | | Annual | | | 06/15/2032 | | | | $ | | | | 220 | | | $ | (9 | ) | | $ | (23 | ) | | $ | (32 | ) | | $ | 0 | | | $ | 0 | |
| | | | | 3.000 | | | Annual | | | 06/21/2033 | | | | | | | | 40 | | | | 0 | | | | (2 | ) | | | (2 | ) | | | 0 | | | | 0 | |
| | | | | 3.500 | | | Annual | | | 12/20/2033 | | | | | | | | 2,900 | | | | 93 | | | | (99 | ) | | | (6 | ) | | | 2 | | | | 0 | |
| | | | | 3.500 | | | Annual | | | 12/20/2033 | | | | | | | | 1,500 | | | | 21 | | | | (17 | ) | | | 4 | | | | 0 | | | | (1 | ) |
| | | | | 3.750 | | | Annual | | | 06/20/2034 | | | | | | | | 700 | | | | (25 | ) | | | 3 | | | | (22 | ) | | | 0 | | | | 0 | |
| | | | | 3.000 | | | Semi-Annual | | | 12/19/2048 | | | | | | | | 1,900 | | | | (5 | ) | | | (207 | ) | | | (212 | ) | | | 0 | | | | (7 | ) |
| | | | | 1.500 | | | Annual | | | 06/15/2052 | | | | | | | | 5,400 | | | | 468 | | | | 1,445 | | | | 1,913 | | | | 21 | | | | 0 | |
| | | | | 1.750 | | | Annual | | | 06/15/2052 | | | | | | | | 6,000 | | | | 713 | | | | 1,129 | | | | 1,842 | | | | 23 | | | | 0 | |
| | | | | 11.157 | | | Maturity | | | 01/02/2025 | | | | BRL | | | | 300 | | | | 0 | | | | (1 | ) | | | (1 | ) | | | 0 | | | | 0 | |
| | | | | 11.177 | | | Maturity | | | 01/02/2025 | | | | | | | | 200 | | | | 0 | | | | (1 | ) | | | (1 | ) | | | 0 | | | | 0 | |
| | | | | 11.367 | | | Maturity | | | 01/02/2025 | | | | | | | | 200 | | | | 0 | | | | (1 | ) | | | (1 | ) | | | 0 | | | | 0 | |
| | | | | 12.018 | | | Maturity | | | 01/02/2025 | | | | | | | | 600 | | | | 0 | | | | 0 | | | | 0 | | | | 0 | | | | 0 | |
| | | | | 12.098 | | | Maturity | | | 01/02/2025 | | | | | | | | 1,000 | | | | 0 | | | | 0 | | | | 0 | | | | 0 | | | | 0 | |
| | | | | 12.158 | | | Maturity | | | 01/02/2025 | | | | | | | | 500 | | | | 0 | | | | 0 | | | | 0 | | | | 0 | | | | 0 | |
| | | | | 12.163 | | | Maturity | | | 01/02/2025 | | | | | | | | 500 | | | | 0 | | | | 0 | | | | 0 | | | | 0 | | | | 0 | |
| | | | | 12.178 | | | Maturity | | | 01/02/2025 | | | | | | | | 1,000 | | | | 0 | | | | 1 | | | | 1 | | | | 0 | | | | 0 | |
| | | | | 11.250 | | | Maturity | | | 01/04/2027 | | | | | | | | 300 | | | | 0 | | | | 1 | | | | 1 | | | | 0 | | | | 0 | |
| | | | | 11.275 | | | Maturity | | | 01/04/2027 | | | | | | | | 100 | | | | 0 | | | | 0 | | | | 0 | | | | 0 | | | | 0 | |
| | | | | 11.290 | | | Maturity | | | 01/04/2027 | | | | | | | | 100 | | | | 0 | | | | 0 | | | | 0 | | | | 0 | | | | 0 | |
| | | | | 11.731 | | | Maturity | | | 01/04/2027 | | | | | | | | 100 | | | | 0 | | | | 1 | | | | 1 | | | | 0 | | | | 0 | |
| | | | | 11.746 | | | Maturity | | | 01/04/2027 | | | | | | | | 300 | | | | 0 | | | | 2 | | | | 2 | | | | 0 | | | | 0 | |
| | | | | 11.901 | | | Maturity | | | 01/04/2027 | | | | | | | | 800 | | | | 0 | | | | 5 | | | | 5 | | | | 0 | | | | 0 | |
| | | | | 3.300 | | | | | | 06/19/2024 | | | | CAD | | | | 4,900 | | | | 369 | | | | (407 | ) | | | (38 | ) | | | 0 | | | | (1 | ) |
| | | | | 3.500 | | | Semi-Annual | | | 06/20/2044 | | | | | | | | 600 | | | | (107 | ) | | | 107 | | | | 0 | | | | 1 | | | | 0 | |
| | | | | 0.650 | | | Annual | | | 02/26/2029 | | | | EUR | | | | 6,100 | | | | 6 | | | | (638 | ) | | | (632 | ) | | | 0 | | | | (24 | ) |
| | | | | 0.150 | | | Annual | | | 03/18/2030 | | | | | | | | 1,300 | | | | (18 | ) | | | 249 | | | | 231 | | | | 7 | | | | 0 | |
| | | | | 0.150 | | | Annual | | | 06/17/2030 | | | | | | | | 3,000 | | | | (132 | ) | | | 585 | | | | 453 | | | | 18 | | | | 0 | |
| | | | | 0.250 | | | Annual | | | 09/21/2032 | | | | | | | | 800 | | | | 72 | | | | 91 | | | | 163 | | | | 7 | | | | 0 | |
| | | | | 1.250 | | | Annual | | | 08/19/2049 | | | | | | | | 2,700 | | | | 11 | | | | 670 | | | | 681 | | | | 57 | | | | 0 | |
| | | | | 0.250 | | | Annual | | | 03/18/2050 | | | | | | | | 400 | | | | 48 | | | | (235 | ) | | | (187 | ) | | | 0 | | | | (8 | ) |
| | | | | 0.500 | | | Annual | | | 06/17/2050 | | | | | | | | 1,000 | | | | 171 | | | | (574 | ) | | | (403 | ) | | | 0 | | | | (20 | ) |
| | | | | 0.830 | | | Annual | | | 12/09/2052 | | | | | | | | 1,600 | | | | 11 | | | | 92 | | | | 103 | | | | 8 | | | | 0 | |
| | | | | 8.675 | | | Lunar | | | 04/03/2024 | | | | MXN | | | | 2,700 | | | | 0 | | | | 1 | | | | 1 | | | | 0 | | | | 0 | |
| | | | | 8.660 | | | Lunar | | | 04/04/2024 | | | | | | | | 1,100 | | | | 0 | | | | 1 | | | | 1 | | | | 0 | | | | 0 | |
| | | | | 8.750 | | | Lunar | | | 04/05/2024 | | | | | | | | 1,000 | | | | 0 | | | | 1 | | | | 1 | | | | 0 | | | | 0 | |
| | | | | 8.410 | | | Lunar | | | 03/31/2027 | | | | | | | | 300 | | | | 0 | | | | 0 | | | | 0 | | | | 0 | | | | 0 | |
| | | | | 8.730 | | | Lunar | | | 04/06/2027 | | | | | | | | 400 | | | | 0 | | | | 0 | | | | 0 | | | | 0 | | | | 0 | |
| | | | | 7.495 | | | Lunar | | | 01/14/2032 | | | | | | | | 200 | | | | 1 | | | | 0 | | | | 1 | | | | 0 | | | | 0 | |
| | | | | 7.498 | | | Lunar | | | 01/15/2032 | | | | | | | | 800 | | | | 3 | | | | 0 | | | | 3 | | | | 0 | | | | 0 | |
| | | | | 8.732 | | | Lunar | | | 03/30/2032 | | | | | | | | 200 | | | | 0 | | | | 0 | | | | 0 | | | | 0 | | | | 0 | |
| | | | | 8.701 | | | Lunar | | | 03/31/2032 | | | | | | | | 500 | | | | 0 | | | | 0 | | | | 0 | | | | 0 | | | | 0 | |
| | | | | 3.500 | | | Semi-Annual | | | 06/19/2034 | | | | CAD | | | | 1,000 | | | | 35 | | | | (2 | ) | | | 33 | | | | 1 | | | | 0 | |
| | | | | | | | | | | | | | | | | | | | | | | | | |
| | | | | | | | | | | | | | | | | | | | | | | | | |
| | | | | | | | | | | | | | | | | | | | | | | | | |
FINANCIAL DERIVATIVE INSTRUMENTS: EXCHANGE-TRADED OR CENTRALLY CLEARED SUMMARY
The following is a summary of the market value and variation margin of Exchange-Traded or Centrally Cleared Financial Derivative Instruments as of December 31, 2023:
| | | | | | | | | | | | | | | | | | | | | | | | | | | | | | | | | | | | |
| | | Financial Derivative Assets | | | | | | Financial Derivative Liabilities | |
| | | | | | | | | | | | | | | | | | Variation Margin
Liability | | | | |
| | | | | | | | | | | | | | | | | | | | | | | | | | | | |
Total Exchange-Traded or Centrally Cleared | | | | | | | | | | | | | | | | | | | | | | | | | | | | | | | | | | | | |
| | | | | | | | | | | | | | | | | | | | | | | | | | | | | | | | | | | | |
Cash of $3,052 has been pledged as collateral for exchange-traded and centrally cleared financial derivative instruments as of December 31, 2023. See Note 8, Master Netting Arrangements, in the Notes to Financial Statements for more information.
| This instrument has a forward starting effective date. See Note 2, Securities Transactions and Investment Income, in the Notes to Financial Statements for further information. |
| | | | | | | | | | | | |
| See Accompanying Notes | | | | | | | | | | DECEMBER 31, 2023 | | | |
| | | | | | | | |
| | PIMCO Global StocksPLUS & Income Fund | | | | | | |
(m) FINANCIAL DERIVATIVE INSTRUMENTS: OVER THE COUNTER
FORWARD FOREIGN CURRENCY CONTRACTS:
| | | | | | | | | | | | | | | | | | | | | | | | |
| | | | | | | | | | | Unrealized Appreciation/
(Depreciation) | |
| | | | | | |
| | | 01/2024 | | | GBP | | | 38 | | | $ | | | 49 | | | $ | 0 | | | $ | 0 | |
| | | 01/2024 | | | $ | | | 97 | | | GBP | | | 77 | | | | 1 | | | | 0 | |
| | | | | | | |
| | | 01/2024 | | | CAD | | | 18 | | | $ | | | 13 | | | | 0 | | | | 0 | |
| | | 01/2024 | | | EUR | | | 171 | | | | | | 187 | | | | 0 | | | | (2 | ) |
| | | 01/2024 | | | GBP | | | 162 | | | | | | 205 | | | | 0 | | | | (1 | ) |
| | | 01/2024 | | | $ | | | 104 | | | AUD | | | 158 | | | | 4 | | | | 0 | |
| | | 01/2024 | | | | | | 356 | | | EUR | | | 325 | | | | 3 | | | | 0 | |
| | | 01/2024 | | | | | | 121 | | | JPY | | | 17,800 | | | | 5 | | | | 0 | |
| | | 02/2024 | | | TWD | | | 1,379 | | | $ | | | 43 | | | | 0 | | | | (2 | ) |
| | | 03/2024 | | | $ | | | 37 | | | IDR | | | 576,901 | | | | 0 | | | | 0 | |
| | | | | | | |
| | | 03/2024 | | | | | | 359 | | | TRY | | | 11,245 | | | | 0 | | | | (4 | ) |
| | | 04/2024 | | | | | | 1,311 | | | | | | 42,370 | | | | 0 | | | | (20 | ) |
| | | | | | | |
| | | 01/2024 | | | GBP | | | 25 | | | $ | | | 32 | | | | 0 | | | | 0 | |
| | | 01/2024 | | | HUF | | | 2,741 | | | | | | 8 | | | | 0 | | | | 0 | |
| | | | | | | |
| | | 01/2024 | | | $ | | | 10 | | | CHF | | | 9 | | | | 0 | | | | 0 | |
| | | 03/2024 | | | | | | 50 | | | IDR | | | 773,642 | | | | 0 | | | | 0 | |
| | | | | | | |
| | | 01/2024 | | | HUF | | | 32,256 | | | $ | | | 92 | | | | 0 | | | | (1 | ) |
| | | | | | | |
| | | 01/2024 | | | AUD | | | 41 | | | | | | 27 | | | | 0 | | | | (1 | ) |
| | | 01/2024 | | | CAD | | | 218 | | | | | | 161 | | | | 0 | | | | (4 | ) |
| | | 01/2024 | | | EUR | | | 10,245 | | | | | | 11,263 | | | | 0 | | | | (50 | ) |
| | | 01/2024 | | | $ | | | 109 | | | EUR | | | 99 | | | | 1 | | | | 0 | |
| | | 03/2024 | | | | | | 13 | | | TWD | | | 404 | | | | 1 | | | | 0 | |
| | | | | | | |
| | | 01/2024 | | | | | | 138 | | | JPY | | | 20,200 | | | | 5 | | | | 0 | |
| | | 03/2024 | | | IDR | | | 4,302,268 | | | $ | | | 279 | | | | 0 | | | | 0 | |
| | | 03/2024 | | | $ | | | 167 | | | IDR | | | 2,570,728 | | | | 0 | | | | 0 | |
| | | | | | | |
| | | 01/2024 | | | | | | 107 | | | CHF | | | 93 | | | | 4 | | | | 0 | |
| | | 03/2024 | | | TWD | | | 3,538 | | | $ | | | 114 | | | | 0 | | | | (2 | ) |
| | | 03/2024 | | | $ | | | 33 | | | IDR | | | 504,859 | | | | 0 | | | | 0 | |
| | | | | | | |
| | | 03/2024 | | | | | | 137 | | | TWD | | | 4,308 | | | | 5 | | | | 0 | |
| | | | | | | |
| | | 01/2024 | | | CAD | | | 20 | | | $ | | | 15 | | | | 0 | | | | 0 | |
| | | 01/2024 | | | GBP | | | 792 | | | | | | 1,002 | | | | 0 | | | | (7 | ) |
| | | | | | | | | | | | | | | | | | | | | | | | |
Total Forward Foreign Currency Contracts | | | | | | | | | |
| | | | | | | | | |
CREDIT DEFAULT SWAPS ON ASSET-BACKED SECURITIES - SELL PROTECTION
(1)
| | | | | | | | | | | | | | | | | | | | | | | | | | | | | | | | | | | | |
| | | | | | | | | | | | | | | | | | Unrealized
Appreciation/
(Depreciation) | | | Swap Agreements, at Value (4) | |
| | | | | | |
| BOA | | Long Beach Mortgage Loan Trust 6.584% due 07/25/2033 | | | 6.250% | | | Monthly | | | 07/25/2033 | | | $ | | | | | 88 | | | $ | 0 | | | $ | 0 | | | $ | 0 | | | $ | 0 | |
| | | | | | | | | | | | | | | | | | | | | | | | | | | | | | | | | | |
CREDIT DEFAULT SWAPS ON CORPORATE ISSUES - SELL PROTECTION
(1)
| | | | | | | | | | | | | | | | | | | | | | | | | | | | | | | | | | | | | | | | | | |
| | | | | | | | | | | | | Implied Credit Spread at December 31, 2023 (2) | | | | | | | | | Unrealized
Appreciation/
(Depreciation) | | | Swap Agreements, at Value (4) | |
| | | | | | |
| DUB | | | | | 4.650 | % | | | Quarterly | | | | 06/30/2029 | | | | 0.075 | % | | $ | | | | | 400 | | | $ | 0 | | | $ | 35 | | | $ | 35 | | | $ | 0 | |
| | | | | | | | | | | |
| MYC | | | | | 1.000 | | | | Quarterly | | | | 12/20/2028 | | | | 5.188 | | | | | | | | 100 | | | | (20 | ) | | | 3 | | | | 0 | | | | (17 | ) |
| | | | | | | | | | | | | | | | | | | | | | | | | | | | | | | | | | | | | | | | | | |
| | | | | | | | | | | | | | | | | | $ | (20 | ) | | $ | 38 | | | $ | 35 | | | $ | (17 | ) |
| | | | | | | | | | | | | | | | | |
CREDIT DEFAULT SWAPS ON CREDIT INDICES - SELL PROTECTION
(1)
| | | | | | | | | | | | | | | | | | | | | | | | | | | | | | | | | | | | |
| | | | | | | | | | | | | | | | | | Unrealized
Appreciation/
(Depreciation) | | | Swap Agreements, at Value (4) | |
| | | | | | |
| GST | | | | | 0.320 | % | | Monthly | | | 07/25/2045 | | | $ | | | | | 705 | | | $ | (140 | ) | | $ | 87 | | | $ | 0 | | | $ | (53 | ) |
| | | | | 0.090 | | | Monthly | | | 08/25/2037 | | | | | | | | 548 | | | | (350 | ) | | | 306 | | | | 0 | | | | (44 | ) |
| | | | | | | | | | | | | | | | | | | | | | | | | | | | | | | | | | | | |
| | | | | | | | | | | | | | | | | | | | $ | (490 | ) | | $ | 393 | | | $ | 0 | | | $ | (97 | ) |
| | | | | | | | | | | | | | | | | | | | | | | | | | | | | | | | | | |
| | | | | | | | |
| | | | | | December 31, 2023 | | (Unaudited) |
TOTAL RETURN SWAPS ON EQUITY INDICES
| | | | | | | | | | | | | | | | | | | | | | | | | | | | | | | | | | | | | | | | | | |
| | | | | | | | | | | | | | | | | | | | | | | Unrealized
Appreciation/
(Depreciation) | | | | |
| | | | | | |
| JPM | | | | | | | 79 | | | 5.300% (1-Month USD-LIBOR less a specified spread) | | | Monthly | | | | 05/08/2024 | | | $ | | | | | 615 | | | $ | 0 | | | $ | (2 | ) | | $ | 0 | | | $ | (2 | ) |
| | | | | | | 206 | | | 5.460% (1-Month USD-LIBOR plus a specified spread) | | | Monthly | | | | 01/08/2025 | | | | | | | | 1,603 | | | | 0 | | | | 0 | | | | 0 | | | | 0 | |
| | | | | | | | | | | | |
| MYI | | | | | | | 5,193 | | | 5.365% (1-Month USD-LIBOR plus a specified spread) | | | Maturity | | | | 11/20/2024 | | | | | | | | 37,681 | | | | 0 | | | | 2,483 | | | | 2,483 | | | | 0 | |
| | | | | | | | | | | | | | | | | | | | | | | | | | | | | | | | | | | | | | | | | | |
| | | | | | | | | | | | | | | | | | | | | | | | | $ | 0 | | | $ | 2,481 | | | $ | 2,483 | | | $ | (2 | ) |
| | | | | | | | | | | | | | | | | | | | | | | | | | | | | | | | | | | | | | | |
| | | | | | | | | | | | | | | | | |
| | | | | | | | | | | | | | | | | |
FINANCIAL DERIVATIVE INSTRUMENTS: OVER THE COUNTER SUMMARY
The following is a summary by counterparty of the market value of OTC financial derivative instruments and collateral pledged/(received) as of December 31, 2023:
| | | | | | | | | | | | | | | | | | | | | | | | | | | | | | | | | | | | | | | | | | | | | | | | |
| | | Financial Derivative Assets | | | | | | Financial Derivative Liabilities | | | | | | | | | | |
| | Forward
Foreign
Currency
Contracts | | | | | | | | | | | | | | | Forward
Foreign
Currency
Contracts | | | | | | | | | | | | Net Market
Value of OTC
Derivatives | | | Collateral
Pledged/
(Received) | | | | |
| | $ | 1 | | | $ | 0 | | | $ | 0 | | | $ | 1 | | | | | | | $ | 0 | | | $ | 0 | | | $ | 0 | | | $ | 0 | | | $ | 1 | | | $ | 0 | | | $ | 1 | |
| | | 12 | | | | 0 | | | | 0 | | | | 12 | | | | | | | | (5 | ) | | | 0 | | | | 0 | | | | (5 | ) | | | 7 | | | | 0 | | | | 7 | |
| | | 0 | | | | 0 | | | | 0 | | | | 0 | | | | | | | | (24 | ) | | | 0 | | | | 0 | | | | (24 | ) | | | (24 | ) | | | 0 | | | | (24 | ) |
| | | 0 | | | | 0 | | | | 35 | | | | 35 | | | | | | | | 0 | | | | 0 | | | | 0 | | | | 0 | | | | 35 | | | | 0 | | | | 35 | |
| | | 0 | | | | 0 | | | | 0 | | | | 0 | | | | | | | | 0 | | | | 0 | | | | (97 | ) | | | (97 | ) | | | (97 | ) | | | 233 | | | | 136 | |
| | | 0 | | | | 0 | | | | 0 | | | | 0 | | | | | | | | (1 | ) | | | 0 | | | | (2 | ) | | | (3 | ) | | | (3 | ) | | | 0 | | | | (3 | ) |
| | | 2 | | | | 0 | | | | 0 | | | | 2 | | | | | | | | (55 | ) | | | 0 | | | | 0 | | | | (55 | ) | | | (53 | ) | | | 0 | | | | (53 | ) |
| | | 0 | | | | 0 | | | | 0 | | | | 0 | | | | | | | | 0 | | | | 0 | | | | (17 | ) | | | (17 | ) | | | (17 | ) | | | 0 | | | | (17 | ) |
| | | 5 | | | | 0 | | | | 2,483 | | | | 2,488 | | | | | | | | 0 | | | | 0 | | | | 0 | | | | 0 | | | | 2,488 | | | | (2,510 | ) | | | (22 | ) |
| | | 4 | | | | 0 | | | | 0 | | | | 4 | | | | | | | | (2 | ) | | | 0 | | | | 0 | | | | (2 | ) | | | 2 | | | | 0 | | | | 2 | |
| | | 5 | | | | 0 | | | | 0 | | | | 5 | | | | | | | | 0 | | | | 0 | | | | 0 | | | | 0 | | | | 5 | | | | 0 | | | | 5 | |
| | | 0 | | | | 0 | | | | 0 | | | | 0 | | | | | | | | (7 | ) | | | 0 | | | | 0 | | | | (7 | ) | | | (7 | ) | | | 0 | | | | (7 | ) |
| | | | | | | | | | | | | | | | | | | | | | | | | | | | | | | | | | | | | | | | | | | | | | | | |
| | | | | | | | | | | | | | | | | | | | | | | | | | | | | | | | | | | | | | | | | | | | | | | | |
| | | | | | | | | | | | | | | | | | | | | | | | | | | | | | | | | | | | | | | | | | | | | | | | |
| Securities with an aggregate market value of $233 have been pledged as collateral for financial derivative instruments as governed by International Swaps and Derivatives Association, Inc. master agreements as of December 31, 2023. |
| If the Fund is a seller of protection and a credit event occurs, as defined under the terms of that particular swap agreement, the Fund will either (i) pay to the buyer of protection an amount equal to the notional amount of the swap and take delivery of the referenced obligation or underlying securities comprising the referenced index or (ii) pay a net settlement amount in the form of cash, securities or other deliverable obligations equal to the notional amount of the swap less the recovery value of the referenced obligation or underlying securities comprising the referenced index. |
| Implied credit spreads, represented in absolute terms, utilized in determining the market value of credit default swap agreements on corporate issues as of period end serve as indicators of the current status of the payment/performance risk and represent the likelihood or risk of default for the credit derivative. The implied credit spread of a particular referenced entity reflects the cost of buying/selling protection and may include upfront payments required to be made to enter into the agreement. Wider credit spreads represent a deterioration of the referenced entity’s credit soundness and a greater likelihood or risk of default or other credit event occurring as defined under the terms of the agreement. |
| The maximum potential amount the Fund could be required to pay as a seller of credit protection or receive as a buyer of credit protection if a credit event occurs as defined under the terms of that particular swap agreement. |
| The prices and resulting values for credit default swap agreements serve as indicators of the current status of the payment/performance risk and represent the likelihood of an expected liability (or profit) for the credit derivative should the notional amount of the swap agreement be closed/sold as of the period end. Increasing market values, in absolute terms when compared to the notional amount of the swap, represent a deterioration of the underlying referenced instrument’s credit soundness and a greater likelihood or risk of default or other credit event occurring as defined under the terms of the agreement. |
| Receive represents that the Fund receives payments for any positive net return on the underlying reference. The Fund makes payments for any negative net return on such underlying reference. Pay represents that the Fund receives payments for any negative net return on the underlying reference. The Fund makes payments for any positive net return on such underlying reference. |
| Net Exposure represents the net receivable/(payable) that would be due from/to the counterparty in the event of default. Exposure from OTC financial derivative instruments can only be netted across transactions governed under the same master agreement with the same legal entity. See Note 8, Master Netting Arrangements, in the Notes to Financial Statements for more information. |
| | | | | | | | | | | | |
| See Accompanying Notes | | | | | | | | | | DECEMBER 31, 2023 | | | |
| | | | | | | | |
| | PIMCO Global StocksPLUS & Income Fund | | | | | | |
FAIR VALUE OF FINANCIAL DERIVATIVE INSTRUMENTS
The following is a summary of the fair valuation of the Fund’s derivative instruments categorized by risk exposure. See Note 7, Principal and Other Risks, in the Notes to Financial Statements on risks of the Fund.
Fair Values of Financial Derivative Instruments on the Statements of Assets and Liabilities as of December 31, 2023:
| | | | | | | | | | | | | | | | | | | | | | | | |
| | | Derivatives not accounted for as hedging instruments | |
| | | | | | | | | | | | | | | | | | | |
Financial Derivative Instruments - Assets | |
Exchange-traded or centrally cleared | |
| | $ | 0 | | | $ | 0 | | | $ | 27 | | | $ | 0 | | | $ | 0 | | | $ | 27 | |
| | | 0 | | | | 0 | | | | 0 | | | | 0 | | | | 178 | | | | 178 | |
| | | | | | | | | | | | | | | | | | | | | | | | |
| | $ | 0 | | | $ | 0 | | | $ | 27 | | | $ | 0 | | | $ | 178 | | | $ | 205 | |
| | | | | | | | | | | | | | | | | | | | | | | | |
| |
Forward Foreign Currency Contracts | | $ | 0 | | | $ | 0 | | | $ | 0 | | | $ | 29 | | | $ | 0 | | | $ | 29 | |
| | | 0 | | | | 35 | | | | 2,483 | | | | 0 | | | | 0 | | | | 2,518 | |
| | | | | | | | | | | | | | | | | | | | | | | | |
| | $ | 0 | | | $ | 35 | | | $ | 2,483 | | | $ | 29 | | | $ | 0 | | | $ | 2,547 | |
| | | | | | | | | | | | | | | | | | | | | | | | |
| | $ | 0 | | | $ | 35 | | | $ | 2,510 | | | $ | 29 | | | $ | 178 | | | $ | 2,752 | |
| | | | | | | | | | | | | | | | | | | | | | | | |
|
Financial Derivative Instruments - Liabilities | |
Exchange-traded or centrally cleared | |
| | $ | 0 | | | $ | 0 | | | $ | 710 | | | $ | 0 | | | $ | 0 | | | $ | 710 | |
| | | 0 | | | | 0 | | | | 108 | | | | 0 | | | | 1 | | | | 109 | |
| | | 0 | | | | 0 | | | | 0 | | | | 0 | | | | 68 | | | | 68 | |
| | | | | | | | | | | | | | | | | | | | | | | | |
| | $ | 0 | | | $ | 0 | | | $ | 818 | | | $ | 0 | | | $ | 69 | | | $ | 887 | |
| | | | | | | | | | | | | | | | | | | | | | | | |
| |
Forward Foreign Currency Contracts | | $ | 0 | | | $ | 0 | | | $ | 0 | | | $ | 94 | | | $ | 0 | | | $ | 94 | |
| | | 0 | | | | 114 | | | | 2 | | | | 0 | | | | 0 | | | | 116 | |
| | | | | | | | | | | | | | | | | | | | | | | | |
| | $ | 0 | | | $ | 114 | | | $ | 2 | | | $ | 94 | | | $ | 0 | | | $ | 210 | |
| | | | | | | | | | | | | | | | | | | | | | | | |
| | $ | 0 | | | $ | 114 | | | $ | 820 | | | $ | 94 | | | $ | 69 | | | $ | 1,097 | |
| | | | | | | | | | | | | | | | | | | | | | | | |
The effect of Financial Derivative Instruments on the Statements of Operations for the period ended December 31, 2023:
| | | | | | | | | | | | | | | | | | | | | | | | |
| | | Derivatives not accounted for as hedging instruments | |
| | | | | | | | | | | | | | | | | | | |
Net Realized Gain (Loss) on Financial Derivative Instruments | |
Exchange-traded or centrally cleared | |
| | $ | 0 | | | $ | 0 | | | $ | (410 | ) | | $ | 0 | | | $ | 0 | | | $ | (410 | ) |
| | | 0 | | | | 0 | | | | (2,399 | ) | | | 0 | | | | 0 | | | | (2,399 | ) |
| | | 0 | | | | 0 | | | | 1,704 | | | | 0 | | | | 1 | | | | 1,705 | |
| | | 0 | | | | 0 | | | | 0 | | | | 0 | | | | (2,225 | ) | | | (2,225 | ) |
| | | | | | | | | | | | | | | | | | | | | | | | |
| | $ | 0 | | | $ | 0 | | | $ | (1,105 | ) | | $ | 0 | | | $ | (2,224 | ) | | $ | (3,329 | ) |
| | | | | | | | | | | | | | | | | | | | | | | | |
| |
Forward Foreign Currency Contracts | | $ | 0 | | | $ | 0 | | | $ | 0 | | | $ | (167 | ) | | $ | 0 | | | $ | (167 | ) |
| | | 0 | | | | (37 | ) | | | 7,583 | | | | 0 | | | | 0 | | | | 7,546 | |
| | | | | | | | | | | | | | | | | | | | | | | | |
| | $ | 0 | | | $ | (37 | ) | | $ | 7,583 | | | $ | (167 | ) | | $ | 0 | | | $ | 7,379 | |
| | | | | | | | | | | | | | | | | | | | | | | | |
| | $ | 0 | | | $ | (37 | ) | | $ | 6,478 | | | $ | (167 | ) | | $ | (2,224 | ) | | $ | 4,050 | |
| | | | | | | | | | | | | | | | | | | | | | | | |
|
Net Change in Unrealized Appreciation (Depreciation) on Financial Derivative Instruments | |
Exchange-traded or centrally cleared | |
| | $ | 0 | | | $ | 0 | | | $ | 41 | | | $ | 0 | | | $ | 0 | | | $ | 41 | |
| | | 0 | | | | 0 | | | | (185 | ) | | | 0 | | | | 0 | | | | (185 | ) |
| | | 0 | | | | 0 | | | | 261 | | | | 0 | | | | (11 | ) | | | 250 | |
| | | 0 | | | | 0 | | | | 0 | | | | 0 | | | | 2,653 | | | | 2,653 | |
| | | | | | | | | | | | | | | | | | | | | | | | |
| | $ | 0 | | | $ | 0 | | | $ | 117 | | | $ | 0 | | | $ | 2,642 | | | $ | 2,759 | |
| | | | | | | | | | | | | | | | | | | | | | | | |
| |
Forward Foreign Currency Contracts | | $ | 0 | | | $ | 0 | | | $ | 0 | | | $ | 120 | | | $ | 0 | | | $ | 120 | |
| | | 0 | | | | 170 | | | | (6,332 | ) | | | 0 | | | | 0 | | | | (6,162 | ) |
| | | | | | | | | | | | | | | | | | | | | | | | |
| | $ | 0 | | | $ | 170 | | | $ | (6,332 | ) | | $ | 120 | | | $ | 0 | | | $ | (6,042 | ) |
| | | | | | | | | | | | | | | | | | | | | | | | |
| | $ | 0 | | | $ | 170 | | | $ | (6,215 | ) | | $ | 120 | | | $ | 2,642 | | | $ | (3,283 | ) |
| | | | | | | | | | | | | | | | | | | | | | | | |
| | | | | | | | |
| | | | | | December 31, 2023 | | (Unaudited) |
The following is a summary of the fair valuations according to the inputs used as of December 31, 2023 in valuing the Fund’s assets and liabilities:
| | | | | | | | | | | | | | | | |
| | | | | | | | | | | | |
Investments in Securities, at Value | |
Loan Participations and Assignments | | $ | 0 | | | $ | 10,794 | | | $ | 5,825 | | | $ | 16,619 | |
| |
| | | 0 | | | | 8,596 | | | | 1,471 | | | | 10,067 | |
| | | 0 | | | | 18,705 | | | | 0 | | | | 18,705 | |
| | | 0 | | | | 2,443 | | | | 0 | | | | 2,443 | |
Convertible Bonds & Notes | |
| | | 0 | | | | 12 | | | | 0 | | | | 12 | |
| | | 0 | | | | 321 | | | | 0 | | | | 321 | |
| |
| | | 0 | | | | 290 | | | | 0 | | | | 290 | |
| | | 0 | | | | 780 | | | | 0 | | | | 780 | |
| | | 0 | | | | 41,937 | | | | 0 | | | | 41,937 | |
Non-Agency Mortgage-Backed Securities | | | 0 | | | | 12,659 | | | | 1,070 | | | | 13,729 | |
| | | 0 | | | | 4,514 | | | | 1,094 | | | | 5,608 | |
| | | 0 | | | | 3,083 | | | | 0 | | | | 3,083 | |
| |
| | | 239 | | | | 0 | | | | 43 | | | | 282 | |
| | | 0 | | | | 0 | | | | 15 | | | | 15 | |
| | | 415 | | | | 0 | | | | 980 | | | | 1,395 | |
| | | 0 | | | | 0 | | | | 3,663 | | | | 3,663 | |
| | | 0 | | | | 0 | | | | 957 | | | | 957 | |
| | | 2 | | | | 0 | | | | 0 | | | | 2 | |
| | | 0 | | | | 0 | | | | 1,555 | | | | 1,555 | |
| |
| | | 0 | | | | 0 | | | | 1 | | | | 1 | |
| |
| | | 0 | | | | 1,884 | | | | 0 | | | | 1,884 | |
Real Estate Investment Trusts | |
| | | 258 | | | | 0 | | | | 0 | | | | 258 | |
| |
| | | 0 | | | | 499 | | | | 0 | | | | 499 | |
| | | 0 | | | | 33 | | | | 0 | | | | 33 | |
| | | | | | | | | | | | | | | | |
| | | | | | | | | | | | |
| | $ | 0 | | | $ | 101 | | | $ | 0 | | | $ | 101 | |
| | | 0 | | | | 274 | | | | 0 | | | | 274 | |
| | | | | | | | | | | | | | | | |
| | $ | 914 | | | $ | 106,925 | | | $ | 16,674 | | | $ | 124,513 | |
| | | | | | | | | | | | | | | | |
|
Investments in Affiliates, at Value | |
| |
Central Funds Used for Cash Management Purposes | | $ | 14,325 | | | $ | 0 | | | $ | 0 | | | $ | 14,325 | |
| | | | | | | | | | | | | | | | |
| | | | |
| | $ | 15,239 | | | $ | 106,925 | | | $ | 16,674 | | | $ | 138,838 | |
| | | | | | | | | | | | | | | | |
|
Short Sales, at Value - Liabilities | |
| | $ | 0 | | | $ | (655 | ) | | $ | 0 | | | $ | (655 | ) |
| | | | | | | | | | | | | | | | |
|
Financial Derivative Instruments - Assets | |
Exchange-traded or centrally cleared | | | 27 | | | | 178 | | | | 0 | | | | 205 | |
| | | 0 | | | | 2,512 | | | | 35 | | | | 2,547 | |
| | | | | | | | | | | | | | | | |
| | $ | 27 | | | $ | 2,690 | | | $ | 35 | | | $ | 2,752 | |
| | | | | | | | | | | | | | | | |
|
Financial Derivative Instruments - Liabilities | |
Exchange-traded or centrally cleared | | | (818 | ) | | | (69 | ) | | | 0 | | | | (887 | ) |
| | | 0 | | | | (113 | ) | | | (97 | ) | | | (210 | ) |
| | | | | | | | | | | | | | | | |
| | $ | (818 | ) | | $ | (182 | ) | | $ | (97 | ) | | $ | (1,097 | ) |
| | | | | | | | | | | | | | | | |
| | | | |
Total Financial Derivative Instruments | | $ | (791 | ) | | $ | 2,508 | | | $ | (62 | ) | | $ | 1,655 | |
| | | | | | | | | | | | | | | | |
| | | | |
| | $ | 14,448 | | | $ | 108,778 | | | $ | 16,612 | | | $ | 139,838 | |
| | | | | | | | | | | | | | | | |
The following is a reconciliation of the fair valuations using significant unobservable inputs (Level 3) for the Fund during the period ended December 31, 2023:
| | | | | | | | | | | | | | | | | | | | | | | | | | | | | | | | | | | | | | | | |
| | Beginning
Balance
at 06/30/2023 | | | | | | | | | Accrued
Discounts/
(Premiums) | | | | | | Net Change in Unrealized Appreciation/ (Depreciation) (2) | | | | | | | | | Ending
Balance
at 12/31/2023 | | | Net Change in Unrealized Appreciation/ (Depreciation) on Investments Held at 12/31/2023 (2) | |
Investments in Securities, at Value | |
Loan Participations and Assignments | | $ | 8,723 | | | $ | 3,390 | | | $ | (4,036 | ) | | $ | 161 | | | $ | (727 | ) | | $ | 641 | | | $ | 0 | | | $ | (2,327 | ) | | $ | 5,825 | | | $ | 160 | |
| |
| | | 0 | | | | 0 | | | | 0 | | | | 0 | | | | 0 | | | | 0 | | | | 1,471 | | | | 0 | | | | 1,471 | | | | 0 | |
| | | 213 | | | | 0 | | | | 0 | | | | 1 | | | | 0 | | | | 8 | | | | 0 | | | | (222 | ) | | | 0 | | | | 0 | |
Non-Agency Mortgage-Backed Securities | | | 1,250 | | | | 0 | | | | (62 | ) | | | 12 | | | | 13 | | | | (23 | ) | | | 0 | | | | (120 | ) | | | 1,070 | | | | (23 | ) |
| | | 1,396 | | | | 0 | | | | (3 | ) | | | 1 | | | | 1 | | | | (301 | ) | | | 0 | | | | 0 | | | | 1,094 | | | | (301 | ) |
| |
| | | 58 | | | | 0 | | | | 0 | | | | 0 | | | | 0 | | | | (15 | ) | | | 0 | | | | 0 | | | | 43 | | | | (15 | ) |
| | | 15 | | | | 0 | | | | 0 | | | | 0 | | | | 0 | | | | 0 | | | | 0 | | | | 0 | | | | 15 | | | | 0 | |
| | | 789 | | | | 0 | | | | 0 | | | | 0 | | | | 0 | | | | 191 | | | | 0 | | | | 0 | | | | 980 | | | | 191 | |
| | | 0 | | | | 2,984 | | | | 0 | | | | 0 | | | | 0 | | | | 679 | | | | 0 | | | | 0 | | | | 3,663 | | | | 679 | |
| | | 1000 | | | | 20 | | | | 0 | | | | 0 | | | | 0 | | | | (63 | ) | | | 0 | | | | 0 | | | | 957 | | | | 42 | |
| | | 0 | | | | 403 | | | | 0 | | | | 0 | | | | 0 | | | | 1,152 | | | | 0 | | | | 0 | | | | 1,555 | | | | 1152 | |
| |
| | | 18 | | | | 0 | | | | (34 | ) | | | 0 | | | | 34 | | | | (18 | ) | | | 0 | | | | 0 | | | | 0 | | | | 0 | |
| |
| | | 26 | | | | 0 | | | | (34 | ) | | | 0 | | | | 34 | | | | (25 | ) | | | 0 | | | | 0 | | | | 1 | | | | 0 | |
| | | 805 | | | | 0 | | | | (403 | ) | | | 0 | | | | 0 | | | | (402 | ) | | | 0 | | | | 0 | | | | 0 | | | | 0 | |
| | | | | | | | | | | | |
| See Accompanying Notes | | | | | | | | | | DECEMBER 31, 2023 | | | |
| | | | | | | | |
| | PIMCO Global StocksPLUS & Income Fund | | | | December 31, 2023 | | (Unaudited) |
| | | | | | | | | | | | | | | | | | | | | | | | | | | | | | | | | | | | | | | | |
| | Beginning
Balance
at 06/30/2023 | | | | | | | | | Accrued
Discounts/
(Premiums) | | | | | | Net Change in Unrealized Appreciation/ (Depreciation) (2) | | | | | | | | | Ending
Balance
at 12/31/2023 | | | Net Change in Unrealized Appreciation/ (Depreciation) on Investments Held at 12/31/2023 (2) | |
| | | | | | | | | | | | | | | | | | | | | | | | | | | | | | | | | | | | | | | | |
| | $ | 545 | | | $ | 0 | | | $ | 0 | | | $ | 0 | | | $ | 0 | | | $ | (545 | ) | | $ | 0 | | | $ | 0 | | | $ | 0 | | | $ | 0 | |
| | | | | | | | | | | | | | | | | | | | | | | | | | | | | | | | | | | | | | | | |
| | $ | 14,838 | | | $ | 6,797 | | | $ | (4,572 | ) | | $ | 175 | | | $ | (645 | ) | | $ | 1,279 | | | $ | 1,471 | | | $ | (2,669 | ) | | $ | 16,674 | | | $ | 1,885 | |
| | | | | | | | | | | | | | | | | | | | | | | | | | | | | | | | | | | | | | | | |
| | | | | | | | |
Financial Derivative Instruments - Assets | | | | | | | | | | | | | | | | | | | | | | | | | | | | | | | | | |
| | $ | 17 | | | $ | 0 | | | $ | 0 | | | $ | 0 | | | $ | 0 | | | $ | 18 | | | $ | 0 | | | $ | 0 | | | $ | 35 | | | $ | 18 | |
| | | | | | | | | | | | | | | | | | | | | | | | | | | | | | | | | | | | | | | | |
|
Financial Derivative Instruments - Liabilities | |
| | $ | (128 | ) | | $ | 148 | | | $ | (211 | ) | | $ | 0 | | | $ | (55 | ) | | $ | 149 | | | $ | 0 | | | $ | 0 | | | $ | (97 | ) | | $ | (43 | ) |
| | | | | | | | | | | | | | | | | | | | | | | | | | | | | | | | | | | | | | | | |
| | | | | | | | | | |
| | $ | 14,727 | | | $ | 6,945 | | | $ | (4,783 | ) | | $ | 175 | | | $ | (700 | ) | | $ | 1,446 | | | $ | 1,471 | | | $ | (2,669 | ) | | $ | 16,612 | | | $ | 1,860 | |
| | | | | | | | | | | | | | | | | | | | | | | | | | | | | | | | | | | | | | | | |
The following is a summary of significant unobservable inputs used in the fair valuations of assets and liabilities categorized within Level 3 of the fair value hierarchy:
| | | | | | | | | | | | | | | | | | | | |
| | Ending
Balance
at 12/31/2023 | | | | | | | | | | (% Unless Noted Otherwise) | |
| | | | | | |
Investments in Securities, at Value | |
Loan Participations and Assignments | | $ | 2,083 | | | | | | | | X | | | | 14.500 | | | | — | |
| | | 3,742 | | | | | | | | | | | | 8.670-26.490 | | | | 14.177 | |
| |
| | | 1,471 | | | | | | | | | | | | 54.375 | | | | — | |
Non-Agency Mortgage-Backed Securities | | | 1,070 | | | Fair Valuation of Odd Lot Positions | | | | | | | | | 2.500 | | | | — | |
| | | 1,052 | | | | | | | | | | | | 12.000-17.000 | | | | 13.064 | |
| | | 42 | | | Fair Valuation of Odd Lot Positions | | | | | | | | | 2.500 | | | | — | |
| | | | |
| | | 43 | | | | | Stock Price w/Liquidity Discount | | | | | | | 10.000 | | | | — | |
| | | 15 | | | | | | | | X | | | | 4.000 | | | | — | |
| | | 979 | | | | | | | | X | | | | 4.000 | | | | — | |
| | | 1 | | | | | | | | | | | | 60.720 | | | | — | |
| | | 3,663 | | | | | | | | X | | | | 14.500 | | | | — | |
| | | 77 | | | Comparable Multiple/Discounted Cash Flow | | Revenue Multiple/EBITDA Multiple/Discount Rate | | | X/X/% | | | | 0.550/6.500/10.000 | | | | — | |
| | | 304 | | | | | | | | | | | | 17.280 | | | | — | |
| | | 576 | | | Indicative Market Quotation | | | | | $ | | | | 3.500-24.833 | | | | 21.218 | |
| | | 1,555 | | | | | | | | X | | | | 5.860 | | | | — | |
| | | | | | | | | | | | | | | | | | | | |
| | | 1 | | | | | | | | | | | | 40.000 | | | | — | |
|
Financial Derivative Instruments - Assets | |
| | | 35 | | | Indicative Market Quotation | | | | | | | | | 7.505 | | | | — | |
|
Financial Derivative Instruments - Liabilities | |
| | | (97 | ) | | Indicative Market Quotation | | | | | | | | | 92.000-92.500 | | | | 92.275 | |
| | | | | | | | | | | | | | | | | | | | |
| | $ | 16,612 | | | | | | | | | | | | | | | | | |
| | | | | | | | | | | | | | | | | | | | |
| Net Purchases and Settlements for Financial Derivative Instruments may include payments made or received upon entering into swap agreements to compensate for differences between the stated terms of the swap agreement and prevailing market conditions. | |
| Any difference between Net Change in Unrealized Appreciation/(Depreciation) and Net Change in Unrealized Appreciation/(Depreciation) on Investments Held at December 31, 2023 may be due to an investment no longer held or categorized as Level 3 at period end. | |
| Security type updated from Banking & Finance to Utilities since prior fiscal year end. | |
| Security type updated from Financials to Industrials since prior fiscal year end. | |
| | | | | | | | |
| | PIMCO Strategic Income Fund, Inc. | | | | December 31, 2023 | | (Unaudited) |
(Amounts in thousands*, except number of shares, contracts, units and ounces, if any)
| | | | | | | | | | | | |
| | | | | | | | | | | |
INVESTMENTS IN SECURITIES 300.5% | |
| |
LOAN PARTICIPATIONS AND ASSIGNMENTS 18.5% | |
|
| |
| | $ | | | 700 | | | $ | | | 695 | |
|
| |
| | | | | 3,480 | | | | | | 3,480 | |
|
| |
TBD% - 15.420% due 05/25/2026 | | | | | 3,121 | | | | | | 2,364 | |
|
Gateway Casinos & Entertainment Ltd. | |
| | | | | 2,635 | | | | | | 2,637 | |
13.588% (CDOR03M + 8.000%) due 10/18/2027 ~ | | CAD | | | 575 | | | | | | 434 | |
|
| |
TBD% - 13.988% due 03/01/2024 « | | $ | | | 2,647 | | | | | | 2,809 | |
|
| |
| | | | | 28 | | | | | | 19 | |
|
Lealand Finance Co. BV (6.431% Cash and 3.000% PIK) | |
9.431% due 06/30/2025 (b) | | | | | 196 | | | | | | 82 | |
|
| |
| | | | | 1,250 | | | | | | 1,249 | |
|
| |
10.042% (SONIA03M + 4.750%) due 11/04/2027 ~ | | GBP | | | 2,749 | | | | | | 3,401 | |
|
| |
| | $ | | | 418 | | | | | | 391 | |
|
| |
TBD% - 14.000% due 09/07/2024 µ | | | | | 412 | | | | | | 412 | |
|
| |
9.175% (EUR003M + 5.250%) due 09/30/2028 ~ | | EUR | | | 2,400 | | | | | | 2,653 | |
|
Promotora de Informaciones SA | |
9.192% (EUR003M + 5.220%) due 12/31/2026 ~ | | | | | 3,792 | | | | | | 3,993 | |
|
Promotora de Informaciones SA (6.942% Cash and 5.000% PIK) | |
11.942% (EUR003M + 5.305%) due 06/30/2027 ~(b) | | | | | 568 | | | | | | 578 | |
|
| |
| | $ | | | 15 | | | | | | 15 | |
|
| |
| | | | | 1,341 | | | | | | 1,280 | |
|
Steenbok Lux Finco 1 SARL | |
10.000% (EUR006M + 10.000%) due 06/30/2026 ~ | | EUR | | | 28 | | | | | | 31 | |
|
Steenbok Lux Finco 2 SARL | |
| | | | | 10,554 | | | | | | 3,772 | |
10.000% (EUR006M + 10.000%) due 06/30/2026 ~ | | | | | 19 | | | | | | 21 | |
|
| |
| | $ | | | 4,830 | | | | | | 4,272 | |
|
| |
| | | | | 3,387 | | | | | | 2,583 | |
|
Westmoreland Mining Holdings LLC | |
| | | | | 3 | | | | | | 2 | |
|
| |
| | | | | 16 | | | | | | 15 | |
| | | | | | | | | | | | |
Total Loan Participations and Assignments (Cost $39,796) | | | | |
| | | | |
| |
CORPORATE BONDS & NOTES 55.0% | |
| |
| |
|
| |
| | EUR | | | 2,900 | | | | | | 1,133 | |
| | | | | 1,800 | | | | | | 700 | |
|
| |
6.608% due 09/13/2029 (k) | | $ | | | 500 | | | | | | 527 | |
|
| |
| | | | | 1,600 | | | | | | 1,645 | |
|
| |
8.500% due 11/15/2029 (k) | | | | | 2,400 | | | | | | 2,179 | |
| | | | | | | | | | | | |
| | | | | | | | | | | |
|
Banca Monte dei Paschi di Siena SpA | |
2.625% due 04/28/2025 (k) | | EUR | | | 765 | | | $ | | | 824 | |
| | | | | 400 | | | | | | 443 | |
| | | | | 1,304 | | | | | | 1,452 | |
| | | | | 400 | | | | | | 445 | |
| | | | | 1,360 | | | | | | 1,653 | |
|
Banco de Credito del Peru SA | |
| | PEN | | | 400 | | | | | | 105 | |
|
| |
2.894% due 11/24/2032 •(k) | | $ | | | 200 | | | | | | 164 | |
6.224% due 05/09/2034 (k) | | | | | 2,800 | | | | | | 2,906 | |
7.437% due 11/02/2033 •(k) | | | | | 800 | | | | | | 896 | |
|
| |
6.714% due 10/19/2029 (k) | | | | | 1,900 | | | | | | 2,003 | |
|
Brandywine Operating Partnership LP | |
| | | | | 200 | | | | | | 179 | |
| | | | | 100 | | | | | | 101 | |
|
| |
6.208% due 01/18/2029 •(k) | | | | | 1,200 | | | | | | 1,225 | |
6.840% due 09/13/2034 (k) | | | | | 1,600 | | | | | | 1,691 | |
|
| |
5.950% due 08/15/2034 (k) | | | | | 2,700 | | | | | | 2,839 | |
|
Corestate Capital Holding SA (8.000% Cash or 9.000% PIK) | |
8.000% due 12/31/2026 ^(b)(c) | | EUR | | | 130 | | | | | | 75 | |
|
Country Garden Holdings Co. Ltd. | |
5.400% due 05/27/2025 ^(c) | | $ | | | 1,000 | | | | | | 83 | |
6.150% due 09/17/2025 ^(c) | | | | | 200 | | | | | | 17 | |
| | | | |
Credit Suisse AG AT1 Claim | | | | | 600 | | | | | | 72 | |
|
| |
3.547% due 09/18/2031 •(k) | | | | | 300 | | | | | | 263 | |
6.720% due 01/18/2029 •(k) | | | | | 600 | | | | | | 629 | |
6.819% due 11/20/2029 (k) | | | | | 600 | | | | | | 632 | |
|
| |
| | | | | 100 | | | | | | 83 | |
| | | | | 100 | | | | | | 88 | |
4.500% due 06/01/2027 (k) | | | | | 300 | | | | | | 283 | |
|
| |
| | | | | 100 | | | | | | 79 | |
|
Fairfax India Holdings Corp. | |
5.000% due 02/26/2028 (k) | | | | | 2,400 | | | | | | 2,172 | |
|
| |
| | | | | 100 | | | | | | 83 | |
|
| |
2.804% due 05/24/2032 •(k) | | | | | 200 | | | | | | 167 | |
6.254% due 03/09/2034 •(k) | | | | | 3,000 | | | | | | 3,190 | |
|
Hudson Pacific Properties LP | |
| | | | | 300 | | | | | | 221 | |
| | | | | 100 | | | | | | 84 | |
| | | | | 300 | | | | | | 244 | |
5.950% due 02/15/2028 (k) | | | | | 900 | | | | | | 797 | |
|
| |
| | | | | 3,600 | | | | | | 3,840 | |
| | | | | 200 | | | | | | 220 | |
|
| |
| | | | | 100 | | | | | | 76 | |
| | | | | 100 | | | | | | 92 | |
| | | | | 100 | | | | | | 95 | |
|
| |
6.750% due 11/17/2028 (k) | | | | | 1,600 | | | | | | 1,707 | |
|
Santander U.K. Group Holdings PLC | |
3.823% due 11/03/2028 •(k) | | | | | 2,130 | | | | | | 2,003 | |
|
| |
6.446% due 01/10/2029 •(k) | | | | | 2,000 | | | | | | 2,071 | |
6.691% due 01/10/2034 •(k) | | | | | 3,500 | | | | | | 3,700 | |
| | | | |
| | | | | | | | | | | | |
1.800% due 02/02/2031 ^(c) | | | | | 502 | | | | | | 333 | |
2.100% due 05/15/2028 ^(c) | | | | | 100 | | | | | | 66 | |
4.570% due 04/29/2033 ^(c) | | | | | 600 | | | | | | 397 | |
|
| |
6.442% due 08/11/2028 •(k) | | | | | 3,050 | | | | | | 3,169 | |
| | | | | | | | | | | | |
| | | | | | | | | | | |
|
| |
6.000% due 01/15/2030 (k) | | $ | | | 2,738 | | | $ | | | 1,916 | |
10.500% due 02/15/2028 (k) | | | | | 251 | | | | | | 255 | |
|
| |
4.500% due 09/01/2026 (k) | | | | | 350 | | | | | | 339 | |
5.750% due 02/01/2027 (k) | | | | | 2,000 | | | | | | 2,007 | |
| | | | | | | | | | |
| | | | | | | | | | | 54,658 | |
| | | | | | | | | | |
| |
| |
|
American Airlines Pass-Through Trust | |
3.000% due 04/15/2030 (k) | | | | | 134 | | | | | | 122 | |
3.350% due 04/15/2031 (k) | | | | | 843 | | | | | | 762 | |
3.700% due 04/01/2028 (k) | | | | | 1,268 | | | | | | 1,181 | |
|
| |
6.343% due 08/02/2030 (k) | | | | | 400 | | | | | | 420 | |
6.421% due 08/02/2033 (k) | | | | | 300 | | | | | | 314 | |
|
Carvana Co. (12.000% PIK) | |
12.000% due 12/01/2028 (b) | | | | | 188 | | | | | | 152 | |
|
Carvana Co. (13.000% PIK) | |
13.000% due 06/01/2030 (b)(k) | | | | | 2,336 | | | | | | 1,865 | |
|
Carvana Co. (14.000% PIK) | |
14.000% due 06/01/2031 (b)(k) | | | | | 1,485 | | | | | | 1,200 | |
| | | | |
| | | | | | | | | | | | |
| | EUR | | | 416 | | | | | | 425 | |
8.750% due 04/01/2027 (k) | | $ | | | 4,612 | | | | | | 4,206 | |
|
| |
7.507% due 01/10/2032 (k) | | | | | 545 | | | | | | 574 | |
|
Exela Intermediate LLC (11.500% PIK) | |
11.500% due 04/15/2026 (b) | | | | | 41 | | | | | | 7 | |
|
Gazprom PJSC Via Gaz Capital SA | |
| | | | | 1,710 | | | | | | 1,559 | |
|
Intelsat Jackson Holdings SA | |
6.500% due 03/15/2030 (k) | | | | | 7,256 | | | | | | 6,930 | |
|
| |
11.000% due 10/15/2030 (k) | | | | | 1,700 | | | | | | 1,792 | |
|
Newfold Digital Holdings Group, Inc. | |
| | | | | 100 | | | | | | 76 | |
|
| |
4.810% due 09/17/2030 (k) | | | | | 6,000 | | | | | | 5,613 | |
|
| |
| | | | | 784 | | | | | | 651 | |
| | | | | 200 | | | | | | 174 | |
| | | | | 350 | | | | | | 341 | |
|
| |
4.875% due 09/30/2039 (k) | | | | | 710 | | | | | | 656 | |
|
| |
10.625% due 06/28/2028 (k) | | | | | 1,454 | | | | | | 1,116 | |
|
United Airlines Pass-Through Trust | |
| | | | | 73 | | | | | | 67 | |
|
| |
0.000% due 12/29/2049 ~(h) | | BRL | | | 50,000 | | | | | | 3,639 | |
|
| |
| | $ | | | 300 | | | | | | 318 | |
|
Wesco Aircraft Holdings, Inc. (7.500% Cash and 3.000% PIK) | |
10.500% due 11/15/2026 ^(b)(c) | | | | | 10,800 | | | | | | 9,828 | |
| | | | | | | | | | | | |
| | | | | | | | 43,988 | |
| | | | | | | | | |
| |
| |
|
| |
6.750% due 12/31/2026 (k) | | | | | 1,479 | | | | | | 1,052 | |
|
| |
10.000% due 07/27/2025 ^(c) | | | | | 3,220 | | | | | | 161 | |
|
Pacific Gas & Electric Co. | |
| | | | | 100 | | | | | | 74 | |
4.000% due 12/01/2046 (k) | | | | | 200 | | | | | | 147 | |
4.200% due 03/01/2029 (k) | | | | | 1,300 | | | | | | 1,230 | |
4.200% due 06/01/2041 (k) | | | | | 200 | | | | | | 160 | |
4.300% due 03/15/2045 (k) | | | | | 950 | | | | | | 746 | |
4.750% due 02/15/2044 (k) | | | | | 1,492 | | | | | | 1,249 | |
6.950% due 03/15/2034 (k) | | | | | 1,020 | | | | | | 1,122 | |
| | | | | | | | | | | | |
| See Accompanying Notes | | | | | | | | | | DECEMBER 31, 2023 | | | |
| | | | | | | | |
| | PIMCO Strategic Income Fund, Inc. | | | | | | |
| | | | | | | | | | | | |
| | | | | | | | | | | |
|
| |
5.375% due 03/22/2030 (k) | | $ | | | 2,800 | | | $ | | | 2,320 | |
|
Tierra Mojada Luxembourg SARL | |
5.750% due 12/01/2040 (k) | | | | | 1,176 | | | | | | 1,062 | |
|
Vistra Operations Co. LLC | |
6.950% due 10/15/2033 (k) | | | | | 2,400 | | | | | | 2,529 | |
| | | | | | | | | | | | |
| | | | | | | | 11,852 | |
| | | | | | | | | |
Total Corporate Bonds & Notes (Cost $119,400) | | | | |
| | | | |
| |
CONVERTIBLE BONDS & NOTES 0.0% | |
| |
| |
|
Corestate Capital Holding SA (8.000% Cash or 9.000% PIK) | |
8.000% due 12/31/2026 ^(b)(c) | | EUR | | | 151 | | | | | | 87 | |
| | | | | | | | | | | | |
Total Convertible Bonds & Notes (Cost $172) | | | | |
| | | | |
| |
MUNICIPAL BONDS & NOTES 2.9% | |
| |
| |
|
Golden State, California Tobacco Securitization Corp. Revenue Bonds, Series 2021 | |
| | $ | | | 80 | | | | | | 73 | |
| | | | | 1,000 | | | | | | 815 | |
| | | | | 890 | | | | | | 825 | |
| | | | | | | | | | | | |
| | | | | | | | 1,713 | |
| | | | | | | | | |
| |
| |
|
Illinois State General Obligation Bonds, (BABs), Series 2010 | |
| | | | | 14 | | | | | | 15 | |
| | | | | | | | | | | | |
| |
| |
|
Detroit, Michigan General Obligation Bonds, Series 2014 | |
| | | | | 1,900 | | | | | | 1,412 | |
| | | | | | | | | | | | |
| |
| |
|
Commonwealth of Puerto Rico Bonds, Series 2022 | |
| | | | | 1,022 | | | | | | 558 | |
| | | | | | | | | | | | |
| |
| |
|
Tobacco Settlement Finance Authority, West Virginia Revenue Bonds, Series 2007 | |
0.000% due 06/01/2047 (f) | | | | | 25,300 | | | | | | 2,242 | |
| | | | | | | | | | | | |
Total Municipal Bonds & Notes (Cost $6,812) | | | | |
| | | | |
| |
U.S. GOVERNMENT AGENCIES 169.1% | |
|
| |
0.000% due 02/25/2052 •(a)(k) | | | | | 121,386 | | | | | | 1,246 | |
0.000% due 08/25/2054 ~(a)(k) | | | | | 4,283 | | | | | | 223 | |
0.548% due 10/25/2049 ~(a)(k) | | | | | 6,102 | | | | | | 739 | |
0.598% due 02/25/2049 •(a) | | | | | 65 | | | | | | 7 | |
0.648% due 07/25/2050 •(a)(k) | | | | | 918 | | | | | | 105 | |
1.181% due 12/25/2042 ~(a) | | | | | 2,464 | | | | | | 55 | |
1.298% due 07/25/2041 •(a)(k) | | | | | 330 | | | | | | 27 | |
2.500% due 12/25/2027 (a)(k) | | | | | 593 | | | | | | 18 | |
3.000% due 06/25/2050 (a)(k) | | | | | 1,109 | | | | | | 221 | |
3.500% due 07/25/2036 (a)(k) | | | | | 2,900 | | | | | | 311 | |
3.500% due 07/25/2042 - 12/25/2049 (a) | | | | | 357 | | | | | | 43 | |
4.000% due 06/25/2050 (a)(k) | | | | | 580 | | | | | | 103 | |
4.250% due 11/25/2024 (k) | | | | | 10 | | | | | | 10 | |
4.500% due 07/25/2040 (k) | | | | | 357 | | | | | | 351 | |
| | | | | 231 | | | | | | 225 | |
| | | | | 15 | | | | | | 14 | |
5.000% due 07/25/2037 (a) | | | | | 442 | | | | | | 67 | |
5.000% due 01/25/2038 - 07/25/2038 (k) | | | | | 2,321 | | | | | | 2,329 | |
| | | | | | | | | | | | |
| | | | | | | | | | | |
| | $ | | | 6 | | | $ | | | 6 | |
5.500% due 11/25/2032 - 04/25/2035 (k) | | | | | 2,305 | | | | | | 2,318 | |
| | | | | 167 | | | | | | 170 | |
| | | | | 10 | | | | | | 11 | |
| | | | | 745 | | | | | | 737 | |
6.000% due 09/25/2031 (k) | | | | | 60 | | | | | | 61 | |
| | | | | 527 | | | | | | 534 | |
| | | | | 2 | | | | | | 2 | |
| | | | | 6 | | | | | | 6 | |
6.500% due 04/01/2031 - 11/01/2047 | | | | | 1,658 | | | | | | 1,695 | |
6.500% due 09/25/2031 - 03/25/2032 (k) | | | 267 | | | | | | 273 | |
| | | | | 2 | | | | | | 2 | |
7.000% due 06/18/2027 - 01/01/2047 | | | | | 398 | | | | | | 409 | |
7.000% due 02/25/2035 (k) | | | | | 34 | | | | | | 35 | |
| | | | | 165 | | | | | | 161 | |
7.500% due 11/25/2026 - 06/25/2044 | | | | | 416 | | | | | | 422 | |
| | | | | 54 | | | | | | 55 | |
| | | | | 496 | | | | | | 507 | |
8.500% due 06/18/2027 - 06/25/2030 | | | | | 43 | | | | | | 44 | |
|
| |
0.000% due 08/15/2036 - 11/15/2038 ~(a)(k) | | | 10,001 | | | | | | 508 | |
0.000% due 11/15/2048 •(a)(k) | | | | | 5,059 | | | | | | 206 | |
0.548% due 04/25/2048 ~(a)(k) | | | | | 14,945 | | | | | | 2,120 | |
0.548% due 11/25/2049 •(a)(k) | | | | | 11,626 | | | | | | 1,582 | |
0.698% due 05/25/2050 •(a)(k) | | | | | 619 | | | | | | 86 | |
2.010% due 11/25/2045 ~(a) | | | | | 5,336 | | | | | | 370 | |
3.000% due 11/25/2050 - 01/25/2051 (a)(k) | | | 8,927 | | | | | | 1,349 | |
3.500% due 05/25/2050 (a) | | | | | 505 | | | | | | 100 | |
| | | | | 62 | | | | | | 60 | |
| | | | | 979 | | | | | | 1,010 | |
5.500% due 06/15/2041 (k) | | | | | 1,082 | | | | | | 1,113 | |
6.000% due 12/15/2028 - 03/15/2035 (k) | | | | | 570 | | | | | | 582 | |
6.000% due 04/15/2031 - 02/01/2034 | | | | | 60 | | | | | | 61 | |
| | | | | 1 | | | | | | 1 | |
6.500% due 03/15/2026 - 09/01/2047 | | | | | 267 | | | | | | 273 | |
6.500% due 02/15/2028 - 03/25/2044 (k) | | | | | 2,374 | | | | | | 2,438 | |
| | | | | 34 | | | | | | 34 | |
7.000% due 01/15/2024 - 10/25/2043 | | | | | 453 | | | | | | 474 | |
7.000% due 07/15/2027 - 06/15/2031 (k) | | | | | 542 | | | | | | 557 | |
7.500% due 05/15/2024 (k) | | | | | 3 | | | | | | 3 | |
7.500% due 12/01/2025 - 02/25/2042 | | | | | 326 | | | | | | 329 | |
8.000% due 07/01/2024 - 04/15/2030 | | | | | 33 | | | | | | 33 | |
| | | | | 650 | | | | | | 711 | |
| | | | | 1,354 | | | | | | 1,425 | |
|
| |
0.578% due 08/20/2049 - 09/20/2049 •(a)(k) | | | | | 35,210 | | | | | | 3,840 | |
0.578% due 09/20/2049 ~(a)(k) | | | | | 12,512 | | | | | | 1,462 | |
0.728% due 06/20/2047 •(a)(k) | | | | | 5,061 | | | | | | 552 | |
6.000% due 04/15/2029 - 12/15/2038 | | | | | 502 | | | | | | 516 | |
6.500% due 04/15/2032 - 10/20/2038 | | | | | 162 | | | | | | 167 | |
7.000% due 07/15/2025 - 06/15/2026 | | | | | 3 | | | | | | 3 | |
7.500% due 10/15/2025 - 02/15/2029 | | | | | 189 | | | | | | 190 | |
| | | | | 5 | | | | | | 5 | |
|
| |
| | | | | 12,000 | | | | | | 11,477 | |
| | | | | 100 | | | | | | 98 | |
|
U.S. Small Business Administration | |
| | | | | 11 | | | | | | 11 | |
| | | | | 54 | | | | | | 54 | |
| | | | | | | | | | | | |
| | | | | | | | | | | |
| | $ | | | 4 | | | $ | | | 4 | |
| | | | | 6 | | | | | | 6 | |
|
Uniform Mortgage-Backed Security | |
4.000% due 06/01/2047 - 03/01/2048 | | | | | 337 | | | | | | 325 | |
4.000% due 09/01/2047 (k) | | | | | 4,832 | | | | | | 4,657 | |
4.500% due 03/01/2028 - 08/01/2041 | | | | | 108 | | | | | | 108 | |
6.000% due 12/01/2032 - 06/01/2040 | | | | | 1,767 | | | | | | 1,843 | |
6.500% due 09/01/2028 - 02/01/2038 | | | | | 627 | | | | | | 655 | |
8.000% due 12/01/2024 - 11/01/2031 | | | | | 59 | | | | | | 59 | |
|
Uniform Mortgage-Backed Security, TBA | |
| | | | | 700 | | | | | | 693 | |
| | | | | 400 | | | | | | 402 | |
6.500% due 01/01/2054 - 02/01/2054 | | | | | 276,000 | | | | | | 282,837 | |
|
| |
| | | | | 33 | | | | | | 33 | |
6.750% due 02/15/2026 - 06/15/2026 | | | | | 16 | | | | | | 16 | |
| | | | | 697 | | | | | | 731 | |
| | | | | | | | | | | | |
Total U.S. Government Agencies (Cost $355,566) | | | | |
| | | | |
| |
NON-AGENCY MORTGAGE-BACKED SECURITIES 31.1% | |
|
Adjustable Rate Mortgage Trust | |
| | | | | 162 | | | | | | 150 | |
| | | | | 107 | | | | | | 102 | |
|
Ashford Hospitality Trust | |
6.934% due 04/15/2035 ~(k) | | | | | 2,200 | | | | | | 2,152 | |
|
Atrium Hotel Portfolio Trust | |
7.159% due 12/15/2036 ~(k) | | | | | 1,600 | | | | | | 1,470 | |
|
Banc of America Mortgage Trust | |
| | | | | 4 | | | | | | 3 | |
|
Bancorp Commercial Mortgage Trust | |
| | | | | 272 | | | | | | 269 | |
|
| |
| | | | | 121 | | | | | | 100 | |
|
| |
| | | | | 208 | | | | | | 105 | |
|
Bear Stearns Commercial Mortgage Securities Trust | |
| | | | | 117 | | | | | | 112 | |
| | | | | 393 | | | | | | 368 | |
|
| |
| | | | | 1,000 | | | | | | 972 | |
|
| |
| | | | | 1,100 | | | | | | 925 | |
|
Citigroup Commercial Mortgage Trust | |
| | | | | 637 | | | | | | 411 | |
|
Citigroup Mortgage Loan Trust | |
| | | | | 1 | | | | | | 1 | |
|
Colony Mortgage Capital Ltd. | |
7.500% due 11/15/2038 •(k) | | | | | 1,000 | | | | | | 919 | |
|
Commercial Mortgage Loan Trust | |
| | | | | 777 | | | | | | 86 | |
|
Commercial Mortgage Trust | |
| | | | | 1,380 | | | | | | 965 | |
|
Countrywide Alternative Loan Trust | |
| | | | | 874 | | | | | | 711 | |
|
Countrywide Home Loan Mortgage Pass-Through Trust | |
| | | | | 134 | | | | | | 123 | |
| | | | | 666 | | | | | | 579 | |
| | | | | 874 | | | | | | 569 | |
|
Countrywide Home Loan Reperforming REMIC Trust | |
| | | | | 185 | | | | | | 183 | |
| | | | | 39 | | | | | | 38 | |
|
Credit Suisse First Boston Mortgage-Backed Pass-Through Certificates | |
| | | | | 134 | | | | | | 130 | |
|
Credit Suisse Mortgage Capital Mortgage-Backed Trust | |
| | | | | 731 | | | | | | 114 | |
| | | | | | | | |
| | | | | | December 31, 2023 | | (Unaudited) |
| | | | | | | | | | | | |
| | | | | | | | | | | |
|
Credit Suisse Mortgage Capital Trust | |
| | $ | | | 1,200 | | | $ | | | 991 | |
|
| |
| | GBP | | | 1,582 | | | | | | 1,853 | |
| | | | | 1,130 | | | | | | 1,297 | |
| | | | | 960 | | | | | | 1,185 | |
|
| |
12.837% due 10/25/2041 •(k) | | $ | | | 2,800 | | | | | | 2,949 | |
13.137% due 11/25/2041 ~(k) | | | | | 2,800 | | | | | | 2,973 | |
|
GC Pastor Hipotecario FTA | |
| | EUR | | | 692 | | | | | | 669 | |
|
GMAC Mortgage Corp. Loan Trust | |
| | $ | | | 16 | | | | | | 13 | |
|
GS Mortgage Securities Corp. Trust | |
4.591% due 10/10/2032 ~(k) | | | | | 2,200 | | | | | | 1,981 | |
| | | | | 400 | | | | | | 353 | |
8.762% due 08/15/2039 ~(k) | | | | | 3,400 | | | | | | 3,428 | |
|
| |
| | | | | 385 | | | | | | 376 | |
|
GSMPS Mortgage Loan Trust | |
7.000% due 06/25/2043 (k) | | | | | 1,318 | | | | | | 1,345 | |
| | | | | 11 | | | | | | 11 | |
| | | | | 281 | | | | | | 260 | |
|
| |
| | | | | 40 | | | | | | 34 | |
| | | | | 1 | | | | | | 1 | |
|
ILPT Commercial Mortgage Trust | |
| | | | | 1,400 | | | | | | 1,349 | |
|
IM Pastor Fondo de Titluzacion Hipotecaria | |
| | EUR | | | 194 | | | | | | 187 | |
|
JP Morgan Chase Commercial Mortgage Securities Trust | |
| | $ | | | 976 | | | | | | 900 | |
| | | | | 900 | | | | | | 474 | |
11.866% due 11/15/2038 •(k) | | | | | 2,200 | | | | | | 2,003 | |
|
| |
| | | | | 633 | | | | | | 514 | |
| | | | | 4 | | | | | | 3 | |
|
LUXE Commercial Mortgage Trust | |
8.234% due 10/15/2038 •(k) | | | | | 3,016 | | | | | | 2,947 | |
|
MASTR Adjustable Rate Mortgages Trust | |
| | | | | 221 | | | | | | 197 | |
|
MASTR Alternative Loan Trust | |
| | | | | 226 | | | | | | 125 | |
| | | | | 18 | | | | | | 18 | |
|
MASTR Reperforming Loan Trust | |
| | | | | 2,184 | | | | | | 1,527 | |
| | | | | 1,148 | | | | | | 833 | |
|
| |
| | | | | 300 | | | | | | 248 | |
|
Morgan Stanley Re-REMIC Trust | |
| | | | | 6,792 | | | | | | 6,027 | |
|
NAAC Reperforming Loan REMIC Trust | |
| | | | | 474 | | | | | | 423 | |
7.500% due 03/25/2034 (k) | | | | | 1,439 | | | | | | 1,294 | |
| | | | | 1,423 | | | | | | 1,276 | |
|
| |
| | | | | 1,000 | | | | | | 943 | |
|
| |
| | EUR | | | 1,086 | | | | | | 1,114 | |
| | | | | 1,086 | | | | | | 1,057 | |
|
RBSSP Resecuritization Trust | |
| | $ | | | 2,216 | | | | | | 1,203 | |
| | | | | 5,226 | | | | | | 1,887 | |
|
Residential Accredit Loans, Inc. Trust | |
| | | | | 708 | | | | | | 605 | |
|
Residential Asset Mortgage Products Trust | |
| | | | | 166 | | | | | | 167 | |
| | | | | 616 | | | | | | 301 | |
| | | | | 7 | | | | | | 3 | |
|
Structured Asset Securities Corp. Mortgage Loan Trust | |
| | | | | 2,097 | | | | | | 1,264 | |
|
WaMu Mortgage Pass-Through Certificates Trust | |
| | | | | 51 | | | | | | 49 | |
| | | | | | | | | | | | |
| | | | | | | | | | | |
|
Washington Mutual Mortgage Pass-Through Certificates Trust | |
| | $ | | | 29 | | | $ | | | 29 | |
| | | | | 83 | | | | | | 81 | |
|
Wells Fargo Commercial Mortgage Trust | |
4.928% due 12/15/2039 ~(k) | | | | | 2,558 | | | | | | 2,136 | |
| | | | | | | | | | | | |
Total Non-Agency Mortgage-Backed Securities (Cost $67,596) | | | | | | | |
| | | | | | | | | | | | |
| |
ASSET-BACKED SECURITIES 6.6% | |
|
Access Financial Manufactured Housing Contract Trust | |
| | | | | 200 | | | | | | 2 | |
|
Ameriquest Mortgage Securities, Inc. Asset-Backed Pass-Through Certificates | |
| | | | | 39 | | | | | | 1 | |
|
Bear Stearns Asset-Backed Securities Trust | |
| | | | | 119 | | | | | | 113 | |
|
| |
| | | | | 48 | | | | | | 43 | |
|
Conseco Finance Securitizations Corp. | |
| | | | | 1,417 | | | | | | 395 | |
|
Countrywide Asset-Backed Certificates Trust | |
4.488% due 11/25/2034 •(k) | | | | | 2,297 | | | | | | 1,796 | |
5.870% due 06/25/2037 •(k) | | | | | 1,404 | | | | | | 1,411 | |
|
| |
| | | | | 1,272 | | | | | | 833 | |
|
| |
| | | | | 1,213 | | | | | | 958 | |
|
Exeter Automobile Receivables Trust | |
0.000% due 05/15/2031 «(f) | | | | | 7 | | | | | | 1,654 | |
|
Flagship Credit Auto Trust | |
0.000% due 12/15/2025 «(f) | | | | | 12 | | | | | | 706 | |
|
Madison Park Funding Ltd. | |
| | | | | 500 | | | | | | 257 | |
|
| |
| | | | | 250 | | | | | | 165 | |
|
| |
0.000% due 12/15/2028 «(f) | | | | | 6 | | | | | | 40 | |
0.000% due 04/16/2029 «(f) | | | | | 10 | | | | | | 93 | |
0.000% due 07/16/2029 «(f) | | | | | 7 | | | | | | 158 | |
|
National Collegiate Commutation Trust | |
| | | | | 10,400 | | | | | | 2,768 | |
|
SMB Private Education Loan Trust | |
0.000% due 10/15/2048 «(f) | | | | | 5 | | | | | | 1,333 | |
0.000% due 02/16/2055 «(f) | | | | | 0 | | | | | | 528 | |
| | | | | | | | | | | | |
Total Asset-Backed Securities (Cost $35,361) | | | | |
| | | | | | | | | | | | |
| |
| |
|
Argentina Government International Bond | |
| | | | | 515 | | | | | | 198 | |
| | | | | 269 | | | | | | 107 | |
3.500% due 07/09/2041 þ(k) | | | | | 1,880 | | | | | | 642 | |
3.625% due 07/09/2035 þ(k) | | | | | 904 | | | | | | 298 | |
| | | | | 115 | | | | | | 40 | |
4.250% due 01/09/2038 þ(k) | | | | | 4,388 | | | | | | 1,745 | |
|
Ghana Government International Bond | |
6.375% due 02/11/2027 ^(c) | | | | | 323 | | | | | | 145 | |
7.875% due 02/11/2035 ^(c) | | | | | 388 | | | | | | 171 | |
|
Romania Government International Bond | |
| | EUR | | | 1,900 | | | | | | 2,160 | |
|
Venezuela Government International Bond | |
8.250% due 10/13/2024 ^(c) | | $ | | | 13 | | | | | | 2 | |
9.250% due 09/15/2027 ^(c) | | | | | 171 | | | | | | 33 | |
| | | | | | | | | | | | |
Total Sovereign Issues (Cost $7,257) | | | | |
| | | | | | | | | | | | |
| |
| | | | | | | | | | | |
| |
| |
COMMUNICATION SERVICES 0.5% | |
| | | | |
Clear Channel Outdoor Holdings, Inc. (d) | | | | | 291,816 | | | | | | 531 | |
| | | | | | | | | | | | |
| | | | | | | | | | | |
| | | | |
iHeartMedia, Inc. ‘A’ (d) | | | | | 68,102 | | | $ | | | 182 | |
| | | | |
iHeartMedia, Inc. ‘B’ «(d) | | | | | 52,880 | | | | | | 127 | |
| | | | |
Promotora de Informaciones SA (d) | | | | | 207,627 | | | | | | 66 | |
| | | | | | | | | | | | |
| | | | | | | | | | | 906 | |
| | | | | | | | | | | | |
| |
CONSUMER DISCRETIONARY 0.0% | |
| | | | |
Steinhoff International Holdings NV «(d)(i) | | | | | 17,707,907 | | | | | | 0 | |
| | | | | | | | | | | | |
| |
| |
| | | |
Axis Energy Services ‘A’ «(i) | | | 422 | | | | | | 13 | |
| | | | | | | | | | | | |
| |
| |
| | | | |
Banca Monte dei Paschi di Siena SpA (d) | | | | | 323,500 | | | | | | 1,088 | |
| | | |
Intelsat Emergence SA «(d)(i) | | | 98,888 | | | | | | 2,817 | |
| | | | | | | | | | | | |
| | | | | | | | | | | 3,905 | |
| | | | | | | | | | | | |
| |
| |
| | | | |
| | | | | 192,582 | | | | | | 9,878 | |
| | | | | | | | | | | | |
| |
| |
| | | | |
| | | | | 7,719 | | | | | | 129 | |
| | | |
Neiman Marcus Group Ltd. LLC «(d)(i) | | | 32,851 | | | | | | 4,924 | |
| | | |
Syniverse Holdings, Inc. «(i) | | | 888,904 | | | | | | 778 | |
| | | | |
Westmoreland Mining Holdings «(d)(i) | | | | | 69 | | | | | | 0 | |
| | | |
Westmoreland Mining LLC «(d)(i) | | | 70 | | | | | | 0 | |
| | | | | | | | | | | | |
| | | | | | | | | | | 5,831 | |
| | | | | | | | | | | | |
| |
| |
| | | | |
| | | | | 28,052 | | | | | | 830 | |
| | | | | | | | | | | | |
Total Common Stocks (Cost $21,563) | | | | |
| | | | | | | | | | | | |
| |
| |
| | | | | | | | | | | | |
| |
| | | | |
Intelsat Emergence SA - Exp. 02/17/2027 « | | | | | 711 | | | | | | 2 | |
| | | | | | | | | | | | |
Total Warrants (Cost $2,662) | | | | |
| | | | | | | | | | | | |
| |
PREFERRED SECURITIES 1.9% | |
| | | | | | | | | | | | |
| |
| | | | |
| | | | | | | | | | | | |
5.000% due 03/15/2026 •(h) | | | | | 1,300,000 | | | | | | 1,186 | |
| | | | |
Farm Credit Bank of Texas | | | | | | | | | | | | |
5.700% due 09/15/2025 •(h) | | | | | 1,000,000 | | | | | | 949 | |
|
Stichting AK Rabobank Certificaten | |
6.500% due 12/29/2049 þ(h) | | | | | 1,461,600 | | | | | | 1,620 | |
|
| |
4.000% due 05/15/2026 ^(c)(h) | | | 100,000 | | | | | | 1 | |
4.700% due 11/15/2031 ^(c)(h) | | | 26,000 | | | | | | 0 | |
| | | | | | | | | | | | |
Total Preferred Securities (Cost $4,281) | | | | |
| | | | | | | | | | | | |
| |
REAL ESTATE INVESTMENT TRUSTS 0.7% | |
| | | | | | | | | | | | |
| |
| | | |
CBL & Associates Properties, Inc. | | | 2,011 | | | | | | 49 | |
| | | | |
| | | | | 54,523 | | | | | | 315 | |
| | | | |
| | | | | 33,427 | | | | | | 1,066 | |
| | | | | | | | | | | | |
Total Real Estate Investment Trusts (Cost $850) | | | | |
| | | | |
| |
| | | | | | | | | | | | |
| See Accompanying Notes | | | | | | | | | | DECEMBER 31, 2023 | | | |
| | | | | | | | |
| | PIMCO Strategic Income Fund, Inc. | | | | | | |
| | | | | | | | | | | | |
| | | | | | | | | | | |
SHORT-TERM INSTRUMENTS 1.3% | |
| | | | | | | | | | | | |
REPURCHASE AGREEMENTS (j) 0.7% | |
| | | | | | | | $ | | | 1,482 | |
| | | | | | | | | | | | |
| |
| |
|
Argentina Treasury Bond BONCER | |
| | ARS | | | 5,329 | | | | | | 6 | |
| | | | | | | | | | | | |
| |
HUNGARY TREASURY BILLS 0.1% | |
10.900% due 01/04/2024 (f)(g) | | HUF | | | 70,000 | | | | | | 202 | |
| | | | | | | | | | | | |
| |
| |
5.414% due 01/25/2024 -
03/28/2024 (e)(f)(n) | | $ | | | 958 | | | | | | 951 | |
| | | | | | | | | | | | |
Total Short-Term Instruments
(Cost $2,642) | | | | |
| | | | | | | | | | | | |
| | | | |
| | | | | | | | | | | | |
Total Investments in Securities
(Cost $663,958) | | | | | | | |
| | | | | | | | | | | | |
| | | | | | | | | | | | |
| | | | | | | | | | | |
INVESTMENTS IN AFFILIATES 2.4% | |
| | | | | | | | | | | | |
SHORT-TERM INSTRUMENTS 2.4% | |
| | | | | | | | | | | | |
CENTRAL FUNDS USED FOR CASH MANAGEMENT PURPOSES 2.4% | |
| | | | |
PIMCO Short-Term Floating NAV Portfolio III | | | | | 489,476 | | | $ | | | 4,761 | |
| | | | | | | | | | | | |
Total Short-Term Instruments
(Cost $4,760) | | | | | | | |
| | | | | | | | | | | | |
|
| |
Total Investments in Affiliates
(Cost $4,760) | | | | | | | |
| | | | |
| | | | | | | | | | | | |
Total Investments 302.9%
(Cost $668,718) | | | $ | | | | |
| |
Financial Derivative
Instruments (l)(m) (0.0)% (Cost or Premiums, net $9,529) | | | | | | | | | | |
| |
Other Assets and Liabilities, net (202.9)% | | | | |
| | | | | | | | | | | | |
| | | $ | | | | |
| | | | | | | | | | | | |
NOTES TO SCHEDULE OF INVESTMENTS:
| A zero balance may reflect actual amounts rounding to less than one thousand. |
| Security valued using significant unobservable inputs (Level 3). |
| All or a portion of this amount represents unfunded loan commitments. The interest rate for the unfunded portion will be determined at the time of funding. See Note 4, Securities and Other Investments, in the Notes to Financial Statements for more information regarding unfunded loan commitments. |
| Variable or Floating rate security. Rate shown is the rate in effect as of period end. Certain variable rate securities are not based on a published reference rate and spread, rather are determined by the issuer or agent and are based on current market conditions. Reference rate is as of reset date, which may vary by security. These securities may not indicate a reference rate and/or spread in their description. |
| Rate shown is the rate in effect as of period end. The rate may be based on a fixed rate, a capped rate or a floor rate and may convert to a variable or floating rate in the future. These securities do not indicate a reference rate and spread in their description. |
| Coupon represents a rate which changes periodically based on a predetermined schedule or event. Rate shown is the rate in effect as of period end. |
| Security is an Interest Only (“IO”) or IO Strip. |
| Security is not accruing income as of the date of this report. |
| Security did not produce income within the last twelve months. |
| Coupon represents a weighted average yield to maturity. |
| Coupon represents a yield to maturity. |
| Perpetual maturity; date shown, if applicable, represents next contractual call date. |
(i) RESTRICTED SECURITIES:
| | | | | | | | | | | | | | | | |
| | | | | | | | | | | Market Value
as Percentage
of Net Assets | |
| | | | | | $ | 8,047 | | | $ | 9,878 | | | | 4.92 | % |
| | | 07/01/2021 | | | | 6 | | | | 13 | | | | 0.01 | |
| | | 06/19/2017 - 07/03/2023 | | | | 6,775 | | | | 2,817 | | | | 1.40 | |
| | | 06/01/2022 | | | | 347 | | | | 129 | | | | 0.06 | |
Neiman Marcus Group Ltd. LLC | | | 09/25/2020 | | | | 1,058 | | | | 4,924 | | | | 2.45 | |
Steinhoff International Holdings NV | | | 06/30/2023 - 10/30/2023 | | | | 0 | | | | 0 | | | | 0.00 | |
| | | 05/12/2022 - 11/30/2023 | | | | 874 | | | | 778 | | | | 0.39 | |
Westmoreland Mining Holdings | | | 03/26/2019 | | | | 0 | | | | 0 | | | | 0.00 | |
| | | 06/30/2023 | | | | 1 | | | | 0 | | | | 0.00 | |
| | | | | | | | | | | | | | | | |
| | | $ | 17,108 | | | $ | 18,539 | | | | 9.23 | % |
| | | | | | | | | | | | | |
| | | | | | | | |
| | | | | | December 31, 2023 | | (Unaudited) |
BORROWINGS AND OTHER FINANCING TRANSACTIONS
(j) REPURCHASE AGREEMENTS:
| | | | | | | | | | | | | | | | | | | | | | | | | | | | | | |
| | | | | | | | | | | | | | | | | | | Repurchase
Agreements,
at Value | | | Repurchase Agreement Proceeds to be Received (1) | |
| FICC | | | 2.600 | % | | | 12/29/2023 | | | | 01/02/2024 | | | $ | 1,482 | | | U.S. Treasury Notes 4.875% due 11/30/2025 | | $ | (1,512 | ) | | $ | 1,482 | | | $ | 1,482 | |
| | | | | | | | | | | | | | | | | | | | | | | | | | | | | | |
Total Repurchase Agreements | | | | | | | | | | | | | | | |
| | | | | | | | | | | | | | | |
REVERSE REPURCHASE AGREEMENTS:
| | | | | | | | | | | | | | | | | | | | | | |
| | | | | | | | | | | | | | Payable for
Reverse
Repurchase
Agreements | |
| | | 5.900 | % | | | 12/04/2023 | | | | 03/04/2024 | | | $ | | | (890 | ) | | $ | (894 | ) |
| | | 5.610 | | | | 12/11/2023 | | | | 03/11/2024 | | | | | | (1,134 | ) | | | (1,138 | ) |
| | | 5.970 | | | | 10/10/2023 | | | | 01/08/2024 | | | | | | (3,117 | ) | | | (3,160 | ) |
| | | 5.550 | | | | 09/18/2023 | | | | TBD | | | | | | (3,007 | ) | | | (3,056 | ) |
| | | 5.650 | | | | 09/18/2023 | | | | TBD | | | | | | (494 | ) | | | (502 | ) |
| | | 5.700 | | | | 09/18/2023 | | | | TBD | | | | | | (226 | ) | | | (230 | ) |
| | | 6.060 | | | | 07/14/2023 | | | | 01/10/2024 | | | | | | (6,135 | ) | | | (6,312 | ) |
| | | 6.120 | | | | 07/31/2023 | | | | 01/29/2024 | | | | | | (3,856 | ) | | | (3,957 | ) |
| | | 6.150 | | | | 12/20/2023 | | | | 05/15/2024 | | | | | | (5,323 | ) | | | (5,335 | ) |
| | | 6.180 | | | | 11/24/2023 | | | | 04/08/2024 | | | | | | (363 | ) | | | (365 | ) |
| | | 6.650 | | | | 12/20/2023 | | | | 04/16/2024 | | | | | | (2,477 | ) | | | (2,483 | ) |
| | | 6.950 | | | | 12/20/2023 | | | | 04/16/2024 | | | | | | (3,827 | ) | | | (3,836 | ) |
| | | 6.150 | | | | 11/09/2023 | | | | TBD | | | | | | (958 | ) | | | (967 | ) |
| | | 6.515 | | | | 11/09/2023 | | | | 02/07/2024 | | | | | | (1,708 | ) | | | (1,725 | ) |
| | | 6.565 | | | | 11/09/2023 | | | | 02/07/2024 | | | | | | (3,135 | ) | | | (3,166 | ) |
| | | 6.700 | | | | 12/08/2023 | | | | 04/08/2024 | | | | | | (1,395 | ) | | | (1,402 | ) |
| | | 6.100 | | | | 07/06/2023 | | | | 01/08/2024 | | | | | | (2,185 | ) | | | (2,250 | ) |
| | | 6.100 | | | | 09/08/2023 | | | | 03/06/2024 | | | | | | (3,203 | ) | | | (3,266 | ) |
| | | 6.100 | | | | 10/06/2023 | | | | 01/08/2024 | | | | | | (543 | ) | | | (551 | ) |
| | | 6.100 | | | | 11/20/2023 | | | | 05/20/2024 | | | | | | (796 | ) | | | (802 | ) |
| | | 6.020 | | | | 08/16/2023 | | | | 02/16/2024 | | | | | | (625 | ) | | | (639 | ) |
| | | 6.318 | | | | 12/18/2023 | | | | 02/16/2024 | | | | | | (782 | ) | | | (784 | ) |
| | | 6.518 | | | | 12/18/2023 | | | | 02/16/2024 | | | | | | (1,534 | ) | | | (1,539 | ) |
| | | 5.930 | | | | 11/06/2023 | | | | 05/06/2024 | | | | | | (406 | ) | | | (410 | ) |
| | | 5.930 | | | | 12/04/2023 | | | | 02/29/2024 | | | | | | (403 | ) | | | (405 | ) |
| | | 6.030 | | | | 12/21/2023 | | | | 03/21/2024 | | | | | | (3,012 | ) | | | (3,018 | ) |
| | | 5.750 | | | | 12/15/2023 | | | | 02/02/2024 | | | | | | (2,236 | ) | | | (2,243 | ) |
| | | 6.380 | | | | 01/02/2024 | | | | 04/03/2024 | | | | | | (1,684 | ) | | | (1,684 | ) |
| | | 6.430 | | | | 07/03/2023 | | | | 01/02/2024 | | | | | | (1,766 | ) | | | (1,824 | ) |
| | | 6.200 | | | | 11/27/2023 | | | | 05/22/2024 | | | | | | (1,251 | ) | | | (1,259 | ) |
| | | 6.350 | | | | 11/27/2023 | | | | 05/22/2024 | | | | | | (2,373 | ) | | | (2,388 | ) |
| | | 5.550 | | | | 12/13/2023 | | | | 01/16/2024 | | | | | | (4,413 | ) | | | (4,426 | ) |
| | | 5.570 | | | | 11/27/2023 | | | | 02/27/2024 | | | | | | (4,992 | ) | | | (5,020 | ) |
| | | 5.650 | | | | 08/16/2023 | | | | 02/16/2024 | | | | | | (1,422 | ) | | | (1,453 | ) |
| | | 5.860 | | | | 12/18/2023 | | | | 01/17/2024 | | | | | | (1,450 | ) | | | (1,453 | ) |
| | | 6.020 | | | | 08/16/2023 | | | | 02/16/2024 | | | | | | (858 | ) | | | (878 | ) |
| | | 6.020 | | | | 08/17/2023 | | | | 02/16/2024 | | | | | | (2,047 | ) | | | (2,094 | ) |
| | | 6.740 | | | | 12/19/2023 | | | | 02/02/2024 | | | | | | (803 | ) | | | (805 | ) |
| | | 6.750 | | | | 01/02/2024 | | | | 02/16/2024 | | | | | | (824 | ) | | | (824 | ) |
| | | 5.880 | | | | 11/10/2023 | | | | 02/08/2024 | | | | | | (2,385 | ) | | | (2,405 | ) |
| | | 5.490 | | | | 10/30/2023 | | | | TBD | | | | | | (2,836 | ) | | | (2,863 | ) |
| | | 5.500 | | | | 07/28/2023 | | | | TBD | | | | | | (410 | ) | | | (420 | ) |
| | | 5.570 | | | | 07/28/2023 | | | | TBD | | | | | | (218 | ) | | | (223 | ) |
| | | 5.830 | | | | 10/13/2023 | | | | 01/11/2024 | | | | | | (2,357 | ) | | | (2,388 | ) |
| | | 6.100 | | | | 10/12/2023 | | | | 04/12/2024 | | | | | | (1,653 | ) | | | (1,675 | ) |
| | | 6.120 | | | | 10/10/2023 | | | | 04/10/2024 | | | | | | (577 | ) | | | (585 | ) |
| | | 6.120 | | | | 11/14/2023 | | | | 04/10/2024 | | | | | | (1,010 | ) | | | (1,018 | ) |
| | | 4.490 | | | | 11/30/2023 | | | | TBD | | | | | | (2,583 | ) | | | (2,594 | ) |
| | | 5.470 | | | | 07/28/2023 | | | | TBD | | | | | | (1,577 | ) | | | (1,616 | ) |
| | | 5.490 | | | | 07/28/2023 | | | | TBD | | | | | | (1,629 | ) | | | (1,670 | ) |
| | | 5.490 | | | | 11/27/2023 | | | | TBD | | | | | | (5,154 | ) | | | (5,183 | ) |
| | | 5.650 | | | | 07/28/2023 | | | | TBD | | | | | | (3,979 | ) | | | (4,077 | ) |
| | | 5.710 | | | | 12/19/2023 | | | | 02/20/2024 | | | | | | (8,890 | ) | | | (8,910 | ) |
| | | 4.100 | | | | 11/10/2023 | | | | TBD | | | EUR | | | (577 | ) | | | (640 | ) |
| | | 6.070 | | | | 08/28/2023 | | | | 02/26/2024 | | | $ | | | (1,393 | ) | | | (1,423 | ) |
| | | | | | | | | | | | | | | | | | | | | | |
Total Reverse Repurchase Agreements | | | | | | | | | | | |
| | | | | | | | | | | | | | | | | | | | | | |
| | | | | | | | | | | | |
| See Accompanying Notes | | | | | | | | | | DECEMBER 31, 2023 | | | |
| | | | | | | | |
| | PIMCO Strategic Income Fund, Inc. | | | | | | |
| | | | | | | | | | | | | | | | | | | | |
| | | | | | | | | | | | | | | |
U.S. Government Agencies (1.7)% | |
Uniform Mortgage-Backed Security, TBA | | | 2.000 | % | | | 01/01/2039 | | | $ | 300 | | | $ | (264 | ) | | $ | (269 | ) |
Uniform Mortgage-Backed Security, TBA | | | 2.000 | | | | 01/01/2054 | | | | 1,950 | | | | (1,488 | ) | | | (1,594 | ) |
Uniform Mortgage-Backed Security, TBA | | | 2.500 | | | | 02/01/2054 | | | | 600 | | | | (492 | ) | | | (511 | ) |
Uniform Mortgage-Backed Security, TBA | | | 4.000 | | | | 01/01/2054 | | | | 1,200 | | | | (1,103 | ) | | | (1,135 | ) |
| | | | | | | | | | | | | | | | | | | | |
| | | | | | | | | | | | | | | | | | | | |
| | | | | | | | | | | | | | | | | | | | |
BORROWINGS AND OTHER FINANCING TRANSACTIONS SUMMARY
The following is a summary by counterparty of the market value of Borrowings and Other Financing Transactions and collateral pledged/(received) as of December 31, 2023:
| | | | | | | | | | | | | | | | | | | | | | | | |
| | Repurchase Agreement Proceeds to be Received (1) | | | Payable for
Reverse
Repurchase
Agreements | | | Payable for Sale-Buyback Transactions | | | Total
Borrowings and
Other Financing
Transactions | | | Collateral
Pledged/(Received) | | | | |
Global/Master Repurchase Agreement | |
| | $ | 0 | | | $ | (894 | ) | | $ | 0 | | | $ | (894 | ) | | $ | 1,403 | | | $ | 509 | |
| | | 0 | | | | (4,298 | ) | | | 0 | | | | (4,298 | ) | | | 4,855 | | | | 557 | |
| | | 0 | | | | (26,076 | ) | | | 0 | | | | (26,076 | ) | | | 33,224 | | | | 7,148 | |
| | | 0 | | | | (7,260 | ) | | | 0 | | | | (7,260 | ) | | | 9,359 | | | | 2,099 | |
| | | 0 | | | | (6,869 | ) | | | 0 | | | | (6,869 | ) | | | 8,294 | | | | 1,425 | |
| | | 0 | | | | (639 | ) | | | 0 | | | | (639 | ) | | | 724 | | | | 85 | |
| | | 0 | | | | (2,323 | ) | | | 0 | | | | (2,323 | ) | | | 2,901 | | | | 578 | |
| | | 1,482 | | | | 0 | | | | 0 | | | | 1,482 | | | | (1,512 | ) | | | (30 | ) |
| | | 0 | | | | (3,833 | ) | | | 0 | | | | (3,833 | ) | | | 4,447 | | | | 614 | |
| | | 0 | | | | (2,243 | ) | | | 0 | | | | (2,243 | ) | | | 2,361 | | | | 118 | |
| | | 0 | | | | (3,508 | ) | | | 0 | | | | (3,508 | ) | | | 2,136 | | | | (1,372 | ) |
| | | 0 | | | | (3,647 | ) | | | 0 | | | | (3,647 | ) | | | 4,417 | | | | 770 | |
| | | 0 | | | | (4,426 | ) | | | 0 | | | | (4,426 | ) | | | 4,657 | | | | 231 | |
| | | 0 | | | | (10,898 | ) | | | 0 | | | | (10,898 | ) | | | 11,986 | | | | 1,088 | |
| | | 0 | | | | (1,629 | ) | | | 0 | | | | (1,629 | ) | | | 1,116 | | | | (513 | ) |
| | | 0 | | | | (2,405 | ) | | | 0 | | | | (2,405 | ) | | | 2,651 | | | | 246 | |
| | | 0 | | | | (9,172 | ) | | | 0 | | | | (9,172 | ) | | | 10,245 | | | | 1,073 | |
| | | 0 | | | | (24,050 | ) | | | 0 | | | | (24,050 | ) | | | 24,814 | | | | 764 | |
| | | 0 | | | | (2,063 | ) | | | 0 | | | | (2,063 | ) | | | 2,671 | | | | 608 | |
| | | | | | | | | | | | | | | | | | | | | | | | |
Total Borrowings and Other Financing Transactions | | | | | | | | | | | | | | | | | | | | | | | | |
| | | | | | | | | | | | | | | | | | | | | | | | |
CERTAIN TRANSFERS ACCOUNTED FOR AS SECURED BORROWINGS
Remaining Contractual Maturity of the Agreements
| | | | | | | | | | | | | | | | | | | | |
| | | | | | | | | | | | | | | | |
Reverse Repurchase Agreements | |
| | $ | 0 | | | $ | (18,619 | ) | | $ | (17,213 | ) | | $ | (28,897 | ) | | $ | (64,729 | ) |
| | | 0 | | | | (5,880 | ) | | | (13,215 | ) | | | (5,335 | ) | | | (24,430 | ) |
Non-Agency Mortgage-Backed Securities | | | 0 | | | | (1,824 | ) | | | (9,133 | ) | | | (8,885 | ) | | | (19,842 | ) |
| | | 0 | | | | 0 | | | | 0 | | | | (2,482 | ) | | | (2,482 | ) |
| | | 0 | | | | 0 | | | | (2,242 | ) | | | 0 | | | | (2,242 | ) |
| | | | | | | | | | | | | | | | | | | | |
| | | | | | | | | | | | | | | | | | | | |
| | | | | | | | | | | | | | | | | | | | |
Payable for reverse repurchase agreements (5) | | | | | |
| | | | | |
| Securities with an aggregate market value of $135,637 have been pledged as collateral under the terms of the above master agreements as of December 31, 2023. |
| Includes accrued interest. |
| The average amount of borrowings outstanding during the period ended December 31, 2023 was $(104,425) at a weighted average interest rate of 5.758%. Average borrowings may include reverse repurchase agreements and sale-buyback transactions, if held during the period. |
| Open maturity reverse repurchase agreement. |
| Net Exposure represents the net receivable/(payable) that would be due from/to the counterparty in the event of default. Exposure from borrowings and other financing transactions can only be netted across transactions governed under the same master agreement with the same legal entity. See Note 8, Master Netting Arrangements, in the Notes to Financial Statements for more information. |
| Unsettled reverse repurchase agreements liability of $(2,508) is outstanding at period end. |
| | | | | | | | |
| | | | | | December 31, 2023 | | (Unaudited) |
(l) FINANCIAL DERIVATIVE INSTRUMENTS: EXCHANGE-TRADED OR CENTRALLY CLEARED
| | | | | | | | | | | | | | | | | | | | | | | | |
| | | | | | | | | | | Unrealized
Appreciation/
(Depreciation) | | | | |
| | | | | | |
3-Month SOFR Active Contract December Futures | | | 03/2024 | | | | 10 | | | $ | (2,366 | ) | | $ | 67 | | | $ | 0 | | | $ | 0 | |
3-Month SOFR Active Contract December Futures | | | 03/2025 | | | | 4 | | | | (963 | ) | | | 15 | | | | 0 | | | | 0 | |
3-Month SOFR Active Contract December Futures | | | 03/2026 | | | | 5 | | | | (1,212 | ) | | | 11 | | | | 0 | | | | (1 | ) |
3-Month SOFR Active Contract June Futures | | | 09/2024 | | | | 6 | | | | (1,432 | ) | | | 32 | | | | 0 | | | | 0 | |
3-Month SOFR Active Contract June Futures | | | 09/2025 | | | | 4 | | | | (968 | ) | | | 11 | | | | 0 | | | | (1 | ) |
3-Month SOFR Active Contract March Futures | | | 06/2024 | | | | 7 | | | | (1,663 | ) | | | 43 | | | | 0 | | | | 0 | |
3-Month SOFR Active Contract March Futures | | | 06/2025 | | | | 4 | | | | (966 | ) | | | 12 | | | | 0 | | | | 0 | |
3-Month SOFR Active Contract March Futures | | | 06/2026 | | | | 4 | | | | (969 | ) | | | 9 | | | | 0 | | | | 0 | |
3-Month SOFR Active Contract September Futures | | | 12/2024 | | | | 6 | | | | (1,439 | ) | | | 27 | | | | 0 | | | | (1 | ) |
3-Month SOFR Active Contract September Futures | | | 12/2025 | | | | 4 | | | | (969 | ) | | | 9 | | | | 0 | | | | 0 | |
| | | | | | | | | | | | | | | | | | | | | | | | |
| | | | | | | | | | | | | |
| | | | | | | | | | | | | | | | | | | | | | | | |
CREDIT DEFAULT SWAPS ON CORPORATE ISSUES - SELL PROTECTION
(1)
| | | | | | | | | | | | | | | | | | | | | | | | | | | | | | | | | | | | | | |
| | | | | | | | | | | | Implied Credit Spread at December 31, 2023 (2) | | | | | | | | Unrealized
Appreciation/
(Depreciation) | | | | | | | |
| | | | | | |
| AT&T, Inc. | | | | | 1.000% | | | Quarterly | | | 06/20/2028 | | | 0.750% | | $ | 500 | | | $ | (5 | ) | | $ | 10 | | | $ | 5 | | | $ | 0 | | | $ | 0 | |
| | | | | | | | | | | | | | | | | | | | | | | | | | | | | | | | | | | | | | |
| | | | | | | | | | | | | | | | | | | | | | | | | | | | | | | | | | | | | | | | |
| | | | | | | | | | | | | | | | | | Unrealized
Appreciation/
(Depreciation) | | | | | | | |
| | | | | | |
| | | | | 5.000 | % | | Annual | | | 03/20/2029 | | | | GBP | | | | 14,900 | | | $ | 1,464 | | | $ | 11 | | | $ | 1,475 | | | $ | 0 | | | $ | (47 | ) |
| | | | | 0.750 | | | Annual | | | 09/21/2052 | | | | | | | | 5,900 | | | | 680 | | | | 3,001 | | | | 3,681 | | | | 115 | | | | 0 | |
| | | | | 3.000 | | | | | | 06/19/2024 | | | | $ | | | | 32,500 | | | | (307 | ) | | | 725 | | | | 418 | | | | 9 | | | | 0 | |
| | | | | 1.500 | | | Semi-Annual | | | 12/18/2024 | | | | | | | | 14,000 | | | | 12 | | | | 485 | | | | 497 | | | | 6 | | | | 0 | |
| | | | | 2.450 | | | Annual | | | 12/20/2024 | | | | | | | | 8,800 | | | | (1 | ) | | | 206 | | | | 205 | | | | 2 | | | | 0 | |
| | | | | 2.350 | | | Annual | | | 01/17/2025 | | | | | | | | 4,400 | | | | 0 | | | | 100 | | | | 100 | | | | 0 | | | | (1 | ) |
| | | | | 2.000 | | | Semi-Annual | | | 06/20/2025 | | | | | | | | 8,400 | | | | 130 | | | | 200 | | | | 330 | | | | 2 | | | | 0 | |
| | | | | 3.750 | | | Annual | | | 06/21/2025 | | | | | | | | 142,900 | | | | (321 | ) | | | 2,916 | | | | 2,595 | | | | 0 | | | | (6 | ) |
| | | | | 2.300 | | | Annual | | | 01/17/2026 | | | | | | | | 700 | | | | 0 | | | | 23 | | | | 23 | | | | 0 | | | | 0 | |
| | | | | 1.350 | | | Semi-Annual | | | 01/20/2027 | | | | | | | | 3,200 | | | | (1 | ) | | | 263 | | | | 262 | | | | 1 | | | | 0 | |
| | | | | 1.360 | | | Semi-Annual | | | 02/15/2027 | | | | | | | | 2,130 | | | | 0 | | | | 170 | | | | 170 | | | | 1 | | | | 0 | |
| | | | | 1.450 | | | Semi-Annual | | | 02/17/2027 | | | | | | | | 3,500 | | | | (1 | ) | | | 269 | | | | 268 | | | | 1 | | | | 0 | |
| | | | | 1.420 | | | Semi-Annual | | | 02/24/2027 | | | | | | | | 1,000 | | | | 0 | | | | 77 | | | | 77 | | | | 0 | | | | 0 | |
| | | | | 1.650 | | | Semi-Annual | | | 02/24/2027 | | | | | | | | 3,400 | | | | (9 | ) | | | (228 | ) | | | (237 | ) | | | 0 | | | | (1 | ) |
| | | | | 1.000 | | | Annual | | | 06/15/2027 | | | | | | | | 11,200 | | | | (763 | ) | | | (474 | ) | | | (1,237 | ) | | | 0 | | | | 0 | |
| | | | | 1.750 | | | Annual | | | 06/15/2027 | | | | | | | | 28,200 | | | | (1,308 | ) | | | (1,010 | ) | | | (2,318 | ) | | | 2 | | | | 0 | |
| | | | | 2.000 | | | Annual | | | 12/21/2027 | | | | | | | | 47,200 | | | | 3,512 | | | | (683 | ) | | | 2,829 | | | | 0 | | | | (5 | ) |
| | | | | 1.420 | | | Semi-Annual | | | 08/17/2028 | | | | | | | | 3,800 | | | | (1 | ) | | | 394 | | | | 393 | | | | 0 | | | | 0 | |
| | | | | 1.370 | | | Semi-Annual | | | 08/25/2028 | | | | | | | | 11,363 | | | | (3 | ) | | | 1,194 | | | | 1,191 | | | | 0 | | | | 0 | |
| | | | | 1.500 | | | Semi-Annual | | | 12/15/2028 | | | | | | | | 7,141 | | | | 97 | | | | (853 | ) | | | (756 | ) | | | 0 | | | | 0 | |
| | | | | 3.750 | | | Annual | | | 12/20/2028 | | | | | | | | 59,000 | | | | 1,147 | | | | (1,698 | ) | | | (551 | ) | | | 0 | | | | (23 | ) |
| | | | | 1.500 | | | Semi-Annual | | | 01/12/2029 | | | | | | | | 2,365 | | | | 0 | | | | 262 | | | | 262 | | | | 0 | | | | 0 | |
| | | | | 1.700 | | | Semi-Annual | | | 01/12/2029 | | | | | | | | 8,600 | | | | (26 | ) | | | (840 | ) | | | (866 | ) | | | 0 | | | | 0 | |
| | | | | 1.000 | | | Annual | | | 06/15/2029 | | | | | | | | 2,810 | | | | (113 | ) | | | (303 | ) | | | (416 | ) | | | 0 | | | | 0 | |
| | | | | 1.750 | | | Annual | | | 06/15/2029 | | | | | | | | 73,390 | | | | (5,265 | ) | | | (2,572 | ) | | | (7,837 | ) | | | 2 | | | | 0 | |
| | | | | 3.000 | | | Semi-Annual | | | 06/19/2029 | | | | | | | | 44,200 | | | | 2,283 | | | | (4,042 | ) | | | (1,759 | ) | | | 3 | | | | 0 | |
| | | | | 3.750 | | | Annual | | | 06/20/2029 | | | | | | | | 13,500 | | | | (254 | ) | | | (6 | ) | | | (260 | ) | | | 0 | | | | (5 | ) |
| | | | | 1.500 | | | Semi-Annual | | | 12/18/2029 | | | | | | | | 4,500 | | | | (46 | ) | | | (506 | ) | | | (552 | ) | | | 0 | | | | (2 | ) |
| | | | | 2.000 | | | Annual | | | 12/21/2029 | | | | | | | | 13,700 | | | | (1,410 | ) | | | 305 | | | | (1,105 | ) | | | 0 | | | | (3 | ) |
| | | | | 3.000 | | | Annual | | | 06/21/2030 | | | | | | | | 6,800 | | | | 179 | | | | 97 | | | | 276 | | | | 0 | | | | 0 | |
| | | | | 1.000 | | | Semi-Annual | | | 12/16/2030 | | | | | | | | 4,805 | | | | 21 | | | | 796 | | | | 817 | | | | 3 | | | | 0 | |
| | | | | 3.500 | | | Annual | | | 12/20/2030 | | | | | | | | 3,900 | | | | 259 | | | | (262 | ) | | | (3 | ) | | | 0 | | | | 0 | |
| | | | | 1.750 | | | Semi-Annual | | | 12/15/2031 | | | | | | | | 12,200 | | | | (165 | ) | | | 1,866 | | | | 1,701 | | | | 7 | | | | 0 | |
| | | | | 1.250 | | | Annual | | | 06/15/2032 | | | | | | | | 38,250 | | | | 4,949 | | | | 2,071 | | | | 7,020 | | | | 30 | | | | 0 | |
| | | | | 1.750 | | | Annual | | | 06/15/2032 | | | | | | | | 46,980 | | | | 1,980 | | | | 4,829 | | | | 6,809 | | | | 29 | | | | 0 | |
| | | | | 3.000 | | | Annual | | | 06/21/2033 | | | | | | | | 8,305 | | | | 320 | | | | 97 | | | | 417 | | | | 6 | | | | 0 | |
| | | | | 3.500 | | | Annual | | | 12/20/2033 | | | | | | | | 2,510 | | | | 42 | | | | (47 | ) | | | (5 | ) | | | 2 | | | | 0 | |
| | | | | | | | | | | | |
| See Accompanying Notes | | | | | | | | | | DECEMBER 31, 2023 | | | |
| | | | | | | | |
| | PIMCO Strategic Income Fund, Inc. | | | | | | |
| | | | | | | | | | | | | | | | | | | | | | | | | | | | | | | | | | | | | | | | |
| | | | | | | | | | | | | | | | | | Unrealized
Appreciation/
(Depreciation) | | | | | | | |
| | | | | | |
| | | | | 3.750 | % | | Annual | | | 06/20/2034 | | | | $ | | | | 1,300 | | | $ | (46 | ) | | $ | 5 | | | $ | (41 | ) | | $ | 1 | | | $ | 0 | |
| | | | | 2.000 | | | | | | 01/15/2050 | | | | | | | | 4,400 | | | | (31 | ) | | | 1,278 | | | | 1,247 | | | | 15 | | | | 0 | |
| | | | | 1.750 | | | Semi-Annual | | | 01/22/2050 | | | | | | | | 4,100 | | | | (10 | ) | | | 1,348 | | | | 1,338 | | | | 14 | | | | 0 | |
| | | | | 1.875 | | | Semi-Annual | | | 02/07/2050 | | | | | | | | 1,400 | | | | (5 | ) | | | 429 | | | | 424 | | | | 5 | | | | 0 | |
| | | | | 1.250 | | | Semi-Annual | | | 12/16/2050 | | | | | | | | 5,700 | | | | 537 | | | | 1,836 | | | | 2,373 | | | | 18 | | | | 0 | |
| | | | | 1.450 | | | Semi-Annual | | | 04/07/2051 | | | | | | | | 3,500 | | | | (1 | ) | | | 1,381 | | | | 1,380 | | | | 13 | | | | 0 | |
| | | | | 1.650 | | | Semi-Annual | | | 04/08/2051 | | | | | | | | 2,100 | | | | 1 | | | | (754 | ) | | | (753 | ) | | | 0 | | | | (8 | ) |
| | | | | 1.500 | | | Annual | | | 06/15/2052 | | | | | | | | 2,800 | | | | (106 | ) | | | (886 | ) | | | (992 | ) | | | 0 | | | | (11 | ) |
| | | | | 1.750 | | | Annual | | | 06/15/2052 | | | | | | | | 6,900 | | | | 1,128 | | | | 972 | | | | 2,100 | | | | 26 | | | | 0 | |
| | | | | 11.823 | | | Maturity | | | 01/04/2027 | | | | BRL | | | | 40,300 | | | | 0 | | | | (256 | ) | | | (256 | ) | | | 5 | | | | 0 | |
| | | | | 12.047 | | | Maturity | | | 01/04/2027 | | | | | | | | 39,700 | | | | 0 | | | | 290 | | | | 290 | | | | 0 | | | | (5 | ) |
| | | | | 3.300 | | | Semi-Annual | | | 06/19/2024 | | | | CAD | | | | 11,200 | | | | 624 | | | | (710 | ) | | | (86 | ) | | | 0 | | | | (2 | ) |
| | | | | 3.500 | | | Semi-Annual | | | 06/20/2044 | | | | | | | | 1,300 | | | | (183 | ) | | | 183 | | | | 0 | | | | 1 | | | | 0 | |
| | | | | 0.260 | | | Annual | | | 09/06/2024 | | | | EUR | | | | 15,100 | | | | 2 | | | | 588 | | | | 590 | | | | 8 | | | | 0 | |
| | | | | 3.250 | | | Annual | | | 03/20/2029 | | | | | | | | 2,500 | | | | 117 | | | | (2 | ) | | | 115 | | | | 0 | | | | (9 | ) |
| | | | | 0.500 | | | Annual | | | 09/21/2052 | | | | | | | | 3,500 | | | | 303 | | | | 1,207 | | | | 1,510 | | | | 71 | | | | 0 | |
| | | | | 0.830 | | | Annual | | | 12/09/2052 | | | | | | | | 3,700 | | | | 23 | | | | 214 | | | | 237 | | | | 19 | | | | 0 | |
| | | | | 3.500 | | | Semi-Annual | | | 06/19/2034 | | | | CAD | | | | 2,000 | | | | 69 | | | | (4 | ) | | | 65 | | | | 2 | | | | 0 | |
| | | | | | | | | | | | | | | | | | | | | | | | | | | | | | | | | | | | | | | | |
| | | | | | | $ | 9,503 | | | $ | 13,952 | | | $ | 23,455 | | | $ | 419 | | | $ | (128 | ) |
| | | | | | | | | | | | | | | | | | | | | | | | | | | | | | | | | | | | | | | | |
| | | | | | | | | | | | | | | | | | | | | |
| | | | | | | | | | | | | | | | | | | | | | | | | | | | | | | | | | | | | | | | |
FINANCIAL DERIVATIVE INSTRUMENTS: EXCHANGE-TRADED OR CENTRALLY CLEARED SUMMARY
The following is a summary of the market value and variation margin of Exchange-Traded or Centrally Cleared Financial Derivative Instruments as of December 31, 2023:
| | | | | | | | | | | | | | | | | | | | | | | | | | | | | | | | | | | | |
| | | Financial Derivative Assets | | | | | | Financial Derivative Liabilities | |
| | | | | | | | | | | | | | | | | | Variation Margin
Liability | | | | |
| | | | | | | | | | | | | | | | | | | | | | | | | |
Total Exchange-Traded or Centrally Cleared | | | | | | | | | | | | | | | | | | | | | | | | | | | | | | | | | | | | |
| | | | | | | | | | | | | | | | | | | | | | | | | | | | | | | | | | | | |
Cash of $7,986 has been pledged as collateral for exchange-traded and centrally cleared financial derivative instruments as of December 31, 2023. See Note 8, Master Netting Arrangements, in the Notes to Financial Statements for more information.
| If the Fund is a seller of protection and a credit event occurs, as defined under the terms of that particular swap agreement, the Fund will either (i) pay to the buyer of protection an amount equal to the notional amount of the swap and take delivery of the referenced obligation or underlying securities comprising the referenced index or (ii) pay a net settlement amount in the form of cash, securities or other deliverable obligations equal to the notional amount of the swap less the recovery value of the referenced obligation or underlying securities comprising the referenced index. |
| Implied credit spreads, represented in absolute terms, utilized in determining the market value of credit default swap agreements on corporate issues as of period end serve as indicators of the current status of the payment/performance risk and represent the likelihood or risk of default for the credit derivative. The implied credit spread of a particular referenced entity reflects the cost of buying/selling protection and may include upfront payments required to be made to enter into the agreement. Wider credit spreads represent a deterioration of the referenced entity’s credit soundness and a greater likelihood or risk of default or other credit event occurring as defined under the terms of the agreement. |
| The maximum potential amount the Fund could be required to pay as a seller of credit protection or receive as a buyer of credit protection if a credit event occurs as defined under the terms of that particular swap agreement. |
| The prices and resulting values for credit default swap agreements serve as indicators of the current status of the payment/performance risk and represent the likelihood of an expected liability (or profit) for the credit derivative should the notional amount of the swap agreement be closed/sold as of the period end. Increasing market values, in absolute terms when compared to the notional amount of the swap, represent a deterioration of the underlying referenced instrument’s credit soundness and a greater likelihood or risk of default or other credit event occurring as defined under the terms of the agreement. |
| This instrument has a forward starting effective date. See Note 2, Securities Transactions and Investment Income, in the Notes to Financial Statements for further information. |
(m) FINANCIAL DERIVATIVE INSTRUMENTS: OVER THE COUNTER
FORWARD FOREIGN CURRENCY CONTRACTS:
| | | | | | | | | | | | | | | | | | | | | | | | |
| | | | | | | | | | | Unrealized Appreciation/
(Depreciation) | |
| | | | | | |
| | | 01/2024 | | | GBP | | | 242 | | | $ | | | 308 | | | $ | 0 | | | $ | (1 | ) |
| | | | | | | |
| | | 01/2024 | | | | | | 924 | | | | | | 1,172 | | | | 0 | | | | (6 | ) |
| | | 01/2024 | | | $ | | | 872 | | | EUR | | | 789 | | | | 2 | | | | (2 | ) |
| | | 01/2024 | | | | | | 1 | | | HUF | | | 472 | | | | 0 | | | | 0 | |
| | | 01/2024 | | | ZAR | | | 206 | | | $ | | | 11 | | | | 0 | | | | 0 | |
| | | | | | | |
| | | 03/2024 | | | $ | | | 858 | | | TRY | | | 26,876 | | | | 0 | | | | (9 | ) |
| | | 04/2024 | | | | | | 3,136 | | | | | | 101,351 | | | | 0 | | | | (47 | ) |
| | | | | | | | |
| | | | | | December 31, 2023 | | (Unaudited) |
| | | | | | | | | | | | | | | | | | | | | | | | |
| | | | | | | | | | | Unrealized Appreciation/
(Depreciation) | |
| | | | | | |
| | | 01/2024 | | | HUF | | | 2,741 | | | $ | | | 8 | | | $ | 0 | | | $ | 0 | |
| | | 03/2024 | | | $ | | | 61 | | | PEN | | | 228 | | | | 1 | | | | 0 | |
| | | | | | | |
| | | 01/2024 | | | EUR | | | 156 | | | $ | | | 171 | | | | 0 | | | | (1 | ) |
| | | | | | | |
| | | 01/2024 | | | MXN | | | 3,612 | | | | | | 206 | | | | 0 | | | | (6 | ) |
| | | | | | | |
| | | 01/2024 | | | HUF | | | 63,914 | | | | | | 182 | | | | 0 | | | | (2 | ) |
| | | | | | | |
| | | 01/2024 | | | EUR | | | 22,420 | | | | | | 24,515 | | | | 0 | | | | (242 | ) |
| | | | | | | |
| | | 01/2024 | | | HUF | | | 3,554 | | | | | | 10 | | | | 0 | | | | 0 | |
| | | | | | | |
| | | 04/2024 | | | MXN | | | 5 | | | | | | 0 | | | | 0 | | | | 0 | |
| | | | | | | |
| | | 01/2024 | | | EUR | | | 1,365 | | | | | | 1,495 | | | | 0 | | | | (12 | ) |
| | | | | | | |
| | | 01/2024 | | | GBP | | | 154 | | | | | | 193 | | | | 0 | | | | (3 | ) |
| | | | | | | |
| | | 01/2024 | | | CAD | | | 468 | | | | | | 347 | | | | 0 | | | | (6 | ) |
| | | 01/2024 | | | GBP | | | 5,020 | | | | | | 6,353 | | | | 0 | | | | (46 | ) |
| | | | | | | | | | | | | | | | | | | | | | | | |
Total Forward Foreign Currency Contracts | | | | | | | | | |
| | | | | | | | | | | | | | | | | | | | | | | | |
CREDIT DEFAULT SWAPS ON CORPORATE ISSUES - SELL PROTECTION
(1)
| | | | | | | | | | | | | | | | | | | | | | | | | | | | | | | | | | | | | | |
| | | | | | | | | | | | | Implied Credit Spread at December 31, 2023 (2) | | | | | | | | | Unrealized
Appreciation/
(Depreciation) | | | Swap Agreements, at Value (4) | |
| | | | | | |
| GST | | | | | 5.000 | % | | | Quarterly | | | | 06/20/2027 | | | | 1.349 | % | | | $ 500 | | | $ | 70 | | | $ | (11 | ) | | $ | 59 | | | $ | 0 | |
| MYC | | | | | 1.000 | | | | Quarterly | | | | 12/20/2028 | | | | 5.188 | | | | 200 | | | | (39 | ) | | | 6 | | | | 0 | | | | (33 | ) |
| | | | | | | | | | | | | | | | | | | | | | | | | | | | | | | | | | | | | | |
| | | | | | | | | | | | | | | | | | | | | | | | | | | | | | | | | | | | |
| | | | | | | | | | | | | | | | | | | | | | | | | | | | | | | | | | | | | | |
FINANCIAL DERIVATIVE INSTRUMENTS: OVER THE COUNTER SUMMARY
The following is a summary by counterparty of the market value of OTC financial derivative instruments and collateral pledged/(received) as of December 31, 2023:
| | | | | | | | | | | | | | | | | | | | | | | | | | | | | | | | | | | | | | | | | | | | | | | | |
| | | Financial Derivative Assets | | | | | | Financial Derivative Liabilities | | | | | | | | | | |
| | Forward
Foreign
Currency
Contracts | | | | | | | | | | | | | | | Forward
Foreign
Currency
Contracts | | | | | | | | | | | | Net Market
Value of OTC
Derivatives | | | Collateral
Pledged/
(Received) | | | | |
| | $ | 0 | | | $ | 0 | | | $ | 0 | | | $ | 0 | | | | | | | $ | (1 | ) | | $ | 0 | | | $ | 0 | | | $ | (1 | ) | | $ | (1 | ) | | $ | 0 | | | $ | (1 | ) |
| | | 2 | | | | 0 | | | | 0 | | | | 2 | | | | | | | | (8 | ) | | | 0 | | | | 0 | | | | (8 | ) | | | (6 | ) | | | 0 | | | | (6 | ) |
| | | 0 | | | | 0 | | | | 0 | | | | 0 | | | | | | | | (56 | ) | | | 0 | | | | 0 | | | | (56 | ) | | | (56 | ) | | | 0 | | | | (56 | ) |
| | | 1 | | | | 0 | | | | 0 | | | | 1 | | | | | | | | 0 | | | | 0 | | | | 0 | | | | 0 | | | | 1 | | | | 0 | | | | 1 | |
| | | 0 | | | | 0 | | | | 0 | | | | 0 | | | | | | | | (1 | ) | | | 0 | | | | 0 | | | | (1 | ) | | | (1 | ) | | | 0 | | | | (1 | ) |
| | | 0 | | | | 0 | | | | 0 | | | | 0 | | | | | | | | (6 | ) | | | 0 | | | | 0 | | | | (6 | ) | | | (6 | ) | | | 0 | | | | (6 | ) |
| | | 0 | | | | 0 | | | | 59 | | | | 59 | | | | | | | | 0 | | | | 0 | | | | 0 | | | | 0 | | | | 59 | | | | 0 | | | | 59 | |
| | | 0 | | | | 0 | | | | 0 | | | | 0 | | | | | | | | (2 | ) | | | 0 | | | | 0 | | | | (2 | ) | | | (2 | ) | | | 0 | | | | (2 | ) |
| | | 0 | | | | 0 | | | | 0 | | | | 0 | | | | | | | | (242 | ) | | | 0 | | | | 0 | | | | (242 | ) | | | (242 | ) | | | 389 | | | | 147 | |
| | | 0 | | | | 0 | | | | 0 | | | | 0 | | | | | | | | 0 | | | | 0 | | | | (33 | ) | | | (33 | ) | | | (33 | ) | | | 0 | | | | (33 | ) |
| | | 0 | | | | 0 | | | | 0 | | | | 0 | | | | | | | | (12 | ) | | | 0 | | | | 0 | | | | (12 | ) | | | (12 | ) | | | 0 | | | | (12 | ) |
| | | 0 | | | | 0 | | | | 0 | | | | 0 | | | | | | | | (3 | ) | | | 0 | | | | 0 | | | | (3 | ) | | | (3 | ) | | | 0 | | | | (3 | ) |
| | | 0 | | | | 0 | | | | 0 | | | | 0 | | | | | | | | (52 | ) | | | 0 | | | | 0 | | | | (52 | ) | | | (52 | ) | | | 0 | | | | (52 | ) |
| | | | | | | | | | | | | | | | | | | | | | | | | | | | | | | | | | | | | | | | | | | | | | | | |
| | | | | | | | | | | | | | | | | | | | | | | | | | | | | | | | | | | | | | | | | | | | | | | | |
| | | | | | | | | | | | | | | | | | | | | | | | | | | | | | | | | | | | | | | | | | | | | | | | |
| Securities with an aggregate market value of $389 have been pledged as collateral for financial derivative instruments as governed by International Swaps and Derivatives Association, Inc. master agreements as of December 31, 2023. |
| If the Fund is a seller of protection and a credit event occurs, as defined under the terms of that particular swap agreement, the Fund will either (i) pay to the buyer of protection an amount equal to the notional amount of the swap and take delivery of the referenced obligation or underlying securities comprising the referenced index or (ii) pay a net settlement amount in the form of cash, securities or other deliverable obligations equal to the notional amount of the swap less the recovery value of the referenced obligation or underlying securities comprising the referenced index. |
| Implied credit spreads, represented in absolute terms, utilized in determining the market value of credit default swap agreements on corporate issues as of period end serve as indicators of the current status of the payment/performance risk and represent the likelihood or risk of default for the credit derivative. The implied credit spread of a particular referenced entity reflects the cost of buying/selling protection and may include upfront payments required to be made to enter into the agreement. Wider credit spreads represent a deterioration of the referenced entity’s credit soundness and a greater likelihood or risk of default or other credit event occurring as defined under the terms of the agreement. |
| The maximum potential amount the Fund could be required to pay as a seller of credit protection or receive as a buyer of credit protection if a credit event occurs as defined under the terms of that particular swap agreement. |
| | | | | | | | | | | | |
| See Accompanying Notes | | | | | | | | | | DECEMBER 31, 2023 | | | |
| | | | | | | | |
| | PIMCO Strategic Income Fund, Inc. | | | | | | |
| The prices and resulting values for credit default swap agreements serve as indicators of the current status of the payment/performance risk and represent the likelihood of an expected liability (or profit) for the credit derivative should the notional amount of the swap agreement be closed/sold as of the period end. Increasing market values, in absolute terms when compared to the notional amount of the swap, represent a deterioration of the underlying referenced instrument’s credit soundness and a greater likelihood or risk of default or other credit event occurring as defined under the terms of the agreement. |
| Net Exposure represents the net receivable/(payable) that would be due from/to the counterparty in the event of default. Exposure from OTC financial derivative instruments can only be netted across transactions governed under the same master agreement with the same legal entity. See Note 8, Master Netting Arrangements, in the Notes to Financial Statements for more information. |
FAIR VALUE OF FINANCIAL DERIVATIVE INSTRUMENTS
The following is a summary of the fair valuation of the Fund’s derivative instruments categorized by risk exposure. See Note 7, Principal and Other Risks, in the Notes to Financial Statements on risks of the Fund.
Fair Values of Financial Derivative Instruments on the Statements of Assets and Liabilities as of December 31, 2023:
| | | | | | | | | | | | | | | | | | | | | | | | |
| | | Derivatives not accounted for as hedging instruments | |
| | | | | | | | | | | | | | | | | | | |
Financial Derivative Instruments - Assets | |
Exchange-traded or centrally cleared | |
| | $ | 0 | | | $ | 0 | | | $ | 0 | | | $ | 0 | | | $ | 419 | | | $ | 419 | |
| | | | | | | | | | | | | | | | | | | | | | | | |
| |
Forward Foreign Currency Contracts | | $ | 0 | | | $ | 0 | | | $ | 0 | | | $ | 3 | | | $ | 0 | | | $ | 3 | |
| | | 0 | | | | 59 | | | | 0 | | | | 0 | | | | 0 | | | | 59 | |
| | | | | | | | | | | | | | | | | | | | | | | | |
| | $ | 0 | | | $ | 59 | | | $ | 0 | | | $ | 3 | | | $ | 0 | | | $ | 62 | |
| | | | | | | | | | | | | | | | | | | | | | | | |
| | $ | 0 | | | $ | 59 | | | $ | 0 | | | $ | 3 | | | $ | 419 | | | $ | 481 | |
| | | | | | | | | | | | | | | | | | | | | | | | |
|
Financial Derivative Instruments - Liabilities | |
Exchange-traded or centrally cleared | |
| | $ | 0 | | | $ | 0 | | | $ | 0 | | | $ | 0 | | | $ | 3 | | | $ | 3 | |
| | | 0 | | | | 0 | | | | 0 | | | | 0 | | | | 128 | | | | 128 | |
| | | | | | | | | | | | | | | | | | | | | | | | |
| | $ | 0 | | | $ | 0 | | | $ | 0 | | | $ | 0 | | | $ | 131 | | | $ | 131 | |
| | | | | | | | | | | | | | | | | | | | | | | | |
| |
Forward Foreign Currency Contracts | | $ | 0 | | | $ | 0 | | | $ | 0 | | | $ | 383 | | | $ | 0 | | | $ | 383 | |
| | | 0 | | | | 33 | | | | 0 | | | | 0 | | | | 0 | | | | 33 | |
| | | | | | | | | | | | | | | | | | | | | | | | |
| | $ | 0 | | | $ | 33 | | | $ | 0 | | | $ | 383 | | | $ | 0 | | | $ | 416 | |
| | | | | | | | | | | | | | | | | | | | | | | | |
| | $ | 0 | | | $ | 33 | | | $ | 0 | | | $ | 383 | | | $ | 131 | | | $ | 547 | |
| | | | | | | | | | | | | | | | | | | | | | | | |
The effect of Financial Derivative Instruments on the Statements of Operations for the period ended December 31, 2023:
| | | | | | | | | | | | | | | | | | | | | | | | |
| | | Derivatives not accounted for as hedging instruments | |
| | | | | | | | | | | | | | | | | | | |
Net Realized Gain (Loss) on Financial Derivative Instruments | |
Exchange-traded or centrally cleared | |
| | $ | 0 | | | $ | 2 | | | $ | 0 | | | $ | 0 | | | $ | 5,018 | | | $ | 5,020 | |
| | | | | | | | | | | | | | | | | | | | | | | | |
| |
Forward Foreign Currency Contracts | | $ | 0 | | | $ | 0 | | | $ | 0 | | | $ | 32 | | | $ | 0 | | | $ | 32 | |
| | | 0 | | | | 12 | | | | 0 | | | | 0 | | | | 0 | | | | 12 | |
| | | | | | | | | | | | | | | | | | | | | | | | |
| | $ | 0 | | | $ | 12 | | | $ | 0 | | | $ | 32 | | | $ | 0 | | | $ | 44 | |
| | | | | | | | | | | | | | | | | | | | | | | | |
| | $ | 0 | | | $ | 14 | | | $ | 0 | | | $ | 32 | | | $ | 5,018 | | | $ | 5,064 | |
| | | | | | | | | | | | | | | | | | | | | | | | |
|
Net Change in Unrealized Appreciation (Depreciation) on Financial Derivative Instruments | |
Exchange-traded or centrally cleared | |
| | $ | 0 | | | $ | 0 | | | $ | 0 | | | $ | 0 | | | $ | (34 | ) | | $ | (34 | ) |
| | | 0 | | | | 10 | | | | 0 | | | | 0 | | | | (5,789 | ) | | | (5,779 | ) |
| | | | | | | | | | | | | | | | | | | | | | | | |
| | $ | 0 | | | $ | 10 | | | $ | 0 | | | $ | 0 | | | $ | (5,823 | ) | | $ | (5,813 | ) |
| | | | | | | | | | | | | | | | | | | | | | | | |
| |
Forward Foreign Currency Contracts | | $ | 0 | | | $ | 0 | | | $ | 0 | | | $ | 277 | | | $ | 0 | | | $ | 277 | |
| | | 0 | | | | 1 | | | | 0 | | | | 0 | | | | 0 | | | | 1 | |
| | | | | | | | | | | | | | | | | | | | | | | | |
| | $ | 0 | | | $ | 1 | | | $ | 0 | | | $ | 277 | | | $ | 0 | | | $ | 278 | |
| | | | | | | | | | | | | | | | | | | | | | | | |
| | $ | 0 | | | $ | 11 | | | $ | 0 | | | $ | 277 | | | $ | (5,823 | ) | | $ | (5,535 | ) |
| | | | | | | | | | | | | | | | | | | | | | | | |
| | | | | | | | |
| | | | | | December 31, 2023 | | (Unaudited) |
The following is a summary of the fair valuations according to the inputs used as of December
31, 2023 in valuing the Fund’s assets and
liabilities:
| | | | | | | | | | | | | | | | |
| | | | | | | | | | | | |
Investments in Securities, at Value | |
Loan Participations and Assignments | | $ | 0 | | | $ | 29,619 | | | $ | 7,569 | | | $ | 37,188 | |
| |
| | | 0 | | | | 54,658 | | | | 0 | | | | 54,658 | |
| | | 0 | | | | 43,988 | | | | 0 | | | | 43,988 | |
| | | 0 | | | | 11,852 | | | | 0 | | | | 11,852 | |
Convertible Bonds & Notes | |
| | | 0 | | | | 87 | | | | 0 | | | | 87 | |
| |
| | | 0 | | | | 1,713 | | | | 0 | | | | 1,713 | |
| | | 0 | | | | 15 | | | | 0 | | | | 15 | |
| | | 0 | | | | 1,412 | | | | 0 | | | | 1,412 | |
| | | 0 | | | | 558 | | | | 0 | | | | 558 | |
| | | 0 | | | | 2,242 | | | | 0 | | | | 2,242 | |
| | | 0 | | | | 339,711 | | | | 0 | | | | 339,711 | |
Non-Agency Mortgage-Backed Securities | | | 0 | | | | 61,465 | | | | 995 | | | | 62,460 | |
| | | 0 | | | | 8,628 | | | | 4,626 | | | | 13,254 | |
| | | 0 | | | | 5,541 | | | | 0 | | | | 5,541 | |
| |
| | | 779 | | | | 0 | | | | 127 | | | | 906 | |
| | | 0 | | | | 0 | | | | 13 | | | | 13 | |
| | | 1,088 | | | | 0 | | | | 2,817 | | | | 3,905 | |
| | | 0 | | | | 0 | | | | 9,878 | | | | 9,878 | |
| | | 0 | | | | 0 | | | | 5,831 | | | | 5,831 | |
| | | 0 | | | | 0 | | | | 830 | | | | 830 | |
| |
| | | 0 | | | | 0 | | | | 2 | | | | 2 | |
| |
| | | 0 | | | | 3,756 | | | | 0 | | | | 3,756 | |
Real Estate Investment Trusts | |
| | | 1,430 | | | | 0 | | | | 0 | | | | 1,430 | |
| |
| | | 0 | | | | 1,482 | | | | 0 | | | | 1,482 | |
| | | | | | | | | | | | | | | | |
| | | | | | | | | | | | |
| | $ | 0 | | | $ | 6 | | | $ | 0 | | | $ | 6 | |
| | | 0 | | | | 202 | | | | 0 | | | | 202 | |
| | | 0 | | | | 951 | | | | 0 | | | | 951 | |
| | | | | | | | | | | | | | | | |
| | $ | 3,297 | | | $ | 567,886 | | | $ | 32,688 | | | $ | 603,871 | |
| | | | | | | | | | | | | | | | |
|
Investments in Affiliates, at Value | |
| |
Central Funds Used for Cash Management Purposes | | $ | 4,761 | | | $ | 0 | | | $ | 0 | | | $ | 4,761 | |
| | | | | | | | | | | | | | | | |
| | | | |
| | $ | 8,058 | | | $ | 567,886 | | | $ | 32,688 | | | $ | 608,632 | |
| | | | | | | | | | | | | | | | |
|
Short Sales, at Value - Liabilities | |
| | $ | 0 | | | $ | (3,509 | ) | | $ | 0 | | | $ | (3,509 | ) |
| | | | | | | | | | | | | | | | |
|
Financial Derivative Instruments - Assets | |
Exchange-traded or centrally cleared | | | 0 | | | | 419 | | | | 0 | | | | 419 | |
| | | 0 | | | | 62 | | | | 0 | | | | 62 | |
| | | | | | | | | | | | | | | | |
| | $ | 0 | | | $ | 481 | | | $ | 0 | | | $ | 481 | |
| | | | | | | | | | | | | | | | |
|
Financial Derivative Instruments - Liabilities | |
Exchange-traded or centrally cleared | | | 0 | | | | (131 | ) | | | 0 | | | | (131 | ) |
| | | 0 | | | | (416 | ) | | | 0 | | | | (416 | ) |
| | | | | | | | | | | | | | | | |
| | $ | 0 | | | $ | (547 | ) | | $ | 0 | | | $ | (547 | ) |
| | | | | | | | | | | | | | | | |
| | | | |
Total Financial Derivative Instruments | | $ | 0 | | | $ | (66 | ) | | $ | 0 | | | $ | (66 | ) |
| | | | | | | | | | | | | | | | |
| | | | |
| | $ | 8,058 | | | $ | 564,311 | | | $ | 32,688 | | | $ | 605,057 | |
| | | | | | | | | | | | | | | | |
The following is a reconciliation of the fair valuations using significant unobservable inputs (Level 3) for the Fund during the period ended December 31, 2023:
| | | | | | | | | | | | | | | | | | | | | | | | | | | | | | | | | | | | | | | | |
| | Beginning
Balance
at 06/30/2023 | | | | | | | | | Accrued
Discounts/
(Premiums) | | | | | | Net Change in Unrealized Appreciation/ (Depreciation) (1) | | | | | | | | | Ending
Balance
at 12/31/2023 | | | Net Change in Unrealized Appreciation/ (Depreciation) on Investments Held at 12/31/2023 (1) | |
Investments in Securities, at Value | |
Loan Participations and Assignments | | $ | 19,077 | | | $ | 9,632 | | | $ | (15,948 | ) | | $ | 320 | | | $ | (2,738 | ) | | $ | 2,967 | | | $ | 0 | | | $ | (5,741 | ) | | $ | 7,569 | | | $ | 288 | |
Non-Agency Mortgage-Backed Securities | | | 1,151 | | | | 0 | | | | (170 | ) | | | 0 | | | | (1 | ) | | | 15 | | | | 0 | | | | 0 | | | | 995 | | | | 7 | |
| | | 6,006 | | | | 0 | | | | (25 | ) | | | 1 | | | | 4 | | | | (1,360 | ) | | | 0 | | | | 0 | | | | 4,626 | | | | (1,357 | ) |
| |
| | | 173 | | | | 0 | | | | 0 | | | | 0 | | | | 0 | | | | (46 | ) | | | 0 | | | | 0 | | | | 127 | | | | (46 | ) |
| | | 13 | | | | 0 | | | | 0 | | | | 0 | | | | 0 | | | | 0 | | | | 0 | | | | 0 | | | | 13 | | | | 0 | |
| | | 2,269 | | | | 0 | | | | 0 | | | | 0 | | | | 0 | | | | 548 | | | | 0 | | | | 0 | | | | 2,817 | | | | 548 | |
| | | 0 | | | | 8,047 | | | | 0 | | | | 0 | | | | 0 | | | | 1,831 | | | | 0 | | | | 0 | | | | 9,878 | | | | 1,831 | |
| | | 5,762 | | | | 400 | | | | 0 | | | | 0 | | | | 0 | | | | (331 | ) | | | 0 | | | | 0 | | | | 5,831 | | | | (331 | ) |
| | | 0 | | | | 129 | | | | 0 | | | | 0 | | | | 0 | | | | 701 | | | | 0 | | | | 0 | | | | 830 | | | | 701 | |
| |
| | | 50 | | | | 0 | | | | (98 | ) | | | 0 | | | | 98 | | | | (50 | ) | | | 0 | | | | 0 | | | | 0 | | | | 0 | |
| |
| | | 76 | | | | 0 | | | | (98 | ) | | | 0 | | | | 98 | | | | (74 | ) | | | 0 | | | | 0 | | | | 2 | | | | 1 | |
| | | 429 | | | | 0 | | | | (129 | ) | | | 0 | | | | 0 | | | | (300 | ) | | | 0 | | | | 0 | | | | 0 | | | | 0 | |
| | | | | | | | | | | | | | | | | | | | | | | | | | | | | | | | | | | | | | | | |
| | | | | | | | | | |
| | $ | 35,006 | | | $ | 18,208 | | | $ | (16,468 | ) | | $ | 321 | | | $ | (2,539 | ) | | $ | 3,901 | | | $ | 0 | | | $ | (5,741 | ) | | $ | 32,688 | | | $ | 1,642 | |
| | | | | | | | | | | | | | | | | | | | | | | | | | | | | | | | | | | | | | | | |
| | | | | | | | | | | | |
| See Accompanying Notes | | | | | | | | | | DECEMBER 31, 2023 | | | |
| | | | | | | | |
| | PIMCO Strategic Income Fund, Inc. | | | | December 31, 2023 | | (Unaudited) |
The following is a summary of significant unobservable inputs used in the fair valuations of assets and liabilities categorized within Level 3 of the fair value hierarchy:
| | | | | | | | | | | | | | | | | | |
| | Ending
Balance
at 12/31/2023 | | | | | | | | | (% Unless Noted Otherwise) | |
| | | | | | | | |
Investments in Securities, at Value | |
Loan Participations and Assignments | | $ | 3,480 | | | | | | | X | | | 14.500 | | | | — | |
| | | 4,089 | | | | | | | | | | 8.800-26.490 | | | | 20.951 | |
Non-Agency Mortgage-Backed Securities | | | 995 | | | Fair Valuation of Odd Lot Positions | | | | | | | 2.500 | | | | — | |
| | | 4,513 | | | | | | | | | | 12.000-17.000 | | | | 14.677 | |
| | | 113 | | | Fair Valuation of Odd Lot Positions | | | | | | | 2.500 | | | | — | |
| |
| | | 127 | | | | | Stock Price w/Liquidity Discount | | | | | 10.000 | | | | — | |
| | | 13 | | | | | | | X | | | 4.000 | | | | — | |
| | | 2,817 | | | | | | | X | | | 4.000 | | | | — | |
| | | 9,878 | | | | | | | X | | | 14.500 | | | | | |
| | | 129 | | | Indicative Market Quotation | | | | $ | | | 3.500-16.667 | | | | 16.614 | |
| | | 4,923 | | | Comparable Multiple/Discounted Cash Flow | | Revenue Multiple/EBITDA Multiple/Discount Rate | | X/X/% | | | 0.550/6.500/10.000 | | | | — | |
| | | 779 | | | | | | | | | | 17.280 | | | | — | |
| | | 830 | | | | | | | X | | | 5.860 | | | | — | |
| |
| | | 2 | | | | | | | | | | 40.000 | | | | — | |
| | | | | | | | | | | | | | | | | | |
| | $ | 32,688 | | | | | | | | | | | | | | | |
| | | | | | | | | | | | | | | | | | |
| Any difference between Net Change in Unrealized Appreciation/(Depreciation) and Net Change in Unrealized Appreciation/(Depreciation) on Investments Held at December 31, 2023 may be due to an investment no longer held or categorized as Level 3 at period end. | |
| | | | | | | | |
Consolidated Schedule of Investments | | | | | | December 31, 2023 | | (Unaudited) |
(Amounts in thousands*, except number of shares, contracts, units and ounces, if any)
| | | | | | | | | | | | |
| | | | | | | | | | | |
INVESTMENTS IN SECURITIES 159.0% | |
| |
LOAN PARTICIPATIONS AND ASSIGNMENTS 27.1% | |
|
| |
| | $ | | | 99 | | | $ | | | 99 | |
| | | | | 12,659 | | | | | | 12,659 | |
|
| |
| | | | | 1,844 | | | | | | 1,804 | |
|
CIRCOR International, Inc. | |
TBD% - 0.500% due 06/20/2029 «µ | | | 166 | | | | | | 165 | |
| | | | | 1,434 | | | | | | 1,432 | |
|
| |
1.138% - 4.414% (EUR012M + 3.250%) due 03/28/2025 ~ | | EUR | | | 3,392 | | | | | | 3,247 | |
4.969% (EUR012M + 4.000%) due 03/28/2026 ~ | | | | | 18,708 | | | | | | 17,906 | |
|
| |
TBD% - 14.148% due 06/30/2028 «µ | | $ | | | 3,500 | | | | | | 3,519 | |
|
| |
TBD% - 15.420% due 05/25/2026 | | | | | 15,258 | | | | | | 11,558 | |
|
| |
9.448% (EUR003M + 5.500%) due 03/29/2030 ~ | | EUR | | | 2,400 | | | | | | 2,434 | |
| | $ | | | 3,772 | | | | | | 3,481 | |
|
Espai Barca Fondo De Titulizacion | |
6.500% - 11.500% due 05/31/2028 « | | EUR | | | 3,608 | | | | | | 4,152 | |
|
iHeartCommunications, Inc. | |
| | $ | | | 1,000 | | | | | | 867 | |
| | | | | 2,400 | | | | | | 2,070 | |
|
| |
TBD% - 13.988% due 03/01/2024 « | | | 1,742 | | | | | | 1,848 | |
|
| |
| | | | | 2,400 | | | | | | 2,397 | |
|
| |
8.752% (EUR003M + 4.750%) due 11/04/2027 ~ | | EUR | | | 8,643 | | | | | | 9,087 | |
|
MPH Acquisition Holdings LLC | |
| | $ | | | 1,293 | | | | | | 1,251 | |
|
| |
| | | | | 4,614 | | | | | | 4,322 | |
|
| |
TBD% - 14.000% due 09/07/2024 µ | | | 6,352 | | | | | | 6,352 | |
7.362% (LIBOR03M + 1.750%) due 02/26/2035 ~ | | | | | 7,765 | | | | | | 388 | |
|
| |
9.175% (EUR003M + 5.250%) due 09/30/2028 ~ | | EUR | | | 8,800 | | | | | | 9,727 | |
|
Promotora de Informaciones SA | |
8.942% (EUR003M + 5.000%) due 06/30/2026 «~ | | | | | 16,000 | | | | | | 17,637 | |
9.192% (EUR003M + 5.220%) due 12/31/2026 ~ | | | | | 3,208 | | | | | | 3,378 | |
|
Rising Tide Holdings, Inc. | |
| | $ | | | 2,470 | | | | | | 2,381 | |
|
Steenbok Lux Finco 1 SARL | |
10.000% (EUR006M + 10.000%) due 06/30/2026 ~ | | EUR | | | 27 | | | | | | 30 | |
|
Steenbok Lux Finco 2 SARL | |
| | | | | 24,168 | | | | | | 10,113 | |
10.000% (EUR006M + 10.000%) due 06/30/2026 ~ | | | | | 18 | | | | | | 20 | |
|
| |
| | $ | | | 17,861 | | | | | | 15,795 | |
|
Team Health Holdings, Inc. | |
| | | | | 1,518 | | | | | | 1,164 | |
|
| |
| | | | | 14,586 | | | | | | 729 | |
1.750% (LIBOR06M + 1.750%) due 02/26/2035 ~ | | | | | 6,008 | | | | | | 300 | |
|
| |
| | | | | 21,636 | | | | | | 16,497 | |
| | | | | | | | | | | | |
| | | | | | | | | | | |
|
| |
| | $ | | | 7,620 | | | $ | | | 7,544 | |
| | | | | | | | | | | | |
Total Loan Participations and Assignments
(Cost $191,943) | | | | |
| | | | |
| |
CORPORATE BONDS & NOTES 28.5% | |
| |
| |
|
Adler Financing SARL (12.500% PIK) | |
12.500% due 06/30/2025 (b)(i) | | EUR | | | 14,042 | | | | | | 16,366 | |
|
| |
| | | | | 1,200 | | | | | | 1,010 | |
|
| |
| | | | | 900 | | | | | | 705 | |
| | | | | 4,000 | | | | | | 1,562 | |
| | | | | 5,100 | | | | | | 1,897 | |
| | | | | 1,200 | | | | | | 467 | |
| | | | | 6,800 | | | | | | 2,774 | |
|
| |
8.500% due 11/15/2029 (i) | | $ | | | 8,000 | | | | | | 7,265 | |
|
Banca Monte dei Paschi di Siena SpA | |
2.625% due 04/28/2025 (i) | | EUR | | | 2,677 | | | | | | 2,885 | |
7.708% due 01/18/2028 •(i) | | | | | 2,400 | | | | | | 2,656 | |
8.000% due 01/22/2030 •(i) | | | | | 956 | | | | | | 1,065 | |
10.500% due 07/23/2029 (i) | | | | | 8,348 | | | | | | 10,144 | |
|
| |
7.500% due 02/16/2027 (i) | | | | | 4,000 | | | | | | 4,070 | |
|
Corestate Capital Holding SA (8.000% Cash or 9.000% PIK) | |
8.000% due 12/31/2026 ^(b)(c) | | | | | 432 | | | | | | 250 | |
|
| |
| | $ | | | 250 | | | | | | 251 | |
|
| |
14.702% (T-BILL 1MO + 9.500%) due 04/22/2025 ~ | | | 939 | | | | | | 886 | |
|
Kennedy Wilson Europe Real Estate Ltd. | |
| | EUR | | | 500 | | | | | | 502 | |
|
Long Walk Reinsurance Ltd. | |
| | $ | | | 800 | | | | | | 800 | |
|
| |
17.092% (T-BILL 3MO + 11.750%) due 04/09/2029 ~ | | | 1,815 | | | | | | 1,430 | |
|
| |
1.800% due 02/02/2031 ^(c) | | | | | 1,395 | | | | | | 926 | |
2.100% due 05/15/2028 ^(c) | | | | | 200 | | | | | | 132 | |
3.125% due 06/05/2030 ^(c) | | | | | 200 | | | | | | 131 | |
3.500% due 01/29/2025 ^(c) | | | | | 100 | | | | | | 66 | |
4.345% due 04/29/2028 ^(c) | | | | | 600 | | | | | | 398 | |
4.570% due 04/29/2033 ^(c) | | | | | 1,900 | | | | | | 1,256 | |
|
| |
6.000% due 01/15/2030 (i) | | | | | 8,400 | | | | | | 5,879 | |
10.500% due 02/15/2028 (i) | | | | | 2,671 | | | | | | 2,710 | |
|
| |
| | | | | 900 | | | | | | 896 | |
|
| |
17.332% (T-BILL 1MO + 12.000%) due 03/10/2031 ~ | | | 700 | | | | | | 738 | |
|
| |
15.310% (T-BILL 3MO + 9.750%) due 06/06/2025 ~ | | | 980 | | | | | | 1,010 | |
| | | | | | | | | | | | |
| | | | | | | | | | | 71,127 | |
| | | | | | | | | | | | |
| |
| |
|
| |
10.500% due 05/15/2027 (i) | | | | | 17,400 | | | | | | 11,286 | |
|
Carvana Co. (12.000% PIK) | |
12.000% due 12/01/2028 (b)(i) | | | | | 768 | | | | | | 622 | |
|
Carvana Co. (13.000% PIK) | |
13.000% due 06/01/2030 (b)(i) | | | | | 5,645 | | | | | | 4,507 | |
|
Carvana Co. (14.000% PIK) | |
14.000% due 06/01/2031 (b)(i) | | | | | 6,456 | | | | | | 5,217 | |
| | | | | | | | | | | | |
| | | | | | | | | | | |
|
| |
7.750% due 04/01/2027 (i) | | EUR | | | 2,000 | | | $ | | | 2,043 | |
| | $ | | | 2,000 | | | | | | 1,824 | |
|
| |
5.875% due 08/15/2027 (i) | | | | | 1,600 | | | | | | 1,505 | |
|
| |
5.250% due 12/01/2026 (i) | | | | | 3,400 | | | | | | 2,919 | |
5.750% due 12/01/2028 (i) | | | | | 14,100 | | | | | | 11,273 | |
|
Intelsat Jackson Holdings SA | |
6.500% due 03/15/2030 (i) | | | | | 7,000 | | | | | | 6,686 | |
|
Inter Media & Communication SpA | |
6.750% due 02/09/2027 (i) | | EUR | | | 1,400 | | | | | | 1,494 | |
|
Legacy LifePoint Health LLC | |
| | $ | | | 400 | | | | | | 370 | |
|
| |
| | | | | 1,000 | | | | | | 1,012 | |
11.000% due 10/15/2030 (i) | | | | | 3,780 | | | | | | 3,986 | |
|
| |
| | EUR | | | 1,000 | | | | | | 993 | |
|
Newfold Digital Holdings Group, Inc. | |
| | $ | | | 300 | | | | | | 227 | |
| | | | | 2,300 | | | | | | 2,476 | |
|
| |
6.700% due 02/16/2032 (i) | | | | | 1,978 | | | | | | 1,644 | |
6.840% due 01/23/2030 (i) | | | | | 800 | | | | | | 694 | |
8.750% due 06/02/2029 (i) | | | | | 1,489 | | | | | | 1,448 | |
|
| |
| | | | | 3,254 | | | | | | 3,221 | |
|
| |
| | | | | 4,470 | | | | | | 3,431 | |
|
| |
0.000% due 12/29/2049 ~(g) | | BRL | | | 10,300 | | | | | | 750 | |
|
| |
| | $ | | | 900 | | | | | | 953 | |
|
| |
7.500% due 09/01/2025 (i) | | | | | 7,120 | | | | | | 5,883 | |
|
Wesco Aircraft Holdings, Inc. (7.500% Cash and 3.000% PIK) | |
10.500% due 11/15/2026 ^(b)(c) | | | 7,105 | | | | | | 6,465 | |
|
| |
7.750% due 08/15/2028 (i) | | | | | 23,816 | | | | | | 20,885 | |
| | | | | | | | | | | | |
| | | | | | | | | | | 103,814 | |
| | | | | | | | | | | | |
| |
| |
|
| |
10.000% due 07/27/2025 ^(c) | | | | | 34,485 | | | | | | 1,724 | |
|
| |
5.375% due 03/22/2030 (i) | | | | | 11,082 | | | | | | 9,180 | |
| | | | | | | | | | | | |
| | | | | | | | | | | 10,904 | |
| | | | | | | | | | | | |
Total Corporate Bonds & Notes
(Cost $214,661) | | | | |
| | | | |
| |
MUNICIPAL BONDS & NOTES 2.9% | |
| |
| |
|
Commonwealth of Puerto Rico Bonds, Series 2022 | |
| | | | | 24,294 | | | | | | 13,271 | |
| | | | | 13,494 | | | | | | 5,532 | |
| | | | | | | | | | | | |
Total Municipal Bonds & Notes
(Cost $19,985) | | | | |
| | | | |
| |
NON-AGENCY MORTGAGE-BACKED SECURITIES 56.8% | |
|
| |
4.649% due 02/10/2036 ~(i) | | | | | 14,239 | | | | | | 10,176 | |
|
| |
| | | | | 2,680 | | | | | | 2,300 | |
|
Ashford Hospitality Trust | |
8.284% due 06/15/2035 •(i) | | | | | 1,000 | | | | | | 966 | |
8.634% due 04/15/2035 •(i) | | | | | 14,536 | | | | | | 13,938 | |
|
Atrium Hotel Portfolio Trust | |
9.059% due 06/15/2035 •(i) | | | | | 6,223 | | | | | | 5,816 | |
| | | | | | | | | | | | |
| See Accompanying Notes | | | | | | | | | | DECEMBER 31, 2023 | | | |
| | | | | | | | |
Consolidated Schedule of Investments | | | | | | | | |
| | | | | | | | | | | | |
| | | | | | | | | | | |
|
BAMLL Commercial Mortgage Securities Trust | |
7.986% due 03/15/2037 •(i) | | $ | | | 2,000 | | | $ | | | 1,917 | |
8.186% due 03/15/2037 •(i) | | | | | 3,000 | | | | | | 2,862 | |
|
Barclays Commercial Mortgage Securities Trust | |
3.688% due 02/15/2053 ~(i) | | | | | 4,785 | | | | | | 2,965 | |
|
Barclays Commercial Real Estate Trust | |
4.563% due 08/10/2033 ~(i) | | | | | 5,370 | | | | | | 3,530 | |
|
| |
| | | | | 38,346 | | | | | | 7,535 | |
3.587% due 04/25/2038 ~(i) | | | | | 3,424 | | | | | | 2,664 | |
|
| |
8.926% due 03/15/2036 •(i) | | | | | 6,750 | | | | | | 4,188 | |
9.926% due 03/15/2036 •(i) | | | | | 2,500 | | | | | | 1,427 | |
|
| |
3.440% due 08/15/2052 ~(i) | | | | | 8,600 | | | | | | 6,691 | |
|
Beneria Cowen & Pritzer Collateral Funding Corp. | |
9.114% due 06/15/2038 •(i) | | | | | 5,500 | | | | | | 3,697 | |
|
| |
3.269% due 02/17/2055 ~(i) | | | | | 9,615 | | | | | | 7,609 | |
3.939% due 02/17/2055 ~(i) | | | | | 11,000 | | | | | | 6,513 | |
|
Braemar Hotels & Resorts Trust | |
7.934% due 06/15/2035 •(i) | | | | | 8,500 | | | | | | 7,993 | |
|
| |
10.862% due 02/15/2037 •(i) | | | | | 8,800 | | | | | | 5,089 | |
11.862% due 02/15/2037 •(i) | | | | | 1,500 | | | | | | 823 | |
|
| |
7.713% due 10/15/2036 •(i) | | | | | 4,000 | | | | | | 3,753 | |
8.579% due 05/15/2030 •(i) | | | | | 3,754 | | | | | | 3,656 | |
|
Canada Square Funding PLC | |
7.670% due 12/17/2057 •(i) | | GBP | | | 2,000 | | | | | | 2,529 | |
|
Citigroup Commercial Mortgage Trust | |
8.526% due 12/15/2036 •(i) | | $ | | | 585 | | | | | | 567 | |
9.376% due 12/15/2036 •(i) | | | | | 3,400 | | | | | | 3,286 | |
|
| |
4.737% due 03/25/2067 ~(i) | | | | | 7,200 | | | | | | 6,393 | |
|
Connecticut Avenue Securities Trust | |
10.587% due 03/25/2042 •(i) | | | | | 2,000 | | | | | | 2,135 | |
14.837% due 03/25/2042 •(i) | | | | | 5,200 | | | | | | 5,819 | |
|
Countrywide Home Loan Mortgage Pass-Through Trust | |
6.500% due 01/25/2038 (i) | | | | | 14,418 | | | | | | 6,910 | |
|
Credit Suisse Mortgage Capital Trust | |
8.744% due 07/15/2032 •(i) | | | | | 12,000 | | | | | | 10,874 | |
|
| |
7.509% due 06/15/2033 •(i) | | | | | 15,000 | | | | | | 9,703 | |
|
| |
3.704% due 05/10/2041 ~(i) | | | | | 14,250 | | | | | | 6,603 | |
|
Extended Stay America Trust | |
9.176% due 07/15/2038 ~(i) | | | | | 10,893 | | | | | | 10,686 | |
|
| |
| | | | | 620 | | | | | | 630 | |
| | | | | 760 | | | | | | 789 | |
8.387% due 01/25/2034 ~(i) | | | | | 855 | | | | | | 865 | |
9.087% due 02/25/2042 •(i) | | | | | 5,200 | | | | | | 5,379 | |
10.087% due 02/25/2042 •(i) | | | | | 1,700 | | | | | | 1,763 | |
10.837% due 01/25/2034 •(i) | | | | | 900 | | | | | | 959 | |
13.837% due 02/25/2042 •(i) | | | | | 800 | | | | | | 861 | |
|
GS Mortgage Securities Corp. Trust | |
8.326% due 08/15/2032 ~(i) | | | | | 5,000 | | | | | | 4,769 | |
|
GSMSC Resecuritization Trust | |
6.049% due 11/26/2037 (i) | | | | | 15,765 | | | | | | 14,200 | |
|
| |
8.220% due 01/28/2054 ~(i) | | GBP | | | 10,416 | | | | | | 12,696 | |
|
| |
8.309% due 12/15/2034 •(i) | | $ | | | 1,250 | | | | | | 1,228 | |
|
| |
8.625% due 11/15/2036 •(i) | | | | | 7,744 | | | | | | 7,448 | |
9.375% due 11/15/2036 •(i) | | | | | 11,600 | | | | | | 11,106 | |
|
| |
3.242% due 10/14/2039 ~(i) | | | | | 2,700 | | | | | | 2,065 | |
|
JP Morgan Chase Commercial Mortgage Securities Trust | |
5.364% due 07/05/2033 ~(i) | | | | | 1,183 | | | | | | 802 | |
7.666% due 06/15/2038 •(i) | | | | | 3,276 | | | | | | 2,454 | |
| | | | | | | | | | | | |
| | | | | | | | | | | |
7.709% due 12/15/2031 •(i) | | $ | | | 5,211 | | | $ | | | 4,945 | |
8.576% due 03/15/2036 •(i) | | | | | 2,000 | | | | | | 852 | |
| | | | | 250 | | | | | | 170 | |
9.326% due 03/15/2036 ~(i) | | | | | 19,256 | | | | | | 7,135 | |
| | | | | 1,325 | | | | | | 172 | |
|
Jupiter Mortgage No. 1 PLC | |
| | GBP | | | 6,424 | | | | | | 8,175 | |
|
| |
4.032% due 08/15/2034 ~(i) | | $ | | | 745 | | | | | | 533 | |
|
Morgan Stanley Bank of America Merrill Lynch Trust | |
4.750% due 12/15/2046 ~(i) | | | | | 4,214 | | | | | | 3,702 | |
|
Morgan Stanley Capital Trust | |
8.209% due 07/15/2035 ~(i) | | | | | 7,084 | | | | | | 6,817 | |
|
| |
| | | | | 5,000 | | | | | | 2,816 | |
2.718% due 12/15/2036 (i) | | | | | 11,198 | | | | | | 5,969 | |
|
Natixis Commercial Mortgage Securities Trust | |
3.790% due 11/15/2032 ~(i) | | | | | 3,000 | | | | | | 1,635 | |
|
| |
8.098% due 04/15/2032 •(i) | | | | | 7,900 | | | | | | 7,335 | |
|
New Residential Mortgage Loan Trust | |
| | | | | 15,500 | | | | | | 7,713 | |
|
Residential Mortgage Securities PLC | |
9.520% due 06/20/2070 •(i) | | GBP | | | 2,500 | | | | | | 3,183 | |
|
Seasoned Credit Risk Transfer Trust | |
2.727% due 11/25/2061 ~(a) | | $ | | | 6,731 | | | | | | 2,033 | |
4.500% due 02/25/2059 (i) | | | | | 8,981 | | | | | | 7,865 | |
4.500% due 11/25/2061 ~(i) | | | | | 5,900 | | | | | | 4,802 | |
4.750% due 08/25/2058 (i) | | | | | 8,337 | | | | | | 7,496 | |
|
SFO Commercial Mortgage Trust | |
| | | | | 340 | | | | | | 281 | |
8.376% due 05/15/2038 •(i) | | | | | 6,500 | | | | | | 5,030 | |
|
| |
7.220% due 02/25/2053 •(i) | | GBP | | | 3,800 | | | | | | 4,642 | |
7.970% due 02/25/2053 •(i) | | | | | 8,379 | | | | | | 10,077 | |
|
Stratton Mortgage Funding PLC | |
| | | | | 5,721 | | | | | | 7,286 | |
|
| |
| | EUR | | | 2,747 | | | | | | 2,562 | |
|
WaMu Mortgage Pass-Through Certificates Trust | |
6.370% due 10/25/2045 •(i) | | $ | | | 7,602 | | | | | | 6,346 | |
|
Wells Fargo Commercial Mortgage Trust | |
3.860% due 09/15/2031 ~(i) | | | | | 1,500 | | | | | | 1,383 | |
4.928% due 12/15/2039 ~(i) | | | | | 8,600 | | | | | | 6,920 | |
8.216% due 02/15/2037 •(i) | | | | | 3,080 | | | | | | 3,009 | |
| | | | | | | | | | | | |
Total Non-Agency Mortgage-Backed Securities (Cost $432,180) | | | | |
| | | | |
| |
ASSET-BACKED SECURITIES 33.0% | |
|
ACE Securities Corp. Home Equity Loan Trust | |
5.890% due 04/25/2036 •(i) | | | | | 24,252 | | | | | | 17,543 | |
5.910% due 08/25/2036 •(i) | | | | | 21,473 | | | | | | 5,282 | |
|
Bear Stearns Asset-Backed Securities Trust | |
6.520% due 07/25/2034 ~(i) | | | | | 5,121 | | | | | | 5,133 | |
|
| |
5.760% due 05/25/2037 •(i) | | | | | 16,250 | | | | | | 13,083 | |
|
Cologix Canadian Issuer LP | |
| | CAD | | | 5,400 | | | | | | 3,770 | |
|
Countrywide Asset-Backed Certificates Trust | |
5.720% due 06/25/2047 •(i) | | $ | | | 10,208 | | | | | | 8,155 | |
5.730% due 06/25/2047 •(i) | | | | | 14,733 | | | | | | 11,617 | |
5.965% due 03/25/2037 •(i) | | | | | 11,429 | | | | | | 10,208 | |
| | | | | 2,000 | | | | | | 1,595 | |
|
| |
| | EUR | | | 4,000 | | | | | | 2,363 | |
|
| |
9.000% due 04/08/2039 •(i) | | $ | | | 125,567 | | | | | | 8,618 | |
|
First Franklin Mortgage Loan Trust | |
5.780% due 10/25/2036 •(i) | | | | | 15,000 | | | | | | 11,884 | |
|
Flagship Credit Auto Trust | |
0.000% due 06/15/2029 «(f) | | | | | 25 | | | | | | 1,885 | |
|
| |
5.890% due 05/25/2046 •(i) | | | | | 10,547 | | | | | | 8,240 | |
| | | | | | | | | | | | |
| | | | | | | | | | | |
6.415% due 07/25/2045 •(i) | | $ | | | 15,226 | | | $ | | | 11,709 | |
|
Home Equity Mortgage Loan Asset-Backed Trust | |
6.385% due 10/25/2035 •(i) | | | | | 11,200 | | | | | | 9,163 | |
|
HSI Asset Securitization Corp. Trust | |
6.280% due 12/25/2035 •(i) | | | | | 13,243 | | | | | | 9,949 | |
|
LendingPoint Pass-Through Trust | |
0.000% due 04/15/2028 «(f) | | | | | 7,600 | | | | | | 1,305 | |
0.000% due 05/15/2028 «(f) | | | | | 7,554 | | | | | | 1,466 | |
|
Long Beach Mortgage Loan Trust | |
7.045% due 02/25/2035 •(i) | | | | | 10,153 | | | | | | 8,876 | |
|
Merrill Lynch Mortgage Investors Trust | |
6.520% due 04/25/2036 •(i) | | | | | 5,919 | | | | | | 4,703 | |
|
| |
6.170% due 07/25/2051 þ(i) | | | | | 11,600 | | | | | | 11,216 | |
|
| |
| | | | | 3,000 | | | | | | 2,897 | |
|
| |
| | | | | 3,200 | | | | | | 1,368 | |
|
| |
| | | | | 4,000 | | | | | | 2,813 | |
|
| |
| | | | | 14,600 | | | | | | 8,070 | |
|
Saxon Asset Securities Trust | |
5.760% due 01/25/2047 ~(i) | | | | | 1,707 | | | | | | 1,580 | |
|
Securitized Asset-Backed Receivables LLC Trust | |
6.070% due 11/25/2035 •(i) | | | | | 6,160 | | | | | | 5,060 | |
|
SMB Private Education Loan Trust | |
0.000% due 11/16/2054 «(f) | | | | | 9 | | | | | | 7,872 | |
0.000% due 02/16/2055 «(f) | | | | | 5 | | | | | | 5,768 | |
5.950% due 02/16/2055 (i) | | | | | 5,730 | | | | | | 5,477 | |
|
Structured Asset Securities Corp. Mortgage Loan Trust | |
6.895% due 02/25/2036 ~(i) | | | | | 6,876 | | | | | | 6,378 | |
| | | | | | | | | | | | |
Total Asset-Backed Securities (Cost $255,960) | | | | |
| | | | |
| |
| |
|
Russia Government International Bond | |
5.625% due 04/04/2042 ^(c) | | | | | 8,800 | | | | | | 5,917 | |
5.875% due 09/16/2043 ^(c) | | | | | 200 | | | | | | 127 | |
| | | | | | | | | | | | |
Total Sovereign Issues (Cost $2,798) | | | | |
| | | | |
| |
| | | | | | | | | | | |
| |
| |
CONSUMER DISCRETIONARY 0.0% | |
| | | | |
Steinhoff International Holdings NV «(d)(h) | | | | | 39,030,044 | | | | | | 0 | |
| | | | | | | | | | | | |
| |
| |
| | | | |
| | | | | 157,845 | | | | | | 85 | |
| | | | |
Banca Monte dei Paschi di Siena SpA (d) | | | | | 1,073,500 | | | | | | 3,610 | |
| | | | | | | | | | | | |
| | | | | | | | | | | 3,695 | |
| | | | | | | | | | | | |
| |
| |
| | | | |
| | | | | 718,727 | | | | | | 36,864 | |
| | | | | | | | | | | | |
| |
| |
| | | | |
Syniverse Holdings, Inc. «(h) | | | | | 10,034,506 | | | | | | 8,785 | |
| | | | | | | | | | | | |
| |
| |
| | | | |
| | | | | 349,513 | | | | | | 205 | |
| | | | | | | | | | | | |
| |
| |
| | | | |
| | | | | 8,371 | | | | | | 88 | |
| | | | | | | | | | | | |
Total Common Stocks (Cost $42,115) | | | | |
| | | | |
| |
| | | | | | | | |
| | | | | | December 31, 2023 | | (Unaudited) |
| | | | | | | | | | | | |
| | | | | | | | | | | |
| |
| |
| |
| | | | |
West Marine - Exp. 09/08/2028 « | | | | | 14,259 | | | $ | | | 0 | |
| | | | | | | | | | | | |
| | | | |
| | | | |
| |
PREFERRED SECURITIES 0.1% | |
| |
| |
|
Stichting AK Rabobank Certificaten | |
6.500% due 12/29/2049 þ(g) | | | | | 728,525 | | | | | | 808 | |
|
| |
4.000% due 05/15/2026 ^(c)(g) | | | | | 200,000 | | | | | | 2 | |
4.250% due 11/15/2026 ^(c)(g) | | | | | 100,000 | | | | | | 1 | |
4.700% due 11/15/2031 ^(c)(g) | | | | | 190,000 | | | | | | 3 | |
| | | | | | | | | | | | |
Total Preferred Securities (Cost $1,077) | | | | |
| | | | |
| |
REAL ESTATE INVESTMENT TRUSTS 0.5% | |
| |
| |
| | | | |
KKR Real Estate Finance Trust, Inc. | | | | | 83,280 | | | | | | 1,102 | |
| | | | | | | | | | | | |
| | | | | | | | | | | |
| | | | |
TPG RE Finance Trust, Inc. | | | | | 346,700 | | | $ | | | 2,253 | |
| | | | | | | | | | | | |
Total Real Estate Investment Trusts (Cost $6,062) | | | | |
| | | | |
| |
| | | | | | | | | | | |
SHORT-TERM INSTRUMENTS 1.6% | |
| |
| |
5.374% due 01/11/2024 - 02/29/2024 (e)(f)(i)(l) | | $ | | | 10,353 | | | | | | 10,277 | |
| | | | | | | | | | | | |
Total Short-Term Instruments
(Cost $10,277) | | | | |
| | | | |
| | | | |
| | | | | | | | | | | | |
Total Investments in Securities
(Cost $1,177,058) | | | | |
| | | | |
| |
| | | | | | | | | | | | |
| | | | | | | | | | | |
INVESTMENTS IN AFFILIATES 14.1% | |
| |
SHORT-TERM INSTRUMENTS 14.1% | |
| |
CENTRAL FUNDS USED FOR CASH MANAGEMENT PURPOSES 14.1% | |
| | | | |
PIMCO Short-Term Floating NAV Portfolio III | | | | | 9,446,743 | | | $ | | | 91,888 | |
| | | | | | | | | | | | |
Total Short-Term Instruments
(Cost $91,866) | | | | |
| | | | |
| | | | |
| | | | | | | | | | | | |
Total Investments in Affiliates
(Cost $91,866) | | | | |
| | | | |
| | | | | | | | | | | | |
Total Investments 173.1%
(Cost $1,268,924) | | | $ | | | | |
| |
Financial Derivative
Instruments (j)(k) 0.1% (Cost or Premiums, net $11,229) | | | | | | | |
| |
Other Assets and Liabilities, net (73.2)% | | | | |
| | | | |
| | | $ | | | | |
| | | | | | | |
NOTES TO CONSOLIDATED SCHEDULE OF INVESTMENTS:
| A zero balance may reflect actual amounts rounding to less than one thousand. |
| Security valued using significant unobservable inputs (Level 3). |
| All or a portion of this amount represents unfunded loan commitments. The interest rate for the unfunded portion will be determined at the time of funding. See Note 4, Securities and Other Investments, in the Notes to Financial Statements for more information regarding unfunded loan commitments. |
| Variable or Floating rate security. Rate shown is the rate in effect as of period end. Certain variable rate securities are not based on a published reference rate and spread, rather are determined by the issuer or agent and are based on current market conditions. Reference rate is as of reset date, which may vary by security. These securities may not indicate a reference rate and/or spread in their description. |
| Rate shown is the rate in effect as of period end. The rate may be based on a fixed rate, a capped rate or a floor rate and may convert to a variable or floating rate in the future. These securities do not indicate a reference rate and spread in their description. |
| Coupon represents a rate which changes periodically based on a predetermined schedule or event. Rate shown is the rate in effect as of period end. |
| Security is an Interest Only (“IO”) or IO Strip. |
| Security is not accruing income as of the date of this report. |
| Security did not produce income within the last twelve months. |
| Coupon represents a weighted average yield to maturity. |
| Perpetual maturity; date shown, if applicable, represents next contractual call date. |
(h) RESTRICTED SECURITIES:
| | | | | | | | | | | | | | | | |
| | | | | | | | | | | Market Value
as Percentage
of Net Assets | |
| | | | | | $ | 30,032 | | | $ | 36,864 | | | | 5.66 | % |
Steinhoff International Holdings NV | | | | | | | 0 | | | | 0 | | | | 0.00 | |
| | | | | | | 9,868 | | | | 8,785 | | | | 1.35 | |
| | | 09/12/2023 | | | | 120 | | | | 88 | | | | 0.01 | |
| | | | | | | | | | | | | | | | |
| | | $ | 40,020 | | | $ | 45,737 | | | | 7.02 | % |
| | | | | | | | | | | | | |
BORROWINGS AND OTHER FINANCING TRANSACTIONS
REVERSE REPURCHASE AGREEMENTS:
| | | | | | | | | | | | | | | | | | | | | | | | |
| | | | | | | | | | | | | | Payable for
Reverse
Repurchase
Agreements | |
| | | 6.700 | % | | | 12/07/2023 | | | | 04/04/2024 | | | | $ | | | | (4,276 | ) | | $ | (4,296 | ) |
| | | 4.200 | | | | 11/23/2023 | | | | TBD | | | | EUR | | | | (2,497 | ) | | | (2,768 | ) |
| | | 4.220 | | | | 12/08/2023 | | | | TBD | | | | | | | | (1,296 | ) | | | (1,435 | ) |
| | | | | | | | | | | | |
| See Accompanying Notes | | | | | | | | | | DECEMBER 31, 2023 | | | |
| | | | | | | | |
Consolidated Schedule of Investments | | | | | | | | |
| | | | | | | | | | | | | | | | | | | | | | | | |
| | | | | | | | | | | | | | Payable for
Reverse
Repurchase
Agreements | |
| | | 5.750 | % | | | 11/07/2023 | | | | 01/03/2024 | | | | $ | | | | (6,848 | ) | | $ | (6,909 | ) |
| | | 5.800 | | | | 12/07/2023 | | | | 12/06/2025 | | | | | | | | (481 | ) | | | (483 | ) |
| | | 5.850 | | | | 12/07/2023 | | | | 12/06/2025 | | | | | | | | (2,757 | ) | | | (2,768 | ) |
| | | 6.060 | | | | 07/14/2023 | | | | 01/10/2024 | | | | | | | | (15,295 | ) | | | (15,738 | ) |
| | | 6.650 | | | | 12/20/2023 | | | | 01/17/2024 | | | | | | | | (1,061 | ) | | | (1,063 | ) |
| | | 6.650 | | | | 12/20/2023 | | | | 04/16/2024 | | | | | | | | (42,219 | ) | | | (42,320 | ) |
| | | 6.650 | | | | 12/20/2023 | | | | 05/15/2024 | | | | | | | | (14,687 | ) | | | (14,721 | ) |
| | | 6.750 | | | | 12/20/2023 | | | | 04/16/2024 | | | | | | | | (3,326 | ) | | | (3,334 | ) |
| | | 6.950 | | | | 12/20/2023 | | | | 05/15/2024 | | | | | | | | (545 | ) | | | (546 | ) |
| | | 4.250 | | | | 09/29/2023 | | | | TBD | | | | EUR | | | | (2,873 | ) | | | (3,205 | ) |
| | | 6.600 | | | | 12/15/2023 | | | | 04/15/2024 | | | | $ | | | | (35,114 | ) | | | (35,229 | ) |
| | | 6.617 | | | | 11/20/2023 | | | | 02/20/2024 | | | | | | | | (452 | ) | | | (455 | ) |
| | | 6.670 | | | | 09/15/2023 | | | | 03/13/2024 | | | | | | | | (3,972 | ) | | | (4,053 | ) |
| | | 6.682 | | | | 07/10/2023 | | | | 01/10/2024 | | | | | | | | (2,737 | ) | | | (2,826 | ) |
| | | 6.700 | | | | 12/08/2023 | | | | 04/08/2024 | | | | | | | | (4,031 | ) | | | (4,050 | ) |
| | | 6.732 | | | | 07/10/2023 | | | | 01/10/2024 | | | | | | | | (5,625 | ) | | | (5,810 | ) |
| | | 6.750 | | | | 10/19/2023 | | | | 04/16/2024 | | | | | | | | (6,142 | ) | | | (6,229 | ) |
| | | 6.760 | | | | 07/24/2023 | | | | 01/24/2024 | | | | | | | | (6,081 | ) | | | (6,266 | ) |
| | | 6.800 | | | | 12/15/2023 | | | | 04/15/2024 | | | | | | | | (4,133 | ) | | | (4,147 | ) |
| | | 6.833 | | | | 08/07/2023 | | | | 01/30/2024 | | | | | | | | (8,348 | ) | | | (8,582 | ) |
| | | 6.100 | | | | 11/20/2023 | | | | 05/20/2024 | | | | | | | | (1,607 | ) | | | (1,619 | ) |
| | | 6.130 | | | | 10/10/2023 | | | | 04/08/2024 | | | | | | | | (14,923 | ) | | | (15,133 | ) |
| | | 6.472 | | | | 12/08/2023 | | | | 02/02/2024 | | | | | | | | (8,521 | ) | | | (8,559 | ) |
| | | 6.968 | | | | 12/18/2023 | | | | 02/16/2024 | | | | | | | | (15,287 | ) | | | (15,332 | ) |
| | | 6.740 | | | | 10/26/2023 | | | | 07/29/2024 | | | | | | | | (8,251 | ) | | | (8,356 | ) |
| | | 3.750 | | | | 09/29/2023 | | | | TBD | | | | EUR | | | | (5,129 | ) | | | (5,717 | ) |
| | | 6.290 | | | | 07/17/2023 | | | | 01/16/2024 | | | | $ | | | | (785 | ) | | | (808 | ) |
| | | 6.465 | | | | 07/17/2023 | | | | 01/16/2024 | | | | | | | | (797 | ) | | | (821 | ) |
| | | 6.600 | | | | 07/12/2023 | | | | 01/08/2024 | | | | | | | | (5,185 | ) | | | (5,351 | ) |
| | | 6.625 | | | | 07/12/2023 | | | | 01/08/2024 | | | | | | | | (2,870 | ) | | | (2,962 | ) |
| | | 6.650 | | | | 07/10/2023 | | | | 01/02/2024 | | | | | | | | (3,177 | ) | | | (3,280 | ) |
| | | 6.650 | | | | 07/12/2023 | | | | 01/08/2024 | | | | | | | | (3,827 | ) | | | (3,950 | ) |
| | | 6.680 | | | | 01/02/2024 | | | | 04/03/2024 | | | | | | | | (3,695 | ) | | | (3,695 | ) |
| | | 6.690 | | | | 07/17/2023 | | | | 01/16/2024 | | | | | | | | (1,417 | ) | | | (1,462 | ) |
| | | 5.760 | | | | 12/22/2023 | | | | 03/22/2024 | | | | GBP | | | | (6,562 | ) | | | (8,378 | ) |
| | | 5.910 | | | | 12/15/2023 | | | | 02/15/2024 | | | | | | | | (5,789 | ) | | | (7,401 | ) |
| | | 6.110 | | | | 12/22/2023 | | | | 03/22/2024 | | | | | | | | (7,020 | ) | | | (8,964 | ) |
| | | 6.600 | | | | 11/27/2023 | | | | 05/22/2024 | | | | $ | | | | (5,582 | ) | | | (5,619 | ) |
| | | 6.600 | | | | 12/11/2023 | | | | 06/11/2024 | | | | | | | | (1,944 | ) | | | (1,952 | ) |
| | | 6.650 | | | | 11/10/2023 | | | | 05/08/2024 | | | | | | | | (7,868 | ) | | | (7,944 | ) |
| | | 6.650 | | | | 11/15/2023 | | | | 05/13/2024 | | | | | | | | (8,090 | ) | | | (8,161 | ) |
| | | 6.700 | | | | 11/15/2023 | | | | 05/13/2024 | | | | | | | | (1,834 | ) | | | (1,850 | ) |
| | | 6.750 | | | | 11/10/2023 | | | | 05/08/2024 | | | | | | | | (4,338 | ) | | | (4,380 | ) |
| | | 6.750 | | | | 11/15/2023 | | | | 05/13/2024 | | | | | | | | (6,182 | ) | | | (6,237 | ) |
| | | 6.550 | | | | 12/13/2023 | | | | 06/20/2024 | | | | | | | | (66,018 | ) | | | (66,258 | ) |
| | | 6.850 | | | | 11/08/2023 | | | | 05/08/2024 | | | | | | | | (3,462 | ) | | | (3,498 | ) |
| | | 6.850 | | | | 12/22/2023 | | | | 06/24/2024 | | | | | | | | (593 | ) | | | (594 | ) |
| | | 6.500 | | | | 12/11/2023 | | | | 04/12/2024 | | | | | | | | (1,923 | ) | | | (1,930 | ) |
| | | 4.500 | | | | 11/22/2023 | | | | 01/22/2024 | | | | EUR | | | | (12,440 | ) | | | (13,803 | ) |
| | | 5.600 | | | | 12/05/2023 | | | | TBD | | | | $ | | | | (1,220 | ) | | | (1,225 | ) |
| | | 5.600 | | | | 12/05/2023 | | | | TBD | | | | | | | | (1,914 | ) | | | (1,922 | ) |
| | | 5.600 | | | | 12/07/2023 | | | | TBD | | | | | | | | (9,281 | ) | | | (9,318 | ) |
| | | 6.100 | | | | 10/12/2023 | | | | 04/12/2024 | | | | | | | | (2,095 | ) | | | (2,124 | ) |
| | | 6.110 | | | | 07/03/2023 | | | | 01/03/2024 | | | | | | | | (3,317 | ) | | | (3,418 | ) |
| | | 6.120 | | | | 10/10/2023 | | | | 04/10/2024 | | | | | | | | (15,265 | ) | | | (15,480 | ) |
| | | 6.120 | | | | 10/18/2023 | | | | 04/10/2024 | | | | | | | | (5,057 | ) | | | (5,121 | ) |
| | | 6.650 | | | | 11/07/2023 | | | | 05/07/2024 | | | | | | | | (700 | ) | | | (707 | ) |
| | | 6.700 | | | | 11/07/2023 | | | | 05/07/2024 | | | | | | | | (3,851 | ) | | | (3,891 | ) |
| | | 6.750 | | | | 11/17/2023 | | | | 05/15/2024 | | | | | | | | (362 | ) | | | (366 | ) |
| | | 4.200 | | | | 12/08/2023 | | | | TBD | | | | EUR | | | | (4,614 | ) | | | (5,108 | ) |
| | | 4.320 | | | | 11/17/2023 | | | | 02/21/2024 | | | | | | | | (2,953 | ) | | | (3,278 | ) |
| | | 6.540 | | | | 12/05/2023 | | | | 06/05/2024 | | | | $ | | | | (10,521 | ) | | | (10,575 | ) |
| | | 6.640 | | | | 10/17/2023 | | | | 01/16/2024 | | | | | | | | (2,822 | ) | | | (2,862 | ) |
| | | 6.770 | | | | 06/30/2023 | | | | 01/04/2024 | | | | | | | | (14,804 | ) | | | (15,321 | ) |
| | | 6.780 | | | | 10/19/2023 | | | | 04/16/2024 | | | | | | | | (8,902 | ) | | | (9,028 | ) |
| | | 6.800 | | | | 07/27/2023 | | | | 04/26/2024 | | | | | | | | (621 | ) | | | (640 | ) |
| | | | | | | | | | | | | | | | | | | | | | | | |
Total Reverse Repurchase Agreements | | | | | | | | | | | | | | | | | |
| | | | | | | | | | | | | | | | | | | | | | | | |
| | | | | | | | |
| | | | | | December 31, 2023 | | (Unaudited) |
BORROWINGS AND OTHER FINANCING TRANSACTIONS SUMMARY
The following is a summary by counterparty of the market value of Borrowings and Other Financing Transactions and collateral pledged/(received) as of December 31, 2023:
| | | | | | | | | | | | | | | | | | | | | | | | |
| | Repurchase
Agreement
Proceeds
to be
Received | | | Payable for
Reverse
Repurchase
Agreements | | | Payable for Sale-Buyback Transactions | | | Total
Borrowings and
Other Financing
Transactions | | | Collateral
Pledged/(Received) | | | | |
Global/Master Repurchase Agreement | |
| | $ | 0 | | | $ | (4,296 | ) | | $ | 0 | | | $ | (4,296 | ) | | $ | 5,451 | | | $ | 1,155 | |
| | | 0 | | | | (92,085 | ) | | | 0 | | | | (92,085 | ) | | | 117,621 | | | | 25,536 | |
| | | 0 | | | | (80,852 | ) | | | 0 | | | | (80,852 | ) | | | 106,073 | | | | 25,221 | |
| | | 0 | | | | (16,752 | ) | | | 0 | | | | (16,752 | ) | | | 20,388 | | | | 3,636 | |
| | | 0 | | | | (23,891 | ) | | | 0 | | | | (23,891 | ) | | | 31,783 | | | | 7,892 | |
| | | 0 | | | | (8,356 | ) | | | 0 | | | | (8,356 | ) | | | 10,734 | | | | 2,378 | |
| | | 0 | | | | (5,717 | ) | | | 0 | | | | (5,717 | ) | | | 5,528 | | | | (189 | ) |
| | | 0 | | | | (22,329 | ) | | | 0 | | | | (22,329 | ) | | | 24,362 | | | | 2,033 | |
| | | 0 | | | | (24,743 | ) | | | 0 | | | | (24,743 | ) | | | 33,013 | | | | 8,270 | |
| | | 0 | | | | (36,143 | ) | | | 0 | | | | (36,143 | ) | | | 51,983 | | | | 15,840 | |
| | | 0 | | | | (66,258 | ) | | | 0 | | | | (66,258 | ) | | | 90,561 | | | | 24,303 | |
| | | 0 | | | | (4,092 | ) | | | 0 | | | | (4,092 | ) | | | 6,777 | | | | 2,685 | |
| | | 0 | | | | (1,930 | ) | | | 0 | | | | (1,930 | ) | | | 2,664 | | | | 734 | |
| | | 0 | | | | (57,375 | ) | | | 0 | | | | (57,375 | ) | | | 69,507 | | | | 12,132 | |
| | | 0 | | | | (46,812 | ) | | | 0 | | | | (46,812 | ) | | | 63,327 | | | | 16,515 | |
| | | | | | | | | | | | | | | | | | | | | | | | |
Total Borrowings and Other Financing Transactions | | | | | | | | | | | | | | | | | | | | | | | | |
| | | | | | | | | | | | | | | | | | | | | | | | |
CERTAIN TRANSFERS ACCOUNTED FOR AS SECURED BORROWINGS
Remaining Contractual Maturity of the Agreements
| | | | | | | | | | | | | | | | | | | | |
| | | | | | | | | | | | | | | | |
Reverse Repurchase Agreements | |
| | $ | 0 | | | $ | (39,868 | ) | | $ | (3,278 | ) | | $ | (73,427 | ) | | $ | (116,573 | ) |
Non-Agency Mortgage-Backed Securities | | | 0 | | | | (60,301 | ) | | | (37,810 | ) | | | (146,159 | ) | | | (244,270 | ) |
| | | 0 | | | | (1,063 | ) | | | (15,332 | ) | | | (110,698 | ) | | | (127,093 | ) |
| | | | | | | | | | | | | | | | | | | | |
| | | | | | | | | | | | | | | | | | | | |
| | | | | | | | | | | | | | | | | | | | |
Payable for reverse repurchase agreements (4) | | | | | |
| | | | | |
| Securities with an aggregate market value of $642,928 and cash of $5,559 have been pledged as collateral under the terms of the above master agreements as of December 31, 2023. |
| The average amount of borrowings outstanding during the period ended December 31, 2023 was $(480,746) at a weighted average interest rate of 6.275%. Average borrowings may include reverse repurchase agreements and sale-buyback transactions, if held during the period. |
| Open maturity reverse repurchase agreement. |
| Net Exposure represents the net receivable/(payable) that would be due from/to the counterparty in the event of default. Exposure from borrowings and other financing transactions can only be netted across transactions governed under the same master agreement with the same legal entity. See Note 8, Master Netting Arrangements, in the Notes to Financial Statements for more information. |
| Unsettled reverse repurchase agreements liability of $(3,695) is outstanding at period end. |
(j) FINANCIAL DERIVATIVE INSTRUMENTS: EXCHANGE-TRADED OR CENTRALLY CLEARED
| | | | | | | | | | | | | | | | | | | | | | | | |
| | | | | | | | | | | Unrealized
Appreciation/
(Depreciation) | | | | |
| | | | | | |
3-Month SOFR Active Contract December Futures | | | 03/2024 | | | | 32 | | | $ | (7,571 | ) | | $ | 214 | | | $ | 0 | | | $ | 0 | |
3-Month SOFR Active Contract December Futures | | | 03/2025 | | | | 17 | | | | (4,091 | ) | | | 63 | | | | 0 | | | | (1 | ) |
3-Month SOFR Active Contract December Futures | | | 03/2026 | | | | 18 | | | | (4,362 | ) | | | 41 | | | | 0 | | | | (2 | ) |
3-Month SOFR Active Contract June Futures | | | 09/2024 | | | | 20 | | | | (4,774 | ) | | | 105 | | | | 0 | | | | (1 | ) |
3-Month SOFR Active Contract June Futures | | | 09/2025 | | | | 17 | | | | (4,114 | ) | | | 44 | | | | 0 | | | | (2 | ) |
3-Month SOFR Active Contract March Futures | | | 06/2024 | | | | 28 | | | | (6,651 | ) | | | 171 | | | | 0 | | | | (1 | ) |
3-Month SOFR Active Contract March Futures | | | 06/2025 | | | | 15 | | | | (3,622 | ) | | | 46 | | | | 0 | | | | (2 | ) |
3-Month SOFR Active Contract March Futures | | | 06/2026 | | | | 16 | | | | (3,877 | ) | | | 36 | | | | 0 | | | | (1 | ) |
3-Month SOFR Active Contract September Futures | | | 12/2024 | | | | 19 | | | | (4,555 | ) | | | 85 | | | | 0 | | | | (1 | ) |
3-Month SOFR Active Contract September Futures | | | 12/2025 | | | | 13 | | | | (3,149 | ) | | | 31 | | | | 0 | | | | (1 | ) |
| | | | | | | | | | | | | | | | | | | | | | | | |
| | | | | | | | | | | | | |
| | | | | | | | | | | | | |
| | | | | | | | | | | | |
| See Accompanying Notes | | | | | | | | | | DECEMBER 31, 2023 | | | |
| | | | | | | | |
Consolidated Schedule of Investments | | | | | | | | |
| | | | | | | | | | | | | | | | | | | | | | | | | | | | | | | | | | | | | | | | |
| | | | | | | | | | | | | | | | | | Unrealized
Appreciation/
(Depreciation) | | | | | | | |
| | | | | | |
| | | | | 5.000 | % | | Annual | | | 03/20/2029 | | | | GBP | | | | 1,700 | | | $ | 167 | | | $ | 1 | | | $ | 168 | | | $ | 0 | | | $ | (5 | ) |
| | | | | 2.450 | | | Annual | | | 12/20/2024 | | | | $ | | | | 32,400 | | | | (2 | ) | | | 758 | | | | 756 | | | | 9 | | | | 0 | |
| | | | | 4.500 | | | Annual | | | 12/21/2024 | | | | | | | | 146,000 | | | | (740 | ) | | | 661 | | | | (79 | ) | | | 13 | | | | 0 | |
| | | | | 2.350 | | | Annual | | | 01/17/2025 | | | | | | | | 16,200 | | | | 2 | | | | 366 | | | | 368 | | | | 0 | | | | (2 | ) |
| | | | | 2.300 | | | Annual | | | 01/17/2026 | | | | | | | | 2,600 | | | | 1 | | | | 84 | | | | 85 | | | | 0 | | | | (1 | ) |
| | | | | 4.500 | | | Annual | | | 12/21/2027 | | | | | | | | 207,700 | | | | (177 | ) | | | 7,463 | | | | 7,286 | | | | 121 | | | | 0 | |
| | | | | 3.750 | | | Annual | | | 12/20/2028 | | | | | | | | 76,900 | | | | 639 | | | | 91 | | | | 730 | | | | 28 | | | | 0 | |
| | | | | 3.750 | | | Annual | | | 06/20/2029 | | | | | | | | 1,400 | | | | (27 | ) | | | 0 | | | | (27 | ) | | | 0 | | | | (1 | ) |
| | | | | 1.750 | | | Annual | | | 06/15/2052 | | | | | | | | 25,600 | | | | 6,320 | | | | 1,470 | | | | 7,790 | | | | 97 | | | | 0 | |
| | | | | 1.750 | | | Annual | | | 12/21/2052 | | | | | | | | 17,400 | | | | 4,191 | | | | 801 | | | | 4,992 | | | | 66 | | | | 0 | |
| | | | | 3.400 | | | Annual | | | 12/21/2052 | | | | | | | | 22,900 | | | | 40 | | | | (328 | ) | | | (288 | ) | | | 97 | | | | 0 | |
| | | | | 0.500 | | | Annual | | | 09/21/2052 | | | | EUR | | | | 7,800 | | | | 676 | | | | 2,689 | | | | 3,365 | | | | 159 | | | | 0 | |
| | | | | 0.830 | | | Annual | | | 12/09/2052 | | | | | | | | 22,900 | | | | 313 | | | | 1,155 | | | | 1,468 | | | | 116 | | | | 0 | |
| | | | | | | | | | | | | | | | | | | | | | | | | |
| | | | | | | | | | | | | | | | | | | | | | | | | | | | | |
| | | | | | | | | | | | | | | | | | | | | | | | | |
FINANCIAL DERIVATIVE INSTRUMENTS: EXCHANGE-TRADED OR CENTRALLY CLEARED SUMMARY
The following is a summary of the market value and variation margin of Exchange-Traded or Centrally Cleared Financial Derivative Instruments as of December 31, 2023:
| | | | | | | | | | | | | | | | | | | | | | | | | | | | | | | | | | | | |
| | | Financial Derivative Assets | | | | | | Financial Derivative Liabilities | |
| | | | | | | | | | | | | | | | | | Variation Margin
Liability | | | | |
| | | | | | | | | | | | | | | | | | | | | | |
Total Exchange-Traded or Centrally Cleared | | | | | | | | | | | | | | | | | | | | | | | | | | | | | | | | | | | | |
| | | | | | | | | | | | | | | | | | | | | | | | | | | | | | | | | | | | |
Cash of $7,792 has been pledged as collateral for exchange-traded and centrally cleared financial derivative instruments as of December 31, 2023.
| This instrument has a forward starting effective date. See Note 2, Securities Transactions and Investment Income, in the Notes to Financial Statements for further information. |
(k) FINANCIAL DERIVATIVE INSTRUMENTS: OVER THE COUNTER
FORWARD FOREIGN CURRENCY CONTRACTS:
| | | | | | | | | | | | | | | | | | | | | | | | |
| | | | | | | | | | | Unrealized Appreciation/
(Depreciation) | |
| | | | | | |
| | | 01/2024 | | | GBP | | | 998 | | | $ | | | 1,266 | | | $ | 0 | | | $ | (6 | ) |
| | | | | | | |
| | | 01/2024 | | | EUR | | | 740 | | | | | | 807 | | | | 0 | | | | (10 | ) |
| | | 01/2024 | | | GBP | | | 2,845 | | | | | | 3,608 | | | | 0 | | | | (18 | ) |
| | | 01/2024 | | | $ | | | 6,620 | | | EUR | | | 6,109 | | | | 128 | | | | (2 | ) |
| | | | | | | |
| | | 01/2024 | | | GBP | | | 141 | | | $ | | | 179 | | | | 0 | | | | (1 | ) |
| | | | | | | |
| | | 01/2024 | | | EUR | | | 502 | | | | | | 541 | | | | 0 | | | | (13 | ) |
| | | | | | | |
| | | 01/2024 | | | CAD | | | 4,636 | | | | | | 3,426 | | | | 0 | | | | (74 | ) |
| | | | | | | |
| | | 01/2024 | | | EUR | | | 99,946 | | | | | | 109,937 | | | | 0 | | | | (424 | ) |
| | | 01/2024 | | | GBP | | | 15,456 | | | | | | 19,560 | | | | 0 | | | | (142 | ) |
| | | | | | | | | | | | | | | | | | | | | | | | |
Total Forward Foreign Currency Contracts | | | | | | | | | |
| | | | | | | | | |
CREDIT DEFAULT SWAPS ON CORPORATE ISSUES - SELL PROTECTION
(1)
| | | | | | | | | | | | | | | | | | | | | | | | | | | | | | | | | | | | | | | | |
| | | | | | | | | | | | Implied Credit Spread at December 31, 2023 (2) | | | | | | | | | Unrealized
Appreciation/
(Depreciation) | | | Swap Agreements, at Value (4) | |
| | | | | | |
| BPS | | | | | 1.000% | | | Quarterly | | | 12/20/2028 | | | | 5.188% | | | $ | | | | | 900 | | | $ | (174 | ) | | $ | 24 | | | $ | 0 | | | $ | (150 | ) |
| | | | | | | | | | | | | | | | | | | | | | | | | | | | | | | | | | | | | | | | |
| | | | | | | | |
| | | | | | December 31, 2023 | | (Unaudited) |
TOTAL RETURN SWAPS ON LOAN PARTICIPATIONS AND ASSIGNMENTS
| | | | | | | | | | | | | | | | | | | | | | | | | | | | | | | | | | |
| | | | | | | | | | | | | | | | | | | Unrealized
Appreciation/
(Depreciation) | | | | |
| | | | | | |
| | | | | | | | | | Quarterly | | | 01/31/2024 | | | $ | | 204 | | $ | 0 | | | $ | 57 | | | $ | 57 | | | $ | 0 | |
| | | | | | | | | | Quarterly | | | 01/31/2024 | | | | | 280 | | | 0 | | | | 246 | | | | 246 | | | | 0 | |
| | | | | | | | | | Quarterly | | | 01/29/2024 | | | | | 724 | | | 0 | | | | 116 | | | | 116 | | | | 0 | |
| | | | | | | | | | Quarterly | | | 02/15/2024 | | | | | 339 | | | 0 | | | | 473 | | | | 473 | | | | 0 | |
| | | | | | | | | | | | | | | | | | | | | | | | | | | | | | | | | | |
| | $ | 0 | | | $ | 892 | | | $ | 892 | | | $ | 0 | |
| | | | | | | | | | | | | | | | | | | | | | | | | | | | | | | | | | |
| | | | | | | | | | | | | | | | |
| | | | | | | | | | | | | | | | |
FINANCIAL DERIVATIVE INSTRUMENTS: OVER THE COUNTER SUMMARY
The following is a summary by counterparty of the market value of OTC financial derivative instruments and collateral pledged/(received) as of December 31, 2023:
| | | | | | | | | | | | | | | | | | | | | | | | | | | | | | | | | | | | | | | | | | | | | | | | |
| | | Financial Derivative Assets | | | | | | Financial Derivative Liabilities | | | | | | | | | | |
| | Forward
Foreign
Currency
Contracts | | | | | | | | | | | | | | | Forward
Foreign
Currency
Contracts | | | | | | | | | | | | Net Market
Value of OTC
Derivatives | | | Collateral
Pledged/
(Received) | | | | |
| | $ | 0 | | | $ | 0 | | | $ | 0 | | | $ | 0 | | | | | | | $ | (6 | ) | | $ | 0 | | | $ | 0 | | | $ | (6 | ) | | $ | (6 | ) | | $ | 0 | | | $ | (6 | ) |
| | | 128 | | | | 0 | | | | 892 | | | | 1,020 | | | | | | | | (30 | ) | | | 0 | | | | (150 | ) | | | (180 | ) | | | 840 | | | | (470 | ) | | | 370 | |
| | | 0 | | | | 0 | | | | 0 | | | | 0 | | | | | | | | (1 | ) | | | 0 | | | | 0 | | | | (1 | ) | | | (1 | ) | | | 0 | | | | (1 | ) |
| | | 0 | | | | 0 | | | | 0 | | | | 0 | | | | | | | | (13 | ) | | | 0 | | | | 0 | | | | (13 | ) | | | (13 | ) | | | 0 | | | | (13 | ) |
| | | 0 | | | | 0 | | | | 0 | | | | 0 | | | | | | | | (74 | ) | | | 0 | | | | 0 | | | | (74 | ) | | | (74 | ) | | | 0 | | | | (74 | ) |
| | | 0 | | | | 0 | | | | 0 | | | | 0 | | | | | | | | (566 | ) | | | 0 | | | | 0 | | | | (566 | ) | | | (566 | ) | | | 1,322 | | | | 756 | |
| | | | | | | | | | | | | | | | | | | | | | | | | | | | | | | | | | | | | | | | | | | | | | | | |
| | | | | | | | | | | | | | | | | | | | | | | | | | | | | | | | | | | | | | | | | | | | | | | | |
| | | | | | | | | | | | | | | | | | | | | | | | | | | | | | | | | | | | | | | | | | | | | | | | |
| Securities with an aggregate market value of $1,322 have been pledged as collateral for financial derivative instruments as governed by International Swaps and Derivatives Association, Inc. master agreements as of December 31, 2023. |
| If the Fund is a seller of protection and a credit event occurs, as defined under the terms of that particular swap agreement, the Fund will either (i) pay to the buyer of protection an amount equal to the notional amount of the swap and take delivery of the referenced obligation or underlying securities comprising the referenced index or (ii) pay a net settlement amount in the form of cash, securities or other deliverable obligations equal to the notional amount of the swap less the recovery value of the referenced obligation or underlying securities comprising the referenced index. |
| Implied credit spreads, represented in absolute terms, utilized in determining the market value of credit default swap agreements on corporate issues as of period end serve as indicators of the current status of the payment/performance risk and represent the likelihood or risk of default for the credit derivative. The implied credit spread of a particular referenced entity reflects the cost of buying/selling protection and may include upfront payments required to be made to enter into the agreement. Wider credit spreads represent a deterioration of the referenced entity’s credit soundness and a greater likelihood or risk of default or other credit event occurring as defined under the terms of the agreement. |
| The maximum potential amount the Fund could be required to pay as a seller of credit protection or receive as a buyer of credit protection if a credit event occurs as defined under the terms of that particular swap agreement. |
| The prices and resulting values for credit default swap agreements serve as indicators of the current status of the payment/performance risk and represent the likelihood of an expected liability (or profit) for the credit derivative should the notional amount of the swap agreement be closed/sold as of the period end. Increasing market values, in absolute terms when compared to the notional amount of the swap, represent a deterioration of the underlying referenced instrument’s credit soundness and a greater likelihood or risk of default or other credit event occurring as defined under the terms of the agreement. |
| Net Exposure represents the net receivable/(payable) that would be due from/to the counterparty in the event of default. Exposure from OTC derivatives can only be netted across transactions governed under the same master agreement with the same legal entity. Note 8, Master Netting Arrangements, in the Notes to Financial Statements for more information. |
FAIR VALUE OF FINANCIAL DERIVATIVE INSTRUMENTS
The following is a summary of the fair valuation of the Fund’s derivative instruments categorized by risk exposure. See Note 7, Principal and Other Risks, in the Notes to Financial Statements on risks of the Fund.
Fair Values of Financial Derivative Instruments on the Consolidated Statements of Assets and Liabilities as of December 31, 2023:
| | | | | | | | | | | | | | | | | | | | | | | | |
| | | Derivatives not accounted for as hedging instruments | |
| | | | | | | | | | | | | | | | | | | |
Financial Derivative Instruments - Assets | |
Exchange-traded or centrally cleared | |
| | $ | 0 | | | $ | 0 | | | $ | 0 | | | $ | 0 | | | $ | 706 | | | $ | 706 | |
| | | | | | | | | | | | | | | | | | | | | | | | |
| |
Forward Foreign Currency Contracts | | $ | 0 | | | $ | 0 | | | $ | 0 | | | $ | 128 | | | $ | 0 | | | $ | 128 | |
| | | 0 | | | | 0 | | | | 0 | | | | 0 | | | | 892 | | | | 892 | |
| | | | | | | | | | | | | | | | | | | | | | | | |
| | $ | 0 | | | $ | 0 | | | $ | 0 | | | $ | 128 | | | $ | 892 | | | $ | 1,020 | |
| | | | | | | | | | | | | | | | | | | | | | | | |
| | $ | 0 | | | $ | 0 | | | $ | 0 | | | $ | 128 | | | $ | 1,598 | | | $ | 1,726 | |
| | | | | | | | | | | | | | | | | | | | | | | | |
| | | | | | | | | | | | |
| See Accompanying Notes | | | | | | | | | | DECEMBER 31, 2023 | | | |
| | | | | | | | |
Consolidated Schedule of Investments | | | | | | | | |
| | | | | | | | | | | | | | | | | | | | | | | | |
| | | Derivatives not accounted for as hedging instruments | |
| | | | | | | | | | | | | | | | | | | |
Financial Derivative Instruments - Liabilities | |
Exchange-traded or centrally cleared | |
| | $ | 0 | | | $ | 0 | | | $ | 0 | | | $ | 0 | | | $ | 12 | | | $ | 12 | |
| | | 0 | | | | 0 | | | | 0 | | | | 0 | | | | 9 | | | | 9 | |
| | | | | | | | | | | | | | | | | | | | | | | | |
| | $ | 0 | | | $ | 0 | | | $ | 0 | | | $ | 0 | | | $ | 21 | | | $ | 21 | |
| | | | | | | | | | | | | | | | | | | | | | | | |
| |
Forward Foreign Currency Contracts | | $ | 0 | | | $ | 0 | | | $ | 0 | | | $ | 690 | | | $ | 0 | | | $ | 690 | |
| | | 0 | | | | 150 | | | | 0 | | | | 0 | | | | 0 | | | | 150 | |
| | | | | | | | | | | | | | | | | | | | | | | | |
| | $ | 0 | | | $ | 150 | | | $ | 0 | | | $ | 690 | | | $ | 0 | | | $ | 840 | |
| | | | | | | | | | | | | | | | | | | | | | | | |
| | $ | 0 | | | $ | 150 | | | $ | 0 | | | $ | 690 | | | $ | 21 | | | $ | 861 | |
| | | | | | | | | | | | | | | | | | | | | | | | |
The effect of Financial Derivative Instruments on the Consolidated Statements of Operations for the period ended December 31, 2023:
| | | | | | | | | | | | | | | | | | | | | | | | |
| | | Derivatives not accounted for as hedging instruments | |
| | | | | | | | | | | | | | | | | | | |
Net Realized Gain (Loss) on Financial Derivative Instruments | |
Exchange-traded or centrally cleared | |
| | $ | 0 | | | $ | 0 | | | $ | 0 | | | $ | 0 | | | $ | (4,863 | ) | | $ | (4,863 | ) |
| | | | | | | | | | | | | | | | | | | | | | | | |
| |
Forward Foreign Currency Contracts | | $ | 0 | | | $ | 0 | | | $ | 0 | | | $ | 1,491 | | | $ | 0 | | | $ | 1,491 | |
| | | 0 | | | | 2,003 | | | | 0 | | | | 0 | | | | (174 | ) | | | 1,829 | |
| | | | | | | | | | | | | | | | | | | | | | | | |
| | $ | 0 | | | $ | 2,003 | | | $ | 0 | | | $ | 1,491 | | | $ | (174 | ) | | $ | 3,320 | |
| | | | | | | | | | | | | | | | | | | | | | | | |
| | $ | 0 | | | $ | 2,003 | | | $ | 0 | | | $ | 1,491 | | | $ | (5,037 | ) | | $ | (1,543 | ) |
| | | | | | | | | | | | | | | | | | | | | | | | |
|
Net Change in Unrealized Appreciation (Depreciation) on Financial Derivative Instruments | |
Exchange-traded or centrally cleared | |
| | $ | 0 | | | $ | 0 | | | $ | 0 | | | $ | 0 | | | $ | (125 | ) | | $ | (125 | ) |
| | | 0 | | | | 0 | | | | 0 | | | | 0 | | | | 10,191 | | | | 10,191 | |
| | | | | | | | | | | | | | | | | | | | | | | | |
| | $ | 0 | | | $ | 0 | | | $ | 0 | | | $ | 0 | | | $ | 10,066 | | | $ | 10,066 | |
| | | | | | | | | | | | | | | | | | | | | | | | |
| |
Forward Foreign Currency Contracts | | $ | 0 | | | $ | 0 | | | $ | 0 | | | $ | (1,806 | ) | | $ | 0 | | | $ | (1,806 | ) |
| | | 0 | | | | 32 | | | | 0 | | | | 0 | | | | 893 | | | | 925 | |
| | | | | | | | | | | | | | | | | | | | | | | | |
| | $ | 0 | | | $ | 32 | | | $ | 0 | | | $ | (1,806 | ) | | $ | 893 | | | $ | (881 | ) |
| | | | | | | | | | | | | | | | | | | | | | | | |
| | $ | 0 | | | $ | 32 | | | $ | 0 | | | $ | (1,806 | ) | | $ | 10,959 | | | $ | 9,185 | |
| | | | | | | | | | | | | | | | | | | | | | | | |
The following is a summary of the fair valuations according to the inputs used as of December 31, 2023 in valuing the Fund’s assets and
liabilities:
| | | | | | | | | | | | | | | | |
| | | | | | | | | | | | |
Investments in Securities, at Value | |
Loan Participations and Assignments | | $ | 0 | | | $ | 132,461 | | | $ | 43,892 | | | $ | 176,353 | |
| |
| | | 0 | | | | 71,127 | | | | 0 | | | | 71,127 | |
| | | 0 | | | | 100,593 | | | | 3,221 | | | | 103,814 | |
| | | 0 | | | | 10,904 | | | | 0 | | | | 10,904 | |
| |
| | | 0 | | | | 18,803 | | | | 0 | | | | 18,803 | |
Non-Agency Mortgage-Backed Securities | | | 0 | | | | 370,511 | | | | 0 | | | | 370,511 | |
| | | 0 | | | | 196,750 | | | | 18,296 | | | | 215,046 | |
| | | 0 | | | | 6,044 | | | | 0 | | | | 6,044 | |
| |
| | | 3,610 | | | | 0 | | | | 85 | | | | 3,695 | |
| | | 0 | | | | 0 | | | | 36,864 | | | | 36,864 | |
| | | 0 | | | | 0 | | | | 8,785 | | | | 8,785 | |
| | | 205 | | | | 0 | | | | 0 | | | | 205 | |
| | | 0 | | | | 0 | | | | 88 | | | | 88 | |
| | | | | | | | | | | | | | | | |
| | | | | | | | | | | | |
| |
| | $ | 0 | | | $ | 814 | | | $ | 0 | | | $ | 814 | |
Real Estate Investment Trusts | |
| | | 3,355 | | | | 0 | | | | 0 | | | | 3,355 | |
| |
| | | 0 | | | | 10,277 | | | | 0 | | | | 10,277 | |
| | | | | | | | | | | | | | | | |
| | $ | 7,170 | | | $ | 918,284 | | | $ | 111,231 | | | $ | 1,036,685 | |
| | | | | | | | | | | | | | | | |
|
Investments in Affiliates, at Value | |
| |
Central Funds Used for Cash Management Purposes | | $ | 91,888 | | | $ | 0 | | | $ | 0 | | | $ | 91,888 | |
| | | | | | | | | | | | | | | | |
| | | | |
| | $ | 99,058 | | | $ | 918,284 | | | $ | 111,231 | | | $ | 1,128,573 | |
| | | | | | | | | | | | | | | | |
| | | | | | | | |
| | | | | | December 31, 2023 | | (Unaudited) |
| | | | | | | | | | | | | | | | |
| | | | | | | | | | | | |
Financial Derivative Instruments - Assets | |
Exchange-traded or centrally cleared | | $ | 0 | | | $ | 706 | | | $ | 0 | | | $ | 706 | |
| | | 0 | | | | 1,020 | | | | 0 | | | | 1,020 | |
| | | | | | | | | | | | | | | | |
| | $ | 0 | | | $ | 1,726 | | | $ | 0 | | | $ | 1,726 | |
| | | | | | | | | | | | | | | | |
|
Financial Derivative Instruments - Liabilities | |
Exchange-traded or centrally cleared | | | 0 | | | | (21 | ) | | | 0 | | | | (21 | ) |
| | | | | | | | | | | | | | | | |
| | | | | | | | | | | | |
| | $ | 0 | | | $ | (840 | ) | | $ | 0 | | | $ | (840 | ) |
| | | | | | | | | | | | | | | | |
| | $ | 0 | | | $ | (861 | ) | | $ | 0 | | | $ | (861 | ) |
| | | | | | | | | | | | | | | | |
| | | | |
Total Financial Derivative Instruments | | $ | 0 | | | $ | 865 | | | $ | 0 | | | $ | 865 | |
| | | | | | | | | | | | | | | | |
| | | | |
| | $ | 99,058 | | | $ | 919,149 | | | $ | 111,231 | | | $ | 1,129,438 | |
| | | | | | | | | | | | | | | | |
The following is a reconciliation of the fair valuations using significant unobservable inputs (Level 3) for the Fund during the period ended December 31, 2023:
| | | | | | | | | | | | | | | | | | | | | | | | | | | | | | | | | | | | | | | | |
| | Beginning
Balance
at 06/30/2023 | | | | | | | | | Accrued
Discounts/
(Premiums) | | | | | | Net Change in Unrealized Appreciation/ (Depreciation) (1) | | | | | | | | | Ending
Balance
at 12/31/2023 | | | Net Change in Unrealized Appreciation/ (Depreciation) on Investments Held at 12/31/2023 (1) | |
Investments in Securities, at Value | |
Loan Participations and Assignments | | $ | 95,228 | | | $ | 32,165 | | | $ | (63,869 | ) | | $ | 1,624 | | | $ | (10,313 | ) | | $ | 5,513 | | | $ | 9,727 | | | $ | (26,183 | ) | | $ | 43,892 | | | $ | 983 | |
| |
| | | 0 | | | | 3,221 | | | | 0 | | | | 0 | | | | 0 | | | | 0 | | | | 0 | | | | 0 | | | | 3,221 | | | | 0 | |
| | | 22,982 | | | | 0 | | | | 0 | | | | 0 | | | | 0 | | | | (4,686 | ) | | | 0 | | | | 0 | | | | 18,296 | | | | (4,686 | ) |
| |
| | | 84 | | | | 0 | | | | 0 | | | | 0 | | | | 0 | | | | 1 | | | | 0 | | | | 0 | | | | 85 | | | | 1 | |
| | | 0 | | | | 30,032 | | | | 0 | | | | 0 | | | | 0 | | | | 6,832 | | | | 0 | | | | 0 | | | | 36,864 | | | | 6,832 | |
| | | 8,692 | | | | 590 | | | | 0 | | | | 0 | | | | 0 | | | | (497 | ) | | | 0 | | | | 0 | | | | 8,785 | | | | (497 | ) |
| | | 0 | | | | 120 | | | | 0 | | | | 0 | | | | 0 | | | | (32 | ) | | | 0 | | | | 0 | | | | 88 | | | | (32 | ) |
| | | | | | | | | | | | | | | | | | | | | | | | | | | | | | | | | | | | | | | | |
| | | | | | | | | | |
| | $ | 126,986 | | | $ | 66,128 | | | $ | (63,869 | ) | | $ | 1,624 | | | $ | (10,313 | ) | | $ | 7,131 | | | $ | 9,727 | | | $ | (26,183 | ) | | $ | 111,231 | | | $ | 2,601 | |
| | | | | | | | | | | | | | | | | | | | | | | | | | | | | | | | | | | | | | | | |
The following is a summary of significant unobservable inputs used in the fair valuations of assets and liabilities categorized within Level 3 of the fair value hierarchy:
| | | | | | | | | | | | | | | | | | |
| | Ending
Balance
at 12/31/2023 | | | | | | | | | (% Unless Noted Otherwise) | |
| | | | | | |
Investments in Securities, at Value | |
Loan Participations and Assignments | | $ | 12,758 | | | | | | | X | | | 14.500 | | | | — | |
| | | 31,134 | | | | | | | | | | | | | | 10.916 | |
| | | | | | | | | | | | | | | | | | |
| | | 3,221 | | | | | | | | | | 99.000 | | | | — | |
| | | 18,296 | | | | | | | | | | | | | | 15.647 | |
| | | | |
| | | 85 | | | | | | | | | | 60.720 | | | | — | |
| | | 36,864 | | | | | | | X | | | 14.500 | | | | — | |
| | | 8,785 | | | | | | | | | | 17.280 | | | | — | |
| | | 88 | | | Discounted Cash Flow/Comparable Companies | | Discount Rate/Revenue Multiple | | %/X | | | 17.250/0.550 | | | | — | |
| | | | | | | | | | | | | | | | | | |
| | $ | 111,231 | | | | | | | | | | | | | | | |
| | | | | | | | | | | | | | | | | | |
| Any difference between Net Change in Unrealized Appreciation/(Depreciation) and Net Change in Unrealized Appreciation/(Depreciation) on Investments Held at December 31, 2023 may be due to an investment no longer held or categorized as Level 3 at period end. | |
| | | | | | | | | | | | |
| See Accompanying Notes | | | | | | | | | | DECEMBER 31, 2023 | | | |
| | | | | | | | |
Consolidated Schedule of Investments | | PIMCO Dynamic Income Fund | | | | | | |
(Amounts in thousands*, except number of shares, contracts, units and ounces, if any)
| | | | | | | | | | | | |
| | | | | | | | | | | |
INVESTMENTS IN SECURITIES 146.2% | |
| |
LOAN PARTICIPATIONS AND ASSIGNMENTS 29.1% | |
|
| |
| | $ | | | 15,953 | | | $ | | | 15,953 | |
| | | | | 107,366 | | | | | | 107,366 | |
|
| |
| | | | | 2,808 | | | | | | 2,749 | |
|
| |
TBD% (EUR003M + 3.500%) due 06/29/2026 «~ | | EUR | | | 8,804 | | | | | | 9,511 | |
TBD% (SONIA03M + 3.500%) due 06/29/2026 «~ | | GBP | | | 2,500 | | | | | | 3,119 | |
|
| |
TBD% (EUR001M + 3.750%) due 06/30/2025 ~ | | EUR | | | 2,427 | | | | | | 2,688 | |
|
CIRCOR International, Inc. | |
| | $ | | | 9,234 | | | | | | 9,222 | |
| | | | | 1,066 | | | | | | 1,063 | |
|
| |
1.138% (EUR012M + 3.250%) due 03/28/2025 ~ | | EUR | | | 7,874 | | | | | | 7,536 | |
4.969% (EUR012M + 4.000%) due 03/28/2026 ~ | | | | | 64,126 | | | | | | 61,377 | |
|
| |
| | $ | | | 23,500 | | | | | | 23,630 | |
|
| |
TBD% - 15.420% due 05/25/2026 | | | 82,816 | | | | | | 62,733 | |
|
Encina Private Credit LLC | |
TBD% - 9.241% due 11/30/2025 «µ | | | 3,506 | | | | | | 3,432 | |
|
| |
9.448% (EUR003M + 5.500%) due 03/29/2030 ~ | | EUR | | | 16,200 | | | | | | 16,428 | |
| | $ | | | 25,111 | | | | | | 23,175 | |
|
Espai Barca Fondo De Titulizacion | |
| | EUR | | | 24,586 | | | | | | 28,296 | |
|
| |
| | $ | | | 42,002 | | | | | | 42,212 | |
|
Gateway Casinos & Entertainment Ltd. | |
| | | | | 48,457 | | | | | | 48,495 | |
13.588% (CDOR03M + 8.000%) due 10/18/2027 ~ | | CAD | | | 19,256 | | | | | | 14,544 | |
|
| |
| | $ | | | 3,332 | | | | | | 2,988 | |
|
| |
| | | | | 3 | | | | | | 3 | |
|
iHeartCommunications, Inc. | |
| | | | | 3,648 | | | | | | 3,163 | |
| | | | | 12,300 | | | | | | 10,607 | |
|
| |
TBD% - 13.988% due 03/01/2024 « | | | 50,319 | | | | | | 53,390 | |
|
| |
| | | | | 25,445 | | | | | | 24,222 | |
|
| |
| | | | | 385 | | | | | | 268 | |
|
Lealand Finance Co. BV (6.431% Cash and 3.000% PIK) | |
9.431% due 06/30/2025 (c) | | | | | 5,948 | | | | | | 2,488 | |
|
| |
| | | | | 11,910 | | | | | | 11,764 | |
|
| |
| | | | | 34,662 | | | | | | 34,623 | |
|
| |
8.752% (EUR003M + 4.750%) due 11/04/2027 ~ | | EUR | | | 22,200 | | | | | | 23,340 | |
10.042% (SONIA03M + 4.750%) due 11/04/2027 ~ | | GBP | | | 22,219 | | | | | | 27,487 | |
|
| |
11.425% (EUR003M + 7.500%) due 07/26/2027 «~ | | EUR | | | 29,601 | | | | | | 32,678 | |
|
MPH Acquisition Holdings LLC | |
| | $ | | | 9,775 | | | | | | 9,451 | |
|
| |
| | | | | 4,773 | | | | | | 4,471 | |
| | | | | | | | | | | | |
| | | | | | | | | | | |
|
| |
| | $ | | | 1,300 | | | $ | | | 1,059 | |
|
| |
TBD% - 14.000% due 09/07/2024 µ | | | | | 27,898 | | | | | | 27,898 | |
7.362% (LIBOR03M + 1.750%) due 02/26/2035 ~ | | | 3,128 | | | | | | 156 | |
|
| |
9.175% (EUR003M + 5.250%) due 09/30/2028 ~ | | EUR | | | 51,900 | | | | | | 57,367 | |
|
| |
6.738% (EUR003M + 2.750%) due 06/30/2024 «~(j) | | | | | 32,963 | | | | | | 35,200 | |
|
Project Quasar Pledgco SLU | |
7.083% (EUR001M + 3.250%) due 03/15/2026 «~ | | | | | 15,983 | | | | | | 17,096 | |
|
Promotora de Informaciones SA | |
8.942% (EUR003M + 5.000%) due 06/30/2026 «~ | | | | | 15,200 | | | | | | 16,755 | |
9.192% (EUR003M + 5.220%) due 12/31/2026 ~ | | | | | 110,716 | | | | | | 116,572 | |
|
Promotora de Informaciones SA (6.942% Cash and 5.000% PIK) | |
11.942% (EUR003M + 5.305%) due 06/30/2027 ~(c) | | | 11,151 | | | | | | 11,366 | |
|
| |
| | $ | | | 1,466 | | | | | | 1,459 | |
|
| |
10.965% (SONIA03M + 5.500%) due 01/31/2028 «~ | | GBP | | | 16,500 | | | | | | 19,770 | |
|
| |
| | $ | | | 20,303 | | | | | | 16,353 | |
|
Republic of Cote d’lvoire | |
9.055% (EUR006M + 5.000%) due 03/19/2027 «~ | | EUR | | | 700 | | | | | | 746 | |
|
Rising Tide Holdings, Inc. | |
| | $ | | | 158 | | | | | | 152 | |
|
| |
| | | | | 27,587 | | | | | | 26,347 | |
|
Steenbok Lux Finco 1 SARL | |
10.000% (EUR006M + 10.000%) due 06/30/2026 ~ | | EUR | | | 278 | | | | | | 312 | |
|
Steenbok Lux Finco 2 SARL | |
| | | | | 183,296 | | | | | | 73,651 | |
10.000% (EUR006M + 10.000%) due 06/30/2026 ~ | | | 186 | | | | | | 208 | |
|
| |
TBD% - 5.500% due 10/31/2028 « | | $ | | | 25,100 | | | | | | 24,025 | |
|
Surgery Center Holdings, Inc. | |
| | | | | 958 | | | | | | 963 | |
|
| |
| | | | | 112,193 | | | | | | 99,220 | |
|
| |
1.750% (LIBOR06M + 1.750%) due 02/26/2035 ~ | | | | | 41,251 | | | | | | 2,062 | |
| | | | | 38,115 | | | | | | 1,906 | |
|
| |
| | | | | 101,935 | | | | | | 77,726 | |
|
| |
| | | | | 12,859 | | | | | | 10,729 | |
|
Westmoreland Mining Holdings LLC | |
| | | | | 9,275 | | | | | | 6,863 | |
|
| |
| | | | | 46,280 | | | | | | 45,817 | |
| | | | | 14,089 | | | | | | 13,367 | |
| | | | | | | | | | | | |
Total Loan Participations and Assignments (Cost $1,502,759) | | | | |
| | | | |
| |
CORPORATE BONDS & NOTES 29.0% | |
| |
| |
|
Adler Financing SARL (12.500% PIK) | |
12.500% due 06/30/2025 (c)(l) | | EUR | | | 27,533 | | | | | | 32,090 | |
| | | | | | | | | | | | |
| | | | | | | | | | | |
|
| |
3.000% due 04/27/2026 (l) | | EUR | | | 10,700 | | | $ | | | 9,004 | |
|
| |
| | | | | 600 | | | | | | 470 | |
4.625% due 01/14/2026 (l) | | | | | 23,400 | | | | | | 9,138 | |
5.000% due 04/27/2027 (l) | | | | | 14,600 | | | | | | 5,432 | |
5.000% due 01/14/2029 (l) | | | | | 400 | | | | | | 146 | |
5.500% due 11/13/2026 (l) | | | | | 2,700 | | | | | | 1,050 | |
6.000% due 08/05/2025 (l) | | | | | 11,900 | | | | | | 4,854 | |
|
| |
5.100% due 12/31/2099 (i) | | $ | | | 185 | | | | | | 242 | |
|
| |
8.500% due 11/15/2029 (l) | | | | | 5,100 | | | | | | 4,631 | |
|
Banca Monte dei Paschi di Siena SpA | |
1.875% due 01/09/2026 (l) | | EUR | | | 15,432 | | | | | | 16,204 | |
2.625% due 04/28/2025 (l) | | | | | 17,530 | | | | | | 18,892 | |
7.708% due 01/18/2028 •(l) | | | | | 33,989 | | | | | | 37,618 | |
8.000% due 01/22/2030 •(l) | | | | | 8,451 | | | | | | 9,411 | |
8.500% due 09/10/2030 •(l) | | | | | 4,762 | | | | | | 5,299 | |
10.500% due 07/23/2029 (l) | | | | | 23,185 | | | | | | 28,173 | |
|
Banco de Credito del Peru SA | |
| | PEN | | | 6,500 | | | | | | 1,707 | |
|
| |
7.500% due 02/16/2027 (l) | | EUR | | | 10,000 | | | | | | 10,176 | |
|
Brandywine Operating Partnership LP | |
| | $ | | | 100 | | | | | | 101 | |
|
CIFI Holdings Group Co. Ltd. | |
4.375% due 04/12/2027 ^(d) | | | | | 400 | | | | | | 24 | |
4.450% due 08/17/2026 ^(d) | | | | | 300 | | | | | | 21 | |
5.250% due 05/13/2026 ^(d) | | | | | 200 | | | | | | 12 | |
|
| |
22.582% (T-BILL 1MO + 9.250%) due 07/08/2028 ~ | | | | | 7,059 | | | | | | 5,647 | |
|
Corestate Capital Holding SA (8.000% Cash or 9.000% PIK) | |
8.000% due 12/31/2026 ^(c)(d) | | EUR | | | 281 | | | | | | 162 | |
|
Corestate Capital Holding SA (Cash 10.000% or 11.000% PIK) | |
10.000% due 12/31/2026 «(c) | | | | | 400 | | | | | | 442 | |
|
Corsair International Ltd. | |
| | | | | 4,900 | | | | | | 5,409 | |
| | | | | 2,100 | | | | | | 2,318 | |
|
| |
15.172% (T-BILL 1MO + 9.250%) due 04/03/2028 ~ | | $ | | | 600 | | | | | | 599 | |
|
Country Garden Holdings Co. Ltd. | |
2.700% due 07/12/2026 ^(d) | | | | | 200 | | | | | | 15 | |
3.125% due 10/22/2025 ^(d) | | | | | 1,200 | | | | | | 105 | |
3.875% due 10/22/2030 ^(d)(l) | | | | | 800 | | | | | | 63 | |
4.800% due 08/06/2030 ^(d) | | | | | 200 | | | | | | 17 | |
6.150% due 09/17/2025 ^(d) | | | | | 1,000 | | | | | | 84 | |
8.000% due 01/27/2024 ^(d) | | | | | 200 | | | | | | 16 | |
| | | | |
Credit Suisse AG AT1 Claim | | | | | 5,060 | | | | | | 607 | |
|
| |
| | | | | 1,100 | | | | | | 1,105 | |
|
| |
| | | | | 100 | | | | | | 95 | |
|
Fairfax India Holdings Corp. | |
5.000% due 02/26/2028 (l) | | | | | 12,350 | | | | | | 11,177 | |
|
| |
18.912% (T-BILL 3MO + 13.000%) due 03/01/2024 ~ | | | | | 6,084 | | | | | | 6,090 | |
22.662% (T-BILL 3MO + 16.750%) due 03/01/2024 ~ | | | | | 1,737 | | | | | | 1,631 | |
|
Hudson Pacific Properties LP | |
| | | | | 200 | | | | | | 168 | |
| | | | | 200 | | | | | | 177 | |
|
| |
| | | | | 2,800 | | | | | | 3,077 | |
|
Jefferson Capital Holdings LLC | |
6.000% due 08/15/2026 (l) | | | | | 9,948 | | | | | | 9,530 | |
|
Kennedy Wilson Europe Real Estate Ltd. | |
3.250% due 11/12/2025 (l) | | EUR | | | 3,900 | | | | | | 3,913 | |
|
| |
| | $ | | | 100 | | | | | | 76 | |
| | | | | | | | |
| | | | | | December 31, 2023 | | (Unaudited) |
| | | | | | | | | | | | |
| | | | | | | | | | | |
|
Long Walk Reinsurance Ltd. | |
| | $ | | | 5,800 | | | $ | | | 5,802 | |
|
| |
| | | | | 824 | | | | | | 824 | |
|
Preferred Term Securities Ltd. | |
6.026% (US0003M + 0.380%) due 09/23/2035 ~ | | | | | 34 | | | | | | 34 | |
|
| |
17.092% (T-BILL 3MO + 11.750%) due 04/09/2029 ~ | | | | | 11,610 | | | | | | 9,145 | |
|
| |
| | | | | 200 | | | | | | 59 | |
| | | | | 200 | | | | | | 112 | |
|
Sunac China Holdings Ltd. (5.000% Cash or 6.000% PIK) | |
5.000% due 09/30/2026 (c) | | | | | 22 | | | | | | 2 | |
|
Sunac China Holdings Ltd. (5.250% Cash or 6.250% PIK) | |
5.250% due 09/30/2027 (c) | | | | | 22 | | | | | | 2 | |
|
Sunac China Holdings Ltd. (5.500% Cash or 6.500% PIK) | |
5.500% due 09/30/2027 (c) | | | | | 44 | | | | | | 3 | |
|
Sunac China Holdings Ltd. (5.750% Cash or 6.750% PIK) | |
5.750% due 09/30/2028 (c) | | | | | 65 | | | | | | 3 | |
|
Sunac China Holdings Ltd. (6.000% Cash or 7.000% PIK) | |
6.000% due 09/30/2029 (c) | | | | | 65 | | | | | | 4 | |
|
Sunac China Holdings Ltd. (6.250% Cash or 7.250% PIK) | |
6.250% due 09/30/2030 (c) | | | | | 31 | | | | | | 1 | |
|
| |
1.800% due 02/02/2031 ^(d) | | | | | 9,346 | | | | | | 6,206 | |
2.100% due 05/15/2028 ^(d) | | | | | 1,200 | | | | | | 790 | |
3.125% due 06/05/2030 ^(d) | | | | | 1,600 | | | | | | 1,052 | |
3.500% due 01/29/2025 ^(d) | | | | | 700 | | | | | | 461 | |
4.345% due 04/29/2028 ^(d) | | | | | 3,916 | | | | | | 2,597 | |
4.570% due 04/29/2033 ^(d) | | | | | 12,400 | | | | | | 8,199 | |
|
Toll Road Investors Partnership LP | |
0.000% due 02/15/2043 (g)(l) | | | | | 31,012 | | | | | | 8,428 | |
|
| |
6.000% due 01/15/2030 (l) | | | | | 57,451 | | | | | | 40,209 | |
6.500% due 02/15/2029 (l) | | | | | 9,015 | | | | | | 6,515 | |
10.500% due 02/15/2028 (l) | | | | | 25,502 | | | | | | 25,876 | |
|
| |
| | | | | 6,800 | | | | | | 6,768 | |
|
| |
17.332% (T-BILL 1MO + 12.000%) due 03/10/2031 ~ | | | | | 4,600 | | | | | | 4,850 | |
|
Voyager Aviation Holdings LLC | |
8.500% due 05/09/2026 ^«(d) | | | | | 122,450 | | | | | | 66,582 | |
| | | | | | | | | | | | |
| | | | | | | | | | | 441,742 | |
| | | | | | | | | | | | |
| |
| |
|
| |
5.750% due 08/15/2029 (l) | | | | | 4,330 | | | | | | 3,848 | |
|
Carvana Co. (12.000% PIK) | |
12.000% due 12/01/2028 (c) | | | | | 5,017 | | | | | | 4,061 | |
|
Carvana Co. (13.000% PIK) | |
13.000% due 06/01/2030 (c) | | | | | 46,165 | | | | | | 36,863 | |
|
Carvana Co. (14.000% PIK) | |
14.000% due 06/01/2031 (c) | | | | | 45,658 | | | | | | 36,896 | |
|
| |
7.750% due 04/01/2027 (l) | | EUR | | | 38,535 | | | | | | 39,371 | |
8.750% due 04/01/2027 (l) | | $ | | | 56,461 | | | | | | 51,486 | |
|
Constellation Oil Services Holding SA (3.000% Cash or 4.000% PIK) | |
3.000% due 12/31/2026 (c) | | | | | 232 | | | | | | 169 | |
|
| |
7.507% due 01/10/2032 (l) | | | | | 1,636 | | | | | | 1,721 | |
| | | | | | | | | | | | |
| | | | | | | | | | | |
|
| |
| | $ | | | 11,600 | | | $ | | | 10,909 | |
|
| |
5.250% due 12/01/2026 (l) | | | | | 17,440 | | | | | | 14,974 | |
5.750% due 12/01/2028 (l) | | | | | 25,200 | | | | | | 20,147 | |
|
| |
11.750% due 11/15/2027 (l) | | | | | 9,200 | | | | | | 9,611 | |
|
Exela Intermediate LLC (11.500% PIK) | |
11.500% due 04/15/2026 (c) | | | | | 590 | | | | | | 106 | |
|
Gazprom PJSC Via Gaz Capital SA | |
| | | | | 300 | | | | | | 242 | |
| | | | | 1,081 | | | | | | 986 | |
|
| |
| | | | | 3,700 | | | | | | 3,617 | |
|
Intelsat Jackson Holdings SA | |
6.500% due 03/15/2030 (l) | | | | | 129,139 | | | | | | 123,341 | |
|
Inter Media & Communication SpA | |
6.750% due 02/09/2027 (l) | | EUR | | | 10,250 | | | | | | 10,937 | |
| | | | | 4,600 | | | | | | 4,908 | |
|
Iris Holdings, Inc. (8.750% Cash or 9.500% PIK) | |
8.750% due 02/15/2026 (c)(l) | | $ | | | 1,900 | | | | | | 1,615 | |
|
Legacy LifePoint Health LLC | |
4.375% due 02/15/2027 (l) | | | | | 2,920 | | | | | | 2,699 | |
|
| |
| | | | | 7,956 | | | | | | 8,050 | |
| | | | | 26,239 | | | | | | 27,666 | |
|
| |
| | EUR | | | 6,600 | | | | | | 6,553 | |
|
Newfold Digital Holdings Group, Inc. | |
6.000% due 02/15/2029 (l) | | $ | | | 15,996 | | | | | | 12,101 | |
| | | | | 7,330 | | | | | | 7,891 | |
|
Odebrecht Oil & Gas Finance Ltd. | |
0.000% due 01/29/2024 (g)(i) | | | | | 5,220 | | | | | | 179 | |
|
Olympus Water U.S. Holding Corp. | |
5.375% due 10/01/2029 (l) | | EUR | | | 2,200 | | | | | | 2,085 | |
|
| |
6.700% due 02/16/2032 (l) | | $ | | | 14,345 | | | | | | 11,920 | |
6.840% due 01/23/2030 (l) | | | | | 6,700 | | | | | | 5,816 | |
8.750% due 06/02/2029 (l) | | | | | 11,420 | | | | | | 11,110 | |
|
| |
| | | | | 24,849 | | | | | | 24,601 | |
|
| |
| | EUR | | | 500 | | | | | | 423 | |
| | | | | 900 | | | | | | 777 | |
|
Russian Railways Via RZD Capital PLC | |
7.487% due 03/25/2031 ^(d) | | GBP | | | 200 | | | | | | 166 | |
|
| |
| | $ | | | 1,657 | | | | | | 1,654 | |
|
| |
4.875% due 09/30/2039 (l) | | | | | 15,110 | | | | | | 13,954 | |
5.750% due 09/30/2039 (l) | | | | | 68,484 | | | | | | 68,186 | |
|
| |
10.625% due 06/28/2028 (l) | | | | | 12,881 | | | | | | 9,886 | |
|
| |
0.000% due 12/29/2049 ~(i) | | BRL | | | 830,470 | | | | | | 60,441 | |
|
| |
| | $ | | | 200 | | | | | | 202 | |
8.375% due 06/01/2031 (l) | | | | | 1,000 | | | | | | 1,001 | |
| | | | | 5,300 | | | | | | 5,612 | |
|
| |
7.500% due 09/01/2025 (l) | | | | | 27,985 | | | | | | 23,125 | |
|
Wesco Aircraft Holdings, Inc. | |
10.500% due 11/15/2026 ^(d) | | | | | 2,377 | | | | | | 2,163 | |
|
Wesco Aircraft Holdings, Inc. (7.500% Cash and 3.000% PIK) | |
10.500% due 11/15/2026 ^(c)(d) | | | | | 202,913 | | | | | | 184,651 | |
|
| |
7.750% due 08/15/2028 (l) | | | | | 64,273 | | | | | | 56,362 | |
|
| |
| | | | | 1,618 | | | | | | 1,613 | |
| | | | | | | | | | | | |
| | | | | | | | | | | 926,695 | |
| | | | | | | | | | | | |
| |
| | | | | | | | | | | | |
| | | | | | | | | | | |
| |
|
| |
| | $ | | | 2,721 | | | $ | | | 2,522 | |
|
Gazprom PJSC via Gaz Finance PLC | |
| | | | | 200 | | | | | | 135 | |
|
| |
6.750% due 12/31/2026 (l) | | | | | 6,185 | | | | | | 4,399 | |
|
| |
10.000% due 07/27/2025 ^(d) | | | | | 139,217 | | | | | | 6,961 | |
|
| |
5.375% due 03/22/2030 (l) | | | | | 42,051 | | | | | | 34,835 | |
|
Tierra Mojada Luxembourg SARL | |
5.750% due 12/01/2040 (l) | | | | | 8,181 | | | | | | 7,391 | |
| | | | | | | | | | | | |
| | | | | | | | | | | 56,243 | |
| | | | | | | | | | | | |
Total Corporate Bonds & Notes (Cost $1,645,160) | | | | |
| | | | |
| |
CONVERTIBLE BONDS & NOTES 0.6% | |
| |
| |
|
Corestate Capital Holding SA (8.000% Cash or 9.000% PIK) | |
8.000% due 12/31/2026 ^(c)(d) | | EUR | | | 2,219 | | | | | | 1,283 | |
|
| |
5.500% due 03/15/2026 (l) | | $ | | | 7,700 | | | | | | 7,132 | |
|
Sunac China Holdings Ltd. (1.000% PIK) | |
1.000% due 09/30/2032 (c) | | | | | 66 | | | | | | 5 | |
| | | | | | | | | | | | |
| | | | | | | | | | | 8,420 | |
| | | | | | | | | | | | |
| |
| |
|
Multiplan Corp. (6.000% Cash or 7.000% PIK) | |
6.000% due 10/15/2027 (c)(l) | | | | | 33,700 | | | | | | 22,377 | |
| | | | | | | | | | | | |
Total Convertible Bonds & Notes (Cost $43,464) | | | | |
| | | | |
| |
MUNICIPAL BONDS & NOTES 2.1% | |
| |
| |
|
Michigan Tobacco Settlement Finance Authority Revenue Bonds, Series 2008 | |
0.000% due 06/01/2046 (g) | | | | | 23,000 | | | | | | 2,949 | |
| | | | | | | | | | | | |
| |
| |
|
Commonwealth of Puerto Rico Bonds, Series 2022 | |
| | | | | 35,820 | | | | | | 19,566 | |
| | | | | 96,335 | | | | | | 51,269 | |
| | | | | | | | | | | | |
| | | | | | | | | | | 70,835 | |
| | | | | | | | | | | | |
| |
| |
|
Tobacco Settlement Finance Authority, West Virginia Revenue Bonds, Series 2007 | |
0.000% due 06/01/2047 (g) | | | | | 355,485 | | | | | | 31,501 | |
| | | | | | | | | | | | |
Total Municipal Bonds & Notes (Cost $105,195) | | | | |
| | | | |
| |
U.S. GOVERNMENT AGENCIES 1.5% | |
|
| |
0.000% due 10/25/2042 •(l) | | | | | 1,015 | | | | | | 804 | |
0.000% due 10/25/2060 ~(a)(l) | | | 19,438 | | | | | | 1,772 | |
0.108% due 01/25/2041 •(l) | | | | | 3,143 | | | | | | 3,025 | |
0.468% due 07/25/2041 •(a)(l) | | | | | 1,752 | | | | | | 143 | |
0.548% due 08/25/2038 •(a) | | | | | 364 | | | | | | 23 | |
0.598% due 08/25/2049 •(a) | | | | | 161 | | | | | | 18 | |
0.598% due 07/25/2059 •(a)(l) | | | | | 6,375 | | | | | | 836 | |
0.618% due 10/25/2040 •(a)(l) | | | | | 1,818 | | | | | | 89 | |
0.698% due 02/25/2043 •(a)(l) | | | | | 1,470 | | | | | | 152 | |
0.898% due 12/25/2037 •(a) | | | | | 33 | | | | | | 2 | |
1.036% due 08/25/2043 ~(a) | | | | | 19,178 | | | | | | 648 | |
1.068% due 09/25/2037 ~(a)(l) | | | | | 281 | | | | | | 18 | |
1.148% due 03/25/2040 •(a)(l) | | | | | 1,352 | | | | | | 63 | |
| | | | | | | | | | | | |
| See Accompanying Notes | | | | | | | | | | DECEMBER 31, 2023 | | | |
| | | | | | | | |
Consolidated Schedule of Investments | | PIMCO Dynamic Income Fund | | | | | | |
| | | | | | | | | | | | |
| | | | | | | | | | | |
1.188% due 12/25/2036 ~(a)(l) | | $ | | | 1,254 | | | $ | | | 122 | |
1.198% due 11/25/2036 •(a) | | | | | 38 | | | | | | 2 | |
1.268% due 06/25/2037 •(a) | | | | | 148 | | | | | | 10 | |
1.528% due 03/25/2038 •(a)(l) | | | | | 702 | | | | | | 78 | |
1.548% due 02/25/2038 •(a)(l) | | | | | 433 | | | | | | 49 | |
3.000% due 01/25/2042 (a)(l) | | | | | 105 | | | | | | 4 | |
3.500% due 08/25/2032 -
06/25/2050 (a)(l) | | | | | 16,825 | | | | | | 3,041 | |
4.000% due 06/25/2050 (a)(l) | | | | | 9,604 | | | | | | 1,787 | |
4.500% due 04/25/2042 (a)(l) | | | | | 574 | | | | | | 70 | |
5.000% due 01/25/2048 (a)(l) | | | | | 4,121 | | | | | | 877 | |
|
| |
0.000% due 09/15/2041 ~(l) | | | | | 602 | | | | | | 547 | |
0.000% due 11/15/2048 •(a)(l) | | | | | 34,149 | | | | | | 1,389 | |
0.497% due 04/15/2039 •(a)(l) | | | | | 1,097 | | | | | | 125 | |
0.648% due 06/25/2050 •(a)(l) | | | | | 1,012 | | | | | | 122 | |
0.697% due 01/15/2047 •(a) | | | | | 250 | | | | | | 34 | |
0.698% due 05/25/2050 •(a)(l) | | | | | 7,169 | | | | | | 991 | |
0.700% due 11/25/2055 ~(a)(l) | | | | | 260,174 | | | | | | 15,555 | |
0.747% due 09/15/2042 ~(a)(l) | | | | | 485 | | | | | | 34 | |
0.847% due 05/15/2037 •(a)(l) | | | | | 789 | | | | | | 69 | |
0.957% due 05/15/2037 •(a) | | | | | 51 | | | | | | 5 | |
0.963% due 01/25/2051 •(a)(l) | | | | | 9,585 | | | | | | 1,367 | |
1.017% due 07/15/2036 •(a)(l) | | | | | 977 | | | | | | 92 | |
1.127% due 09/15/2036 •(a)(l) | | | | | 328 | | | | | | 32 | |
1.147% due 05/15/2041 •(a)(l) | | | | | 608 | | | | | | 62 | |
1.247% due 04/15/2036 ~(a)(l) | | | | | 193 | | | | | | 13 | |
2.010% due 11/25/2045 ~(a)(l) | | | | | 75,137 | | | | | | 5,206 | |
2.327% due 09/15/2036 •(a)(l) | | | | | 533 | | | | | | 70 | |
3.000% due 06/25/2050 (a)(l) | | | | | 11,109 | | | | | | 2,063 | |
3.500% due 07/25/2050 (a)(l) | | | | | 23,331 | | | | | | 4,437 | |
4.000% due 03/15/2027 (a) | | | | | 77 | | | | | | 3 | |
4.000% due 07/25/2050 (a)(l) | | | | | 18,283 | | | | | | 4,033 | |
5.000% due 05/25/2048 (a)(l) | | | | | 6,398 | | | | | | 1,050 | |
10.602% due 10/25/2029 •(l) | | | | | 8,600 | | | | | | 9,405 | |
14.452% due 03/25/2029 •(l) | | | | | 6,832 | | | | | | 7,474 | |
15.952% due 10/25/2028 •(l) | | | | | 1,478 | | | | | | 1,659 | |
|
| |
0.628% due 12/20/2048 •(a)(l) | | | | | 2,804 | | | | | | 270 | |
0.648% due 08/20/2042 ~(a)(l) | | | | | 1,373 | | | | | | 154 | |
0.778% due 12/20/2040 •(a)(l) | | | | | 951 | | | | | | 47 | |
2.500% due 09/20/2036 (a)(l) | | | | | 44,264 | | | | | | 3,700 | |
3.500% due 06/20/2042 (a)(l) | | | | | 185 | | | | | | 27 | |
| | | | | | | | | | | | |
Total U.S. Government Agencies (Cost $82,861) | | | | |
| | | | |
| |
NON-AGENCY MORTGAGE-BACKED SECURITIES 44.4% | |
|
| |
4.649% due 02/10/2036 ~(l) | | | | | 7,541 | | | | | | 5,554 | |
|
| |
| | | | | 2,500 | | | | | | 2,145 | |
3.657% due 06/05/2037 ~(l) | | | | | 14,261 | | | | | | 11,480 | |
|
280 Park Avenue Mortgage Trust | |
7.194% due 09/15/2034 ~(l) | | | | | 12,600 | | | | | | 11,526 | |
8.485% due 09/15/2034 •(l) | | | | | 2,500 | | | | | | 2,234 | |
|
Adjustable Rate Mortgage Trust | |
5.206% due 03/25/2037 ~(l) | | | | | 1,323 | | | | | | 1,174 | |
5.399% due 03/25/2036 ~(l) | | | | | 1,932 | | | | | | 996 | |
5.730% due 03/25/2036 ~(l) | | | | | 3,140 | | | | | | 1,853 | |
5.770% due 03/25/2037 ~(l) | | | | | 687 | | | | | | 753 | |
6.263% due 11/25/2037 ~(l) | | | | | 832 | | | | | | 538 | |
|
American Home Mortgage Assets Trust | |
| | | | | 384 | | | | | | 356 | |
6.050% due 08/25/2037 •(l) | | | | | 7,221 | | | | | | 6,390 | |
|
American Home Mortgage Investment Trust | |
| | | | | 2,519 | | | | | | 903 | |
6.070% due 09/25/2045 •(l) | | | | | 2,484 | | | | | | 2,171 | |
6.370% due 02/25/2044 ~(l) | | | | | 8,193 | | | | | | 7,522 | |
| | | | | 4,653 | | | | | | 722 | |
|
| |
| | | | | 2,021 | | | | | | 0 | |
|
ASG Resecuritization Trust | |
3.270% due 01/28/2037 ~(l) | | | | | 8,255 | | | | | | 6,799 | |
6.000% due 06/28/2037 ~(l) | | | | | 24,869 | | | | | | 12,315 | |
|
Ashford Hospitality Trust | |
6.934% due 04/15/2035 ~(l) | | | | | 10,360 | | | | | | 10,135 | |
8.634% due 04/15/2035 •(l) | | | | | 10,939 | | | | | | 10,489 | |
| | | | | | | | | | | | |
| | | | | | | | | | | |
|
Atrium Hotel Portfolio Trust | |
7.309% due 12/15/2036 ~(l) | | $ | | | 1,840 | | | $ | | | 1,668 | |
7.609% due 12/15/2036 •(l) | | | | | 8,800 | | | | | | 7,665 | |
7.959% due 06/15/2035 •(l) | | | | | 5,451 | | | | | | 5,227 | |
|
Austin Fairmont Hotel Trust | |
8.209% due 09/15/2032 •(l) | | | | | 5,000 | | | | | | 4,839 | |
|
| |
0.000% due 12/28/2049 (b)(g) | | GBP | | | 6,403 | | | | | | 5,799 | |
0.000% due 12/28/2049 (b)(g) | | | | | 5,085 | | | | | | 4,391 | |
0.000% due 12/28/2049 (a) | | | | | 9,500 | | | | | | 135 | |
5.187% due 12/28/2049 (l) | | | | | 8,029 | | | | | | 10,189 | |
8.687% due 12/28/2049 (l) | | | | | 11,241 | | | | | | 13,624 | |
8.937% due 12/28/2049 (l) | | | | | 8,564 | | | | | | 9,955 | |
| | | | | 2,676 | | | | | | 3,024 | |
|
BAMLL Commercial Mortgage Securities Trust | |
2.627% due 01/15/2032 (l) | | $ | | | 18,810 | | | | | | 14,657 | |
| | | | | 7,579 | | | | | | 7,433 | |
7.726% due 03/15/2037 •(l) | | | | | 14,228 | | | | | | 13,782 | |
|
Banc of America Alternative Loan Trust | |
1.170% due 06/25/2037 •(a) | | | | | 304 | | | | | | 29 | |
| | | | | 283 | | | | | | 211 | |
| | | | | 96 | | | | | | 79 | |
| | | | | 43 | | | | | | 37 | |
6.000% due 07/25/2046 (l) | | | | | 652 | | | | | | 551 | |
|
Banc of America Funding Trust | |
0.000% due 06/26/2035 ~(l) | | | | | 1,755 | | | | | | 1,573 | |
0.000% due 11/26/2036 ~(l) | | | | | 25,743 | | | | | | 7,890 | |
3.591% due 08/25/2047 ~(l) | | | | | 2,392 | | | | | | 1,965 | |
3.864% due 05/26/2036 ~(l) | | | | | 4,845 | | | | | | 3,960 | |
3.896% due 03/20/2036 ~(l) | | | | | 842 | | | | | | 679 | |
| | | | | 396 | | | | | | 283 | |
| | | | | 79 | | | | | | 65 | |
| | | | | 173 | | | | | | 145 | |
| | | | | 380 | | | | | | 293 | |
| | | | | 262 | | | | | | 216 | |
| | | | | 99 | | | | | | 94 | |
4.732% due 04/20/2035 ~(l) | | | | | 910 | | | | | | 811 | |
| | | | | 24 | | | | | | 23 | |
5.652% due 09/20/2046 ~(l) | | | | | 683 | | | | | | 660 | |
5.890% due 04/25/2037 •(l) | | | | | 920 | | | | | | 763 | |
5.892% due 04/20/2047 •(l) | | | | | 4,640 | | | | | | 3,651 | |
6.000% due 10/25/2037 (l) | | | | | 2,757 | | | | | | 2,303 | |
6.147% due 02/20/2035 •(l) | | | | | 2,923 | | | | | | 2,785 | |
6.619% due 07/26/2036 ~(l) | | | | | 8,672 | | | | | | 2,775 | |
|
Banc of America Mortgage Trust | |
| | | | | 98 | | | | | | 89 | |
5.750% due 10/25/2036 (l) | | | | | 652 | | | | | | 516 | |
| | | | | 575 | | | | | | 426 | |
| | | | | 79 | | | | | | 62 | |
| | | | | 61 | | | | | | 51 | |
|
Bancorp Commercial Mortgage Trust | |
9.193% due 08/15/2032 ~(l) | | | | | 600 | | | | | | 593 | |
|
Barclays Commercial Mortgage Securities Trust | |
8.484% due 10/15/2037 •(l) | | | | | 2,600 | | | | | | 2,482 | |
9.209% due 07/15/2037 ~(l) | | | | | 5,000 | | | | | | 4,581 | |
|
Barclays Commercial Real Estate Trust | |
4.563% due 08/10/2033 ~(l) | | | | | 7,790 | | | | | | 6,268 | |
|
Bayview Commercial Asset Trust | |
5.800% due 03/25/2037 •(l) | | | | | 133 | | | | | | 122 | |
|
| |
2.145% due 02/26/2037 ~(l) | | | | | 8,124 | | | | | | 6,391 | |
3.372% due 04/26/2037 ~(l) | | | | | 6,322 | | | | | | 5,229 | |
| | | | | 384 | | | | | | 328 | |
3.671% due 05/26/2037 ~(l) | | | | | 1,595 | | | | | | 1,421 | |
3.840% due 03/26/2037 ~(l) | | | | | 714 | | | | | | 570 | |
4.056% due 05/26/2036 •(l) | | | | | 3,667 | | | | | | 3,002 | |
4.325% due 02/26/2036 ~(l) | | | | | 2,482 | | | | | | 1,711 | |
4.498% due 02/26/2047 •(l) | | | | | 11,343 | | | | | | 8,824 | |
4.502% due 03/27/2037 ~(l) | | | | | 4,521 | | | | | | 3,705 | |
4.656% due 06/26/2036 ~(l) | | | | | 2,072 | | | | | | 1,716 | |
5.057% due 11/26/2035 ~(l) | | | | | 2,212 | | | | | | 1,926 | |
5.117% due 07/26/2045 ~(l) | | | | | 3,294 | | | | | | 3,114 | |
5.500% due 05/26/2035 ~(l) | | | | | 4,712 | | | | | | 4,017 | |
5.500% due 12/26/2035 ~(l) | | | | | 8,388 | | | | | | 5,123 | |
5.750% due 01/26/2036 ~(l) | | | | | 20,824 | | | | | | 5,573 | |
6.000% due 06/26/2037 ~(l) | | | | | 1,524 | | | | | | 1,319 | |
6.000% due 08/26/2037 ~(l) | | | | | 2,223 | | | | | | 1,712 | |
6.000% due 10/26/2037 ~(l) | | | | | 1,625 | | | | | | 1,162 | |
| | | | | | | | | | | | |
| | | | | | | | | | | |
| | $ | | | 369 | | | $ | | | 288 | |
|
Bear Stearns Adjustable Rate Mortgage Trust | |
4.067% due 06/25/2047 ~(l) | | | | | 1,280 | | | | | | 1,150 | |
| | | | | 153 | | | | | | 132 | |
| | | | | 307 | | | | | | 276 | |
| | | | | 34 | | | | | | 31 | |
| | | | | 50 | | | | | | 45 | |
| | | | | 12 | | | | | | 8 | |
|
| |
| | | | | 219 | | | | | | 199 | |
3.884% due 04/25/2037 ~(l) | | | | | 4,053 | | | | | | 2,940 | |
| | | | | 115 | | | | | | 98 | |
| | | | | 129 | | | | | | 124 | |
4.104% due 11/25/2035 ~(l) | | | | | 8,646 | | | | | | 4,905 | |
4.180% due 03/25/2036 ~(l) | | | | | 1,114 | | | | | | 677 | |
| | | | | 1,593 | | | | | | 713 | |
| | | | | 281 | | | | | | 142 | |
4.332% due 07/25/2036 ~(l) | | | | | 50,875 | | | | | | 25,389 | |
4.432% due 12/25/2046 ~(l) | | | | | 3,253 | | | | | | 1,692 | |
4.454% due 09/25/2035 ~(l) | | | | | 7,334 | | | | | | 2,854 | |
4.517% due 08/25/2046 ~(l) | | | | | 4,055 | | | | | | 2,872 | |
| | | | | 215 | | | | | | 154 | |
| | | | | 25 | | | | | | 18 | |
| | | | | 180 | | | | | | 167 | |
5.790% due 06/25/2046 •(l) | | | | | 1,141 | | | | | | 1,007 | |
5.810% due 08/25/2036 ~(l) | | | | | 14,093 | | | | | | 12,958 | |
5.870% due 02/25/2034 •(l) | | | | | 2,388 | | | | | | 2,160 | |
5.970% due 01/25/2036 ~(l) | | | | | 3,333 | | | | | | 3,063 | |
6.595% due 01/25/2035 •(l) | | | | | 941 | | | | | | 872 | |
6.595% due 03/25/2035 •(l) | | | | | 6,324 | | | | | | 5,420 | |
|
Bear Stearns Asset-Backed Securities Trust | |
| | | | | 271 | | | | | | 159 | |
6.500% due 03/25/2037 þ(l) | | | | | 8,860 | | | | | | 7,572 | |
|
Bear Stearns Mortgage Funding Trust | |
| | | | | 250 | | | | | | 243 | |
|
| |
8.926% due 03/15/2036 •(l) | | | | | 6,000 | | | | | | 3,723 | |
|
| |
| | | | | 700 | | | | | | 81 | |
3.899% due 03/15/2062 (l) | | | | | 5,423 | | | | | | 3,772 | |
|
Beneria Cowen & Pritzer Collateral Funding Corp. | |
9.114% due 06/15/2038 •(l) | | | | | 11,100 | | | | | | 7,460 | |
|
BIG Commercial Mortgage Trust | |
7.702% due 02/15/2039 (l) | | | | | 485 | | | | | | 467 | |
|
| |
3.269% due 02/17/2055 ~(l) | | | | | 7,850 | | | | | | 6,212 | |
|
Braemar Hotels & Resorts Trust | |
7.334% due 06/15/2035 (l) | | | | | 6,500 | | | | | | 6,174 | |
7.934% due 06/15/2035 •(l) | | | | | 11,000 | | | | | | 10,344 | |
|
| |
0.000% due 10/16/2062 ~(l) | | GBP | | | 39,972 | | | | | | 36,796 | |
| | | | | 20,785 | | | | | | 12,515 | |
0.000% due 10/16/2062 (g) | | | | | 5,795 | | | | | | 4 | |
11.220% due 10/16/2062 •(l) | | | | | 23,983 | | | | | | 29,153 | |
14.220% due 10/16/2062 ~(l) | | | | | 11,991 | | | | | | 14,740 | |
|
BSREP Commercial Mortgage Trust | |
6.426% due 08/15/2038 •(l) | | $ | | | 6,823 | | | | | | 6,426 | |
6.826% due 08/15/2038 ~(l) | | | | | 474 | | | | | | 414 | |
|
| |
7.112% due 02/15/2037 •(l) | | | | | 3,300 | | | | | | 2,397 | |
|
BX Commercial Mortgage Trust | |
7.326% due 11/15/2038 (l) | | | | | 22,375 | | | | | | 21,854 | |
7.673% due 11/15/2038 (l) | | | | | 7,750 | | | | | | 7,552 | |
7.826% due 04/15/2034 ~(l) | | | | | 6,000 | | | | | | 5,106 | |
7.826% due 02/15/2038 (l) | | | | | 1,996 | | | | | | 1,873 | |
8.563% due 04/15/2034 •(l) | | | | | 4,000 | | | | | | 3,298 | |
|
| |
7.363% due 10/15/2036 (l) | | | | | 2,741 | | | | | | 2,596 | |
7.713% due 10/15/2036 •(l) | | | | | 1,760 | | | | | | 1,651 | |
7.721% due 10/15/2036 (l) | | | | | 12,000 | | | | | | 11,368 | |
7.904% due 10/15/2026 •(l) | | | | | 1,408 | | | | | | 1,342 | |
8.213% due 10/15/2036 •(l) | | | | | 7,993 | | | | | | 7,463 | |
8.579% due 05/15/2030 •(l) | | | | | 5,500 | | | | | | 5,356 | |
|
| |
2.775% due 01/15/2044 ~(l) | | | | | 3,000 | | | | | | 1,866 | |
| | | | | | | | |
| | | | | | December 31, 2023 | | (Unaudited) |
| | | | | | | | | | | | |
| | | | | | | | | | | |
|
| |
3.957% due 03/10/2039 (l) | | $ | | | 24,500 | | | $ | | | 20,607 | |
|
CBA Commercial Small Balance Commercial Mortgage | |
| | | | | 281 | | | | | | 258 | |
|
| |
5.688% due 10/15/2048 (l) | | | | | 1,336 | | | | | | 1,198 | |
|
Chase Mortgage Finance Trust | |
4.501% due 01/25/2036 ~(l) | | | | | 3,110 | | | | | | 2,785 | |
4.885% due 03/25/2037 ~(l) | | | | | 967 | | | | | | 920 | |
| | | | | 507 | | | | | | 286 | |
|
Citigroup Commercial Mortgage Trust | |
5.442% due 12/10/2049 ~(l) | | | | | 5,655 | | | | | | 3,648 | |
9.376% due 12/15/2036 •(l) | | | | | 10,233 | | | | | | 9,890 | |
|
Citigroup Global Markets Mortgage Securities, Inc. | |
| | | | | 112 | | | | | | 105 | |
|
Citigroup Mortgage Loan Trust | |
| | | | | 1,632 | | | | | | 85 | |
3.384% due 07/25/2036 ~(l) | | | | | 1,933 | | | | | | 1,172 | |
3.732% due 03/25/2037 ~(l) | | | | | 1,873 | | | | | | 1,624 | |
| | | | | 448 | | | | | | 409 | |
4.523% due 09/25/2037 ~(l) | | | | | 2,169 | | | | | | 1,917 | |
| | | | | 165 | | | | | | 159 | |
4.738% due 08/25/2034 ~(l) | | | | | 5,841 | | | | | | 5,423 | |
| | | | | 256 | | | | | | 217 | |
4.788% due 10/25/2035 ~(l) | | | | | 896 | | | | | | 842 | |
5.018% due 02/25/2036 ~(l) | | | | | 4,473 | | | | | | 4,093 | |
| | | | | 196 | | | | | | 176 | |
5.500% due 12/25/2035 (l) | | | | | 1,908 | | | | | | 1,025 | |
6.000% due 07/25/2036 (l) | | | | | 3,975 | | | | | | 1,958 | |
| | | | | 863 | | | | | | 481 | |
| | | | | 92 | | | | | | 84 | |
|
Colony Mortgage Capital Ltd. | |
7.151% due 11/15/2038 •(l) | | | | | 2,020 | | | | | | 1,880 | |
7.500% due 11/15/2038 •(l) | | | | | 8,005 | | | | | | 7,359 | |
8.196% due 11/15/2038 ~(l) | | | | | 15,475 | | | | | | 13,917 | |
8.892% due 11/15/2038 •(l) | | | | | 24,000 | | | | | | 21,160 | |
|
| |
4.737% due 03/25/2067 ~(l) | | | | | 4,900 | | | | | | 4,351 | |
|
Commercial Mortgage Lease-Backed Certificates | |
6.250% due 06/20/2031 ~(l) | | | | | 308 | | | | | | 306 | |
|
Commercial Mortgage Loan Trust | |
6.589% due 12/10/2049 ~(l) | | | | | 4,688 | | | | | | 517 | |
|
Commercial Mortgage Trust | |
2.819% due 01/10/2039 (l) | | | | | 9,131 | | | | | | 8,022 | |
3.633% due 02/10/2037 (l) | | | | | 28,830 | | | | | | 26,978 | |
4.000% due 06/10/2046 (l) | | | | | 3,500 | | | | | | 3,074 | |
6.012% due 07/10/2038 ~(l) | | | | | 4,688 | | | | | | 1,181 | |
9.626% due 12/15/2038 ~(l) | | | | | 10,004 | | | | | | 7,890 | |
10.476% due 12/15/2038 ~(l) | | | | | 5,000 | | | | | | 3,745 | |
11.476% due 12/15/2038 ~(l) | | | | | 3,360 | | | | | | 2,350 | |
|
Connecticut Avenue Securities Trust | |
8.087% due 12/25/2041 ~(l) | | | | | 2,600 | | | | | | 2,611 | |
10.587% due 03/25/2042 •(l) | | | | | 1,400 | | | | | | 1,495 | |
10.837% due 12/25/2041 •(l) | | | | | 1,200 | | | | | | 1,215 | |
11.337% due 10/25/2041 •(l) | | | | | 3,600 | | | | | | 3,695 | |
11.687% due 05/25/2042 •(l) | | | | | 550 | | | | | | 600 | |
14.837% due 03/25/2042 •(l) | | | | | 3,400 | | | | | | 3,804 | |
15.937% due 05/25/2042 ~(l) | | | | | 600 | | | | | | 691 | |
|
Countrywide Alternative Loan Resecuritization Trust | |
| | | | | 5,103 | | | | | | 1,054 | |
|
Countrywide Alternative Loan Trust | |
0.824% due 12/25/2035 ~(a) | | | | | 7,495 | | | | | | 315 | |
1.680% due 07/25/2036 •(a) | | | | | 6,752 | | | | | | 1,177 | |
1.790% due 12/25/2035 ~(a) | | | | | 2,929 | | | | | | 211 | |
3.810% due 11/25/2035 •(l) | | | | | 7,636 | | | | | | 7,098 | |
| | | | | 69 | | | | | | 60 | |
4.326% due 05/25/2036 ~(l) | | | | | 2,322 | | | | | | 2,028 | |
| | | | | 56 | | | | | | 53 | |
| | | | | 702 | | | | | | 354 | |
| | | | | 450 | | | | | | 271 | |
| | | | | 110 | | | | | | 74 | |
5.500% due 11/25/2035 (l) | | | | | 1,358 | | | | | | 828 | |
| | | | | 1,417 | | | | | | 834 | |
| | | | | 702 | | | | | | 388 | |
| | | | | 59 | | | | | | 53 | |
| | | | | | | | | | | | |
| | | | | | | | | | | |
| | $ | | | 843 | | | $ | | | 494 | |
5.500% due 02/25/2036 (l) | | | | | 769 | | | | | | 540 | |
5.500% due 05/25/2036 (l) | | | | | 3,245 | | | | | | 2,673 | |
5.500% due 04/25/2037 (l) | | | | | 1,502 | | | | | | 787 | |
| | | | | 15 | | | | | | 13 | |
| | | | | 382 | | | | | | 313 | |
| | | | | 506 | | | | | | 405 | |
| | | | | 126 | | | | | | 66 | |
5.750% due 05/25/2036 •(l) | | | | | 1,179 | | | | | | 379 | |
| | | | | 144 | | | | | | 57 | |
5.750% due 01/25/2037 (l) | | | | | 7,662 | | | | | | 3,913 | |
5.750% due 04/25/2037 (l) | | | | | 939 | | | | | | 779 | |
| | | | | 780 | | | | | | 369 | |
5.830% due 05/25/2036 •(l) | | | | | 7,124 | | | | | | 6,379 | |
5.850% due 09/25/2046 •(l) | | | | | 5,278 | | | | | | 4,482 | |
5.862% due 11/25/2046 •(l) | | | | | 2,345 | | | | | | 1,957 | |
5.890% due 08/25/2047 •(l) | | | | | 810 | | | | | | 668 | |
5.910% due 05/25/2047 •(l) | | | | | 4,290 | | | | | | 2,820 | |
5.930% due 03/25/2036 •(l) | | | | | 7,538 | | | | | | 7,202 | |
5.970% due 06/25/2037 •(l) | | | | | 5,316 | | | | | | 4,494 | |
5.990% due 07/25/2036 •(l) | | | | | 7,679 | | | | | | 6,375 | |
| | | | | 283 | | | | | | 133 | |
| | | | | 315 | | | | | | 49 | |
| | | | | 641 | | | | | | 316 | |
| | | | | 227 | | | | | | 131 | |
| | | | | 214 | | | | | | 119 | |
| | | | | 669 | | | | | | 282 | |
| | | | | 607 | | | | | | 488 | |
6.000% due 01/25/2037 (l) | | | | | 785 | | | | | | 481 | |
| | | | | 2,107 | | | | | | 854 | |
| | | | | 2,507 | | | | | | 957 | |
6.000% due 03/25/2037 (l) | | | | | 8,137 | | | | | | 3,105 | |
6.000% due 04/25/2037 (l) | | | | | 8,779 | | | | | | 4,118 | |
6.000% due 09/25/2037 (l) | | | | | 7,595 | | | | | | 2,719 | |
| | | | | 67 | | | | | | 61 | |
6.150% due 09/25/2035 •(l) | | | | | 2,440 | | | | | | 1,605 | |
| | | | | 97 | | | | | | 70 | |
| | | | | 655 | | | | | | 661 | |
| | | | | 495 | | | | | | 211 | |
6.322% due 07/20/2035 •(l) | | | | | 4,286 | | | | | | 3,667 | |
| | | | | 25 | | | | | | 23 | |
| | | | | 342 | | | | | | 163 | |
6.500% due 11/25/2036 (l) | | | | | 8,380 | | | | | | 2,756 | |
|
Countrywide Asset-Backed Certificates Trust | |
| | | | | 351 | | | | | | 305 | |
|
Countrywide Home Loan Mortgage Pass-Through Trust | |
| | | | | 18 | | | | | | 16 | |
3.666% due 03/25/2037 ~(l) | | | | | 2,916 | | | | | | 2,296 | |
3.873% due 05/20/2036 ~(l) | | | | | 529 | | | | | | 477 | |
| | | | | 27 | | | | | | 25 | |
4.441% due 11/20/2035 ~(l) | | | | | 5,066 | | | | | | 4,575 | |
4.638% due 11/25/2035 ~(l) | | | | | 802 | | | | | | 650 | |
4.712% due 09/25/2047 ~(l) | | | | | 1,628 | | | | | | 1,245 | |
4.751% due 06/25/2047 ~(l) | | | | | 1,193 | | | | | | 1,182 | |
4.970% due 09/20/2036 ~(l) | | | | | 2,465 | | | | | | 2,157 | |
| | | | | 20 | | | | | | 11 | |
| | | | | 47 | | | | | | 44 | |
| | | | | 30 | | | | | | 16 | |
| | | | | 24 | | | | | | 14 | |
| | | | | 142 | | | | | | 66 | |
6.000% due 08/25/2037 (l) | | | | | 3,022 | | | | | | 1,352 | |
| | | | | 1 | | | | | | 1 | |
| | | | | 146 | | | | | | 95 | |
| | | | | 34 | | | | | | 7 | |
7.340% due 03/25/2046 •(l) | | | | | 23,061 | | | | | | 15,020 | |
|
Credit Suisse Commercial Mortgage Trust | |
5.613% due 01/15/2049 ~(l) | | | | | 10,300 | | | | | | 10,329 | |
|
Credit Suisse First Boston Mortgage Securities Corp. | |
| | | | | 235 | | | | | | 146 | |
| | | | | 667 | | | | | | 684 | |
|
Credit Suisse Mortgage Capital Certificates | |
2.033% due 02/27/2047 ~(l) | | | | | 31,975 | | | | | | 12,586 | |
3.764% due 05/26/2036 ~(l) | | | | | 2,826 | | | | | | 2,344 | |
3.879% due 05/27/2036 ~(l) | | | | | 2,060 | | | | | | 1,626 | |
3.913% due 04/28/2037 ~(l) | | | | | 2,068 | | | | | | 1,914 | |
3.945% due 12/29/2037 ~(l) | | | | | 2,806 | | | | | | 1,515 | |
4.140% due 09/26/2047 ~(l) | | | | | 15,801 | | | | | | 7,432 | |
4.347% due 06/25/2036 ~(l) | | | | | 3,146 | | | | | | 2,763 | |
4.490% due 10/26/2036 ~(l) | | | | | 9,251 | | | | | | 8,408 | |
4.549% due 07/26/2037 ~(l) | | | | | 5,516 | | | | | | 4,811 | |
| | | | | | | | | | | | |
| | | | | | | | | | | |
5.121% due 04/26/2035 ~(l) | | $ | | | 6,797 | | | $ | | | 6,162 | |
5.750% due 05/26/2037 (l) | | | | | 11,176 | | | | | | 5,184 | |
7.000% due 08/26/2036 (l) | | | | | 14,303 | | | | | | 3,346 | |
| | | | | 2,934 | | | | | | 1,331 | |
12.427% due 11/27/2037 •(l) | | | | | 8,559 | | | | | | 7,181 | |
25.115% due 11/25/2037 •(l) | | | | | 7,092 | | | | | | 6,001 | |
|
Credit Suisse Mortgage Capital Mortgage-Backed Trust | |
| | | | | 1,557 | | | | | | 768 | |
| | | | | 139 | | | | | | 67 | |
| | | | | 407 | | | | | | 81 | |
6.396% due 04/25/2036 þ(l) | | | | | 4,477 | | | | | | 2,386 | |
| | | | | 2,352 | | | | | | 782 | |
| | | | | 311 | | | | | | 121 | |
|
Credit Suisse Mortgage Capital Trust | |
3.704% due 08/15/2037 (l) | | | | | 7,296 | | | | | | 6,463 | |
6.500% due 07/26/2036 (l) | | | | | 11,380 | | | | | | 2,934 | |
| | | | | 1,000 | | | | | | 885 | |
7.344% due 07/15/2032 •(l) | | | | | 3,121 | | | | | | 2,871 | |
8.376% due 07/15/2038 •(l) | | | | | 15,850 | | | | | | 9,544 | |
8.744% due 07/15/2032 •(l) | | | | | 7,454 | | | | | | 6,755 | |
9.376% due 07/15/2038 •(l) | | | | | 13,700 | | | | | | 7,699 | |
9.794% due 07/15/2032 ~(l) | | | | | 15,000 | | | | | | 13,272 | |
|
| |
6.254% due 06/15/2033 •(l) | | | | | 1,100 | | | | | | 1,011 | |
6.439% due 06/15/2033 •(l) | | | | | 1,600 | | | | | | 1,375 | |
| | | | | 1,000 | | | | | | 949 | |
7.509% due 06/15/2033 •(l) | | | | | 3,600 | | | | | | 2,329 | |
8.059% due 06/15/2033 •(l) | | | | | 6,100 | | | | | | 3,443 | |
| | | | | 26,404 | | | | | | 16,631 | |
|
| |
3.791% due 12/10/2036 (l) | | | | | 17,961 | | | | | | 16,381 | |
|
Deutsche ALT-A Securities, Inc. Mortgage Loan Trust | |
| | | | | 441 | | | | | | 366 | |
| | | | | 306 | | | | | | 179 | |
|
Deutsche ALT-B Securities, Inc. Mortgage Loan Trust | |
5.770% due 04/25/2037 •(l) | | | | | 3,758 | | | | | | 2,545 | |
| | | | | 36 | | | | | | 29 | |
|
Deutsche Mortgage Securities, Inc. Mortgage Loan Trust | |
| | | | | 62 | | | | | | 59 | |
|
| |
3.704% due 05/10/2041 ~(l) | | | | | 29,000 | | | | | | 15,565 | |
|
Downey Savings & Loan Association Mortgage Loan Trust | |
| | | | | 209 | | | | | | 223 | |
|
| |
| | GBP | | | 6 | | | | | | 2,348 | |
4.798% due 03/13/2045 •(l) | | EUR | | | 7,067 | | | | | | 6,666 | |
6.589% (SONIO/N + 1.369%) due 06/13/2045 ~(l) | | GBP | | | 14,072 | | | | | | 15,416 | |
6.939% due 09/13/2045 •(l) | | | | | 15,554 | | | | | | 18,221 | |
7.089% (SONIO/N + 1.869%) due 06/13/2045 ~(l) | | | | | 8,667 | | | | | | 8,794 | |
7.589% due 09/13/2045 •(l) | | | | | 11,113 | | | | | | 12,752 | |
8.839% (SONIO/N + 3.619%) due 06/13/2045 ~(l) | | | | | 3,082 | | | | | | 2,999 | |
9.189% due 09/13/2045 ~(l) | | | | | 9,266 | | | | | | 11,432 | |
|
Extended Stay America Trust | |
9.176% due 07/15/2038 ~(l) | | $ | | | 42,845 | | | | | | 42,031 | |
|
First Horizon Alternative Mortgage Securities Trust | |
0.000% due 12/26/2049 (b)(g) | | | | | 2 | | | | | | 0 | |
1.630% due 11/25/2036 •(a) | | | | | 718 | | | | | | 96 | |
| | | | | 32 | | | | | | 24 | |
| | | | | 423 | | | | | | 339 | |
| | | | | 412 | | | | | | 287 | |
| | | | | 58 | | | | | | 4 | |
| | | | | 54 | | | | | | 17 | |
|
First Horizon Mortgage Pass-Through Trust | |
| | | | | 2,248 | | | | | | 950 | |
| | | | | 14 | | | | | | 9 | |
| | | | | 188 | | | | | | 103 | |
| | | | | 213 | | | | | | 81 | |
|
| |
8.687% due 09/25/2041 •(l) | | | | | 6,000 | | | | | | 5,999 | |
9.087% due 02/25/2042 •(l) | | | | | 16,000 | | | | | | 16,552 | |
10.087% due 02/25/2042 •(l) | | | | | 5,000 | | | | | | 5,185 | |
10.087% due 01/25/2051 •(l) | | | | | 2,300 | | | | | | 2,355 | |
| | | | | | | | | | | | |
| See Accompanying Notes | | | | | | | | | | DECEMBER 31, 2023 | | | |
| | | | | | | | |
Consolidated Schedule of Investments | | PIMCO Dynamic Income Fund | | | | | | |
| | | | | | | | | | | | |
| | | | | | | | | | | |
10.137% due 10/25/2050 •(l) | | $ | | | 2,500 | | | $ | | | 2,803 | |
10.837% due 01/25/2034 •(l) | | | | | 2,800 | | | | | | 2,983 | |
11.587% due 09/25/2041 •(l) | | | | | 6,400 | | | | | | 6,476 | |
| | | | | 500 | | | | | | 511 | |
12.837% due 10/25/2041 •(l) | | | | | 4,900 | | | | | | 5,162 | |
13.837% due 02/25/2042 •(l) | | | | | 2,350 | | | | | | 2,531 | |
|
GC Pastor Hipotecario FTA | |
4.093% due 06/21/2046 ~(l) | | EUR | | | 17,020 | | | | | | 16,444 | |
|
GMAC Mortgage Corp. Loan Trust | |
| | $ | | | 17 | | | | | | 14 | |
|
GreenPoint Mortgage Funding Trust | |
5.670% due 12/25/2046 •(l) | | | | | 2,505 | | | | | | 2,326 | |
| | | | | 500 | | | | | | 439 | |
|
GS Mortgage Securities Corp. Trust | |
4.591% due 10/10/2032 ~(l) | | | | | 39,357 | | | | | | 35,325 | |
| | | | | 1,298 | | | | | | 981 | |
7.676% due 08/15/2032 •(l) | | | | | 6,330 | | | | | | 6,079 | |
8.209% due 11/15/2032 •(l) | | | | | 10,358 | | | | | | 9,957 | |
8.326% due 08/15/2032 ~(l) | | | | | 10,621 | | | | | | 10,130 | |
8.826% due 08/15/2032 •(l) | | | | | 11,668 | | | | | | 11,077 | |
|
GS Mortgage Securities Trust | |
0.448% due 08/10/2043 ~(a) | | | | | 1,006 | | | | | | 9 | |
|
GS Mortgage-Backed Securities Trust | |
| | | | | 26 | | | | | | 26 | |
0.000% due 07/25/2059 ~(a) | | | | | 247,246 | | | | | | 1,892 | |
3.558% due 07/25/2059 ~(l) | | | | | 20,073 | | | | | | 12,838 | |
|
GSC Capital Corp. Mortgage Trust | |
5.830% due 05/25/2036 •(l) | | | | | 1,100 | | | | | | 1,029 | |
|
| |
| | | | | 260 | | | | | | 239 | |
| | | | | 8 | | | | | | 7 | |
| | | | | 115 | | | | | | 62 | |
| | | | | 230 | | | | | | 56 | |
| | | | | 252 | | | | | | 241 | |
| | | | | 597 | | | | | | 221 | |
|
HarborView Mortgage Loan Trust | |
| | | | | 44 | | | | | | 37 | |
| | | | | 945 | | | | | | 468 | |
5.850% due 02/19/2046 •(l) | | | | | 683 | | | | | | 564 | |
5.890% due 11/19/2036 •(l) | | | | | 1,025 | | | | | | 883 | |
5.950% due 03/19/2036 •(l) | | | | | 6,997 | | | | | | 6,447 | |
5.970% due 01/19/2036 •(l) | | | | | 4,254 | | | | | | 2,569 | |
| | | | | 65 | | | | | | 57 | |
| | | | | 102 | | | | | | 83 | |
6.447% due 06/20/2035 ~(l) | | | | | 3,818 | | | | | | 3,360 | |
| | | | | 881 | | | | | | 762 | |
|
| |
| | GBP | | | 2,200 | | | | | | 2,728 | |
7.720% due 01/28/2054 •(l) | | | | | 12,153 | | | | | | 14,986 | |
|
| |
3.917% due 04/25/2037 ~(l) | | $ | | | 2,271 | | | | | | 2,015 | |
5.970% due 03/25/2035 ~(l) | | | | | 3,636 | | | | | | 2,955 | |
|
HSI Asset Loan Obligation Trust | |
6.000% due 06/25/2037 (l) | | | | | 2,206 | | | | | | 1,898 | |
|
IM Pastor Fondo de Titluzacion Hipotecaria | |
4.056% due 03/22/2043 ~(l) | | EUR | | | 12,576 | | | | | | 12,094 | |
4.056% due 03/22/2044 •(l) | | | | | 22,001 | | | | | | 21,385 | |
|
| |
| | $ | | | 93 | | | | | | 82 | |
| | | | | 51 | | | | | | 47 | |
|
Impac Secured Assets Trust | |
| | | | | 2 | | | | | | 2 | |
6.330% due 03/25/2036 (l) | | | | | 1,026 | | | | | | 830 | |
|
IndyMac IMSC Mortgage Loan Trust | |
3.940% due 06/25/2037 ~(l) | | | | | 2,715 | | | | | | 1,618 | |
|
IndyMac INDA Mortgage Loan Trust | |
| | | | | 14 | | | | | | 12 | |
| | | | | 411 | | | | | | 325 | |
|
IndyMac INDX Mortgage Loan Trust | |
| | | | | 200 | | | | | | 168 | |
| | | | | 131 | | | | | | 112 | |
3.278% due 05/25/2037 ~(l) | | | | | 1,624 | | | | | | 1,272 | |
3.681% due 06/25/2036 ~(l) | | | | | 563 | | | | | | 489 | |
3.751% due 11/25/2035 ~(l) | | | | | 2,219 | | | | | | 2,053 | |
3.834% due 11/25/2036 ~(l) | | | | | 536 | | | | | | 493 | |
5.870% due 11/25/2046 •(l) | | | | | 3,241 | | | | | | 2,944 | |
| | | | | | | | | | | | |
| | | | | | | | | | | |
| | $ | | | 96 | | | $ | | | 87 | |
| | | | | 37 | | | | | | 33 | |
5.970% due 02/25/2037 ~(l) | | | | | 2,001 | | | | | | 1,247 | |
| | | | | 314 | | | | | | 218 | |
| | | | | 106 | | | | | | 87 | |
| | | | | 180 | | | | | | 151 | |
|
| |
3.242% due 10/14/2039 ~(l) | | | | | 2,900 | | | | | | 2,218 | |
|
Jefferies Resecuritization Trust | |
| | | | | 3,485 | | | | | | 985 | |
|
JP Morgan Alternative Loan Trust | |
| | | | | 553 | | | | | | 308 | |
| | | | | 69 | | | | | | 73 | |
| | | | | 8 | | | | | | 3 | |
5.870% due 06/25/2037 •(l) | | | | | 22,063 | | | | | | 8,776 | |
5.957% due 06/27/2037 •(l) | | | | | 4,603 | | | | | | 3,194 | |
| | | | | 532 | | | | | | 366 | |
6.045% due 06/27/2037 ~(l) | | | | | 13,149 | | | | | | 5,857 | |
6.460% due 12/25/2036 þ(l) | | | | | 1,931 | | | | | | 1,817 | |
|
JP Morgan Chase Commercial Mortgage Securities Trust | |
4.128% due 07/05/2031 (l) | | | | | 3,360 | | | | | | 3,015 | |
4.248% due 07/05/2033 (l) | | | | | 6,360 | | | | | | 5,600 | |
4.379% due 07/05/2031 (l) | | | | | 15,293 | | | | | | 12,732 | |
4.580% due 07/05/2031 (l) | | | | | 1,160 | | | | | | 747 | |
| | | | | 976 | | | | | | 900 | |
6.469% due 04/15/2037 •(l) | | | | | 1,464 | | | | | | 1,294 | |
7.026% due 12/15/2036 •(l) | | | | | 7,905 | | | | | | 5,281 | |
7.085% due 07/05/2033 •(l) | | | | | 3,000 | | | | | | 2,578 | |
7.226% due 03/15/2036 ~(l) | | | | | 7,900 | | | | | | 4,157 | |
| | | | | 1,000 | | | | | | 1,027 | |
7.316% due 06/15/2038 •(l) | | | | | 2,000 | | | | | | 1,632 | |
7.476% due 12/15/2036 •(l) | | | | | 3,030 | | | | | | 741 | |
| | | | | 1,300 | | | | | | 154 | |
8.726% due 02/15/2035 •(l) | | | | | 14,848 | | | | | | 14,165 | |
8.991% due 11/15/2038 •(l) | | | | | 9,000 | | | | | | 8,755 | |
9.741% due 11/15/2038 •(l) | | | | | 1,500 | | | | | | 1,428 | |
10.736% due 11/15/2038 •(l) | | | | | 19,700 | | | | | | 18,199 | |
|
| |
| | | | | 175 | | | | | | 139 | |
| | | | | 12 | | | | | | 9 | |
| | | | | 271 | | | | | | 197 | |
4.425% due 06/25/2037 ~(l) | | | | | 1,511 | | | | | | 1,198 | |
| | | | | 19 | | | | | | 17 | |
| | | | | 334 | | | | | | 163 | |
|
JP Morgan Resecuritization Trust | |
6.000% due 09/26/2036 ~(l) | | | | | 1,017 | | | | | | 752 | |
| | | | | 233 | | | | | | 209 | |
| | | | | 3,927 | | | | | | 1,204 | |
|
Lansdowne Mortgage Securities PLC | |
4.272% due 09/16/2048 •(l) | | EUR | | | 5,732 | | | | | | 5,690 | |
| | | | | 900 | | | | | | 785 | |
|
| |
6.000% due 11/26/2036 (l) | | $ | | | 6,289 | | | | | | 5,719 | |
6.250% due 10/26/2036 (l) | | | | | 3,555 | | | | | | 1,777 | |
|
| |
| | | | | 172 | | | | | | 111 | |
| | | | | 451 | | | | | | 359 | |
| | | | | 335 | | | | | | 166 | |
| | | | | 14 | | | | | | 13 | |
| | | | | 418 | | | | | | 390 | |
| | | | | 3,151 | | | | | | 1,003 | |
| | | | | 31,128 | | | | | | 7,192 | |
|
| |
6.030% due 07/25/2037 •(l) | | | | | 22,492 | | | | | | 15,200 | |
| | | | | 216 | | | | | | 179 | |
6.470% due 07/25/2047 •(l) | | | | | 3,350 | | | | | | 2,889 | |
|
LUXE Commercial Mortgage Trust | |
8.734% due 10/15/2038 •(l) | | | | | 5,211 | | | | | | 5,038 | |
|
| |
3.366% due 08/15/2034 ~(l) | | | | | 2,620 | | | | | | 2,201 | |
|
MASTR Adjustable Rate Mortgages Trust | |
| | | | | 177 | | | | | | 157 | |
| | | | | 15 | | | | | | 14 | |
6.150% due 05/25/2047 ~(l) | | | | | 6,765 | | | | | | 5,336 | |
|
MASTR Alternative Loan Trust | |
5.820% due 03/25/2036 •(l) | | | | | 19,954 | | | | | | 2,123 | |
5.870% due 03/25/2036 ~(l) | | | | | 26,374 | | | | | | 2,879 | |
| | | | | | | | | | | | |
| | | | | | | | | | | |
|
Merrill Lynch Alternative Note Asset Trust | |
6.000% due 05/25/2037 (l) | | $ | | | 2,287 | | | $ | | | 1,774 | |
|
Merrill Lynch Mortgage Investors Trust | |
3.853% due 03/25/2036 ~(l) | | | | | 6,490 | | | | | | 3,521 | |
4.290% due 05/25/2036 ~(l) | | | | | 899 | | | | | | 820 | |
|
| |
| | | | | 1,310 | | | | | | 1,220 | |
|
| |
| | | | | 475 | | | | | | 451 | |
|
| |
4.039% due 04/25/2065 ~(l) | | | | | 14,456 | | | | | | 12,136 | |
|
Morgan Stanley Capital Trust | |
2.428% due 04/05/2042 (l) | | | | | 2,985 | | | | | | 2,104 | |
3.912% due 09/09/2032 (l) | | | | | 25,312 | | | | | | 20,853 | |
6.426% due 12/15/2036 •(l) | | | | | 6,246 | | | | | | 4,843 | |
| | | | | 453 | | | | | | 194 | |
7.720% due 12/15/2036 •(l) | | | | | 18,590 | | | | | | 5,594 | |
7.859% due 11/15/2034 ~(l) | | | | | 6,183 | | | | | | 5,976 | |
8.709% due 07/15/2035 •(l) | | | | | 10,478 | | | | | | 10,045 | |
9.671% due 12/15/2038 •(l) | | | | | 18,000 | | | | | | 13,051 | |
10.570% due 12/15/2038 ~(l) | | | | | 19,500 | | | | | | 13,359 | |
|
Morgan Stanley Mortgage Capital Holdings Trust | |
3.740% due 09/13/2039 ~(l) | | | | | 1,780 | | | | | | 1,269 | |
|
Morgan Stanley Mortgage Loan Trust | |
| | | | | 1,536 | | | | | | 675 | |
| | | | | 502 | | | | | | 415 | |
| | | | | 167 | | | | | | 111 | |
5.758% due 01/25/2035 ~(l) | | | | | 158 | | | | | | 126 | |
| | | | | 272 | | | | | | 244 | |
| | | | | 145 | | | | | | 26 | |
| | | | | 1,769 | | | | | | 513 | |
| | | | | 136 | | | | | | 50 | |
|
Morgan Stanley Re-REMIC Trust | |
2.278% due 02/26/2037 ~(l) | | | | | 1,987 | | | | | | 1,732 | |
3.109% due 03/26/2037 þ(l) | | | | | 1,213 | | | | | | 1,170 | |
4.642% due 07/26/2035 ~(l) | | | | | 5,844 | | | | | | 5,549 | |
5.150% due 06/26/2035 ~(l) | | | | | 10,725 | | | | | | 8,033 | |
5.891% due 09/26/2035 ~(l) | | | | | 527 | | | | | | 496 | |
6.000% due 04/26/2036 (l) | | | | | 6,721 | | | | | | 6,675 | |
|
Mortgage Equity Conversion Asset Trust | |
| | | | | 2,281 | | | | | | 2,082 | |
|
| |
8.539% due 03/13/2046 •(l) | | GBP | | | 1,000 | | | | | | 1,274 | |
|
| |
4.250% due 12/15/2036 ~(l) | | $ | | | 3,700 | | | | | | 1,071 | |
|
| |
3.316% due 07/11/2039 ~(l) | | | | | 21,938 | | | | | | 19,337 | |
|
Natixis Commercial Mortgage Securities Trust | |
4.058% due 04/10/2037 ~(l) | | | | | 5,880 | | | | | | 2,994 | |
|
| |
| | | | | 1,200 | | | | | | 1,131 | |
7.448% due 04/15/2032 (l) | | | | | 13,642 | | | | | | 12,728 | |
|
New Residential Mortgage Loan Trust | |
| | | | | 8,300 | | | | | | 4,130 | |
|
| |
3.558% due 08/25/2061 þ(l) | | | | | 1,000 | | | | | | 861 | |
5.250% due 07/25/2062 þ(l) | | | | | 13,693 | | | | | | 13,418 | |
|
| |
5.175% due 12/15/2050 •(l) | | EUR | | | 979 | | | | | | 1,005 | |
5.425% due 12/15/2050 •(l) | | | | | 1,870 | | | | | | 1,819 | |
|
Nomura Asset Acceptance Corp. Alternative Loan Trust | |
5.790% due 10/25/2036 •(l) | | $ | | | 980 | | | | | | 801 | |
|
Nomura Resecuritization Trust | |
4.539% due 09/26/2035 ~(l) | | | | | 3,817 | | | | | | 3,318 | |
|
NovaStar Mortgage Funding Trust | |
| | | | | 135 | | | | | | 123 | |
|
NYO Commercial Mortgage Trust | |
| | | | | 2,000 | | | | | | 1,851 | |
7.021% due 11/15/2038 •(l) | | | | | 2,200 | | | | | | 1,945 | |
|
PMT Credit Risk Transfer Trust | |
8.371% due 02/27/2024 •(l) | | | | | 4,101 | | | | | | 4,085 | |
|
| |
5.820% due 06/25/2036 ~(l) | | | | | 1,386 | | | | | | 951 | |
| | | | | 41 | | | | | | 36 | |
| | | | | | | | |
| | | | | | December 31, 2023 | | (Unaudited) |
| | | | | | | | | | | | |
| | | | | | | | | | | |
|
RBSSP Resecuritization Trust | |
4.793% due 05/26/2037 ~(l) | | $ | | | 2,763 | | | $ | | | 1,617 | |
4.925% due 07/26/2045 ~(l) | | | | | 9,640 | | | | | | 9,115 | |
5.107% due 09/26/2035 ~(l) | | | | | 3,253 | | | | | | 1,882 | |
6.000% due 03/26/2036 ~(l) | | | | | 3,469 | | | | | | 1,929 | |
| | | | | 381 | | | | | | 328 | |
|
| |
| | | | | 1 | | | | | | 1 | |
|
Residential Accredit Loans, Inc. Trust | |
| | | | | 41 | | | | | | 31 | |
| | | | | 304 | | | | | | 274 | |
5.830% due 07/25/2036 •(l) | | | | | 6,883 | | | | | | 2,776 | |
5.850% due 05/25/2037 •(l) | | | | | 6,850 | | | | | | 6,062 | |
5.890% due 06/25/2037 •(l) | | | | | 664 | | | | | | 584 | |
6.000% due 08/25/2035 (l) | | | | | 582 | | | | | | 497 | |
6.000% due 12/25/2035 (l) | | | | | 1,203 | | | | | | 1,046 | |
| | | | | 139 | | | | | | 104 | |
6.000% due 09/25/2036 (l) | | | | | 3,006 | | | | | | 1,287 | |
6.000% due 11/25/2036 (l) | | | | | 1,386 | | | | | | 1,057 | |
| | | | | 210 | | | | | | 163 | |
6.012% due 01/25/2046 •(l) | | | | | 2,843 | | | | | | 2,240 | |
6.250% due 02/25/2037 (l) | | | | | 2,044 | | | | | | 1,583 | |
6.500% due 09/25/2037 (l) | | | | | 747 | | | | | | 599 | |
7.000% due 10/25/2037 (l) | | | | | 4,455 | | | | | | 3,465 | |
|
Residential Asset Mortgage Products Trust | |
| | | | | 314 | | | | | | 200 | |
|
Residential Asset Securitization Trust | |
| | | | | 568 | | | | | | 349 | |
| | | | | 166 | | | | | | 68 | |
| | | | | 2,795 | | | | | | 931 | |
6.000% due 07/25/2037 (l) | | | | | 6,206 | | | | | | 2,514 | |
| | | | | 4,037 | | | | | | 988 | |
|
Residential Funding Mortgage Securities, Inc. Trust | |
| | | | | 110 | | | | | | 84 | |
| | | | | 50 | | | | | | 41 | |
| | | | | 387 | | | | | | 297 | |
| | | | | 154 | | | | | | 115 | |
|
| |
| | | | | 5,847 | | | | | | 5,356 | |
|
Seasoned Credit Risk Transfer Trust | |
2.727% due 11/25/2061 ~(a) | | | | | 4,490 | | | | | | 1,357 | |
3.896% due 11/25/2059 ~(l) | | | | | 6,776 | | | | | | 2,566 | |
4.250% due 11/25/2059 ~(l) | | | | | 4,530 | | | | | | 4,051 | |
4.250% due 09/25/2060 (l) | | | | | 1,800 | | | | | | 1,628 | |
4.250% due 03/25/2061 ~(l) | | | | | 700 | | | | | | 590 | |
4.500% due 11/25/2061 ~(l) | | | | | 3,900 | | | | | | 3,174 | |
5.000% due 04/25/2062 ~(l) | | | | | 3,400 | | | | | | 2,822 | |
| | | | | 496 | | | | | | 252 | |
| | | | | 1,594 | | | | | | 1,123 | |
| | | | | 1,198 | | | | | | 896 | |
|
| |
| | | | | 78 | | | | | | 60 | |
| | | | | 100 | | | | | | 20 | |
| | | | | 131 | | | | | | 116 | |
| | | | | 167 | | | | | | 141 | |
| | | | | 208 | | | | | | 192 | |
|
SFO Commercial Mortgage Trust | |
6.626% due 05/15/2038 ~(l) | | | | | 18,150 | | | | | | 17,028 | |
6.976% due 05/15/2038 •(l) | | | | | 2,120 | | | | | | 1,929 | |
7.276% due 05/15/2038 •(l) | | | | | 1,760 | | | | | | 1,549 | |
|
SG Commercial Mortgage Securities Trust | |
4.509% due 02/15/2041 ~(l) | | | | | 9,000 | | | | | | 6,709 | |
|
SMRT Commercial Mortgage Trust | |
8.062% due 01/15/2039 •(l) | | | | | 30,200 | | | | | | 28,471 | |
|
Starwood Mortgage Residential Trust | |
| | | | | 500 | | | | | | 329 | |
|
| |
8.476% due 04/15/2034 •(l) | | | | | 13,424 | | | | | | 12,912 | |
9.476% due 04/15/2034 •(l) | | | | | 6,612 | | | | | | 6,400 | |
|
| |
7.220% due 02/25/2053 •(l) | | GBP | | | 1,967 | | | | | | 2,403 | |
7.970% due 02/25/2053 •(l) | | | | | 4,300 | | | | | | 5,172 | |
|
Stratton Mortgage Funding PLC | |
8.721% due 07/20/2060 •(l) | | | | | 6,378 | | | | | | 8,112 | |
| | | | | 2,500 | | | | | | 3,194 | |
|
Structured Adjustable Rate Mortgage Loan Trust | |
3.943% due 02/25/2037 ~(l) | | $ | | | 5,125 | | | | | | 3,547 | |
| | | | | | | | | | | | |
| | | | | | | | | | | |
| | $ | | | 1,012 | | | $ | | | 478 | |
| | | | | 558 | | | | | | 281 | |
| | | | | 2,255 | | | | | | 454 | |
|
Structured Asset Mortgage Investments Trust | |
| | | | | 2,732 | | | | | | 1,293 | |
| | | | | 883 | | | | | | 263 | |
5.850% due 07/25/2046 •(l) | | | | | 8,483 | | | | | | 5,942 | |
5.890% due 05/25/2036 •(l) | | | | | 1,417 | | | | | | 954 | |
5.890% due 08/25/2036 ~(l) | | | | | 742 | | | | | | 599 | |
| | | | | 55 | | | | | | 49 | |
|
Structured Asset Securities Corp. Mortgage Pass-Through Certificates | |
| | | | | 66 | | | | | | 64 | |
|
SunTrust Adjustable Rate Mortgage Loan Trust | |
5.068% due 02/25/2037 ~(l) | | | | | 1,141 | | | | | | 993 | |
|
SunTrust Alternative Loan Trust | |
1.680% due 04/25/2036 ~(a) | | | | | 3,890 | | | | | | 602 | |
|
TBW Mortgage-Backed Trust | |
| | | | | 204 | | | | | | 75 | |
6.500% due 07/25/2036 (l) | | | | | 18,288 | | | | | | 4,573 | |
|
TDA Mixto Fondo de Titulizacion de Activos | |
4.131% due 12/28/2050 •(l) | | EUR | | | 6,334 | | | | | | 5,866 | |
4.152% due 10/28/2050 •(l) | | | | | 8,022 | | | | | | 4,688 | |
|
| |
7.876% due 03/15/2038 (l) | | $ | | | 9,486 | | | | | | 9,124 | |
|
| |
| | | | | 1,000 | | | | | | 906 | |
9.376% due 07/15/2039 •(l) | | | | | 4,435 | | | | | | 2,512 | |
|
Verus Securitization Trust | |
5.365% due 07/25/2067 ~(l) | | | | | 4,300 | | | | | | 4,019 | |
|
| |
3.903% due 01/10/2035 ~(l) | | | | | 4,814 | | | | | | 3,780 | |
|
Waikiki Beach Hotel Trust | |
7.756% due 12/15/2033 •(l) | | | | | 19,450 | | | | | | 18,915 | |
8.406% due 12/15/2033 •(l) | | | | | 20,500 | | | | | | 19,429 | |
|
WaMu Mortgage Pass-Through Certificates Trust | |
| | | | | 232 | | | | | | 185 | |
3.704% due 02/25/2037 ~(l) | | | | | 1,519 | | | | | | 1,275 | |
3.777% due 03/25/2037 ~(l) | | | | | 1,589 | | | | | | 1,391 | |
3.814% due 06/25/2037 ~(l) | | | | | 611 | | | | | | 523 | |
3.878% due 07/25/2037 ~(l) | | | | | 1,011 | | | | | | 756 | |
| | | | | 94 | | | | | | 80 | |
| | | | | 21 | | | | | | 19 | |
| | | | | 494 | | | | | | 428 | |
4.485% due 08/25/2036 ~(l) | | | | | 893 | | | | | | 815 | |
| | | | | 1,600 | | | | | | 1,128 | |
| | | | | 368 | | | | | | 305 | |
5.822% due 07/25/2047 •(l) | | | | | 11,018 | | | | | | 8,764 | |
| | | | | 208 | | | | | | 174 | |
| | | | | 96 | | | | | | 90 | |
6.060% due 07/25/2046 •(l) | | | | | 2,398 | | | | | | 1,976 | |
| | | | | 78 | | | | | | 72 | |
|
Warwick Finance Residential Mortgages PLC | |
0.000% due 12/21/2049 (g) | | GBP | | | 0 | | | | | | 1,815 | |
| | | | | 646 | | | | | | 809 | |
| | | | | 646 | | | | | | 795 | |
|
Washington Mutual Mortgage Pass-Through Certificates Trust | |
| | $ | | | 63 | | | | | | 55 | |
5.750% due 11/25/2035 (l) | | | | | 773 | | | | | | 682 | |
| | | | | 245 | | | | | | 195 | |
5.950% due 01/25/2047 •(l) | | | | | 7,155 | | | | | | 6,539 | |
6.000% due 07/25/2036 •(l) | | | | | 3,067 | | | | | | 2,047 | |
6.000% due 04/25/2037 (l) | | | | | 1,217 | | | | | | 1,034 | |
6.467% due 05/25/2036 þ(l) | | | | | 3,396 | | | | | | 2,864 | |
7.329% due 06/25/2046 •(l) | | | | | 5,341 | | | | | | 2,876 | |
|
Wells Fargo Alternative Loan Trust | |
5.332% due 07/25/2037 ~(l) | | | | | 1,171 | | | | | | 1,055 | |
| | | | | 169 | | | | | | 143 | |
|
Wells Fargo Commercial Mortgage Trust | |
4.557% due 09/15/2031 (l) | | | | | 27,000 | | | | | | 24,497 | |
8.216% due 02/15/2037 •(l) | | | | | 10,000 | | | | | | 9,770 | |
|
Wells Fargo Mortgage Loan Trust | |
4.285% due 03/27/2037 ~(l) | | | | | 3,243 | | | | | | 1,980 | |
4.773% due 04/27/2036 ~(l) | | | | | 3,144 | | | | | | 2,907 | |
|
Wells Fargo Mortgage-Backed Securities Trust | |
| | | | | 26 | | | | | | 24 | |
| | | | | | | | | | | | |
| | | | | | | | | | | |
| | $ | | | 27 | | | $ | | | 24 | |
| | | | | 3 | | | | | | 3 | |
| | | | | 4 | | | | | | 4 | |
|
| |
3.596% due 11/10/2036 ~(l) | | | | | 8,000 | | | | | | 801 | |
|
| |
0.341% due 07/05/2037 (a) | | | | | 515,000 | | | | | | 4,481 | |
7.690% due 07/05/2037 (l) | | | | | 11,200 | | | | | | 11,084 | |
8.455% due 07/05/2037 (l) | | | | | 11,200 | | | | | | 11,118 | |
9.835% due 07/05/2037 (l) | | | | | 9,010 | | | | | | 8,917 | |
| | | | | | | | | | | | |
Total Non-Agency Mortgage-Backed Securities (Cost $2,348,161) | | | | |
| | | | |
| |
ASSET-BACKED SECURITIES 26.0% | |
|
510 Loan Acquisition Trust | |
8.107% due 09/25/2060 þ(l) | | | | | 15,679 | | | | | | 15,700 | |
|
| |
5.620% due 10/25/2036 •(l) | | | | | 697 | | | | | | 695 | |
| | | | | 167 | | | | | | 156 | |
| | | | | 469 | | | | | | 448 | |
|
| |
6.480% due 11/08/2039 •(l) | | | | | 8,674 | | | | | | 2,452 | |
|
Access Financial Manufactured Housing Contract Trust | |
| | | | | 200 | | | | | | 2 | |
|
ACE Securities Corp. Home Equity Loan Trust | |
5.690% due 12/25/2036 •(l) | | | | | 21,320 | | | | | | 5,613 | |
6.430% due 08/25/2035 •(l) | | | | | 5,048 | | | | | | 3,510 | |
6.565% due 07/25/2035 •(l) | | | | | 17,938 | | | | | | 16,293 | |
|
| |
| | EUR | | | 1,800 | | | | | | 623 | |
|
Aegis Asset-Backed Securities Trust Mortgage Pass-Through Certificates | |
7.570% due 09/25/2034 •(l) | | $ | | | 740 | | | | | | 693 | |
|
AIM Aviation Finance Ltd. | |
6.213% due 02/15/2040 þ(l) | | | | | 1,452 | | | | | | 977 | |
|
Ameriquest Mortgage Securities, Inc. Asset-Backed Pass-Through Certificates | |
3.731% due 09/25/2032 •(l) | | | | | 1,148 | | | | | | 1,015 | |
| | | | | 154 | | | | | | 147 | |
7.195% due 08/25/2035 (l) | | | | | 6,344 | | | | | | 5,543 | |
| | | | | 259 | | | | | | 253 | |
|
| |
5.620% due 09/25/2036 •(l) | | | | | 7,623 | | | | | | 2,450 | |
5.670% due 06/25/2036 •(l) | | | | | 6,493 | | | | | | 1,723 | |
| | | | | 1,027 | | | | | | 333 | |
| | | | | 3,655 | | | | | | 970 | |
5.850% due 03/25/2036 •(l) | | | | | 10,069 | | | | | | 5,388 | |
|
Argent Securities, Inc. Asset-Backed Pass-Through Certificates | |
6.160% due 11/25/2035 •(l) | | | | | 29,851 | | | | | | 25,600 | |
6.230% due 02/25/2036 •(l) | | | | | 20,996 | | | | | | 16,284 | |
|
Banco Bilbao Vizcaya Argentaria | |
| | EUR | | | 547 | | | | | | 354 | |
|
Bear Stearns Asset-Backed Securities Trust | |
| | $ | | | 106 | | | | | | 100 | |
| | | | | 36 | | | | | | 35 | |
| | | | | 24 | | | | | | 23 | |
| | | | | 129 | | | | | | 101 | |
| | | | | 2,494 | | | | | | 1,172 | |
5.458% due 12/25/2036 ~(l) | | | | | 8,881 | | | | | | 12,479 | |
| | | | | 1 | | | | | | 3 | |
|
Bombardier Capital Mortgage Securitization Corp. | |
| | | | | 3,549 | | | | | | 428 | |
|
Carlyle Global Market Strategies CLO Ltd. | |
| | | | | 2,900 | | | | | | 489 | |
|
Carrington Mortgage Loan Trust | |
| | | | | 584 | | | | | | 453 | |
5.890% due 12/26/2036 •(l) | | | | | 13,201 | | | | | | 10,671 | |
|
| |
| | | | | 3,390 | | | | | | 703 | |
|
Citigroup Mortgage Loan Trust | |
| | | | | 1,426 | | | | | | 691 | |
| | | | | 426 | | | | | | 279 | |
5.770% due 12/25/2036 •(l) | | | | | 17,161 | | | | | | 6,857 | |
| | | | | | | | | | | | |
| See Accompanying Notes | | | | | | | | | | DECEMBER 31, 2023 | | | |
| | | | | | | | |
Consolidated Schedule of Investments | | PIMCO Dynamic Income Fund | | | | | | |
| | | | | | | | | | | | |
| | | | | | | | | | | |
5.790% due 09/25/2036 •(l) | | $ | | | 10,605 | | | $ | | | 7,702 | |
5.790% due 12/25/2036 •(l) | | | | | 11,111 | | | | | | 6,207 | |
5.910% due 12/25/2036 •(l) | | | | | 12,573 | | | | | | 5,043 | |
6.170% due 11/25/2046 •(l) | | | | | 4,267 | | | | | | 3,351 | |
| | | | | 365 | | | | | | 140 | |
| | | | | 2,124 | | | | | | 814 | |
|
Cologix Canadian Issuer LP | |
| | CAD | | | 2,000 | | | | | | 1,396 | |
|
| |
| | $ | | | 414 | | | | | | 363 | |
| | | | | 1,799 | | | | | | 1,601 | |
| | | | | 6,124 | | | | | | 2,167 | |
|
Conseco Finance Securitizations Corp. | |
| | | | | 288 | | | | | | 288 | |
| | | | | 1,457 | | | | | | 406 | |
| | | | | 2,914 | | | | | | 557 | |
8.260% due 12/01/2030 ~(l) | | | | | 4,584 | | | | | | 1,105 | |
8.850% due 12/01/2030 ~(l) | | | | | 5,630 | | | | | | 995 | |
9.163% due 03/01/2033 ~(l) | | | | | 9,869 | | | | | | 9,554 | |
9.546% due 12/01/2033 ~(l) | | | | | 6,150 | | | | | | 5,986 | |
|
| |
| | EUR | | | 1,401 | | | | | | 258 | |
|
| |
6.000% due 09/04/2038 (l) | | $ | | | 3,722 | | | | | | 1,719 | |
7.131% due 09/04/2038 •(l) | | | | | 23,494 | | | | | | 9,553 | |
|
Countrywide Asset-Backed Certificates Trust | |
| | | | | 1 | | | | | | 1 | |
4.434% due 10/25/2032 ~(l) | | | | | 2,812 | | | | | | 2,791 | |
5.720% due 11/25/2047 •(l) | | | | | 3,472 | | | | | | 3,057 | |
5.750% due 03/25/2037 ~(l) | | | | | 10,996 | | | | | | 10,421 | |
| | | | | 208 | | | | | | 236 | |
5.860% due 01/25/2046 •(l) | | | | | 36,548 | | | | | | 28,856 | |
5.870% due 06/25/2037 •(l) | | | | | 17,764 | | | | | | 17,848 | |
5.950% due 03/25/2036 •(l) | | | | | 14,619 | | | | | | 13,292 | |
5.950% due 05/25/2036 •(l) | | | | | 3,956 | | | | | | 3,291 | |
6.055% due 04/25/2036 •(l) | | | | | 8,762 | | | | | | 7,991 | |
| | | | | 281 | | | | | | 215 | |
6.370% due 03/25/2047 •(l) | | | | | 961 | | | | | | 735 | |
6.570% due 05/25/2047 •(l) | | | | | 4,828 | | | | | | 3,801 | |
6.640% due 04/25/2036 ~(l) | | | | | 9,461 | | | | | | 7,848 | |
6.867% due 09/25/2046 þ(l) | | | | | 6,156 | | | | | | 4,114 | |
7.495% due 11/25/2035 •(l) | | | | | 5,913 | | | | | | 4,068 | |
|
Credit Suisse First Boston Mortgage Securities Corp. | |
6.520% due 02/25/2031 •(l) | | | | | 610 | | | | | | 587 | |
|
Credit-Based Asset Servicing & Securitization CBO Corp. | |
| | | | | 98,373 | | | | | | 10 | |
|
CSAB Mortgage-Backed Trust | |
5.500% due 05/25/2037 (l) | | | | | 1,921 | | | | | | 1,336 | |
|
| |
9.000% due 04/08/2039 •(l) | | | | | 7,546 | | | | | | 518 | |
|
| |
3.473% due 06/15/2040 (l) | | | | | 1,119 | | | | | | 711 | |
4.947% due 06/15/2040 (l) | | | | | 7,412 | | | | | | 4,855 | |
|
| |
8.845% due 04/25/2042 •(l) | | | | | 1,497 | | | | | | 1,448 | |
|
Encore Credit Receivables Trust | |
| | | | | 337 | | | | | | 324 | |
|
| |
| | EUR | | | 2,809 | | | | | | 3,099 | |
|
Exeter Automobile Receivables Trust | |
0.000% due 05/15/2031 «(g) | | $ | | | 22 | | | | | | 5,367 | |
0.000% due 08/15/2031 «(g) | | | | | 24 | | | | | | 7,682 | |
0.000% due 07/15/2033 «(g)(l) | | | | | 27 | | | | | | 23,347 | |
0.000% due 12/15/2033 «(g) | | | | | 25 | | | | | | 4,619 | |
|
| |
| | GBP | | | 15,058 | | | | | | 5,527 | |
|
Fieldstone Mortgage Investment Trust | |
5.810% due 07/25/2036 •(l) | | $ | | | 4,169 | | | | | | 2,030 | |
|
First Franklin Mortgage Loan Trust | |
6.040% due 02/25/2036 •(l) | | | | | 5,500 | | | | | | 5,104 | |
6.415% due 09/25/2035 •(l) | | | | | 5,831 | | | | | | 5,163 | |
6.445% due 05/25/2036 •(l) | | | | | 16,259 | | | | | | 14,607 | |
|
Flagship Credit Auto Trust | |
0.000% due 12/15/2027 «(g) | | | | | 9 | | | | | | 695 | |
0.000% due 06/15/2029 «(g) | | | | | 3 | | | | | | 227 | |
| | | | | | | | | | | | |
| | | | | | | | | | | |
|
| |
0.000% due 09/20/2027 «(g) | | $ | | | 10 | | | $ | | | 780 | |
|
| |
| | | | | 2,828 | | | | | | 1,285 | |
| | | | | 1,109 | | | | | | 376 | |
|
| |
8.770% due 08/04/2035 •(l) | | | | | 31,282 | | | | | | 3,639 | |
|
GMACM Home Equity Loan Trust | |
6.749% due 12/25/2037 þ(l) | | | | | 596 | | | | | | 613 | |
|
Greenpoint Manufactured Housing | |
9.230% due 12/15/2029 ~(l) | | | | | 5,980 | | | | | | 5,742 | |
|
| |
5.530% due 01/25/2037 •(l) | | | | | 2,563 | | | | | | 1,478 | |
| | | | | 765 | | | | | | 441 | |
| | | | | 809 | | | | | | 426 | |
| | | | | 3,346 | | | | | | 1,590 | |
5.720% due 12/25/2036 •(l) | | | | | 3,778 | | | | | | 1,783 | |
| | | | | 426 | | | | | | 268 | |
6.010% due 04/25/2036 •(l) | | | | | 15,207 | | | | | | 9,628 | |
| | | | | 97 | | | | | | 95 | |
7.345% due 06/25/2034 ~(l) | | | | | 1,253 | | | | | | 1,153 | |
|
| |
5.880% due 12/10/2039 •(l) | | | | | 32,573 | | | | | | 15,026 | |
|
Home Equity Mortgage Loan Asset-Backed Trust | |
| | | | | 467 | | | | | | 217 | |
5.630% due 11/25/2036 •(l) | | | | | 3,026 | | | | | | 2,647 | |
5.710% due 04/25/2037 •(l) | | | | | 16,694 | | | | | | 10,797 | |
5.790% due 04/25/2037 •(l) | | | | | 2,504 | | | | | | 2,145 | |
|
| |
| | | | | 108,638 | | | | | | 20,898 | |
| | | | | 4,871 | | | | | | 1 | |
| | | | | 1,690 | | | | | | 0 | |
|
HSI Asset Securitization Corp. Trust | |
5.660% due 01/25/2037 •(l) | | | | | 27,799 | | | | | | 19,346 | |
| | | | | 19,871 | | | | | | 5,295 | |
5.790% due 10/25/2036 •(l) | | | | | 6,513 | | | | | | 2,634 | |
5.810% due 12/25/2036 •(l) | | | | | 12,171 | | | | | | 3,206 | |
|
IXIS Real Estate Capital Trust | |
6.445% due 09/25/2035 •(l) | | | | | 2,433 | | | | | | 2,427 | |
|
JP Morgan Mortgage Acquisition Trust | |
5.462% due 09/25/2029 þ(l) | | | | | 2,499 | | | | | | 1,523 | |
| | | | | 6 | | | | | | 2 | |
| | | | | 163 | | | | | | 161 | |
| | | | | 1,310 | | | | | | 556 | |
| | | | | 971 | | | | | | 260 | |
5.888% due 10/25/2036 þ(l) | | | | | 6,846 | | | | | | 4,171 | |
|
| |
1.074% due 04/25/2038 «~(a) | | | | | 744 | | | | | | 16 | |
|
Labrador Aviation Finance Ltd. | |
4.300% due 01/15/2042 (l) | | | | | 3,028 | | | | | | 2,589 | |
|
Lehman ABS Mortgage Loan Trust | |
5.560% due 06/25/2037 •(l) | | | | | 3,361 | | | | | | 2,148 | |
|
| |
4.308% due 05/25/2037 ~(l) | | | | | 6,390 | | | | | | 5,244 | |
| | | | | 245 | | | | | | 244 | |
|
LendingPoint Pass-Through Trust | |
0.000% due 03/15/2028 «(g) | | | | | 1,400 | | | | | | 262 | |
0.000% due 04/15/2028 «(g) | | | | | 1,700 | | | | | | 292 | |
|
| |
8.526% due 07/15/2035 ~(l) | | | | | 2,705 | | | | | | 2,557 | |
|
Long Beach Mortgage Loan Trust | |
5.850% due 02/25/2036 •(l) | | | | | 17,341 | | | | | | 13,844 | |
6.010% due 05/25/2046 ~(l) | | | | | 8,151 | | | | | | 2,470 | |
6.175% due 11/25/2035 •(l) | | | | | 56,097 | | | | | | 50,467 | |
|
Madison Park Funding Ltd. | |
0.000% due 07/27/2047 ~(l) | | | | | 5,600 | | | | | | 2,879 | |
|
| |
| | | | | 6,450 | | | | | | 4,257 | |
|
| |
| | | | | 17,150 | | | | | | 10,607 | |
|
| |
0.000% due 12/04/2044 ^(d)(g) | | | | | 1,015 | | | | | | 0 | |
5.316% due 12/04/2044 •(l) | | | | | 17,556 | | | | | | 3,712 | |
5.586% due 12/04/2044 ^(d) | | | | | 4,126 | | | | | | 72 | |
| | | | | 1,045 | | | | | | 18 | |
| | | | | | | | | | | | |
| | | | | | | | | | | |
|
| |
0.000% due 07/16/2029 «(g) | | $ | | | 16 | | | $ | | | 380 | |
0.000% due 09/17/2029 «(g) | | | | | 35 | | | | | | 1,027 | |
0.000% due 03/15/2030 «(g) | | | | | 33 | | | | | | 1,075 | |
0.000% due 09/16/2030 «(g) | | | | | 9 | | | | | | 270 | |
|
MASTR Asset-Backed Securities Trust | |
| | | | | 2,699 | | | | | | 1,041 | |
5.770% due 03/25/2036 •(l) | | | | | 5,051 | | | | | | 3,069 | |
5.810% due 06/25/2036 •(l) | | | | | 3,744 | | | | | | 3,276 | |
5.830% due 02/25/2036 •(l) | | | | | 6,054 | | | | | | 2,321 | |
| | | | | 2,579 | | | | | | 942 | |
6.010% due 12/25/2035 •(l) | | | | | 15,111 | | | | | | 12,494 | |
| | | | | 163 | | | | | | 160 | |
|
| |
| | | | | 2,521 | | | | | | 2,509 | |
|
Morgan Stanley ABS Capital, Inc. Trust | |
| | | | | 1,385 | | | | | | 597 | |
| | | | | 1,177 | | | | | | 670 | |
| | | | | 3,240 | | | | | | 1,140 | |
5.610% due 10/25/2036 ~(l) | | | | | 7,204 | | | | | | 3,110 | |
5.620% due 11/25/2036 •(l) | | | | | 12,831 | | | | | | 7,305 | |
5.690% due 10/25/2036 •(l) | | | | | 3,471 | | | | | | 1,500 | |
5.770% due 06/25/2036 •(l) | | | | | 4,573 | | | | | | 2,384 | |
| | | | | 484 | | | | | | 400 | |
5.770% due 09/25/2036 •(l) | | | | | 6,510 | | | | | | 2,308 | |
5.800% due 02/25/2037 •(l) | | | | | 4,420 | | | | | | 2,095 | |
6.505% due 01/25/2035 •(l) | | | | | 6,377 | | | | | | 5,361 | |
| | | | | 245 | | | | | | 244 | |
|
Morgan Stanley Capital, Inc. Trust | |
| | | | | 10 | | | | | | 8 | |
|
Morgan Stanley Home Equity Loan Trust | |
5.700% due 04/25/2037 •(l) | | | | | 21,340 | | | | | | 11,120 | |
|
National Collegiate Commutation Trust | |
0.000% due 03/25/2038 •(l) | | | | | 135,200 | | | | | | 35,989 | |
|
New Century Home Equity Loan Trust | |
| | | | | 229 | | | | | | 195 | |
|
Nomura Home Equity Loan, Inc. Home Equity Loan Trust | |
5.750% due 07/25/2036 ~(l) | | | | | 3,500 | | | | | | 2,788 | |
| | | | | 4,194 | | | | | | 935 | |
|
NovaStar Mortgage Funding Trust | |
| | | | | 1,052 | | | | | | 317 | |
|
Oakwood Mortgage Investors, Inc. | |
| | | | | 986 | | | | | | 994 | |
| | | | | 1,163 | | | | | | 1,086 | |
|
| |
| | | | | 11 | | | | | | 4,583 | |
|
Option One Mortgage Loan Trust | |
5.600% due 07/25/2037 •(l) | | | | | 20,368 | | | | | | 12,961 | |
| | | | | 266 | | | | | | 166 | |
5.610% due 01/25/2037 •(l) | | | | | 7,702 | | | | | | 4,369 | |
| | | | | 2 | | | | | | 1 | |
| | | | | 1,571 | | | | | | 891 | |
| | | | | 485 | | | | | | 237 | |
5.800% due 04/25/2037 ~(l) | | | | | 1,997 | | | | | | 953 | |
|
| |
5.863% due 10/03/2045 •(l) | | | | | 391,989 | | | | | | 124,753 | |
|
Ownit Mortgage Loan Trust | |
3.192% due 10/25/2035 þ(l) | | | | | 3,506 | | | | | | 2,005 | |
|
Pagaya AI Debt Selection Trust | |
| | | | | 1,500 | | | | | | 1,263 | |
| | | | | 6,000 | | | | | | 6,086 | |
|
| |
6.624% due 07/22/2039 ~(l) | | | | | 6,700 | | | | | | 2,808 | |
|
Park Place Securities, Inc. Asset-Backed Pass-Through Certificates | |
7.345% due 10/25/2034 •(l) | | | | | 1,161 | | | | | | 970 | |
|
| |
| | | | | 1,200 | | | | | | 1,078 | |
| | | | | 2,900 | | | | | | 2,599 | |
3.967% due 09/25/2051 þ(l) | | | | | 3,900 | | | | | | 3,611 | |
6.170% due 07/25/2051 þ(l) | | | | | 2,100 | | | | | | 2,030 | |
| | | | | 986 | | | | | | 1,002 | |
|
| |
6.291% due 02/25/2027 þ(l) | | | | | 1,000 | | | | | | 966 | |
| | | | | | | | |
| | | | | | December 31, 2023 | | (Unaudited) |
| | | | | | | | | | | | |
| | | | | | | | | | | |
|
Putnam Structured Product Funding Ltd. | |
1.584% due 10/15/2038 •(l) | | $ | | | 766 | | | $ | | | 530 | |
|
| |
8.095% due 05/25/2046 •(l) | | | | | 17,151 | | | | | | 16,515 | |
|
Renaissance Home Equity Loan Trust | |
| | | | | 3,152 | | | | | | 854 | |
|
Residential Asset Mortgage Products Trust | |
| | | | | 358 | | | | | | 341 | |
5.970% due 04/25/2034 •(l) | | | | | 1,361 | | | | | | 1,338 | |
6.050% due 04/25/2034 •(l) | | | | | 518 | | | | | | 517 | |
6.520% due 04/25/2034 •(l) | | | | | 1,041 | | | | | | 989 | |
6.790% due 04/25/2034 •(l) | | | | | 1,738 | | | | | | 1,690 | |
|
Residential Asset Securities Corp. Trust | |
5.730% due 11/25/2036 ~(l) | | | | | 4,263 | | | | | | 3,919 | |
5.810% due 10/25/2036 •(l) | | | | | 2,800 | | | | | | 2,697 | |
5.950% due 08/25/2036 •(l) | | | | | 8,984 | | | | | | 8,128 | |
5.965% due 04/25/2036 •(l) | | | | | 5,975 | | | | | | 4,621 | |
6.130% due 12/25/2035 •(l) | | | | | 6,818 | | | | | | 6,079 | |
|
| |
0.000% due 10/15/2029 ~(l) | | | | | 11,667 | | | | | | 4,031 | |
| | | | | 4,967 | | | | | | 1,698 | |
| | | | | 4,967 | | | | | | 2,012 | |
0.000% due 04/20/2034 ~(l) | | | | | 22,000 | | | | | | 13,090 | |
|
Saxon Asset Securities Trust | |
1.458% due 11/25/2035 •(l) | | | | | 5,547 | | | | | | 3,548 | |
2.164% due 03/25/2035 •(l) | | | | | 5,096 | | | | | | 2,798 | |
|
Securitized Asset-Backed Receivables LLC Trust | |
5.750% due 07/25/2036 •(l) | | | | | 12,244 | | | | | | 10,032 | |
| | | | | 2,632 | | | | | | 911 | |
| | | | | 222 | | | | | | 96 | |
5.970% due 05/25/2036 •(l) | | | | | 15,209 | | | | | | 7,975 | |
6.070% due 11/25/2035 •(l) | | | | | 10,192 | | | | | | 8,372 | |
6.130% due 08/25/2035 •(l) | | | | | 1,590 | | | | | | 1,270 | |
| | | | | 6 | | | | | | 5 | |
|
| |
| | EUR | | | 1,400 | | | | | | 750 | |
|
SLM Student Loan EDC Repackaging Trust | |
0.000% due 10/28/2029 «(g)(l) | | $ | | | 36 | | | | | | 18,553 | |
|
| |
0.000% due 01/25/2042 «(g) | | | | | 31 | | | | | | 6,981 | |
|
SMB Private Education Loan Trust | |
0.000% due 10/15/2048 «(g) | | | | | 8 | | | | | | 2,371 | |
0.000% due 09/15/2054 «(g)(l) | | | | | 49,066 | | | | | | 63,082 | |
0.000% due 11/16/2054 «(g) | | | | | 5 | | | | | | 4,705 | |
0.000% due 02/16/2055 «(g) | | | | | 9 | | | | | | 11,128 | |
5.950% due 02/16/2055 (l) | | | | | 11,206 | | | | | | 10,710 | |
|
SoFi Professional Loan Program LLC | |
0.000% due 05/25/2040 (g) | | | | | 31,475 | | | | | | 2,590 | |
0.000% due 07/25/2040 «(g) | | | | | 157 | | | | | | 1,651 | |
0.000% due 09/25/2040 «(g) | | | | | 14,219 | | | | | | 1,730 | |
|
| |
5.988% due 10/07/2037 ~(l) | | | | | 17,418 | | | | | | 14,544 | |
|
Soundview Home Loan Trust | |
5.620% due 06/25/2037 ~(l) | | | | | 2,202 | | | | | | 1,454 | |
5.650% due 02/25/2037 ~(l) | | | | | 6,907 | | | | | | 1,932 | |
5.730% due 02/25/2037 •(l) | | | | | 8,016 | | | | | | 2,267 | |
5.750% due 06/25/2037 •(l) | | | | | 5,440 | | | | | | 3,592 | |
6.420% due 10/25/2037 ~(l) | | | | | 4,093 | | | | | | 2,997 | |
6.570% due 09/25/2037 •(l) | | | | | 1,694 | | | | | | 1,355 | |
|
| |
| | | | | 48 | | | | | | 9 | |
0.454% due 01/06/2041 •(l) | | | | | 168,529 | | | | | | 32,304 | |
|
Specialty Underwriting & Residential Finance Trust | |
| | | | | 2,482 | | | | | | 898 | |
| | | | | 2,960 | | | | | | 1,453 | |
| | | | | 283 | | | | | | 154 | |
|
| |
| | | | | 615 | | | | | | 559 | |
|
Structured Asset Securities Corp. | |
11.470% due 05/25/2032 •(l) | | | | | 4,995 | | | | | | 4,403 | |
|
Taberna Preferred Funding Ltd. | |
| | | | | 1,395 | | | | | | 1,325 | |
| | | | | 2,789 | | | | | | 2,510 | |
6.034% due 08/05/2036 •(l) | | | | | 11,217 | | | | | | 10,095 | |
|
| |
| | | | | 676 | | | | | | 113 | |
| | | | | | | | | | | | |
| | | | | | | | | | | |
|
| |
5.975% due 07/15/2036 •(l) | | $ | | | 3,334 | | | $ | | | 3,084 | |
|
UCFC Home Equity Loan Trust | |
| | | 343 | | | | | | 324 | |
|
| |
5.906% due 10/05/2045 •(l) | | | 240,688 | | | | | | 58,933 | |
| | | | | | | | | | | | |
Total Asset-Backed Securities (Cost $1,794,722) | | | | |
| | | | |
| |
| |
|
Argentina Government International Bond | |
0.750% due 07/09/2030 þ(l) | | | 31,687 | | | | | | 12,165 | |
1.000% due 07/09/2029 (l) | | | 5,302 | | | | | | 2,117 | |
3.500% due 07/09/2041 þ(l) | | | 17,060 | | | | | | 5,828 | |
| | | | | 1,200 | | | | | | 409 | |
3.625% due 07/09/2035 þ(l) | | | 33,944 | | | | | | 11,204 | |
| | | | | 230 | | | | | | 80 | |
4.250% due 01/09/2038 þ(l) | | | 76,360 | | | | | | 30,357 | |
| | ARS | | | 555,410 | | | | | | 173 | |
|
Argentina Treasury Bond BONCER | |
| | | | | 1,396,020 | | | | | | 2,303 | |
|
Autonomous City of Buenos Aires | |
122.642% (BADLARPP + 3.750%) due 02/22/2028 ~ | | | 155,766 | | | | | | 137 | |
|
Ecuador Government International Bond | |
6.000% due 07/31/2030 þ(l) | | $ | | | 2,960 | | | | | | 1,385 | |
|
Ghana Government International Bond | |
6.375% due 02/11/2027 ^(d) | | | 1,000 | | | | | | 449 | |
6.375% due 02/11/2027 ^(d)(l) | | | 3,477 | | | | | | 1,561 | |
7.875% due 02/11/2035 ^(d)(l) | | | 5,412 | | | | | | 2,383 | |
8.750% due 03/11/2061 ^(d)(l) | | | 1,500 | | | | | | 652 | |
|
Peru Government International Bond | |
| | PEN | | | 100 | | | | | | 23 | |
| | | | | 1 | | | | | | 0 | |
| | | | | 5 | | | | | | 1 | |
| | | | | 15 | | | | | | 4 | |
| | | | | 5 | | | | | | 1 | |
|
Provincia de Buenos Aires | |
| | ARS | | | 2,270,878 | | | | | | 1,888 | |
|
Romania Government International Bond | |
| | EUR | | | 400 | | | | | | 455 | |
| | | | | 3,000 | | | | | | 3,509 | |
|
Russia Government International Bond | |
5.100% due 03/28/2035 ^(d) | | $ | | | 600 | | | | | | 243 | |
5.625% due 04/04/2042 ^(d) | | | 10,200 | | | | | | 6,858 | |
5.875% due 09/16/2043 ^(d) | | | 200 | | | | | | 126 | |
|
Turkiye Ihracat Kredi Bankasi AS | |
8.250% due 01/24/2024 (l) | | | 1,400 | | | | | | 1,403 | |
|
Ukraine Government International Bond | |
| | EUR | | | 10,155 | | | | | | 2,332 | |
| | $ | | | 13,000 | | | | | | 3,027 | |
|
Venezuela Government International Bond | |
8.250% due 10/13/2034 ^(d) | | | 136 | | | | | | 21 | |
9.250% due 09/15/2037 ^(d) | | | 734 | | | | | | 141 | |
| | | | | | | | | | | | |
Total Sovereign Issues (Cost $171,399) | | | | |
| | | | |
| |
| | | | | | | | | | | |
| |
| |
COMMUNICATION SERVICES 0.3% | |
| | | | |
Clear Channel Outdoor Holdings, Inc. (e) | | | | | 4,853,248 | | | | | | 8,833 | |
| | | | |
iHeartMedia, Inc. ‘A’ (e) | | | | | 2,021,190 | | | | | | 5,397 | |
| | | | |
Promotora de Informaciones SA (e) | | | | | 4,079,279 | | | | | | 1,306 | |
| | | | | | | | | | | | |
| | | | | | | | | | | 15,536 | |
| | | | | | | | | | | | |
| |
CONSUMER DISCRETIONARY 0.0% | |
| | | |
Caesars Entertainment, Inc. (e) | | | 2 | | | | | | 0 | |
| | | | |
Desarrolladora Homex SAB de CV (e) | | | | | 719,113 | | | | | | 1 | |
| | | | | | | | | | | | |
| | | | | | | | | | | |
| | | | |
Steinhoff International Holdings NV «(e)(j) | | | | | 299,163,217 | | | $ | | | 0 | |
| | | | |
Urbi Desarrollos Urbanos SAB de CV (e) | | | | | 4,776 | | | | | | 2 | |
| | | | | | | | | | | | |
| | | | | | | | | | | 3 | |
| | | | | | | | | | | | |
| |
| |
| | | | |
Axis Energy Services ‘A’ «(j) | | | | | 17,105 | | | | | | 507 | |
| | | | |
Constellation Oil ‘B’ «(e)(j) | | | | | 252,651 | | | | | | 27 | |
| | | | | | | | | | | | |
| | | | | | | | | | | 534 | |
| | | | | | | | | | | | |
| |
| |
| | | | |
| | | | | 309,490 | | | | | | 167 | |
| | | | |
Banca Monte dei Paschi di Siena SpA (e) | | | | | 6,139,000 | | | | | | 20,643 | |
| | | | |
Corestate Capital Holding SA «(e)(j) | | | | | 843,935 | | | | | | 0 | |
| | | | |
Intelsat Emergence SA «(e)(j) | | | | | 1,755,207 | | | | | | 50,005 | |
| | | | |
| | | | | 12,342 | | | | | | 383 | |
| | | | | | | | | | | | |
| | | | | | | | | | | 71,198 | |
| | | | | | | | | | | | |
| |
| |
| | | | |
Drillco Holding Lux SA «(e) | | | | | 237,856 | | | | | | 5,907 | |
| | | | |
| | | | | 26,427 | | | | | | 656 | |
| | | | |
Mcdermott International Ltd. (e) | | | | | 585,421 | | | | | | 53 | |
| | | | |
Syniverse Holdings, Inc. «(j) | | | | | 18,484,014 | | | | | | 16,182 | |
| | | | |
Voyager Aviation Holdings LLC «(e) | | | | | 16,278 | | | | | | 0 | |
| | | | |
Westmoreland Mining Holdings «(e)(j) | | | | | 238,883 | | | | | | 955 | |
| | | | |
Westmoreland Mining LLC «(e)(j) | | | | | 240,987 | | | | | | 843 | |
| | | | | | | | | | | | |
| | | | | | | | | | | 24,596 | |
| | | | | | | | | | | | |
| |
| |
| | | | |
| | | | | 685,298 | | | | | | 401 | |
| | | | |
Stearns Holding LLC ‘B’ «(e) | | | | | 59,964 | | | | | | 0 | |
| | | | |
Sunac Services Holdings Ltd. | | | | | 176,437 | | | | | | 42 | |
| | | | | | | | | | | | |
| | | | | | | | | | | 443 | |
| | | | | | | | | | | | |
| |
| |
| | | | |
| | | | | 450,094 | | | | | | 16,091 | |
| | | | |
| | | | | 43,000 | | | | | | 452 | |
| | | | |
| | | | | 3,155,914 | | | | | | 93,388 | |
| | | | | | | | | | | | |
| | | | | | | | | | | 109,931 | |
| | | | | | | | | | | | |
Total Common Stocks (Cost $286,386) | | | | |
| | | | |
| |
| |
| |
| |
| | | | |
Guaranteed Rate, Inc. - Exp. 12/31/2060 « | | | | | 288 | | | | | | 0 | |
| | | | |
Intelsat Emergence SA - Exp. 02/17/2027 « | | | | | 13,833 | | | | | | 35 | |
| | | | | | | | | | | | |
| | | | | | | | | | | 35 | |
| | | | | | | | | | | | |
| |
| |
| | | | |
West Marine - Exp. 09/08/2028 « | | | | | 5,580 | | | | | | 0 | |
| | | | | | | | | | | | |
Total Warrants (Cost $43,537) | | | | |
| | | | |
| |
| | | | | | | | | | | | |
| See Accompanying Notes | | | | | | | | | | DECEMBER 31, 2023 | | | |
| | | | | | | | |
Consolidated Schedule of Investments | | PIMCO Dynamic Income Fund | | | | | | |
| | | | | | | | | | | | |
| | | | | | | | | | | |
PREFERRED SECURITIES 1.5% | |
| |
| |
|
| |
7.405% (US0003M + 1.750%) due 01/15/2067 ~(l) | | | | | 35,500,000 | | | $ | | | 18,054 | |
|
| |
5.250% due 06/15/2026 •(i) | | | | | 10,000,000 | | | | | | 9,183 | |
|
| |
5.000% due 03/15/2026 •(i)(l) | | | | | 4,300,000 | | | | | | 3,922 | |
|
| |
4.875% due 08/15/2026 •(i)(l) | | | | | 1,900,000 | | | | | | 1,805 | |
|
| |
0.000% due 04/26/2028 (g) | | | | | 2,600 | | | | | | 1,344 | |
|
Stichting AK Rabobank Certificaten | |
6.500% due 12/29/2049 þ(i)(l) | | | | | 35,376,700 | | | | | | 39,212 | |
|
| |
4.000% due 05/15/2026 ^(d)(i) | | | | | 1,600,000 | | | | | | 18 | |
4.250% due 11/15/2026 ^(d)(i) | | | | | 1,000,000 | | | | | | 13 | |
4.700% due 11/15/2031 ^(d)(i) | | | | | 1,593,000 | | | | | | 23 | |
| | | | | | | | | | | | |
| | | | | | | | | | | 73,574 | |
| | | | | | | | | | | | |
| |
| |
|
Voyager Aviation Holdings LLC | |
| | | | | 97,668 | | | | | | 0 | |
| | | | | | | | | | | | |
Total Preferred Securities (Cost $118,472) | | | | |
| | | | |
| |
REAL ESTATE INVESTMENT TRUSTS 0.7% | |
| |
| |
| | | |
CBL & Associates Properties, Inc. | | | 17,153 | | | | | | 419 | |
| | | | |
| | | | | 1,591,211 | | | | | | 9,197 | |
| | | | |
| | | | | 711,293 | | | | | | 22,676 | |
| | | | | | | | | | | | |
Total Real Estate Investment Trusts (Cost $18,967) | | | | |
| | | | |
| | | | | | | | | | | | |
| | | | | | | | | | | |
SHORT-TERM INSTRUMENTS 4.8% | |
| |
REPURCHASE AGREEMENTS (k) 3.1% | |
| | | | | | | | $ | | | 154,274 | |
| | | | | | | | | | | | |
| |
| |
|
Argentina Treasury Bond BONCER | |
| | ARS | | | 610,293 | | | | | | 645 | |
| | | | | | | | | | | | |
| |
HUNGARY TREASURY BILLS 0.1% | |
10.900% due 01/04/2024 (g)(h) | | HUF | | | 1,796,000 | | | | | | 5,174 | |
| | | | | | | | | | | | |
| |
| |
5.411% due 01/25/2024 - 03/28/2024 (f)(g)(l)(n)(p) | | $ | | | 77,718 | | | | | | 77,255 | |
| | | | | | | | | | | | |
Total Short-Term Instruments (Cost $237,442) | | | | |
| | | | |
| | | | |
| | | | | | | | | | | | |
Total Investments in Securities (Cost $8,398,525) | | | | |
| | | | |
| |
| | | | | | | | | | | |
INVESTMENTS IN AFFILIATES 17.6% | |
| |
| |
| |
AFFILIATED INVESTMENTS 5.5% | |
| | | | |
| | | | | 3,517,243 | | | | | | 180,403 | |
| | | |
Neiman Marcus Group Ltd. LLC «(j) | | | 602,840 | | | | | | 90,348 | |
| | | | | | | | | | | | |
| | | | | | | | | | | |
| | | |
Sierra Hamilton Holder LLC «(j) | | | 30,337,712 | | | $ | | | 3 | |
| | | | | | | | | | | | |
| | | | | | | | | | | 270,754 | |
| | | | | | | | | | | | |
Total Common Stocks (Cost $174,034) | | | | |
| | | | |
| |
SHORT-TERM INSTRUMENTS 12.1% | |
| |
CENTRAL FUNDS USED FOR CASH MANAGEMENT PURPOSES 12.1% | |
| | | |
PIMCO Short-Term
Floating NAV Portfolio III | | | 60,917,635 | | | | | | 592,546 | |
| | | | | | | | | | | | |
Total Short-Term Instruments (Cost $592,411) | | | | |
| | | | |
| | | | |
| | | | | | | | | | | | |
Total Investments in Affiliates (Cost $766,445) | | | | |
| |
| | | | |
Total Investments 163.8% (Cost $9,164,970) | | | $ | | | | |
| |
Financial Derivative
Instruments (m)(o) 0.1% (Cost or Premiums, net $27,997) | | | | | | | |
| |
Other Assets and Liabilities, net (63.9)% | | | | |
| | | | |
| | | $ | | | | |
| | | | | | | |
NOTES TO CONSOLIDATED SCHEDULE OF INVESTMENTS:
| A zero balance may reflect actual amounts rounding to less than one thousand. |
| Security valued using significant unobservable inputs (Level 3). |
| All or a portion of this amount represents unfunded loan commitments. The interest rate for the unfunded portion will be determined at the time of funding. See Note 4, Securities and Other Investments, in the Notes to Financial Statements for more information regarding unfunded loan commitments. |
| Variable or Floating rate security. Rate shown is the rate in effect as of period end. Certain variable rate securities are not based on a published reference rate and spread, rather are determined by the issuer or agent and are based on current market conditions. Reference rate is as of reset date, which may vary by security. These securities may not indicate a reference rate and/or spread in their description. |
| Rate shown is the rate in effect as of period end. The rate may be based on a fixed rate, a capped rate or a floor rate and may convert to a variable or floating rate in the future. These securities do not indicate a reference rate and spread in their description. |
| Coupon represents a rate which changes periodically based on a predetermined schedule or event. Rate shown is the rate in effect as of period end. |
| Security is an Interest Only (“IO”) or IO Strip. |
| Security is not accruing income as of the date of this report. |
| Security did not produce income within the last twelve months. |
| Coupon represents a weighted average yield to maturity. |
| Coupon represents a yield to maturity. |
| Perpetual maturity; date shown, if applicable, represents next contractual call date. |
| | | | | | | | |
| | | | | | December 31, 2023 | | (Unaudited) |
(j) RESTRICTED SECURITIES:
| | | | | | | | | | | | | | | | |
| | | | | | | | | | | Market Value
as Percentage
of Net Assets | |
| | | | | | $ | 146,968 | | | $ | 180,403 | | | | 3.68 | % |
| | | 07/01/2021 | | | | 252 | | | | 507 | | | | 0.01 | |
| | | 06/10/2022 | | | | 27 | | | | 27 | | | | 0.00 | |
Corestate Capital Holding SA | | | 08/22/2023 | | | | 0 | | | | 0 | | | | 0.00 | |
| | | | | | | 114,056 | | | | 50,005 | | | | 1.02 | |
Neiman Marcus Group Ltd. LLC | | | 09/25/2020 | | | | 19,376 | | | | 90,348 | | | | 1.84 | |
Project Anfora Senior 6.738% due 06/30/2024 | | | 09/30/2019 | | | | 35,888 | | | | 35,200 | | | | 0.72 | |
Sierra Hamilton Holder LLC | | | 07/31/2017 | | | | 7,690 | | | | 3 | | | | 0.00 | |
Steinhoff International Holdings NV | | | | | | | 0 | | | | 0 | | | | 0.00 | |
| | | | | | | 18,177 | | | | 16,182 | | | | 0.33 | |
| | | 07/20/2018 | | | | 14,263 | | | | 16,091 | | | | 0.32 | |
| | | 09/12/2023 | | | | 619 | | | | 452 | | | | 0.01 | |
Westmoreland Mining Holdings | | | | | | | 6,949 | | | | 955 | | | | 0.02 | |
| | | 06/30/2023 | | | | 1,597 | | | | 843 | | | | 0.02 | |
| | | | | | | | | | | | | | | | |
| | | $ | 365,862 | | | $ | 391,016 | | | | 7.97 | % |
| | | | | | | | | | | | | |
BORROWINGS AND OTHER FINANCING TRANSACTIONS
(k) REPURCHASE AGREEMENTS:
| | | | | | | | | | | | | | | | | | | | | | | | | | | | | | |
| | | | | | | | | | | | | | | | | | | Repurchase
Agreements,
at Value | | | Repurchase Agreement Proceeds to be Received (1) | |
| DEU | | | 5.150 | % | | | 12/29/2023 | | | | 01/02/2024 | | | $ | 4,300 | | | U.S. Treasury Notes 0.625% due 05/15/2030 | | $ | (4,385 | ) | | $ | 4,300 | | | $ | 4,303 | |
| JPS | | | 5.360 | | | | 11/02/2023 | | | | TBD | | | | 149,974 | | | U.S. Treasury Bonds 1.375% - 3.875% due 08/15/2040 - 11/15/2040 | | | (176,394 | ) | | | 149,974 | | | | 151,330 | |
| | | | | | | | | | | | | | | | | | | | | | | | | | | | | | |
Total Repurchase Agreements | | | | | | | | | | | | | | | |
| | | | | | | | | | | | | | | |
REVERSE REPURCHASE AGREEMENTS:
| | | | | | | | | | | | | | | | | | | | | | |
| | | | | | | | | | | | | | Payable for
Reverse
Repurchase
Agreements | |
| | | 0.500 | % | | | 08/15/2022 | | | | TBD | | | $ | | | (703 | ) | | $ | (703 | ) |
| | | 6.480 | | | | 07/17/2023 | | | | 01/17/2024 | | | | | | (1,945 | ) | | | (2,004 | ) |
| | | 6.533 | | | | 08/03/2023 | | | | 02/05/2024 | | | | | | (30,260 | ) | | | (31,095 | ) |
| | | 6.533 | | | | 08/07/2023 | | | | 02/07/2024 | | | | | | (26,450 | ) | | | (27,161 | ) |
| | | 6.545 | | | | 08/30/2023 | | | | 03/01/2024 | | | | | | (4,444 | ) | | | (4,545 | ) |
| | | 6.573 | | | | 09/08/2023 | | | | 03/08/2024 | | | | | | (23,669 | ) | | | (24,170 | ) |
| | | 6.634 | | | | 10/12/2023 | | | | 04/12/2024 | | | | | | (72,638 | ) | | | (73,736 | ) |
| | | 6.636 | | | | 10/10/2023 | | | | 04/10/2024 | | | | | | (6,614 | ) | | | (6,717 | ) |
| | | 5.900 | | | | 12/04/2023 | | | | 03/04/2024 | | | | | | (3,625 | ) | | | (3,642 | ) |
| | | 6.450 | | | | 12/15/2023 | | | | 04/15/2024 | | | | | | (18,378 | ) | | | (18,436 | ) |
| | | 6.450 | | | | 12/21/2023 | | | | 04/19/2024 | | | | | | (11,075 | ) | | | (11,098 | ) |
| | | 6.500 | | | | 12/15/2023 | | | | 04/15/2024 | | | | | | (14,889 | ) | | | (14,937 | ) |
| | | 6.550 | | | | 12/21/2023 | | | | 04/19/2024 | | | | | | (3,439 | ) | | | (3,447 | ) |
| | | 6.650 | | | | 12/15/2023 | | | | 04/15/2024 | | | | | | (4,374 | ) | | | (4,388 | ) |
| | | 6.700 | | | | 12/07/2023 | | | | 04/04/2024 | | | | | | (8,406 | ) | | | (8,446 | ) |
| | | 4.126 | | | | 08/11/2023 | | | | 02/12/2024 | | | EUR | | | (2,900 | ) | | | (3,254 | ) |
| | | 4.343 | | | | 12/15/2023 | | | | 03/15/2024 | | | | | | (14,618 | ) | | | (16,172 | ) |
| | | 4.352 | | | | 12/12/2023 | | | | 03/12/2024 | | | | | | (11,950 | ) | | | (13,226 | ) |
| | | 4.355 | | | | 12/01/2023 | | | | 02/01/2024 | | | | | | (18,749 | ) | | | (20,777 | ) |
| | | 4.380 | | | | 09/20/2023 | | | | TBD | | | | | | (2,611 | ) | | | (2,918 | ) |
| | | 4.400 | | | | 11/14/2023 | | | | 03/14/2024 | | | | | | (2,780 | ) | | | (3,087 | ) |
| | | 4.432 | | | | 11/17/2023 | | | | 02/19/2024 | | | | | | (9,359 | ) | | | (10,389 | ) |
| | | 5.850 | | | | 12/15/2023 | | | | 02/13/2024 | | | $ | | | (5,946 | ) | | | (5,964 | ) |
| | | 6.030 | | | | 11/06/2023 | | | | 03/06/2024 | | | GBP | | | (6,697 | ) | | | (8,616 | ) |
| | | 6.060 | | | | 07/14/2023 | | | | 01/10/2024 | | | $ | | | (9,305 | ) | | | (9,574 | ) |
| | | 6.060 | | | | 10/11/2023 | | | | 01/10/2024 | | | | | | (66,647 | ) | | | (67,578 | ) |
| | | 6.080 | | | | 07/21/2023 | | | | 01/17/2024 | | | | | | (1,950 | ) | | | (2,004 | ) |
| | | 6.090 | | | | 10/11/2023 | | | | 01/16/2024 | | | | | | (21,579 | ) | | | (21,882 | ) |
| | | 6.100 | | | | 09/19/2023 | | | | 03/18/2024 | | | | | | (17,457 | ) | | | (17,763 | ) |
| | | 6.120 | | | | 07/31/2023 | | | | 01/29/2024 | | | | | | (1,084 | ) | | | (1,112 | ) |
| | | 6.120 | | | | 08/04/2023 | | | | 01/29/2024 | | | | | | (761 | ) | | | (780 | ) |
| | | 6.150 | | | | 12/20/2023 | | | | 04/16/2024 | | | | | | (6,635 | ) | | | (6,650 | ) |
| | | | | | | | | | | | |
| See Accompanying Notes | | | | | | | | | | DECEMBER 31, 2023 | | | |
| | | | | | | | |
Consolidated Schedule of Investments | | PIMCO Dynamic Income Fund | | | | | | |
| | | | | | | | | | | | | | | | | | | | | | |
| | | | | | | | | | | | | | Payable for
Reverse
Repurchase
Agreements | |
| | | 6.230 | % | | | 10/17/2023 | | | | 01/17/2024 | | | $ | | | (7,479 | ) | | $ | (7,578 | ) |
| | | 6.500 | | | | 12/20/2023 | | | | 05/15/2024 | | | | | | (3,080 | ) | | | (3,088 | ) |
| | | 6.650 | | | | 12/20/2023 | | | | 04/16/2024 | | | | | | (143,618 | ) | | | (143,958 | ) |
| | | 6.650 | | | | 12/20/2023 | | | | 05/15/2024 | | | | | | (37,297 | ) | | | (37,385 | ) |
| | | 6.690 | | | | 12/20/2023 | | | | 04/16/2024 | | | | | | (3,530 | ) | | | (3,539 | ) |
| | | 6.750 | | | | 12/20/2023 | | | | 04/16/2024 | | | | | | (11,431 | ) | | | (11,459 | ) |
| | | 6.750 | | | | 12/20/2023 | | | | 05/15/2024 | | | | | | (4,062 | ) | | | (4,072 | ) |
| | | 6.910 | | | | 12/20/2023 | | | | 04/16/2024 | | | | | | (3,092 | ) | | | (3,100 | ) |
| | | 6.950 | | | | 12/20/2023 | | | | 04/16/2024 | | | | | | (7,474 | ) | | | (7,492 | ) |
| | | 6.950 | | | | 12/20/2023 | | | | 05/15/2024 | | | | | | (1,599 | ) | | | (1,603 | ) |
| | | 4.080 | | | | 09/20/2023 | | | | TBD | | | EUR | | | (8,945 | ) | | | (9,990 | ) |
| | | 4.250 | | | | 09/20/2023 | | | | TBD | | | | | | (3,016 | ) | | | (3,369 | ) |
| | | 4.350 | | | | 11/06/2023 | | | | 01/11/2024 | | | | | | (15,012 | ) | | | (16,685 | ) |
| | | 4.440 | | | | 10/02/2023 | | | | 02/02/2024 | | | | | | (4,523 | ) | | | (5,048 | ) |
| | | 4.610 | | | | 12/06/2023 | | | | 04/08/2024 | | | | | | (16,987 | ) | | | (18,817 | ) |
| | | 5.600 | | | | 07/28/2023 | | | | TBD | | | $ | | | (893 | ) | | | (915 | ) |
| | | 5.940 | | | | 12/06/2023 | | | | 04/08/2024 | | | GBP | | | (3,771 | ) | | | (4,828 | ) |
| | | 6.103 | | | | 12/19/2023 | | | | 06/19/2024 | | | | | | (8,758 | ) | | | (11,190 | ) |
| | | 6.381 | | | | 12/15/2023 | | | | 03/15/2024 | | | | | | (10,212 | ) | | | (13,058 | ) |
| | | 6.440 | | | | 10/13/2023 | | | | 01/12/2024 | | | $ | | | (19,958 | ) | | | (20,247 | ) |
| | | 6.550 | | | | 12/15/2023 | | | | 04/15/2024 | | | | | | (14,499 | ) | | | (14,545 | ) |
| | | 6.560 | | | | 12/22/2023 | | | | 04/22/2024 | | | | | | (5,228 | ) | | | (5,238 | ) |
| | | 6.590 | | | | 10/18/2023 | | | | 01/17/2024 | | | | | | (24,286 | ) | | | (24,624 | ) |
| | | 6.600 | | | | 12/15/2023 | | | | 04/15/2024 | | | | | | (6,843 | ) | | | (6,866 | ) |
| | | 6.630 | | | | 11/27/2023 | | | | 02/26/2024 | | | | | | (9,959 | ) | | | (10,025 | ) |
| | | 6.640 | | | | 08/30/2023 | | | | 02/26/2024 | | | | | | (15,151 | ) | | | (15,500 | ) |
| | | 6.660 | | | | 12/22/2023 | | | | 04/22/2024 | | | | | | (1,529 | ) | | | (1,532 | ) |
| | | 6.670 | | | | 09/15/2023 | | | | 03/13/2024 | | | | | | (9,637 | ) | | | (9,832 | ) |
| | | 6.680 | | | | 11/27/2023 | | | | 02/26/2024 | | | | | | (4,063 | ) | | | (4,090 | ) |
| | | 6.700 | | | | 12/08/2023 | | | | 04/08/2024 | | | | | | (14,114 | ) | | | (14,179 | ) |
| | | 6.720 | | | | 08/10/2023 | | | | 02/06/2024 | | | | | | (1,266 | ) | | | (1,300 | ) |
| | | 6.720 | | | | 09/15/2023 | | | | 03/13/2024 | | | | | | (3,544 | ) | | | (3,616 | ) |
| | | 6.730 | | | | 08/03/2023 | | | | 01/31/2024 | | | | | | (8,072 | ) | | | (8,301 | ) |
| | | 6.740 | | | | 10/18/2023 | | | | 01/17/2024 | | | | | | (1,950 | ) | | | (1,978 | ) |
| | | 6.760 | | | | 07/24/2023 | | | | 01/24/2024 | | | | | | (9,718 | ) | | | (10,014 | ) |
| | | 6.770 | | | | 09/15/2023 | | | | 03/13/2024 | | | | | | (14,231 | ) | | | (14,522 | ) |
| | | 6.790 | | | | 08/24/2023 | | | | 02/23/2024 | | | | | | (6,780 | ) | | | (6,947 | ) |
| | | 6.790 | | | | 08/30/2023 | | | | 02/26/2024 | | | | | | (9,604 | ) | | | (9,831 | ) |
| | | 6.820 | | | | 10/02/2023 | | | | 04/01/2024 | | | | | | (5,161 | ) | | | (5,251 | ) |
| | | 6.821 | | | | 08/14/2023 | | | | 02/09/2024 | | | | | | (4,656 | ) | | | (4,780 | ) |
| | | 6.840 | | | | 08/30/2023 | | | | 02/26/2024 | | | | | | (292 | ) | | | (299 | ) |
| | | 6.100 | | | | 11/20/2023 | | | | 05/20/2024 | | | | | | (21,860 | ) | | | (22,017 | ) |
| | | 6.130 | | | | 10/19/2023 | | | | 04/16/2024 | | | | | | (22,864 | ) | | | (23,152 | ) |
| | | 6.130 | | | | 10/23/2023 | | | | 04/22/2024 | | | | | | (969 | ) | | | (981 | ) |
| | | 5.880 | | | | 07/28/2023 | | | | 01/24/2024 | | | | | | (1,695 | ) | | | (1,738 | ) |
| | | 5.930 | | | | 01/02/2024 | | | | 04/02/2024 | | | | | | (5,574 | ) | | | (5,574 | ) |
| | | 5.990 | | | | 10/02/2023 | | | | 01/02/2024 | | | | | | (639 | ) | | | (649 | ) |
| | | 5.990 | | | | 10/03/2023 | | | | 01/02/2024 | | | | | | (4,843 | ) | | | (4,916 | ) |
| | | 6.100 | | | | 11/07/2023 | | | | 03/06/2024 | | | | | | (10,756 | ) | | | (10,857 | ) |
| | | 6.100 | | | | 12/07/2023 | | | | 04/05/2024 | | | | | | (16,963 | ) | | | (17,037 | ) |
| | | 6.100 | | | | 12/29/2023 | | | | 04/29/2024 | | | | | | (18,058 | ) | | | (18,070 | ) |
| | | 6.130 | | | | 07/28/2023 | | | | 01/24/2024 | | | | | | (7,952 | ) | | | (8,166 | ) |
| | | 6.150 | | | | 12/06/2023 | | | | 04/04/2024 | | | | | | (364 | ) | | | (366 | ) |
| | | 6.220 | | | | 10/16/2023 | | | | 01/16/2024 | | | | | | (3,090 | ) | | | (3,132 | ) |
| | | 6.250 | | | | 12/06/2023 | | | | 04/04/2024 | | | | | | (13,216 | ) | | | (13,278 | ) |
| | | 6.350 | | | | 12/06/2023 | | | | 04/04/2024 | | | | | | (18,518 | ) | | | (18,606 | ) |
| | | 6.640 | | | | 08/15/2023 | | | | 02/09/2024 | | | | | | (7,610 | ) | | | (7,807 | ) |
| | | 6.650 | | | | 08/16/2023 | | | | 02/09/2024 | | | | | | (3,843 | ) | | | (3,942 | ) |
| | | 6.020 | | | | 08/16/2023 | | | | 02/16/2024 | | | | | | (491 | ) | | | (503 | ) |
| | | 4.530 | | | | 09/07/2023 | | | | TBD | | | EUR | | | (12,578 | ) | | | (14,083 | ) |
| | | 6.060 | | | | 12/05/2023 | | | | 02/02/2024 | | | $ | | | (2,617 | ) | | | (2,629 | ) |
| | | 6.068 | | | | 12/18/2023 | | | | 02/16/2024 | | | | | | (11,189 | ) | | | (11,217 | ) |
| | | 6.110 | | | | 12/05/2023 | | | | 02/02/2024 | | | | | | (3,461 | ) | | | (3,478 | ) |
| | | 6.168 | | | | 12/18/2023 | | | | 02/16/2024 | | | | | | (6,129 | ) | | | (6,145 | ) |
| | | 6.218 | | | | 12/18/2023 | | | | 02/16/2024 | | | | | | (2,835 | ) | | | (2,842 | ) |
| | | 6.310 | | | | 12/05/2023 | | | | 02/02/2024 | | | | | | (14,312 | ) | | | (14,382 | ) |
| | | 6.460 | | | | 12/05/2023 | | | | 02/02/2024 | | | | | | (7,589 | ) | | | (7,627 | ) |
| | | 6.468 | | | | 12/18/2023 | | | | 02/16/2024 | | | | | | (1,501 | ) | | | (1,505 | ) |
| | | 6.472 | | | | 12/08/2023 | | | | 02/02/2024 | | | | | | (2,142 | ) | | | (2,152 | ) |
| | | 6.510 | | | | 12/05/2023 | | | | 02/02/2024 | | | | | | (21,115 | ) | | | (21,222 | ) |
| | | | | | | | |
| | | | | | December 31, 2023 | | (Unaudited) |
| | | | | | | | | | | | | | | | | | | | | | |
| | | | | | | | | | | | | | Payable for
Reverse
Repurchase
Agreements | |
| | | 6.718 | % | | | 12/18/2023 | | | | 02/16/2024 | | | $ | | | (23,829 | ) | | $ | (23,896 | ) |
| | | 6.793 | | | | 12/18/2023 | | | | 02/16/2024 | | | | | | (1,780 | ) | | | (1,785 | ) |
| | | 6.893 | | | | 12/18/2023 | | | | 02/16/2024 | | | | | | (11,410 | ) | | | (11,442 | ) |
| | | 6.918 | | | | 12/18/2023 | | | | 02/16/2024 | | | | | | (45,684 | ) | | | (45,816 | ) |
| | | 6.922 | | | | 12/08/2023 | | | | 02/02/2024 | | | | | | (43,849 | ) | | | (44,060 | ) |
| | | 6.968 | | | | 12/18/2023 | | | | 02/16/2024 | | | | | | (4,696 | ) | | | (4,709 | ) |
| | | 6.972 | | | | 12/08/2023 | | | | 02/02/2024 | | | | | | (12,226 | ) | | | (12,285 | ) |
| | | 6.993 | | | | 12/18/2023 | | | | 02/16/2024 | | | | | | (14,742 | ) | | | (14,785 | ) |
| | | 7.072 | | | | 12/08/2023 | | | | 02/02/2024 | | | | | | (37,659 | ) | | | (37,844 | ) |
| | | 7.093 | | | | 12/18/2023 | | | | 02/16/2024 | | | | | | (8,742 | ) | | | (8,768 | ) |
| | | 7.122 | | | | 12/08/2023 | | | | 02/02/2024 | | | | | | (20,623 | ) | | | (20,725 | ) |
| | | 7.193 | | | | 12/18/2023 | | | | 02/16/2024 | | | | | | (3,583 | ) | | | (3,594 | ) |
| | | 6.226 | | | | 12/28/2023 | | | | 09/27/2024 | | | | | | (116,362 | ) | | | (116,463 | ) |
| | | 6.276 | | | | 12/28/2023 | | | | 09/27/2024 | | | | | | (8,579 | ) | | | (8,586 | ) |
| | | 6.326 | | | | 12/28/2023 | | | | 09/27/2024 | | | | | | (4,107 | ) | | | (4,110 | ) |
| | | 6.476 | | | | 12/28/2023 | | | | 09/27/2024 | | | | | | (2,552 | ) | | | (2,555 | ) |
| | | 6.670 | | | | 10/26/2023 | | | | 07/29/2024 | | | | | | (6,407 | ) | | | (6,486 | ) |
| | | 6.700 | | | | 10/26/2023 | | | | 07/29/2024 | | | | | | (55,129 | ) | | | (55,826 | ) |
| | | 6.720 | | | | 10/26/2023 | | | | 07/29/2024 | | | | | | (18,798 | ) | | | (19,036 | ) |
| | | 6.740 | | | | 10/26/2023 | | | | 07/29/2024 | | | | | | (8,075 | ) | | | (8,178 | ) |
| | | 6.780 | | | | 10/26/2023 | | | | 07/29/2024 | | | | | | (2,485 | ) | | | (2,517 | ) |
| | | 6.900 | | | | 07/21/2023 | | | | 04/16/2024 | | | | | | (4,581 | ) | | | (4,721 | ) |
| | | 4.300 | | | | 12/19/2023 | | | | 03/19/2024 | | | EUR | | | (2,280 | ) | | | (2,521 | ) |
| | | 5.880 | | | | 11/06/2023 | | | | 05/06/2024 | | | $ | | | (2,808 | ) | | | (2,834 | ) |
| | | 5.950 | | | | 01/02/2024 | | | | 04/04/2024 | | | | | | (7,775 | ) | | | (7,775 | ) |
| | | 5.960 | | | | 11/08/2023 | | | | 04/08/2024 | | | | | | (720 | ) | | | (726 | ) |
| | | 6.000 | | | | 08/01/2023 | | | | 01/02/2024 | | | | | | (7,417 | ) | | | (7,607 | ) |
| | | 6.020 | | | | 12/04/2023 | | | | 02/29/2024 | | | | | | (44,236 | ) | | | (44,450 | ) |
| | | 2.250 | | | | 11/14/2023 | | | | TBD | | | EUR | | | (268 | ) | | | (297 | ) |
| | | 3.700 | | | | 09/22/2023 | | | | TBD | | | $ | | | (927 | ) | | | (937 | ) |
| | | 5.750 | | | | 12/15/2023 | | | | 02/02/2024 | | | | | | (37,928 | ) | | | (38,037 | ) |
| | | 6.232 | | | | 12/04/2023 | | | | 03/04/2024 | | | GBP | | | (11,437 | ) | | | (14,650 | ) |
| | | 6.260 | | | | 07/03/2023 | | | | 01/02/2024 | | | $ | | | (2,878 | ) | | | (2,969 | ) |
| | | 6.280 | | | | 01/02/2024 | | | | 04/03/2024 | | | | | | (1,859 | ) | | | (1,859 | ) |
| | | 6.310 | | | | 07/03/2023 | | | | 01/02/2024 | | | | | | (6,264 | ) | | | (6,465 | ) |
| | | 6.330 | | | | 01/02/2024 | | | | 04/03/2024 | | | | | | (3,990 | ) | | | (3,990 | ) |
| | | 6.355 | | | | 12/26/2023 | | | | 03/25/2024 | | | | | | (1,422 | ) | | | (1,424 | ) |
| | | 6.380 | | | | 01/02/2024 | | | | 04/03/2024 | | | | | | (1,094 | ) | | | (1,094 | ) |
| | | 6.405 | | | | 12/26/2023 | | | | 03/25/2024 | | | | | | (1,438 | ) | | | (1,439 | ) |
| | | 6.430 | | | | 07/03/2023 | | | | 01/02/2024 | | | | | | (1,169 | ) | | | (1,207 | ) |
| | | 6.446 | | | | 07/18/2023 | | | | 01/16/2024 | | | | | | (9,488 | ) | | | (9,773 | ) |
| | | 6.455 | | | | 12/26/2023 | | | | 03/25/2024 | | | | | | (1,651 | ) | | | (1,653 | ) |
| | | 6.460 | | | | 07/03/2023 | | | | 01/02/2024 | | | | | | (5,193 | ) | | | (5,363 | ) |
| | | 6.480 | | | | 07/03/2023 | | | | 01/02/2024 | | | | | | (14,296 | ) | | | (14,767 | ) |
| | | 6.480 | | | | 01/02/2024 | | | | 04/03/2024 | | | | | | (20,819 | ) | | | (20,819 | ) |
| | | 6.496 | | | | 07/18/2023 | | | | 01/16/2024 | | | | | | (5,179 | ) | | | (5,336 | ) |
| | | 6.505 | | | | 12/26/2023 | | | | 03/25/2024 | | | | | | (1,601 | ) | | | (1,603 | ) |
| | | 6.596 | | | | 07/18/2023 | | | | 01/16/2024 | | | | | | (2,151 | ) | | | (2,217 | ) |
| | | 6.600 | | | | 07/12/2023 | | | | 01/08/2024 | | | | | | (3,529 | ) | | | (3,642 | ) |
| | | 6.646 | | | | 07/18/2023 | | | | 01/16/2024 | | | | | | (4,677 | ) | | | (4,823 | ) |
| | | 6.650 | | | | 07/12/2023 | | | | 01/08/2024 | | | | | | (1,590 | ) | | | (1,641 | ) |
| | | 6.660 | | | | 07/03/2023 | | | | 01/02/2024 | | | | | | (1,110 | ) | | | (1,148 | ) |
| | | 6.696 | | | | 07/18/2023 | | | | 01/16/2024 | | | | | | (1,052 | ) | | | (1,085 | ) |
| | | 6.705 | | | | 12/26/2023 | | | | 03/25/2024 | | | | | | (1,154 | ) | | | (1,156 | ) |
| | | 6.710 | | | | 07/03/2023 | | | | 01/02/2024 | | | | | | (2,307 | ) | | | (2,386 | ) |
| | | 6.730 | | | | 01/02/2024 | | | | 04/03/2024 | | | | | | (2,317 | ) | | | (2,317 | ) |
| | | 6.746 | | | | 07/18/2023 | | | | 01/16/2024 | | | | | | (2,406 | ) | | | (2,482 | ) |
| | | 6.755 | | | | 12/26/2023 | | | | 03/25/2024 | | | | | | (4,933 | ) | | | (4,939 | ) |
| | | 6.880 | | | | 01/02/2024 | | | | 04/03/2024 | | | | | | (378 | ) | | | (378 | ) |
| | | 5.880 | | | | 12/22/2023 | | | | 03/22/2024 | | | GBP | | | (10,423 | ) | | | (13,310 | ) |
| | | 5.920 | | | | 12/22/2023 | | | | 03/22/2024 | | | | | | (6,580 | ) | | | (8,402 | ) |
| | | 5.760 | | | | 12/22/2023 | | | | 03/22/2024 | | | | | | (1,436 | ) | | | (1,834 | ) |
| | | 5.910 | | | | 12/15/2023 | | | | 02/15/2024 | | | | | | (2,999 | ) | | | (3,834 | ) |
| | | 5.970 | | | | 10/10/2023 | | | | 01/08/2024 | | | $ | | | (2,947 | ) | | | (2,988 | ) |
| | | 6.070 | | | | 11/17/2023 | | | | 02/15/2024 | | | | | | (10,506 | ) | | | (10,587 | ) |
| | | 6.120 | | | | 11/17/2023 | | | | 02/15/2024 | | | | | | (1,933 | ) | | | (1,948 | ) |
| | | 5.920 | | | | 11/28/2023 | | | | 03/28/2024 | | | GBP | | | (1,461 | ) | | | (1,873 | ) |
| | | 5.920 | | | | 11/28/2023 | | | | 05/28/2024 | | | | | | (17,010 | ) | | | (21,805 | ) |
| | | 5.931 | | | | 11/06/2023 | | | | 03/06/2024 | | | | | | (4,738 | ) | | | (6,094 | ) |
| | | 5.961 | | | | 11/06/2023 | | | | 03/06/2024 | | | | | | (5,824 | ) | | | (7,492 | ) |
| | | | | | | | | | | | |
| See Accompanying Notes | | | | | | | | | | DECEMBER 31, 2023 | | | |
| | | | | | | | |
Consolidated Schedule of Investments | | PIMCO Dynamic Income Fund | | | | | | |
| | | | | | | | | | | | | | | | | | | | | | |
| | | | | | | | | | | | | | Payable for
Reverse
Repurchase
Agreements | |
| | | 5.991 | % | | | 11/06/2023 | | | | 03/06/2024 | | | GBP | | | (6,530 | ) | | $ | (8,400 | ) |
| | | 6.010 | | | | 11/28/2023 | | | | 05/28/2024 | | | | | | (9,598 | ) | | | (12,305 | ) |
| | | 6.300 | | | | 12/05/2023 | | | | 06/03/2024 | | | $ | | | (7,998 | ) | | | (8,037 | ) |
| | | 6.500 | | | | 11/27/2023 | | | | 05/22/2024 | | | | | | (4,700 | ) | | | (4,730 | ) |
| | | 6.550 | | | | 10/03/2023 | | | | 01/03/2024 | | | | | | (1,866 | ) | | | (1,897 | ) |
| | | 6.600 | | | | 12/18/2023 | | | | 06/17/2024 | | | | | | (15,087 | ) | | | (15,128 | ) |
| | | 6.650 | | | | 11/15/2023 | | | | 05/13/2024 | | | | | | (5,817 | ) | | | (5,868 | ) |
| | | 6.650 | | | | 12/05/2023 | | | | 06/04/2024 | | | | | | (41,172 | ) | | | (41,382 | ) |
| | | 6.650 | | | | 12/18/2023 | | | | 06/17/2024 | | | | | | (2,812 | ) | | | (2,820 | ) |
| | | 6.700 | | | | 12/05/2023 | | | | 06/03/2024 | | | | | | (15,286 | ) | | | (15,364 | ) |
| | | 6.700 | | | | 12/11/2023 | | | | 06/11/2024 | | | | | | (14,923 | ) | | | (14,984 | ) |
| | | 6.700 | | | | 12/18/2023 | | | | 06/17/2024 | | | | | | (25,157 | ) | | | (25,226 | ) |
| | | 6.750 | | | | 12/05/2023 | | | | 06/03/2024 | | | | | | (32,277 | ) | | | (32,445 | ) |
| | | 4.316 | | | | 12/05/2023 | | | | 03/05/2024 | | | EUR | | | (11,779 | ) | | | (13,047 | ) |
| | | 6.550 | | | | 12/13/2023 | | | | 06/20/2024 | | | $ | | | (52,604 | ) | | | (52,796 | ) |
| | | 6.700 | | | | 12/13/2023 | | | | 06/20/2024 | | | | | | (445 | ) | | | (446 | ) |
| | | 5.750 | | | | 12/14/2023 | | | | TBD | | | | | | (2,790 | ) | | | (2,798 | ) |
| | | 6.460 | | | | 12/15/2023 | | | | 01/16/2024 | | | | | | (2,434 | ) | | | (2,442 | ) |
| | | 6.470 | | | | 12/18/2023 | | | | 04/18/2024 | | | | | | (3,038 | ) | | | (3,046 | ) |
| | | 6.610 | | | | 12/15/2023 | | | | 01/16/2024 | | | | | | (9,645 | ) | | | (9,677 | ) |
| | | 6.780 | | | | 12/22/2023 | | | | 06/24/2024 | | | | | | (1,230 | ) | | | (1,233 | ) |
| | | 6.830 | | | | 12/22/2023 | | | | 06/24/2024 | | | | | | (775 | ) | | | (777 | ) |
| | | 6.850 | | | | 11/08/2023 | | | | 05/08/2024 | | | | | | (2,264 | ) | | | (2,287 | ) |
| | | 6.850 | | | | 12/22/2023 | | | | 06/24/2024 | | | | | | (3,335 | ) | | | (3,342 | ) |
| | | 7.200 | | | | 12/18/2023 | | | | 04/18/2024 | | | | | | (69,176 | ) | | | (69,381 | ) |
| | | 4.000 | | | | 05/10/2023 | | | | TBD | | | EUR | | | (5,307 | ) | | | (6,002 | ) |
| | | 4.050 | | | | 11/27/2023 | | | | 05/09/2025 | | | | | | (15,891 | ) | | | (17,594 | ) |
| | | 4.200 | | | | 05/10/2023 | | | | TBD | | | | | | (21,040 | ) | | | (23,793 | ) |
| | | 4.950 | | | | 11/03/2023 | | | | 02/29/2024 | | | | | | (2,772 | ) | | | (3,085 | ) |
| | | 5.770 | | | | 12/14/2023 | | | | 03/18/2024 | | | GBP | | | (837 | ) | | | (1,070 | ) |
| | | 5.860 | | | | 12/18/2023 | | | | 01/17/2024 | | | $ | | | (1,597 | ) | | | (1,601 | ) |
| | | 5.900 | | | | 12/06/2023 | | | | 03/05/2024 | | | | | | (5,544 | ) | | | (5,568 | ) |
| | | 6.020 | | | | 08/17/2023 | | | | 02/16/2024 | | | | | | (9,170 | ) | | | (9,382 | ) |
| | | 6.020 | | | | 08/21/2023 | | | | 02/16/2024 | | | | | | (3,936 | ) | | | (4,025 | ) |
| | | 6.000 | | | | 12/19/2023 | | | | 03/19/2024 | | | | | | (22,343 | ) | | | (22,395 | ) |
| | | 6.130 | | | | 12/04/2023 | | | | 04/04/2024 | | | | | | (26,665 | ) | | | (26,795 | ) |
| | | 6.540 | | | | 12/01/2023 | | | | 04/01/2024 | | | | | | (7,854 | ) | | | (7,899 | ) |
| | | 6.550 | | | | 01/02/2024 | | | | 05/02/2024 | | | | | | (7,844 | ) | | | (7,844 | ) |
| | | 6.580 | | | | 11/03/2023 | | | | 05/03/2024 | | | | | | (30,529 | ) | | | (30,860 | ) |
| | | 6.590 | | | | 12/01/2023 | | | | 04/01/2024 | | | | | | (9,698 | ) | | | (9,754 | ) |
| | | 6.600 | | | | 12/22/2023 | | | | 06/21/2024 | | | | | | (16,389 | ) | | | (16,422 | ) |
| | | 6.600 | | | | 01/02/2024 | | | | 05/02/2024 | | | | | | (9,684 | ) | | | (9,684 | ) |
| | | 6.610 | | | | 12/11/2023 | | | | 04/11/2024 | | | | | | (12,259 | ) | | | (12,308 | ) |
| | | 6.620 | | | | 01/02/2024 | | | | 05/02/2024 | | | | | | (2,320 | ) | | | (2,320 | ) |
| | | 6.630 | | | | 11/03/2023 | | | | 05/03/2024 | | | | | | (8,259 | ) | | | (8,349 | ) |
| | | 6.630 | | | | 12/01/2023 | | | | 04/01/2024 | | | | | | (6,487 | ) | | | (6,525 | ) |
| | | 6.640 | | | | 10/02/2023 | | | | 01/02/2024 | | | | | | (5,746 | ) | | | (5,843 | ) |
| | | 6.640 | | | | 01/02/2024 | | | | 05/02/2024 | | | | | | (4,216 | ) | | | (4,216 | ) |
| | | 6.650 | | | | 11/03/2023 | | | | 05/03/2024 | | | | | | (24,611 | ) | | | (24,878 | ) |
| | | 6.650 | | | | 01/02/2024 | | | | 04/02/2024 | | | | | | (6,043 | ) | | | (6,043 | ) |
| | | 6.720 | | | | 11/03/2023 | | | | 05/03/2024 | | | | | | (7,364 | ) | | | (7,443 | ) |
| | | 6.740 | | | | 11/03/2023 | | | | 05/03/2024 | | | | | | (5,020 | ) | | | (5,074 | ) |
| | | 6.740 | | | | 12/11/2023 | | | | 04/11/2024 | | | | | | (5,423 | ) | | | (5,445 | ) |
| | | 6.740 | | | | 12/19/2023 | | | | 02/02/2024 | | | | | | (4,417 | ) | | | (4,427 | ) |
| | | 6.750 | | | | 01/02/2024 | | | | 02/16/2024 | | | | | | (4,534 | ) | | | (4,534 | ) |
| | | 6.820 | | | | 12/11/2023 | | | | 04/11/2024 | | | | | | (953 | ) | | | (957 | ) |
| | | 6.850 | | | | 11/10/2023 | | | | 05/10/2024 | | | | | | (2,365 | ) | | | (2,388 | ) |
| | | 6.870 | | | | 11/10/2023 | | | | 03/11/2024 | | | | | | (776 | ) | | | (783 | ) |
| | | 5.780 | | | | 08/18/2023 | | | | 02/20/2024 | | | | | | (2,979 | ) | | | (3,045 | ) |
| | | 6.662 | | | | 10/23/2023 | | | | 04/22/2024 | | | | | | (35,723 | ) | | | (36,192 | ) |
| | | 6.712 | | | | 10/23/2023 | | | | 04/22/2024 | | | | | | (17,427 | ) | | | (17,658 | ) |
| | | 6.762 | | | | 10/23/2023 | | | | 04/22/2024 | | | | | | (8,591 | ) | | | (8,705 | ) |
| | | 4.200 | | | | 11/07/2023 | | | | 01/08/2024 | | | EUR | | | (19,107 | ) | | | (21,229 | ) |
| | | 4.500 | | | | 11/22/2023 | | | | 01/22/2024 | | | | | | (1,850 | ) | | | (2,052 | ) |
| | | 5.600 | | | | 12/05/2023 | | | | TBD | | | $ | | | (23,875 | ) | | | (23,979 | ) |
| | | 5.990 | | | | 10/12/2023 | | | | 01/22/2024 | | | | | | (692 | ) | | | (702 | ) |
| | | 6.070 | | | | 08/17/2023 | | | | 02/20/2024 | | | | | | (2,172 | ) | | | (2,222 | ) |
| | | 6.070 | | | | 08/22/2023 | | | | 02/22/2024 | | | | | | (11,558 | ) | | | (11,817 | ) |
| | | 6.070 | | | | 10/17/2023 | | | | 02/22/2024 | | | | | | (606 | ) | | | (614 | ) |
| | | 6.070 | | | | 10/19/2023 | | | | 02/22/2024 | | | | | | (1,051 | ) | | | (1,064 | ) |
| | | | | | | | |
| | | | | | December 31, 2023 | | (Unaudited) |
| | | | | | | | | | | | | | | | | | | | | | |
| | | | | | | | | | | | | | Payable for
Reverse
Repurchase
Agreements | |
| | | 6.070 | % | | | 12/28/2023 | | | | 02/22/2024 | | | $ | | | (3,041 | ) | | $ | (3,043 | ) |
| | | 6.090 | | | | 07/31/2023 | | | | 01/31/2024 | | | | | | (1,662 | ) | | | (1,706 | ) |
| | | 6.100 | | | | 10/12/2023 | | | | 04/12/2024 | | | | | | (16,869 | ) | | | (17,103 | ) |
| | | 6.120 | | | | 07/24/2023 | | | | 01/24/2024 | | | | | | (836 | ) | | | (859 | ) |
| | | 6.120 | | | | 07/27/2023 | | | | 01/29/2024 | | | | | | (1,375 | ) | | | (1,412 | ) |
| | | 6.120 | | | | 07/28/2023 | | | | 01/29/2024 | | | | | | (8,684 | ) | | | (8,914 | ) |
| | | 6.120 | | | | 10/10/2023 | | | | 04/10/2024 | | | | | | (44,437 | ) | | | (45,063 | ) |
| | | 6.120 | | | | 12/01/2023 | | | | 04/10/2024 | | | | | | (3,311 | ) | | | (3,328 | ) |
| | | 6.650 | | | | 10/02/2023 | | | | 03/28/2024 | | | | | | (3,185 | ) | | | (3,239 | ) |
| | | 6.650 | | | | 10/06/2023 | | | | 04/05/2024 | | | | | | (3,980 | ) | | | (4,044 | ) |
| | | 6.650 | | | | 12/29/2023 | | | | 06/28/2024 | | | | | | (29,899 | ) | | | (29,921 | ) |
| | | 6.700 | | | | 08/10/2023 | | | | 02/09/2024 | | | | | | (10,836 | ) | | | (11,127 | ) |
| | | 6.700 | | | | 11/07/2023 | | | | 05/07/2024 | | | | | | (26,734 | ) | | | (27,009 | ) |
| | | 6.700 | | | | 11/29/2023 | | | | 05/28/2024 | | | | | | (4,119 | ) | | | (4,145 | ) |
| | | 6.750 | | | | 08/10/2023 | | | | 02/09/2024 | | | | | | (11,057 | ) | | | (11,353 | ) |
| | | 6.750 | | | | 12/01/2023 | | | | 05/31/2024 | | | | | | (5,434 | ) | | | (5,466 | ) |
| | | 4.100 | | | | 11/27/2023 | | | | 06/06/2025 | | | EUR | | | (1,960 | ) | | | (2,171 | ) |
| | | 4.230 | | | | 07/05/2023 | | | | TBD | | | | | | (7,274 | ) | | | (8,192 | ) |
| | | 4.261 | | | | 12/06/2023 | | | | 02/06/2024 | | | | | | (7,508 | ) | | | (8,315 | ) |
| | | 4.473 | | | | 12/21/2023 | | | | 03/22/2024 | | | | | | (17,149 | ) | | | (18,960 | ) |
| | | 4.506 | | | | 11/27/2023 | | | | 02/27/2024 | | | | | | (305 | ) | | | (338 | ) |
| | | 4.600 | | | | 06/21/2023 | | | | TBD | | | | | | (23,445 | ) | | | (26,491 | ) |
| | | 4.658 | | | | 12/06/2023 | | | | 03/06/2024 | | | | | | (4,677 | ) | | | (5,181 | ) |
| | | 5.750 | | | | 12/01/2023 | | | | 01/02/2024 | | | $ | | | (6,595 | ) | | | (6,629 | ) |
| | | 5.845 | | | | 12/21/2023 | | | | 03/22/2024 | | | GBP | | | (2,137 | ) | | | (2,730 | ) |
| | | 5.920 | | | | 10/03/2023 | | | | 01/02/2024 | | | $ | | | (11,232 | ) | | | (11,400 | ) |
| | | 5.950 | | | | 10/03/2023 | | | | 01/02/2024 | | | | | | (133 | ) | | | (135 | ) |
| | | 6.100 | | | | 07/10/2023 | | | | 01/05/2024 | | | | | | (16,649 | ) | | | (17,145 | ) |
| | | 6.100 | | | | 08/09/2023 | | | | 01/05/2024 | | | | | | (7,021 | ) | | | (7,194 | ) |
| | | 6.100 | | | | 10/19/2023 | | | | 04/16/2024 | | | | | | (1,204 | ) | | | (1,220 | ) |
| | | 6.150 | | | | 07/28/2023 | | | | 01/26/2024 | | | | | | (487 | ) | | | (500 | ) |
| | | 6.250 | | | | 07/03/2023 | | | | 01/05/2024 | | | | | | (11,529 | ) | | | (11,895 | ) |
| | | 6.250 | | | | 08/31/2023 | | | | 02/27/2024 | | | | | | (2,656 | ) | | | (2,713 | ) |
| | | 6.250 | | | | 10/06/2023 | | | | 01/05/2024 | | | | | | (11,923 | ) | | | (12,105 | ) |
| | | 6.570 | | | | 08/04/2023 | | | | 02/06/2024 | | | | | | (3,286 | ) | | | (3,377 | ) |
| | | 6.610 | | | | 06/06/2023 | | | | 03/06/2024 | | | | | | (13,838 | ) | | | (14,371 | ) |
| | | 6.640 | | | | 10/17/2023 | | | | 01/16/2024 | | | | | | (19,115 | ) | | | (19,386 | ) |
| | | 6.670 | | | | 06/30/2023 | | | | 01/04/2024 | | | | | | (6,530 | ) | | | (6,755 | ) |
| | | 6.670 | | | | 07/03/2023 | | | | 01/05/2024 | | | | | | (9,685 | ) | | | (10,013 | ) |
| | | 6.670 | | | | 08/01/2023 | | | | 05/01/2024 | | | | | | (15,552 | ) | | | (15,996 | ) |
| | | 6.700 | | | | 07/28/2023 | | | | 04/26/2024 | | | | | | (39,699 | ) | | | (40,866 | ) |
| | | 6.700 | | | | 10/06/2023 | | | | 01/04/2024 | | | | | | (26,551 | ) | | | (26,986 | ) |
| | | 6.750 | | | | 07/27/2023 | | | | 04/26/2024 | | | | | | (14,090 | ) | | | (14,510 | ) |
| | | 6.770 | | | | 08/04/2023 | | | | 02/06/2024 | | | | | | (1,103 | ) | | | (1,134 | ) |
| | | 6.900 | | | | 09/26/2023 | | | | 03/25/2024 | | | | | | (4,852 | ) | | | (4,943 | ) |
| | | 6.040 | | | | 12/04/2023 | | | | 01/04/2024 | | | | | | (46,484 | ) | | | (46,710 | ) |
| | | | | | | | | | | | | | | | | | | | | | |
Total Reverse Repurchase Agreements | | | | | | | | | | | | | | | |
| | | | | | | | | | | | | | | | | | | | | | |
BORROWINGS AND OTHER FINANCING TRANSACTIONS SUMMARY
The following is a summary by counterparty of the market value of Borrowings and Other Financing Transactions and collateral pledged/(received) as of December 31, 2023:
| | | | | | | | | | | | | | | | | | | | | | | | |
| | Repurchase Agreement Proceeds to be Received (1) | | | Payable for
Reverse
Repurchase
Agreements | | | Payable for Sale-Buyback Transactions | | | Total
Borrowings and
Other Financing
Transactions | | | Collateral
Pledged/(Received) | | | | |
Global/Master Repurchase Agreement | | | | | | | | | | | | | | | | | | | | | | | | |
| | $ | 0 | | | $ | (703 | ) | | $ | 0 | | | $ | (703 | ) | | $ | 0 | | | $ | (703 | ) |
| | | 0 | | | | (169,428 | ) | | | 0 | | | | (169,428 | ) | | | 220,806 | | | | 51,378 | |
| | | 0 | | | | (3,642 | ) | | | 0 | | | | (3,642 | ) | | | 4,554 | | | | 912 | |
| | | 0 | | | | (60,752 | ) | | | 0 | | | | (60,752 | ) | | | 75,506 | | | | 14,754 | |
| | | 0 | | | | (435,020 | ) | | | 0 | | | | (435,020 | ) | | | 542,690 | | | | 107,670 | |
| | | 0 | | | | (277,417 | ) | | | 0 | | | | (277,417 | ) | | | 372,450 | | | | 95,033 | |
| | | 0 | | | | (46,150 | ) | | | 0 | | | | (46,150 | ) | | | 56,260 | | | | 10,110 | |
| | | 0 | | | | (114,138 | ) | | | 0 | | | | (114,138 | ) | | | 131,256 | | | | 17,118 | |
| | | 0 | | | | (503 | ) | | | 0 | | | | (503 | ) | | | 633 | | | | 130 | |
| | | 0 | | | | (316,991 | ) | | | 0 | | | | (316,991 | ) | | | 460,394 | | | | 143,403 | |
| | | 4,303 | | | | 0 | | | | 0 | | | | 4,303 | | | | (4,385 | ) | | | (82 | ) |
| | | | | | | | | | | | |
| See Accompanying Notes | | | | | | | | | | DECEMBER 31, 2023 | | | |
| | | | | | | | |
Consolidated Schedule of Investments | | PIMCO Dynamic Income Fund | | | | | | |
| | | | | | | | | | | | | | | | | | | | | | | | |
| | Repurchase Agreement Proceeds to be Received (1) | | | Payable for
Reverse
Repurchase
Agreements | | | Payable for Sale-Buyback Transactions | | | Total
Borrowings and
Other Financing
Transactions | | | Collateral
Pledged/(Received) | | | | |
| | $ | 0 | | | $ | (228,478 | ) | | $ | 0 | | | $ | (228,478 | ) | | $ | 282,034 | | | $ | 53,556 | |
| | | 0 | | | | (65,913 | ) | | | 0 | | | | (65,913 | ) | | | 67,228 | | | | 1,315 | |
| | | 0 | | | | (53,921 | ) | | | 0 | | | | (53,921 | ) | | | 65,662 | | | | 11,741 | |
| | | 151,330 | | | | (107,975 | ) | | | 0 | | | | 43,355 | | | | (58,092 | ) | | | (14,737 | ) |
| | | 0 | | | | (21,712 | ) | | | 0 | | | | (21,712 | ) | | | 27,257 | | | | 5,545 | |
| | | 0 | | | | (21,191 | ) | | | 0 | | | | (21,191 | ) | | | 25,947 | | | | 4,756 | |
| | | 0 | | | | (225,850 | ) | | | 0 | | | | (225,850 | ) | | | 303,880 | | | | 78,030 | |
| | | 0 | | | | (13,047 | ) | | | 0 | | | | (13,047 | ) | | | 16,234 | | | | 3,187 | |
| | | 0 | | | | (53,242 | ) | | | 0 | | | | (53,242 | ) | | | 71,353 | | | | 18,111 | |
| | | 0 | | | | (2,798 | ) | | | 0 | | | | (2,798 | ) | | | 3,502 | | | | 704 | |
| | | 0 | | | | (92,185 | ) | | | 0 | | | | (92,185 | ) | | | 155,761 | | | | 63,576 | |
| | | 0 | | | | (51,544 | ) | | | 0 | | | | (51,544 | ) | | | 53,217 | | | | 1,673 | |
| | | 0 | | | | (20,576 | ) | | | 0 | | | | (20,576 | ) | | | 24,436 | | | | 3,860 | |
| | | 0 | | | | 0 | | | | 0 | | | | 0 | | | | (20 | ) | | | (20 | ) |
| | | 0 | | | | (233,186 | ) | | | 0 | | | | (233,186 | ) | | | 255,968 | | | | 22,782 | |
| | | 0 | | | | (65,600 | ) | | | 0 | | | | (65,600 | ) | | | 89,360 | | | | 23,760 | |
| | | 0 | | | | (21,229 | ) | | | 0 | | | | (21,229 | ) | | | 23,788 | | | | 2,559 | |
| | | 0 | | | | (220,182 | ) | | | 0 | | | | (220,182 | ) | | | 277,409 | | | | 57,227 | |
| | | 0 | | | | (301,651 | ) | | | 0 | | | | (301,651 | ) | | | 376,859 | | | | 75,208 | |
| | | 0 | | | | (46,710 | ) | | | 0 | | | | (46,710 | ) | | | 53,711 | | | | 7,001 | |
| | | | | | | | | | | | | | | | | | | | | | | | |
Total Borrowings and Other Financing Transactions | | | | | | | | | | | | | | | | | | | | | | | | |
| | | | | | | | | | | | | | | | | | | | | | | | |
CERTAIN TRANSFERS ACCOUNTED FOR AS SECURED BORROWINGS
Remaining Contractual Maturity of the Agreements
| | | | | | | | | | | | | | | | | | | | |
| | | | | | | | | | | | | | | | |
Reverse Repurchase Agreements | |
| | $ | 0 | | | $ | (242,313 | ) | | $ | (167,623 | ) | | $ | (294,622 | ) | | $ | (704,558 | ) |
Convertible Bonds & Notes | | | 0 | | | | (5,843 | ) | | | (17,763 | ) | | | 0 | | | | (23,606 | ) |
| | | 0 | | | | (1,601 | ) | | | (46,640 | ) | | | (7,825 | ) | | | (56,066 | ) |
Non-Agency Mortgage-Backed Securities | | | 0 | | | | (198,001 | ) | | | (375,872 | ) | | | (862,783 | ) | | | (1,436,656 | ) |
| | | 0 | | | | (53,169 | ) | | | (327,813 | ) | | | (527,115 | ) | | | (908,097 | ) |
| | | 0 | | | | (8,280 | ) | | | (38,037 | ) | | | (3,714 | ) | | | (50,031 | ) |
| | | 0 | | | | (4,837 | ) | | | 0 | | | | (9,436 | ) | | | (14,273 | ) |
| | | | | | | | | | | | | | | | | | | | |
| | | | | | | | | | | | | | | | | | | | |
| | | | | | | | | | | | | | | | | | | | |
Payable for reverse repurchase agreements (6) | | | | | |
| | | | | |
| Securities with an aggregate market value of $4,153,609 and cash of $43,691 have been pledged as collateral under the terms of the above master agreements as of December 31, 2023. |
| Includes accrued interest. |
| Open maturity repurchase agreement. |
| The average amount of borrowings outstanding during the period ended December 31, 2023 was $(3,303,973) at a weighted average interest rate of 6.152%. Average borrowings may include reverse repurchase agreements and sale-buyback transactions, if held during the period. |
| Open maturity reverse repurchase agreement. |
| Net Exposure represents the net receivable/(payable) that would be due from/to the counterparty in the event of default. Exposure from borrowings and other financing transactions can only be netted across transactions governed under the same master agreement with the same legal entity. See Note 8, Master Netting Arrangements, in the Notes to Financial Statements for more information. |
| Unsettled reverse repurchase agreements liability of $(78,447) is outstanding at period end. |
(m) FINANCIAL DERIVATIVE INSTRUMENTS: EXCHANGE-TRADED OR CENTRALLY CLEARED
| | | | | | | | | | | | | | | | | | | | | | | | | | | | |
| | | | | | | | | | | Unrealized
Appreciation/
(Depreciation) | | | | |
| | | | | | |
3-Month SOFR Active Contract December Futures | | | 03/2024 | | | | 179 | | | $ | | | | | (42,353 | ) | | $ | 1,198 | | | $ | 0 | | | $ | (2 | ) |
3-Month SOFR Active Contract December Futures | | | 03/2025 | | | | 93 | | | | | | | | (22,383 | ) | | | 346 | | | | 0 | | | | (8 | ) |
3-Month SOFR Active Contract December Futures | | | 03/2026 | | | | 102 | | | | | | | | (24,718 | ) | | | 232 | | | | 0 | | | | (9 | ) |
3-Month SOFR Active Contract June Futures | | | 09/2024 | | | | 117 | | | | | | | | (27,929 | ) | | | 616 | | | | 0 | | | | (6 | ) |
3-Month SOFR Active Contract June Futures | | | 09/2025 | | | | 94 | | | | | | | | (22,746 | ) | | | 245 | | | | 0 | | | | (9 | ) |
| | | | | | | | |
| | | | | | December 31, 2023 | | (Unaudited) |
| | | | | | | | | | | | | | | | | | | | | | | | | | | | |
| | | | | | | | | | | Unrealized
Appreciation/
(Depreciation) | | | | |
| | | | | | |
3-Month SOFR Active Contract March Futures | | | 06/2024 | | | | 155 | | | $ | | | | | (36,818 | ) | | $ | 946 | | | $ | 0 | | | $ | (4 | ) |
3-Month SOFR Active Contract March Futures | | | 06/2025 | | | | 85 | | | | | | | | (20,523 | ) | | | 262 | | | | 0 | | | | (9 | ) |
3-Month SOFR Active Contract March Futures | | | 06/2026 | | | | 95 | | | | | | | | (23,021 | ) | | | 212 | | | | 0 | | | | (7 | ) |
3-Month SOFR Active Contract September Futures | | | 12/2024 | | | | 108 | | | | | | | | (25,894 | ) | | | 481 | | | | 0 | | | | (8 | ) |
3-Month SOFR Active Contract September Futures | | | 12/2025 | | | | 76 | | | | | | | | (18,411 | ) | | | 178 | | | | 0 | | | | (8 | ) |
| | | | | | | | | | | | | | | | | | | | | | | | | | | | |
| | | | | | | | | | | | | | | | | |
| | | | | | | | | | | | | | | | | |
CREDIT DEFAULT SWAPS ON CORPORATE ISSUES - SELL PROTECTION
(1)
| | | | | | | | | | | | | | | | | | | | | | | | | | | | | | | | | | | | | | | | | | | | |
| | | | | | | | | | | Implied Credit Spread at December 31, 2023 (2) | | | | | | | | | Unrealized
Appreciation/
(Depreciation) | | | | | | | |
| | | | | | |
Jaguar Land Rover Automotive | | | 5.000 | % | | | Quarterly | | | | 06/20/2026 | | | | 1.875 | % | | | EUR | | | | 600 | | | $ | 39 | | | $ | 11 | | | $ | 50 | | | $ | 0 | | | $ | 0 | |
Jaguar Land Rover Automotive | | | 5.000 | | | | Quarterly | | | | 12/20/2026 | | | | 2.236 | | | | | | | | 12,613 | | | | 637 | | | | 461 | | | | 1,098 | | | | 14 | | | | 0 | |
| | | | | | | | | | | | | | | | | | | | | | | | | | | | | | | | | | | | | | | | | | | | |
| | | | | | | | | | | | | | | $ | 676 | | | $ | 472 | | | $ | 1,148 | | | $ | 14 | | | $ | 0 | |
| | | | | | | | | | | | | | | | | | | | | | | | | | | | | | | | | |
| | | | | | | | | | | | | | | | | | | | | | | | | | | | | | | | | | | | | | | | |
| | | | | | | | | | | | | | | | | | Unrealized
Appreciation/
(Depreciation) | | | | | | | |
| | | | | | |
| | 1-Day GBP-SONIO Compounded-OIS | | | 5.000 | % | | Annual | | | 03/20/2029 | | | | GBP | | | | 155,500 | | | $ | 15,281 | | | $ | 111 | | | $ | 15,392 | | | $ | 0 | | | $ | (492 | ) |
| | 1-Day GBP-SONIO Compounded-OIS | | | 0.500 | | | Annual | | | 09/16/2030 | | | | | | | | 27,000 | | | | 335 | | | | 5,787 | | | | 6,122 | | | | 158 | | | | 0 | |
| | 1-Day GBP-SONIO Compounded-OIS | | | 0.750 | | | Annual | | | 09/21/2052 | | | | | | | | 28,300 | | | | (2,278 | ) | | | 19,937 | | | | 17,659 | | | | 552 | | | | 0 | |
| | 1-Day USD-SOFR Compounded-OIS | | | 5.250 | | | Annual | | | 06/20/2024 | | | | $ | | | | 152,800 | | | | (42 | ) | | | 141 | | | | 99 | | | | 1 | | | | 0 | |
| | 1-Day USD-SOFR Compounded-OIS | | | 2.450 | | | Annual | | | 12/20/2024 | | | | | | | | 189,000 | | | | (13 | ) | | | 4,425 | | | | 4,412 | | | | 49 | | | | 0 | |
| | 1-Day USD-SOFR Compounded-OIS | | | 2.350 | | | Annual | | | 01/17/2025 | | | | | | | | 94,800 | | | | 10 | | | | 2,141 | | | | 2,151 | | | | 0 | | | | (12 | ) |
| | 1-Day USD-SOFR Compounded-OIS | | | 2.300 | | | Annual | | | 01/17/2026 | | | | | | | | 15,100 | | | | 7 | | | | 489 | | | | 496 | | | | 0 | | | | (6 | ) |
| | 1-Day USD-SOFR Compounded-OIS | | | 4.500 | | | Annual | | | 06/16/2026 | | | | | | | | 204,800 | | | | (591 | ) | | | 3,931 | | | | 3,340 | | | | 61 | | | | 0 | |
| | 1-Day USD-SOFR Compounded-OIS | | | 1.000 | | | Annual | | | 12/15/2026 | | | | | | | | 11,200 | | | | 21 | | | | (905 | ) | | | (884 | ) | | | 0 | | | | (3 | ) |
| | 1-Day USD-SOFR Compounded-OIS | | | 4.500 | | | Annual | | | 12/21/2026 | | | | | | | | 853,000 | | | | (3,163 | ) | | | 22,685 | | | | 19,522 | | | | 216 | | | | 0 | |
| | 1-Day USD-SOFR Compounded-OIS | | | 1.360 | | | | | | 02/15/2027 | | | | | | | | 13,450 | | | | (2 | ) | | | 1,075 | | | | 1,073 | | | | 4 | | | | 0 | |
| | 1-Day USD-SOFR Compounded-OIS | | | 4.500 | | | Annual | | | 02/15/2027 | | | | | | | | 58,000 | | | | (137 | ) | | | 1,573 | | | | 1,436 | | | | 13 | | | | 0 | |
| | 1-Day USD-SOFR Compounded-OIS | | | 4.500 | | | Annual | | | 06/21/2027 | | | | | | | | 221,100 | | | | (425 | ) | | | 6,872 | | | | 6,447 | | | | 62 | | | | 0 | |
| | 1-Day USD-SOFR Compounded-OIS | | | 3.700 | | | Annual | | | 12/05/2027 | | | | | | | | 864,600 | | | | (534 | ) | | | 2,102 | | | | 1,568 | | | | 338 | | | | 0 | |
| | 1-Day USD-SOFR Compounded-OIS | | | 4.500 | | | Annual | | | 12/21/2027 | | | | | | | | 96,300 | | | | (131 | ) | | | 3,523 | | | | 3,392 | | | | 48 | | | | 0 | |
| | 1-Day USD-SOFR Compounded-OIS | | | 0.500 | | | Semi-Annual | | | 06/16/2028 | | | | | | | | 660 | | | | (31 | ) | | | (60 | ) | | | (91 | ) | | | 0 | | | | 0 | |
| | 1-Day USD-SOFR Compounded-OIS | | | 2.250 | | | Semi-Annual | | | 06/20/2028 | | | | | | | | 8,200 | | | | (269 | ) | | | (274 | ) | | | (543 | ) | | | 1 | | | | 0 | |
| | 1-Day USD-SOFR Compounded-OIS | | | 3.750 | | | Annual | | | 12/20/2028 | | | | | | | | 170,600 | | | | 1,577 | | | | 41 | | | | 1,618 | | | | 63 | | | | 0 | |
| | 1-Day USD-SOFR Compounded-OIS | | | 3.750 | | | Annual | | | 06/20/2029 | | | | | | | | 123,500 | | | | (2,337 | ) | | | (42 | ) | | | (2,379 | ) | | | 0 | | | | (45 | ) |
| | 1-Day USD-SOFR Compounded-OIS | | | 4.500 | | | Annual | | | 12/21/2029 | | | | | | | | 248,300 | | | | 224 | | | | 13,794 | | | | 14,018 | | | | 55 | | | | 0 | |
| | 1-Day USD-SOFR Compounded-OIS | | | 1.500 | | | Annual | | | 12/15/2031 | | | | | | | | 98,500 | | | | (2,199 | ) | | | 15,701 | | | | 13,502 | | | | 56 | | | | 0 | |
| | 1-Day USD-SOFR Compounded-OIS | | | 1.750 | | | Semi-Annual | | | 12/15/2031 | | | | | | | | 16,600 | | | | (225 | ) | | | 2,539 | | | | 2,314 | | | | 10 | | | | 0 | |
| | 1-Day USD-SOFR Compounded-OIS | | | 2.000 | | | Annual | | | 12/21/2032 | | | | | | | | 88,000 | | | | 10,651 | | | | (733 | ) | | | 9,918 | | | | 75 | | | | 0 | |
| | 1-Day USD-SOFR Compounded-OIS | | | 3.850 | | | Annual | | | 12/21/2038 | | | | | | | | 108,200 | | | | 418 | | | | (4,940 | ) | | | (4,522 | ) | | | 210 | | | | 0 | |
| | 1-Day USD-SOFR Compounded-OIS | | | 2.750 | | | Semi-Annual | | | 03/20/2043 | | | | | | | | 1,300 | | | | (4 | ) | | | 178 | | | | 174 | | | | 3 | | | | 0 | |
| | 1-Day USD-SOFR Compounded-OIS | | | 2.750 | | | Semi-Annual | | | 12/16/2045 | | | | | | | | 3,800 | | | | (44 | ) | | | 613 | | | | 569 | | | | 11 | | | | 0 | |
| | 1-Day USD-SOFR Compounded-OIS | | | 2.500 | | | Semi-Annual | | | 06/20/2048 | | | | | | | | 3,100 | | | | 256 | | | | 343 | | | | 599 | | | | 10 | | | | 0 | |
| | 1-Day USD-SOFR Compounded-OIS | | | 2.250 | | | Semi-Annual | | | 03/12/2050 | | | | | | | | 20,500 | | | | (367 | ) | | | 5,178 | | | | 4,811 | | | | 72 | | | | 0 | |
| | 1-Day USD-SOFR Compounded-OIS | | | 1.750 | | | Annual | | | 06/15/2052 | | | | | | | | 68,000 | | | | 16,788 | | | | 3,904 | | | | 20,692 | | | | 257 | | | | 0 | |
| | 1-Day USD-SOFR Compounded-OIS | | | 1.750 | | | Annual | | | 12/21/2052 | | | | | | | | 45,800 | | | | 11,031 | | | | 2,108 | | | | 13,139 | | | | 174 | | | | 0 | |
| | 1-Day USD-SOFR Compounded-OIS | | | 3.500 | | | Annual | | | 12/21/2052 | | | | | | | | 92,160 | | | | 786 | | | | (3,943 | ) | | | (3,157 | ) | | | 443 | | | | 0 | |
| | | | | 11.157 | | | Maturity | | | 01/02/2025 | | | | BRL | | | | 7,800 | | | | 0 | | | | (32 | ) | | | (32 | ) | | | 0 | | | | (1 | ) |
| | | | | 11.177 | | | Maturity | | | 01/02/2025 | | | | | | | | 5,200 | | | | 0 | | | | (21 | ) | | | (21 | ) | | | 0 | | | | 0 | |
| | | | | 11.367 | | | Maturity | | | 01/02/2025 | | | | | | | | 6,400 | | | | 0 | | | | (20 | ) | | | (20 | ) | | | 0 | | | | (1 | ) |
| | | | | 12.018 | | | Maturity | | | 01/02/2025 | | | | | | | | 17,400 | | | | 0 | | | | (1 | ) | | | (1 | ) | | | 0 | | | | (2 | ) |
| | | | | 12.098 | | | Maturity | | | 01/02/2025 | | | | | | | | 28,900 | | | | 0 | | | | 10 | | | | 10 | | | | 0 | | | | (2 | ) |
| | | | | 12.158 | | | Maturity | | | 01/02/2025 | | | | | | | | 14,600 | | | | 0 | | | | 9 | | | | 9 | | | | 0 | | | | (1 | ) |
| | | | | 12.163 | | | Maturity | | | 01/02/2025 | | | | | | | | 14,300 | | | | 0 | | | | 9 | | | | 9 | | | | 0 | | | | (1 | ) |
| | | | | 12.178 | | | Maturity | | | 01/02/2025 | | | | | | | | 29,100 | | | | 0 | | | | 21 | | | | 21 | | | | 0 | | | | (2 | ) |
| | | | | 11.250 | | | Maturity | | | 01/04/2027 | | | | | | | | 9,400 | | | | 0 | | | | 19 | | | | 19 | | | | 0 | | | | (1 | ) |
| | | | | 11.275 | | | Maturity | | | 01/04/2027 | | | | | | | | 4,700 | | | | 0 | | | | 10 | | | | 10 | | | | 0 | | | | (1 | ) |
| | | | | 11.290 | | | Maturity | | | 01/04/2027 | | | | | | | | 4,700 | | | | 0 | | | | 11 | | | | 11 | | | | 0 | | | | (1 | ) |
| | | | | 11.731 | | | Maturity | | | 01/04/2027 | | | | | | | | 2,400 | | | | 0 | | | | 12 | | | | 12 | | | | 0 | | | | 0 | |
| | | | | 11.746 | | | Maturity | | | 01/04/2027 | | | | | | | | 10,500 | | | | 0 | | | | 56 | | | | 56 | | | | 0 | | | | (1 | ) |
| | | | | 11.823 | | | Maturity | | | 01/04/2027 | | | | | | | | 599,100 | | | | 0 | | | | (3,812 | ) | | | (3,812 | ) | | | 77 | | | | 0 | |
| | | | | 11.901 | | | Maturity | | | 01/04/2027 | | | | | | | | 25,100 | | | | 0 | | | | 159 | | | | 159 | | | | 0 | | | | (3 | ) |
| | | | | | | | | | | | |
| See Accompanying Notes | | | | | | | | | | DECEMBER 31, 2023 | | | |
| | | | | | | | |
Consolidated Schedule of Investments | | PIMCO Dynamic Income Fund | | | | | | |
| | | | | | | | | | | | | | | | | | | | | | | | | | | | | | | | | | | | | | | | |
| | | | | | | | | | | | | | | | | | Unrealized
Appreciation/
(Depreciation) | | | | | | | |
| | | | | | |
| | | | | 12.047 | % | | Maturity | | | 01/04/2027 | | | | BRL | | | | 437,000 | | | $ | 0 | | | $ | 3,191 | | | $ | 3,191 | | | $ | 0 | | | $ | (57 | ) |
| | | | | 0.150 | | | Annual | | | 03/18/2030 | | | | EUR | | | | 20,400 | | | | 373 | | | | 3,249 | | | | 3,622 | | | | 105 | | | | 0 | |
| | | | | 0.150 | | | Annual | | | 06/17/2030 | | | | | | | | 1,200 | | | | (1 | ) | | | 182 | | | | 181 | | | | 7 | | | | 0 | |
| | | | | 0.250 | | | Annual | | | 03/18/2050 | | | | | | | | 2,500 | | | | 139 | | | | 1,027 | | | | 1,166 | | | | 47 | | | | 0 | |
| | | | | 0.500 | | | Annual | | | 06/17/2050 | | | | | | | | 500 | | | | (16 | ) | | | 218 | | | | 202 | | | | 10 | | | | 0 | |
| | | | | 0.500 | | | Annual | | | 09/21/2052 | | | | | | | | 34,600 | | | | 2,992 | | | | 11,935 | | | | 14,927 | | | | 706 | | | | 0 | |
| | | | | 0.830 | | | Annual | | | 12/09/2052 | | | | | | | | 143,700 | | | | 1,990 | | | | 7,224 | | | | 9,214 | | | | 725 | | | | 0 | |
| | | | | 2.750 | | | Annual | | | 03/20/2054 | | | | | | | | 13,500 | | | | 131 | | | | (1,535 | ) | | | (1,404 | ) | | | 381 | | | | 0 | |
| | | | | 8.675 | | | Lunar | | | 04/03/2024 | | | | MXN | | | | 63,800 | | | | 0 | | | | 33 | | | | 33 | | | | 1 | | | | 0 | |
| | | | | 8.660 | | | Lunar | | | 04/04/2024 | | | | | | | | 32,100 | | | | 0 | | | | 17 | | | | 17 | | | | 1 | | | | 0 | |
| | | | | 8.750 | | | Lunar | | | 04/05/2024 | | | | | | | | 11,300 | | | | 0 | | | | 6 | | | | 6 | | | | 0 | | | | 0 | |
| | | | | 8.410 | | | Lunar | | | 03/31/2027 | | | | | | | | 7,600 | | | | 0 | | | | 8 | | | | 8 | | | | 0 | | | | 0 | |
| | | | | 8.730 | | | Lunar | | | 04/06/2027 | | | | | | | | 4,700 | | | | 0 | | | | 2 | | | | 2 | | | | 0 | | | | 0 | |
| | | | | 7.495 | | | Lunar | | | 01/14/2032 | | | | | | | | 2,300 | | | | 9 | | | | (1 | ) | | | 8 | | | | 0 | | | | 0 | |
| | | | | 7.498 | | | Lunar | | | 01/15/2032 | | | | | | | | 9,500 | | | | 39 | | | | (8 | ) | | | 31 | | | | 0 | | | | 0 | |
| | | | | 8.732 | | | Lunar | | | 03/30/2032 | | | | | | | | 2,400 | | | | 0 | | | | (2 | ) | | | (2 | ) | | | 0 | | | | 0 | |
| | | | | 8.701 | | | Lunar | | | 03/31/2032 | | | | | | | | 5,600 | | | | 0 | | | | (5 | ) | | | (5 | ) | | | 0 | | | | 0 | |
| | | | | | | | | | | | | | | | | | | | | | | | | | | | | | | | | | | | | | | | |
| | | | | | | $ | 50,249 | | | $ | 130,265 | | | $ | 180,514 | | | $ | 5,002 | | | $ | (632 | ) |
| | | | | | | | | | | | | | | | | | | | | | | | | |
| | | | | | | | | | | | | | | | | | | | | | | | | |
| | | | | | | | | | | | | | | | | | | | | | | | | |
FINANCIAL DERIVATIVE INSTRUMENTS: EXCHANGE-TRADED OR CENTRALLY CLEARED SUMMARY
The following is a summary of the market value and variation margin of Exchange-Traded or Centrally Cleared Financial Derivative Instruments as of December 31, 2023:
| | | | | | | | | | | | | | | | | | | | | | | | | | | | | | | | | | | | |
| | | Financial Derivative Assets | | | | | | Financial Derivative Liabilities | |
| | | | | | | | | | | | | | | | | | Variation Margin
Liability | | | | |
| | | | | | | | | | | | | | | | | | | | | | |
Total Exchange-Traded or Centrally Cleared | | | | | | | | | | | | | | | | | | | | | | | | | | | | | | | | | | | | |
| | | | | | | | | | | | | | | | | | | | | | | | | | | | | | | | | | | | |
| Securities with an aggregate market value of $1,724 and cash of $74,860 have been pledged as collateral for exchange-traded and centrally cleared financial derivative instruments as of December 31, 2023. |
| If the Fund is a seller of protection and a credit event occurs, as defined under the terms of that particular swap agreement, the Fund will either (i) pay to the buyer of protection an amount equal to the notional amount of the swap and take delivery of the referenced obligation or underlying securities comprising the referenced index or (ii) pay a net settlement amount in the form of cash, securities or other deliverable obligations equal to the notional amount of the swap less the recovery value of the referenced obligation or underlying securities comprising the referenced index. |
| Implied credit spreads, represented in absolute terms, utilized in determining the market value of credit default swap agreements on corporate issues as of period end serve as indicators of the current status of the payment/performance risk and represent the likelihood or risk of default for the credit derivative. The implied credit spread of a particular referenced entity reflects the cost of buying/selling protection and may include upfront payments required to be made to enter into the agreement. Wider credit spreads represent a deterioration of the referenced entity’s credit soundness and a greater likelihood or risk of default or other credit event occurring as defined under the terms of the agreement. |
| The maximum potential amount the Fund could be required to pay as a seller of credit protection or receive as a buyer of credit protection if a credit event occurs as defined under the terms of that particular swap agreement. |
| The prices and resulting values for credit default swap agreements serve as indicators of the current status of the payment/performance risk and represent the likelihood of an expected liability (or profit) for the credit derivative should the notional amount of the swap agreement be closed/sold as of the period end. Increasing market values, in absolute terms when compared to the notional amount of the swap, represent a deterioration of the underlying referenced instrument’s credit soundness and a greater likelihood or risk of default or other credit event occurring as defined under the terms of the agreement. |
| This instrument has a forward starting effective date. See Note 2, Securities Transactions and Investment Income, in the Notes to Financial Statements for further information. |
(o) FINANCIAL DERIVATIVE INSTRUMENTS: OVER THE COUNTER
FORWARD FOREIGN CURRENCY CONTRACTS:
| | | | | | | | | | | | | | | | | | | | | | | | |
| | | | | | | | | | | Unrealized Appreciation/
(Depreciation) | |
| | | | | | |
| | | 03/2024 | | | CNH | | | 6,800 | | | $ | | | 943 | | | $ | 0 | | | $ | (16 | ) |
| | | | | | | |
| | | 01/2024 | | | GBP | | | 5,459 | | | | | | 6,934 | | | | 0 | | | | (25 | ) |
| | | 02/2024 | | | $ | | | 4 | | | CNY | | | 31 | | | | 0 | | | | 0 | |
| | | 03/2024 | | | CNH | | | 9,570 | | | $ | | | 1,321 | | | | 0 | | | | (29 | ) |
| | | 03/2024 | | | $ | | | 4 | | | INR | | | 325 | | | | 0 | | | | 0 | |
| | | | | | | |
| | | 01/2024 | | | EUR | | | 586,411 | | | $ | | | 645,466 | | | | 0 | | | | (2,052 | ) |
| | | 01/2024 | | | GBP | | | 20,813 | | | | | | 26,400 | | | | 0 | | | | (130 | ) |
| | | 01/2024 | | | HUF | | | 260,958 | | | | | | 744 | | | | 0 | | | | (8 | ) |
| | | | | | | | |
| | | | | | December 31, 2023 | | (Unaudited) |
| | | | | | | | | | | | | | | | | | | | | | | | |
| | | | | | | | | | | Unrealized Appreciation/
(Depreciation) | |
| | | | | | |
| | | 01/2024 | | | $ | | | 17,009 | | | EUR | | | 15,371 | | | $ | 14 | | | $ | (50 | ) |
| | | 01/2024 | | | | | | 4 | | | HUF | | | 1,454 | | | | 0 | | | | 0 | |
| | | 02/2024 | | | | | | 6 | | | CNY | | | 42 | | | | 0 | | | | 0 | |
| | | 03/2024 | | | CNH | | | 6,623 | | | $ | | | 920 | | | | 0 | | | | (15 | ) |
| | | 03/2024 | | | $ | | | 1,745 | | | IDR | | | 26,896,026 | | | | 0 | | | | 0 | |
| | | 03/2024 | | | | | | 4 | | | INR | | | 332 | | | | 0 | | | | 0 | |
| | | | | | | |
| | | 01/2024 | | | | | | 5,507 | | | EUR | | | 5,076 | | | | 97 | | | | 0 | |
| | | 01/2024 | | | | | | 1,477 | | | PLN | | | 6,459 | | | | 164 | | | | 0 | |
| | | 03/2024 | | | TRY | | | 119 | | | $ | | | 4 | | | | 0 | | | | 0 | |
| | | 03/2024 | | | $ | | | 20,948 | | | TRY | | | 656,175 | | | | 0 | | | | (212 | ) |
| | | 04/2024 | | | | | | 75,579 | | | | | | 2,442,599 | | | | 0 | | | | (1,134 | ) |
| | | | | | | |
| | | 01/2024 | | | CHF | | | 89 | | | $ | | | 103 | | | | 0 | | | | (4 | ) |
| | | 01/2024 | | | EUR | | | 6,359 | | | | | | 7,014 | | | | 0 | | | | (8 | ) |
| | | 01/2024 | | | GBP | | | 2,534 | | | | | | 3,209 | | | | 0 | | | | (21 | ) |
| | | 01/2024 | | | HUF | | | 35,638 | | | | | | 102 | | | | 0 | | | | (1 | ) |
| | | 01/2024 | | | $ | | | 1,385 | | | EUR | | | 1,251 | | | | 0 | | | | (3 | ) |
| | | 02/2024 | | | BRL | | | 2,261 | | | $ | | | 441 | | | | 0 | | | | (24 | ) |
| | | 02/2024 | | | $ | | | 964 | | | TRY | | | 29,195 | | | | 0 | | | | (6 | ) |
| | | | | | | |
| | | 03/2024 | | | CNH | | | 4,555 | | | $ | | | 632 | | | | 0 | | | | (11 | ) |
| | | | | | | |
| | | 01/2024 | | | CAD | | | 18,549 | | | | | | 13,650 | | | | 0 | | | | (351 | ) |
| | | 01/2024 | | | $ | | | 911 | | | MXN | | | 15,976 | | | | 26 | | | | 0 | |
| | | 03/2024 | | | CNH | | | 2,962 | | | $ | | | 410 | | | | 0 | | | | (7 | ) |
| | | 03/2024 | | | $ | | | 2,372 | | | IDR | | | 36,428,191 | | | | 0 | | | | (9 | ) |
| | | | | | | |
| | | 01/2024 | | | HUF | | | 1,127,566 | | | $ | | | 3,213 | | | | 0 | | | | (37 | ) |
| | | 03/2024 | | | $ | | | 36 | | | IDR | | | 552,176 | | | | 0 | | | | 0 | |
| | | 03/2024 | | | | | | 4 | | | INR | | | 338 | | | | 0 | | | | 0 | |
| | | | | | | |
| | | 01/2024 | | | AUD | | | 444 | | | $ | | | 294 | | | | 0 | | | | (8 | ) |
| | | 01/2024 | | | EUR | | | 12,664 | | | | | | 13,781 | | | | 0 | | | | (203 | ) |
| | | 01/2024 | | | HUF | | | 502,597 | | | | | | 1,406 | | | | 0 | | | | (41 | ) |
| | | 01/2024 | | | $ | | | 1,471 | | | GBP | | | 1,156 | | | | 2 | | | | 0 | |
| | | 03/2024 | | | | | | 44 | | | IDR | | | 672,545 | | | | 0 | | | | 0 | |
| | | | | | | |
| | | 01/2024 | | | HUF | | | 53,446 | | | $ | | | 152 | | | | 0 | | | | (2 | ) |
| | | 02/2024 | | | $ | | | 5 | | | CNY | | | 32 | | | | 0 | | | | 0 | |
| | | 03/2024 | | | CNH | | | 6,489 | | | $ | | | 900 | | | | 0 | | | | (16 | ) |
| | | 03/2024 | | | IDR | | | 201,887,781 | | | | | | 13,117 | | | | 16 | | | | 0 | |
| | | 03/2024 | | | $ | | | 7,792 | | | IDR | | | 119,850,236 | | | | 0 | | | | (15 | ) |
| | | | | | | |
| | | 03/2024 | | | CNH | | | 6,370 | | | $ | | | 880 | | | | 0 | | | | (19 | ) |
| | | 03/2024 | | | $ | | | 1,536 | | | IDR | | | 23,537,394 | | | | 0 | | | | (9 | ) |
| | | 03/2024 | | | | | | 9 | | | INR | | | 736 | | | | 0 | | | | 0 | |
| | | | | | | |
| | | 03/2024 | | | CNH | | | 3,081 | | | $ | | | 427 | | | | 0 | | | | (8 | ) |
| | | | | | | |
| | | 01/2024 | | | GBP | | | 113,081 | | | | | | 143,106 | | | | 0 | | | | (1,037 | ) |
| | | 03/2024 | | | CZK | | | 12,190 | | | | | | 548 | | | | 4 | | | | 0 | |
| | | | | | | | | | | | | | | | | | | | | | | | |
Total Forward Foreign Currency Contracts | | | | | | | | | |
| | | | | | | | | |
CREDIT DEFAULT SWAPS ON CORPORATE ISSUES - SELL PROTECTION
(1)
| | | | | | | | | | | | | | | | | | | | | | | | | | | | | | | | | | | | |
| | | | | | | | | | | | Implied Credit Spread at December 31, 2023 (2) | | | | | | | | | Unrealized
Appreciation/
(Depreciation) | | | Swap Agreements, at Value (4) | |
| | | | | | |
| BPS | | | | | 1.000 | % | | Quarterly | | | 12/20/2028 | | | | 5.188 | % | | $ | 3,000 | | | $ | (580 | ) | | $ | 79 | | | $ | 0 | | | $ | (501 | ) |
| DUB | | | | | 4.650 | | | Quarterly | | | 06/30/2029 | | | | 0.075 | | | | 22,100 | | | | 0 | | | | 1,922 | | | | 1,922 | | | | 0 | |
| MYC | | | | | 1.000 | | | Quarterly | | | 12/20/2028 | | | | 5.188 | | | | 3,700 | | | | (722 | ) | | | 105 | | | | 0 | | | | (617 | ) |
| | | | | | | | | | | | | | | | | | | | | | | | | | | | | | | | | | | | |
| | | | | | | | | | | | | | | | | | | | $ | (1,302 | ) | | $ | 2,106 | | | $ | 1,922 | | | $ | (1,118 | ) |
| | | | | | | | | | | | | | | | | | | | | | | | | | | | | | | | | | |
CREDIT DEFAULT SWAPS ON CREDIT INDICES - SELL PROTECTION
(1)
| | | | | | | | | | | | | | | | | | | | | | | | | | | | | | | | | | |
| | | | | | | | | | | | | | | | | | | Unrealized
Appreciation/
(Depreciation) | | | Swap Agreements, at Value (4) | |
| | | | | | |
| FBF | | | | | 0.170 | % | | | Monthly | | | | 05/25/2046 | | | | $ 22,375 | | | $ | (19,916 | ) | | $ | 16,325 | | | $ | 0 | | | $ | (3,591 | ) |
| GST | | | | | 0.320 | | | | Monthly | | | | 07/25/2045 | | | | 4,540 | | | | (903 | ) | | | 562 | | | | 0 | | | | (341 | ) |
| | | | | 0.090 | | | | Monthly | | | | 08/25/2037 | | | | 1,591 | | | | (831 | ) | | | 705 | | | | 0 | | | | (126 | ) |
| | | | | | | | | | | | | | | | | | | | | | | | | | | | | | | | | | |
| | | | | | | | | | | | | | | | | | $ | (21,650 | ) | | $ | 17,592 | | | $ | 0 | | | $ | (4,058 | ) |
| | | | | | | | | | | | | | | | | | | | | | | | | | | | | | | | |
| | | | | | | | | | | | |
| See Accompanying Notes | | | | | | | | | | DECEMBER 31, 2023 | | | |
| | | | | | | | |
Consolidated Schedule of Investments | | PIMCO Dynamic Income Fund | | | | | | |
TOTAL RETURN SWAPS ON LOAN PARTICIPATIONS AND ASSIGNMENTS
| | | | | | | | | | | | | | | | | | | | | | | | | | | | | | | | | | |
| | | | | | | | | | | | | | | | | | | Unrealized
Appreciation/
(Depreciation) | | | | |
| | | | | | |
| | | | | | | | | | | 01/31/2024 | | | $ | | | 225 | | | $ | 0 | | | $ | 62 | | | $ | 62 | | | $ | 0 | |
| | | | | | | | | | | 01/31/2024 | | | | | | 240 | | | | 0 | | | | 154 | | | | 154 | | | | 0 | |
| | | | Gateway Casinos & Entertainment Limited | | | | | | | 01/24/2024 | | | | | | 299 | | | | 0 | | | | 1,052 | | | | 1,052 | | | | 0 | |
| | | | | | | | | | | 01/31/2024 | | | | | | 2,362 | | | | 0 | | | | 2,079 | | | | 2,079 | | | | 0 | |
| | | | | | | | | | | 01/29/2024 | | | | | | 5,582 | | | | 0 | | | | 894 | | | | 894 | | | | 0 | |
| | | | | | | | | | | 02/15/2024 | | | | | | 4,200 | | | | 0 | | | | 5,861 | | | | 5,861 | | | | 0 | |
| | | | | | | | | | | | | | | | | | | | | | | | | | | | | | | | | | |
| | | $ | 0 | | | $ | 10,102 | | | $ | 10,102 | | | $ | 0 | |
| | | | | | | | | | | | | | | | | |
TOTAL RETURN SWAPS ON EQUITY INDICES
| | | | | | | | | | | | | | | | | | | | | | | | | | | | | | | | | | | | |
| | | | | | | | | | | | | | | | | | | | Unrealized
Appreciation/
(Depreciation) | | | | |
| | | | | | |
| | | | United States Treasury Inflation Indexed Bonds « | | N/A | | 0.000% | | Maturity | | 01/28/2036 | | | CNY | | | | 59,900 | | | $ | 24 | | | $ | (2,394 | ) | | $ | 0 | | | $ | (2,370 | ) |
| | | | | | | | | | | | | | | | | | | | | | | | | | | | | | | | | | | | |
| | | | | | | | | | | | | | | | | | | | | |
| | | | | | | | | | | | | | | | | |
FINANCIAL DERIVATIVE INSTRUMENTS: OVER THE COUNTER SUMMARY
The following is a summary by counterparty of the market value of OTC financial derivative instruments and collateral pledged/(received) as of December 31, 2023:
| | | | | | | | | | | | | | | | | | | | | | | | | | | | | | | | | | | | | | | | | | | | | | | | |
| | | Financial Derivative Assets | | | | | | Financial Derivative Liabilities | | | | | | | | | | |
| | Forward
Foreign
Currency
Contracts | | | | | | | | | | | | | | | Forward
Foreign
Currency
Contracts | | | | | | | | | | | | Net Market
Value of OTC
Derivatives | | | Collateral
Pledged/
(Received) | | | | |
| | $ | 0 | | | $ | 0 | | | $ | 0 | | | $ | 0 | | | | | | | $ | (16 | ) | | $ | 0 | | | $ | 0 | | | $ | (16 | ) | | $ | (16 | ) | | $ | 0 | | | $ | (16 | ) |
| | | 0 | | | | 0 | | | | 0 | | | | 0 | | | | | | | | (54 | ) | | | 0 | | | | 0 | | | | (54 | ) | | | (54 | ) | | | 0 | | | | (54 | ) |
| | | 14 | | | | 0 | | | | 10,102 | | | | 10,116 | | | | | | | | (2,255 | ) | | | 0 | | | | (501 | ) | | | (2,756 | ) | | | 7,360 | | | | (3,570 | ) | | | 3,790 | |
| | | 261 | | | | 0 | | | | 0 | | | | 261 | | | | | | | | (1,346 | ) | | | 0 | | | | 0 | | | | (1,346 | ) | | | (1,085 | ) | | | 1,005 | | | | (80 | ) |
| | | 0 | | | | 0 | | | | 0 | | | | 0 | | | | | | | | (67 | ) | | | 0 | | | | 0 | | | | (67 | ) | | | (67 | ) | | | 0 | | | | (67 | ) |
| | | 0 | | | | 0 | | | | 1,922 | | | | 1,922 | | | | | | | | (11 | ) | | | 0 | | | | 0 | | | | (11 | ) | | | 1,911 | | | | (1,830 | ) | | | 81 | |
| | | 0 | | | | 0 | | | | 0 | | | | 0 | | | | | | | | 0 | | | | 0 | | | | (3,591 | ) | | | (3,591 | ) | | | (3,591 | ) | | | 2,957 | | | | (634 | ) |
| | | 26 | | | | 0 | | | | 0 | | | | 26 | | | | | | | | (367 | ) | | | 0 | | | | 0 | | | | (367 | ) | | | (341 | ) | | | 261 | | | | (80 | ) |
| | | 0 | | | | 0 | | | | 0 | | | | 0 | | | | | | | | 0 | | | | 0 | | | | (467 | ) | | | (467 | ) | | | (467 | ) | | | 533 | | | | 66 | |
| | | 0 | | | | 0 | | | | 0 | | | | 0 | | | | | | | | (37 | ) | | | 0 | | | | 0 | | | | (37 | ) | | | (37 | ) | | | 0 | | | | (37 | ) |
| | | 2 | | | | 0 | | | | 0 | | | | 2 | | | | | | | | (252 | ) | | | 0 | | | | 0 | | | | (252 | ) | | | (250 | ) | | | 330 | | | | 80 | |
| | | 0 | | | | 0 | | | | 0 | | | | 0 | | | | | | | | 0 | | | | 0 | | | | (2,987 | ) | | | (2,987 | ) | | | (2,987 | ) | | | 1,211 | | | | (1,776 | ) |
| | | 16 | | | | 0 | | | | 0 | | | | 16 | | | | | | | | (33 | ) | | | 0 | | | | 0 | | | | (33 | ) | | | (17 | ) | | | 0 | | | | (17 | ) |
| | | 0 | | | | 0 | | | | 0 | | | | 0 | | | | | | | | (28 | ) | | | 0 | | | | 0 | | | | (28 | ) | | | (28 | ) | | | 0 | | | | (28 | ) |
| | | 0 | | | | 0 | | | | 0 | | | | 0 | | | | | | | | (8 | ) | | | 0 | | | | 0 | | | | (8 | ) | | | (8 | ) | | | 0 | | | | (8 | ) |
| | | 4 | | | | 0 | | | | 0 | | | | 4 | | | | | | | | (1,037 | ) | | | 0 | | | | 0 | | | | (1,037 | ) | | | (1,033 | ) | | | 1,571 | | | | 538 | |
| | | | | | | | | | | | | | | | | | | | | | | | | | | | | | | | | | | | | | | | | | | | | | | | |
| | | | | | | | | | | | | | | | | | | | | | | | | | | | | | | | | | | | | | | | | | | | | | | | |
| | | | | | | | | | | | | | | | | | | | | | | | | | | | | | | | | | | | | | | | | | | | | | | | |
| Securities with an aggregate market value of $7,868 have been pledged as collateral for financial derivative instruments as governed by International Swaps and Derivatives Association, Inc. master agreements as of December 31, 2023. |
| If the Fund is a seller of protection and a credit event occurs, as defined under the terms of that particular swap agreement, the Fund will either (i) pay to the buyer of protection an amount equal to the notional amount of the swap and take delivery of the referenced obligation or underlying securities comprising the referenced index or (ii) pay a net settlement amount in the form of cash, securities or other deliverable obligations equal to the notional amount of the swap less the recovery value of the referenced obligation or underlying securities comprising the referenced index. |
| Implied credit spreads, represented in absolute terms, utilized in determining the market value of credit default swap agreements on corporate issues as of period end serve as indicators of the current status of the payment/performance risk and represent the likelihood or risk of default for the credit derivative. The implied credit spread of a particular referenced entity reflects the cost of buying/selling protection and may include upfront payments required to be made to enter into the agreement. Wider credit spreads represent a deterioration of the referenced entity’s credit soundness and a greater likelihood or risk of default or other credit event occurring as defined under the terms of the agreement. |
| The maximum potential amount the Fund could be required to pay as a seller of credit protection or receive as a buyer of credit protection if a credit event occurs as defined under the terms of that particular swap agreement. |
| The prices and resulting values for credit default swap agreements serve as indicators of the current status of the payment/performance risk and represent the likelihood of an expected liability (or profit) for the credit derivative should the notional amount of the swap agreement be closed/sold as of the period end. Increasing market values, in absolute terms when compared to the notional amount of the swap, represent a deterioration of the underlying referenced instrument’s credit soundness and a greater likelihood or risk of default or other credit event occurring as defined under the terms of the agreement. |
| Receive represents that the Fund receives payments for any positive net return on the underlying reference. The Fund makes payments for any negative net return on such underlying reference. Pay represents that the Fund receives payments for any negative net return on the underlying reference. The Fund makes payments for any positive net return on such underlying reference. |
| | | | | | | | |
| | | | | | December 31, 2023 | | (Unaudited) |
| Net Exposure represents the net receivable/(payable) that would be due from/to the counterparty in the event of default. Exposure from OTC derivatives can only be netted across transactions governed under the same master agreement with the same legal entity. See Note 8, Master Netting Arrangements, in the Notes to Financial Statements for more information. |
FAIR VALUE OF FINANCIAL DERIVATIVE INSTRUMENTS
The following is a summary of the fair valuation of the Fund’s derivative instruments categorized by risk exposure. See Note 7, Principal and Other Risks, in the Notes to Financial Statements on risks of the Fund.
Fair Values of Financial Derivative Instruments on the Consolidated Statements of Assets and Liabilities as of December 31, 2023:
| | | | | | | | | | | | | | | | | | | | | | | | |
| | | Derivatives not accounted for as hedging instruments | |
| | | | | | | | | | | | | | | | | | | |
Financial Derivative Instruments - Assets | |
Exchange-traded or centrally cleared | |
| | $ | 0 | | | $ | 14 | | | $ | 0 | | | $ | 0 | | | $ | 5,002 | | | $ | 5,016 | |
| | | | | | | | | | | | | | | | | | | | | | | | |
| |
Forward Foreign Currency Contracts | | $ | 0 | | | $ | 0 | | | $ | 0 | | | $ | 323 | | | $ | 0 | | | $ | 323 | |
| | | 0 | | | | 12,024 | | | | 0 | | | | 0 | | | | 0 | | | | 12,024 | |
| | | | | | | | | | | | | | | | | | | | | | | | |
| | $ | 0 | | | $ | 12,024 | | | $ | 0 | | | $ | 323 | | | $ | 0 | | | $ | 12,347 | |
| | | | | | | | | | | | | | | | | | | | | | | | |
| | $ | 0 | | | $ | 12,038 | | | $ | 0 | | | $ | 323 | | | $ | 5,002 | | | $ | 17,363 | |
| | | | | | | | | | | | | | | | | | | | | | | | |
|
Financial Derivative Instruments - Liabilities | |
Exchange-traded or centrally cleared | |
| | $ | 0 | | | $ | 0 | | | $ | 0 | | | $ | 0 | | | $ | 70 | | | $ | 70 | |
| | | 0 | | | | 0 | | | | 0 | | | | 0 | | | | 632 | | | | 632 | |
| | | | | | | | | | | | | | | | | | | | | | | | |
| | $ | 0 | | | $ | 0 | | | $ | 0 | | | $ | 0 | | | $ | 702 | | | $ | 702 | |
| | | | | | | | | | | | | | | | | | | | | | | | |
| |
Forward Foreign Currency Contracts | | $ | 0 | | | $ | 0 | | | $ | 0 | | | $ | 5,511 | | | $ | 0 | | | $ | 5,511 | |
| | | 0 | | | | 5,176 | | | | 2,370 | | | | 0 | | | | 0 | | | | 7,546 | |
| | | | | | | | | | | | | | | | | | | | | | | | |
| | $ | 0 | | | $ | 5,176 | | | $ | 2,370 | | | $ | 5,511 | | | $ | 0 | | | $ | 13,057 | |
| | | | | | | | | | | | | | | | | | | | | | | | |
| | $ | 0 | | | $ | 5,176 | | | $ | 2,370 | | | $ | 5,511 | | | $ | 702 | | | $ | 13,759 | |
| | | | | | | | | | | | | | | | | | | | | | | | |
The effect of Financial Derivative Instruments on the Consolidated Statements of Operations for the period ended December 31, 2023:
| | | | | | | | | | | | | | | | | | | | | | | | |
| | | Derivatives not accounted for as hedging instruments | |
| | | | | | | | | | | | | | | | | | | |
Net Realized Gain (Loss) on Financial Derivative Instruments | |
Exchange-traded or centrally cleared | |
| | $ | 0 | | | $ | 365 | | | $ | 0 | | | $ | 0 | | | $ | (160,247 | ) | | $ | (159,882 | ) |
| | | | | | | | | | | | | | | | | | | | | | | | |
| |
Forward Foreign Currency Contracts | | $ | 0 | | | $ | 0 | | | $ | 0 | | | $ | (9,717 | ) | | $ | 0 | | | $ | (9,717 | ) |
| | | 0 | | | | 8,021 | | | | 0 | | | | 0 | | | | (2,545 | ) | | | 5,476 | |
| | | | | | | | | | | | | | | | | | | | | | | | |
| | $ | 0 | | | $ | 8,021 | | | $ | 0 | | | $ | (9,717 | ) | | $ | (2,545 | ) | | $ | (4,241 | ) |
| | | | | | | | | | | | | | | | | | | | | | | | |
| | $ | 0 | | | $ | 8,386 | | | $ | 0 | | | $ | (9,717 | ) | | $ | (162,792 | ) | | $ | (164,123 | ) |
| | | | | | | | | | | | | | | | | | | | | | | | |
|
Net Change in Unrealized Appreciation (Depreciation) on Financial Derivative Instruments | |
Exchange-traded or centrally cleared | |
| | $ | 0 | | | $ | 0 | | | $ | 0 | | | $ | 0 | | | $ | (713 | ) | | $ | (713 | ) |
| | | 0 | | | | 1,194 | | | | 0 | | | | 0 | | | | 187,425 | | | | 188,619 | |
| | | | | | | | | | | | | | | | | | | | | | | | |
| | $ | 0 | | | $ | 1,194 | | | $ | 0 | | | $ | 0 | | | $ | 186,712 | | | $ | 187,906 | |
| | | | | | | | | | | | | | | | | | | | | | | | |
| |
Forward Foreign Currency Contracts | | $ | 0 | | | $ | 0 | | | $ | 0 | | | $ | 11,572 | | | $ | 0 | | | $ | 11,572 | |
| | | 0 | | | | 2,691 | | | | (1,967 | ) | | | 0 | | | | 10,102 | | | | 10,826 | |
| | | | | | | | | | | | | | | | | | | | | | | | |
| | $ | 0 | | | $ | 2,691 | | | $ | (1,967 | ) | | $ | 11,572 | | | $ | 10,102 | | | $ | 22,398 | |
| | | | | | | | | | | | | | | | | | | | | | | | |
| | $ | 0 | | | $ | 3,885 | | | $ | (1,967 | ) | | $ | 11,572 | | | $ | 196,814 | | | $ | 210,304 | |
| | | | | | | | | | | | | | | | | | | | | | | | |
| | | | | | | | | | | | |
| See Accompanying Notes | | | | | | | | | | DECEMBER 31, 2023 | | | |
| | | | | | | | |
Consolidated Schedule of Investments | | PIMCO Dynamic Income Fund | | | | | | |
The following is a summary of the fair valuations according to the inputs used as of December 31, 2023 in valuing the Fund’s assets and
liabilities:
| | | | | | | | | | | | | | | | |
| | | | | | | | | | | | |
Investments in Securities, at Value | |
Loan Participations and Assignments | | $ | 0 | | | $ | 959,656 | | | $ | 469,961 | | | $ | 1,429,617 | |
| |
| | | 0 | | | | 374,718 | | | | 67,024 | | | | 441,742 | |
| | | 0 | | | | 900,481 | | | | 26,214 | | | | 926,695 | |
| | | 0 | | | | 56,243 | | | | 0 | | | | 56,243 | |
Convertible Bonds & Notes | |
| | | 0 | | | | 8,420 | | | | 0 | | | | 8,420 | |
| | | 0 | | | | 22,377 | | | | 0 | | | | 22,377 | |
| |
| | | 0 | | | | 2,949 | | | | 0 | | | | 2,949 | |
| | | 0 | | | | 70,835 | | | | 0 | | | | 70,835 | |
| | | 0 | | | | 31,501 | | | | 0 | | | | 31,501 | |
| | | 0 | | | | 73,668 | | | | 0 | | | | 73,668 | |
Non-Agency Mortgage-Backed Securities | | | 0 | | | | 2,172,663 | | | | 8,010 | | | | 2,180,673 | |
| | | 0 | | | | 1,115,829 | | | | 158,244 | | | | 1,274,073 | |
| | | 0 | | | | 91,235 | | | | 0 | | | | 91,235 | |
| |
| | | 15,536 | | | | 0 | | | | 0 | | | | 15,536 | |
| | | 3 | | | | 0 | | | | 0 | | | | 3 | |
| | | 0 | | | | 0 | | | | 534 | | | | 534 | |
| | | 20,643 | | | | 383 | | | | 50,172 | | | | 71,198 | |
| | | 53 | | | | 0 | | | | 24,543 | | | | 24,596 | |
| | | 443 | | | | 0 | | | | 0 | | | | 443 | |
| | | 0 | | | | 0 | | | | 109,931 | | | | 109,931 | |
| |
| | | 0 | | | | 0 | | | | 35 | | | | 35 | |
| |
| | | 0 | | | | 73,574 | | | | 0 | | | | 73,574 | |
Real Estate Investment Trusts | |
| | | 32,292 | | | | 0 | | | | 0 | | | | 32,292 | |
| |
| | | 0 | | | | 154,274 | | | | 0 | | | | 154,274 | |
| | | 0 | | | | 645 | | | | 0 | | | | 645 | |
| | | | | | | | | | | | | | | | |
| | | | | | | | | | | | |
| | $ | 0 | | | $ | 5,174 | | | $ | 0 | | | $ | 5,174 | |
| | | 0 | | | | 77,255 | | | | 0 | | | | 77,255 | |
| | | | | | | | | | | | | | | | |
| | $ | 68,970 | | | $ | 6,191,880 | | | $ | 914,668 | | | $ | 7,175,518 | |
| | | | | | | | | | | | | | | | |
|
Investments in Affiliates, at Value | |
| |
| | | 0 | | | | 0 | | | | 270,754 | | | | 270,754 | |
| |
Central Funds Used for Cash Management Purposes | | | 592,546 | | | | 0 | | | | 0 | | | | 592,546 | |
| | | | | | | | | | | | | | | | |
| | $ | 592,546 | | | $ | 0 | | | $ | 270,754 | | | $ | 863,300 | |
| | | | | | | | | | | | | | | | |
| | | | |
| | $ | 661,516 | | | $ | 6,191,880 | | | $ | 1,185,422 | | | $ | 8,038,818 | |
| | | | | | | | | | | | | | | | |
|
Financial Derivative Instruments - Assets | |
Exchange-traded or centrally cleared | | | 0 | | | | 5,016 | | | | 0 | | | | 5,016 | |
| | | 0 | | | | 10,426 | | | | 1,921 | | | | 12,347 | |
| | | | | | | | | | | | | | | | |
| | $ | 0 | | | $ | 15,442 | | | $ | 1,921 | | | $ | 17,363 | |
| | | | | | | | | | | | | | | | |
|
Financial Derivative Instruments - Liabilities | |
Exchange-traded or centrally cleared | | | 0 | | | | (702 | ) | | | 0 | | | | (702 | ) |
| | | 0 | | | | (6,629 | ) | | | (6,428 | ) | | | (13,057 | ) |
| | | | | | | | | | | | | | | | |
| | $ | 0 | | | $ | (7,331 | ) | | $ | (6,428 | ) | | $ | (13,759 | ) |
| | | | | | | | | | | | | | | | |
| | | | |
Total Financial Derivative Instruments | | $ | 0 | | | $ | 8,111 | | | $ | (4,507 | ) | | $ | 3,604 | |
| | | | | | | | | | | | | | | | |
| | | | |
| | $ | 661,516 | | | $ | 6,199,991 | | | $ | 1,180,915 | | | $ | 8,042,422 | |
| | | | | | | | | | | | | | | | |
The following is a reconciliation of the fair valuations using significant unobservable inputs (Level 3) for the Fund during the period ended December 31, 2023:
| | | | | | | | | | | | | | | | | | | | | | | | | | | | | | | | | | | | | | | | |
| | Beginning
Balance
at 06/30/2023 | | | | | | | | | Accrued
Discounts/
(Premiums) | | | | | | Net Change in Unrealized Appreciation/ (Depreciation) (2) | | | | | | | | | Ending
Balance
at 12/31/2023 | | | Net Change in Unrealized Appreciation/ (Depreciation) on Investments Held at 12/31/2023 (2) | |
Investments in Securities, at Value | |
Loan Participations and Assignments | | $ | 668,961 | | | $ | 154,812 | | | $ | (225,875 | ) | | $ | 8,563 | | | $ | (40,981 | ) | | $ | 40,851 | | | $ | 52,448 | | | $ | (188,818 | ) | | $ | 469,961 | | | $ | 9,922 | |
| |
| | | 0 | | | | 432 | | | | 0 | | | | 0 | | | | 0 | | | | 10 | | | | 66,582 | | | | 0 | | | | 67,024 | | | | 9 | |
| | | 1,919 | | | | 26,218 | | | | (1,922 | ) | | | 1 | | | | 0 | | | | (2 | ) | | | 0 | | | | 0 | | | | 26,214 | | | | (3 | ) |
| | | 2,435 | | | | 0 | | | | 0 | | | | 18 | | | | 0 | | | | 70 | | | | 0 | | | | (2,523 | ) | | | 0 | | | | 0 | |
Non-Agency Mortgage-Backed Securities | | | 14,819 | | | | 18 | | | | (5,584 | ) | | | 70 | | | | 83 | | | | (20 | ) | | | 519 | | | | (1,895 | ) | | | 8,010 | | | | (45 | ) |
| | | 180,530 | | | | 0 | | | | (4,496 | ) | | | 132 | | | | (1,956 | ) | | | (15,871 | ) | | | 0 | | | | (95 | ) | | | 158,244 | | | | (15,419 | ) |
| |
| | | 541 | | | | 0 | | | | 0 | | | | 0 | | | | 0 | | | | (7 | ) | | | 0 | | | | 0 | | | | 534 | | | | (7 | ) |
| | | 40,447 | | | | 0 | | | | 0 | | | | 0 | | | | 0 | | | | 9,725 | | | | 0 | | | | 0 | | | | 50,172 | | | | 9,724 | |
| | | 25,666 | | | | 1,088 | | | | 0 | | | | 0 | | | | 0 | | | | (2,211 | ) | | | 0 | | | | 0 | | | | 24,543 | | | | (302 | ) |
| | | 12,603 | | | | 25,727 | | | | 0 | | | | 0 | | | | 0 | | | | 71,601 | | | | 0 | | | | 0 | | | | 109,931 | | | | 71,600 | |
| |
| | | 895 | | | | 0 | | | | (1,736 | ) | | | 0 | | | | 1,736 | | | | (895 | ) | | | 0 | | | | 0 | | | | 0 | | | | 0 | |
| |
| | | 1,348 | | | | 0 | | | | (1,747 | ) | | | 0 | | | | 1,747 | | | | (1,313 | ) | | | 0 | | | | 0 | | | | 35 | | | | 14 | |
| | | 0 | | | | 0 | | | | 0 | | | | 0 | | | | 0 | | | | 0 | | | | 0 | | | | 0 | | | | 0 | | | | 0 | |
| | | 48,317 | | | | 0 | | | | (25,109 | ) | | | 0 | | | | 0 | | | | (23,208 | ) | | | 0 | | | | 0 | | | | 0 | | | | 0 | |
| | | | | | | | |
| | | | | | December 31, 2023 | | (Unaudited) |
| | | | | | | | | | | | | | | | | | | | | | | | | | | | | | | | | | | | | | | | |
| | Beginning
Balance
at 06/30/2023 | | | | | | | | | Accrued
Discounts/
(Premiums) | | | | | | Net Change in Unrealized Appreciation/ (Depreciation) (2) | | | | | | | | | Ending
Balance
at 12/31/2023 | | | Net Change in Unrealized Appreciation/ (Depreciation) on Investments Held at 12/31/2023 (2) | |
| | | | | | | | | | | | | | | | | | | | | | | | | | | | | | | | | | | | | | | | |
| | $ | 23,548 | | | $ | 0 | | | $ | 0 | | | $ | 0 | | | $ | 0 | | | $ | (23,548 | ) | | $ | 0 | | | $ | 0 | | | $ | 0 | | | $ | (23,548 | ) |
| | | | | | | | | | | | | | | | | | | | | | | | | | | | | | | | | | | | | | | | |
| | | 441 | | | | 0 | | | | (432 | ) | | | 0 | | | | 13 | | | | (22 | ) | | | 0 | | | | 0 | | | | 0 | | | | 0 | |
| | | | | | | | | | | | | | | | | | | | | | | | | | | | | | | | | | | | | | | | |
| | $ | 1,022,470 | | | $ | 208,295 | | | $ | (266,901 | ) | | $ | 8,784 | | | $ | (39,358 | ) | | $ | 55,160 | | | $ | 119,549 | | | $ | (193,331 | ) | | $ | 914,668 | | | $ | 51,945 | |
| | | | | | | | | | | | | | | | | | | | | | | | | | | | | | | | | | | | | | | | |
| | | | | | | | |
Investments in Affiliates | | | | | | | | | | | | | | | | | | | | | | | | | | | | | | | | | |
| |
| | $ | 91,594 | | | $ | 146,968 | | | $ | 0 | | | $ | 0 | | | $ | 0 | | | $ | 32,192 | | | $ | 0 | | | $ | 0 | | | $ | 270,754 | | | $ | 32,192 | |
| | | | | | | | | | | | | | | | | | | | | | | | | | | | | | | | | | | | | | | | |
| | | | | | | | |
Financial Derivative Instruments - Assets | | | | | | | | | | | | | | | | | | | | | | | | | | | | | | | | | |
| | $ | 952 | | | $ | 0 | | | $ | 0 | | | $ | 0 | | | $ | 0 | | | $ | 969 | | | $ | 0 | | | $ | 0 | | | $ | 1,921 | | | $ | 975 | |
| | | | | | | | | | | | | | | | | | | | | | | | | | | | | | | | | | | | | | | | |
|
Financial Derivative Instruments - Liabilities | |
| | $ | (6,859 | ) | | $ | 726 | | | $ | (5,448 | ) | | $ | 0 | | | $ | 106 | | | $ | 5,047 | | | $ | 0 | | | $ | 0 | | | $ | (6,428 | ) | | $ | 118 | |
| | | | | | | | | | | | | | | | | | | | | | | | | | | | | | | | | | | | | | | | |
| | | | | | | | | | |
| | $ | 1,108,157 | | | $ | 355,989 | | | $ | (272,349 | ) | | $ | 8,784 | | | $ | (39,252 | ) | | $ | 93,368 | | | $ | 119,549 | | | $ | (193,331 | ) | | $ | 1,180,915 | | | $ | 85,230 | |
| | | | | | | | | | | | | | | | | | | | | | | | | | | | | | | | | | | | | | | | |
The following is a summary of significant unobservable inputs used in the fair valuations of assets and liabilities categorized within Level 3 of the fair value hierarchy:
| | | | | | | | | | | | | | | | | | |
| | Ending
Balance
at 12/31/2023 | | | | | | | | | (% Unless Noted Otherwise) | |
| | | | | | |
Investments in Securities, at Value | |
Loan Participations and Assignments | | $ | 123,318 | | | | | | | X | | | 14.500 | | | | — | |
| | | 293,449 | | | | | | | | | | 6.020-26.490 | | | | 11.696 | |
| | | 746 | | | Indicative Market Quotation | | | | | | | 96.500 | | | | — | |
| | | 52,448 | | | | | | | | | | 94.000-100.000 | | | | 97.738 | |
| |
| | | 66,582 | | | | | | | | | | 54.375 | | | | — | |
| | | 442 | | | | | | | | | | 100.000 | | | | — | |
| | | 1,613 | | | | | | | | | | 6.020 | | | | — | |
| | | 24,601 | | | | | | | | | | 99.000 | | | | — | |
Non-Agency Mortgage-Backed Securities | | | 8,010 | | | Fair Valuation Of Odd Lot Positions | | | | | | | 2.500 | | | | — | |
| | | 156,223 | | | | | | | | | | 10.250-20.000 | | | | 14.427 | |
| | | 16 | | | | | | | | | | 12.000 | | | | — | |
| | | 2,005 | | | Fair Valuation Of Odd Lot Positions | | | | | | | 2.500 | | | | — | |
| | | | |
| | | 534 | | | | | | | X | | | 4.000-4.300 | | | | 4.015 | |
| | | 50,005 | | | | | | | X | | | 4.000 | | | | — | |
| | | 167 | | | | | | | | | | 60.720 | | | | — | |
| | | 16,181 | | | | | | | | | | 17.280 | | | | — | |
| | | 8,362 | | | Indicative Market Quotation | | | | $ | | | 3.500-24.833 | | | | 20.301 | |
| | | 93,388 | | | | | | | X | | | 5.860 | | | | — | |
| | | 452 | | | Discounted Cash Flow/Comparable Companies | | Discount Rate/Revenue Multiple | | %/X | | | 17.250/0.550 | | | | — | |
| | | 16,091 | | | Indicative Market Quotation | | | | $ | | | 35.750 | | | | — | |
| |
| | | 35 | | | | | | | | | | 40.000 | | | | — | |
|
Investments in Affiliates | |
| | | | |
| | | 90,348 | | | Comparable Companies/Discounted Cash Flow | | Revenue Multiple/EBITDA Multiple/Discount Rate | | X/X/% | | | 0.550/6.500/10.000 | | | | — | |
| | | 180,403 | | | | | | | X | | | 14.500 | | | | — | |
| | | 3 | | | | | | | $ | | | 0.000 | | | | — | |
| | | | |
Financial Derivative Instruments - Assets | | | | | | | | | | | | |
| | | 1,921 | | | Indicative Market Quotation | | | | | | | 7.505 | | | | — | |
| | | | | | | | | | | | | | | | | | |
| | | | | | | | | | | | |
| See Accompanying Notes | | | | | | | | | | DECEMBER 31, 2023 | | | |
| | | | | | | | |
Consolidated Schedule of Investments | | PIMCO Dynamic Income Fund | | | | December 31, 2023 | | (Unaudited) |
| | | | | | | | | | | | | | | | | | | | |
| | Ending
Balance
at 12/31/2023 | | | | | | | | | | (% Unless Noted Otherwise) | |
| | | | | | |
| | | | |
Financial Derivative Instruments - Liabilities | | | | | | | | | | | | | | |
| | $ | (6,428 | ) | | Indicative Market Quotation | | | | | | | | | | | | | 55.776 | |
| | | | | | | | | | | | | | | | | | | | |
| | $ | 1,180,915 | | | | | | | | | | | | | | | | | |
| | | | | | | | | | | | | | | | | | | | |
| Net Purchases and Settlements for Financial Derivative Instruments may include payments made or received upon entering into swap agreements to compensate for differences between the stated terms of the swap agreement and prevailing market conditions. |
| Any difference between Net Change in Unrealized Appreciation/(Depreciation) and Net Change in Unrealized Appreciation/(Depreciation) on Investments Held at December 31, 2023 may be due to an investment no longer held or categorized as Level 3 at period end. |
| Security type updated from Banking & Finance to Utilities since prior fiscal year end. |
| | | | | | | | |
Consolidated Schedule of Investments | | PIMCO Dynamic Income Opportunities Fund | | | | December 31, 2023 | | (Unaudited) |
(Amounts in thousands*, except number of shares, contracts, units and ounces, if any)
| | | | | | | | | | | | |
| | | | | | | | | | | |
INVESTMENTS IN SECURITIES 153.0% | |
| |
LOAN PARTICIPATIONS AND ASSIGNMENTS 27.4% | |
|
| |
| | $ | | | 29,374 | | | $ | | | 29,374 | |
|
| |
7.593% (EUR001M + 3.750%) due 06/30/2025 ~ | | EUR | | | 275 | | | | | | 304 | |
|
| |
4.969% (EUR012M + 4.000%) due 03/28/2026 ~ | | | | | 21,515 | | | | | | 20,592 | |
|
| |
TBD% - 15.420% due 05/25/2026 | | $ | | | 23,711 | | | | | | 17,961 | |
|
| |
9.448% (EUR003M + 5.500%) due 03/29/2030 ~ | | EUR | | | 5,200 | | | | | | 5,273 | |
| | $ | | | 7,940 | | | | | | 7,328 | |
|
Espai Barca Fondo De Titulizacion | |
6.500% - 11.500% due 05/31/2028 « | | EUR | | | 7,628 | | | | | | 8,779 | |
|
Gateway Casinos & Entertainment Ltd. | |
| | $ | | | 10,834 | | | | | | 10,843 | |
13.588% (CDOR03M + 8.000%) due 10/18/2027 ~ | | CAD | | | 9,962 | | | | | | 7,524 | |
|
| |
| | $ | | | 1,583 | | | | | | 1,419 | |
|
iHeartCommunications, Inc. | |
| | | | | 2,000 | | | | | | 1,734 | |
| | | | | 5,047 | | | | | | 4,352 | |
|
| |
TBD% - 13.988% due 03/01/2024 « | | | | | 20,573 | | | | | | 21,829 | |
|
| |
| | | | | 2,866 | | | | | | 2,831 | |
|
| |
| | | | | 5,700 | | | | | | 5,694 | |
|
MPH Acquisition Holdings LLC | |
| | | | | 2,786 | | | | | | 2,694 | |
|
| |
| | | | | 19,425 | | | | | | 18,195 | |
|
| |
8.864% (EUR006M + 4.750%) due 12/31/2025 ~ | | EUR | | | 7,000 | | | | | | 7,184 | |
|
| |
TBD% - 14.000% due 09/07/2024 µ | | $ | | | 12,768 | | | | | | 12,769 | |
7.362% (LIBOR03M + 1.750%) due 02/26/2035 ~ | | | | | 29,964 | | | | | | 1,498 | |
|
| |
9.175% (EUR003M + 5.250%) due 09/30/2028 ~ | | EUR | | | 9,500 | | | | | | 10,501 | |
|
Project Quasar Pledgco SLU | |
7.083% (EUR001M + 3.250%) due 03/15/2026 «~ | | | | | 9,245 | | | | | | 9,888 | |
|
Promotora de Informaciones SA | |
9.192% (EUR003M + 5.220%) due 12/31/2026 ~ | | | | | 29,650 | | | | | | 31,219 | |
|
Promotora de Informaciones SA (6.942% Cash and 5.000% PIK) | |
11.942% (EUR003M + 5.305%) due 06/30/2027 ~(c) | | | | | 5,466 | | | | | | 5,572 | |
|
| |
10.965% (SONIA03M + 5.500%) due 01/31/2028 «~ | | GBP | | | 20,000 | | | | | | 23,963 | |
|
Republic of Cote d’lvoire | |
9.055% (EUR006M + 5.000%) due 03/19/2027 «~ | | EUR | | | 700 | | | | | | 746 | |
|
| |
| | $ | | | 19,685 | | | | | | 18,800 | |
|
Steenbok Lux Finco 1 SARL | |
10.000% (EUR006M + 10.000%) due 06/30/2026 ~ | | EUR | | | 60 | | | | | | 67 | |
|
Steenbok Lux Finco 2 SARL | |
| | | | | 71,841 | | | | | | 30,821 | |
| | | | | | | | | | | | |
| | | | | | | | | | | |
10.000% (EUR006M + 10.000%) due 06/30/2026 ~ | | EUR | | | 40 | | | $ | | | 45 | |
|
| |
TBD% - 5.550% due 10/31/2028 « | | $ | | | 22,100 | | | | | | 21,153 | |
|
| |
| | | | | 2,732 | | | | | | 2,416 | |
|
| |
1.750% (LIBOR06M + 1.750%) due 02/26/2035 ~ | | | | | 3,866 | | | | | | 193 | |
| | | | | 2,363 | | | | | | 118 | |
|
| |
| | | | | 30,237 | | | | | | 23,056 | |
|
| |
| | | | | 16,810 | | | | | | 16,642 | |
| | | | | | | | | | | | |
Total Loan Participations and Assignments (Cost $418,155) | | | | |
| | | | |
| |
CORPORATE BONDS & NOTES 37.2% | |
| |
| |
|
Adler Financing SARL (12.500% PIK) | |
12.500% due 06/30/2025 (c)(k) | | EUR | | | 5,980 | | | | | | 6,970 | |
|
| |
3.000% due 04/27/2026 (k) | | | | | 15,900 | | | | | | 13,380 | |
|
| |
4.625% due 01/14/2026 (k) | | | | | 13,000 | | | | | | 5,077 | |
| | | | | 1,800 | | | | | | 670 | |
| | | | | 3,800 | | | | | | 1,550 | |
|
Banca Monte dei Paschi di Siena SpA | |
1.875% due 01/09/2026 (k) | | | | | 727 | | | | | | 763 | |
7.708% due 01/18/2028 •(k) | | | | | 6,500 | | | | | | 7,194 | |
8.000% due 01/22/2030 •(k) | | | | | 1,603 | | | | | | 1,785 | |
10.500% due 07/23/2029 (k) | | | | | 16,766 | | | | | | 20,373 | |
|
| |
22.582% (T-BILL 3MO + 17.250%) due 07/08/2028 ~ | | $ | | | 2,824 | | | | | | 2,259 | |
|
Corestate Capital Holding SA (Cash 10.000% or 11.000% PIK) | |
10.000% due 12/31/2026 «(c) | | EUR | | | 300 | | | | | | 331 | |
|
Corsair International Ltd. | |
| | | | | 1,700 | | | | | | 1,877 | |
| | | | | 1,100 | | | | | | 1,214 | |
| | | | |
Credit Suisse AG AT1 Claim | | $ | | | 800 | | | | | | 96 | |
|
| |
| | | | | 300 | | | | | | 301 | |
|
Fairfax India Holdings Corp. | |
5.000% due 02/26/2028 (k) | | | | | 18,350 | | | | | | 16,607 | |
|
| |
18.912% (T-BILL 3MO + 13.000%) due 03/01/2024 ~(k) | | | | | 3,920 | | | | | | 3,924 | |
22.662% (T-BILL 3MO + 16.750%) due 03/01/2024 ~ | | | | | 1,120 | | | | | | 1,051 | |
|
| |
14.702% (T-BILL 1MO + 9.500%) due 04/22/2025 ~ | | | | | 2,347 | | | | | | 2,216 | |
|
Jefferson Capital Holdings LLC | |
| | | | | 345 | | | | | | 330 | |
|
Kennedy Wilson Europe Real Estate Ltd. | |
3.250% due 11/12/2025 (k) | | EUR | | | 1,100 | | | | | | 1,104 | |
|
Long Walk Reinsurance Ltd. | |
| | $ | | | 1,700 | | | | | | 1,701 | |
|
| |
17.092% (T-BILL 3MO + 11.750%) due 04/09/2029 ~ | | | | | 4,164 | | | | | | 3,280 | |
|
| |
1.800% due 02/02/2031 ^(d) | | | | | 3,175 | | | | | | 2,108 | |
2.100% due 05/15/2028 ^(d) | | | | | 400 | | | | | | 263 | |
3.125% due 06/05/2030 ^(d) | | | | | 500 | | | | | | 329 | |
3.500% due 01/29/2025 ^(d) | | | | | 200 | | | | | | 132 | |
4.345% due 04/29/2028 ^(d) | | | | | 1,300 | | | | | | 862 | |
4.570% due 04/29/2033 ^(d) | | | | | 4,000 | | | | | | 2,645 | |
|
| |
6.000% due 01/15/2030 (k) | | | | | 21,202 | | | | | | 14,839 | |
| | | | | | | | | | | | |
| | | | | | | | | | | |
6.500% due 02/15/2029 (k) | | $ | | | 26,904 | | | $ | | | 19,442 | |
10.500% due 02/15/2028 (k) | | | | | 6,343 | | | | | | 6,436 | |
|
| |
| | | | | 2,000 | | | | | | 1,990 | |
|
| |
17.332% (T-BILL 1MO + 12.000%) due 03/10/2031 ~ | | | | | 1,600 | | | | | | 1,687 | |
|
Voyager Aviation Holdings LLC | |
8.500% due 05/09/2026 ^«(d) | | | | | 49,287 | | | | | | 26,800 | |
| | | | | | | | | | | | |
| | | | | | | | | | | 171,586 | |
| | | | | | | | | | | | |
| |
| |
|
| |
5.750% due 08/15/2029 (k) | | | | | 1,153 | | | | | | 1,025 | |
|
Carvana Co. (12.000% PIK) | |
12.000% due 12/01/2028 (c)(k) | | | | | 1,746 | | | | | | 1,413 | |
|
Carvana Co. (13.000% PIK) | |
13.000% due 06/01/2030 (c)(k) | | | | | 12,930 | | | | | | 10,325 | |
|
Carvana Co. (14.000% PIK) | |
14.000% due 06/01/2031 (c)(k) | | | | | 12,902 | | | | | | 10,426 | |
|
| |
7.750% due 04/01/2027 (k) | | EUR | | | 3,800 | | | | | | 3,882 | |
8.750% due 04/01/2027 (k) | | $ | | | 19,353 | | | | | | 17,648 | |
|
| |
5.875% due 08/15/2027 (k) | | | | | 3,400 | | | | | | 3,197 | |
|
| |
5.250% due 12/01/2026 (k) | | | | | 5,630 | | | | | | 4,834 | |
|
| |
11.750% due 11/15/2027 (k) | | | | | 7,400 | | | | | | 7,731 | |
|
Intelsat Jackson Holdings SA | |
6.500% due 03/15/2030 (k) | | | | | 48,922 | | | | | | 46,726 | |
|
Inter Media & Communication SpA | |
6.750% due 02/09/2027 (k) | | EUR | | | 4,200 | | | | | | 4,482 | |
|
Iris Holdings, Inc. (8.750% Cash or 9.500% PIK) | |
8.750% due 02/15/2026 (c)(k) | | $ | | | 18,158 | | | | | | 15,433 | |
|
Legacy LifePoint Health LLC | |
| | | | | 800 | | | | | | 739 | |
|
| |
9.875% due 08/15/2030 (k) | | | | | 2,100 | | | | | | 2,125 | |
11.000% due 10/15/2030 (k) | | | | | 7,980 | | | | | | 8,414 | |
|
| |
| | EUR | | | 2,300 | | | | | | 2,284 | |
|
Newfold Digital Holdings Group, Inc. | |
6.000% due 02/15/2029 (k) | | $ | | | 11,400 | | | | | | 8,624 | |
|
| |
6.700% due 02/16/2032 (k) | | | | | 4,206 | | | | | | 3,495 | |
6.840% due 01/23/2030 (k) | | | | | 2,000 | | | | | | 1,736 | |
8.750% due 06/02/2029 (k) | | | | | 3,253 | | | | | | 3,165 | |
|
| |
| | | | | 7,001 | | | | | | 6,931 | |
|
| |
| | | | | 345 | | | | | | 345 | |
|
Turkish Airlines Pass-Through Trust | |
| | | | | 222 | | | | | | 210 | |
|
| |
| | | | | 7,141 | | | | | | 5,480 | |
|
| |
0.000% due 12/29/2049 ~(i) | | BRL | | | 340,000 | | | | | | 24,745 | |
|
| |
| | $ | | | 1,800 | | | | | | 1,906 | |
|
| |
7.500% due 09/01/2025 (k) | | | | | 14,989 | | | | | | 12,386 | |
|
Wesco Aircraft Holdings, Inc. (7.500% Cash and 3.000% PIK) | |
10.500% due 11/15/2026 ^(c)(d) | | | | | 83,934 | | | | | | 76,380 | |
|
| |
7.750% due 08/15/2028 (k) | | | | | 51,680 | | | | | | 45,319 | |
| | | | | | | | | | | | |
| | | | | | | | | | | 331,406 | |
| | | | | | | | | | | | |
| |
| | | | | | | | | | | | |
| See Accompanying Notes | | | | | | | | | | DECEMBER 31, 2023 | | | |
| | | | | | | | |
Consolidated Schedule of Investments | | PIMCO Dynamic Income Opportunities Fund | | | | | | |
| | | | | | | | | | | | |
| | | | | | | | | | | |
| |
|
Gazprom PJSC via Gaz Finance PLC | |
| | $ | | | 200 | | | $ | | | 135 | |
|
| |
6.750% due 12/31/2026 (k) | | | | | 1,113 | | | | | | 791 | |
|
| |
| | | | | 64,741 | | | | | | 3,237 | |
|
| |
5.375% due 03/22/2030 (k) | | | | | 16,625 | | | | | | 13,772 | |
| | | | | | | | | | | | |
| | | | | | | | | | | 17,935 | |
| | | | | | | | | | | | |
Total Corporate Bonds & Notes (Cost $630,536) | | | | |
| | | | |
| |
CONVERTIBLE BONDS & NOTES 1.8% | |
| |
| |
|
Corestate Capital Holding SA (8.000% Cash or 9.000% PIK) | |
8.000% due 12/31/2026 ^(c)(d) | | EUR | | | 1,518 | | | | | | 878 | |
|
| |
5.500% due 03/15/2026 (k) | | $ | | | 24,225 | | | | | | 22,439 | |
| | | | | | | | | | | | |
| | | | | | | | | | | 23,317 | |
| | | | | | | | | | | | |
| |
| |
|
| |
3.375% due 08/15/2026 (k) | | | | | 3,700 | | | | | | 1,980 | |
| | | | | | | | | | | | |
Total Convertible Bonds & Notes (Cost $29,660) | | | | |
| | | | |
| |
MUNICIPAL BONDS & NOTES 1.8% | |
| |
| |
|
Commonwealth of Puerto Rico Bonds, Series 2022 | |
| | | | | 16,082 | | | | | | 8,785 | |
| | | | | 28,610 | | | | | | 13,910 | |
| | | | | | | | | | | | |
| | | | | | | | | | | 22,695 | |
| | | | | | | | | | | | |
| |
| |
|
Tobacco Settlement Finance Authority, West Virginia Revenue Bonds, Series 2007 | |
0.000% due 06/01/2047 (g) | | | | | 25,000 | | | | | | 2,215 | |
| | | | | | | | | | | | |
Total Municipal Bonds & Notes (Cost $26,344) | | | | |
| | | | |
| |
U.S. GOVERNMENT AGENCIES 1.8% | |
|
| |
2.500% due 04/25/2049 - 02/25/2050 (a)(k) | | | | | 21,841 | | | | | | 2,930 | |
3.000% due 12/25/2032 - 01/25/2051 (a)(k) | | | | | 12,501 | | | | | | 1,941 | |
3.500% due 05/25/2030 (a)(k) | | | | | 3,878 | | | | | | 224 | |
4.000% due 09/25/2051 (a)(k) | | | | | 23,913 | | | | | | 5,202 | |
4.500% due 07/25/2045 (a)(k) | | | | | 2,334 | | | | | | 462 | |
5.000% due 08/25/2043 (a)(k) | | | | | 2,572 | | | | | | 493 | |
|
| |
0.547% due 07/15/2042 •(a)(k) | | | | | 1,760 | | | | | | 195 | |
0.747% due 03/15/2043 -
11/15/2047 •(a)(k) | | | | | 8,543 | | | | | | 771 | |
2.000% due 11/25/2050 -
01/25/2051 (a)(k) | | | | | 18,794 | | | | | | 1,639 | |
3.000% due 11/25/2050 -
09/25/2051 (a)(k) | | | | | 44,913 | | | | | | 6,566 | |
3.500% due 04/25/2041 (a)(k) | | | | | 8,339 | | | | | | 1,060 | |
4.000% due 11/25/2048 -
06/25/2051 (a)(k) | | | | | 13,961 | | | | | | 2,656 | |
4.500% due 12/25/2050 (a)(k) | | | | | 4,210 | | | | | | 932 | |
| | | | | | | | | | | | |
Total U.S. Government Agencies (Cost $23,545) | | | | |
| | | | |
| |
| | | | | | | | | | | | |
| | | | | | | | | | | |
NON-AGENCY MORTGAGE-BACKED SECURITIES 45.6% | |
|
280 Park Avenue Mortgage Trust | |
8.485% due 09/15/2034 •(k) | | $ | | | 4,750 | | | $ | | | 4,245 | |
|
Adjustable Rate Mortgage Trust | |
4.611% due 02/25/2036 (k) | | | | | 6,741 | | | | | | 4,382 | |
| | | | | 1,127 | | | | | | 726 | |
|
Ashford Hospitality Trust | |
7.634% due 04/15/2035 •(k) | | | | | 2,500 | | | | | | 2,397 | |
8.634% due 04/15/2035 •(k) | | | | | 8,700 | | | | | | 8,342 | |
|
Atrium Hotel Portfolio Trust | |
8.709% due 12/15/2036 •(k) | | | | | 1,111 | | | | | | 942 | |
9.059% due 06/15/2035 •(k) | | | | | 11,037 | | | | | | 10,315 | |
|
Austin Fairmont Hotel Trust | |
7.659% due 09/15/2032 •(k) | | | | | 4,900 | | | | | | 4,804 | |
|
Banc of America Funding Trust | |
2.726% due 09/26/2036 ~(k) | | | | | 4,445 | | | | | | 3,169 | |
5.710% due 06/26/2036 •(k) | | | | | 3,214 | | | | | | 2,731 | |
| | | | | 294 | | | | | | 184 | |
|
Barclays Commercial Mortgage Securities Trust | |
3.688% due 02/15/2053 ~(k) | | | | | 15,650 | | | | | | 10,745 | |
9.209% due 07/15/2037 ~(k) | | | | | 4,000 | | | | | | 3,665 | |
|
Barclays Commercial Real Estate Trust | |
4.563% due 08/10/2033 ~(k) | | | | | 16,650 | | | | | | 10,946 | |
|
Bear Stearns Commercial Mortgage Securities Trust | |
| | | | | 37 | | | | | | 36 | |
|
| |
8.926% due 03/15/2036 •(k) | | | | | 5,750 | | | | | | 3,568 | |
| | | | | 7,125 | | | | | | 4,066 | |
|
Beneria Cowen & Pritzer Collateral Funding Corp. | |
7.968% due 06/15/2038 •(k) | | | | | 10,000 | | | | | | 7,214 | |
| | | | | 5,000 | | | | | | 3,360 | |
|
Braemar Hotels & Resorts Trust | |
7.934% due 06/15/2035 •(k) | | | | | 7,900 | | | | | | 7,429 | |
|
Citigroup Commercial Mortgage Trust | |
3.518% due 05/10/2035 ~(k) | | | | | 1,300 | | | | | | 1,123 | |
3.790% due 12/15/2072 ~(k) | | | | | 4,600 | | | | | | 1,650 | |
8.526% due 12/15/2036 •(k) | | | | | 8,811 | | | | | | 8,545 | |
|
Citigroup Mortgage Loan Trust | |
4.546% due 08/25/2036 ~(k) | | | | | 1,272 | | | | | | 1,117 | |
|
Colony Mortgage Capital Ltd. | |
8.196% due 11/15/2038 ~(k) | | | | | 15,000 | | | | | | 13,490 | |
|
Commercial Mortgage Trust | |
| | | | | 2,300 | | | | | | 1,714 | |
7.059% due 06/15/2034 ~(k) | | | | | 4,950 | | | | | | 3,201 | |
7.903% due 06/15/2034 •(k) | | | | | 7,400 | | | | | | 3,111 | |
|
Countrywide Alternative Loan Trust | |
6.250% due 12/25/2036 (k) | | | | | 4,574 | | | | | | 2,009 | |
|
Credit Suisse Mortgage Capital Trust | |
0.000% due 02/25/2067 (a) | | | | | 377,438 | | | | | | 788 | |
0.005% due 02/25/2067 (a) | | | | | 377,438 | | | | | | 136 | |
| | | | | 10,781 | | | | | | 8,348 | |
4.000% due 02/25/2067 (k) | | | | | 11,699 | | | | | | 7,221 | |
| | | | | 12,126 | | | | | | 6,739 | |
4.025% due 01/25/2060 (k) | | | | | 8,144 | | | | | | 5,838 | |
| | | | | 9,147 | | | | | | 1,402 | |
8.744% due 07/15/2032 •(k) | | | | | 19,982 | | | | | | 18,108 | |
|
CRSNT Commercial Mortgage Trust | |
8.984% due 04/15/2036 •(k) | | | | | 7,000 | | | | | | 5,947 | |
|
Deutsche Mortgage & Asset Receiving Corp. | |
4.006% due 11/27/2036 •(k) | | | | | 6,340 | | | | | | 5,585 | |
|
| |
0.665% due 05/10/2041 ~(a) | | | | | 309,500 | | | | | | 11,250 | |
3.704% due 05/10/2041 ~(k) | | | | | 32,400 | | | | | | 15,835 | |
|
| |
8.226% due 10/15/2043 •(k) | | | | | 5,500 | | | | | | 3,970 | |
|
Extended Stay America Trust | |
9.176% due 07/15/2038 ~(k) | | | | | 17,549 | | | | | | 17,215 | |
|
| |
10.087% due 02/25/2042 •(k) | | | | | 2,600 | | | | | | 2,696 | |
10.837% due 01/25/2034 •(k) | | | | | 4,000 | | | | | | 4,261 | |
12.837% due 10/25/2041 •(k) | | | | | 22,000 | | | | | | 23,174 | |
13.837% due 02/25/2042 •(k) | | | | | 1,200 | | | | | | 1,292 | |
|
GCT Commercial Mortgage Trust | |
8.826% due 02/15/2038 •(k) | | | | | 49,700 | | | | | | 2,814 | |
| | | | | | | | | | | | |
| | | | | | | | | | | |
|
| |
| | GBP | | | 1,940 | | | $ | | | 2,315 | |
|
| |
| | $ | | | 13,000 | | | | | | 45 | |
| | | | | 27,000 | | | | | | 96 | |
|
GS Mortgage Securities Corp. Trust | |
8.209% due 11/15/2032 •(k) | | | | | 10,782 | | | | | | 10,365 | |
|
GS Mortgage-Backed Securities Corp. Trust | |
| | | | | 158 | | | | | | 150 | |
0.000% due 12/25/2060 ~(a) | | | | | 172,234 | | | | | | 4,103 | |
0.165% due 12/25/2060 ~(a) | | | | | 149,984 | | | | | | 1,019 | |
3.921% due 12/25/2060 ~(k) | | | | | 34,468 | | | | | | 20,559 | |
|
| |
8.159% due 05/15/2038 •(k) | | | | | 34,720 | | | | | | 33,492 | |
8.159% (TSFR1M + 2.797%) due 05/15/2038 ~(k) | | | | | 5,000 | | | | | | 4,823 | |
|
| |
8.309% due 12/15/2034 •(k) | | | | | 6,953 | | | | | | 6,830 | |
|
| |
| | | | | 1,676 | | | | | | 1,612 | |
|
JP Morgan Alternative Loan Trust | |
5.750% due 03/25/2037 •(k) | | | | | 13,568 | | | | | | 13,862 | |
|
JP Morgan Chase Commercial Mortgage Securities Trust | |
7.776% due 02/15/2035 •(k) | | | | | 1,310 | | | | | | 1,256 | |
8.085% due 07/05/2033 ~(k) | | | | | 5,012 | | | | | | 4,048 | |
8.435% due 07/05/2033 ~(k) | | | | | 10,000 | | | | | | 7,501 | |
8.576% due 03/15/2036 •(k) | | | | | 25,550 | | | | | | 10,879 | |
9.326% due 03/15/2036 ~(k) | | | | | 9,500 | | | | | | 3,520 | |
| | | | | 700 | | | | | | 91 | |
|
JP Morgan Resecuritization Trust | |
4.587% due 12/27/2046 •(k) | | | | | 12,364 | | | | | | 9,613 | |
|
Mill City Mortgage Loan Trust | |
| | | | | 141,189 | | | | | | 3,510 | |
0.000% due 04/25/2057 ~(a) | | | | | 141,189 | | | | | | 525 | |
0.000% due 11/25/2058 ~(a) | | | | | 117,899 | | | | | | 514 | |
| | | | | 117,899 | | | | | | 376 | |
1.674% due 04/25/2057 ~(k) | | | | | 19,586 | | | | | | 12,277 | |
1.993% due 11/25/2058 ~(k) | | | | | 16,205 | | | | | | 9,276 | |
|
Morgan Stanley Capital Trust | |
| | | | | 4,294 | | | | | | 1,292 | |
7.859% due 11/15/2034 ~(k) | | | | | 5,370 | | | | | | 5,190 | |
8.809% due 11/15/2034 •(k) | | | | | 3,357 | | | | | | 3,217 | |
|
Morgan Stanley Re-REMIC Trust | |
3.109% due 03/26/2037 þ(k) | | | | | 3,033 | | | | | | 2,926 | |
|
| |
2.718% due 12/15/2036 (k) | | | | | 28,715 | | | | | | 15,780 | |
|
Natixis Commercial Mortgage Securities Trust | |
3.790% due 11/15/2032 ~(k) | | | | | 15,192 | | | | | | 8,135 | |
|
| |
8.098% due 04/15/2032 •(k) | | | | | 7,491 | | | | | | 6,955 | |
|
New Residential Mortgage Loan Trust | |
3.528% due 07/25/2055 ~(k) | | | | | 1,242 | | | | | | 952 | |
4.008% due 07/25/2059 ~(k) | | | | | 5,000 | | | | | | 3,341 | |
4.328% due 07/25/2055 ~(k) | | | | | 1,000 | | | | | | 762 | |
|
| |
5.250% due 07/25/2062 þ(k) | | | | | 2,209 | | | | | | 2,164 | |
|
PMT Credit Risk Transfer Trust | |
8.371% due 02/27/2024 •(k) | | | | | 15,814 | | | | | | 15,750 | |
|
Residential Accredit Loans, Inc. Trust | |
5.890% due 06/25/2037 •(k) | | | | | 773 | | | | | | 680 | |
|
Seasoned Credit Risk Transfer Trust | |
3.074% due 05/25/2057 ~(k) | | | | | 18,288 | | | | | | 6,756 | |
4.250% due 09/25/2060 (k) | | | | | 7,547 | | | | | | 6,824 | |
4.250% due 03/25/2061 ~(k) | | | | | 3,263 | | | | | | 2,749 | |
4.750% due 10/25/2058 ~(k) | | | | | 2,360 | | | | | | 2,176 | |
12.415% due 09/25/2060 ~(k) | | | | | 4,233 | | | | | | 2,982 | |
14.758% due 11/25/2060 ~(k) | | | | | 5,541 | | | | | | 4,146 | |
|
SFO Commercial Mortgage Trust | |
8.376% due 05/15/2038 •(k) | | | | | 18,000 | | | | | | 13,928 | |
9.126% due 05/15/2038 •(k) | | | | | 8,000 | | | | | | 5,728 | |
|
| |
0.000% due 07/15/2059 (g)(k) | | GBP | | | 10,853 | | | | | | 29,961 | |
8.720% due 07/15/2059 ~(k) | | | | | 10,843 | | | | | | 13,720 | |
9.720% due 07/15/2059 •(k) | | | | | 5,421 | | | | | | 6,863 | |
| | | | | | | | |
| | | | | | December 31, 2023 | | (Unaudited) |
| | | | | | | | | | | | |
| | | | | | | | | | | |
10.220% due 07/15/2059 •(k) | | GBP | | | 6,702 | | | $ | | | 8,532 | |
|
| |
8.626% due 07/15/2039 •(k) | | $ | | | 10,000 | | | | | | 6,465 | |
9.376% due 07/15/2039 •(k) | | | | | 7,000 | | | | | | 3,966 | |
|
Verus Securitization Trust | |
3.195% due 10/25/2063 ~(k) | | | | | 1,800 | | | | | | 1,449 | |
|
Waikiki Beach Hotel Trust | |
7.756% due 12/15/2033 •(k) | | | | | 3,000 | | | | | | 2,917 | |
8.406% due 12/15/2033 •(k) | | | | | 5,000 | | | | | | 4,739 | |
|
WaMu Mortgage Pass-Through Certificates Trust | |
5.822% due 07/25/2047 •(k) | | | | | 2,114 | | | | | | 1,682 | |
6.520% due 12/25/2045 ~(k) | | | | | 12,689 | | | | | | 10,567 | |
|
Wells Fargo Mortgage-Backed Securities Trust | |
6.478% due 10/25/2036 ~(k) | | | | | 231 | | | | | | 216 | |
| | | | | | | | | | | | |
Total Non-Agency Mortgage-Backed Securities (Cost $840,521) | | | | |
| | | | |
| |
ASSET-BACKED SECURITIES 22.3% | |
|
Aames Mortgage Investment Trust | |
8.170% due 01/25/2035 •(k) | | | | | 5,000 | | | | | | 3,555 | |
|
ACE Securities Corp. Home Equity Loan Trust | |
5.845% due 08/25/2036 •(k) | | | | | 24,327 | | | | | | 18,150 | |
|
Ameriquest Mortgage Securities, Inc. Asset-Backed Pass-Through Certificates | |
7.270% due 07/25/2035 •(k) | | | | | 7,500 | | | | | | 5,983 | |
|
Argent Securities, Inc. Asset-Backed Pass-Through Certificates | |
6.160% due 01/25/2036 •(k) | | | | | 21,429 | | | | | | 20,009 | |
|
Asset-Backed Securities Corp. Home Equity Loan Trust | |
5.700% due 05/25/2037 •(k) | | | | | 8,083 | | | | | | 5,568 | |
|
| |
6.012% due 12/08/2045 •(k) | | | | | 25,992 | | | | | | 8,202 | |
|
Bear Stearns Asset-Backed Securities Trust | |
5.146% due 01/25/2037 •(k) | | | | | 6,306 | | | | | | 5,593 | |
|
| |
6.970% due 11/25/2037 (k) | | | | | 32,783 | | | | | | 21,620 | |
|
Carvana Auto Receivables Trust | |
0.000% due 01/10/2028 «(g) | | | | | 10 | | | | | | 1,323 | |
|
College Avenue Student Loans LLC | |
| | | | | 1,361 | | | | | | 1,252 | |
|
Duke Funding High Grade Ltd. | |
0.090% due 08/02/2049 (a) | | | | | 840,370 | | | | | | 165 | |
| | | | | 29,910 | | | | | | 225 | |
|
Encore Credit Receivables Trust | |
7.225% due 10/25/2035 •(k) | | | | | 5,815 | | | | | | 5,296 | |
|
Exeter Automobile Receivables Trust | |
0.000% due 05/15/2031 «(g) | | | | | 7 | | | | | | 1,654 | |
0.000% due 08/15/2031 «(g) | | | | | 12 | | | | | | 3,865 | |
0.000% due 12/15/2033 «(g) | | | | | 12 | | | | | | 2,336 | |
|
Fieldstone Mortgage Investment Trust | |
8.395% due 08/25/2034 •(k) | | | | | 2,855 | | | | | | 2,163 | |
|
First Franklin Mortgage Loan Trust | |
5.780% due 10/25/2036 •(k) | | | | | 6,000 | | | | | | 4,754 | |
6.400% due 11/25/2035 •(k) | | | | | 8,078 | | | | | | 6,790 | |
|
| |
6.490% due 12/25/2035 •(k) | | | | | 10,880 | | | | | | 9,226 | |
|
Flagship Credit Auto Trust | |
0.000% due 04/17/2028 «(g) | | | | | 10 | | | | | | 994 | |
|
| |
0.000% due 09/20/2027 «(g) | | | | | 4 | | | | | | 331 | |
|
| |
6.520% due 01/25/2035 (k) | | | | | 6,979 | | | | | | 5,177 | |
|
| |
0.000% due 04/15/2031 ~(k) | | | | | 27,000 | | | | | | 9,571 | |
|
| |
5.920% due 08/25/2036 ~(k) | | | | | 16,132 | | | | | | 12,947 | |
|
| |
0.000% due 04/20/2034 ~(k) | | | | | 10,000 | | | | | | 7,520 | |
|
Madison Park Funding Ltd. | |
0.000% due 07/27/2047 ~(k) | | | | | 5,600 | | | | | | 2,879 | |
|
| |
0.000% due 09/16/2030 «(g) | | | | | 38 | | | | | | 1,162 | |
| | | | | | | | | | | | |
| | | | | | | | | | | |
|
MASTR Asset-Backed Securities Trust | |
6.055% due 01/25/2036 (k) | | $ | | | 6,239 | | | $ | | | 4,443 | |
|
| |
5.994% due 04/06/2046 ~(k) | | | | | 327,058 | | | | | | 33 | |
5.999% due 10/06/2042 •(k) | | | | | 213,556 | | | | | | 12,087 | |
|
Morgan Stanley ABS Capital, Inc. Trust | |
6.580% due 07/25/2035 ~(k) | | | | | 10,874 | | | | | | 8,134 | |
|
Morgan Stanley Home Equity Loan Trust | |
6.535% due 05/25/2035 •(k) | | | | | 5,328 | | | | | | 4,715 | |
|
| |
| | | | | 13,000 | | | | | | 8,018 | |
|
New Century Home Equity Loan Trust | |
6.490% due 06/25/2035 •(k) | | | | | 17,505 | | | | | | 16,973 | |
|
| |
3.721% due 07/25/2051 þ(k) | | | | | 2,600 | | | | | | 2,336 | |
3.967% due 09/25/2051 þ(k) | | | | | 17,900 | | | | | | 16,573 | |
|
Ready Capital Mortgage Financing LLC | |
9.220% due 04/25/2038 •(k) | | | | | 7,000 | | | | | | 6,668 | |
|
Residential Asset Mortgage Products Trust | |
| | | | | 5,121 | | | | | | 4,081 | |
|
Securitized Asset-Backed Receivables LLC Trust | |
5.970% due 03/25/2036 •(k) | | | | | 1,458 | | | | | | 893 | |
|
Sierra Madre Funding Ltd. | |
| | | | | 1,041 | | | | | | 733 | |
|
SMB Private Education Loan Trust | |
0.000% due 02/16/2055 «(g) | | | | | 5 | | | | | | 5,981 | |
|
Specialty Underwriting & Residential Finance Trust | |
5.770% due 09/25/2037 •(k) | | | | | 22,717 | | | | | | 7,438 | |
|
Structured Asset Investment Loan Trust | |
6.445% due 07/25/2035 (k) | | | | | 10,604 | | | | | | 7,734 | |
|
Structured Asset Securities Corp. Mortgage Loan Trust | |
5.770% due 04/25/2036 •(k) | | | | | 20,728 | | | | | | 17,047 | |
|
Structured Finance Advisors ABS CDO Ltd. | |
5.656% due 07/02/2037 •(k) | | | | | 41,770 | | | | | | 6,963 | |
|
| |
5.875% due 12/06/2045 •(k) | | | | | 49,629 | | | | | | 12,607 | |
| | | | | | | | | | | | |
Total Asset-Backed Securities (Cost $420,518) | | | | |
| | | | |
| |
| |
|
Argentina Government International Bond | |
3.500% due 07/09/2041 þ(k) | | | | | 5,233 | | | | | | 1,788 | |
|
Ecuador Government International Bond | |
3.500% due 07/31/2035 þ(k) | | | | | 3,300 | | | | | | 1,186 | |
6.000% due 07/31/2030 þ(k) | | | | | 14,720 | | | | | | 6,889 | |
|
Russia Government International Bond | |
5.100% due 03/28/2035 ^(d) | | | | | 200 | | | | | | 81 | |
5.625% due 04/04/2042 ^(d) | | | | | 4,200 | | | | | | 2,824 | |
|
Ukraine Government International Bond | |
| | | | | 10,700 | | | | | | 2,491 | |
| | | | | | | | | | | | |
Total Sovereign Issues (Cost $26,424) | | | | |
| | | | |
| |
| | | | | | | | | | | |
| |
| |
COMMUNICATION SERVICES 0.0% | |
| | | | |
Promotora de Informaciones SA (e) | | | | | 1,623,357 | | | | | | 520 | |
| | | | | | | | | | | | |
| |
CONSUMER DISCRETIONARY 0.0% | |
| | | | |
Steinhoff International Holdings NV «(e)(j) | | | | | 115,240,755 | | | | | | 0 | |
| | | | | | | | | | | | |
| |
| |
| | | | |
| | | | | 67,217 | | | | | | 36 | |
| | | | |
Banca Monte dei Paschi di Siena SpA (e) | | | | | 2,274,000 | | | | | | 7,647 | |
| | | | |
Corestate Capital Holding SA «(e)(j) | | | | | 632,951 | | | | | | 0 | |
| | | | | | | | | | | | |
| | | | | | | | | | | |
| | | | |
Intelsat Emergence SA «(e)(j) | | | | | 652,149 | | | $ | | | 18,579 | |
| | | | |
| | | | | 5,143 | | | | | | 160 | |
| | | | | | | | | | | | |
| | | | | | | | | | | 26,422 | |
| | | | | | | | | | | | |
| |
| |
| | | | |
| | | | | 1,571,862 | | | | | | 80,622 | |
| | | | | | | | | | | | |
| |
| |
| | | | |
| | | | | 373,201 | | | | | | 6,220 | |
| | | | |
Syniverse Holdings, Inc. «(j) | | | | | 7,141,753 | | | | | | 6,252 | |
| | | | |
Voyager Aviation Holdings LLC «(e) | | | | | 6,860 | | | | | | 0 | |
| | | | | | | | | | | | |
| | | | | | | | | | | 12,472 | |
| | | | | | | | | | | | |
| |
| |
| | | | |
| | | | | 148,837 | | | | | | 87 | |
| | | | | | | | | | | | |
Total Common Stocks (Cost $125,667) | | | | |
| | | | |
| |
PREFERRED SECURITIES 0.0% | |
| |
| |
|
| |
4.000% due 05/15/2026 ^(d)(i) | | | | | 500,000 | | | | | | 5 | |
4.250% due 11/15/2026 ^(d)(i) | | | | | 300,000 | | | | | | 4 | |
4.700% due 11/15/2031 ^(d)(i) | | | | | 492,000 | | | | | | 7 | |
| | | | | | | | | | | | |
| | | | | | | | | | | 16 | |
| | | | | | | | | | | | |
| |
| |
|
Voyager Aviation Holdings LLC | |
| | | | | 41,160 | | | | | | 0 | |
| | | | | | | | | | | | |
Total Preferred Securities (Cost $13,613) | | | | |
| | | | |
| |
REAL ESTATE INVESTMENT TRUSTS 1.9% | |
| |
| |
| | | | |
Annaly Capital Management, Inc. | | | | | 609,500 | | | | | | 11,806 | |
| | | | |
KKR Real Estate Finance Trust, Inc. | | | | | 442,832 | | | | | | 5,859 | |
| | | | |
PennyMac Mortgage Investment Trust | | | | | 556,200 | | | | | | 8,315 | |
| | | | | | | | | | | | |
Total Real Estate Investment Trusts (Cost $35,164) | | | | |
| | | | |
| |
| | | | | | | | | | | |
SHORT-TERM INSTRUMENTS 3.5% | |
| |
HUNGARY TREASURY BILLS 0.1% | |
10.900% due 01/04/2024 (g)(h) | | HUF | | | 598,000 | | | | | | 1,723 | |
| | | | | | | | | | | | |
| |
| |
5.376% due 01/25/2024 - 03/28/2024 (f)(g)(n) | | $ | | | 48,455 | | | | | | 48,098 | |
| | | | | | | | | | | | |
Total Short-Term Instruments
(Cost $49,834) | | | | |
| | | | |
| | | | |
| | | | | | | | | | | | |
Total Investments in Securities (Cost $2,639,981) | | | | |
| | | | |
| | | | | | | | | | | | |
| See Accompanying Notes | | | | | | | | | | DECEMBER 31, 2023 | | | |
| | | | | | | | |
Consolidated Schedule of Investments | | PIMCO Dynamic Income Opportunities Fund | | | | | | |
| | | | | | | | | | | | |
| | | | | | | | | | | |
INVESTMENTS IN AFFILIATES 11.0% | |
| |
SHORT-TERM INSTRUMENTS 11.0% | |
| |
CENTRAL FUNDS USED FOR CASH MANAGEMENT PURPOSES 11.0% | |
| | | |
PIMCO Short-Term
Floating NAV Portfolio III | | | 15,866,590 | | | $ | | | 154,334 | |
| | | | | | | | | | | | |
Total Short-Term Instruments
(Cost $154,296) | | | | |
| | | | |
| | | | |
| | | | | | | | | | | | |
Total Investments in Affiliates
(Cost $154,296) | | | | |
| |
| | | | |
Total Investments 164.0%
(Cost $2,794,277) | | | $ | | | | |
| |
Financial Derivative
Instruments (l)(m) 0.4% (Cost or Premiums, net $20,388) | | | | | | | |
| |
Other Assets and Liabilities, net (64.4)% | | | | |
| | | | |
| | | $ | | | | |
| | | | | | | |
NOTES TO CONSOLIDATED SCHEDULE OF INVESTMENTS:
| A zero balance may reflect actual amounts rounding to less than one thousand. |
| Security valued using significant unobservable inputs (Level 3). |
| All or a portion of this amount represents unfunded loan commitments. The interest rate for the unfunded portion will be determined at the time of funding. See Note 4, Securities and Other Investments, in the Notes to Financial Statements for more information regarding unfunded loan commitments. |
| Variable or Floating rate security. Rate shown is the rate in effect as of period end. Certain variable rate securities are not based on a published reference rate and spread, rather are determined by the issuer or agent and are based on current market conditions. Reference rate is as of reset date, which may vary by security. These securities may not indicate a reference rate and/or spread in their description. |
| Rate shown is the rate in effect as of period end. The rate may be based on a fixed rate, a capped rate or a floor rate and may convert to a variable or floating rate in the future. These securities do not indicate a reference rate and spread in their description. |
| Coupon represents a rate which changes periodically based on a predetermined schedule or event. Rate shown is the rate in effect as of period end. |
| Security is an Interest Only (“IO”) or IO Strip. |
| Security is not accruing income as of the date of this report. |
| Security did not produce income within the last twelve months. |
| Coupon represents a weighted average yield to maturity. |
| Coupon represents a yield to maturity. |
| Perpetual maturity; date shown, if applicable, represents next contractual call date. |
(j) RESTRICTED SECURITIES:
| | | | | | | | | | | | | | | | |
| | | | | | | | | | | Market Value
as Percentage
of Net Assets | |
| | | | | | $ | 65,680 | | | $ | 80,622 | | | | 5.76 | % |
Corestate Capital Holding SA | | | 08/22/2023 | | | | 0 | | | | 0 | | | | 0.00 | |
| | | | | | | 38,681 | | | | 18,579 | | | | 1.33 | |
| | | | | | | 8,750 | | | | 6,220 | | | | 0.44 | |
Steinhoff International Holdings NV | | | | | | | 0 | | | | 0 | | | | 0.00 | |
| | | | | | | 7,023 | | | | 6,252 | | | | 0.45 | |
| | | | | | | | | | | | | | | | |
| | | $ | 120,134 | | | $ | 111,673 | | | | 7.98 | % |
| | | | | | | | | | | | | |
| | | | | | | | |
| | | | | | December 31, 2023 | | (Unaudited) |
BORROWINGS AND OTHER FINANCING TRANSACTIONS
REVERSE REPURCHASE AGREEMENTS:
| | | | | | | | | | | | | | | | | | | | | | | | |
| | | | | | | | | | | | | | Payable for
Reverse
Repurchase
Agreements | |
| | | 5.900 | % | | | 12/04/2023 | | | | 03/04/2024 | | | | $ | | | | (12,611 | ) | | $ | (12,671 | ) |
| | | 4.220 | | | | 12/08/2023 | | | | TBD | | | | EUR | | | | (3,889 | ) | | | (4,306 | ) |
| | | 4.352 | | | | 12/12/2023 | | | | 03/12/2024 | | | | | | | | (401 | ) | | | (444 | ) |
| | | 4.355 | | | | 12/01/2023 | | | | 02/01/2024 | | | | | | | | (6,317 | ) | | | (7,000 | ) |
| | | 4.380 | | | | 09/20/2023 | | | | TBD | | | | | | | | (1,565 | ) | | | (1,749 | ) |
| | | 4.413 | | | | 11/20/2023 | | | | 01/22/2024 | | | | | | | | (15,382 | ) | | | (17,070 | ) |
| | | 5.750 | | | | 11/07/2023 | | | | TBD | | | | $ | | | | (16,178 | ) | | | (16,323 | ) |
| | | 5.800 | | | | 12/07/2023 | | | | TBD | | | | | | | | (1,093 | ) | | | (1,097 | ) |
| | | 5.850 | | | | 12/07/2023 | | | | TBD | | | | | | | | (5,948 | ) | | | (5,973 | ) |
| | | 6.050 | | | | 11/20/2023 | | | | 02/20/2024 | | | | | | | | (5,164 | ) | | | (5,202 | ) |
| | | 6.060 | | | | 07/14/2023 | | | | 01/10/2024 | | | | | | | | (46,089 | ) | | | (47,423 | ) |
| | | 6.060 | | | | 12/26/2023 | | | | 01/10/2024 | | | | | | | | (742 | ) | | | (743 | ) |
| | | 6.080 | | | | 07/21/2023 | | | | 01/17/2024 | | | | | | | | (11,897 | ) | | | (12,229 | ) |
| | | 6.120 | | | | 07/31/2023 | | | | 01/29/2024 | | | | | | | | (14,198 | ) | | | (14,567 | ) |
| | | 6.220 | | | | 08/30/2023 | | | | 02/26/2024 | | | | | | | | (2,676 | ) | | | (2,734 | ) |
| | | 6.500 | | | | 12/20/2023 | | | | 05/15/2024 | | | | | | | | (3,901 | ) | | | (3,910 | ) |
| | | 6.650 | | | | 12/20/2023 | | | | 04/16/2024 | | | | | | | | (81,393 | ) | | | (81,586 | ) |
| | | 6.650 | | | | 12/20/2023 | | | | 05/15/2024 | | | | | | | | (12,988 | ) | | | (13,019 | ) |
| | | 6.750 | | | | 12/20/2023 | | | | 04/16/2024 | | | | | | | | (1,878 | ) | | | (1,883 | ) |
| | | 6.830 | | | | 12/20/2023 | | | | 02/26/2024 | | | | | | | | (2,646 | ) | | | (2,652 | ) |
| | | 6.910 | | | | 12/20/2023 | | | | 04/16/2024 | | | | | | | | (9,277 | ) | | | (9,300 | ) |
| | | 6.950 | | | | 12/20/2023 | | | | 04/16/2024 | | | | | | | | (15,832 | ) | | | (15,871 | ) |
| | | 4.250 | | | | 09/20/2023 | | | | TBD | | | | EUR | | | | (1,281 | ) | | | (1,430 | ) |
| | | 6.431 | | | | 12/15/2023 | | | | 03/15/2024 | | | | GBP | | | | (7,800 | ) | | | (9,974 | ) |
| | | 6.540 | | | | 10/13/2023 | | | | 01/12/2024 | | | | $ | | | | (5,374 | ) | | | (5,453 | ) |
| | | 6.540 | | | | 11/29/2023 | | | | 01/12/2024 | | | | | | | | (3,020 | ) | | | (3,039 | ) |
| | | 6.590 | | | | 10/13/2023 | | | | 01/12/2024 | | | | | | | | (9,701 | ) | | | (9,845 | ) |
| | | 6.617 | | | | 11/20/2023 | | | | 02/20/2024 | | | | | | | | (6,802 | ) | | | (6,856 | ) |
| | | 6.667 | | | | 11/20/2023 | | | | 02/20/2024 | | | | | | | | (2,918 | ) | | | (2,942 | ) |
| | | 6.670 | | | | 12/12/2023 | | | | 03/11/2024 | | | | | | | | (5,567 | ) | | | (5,589 | ) |
| | | 6.690 | | | | 08/30/2023 | | | | 02/26/2024 | | | | | | | | (7,490 | ) | | | (7,664 | ) |
| | | 6.700 | | | | 09/05/2023 | | | | 03/04/2024 | | | | | | | | (6,328 | ) | | | (6,468 | ) |
| | | 6.720 | | | | 08/10/2023 | | | | 02/06/2024 | | | | | | | | (24,765 | ) | | | (25,435 | ) |
| | | 6.720 | | | | 12/12/2023 | | | | 03/11/2024 | | | | | | | | (4,958 | ) | | | (4,977 | ) |
| | | 6.730 | | | | 08/03/2023 | | | | 01/31/2024 | | | | | | | | (11,322 | ) | | | (11,644 | ) |
| | | 6.732 | | | | 07/10/2023 | | | | 01/10/2024 | | | | | | | | (3,626 | ) | | | (3,745 | ) |
| | | 6.740 | | | | 08/30/2023 | | | | 02/26/2024 | | | | | | | | (778 | ) | | | (796 | ) |
| | | 6.750 | | | | 09/05/2023 | | | | 03/04/2024 | | | | | | | | (4,620 | ) | | | (4,723 | ) |
| | | 6.770 | | | | 12/12/2023 | | | | 03/11/2024 | | | | | | | | (12,196 | ) | | | (12,244 | ) |
| | | 6.800 | | | | 09/05/2023 | | | | 03/04/2024 | | | | | | | | (6,900 | ) | | | (7,055 | ) |
| | | 6.100 | | | | 11/20/2023 | | | | 05/20/2024 | | | | | | | | (6,861 | ) | | | (6,911 | ) |
| | | 6.130 | | | | 10/23/2023 | | | | 04/22/2024 | | | | | | | | (27,751 | ) | | | (28,082 | ) |
| | | 6.020 | | | | 08/16/2023 | | | | 02/16/2024 | | | | | | | | (20 | ) | | | (20 | ) |
| | | 6.368 | | | | 12/18/2023 | | | | 02/16/2024 | | | | | | | | (1,071 | ) | | | (1,071 | ) |
| | | 6.922 | | | | 12/08/2023 | | | | 02/02/2024 | | | | | | | | (18,312 | ) | | | (18,400 | ) |
| | | 6.972 | | | | 12/08/2023 | | | | 02/02/2024 | | | | | | | | (22,962 | ) | | | (23,074 | ) |
| | | 6.226 | | | | 12/28/2023 | | | | 09/27/2024 | | | | | | | | (13,741 | ) | | | (13,753 | ) |
| | | 6.700 | | | | 10/26/2023 | | | | 07/29/2024 | | | | | | | | (2,521 | ) | | | (2,553 | ) |
| | | 6.750 | | | | 10/26/2023 | | | | 07/29/2024 | | | | | | | | (1,564 | ) | | | (1,584 | ) |
| | | 6.780 | | | | 10/26/2023 | | | | 07/29/2024 | | | | | | | | (11,406 | ) | | | (11,552 | ) |
| | | 2.250 | | | | 12/08/2023 | | | | TBD | | | | EUR | | | | (271 | ) | | | (299 | ) |
| | | 5.750 | | | | 12/15/2023 | | | | 02/02/2024 | | | | $ | | | | (6,564 | ) | | | (6,583 | ) |
| | | 5.950 | | | | 12/15/2023 | | | | 02/02/2024 | | | | | | | | (978 | ) | | | (981 | ) |
| | | 6.610 | | | | 07/03/2023 | | | | 01/02/2024 | | | | | | | | (1,254 | ) | | | (1,296 | ) |
| | | 6.625 | | | | 07/12/2023 | | | | 01/08/2024 | | | | | | | | (3,325 | ) | | | (3,432 | ) |
| | | 6.630 | | | | 01/02/2024 | | | | 04/03/2024 | | | | | | | | (1,233 | ) | | | (1,233 | ) |
| | | 6.650 | | | | 07/12/2023 | | | | 01/08/2024 | | | | | | | | (11,983 | ) | | | (12,368 | ) |
| | | 6.680 | | | | 07/03/2023 | | | | 01/02/2024 | | | | | | | | (9,756 | ) | | | (10,087 | ) |
| | | 6.680 | | | | 01/02/2024 | | | | 04/03/2024 | | | | | | | | (8,708 | ) | | | (8,708 | ) |
| | | 6.710 | | | | 07/03/2023 | | | | 01/02/2024 | | | | | | | | (2,634 | ) | | | (2,724 | ) |
| | | 6.730 | | | | 01/02/2024 | | | | 04/03/2024 | | | | | | | | (2,432 | ) | | | (2,432 | ) |
| | | 6.880 | | | | 01/02/2024 | | | | 04/03/2024 | | | | | | | | (593 | ) | | | (593 | ) |
| | | 5.760 | | | | 12/22/2023 | | | | 03/22/2024 | | | | GBP | | | | (9,076 | ) | | | (11,589 | ) |
| | | 6.010 | | | | 11/06/2023 | | | | 03/06/2024 | | | | | | | | (4,080 | ) | | | (5,248 | ) |
| | | 6.110 | | | | 11/06/2023 | | | | 03/06/2024 | | | | | | | | (5,619 | ) | | | (7,230 | ) |
| | | 6.160 | | | | 11/06/2023 | | | | 03/06/2024 | | | | | | | | (6,501 | ) | | | (8,365 | ) |
| | | | | | | | | | | | |
| See Accompanying Notes | | | | | | | | | | DECEMBER 31, 2023 | | | |
| | | | | | | | |
Consolidated Schedule of Investments | | PIMCO Dynamic Income Opportunities Fund | | | | | | |
| | | | | | | | | | | | | | | | | | | | | | | | |
| | | | | | | | | | | | | | Payable for
Reverse
Repurchase
Agreements | |
| | | 6.500 | % | | | 11/27/2023 | | | | 05/22/2024 | | | | $ | | | | (9,217 | ) | | $ | (9,276 | ) |
| | | 6.600 | | | | 12/11/2023 | | | | 06/11/2024 | | | | | | | | (7,729 | ) | | | (7,759 | ) |
| | | 6.650 | | | | 11/15/2023 | | | | 05/13/2024 | | | | | | | | (1,981 | ) | | | (1,999 | ) |
| | | 6.650 | | | | 12/05/2023 | | | | 06/04/2024 | | | | | | | | (9,954 | ) | | | (10,004 | ) |
| | | 6.700 | | | | 12/05/2023 | | | | 06/03/2024 | | | | | | | | (29,753 | ) | | | (29,906 | ) |
| | | 6.750 | | | | 12/05/2023 | | | | 06/03/2024 | | | | | | | | (39,280 | ) | | | (39,484 | ) |
| | | 6.550 | | | | 12/13/2023 | | | | 06/20/2024 | | | | | | | | (9,954 | ) | | | (9,990 | ) |
| | | 6.700 | | | | 12/13/2023 | | | | 06/20/2024 | | | | | | | | (6,518 | ) | | | (6,542 | ) |
| | | 5.650 | | | | 07/28/2023 | | | | TBD | | | | | | | | (591 | ) | | | (606 | ) |
| | | 6.470 | | | | 12/18/2023 | | | | 04/18/2024 | | | | | | | | (13,600 | ) | | | (13,636 | ) |
| | | 6.890 | | | | 12/18/2023 | | | | 04/18/2024 | | | | | | | | (3,594 | ) | | | (3,604 | ) |
| | | 5.860 | | | | 12/18/2023 | | | | 01/17/2024 | | | | | | | | (5,096 | ) | | | (5,108 | ) |
| | | 6.020 | | | | 08/17/2023 | | | | 02/16/2024 | | | | | | | | (3,091 | ) | | | (3,162 | ) |
| | | 6.000 | | | | 12/19/2023 | | | | 03/19/2024 | | | | | | | | (10,669 | ) | | | (10,694 | ) |
| | | 6.130 | | | | 12/04/2023 | | | | 04/04/2024 | | | | | | | | (23,229 | ) | | | (23,342 | ) |
| | | 6.180 | | | | 12/04/2023 | | | | 04/04/2024 | | | | | | | | (6,217 | ) | | | (6,248 | ) |
| | | 6.500 | | | | 12/11/2023 | | | | 04/12/2024 | | | | | | | | (3,356 | ) | | | (3,369 | ) |
| | | 6.550 | | | | 12/11/2023 | | | | 04/12/2024 | | | | | | | | (10,806 | ) | | | (10,849 | ) |
| | | 6.580 | | | | 12/06/2023 | | | | 06/04/2024 | | | | | | | | (13,532 | ) | | | (13,599 | ) |
| | | 6.600 | | | | 12/11/2023 | | | | 04/12/2024 | | | | | | | | (3,442 | ) | | | (3,456 | ) |
| | | 6.620 | | | | 12/01/2023 | | | | 04/01/2024 | | | | | | | | (17,792 | ) | | | (17,893 | ) |
| | | 6.630 | | | | 01/02/2024 | | | | 05/02/2024 | | | | | | | | (18,449 | ) | | | (18,449 | ) |
| | | 6.640 | | | | 10/02/2023 | | | | 01/02/2024 | | | | | | | | (18,079 | ) | | | (18,383 | ) |
| | | 6.650 | | | | 01/02/2024 | | | | 04/02/2024 | | | | | | | | (19,012 | ) | | | (19,012 | ) |
| | | 6.800 | | | | 12/11/2023 | | | | 04/11/2024 | | | | | | | | (2,405 | ) | | | (2,415 | ) |
| | | 5.600 | | | | 12/05/2023 | | | | TBD | | | | | | | | (6,947 | ) | | | (6,977 | ) |
| | | 5.600 | | | | 12/07/2023 | | | | TBD | | | | | | | | (2,686 | ) | | | (2,697 | ) |
| | | 6.070 | | | | 08/22/2023 | | | | 02/22/2024 | | | | | | | | (4,398 | ) | | | (4,496 | ) |
| | | 6.120 | | | | 07/24/2023 | | | | 01/24/2024 | | | | | | | | (5,767 | ) | | | (5,923 | ) |
| | | 6.120 | | | | 10/10/2023 | | | | 04/10/2024 | | | | | | | | (2,500 | ) | | | (2,536 | ) |
| | | 6.650 | | | | 10/04/2023 | | | | 04/04/2024 | | | | | | | | (3,749 | ) | | | (3,810 | ) |
| | | 6.700 | | | | 11/29/2023 | | | | 05/28/2024 | | | | | | | | (8,386 | ) | | | (8,438 | ) |
| | | 4.100 | | | | 11/16/2023 | | | | TBD | | | | EUR | | | | (241 | ) | | | (268 | ) |
| | | 4.100 | | | | 12/15/2023 | | | | 06/06/2025 | | | | | | | | (314 | ) | | | (347 | ) |
| | | 4.180 | | | | 05/10/2023 | | | | TBD | | | | | | | | (2,410 | ) | | | (2,728 | ) |
| | | 4.230 | | | | 05/10/2023 | | | | TBD | | | | | | | | (5,818 | ) | | | (6,587 | ) |
| | | 4.371 | | | | 11/14/2023 | | | | 02/14/2024 | | | | | | | | (12,735 | ) | | | (14,141 | ) |
| | | 5.760 | | | | 04/27/2023 | | | | 01/22/2024 | | | | $ | | | | (15,801 | ) | | | (16,433 | ) |
| | | 5.920 | | | | 10/03/2023 | | | | 01/02/2024 | | | | | | | | (767 | ) | | | (779 | ) |
| | | 5.950 | | | | 10/03/2023 | | | | 01/02/2024 | | | | | | | | (3,059 | ) | | | (3,105 | ) |
| | | 6.100 | | | | 07/10/2023 | | | | 01/05/2024 | | | | | | | | (586 | ) | | | (604 | ) |
| | | 6.250 | | | | 10/18/2023 | | | | 01/05/2024 | | | | | | | | (4,572 | ) | | | (4,632 | ) |
| | | 6.420 | | | | 06/30/2023 | | | | 01/04/2024 | | | | | | | | (6,130 | ) | | | (6,334 | ) |
| | | 6.540 | | | | 12/05/2023 | | | | 06/05/2024 | | | | | | | | (3,706 | ) | | | (3,725 | ) |
| | | 6.620 | | | | 06/30/2023 | | | | 01/04/2024 | | | | | | | | (10,699 | ) | | | (11,064 | ) |
| | | 6.660 | | | | 12/12/2023 | | | | 01/12/2024 | | | | | | | | (2,708 | ) | | | (2,718 | ) |
| | | 6.770 | | | | 06/30/2023 | | | | 01/04/2024 | | | | | | | | (10,697 | ) | | | (11,071 | ) |
| | | | | | | | | | | | | | | | | | | | | | | | |
Total Reverse Repurchase Agreements | | | | | | | | | | | | | | | | | |
| | | | | | | | | | | | | | | | | | | | | | | | |
BORROWINGS AND OTHER FINANCING TRANSACTIONS SUMMARY
The following is a summary by counterparty of the market value of Borrowings and Other Financing Transactions and collateral pledged/(received) as of December 31, 2023:
| | | | | | | | | | | | | | | | | | | | | | | | |
| | Repurchase
Agreement
Proceeds
to be
Received | | | Payable for
Reverse
Repurchase
Agreements | | | Payable for Sale-Buyback Transactions | | | Total
Borrowings and
Other Financing
Transactions | | | Collateral
Pledged/(Received) | | | | |
Global/Master Repurchase Agreement | |
| | $ | 0 | | | $ | (12,671 | ) | | $ | 0 | | | $ | (12,671 | ) | | $ | 15,233 | | | $ | 2,562 | |
| | | 0 | | | | (265,081 | ) | | | 0 | | | | (265,081 | ) | | | 338,350 | | | | 73,269 | |
| | | 0 | | | | (129,879 | ) | | | 0 | | | | (129,879 | ) | | | 172,503 | | | | 42,624 | |
| | | 0 | | | | (34,993 | ) | | | 0 | | | | (34,993 | ) | | | 40,523 | | | | 5,530 | |
| | | 0 | | | | (20 | ) | | | 0 | | | | (20 | ) | | | 30 | | | | 10 | |
| | | 0 | | | | (42,545 | ) | | | 0 | | | | (42,545 | ) | | | 61,180 | | | | 18,635 | |
| | | 0 | | | | (29,442 | ) | | | 0 | | | | (29,442 | ) | | | 44,198 | | | | 14,756 | |
| | | 0 | | | | (7,863 | ) | | | 0 | | | | (7,863 | ) | | | 9,401 | | | | 1,538 | |
| | | 0 | | | | (42,873 | ) | | | 0 | | | | (42,873 | ) | | | 41,280 | | | | (1,593 | ) |
| | | 0 | | | | (11,589 | ) | | | 0 | | | | (11,589 | ) | | | 13,716 | | | | 2,127 | |
| | | | | | | | |
| | | | | | December 31, 2023 | | (Unaudited) |
| | | | | | | | | | | | | | | | | | | | | | | | |
| | Repurchase
Agreement
Proceeds
to be
Received | | | Payable for
Reverse
Repurchase
Agreements | | | Payable for Sale-Buyback Transactions | | | Total
Borrowings and
Other Financing
Transactions | | | Collateral
Pledged/(Received) | | | | |
| | $ | 0 | | | $ | (119,271 | ) | | $ | 0 | | | $ | (119,271 | ) | | $ | 166,980 | | | $ | 47,709 | |
| | | 0 | | | | (16,532 | ) | | | 0 | | | | (16,532 | ) | | | 24,306 | | | | 7,774 | |
| | | 0 | | | | (606 | ) | | | 0 | | | | (606 | ) | | | 762 | | | | 156 | |
| | | 0 | | | | (17,240 | ) | | | 0 | | | | (17,240 | ) | | | 23,162 | | | | 5,922 | |
| | | 0 | | | | (8,270 | ) | | | 0 | | | | (8,270 | ) | | | 9,383 | | | | 1,113 | |
| | | 0 | | | | (147,709 | ) | | | 0 | | | | (147,709 | ) | | | 142,433 | | | | (5,276 | ) |
| | | 0 | | | | (34,877 | ) | | | 0 | | | | (34,877 | ) | | | 44,772 | | | | 9,895 | |
| | | 0 | | | | (84,536 | ) | | | 0 | | | | (84,536 | ) | | | 105,846 | | | | 21,310 | |
| | | | | | | | | | | | | | | | | | | | | | | | |
Total Borrowings and Other Financing Transactions | | | | | | | | | | | | | | | | | | | | | | | | |
| | | | | | | | | | | | | | | | | | | | | | | | |
CERTAIN TRANSFERS ACCOUNTED FOR AS SECURED BORROWINGS
Remaining Contractual Maturity of the Agreements
| | | | | | | | | | | | | | | | | | | | |
| | | | | | | | | | | | | | | | |
Reverse Repurchase Agreements | |
| | $ | 0 | | | $ | (122,086 | ) | | $ | (44,711 | ) | | $ | (117,900 | ) | | $ | (284,697 | ) |
Convertible Bonds & Notes | | | 0 | | | | (19,804 | ) | | | 0 | | | | 0 | | | | (19,804 | ) |
| | | 0 | | | | (5,108 | ) | | | (15,854 | ) | | | 0 | | | | (20,962 | ) |
Non-Agency Mortgage-Backed Securities | | | 0 | | | | (83,177 | ) | | | (76,590 | ) | | | (228,126 | ) | | | (387,893 | ) |
| | | 0 | | | | 0 | | | | (107,405 | ) | | | (126,640 | ) | | | (234,045 | ) |
| | | 0 | | | | 0 | | | | (7,564 | ) | | | (605 | ) | | | (8,169 | ) |
| | | | | | | | | | | | | | | | | | | | |
| | | | | | | | | | | | | | | | | | | | |
| | | | | | | | | | | | | | | | | | | | |
Payable for reverse repurchase agreements (4) | | | | | |
| | | | | |
| Securities with an aggregate market value of $1,252,763 and cash of $13,319 have been pledged as collateral under the terms of the above master agreements as of December 31, 2023. |
| The average amount of borrowings outstanding during the period ended December 31, 2023 was $(1,011,999) at a weighted average interest rate of 6.172%. Average borrowings may include reverse repurchase agreements and sale-buyback transactions, if held during the period. |
| Open maturity reverse repurchase agreement. |
| Net Exposure represents the net receivable/(payable) that would be due from/to the counterparty in the event of default. Exposure from borrowings and other financing transactions can only be netted across transactions governed under the same master agreement with the same legal entity. See Note 8, Master Netting Arrangements, in the Notes to Financial Statements for more information. |
| Unsettled reverse repurchase agreements liability of $(50,427) is outstanding at period end. |
(l) FINANCIAL DERIVATIVE INSTRUMENTS: EXCHANGE-TRADED OR CENTRALLY CLEARED
| | | | | | | | | | | | | | | | | | | | | | | | |
| | | | | | | | | | | Unrealized
Appreciation/
(Depreciation) | | | | |
| | | | | | |
3-Month SOFR Active Contract December Futures | | | 03/2024 | | | | 66 | | | $ | (15,616 | ) | | $ | 442 | | | $ | 0 | | | $ | (1 | ) |
3-Month SOFR Active Contract December Futures | | | 03/2025 | | | | 35 | | | | (8,424 | ) | | | 130 | | | | 0 | | | | (3 | ) |
3-Month SOFR Active Contract December Futures | | | 03/2026 | | | | 38 | | | | (9,209 | ) | | | 87 | | | | 0 | | | | (3 | ) |
3-Month SOFR Active Contract June Futures | | | 09/2024 | | | | 44 | | | | (10,503 | ) | | | 232 | | | | 0 | | | | (2 | ) |
3-Month SOFR Active Contract June Futures | | | 09/2025 | | | | 35 | | | | (8,469 | ) | | | 91 | | | | 0 | | | | (4 | ) |
3-Month SOFR Active Contract March Futures | | | 06/2024 | | | | 58 | | | | (13,777 | ) | | | 354 | | | | 0 | | | | (1 | ) |
3-Month SOFR Active Contract March Futures | | | 06/2025 | | | | 31 | | | | (7,485 | ) | | | 95 | | | | 0 | | | | (3 | ) |
3-Month SOFR Active Contract March Futures | | | 06/2026 | | | | 36 | | | | (8,724 | ) | | | 80 | | | | 0 | | | | (3 | ) |
3-Month SOFR Active Contract September Futures | | | 12/2024 | | | | 41 | | | | (9,830 | ) | | | 183 | | | | 0 | | | | (3 | ) |
3-Month SOFR Active Contract September Futures | | | 12/2025 | | | | 29 | | | | (7,025 | ) | | | 68 | | | | 0 | | | | (3 | ) |
| | | | | | | | | | | | | | | | | | | | | | | | |
| | | | | | | | | | | | | |
| | | | | | | | | | | | | |
| | | | | | | | | | | | |
| See Accompanying Notes | | | | | | | | | | DECEMBER 31, 2023 | | | |
| | | | | | | | |
Consolidated Schedule of Investments | | PIMCO Dynamic Income Opportunities Fund | | | | | | |
CREDIT DEFAULT SWAPS ON CORPORATE ISSUES - SELL PROTECTION
(1)
| | | | | | | | | | | | | | | | | | | | | | | | | | | | | | | | | | | | | | | | | | | | |
| | | | | | | | | | | Implied Credit Spread at December 31, 2023 (2) | | | | | | | | | Unrealized
Appreciation/
(Depreciation) | | | | | | | |
| | | | | | |
Jaguar Land Rover Automotive | | | 5.000 | % | | | Quarterly | | | | 06/20/2026 | | | | 1.875 | % | | | EUR | | | | 1,000 | | | $ | 64 | | | $ | 19 | | | $ | 83 | | | $ | 0 | | | $ | 0 | |
Jaguar Land Rover Automotive | | | 5.000 | | | | Quarterly | | | | 12/20/2026 | | | | 2.236 | | | | | | | | 13,300 | | | | 739 | | | | 419 | | | | 1,158 | | | | 14 | | | | 0 | |
| | | | | | | | | | | | | | | | | | | | | | | | | | | | | | | | | | | | | | | | | | | | |
| | | | | | | | | | | | | | | $ | 803 | | | $ | 438 | | | $ | 1,241 | | | $ | 14 | | | $ | 0 | |
| | | | | | | | | | | | | | | | | | | | | | | | | | | | | | | | | |
| | | | | | | | | | | | | | | | | | | | | | | | | | | | | | | | | | | | | | | | |
| | | | | | | | | | | | | | | | | | Unrealized
Appreciation/
(Depreciation) | | | | | | | |
| | | | | | |
| | | | | 5.000 | % | | Annual | | | 03/20/2029 | | | | GBP | | | | 25,800 | | | $ | 2,535 | | | $ | 19 | | | $ | 2,554 | | | $ | 0 | | | $ | (82 | ) |
| | | | | 0.750 | | | Annual | | | 09/21/2052 | | | | | | | | 9,800 | | | | 286 | | | | 5,829 | | | | 6,115 | | | | 191 | | | | 0 | |
| | | | | 1.250 | | | Annual | | | 09/21/2026 | | | | $ | | | | 58,100 | | | | (4,282 | ) | | | (241 | ) | | | (4,523 | ) | | | 0 | | | | (12 | ) |
| | | | | 4.500 | | | Annual | | | 12/21/2027 | | | | | | | | 584,200 | | | | (54 | ) | | | 20,634 | | | | 20,580 | | | | 293 | | | | 0 | |
| | | | | 0.500 | | | | | | 06/16/2028 | | | | | | | | 6,300 | | | | (259 | ) | | | (611 | ) | | | (870 | ) | | | 0 | | | | (1 | ) |
| | | | | 4.500 | | | Annual | | | 12/15/2028 | | | | | | | | 42,900 | | | | 25 | | | | 1,961 | | | | 1,986 | | | | 23 | | | | 0 | |
| | | | | 3.750 | | | Annual | | | 06/20/2029 | | | | | | | | 49,800 | | | | (924 | ) | | | (26 | ) | | | (950 | ) | | | 0 | | | | (23 | ) |
| | | | | 4.250 | | | Annual | | | 12/21/2029 | | | | | | | | 145,000 | | | | (1,424 | ) | | | 7,750 | | | | 6,326 | | | | 31 | | | | 0 | |
| | | | | 3.500 | | | Annual | | | 12/20/2033 | | | | | | | | 50,400 | | | | 479 | | | | (361 | ) | | | 118 | | | | 0 | | | | (38 | ) |
| | | | | 1.750 | | | Annual | | | 06/15/2052 | | | | | | | | 40,100 | | | | 9,900 | | | | 2,303 | | | | 12,203 | | | | 152 | | | | 0 | |
| | | | | 1.750 | | | Annual | | | 12/21/2052 | | | | | | | | 27,100 | | | | 6,527 | | | | 1,247 | | | | 7,774 | | | | 103 | | | | 0 | |
| | | | | 3.500 | | | Annual | | | 12/21/2052 | | | | | | | | 81,300 | | | | (245 | ) | | | (2,540 | ) | | | (2,785 | ) | | | 391 | | | | 0 | |
| | | | | 3.250 | | | Annual | | | 03/20/2029 | | | | EUR | | | | 43,600 | | | | 2,033 | | | | (22 | ) | | | 2,011 | | | | 0 | | | | (156 | ) |
| | | | | 0.250 | | | Annual | | | 09/21/2032 | | | | | | | | 50,200 | | | | 4,740 | | | | 5,493 | | | | 10,233 | | | | 426 | | | | 0 | |
| | | | | 1.750 | | | Annual | | | 03/15/2033 | | | | | | | | 5,700 | | | | 448 | | | | (84 | ) | | | 364 | | | | 54 | | | | 0 | |
| | | | | 0.830 | | | Annual | | | 12/09/2052 | | | | | | | | 29,900 | | | | 182 | | | | 1,735 | | | | 1,917 | | | | 151 | | | | 0 | |
| | | | | 8.675 | | | Lunar | | | 04/03/2024 | | | | MXN | | | | 41,000 | | | | 0 | | | | 21 | | | | 21 | | | | 1 | | | | 0 | |
| | | | | 8.660 | | | Lunar | | | 04/04/2024 | | | | | | | | 17,100 | | | | 0 | | | | 9 | | | | 9 | | | | 0 | | | | 0 | |
| | | | | 8.750 | | | Lunar | | | 04/05/2024 | | | | | | | | 10,200 | | | | 0 | | | | 5 | | | | 5 | | | | 0 | | | | 0 | |
| | | | | 8.410 | | | Lunar | | | 03/31/2027 | | | | | | | | 4,900 | | | | 0 | | | | 5 | | | | 5 | | | | 0 | | | | 0 | |
| | | | | 8.730 | | | Lunar | | | 04/06/2027 | | | | | | | | 4,300 | | | | 0 | | | | 2 | | | | 2 | | | | 0 | | | | 0 | |
| | | | | 7.495 | | | Lunar | | | 01/14/2032 | | | | | | | | 2,100 | | | | 8 | | | | (1 | ) | | | 7 | | | | 0 | | | | 0 | |
| | | | | 7.498 | | | Lunar | | | 01/15/2032 | | | | | | | | 8,700 | | | | 36 | | | | (7 | ) | | | 29 | | | | 0 | | | | 0 | |
| | | | | 8.732 | | | Lunar | | | 03/30/2032 | | | | | | | | 2,100 | | | | 0 | | | | (2 | ) | | | (2 | ) | | | 0 | | | | 0 | |
| | | | | 8.701 | | | Lunar | | | 03/31/2032 | | | | | | | | 5,000 | | | | 0 | | | | (4 | ) | | | (4 | ) | | | 0 | | | | 0 | |
| | | | | | | | | | | | | | | | | | | | | | | | | | | | | | | | | | | | | | | | |
| | | | | | | $ | 20,011 | | | $ | 43,114 | | | $ | 63,125 | | | $ | 1,816 | | | $ | (312 | ) |
| | | | | | | | | | | | | | | | | | | | | | | | | |
| | | | | | | | | | | | | | | | | | | | | | | | | |
| | | | | | | | | | | | | | | | | | | | | | | | | |
FINANCIAL DERIVATIVE INSTRUMENTS: EXCHANGE-TRADED OR CENTRALLY CLEARED SUMMARY
The following is a summary of the market value and variation margin of Exchange-Traded or Centrally Cleared Financial Derivative Instruments as of December 31, 2023:
| | | | | | | | | | | | | | | | | | | | | | | | | | | | | | | | | | | | |
| | | Financial Derivative Assets | | | | | | Financial Derivative Liabilities | |
| | | | | | | | | | | | | | | | | | Variation Margin
Liability | | | | |
| | | | | | | | | | | | | | | | | | | | | | |
Total Exchange-Traded or Centrally Cleared | | | | | | | | | | | | | | | | | | | | | | | | | | | | | | | | | | | | |
| | | | | | | | | | | | | | | | | | | | | | | | | | | | | | | | | | | | |
Cash of $40,145 has been pledged as collateral for exchange-traded and centrally cleared financial derivative instruments as of December 31, 2023.
| If the Fund is a seller of protection and a credit event occurs, as defined under the terms of that particular swap agreement, the Fund will either (i) pay to the buyer of protection an amount equal to the notional amount of the swap and take delivery of the referenced obligation or underlying securities comprising the referenced index or (ii) pay a net settlement amount in the form of cash, securities or other deliverable obligations equal to the notional amount of the swap less the recovery value of the referenced obligation or underlying securities comprising the referenced index. |
| Implied credit spreads, represented in absolute terms, utilized in determining the market value of credit default swap agreements on corporate issues as of period end serve as indicators of the current status of the payment/performance risk and represent the likelihood or risk of default for the credit derivative. The implied credit spread of a particular referenced entity reflects the cost of buying/selling protection and may include upfront payments required to be made to enter into the agreement. Wider credit spreads represent a deterioration of the referenced entity’s credit soundness and a greater likelihood or risk of default or other credit event occurring as defined under the terms of the agreement. |
| The maximum potential amount the Fund could be required to pay as a seller of credit protection or receive as a buyer of credit protection if a credit event occurs as defined under the terms of that particular swap agreement. |
| | | | | | | | |
| | | | | | December 31, 2023 | | (Unaudited) |
| The prices and resulting values for credit default swap agreements serve as indicators of the current status of the payment/performance risk and represent the likelihood of an expected liability (or profit) for the credit derivative should the notional amount of the swap agreement be closed/sold as of the period end. Increasing market values, in absolute terms when compared to the notional amount of the swap, represent a deterioration of the underlying referenced instrument’s credit soundness and a greater likelihood or risk of default or other credit event occurring as defined under the terms of the agreement. |
| This instrument has a forward starting effective date. See Note 2, Securities Transactions and Investment Income, in the Notes to Financial Statements for further information. |
(m) FINANCIAL DERIVATIVE INSTRUMENTS: OVER THE COUNTER
FORWARD FOREIGN CURRENCY CONTRACTS:
| | | | | | | | | | | | | | | | | | | | | | | | |
| | | | | | | | | | | Unrealized Appreciation/
(Depreciation) | |
| | | | | | |
| | | 01/2024 | | | GBP | | | 1,432 | | | $ | | | 1,819 | | | $ | 0 | | | $ | (7 | ) |
| | | | | | | |
| | | 01/2024 | | | EUR | | | 1,468 | | | | | | 1,586 | | | | 0 | | | | (35 | ) |
| | | 01/2024 | | | GBP | | | 5,461 | | | | | | 6,927 | | | | 0 | | | | (34 | ) |
| | | 01/2024 | | | HUF | | | 328,804 | | | | | | 936 | | | | 0 | | | | (12 | ) |
| | | 01/2024 | | | $ | | | 10,640 | | | EUR | | | 9,745 | | | | 128 | | | | (8 | ) |
| | | 01/2024 | | | | | | 3 | | | HUF | | | 967 | | | | 0 | | | | 0 | |
| | | 03/2024 | | | IDR | | | 3,263,802 | | | $ | | | 212 | | | | 0 | | | | 0 | |
| | | | | | | |
| | | 01/2024 | | | EUR | | | 147,708 | | | | | | 162,447 | | | | 0 | | | | (654 | ) |
| | | 01/2024 | | | GBP | | | 245 | | | | | | 310 | | | | 0 | | | | (2 | ) |
| | | 03/2024 | | | $ | | | 5,962 | | | TRY | | | 186,754 | | | | 0 | | | | (60 | ) |
| | | 04/2024 | | | | | | 21,783 | | | | | | 703,994 | | | | 0 | | | | (327 | ) |
| | | | | | | |
| | | 01/2024 | | | CHF | | | 116 | | | $ | | | 133 | | | | 0 | | | | (5 | ) |
| | | 01/2024 | | | EUR | | | 2,191 | | | | | | 2,405 | | | | 0 | | | | (14 | ) |
| | | 01/2024 | | | GBP | | | 351 | | | | | | 444 | | | | 0 | | | | (3 | ) |
| | | 01/2024 | | | HUF | | | 179,796 | | | | | | 513 | | | | 0 | | | | (5 | ) |
| | | 01/2024 | | | MXN | | | 264,522 | | | | | | 15,004 | | | | 0 | | | | (504 | ) |
| | | 01/2024 | | | $ | | | 14,190 | | | MXN | | | 260,661 | | | | 1,092 | | | | 0 | |
| | | 02/2024 | | | BRL | | | 7,669 | | | $ | | | 1,516 | | | | 0 | | | | (60 | ) |
| | | 02/2024 | | | $ | | | 718 | | | BRL | | | 3,682 | | | | 39 | | | | 0 | |
| | | 03/2024 | | | PEN | | | 217 | | | $ | | | 58 | | | | 0 | | | | (1 | ) |
| | | 03/2024 | | | $ | | | 1,181 | | | IDR | | | 18,212,064 | | | | 1 | | | | 0 | |
| | | | | | | |
| | | 01/2024 | | | HUF | | | 88,244 | | | $ | | | 251 | | | | 0 | | | | (4 | ) |
| | | 03/2024 | | | IDR | | | 12,424,949 | | | | | | 808 | | | | 1 | | | | 0 | |
| | | 03/2024 | | | $ | | | 87 | | | IDR | | | 1,332,836 | | | | 0 | | | | 0 | |
| | | | | | | |
| | | 01/2024 | | | GBP | | | 239 | | | $ | | | 300 | | | | 0 | | | | (4 | ) |
| | | 03/2024 | | | IDR | | | 2,019,604 | | | | | | 132 | | | | 1 | | | | 0 | |
| | | | | | | |
| | | 01/2024 | | | CAD | | | 10,101 | | | | | | 7,447 | | | | 0 | | | | (177 | ) |
| | | 01/2024 | | | GBP | | | 29,669 | | | | | | 37,547 | | | | 0 | | | | (272 | ) |
| | | | | | | | | | | | | | | | | | | | | | | | |
Total Forward Foreign Currency Contracts | | | | | | | | | |
| | | | | | | | | |
CREDIT DEFAULT SWAPS ON CORPORATE ISSUES - SELL PROTECTION
(1)
| | | | | | | | | | | | | | | | | | | | | | | | | | | | | | | | | | | | | | | | |
| | | | | | | | | | | | Implied Credit Spread at December 31, 2023 (2) | | | | | | | | | Unrealized
Appreciation/
(Depreciation) | | | Swap Agreements, at Value (4) | |
| | | | | | |
| BYL | | Banca Monte Dei Paschi Di | | | 5.000 | % | | Quarterly | | | 06/20/2024 | | | | 1.142 | % | | | EUR | | | | 2,000 | | | $ | (55 | ) | | $ | 99 | | | $ | 44 | | | $ | 0 | |
| MYC | | | | | 1.000 | | | Quarterly | | | 12/20/2028 | | | | 5.188 | | | | $ | | | | 1,900 | | | | (371 | ) | | | 54 | | | | 0 | | | | (317 | ) |
| | | | | | | | | | | | | | | | | | | | | | | | | | | | | | | | | | | | | | | | |
| | | | | | | | | | | | | | | | $ | (426 | ) | | $ | 153 | | | $ | 44 | | | $ | (317 | ) |
| | | | | | | | | | | | | | | | | | | | | | | | | | | | | | |
TOTAL RETURN SWAPS ON LOAN PARTICIPATIONS AND ASSIGNMENTS
| | | | | | | | | | | | | | | | | | | | | | | | | | | | | | | | |
| | | | | | | | | | | | | | | | | | | Unrealized
Appreciation/
(Depreciation) | | | | |
| | | | | | |
| | | | | | | | | | | 01/31/2024 | | | $ | 30 | | | $ | 0 | | | $ | 16 | | | $ | 16 | | | $ | 0 | |
| | | | Gateway Casinos & Entertainment Limited | | | | | | | 01/24/2024 | | | | 261 | | | | 0 | | | | 921 | | | | 921 | | | | 0 | |
| | | | | | | | | | | 01/31/2024 | | | | 1,254 | | | | 0 | | | | 1,104 | | | | 1,104 | | | | 0 | |
| | | | | | | | | | | 03/29/2024 | | | | 4,030 | | | | 0 | | | | (506 | ) | | | 0 | | | | (506 | ) |
| | | | | | | | | | | 01/29/2024 | | | | 1,530 | | | | 0 | | | | 245 | | | | 245 | | | | 0 | |
| | | | | | | | | | | 02/15/2024 | | | | 2,649 | | | | 0 | | | | 3,697 | | | | 3,697 | | | | 0 | |
| | | | | | | | | | | | | | | | | | | | | | | | | | | | | | | | |
| | | $ | 0 | | | $ | 5,477 | | | $ | 5,983 | | | $ | (506 | ) |
| | | | | | | | | | | | | | | | | |
| | | | | | | | | | | | | | | | | |
| | | | | | | | | | | | | | | | | |
| | | | | | | | | | | | |
| See Accompanying Notes | | | | | | | | | | DECEMBER 31, 2023 | | | |
| | | | | | | | |
Consolidated Schedule of Investments | | PIMCO Dynamic Income Opportunities Fund | | | | | | |
FINANCIAL DERIVATIVE INSTRUMENTS: OVER THE COUNTER SUMMARY
The following is a summary by counterparty of the market value of OTC financial derivative instruments and collateral pledged/(received) as of December 31, 2023:
| | | | | | | | | | | | | | | | | | | | | | | | | | | | | | | | | | | | | | | | | | | | | | | | |
| | | Financial Derivative Assets | | | | | | Financial Derivative Liabilities | | | | | | | | | | |
| | Forward
Foreign
Currency
Contracts | | | | | | | | | | | | | | | Forward
Foreign
Currency
Contracts | | | | | | | | | | | | Net Market
Value of OTC
Derivatives | | | Collateral
Pledged/
(Received) | | | | |
| | $ | 0 | | | $ | 0 | | | $ | 0 | | | $ | 0 | | | | | | | $ | (7 | ) | | $ | 0 | | | $ | 0 | | | $ | (7 | ) | | $ | (7 | ) | | $ | 0 | | | $ | (7 | ) |
| | | 128 | | | | 0 | | | | 5,983 | | | | 6,111 | | | | | | | | (89 | ) | | | 0 | | | | (506 | ) | | | (595 | ) | | | 5,516 | | | | (2,500 | ) | | | 3,016 | |
| | | 0 | | | | 0 | | | | 0 | | | | 0 | | | | | | | | (1,043 | ) | | | 0 | | | | 0 | | | | (1,043 | ) | | | (1,043 | ) | | | 1,837 | | | | 794 | |
| | | 0 | | | | 0 | | | | 44 | | | | 44 | | | | | | | | 0 | | | | 0 | | | | 0 | | | | 0 | | | | 44 | | | | 0 | | | | 44 | |
| | | 1,132 | | | | 0 | | | | 0 | | | | 1,132 | | | | | | | | (592 | ) | | | 0 | | | | 0 | | | | (592 | ) | | | 540 | | | | (500 | ) | | | 40 | |
| | | 0 | | | | 0 | | | | 0 | | | | 0 | | | | | | | | 0 | | | | 0 | | | | (317 | ) | | | (317 | ) | | | (317 | ) | | | 362 | | | | 45 | |
| | | 1 | | | | 0 | | | | 0 | | | | 1 | | | | | | | | (4 | ) | | | 0 | | | | 0 | | | | (4 | ) | | | (3 | ) | | | 0 | | | | (3 | ) |
| | | 1 | | | | 0 | | | | 0 | | | | 1 | | | | | | | | (4 | ) | | | 0 | | | | 0 | | | | (4 | ) | | | (3 | ) | | | 0 | | | | (3 | ) |
| | | 0 | | | | 0 | | | | 0 | | | | 0 | | | | | | | | (449 | ) | | | 0 | | | | 0 | | | | (449 | ) | | | (449 | ) | | | 619 | | | | 170 | |
| | | | | | | | | | | | | | | | | | | | | | | | | | | | | | | | | | | | | | | | | | | | | | | | |
| | | | | | | | | | | | | | | | | | | | | | | | | | | | | | | | | | | | | | | | | | | | | | | | |
| | | | | | | | | | | | | | | | | | | | | | | | | | | | | | | | | | | | | | | | | | | | | | | | |
| Securities with an aggregate market value of $2,818 have been pledged as collateral for financial derivative instruments as governed by International Swaps and Derivatives Association, Inc. master agreements as of December 31, 2023. |
| If the Fund is a seller of protection and a credit event occurs, as defined under the terms of that particular swap agreement, the Fund will either (i) pay to the buyer of protection an amount equal to the notional amount of the swap and take delivery of the referenced obligation or underlying securities comprising the referenced index or (ii) pay a net settlement amount in the form of cash, securities or other deliverable obligations equal to the notional amount of the swap less the recovery value of the referenced obligation or underlying securities comprising the referenced index. |
| Implied credit spreads, represented in absolute terms, utilized in determining the market value of credit default swap agreements on corporate issues as of period end serve as indicators of the current status of the payment/performance risk and represent the likelihood or risk of default for the credit derivative. The implied credit spread of a particular referenced entity reflects the cost of buying/selling protection and may include upfront payments required to be made to enter into the agreement. Wider credit spreads represent a deterioration of the referenced entity’s credit soundness and a greater likelihood or risk of default or other credit event occurring as defined under the terms of the agreement. |
| The maximum potential amount the Fund could be required to pay as a seller of credit protection or receive as a buyer of credit protection if a credit event occurs as defined under the terms of that particular swap agreement. |
| The prices and resulting values for credit default swap agreements serve as indicators of the current status of the payment/performance risk and represent the likelihood of an expected liability (or profit) for the credit derivative should the notional amount of the swap agreement be closed/sold as of the period end. Increasing market values, in absolute terms when compared to the notional amount of the swap, represent a deterioration of the underlying referenced instrument’s credit soundness and a greater likelihood or risk of default or other credit event occurring as defined under the terms of the agreement. |
| Net Exposure represents the net receivable/(payable) that would be due from/to the counterparty in the event of default. Exposure from OTC derivatives can only be netted across transactions governed under the same master agreement with the same legal entity. See Note 8, Master netting Arrangements, in the Notes to Financial Statements for more information. |
FAIR VALUE OF FINANCIAL DERIVATIVE INSTRUMENTS
The following is a summary of the fair valuation of the Fund’s derivative instruments categorized by risk exposure. See Note 7, Principal and Other Risks, in the Notes to Financial Statements on risks of the Fund.
Fair Values of Financial Derivative Instruments on the Consolidated Statements of Assets and Liabilities as of December 31, 2023:
| | | | | | | | | | | | | | | | | | | | | | | | |
| | | Derivatives not accounted for as hedging instruments | |
| | | | | | | | | | | | | | | | | | | |
Financial Derivative Instruments - Assets | |
Exchange-traded or centrally cleared | |
| | $ | 0 | | | $ | 14 | | | $ | 0 | | | $ | 0 | | | $ | 1,816 | | | $ | 1,830 | |
| | | | | | | | | | | | | | | | | | | | | | | | |
| |
Forward Foreign Currency Contracts | | $ | 0 | | | $ | 0 | | | $ | 0 | | | $ | 1,262 | | | $ | 0 | | | $ | 1,262 | |
| | | 0 | | | | 6,027 | | | | 0 | | | | 0 | | | | 0 | | | | 6,027 | |
| | | | | | | | | | | | | | | | | | | | | | | | |
| | $ | 0 | | | $ | 6,027 | | | $ | 0 | | | $ | 1,262 | | | $ | 0 | | | $ | 7,289 | |
| | | | | | | | | | | | | | | | | | | | | | | | |
| | $ | 0 | | | $ | 6,041 | | | $ | 0 | | | $ | 1,262 | | | $ | 1,816 | | | $ | 9,119 | |
| | | | | | | | | | | | | | | | | | | | | | | | |
|
Financial Derivative Instruments - Liabilities | |
Exchange-traded or centrally cleared | |
| | $ | 0 | | | $ | 0 | | | $ | 0 | | | $ | 0 | | | $ | 26 | | | $ | 26 | |
| | | 0 | | | | 0 | | | | 0 | | | | 0 | | | | 312 | | | | 312 | |
| | | | | | | | | | | | | | | | | | | | | | | | |
| | $ | 0 | | | $ | 0 | | | $ | 0 | | | $ | 0 | | | $ | 338 | | | $ | 338 | |
| | | | | | | | | | | | | | | | | | | | | | | | |
| |
Forward Foreign Currency Contracts | | $ | 0 | | | $ | 0 | | | $ | 0 | | | $ | 2,188 | | | $ | 0 | | | $ | 2,188 | |
| | | 0 | | | | 823 | | | | 0 | | | | 0 | | | | 0 | | | | 823 | |
| | | | | | | | | | | | | | | | | | | | | | | | |
| | $ | 0 | | | $ | 823 | | | $ | 0 | | | $ | 2,188 | | | $ | 0 | | | $ | 3,011 | |
| | | | | | | | | | | | | | | | | | | | | | | | |
| | $ | 0 | | | $ | 823 | | | $ | 0 | | | $ | 2,188 | | | $ | 338 | | | $ | 3,349 | |
| | | | | | | | | | | | | | | | | | | | | | | | |
| | | | | | | | |
| | | | | | December 31, 2023 | | (Unaudited) |
The effect of Financial Derivative Instruments on the Consolidated Statements of Operations for the period ended December 31, 2023:
| | | | | | | | | | | | | | | | | | | | | | | | |
| | | Derivatives not accounted for as hedging instruments | |
| | | | | | | | | | | | | | | | | | | |
Net Realized Gain (Loss) on Financial Derivative Instruments | |
Exchange-traded or centrally cleared | |
| | $ | 0 | | | $ | 393 | | | $ | 0 | | | $ | 0 | | | $ | (42,082 | ) | | $ | (41,689 | ) |
| | | | | | | | | | | | | | | | | | | | | | | | |
| |
Forward Foreign Currency Contracts | | $ | 0 | | | $ | 0 | | | $ | 0 | | | $ | 1,220 | | | $ | 0 | | | $ | 1,220 | |
| | | 0 | | | | 4,433 | | | | 0 | | | | 0 | | | | 0 | | | | 4,433 | |
| | | | | | | | | | | | | | | | | | | | | | | | |
| | $ | 0 | | | $ | 4,433 | | | $ | 0 | | | $ | 1,220 | | | $ | 0 | | | $ | 5,653 | |
| | | | | | | | | | | | | | | | | | | | | | | | |
| | $ | 0 | | | $ | 4,826 | | | $ | 0 | | | $ | 1,220 | | | $ | (42,082 | ) | | $ | (36,036 | ) |
| | | | | | | | | | | | | | | | | | | | | | | | |
|
Net Change in Unrealized Appreciation (Depreciation) on Financial Derivative Instruments | |
Exchange-traded or centrally cleared | |
| | $ | 0 | | | $ | 0 | | | $ | 0 | | | $ | 0 | | | $ | (267 | ) | | $ | (267 | ) |
| | | 0 | | | | 1,285 | | | | 0 | | | | 0 | | | | 52,707 | | | | 53,992 | |
| | | | | | | | | | | | | | | | | | | | | | | | |
| | $ | 0 | | | $ | 1,285 | | | $ | 0 | | | $ | 0 | | | $ | 52,440 | | | $ | 53,725 | |
| | | | | | | | | | | | | | | | | | | | | | | | |
| |
Forward Foreign Currency Contracts | | $ | 0 | | | $ | 0 | | | $ | 0 | | | $ | (1,304 | ) | | $ | 0 | | | $ | (1,304 | ) |
| | | 0 | | | | 5,548 | | | | 0 | | | | 0 | | | | 0 | | | | 5,548 | |
| | | | | | | | | | | | | | | | | | | | | | | | |
| | $ | 0 | | | $ | 5,548 | | | $ | 0 | | | $ | (1,304 | ) | | $ | 0 | | | $ | 4,244 | |
| | | | | | | | | | | | | | | | | | | | | | | | |
| | $ | 0 | | | $ | 6,833 | | | $ | 0 | | | $ | (1,304 | ) | | $ | 52,440 | | | $ | 57,969 | |
| | | | | | | | | | | | | | | | | | | | | | | | |
The following is a summary of the fair valuations according to the inputs used as of December 31, 2023 in valuing the Fund’s assets and liabilities:
| | | | | | | | | | | | | | | | |
| | | | | | | | | | | | |
Investments in Securities, at Value | |
Loan Participations and Assignments | | $ | 0 | | | $ | 248,845 | | | $ | 134,532 | | | $ | 383,377 | |
| |
| | | 0 | | | | 144,455 | | | | 27,131 | | | | 171,586 | |
| | | 0 | | | | 324,475 | | | | 6,931 | | | | 331,406 | |
| | | 0 | | | | 17,935 | | | | 0 | | | | 17,935 | |
Convertible Bonds & Notes | |
| | | 0 | | | | 23,317 | | | | 0 | | | | 23,317 | |
| | | 0 | | | | 1,980 | | | | 0 | | | | 1,980 | |
| |
| | | 0 | | | | 22,695 | | | | 0 | | | | 22,695 | |
| | | 0 | | | | 2,215 | | | | 0 | | | | 2,215 | |
| | | 0 | | | | 25,071 | | | | 0 | | | | 25,071 | |
Non-Agency Mortgage-Backed Securities | | | 0 | | | | 637,687 | | | | 325 | | | | 638,012 | |
| | | 0 | | | | 286,103 | | | | 25,664 | | | | 311,767 | |
| | | 0 | | | | 15,259 | | | | 0 | | | | 15,259 | |
| |
| | | 520 | | | | 0 | | | | 0 | | | | 520 | |
| | | 7,647 | | | | 160 | | | | 18,615 | | | | 26,422 | |
| | | 0 | | | | 0 | | | | 80,622 | | | | 80,622 | |
| | | 0 | | | | 0 | | | | 12,472 | | | | 12,472 | |
| | | 87 | | | | 0 | | | | 0 | | | | 87 | |
| |
| | | 0 | | | | 16 | | | | 0 | | | | 16 | |
Real Estate Investment Trusts | |
| | | 25,980 | | | | 0 | | | | 0 | | | | 25,980 | |
| | | | | | | | | | | | | | | | |
| | | | | | | | | | | | |
| |
| | $ | 0 | | | $ | 1,723 | | | $ | 0 | | | $ | 1,723 | |
| | | 0 | | | | 48,098 | | | | 0 | | | | 48,098 | |
| | | | | | | | | | | | | | | | |
| | $ | 34,234 | | | $ | 1,800,034 | | | $ | 306,292 | | | $ | 2,140,560 | |
| | | | | | | | | | | | | | | | |
|
Investments in Affiliates, at Value | |
| |
Central Funds Used for Cash Management Purposes | | $ | 154,334 | | | $ | 0 | | | $ | 0 | | | $ | 154,334 | |
| | | | | | | | | | | | | | | | |
| | | | |
| | $ | 188,568 | | | $ | 1,800,034 | | | $ | 306,292 | | | $ | 2,294,894 | |
| | | | | | | | | | | | | | | | |
|
Financial Derivative Instruments - Assets | |
Exchange-traded or centrally cleared | | | 0 | | | | 1,830 | | | | 0 | | | | 1,830 | |
| | | 0 | | | | 7,289 | | | | 0 | | | | 7,289 | |
| | | | | | | | | | | | | | | | |
| | $ | 0 | | | $ | 9,119 | | | $ | 0 | | | $ | 9,119 | |
| | | | | | | | | | | | | | | | |
|
Financial Derivative Instruments - Liabilities | |
Exchange-traded or centrally cleared | | | 0 | | | | (338 | ) | | | 0 | | | | (338 | ) |
| | | 0 | | | | (3,011 | ) | | | 0 | | | | (3,011 | ) |
| | | | | | | | | | | | | | | | |
| | $ | 0 | | | $ | (3,349 | ) | | $ | 0 | | | $ | (3,349 | ) |
| | | | | | | | | | | | | | | | |
| | | | |
Total Financial Derivative Instruments | | $ | 0 | | | $ | 5,770 | | | $ | 0 | | | $ | 5,770 | |
| | | | | | | | | | | | | | | | |
| | | | |
| | $ | 188,568 | | | $ | 1,805,804 | | | $ | 306,292 | | | $ | 2,300,664 | |
| | | | | | | | | | | | | | | | |
| | | | | | | | | | | | |
| See Accompanying Notes | | | | | | | | | | DECEMBER 31, 2023 | | | |
| | | | | | | | |
Consolidated Schedule of Investments | | PIMCO Dynamic Income Opportunities Fund | | | | December 31, 2023 | | (Unaudited) |
The following is a reconciliation of the fair valuations using significant unobservable inputs (Level 3) for the Fund during the period ended December 31, 2023:
| | | | | | | | | | | | | | | | | | | | | | | | | | | | | | | | | | | | | | | | |
| | Beginning
Balance
at 06/30/2023 | | | | | | | | | Accrued
Discounts/
(Premiums) | | | | | | Net Change in Unrealized Appreciation/ (Depreciation) (1) | | | | | | | | | Ending
Balance
at 12/31/2023 | | | Net Change in Unrealized Appreciation/ (Depreciation) on Investments Held at 12/31/2023 (1) | |
Investments in Securities, at Value | | | | | | | | | | | | | | | | | | | | | | | | | | | | | |
Loan Participations and Assignments | | $ | 225,406 | | | $ | 58,078 | | | $ | (111,894 | ) | | $ | 3,981 | | | $ | (19,691 | ) | | $ | 18,353 | | | $ | 23,963 | | | $ | (63,664 | ) | | $ | 134,532 | | | $ | 3,840 | |
| | | | | | | | | | | | | | | | | | | | | | | | | | | | | | | | | | | | | | | | |
| | | 0 | | | | 324 | | | | 0 | | | | 0 | | | | 0 | | | | 7 | | | | 26,800 | | | | 0 | | | | 27,131 | | | | 7 | |
| | | 0 | | | | 6,931 | | | | 0 | | | | 0 | | | | 0 | | | | 0 | | | | 0 | | | | 0 | | | | 6,931 | | | | 0 | |
Non-Agency Mortgage-Backed Securities | | | 496 | | | | 0 | | | | (36 | ) | | | 1 | | | | 3 | | | | (139 | ) | | | 0 | | | | 0 | | | | 325 | | | | (148 | ) |
| | | 30,821 | | | | 0 | | | | 0 | | | | 161 | | | | 0 | | | | (5,318 | ) | | | 0 | | | | 0 | | | | 25,664 | | | | (5,318 | ) |
| | | | | | | | | | | | | | | | | | | | | | | | | | | | | | | | | | | | | | | | |
| | | 15,001 | | | | 0 | | | | 0 | | | | 0 | | | | 0 | | | | 3,614 | | | | 0 | | | | 0 | | | | 18,615 | | | | 3,614 | |
| | | 0 | | | | 65,680 | | | | 0 | | | | 0 | | | | 0 | | | | 14,942 | | | | 0 | | | | 0 | | | | 80,622 | | | | 14,942 | |
| | | 12,134 | | | | 420 | | | | 0 | | | | 0 | | | | 0 | | | | (82 | ) | | | 0 | | | | 0 | | | | 12,472 | | | | (82 | ) |
| | | | | | | | | | | | | | | | | | | | | | | | | | | | | | | | | | | | | | | | |
| | | 324 | | | | 0 | | | | (628 | ) | | | 0 | | | | 628 | | | | (324 | ) | | | 0 | | | | 0 | | | | 0 | | | | 0 | |
| | | | | | | | | | | | | | | | | | | | | | | | | | | | | | | | | | | | | | | | |
| | | 494 | | | | 0 | | | | (651 | ) | | | 0 | | | | 651 | | | | (494 | ) | | | 0 | | | | 0 | | | | 0 | | | | 0 | |
| | | | | | | | | | | | | | | | | | | | | | | | | | | | | | | | | | | | | | | | |
| | | 9,924 | | | | 0 | | | | 0 | | | | 0 | | | | 0 | | | | (9,924 | ) | | | 0 | | | | 0 | | | | 0 | | | | (9,924 | ) |
| | | | | | | | | | | | | | | | | | | | | | | | | | | | | | | | | | | | | | | | |
| | | 331 | | | | 0 | | | | (324 | ) | | | 0 | | | | 10 | | | | (17 | ) | | | 0 | | | | 0 | | | | 0 | | | | 0 | |
| | | | | | | | | | | | | | | | | | | | | | | | | | | | | | | | | | | | | | | | |
| | | | | | | | | | |
| | $ | 294,931 | | | $ | 131,433 | | | $ | (113,533 | ) | | $ | 4,143 | | | $ | (18,399 | ) | | $ | 20,618 | | | $ | 50,763 | | | $ | (63,664 | ) | | $ | 306,292 | | | $ | 6931 | |
| | | | | | | | | | | | | | | | | | | | | | | | | | | | | | | | | | | | | | | | |
The following is a summary of significant unobservable inputs used in the fair valuations of assets and liabilities categorized within Level 3 of the fair value hierarchy:
| | | | | | | | | | | | | | | | | | | | |
| | Ending
Balance
at 12/31/2023 | | | | | | | | | | (% Unless Noted Otherwise) | |
| | | | | | | | | |
Investments in Securities, at Value | |
Loan Participations and Assignments | | $ | 29,374 | | | | | | | | X | | | | 14.500 | | | | — | |
| | | 80,449 | | | | | | | | | | | | | | | | 13.179 | |
| | | 746 | | | Indicative Market Quotation | | | | | | | | | 96.500 | | | | — | |
| | | 23,963 | | | | | | | | | | | | 94.000 | | | | — | |
| |
| | | 26,800 | | | | | | | | | | | | 54.375 | | | | — | |
| | | 331 | | | | | | | | | | | | 100.000 | | | | — | |
| | | 6,931 | | | | | | | | | | | | 99.000 | | | | — | |
Non-Agency Mortgage-Backed Securities | | | 141 | | | | | | | | | | | | 30.000 | | | | — | |
| | | 184 | | | Fair Valuation of Odd Lot Positions | | | | | | | | | 2.500 | | | | — | |
| | | 25,664 | | | | | | | | | | | | | | | | 17.800 | |
| |
| | | 18,579 | | | | | | | | X | | | | 4.000 | | | | — | |
| | | 36 | | | | | | | | | | | | 60.720 | | | | — | |
| | | 80,622 | | | | | | | | X | | | | 14.500 | | | | — | |
| | | 6,252 | | | | | | | | | | | | 17.280 | | | | — | |
| | | 6,220 | | | Indicative Market Quotation | | | | | $ | | | | 16.667 | | | | — | |
| | | | | | | | | | | | | | | | | | | | |
| | $ | 306,292 | | | | | | | | | | | | | | | | | |
| | | | | | | | | | | | | | | | | | | | |
| Any difference between Net Change in Unrealized Appreciation/(Depreciation) and Net Change in Unrealized Appreciation/(Depreciation) on Investments Held at December 31, 2023 may be due to an investment no longer held or categorized as Level 3 at period end. |
| | | | | | |
Notes to Financial Statements | | | | December 31, 2023 | | (Unaudited) |
1. ORGANIZATION
PCM Fund, Inc., PIMCO Global StocksPLUS
& Income Fund, PIMCO Strategic Income Fund, Inc., PIMCO Access Income Fund, PIMCO Dynamic Income Fund, and PIMCO Dynamic Income Opportunities Fund (each a “Fund” and collectively the “Funds”) are organized as
closed-end
management investment companies registered under the Investment Company Act of 1940, as amended, and the rules and regulations thereunder (the “Act”). PIMCO Global StocksPLUS
& Income Fund, PIMCO Access Income Fund, PIMCO Dynamic Income Fund, and PIMCO Dynamic Income Opportunities Fund were organized as Massachusetts business trusts on the dates shown in the table below. PCM Fund, Inc. and PIMCO Strategic Income Fund, Inc. were organized as Maryland corporations on the dates shown in the table below. Pacific Investment Management Company LLC (“PIMCO” or the “Manager”) serves as the Funds’ investment manager.
| | | | | | | | |
| | | | | | |
| | |
| PCM Fund, Inc. | | | | | | | June 23, 1993 | |
| | |
PIMCO Global StocksPLUS & Income Fund | | | | | | | February 16, 2005 | |
| | |
| PIMCO Strategic Income Fund, Inc. | | | | | | | December 9, 1993 | |
| | |
| PIMCO Access Income Fund | | | | | | | October 1, 2021 | |
| | |
| PIMCO Dynamic Income Fund | | | | | | | January 19, 2011 | |
| | |
| PIMCO Dynamic Income Opportunities Fund | | | | | | | December 23, 2019 | |
PIMCO Access Income Fund, PIMCO Dynamic Income Fund, and PIMCO Dynamic Income Opportunities have established wholly-owned subsidiaries in Delaware. See Note 14, Basis for Consolidation in the Notes to Financial Statements for more information regarding the treatment of the Fund’s subsidiaries in the financial statements.
Hereinafter, the Board of Trustees of the Funds shall be collectively referred to as the “Board.”
2. SIGNIFICANT ACCOUNTING POLICIES
The following is a summary of significant accounting policies consistently followed by each Fund in the preparation of its financial statements in conformity with accounting principles generally accepted in the United States of America (“U.S. GAAP”). Each Fund is treated as an investment company under the reporting requirements of U.S. GAAP. The functional and reporting currency for the Funds is the U.S. dollar. The preparation of financial statements in accordance with U.S. GAAP requires management to make estimates and assumptions that affect the reported amounts of assets and liabilities and disclosure of contingent assets and liabilities at the date of the financial statements and the reported amounts of increases and decreases in net assets from operations during the reporting period. Actual results could differ from those estimates.
(a) Securities Transactions and Investment Income
Securities transactions are recorded as of the trade date for financial reporting
purposes. Securities purchased or sold on a when-issued or delayed-delivery basis may be settled beyond a standard settlement period for the security after the trade date. Realized gains (losses) from securities sold are recorded on the identified cost basis. Dividend income is recorded on the
ex-dividend
date, except certain dividends from foreign securities where the
ex-dividend
date may have passed, which are recorded as soon as a Fund is informed of the
ex-dividend
date. Interest income, adjusted for the accretion of discounts and amortization of premiums, is recorded on the accrual basis from settlement date, with the exception of securities with a forward starting effective date, where interest income is recorded on the accrual basis from effective date. For convertible securities, premiums attributable to the conversion feature are not amortized. Estimated tax liabilities on certain foreign securities are recorded on an accrual basis and are reflected as components of interest income or net change in unrealized appreciation (depreciation) on investments on the Statements of Operations, as appropriate. Tax liabilities realized as a result of such security sales are reflected as a component of net realized gain (loss) on investments on the Statements of Operations. Paydown gains (losses) on mortgage-related and other asset-backed securities, if any, are recorded as components of interest income on the Statements of Operations. Income or short-term capital gain distributions received from registered investment companies, if any, are recorded as dividend income. Long-term capital gain distributions received from registered investment companies, if any, are recorded as realized gains.
Debt obligations may be placed on
non-accrual
status and related interest income may be reduced by ceasing current accruals and writing off interest receivable when the collection of all or a portion of interest has become doubtful based on consistently applied procedures. A debt obligation is removed from
non-accrual
status when the issuer resumes interest payments or when collectability of interest is probable. A debt obligation may be granted, in certain situations, a contractual or
non-contractual
forbearance for interest payments that are expected to be paid after agreed upon pay dates.
(b) Foreign Currency Translation
The market values of foreign securities, currency holdings and other assets and liabilities denominated in foreign currencies are translated into U.S. dollars based on the current exchange rates each business day. Purchases and sales of securities and income and expense items denominated in foreign currencies, if any, are translated into U.S. dollars at the exchange rate in effect on the transaction date. The Funds do not separately report the effects of changes in foreign exchange rates from changes in market prices on securities held. Such changes are included in net realized gain (loss) and net change in unrealized appreciation (depreciation) from investments on the Statements of Operations. The Funds may invest in foreign currency-denominated securities and may
| | | | | | |
Notes to Financial Statements | | | | | | |
engage in foreign currency transactions either on a spot (cash) basis at the rate prevailing in the currency exchange market at the time or through a forward foreign currency contract. Realized foreign exchange gains (losses) arising from sales of spot foreign currencies, currency gains (losses) realized between the trade and settlement dates on securities transactions and the difference between the recorded amounts of dividends, interest, and foreign withholding taxes and the U.S. dollar equivalent of the amounts actually received or paid are included in net realized gain (loss) on foreign currency transactions on the Statements of Operations. Net unrealized foreign exchange gains (losses) arising from changes in foreign exchange rates on foreign denominated assets and liabilities other than investments in securities held at the end of the reporting period are included in net change in unrealized appreciation (depreciation) on foreign currency assets and liabilities on the Statements of Operations.
(c) Distributions — Common Shares
The following table shows the anticipated frequency of distributions from net investment income to common shareholders.
| | | | | | | | | | | | |
| | | | | | | |
| | | |
| | | | | | | | | |
| | | |
| PCM Fund, Inc. | | | | | | | Monthly | | | | Monthly | |
| | | |
PIMCO Global StocksPLUS & Income Fund | | | | | | | Monthly | | | | Monthly | |
| | | |
| PIMCO Strategic Income Fund, Inc. | | | | | | | Monthly | | | | Monthly | |
| | | |
| PIMCO Access Income Fund | | | | | | | Monthly | | | | Monthly | |
| | | |
| PIMCO Dynamic Income Fund | | | | | | | Monthly | | | | Monthly | |
| | | |
| PIMCO Dynamic Income Opportunities Fund | | | | | | | Monthly | | | | Monthly | |
Each Fund other than PIMCO Global StocksPLUS
& Income Fund and PIMCO Strategic Income Fund, Inc. generally distributes each year all of its net investment income and net short-term capital gains. PIMCO Global StocksPLUS
& Income Fund and PIMCO Strategic Income Fund, Inc. intend to distribute all or substantially all of their net investment income and net short-term capital gains over time. In addition, at least annually, each Fund generally distributes net realized long-term capital gains not previously distributed, if any. A Fund may revise its distribution policy or postpone the payment of distributions at any time.
Certain Funds may invest in one or more wholly-owned subsidiaries (each a “Subsidiary” and collectively the “Subsidiaries”) that are treated as disregarded entities for U.S. federal income tax purposes. In the case of a subsidiary that is so treated, for U.S. federal income tax purposes, (i) the Fund is treated as owning the subsidiary’s assets directly; (ii) any income, gain, loss, deduction or other tax items arising in respect of the subsidiary’s assets will be treated as if they are realized or incurred, as applicable, directly by the Fund; and (iii) distributions, if any, the Fund receives from the subsidiary will have no effect on a Fund’s U.S. federal income tax liability.
As of the end of the fiscal year, none of the Funds were in default on long-term debt or had any accumulated dividend in arrears.
A Fund may engage in investment strategies, including those that employ the use of derivatives, to, among other things, seek to generate current, distributable income without regard to possible declines in the Fund’s net asset value (“NAV”). A Fund’s income and gain generating strategies, including certain derivatives strategies, may generate current, distributable income, even if such strategies could potentially result in declines in the Fund’s NAV. A Fund’s income and gain generating strategies, including certain derivatives strategies, may generate current income and gains taxable as ordinary income sufficient to support monthly distributions even in situations when the Fund has experienced a decline in net assets due to, for example, adverse changes in the broad U.S. or
non-U.S.
equity markets or the Fund’s debt investments, or arising from its use of derivatives. A Fund may enter into opposite sides of interest rate swap and other derivatives for the principal purpose of generating distributable gains on the one side (characterized as ordinary income for tax purposes) that are not part of the Fund’s duration or yield curve management strategies, and with a substantial possibility that the Fund will experience a corresponding capital loss and decline in NAV with respect to the opposite side transaction (to the extent it does not have corresponding offsetting capital gains). Consequently, common shareholders may receive distributions and owe tax on amounts that are effectively a taxable return of the shareholder’s investment in the Fund at a time when their investment in a Fund has declined in value, which may be taxed at ordinary income rates. The tax treatment of certain derivatives in which a Fund invests may be unclear and thus subject to recharacterization. Any recharacterization of payments made or received by a Fund pursuant to derivatives potentially could affect the amount, timing or character of Fund distributions. In addition, the tax treatment of such investment strategies may be changed by regulation or otherwise.
Income distributions and capital gain distributions are determined in accordance with income tax regulations which may differ from U.S. GAAP. Differences between tax regulations and U.S. GAAP may cause timing differences between income and capital gain recognition. Further, the character of investment income and capital gains may be different for certain transactions under the two methods of accounting. As a result, income distributions and capital gain distributions declared during a fiscal period may differ significantly from the net investment income (loss) and realized gains (losses) reported on each Fund’s annual financial statements presented under U.S. GAAP.
Separately, if a Fund determines or estimates, as applicable, that a portion of a distribution may be comprised of amounts from sources other than net investment income in accordance with its policies,
| | | | | | |
| | | | December 31, 2023 | | (Unaudited) |
accounting records (if applicable), and accounting practices, the Fund will notify shareholders of the estimated composition of such distribution through a Section 19 Notice. For these purposes, a Fund determines or estimates, as applicable, the source or sources from which a distribution is paid, to the close of the period as of which it is paid, in reference to its internal accounting records and related accounting practices. If, based on such accounting records and practices, it is determined or estimated, as applicable, that a particular distribution does not include capital gains or
paid-in
surplus or other capital sources, a Section 19 Notice generally would not be issued. It is important to note that differences exist between a Fund’s daily internal accounting records and practices, a Fund’s financial statements presented in accordance with U.S. GAAP, and recordkeeping practices under income tax regulations. For instance, a Fund’s internal accounting records and practices may take into account, among other factors,
tax-related
characteristics of certain sources of distributions that differ from treatment under U.S. GAAP. Examples of such differences may include, but are not limited to, for certain Funds, the treatment of periodic payments under interest rate swap contracts. Accordingly, among other consequences, it is possible that a Fund may not issue a Section 19 Notice in situations where a Fund’s financial statements prepared later and in accordance with U.S. GAAP and/or the final tax character of those distributions might later report that the sources of those distributions included capital gains and/or a return of capital. Please visit www.pimco.com for the most recent Section 19 Notice, if applicable, for additional information regarding the estimated composition of distributions. Final determination of a distribution’s tax character will be provided to shareholders when such information is available.
Distributions classified as a tax basis return of capital at a Fund’s fiscal year end, if any, are reflected on the Statements of Changes in Net Assets and have been recorded to paid in capital on the Statements of Assets and Liabilities. In addition, other amounts have been reclassified between distributable earnings (accumulated loss) and paid in capital on the Statements of Assets and Liabilities to more appropriately conform U.S. GAAP to tax characterizations of distributions.
(d) New Accounting Pronouncements and Regulatory Updates
In March 2020, the Financial Accounting Standards Board (“FASB”) issued an Accounting Standards Update (“ASU”), ASU
2020-04,
Reference Rate Reform (Topic 848), which provides optional guidance to ease the potential accounting burden associated with transitioning away from the London Interbank Offered Rate and other reference rates that are expected to be discontinued. ASU
2020-04
is effective for certain reference rate-related contract modifications that occurred during the period March 12, 2020 through December 31, 2024. In January 2021 and December 2022, FASB issued ASU
2021-1
and
ASU 2022-06,
which include additional amendments to Topic 848. Management is continuously evaluating the potential effect a discontinuation of LIBOR could have on the Funds’ investments and has determined that it is unlikely the ASU’s adoption will have a material impact on the Funds’ financial statements.
In June 2022, the FASB issued ASU
2022-03,
Fair Value Measurement (Topic 820), which affects all entities that have investments in equity securities measured at fair value that are subject to a contractual sale restriction. The amendments in ASU
2022-03
clarify that a contractual restriction on the sale of an equity security is not considered part of the unit of account of the equity security and, therefore, is not considered in measuring the fair value. The amendments also require additional disclosures for equity securities subject to contractual sale restrictions that are measured at fair value in accordance with Topic 820. The effective date for the amendments in ASU
2022-03
is for fiscal years beginning after December 15, 2023 and interim periods within those fiscal years. Management has implemented changes in connection with the rule and has determined that there was no material impact to the Portfolio’s financial statements.
The U.S. Securities and Exchange Commission (“SEC”) made a final ruling on February 15, 2023 to adopt proposed amendments to the Settlement Cycle Rule (Rule
15c6-1)
and other related rules under the Securities Exchange Act of 1934, as amended, to shorten the standard settlement cycle for most broker-dealer transactions from two business days after the trade date (T+2) to one business day after the trade date (T+1). The effective date was May 5, 2023, and the compliance date for the amendments is May 28, 2024. At this time, management is evaluating the implications of these changes on the financial statements.
In September 2023, the SEC adopted amendments to a current rule governing fund naming conventions. In general, the current rule requires funds with certain types of names to adopt a policy to invest at least 80% of their assets in the type of investment suggested by the name. The amendments expand the scope of the current rule in a number of ways that are expected to result in an increase in the types of fund names that would require the fund to adopt an 80% investment policy under the rule. Additionally, the amendments address deviations from a fund’s 80% investment policy and the use and valuation of derivatives instruments for purposes of the rule. The amendments are effective as of December 11, 2023, but the SEC is providing a
24-month
compliance period following the effective date for fund groups with net assets of $1 billion or more (and a
30-month
compliance period for fund groups with net assets of less than $1 billion). At this time, management is evaluating the implications of these changes on the financial statements.
| | | | | | |
Notes to Financial Statements | | | | | | |
3. INVESTMENT VALUATION AND FAIR VALUE MEASUREMENTS
(a) Investment Valuation Policies
The NAV of a Fund’s shares, or each of their respective share classes as applicable, is determined by dividing the total value of portfolio investments and other assets attributable to the Fund or class, less any liabilities, as applicable, by the total number of shares outstanding.
On each day that the New York Stock Exchange (“NYSE”) is open, the Funds’ shares are ordinarily valued as of the close of regular trading (normally 4:00 p.m., Eastern time) (“NYSE Close”). Information that becomes known to the Funds or their agents after the time as of which NAV has been calculated on a particular day will not generally be used to retroactively adjust the price of a security or the NAV determined earlier that day. If regular trading on the NYSE closes earlier than scheduled, each Fund may calculate its NAV as of the earlier closing time or calculate its NAV as of the NYSE Close for that day. Each Fund generally does not calculate its NAV on days on which the NYSE is not open for business. If the NYSE is closed on a day it would normally be open for business, each Fund may calculate its NAV as of the NYSE Close for such day or such other time that each Fund may determine.
For purposes of calculating NAV, portfolio securities and other assets for which market quotations are readily available are valued at market value. A market quotation is readily available only when that quotation is a quoted price (unadjusted) in active markets for identical investments that a Fund can access at the measurement date, provided that a quotation will not be readily available if it is not reliable. Market value is generally determined on the basis of official closing prices or the last reported sales prices. The Funds will normally use pricing data for domestic equity securities received shortly after the NYSE Close and do not normally take into account trading, clearances or settlements that take place after the NYSE Close. A foreign
(non-U.S.)
equity security traded on a foreign exchange or on more than one exchange is typically valued using pricing information from the exchange considered by PIMCO to be the primary exchange. If market value pricing is used, a foreign
(non-U.S.)
equity security will be valued as of the close of trading on the foreign exchange, or the NYSE Close, if the NYSE Close occurs before the end of trading on the foreign exchange.
Investments for which market quotations are not readily available are valued at fair value as determined in good faith pursuant to Rule
2a-5
under the Act. As a general principle, the fair value of a security or other asset is the price that would be received to sell an asset or paid to transfer a liability in an orderly transaction between market participants at the measurement date. Pursuant to Rule
2a-5,
the Board has designated PIMCO as the valuation designee (“Valuation Designee”) for each Fund to perform the fair value determination relating to all Fund
investments. PIMCO may carry out its designated responsibilities as Valuation Designee through various teams and committees. The Valuation Designee’s policies and procedures govern the Valuation Designee’s selection and application of methodologies for determining and calculating the fair value of Fund investments. The Valuation Designee may value Fund portfolio securities for which market quotations are not readily available and other Fund assets utilizing inputs from pricing services, quotation reporting systems, valuation agents and other third-party sources (together, “Pricing Sources”).
Domestic and foreign
(non-U.S.)
fixed income securities,
non-exchange
traded derivatives, and equity options are normally valued on the basis of quotes obtained from brokers and dealers or Pricing Sources using data reflecting the earlier closing of the principal markets for those securities. Prices obtained from Pricing Sources may be based on, among other things, information provided by market makers or estimates of market values obtained from yield data relating to investments or securities with similar characteristics. Certain fixed income securities purchased on a delayed-delivery basis are marked to market daily until settlement at the forward settlement date. Exchange-traded options, except equity options, futures and options on futures are valued at the settlement price determined by the relevant exchange. Swap agreements are valued on the basis of bid quotes obtained from brokers and dealers or market-based prices supplied by Pricing Sources. With respect to any portion of a Fund’s assets that are invested in one or more
open-end
management investment companies (other than ETFs), the Fund’s NAV will be calculated based on the NAVs of such investments.
If a foreign
(non-U.S.)
equity security’s value has materially changed after the close of the security’s primary exchange or principal market but before the NYSE Close, the security may be valued at fair value. Foreign
(non-U.S.)
equity securities that do not trade when the NYSE is open are also valued at fair value. With respect to foreign
(non-U.S.)
equity securities, a Fund may determine the fair value of investments based on information provided by Pricing Sources, which may recommend fair value or adjustments with reference to other securities, indexes or assets. In considering whether fair valuation is required and in determining fair values, the Valuation Designee may, among other things, consider significant events (which may be considered to include changes in the value of U.S. securities or securities indexes) that occur after the close of the relevant market and before the NYSE Close. A Fund may utilize modeling tools provided by third-party vendors to determine fair values of foreign
(non-U.S.)
securities. For these purposes, unless otherwise determined by the Valuation Designee, any movement in the applicable reference index or instrument (“zero trigger”) between the earlier close of the applicable foreign market and the NYSE Close may be deemed to be a significant event, prompting
| | | | | | |
| | | | December 31, 2023 | | (Unaudited) |
the application of the pricing model (effectively resulting in daily fair valuations). Foreign exchanges may permit trading in foreign
(non-U.S.)
equity securities on days when a Fund is not open for business, which may result in a Fund’s portfolio investments being affected when shareholders are unable to buy or sell shares.
Whole loans may be fair valued using inputs that take into account borrower- or loan-level data (e.g., credit risk of the borrower) that is updated periodically throughout the life of each individual loan; any new borrower- or loan-level data received in written reports periodically by the Fund normally will be taken into account in calculating the NAV. The Fund’s whole loan investments, including those originated by the Fund or through an alternative lending platform, generally are fair valued in accordance with procedures approved by the Board.
Investments valued in currencies other than the U.S. dollar are converted to the U.S. dollar using exchange rates obtained from Pricing Sources. As a result, the value of such investments and, in turn, the NAV of a Fund’s shares may be affected by changes in the value of currencies in relation to the U.S. dollar. The value of investments traded in markets outside the United States or denominated in currencies other than the U.S. dollar may be affected significantly on a day that a Fund is not open for business. As a result, to the extent that a Fund holds foreign
(non-U.S.)
investments, the value of those investments may change at times when shareholders are unable to buy or sell shares and the value of such investments will be reflected in each Fund’s next calculated NAV.
Fair valuation may require subjective determinations about the value of a security. While the Funds’ and Valuation Designee’s policies and procedures are intended to result in a calculation of a Fund’s NAV that fairly reflects security values as of the time of pricing, a Fund cannot ensure that fair values accurately reflect the price that a Fund could obtain for a security if it were to dispose of that security as of the time of pricing (for instance, in a forced or distressed sale). The prices used by a Fund may differ from the value that would be realized if the securities were sold.
(b) Fair Value Hierarchy
U.S. GAAP describes fair value as the price that a Fund would receive to sell an asset or pay to transfer a liability in an orderly transaction between market participants at the measurement date. It establishes a fair value hierarchy that prioritizes inputs to valuation methods and requires disclosure of the fair value hierarchy, separately for each major category of assets and liabilities, that segregates fair value measurements into levels (Level 1, 2 or 3). The inputs or methodology used for valuing securities are not necessarily an indication of the risks associated with investing in those securities. Levels 1, 2 and 3 of the fair value hierarchy are defined as follows:
| | Level 1 — Quoted prices (unadjusted) in active markets or exchanges for identical assets and liabilities. |
| | Level 2 — Significant other observable inputs, which may include, but are not limited to, quoted prices for similar assets or liabilities in markets that are active, quoted prices for identical or similar assets or liabilities in markets that are not active, inputs other than quoted prices that are observable for the assets or liabilities (such as interest rates, yield curves, volatilities, prepayment speeds, loss severities, credit risks and default rates) or other market corroborated inputs. |
| | Level 3 — Significant unobservable inputs based on the best information available in the circumstances, to the extent observable inputs are not available, which may include assumptions made by the Valuation Designee that are used in determining the fair value of investments. |
Assets or liabilities categorized as Level 2 or 3 as of period end have been transferred between Levels 2 and 3 since the prior period due to changes in the method utilized in valuing the investments. Transfers from Level 2 to Level 3 are a result of a change, in the normal course of business, from the use of methods used by Pricing Sources (Level 2) to the use of a Broker Quote or valuation technique which utilizes significant unobservable inputs due to an absence of current or reliable market-based data (Level 3). Transfers from Level 3 to Level 2 are a result of the availability of current and reliable market-based data provided by Pricing Sources or other valuation techniques which utilize significant observable inputs. In accordance with the requirements of U.S. GAAP, the amounts of transfers into and out of Level 3, if material, are disclosed in the Notes to Schedule of Investments for each respective Fund.
For fair valuations using significant unobservable inputs, U.S. GAAP requires a reconciliation of the beginning to ending balances for reported fair values that presents changes attributable to realized gain (loss), unrealized appreciation (depreciation), purchases and sales, accrued discounts (premiums), and transfers into and out of the Level 3 category during the period. The end of period value is used for the transfers between Levels of a Fund’s assets and liabilities. Additionally, U.S. GAAP requires quantitative information regarding the significant unobservable inputs used in the determination of fair value of assets or liabilities categorized as Level 3 in the fair value hierarchy. In accordance with the requirements of U.S. GAAP, a fair value hierarchy and, if material, a Level 3 reconciliation and details of significant unobservable inputs, have been included in the Notes to Schedule of Investments for each respective Fund.
(c) Valuation Techniques and the Fair Value Hierarchy
Level
1, Level
2 and Level
3 trading assets and trading liabilities, at fair value
The valuation methods (or “techniques”) and significant inputs used in determining the fair values of portfolio securities or other
| | | | | | |
Notes to Financial Statements | | | | | | |
assets and liabilities categorized as Level 1, Level 2 and Level 3 of the fair value hierarchy are as follows:
Common stocks, ETFs, exchange-traded notes and financial derivative instruments, such as futures contracts, rights and warrants, or options on futures that are traded on a national securities exchange, are stated at the last reported sale or settlement price on the day of valuation. To the extent these securities are actively traded and valuation adjustments are not applied, they are categorized as Level 1 of the fair value hierarchy.
Investments in registered
open-end
investment companies (other than ETFs) will be valued based upon the NAVs of such investments and are categorized as Level 1 of the fair value hierarchy. Investments in unregistered
open-end
investment companies will be calculated based upon the NAVs of such investments and are considered Level 1 provided that the NAVs are observable, calculated daily and are the value at which both purchases and sales will be conducted.
Fixed income securities including corporate, convertible and municipal bonds and notes, U.S. government agencies, U.S. treasury obligations, sovereign issues, bank loans, convertible preferred securities,
non-U.S.
bonds, and short-term debt instruments (such as commercial paper, time deposits, and certificates of deposit) are normally valued on the basis of quotes obtained from brokers and dealers or Pricing Sources that use broker-dealer quotations, reported trades or valuation estimates from their internal pricing models. The Pricing Sources’ internal models use inputs that are observable such as issuer details, interest rates, yield curves, prepayment speeds, credit risks/spreads, default rates and quoted prices for similar assets. Securities that use similar valuation techniques and inputs as described above are categorized as Level 2 of the fair value hierarchy.
Fixed income securities purchased on a delayed-delivery basis or as a repurchase commitment in a sale-buyback transaction are marked to market daily until settlement at the forward settlement date and are categorized as Level 2 of the fair value hierarchy.
Mortgage-related and asset-backed securities are usually issued as separate tranches, or classes, of securities within each deal. These securities are also normally valued by Pricing Sources that use broker-dealer quotations, reported trades or valuation estimates from their internal pricing models. The pricing models for these securities usually consider tranche-level attributes, current market data, estimated cash flows and market-based yield spreads for each tranche, and incorporate deal collateral performance, as available. Mortgage-related and asset-backed securities that use similar valuation techniques and inputs as described above are categorized as Level 2 of the fair value hierarchy.
Valuation adjustments may be applied to certain securities that are solely traded on a foreign exchange to account for the market movement between the close of the foreign market and the NYSE Close. These securities are valued using Pricing Sources that consider the correlation of the trading patterns of the foreign security to the intraday trading in the U.S. markets for investments. Securities using these valuation adjustments are categorized as Level 2 of the fair value hierarchy. Preferred securities and other equities traded on inactive markets or valued by reference to similar instruments are also categorized as Level 2 of the fair value hierarchy.
Valuation adjustments may be applied to certain exchange traded futures and options to account for market movement between the exchange settlement and the NYSE Close. These securities are valued using quotes obtained from a quotation reporting system, established market makers or Pricing Sources. Financial derivatives using these valuation adjustments are categorized as Level 2 of the fair value hierarchy.
Equity exchange-traded options and over the counter financial derivative instruments, such as forward foreign currency contracts and options contracts derive their value from underlying asset prices, indexes, reference rates, and other inputs or a combination of these factors. These contracts are normally valued on the basis of quotes obtained from a quotation reporting system, established market makers or Pricing Sources (normally determined as of the NYSE Close). Depending on the product and the terms of the transaction, financial derivative instruments can be valued by Pricing Sources using a series of techniques, including simulation pricing models. The pricing models use inputs that are observed from actively quoted markets such as quoted prices, issuer details, indexes, bid/ask spreads, interest rates, implied volatilities, yield curves, dividends and exchange rates. Financial derivative instruments that use similar valuation techniques and inputs as described above are categorized as Level 2 of the fair value hierarchy.
Centrally cleared swaps and over the counter swaps derive their value from underlying asset prices, indexes, reference rates, and other inputs or a combination of these factors. They are valued using a broker-dealer bid quotation or on market-based prices provided by Pricing Sources (normally determined as of the NYSE Close). Centrally cleared swaps and over the counter swaps can be valued by Pricing Sources using a series of techniques, including simulation pricing models. The pricing models may use inputs that are observed from actively quoted markets such as the overnight index swap rate, LIBOR forward rate, interest rates, yield curves and credit spreads. These securities are categorized as Level 2 of the fair value hierarchy.
| | | | | | |
| | | | December 31, 2023 | | (Unaudited) |
If third-party evaluated vendor pricing is not available or not deemed to be indicative of fair value, the Manager may elect to obtain Broker Quotes directly from the broker-dealer or passed through from a third-party vendor. In the event that fair value is based upon a single sourced Broker Quote, these securities are categorized as Level 3 of the fair value hierarchy. Broker Quotes are typically received from established market participants. Although independently received, the Manager does not have the transparency to view the underlying inputs which support the market quotation. Significant changes in the Broker Quote would have direct and proportional changes in the fair value of the security.
Reference instrument valuation estimates fair value by utilizing the correlation of the security to one or more broad-based securities, market indexes, and/or other financial instruments, whose pricing information is readily available. Unobservable inputs may include those used in algorithms based on percentage change in the reference instruments and/or weights of each reference instrument. Significant changes in the unobservable inputs would result in direct and proportional changes in the fair value of the security. These securities are categorized as Level 2 or Level 3 of the fair value hierarchy depending on the source or input of the reference instrument.
Expected recovery valuation estimates that the fair value of an existing asset can be recovered, net of any liability. Significant changes in the unobservable inputs would result in direct and proportional changes in the fair value of the security. These securities are categorized as Level 3 of the fair value hierarchy.
The Discounted Cash Flow model is based on future cash flows generated by the investment and may be normalized based on expected investment performance. Future cash flows are discounted to present value using an appropriate rate of return, typically calibrated to the initial transaction date and adjusted based on Capital Asset Pricing Model and/or other market-based inputs. Significant changes in the unobservable inputs would result in direct and proportional changes in the fair value of the security. These securities are categorized as Level 3 of the fair value hierarchy.
The Comparable Companies model is based on application of valuation multiples from publicly traded comparable companies to the financials of the subject company. Adjustments may be made to the market-derived valuation multiples based on differences between the comparable companies and the subject company. Significant changes in the unobservable inputs would result in direct and proportional changes in the fair value of the security. These securities are categorized as Level 3 of the fair value hierarchy.
The Option Pricing Model is a commonly accepted method of allocating enterprise value across a capital structure. The method may be utilized when a capital structure includes multiple instruments with varying rights and preferences, there is no short term exit horizon, the nature of an exit event is unknown, or if the enterprise value is not sufficient to cover outstanding debt and preferred claims. The Option Pricing Model can also be used as a method to estimate enterprise value by ‘back-solving’ if there are recent indicative transactions for securities with the same issuer. The Option Pricing Model uses Black-Scholes option pricing, a generally accepted option model typically used to value call options, puts, warrants, and convertible preferred securities. Significant changes in unobservable inputs would result in direct changes in the fair value of the security. These securities are categorized as level 3 of the fair value hierarchy.
Securities may be valued based on purchase prices of privately negotiated transactions. Significant changes in the unobservable inputs would result in direct and proportional changes in the fair value of the security. These securities are categorized as Level 3 of the fair value hierarchy.
Securities that are smaller in size than
institutional-sized
or round lot positions of the particular security/instrument type may apply an adjustment factor to the daily vendor-provided price for the corresponding round lot position to arrive at a fair value for the applicable odd lot positions. The adjustment factor is determined by comparing the prices of internal trades with vendor prices, calculating the weighted average differences, and using that difference as an adjustment factor to vendor prices. These securities are categorized as Level 3 of the fair value hierarchy.
Short-term debt instruments (such as commercial paper, time deposits, and certificates of deposit) having a remaining maturity of 60 days or less may be valued at amortized cost, so long as the amortized cost value of such short-term debt instruments is approximately the same as the fair value of the instrument as determined without the use of amortized cost valuation. These securities are categorized as Level 2 or Level 3 of the fair value hierarchy depending on the source of the base price.
When a fair valuation method is applied by PIMCO that uses significant unobservable inputs, investments will be priced by a method that the Valuation Designee believes reflects fair value and are categorized as Level 3 of the fair value hierarchy.
| | | | | | |
Notes to Financial Statements | | | | | | |
4. SECURITIES AND OTHER INVESTMENTS
(a) Investments in Affiliates
Each Fund may invest in the PIMCO Short Asset Portfolio and the PIMCO Short-Term Floating NAV Portfolio III (“Central Funds”) to the extent permitted by the Act and rules thereunder. The Central Funds are registered investment companies created for use solely by the series of the Trust and other series of registered investment companies advised by the Adviser, in connection with their cash management activities. The main investments of the Central Funds are money market and short maturity fixed income instruments. The Central Funds may incur expenses related to their investment activities, but do not pay Investment Advisory Fees or Supervisory and Administrative Fees to the Adviser. The Central Funds are considered to be affiliated with the Funds. A complete schedule of portfolio holdings for each affiliate fund is filed with the SEC for the first and third quarters of each fiscal year on Form NPORT and is available at the SEC’s website at www.sec.gov. A copy of each affiliate fund’s shareholder report is also available at the SEC’s website at www.sec.gov, on the Funds’ website at www.pimco.com, or upon request, as applicable. The tables below show the Funds’ transactions in and earnings from investments in the affiliated Funds for the period ended December 31, 2023 (amounts in thousands
):
Investment in PIMCO Short-Term Floating NAV Portfolio III
| | | | | | | | | | | | | | | | | | | | | | | | | | | | | | | | | | | | |
| | | | | | | | | | | | | | | | | Change in
Unrealized
Appreciation
(Depreciation) | | | | | | | | | Realized Net Capital Gain Distributions (1) | |
| | | | | | | | | |
| PCM Fund, Inc. | | | | | | $ | 0 | | | $ | 12,863 | | | $ | (3,300 | ) | | $ | 1 | | | $ | 2 | | | $ | 9,566 | | | $ | 59 | | | $ | 0 | |
| | | | | | | | | |
PIMCO Global StocksPLUS & Income Fund | | | | | | | 0 | | | | 24,922 | | | | (10,600 | ) | | | 0 | | | | 3 | | | | 14,325 | | | | 113 | | | | 0 | |
| | | | | | | | | |
| PIMCO Strategic Income Fund, Inc. | | | | | | | 0 | | | | 28,659 | | | | (23,900 | ) | | | 1 | | | | 1 | | | | 4,761 | | | | 56 | | | | 0 | |
| | | | | | | | | |
| PIMCO Access Income Fund | | | | | | | 0 | | | | 117,463 | | | | (25,600 | ) | | | 3 | | | | 22 | | | | 91,888 | | | | 419 | | | | 0 | |
| | | | | | | | | |
| PIMCO Dynamic Income Fund | | | | | | | 0 | | | | 747,986 | | | | (155,600 | ) | | | 25 | | | | 135 | | | | 592,546 | | | | 3,180 | | | | 0 | |
| | | | | | | | | |
| PIMCO Dynamic Income Opportunities Fund | | | | | | | 0 | | | | 236,793 | | | | (82,500 | ) | | | 3 | | | | 38 | | | | 154,334 | | | | 906 | | | | 0 | |
| A zero balance may reflect actual amounts rounding to less than one thousand. |
| The tax characterization of distributions is determined in accordance with Federal income tax regulations and may contain a return of capital. The actual tax characterization of distributions received is determined at the end of the fiscal year of the affiliated fund. See Note 2, Distributions to Shareholders, in the Notes to Financial Statements for more information. |
An affiliate includes any company in which a Fund owns 5% or more of the company’s outstanding voting shares. The table below represents transactions in and earnings from these affiliated issuers for the period ended December 31, 2023 (amounts in thousands
, except number of shares).
PIMCO Dynamic Income Fund
| | | | | | | | | | | | | | | | | | | | | | | | | | | | | | | | | | | | |
| | | | | Market Value
at 06/30/2023 | | | | | | | | | | | | Change in
Unrealized
Appreciation
(Depreciation) | | | Market Value
at 12/31/2023 | | | | | | | |
| | | | | | | | | |
| Amsurg Equity | | | | | | $ | 0 | | | $ | 146,968 | | | $ | 0 | | | $ | 0 | | | $ | 33,435 | | | $ | 180,403 | | | $ | 0 | | | | 3,517,243 | |
| | | | | | | | | |
| Neiman Marcus Group Ltd. LLC | | | | | | | 91,591 | | | | 0 | | | | 0 | | | | 0 | | | | (1,243 | ) | | | 90,348 | | | | 0 | | | | 602,840 | |
| | | | | | | | | |
| Sierra Hamilton Holder LLC | | | | | | | 3 | | | | 0 | | | | 0 | | | | 0 | | | | 0 | | | | 3 | | | | 0 | | | | 30,337,712 | |
| A zero balance may reflect actual amounts rounding to less than one thousand. |
(b) Investments in Securities
The Funds may utilize the investments and strategies described below to the extent permitted by each Fund’s respective investment policies.
Loans and Other Indebtedness, Loan Participations and Assignments
are direct debt instruments which are interests in amounts owed to lenders or lending syndicates by corporate, governmental, or other borrowers. A Fund’s investments in loans may be in the form of direct investments, participations in loans or assignments of all or a portion of loans from third parties or exposure
to investments in loans through investments in a mutual fund or other pooled investment vehicle. A loan is often administered by a bank or other financial institution (the “agent”) that acts as agent for all holders. The agent administers the terms of the loan, as specified in the loan agreement. A Fund may invest in multiple series or tranches of a loan, which may have varying terms and carry different associated risks. A Fund generally has no right to enforce compliance with the terms of the loan agreement with the borrower. As a result, a Fund may be subject to the credit risk of both the borrower and the agent that is selling the loan agreement.
| | | | | | |
| | | | December 31, 2023 | | (Unaudited) |
In the event of the insolvency of the agent selling a participation, a Fund may be treated as a general creditor of the agent and may not benefit from any
set-off
between the agent and the borrower. When a Fund purchases assignments from agents it acquires direct rights against the borrowers of the loans. These loans may include participations in bridge loans, which are loans taken out by borrowers for a short period (typically less than one year) pending arrangement of more permanent financing through, for example, the issuance of bonds, frequently high yield bonds issued for the purpose of acquisitions.
Investments in loans are generally subject to risks similar to those of investments in other types of debt obligations, including, among others, credit risk, interest rate risk, variable and floating rate securities risk, and risks associated with mortgage-related securities. In addition, in many cases loans are subject to the risks associated with below-investment grade securities. The Funds may be subject to heightened or additional risks and potential liabilities and costs by investing in mezzanine and other subordinated loans, including those arising under bankruptcy, fraudulent conveyance, equitable subordination, environmental and other laws and regulations, and risks and costs associated with debt servicing and taking foreclosure actions associated with the loans.
Additionally, because loans are not ordinarily registered with the SEC or any state securities commission or listed on any securities exchange, there is usually less publicly available information about such instruments. In addition, loans may not be considered “securities” for purposes of the anti-fraud provisions under the federal securities laws and, as a result, as a purchaser of these instruments, a Fund may not be entitled to the anti-fraud protections of the federal securities laws. In the course of investing in such instruments, a Fund may come into possession of material nonpublic information and, because of prohibitions on trading in securities of issuers while in possession of such information, the Fund may be unable to enter into a transaction in a publicly-traded security of that issuer when it would otherwise be advantageous for the Fund to do so. Alternatively, a Fund may choose not to receive material nonpublic information about an issuer of such loans, with the result that the Fund may have less information about such issuers than other investors who transact in such assets.
The types of loans and related investments in which the Funds may invest include, among others, senior loans, subordinated loans (including second lien loans,
B-Notes
and mezzanine loans), whole loans, commercial real estate and other commercial loans and structured loans. The Funds may acquire direct interests in loans through primary loan distributions and/or in private transactions. In the case of subordinated loans, there may be significant indebtedness ranking ahead of the borrower’s obligation to the holder of such a loan, including in the event of the borrower’s insolvency. Mezzanine
loans are typically secured by a pledge of an equity interest in the mortgage borrower that owns the real estate rather than an interest in a mortgage.
Investments in loans may include unfunded loan commitments, which are contractual obligations for future funding. Unfunded loan commitments may include revolving credit facilities, which may obligate a Fund to supply additional cash to the borrower on demand. Unfunded loan commitments represent a future obligation in full, even though a percentage of the committed amount may not be utilized by the borrower. When investing in a loan participation, a Fund has the right to receive payments of principal, interest and any fees to which it is entitled only from the agent selling the loan agreement and only upon receipt of payments by the agent from the borrower. Because investing in unfunded loan commitments creates a future obligation for a Fund to provide funding to a borrower upon demand in exchange for a fee, the Fund will segregate or earmark liquid assets with the Fund’s custodian in amounts sufficient to satisfy any such future obligations. A Fund may receive a commitment fee based on the undrawn portion of the underlying line of credit portion of a loan. In certain circumstances, a Fund may receive a penalty fee upon the prepayment of a loan by a borrower. Fees earned or paid are recorded as a component of interest income or interest expense, respectively, on the Statements of Operations. Unfunded loan commitments, if any, are reflected as a liability on the Statements of Assets and Liabilities.
Mortgage-Related and Other Asset-Backed Securities
directly or indirectly represent a participation in, or are secured by and payable from, loans on real property. Mortgage-related securities are created from pools of residential or commercial mortgage loans, including mortgage loans made by savings and loan institutions, mortgage bankers, commercial banks and others. These securities typically provide a monthly payment which consists of both principal and interest. Interest may be determined by fixed or adjustable rates. In times of declining interest rates, there is a greater likelihood that a Fund’s higher yielding securities will be
pre-paid
with the Fund being unable to reinvest the proceeds in an investment with as great a yield. The rate of prepayments on underlying mortgages will affect the price and volatility of a mortgage-related security, and may have the effect of shortening or extending the effective duration of the security relative to what was anticipated at the time of purchase. Interest-only and principal-only securities are especially sensitive to interest rate changes, which can affect not only their prices but can also change the income flows and repayment assumptions about those investments. The timely payment of principal and interest of certain mortgage-related securities is guaranteed with the full faith and credit of the U.S. Government. Pools created and guaranteed by
non-governmental
issuers, including government-sponsored corporations, may be supported by various forms of insurance or guarantees, but there can be no assurance that
| | | | | | |
Notes to Financial Statements | | | | | | |
private insurers or guarantors can meet their obligations under the insurance policies or guarantee arrangements. Many of the risks of investing in mortgage-related securities secured by commercial mortgage loans reflect the effects of local and other economic conditions on real estate markets, the ability of tenants to make lease payments, and the ability of a property to attract and retain tenants. These securities may be less liquid and may exhibit greater price volatility than other types of mortgage-related or other asset-backed securities. Other asset-backed securities are created from many types of assets, including, but not limited to, auto loans, accounts receivable such as credit card receivables and hospital account receivables, home equity loans, student loans, boat loans, mobile home loans, recreational vehicle loans, manufactured housing loans, aircraft leases, computer leases and syndicated bank loans. The Funds may invest in any level of the capital structure of an issuer of mortgage-backed or asset-backed securities, including the equity or “first loss” tranche.
Collateralized Debt Obligations
(“CDOs”) include Collateralized Bond Obligations (“CBOs”), Collateralized Loan Obligations (“CLOs”) and other similarly structured securities. CBOs and CLOs are types of asset-backed securities. A CBO is a trust which is typically backed by a diversified pool of high risk, below investment grade fixed income securities. A CLO is a trust typically collateralized by a pool of loans, which may include, among others, domestic and foreign senior secured loans, senior unsecured loans, and subordinate corporate loans, including loans that may be rated below investment grade or equivalent unrated loans. For both CBOs and CLOs, the cash flows from the trust are split into two or more portions, called tranches, varying in risk and yield. The riskiest portion is the “equity” tranche which bears the bulk of defaults from the bonds or loans in the trust and serves to protect the other, more senior tranches from default in all but the most severe circumstances. Since it is partially protected from defaults, a senior tranche from a CBO trust or CLO trust typically has higher ratings and lower yields than the underlying securities, and can be rated investment grade. Despite the protection from the equity tranche, CBO or CLO tranches can experience substantial losses due to actual defaults, increased sensitivity to defaults due to collateral default and disappearance of protecting tranches, market anticipation of defaults and aversion to CBO or CLO securities as a class. The risks of an investment in a CDO depend largely on the type of the collateral securities and the class of the CDO in which a Fund invests. CDOs carry additional risks including, but not limited to, (i) the possibility that distributions from collateral securities will not be adequate to make interest or other payments, (ii) the collateral may decline in value or default, (iii) the risk that a Fund may invest in CDOs that are subordinate to other classes, and (iv) the complex structure of the security may not be fully understood at the time of investment and may produce disputes with the issuer or unexpected investment results.
Collateralized Mortgage Obligations
(“CMOs”) are debt obligations of a legal entity that are collateralized by whole mortgage loans or private mortgage bonds and divided into classes. CMOs are structured into multiple classes, often referred to as “tranches,” with each class bearing a different stated maturity and entitled to a different schedule for payments of principal and interest, including prepayments. CMOs may be less liquid and may exhibit greater price volatility than other types of mortgage-related or asset-backed securities.
As CMOs have evolved, some classes of CMO bonds have become more common. For example, a Fund may invest in
parallel-pay
and planned amortization class (“PAC”) CMOs and multi-class pass-through certificates.
Parallel-pay
CMOs and multi-class pass-through certificates are structured to provide payments of principal on each payment date to more than one class. These simultaneous payments are taken into account in calculating the stated maturity date or final distribution date of each class, which, as with other CMO and multi-class pass-through structures, must be retired by its stated maturity date or final distribution date but may be retired earlier. PACs generally require payments of a specified amount of principal on each payment date. PACs are
parallel-pay
CMOs with the required principal amount on such securities having the highest priority after interest has been paid to all classes. Any CMO or multi-class pass-through structure that includes PAC securities must also have support tranches — known as support bonds, companion bonds or
non-PAC
bonds — which lend or absorb principal cash flows to allow the PAC securities to maintain their stated maturities and final distribution dates within a range of actual prepayment experience. These support tranches are subject to a higher level of maturity risk compared to other mortgage-related securities, and usually provide a higher yield to compensate investors. If principal cash flows are received in amounts outside a
pre-determined
range such that the support bonds cannot lend or absorb sufficient cash flows to the PAC securities as intended, the PAC securities are subject to heightened maturity risk. A Fund may invest in various tranches of CMO bonds, including support bonds and equity or “first loss” tranches (see “Collateralized Debt Obligations” above).
Stripped Mortgage-Backed Securities
(“SMBS”) are derivative multi-class mortgage securities. SMBS are usually structured with two classes that receive different proportions of the interest and principal distributions on a pool of mortgage assets. An SMBS will have one class that will receive all of the interest (the interest-only or “IO” class), while the other class will receive the entire principal (the principal-only or “PO” class). IOs and POs can be extremely volatile in response to changes in interest rates. As interest rates rise and fall, the value of IOs tends to move in the same direction as interest rates. POs perform best when prepayments on the underlying mortgages rise since this increases the rate at which the principal is returned and the yield to maturity on the PO. When payments on mortgages underlying a PO are
| | | | | | |
| | | | December 31, 2023 | | (Unaudited) |
slower than anticipated, the life of the PO is lengthened and the yield to maturity is reduced. The yield to maturity on an IO class is extremely sensitive to the rate of principal payments (including prepayments) on the related underlying mortgage assets, and a rapid rate of principal payments may have a material adverse effect on a Fund’s yield to maturity from these securities. If the underlying mortgage assets experience greater than anticipated prepayments of principal, the Funds may fail to recoup some or all of its initial investment in these securities even if the security is in one of the highest rating categories.
Payments received for IOs are included in interest income on the Statements of Operations. Because no principal will be received at the maturity of an IO, adjustments are made to the cost of the security on a monthly basis until maturity. These adjustments are included in interest income on the Statements of Operations. Payments received for POs are treated as reductions to the cost and par value of the securities.
may give the issuer the option at each interest payment date of making interest payments in either cash and/or additional debt securities. Those additional debt securities usually have the same terms, including maturity dates and interest rates, and associated risks as the original bonds. The daily market quotations of the original bonds may include the accrued interest (referred to as a dirty price) and require a pro rata adjustment from the unrealized appreciation (depreciation) on investments to interest receivable on the Statements of Assets and Liabilities.
Perpetual Bonds
are fixed income securities with no maturity date but pay a coupon in perpetuity (with no specified ending or maturity date). Unlike typical fixed income securities, there is no obligation for perpetual bonds to repay principal. The coupon payments, however, are mandatory. While perpetual bonds have no maturity date, they may have a callable date in which the perpetuity is eliminated and the issuer may return the principal received on the specified call date. Additionally, a perpetual bond may have additional features, such as interest rate increases at periodic dates or an increase as of a predetermined point in the future.
Real Estate Investment Trusts
(“REITs”)
are pooled investment vehicles that own, and typically operate, income-producing real estate. If a REIT meets certain requirements, including distributing to shareholders substantially all of its taxable income (other than net capital gains), then it is not taxed on the income distributed to shareholders. Distributions received from REITs may be characterized as income, capital gain or a return of capital. A return of capital is recorded by a Fund as a reduction to the cost basis of its investment in the REIT. REITs are subject to management fees and other expenses, and so the Funds that invest in REITs will bear their proportionate share of the costs of the REITs’ operations.
Restricted Investments
are subject to legal or contractual restrictions on resale and may generally be sold privately, but may be required to be registered or exempted from such registration before being sold to the public. Private placement securities are generally considered to be restricted except for those securities traded between qualified institutional investors under the provisions of Rule 144A of the Securities Act of 1933. Disposal of restricted investments may involve time-consuming negotiations and expenses, and prompt sale at an acceptable price may be difficult to achieve. Restricted investments held by the Funds as of December 31, 2023, as applicable, are disclosed in the Notes to Schedules of Investments.
Securities Issued by U.S. Government Agencies or Government-Sponsored Enterprises
are obligations of and, in certain cases, guaranteed by, the U.S. Government, its agencies or instrumentalities. Some U.S. Government securities, such as Treasury bills, notes and bonds, and securities guaranteed by the Government National Mortgage Association, are supported by the full faith and credit of the U.S. Government; others, such as those of the Federal Home Loan Banks, are supported by the right of the issuer to borrow from the U.S. Department of the Treasury (the “U.S. Treasury”); and others, such as those of the Federal National Mortgage Association (“FNMA” or “Fannie Mae”), are supported by the discretionary authority of the U.S. Government to purchase the agency’s obligations. U.S. Government securities may include zero coupon securities which do not distribute interest on a current basis and tend to be subject to a greater risk than interest-paying securities of similar maturities.
Government-related guarantors (i.e., not backed by the full faith and credit of the U.S. Government) include FNMA and the Federal Home Loan Mortgage Corporation (“FHLMC” or “Freddie Mac”). FNMA is a government-sponsored corporation. FNMA purchases conventional (i.e., not insured or guaranteed by any government agency) residential mortgages from a list of approved seller/servicers which include state and federally chartered savings and loan associations, mutual savings banks, commercial banks and credit unions and mortgage bankers. Pass-through securities issued by FNMA are guaranteed as to timely payment of principal and interest by FNMA, but are not backed by the full faith and credit of the U.S. Government. FHLMC issues Participation Certificates (“PCs”), which are pass-through securities, each representing an undivided interest in a pool of residential mortgages. FHLMC guarantees the timely payment of interest and ultimate collection of principal, but PCs are not backed by the full faith and credit of the U.S. Government. Instead, they are supported only by the discretionary authority of the U.S. Government to purchase the agency’s obligations.
In June 2019, FNMA and FHLMC started issuing Uniform Mortgage Backed Securities in place of their current offerings of
TBA-eligible
| | | | | | |
Notes to Financial Statements | | | | | | |
securities (the “Single Security Initiative”). The Single Security Initiative seeks to support the overall liquidity of the TBA market and aligns the characteristics of FNMA and FHLMC certificates. The long-term effects that the Single Security Initiative may have on the market for TBA and other mortgage-backed securities are uncertain.
Roll-timing strategies can be used where a Fund seeks to extend the expiration or maturity of a position, such as a TBA security on an underlying asset, by closing out the position before expiration and opening a new position with respect to substantially the same underlying asset with a later expiration date. TBA securities purchased or sold are reflected on the Statements of Assets and Liabilities as an asset or liability, respectively. Recently finalized FINRA rules include mandatory margin requirements for the TBA market that require the Funds to post collateral in connection with their TBA transactions. There is no similar requirement applicable to the Funds’ TBA counterparties. The required collateralization of TBA trades could increase the cost of TBA transactions to the Funds and impose added operational complexity.
Warrants
are securities that are usually issued together with a debt security or preferred security and that give the holder the right to buy a proportionate amount of common stock at a specified price. Warrants normally have a life that is measured in years and entitle the holder to buy common stock of a company at a price that is usually higher than the market price at the time the warrant is issued. Warrants may entail greater risks than certain other types of investments. Generally, warrants do not carry the right to receive dividends or exercise voting rights with respect to the underlying securities, and they do not represent any rights in the assets of the issuer. In addition, their value does not necessarily change with the value of the underlying securities, and they cease to have value if they are not exercised on or before their expiration date. If the market price of the underlying stock does not exceed the exercise price during the life of the warrant, the warrant will expire worthless. Warrants may increase the potential profit or loss to be realized from the investment as compared with investing the same amount in the underlying securities. Similarly, the percentage increase or decrease in the value of an equity security warrant may be greater than the percentage increase or decrease in the value of the underlying common stock. Warrants may relate to the purchase of equity or debt securities. Debt obligations with warrants attached to purchase equity securities have many characteristics of convertible securities and their prices may, to some degree, reflect the performance of the underlying stock. Debt obligations also may be issued with warrants attached to purchase additional debt securities at the same coupon rate. A decline in interest rates would permit a Fund to sell such warrants at a profit. If interest rates rise, these warrants would generally expire with no value.
When-Issued Transactions
are purchases or sales made on a when-issued basis. These transactions are made conditionally because a security, although authorized, has not yet been issued in the market. Transactions to purchase or sell securities on a when-issued basis involve a commitment by a Fund to purchase or sell these securities for a predetermined price or yield, with payment and delivery taking place beyond the customary settlement period. A Fund may sell when-issued securities before they are delivered, which may result in a realized gain (loss).
5. BORROWINGS AND OTHER FINANCING TRANSACTIONS
The Funds may enter into the borrowings and other financing transactions described below to the extent permitted by each Fund’s respective investment policies.
The following disclosures contain information on a Fund’s ability to lend or borrow cash or securities to the extent permitted under the Act, which may be viewed as borrowing or financing transactions by a Fund. The location of these instruments in each Fund’s financial statements is described below.
(a) Repurchase Agreements
Under the terms of a typical repurchase agreement, a Fund purchases an underlying debt obligation (collateral) subject to an obligation of the seller to repurchase, and a Fund to resell, the obligation at an agreed-upon price and time. In an open maturity repurchase agreement, there is no
pre-determined
repurchase date and the agreement can be terminated by a Fund or counterparty at any time. The underlying securities for all repurchase agreements are held by a Fund’s custodian or designated subcustodians (in the case of
tri-party
repurchase agreements) and in certain instances will remain in custody with the counterparty. Traditionally, a Fund has used bilateral repurchase agreements wherein the underlying securities will be held by a Fund’s custodian. The market value of the collateral must be equal to or exceed the total amount of the repurchase obligations, including interest. Repurchase agreements, if any, including accrued interest, are included on the Statements of Assets and Liabilities. Interest earned is recorded as a component of interest income on the Statements of Operations. In periods of increased demand for collateral, a Fund may pay a fee for the receipt of collateral, which may result in interest expense to the Fund.
(b) Reverse Repurchase Agreements
In a reverse repurchase agreement, a Fund delivers a security in exchange for cash to a financial institution, the counterparty, with a simultaneous agreement to repurchase the same or substantially the same security at an agreed upon price and date. In an open maturity reverse repurchase agreement, there is no
pre-determined
repurchase date and the
| | | | | | |
| | | | December 31, 2023 | | (Unaudited) |
agreement can be terminated by a Fund or counterparty at any time. A Fund is entitled to receive principal and interest payments, if any, made on the security delivered to the counterparty during the term of the agreement. Cash received in exchange for securities delivered plus accrued interest payments to be made by a Fund to counterparties are reflected as a liability on the Statements of Assets and Liabilities. Interest payments made by a Fund to counterparties are recorded as a component of interest expense on the Statements of Operations. In periods of increased demand for the security, a Fund may receive a fee for use of the security by the counterparty, which may result in interest income to the Fund. In the event the buyer of securities under a reverse repurchase agreement files for bankruptcy or becomes insolvent, a Fund’s use of the proceeds of the agreement may be restricted pending a determination by the other party, or its trustee or receiver, whether to enforce a Fund’s obligation to repurchase the securities. Reverse repurchase agreements involve leverage risk and also the risk that the market value of the securities to be repurchased may decline below the repurchase price.
(c) Short Sales
Short sales are transactions in which a Fund sells a security that it may not own. A Fund may make short sales of securities to (i) offset potential declines in long positions in similar securities, (ii) to increase the flexibility of the Fund, (iii) for investment return, (iv) as part of a risk arbitrage strategy, and (v) as part of its overall portfolio management strategies involving the use of derivative instruments. When a Fund engages in a short sale, it may borrow the security sold short and deliver it to the counterparty. A Fund will ordinarily have to pay a fee or premium to borrow a security and be obligated to repay the lender of the security any dividend or interest that accrues on the security during the period of the loan. Securities sold in short sale transactions and the dividend or interest payable on such securities, if any, are reflected as payable for short sales on the Statements of Assets and Liabilities. Short sales expose a Fund to the risk that it will be required to cover its short position at a time when the security or other asset has appreciated in value, thus resulting in losses to a Fund. A short sale is “against the box” if a Fund holds in its portfolio or has the right to acquire the security sold short, or securities identical to the security sold short, at no additional cost. A Fund will be subject to additional risks to the extent that it engages in short sales that are not “against the box.” A Fund’s loss on a short sale could theoretically be unlimited in cases where a Fund is unable, for whatever reason, to close out its short position.
6. FINANCIAL DERIVATIVE INSTRUMENTS
The Funds may enter into the financial derivative instruments described below to the extent permitted by each Fund’s respective investment policies.
The following disclosures contain information on how and why the Funds use financial derivative instruments, and how financial derivative instruments affect the Funds’ financial position, results of operations and cash flows. The location and fair value amounts of these instruments on the Statements of Assets and Liabilities and the net realized gain (loss) and net change in unrealized appreciation (depreciation) on the Statements of Operations, each categorized by type of financial derivative contract and related risk exposure, are included in a table in the Notes to Schedules of Investments. The financial derivative instruments outstanding as of period end and the amounts of net realized gain (loss) and net change in unrealized appreciation (depreciation) on financial derivative instruments during the period, as disclosed in the Notes to Schedules of Investments, serve as indicators of the volume of financial derivative activity for the Funds.
PIMCO Global StocksPLUS
& Income Fund is subject to regulation as a commodity pool under the Commodity Exchange Act by the Commodity Futures Trading Commission (the “CFTC”). The Manager has registered with the CFTC as a Commodity Pool Operator and a Commodity Trading Adviser with respect to the Fund, and is a member of the National Futures Association. As a result, additional CFTC-mandated disclosure, reporting and recordkeeping obligations apply to PIMCO Global StocksPLUS
& Income Fund.
(a) Forward Foreign Currency Contracts
may be engaged, in connection with settling planned purchases or sales of securities, to hedge the currency exposure associated with some or all of a Fund’s securities or as part of an investment strategy. A forward foreign currency contract is an agreement between two parties to buy and sell a currency at a set price on a future date. The market value of a forward foreign currency contract fluctuates with changes in foreign currency exchange rates. Forward foreign currency contracts are marked to market daily, and the change in value is recorded by a Fund as an unrealized gain (loss). Realized gains (losses) are equal to the difference between the value of the contract at the time it was opened and the value at the time it was closed and are recorded upon delivery or receipt of the currency. These contracts may involve market risk in excess of the unrealized gain (loss) reflected on the Statements of Assets and Liabilities. In addition, a Fund could be exposed to risk if the counterparties are unable to meet the terms of the contracts or if the value of the currency changes unfavorably to the U.S. dollar. To mitigate such risk, cash or securities may be exchanged as collateral pursuant to the terms of the underlying contracts.
(b) Futures Contracts
are agreements to buy or sell a security or other asset for a set price on a future date and are traded on an exchange. A Fund may use futures contracts to manage its exposure to the securities markets or to movements in interest rates and currency values. The
| | | | | | |
Notes to Financial Statements | | | | | | |
primary risks associated with the use of futures contracts are the imperfect correlation between the change in market value of the securities held by a Fund and the prices of futures contracts and the possibility of an illiquid market. Futures contracts are valued based upon their quoted daily settlement prices. Upon entering into a futures contract, a Fund is required to deposit with its futures broker an amount of cash, U.S. Government and Agency Obligations, or select sovereign debt, in accordance with the initial margin requirements of the broker or exchange. Futures contracts are marked to market daily and based on such movements in the price of the contracts, an appropriate payable or receivable for the change in value may be posted or collected by the Fund (“Futures Variation Margin”). Futures Variation Margins, if any, are disclosed within centrally cleared financial derivative instruments on the Statements of Assets and Liabilities. Gains (losses) are recognized but not considered realized until the contracts expire or close. Futures contracts involve, to varying degrees, risk of loss in excess of the Futures Variation Margin included within exchange-traded or centrally cleared financial derivative instruments on the Statements of Assets and Liabilities.
(c) Options Contracts
may be written or purchased to enhance returns or to hedge an existing position or future investment. The Fund may write call and put options on securities and financial derivative instruments it owns or in which it may invest. Writing put options tends to increase a Fund’s exposure to the underlying instrument. Writing call options tends to decrease a Fund’s exposure to the underlying instrument. When a Fund writes a call or put, an amount equal to the premium received is recorded and subsequently marked to market to reflect the current value of the option written. These amounts are included on the Statements of Assets and Liabilities. Premiums received from writing options which expire are treated as realized gains. Premiums received from writing options which are exercised or closed are added to the proceeds or offset against amounts paid on the underlying futures, swap, security or currency transaction to determine the realized gain (loss). Certain options may be written with premiums to be determined on a future date. The premiums for these options are based upon implied volatility parameters at specified terms. A Fund as a writer of an option has no control over whether the underlying instrument may be sold (“call”) or purchased (“put”) and as a result bears the market risk of an unfavorable change in the price of the instrument underlying the written option. There is the risk a Fund may not be able to enter into a closing transaction because of an illiquid market.
Purchasing call options tends to increase a Fund’s exposure to the underlying instrument. Purchasing put options tends to decrease a Fund’s exposure to the underlying instrument. A Fund pays a premium which is included as an asset on the Statements of Assets and
Liabilities and subsequently marked to market to reflect the current value of the option. Premiums paid for purchasing options which expire are treated as realized losses. Certain options may be purchased with premiums to be determined on a future date. The premiums for these options are based upon implied volatility parameters at specified terms. The risk associated with purchasing put and call options is limited to the premium paid. Premiums paid for purchasing options which are exercised or closed are added to the amounts paid or offset against the proceeds on the underlying investment transaction to determine the realized gain (loss) when the underlying transaction is executed.
Options on Indexes
(“Index Option”) use a specified index as the underlying instrument for the option contract. The exercise for an Index Option will not include physical delivery of the underlying index but will result in a cash transfer of the amount of the difference between the settlement price of the underlying index and the strike price.
(d) Swap Agreements
are bilaterally negotiated agreements between a Fund and a counterparty to exchange or swap investment cash flows, assets, foreign currencies or market-linked returns at specified, future intervals. Swap agreements may be privately negotiated in the over the counter market (“OTC swaps”) or may be cleared through a third party, known as a central counterparty or derivatives clearing organization (“Centrally Cleared Swaps”). A Fund may enter into asset, credit default, cross-currency, interest rate, total return, variance and other forms of swap agreements to manage its exposure to credit, currency, interest rate, commodity, equity and inflation risk. In connection with these agreements, securities or cash may be identified as collateral or margin in accordance with the terms of the respective swap agreements to provide assets of value and recourse in the event of default or bankruptcy/insolvency.
Centrally Cleared Swaps are marked to market daily based upon valuations as determined from the underlying contract or in accordance with the requirements of the central counterparty or derivatives clearing organization. Changes in market value, if any, are reflected as a component of net change in unrealized appreciation (depreciation) on the Statements of Operations. Daily changes in valuation of centrally cleared swaps, if any, are disclosed within centrally cleared financial derivative instruments on the Statements of Assets and Liabilities. Centrally Cleared and OTC swap payments received or paid at the beginning of the measurement period are included on the Statements of Assets and Liabilities and represent premiums paid or received upon entering into the swap agreement to compensate for differences between the stated terms of the swap agreement and prevailing market conditions (credit spreads, currency exchange rates, interest rates, and other relevant factors). Upfront premiums received (paid) are initially recorded as liabilities (assets) and subsequently marked to market to reflect the current value of the swap. These upfront
| | | | | | |
| | | | December 31, 2023 | | (Unaudited) |
premiums are recorded as realized gain (loss) on the Statements of Operations upon termination or maturity of the swap. A liquidation payment received or made at the termination of the swap is recorded as realized gain (loss) on the Statements of Operations. Net periodic payments received or paid by a Fund are included as part of realized gain (loss) on the Statements of Operations.
For purposes of a Fund’s investment policy adopted pursuant to
Rule 35d-1
under the Act (if any), the Fund will account for derivative instruments at market value. For purposes of applying a Fund’s other investment policies and restrictions, swap agreements, like other derivative instruments, may be valued by a Fund at market value, notional value or full exposure value. In the case of a credit default swap, in applying certain of a Fund’s investment policies and restrictions, the Funds will value the credit default swap at its notional value or its full exposure value (i.e., the sum of the notional amount for the contract plus the market value), but may value the credit default swap at market value for purposes of applying certain of a Fund’s other investment policies and restrictions. For example, a Fund may value credit default swaps at full exposure value for purposes of a Fund’s credit quality guidelines (if any) because such value in general better reflects a Fund’s actual economic exposure during the term of the credit default swap agreement. As a result, a Fund may, at times, have notional exposure to an asset class (before netting) that is greater or lesser than the stated limit or restriction noted in a Fund’s prospectus. In this context, both the notional amount and the market value may be positive or negative depending on whether a Fund is selling or buying protection through the credit default swap. The manner in which certain securities or other instruments are valued by a Fund for purposes of applying investment policies and restrictions may differ from the manner in which those investments are valued by other types of investors.
Entering into swap agreements involves, to varying degrees, elements of interest, credit, market and documentation risk in excess of the amounts recognized on the Statements of Assets and Liabilities. Such risks involve the possibility that there will be no liquid market for these agreements, that the counterparty to the agreements may fail to perform or meet an obligation or disagree as to the meaning of contractual terms in the agreements and that there may be unfavorable changes in interest rates or the values of the asset upon which the swap is based.
A Fund’s maximum risk of loss from counterparty credit risk is the discounted net value of the cash flows to be received from the counterparty over the contract’s remaining life, to the extent that amount is positive. The risk may be mitigated by having a master netting arrangement between a Fund and the counterparty and by the posting of collateral to a Fund to cover a Fund’s exposure to the counterparty.
To the extent a Fund has a policy to limit the net amount owed to or to be received from a single counterparty under existing swap agreements, such limitation only applies to counterparties to OTC swaps and does not apply to centrally cleared swaps where the counterparty is a central counterparty or derivatives clearing organization.
Credit Default Swap Agreements
on corporate, loan, sovereign, U.S. municipal or U.S. Treasury issues are entered into to provide a measure of protection against defaults of the issuers (
, to reduce risk where a Fund owns or has exposure to the referenced obligation) or to take an active long or short position with respect to the likelihood of a particular issuer’s default. Credit default swap agreements involve one party making a stream of payments (referred to as the buyer of protection) to another party (the seller of protection) in exchange for the right to receive a specified return in the event that the referenced entity, obligation or index, as specified in the swap agreement, undergoes a certain credit event. As a seller of protection on credit default swap agreements, a Fund will generally receive from the buyer of protection a fixed rate of income throughout the term of the swap provided that there is no credit event. As the seller, a Fund would effectively add leverage to its portfolio because, in addition to its total net assets, a Fund would be subject to investment exposure on the notional amount of the swap.
If a Fund is a seller of protection and a credit event occurs, as defined under the terms of that particular swap agreement, a Fund will either (i) pay to the buyer of protection an amount equal to the notional amount of the swap and take delivery of the referenced obligation or underlying securities comprising the referenced index or (ii) pay a net settlement amount in the form of cash, securities or other deliverable obligations equal to the notional amount of the swap less the recovery value of the referenced obligation or underlying securities comprising the referenced index. If a Fund is a buyer of protection and a credit event occurs, as defined under the terms of that particular swap agreement, a Fund will either (i) receive from the seller of protection an amount equal to the notional amount of the swap and deliver the referenced obligation, other deliverable obligations or underlying securities comprising the referenced index or (ii) receive a net settlement amount in the form of cash or securities equal to the notional amount of the swap less the recovery value of the referenced obligation or underlying securities comprising the referenced index. Recovery values are estimated by market makers considering either industry standard recovery rates or entity specific factors and considerations until a credit event occurs. If a credit event has occurred, the recovery value is determined by a facilitated auction whereby a minimum number of allowable broker bids, together with a specified valuation method, are used to calculate the settlement value. The ability to deliver other obligations may result in a
| | | | | | |
Notes to Financial Statements | | | | | | |
option (the buyer of protection’s right to choose the deliverable obligation with the lowest value following a credit event).
Credit default swap agreements on corporate or sovereign issues involve one party making a stream of payments to another party in exchange for the right to receive a specified return in the event of a default or other credit event. If a credit event occurs and cash settlement is not elected, a variety of other deliverable obligations may be delivered in lieu of the specific referenced obligation. The ability to deliver other obligations may result in a
option (the buyer of protection’s right to choose the deliverable obligation with the lowest value following a credit event).
Credit default swap agreements on asset-backed securities involve one party making a stream of payments to another party in exchange for the right to receive a specified return in the event that the referenced entity, obligation or index, as specified in the agreement, undergoes a certain credit event. Unlike credit default swaps on corporate, loan, sovereign, U.S. municipal or U.S. Treasury issues, deliverable obligations in most instances would be limited to the specific referenced obligation, or in some cases, specific tranches of the specified reference obligation, as performance for asset-backed securities can vary across deals. Prepayments, principal paydowns, and other writedown or loss events on the underlying mortgage loans will reduce the outstanding principal balance of the referenced obligation. These reductions may be temporary or permanent as defined under the terms of the swap agreement and the notional amount for the swap agreement will be adjusted by corresponding amounts. A Fund may use credit default swaps on asset-backed securities to provide a measure of protection against defaults of the referenced obligation or to take an active long or short position with respect to the likelihood of a particular referenced obligation’s default.
Credit default swap agreements on credit indexes involve one party making a stream of payments to another party in exchange for the right to receive a specified return in the event of a write-down, principal shortfall, interest shortfall or default of all or part of the referenced entities comprising the credit index. A credit index is a basket of credit instruments or exposures designed to be representative of some part of the credit market as a whole. These indexes are made up of reference credits that are judged by a poll of dealers to be the most liquid entities in the credit default swap market based on the sector of the index. Components of the indexes may include, but are not limited to, investment grade securities, high yield securities, asset-backed securities, emerging markets, and/or various credit ratings within each sector. Credit indexes are traded using credit default swaps with standardized terms including a fixed spread and standard maturity dates. An index credit default swap references all the names in the index, and if there is a default, the credit event is settled based on that
name’s weight in the index. The composition of the indexes changes periodically, usually every six months, and for most indexes, each name has an equal weight in the index. Credit default swaps on credit indexes may be used to hedge a portfolio of credit default swaps or bonds, which is less expensive than it would be to buy many credit default swaps to achieve a similar effect. Credit default swaps on indexes are instruments for protecting investors owning bonds against default, and traders use them to speculate on changes in credit quality.
Implied credit spreads, represented in absolute terms, utilized in determining the market value of credit default swap agreements on corporate, loan, sovereign, U.S. municipal or U.S. Treasury issues as of period end, if any, are disclosed in the Notes to Schedules of Investments. They serve as an indicator of the current status of payment/performance risk and represent the likelihood or risk of default for the reference entity. The implied credit spread of a particular referenced entity reflects the cost of buying/selling protection and may include upfront payments required to be made to enter into the agreement. Wider credit spreads represent a deterioration of the referenced entity’s credit soundness and a greater likelihood or risk of default or other credit event occurring as defined under the terms of the agreement. For credit default swap agreements on asset-backed securities and credit indexes, the quoted market prices and resulting values serve as the indicator of the current status of the payment/performance risk. Increasing market values, in absolute terms when compared to the notional amount of the swap, represent a deterioration of the referenced entity’s credit soundness and a greater likelihood or risk of default or other credit event occurring as defined under the terms of the agreement.
The maximum potential amount of future payments (undiscounted) that a Fund as a seller of protection could be required to make under a credit default swap agreement equals the notional amount of the agreement. Notional amounts of each individual credit default swap agreement outstanding as of period end for which a Fund is the seller of protection are disclosed in the Notes to Schedules of Investments. These potential amounts would be partially offset by any recovery values of the respective referenced obligations, upfront payments received upon entering into the agreement, or net amounts received from the settlement of buy protection credit default swap agreements entered into by a Fund for the same referenced entity or entities.
Interest Rate Swap Agreements
may be entered into to help hedge against interest rate risk exposure and to maintain a Fund’s ability to generate income at prevailing market rates. The value of the fixed rate bonds that the Funds hold may decrease if interest rates rise. To help hedge against this risk and to maintain its ability to generate income at prevailing market rates, a Fund may enter into interest rate swap agreements. Interest rate swap agreements involve the exchange by a
| | | | | | |
| | | | December 31, 2023 | | (Unaudited) |
Fund with another party for their respective commitment to pay or receive interest on the notional amount of principal. Certain forms of interest rate swap agreements may include: (i) interest rate caps, under which, in return for a premium, one party agrees to make payments to the other to the extent that interest rates exceed a specified rate, or ‘‘cap,’’ (ii) interest rate floors, under which, in return for a premium, one party agrees to make payments to the other to the extent that interest rates fall below a specified rate, or ‘‘floor,’’ (iii) interest rate collars, under which a party sells a cap and purchases a floor or vice versa in an attempt to protect itself against interest rate movements exceeding given minimum or maximum levels, (iv) callable interest rate swaps, under which the buyer pays an upfront fee in consideration for the right to early terminate the swap transaction in whole, at zero cost and at a predetermined date and time prior to the maturity date, (v) spreadlocks, which allow the interest rate swap users to lock in the forward differential (or spread) between the interest rate swap rate and a specified benchmark, or (vi) basis swaps, under which two parties can exchange variable interest rates based on different segments of money markets.
Total Return Swap Agreements
are entered into to gain or mitigate exposure to the underlying reference asset. Total return swap agreements involve commitments where single or multiple cash flows are exchanged based on the price of an underlying reference asset and on a fixed or variable interest rate. Total return swap agreements may involve commitments to pay interest in exchange for a market-linked return. One counterparty pays out the total return of a specific underlying reference asset, which may include a single security, a basket of securities, or an index, and in return receives a fixed or variable rate. At the maturity date, a net cash flow is exchanged where the total return is equivalent to the return of the underlying reference asset less a financing rate, if any. As a receiver, a Fund would receive payments based on any net positive total return and would owe payments in the event of a net negative total return. As the payer, a Fund would owe payments on any net positive total return, and would receive payments in the event of a net negative total return.
7. PRINCIPAL AND OTHER RISKS
In the normal course of business, the Funds trade financial instruments and enter into financial transactions where risk of potential loss exists due to such things as changes in the market (market risk) or failure or inability of the other party to a transaction to perform (credit and counterparty risk). See below for a detailed description of select principal risks. For a complete list of the principal risks the Funds may be subject to, please see the Principal Risks of the Funds section of the Funds’ annual report dated June 30, 2023.
| | | | | | | | | | | | | | | | |
| | | | | | | | PIMCO Global StocksPLUS
& Income Fund (PGP) | | PIMCO
Strategic
Income Fund,
Inc. (RCS) | | PIMCO
Access
Income
Fund (PAXS) | | PIMCO
Dynamic
Income
Fund (PDI) | | PIMCO
Dynamic
Income
Opportunities
Fund (PDO) |
| | | | | | | |
| Asset Allocation | | | | | | X | | X | | X | | X | | X | | X |
| | | | | | | |
| Call | | | | | | X | | X | | X | | X | | X | | X |
| | | | | | | |
| Collateralized Bond Obligations, Collateralized Loan Obligations and Collateralized Debt Obligations | | | | | | X | | X | | X | | X | | X | | X |
| | | | | | | |
| Confidential Information Access | | | | | | X | | X | | X | | X | | X | | X |
| | | | | | | |
| Contingent Convertible Securities | | | | | | X | | X | | X | | X | | X | | X |
| | | | | | | |
| Convertible Securities | | | | | | X | | X | | X | | X | | X | | X |
| | | | | | | |
| Corporate Debt | | | | | | X | | X | | X | | X | | X | | X |
| | | | | | | |
| Counterparty | | | | | | X | | X | | X | | X | | X | | X |
| | | | | | | |
| “Covenant-lite” Obligations | | | | | | X | | X | | X | | X | | X | | X |
| | | | | | | |
| Credit Default Swaps | | | | | | X | | X | | X | | X | | X | | X |
| | | | | | | |
| Credit | | | | | | X | | X | | X | | X | | X | | X |
| | | | | | | |
| Currency | | | | | | X | | X | | X | | X | | X | | X |
| | | | | | | |
| Cyber Security | | | | | | X | | X | | X | | X | | X | | X |
| | | | | | | |
| Debt Securities | | | | | | X | | X | | X | | X | | X | | X |
| | | | | | | |
| Derivatives | | | | | | X | | X | | X | | X | | X | | X |
| | | | | | | |
| Distressed and Defaulted Securities | | | | | | X | | X | | X | | X | | X | | X |
| | | | | | | |
| Distribution Rate | | | | | | X | | X | | X | | X | | X | | X |
| | | | | | | |
| Emerging Markets | | | | | | X | | X | | X | | X | | X | | X |
| | | | | | | |
| Equity Securities and Related Market | | | | | | X | | X | | X | | X | | X | | X |
| | | | | | | |
| Focused Investment | | | | | | X | | X | | X | | X | | X | | X |
| | | | | | |
Notes to Financial Statements | | | | | | |
| | | | | | | | | | | | | | | | |
| | | | | | | | PIMCO Global StocksPLUS
& Income Fund (PGP) | | PIMCO
Strategic
Income Fund,
Inc. (RCS) | | PIMCO
Access
Income
Fund (PAXS) | | PIMCO
Dynamic
Income
Fund (PDI) | | PIMCO
Dynamic
Income
Opportunities
Fund (PDO) |
| | | | | | | |
| Foreign (Non·U.S.) Investment | | | | | | X | | X | | X | | X | | X | | X |
| | | | | | | |
| Foreign Loan Originations | | | | | | — | | — | | — | | X | | X | | X |
| | | | | | | |
| High Yield Securities | | | | | | X | | X | | X | | X | | X | | X |
| | | | | | | |
| Inflation/Deflation | | | | | | X | | X | | X | | X | | X | | X |
| | | | | | | |
| Inflation-Indexed Security | | | | | | X | | X | | X | | X | | X | | X |
| | | | | | | |
| Interest Rate | | | | | | X | | X | | X | | X | | X | | X |
| | | | | | | |
| Issuer | | | | | | X | | X | | X | | X | | X | | X |
| | | | | | | |
| Leverage | | | | | | X | | X | | X | | X | | X | | X |
| | | | | | | |
| Limited Term | | | | | | — | | — | | — | | X | | — | | X |
| | | | | | | |
| Liquidity | | | | | | X | | X | | X | | X | | X | | X |
| | | | | | | |
| Loan Origination | | | | | | — | | — | | — | | X | | X | | X |
| | | | | | | |
| Loans and Other Indebtedness; Loan Participations and Assignments | | | | | | X | | X | | X | | X | | X | | X |
| | | | | | | |
| Management | | | | | | X | | X | | X | | X | | X | | X |
| | | | | | | |
| Market Discount | | | | | | X | | X | | X | | X | | X | | X |
| | | | | | | |
| Market Disruptions | | | | | | X | | X | | X | | X | | X | | X |
| | | | | | | |
| Market | | | | | | X | | X | | X | | X | | X | | X |
| | | | | | | |
| Mortgage-Related and Other Asset-Backed Securities | | | | | | X | | X | | X | | X | | X | | X |
| | | | | | | |
| Mortgage-Related Derivative Instruments | | | | | | X | | X | | X | | X | | X | | X |
| | | | | | | |
| | | | | | — | | — | | — | | X | | — | | X |
| | | | | | | |
| Operational | | | | | | X | | X | | X | | X | | X | | X |
| | | | | | | |
| Other Investment Companies | | | | | | X | | X | | X | | X | | X | | X |
| | | | | | | |
| Platform | | | | | | — | | — | | — | | X | | X | | X |
| | | | | | | |
| Portfolio Turnover | | | | | | X | | X | | X | | X | | X | | X |
| | | | | | | |
| Potential Conflicts of Interest Risk-Allocation of Investment Opportunities | | | | | | X | | X | | X | | X | | X | | X |
| | | | | | | |
| Preferred Securities | | | | | | X | | X | | X | | X | | X | | X |
| | | | | | | |
| Privacy and Data Security | | | | | | X | | X | | X | | X | | X | | X |
| | | | | | | |
| Private Placement and Restricted Securities | | | | | | X | | X | | X | | X | | X | | X |
| | | | | | | |
| Privately-Issued Mortgage-Related Securities | | | | | | X | | X | | X | | X | | X | | X |
| | | | | | | |
| Real Estate | | | | | | X | | X | | X | | X | | X | | X |
| | | | | | | |
| Regulation S Securities | | | | | | X | | X | | X | | X | | — | | — |
| | | | | | | |
| Regulatory Changes | | | | | | X | | X | | X | | X | | X | | X |
| | | | | | | |
| Regulatory Risk-Commodity Pool Operator | | | | | | X | | X | | X | | X | | X | | X |
| | | | | | | |
| Regulatory Risk-LIBOR | | | | | | — | | — | | — | | X | | X | | X |
| | | | | | | |
| Reinvestment | | | | | | X | | X | | X | | X | | X | | X |
| | | | | | | |
| REIT | | | | | | — | | — | | — | | X | | X | | — |
| | | | | | | |
| Repurchase Agreements | | | | | | X | | X | | X | | X | | X | | X |
| | | | | | | |
| Risk Retention Investment | | | | | | X | | X | | X | | X | | X | | X |
| | | | | | | |
| Securities Lending | | | | | | — | | — | | — | | — | | X | | — |
| | | | | | | |
| Senior Debt | | | | | | X | | X | | X | | X | | X | | X |
| | | | | | | |
| Short Exposure | | | | | | X | | X | | X | | X | | X | | X |
| | | | | | | |
| Smaller Company | | | | | | X | | X | | X | | X | | X | | X |
| | | | | | | |
| Sovereign Debt | | | | | | X | | X | | X | | X | | X | | X |
| | | | | | | |
| Special Purpose Acquisition Companies (“SPACs”) | | | | | | — | | — | | — | | — | | X | | — |
| | | | | | | |
| Structured Investments | | | | | | X | | X | | X | | X | | X | | X |
| | | | | | | |
| Subprime | | | | | | X | | X | | X | | X | | X | | X |
| | | | | | | |
| Subsidiary | | | | | | — | | — | | — | | X | | X | | X |
| | | | | | | |
| Synthetic Convertible Securities | | | | | | X | | X | | X | | X | | X | | X |
| | | | | | | |
| Tax | | | | | | X | | X | | X | | X | | X | | X |
| | | | | | | |
| U.S. Government Securities | | | | | | X | | X | | X | | X | | X | | X |
| | | | | | | |
| Valuation | | | | | | X | | X | | X | | X | | X | | X |
| | | | | | | |
Zero-Coupon Bond, Step-Ups and Securities | | | | | | — | | — | | — | | X | | X | | X |
| | | | | | |
| | | | December 31, 2023 | | (Unaudited) |
Asset Allocation Risk
is the risk that a Fund could lose money as a result of less than optimal or poor asset allocation decisions. A Fund could miss attractive investment opportunities by underweighting markets that subsequently experience significant returns and could lose value by overweighting markets that subsequently experience significant declines.
Call Risk
is the risk that an issuer may exercise its right to redeem a fixed income security earlier than expected (a call). Issuers may call outstanding securities prior to their maturity for a number of reasons (e.g., declining interest rates, changes in credit spreads and improvements in the issuer’s credit quality). If an issuer calls a security in which the Fund has invested, the Fund may not recoup the full amount of its initial investment or may not realize the full anticipated earnings from the investment and may be forced to reinvest in lower- yielding securities, securities with greater credit risks or securities with other, less favorable features.
Collateralized Bond Obligations, Collateralized Loan Obligations and Collateralized Debt Obligations Risk
is the risk that an investment in a CLO, CBO or other CDO depends largely on the type of the collateral securities and the class/tranche of the instrument in which the Fund invests. In addition to the normal risks associated with debt instruments (e.g., interest rate risk and credit risk), CLOs, CBOs and CDOs carry additional risks including, but not limited to: (i) the possibility that distributions from the collateral will not be adequate to make interest or other payments; (ii) the risk that the quality of the collateral may decline in value or default; (iii) the risk that the Fund may invest in CBOs, CLOs or other CDOs that are subordinate to other classes; and (iv) the risk that the complex structure of the security may not be fully understood at the time of investment and may produce disputes with the issuer or others and may produce unexpected investment results.
Confidential Information Access Risk
is the risk that, in managing the Fund (and other PIMCO clients), PIMCO may from time to time have the opportunity to receive material,
non-public
information (“Confidential Information”) about the issuers of certain investments, including, without limitation, senior floating rate loans, other loans and related investments being considered for acquisition by the Fund or held in the Fund’s portfolio. If PIMCO intentionally or unintentionally comes into possession of Confidential Information, it may be unable, potentially for a substantial period of time, to purchase or sell investments to which such Confidential Information relates.
Contingent Convertible Securities Risk
is the risk of investing in contingent convertible securities, including the risk that interest payments will be cancelled by the issuer or a regulatory authority, the risk of ranking junior to other creditors in the event of a liquidation or other bankruptcy-related event as a result of holding subordinated
debt, the risk of the Fund’s investment becoming further subordinated as a result of conversion from debt to equity, the risk that the principal amount due can be written down to a lesser amount (including potentially to zero), and the general risks applicable to fixed income investments, including interest rate risk, credit risk, market risk and liquidity risk, any of which could result in losses to the Fund.
Convertible Securities Risk
is the risk that the market values of convertible securities may decline as interest rates increase and, conversely, may increase as interest rates decline. A convertible security’s market value, however, tends to reflect the market price of the common stock of the issuing company when that stock price approaches or is greater than the convertible security’s “conversion price.” The conversion price is defined as the predetermined price at which the convertible security could be exchanged for the associated stock. As the market price of the underlying common stock declines, the price of the convertible security tends to be influenced more by the yield of the convertible security. Thus, it may not decline in price to the same extent as the underlying common stock. In the event of a liquidation of the issuing company, holders of convertible securities may be paid before the company’s common stockholders but after holders of any senior debt obligations of the company. Consequently, the issuer’s convertible securities generally entail less risk than its common stock but more risk than its debt obligations. Convertible securities are often rated below investment grade or not rated.
Corporate Debt Securities Risk
is the risk that the market value of a corporate debt security may be affected by factors directly relating to the issuer and that the issuers of corporate debt securities may not be able to meet their obligations on interest or principal payments at the time called for by an instrument. The market value of corporate debt securities generally may be expected to rise and fall inversely with interest rates. In addition, certain corporate debt securities may be highly customized and as a result may be subject to, among others, liquidity and valuation/pricing transparency risks.
Counterparty Risk
is the risk that the Fund will be subject to credit risk with respect to the counterparties to the derivative contracts and other instruments entered into by the Fund or held by special purpose or structured vehicles in which the Fund invests. If a counterparty becomes bankrupt or otherwise fails to perform its obligations under a derivative contract due to financial difficulties, the Fund may experience significant delays in obtaining any recovery (including recovery of any collateral it has provided to the counterparty) in a dissolution, assignment for the benefit of creditors, liquidation,
winding-up,
bankruptcy, or other analogous proceeding.
“Covenant-Lite” Obligations Risk
is the risk that covenant-lite obligations contain fewer maintenance covenants than other
| | | | | | |
Notes to Financial Statements | | | | | | |
obligations, or no maintenance covenants, and may not include terms that allow the lender to monitor the performance of the borrower and declare a default if certain criteria are breached. Covenant-lite loans may carry more risk than traditional loans as they allow individuals and corporations to engage in activities that would otherwise be difficult or impossible under a covenant-heavy loan agreement. In the event of default, covenant-lite loans may exhibit diminished recovery values as the lender may not have the opportunity to negotiate with the borrower prior to default.
Credit Default Swaps Risk
is the risk of investing in credit default swaps, including illiquidity risk, counterparty risk, leverage risk and credit risk. A buyer generally also will lose its investment and recover nothing should no credit event occur and the swap is held to its termination date. If a credit event were to occur, the value of any deliverable obligation received by the seller (if any), coupled with the upfront or periodic payments previously received, may be less than the full notional value it pays to the buyer, resulting in a loss of value to the seller. When the Fund acts as a seller of a credit default swap, it is exposed to many of the same risks of leverage described herein. As the seller, a Fund would receive a stream of payments over the term of the swap agreement provided that no event of default has occurred with respect to the referenced debt obligation upon which the swap is based. A Fund would effectively add leverage to its portfolio because, if a default occurs, the stream of payments may stop and, in addition to its total net assets, the Fund would be subject to investment exposure on the notional amount of the swap. In addition, selling credit default swaps may not be profitable for the Fund if no secondary market exists or the Fund is otherwise unable to close out these transactions at advantageous times.
Credit Risk
is the risk that a Fund could lose money if the issuer or guarantor of a fixed income security (including a security purchased with securities lending collateral), the counterparty to a derivatives contract, or the issuer or guarantor of collateral, repurchase agreement or a loan of portfolio securities, is unable or unwilling, or is perceived (whether by market participants, rating agencies, pricing services or otherwise) as unable or unwilling, to make timely principal and/or interest payments or to otherwise honor its financial obligations. The risk that such issuer, guarantor or counterparty is less willing or able to do so is heightened in market environments where interest rates are rising. Securities are subject to varying degrees of credit risk, which are often reflected in credit ratings.
Currency Risk
is the risk that investments denominated in foreign
(non-U.S.)
currencies or that trade in and receive revenues in, foreign
(non-U.S.)
currencies, or derivatives or other instruments that provide exposure to foreign
(non-U.S.)
currencies may decline in value, due to the risk that those currencies will decline in value relative to the U.S.
dollar, or, in the case of hedging positions, that the U.S. dollar will decline in value relative to the currency being hedged.
Cyber Security Risk
is the risk that, as the use of technology, including cloud-based technology, has become more prevalent in the course of business, the Funds have become potentially more susceptible to operational and information security risks resulting from breaches in cyber security. A breach in cyber security refers to both intentional and unintentional cyber events from outside threat actors or internal resources that may, among other things, cause a Fund to lose proprietary information, suffer data corruption and/or destruction, lose operational capacity, result in the unauthorized release or other misuse of confidential information or otherwise disrupt normal business operations. Cyber security failures or breaches may result in financial losses to a Fund and its shareholders.
These failures or breaches may also result in disruptions to business operations, potentially resulting in financial losses; interference with a Fund’s ability to calculate its net asset value, process shareholder transactions or otherwise transact business with shareholders; impediments to trading; violations of applicable privacy and other laws; regulatory fines; penalties; third-party claims in litigation; reputational damage; reimbursement or other compensation costs; additional compliance and cyber security risk management costs and other adverse consequences. In addition, substantial costs may be incurred in order to prevent any cyber incidents in the future. There is also a risk that cyber security breaches may not be detected. The Fund and its shareholders may suffer losses as a result of a cyber security breach related to the Fund, its service providers, trading counterparties or the issuers in which the Fund invests.
Debt Securities Risk
is the risk that prices of bonds and other fixed income securities will generally increase as interest rates fall and decrease as interest rates rise. Income from the Fund’s portfolio may decline if the Fund invests the proceeds from matured, traded or called fixed income securities at market interest rates that are below the portfolio’s current earnings rate. The value of most bond funds and fixed income securities are impacted by changes in interest rates. Bonds and bond funds with longer durations tend to be more sensitive and more volatile than securities with shorter durations; bond prices generally fall as interest rates rise.
Derivatives Risk
is the risk of investing in derivative instruments (such as forwards, futures, swaps and structured securities) and other similar investments, including leverage risk, liquidity risk (which may be heightened for highly-customized derivatives), interest rate risk, market risk, counterparty (including credit) risk, operational risk (such as documentation issues, settlement issues and systems failures), legal risk (such as insufficient documentation, insufficient capacity or authority of
| | | | | | |
| | | | December 31, 2023 | | (Unaudited) |
a counterparty, and issues with the legality or enforceability of a contract), counterparty risk, tax risk and management risk as well as risks arising from changes in applicable requirements, risks arising from margin requirements and risks arising from mispricing or valuation complexity. Changes in the value of a derivative or other similar investments may not correlate perfectly with, and may be more sensitive to market events than, the underlying asset, rate or index, and a Fund could lose more than the initial amount invested. Changes in the value of a derivative or other similar instrument may also create margin delivery or settlement payment obligations for a Fund. A Fund’s use of derivatives or other similar investments may result in losses to the Fund, a reduction in the Fund’s returns and/or increased volatility.
(“OTC”) derivatives or other similar investments are also subject to the risk that a counterparty to the transaction will not fulfill its contractual obligations to the other party, as many of the protections afforded to centrally-cleared derivative transactions might not be available for OTC derivatives or other similar investments. The primary credit risk on derivatives or other similar investments that are exchange-traded or traded through a central clearing counterparty resides with a Fund’s clearing broker, or the clearinghouse. Changes in regulation relating to a registered fund’s use of derivatives and related instruments could potentially limit or impact a Fund’s ability to invest in derivatives, limit a Fund’s ability to employ certain strategies that use derivatives or other similar investments and/or adversely affect the value of derivatives or other similar investments and a Fund’s performance.
Distressed and Defaulted Securities Risk
is the risk of investing in the securities of financially distressed issuers, including the risk of default. These securities may fluctuate more in price and are typically less liquid. Distressed securities generally trade significantly below “par” or fall value. The Fund also will be subject to significant uncertainty as to when, and in what manner, and for what value obligations evidenced by securities of financially distressed issuers will eventually be satisfied.
Distribution Rate Risk
is the risk that, to the extent a Fund seeks to maintain a level distribution rate, the Fund’s distribution rate may be affected by numerous factors, including but not limited to changes in realized and projected market returns, fluctuations in market interest rates, Fund performance and other factors. There can be no assurance that a change in market conditions or other factors will not result in a change in a Fund’s distribution rate or that the rate will be sustainable in the future.
Emerging Markets Risk
is the risk of investing in emerging market securities, primarily increased foreign
(non-U.S.)
investment risk.
Equity Securities and Related Market Risk
is the risk that the value of equity securities, such as common stocks and preferred securities, may decline due to general market conditions which are not specifically
related to a particular company or to factors affecting a particular industry or industries. Equity securities generally have greater price volatility than fixed income securities.
Focused Investment Risk
is the risk that, to the extent that the Fund focuses its investments in a particular industry, country or geographic region, the NAV of its common shares will be more susceptible to events or factors affecting companies in that industry, country or geographic region.
Foreign
(Non-U.S.)
Investment Risk
is the risk that investing in foreign
(non-U.S.)
securities may result in the Fund experiencing more rapid and extreme changes in value than a fund that invests exclusively in securities of U.S. issuers or securities that trade exclusively in U.S. markets due to smaller markets, differing reporting, accounting and auditing standards, increased risk of delayed settlement of portfolio transactions or loss of certificates of portfolio securities, and the risk of unfavorable foreign government actions, including nationalization, expropriation or confiscatory taxation, currency blockage, political changes, diplomatic developments or the imposition of sanctions and other similar measures. Foreign securities may also be less liquid (particularly during market closures due to local holidays or other reasons) and more difficult to value than securities of U.S. issuers.
Foreign Loan Originations Risk
is the risk associated with a Fund originating loans to foreign entities and individuals, including foreign
(non-U.S.)
and emerging market entities and individuals, which may involve risks not ordinarily associated with exposure to loans to U.S. entities and individuals due to more or less governmental supervision and regulation than exists in the U.S. Due to differences in legal systems, there may be difficulty in obtaining or enforcing a court judgment outside the U.S. In addition, to the extent that investments are made in a limited number of countries, events in those countries will have a more significant impact on the Fund. The Fund’s loans to foreign entities and individuals may be subject to risks of increased transaction costs, potential delays in settlement or unfavorable differences between the U.S. economy and foreign economies.
High Yield Securities Risk
is the risk that high yield securities and unrated securities of similar credit quality (commonly known as “junk bonds”) are subject to greater levels of credit, call and liquidity risks, including the risk that a court will subordinate high yield senior debt to other debt of the issuer or take other actions detrimental to holders of the senior debt. High yield securities are considered primarily speculative with respect to the issuer’s continuing ability to make principal and interest payments and may be more volatile than higher-rated securities of similar maturity.
Inflation/Deflation Risk
is the risk that the value of assets or income from the Fund’s investments will be worth less in the future as inflation
| | | | | | |
Notes to Financial Statements | | | | | | |
decreases the value of payments at future dates. As inflation increases, the real value of the Fund’s portfolio could decline. Deflation risk is the risk that prices throughout the economy decline over time. Deflation may have an adverse effect on the creditworthiness of issuers and may make issuer default more likely, which may result in a decline in the value of the Fund’s portfolio and common shares.
Inflation-Indexed Security Risk
is the risk that inflation-indexed debt securities are subject to the effects of changes in market interest rates caused by factors other than inflation (real interest rates). In general, the value of an inflation-indexed security, including TIPS, tends to decrease when real interest rates increase and can increase when real interest rates decrease. Interest payments on inflation-indexed securities are unpredictable and will fluctuate as the principal and interest are adjusted for inflation. There can be no assurance that the inflation index used will accurately measure the real rate of inflation in the prices of goods and services. Any increase in the principal amount of an inflation-indexed debt security will be considered taxable ordinary income for the amount of the increase in the calendar year, even though the Fund will not receive the principal until maturity.
Interest Rate Risk
is the risk that fixed income securities and other instruments in the Fund’s portfolio will fluctuate in value because of a change in interest rates; a fund with a longer average portfolio duration will be more sensitive to changes in interest rates than a fund with a shorter average portfolio duration. Further, in market environments where interest rates are rising, issuers may be less willing or able to make principal and interest payments on fixed income investments when due.
Issuer Risk
is the risk that the value of a security may decline for a reason directly related to the issuer, such as management performance, major litigation, investigations or other controversies, changes in financial condition or credit rating, changes in government regulations affecting the issuer or its competitive environment and strategic initiatives such as mergers, acquisitions or dispositions and the market response to any such initiatives, financial leverage, reputation or reduced demand for the issuer’s goods or services.
Leverage Risk
is the risk that certain transactions of a Fund, such as reverse repurchase agreements, loans of portfolio securities, and the use of when-issued, delayed delivery or forward commitment transactions, or derivative instruments, may give rise to leverage, magnifying gains and losses and causing a Fund to be more volatile than if it had not been leveraged. Leveraging transactions pursued by a Fund may increase its duration and sensitivity to interest rate movements. This means that leverage entails a heightened risk of loss.
Limited Term Risk
is the risk that unless the limited term provision of the Fund’s Declaration of Trust is amended by shareholders in
accordance with the Declaration of Trust, or unless the Fund completes an Eligible Tender Offer and converts to perpetual existence, the Fund will terminate on or about a date specified in the Fund’s Prospectus.
Liquidity Risk
is the risk that a particular investment may be difficult to purchase or sell and that a Fund may be unable to sell illiquid investments at an advantageous time or price or possibly require a Fund to dispose of other investments at unfavorable times or prices in order to satisfy its obligations, which could prevent the Fund from taking advantage of other investment opportunities. Additionally, the market for certain investments may become illiquid under adverse market or economic conditions independent of any specific adverse changes in the conditions of a particular issuer.
Loan Origination Risk
is the risk associated with the fact that a Fund may also seek to originate loans, including, without limitation, residential and/or commercial real estate or mortgage-related loans, consumer loans or other types of loans, which may be in the form of whole loans, secured and unsecured notes, senior and second lien loans, mezzanine loans, bridge loans or similar investments. A Fund may originate loans to corporations and/or other legal entities and individuals, including foreign
(non-U.S.)
entities and individuals. Such borrowers may have credit ratings that are determined by one or more NRSROs or PIMCO to be below investment grade. This may include loans to public or private firms or individuals, such as in connection with housing development projects. The loans the Fund invests in or originates may vary in maturity and/or duration. The Fund is not limited in the amount, size or type of loans it may invest in and/or originate, including with respect to a single borrower or with respect to borrowers that are determined to be below investment grade, other than pursuant to any applicable law. The Fund’s investment in or origination of loans may also be limited by the requirements the Fund intends to observe under Subchapter M of the Code in order to qualify as a RIC. A Fund may subsequently offer such investments for sale to third parties, provided that there is no assurance that a Fund will complete the sale of such an investment. If a Fund is unable to sell, assign or successfully close transactions for the loans that it originates, the Fund will be forced to hold its interest in such loans for an indeterminate period of time. This could result in a Fund’s investments having high exposure to certain borrowers. A Fund will be responsible for the expenses associated with originating a loan (whether or not consummated). This may include significant legal and due diligence expenses, which will be indirectly borne by a Fund and Common Shareholders.
Loans and Other Indebtedness; Loan Participations and Assignments Risk
is the risk that scheduled interest or principal payments will not be made in a timely manner or at all, either of which may adversely affect the values of a loan. Additionally, there is a risk that the collateral underlying a loan may be unavailable or insufficient to satisfy
| | | | | | |
| | | | December 31, 2023 | | (Unaudited) |
a borrower’s obligation, and the Fund could become part owner of any collateral if a loan is foreclosed, subjecting a Fund to costs associated with owning and disposing of the collateral.
In the event of the insolvency of the lender selling a participation, there is a risk that a Fund may be treated as a general creditor of the lender and may not benefit from any
set-off
between the lender and the borrower.
If a loan is foreclosed, the Fund may become owner of the loan’s collateral. The Fund may bear the costs and liabilities associated with owning and holding or disposing of the collateral.
There is the risk that a Fund may have difficulty disposing of loans and loan participations due to the lack of a liquid secondary market for loans and loan participations.
To the extent a Fund acquires loans, including bank loans, the Fund may be subject to greater levels of credit risk, call risk, settlement risk and liquidity risk than funds that do not acquire such instruments.
Management Risk
is the risk that the investment techniques and risk analyses applied by PIMCO will not produce the desired results and that actual or potential conflicts of interest, legislative, regulatory, or tax restrictions, policies or developments may affect the investment techniques available to PIMCO and the individual portfolio manager in connection with managing the Fund and may cause PIMCO to restrict or prohibit participation in certain investments. There is no guarantee that the investment objective of the Fund will be achieved.
Market Discount Risk
is the risk that the price of the Fund’s common shares of beneficial interest will fluctuate with market conditions and other factors. Shares of
closed-end
management investment companies frequently trade at a discount from their net asset value.
Market Disruptions Risk
is the risk of investment and operational risks associated with financial, economic and other global market developments and disruptions, including those arising from war, terrorism, social unrest, recessions, supply chain disruptions, market manipulation, government interventions, defaults and shutdowns, political changes or diplomatic developments, public health emergencies (such as the spread of infectious diseases, pandemics and epidemics) and natural/ environmental disasters, climate-change and climate related events, which can all negatively impact the securities markets , interest rates, auctions, secondary trading, ratings, credit risk, inflation, deflation or other factors relating to the Fund’s investments or PIMCO’s operations and cause a Fund to lose value. Furthermore, events involving limited liquidity, defaults,
non-performance
or other adverse developments that affect financial institutions or the financial services industry generally, or concerns or rumors about any events of
these kinds or other similar risks, have in the past and may in the future lead to market-wide liquidity problems. These events can also impair the technology and other operational systems upon which a Fund’s service providers, including PIMCO as a Fund’s investment adviser, rely, and could otherwise disrupt a Fund’s service providers’ ability to fulfill their obligations to a Fund.
Market Risk
is the risk that the value of securities owned by a Fund may go up or down, sometimes rapidly or unpredictably, due to factors affecting securities markets generally or particular industries or companies.
Mortgage-Related and Other Asset-Backed Securities Risk
is the risk of investing in mortgage-related and other asset-backed securities, including interest rate risk, extension risk, prepayment risk and credit risk.
Mortgage-Related Derivative Instruments Risk
is the risk associated with mortgage-related and other asset-backed instruments, privately- issued mortgage-related securities, the mortgage market, the real estate industry, derivatives and credit default swaps. See “Mortgage- Related and Other Asset-Backed Instruments Risk,” “Privately-Issued Mortgage-Related Securities Risk,” “Derivatives Risk,” and “Credit Default Swaps Risk.”
is the risk of focusing investments in a small number of issuers, including being more susceptible to risks associated with a single economic, political or regulatory occurrence than a more diversified portfolio might be. Funds that are
“non-diversified”
may invest a greater percentage of their assets in the securities of a single issuer (such as bonds issued by a particular state) than funds that are “diversified.”
Operational Risk
is the risk arising from factors such as processing errors, human errors, inadequate or failed internal or external processes, failures in systems and technology, changes in personnel and errors caused by third-party service providers. The occurrence of any of these failures, errors or breaches could result in a loss of information, regulatory scrutiny, reputational damage or other events, any of which could have a material adverse effect on a Fund. While a Fund seeks to minimize such events through controls and oversight, there may still be failures that could cause losses to the Fund.
Other Investment Companies Risk
is the risk that Common Shareholders may be subject to duplicative expenses to the extent the Fund invests in other investment companies. In addition, these other investment companies may utilize leverage, in which case an investment would subject the Fund to additional risks associated with leverage.
| | | | | | |
Notes to Financial Statements | | | | | | |
Platform Risk
is the risk resulting from the fact that the Alt Lending ABS in which the Fund invests are typically not listed on any securities exchange and not registered under the Securities Act. In addition, the Fund anticipates that these instruments may only be sold to a limited number of investors and may have a limited or
non-existent
secondary market. Accordingly, the Fund currently expects that certain of the investments in Alt Lending ABS will face heightened levels of liquidity risk. Although currently there is generally no active reliable, secondary market for certain Alt Lending ABS, a secondary market for these Alt Lending ABS may develop. If the Fund purchases Alt Lending ABS on an alternative lending platform, the Fund will have the right to receive principal and interest payments due on loans underlying the Alt Lending ABS only if the platform servicing the loans receives the borrower’s payments on such loans and passes such payments through to the Fund. If a borrower is unable or fails to make payments on a loan for any reason, the Fund may be greatly limited in its ability to recover any outstanding principal or interest due, as (among other reasons) the Fund may not have direct recourse against the borrower or may otherwise be limited in its ability to directly enforce its rights under the loan, whether through the borrower or the platform through which such loan was originated. For example, the loan may be unsecured or under-collateralized and/or it may be impracticable to commence a legal proceeding against the defaulting borrower.
Portfolio Turnover Risk
is the risk that a high portfolio turnover will result in greater expenses to the Fund, including brokerage commissions or dealer
mark-ups
and other transaction costs on the sale of securities and reinvestments in other securities. Such sales may result in realization of taxable capital gains (including short-term capital gains, which are generally taxed to shareholders at ordinary income tax rates when distributed net of short-term capital losses and net long-term capital losses) and may adversely affect the Fund’s
after-tax
returns.
Potential Conflicts of Interest Risk — Allocation of Investment Opportunities
is the risk that PIMCO’s or any of its affiliate’s interests or the interests of its clients may conflict with those of the Funds and the results of the Fund’s investment activities may differ from those of the Fund’s affiliates, or another account managed by PIMCO or its affiliates, and it is possible that the Fund could sustain losses during periods in which one or more of the Fund’s affiliates and/or other accounts managed by PIMCO or its affiliates, including proprietary accounts, achieve profits on their trading.
Preferred Securities Risk
is the risk that certain preferred securities contain provisions that allow an issuer under certain conditions to skip or defer distributions which may require the Fund to include the amount of the deferred distribution in its taxable income for tax purposes although it does not currently receive such amount in cash. Additionally, preferred securities are subordinated to bonds and other
debt securities in an issuer’s capital structure in terms of priority for corporate income and liquidation payments, and therefore will be subject to greater credit risk than those debt securities. Preferred securities may trade less frequently and in a more limited volume and may be subject to more abrupt or erratic price movements than many other securities, such as common stocks, corporate debt securities and U.S. Government securities.
Privacy and Data Security Risk
is the risk resulting from the fact that the Gramm-Leach-Bliley Act (“GLBA”) and other laws limit the disclosure of certain
non-public
personal information about a consumer to
non-affiliated
third parties and require financial institutions to disclose certain privacy policies and practices with respect to information sharing with both affiliates and
non-affiliated
third parties. Many states and a number of
non-U.S.
jurisdictions have enacted privacy and data security laws requiring safeguards on the privacy and security of consumers’ personally identifiable information. Other laws deal with obligations to safeguard and dispose of private information in a manner designed to avoid its dissemination. Privacy rules adopted by the U.S. Federal Trade Commission and the SEC implement GLBA and other requirements and govern the disclosure of consumer financial information by certain financial institutions, ranging from banks to private investment funds. U.S. platforms following certain models generally are required to have privacy policies that conform to these GLBA and other requirements. In addition, such platforms typically have policies and procedures intended to maintain platform participants’ personal information securely and dispose of it properly.
Private Placement and Restricted Securities Risk
is the risk that securities received in a private placement may be subject to strict restrictions on resale, and there may be no liquid secondary market or ready purchaser for such securities and the risk that the Fund’s investment in securities that have not been registered for public sale, but that are eligible for purchase and sale pursuant to Rule 144A under the Securities Act, may be relatively less liquid than registered securities traded on established securities markets. The Fund may be unable to dispose of such securities when it desires to do so, or at the most favorable time or price. Private placements may also raise
Privately-Issued Mortgage-Related Securities Risk
is the risk of nonpayment because there are no direct or indirect government or agency guarantees of payments in the pools created by
non-governmental
issuers.
Real Estate Risk is the risk
associated with investing in real estate investments, including investments in equity or debt securities issued by private and public real estate investment trusts (“REITs”), real estate operating companies (“REOCs”), private or public real estate-related
| | | | | | |
| | | | December 31, 2023 | | (Unaudited) |
loans and real estate-linked derivative instruments. The Fund will be subject to the risks associated with owning real estate and with the real estate industry generally.
Regulation S Securities Risk
is the risk that Regulation S securities may be less liquid than publicly traded securities and may not be subject to the disclosure and other investor protection requirements that would be applicable if they were publicly traded. Accordingly, Regulation S Securities may involve a high degree of business and financial risk and may result in substantial losses.
Regulatory Changes Risk
is the risk that is associated with the fact that financial entities, such as investment companies and investment advisers, are generally subject to extensive government regulation and intervention. Government regulation and/or intervention may change the way the Fund is regulated, affect the expenses incurred directly by the Fund and the value of its investments, and limit and /or preclude the Fund’s ability to achieve its investment objectives. Government regulation may change frequently and may have significant adverse consequences. The current direction of governments and regulators may have the effect of reducing market liquidity, market resiliency and money supply, whether through higher rates, tighter financial regulations or rule proposals that may prevent funds from participating in certain markets. The Fund and the Investment Manager have historically been eligible for exemptions from certain regulations. However, there is no assurance that the Fund and the Investment Manager will continue to be eligible for such exemptions. Moreover, government regulation may have unpredictable and unintended effects.
Regulatory Risk — Commodity Pool Operator
is the risk associated with the CFTC’s adopted regulations that subject registered investment companies and their investment advisers to regulation by the CFTC if the registered investment company invests more than a prescribed level of its liquidation value in futures, options on futures or commodities, swaps or other financial instruments regulated under the Commodity Exchange Act (“CEA”) and the rules thereunder (“commodity interests”), or if the Fund markets itself as providing investment exposure to such instruments. The Investment Manager is registered with the CFTC as a Commodity Pool Operator.
Regulatory Risk — LIBOR
is the risk related to the discontinuation and replacement of the London Interbank Offered Rate (“LIBOR”). Certain instruments held by a Fund rely or relied in some fashion upon LIBOR. Although the transition process away from LIBOR for most instruments has been completed, some LIBOR use is continuing and there are potential effects related to the transition away from LIBOR or the continued use of LIBOR on a Fund, or on certain instruments in which a Fund invests, which can be difficult to ascertain and could result in losses to a Fund.
Reinvestment Risk
is the risk that income from the Fund’s portfolio will decline if and when the Fund invests the proceeds from matured, traded or called debt obligations at market interest rates that are below the portfolio’s current earnings rate. The Fund also may choose to sell higher yielding portfolio securities and to purchase lower yielding securities to achieve greater portfolio diversification, because the portfolio managers believe the current holdings are overvalued or for other investment-related reasons.
REIT Risk
is the risk associated with investing in REITs, which are pooled investment vehicles that own, and usually operate, income- producing real estate. Some REITs also finance real estate. If a REIT meets certain requirements, including distributing to shareholders substantially all of its taxable income (other than net capital gains), then it is not typically taxed on the income distributed to shareholders. Therefore, REITs may pay higher dividends than other issuers.
Repurchase Agreements Risk
is the risk that, if the party agreeing to repurchase a security should default, the Fund will seek to sell the securities which it holds, which could involve procedural costs or delays in addition to a loss on the securities if their value should fall below their repurchase price.
Risk Retention Investment Risk
is the risk associated with the Fund’s investments in risk retention tranches of commercial mortgage-backed securities (“CMBS”) or other eligible securitizations, if any (“risk retention tranches”), which are eligible residual interests typically held by the sponsors of such securitizations pursuant to the final rules implementing the credit risk retention requirements of Section 941 of the Dodd-Frank Act (the “U.S. Risk Retention Rules”). There can be no assurance that the applicable federal agencies charged with the implementation of the final U.S. Risk Retention Rules (the Federal Deposit Insurance Corporation, the Comptroller of the Currency, the Federal Reserve Board, the SEC, the Department of Housing and Urban Development, and the Federal Housing Finance Agency) could not take positions in the future that differ from the interpretation of such rules taken or embodied in such securitizations, or that the final U.S. Risk Retention Rules will not change. Furthermore, if the Fund breaches any undertakings in any risk retention agreement, it will be exposed to claims by the other parties thereto, including for any losses incurred as a result of such breach, which could be significant and exceed the value of the Fund’s investments.
Securities Lending Risk
is the risk that, when a Fund lends portfolio securities, its investment performance will continue to reflect changes in the value of the securities loaned and lose rights in the collateral or delay in recovery of the collateral if the borrower fails to return the security loaned or becomes insolvent. The Fund may pay lending fees to a party, which may be an affiliate of the Fund, arranging the loan.
| | | | | | |
Notes to Financial Statements | | | | | | |
Senior Debt Risk
is the risk that the Fund may be subject to greater levels of credit risk than funds that do not invest in below investment grade senior debt. The Fund may also be subject to greater levels of liquidity risk than funds that do not invest in senior debt. Restrictions on transfers in loan agreements, a lack of publicly available information and other factors may, in certain instances, make senior debt more difficult to sell at an advantageous time or price than other types of securities or instruments.
Short Exposure Risk
is the risk of entering into short sales or other short positions, including the potential loss of more money than the actual cost of the investment, and the risk that the third party to the short sale or other short position will not fulfill its contractual obligations, causing a loss to a Fund.
Smaller Company Risk
is the risk that the value of securities issued by a smaller company may go up or down, sometimes rapidly and unpredictably as compared to more widely held securities, due to narrow markets and limited resources of smaller companies. A Fund’s investments in smaller companies subject it to greater levels of credit, market and issuer risk.
Sovereign Debt Risk
is the risk that investments in fixed income instruments issued by sovereign entities may decline in value as a result of default or other adverse credit event resulting from an issuer’s inability or unwillingness to make principal or interest payments in a timely fashion.
Special Purpose Acquisition Companies (“SPACs”) Risk
is the risk that, because SPACs and similar entities are in essence “blank check” companies without operating history or ongoing business other than seeking acquisitions, the value of their securities is particularly dependent on the ability of the entity’s management to identify and complete a profitable acquisition. A SPAC’s structure may result in significant dilution of a stockholder’s share value immediately upon the completion of a business combination due to, among other reasons, interests held by the SPAC sponsor, conversion of warrants into additional shares, shares issued in connection with a business combination and/or certain embedded costs. There is no guarantee that the SPACs in which the Fund invests will complete an acquisition or that any acquisitions that are completed will be profitable. Some SPACs may pursue acquisitions only within certain industries or regions, which may increase the volatility of their prices. In addition, these securities, which are typically traded in the
market, may be considered illiquid and/or be subject to restrictions on resale.
Structured Investments Risk
is the risk that the Fund’s investment in structured products, including structured notes, credit-linked notes and other types of structured products bear the risks of the underlying
investments, index or reference obligation and are subject to counterparty risk. The Fund may have the right to receive payments only from the structured product, and generally does not have direct rights against the issuer or the entity that sold the assets to be securitized. Structured products generally entail risks associated with derivative instruments.
Subprime Risk
is the risk that loans, and debt instruments collateralized by loans (including Alt Lending ABS), acquired by the Fund may be subprime in quality, or may become subprime in quality. Although there is no specific legal or market definition of “subprime,” subprime loans are generally understood to refer to loans made to borrowers that display poor credit histories and other characteristics that correlate with a higher default risk. Accordingly, subprime loans, and debt instruments secured by such loans, have speculative characteristics and are subject to heightened risks, including the risk of nonpayment of interest or repayment of principal, and the risks associated with investments in high yield securities. In addition, these instruments could be subject to increased regulatory scrutiny. The Fund is not restricted by any particular borrower credit risk criteria and/or qualifications when acquiring loans or debt instruments collateralized by loans.
Subsidiary Risk
is the risk that, by investing in a Fund’s subsidiary, the Fund would be indirectly exposed to the risks associated with the subsidiary’s investments. Fund subsidiaries are not registered under the 1940 Act and may not be subject to all the investor protections of the 1940 Act. There is no guarantee that the investment objective of a subsidiary will be achieved.
Synthetic Convertible Securities Risk
is the risk that the values of synthetic convertible securities will respond differently to market fluctuations than a traditional convertible security because a synthetic convertible is composed of two or more separate securities or instruments, (such as a debt security and a warrant or option to purchase another security), each with its own market value. Synthetic convertible securities are also subject to the risks associated with derivatives. In addition, if the value of the underlying common stock or the level of the index involved in the convertible element falls below the strike price of the warrant or option, the warrant or option may lose all value.
Tax Risk
is the risk that if, in any year, the Fund were to fail to qualify for treatment as a regulated investment company under the Tax Code, and were ineligible to or did not otherwise cure such failure, the Fund would be subject to tax on its taxable income at corporate rates and, when such income is distributed, shareholders would be subject to a further tax to the extent of the Fund’s current or accumulated earnings and profits.
| | | | | | |
| | | | December 31, 2023 | | (Unaudited) |
U.S. Government Securities Risk
is the risk that the obligations supported by (i) the full faith and credit of the United States, (ii) the right of the issuer to borrow from the U.S. Treasury, (iii) the discretionary authority of the U.S. Government to purchase the agency’s obligations (iv) or only by the credit of the agency, instrumentality or corporation will not be satisfied in full, or that such obligations will decrease in value or default. U.S. government securities are subject to market risk, interest rate risk and credit risk.
Valuation Risk
is the risk that fair value pricing used when market quotations are not readily available may not result in adjustments to the prices of securities or other assets, or that fair value pricing may not reflect actual market value. It is possible that the fair value determined in good faith for a security or other asset will be materially different from quoted or published prices, from the prices used by others for the same security or other asset and/or from the value that actually could be or is realized upon the sale of that security or other asset.
Zero-Coupon Bond,
Step-Ups
and
Securities Risk
is the risk presented by the market prices of
zero-coupon,
step ups and
securities generally being more volatile than the prices of securities that pay interest periodically and in cash and being likely to respond to changes in interest rates to a greater degree than other types of debt securities with similar maturities and credit quality. In addition, as these securities may not pay cash interest, the Fund’s investment exposure to these securities and their risks, including credit risk, will increase during the time these securities are held in the Fund’s portfolio.
In general, a Fund may be subject to additional risks, including, but not limited to, risks related to government regulation and intervention in financial markets, operational risks, risks associated with financial, economic and global market disruptions, and cyber security risks. Please see a Fund’s Prospectus and Statement of Additional Information for a more detailed description of the risks of investing in a Fund. Please see the Important Information section of this report for additional discussion of certain regulatory and market developments that may impact a Fund’s performance.
8. MASTER NETTING ARRANGEMENTS
A Fund may be subject to various netting arrangements (“Master Agreements”) with select counterparties. Master Agreements govern the terms of certain transactions, and are intended to reduce the counterparty risk associated with relevant transactions by specifying credit protection mechanisms and providing standardization that is intended to improve legal certainty. Each type of Master Agreement governs certain types of transactions. Different types of transactions may be traded out of different legal entities or affiliates of a particular organization, resulting in the need for multiple agreements with a
single counterparty. As the Master Agreements are specific to unique operations of different asset types, they allow a Fund to close out and net its total exposure to a counterparty in the event of a default with respect to all the transactions governed under a single Master Agreement with a counterparty. For financial reporting purposes the Statements of Assets and Liabilities generally present derivative assets and liabilities on a gross basis, which reflects the full risks and exposures prior to netting.
Master Agreements can also help limit counterparty risk by specifying collateral posting arrangements at
pre-arranged
exposure levels. Under most Master Agreements, collateral is routinely transferred if the total net exposure to certain transactions (net of existing collateral already in place) governed under the relevant Master Agreement with a counterparty in a given account exceeds a specified threshold, which typically ranges from zero to $250,000 depending on the counterparty and the type of Master Agreement. United States Treasury Bills and U.S. dollar cash are generally the preferred forms of collateral, although other securities may be used depending on the terms outlined in the applicable Master Agreement. Securities and cash pledged as collateral are reflected as assets on the Statements of Assets and Liabilities as either a component of Investments at value (securities) or Deposits with counterparty. Cash collateral received is not typically held in a segregated account and as such is reflected as a liability on the Statements of Assets and Liabilities as Deposits from counterparty. The market value of any securities received as collateral is not reflected as a component of NAV. A Fund’s overall exposure to counterparty risk can change substantially within a short period, as it is affected by each transaction subject to the relevant Master Agreement.
Master Repurchase Agreements and Global Master Repurchase Agreements (individually and collectively “Master Repo Agreements”) govern repurchase, reverse repurchase, and certain sale-buyback transactions between a Fund and select counterparties. Master Repo Agreements maintain provisions for, among other things, initiation, income payments, events of default, and maintenance of collateral. The market value of transactions under the Master Repo Agreement, collateral pledged or received, and the net exposure by counterparty as of period end are disclosed in the Notes to Schedules of Investments.
Master Securities Forward Transaction Agreements (“Master Forward Agreements”) govern certain forward settling transactions, such as TBA securities, delayed-delivery or certain sale-buyback transactions by and between a Fund and select counterparties. The Master Forward Agreements maintain provisions for, among other things, transaction initiation and confirmation, payment and transfer, events of default, termination, and maintenance of collateral. The market value of forward settling transactions, collateral pledged or received, and the net exposure by counterparty as of period end is disclosed in the Notes to Schedules of Investments.
| | | | | | |
Notes to Financial Statements | | | | | | |
Customer Account Agreements and related addenda govern cleared derivatives transactions such as futures, options on futures, and cleared OTC derivatives. Such transactions require posting of initial margin as determined by each relevant clearing agency which is segregated in an account at a futures commission merchant (“FCM”) registered with the CFTC. In the United States, counterparty risk may be reduced as creditors of an FCM cannot have a claim to Fund assets in the segregated account. Portability of exposure reduces risk to the Funds. Variation margin, which reflects changes in market value, is generally exchanged daily, but may not be netted between futures and cleared OTC derivatives unless the parties have agreed to a separate arrangement in respect of portfolio margining. The market value or accumulated unrealized appreciation (depreciation), initial margin posted, and any unsettled variation margin as of period end are disclosed in the Notes to Schedules of Investments.
Prime Broker Arrangements may be entered into to facilitate execution and/or clearing of listed equity option transactions or short sales of equity securities between a Fund and selected counterparties. The arrangements provide guidelines surrounding the rights, obligations, and other events, including, but not limited to, margin, execution, and settlement. These agreements maintain provisions for, among other things, payments, maintenance of collateral, events of default, and termination. Margin and other assets delivered as collateral are typically in the possession of the prime broker and would offset any obligations due to the prime broker. The market values of listed options and securities sold short and related collateral are disclosed in the Notes to Schedules of Investments.
International Swaps and Derivatives Association, Inc. Master Agreements and Credit Support Annexes (“ISDA Master Agreements”) govern bilateral OTC derivative transactions entered into by a Fund with select counterparties. ISDA Master Agreements maintain provisions for general obligations, representations, agreements, collateral posting and events of default or termination. Events of termination include conditions that may entitle counterparties to elect to terminate early and cause settlement of all outstanding transactions under the applicable ISDA Master Agreement. Any election to terminate early could be material to the financial statements. The ISDA Master Agreement may contain additional provisions that add counterparty protection beyond coverage of existing daily exposure if the counterparty has a decline in credit quality below a predefined level or as required by regulation. Similarly, if required by regulation, the Funds may be required to post additional collateral beyond coverage of daily exposure. These amounts, if any, may (or if required by law, will) be segregated with a third-party custodian. To the extent the Funds are required by regulation to post additional collateral beyond coverage of daily exposure, they could potentially incur costs, including in procuring eligible assets to meet collateral requirements, associated with such
posting. The market value of OTC financial derivative instruments, collateral received or pledged, and net exposure by counterparty as of period end are disclosed in the Notes to Schedules of Investments.
9. FEES AND EXPENSES
(a) Management Fee
PIMCO is a majority-owned subsidiary of Allianz Asset Management of America LLC (“Allianz Asset Management”) and serves as the Manager to the Funds, pursuant to an investment management agreement.
Pursuant to the Investment Management Agreements with PIMCO (the “Agreement”), and subject to the supervision of the Board, PIMCO is responsible for providing to each Fund investment guidance and policy direction in connection with the management of the Fund, including oral and written research, analysis, advice, and statistical and economic data and information. In addition, pursuant to the Agreement and subject to the general supervision of the Board, PIMCO, at its expense, provides or causes to be furnished most other supervisory and administrative services the Funds require, including but not limited to, expenses of most third-party service providers (e.g., audit, custodial, legal, transfer agency, printing) and other expenses, such as those associated with insurance, proxy solicitations and mailings for shareholder meetings, NYSE listing and related fees, tax services, valuation services and other services the Funds require for their daily operations. Pursuant to the Agreements, PIMCO receives an annual fee, payable monthly, at the annual rates shown in the table below:
| | | | | | | | |
| | | | | | |
| | |
| PCM Fund, Inc. | | | | | | | 0.900% | |
| | |
PIMCO Global StocksPLUS & Income Fund | | | | | | | 1.105% | |
| | |
| PIMCO Strategic Income Fund, Inc. | | | | | | | 0.955% | |
| | |
| PIMCO Access Income Fund | | | | | | | 1.250% | |
| | |
| PIMCO Dynamic Income Fund | | | | | | | 1.100% | |
| | |
| PIMCO Dynamic Income Opportunities Fund | | | | | | | 1.150% | |
| Management fees calculated based on the Fund’s average daily “total managed assets”. Total managed assets refer to the total assets of the Fund (including assets attributable to any reverse repurchase agreements, borrowings and preferred shares that may be outstanding) minus accrued liabilities (other than liabilities representing reverse repurchase agreements and borrowings). |
| Management fees calculated based on the Fund’s average daily “total managed assets”. Total managed assets refer to the total assets of the Fund (including assets attributable to any preferred shares and borrowings that may be outstanding) minus accrued liabilities (other than liabilities representing borrowings). |
| Management fees calculated based on the Fund’s average daily net asset value (including daily net assets attributable to any preferred shares of the Fund that may be outstanding). |
| Management fees calculated based on the Fund’s average daily “total managed assets”. Total managed assets refer to the total assets of the Fund (including any assets attributable to any reverse repurchase agreements, dollar rolls/buy backs, borrowings and preferred shares that may be outstanding) minus accrued liabilities (other than liabilities representing reverse repurchase agreements, dollar rolls/buy backs and borrowings). |
| Management fees calculated based on the Fund’s average daily “total managed assets.” Total managed assets include total assets of the Fund (including assets attributable to any reverse repurchase agreements, dollar rolls, borrowings and preferred shares that may be outstanding) minus accrued liabilities (other than liabilities representing reverse repurchase agreements, dollar rolls and borrowings). |
| | | | | | |
| | | | December 31, 2023 | | (Unaudited) |
In rendering investment advisory services to each Fund, PIMCO may use the resources of one or more foreign
(non-U.S.)
affiliates that are not registered under the Investment Advisers Act of 1940, as amended (the “Advisers Act”) (the “PIMCO Overseas Affiliates”), to provide portfolio management, research and trading services to a Fund under the Memorandums of Understanding (“MOUs”). Each of the PIMCO Overseas Affiliates are Participating Affiliates of PIMCO as that term is used in relief granted by the staff of the SEC allowing U.S. registered advisers to use investment advisory and trading resources of unregistered advisory affiliates subject to the regulatory supervision of the registered adviser. Each PIMCO Overseas Affiliate and any of their respective employees who provide services to the Funds are considered under the MOUs to be “associated persons” of PIMCO as that term is defined in the Advisers Act for purposes of PIMCO’s required supervision.
(b) Fund Expenses
With respect to each Fund other than PIMCO Access Income Fund and PIMCO Dynamic Income Opportunities Fund, each Fund bears other expenses, which may vary and affect the total level of expenses paid by shareholders, such as (i) salaries and other compensation or expenses, including travel expenses of any of the Fund’s executive officers and employees, if any, who are not officers, directors, shareholders, members, partners or employees of PIMCO or its subsidiaries or affiliates; (ii) taxes and governmental fees, if any, levied against the Fund; (iii) brokerage fees and commissions and other portfolio transaction expenses incurred by or for the Fund (including, without limitation, fees and expenses of outside legal counsel or third-party consultants retained in connection with reviewing, negotiating and structuring specialized loans and other investments made by the Fund, subject to specific or general authorization by the Fund’s Board (for example,
so-called
“broken-deal costs” (e.g., fees, costs, expenses and liabilities, including, for example, due diligence-related fees, costs, expenses and liabilities, with respect to unconsummated investments))); (iv) expenses of the Fund’s securities lending (if any), including any securities lending agent fees, as governed by a separate securities lending agreement; (v) costs, including interest expenses, of borrowing money or engaging in other types of leverage financing, including, without limitation, through the use by the Fund of reverse repurchase agreements, tender option bonds, bank borrowings and credit facilities; (vi) costs, including dividend and/or interest expenses and other costs (including, without limitation, offering and related legal costs, fees to brokers, fees to auction agents, fees to transfer agents, fees to ratings agencies and fees to auditors associated with satisfying ratings agency requirements for preferred shares or other securities issued by the Fund and other related requirements in the Fund’s organizational documents) associated with the Fund’s issuance, offering, redemption and maintenance of preferred shares, commercial paper or other senior securities for the purpose of incurring leverage; (vii) fees and expenses
of any underlying funds or other pooled vehicles in which the Fund invests; (viii) dividend and interest expenses on short positions taken by the Fund; (ix) fees and expenses, including travel expenses, and fees and expenses of legal counsel retained for their benefit, of Trustees who are not officers, employees, partners, shareholders or members of PIMCO or its subsidiaries or affiliates; (x) extraordinary expenses, including extraordinary legal expenses, that may arise, including expenses incurred in connection with litigation, proceedings, other claims, and the legal obligations of the Fund to indemnify its Trustees, officers, employees, shareholders, distributors, and agents with respect thereto; (xi) organizational and offering expenses of the Fund, including with respect to share offerings, such as rights offerings and shelf offerings, following the Fund’s initial offering, and expenses associated with tender offers and other share repurchases and redemptions; and (xii) expenses of the Fund which are capitalized in accordance with U.S. GAAP.
With respect to PIMCO Access Income Fund, the Fund bears other expenses, which may vary and affect the total level of expenses paid by shareholders, such as (i) salaries and other compensation or expenses, including travel expenses, of any of the Fund’s executive officers and employees, if any, who are not officers, directors, shareholders, members, partners or employees of PIMCO or its subsidiaries or affiliates; (ii) taxes and governmental fees, if any, levied against the Fund; (iii) brokerage fees and commissions, and other portfolio transaction expenses incurred by or for the Fund (including, without limitation, fees and expenses of outside legal counsel or third-party consultants retained in connection with reviewing, negotiating, structuring, acquiring, disposing of and/or terminating specialized loans and other investments made by the Fund, any costs associated with originating loans, asset securitizations, alternative lending-related strategies and
so-called
“broker-deal costs” (e.g., fees, costs, expenses and liabilities, including, for example, due diligence-related fees, costs, expenses and liabilities, with respect to unconsummated investments)) (for these purposes, it is understood that “portfolio transaction expenses” shall be interpreted broadly to include, by way of example and without limitation, any expenses relating to the Fund’s investments (including those made by a subsidiary of the Fund) in commercial and residential real estate, including
for-sale
and
for-rent
housing, office, hotel, retail and industrial investments, and/or any other expenses incurred by a direct or indirect portfolio investment of the Fund, such as expenses paid directly by a portfolio investment and other expenses that are capitalized or otherwise embedded into the cost basis of a portfolio investment); (iv) expenses of the Fund’s securities lending (if any), including any securities lending agent fees, as governed by a separate securities lending agreement; (v) costs, including interest expenses, of borrowing money or engaging in other types of leverage financing including, without limitation, through the use by the Fund of
| | | | | | |
Notes to Financial Statements | | | | | | |
reverse repurchase agreements, dollar rolls/buy backs, bank borrowings, credit facilities and tender option bonds; (vi) costs, including dividend and/or interest expenses and other costs (including, without limitation, offering and related legal costs, fees to brokers, fees to auction agents, fees to transfer agents, fees to ratings agencies and fees to auditors associated with satisfying ratings agency requirements for preferred shares or other securities issued by the Fund and other related requirements in the Fund’s organizational documents) associated with the Fund’s issuance, offering, redemption and maintenance of preferred shares, commercial paper or other instruments (such as the use of reverse repurchase agreements, dollar rolls/buy backs, bank borrowings, credit facilities and tender option bonds) for the purpose of incurring leverage; (vii) fees and expenses of any underlying funds or other pooled vehicles in which the Fund invests (except as otherwise agreed to between PIMCO and any such fund or vehicle); (viii) dividend and interest expenses on short positions taken by the Fund; (ix) fees and expenses, including travel expenses, and fees and expenses of legal counsel retained for their benefit, of Trustees who are not officers, employees, partners, shareholders or members of PIMCO or its subsidiaries or affiliates; (x) extraordinary expenses, including extraordinary legal expenses, as may arise, including, without limitation, expenses incurred in connection with litigation, proceedings, other claims, and the legal obligations of the Fund to indemnify its Trustees, officers, employees, shareholders, distributors, and agents with respect thereto; (xi) fees and expenses, including legal, printing and mailing, solicitation and other fees and expenses associated with and incident to shareholder meetings and proxy solicitations involving contested elections of Trustees, shareholder proposals or other
non-routine
matters that are not initiated or proposed by Fund management; (xii) organizational and offering expenses of the Fund, including registration (including share registration fees), legal, marketing, printing, accounting and other expenses, associated with organizing the Fund in its state of jurisdiction and in connection with the initial registration of the Fund under the Act and the initial registration of its Shares under the Securities Act of 1933, as amended (the “Securities Act”), and with respect to share offerings, such as rights offerings and shelf offerings, following the Fund’s initial offering, expenses associated with tender offers and other Share repurchases and redemptions; (xiii) fees and expenses associated with seeking, applying for and obtaining formal exemptive,
no-action
and/or other relief from the SEC in connection with the operation of a managed distribution plan (xiv) expenses of the Fund which are capitalized in accordance with U.S. GAAP.
With respect to PIMCO Dynamic Income Opportunities Fund, the Fund bears other expenses, which may vary and affect the total level of expenses paid by shareholders, such as (i) salaries and other compensation or expenses, including travel expenses, of any of the
Fund’s executive officers and employees, if any, who are not officers, directors, shareholders, members, partners or employees of PIMCO or its subsidiaries or affiliates; (ii) taxes and governmental fees, if any, levied against the Fund; (iii) brokerage fees and commissions, and other portfolio transaction expenses incurred by or for the Fund (including, without limitation, fees and expenses of outside legal counsel or third-party consultants retained in connection with reviewing, negotiating and structuring specialized loans and other investments made by the Fund, and any costs associated with originating loans, asset securitizations, alternative lending-related strategies and
so-called
“broken-deal costs” (e.g., fees, costs, expenses and liabilities, including, for example, due diligence-related fees, costs, expenses and liabilities, with respect to unconsummated investments)); (iv) expenses of the Fund’s securities lending (if any), including any securities lending agent fees, as governed by a separate securities lending agreement; (v) costs, including interest expenses, of borrowing money or engaging in other types of leverage financing including, without limitation, through the use by the Fund of reverse repurchase agreements, dollar rolls, tender option bonds, bank borrowings and credit facilities; (vi) costs, including dividend and/or interest expenses and other costs (including, without limitation, offering and related legal costs, fees to brokers, fees to auction agents, fees to transfer agents, fees to ratings agencies and fees to auditors associated with satisfying ratings agency requirements for preferred shares or other securities issued by the Fund and other related requirements in the Fund’s organizational documents) associated with the Fund’s issuance, offering, redemption and maintenance of preferred shares, commercial paper or other instruments (such as the use of reverse repurchase agreements, dollar rolls, bank borrowings, credit facilities and tender option bonds) for the purpose of incurring leverage; (vii) fees and expenses of any underlying funds or other pooled vehicles in which the Fund invests; (viii) dividend and interest expenses on short positions taken by the Fund; (ix) fees and expenses, including travel expenses, and fees and expenses of legal counsel retained for their benefit, of Trustees who are not officers, employees, partners, shareholders or members of PIMCO or its subsidiaries or affiliates; (x) extraordinary expenses, including extraordinary legal expenses, as may arise, including, without limitation, expenses incurred in connection with litigation, proceedings, other claims, and the legal obligations of the Fund to indemnify its trustees, officers, employees, shareholders, distributors, and agents with respect thereto; (xi) fees and expenses, including legal, printing and mailing, solicitation and other fees and expenses associated with and incident to shareholder meetings and proxy solicitations involving contested elections of trustees, shareholder proposals or other
non-routine
matters that are not initiated or proposed by Fund management; (xii) organizational and offering expenses of the Fund, including registration (including registration fees), legal, marketing, printing, accounting and other expenses,
| | | | | | |
| | | | December 31, 2023 | | (Unaudited) |
associated with organizing the Fund in its state of jurisdiction and in connection with the initial registration of the Fund under the Act, and the rules and regulations thereunder, and the initial registration of its Shares under the Securities Act of 1933, as amended, and with respect to Share offerings, such as rights offerings and shelf offerings, following the Fund’s initial offering, expenses associated with tender offers and other repurchases and redemptions, and fees and expenses associated with seeking, applying for and obtaining formal exemptive,
no-action
and/or other relief from the SEC in connection with the operation of a managed distribution plan; and (xiii) expenses of the Fund which are capitalized in accordance with U.S. GAAP Without limiting the generality or scope of the foregoing, it is understood that the Funds may bear such expenses either directly or indirectly through contracts or arrangements with PIMCO or an affiliated or unaffiliated third party.
Each of the Trustees of the Funds who is not an interested person under Section 2(a)(19) of the Act, (the “Independent Trustees”), also serves as a trustee of a number of other
closed-end
funds for which PIMCO serves as investment manager (together with the Funds, the “PIMCO
Closed-End
Funds”), as well as PIMCO California Flexible Municipal Income Fund, PIMCO Flexible Emerging Markets Income Fund, PIMCO Flexible Credit Income Fund and PIMCO Flexible Municipal Income Fund, each a closed end management investment company managed by PIMCO that is operated as an “interval fund” and PIMCO Managed Accounts Trust, an
open-end
management investment company with multiple series for which PIMCO serves as investment adviser and administrator.
The Funds pay no compensation directly to any Trustee or any other officer who is affiliated with the Manager, all of whom receive remuneration for their services to the Funds from the Manager or its affiliates.
10. RELATED PARTY TRANSACTIONS
The Manager is a related party. Fees payable to this party are disclosed in Note 9, Fees and Expenses, and the accrued related party fee amounts are disclosed on the Statements of Assets and Liabilities.
11. GUARANTEES AND INDEMNIFICATIONS
Under the organizational documents of PIMCO Global StocksPLUS
& Income Fund, PIMCO Access Income Fund, PIMCO Dynamic Income Fund and PIMCO Dynamic Income Opportunities Fund, each Trustee and officer is indemnified, to the extent permitted by the Act, against certain liabilities that may arise out of performance of their duties to the Funds. Under the organizational documents of PCM Fund, Inc., and PIMCO Strategic Income Fund, Inc., each Director and officer is indemnified to the fullest extent permitted by Maryland law and the Act. For PCM Fund, Inc., employees and agents of the Fund are indemnified to the maximum extent permitted by Maryland law and the Act. For PIMCO Strategic Income Fund, Inc., employees and agents of the Fund may be indemnified to the extent determined by the Board and subject to the limitations of the Act. Additionally, in the normal course of business, the Funds enter into contracts that contain a variety of indemnification clauses. The Funds’ maximum exposure under these arrangements is unknown as this would involve future claims that may be made against the Funds that have not yet occurred. However, the Funds have not had prior claims or losses pursuant to these contracts.
12. PURCHASES AND SALES OF SECURITIES
The length of time a Fund has held a particular security is not generally a consideration in investment decisions. A change in the securities held by a Fund is known as “portfolio turnover.” Each Fund may engage in frequent and active trading of portfolio securities to achieve its investment objective(s), particularly during periods of volatile market movements. High portfolio turnover may involve correspondingly greater transaction costs, including brokerage commissions or dealer
mark-ups
and other transaction costs on the sale of securities and reinvestments in other securities, which are borne by the Fund. Such sales may also result in realization of taxable capital gains, including short-term capital gains (which are generally taxed at ordinary income tax rates when distributed to shareholders). The transaction costs associated with portfolio turnover may adversely affect a Fund’s performance. The portfolio turnover rates are reported in the Financial Highlights.
Purchases and sales of securities (excluding short-term investments) for the period ended December 31, 2023, were as follows (amounts in thousands
):
| | | | | | | | | | | | | | | | | | | | |
| | | | | | | | |
| | | | |
| | | | | | | | | | | | | |
| | | | | |
| PCM Fund, Inc. | | | | | | $ | 0 | | | $ | 261 | | | $ | 5,413 | | | $ | 14,577 | |
| | | | | |
Global StocksPLUS & Income Fund | | | | | | | 324,211 | | | | 324,075 | | | | 9,726 | | | | 8,348 | |
| | | | | |
| PIMCO Strategic Income Fund, Inc. | | | | | | | 2,398,365 | | | | 2,357,804 | | | | 48,797 | | | | 17,703 | |
| | | | | |
| PIMCO Access Income Fund | | | | | | | 0 | | | | 0 | | | | 78,848 | | | | 63,183 | |
| | | | | |
| PIMCO Dynamic Income Fund | | | | | | | 0 | | | | 0 | | | | 570,495 | | | | 617,443 | |
| | | | | |
| PIMCO Dynamic Income Opportunities Fund | | | | | | | 193 | | | | 12,911 | | | | 160,601 | | | | 288,774 | |
| A zero balance may reflect actual amounts rounding to less than one thousand. |
| | | | | | |
Notes to Financial Statements | | | | | | |
13. COMMON SHARES OFFERING
PCM Fund, Inc. has the authority to issue 300 million shares of $0.001 par value common stock. PIMCO Strategic Income Fund, Inc. has the authority to issue 500 million shares of $0.00001 par value common stock. PIMCO Access Income Fund (“PAXS”) has the authority to issue 43.3 million shares of $0.00001 par value common shares. Each of PIMCO Global StocksPLUS
& Income Fund, PIMCO Dynamic Income Fund (“PDI”) and PIMCO Dynamic Income Opportunities Fund (“PDO”) has been authorized to issue an unlimited number of Common Shares at a par value of $0.00001 per share (each of the foregoing Fund’s shares as the context requires, “Common Shares”).
As of the end of the reporting period, PDI had an effective registration statement on file with the SEC authorizing the Fund to issue shares through the “shelf” registration process pursuant to Rule 415 under the Securities Act (each, a “Shelf Registration Statement”). Pursuant to such Shelf Registration Statement, PDI may offer and sell Common
Shares having an aggregate offering value of up to $2,000,000,000. PDI may have had one or more prior Shelf Registration Statements in effect during this and/or previous fiscal periods authorizing the sale of additional Common Shares.
As of the end of the reporting period, PDO had an effective registration statement on file with the SEC authorizing the Fund to issue shares through the “shelf” registration process pursuant to Rule 415 under the Securities Act. Pursuant to such Shelf Registration Statement, PDO may offer and sell Common Shares having an aggregate offering value of up to $500,000,000.
PDI and PDO have each entered into a sales agreement (a “Sales Agreement”) with JonesTrading Institutional Services LLC (“JonesTrading”), pursuant to which each respective Fund may offer and sell its Common Shares offered by an applicable prospectus supplement through JonesTrading as its agent in negotiated transactions or transactions that are deemed to be “at the market” as defined in Rule 415 under the Securities Act, including sales made directly on the NYSE or sales made to or through a market maker other than on an exchange, at prices related to the prevailing market prices or at negotiated prices. Each Fund will pay JonesTrading compensation of up to 1.00% of the gross proceeds with respect to sales of the Common Shares actually effected by JonesTrading under its respective Sales Agreement.
The aggregate dollar amount of Common Shares registered under PDI’s and PDO’s Shelf Registration Statement as of the end of the periods described below, as well as the number of Common Shares sold and the total amount of offering proceeds (net of offering costs, if any) received by the Fund under one or more Shelf Registration Statements during the Fund’s most recent and prior fiscal periods were as follows:
| | | | | | | | | | | | | | | | | | | | | | | | |
| | | | | | | | | | |
| | | | | | | | | | | | | | | | | | | |
| | | | | | |
| Common Shares registered (aggregate $) | | | | | | $ | 2,000,000,000 | | | $ | 1,000,000,000 | | | | | | | $ | 500,000,000 | | | $ | 500,000,000 | |
| | | | | | |
| Common Shares sold | | | | | | | 17,986,406 | | | | 33,640,810 | | | | | | | | 1,066,194 | | | | 37,311 | |
| | | | | | |
| Offering proceeds (net of offering costs) | | | | | | | 324,491,453 | | | | 659,396,856 | | | | | | | | 13,728,723 | | | | 526,677 | |
A Fund may not sell any Common Shares at a price below the NAV of such Common Shares, exclusive of any distributing commission or discount. Sales of the Common Shares, if any, may be made in negotiated transactions or transactions that are deemed to be “at the market”, including sales made directly on the NYSE or sales made to or through a market maker other than on an exchange, at prices related to the prevailing market prices or at negotiated prices.
14. BASIS FOR CONSOLIDATION
PIMCO Access Income Fund, PIMCO Dynamic Income Fund, and PIMCO Dynamic Income Opportunities Fund’s subsidiaries were each formed as a wholly owned subsidiary acting as an investment vehicle for the Fund in order to effect certain investments for the Fund consistent with the Fund’s investment objectives and policies in effect from time to time. Each Fund’s investment portfolio has been consolidated and includes the portfolio holdings of the Fund and its subsidiaries. Accordingly, the consolidated financial statements include the accounts of each Fund and its subsidiaries. All inter-company transactions and balances have been eliminated. This structure was established so that certain investments could be held by a separate legal entity from the Fund. See the table below for details regarding the structure, incorporation and relationship as of period end of the subsidiaries.
| | | | | | |
| | | | December 31, 2023 | | (Unaudited) |
| | | | | | | | | | | | | | |
| | | | | | | | | | Subsidiary %
of Consolidated
| |
| | | | |
| PIMCO Access Income Fund | | | | | | PAXSLS I LLC | | | 12/13/2021 | | | | 0.0% | |
| | | | |
| PIMCO Access Income Fund | | | | | | RLM 4355 LLC | | | 12/13/2021 | | | | 0.0% | |
| | | | |
| PIMCO Dynamic Income Fund | | | | | | PCILS I LLC | | | 03/07/2013 | | | | 0.0% | |
| | | | |
| PIMCO Dynamic Income Fund | | | | | | PDILS I LLC | | | 03/12/2013 | | | | 0.0% | |
| | | | |
| PIMCO Dynamic Income Opportunities Fund | | | | | | PDOLS I LLC | | | 01/15/2021 | | | | 0.0% | |
| | | | |
| PIMCO Dynamic Income Opportunities Fund | | | | | | RLM 4365 LLC | | | 01/15/2021 | | | | 0.0% | |
| A zero balance may reflect actual amounts rounding to less than 0.01%. |
15. REGULATORY AND LITIGATION MATTERS
The Funds are not named as defendants in any material litigation or arbitration proceedings and are not aware of any material litigation or claim pending or threatened against them.
The foregoing speaks only as of the date of this report.
16. FEDERAL INCOME TAX MATTERS
Each Fund intends to qualify as a regulated investment company under Subchapter M of the Internal Revenue Code (the “Code”) and distribute all of its taxable income and net realized gains, if applicable, to shareholders. Accordingly, no provision for Federal income taxes has been made.
A Fund may be subject to local withholding taxes, including those imposed on realized capital gains. Any applicable foreign capital gains tax is accrued daily based upon net unrealized gains, and may be payable following the sale of any applicable investments.
In accordance with U.S. GAAP, the Manager has reviewed the Funds’ tax positions for all open tax years. As of December 31, 2023, the Funds have recorded no liability for net unrecognized tax benefits relating to uncertain income tax positions they have taken or expect to take in future tax returns.
The Funds file U.S. federal, state, and local tax returns as required. The Funds’ tax returns are subject to examination by relevant tax authorities until expiration of the applicable statute of limitations, which is generally three years after the filing of the tax return but which can be extended to six years in certain circumstances. Tax returns for open years have incorporated no uncertain tax positions that require a provision for income taxes.
Under the Regulated Investment Company Modernization Act of 2010, a fund is permitted to carry forward any new capital losses for an unlimited period. Additionally, such capital losses that are carried forward will retain their character as either short-term or long-term capital losses rather than being considered all short-term under previous law.
As of their last fiscal year ended June 30, 2023, the Funds had the following post-effective capital losses with no expiration (amounts in thousands
):
| | | | | | | | | | | | |
| | | | | | | | | | |
| | | |
| PCM Fund, Inc. | | | | | | $ | 1,206 | | | $ | 12,859 | |
| | | |
PIMCO Global StocksPLUS & Income Fund | | | | | | | 24,926 | | | | 11,787 | |
| | | |
| PIMCO Strategic Income Fund, Inc. | | | | | | | 32,348 | | | | 53,741 | |
| | | |
| PIMCO Access Income Fund | | | | | | | 37,291 | | | | 13,113 | |
| | | |
| PIMCO Dynamic Income Fund | | | | | | | 293,082 | | | | 371,130 | |
| | | |
| PIMCO Dynamic Income Opportunities Fund | | | | | | | 20,765 | | | | 159,793 | |
| A zero balance may reflect actual amounts rounding to less than one thousand. |
As of December 31, 2023, the aggregate cost and the net unrealized appreciation/(depreciation) of investments for federal income tax purposes are as follows (amounts in thousands
):
| | | | | | | | | | | | | | | | | | | | |
| | | | | | | | | | | | | | | Net Unrealized Appreciation/ (Depreciation) (1) | |
| | | | | |
| PCM Fund, Inc. | | | | | | $ | 151,317 | | | $ | 15,339 | | | $ | (30,217 | ) | | $ | (14,878 | ) |
| | | | | |
PIMCO Global StocksPLUS & Income Fund | | | | | | | 162,111 | | | | 18,297 | | | | (33,488 | ) | | | (15,191 | ) |
| | | | | |
| PIMCO Strategic Income Fund, Inc. | | | | | | | 674,900 | | | | 49,360 | | | | (95,795 | ) | | | (46,435 | ) |
| | | | | |
| PIMCO Access Income Fund | | | | | | | 1,280,153 | | | | 55,722 | | | | (179,672 | ) | | | (123,950 | ) |
| | | | | |
| PIMCO Dynamic Income Fund | | | | | | | 9,192,967 | | | | 690,205 | | | | (1,658,686 | ) | | | (968,481 | ) |
| | | | | |
| PIMCO Dynamic Income Opportunities Fund | | | | | | | 2,814,665 | | | | 114,935 | | | | (564,300 | ) | | | (449,365 | ) |
| A zero balance may reflect actual amounts rounding to less than one thousand. |
| Primary differences, if any, between book and tax net unrealized appreciation/(depreciation) are attributable to wash sale loss deferrals for federal income tax purposes. |
| | | | | | |
Notes to Financial Statements | | | | December 31, 2023 | | (Unaudited) |
17. SUBSEQUENT EVENTS
In preparing these financial statements, the Funds’ management has evaluated events and transactions for potential recognition or disclosure through the date the financial statements were issued.
On January 02, 2024, the following distributions were declared to common shareholders payable February 01, 2024 to shareholders of record on January 12, 2024:
| | | | | | | | |
| PCM Fund, Inc. | | | | | | $ | 0.080000 per common share | |
PIMCO Global StocksPLUS & Income Fund | | | | | | $ | 0.069000 per common share | |
| PIMCO Strategic Income Fund, Inc. | | | | | | $ | 0.051000 per common share | |
| PIMCO Access Income Fund | | | | | | $ | 0.149400 per common share | |
| PIMCO Dynamic Income Fund | | | | | | $ | 0.220500 per common share | |
| PIMCO Dynamic Income Opportunities Fund | | | | | | $ | 0.127900 per common share | |
On February 01, 2024, the following distributions were declared to common shareholders payable March 01, 2024 to shareholders of record on February 12, 2024:
| | | | | | | | |
| PCM Fund, Inc. | | | | | | $ | 0.080000 per common share | |
PIMCO Global StocksPLUS & Income Fund | | | | | | $ | 0.069000 per common share | |
| PIMCO Strategic Income Fund, Inc. | | | | | | $ | 0.051000 per common share | |
| PIMCO Access Income Fund | | | | | | $ | 0.149400 per common share | |
| PIMCO Dynamic Income Fund | | | | | | $ | 0.220500 per common share | |
| PIMCO Dynamic Income Opportunities Fund | | | | | | $ | 0.127900 per common share | |
There were no other subsequent events identified that require recognition or disclosure.
| | | | | | |
| | (abbreviations that may be used in the preceding statements) | | | | (Unaudited) |
| | | | | | | | | | |
| | | | |
Counterparty Abbreviations: | | | | | | | | |
| | | | | |
| | Australia and New Zealand Banking Group | | | | | | | | Nomura Securities International, Inc. |
| | | | | |
| | | | | | Credit Suisse International | | | | |
| | | | | |
| | | | | | Fixed Income Clearing Corporation | | | | Royal Bank of Canada Europe Limited |
| | | | | |
| | | | | | | | | | |
| | | | | |
| | | | | | Goldman Sachs International | | | | RBC (Barbados) Trading Bank Corp. |
| | | | | |
| | | | | | Crédit Agricole Corporate and Investment Bank S.A. | | | | |
| | | | | |
| | | | | | | | | | Citigroup Global Markets Ltd. |
| | | | | |
| | | | | | JP Morgan Chase Bank N.A. | | | | Standard Chartered Bank, London |
| | | | | |
| | Barclays Bank PLC London Branch | | | | J.P. Morgan Securities LLC | | | | |
| | | | | |
| | The Bank of Nova Scotia - Toronto | | | | | | | | |
| | | | | |
| | | | | | Merrill Lynch International | | | | The Toronto-Dominion Bank |
| | | | | |
| | Natixis Securities Americas LLC | | | | | | | | |
| | | | | |
| | | | | | Morgan Stanley & Co. LLC. | | | | |
| | | | | |
| | Canadian Imperial Bank of Commerce | | | | Morgan Stanley Capital Services LLC | | | | Wells Fargo Securities, LLC |
| | | | | |
| | | | | | Morgan Stanley & Co. International PLC | | | | |
| | | | | |
| | Deutsche Bank Securities, Inc. | | | | Mizuho Securities USA LLC | | | | |
| | | | |
| | | | | | | | |
| | | | | |
| | | | | | | | | | |
| | | | | |
| | | | | | | | | | |
| | | | | |
| | | | | | | | | | |
| | | | | |
| | | | | | | | | | |
| | | | | |
| | | | | | | | | | |
| | | | | |
| | Chinese Renminbi (Offshore) | | | | | | | | |
| | | | | |
| | Chinese Renminbi (Mainland) | | | | | | | | |
| | | | |
| | | | | | | | |
| | | | | |
| | Chicago Mercantile Exchange | | | | | | | | |
| | | | |
Index/Spread Abbreviations: | | | | | | | | |
| | | | | |
| | Asset-Backed Securities Index - Home Equity | | | | | | | | Standard & Poor’s 500 Index |
| | | | | |
| | Argentina Badlar Floating Rate Notes | | | | | | | | Secured Overnight Financing Rate |
| | | | | |
| | Canadian Overnight Repo Rate Average | | | | | | | | Sterling Overnight Index Average 3 Month |
| | | | | |
| | | | | | | | | | Sterling Overnight Interbank Average Rate |
| | | | | |
| | | | | | | | | | |
| | | | | |
| | | | | | | | | | |
| | | | |
Municipal Bond or Agency Abbreviations: | | | | | | | | |
| | | | | |
| | American Capital Access Holding Ltd. | | | | | | | | |
| | | | |
| | | | | | | | |
| | | | | |
| | | | | | Designated Activity Company | | | | Real Estate Mortgage Investment Conduit |
| | | | | |
| | | | | | Earnings before Interest, Taxes, Depreciation and Amoritization | | | | |
| | | | | |
| | | | | | Euro Interbank Offered Rate | | | | |
| | | | | |
| | Brazil Interbank Deposit Rate | | | | London Interbank Offered Rate | | | | Interest rate to be determined when loan settles or at the time of funding |
| | | | | |
| | Collateralized Bond Obligation | | | | Monthly payment based on 28-day periods. One year consists of 13 periods. | | | | Tasa de Interés Interbancaria de Equilibrio “Equilibrium Interbank Interest Rate” |
| | | | | |
| | Collateralized Debt Obligation | | | | | | | | |
| | | | | |
| | Collateralized Loan Obligation | | | | | | | | |
For purposes of Section 19 of the Investment Company Act of 1940 (the “Act”), the Funds estimated the periodic sources of any dividends paid during the period covered by this report in accordance with good accounting practice. Pursuant to Rule
19a-1(e)
under the Act, the table below sets forth the actual source information for dividends paid during the six month period ended December 31, 2023 calculated as of each distribution period pursuant to Section 19 of the Act. The information below is not provided for U.S. federal income tax reporting purposes. The tax character of all dividends and distributions is reported on Form
1099-DIV
(for shareholders who receive U.S. federal tax reporting) at the end of each calendar year. See the Financial Highlights section of this report for the tax characterization of distributions determined in accordance with federal income tax regulations for the fiscal year.
| | | | | | | | | | | | | | | | | | | | |
| | | | | | | | Net Realized
Capital Gains* | | | Paid-in Surplus or Other Capital Sources** | | | | |
| | | | | |
| July 2023 | | | | | | $ | 0.0518 | | | $ | 0.0000 | | | $ | 0.0282 | | | $ | 0.0800 | |
| | | | | |
| August 2023 | | | | | | $ | 0.0386 | | | $ | 0.0000 | | | $ | 0.0414 | | | $ | 0.0800 | |
| | | | | |
| September 2023 | | | | | | $ | 0.0443 | | | $ | 0.0000 | | | $ | 0.0357 | | | $ | 0.0800 | |
| | | | | |
| October 2023 | | | | | | $ | 0.0487 | | | $ | 0.0000 | | | $ | 0.0313 | | | $ | 0.0800 | |
| | | | | |
| November 2023 | | | | | | $ | 0.0603 | | | $ | 0.0000 | | | $ | 0.0197 | | | $ | 0.0800 | |
| | | | | |
| December 2023 | | | | | | $ | 0.0391 | | | $ | 0.0000 | | | $ | 0.0409 | | | $ | 0.0800 | |
| | | | | |
PIMCO Global StocksPLUS & Income Fund | | | | | | | | Net Realized
Capital Gains* | | | Paid-in Surplus or Other Capital Sources** | | | | |
| | | | | |
| July 2023 | | | | | | $ | 0.0690 | | | $ | 0.0000 | | | $ | 0.0000 | | | $ | 0.0690 | |
| | | | | |
| August 2023 | | | | | | $ | 0.0690 | | | $ | 0.0000 | | | $ | 0.0000 | | | $ | 0.0690 | |
| | | | | |
| September 2023 | | | | | | $ | 0.0690 | | | $ | 0.0000 | | | $ | 0.0000 | | | $ | 0.0690 | |
| | | | | |
| October 2023 | | | | | | $ | 0.0485 | | | $ | 0.0000 | | | $ | 0.0205 | | | $ | 0.0690 | |
| | | | | |
| November 2023 | | | | | | $ | 0.0690 | | | $ | 0.0000 | | | $ | 0.0000 | | | $ | 0.0690 | |
| | | | | |
| December 2023 | | | | | | $ | 0.0690 | | | $ | 0.0000 | | | $ | 0.0000 | | | $ | 0.0690 | |
| | | | | |
PIMCO Strategic Income Fund, Inc. | | | | | | | | Net Realized
Capital Gains* | | | Paid-in Surplus or Other Capital Sources** | | | | |
| | | | | |
| July 2023 | | | | | | $ | 0.0488 | | | $ | 0.0000 | | | $ | 0.0022 | | | $ | 0.0510 | |
| | | | | |
| August 2023 | | | | | | $ | 0.0505 | | | $ | 0.0000 | | | $ | 0.0005 | | | $ | 0.0510 | |
| | | | | |
| September 2023 | | | | | | $ | 0.0487 | | | $ | 0.0000 | | | $ | 0.0023 | | | $ | 0.0510 | |
| | | | | |
| October 2023 | | | | | | $ | 0.0506 | | | $ | 0.0000 | | | $ | 0.0004 | | | $ | 0.0510 | |
| | | | | |
| November 2023 | | | | | | $ | 0.0478 | | | $ | 0.0000 | | | $ | 0.0032 | | | $ | 0.0510 | |
| | | | | |
| December 2023 | | | | | | $ | 0.0510 | | | $ | 0.0000 | | | $ | 0.0000 | | | $ | 0.0510 | |
| | | | | |
PIMCO Dynamic Income Fund | | | | | | | | Net Realized
Capital Gains* | | | Paid-in Surplus or Other Capital Sources** | | | | |
| | | | | |
| July 2023 | | | | | | $ | 0.1669 | | | $ | 0.0000 | | | $ | 0.0536 | | | $ | 0.2205 | |
| | | | | |
| August 2023 | | | | | | $ | 0.1234 | | | $ | 0.0000 | | | $ | 0.0971 | | | $ | 0.2205 | |
| | | | | |
| September 2023 | | | | | | $ | 0.1325 | | | $ | 0.0000 | | | $ | 0.0880 | | | $ | 0.2205 | |
| | | | | |
| October 2023 | | | | | | $ | 0.1394 | | | $ | 0.0000 | | | $ | 0.0811 | | | $ | 0.2205 | |
| | | | | |
| November 2023 | | | | | | $ | 0.1929 | | | $ | 0.0000 | | | $ | 0.0276 | | | $ | 0.2205 | |
| | | | | |
| December 2023 | | | | | | $ | 0.1608 | | | $ | 0.0000 | | | $ | 0.0597 | | | $ | 0.2205 | |
| | | | | |
PIMCO Dynamic Income Opportunities Fund | | | | | | | | Net Realized
Capital Gains* | | | Paid-in Surplus or Other Capital Sources** | | | | |
| | | | | |
| July 2023 | | | | | | $ | 0.1059 | | | $ | 0.0000 | | | $ | 0.0220 | | | $ | 0.1279 | |
| | | | | |
| August 2023 | | | | | | $ | 0.1001 | | | $ | 0.0000 | | | $ | 0.0278 | | | $ | 0.1279 | |
| | | | | |
| September 2023 | | | | | | $ | 0.1009 | | | $ | 0.0000 | | | $ | 0.0270 | | | $ | 0.1279 | |
| | | | | |
| October 2023 | | | | | | $ | 0.0728 | | | $ | 0.0000 | | | $ | 0.0551 | | | $ | 0.1279 | |
| | | | | |
| November 2023 | | | | | | $ | 0.1279 | | | $ | 0.0000 | | | $ | 0.0000 | | | $ | 0.1279 | |
| | | | | |
| December 2023 | | | | | | $ | 0.1279 | | | $ | 0.0000 | | | $ | 0.0000 | | | $ | 0.1279 | |
| | | | | | | | | | | | | | | | | | | | |
| | | | | | | | Net Realized
Capital Gains* | | | Paid-in Surplus or Other Capital Sources** | | | | |
| | | | | |
| July 2023 | | | | | | $ | 0.1214 | | | $ | 0.0000 | | | $ | 0.0280 | | | $ | 0.1494 | |
| | | | | |
| August 2023 | | | | | | $ | 0.1489 | | | $ | 0.0000 | | | $ | 0.0005 | | | $ | 0.1494 | |
| | | | | |
| September 2023 | | | | | | $ | 0.1128 | | | $ | 0.0000 | | | $ | 0.0366 | | | $ | 0.1494 | |
| | | | | |
| October 2023 | | | | | | $ | 0.1169 | | | $ | 0.0000 | | | $ | 0.0325 | | | $ | 0.1494 | |
| | | | | |
| November 2023 | | | | | | $ | 0.1494 | | | $ | 0.0000 | | | $ | 0.0000 | | | $ | 0.1494 | |
| | | | | |
| December 2023 | | | | | | $ | 0.1117 | | | $ | 0.0000 | | | $ | 0.0377 | | | $ | 0.1494 | |
| * | The source of dividends provided in the table differs, in some respects, from information presented in this report prepared in accordance with generally accepted accounting principles, or U.S. GAAP. For example, net earnings from certain interest rate swap contracts are included as a source of net investment income for purposes of Section 19(a). Accordingly, the information in the table may differ from information in the accompanying financial statements that are presented on the basis of U.S. GAAP and may differ from tax information presented in the footnotes. Amounts shown may include accumulated, as well as fiscal period net income and net profits. |
| ** | Occurs when a fund distributes an amount greater than its accumulated net income and net profits. Amounts are not reflective of a fund’s net income, yield, earnings or investment performance. |
| | | | |
Changes to Portfolio Managers | | | | (Unaudited) |
Effective October 2, 2023, Daniel J. Ivascyn, Alfred T. Murata, Russell Gannaway, Bryan Tsu, and Giang Bui are primarily responsible for the day-to-day management of PIMCO PCM Fund, Inc.
Pacific Investment Management Company LLC
650 Newport Center Drive,
State Street Bank and Trust Company
1100 Main Street, Suite 400
Transfer Agent, Dividend Paying Agent and Registrar
Equiniti Trust Company, LLC (“EQ”)
Independent Registered Public Accounting Firm
PricewaterhouseCoopers LLP
1100 Walnut Street, Suite 1300
This report is submitted for the general information of the shareholders of the Funds listed on the Report cover.
CEF4010SAR_123123
The information required by this Item 2 is only required in an annual report on this Form N-CSR.
| Item 3. | Audit Committee Financial Expert. |
The information required by this Item 3 is only required in an annual report on this Form N-CSR.
| Item 4. | Principal Accountant Fees and Services. |
The information required by this Item 4 is only required in an annual report on this Form N-CSR.
| Item 5. | Audit Committee of Listed Registrants. |
The information required by this Item 5 is only required in an annual report on this Form N-CSR.
| Item 6. | Schedule of Investments. |
The information required by this Item 6 is included as part of the semiannual report to shareholders filed under Item 1 of this Form N-CSR.
| Item 7. | Disclosure of Proxy Voting Policies and Procedures for Closed-End Management Investment Companies. |
The information required by this Item 7 is only required in an annual report on this Form N-CSR.
| Item 8. | Portfolio Managers of Closed-End Management Investment Companies. |
(a)(1)
As of March 4, 2024, the following individuals have primary responsibility for the day-to-day management of the PCM Fund, Inc. (the “Fund”):
Daniel J. Ivascyn - Mr. Ivascyn has been the lead portfolio manager of the Fund since May 2002. Mr. Ivascyn is Group Chief Investment Officer and a managing director in the Newport Beach office. Prior to joining PIMCO in 1998, he worked at Bear Stearns in the asset-backed securities group, as well as T. Rowe Price and Fidelity Investments.
Alfred T. Murata - Mr. Murata has been a portfolio manager of the Fund since June 2017. Mr. Murata is a managing director in the Newport Beach office and a portfolio manager on the mortgage credit team. Prior to joining PIMCO in 2001, he researched and implemented exotic equity and interest rate derivatives at Nikko Financial Technologies.
Russell Gannaway - Mr. Gannaway is a managing director and portfolio manager in the Newport Beach office, focusing on PIMCO’s suite of alternative credit strategies. Mr. Gannaway is a senior member of the Tactical Opportunities portfolio management team and a member of the portfolio committee for several opportunistic credit and real estate funds. Prior to joining PIMCO in 2009, he served as an associate with JER Partners in New York.
Bryan Tsu - Mr. Tsu has been a portfolio manager of the Fund since June 2017. Mr. Tsu is an executive vice president and portfolio manager in the New York office, focusing on commercial mortgage-backed securities and collateralized loan obligations. Prior to joining PIMCO in 2008, he worked at Bear Stearns in New York, syndicating collateralized loan and collateralized debt obligations and other asset-backed transactions.
Giang Bui
Ms. Bui has been a portfolio manager of the Fund since October 2023. Ms. Bui is an executive vice president in the Newport Beach office and a portfolio manager and trader of securitized debt instruments and bank loans, focusing on
collateralized loan obligations (CLOs), leveraged loans, asset-backed collateralized debt obligations, and off-the-run sectors within structured products. Ms Bui joined PIMCO in 2000 and is a member of the bank loan portfolio management team, responsible for bank loan investments and the management of PIMCO-issued CLOs. She has 24 years of investment experience and holds an MBA from the Anderson School of Management at the University of California, Los Angeles and an undergraduate degree from the University of California, San Diego.
(a)(2)
The following summarizes information regarding each of the accounts, excluding the Fund, managed by the Portfolio Managers as of December 31, 2023, including accounts managed by a team, committee, or other group that includes a Portfolio Manager. Unless mentioned otherwise, the advisory fee charged for managing each of the accounts listed below is not based on performance.
| | | | | | | | | | | | |
| | | Registered Investment
Companies | | Other Pooled Investment
Vehicles | | Other Accounts
|
Portfolio Manager | | # | | AUM($million) | | # | | AUM($million) | | # | | AUM($million) |
Daniel J. Ivascyn1 | | 22 | | $184,109.08 | | 24 | | $99,993.65 | | 27 | | $39,157.74 |
Alfred T. Murata2 | | 22 | | $188,475.34 | | 22 | | $46,920.92 | | 6 | | $1,476.14 |
Russell Gannaway3 | | 6 | | $9,876.97 | | 9 | | $13,791.21 | | 0 | | $0.00 |
Bryan Tsu4 | | 17 | | $17,871.22 | | 7 | | $8,689.62 | | 31 | | $63,273.34 |
Giang Bui5 | | 7 | | $5,218.21 | | 3 | | $7,190.21 | | 1 | | $466.66 |
1 Of these Other Pooled Investment Vehicles, 10 accounts totaling $18,483.74 million in assets pay an advisory fee that is based in part on the performance of the accounts. Of these Other Accounts, 1 account totaling $318.34 million in assets pays an advisory fee that is based in part on the performance of the accounts.
2 Of these Other Pooled Investment Vehicles, 5 accounts totaling $8,858.53 million in assets pay an advisory fee that is based in part on the performance of the accounts.
3 Of these Other Pooled Investment Vehicles, 6 accounts totaling $13,603.15 million in assets pay an advisory fee that is based in part on the performance of the accounts.
4 Of these Other Pooled Investment Vehicles, 3 accounts totaling $3,260.56 million in assets pays an advisory fee that is based in part on the performance of the accounts. Of these Other Accounts, 4 accounts totaling $535.16 million in assets pay an advisory fee that is based in part on the performance of the accounts.
5 Of these Other Pooled Investment Vehicles, 2 account(s) totaling $6,783.38 million in assets pay(s) an advisory fee that is based in part on the performance of the accounts.
From time to time, potential and actual conflicts of interest may arise between a portfolio manager’s management of the investments of the Fund, on the one hand, and the management of other accounts, on the other. Potential and actual conflicts of interest may also arise as a result of PIMCO’s other business activities and PIMCO’s possession of material non-public information (“MNPI”) about an issuer. Other accounts managed by a portfolio manager might have similar investment objectives or strategies as the Fund, track the same index the Fund tracks or otherwise hold, purchase, or sell securities that are eligible to be held, purchased or sold by the Fund. The other accounts might also have different investment objectives or strategies than the Fund. Investors should be aware that investments made by the Fund and the results achieved by the Fund at any given time are not expected to be the same as those made by other funds for which PIMCO acts as investment adviser, including funds with names, investment objectives and policies, and/or portfolio
management teams, similar to the Fund. This may be attributable to a wide variety of factors, including, but not limited to, the use of a different strategy or portfolio management team, when a particular fund commenced operations or the size of a particular fund, in each case as compared to other similar funds. Potential and actual conflicts of interest may also arise as a result of PIMCO serving as investment adviser to accounts that invest in the Fund or to accounts in which the Fund invests. In this case, such conflicts of interest could in theory give rise to incentives for PIMCO to, among other things, vote proxies, purchase or redeem shares of the underlying account, or take other actions with respect to the underlying account, in a manner beneficial to the investing account and/or PIMCO but detrimental to the underlying account. Such conflicts of interest could similarly in theory give rise to incentives for PIMCO to, among other things, vote proxies or purchase or redeem shares of the underlying account, or take other actions with respect to the underlying account, in a manner beneficial to the underlying account and/or PIMCO and that may or may not be detrimental to the investing account. For example, even if there is a fee waiver or reimbursement in place relating to the Fund’s investment in an underlying account, or relating to an investing account’s investment in the Fund, this will not necessarily eliminate all conflicts of interest, as PIMCO could nevertheless have a financial incentive to favor investments in PIMCO-affiliated funds and managers (for example, to increase the assets under management of PIMCO or a fund, product or line of business, or otherwise provide support to, certain funds, products or lines of business), which could also impact the manner in which certain transaction fees are set. Conversely, PIMCO’s duties to the Fund, as well as regulatory or other limitations applicable to the Fund, may affect the courses of action available to PIMCO-advised accounts (including the Fund) that invest in the Fund in a manner that is detrimental to such investing accounts. In addition, regulatory restrictions, actual or potential conflicts of interest or other considerations may cause PIMCO to restrict or prohibit participation in certain investments.
Because PIMCO is affiliated with Allianz SE, a large multi-national financial institution (together with its affiliates, “Allianz”), conflicts similar to those described below may occur between the Fund or other accounts managed by PIMCO and PIMCO’s affiliates or accounts managed by those affiliates. Those affiliates (or their clients), which generally operate autonomously from PIMCO, may take actions that are adverse to the Fund or other accounts managed by PIMCO. In many cases, PIMCO will not be in a position to mitigate those actions or address those conflicts, which could adversely affect the performance of the Fund or other accounts managed by PIMCO (each, a “Client,” and collectively, the “Clients”). In addition, because certain Clients are affiliates of PIMCO or have investors who are affiliates or employees of PIMCO, PIMCO may have incentives to resolve conflicts of interest in favor of these Clients over other Clients.
Knowledge and Timing of Fund Trades. A potential conflict of interest may arise as a result of a portfolio manager’s day-to-day management of the Fund. Because of their positions with the Fund, the portfolio managers know the size, timing and possible market impact of the Fund’s trades. It is theoretically possible that the portfolio managers could use this information to the advantage of other accounts they manage and to the possible detriment of the Fund.
Cross Trades. A potential conflict of interest may arise in instances where the Fund buys an instrument from a Client or sells an instrument to a Client (each, a “cross trade”). Such conflicts of interest may arise, among other reasons, as a result of PIMCO representing the interests of both the buying party and the selling party in the cross trade or because the price at which the instrument is bought or sold through a cross trade may not be as favorable as the price that might have been obtained had the trade been executed in the open market. PIMCO effects cross trades when appropriate pursuant to procedures adopted under applicable rules and SEC guidance. Among other things, such procedures require that the cross trade is consistent with the respective investment policies and investment restrictions of both parties and is in the best interests of both the buying and selling accounts.
Investment Opportunities. A potential conflict of interest may arise as a result of a portfolio manager’s management of a number of accounts with varying investment guidelines. Often, an investment opportunity may be suitable for one or more Clients, but may not be available in sufficient quantities for all accounts to participate fully. In addition, regulatory issues applicable to PIMCO or the Fund or other accounts may result in the Fund not receiving securities that may otherwise be appropriate for them. Similarly, there may be limited opportunity to sell an investment held by the Fund and another Client. In addition, regulatory issues applicable to PIMCO or the Fund or other accounts may result in the Fund not receiving securities that may otherwise be appropriate for it. Similarly, there may be limited opportunity to sell an investment held by the Fund and another Client. PIMCO has adopted policies and procedures reasonably designed to allocate investment opportunities on a fair and equitable basis over time. In addition, regulatory issues applicable to PIMCO or one or more Clients may result in certain Clients not receiving securities that may otherwise be appropriate for them.
PIMCO seeks to allocate orders across eligible Client accounts with similar investment guidelines and investment styles fairly and equitably, taking into consideration relevant factors including, among others, applicable investment
restrictions and guidelines, including regulatory restrictions; Client account-specific investment objectives, restrictions and other Client instructions, as applicable; risk tolerances; amounts of available cash; the need to rebalance a Client account’s portfolio (e.g., due to investor contributions and redemptions); whether the allocation would result in a Client account receiving a trivial amount or an amount below the established minimum quantity; regulatory requirements; the origin of the investment; the bases for an issuer’s allocation to PIMCO; and other Client account-specific factors. As part of PIMCO’s trade allocation process, portions of new fixed income investment opportunities are distributed among Client account categories where the relevant portfolio managers seek to participate in the investment. Those portions are then further allocated among the Client accounts within such categories pursuant to PIMCO’s trade allocation policy. Portfolio managers managing quantitative strategies and specialized accounts, such as those focused on international securities, mortgage-backed securities, bank loans, or other specialized asset classes, will likely receive an increased distribution of new fixed income investment opportunities where the investment involves a quantitative strategy or specialized asset class that matches the investment objective or focus of the Client account category. PIMCO seeks to allocate fixed income investments to Client accounts with the general purpose of maintaining consistent concentrations across similar accounts and achieving, as nearly as possible, portfolio characteristic parity among such accounts. Client accounts furthest from achieving portfolio characteristic parity typically receive priority in allocations. With respect to an order to buy or sell an equity security in the secondary market, PIMCO seeks to allocate the order across Client accounts with similar investment guidelines and investment styles fairly and equitably over time, taking into consideration the relevant factors discussed above.
Any particular allocation decision among Client accounts may be more or less advantageous to any one Client or group of Clients, and certain allocations will, to the extent consistent with PIMCO’s fiduciary obligations, deviate from a pro rata basis among Clients in order to address for example, differences in legal, tax, regulatory, risk management, concentration, exposure, Client guideline limitations and/or mandate or strategy considerations for the relevant Clients. PIMCO may determine that an investment opportunity or particular purchases or sales are appropriate for one or more Clients, but not appropriate for other Clients, or are appropriate or suitable for, or available to, Clients but in different sizes, terms, or timing than is appropriate or suitable for other Clients. For example, some Clients have higher risk tolerances than other Clients, such as private funds, which, in turn, allows PIMCO to allocate a wider variety and/or greater percentage of certain types of investments (which may or may not outperform other types of investments) to such Clients. Further, the respective risk tolerances of different types of Clients may change over time as market conditions change. Those Clients receiving an increased allocation as a result of the effect of their respective risk tolerance may be Clients that pay higher investment management fees or that pay incentive fees. In addition, certain Client account categories focusing on certain types of investments or asset classes will be given priority in new issue distribution and allocation with respect to the investments or asset classes that are the focus of their investment mandate. PIMCO may also take into account the bases for an issuer’s allocation to PIMCO, for example, by giving priority allocations to Client accounts holding existing positions in the issuer’s debt if the issuer’s allocation to PIMCO is based on such holdings. PIMCO also may determine not to allocate to or purchase or sell for certain Clients all investments for which all Clients may be eligible. Legal, contractual, or regulatory issues and/or related expenses applicable to PIMCO or one or more Clients may result in certain Clients not receiving securities that may otherwise be appropriate for them or may result in PIMCO selling securities out of Client accounts even if it might otherwise be beneficial to continue to hold them. Additional factors that are taken into account in the distribution and allocation of investment opportunities to Client accounts include, without limitation: ability to utilize leverage and risk tolerance of the Client account; the amount of discretion and trade authority given to PIMCO by the Client; availability of other similar investment opportunities; the Client account’s investment horizon and objectives; hedging, cash and liquidity needs of the portfolio; minimum increments and lot sizes; and underlying benchmark factors. Given all of the foregoing factors, the amount, timing, structuring, or terms of an investment by a Client, including the Fund, may differ from, and performance may be lower than, investments and performance of other Clients, including those that may provide greater fees or other compensation (including performance-based fees or allocations) to PIMCO. PIMCO has also adopted additional procedures to complement the general trade allocation policy that are designed to address potential conflicts of interest due to the side-by-side management of the Fund and certain pooled investment vehicles, including investment opportunity allocation issues.
From time to time, PIMCO may take an investment position or action for one or more Clients that may be different from, or inconsistent with, an action or position taken for one or more other Clients having similar or differing investment objectives. These positions and actions may adversely impact, or in some instances may benefit, one or more affected Clients (including Clients that are PIMCO affiliates) in which PIMCO has an interest, or which pays PIMCO higher fees or a performance fee. For example, a Client may buy a security and another Client may establish a short position in that same security. The subsequent short sale may result in a decrease in the price of the security that the other Client holds.
Similarly, transactions or investments by one or more Clients may have the effect of diluting or otherwise disadvantaging the values, prices or investment strategies of another Client.
When PIMCO implements for one Client a portfolio decision or strategy ahead of, or contemporaneously with, similar portfolio decisions or strategies of another Client, market impact, liquidity constraints or other factors could result in one or more Clients receiving less favorable trading results, the costs of implementing such portfolio decisions or strategies could be increased or such Clients could otherwise be disadvantaged. On the other hand, potential conflicts may also arise because portfolio decisions regarding a Client may benefit other Clients. For example, the sale of a long position or establishment of a short position for a Client may decrease the price of the same security sold short by (and therefore benefit) other Clients, and the purchase of a security or covering of a short position in a security for a Client may increase the price of the same security held by (and therefore benefit) other Clients.
Under certain circumstances, a Client may invest in a transaction in which one or more other Clients are expected to participate, or already have made or will seek to make, an investment. In addition, to the extent permitted by applicable law, a Client may also engage in investment transactions that may result in other Clients being relieved of obligations, or that may cause other Clients to divest certain investments (e.g., a Client may make a loan to, or directly or indirectly acquire securities or indebtedness of, a company that uses the proceeds to refinance or reorganize its capital structure, which could result in repayment of debt held by another Client). Such Clients (or groups of Clients) may have conflicting interests and objectives in connection with such investments, including with respect to views on the operations or activities of the issuer involved, the targeted returns from the investment and the timeframe for, and method of, exiting the investment. When making such investments, PIMCO may do so in a way that favors one Client over another Client, even if both Clients are investing in the same security at the same time. Certain Clients may invest on a “parallel” basis (i.e., proportionately in all transactions at substantially the same time and on substantially the same terms and conditions). In addition, other accounts may expect to invest in many of the same types of investments as another account. However, there may be investments in which one or more of such accounts does not invest (or invests on different terms or on a non-pro rata basis) due to factors such as legal, tax, regulatory, business, contractual or other similar considerations or due to the provisions of a Client’s governing documents. Decisions as to the allocation of investment opportunities among such Clients present numerous conflicts of interest, which may not be resolved in a manner that is favorable to a Client’s interests. To the extent an investment is not allocated pro rata among such entities, a Client could incur a disproportionate amount of income or loss related to such investment relative to such other Client.
In addition, Clients may invest alongside one another in the same underlying investments or otherwise pursuant to a substantially similar investment strategy as one or more other Clients. In such cases, certain Clients may have preferential liquidity and information rights relative to other Clients holding the same investments, with the result that such Clients will be able to withdraw/redeem their interests in underlying investments in priority to Clients who may have more limited access to information or more restrictive withdrawal/redemption rights. Clients with more limited information rights or more restrictive liquidity may therefore be adversely affected in the event of a downturn in the markets.
Further, potential conflicts may be inherent in PIMCO’s use of multiple strategies. For example, conflicts will arise in cases where different Clients invest in different parts of an issuer’s capital structure, including circumstances in which one or more Clients may own private securities or obligations of an issuer and other Clients may own or seek to acquire private securities of the same issuer. For example, a Client may acquire a loan, loan participation or a loan assignment of a particular borrower in which one or more other Clients have an equity investment, or may invest in senior debt obligations of an issuer for one Client and junior debt obligations or equity of the same issuer for another Client.
PIMCO may also, for example, direct a Client to invest in a tranche of a structured finance vehicle, such as a CLO or CDO, where PIMCO is also, at the same or different time, directing another Client to make investments in a different tranche of the same vehicle, which tranche’s interests may be adverse to other tranches. PIMCO may also cause a Client to purchase from, or sell assets to, an entity, such as a structured finance vehicle, in which other Clients may have an interest, potentially in a manner that will have an adverse effect on the other Clients. There may also be conflicts where, for example, a Client holds certain debt or equity securities of an issuer, and that same issuer has issued other debt, equity or other instruments that are owned by other Clients or by an entity, such as a structured finance vehicle, in which other Clients have an interest.
In each of the situations described above, PIMCO may take actions with respect to the assets held by one Client that are adverse to the other Clients, for example, by foreclosing on loans, by putting an issuer into default, or by exercising rights to purchase or sell to an issuer, causing an issuer to take actions adverse to certain classes of securities, or otherwise. In negotiating the terms and conditions of any such investments, or any subsequent amendments or waivers or taking any
other actions, PIMCO may find that the interests of a Client and the interests of one or more other Clients could conflict. In these situations, decisions over items such as whether to make the investment or take an action, proxy voting, corporate reorganization, how to exit an investment, or bankruptcy or similar matters (including, for example, whether to trigger an event of default or the terms of any workout) may result in conflicts of interest. Similarly, if an issuer in which a Client and one or more other Clients directly or indirectly hold different classes of securities (or other assets, instruments or obligations issued by such issuer or underlying investments of such issuer) encounters financial problems, decisions over the terms of any workout will raise conflicts of interests (including, for example, conflicts over proposed waivers and amendments to debt covenants). For example, a debt holder may be better served by a liquidation of the issuer in which it may be paid in full, whereas an equity or junior bond holder might prefer a reorganization that holds the potential to create value for the equity holders. In some cases PIMCO may refrain from taking certain actions or making certain investments on behalf of Clients in order to avoid or mitigate certain conflicts of interest or to prevent adverse regulatory or other effects on PIMCO, or may sell investments for certain Clients (in each case potentially disadvantaging the Clients on whose behalf the actions are not taken, investments not made, or investments sold). In other cases, PIMCO may not refrain from taking actions or making investments on behalf of certain Clients that have the potential to disadvantage other Clients. In addition, PIMCO may take actions or refrain from taking actions in order to mitigate legal risks to PIMCO or its affiliates or its Clients even if disadvantageous to a Client’s account. Moreover, a Client may invest in a transaction in which one or more other Clients are expected to participate, or already have made or will seek to make, an investment.
Additionally, certain conflicts may exist with respect to portfolio managers who make investment decisions on behalf of several different types of Clients. Such portfolio managers may have an incentive to allocate trades, time or resources to certain Clients, including those Clients who pay higher investment management fees or that pay incentive fees or allocations, over other Clients. These conflicts may be heightened with respect to portfolio managers who are eligible to receive a performance allocation under certain circumstances as part of their compensation.
From time to time, PIMCO personnel may come into possession of MNPI which, if disclosed, might affect an investor’s decision to buy, sell or hold a security. Should a PIMCO employee come into possession of MNPI with respect to an issuer, he or she generally will be prohibited from communicating such information to, or using such information for the benefit of, Clients, which could limit the ability of Clients to buy, sell or hold certain investments, thereby limiting the investment opportunities or exit strategies available to Clients. In addition, holdings in the securities or other instruments of an issuer by PIMCO or its affiliates may affect the ability of a Client to make certain acquisitions of or enter into certain transactions with such issuer. PIMCO has no obligation or responsibility to disclose such information to, or use such information for the benefit of, any person (including Clients).
PIMCO maintains one or more restricted lists of companies whose securities are subject to certain trading prohibitions due to PIMCO’s business activities. PIMCO may restrict trading in an issuer’s securities if the issuer is on a restricted list or if PIMCO has MNPI about that issuer. In some situations, PIMCO may restrict Clients from trading in a particular issuer’s securities in order to allow PIMCO to receive MNPI on behalf of other Clients. A Client may be unable to buy or sell certain securities until the restriction is lifted, which could disadvantage the Client. PIMCO may also be restricted from making (or divesting of) investments in respect of some Clients but not others. In some cases PIMCO may not initiate or recommend certain types of transactions, or may otherwise restrict or limit its advice relating to certain securities if a security is restricted due to MNPI or if PIMCO is seeking to limit receipt of MNPI.
PIMCO may conduct litigation or engage in other legal actions on behalf of one or more Clients. In such cases, Clients may be required to bear certain fees, costs, expenses and liabilities associated with the litigation. Other Clients that are or were investors in, or otherwise involved with, the subject investments may or may not (depending on the circumstances) be parties to such litigation actions, with the result that certain Clients may participate in litigation actions in which not all Clients with similar investments may participate, and such non-participating Clients may benefit from the results of such litigation actions without bearing or otherwise being subject to the associated fees, costs, expenses and liabilities. PIMCO, for example, typically does not pursue legal claims on behalf of its separate accounts. Furthermore, in certain situations, litigation or other legal actions pursued by PIMCO on behalf of a Client may be brought against or be otherwise adverse to a portfolio company or other investment held by a Client.
Co-Investments. The 1940 Act imposes significant limits on co-investment with affiliates of the Fund. The Fund has received exemptive relief from the SEC that, to the extent the Fund relies on such relief, permits it to (among other things) co-invest with certain other persons, including certain affiliates of the Investment Manager and certain public or private funds managed by the Investment Manager and its affiliates, subject to certain terms and conditions. Co-investment transactions may give rise to conflicts of interest or perceived conflicts of interest among the Fund and its affiliates. The exemptive relief from the SEC with respect to co-investments imposes extensive conditions on any co-investments made in
reliance on such relief that may limit or restrict the Fund’s ability to participate in an investment or participate in an investment to a lesser extent. An inability to receive the desired allocation to potential investments may affect the Fund’s ability to achieve the desired investment returns. In the event investment opportunities are allocated among the Fund and its affiliates pursuant to co-investment exemptive relief, the Fund may not be able to structure its investment portfolio in the manner desired. Although PIMCO will endeavor to allocate investment opportunities in a fair and equitable manner, the Fund will generally not be permitted to co-invest in any issuer in which a fund managed by PIMCO or any of its downstream affiliates (other than the Fund and its downstream affiliates) currently has an investment. However, the Fund would be able to co-invest with funds managed by PIMCO or any of its downstream affiliates, subject to compliance with existing regulatory guidance, applicable regulations and its allocation procedures. Pursuant to co-investment exemptive relief, the Fund will be able to invest in opportunities in which PIMCO and/or its affiliates has an investment, and PIMCO and/or its affiliates will be able to invest in opportunities in which the Fund has made an investment. From time to time, the Fund and its affiliates may make investments at different levels of an issuer’s capital structure or otherwise in different classes of an issuer’s securities. Such investments inherently give rise to conflicts of interest or perceived conflicts of interest between or among the various classes of securities that may be held by such entities. PIMCO has adopted procedures governing the co-investment in securities acquired in private placements with certain clients of PIMCO.
The foregoing is not a complete list of conflicts to which PIMCO or Clients may be subject. PIMCO seeks to review conflicts on a case-by-case basis as they arise. Any review will take into consideration the interests of the relevant Clients, the circumstances giving rise to the conflict, applicable PIMCO policies and procedures, and applicable laws. Clients (and investors in the Fund) should be aware that conflicts will not necessarily be resolved in favor of their interests and may in fact be resolved in a manner adverse to their interests. PIMCO will attempt to resolve such matters fairly, but even so, matters may be resolved in favor of other Clients which pay PIMCO higher fees or performance fees or in which PIMCO or its affiliates have a significant proprietary interest. There can be no assurance that any actual or potential conflicts of interest will not result in a particular Client or group of Clients receiving less favorable investment terms in or returns from certain investments than if such conflicts of interest did not exist.
Conflicts like those described above may also occur between Clients, on the one hand, and PIMCO or its affiliates, on the other. These conflicts will not always be resolved in favor of the Client. In addition, because PIMCO is affiliated with Allianz, a large multi-national financial institution, conflicts similar to those described above may occur between clients of PIMCO and PIMCO’s affiliates or accounts managed by those affiliates. Those affiliates (or their clients), which generally operate autonomously from PIMCO, may take actions that are adverse to PIMCO’s Clients. In many cases, PIMCO will have limited or no ability to mitigate those actions or address those conflicts, which could adversely affect Client performance. In addition, certain regulatory or internal restrictions may prohibit PIMCO from using certain brokers or investing in certain companies (even if such companies are not affiliated with Allianz) because of the applicability of certain laws and regulations or internal Allianz policies applicable to PIMCO, Allianz SE or their affiliates. An account’s willingness to negotiate terms or take actions with respect to an investment may also be, directly or indirectly, constrained or otherwise impacted to the extent Allianz SE, PIMCO, and/or their affiliates, directors, partners, managers, members, officers or personnel are also invested therein or otherwise have a connection to the subject investment (e.g., serving as a trustee or board member thereof).
Performance Fees. A portfolio manager may advise certain accounts with respect to which the advisory fee is based entirely or partially on performance. Performance fee arrangements may create a conflict of interest for the portfolio manager in that the portfolio manager may have an incentive to allocate the investment opportunities that he or she believes might be the most profitable to such other accounts instead of allocating them to the Fund. PIMCO has adopted policies and procedures reasonably designed to allocate investment opportunities between the Fund and such other accounts on a fair and equitable basis over time.
Certain service providers to the Fund are expected to be owned by or otherwise related to or affiliated with a Client, and in certain cases, such service providers are expected to be, or are owned by, employed by, or otherwise related to, PIMCO, Allianz SE, their affiliates and/or their respective employees, consultants and other personnel. PIMCO may, in its sole discretion, determine to provide, or engage or recommend an affiliate of PIMCO to provide, certain services to the Fund, instead of engaging or recommending one or more third parties to provide such services. Subject to the governance requirements of a particular fund and applicable law, PIMCO or its affiliates, as applicable, will receive compensation in connection with the provision of such services. As a result, PIMCO faces a conflict of interest when selecting or recommending service providers for the Fund. Fees paid to an affiliated service provider will be determined in PIMCO’s commercially reasonable discretion, taking into account the relevant facts and circumstances, and consistent with PIMCO’s responsibilities. Although PIMCO has adopted various policies and procedures intended to mitigate or otherwise
manage conflicts of interest with respect to affiliated service providers, there can be no guarantee that such policies and procedures (which may be modified or terminated at any time in PIMCO’s sole discretion) will be successful.
(a)(3)
As of December 31, 2023, the following explains the compensation structure of the individuals who have primary responsibility for day-to-day portfolio management of the Fund:
Portfolio Manager Compensation
PIMCO and its affiliates approach to compensation seeks to provide professionals with a compensation process that is driven by values of collaboration, openness, responsibility and excellence.
Generally, compensation packages consist of three components. The compensation program for portfolio managers is designed to align with clients’ interests, emphasizing each portfolio manager’s ability to generate long-term investment success for clients, among other factors. A portfolio manager’s compensation is not based solely on the performance of the Fund or any other account managed by that portfolio manager:
Base Salary – Base salary is determined based on core job responsibilities, positions/levels and market factors. Base salary levels are reviewed annually, when there is a significant change in job responsibilities or position, or a significant change in market levels.
Variable Compensation – In addition to a base salary, portfolio managers have a variable component of their compensation, which is based on a combination of individual and company performance and includes both qualitative and quantitative factors. The following non-exhaustive list of qualitative and quantitative factors is considered when determining total compensation for portfolio managers:
| | • | | Performance measured over a variety of longer- and shorter-term periods, including 5-year, 4-year, 3-year, 2-year and 1-year dollar-weighted and account-weighted, pre-tax total and risk-adjusted investment performance as judged against the applicable benchmarks (which may include internal investment performance-related benchmarks) for each account managed by a portfolio manager (including the Fund) and relative to applicable industry peer groups and; |
| | • | | Amount and nature of assets managed by the portfolio manager. |
The variable compensation component of an employee’s compensation may include a deferred component. The deferred portion will generally be subject to vesting and may appreciate or depreciate based on the performance of PIMCO and/or its affiliates. PIMCO’s Long-Term Incentive Plan provides participants with deferred cash awards that appreciate or depreciate based on PIMCO’s operating earnings over a rolling three-year period.
Portfolio managers who are Managing Directors of PIMCO receive compensation from a non-qualified profit sharing plan consisting of a portion of PIMCO’s net profits. Portfolio managers who are Managing Directors receive an amount determined by the Compensation Committee, based upon an individual’s overall contribution to the firm.
(a)(4)
The following summarizes the dollar range of securities of the Fund the Portfolio Managers beneficially owned as of December 31, 2023:
| | |
| Portfolio Manager | | Dollar Range of Equity Securities of the Fund Owned as of December 31, 2023 |
Daniel J. Ivascyn | | $500,001 - $1,000,000 |
Alfred T. Murata | | None |
Russell Gannaway | | None |
Bryan Tsu | | $10,001 - $50,000 |
| Item 9. | Purchases of Equity Securities by Closed-End Management Investment Company and Affiliated Purchasers. |
None.
| Item 10. | Submission of Matters to a Vote of Security Holders. |
There have been no material changes to the procedures by which shareholders may recommend nominees to the Fund’s Board of Trustees since the Fund last provided disclosure in response to this item.
| Item 11. | Controls and Procedures. |
| | (a) | The principal executive officer and principal financial & accounting officer have concluded as of a date within 90 days of the filing date of this report, based on their evaluation of the Registrant’s disclosure controls and procedures (as defined in Rule 30a-3(c) under the 1940 Act), that the design of such procedures is effective to provide reasonable assurance that material information required to be disclosed by the Registrant on Form N-CSR is recorded, processed, summarized and reported within the time periods specified in the Commission’s rules and forms. |
| | (b) | There were no changes in the Registrant’s internal control over financial reporting (as defined in Rule 30a-3(d) under the 1940 Act (17 CFR 270.30a-3(d))) that occurred during the period covered by this report that have materially affected, or are reasonably likely to materially affect, the Registrant’s internal control over financial reporting. |
| Item 12. | Disclosure of Securities Lending Activities for Closed-End Management Investment Companies. |
None.
Signatures
Pursuant to the requirements of the Securities Exchange Act of 1934 and the Investment Company Act of 1940, the registrant has duly caused this report to be signed on its behalf by the undersigned, thereunto duly authorized.
| | |
|
| PCM Fund, Inc. |
| |
| By: | | /s/ Joshua D. Ratner |
| | |
| | Joshua D. Ratner |
| | President (Principal Executive Officer) |
| |
| Date: | | March 4, 2024 |
Pursuant to the requirements of the Securities Exchange Act of 1934 and the Investment Company Act of 1940, this report has been signed below by the following persons on behalf of the registrant and in the capacities and on the dates indicated.
| | |
| By: | | /s/ Joshua D. Ratner |
| | |
| | Joshua D. Ratner |
| | President (Principal Executive Officer) |
| |
| Date: | | March 4, 2024 |
| |
| By: | | /s/ Bijal Y. Parikh |
| | |
| | Bijal Y. Parikh |
| | Treasurer (Principal Financial & Accounting Officer) |
| |
| Date: | | March 4, 2024 |