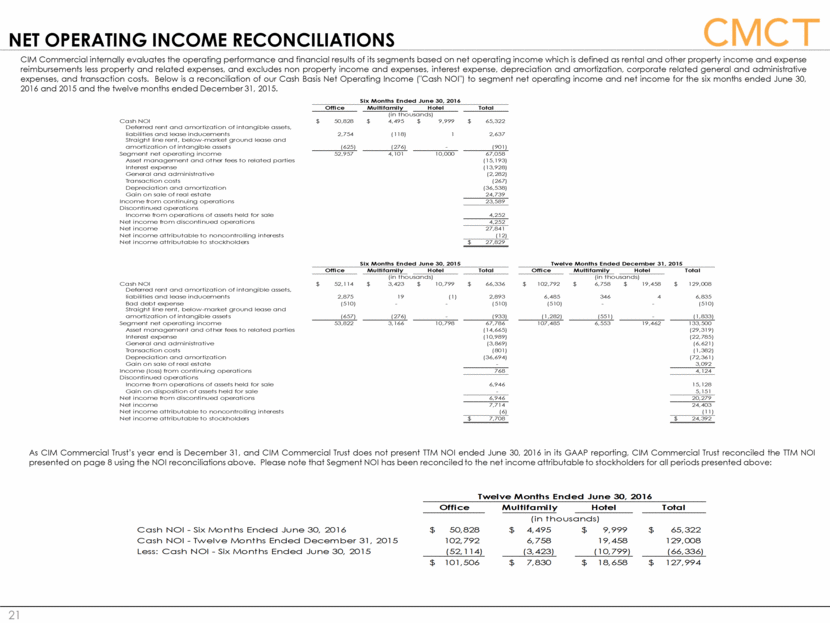
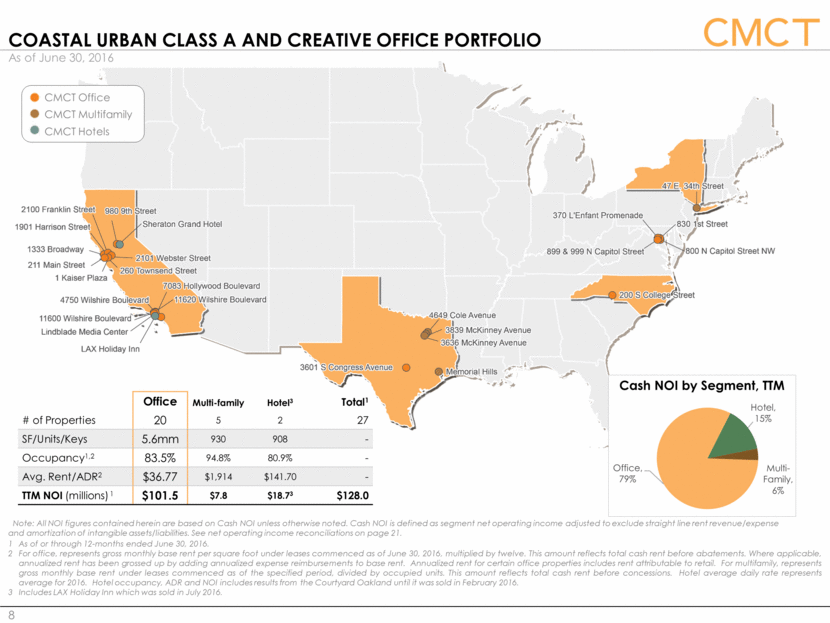
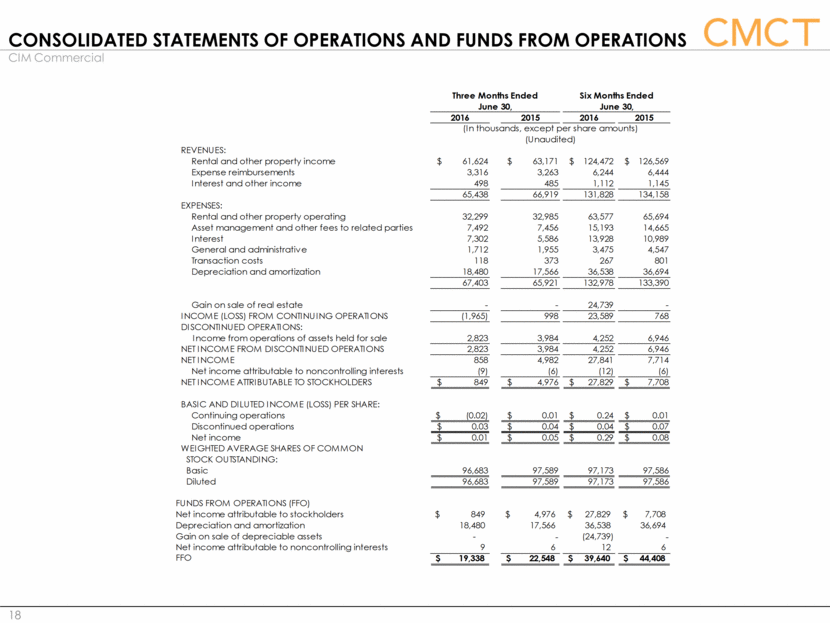
Net operating income Reconciliations 21 CIM Commercial internally evaluates the operating performance and financial results of its segments based on net operating income which is defined as rental and other property income and expense reimbursements less property and related expenses, and excludes non property income and expenses, interest expense, depreciation and amortization, corporate related general and administrative expenses, and transaction costs. Below is a reconciliation of our Cash Basis Net Operating Income ("Cash NOI") to segment net operating income and net income for the six months ended June 30, 2016 and 2015 and the twelve months ended December 31, 2015. As CIM Commercial Trust’s year end is December 31, and CIM Commercial Trust does not present TTM NOI ended June 30, 2016 in its GAAP reporting, CIM Commercial Trust reconciled the TTM NOI presented on page 8 using the NOI reconciliations above. Please note that Segment NOI has been reconciled to the net income attributable to stockholders for all periods presented above: Six Months Ended June 30, 2016 Office Multifamily Hotel Total (in thousands) Cash NOI $ 50,828 $ 4,495 $ 9,999 $ 65,322 Deferred rent and amortization of intangible assets, liabilities and lease inducements 2,754 (118) 1 2,637 Straight line rent, below-market ground lease and amortization of intangible assets (625) (276) - (901) Segment net operating income 52,957 4,101 10,000 67,058 Asset management and other fees to related parties (15,193) Interest expense (13,928) General and administrative (2,282) Transaction costs (267) Depreciation and amortization (36,538) Gain on sale of real estate 24,739 Income from continuing operations 23,589 Discontinued operations Income from operations of assets held for sale 4,252 Net income from discontinued operations 4,252 Net income 27,841 Net income attributable to noncontrolling interests (12) Net income attributable to stockholders $ 27,829 Six Months Ended June 30, 2015 Twelve Months Ended December 31, 2015 Office Multifamily Hotel Total Office Multifamily Hotel Total (in thousands) (in thousands) Cash NOI $ 52,114 $ 3,423 $ 10,799 $ 66,336 $ 102,792 $ 6,758 $ 19,458 $ 129,008 Deferred rent and amortization of intangible assets, liabilities and lease inducements 2,875 19 (1) 2,893 6,485 346 4 6,835 Bad debt expense (510) - - (510) (510) - - (510) Straight line rent, below-market ground lease and amortization of intangible assets (657) (276) - (933) (1,282) (551) - (1,833) Segment net operating income 53,822 3,166 10,798 67,786 107,485 6,553 19,462 133,500 Asset management and other fees to related parties (14,665) (29,319) Interest expense (10,989) (22,785) General and administrative (3,869) (6,621) Transaction costs (801) (1,382) Depreciation and amortization (36,694) (72,361) Gain on sale of real estate - 3,092 Income (loss) from continuing operations 768 4,124 Discontinued operations Income from operations of assets held for sale 6,946 15,128 Gain on disposition of assets held for sale - 5,151 Net income from discontinued operations 6,946 20,279 Net income 7,714 24,403 Net income attributable to noncontrolling interests (6) (11) Net income attributable to stockholders $ 7,708 $ 24,392 Twelve Months Ended June 30, 2016 Office Multifamily Hotel Total (in thousands) Cash NOI - Six Months Ended June 30, 2016 $ 50,828 $ 4,495 $ 9,999 $ 65,322 Cash NOI - Twelve Months Ended December 31, 2015 102,792 6,758 19,458 129,008 Less: Cash NOI - Six Months Ended June 30, 2015 (52,114) (3,423) (10,799) (66,336) $ 101,506 $ 7,830 $ 18,658 $ 127,994
