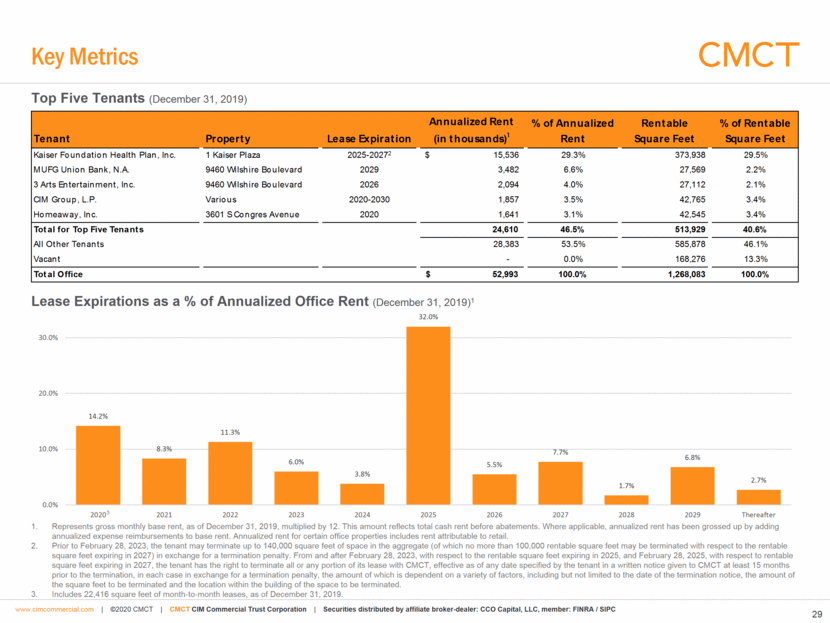
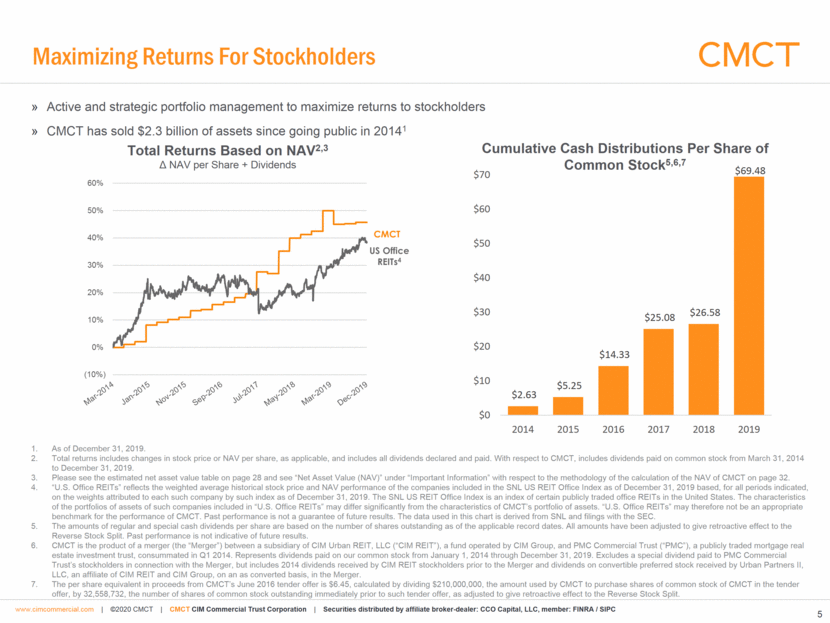
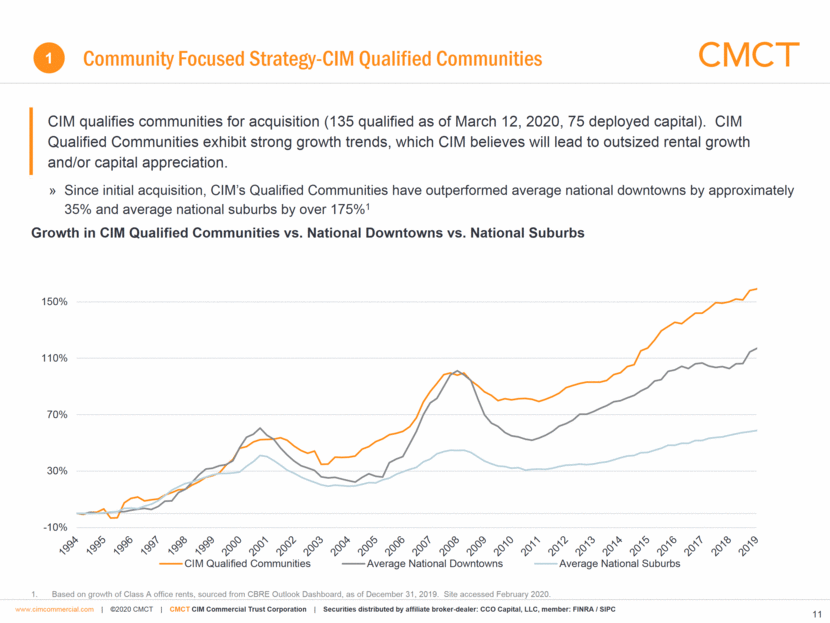
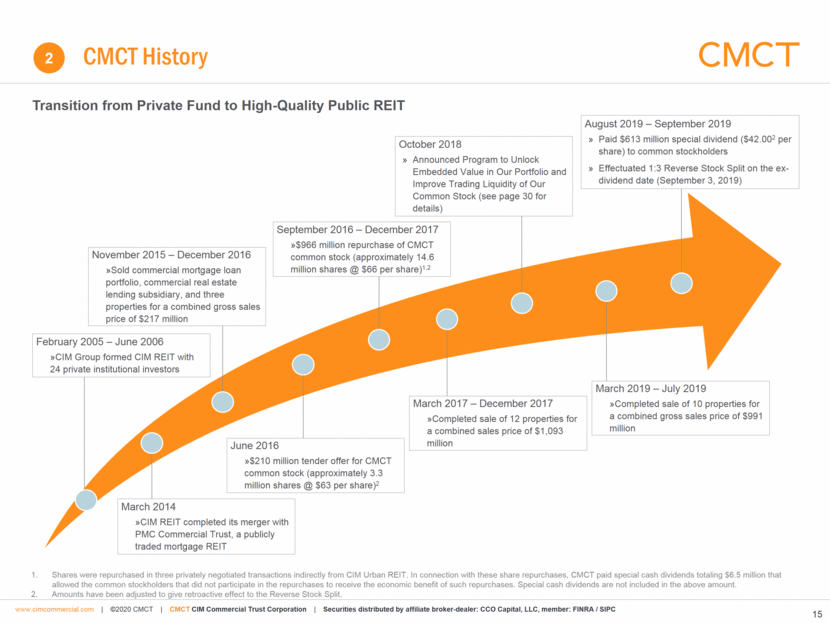
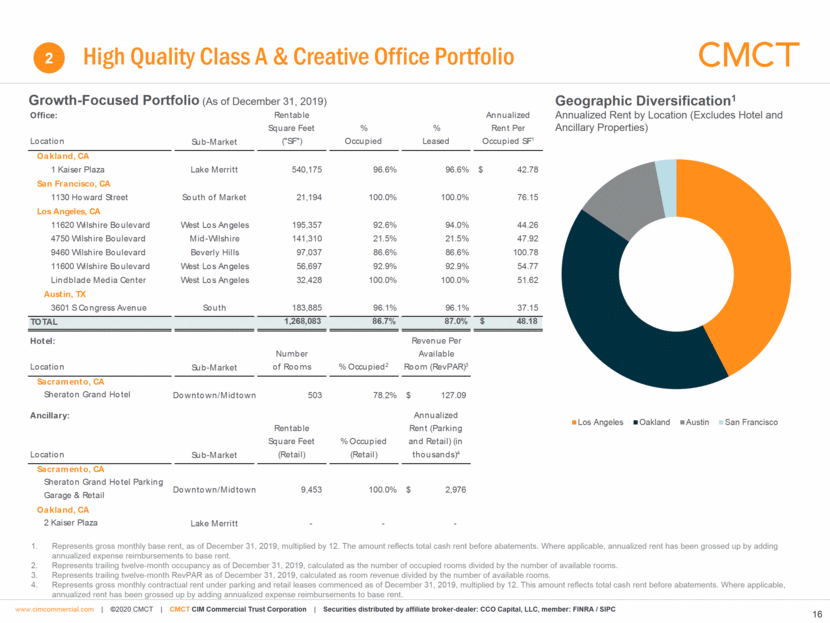
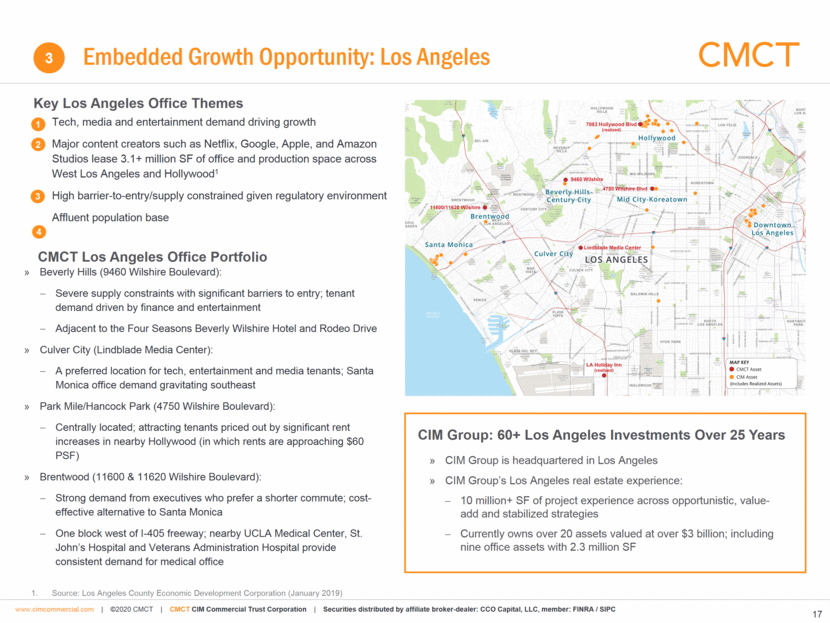
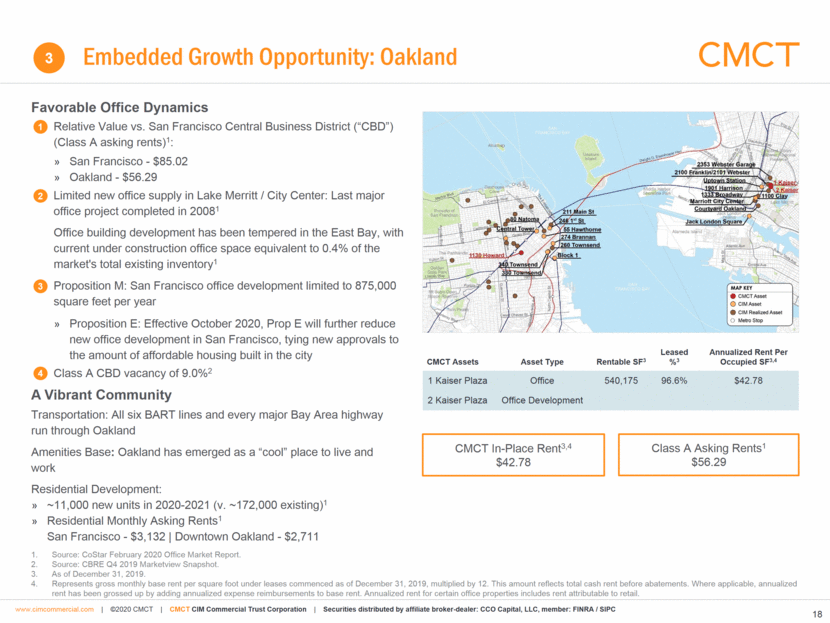
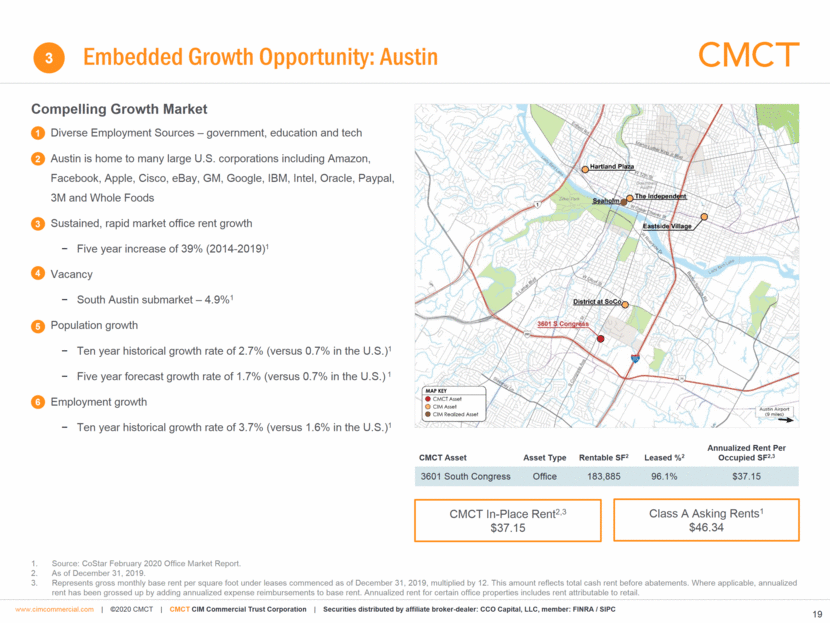
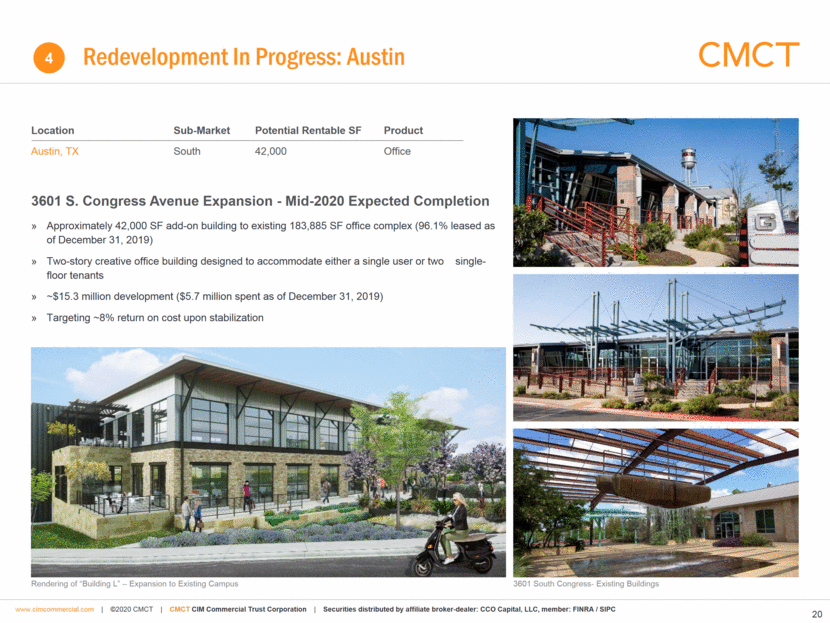
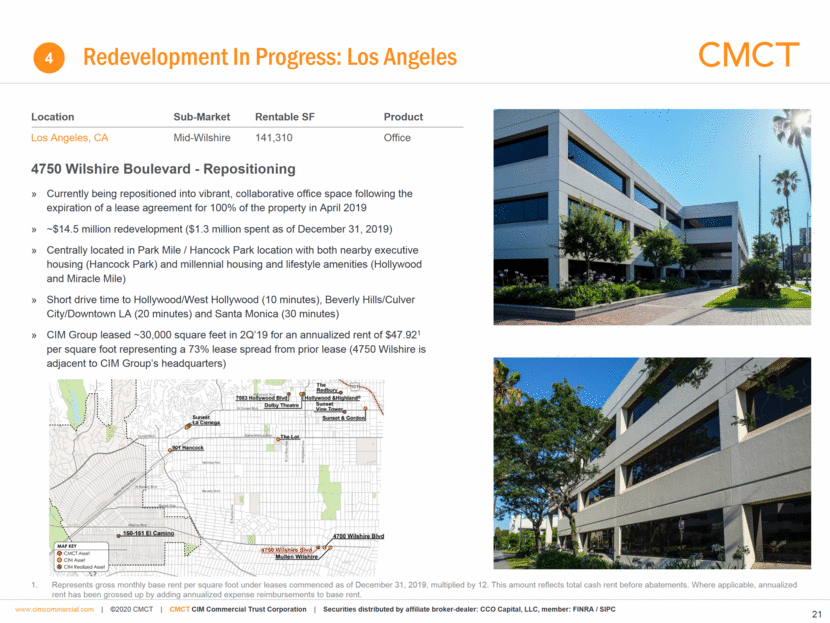
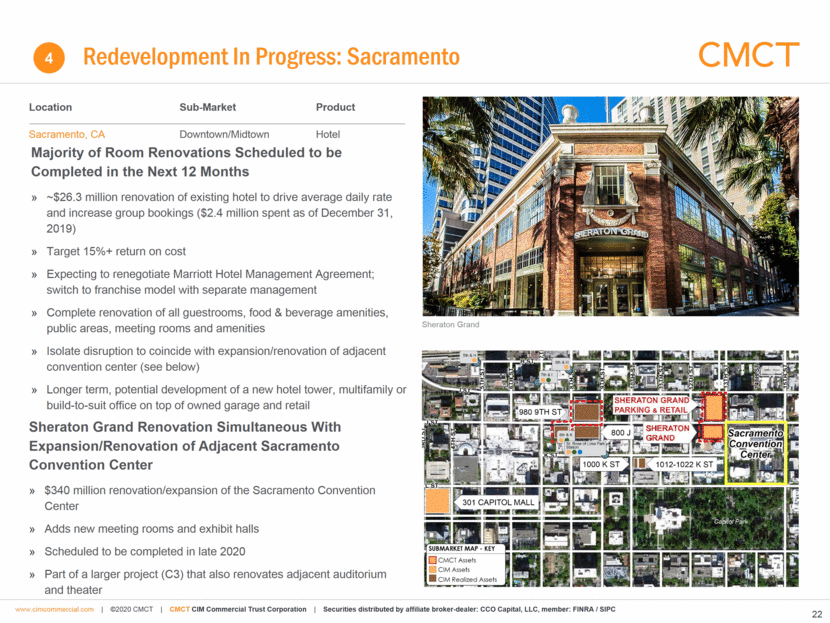
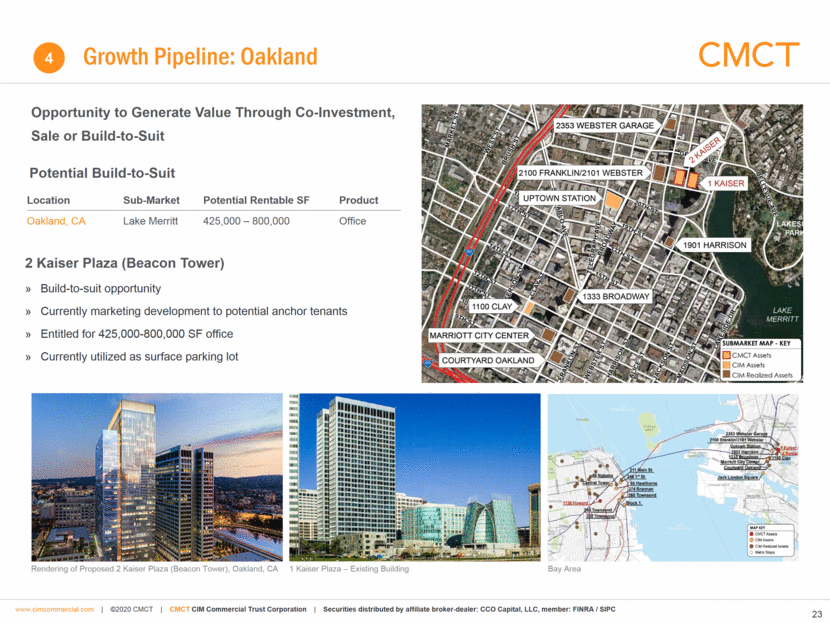
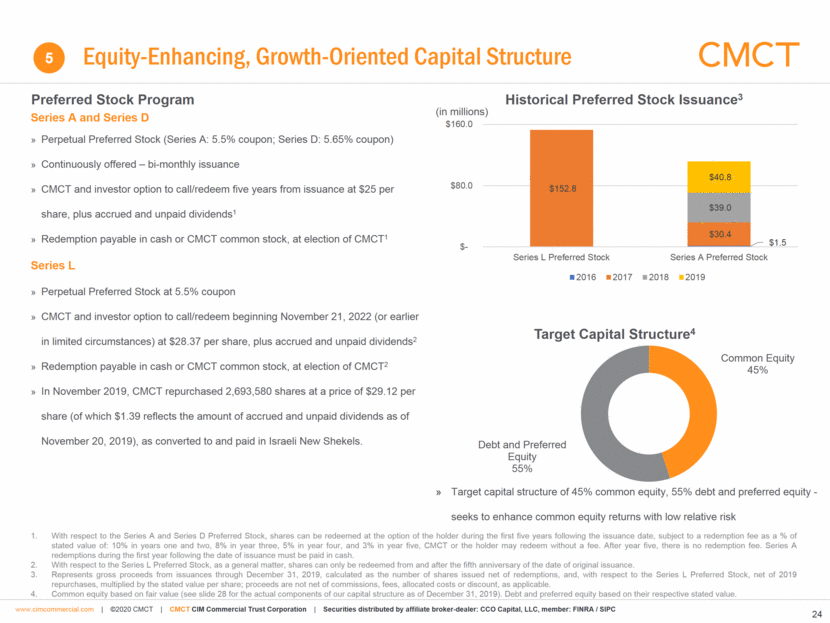
Key Metrics 29 Lease Expirations as a % of Annualized Office Rent (December 31, 2019)1 Top Five Tenants (December 31, 2019) Represents gross monthly base rent, as of December 31, 2019, multiplied by 12. This amount reflects total cash rent before abatements. Where applicable, annualized rent has been grossed up by adding annualized expense reimbursements to base rent. Annualized rent for certain office properties includes rent attributable to retail. Prior to February 28, 2023, the tenant may terminate up to 140,000 square feet of space in the aggregate (of which no more than 100,000 rentable square feet may be terminated with respect to the rentable square feet expiring in 2027) in exchange for a termination penalty. From and after February 28, 2023, with respect to the rentable square feet expiring in 2025, and February 28, 2025, with respect to rentable square feet expiring in 2027, the tenant has the right to terminate all or any portion of its lease with CMCT, effective as of any date specified by the tenant in a written notice given to CMCT at least 15 months prior to the termination, in each case in exchange for a termination penalty, the amount of which is dependent on a variety of factors, including but not limited to the date of the termination notice, the amount of the square feet to be terminated and the location within the building of the space to be terminated. Includes 22,416 square feet of month-to-month leases, as of December 31, 2019. 3 14.2% 8.3% 11.3% 6.0% 3.8% 32.0% 5.5% 7.7% 1.7% 6.8% 2.7% 0.0% 10.0% 20.0% 30.0% 2020 2021 2022 2023 2024 2025 2026 2027 2028 2029 Thereafter Tenant Property Lease Expiration Annualized Rent (in thousands) 1 % of Annualized Rent Rentable Square Feet % of Rentable Square Feet Kaiser Foundation Health Plan, Inc. 1 Kaiser Plaza 2025-2027 2 15,536 $ 29.3% 373,938 29.5% MUFG Union Bank, N.A. 9460 Wilshire Boulevard 2029 3,482 6.6% 27,569 2.2% 3 Arts Entertainment, Inc. 9460 Wilshire Boulevard 2026 2,094 4.0% 27,112 2.1% CIM Group, L.P. Various 2020-2030 1,857 3.5% 42,765 3.4% Homeaway, Inc. 3601 S Congres Avenue 2020 1,641 3.1% 42,545 3.4% Total for Top Five Tenants 24,610 46.5% 513,929 40.6% All Other Tenants 28,383 53.5% 585,878 46.1% Vacant - 0.0% 168,276 13.3% Total Office 52,993 $ 100.0% 1,268,083 100.0%
