UNITED STATES
SECURITIES AND EXCHANGE COMMISSION
Washington, D.C. 20549
FORM N-CSR
CERTIFIED SHAREHOLDER REPORT OF REGISTERED
MANAGEMENT INVESTMENT COMPANIES
Investment Company Act file number: 811-07852
USAA Mutual Funds Trust
(Exact name of registrant as specified in charter)
| | 15935 La Cantera Pkwy, San Antonio, Texas | 78256 | |
| | (Address of principal executive offices) | (Zip code) | |
Citi Fund Services Ohio, Inc., 4400 Easton Commons, Suite 200, Columbus, OH 43219
(Name and address of agent for service)
Registrant’s telephone number, including area code: 800-235-8396
Date of fiscal year end: May 31
Date of reporting period: November 30, 2022
Item 1. Reports to Stockholders.

NOVEMBER 30, 2022
Semi Annual Report
USAA Cornerstone Moderately
Conservative Fund
Victory Capital means Victory Capital Management Inc., the investment adviser of the USAA Mutual Funds. USAA Mutual Funds are distributed by Victory Capital Services, Inc., member FINRA, an affiliate of Victory Capital. Victory Capital and its affiliates are not affiliated with United Services Automobile Association or its affiliates. USAA and the USAA logos are registered trademarks and the USAA Mutual Funds and USAA Investments logos are trademarks of United Services Automobile Association and are being used by Victory Capital and its affiliates under license.
www.vcm.com
News, Information And Education 24 Hours A Day, 7 Days A Week
The Victory Capital website gives fund shareholders, prospective shareholders, and investment professionals a convenient way to access fund information, get guidance, and track fund performance anywhere they can access the Internet. The site includes:
• Detailed performance records
• Daily share prices
• The latest fund news
• Investment resources to help you become a better investor
• A section dedicated to investment professionals
Whether you're a potential investor searching for the fund that matches your investment philosophy, a seasoned investor interested in planning tools, or an investment professional, www.vcm.com has what you seek. Visit us anytime. We're always open.
TABLE OF CONTENTS
Investment Objective & Portfolio Holdings | | | 2 | | |
Schedule of Portfolio Investments | | | 3 | | |
Financial Statements | |
Statement of Assets and Liabilities | | | 8 | | |
Statement of Operations | | | 9 | | |
Statements of Changes in Net Assets | | | 10 | | |
Financial Highlights | | | 12 | | |
Notes to Financial Statements | | | 14 | | |
Supplemental Information | | | 25 | | |
Proxy Voting and Portfolio Holdings Information | | | 25 | | |
Expense Example | | | 25 | | |
Privacy Policy (inside back cover) | | | |
This report is for the information of the shareholders and others who have received a copy of the currently effective prospectus of the Fund, managed by Victory Capital Management Inc. It may be used as sales literature only when preceded or accompanied by a current prospectus, which provides further details about the Fund.
IRA DISTRIBUTION WITHHOLDING DISCLOSURE
We generally must withhold federal income tax at a rate of 10% of the taxable portion of your distribution and, if you live in a state that requires state income tax withholding, at your state's tax rate. However, you may elect not to have withholding apply or to have income tax withheld at a higher rate. Any withholding election that you make will apply to any subsequent distribution unless and until you change or revoke the election. If you wish to make a withholding election, or change or revoke a prior withholding election, call (800) 235-8396, and form W-4P (OMB No. 1545-0074 withholding certificate for pension or annuity payments) will be electronically sent.
If you do not have a withholding election in place by the date of a distribution, federal income tax will be withheld from the taxable portion of your distribution at a rate of 10%. If you must pay estimated taxes, you may be subject to estimated tax penalties if your estimated tax payments are not sufficient and sufficient tax is not withheld from your distribution.
For more specific information, please consult your tax adviser.
• NOT FDIC INSURED • NO BANK GUARANTEE • MAY LOSE VALUE
1
USAA Mutual Funds Trust
USAA Cornerstone Moderately Conservative Fund | | November 30, 2022 | |
(Unaudited)
Investment Objective and Portfolio Holdings:
The Fund seeks current income with a secondary focus on capital appreciation.
Asset Allocation*:
November 30, 2022
(% of Net Assets)
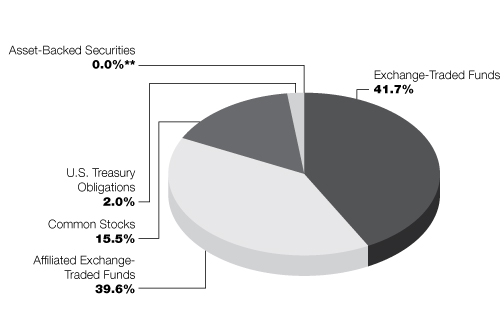
* Does not include futures contracts, money market instruments, and short-term investments purchased with cash collateral from securities loaned.
Percentages are of the net assets of the Fund and may not equal 100%.
** Percentage is less than 0.05%.
2
USAA Mutual Funds Trust
USAA Cornerstone Moderately Conservative Fund | | Schedule of Portfolio Investments
November 30, 2022 | |
(Amounts in Thousands, Except for Shares) (Unaudited)
Security Description | | Shares or
Principal
Amount | | Value | |
Asset-Backed Securities (0.0%) (a) | |
NP SPE II LLC, Series 2017-1A, Class A1, 3.37%, 10/21/47 (b) | | $ | 55 | | | $ | 52 | | |
Total Asset-Backed Securities (Cost $55) | | | 52 | | |
Common Stocks (15.5%) | |
Communication Services (1.3%): | |
AT&T, Inc. | | | 30,371 | | | | 586 | | |
Comcast Corp. Class A | | | 7,179 | | | | 263 | | |
Omnicom Group, Inc. | | | 3,223 | | | | 257 | | |
The Interpublic Group of Cos., Inc. | | | 17,348 | | | | 596 | | |
Verizon Communications, Inc. | | | 17,765 | | | | 692 | | |
| | | | 2,394 | | |
Consumer Discretionary (1.1%): | |
Best Buy Co., Inc. | | | 3,488 | | | | 298 | | |
eBay, Inc. | | | 5,443 | | | | 247 | | |
Garmin Ltd. | | | 689 | | | | 64 | | |
Lennar Corp. Class A | | | 6,836 | | | | 600 | | |
Target Corp. | | | 3,204 | | | | 535 | | |
Whirlpool Corp. | | | 1,649 | | | | 242 | | |
| | | | 1,986 | | |
Consumer Staples (0.6%): | |
Altria Group, Inc. | | | 13,458 | | | | 627 | | |
Philip Morris International, Inc. | | | 4,446 | | | | 443 | | |
| | | | 1,070 | | |
Energy (0.6%): | |
EOG Resources, Inc. | | | 2,946 | | | | 418 | | |
Exxon Mobil Corp. | | | 5,393 | | | | 601 | | |
ONEOK, Inc. | | | 1,202 | | | | 80 | | |
| | | | 1,099 | | |
Financials (1.5%): | |
Ameriprise Financial, Inc. | | | 2,065 | | | | 686 | | |
Discover Financial Services | | | 3,048 | | | | 330 | | |
JPMorgan Chase & Co. | | | 3,771 | | | | 521 | | |
Regions Financial Corp. | | | 5,684 | | | | 132 | | |
Signature Bank | | | 1,113 | | | | 155 | | |
Synchrony Financial | | | 9,204 | | | | 346 | | |
The Goldman Sachs Group, Inc. | | | 713 | | | | 275 | | |
The Hartford Financial Services Group, Inc. | | | 5,325 | | | | 407 | | |
| | | | 2,852 | | |
Health Care (2.2%): | |
Abbott Laboratories | | | 4,740 | | | | 510 | | |
AbbVie, Inc. | | | 2,320 | | | | 374 | | |
Amgen, Inc. | | | 1,220 | | | | 349 | | |
Bristol-Myers Squibb Co. | | | 2,117 | | | | 170 | | |
Cardinal Health, Inc. | | | 3,952 | | | | 317 | | |
See notes to financial statements.
3
USAA Mutual Funds Trust
USAA Cornerstone Moderately Conservative Fund | | Schedule of Portfolio Investments — continued
November 30, 2022 | |
(Amounts in Thousands, Except for Shares) (Unaudited)
Security Description | | Shares | | Value | |
Elevance Health, Inc. | | | 310 | | | $ | 165 | | |
Gilead Sciences, Inc. | | | 7,989 | | | | 702 | | |
Medtronic PLC | | | 2,873 | | | | 227 | | |
Merck & Co., Inc. | | | 2,844 | | | | 313 | | |
Pfizer, Inc. | | | 4,325 | | | | 217 | | |
UnitedHealth Group, Inc. | | | 729 | | | | 399 | | |
West Pharmaceutical Services, Inc. | | | 1,707 | | | | 401 | | |
| | | | 4,144 | | |
Industrials (1.3%): | |
3M Co. | | | 4,026 | | | | 507 | | |
Cintas Corp. | | | 266 | | | | 123 | | |
Lockheed Martin Corp. | | | 871 | | | | 423 | | |
Masco Corp. | | | 7,692 | | | | 391 | | |
Robert Half International, Inc. | | | 4,847 | | | | 382 | | |
United Parcel Service, Inc. Class B | | | 2,732 | | | | 518 | | |
| | | | 2,344 | | |
Information Technology (5.8%): | |
Accenture PLC Class A | | | 2,484 | | | | 747 | | |
Apple, Inc. | | | 14,457 | | | | 2,140 | | |
Applied Materials, Inc. | | | 2,523 | | | | 277 | | |
Automatic Data Processing, Inc. | | | 907 | | | | 240 | | |
Broadcom, Inc. | | | 1,313 | | | | 723 | | |
Cisco Systems, Inc. | | | 11,339 | | | | 564 | | |
Cognizant Technology Solutions Corp. Class A | | | 3,285 | | | | 204 | | |
HP, Inc. | | | 6,716 | | | | 202 | | |
Intel Corp. | | | 16,703 | | | | 502 | | |
International Business Machines Corp. | | | 2,684 | | | | 400 | | |
KLA Corp. | | | 1,576 | | | | 620 | | |
Lam Research Corp. | | | 405 | | | | 191 | | |
Mastercard, Inc. Class A | | | 294 | | | | 105 | | |
Microsoft Corp. | | | 8,543 | | | | 2,180 | | |
Motorola Solutions, Inc. | | | 597 | | | | 162 | | |
NetApp, Inc. | | | 1,703 | | | | 115 | | |
Paychex, Inc. | | | 3,715 | | | | 461 | | |
QUALCOMM, Inc. | | | 4,064 | | | | 514 | | |
Teradyne, Inc. | | | 2,398 | | | | 224 | | |
Visa, Inc. Class A | | | 1,582 | | | | 343 | | |
| | | | 10,914 | | |
Materials (0.4%): | |
CF Industries Holdings, Inc. | | | 1,988 | | | | 215 | | |
LyondellBasell Industries NV Class A | | | 3,867 | | | | 329 | | |
Newmont Corp. | | | 2,094 | | | | 100 | | |
Nucor Corp. | | | 562 | | | | 84 | | |
The Mosaic Co. | | | 1,801 | | | | 92 | | |
| | | | 820 | | |
Real Estate (0.3%): | |
American Tower Corp. | | | 564 | | | | 125 | | |
Crown Castle, Inc. | | | 991 | | | | 140 | | |
See notes to financial statements.
4
USAA Mutual Funds Trust
USAA Cornerstone Moderately Conservative Fund | | Schedule of Portfolio Investments — continued
November 30, 2022 | |
(Amounts in Thousands, Except for Shares) (Unaudited)
Security Description | | Shares or
Principal
Amount | | Value | |
Digital Realty Trust, Inc. | | | 1,029 | | | $ | 116 | | |
Equinix, Inc. | | | 80 | | | | 55 | | |
Prologis, Inc. | | | 1,532 | | | | 180 | | |
| | | | 616 | | |
Utilities (0.4%): | |
Evergy, Inc. | | | 5,325 | | | | 316 | | |
Pinnacle West Capital Corp. | | | 2,352 | | | | 184 | | |
The Southern Co. | | | 3,149 | | | | 213 | | |
| | | | 713 | | |
Total Common Stocks (Cost $27,755) | | | 28,952 | | |
U.S. Treasury Obligations (2.0%) | |
U.S. Treasury Notes, 1.63%, 4/30/23 (c) | | $ | 3,800 | | | | 3,754 | | |
Total U.S. Treasury Obligations (Cost $3,797) | | | 3,754 | | |
Exchange-Traded Funds (41.7%) | |
First Trust TCW Securitized Plus ETF | | | 136,569 | | | | 2,918 | | |
Invesco DB Commodity Index Tracking Fund (d) (e) | | | 22,900 | | | | 584 | | |
Invesco FTSE RAFI Developed Markets ex-US ETF | | | 35,176 | | | | 1,489 | | |
Invesco FTSE RAFI Emerging Markets ETF | | | 86,305 | | | | 1,560 | | |
iShares 0-5 Year TIPS Bond ETF | | | 36,290 | | | | 3,545 | | |
iShares 20+ Year Treasury Bond ETF | | | 5,248 | | | | 539 | | |
iShares 7-10 Year Treasury Bond ETF | | | 34,855 | | | | 3,402 | | |
iShares Core MSCI Emerging Markets ETF | | | 84,595 | | | | 4,108 | | |
iShares Core S&P 500 ETF | | | 3,510 | | | | 1,437 | | |
iShares Core S&P Small-Cap ETF | | | 39,211 | | | | 3,993 | | |
iShares Core US Aggregate Bond ETF | | | 25,045 | | | | 2,462 | | |
iShares iBoxx High Yield Corporate Bond ETF (e) | | | 95,171 | | | | 7,201 | | |
iShares JP Morgan USD Emerging Markets Bond ETF | | | 14,224 | | | | 1,229 | | |
iShares MSCI Canada ETF (e) | | | 27,600 | | | | 971 | | |
iShares MSCI International Momentum Factor ETF (e) | | | 71,831 | | | | 2,275 | | |
iShares MSCI International Quality Factor ETF | | | 81,444 | | | | 2,719 | | |
iShares Russell 2000 ETF (e) | | | 11,311 | | | | 2,119 | | |
JPMorgan BetaBuilders Canada ETF | | | 4,851 | | | | 297 | | |
Schwab Fundamental Emerging Markets Large Co. Index ETF | | | 170,705 | | | | 4,502 | | |
Schwab Fundamental International Large Co. Index ETF | | | 237,343 | | | | 7,168 | | |
Schwab Fundamental International Small Co. Index ETF | | | 50,100 | | | | 1,593 | | |
SPDR Gold Shares (d) | | | 10,332 | | | | 1,703 | | |
SPDR S&P Emerging Markets SmallCap ETF (e) | | | 7,496 | | | | 378 | | |
Vanguard FTSE All-World ex-U.S. ETF | | | 12,645 | | | | 656 | | |
Vanguard FTSE Developed Markets ETF | | | 125,318 | | | | 5,440 | | |
Vanguard Mortgage-Backed Securities ETF | | | 56,777 | | | | 2,617 | | |
Vanguard Real Estate ETF | | | 7,052 | | | | 621 | | |
Vanguard S&P 500 ETF | | | 1,293 | | | | 484 | | |
Vanguard Short-Term Bond ETF | | | 57,182 | | | | 4,317 | | |
Vanguard Small-Cap Value ETF | | | 11,516 | | | | 1,952 | | |
Vanguard Total Stock Market ETF | | | 6,593 | | | | 1,345 | | |
See notes to financial statements.
5
USAA Mutual Funds Trust
USAA Cornerstone Moderately Conservative Fund | | Schedule of Portfolio Investments — continued
November 30, 2022 | |
(Amounts in Thousands, Except for Shares) (Unaudited)
Security Description | | Shares | | Value | |
Wisdom Tree Trust — WisdomTree Emerging Markets SmallCap Dividend Fund | | | 5,259 | | | $ | 236 | | |
Xtrackers USD High Yield Corporate Bond ETF (e) | | | 69,791 | | | | 2,416 | | |
Total Exchange-Traded Funds (Cost $74,871) | | | 78,276 | | |
Affiliated Exchange-Traded Funds (39.6%) | |
VictoryShares Emerging Markets Value Momentum ETF | | | 9,770 | | | | 394 | | |
VictoryShares ESG Core Plus Bond ETF | | | 686,365 | | | | 14,652 | | |
VictoryShares USAA Core Intermediate-Term Bond ETF | | | 1,217,107 | | | | 55,794 | | |
VictoryShares USAA Core Short-Term Bond ETF | | | 69,125 | | | | 3,367 | | |
Total Affiliated Exchange-Traded Funds (Cost $85,371) | | | 74,207 | | |
Collateral for Securities Loaned (3.3%)^ | |
Goldman Sachs Financial Square Government Fund, Institutional
Shares, 3.73% (f) | | | 1,565,018 | | | | 1,565 | | |
HSBC U.S. Government Money Market Fund, I Shares, 3.75% (f) | | | 1,565,018 | | | | 1,565 | | |
Invesco Government & Agency Portfolio, Institutional Shares, 3.74% (f) | | | 1,565,018 | | | | 1,565 | | |
Morgan Stanley Institutional Liquidity Government Portfolio, Institutional
Shares, 3.62% (f) | | | 1,565,018 | | | | 1,565 | | |
Total Collateral for Securities Loaned (Cost $6,260) | | | 6,260 | | |
Total Investments (Cost $198,109) — 102.1% | | | 191,501 | | |
Liabilities in excess of other assets — (2.1)% | | | (3,913 | ) | |
NET ASSETS — 100.00% | | $ | 187,588 | | |
At November 30, 2022, the Fund's investments in foreign securities were 17.9% of net assets.
^ Purchased with cash collateral from securities on loan.
(a) Amount represents less than 0.05% of net assets.
(b) Rule 144A security or other security that is restricted as to resale to institutional investors. The Fund's Adviser has deemed this security to be liquid (unless otherwise noted as illiquid) based upon procedures approved by the Board of Trustees. As of November 30, 2022, the fair value of these securities was $52 thousands and amounted to less than 0.05% of net assets.
(c) All or a portion of this security has been segregated as collateral for derivative instruments.
(d) Non-income producing security.
(e) All or a portion of this security is on loan.
(f) Rate disclosed is the daily yield on November 30, 2022.
ETF — Exchange-Traded Fund
LLC — Limited Liability Company
PLC — Public Limited Company
See notes to financial statements.
6
USAA Mutual Funds Trust
USAA Cornerstone Moderately Conservative Fund | | Schedule of Portfolio Investments — continued
November 30, 2022 | |
(Unaudited)
Futures Contracts Purchased
(Amounts not in thousands) | |
| | | Number of
Contracts | | Expiration
Date | | Notional
Amount | | Value | | Unrealized
Appreciation/
(Depreciation) | |
Euro Stoxx 50 Futures | | | 47 | | | 12/16/22 | | $ | 1,745,791 | | | $ | 1,939,017 | | | $ | 193,226 | | |
FTSE 100 Index Futures | | | 34 | | | 12/16/22 | | | 3,011,203 | | | | 3,113,293 | | | | 102,090 | | |
S&P/Toronto Stock Exchange
60 Index Futures | | | 16 | | | 12/15/22 | | | 2,855,170 | | | | 2,950,900 | | | | 95,730 | | |
| | | $ | 391,046 | | |
Futures Contracts Sold | |
(Amounts not in thousands) | |
| | | Number of
Contracts | | Expiration
Date | | Notional
Amount | | Value | | Unrealized
Appreciation/
(Depreciation) | |
ASX SPI 200 Index Futures | | | 13 | | | 12/15/22 | | $ | 1,529,838 | | | $ | 1,611,966 | | | $ | (82,128 | ) | |
E-Mini Russell 2000 Index Futures | | | 11 | | | 12/16/22 | | | 990,462 | | | | 1,038,125 | | | | (47,663 | ) | |
Hang Seng Index Futures | | | 13 | | | 12/29/22 | | | 1,468,674 | | | | 1,549,291 | | | | (80,617 | ) | |
Swiss Market Index Futures | | | 14 | | | 12/16/22 | | | 1,615,762 | | | | 1,651,707 | | | | (35,945 | ) | |
Tokyo Price Index Futures | | | 11 | | | 12/8/22 | | | 1,559,560 | | | | 1,585,428 | | | | (25,868 | ) | |
| | | $ | (272,221 | ) | |
Total unrealized appreciation | | $ | 391,046 | | |
Total unrealized depreciation | | | (272,221 | ) | |
Total net unrealized appreciation (depreciation) | | $ | 118,825 | | |
See notes to financial statements.
7
USAA Mutual Funds Trust | | Statement of Assets and Liabilities
November 30, 2022 | |
(Amounts in Thousands, Except Per Share Amounts) (Unaudited)
| | | USAA Cornerstone
Moderately
Conservative Fund | |
Assets: | |
Affiliated investments, at value (Cost $85,371) | | $ | 74,207 | | |
Unaffiliated investments, at value (Cost $112,738) | | | 117,294 | (a) | |
Cash | | | 1,716 | | |
Deposit with broker for futures contracts | | | 845 | | |
Receivables: | |
Interest and dividends | | | 93 | | |
Capital shares issued | | | 65 | | |
Investments sold | | | 1,111 | | |
Variation margin on open futures contracts | | | 70 | | |
From Adviser for ETF reimbursements | | | 57 | | |
From Adviser for expense limitation agreement | | | 15 | | |
Prepaid expenses | | | 8 | | |
Total Assets | | | 195,481 | | |
Liabilities: | |
Payables: | |
Collateral received on loaned securities | | | 6,260 | | |
Collateral received from broker for futures contract | | | 191 | | |
Investments purchased | | | 1,103 | | |
Capital shares redeemed | | | 73 | | |
Variation margin on open futures contracts | | | 74 | | |
Accrued expenses and other payables: | |
Investment advisory fees | | | 75 | | |
Administration fees | | | 23 | | |
Custodian fees | | | 5 | | |
Transfer agent fees | | | 35 | | |
Compliance fees | | | — | (b) | |
Trustees' fees | | | 1 | | |
Other accrued expenses | | | 53 | | |
Total Liabilities | | | 7,893 | | |
Net Assets: | |
Capital | | | 187,997 | | |
Total accumulated earnings/(loss) | | | (409 | ) | |
Net Assets | | $ | 187,588 | | |
Shares (unlimited number of shares authorized with no par value): | | | 17,380 | | |
Net asset value, offering and redemption price per share: (c) | | $ | 10.79 | | |
(a) Includes $6,072 thousand of securities on loan.
(b) Rounds to less than $1 thousand.
(c) Per share amount may not recalculate due to rounding of net assets and/or shares outstanding.
See notes to financial statements.
8
USAA Mutual Funds Trust | | Statement of Operations
For the Six Months Ended November 30, 2022 | |
(Amounts in Thousands) (Unaudited)
| | | USAA Cornerstone
Moderately
Conservative Fund | |
Investment Income: | |
Income distributions from affiliated funds | | $ | 973 | | |
Dividends from unaffiliated investments | | | 1,470 | | |
Interest from unaffiliated investments | | | 51 | | |
Securities lending (net of fees) | | | 54 | | |
Foreign tax withholding | | | (1 | ) | |
Total Income | | | 2,547 | | |
Expenses: | |
Investment advisory fees | | | 468 | | |
Administration fees | | | 141 | | |
Sub-Administration fees | | | 37 | | |
Custodian fees | | | 9 | | |
Transfer agent fees | | | 222 | | |
Trustees' fees | | | 24 | | |
Compliance fees | | | 1 | | |
Legal and audit fees | | | 35 | | |
State registration and filing fees | | | 14 | | |
Interfund lending fees | | | — | (a) | |
Other expenses | | | 34 | | |
Total Expenses | | | 985 | | |
Expenses waived/reimbursed by Adviser | | | (141 | ) | |
Net Expenses | | | 844 | | |
Net Investment Income (Loss) | | | 1,703 | | |
Realized/Unrealized Gains (Losses) from Investments: | |
Net realized gains (losses) from affiliated funds | | | (467 | ) | |
Net realized gains (losses) from unaffiliated investment securities and
foreign currency transactions | | | (4,018 | ) | |
Net realized gains (losses) from futures contracts | | | 42 | | |
Net change in unrealized appreciation/depreciation on affiliated
investment securities | | | (3,261 | ) | |
Net change in unrealized appreciation/depreciation on unaffiliated
investment securities and foreign currency translations | | | (861 | ) | |
Net change in unrealized appreciation/depreciation on futures contracts | | | 288 | | |
Net realized/unrealized gains (losses) on investments | | | (8,277 | ) | |
Change in net assets resulting from operations | | $ | (6,574 | ) | |
(a) Rounds to less than $1 thousand.
See notes to financial statements.
9
USAA Mutual Funds Trust | | Statements of Changes in Net Assets | |
(Amounts in Thousands)
| | | USAA Cornerstone Moderately
Conservative Fund | |
| | | Six Months
Ended
November 30,
2022
(Unaudited) | | Year
Ended
May 31,
2022 | |
From Investments: | |
Operations: | |
Net Investment Income (Loss) | | $ | 1,703 | | | $ | 2,669 | | |
Net realized gains (losses) | | | (4,443 | ) | | | 14,303 | | |
Net change in unrealized appreciation/depreciation | | | (3,834 | ) | | | (29,807 | ) | |
Change in net assets resulting from operations | | | (6,574 | ) | | | (12,835 | ) | |
Change in net assets resulting from distributions to shareholders | | | (1,184 | ) | | | (14,110 | ) | |
Change in net assets resulting from capital transactions | | | (4,998 | ) | | | 5,397 | | |
Change in net assets | | | (12,756 | ) | | | (21,548 | ) | |
Net Assets: | |
Beginning of period | | | 200,344 | | | | 221,892 | | |
End of period | | $ | 187,588 | | | $ | 200,344 | | |
Capital Transactions: | |
Proceeds from shares issued | | $ | 7,502 | | | $ | 24,022 | | |
Distributions reinvested | | | 1,178 | | | | 14,047 | | |
Cost of shares redeemed | | | (13,678 | ) | | | (32,672 | ) | |
Change in net assets resulting from capital transactions | | $ | (4,998 | ) | | $ | 5,397 | | |
Share Transactions: | |
Issued | | | 712 | | | | 1,948 | | |
Reinvested | | | 112 | | | | 1,142 | | |
Redeemed | | | (1,291 | ) | | | (2,665 | ) | |
Change in Shares | | | (467 | ) | | | 425 | | |
See notes to financial statements.
10
This page is intentionally left blank.
11
USAA Mutual Funds Trust | | Financial Highlights | |
For a Share Outstanding Throughout Each Period
| | | | | Investment Activities | | Distributions to
Shareholders From | |
| | | Net Asset
Value,
Beginning of
Period | | Net
Investment
Income
(Loss) | | Net Realized
and Unrealized
Gains
(Losses) | | Total from
Investment
Activities | | Net
Investment
Income | | Net Realized
Gains from
Investments | |
USAA Cornerstone Moderately Conservative Fund | | | |
Six Months Ended
November 30, 2022
(Unaudited) | | $ | 11.23 | | | | 0.10 | (f) | | | (0.47 | ) | | | (0.37 | ) | | | (0.07 | ) | | | — | | |
Year Ended May 31:
2022 | | $ | 12.74 | | | | 0.15 | (f) | | | (0.85 | ) | | | (0.70 | ) | | | (0.17 | ) | | | (0.64 | ) | |
2021 | | $ | 11.14 | | | | 0.16 | (f) | | | 1.64 | | | | 1.80 | | | | (0.17 | ) | | | (0.03 | ) | |
2020 | | $ | 10.94 | | | | 0.23 | (f) | | | 0.22 | | | | 0.45 | | | | (0.23 | ) | | | (0.02 | ) | |
2019 | | $ | 11.29 | | | | 0.24 | | | | (0.14 | ) | | | 0.10 | | | | (0.24 | ) | | | (0.21 | ) | |
2018 | | $ | 11.34 | | | | 0.21 | | | | 0.23 | | | | 0.44 | | | | (0.21 | ) | | | (0.28 | ) | |
(a) Not annualized for periods less than one year.
(b) Assumes reinvestment of all net investment income and realized capital gain distributions, if any, during the period. Includes adjustments in accordance with U.S. Generally Accepted Accounting Principles and could differ from the Lipper reported return.
(c) Annualized for periods less than one year.
(d) The net expense ratio may not correlate to the applicable expense limits in place during the period since the current contractual expense limitation is applied for a period beginning July 1, 2019, and in effect through September 30, 2023, instead of coinciding with the Fund's fiscal year end. Details of the current contractual expense limitation in effect can be found in Note 4 of the accompanying Notes to Financial Statements.
(e) Does not include acquired fund fees and expenses, if any.
(f) Per share net investment income (loss) has been calculated using the average daily shares method.
(g) Reflects increased usage of quantitative investment strategies.
See notes to financial statements.
12
USAA Mutual Funds Trust | | Financial Highlights — continued | |
For a Share Outstanding Throughout Each Period
| | | | | Ratios to Average Net Assets | | Supplemental Data | |
| | | Total
Distributions | | Net Asset
Value,
End of
Period | | Total
Return(a)(b) | | Net
Expenses(c)(d)(e) | | Net
Investment
Income
(Loss)(c) | | Gross
Expenses(c)(e) | | Net Assets,
End of
Period
(000's) | | Portfolio
Turnover(a) | |
USAA Cornerstone Moderately Conservative Fund | |
Six Months Ended
November 30, 2022
(Unaudited) | | | (0.07 | ) | | $ | 10.79 | | | | (3.30 | )% | | | 0.90 | % | | | 1.82 | % | | | 1.05 | % | | $ | 187,588 | | | | 29 | % | |
Year Ended May 31:
2022 | | | (0.81 | ) | | $ | 11.23 | | | | (5.95 | )% | | | 0.90 | % | | | 1.23 | % | | | 1.00 | % | | $ | 200,344 | | | | 61 | % | |
2021 | | | (0.20 | ) | | $ | 12.74 | | | | 16.30 | % | | | 0.90 | % | | | 1.35 | % | | | 1.02 | % | | $ | 221,892 | | | | 52 | % | |
2020 | | | (0.25 | ) | | $ | 11.14 | | | | 4.09 | % | | | 0.90 | % | | | 2.05 | % | | | 1.02 | % | | $ | 220,787 | | | | 84 | % | |
2019 | | | (0.45 | ) | | $ | 10.94 | | | | 0.99 | % | | | 0.90 | % | | | 2.22 | % | | | 1.08 | % | | $ | 226,484 | | | | 77 | %(g) | |
2018 | | | (0.49 | ) | | $ | 11.29 | | | | 3.89 | % | | | 0.90 | % | | | 1.84 | % | | | 1.07 | % | | $ | 221,721 | | | | 45 | % | |
See notes to financial statements.
13
USAA Mutual Funds Trust | | Notes to Financial Statements
November 30, 2022 | |
(Unaudited)
1. Organization:
USAA Mutual Funds Trust (the "Trust") is organized as a Delaware statutory trust and is registered under the Investment Company Act of 1940, as amended (the "1940 Act"), as an open-end investment company. The Trust is comprised of 45 funds and is authorized to issue an unlimited number of shares, which are units of beneficial interest with no par value.
The accompanying financial statements are those of the USAA Cornerstone Moderately Conservative Fund (the "Fund"). The Fund is classified as diversified under the 1940 Act.
Victory Capital Management ("VCM" or the "Adviser"), is an indirect wholly owned subsidiary of Victory Capital Holdings, Inc., a publicly traded Delaware corporation, and a wholly owned direct subsidiary of Victory Capital Operating, LLC.
Under the Trust's organizational documents, its officers and trustees are indemnified against certain liabilities arising out of the performance of their duties to the Fund. In addition, in the normal course of business, the Fund enters into contracts with its vendors and others that provide for general indemnifications. The Fund's maximum exposure under these arrangements is unknown, as this would involve future claims that may be made against the Fund. However, based on experience, the Fund expects that risk of loss to be remote.
2. Significant Accounting Policies:
The following is a summary of significant accounting policies followed by the Trust in the preparation of its financial statements. The policies are in conformity with U.S. Generally Accepted Accounting Principles ("GAAP"). The preparation of financial statements in accordance with GAAP requires management to make estimates and assumptions that affect the reported amounts of assets and liabilities and disclosure of contingent assets and liabilities at the date of the financial statements and the reported amounts of income and expenses for the period. Actual results could differ from those estimates. The Fund follows the specialized accounting and reporting requirements under GAAP that are applicable to investment companies under Accounting Standards Codification Topic 946.
Investment Valuation:
The Fund records investments at fair value. Fair value is defined as the price that would be received to sell an asset or paid to transfer a liability in an orderly transaction between market participants at the measurement date.
The valuation techniques described below maximize the use of observable inputs and minimize the use of unobservable inputs in determining fair value. The inputs used for valuing the Fund's investments are summarized in the three broad levels listed below:
• Level 1 — quoted prices (unadjusted) in active markets for identical securities
• Level 2 — other significant observable inputs (including quoted prices for similar securities, interest rates, or credit spreads, applicable to those securities, etc.)
• Level 3 — significant unobservable inputs (including the Adviser's assumptions in determining the fair value of investments)
Changes in valuation techniques may result in transfers in or out of an assigned level within the disclosure hierarchy. The inputs or methodologies used for valuation techniques are not necessarily an indication of the risks associated with entering into those investments.
The Adviser, acting as the valuation designee has established the Pricing and Liquidity Committee (the "Committee"), and subject to the Trust's Board of Trustees' (the "Board") oversight, the Committee administers and oversees the Fund's valuation policies and procedures, which are approved by the Board.
Portfolio securities listed or traded on securities exchanges, including Exchange-Traded Funds ("ETFs"), and American Depositary Receipts ("ADRs"), are valued at the closing price on the exchange or system
14
USAA Mutual Funds Trust | | Notes to Financial Statements — continued
November 30, 2022 | |
(Unaudited)
where the security is principally traded, if available, or at the Nasdaq Official Closing Price. If there have been no sales for that day on the exchange or system, then a security is valued at the last available bid quotation on the exchange or system where the security is principally traded. In each of these situations, valuations are typically categorized as Level 1 in the fair value hierarchy.
Investments in open-end investment companies, including underlying funds, are valued at their net asset value ("NAV"). These valuations are typically categorized as Level 1 in the fair value hierarchy.
Debt securities are valued each business day by a pricing service approved by the Board. The approved pricing service uses the evaluated bid or the last sale price to value securities. Debt obligations maturing within 60 days may be valued at amortized cost, provided that the amortized cost represents the fair value of such securities. These valuations are typically categorized as Level 2 in the fair value hierarchy.
Futures contracts are valued at the settlement price established each day by the board of trade or an exchange on which they are traded. These valuations are typically categorized as Level 1 in the fair value hierarchy.
In the event that price quotations or valuations are not readily available, investments are valued at fair value in accordance with procedures established by and under the general supervision and responsibility of the Board. These valuations are typically categorized as Level 2 or Level 3 in the fair value hierarchy, based on the observability of inputs used to determine the fair value. The effect of fair value pricing is that securities may not be priced on the basis of quotations from the primary market in which they are traded, and the actual price realized from the sale of a security may differ materially from the fair value price. Valuing these securities at fair value is intended to cause the Fund's NAV to be more reliable than it otherwise would be.
A summary of the valuations as of November 30, 2022, based upon the three levels defined above, is included in the table below while the breakdown, by category, of investments is disclosed on the Schedule of Portfolio Investments (amounts in thousands):
| | | Level 1 | | Level 2 | | Level 3 | | Total | |
Asset-Backed Securities | | $ | — | | | $ | 52 | | | $ | — | | | $ | 52 | | |
Common Stocks | | | 28,952 | | | | — | | | | — | | | | 28,952 | | |
U.S. Treasury Obligations | | | — | | | | 3,754 | | | | — | | | | 3,754 | | |
Exchange-Traded Funds | | | 78,276 | | | | — | | | | — | | | | 78,276 | | |
Affiliated Exchange-Traded Funds | | | 74,207 | | | | — | | | | — | | | | 74,207 | | |
Collateral for Securities Loaned | | | 6,260 | | | | — | | | | — | | | | 6,260 | | |
Total | | $ | 187,695 | | | $ | 3,806 | | | $ | — | | | $ | 191,501 | | |
Other Financial Investments* | |
Assets: | |
Futures Contracts | | $ | 391 | | | $ | — | | | $ | — | | | $ | 391 | | |
Liabilities: | |
Futures Contracts | | $ | (272 | ) | | $ | — | | | $ | — | | | $ | (272 | ) | |
Total | | $ | 119 | | | $ | — | | | $ | — | | | $ | 119 | | |
* Futures contracts are valued at the unrealized appreciation (depreciation) on the investment.
For the six months ended November 30, 2022, there were no transfers into/out of Level 3.
Real Estate Investment Trusts ("REITs"):
The Fund may invest in REITs, which report information on the source of their distributions annually. REITs are pooled investment vehicles that invest primarily in income producing real estate or real estate related loans or interests (such as mortgages). Certain distributions received from REITs during the year are recorded as realized gains or return of capital as estimated by the Fund or when such information becomes known.
15
USAA Mutual Funds Trust | | Notes to Financial Statements — continued
November 30, 2022 | |
(Unaudited)
Investment Companies:
Exchange-Traded Funds:
The Fund may invest in ETFs, the shares of which are bought and sold on a securities exchange. An ETF trades like common stock and represents a fixed portfolio of securities often designed to track the performance and dividend yield of a particular domestic or foreign market index. The Fund may purchase shares of an ETF to temporarily gain exposure to a portion of the U.S. or a foreign market while awaiting purchase of underlying securities. The risks of owning an ETF generally reflect the risks of owning the underlying securities the ETF is designed to track, although the lack of liquidity of an ETF could result in it being more volatile. Additionally, ETFs have fees and expenses that reduce their value.
Open-End Funds:
The Fund may invest in portfolios of open-end investment companies. These investment companies value securities in their portfolios for which market quotations are readily available at their market values (generally the last reported sale price) and all other securities and assets at their fair value by the methods established by the board of directors of the underlying funds.
Mortgage- and Asset-Backed Securities:
The values of some mortgage-related or asset-backed securities may be particularly sensitive to changes in prevailing interest rates. Early repayment of principal on some mortgage-related securities may expose the Fund to a lower rate of return upon reinvestment of principal. The values of mortgage- and asset-backed securities depend in part on the credit quality and adequacy of the underlying assets or collateral and may fluctuate in response to the market's perception of these factors as well as current and future repayment rates. Some mortgage-backed securities are backed by the full faith and credit of the U.S. government (e.g., mortgage-backed securities issued by the Government National Mortgage Association, commonly known as "Ginnie Mae"), while other mortgage-backed securities (e.g., mortgage-backed securities issued by the Federal National Mortgage Association and the Federal Home Loan Mortgage Corporation, commonly known as "Fannie Mae" and "Freddie Mac," respectively), are backed only by the credit of the government entity issuing them. In addition, some mortgage-backed securities are issued by private entities and, as such, are not guaranteed by the U.S. government or any agency or instrumentality of the U.S. government.
Derivative Instruments:
Futures Contracts:
The Fund may enter into contracts for the future delivery of securities or foreign currencies and futures contracts based on a specific security, class of securities, foreign currency or an index, and purchase or sell options on any such futures contracts. A futures contract on a securities index is an agreement obligating either party to pay, and entitling the other party to receive, while the contract is outstanding, cash payments based on the level of a specified securities index. No physical delivery of the underlying asset is made. The Fund may enter into futures contracts in an effort to hedge against market risks. The acquisition of put and call options on futures contracts will give the Fund the right (but not the obligation), for a specified price, to sell or to purchase the underlying futures contract, upon exercise of the option, at any time during the option period. Futures transactions involve brokerage costs and require the Fund to segregate assets to cover contracts that would require it to purchase securities or currencies. A good faith margin deposit, known as initial margin, of cash or government securities with a broker or custodian is required to initiate and maintain open positions in futures contracts. Subsequent payments, known as variation margin, are made or received by the Fund based on the change in the market value of the position and are recorded as unrealized appreciation or depreciation until the contract is closed out, at which time the gain or loss is realized. The Fund may lose the expected benefit of futures transactions if interest rates, exchange rates or securities prices change in an unanticipated
16
USAA Mutual Funds Trust | | Notes to Financial Statements — continued
November 30, 2022 | |
(Unaudited)
manner. Such unanticipated changes may also result in lower overall performance than if the Fund had not entered into any futures transactions. In addition, the value of the Fund's futures positions may not prove to be perfectly or even highly correlated with the value of its portfolio securities or foreign currencies, limiting the Fund's ability to hedge effectively against interest rate, exchange rate and/or market risk and giving rise to additional risks. There is no assurance of liquidity in the secondary market for purposes of closing out futures positions. The collateral held by the Fund is reflected on the Statement of Assets and Liabilities under Deposit with broker for futures contracts and Collateral received from broker for futures contracts.
Management has determined that no offsetting requirements exist as a result of their conclusion that the Fund is not subject to master netting agreements for futures contracts. During the six months ended November 30, 2022, the Fund entered into futures contracts primarily for the strategy of gaining exposure to a particular asset class or securities market.
Summary of Derivative Instruments:
The following table summarizes the fair values of derivative instruments on the Statement of Assets and Liabilities, categorized by risk exposure, as of November 30, 2022 (amounts in thousands):
| | | Assets | | Liabilities | |
| | | Variation Margin
Receivable on Open
Futures Contracts* | | Variation Margin
Payable on Open
Futures Contracts* | |
Equity Risk Exposure | | $ | 391 | | | $ | 272 | | |
* Includes cumulative unrealized appreciation (depreciation) of futures contracts as reported on the Schedule of Portfolio Investments. Only current day's variation margin for futures contracts is reported within the Statement of Assets and Liabilities.
The following table presents the effect of derivative instruments on the Statement of Operations, categorized by risk exposure, for the six months ended November 30, 2022 (amounts in thousands):
| | | Net Realized Gains (Losses) on
Derivatives Recognized as
a Result of Operations | | Net Change in Unrealized
Appreciation/Depreciation
on Derivatives Recognized
as a Result of Operations | |
| | | Net Realized Gains (Losses)
from Futures Contracts | | Net Change in Unrealized
Appreciation/Depreciation
on Futures Contracts | |
Equity Risk Exposure | | $ | 42 | | | $ | 288 | | |
All open derivative positions at period end are reflected on the Fund's Schedule of Portfolio Investments. The underlying face value of open derivative positions relative to the Fund's net assets at period end is generally representative of the notional amount of open positions to net assets throughout the period.
Investment Transactions and Related Income:
Changes in holdings of investments are accounted for no later than one business day following the trade date. For financial reporting purposes, however, investment transactions are accounted for on trade date or the last business day of the reporting period. Interest income is determined on the basis of coupon interest accrued using the effective interest method which adjusts, where applicable, the amortization of premiums or accretion of discounts. Dividend income is recorded on the ex-dividend date. Gains or losses realized on sales of securities are recorded on the identified cost basis. Paydown gains or losses on applicable securities, if any, are recorded as components of Interest income on the Statement of Operations.
17
USAA Mutual Funds Trust | | Notes to Financial Statements — continued
November 30, 2022 | |
(Unaudited)
Withholding taxes on interest, dividends, and gains as a result of certain investments in ADRs by the Fund have been provided for in accordance with each investment's applicable country's tax rules and rates.
Securities Lending:
The Fund, through a Securities Lending Agreement with Citibank, N.A. ("Citibank"), may lend its securities to qualified financial institutions, such as certain broker-dealers and banks, to earn additional income, net of income retained by Citibank. Borrowers are required to initially secure their loans for collateral in the amount of at least 102% of the value of U.S. securities loaned or at least 105% of the value of non-U.S. securities loaned, marked-to-market daily. Any collateral shortfalls associated with increases in the valuation of the securities loaned are generally cured the next business day. The collateral can be received in the form of cash collateral and/or non-cash collateral. Non-cash collateral can include U.S. Government Securities and other securities as permitted by Securities and Exchange Commission ("SEC") guidelines. The cash collateral is invested in short-term instruments or cash equivalents, primarily open-end investment companies, as noted on the Fund's Schedule of Portfolio Investments. The Fund effectively does not have control of the non-cash collateral and therefore it is not disclosed on the Fund's Schedule of Portfolio Investments. Collateral requirements are determined daily based on the value of the Fund's securities on loan as of the end of the prior business day. During the time portfolio securities are on loan, the borrower will pay the Fund any dividends or interest paid on such securities plus any fee negotiated between the parties to the lending agreement. The Fund also earns a return from the collateral. The Fund pays Citibank various fees in connection with the investment of cash collateral and fees based on the investment income received from securities lending activities. Securities lending income (net of these fees) is disclosed on the Statement of Operations. Loans are terminable upon demand and the borrower must return the loaned securities within the lesser of one standard settlement period or five business days. Although risk is mitigated by the collateral, the Fund could experience a delay in recovering its securities and possible loss of income or value if the borrower fails to return them. In addition, there is a risk that the value of the short-term investments will be less than the amount of cash collateral required to be returned to the borrower.
The Fund's agreement with Citibank does not include master netting provisions. Non-cash collateral received by the Fund may not be sold or repledged, except to satisfy borrower default.
The following table (amounts in thousands) is a summary of the Fund's securities lending transactions as of November 30, 2022.
Value of
Securities on Loan | | Non-Cash
Collateral | | Cash
Collateral | |
| $ | 6,219 | (a) | | $ | — | | | $ | 6,260 | | |
(a) Includes $147 thousand of securities on loan that were sold prior to November 30, 2022.
Foreign Currency Translations:
The accounting records of the Fund are maintained in U.S. dollars. Investment securities and other assets and liabilities of the Fund denominated in a foreign currency are translated into U.S. dollars at current exchange rates. Purchases and sales of securities, income receipts, and expense payments are translated into U.S. dollars at the exchange rates on the date of the transactions. The Fund does not isolate the portion of the results of operations resulting from changes in foreign exchange rates on investments from fluctuations arising from changes in market prices of securities held. Such fluctuations are disclosed as Net change in unrealized appreciation/depreciation on unaffiliated investment securities and foreign currency translations on the Statement of Operations. Any realized gains or losses from these fluctuations are disclosed as Net realized gains (losses) from unaffiliated investment securities and foreign currency transactions on the Statement of Operations.
18
USAA Mutual Funds Trust | | Notes to Financial Statements — continued
November 30, 2022 | |
(Unaudited)
Foreign Taxes:
The Fund may be subject to foreign taxes related to foreign income received (a portion of which may be reclaimable), capital gains on the sale of securities, and certain foreign currency transactions. All foreign taxes are recorded in accordance with the applicable regulations and rates that exist in the foreign jurisdictions in which the Fund invests.
Federal Income Taxes:
The Fund intends to continue to qualify as a regulated investment company by complying with the provisions available to certain investment companies, as defined in applicable sections of the Internal Revenue Code, and to make distributions of net investment income and net realized gains sufficient to relieve it from all, or substantially all, federal income taxes. Accordingly, no provision for federal income taxes is required in the financial statements. The Fund has a tax year end of May 31.
For the six months ended November 30, 2022, the Fund did not incur any income tax, interest, or penalties, and has recorded no liability for net unrecognized tax benefits relating to uncertain tax positions.
Management of the Fund has reviewed tax positions taken in tax years that remain subject to examination by all major tax jurisdictions, including federal (i.e., the last four tax years, which includes the current fiscal tax year end). Management believes that there is no tax liability resulting from unrecognized tax benefits related to uncertain tax positions taken.
Allocations:
Expenses directly attributable to the Fund are charged to the Fund, while expenses that are attributable to more than one fund in the Trust, or jointly with an affiliated trust, are allocated among the respective funds in the Trust and/or an affiliated trust based upon net assets or another appropriate basis.
Cross-Trade Transactions:
Pursuant to Rule 17a-7 under the 1940 Act, the Fund may engage in cross-trades, which are securities transactions with affiliated investment companies and advisory accounts managed by the Adviser and any applicable sub-adviser under specified conditions outlined in the valuation policies and procedures adopted by the Board. In addition, as defined under the valuation policies and procedures, each transaction must be effected at the independent current market price. For the six months ended November 30, 2022, the Fund engaged in the following securities transactions with affiliated funds, which resulted in the following net realized gains (losses) (amounts in thousands):
| Purchases | | Sales | | Net Realized
Gains (Losses) | |
| $ | — | | | $ | 535 | | | $ | (80 | ) | |
3. Purchases and Sales:
Purchases and sales of securities (excluding securities maturing less than one year from acquisition) for the six months ended November 30, 2022, were as follows for the Fund (amounts in thousands):
Excluding
U.S. Government Securities | | U.S. Government Securities | |
Purchases | | Sales | | Purchases | | Sales | |
$ | 53,012 | | | $ | 56,878 | | | $ | — | | | $ | 135 | | |
19
USAA Mutual Funds Trust | | Notes to Financial Statements — continued
November 30, 2022 | |
(Unaudited)
4. Fees and Transactions with Affiliates and Related Parties:
Investment Advisory Fees:
Investment advisory services are provided to the Fund by the Adviser, which is a New York corporation registered as an investment adviser with the SEC.
Under the terms of the Investment Advisory Agreement, the Adviser is entitled to receive fees accrued daily and paid monthly at an annualized rate of 0.50% of the Fund's average daily net assets. Amounts incurred and paid to VCM for the six months ended November 30, 2022, are reflected on the Statement of Operations as Investment advisory fees.
The Trust relies on an exemptive order granted to VCM and its affiliated funds by the SEC in March 2019, permitting the use of a "manager-of-managers" structure for certain funds. Under a manager-of-managers structure, the investment adviser may select (with approval of the Board and without shareholder approval) one or more subadvisers to manage the day-to-day investment of a fund's assets. For the six months ended November 30, 2022, the Fund had no subadvisers.
Administration and Servicing Fees:
VCM also serves as the Fund's administrator and fund accountant. Under the Fund Administration, Servicing and Accounting Agreement, VCM is paid an administration and servicing fee that is accrued daily and paid monthly at an annualized rate of 0.15%, which is based on the Fund's average daily net assets. Amounts incurred for the six months ended November 30, 2022, are reflected on the Statement of Operations as Administration fees.
Citi Fund Services Ohio, Inc. ("Citi"), an affiliate of Citibank, acts as sub-administrator and sub-fund accountant to the Fund pursuant to a Sub-Administration and Sub-Fund Accounting Services Agreement between VCM and Citi. VCM pays Citi a fee for providing these services. The Fund reimburses VCM and Citi for out-of-pocket expenses incurred in providing these services and certain other expenses specifically allocated to the Fund. Amounts incurred for the six months ended November 30, 2022, are reflected on the Statement of Operations as Sub-Administration fees.
The Fund (as part of the Trust) has entered into an agreement with the Adviser to provide compliance services, pursuant to which the Adviser furnishes its compliance personnel, including the services of the Chief Compliance Officer ("CCO"), and other resources reasonably necessary to provide the Trust with compliance oversight services related to the design, administration, and oversight of a compliance program for the Trust in accordance with Rule 38a-1 under the 1940 Act. The CCO is an employee of the Adviser, which pays the compensation of the CCO and support staff. The funds in the Trust, Victory Variable Insurance Funds, Victory Portfolios, and Victory Portfolios II (collectively, the "Victory Funds Complex") in the aggregate, compensate the Adviser for these services. Amounts incurred for the six months ended November 30, 2022, are reflected on the Statement of Operations as Compliance fees.
Transfer Agency Fees:
Victory Capital Transfer Agency, Inc. ("VCTA"), an affiliate of the Adviser, provides transfer agency services to the Fund. VCTA provides transfer agent services to the Fund based on an annual charge of $23 per shareholder account plus out-of-pocket expenses. VCTA pays a portion of these fees to certain intermediaries for the administration and servicing of accounts that are held with such intermediaries. Amounts incurred and paid to VCTA for the six months ended November 30, 2022, are reflected on the Statement of Operations as Transfer agent fees.
FIS Investor Services LLC serves as sub-transfer agent and dividend disbursing agent for the Fund pursuant to a Sub-Transfer Agent Agreement between VCTA and FIS Investor Services LLC. VCTA provides FIS Investor Services LLC a fee for providing these services.
20
USAA Mutual Funds Trust | | Notes to Financial Statements — continued
November 30, 2022 | |
(Unaudited)
Distributor/Underwriting Services:
Victory Capital Services, Inc. (the "Distributor"), an affiliate of the Adviser, serves as Distributor for the continuous offering of the shares of the Fund pursuant to a Distribution Agreement between the Distributor and the Trust and receives no fee or other compensation for these services.
Other Fees:
Citibank serves as the Fund's custodian. The Fund pays Citibank a fee for providing these services. Amounts incurred for the six months ended November 30, 2022, are reflected on the Statement of Operations as Custodian fees.
K&L Gates LLP provides legal services to the Trust.
The Adviser has entered into an expense limitation agreement with the Fund until at least September 30, 2023. Under the terms of the agreement, the Adviser has agreed to waive fees or reimburse certain expenses to the extent that ordinary operating expenses incurred in any fiscal year exceed the expense limit for the Fund. Such excess amounts will be the liability of the Adviser. Acquired fund fees and expenses, interest, taxes, brokerage commissions, other expenditures, which are capitalized in accordance with GAAP, and other extraordinary expenses not incurred in the ordinary course of the Fund's business are excluded from the expense limits. As of November 30, 2022, the expense limit (excluding voluntary waivers) is 0.90%.
In addition, the Fund invests in affiliated VCM exchange-traded fund(s) ("affiliated ETFs"). The Fund's advisory fee is reimbursed by VCM that to the extent of the indirect advisory fee incurred through the Fund's proportional investment in the affiliated ETFs. These affiliated ETF advisory fee reimbursements are not available for recoupment. For the six months ended November 30, 2022, the Fund incurred reimbursable expenses of $141 thousand, of which $117 thousand consisted of affiliated ETF Adviser for reimbursement and is reflected on the Statement of Operations as Expenses waived/reimbursed by Adviser. The Fund has a receivable related to these reimbursable expenses from the Advisor for $57 thousand, pursuant to the Fund's expense limitation agreement and is reflected on the Statement of Assets and Liabilities as Receivable from Advisor for ETF reimbursements.
Under the terms of the expense limitation agreement, as amended June 29, 2022, the Fund has agreed to repay fees and expenses that were waived or reimbursed by the Adviser for a period of up to three years (thirty-six (36) months) after the waiver or reimbursement took place, subject to the lesser of any operating expense limits in effect at the time of: (a) the original waiver or expense reimbursement; or (b) the recoupment, after giving effect to the recoupment amount. For the six months ended November 30, 2022, the Fund incurred reimbursable expenses, of which $24 thousand consisted of reimbursements for expense limitation agreement and is reflected on the Statement of Operations as Expenses waived/reimbursed by Adviser. The Fund has a receivable related to these reimbursable expenses from the Advisor for $15 thousand pursuant to the Fund's expense limitation agreement and is reflected on the Statement of Assets and Liabilities as Receivable from Advisor for expense limitation agreement.
As of November 30, 2022, the following amounts are available to be repaid to the Adviser (amounts in thousands). The Fund has not recorded any amounts available to be repaid as a liability due to an assessment that such repayments are not probable at November 30, 2022.
Expires
2023 | | Expires
2024 | | Expires
2025 | | Expires
2026 | | Total | |
| $ | 148 | | | $ | 246 | | | $ | 47 | | | $ | 24 | | | $ | 465 | | |
The Adviser may voluntarily waive or reimburse additional fees to assist the Fund in maintaining competitive expense ratios. Voluntary waivers and reimbursements applicable to the Fund are not available to be recouped at a future time. There were no voluntary waivers or reimbursements for the six months ended November 30, 2022.
Certain officers and/or interested trustees of the Fund are also officers and/or employees of the Adviser, administrator, fund accountant, sub-administrator, sub-fund accountant, custodian, and Distributor.
21
USAA Mutual Funds Trust | | Notes to Financial Statements — continued
November 30, 2022 | |
(Unaudited)
5. Risks:
The Fund may be subject to other risks in addition to these identified risks.
Tactical Allocation Risk — The Fund has a targeted risk tolerance and a corresponding asset allocation target; however, mere asset allocation and volatility are not the sole determination of risk. The Fund's managers will tactically allocate away from the target allocation as market conditions and the perceived risks warrant. The Fund bears the risk that the managers' tactical allocation will not be successful.
Affiliated Funds Risk — The risks of the Fund directly correspond to the risks of the underlying affiliated funds in which the Fund invests. By investing in the underlying affiliated funds, the Fund has exposure to the risk of many different areas of the market. The degree to which the risks described below apply to the Fund varies according to the Fund's asset allocation. For instance, the more the Fund is allocated to stock funds, the greater the risk associated with equity securities. The Fund also is subject to asset allocation risk (i.e., the risk that allocations will not produce the intended results) and to management risk (i.e., the risk that the selection of underlying affiliated funds will not produce the intended results).
Conflict of Interest Risk — In managing a Fund that invests in underlying affiliated funds, the Adviser may have conflicts of interest in allocating the Fund's assets among the various underlying affiliated funds. This is because the fees payable by some of the underlying affiliated funds to the Adviser and/or its affiliates are higher than the fees payable by other underlying affiliated funds, and because the Adviser also manages and administers the underlying affiliated funds.
ETF Risk — The Fund may invest in shares of ETFs, which generally are registered investment companies that hold a portfolio of common stocks or debt securities, the shares of which are traded on an exchange. ETFs incur their own management and other fees and expenses, such as trustees' fees, operating expenses, registration fees, and marketing expenses, a proportionate share of which will be borne indirectly by the Fund as a shareholder in an ETF. As a result, the Fund's investment in an ETF will cause the Fund to indirectly bear the fees and expenses of the ETF and, in turn, the Fund's performance may be lower than if the Fund were to invest directly in the underlying securities held by the ETF. For investments in affiliated ETFs, the Fund's management fee is reimbursed by the Adviser to the extent of the indirect management fee incurred through the Fund's investment in the affiliated ETFs. The Adviser may have conflicts of interest in allocating assets among affiliated and unaffiliated ETFs, because the Adviser also manages and administers the affiliated ETFs, and the Adviser and its affiliates receive other fees from the affiliated ETFs. In addition, the Fund also will be subject to the risks associated with the securities or other investments held by the ETFs.
Market Risk — Overall market risks may affect the value of the Fund. Domestic and international factors such as political events, war, terrorism, trade disputes, inflation rates, interest rate levels and other fiscal and monetary policy changes, cybersecurity incidents, pandemics and other public health crises, sanctions against a particular foreign country, its nationals, businesses or industries and related geopolitical events, as well as environmental disasters such as earthquakes, fires, and floods, or other catastrophes, may add to instability in global economies and markets generally, and may lead to increased market volatility. Global economies and financial markets are highly interconnected, which increases the possibility that conditions in one country or region might adversely affect issuers in another country or region. The impact of these and other factors may be short-term or may last for extended periods.
6. Borrowing and Interfund Lending:
Line of Credit:
The Victory Funds Complex participates in a short-term demand note "Line of Credit" agreement with Citibank. The Line of Credit agreement with Citibank was renewed on June 27, 2022, with a termination date of June 26, 2023. Under the agreement with Citibank, the Victory Funds Complex may borrow up to $600 million, of which $300 million is committed and $300 million is uncommitted. $40 million of the Line of Credit is reserved for use by the Victory Floating Rate Fund, another series of the Victory Funds Complex, with Victory Floating Rate Fund paying the related commitment fees for that amount.
22
USAA Mutual Funds Trust | | Notes to Financial Statements — continued
November 30, 2022 | |
(Unaudited)
The purpose of the Line of Credit is to meet temporary or emergency cash needs. For the six months ended November 30, 2022, Citibank received an annual commitment fee of 0.15% on $300 million for providing the Line of Credit. Each fund in the Victory Funds Complex paid a pro-rata portion of the commitment fees plus any interest on amounts borrowed. For the period from June 1, 2022, through June 27, 2022, interest was based on the one-month London Interbank Offered Rate ("LIBOR") plus one percent. Effective with the renewal, for the period June 28, 2022, through November 30, 2022, interest was based on the one-month Secured Overnight Financing Rate ("SOFR") plus 1.10 percent. Interest charged to the Fund during the period, if applicable, is reflected on the Statement of Operations under Line of credit fees.
The Fund had no borrowings under the Line of Credit agreement during the six months ended November 30, 2022.
Interfund Lending:
The Trust and the Adviser rely on an exemptive order granted by the SEC in March 2017 (the "Order"), permitting the establishment and operation of an Interfund Lending Facility (the "Facility"). The Facility allows the Fund to directly lend and borrow money to or from any other fund in the Victory Funds Complex that is permitted to participate in the Facility, relying upon the Order at rates beneficial to both the borrowing and lending funds. Advances under the Facility are allowed for temporary or emergency purposes, including the meeting of redemption requests that otherwise might require the untimely disposition of securities, and are subject to each Fund's borrowing restrictions. The interfund loan rate is determined, as specified in the Order, by averaging the current repurchase agreement rate and the current bank loan rate. As a Borrower, interest charged to the Fund, if any, during the period, is reflected on the Statement of Operations under Interfund lending fees. As a Lender, interest earned by the Fund, if any, during the period, is reflected on the Statement of Operations under Interfund lending.
The average borrowing or lending for the days outstanding and average interest rate for the Fund for six months ended November 30, 2022, were as follows (amounts in thousands):
Borrower
or Lender | | Amount
Outstanding at
November 30, 2022 | | Average
Borrowing* | | Days
Borrowing
Outstanding | | Average
Interest
Rate* | | Maximum
Borrowing
During
the Period | |
| Borrower | | $ | — | | | $ | 992 | | | | 4 | | | | 2.86 | % | | $ | 992 | | |
* For the six months ended November 30, 2022, based on the number of days borrowings were outstanding.
7. Federal Income Tax Information:
The Fund intends to distribute any net investment income quarterly. Distributable net realized gains, if any, are declared and paid at least annually.
The amounts of dividends from net investment income and distributions from net realized gains (collectively, distributions to shareholders) are determined in accordance with federal income tax regulations, which may differ from GAAP. To the extent these "book/tax" differences are permanent in nature (e.g., net operating loss and distribution reclassification), such amounts are reclassified within the components of net assets based on their federal tax-basis treatment; temporary differences (e.g., wash sales) do not require reclassification. To the extent dividends and distributions exceed net investment income and net realized gains for tax purposes, they are reported as distributions of capital. Net investment losses incurred by the Fund may be reclassified as an offset to capital on the accompanying Statement of Assets and Liabilities.
The tax character of current year distributions paid and the tax basis of the current components of accumulated earnings (loss) will be determined at the end of the current tax year.
At the tax year ended May 31, 2022, the Fund had no capital loss carryforwards for federal income tax purposes.
23
USAA Mutual Funds Trust | | Notes to Financial Statements — continued
November 30, 2022 | |
(Unaudited)
8. Affiliated Securities:
An affiliated security is a security in which the Fund has ownership of at least 5% of the security's outstanding voting shares, an investment company managed by VCM, or an issuer under common control with a Fund or VCM. The Fund does not invest in affiliated securities for the purpose of exercising management or control. These securities are noted as affiliated on the Fund's Schedule of Portfolio Investments. The financial statements of the underlying funds can be found in shareholder reports filed with the SEC by each such underlying fund semi-annually on Form N-CSR and are available for download from both the SEC's as well as each respective underlying fund's website. Transactions in affiliated securities during the six months ended November 30, 2022, were as follows (amounts in thousands):
| | | Fair
Value
5/31/2022 | | Purchases
at Cost | | Proceeds
from
Sales | | Realized
Gains
(Losses) | | Capital
Gain
Distribution | | Net
Change in
Unrealized
Appreciation/
Depreciation | | Fair Value
11/30/2022 | | Dividend
Income | |
VictoryShares Emerging Markets
Value Momentum ETF | | $ | 436 | | | $ | — | | | $ | — | | | $ | — | | | $ | — | | | $ | (42 | ) | | $ | 394 | | | $ | 11 | | |
VictoryShares ESG Core
Plus Bond ETF | | | 15,102 | | | | 628 | | | | (314 | ) | | | — | | | | — | | | | (764 | ) | | | 14,652 | | | | 253 | | |
VictoryShares USAA Core
Intermediate-Term Bond ETF | | | 59,452 | | | | 2,442 | | | | (3,223 | ) | | | (467 | ) | | | — | | | | (2,410 | ) | | | 55,794 | | | | 670 | | |
VictoryShares USAA Core
Short-Term Bond ETF | | | 2,712 | | | | 700 | | | | — | | | | — | | | | — | | | | (45 | ) | | | 3,367 | | | | 39 | | |
| | | $ | 77,702 | | | $ | 3,770 | | | $ | (3,537 | ) | | $ | (467 | ) | | $ | — | | | $ | (3,261 | ) | | $ | 74,207 | | | $ | 973 | | |
24
USAA Mutual Funds Trust | | Supplemental Information
November 30, 2022 | |
(Unaudited)
Proxy Voting and Portfolio Holdings Information
Proxy Voting:
Information regarding the policies and procedures the Fund uses to determine how to vote proxies relating to portfolio securities is available without charge, upon request, by calling (800) 235-8396. The information is also included in the Fund's Statement of Additional Information, which is available on the SEC's website at www.sec.gov.
Information relating to how the Fund voted proxies relating to portfolio securities held during the most recent 12 months ended June 30 is available on the SEC's website at www.sec.gov.
Availability of Schedules of Portfolio Investments:
The Trust files a complete list of Schedules of Portfolio Investments with the SEC for the first and third quarter of each fiscal year on Form N-PORT. Form N-PORT is available on the SEC's website at www.sec.gov.
Expense Example
As a shareholder of the Fund, you may incur two types of costs: (1) transaction costs and (2) ongoing costs, including management fees and other Fund expenses. These examples are intended to help you understand your ongoing costs (in dollars) of investing in the Fund and to compare these costs with the ongoing costs of investing in other mutual funds.
These examples are based on an investment of $1,000 invested at the beginning of the period and held for the entire period from June 1, 2022, through November 30, 2022.
The Actual Expense figures in the table below provide information about actual account values and actual expenses. You may use the information below, together with the amount you invested, to estimate the expenses that you paid over the period. Simply divide your account value by $1,000 (for example, an $8,600 account value divided by $1,000 = 8.6), then multiply the result by the number in the table under the heading entitled "Actual Expenses Paid During Period" to estimate the expenses you paid on your account during this period.
The Hypothetical Expense figures in the table below provide information about hypothetical account values and hypothetical expenses based on the Fund's actual expense ratio and an assumed rate of return of 5% per year before expenses, which is not the Fund's actual return. The hypothetical account values and expenses may not be used to estimate the actual ending account balance or expenses you paid for the period. You may use this information to compare this 5% hypothetical example with the 5% hypothetical examples that appear in shareholder reports of other funds.
Please note the expenses shown in the table below are meant to highlight your ongoing costs only and do not reflect any transactional costs. Therefore, the hypothetical expenses in the table are useful in comparing ongoing costs only and will not help you determine the relative total costs of owning different funds. In addition, if these transactional costs were included, your costs would have been higher.
Beginning
Account Value
6/1/22 | | Actual
Ending
Account Value
11/30/22 | | Hypothetical
Ending
Account Value
11/30/22 | | Actual
Expenses Paid
During Period
6/1/22-11/30/22* | | Hypothetical
Expenses Paid
During Period
6/1/22-11/30/22* | | Annualized
Expense Ratio
During Period
6/1/22-11/30/22 | |
| $ | 1,000.00 | | | $ | 967.00 | | | $ | 1,020.56 | | | $ | 4.44 | | | $ | 4.56 | | | | 0.90 | % | |
* Expenses are equal to the average account value multiplied by the Fund's annualized expense ratio multiplied by 183/365 (the number of days in the most recent fiscal half-year divided by the number of days in the fiscal year).
25
Privacy Policy
Protecting the Privacy of Information
The Trust respects your right to privacy. We also know that you expect us to conduct and process your business in an accurate and efficient manner. To do so, we must collect and maintain certain personal information about you. This is the information we collect from you on applications or other forms, and from the transactions you make with us or third parties. It may include your name, address, social security number, account transactions and balances, and information about investment goals and risk tolerance.
We do not disclose any information about you or about former customers to anyone except as permitted or required by law. Specifically, we may disclose the information we collect to companies that perform services on our behalf, such as the transfer agent that processes shareholder accounts and printers and mailers that assist us in the distribution of investor materials. We may also disclose this information to companies that perform marketing services on our behalf. This allows us to continue to offer you Victory investment products and services that meet your investing needs, and to effect transactions that you request or authorize. These companies will use this information only in connection with the services for which we hired them. They are not permitted to use or share this information for any other purpose.
To protect your personal information internally, we permit access only by authorized employees and maintain physical, electronic, and procedural safeguards to guard your personal information.*
* You may have received communications regarding information about privacy policies from other financial institutions which gave you the opportunity to "opt-out" of certain information sharing with companies which are not affiliated with that financial institution. The Trust does not share information with other companies for purposes of marketing solicitations for products other than the Trust. Therefore, the Trust does not provide opt-out options to their shareholders.
P.O. Box 182593
Columbus, Ohio 43218-2593

Visit our website at: | | Call | |
www.vcm.com | | (800) 235-8396 | |

NOVEMBER 30, 2022
Semi Annual Report
USAA Cornerstone Aggressive Fund
Victory Capital means Victory Capital Management Inc., the investment adviser of the USAA Mutual Funds. USAA Mutual Funds are distributed by Victory Capital Services, Inc., member FINRA, an affiliate of Victory Capital. Victory Capital and its affiliates are not affiliated with United Services Automobile Association or its affiliates. USAA and the USAA logos are registered trademarks and the USAA Mutual Funds and USAA Investments logos are trademarks of United Services Automobile Association and are being used by Victory Capital and its affiliates under license.
www.vcm.com
News, Information And Education 24 Hours A Day, 7 Days A Week
The Victory Capital website gives fund shareholders, prospective shareholders, and investment professionals a convenient way to access fund information, get guidance, and track fund performance anywhere they can access the Internet. The site includes:
• Detailed performance records
• Daily share prices
• The latest fund news
• Investment resources to help you become a better investor
• A section dedicated to investment professionals
Whether you're a potential investor searching for the fund that matches your investment philosophy, a seasoned investor interested in planning tools, or an investment professional, www.vcm.com has what you seek. Visit us anytime. We're always open.
TABLE OF CONTENTS
Investment Objective & Portfolio Holdings | | | 2 | | |
Schedule of Portfolio Investments | | | 3 | | |
Financial Statements | |
Statement of Assets and Liabilities | | | 14 | | |
Statement of Operations | | | 15 | | |
Statements of Changes in Net Assets | | | 16 | | |
Financial Highlights | | | 18 | | |
Notes to Financial Statements | | | 20 | | |
Supplemental Information | | | 31 | | |
Proxy Voting and Portfolio Holdings Information | | | 31 | | |
Expense Example | | | 31 | | |
Privacy Policy (inside back cover) | | | |
This report is for the information of the shareholders and others who have received a copy of the currently effective prospectus of the Fund, managed by Victory Capital Management Inc. It may be used as sales literature only when preceded or accompanied by a current prospectus, which provides further details about the Fund.
IRA DISTRIBUTION WITHHOLDING DISCLOSURE
We generally must withhold federal income tax at a rate of 10% of the taxable portion of your distribution and, if you live in a state that requires state income tax withholding, at your state's tax rate. However, you may elect not to have withholding apply or to have income tax withheld at a higher rate. Any withholding election that you make will apply to any subsequent distribution unless and until you change or revoke the election. If you wish to make a withholding election, or change or revoke a prior withholding election, call (800) 235-8396, and form W-4P (OMB No. 1545-0074 withholding certificate for pension or annuity payments) will be electronically sent.
If you do not have a withholding election in place by the date of a distribution, federal income tax will be withheld from the taxable portion of your distribution at a rate of 10%. If you must pay estimated taxes, you may be subject to estimated tax penalties if your estimated tax payments are not sufficient and sufficient tax is not withheld from your distribution.
For more specific information, please consult your tax adviser.
• NOT FDIC INSURED • NO BANK GUARANTEE • MAY LOSE VALUE
1
USAA Mutual Funds Trust
USAA Cornerstone Aggressive Fund | | November 30, 2022 | |
(Unaudited)
Investment Objective and Portfolio Holdings:
The Fund seeks capital appreciation over the long term and also considers the potential for current income.
Asset Allocation*:
November 30, 2022
(% of Net Assets)
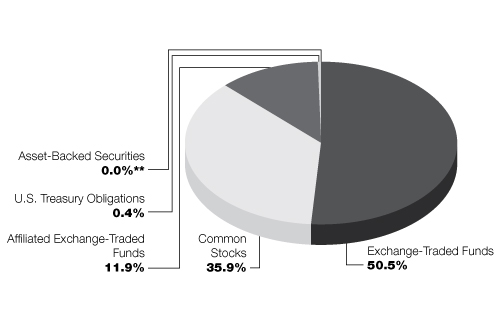
* Does not include futures contracts, money market instruments, and short-term investments purchased with cash collateral from securities loaned.
** Percentage is less than 0.05%.
Percentages are of the net assets of the Fund and may not equal 100%.
2
USAA Mutual Funds Trust
USAA Cornerstone Aggressive Fund | | Schedule of Portfolio Investments
November 30, 2022 | |
(Amounts in Thousands, Except for Shares) (Unaudited)
Security Description | | Shares or
Principal
Amount | | Value | |
Asset-Backed Securities (0.0%) (a) | |
NP SPE II LLC, Series 2017-1A, Class A1, 3.37%, 10/21/47 (b) | | $ | 24 | | | $ | 22 | | |
Total Asset-Backed Securities (Cost $24) | | | 22 | | |
Common Stocks (35.9%) | |
Communication Services (2.3%): | |
Alphabet, Inc. Class C (c) | | | 15,663 | | | | 1,589 | | |
AMC Networks, Inc. Class A (c) | | | 2,581 | | | | 52 | | |
AT&T, Inc. | | | 66,712 | | | | 1,286 | | |
Cargurus, Inc. (c) | | | 5,433 | | | | 71 | | |
Comcast Corp. Class A | | | 19,345 | | | | 709 | | |
EchoStar Corp. Class A (c) | | | 5,280 | | | | 92 | | |
iHeartMedia, Inc. Class A (c) | | | 8,363 | | | | 67 | | |
Match Group, Inc. (c) | | | 9,088 | | | | 459 | | |
Meta Platforms, Inc. Class A (c) | | | 6,354 | | | | 750 | | |
Sirius XM Holdings, Inc. (d) | | | 150,998 | | | | 980 | | |
TechTarget, Inc. (c) | | | 1,222 | | | | 56 | | |
Thryv Holdings, Inc. (c) | | | 2,767 | | | | 53 | | |
T-Mobile U.S., Inc. (c) | | | 4,033 | | | | 611 | | |
Verizon Communications, Inc. | | | 17,857 | | | | 696 | | |
World Wrestling Entertainment, Inc. Class A | | | 2,214 | | | | 177 | | |
Ziff Davis, Inc. (c) | | | 1,799 | | | | 166 | | |
ZipRecruiter, Inc. (c) | | | 4,900 | | | | 81 | | |
| | | | 7,895 | | |
Consumer Discretionary (3.1%): | |
AutoNation, Inc. (c) | | | 1,691 | | | | 210 | | |
AutoZone, Inc. (c) | | | 445 | | | | 1,148 | | |
Best Buy Co., Inc. | | | 6,237 | | | | 532 | | |
Crocs, Inc. (c) | | | 1,349 | | | | 136 | | |
Dick's Sporting Goods, Inc. | | | 904 | | | | 108 | | |
Dillard's, Inc. Class A (d) | | | 251 | | | | 90 | | |
Dollar General Corp. | | | 2,155 | | | | 551 | | |
Ford Motor Co. | | | 39,347 | | | | 547 | | |
General Motors Co. | | | 14,351 | | | | 582 | | |
Genuine Parts Co. | | | 2,892 | | | | 530 | | |
G-III Apparel Group Ltd. (c) | | | 3,298 | | | | 71 | | |
Graham Holdings Co. Class B | | | 275 | | | | 177 | | |
Group 1 Automotive, Inc. | | | 879 | | | | 170 | | |
Installed Building Products, Inc. | | | 991 | | | | 84 | | |
KB Home | | | 3,436 | | | | 108 | | |
Kontoor Brands, Inc. | | | 2,786 | | | | 121 | | |
Lennar Corp. Class A | | | 6,079 | | | | 534 | | |
Lowe's Cos., Inc. | | | 3,023 | | | | 643 | | |
MarineMax, Inc. (c) | | | 2,571 | | | | 85 | | |
McDonald's Corp. | | | 2,596 | | | | 708 | | |
Meritage Homes Corp. (c) | | | 990 | | | | 86 | | |
Murphy USA, Inc. | | | 349 | | | | 103 | | |
O'Reilly Automotive, Inc. (c) | | | 1,314 | | | | 1,136 | | |
See notes to financial statements.
3
USAA Mutual Funds Trust
USAA Cornerstone Aggressive Fund | | Schedule of Portfolio Investments — continued
November 30, 2022 | |
(Amounts in Thousands, Except for Shares) (Unaudited)
Security Description | | Shares | | Value | |
Perdoceo Education Corp. (c) | | | 10,197 | | | $ | 146 | | |
Rent-A-Center, Inc. | | | 2,399 | | | | 58 | | |
Signet Jewelers Ltd. | | | 1,156 | | | | 75 | | |
Skyline Champion Corp. (c) | | | 1,871 | | | | 97 | | |
Sonic Automotive, Inc. Class A | | | 3,303 | | | | 176 | | |
Sturm Ruger & Co., Inc. | | | 1,219 | | | | 67 | | |
Target Corp. | | | 2,660 | | | | 444 | | |
Taylor Morrison Home Corp. (c) | | | 3,153 | | | | 96 | | |
The Home Depot, Inc. | | | 2,490 | | | | 807 | | |
Thor Industries, Inc. | | | 1,104 | | | | 95 | | |
Williams-Sonoma, Inc. | | | 1,071 | | | | 125 | | |
Wingstop, Inc. | | | 807 | | | | 134 | | |
| | | | 10,780 | | |
Consumer Staples (1.8%): | |
Altria Group, Inc. | | | 26,238 | | | | 1,222 | | |
Coca-Cola Consolidated, Inc. | | | 147 | | | | 72 | | |
Colgate-Palmolive Co. | | | 7,169 | | | | 556 | | |
General Mills, Inc. | | | 7,185 | | | | 613 | | |
Herbalife Nutrition Ltd. (c) | | | 3,174 | | | | 56 | | |
Ingles Markets, Inc. Class A | | | 1,679 | | | | 170 | | |
National Beverage Corp. | | | 2,597 | | | | 134 | | |
Nu Skin Enterprises, Inc. Class A | | | 1,890 | | | | 79 | | |
PepsiCo, Inc. | | | 4,142 | | | | 768 | | |
Philip Morris International, Inc. | | | 6,535 | | | | 651 | | |
Sprouts Farmers Market, Inc. (c) | | | 5,671 | | | | 195 | | |
The Hershey Co. | | | 2,510 | | | | 590 | | |
Tyson Foods, Inc. Class A | | | 8,486 | | | | 562 | | |
Walgreens Boots Alliance, Inc. | | | 13,564 | | | | 563 | | |
WD-40 Co. | | | 503 | | | | 84 | | |
| | | | 6,315 | | |
Energy (2.0%): | |
Antero Resources Corp. (c) | | | 3,245 | | | | 119 | | |
Arch Resources, Inc. (d) | | | 795 | | | | 123 | | |
California Resources Corp. | | | 2,829 | | | | 128 | | |
Chevron Corp. | | | 4,373 | | | | 802 | | |
CNX Resources Corp. (c) | | | 3,549 | | | | 62 | | |
ConocoPhillips | | | 5,027 | | | | 621 | | |
Devon Energy Corp. | | | 6,927 | | | | 475 | | |
EOG Resources, Inc. | | | 3,753 | | | | 533 | | |
Exxon Mobil Corp. | | | 16,864 | | | | 1,878 | | |
HF Sinclair Corp. | | | 1,112 | | | | 69 | | |
Marathon Oil Corp. | | | 16,117 | | | | 494 | | |
Marathon Petroleum Corp. | | | 4,634 | | | | 564 | | |
Ovintiv, Inc. | | | 1,384 | | | | 77 | | |
PBF Energy, Inc. Class A | | | 2,311 | | | | 92 | | |
PDC Energy, Inc. | | | 1,808 | | | | 134 | | |
SM Energy Co. | | | 2,632 | | | | 113 | | |
Texas Pacific Land Corp. | | | 39 | | | | 101 | | |
Valero Energy Corp. | | | 4,014 | | | | 536 | | |
See notes to financial statements.
4
USAA Mutual Funds Trust
USAA Cornerstone Aggressive Fund | | Schedule of Portfolio Investments — continued
November 30, 2022 | |
(Amounts in Thousands, Except for Shares) (Unaudited)
Security Description | | Shares | | Value | |
W&T Offshore, Inc. (c) | | | 6,281 | | | $ | 43 | | |
World Fuel Services Corp. | | | 4,086 | | | | 116 | | |
| | | | 7,080 | | |
Financials (4.9%): | |
Affiliated Managers Group, Inc. | | | 832 | | | | 133 | | |
AGNC Investment Corp. | | | 6,730 | | | | 67 | | |
American Express Co. | | | 3,790 | | | | 597 | | |
Annaly Capital Management, Inc. | | | 943 | | | | 20 | | |
Aon PLC Class A | | | 1,786 | | | | 551 | | |
Arch Capital Group Ltd. (c) | | | 9,265 | | | | 555 | | |
Artisan Partners Asset Management, Inc. Class A | | | 3,252 | | | | 113 | | |
Berkshire Hathaway, Inc. Class B (c) | | | 5,655 | | | | 1,802 | | |
Capital One Financial Corp. | | | 5,262 | | | | 543 | | |
Cathay General Bancorp | | | 5,287 | | | | 246 | | |
Citigroup, Inc. | | | 12,305 | | | | 596 | | |
Cohen & Steers, Inc. | | | 1,254 | | | | 83 | | |
Cullen/Frost Bankers, Inc. | | | 561 | | | | 81 | | |
Enstar Group Ltd. (c) | | | 651 | | | | 142 | | |
Essent Group Ltd. | | | 4,995 | | | | 200 | | |
FactSet Research Systems, Inc. | | | 1,097 | | | | 506 | | |
International Bancshares Corp. | | | 4,425 | | | | 233 | | |
Jefferies Financial Group, Inc. | | | 3,408 | | | | 129 | | |
JPMorgan Chase & Co. | | | 6,650 | | | | 919 | | |
Lakeland Financial Corp. | | | 1,706 | | | | 135 | | |
LPL Financial Holdings, Inc. | | | 2,073 | | | | 491 | | |
M&T Bank Corp. | | | 3,093 | | | | 526 | | |
Marsh & McLennan Cos., Inc. | | | 3,413 | | | | 591 | | |
Mercury General Corp. | | | 2,751 | | | | 100 | | |
MetLife, Inc. | | | 7,685 | | | | 589 | | |
MGIC Investment Corp. | | | 10,620 | | | | 146 | | |
Morgan Stanley | | | 7,098 | | | | 661 | | |
Mr. Cooper Group, Inc. (c) | | | 1,621 | | | | 73 | | |
MSCI, Inc. | | | 967 | | | | 491 | | |
NMI Holdings, Inc. Class A (c) | | | 9,856 | | | | 212 | | |
OneMain Holdings, Inc. | | | 3,091 | | | | 122 | | |
Pathward Financial, Inc. | | | 3,879 | | | | 169 | | |
PJT Partners, Inc. Class A | | | 1,601 | | | | 123 | | |
PROG Holdings, Inc. (c) | | | 3,118 | | | | 61 | | |
Prudential Financial, Inc. | | | 5,190 | | | | 561 | | |
Radian Group, Inc. | | | 10,679 | | | | 209 | | |
Raymond James Financial, Inc. | | | 4,118 | | | | 481 | | |
Regions Financial Corp. | | | 21,857 | | | | 507 | | |
ServisFirst Bancshares, Inc. | | | 2,015 | | | | 153 | | |
Signature Bank | | | 3,092 | | | | 431 | | |
Starwood Property Trust, Inc. | | | 3,503 | | | | 75 | | |
Stewart Information Services Corp. | | | 2,606 | | | | 115 | | |
T. Rowe Price Group, Inc. | | | 3,729 | | | | 466 | | |
The Bancorp, Inc. (c) | | | 3,125 | | | | 94 | | |
The Goldman Sachs Group, Inc. | | | 1,680 | | | | 649 | | |
The Progressive Corp. | | | 4,496 | | | | 594 | | |
See notes to financial statements.
5
USAA Mutual Funds Trust
USAA Cornerstone Aggressive Fund | | Schedule of Portfolio Investments — continued
November 30, 2022 | |
(Amounts in Thousands, Except for Shares) (Unaudited)
Security Description | | Shares | | Value | |
Unum Group | | | 3,784 | | | $ | 160 | | |
W.R. Berkley Corp. | | | 7,500 | | | | 572 | | |
Western Alliance Bancorp | | | 1,248 | | | | 86 | | |
| | | | 17,159 | | |
Health Care (6.4%): | |
AbbVie, Inc. | | | 10,133 | | | | 1,633 | | |
Alector, Inc. (c) | | | 8,439 | | | | 72 | | |
Alkermes PLC (c) | | | 4,886 | | | | 121 | | |
Amedisys, Inc. (c) | | | 1,012 | | | | 92 | | |
AmerisourceBergen Corp. | | | 3,477 | | | | 593 | | |
Amgen, Inc. | | | 6,798 | | | | 1,947 | | |
AMN Healthcare Services, Inc. (c) | | | 1,167 | | | | 144 | | |
Arcus Biosciences, Inc. (c) | | | 4,138 | | | | 146 | | |
Biogen, Inc. (c) | | | 1,892 | | | | 577 | | |
Bristol-Myers Squibb Co. | | | 17,547 | | | | 1,409 | | |
Catalyst Pharmaceuticals, Inc. (c) | | | 7,379 | | | | 124 | | |
Chemed Corp. | | | 241 | | | | 125 | | |
Cigna Corp. | | | 4,013 | | | | 1,320 | | |
Corcept Therapeutics, Inc. (c) | | | 3,761 | | | | 95 | | |
CVS Health Corp. | | | 6,542 | | | | 667 | | |
Dynavax Technologies Corp. (c) (d) | | | 4,340 | | | | 54 | | |
Elevance Health, Inc. | | | 2,594 | | | | 1,382 | | |
Eli Lilly & Co. | | | 4,362 | | | | 1,619 | | |
Emergent BioSolutions, Inc. (c) | | | 4,242 | | | | 52 | | |
Encompass Health Corp. | | | 1,716 | | | | 100 | | |
Exelixis, Inc. (c) | | | 5,464 | | | | 93 | | |
Figs, Inc. Class A (c) | | | 10,449 | | | | 82 | | |
Fulgent Genetics, Inc. (c) | | | 2,975 | | | | 108 | | |
Gilead Sciences, Inc. | | | 7,468 | | | | 656 | | |
Halozyme Therapeutics, Inc. (c) | | | 3,864 | | | | 221 | | |
Harmony Biosciences Holdings, Inc. (c) | | | 1,039 | | | | 62 | | |
IDEXX Laboratories, Inc. (c) | | | 1,169 | | | | 498 | | |
Innoviva, Inc. (c) | | | 7,472 | | | | 98 | | |
iTeos Therapeutics, Inc. (c) | | | 3,268 | | | | 66 | | |
Johnson & Johnson | | | 5,284 | | | | 941 | | |
McKesson Corp. | | | 1,587 | | | | 606 | | |
Medpace Holdings, Inc. (c) | | | 546 | | | | 115 | | |
Merck & Co., Inc. | | | 15,101 | | | | 1,663 | | |
Mettler-Toledo International, Inc. (c) | | | 344 | | | | 506 | | |
Multiplan Corp. (c) (d) | | | 26,186 | | | | 39 | | |
National HealthCare Corp. | | | 1,863 | | | | 115 | | |
Organon & Co. | | | 2,997 | | | | 78 | | |
Owens & Minor, Inc. | | | 3,152 | | | | 65 | | |
Pfizer, Inc. | | | 16,070 | | | | 806 | | |
Prestige Consumer Healthcare, Inc. (c) | | | 1,630 | | | | 100 | | |
QuidelOrtho Corp. (c) | | | 1,363 | | | | 119 | | |
Select Medical Holdings Corp. | | | 3,411 | | | | 84 | | |
SIGA Technologies, Inc. (d) | | | 5,983 | | | | 55 | | |
Syneos Health, Inc. (c) | | | 3,557 | | | | 125 | | |
Tenet Healthcare Corp. (c) | | | 2,001 | | | | 92 | | |
See notes to financial statements.
6
USAA Mutual Funds Trust
USAA Cornerstone Aggressive Fund | | Schedule of Portfolio Investments — continued
November 30, 2022 | |
(Amounts in Thousands, Except for Shares) (Unaudited)
Security Description | | Shares | | Value | |
United Therapeutics Corp. (c) | | | 568 | | | $ | 159 | | |
UnitedHealth Group, Inc. | | | 3,757 | | | | 2,058 | | |
Vanda Pharmaceuticals, Inc. (c) | | | 7,906 | | | | 86 | | |
Waters Corp. (c) | | | 1,492 | | | | 517 | | |
| | | | 22,485 | | |
Industrials (4.4%): | |
3M Co. | | | 4,464 | | | | 562 | | |
Advanced Drainage Systems, Inc. | | | 789 | | | | 77 | | |
AGCO Corp. | | | 683 | | | | 91 | | |
Allison Transmission Holdings, Inc. | | | 4,280 | | | | 192 | | |
American Woodmark Corp. (c) | | | 1,919 | | | | 104 | | |
ArcBest Corp. | | | 1,542 | | | | 128 | | |
Atkore, Inc. (c) | | | 1,227 | | | | 150 | | |
Boise Cascade Co. | | | 2,397 | | | | 177 | | |
Builders FirstSource, Inc. (c) | | | 1,285 | | | | 82 | | |
Cadre Holdings, Inc. | | | 1,664 | | | | 43 | | |
Carlisle Cos., Inc. | | | 2,107 | | | | 554 | | |
Cintas Corp. | | | 1,166 | | | | 538 | | |
Crane Holdings Co. | | | 472 | | | | 50 | | |
Cummins, Inc. | | | 2,205 | | | | 554 | | |
EMCOR Group, Inc. | | | 1,020 | | | | 158 | | |
Fastenal Co. | | | 9,785 | | | | 504 | | |
FedEx Corp. | | | 3,120 | | | | 569 | | |
General Dynamics Corp. | | | 4,591 | | | | 1,159 | | |
Hillenbrand, Inc. | | | 1,297 | | | | 65 | | |
HNI Corp. | | | 2,040 | | | | 59 | | |
Illinois Tool Works, Inc. | | | 2,436 | | | | 554 | | |
Kelly Services, Inc. Class A | | | 3,927 | | | | 67 | | |
Kforce, Inc. | | | 1,263 | | | | 75 | | |
Lockheed Martin Corp. | | | 3,809 | | | | 1,848 | | |
ManpowerGroup, Inc. | | | 1,586 | | | | 139 | | |
Masco Corp. | | | 9,470 | | | | 481 | | |
Masonite International Corp. (c) | | | 1,210 | | | | 91 | | |
Matson, Inc. | | | 1,516 | | | | 97 | | |
MDU Resources Group, Inc. | | | 4,288 | | | | 135 | | |
MSC Industrial Direct Co., Inc. | | | 1,964 | | | | 169 | | |
Mueller Industries, Inc. | | | 2,854 | | | | 196 | | |
Northrop Grumman Corp. | | | 1,136 | | | | 606 | | |
Otis Worldwide Corp. | | | 6,496 | | | | 507 | | |
PACCAR, Inc. | | | 10,600 | | | | 1,123 | | |
Republic Services, Inc. | | | 4,116 | | | | 573 | | |
Rush Enterprises, Inc. Class A | | | 3,008 | | | | 155 | | |
Saia, Inc. (c) | | | 401 | | | | 98 | | |
Steelcase, Inc. Class A | | | 6,952 | | | | 55 | | |
The GEO Group, Inc. (c) | | | 11,069 | | | | 131 | | |
The Timken Co. | | | 2,348 | | | | 178 | | |
The Toro Co. | | | 497 | | | | 55 | | |
Trex Co., Inc. (c) | | | 1,792 | | | | 82 | | |
Triton International Ltd. | | | 2,376 | | | | 160 | | |
UFP Industries, Inc. | | | 1,210 | | | | 99 | | |
See notes to financial statements.
7
USAA Mutual Funds Trust
USAA Cornerstone Aggressive Fund | | Schedule of Portfolio Investments — continued
November 30, 2022 | |
(Amounts in Thousands, Except for Shares) (Unaudited)
Security Description | | Shares | | Value | |
United Parcel Service, Inc. Class B | | | 3,511 | | | $ | 666 | | |
W.W. Grainger, Inc. | | | 1,775 | | | | 1,070 | | |
XPO Logistics, Inc. (c) | | | 1,884 | | | | 73 | | |
Zurn Elkay Water Solutions Corp. | | | 3,312 | | | | 80 | | |
| | | | 15,379 | | |
Information Technology (7.3%): | |
Accenture PLC Class A | | | 2,206 | | | | 664 | | |
Adeia, Inc. | | | 5,350 | | | | 59 | | |
Adobe, Inc. (c) | | | 1,772 | | | | 611 | | |
Amkor Technology, Inc. | | | 7,375 | | | | 207 | | |
Apple, Inc. | | | 36,173 | | | | 5,355 | | |
Automatic Data Processing, Inc. | | | 2,371 | | | | 626 | | |
Avid Technology, Inc. (c) | | | 2,695 | | | | 76 | | |
Badger Meter, Inc. | | | 1,029 | | | | 119 | | |
Broadcom, Inc. | | | 1,345 | | | | 741 | | |
Ciena Corp. (c) | | | 1,738 | | | | 78 | | |
Cisco Systems, Inc. | | | 29,771 | | | | 1,480 | | |
Cognizant Technology Solutions Corp. Class A | | | 9,138 | | | | 568 | | |
CSG Systems International, Inc. | | | 2,858 | | | | 177 | | |
Diodes, Inc. (c) | | | 1,276 | | | | 118 | | |
Domo, Inc. Class B (c) | | | 5,753 | | | | 82 | | |
DXC Technology Co. (c) | | | 3,240 | | | | 96 | | |
Ebix, Inc. (d) | | | 3,276 | | | | 62 | | |
Enphase Energy, Inc. (c) | | | 1,792 | | | | 575 | | |
EVERTEC, Inc. | | | 2,999 | | | | 101 | | |
Fair Isaac Corp. (c) | | | 1,620 | | | | 1,004 | | |
HP, Inc. | | | 33,674 | | | | 1,012 | | |
Intel Corp. | | | 20,263 | | | | 609 | | |
International Business Machines Corp. | | | 8,739 | | | | 1,301 | | |
Jabil, Inc. | | | 1,708 | | | | 123 | | |
Kulicke & Soffa Industries, Inc. | | | 1,429 | | | | 69 | | |
Lattice Semiconductor Corp. (c) | | | 2,351 | | | | 171 | | |
Lumentum Holdings, Inc. (c) | | | 1,123 | | | | 62 | | |
Manhattan Associates, Inc. (c) | | | 692 | | | | 87 | | |
Maximus, Inc. | | | 1,473 | | | | 104 | | |
Methode Electronics, Inc. | | | 2,528 | | | | 115 | | |
Micron Technology, Inc. | | | 8,828 | | | | 509 | | |
Microsoft Corp. | | | 8,559 | | | | 2,184 | | |
MKS Instruments, Inc. | | | 897 | | | | 75 | | |
Motorola Solutions, Inc. | | | 2,156 | | | | 587 | | |
NCR Corp. (c) | | | 3,060 | | | | 73 | | |
ON Semiconductor Corp. (c) | | | 6,753 | | | | 508 | | |
Oracle Corp. | | | 7,943 | | | | 660 | | |
Palo Alto Networks, Inc. (c) | | | 3,215 | | | | 546 | | |
Paychex, Inc. | | | 4,363 | | | | 541 | | |
Perficient, Inc. (c) | | | 1,173 | | | | 83 | | |
QUALCOMM, Inc. | | | 4,972 | | | | 629 | | |
Qualys, Inc. (c) | | | 1,015 | | | | 125 | | |
Rimini Street, Inc. (c) | | | 14,354 | | | | 60 | | |
Sanmina Corp. (c) | | | 2,610 | | | | 172 | | |
See notes to financial statements.
8
USAA Mutual Funds Trust
USAA Cornerstone Aggressive Fund | | Schedule of Portfolio Investments — continued
November 30, 2022 | |
(Amounts in Thousands, Except for Shares) (Unaudited)
Security Description | | Shares | | Value | |
SPS Commerce, Inc. (c) | | | 899 | | | $ | 128 | | |
Squarespace, Inc. Class A (c) | | | 2,495 | | | | 51 | | |
Synaptics, Inc. (c) | | | 1,196 | | | | 127 | | |
Teradata Corp. (c) | | | 1,772 | | | | 61 | | |
Texas Instruments, Inc. | | | 7,206 | | | | 1,300 | | |
The Hackett Group, Inc. | | | 4,379 | | | | 101 | | |
TTEC Holdings, Inc. | | | 1,040 | | | | 50 | | |
VeriSign, Inc. (c) | | | 2,530 | | | | 506 | | |
Vishay Intertechnology, Inc. | | | 5,421 | | | | 125 | | |
| | | | 25,653 | | |
Materials (1.5%): | |
CF Industries Holdings, Inc. | | | 4,529 | | | | 490 | | |
Commercial Metals Co. | | | 1,988 | | | | 98 | | |
Corteva, Inc. | | | 7,671 | | | | 515 | | |
Greif, Inc. Class A | | | 1,938 | | | | 136 | | |
Huntsman Corp. | | | 2,562 | | | | 71 | | |
Louisiana-Pacific Corp. | | | 3,324 | | | | 212 | | |
LyondellBasell Industries NV Class A | | | 6,134 | | | | 522 | | |
Nucor Corp. | | | 7,489 | | | | 1,123 | | |
Reliance Steel & Aluminum Co. | | | 702 | | | | 149 | | |
Sealed Air Corp. | | | 9,772 | | | | 520 | | |
Steel Dynamics, Inc. | | | 5,084 | | | | 529 | | |
The Sherwin-Williams Co. | | | 2,124 | | | | 529 | | |
Tronox Holdings PLC | | | 4,189 | | | | 59 | | |
United States Steel Corp. | | | 2,933 | | | | 77 | | |
Warrior Met Coal, Inc. | | | 2,556 | | | | 94 | | |
| | | | 5,124 | | |
Real Estate (1.1%): | |
Alexandria Real Estate Equities, Inc. | | | 378 | | | | 59 | | |
American Homes 4 Rent Class A | | | 855 | | | | 28 | | |
American Tower Corp. | | | 1,251 | | | | 277 | | |
AvalonBay Communities, Inc. | | | 376 | | | | 66 | | |
Boston Properties, Inc. | | | 400 | | | | 29 | | |
Camden Property Trust | | | 263 | | | | 32 | | |
CBRE Group, Inc. Class A (c) | | | 905 | | | | 72 | | |
Crown Castle, Inc. | | | 1,183 | | | | 167 | | |
CubeSmart | | | 2,102 | | | | 87 | | |
Digital Realty Trust, Inc. | | | 759 | | | | 85 | | |
Equinix, Inc. | | | 241 | | | | 166 | | |
Equity LifeStyle Properties, Inc. | | | 467 | | | | 31 | | |
Equity Residential | | | 958 | | | | 62 | | |
Essex Property Trust, Inc. | | | 175 | | | | 39 | | |
Extra Space Storage, Inc. | | | 360 | | | | 58 | | |
First Industrial Realty Trust, Inc. | | | 1,825 | | | | 92 | | |
Franklin Street Properties Corp. | | | 12,562 | | | | 37 | | |
Gaming and Leisure Properties, Inc. | | | 2,278 | | | | 120 | | |
Healthcare Realty Trust, Inc. | | | 1,047 | | | | 22 | | |
Healthpeak Properties, Inc. | | | 1,454 | | | | 38 | | |
Host Hotels & Resorts, Inc. | | | 1,905 | | | | 36 | | |
See notes to financial statements.
9
USAA Mutual Funds Trust
USAA Cornerstone Aggressive Fund | | Schedule of Portfolio Investments — continued
November 30, 2022 | |
(Amounts in Thousands, Except for Shares) (Unaudited)
Security Description | | Shares | | Value | |
Innovative Industrial Properties, Inc. | | | 536 | | | $ | 65 | | |
Invitation Homes, Inc. | | | 1,531 | | | | 50 | | |
Iron Mountain, Inc. | | | 779 | | | | 42 | | |
Kimco Realty Corp. | | | 4,921 | | | | 113 | | |
LTC Properties, Inc. | | | 1,829 | | | | 72 | | |
Medical Properties Trust, Inc. | | | 1,587 | | | | 21 | | |
Mid-America Apartment Communities, Inc. | | | 308 | | | | 51 | | |
National Health Investors, Inc. | | | 2,031 | | | | 114 | | |
Office Properties Income Trust | | | 2,774 | | | | 42 | | |
Omega Healthcare Investors, Inc. | | | 2,866 | | | | 87 | | |
One Liberty Properties, Inc. | | | 1,831 | | | | 44 | | |
Prologis, Inc. | | | 2,498 | | | | 294 | | |
Public Storage | | | 425 | | | | 127 | | |
Realty Income Corp. | | | 1,440 | | | | 91 | | |
Regency Centers Corp. | | | 412 | | | | 27 | | |
Rexford Industrial Realty, Inc. | | | 2,197 | | | | 122 | | |
Ryman Hospitality Properties, Inc. | | | 1,239 | | | | 113 | | |
SBA Communications Corp. | | | 295 | | | | 88 | | |
Simon Property Group, Inc. | | | 886 | | | | 106 | | |
SITE Centers Corp. | | | 7,123 | | | | 97 | | |
SL Green Realty Corp. | | | 1,378 | | | | 58 | | |
Sun Communities, Inc. | | | 301 | | | | 44 | | |
Tejon Ranch Co. (c) | | | 3,100 | | | | 61 | | |
Terreno Realty Corp. | | | 1,332 | | | | 78 | | |
UDR, Inc. | | | 801 | | | | 33 | | |
Ventas, Inc. | | | 1,061 | | | | 49 | | |
VICI Properties, Inc. | | | 2,835 | | | | 97 | | |
Vornado Realty Trust (d) | | | 439 | | | | 11 | | |
Welltower, Inc. | | | 1,118 | | | | 79 | | |
Weyerhaeuser Co. | | | 2,021 | | | | 66 | | |
WP Carey, Inc. | | | 480 | | | | 38 | | |
Zillow Group, Inc. Class C (c) | | | 603 | | | | 23 | | |
| | | | 4,006 | | |
Utilities (1.1%): | |
American States Water Co. | | | 1,937 | | | | 190 | | |
Consolidated Edison, Inc. | | | 6,047 | | | | 593 | | |
DTE Energy Co. | | | 4,379 | | | | 508 | | |
Exelon Corp. | | | 14,695 | | | | 608 | | |
Montauk Renewables, Inc. (c) | | | 4,886 | | | | 59 | | |
NorthWestern Corp. | | | 2,637 | | | | 154 | | |
Otter Tail Corp. | | | 2,371 | | | | 141 | | |
Sempra Energy | | | 3,555 | | | | 591 | | |
The AES Corp. | | | 17,822 | | | | 516 | | |
UGI Corp. | | | 12,583 | | | | 486 | | |
| | | | 3,846 | | |
Total Common Stocks (Cost $102,883) | | | 125,722 | | |
See notes to financial statements.
10
USAA Mutual Funds Trust
USAA Cornerstone Aggressive Fund | | Schedule of Portfolio Investments — continued
November 30, 2022 | |
(Amounts in Thousands, Except for Shares) (Unaudited)
Security Description | | Shares or
Principal
Amount | | Value | |
U.S. Treasury Obligations (0.4%) | |
U.S. Treasury Notes, 1.63%, 4/30/23 (e) | | $ | 1,567 | | | $ | 1,548 | | |
Total U.S. Treasury Obligations (Cost $1,572) | | | 1,548 | | |
Exchange-Traded Funds (50.5%) | |
Invesco DB Commodity Index Tracking Fund (c) (d) | | | 28,600 | | | | 729 | | |
Invesco FTSE RAFI Developed Markets ex-US ETF | | | 43,991 | | | | 1,862 | | |
Invesco FTSE RAFI Emerging Markets ETF | | | 240,641 | | | | 4,348 | | |
iShares 0-5 Year TIPS Bond ETF | | | 15,737 | | | | 1,537 | | |
iShares 7-10 Year Treasury Bond ETF (d) | | | 11,250 | | | | 1,098 | | |
iShares Core MSCI EAFE ETF | | | 103,179 | | | | 6,505 | | |
iShares Core MSCI Emerging Markets ETF | | | 73,363 | | | | 3,563 | | |
iShares Core S&P 500 ETF | | | 45,540 | | | | 18,640 | | |
iShares Core US Aggregate Bond ETF | | | 24,105 | | | | 2,369 | | |
iShares iBoxx High Yield Corporate Bond ETF (d) | | | 103,844 | | | | 7,857 | | |
iShares JP Morgan USD Emerging Markets Bond ETF | | | 17,103 | | | | 1,478 | | |
iShares MSCI Canada ETF (d) | | | 103,640 | | | | 3,647 | | |
iShares MSCI International Momentum Factor ETF (d) | | | 146,564 | | | | 4,642 | | |
iShares MSCI International Quality Factor ETF | | | 165,207 | | | | 5,516 | | |
iShares Russell 2000 ETF (d) | | | 29,459 | | | | 5,520 | | |
JPMorgan BetaBuilders Canada ETF | | | 15,061 | | | | 922 | | |
Schwab Fundamental Emerging Markets Large Co. Index ETF | | | 430,014 | | | | 11,340 | | |
Schwab Fundamental International Large Co. Index ETF | | | 829,619 | | | | 25,055 | | |
Schwab Fundamental International Small Co. Index ETF | | | 91,800 | | | | 2,918 | | |
SPDR Gold Shares (c) | | | 12,989 | | | | 2,141 | | |
SPDR S&P Emerging Markets SmallCap ETF (d) | | | 14,790 | | | | 745 | | |
Vanguard FTSE All-World ex-U.S. ETF | | | 74,796 | | | | 3,882 | | |
Vanguard FTSE Developed Markets ETF | | | 584,901 | | | | 25,391 | | |
Vanguard FTSE Emerging Markets ETF | | | 299,292 | | | | 12,127 | | |
Vanguard Mortgage-Backed Securities ETF | | | 37,883 | | | | 1,746 | | |
Vanguard Real Estate ETF | | | 19,078 | | | | 1,680 | | |
Vanguard S&P 500 ETF | | | 3,015 | | | | 1,129 | | |
Vanguard Short-Term Bond ETF | | | 80,810 | | | | 6,101 | | |
Vanguard Short-Term Corporate Bond ETF | | | 23,551 | | | | 1,778 | | |
Vanguard Total Stock Market ETF | | | 41,499 | | | | 8,468 | | |
Wisdom Tree Trust — WisdomTree Emerging Markets SmallCap Dividend Fund | | | 16,645 | | | | 748 | | |
Xtrackers USD High Yield Corporate Bond ETF (d) | | | 42,134 | | | | 1,459 | | |
Total Exchange-Traded Funds (Cost $160,068) | | | 176,941 | | |
Affiliated Exchange-Traded Funds (11.9%) | |
VictoryShares Emerging Markets Value Momentum ETF | | | 16,000 | | | | 645 | | |
VictoryShares ESG Core Plus Bond ETF | | | 302,044 | | | | 6,448 | | |
VictoryShares USAA Core Intermediate-Term Bond ETF | | | 647,046 | | | | 29,662 | | |
VictoryShares USAA Core Short-Term Bond ETF | | | 103,145 | | | | 5,024 | | |
Total Affiliated Exchange-Traded Funds (Cost $47,195) | | | 41,779 | | |
See notes to financial statements.
11
USAA Mutual Funds Trust
USAA Cornerstone Aggressive Fund | | Schedule of Portfolio Investments — continued
November 30, 2022 | |
(Amounts in Thousands, Except for Shares) (Unaudited)
Security Description | | Shares | | Value | |
Collateral for Securities Loaned (4.6%)^ | |
Goldman Sachs Financial Square Government Fund, Institutional Shares,
3.73% (f) | | | 4,057,356 | | | $ | 4,057 | | |
HSBC U.S. Government Money Market Fund, I Shares, 3.75% (f) | | | 4,057,356 | | | | 4,058 | | |
Invesco Government & Agency Portfolio, Institutional Shares, 3.74% (f) | | | 4,057,356 | | | | 4,057 | | |
Morgan Stanley Institutional Liquidity Government Portfolio, Institutional Shares,
3.62% (f) | | | 4,057,356 | | | | 4,057 | | |
Total Collateral for Securities Loaned (Cost $16,229) | | | 16,229 | | |
Total Investments (Cost $327,971) — 103.3% | | | 362,241 | | |
Liabilities in excess of other assets — (3.3)% | | | (11,677 | ) | |
NET ASSETS — 100.00% | | $ | 350,564 | | |
At November 30, 2022, the Fund's investments in foreign securities were 32.7% of net assets.
^ Purchased with cash collateral from securities on loan.
(a) Amount represents less than 0.05% of net assets.
(b) Rule 144A security or other security that is restricted as to resale to institutional investors. The Fund's Adviser has deemed this security to be liquid (unless otherwise noted as illiquid) based upon procedures approved by the Board of Trustees. As of November 30, 2022, the fair value of these securities was $22 thousands and amounted to less than 0.05% of net assets.
(c) Non-income producing security.
(d) All or a portion of this security is on loan.
(e) All or a portion of this security has been segregated as collateral for derivative instruments.
(f) Rate disclosed is the daily yield on November 30, 2022.
ETF — Exchange-Traded Fund
LLC — Limited Liability Company
PLC — Public Limited Company
Futures Contracts Purchased | |
(Amounts not in thousands) | |
| | | Number of
Contracts | | Expiration
Date | | Notional
Amount | | Value | | Unrealized
Appreciation/
(Depreciation) | |
Euro Stoxx 50 Futures | | | 91 | | | 12/16/22 | | $ | 3,387,950 | | | $ | 3,754,266 | | | $ | 366,316 | | |
FTSE 100 Index Futures | | | 62 | | | 12/16/22 | | | 5,502,000 | | | | 5,677,182 | | | | 175,182 | | |
S&P/Toronto Stock Exchange 60 Index
Futures | | | 27 | | | 12/15/22 | | | 4,822,833 | | | | 4,979,643 | | | | 156,810 | | |
| | | $ | 698,308 | | |
See notes to financial statements.
12
USAA Mutual Funds Trust
USAA Cornerstone Aggressive Fund | | Schedule of Portfolio Investments — continued
November 30, 2022 | |
(Unaudited)
Futures Contracts Sold | |
(Amounts not in thousands) | |
| | | Number of
Contracts | | Expiration
Date | | Notional
Amount | | Value | | Unrealized
Appreciation/
(Depreciation) | |
ASX SPI 200 Index Futures | | | 22 | | | 12/15/22 | | $ | 2,587,630 | | | $ | 2,727,942 | | | $ | (140,312 | ) | |
E-Mini Russell 2000 Index Futures | | | 31 | | | 12/16/22 | | | 2,801,828 | | | | 2,925,625 | | | | (123,797 | ) | |
Hang Seng Index Futures | | | 19 | | | 12/29/22 | | | 2,146,524 | | | | 2,264,349 | | | | (117,825 | ) | |
Swiss Market Index Futures | | | 18 | | | 12/16/22 | | | 2,077,409 | | | | 2,123,623 | | | | (46,214 | ) | |
Tokyo Price Index Futures | | | 16 | | | 12/08/22 | | | 2,266,190 | | | | 2,306,077 | | | | (39,887 | ) | |
| | | $ | (468,035 | ) | |
Total unrealized appreciation | | $ | 698,308 | | |
Total unrealized depreciation | | | (468,035 | ) | |
Total net unrealized appreciation (depreciation) | | $ | 230,273 | | |
See notes to financial statements.
13
USAA Mutual Funds Trust | | Statement of Assets and Liabilities
November 30, 2022 | |
(Amounts in Thousands, Except Per Share Amounts) (Unaudited)
| | | USAA Cornerstone
Aggressive Fund | |
Assets: | |
Affiliated investments, at value (Cost $47,195) | | $ | 41,779 | | |
Unaffiliated investments, at value (Cost $280,776) | | | 320,462 | (a) | |
Cash | | | 1,481 | | |
Deposit with broker for futures contracts | | | 3,375 | | |
Receivables: | |
Interest and dividends | | | 253 | | |
Capital shares issued | | | 100 | | |
Investments sold | | | 815 | | |
Variation margin on open futures contracts | | | 125 | | |
From Adviser for ETF reimbursements | | | 29 | | |
From Adviser for expense limitation agreement | | | 22 | | |
Prepaid expenses | | | 10 | | |
Total Assets | | | 368,451 | | |
Liabilities: | |
Payables: | |
Collateral received on loaned securities | | | 16,229 | | |
Collateral received from broker for futures contract | | | 166 | | |
Investments purchased | | | 786 | | |
Capital shares redeemed | | | 205 | | |
Variation margin on open futures contracts | | | 146 | | |
Accrued expenses and other payables: | |
Investment advisory fees | | | 167 | | |
Administration fees | | | 42 | | |
Custodian fees | | | 6 | | |
Transfer agent fees | | | 80 | | |
Compliance fees | | | — | (b) | |
Trustees' fees | | | 1 | | |
Other accrued expenses | | | 59 | | |
Total Liabilities | | | 17,887 | | |
Net Assets: | |
Capital | | | 306,723 | | |
Total accumulated earnings/(loss) | | | 43,841 | | |
Net Assets | | $ | 350,564 | | |
Shares (unlimited number of shares authorized with no par value): | | | 26,324 | | |
Net asset value, offering and redemption price per share: (c) | | $ | 13.32 | | |
(a) Includes $15,822 thousand of securities on loan.
(b) Rounds to less than $1 thousand.
(c) Per share amount may not recalculate due to rounding of net assets and/or shares outstanding.
See notes to financial statements.
14
USAA Mutual Funds Trust | | Statement of Operations
For the Six Months Ended November 30, 2022 | |
(Amounts in Thousands) (Unaudited)
| | | USAA Cornerstone
Aggressive Fund | |
Investment Income: | |
Income distributions from affiliated funds | | $ | 509 | | |
Dividends from unaffiliated investments | | | 3,640 | | |
Interest from unaffiliated investments | | | 34 | | |
Securities lending (net of fees) | | | 132 | | |
Foreign tax withholding | | | (1 | ) | |
Total Income | | | 4,314 | | |
Expenses: | |
Investment advisory fees | | | 1,014 | | |
Administration fees | | | 254 | | |
Sub-Administration fees | | | 46 | | |
Custodian fees | | | 12 | | |
Transfer agent fees | | | 503 | | |
Trustees' fees | | | 24 | | |
Compliance fees | | | 2 | | |
Legal and audit fees | | | 35 | | |
State registration and filing fees | | | 17 | | |
Other expenses | | | 49 | | |
Total Expenses | | | 1,956 | | |
Expenses waived/reimbursed by Adviser | | | (97 | ) | |
Net Expenses | | | 1,859 | | |
Net Investment Income (Loss) | | | 2,455 | | |
Realized/Unrealized Gains (Losses) from Investments: | |
Net realized gains (losses) from unaffiliated investment securities and foreign
currency transactions | | | (5,178 | ) | |
Net realized gains (losses) from futures contracts | | | 510 | | |
Net change in unrealized appreciation/depreciation on affiliated funds | | | (1,679 | ) | |
Net change in unrealized appreciation/depreciation on unaffiliated investment
securities and foreign currency translations | | | (2,664 | ) | |
Net change in unrealized appreciation/depreciation on futures contracts | | | 244 | | |
Net realized/unrealized gains (losses) on investments | | | (8,767 | ) | |
Change in net assets resulting from operations | | $ | (6,312 | ) | |
See notes to financial statements.
15
USAA Mutual Funds Trust | | Statements of Changes in Net Assets | |
(Amounts in Thousands)
| | | USAA Cornerstone Aggressive Fund | |
| | | Six Months
Ended
November 30,
2022
(Unaudited) | | Year
Ended
May 31,
2022 | |
From Investments: | |
Operations: | |
Net Investment Income (Loss) | | $ | 2,455 | | | $ | 4,301 | | |
Net realized gains (losses) | | | (4,668 | ) | | | 20,815 | | |
Net change in unrealized appreciation/depreciation | | | (4,099 | ) | | | (39,461 | ) | |
Change in net assets resulting from operations | | | (6,312 | ) | | | (14,345 | ) | |
Change in net assets resulting from distributions to shareholders | | | — | | | | (31,884 | ) | |
Change in net assets resulting from capital transactions | | | (4,207 | ) | | | 19,816 | | |
Change in net assets | | | (10,519 | ) | | | (26,413 | ) | |
Net Assets: | |
Beginning of period | | | 361,083 | | | | 387,496 | | |
End of period | | $ | 350,564 | | | $ | 361,083 | | |
Capital Transactions: | |
Proceeds from shares issued | | $ | 14,668 | | | $ | 46,933 | | |
Distributions reinvested | | | — | | | | 31,825 | | |
Cost of shares redeemed | | | (18,875 | ) | | | (58,942 | ) | |
Change in net assets resulting from capital transactions | | $ | (4,207 | ) | | $ | 19,816 | | |
Share Transactions: | |
Issued | | | 1,154 | | | | 3,145 | | |
Reinvested | | | — | | | | 2,151 | | |
Redeemed | | | (1,483 | ) | | | (3,957 | ) | |
Change in Shares | | | (329 | ) | | | 1,339 | | |
See notes to financial statements.
16
This page is intentionally left blank.
17
USAA Mutual Funds Trust | | Financial Highlights | |
For a Share Outstanding Throughout Each Period
| | | | | Investment Activities | | Distributions to
Shareholders From | |
| | | Net Asset
Value,
Beginning of
Period | | Net
Investment
Income
(Loss) | | Net Realized
and Unrealized
Gains
(Losses) | | Total from
Investment
Activities | | Net
Investment
Income | | Net Realized
Gains from
Investments | |
USAA Cornerstone Aggressive Fund | | | |
Six Months Ended
November 30, 2022
(Unaudited) | | $ | 13.55 | | | | 0.09 | (f) | | | (0.32 | ) | | | (0.23 | ) | | | — | | | | — | | |
Year Ended May 31:
2022 | | $ | 15.31 | | | | 0.17 | (f) | | | (0.66 | ) | | | (0.49 | ) | | | (0.17 | ) | | | (1.10 | ) | |
2021 | | $ | 11.74 | | | | 0.12 | (f) | | | 3.71 | | | | 3.83 | | | | (0.18 | ) | | | (0.08 | ) | |
2020 | | $ | 11.73 | | | | 0.20 | (f) | | | 0.03 | | | �� | 0.23 | | | | (0.15 | ) | | | (0.07 | ) | |
2019 | | $ | 12.81 | | | | 0.15 | | | | (0.57 | ) | | | (0.42 | ) | | | (0.18 | ) | | | (0.48 | ) | |
2018 | | $ | 12.57 | | | | 0.16 | | | | 0.94 | | | | 1.10 | | | | (0.14 | ) | | | (0.72 | ) | |
(a) Not annualized for periods less than one year.
(b) Assumes reinvestment of all net investment income and realized capital gain distributions, if any, during the period. Includes adjustments in accordance with U.S. Generally Accepted Accounting Principles and could differ from the Lipper reported return.
(c) Annualized for periods less than one year.
(d) The net expense ratio may not correlate to the applicable expense limits in place during the period since the current contractual expense limitation is applied for a period beginning July 1, 2019 and in effect through September 30, 2023, instead of coinciding with the Fund's fiscal year end. Details of the current contractual expense limitation in effect can be found in Note 4 of the accompanying Notes to Financial Statements.
(e) Does not include acquired fund fees and expenses, if any.
(f) Per share net investment income (loss) has been calculated using the average daily shares method.
(g) Reflects increased trading activity due to usage of quantitative investment strategies.
See notes to financial statements.
18
USAA Mutual Funds Trust | | Financial Highlights — continued | |
For a Share Outstanding Throughout Each Period
| | | | | Ratios to Average Net Assets | | Supplemental Data | |
| | | Total
Distributions | | Net Asset
Value,
End of
Period | | Total
Return(a)(b) | | Net
Expenses(c)(d)(e) | | Net
Investment
Income
(Loss)(c) | | Gross
Expenses(c)(e) | | Net Assets,
End of
Period
(000's) | | Portfolio
Turnover(a) | |
USAA Cornerstone Aggressive Fund | |
Six Months Ended
November 30, 2022
(Unaudited) | | | — | | | $ | 13.32 | | | | (1.70 | )% | | | 1.10 | % | | | 1.45 | % | | | 1.16 | % | | $ | 350,564 | | | | 37 | % | |
Year Ended May 31:
2022 | | | (1.27 | ) | | $ | 13.55 | | | | (3.84 | )% | | | 1.10 | % | | | 1.11 | % | | | 1.12 | % | | $ | 361,083 | | | | 43 | % | |
2021 | | | (0.26 | ) | | $ | 15.31 | | | | 32.91 | % | | | 1.10 | % | | | 0.88 | % | | | 1.17 | % | | $ | 387,496 | | | | 64 | % | |
2020 | | | (0.22 | ) | | $ | 11.74 | | | | 1.78 | % | | | 1.10 | % | | | 1.68 | % | | | 1.18 | % | | $ | 343,560 | | | | 90 | % | |
2019 | | | (0.66 | ) | | $ | 11.73 | | | | (3.04 | )% | | | 1.10 | % | | | 1.54 | % | | | 1.24 | % | | $ | 351,410 | | | | 95 | %(g) | |
2018 | | | (0.86 | ) | | $ | 12.81 | | | | 8.85 | % | | | 1.10 | % | | | 1.18 | % | | | 1.25 | % | | $ | 344,768 | | | | 65 | % | |
See notes to financial statements.
19
USAA Mutual Funds Trust | | Notes to Financial Statements
November 30, 2022 | |
(Unaudited)
1. Organization:
USAA Mutual Funds Trust (the "Trust") is organized as a Delaware statutory trust and is registered under the Investment Company Act of 1940, as amended (the "1940 Act"), as an open-end investment company. The Trust is comprised of 45 funds and is authorized to issue an unlimited number of shares, which are units of beneficial interest with no par value.
The accompanying financial statements are those of the USAA Cornerstone Aggressive Fund (the "Fund"). The Fund is classified as diversified under the 1940 Act.
Victory Capital Management ("VCM" or the "Adviser"), is an indirect wholly owned subsidiary of Victory Capital Holdings, Inc., a publicly traded Delaware corporation, and a wholly owned direct subsidiary of Victory Capital Operating, LLC.
Under the Trust's organizational documents, its officers and trustees are indemnified against certain liabilities arising out of the performance of their duties to the Fund. In addition, in the normal course of business, the Fund enters into contracts with its vendors and others that provide for general indemnifications. The Fund's maximum exposure under these arrangements is unknown, as this would involve future claims that may be made against the Fund. However, based on experience, the Fund expects that risk of loss to be remote.
2. Significant Accounting Policies:
The following is a summary of significant accounting policies followed by the Trust in the preparation of its financial statements. The policies are in conformity with U.S. Generally Accepted Accounting Principles ("GAAP"). The preparation of financial statements in accordance with GAAP requires management to make estimates and assumptions that affect the reported amounts of assets and liabilities and disclosure of contingent assets and liabilities at the date of the financial statements and the reported amounts of income and expenses for the period. Actual results could differ from those estimates. The Fund follows the specialized accounting and reporting requirements under GAAP that are applicable to investment companies under Accounting Standards Codification Topic 946.
Investment Valuation:
The Fund records investments at fair value. Fair value is defined as the price that would be received to sell an asset or paid to transfer a liability in an orderly transaction between market participants at the measurement date.
The valuation techniques described below maximize the use of observable inputs and minimize the use of unobservable inputs in determining fair value. The inputs used for valuing the Fund's investments are summarized in the three broad levels listed below:
• Level 1 — quoted prices (unadjusted) in active markets for identical securities
• Level 2 — other significant observable inputs (including quoted prices for similar securities, interest, or credit spreads, applicable to those securities, etc.)
• Level 3 — significant unobservable inputs (including the Adviser's assumptions in determining the fair value of investments)
Changes in valuation techniques may result in transfers in or out of an assigned level within the disclosure hierarchy. The inputs or methodologies used for valuation techniques are not necessarily an indication of the risks associated with entering into those investments.
The Adviser acting as the valuation designee has established the Pricing and Liquidity Committee (the "Committee"), and subject to the Trust's Board of Trustees' (the "Board") oversight, the Committee administers and oversees the Fund's valuation policies and procedures, which are approved by the Board.
Portfolio securities listed or traded on securities exchanges, including Exchange-Traded Funds ("ETFs"), and American Depositary Receipts ("ADRs"), are valued at the closing price on the exchange or system where the security is principally traded, if available, or at the Nasdaq Official Closing Price. If there have been no sales for that day on the exchange or system, then a security is valued at the last available
20
USAA Mutual Funds Trust | | Notes to Financial Statements — continued
November 30, 2022 | |
(Unaudited)
bid quotation on the exchange or system where the security is principally traded. In each of these situations, valuations are typically categorized as Level 1 in the fair value hierarchy.
Investments in open-end investment companies, including underlying funds, are valued at their net asset value ("NAV"). These valuations are typically categorized as Level 1 in the fair value hierarchy.
Debt securities are valued each business day by a pricing service approved by the Board. The approved pricing service uses the evaluated bid or the last sale price to value securities. Debt obligations maturing within 60 days may be valued at amortized cost, provided that the amortized cost represents the fair value of such securities. These valuations are typically categorized as Level 2 in the fair value hierarchy.
Futures contracts are valued at the settlement price established each day by the board of trade or an exchange on which they are traded. These valuations are typically categorized as Level 1 in the fair value hierarchy.
In the event that price quotations or valuations are not readily available, investments are valued at fair value in accordance with procedures established by and under the general supervision and responsibility of the Board. These valuations are typically categorized as Level 2 or Level 3 in the fair value hierarchy, based on the observability of inputs used to determine the fair value. The effect of fair value pricing is that securities may not be priced on the basis of quotations from the primary market in which they are traded, and the actual price realized from the sale of a security may differ materially from the fair value price. Valuing these securities at fair value is intended to cause the Fund's NAV to be more reliable than it otherwise would be.
A summary of the valuations as of November 30, 2022, based upon the three levels defined above, is included in the table below while the breakdown, by category, of investments is disclosed on the Schedule of Portfolio Investments (amounts in thousands):
| | | Level 1 | | Level 2 | | Level 3 | | Total | |
Asset-Backed Securities | | $ | — | | | $ | 22 | | | $ | — | | | $ | 22 | | |
Common Stocks | | | 125,722 | | | | — | | | | — | | | | 125,722 | | |
U.S. Treasury Obligations | | | — | | | | 1,548 | | | | — | | | | 1,548 | | |
Exchange-Traded Funds | | | 176,941 | | | | — | | | | — | | | | 176,941 | | |
Affiliated Exchange-Traded Funds | | | 41,779 | | | | — | | | | — | | | | 41,779 | | |
Collateral for Securities Loaned | | | 16,229 | | | | — | | | | — | | | | 16,229 | | |
Total | | $ | 360,671 | | | $ | 1,570 | | | $ | — | | | $ | 362,241 | | |
Other Financial Investments* | |
Assets: | |
Futures Contracts | | $ | 698 | | | $ | — | | | $ | — | | | $ | 698 | | |
Liabilities: | |
Futures Contracts | | $ | (468 | ) | | $ | — | | | $ | — | | | $ | (468 | ) | |
Total | | $ | 230 | | | $ | — | | | $ | — | | | $ | 230 | | |
* Futures contracts are valued at the unrealized appreciation (depreciation) on the investment.
For the six months ended November 30, 2022, there were no transfers into/out of Level 3.
Real Estate Investment Trusts ("REITs"):
The Fund may invest in REITs, which report information on the source of their distributions annually. REITs are pooled investment vehicles that invest primarily in income producing real estate or real estate related loans or interests (such as mortgages). Certain distributions received from REITs during the year are recorded as realized gains or return of capital as estimated by the Fund or when such information becomes known.
21
USAA Mutual Funds Trust | | Notes to Financial Statements — continued
November 30, 2022 | |
(Unaudited)
Investment Companies:
Exchange-Traded Funds:
The Fund may invest in ETFs, the shares of which are bought and sold on a securities exchange. An ETF trades like common stock and represents a fixed portfolio of securities often designed to track the performance and dividend yield of a particular domestic or foreign market index. The Fund may purchase shares of an ETF to temporarily gain exposure to a portion of the U.S. or a foreign market while awaiting purchase of underlying securities. The risks of owning an ETF generally reflect the risks of owning the underlying securities the ETF is designed to track, although the lack of liquidity of an ETF could result in it being more volatile. Additionally, ETFs have fees and expenses that reduce their value.
Open-End Funds:
The Fund may invest in portfolios of open-end investment companies. These investment companies value securities in their portfolios for which market quotations are readily available at their market values (generally the last reported sale price) and all other securities and assets at their fair value by the methods established by the board of directors of the underlying funds.
Mortgage- and Asset-Backed Securities:
The values of some mortgage-related or asset-backed securities may be particularly sensitive to changes in prevailing interest rates. Early repayment of principal on some mortgage-related securities may expose the Fund to a lower rate of return upon reinvestment of principal. The values of mortgage- and asset-backed securities depend in part on the credit quality and adequacy of the underlying assets or collateral and may fluctuate in response to the market's perception of these factors as well as current and future repayment rates. Some mortgage-backed securities are backed by the full faith and credit of the U.S. government (e.g., mortgage-backed securities issued by the Government National Mortgage Association, commonly known as "Ginnie Mae"), while other mortgage-backed securities (e.g., mortgage-backed securities issued by the Federal National Mortgage Association and the Federal Home Loan Mortgage Corporation, commonly known as "Fannie Mae" and "Freddie Mac," respectively), are backed only by the credit of the government entity issuing them. In addition, some mortgage-backed securities are issued by private entities and, as such, are not guaranteed by the U.S. government or any agency or instrumentality of the U.S. government.
Derivative Instruments:
Futures Contracts:
The Fund may enter into contracts for the future delivery of securities or foreign currencies and futures contracts based on a specific security, class of securities, foreign currency or an index, and purchase or sell options on any such futures contracts. A futures contract on a securities index is an agreement obligating either party to pay, and entitling the other party to receive, while the contract is outstanding, cash payments based on the level of a specified securities index. No physical delivery of the underlying asset is made. The Fund may enter into futures contracts in an effort to hedge against market risks. The acquisition of put and call options on futures contracts will give the Fund the right (but not the obligation), for a specified price, to sell or to purchase the underlying futures contract, upon exercise of the option, at any time during the option period. Futures transactions involve brokerage costs and require the Fund to segregate assets to cover contracts that would require it to purchase securities or currencies. A good faith margin deposit, known as initial margin, of cash or government securities with a broker or custodian is required to initiate and maintain open positions in futures contracts. Subsequent payments, known as variation margin, are made or received by the Fund based on the change in the market value of the position and are recorded as unrealized appreciation or depreciation until the contract is closed out, at which time the gain or loss is realized. The Fund may lose the expected benefit of futures transactions if interest rates, exchange rates or securities prices change in an unanticipated
22
USAA Mutual Funds Trust | | Notes to Financial Statements — continued
November 30, 2022 | |
(Unaudited)
manner. Such unanticipated changes may also result in lower overall performance than if the Fund had not entered into any futures transactions. In addition, the value of the Fund's futures positions may not prove to be perfectly or even highly correlated with the value of its portfolio securities or foreign currencies, limiting the Fund's ability to hedge effectively against interest rate, exchange rate and/or market risk and giving rise to additional risks. There is no assurance of liquidity in the secondary market for purposes of closing out futures positions. The collateral held by the Fund is reflected on the Statement of Assets and Liabilities under Deposit with broker for futures contracts and Collateral received from broker for futures contracts.
Management has determined that no offsetting requirements exist as a result of their conclusion that the Fund is not subject to master netting agreements for futures contracts. During the six months ended November 30, 2022, the Fund entered into futures contracts primarily for the strategy of gaining exposure to a particular asset class or securities market.
Summary of Derivative Instruments:
The following table summarizes the fair values of derivative instruments on the Statement of Assets and Liabilities, categorized by risk exposure, as of November 30, 2022 (amounts in thousands):
| | | Assets | | Liabilities | |
| | | Variation Margin
Receivable on Open
Futures Contracts* | | Variation Margin
Payable on Open
Futures Contracts* | |
Equity Risk Exposure | | $ | 698 | | | $ | 468 | | |
* Includes cumulative unrealized appreciation (depreciation) of futures contracts as reported on the Schedule of Portfolio Investments. Only current day's variation margin for futures contracts is reported within the Statement of Assets and Liabilities.
The following table presents the effect of derivative instruments on the Statement of Operations, categorized by risk exposure, for the six months ended November 30, 2022 (amounts in thousands):
| | | Net Realized Gains (Losses) on
Derivatives Recognized as
a Result of Operations | | Net Change in Unrealized
Appreciation/Depreciation
on Derivatives Recognized
as a Result of Operations | |
| | | Net Realized Gains (Losses)
from Futures Contracts | | Net Change in Unrealized
Appreciation/Depreciation
on Futures Contracts | |
Equity Risk Exposure | | $ | 510 | | | $ | 244 | | |
All open derivative positions at period end are reflected on the Fund's Schedule of Portfolio Investments. The underlying face value of open derivative positions relative to the Fund's net assets at period end is generally representative of the notional amount of open positions to net assets throughout the period.
Investment Transactions and Related Income:
Changes in holdings of investments are accounted for no later than one business day following the trade date. For financial reporting purposes, however, investment transactions are accounted for on trade date or the last business day of the reporting period. Interest income is determined on the basis of coupon interest accrued using the effective interest method which adjusts, where applicable, the amortization of premiums or accretion of discounts. Dividend income is recorded on the ex-dividend date. Gains or losses realized on sales of securities are recorded on the identified cost basis. Paydown gains or losses on applicable securities, if any, are recorded as components of Interest income on the Statement of Operations.
Withholding taxes on interest, dividends, and gains as a result of certain investments in ADRs by the Fund have been provided for in accordance with each investment's applicable country's tax rules and rates.
23
USAA Mutual Funds Trust | | Notes to Financial Statements — continued
November 30, 2022 | |
(Unaudited)
Securities Lending:
The Fund, through a Securities Lending Agreement with Citibank, N.A. ("Citibank"), may lend its securities to qualified financial institutions, such as certain broker-dealers and banks, to earn additional income, net of income retained by Citibank. Borrowers are required to initially secure their loans for collateral in the amount of at least 102% of the value of U.S. securities loaned or at least 105% of the value of non-U.S. securities loaned, marked-to-market daily. Any collateral shortfalls associated with increases in the valuation of the securities loaned are generally cured the next business day. The collateral can be received in the form of cash collateral and/or non-cash collateral. Non-cash collateral can include U.S. Government Securities and other securities as permitted by Securities and Exchange Commission ("SEC") guidelines. The cash collateral is invested in short-term instruments or cash equivalents, primarily open-end investment companies, as noted on the Fund's Schedule of Portfolio Investments. The Fund effectively does not have control of the non-cash collateral and therefore it is not disclosed on the Fund's Schedule of Portfolio Investments. Collateral requirements are determined daily based on the value of the Fund's securities on loan as of the end of the prior business day. During the time portfolio securities are on loan, the borrower will pay the Fund any dividends or interest paid on such securities plus any fee negotiated between the parties to the lending agreement. The Fund also earns a return from the collateral. The Fund pays Citibank various fees in connection with the investment of cash collateral and fees based on the investment income received from securities lending activities. Securities lending income (net of these fees) is disclosed on the Statement of Operations. Loans are terminable upon demand and the borrower must return the loaned securities within the lesser of one standard settlement period or five business days. Although risk is mitigated by the collateral, the Fund could experience a delay in recovering its securities and possible loss of income or value if the borrower fails to return them. In addition, there is a risk that the value of the short-term investments will be less than the amount of cash collateral required to be returned to the borrower.
The Fund's agreement with Citibank does not include master netting provisions. Non-cash collateral received by the Fund may not be sold or repledged, except to satisfy borrower default.
The following table (amounts in thousands) is a summary of the Fund's securities lending transactions as of November 30, 2022.
Value of
Securities on Loan | | Non-Cash
Collateral | | Cash
Collateral | |
| $ | 16,104 | (a) | | $ | — | | | $ | 16,229 | | |
(a) Includes $282 thousand of securities on loan that were sold prior to November 30, 2022.
Foreign Currency Translations:
The accounting records of the Fund are maintained in U.S. dollars. Investment securities and other assets and liabilities of the Fund denominated in a foreign currency are translated into U.S. dollars at current exchange rates. Purchases and sales of securities, income receipts, and expense payments are translated into U.S. dollars at the exchange rates on the date of the transactions. The Fund does not isolate the portion of the results of operations resulting from changes in foreign exchange rates on investments from fluctuations arising from changes in market prices of securities held. Such fluctuations are disclosed as Net change in unrealized appreciation/depreciation on unaffiliated investment securities and foreign currency translations on the Statement of Operations. Any realized gains or losses from these fluctuations are disclosed as Net realized gains (losses) from unaffiliated investment securities and foreign currency transactions on the Statement of Operations.
Foreign Taxes:
The Fund may be subject to foreign taxes related to foreign income received (a portion of which may be reclaimable), capital gains on the sale of securities, and certain foreign currency transactions. All foreign taxes are recorded in accordance with the applicable regulations and rates that exist in the foreign jurisdictions in which the Fund invests.
24
USAA Mutual Funds Trust | | Notes to Financial Statements — continued
November 30, 2022 | |
(Unaudited)
Federal Income Taxes:
The Fund intends to continue to qualify as a regulated investment company by complying with the provisions available to certain investment companies, as defined in applicable sections of the Internal Revenue Code, and to make distributions of net investment income and net realized gains sufficient to relieve it from all, or substantially all, federal income taxes. Accordingly, no provision for federal income taxes is required in the financial statements. The Fund has a tax year end of May 31.
For the six months ended November 30, 2022, the Fund did not incur any income tax, interest, or penalties, and has recorded no liability for net unrecognized tax benefits relating to uncertain tax positions.
Management of the Fund has reviewed tax positions taken in tax years that remain subject to examination by all major tax jurisdictions, including federal (i.e., the last four tax years, which includes the current fiscal tax year end). Management believes that there is no tax liability resulting from unrecognized tax benefits related to uncertain tax positions taken.
Allocations:
Expenses directly attributable to the Fund are charged to the Fund, while expenses that are attributable to more than one fund in the Trust, or jointly with an affiliated trust, are allocated among the respective funds in the Trust and/or an affiliated trust based upon net assets or another appropriate basis.
Cross-Trade Transactions:
Pursuant to Rule 17a-7 under the 1940 Act, the Fund may engage in cross-trades, which are securities transactions with affiliated investment companies and advisory accounts managed by the Adviser and any applicable sub-adviser under specified conditions outlined in the valuation policies and procedures adopted by the Board. In addition, as defined under the valuation policies and procedures, each transaction must be effected at the independent current market price. For the six months ended November 30, 2022, the Fund engaged in the following securities transactions with affiliated funds, which resulted in the following net realized gains (losses) (amounts in thousands):
| Purchases | | Sales | | Net Realized
Gains (Losses) | |
| $ | — | | | $ | 44 | | | $ | (3 | ) | |
3. Purchases and Sales:
Purchases and sales of securities (excluding securities maturing less than one year from acquisition) for the six months ended November 30, 2022, were as follows for the Fund (amounts in thousands):
Excluding
U.S. Government Securities | | U.S. Government Securities | |
Purchases | | Sales | | Purchases | | Sales | |
$ | 122,239 | | | $ | 122,407 | | | $ | — | | | $ | 68 | | |
4. Fees and Transactions with Affiliates and Related Parties:
Investment Advisory Fees:
Investment advisory services are provided to the Fund by the Adviser, which is a New York corporation registered as an investment adviser with the SEC.
Under the terms of the Investment Advisory Agreement, the Adviser is entitled to receive fees accrued daily and paid monthly at an annualized rate of 0.60% of the Fund's average daily net assets. Amounts incurred and paid to VCM for the six months ended November 30, 2022, are reflected on the Statement of Operations as Investment advisory fees.
25
USAA Mutual Funds Trust | | Notes to Financial Statements — continued
November 30, 2022 | |
(Unaudited)
The Trust relies on an exemptive order granted to VCM and its affiliated funds by the SEC in March 2019, permitting the use of a "manager-of-managers" structure for certain funds. Under a manager-of-managers structure, the investment adviser may select (with approval of the Board and without shareholder approval) one or more subadvisers to manage the day-to-day investment of a fund's assets. For the six months ended November 30, 2022, the Fund had no subadvisers.
Administration and Servicing Fees:
VCM also serves as the Fund's administrator and fund accountant. Under the Fund Administration, Servicing and Accounting Agreement, VCM is paid an administration and servicing fee that is accrued daily and paid monthly at an annualized rate of 0.15%, which is based on the Fund's average daily net assets. Amounts incurred for the six months ended November 30, 2022, are reflected on the Statement of Operations as Administration fees.
Citi Fund Services Ohio, Inc. ("Citi"), an affiliate of Citibank, acts as sub-administrator and sub-fund accountant to the Fund pursuant to a Sub-Administration and Sub-Fund Accounting Services Agreement between VCM and Citi. VCM pays Citi a fee for providing these services. The Fund reimburses VCM and Citi for out-of-pocket expenses incurred in providing these services and certain other expenses specifically allocated to the Fund. Amounts incurred for the six months ended November 30, 2022, are reflected on the Statement of Operations as Sub-Administration fees.
The Fund (as part of the Trust) has entered into an agreement with the Adviser to provide compliance services, pursuant to which the Adviser furnishes its compliance personnel, including the services of the Chief Compliance Officer ("CCO"), and other resources reasonably necessary to provide the Trust with compliance oversight services related to the design, administration, and oversight of a compliance program for the Trust in accordance with Rule 38a-1 under the 1940 Act. The CCO is an employee of the Adviser, which pays the compensation of the CCO and support staff. The funds in the Trust, Victory Variable Insurance Funds, Victory Portfolios, and Victory Portfolios II (collectively, the "Victory Funds Complex") in the aggregate, compensate the Adviser for these services. Amounts incurred for the six months ended November 30, 2022, are reflected on the Statement of Operations as Compliance fees.
Transfer Agency Fees:
Victory Capital Transfer Agency, Inc. ("VCTA"), an affiliate of the Adviser, provides transfer agency services to the Fund. VCTA provides transfer agent services to the Fund based on an annual charge of $23 per shareholder account plus out-of-pocket expenses. VCTA pays a portion of these fees to certain intermediaries for the administration and servicing of accounts that are held with such intermediaries. Amounts incurred and paid to VCTA for the six months ended November 30, 2022, are reflected on the Statement of Operations as Transfer agent fees.
FIS Investor Services LLC serves as sub-transfer agent and dividend disbursing agent for the Fund pursuant to a Sub-Transfer Agent Agreement between VCTA and FIS Investor Services LLC. VCTA provides FIS Investor Services LLC a fee for providing these services.
Distributor/Underwriting Services:
Victory Capital Services, Inc. (the "Distributor"), an affiliate of the Adviser, serves as Distributor for the continuous offering of the shares of the Fund pursuant to a Distribution Agreement between the Distributor and the Trust and receives no fee or other compensation for these services.
Other Fees:
Citibank serves as the Fund's custodian. The Fund pays Citibank a fee for providing these services. Amounts incurred for the six months ended November 30, 2022, are reflected on the Statement of Operations as Custodian fees.
K&L Gates LLP provides legal services to the Trust.
26
USAA Mutual Funds Trust | | Notes to Financial Statements — continued
November 30, 2022 | |
(Unaudited)
The Adviser has entered into an expense limitation agreement with the Fund until at least September 30, 2023. Under the terms of the agreement, the Adviser has agreed to waive fees or reimburse certain expenses to the extent that ordinary operating expenses incurred in any fiscal year exceed the expense limit for the Fund. Such excess amounts will be the liability of the Adviser. Acquired fund fees and expenses, interest, taxes, brokerage commissions, other expenditures, which are capitalized in accordance with GAAP, and other extraordinary expenses not incurred in the ordinary course of the Fund's business are excluded from the expense limit. As of November 30, 2022, the expense limit (excluding voluntary waivers) was 01.10%.
In addition, the Fund invests in affiliated VCM exchange-traded fund(s) ("affiliated ETFs"). The Fund's advisory fee is reimbursed by VCM that to the extent of the indirect advisory fee incurred through the Fund's proportional investment in the affiliated ETFs. These affiliated ETF advisory fee reimbursements are not available for recoupment. For the six months ended November 30, 2022, the Fund incurred reimbursable expense of $97 thousand, of which $59 thousand consisted of affiliated ETF Adviser for reimbursement and is reflected on the Statement of Operations as Expenses waived/reimbursed by Adviser. The Fund has a receivable related to these reimbursable expenses from the Advisor for $29 thousand, pursuant to the Fund's expense limitation agreement and is reflected on the Statement of Assets and Liabilities as Receivable from Advisor for ETF reimbursements.
Under the terms of the expense limitation agreement, as amended June 29, 2022, the Fund has agreed to repay fees and expenses that were waived or reimbursed by the Adviser for a period of up to three years (thirty-six (36) months) after the waiver or reimbursement took place, subject to the lesser of any operating expense limits in effect at the time of: (a) the original waiver or expense reimbursement; or (b) the recoupment, after giving effect to the recoupment amount. For the six months ended November 30, 2022, the Fund incurred reimbursable expenses, of which $38 thousand consisted of reimbursements for expense limitation agreement and is reflected on the Statement of Operations as Expenses waived/reimbursed by Adviser. The Fund has a receivable related to these reimbursable expenses from the Advisor for $22 thousand pursuant to the Fund's expense limitation agreement and is reflected on the Statement of Assets and Liabilities as Receivable from Advisor for expense limitation agreement.
As of November 30, 2022, the following amounts are available to be repaid to the Adviser (amounts in thousands). The Fund has not recorded any amounts available to be repaid as a liability due to an assessment that such repayments are not probable at November 30, 2022.
Expires
2023 | | Expires
2024 | | Expires
2025 | | Expires
2026 | | Total | |
| $ | 167 | | | $ | 236 | | | $ | — | | | $ | 38 | | | $ | 441 | | |
The Adviser may voluntarily waive or reimburse additional fees to assist the Fund in maintaining competitive expense ratios. Voluntary waivers and reimbursements applicable to the Fund are not available to be recouped at a future time. There were no voluntary waivers or reimbursements for the six months ended November 30, 2022.
Certain officers and/or interested trustees of the Fund are also officers and/or employees of the Adviser, administrator, fund accountant, sub-administrator, sub-fund accountant, custodian, and Distributor.
5. Risks:
The Fund may be subject to other risks in addition to these identified risks.
Tactical Allocation Risk — The Fund has a targeted risk tolerance and a corresponding asset allocation target; however, mere asset allocation and volatility are not the sole determination of risk. The Fund's managers will tactically allocate away from the target allocation as market conditions and the perceived risks warrant. The Fund bears the risk that the managers' tactical allocation will not be successful.
Affiliated Funds Risk — The risks of the Fund directly correspond to the risks of the underlying affiliated funds in which the Fund invests. By investing in the underlying affiliated funds, the Fund has exposure to the risk of many different areas of the market. The degree to which the risks described below apply to the Fund varies according to the Fund's asset allocation. For instance, the more the
27
USAA Mutual Funds Trust | | Notes to Financial Statements — continued
November 30, 2022 | |
(Unaudited)
Fund is allocated to stock funds, the greater the risk associated with equity securities. The Fund also is subject to asset allocation risk (i.e., the risk that allocations will not produce the intended results) and to management risk (i.e., the risk that the selection of underlying affiliated funds will not produce the intended results).
Conflict of Interest Risk — In managing a Fund that invests in underlying affiliated funds, the Adviser may have conflicts of interest in allocating the Fund's assets among the various underlying affiliated funds. This is because the fees payable by some of the underlying affiliated funds to the Adviser and/or its affiliates are higher than the fees payable by other underlying affiliated funds, and because the Adviser also manages and administers the underlying affiliated funds.
ETF Risk — The Fund may invest in shares of ETFs, which generally are registered investment companies that hold a portfolio of common stocks or debt securities, the shares of which are traded on an exchange. ETFs incur their own management and other fees and expenses, such as trustees' fees, operating expenses, registration fees, and marketing expenses, a proportionate share of which will be borne indirectly by the Fund as a shareholder in an ETF. As a result, the Fund's investment in an ETF will cause the Fund to indirectly bear the fees and expenses of the ETF and, in turn, the Fund's performance may be lower than if the Fund were to invest directly in the underlying securities held by the ETF. For investments in affiliated ETFs, the Fund's management fee is reimbursed by the Adviser to the extent of the indirect management fee incurred through the Fund's investment in the affiliated ETFs. The Adviser may have conflicts of interest in allocating assets among affiliated and unaffiliated ETFs, because the Adviser also manages and administers the affiliated ETFs, and the Adviser and its affiliates receive other fees from the affiliated ETFs. In addition, the Fund also will be subject to the risks associated with the securities or other investments held by the ETFs.
Market Risk — Overall market risks may affect the value of the Fund. Domestic and international factors such as political events, war, terrorism, trade disputes, inflation rates, interest rate levels and other fiscal and monetary policy changes, cybersecurity incidents, pandemics and other public health crises, sanctions against a particular foreign country, its nationals, businesses or industries and related geopolitical events, as well as environmental disasters such as earthquakes, fires, and floods, or other catastrophes, may add to instability in global economies and markets generally, and may lead to increased market volatility. Global economies and financial markets are highly interconnected, which increases the possibility that conditions in one country or region might adversely affect issuers in another country or region. The impact of these and other factors may be short-term or may last for extended periods.
6. Borrowing and Interfund Lending:
Line of Credit:
The Victory Funds Complex participates in a short-term demand note "Line of Credit" agreement with Citibank. The Line of Credit agreement with Citibank was renewed on June 27, 2022, with a termination date of June 26, 2023. Under the agreement with Citibank, the Victory Funds Complex may borrow up to $600 million, of which $300 million is committed and $300 million is uncommitted. $40 million of the Line of Credit is reserved for use by the Victory Floating Rate Fund, another series of the Victory Funds Complex, with Victory Floating Rate Fund paying the related commitment fees for that amount. The purpose of the Line of Credit is to meet temporary or emergency cash needs. For the six months ended November 30, 2022, Citibank received an annual commitment fee of 0.15% on $300 million for providing the Line of Credit. Each fund in the Victory Funds Complex paid a pro-rata portion of the commitment fees plus any interest on amounts borrowed. For the period from June 1, 2022, through June 27, 2022, interest was based on the one-month London Interbank Offered Rate ("LIBOR") plus one percent. Effective with the renewal, for the period June 28, 2022, through November 30, 2022, interest was based on the one-month Secured Overnight Financing Rate ("SOFR") plus 1.10 percent. Interest charged to the Fund during the period, if applicable, is reflected on the Statement of Operations under Line of credit fees.
28
USAA Mutual Funds Trust | | Notes to Financial Statements — continued
November 30, 2022 | |
(Unaudited)
The Fund had no borrowings under the Line of Credit agreement during the six months ended November 30, 2022.
Interfund Lending:
The Trust and the Adviser rely on an exemptive order granted by the SEC in March 2017 (the "Order"), permitting the establishment and operation of an Interfund Lending Facility (the "Facility"). The Facility allows the Fund to directly lend and borrow money to or from any other fund in the Victory Funds Complex that is permitted to participate in the Facility, relying upon the Order at rates beneficial to both the borrowing and lending funds. Advances under the Facility are allowed for temporary or emergency purposes, including the meeting of redemption requests that otherwise might require the untimely disposition of securities, and are subject to each Fund's borrowing restrictions. The interfund loan rate is determined, as specified in the Order, by averaging the current repurchase agreement rate and the current bank loan rate. As a Borrower, interest charged to the Fund, if any, during the period, is reflected on the Statement of Operations under Interfund lending fees. As a Lender, interest earned by the Fund, if any, during the period, is reflected on the Statement of Operations under Interfund lending.
The Fund did not utilize or participate in the Facility during the six months ended November 30, 2022.
7. Federal Income Tax Information:
The Fund intends to distribute any net investment income annually. Distributable net realized gains, if any, are declared and paid at least annually.
The amounts of dividends from net investment income and distributions from net realized gains (collectively, distributions to shareholders) are determined in accordance with federal income tax regulations, which may differ from GAAP. To the extent these "book/tax" differences are permanent in nature (e.g., net operating loss and distribution reclassification), such amounts are reclassified within the components of net assets based on their federal tax-basis treatment; temporary differences (e.g., wash sales) do not require reclassification. To the extent dividends and distributions exceed net investment income and net realized gains for tax purposes, they are reported as distributions of capital. Net investment losses incurred by the Fund may be reclassified as an offset to capital on the accompanying Statement of Assets and Liabilities.
The tax character of current year distributions paid and the tax basis of the current components of accumulated earnings (loss) will be determined at the end of the current tax year.
At the tax year ended May 31, 2022, the Fund had no capital loss carryforwards for federal income tax purposes.
8. Affiliated Securities:
An affiliated security is a security in which the Fund has ownership of at least 5% of the security's outstanding voting shares, an investment company managed by VCM, or an issuer under common control with a Fund or VCM. The Fund does not invest in affiliated securities for the purpose of exercising management or control. These securities are noted as affiliated on the Fund's Schedule of Portfolio Investments. The financial statements of the underlying funds can be found in shareholder reports filed with the SEC by each such underlying fund semi-annually on Form N-CSR and are available for
29
USAA Mutual Funds Trust | | Notes to Financial Statements — continued
November 30, 2022 | |
(Unaudited)
download from both the SEC's as well as each respective underlying fund's website. Transactions in affiliated securities during the six months ended November 30, 2022, were as follows (amounts in thousands):
| | | Fair
Value
5/31/2022 | | Purchases
at Cost | | Proceeds
from
Sales | | Realized
Gains
(Losses) | | Capital
Gain
Distribution | | Net
Change in
Unrealized
Appreciation/
Depreciation | | Fair Value
11/30/2022 | | Dividend
Income | |
VictoryShares Emerging Markets
Value Momentum ETF | | $ | 714 | | | $ | — | | | $ | — | | | $ | — | | | $ | — | | | $ | (69 | ) | | $ | 645 | | | $ | 19 | | |
VictoryShares ESG Core
Plus Bond ETF | | | 6,641 | | | | 286 | | | | (143 | ) | | | — | | | | — | | | | (336 | ) | | | 6,448 | | | | 111 | | |
VictoryShares USAA Core
Intermediate-Term Bond ETF | | | 26,922 | | | | 4,381 | | | | (458 | ) | | | — | | | | — | | | | (1,183 | ) | | | 29,662 | | | | 312 | | |
VictoryShares USAA Core
Short-Term Bond ETF | | | 5,115 | | | | — | | | | — | | | | — | | | | — | | | | (91 | ) | | | 5,024 | | | | 67 | | |
| | | $ | 39,392 | | | $ | 4,667 | | | $ | (601 | ) | | $ | — | | | $ | — | | | $ | (1,679 | ) | | $ | 41,779 | | | $ | 509 | | |
30
USAA Mutual Funds Trust | | Supplemental Information
November 30, 2022 | |
(Unaudited)
Proxy Voting and Portfolio Holdings Information
Proxy Voting:
Information regarding the policies and procedures the Fund uses to determine how to vote proxies relating to portfolio securities is available without charge, upon request, by calling (800) 235-8396. The information is also included in the Fund's Statement of Additional Information, which is available on the SEC's website at www.sec.gov.
Information relating to how the Fund voted proxies relating to portfolio securities held during the most recent 12 months ended June 30 is available on the SEC's website at www.sec.gov.
Availability of Schedules of Portfolio Investments:
The Trust files a complete list of Schedules of Portfolio Investments with the SEC for the first and third quarter of each fiscal year on Form N-PORT. Form N-PORT is available on the SEC's website at www.sec.gov.
Expense Example
As a shareholder of the Fund, you may incur two types of costs: (1) transaction costs and (2) ongoing costs, including management fees and other Fund expenses. These examples are intended to help you understand your ongoing costs (in dollars) of investing in the Fund and to compare these costs with the ongoing costs of investing in other mutual funds.
These examples are based on an investment of $1,000 invested at the beginning of the period and held for the entire period from June 1, 2022, through November 30, 2022.
The Actual Expense figures in the table below provide information about actual account values and actual expenses. You may use the information below, together with the amount you invested, to estimate the expenses that you paid over the period. Simply divide your account value by $1,000 (for example, an $8,600 account value divided by $1,000 = 8.6), then multiply the result by the number in the table under the heading entitled "Actual Expenses Paid During Period" to estimate the expenses you paid on your account during this period.
The Hypothetical Expense figures in the table below provide information about hypothetical account values and hypothetical expenses based on the Fund's actual expense ratio and an assumed rate of return of 5% per year before expenses, which is not the Fund's actual return. The hypothetical account values and expenses may not be used to estimate the actual ending account balance or expenses you paid for the period. You may use this information to compare this 5% hypothetical example with the 5% hypothetical examples that appear in shareholder reports of other funds.
Please note the expenses shown in the table below are meant to highlight your ongoing costs only and do not reflect any transactional costs. Therefore, the hypothetical expenses in the table are useful in comparing ongoing costs only and will not help you determine the relative total costs of owning different funds. In addition, if these transactional costs were included, your costs would have been higher.
Beginning
Account Value
6/1/22 | | Actual
Ending
Account Value
11/30/22 | | Hypothetical
Ending
Account Value
11/30/22 | | Actual
Expenses Paid
During Period
6/1/22-11/30/22* | | Hypothetical
Expenses Paid
During Period
6/1/22-11/30/22* | | Annualized
Expense Ratio
During Period
6/1/22-11/30/22 | |
| $ | 1,000.00 | | | $ | 983.00 | | | $ | 1,019.55 | | | $ | 5.47 | | | $ | 5.57 | | | | 1.10 | % | |
* Expenses are equal to the average account value multiplied by the Fund's annualized expense ratio multiplied by 183/365 (the number of days in the most recent fiscal half-year divided by the number of days in the fiscal year).
31
Privacy Policy
Protecting the Privacy of Information
The Trust respects your right to privacy. We also know that you expect us to conduct and process your business in an accurate and efficient manner. To do so, we must collect and maintain certain personal information about you. This is the information we collect from you on applications or other forms, and from the transactions you make with us or third parties. It may include your name, address, social security number, account transactions and balances, and information about investment goals and risk tolerance.
We do not disclose any information about you or about former customers to anyone except as permitted or required by law. Specifically, we may disclose the information we collect to companies that perform services on our behalf, such as the transfer agent that processes shareholder accounts and printers and mailers that assist us in the distribution of investor materials. We may also disclose this information to companies that perform marketing services on our behalf. This allows us to continue to offer you Victory investment products and services that meet your investing needs, and to effect transactions that you request or authorize. These companies will use this information only in connection with the services for which we hired them. They are not permitted to use or share this information for any other purpose.
To protect your personal information internally, we permit access only by authorized employees and maintain physical, electronic, and procedural safeguards to guard your personal information.*
* You may have received communications regarding information about privacy policies from other financial institutions which gave you the opportunity to "opt-out" of certain information sharing with companies which are not affiliated with that financial institution. The Trust does not share information with other companies for purposes of marketing solicitations for products other than the Trust. Therefore, the Trust does not provide opt-out options to their shareholders.
P.O. Box 182593
Columbus, Ohio 43218-2593

Visit our website at: | | Call | |
www.vcm.com | | (800) 235-8396 | |

NOVEMBER 30, 2022
Semi Annual Report
USAA Cornerstone Conservative Fund
Victory Capital means Victory Capital Management Inc., the investment adviser of the USAA Mutual Funds. USAA Mutual Funds are distributed by Victory Capital Services, Inc., member FINRA, an affiliate of Victory Capital. Victory Capital and its affiliates are not affiliated with United Services Automobile Association or its affiliates. USAA and the USAA logos are registered trademarks and the USAA Mutual Funds and USAA Investments logos are trademarks of United Services Automobile Association and are being used by Victory Capital and its affiliates under license.
www.vcm.com
News, Information And Education 24 Hours A Day, 7 Days A Week
The Victory Capital website gives fund shareholders, prospective shareholders, and investment professionals a convenient way to access fund information, get guidance, and track fund performance anywhere they can access the Internet. The site includes:
• Detailed performance records
• Daily share prices
• The latest fund news
• Investment resources to help you become a better investor
• A section dedicated to investment professionals
Whether you're a potential investor searching for the fund that matches your investment philosophy, a seasoned investor interested in planning tools, or an investment professional, www.vcm.com has what you seek. Visit us anytime. We're always open.
TABLE OF CONTENTS
Investment Objective & Portfolio Holdings | | | 2 | | |
Schedule of Portfolio Investments | | | 3 | | |
Financial Statements | |
Statement of Assets and Liabilities | | | 4 | | |
Statement of Operations | | | 5 | | |
Statements of Changes in Net Assets | | | 6 | | |
Financial Highlights | | | 8 | | |
Notes to Financial Statements | | | 10 | | |
Supplemental Information | | | 18 | | |
Proxy Voting and Portfolio Holdings Information | | | 18 | | |
Expense Example | | | 18 | | |
Privacy Policy (inside back cover) | | | |
This report is for the information of the shareholders and others who have received a copy of the currently effective prospectus of the Fund, managed by Victory Capital Management Inc. It may be used as sales literature only when preceded or accompanied by a current prospectus, which provides further details about the Fund.
IRA DISTRIBUTION WITHHOLDING DISCLOSURE
We generally must withhold federal income tax at a rate of 10% of the taxable portion of your distribution and, if you live in a state that requires state income tax withholding, at your state's tax rate. However, you may elect not to have withholding apply or to have income tax withheld at a higher rate. Any withholding election that you make will apply to any subsequent distribution unless and until you change or revoke the election. If you wish to make a withholding election, or change or revoke a prior withholding election, call (800) 235-8396, and form W-4P (OMB No. 1545-0074 withholding certificate for pension or annuity payments) will be electronically sent.
If you do not have a withholding election in place by the date of a distribution, federal income tax will be withheld from the taxable portion of your distribution at a rate of 10%. If you must pay estimated taxes, you may be subject to estimated tax penalties if your estimated tax payments are not sufficient and sufficient tax is not withheld from your distribution.
For more specific information, please consult your tax adviser.
• NOT FDIC INSURED • NO BANK GUARANTEE • MAY LOSE VALUE
1
USAA Mutual Funds Trust
USAA Cornerstone Conservative Fund | | November 30, 2022 | |
(Unaudited)
Investment Objective and Portfolio Holdings:
The Fund seeks current income and also considers the potential for capital appreciation.
Top 10 Holdings*:
November 30, 2022
(% of Net Assets)
USAA Intermediate-Term Bond Fund Institutional Shares | | | 19.1 | % | |
VictoryShares USAA Core Short-Term Bond ETF | | | 15.5 | % | |
USAA Government Securities Fund Institutional Shares | | | 15.1 | % | |
USAA Income Fund Institutional Shares | | | 9.2 | % | |
VictoryShares USAA Core Intermediate-Term Bond ETF | | �� | 7.3 | % | |
USAA High Income Fund Institutional Shares | | | 5.4 | % | |
USAA 500 Index Fund Reward Shares | | | 4.8 | % | |
USAA International Fund Institutional Shares | | | 3.5 | % | |
USAA Short-Term Bond Fund Institutional Shares | | | 3.1 | % | |
VictoryShares US Value Momentum ETF | | | 2.6 | % | |
Asset Allocation*:
November 30, 2022
(% of Net Assets)
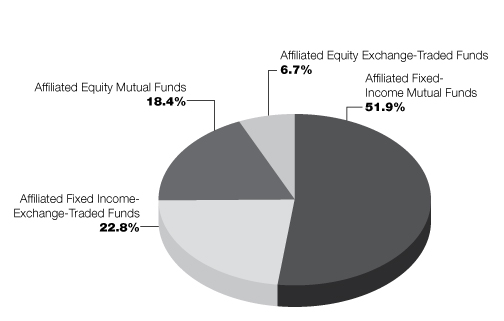
* Does not include futures contracts, money market instruments, and short-term investments purchased with cash collateral from securities loaned.
Percentages are of the net assets of the Fund and may not equal 100%.
Refer to the Schedule of Portfolio Investments for a complete list of securities.
2
USAA Mutual Funds Trust
USAA Cornerstone Conservative Fund | | Schedule of Portfolio Investments
November 30, 2022 | |
(Amounts in Thousands, Except for Shares) (Unaudited)
Security Description | | Shares | | Value | |
Affiliated Exchange-Traded Funds (29.5%) | |
VictoryShares Emerging Markets Value Momentum ETF | | | 67,940 | | | $ | 2,739 | | |
VictoryShares International Value Momentum ETF | | | 113,561 | | | | 4,744 | | |
VictoryShares US Small Mid Cap Value Momentum ETF | | | 18,550 | | | | 1,243 | | |
VictoryShares US Value Momentum ETF | | | 81,189 | | | | 5,389 | | |
VictoryShares USAA Core Intermediate-Term Bond ETF | | | 334,133 | | | | 15,317 | | |
VictoryShares USAA Core Short-Term Bond ETF | | | 669,201 | | | | 32,598 | | |
Total Affiliated Exchange-Traded Funds (Cost $63,944) | | | 62,030 | | |
Affiliated Mutual Funds (70.3%) | |
USAA 500 Index Fund Reward Shares | | | 191,905 | | | | 10,144 | | |
USAA Emerging Markets Fund Institutional Shares | | | 120,040 | | | | 2,183 | | |
USAA Government Securities Fund Institutional Shares | | | 3,602,596 | | | | 31,811 | | |
USAA Growth Fund Institutional Shares | | | 59,004 | | | | 1,556 | | |
USAA High Income Fund Institutional Shares | | | 1,706,265 | | | | 11,381 | | |
USAA Income Fund Institutional Shares | | | 1,729,631 | | | | 19,372 | | |
USAA Income Stock Fund Institutional Shares | | | 91,271 | | | | 1,790 | | |
USAA Intermediate-Term Bond Fund Institutional Shares | | | 4,459,364 | | | | 40,313 | | |
USAA International Fund Institutional Shares | | | 314,618 | | | | 7,412 | | |
USAA Nasdaq-100 Index Fund R6 Shares | | | 47,363 | | | | 1,515 | | |
USAA Precious Metals and Minerals Fund Institutional Shares | | | 61,676 | | | | 1,020 | | |
USAA Short-Term Bond Fund Institutional Shares | | | 750,790 | | | | 6,539 | | |
USAA Small Cap Stock Fund Institutional Shares | | | 101,426 | | | | 1,323 | | |
USAA Target Managed Allocation Fund | | | 581,717 | | | | 5,381 | | |
USAA Value Fund Institutional Shares | | | 101,192 | | | | 1,845 | | |
Victory Market Neutral Income Fund Class I | | | 498,539 | | | | 4,492 | | |
Total Affiliated Mutual Funds (Cost $158,771) | | | 148,077 | | |
Total Investments (Cost $222,715) — 99.8% | | | 210,107 | | |
Other assets in excess of liabilities — 0.2% | | | 482 | | |
NET ASSETS — 100.00% | | $ | 210,589 | | |
At November 30, 2022, the Fund's investments in foreign securities were 8.1% of net assets.
ETF — Exchange-Traded Fund
See notes to financial statements.
3
USAA Mutual Funds Trust | | Statement of Assets and Liabilities
November 30, 2022 | |
(Amounts in Thousands, Except Per Share Amounts) (Unaudited)
| | | USAA Cornerstone
Conservative Fund | |
Assets: | |
Affiliated investments, at value (Cost $222,715) | | $ | 210,107 | | |
Cash | | | 535 | | |
Receivables: | |
Capital shares issued | | | 19 | | |
From Adviser | | | 9 | | |
Prepaid expenses | | | 9 | | |
Total Assets | | | 210,679 | | |
Liabilities: | |
Payables: | |
Capital shares redeemed | | | 46 | | |
Accrued expenses and other payables: | |
Custodian fees | | | 2 | | |
Compliance fees | | | — | (a) | |
Trustees' fees | | | 1 | | |
Other accrued expenses | | | 41 | | |
Total Liabilities | | | 90 | | |
Net Assets: | |
Capital | | | 219,914 | | |
Total accumulated earnings/(loss) | | | (9,325 | ) | |
Net Assets | | $ | 210,589 | | |
Shares (unlimited number of shares authorized with no par value): | | | 20,459 | | |
Net asset value, offering and redemption price per share: (b) | | $ | 10.29 | | |
(a) Rounds to less than $1 thousand.
(b) Per share amount may not recalculate due to rounding of net assets and/or shares outstanding.
See notes to financial statements.
4
USAA Mutual Funds Trust | | Statement of Operations
For the Six Months Ended November 30, 2022 | |
(Amounts in Thousands) (Unaudited)
| | | USAA Cornerstone
Conservative Fund | |
Investment Income: | |
Income distributions from affiliated funds | | $ | 2,877 | | |
Interest from unaffiliated investments | | | 3 | | |
Securities lending (net of fees) | | | 1 | | |
Total Income | | | 2,881 | | |
Expenses: | |
Sub-Administration fees | | | 9 | | |
Custodian fees | | | 3 | | |
Trustees' fees | | | 24 | | |
Compliance fees | | | 1 | | |
Printing fees | | | 18 | | |
Legal and audit fees | | | 32 | | |
State registration and filing fees | | | 25 | | |
Interfund lending fees | | | — | (a) | |
Other expenses | | | 14 | | |
Total Expenses | | | 126 | | |
Expenses waived/reimbursed by Adviser | | | (20 | ) | |
Net Expenses | | | 106 | | |
Net Investment Income (Loss) | | | 2,775 | | |
Realized/Unrealized Gains (Losses) from Investments: | |
Net realized gains (losses) from sales of affiliated funds | | | (878 | ) | |
Net change in unrealized appreciation/depreciation on affiliated funds | | | (8,057 | ) | |
Net realized/unrealized gains (losses) on investments | | | (8,935 | ) | |
Change in net assets resulting from operations | | $ | (6,160 | ) | |
(a) Rounds to less than $1 thousand.
See notes to financial statements.
5
USAA Mutual Funds Trust | | Statements of Changes in Net Assets | |
(Amounts in Thousands)
| | | USAA Cornerstone
Conservative Fund | |
| | | Six Months
Ended
November 30,
2022
(Unaudited) | | Year
Ended
May 31,
2022 | |
From Investments: | |
Operations: | |
Net Investment Income (Loss) | | $ | 2,775 | | | $ | 6,515 | | |
Net realized gains (losses) | | | (878 | ) | | | 4,004 | | |
Net change in unrealized appreciation/depreciation | | | (8,057 | ) | | | (25,778 | ) | |
Change in net assets resulting from operations | | | (6,160 | ) | | | (15,259 | ) | |
Change in net assets resulting from distributions to shareholders | | | (2,459 | ) | | | (9,581 | ) | |
Change in net assets resulting from capital transactions | | | (3,929 | ) | | | 4,027 | | |
Change in net assets | | | (12,548 | ) | | | (20,813 | ) | |
Net Assets: | |
Beginning of period | | | 223,137 | | | | 243,950 | | |
End of period | | $ | 210,589 | | | $ | 223,137 | | |
Capital Transactions: | |
Proceeds from shares issued | | $ | 15,188 | | | $ | 60,512 | | |
Distributions reinvested | | | 2,442 | | | | 9,518 | | |
Cost of shares redeemed | | | (21,559 | ) | | | (66,003 | ) | |
Change in net assets resulting from capital transactions | | $ | (3,929 | ) | | $ | 4,027 | | |
Share Transactions: | |
Issued | | | 1,482 | | | | 5,222 | | |
Reinvested | | | 240 | | | | 819 | | |
Redeemed | | | (2,115 | ) | | | (5,759 | ) | |
Change in Shares | | | (393 | ) | | | 282 | | |
See notes to financial statements.
6
This page is intentionally left blank.
7
USAA Mutual Funds Trust | | Financial Highlights | |
For a Share Outstanding Throughout Each Period
| | | | | Investment Activities | | Distributions to
Shareholders From | |
| | | Net Asset
Value,
Beginning
of Period | | Net
Investment
Income
(Loss) | | Net
Realized
and
Unrealized
Gains
(Losses) | | Total from
Investment
Activities | | Net
Investment
Income | | Net
Realized
Gains from
Investments | |
USAA Cornerstone Conservative Fund | | | |
Six Months Ended
November 30, 2022
(Unaudited) | | $ | 10.70 | | | | 0.13 | (f) | | | (0.42 | ) | | | (0.29 | ) | | | (0.12 | ) | | | — | | |
Year Ended May 31:
2022 | | $ | 11.86 | | | | 0.31 | (f) | | | (1.01 | ) | | | (0.70 | ) | | | (0.31 | ) | | | (0.15 | ) | |
2021 | | $ | 10.96 | | | | 0.30 | (f) | | | 1.03 | | | | 1.33 | | | | (0.31 | ) | | | (0.12 | ) | |
2020 | | $ | 10.72 | | | | 0.32 | (f) | | | 0.25 | | | | 0.57 | | | | (0.33 | ) | | | — | | |
2019 | | $ | 10.64 | | | | 0.32 | | | | 0.08 | | | | 0.40 | | | | (0.32 | ) | | | — | | |
2018 | | $ | 10.76 | | | | 0.30 | | | | (0.11 | ) | | | 0.19 | | | | (0.31 | ) | | | — | | |
(a) Not annualized for periods less than one year.
(b) Assumes reinvestment of all net investment income and realized capital gain distributions, if any, during the period. Includes adjustments in accordance with U.S. Generally Accepted Accounting Principles and could differ from the Lipper reported return.
(c) Annualized for periods less than one year.
(d) The net expense ratio may not correlate to the applicable expense limits in place during the period since the current contractual expense limitation is applied for a period beginning July 1, 2019 and in effect through September 30, 2023, instead of coinciding with the Fund's fiscal year end. Details of the current contractual expense limitation in effect can be found in Note 4 of the accompanying Notes to Financial Statements.
(e) Does not include acquired fund fees and expenses, if any.
(f) Per share net investment income (loss) has been calculated using the average daily shares method.
See notes to financial statements.
8
USAA Mutual Funds Trust | | Financial Highlights — continued | |
For a Share Outstanding Throughout Each Period
| | | | | Ratios to Average Net Assets | | Supplemental Data | |
| | | Total
Distributions | | Net
Asset
Value,
End of
Period | | Total
Return(a)(b) | | Net
Expenses(c)(d)(e) | | Net
Investment
Income
(Loss)(c) | | Gross
Expenses(c)(e) | | Net
Assets,
End of
Period
(000's) | | Portfolio
Turnover(a) | |
USAA Cornerstone Conservative Fund | |
Six Months Ended
November 30, 2022
(Unaudited) | | | (0.12 | ) | | $ | 10.29 | | | | (2.71 | )% | | | 0.10 | % | | | 2.60 | % | | | 0.12 | % | | $ | 210,589 | | | | 1 | % | |
Year Ended May 31:
2022 | | | (0.46 | ) | | $ | 10.70 | | | | (6.19 | )% | | | 0.08 | % | | | 2.68 | % | | | 0.08 | % | | $ | 223,137 | | | | 11 | % | |
2021 | | | (0.43 | ) | | $ | 11.86 | | | | 12.28 | % | | | 0.10 | % | | | 2.61 | % | | | 0.10 | % | | $ | 243,950 | | | | 15 | % | |
2020 | | | (0.33 | ) | | $ | 10.96 | | | | 5.45 | % | | | 0.09 | % | | | 2.92 | % | | | 0.10 | % | | $ | 205,950 | | | | 8 | % | |
2019 | | | (0.32 | ) | | $ | 10.72 | | | | 3.84 | % | | | 0.10 | % | | | 2.99 | % | | | 0.12 | % | | $ | 193,265 | | | | 22 | % | |
2018 | | | (0.31 | ) | | $ | 10.64 | | | | 1.79 | % | | | 0.10 | % | | | 2.87 | % | | | 0.12 | % | | $ | 196,292 | | | | 5 | % | |
See notes to financial statements.
9
USAA Mutual Funds Trust | | Notes to Financial Statements
November 30, 2022 | |
(Unaudited)
1. Organization:
USAA Mutual Funds Trust (the "Trust") is organized as a Delaware statutory trust and is registered under the Investment Company Act of 1940, as amended (the "1940 Act"), as an open-end investment company. The Trust is comprised of 45 funds and is authorized to issue an unlimited number of shares, which are units of beneficial interest with no par value.
The accompanying financial statements are those of the USAA Cornerstone Conservative Fund (the "Fund"). The Fund is classified as diversified under the 1940 Act. The Fund is a "fund of funds" in that it invests in a selection of affiliated mutual funds and exchange-traded funds ("ETFs") managed by the Fund's Adviser, Victory Capital Management Inc. ("VCM" or the "Adviser"), an affiliate of the Fund. The Adviser is an indirect wholly owned subsidiary of Victory Capital Holdings, Inc., a publicly traded Delaware corporation, and a wholly owned direct subsidiary of Victory Capital Operating, LLC.
The Fund may rely on various exemptions contained in the 1940 Act and in exemptive rules or orders thereunder issued by the Securities and Exchange Commission ("SEC") that permit funds, subject to certain conditions, to invest in one or more ETFs and certain other types of investment companies in amounts that exceed limits set forth in the 1940 Act that would otherwise be applicable.
Under the Trust's organizational documents, its officers and trustees are indemnified against certain liabilities arising out of the performance of their duties to the Fund. In addition, in the normal course of business, the Fund enters into contracts with its vendors and others that provide for general indemnifications. The Fund's maximum exposure under these arrangements is unknown, as this would involve future claims that may be made against the Fund. However, based on experience, the Fund expects that risk of loss to be remote.
2. Significant Accounting Policies:
The following is a summary of significant accounting policies followed by the Trust in the preparation of its financial statements. The policies are in conformity with U.S. Generally Accepted Accounting Principles ("GAAP"). The preparation of financial statements in accordance with GAAP requires management to make estimates and assumptions that affect the reported amounts of assets and liabilities and disclosure of contingent assets and liabilities at the date of the financial statements and the reported amounts of income and expenses for the period. Actual results could differ from those estimates. The Fund follows the specialized accounting and reporting requirements under GAAP that are applicable to investment companies under Accounting Standards Codification Topic 946.
Investment Valuation:
The Fund records investments at fair value. Fair value is defined as the price that would be received to sell an asset or paid to transfer a liability in an orderly transaction between market participants at the measurement date.
The valuation techniques described below maximize the use of observable inputs and minimize the use of unobservable inputs in determining fair value. The inputs used for valuing the Fund's investments are summarized in the three broad levels listed below:
• Level 1 — quoted prices (unadjusted) in active markets for identical securities
• Level 2 — other significant observable inputs (including quoted prices for similar securities, interest rates, or credit spreads, applicable to those securities, etc.)
• Level 3 — significant unobservable inputs (including the Adviser's assumptions in determining the fair value of investments)
Changes in valuation techniques may result in transfers in or out of an assigned level within the disclosure hierarchy. The inputs or methodologies used for valuation techniques are not necessarily an indication of the risks associated with entering into those investments.
The Adviser, acting as the valuation designee has established the Pricing and Liquidity Committee (the "Committee"), and subject to the Trust's Board of Trustees' (the "Board") oversight, the Committee
10
USAA Mutual Funds Trust | | Notes to Financial Statements — continued
November 30, 2022 | |
(Unaudited)
administers and oversees the Fund's valuation policies and procedures, which are approved by the Board.
Portfolio securities listed or traded on securities exchanges, including ETFs, are valued at the closing price on the exchange or system where the security is principally traded, if available, or at the Nasdaq Official Closing Price. If there have been no sales for that day on the exchange or system, then a security is valued at the last available bid quotation on the exchange or system where the security is principally traded. In each of these situations, valuations are typically categorized as Level 1 in the fair value hierarchy.
Investments in the underlying affiliated Funds and other open-end investment companies, other than ETFs, are valued at their net asset value ("NAV") at the end of each business day. These valuations are typically categorized as Level 1 in the fair value hierarchy.
The underlying affiliated Funds have specific valuation procedures. In the event that price quotations or valuations are not readily available, are not reflective of market value, or a significant event has been recognized in relation to a security or class of securities, the securities are valued in good faith by the Committee in accordance with valuation procedures approved by the Board. The effect of fair value pricing is that securities may not be priced on the basis of quotations from the primary market in which they are traded and the actual price realized from the sale of a security may differ materially from the fair value price. Valuing these securities at fair value is intended to cause the Fund's NAV to be more reliable than it otherwise would be.
A summary of the valuations as of November 30, 2022, based upon the three levels defined above, is included in the table below while the breakdown, by category, of investments is disclosed on the Schedule of Portfolio Investments (amounts in thousands):
| | | Level 1 | | Level 2 | | Level 3 | | Total | |
Affiliated Exchange-Traded Funds | | $ | 62,030 | | | $ | — | | | $ | — | | | $ | 62,030 | | |
Affiliated Mutual Funds | | | 148,077 | | | | — | | | | — | | | | 148,077 | | |
Total | | $ | 210,107 | | | $ | — | | | $ | — | | | $ | 210,107 | | |
For the six months ended November 30, 2022, there were no transfers into/out of Level 3.
Investment Companies:
Exchange-Traded Funds:
The Fund may invest in ETFs, the shares of which are bought and sold on a securities exchange. An ETF trades like common stock and represents a fixed portfolio of securities often designed to track the performance and dividend yield of a particular domestic or foreign market index. The Fund may purchase shares of an ETF to temporarily gain exposure to a portion of the U.S. or a foreign market while awaiting purchase of underlying securities. The risks of owning an ETF generally reflect the risks of owning the underlying securities the ETF is designed to track, although the lack of liquidity of an ETF could result in it being more volatile. Additionally, ETFs have fees and expenses that reduce their value.
Open-End Funds:
The Fund may invest in portfolios of open-end investment companies. These investment companies value securities in their portfolios for which market quotations are readily available at their market values (generally the last reported sale price) and all other securities and assets at their fair value by the methods established by the board of directors of the underlying funds.
Investment Transactions and Related Income:
Changes in holdings of investments are accounted for no later than one business day following the trade date. For financial reporting purposes, however, investment transactions are accounted for on
11
USAA Mutual Funds Trust | | Notes to Financial Statements — continued
November 30, 2022 | |
(Unaudited)
trade date or the last business day of the reporting period. Interest income is determined on the basis of coupon interest accrued using the effective interest method which adjusts, where applicable, the amortization of premiums or accretion of discounts. Dividend income is recorded on the ex-dividend date. Gains or losses realized on sales of securities are recorded on the identified cost basis.
Securities Lending:
The Fund, through a Securities Lending Agreement with Citibank, N.A. ("Citibank"), may lend its securities to qualified financial institutions, such as certain broker-dealers and banks, to earn additional income, net of income retained by Citibank. Borrowers are required to initially secure their loans for collateral in the amount of at least 102% of the value of U.S. securities loaned or at least 105% of the value of non-U.S. securities loaned, marked-to-market daily. Any collateral shortfalls associated with increases in the valuation of the securities loaned are generally cured the next business day. The collateral can be received in the form of cash collateral and/or non-cash collateral. Non-cash collateral can include U.S. Government Securities and other securities as permitted by Securities and Exchange Commission ("SEC") guidelines. The cash collateral is invested in short-term instruments or cash equivalents, primarily open-end investment companies, as noted on the Fund's Schedule of Portfolio Investments. The Fund effectively does not have control of the non-cash collateral and therefore it is not disclosed on the Fund's Schedule of Portfolio Investments. Collateral requirements are determined daily based on the value of the Fund's securities on loan as of the end of the prior business day. During the time portfolio securities are on loan, the borrower will pay the Fund any dividends or interest paid on such securities plus any fee negotiated between the parties to the lending agreement. The Fund also earns a return from the collateral. The Fund pays Citibank various fees in connection with the investment of cash collateral and fees based on the investment income received from securities lending activities. Securities lending income (net of these fees) is disclosed on the Statement of Operations. Loans are terminable upon demand and the borrower must return the loaned securities within the lesser of one standard settlement period or five business days. Although risk is mitigated by the collateral, the Fund could experience a delay in recovering its securities and possible loss of income or value if the borrower fails to return them. In addition, there is a risk that the value of the short-term investments will be less than the amount of cash collateral required to be returned to the borrower.
The Fund's agreement with Citibank does not include master netting provisions. Non-cash collateral received by the Fund may not be sold or repledged, except to satisfy borrower default.
As of November 30, 2022, the Fund did not have any securities on loan.
Federal Income Taxes:
The Fund intends to continue to qualify as a regulated investment company by complying with the provisions available to certain investment companies, as defined in applicable sections of the Internal Revenue Code, and to make distributions of net investment income and net realized gains sufficient to relieve it from all, or substantially all, federal income taxes. Accordingly, no provision for federal income taxes is required in the financial statements. The Fund has a tax year end of May 31.
For the six months ended November 30, 2022, the Fund did not incur any income tax, interest, or penalties, and has recorded no liability for net unrecognized tax benefits relating to uncertain tax positions.
Management of the Fund has reviewed tax positions taken in tax years that remain subject to examination by all major tax jurisdictions, including federal (i.e., the last four tax years, which includes the current fiscal tax year end). Management believes that there is no tax liability resulting from unrecognized tax benefits related to uncertain tax positions taken.
Allocations:
Expenses directly attributable to the Fund are charged to the Fund, while expenses that are attributable to more than one fund in the Trust, or jointly with an affiliated trust, are allocated among the respective funds in the Trust and/or an affiliated trust based upon net assets or another appropriate basis.
12
USAA Mutual Funds Trust | | Notes to Financial Statements — continued
November 30, 2022 | |
(Unaudited)
3. Purchases and Sales:
Purchases and sales of securities (excluding securities maturing less than one year from acquisition) for the six months ended November 30, 2022, were as follows for the Fund (amounts in thousands):
Excluding
U.S. Government Securities | |
Purchases | | Sales | |
$ | 2,700 | | | $ | 6,114 | | |
4. Fees and Transactions with Affiliates and Related Parties:
Investment Advisory Fees:
Investment advisory services are provided to the Fund by the Adviser, which is a New York corporation registered as an investment adviser with the SEC. The Adviser does not receive any fees from the Fund for these services.
The Trust relies on an exemptive order granted to VCM and its affiliated funds by the SEC in March 2019, permitting the use of a "manager-of-managers" structure for certain funds. Under a manager-of-managers structure, the investment adviser may select (with approval of the Board and without shareholder approval) one or more subadvisers to manage the day-to-day investment of a fund's assets. For the six months ended November 30, 2022, the Fund had no subadvisers.
Administration and Servicing Fees:
VCM serves as the Fund's administrator and fund accountant. Under the Fund Administration, Servicing and Accounting Agreement, VCM does not receive any fees from the Fund for these services.
Citi Fund Services Ohio, Inc. ("Citi"), an affiliate of Citibank, acts as sub-administrator and sub-fund accountant to the Fund pursuant to a Sub-Administration and Sub-Fund Accounting Services Agreement between VCM and Citi. VCM pays Citi a fee for providing these services. The Fund reimburses VCM and Citi for out-of-pocket expenses incurred in providing these services and certain other expenses specifically allocated to the Fund. Amounts incurred for the six months ended November 30, 2022, are reflected on the Statement of Operations as Sub-Administration fees.
The Fund (as part of the Trust) has entered into an agreement with the Adviser to provide compliance services, pursuant to which the Adviser furnishes its compliance personnel, including the services of the Chief Compliance Officer ("CCO"), and other resources reasonably necessary to provide the Trust with compliance oversight services related to the design, administration, and oversight of a compliance program for the Trust in accordance with Rule 38a-1 under the 1940 Act. The CCO is an employee of the Adviser, which pays the compensation of the CCO and support staff. The funds in the Trust, Victory Variable Insurance Funds, Victory Portfolios, and Victory Portfolios II (collectively, the "Victory Funds Complex") in the aggregate, compensate the Adviser for these services. Amounts incurred for the six months ended November 30, 2022, are reflected on the Statement of Operations as Compliance fees.
Transfer Agency Fees:
Victory Capital Transfer Agency, Inc. ("VCTA"), an affiliate of the Adviser, provides transfer agency services to the Fund. VCTA does not receive any fees from the Fund for these services.
FIS Investor Services LLC serves as sub-transfer agent and dividend disbursing agent for the Fund pursuant to a Sub-Transfer Agent Agreement between VCTA and FIS Investor Services LLC. VCTA provides FIS Investor Services LLC a fee for providing these services.
Distributor/Underwriting Services:
Victory Capital Services, Inc. (the "Distributor"), an affiliate of the Adviser, serves as Distributor for the continuous offering of the shares of the Fund pursuant to a Distribution Agreement between the Distributor and the Trust and receives no fee or other compensation for these services.
13
USAA Mutual Funds Trust | | Notes to Financial Statements — continued
November 30, 2022 | |
(Unaudited)
Other Fees:
Citibank serves as the Fund's custodian. The Fund pays Citibank a fee for providing these services. Amounts incurred for the six months ended November 30, 2022, are reflected on the Statement of Operations as Custodian fees.
K&L Gates LLP provides legal services to the Trust.
The Adviser has entered into an expense limitation agreement with the Fund until at least September 30, 2023. Under the terms of the agreement, the Adviser has agreed to waive fees or reimburse certain expenses to the extent that ordinary operating expenses incurred in any fiscal year exceed the expense limit for the Fund. Such excess amounts will be the liability of the Adviser. Acquired fund fees and expenses, interest, taxes, brokerage commissions, other expenditures, which are capitalized in accordance with GAAP, and other extraordinary expenses not incurred in the ordinary course of the Fund's business are excluded from the expense limit. As of November 30, 2022, the expense limit (excluding voluntary waivers) was 0.10%.
Under the terms of the expense limitation agreement, as amended June 29, 2022, the Fund has agreed to repay fees and expenses that were waived or reimbursed by the Adviser for a period of up to three years (thirty-six (36) months) after the waiver or reimbursement took place, subject to the lesser of any operating expense limits in effect at the time of: (a) the original waiver or expense reimbursement; or (b) the recoupment, after giving effect to the recoupment amount.
As of November 30, 2022, the following amounts are available to be repaid to the Adviser (amounts in thousands). The Fund has not recorded any amounts available to be repaid as a liability due to an assessment that such repayments are not probable at November 30, 2022.
Expires
2026 | | Total | |
| $ | 20 | | | $ | 20 | | |
The Adviser may voluntarily waive or reimburse additional fees to assist the Fund in maintaining competitive expense ratios. Voluntary waivers and reimbursements applicable to the Fund are not available to be recouped at a future time. There were no voluntary waivers or reimbursements for the six months ended November 30, 2022.
Certain officers and/or interested trustees of the Fund are also officers and/or employees of the Adviser, administrator, fund accountant, sub-administrator, sub-fund accountant, custodian, and Distributor.
5. Risks:
The Fund may be subject to other risks in addition to these identified risks.
Tactical Allocation Risk — The Fund has a targeted risk tolerance and a corresponding asset allocation target; however, mere asset allocation and volatility are not the sole determination of risk. The Fund's managers will tactically allocate away from the target allocation as market conditions and the perceived risks warrant. The Fund bears the risk that the managers' tactical allocation will not be successful.
Affiliated Funds Risk — The risks of the Fund directly correspond to the risks of the underlying affiliated funds in which the Fund invests. By investing in the underlying affiliated funds, the Fund has exposure to the risk of many different areas of the market. The degree to which the risks described below apply to the Fund varies according to the Fund's asset allocation. For instance, the more the Fund is allocated to stock funds, the greater the risk associated with equity securities. The Fund also is subject to asset allocation risk (i.e., the risk that allocations will not produce the intended results) and to management risk (i.e., the risk that the selection of underlying affiliated funds will not produce the intended results).
Conflict of Interest Risk — In managing a Fund that invests in underlying affiliated funds, the Adviser may have conflicts of interest in allocating the Fund's assets among the various underlying affiliated funds. This is because the fees payable by some of the underlying affiliated funds to the Adviser and/or its affiliates are higher than the fees payable by other underlying affiliated funds, and because the Adviser also manages and administers the underlying affiliated funds.
14
USAA Mutual Funds Trust | | Notes to Financial Statements — continued
November 30, 2022 | |
(Unaudited)
ETF Risk — The Fund may invest in shares of ETFs, which generally are registered investment companies that hold a portfolio of common stocks or debt securities, the shares of which are traded on an exchange. ETFs incur their own management and other fees and expenses, such as trustees' fees operating expenses, registration fees, and marketing expenses, a proportionate share of which would be indirectly borne by the Fund. As a result, an investment by the Fund in an ETF will cause the Fund to indirectly bear the fees and expenses of the ETF and, in turn, performance may be lower than if the Fund were to invest directly in the securities underlying the ETF. In addition, the Fund will be indirectly exposed to all of the risk of securities held by the ETFs.
Market Risk — Overall market risks may affect the value of the Fund. Domestic and international factors such as political events, war, terrorism, trade disputes, inflation rates, interest rate levels and other fiscal and monetary policy changes, cybersecurity incidents, pandemics and other public health crises, sanctions against a particular foreign country, its nationals, businesses or industries and related geopolitical events, as well as environmental disasters such as earthquakes, fires, and floods, or other catastrophes, may add to instability in global economies and markets generally, and may lead to increased market volatility. Global economies and financial markets are highly interconnected, which increases the possibility that conditions in one country or region might adversely affect issuers in another country or region. The impact of these and other factors may be short-term or may last for extended periods.
6. Borrowing and Interfund Lending:
Line of Credit:
The Victory Funds Complex participates in a short-term demand note "Line of Credit" agreement with Citibank. The Line of Credit agreement with Citibank was renewed on June 27, 2022, with a termination date of June 26, 2023. Under the agreement with Citibank, the Victory Funds Complex may borrow up to $600 million, of which $300 million is committed and $300 million is uncommitted. $40 million of the Line of Credit is reserved for use by the Victory Floating Rate Fund, another series of the Victory Funds Complex, with Victory Floating Rate Fund paying the related commitment fees for that amount. The purpose of the Line of Credit is to meet temporary or emergency cash needs. For the six months ended November 30, 2022, Citibank received an annual commitment fee of 0.15% on $300 million for providing the Line of Credit. Each fund in the Victory Funds Complex paid a pro-rata portion of the commitment fees plus any interest on amounts borrowed. For the period from June 1, 2022, through June 27, 2022, interest was based on the one-month London Interbank Offered Rate ("LIBOR") plus one percent. Effective with the renewal, for the period June 28, 2022, through November 30, 2022, interest was based on the one-month Secured Overnight Financing Rate ("SOFR") plus 1.10 percent. Interest charged to the Fund during the period, if applicable, is reflected on the Statement of Operations under Line of credit fees.
The Fund had no borrowings under the Line of Credit agreement during the six months ended November 30, 2022.
Interfund Lending:
The Trust and the Adviser rely on an exemptive order granted by the SEC in March 2017 (the "Order"), permitting the establishment and operation of an Interfund Lending Facility (the "Facility"). The Facility allows the Fund to directly lend and borrow money to or from any other fund in the Victory Funds Complex that is permitted to participate in the Facility, relying upon the Order at rates beneficial to both the borrowing and lending funds. Advances under the Facility are allowed for temporary or emergency purposes, including the meeting of redemption requests that otherwise might require the untimely disposition of securities, and are subject to each Fund's borrowing restrictions. The interfund loan rate is determined, as specified in the Order, by averaging the current repurchase agreement rate and the current bank loan rate. As a Borrower, interest charged to the Fund, if any, during the period, is reflected on the Statement of Operations under Interfund lending fees. As a Lender, interest earned by the Fund, if any, during the period, is reflected on the Statement of Operations under Interfund lending.
15
USAA Mutual Funds Trust | | Notes to Financial Statements — continued
November 30, 2022 | |
(Unaudited)
The average borrowing or lending for the days outstanding and average interest rate for the Fund for six months ended November 30, 2022, were as follows (amounts in thousands):
Borrower
or
Lender | | Amount
Outstanding
at
November 30,
2022 | | Average
Borrowing* | | Days
Borrowing
Outstanding | | Average
Interest
Rate* | | Maximum
Borrowing
During
the Period | |
Borrower | | $ | — | | | $ | 1,243 | | | | 1 | | | | 3.58 | % | | $ | 1,243 | | |
* For the six months ended November 30, 2022, based on the number of days borrowings were outstanding.
7. Federal Income Tax Information:
The Fund intends to distribute any net investment income quarterly. Distributable net realized gains, if any, are declared and paid at least annually.
The amounts of dividends from net investment income and distributions from net realized gains (collectively, distributions to shareholders) are determined in accordance with federal income tax regulations, which may differ from GAAP. To the extent these "book/tax" differences are permanent in nature (e.g., net operating loss and distribution reclassification), such amounts are reclassified within the components of net assets based on their federal tax-basis treatment; temporary differences (e.g., wash sales) do not require reclassification. To the extent dividends and distributions exceed net investment income and net realized gains for tax purposes, they are reported as distributions of capital. Net investment losses incurred by the Fund may be reclassified as an offset to capital on the accompanying Statement of Assets and Liabilities.
The tax character of current year distributions paid and the tax basis of the current components of accumulated earnings (loss) will be determined at the end of the current tax year.
At the tax year ended May 31, 2022, the Fund had no capital loss carryforwards for federal income tax purposes.
8. Affiliated Securities:
An affiliated security is a security in which the Fund has ownership of at least 5% of the security's outstanding voting shares, an investment company managed by VCM, or an issuer under common control with a Fund or VCM. The Fund does not invest in affiliated securities for the purpose of exercising management or control. These securities are noted as affiliated on the Fund's Schedule of Portfolio Investments. The financial statements of the underlying funds can be found in shareholder reports filed with the SEC by each such underlying fund semi-annually on Form N-CSR and are available for download from both the SEC's as well as each respective underlying fund's website. Transactions in affiliated securities during the six months ended November 30, 2022, were as follows (amounts in thousands):
| | | Fair
Value
5/31/2022 | | Purchases
at Cost | | Proceeds
from
Sales | | Realized
Gains
(Losses) | | Capital
Gain
Distribution | | Net
Change in
Unrealized
Appreciation/
Depreciation | | Fair Value
11/30/2022 | | Dividend
Income | |
USAA 500 Index Fund Reward
Shares | | $ | 9,498 | | | $ | 713 | | | $ | — | | | $ | — | | | $ | — | | | $ | (67 | ) | | $ | 10,144 | | | $ | 68 | | |
USAA Emerging Markets Fund
Institutional Shares | | | 2,397 | | | | — | | | | — | | | | — | | | | — | | | | (214 | ) | | | 2,183 | | | | — | | |
USAA Government Securities
Fund Institutional Shares | | | 33,143 | | | | 423 | | | | (432 | ) | | | (40 | ) | | | — | | | | (1,283 | ) | | | 31,811 | | | | 370 | | |
USAA Growth Fund Institutional
Shares | | | 1,584 | | | | — | | | | — | | | | — | | | | — | | | | (28 | ) | | | 1,556 | | | | — | | |
16
USAA Mutual Funds Trust | | Notes to Financial Statements — continued
November 30, 2022 | |
(Unaudited)
| | | Fair
Value
5/31/2022 | | Purchases
at Cost | | Proceeds
from
Sales | | Realized
Gains
(Losses) | | Capital
Gain
Distribution | | Net
Change in
Unrealized
Appreciation/
Depreciation | | Fair Value
11/30/2022 | | Dividend
Income | |
USAA High Income Fund
Institutional Shares | | $ | 11,702 | | | $ | 340 | | | $ | — | | | $ | — | | | $ | — | | | $ | (661 | ) | | $ | 11,381 | | | $ | 340 | | |
USAA Income Fund Institutional
Shares | | | 25,719 | | | | 361 | | | | (5,276 | ) | | | (886 | ) | | | — | | | | (546 | ) | | | 19,372 | | | | 361 | | |
USAA Income Stock Fund
Institutional Shares | | | 1,942 | | | | 20 | | | | (202 | ) | | | 52 | | | | — | | | | (22 | ) | | | 1,790 | | | | 20 | | |
USAA Intermediate-Term Bond
Fund Institutional Shares | | | 41,913 | | | | 642 | | | | — | | | | — | | | | — | | | | (2,242 | ) | | | 40,313 | | | | 706 | | |
USAA International Fund
Institutional Shares | | | 7,592 | | | | — | | | | — | | | | — | | | | — | | | | (180 | ) | | | 7,412 | | | | — | | |
USAA NASDAQ-100 Index Fund
R6 Shares | | | 1,588 | | | | — | | | | — | | | | — | | | | — | | | | (73 | ) | | | 1,515 | | | | — | | |
USAA Precious Metals and
Minerals Fund Institutional
Shares | | | 1,143 | | | | — | | | | — | | | | — | | | | — | | | | (123 | ) | | | 1,020 | | | | — | | |
USAA Short-Term Bond Fund
Institutional Shares | | | 6,564 | | | | 94 | | | | — | | | | — | | | | — | | | | (119 | ) | | | 6,539 | | | | 82 | | |
USAA Small Cap Stock Fund
Institutional Shares | | | 1,293 | | | | — | | | | — | | | | — | | | | — | | | | 30 | | | | 1,323 | | | | — | | |
USAA Target Managed Allocation
Fund | | | 5,689 | | | | — | | | | — | | | | — | | | | — | | | | (308 | ) | | | 5,381 | | | | — | | |
USAA Value Fund Institutional
Shares | | | 2,057 | | | | — | | | | (204 | ) | | | (4 | ) | | | — | | | | (4 | ) | | | 1,845 | | | | — | | |
Victory Market Neutral Income
Fund Class I | | | 4,689 | | | | 107 | | | | — | | | | — | | | | — | | | | (304 | ) | | | 4,492 | | | | 107 | | |
VictoryShares Emerging Markets
Value Momentum ETF | | | 3,030 | | | | — | | | | — | | | | — | | | | — | | | | (291 | ) | | | 2,739 | | | | 79 | | |
VictoryShares International Value
Momentum ETF | | | 5,063 | | | | — | | | | — | | | | — | | | | — | | | | (319 | ) | | | 4,744 | | | | 76 | | |
VictoryShares US Small Mid Cap
Value Momentum ETF | | | 1,228 | | | | — | | | | — | | | | — | | | | — | | | | 15 | | | | 1,243 | | | | 7 | | |
VictoryShares US Value
Momentum ETF | | | 5,364 | | | | — | | | | — | | | | — | | | | — | | | | 25 | | | | 5,389 | | | | 45 | | |
VictoryShares USAA Core
Intermediate-Term Bond ETF | | | 16,072 | | | | — | | | | — | | | | — | | | | — | | | | (755 | ) | | | 15,317 | | | | 180 | | |
VictoryShares USAA Core
Short-Term Bond ETF | | | 33,186 | | | | — | | | | — | | | | — | | | | — | | | | (588 | ) | | | 32,598 | | | | 436 | | |
| | | $ | 222,456 | | | $ | 2,700 | | | $ | (6,114 | ) | | $ | (878 | ) | | $ | — | | | $ | (8,057 | ) | | $ | 210,107 | | | $ | 2,877 | | |
17
USAA Mutual Funds Trust | | Supplemental Information
November 30, 2022 | |
(Unaudited)
Proxy Voting and Portfolio Holdings Information
Proxy Voting:
Information regarding the policies and procedures the Fund uses to determine how to vote proxies relating to portfolio securities is available without charge, upon request, by calling (800) 235-8396. The information is also included in the Fund's Statement of Additional Information, which is available on the SEC's website at www.sec.gov.
Information relating to how the Fund voted proxies relating to portfolio securities held during the most recent 12 months ended June 30 is available on the SEC's website at www.sec.gov.
Availability of Schedules of Portfolio Investments:
The Trust files a complete list of Schedules of Portfolio Investments with the SEC for the first and third quarter of each fiscal year on Form N-PORT. Form N-PORT is available on the SEC's website at www.sec.gov.
Expense Example
As a shareholder of the Fund, you may incur two types of costs: (1) transaction costs and (2) ongoing costs, including management fees and other Fund expenses. These examples are intended to help you understand your ongoing costs (in dollars) of investing in the Fund and to compare these costs with the ongoing costs of investing in other mutual funds.
These examples are based on an investment of $1,000 invested at the beginning of the period and held for the entire period from June 1, 2022, through November 30, 2022.
The Actual Expense figures in the table below provide information about actual account values and actual expenses. You may use the information below, together with the amount you invested, to estimate the expenses that you paid over the period. Simply divide your account value by $1,000 (for example, an $8,600 account value divided by $1,000 = 8.6), then multiply the result by the number in the table under the heading entitled "Actual Expenses Paid During Period" to estimate the expenses you paid on your account during this period.
The Hypothetical Expense figures in the table below provide information about hypothetical account values and hypothetical expenses based on the Fund's actual expense ratio and an assumed rate of return of 5% per year before expenses, which is not the Fund's actual return. The hypothetical account values and expenses may not be used to estimate the actual ending account balance or expenses you paid for the period. You may use this information to compare this 5% hypothetical example with the 5% hypothetical examples that appear in shareholder reports of other funds.
Please note the expenses shown in the table below are meant to highlight your ongoing costs only and do not reflect any transactional costs. Therefore, the hypothetical expenses in the table are useful in comparing ongoing costs only and will not help you determine the relative total costs of owning different funds. In addition, if these transactional costs were included, your costs would have been higher.
Beginning
Account Value
6/1/22 | | Actual
Ending
Account Value
11/30/22 | | Hypothetical
Ending
Account Value
11/30/22 | | Actual
Expenses Paid
During Period
6/1/22-11/30/22* | | Hypothetical
Expenses Paid
During Period
6/1/22-11/30/22* | | Annualized
Expense Ratio
During Period
6/1/22-11/30/22 | |
| $ | 1,000.00 | | | $ | 972.90 | | | $ | 1,024.57 | | | $ | 0.49 | | | $ | 0.51 | | | | 0.10 | % | |
* Expenses are equal to the average account value multiplied by the Fund's annualized expense ratio multiplied by 183/365 (the number of days in the most recent fiscal half-year divided by the number of days in the fiscal year).
18
Privacy Policy
Protecting the Privacy of Information
The Trust respects your right to privacy. We also know that you expect us to conduct and process your business in an accurate and efficient manner. To do so, we must collect and maintain certain personal information about you. This is the information we collect from you on applications or other forms, and from the transactions you make with us or third parties. It may include your name, address, social security number, account transactions and balances, and information about investment goals and risk tolerance.
We do not disclose any information about you or about former customers to anyone except as permitted or required by law. Specifically, we may disclose the information we collect to companies that perform services on our behalf, such as the transfer agent that processes shareholder accounts and printers and mailers that assist us in the distribution of investor materials. We may also disclose this information to companies that perform marketing services on our behalf. This allows us to continue to offer you Victory investment products and services that meet your investing needs, and to effect transactions that you request or authorize. These companies will use this information only in connection with the services for which we hired them. They are not permitted to use or share this information for any other purpose.
To protect your personal information internally, we permit access only by authorized employees and maintain physical, electronic, and procedural safeguards to guard your personal information.*
* You may have received communications regarding information about privacy policies from other financial institutions which gave you the opportunity to "opt-out" of certain information sharing with companies which are not affiliated with that financial institution. The Trust does not share information with other companies for purposes of marketing solicitations for products other than the Trust. Therefore, the Trust does not provide opt-out options to their shareholders.
P.O. Box 182593
Columbus, Ohio 43218-2593

Visit our website at: | | Call | |
www.vcm.com | | (800) 235-8396 | |

NOVEMBER 30, 2022
Semi Annual Report
USAA Cornerstone Equity Fund
Victory Capital means Victory Capital Management Inc., the investment adviser of the USAA Mutual Funds. USAA Mutual Funds are distributed by Victory Capital Services, Inc., member FINRA, an affiliate of Victory Capital. Victory Capital and its affiliates are not affiliated with United Services Automobile Association or its affiliates. USAA and the USAA logos are registered trademarks and the USAA Mutual Funds and USAA Investments logos are trademarks of United Services Automobile Association and are being used by Victory Capital and its affiliates under license.
www.vcm.com
News, Information And Education 24 Hours A Day, 7 Days A Week
The Victory Capital website gives fund shareholders, prospective shareholders, and investment professionals a convenient way to access fund information, get guidance, and track fund performance anywhere they can access the Internet. The site includes:
• Detailed performance records
• Daily share prices
• The latest fund news
• Investment resources to help you become a better investor
• A section dedicated to investment professionals
Whether you're a potential investor searching for the fund that matches your investment philosophy, a seasoned investor interested in planning tools, or an investment professional, www.vcm.com has what you seek. Visit us anytime. We're always open.
TABLE OF CONTENTS
Investment Objective & Portfolio Holdings | | | 2 | | |
Schedule of Portfolio Investments | | | 3 | | |
Financial Statements | |
Statement of Assets and Liabilities | | | 4 | | |
Statement of Operations | | | 5 | | |
Statements of Changes in Net Assets | | | 6 | | |
Financial Highlights | | | 8 | | |
Notes to Financial Statements | | | 10 | | |
Supplemental Information | | | 18 | | |
Proxy Voting and Portfolio Holdings Information | | | 18 | | |
Expense Example | | | 18 | | |
Privacy Policy (inside back cover) | | | |
This report is for the information of the shareholders and others who have received a copy of the currently effective prospectus of the Fund, managed by Victory Capital Management Inc. It may be used as sales literature only when preceded or accompanied by a current prospectus, which provides further details about the Fund.
IRA DISTRIBUTION WITHHOLDING DISCLOSURE
We generally must withhold federal income tax at a rate of 10% of the taxable portion of your distribution and, if you live in a state that requires state income tax withholding, at your state's tax rate. However, you may elect not to have withholding apply or to have income tax withheld at a higher rate. Any withholding election that you make will apply to any subsequent distribution unless and until you change or revoke the election. If you wish to make a withholding election, or change or revoke a prior withholding election, call (800) 235-8396, and form W-4P (OMB No. 1545-0074 withholding certificate for pension or annuity payments) will be electronically sent.
If you do not have a withholding election in place by the date of a distribution, federal income tax will be withheld from the taxable portion of your distribution at a rate of 10%. If you must pay estimated taxes, you may be subject to estimated tax penalties if your estimated tax payments are not sufficient and sufficient tax is not withheld from your distribution.
For more specific information, please consult your tax adviser.
• NOT FDIC INSURED • NO BANK GUARANTEE • MAY LOSE VALUE
1
USAA Mutual Funds Trust
USAA Cornerstone Equity Fund | | November 30, 2022 | |
(Unaudited)
Investment Objective and Portfolio Holdings:
The Fund seeks capital appreciation over the long term.
Top 10 Holdings*:
November 30, 2022
(% of Net Assets)
USAA 500 Index Fund Reward Shares | | | 20.8 | % | |
USAA International Fund Institutional Shares | | | 15.2 | % | |
VictoryShares US Value Momentum ETF | | | 13.4 | % | |
VictoryShares International Value Momentum ETF | | | 11.5 | % | |
USAA Target Managed Allocation Fund | | | 6.6 | % | |
VictoryShares Emerging Markets Value Momentum ETF | | | 5.3 | % | |
USAA Emerging Markets Fund Institutional Shares | | | 4.8 | % | |
USAA Income Stock Fund Institutional Shares | | | 4.2 | % | |
VictoryShares Westend US Sector ETF | | | 4.0 | % | |
USAA Nasdaq-100 Index Fund R6 Shares | | | 4.0 | % | |
Asset Allocation*:
November 30, 2022
(% of Net Assets)
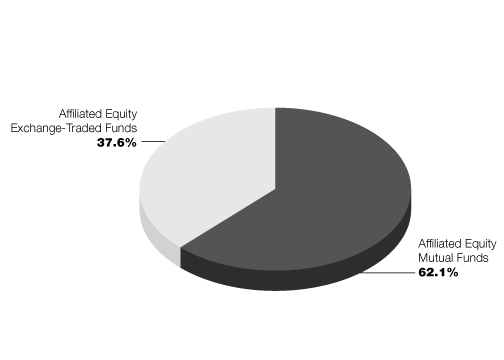
* Does not include futures contracts, money market instruments, and short-term investments purchased with cash collateral from securities loaned.
Percentages are of the net assets of the Fund and may not equal 100%.
Refer to the Schedule of Portfolio Investments for a complete list of securities.
2
USAA Mutual Funds Trust
USAA Cornerstone Equity Fund | | Schedule of Portfolio Investments
November 30, 2022 | |
(Amounts in Thousands, Except for Shares) (Unaudited)
Security Description | | Shares | | Value | |
Affiliated Exchange-Traded Funds (37.6%) | |
VictoryShares Emerging Markets Value Momentum ETF | | | 266,858 | | | $ | 10,757 | | |
VictoryShares International Value Momentum ETF | | | 555,112 | | | | 23,190 | | |
VictoryShares US Small Mid Cap Value Momentum ETF (a) | | | 100,558 | | | | 6,740 | | |
VictoryShares US Value Momentum ETF | | | 405,692 | | | | 26,926 | | |
VictoryShares Westend US Sector ETF (a) | | | 285,542 | | | | 8,026 | | |
Total Affiliated Exchange-Traded Funds (Cost $73,224) | | | 75,639 | | |
Affiliated Mutual Funds (62.1%) | |
USAA 500 Index Fund Reward Shares | | | 790,405 | | | | 41,781 | | |
USAA Emerging Markets Fund Institutional Shares | | | 527,327 | | | | 9,592 | | |
USAA Growth Fund Institutional Shares | | | 117,837 | | | | 3,109 | | |
USAA Income Stock Fund Institutional Shares | | | 429,614 | | | | 8,425 | | |
USAA International Fund Institutional Shares | | | 1,301,236 | | | | 30,657 | | |
USAA Nasdaq-100 Index Fund R6 Shares | | | 249,186 | | | | 7,971 | | |
USAA Precious Metals and Minerals Fund Institutional Shares | | | 44,305 | | | | 733 | | |
USAA Small Cap Stock Fund Institutional Shares | | | 416,784 | | | | 5,435 | | |
USAA Target Managed Allocation Fund | | | 1,425,755 | | | | 13,188 | | |
USAA Value Fund Institutional Shares | | | 224,889 | | | | 4,100 | | |
Total Affiliated Mutual Funds (Cost $110,681) | | | 124,991 | | |
Collateral for Securities Loaned (0.4%)^ | |
Goldman Sachs Financial Square Government Fund, Institutional Shares, 3.73% (b) | | | 190,813 | | | | 191 | | |
HSBC U.S. Government Money Market Fund, I Shares, 3.75% (b) | | | 190,813 | | | | 190 | | |
Invesco Government & Agency Portfolio, Institutional Shares, 3.74% (b) | | | 190,813 | | | | 191 | | |
Morgan Stanley Institutional Liquidity Government Portfolio, Institutional
Shares, 3.62% (b) | | | 190,813 | | | | 191 | | |
Total Collateral for Securities Loaned (Cost $763) | | | 763 | | |
Total Investments (Cost $184,668) — 100.1% | | | 201,393 | | |
Liabilities in excess of other assets — (0.1)% | | | (206 | ) | |
NET ASSETS — 100.00% | | $ | 201,187 | | |
At November 30, 2022, the Fund's investments in foreign securities were 36.9% of net assets.
^ Purchased with cash collateral from securities on loan.
(a) All or a portion of this security is on loan.
(b) Rate disclosed is the daily yield on November 30, 2022.
ETF — Exchange-Traded Fund
See notes to financial statements.
3
USAA Mutual Funds Trust | | Statement of Assets and Liabilities
November 30, 2022 | |
(Amounts in Thousands, Except Per Share Amounts) (Unaudited)
| | | USAA Cornerstone
Equity Fund | |
Assets: | |
Affiliated investments, at value (Cost $183,905) | | $ | 200,630 | (a) | |
Unaffiliated investments, at value (Cost $763) | | | 763 | | |
Cash | | | 572 | | |
Receivables: | |
Interest | | | 2 | | |
Capital shares issued | | | 103 | | |
From Adviser | | | 10 | | |
Prepaid expenses | | | 8 | | |
Total Assets | | | 202,088 | | |
Liabilities: | |
Payables: | |
Collateral received on loaned securities | | | 763 | | |
Capital shares redeemed | | | 92 | | |
Accrued expenses and other payables: | |
Custodian fees | | | 2 | | |
Compliance fees | | | — | (b) | |
Trustees' fees | | | 1 | | |
Other accrued expenses | | | 43 | | |
Total Liabilities | | | 901 | | |
Net Assets: | |
Capital | | | 174,056 | | |
Total accumulated earnings/(loss) | | | 27,131 | | |
Net Assets | | $ | 201,187 | | |
Shares (unlimited number of shares authorized with no par value): | | | 13,182 | | |
Net asset value, offering and redemption price per share: (c) | | $ | 15.26 | | |
(a) Includes $758 thousand of securities on loan.
(b) Rounds to less than $1 thousand.
(c) Per share amount may not recalculate due to rounding of net assets and/or shares outstanding.
See notes to financial statements.
4
USAA Mutual Funds Trust | | Statement of Operations
For the Six Months Ended November 30, 2022 | |
(Amounts in Thousands) (Unaudited)
| | | USAA Cornerstone
Equity Fund | |
Investment Income: | |
Income distributions from affiliated funds | | $ | 1,327 | | |
Interest from unaffiliated investments | | | 2 | | |
Securities lending (net of fees) | | | 18 | | |
Total Income | | | 1,347 | | |
Expenses: | |
Sub-Administration fees | | | 9 | | |
Custodian fees | | | 3 | | |
Trustees' fees | | | 24 | | |
Compliance fees | | | 1 | | |
Printing fees | | | 22 | | |
Legal and audit fees | | | 32 | | |
State registration and filing fees | | | 15 | | |
Other expenses | | | 13 | | |
Total Expenses | | | 119 | | |
Expenses waived/reimbursed by Adviser | | | (23 | ) | |
Net Expenses | | | 96 | | |
Net Investment Income (Loss) | | | 1,251 | | |
Realized/Unrealized Gains (Losses) from Investments: | |
Net realized gains (losses) from affiliated funds | | | 22 | | |
Net change in unrealized appreciation/depreciation on affiliated funds | | | (5,760 | ) | |
Net realized/unrealized gains (losses) on investments | | | (5,738 | ) | |
Change in net assets resulting from operations | | $ | (4,487 | ) | |
See notes to financial statements.
5
USAA Mutual Funds Trust | | Statements of Changes in Net Assets | |
(Amounts in Thousands)
| | | USAA Cornerstone Equity Fund | |
| | | Six Months
Ended
November 30,
2022
(Unaudited) | | Year
Ended
May 31,
2022 | |
From Investments: | |
Operations: | |
Net Investment Income (Loss) | | $ | 1,251 | | | $ | 6,930 | | |
Net realized gains (losses) | | | 22 | | | | 10,451 | | |
Net change in unrealized appreciation/depreciation | | | (5,760 | ) | | | (31,549 | ) | |
Change in net assets resulting from operations | | | (4,487 | ) | | | (14,168 | ) | |
Change in net assets resulting from distributions to shareholders | | | — | | | | (10,625 | ) | |
Change in net assets resulting from capital transactions | | | (2,235 | ) | | | 466 | | |
Change in net assets | | | (6,722 | ) | | | (24,327 | ) | |
Net Assets: | |
Beginning of period | | | 207,909 | | | | 232,236 | | |
End of period | | $ | 201,187 | | | $ | 207,909 | | |
Capital Transactions: | |
Proceeds from shares issued | | $ | 8,639 | | | $ | 27,268 | | |
Distributions reinvested | | | — | | | | 10,602 | | |
Cost of shares redeemed | | | (10,874 | ) | | | (37,404 | ) | |
Change in net assets resulting from capital transactions | | $ | (2,235 | ) | | $ | 466 | | |
Share Transactions: | |
Issued | | | 599 | | | | 1,585 | | |
Reinvested | | | — | | | | 608 | | |
Redeemed | | | (754 | ) | | | (2,174 | ) | |
Change in Shares | | | (155 | ) | | | 19 | | |
See notes to financial statements.
6
This page is intentionally left blank.
7
USAA Mutual Funds Trust | | Financial Highlights | |
For a Share Outstanding Throughout Each Period
| | | | | Investment Activities | | Distributions to
Shareholders From | |
| | | Net Asset
Value,
Beginning of
Period | | Net
Investment
Income (Loss) | | Net Realized
and Unrealized
Gains (Losses) | | Total from
Investment
Activities | | Net
Investment
Income | | Net Realized
Gains from
Investments | |
USAA Cornerstone Equity Fund | | | |
Six Months Ended
November 30, 2022
(Unaudited) | | $ | 15.59 | | | | 0.09 | (f) | | | (0.42 | ) | | | (0.33 | ) | | | — | | | | — | | |
Year Ended May 31:
2022 | | $ | 17.44 | | | | 0.52 | (f) | | | (1.56 | ) | | | (1.04 | ) | | | (0.59 | ) | | | (0.22 | ) | |
2021 | | $ | 13.28 | | | | 0.27 | (f) | | | 5.16 | | | | 5.43 | | | | (0.20 | ) | | | (1.07 | ) | |
2020 | | $ | 13.90 | | | | 0.34 | (f) | | | (0.24 | ) | | | 0.10 | | | | (0.32 | ) | | | (0.40 | ) | |
2019 | | $ | 15.49 | | | | 0.26 | | | | (0.99 | ) | | | (0.73 | ) | | | (0.25 | ) | | | (0.61 | ) | |
2018 | | $ | 14.31 | | | | 0.22 | | | | 1.26 | | | | 1.48 | | | | (0.22 | ) | | | (0.08 | ) | |
(a) Not annualized for periods less than one year.
(b) Assumes reinvestment of all net investment income and realized capital gain distributions, if any, during the period. Includes adjustments in accordance with U.S. Generally Accepted Accounting Principles and could differ from the Lipper reported return.
(c) Annualized for periods less than one year.
(d) The net expense ratio may not correlate to the applicable expense limits in place during the period since the current contractual expense limitation is applied for a period beginning July 1, 2019, and in effect through September 30, 2023, instead of coinciding with the Fund's fiscal year end. Details of the current contractual expense limitation in effect can be found in Note 4 of the accompanying Notes to Financial Statements.
(e) Does not include acquired fund fees and expenses, if any.
(f) Per share net investment income (loss) has been calculated using the average daily shares method.
(g) Reflects increased usage of quantitative investment strategies.
(h) Reflects an increase in trading activity due to asset allocation shifts.
See notes to financial statements.
8
USAA Mutual Funds Trust | | Financial Highlights — continued | |
For a Share Outstanding Throughout Each Period
| | | | | Ratios to Average Net Assets | | Supplemental Data | |
| | | Total
Distributions | | Net Asset
Value,
End of
Period | | Total
Return(a)(b) | | Net
Expenses(c)(d)(e) | | Net
Investment
Income
(Loss)(c) | | Gross
Expenses(c)(e) | | Net Assets,
End of
Period
(000's) | | Portfolio
Turnover(a) | |
USAA Cornerstone Equity Fund | |
Six Months Ended
November 30, 2022
(Unaudited) | | | — | | | $ | 15.26 | | | | (2.12 | )% | | | 0.10 | % | | | 1.30 | % | | | 0.12 | % | | $ | 201,187 | | | | 5 | % | |
Year Ended May 31:
2022 | | | (0.81 | ) | | $ | 15.59 | | | | (6.41 | )% | | | 0.09 | % | | | 3.04 | % | | | 0.09 | % | | $ | 207,909 | | | | 12 | % | |
2021 | | | (1.27 | ) | | $ | 17.44 | | | | 42.26 | % | | | 0.10 | % | | | 1.74 | % | | | 0.11 | % | | $ | 232,236 | | | | 5 | % | |
2020 | | | (0.72 | ) | | $ | 13.28 | | | | 0.14 | % | | | 0.10 | % | | | 2.38 | % | | | 0.10 | % | | $ | 191,013 | | | | 6 | % | |
2019 | | | (0.86 | ) | | $ | 13.90 | | | | (4.35 | )% | | | 0.10 | % | | | 1.79 | % | | | 0.13 | % | | $ | 202,288 | | | | 11 | %(g) | |
2018 | | | (0.30 | ) | | $ | 15.49 | | | | 10.32 | % | | | 0.10 | % | | | 1.46 | % | | | 0.13 | % | | $ | 200,186 | | | | 38 | %(h) | |
See notes to financial statements.
9
USAA Mutual Funds Trust | | Notes to Financial Statements
November 30, 2022 | |
(Unaudited)
1. Organization:
USAA Mutual Funds Trust (the "Trust") is organized as a Delaware statutory trust and is registered under the Investment Company Act of 1940, as amended (the "1940 Act"), as an open-end investment company. The Trust is comprised of 45 funds and is authorized to issue an unlimited number of shares, which are units of beneficial interest with no par value.
The accompanying financial statements are those of the USAA Cornerstone Equity Fund (the "Fund"). The Fund is classified as diversified under the 1940 Act. The Fund is a "fund of funds" in that it invests in a selection of affiliated mutual funds and exchange-traded funds ("ETFs") managed by the Fund's Adviser, Victory Capital Management Inc. ("VCM" or the "Adviser"), an affiliate of the Fund. The Adviser is an indirect wholly owned subsidiary of Victory Capital Holdings, Inc., a publicly traded Delaware corporation, and a wholly owned direct subsidiary of Victory Capital Operating, LLC.
The Fund may rely on various exemptions contained in the 1940 Act and in exemptive rules or orders thereunder issued by the Securities and Exchange Commission ("SEC") that permit funds, subject to certain conditions, to invest in one or more ETFs and certain other types of investment companies in amounts that exceed limits set forth in the 1940 Act that would otherwise be applicable.
Under the Trust's organizational documents, its officers and trustees are indemnified against certain liabilities arising out of the performance of their duties to the Fund. In addition, in the normal course of business, the Fund enters into contracts with its vendors and others that provide for general indemnifications. The Fund's maximum exposure under these arrangements is unknown, as this would involve future claims that may be made against the Fund. However, based on experience, the Fund expects that risk of loss to be remote.
2. Significant Accounting Policies:
The following is a summary of significant accounting policies followed by the Trust in the preparation of its financial statements. The policies are in conformity with U.S. Generally Accepted Accounting Principles ("GAAP"). The preparation of financial statements in accordance with GAAP requires management to make estimates and assumptions that affect the reported amounts of assets and liabilities and disclosure of contingent assets and liabilities at the date of the financial statements and the reported amounts of income and expenses for the period. Actual results could differ from those estimates. The Fund follows the specialized accounting and reporting requirements under GAAP that are applicable to investment companies under Accounting Standards Codification Topic 946.
Investment Valuation:
The Fund records investments at fair value. Fair value is defined as the price that would be received to sell an asset or paid to transfer a liability in an orderly transaction between market participants at the measurement date.
The valuation techniques described below maximize the use of observable inputs and minimize the use of unobservable inputs in determining fair value. The inputs used for valuing the Fund's investments are summarized in the three broad levels listed below:
• Level 1 — quoted prices (unadjusted) in active markets for identical securities
• Level 2 — other significant observable inputs (including quoted prices for similar securities, interest rates, or credit spreads, applicable to those securities, etc.)
• Level 3 — significant unobservable inputs (including the Adviser's assumptions in determining the fair value of investments)
Changes in valuation techniques may result in transfers in or out of an assigned level within the disclosure hierarchy. The inputs or methodologies used for valuation techniques are not necessarily an indication of the risks associated with entering into those investments.
The Adviser, acting as the valuation designee has established the Pricing and Liquidity Committee (the "Committee"), and subject to the Trust's Board of Trustees' (the "Board") oversight, the Committee administers and oversees the Fund's valuation policies and procedures, which are approved by the Board.
10
USAA Mutual Funds Trust | | Notes to Financial Statements — continued
November 30, 2022 | |
(Unaudited)
Portfolio securities listed or traded on securities exchanges, including ETFs, are valued at the closing price on the exchange or system where the security is principally traded, if available, or at the Nasdaq Official Closing Price. If there have been no sales for that day on the exchange or system, then a security is valued at the last available bid quotation on the exchange or system where the security is principally traded. In each of these situations, valuations are typically categorized as Level 1 in the fair value hierarchy.
Investments in the underlying affiliated Funds and other open-end investment companies, other than ETFs, are valued at their net asset value ("NAV") at the end of each business day. These valuations are typically categorized as Level 1 in the fair value hierarchy.
The underlying affiliated Funds have specific valuation procedures. In the event that price quotations or valuations are not readily available, are not reflective of market value, or a significant event has been recognized in relation to a security or class of securities, the securities are valued in good faith by the Committee in accordance with valuation procedures approved by the Board. The effect of fair value pricing is that securities may not be priced on the basis of quotations from the primary market in which they are traded and the actual price realized from the sale of a security may differ materially from the fair value price. Valuing these securities at fair value is intended to cause the Fund's NAV to be more reliable than it otherwise would be.
A summary of the valuations as of November 30, 2022, based upon the three levels defined above, is included in the table below while the breakdown, by category, of investments is disclosed on the Schedule of Portfolio Investments (amounts in thousands):
| | | Level 1 | | Level 2 | | Level 3 | | Total | |
Affiliated Exchange-Traded Funds | | $ | 75,639 | | | $ | — | | | $ | — | | | $ | 75,639 | | |
Affiliated Mutual Funds | | | 124,991 | | | | — | | | | — | | | | 124,991 | | |
Collateral for Securities Loaned | | | 763 | | | | — | | | | — | | | | 763 | | |
Total | | $ | 201,393 | | | $ | — | | | $ | — | | | $ | 201,393 | | |
For the six months ended November 30, 2022, there were no transfers into/out of Level 3.
Investment Companies:
Exchange-Traded Funds:
The Fund may invest in ETFs, the shares of which are bought and sold on a securities exchange. An ETF trades like common stock and represents a fixed portfolio of securities often designed to track the performance and dividend yield of a particular domestic or foreign market index. The Fund may purchase shares of an ETF to temporarily gain exposure to a portion of the U.S. or a foreign market while awaiting purchase of underlying securities. The risks of owning an ETF generally reflect the risks of owning the underlying securities the ETF is designed to track, although the lack of liquidity of an ETF could result in it being more volatile. Additionally, ETFs have fees and expenses that reduce their value.
Open-End Funds:
The Fund may invest in portfolios of open-end investment companies. These investment companies value securities in their portfolios for which market quotations are readily available at their market values (generally the last reported sale price) and all other securities and assets at their fair value by the methods established by the board of directors of the underlying funds.
Investment Transactions and Related Income:
Changes in holdings of investments are accounted for no later than one business day following the trade date. For financial reporting purposes, however, investment transactions are accounted for on trade date or the last business day of the reporting period. Interest income is determined on the basis of coupon interest accrued using the effective interest method which adjusts, where applicable, the
11
USAA Mutual Funds Trust | | Notes to Financial Statements — continued
November 30, 2022 | |
(Unaudited)
amortization of premiums or accretion of discounts. Dividend income is recorded on the ex-dividend date. Gains or losses realized on sales of securities are recorded on the identified cost basis.
Securities Lending:
The Fund, through a Securities Lending Agreement with Citibank, N.A. ("Citibank"), may lend its securities to qualified financial institutions, such as certain broker-dealers and banks, to earn additional income, net of income retained by Citibank. Borrowers are required to initially secure their loans for collateral in the amount of at least 102% of the value of U.S. securities loaned or at least 105% of the value of non-U.S. securities loaned, marked-to-market daily. Any collateral shortfalls associated with increases in the valuation of the securities loaned are generally cured the next business day. The collateral can be received in the form of cash collateral and/or non-cash collateral. Non-cash collateral can include U.S. Government Securities and other securities as permitted by Securities and Exchange Commission ("SEC") guidelines. The cash collateral is invested in short-term instruments or cash equivalents, primarily open-end investment companies, as noted on the Fund's Schedule of Portfolio Investments. The Fund effectively does not have control of the non-cash collateral and therefore it is not disclosed on the Fund's Schedule of Portfolio Investments. Collateral requirements are determined daily based on the value of the Fund's securities on loan as of the end of the prior business day. During the time portfolio securities are on loan, the borrower will pay the Fund any dividends or interest paid on such securities plus any fee negotiated between the parties to the lending agreement. The Fund also earns a return from the collateral. The Fund pays Citibank various fees in connection with the investment of cash collateral and fees based on the investment income received from securities lending activities. Securities lending income (net of these fees) is disclosed on the Statement of Operations. Loans are terminable upon demand and the borrower must return the loaned securities within the lesser of one standard settlement period or five business days. Although risk is mitigated by the collateral, the Fund could experience a delay in recovering its securities and possible loss of income or value if the borrower fails to return them. In addition, there is a risk that the value of the short-term investments will be less than the amount of cash collateral required to be returned to the borrower.
The Fund's agreement with Citibank does not include master netting provisions. Non-cash collateral received by the Fund may not be sold or repledged, except to satisfy borrower default.
The following table (amounts in thousands) is a summary of the Fund's securities lending transactions as of November 30, 2022.
Value of
Securities on Loan | | Non-Cash
Collateral | | Cash
Collateral | |
| $ | 758 | | | $ | — | | | $ | 763 | | |
Federal Income Taxes:
The Fund intends to continue to qualify as a regulated investment company by complying with the provisions available to certain investment companies, as defined in applicable sections of the Internal Revenue Code, and to make distributions of net investment income and net realized gains sufficient to relieve it from all, or substantially all, federal income taxes. Accordingly, no provision for federal income taxes is required in the financial statements. The Fund has a tax year end of May 31.
For the six months ended November 30, 2022, the Fund did not incur any income tax, interest, or penalties, and has recorded no liability for net unrecognized tax benefits relating to uncertain tax positions.
Management of the Fund has reviewed tax positions taken in tax years that remain subject to examination by all major tax jurisdictions, including federal (i.e., the last four tax years, which includes the current fiscal tax year end). Management believes that there is no tax liability resulting from unrecognized tax benefits related to uncertain tax positions taken.
12
USAA Mutual Funds Trust | | Notes to Financial Statements — continued
November 30, 2022 | |
(Unaudited)
Allocations:
Expenses directly attributable to the Fund are charged to the Fund, while expenses that are attributable to more than one fund in the Trust, or jointly with an affiliated trust, are allocated among the respective funds in the Trust and/or an affiliated trust based upon net assets or another appropriate basis.
3. Purchases and Sales:
Purchases and sales of securities (excluding securities maturing less than one year from acquisition) for the six months ended November 30, 2022, were as follows for the Fund (amounts in thousands):
Excluding
U.S. Government Securities | |
Purchases | | Sales | |
$ | 10,171 | | | $ | 11,040 | | |
4. Fees and Transactions with Affiliates and Related Parties:
Investment Advisory Fees:
Investment advisory services are provided to the Fund by the Adviser, which is a New York corporation registered as an investment adviser with the SEC. The Adviser does not receive any fees from the Fund for these services.
The Trust relies on an exemptive order granted to VCM and its affiliated funds by the SEC in March 2019, permitting the use of a "manager-of-managers" structure for certain funds. Under a manager-of-managers structure, the investment adviser may select (with approval of the Board and without shareholder approval) one or more subadvisers to manage the day-to-day investment of a fund's assets. For the six months ended November 30, 2022, the Fund had no subadvisers.
Administration and Servicing Fees:
VCM serves as the Fund's administrator and fund accountant. Under the Fund Administration, Servicing and Accounting Agreement, VCM does not receive any fees from the Fund for these services.
Citi Fund Services Ohio, Inc. ("Citi"), an affiliate of Citibank, acts as sub-administrator and sub-fund accountant to the Fund pursuant to a Sub-Administration and Sub-Fund Accounting Services Agreement between VCM and Citi. VCM pays Citi a fee for providing these services. The Fund reimburses VCM and Citi for out-of-pocket expenses incurred in providing these services and certain other expenses specifically allocated to the Fund. Amounts incurred for the six months ended November 30, 2022, are reflected on the Statement of Operations as Sub-Administration fees.
The Fund (as part of the Trust) has entered into an agreement with the Adviser to provide compliance services, pursuant to which the Adviser furnishes its compliance personnel, including the services of the Chief Compliance Officer ("CCO"), and other resources reasonably necessary to provide the Trust with compliance oversight services related to the design, administration, and oversight of a compliance program for the Trust in accordance with Rule 38a-1 under the 1940 Act. The CCO is an employee of the Adviser, which pays the compensation of the CCO and support staff. The funds in the Trust, Victory Variable Insurance Funds, Victory Portfolios, and Victory Portfolios II (collectively, the "Victory Funds Complex") in the aggregate, compensate the Adviser for these services. Amounts incurred for the six months ended November 30, 2022, are reflected on the Statement of Operations as Compliance fees.
Transfer Agency Fees:
Victory Capital Transfer Agency, Inc. ("VCTA"), an affiliate of the Adviser, provides transfer agency services to the Fund. VCTA does not receive any fees from the Fund for these services.
FIS Investor Services LLC serves as sub-transfer agent and dividend disbursing agent for the Fund pursuant to a Sub-Transfer Agent Agreement between VCTA and FIS Investor Services LLC. VCTA provides FIS Investor Services LLC a fee for providing these services.
13
USAA Mutual Funds Trust | | Notes to Financial Statements — continued
November 30, 2022 | |
(Unaudited)
Distributor/Underwriting Services:
Victory Capital Services, Inc. (the "Distributor"), an affiliate of the Adviser, serves as Distributor for the continuous offering of the shares of the Fund pursuant to a Distribution Agreement between the Distributor and the Trust and receives no fee or other compensation for these services.
Other Fees:
Citibank serves as the Fund's custodian. The Fund pays Citibank a fee for providing these services. Amounts incurred for the six months ended November 30, 2022, are reflected on the Statement of Operations as Custodian fees.
K&L Gates LLP provides legal services to the Trust.
The Adviser has entered into an expense limitation agreement with the Fund until at least September 30, 2023. Under the terms of the agreement, the Adviser has agreed to waive fees or reimburse certain expenses to the extent that ordinary operating expenses incurred in any fiscal year exceed the expense limit for the Fund. Such excess amounts will be the liability of the Adviser. Acquired fund fees and expenses, interest, taxes, brokerage commissions, other expenditures, which are capitalized in accordance with GAAP, and other extraordinary expenses not incurred in the ordinary course of the Fund's business are excluded from the expense limit. As of November 30, 2022, the expense limit (excluding voluntary waivers) was 0.10%.
Under the terms of the expense limitation agreement, as amended June 29, 2022, the Fund has agreed to repay fees and expenses that were waived or reimbursed by the Adviser for a period of up to three years (thirty-six (36) months) after the waiver or reimbursement took place, subject to the lesser of any operating expense limits in effect at the time of: (a) the original waiver or expense reimbursement; or (b) the recoupment, after giving effect to the recoupment amount.
As of November 30, 2022, the following amounts are available to be repaid to the Adviser (amounts in thousands). The Fund has not recorded any amounts available to be repaid as a liability due to an assessment that such repayments are not probable at November 30, 2022.
Expires
2026 | | Total | |
| $ | 23 | | | $ | 23 | | |
The Adviser may voluntarily waive or reimburse additional fees to assist the Fund in maintaining competitive expense ratios. Voluntary waivers and reimbursements applicable to the Fund are not available to be recouped at a future time. There were no voluntary waivers or reimbursements for the six months ended November 30, 2022.
Certain officers and/or interested trustees of the Fund are also officers and/or employees of the Adviser, administrator, fund accountant, sub-administrator, sub-fund accountant, custodian, and Distributor.
5. Risks:
The Fund may be subject to other risks in addition to these identified risks.
Affiliated Funds Risk — The risks of the Fund directly correspond to the risks of the underlying affiliated funds in which the Fund invests. By investing in the underlying affiliated funds, the Fund has exposure to the risk of many different areas of the market. The degree to which the risks described below apply to the Fund varies according to the Fund's asset allocation. For instance, the more the Fund is allocated to stock funds, the greater the risk associated with equity securities. The Fund also is subject to asset allocation risk (i.e., the risk that allocations will not produce the intended results) and to management risk (i.e., the risk that the selection of underlying affiliated funds will not produce the intended results).
Conflict of Interest Risk — In managing a Fund that invests in underlying affiliated funds, the Adviser may have conflicts of interest in allocating the Fund's assets among the various underlying affiliated funds. This is because the fees payable by some of the underlying affiliated funds to the Adviser and/or its affiliates are higher than the fees payable by other underlying affiliated funds, and because the Adviser also manages and administers the underlying affiliated funds.
14
USAA Mutual Funds Trust | | Notes to Financial Statements — continued
November 30, 2022 | |
(Unaudited)
Equity Risk — The Fund may invest in underlying affiliated funds that invest in equity securities. The value of the equity securities in which the Fund invests may decline in response to developments affecting individual companies and/or general market, economic and political conditions and other factors. A company's earnings or dividends may not increase as expected due to poor management decisions, competitive pressures, breakthroughs in technology, reliance on suppliers, labor problems or shortages, corporate restructurings, fraudulent disclosures, natural disasters, military confrontations, war, terrorism, public health crises, or other events, conditions, and factors. Price changes may be temporary or may last for extended periods.
ETF Risk — The Fund may invest in shares of ETFs, which generally are registered investment companies that hold a portfolio of common stocks or debt securities, the shares of which are traded on an exchange. ETFs incur their own management and other fees and expenses, such as trustees' fees operating expenses, registration fees, and marketing expenses, a proportionate share of which would be indirectly borne by the Fund. As a result, an investment by the Fund in an ETF will cause the Fund to indirectly bear the fees and expenses of the ETF and, in turn, performance may be lower than if the Fund were to invest directly in the securities underlying the ETF. In addition, the Fund will be indirectly exposed to all of the risk of securities held by the ETFs.
Market Risk — Overall market risks may affect the value of the Fund. Domestic and international factors such as political events, war, terrorism, trade disputes, inflation rates, interest rate levels and other fiscal and monetary policy changes, cybersecurity incidents, pandemics and other public health crises, sanctions against a particular foreign country, its nationals, businesses or industries and related geopolitical events, as well as environmental disasters such as earthquakes, fires, and floods, or other catastrophes, may add to instability in global economies and markets generally, and may lead to increased market volatility. Global economies and financial markets are highly interconnected, which increases the possibility that conditions in one country or region might adversely affect issuers in another country or region. The impact of these and other factors may be short-term or may last for extended periods.
6. Borrowing and Interfund Lending:
Line of Credit:
The Victory Funds Complex participates in a short-term demand note "Line of Credit" agreement with Citibank. The Line of Credit agreement with Citibank was renewed on June 27, 2022, with a termination date of June 26, 2023. Under the agreement with Citibank, the Victory Funds Complex may borrow up to $600 million, of which $300 million is committed and $300 million is uncommitted. $40 million of the Line of Credit is reserved for use by the Victory Floating Rate Fund, another series of the Victory Funds Complex, with Victory Floating Rate Fund paying the related commitment fees for that amount. The purpose of the Line of Credit is to meet temporary or emergency cash needs. For the six months ended November 30, 2022, Citibank received an annual commitment fee of 0.15% on $300 million for providing the Line of Credit. Each fund in the Victory Funds Complex paid a pro-rata portion of the commitment fees plus any interest on amounts borrowed. For the period from June 1, 2022, through June 27, 2022, interest was based on the one-month London Interbank Offered Rate ("LIBOR") plus one percent. Effective with the renewal, for the period June 28, 2022, through November 30, 2022, interest was based on the one-month Secured Overnight Financing Rate ("SOFR") plus 1.10 percent. Interest charged to the Fund during the period, if applicable, is reflected on the Statement of Operations under Line of credit fees.
The Fund had no borrowings under the Line of Credit agreement during the six months ended November 30, 2022.
Interfund Lending:
The Trust and the Adviser rely on an exemptive order granted by the SEC in March 2017 (the "Order"), permitting the establishment and operation of an Interfund Lending Facility (the "Facility"). The Facility allows the Fund to directly lend and borrow money to or from any other fund in the Victory Funds Complex that is permitted to participate in the Facility, relying upon the Order at rates beneficial to
15
USAA Mutual Funds Trust | | Notes to Financial Statements — continued
November 30, 2022 | |
(Unaudited)
both the borrowing and lending funds. Advances under the Facility are allowed for temporary or emergency purposes, including the meeting of redemption requests that otherwise might require the untimely disposition of securities, and are subject to each Fund's borrowing restrictions. The interfund loan rate is determined, as specified in the Order, by averaging the current repurchase agreement rate and the current bank loan rate. As a Borrower, interest charged to the Fund, if any, during the period, is reflected on the Statement of Operations under Interfund lending fees. As a Lender, interest earned by the Fund, if any, during the period, is reflected on the Statement of Operations under Interfund lending.
The Fund did not utilize or participate in the Facility during the six months ended November 30, 2022.
7. Federal Income Tax Information:
The Fund intends to distribute any net investment income annually. Distributable net realized gains, if any, are declared and paid at least annually.
The amounts of dividends from net investment income and distributions from net realized gains (collectively, distributions to shareholders) are determined in accordance with federal income tax regulations, which may differ from GAAP. To the extent these "book/tax" differences are permanent in nature (e.g., net operating loss and distribution reclassification), such amounts are reclassified within the components of net assets based on their federal tax-basis treatment; temporary differences (e.g., wash sales) do not require reclassification. To the extent dividends and distributions exceed net investment income and net realized gains for tax purposes, they are reported as distributions of capital. Net investment losses incurred by the Fund may be reclassified as an offset to capital on the accompanying Statement of Assets and Liabilities.
The tax character of current year distributions paid and the tax basis of the current components of accumulated earnings (loss) will be determined at the end of the current tax year.
At the tax year ended May 31, 2022, the Fund had no capital loss carryforwards for federal income tax purposes.
8. Affiliated Securities:
An affiliated security is a security in which the Fund has ownership of at least 5% of the security's outstanding voting shares, an investment company managed by VCM, or an issuer under common control with a Fund or VCM. The Fund does not invest in affiliated securities for the purpose of exercising management or control. These securities are noted as affiliated on the Fund's Schedule of Portfolio Investments. The financial statements of the underlying funds can be found in shareholder reports filed with the SEC by each such underlying fund semi-annually on Form N-CSR and are available for download from both the SEC's as well as each respective underlying fund's website. Transactions in affiliated securities during the six months ended November 30, 2022, were as follows (amounts in thousands):
| | | Fair
Value
5/31/2022 | | Purchases
at Cost | | Proceeds
from
Sales | | Realized
Gains
(Losses) | | Capital
Gain
Distribution | | Net
Change
in Unrealized
Appreciation/
Depreciation | | Fair Value
11/30/2022 | | Dividend
Income | |
USAA 500 Index Fund
Reward Shares | | $ | 42,772 | | | $ | 292 | | | $ | (823 | ) | | $ | (83 | ) | | $ | — | | | $ | (377 | ) | | $ | 41,781 | | | $ | 292 | | |
USAA NASDAQ-100
Index Fund R6 Shares | | | 7,275 | | | | 1,000 | | | | — | | | | — | | | | — | | | | (304 | ) | | | 7,971 | | | | — | | |
VictoryShares WestEnd
US Sector ETF | | | — | | | | 7,440 | | | | — | | | | — | | | | — | | | | 586 | | | | 8,026 | | | | — | | |
USAA Emerging Markets
Fund Institutional
Shares | | | 10,418 | | | | 518 | | | | (380 | ) | | | (148 | ) | | | — | | | | (816 | ) | | | 9,592 | | | | — | | |
16
USAA Mutual Funds Trust | | Notes to Financial Statements — continued
November 30, 2022 | |
(Unaudited)
| | | Fair
Value
5/31/2022 | | Purchases
at Cost | | Proceeds
from
Sales | | Realized
Gains
(Losses) | | Capital
Gain
Distribution | | Net
Change
in Unrealized
Appreciation/
Depreciation | | Fair Value
11/30/2022 | | Dividend
Income | |
USAA Growth Fund
Institutional Shares | | $ | 7,936 | | | $ | — | | | $ | (4,325 | ) | | $ | 249 | | | $ | — | | | $ | (751 | ) | | $ | 3,109 | | | $ | — | | |
USAA Income Stock Fund
Institutional Shares | | | 9,232 | | | | 92 | | | | (1,019 | ) | | | 62 | | | | — | | | | 58 | | | | 8,425 | | | | 92 | | |
USAA International
Fund Institutional
Shares | | | 30,529 | | | | 829 | | | | — | | | | — | | | | — | | | | (701 | ) | | | 30,657 | | | | — | | |
USAA Precious Metals and
Minerals Fund
Institutional Shares | | | 821 | | | | — | | | | — | | | | — | | | | — | | | | (88 | ) | | | 733 | | | | — | | |
USAA Small Cap Stock Fund
Institutional Shares | | | 5,314 | | | | — | | | | — | | | | — | | | | — | | | | 121 | | | | 5,435 | | | | — | | |
USAA Target Managed
Allocation Fund | | | 13,944 | | | | — | | | | — | | | | — | | | | — | | | | (756 | ) | | | 13,188 | | | | — | | |
USAA Value Fund
Institutional Shares | | | 8,882 | | | | — | | | | (4,493 | ) | | | (58 | ) | | | — | | | | (231 | ) | | | 4,100 | | | | — | | |
VictoryShares Emerging
Markets Value
Momentum ETF | | | 11,900 | | | | — | | | | — | | | | — | | | | — | | | | (1,143 | ) | | | 10,757 | | | | 310 | | |
VictoryShares International
Value Momentum ETF | | | 24,749 | | | | — | | | | — | | | | — | | | | — | | | | (1,559 | ) | | | 23,190 | | | | 372 | | |
VictoryShares US Small
Mid Cap Value
Momentum ETF | | | 6,659 | | | | — | | | | — | | | | — | | | | — | | | | 81 | | | | 6,740 | | | | 36 | | |
VictoryShares US Value
Momentum ETF | | | 26,806 | | | | — | | | | — | | | | — | | | | — | | | | 120 | | | | 26,926 | | | | 225 | | |
| | | $ | 207,237 | | | $ | 10,171 | | | $ | (11,040 | ) | | $ | 22 | | | $ | — | | | $ | (5,760 | ) | | $ | 200,630 | | | $ | 1,327 | | |
17
USAA Mutual Funds Trust | | Supplemental Information
November 30, 2022 | |
(Unaudited)
Proxy Voting and Portfolio Holdings Information
Proxy Voting:
Information regarding the policies and procedures the Fund uses to determine how to vote proxies relating to portfolio securities is available without charge, upon request, by calling (800) 235-8396. The information is also included in the Fund's Statement of Additional Information, which is available on the SEC's website at www.sec.gov.
Information relating to how the Fund voted proxies relating to portfolio securities held during the most recent 12 months ended June 30 is available on the SEC's website at www.sec.gov.
Availability of Schedules of Portfolio Investments:
The Trust files a complete list of Schedules of Portfolio Investments with the SEC for the first and third quarter of each fiscal year on Form N-PORT. Form N-PORT is available on the SEC's website at www.sec.gov.
Expense Example
As a shareholder of the Fund, you may incur two types of costs: (1) transaction costs and (2) ongoing costs, including management fees and other Fund expenses. These examples are intended to help you understand your ongoing costs (in dollars) of investing in the Fund and to compare these costs with the ongoing costs of investing in other mutual funds.
These examples are based on an investment of $1,000 invested at the beginning of the period and held for the entire period from June 1, 2022, through November 30, 2022.
The Actual Expense figures in the table below provide information about actual account values and actual expenses. You may use the information below, together with the amount you invested, to estimate the expenses that you paid over the period. Simply divide your account value by $1,000 (for example, an $8,600 account value divided by $1,000 = 8.6), then multiply the result by the number in the table under the heading entitled "Actual Expenses Paid During Period" to estimate the expenses you paid on your account during this period.
The Hypothetical Expense figures in the table below provide information about hypothetical account values and hypothetical expenses based on the Fund's actual expense ratio and an assumed rate of return of 5% per year before expenses, which is not the Fund's actual return. The hypothetical account values and expenses may not be used to estimate the actual ending account balance or expenses you paid for the period. You may use this information to compare this 5% hypothetical example with the 5% hypothetical examples that appear in shareholder reports of other funds.
Please note the expenses shown in the table below are meant to highlight your ongoing costs only and do not reflect any transactional costs. Therefore, the hypothetical expenses in the table are useful in comparing ongoing costs only and will not help you determine the relative total costs of owning different funds. In addition, if these transactional costs were included, your costs would have been higher.
Beginning
Account Value
6/1/22 | | Actual
Ending
Account Value
11/30/22 | | Hypothetical
Ending
Account Value
11/30/22 | | Actual
Expenses Paid
During Period
6/1/22-11/30/22* | | Hypothetical
Expenses Paid
During Period
6/1/22-11/30/22* | | Annualized
Expense Ratio
During Period
6/1/22-11/30/22 | |
| $ | 1,000.00 | | | $ | 978.80 | | | $ | 1,024.57 | | | $ | 0.50 | | | $ | 0.51 | | | | 0.10 | % | |
* Expenses are equal to the average account value multiplied by the Fund's annualized expense ratio multiplied by 183/365 (the number of days in the most recent fiscal half-year divided by the number of days in the fiscal year).
18
Privacy Policy
Protecting the Privacy of Information
The Trust respects your right to privacy. We also know that you expect us to conduct and process your business in an accurate and efficient manner. To do so, we must collect and maintain certain personal information about you. This is the information we collect from you on applications or other forms, and from the transactions you make with us or third parties. It may include your name, address, social security number, account transactions and balances, and information about investment goals and risk tolerance.
We do not disclose any information about you or about former customers to anyone except as permitted or required by law. Specifically, we may disclose the information we collect to companies that perform services on our behalf, such as the transfer agent that processes shareholder accounts and printers and mailers that assist us in the distribution of investor materials. We may also disclose this information to companies that perform marketing services on our behalf. This allows us to continue to offer you Victory investment products and services that meet your investing needs, and to effect transactions that you request or authorize. These companies will use this information only in connection with the services for which we hired them. They are not permitted to use or share this information for any other purpose.
To protect your personal information internally, we permit access only by authorized employees and maintain physical, electronic, and procedural safeguards to guard your personal information.*
* You may have received communications regarding information about privacy policies from other financial institutions which gave you the opportunity to "opt-out" of certain information sharing with companies which are not affiliated with that financial institution. The Trust does not share information with other companies for purposes of marketing solicitations for products other than the Trust. Therefore, the Trust does not provide opt-out options to their shareholders.
P.O. Box 182593
Columbus, Ohio 43218-2593

Visit our website at: | | Call | |
www.vcm.com | | (800) 235-8396 | |

NOVEMBER 30, 2022
Semi Annual Report
USAA Cornerstone Moderate Fund
Victory Capital means Victory Capital Management Inc., the investment adviser of the USAA Mutual Funds. USAA Mutual Funds are distributed by Victory Capital Services, Inc., member FINRA, an affiliate of Victory Capital. Victory Capital and its affiliates are not affiliated with United Services Automobile Association or its affiliates. USAA and the USAA logos are registered trademarks and the USAA Mutual Funds and USAA Investments logos are trademarks of United Services Automobile Association and are being used by Victory Capital and its affiliates under license.
www.vcm.com
News, Information And Education 24 Hours A Day, 7 Days A Week
The Victory Capital website gives fund shareholders, prospective shareholders, and investment professionals a convenient way to access fund information, get guidance, and track fund performance anywhere they can access the Internet. The site includes:
• Detailed performance records
• Daily share prices
• The latest fund news
• Investment resources to help you become a better investor
• A section dedicated to investment professionals
Whether you're a potential investor searching for the fund that matches your investment philosophy, a seasoned investor interested in planning tools, or an investment professional, www.vcm.com has what you seek. Visit us anytime. We're always open.
TABLE OF CONTENTS
Investment Objective & Portfolio Holdings | | | 2 | | |
Schedule of Portfolio Investments | | | 3 | | |
Financial Statements | |
Statement of Assets and Liabilities | | | 10 | | |
Statement of Operations | | | 11 | | |
Statements of Changes in Net Assets | | | 12 | | |
Financial Highlights | | | 14 | | |
Notes to Financial Statements | | | 16 | | |
Supplemental Information | | | 26 | | |
Proxy Voting and Portfolio Holdings Information | | | 26 | | |
Expense Example | | | 26 | | |
Privacy Policy (inside back cover) | | | |
This report is for the information of the shareholders and others who have received a copy of the currently effective prospectus of the Fund, managed by Victory Capital Management Inc. It may be used as sales literature only when preceded or accompanied by a current prospectus, which provides further details about the Fund.
IRA DISTRIBUTION WITHHOLDING DISCLOSURE
We generally must withhold federal income tax at a rate of 10% of the taxable portion of your distribution and, if you live in a state that requires state income tax withholding, at your state's tax rate. However, you may elect not to have withholding apply or to have income tax withheld at a higher rate. Any withholding election that you make will apply to any subsequent distribution unless and until you change or revoke the election. If you wish to make a withholding election, or change or revoke a prior withholding election, call (800) 235-8396, and form W-4P (OMB No. 1545-0074 withholding certificate for pension or annuity payments) will be electronically sent.
If you do not have a withholding election in place by the date of a distribution, federal income tax will be withheld from the taxable portion of your distribution at a rate of 10%. If you must pay estimated taxes, you may be subject to estimated tax penalties if your estimated tax payments are not sufficient and sufficient tax is not withheld from your distribution.
For more specific information, please consult your tax adviser.
• NOT FDIC INSURED • NO BANK GUARANTEE • MAY LOSE VALUE
1
USAA Mutual Funds Trust
USAA Cornerstone Moderate Fund | | November 30, 2022 | |
(Unaudited)
Investment Objective and Portfolio Holdings:
The Fund seeks high total return.
Asset Allocation*:
November 30, 2022
(% of Net Assets)
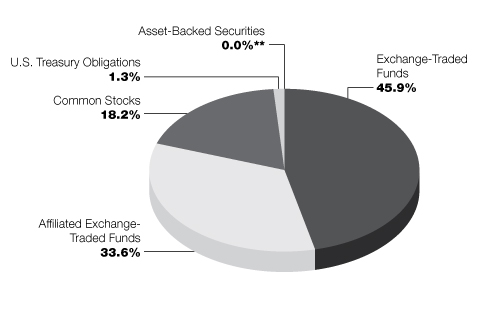
* Does not include futures contracts, money market instruments, and short-term investments purchased with cash collateral from securities loaned.
** Percentage is less than 0.05%
Percentages are of the net assets of the Fund and may not equal 100%.
2
USAA Mutual Funds Trust
USAA Cornerstone Moderate Fund | | Schedule of Portfolio Investments
November 30, 2022 | |
(Amounts in Thousands, Except for Shares) (Unaudited)
Security Description | | Shares or
Principal
Amount | | Value | |
Asset-Backed Securities (0.0%) (a) | |
NP SPE II LLC, Series 2017-1A, Class A1, 3.37%, 10/21/47 (b) | | $ | 251 | | | $ | 236 | | |
Total Asset-Backed Securities (Cost $251) | | | 236 | | |
Common Stocks (18.2%) | |
Communication Services (1.2%): | |
Alphabet, Inc. Class C (c) | | | 29,689 | | | | 3,012 | | |
AT&T, Inc. | | | 126,445 | | | | 2,438 | | |
Comcast Corp. Class A | | | 36,667 | | | | 1,344 | | |
Match Group, Inc. (c) | | | 17,225 | | | | 871 | | |
Meta Platforms, Inc. Class A (c) | | | 12,044 | | | | 1,422 | | |
Sirius XM Holdings, Inc. (d) | | | 286,200 | | | | 1,857 | | |
T-Mobile U.S., Inc. (c) | | | 7,645 | | | | 1,158 | | |
Verizon Communications, Inc. | | | 33,847 | | | | 1,319 | | |
| | | | 13,421 | | |
Consumer Discretionary (1.4%): | |
AutoZone, Inc. (c) | | | 844 | | | | 2,177 | | |
Best Buy Co., Inc. | | | 11,841 | | | | 1,010 | | |
Dollar General Corp. | | | 4,086 | | | | 1,045 | | |
Ford Motor Co. | | | 74,577 | | | | 1,037 | | |
General Motors Co. | | | 27,244 | | | | 1,105 | | |
Genuine Parts Co. | | | 5,481 | | | | 1,005 | | |
Lennar Corp. Class A | | | 11,995 | | | | 1,053 | | |
Lowe's Cos., Inc. | | | 5,731 | | | | 1,218 | | |
McDonald's Corp. | | | 4,921 | | | | 1,342 | | |
O'Reilly Automotive, Inc. (c) | | | 2,494 | | | | 2,156 | | |
Target Corp. | | | 5,043 | | | | 842 | | |
The Home Depot, Inc. | | | 4,721 | | | | 1,530 | | |
| | | | 15,520 | | |
Consumer Staples (1.0%): | |
Altria Group, Inc. | | | 49,732 | | | | 2,316 | | |
Colgate-Palmolive Co. | | | 13,589 | | | | 1,053 | | |
General Mills, Inc. | | | 13,620 | | | | 1,162 | | |
PepsiCo, Inc. | | | 7,852 | | | | 1,457 | | |
Philip Morris International, Inc. | | | 12,387 | | | | 1,234 | | |
The Hershey Co. | | | 4,758 | | | | 1,119 | | |
Tyson Foods, Inc. Class A | | | 16,084 | | | | 1,066 | | |
Walgreens Boots Alliance, Inc. | | | 25,750 | | | | 1,069 | | |
| | | | 10,476 | | |
Energy (1.0%): | |
Chevron Corp. | | | 8,289 | | | | 1,519 | | |
ConocoPhillips | | | 9,528 | | | | 1,177 | | |
Devon Energy Corp. | | | 13,131 | | | | 900 | | |
EOG Resources, Inc. | | | 7,114 | | | | 1,010 | | |
Exxon Mobil Corp. | | | 32,015 | | | | 3,564 | | |
Marathon Oil Corp. | | | 30,549 | | | | 936 | | |
See notes to financial statements.
3
USAA Mutual Funds Trust
USAA Cornerstone Moderate Fund | | Schedule of Portfolio Investments — continued
November 30, 2022 | |
(Amounts in Thousands, Except for Shares) (Unaudited)
Security Description | | Shares | | Value | |
Marathon Petroleum Corp. | | | 8,797 | | | $ | 1,071 | | |
Valero Energy Corp. | | | 7,609 | | | | 1,017 | | |
| | | | 11,194 | | |
Financials (2.4%): | |
American Express Co. | | | 7,183 | | | | 1,132 | | |
Annaly Capital Management, Inc. | | | 1,754 | | | | 38 | | |
Aon PLC Class A | | | 3,371 | | | | 1,039 | | |
Arch Capital Group Ltd. (c) | | | 17,560 | | | | 1,052 | | |
Berkshire Hathaway, Inc. Class B (c) | | | 10,719 | | | | 3,415 | | |
Capital One Financial Corp. | | | 9,975 | | | | 1,030 | | |
Citigroup, Inc. | | | 23,324 | | | | 1,129 | | |
FactSet Research Systems, Inc. | | | 2,083 | | | | 961 | | |
JPMorgan Chase & Co. | | | 12,606 | | | | 1,742 | | |
LPL Financial Holdings, Inc. | | | 3,929 | | | | 930 | | |
M&T Bank Corp. | | | 5,862 | | | | 997 | | |
Marsh & McLennan Cos., Inc. | | | 6,469 | | | | 1,120 | | |
MetLife, Inc. | | | 14,567 | | | | 1,117 | | |
Morgan Stanley | | | 13,317 | | | | 1,239 | | |
MSCI, Inc. | | | 1,837 | | | | 933 | | |
Prudential Financial, Inc. | | | 9,838 | | | | 1,063 | | |
Raymond James Financial, Inc. | | | 7,819 | | | | 914 | | |
Regions Financial Corp. | | | 41,046 | | | | 953 | | |
Signature Bank | | | 5,861 | | | | 818 | | |
T. Rowe Price Group, Inc. | | | 6,989 | | | | 873 | | |
The Goldman Sachs Group, Inc. | | | 3,184 | | | | 1,229 | | |
The Progressive Corp. | | | 8,481 | | | | 1,121 | | |
W.R. Berkley Corp. | | | 14,216 | | | | 1,084 | | |
| | | | 25,929 | | |
Health Care (3.4%): | |
AbbVie, Inc. | | | 19,206 | | | | 3,096 | | |
AmerisourceBergen Corp. | | | 6,590 | | | | 1,125 | | |
Amgen, Inc. | | | 12,885 | | | | 3,690 | | |
Biogen, Inc. (c) | | | 3,586 | | | | 1,094 | | |
Bristol-Myers Squibb Co. | | | 33,258 | | | | 2,670 | | |
Cigna Corp. | | | 7,619 | | | | 2,506 | | |
CVS Health Corp. | | | 12,401 | | | | 1,263 | | |
Elevance Health, Inc. | | | 4,917 | | | | 2,620 | | |
Eli Lilly & Co. | | | 8,269 | | | | 3,068 | | |
Gilead Sciences, Inc. | | | 14,156 | | | | 1,243 | | |
IDEXX Laboratories, Inc. (c) | | | 2,219 | | | | 945 | | |
Johnson & Johnson | | | 10,015 | | | | 1,783 | | |
McKesson Corp. | | | 3,008 | | | | 1,148 | | |
Merck & Co., Inc. | | | 28,622 | | | | 3,152 | | |
Mettler-Toledo International, Inc. (c) | | | 653 | | | | 960 | | |
Pfizer, Inc. | | | 30,459 | | | | 1,527 | | |
UnitedHealth Group, Inc. | | | 7,122 | | | | 3,901 | | |
Waters Corp. (c) | | | 2,829 | | | | 981 | | |
| | | | 36,772 | | |
See notes to financial statements.
4
USAA Mutual Funds Trust
USAA Cornerstone Moderate Fund | | Schedule of Portfolio Investments — continued
November 30, 2022 | |
(Amounts in Thousands, Except for Shares) (Unaudited)
Security Description | | Shares | | Value | |
Industrials (2.1%): | |
3M Co. | | | 8,461 | | | $ | 1,066 | | |
Carlisle Cos., Inc. | | | 3,993 | | | | 1,051 | | |
Cintas Corp. | | | 2,211 | | | | 1,021 | | |
Cummins, Inc. | | | 4,179 | | | | 1,049 | | |
Fastenal Co. | | | 18,548 | | | | 955 | | |
FedEx Corp. | | | 5,914 | | | | 1,078 | | |
General Dynamics Corp. | | | 8,703 | | | | 2,196 | | |
Illinois Tool Works, Inc. | | | 4,488 | | | | 1,021 | | |
Lockheed Martin Corp. | | | 7,232 | | | | 3,509 | | |
Masco Corp. | | | 17,950 | | | | 911 | | |
Northrop Grumman Corp. | | | 2,154 | | | | 1,149 | | |
Otis Worldwide Corp. | | | 12,312 | | | | 961 | | |
PACCAR, Inc. | | | 20,092 | | | | 2,128 | | |
Republic Services, Inc. | | | 7,802 | | | | 1,087 | | |
United Parcel Service, Inc. Class B | | | 6,655 | | | | 1,263 | | |
W.W. Grainger, Inc. | | | 3,366 | | | | 2,030 | | |
| | | | 22,475 | | |
Information Technology (3.9%): | |
Accenture PLC Class A | | | 4,183 | | | | 1,259 | | |
Adobe, Inc. (c) | | | 3,359 | | | | 1,159 | | |
Apple, Inc. | | | 68,563 | | | | 10,149 | | |
Automatic Data Processing, Inc. | | | 4,495 | | | | 1,187 | | |
Broadcom, Inc. | | | 2,549 | | | | 1,405 | | |
Cisco Systems, Inc. | | | 56,428 | | | | 2,806 | | |
Cognizant Technology Solutions Corp. Class A | | | 17,320 | | | | 1,078 | | |
Enphase Energy, Inc. (c) | | | 3,397 | | | | 1,089 | | |
Fair Isaac Corp. (c) | | | 3,071 | | | | 1,903 | | |
HP, Inc. | | | 63,826 | | | | 1,917 | | |
Intel Corp. | | | 38,408 | | | | 1,155 | | |
International Business Machines Corp. | | | 16,564 | | | | 2,466 | | |
Micron Technology, Inc. | | | 16,760 | | | | 966 | | |
Microsoft Corp. | | | 16,222 | | | | 4,139 | | |
Motorola Solutions, Inc. | | | 4,086 | | | | 1,112 | | |
ON Semiconductor Corp. (c) | | | 12,800 | | | | 963 | | |
Oracle Corp. | | | 15,303 | | | | 1,271 | | |
Palo Alto Networks, Inc. (c) | | | 6,094 | | | | 1,035 | | |
Paychex, Inc. | | | 8,270 | | | | 1,026 | | |
QUALCOMM, Inc. | | | 9,424 | | | | 1,192 | | |
Texas Instruments, Inc. | | | 13,659 | | | | 2,465 | | |
VeriSign, Inc. (c) | | | 4,796 | | | | 958 | | |
| | | | 42,700 | | |
Materials (0.7%): | |
CF Industries Holdings, Inc. | | | 8,585 | | | | 929 | | |
Corteva, Inc. | | | 14,563 | | | | 978 | | |
LyondellBasell Industries NV Class A | | | 11,645 | | | | 990 | | |
Nucor Corp. | | | 14,346 | | | | 2,151 | | |
See notes to financial statements.
5
USAA Mutual Funds Trust
USAA Cornerstone Moderate Fund | | Schedule of Portfolio Investments — continued
November 30, 2022 | |
(Amounts in Thousands, Except for Shares) (Unaudited)
Security Description | | Shares | | Value | |
Sealed Air Corp. | | | 18,522 | | | $ | 986 | | |
Steel Dynamics, Inc. | | | 9,637 | | | | 1,001 | | |
The Sherwin-Williams Co. | | | 4,032 | | | | 1,005 | | |
| | | | 8,040 | | |
Real Estate (0.5%): | |
Alexandria Real Estate Equities, Inc. | | | 636 | | | | 99 | | |
American Homes 4 Rent Class A | | | 1,623 | | | | 54 | | |
American Tower Corp. | | | 2,376 | | | | 526 | | |
AvalonBay Communities, Inc. | | | 708 | | | | 124 | | |
Boston Properties, Inc. | | | 747 | | | | 54 | | |
Camden Property Trust | | | 487 | | | | 59 | | |
CBRE Group, Inc. Class A (c) | | | 1,679 | | | | 134 | | |
Crown Castle, Inc. | | | 2,209 | | | | 312 | | |
Digital Realty Trust, Inc. | | | 1,370 | | | | 154 | | |
Equinix, Inc. | | | 470 | | | | 325 | | |
Equity LifeStyle Properties, Inc. | | | 879 | | | | 58 | | |
Equity Residential | | | 1,868 | | | | 121 | | |
Essex Property Trust, Inc. | | | 327 | | | | 72 | | |
Extra Space Storage, Inc. | | | 661 | | | | 106 | | |
Gaming and Leisure Properties, Inc. | | | 1,390 | | | | 73 | | |
Healthcare Realty Trust, Inc. | | | 1,989 | | | | 41 | | |
Healthpeak Properties, Inc. | | | 2,671 | | | | 70 | | |
Host Hotels & Resorts, Inc. | | | 3,450 | | | | 65 | | |
Invitation Homes, Inc. | | | 2,844 | | | | 93 | | |
Iron Mountain, Inc. | | | 1,461 | | | | 79 | | |
Kimco Realty Corp. | | | 3,379 | | | | 77 | | |
Medical Properties Trust, Inc. | | | 2,885 | | | | 38 | | |
Mid-America Apartment Communities, Inc. | | | 574 | | | | 95 | | |
Prologis, Inc. | | | 4,722 | | | | 556 | | |
Public Storage | | | 803 | | | | 239 | | |
Realty Income Corp. | | | 3,102 | | | | 196 | | |
Regency Centers Corp. | | | 861 | | | | 57 | | |
SBA Communications Corp. | | | 560 | | | | 168 | | |
Simon Property Group, Inc. | | | 1,694 | | | | 202 | | |
Sun Communities, Inc. | | | 501 | | | | 74 | | |
UDR, Inc. | | | 1,487 | | | | 62 | | |
Ventas, Inc. | | | 1,882 | | | | 88 | | |
VICI Properties, Inc. | | | 5,277 | | | | 180 | | |
Vornado Realty Trust | | | 808 | | | | 20 | | |
Welltower, Inc. | | | 2,095 | | | | 149 | | |
Weyerhaeuser Co. | | | 3,701 | | | | 121 | | |
WP Carey, Inc. | | | 880 | | | | 69 | | |
Zillow Group, Inc. Class C (c) | | | 1,120 | | | | 43 | | |
| | | | 5,053 | | |
Utilities (0.6%): | |
Consolidated Edison, Inc. | | | 11,463 | | | | 1,124 | | |
DTE Energy Co. | | | 8,300 | | | | 963 | | |
Exelon Corp. | | | 27,853 | | | | 1,152 | | |
See notes to financial statements.
6
USAA Mutual Funds Trust
USAA Cornerstone Moderate Fund | | Schedule of Portfolio Investments — continued
November 30, 2022 | |
(Amounts in Thousands, Except for Shares) (Unaudited)
Security Description | | Shares or
Principal
Amount | | Value | |
Sempra Energy | | | 6,738 | | | $ | 1,120 | | |
The AES Corp. | | | 33,780 | | | | 977 | | |
UGI Corp. | | | 23,850 | | | | 922 | | |
| | | | 6,258 | | |
Total Common Stocks (Cost $159,841) | | | 197,838 | | |
U.S. Treasury Obligations (1.3%) | |
U.S. Treasury Notes, 1.63%, 4/30/23 (e) | | $ | 14,658 | | | | 14,480 | | |
Total U.S. Treasury Obligations (Cost $14,651) | | | 14,480 | | |
Exchange-Traded Funds (45.9%) | |
Invesco DB Commodity Index Tracking Fund (c) | | | 114,500 | | | | 2,919 | | |
Invesco FTSE RAFI Developed Markets ex-US ETF | | | 335,920 | | | | 14,216 | | |
Invesco FTSE RAFI Emerging Markets ETF | | | 686,690 | | | | 12,409 | | |
iShares 0-5 Year TIPS Bond ETF | | | 181,167 | | | | 17,696 | | |
iShares 20+ Year Treasury Bond ETF | | | 66,687 | | | | 6,851 | | |
iShares 7-10 Year Treasury Bond ETF | | | 198,365 | | | | 19,362 | | |
iShares Core MSCI EAFE ETF | | | 123,049 | | | | 7,758 | | |
iShares Core MSCI Emerging Markets ETF | | | 613,155 | | | | 29,775 | | |
iShares Core S&P 500 ETF | | | 75,600 | | | | 30,945 | | |
iShares Core S&P Small-Cap ETF | | | 393,587 | | | | 40,083 | | |
iShares Core US Aggregate Bond ETF | | | 114,078 | | | | 11,213 | | |
iShares iBoxx High Yield Corporate Bond ETF (d) | | | 522,903 | | | | 39,563 | | |
iShares JP Morgan USD Emerging Markets Bond ETF | | | 86,421 | | | | 7,469 | | |
iShares MSCI Canada ETF (d) | | | 170,329 | | | | 5,994 | | |
iShares MSCI International Momentum Factor ETF (d) | | | 401,271 | | | | 12,708 | | |
iShares MSCI International Quality Factor ETF (d) | | | 457,001 | | | | 15,259 | | |
iShares Russell 2000 ETF (d) | | | 70,263 | | | | 13,165 | | |
JPMorgan BetaBuilders Canada ETF | | | 32,299 | | | | 1,977 | | |
Schwab Fundamental Emerging Markets Large Co. Index ETF | | | 920,892 | | | | 24,284 | | |
Schwab Fundamental International Large Co. Index ETF | | | 1,549,839 | | | | 46,805 | | |
Schwab Fundamental International Small Co. Index ETF | | | 266,700 | | | | 8,478 | | |
SPDR Gold Shares (c) | | | 53,784 | | | | 8,864 | | |
SPDR S&P Emerging Markets SmallCap ETF | | | 34,497 | | | | 1,739 | | |
Vanguard FTSE All-World ex-U.S. ETF | | | 86,591 | | | | 4,494 | | |
Vanguard FTSE Developed Markets ETF (d) | | | 918,252 | | | | 39,861 | | |
Vanguard FTSE Emerging Markets ETF | | | 47,000 | | | | 1,905 | | |
Vanguard Mortgage-Backed Securities ETF | | | 279,324 | | | | 12,874 | | |
Vanguard Real Estate ETF (d) | | | 55,850 | | | | 4,919 | | |
Vanguard S&P 500 ETF | | | 5,306 | | | | 1,987 | | |
Vanguard Short-Term Bond ETF | | | 350,980 | | | | 26,499 | | |
Vanguard Short-Term Corporate Bond ETF | | | 44,267 | | | | 3,342 | | |
Vanguard Total Stock Market ETF | | | 54,053 | | | | 11,030 | | |
Wisdom Tree Trust — WisdomTree Emerging Markets SmallCap Dividend Fund | | | 59,797 | | | | 2,686 | | |
Xtrackers USD High Yield Corporate Bond ETF (d) | | | 332,534 | | | | 11,512 | | |
Total Exchange-Traded Funds (Cost $469,372) | | | 500,641 | | |
See notes to financial statements.
7
USAA Mutual Funds Trust
USAA Cornerstone Moderate Fund | | Schedule of Portfolio Investments — continued
November 30, 2022 | |
(Amounts in Thousands, Except for Shares) (Unaudited)
Security Description | | Shares | | Value | |
Affiliated Exchange-Traded Funds (33.6%) | |
VictoryShares Emerging Markets Value Momentum ETF | | | 51,500 | | | $ | 2,076 | | |
VictoryShares ESG Core Plus Bond ETF | | | 3,286,188 | | | | 70,152 | | |
VictoryShares USAA Core Intermediate-Term Bond ETF | | | 6,057,948 | | | | 277,706 | | |
VictoryShares USAA Core Short-Term Bond ETF | | | 341,251 | | | | 16,623 | | |
Total Affiliated Exchange-Traded Funds (Cost $422,755) | | | 366,557 | | |
Collateral for Securities Loaned (9.0%)^ | |
Goldman Sachs Financial Square Government Fund, Institutional Shares,
3.73% (f) | | | 24,603,553 | | | | 24,604 | | |
HSBC U.S. Government Money Market Fund, I Shares, 3.75% (f) | | | 24,603,553 | | | | 24,603 | | |
Invesco Government & Agency Portfolio, Institutional Shares, 3.74% (f) | | | 24,603,553 | | | | 24,603 | | |
Morgan Stanley Institutional Liquidity Government Portfolio, Institutional Shares,
3.62% (f) | | | 24,603,553 | | | | 24,604 | | |
Total Collateral for Securities Loaned (Cost $98,414) | | | 98,414 | | |
Total Investments (Cost $1,165,284) — 108.0% | | | 1,178,166 | | |
Liabilities in excess of other assets — (8.0)% | | | (87,329 | ) | |
NET ASSETS — 100.00% | | $ | 1,090,837 | | |
At November 30, 2022, the Fund's investments in foreign securities were 20.3% of net assets.
^ Purchased with cash collateral from securities on loan.
(a) Amount represents less than 0.05% of net assets.
(b) Rule 144A security or other security that is restricted as to resale to institutional investors. The Fund's Adviser has deemed this security to be liquid (unless otherwise noted as illiquid) based upon procedures approved by the Board of Trustees. As of November 30, 2022, the fair value of these securities was $236 thousands and amounted to less than 0.05% of net assets.
(c) Non-income producing security.
(d) All or a portion of this security is on loan.
(e) All or a portion of this security has been segregated as collateral for derivative instruments.
(f) Rate disclosed is the daily yield on November 30, 2022.
ETF — Exchange-Traded Fund
LLC — Limited Liability Company
PLC — Public Limited Company
See notes to financial statements.
8
USAA Mutual Funds Trust
USAA Cornerstone Moderate Fund | | Schedule of Portfolio Investments — continued
November 30, 2022 | |
(Unaudited)
Futures Contracts Purchased
(Amounts not in thousands) | |
| | | Number of
Contracts | | Expiration
Date | | Notional
Amount | | Value | | Unrealized
Appreciation/
(Depreciation) | |
Euro Stoxx 50 Futures | | | 271 | | | 12/16/22 | | $ | 10,066,334 | | | $ | 11,180,287 | | | $ | 1,113,953 | | |
FTSE 100 Index Futures | | | 194 | | | 12/16/22 | | | 17,221,043 | | | | 17,764,086 | | | | 543,043 | | |
S&P/Toronto Stock Exchange 60 Index
Futures | | | 95 | | | 12/15/22 | | | 16,959,541 | | | | 17,520,967 | | | | 561,426 | | |
| | | $ | 2,218,422 | | |
Futures Contracts Sold | |
(Amounts not in thousands) | |
| | | Number of
Contracts | | Expiration
Date | | Notional
Amount | | Value | | Unrealized
Appreciation/
(Depreciation) | |
ASX SPI 200 Index Futures | | | 81 | | | 12/15/22 | | $ | 9,526,287 | | | $ | 10,043,787 | | | $ | (517,500 | ) | |
E-Mini Russell 2000 Index Futures | | | 42 | | | 12/16/22 | | | 3,793,910 | | | | 3,963,750 | | | | (169,840 | ) | |
Hang Seng Index Futures | | | 39 | | | 12/29/22 | | | 4,406,023 | | | | 4,647,874 | | | | (241,851 | ) | |
Swiss Market Index Futures | | | 72 | | | 12/16/22 | | | 8,309,636 | | | | 8,494,493 | | | | (184,857 | ) | |
Tokyo Price Index Futures | | | 67 | | | 12/08/22 | | | 9,571,843 | | | | 9,656,696 | | | | (84,853 | ) | |
| | | $ | (1,198,901 | ) | |
Total unrealized appreciation | | $ | 2,218,422 | | |
Total unrealized depreciation | | | (1,198,901 | ) | |
Total net unrealized appreciation (depreciation) | | $ | 1,019,521 | | |
See notes to financial statements.
9
USAA Mutual Funds Trust | | Statement of Assets and Liabilities
November 30, 2022 | |
(Amounts in Thousands, Except Per Share Amounts) (Unaudited)
| | | USAA Cornerstone
Moderate Fund | |
Assets: | |
Affiliated investments, at value (Cost $422,755) | | $ | 366,557 | | |
Unaffiliated investments, at value (Cost $742,529) | | | 811,609 | (a) | |
Cash | | | 6,769 | | |
Deposit with broker for futures contracts | | | 4,338 | | |
Receivables: | |
Interest and dividends | | | 457 | | |
Capital shares issued | | | 310 | | |
Investments sold | | | 4,483 | | |
Variation margin on open futures contracts | | | 394 | | |
From Adviser for ETF reimbursements | | | 286 | | |
Prepaid expenses | | | 15 | | |
Total Assets | | | 1,195,218 | | |
Liabilities: | |
Payables: | |
Collateral received on loaned securities | | | 98,414 | | |
Collateral received from broker for futures contracts | | | 705 | | |
Investments purchased | | | 3,788 | | |
Capital shares redeemed | | | 257 | | |
Variation margin on open futures contracts | | | 307 | | |
Accrued expenses and other payables: | |
Investment advisory fees | | | 514 | | |
Administration fees | | | 131 | | |
Custodian fees | | | 15 | | |
Transfer agent fees | | | 168 | | |
Compliance fees | | | 1 | | |
Trustees' fees | | | 1 | | |
Other accrued expenses | | | 80 | | |
Total Liabilities | | | 104,381 | | |
Net Assets: | |
Capital | | | 1,059,610 | | |
Total accumulated earnings/(loss) | | | 31,227 | | |
Net Assets | | $ | 1,090,837 | | |
Shares (unlimited number of shares authorized with no par value): | | | 75,602 | | |
Net asset value, offering and redemption price per share: (b) | | $ | 14.43 | | |
(a) Includes $96,858 thousand of securities on loan.
(b) Per share amount may not recalculate due to rounding of net assets and/or shares outstanding.
See notes to financial statements.
10
USAA Mutual Funds Trust | | Statement of Operations
For the Six Months Ended November 30, 2022 | |
(Amounts in Thousands) (Unaudited)
| | | USAA Cornerstone
Moderate Fund | |
Investment Income: | |
Income distributions from affiliated funds | | $ | 4,913 | | |
Dividends from unaffiliated investments | | | 8,508 | | |
Interest from unaffiliated investments | | | 203 | | |
Securities lending (net of fees) | | | 360 | | |
Foreign tax withholding | | | (2 | ) | |
Total Income | | | 13,982 | | |
Expenses: | |
Investment advisory fees | | | 3,170 | | |
Administration fees | | | 806 | | |
Sub-Administration fees | | | 36 | | |
Custodian fees | | | 29 | | |
Transfer agent fees | | | 1,027 | | |
Trustees' fees | | | 24 | | |
Compliance fees | | | 5 | | |
Legal and audit fees | | | 45 | | |
State registration and filing fees | | | 25 | | |
Other expenses | | | 96 | | |
Total Expenses | | | 5,263 | | |
Expenses waived/reimbursed by Adviser | | | (590 | ) | |
Net Expenses | | | 4,673 | | |
Net Investment Income (Loss) | | | 9,309 | | |
Realized/Unrealized Gains (Losses) from Investments: | |
Net realized gains (losses) from affiliated funds | | | (4,060 | ) | |
Net realized gains (losses) from unaffiliated investment securities and
foreign currency transactions | | | (10,693 | ) | |
Net realized gains (losses) from futures contracts | | | (12 | ) | |
Net change in unrealized appreciation/depreciation on affiliated funds | | | (15,098 | ) | |
Net change in unrealized appreciation/depreciation on unaffiliated
investment securities and foreign currency translations | | | (10,942 | ) | |
Net change in unrealized appreciation/depreciation on futures contracts | | | 1,630 | | |
Net realized/unrealized gains (losses) on investments | | | (39,175 | ) | |
Change in net assets resulting from operations | | $ | (29,866 | ) | |
See notes to financial statements.
11
USAA Mutual Funds Trust | | Statements of Changes in Net Assets | |
(Amounts in Thousands)
| | | USAA Cornerstone Moderate Fund | |
| | | Six Months
Ended
November 30,
2022
(Unaudited) | | Year
Ended
May 31,
2022 | |
From Investments: | |
Operations: | |
Net Investment Income (Loss) | | $ | 9,309 | | | $ | 15,773 | | |
Net realized gains (losses) | | | (14,765 | ) | | | 59,583 | | |
Net change in unrealized appreciation/depreciation | | | (24,410 | ) | | | (145,278 | ) | |
Change in net assets resulting from operations | | | (29,866 | ) | | | (69,922 | ) | |
Change in net assets resulting from distributions to shareholders | | | (6,566 | ) | | | (85,781 | ) | |
Change in net assets resulting from capital transactions | | | (12,639 | ) | | | 30,079 | | |
Change in net assets | | | (49,071 | ) | | | (125,624 | ) | |
Net Assets: | |
Beginning of period | | | 1,139,908 | | | | 1,265,532 | | |
End of period | | $ | 1,090,837 | | | $ | 1,139,908 | | |
Capital Transactions: | |
Proceeds from shares issued | | $ | 31,906 | | | $ | 94,555 | | |
Distributions reinvested | | | 6,521 | | | | 85,309 | | |
Cost of shares redeemed | | | (51,066 | ) | | | (149,785 | ) | |
Change in net assets resulting from capital transactions | | $ | (12,639 | ) | | $ | 30,079 | | |
Share Transactions: | |
Issued | | | 2,261 | | | | 5,775 | | |
Reinvested | | | 467 | | | | 5,212 | | |
Redeemed | | | (3,623 | ) | | | (9,130 | ) | |
Change in Shares | | | (895 | ) | | | 1,857 | | |
See notes to financial statements.
12
This page is intentionally left blank.
13
USAA Mutual Funds Trust | | Financial Highlights | |
For a Share Outstanding Throughout Each Period
| | | | | Investment Activities | | Distributions to
Shareholders From | |
| | | Net Asset
Value,
Beginning of
Period | | Net
Investment
Income
(Loss) | | Net Realized
and Unrealized
Gains (Losses) | | Total from
Investment
Activities | | Net
Investment
Income | | Net Realized
Gains from
Investments | |
USAA Cornerstone Moderate Fund | | | |
Six Months Ended
November 30, 2022
(Unaudited) | | $ | 14.90 | | | | 0.12 | (f) | | | (0.50 | ) | | | (0.38 | ) | | | (0.09 | ) | | | — | | |
Year Ended May 31: | |
2022 | | $ | 16.96 | | | | 0.21 | (f) | | | (1.11 | ) | | | (0.90 | ) | | | (0.23 | ) | | | (0.93 | ) | |
2021 | | $ | 14.24 | | | | 0.20 | (f) | | | 2.76 | | | | 2.96 | | | | (0.21 | ) | | | (0.03 | ) | |
2020 | | $ | 14.11 | | | | 0.29 | (f) | | | 0.13 | | | | 0.42 | | | | (0.29 | ) | | | — | | |
2019 | | $ | 14.83 | | | | 0.30 | | | | (0.31 | ) | | | (0.01 | ) | | | (0.29 | ) | | | (0.42 | ) | |
2018 | | $ | 15.05 | | | | 0.26 | | | | 0.55 | | | | 0.81 | | | | (0.26 | ) | | | (0.77 | ) | |
(a) Not annualized for periods less than one year.
(b) Assumes reinvestment of all net investment income and realized capital gain distributions, if any, during the period. Includes adjustments in accordance with U.S. Generally Accepted Accounting Principles and could differ from the Lipper reported return.
(c) Annualized for periods less than one year.
(d) The net expense ratio may not correlate to the applicable expense limits in place during the period since the current contractual expense limitation is applied for a period beginning July 1, 2019 and in effect through September 30, 2023, instead of coinciding with the Fund's fiscal year end. Details of the current contractual expense limitation in effect can be found in Note 4 of the accompanying Notes to Financial Statements.
(e) Does not include acquired fund fees and expenses, if any.
(f) Per share net investment income (loss) has been calculated using the average daily shares method.
(g) Reflects increased trading activity due to usage of quantitative investment strategies.
See notes to financial statements.
14
USAA Mutual Funds Trust | | Financial Highlights — continued | |
For a Share Outstanding Throughout Each Period
| | | | | Ratios to Average Net Assets | | Supplemental Data | |
| | | Total
Distributions | | Net Asset
Value,
End of
Period | | Total
Return(a)(b) | | Net
Expenses(c)(d)(e) | | Net
Investment
Income
(Loss)(c) | | Gross
Expenses(c)(e) | | Net Assets,
End of
Period
(000's) | | Portfolio
Turnover(a) | |
USAA Cornerstone Moderate Fund | |
Six Months Ended
November 30, 2022
(Unaudited) | | | (0.09 | ) | | $ | 14.43 | | | | (2.55 | )% | | | 0.87 | % | | | 1.73 | % | | | 0.98 | % | | $ | 1,090,837 | | | | 30 | % | |
Year Ended May 31: | |
2022 | | | (1.16 | ) | | $ | 14.90 | | | | (5.82 | )% | | | 0.87 | % | | | 1.28 | % | | | 0.95 | % | | $ | 1,139,908 | | | | 47 | % | |
2021 | | | (0.24 | ) | | $ | 16.96 | | | | 21.00 | % | | | 0.97 | % | | | 1.29 | % | | | 0.98 | % | | $ | 1,265,532 | | | | 53 | % | |
2020 | | | (0.29 | ) | | $ | 14.24 | | | | 2.98 | % | | | 1.00 | % | | | 2.01 | % | | | 1.00 | % | | $ | 1,131,458 | | | | 87 | % | |
2019 | | | (0.71 | ) | | $ | 14.11 | | | | 0.13 | % | | | 1.00 | % | | | 2.10 | % | | | 1.02 | % | | $ | 1,163,374 | | | | 81 | %(g) | |
2018 | | | (1.03 | ) | | $ | 14.83 | | | | 5.42 | % | | | 1.00 | % | | | 1.73 | % | | | 1.03 | % | | $ | 1,184,032 | | | | 51 | % | |
See notes to financial statements.
15
USAA Mutual Funds Trust | | Notes to Financial Statements
November 30, 2022 | |
(Unaudited)
1. Organization:
USAA Mutual Funds Trust (the "Trust") is organized as a Delaware statutory trust and is registered under the Investment Company Act of 1940, as amended (the "1940 Act"), as an open-end investment company. The Trust is comprised of 45 funds and is authorized to issue an unlimited number of shares, which are units of beneficial interest with no par value.
The accompanying financial statements are those of the USAA Cornerstone Moderate Fund (the "Fund"). The Fund is classified as diversified under the 1940 Act.
Victory Capital Management ("VCM" or the "Adviser"), is an indirect wholly owned subsidiary of Victory Capital Holdings, Inc., a publicly traded Delaware corporation, and a wholly owned direct subsidiary of Victory Capital Operating, LLC.
Under the Trust's organizational documents, its officers and trustees are indemnified against certain liabilities arising out of the performance of their duties to the Fund. In addition, in the normal course of business, the Fund enters into contracts with its vendors and others that provide for general indemnifications. The Fund's maximum exposure under these arrangements is unknown, as this would involve future claims that may be made against the Fund. However, based on experience, the Fund expects that risk of loss to be remote.
2. Significant Accounting Policies:
The following is a summary of significant accounting policies followed by the Trust in the preparation of its financial statements. The policies are in conformity with U.S. Generally Accepted Accounting Principles ("GAAP"). The preparation of financial statements in accordance with GAAP requires management to make estimates and assumptions that affect the reported amounts of assets and liabilities and disclosure of contingent assets and liabilities at the date of the financial statements and the reported amounts of income and expenses for the period. Actual results could differ from those estimates. The Fund follows the specialized accounting and reporting requirements under GAAP that are applicable to investment companies under Accounting Standards Codification Topic 946.
Investment Valuation:
The Fund records investments at fair value. Fair value is defined as the price that would be received to sell an asset or paid to transfer a liability in an orderly transaction between market participants at the measurement date.
The valuation techniques described below maximize the use of observable inputs and minimize the use of unobservable inputs in determining fair value. The inputs used for valuing the Fund's investments are summarized in the three broad levels listed below:
• Level 1 — quoted prices (unadjusted) in active markets for identical securities
• Level 2 — other significant observable inputs (including quoted prices for similar securities, interest rates, or credit spreads, applicable to those securities, etc.)
• Level 3 — significant unobservable inputs (including the Adviser's assumptions in determining the fair value of investments)
Changes in valuation techniques may result in transfers in or out of an assigned level within the disclosure hierarchy. The inputs or methodologies used for valuation techniques are not necessarily an indication of the risks associated with entering into those investments.
The Adviser, acting as the valuation designee has established the Pricing and Liquidity Committee (the "Committee"), and subject to the Trust's Board of Trustees' (the "Board") oversight, the Committee administers and oversees the Fund's valuation policies and procedures, which are approved by the Board.
Portfolio securities listed or traded on securities exchanges, including Exchange-Traded Funds ("ETFs"), and American Depositary Receipts ("ADRs"), are valued at the closing price on the exchange or system where the security is principally traded, if available, or at the Nasdaq Official Closing Price. If there
16
USAA Mutual Funds Trust | | Notes to Financial Statements — continued
November 30, 2022 | |
(Unaudited)
have been no sales for that day on the exchange or system, then a security is valued at the last available bid quotation on the exchange or system where the security is principally traded. In each of these situations, valuations are typically categorized as Level 1 in the fair value hierarchy.
Investments in open-end investment companies, including underlying funds, are valued at their net asset value ("NAV"). These valuations are typically categorized as Level 1 in the fair value hierarchy.
Debt securities are valued each business day by a pricing service approved by the Board. The approved pricing service uses the evaluated bid or the last sale price to value securities. Debt obligations maturing within 60 days may be valued at amortized cost, provided that the amortized cost represents the fair value of such securities. These valuations are typically categorized as Level 2 in the fair value hierarchy.
Futures contracts are valued at the settlement price established each day by the board of trade or an exchange on which they are traded. These valuations are typically categorized as Level 1 in the fair value hierarchy.
In the event that price quotations or valuations are not readily available, investments are valued at fair value in accordance with procedures established by and under the general supervision and responsibility of the Board. These valuations are typically categorized as Level 2 or Level 3 in the fair value hierarchy, based on the observability of inputs used to determine the fair value. The effect of fair value pricing is that securities may not be priced on the basis of quotations from the primary market in which they are traded, and the actual price realized from the sale of a security may differ materially from the fair value price. Valuing these securities at fair value is intended to cause the Fund's NAV to be more reliable than it otherwise would be.
A summary of the valuations as of November 30, 2022, based upon the three levels defined above, is included in the table below while the breakdown, by category, of investments is disclosed on the Schedule of Portfolio Investments (amounts in thousands):
| | | Level 1 | | Level 2 | | Level 3 | | Total | |
Asset-Backed Securities | | $ | — | | | $ | 236 | | | $ | — | | | $ | 236 | | |
Common Stocks | | | 197,838 | | | | — | | | | — | | | | 197,838 | | |
U.S. Treasury Obligations | | | — | | | | 14,480 | | | | — | | | | 14,480 | | |
Exchange-Traded Funds | | | 500,641 | | | | — | | | | — | | | | 500,641 | | |
Affiliated Exchange-Traded Funds | | | 366,557 | | | | — | | | | — | | | | 366,557 | | |
Collateral for Securities Loaned | | | 98,414 | | | | — | | | | — | | | | 98,414 | | |
Total | | $ | 1,163,450 | | | $ | 14,716 | | | $ | — | | | $ | 1,178,166 | | |
Other Financial Investments* | |
Assets: | |
Futures Contracts | | $ | 2,219 | | | $ | — | | | $ | — | | | $ | 2,219 | | |
Liabilities: | |
Futures Contracts | | $ | (1,199 | ) | | $ | — | | | $ | — | | | $ | (1,199 | ) | |
Total | | $ | 1,020 | | | $ | — | | | $ | — | | | $ | 1,020 | | |
* Futures contracts are valued at the unrealized appreciation (depreciation) on the investment.
For the six months ended November 30, 2022, there were no transfers into/out of Level 3.
Real Estate Investment Trusts ("REITs"):
The Fund may invest in REITs, which report information on the source of their distributions annually. REITs are pooled investment vehicles that invest primarily in income producing real estate or real estate related loans or interests (such as mortgages). Certain distributions received from REITs during the year are recorded as realized gains or return of capital as estimated by the Fund or when such information becomes known.
17
USAA Mutual Funds Trust | | Notes to Financial Statements — continued
November 30, 2022 | |
(Unaudited)
Investment Companies:
Exchange-Traded Funds:
The Fund may invest in ETFs, the shares of which are bought and sold on a securities exchange. An ETF trades like common stock and represents a fixed portfolio of securities often designed to track the performance and dividend yield of a particular domestic or foreign market index. The Fund may purchase shares of an ETF to temporarily gain exposure to a portion of the U.S. or a foreign market while awaiting purchase of underlying securities. The risks of owning an ETF generally reflect the risks of owning the underlying securities the ETF is designed to track, although the lack of liquidity of an ETF could result in it being more volatile. Additionally, ETFs have fees and expenses that reduce their value.
Open-End Funds:
The Fund may invest in portfolios of open-end investment companies. These investment companies value securities in their portfolios for which market quotations are readily available at their market values (generally the last reported sale price) and all other securities and assets at their fair value by the methods established by the board of directors of the underlying funds.
Mortgage-and Asset-Backed Securities:
The values of some mortgage-related or asset-backed securities may be particularly sensitive to changes in prevailing interest rates. Early repayment of principal on some mortgage-related securities may expose the Fund to a lower rate of return upon reinvestment of principal. The values of mortgage- and asset-backed securities depend in part on the credit quality and adequacy of the underlying assets or collateral and may fluctuate in response to the market's perception of these factors as well as current and future repayment rates. Some mortgage-backed securities are backed by the full faith and credit of the U.S. government (e.g., mortgage-backed securities issued by the Government National Mortgage Association, commonly known as "Ginnie Mae"), while other mortgage-backed securities (e.g., mortgage-backed securities issued by the Federal National Mortgage Association and the Federal Home Loan Mortgage Corporation, commonly known as "Fannie Mae" and "Freddie Mac," respectively), are backed only by the credit of the government entity issuing them. In addition, some mortgage-backed securities are issued by private entities and, as such, are not guaranteed by the U.S. government or any agency or instrumentality of the U.S. government.
Derivative Instruments:
Futures Contracts:
The Fund may enter into contracts for the future delivery of securities or foreign currencies and futures contracts based on a specific security, class of securities, foreign currency or an index, and purchase or sell options on any such futures contracts. A futures contract on a securities index is an agreement obligating either party to pay, and entitling the other party to receive, while the contract is outstanding, cash payments based on the level of a specified securities index. No physical delivery of the underlying asset is made. The Fund may enter into futures contracts in an effort to hedge against market risks. The acquisition of put and call options on futures contracts will give the Fund the right (but not the obligation), for a specified price, to sell or to purchase the underlying futures contract, upon exercise of the option, at any time during the option period. Futures transactions involve brokerage costs and require the Fund to segregate assets to cover contracts that would require it to purchase securities or currencies. A good faith margin deposit, known as initial margin, of cash or government securities with a broker or custodian is required to initiate and maintain open positions in futures contracts. Subsequent payments, known as variation margin, are made or received by the Fund based on the change in the market value of the position and are recorded as unrealized appreciation or depreciation until the contract is closed out, at which time the gain or loss is realized. The Fund may lose the expected benefit of futures transactions if interest rates, exchange rates or securities prices change in an unanticipated
18
USAA Mutual Funds Trust | | Notes to Financial Statements — continued
November 30, 2022 | |
(Unaudited)
manner. Such unanticipated changes may also result in lower overall performance than if the Fund had not entered into any futures transactions. In addition, the value of the Fund's futures positions may not prove to be perfectly or even highly correlated with the value of its portfolio securities or foreign currencies, limiting the Fund's ability to hedge effectively against interest rate, exchange rate and/or market risk and giving rise to additional risks. There is no assurance of liquidity in the secondary market for purposes of closing out futures positions. The collateral held by the Fund is reflected on the Statement of Assets and Liabilities under Deposit with broker for futures contracts and Collateral received from broker for futures contracts.
Management has determined that no offsetting requirements exist as a result of their conclusion that the Fund is not subject to master netting agreements for futures contracts. During the six months ended November 30, 2022, the Fund entered into futures contracts primarily for the strategy of gaining exposure to a particular asset class or securities market.
Summary of Derivative Instruments:
The following table summarizes the fair values of derivative instruments on the Statement of Assets and Liabilities, categorized by risk exposure, as of November 30, 2022 (amounts in thousands):
| | | Assets | | Liabilities | |
| | | Variation Margin
Receivable on Open
Futures Contracts* | | Variation Margin
Payable on Open
Futures Contracts* | |
Equity Risk Exposure | | $ | 2,219 | | | $ | 1,199 | | |
* Includes cumulative unrealized appreciation (depreciation) of futures contracts as reported on the Schedule of Portfolio Investments. Only current day's variation margin for futures contracts is reported within the Statement of Assets and Liabilities.
The following table presents the effect of derivative instruments on the Statement of Operations, categorized by risk exposure, for the six months ended November 30, 2022 (amounts in thousands):
| | | Net Realized Gains (Losses) on
Derivatives Recognized as
a Result of Operations | | Net Change in Unrealized
Appreciation/Depreciation
on Derivatives Recognized
as a Result of Operations | |
| | | Net Realized Gains (Losses)
from Futures Contracts | | Net Change in Unrealized
Appreciation/Depreciation
on Futures Contracts | |
Equity Risk Exposure | | $ | (12 | ) | | $ | 1,630 | | |
All open derivative positions at period end are reflected on the Fund's Schedule of Portfolio Investments. The underlying face value of open derivative positions relative to the Fund's net assets at period end is generally representative of the notional amount of open positions to net assets throughout the period.
Investment Transactions and Related Income:
Changes in holdings of investments are accounted for no later than one business day following the trade date. For financial reporting purposes, however, investment transactions are accounted for on trade date or the last business day of the reporting period. Interest income is determined on the basis of coupon interest accrued using the effective interest method which adjusts, where applicable, the amortization of premiums or accretion of discounts. Dividend income is recorded on the ex-dividend date. Gains or losses realized on sales of securities are recorded on the identified cost basis. Paydown gains or losses on applicable securities, if any, are recorded as components of Interest income on the Statement of Operations.
Withholding taxes on interest, dividends, and gains as a result of certain investments in ADRs by the Fund have been provided for in accordance with each investment's applicable country's tax rules and rates.
19
USAA Mutual Funds Trust | | Notes to Financial Statements — continued
November 30, 2022 | |
(Unaudited)
Securities Lending:
The Fund, through a Securities Lending Agreement with Citibank, N.A. ("Citibank"), may lend its securities to qualified financial institutions, such as certain broker-dealers and banks, to earn additional income, net of income retained by Citibank. Borrowers are required to initially secure their loans for collateral in the amount of at least 102% of the value of U.S. securities loaned or at least 105% of the value of non-U.S. securities loaned, marked-to-market daily. Any collateral shortfalls associated with increases in the valuation of the securities loaned are generally cured the next business day. The collateral can be received in the form of cash collateral and/or non-cash collateral. Non-cash collateral can include U.S. Government Securities and other securities as permitted by Securities and Exchange Commission ("SEC") guidelines. The cash collateral is invested in short-term instruments or cash equivalents, primarily open-end investment companies, as noted on the Fund's Schedule of Portfolio Investments. The Fund effectively does not have control of the non-cash collateral and therefore it is not disclosed on the Fund's Schedule of Portfolio Investments. Collateral requirements are determined daily based on the value of the Fund's securities on loan as of the end of the prior business day. During the time portfolio securities are on loan, the borrower will pay the Fund any dividends or interest paid on such securities plus any fee negotiated between the parties to the lending agreement. The Fund also earns a return from the collateral. The Fund pays Citibank various fees in connection with the investment of cash collateral and fees based on the investment income received from securities lending activities. Securities lending income (net of these fees) is disclosed on the Statement of Operations. Loans are terminable upon demand and the borrower must return the loaned securities within the lesser of one standard settlement period or five business days. Although risk is mitigated by the collateral, the Fund could experience a delay in recovering its securities and possible loss of income or value if the borrower fails to return them. In addition, there is a risk that the value of the short-term investments will be less than the amount of cash collateral required to be returned to the borrower.
The Fund's agreement with Citibank does not include master netting provisions. Non-cash collateral received by the Fund may not be sold or repledged, except to satisfy borrower default.
The following table (amounts in thousands) is a summary of the Fund's securities lending transactions as of November 30, 2022.
Value of
Securities on Loan | | Non-Cash
Collateral | | Cash
Collateral | |
| $ | 97,776 | (a) | | $ | — | | | $ | 98,414 | | |
(a) Includes $918 thousand of securities on loan that were sold prior to November 30, 2022.
Foreign Currency Translations:
The accounting records of the Fund are maintained in U.S. dollars. Investment securities and other assets and liabilities of the Fund denominated in a foreign currency are translated into U.S. dollars at current exchange rates. Purchases and sales of securities, income receipts, and expense payments are translated into U.S. dollars at the exchange rates on the date of the transactions. The Fund does not isolate the portion of the results of operations resulting from changes in foreign exchange rates on investments from fluctuations arising from changes in market prices of securities held. Such fluctuations are disclosed as Net change in unrealized appreciation/depreciation on unaffiliated investment securities and foreign currency translations on the Statement of Operations. Any realized gains or losses from these fluctuations are disclosed as Net realized gains (losses) from unaffiliated investment securities and foreign currency transactions on the Statement of Operations.
Foreign Taxes:
The Fund may be subject to foreign taxes related to foreign income received (a portion of which may be reclaimable), capital gains on the sale of securities, and certain foreign currency transactions. All foreign taxes are recorded in accordance with the applicable regulations and rates that exist in the foreign jurisdictions in which the Fund invests.
20
USAA Mutual Funds Trust | | Notes to Financial Statements — continued
November 30, 2022 | |
(Unaudited)
Federal Income Taxes:
The Fund intends to continue to qualify as a regulated investment company by complying with the provisions available to certain investment companies, as defined in applicable sections of the Internal Revenue Code, and to make distributions of net investment income and net realized gains sufficient to relieve it from all, or substantially all, federal income taxes. Accordingly, no provision for federal income taxes is required in the financial statements. The Fund has a tax year end of May 31.
For the six months ended November 30, 2022, the Fund did not incur any income tax, interest, or penalties, and has recorded no liability for net unrecognized tax benefits relating to uncertain tax positions.
Management of the Fund has reviewed tax positions taken in tax years that remain subject to examination by all major tax jurisdictions, including federal (i.e., the last four tax years, which includes the current fiscal tax year end). Management believes that there is no tax liability resulting from unrecognized tax benefits related to uncertain tax positions taken.
Allocations:
Expenses directly attributable to the Fund are charged to the Fund, while expenses that are attributable to more than one fund in the Trust, or jointly with an affiliated trust, are allocated among the respective funds in the Trust and/or an affiliated trust based upon net assets or another appropriate basis.
Cross-Trade Transactions:
Pursuant to Rule 17a-7 under the 1940 Act, the Fund may engage in cross-trades, which are securities transactions with affiliated investment companies and advisory accounts managed by the Adviser and any applicable sub-adviser under specified conditions outlined in the valuation policies and procedures adopted by the Board. In addition, as defined under the valuation policies and procedures, each transaction must be effected at the independent current market price. For the six months ended November 30, 2022, the Fund engaged in the following securities transactions with affiliated funds, which resulted in the following net realized gains (losses) (amounts in thousands):
| Purchases | | Sales | | Net Realized
Gains (Losses) | |
| $ | — | | | $ | 1,779 | | | $ | (252 | ) | |
3. Purchases and Sales:
Purchases and sales of securities (excluding securities maturing less than one year from acquisition) for the six months ended November 30, 2022, were as follows for the Fund (amounts in thousands):
Excluding
U.S. Government Securities | | U.S. Government Securities | |
Purchases | | Sales | | Purchases | | Sales | |
$ | 322,641 | | | $ | 321,887 | | | $ | — | | | $ | 609 | | |
4. Fees and Transactions with Affiliates and Related Parties:
Investment Advisory Fees:
Investment advisory services are provided to the Fund by the Adviser, which is a New York corporation registered as an investment adviser with the SEC.
Under the terms of the Investment Advisory Agreement, the Adviser is entitled to receive fees accrued daily and paid monthly at an annualized rate of 0.59% of the Fund's average daily net assets. Amounts incurred and paid to VCM for the six months ended November 30, 2022, are reflected on the Statement of Operations as Investment advisory fees.
21
USAA Mutual Funds Trust | | Notes to Financial Statements — continued
November 30, 2022 | |
(Unaudited)
The Trust relies on an exemptive order granted to VCM and its affiliated funds by the SEC in March 2019, permitting the use of a "manager-of-managers" structure for certain funds. Under a manager-of-managers structure, the investment adviser may select (with approval of the Board and without shareholder approval) one or more subadvisers to manage the day-to-day investment of a fund's assets. For the six months ended November 30, 2022, the Fund had no subadvisers.
Administration and Servicing Fees:
VCM also serves as the Fund's administrator and fund accountant. Under the Fund Administration, Servicing and Accounting Agreement, VCM is paid an administration and servicing fee that is accrued daily and paid monthly at an annualized rate of 0.15%, which is based on the Fund's average daily net assets. Amounts incurred for the six months ended November 30, 2022, are reflected on the Statement of Operations as Administration fees.
Citi Fund Services Ohio, Inc. ("Citi"), an affiliate of Citibank, acts as sub-administrator and sub-fund accountant to the Fund pursuant to a Sub-Administration and Sub-Fund Accounting Services Agreement between VCM and Citi. VCM pays Citi a fee for providing these services. The Fund reimburses VCM and Citi for out-of-pocket expenses incurred in providing these services and certain other expenses specifically allocated to the Fund. Amounts incurred for the six months ended November 30, 2022, are reflected on the Statement of Operations as Sub-Administration fees.
The Fund (as part of the Trust) has entered into an agreement with the Adviser to provide compliance services, pursuant to which the Adviser furnishes its compliance personnel, including the services of the Chief Compliance Officer ("CCO"), and other resources reasonably necessary to provide the Trust with compliance oversight services related to the design, administration, and oversight of a compliance program for the Trust in accordance with Rule 38a-1 under the 1940 Act. The CCO is an employee of the Adviser, which pays the compensation of the CCO and support staff. The funds in the Trust, Victory Variable Insurance Funds, Victory Portfolios, and Victory Portfolios II (collectively, the "Victory Funds Complex") in the aggregate, compensate the Adviser for these services. Amounts incurred for the six months ended November 30, 2022, are reflected on the Statement of Operations as Compliance fees.
Transfer Agency Fees:
Victory Capital Transfer Agency, Inc. ("VCTA"), an affiliate of the Adviser, provides transfer agency services to the Fund. VCTA provides transfer agent services to the Fund based on an annual charge of $23 per shareholder account plus out-of-pocket expenses. VCTA pays a portion of these fees to certain intermediaries for the administration and servicing of accounts that are held with such intermediaries. Amounts incurred and paid to VCTA for the six months ended November 30, 2022, are reflected on the Statement of Operations as Transfer agent fees.
FIS Investor Services LLC serves as sub-transfer agent and dividend disbursing agent for the Fund pursuant to a Sub-Transfer Agent Agreement between VCTA and FIS Investor Services LLC. VCTA provides FIS Investor Services LLC a fee for providing these services.
Distributor/Underwriting Services:
Victory Capital Services, Inc. (the "Distributor"), an affiliate of the Adviser, serves as Distributor for the continuous offering of the shares of the Fund pursuant to a Distribution Agreement between the Distributor and the Trust and receives no fee or other compensation for these services.
Other Fees:
Citibank serves as the Fund's custodian. The Fund pays Citibank a fee for providing these services. Amounts incurred for the six months ended November 30, 2022, are reflected on the Statement of Operations as Custodian fees.
K&L Gates LLP provides legal services to the Trust.
The Adviser has entered into an expense limitation agreement with the Fund until at least September 30, 2023. Under the terms of the agreement, the Adviser has agreed to waive fees or reimburse certain expenses to the extent that ordinary operating expenses incurred in any fiscal year exceed the expense
22
USAA Mutual Funds Trust | | Notes to Financial Statements — continued
November 30, 2022 | |
(Unaudited)
limit for the Fund. Such excess amounts will be the liability of the Adviser. Acquired fund fees and expenses, interest, taxes, brokerage commissions, other expenditures, which are capitalized in accordance with GAAP, and other extraordinary expenses not incurred in the ordinary course of the Fund's business are excluded from the expense limits. As of November 30, 2022, the expense limit (excluding voluntary waivers) was 1.00%.
In addition, the Fund invests in affiliated VCM exchange-traded fund(s) ("affiliated ETFs"). The Fund's advisory fee is reimbursed by VCM that to the extent of the indirect advisory fee incurred through the Fund's proportional investment in the affiliated ETFs. These affiliated ETF advisory fee reimbursements are not available for recoupment. For the six months ended November 30, 2022, the Fund incurred reimbursable expense of $590 thousand, of which $590 thousand consisted of affiliated ETF Adviser fee reimbursements and is reflected on the Statement of Operations as Expenses waived/reimbursed by Adviser. The Fund has a receivable related to these reimbursable expenses from the Adviser for $286 thousand, pursuant to the Fund's expense limitation agreement and is reflected on the Statement of Assets and Liabilities as Receivable from Advisor for ETF reimbursements.
Under the terms of the expense limitation agreement, as amended June 29, 2022, the Fund has agreed to repay fees and expenses that were waived or reimbursed by the Adviser for a period of up to three years (thirty-six (36) months) after the waiver or reimbursement took place, subject to the lesser of any operating expense limits in effect at the time of: (a) the original waiver or expense reimbursement; or (b) the recoupment, after giving effect to the recoupment amount. As of November 30, 2022, there are no amounts available to be repaid to the Adviser.
The Adviser may voluntarily waive or reimburse additional fees to assist the Fund in maintaining competitive expense ratios. Voluntary waivers and reimbursements applicable to the Fund are not available to be recouped at a future time. There were no voluntary waivers or reimbursements for the six months ended November 30, 2022.
Certain officers and/or interested trustees of the Fund are also officers and/or employees of the Adviser, administrator, fund accountant, sub-administrator, sub-fund accountant, custodian, and Distributor.
5. Risks:
The Fund may be subject to other risks in addition to these identified risks.
Tactical Allocation Risk — The Fund has a targeted risk tolerance and a corresponding asset allocation target; however, mere asset allocation and volatility are not the sole determination of risk. The Fund's managers will tactically allocate away from the target allocation as market conditions and the perceived risks warrant. The Fund bears the risk that the managers' tactical allocation will not be successful.
Affiliated Funds Risk — The risks of the Fund directly correspond to the risks of the underlying affiliated funds in which the Fund invests. By investing in the underlying affiliated funds, the Fund has exposure to the risk of many different areas of the market. The degree to which the risks described below apply to the Fund varies according to the Fund's asset allocation. For instance, the more the Fund is allocated to stock funds, the greater the risk associated with equity securities. The Fund also is subject to asset allocation risk (i.e., the risk that allocations will not produce the intended results) and to management risk (i.e., the risk that the selection of underlying affiliated funds will not produce the intended results).
Conflict of Interest Risk — In managing a Fund that invests in underlying affiliated funds, the Adviser may have conflicts of interest in allocating the Fund's assets among the various underlying affiliated funds. This is because the fees payable by some of the underlying affiliated funds to the Adviser and/or its affiliates are higher than the fees payable by other underlying affiliated funds, and because the Adviser also manages and administers the underlying affiliated funds.
ETF Risk — The Fund may invest in shares of ETFs, which generally are registered investment companies that hold a portfolio of common stocks or debt securities, the shares of which are traded on an exchange. ETFs incur their own management and other fees and expenses, such as trustees' fees,
23
USAA Mutual Funds Trust | | Notes to Financial Statements — continued
November 30, 2022 | |
(Unaudited)
operating expenses, registration fees, and marketing expenses, a proportionate share of which will be borne indirectly by the Fund as a shareholder in an ETF. As a result, the Fund's investment in an ETF will cause the Fund to indirectly bear the fees and expenses of the ETF and, in turn, the Fund's performance may be lower than if the Fund were to invest directly in the underlying securities held by the ETF. For investments in affiliated ETFs, the Fund's management fee is reimbursed by the Adviser to the extent of the indirect management fee incurred through the Fund's investment in the affiliated ETFs. The Adviser may have conflicts of interest in allocating assets among affiliated and unaffiliated ETFs, because the Adviser also manages and administers the affiliated ETFs, and the Adviser and its affiliates receive other fees from the affiliated ETFs. In addition, the Fund also will be subject to the risks associated with the securities or other investments held by the ETFs.
Market Risk — Overall market risks may affect the value of the Fund. Domestic and international factors such as political events, war, terrorism, trade disputes, inflation rates, interest rate levels and other fiscal and monetary policy changes, cybersecurity incidents, pandemics and other public health crises, sanctions against a particular foreign country, its nationals, businesses or industries and related geopolitical events, as well as environmental disasters such as earthquakes, fires, and floods, or other catastrophes, may add to instability in global economies and markets generally, and may lead to increased market volatility. Global economies and financial markets are highly interconnected, which increases the possibility that conditions in one country or region might adversely affect issuers in another country or region. The impact of these and other factors may be short-term or may last for extended periods.
6. Borrowing and Interfund Lending:
Line of Credit:
The Victory Funds Complex participates in a short-term demand note "Line of Credit" agreement with Citibank. The Line of Credit agreement with Citibank was renewed on June 27, 2022, with a termination date of June 26, 2023. Under the agreement with Citibank, the Victory Funds Complex may borrow up to $600 million, of which $300 million is committed and $300 million is uncommitted. $40 million of the Line of Credit is reserved for use by the Victory Floating Rate Fund, another series of the Victory Funds Complex, with Victory Floating Rate Fund paying the related commitment fees for that amount. The purpose of the Line of Credit is to meet temporary or emergency cash needs. For the six months ended November 30, 2022, Citibank received an annual commitment fee of 0.15% on $300 million for providing the Line of Credit. Each fund in the Victory Funds Complex paid a pro-rata portion of the commitment fees plus any interest on amounts borrowed. For the period from June 1, 2022, through June 27, 2022, interest was based on the one-month London Interbank Offered Rate ("LIBOR") plus one percent. Effective with the renewal, for the period June 28, 2022, through November 30, 2022, interest was based on the one-month Secured Overnight Financing Rate ("SOFR") plus 1.10 percent. Interest charged to the Fund during the period, if applicable, is reflected on the Statement of Operations under Line of credit fees.
The Fund had no borrowings under the Line of Credit agreement during the six months ended November 30, 2022.
Interfund Lending:
The Trust and the Adviser rely on an exemptive order granted by the SEC in March 2017 (the "Order"), permitting the establishment and operation of an Interfund Lending Facility (the "Facility"). The Facility allows the Fund to directly lend and borrow money to or from any other fund in the Victory Funds Complex that is permitted to participate in the Facility, relying upon the Order at rates beneficial to both the borrowing and lending funds. Advances under the Facility are allowed for temporary or emergency purposes, including the meeting of redemption requests that otherwise might require the untimely disposition of securities, and are subject to each Fund's borrowing restrictions. The interfund loan rate is determined, as specified in the Order, by averaging the current repurchase agreement rate and the current bank loan rate. As a Borrower, interest charged to the Fund, if any, during the period,
24
USAA Mutual Funds Trust | | Notes to Financial Statements — continued
November 30, 2022 | |
(Unaudited)
is reflected on the Statement of Operations under Interfund lending fees. As a Lender, interest earned by the Fund, if any, during the period, is reflected on the Statement of Operations under Interfund lending.
The Fund did not utilize or participate in the Facility during the six months ended November 30, 2022.
7. Federal Income Tax Information:
The Fund intends to distribute any net investment income quarterly. Distributable net realized gains, if any, are declared and paid at least annually.
The amounts of dividends from net investment income and distributions from net realized gains (collectively, distributions to shareholders) are determined in accordance with federal income tax regulations, which may differ from GAAP. To the extent these "book/tax" differences are permanent in nature (e.g., net operating loss and distribution reclassification), such amounts are reclassified within the components of net assets based on their federal tax-basis treatment; temporary differences (e.g., wash sales) do not require reclassification. To the extent dividends and distributions exceed net investment income and net realized gains for tax purposes, they are reported as distributions of capital. Net investment losses incurred by the Fund may be reclassified as an offset to capital on the accompanying Statement of Assets and Liabilities.
The tax character of current year distributions paid and the tax basis of the current components of accumulated earnings (loss) will be determined at the end of the current tax year.
At the tax year ended May 31, 2022, the Fund had no capital loss carryforwards for federal income tax purposes.
8. Affiliated Securities:
An affiliated security is a security in which the Fund has ownership of at least 5% of the security's outstanding voting shares, an investment company managed by VCM, or an issuer under common control with a Fund or VCM. The Fund does not invest in affiliated securities for the purpose of exercising management or control. These securities are noted as affiliated on the Fund's Schedule of Portfolio Investments. The financial statements of the underlying funds can be found in shareholder reports filed with the SEC by each such underlying fund semi-annually on Form N-CSR and are available for download from both the SEC's as well as each respective underlying fund's website. Transactions in affiliated securities during the six months ended November 30, 2022, were as follows (amounts in thousands):
| | | Fair
Value
5/31/2022 | | Purchases
at Cost | | Proceeds
from
Sales | | Realized
Gains
(Losses) | | Capital
Gain
Distribution | | Net
Change
in Unrealized
Appreciation/
Depreciation | | Fair Value
11/30/2022 | | Dividend
Income | |
VictoryShares Emerging
Markets Value
Momentum ETF | | $ | 2,297 | | | $ | — | | | $ | — | | | $ | — | | | $ | — | | | $ | (221 | ) | | $ | 2,076 | | | $ | 60 | | |
VictoryShares ESG
Core Plus Bond ETF | | | 72,447 | | | | 2,734 | | | | (1,367 | ) | | | — | | | | — | | | | (3,662 | ) | | | 70,152 | | | | 1,210 | | |
VictoryShares USAA Core
Intermediate-Term
Bond ETF | | | 305,869 | | | | 9,656 | | | | (22,843 | ) | | | (4,060 | ) | | | — | | | | (10,916 | ) | | | 277,706 | | | | 3,421 | | |
VictoryShares USAA Core
Short-Term Bond ETF | | | 16,922 | | | | — | | | | — | | | | — | | | | — | | | | (299 | ) | | | 16,623 | | | | 222 | | |
| | | $ | 397,535 | | | $ | 12,390 | | | $ | (24,210 | ) | | $ | (4,060 | ) | | $ | — | | | $ | (15,098 | ) | | $ | 366,557 | | | $ | 4,913 | | |
25
USAA Mutual Funds Trust | | Supplemental Information
November 30, 2022 | |
(Unaudited)
Proxy Voting and Portfolio Holdings Information
Proxy Voting:
Information regarding the policies and procedures the Fund uses to determine how to vote proxies relating to portfolio securities is available without charge, upon request, by calling (800) 235-8396. The information is also included in the Fund's Statement of Additional Information, which is available on the SEC's website at www.sec.gov.
Information relating to how the Fund voted proxies relating to portfolio securities held during the most recent 12 months ended June 30 is available on the SEC's website at www.sec.gov.
Availability of Schedules of Portfolio Investments:
The Trust files a complete list of Schedules of Portfolio Investments with the SEC for the first and third quarter of each fiscal year on Form N-PORT. Form N-PORT is available on the SEC's website at www.sec.gov.
Expense Example
As a shareholder of the Fund, you may incur two types of costs: (1) transaction costs and (2) ongoing costs, including management fees and other Fund expenses. These examples are intended to help you understand your ongoing costs (in dollars) of investing in the Fund and to compare these costs with the ongoing costs of investing in other mutual funds.
These examples are based on an investment of $1,000 invested at the beginning of the period and held for the entire period from June 1, 2022, through November 30, 2022.
The Actual Expense figures in the table below provide information about actual account values and actual expenses. You may use the information below, together with the amount you invested, to estimate the expenses that you paid over the period. Simply divide your account value by $1,000 (for example, an $8,600 account value divided by $1,000 = 8.6), then multiply the result by the number in the table under the heading entitled "Actual Expenses Paid During Period" to estimate the expenses you paid on your account during this period.
The Hypothetical Expense figures in the table below provide information about hypothetical account values and hypothetical expenses based on the Fund's actual expense ratio and an assumed rate of return of 5% per year before expenses, which is not the Fund's actual return. The hypothetical account values and expenses may not be used to estimate the actual ending account balance or expenses you paid for the period. You may use this information to compare this 5% hypothetical example with the 5% hypothetical examples that appear in shareholder reports of other funds.
Please note the expenses shown in the table below are meant to highlight your ongoing costs only and do not reflect any transactional costs. Therefore, the hypothetical expenses in the table are useful in comparing ongoing costs only and will not help you determine the relative total costs of owning different funds. In addition, if these transactional costs were included, your costs would have been higher.
Beginning
Account Value
6/1/22 | | Actual
Ending
Account Value
11/30/22 | | Hypothetical
Ending
Account Value
11/30/22 | | Actual
Expenses Paid
During Period
6/1/22-11/30/22* | | Hypothetical
Expenses Paid
During Period
6/1/22-11/30/22* | | Annualized
Expense Ratio
During Period
6/1/22-11/30/22 | |
| $ | 1,000.00 | | | $ | 974.50 | | | $ | 1,020.71 | | | $ | 4.31 | | | $ | 4.41 | | | | 0.87 | % | |
* Expenses are equal to the average account value multiplied by the Fund's annualized expense ratio multiplied by 183/365 (the number of days in the most recent fiscal half-year divided by the number of days in the fiscal year).
26
Privacy Policy
Protecting the Privacy of Information
The Trust respects your right to privacy. We also know that you expect us to conduct and process your business in an accurate and efficient manner. To do so, we must collect and maintain certain personal information about you. This is the information we collect from you on applications or other forms, and from the transactions you make with us or third parties. It may include your name, address, social security number, account transactions and balances, and information about investment goals and risk tolerance.
We do not disclose any information about you or about former customers to anyone except as permitted or required by law. Specifically, we may disclose the information we collect to companies that perform services on our behalf, such as the transfer agent that processes shareholder accounts and printers and mailers that assist us in the distribution of investor materials. We may also disclose this information to companies that perform marketing services on our behalf. This allows us to continue to offer you Victory investment products and services that meet your investing needs, and to effect transactions that you request or authorize. These companies will use this information only in connection with the services for which we hired them. They are not permitted to use or share this information for any other purpose.
To protect your personal information internally, we permit access only by authorized employees and maintain physical, electronic, and procedural safeguards to guard your personal information.*
* You may have received communications regarding information about privacy policies from other financial institutions which gave you the opportunity to "opt-out" of certain information sharing with companies which are not affiliated with that financial institution. The Trust does not share information with other companies for purposes of marketing solicitations for products other than the Trust. Therefore, the Trust does not provide opt-out options to their shareholders.
P.O. Box 182593
Columbus, Ohio 43218-2593

Visit our website at: | | Call | |
www.vcm.com | | (800) 235-8396 | |

NOVEMBER 30, 2022
Semi Annual Report
USAA Cornerstone Moderately
Aggressive Fund
Victory Capital means Victory Capital Management Inc., the investment adviser of the USAA Mutual Funds. USAA Mutual Funds are distributed by Victory Capital Services, Inc., member FINRA, an affiliate of Victory Capital. Victory Capital and its affiliates are not affiliated with United Services Automobile Association or its affiliates. USAA and the USAA logos are registered trademarks and the USAA Mutual Funds and USAA Investments logos are trademarks of United Services Automobile Association and are being used by Victory Capital and its affiliates under license.
www.vcm.com
News, Information And Education 24 Hours A Day, 7 Days A Week
The Victory Capital website gives fund shareholders, prospective shareholders, and investment professionals a convenient way to access fund information, get guidance, and track fund performance anywhere they can access the Internet. The site includes:
• Detailed performance records
• Daily share prices
• The latest fund news
• Investment resources to help you become a better investor
• A section dedicated to investment professionals
Whether you're a potential investor searching for the fund that matches your investment philosophy, a seasoned investor interested in planning tools, or an investment professional, www.vcm.com has what you seek. Visit us anytime. We're always open.
TABLE OF CONTENTS
Investment Objective & Portfolio Holdings | | | 2 | | |
Schedule of Portfolio Investments | | | 3 | | |
Financial Statements | |
Statement of Assets and Liabilities | | | 13 | | |
Statement of Operations | | | 14 | | |
Statements of Changes in Net Assets | | | 15 | | |
Financial Highlights | | | 16 | | |
Notes to Financial Statements | | | 18 | | |
Supplemental Information | | | 28 | | |
Proxy Voting and Portfolio Holdings Information | | | 28 | | |
Expense Example | | | 28 | | |
Privacy Policy (inside back cover) | | | |
This report is for the information of the shareholders and others who have received a copy of the currently effective prospectus of the Fund, managed by Victory Capital Management Inc. It may be used as sales literature only when preceded or accompanied by a current prospectus, which provides further details about the Fund.
IRA DISTRIBUTION WITHHOLDING DISCLOSURE
We generally must withhold federal income tax at a rate of 10% of the taxable portion of your distribution and, if you live in a state that requires state income tax withholding, at your state's tax rate. However, you may elect not to have withholding apply or to have income tax withheld at a higher rate. Any withholding election that you make will apply to any subsequent distribution unless and until you change or revoke the election. If you wish to make a withholding election, or change or revoke a prior withholding election, call (800) 235-8396, and form W-4P (OMB No. 1545-0074 withholding certificate for pension or annuity payments) will be electronically sent.
If you do not have a withholding election in place by the date of a distribution, federal income tax will be withheld from the taxable portion of your distribution at a rate of 10%. If you must pay estimated taxes, you may be subject to estimated tax penalties if your estimated tax payments are not sufficient and sufficient tax is not withheld from your distribution.
For more specific information, please consult your tax adviser.
• NOT FDIC INSURED • NO BANK GUARANTEE • MAY LOSE VALUE
1
USAA Mutual Funds Trust
USAA Cornerstone Moderately Aggressive Fund | | November 30, 2022 | |
(Unaudited)
Investment Objective and Portfolio Holdings:
The Fund seeks capital appreciation with a secondary focus on current income.
Asset Allocation*:
November 30, 2022
(% of Net Assets)
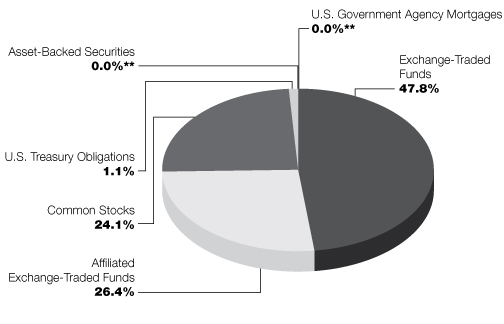
* Does not include futures contracts, money market instruments, and short-term investments purchased with cash collateral from securities loaned.
** Percentage is less than 0.05%.
Percentages are of the net assets of the Fund and may not equal 100%.
2
USAA Mutual Funds Trust
USAA Cornerstone Moderately Aggressive Fund | | Schedule of Portfolio Investments
November 30, 2022 | |
(Amounts in Thousands, Except for Shares) (Unaudited)
Security Description | | Shares or
Principal
Amount | | Value | |
Asset-Backed Securities (0.0%) (a) | |
NP SPE II LLC, Series 2017-1A, Class A1, 3.37%, 10/21/47 (b) | | $ | 455 | | | $ | 428 | | |
Total Asset-Backed Securities (Cost $455) | | | 428 | | |
Common Stocks (24.1%) | |
Communication Services (1.6%): | |
Alphabet, Inc. Class C (c) | | | 87,684 | | | | 8,895 | | |
AT&T, Inc. | | | 373,446 | | | | 7,200 | | |
Cogent Communications Holdings, Inc. | | | 4,708 | | | | 273 | | |
Comcast Corp. Class A | | | 108,292 | | | | 3,968 | | |
John Wiley & Sons, Inc. Class A | | | 6,569 | | | | 311 | | |
Match Group, Inc. (c) | | | 50,873 | | | | 2,572 | | |
Meta Platforms, Inc. Class A (c) | | | 35,572 | | | | 4,201 | | |
Sirius XM Holdings, Inc. (d) | | | 845,266 | | | | 5,486 | | |
T-Mobile U.S., Inc. (c) | | | 22,578 | | | | 3,420 | | |
Verizon Communications, Inc. | | | 99,966 | | | | 3,897 | | |
Ziff Davis, Inc. (c) | | | 4,494 | | | | 415 | | |
| | | | 40,638 | | |
Consumer Discretionary (1.9%): | |
Academy Sports & Outdoors, Inc. | | | 8,700 | | | | 439 | | |
Asbury Automotive Group, Inc. | | | 1,290 | | | | 242 | | |
AutoZone, Inc. (c) | | | 2,493 | | | | 6,429 | | |
Best Buy Co., Inc. | | | 34,939 | | | | 2,980 | | |
Dillard's, Inc. Class A | | | 538 | | | | 194 | | |
Dollar General Corp. | | | 12,067 | | | | 3,085 | | |
Ford Motor Co. | | | 220,259 | | | | 3,062 | | |
Frontdoor, Inc. (c) | | | 9,997 | | | | 234 | | |
General Motors Co. | | | 76,418 | | | | 3,100 | | |
Genuine Parts Co. | | | 16,189 | | | | 2,968 | | |
GoPro, Inc. Class A (c) | | | 54,997 | | | | 301 | | |
Graham Holdings Co. Class B | | | 440 | | | | 283 | | |
La-Z-Boy, Inc. | | | 12,730 | | | | 347 | | |
Lennar Corp. Class A | | | 35,372 | | | | 3,107 | | |
Lowe's Cos., Inc. | | | 16,926 | | | | 3,598 | | |
MarineMax, Inc. (c) | | | 8,108 | | | | 268 | | |
McDonald's Corp. | | | 14,534 | | | | 3,965 | | |
Meritage Homes Corp. (c) | | | 3,569 | | | | 308 | | |
O'Reilly Automotive, Inc. (c) | | | 7,361 | | | | 6,364 | | |
Perdoceo Education Corp. (c) | | | 18,126 | | | | 260 | | |
Rent-A-Center, Inc. | | | 12,682 | | | | 305 | | |
Shoe Carnival, Inc. | | | 12,264 | | | | 324 | | |
Signet Jewelers Ltd. | | | 6,165 | | | | 401 | | |
Smith & Wesson Brands, Inc. | | | 23,705 | | | | 279 | | |
Target Corp. | | | 14,895 | | | | 2,488 | | |
The Home Depot, Inc. | | | 13,943 | | | | 4,517 | | |
| | | | 49,848 | | |
See notes to financial statements.
3
USAA Mutual Funds Trust
USAA Cornerstone Moderately Aggressive Fund | | Schedule of Portfolio Investments — continued
November 30, 2022 | |
(Amounts in Thousands, Except for Shares) (Unaudited)
Security Description | | Shares | | Value | |
Consumer Staples (1.3%): | |
Altria Group, Inc. | | | 146,881 | | | $ | 6,842 | | |
Colgate-Palmolive Co. | | | 40,135 | | | | 3,110 | | |
General Mills, Inc. | | | 40,225 | | | | 3,431 | | |
Herbalife Nutrition Ltd. (c) | | | 12,770 | | | | 224 | | |
Ingles Markets, Inc. Class A | | | 1,914 | | | | 194 | | |
Nu Skin Enterprises, Inc. Class A | | | 8,163 | | | | 340 | | |
PepsiCo, Inc. | | | 23,190 | | | | 4,302 | | |
Philip Morris International, Inc. | | | 36,585 | | | | 3,646 | | |
Sprouts Farmers Market, Inc. (c) | | | 5,501 | | | | 189 | | |
The Hershey Co. | | | 14,054 | | | | 3,305 | | |
Tyson Foods, Inc. Class A | | | 47,504 | | | | 3,149 | | |
United Natural Foods, Inc. (c) | | | 5,017 | | | | 239 | | |
Vector Group Ltd. | | | 30,912 | | | | 343 | | |
Walgreens Boots Alliance, Inc. | | | 75,978 | | | | 3,153 | | |
Weis Markets, Inc. | | | 2,156 | | | | 188 | | |
| | | | 32,655 | | |
Energy (1.4%): | |
Arch Resources, Inc. | | | 914 | | | | 141 | | |
California Resources Corp. | | | 7,795 | | | | 354 | | |
Chevron Corp. | | | 24,481 | | | | 4,488 | | |
Civitas Resources, Inc. | | | 4,816 | | | | 324 | | |
Comstock Resources, Inc. | | | 11,853 | | | | 217 | | |
ConocoPhillips | | | 28,142 | | | | 3,476 | | |
CONSOL Energy, Inc. | | | 2,543 | | | | 197 | | |
Devon Energy Corp. | | | 38,781 | | | | 2,657 | | |
EOG Resources, Inc. | | | 21,010 | | | | 2,982 | | |
Exxon Mobil Corp. | | | 94,461 | | | | 10,517 | | |
Magnolia Oil & Gas Corp. Class A | | | 11,543 | | | | 301 | | |
Marathon Oil Corp. | | | 90,225 | | | | 2,764 | | |
Marathon Petroleum Corp. | | | 25,957 | | | | 3,162 | | |
Matador Resources Co. | | | 4,487 | | | | 298 | | |
Murphy Oil Corp. | | | 6,496 | | | | 307 | | |
PBF Energy, Inc. Class A | | | 5,191 | | | | 206 | | |
SM Energy Co. | | | 6,431 | | | | 277 | | |
Valero Energy Corp. | | | 22,474 | | | | 3,003 | | |
| | | | 35,671 | | |
Financials (3.3%): | |
American Express Co. | | | 21,217 | | | | 3,344 | | |
Annaly Capital Management, Inc. | | | 5,534 | | | | 120 | | |
Aon PLC Class A | | | 9,939 | | | | 3,064 | | |
Arbor Realty Trust, Inc. | | | 19,783 | | | | 294 | | |
Arch Capital Group Ltd. (c) | | | 51,864 | | | | 3,107 | | |
Atlantic Union Bankshares Corp. | | | 9,174 | | | | 327 | | |
BancFirst Corp. | | | 1,207 | | | | 123 | | |
Berkshire Hathaway, Inc. Class B (c) | | | 31,659 | | | | 10,087 | | |
Blackstone Mortgage Trust, Inc. Class A | | | 14,144 | | | | 357 | | |
Capital One Financial Corp. | | | 29,461 | | | | 3,042 | | |
Cathay General Bancorp | | | 10,369 | | | | 482 | | |
See notes to financial statements.
4
USAA Mutual Funds Trust
USAA Cornerstone Moderately Aggressive Fund | | Schedule of Portfolio Investments — continued
November 30, 2022 | |
(Amounts in Thousands, Except for Shares) (Unaudited)
Security Description | | Shares | | Value | |
Citigroup, Inc. | | | 68,885 | | | $ | 3,335 | | |
City Holding Co. | | | 417 | | | | 42 | | |
Eagle Bancorp, Inc. | | | 5,798 | | | | 273 | | |
Enact Holdings, Inc. | | | 7,209 | | | | 179 | | |
Essent Group Ltd. | | | 13,024 | | | | 522 | | |
FactSet Research Systems, Inc. | | | 6,147 | | | | 2,835 | | |
First BanCorp | | | 29,550 | | | | 454 | | |
First Financial Bankshares, Inc. | | | 3,249 | | | | 120 | | |
Fulton Financial Corp. | | | 17,745 | | | | 330 | | |
Hancock Whitney Corp. | | | 9,846 | | | | 540 | | |
Hannon Armstrong Sustainable Infrastructure Capital, Inc. | | | 9,208 | | | | 299 | | |
Heartland Financial USA, Inc. | | | 4,142 | | | | 202 | | |
Hope Bancorp, Inc. | | | 22,287 | | | | 303 | | |
International Bancshares Corp. | | | 7,839 | | | | 413 | | |
JPMorgan Chase & Co. | | | 37,231 | | | | 5,145 | | |
Lakeland Financial Corp. | | | 547 | | | | 43 | | |
LPL Financial Holdings, Inc. | | | 11,605 | | | | 2,747 | | |
M&T Bank Corp. | | | 17,315 | | | | 2,944 | | |
Marsh & McLennan Cos., Inc. | | | 19,105 | | | | 3,309 | | |
MetLife, Inc. | | | 43,022 | | | | 3,300 | | |
Morgan Stanley | | | 39,270 | | | | 3,655 | | |
MSCI, Inc. | | | 5,421 | | | | 2,753 | | |
NMI Holdings, Inc. Class A (c) | | | 17,922 | | | | 386 | | |
OceanFirst Financial Corp. | | | 7,438 | | | | 174 | | |
OFG Bancorp | | | 10,304 | | | | 298 | | |
Pathward Financial, Inc. | | | 7,379 | | | | 321 | | |
Piper Sandler Cos. | | | 2,021 | | | | 290 | | |
Preferred Bank | | | 1,980 | | | | 150 | | |
PROG Holdings, Inc. (c) | | | 17,454 | | | | 344 | | |
Prudential Financial, Inc. | | | 29,057 | | | | 3,139 | | |
Radian Group, Inc. | | | 24,188 | | | | 473 | | |
Raymond James Financial, Inc. | | | 23,071 | | | | 2,697 | | |
Regions Financial Corp. | | | 121,038 | | | | 2,809 | | |
Selective Insurance Group, Inc. | | | 4,566 | | | | 439 | | |
ServisFirst Bancshares, Inc. | | | 1,434 | | | | 109 | | |
Signature Bank | | | 17,310 | | | | 2,415 | | |
Southside Bancshares, Inc. | | | 4,314 | | | | 157 | | |
Stewart Information Services Corp. | | | 6,516 | | | | 288 | | |
T. Rowe Price Group, Inc. | | | 20,612 | | | | 2,575 | | |
The Bancorp, Inc. (c) | | | 9,814 | | | | 294 | | |
The Bank of NT Butterfield & Son Ltd. | | | 7,336 | | | | 255 | | |
The Goldman Sachs Group, Inc. | | | 9,405 | | | | 3,632 | | |
The Progressive Corp. | | | 25,011 | | | | 3,305 | | |
UMB Financial Corp. | | | 5,439 | | | | 465 | | |
Valley National Bancorp | | | 44,704 | | | | 566 | | |
W.R. Berkley Corp. | | | 41,985 | | | | 3,203 | | |
Washington Federal, Inc. | | | 5,188 | | | | 183 | | |
| | | | 87,057 | | |
See notes to financial statements.
5
USAA Mutual Funds Trust
USAA Cornerstone Moderately Aggressive Fund | | Schedule of Portfolio Investments — continued
November 30, 2022 | |
(Amounts in Thousands, Except for Shares) (Unaudited)
Security Description | | Shares | | Value | |
Health Care (4.4%): | |
AbbVie, Inc. | | | 56,725 | | | $ | 9,143 | | |
AbCellera Biologics, Inc. (c) | | | 13,444 | | | | 173 | | |
Alector, Inc. (c) | | | 21,832 | | | | 185 | | |
AmerisourceBergen Corp. | | | 19,465 | | | | 3,322 | | |
Amgen, Inc. | | | 38,056 | | | | 10,899 | | |
Amphastar Pharmaceuticals, Inc. (c) | | | 3,021 | | | | 89 | | |
Arcus Biosciences, Inc. (c) | | | 8,808 | | | | 310 | | |
Arrowhead Pharmaceuticals, Inc. (c) | | | 9,787 | | | | 315 | | |
Avid Bioservices, Inc. (c) | | | 14,481 | | | | 227 | | |
Biogen, Inc. (c) | | | 10,593 | | | | 3,233 | | |
Bristol-Myers Squibb Co. | | | 98,225 | | | | 7,885 | | |
Catalyst Pharmaceuticals, Inc. (c) | | | 7,405 | | | | 124 | | |
Cigna Corp. | | | 22,482 | | | | 7,394 | | |
CVS Health Corp. | | | 36,625 | | | | 3,731 | | |
Dynavax Technologies Corp. (c) | | | 9,234 | | | | 115 | | |
Eagle Pharmaceuticals, Inc. (c) | | | 2,455 | | | | 89 | | |
Elevance Health, Inc. | | | 14,522 | | | | 7,739 | | |
Eli Lilly & Co. | | | 24,422 | | | | 9,063 | | |
Emergent BioSolutions, Inc. (c) | | | 15,441 | | | | 190 | | |
Fulgent Genetics, Inc. (c) | | | 7,636 | | | | 277 | | |
Gilead Sciences, Inc. | | | 41,808 | | | | 3,672 | | |
IDEXX Laboratories, Inc. (c) | | | 6,548 | | | | 2,789 | | |
iTeos Therapeutics, Inc. (c) | | | 6,167 | | | | 124 | | |
Johnson & Johnson | | | 29,579 | | | | 5,265 | | |
McKesson Corp. | | | 8,885 | | | | 3,391 | | |
Medpace Holdings, Inc. (c) | | | 509 | | | | 107 | | |
Merck & Co., Inc. | | | 84,535 | | | | 9,309 | | |
Merit Medical Systems, Inc. (c) | | | 4,564 | | | | 329 | | |
Mettler-Toledo International, Inc. (c) | | | 1,927 | | | | 2,832 | | |
ModivCare, Inc. (c) | | | 3,140 | | | | 242 | | |
NextGen Healthcare, Inc. | | | 12,663 | | | | 263 | | |
NuVasive, Inc. (c) | | | 8,396 | | | | 326 | | |
Owens & Minor, Inc. | | | 15,386 | | | | 317 | | |
Pfizer, Inc. | | | 89,959 | | | | 4,510 | | |
Prestige Consumer Healthcare, Inc. (c) | | | 975 | | | | 60 | | |
Prothena Corp. PLC (c) | | | 3,643 | | | | 228 | | |
Sage Therapeutics, Inc. (c) | | | 9,249 | | | | 380 | | |
Select Medical Holdings Corp. | | | 13,052 | | | | 321 | | |
SIGA Technologies, Inc. | | | 14,627 | | | | 134 | | |
Supernus Pharmaceuticals, Inc. (c) | | | 4,331 | | | | 159 | | |
UnitedHealth Group, Inc. | | | 21,036 | | | | 11,523 | | |
Vanda Pharmaceuticals, Inc. (c) | | | 12,386 | | | | 135 | | |
Vir Biotechnology, Inc. (c) | | | 6,449 | | | | 182 | | |
Waters Corp. (c) | | | 8,356 | | | | 2,896 | | |
Xencor, Inc. (c) | | | 7,912 | | | | 235 | | |
| | | | 114,232 | | |
See notes to financial statements.
6
USAA Mutual Funds Trust
USAA Cornerstone Moderately Aggressive Fund | | Schedule of Portfolio Investments — continued
November 30, 2022 | |
(Amounts in Thousands, Except for Shares) (Unaudited)
Security Description | | Shares | | Value | |
Industrials (2.7%): | |
3M Co. | | | 24,989 | | | $ | 3,148 | | |
ABM Industries, Inc. | | | 6,475 | | | | 306 | | |
Albany International Corp. | | | 2,894 | | | | 293 | | |
ArcBest Corp. | | | 4,169 | | | | 345 | | |
Atkore, Inc. (c) | | | 2,147 | | | | 262 | | |
BlueLinx Holdings, Inc. | | | 3,586 | | | | 249 | | |
Boise Cascade Co. | | | 4,721 | | | | 350 | | |
Carlisle Cos., Inc. | | | 11,795 | | | | 3,103 | | |
Cintas Corp. | | | 6,532 | | | | 3,016 | | |
Cummins, Inc. | | | 12,345 | | | | 3,101 | | |
Fastenal Co. | | | 54,780 | | | | 2,822 | | |
FedEx Corp. | | | 17,468 | | | | 3,183 | | |
General Dynamics Corp. | | | 25,704 | | | | 6,487 | | |
HNI Corp. | | | 7,994 | | | | 232 | | |
Hub Group, Inc. Class A (c) | | | 4,691 | | | | 395 | | |
Illinois Tool Works, Inc. | | | 13,029 | | | | 2,964 | | |
Korn Ferry | | | 5,382 | | | | 307 | | |
Lockheed Martin Corp. | | | 21,339 | | | | 10,353 | | |
Masco Corp. | | | 53,014 | | | | 2,692 | | |
Matson, Inc. | | | 4,694 | | | | 299 | | |
Mueller Industries, Inc. | | | 5,237 | | | | 360 | | |
Northrop Grumman Corp. | | | 6,363 | | | | 3,393 | | |
Otis Worldwide Corp. | | | 36,364 | | | | 2,840 | | |
PACCAR, Inc. | | | 59,341 | | | | 6,285 | | |
Republic Services, Inc. | | | 23,042 | | | | 3,210 | | |
Resideo Technologies, Inc. (c) | | | 17,586 | | | | 285 | | |
Rush Enterprises, Inc. Class A | | | 7,374 | | | | 380 | | |
Sterling Infrastructure, Inc. (c) | | | 8,635 | | | | 283 | | |
Titan Machinery, Inc. (c) | | | 5,019 | | | | 221 | | |
TriNet Group, Inc. (c) | | | 4,377 | | | | 317 | | |
UFP Industries, Inc. | | | 2,934 | | | | 240 | | |
United Parcel Service, Inc. Class B | | | 19,656 | | | | 3,729 | | |
W.W. Grainger, Inc. | | | 9,941 | | | | 5,995 | | |
| | | | 71,445 | | |
Information Technology (5.0%): | |
Accenture PLC Class A | | | 12,354 | | | | 3,718 | | |
Adobe, Inc. (c) | | | 9,920 | | | | 3,422 | | |
Apple, Inc. | | | 202,495 | | | | 29,975 | | |
Automatic Data Processing, Inc. | | | 13,275 | | | | 3,506 | | |
Broadcom, Inc. | | | 7,529 | | | | 4,149 | | |
Cisco Systems, Inc. | | | 166,657 | | | | 8,286 | | |
Cognizant Technology Solutions Corp. Class A | | | 51,154 | | | | 3,182 | | |
Consensus Cloud Solutions, Inc. (c) | | | 3,137 | | | | 178 | | |
Diodes, Inc. (c) | | | 3,691 | | | | 340 | | |
Enphase Energy, Inc. (c) | | | 10,035 | | | | 3,217 | | |
Fair Isaac Corp. (c) | | | 9,072 | | | | 5,622 | | |
FormFactor, Inc. (c) | | | 12,678 | | | | 292 | | |
HP, Inc. | | | 188,504 | | | | 5,663 | | |
Intel Corp. | | | 113,434 | | | | 3,411 | | |
See notes to financial statements.
7
USAA Mutual Funds Trust
USAA Cornerstone Moderately Aggressive Fund | | Schedule of Portfolio Investments — continued
November 30, 2022 | |
(Amounts in Thousands, Except for Shares) (Unaudited)
Security Description | | Shares | | Value | |
International Business Machines Corp. | | | 48,920 | | | $ | 7,284 | | |
Kulicke & Soffa Industries, Inc. | | | 6,116 | | | | 293 | | |
Micron Technology, Inc. | | | 49,453 | | | | 2,851 | | |
Microsoft Corp. | | | 47,912 | | | | 12,224 | | |
Motorola Solutions, Inc. | | | 12,068 | | | | 3,285 | | |
ON Semiconductor Corp. (c) | | | 37,804 | | | | 2,843 | | |
Oracle Corp. | | | 45,126 | | | | 3,747 | | |
OSI Systems, Inc. (c) | | | 3,321 | | | | 294 | | |
Palo Alto Networks, Inc. (c) | | | 17,999 | | | | 3,058 | | |
Paychex, Inc. | | | 24,427 | | | | 3,030 | | |
Power Integrations, Inc. | | | 3,757 | | | | 302 | | |
QUALCOMM, Inc. | | | 27,833 | | | | 3,521 | | |
Sanmina Corp. (c) | | | 5,987 | | | | 396 | | |
Synaptics, Inc. (c) | | | 2,912 | | | | 309 | | |
Texas Instruments, Inc. | | | 40,340 | | | | 7,280 | | |
TTEC Holdings, Inc. | | | 6,253 | | | | 300 | | |
VeriSign, Inc. (c) | | | 14,166 | | | | 2,831 | | |
Viavi Solutions, Inc. (c) | | | 26,670 | | | | 302 | | |
Vishay Intertechnology, Inc. | | | 16,462 | | | | 379 | | |
| | | | 129,490 | | |
Materials (1.0%): | |
CF Industries Holdings, Inc. | | | 25,357 | | | | 2,743 | | |
Commercial Metals Co. | | | 9,295 | | | | 458 | | |
Corteva, Inc. | | | 42,971 | | | | 2,886 | | |
Greif, Inc. Class A | | | 5,059 | | | | 356 | | |
LyondellBasell Industries NV Class A | | | 34,361 | | | | 2,921 | | |
Minerals Technologies, Inc. | | | 4,960 | | | | 299 | | |
Nucor Corp. | | | 42,328 | | | | 6,347 | | |
Ryerson Holding Corp. | | | 9,012 | | | | 266 | | |
Sealed Air Corp. | | | 54,703 | | | | 2,912 | | |
Steel Dynamics, Inc. | | | 28,464 | | | | 2,958 | | |
Sylvamo Corp. | | | 3,407 | | | | 184 | | |
The Sherwin-Williams Co. | | | 11,897 | | | | 2,964 | | |
Warrior Met Coal, Inc. | | | 6,101 | | | | 225 | | |
| | | | 25,519 | | |
Real Estate (0.8%): | |
Agree Realty Corp. | | | 3,919 | | | | 274 | | |
Alexandria Real Estate Equities, Inc. | | | 2,007 | | | | 312 | | |
American Homes 4 Rent Class A | | | 4,789 | | | | 158 | | |
American Tower Corp. | | | 7,012 | | | | 1,551 | | |
Apple Hospitality REIT, Inc. | | | 19,567 | | | | 334 | | |
AvalonBay Communities, Inc. | | | 2,235 | | | | 391 | | |
Boston Properties, Inc. | | | 2,356 | | | | 170 | | |
Broadstone Net Lease, Inc. | | | 17,306 | | | | 294 | | |
Camden Property Trust | | | 1,537 | | | | 185 | | |
CBRE Group, Inc. Class A (c) | | | 5,297 | | | | 422 | | |
Corporate Office Properties Trust | | | 11,001 | | | | 306 | | |
Crown Castle, Inc. | | | 6,628 | | | | 937 | | |
Digital Realty Trust, Inc. | | | 4,323 | | | | 486 | | |
See notes to financial statements.
8
USAA Mutual Funds Trust
USAA Cornerstone Moderately Aggressive Fund | | Schedule of Portfolio Investments — continued
November 30, 2022 | |
(Amounts in Thousands, Except for Shares) (Unaudited)
Security Description | | Shares | | Value | |
Equinix, Inc. | | | 1,388 | | | $ | 959 | | |
Equity LifeStyle Properties, Inc. | | | 2,774 | | | | 184 | | |
Equity Residential | | | 5,893 | | | | 382 | | |
Essential Properties Realty Trust, Inc. | | | 13,208 | | | | 307 | | |
Essex Property Trust, Inc. | | | 1,030 | | | | 227 | | |
Extra Space Storage, Inc. | | | 2,085 | | | | 335 | | |
Gaming and Leisure Properties, Inc. | | | 4,107 | | | | 216 | | |
Healthpeak Properties, Inc. | | | 8,426 | | | | 221 | | |
Host Hotels & Resorts, Inc. | | | 10,884 | | | | 206 | | |
Independence Realty Trust, Inc. | | | 18,940 | | | | 343 | | |
Invitation Homes, Inc. | | | 8,971 | | | | 293 | | |
Iron Mountain, Inc. | | | 4,610 | | | | 251 | | |
Kimco Realty Corp. | | | 10,300 | | | | 236 | | |
Kite Realty Group Trust | | | 16,560 | | | | 378 | | |
Medical Properties Trust, Inc. | | | 9,101 | | | | 119 | | |
Mid-America Apartment Communities, Inc. | | | 1,812 | | | | 299 | | |
Office Properties Income Trust | | | 15,447 | | | | 236 | | |
Physicians Realty Trust | | | 21,621 | | | | 323 | | |
PotlatchDeltic Corp. | | | 6,736 | | | | 322 | | |
Prologis, Inc. | | | 14,117 | | | | 1,663 | | |
Public Storage | | | 2,533 | | | | 755 | | |
Realty Income Corp. | | | 9,455 | | | | 596 | | |
Regency Centers Corp. | | | 2,715 | | | | 180 | | |
Ryman Hospitality Properties, Inc. | | | 4,046 | | | | 370 | | |
SBA Communications Corp. | | | 1,767 | | | | 529 | | |
Simon Property Group, Inc. | | | 5,343 | | | | 638 | | |
SITE Centers Corp. | | | 21,946 | | | | 298 | | |
STAG Industrial, Inc. | | | 12,235 | | | | 403 | | |
Sun Communities, Inc. | | | 1,582 | | | | 232 | | |
Terreno Realty Corp. | | | 5,972 | | | | 350 | | |
The Macerich Co. | | | 22,491 | | | | 286 | | |
UDR, Inc. | | | 4,691 | | | | 195 | | |
Ventas, Inc. | | | 5,937 | | | | 276 | | |
VICI Properties, Inc. | | | 16,083 | | | | 550 | | |
Vornado Realty Trust | | | 2,548 | | | | 64 | | |
Welltower, Inc. | | | 6,609 | | | | 469 | | |
Weyerhaeuser Co. | | | 11,676 | | | | 382 | | |
WP Carey, Inc. | | | 2,776 | | | | 219 | | |
Zillow Group, Inc. Class C (c) | | | 3,416 | | | | 130 | | |
| | | | 20,242 | | |
Utilities (0.7%): | |
American States Water Co. | | | 2,921 | | | | 286 | | |
Consolidated Edison, Inc. | | | 33,855 | | | | 3,319 | | |
DTE Energy Co. | | | 24,514 | | | | 2,844 | | |
Exelon Corp. | | | 82,262 | | | | 3,403 | | |
Otter Tail Corp. | | | 4,814 | | | | 287 | | |
Portland General Electric Co. | | | 6,495 | | | | 320 | | |
Sempra Energy | | | 19,901 | | | | 3,308 | | |
Southwest Gas Holdings, Inc. | | | 3,156 | | | | 216 | | |
See notes to financial statements.
9
USAA Mutual Funds Trust
USAA Cornerstone Moderately Aggressive Fund | | Schedule of Portfolio Investments — continued
November 30, 2022 | |
(Amounts in Thousands, Except for Shares) (Unaudited)
Security Description | | Shares or
Principal
Amount | | Value | |
The AES Corp. | | | 99,768 | | | $ | 2,885 | | |
UGI Corp. | | | 70,441 | | | | 2,723 | | |
| | | | 19,591 | | |
Total Common Stocks (Cost $506,454) | | | 626,388 | | |
U.S. Government Agency Mortgages (0.0%) (a) | |
Government National Mortgage Association 6.50%, 4/15/24 | | $ | 1 | | | | 1 | | |
Total U.S. Government Agency Mortgages (Cost $1) | | | 1 | | |
U.S. Treasury Obligations (1.1%) | |
U.S. Treasury Notes, 1.63%, 4/30/23 (e) | | | 29,000 | | | | 28,647 | | |
Total U.S. Treasury Obligations (Cost $28,987) | | | 28,647 | | |
Exchange-Traded Funds (47.8%) | |
Invesco DB Commodity Index Tracking Fund (c) (d) | | | 256,100 | | | | 6,528 | | |
Invesco FTSE RAFI Developed Markets ex-US ETF | | | 653,206 | | | | 27,644 | | |
Invesco FTSE RAFI Emerging Markets ETF (d) | | | 1,539,501 | | | | 27,819 | | |
iShares 0-5 Year TIPS Bond ETF | | | 207,506 | | | | 20,269 | | |
iShares 20+ Year Treasury Bond ETF | | | 63,402 | | | | 6,513 | | |
iShares 7-10 Year Treasury Bond ETF | | | 363,045 | | | | 35,437 | | |
iShares Core MSCI EAFE ETF | | | 32,626 | | | | 2,057 | | |
iShares Core MSCI Emerging Markets ETF | | | 2,071,821 | | | | 100,608 | | |
iShares Core S&P 500 ETF | | | 191,228 | | | | 78,273 | | |
iShares Core S&P Small-Cap ETF | | | 754,626 | | | | 76,851 | | |
iShares Core US Aggregate Bond ETF | | | 263,825 | | | | 25,931 | | |
iShares iBoxx High Yield Corporate Bond ETF (d) | | | 1,140,137 | | | | 86,263 | | |
iShares JP Morgan USD Emerging Markets Bond ETF | | | 155,006 | | | | 13,397 | | |
iShares MSCI Canada ETF (d) | | | 461,409 | | | | 16,237 | | |
iShares MSCI International Momentum Factor ETF (d) | | | 1,164,448 | | | | 36,878 | | |
iShares MSCI International Quality Factor ETF | | | 1,315,008 | | | | 43,908 | | |
iShares Russell 2000 ETF (d) | | | 190,696 | | | | 35,731 | | |
JPMorgan BetaBuilders Canada ETF | | | 90,184 | | | | 5,520 | | |
Schwab Fundamental Emerging Markets Large Co. Index ETF | | | 2,206,197 | | | | 58,177 | | |
Schwab Fundamental International Large Co. Index ETF | | | 3,168,339 | | | | 95,684 | | |
Schwab Fundamental International Small Co. Index ETF | | | 593,600 | | | | 18,871 | | |
SPDR Gold Shares (c) | | | 126,837 | | | | 20,904 | | |
SPDR S&P Emerging Markets SmallCap ETF (d) | | | 107,983 | | | | 5,442 | | |
Vanguard FTSE All-World ex-U.S. ETF | | | 299,875 | | | | 15,563 | | |
Vanguard FTSE Developed Markets ETF (d) | | | 4,248,011 | | | | 184,406 | | |
Vanguard Mid-Capital ETF | | | 30,077 | | | | 6,513 | | |
Vanguard Mortgage-Backed Securities ETF | | | 408,949 | | | | 18,848 | | |
Vanguard Real Estate ETF (d) | | | 130,232 | | | | 11,471 | | |
Vanguard S&P 500 ETF | | | 10,312 | | | | 3,862 | | |
Vanguard Short-Term Bond ETF (d) | | | 902,507 | | | | 68,139 | | |
Vanguard Short-Term Corporate Bond ETF | | | 186,391 | | | | 14,073 | | |
Vanguard Total Stock Market ETF | | | 189,367 | | | | 38,642 | | |
See notes to financial statements.
10
USAA Mutual Funds Trust
USAA Cornerstone Moderately Aggressive Fund | | Schedule of Portfolio Investments — continued
November 30, 2022 | |
(Amounts in Thousands, Except for Shares) (Unaudited)
Security Description | | Shares | | Value | |
Wisdom Tree Trust — WisdomTree Emerging Markets SmallCap Dividend Fund | | | 202,622 | | | $ | 9,100 | | |
Xtrackers USD High Yield Corporate Bond ETF (d) | | | 770,152 | | | | 26,663 | | |
Total Exchange-Traded Funds (Cost $1,161,457) | | | 1,242,222 | | |
Affiliated Exchange-Traded Funds (26.4%) | |
VictoryShares Emerging Markets Value Momentum ETF | | | 68,000 | | | | 2,741 | | |
VictoryShares ESG Core Plus Bond ETF | | | 5,668,278 | | | | 121,004 | | |
VictoryShares USAA Core Intermediate-Term Bond ETF | | | 11,270,680 | | | | 516,666 | | |
VictoryShares USAA Core Short-Term Bond ETF | | | 969,310 | | | | 47,217 | | |
Total Affiliated Exchange-Traded Funds (Cost $791,939) | | | 687,628 | | |
Collateral for Securities Loaned (5.9%)^ | |
Goldman Sachs Financial Square Government Fund, Institutional Shares,
3.73% (f) | | | 38,436,042 | | | | 38,436 | | |
HSBC U.S. Government Money Market Fund, I Shares, 3.75% (f) | | | 38,436,042 | | | | 38,436 | | |
Invesco Government & Agency Portfolio, Institutional Shares, 3.74% (f) | | | 38,436,042 | | | | 38,436 | | |
Morgan Stanley Institutional Liquidity Government Portfolio,
Institutional Shares, 3.62% (f) | | | 38,436,042 | | | | 38,436 | | |
Total Collateral for Securities Loaned (Cost $153,744) | | | 153,744 | | |
Total Investments (Cost $2,643,037) — 105.3% | | | 2,739,058 | | |
Liabilities in excess of other assets — (5.3)% | | | (138,623 | ) | |
NET ASSETS — 100.00% | | $ | 2,600,435 | | |
At November 30, 2022, the Fund's investments in foreign securities were 24.4% of net assets.
^ Purchased with cash collateral from securities on loan.
(a) Amount represents less than 0.05% of net assets.
(b) Rule 144A security or other security that is restricted as to resale to institutional investors. The Fund's Adviser has deemed this security to be liquid (unless otherwise noted as illiquid) based upon procedures approved by the Board of Trustees. As of November 30, 2022, the fair value of these securities was $428 thousands and amounted to less than 0.05% of net assets.
(c) Non-income producing security.
(d) All or a portion of this security is on loan.
(e) All or a portion of this security has been segregated as collateral for derivative instruments.
(f) Rate disclosed is the daily yield on November 30, 2022.
ETF — Exchange-Traded Fund
LLC — Limited Liability Company
PLC — Public Limited Company
REIT — Real Estate Investment Trust
See notes to financial statements.
11
USAA Mutual Funds Trust
USAA Cornerstone Moderately Aggressive Fund | | Schedule of Portfolio Investments — continued
November 30, 2022 | |
(Unaudited)
Futures Contracts Purchased
(Amounts not in thousands)
| | | Number of
Contracts | | Expiration
Date | | Notional
Amount | | Value | | Unrealized
Appreciation/
(Depreciation) | |
Euro Stoxx 50 Futures | | | 602 | | | 12/19/22 | | $ | 22,364,481 | | | $ | 24,835,914 | | | $ | 2,471,433 | | |
FTSE 100 Index Futures | | | 459 | | | 12/19/22 | | | 40,746,062 | | | | 42,029,462 | | | | 1,283,400 | | |
S&P/Toronto Stock Exchange 60 Index
Futures | | | 216 | | | 12/16/22 | | | 38,562,546 | | | | 39,837,145 | | | | 1,274,599 | | |
| | | $ | 5,029,432 | | |
Futures Contracts Sold
(Amounts not in thousands)
| | | Number of
Contracts | | Expiration
Date | | Notional
Amount | | Value | | Unrealized
Appreciation/
(Depreciation) | |
ASX SPI 200 Index Futures | | | 184 | | | 12/16/22 | | $ | 21,637,743 | | | $ | 22,815,516 | | | $ | (1,177,773 | ) | |
E-Mini Russell 2000 Index Futures | | | 221 | | | 12/19/22 | | | 20,019,685 | | | | 20,856,875 | | | | (837,190 | ) | |
Hang Seng Index Futures | | | 96 | | | 12/30/22 | | | 10,845,596 | | | | 11,440,921 | | | | (595,325 | ) | |
Swiss Market Index Futures | | | 166 | | | 12/19/22 | | | 19,158,326 | | | | 19,584,526 | | | | (426,200 | ) | |
Tokyo Price Index Futures | | | 127 | | | 12/9/22 | | | 18,001,182 | | | | 18,304,483 | | | | (303,301 | ) | |
| | | $ | (3,339,789 | ) | |
Total unrealized appreciation | | $ | 5,029,432 | | |
Total unrealized depreciation | | | (3,339,789 | ) | |
Total net unrealized appreciation (depreciation) | | $ | 1,689,643 | | |
See notes to financial statements.
12
USAA Mutual Funds Trust | | Statement of Assets and Liabilities
November 30, 2022 | |
(Amounts in Thousands, Except Per Share Amounts) (Unaudited)
| | | USAA Cornerstone
Moderately
Aggressive Fund | |
Assets: | |
Affiliated investments, at value (Cost $791,939) | | $ | 687,628 | | |
Unaffiliated investments, at value (Cost $1,851,098) | | | 2,051,430 | (a) | |
Cash | | | 10,964 | | |
Deposit with broker for futures contracts | | | 9,836 | | |
Receivables: | |
Interest and dividends | | | 1,303 | | |
Capital shares issued | | | 140 | | |
Investments sold | | | 6,654 | | |
Variation margin on open futures contracts | | | 927 | | |
Reclaims | | | 5 | | |
From Adviser for ETF reimbursements | | | 518 | | |
Prepaid expenses | | | 28 | | |
Total Assets | | | 2,769,433 | | |
Liabilities: | |
Payables: | |
Collateral received on loaned securities | | | 153,744 | | |
Collateral received from broker for futures contract | | | 2,978 | | |
Investments purchased | | | 8,166 | | |
Capital shares redeemed | | | 1,024 | | |
Variation margin on open futures contracts | | | 1,025 | | |
Accrued expenses and other payables: | |
Investment advisory fees | | | 1,224 | | |
Administration fees | | | 303 | | |
Custodian fees | | | 29 | | |
Transfer agent fees | | | 402 | | |
Compliance fees | | | 2 | | |
Trustees' fees | | | — | (b) | |
Other accrued expenses | | | 101 | | |
Total Liabilities | | | 168,998 | | |
Net Assets: | |
Capital | | | 2,417,627 | | |
Total accumulated earnings/(loss) | | | 182,808 | | |
Net Assets | | $ | 2,600,435 | | |
Shares (unlimited number of shares authorized with no par value): | | | 103,278 | | |
Net asset value, offering and redemption price per share: (c) | | $ | 25.18 | | |
(a) Includes $149,979 thousand of securities on loan.
(b) Rounds to less than $1 thousand.
(c) Per share amount may not recalculate due to rounding of net assets and/or shares outstanding.
See notes to financial statements.
13
USAA Mutual Funds Trust | | Statement of Operations
For the Six Months Ended November 30, 2022 | |
(Amounts in Thousands) (Unaudited)
| | | USAA Cornerstone
Moderately
Aggressive Fund | |
Investment Income: | |
Income distributions from affiliated funds | | $ | 8,857 | | |
Dividends from unaffiliated investments | | | 23,026 | | |
Interest from unaffiliated investments | | | 365 | | |
Securities lending (net of fees) | | | 931 | | |
Foreign tax withholding | | | (6 | ) | |
Total Income | | | 33,173 | | |
Expenses: | |
Investment advisory fees | | | 7,525 | | |
Administration fees | | | 1,913 | | |
Sub-Administration fees | | | 36 | | |
Custodian fees | | | 58 | | |
Transfer agent fees | | | 2,440 | | |
Trustees' fees | | | 25 | | |
Compliance fees | | | 12 | | |
Legal and audit fees | | | 50 | | |
State registration and filing fees | | | 29 | | |
Other expenses | | | 203 | | |
Total Expenses | | | 12,291 | | |
Expenses waived/reimbursed by Adviser | | | (1,062 | ) | |
Net Expenses | | | 11,229 | | |
Net Investment Income (Loss) | | | 21,944 | | |
Realized/Unrealized Gains (Losses) from Investments: | |
Net realized gains (losses) from affiliated funds | | | (678 | ) | |
Net realized gains (losses) from unaffiliated investment securities and
foreign currency transactions | | | (24,641 | ) | |
Net realized gains (losses) from futures contracts | | | 649 | | |
Net change in unrealized appreciation/depreciation on affiliated funds | | | (32,313 | ) | |
Net change in unrealized appreciation/depreciation on unaffiliated
investment securities and foreign currency translations | | | (31,224 | ) | |
Net change in unrealized appreciation/depreciation on futures contracts | | | 3,106 | | |
Net realized/unrealized gains (losses) on investments | | | (85,101 | ) | |
Change in net assets resulting from operations | | $ | (63,157 | ) | |
See notes to financial statements.
14
USAA Mutual Funds Trust | | Statements of Changes in Net Assets | |
(Amounts in Thousands)
| | | USAA Cornerstone
Moderately
Aggressive Fund | |
| | | Six Months
Ended
November 30,
2022
(Unaudited) | | Year
Ended
May 31,
2022 | |
From Investments: | |
Operations: | |
Net Investment Income (Loss) | | $ | 21,944 | | | $ | 37,296 | | |
Net realized gains (losses) | | | (24,670 | ) | | | 130,922 | | |
Net change in unrealized appreciation/depreciation | | | (60,431 | ) | | | (323,766 | ) | |
Change in net assets resulting from operations | | | (63,157 | ) | | | (155,548 | ) | |
Change in net assets resulting from distributions to shareholders | | | — | | | | (229,481 | ) | |
Change in net assets resulting from capital transactions | | | (56,473 | ) | | | 78,119 | | |
Change in net assets | | | (119,630 | ) | | | (306,910 | ) | |
Net Assets: | |
Beginning of period | | | 2,720,065 | | | | 3,026,975 | | |
End of period | | $ | 2,600,435 | | | $ | 2,720,065 | | |
Capital Transactions: | |
Proceeds from shares issued | | $ | 65,236 | | | $ | 177,611 | | |
Distributions reinvested | | | — | | | | 227,559 | | |
Cost of shares redeemed | | | (121,709 | ) | | | (327,051 | ) | |
Change in net assets resulting from capital transactions | | $ | (56,473 | ) | | $ | 78,119 | | |
Share Transactions: | |
Issued | | | 2,680 | | | | 6,233 | | |
Reinvested | | | — | | | | 8,036 | | |
Redeemed | | | (5,000 | ) | | | (11,454 | ) | |
Change in Shares | | | (2,320 | ) | | | 2,815 | | |
See notes to financial statements.
15
USAA Mutual Funds Trust | | Financial Highlights | |
For a Share Outstanding Throughout Each Period
| | | | | Investment Activities | | Distributions to
Shareholders From | |
| | | Net Asset
Value,
Beginning of
Period | | Net
Investment
Income (Loss) | | Net Realized
and Unrealized
Gains (Losses) | | Total from
Investment
Activities | | Net
Investment
Income | | Net Realized
Gains from
Investments | |
USAA Cornerstone Moderately Aggressive Fund | | | |
Six Months Ended
November 30, 2022
(Unaudited) | | $ | 25.76 | | | | 0.21 | (f) | | | (0.79 | ) | | | (0.58 | ) | | | — | | | | — | | |
Year Ended May 31:
2022 | | $ | 29.45 | | | | 0.36 | (f) | | | (1.77 | ) | | | (1.41 | ) | | | (0.35 | ) | | | (1.93 | ) | |
2021 | | $ | 24.10 | | | | 0.32 | (f) | | | 5.56 | | | | 5.88 | | | | (0.37 | ) | | | (0.16 | ) | |
2020 | | $ | 23.97 | | | | 0.48 | (f) | | | 0.18 | | | | 0.66 | | | | (0.39 | ) | | | (0.14 | ) | |
2019 | | $ | 25.78 | | | | 0.46 | | | | (0.79 | ) | | | (0.33 | ) | | | (0.39 | ) | | | (1.09 | ) | |
2018 | | $ | 26.09 | | | | 0.42 | | | | 1.28 | | | | 1.70 | | | | (0.44 | ) | | | (1.57 | ) | |
(a) Not annualized for periods less than one year.
(b) Assumes reinvestment of all net investment income and realized capital gain distributions, if any, during the period. Includes adjustments in accordance with U.S. Generally Accepted Accounting Principles and could differ from the Lipper reported return.
(c) Annualized for periods less than one year.
(d) The net expense ratio may not correlate to the applicable expense limits in place during the period since the current contractual expense limitation is applied for a period beginning July 1, 2019 and in effect through September 30, 2023, instead of coinciding with the Fund's fiscal year end. Details of the current contractual expense limitation in effect can be found in Note 4 of the accompanying Notes to Financial Statements.
(e) Does not include acquired fund fees and expenses, if any.
(f) Per share net investment income (loss) has been calculated using the average daily shares method.
(g) Effective June 22, 2018, USAA Asset Management Company (previous Investment Adviser) voluntarily agreed to limit the annual expenses of the Fund to 0.98% of the Fund's average daily net assets.
(h) For the year ended May 31, 2019, the portfolio turnover calculation excludes the value of securities purchased of $370,785 thousand and sold of $3,096 thousand after the Fund's acquisition of First Start Growth Fund. Reflects increased trading activity due to usage of quantitative investment strategies.
See notes to financial statements.
16
USAA Mutual Funds Trust | | Financial Highlights — continued | |
For a Share Outstanding Throughout Each Period
| | | | | Ratios to Average Net Assets | | Supplemental Data | |
| | | Total
Distributions | | Net Asset
Value,
End of
Period | | Total
Return(a)(b) | | Net
Expenses(c)(d)(e) | | Net
Investment
Income
(Loss)(c) | | Gross
Expenses(c)(e) | | Net Assets,
End of
Period
(000's) | | Portfolio
Turnover(a) | |
USAA Cornerstone Moderately Aggressive Fund | |
Six Months Ended
November 30, 2022
(Unaudited) | | | — | | | $ | 25.18 | | | | (2.25 | )% | | | 0.88 | % | | | 1.72 | % | | | 0.96 | % | | $ | 2,600,435 | | | | 31 | % | |
Year Ended May 31:
2022 | | | (2.28 | ) | | $ | 25.76 | | | | (5.43 | )% | | | 0.88 | % | | | 1.26 | % | | | 0.93 | % | | $ | 2,720,065 | | | | 44 | % | |
2021 | | | (0.53 | ) | | $ | 29.45 | | | | 24.58 | % | | | 0.96 | % | | | 1.18 | % | | | 0.97 | % | | $ | 3,026,975 | | | | 64 | % | |
2020 | | | (0.53 | ) | | $ | 24.10 | | | | 2.59 | % | | | 0.98 | % | | | 1.94 | % | | | 0.99 | % | | $ | 2,662,354 | | | | 92 | % | |
2019 | | | (1.48 | ) | | $ | 23.97 | | | | (1.20 | )% | | | 0.98 | %(g) | | | 1.91 | % | | | 1.01 | % | | $ | 2,777,038 | | | | 95 | %(h) | |
2018 | | | (2.01 | ) | | $ | 25.78 | | | | 6.52 | % | | | 0.97 | % | | | 1.64 | % | | | 0.97 | % | | $ | 2,493,883 | | | | 56 | % | |
See notes to financial statements.
17
USAA Mutual Funds Trust | | Notes to Financial Statements
November 30, 2022 | |
(Unaudited)
1. Organization:
USAA Mutual Funds Trust (the "Trust") is organized as a Delaware statutory trust and is registered under the Investment Company Act of 1940, as amended (the "1940 Act"), as an open-end investment company. The Trust is comprised of 45 funds and is authorized to issue an unlimited number of shares, which are units of beneficial interest with no par value.
The accompanying financial statements are those of the USAA Cornerstone Moderately Aggressive Fund (the "Fund"). The Fund is classified as diversified under the 1940 Act.
Victory Capital Management ("VCM" or the "Adviser"), is an indirect wholly owned subsidiary of Victory Capital Holdings, Inc., a publicly traded Delaware corporation, and a wholly owned direct subsidiary of Victory Capital Operating, LLC.
Under the Trust's organizational documents, its officers and trustees are indemnified against certain liabilities arising out of the performance of their duties to the Fund. In addition, in the normal course of business, the Fund enters into contracts with its vendors and others that provide for general indemnifications. The Fund's maximum exposure under these arrangements is unknown, as this would involve future claims that may be made against the Fund. However, based on experience, the Fund expects that risk of loss to be remote.
2. Significant Accounting Policies:
The following is a summary of significant accounting policies followed by the Trust in the preparation of its financial statements. The policies are in conformity with U.S. Generally Accepted Accounting Principles ("GAAP"). The preparation of financial statements in accordance with GAAP requires management to make estimates and assumptions that affect the reported amounts of assets and liabilities and disclosure of contingent assets and liabilities at the date of the financial statements and the reported amounts of income and expenses for the period. Actual results could differ from those estimates. The Fund follows the specialized accounting and reporting requirements under GAAP that are applicable to investment companies under Accounting Standards Codification Topic 946.
Investment Valuation:
The Fund records investments at fair value. Fair value is defined as the price that would be received to sell an asset or paid to transfer a liability in an orderly transaction between market participants at the measurement date.
The valuation techniques described below maximize the use of observable inputs and minimize the use of unobservable inputs in determining fair value. The inputs used for valuing the Fund's investments are summarized in the three broad levels listed below:
• Level 1 — quoted prices (unadjusted) in active markets for identical securities
• Level 2 — other significant observable inputs (including quoted prices for similar securities, interest rates, or credit spreads, applicable to those securities, etc.)
• Level 3 — significant unobservable inputs (including the Adviser's assumptions in determining the fair value of investments)
Changes in valuation techniques may result in transfers in or out of an assigned level within the disclosure hierarchy. The inputs or methodologies used for valuation techniques are not necessarily an indication of the risks associated with entering into those investments.
The Adviser, acting as the valuation designee has established the Pricing and Liquidity Committee (the "Committee"), and subject to the Trust's Board of Trustees' (the "Board") oversight, the Committee administers and oversees the Fund's valuation policies and procedures, which are approved by the Board.
Portfolio securities listed or traded on securities exchanges, including Exchange-Traded Funds ("ETFs"), and American Depositary Receipts ("ADRs"), are valued at the closing price on the exchange or system where the security is principally traded, if available, or at the Nasdaq Official Closing Price. If there have been no sales for that day on the exchange or system, then a security is valued at the last available
18
USAA Mutual Funds Trust | | Notes to Financial Statements — continued
November 30, 2022 | |
(Unaudited)
bid quotation on the exchange or system where the security is principally traded. In each of these situations, valuations are typically categorized as Level 1 in the fair value hierarchy.
Investments in open-end investment companies, including underlying funds, are valued at their net asset value ("NAV"). These valuations are typically categorized as Level 1 in the fair value hierarchy.
Debt securities are valued each business day by a pricing service approved by the Board. The approved pricing service uses the evaluated bid or the last sale price to value securities. Debt obligations maturing within 60 days may be valued at amortized cost, provided that the amortized cost represents the fair value of such securities. These valuations are typically categorized as Level 2 in the fair value hierarchy.
Futures contracts are valued at the settlement price established each day by the board of trade or an exchange on which they are traded. These valuations are typically categorized as Level 1 in the fair value hierarchy.
In the event that price quotations or valuations are not readily available, investments are valued at fair value in accordance with procedures established by and under the general supervision and responsibility of the Board. These valuations are typically categorized as Level 2 or Level 3 in the fair value hierarchy, based on the observability of inputs used to determine the fair value. The effect of fair value pricing is that securities may not be priced on the basis of quotations from the primary market in which they are traded, and the actual price realized from the sale of a security may differ materially from the fair value price. Valuing these securities at fair value is intended to cause the Fund's NAV to be more reliable than it otherwise would be.
A summary of the valuations as of November 30, 2022, based upon the three levels defined above, is included in the table below while the breakdown, by category, of investments is disclosed on the Schedule of Portfolio Investments (amounts in thousands):
| | | Level 1 | | Level 2 | | Level 3 | | Total | |
Asset-Backed Securities | | $ | — | | | $ | 428 | | | $ | — | | | $ | 428 | | |
Common Stocks | | | 626,388 | | | | — | | | | — | | | | 626,388 | | |
U.S. Government Agency Mortgages | | | — | | | | 1 | | | | — | | | | 1 | | |
U.S. Treasury Obligations | | | — | | | | 28,647 | | | | — | | | | 28,647 | | |
Exchange-Traded Funds | | | 1,242,222 | | | | — | | | | — | | | | 1,242,222 | | |
Affiliated Exchange-Traded Funds | | | 687,628 | | | | — | | | | — | | | | 687,628 | | |
Collateral for Securities Loaned | | | 153,744 | | | | — | | | | — | | | | 153,744 | | |
Total | | $ | 2,709,982 | | | $ | 29,076 | | | $ | — | | | $ | 2,739,058 | | |
Other Financial Investments* | |
Assets: | |
Futures Contracts | | $ | 5,030 | | | $ | — | | | $ | — | | | $ | 5,030 | | |
Liabilities: | |
Futures Contracts | | $ | (3,340 | ) | | $ | — | | | $ | — | | | $ | (3,340 | ) | |
Total | | $ | 1,690 | | | $ | — | | | $ | — | | | $ | 1,690 | | |
* Futures contracts are valued at the unrealized appreciation (depreciation) on the investment.
For the six months ended November 30, 2022, there were no transfers into/out of Level 3.
Real Estate Investment Trusts ("REITs"):
The Fund may invest in REITs, which report information on the source of their distributions annually. REITs are pooled investment vehicles that invest primarily in income producing real estate or real estate related loans or interests (such as mortgages). Certain distributions received from REITs during the year are recorded as realized gains or return of capital as estimated by the Fund or when such information becomes known.
19
USAA Mutual Funds Trust | | Notes to Financial Statements — continued
November 30, 2022 | |
(Unaudited)
Investment Companies:
Exchange-Traded Funds:
The Fund may invest in ETFs, the shares of which are bought and sold on a securities exchange. An ETF trades like common stock and represents a fixed portfolio of securities often designed to track the performance and dividend yield of a particular domestic or foreign market index. The Fund may purchase shares of an ETF to temporarily gain exposure to a portion of the U.S. or a foreign market while awaiting purchase of underlying securities. The risks of owning an ETF generally reflect the risks of owning the underlying securities the ETF is designed to track, although the lack of liquidity of an ETF could result in it being more volatile. Additionally, ETFs have fees and expenses that reduce their value.
Open-End Funds:
The Fund may invest in portfolios of open-end investment companies. These investment companies value securities in their portfolios for which market quotations are readily available at their market values (generally the last reported sale price) and all other securities and assets at their fair value by the methods established by the board of directors of the underlying funds.
Mortgage- and Asset-Backed Securities:
The values of some mortgage-related or asset-backed securities may be particularly sensitive to changes in prevailing interest rates. Early repayment of principal on some mortgage-related securities may expose the Fund to a lower rate of return upon reinvestment of principal. The values of mortgage- and asset-backed securities depend in part on the credit quality and adequacy of the underlying assets or collateral and may fluctuate in response to the market's perception of these factors as well as current and future repayment rates. Some mortgage-backed securities are backed by the full faith and credit of the U.S. government (e.g., mortgage-backed securities issued by the Government National Mortgage Association, commonly known as "Ginnie Mae"), while other mortgage-backed securities (e.g., mortgage-backed securities issued by the Federal National Mortgage Association and the Federal Home Loan Mortgage Corporation, commonly known as "Fannie Mae" and "Freddie Mac," respectively), are backed only by the credit of the government entity issuing them. In addition, some mortgage-backed securities are issued by private entities and, as such, are not guaranteed by the U.S. government or any agency or instrumentality of the U.S. government.
Derivative Instruments:
Futures Contracts:
The Fund may enter into contracts for the future delivery of securities or foreign currencies and futures contracts based on a specific security, class of securities, foreign currency or an index, and purchase or sell options on any such futures contracts. A futures contract on a securities index is an agreement obligating either party to pay, and entitling the other party to receive, while the contract is outstanding, cash payments based on the level of a specified securities index. No physical delivery of the underlying asset is made. The Fund may enter into futures contracts in an effort to hedge against market risks. The acquisition of put and call options on futures contracts will give the Fund the right (but not the obligation), for a specified price, to sell or to purchase the underlying futures contract, upon exercise of the option, at any time during the option period. Futures transactions involve brokerage costs and require the Fund to segregate assets to cover contracts that would require it to purchase securities or currencies. A good faith margin deposit, known as initial margin, of cash or government securities with a broker or custodian is required to initiate and maintain open positions in futures contracts. Subsequent payments, known as variation margin, are made or received by the Fund based on the change in the market value of the position and are recorded as unrealized appreciation or depreciation until the contract is closed out, at which time the gain or loss is realized. The Fund may lose the expected benefit of futures transactions if interest rates, exchange rates or securities prices change in an unanticipated
20
USAA Mutual Funds Trust | | Notes to Financial Statements — continued
November 30, 2022 | |
(Unaudited)
manner. Such unanticipated changes may also result in lower overall performance than if the Fund had not entered into any futures transactions. In addition, the value of the Fund's futures positions may not prove to be perfectly or even highly correlated with the value of its portfolio securities or foreign currencies, limiting the Fund's ability to hedge effectively against interest rate, exchange rate and/or market risk and giving rise to additional risks. There is no assurance of liquidity in the secondary market for purposes of closing out futures positions. The collateral held by the Fund is reflected on the Statement of Assets and Liabilities under Deposit with broker for futures contracts and Collateral received from broker for futures contracts.
Management has determined that no offsetting requirements exist as a result of their conclusion that the Fund is not subject to master netting agreements for futures contracts. During the six months ended November 30, 2022, the Fund entered into futures contracts primarily for the strategy of gaining exposure to a particular asset class or securities market.
Summary of Derivative Instruments:
The following table summarizes the fair values of derivative instruments on the Statement of Assets and Liabilities, categorized by risk exposure, as of November 30, 2022 (amounts in thousands):
| | | Assets | | Liabilities | |
| | | Variation Margin
Receivable on Open
Futures Contracts* | | Variation Margin
Payable on Open
Futures Contracts* | |
Equity Risk Exposure | | $ | 5,030 | | | $ | 3,340 | | |
* Includes cumulative unrealized appreciation (depreciation) of futures contracts as reported on the Schedule of Portfolio Investments. Only current day's variation margin for futures contracts is reported within the Statement of Assets and Liabilities.
The following table presents the effect of derivative instruments on the Statement of Operations, categorized by risk exposure, for the six months ended November 30, 2022 (amounts in thousands):
| | | Net Realized Gains (Losses) on
Derivatives Recognized as
a Result of Operations | | Net Change in Unrealized
Appreciation/Depreciation
on Derivatives Recognized
as a Result of Operations | |
| | | Net Realized Gains (Losses)
from Futures Contracts | | Net Change in Unrealized
Appreciation/Depreciation
on Futures Contracts | |
Equity Risk Exposure | | $ | 649 | | | $ | 3,106 | | |
All open derivative positions at period end are reflected on the Fund's Schedule of Portfolio Investments. The underlying face value of open derivative positions relative to the Fund's net assets at period end is generally representative of the notional amount of open positions to net assets throughout the period.
Investment Transactions and Related Income:
Changes in holdings of investments are accounted for no later than one business day following the trade date. For financial reporting purposes, however, investment transactions are accounted for on trade date or the last business day of the reporting period. Interest income is determined on the basis of coupon interest accrued using the effective interest method which adjusts, where applicable, the amortization of premiums or accretion of discounts. Dividend income is recorded on the ex-dividend date. Gains or losses realized on sales of securities are recorded on the identified cost basis. Paydown gains or losses on applicable securities, if any, are recorded as components of Interest income on the Statement of Operations.
Withholding taxes on interest, dividends, and gains as a result of certain investments in ADRs by the Fund have been provided for in accordance with each investment's applicable country's tax rules and rates.
21
USAA Mutual Funds Trust | | Notes to Financial Statements — continued
November 30, 2022 | |
(Unaudited)
Securities Lending:
The Fund, through a Securities Lending Agreement with Citibank, N.A. ("Citibank"), may lend its securities to qualified financial institutions, such as certain broker-dealers and banks, to earn additional income, net of income retained by Citibank. Borrowers are required to initially secure their loans for collateral in the amount of at least 102% of the value of U.S. securities loaned or at least 105% of the value of non-U.S. securities loaned, marked-to-market daily. Any collateral shortfalls associated with increases in the valuation of the securities loaned are generally cured the next business day. The collateral can be received in the form of cash collateral and/or non-cash collateral. Non-cash collateral can include U.S. Government Securities and other securities as permitted by Securities and Exchange Commission ("SEC") guidelines. The cash collateral is invested in short-term instruments or cash equivalents, primarily open-end investment companies, as noted on the Fund's Schedule of Portfolio Investments. The Fund effectively does not have control of the non-cash collateral and therefore it is not disclosed on the Fund's Schedule of Portfolio Investments. Collateral requirements are determined daily based on the value of the Fund's securities on loan as of the end of the prior business day. During the time portfolio securities are on loan, the borrower will pay the Fund any dividends or interest paid on such securities plus any fee negotiated between the parties to the lending agreement. The Fund also earns a return from the collateral. The Fund pays Citibank various fees in connection with the investment of cash collateral and fees based on the investment income received from securities lending activities. Securities lending income (net of these fees) is disclosed on the Statement of Operations. Loans are terminable upon demand and the borrower must return the loaned securities within the lesser of one standard settlement period or five business days. Although risk is mitigated by the collateral, the Fund could experience a delay in recovering its securities and possible loss of income or value if the borrower fails to return them. In addition, there is a risk that the value of the short-term investments will be less than the amount of cash collateral required to be returned to the borrower.
The Fund's agreement with Citibank does not include master netting provisions. Non-cash collateral received by the Fund may not be sold or repledged, except to satisfy borrower default.
The following table (amounts in thousands) is a summary of the Fund's securities lending transactions as of November 30, 2022.
Value of
Securities on Loan | | Non-Cash
Collateral | | Cash
Collateral | |
| $ | 152,107 | (a) | | $ | — | | | $ | 153,744 | | |
(a) Includes $2,128 thousand of securities on loan that were sold on November 30, 2022.
Foreign Currency Translations:
The accounting records of the Fund are maintained in U.S. dollars. Investment securities and other assets and liabilities of the Fund denominated in a foreign currency are translated into U.S. dollars at current exchange rates. Purchases and sales of securities, income receipts, and expense payments are translated into U.S. dollars at the exchange rates on the date of the transactions. The Fund does not isolate the portion of the results of operations resulting from changes in foreign exchange rates on investments from fluctuations arising from changes in market prices of securities held. Such fluctuations are disclosed as Net change in unrealized appreciation/depreciation on unaffiliated investment securities and foreign currency translations on the Statement of Operations. Any realized gains or losses from these fluctuations are disclosed as Net realized gains (losses) from unaffiliated investment securities and foreign currency transactions on the Statement of Operations.
Foreign Taxes:
The Fund may be subject to foreign taxes related to foreign income received (a portion of which may be reclaimable), capital gains on the sale of securities, and certain foreign currency transactions. All foreign taxes are recorded in accordance with the applicable regulations and rates that exist in the foreign jurisdictions in which the Fund invests.
22
USAA Mutual Funds Trust | | Notes to Financial Statements — continued
November 30, 2022 | |
(Unaudited)
Federal Income Taxes:
The Fund intends to continue to qualify as a regulated investment company by complying with the provisions available to certain investment companies, as defined in applicable sections of the Internal Revenue Code, and to make distributions of net investment income and net realized gains sufficient to relieve it from all, or substantially all, federal income taxes. Accordingly, no provision for federal income taxes is required in the financial statements. The Fund has a tax year end of May 31.
For the six months ended November 30, 2022, the Fund did not incur any income tax, interest, or penalties, and has recorded no liability for net unrecognized tax benefits relating to uncertain tax positions.
Management of the Fund has reviewed tax positions taken in tax years that remain subject to examination by all major tax jurisdictions, including federal (i.e., the last four tax years, which includes the current fiscal tax year end). Management believes that there is no tax liability resulting from unrecognized tax benefits related to uncertain tax positions taken.
Allocations:
Expenses directly attributable to the Fund are charged to the Fund, while expenses that are attributable to more than one fund in the Trust, or jointly with an affiliated trust, are allocated among the respective funds in the Trust and/or an affiliated trust based upon net assets or another appropriate basis.
Cross-Trade Transactions:
Pursuant to Rule 17a-7 under the 1940 Act, the Fund may engage in cross-trades, which are securities transactions with affiliated investment companies and advisory accounts managed by the Adviser and any applicable sub-adviser under specified conditions outlined in the valuation policies and procedures adopted by the Board. In addition, as defined under the valuation policies and procedures, each transaction must be effected at the independent current market price. For the six months ended November 30, 2022, the Fund engaged in the following securities transactions with affiliated funds, which resulted in the following net realized gains (losses) (amounts in thousands):
| Purchases | | Sales | | Net Realized
Gains (Losses) | |
| $ | — | | | $ | 1,684 | | | $ | 202 | | |
3. Purchases and Sales:
Purchases and sales of securities (excluding securities maturing less than one year from acquisition) for the six months ended November 30, 2022, were as follows for the Fund (amounts in thousands):
Excluding
U.S. Government Securities | | U.S. Government Securities | |
Purchases | | Sales | | Purchases | | Sales | |
$ | 797,706 | | | $ | 803,479 | | | $ | — | | | $ | 1,016 | | |
4. Fees and Transactions with Affiliates and Related Parties:
Investment Advisory Fees:
Investment advisory services are provided to the Fund by the Adviser, which is a New York corporation registered as an investment adviser with the SEC.
Under the terms of the Investment Advisory Agreement, the Adviser is entitled to receive fees accrued daily and paid monthly at an annualized rate of 0.59% of the Fund's average daily net assets. Amounts incurred and paid to VCM for the six months ended November 30, 2022, are reflected on the Statement of Operations as Investment advisory fees.
23
USAA Mutual Funds Trust | | Notes to Financial Statements — continued
November 30, 2022 | |
(Unaudited)
The Trust relies on an exemptive order granted to VCM and its affiliated funds by the SEC in March 2019, permitting the use of a "manager-of-managers" structure for certain funds. Under a manager-of-managers structure, the investment adviser may select (with approval of the Board and without shareholder approval) one or more subadvisers to manage the day-to-day investment of a fund's assets. For the six months ended November 30, 2022, the Fund had no subadvisers.
Administration and Servicing Fees:
VCM also serves as the Fund's administrator and fund accountant. Under the Fund Administration, Servicing and Accounting Agreement, VCM is paid an administration and servicing fee that is accrued daily and paid monthly at an annualized rate of 0.15%, which is based on the Fund's average daily net assets. Amounts incurred for the six months ended November 30, 2022, are reflected on the Statement of Operations as Administration fees.
Citi Fund Services Ohio, Inc. ("Citi"), an affiliate of Citibank, acts as sub-administrator and sub-fund accountant to the Fund pursuant to a Sub-Administration and Sub-Fund Accounting Services Agreement between VCM and Citi. VCM pays Citi a fee for providing these services. The Fund reimburses VCM and Citi for out-of-pocket expenses incurred in providing these services and certain other expenses specifically allocated to the Fund. Amounts incurred for the six months ended November 30, 2022, are reflected on the Statement of Operations as Sub-Administration fees.
The Fund (as part of the Trust) has entered into an agreement with the Adviser to provide compliance services, pursuant to which the Adviser furnishes its compliance personnel, including the services of the Chief Compliance Officer ("CCO"), and other resources reasonably necessary to provide the Trust with compliance oversight services related to the design, administration, and oversight of a compliance program for the Trust in accordance with Rule 38a-1 under the 1940 Act. The CCO is an employee of the Adviser, which pays the compensation of the CCO and support staff. The funds in the Trust, Victory Variable Insurance Funds, Victory Portfolios, and Victory Portfolios II (collectively, the "Victory Funds Complex") in the aggregate, compensate the Adviser for these services. Amounts incurred for the six months ended November 30, 2022, are reflected on the Statement of Operations as Compliance fees.
Transfer Agency Fees:
Victory Capital Transfer Agency, Inc. ("VCTA"), an affiliate of the Adviser, provides transfer agency services to the Fund. VCTA provides transfer agent services to the Fund based on an annual charge of $23 per shareholder account plus out-of-pocket expenses. VCTA pays a portion of these fees to certain intermediaries for the administration and servicing of accounts that are held with such intermediaries. Amounts incurred and paid to VCTA for the six months ended November 30, 2022, are reflected on the Statement of Operations as Transfer agent fees.
FIS Investor Services LLC serves as sub-transfer agent and dividend disbursing agent for the Fund pursuant to a Sub-Transfer Agent Agreement between VCTA and FIS Investor Services LLC. VCTA provides FIS Investor Services LLC a fee for providing these services.
Distributor/Underwriting Services:
Victory Capital Services, Inc. (the "Distributor"), an affiliate of the Adviser, serves as Distributor for the continuous offering of the shares of the Fund pursuant to a Distribution Agreement between the Distributor and the Trust and receives no fee or other compensation for these services.
Other Fees:
Citibank serves as the Fund's custodian. The Fund pays Citibank a fee for providing these services. Amounts incurred for the six months ended November 30, 2022, are reflected on the Statement of Operations as Custodian fees.
K&L Gates LLP provides legal services to the Trust.
24
USAA Mutual Funds Trust | | Notes to Financial Statements — continued
November 30, 2022 | |
(Unaudited)
The Adviser has entered into an expense limitation agreement with the Fund until at least September 30, 2023. Under the terms of the agreement, the Adviser has agreed to waive fees or reimburse certain expenses to the extent that ordinary operating expenses incurred in any fiscal year exceed the expense limit for the Fund. Such excess amounts will be the liability of the Adviser. Acquired fund fees and expenses, interest, taxes, brokerage commissions, other expenditures, which are capitalized in accordance with GAAP, and other extraordinary expenses not incurred in the ordinary course of the Fund's business are excluded from the expense limit. As of November 30, 2022, the expense limit (excluding voluntary waivers) was 0.98%.
In addition, the Fund invests in affiliated VCM exchange-traded fund(s) ("affiliated ETFs"). The Fund's advisory fee is reimbursed by VCM that to the extent of the indirect advisory fee incurred through the Fund's proportional investment in the affiliated ETFs. These affiliated ETF advisory fee reimbursements are not available for recoupment. For the six months ended November 30, 2022, the Fund incurred reimbursable expense of $1,062 thousand, of which $1,062 thousand consisted of affiliated ETF Adviser fee reimbursements and is reflected on the Statement of Operations as Expenses waived/reimbursed by Adviser. The Fund has a receivable related to these reimbursable expenses from the Adviser for $518 thousand, pursuant to the Fund's expense limitation agreement and is reflected on the Statement of Assets and Liabilities as Receivable from Advisor for ETF reimbursements.
Under the terms of the expense limitation agreement, as amended June 29, 2022, the Fund has agreed to repay fees and expenses that were waived or reimbursed by the Adviser for a period of up to three years (thirty-six (36) months) after the waiver or reimbursement took place, subject to the lesser of any operating expense limits in effect at the time of: (a) the original waiver or expense reimbursement; or (b) the recoupment, after giving effect to the recoupment amount. As of November 30, 2022, there are no amounts available to be repaid to the Adviser.
The Adviser may voluntarily waive or reimburse additional fees to assist the Fund in maintaining competitive expense ratios. Voluntary waivers and reimbursements applicable to the Fund are not available to be recouped at a future time. There were no voluntary waivers or reimbursements for the six months ended November 30, 2022.
Certain officers and/or interested trustees of the Fund are also officers and/or employees of the Adviser, administrator, fund accountant, sub-administrator, sub-fund accountant, custodian, and Distributor.
5. Risks:
The Fund may be subject to other risks in addition to these identified risks.
Tactical Allocation Risk — The Fund has a targeted risk tolerance and a corresponding asset allocation target; however, mere asset allocation and volatility are not the sole determination of risk. The Fund's managers will tactically allocate away from the target allocation as market conditions and the perceived risks warrant. The Fund bears the risk that the managers' tactical allocation will not be successful.
Affiliated Funds Risk — The risks of the Fund directly correspond to the risks of the underlying affiliated funds in which the Fund invests. By investing in the underlying affiliated funds, the Fund has exposure to the risk of many different areas of the market. The degree to which the risks described below apply to the Fund varies according to the Fund's asset allocation. For instance, the more the Fund is allocated to stock funds, the greater the risk associated with equity securities. The Fund also is subject to asset allocation risk (i.e., the risk that allocations will not produce the intended results) and to management risk (i.e., the risk that the selection of underlying affiliated funds will not produce the intended results).
Conflict of Interest Risk — In managing a Fund that invests in underlying affiliated funds, the Adviser may have conflicts of interest in allocating the Fund's assets among the various underlying affiliated funds. This is because the fees payable by some of the underlying affiliated funds to the Adviser and/or its affiliates are higher than the fees payable by other underlying affiliated funds, and because the Adviser also manages and administers the underlying affiliated funds.
25
USAA Mutual Funds Trust | | Notes to Financial Statements — continued
November 30, 2022 | |
(Unaudited)
ETF Risk —The Fund may invest in shares of ETFs, which generally are registered investment companies that hold a portfolio of common stocks or debt securities, the shares of which are traded on an exchange. ETFs incur their own management and other fees and expenses, such as trustees' fees, operating expenses, registration fees, and marketing expenses, a proportionate share of which will be borne indirectly by the Fund as a shareholder in an ETF. As a result, the Fund's investment in an ETF will cause the Fund to indirectly bear the fees and expenses of the ETF and, in turn, the Fund's performance may be lower than if the Fund were to invest directly in the underlying securities held by the ETF. For investments in affiliated ETFs, the Fund's management fee is reimbursed by the Adviser to the extent of the indirect management fee incurred through the Fund's investment in the affiliated ETFs. The Adviser may have conflicts of interest in allocating assets among affiliated and unaffiliated ETFs, because the Adviser also manages and administers the affiliated ETFs, and the Adviser and its affiliates receive other fees from the affiliated ETFs. In addition, the Fund also will be subject to the risks associated with the securities or other investments held by the ETFs.
Market Risk — Overall market risks may affect the value of the Fund. Domestic and international factors such as political events, war, terrorism, trade disputes, inflation rates, interest rate levels and other fiscal and monetary policy changes, cybersecurity incidents, pandemics and other public health crises, sanctions against a particular foreign country, its nationals, businesses or industries and related geopolitical events, as well as environmental disasters such as earthquakes, fires, and floods, or other catastrophes, may add to instability in global economies and markets generally, and may lead to increased market volatility. Global economies and financial markets are highly interconnected, which increases the possibility that conditions in one country or region might adversely affect issuers in another country or region. The impact of these and other factors may be short-term or may last for extended periods.
6. Borrowing and Interfund Lending:
Line of Credit:
The Victory Funds Complex participates in a short-term demand note "Line of Credit" agreement with Citibank. The Line of Credit agreement with Citibank was renewed on June 27, 2022, with a termination date of June 26, 2023. Under the agreement with Citibank, the Victory Funds Complex may borrow up to $600 million, of which $300 million is committed and $300 million is uncommitted. $40 million of the Line of Credit is reserved for use by the Victory Floating Rate Fund, another series of the Victory Funds Complex, with Victory Floating Rate Fund paying the related commitment fees for that amount. The purpose of the Line of Credit is to meet temporary or emergency cash needs. For the six months ended November 30, 2022, Citibank received an annual commitment fee of 0.15% on $300 million for providing the Line of Credit. Each fund in the Victory Funds Complex paid a pro-rata portion of the commitment fees plus any interest on amounts borrowed. For the period from June 1, 2022, through June 27, 2022, interest was based on the one-month London Interbank Offered Rate ("LIBOR") plus one percent. Effective with the renewal, for the period June 28, 2022, through November 30, 2022, interest was based on the one-month Secured Overnight Financing Rate ("SOFR") plus 1.10 percent. Interest charged to the Fund during the period, if applicable, is reflected on the Statement of Operations under Line of credit fees.
The Fund had no borrowings under the Line of Credit agreement during the six months ended November 30, 2022.
Interfund Lending:
The Trust and the Adviser rely on an exemptive order granted by the SEC in March 2017 (the "Order"), permitting the establishment and operation of an Interfund Lending Facility (the "Facility"). The Facility allows the Fund to directly lend and borrow money to or from any other fund in the Victory Funds Complex that is permitted to participate in the Facility, relying upon the Order at rates beneficial to both the borrowing and lending funds. Advances under the Facility are allowed for temporary or emergency purposes, including the meeting of redemption requests that otherwise might require the untimely disposition of securities, and are subject to each Fund's borrowing restrictions. The interfund
26
USAA Mutual Funds Trust | | Notes to Financial Statements — continued
November 30, 2022 | |
(Unaudited)
loan rate is determined, as specified in the Order, by averaging the current repurchase agreement rate and the current bank loan rate. As a Borrower, interest charged to the Fund, if any, during the period, is reflected on the Statement of Operations under Interfund lending fees. As a Lender, interest earned by the Fund, if any, during the period, is reflected on the Statement of Operations under Interfund lending.
The Fund did not utilize or participate in the Facility during the six months ended November 30, 2022.
7. Federal Income Tax Information:
The Fund intends to distribute any net investment income annually. Distributable net realized gains, if any, are declared and paid at least annually.
The amounts of dividends from net investment income and distributions from net realized gains (collectively, distributions to shareholders) are determined in accordance with federal income tax regulations, which may differ from GAAP. To the extent these "book/tax" differences are permanent in nature (e.g., net operating loss and distribution reclassification), such amounts are reclassified within the components of net assets based on their federal tax-basis treatment; temporary differences (e.g., wash sales) do not require reclassification. To the extent dividends and distributions exceed net investment income and net realized gains for tax purposes, they are reported as distributions of capital. Net investment losses incurred by the Fund may be reclassified as an offset to capital on the accompanying Statement of Assets and Liabilities.
The tax character of current year distributions paid and the tax basis of the current components of accumulated earnings (loss) will be determined at the end of the current tax year.
At the tax year ended May 31, 2022, the Fund had no capital loss carryforwards for federal income tax purposes.
8. Affiliated Securities:
An affiliated security is a security in which the Fund has ownership of at least 5% of the security's outstanding voting shares, an investment company managed by VCM, or an issuer under common control with a Fund or VCM. The Fund does not invest in affiliated securities for the purpose of exercising management or control. These securities are noted as affiliated on the Fund's Schedule of Portfolio Investments. The financial statements of the underlying funds can be found in shareholder reports filed with the SEC by each such underlying fund semi-annually on Form N-CSR and are available for download from both the SEC's as well as each respective underlying fund's website. Transactions in affiliated securities during the six months ended November 30, 2022, were as follows (amounts in thousands):
| | | Fair
Value
5/31/2022 | | Purchases
at Cost | | Proceeds
from
Sales | | Realized
Gains
(Losses) | | Capital
Gain
Distribution | | Net
Change in
Unrealized
Appreciation/
Depreciation | | Fair Value
11/30/2022 | | Dividend
Income | |
VictoryShares Emerging
Markets Value Momentum
ETF | | $ | 3,032 | | | $ | — | | | $ | — | | | $ | — | | | $ | — | | | $ | (291 | ) | | $ | 2,741 | | | $ | 79 | | |
VictoryShares ESG Core
Plus Bond ETF | | | 124,777 | | | | 5,088 | | | | (2,544 | ) | | | — | | | | — | | | | (6,317 | ) | | | 121,004 | | | | 2,087 | | |
VictoryShares USAA Core
Intermediate-Term Bond
ETF | | | 536,226 | | | | 17,948 | | | | (11,976 | ) | | | (678 | ) | | | — | | | | (24,854 | ) | | | 516,666 | | | | 6,060 | | |
VictoryShares USAA Core
Short-Term Bond ETF | | | 48,068 | | | | — | | | | — | | | | — | | | | — | | | | (851 | ) | | | 47,217 | | | | 631 | | |
| | | $ | 712,103 | | | $ | 23,036 | | | $ | (14,520 | ) | | $ | (678 | ) | | $ | — | | | $ | (32,313 | ) | | $ | 687,628 | | | $ | 8,857 | | |
27
USAA Mutual Funds Trust | | Supplemental Information
November 30, 2022 | |
(Unaudited)
Proxy Voting and Portfolio Holdings Information
Proxy Voting:
Information regarding the policies and procedures the Fund uses to determine how to vote proxies relating to portfolio securities is available without charge, upon request, by calling (800) 235-8396. The information is also included in the Fund's Statement of Additional Information, which is available on the SEC's website at www.sec.gov.
Information relating to how the Fund voted proxies relating to portfolio securities held during the most recent 12 months ended June 30 is available on the SEC's website at www.sec.gov.
Availability of Schedules of Portfolio Investments:
The Trust files a complete list of Schedules of Portfolio Investments with the SEC for the first and third quarter of each fiscal year on Form N-PORT. Form N-PORT is available on the SEC's website at www.sec.gov.
Expense Example
As a shareholder of the Fund, you may incur two types of costs: (1) transaction costs and (2) ongoing costs, including management fees and other Fund expenses. These examples are intended to help you understand your ongoing costs (in dollars) of investing in the Fund and to compare these costs with the ongoing costs of investing in other mutual funds.
These examples are based on an investment of $1,000 invested at the beginning of the period and held for the entire period from June 1, 2022, through November 30, 2022.
The Actual Expense figures in the table below provide information about actual account values and actual expenses. You may use the information below, together with the amount you invested, to estimate the expenses that you paid over the period. Simply divide your account value by $1,000 (for example, an $8,600 account value divided by $1,000 = 8.6), then multiply the result by the number in the table under the heading entitled "Actual Expenses Paid During Period" to estimate the expenses you paid on your account during this period.
The Hypothetical Expense figures in the table below provide information about hypothetical account values and hypothetical expenses based on the Fund's actual expense ratio and an assumed rate of return of 5% per year before expenses, which is not the Fund's actual return. The hypothetical account values and expenses may not be used to estimate the actual ending account balance or expenses you paid for the period. You may use this information to compare this 5% hypothetical example with the 5% hypothetical examples that appear in shareholder reports of other funds.
Please note the expenses shown in the table below are meant to highlight your ongoing costs only and do not reflect any transactional costs. Therefore, the hypothetical expenses in the table are useful in comparing ongoing costs only and will not help you determine the relative total costs of owning different funds. In addition, if these transactional costs were included, your costs would have been higher.
Beginning
Account Value
6/1/22 | | Actual
Ending
Account Value
11/30/22 | | Hypothetical
Ending
Account Value
11/30/22 | | Actual
Expenses Paid
During Period
6/1/22-11/30/22* | | Hypothetical
Expenses Paid
During Period
6/1/22-11/30/22* | | Annualized
Expense Ratio
During Period
6/1/22-11/30/22 | |
| $ | 1,000.00 | | | $ | 977.50 | | | $ | 1,020.66 | | | $ | 4.36 | | | $ | 4.46 | | | | 0.88 | % | |
* Expenses are equal to the average account value multiplied by the Fund's annualized expense ratio multiplied by 183/365 (the number of days in the most recent fiscal half-year divided by the number of days in the fiscal year).
28
Privacy Policy
Protecting the Privacy of Information
The Trust respects your right to privacy. We also know that you expect us to conduct and process your business in an accurate and efficient manner. To do so, we must collect and maintain certain personal information about you. This is the information we collect from you on applications or other forms, and from the transactions you make with us or third parties. It may include your name, address, social security number, account transactions and balances, and information about investment goals and risk tolerance.
We do not disclose any information about you or about former customers to anyone except as permitted or required by law. Specifically, we may disclose the information we collect to companies that perform services on our behalf, such as the transfer agent that processes shareholder accounts and printers and mailers that assist us in the distribution of investor materials. We may also disclose this information to companies that perform marketing services on our behalf. This allows us to continue to offer you Victory investment products and services that meet your investing needs, and to effect transactions that you request or authorize. These companies will use this information only in connection with the services for which we hired them. They are not permitted to use or share this information for any other purpose.
To protect your personal information internally, we permit access only by authorized employees and maintain physical, electronic, and procedural safeguards to guard your personal information.*
* You may have received communications regarding information about privacy policies from other financial institutions which gave you the opportunity to "opt-out" of certain information sharing with companies which are not affiliated with that financial institution. The Trust does not share information with other companies for purposes of marketing solicitations for products other than the Trust. Therefore, the Trust does not provide opt-out options to their shareholders.
P.O. Box 182593
Columbus, Ohio 43218-2593

Visit our website at: | | Call | |
www.vcm.com | | (800) 235-8396 | |

NOVEMBER 30, 2022
Semi Annual Report
USAA Growth and Tax Strategy Fund
Victory Capital means Victory Capital Management Inc., the investment adviser of the USAA Mutual Funds. USAA Mutual Funds are distributed by Victory Capital Services, Inc., member FINRA, an affiliate of Victory Capital. Victory Capital and its affiliates are not affiliated with United Services Automobile Association or its affiliates. USAA and the USAA logos are registered trademarks and the USAA Mutual Funds and USAA Investments logos are trademarks of United Services Automobile Association and are being used by Victory Capital and its affiliates under license.
www.vcm.com
News, Information And Education 24 Hours A Day, 7 Days A Week
The Victory Capital website gives fund shareholders, prospective shareholders, and investment professionals a convenient way to access fund information, get guidance, and track fund performance anywhere they can access the Internet. The site includes:
• Detailed performance records
• Daily share prices
• The latest fund news
• Investment resources to help you become a better investor
• A section dedicated to investment professionals
Whether you're a potential investor searching for the fund that matches your investment philosophy, a seasoned investor interested in planning tools, or an investment professional, www.vcm.com has what you seek. Visit us anytime. We're always open.
TABLE OF CONTENTS
Investment Objective & Portfolio Holdings | | | 2 | | |
Schedule of Portfolio Investments | | | 3 | | |
Financial Statements | |
Statement of Assets and Liabilities | | | 28 | | |
Statement of Operations | | | 29 | | |
Statements of Changes in Net Assets | | | 30 | | |
Financial Highlights | | | 32 | | |
Notes to Financial Statements | | | 34 | | |
Supplemental Information | | | 45 | | |
Proxy Voting and Portfolio Holdings Information | | | 45 | | |
Expense Examples | | | 45 | | |
Privacy Policy (inside back cover) | | | |
This report is for the information of the shareholders and others who have received a copy of the currently effective prospectus of the Fund, managed by Victory Capital Management Inc. It may be used as sales literature only when preceded or accompanied by a current prospectus, which provides further details about the Fund.
IRA DISTRIBUTION WITHHOLDING DISCLOSURE
We generally must withhold federal income tax at a rate of 10% of the taxable portion of your distribution and, if you live in a state that requires state income tax withholding, at your state's tax rate. However, you may elect not to have withholding apply or to have income tax withheld at a higher rate. Any withholding election that you make will apply to any subsequent distribution unless and until you change or revoke the election. If you wish to make a withholding election, or change or revoke a prior withholding election, call (800) 235-8396, and form W-4P (OMB No. 1545-0074 withholding certificate for pension or annuity payments) will be electronically sent.
If you do not have a withholding election in place by the date of a distribution, federal income tax will be withheld from the taxable portion of your distribution at a rate of 10%. If you must pay estimated taxes, you may be subject to estimated tax penalties if your estimated tax payments are not sufficient and sufficient tax is not withheld from your distribution.
For more specific information, please consult your tax adviser.
• NOT FDIC INSURED • NO BANK GUARANTEE • MAY LOSE VALUE
1
USAA Mutual Funds Trust
USAA Growth and Tax Strategy Fund | | November 30, 2022 | |
(Unaudited)
Investment Objective and Portfolio Holdings:
The Fund seeks a conservative balance for the investor between income, the majority of which is exempt from federal income tax, and the potential for long-term growth of capital to preserve purchasing power.
Top 10 Sectors*:
November 30, 2022
(% of Net Assets)
Information Technology | | | 12.7 | % | |
Health Care | | | 7.4 | % | |
Financials | | | 5.8 | % | |
Consumer Discretionary | | | 4.9 | % | |
Industrials | | | 4.1 | % | |
Consumer Staples | | | 3.4 | % | |
Communication Services | | | 3.4 | % | |
Energy | | | 2.5 | % | |
Materials | | | 1.3 | % | |
Utilities | | | 1.3 | % | |
Top 5 Tax-Exempt Bonds:
November 30, 2022
(% of Net Assets)
Port of Port Arthur Navigation District Revenue | | | 2.0 | % | |
Massachusetts Development Finance Agency Revenue | | | 1.9 | % | |
Public Finance Authority Revenue | | | 1.5 | % | |
Illinois Finance Authority Revenue | | | 1.3 | % | |
New Jersey Economic Development Authority Revenue | | | 0.9 | % | |
Top 5 Blue Chip Stocks:
November 30, 2022
(% of Net Assets)
Apple, Inc. | | | 3.2 | % | |
Microsoft Corp. | | | 2.6 | % | |
Amazon.com, Inc. | | | 1.1 | % | |
Berkshire Hathaway, Inc. Class B | | | 0.9 | % | |
Alphabet, Inc. Class A | | | 0.8 | % | |
* Does not include futures contracts, money market instruments, and short-term investments purchased with cash collateral from securities loaned.
Refer to the Schedule of Portfolio Investments for a complete list of securities.
2
USAA Mutual Funds Trust
USAA Growth and Tax Strategy Fund | | Schedule of Portfolio Investments
November 30, 2022 | |
(Amounts in Thousands, Except for Shares) (Unaudited)
Security Description | | Shares | | Value | |
Common Stocks (47.9%) | |
Blue Chip Stocks: | |
Communication Services (3.4%): | |
Activision Blizzard, Inc. | | | 6,138 | | | $ | 454 | | |
Alphabet, Inc. Class A (a) | | | 56,780 | | | | 5,734 | | |
Alphabet, Inc. Class C (a) | | | 54,571 | | | | 5,536 | | |
AT&T, Inc. | | | 89,248 | | | | 1,721 | | |
Charter Communications, Inc. Class A (a) | | | 1,409 | | | | 551 | | |
Comcast Corp. Class A | | | 50,586 | | | | 1,854 | | |
Electronic Arts, Inc. | | | 2,332 | | | | 305 | | |
Fox Corp. Class A | | | 3,851 | | | | 125 | | |
Fox Corp. Class B | | | 335 | | | | 10 | | |
Live Nation Entertainment, Inc. (a) | | | 1,692 | | | | 123 | | |
Meta Platforms, Inc. Class A (a) | | | 19,029 | | | | 2,247 | | |
Netflix, Inc. (a) | | | 5,255 | | | | 1,606 | | |
News Corp. Class A | | | 2,721 | | | | 52 | | |
Omnicom Group, Inc. | | | 2,542 | | | | 203 | | |
Paramount Global Class B | | | 5,167 | | | | 104 | | |
The Interpublic Group of Cos., Inc. | | | 4,839 | | | | 166 | | |
The Walt Disney Co. (a) | | | 16,041 | | | | 1,570 | | |
T-Mobile U.S., Inc. (a) | | | 6,653 | | | | 1,008 | | |
Verizon Communications, Inc. | | | 20,017 | | | | 780 | | |
Warner Bros Discovery, Inc. (a) | | | 513 | | | | 6 | | |
| | | | 24,155 | | |
Consumer Discretionary (4.9%): | |
Advance Auto Parts, Inc. | | | 812 | | | | 123 | | |
Amazon.com, Inc. (a) | | | 79,120 | | | | 7,638 | | |
Aptiv PLC (a) | | | 2,354 | | | | 251 | | |
AutoZone, Inc. (a) | | | 241 | | | | 621 | | |
Bath & Body Works, Inc. | | | 2,727 | | | | 116 | | |
Best Buy Co., Inc. | | | 2,415 | | | | 206 | | |
Booking Holdings, Inc. (a) | | | 417 | | | | 867 | | |
BorgWarner, Inc. | | | 1 | | | | — | (b) | |
CarMax, Inc. (a) | | | 1,983 | | | | 138 | | |
Carnival Corp. (a) | | | 2,980 | | | | 30 | | |
Chipotle Mexican Grill, Inc. (a) | | | 325 | | | | 529 | | |
D.R. Horton, Inc. | | | 3,030 | | | | 261 | | |
Darden Restaurants, Inc. | | | 1,518 | | | | 223 | | |
Dollar General Corp. | | | 2,461 | | | | 629 | | |
Dollar Tree, Inc. (a) | | | 1,591 | | | | 239 | | |
eBay, Inc. | | | 6,813 | | | | 310 | | |
Etsy, Inc. (a) | | | 1,299 | | | | 172 | | |
Expedia Group, Inc. (a) | | | 1,583 | | | | 169 | | |
Ford Motor Co. | | | 48,788 | | | | 678 | | |
Garmin Ltd. | | | 1,028 | | | | 96 | | |
General Motors Co. | | | 13,698 | | | | 556 | | |
Genuine Parts Co. | | | 1,110 | | | | 203 | | |
Hasbro, Inc. | | | 1,004 | | | | 63 | | |
Hilton Worldwide Holdings, Inc. | | | 3,015 | | | | 430 | | |
See notes to financial statements.
3
USAA Mutual Funds Trust
USAA Growth and Tax Strategy Fund | | Schedule of Portfolio Investments — continued
November 30, 2022 | |
(Amounts in Thousands, Except for Shares) (Unaudited)
Security Description | | Shares | | Value | |
Las Vegas Sands Corp. (a) | | | 4,067 | | | $ | 190 | | |
Lennar Corp. Class A | | | 2,669 | | | | 234 | | |
Lennar Corp. Class B | | | 1 | | | | — | (b) | |
LKQ Corp. | | | 3,215 | | | | 175 | | |
Lowe's Cos., Inc. | | | 7,437 | | | | 1,581 | | |
Marriott International, Inc. Class A | | | 2,953 | | | | 488 | | |
McDonald's Corp. | | | 7,151 | | | | 1,951 | | |
MGM Resorts International | | | 4,369 | | | | 161 | | |
Mohawk Industries, Inc. (a) | | | 618 | | | | 63 | | |
Newell Brands, Inc. | | | 2,180 | | | | 28 | | |
NIKE, Inc. Class B | | | 12,097 | | | | 1,327 | | |
Norwegian Cruise Line Holdings Ltd. (a) | | | 2,676 | | | | 44 | | |
O'Reilly Automotive, Inc. (a) | | | 788 | | | | 681 | | |
Penn Entertainment, Inc. (a) | | | 1,933 | | | | 68 | | |
PulteGroup, Inc. | | | 2,360 | | | | 106 | | |
PVH Corp. | | | 928 | | | | 62 | | |
Ralph Lauren Corp. | | | 420 | | | | 47 | | |
Ross Stores, Inc. | | | 3,606 | | | | 424 | | |
Starbucks Corp. | | | 11,086 | | | | 1,133 | | |
Tapestry, Inc. | | | 3,021 | | | | 114 | | |
Target Corp. | | | 5,209 | | | | 870 | | |
Tesla, Inc. (a) | | | 21,834 | | | | 4,251 | | |
The Home Depot, Inc. | | | 10,478 | | | | 3,395 | | |
The TJX Cos., Inc. | | | 12,221 | | | | 978 | | |
Tractor Supply Co. | | | 1,382 | | | | 313 | | |
Ulta Beauty, Inc. (a) | | | 550 | | | | 256 | | |
VF Corp. | | | 2,040 | | | | 67 | | |
Victoria's Secret & Co. (a) | | | 1 | | | | — | (b) | |
Whirlpool Corp. | | | 694 | | | | 102 | | |
Wynn Resorts Ltd. (a) | | | 642 | | | | 54 | | |
Yum! Brands, Inc. | | | 3,523 | | | | 453 | | |
| | | | 34,164 | | |
Consumer Staples (3.4%): | |
Altria Group, Inc. | | | 20,264 | | | | 944 | | |
Archer-Daniels-Midland Co. | | | 6,080 | | | | 593 | | |
Brown-Forman Corp. Class B | | | 1,744 | | | | 127 | | |
Campbell Soup Co. | | | 640 | | | | 34 | | |
Church & Dwight Co., Inc. | | | 2,723 | | | | 223 | | |
Colgate-Palmolive Co. | | | 5,377 | | | | 417 | | |
Conagra Brands, Inc. | | | 3,475 | | | | 132 | | |
Constellation Brands, Inc. Class A | | | 1,408 | | | | 362 | | |
Costco Wholesale Corp. | | | 4,544 | | | | 2,450 | | |
General Mills, Inc. | | | 6,777 | | | | 578 | | |
Hormel Foods Corp. | | | 1,830 | | | | 86 | | |
Kellogg Co. | | | 1,080 | | | | 79 | | |
Kimberly-Clark Corp. | | | 2,120 | | | | 288 | | |
Lamb Weston Holdings, Inc. | | | 1,374 | | | | 119 | | |
McCormick & Co., Inc. | | | 2,942 | | | | 251 | | |
Molson Coors Beverage Co. Class B | | | 2,045 | | | | 113 | | |
Mondelez International, Inc. Class A | | | 12,769 | | | | 863 | | |
See notes to financial statements.
4
USAA Mutual Funds Trust
USAA Growth and Tax Strategy Fund | | Schedule of Portfolio Investments — continued
November 30, 2022 | |
(Amounts in Thousands, Except for Shares) (Unaudited)
Security Description | | Shares | | Value | |
Monster Beverage Corp. (a) | | | 3,965 | | | $ | 408 | | |
PepsiCo, Inc. | | | 15,419 | | | | 2,860 | | |
Philip Morris International, Inc. | | | 16,649 | | | | 1,659 | | |
Sysco Corp. | | | 5,774 | | | | 500 | | |
The Clorox Co. | | | 690 | | | | 103 | | |
The Coca-Cola Co. | | | 27,653 | | | | 1,759 | | |
The Estee Lauder Cos., Inc. | | | 2,324 | | | | 548 | | |
The Hershey Co. | | | 1,804 | | | | 424 | | |
The J.M. Smucker Co. | | | 828 | | | | 128 | | |
The Kraft Heinz Co. | | | 6,993 | | | | 275 | | |
The Kroger Co. | | | 8,039 | | | | 396 | | |
The Procter & Gamble Co. | | | 28,568 | | | | 4,261 | | |
Tyson Foods, Inc. Class A | | | 2,142 | | | | 142 | | |
Walgreens Boots Alliance, Inc. | | | 5,210 | | | | 216 | | |
Walmart, Inc. | | | 14,494 | | | | 2,209 | | |
| | | | 23,547 | | |
Energy (2.5%): | |
APA Corp. | | | 1,896 | | | | 89 | | |
Baker Hughes Co. | | | 8,513 | | | | 247 | | |
Chevron Corp. | | | 22,232 | | | | 4,075 | | |
ConocoPhillips | | | 14,432 | | | | 1,783 | | |
Coterra Energy, Inc. | | | 2,120 | | | | 59 | | |
Devon Energy Corp. | | | 4,851 | | | | 332 | | |
Diamondback Energy, Inc. | | | 2,111 | | | | 313 | | |
EOG Resources, Inc. | | | 4,759 | | | | 676 | | |
Exxon Mobil Corp. | | | 39,044 | | | | 4,347 | | |
Halliburton Co. | | | 9,010 | | | | 341 | | |
Hess Corp. | | | 2,683 | | | | 386 | | |
Kinder Morgan, Inc. | | | 7,546 | | | | 144 | | |
Marathon Oil Corp. | | | 8,612 | | | | 264 | | |
Marathon Petroleum Corp. | | | 6,584 | | | | 802 | | |
Occidental Petroleum Corp. | | | 6,740 | | | | 468 | | |
ONEOK, Inc. | | | 5,513 | | | | 369 | | |
Phillips 66 | | | 2,813 | | | | 305 | | |
Pioneer Natural Resources Co. | | | 2,039 | | | | 481 | | |
Schlumberger NV | | | 17,463 | | | | 900 | | |
The Williams Cos., Inc. | | | 14,342 | | | | 498 | | |
Valero Energy Corp. | | | 4,779 | | | | 639 | | |
| | | | 17,518 | | |
Financials (5.8%): | |
Aflac, Inc. | | | 6,526 | | | | 469 | | |
American Express Co. | | | 6,409 | | | | 1,010 | | |
American International Group, Inc. | | | 9,640 | | | | 608 | | |
Ameriprise Financial, Inc. | | | 1,259 | | | | 418 | | |
Aon PLC Class A | | | 2,360 | | | | 728 | | |
Arthur J. Gallagher & Co. | | | 2,370 | | | | 472 | | |
Assurant, Inc. | | | 653 | | | | 84 | | |
Bank of America Corp. | | | 80,700 | | | | 3,054 | | |
Berkshire Hathaway, Inc. Class B (a) | | | 18,910 | | | | 6,025 | | |
See notes to financial statements.
5
USAA Mutual Funds Trust
USAA Growth and Tax Strategy Fund | | Schedule of Portfolio Investments — continued
November 30, 2022 | |
(Amounts in Thousands, Except for Shares) (Unaudited)
Security Description | | Shares | | Value | |
BlackRock, Inc. | | | 1,540 | | | $ | 1,103 | | |
Brown & Brown, Inc. | | | 1,903 | | | | 113 | | |
Capital One Financial Corp. | | | 4,781 | | | | 494 | | |
Cboe Global Markets, Inc. | | | 1,027 | | | | 130 | | |
Chubb Ltd. | | | 3,972 | | | | 872 | | |
Cincinnati Financial Corp. | | | 1,898 | | | | 211 | | |
Citigroup, Inc. | | | 14,818 | | | | 717 | | |
Citizens Financial Group, Inc. | | | 5,249 | | | | 222 | | |
CME Group, Inc. | | | 3,122 | | | | 551 | | |
Comerica, Inc. | | | 1,616 | | | | 116 | | |
Discover Financial Services | | | 3,419 | | | | 370 | | |
FactSet Research Systems, Inc. | | | 388 | | | | 179 | | |
Fifth Third Bancorp | | | 8,477 | | | | 308 | | |
Huntington Bancshares, Inc. | | | 12,687 | | | | 196 | | |
Intercontinental Exchange, Inc. | | | 5,757 | | | | 624 | | |
Invesco Ltd. | | | 4,160 | | | | 79 | | |
JPMorgan Chase & Co. | | | 32,040 | | | | 4,427 | | |
KeyCorp | | | 11,521 | | | | 217 | | |
Lincoln National Corp. | | | 1,769 | | | | 69 | | |
Loews Corp. | | | 2,402 | | | | 140 | | |
M&T Bank Corp. | | | 2,181 | | | | 371 | | |
Marsh & McLennan Cos., Inc. | | | 5,030 | | | | 871 | | |
MetLife, Inc. | | | 7,410 | | | | 568 | | |
Moody's Corp. | | | 1,624 | | | | 484 | | |
Morgan Stanley | | | 14,869 | | | | 1,384 | | |
MSCI, Inc. | | | 992 | | | | 504 | | |
Nasdaq, Inc. | | | 3,477 | | | | 238 | | |
Northern Trust Corp. (c) | | | 1,649 | | | | 154 | | |
Principal Financial Group, Inc. | | | 2,476 | | | | 222 | | |
Prudential Financial, Inc. | | | 4,592 | | | | 496 | | |
Raymond James Financial, Inc. | | | 1,989 | | | | 233 | | |
Regions Financial Corp. | | | 9,790 | | | | 227 | | |
S&P Global, Inc. | | | 3,628 | | | | 1,280 | | |
State Street Corp. | | | 3,749 | | | | 299 | | |
SVB Financial Group (a) | | | 645 | | | | 150 | | |
Synchrony Financial | | | 6,103 | | | | 229 | | |
T. Rowe Price Group, Inc. | | | 2,189 | | | | 273 | | |
The Allstate Corp. | | | 3,040 | | | | 407 | | |
The Bank of New York Mellon Corp. | | | 5,526 | | | | 254 | | |
The Charles Schwab Corp. | | | 15,402 | | | | 1,271 | | |
The Goldman Sachs Group, Inc. | | | 3,096 | | | | 1,196 | | |
The Hartford Financial Services Group, Inc. | | | 2,900 | | | | 221 | | |
The PNC Financial Services Group, Inc. | | | 4,807 | | | | 809 | | |
The Progressive Corp. | | | 5,434 | | | | 718 | | |
The Travelers Cos., Inc. | | | 2,350 | | | | 446 | | |
Truist Financial Corp. | | | 9,641 | | | | 451 | | |
U.S. Bancorp | | | 11,380 | | | | 517 | | |
W.R. Berkley Corp. | | | 2,739 | | | | 209 | | |
Wells Fargo & Co. | | | 39,812 | | | | 1,909 | | |
See notes to financial statements.
6
USAA Mutual Funds Trust
USAA Growth and Tax Strategy Fund | | Schedule of Portfolio Investments — continued
November 30, 2022 | |
(Amounts in Thousands, Except for Shares) (Unaudited)
Security Description | | Shares | | Value | |
Willis Towers Watson PLC | | | 1,136 | | | $ | 280 | | |
Zions Bancorp NA | | | 1,870 | | | | 97 | | |
| | | | 40,774 | | |
Health Care (7.4%): | |
Abbott Laboratories | | | 20,353 | | | | 2,190 | | |
AbbVie, Inc. | | | 16,903 | | | | 2,724 | | |
ABIOMED, Inc. (a) | | | 568 | | | | 215 | | |
Agilent Technologies, Inc. | | | 3,708 | | | | 575 | | |
Align Technology, Inc. (a) | | | 809 | | | | 159 | | |
AmerisourceBergen Corp. | | | 1,410 | | | | 241 | | |
Amgen, Inc. | | | 5,957 | | | | 1,706 | | |
Baxter International, Inc. | | | 4,106 | | | | 232 | | |
Becton Dickinson & Co. | | | 2,074 | | | | 517 | | |
Biogen, Inc. (a) | | | 1,216 | | | | 371 | | |
Bio-Techne Corp. | | | 364 | | | | 31 | | |
Boston Scientific Corp. (a) | | | 16,790 | | | | 760 | | |
Bristol-Myers Squibb Co. | | | 22,926 | | | | 1,840 | | |
Cardinal Health, Inc. | | | 2,310 | | | | 185 | | |
Centene Corp. (a) | | | 5,336 | | | | 464 | | |
Cigna Corp. | | | 3,445 | | | | 1,133 | | |
CVS Health Corp. | | | 13,059 | | | | 1,330 | | |
Danaher Corp. | | | 6,489 | | | | 1,774 | | |
DaVita, Inc. (a) | | | 748 | | | | 55 | | |
DENTSPLY SIRONA, Inc. | | | 1,150 | | | | 35 | | |
Dexcom, Inc. (a) | | | 3,032 | | | | 353 | | |
Edwards Lifesciences Corp. (a) | | | 6,150 | | | | 475 | | |
Elevance Health, Inc. | | | 2,398 | | | | 1,278 | | |
Eli Lilly & Co. | | | 8,712 | | | | 3,233 | | |
Gilead Sciences, Inc. | | | 8,764 | | | | 770 | | |
HCA Healthcare, Inc. | | | 2,625 | | | | 631 | | |
Henry Schein, Inc. (a) | | | 1,136 | | | | 92 | | |
Hologic, Inc. (a) | | | 2,461 | | | | 187 | | |
Humana, Inc. | | | 1,376 | | | | 757 | | |
IDEXX Laboratories, Inc. (a) | | | 1,028 | | | | 438 | | |
Illumina, Inc. (a) | | | 1,842 | | | | 402 | | |
Incyte Corp. (a) | | | 578 | | | | 46 | | |
Intuitive Surgical, Inc. (a) | | | 4,247 | | | | 1,148 | | |
IQVIA Holdings, Inc. (a) | | | 1,977 | | | | 431 | | |
Johnson & Johnson | | | 28,442 | | | | 5,063 | | |
Laboratory Corp. of America Holdings | | | 1,063 | | | | 256 | | |
McKesson Corp. | | | 1,450 | | | | 553 | | |
Medtronic PLC | | | 6,654 | | | | 526 | | |
Merck & Co., Inc. | | | 26,683 | | | | 2,938 | | |
Mettler-Toledo International, Inc. (a) | | | 250 | | | | 367 | | |
Moderna, Inc. (a) | | | 3,389 | | | | 596 | | |
Molina Healthcare, Inc. (a) | | | 575 | | | | 194 | | |
Organon & Co. | | | 1,845 | | | | 48 | | |
PerkinElmer, Inc. | | | 1,164 | | | | 163 | | |
Pfizer, Inc. | | | 48,283 | | | | 2,420 | | |
Quest Diagnostics, Inc. | | | 1,126 | | | | 171 | | |
See notes to financial statements.
7
USAA Mutual Funds Trust
USAA Growth and Tax Strategy Fund | | Schedule of Portfolio Investments — continued
November 30, 2022 | |
(Amounts in Thousands, Except for Shares) (Unaudited)
Security Description | | Shares | | Value | |
Regeneron Pharmaceuticals, Inc. (a) | | | 1,226 | | | $ | 922 | | |
ResMed, Inc. | | | 1,723 | | | | 397 | | |
STERIS PLC | | | 864 | | | | 160 | | |
Stryker Corp. | | | 3,361 | | | | 786 | | |
The Cooper Cos., Inc. | | | 445 | | | | 141 | | |
Thermo Fisher Scientific, Inc. | | | 3,958 | | | | 2,217 | | |
UnitedHealth Group, Inc. | | | 9,992 | | | | 5,473 | | |
Vertex Pharmaceuticals, Inc. (a) | | | 2,999 | | | | 949 | | |
Viatris, Inc. | | | 4,869 | | | | 54 | | |
Waters Corp. (a) | | | 690 | | | | 239 | | |
West Pharmaceutical Services, Inc. | | | 489 | | | | 115 | | |
Zimmer Biomet Holdings, Inc. | | | 1,229 | | | | 148 | | |
Zoetis, Inc. | | | 4,796 | | | | 739 | | |
| | | | 52,413 | | |
Industrials (4.1%): | |
3M Co. | | | 5,685 | | | | 716 | | |
A O Smith Corp. | | | 1,607 | | | | 98 | | |
Alaska Air Group, Inc. (a) | | | 1,550 | | | | 74 | | |
Allegion PLC | | | 880 | | | | 100 | | |
American Airlines Group, Inc. (a) | | | 6,217 | | | | 90 | | |
AMETEK, Inc. | | | 2,861 | | | | 407 | | |
C.H. Robinson Worldwide, Inc. | | | 779 | | | | 78 | | |
Carrier Global Corp. | | | 7,990 | | | | 354 | | |
Caterpillar, Inc. | | | 5,175 | | | | 1,223 | | |
Cintas Corp. | | | 1,066 | | | | 492 | | |
Copart, Inc. (a) | | | 4,572 | | | | 304 | | |
CoStar Group, Inc. (a) | | | 3,071 | | | | 249 | | |
CSX Corp. | | | 24,039 | | | | 786 | | |
Cummins, Inc. | | | 1,577 | | | | 396 | | |
Deere & Co. | | | 3,434 | | | | 1,514 | | |
Delta Air Lines, Inc. (a) | | | 7,217 | | | | 255 | | |
Dover Corp. | | | 1,435 | | | | 204 | | |
Eaton Corp. PLC | | | 4,316 | | | | 705 | | |
Emerson Electric Co. | | | 4,743 | | | | 454 | | |
Equifax, Inc. | | | 1,334 | | | | 263 | | |
Expeditors International of Washington, Inc. | | | 1,610 | | | | 187 | | |
Fastenal Co. | | | 5,972 | | | | 308 | | |
FedEx Corp. | | | 2,126 | | | | 387 | | |
Fortive Corp. | | | 2,506 | | | | 169 | | |
Fortune Brands Home & Security, Inc. | | | 1,596 | | | | 104 | | |
General Dynamics Corp. | | | 1,726 | | | | 436 | | |
General Electric Co. | | | 11,338 | | | | 975 | | |
Honeywell International, Inc. | | | 7,027 | | | | 1,543 | | |
Howmet Aerospace, Inc. | | | 3,713 | | | | 140 | | |
Huntington Ingalls Industries, Inc. | | | 470 | | | | 109 | | |
IDEX Corp. | | | 779 | | | | 185 | | |
Illinois Tool Works, Inc. | | | 2,480 | | | | 564 | | |
Ingersoll Rand, Inc. | | | 4,166 | | | | 225 | | |
J.B. Hunt Transport Services, Inc. | | | 714 | | | | 131 | | |
Jacobs Solutions, Inc. | | | 1,124 | | | | 142 | | |
See notes to financial statements.
8
USAA Mutual Funds Trust
USAA Growth and Tax Strategy Fund | | Schedule of Portfolio Investments — continued
November 30, 2022 | |
(Amounts in Thousands, Except for Shares) (Unaudited)
Security Description | | Shares | | Value | |
Johnson Controls International PLC | | | 6,676 | | | $ | 444 | | |
L3Harris Technologies, Inc. | | | 2,025 | | | | 460 | | |
Lockheed Martin Corp. | | | 2,228 | | | | 1,081 | | |
Masco Corp. | | | 2,915 | | | | 148 | | |
Nordson Corp. | | | 554 | | | | 131 | | |
Norfolk Southern Corp. | | | 2,582 | | | | 662 | | |
Northrop Grumman Corp. | | | 1,594 | | | | 850 | | |
Old Dominion Freight Line, Inc. | | | 882 | | | | 267 | | |
Otis Worldwide Corp. | | | 3,056 | | | | 239 | | |
PACCAR, Inc. | | | 2,564 | | | | 272 | | |
Parker-Hannifin Corp. | | | 1,216 | | | | 364 | | |
Pentair PLC | | | 869 | | | | 40 | | |
Quanta Services, Inc. | | | 1,444 | | | | 216 | | |
Raytheon Technologies Corp. | | | 14,809 | | | | 1,462 | | |
Republic Services, Inc. | | | 2,086 | | | | 291 | | |
Robert Half International, Inc. | | | 1,284 | | | | 101 | | |
Rockwell Automation, Inc. | | | 1,190 | | | | 314 | | |
Rollins, Inc. | | | 2,318 | | | | 94 | | |
Snap-on, Inc. | | | 594 | | | | 143 | | |
Southwest Airlines Co. (a) | | | 4,959 | | | | 198 | | |
Stanley Black & Decker, Inc. | | | 983 | | | | 80 | | |
Textron, Inc. | | | 2,070 | | | | 148 | | |
The Boeing Co. (a) | | | 4,735 | | | | 847 | | |
Trane Technologies PLC | | | 2,861 | | | | 510 | | |
TransDigm Group, Inc. | | | 593 | | | | 373 | | |
Union Pacific Corp. | | | 7,288 | | | | 1,585 | | |
United Airlines Holdings, Inc. (a) | | | 3,649 | | | | 161 | | |
United Parcel Service, Inc. Class B | | | 6,904 | | | | 1,310 | | |
United Rentals, Inc. (a) | | | 750 | | | | 265 | | |
Verisk Analytics, Inc. | | | 1,450 | | | | 266 | | |
W.W. Grainger, Inc. | | | 478 | | | | 288 | | |
Waste Management, Inc. | | | 3,869 | | | | 649 | | |
Westinghouse Air Brake Technologies Corp. | | | 1,745 | | | | 176 | | |
Xylem, Inc. | | | 1,548 | | | | 174 | | |
| | | | 28,976 | | |
Information Technology (12.7%): | |
Accenture PLC Class A | | | 6,475 | | | | 1,949 | | |
Adobe, Inc. (a) | | | 5,423 | | | | 1,871 | | |
Advanced Micro Devices, Inc. (a) | | | 16,362 | | | | 1,270 | | |
Akamai Technologies, Inc. (a) | | | 1,562 | | | | 148 | | |
Amphenol Corp. Class A | | | 5,634 | | | | 453 | | |
Analog Devices, Inc. | | | 5,096 | | | | 876 | | |
ANSYS, Inc. (a) | | | 796 | | | | 202 | | |
Apple, Inc. | | | 154,626 | | | | 22,889 | | |
Applied Materials, Inc. | | | 10,258 | | | | 1,124 | | |
Arista Networks, Inc. (a) | | | 2,364 | | | | 329 | | |
Autodesk, Inc. (a) | | | 2,574 | | | | 520 | | |
Automatic Data Processing, Inc. | | | 4,304 | | | | 1,137 | | |
Broadcom, Inc. | | | 4,130 | | | | 2,276 | | |
Broadridge Financial Solutions, Inc. | | | 369 | | | | 55 | | |
See notes to financial statements.
9
USAA Mutual Funds Trust
USAA Growth and Tax Strategy Fund | | Schedule of Portfolio Investments — continued
November 30, 2022 | |
(Amounts in Thousands, Except for Shares) (Unaudited)
Security Description | | Shares | | Value | |
Cadence Design Systems, Inc. (a) | | | 2,583 | | | $ | 444 | | |
CDW Corp. | | | 1,428 | | | | 269 | | |
Ceridian HCM Holding, Inc. (a) | | | 1,295 | | | | 89 | | |
Cisco Systems, Inc. | | | 39,302 | | | | 1,954 | | |
Cognizant Technology Solutions Corp. Class A | | | 5,181 | | | | 322 | | |
Corning, Inc. | | | 7,670 | | | | 262 | | |
DXC Technology Co. (a) | | | 3,194 | | | | 95 | | |
Enphase Energy, Inc. (a) | | | 1,224 | | | | 392 | | |
EPAM Systems, Inc. (a) | | | 537 | | | | 198 | | |
F5, Inc. (a) | | | 421 | | | | 65 | | |
Fidelity National Information Services, Inc. | | | 1,247 | | | | 91 | | |
Fiserv, Inc. (a) | | | 6,882 | | | | 718 | | |
Fortinet, Inc. (a) | | | 7,295 | | | | 388 | | |
Gartner, Inc. (a) | | | 843 | | | | 295 | | |
Global Payments, Inc. | | | 2,592 | | | | 269 | | |
Hewlett Packard Enterprise Co. | | | 12,525 | | | | 210 | | |
HP, Inc. | | | 12,818 | | | | 385 | | |
Intel Corp. | | | 29,899 | | | | 899 | | |
International Business Machines Corp. | | | 9,453 | | | | 1,408 | | |
Intuit, Inc. | | | 2,659 | | | | 1,084 | | |
Juniper Networks, Inc. | | | 2,447 | | | | 81 | | |
Keysight Technologies, Inc. (a) | | | 1,866 | | | | 338 | | |
KLA Corp. | | | 1,555 | | | | 611 | | |
Lam Research Corp. | | | 1,595 | | | | 754 | | |
Mastercard, Inc. Class A | | | 8,421 | | | | 3,001 | | |
Microchip Technology, Inc. | | | 5,696 | | | | 451 | | |
Micron Technology, Inc. | | | 10,223 | | | | 589 | | |
Microsoft Corp. | | | 71,508 | | | | 18,245 | | |
Motorola Solutions, Inc. | | | 1,485 | | | | 404 | | |
NetApp, Inc. | | | 2,488 | | | | 168 | | |
NortonLifeLock, Inc. | | | 1,010 | | | | 23 | | |
NVIDIA Corp. | | | 30,201 | | | | 5,111 | | |
NXP Semiconductors NV | | | 2,048 | | | | 360 | | |
ON Semiconductor Corp. (a) | | | 5,140 | | | | 387 | | |
Oracle Corp. | | | 19,157 | | | | 1,591 | | |
Paychex, Inc. | | | 2,957 | | | | 367 | | |
Paycom Software, Inc. (a) | | | 608 | | | | 206 | | |
PayPal Holdings, Inc. (a) | | | 13,699 | | | | 1,074 | | |
Qorvo, Inc. (a) | | | 1,188 | | | | 118 | | |
QUALCOMM, Inc. | | | 12,055 | | | | 1,525 | | |
Roper Technologies, Inc. | | | 1,242 | | | | 545 | | |
Salesforce, Inc. (a) | | | 6,806 | | | | 1,091 | | |
Seagate Technology Holdings PLC | | | 2,345 | | | | 124 | | |
ServiceNow, Inc. (a) | | | 2,279 | | | | 949 | | |
Skyworks Solutions, Inc. | | | 708 | | | | 68 | | |
SolarEdge Technologies, Inc. (a) | | | 224 | | | | 67 | | |
Synopsys, Inc. (a) | | | 1,398 | | | | 475 | | |
TE Connectivity Ltd. | | | 3,470 | | | | 438 | | |
Teledyne Technologies, Inc. (a) | | | 69 | | | | 29 | | |
Texas Instruments, Inc. | | | 8,840 | | | | 1,595 | | |
See notes to financial statements.
10
USAA Mutual Funds Trust
USAA Growth and Tax Strategy Fund | | Schedule of Portfolio Investments — continued
November 30, 2022 | |
(Amounts in Thousands, Except for Shares) (Unaudited)
Security Description | | Shares | | Value | |
VeriSign, Inc. (a) | | | 785 | | | $ | 157 | | |
Visa, Inc. Class A | | | 16,518 | | | | 3,584 | | |
Western Digital Corp. (a) | | | 1,369 | | | | 50 | | |
Xerox Holdings Corp. | | | 1 | | | | — | (b) | |
Zebra Technologies Corp. (a) | | | 649 | | | | 175 | | |
| | | | 89,687 | | |
Materials (1.3%): | |
Air Products and Chemicals, Inc. | | | 1,923 | | | | 596 | | |
Albemarle Corp. | | | 1,201 | | | | 334 | | |
Avery Dennison Corp. | | | 906 | | | | 175 | | |
Ball Corp. | | | 3,726 | | | | 209 | | |
Celanese Corp. | | | 463 | | | | 50 | | |
CF Industries Holdings, Inc. | | | 2,538 | | | | 275 | | |
Corteva, Inc. | | | 8,159 | | | | 548 | | |
Dow, Inc. | | | 8,954 | | | | 456 | | |
DuPont de Nemours, Inc. | | | 3,671 | | | | 259 | | |
Eastman Chemical Co. | | | 1,432 | | | | 124 | | |
Ecolab, Inc. | | | 1,707 | | | | 256 | | |
FMC Corp. | | | 1,168 | | | | 153 | | |
Freeport-McMoRan, Inc. | | | 15,889 | | | | 632 | | |
International Flavors & Fragrances, Inc. | | | 1,485 | | | | 157 | | |
International Paper Co. | | | 3,667 | | | | 136 | | |
Linde PLC | | | 5,953 | | | | 2,003 | | |
LyondellBasell Industries NV Class A | | | 2,696 | | | | 229 | | |
Martin Marietta Materials, Inc. | | | 721 | | | | 264 | | |
Newmont Corp. | | | 8,551 | | | | 406 | | |
Nucor Corp. | | | 2,642 | | | | 396 | | |
PPG Industries, Inc. | | | 1,640 | | | | 222 | | |
Sealed Air Corp. | | | 1,340 | | | | 71 | | |
The Mosaic Co. | | | 4,511 | | | | 231 | | |
The Sherwin-Williams Co. | | | 2,304 | | | | 574 | | |
Vulcan Materials Co. | | | 1,110 | | | | 204 | | |
Westrock Co. | | | 2,863 | | | | 109 | | |
| | | | 9,069 | | |
Real Estate (1.1%): | |
Alexandria Real Estate Equities, Inc. | | | 1,101 | | | | 171 | | |
American Tower Corp. | | | 4,297 | | | | 951 | | |
AvalonBay Communities, Inc. | | | 740 | | | | 129 | | |
Boston Properties, Inc. | | | 1,758 | | | | 127 | | |
CBRE Group, Inc. Class A (a) | | | 3,167 | | | | 252 | | |
Crown Castle, Inc. | | | 4,036 | | | | 571 | | |
Digital Realty Trust, Inc. | | | 3,039 | | | | 342 | | |
Equinix, Inc. | | | 852 | | | | 588 | | |
Equity Residential | | | 2,215 | | | | 144 | | |
Essex Property Trust, Inc. | | | 290 | | | | 64 | | |
Extra Space Storage, Inc. | | | 1,147 | | | | 184 | | |
Federal Realty Investment Trust | | | 884 | | | | 98 | | |
Healthpeak Properties, Inc. | | | 1,880 | | | | 49 | | |
Host Hotels & Resorts, Inc. | | | 8,818 | | | | 167 | | |
See notes to financial statements.
11
USAA Mutual Funds Trust
USAA Growth and Tax Strategy Fund | | Schedule of Portfolio Investments — continued
November 30, 2022 | |
(Amounts in Thousands, Except for Shares) (Unaudited)
Security Description | | Shares | | Value | |
Iron Mountain, Inc. | | | 3,600 | | | $ | 196 | | |
Kimco Realty Corp. | | | 5,368 | | | | 123 | | |
Mid-America Apartment Communities, Inc. | | | 1,273 | | | | 210 | | |
Prologis, Inc. | | | 8,574 | | | | 1,010 | | |
Public Storage | | | 1,221 | | | | 364 | | |
Realty Income Corp. | | | 6,227 | | | | 393 | | |
Regency Centers Corp. | | | 1,923 | | | | 128 | | |
SBA Communications Corp. | | | 1,109 | | | | 332 | | |
Simon Property Group, Inc. | | | 3,796 | | | | 453 | | |
UDR, Inc. | | | 3,662 | | | | 152 | | |
Ventas, Inc. | | | 4,666 | | | | 217 | | |
Welltower, Inc. | | | 4,568 | | | | 325 | | |
Weyerhaeuser Co. | | | 6,892 | | | | 225 | | |
| | | | 7,965 | | |
Utilities (1.3%): | |
Alliant Energy Corp. | | | 3,054 | | | | 172 | | |
Ameren Corp. | | | 2,468 | | | | 220 | | |
American Electric Power Co., Inc. | | | 4,277 | | | | 414 | | |
American Water Works Co., Inc. | | | 2,262 | | | | 343 | | |
CenterPoint Energy, Inc. | | | 6,318 | | | | 197 | | |
CMS Energy Corp. | | | 3,064 | | | | 187 | | |
Consolidated Edison, Inc. | | | 3,777 | | | | 370 | | |
Constellation Energy Corp. | | | 3,575 | | | | 344 | | |
Dominion Energy, Inc. | | | 3,742 | | | | 229 | | |
DTE Energy Co. | | | 1,653 | | | | 192 | | |
Duke Energy Corp. | | | 8,868 | | | | 886 | | |
Edison International | | | 1,730 | | | | 115 | | |
Entergy Corp. | | | 1,967 | | | | 229 | | |
Evergy, Inc. | | | 660 | | | | 39 | | |
Eversource Energy | | | 3,443 | | | | 285 | | |
Exelon Corp. | | | 10,726 | | | | 444 | | |
FirstEnergy Corp. | | | 5,476 | | | | 226 | | |
NextEra Energy, Inc. | | | 18,576 | | | | 1,573 | | |
NiSource, Inc. | | | 4,671 | | | | 131 | | |
NRG Energy, Inc. | | | 2,789 | | | | 118 | | |
PG&E Corp. (a) | | | 14,098 | | | | 221 | | |
PPL Corp. | | | 6,580 | | | | 194 | | |
Public Service Enterprise Group, Inc. | | | 6,188 | | | | 375 | | |
Sempra Energy | | | 1,884 | | | | 313 | | |
The AES Corp. | | | 7,856 | | | | 227 | | |
The Southern Co. | | | 9,551 | | | | 646 | | |
WEC Energy Group, Inc. | | | 2,943 | | | | 292 | | |
Xcel Energy, Inc. | | | 5,211 | | | | 366 | | |
| | | | 9,348 | | |
Total Common Stocks (Cost $107,226) | | | 337,616 | | |
See notes to financial statements.
12
USAA Mutual Funds Trust
USAA Growth and Tax Strategy Fund | | Schedule of Portfolio Investments — continued
November 30, 2022 | |
(Amounts in Thousands, Except for Shares) (Unaudited)
Security Description | | Principal
Amount | | Value | |
Corporate Bonds (0.0%) (f) | |
Real Estate (0.0%): | |
Northwest Senior Housing Corp. — Edgemere Project, Promissory Note,
DIP Loan, 10.00%, 12/31/23 (d) (e) | | $ | 244 | | | $ | 245 | | |
Total Corporate Bonds (Cost $244) | | | 245 | | |
Municipal Bonds (51.5%) | |
Alabama (0.5%): | |
Columbia Industrial Development Board Revenue (NBGA — Southern Co.),
Series A, 1.60%, 12/1/37, Continuously Callable @100 (g) | | | 500 | | | | 500 | | |
Cooper Green Mercy Health Services Authority Revenue, 5.25%, 9/1/52,
Continuously Callable @100 | | | 2,000 | | | | 2,075 | | |
DCH Healthcare Authority Revenue, Series A, 4.00%, 6/1/51, Continuously
Callable @100 | | | 1,000 | | | | 871 | | |
| | | | 3,446 | | |
Alaska (0.1%): | |
Northern Tobacco Securitization Corp. Revenue, Series A, 4.00%, 6/1/50,
Continuously Callable @100 | | | 500 | | | | 428 | | |
Arizona (2.2%): | |
Arizona IDA Revenue
4.00%, 7/1/41, Continuously Callable @100 | | | 400 | | | | 349 | | |
5.00%, 7/1/47, Continuously Callable @100 | | | 1,000 | | | | 1,012 | | |
5.00%, 11/1/47, Continuously Callable @100 | | | 1,000 | | | | 1,030 | | |
4.00%, 7/1/52, Continuously Callable @100 | | | 840 | | | | 656 | | |
Series A, 4.00%, 7/1/51, Continuously Callable @100 | | | 750 | | | | 588 | | |
City of Phoenix IDA Revenue, 5.00%, 7/1/46, Continuously Callable @100 | | | 1,300 | | | | 1,261 | | |
La Paz County IDA Revenue
4.00%, 2/15/41, Continuously Callable @100 | | | 425 | | | | 361 | | |
4.00%, 2/15/46, Continuously Callable @100 | | | 345 | | | | 277 | | |
4.00%, 2/15/51, Continuously Callable @100 | | | 300 | | | | 231 | | |
Maricopa County IDA Revenue
4.00%, 7/1/51, Continuously Callable @100 (h) | | | 1,500 | | | | 1,158 | | |
Series A, 5.00%, 9/1/42, Continuously Callable @100 | | | 500 | | | | 514 | | |
Series A, 4.00%, 7/1/46, Continuously Callable @100 | | | 735 | | | | 656 | | |
Series A, 5.00%, 7/1/49, Continuously Callable @100 | | | 1,000 | | | | 1,001 | | |
Series A, 5.00%, 7/1/54, Continuously Callable @100 | | | 1,275 | | | | 1,257 | | |
Series A, 4.00%, 7/1/56, Continuously Callable @100 | | | 1,000 | | | | 840 | | |
Pima County IDA Revenue, 4.00%, 4/1/46, Continuously Callable @100 | | | 2,000 | | | | 1,747 | | |
Student & Academic Services LLC Revenue, 5.00%, 6/1/44, Continuously
Callable @100 | | | 1,000 | | | | 1,014 | | |
Tempe IDA Revenue, Series B, 4.00%, 12/1/46, Continuously Callable @102 | | | 1,185 | | | | 840 | | |
The IDA of the County of Pima Revenue, 4.00%, 6/15/51, Continuously
Callable @100 (h) | | | 1,000 | | | | 730 | | |
| | | | 15,522 | | |
See notes to financial statements.
13
USAA Mutual Funds Trust
USAA Growth and Tax Strategy Fund | | Schedule of Portfolio Investments — continued
November 30, 2022 | |
(Amounts in Thousands, Except for Shares) (Unaudited)
Security Description | | Principal
Amount | | Value | |
Arkansas (0.1%): | |
Arkansas Development Finance Authority Revenue, 4.00%, 12/1/44,
Continuously Callable @100 | | $ | 1,000 | | | $ | 940 | | |
California (1.1%): | |
California Educational Facilities Authority Revenue, 5.00%, 10/1/52,
Continuously Callable @100 | | | 2,000 | | | | 2,003 | | |
Jurupa Public Financing Authority Special Tax, Series A, 5.00%, 9/1/42,
Continuously Callable @100 | | | 1,200 | | | | 1,220 | | |
State of California, GO, 5.00%, 8/1/45, Continuously Callable @100 | | | 1,000 | | | | 1,036 | | |
Sutter Butte Flood Agency Special Assessment (INS — Build America Mutual
Assurance Co.), 5.00%, 10/1/40, Continuously Callable @100 | | | 1,000 | | | | 1,027 | | |
West Contra Costa Unified School District, GO (INS — National Public Finance
Guarantee Corp.), 8/1/34 (i) | | | 4,435 | | | | 2,833 | | |
| | | | 8,119 | | |
Colorado (1.6%): | |
Colorado Educational & Cultural Facilities Authority Revenue
5.00%, 12/1/38, Continuously Callable @100 | | | 1,000 | | | | 1,037 | | |
5.00%, 4/1/48, Continuously Callable @100 | | | 710 | | | | 711 | | |
4.00%, 1/1/52, Continuously Callable @100 | | | 675 | | | | 514 | | |
5.00%, 9/1/52, Continuously Callable @100 | | | 730 | | | | 711 | | |
4.00%, 1/1/62, Continuously Callable @100 | | | 795 | | | | 576 | | |
Colorado Health Facilities Authority Revenue
5.00%, 6/1/45, Pre-refunded 6/1/25 @ 100 | | | 1,000 | | | | 1,057 | | |
Series A, 4.00%, 9/1/50, Continuously Callable @100 | | | 1,000 | | | | 839 | | |
Series A, 4.00%, 12/1/50, Continuously Callable @103 | | | 1,000 | | | | 814 | | |
Denver Convention Center Hotel Authority Revenue, 5.00%, 12/1/40,
Continuously Callable @100 | | | 1,000 | | | | 991 | | |
Denver Health & Hospital Authority Certificate of Participation, 5.00%, 12/1/48,
Continuously Callable @100 | | | 1,900 | | | | 1,833 | | |
Park Creek Metropolitan District Revenue
5.00%, 12/1/41, Continuously Callable @100 | | | 250 | | | | 255 | | |
5.00%, 12/1/45, Continuously Callable @100 | | | 1,000 | | | | 1,015 | | |
Rampart Range Metropolitan District No. 1 Revenue (INS — Assured Guaranty
Municipal Corp.), 5.00%, 12/1/47, Continuously Callable @100 | | | 1,000 | | | | 1,042 | | |
| | | | 11,395 | | |
Connecticut (0.7%): | |
Connecticut State Health & Educational Facilities Authority Revenue
Series T, 4.00%, 7/1/55, Continuously Callable @100 | | | 1,000 | | | | 847 | | |
Series U, 4.00%, 7/1/52, Continuously Callable @100 | | | 2,000 | | | | 1,710 | | |
State of Connecticut, GO
Series A, 5.00%, 4/15/36, Continuously Callable @100 | | | 1,500 | | | | 1,631 | | |
Series A, 5.00%, 4/15/37, Continuously Callable @100 | | | 1,000 | | | | 1,071 | | |
| | | | 5,259 | | |
Florida (2.2%): | |
Brevard County Health Facilities Authority Revenue, Series A, 5.00%, 4/1/52,
Continuously Callable @100 | | | 1,000 | | | | 1,021 | | |
See notes to financial statements.
14
USAA Mutual Funds Trust
USAA Growth and Tax Strategy Fund | | Schedule of Portfolio Investments — continued
November 30, 2022 | |
(Amounts in Thousands, Except for Shares) (Unaudited)
Security Description | | Principal
Amount | | Value | |
Capital Trust Agency, Inc. Revenue
5.00%, 8/1/40, Continuously Callable @100 | | $ | 300 | | | $ | 304 | | |
5.00%, 8/1/55, Continuously Callable @100 | | | 400 | | | | 364 | | |
City of Atlantic Beach Revenue, Series A, 5.00%, 11/15/53, Continuously
Callable @103 | | | 1,000 | | | | 942 | | |
City of Pompano Beach Revenue
4.00%, 9/1/50, Continuously Callable @103 | | | 1,500 | | | | 1,167 | | |
Series A, 4.00%, 9/1/51, Continuously Callable @103 | | | 500 | | | | 387 | | |
Florida Development Finance Corp. Revenue
5.00%, 7/1/51, Continuously Callable @100 | | | 395 | | | | 356 | | |
Series A, 5.00%, 6/15/52, Continuously Callable @100 | | | 1,250 | | | | 1,212 | | |
Lee County IDA Revenue, Series A, 5.25%, 10/1/52, Continuously
Callable @103 | | | 850 | | | | 782 | | |
Lee Memorial Health System Revenue, Series A-1, 5.00%, 4/1/44, Continuously
Callable @100 | | | 1,450 | | | | 1,467 | | |
Miami Beach Health Facilities Authority Revenue, 4.00%, 11/15/51,
Continuously Callable @100 | | | 500 | | | | 430 | | |
Miami-Dade County Health Facilities Authority Revenue, Series A, 4.00%, 8/1/51,
Continuously Callable @100 | | | 1,000 | | | | 861 | | |
Palm Beach County Educational Facilities Authority Revenue, 4.00%, 10/1/51,
Continuously Callable @100 | | | 1,000 | | | | 805 | | |
Sarasota County Health Facilities Authority Revenue, 5.00%, 5/15/38,
Continuously Callable @103 | | | 700 | | | | 701 | | |
Sarasota County Public Hospital District Revenue, 4.00%, 7/1/52, Continuously
Callable @100 | | | 2,000 | | | | 1,790 | | |
Seminole County IDA Revenue, 4.00%, 6/15/51, Continuously Callable @100 (h) | | | 830 | | | | 632 | | |
Southeast Overtown Park West Community Redevelopment Agency Tax
Allocation, Series A-1, 5.00%, 3/1/30, Continuously Callable @100 (h) | | | 1,000 | | | | 1,022 | | |
Volusia County Educational Facility Authority Revenue, Series B, 5.00%,
10/15/45, Pre-refunded 4/15/25 @ 100 | | | 1,000 | | | | 1,056 | | |
| | | | 15,299 | | |
Georgia (1.4%): | |
Crisp County Hospital Authority Revenue, 4.00%, 7/1/51, Continuously
Callable @100 | | | 575 | | | | 511 | | |
Development Authority of Appling County Revenue, 2.25%, 9/1/41, Continuously
Callable @100 (g) | | | 1,100 | | | | 1,100 | | |
Glynn-Brunswick Memorial Hospital Authority Revenue, 5.00%, 8/1/43,
Continuously Callable @100 | | | 1,000 | | | | 1,004 | | |
Milledgeville & Baldwin County Development Authority Revenue, 4.00%,
6/15/37, Continuously Callable @100 | | | 1,300 | | | | 1,290 | | |
Municipal Electric Authority of Georgia Revenue, 4.00%, 1/1/51, Continuously
Callable @100 | | | 425 | | | | 358 | | |
Private Colleges & Universities Authority Revenue, 4.00%, 6/1/45, Continuously
Callable @100 | | | 750 | | | | 663 | | |
The Development Authority of Burke County Revenue, Series 1, 2.05%, 7/1/49,
Continuously Callable @100 (g) | | | 5,000 | | | | 5,000 | | |
| | | | 9,926 | | |
See notes to financial statements.
15
USAA Mutual Funds Trust
USAA Growth and Tax Strategy Fund | | Schedule of Portfolio Investments — continued
November 30, 2022 | |
(Amounts in Thousands, Except for Shares) (Unaudited)
Security Description | | Principal
Amount | | Value | |
Guam (0.3%): | |
Antonio B Won Pat International Airport Authority Revenue (INS — Assured
Guaranty Municipal Corp.), 5.50%, 10/1/33, Pre-refunded 10/1/23 @ 100 | | $ | 750 | | | $ | 767 | | |
Guam Government Waterworks Authority Revenue, 5.50%, 7/1/43,
Pre-refunded 7/1/23 @ 100 | | | 1,000 | | | | 1,017 | | |
| | | | 1,784 | | |
Illinois (5.1%): | |
Bureau County Township High School District No. 502, GO (INS — Build
America Mutual Assurance Co.), Series A, 5.00%, 12/1/37, Pre-refunded
12/1/27 @ 100 | | | 1,000 | | | | 1,107 | | |
Chicago Board of Education, GO, Series A, 5.00%, 12/1/47, Continuously
Callable @100 | | | 3,200 | | | | 3,035 | | |
Chicago Midway International Airport Revenue, Series B, 5.00%, 1/1/41,
Continuously Callable @100 | | | 1,000 | | | | 1,014 | | |
Chicago O'Hare International Airport Revenue, Series C, 5.00%, 1/1/41,
Continuously Callable @100 | | | 1,000 | | | | 1,030 | | |
Chicago O'Hare International Airport Revenue (INS — Assured Guaranty
Municipal Corp.), 5.25%, 1/1/33, Continuously Callable @100 | | | 1,000 | | | | 1,001 | | |
Chicago Park District, GO, Series C, 4.00%, 1/1/42, Continuously Callable @100 | | | 1,250 | | | | 1,121 | | |
Chicago Transit Authority Sales Tax Receipts Fund Revenue
Series A, 5.00%, 12/1/52, Continuously Callable @100 | | | 685 | | | | 697 | | |
Series A, 4.00%, 12/1/55, Continuously Callable @100 | | | 2,000 | | | | 1,636 | | |
City of Chicago Wastewater Transmission Revenue
5.00%, 1/1/44, Continuously Callable @100 | | | 1,000 | | | | 1,004 | | |
Series A, 5.00%, 1/1/47, Continuously Callable @100 | | | 1,000 | | | | 1,001 | | |
City of Chicago Waterworks Revenue, 5.00%, 11/1/44, Continuously
Callable @100 | | | 1,000 | | | | 1,004 | | |
City of Galesburg Revenue, Series A, 4.00%, 10/1/46, Continuously Callable @100 | | | 1,000 | | | | 880 | | |
Cook County Community College District No. 508, GO (INS — Build America
Mutual Assurance Co.), 5.00%, 12/1/47, Continuously Callable @100 | | | 1,000 | | | | 1,028 | | |
County of Cook Sales Tax Revenue, 5.00%, 11/15/38, Continuously Callable @100 | | | 1,000 | | | | 1,040 | | |
Illinois Educational Facilities Authority Revenue, 4.00%, 11/1/36, Continuously
Callable @102 | | | 1,000 | | | | 963 | | |
Illinois Finance Authority Revenue
3.90%, 3/1/30, Continuously Callable @100 | | | 1,000 | | | | 1,014 | | |
5.00%, 5/15/37, Continuously Callable @100 | | | 1,000 | | | | 995 | | |
5.00%, 5/15/40, Continuously Callable @100 | | | 1,275 | | | | 1,148 | | |
5.00%, 8/15/44, Continuously Callable @100 | | | 1,000 | | | | 1,002 | | |
5.00%, 10/1/44, Continuously Callable @100 | | | 1,000 | | | | 1,056 | | |
4.00%, 10/15/44, Continuously Callable @103 | | | 2,000 | | | | 1,611 | | |
5.00%, 5/15/45, Continuously Callable @100 | | | 1,000 | | | | 871 | | |
Series A, 4.00%, 8/1/51, Continuously Callable @100 | | | 1,000 | | | | 800 | | |
Series C, 4.00%, 2/15/41, Continuously Callable @100 | | | 955 | | | | 928 | | |
Series C, 4.00%, 2/15/41, Pre-refunded 2/15/27 @ 100 | | | 45 | | | | 47 | | |
Metropolitan Pier & Exposition Authority Revenue, 5.00%, 6/15/50,
Continuously Callable @100 | | | 2,500 | | | | 2,533 | | |
Northern Illinois University Revenue (INS — Build America Mutual
Assurance Co.), Series B, 4.00%, 4/1/40, Continuously Callable @100 | | | 600 | | | | 539 | | |
See notes to financial statements.
16
USAA Mutual Funds Trust
USAA Growth and Tax Strategy Fund | | Schedule of Portfolio Investments — continued
November 30, 2022 | |
(Amounts in Thousands, Except for Shares) (Unaudited)
Security Description | | Principal
Amount | | Value | |
Sangamon County Water Reclamation District, GO
Series A, 4.00%, 1/1/49, Continuously Callable @100 | | $ | 1,000 | | | $ | 952 | | |
Series A, 5.75%, 1/1/53, Continuously Callable @100 | | | 1,235 | | | | 1,303 | | |
State of Illinois, GO
4.00%, 10/1/33, Continuously Callable @100 | | | 2,300 | | | | 2,210 | | |
5.50%, 5/1/39, Continuously Callable @100 | | | 225 | | | | 239 | | |
Series A, 5.50%, 3/1/47, Continuously Callable @100 | | | 1,000 | | | | 1,051 | | |
| | | | 35,860 | | |
Indiana (0.5%): | |
Evansville Redevelopment Authority Revenue (INS — Build America Mutual
Assurance Co.), 4.00%, 2/1/39, Continuously Callable @100 | | | 1,000 | | | | 955 | | |
Indiana Finance Authority Revenue, 5.00%, 2/1/40, Continuously Callable @100 | | | 1,000 | | | | 1,010 | | |
Richmond Hospital Authority Revenue, Series A, 5.00%, 1/1/39,
Continuously Callable @100 | | | 1,500 | | | | 1,519 | | |
| | | | 3,484 | | |
Iowa (0.1%): | |
Iowa Tobacco Settlement Authority Revenue, Series A-2, 4.00%, 6/1/49,
Continuously Callable @100 | | | 1,000 | | | | 858 | | |
Kansas (1.4%): | |
City of Coffeyville Electric System Revenue (INS — National Public Finance
Guarantee Corp.), Series B, 5.00%, 6/1/42, Pre-refunded 6/1/25 @ 100 (h) | | | 1,000 | | | | 1,059 | | |
City of Lawrence Revenue
5.00%, 7/1/43, Continuously Callable @100 | | | 1,500 | | | | 1,533 | | |
Series A, 4.00%, 7/1/36, Continuously Callable @100 | | | 1,500 | | | | 1,417 | | |
City of Manhattan Revenue, Series A, 4.00%, 6/1/46, Continuously Callable @103 | | | 1,000 | | | | 754 | | |
City of Wichita Revenue, 4.63%, 9/1/33, Continuously Callable @100 | | | 1,000 | | | | 977 | | |
Wyandotte County-Kansas City Unified Government Tax Allocation, 5.75%,
3/1/41, Continuously Callable @103 (h) | | | 2,000 | | | | 1,916 | | |
Wyandotte County-Kansas City Unified Government Utility System Revenue
Series A, 5.00%, 9/1/44, Continuously Callable @100 | | | 1,250 | | | | 1,273 | | |
Series A, 5.00%, 9/1/45, Continuously Callable @100 | | | 1,000 | | | | 1,020 | | |
| | | | 9,949 | | |
Kentucky (0.8%): | |
City of Ashland Revenue, 5.00%, 2/1/40, Continuously Callable @100 | | | 1,000 | | | | 1,007 | | |
Kentucky Bond Development Corp. Revenue, 4.00%, 6/1/46, Continuously
Callable @100 | | | 750 | | | | 653 | | |
Kentucky Economic Development Finance Authority Revenue, 5.00%, 5/15/46,
Continuously Callable @100 | | | 1,000 | | | | 780 | | |
Kentucky Economic Development Finance Authority Revenue (INS — Assured
Guaranty Municipal Corp.), Series A, 5.00%, 12/1/45, Continuously
Callable @100 | | | 1,000 | | | | 1,010 | | |
Louisville Jefferson County Metropolitan Government Revenue, Series A, 5.00%,
5/15/52, Continuously Callable @100 | | | 2,000 | | | | 2,020 | | |
| | | | 5,470 | | |
See notes to financial statements.
17
USAA Mutual Funds Trust
USAA Growth and Tax Strategy Fund | | Schedule of Portfolio Investments — continued
November 30, 2022 | |
(Amounts in Thousands, Except for Shares) (Unaudited)
Security Description | | Principal
Amount | | Value | |
Louisiana (1.9%): | |
City of Shreveport Water & Sewer Revenue, 5.00%, 12/1/40, Continuously
Callable @100 | | $ | 1,000 | | | $ | 1,018 | | |
City of Shreveport Water & Sewer Revenue (INS — Assured Guaranty Corp.),
Series B, 4.00%, 12/1/44, Continuously Callable @100 | | | 500 | | | | 464 | | |
City of Shreveport Water & Sewer Revenue (INS — Build America Mutual
Assurance Co.), Series C, 5.00%, 12/1/39, Continuously Callable @100 | | | 1,000 | | | | 1,013 | | |
Jefferson Sales Tax District Revenue, Series B, 4.00%, 12/1/42, Continuously
Callable @100 | | | 1,500 | | | | 1,467 | | |
Louisiana Local Government Environmental Facilities & Community
Development Authority Revenue (INS — Assured Guaranty Municipal Corp.)
5.00%, 10/1/39, Continuously Callable @100 | | | 1,000 | | | | 1,023 | | |
5.00%, 10/1/43, Continuously Callable @100 | | | 1,000 | | | | 1,020 | | |
4.00%, 10/1/46, Continuously Callable @100 | | | 1,000 | | | | 931 | | |
Louisiana Public Facilities Authority Revenue
5.00%, 7/1/52, Continuously Callable @100 | | | 1,000 | | | | 1,007 | | |
4.00%, 1/1/56, Continuously Callable @100 | | | 1,000 | | | | 790 | | |
Louisiana Public Facilities Authority Revenue (INS — Build America Mutual
Assurance Co.), 5.25%, 6/1/51, Pre-refunded 6/1/25 @ 100 | | | 1,000 | | | | 1,064 | | |
Parish of East Baton Rouge Capital Improvements District Revenue, 4.00%,
8/1/44, Continuously Callable @100 | | | 1,400 | | | | 1,320 | | |
State of Louisiana Gasoline & Fuels Tax Revenue, Series C, 5.00%, 5/1/45,
Continuously Callable @100 | | | 1,500 | | | | 1,544 | | |
Tobacco Settlement Financing Corp. Revenue, Series A, 5.25%, 5/15/35,
Continuously Callable @100 | | | 1,000 | | | | 1,008 | | |
| | | | 13,669 | | |
Maine (0.3%): | |
Maine Health & Higher Educational Facilities Authority Revenue
Series A, 4.00%, 7/1/46, Continuously Callable @100 | | | 1,000 | | | | 837 | | |
Series A, 4.00%, 7/1/50, Continuously Callable @100 | | | 1,175 | | | | 1,057 | | |
| | | | 1,894 | | |
Maryland (0.3%): | |
City of Gaithersburg Maryland Revenue, 5.13%, 1/1/42, Continuously
Callable @103 | | | 865 | | | | 867 | | |
Maryland Health & Higher Educational Facilities Authority Revenue, 4.00%,
7/1/45, Continuously Callable @100 | | | 1,100 | | | | 952 | | |
| | | | 1,819 | | |
Massachusetts (1.9%): | |
Massachusetts Development Finance Agency Revenue
5.00%, 4/15/40, Continuously Callable @100 | | | 1,000 | | | | 1,001 | | |
5.00%, 7/1/46, Continuously Callable @100 | | | 1,000 | | | | 1,007 | | |
4.00%, 9/1/48, Continuously Callable @100 | | | 1,380 | | | | 1,158 | | |
2.50% (MUNIPSA+60bps), 7/1/49, Continuously Callable @100 (h) (j) | | | 1,250 | | | | 1,279 | | |
4.00%, 7/1/51, Continuously Callable @100 | | | 1,500 | | | | 1,273 | | |
5.00%, 10/1/57, Continuously Callable @105 (h) | | | 1,000 | | | | 1,011 | | |
Series A, 5.00%, 6/1/39, Pre-refunded 6/1/29 @ 100 | | | 1,000 | | | | 1,143 | | |
Series A, 5.50%, 7/1/44, Continuously Callable @100 | | | 500 | | | | 465 | | |
Series A, 5.00%, 7/1/44, Continuously Callable @100 | | | 1,600 | | | | 1,600 | | |
See notes to financial statements.
18
USAA Mutual Funds Trust
USAA Growth and Tax Strategy Fund | | Schedule of Portfolio Investments — continued
November 30, 2022 | |
(Amounts in Thousands, Except for Shares) (Unaudited)
Security Description | | Principal
Amount | | Value | |
Series B, 4.00%, 6/1/50, Continuously Callable @100 | | $ | 1,000 | | | $ | 840 | | |
Series B, 4.00%, 7/1/50, Continuously Callable @100 | | | 850 | | | | 724 | | |
Series D, 5.00%, 7/1/44, Continuously Callable @100 | | | 1,000 | | | | 1,000 | | |
Series F, 5.75%, 7/15/43, Continuously Callable @100 | | | 1,000 | | | | 1,001 | | |
| | | | 13,502 | | |
Michigan (1.6%): | |
City of Wyandotte Electric System Revenue (INS — Build America Mutual
Assurance Co.), Series A, 5.00%, 10/1/44, Continuously Callable @100 | | | 1,000 | | | | 1,022 | | |
Detroit Downtown Development Authority Tax Allocation (INS — Assured
Guaranty Municipal Corp.), 5.00%, 7/1/43, Continuously Callable @100 | | | 1,750 | | | | 1,755 | | |
Jackson Public Schools, GO (NBGA — Michigan School Bond Qualification &
Loan Program), 5.00%, 5/1/42, Continuously Callable @100 | | | 1,000 | | | | 1,057 | | |
Karegnondi Water Authority Revenue, 5.00%, 11/1/41, Continuously
Callable @100 | | | 1,000 | | | | 1,032 | | |
Kentwood Economic Development Corp. Revenue, 4.00%, 11/15/45,
Continuously Callable @103 | | | 500 | | | | 399 | | |
Lincoln Consolidated School District, GO (INS — Assured Guaranty
Municipal Corp.), Series A, 5.00%, 5/1/40, Continuously Callable @100 | | | 1,250 | | | | 1,310 | | |
Livonia Public Schools, GO (INS — Assured Guaranty Municipal Corp.), 5.00%,
5/1/45, Continuously Callable @100 | | | 1,000 | | | | 1,027 | | |
Michigan Finance Authority Revenue
4.00%, 2/1/42, Continuously Callable @100 | | | 745 | | | | 593 | | |
4.00%, 9/1/45, Continuously Callable @100 | | | 1,000 | | | | 882 | | |
4.00%, 12/1/51, Continuously Callable @100 | | | 1,665 | | | | 1,393 | | |
Wayne County Airport Authority Revenue, 5.00%, 12/1/44, Continuously
Callable @100 | | | 1,000 | | | | 1,009 | | |
| | | | 11,479 | | |
Minnesota (0.3%): | |
Housing & Redevelopment Authority Revenue
5.00%, 11/15/44, Pre-refunded 11/15/25 @ 100 | | | 1,000 | | | | 1,062 | | |
5.00%, 11/15/47, Continuously Callable @100 | | | 1,000 | | | | 1,018 | | |
| | | | 2,080 | | |
Missouri (0.9%): | |
Cape Girardeau County IDA Revenue, 4.00%, 3/1/46, Continuously
Callable @100 | | | 750 | | | | 605 | | |
Health & Educational Facilities Authority of the State of Missouri Revenue
4.00%, 2/1/48, Continuously Callable @100 | | | 1,500 | | | | 1,155 | | |
4.00%, 2/15/51, Continuously Callable @100 | | | 480 | | | | 404 | | |
Health & Educational Facilities Authority Revenue
5.00%, 8/1/45, Continuously Callable @100 | | | 1,270 | | | | 1,228 | | |
4.00%, 2/15/49, Continuously Callable @100 | | | 250 | | | | 225 | | |
Missouri Development Finance Board Revenue, 4.00%, 3/1/51, Continuously
Callable @100 | | | 1,000 | | | | 795 | | |
St. Louis Municipal Finance Corp. Revenue (INS — Assured Guaranty Municipal
Corp.), 5.00%, 10/1/38, Continuously Callable @100 | | | 1,000 | | | | 1,029 | | |
St. Louis Municipal Finance Corp. Revenue (INS-Assured Guaranty Corp.),
5.00%, 10/1/45, Continuously Callable @100 | | | 1,000 | | | | 1,024 | | |
| | | | 6,465 | | |
See notes to financial statements.
19
USAA Mutual Funds Trust
USAA Growth and Tax Strategy Fund | | Schedule of Portfolio Investments — continued
November 30, 2022 | |
(Amounts in Thousands, Except for Shares) (Unaudited)
Security Description | | Principal
Amount | | Value | |
Montana (0.1%): | |
Montana Facility Finance Authority Revenue, Series A, 4.00%, 6/1/45,
Continuously Callable @100 | | $ | 485 | | | $ | 433 | | |
Nebraska (0.6%): | |
Central Plains Energy Project Revenue
5.00%, 5/1/53, Callable 1/7/29 @ 100.22 | | | 2,000 | | | | 2,028 | | |
Series A, 5.00%, 9/1/42 | | | 1,000 | | | | 1,033 | | |
Douglas County Hospital Authority No. 3 Revenue, 5.00%, 11/1/48, Continuously
Callable @100 | | | 1,000 | | | | 1,008 | | |
| | | | 4,069 | | |
Nevada (0.6%): | |
City of Carson City Revenue, 5.00%, 9/1/42, Continuously Callable @100 | | | 1,000 | | | | 1,006 | | |
Las Vegas Convention & Visitors Authority Revenue, Series C, 4.00%, 7/1/41,
Continuously Callable @100 | | | 1,555 | | | | 1,462 | | |
Las Vegas Redevelopment Agency Tax Allocation, 5.00%, 6/15/45, Continuously
Callable @100 | | | 1,500 | | | | 1,512 | | |
| | | | 3,980 | | |
New Hampshire (0.2%): | |
New Hampshire Business Finance Authority Revenue, 4.00%, 1/1/51,
Continuously Callable @103 | | | 2,000 | | | | 1,647 | | |
New Jersey (2.6%): | |
Essex County Improvement Authority Revenue, 4.00%, 6/15/51, Continuously
Callable @100 | | | 1,100 | | | | 865 | | |
New Jersey Economic Development Authority Revenue
5.00%, 6/15/42, Continuously Callable @100 | | | 2,000 | | | | 2,048 | | |
5.00%, 6/15/43, Continuously Callable @100 | | | 1,000 | | | | 1,024 | | |
Series A, 4.00%, 7/1/34, Continuously Callable @100 | | | 1,000 | | | | 963 | | |
Series A, 5.00%, 6/15/47, Continuously Callable @100 | | | 1,000 | | | | 1,016 | | |
Series B, 5.00%, 6/15/43, Continuously Callable @100 | | | 1,000 | | | | 1,024 | | |
New Jersey Economic Development Authority Revenue (INS — Assured Guaranty
Municipal Corp.), 5.00%, 6/1/37, Continuously Callable @100 | | | 500 | | | | 512 | | |
New Jersey Educational Facilities Authority Revenue, Series B, 5.00%, 9/1/36,
Continuously Callable @100 | | | 1,000 | | | | 1,029 | | |
New Jersey Educational Facilities Authority Revenue (INS — Assured Guaranty
Municipal Corp.), Series C, 4.00%, 7/1/50, Continuously Callable @100 | | | 1,000 | | | | 917 | | |
New Jersey Health Care Facilities Financing Authority Revenue, 5.00%, 10/1/37,
Continuously Callable @100 | | | 1,000 | | | | 1,035 | | |
New Jersey Transportation Trust Fund Authority Revenue
5.00%, 6/15/48, Continuously Callable @100 (k) | | | 1,000 | | | | 1,022 | | |
Series A, 5.00%, 12/15/35, Continuously Callable @100 | | | 1,000 | | | | 1,049 | | |
Series A, 12/15/38 (i) | | | 1,500 | | | | 687 | | |
Series AA, 5.00%, 6/15/44, Continuously Callable @100 | | | 1,000 | | | | 1,006 | | |
Series BB, 4.00%, 6/15/50, Continuously Callable @100 | | | 1,000 | | | | 877 | | |
South Jersey Transportation Authority LLC Revenue, Series A, 5.00%, 11/1/39,
Continuously Callable @100 | | | 1,250 | | | | 1,262 | | |
South Jersey Transportation Authority Revenue, 5.25%, 11/1/52, Continuously
Callable @100 | | | 500 | | | | 528 | | |
See notes to financial statements.
20
USAA Mutual Funds Trust
USAA Growth and Tax Strategy Fund | | Schedule of Portfolio Investments — continued
November 30, 2022 | |
(Amounts in Thousands, Except for Shares) (Unaudited)
Security Description | | Principal
Amount | | Value | |
The Atlantic County Improvement Authority Revenue, 4.00%, 7/1/53,
Continuously Callable @100 | | $ | 750 | | | $ | 663 | | |
Tobacco Settlement Financing Corp. Revenue, Series A, 5.25%, 6/1/46,
Continuously Callable @100 | | | 500 | | | | 504 | | |
| | | | 18,031 | | |
New Mexico (0.2%): | |
New Mexico Hospital Equipment Loan Council Revenue, Series LA, 5.00%, 7/1/49,
Continuously Callable @102 | | | 1,500 | | | | 1,232 | | |
New York (1.7%): | |
Genesee County Funding Corp. Revenue, Series A, 5.25%, 12/1/52, Continuously
Callable @100 | | | 500 | | | | 503 | | |
Metropolitan Transportation Authority Revenue, Series C, 5.00%, 11/15/42,
Continuously Callable @100 | | | 1,000 | | | | 992 | | |
New York Liberty Development Corp. Revenue
5.25%, 10/1/35 | | | 630 | | | | 690 | | |
5.50%, 10/1/37 | | | 1,500 | | | | 1,667 | | |
2.80%, 9/15/69, Continuously Callable @100 | | | 1,000 | | | | 843 | | |
New York State Dormitory Authority Revenue
4.00%, 2/15/47, Continuously Callable @100 | | | 2,000 | | | | 1,901 | | |
4.00%, 3/15/49, Continuously Callable @100 | | | 750 | | | | 703 | | |
5.00%, 7/1/57, Continuously Callable @100 | | | 1,000 | | | | 959 | | |
Series A, 4.00%, 9/1/50, Continuously Callable @100 | | | 2,000 | | | | 1,549 | | |
Series A, 4.00%, 7/1/52, Continuously Callable @100 | | | 1,000 | | | | 808 | | |
New York State Dormitory Authority Revenue (INS — AMBAC Assurance Corp.),
Series 1, 5.50%, 7/1/40 | | | 1,205 | | | | 1,426 | | |
| | | | 12,041 | | |
North Carolina (0.4%): | |
North Carolina Medical Care Commission Revenue
5.00%, 10/1/35, Continuously Callable @100 | | | 1,000 | | | | 1,006 | | |
5.00%, 1/1/49, Continuously Callable @104 | | | 1,500 | | | | 1,488 | | |
| | | | 2,494 | | |
North Dakota (0.4%): | |
City of Grand Forks Revenue, 4.00%, 12/1/51, Continuously Callable @100 | | | 1,450 | | | | 1,178 | | |
County of Ward Revenue, Series C, 5.00%, 6/1/43, Continuously Callable @100 | | | 1,000 | | | | 839 | | |
University of North Dakota Certificate of Participation (INS — Assured
Guaranty Corp.), Series A, 4.00%, 6/1/51, Continuously Callable @100 | | | 1,000 | | | | 894 | | |
| | | | 2,911 | | |
Ohio (0.8%): | |
County of Warren Revenue, Series A, 4.00%, 7/1/45, Continuously Callable @100 | | | 735 | | | | 643 | | |
Northeast Ohio Medical University Revenue, 5.00%, 12/1/43, Continuously
Callable @100 | | | 775 | | | | 812 | | |
Ohio Higher Educational Facility Commission Revenue
4.00%, 12/1/46, Continuously Callable @100 | | | 750 | | | | 620 | | |
5.25%, 1/1/52, Continuously Callable @100 | | | 1,000 | | | | 1,026 | | |
4.00%, 10/1/52, Continuously Callable @100 | | | 2,000 | | | | 1,608 | | |
See notes to financial statements.
21
USAA Mutual Funds Trust
USAA Growth and Tax Strategy Fund | | Schedule of Portfolio Investments — continued
November 30, 2022 | |
(Amounts in Thousands, Except for Shares) (Unaudited)
Security Description | | Principal
Amount | | Value | |
Southeastern Ohio Port Authority Revenue, 5.00%, 12/1/43, Continuously
Callable @100 | | $ | 750 | | | $ | 597 | | |
| | | | 5,306 | | |
Oklahoma (0.4%): | |
Oklahoma Development Finance Authority Revenue, Series B, 5.50%, 8/15/57,
Continuously Callable @100 | | | 1,000 | | | | 869 | | |
Oklahoma Municipal Power Authority Revenue, Series A, 4.00%, 1/1/47,
Continuously Callable @100 | | | 1,000 | | | | 956 | | |
Pontotoc County Educational Facilities Authority Revenue, 4.00%, 9/1/40,
Continuously Callable @100 | | | 500 | | | | 465 | | |
Tulsa County Industrial Authority Revenue, 5.25%, 11/15/37, Continuously
Callable @102 | | | 750 | | | | 766 | | |
| | | | 3,056 | | |
Oregon (0.5%): | |
Medford Hospital Facilities Authority Revenue, Series A, 4.00%, 8/15/50,
Continuously Callable @100 | | | 1,000 | | | | 905 | | |
Oregon State Facilities Authority Revenue, Series A, 4.00%, 10/1/51,
Continuously Callable @100 | | | 1,000 | | | | 828 | | |
Salem Hospital Facility Authority Revenue
4.00%, 5/15/47, Continuously Callable @103 | | | 1,000 | | | | 792 | | |
5.00%, 5/15/53, Continuously Callable @102 | | | 1,250 | | | | 1,146 | | |
| | | | 3,671 | | |
Pennsylvania (5.1%): | |
Adams County General Authority Revenue, 4.00%, 8/15/45, Continuously
Callable @100 | | | 1,455 | | | | 1,330 | | |
Allegheny County Hospital Development Authority Revenue
4.00%, 7/15/39, Continuously Callable @100 | | | 1,185 | | | | 1,138 | | |
5.00%, 4/1/47, Continuously Callable @100 | | | 1,000 | | | | 1,009 | | |
Berks County IDA Revenue
5.00%, 5/15/43, Continuously Callable @102 | | | 350 | | | | 343 | | |
5.00%, 11/1/50, Continuously Callable @100 | | | 1,500 | | | | 951 | | |
Bucks County IDA Revenue, 4.00%, 8/15/44, Continuously Callable @100 | | | 1,000 | | | | 888 | | |
Butler County Hospital Authority Revenue, 5.00%, 7/1/39, Continuously
Callable @100 | | | 1,125 | | | | 1,122 | | |
Canon Mcmillan School District, GO, 4.00%, 6/1/44, Continuously Callable @100 | | | 1,500 | | | | 1,445 | | |
Central Bradford Progress Authority Revenue, Series B, 4.00%, 12/1/51,
Continuously Callable @100 | | | 2,000 | | | | 1,682 | | |
Chester County IDA Revenue, 5.00%, 10/1/44, Continuously Callable @100 | | | 1,000 | | | | 989 | | |
Commonwealth Financing Authority Revenue, 5.00%, 6/1/35, Continuously
Callable @100 | | | 1,000 | | | | 1,061 | | |
Commonwealth of Pennsylvania Certificate of Participation, Series A, 5.00%,
7/1/43, Continuously Callable @100 | | | 1,000 | | | | 1,050 | | |
Indiana County Hospital Authority Revenue, Series A, 6.00%, 6/1/39,
Pre-refunded 6/1/23 @ 100 | | | 1,625 | | | | 1,633 | | |
Lancaster County Hospital Authority Revenue, 5.00%, 11/1/35, Continuously
Callable @100 | | | 1,000 | | | | 1,023 | | |
Lancaster IDA Revenue, 4.00%, 7/1/51, Continuously Callable @103 | | | 500 | | | | 384 | | |
Latrobe IDA Revenue, 4.00%, 3/1/51, Continuously Callable @100 | | | 800 | | | | 613 | | |
See notes to financial statements.
22
USAA Mutual Funds Trust
USAA Growth and Tax Strategy Fund | | Schedule of Portfolio Investments — continued
November 30, 2022 | |
(Amounts in Thousands, Except for Shares) (Unaudited)
Security Description | | Principal
Amount | | Value | |
Montgomery County IDA Revenue
5.25%, 1/15/45, Pre-refunded 1/15/25 @ 100 | | $ | 1,000 | | | $ | 1,052 | | |
4.00%, 10/1/46, Continuously Callable @100 | | | 625 | | | | 495 | | |
4.00%, 10/1/51, Continuously Callable @100 | | | 825 | | | | 625 | | |
Series C, 4.00%, 11/15/43, Continuously Callable @103 | | | 600 | | | | 502 | | |
Northampton County General Purpose Authority Revenue
4.00%, 8/15/40, Continuously Callable @100 | | | 1,000 | | | | 906 | | |
5.00%, 8/15/43, Continuously Callable @100 | | | 1,000 | | | | 1,017 | | |
Pennsylvania Economic Development Financing Authority Revenue
4.00%, 7/1/46, Continuously Callable @103 | | | 1,000 | | | | 847 | | |
Series A, 4.00%, 10/15/51, Continuously Callable @100 | | | 1,000 | | | | 888 | | |
Pennsylvania Higher Educational Facilities Authority Revenue, Series A, 4.00%,
7/15/46, Continuously Callable @100 | | | 1,575 | | | | 1,311 | | |
Pennsylvania Turnpike Commission Revenue
Series A-1, 5.00%, 12/1/46, Continuously Callable @100 | | | 1,000 | | | | 1,014 | | |
Series A-1, 5.00%, 12/1/47, Continuously Callable @100 | | | 1,000 | | | | 1,033 | | |
Series B, 5.00%, 12/1/39, Continuously Callable @100 | | | 1,000 | | | | 1,036 | | |
Series B, 5.25%, 12/1/44, Continuously Callable @100 | | | 1,000 | | | | 1,018 | | |
Series B, 4.00%, 12/1/51, Continuously Callable @100 | | | 1,000 | | | | 935 | | |
Philadelphia IDA Revenue, 5.00%, 8/1/50, Continuously Callable @100 | | | 1,050 | | | | 979 | | |
Reading School District, GO (INS — Assured Guaranty Municipal Corp.), 5.00%,
3/1/38, Continuously Callable @100 | | | 1,500 | | | | 1,561 | | |
School District of Philadelphia, GO, Series F, 5.00%, 9/1/37, Continuously
Callable @100 | | | 1,000 | | | | 1,034 | | |
The Philadelphia School District, GO, Series A, 5.00%, 9/1/38, Continuously
Callable @100 | | | 1,000 | | | | 1,050 | | |
The School District of Philadelphia, GO, Series A, 4.00%, 9/1/46, Continuously
Callable @100 | | | 1,000 | | | | 902 | | |
Wilkes-Barre Area School District, GO (INS — Build America Mutual
Assurance Co.), 4.00%, 4/15/49, Continuously Callable @100 | | | 1,500 | | | | 1,348 | | |
| | | | 36,214 | | |
Rhode Island (0.2%): | |
Rhode Island Housing & Mortgage Finance Corp. Revenue, Series 15-A, 6.85%,
10/1/24, Continuously Callable @100 | | | 40 | | | | 40 | | |
Rhode Island Turnpike & Bridge Authority Revenue, Series A, 5.00%, 10/1/40,
Continuously Callable @100 | | | 1,000 | | | | 1,034 | | |
| | | | 1,074 | | |
South Carolina (0.3%): | |
Patriots Energy Group Revenue, Series A, 4.00%, 6/1/51, Continuously
Callable @100 | | | 1,100 | | | | 974 | | |
South Carolina Jobs-Economic Development Authority Revenue
5.00%, 11/15/47, Continuously Callable @103 | | | 1,000 | | | | 956 | | |
4.00%, 4/1/49, Continuously Callable @103 | | | 620 | | | | 481 | | |
| | | | 2,411 | | |
Tennessee (1.2%): | |
Greeneville Health & Educational Facilities Board Revenue, 5.00%, 7/1/37,
Continuously Callable @100 | | | 1,500 | | | | 1,546 | | |
Metropolitan Government Nashville & Davidson Country Health & Educational
Facilities Board Revenue, 4.00%, 10/1/51, Continuously Callable @100 | | | 1,000 | | | | 782 | | |
See notes to financial statements.
23
USAA Mutual Funds Trust
USAA Growth and Tax Strategy Fund | | Schedule of Portfolio Investments — continued
November 30, 2022 | |
(Amounts in Thousands, Except for Shares) (Unaudited)
Security Description | | Principal
Amount | | Value | |
Metropolitan Government Nashville & Davidson County Health & Educational
Facilities Board Revenue
5.00%, 10/1/45, Continuously Callable @100 | | $ | 1,000 | | | $ | 1,000 | | |
5.00%, 7/1/46, Continuously Callable @100 | | | 1,000 | | | | 1,005 | | |
5.00%, 10/1/48, Continuously Callable @100 | | | 500 | | | | 496 | | |
Tennergy Corp. Revenue, Series A, 5.50%, 10/1/53, Callable 1/9/30 @ 100.1 | | | 2,500 | | | | 2,606 | | |
The Metropolitan Nashville Airport Authority Revenue, Series A, 4.00%, 7/1/49,
Continuously Callable @100 | | | 1,000 | | | | 891 | | |
| | | | 8,326 | | |
Texas (7.3%): | |
Arlington Higher Education Finance Corp. Revenue (NBGA — Texas Permanent
School Fund), 4.00%, 8/15/44, Continuously Callable @100 | | | 2,165 | | | | 2,035 | | |
Bexar County Health Facilities Development Corp. Revenue, 5.00%, 7/15/37,
Continuously Callable @105 | | | 1,000 | | | | 935 | | |
Central Texas Regional Mobility Authority Revenue, 4.00%, 1/1/41, Continuously
Callable @100 | | | 1,000 | | | | 931 | | |
Central Texas Turnpike System Revenue, Series C, 5.00%, 8/15/42, Continuously
Callable @100 | | | 1,000 | | | | 1,010 | | |
City of Arlington Special Tax (INS — Assured Guaranty Municipal Corp.),
Series A, 5.00%, 2/15/48, Continuously Callable @100 | | | 1,000 | | | | 1,034 | | |
City of Arlington Tax Allocation, 4.00%, 8/15/50, Continuously Callable @100 | | | 1,700 | | | | 1,413 | | |
City of Houston Hotel Occupancy Tax & Special Revenue
5.00%, 9/1/39, Continuously Callable @100 | | | 1,000 | | | | 1,013 | | |
5.00%, 9/1/40, Continuously Callable @100 | | | 1,000 | | | | 1,012 | | |
City of Irving Texas Revenue, 5.00%, 8/15/43, Continuously Callable @100 | | | 1,000 | | | | 1,038 | | |
City of Laredo Waterworks & Sewer System Revenue, 4.00%, 3/1/41,
Continuously Callable @100 | | | 1,000 | | | | 974 | | |
City of Lewisville Special Assessment (INS — ACA Financial Guaranty Corp.),
5.80%, 9/1/25 | | | 2,180 | | | | 2,296 | | |
Clifton Higher Education Finance Corp. Revenue, 4.25%, 8/15/52, Continuously
Callable @100 | | | 1,500 | | | | 1,308 | | |
Clifton Higher Education Finance Corp. Revenue (NBGA — Texas Permanent
School Fund)
5.00%, 8/15/39, Continuously Callable @100 | | | 1,000 | | | | 1,028 | | |
4.00%, 8/15/44, Continuously Callable @100 | | | 1,000 | | | | 982 | | |
County of Bexar Revenue, 4.00%, 8/15/44, Continuously Callable @100 | | | 1,500 | | | | 1,325 | | |
Greater Texas Cultural Education Facilities Finance Corp. Revenue, 4.00%,
3/1/50, Continuously Callable @100 | | | 1,000 | | | | 823 | | |
Harris County Cultural Education Facilities Finance Corp. Revenue, Series A,
5.00%, 6/1/38, Continuously Callable @100 | | | 1,000 | | | | 917 | | |
Harris County Hospital District Revenue, 4.00%, 2/15/42, Continuously
Callable @100 | | | 1,000 | | | | 920 | | |
Hidalgo County Regional Mobility Authority Revenue
Series A, 4.00%, 12/1/41, Continuously Callable @100 | | | 735 | | | | 671 | | |
Series B, 4.00%, 12/1/41, Continuously Callable @100 | | | 700 | | | | 642 | | |
Houston Higher Education Finance Corp. Revenue, 4.00%, 10/1/51,
Continuously Callable @100 | | | 1,100 | | | | 854 | | |
Karnes County Hospital District Revenue, 5.00%, 2/1/44, Continuously
Callable @100 | | | 1,000 | | | | 1,004 | | |
Martin County Hospital District, GO, 4.00%, 4/1/36, Continuously Callable @100 | | | 350 | | | | 343 | | |
See notes to financial statements.
24
USAA Mutual Funds Trust
USAA Growth and Tax Strategy Fund | | Schedule of Portfolio Investments — continued
November 30, 2022 | |
(Amounts in Thousands, Except for Shares) (Unaudited)
Security Description | | Principal
Amount | | Value | |
Matagorda County Navigation District No. 1 Revenue, 4.00%, 6/1/30,
Continuously Callable @100 | | $ | 1,000 | | | $ | 982 | | |
Mesquite Health Facilities Development Corp. Revenue, 2/15/35, Continuously
Callable @100 (l) (m) | | | 1,000 | | | | 793 | | |
New Hope Cultural Education Facilities Finance Corp. Revenue
4.75%, 7/1/47 (l) | | | 1,000 | | | | 800 | | |
Series A, 5.00%, 4/1/47, Pre-refunded 4/1/25 @ 100 | | | 1,600 | | | | 1,686 | | |
New Hope Cultural Education Facilities Finance Corp. Revenue (INS — Assured
Guaranty Municipal Corp.), Series A1, 5.00%, 7/1/38, Continuously
Callable @100 | | | 225 | | | | 228 | | |
North Texas Tollway Authority Revenue
Series B, 5.00%, 1/1/31, Continuously Callable @100 | | | 1,500 | | | | 1,535 | | |
Series B, 5.00%, 1/1/45, Continuously Callable @100 | | | 1,000 | | | | 1,017 | | |
Port of Port Arthur Navigation District Revenue
Series B, 2.30%, 4/1/40, Continuously Callable @100 (g) | | | 6,100 | | | | 6,100 | | |
Series C, 2.32%, 4/1/40, Continuously Callable @100 (g) | | | 8,100 | | | | 8,100 | | |
Princeton Independent School District, GO (NBGA — Texas Permanent
School Fund), 5.00%, 2/15/43, Continuously Callable @100 | | | 1,000 | | | | 1,056 | | |
San Antonio Education Facilities Corp. Revenue, 4.00%, 4/1/54, Continuously
Callable @100 | | | 1,000 | | | | 799 | | |
Tarrant County Cultural Education Facilities Finance Corp. Revenue
5.00%, 11/15/46, Continuously Callable @100 | | | 1,000 | | | | 1,015 | | |
Series A, 11/15/45 (l) (m) | | | 1,000 | | | | 400 | | |
Series A, 5.00%, 7/1/53, Continuously Callable @100 | | | 750 | | | | 764 | | |
Series B, 11/15/36 (l) (m) | | | 1,000 | | | | 400 | | |
Series B, 5.00%, 7/1/48, Continuously Callable @100 | | | 1,500 | | | | 1,525 | | |
| | | | 51,708 | | |
Utah (0.7%): | |
Military Installation Development Authority Revenue, Series A-1, 4.00%, 6/1/41,
Continuously Callable @103 | | | 500 | | | | 397 | | |
Utah Charter School Finance Authority Revenue
4.50%, 10/15/52, Continuously Callable @100 | | | 1,000 | | | | 978 | | |
Series A, 4.00%, 10/15/46, Continuously Callable @100 | | | 860 | | | | 762 | | |
Series A, 4.00%, 4/15/52, Continuously Callable @100 | | | 3,000 | | | | 2,566 | | |
| | | | 4,703 | | |
Vermont (0.1%): | |
Vermont Economic Development Authority Revenue, 4.00%, 5/1/45,
Continuously Callable @103 | | | 1,000 | | | | 755 | | |
Virginia (0.1%): | |
Alexandria IDA Revenue, 5.00%, 10/1/45, Pre-refunded 10/1/25 @ 100 | | | 1,000 | | | | 1,067 | | |
Washington (0.7%): | |
King County Public Hospital District No 2, GO, Series A, 4.00%, 12/1/41,
Continuously Callable @100 | | | 1,000 | | | | 976 | | |
Washington Health Care Facilities Authority Revenue
4.00%, 7/1/42, Continuously Callable @100 | | | 1,000 | | | | 919 | | |
5.00%, 1/1/47, Pre-refunded 1/1/27 @ 100 | | | 1,000 | | | | 1,092 | | |
Washington Higher Education Facilities Authority Revenue, 4.00%, 5/1/45,
Continuously Callable @100 | | | 1,100 | | | | 986 | | |
See notes to financial statements.
25
USAA Mutual Funds Trust
USAA Growth and Tax Strategy Fund | | Schedule of Portfolio Investments — continued
November 30, 2022 | |
(Amounts in Thousands, Except for Shares) (Unaudited)
Security Description | | Shares or
Principal
Amount | | Value | |
Washington State Housing Finance Commission Revenue
5.00%, 1/1/38, Continuously Callable @102 (h) | | $ | 1,000 | | | $ | 998 | | |
Series A-1, 3.50%, 12/20/35 | | | 294 | | | | 269 | | |
| | | | 5,240 | | |
West Virginia (0.2%): | |
West Virginia Hospital Finance Authority Revenue, 4.00%, 1/1/38, Continuously
Callable @100 | | | 1,500 | | | | 1,361 | | |
Wisconsin (1.8%): | |
Public Finance Authority Revenue
5.00%, 7/1/38, Continuously Callable @100 | | | 1,000 | | | | 1,054 | | |
5.00%, 1/1/42, Continuously Callable @103 (h) | | | 600 | | | | 555 | | |
4.00%, 1/1/45, Continuously Callable @100 | | | 1,440 | | | | 1,255 | | |
4.00%, 1/1/47, Continuously Callable @103 | | | 1,000 | | | | 841 | | |
4.00%, 2/1/51, Continuously Callable @100 | | | 1,000 | | | | 834 | | |
Series A, 5.25%, 3/1/47, Continuously Callable @100 | | | 2,000 | | | | 1,995 | | |
Series A, 4.00%, 10/1/47, Continuously Callable @100 | | | 1,000 | | | | 853 | | |
Series A, 5.25%, 10/1/48, Continuously Callable @100 | | | 1,500 | | | | 1,516 | | |
Series A, 4.00%, 10/1/49, Continuously Callable @100 | | | 1,500 | | | | 1,287 | | |
Series A, 4.00%, 7/1/51, Continuously Callable @100 | | | 880 | | | | 669 | | |
Public Finance Authority Revenue (INS — Assured Guaranty Municipal Corp.),
5.00%, 7/1/44, Continuously Callable @100 | | | 600 | | | | 608 | | |
Wisconsin Health & Educational Facilities Authority Revenue
4.00%, 1/1/47, Continuously Callable @103 | | | 600 | | | | 446 | | |
4.00%, 1/1/57, Continuously Callable @103 | | | 1,000 | | | | 698 | | |
| | | | 12,611 | | |
Total Municipal Bonds (Cost $403,776) | | | 362,988 | | |
Exchange-Traded Funds (0.1%) | |
iShares Russell 1000 ETF | | | 2,483 | | | | 557 | | |
Total Exchange-Traded Funds (Cost $489) | | | 557 | | |
Total Investments (Cost $511,735) — 99.5% | | | 701,406 | | |
Other assets in excess of liabilities — 0.5% | | | 3,416 | | |
NET ASSETS — 100.00% | | $ | 704,822 | | |
(a) Non-income producing security.
(b) Rounds to less than $1 thousand.
(c) Northern Trust Corp. is the parent of Northern Trust Investments Inc., which is the sub adviser of the Fund.
(d) Security was fair valued based upon procedures approved by the Board of Trustees and represents 0.1% of net assets as of November 30, 2022. This security is classified as Level 3 within the fair value hierarchy. (See Note 2 in the Notes to Financial Statements)
(e) The Fund's Adviser has deemed this security to be illiquid based upon procedures approved by the Board of Trustees. As of November 30, 2022, illiquid securities were 0.03% of net assets.
(f) Amount represents less than 0.05% of net assets.
See notes to financial statements.
26
USAA Mutual Funds Trust
USAA Growth and Tax Strategy Fund | | Schedule of Portfolio Investments — continued
November 30, 2022 | |
(Unaudited)
(g) Variable Rate Demand Notes that provide the rights to sell the security at face value on either that day or within the rate-reset period. The interest rate is reset on the put date at a stipulated daily, weekly, monthly, quarterly, or other specified time interval to reflect current market conditions. These securities do not indicate a reference rate and spread in their description.
(h) Rule 144A security or other security that is restricted as to resale to institutional investors. The Fund's Adviser has deemed this security to be liquid (unless otherwise noted as illiquid) based upon procedures approved by the Board of Trustees. As of November 30, 2022, the fair value of these securities was $10,360 thousands and amounted to 1.5% of net assets.
(i) Zero-coupon bond.
(j) Variable or Floating-Rate Security. Rate disclosed is as of November 30, 2022.
(k) Security or portion of security purchased on a delayed-delivery and/or when-issued basis.
(l) Currently the issuer is in default with respect to interest and/or principal payments.
(m) Issuer filed for bankruptcy.
AMBAC — American Municipal Bond Assurance Corporation
bps — Basis points
Continuously callable — Investment is continuously callable or will be continuously callable on any date after the first call date until its maturity.
DIP — Debtor-In-Possession
ETF — Exchange-Traded Fund
GO — General Obligation
IDA — Industrial Development Authority
LLC — Limited Liability Company
MUNIPSA — Municipal Swap Index
PLC — Public Limited Company
Credit Enhancements — Adds the financial strength of the provider of the enhancement to support the issuer's ability to repay the principal and interest payments when due. The enhancement may be provided by a high-quality bank, insurance company or other corporation, or a collateral trust. The enhancements do not guarantee the market values of the securities.
INS Principal and interest payments are insured by the name listed. Although bond insurance reduces the risk of loss due to default by an issuer, such bonds remain subject to the risk that value may fluctuate for other reasons, and there is no assurance that the insurance company will meet its obligations.
NBGA Principal and interest payments or, under certain circumstances, underlying mortgages are guaranteed by a nonbank guarantee agreement from the name listed.
See notes to financial statements.
27
USAA Mutual Funds Trust | | Statement of Assets and Liabilities
November 30, 2022 | |
(Amounts in Thousands, Except Per Share Amounts) (Unaudited)
| | | USAA Growth and
Tax Strategy Fund | |
Assets: | |
Investments, at value (Cost $511,735) | | $ | 701,406 | | |
Cash | | | 106 | | |
Receivables: | |
Interest and dividends | | | 5,783 | | |
Capital shares issued | | | 661 | | |
Investments sold | | | 1,305 | | |
From Adviser | | | 9 | | |
Prepaid expenses | | | 33 | | |
Total Assets | | | 709,303 | | |
Liabilities: | |
Payables: | |
Investments purchased | | | 3,579 | | |
Capital shares redeemed | | | 545 | | |
Accrued expenses and other payables: | |
Investment advisory fees | | | 145 | | |
Administration fees | | | 82 | | |
Custodian fees | | | 8 | | |
Transfer agent fees | | | 50 | | |
Compliance fees | | | — | (a) | |
Trustees' fees | | | 1 | | |
| 12b-1 fees | | | 3 | | |
Other accrued expenses | | | 68 | | |
Total Liabilities | | | 4,481 | | |
Net Assets: | |
Capital | | | 527,906 | | |
Total accumulated earnings/(loss) | | | 176,916 | | |
Net Assets | | $ | 704,822 | | |
Net Assets | |
Fund Shares | | $ | 635,503 | | |
Institutional Shares | | | 52,986 | | |
Class A | | | 10,527 | | |
Class C | | | 5,806 | | |
Total | | $ | 704,822 | | |
Shares (unlimited number of shares authorized with no par value): | |
Fund Shares | | | 27,853 | | |
Institutional Shares | | | 2,324 | | |
Class A | | | 463 | | |
Class C | | | 257 | | |
Total | | | 30,897 | | |
Net asset value, offering and redemption price per share: (b) | |
Fund Shares | | $ | 22.82 | | |
Institutional Shares | | | 22.80 | | |
Class A | | | 22.75 | | |
Class C (c) | | | 22.61 | | |
Maximum Sales Charge — Class A | | | 2.25 | % | |
Maximum offering price
(100%/(100%-maximum sales charge) of net asset value adjusted to
the nearest cent) per share — Class A | | $ | 23.28 | | |
(a) Rounds to less than $1 thousand.
(b) Per share amount may not recalculate due to rounding of net assets and/or shares outstanding.
(c) Redemption price per share varies by the length of time shares are held.
See notes to financial statements.
28
USAA Mutual Funds Trust | | Statement of Operations
For the Six Months Ended November 30, 2022 | |
(Amounts in Thousands) (Unaudited)
| | | USAA Growth and
Tax Strategy Fund | |
Investment Income: | |
Dividends | | $ | 2,934 | | |
Interest | | | 7,018 | | |
Securities lending (net of fees) | | | 1 | | |
Foreign tax withholding | | | (1 | ) | |
Total Income | | | 9,952 | | |
Expenses: | |
Investment advisory fees | | | 998 | | |
Administration fees — Fund Shares | | | 482 | | |
Administration fees — Institutional Shares | | | 28 | | |
Administration fees — Class A | | | 7 | | |
Administration fees — Class C | | | 4 | | |
Sub-Administration fees | | | 23 | | |
| 12b-1 fees — Class A | | | 11 | | |
| 12b-1 fees — Class C | | | 27 | | |
Custodian fees | | | 15 | | |
Transfer agent fees — Fund Shares | | | 208 | | |
Transfer agent fees — Institutional Shares | | | 28 | | |
Transfer agent fees — Class A | | | 4 | | |
Transfer agent fees — Class C | | | 3 | | |
Trustees' fees | | | 24 | | |
Compliance fees | | | 3 | | |
Legal and audit fees | | | 42 | | |
State registration and filing fees | | | 46 | | |
Other expenses | | | 81 | | |
Total Expenses | | | 2,034 | | |
Expenses waived/reimbursed by Adviser | | | (23 | ) | |
Net Expenses | | | 2,011 | | |
Net Investment Income (Loss) | | | 7,941 | | |
Realized/Unrealized Gains (Losses) from Investments: | |
Net realized gains (losses) from investment securities | | | (11,481 | ) | |
Net realized gains (losses) from futures contracts | | | (159 | ) | |
Net change in unrealized appreciation/depreciation on investment securities | | | (17,930 | ) | |
Net change in unrealized appreciation/depreciation on futures contracts | | | (203 | ) | |
Net realized/unrealized gains (losses) on investments | | | (29,773 | ) | |
Change in net assets resulting from operations | | $ | (21,832 | ) | |
See notes to financial statements.
29
USAA Mutual Funds Trust | | Statements of Changes in Net Assets | |
(Amounts in Thousands)
| | | USAA Growth and Tax Strategy Fund | |
| | | Six Months
Ended
November 30,
2022
(Unaudited) | | Year
Ended
May 31,
2022 | |
From Investments: | |
Operations: | |
Net Investment Income (Loss) | | $ | 7,941 | | | $ | 13,390 | | |
Net realized gains (losses) | | | (11,640 | ) | | | 6,903 | | |
Net change in unrealized appreciation/depreciation | | | (18,133 | ) | | | (63,171 | ) | |
Change in net assets resulting from operations | | | (21,832 | ) | | | (42,878 | ) | |
Distributions to Shareholders: | |
Fund Shares | | | (6,670 | ) | | | (11,818 | ) | |
Institutional Shares | | | (603 | ) | | | (1,016 | ) | |
Class A | | | (68 | ) | | | (113 | ) | |
Class C | | | (29 | ) | | | (32 | ) | |
Change in net assets resulting from distributions
to shareholders | | | (7,370 | ) | | | (12,979 | ) | |
Change in net assets resulting from capital transactions | | | (39,953 | ) | | | 70,706 | | |
Change in net assets | | | (69,155 | ) | | | 14,849 | | |
Net Assets: | |
Beginning of period | | | 773,977 | | | | 759,128 | | |
End of period | | $ | 704,822 | | | $ | 773,977 | | |
(continues on next page)
See notes to financial statements.
30
USAA Mutual Funds Trust | | Statements of Changes in Net Assets | |
(Amounts in Thousands) (continued)
| | | USAA Growth and Tax Strategy Fund | |
| | | Six Months
Ended
November 30,
2022
(Unaudited) | | Year
Ended
May 31,
2022 | |
Capital Transactions: | |
Fund Shares | |
Proceeds from shares issued | | $ | 22,986 | | | $ | 133,271 | | |
Distributions reinvested | | | 6,385 | | | | 11,312 | | |
Cost of shares redeemed | | | (62,079 | ) | | | (102,872 | ) | |
Total Fund Shares | | $ | (32,708 | ) | | $ | 41,711 | | |
Institutional Shares | |
Proceeds from shares issued | | $ | 6,906 | | | $ | 28,783 | | |
Distributions reinvested | | | 204 | | | | 281 | | |
Cost of shares redeemed | | | (15,855 | ) | | | (15,453 | ) | |
Total Institutional Shares | | $ | (8,745 | ) | | $ | 13,611 | | |
Class A | |
Proceeds from shares issued | | $ | 4,165 | | | $ | 19,318 | | |
Distributions reinvested | | | 51 | | | | 42 | | |
Cost of shares redeemed | | | (3,168 | ) | | | (8,755 | ) | |
Total Class A | | $ | 1,048 | | | $ | 10,605 | | |
Class C | |
Proceeds from shares issued | | $ | 906 | | | $ | 4,830 | | |
Distributions reinvested | | | 25 | | | | 28 | | |
Cost of shares redeemed | | | (479 | ) | | | (79 | ) | |
Total Class C | | $ | 452 | | | $ | 4,779 | | |
Change in net assets resulting from capital transactions | | $ | (39,953 | ) | | $ | 70,706 | | |
Share Transactions: | |
Fund Shares | |
Issued | | | 1,022 | | | | 5,188 | | |
Reinvested | | | 289 | | | | 440 | | |
Redeemed | | | (2,795 | ) | | | (4,081 | ) | |
Total Fund Shares | | | (1,484 | ) | | | 1,547 | | |
Institutional Shares | |
Issued | | | 309 | | | | 1,128 | | |
Reinvested | | | 9 | | | | 11 | | |
Redeemed | | | (719 | ) | | | (615 | ) | |
Total Institutional Shares | | | (401 | ) | | | 524 | | |
Class A | |
Issued | | | 190 | | | | 753 | | |
Reinvested | | | 2 | | | | 2 | | |
Redeemed | | | (142 | ) | | | (363 | ) | |
Total Class A | | | 50 | | | | 392 | | |
Class C | |
Issued | | | 42 | | | | 189 | | |
Reinvested | | | 1 | | | | 1 | | |
Redeemed | | | (22 | ) | | | (3 | ) | |
Total Class C | | | 21 | | | | 187 | | |
Change in Shares | | | (1,814 | ) | | | 2,650 | | |
See notes to financial statements.
31
USAA Mutual Funds Trust | | Financial Highlights | |
For a Share Outstanding Throughout Each Period
| | | | Investment Activities | | Distributions to
Shareholders From | |
| | | Net Asset
Value,
Beginning
of Period | | Net
Investment
Income
(Loss) | | Net
Realized
and
Unrealized
Gains
(Losses) | | Total from
Investment
Activities | | Net
Investment
Income | | Net
Realized
Gains from
Investments | |
USAA Growth and Tax Strategy Fund | | | |
Fund Shares | | | |
Six Months Ended
November 30, 2022
(Unaudited) | | $ | 23.66 | | | | 0.25 | (h) | | | (0.86 | ) | | | (0.61 | ) | | | (0.23 | ) | | | — | | |
Year Ended May 31:
2022 | | $ | 25.25 | | | | 0.42 | (h) | | | (1.60 | ) | | | (1.18 | ) | | | (0.41 | ) | | | — | | |
2021 | | $ | 20.96 | | | | 0.43 | (h) | | | 4.29 | | | | 4.72 | | | | (0.43 | ) | | | — | | |
2020 | | $ | 20.18 | | | | 0.47 | (h) | | | 0.77 | | | | 1.24 | | | | (0.46 | ) | | | — | | |
2019 | | $ | 19.77 | | | | 0.47 | | | | 0.47 | | | | 0.94 | | | | (0.48 | ) | | | (0.05 | ) | |
2018 | | $ | 18.76 | | | | 0.44 | | | | 1.01 | | | | 1.45 | | | | (0.44 | ) | | | — | | |
Institutional Shares | | | |
Six Months Ended
November 30, 2022
(Unaudited) | | $ | 23.65 | | | | 0.25 | (h) | | | (0.87 | ) | | | (0.62 | ) | | | (0.23 | ) | | | — | | |
Year Ended May 31, 2022 | | $ | 25.24 | | | | 0.42 | (h) | | | (1.60 | ) | | | (1.18 | ) | | | (0.41 | ) | | | — | | |
June 29, 2020 (j)
through May 31, 2021 | | $ | 21.05 | | | | 0.40 | (h) | | | 4.12 | | | | 4.52 | | | | (0.33 | ) | | | — | | |
Class A | | | |
Six Months Ended
November 30, 2022
(Unaudited) | | $ | 23.59 | | | | 0.22 | (h) | | | (0.87 | ) | | | (0.65 | ) | | | (0.19 | ) | | | — | | |
Year Ended May 31, 2022 | | $ | 25.22 | | | | 0.36 | (h) | | | (1.62 | ) | | | (1.26 | ) | | | (0.37 | ) | | | — | | |
June 29, 2020 (j)
through May 31, 2021 | | $ | 21.05 | | | | 0.31 | (h) | | | 4.16 | | | | 4.47 | | | | (0.30 | ) | | | — | | |
Class C | | | |
Six Months Ended
November 30, 2022
(Unaudited) | | $ | 23.46 | | | | 0.13 | (h) | | | (0.86 | ) | | | (0.73 | ) | | | (0.12 | ) | | | — | | |
Year Ended May 31, 2022 | | $ | 25.12 | | | | 0.17 | (h) | | | (1.60 | ) | | | (1.43 | ) | | | (0.23 | ) | | | — | | |
June 29, 2020 (j)
through May 31, 2021 | | $ | 21.05 | | | | 0.16 | (h) | | | 4.13 | | | | 4.29 | | | | (0.22 | ) | | | — | | |
(a) Not annualized for periods less than one year.
(b) Assumes reinvestment of all net investment income and realized capital gain distributions, if any, during the period. Includes adjustments in accordance with U.S. Generally Accepted Accounting Principles and could differ from the Lipper reported return.
(c) Annualized for periods less than one year.
(d) The net expense ratio may not correlate to the applicable expense limits in place during the period since the current contractual expense limitation is applied for a period beginning July 1, 2019, and in effect through September 30, 2023, instead of coinciding with the Fund's fiscal year end. Details of the current contractual expense limitation in effect can be found in Note 4 of the accompanying Notes to Financial Statements.
(e) Does not include acquired fund fees and expenses, if any.
See notes to financial statements.
32
USAA Mutual Funds Trust | | Financial Highlights — continued | |
For a Share Outstanding Throughout Each Period
| | | | | Ratios to Average Net Assets | | Supplemental Data | |
| | | Total
Distributions | | Net
Asset
Value,
End of
Period | | Total
Return
(Excludes
Sales
Charge)(a)(b) | | Net
Expenses(c)(d)(e)(f) | | Net
Investment
Income
(Loss)(c) | | Gross
Expenses(c)(e) | | Net
Assets,
End of
Period
(000's) | | Portfolio
Turnover(a)(g) | |
USAA Growth and Tax Strategy Fund | |
Fund Shares | |
Six Months Ended
November 30, 2022
(Unaudited) | | | (0.23 | ) | | $ | 22.82 | | | | (2.54 | )% | | | 0.55 | % | | | 2.24 | % | | | 0.55 | % | | $ | 635,503 | | | | 13 | % | |
Year Ended May 31:
2022 | | | (0.41 | ) | | $ | 23.66 | | | | (4.80 | )% | | | 0.58 | % | | | 1.64 | % | | | 0.58 | % | | $ | 694,234 | | | | 14 | % | |
2021 | | | (0.43 | ) | | $ | 25.25 | | | | 22.79 | % | | | 0.59 | % | | | 1.86 | % | | | 0.59 | % | | $ | 701,841 | | | | 11 | % | |
2020 | | | (0.46 | ) | | $ | 20.96 | | | | 6.25 | % | | | 0.57 | % | | | 2.25 | % | | | 0.57 | % | | $ | 593,579 | | | | 34 | %(i) | |
2019 | | | (0.53 | ) | | $ | 20.18 | | | | 4.83 | % | | | 0.60 | % | | | 2.44 | % | | | 0.60 | % | | $ | 526,320 | | | | 7 | % | |
2018 | | | (0.44 | ) | | $ | 19.77 | | | | 7.81 | % | | | 0.68 | % | | | 2.32 | % | | | 0.68 | % | | $ | 459,682 | | | | 10 | % | |
Institutional Shares | |
Six Months Ended
November 30, 2022
(Unaudited) | | | (0.23 | ) | | $ | 22.80 | | | | (2.58 | )% | | | 0.56 | % | | | 2.24 | % | | | 0.58 | % | | $ | 52,986 | | | | 13 | % | |
Year Ended May 31, 2022 | | | (0.41 | ) | | $ | 23.65 | | | | (4.79 | )% | | | 0.57 | % | | | 1.65 | % | | | 0.57 | % | | $ | 64,446 | | | | 14 | % | |
June 29, 2020 (j)
through May 31, 2021 | | | (0.33 | ) | | $ | 25.24 | | | | 21.62 | % | | | 0.56 | % | | | 1.80 | % | | | 0.59 | % | | $ | 55,541 | | | | 11 | % | |
Class A | |
Six Months Ended
November 30, 2022
(Unaudited) | | | (0.19 | ) | | $ | 22.75 | | | | (2.75 | )% | | | 0.85 | % | | | 1.96 | % | | | 1.10 | % | | $ | 10,527 | | | | 13 | % | |
Year Ended May 31, 2022 | | | (0.37 | ) | | $ | 23.59 | | | | (5.10 | )% | | | 0.86 | % | | | 1.42 | % | | | 1.03 | % | | $ | 9,754 | | | | 14 | % | |
June 29, 2020 (j)
through May 31, 2021 | | | (0.30 | ) | | $ | 25.22 | | | | 21.35 | % | | | 0.86 | % | | | 1.38 | % | | | 13.45 | % | | $ | 525 | | | | 11 | % | |
Class C | |
Six Months Ended
November 30, 2022
(Unaudited) | | | (0.12 | ) | | $ | 22.61 | | | | (3.09 | )% | | | 1.60 | % | | | 1.20 | % | | | 1.86 | % | | $ | 5,806 | | | | 13 | % | |
Year Ended May 31, 2022 | | | (0.23 | ) | | $ | 23.46 | | | | (5.78 | )% | | | 1.61 | % | | | 0.66 | % | | | 1.67 | % | | $ | 5,543 | | | | 14 | % | |
June 29, 2020 (j)
through May 31, 2021 | | | (0.22 | ) | | $ | 25.12 | | | | 20.47 | % | | | 1.60 | % | | | 0.70 | % | | | 5.63 | % | | $ | 1,221 | | | | 11 | % | |
(f) From the period beginning July 1, 2019, the amount of any waivers or reimbursements and the amount of any recoupment are calculated without regard to the impact of any performance adjustment to the Fund's management fee.
(g) Portfolio turnover is calculated on the basis of the Fund as a whole without distinguishing between the classes of shares issued.
(h) Per share net investment income (loss) has been calculated using the average daily shares method.
(i) Reflects an overall increase in purchases and sales of securities.
(j) Commencement of operations.
See notes to financial statements.
33
USAA Mutual Funds Trust | | Notes to Financial Statements
November 30, 2022 | |
(Unaudited)
1. Organization:
USAA Mutual Funds Trust (the "Trust") is organized as a Delaware statutory trust and is registered under the Investment Company Act of 1940, as amended (the "1940 Act"), as an open-end investment company. The Trust is comprised of 45 funds and is authorized to issue an unlimited number of shares, which are units of beneficial interest with no par value.
The accompanying financial statements are those of the USAA Growth and Tax Strategy Fund (the "Fund"). The Fund offers four classes of shares: Fund Shares, Institutional Shares, Class A, and Class C. The Fund is classified as diversified under the 1940 Act.
Each class of shares of the Fund has substantially identical rights and privileges, except with respect to sales charges, fees paid under distribution plans, expenses allocable exclusively to each class of shares, voting rights on matters solely affecting a single class of shares, and the exchange privilege of each class of shares.
Victory Capital Management ("VCM" or the "Adviser"), is an indirect wholly owned subsidiary of Victory Capital Holdings, Inc., a publicly traded Delaware corporation, and a wholly owned direct subsidiary of Victory Capital Operating, LLC.
Under the Trust's organizational documents, its officers and trustees are indemnified against certain liabilities arising out of the performance of their duties to the Fund. In addition, in the normal course of business, the Fund enters into contracts with its vendors and others that provide for general indemnifications. The Fund's maximum exposure under these arrangements is unknown, as this would involve future claims that may be made against the Fund. However, based on experience, the Fund expects that risk of loss to be remote.
2. Significant Accounting Policies:
The following is a summary of significant accounting policies followed by the Trust in the preparation of its financial statements. The policies are in conformity with U.S. Generally Accepted Accounting Principles ("GAAP"). The preparation of financial statements in accordance with GAAP requires management to make estimates and assumptions that affect the reported amounts of assets and liabilities and disclosure of contingent assets and liabilities at the date of the financial statements and the reported amounts of income and expenses for the period. Actual results could differ from those estimates. The Fund follows the specialized accounting and reporting requirements under GAAP that are applicable to investment companies under Accounting Standards Codification Topic 946.
Investment Valuation:
The Fund records investments at fair value. Fair value is defined as the price that would be received to sell an asset or paid to transfer a liability in an orderly transaction between market participants at the measurement date.
The valuation techniques described below maximize the use of observable inputs and minimize the use of unobservable inputs in determining fair value. The inputs used for valuing the Fund's investments are summarized in the three broad levels listed below:
• Level 1 — quoted prices (unadjusted) in active markets for identical securities
• Level 2 — other significant observable inputs (including quoted prices for similar securities, interest rates, or credit spreads, applicable to those securities, etc.)
• Level 3 — significant unobservable inputs (including the Adviser's assumptions in determining the fair value of investments)
Changes in valuation techniques may result in transfers in or out of an assigned level within the disclosure hierarchy. The inputs or methodologies used for valuation techniques are not necessarily an indication of the risks associated with entering into those investments.
The Adviser, acting as the valuation designee has established the Pricing and Liquidity Committee (the "Committee"), and subject to the Trust's Board of Trustees' (the "Board") oversight, the Committee administers and oversees the Fund's valuation policies and procedures, which are approved by the Board.
34
USAA Mutual Funds Trust | | Notes to Financial Statements — continued
November 30, 2022 | |
(Unaudited)
Portfolio securities listed or traded on securities exchanges, including Exchange-Traded Funds ("ETFs"), and American Depositary Receipts ("ADRs"), are valued at the closing price on the exchange or system where the security is principally traded, if available, or at the Nasdaq Official Closing Price. If there have been no sales for that day on the exchange or system, then a security is valued at the last available bid quotation on the exchange or system where the security is principally traded. In each of these situations, valuations are typically categorized as Level 1 in the fair value hierarchy.
Investments in open-end investment companies, other than ETFs, are valued at their net asset value ("NAV"). These valuations are typically categorized as Level 1 in the fair value hierarchy.
Debt securities are valued each business day by a pricing service approved by the Board. The approved pricing service uses the evaluated bid or the last sale price to value securities. Debt obligations maturing within 60 days may be valued at amortized cost, provided that the amortized cost represents the fair value of such securities. These valuations are typically categorized as Level 2 in the fair value hierarchy.
Futures contracts are valued at the settlement price established each day by the board of trade or an exchange on which they are traded. These valuations are typically categorized as Level 1 in the fair value hierarchy.
In the event that price quotations or valuations are not readily available, investments are valued at fair value in accordance with procedures established by and under the general supervision and responsibility of the Board. These valuations are typically categorized as Level 2 or Level 3 in the fair value hierarchy, based on the observability of inputs used to determine the fair value. The effect of fair value pricing is that securities may not be priced on the basis of quotations from the primary market in which they are traded, and the actual price realized from the sale of a security may differ materially from the fair value price. Valuing these securities at fair value is intended to cause the Fund's NAV to be more reliable than it otherwise would be.
A summary of the valuations as of November 30, 2022, based upon the three levels defined above, is included in the table below while the breakdown, by category, of investments is disclosed on the Schedule of Portfolio Investments (amounts in thousands):
| | | Level 1 | | Level 2 | | Level 3 | | Total | |
Common Stocks | | $ | 337,616 | | | $ | — | | | $ | — | | | $ | 337,616 | | |
Corporate Bonds | | | — | | | | — | | | | 245 | | | | 245 | | |
Municipal Bonds | | | — | | | | 362,988 | | | | — | | | | 362,988 | | |
Exchange-Traded Funds | | | 557 | | | | — | | | | — | | | | 557 | | |
Total | | $ | 338,173 | | | $ | 362,988 | | | $ | 245 | | | $ | 701,406 | | |
For the six months ended November 30, 2022, there were no significant transfers into/out of Level 3.
Real Estate Investment Trusts ("REITs"):
The Fund may invest in REITs, which report information on the source of their distributions annually. REITs are pooled investment vehicles that invest primarily in income producing real estate or real estate related loans or interests (such as mortgages). Certain distributions received from REITs during the year are recorded as realized gains or return of capital as estimated by the Fund or when such information becomes known.
Investment Companies:
Exchange-Traded Funds:
The Fund may invest in ETFs, the shares of which are bought and sold on a securities exchange. An ETF trades like common stock and represents a fixed portfolio of securities often designed to track the performance and dividend yield of a particular domestic or foreign market index. The Fund may purchase shares of an ETF to temporarily gain exposure to a portion of the U.S. or a foreign market while awaiting purchase of underlying securities. The risks of owning an ETF generally reflect the
35
USAA Mutual Funds Trust | | Notes to Financial Statements — continued
November 30, 2022 | |
(Unaudited)
risks of owning the underlying securities the ETF is designed to track, although the lack of liquidity of an ETF could result in it being more volatile. Additionally, ETFs have fees and expenses that reduce their value.
Open-End Funds:
The Fund may invest in portfolios of open-end investment companies. These investment companies value securities in their portfolios for which market quotations are readily available at their market values (generally the last reported sale price) and all other securities and assets at their fair value by the methods established by the board of directors of the underlying funds.
Securities Purchased on a Delayed-Delivery or When-Issued Basis:
The Fund may purchase securities on a delayed-delivery or when-issued basis. Delivery and payment for securities that have been purchased by the Fund on a delayed-delivery or when-issued basis, or for delayed draws on loans can generally take place within 35 days a month or more after the trade date. Securities that require more than 35 days to settle are considered a senior security and subject to Rule 18F-4. At the time the Fund makes the commitment to purchase a security on a delayed-delivery or when-issued basis, the Fund records the transaction and reflects the value of the security in determining NAV. No interest accrues to the Fund until the transaction settles and payment takes place. A segregated account is established and the Fund maintains cash and/or marketable securities at least equal in value to commitments for delayed-delivery or when-issued securities. If the Fund owns delayed-delivery or when-issued securities, these values are included in Payables for Investments purchased on the accompanying Statement of Assets and Liabilities and the segregated assets are identified on the Schedule of Portfolio Investments.
Municipal Obligations:
The values of municipal obligations can fluctuate and may be affected by adverse tax, legislative, or political changes, and by financial developments affecting municipal issuers. Payments of municipal obligations may depend on a relatively limited source of revenue, resulting in greater credit risk. Future changes in federal tax laws or the activity of an issuer may adversely affect the tax-exempt status of municipal obligations.
Below-Investment-Grade Securities:
The Fund may invest in below-investment-grade securities (i.e., lower-quality, "junk" debt), which are subject to various risks. Lower-quality debt is considered to be speculative because it is less certain that the issuer will be able to pay interest or repay the principal than in the case of investment-grade debt. These securities can involve a substantially greater risk of default than higher-rated securities, and their values can decline significantly over short periods of time. Lower-quality debt securities tend to be more sensitive to adverse news about their issuers, the market and the economy in general, than higher-quality debt securities. The market for these securities can be less liquid, especially during periods of recession or general market decline.
Derivative Instruments:
Futures Contracts:
The Fund may enter into contracts for the future delivery of securities or foreign currencies and futures contracts based on a specific security, class of securities, foreign currency or an index, and purchase or sell options on any such futures contracts. A futures contract on a securities index is an agreement obligating either party to pay, and entitling the other party to receive, while the contract is outstanding, cash payments based on the level of a specified securities index. No physical delivery of the underlying asset is made. The Fund may enter into futures contracts in an effort to hedge against market risks. The acquisition of put and call options on futures contracts will give the Fund the right (but not the obligation), for a specified price, to sell or to purchase the underlying futures contract, upon exercise
36
USAA Mutual Funds Trust | | Notes to Financial Statements — continued
November 30, 2022 | |
(Unaudited)
of the option, at any time during the option period. Futures transactions involve brokerage costs and require the Fund to segregate assets to cover contracts that would require it to purchase securities or currencies. A good faith margin deposit, known as initial margin, of cash or government securities with a broker or custodian is required to initiate and maintain open positions in futures contracts. Subsequent payments, known as variation margin, are made or received by the Fund based on the change in the market value of the position and are recorded as unrealized appreciation or depreciation until the contract is closed out, at which time the gain or loss is realized. The Fund may lose the expected benefit of futures transactions if interest rates, exchange rates or securities prices change in an unanticipated manner. Such unanticipated changes may also result in lower overall performance than if the Fund had not entered into any futures transactions. In addition, the value of the Fund's futures positions may not prove to be perfectly or even highly correlated with the value of its portfolio securities or foreign currencies, limiting the Fund's ability to hedge effectively against interest rate, exchange rate and/or market risk and giving rise to additional risks. There is no assurance of liquidity in the secondary market for purposes of closing out futures positions. As of November 30, 2022, the Fund had no open futures contracts.
Management has determined that no offsetting requirements exist as a result of their conclusion that the Fund is not subject to master netting agreements for futures contracts. During the six months ended November 30, 2022, the Fund entered into futures contracts primarily for the strategy of hedging or other purposes, including but not limited to, providing liquidity and equitizing cash.
Investment Transactions and Related Income:
Changes in holdings of investments are accounted for no later than one business day following the trade date. For financial reporting purposes, however, investment transactions are accounted for on trade date or the last business day of the reporting period. Interest income is determined on the basis of coupon interest accrued using the effective interest method which adjusts, where applicable, the amortization of premiums or accretion of discounts. Dividend income is recorded on the ex-dividend date. Gains or losses realized on sales of securities are recorded on the identified cost basis. Paydown gains or losses on applicable securities, if any, are recorded as components of Interest income on the Statement of Operations.
Withholding taxes on interest, dividends, and gains as a result of certain investments in ADRs by the Fund have been provided for in accordance with each investment's applicable country's tax rules and rates.
Securities Lending:
The Fund, through a Securities Lending Agreement with Citibank, N.A. ("Citibank"), may lend its securities to qualified financial institutions, such as certain broker-dealers and banks, to earn additional income, net of income retained by Citibank. Borrowers are required to initially secure their loans for collateral in the amount of at least 102% of the value of U.S. securities loaned or at least 105% of the value of non-U.S. securities loaned, marked-to-market daily. Any collateral shortfalls associated with increases in the valuation of the securities loaned are generally cured the next business day. The collateral can be received in the form of cash collateral and/or non-cash collateral. Non-cash collateral can include U.S. Government Securities and other securities as permitted by Securities and Exchange Commission ("SEC") guidelines. The cash collateral is invested in short-term instruments or cash equivalents, primarily open-end investment companies, as noted on the Fund's Schedule of Portfolio Investments. The Fund effectively does not have control of the non-cash collateral and therefore it is not disclosed on the Fund's Schedule of Portfolio Investments. Collateral requirements are determined daily based on the value of the Fund's securities on loan as of the end of the prior business day. During the time portfolio securities are on loan, the borrower will pay the Fund any dividends or interest paid on such securities plus any fee negotiated between the parties to the lending agreement. The Fund also earns a return from the collateral. The Fund pays Citibank various fees in connection with the investment of cash collateral and fees based on the investment income received from securities lending activities. Securities lending income (net of these fees) is disclosed on the Statement of Operations.
37
USAA Mutual Funds Trust | | Notes to Financial Statements — continued
November 30, 2022 | |
(Unaudited)
Loans are terminable upon demand and the borrower must return the loaned securities within the lesser of one standard settlement period or five business days. Although risk is mitigated by the collateral, the Fund could experience a delay in recovering its securities and possible loss of income or value if the borrower fails to return them. In addition, there is a risk that the value of the short-term investments will be less than the amount of cash collateral required to be returned to the borrower.
The Fund's agreement with Citibank does not include master netting provisions. Non-cash collateral received by the Fund may not be sold or repledged, except to satisfy borrower default.
As of November 30, 2022, the Fund did not have any securities on loan.
Foreign Taxes:
The Fund may be subject to foreign taxes related to foreign income received (a portion of which may be reclaimable), capital gains on the sale of securities, and certain foreign currency transactions. All foreign taxes are recorded in accordance with the applicable regulations and rates that exist in the foreign jurisdictions in which the Fund invests.
Federal Income Taxes:
The Fund intends to continue to qualify as a regulated investment company by complying with the provisions available to certain investment companies, as defined in applicable sections of the Internal Revenue Code, and to make distributions of net investment income and net realized gains sufficient to relieve it from all, or substantially all, federal income taxes. Accordingly, no provision for federal income taxes is required in the financial statements. The Fund has a tax year end of May 31.
For the six months ended November 30, 2022, the Fund did not incur any income tax, interest, or penalties, and has recorded no liability for net unrecognized tax benefits relating to uncertain tax positions.
Management of the Fund has reviewed tax positions taken in tax years that remain subject to examination by all major tax jurisdictions, including federal (i.e., the last four tax years, which includes the current fiscal tax year end). Management believes that there is no tax liability resulting from unrecognized tax benefits related to uncertain tax positions taken.
Allocations:
Expenses directly attributable to the Fund are charged to the Fund, while expenses that are attributable to more than one fund in the Trust, or jointly with an affiliated trust, are allocated among the respective funds in the Trust and/or an affiliated trust based upon net assets or another appropriate basis.
Income, expenses (other than class-specific expenses such as transfer agent fees, state registration fees, printing fees, and 12b-1 fees), and realized and unrealized gains or losses on investments are allocated to each class of shares based on its relative net assets on the date income is earned or expenses and realized and unrealized gains and losses are incurred.
Cross-Trade Transactions:
Pursuant to Rule 17a-7 under the 1940 Act, the Fund may engage in cross-trades, which are securities transactions with affiliated investment companies and advisory accounts managed by the Adviser and any applicable sub-adviser under specified conditions outlined in the valuation policies and procedures adopted by the Board. In addition, as defined under the valuation policies and procedures, each transaction must be effected at the independent current market price. For the six months ended November 30, 2022, the Fund engaged in the following securities transactions with affiliated funds, which resulted in the following net realized gains (losses) (amounts in thousands):
| Purchases | | Sales | | Net Realized
Gains (Losses) | |
| $ | 16,600 | | | $ | 18,280 | | | $ | — | | |
38
USAA Mutual Funds Trust | | Notes to Financial Statements — continued
November 30, 2022 | |
(Unaudited)
Fees Paid Indirectly:
Expense offsets to custody fees that arise from credits on cash balances maintained on deposit are reflected on the Statement of Operations, as applicable, as Custodian fees.
3. Purchases and Sales:
Purchases and sales of securities (excluding securities maturing less than one year from acquisition) for the six months ended November 30, 2022, were as follows for the Fund (amounts in thousands):
Excluding
U.S. Government Securities | |
Purchases | | Sales | |
$ | 92,880 | | | $ | 123,860 | | |
4. Fees and Transactions with Affiliates and Related Parties:
Investment Advisory Fees:
Investment advisory services are provided to the Fund by the Adviser, which is a New York corporation registered as an investment adviser with the SEC.
Under the terms of the Investment Advisory Agreement, the Adviser is entitled to receive a base fee and a performance adjustment. The Fund's base fee is accrued daily and paid monthly at an annualized rate of 0.30% of the Fund's average daily net assets. Amounts incurred and paid to VCM for the six months ended November 30, 2022, are reflected on the Statement of Operations as Investment advisory fees.
The performance adjustment for each share class is accrued daily and calculated monthly by comparing the respective class' performance to that of the Lipper Composite Index which is comprised of 51% of the Lipper General & Insured Municipal Bond Funds Index and 49% of the Lipper Large-Cap Core Funds Index.
The performance period for each share class consists of the current month plus the previous 35 months. The following table is utilized to determine the extent of the performance adjustment:
Over/Under Performance Relative to Index
(in basis points)(a) | | Annual Adjustment Rate
(in basis points) | |
| | +/- 20 to 50 | | | | +/- 4 | | |
| | +/- 51 to 100 | | | | +/- 5 | | |
| | +/- 101 and greater | | | | +/- 6 | | |
(a) Based on the difference between the average annual performance of the relevant share class of the Fund and its relevant Lipper index, rounded to the nearest basis point.
Each class' annual performance adjustment rate is multiplied by the average daily net assets of the respective class over the entire performance period, which is then multiplied by a fraction, the numerator of which is the number of days in the month and the denominator of which is 365 (366 in leap years). The resulting amount is then added to (in the case of overperformance),or subtracted from (in the case of underperformance) the base fee.
Under the performance fee arrangement, each class pays a positive performance fee adjustment for a performance period whenever the class outperforms the Lipper Composite Index over that period, even if the class has overall negative returns during the performance period.
39
USAA Mutual Funds Trust | | Notes to Financial Statements — continued
November 30, 2022 | |
(Unaudited)
For the period June 1, 2022, to November 30, 2022, performance adjustments were $(67), $(3), $(1), and less than $(1) for Fund Shares, Institutional Shares, Class A, and Class C, in thousands, respectively. Performance adjustments were (0.02)%, (0.01)%, (0.01)%, and (0.01)% for Fund Shares, Institutional Shares, Class A, and Class C, respectively. The performance adjustment rate included in the investment advisory fee may differ from the maximum over/under Annual Adjustment Rate due to differences in average net assets for the reporting period and rolling 36 month performance periods.
The Trust relies on an exemptive order granted to VCM and its affiliated funds by the SEC in March 2019, permitting the use of a "manager-of-managers" structure for certain funds. Under a manager-of-managers structure, the investment adviser may select (with approval of the Board and without shareholder approval) one or more subadvisers to manage the day-to-day investment of a fund's assets.
VCM entered into a Subadvisory Agreement with Northern Trust Investments, Inc. ("NTI") under which NTI directs the investment and reinvestment of the Fund's assets allocated to it in accordance with the Fund's investment objective, policies, and restrictions, subject to the general supervision of the Board and VCM. This arrangement provides for monthly fees that are paid by VCM. VCM (not the Fund) pays the subadviser fees.
Administration and Servicing Fees:
VCM also serves as the Fund's administrator and fund accountant. Under the Fund Administration, Servicing and Accounting Agreement, VCM is paid an administration and servicing fee that is accrued daily and paid monthly at an annualized rate of 0.15%, 0.10%, 0.15%, and 0.15%, which is based on the Fund's average daily net assets of the Fund Shares, Institutional Shares, Class A, and Class C, respectively. Amounts incurred for the six months ended November 30, 2022, are reflected on the Statement of Operations as Administration fees.
Citi Fund Services Ohio, Inc. ("Citi"), an affiliate of Citibank, acts as sub-administrator and sub-fund accountant to the Fund pursuant to a Sub-Administration and Sub-Fund Accounting Services Agreement between VCM and Citi. VCM pays Citi a fee for providing these services. The Fund reimburses VCM and Citi for out-of-pocket expenses incurred in providing these services and certain other expenses specifically allocated to the Fund. Amounts incurred for the six months ended November 30, 2022, are reflected on the Statement of Operations as Sub-Administration fees.
The Fund (as part of the Trust) has entered into an agreement with the Adviser to provide compliance services, pursuant to which the Adviser furnishes its compliance personnel, including the services of the Chief Compliance Officer ("CCO"), and other resources reasonably necessary to provide the Trust with compliance oversight services related to the design, administration, and oversight of a compliance program for the Trust in accordance with Rule 38a-1 under the 1940 Act. The CCO is an employee of the Adviser, which pays the compensation of the CCO and support staff. The funds in the Trust, Victory Variable Insurance Funds, Victory Portfolios, and Victory Portfolios II (collectively, the "Victory Funds Complex") in the aggregate, compensate the Adviser for these services. Amounts incurred for the six months ended November 30, 2022, are reflected on the Statement of Operations as Compliance fees.
Transfer Agency Fees:
Victory Capital Transfer Agency, Inc. ("VCTA"), an affiliate of the Adviser, provides transfer agency services to the Fund. VCTA provides transfer agent services to the Fund Shares based on an annual charge of $23 per shareholder account plus out-of-pocket expenses. VCTA pays a portion of these fees to certain intermediaries for the administration and servicing of accounts that are held with such intermediaries. Transfer agent fees for Institutional Shares, Class A, and Class C are paid monthly based on a fee accrued daily at an annualized rate of 0.10%, 0.10%, and 0.10%, respectively, of average daily net assets, plus out-of-pocket expenses. Amounts incurred and paid to VCTA for the six months ended November 30, 2022, are reflected on the Statement of Operations as Transfer agent fees.
FIS Investor Services LLC serves as sub-transfer agent and dividend disbursing agent for the Fund pursuant to a Sub-Transfer Agent Agreement between VCTA and FIS Investor Services LLC. VCTA provides FIS Investor Services LLC a fee for providing these services.
40
USAA Mutual Funds Trust | | Notes to Financial Statements — continued
November 30, 2022 | |
(Unaudited)
Distributor/Underwriting Services:
Victory Capital Services, Inc. (the "Distributor"), an affiliate of the Adviser, serves as Distributor for the continuous offering of the shares of the Fund pursuant to a Distribution Agreement between the Distributor and the Trust.
Pursuant to the Distribution and Service Plans adopted in accordance with Rule 12b-1 under the 1940 Act, the Distributor may receive a monthly distribution and service fee, at an annual rate of up to 1.00% of the average daily net assets of Class C and 0.25% of the average daily net assets of Class A. The distribution and service fees paid to the Distributor may be used by the Distributor to pay for activity primarily intended to result in the sale of Class A and Class C. Amounts incurred and paid to the Distributor for the six months ended November 30, 2022, are reflected on the Statement of Operations as 12b-1 fees.
In addition, the Distributor is entitled to receive commissions in connection with sales of Class A. For the six months ended November 30, 2022, the Distributor received less than $1 thousand from commissions earned in connection with sales of Class A.
Other Fees:
Citibank serves as the Fund's custodian. The Fund pays Citibank a fee for providing these services. Amounts incurred for the six months ended November 30, 2022, are reflected on the Statement of Operations as Custodian fees.
K&L Gates LLP provides legal services to the Trust.
The Adviser has entered into an expense limitation agreement with the Fund until at least September 30, 2023. Under the terms of the agreement, the Adviser has agreed to waive fees or reimburse certain expenses to the extent that ordinary operating expenses incurred by certain classes of the Fund in any fiscal year exceed the expense limits for such classes of the Fund. Such excess amounts will be the liability of the Adviser. Performance adjustments, acquired fund fees and expenses, interest, taxes, brokerage commissions, other expenditures, which are capitalized in accordance with GAAP, and other extraordinary expenses not incurred in the ordinary course of the Fund's business are excluded from the expense limits. As of November 30, 2022, the expense limits (excluding voluntary waivers) were 0.61%, 0.57%, 0.86%, and 1.61% for Fund Shares, Institutional Shares, Class A, and Class C, respectively.
Under the terms of the expense limitation agreement, as amended June 29, 2022, the Fund has agreed to repay fees and expenses that were waived or reimbursed by the Adviser for a period of up to three years (thirty-six (36) months) after the waiver or reimbursement took place, subject to the lesser of any operating expense limits in effect at the time of: (a) the original waiver or expense reimbursement; or (b) the recoupment, after giving effect to the recoupment amount.
As of November 30, 2022, the following amounts are available to be repaid to the Adviser (amounts in thousands). The Fund has not recorded any amounts available to be repaid as a liability due to an assessment that such repayments are not probable at November 30, 2022.
Expires
2024 | | Expires
2025 | | Expires
2026 | | Total | |
| $ | 34 | | | $ | 14 | | | $ | 23 | | | $ | 71 | | |
The Adviser may voluntarily waive or reimburse additional fees to assist the Fund in maintaining competitive expense ratios. Voluntary waivers and reimbursements applicable to the Fund are not available to be recouped at a future time. There were no voluntary waivers or reimbursements for the six months ended November 30, 2022.
Certain officers and/or interested trustees of the Fund are also officers and/or employees of the Adviser, administrator, fund accountant, sub-administrator, sub-fund accountant, custodian, and Distributor.
41
USAA Mutual Funds Trust | | Notes to Financial Statements — continued
November 30, 2022 | |
(Unaudited)
5. Risks:
The Fund may be subject to other risks in addition to these identified risks.
Debt Securities Risk — The value of a debt security or other income-producing security changes in response to various factors including, for example, market-related factors (such as changes in interest rates or changes in the risk appetite of investors generally) and changes in the actual or perceived ability of the issuer (or of issuers generally) to meet its (or their) obligations. Other factors that may affect the value of debt securities include, among others, public health crises and responses by governments and companies to such crises. These and other events may affect the creditworthiness of the issuer of a debt security and may impair an issuer's ability to timely meet its debt obligations as they come due.
Credit Risk — The fixed-income securities in the Fund's portfolio are subject to credit risk, which is the possibility that an issuer of a fixed-income security will fail to make timely interest and/or principal payments on its securities or that negative market perceptions of the issuer's ability to make such payments will cause the price of that security to decline. The Fund accepts some credit risk as a recognized means to enhance an investor's return. All fixed-income securities, varying from the highest quality to the very speculative, have some degree of credit risk. Fixed-income securities rated below investment grade, also known as "junk" or high-yield bonds, generally entail greater economic, credit, and liquidity risk than investment-grade securities. Their prices may be more volatile, especially during economic downturns, financial setbacks, or liquidity events.
Interest Rate Risk — As a mutual fund that has the ability to invest in bonds, the Fund is subject to the risk that the market value of the bonds in its portfolio will fluctuate because of changes in interest rates, changes in the supply of and demand for tax-exempt securities, and other market factors. Bond prices generally are linked to the prevailing market interest rates. In general, when interest rates rise, bond prices fall; conversely, when interest rates fall, bond prices rise. The price volatility of a bond also depends on its duration. Generally, the longer the duration of a bond, the greater is its sensitivity to interest rates. To compensate investors for this higher interest rate risk, bonds with longer durations generally offer higher yields than bonds with shorter durations. The ability of an issuer of a debt security to repay principal prior to a security's maturity can increase the security's sensitivity to interest rate changes.
Decisions by the U.S. Federal Reserve regarding interest rate and monetary policy, which can be difficult to predict and sometimes change direction suddenly in response to economic and market events, can have a significant effect on the value of fixed-income securities as well as the overall strength of the U.S. economy. Precise interest rate predictions are difficult to make, and interest rates may change unexpectedly and dramatically in response to extreme changes in market or economic conditions. As a result, the value of fixed-income securities may vary widely under certain market conditions.
Equity Risk — The values of the equity securities in which the Fund invests may decline in response to developments affecting individual companies and/or general market, economic and political conditions and other factors. A company's earnings or dividends may not increase as expected due to poor management decisions, competitive pressures, breakthroughs in technology, reliance on suppliers, labor problems or shortages, corporate restructurings, fraudulent disclosures, natural disasters, military confrontations, war, terrorism, public health crises, or other events, conditions, and factors. Price changes may be temporary or may last for extended periods.
LIBOR Discontinuation Risk — The London Interbank Offered Rate ("LIBOR") discontinuation may adversely affect the financial markets generally and the Fund's operations, finances and investments specifically. LIBOR has been the principal floating-rate benchmark in the financial markets. However, LIBOR has been or will be discontinued as a floating rate benchmark. The date of discontinuation depends on the LIBOR currency and tenor. With limited exceptions, no new LIBOR obligations will be entered into after December 31, 2021. Existing LIBOR obligations have transitioned or will transition to another benchmark, depending on the LIBOR currency and tenor. For some existing LIBOR-based obligations, the contractual consequences of the discontinuation of LIBOR may not be clear.
42
USAA Mutual Funds Trust | | Notes to Financial Statements — continued
November 30, 2022 | |
(Unaudited)
Non-LIBOR floating-rate obligations, including Secured Overnight Financing Rate ("SOFR")-based obligations, may have returns and values that fluctuate more than those of floating-rate debt obligations that are based on LIBOR or other rates. Also, because SOFR and some alternative floating rates are relatively new market indexes, markets for certain non-LIBOR obligations may never develop or may not be liquid. Market terms for non-LIBOR floating rate obligations, such as the spread over the index reflected in interest-rate provisions, may evolve over time, and prices of non-LIBOR floating rate obligations may be different depending on when they are issued and changing views about correct spread levels.
Various SOFR-based rates, including SOFR-based term rates, and various non-SOFR-based rates are expected to develop in response to the discontinuation of U.S. dollar LIBOR, which may create various risks for the Fund and the financial markets more generally. There are non-LIBOR forward-looking floating rates that are not based on SOFR and that may be considered by participants in the financial markets as LIBOR alternatives. Such rates include AMERIBOR (American Interbank Offered Rate), BSBY (Bloomberg Short-Term Bank Yield Index) and BYI (Bank Yield Index). Unlike forward-looking SOFR-based term rates, such rates are intended to reflect a bank credit spread component.
It is not clear how replacement rates for LIBOR — including SOFR-based rates and non-SOFR-based rates — will develop and to what extent they will be used. There is no assurance that these replacement rates will be suitable substitutes for LIBOR, and thus the substitution of such rates for LIBOR could have an adverse effect on the Fund and the financial markets more generally. Concerns about market depth and stability could affect the development of non-SOFR-based term rates, and such rates may create various risks, which may or may not be similar to the risks relating to SOFR.
Market Risk — Overall market risks may affect the value of the Fund. Domestic and international factors such as political events, war, terrorism, trade disputes, inflation rates, interest rate levels and other fiscal and monetary policy changes, cybersecurity incidents, pandemics and other public health crises, sanctions against a particular foreign country, its nationals, businesses or industries and related geopolitical events, as well as environmental disasters such as earthquakes, fires, and floods, or other catastrophes, may add to instability in global economies and markets generally, and may lead to increased market volatility. Global economies and financial markets are highly interconnected, which increases the possibility that conditions in one country or region might adversely affect issuers in another country or region. The impact of these and other factors may be short-term or may last for extended periods.
6. Borrowing and Interfund Lending:
Line of Credit:
The Victory Funds Complex participates in a short-term demand note "Line of Credit" agreement with Citibank. The Line of Credit agreement with Citibank was renewed on June 27, 2022, with a termination date of June 26, 2023. Under the agreement with Citibank, the Victory Funds Complex may borrow up to $600 million, of which $300 million is committed and $300 million is uncommitted. $40 million of the Line of Credit is reserved for use by the Victory Floating Rate Fund, another series of the Victory Funds Complex, with Victory Floating Rate Fund paying the related commitment fees for that amount. The purpose of the Line of Credit is to meet temporary or emergency cash needs. For the six months ended November 30, 2022, Citibank received an annual commitment fee of 0.15% on $300 million for providing the Line of Credit. Each fund in the Victory Funds Complex paid a pro-rata portion of the commitment fees plus any interest on amounts borrowed. For the period from June 1, 2022, through June 27, 2022, interest was based on the one-month LIBOR plus one percent. Effective with the renewal, for the period June 28, 2022, through November 30, 2022, interest was based on the one-month SOFR plus 1.10 percent. Interest charged to the Fund during the period, if applicable, is reflected on the Statement of Operations under Line of credit fees.
The Fund had no borrowings under the Line of Credit agreement during the six months ended November 30, 2022.
43
USAA Mutual Funds Trust | | Notes to Financial Statements — continued
November 30, 2022 | |
(Unaudited)
Interfund Lending:
The Trust and the Adviser rely on an exemptive order granted by the SEC in March 2017 (the "Order"), permitting the establishment and operation of an Interfund Lending Facility (the "Facility"). The Facility allows the Fund to directly lend and borrow money to or from any other fund in the Victory Funds Complex that is permitted to participate in the Facility, relying upon the Order at rates beneficial to both the borrowing and lending funds. Advances under the Facility are allowed for temporary or emergency purposes, including the meeting of redemption requests that otherwise might require the untimely disposition of securities, and are subject to each Fund's borrowing restrictions. The interfund loan rate is determined, as specified in the Order, by averaging the current repurchase agreement rate and the current bank loan rate. As a Borrower, interest charged to the Fund, if any, during the period, is reflected on the Statement of Operations under Interfund lending fees. As a Lender, interest earned by the Fund, if any, during the period, is reflected on the Statement of Operations under Interfund lending.
The Fund did not utilize or participate in the Facility during the six months ended November 30, 2022.
7. Federal Income Tax Information:
The Fund intends to distribute any net investment income quarterly. Distributable net realized gains, if any, are declared and paid at least annually.
The amounts of dividends from net investment income and distributions from net realized gains (collectively, distributions to shareholders) are determined in accordance with federal income tax regulations, which may differ from GAAP. To the extent these "book/tax" differences are permanent in nature (e.g., net operating loss and distribution reclassification), such amounts are reclassified within the components of net assets based on their federal tax-basis treatment; temporary differences (e.g., wash sales) do not require reclassification. To the extent dividends and distributions exceed net investment income and net realized gains for tax purposes, they are reported as distributions of capital. Net investment losses incurred by the Fund may be reclassified as an offset to capital on the accompanying Statement of Assets and Liabilities.
The tax character of current year distributions paid and the tax basis of the current components of accumulated earnings (loss) will be determined at the end of the current tax year.
At the tax year ended May 31, 2022, the Fund had net capital loss carryforwards as summarized in the table below (amounts in thousands). It is unlikely that the Board will authorize a distribution of capital gains realized in the future until the capital loss carryforwards have been used.
Short-Term
Amount | | Total | |
| $ | 4,358 | | | $ | 4,358 | | |
44
USAA Mutual Funds Trust | | Supplemental Information
November 30, 2022 | |
(Unaudited)
Proxy Voting and Portfolio Holdings Information
Proxy Voting:
Information regarding the policies and procedures the Fund uses to determine how to vote proxies relating to portfolio securities is available without charge, upon request, by calling (800) 235-8396. The information is also included in the Fund's Statement of Additional Information, which is available on the SEC's website at www.sec.gov.
Information relating to how the Fund voted proxies relating to portfolio securities held during the most recent 12 months ended June 30 is available on the SEC's website at www.sec.gov.
Availability of Schedules of Portfolio Investments:
The Trust files a complete list of Schedules of Portfolio Investments with the SEC for the first and third quarter of each fiscal year on Form N-PORT. Form N-PORT is available on the SEC's website at www.sec.gov.
Expense Examples
As a shareholder of the Fund, you may incur two types of costs: (1) transaction costs, including sales charges (loads) on purchases; and (2) ongoing costs, including management fees and other Fund expenses. These examples are intended to help you understand your ongoing costs (in dollars) of investing in the Fund and to compare these costs with the ongoing costs of investing in other mutual funds.
These examples are based on an investment of $1,000 invested at the beginning of the period and held for the entire period from June 1, 2022, through November 30, 2022.
The Actual Expense figures in the table below provide information about actual account values and actual expenses. You may use the information below, together with the amount you invested, to estimate the expenses that you paid over the period. Simply divide your account value by $1,000 (for example, an $8,600 account value divided by $1,000 = 8.6), then multiply the result by the number in the table under the heading entitled "Actual Expenses Paid During Period" to estimate the expenses you paid on your account during this period.
The Hypothetical Expense figures in the table below provide information about hypothetical account values and hypothetical expenses based on the Fund's actual expense ratio and an assumed rate of return of 5% per year before expenses, which is not the Fund's actual return. The hypothetical account values and expenses may not be used to estimate the actual ending account balance or expenses you paid for the period. You may use this information to compare this 5% hypothetical example with the 5% hypothetical examples that appear in shareholder reports of other funds.
Please note the expenses shown in the table below are meant to highlight your ongoing costs only and do not reflect any transactional costs. Therefore, the hypothetical expenses in the table are useful in comparing ongoing costs only and will not help you determine the relative total costs of owning different funds. In addition, if these transactional costs were included, your costs would have been higher.
| | | Beginning
Account
Value
6/1/22 | | Actual
Ending
Account
Value
11/30/22 | | Hypothetical
Ending
Account
Value
11/30/22 | | Actual
Expenses
Paid During
Period
6/1/22-
11/30/22* | | Hypothetical
Expenses Paid
During Period
6/1/22-
11/30/22* | | Annualized
Expense Ratio
During Period
6/1/22-
11/30/22 | |
Fund Shares | | $ | 1,000.00 | | | $ | 974.60 | | | $ | 1,022.31 | | | $ | 2.72 | | | $ | 2.79 | | | | 0.55 | % | |
Institutional Shares | | | 1,000.00 | | | | 974.20 | | | | 1,022.26 | | | | 2.77 | | | | 2.84 | | | | 0.56 | % | |
Class A | | | 1,000.00 | | | | 972.50 | | | | 1,020.81 | | | | 4.20 | | | | 4.31 | | | | 0.85 | % | |
Class C | | | 1,000.00 | | | | 969.10 | | | | 1,017.05 | | | | 7.90 | | | | 8.09 | | | | 1.60 | % | |
* Expenses are equal to the average account value multiplied by the Fund's annualized expense ratio multiplied by 183/365 (the number of days in the most recent fiscal half-year divided by the number of days in the fiscal year).
45
Privacy Policy
Protecting the Privacy of Information
The Trust respects your right to privacy. We also know that you expect us to conduct and process your business in an accurate and efficient manner. To do so, we must collect and maintain certain personal information about you. This is the information we collect from you on applications or other forms, and from the transactions you make with us or third parties. It may include your name, address, social security number, account transactions and balances, and information about investment goals and risk tolerance.
We do not disclose any information about you or about former customers to anyone except as permitted or required by law. Specifically, we may disclose the information we collect to companies that perform services on our behalf, such as the transfer agent that processes shareholder accounts and printers and mailers that assist us in the distribution of investor materials. We may also disclose this information to companies that perform marketing services on our behalf. This allows us to continue to offer you Victory investment products and services that meet your investing needs, and to effect transactions that you request or authorize. These companies will use this information only in connection with the services for which we hired them. They are not permitted to use or share this information for any other purpose.
To protect your personal information internally, we permit access only by authorized employees and maintain physical, electronic, and procedural safeguards to guard your personal information.*
* You may have received communications regarding information about privacy policies from other financial institutions which gave you the opportunity to "opt-out" of certain information sharing with companies which are not affiliated with that financial institution. The Trust does not share information with other companies for purposes of marketing solicitations for products other than the Trust. Therefore, the Trust does not provide opt-out options to their shareholders.
P.O. Box 182593
Columbus, Ohio 43218-2593

Visit our website at: | | Call | |
www.vcm.com | | (800) 235-8396 | |

NOVEMBER 30, 2022
Semi Annual Report
USAA Emerging Markets Fund
Victory Capital means Victory Capital Management Inc., the investment adviser of the USAA Mutual Funds. USAA Mutual Funds are distributed by Victory Capital Services, Inc., member FINRA, an affiliate of Victory Capital. Victory Capital and its affiliates are not affiliated with United Services Automobile Association or its affiliates. USAA and the USAA logos are registered trademarks and the USAA Mutual Funds and USAA Investments logos are trademarks of United Services Automobile Association and are being used by Victory Capital and its affiliates under license.
www.vcm.com
News, Information And Education 24 Hours A Day, 7 Days A Week
The Victory Capital website gives fund shareholders, prospective shareholders, and investment professionals a convenient way to access fund information, get guidance, and track fund performance anywhere they can access the Internet. The site includes:
• Detailed performance records
• Daily share prices
• The latest fund news
• Investment resources to help you become a better investor
• A section dedicated to investment professionals
Whether you're a potential investor searching for the fund that matches your investment philosophy, a seasoned investor interested in planning tools, or an investment professional, www.vcm.com has what you seek. Visit us anytime. We're always open.
TABLE OF CONTENTS
Investment Objective & Portfolio Holdings | | | 2 | | |
Schedule of Portfolio Investments | | | 3 | | |
Financial Statements | |
Statement of Assets and Liabilities | | | 17 | | |
Statement of Operations | | | 18 | | |
Statements of Changes in Net Assets | | | 19 | | |
Financial Highlights | | | 22 | | |
Notes to Financial Statements | | | 24 | | |
Supplemental Information | | | 34 | | |
Proxy Voting and Portfolio Holdings Information | | | 34 | | |
Expense Examples | | | 34 | | |
Privacy Policy (inside back cover) | | | |
This report is for the information of the shareholders and others who have received a copy of the currently effective prospectus of the Fund, managed by Victory Capital Management Inc. It may be used as sales literature only when preceded or accompanied by a current prospectus, which provides further details about the Fund.
IRA DISTRIBUTION WITHHOLDING DISCLOSURE
We generally must withhold federal income tax at a rate of 10% of the taxable portion of your distribution and, if you live in a state that requires state income tax withholding, at your state's tax rate. However, you may elect not to have withholding apply or to have income tax withheld at a higher rate. Any withholding election that you make will apply to any subsequent distribution unless and until you change or revoke the election. If you wish to make a withholding election, or change or revoke a prior withholding election, call (800) 235-8396, and form W-4P (OMB No. 1545-0074 withholding certificate for pension or annuity payments) will be electronically sent.
If you do not have a withholding election in place by the date of a distribution, federal income tax will be withheld from the taxable portion of your distribution at a rate of 10%. If you must pay estimated taxes, you may be subject to estimated tax penalties if your estimated tax payments are not sufficient and sufficient tax is not withheld from your distribution.
For more specific information, please consult your tax adviser.
• NOT FDIC INSURED • NO BANK GUARANTEE • MAY LOSE VALUE
1
USAA Mutual Funds Trust
USAA Emerging Markets Fund | | November 30, 2022 | |
(Unaudited)
Investment Objective and Portfolio Holdings:
The Fund seeks capital appreciation.
Top 10 Sectors*:
November 30, 2022
(% of Net Assets)
Information Technology | | | 23.1 | % | |
Financials | | | 20.7 | % | |
Consumer Discretionary | | | 13.2 | % | |
Materials | | | 8.5 | % | |
Industrials | | | 7.7 | % | |
Communication Services | | | 6.4 | % | |
Consumer Staples | | | 5.4 | % | |
Health Care | | | 4.9 | % | |
Energy | | | 4.3 | % | |
Real Estate | | | 2.5 | % | |
Country Allocation:
November 30, 2022
(% of Net Assets)
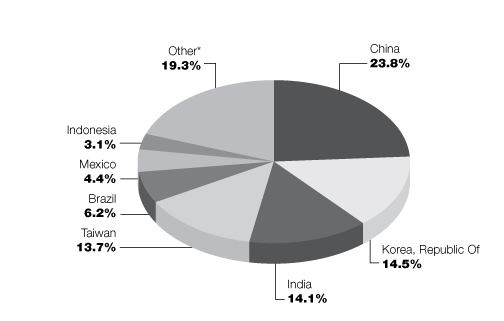
* Includes countries with less than 3.0% of portfolio and short-term investments purchased with cash collateral from securities loaned.
Percentages are of the net assets of the Fund and may not equal 100%.
Refer to the Schedule of Portfolio Investments for a complete list of securities.
2
USAA Mutual Funds Trust
USAA Emerging Markets Fund | | Schedule of Portfolio Investments
November 30, 2022 | |
(Amounts in Thousands, Except for Shares) (Unaudited)
Security Description | | Shares | | Value | |
Common Stocks (98.0%) | |
Brazil (6.2%): | |
Consumer Discretionary (0.9%): | |
Grupo SBF SA | | | 339,636 | | | $ | 955 | | |
Lojas Renner SA | | | 318,500 | | | | 1,421 | | |
Vibra Energia SA | | | 1,005,218 | | | | 3,203 | | |
| | | | 5,579 | | |
Consumer Staples (0.7%): | |
Sao Martinho SA | | | 298,800 | | | | 1,651 | | |
Sendas Distribuidora SA | | | 584,520 | | | | 2,259 | | |
SLC Agricola SA | | | 46,870 | | | | 405 | | |
| | | | 4,315 | | |
Energy (1.1%): | |
3R Petroleum Oleo e Gas SA (a) | | | 59,300 | | | | 423 | | |
Petro Rio SA (a) | | | 82,500 | | | | 573 | | |
Petroleo Brasileiro SA, ADR | | | 549,242 | | | | 6,421 | | |
| | | | 7,417 | | |
Financials (1.1%): | |
Banco do Brasil SA | | | 450,095 | | | | 3,060 | | |
Banco do Estado do Rio Grande do Sul SA Preference Shares | | | 165,900 | | | | 319 | | |
Itau Unibanco Holding SA, ADR | | | 819,704 | | | | 4,082 | | |
| | | | 7,461 | | |
Health Care (0.4%): | |
Hypera SA | | | 313,300 | | | | 2,683 | | |
Industrials (0.6%): | |
CCR SA | | | 955,820 | | | | 2,175 | | |
Randon SA Implementos e Participacoes Preference Shares | | | 272,400 | | | | 490 | | |
Santos Brasil Participacoes SA | | | 274,200 | | | | 402 | | |
SIMPAR SA | | | 530,960 | | | | 781 | | |
| | | | 3,848 | | |
Information Technology (0.3%): | |
Cielo SA | | | 708,400 | | | | 654 | | |
Pagseguro Digital Ltd. Class A (a) | | | 137,786 | | | | 1,451 | | |
| | | | 2,105 | | |
Materials (0.7%): | |
Gerdau SA Preference Shares | | | 281,800 | | | | 1,715 | | |
Vale SA, ADR | | | 171,586 | | | | 2,831 | | |
| | | | 4,546 | | |
Real Estate (0.2%): | |
Multiplan Empreendimentos Imobiliarios SA | | | 294,100 | | | | 1,300 | | |
See notes to financial statements.
3
USAA Mutual Funds Trust
USAA Emerging Markets Fund | | Schedule of Portfolio Investments — continued
November 30, 2022 | |
(Amounts in Thousands, Except for Shares) (Unaudited)
Security Description | | Shares | | Value | |
Utilities (0.2%): | |
Eneva SA (a) | | | 147,100 | | | $ | 350 | | |
Equatorial Energia SA | | | 80,300 | | | | 426 | | |
Omega Energia SA (a) | | | 180,817 | | | | 349 | | |
| | | | 1,125 | | |
| | | | 40,379 | | |
Canada (1.1%): | |
Energy (0.2%): | |
Parex Resources, Inc. | | | 101,478 | | | | 1,453 | | |
Materials (0.9%): | |
First Quantum Minerals Ltd. | | | 233,333 | | | | 5,548 | | |
| | | | 7,001 | | |
Chile (0.1%): | |
Consumer Staples (0.0%): (b) | |
Cencosud SA | | | 318,553 | | | | 476 | | |
Real Estate (0.1%): | |
Cencosud Shopping SA | | | 393,584 | | | | 504 | | |
| | | | 980 | | |
China (23.8%): | |
Communication Services (3.1%): | |
Baidu, Inc. Class A (a) | | | 308,162 | | | | 4,159 | | |
Tencent Holdings Ltd. | | | 427,163 | | | | 16,154 | | |
| | | | 20,313 | | |
Consumer Discretionary (6.3%): | |
361 Degrees International Ltd. (a) | | | 1,050,000 | | | | 459 | | |
Alibaba Group Holding Ltd. (a) | | | 815,304 | | | | 8,873 | | |
Alibaba Group Holding Ltd., ADR (a) | | | 56,017 | | | | 4,905 | | |
BYD Co. Ltd. Class H | | | 136,000 | | | | 3,463 | | |
Gree Electric Appliances, Inc. Class A | | | 510,100 | | | | 2,318 | | |
Hisense Home Appliances Group Co. Ltd. Class A | | | 150,600 | | | | 279 | | |
JD.com, Inc. Class A | | | 273,608 | | | | 7,811 | | |
Meituan Class B (a) (c) | | | 275,900 | | | | 5,948 | | |
Pinduoduo, Inc., ADR (a) | | | 61,543 | | | | 5,049 | | |
Yadea Group Holdings Ltd. (c) | | | 940,000 | | | | 1,784 | | |
| | | | 40,889 | | |
Consumer Staples (2.3%): | |
Chacha Food Co. Ltd. Class A | | | 338,700 | | | | 2,222 | | |
Chenguang Biotech Group Co. Ltd. Class A | | | 745,675 | | | | 1,655 | | |
Hengan International Group Co. Ltd. | | | 627,000 | | | | 2,890 | | |
Inner Mongolia Yili Industrial Group Co. Ltd. Class A | | | 419,100 | | | | 1,697 | | |
Tongwei Co. Ltd. Class A | | | 340,900 | | | | 2,083 | | |
Wuliangye Yibin Co. Ltd. Class A | | | 190,500 | | | | 4,239 | | |
| | | | 14,786 | | |
See notes to financial statements.
4
USAA Mutual Funds Trust
USAA Emerging Markets Fund | | Schedule of Portfolio Investments — continued
November 30, 2022 | |
(Amounts in Thousands, Except for Shares) (Unaudited)
Security Description | | Shares | | Value | |
Energy (0.8%): | |
China Shenhua Energy Co. Ltd. Class H | | | 381,000 | | | $ | 1,181 | | |
PetroChina Co. Ltd. Class H | | | 8,752,000 | | | | 3,983 | | |
| | | | 5,164 | | |
Financials (3.9%): | |
China Construction Bank Corp. Class H | | | 8,187,000 | | | | 4,955 | | |
China Merchants Bank Co. Ltd. Class H | | | 1,025,000 | | | | 5,206 | | |
CITIC Securities Co. Ltd. Class A | | | 547,800 | | | | 1,531 | | |
Industrial & Commercial Bank of China Ltd. Class H | | | 8,150,000 | | | | 4,085 | | |
PICC Property & Casualty Co. Ltd. Class H | | | 2,174,000 | | | | 2,203 | | |
Ping An Insurance Group Co. of China Ltd. | | | 1,207,000 | | | | 7,452 | | |
| | | | 25,432 | | |
Health Care (2.0%): | |
China Animal Healthcare Ltd. (a) (d) (e) | | | 1,673,000 | | | | — | | |
China Medical System Holdings Ltd. | | | 300,000 | | | | 439 | | |
CSPC Pharmaceutical Group Ltd. | | | 2,884,000 | | | | 3,716 | | |
Hygeia Healthcare Holdings Co. Ltd. (a) (c) | | | 333,600 | | | | 2,138 | | |
Pharmaron Beijing Co. Ltd. Class H (c) | | | 215,900 | | | | 1,249 | | |
Shenzhen Mindray Bio-Medical Electronics Co. Ltd. Class A | | | 53,600 | | | | 2,461 | | |
Sinopharm Group Co. Ltd. Class H | | | 1,384,399 | | | | 3,285 | | |
| | | | 13,288 | | |
Industrials (1.8%): | |
Airtac International Group | | | 83,344 | | | | 2,586 | | |
China Railway Group Ltd. Class H | | | 4,145,000 | | | | 2,340 | | |
Sany Heavy Equipment International Holdings Co. Ltd. | | | 387,000 | | | | 414 | | |
Xinte Energy Co. Ltd. Class H (f) | | | 1,209,600 | | | | 2,886 | | |
ZTO Express Cayman, Inc., ADR | | | 130,786 | | | | 3,279 | | |
| | | | 11,505 | | |
Information Technology (1.0%): | |
Glodon Co. Ltd. Class A | | | 289,600 | | | | 2,277 | | |
JinkoSolar Holding Co. Ltd., ADR (a) (f) | | | 6,488 | | | | 333 | | |
Luxshare Precision Industry Co. Ltd. Class A | | | 551,300 | | | | 2,437 | | |
WUS Printed Circuit Kunshan Co. Ltd. Class A | | | 789,360 | | | | 1,419 | | |
| | | | 6,466 | | |
Materials (1.3%): | |
Anhui Conch Cement Co. Ltd. Class H | | | 698,000 | | | | 2,542 | | |
Shandong Nanshan Aluminum Co. Ltd. Class A | | | 2,885,908 | | | | 1,424 | | |
Tianqi Lithium Corp. Class A (a) | | | 146,800 | | | | 1,892 | | |
Wanhua Chemical Group Co. Ltd. Class A | | | 189,800 | | | | 2,392 | | |
| | | | 8,250 | | |
Real Estate (1.0%): | |
A-Living Smart City Services Co. Ltd. (c) (f) | | | 1,288,250 | | | | 1,513 | | |
China Vanke Co. Ltd. Class H | | | 1,210,075 | | | | 2,512 | | |
Greentown China Holdings Ltd. | | | 303,500 | | | | 521 | | |
Longfor Group Holdings Ltd. (c) | | | 724,000 | | | | 2,206 | | |
| | | | 6,752 | | |
See notes to financial statements.
5
USAA Mutual Funds Trust
USAA Emerging Markets Fund | | Schedule of Portfolio Investments — continued
November 30, 2022 | |
(Amounts in Thousands, Except for Shares) (Unaudited)
Security Description | | Shares | | Value | |
Utilities (0.3%): | |
China Longyuan Power Group Corp. Ltd. Class H | | | 1,624,000 | | | $ | 2,003 | | |
| | | | 154,848 | | |
Egypt (0.4%): | |
Communication Services (0.1%): | |
Telecom Egypt Co. | | | 534,239 | | | | 502 | | |
Financials (0.3%): | |
Commercial International Bank Egypt SAE Registered Shares, GDR | | | 1,623,691 | | | | 2,191 | | |
| | | | 2,693 | | |
Greece (1.5%): | |
Consumer Discretionary (0.4%): | |
OPAP SA | | | 165,813 | | | | 2,296 | | |
Financials (0.5%): | |
National Bank of Greece SA (a) | | | 823,177 | | | | 3,386 | | |
Industrials (0.5%): | |
Mytilineos SA | | | 158,747 | | | | 2,995 | | |
Star Bulk Carriers Corp. (f) | | | 22,400 | | | | 431 | | |
| | | | 3,426 | | |
Utilities (0.1%): | |
Terna Energy SA | | | 23,650 | | | | 484 | | |
| | | | 9,592 | | |
Hong Kong (2.7%): | |
Communication Services (0.0%): (b) | |
NetDragon Websoft Holdings Ltd. | | | 179,000 | | | | 357 | | |
Consumer Discretionary (0.7%): | |
Bosideng International Holdings Ltd. | | | 4,282,000 | | | | 2,134 | | |
JS Global Lifestyle Co. Ltd. (c) | | | 2,119,500 | | | | 2,372 | | |
| | | | 4,506 | | |
Health Care (0.1%): | |
The United Laboratories International Holdings Ltd. | | | 824,000 | | | | 432 | | |
Industrials (0.8%): | |
Techtronic Industries Co. Ltd. | | | 427,500 | | | | 5,211 | | |
Information Technology (0.5%): | |
Lenovo Group Ltd. | | | 3,742,000 | | | | 3,196 | | |
Real Estate (0.5%): | |
China Resources Land Ltd. | | | 666,000 | | | | 3,094 | | |
Utilities (0.1%): | |
Canvest Environmental Protection Group Co. Ltd. (f) | | | 598,000 | | | | 337 | | |
China Water Affairs Group Ltd. | | | 494,000 | | | | 403 | | |
| | | | 740 | | |
| | | | 17,536 | | |
See notes to financial statements.
6
USAA Mutual Funds Trust
USAA Emerging Markets Fund | | Schedule of Portfolio Investments — continued
November 30, 2022 | |
(Amounts in Thousands, Except for Shares) (Unaudited)
Security Description | | Shares | | Value | |
Hungary (0.5%): | |
Financials (0.4%): | |
OTP Bank Nyrt | | | 93,798 | | | $ | 2,589 | | |
Health Care (0.1%): | |
Richter Gedeon Nyrt | | | 21,957 | | | | 473 | | |
| | | | 3,062 | | |
India (14.1%): | |
Communication Services (0.5%): | |
Indus Towers Ltd. | | | 867,402 | | | | 2,142 | | |
Sun TV Network Ltd. | | | 139,295 | | | | 846 | | |
| | | | 2,988 | | |
Consumer Discretionary (1.9%): | |
Apollo Tyres Ltd. | | | 119,270 | | | | 466 | | |
Bajaj Auto Ltd. | | | 50,344 | | | | 2,323 | | |
Indian Hotels Co. Ltd. | | | 171,650 | | | | 684 | | |
Kalyan Jewellers India, Ltd. (a) | | | 377,979 | | | | 495 | | |
Mahindra & Mahindra Ltd. | | | 316,475 | | | | 5,091 | | |
Mahindra CIE Automotive Ltd. | | | 217,945 | | | | 764 | | |
Raymond Ltd. | | | 142,413 | | | | 2,404 | | |
| | | | 12,227 | | |
Consumer Staples (0.7%): | |
Dabur India Ltd. | | | 307,278 | | | | 2,229 | | |
Varun Beverages Ltd. | | | 173,135 | | | | 2,663 | | |
| | | | 4,892 | | |
Energy (0.7%): | |
Aegis Logistics Ltd. | | | 120,762 | | | | 484 | | |
Reliance Industries Ltd. | | | 119,131 | | | | 4,008 | | |
| | | | 4,492 | | |
Financials (5.0%): | |
Angel One Ltd. | | | 20,602 | | | | 408 | | |
Axis Bank Ltd. | | | 466,052 | | | | 5,181 | | |
Canara Bank | | | 288,490 | | | | 1,123 | | |
Cholamandalam Investment & Finance Co. Ltd. | | | 430,223 | | | | 3,797 | | |
CreditAccess Grameen Ltd. (a) | | | 31,816 | | | | 378 | | |
ICICI Bank Ltd., ADR | | | 759,994 | | | | 18,027 | | |
IDFC First Bank, Ltd. (a) | | | 476,520 | | | | 346 | | |
Manappuram Finance Ltd. | | | 1,871,946 | | | | 2,668 | | |
Power Finance Corp. Ltd. | | | 263,187 | | | | 441 | | |
| | | | 32,369 | | |
Health Care (0.7%): | |
Apollo Hospitals Enterprise Ltd. | | | 60,495 | | | | 3,530 | | |
Aster DM Healthcare Ltd. (a) (c) | | | 167,487 | | | | 489 | | |
Granules India Ltd. | | | 115,306 | | | | 492 | | |
| | | | 4,511 | | |
See notes to financial statements.
7
USAA Mutual Funds Trust
USAA Emerging Markets Fund | | Schedule of Portfolio Investments — continued
November 30, 2022 | |
(Amounts in Thousands, Except for Shares) (Unaudited)
Security Description | | Shares | | Value | |
Industrials (1.5%): | |
AIA Engineering Ltd. | | | 13,495 | | | $ | 449 | | |
Allcargo Logistics Ltd. | | | 120,146 | | | | 660 | | |
Bharat Electronics Ltd. | | | 659,499 | | | | 857 | | |
CMS Info Systems Ltd. | | | 80,440 | | | | 330 | | |
HG Infra Engineering Ltd. | | | 90,183 | | | | 666 | | |
KEI Industries Ltd. | | | 26,704 | | | | 504 | | |
Larsen & Toubro Ltd. | | | 234,810 | | | | 6,002 | | |
| | | | 9,468 | | |
Information Technology (1.6%): | |
eClerx Services Ltd. | | | 54,306 | | | | 970 | | |
Infosys Ltd., ADR | | | 257,702 | | | | 5,244 | | |
LTIMindtree Ltd. (c) | | | 12,587 | | | | 757 | | |
WNS Holdings Ltd., ADR (a) | | | 37,964 | | | | 3,201 | | |
| | | | 10,172 | | |
Materials (1.0%): | |
Gujarat Fluorochemicals Ltd. | | | 11,286 | | | | 489 | | |
Jindal Steel & Power Ltd. | | | 135,733 | | | | 902 | | |
JK Paper Ltd. | | | 357,042 | | | | 1,855 | | |
National Aluminium Co. Ltd. | | | 358,789 | | | | 344 | | |
Tata Chemicals Ltd. | | | 52,935 | | | | 676 | | |
UPL Ltd. | | | 234,710 | | | | 2,287 | | |
| | | | 6,553 | | |
Real Estate (0.1%): | |
Prestige Estates Projects Ltd. | | | 79,328 | | | | 464 | | |
The Phoenix Mills Ltd. | | | 23,091 | | | | 415 | | |
| | | | 879 | | |
Utilities (0.4%): | |
CESC Ltd. | | | 464,602 | | | | 426 | | |
Power Grid Corp. of India Ltd. | | | 898,453 | | | | 2,479 | | |
| | | | 2,905 | | |
| | | | 91,456 | | |
Indonesia (3.1%): | |
Communication Services (0.5%): | |
PT Media Nusantara Citra Tbk (a) | | | 6,095,900 | | | | 310 | | |
PT Telekomunikasi Indonesia Persero Tbk, ADR | | | 126,415 | | | | 3,221 | | |
| | | | 3,531 | | |
Consumer Discretionary (0.1%): | |
PT Mitra Adiperkasa Tbk (a) | | | 7,347,200 | | | | 679 | | |
Energy (0.3%): | |
PT Adaro Energy Indonesia Tbk | | | 8,674,500 | | | | 2,147 | | |
Financials (2.1%): | |
PT Bank Mandiri Persero Tbk | | | 11,678,090 | | | | 7,878 | | |
PT Bank Rakyat Indonesia Persero Tbk | | | 17,820,846 | | | | 5,670 | | |
| | | | 13,548 | | |
See notes to financial statements.
8
USAA Mutual Funds Trust
USAA Emerging Markets Fund | | Schedule of Portfolio Investments — continued
November 30, 2022 | |
(Amounts in Thousands, Except for Shares) (Unaudited)
Security Description | | Shares | | Value | |
Information Technology (0.1%): | |
PT Erajaya Swasembada Tbk | | | 11,618,000 | | | $ | 301 | | |
| | | | 20,206 | | |
Korea, Republic Of (14.5%): | |
Communication Services (1.0%): | |
Cheil Worldwide, Inc. | | | 18,693 | | | | 347 | | |
JYP Entertainment Corp. | | | 81,791 | | | | 3,823 | | |
KT Corp. | | | 92,487 | | | | 2,640 | | |
| | | | 6,810 | | |
Consumer Discretionary (1.6%): | |
Coway Co. Ltd. | | | 5,579 | | | | 246 | | |
Hyundai Mobis Co. Ltd. | | | 30,745 | | | | 5,032 | | |
Kia Corp. | | | 42,322 | | | | 2,229 | | |
Shinsegae, Inc. | | | 14,666 | | | | 2,372 | | |
Youngone Corp. | | | 12,378 | | | | 451 | | |
| | | | 10,330 | | |
Consumer Staples (0.5%): | |
BGF retail Co. Ltd. | | | 6,290 | | | | 987 | | |
KT&G Corp. | | | 23,697 | | | | 1,798 | | |
Lotte Chilsung Beverage Co. Ltd. | | | 2,567 | | | | 309 | | |
| | | | 3,094 | | |
Financials (2.0%): | |
BNK Financial Group, Inc. | | | 84,101 | | | | 477 | | |
DB Insurance Co. Ltd. | | | 9,196 | | | | 437 | | |
Hana Financial Group, Inc. | | | 104,877 | | | | 3,587 | | |
Samsung Securities Co. Ltd. | | | 88,757 | | | | 2,402 | | |
Shinhan Financial Group Co. Ltd. | | | 105,531 | | | | 3,059 | | |
Woori Financial Group, Inc. | | | 329,066 | | | | 3,288 | | |
| | | | 13,250 | | |
Health Care (0.7%): | |
Daewoong Pharmaceutical Co. Ltd. | | | 1,819 | | | | 206 | | |
Dentium Co. Ltd. | | | 6,446 | | | | 437 | | |
Hk Inno N Corp. (a) | | | 3,834 | | | | 111 | | |
Samsung Biologics Co. Ltd. (a) (c) | | | 5,561 | | | | 3,782 | | |
| | | | 4,536 | | |
Industrials (0.7%): | |
CJ Corp. | | | 27,744 | �� | | | 1,630 | | |
DL E&C Co. Ltd. | | | 12,469 | | | | 403 | | |
Hyundai Glovis Co. Ltd. | | | 2,936 | | | | 398 | | |
LIG Nex1 Co. Ltd. | | | 10,023 | | | | 709 | | |
LX International Corp. | | | 15,630 | | | | 493 | | |
Samsung Engineering Co. Ltd. (a) | | | 34,121 | | | | 645 | | |
| | | | 4,278 | | |
See notes to financial statements.
9
USAA Mutual Funds Trust
USAA Emerging Markets Fund | | Schedule of Portfolio Investments — continued
November 30, 2022 | |
(Amounts in Thousands, Except for Shares) (Unaudited)
Security Description | | Shares | | Value | |
Information Technology (7.8%): | |
Daeduck Electronics Co. Ltd. | | | 26,009 | | | $ | 468 | | |
DB HiTek Co. Ltd. | | | 10,303 | | | | 357 | | |
Innox Advanced Materials Co. Ltd. | | | 65,146 | | | | 1,465 | | |
LEENO Industrial, Inc. | | | 3,901 | | | | 518 | | |
LG Innotek Co. Ltd. | | | 3,101 | | | | 748 | | |
LX Semicon Co. Ltd. | | | 7,422 | | | | 506 | | |
Samsung Electro-Mechanics Co. Ltd. | | | 21,923 | | | | 2,400 | | |
Samsung Electronics Co. Ltd. | | | 625,367 | | | | 30,049 | | |
SK Hynix, Inc. | | | 212,820 | | | | 14,047 | | |
| | | | 50,558 | | |
Materials (0.2%): | |
KCC Corp. | | | 1,489 | | | | 274 | | |
LOTTE Fine Chemical Co. Ltd. | | | 7,355 | | | | 352 | | |
OCI Co. Ltd. | | | 4,577 | | | | 337 | | |
Poongsan Corp. | | | 22,201 | | | | 516 | | |
| | | | 1,479 | | |
| | | | 94,335 | | |
Luxembourg (0.3%): | |
Materials (0.3%): | |
Ternium SA, ADR | | | 58,931 | | | | 1,856 | | |
Malaysia (1.3%): | |
Communication Services (0.1%): | |
TIME dotCom Bhd | | | 459,400 | | | | 505 | | |
Consumer Staples (0.1%): | |
Heineken Malaysia Bhd | | | 107,700 | | | | 608 | | |
Financials (0.6%): | |
Alliance Bank Malaysia BHD | | | 708,600 | | | | 619 | | |
Public Bank Bhd | | | 3,124,100 | | | | 3,171 | | |
| | | | 3,790 | | |
Materials (0.4%): | |
Petronas Chemicals Group Bhd | | | 976,500 | | | | 1,884 | | |
Ta Ann Holdings Bhd | | | 580,300 | | | | 515 | | |
| | | | 2,399 | | |
Real Estate (0.0%): (b) | |
Eco World Development Group Bhd | | | 2,631,500 | | | | 405 | | |
Utilities (0.1%): | |
Mega First Corp. Bhd | | | 599,100 | | | | 452 | | |
| | | | 8,159 | | |
Mexico (4.4%): | |
Communication Services (0.5%): | |
America Movil SAB de CV, ADR | | | 164,710 | | | | 3,205 | | |
Consumer Discretionary (0.2%): | |
Alsea SAB de CV (a) | | | 830,192 | | | | 1,656 | | |
See notes to financial statements.
10
USAA Mutual Funds Trust
USAA Emerging Markets Fund | | Schedule of Portfolio Investments — continued
November 30, 2022 | |
(Amounts in Thousands, Except for Shares) (Unaudited)
Security Description | | Shares | | Value | |
Consumer Staples (0.5%): | |
Fomento Economico Mexicano SAB de CV, ADR | | | 8,727 | | | $ | 697 | | |
Kimberly-Clark de Mexico SAB de CV Class A | | | 1,609,400 | | | | 2,736 | | |
| | | | 3,433 | | |
Energy (0.1%): | |
Vista Energy SAB de CV, ADR (a) | | | 42,663 | | | | 615 | | |
Financials (1.8%): | |
Banco del Bajio SA (c) | | | 280,566 | | | | 937 | | |
Grupo Financiero Banorte SAB de CV Class O | | | 1,386,149 | | | | 11,087 | | |
| | | | 12,024 | | |
Industrials (0.4%): | |
Grupo Aeroportuario del Pacifico SAB de CV Class B | | | 143,502 | | | | 2,316 | | |
Materials (0.8%): | |
Alpek SAB de CV | | | 405,322 | | | | 570 | | |
GCC SAB de CV | | | 140,657 | | | | 1,013 | | |
Grupo Mexico SAB de CV Class B | | | 819,299 | | | | 3,342 | | |
| | | | 4,925 | | |
Real Estate (0.1%): | |
Macquarie Mexico Real Estate Management SA de CV (c) | | | 376,938 | | | | 563 | | |
| | | | 28,737 | | |
Peru (0.6%): | |
Financials (0.6%): | |
Credicorp Ltd. | | | 27,550 | | | | 4,230 | | |
Philippines (0.1%): | |
Financials (0.1%): | |
Security Bank Corp. | | | 286,120 | | | | 488 | | |
Portugal (0.6%): | |
Energy (0.6%): | |
Galp Energia SGPS SA | | | 323,126 | | | | 3,981 | | |
Qatar (0.4%): | |
Energy (0.0%): (b) | |
Qatar Gas Transport Co. Ltd. | | | 427,547 | | | | 468 | | |
Industrials (0.4%): | |
Industries Qatar QSC | | | 603,552 | | | | 2,483 | | |
| | | | 2,951 | | |
Russian Federation (0.0%): (b) | |
Communication Services (0.0%): | |
Mobile TeleSystems PJSC, ADR (a) (d) (e) | | | 253,826 | | | | 14 | | |
Consumer Staples (0.0%): | |
Magnit PJSC (d) (e) | | | 29,318 | | | | 1 | | |
Energy (0.0%): | |
Gazprom PJSC (a) (d) (e) (g) (h) | | | 1,087,480 | | | | 43 | | |
Rosneft Oil Co. PJSC, GDR (a) (d) (e) (g) (h) | | | 457,159 | | | | 21 | | |
| | | | 64 | | |
See notes to financial statements.
11
USAA Mutual Funds Trust
USAA Emerging Markets Fund | | Schedule of Portfolio Investments — continued
November 30, 2022 | |
(Amounts in Thousands, Except for Shares) (Unaudited)
Security Description | | Shares | | Value | |
Financials (0.0%): | |
Moscow Exchange MICEX-RTS PJSC (a) (d) (e) | | | 196,760 | | | $ | 3 | | |
Sberbank of Russia PJSC, ADR (a) (d) (e) (g) (h) | | | 329,652 | | | | 2 | | |
Sberbank of Russia PJSC (a) (d) (e) (g) (h) | | | 687,954 | | | | 3 | | |
| | | | 8 | | |
| | | | 87 | | |
Saudi Arabia (2.0%): | |
Energy (0.1%): | |
Aldrees Petroleum and Transport Services Co. | | | 21,742 | | | | 426 | | |
Financials (1.1%): | |
Alinma Bank | | | 273,574 | | | | 2,532 | | |
The Saudi National Bank | | | 313,195 | | | | 4,313 | | |
| | | | 6,845 | | |
Materials (0.8%): | |
SABIC Agri-Nutrients Co. | | | 89,503 | | | | 3,465 | | |
Saudi Arabian Mining Co. (a) | | | 110,999 | | | | 2,048 | | |
| | | | 5,513 | | |
| | | | 12,784 | | |
South Africa (2.8%): | |
Communication Services (0.5%): | |
MTN Group Ltd. | | | 442,861 | | | | 3,632 | | |
Consumer Discretionary (0.2%): | |
Truworths International Ltd. | | | 143,217 | | | | 475 | | |
Woolworths Holdings Ltd. | | | 295,658 | | | | 1,126 | | |
| | | | 1,601 | | |
Energy (0.1%): | |
Exxaro Resources Ltd. | | | 32,772 | | | | 429 | | |
Financials (1.2%): | |
Absa Group Ltd. | | | 309,300 | | | | 3,712 | | |
Capitec Bank Holdings Ltd. | | | 11,088 | | | | 1,317 | | |
Standard Bank Group Ltd. | | | 247,073 | | | | 2,602 | | |
| | | | 7,631 | | |
Industrials (0.6%): | |
KAP Industrial Holdings Ltd. | | | 1,790,851 | | | | 466 | | |
The Bidvest Group Ltd. | | | 235,847 | | | | 3,174 | | |
| | | | 3,640 | | |
Materials (0.1%): | |
African Rainbow Minerals Ltd. | | | 46,199 | | | | 801 | | |
Real Estate (0.1%): | |
Resilient REIT Ltd. | | | 127,055 | | | | 391 | | |
| | | | 18,125 | | |
See notes to financial statements.
12
USAA Mutual Funds Trust
USAA Emerging Markets Fund | | Schedule of Portfolio Investments — continued
November 30, 2022 | |
(Amounts in Thousands, Except for Shares) (Unaudited)
Security Description | | Shares | | Value | |
Taiwan (13.7%): | |
Communication Services (0.1%): | |
International Games System Co. Ltd. | | | 38,000 | | | $ | 483 | | |
Consumer Discretionary (0.6%): | |
Fulgent Sun International Holding Co. Ltd. | | | 591,000 | | | | 2,919 | | |
Makalot Industrial Co. Ltd. | | | 51,000 | | | | 388 | | |
O-TA Precision Industry Co. Ltd. | | | 85,000 | | | | 326 | | |
Tong Yang Industry Co. Ltd. | | | 217,000 | | | | 337 | | |
| | | | 3,970 | | |
Health Care (0.7%): | |
Lotus Pharmaceutical Co. Ltd. | | | 369,000 | | | | 2,952 | | |
Universal Vision Biotechnology Co. Ltd. | | | 172,550 | | | | 1,499 | | |
| | | | 4,451 | | |
Industrials (0.2%): | |
Aerospace Industrial Development Corp. | | | 296,000 | | | | 322 | | |
Bizlink Holding, Inc. | | | 54,000 | | | | 444 | | |
Chung-Hsin Electric & Machinery Manufacturing Corp. | | | 212,000 | | | | 409 | | |
| | | | 1,175 | | |
Information Technology (11.8%): | |
ASE Technology Holding Co. Ltd., ADR (f) | | | 555,265 | | | | 3,776 | | |
ASE Technology Holding Co. Ltd. | | | 706,000 | | | | 2,258 | | |
Chipbond Technology Corp. | | | 237,000 | | | | 451 | | |
Compeq Manufacturing Co. Ltd. | | | 324,000 | | | | 528 | | |
E Ink Holdings, Inc. | | | 156,000 | | | | 935 | | |
Global Unichip Corp. | | | 28,000 | | | | 678 | | |
Gold Circuit Electronics Ltd. | | | 1,090,800 | | | | 3,492 | | |
Hon Hai Precision Industry Co. Ltd., GDR | | | 300,238 | | | | 1,973 | | |
Hon Hai Precision Industry Co. Ltd. | | | 1,059,000 | | | | 3,468 | | |
King Yuan Electronics Co. Ltd. | | | 347,000 | | | | 403 | | |
Kinsus Interconnect Technology Corp. | | | 132,000 | | | | 536 | | |
Macronix International Co. Ltd. | | | 330,000 | | | | 375 | | |
MediaTek, Inc. | | | 253,000 | | | | 6,114 | | |
Quanta Computer, Inc. | | | 605,000 | | | | 1,410 | | |
Radiant Opto-Electronics Corp. | | | 143,000 | | | | 489 | | |
Sercomm Corp. | | | 155,000 | | | | 424 | | |
Silicon Motion Technology Corp., ADR | | | 72,979 | | | | 4,605 | | |
Simplo Technology Co. Ltd. | | | 48,000 | | | | 476 | | |
Taiwan Semiconductor Manufacturing Co. Ltd. | | | 2,053,000 | | | | 32,976 | | |
Taiwan Semiconductor Manufacturing Co. Ltd., ADR | | | 52,487 | | | | 4,355 | | |
Tong Hsing Electronic Industries Ltd. | | | 66,000 | | | | 422 | | |
Unimicron Technology Corp. | | | 402,000 | | | | 2,070 | | |
Wiwynn Corp. | | | 142,000 | | | | 4,098 | | |
Zhen Ding Technology Holding Ltd. | | | 158,000 | | | | 619 | | |
| | | | 76,931 | | |
See notes to financial statements.
13
USAA Mutual Funds Trust
USAA Emerging Markets Fund | | Schedule of Portfolio Investments — continued
November 30, 2022 | |
(Amounts in Thousands, Except for Shares) (Unaudited)
Security Description | | Shares | | Value | |
Materials (0.3%): | |
Allied Supreme Corp. | | | 56,000 | | | $ | 595 | | |
Formosa Plastics Corp. | | | 481,000 | | | | 1,411 | | |
Taiwan Hon Chuan Enterprise Co. Ltd. | | | 119,000 | | | | 312 | | |
| | | | 2,318 | | |
| | | | 89,328 | | |
Thailand (1.5%): | |
Consumer Discretionary (0.0%): (b) | |
Sri Trang Agro-Industry PCL | | | 387,000 | | | | 209 | | |
Energy (0.3%): | |
PTT Exploration & Production PCL | | | 347,200 | | | | 1,852 | | |
Health Care (0.2%): | |
Chularat Hospital PCL | | | 5,089,300 | | | | 535 | | |
Mega Lifesciences PCL | | | 401,600 | | | | 535 | | |
| | | | 1,070 | | |
Materials (0.6%): | |
Indorama Ventures PCL | | | 2,021,300 | | | | 2,451 | | |
The Siam Cement PCL (e) | | | 121,500 | | | | 1,137 | | |
| | | | 3,588 | | |
Real Estate (0.3%): | |
AP Thailand PCL | | | 5,959,000 | | | | 1,716 | | |
Origin Property PCL | | | 1,730,200 | | | | 519 | | |
| | | | 2,235 | | |
Utilities (0.1%): | |
Gunkul Engineering PCL | | | 2,791,300 | | | | 426 | | |
Ratch Group PCL | | | 338,800 | | | | 395 | | |
| | | | 821 | | |
| | | | 9,775 | | |
Turkey (0.2%): | |
Consumer Staples (0.1%): | |
Coca-Cola Icecek A/S | | | 85,593 | | | | 854 | | |
Industrials (0.1%): | |
Tekfen Holding A/S (f) | | | 204,659 | | | | 491 | | |
| | | | 1,345 | | |
United Arab Emirates (0.2%): | |
Industrials (0.1%): | |
Air Arabia PJSC | | | 925,431 | | | | 524 | | |
Real Estate (0.1%): | |
Emaar Development PJSC (a) | | | 485,246 | | | | 556 | | |
| | | | 1,080 | | |
See notes to financial statements.
14
USAA Mutual Funds Trust
USAA Emerging Markets Fund | | Schedule of Portfolio Investments — continued
November 30, 2022 | |
(Amounts in Thousands, Except for Shares) (Unaudited)
Security Description | | Shares | | Value | |
United Kingdom (1.6%): | |
Consumer Staples (0.5%): | |
Unilever PLC | | | 59,235 | | | $ | 2,971 | | |
Materials (1.1%): | |
Anglo American PLC | | | 120,486 | | | | 5,008 | | |
Mondi PLC | | | 116,103 | | | | 2,193 | | |
| | | | 7,201 | | |
| | | | 10,172 | | |
United States (0.3%): | |
Consumer Discretionary (0.3%): | |
Samsonite International SA (a) (c) | | | 660,900 | | | | 1,791 | | |
Total Common Stocks (Cost $601,752) | | | 636,977 | | |
Exchange-Traded Funds (0.3%) | |
United States (0.3%): | |
iShares MSCI Emerging Markets Small-Cap ETF | | | 38,784 | | | | 1,938 | | |
Total Exchange-Traded Funds (Cost $1,805) | | | 1,938 | | |
Collateral for Securities Loaned (0.8%)^ | |
United States (0.8%): | |
Goldman Sachs Financial Square Government Fund,
Institutional Shares, 3.73% (i) | | | 1,141,512 | | | | 1,142 | | |
HSBC U.S. Government Money Market Fund, I Shares, 3.75% (i) | | | 1,141,412 | | | | 1,141 | | |
Invesco Government & Agency Portfolio, Institutional Shares, 3.74% (i) | | | 1,141,412 | | | | 1,141 | | |
Morgan Stanley Institutional Liquidity Government Portfolio,
Institutional Shares, 3.62% (i) | | | 1,141,512 | | | | 1,142 | | |
Total Collateral for Securities Loaned (Cost $4,566) | | | 4,566 | | |
Total Investments (Cost $608,123) — 99.1% | | | 643,481 | | |
Other assets in excess of liabilities — 0.9% | | | 6,019 | | |
NET ASSETS — 100.00% | | $ | 649,500 | | |
^ Purchased with cash collateral from securities on loan.
(a) Non-income producing security.
(b) Amount represents less than 0.05% of net assets.
(c) Rule 144A security or other security that is restricted as to resale to institutional investors. The Fund's Adviser has deemed this security to be liquid (unless otherwise noted as illiquid) based upon procedures approved by the Board of Trustees. As of November 30, 2022, the fair value of these securities was $25,598 thousands and amounted to 3.9% of net assets.
(d) Security was fair valued based upon procedures approved by the Board of Trustees and represents less than 0.05% of net assets as of November 30, 2022. This security is classified as Level 3 within the fair value hierarchy. (See Note 2 in the Notes to Financial Statements)
(e) The Fund's Adviser has deemed this security to be illiquid based upon procedures approved by the Board of Trustees. At November 30, 2022, illiquid securities were 0.2% of the Fund's net assets.
See notes to financial statements.
15
USAA Mutual Funds Trust
USAA Emerging Markets Fund | | Schedule of Portfolio Investments — continued
November 30, 2022 | |
(Unaudited)
(f) All or a portion of this security is on loan.
(g) Restricted security due to trading restrictions. Russian sanctioned entity by the United States Government.
(h) The following table details the acquisition date and cost of the Fund's Russian sanctioned restricted securities at November 30, 2022 (amount in thousand):
Security Name | | Acquisition Date | | Cost | |
Gazprom PJSC | | 7/28/2021 | | $ | 4,261 | | |
Rosneft Oil Co. PJSC, GDR | | 3/6/2020 | | | 2,920 | | |
Sberbank of Russia PJSC, ADR | | 11/11/2020 | | | 4,362 | | |
Sberbank of Russia PJSC | | 3/2/2015 | | | 800 | | |
(i) Rate disclosed is the daily yield on November 30, 2022.
ADR — American Depositary Receipt
ETF — Exchange-Traded Fund
GDR — Global Depositary Receipt
PCL — Public Company Limited
PLC — Public Limited Company
REIT — Real Estate Investment Trust
See notes to financial statements.
16
USAA Mutual Funds Trust | | Statement of Assets and Liabilities
November 30, 2022 | |
(Amounts in Thousands, Except Per Share Amounts) (Unaudited)
| | | USAA Emerging
Markets Fund | |
Assets: | |
Investments, at value (Cost $608,123) | | $ | 643,481 | (a) | |
Foreign currency, at value (Cost $773) | | | 815 | | |
Cash | | | 9,459 | | |
Receivables: | |
Interest and dividends | | | 1,180 | | |
Capital shares issued | | | 90 | | |
Investments sold | | | 2,362 | | |
Reclaims | | | 29 | | |
From Adviser | | | 113 | | |
Prepaid expenses | | | 35 | | |
Total Assets | | | 657,564 | | |
Liabilities: | |
Payables: | |
Collateral received on loaned securities | | | 4,566 | | |
Investments purchased | | | 1,138 | | |
Capital shares redeemed | | | 393 | | |
Accrued foreign capital gains taxes | | | 1,078 | | |
Accrued expenses and other payables: | |
Investment advisory fees | | | 505 | | |
Administration fees | | | 60 | | |
Custodian fees | | | 97 | | |
Transfer agent fees | | | 85 | | |
Compliance fees | | | — | (b) | |
Trustees' fees | | | 1 | | |
| 12b-1 fees | | | — | (b) | |
Other accrued expenses | | | 141 | | |
Total Liabilities | | | 8,064 | | |
Net Assets: | |
Capital | | | 645,158 | | |
Total accumulated earnings/(loss) | | | 4,342 | | |
Net Assets | | $ | 649,500 | | |
Net Assets | |
Fund Shares | | $ | 240,670 | | |
Institutional Shares | | | 408,763 | | |
Class A | | | 67 | | |
Total | | $ | 649,500 | | |
Shares (unlimited number of shares authorized with no par value): | |
Fund Shares | | | 13,224 | | |
Institutional Shares | | | 22,477 | | |
Class A | | | 4 | | |
Total | | | 35,705 | | |
Net asset value, offering and redemption price per share: (c) | |
Fund Shares | | $ | 18.20 | | |
Institutional Shares | | | 18.19 | | |
Class A | | | 18.26 | | |
Maximum Sales Charge — Class A | | | 5.75 | % | |
Maximum offering price
(100%/(100%-maximum sales charge) of net asset value adjusted to
the nearest cent) per share — Class A | | $ | 19.37 | | |
(a) Includes $6,152 thousand of securities on loan.
(b) Rounds to less than $1 thousand.
(c) Per share amount may not recalculate due to rounding of net assets and/or shares outstanding.
See notes to financial statements.
17
USAA Mutual Funds Trust | | Statement of Operations
For the Six Months Ended November 30, 2022 | |
(Amounts in Thousands) (Unaudited)
| | | USAA Emerging
Markets Fund | |
Investment Income: | |
Dividends | | $ | 15,466 | | |
Interest | | | 41 | | |
Securities lending (net of fees) | | | 36 | | |
Foreign tax withholding | | | (1,442 | ) | |
Total Income | | | 14,101 | | |
Expenses: | |
Investment advisory fees | | | 3,059 | | |
Administration fees — Fund Shares | | | 179 | | |
Administration fees — Institutional Shares | | | 185 | | |
Administration fees — Class A | | | — | (a) | |
Sub-Administration fees | | | 28 | | |
| 12b-1 fees — Class A | | | — | (a) | |
Custodian fees | | | 245 | | |
Transfer agent fees — Fund Shares | | | 313 | | |
Transfer agent fees — Institutional Shares | | | 185 | | |
Transfer agent fees — Class A | | | — | (a) | |
Trustees' fees | | | 24 | | |
Compliance fees | | | 3 | | |
Legal and audit fees | | | 79 | | |
State registration and filing fees | | | 35 | | |
Other expenses | | | 98 | | |
Total Expenses | | | 4,433 | | |
Expenses waived/reimbursed by Adviser | | | (265 | ) | |
Net Expenses | | | 4,168 | | |
Net Investment Income (Loss) | | | 9,933 | | |
Realized/Unrealized Gains (Losses) from Investments: | |
Net realized gains (losses) from investment securities and foreign currency
transactions | | | (27,638 | ) | |
Foreign taxes on realized gains | | | (119 | ) | |
Net change in unrealized appreciation/depreciation on investment securities and
foreign currency translations | | | (40,391 | ) | |
Net change in accrued foreign taxes on unrealized gains | | | (550 | ) | |
Net realized/unrealized gains (losses) on investments | | | (68,698 | ) | |
Change in net assets resulting from operations | | $ | (58,765 | ) | |
(a) Rounds to less than $1 thousand.
See notes to financial statements.
18
USAA Mutual Funds Trust | | Statements of Changes in Net Assets | |
(Amounts in Thousands)
| | | USAA Emerging
Markets Fund | |
| | | Six Months
Ended
November 30,
2022
(Unaudited) | | Year
Ended
May 31,
2022 | |
From Investments: | |
Operations: | |
Net Investment Income (Loss) | | $ | 9,933 | | | $ | 10,376 | | |
Net realized gains (losses) | | | (27,757 | ) | | | 29,377 | | |
Net change in unrealized appreciation/depreciation | | | (40,941 | ) | | | (181,540 | ) | |
Change in net assets resulting from operations | | | (58,765 | ) | | | (141,787 | ) | |
Distributions to Shareholders: | |
Fund Shares | | | — | | | | (2,223 | ) | |
Institutional Shares | | | — | | | | (3,355 | ) | |
Change in net assets resulting from distributions to shareholders | | | — | | | | (5,578 | ) | |
Change in net assets resulting from capital transactions | | | 32,837 | | | | 49,614 | | |
Change in net assets | | | (25,928 | ) | | | (97,751 | ) | |
Net Assets: | |
Beginning of period | | | 675,428 | | | | 773,179 | | |
End of period | | $ | 649,500 | | | $ | 675,428 | | |
Capital Transactions: | |
Fund Shares | |
Proceeds from shares issued | | $ | 4,872 | | | $ | 20,578 | | |
Distributions reinvested | | | — | | | | 2,195 | | |
Cost of shares redeemed | | | (15,419 | ) | | | (51,176 | ) | |
Total Fund Shares | | $ | (10,547 | ) | | $ | (28,403 | ) | |
Institutional Shares | |
Proceeds from shares issued | | $ | 72,028 | | | $ | 122,913 | | |
Distributions reinvested | | | — | | | | 3,352 | | |
Cost of shares redeemed | | | (28,654 | ) | | | (48,191 | ) | |
Total Institutional Shares | | $ | 43,374 | | | $ | 78,074 | | |
Class A | |
Proceeds from shares issued | | $ | 10 | | | $ | — | (a) | |
Cost of shares redeemed | | | — | | | | (57 | ) | |
Total Class A | | $ | 10 | | | $ | (57 | ) | |
Change in net assets resulting from capital transactions | | $ | 32,837 | | | $ | 49,614 | | |
(a) Rounds to less than $1 thousand.
(continues on next page)
See notes to financial statements.
19
USAA Mutual Funds Trust | | Statements of Changes in Net Assets | |
(Amounts in Thousands) (continued)
| | | USAA Emerging
Markets Fund | |
| | | Six Months
Ended
November 30,
2022
(Unaudited) | | Year
Ended
May 31,
2022 | |
Share Transactions: | |
Fund Shares | |
Issued | | | 278 | | | | 918 | | |
Reinvested | | | — | | | | 101 | | |
Redeemed | | | (876 | ) | | | (2,309 | ) | |
Total Fund Shares | | | (598 | ) | | | (1,290 | ) | |
Institutional Shares | |
Issued | | | 4,132 | | | | 5,737 | | |
Reinvested | | | — | | | | 154 | | |
Redeemed | | | (1,633 | ) | | | (2,177 | ) | |
Total Institutional Shares | | | 2,499 | | | | 3,714 | | |
Class A | |
Issued | | | 1 | | | | — | (b) | |
Redeemed | | | — | | | | (3 | ) | |
Total Class A | | | 1 | | | | (3 | ) | |
Change in Shares | | | 1,902 | | | | 2,421 | | |
(b) Rounds to less than 1 thousand shares.
See notes to financial statements.
20
This page is intentionally left blank.
21
USAA Mutual Funds Trust | | Financial Highlights | |
For a Share Outstanding Throughout Each Period
| | | | | Investment Activities | | Distributions to
Shareholders From | |
| | | Net Asset
Value,
Beginning of
Period | | Net
Investment
Income (Loss) | | Net Realized
and Unrealized
Gains (Losses) | | Total from
Investment
Activities | | Net
Investment
Income | | Total
Distributions | |
USAA Emerging Markets Fund | | | |
Fund Shares | | | |
Six Months Ended
November 30, 2022
(Unaudited) | | $ | 20.00 | | | | 0.29 | (i) | | | (2.09 | ) | | | (1.80 | ) | | | — | | | | — | | |
Year Ended May 31:
2022 | | $ | 24.66 | | | | 0.30 | (i) | | | (4.81 | ) | | | (4.51 | ) | | | (0.15 | ) | | | (0.15 | ) | |
2021 | | $ | 16.16 | | | | 0.16 | (i) | | | 8.57 | | | | 8.73 | | | | (0.23 | ) | | | (0.23 | ) | |
2020 | | $ | 17.14 | | | | 0.25 | (i) | | | (1.17 | ) | | | (0.92 | ) | | | (0.06 | ) | | | (0.06 | ) | |
2019 | | $ | 18.84 | | | | 0.17 | | | | (1.67 | ) | | | (1.50 | ) | | | (0.20 | ) | | | (0.20 | ) | |
2018 | | $ | 17.60 | | | | 0.16 | | | | 1.15 | | | | 1.31 | | | | (0.07 | ) | | | (0.07 | ) | |
Institutional Shares | | | |
Six Months Ended
November 30, 2022
(Unaudited) | | $ | 19.97 | | | | 0.29 | (i) | | | (2.07 | ) | | | (1.78 | ) | | | — | | | | — | | |
Year Ended May 31:
2022 | | $ | 24.62 | | | | 0.35 | (i) | | | (4.80 | ) | | | (4.45 | ) | | | (0.20 | ) | | | (0.20 | ) | |
2021 | | $ | 16.14 | | | | 0.20 | (i) | | | 8.55 | | | | 8.75 | | | | (0.27 | ) | | | (0.27 | ) | |
2020 | | $ | 17.10 | | | | 0.29 | (i) | | | (1.17 | ) | | | (0.88 | ) | | | (0.08 | ) | | | (0.08 | ) | |
2019 | | $ | 18.79 | | | | 0.18 | | | | (1.62 | ) | | | (1.44 | ) | | | (0.25 | ) | | | (0.25 | ) | |
2018 | | $ | 17.55 | | | | 0.20 | | | | 1.14 | | | | 1.34 | | | | (0.10 | ) | | | (0.10 | ) | |
Class A | | | |
Six Months Ended
November 30, 2022
(Unaudited) | | $ | 20.09 | | | | 0.25 | (i) | | | (2.08 | ) | | | (1.83 | ) | | | — | | | | — | | |
Year Ended May 31:
2022 | | $ | 24.58 | | | | 0.35 | (i) | | | (4.84 | ) | | | (4.49 | ) | | | — | | | | — | | |
2021 | | $ | 16.08 | | | | 0.07 | (i) | | | 8.62 | | | | 8.69 | | | | (0.19 | ) | | | (0.19 | ) | |
2020 | | $ | 17.08 | | | | 0.20 | (i) | | | (1.16 | ) | | | (0.96 | ) | | | (0.04 | ) | | | (0.04 | ) | |
2019 | | $ | 18.76 | | | | 0.10 | | | | (1.62 | ) | | | (1.52 | ) | | | (0.16 | ) | | | (0.16 | ) | |
2018 | | $ | 17.55 | | | | 0.12 | | | | 1.13 | | | | 1.25 | | | | (0.04 | ) | | | (0.04 | ) | |
(a) Not annualized for periods less than one year.
(b) Assumes reinvestment of all net investment income and realized capital gain distributions, if any, during the period. Includes adjustments in accordance with U.S. Generally Accepted Accounting Principles and could differ from the Lipper reported return.
(c) Annualized for periods less than one year.
(d) The net expense ratio may not correlate to the applicable expense limits in place during the period since the current contractual expense limitation is applied for a period beginning July 1, 2019 and in effect through September 30, 2023, instead of coinciding with the Fund's fiscal year end. Details of the current contractual expense limitation in effect can be found in Note 5 of the accompanying Notes to Financial Statements.
(e) Reflects total annual operating expenses for reductions of expenses paid indirectly for the May 31 fiscal years ended 2019 and 2018. Expenses paid indirectly decreased the expense ratio for each of these respective years by less than 0.01%.
(f) Does not include acquired fund fees and expenses, if any.
See notes to financial statements.
22
USAA Mutual Funds Trust | | Financial Highlights — continued | |
For a Share Outstanding Throughout Each Period
| | | | | Ratios to Average Net Assets | | Supplemental Data | |
| | | Net Asset
Value,
End of
Period | | Total
Return
(Excludes
Sales
Charge)(a)(b) | | Net
Expenses(c)(d)(e)(f)(g) | | Net
Investment
Income
(Loss)(c) | | Gross
Expenses(c)(e)(f) | | Net Assets,
End of
Period
(000's) | | Portfolio
Turnover(a)(h) | |
USAA Emerging Markets Fund | |
Fund Shares | |
Six Months Ended
November 30, 2022
(Unaudited) | | $ | 18.20 | | | | (9.00 | )% | | | 1.48 | % | | | 3.24 | % | | | 1.58 | % | | $ | 240,670 | | | | 26 | % | |
Year Ended May 31:
2022 | | $ | 20.00 | | | | (18.33 | )% | | | 1.47 | % | | | 1.35 | % | | | 1.47 | % | | $ | 276,456 | | | | 54 | % | |
2021 | | $ | 24.66 | | | | 54.25 | % | | | 1.45 | % | | | 0.77 | % | | | 1.47 | % | | $ | 372,624 | | | | 73 | %(j) | |
2020 | | $ | 16.16 | | | | (5.41 | )% | | | 1.48 | % | | | 1.44 | % | | | 1.54 | % | | $ | 281,937 | | | | 124 | %(k) | |
2019 | | $ | 17.14 | | | | (7.86 | )% | | | 1.48 | % | | | 1.02 | % | | | 1.48 | % | | $ | 340,465 | | | | 68 | % | |
2018 | | $ | 18.84 | | | | 7.41 | % | | | 1.46 | % | | | 0.86 | % | | | 1.46 | % | | $ | 402,401 | | | | 59 | % | |
Institutional Shares | |
Six Months Ended
November 30, 2022
(Unaudited) | | $ | 18.19 | | | | (8.91 | )% | | | 1.30 | % | | | 3.27 | % | | | 1.37 | % | | $ | 408,763 | | | | 26 | % | |
Year Ended May 31:
2022 | | $ | 19.97 | | | | (18.15 | )% | | | 1.28 | % | | | 1.59 | % | | | 1.31 | % | | $ | 398,909 | | | | 54 | % | |
2021 | | $ | 24.62 | | | | 54.46 | % | | | 1.26 | % | | | 0.96 | % | | | 1.29 | % | | $ | 400,408 | | | | 73 | %(j) | |
2020 | | $ | 16.14 | | | | (5.17 | )% | | | 1.29 | % | | | 1.67 | % | | | 1.33 | % | | $ | 327,156 | | | | 124 | %(k) | |
2019 | | $ | 17.10 | | | | (7.58 | )% | | | 1.25 | % | | | 1.24 | % | | | 1.25 | % | | $ | 491,978 | | | | 68 | % | |
2018 | | $ | 18.79 | | | | 7.62 | % | | | 1.28 | % | | | 1.09 | % | | | 1.28 | % | | $ | 596,185 | | | | 59 | % | |
Class A | |
Six Months Ended
November 30, 2022
(Unaudited) | | $ | 18.26 | | | | (9.11 | )% | | | 1.75 | % | | | 2.79 | % | | | 35.91 | % | | $ | 67 | | | | 26 | % | |
Year Ended May 31:
2022 | | $ | 20.09 | | | | (18.27 | )% | | | 1.24 | % | | | 1.57 | % | | | 11.21 | % | | $ | 63 | | | | 54 | % | |
2021 | | $ | 24.58 | | | | 54.22 | % | | | 1.72 | % | | | 0.36 | % | | | 1.98 | % | | $ | 147 | | | | 73 | %(j) | |
2020 | | $ | 16.08 | | | | (5.65 | )% | | | 1.75 | % | | | 1.13 | % | | | 1.76 | % | | $ | 4,478 | | | | 124 | %(k) | |
2019 | | $ | 17.08 | | | | (8.07 | )% | | | 1.75 | % | | | 0.73 | % | | | 1.79 | % | | $ | 4,745 | | | | 68 | % | |
2018 | | $ | 18.76 | | | | 7.09 | % | | | 1.72 | %(l) | | | 0.61 | % | | | 1.81 | % | | $ | 5,186 | | | | 59 | % | |
(g) From the period beginning July 1, 2019, the amount of any waivers or reimbursements and the amount of any recoupment are calculated without regard to the impact of any performance adjustment to the Fund's management fee.
(h) Portfolio turnover is calculated on the basis of the Fund as a whole without distinguishing between the classes of shares issued.
(i) Per share net investment income (loss) has been calculated using the average daily shares method.
(j) Reflects a return to normal trading levels after a prior year transition.
(k) Reflects increased trading activity due to current year transition or asset allocation shift.
(l) Prior to October 1, 2017, USAA Asset Management Company (previous Adviser) voluntarily agreed to limit the annual expenses of Class A to 1.65% of the Class A's average daily net assets.
See notes to financial statements.
23
USAA Mutual Funds Trust | | Notes to Financial Statements
November 30, 2022 | |
(Unaudited)
1. Organization:
USAA Mutual Funds Trust (the "Trust") is organized as a Delaware statutory trust and is registered under the Investment Company Act of 1940, as amended (the "1940 Act"), as an open-end investment company. The Trust is comprised of 45 funds and is authorized to issue an unlimited number of shares, which are units of beneficial interest with no par value.
The accompanying financial statements are those of the USAA Emerging Markets Fund (the "Fund"). The Fund offers three classes of shares: Fund Shares, Institutional Shares, and Class A. The Fund is classified as diversified under the 1940 Act.
Each class of shares of the Fund has substantially identical rights and privileges, except with respect to sales charges, fees paid under distribution plans, expenses allocable exclusively to each class of shares, voting rights on matters solely affecting a single class of shares, and the exchange privilege of each class of shares.
Victory Capital Management ("VCM" or the "Adviser"), is an indirect wholly owned subsidiary of Victory Capital Holdings, Inc., a publicly traded Delaware corporation, and a wholly owned direct subsidiary of Victory Capital Operating, LLC.
Under the Trust's organizational documents, its officers and trustees are indemnified against certain liabilities arising out of the performance of their duties to the Fund. In addition, in the normal course of business, the Fund enters into contracts with its vendors and others that provide for general indemnifications. The Fund's maximum exposure under these arrangements is unknown, as this would involve future claims that may be made against the Fund. However, based on experience, the Fund expects that risk of loss to be remote.
2. Significant Accounting Policies:
The following is a summary of significant accounting policies followed by the Trust in the preparation of its financial statements. The policies are in conformity with U.S. Generally Accepted Accounting Principles ("GAAP"). The preparation of financial statements in accordance with GAAP requires management to make estimates and assumptions that affect the reported amounts of assets and liabilities and disclosure of contingent assets and liabilities at the date of the financial statements and the reported amounts of income and expenses for the period. Actual results could differ from those estimates. The Fund follows the specialized accounting and reporting requirements under GAAP that are applicable to investment companies under Accounting Standards Codification Topic 946.
Investment Valuation:
The Fund records investments at fair value. Fair value is defined as the price that would be received to sell an asset or paid to transfer a liability in an orderly transaction between market participants at the measurement date.
The valuation techniques described below maximize the use of observable inputs and minimize the use of unobservable inputs in determining fair value. The inputs used for valuing the Fund's investments are summarized in the three broad levels listed below:
• Level 1 — quoted prices (unadjusted) in active markets for identical securities
• Level 2 — other significant observable inputs (including quoted prices for similar securities, interest rates, or credit spreads, applicable to those securities, etc.)
• Level 3 — significant unobservable inputs (including the Adviser's assumptions in determining the fair value of investments)
Changes in valuation techniques may result in transfers in or out of an assigned level within the disclosure hierarchy. The inputs or methodologies used for valuation techniques are not necessarily an indication of the risks associated with entering into those investments.
24
USAA Mutual Funds Trust | | Notes to Financial Statements — continued
November 30, 2022 | |
(Unaudited)
The Adviser, acting as the valuation designee has established the Pricing and Liquidity Committee (the "Committee"), and subject to the Trust's Board of Trustees' (the "Board") oversight, the Committee administers and oversees the Fund's valuation policies and procedures, which are approved by the Board.
Portfolio securities listed or traded on securities exchanges, including Exchange-Traded Funds ("ETFs"), and American Depositary Receipts ("ADRs"), are valued at the closing price on the exchange or system where the security is principally traded, if available, or at the Nasdaq Official Closing Price. If there have been no sales for that day on the exchange or system, then a security is valued at the last available bid quotation on the exchange or system where the security is principally traded. In each of these situations, valuations are typically categorized as Level 1 in the fair value hierarchy.
Investments in open-end investment companies, other than ETFs, are valued at their net asset value ("NAV"). These valuations are typically categorized as Level 1 in the fair value hierarchy.
In the event that price quotations or valuations are not readily available, investments are valued at fair value in accordance with procedures established by and under the general supervision and responsibility of the Board. These valuations are typically categorized as Level 2 or Level 3 in the fair value hierarchy, based on the observability of inputs used to determine the fair value. The effect of fair value pricing is that securities may not be priced on the basis of quotations from the primary market in which they are traded, and the actual price realized from the sale of a security may differ materially from the fair value price. Valuing these securities at fair value is intended to cause the Fund's NAV to be more reliable than it otherwise would be.
In accordance with procedures adopted by the Board, fair value pricing may be used if events materially affecting the value of foreign securities occur between the time the exchange on which they are traded closes and the time the Fund's NAV is calculated. The Fund uses a systematic valuation model, provided daily by an independent third party to fair value its international equity securities. The valuations are categorized as Level 2 in the fair value hierarchy.
A summary of the valuations as of November 30, 2022, based upon the three levels defined above, is included in the table below while the breakdown, by category, of investments is disclosed on the Schedule of Portfolio Investments (amounts in thousands):
| | | Level 1 | | Level 2 | | Level 3 | | Total | |
Common Stocks | | $ | 140,044 | | | $ | 496,846 | | | $ | 87 | | | $ | 636,977 | | |
Exchange-Traded Funds | | | 1,938 | | | | — | | | | — | | | | 1,938 | | |
Collateral for Securities Loaned | | | 4,566 | | | | — | | | | — | | | | 4,566 | | |
| | | | — | | | | — | | | | — | | | | — | | |
Total | | $ | 146,548 | | | $ | 496,846 | | | $ | 87 | | | $ | 643,481 | | |
For the six months ended November 30, 2022, there were no transfers into/out of Level 3.
Real Estate Investment Trusts ("REITs"):
The Fund may invest in REITs, which report information on the source of their distributions annually. REITs are pooled investment vehicles that invest primarily in income producing real estate or real estate related loans or interests (such as mortgages). Certain distributions received from REITs during the year are recorded as realized gains or return of capital as estimated by the Fund or when such information becomes known.
Investment Companies:
Exchange-Traded Funds:
The Fund may invest in ETFs, the shares of which are bought and sold on a securities exchange. An ETF trades like common stock and represents a fixed portfolio of securities often designed to track the performance and dividend yield of a particular domestic or foreign market index. The Fund may purchase shares of an ETF to temporarily gain exposure to a portion of the U.S. or a foreign market
25
USAA Mutual Funds Trust | | Notes to Financial Statements — continued
November 30, 2022 | |
(Unaudited)
while awaiting purchase of underlying securities. The risks of owning an ETF generally reflect the risks of owning the underlying securities the ETF is designed to track, although the lack of liquidity of an ETF could result in it being more volatile. Additionally, ETFs have fees and expenses that reduce their value.
Open-End Funds:
The Fund may invest in portfolios of open-end investment companies. These investment companies value securities in their portfolios for which market quotations are readily available at their market values (generally the last reported sale price) and all other securities and assets at their fair value by the methods established by the board of directors of the underlying funds.
Derivative Instruments:
Foreign Exchange Currency Contracts:
The Fund may enter into foreign exchange currency contracts to convert U.S. dollars to and from various foreign currencies. A foreign exchange currency contract is an obligation by the Fund to purchase or sell a specific currency at a future date at a price (in U.S. dollars) set at the time of the contract. The Fund does not engage in "cross-currency" foreign exchange contracts (i.e., contracts to purchase or sell one foreign currency in exchange for another foreign currency). The Fund's foreign exchange currency contracts might be considered spot contracts (typically a contract of one week or less) or forward contracts (typically a contract term over one week). A spot contract is entered into for purposes of hedging against foreign currency fluctuations relating to a specific portfolio transaction, such as the delay between a security transaction trade date and settlement date. Forward contracts are entered into for purposes of hedging portfolio holdings or concentrations of such holdings. Each foreign exchange currency contract is adjusted daily by the prevailing spot or forward rate of the underlying currency, and any appreciation or depreciation is recorded for financial statement purposes as unrealized until the contract settlement date, at which time the Fund records realized gains or losses equal to the difference between the value of a contract at the time it was opened and the value at the time it was closed. The Fund could be exposed to risk if a counterparty is unable to meet the terms of a foreign exchange currency contract or if the value of the foreign currency changes unfavorably. In addition, the use of foreign exchange currency contracts does not eliminate fluctuations in the underlying prices of the securities. As of November 30, 2022, the Fund had no open forward foreign exchange currency contracts.
Investment Transactions and Related Income:
Changes in holdings of investments are accounted for no later than one business day following the trade date. For financial reporting purposes, however, investment transactions are accounted for on trade date or the last business day of the reporting period. Interest income is determined on the basis of coupon interest accrued using the effective interest method which adjusts, where applicable, the amortization of premiums or accretion of discounts. Dividend income is recorded on the ex-dividend date. Gains or losses realized on sales of securities are recorded on the identified cost basis.
Withholding taxes on interest, dividends, and gains as a result of certain investments in ADRs by the Fund have been provided for in accordance with each investment's applicable country's tax rules and rates.
Securities Lending:
The Fund, through a Securities Lending Agreement with Citibank, N.A. ("Citibank"), may lend its securities to qualified financial institutions, such as certain broker-dealers and banks, to earn additional income, net of income retained by Citibank. Borrowers are required to initially secure their loans for collateral in the amount of at least 102% of the value of U.S. securities loaned or at least 105% of the value of non-U.S. securities loaned, marked-to-market daily. Any collateral shortfalls associated with increases in the valuation of the securities loaned are generally cured the next business day. The collateral can be received in the form of cash collateral and/or non-cash collateral. Non-cash collateral
26
USAA Mutual Funds Trust | | Notes to Financial Statements — continued
November 30, 2022 | |
(Unaudited)
can include U.S. Government Securities and other securities as permitted by Securities and Exchange Commission ("SEC") guidelines. The cash collateral is invested in short-term instruments or cash equivalents, primarily open-end investment companies, as noted on the Fund's Schedule of Portfolio Investments. The Fund effectively does not have control of the non-cash collateral and therefore it is not disclosed on the Fund's Schedule of Portfolio Investments. Collateral requirements are determined daily based on the value of the Fund's securities on loan as of the end of the prior business day. During the time portfolio securities are on loan, the borrower will pay the Fund any dividends or interest paid on such securities plus any fee negotiated between the parties to the lending agreement. The Fund also earns a return from the collateral. The Fund pays Citibank various fees in connection with the investment of cash collateral and fees based on the investment income received from securities lending activities. Securities lending income (net of these fees) is disclosed on the Statement of Operations. Loans are terminable upon demand and the borrower must return the loaned securities within the lesser of one standard settlement period or five business days. Although risk is mitigated by the collateral, the Fund could experience a delay in recovering its securities and possible loss of income or value if the borrower fails to return them. In addition, there is a risk that the value of the short-term investments will be less than the amount of cash collateral required to be returned to the borrower.
The Fund's agreement with Citibank does not include master netting provisions. Non-cash collateral received by the Fund may not be sold or repledged, except to satisfy borrower default.
The following table (amounts in thousands) is a summary of the Fund's securities lending transactions as of November 30, 2022.
Value of
Securities on Loan | | Non-Cash
Collateral | | Cash
Collateral | |
| $ | 6,152 | | | $ | 1,511 | | | $ | 4,566 | | |
Foreign Currency Translations:
The accounting records of the Fund are maintained in U.S. dollars. Investment securities and other assets and liabilities of the Fund denominated in a foreign currency are translated into U.S. dollars at current exchange rates. Purchases and sales of securities, income receipts, and expense payments are translated into U.S. dollars at the exchange rates on the date of the transactions. The Fund does not isolate the portion of the results of operations resulting from changes in foreign exchange rates on investments from fluctuations arising from changes in market prices of securities held. Such fluctuations are disclosed as Net change in unrealized appreciation/depreciation on investment securities and foreign currency translations on the Statement of Operations. Any realized gains or losses from these fluctuations are disclosed as Net realized gains (losses) from investment securities and foreign currency transactions on the Statement of Operations.
Foreign Taxes:
The Fund may be subject to foreign taxes related to foreign income received (a portion of which may be reclaimable), capital gains on the sale of securities, and certain foreign currency transactions. All foreign taxes are recorded in accordance with the applicable regulations and rates that exist in the foreign jurisdictions in which the Fund invests.
The Fund filed for additional European Union reclaims related to prior years. In September 2022, the Poland Tax Authority issued favorable decisions relating to claims for Poland. These reclaims are recorded when the amount is known and there are no significant uncertainties on collectability. For the six months ended November 30, 2022, the Fund recognized $19 thousand in reclaims. These reclaims are reflected on the Statement of Operations as Dividend Income.
Federal Income Taxes:
The Fund intends to continue to qualify as a regulated investment company by complying with the provisions available to certain investment companies, as defined in applicable sections of the Internal
27
USAA Mutual Funds Trust | | Notes to Financial Statements — continued
November 30, 2022 | |
(Unaudited)
Revenue Code, and to make distributions of net investment income and net realized gains sufficient to relieve it from all, or substantially all, federal income taxes. Accordingly, no provision for federal income taxes is required in the financial statements. The Fund has a tax year end of May 31.
For the six months ended November 30, 2022, the Fund did not incur any income tax, interest, or penalties, and has recorded no liability for net unrecognized tax benefits relating to uncertain tax positions.
Management of the Fund has reviewed tax positions taken in tax years that remain subject to examination by all major tax jurisdictions, including federal (i.e., the last four tax years, which includes the current fiscal tax year end). Management believes that there is no tax liability resulting from unrecognized tax benefits related to uncertain tax positions taken.
Allocations:
Expenses directly attributable to the Fund are charged to the Fund, while expenses that are attributable to more than one fund in the Trust, or jointly with an affiliated trust, are allocated among the respective funds in the Trust and/or an affiliated trust based upon net assets or another appropriate basis.
Income, expenses (other than class-specific expenses such as transfer agent fees, state registration fees, printing fees, and 12b-1 fees), and realized and unrealized gains or losses on investments are allocated to each class of shares based on its relative net assets on the date income is earned or expenses and realized and unrealized gains and losses are incurred.
3. Purchases and Sales:
Purchases and sales of securities (excluding securities maturing less than one year from acquisition) for the six months ended November 30, 2022, were as follows for the Fund (amounts in thousands):
Excluding
U.S. Government Securities | |
Purchases | | Sales | |
$ | 203,281 | | | $ | 157,570 | | |
4. Affiliated Fund Ownership:
The Fund offers its shares for investment by other USAA Mutual Funds. The fund-of-funds do not invest in the underlying funds for the purpose of exercising management or control, and the affiliated fund-of-funds' annual and semi-annual reports may be viewed at www.vcm.com. As of November 30, 2022, certain fund-of-funds owned total outstanding shares of the Fund as follows:
Affiliated USAA Mutual Funds | | Ownership % | |
USAA Cornerstone Conservative Fund | | | 0.3 | | |
| USAA Cornerstone Equity Fund | | | 1.5 | | |
5. Fees and Transactions with Affiliates and Related Parties:
Investment Advisory Fees:
Investment advisory services are provided to the Fund by the Adviser, which is a New York corporation registered as an investment adviser with the SEC.
Under the terms of the Investment Advisory Agreement, the Adviser is entitled to receive a base fee and a performance adjustment. The Fund's base fee is accrued daily and paid monthly at an annualized rate of 1.00% of the Fund's average daily net assets. Amounts incurred and paid to VCM for the six months ended November 30, 2022, are reflected on the Statement of Operations as Investment advisory fees.
28
USAA Mutual Funds Trust | | Notes to Financial Statements — continued
November 30, 2022 | |
(Unaudited)
The performance adjustment for each share class is accrued daily and calculated monthly by comparing the respective class' performance to that of the Lipper Emerging Markets Fund Index. The Lipper Emerging Markets Fund Index tracks the total return performance of the largest funds within the Lipper Emerging Markets Fund category.
The performance period for each share class consists of the current month plus the previous 35 months. The following table is utilized to determine the extent of the performance adjustment:
Over/Under Performance Relative to Index
(in basis points)(a) | | Annual Adjustment Rate
(in basis points) | |
| | +/- 100 to 400 | | | | +/- 4 | | |
| | +/- 401 to 700 | | | | +/- 5 | | |
| | +/- 701 and greater | | | | +/- 6 | | |
(a) Based on the difference between the average annual performance of the relevant share class of the Fund and its relevant Lipper index, rounded to the nearest basis point.
Each class' annual performance adjustment rate is multiplied by the average daily net assets of the respective class over the entire performance period, which is then multiplied by a fraction, the numerator of which is the number of days in the month and the denominator of which is 365 (366 in leap years). The resulting amount is then added to (in the case of overperformance), or subtracted from (in the case of underperformance) the base fee.
Under the performance fee arrangement, each class pays a positive performance fee adjustment for a performance period whenever the class outperforms the Lipper Emerging Markets Fund Index over that period, even if the class has overall negative returns during the performance period.
For the period June 1, 2022, to November 30, 2022, performance adjustments were $0, $13, and $0 for Fund Shares, Institutional Shares, and Class A, in thousands, respectively. Performance adjustments were 0.00%, 0.01%, and 0.00% for Fund Shares, Institutional Shares, and Class A, respectively. The performance adjustment rate included in the investment advisory fee may differ from the maximum over/under Annual Adjustment Rate due to differences in average net assets for the reporting period and rolling 36 month performance periods.
The Trust relies on an exemptive order granted to VCM and its affiliated funds by the SEC in March 2019, permitting the use of a "manager-of-managers" structure for certain funds. Under a manager-of-managers structure, the investment adviser may select (with approval of the Board and without shareholder approval) one or more subadvisers to manage the day-to-day investment of a fund's assets.
VCM entered into an Investment Subadvisory Agreement with Lazard Asset Management LLC ("Lazard"), under which Lazard directs the investment and reinvestment of a portion of the Fund's assets (as allocated from time to time by VCM). This arrangement provides for monthly fees that are paid by VCM. VCM (not the Fund) pays the subadviser fees.
Administration and Servicing Fees:
VCM also serves as the Fund's administrator and fund accountant. Under the Fund Administration, Servicing and Accounting Agreement, VCM is paid an administration and servicing fee that is accrued daily and paid monthly at an annualized rate of 0.15%, 0.10%, and 0.15%, which is based on the Fund's average daily net assets of the Fund Shares, Institutional Shares, and Class A, respectively. Amounts incurred for the six months ended November 30, 2022, are reflected on the Statement of Operations as Administration fees.
Citi Fund Services Ohio, Inc. ("Citi"), an affiliate of Citibank, acts as sub-administrator and sub-fund accountant to the Fund pursuant to a Sub-Administration and Sub-Fund Accounting Services Agreement between VCM and Citi. VCM pays Citi a fee for providing these services. The Fund reimburses VCM and Citi for out-of-pocket expenses incurred in providing these services and certain other expenses
29
USAA Mutual Funds Trust | | Notes to Financial Statements — continued
November 30, 2022 | |
(Unaudited)
specifically allocated to the Fund. Amounts incurred for the six months ended November 30, 2022, are reflected on the Statement of Operations as Sub-Administration fees.
The Fund (as part of the Trust) has entered into an agreement with the Adviser to provide compliance services, pursuant to which the Adviser furnishes its compliance personnel, including the services of the Chief Compliance Officer ("CCO"), and other resources reasonably necessary to provide the Trust with compliance oversight services related to the design, administration, and oversight of a compliance program for the Trust in accordance with Rule 38a-1 under the 1940 Act. The CCO is an employee of the Adviser, which pays the compensation of the CCO and support staff. The funds in the Trust, Victory Variable Insurance Funds, Victory Portfolios, and Victory Portfolios II (collectively, the "Victory Funds Complex") in the aggregate, compensate the Adviser for these services. Amounts incurred for the six months ended November 30, 2022, are reflected on the Statement of Operations as Compliance fees.
Transfer Agency Fees:
Victory Capital Transfer Agency, Inc. ("VCTA"), an affiliate of the Adviser, provides transfer agency services to the Fund. VCTA provides transfer agent services to the Fund Shares based on an annual charge of $23 per shareholder account plus out-of-pocket expenses. VCTA pays a portion of these fees to certain intermediaries for the administration and servicing of accounts that are held with such intermediaries. Transfer agent fees for Institutional Shares and Class A are paid monthly based on a fee accrued daily at an annualized rate of 0.10% and 0.10%, respectively, of average daily net assets, plus out-of-pocket expenses. Amounts incurred and paid to VCTA for the six months ended November 30, 2022, are reflected on the Statement of Operations as Transfer agent fees.
FIS Investor Services LLC serves as sub-transfer agent and dividend disbursing agent for the Fund pursuant to a Sub-Transfer Agent Agreement between VCTA and FIS Investor Services LLC. VCTA provides FIS Investor Services LLC a fee for providing these services.
Distributor/Underwriting Services:
Victory Capital Services, Inc. (the "Distributor"), an affiliate of the Adviser, serves as Distributor for the continuous offering of the shares of the Fund pursuant to a Distribution Agreement between the Distributor and the Trust.
Pursuant to the Distribution and Service Plans adopted in accordance with Rule 12b-1 under the 1940 Act, the Distributor may receive a monthly distribution and service fee, at an annual rate of up to 0.25% of the average daily net assets of Class A. The distribution and service fees paid to the Distributor may be used by the Distributor to pay for activity primarily intended to result in the sale of Class A. Amounts incurred and paid to the Distributor for the six months ended November 30, 2022, are reflected on the Statement of Operations as 12b-1 fees.
In addition, the Distributor is entitled to receive commissions in connection with sales of Class A. For the six months ended November 30, 2022, the Distributor did not receive any commissions.
Other Fees:
Citibank serves as the Fund's custodian. The Fund pays Citibank a fee for providing these services. Amounts incurred for the six months ended November 30, 2022, are reflected on the Statement of Operations as Custodian fees.
K&L Gates LLP provides legal services to the Trust.
The Adviser has entered into an expense limitation agreement with the Fund until at least September 30, 2023. Under the terms of the agreement, the Adviser has agreed to waive fees or reimburse certain expenses to the extent that ordinary operating expenses incurred by certain classes of the Fund in any fiscal year exceed the expense limits for such classes of the Fund. Such excess amounts will be the liability of the Adviser. Performance adjustments, acquired fund fees and expenses, interest, taxes, brokerage commissions, other expenditures, which are capitalized in accordance with GAAP, and other extraordinary expenses not incurred in the ordinary course of the Fund's business are excluded from
30
USAA Mutual Funds Trust | | Notes to Financial Statements — continued
November 30, 2022 | |
(Unaudited)
the expense limits. As of November 30, 2022, the expense limits (excluding voluntary waivers) were 1.48%, 1.29%, and 1.75% for Fund Shares, Institutional Shares, and Class A, respectively.
Under the terms of the expense limitation agreement, as amended June 29, 2022, the Fund has agreed to repay fees and expenses that were waived or reimbursed by the Adviser for a period of up to three years (thirty-six (36) months) after the waiver or reimbursement took place, subject to the lesser of any operating expense limits in effect at the time of: (a) the original waiver or expense reimbursement; or (b) the recoupment, after giving effect to the recoupment amount.
As of November 30, 2022, the following amounts are available to be repaid to the Adviser (amounts in thousands). The Fund has not recorded any amounts available to be repaid as a liability due to an assessment that such repayments are not probable at November 30, 2022.
Expires
2023 | | Expires
2024 | | Expires
2025 | | Expires
2026 | | Total | |
| $ | 261 | | | $ | 215 | | | $ | 111 | | | $ | 265 | | | $ | 852 | | |
The Adviser may voluntarily waive or reimburse additional fees to assist the Fund in maintaining competitive expense ratios. Voluntary waivers and reimbursements applicable to the Fund are not available to be recouped at a future time. There were no voluntary waivers or reimbursements for the six months ended November 30, 2022.
Certain officers and/or interested trustees of the Fund are also officers and/or employees of the Adviser, administrator, fund accountant, sub-administrator, sub-fund accountant, custodian, and Distributor.
6. Risks:
The Fund may be subject to other risks in addition to these identified risks.
Market Risk — Overall market risks may affect the value of the Fund. Domestic and international factors such as political events, war, terrorism, trade disputes, inflation rates, interest rate levels and other fiscal and monetary policy changes, cybersecurity incidents, pandemics and other public health crises, sanctions against a particular foreign country, its nationals, businesses or industries and related geopolitical events, as well as environmental disasters such as earthquakes, fires, and floods, or other catastrophes, may add to instability in global economies and markets generally, and may lead to increased market volatility. Global economies and financial markets are highly interconnected, which increases the possibility that conditions in one country or region might adversely affect issuers in another country or region. The impact of these and other factors may be short-term or may last for extended periods.
Equity Risk — The values of the equity securities in which the Fund invests may decline in response to developments affecting individual companies and/or general market, economic and political conditions and other factors. A company's earnings or dividends may not increase as expected due to poor management decisions, competitive pressures, breakthroughs in technology, reliance on suppliers, labor problems or shortages, corporate restructurings, fraudulent disclosures, natural disasters, military confrontations, war, terrorism, public health crises, or other events, conditions, and factors. Price changes may be temporary or may last for extended periods.
Foreign Securities Risk — Foreign markets can be more volatile than the U.S. market due to increased risks of adverse issuer, political, regulatory, market, or economic developments and can perform differently from the U.S. market. Global markets, or those in a particular region, may all react in similar fashion to important political, economic, or other developments. Events and evolving conditions in certain economies or markets may alter the risks associated with investments tied to countries or regions that historically were perceived as comparatively stable and make such investments riskier and more volatile.
31
USAA Mutual Funds Trust | | Notes to Financial Statements — continued
November 30, 2022 | |
(Unaudited)
7. Borrowing and Interfund Lending:
Line of Credit:
The Victory Funds Complex participates in a short-term demand note "Line of Credit" agreement with Citibank. The Line of Credit agreement with Citibank was renewed on June 27, 2022, with a termination date of June 26, 2023. Under the agreement with Citibank, the Victory Funds Complex may borrow up to $600 million, of which $300 million is committed and $300 million is uncommitted. $40 million of the Line of Credit is reserved for use by the Victory Floating Rate Fund, another series of the Victory Funds Complex, with Victory Floating Rate Fund paying the related commitment fees for that amount. The purpose of the Line of Credit is to meet temporary or emergency cash needs. For the six months ended November 30, 2022, Citibank received an annual commitment fee of 0.15% on $300 million for providing the Line of Credit. Each fund in the Victory Funds Complex paid a pro-rata portion of the commitment fees plus any interest on amounts borrowed. For the period from June 1, 2022, through June 27, 2022, interest was based on the one-month London Interbank Offered Rate ("LIBOR") plus one percent. Effective with the renewal, for the period June 28, 2022, through November 30, 2022, interest was based on the one-month Secured Overnight Financing Rate ("SOFR") plus 1.10 percent. Interest charged to the Fund during the period, if applicable, is reflected on the Statement of Operations under Line of credit fees.
The average borrowing for the days outstanding and average interest rate for the Fund during the six months ended November 30, 2022, were as follows (amounts in thousands):
Amount
Outstanding at
November 30, 2022 | | Average
Borrowing* | | Days
Borrowing
Outstanding | | Average
Interest
Rate* | | Maximum
Borrowing
During the
Period | |
| $ | — | | | $ | 1,788 | | | | 1 | | | | 3.88 | % | | $ | 1,788 | | |
* For the six months ended November 30, 2022, based on the number of days borrowings were outstanding.
Interfund Lending:
The Trust and the Adviser rely on an exemptive order granted by the SEC in March 2017 (the "Order"), permitting the establishment and operation of an Interfund Lending Facility (the "Facility"). The Facility allows the Fund to directly lend and borrow money to or from any other fund in the Victory Funds Complex that is permitted to participate in the Facility, relying upon the Order at rates beneficial to both the borrowing and lending funds. Advances under the Facility are allowed for temporary or emergency purposes, including the meeting of redemption requests that otherwise might require the untimely disposition of securities, and are subject to each Fund's borrowing restrictions. The interfund loan rate is determined, as specified in the Order, by averaging the current repurchase agreement rate and the current bank loan rate. As a Borrower, interest charged to the Fund, if any, during the period, is reflected on the Statement of Operations under Interfund lending fees. As a Lender, interest earned by the Fund, if any, during the period, is reflected on the Statement of Operations under Interfund lending.
The Fund did not utilize or participate in the Facility during the six months ended November 30, 2022.
8. Federal Income Tax Information:
The Fund intends to distribute any net investment income annually. Distributable net realized gains, if any, are declared and paid at least annually.
The amounts of dividends from net investment income and distributions from net realized gains (collectively, distributions to shareholders) are determined in accordance with federal income tax regulations, which may differ from GAAP. To the extent these "book/tax" differences are permanent in nature (e.g., net operating loss and distribution reclassification), such amounts are reclassified within
32
USAA Mutual Funds Trust | | Notes to Financial Statements — continued
November 30, 2022 | |
(Unaudited)
the components of net assets based on their federal tax-basis treatment; temporary differences (e.g., wash sales) do not require reclassification. To the extent dividends and distributions exceed net investment income and net realized gains for tax purposes, they are reported as distributions of capital. Net investment losses incurred by the Fund may be reclassified as an offset to capital on the accompanying Statement of Assets and Liabilities.
The tax character of current year distributions paid and the tax basis of the current components of accumulated earnings (loss) will be determined at the end of the current tax year.
At the tax year ended May 31, 2022, the Fund had net capital loss carryforwards as summarized in the table below (amounts in thousands). It is unlikely that the Board will authorize a distribution of capital gains realized in the future until the capital loss carryforwards have been used.
| Short-Term Amount | | Total | |
| $ | 13,777 | | | $ | 13,777 | | |
9. Subsequent Event:
On December 9, 2022, the Board of Trustees of USAA Mutual Funds Trust ("Trust"), upon the recommendation of Victory Capital Management Inc., the Trust's investment adviser, approved a Plan of Liquidation ("Plan") for the USAA Emerging Markets Fund Class A (the "Share Class"). It is anticipated that the Share Class will liquidate on or about February 22, 2023. On the liquidation date, the Share Class will redeem all its outstanding shares at the net asset value of such shares.
Effective December 19, 2022, the Share Class will be closed to new investors and shareholder accounts. Through the NAV on February 15, 2023, the Share Class will continue to accept additional investments (including through the reinvestment of dividends and capital gains) from existing shareholders. Please note that no other classes of the Fund are affected.
33
USAA Mutual Funds Trust | | Supplemental Information
November 30, 2022 | |
(Unaudited)
Proxy Voting and Portfolio Holdings Information
Proxy Voting:
Information regarding the policies and procedures the Fund uses to determine how to vote proxies relating to portfolio securities is available without charge, upon request, by calling (800) 235-8396. The information is also included in the Fund's Statement of Additional Information, which is available on the SEC's website at www.sec.gov.
Information relating to how the Fund voted proxies relating to portfolio securities held during the most recent 12 months ended June 30 is available on the SEC's website at www.sec.gov.
Availability of Schedules of Portfolio Investments:
The Trust files a complete list of Schedules of Portfolio Investments with the SEC for the first and third quarter of each fiscal year on Form N-PORT. Form N-PORT is available on the SEC's website at www.sec.gov.
Expense Examples
As a shareholder of the Fund, you may incur two types of costs: (1) transaction costs, including sales charges (loads) on purchases; and (2) ongoing costs, including management fees and other Fund expenses. These examples are intended to help you understand your ongoing costs (in dollars) of investing in the Fund and to compare these costs with the ongoing costs of investing in other mutual funds.
These examples are based on an investment of $1,000 invested at the beginning of the period and held for the entire period from June 1, 2022, through November 30, 2022.
The Actual Expense figures in the table below provide information about actual account values and actual expenses. You may use the information below, together with the amount you invested, to estimate the expenses that you paid over the period. Simply divide your account value by $1,000 (for example, an $8,600 account value divided by $1,000 = 8.6), then multiply the result by the number in the table under the heading entitled "Actual Expenses Paid During Period" to estimate the expenses you paid on your account during this period.
The Hypothetical Expense figures in the table below provide information about hypothetical account values and hypothetical expenses based on the Fund's actual expense ratio and an assumed rate of return of 5% per year before expenses, which is not the Fund's actual return. The hypothetical account values and expenses may not be used to estimate the actual ending account balance or expenses you paid for the period. You may use this information to compare this 5% hypothetical example with the 5% hypothetical examples that appear in shareholder reports of other funds.
Please note the expenses shown in the table below are meant to highlight your ongoing costs only and do not reflect any transactional costs. Therefore, the hypothetical expenses in the table are useful in comparing ongoing costs only and will not help you determine the relative total costs of owning different funds. In addition, if these transactional costs were included, your costs would have been higher.
| | | Beginning
Account
Value
6/1/22 | | Actual
Ending
Account
Value
11/30/22 | | Hypothetical
Ending
Account
Value
11/30/22 | | Actual
Expenses
Paid
During
Period
6/1/22-
11/30/22* | | Hypothetical
Expenses
Paid
During
Period
6/1/22-
11/30/22* | | Annualized
Expense
Ratio
During
Period
6/1/22-
11/30/22 | |
Fund Shares | | $ | 1,000.00 | | | $ | 910.00 | | | $ | 1,017.65 | | | $ | 7.09 | | | $ | 7.49 | | | | 1.48 | % | |
Institutional Shares | | | 1,000.00 | | | | 910.90 | | | | 1,018.55 | | | | 6.23 | | | | 6.58 | | | | 1.30 | % | |
Class A | | | 1,000.00 | | | | 908.90 | | | | 1,016.29 | | | | 8.37 | | | | 8.85 | | | | 1.75 | % | |
* Expenses are equal to the average account value multiplied by the Fund's annualized expense ratio multiplied by 183/365 (the number of days in the most recent fiscal half-year divided by the number of days in the fiscal year).
34
Privacy Policy
Protecting the Privacy of Information
The Trust respects your right to privacy. We also know that you expect us to conduct and process your business in an accurate and efficient manner. To do so, we must collect and maintain certain personal information about you. This is the information we collect from you on applications or other forms, and from the transactions you make with us or third parties. It may include your name, address, social security number, account transactions and balances, and information about investment goals and risk tolerance.
We do not disclose any information about you or about former customers to anyone except as permitted or required by law. Specifically, we may disclose the information we collect to companies that perform services on our behalf, such as the transfer agent that processes shareholder accounts and printers and mailers that assist us in the distribution of investor materials. We may also disclose this information to companies that perform marketing services on our behalf. This allows us to continue to offer you Victory investment products and services that meet your investing needs, and to effect transactions that you request or authorize. These companies will use this information only in connection with the services for which we hired them. They are not permitted to use or share this information for any other purpose.
To protect your personal information internally, we permit access only by authorized employees and maintain physical, electronic, and procedural safeguards to guard your personal information.*
* You may have received communications regarding information about privacy policies from other financial institutions which gave you the opportunity to "opt-out" of certain information sharing with companies which are not affiliated with that financial institution. The Trust does not share information with other companies for purposes of marketing solicitations for products other than the Trust. Therefore, the Trust does not provide opt-out options to their shareholders.
P.O. Box 182593,
Columbus, Ohio 43218-2593

Visit our website at: | | Call | |
www.vcm.com | | (800) 235-8396 | |

NOVEMBER 30, 2022
Semi Annual Report
USAA Precious Metals and Minerals Fund
Victory Capital means Victory Capital Management Inc., the investment adviser of the USAA Mutual Funds. USAA Mutual Funds are distributed by Victory Capital Services, Inc., member FINRA, an affiliate of Victory Capital. Victory Capital and its affiliates are not affiliated with United Services Automobile Association or its affiliates. USAA and the USAA logos are registered trademarks and the USAA Mutual Funds and USAA Investments logos are trademarks of United Services Automobile Association and are being used by Victory Capital and its affiliates under license.
www.vcm.com
News, Information And Education 24 Hours A Day, 7 Days A Week
The Victory Capital website gives fund shareholders, prospective shareholders, and investment professionals a convenient way to access fund information, get guidance, and track fund performance anywhere they can access the Internet. The site includes:
• Detailed performance records
• Daily share prices
• The latest fund news
• Investment resources to help you become a better investor
• A section dedicated to investment professionals
Whether you're a potential investor searching for the fund that matches your investment philosophy, a seasoned investor interested in planning tools, or an investment professional, www.vcm.com has what you seek. Visit us anytime. We're always open.
TABLE OF CONTENTS
Investment Objective & Portfolio Holdings | | | 2 | | |
Schedule of Portfolio Investments | | | 3 | | |
Financial Statements | |
Statement of Assets and Liabilities | | | 6 | | |
Statement of Operations | | | 7 | | |
Statements of Changes in Net Assets | | | 8 | | |
Financial Highlights | | | 10 | | |
Notes to Financial Statements | | | 12 | | |
Supplemental Information | | | 21 | | |
Proxy Voting and Portfolio Holdings Information | | | 21 | | |
Expense Examples | | | 21 | | |
Privacy Policy (inside back cover) | | | |
This report is for the information of the shareholders and others who have received a copy of the currently effective prospectus of the Fund, managed by Victory Capital Management Inc. It may be used as sales literature only when preceded or accompanied by a current prospectus, which provides further details about the Fund.
IRA DISTRIBUTION WITHHOLDING DISCLOSURE
We generally must withhold federal income tax at a rate of 10% of the taxable portion of your distribution and, if you live in a state that requires state income tax withholding, at your state's tax rate. However, you may elect not to have withholding apply or to have income tax withheld at a higher rate. Any withholding election that you make will apply to any subsequent distribution unless and until you change or revoke the election. If you wish to make a withholding election, or change or revoke a prior withholding election, call (800) 235-8396, and form W-4P (OMB No. 1545-0074 withholding certificate for pension or annuity payments) will be electronically sent.
If you do not have a withholding election in place by the date of a distribution, federal income tax will be withheld from the taxable portion of your distribution at a rate of 10%. If you must pay estimated taxes, you may be subject to estimated tax penalties if your estimated tax payments are not sufficient and sufficient tax is not withheld from your distribution.
For more specific information, please consult your tax adviser.
• NOT FDIC INSURED • NO BANK GUARANTEE • MAY LOSE VALUE
1
USAA Mutual Funds Trust
USAA Precious Metals and Minerals Fund | | November 30, 2022 | |
(Unaudited)
Investment Objective and Portfolio Holdings:
The Fund seeks long-term capital appreciation and to protect the purchasing power of shareholders' capital against inflation.
Top 10 Equity Holdings*:
November 30, 2022
(% of Net Assets)
Newmont Corp. | | | 12.7 | % | |
Barrick Gold Corp. | | | 9.3 | % | |
Aginco Eagle Mines Ltd. | | | 9.0 | % | |
Franco-Nevada Corp. | | | 7.9 | % | |
Wheaton Precious Metals Corp. | | | 5.2 | % | |
B2Gold Corp. | | | 4.1 | % | |
Yamana Gold, Inc. | | | 4.1 | % | |
Gold Fields Ltd., ADR | | | 3.8 | % | |
Northern Star Resources Ltd. | | | 3.4 | % | |
Newcrest Mining Ltd. | | | 3.3 | % | |
Portfolio Composition*:
November 30, 2022
(% of Net Assets)
* Does not include futures contracts, money market instruments, and short-term investments purchased with cash collateral from securities loaned.
Percentages are of the net assets of the Fund and may not equal 100%.
Refer to the Schedule of Portfolio Investments for a complete list of securities.
2
USAA Mutual Funds Trust
USAA Precious Metals and Minerals Fund | | Schedule of Portfolio Investments
November 30, 2022 | |
(Amounts in Thousands, Except for Shares) (Unaudited)
Security Description | | Shares | | Value | |
Common Stocks (99.9%) | |
Australia (12.3%): | |
Materials (12.3%): | |
De Grey Mining, Ltd. (a) (b) | | | 1,165,515 | | | $ | 1,030 | | |
Evolution Mining Ltd. | | | 4,391,696 | | | | 8,105 | | |
Gold Road Resources Ltd. | | | 1,928,577 | | | | 2,314 | | |
Newcrest Mining Ltd. | | | 1,223,419 | | | | 16,688 | | |
Northern Star Resources Ltd. | | | 2,396,263 | | | | 17,389 | | |
Perseus Mining Ltd. | | | 4,308,434 | | | | 6,599 | | |
Ramelius Resources Ltd. | | | 3,271,854 | | | | 1,915 | | |
Regis Resources Ltd. | | | 2,128,654 | | | | 2,816 | | |
Silver Lake Resources Ltd. (a) | | | 4,268,850 | | | | 3,540 | | |
West African Resources, Ltd. (a) | | | 1,930,796 | | | | 1,561 | | |
| | | | 61,957 | | |
Canada (55.5%): | |
Materials (55.5%): | |
Aginco Eagle Mines Ltd. (b) | | | 905,641 | | | | 45,619 | | |
Alamos Gold, Inc. (b) | | | 1,119,616 | | | | 10,855 | | |
B2Gold Corp. | | | 5,999,753 | | | | 20,921 | | |
Barrick Gold Corp. | | | 2,880,649 | | | | 47,012 | | |
Centerra Gold, Inc. (b) | | | 1,499,019 | | | | 8,013 | | |
Dundee Precious Metals, Inc. | | | 1,505,141 | | | | 7,106 | | |
Eldorado Gold Corp. (a) | | | 179,157 | | | | 1,372 | | |
Equinox Gold Corp. (a) | | | 68,782 | | | | 242 | | |
Franco-Nevada Corp. | | | 271,530 | | | | 39,668 | | |
Great Basin Gold Ltd. (a) (c) (d) | | | 6,500,000 | | | | — | | |
IAMGOLD Corp. (a) | | | 914,093 | | | | 1,869 | | |
K92 Mining, Inc. (a) | | | 483,061 | | | | 2,776 | | |
Karora Resources, Inc. (a) | | | 419,439 | | | | 1,385 | | |
Kinross Gold Corp. | | | 1,108,016 | | | | 4,576 | | |
Lundin Gold, Inc. | | | 78,200 | | | | 772 | | |
Nautilus Minerals, Inc. (a) (c) (d) | | | 5,757,622 | | | | — | | |
New Gold, Inc. (a) | | | 1,183,000 | | | | 1,311 | | |
Northern Star Mining Corp. (a) (c) (d) | | | 375,000 | | | | — | | |
OceanaGold Corp. (a) | | | 2,084,516 | | | | 3,549 | | |
Osisko Gold Royalties Ltd. | | | 303,400 | | | | 3,828 | | |
Sandstorm Gold Ltd. | | | 658,794 | | | | 3,419 | | |
SSR Mining, Inc. | | | 992,179 | | | | 15,041 | | |
Torex Gold Resources, Inc. (a) | | | 859,889 | | | | 7,960 | | |
Victoria Gold Corp. (a) | | | 112,390 | | | | 679 | | |
Wesdome Gold Mines Ltd. (a) | | | 722,933 | | | | 4,880 | | |
Wheaton Precious Metals Corp. | | | 674,637 | | | | 26,333 | | |
Yamana Gold, Inc. | | | 3,769,219 | | | | 20,542 | | |
| | | | 279,728 | | |
See notes to financial statements.
3
USAA Mutual Funds Trust
USAA Precious Metals and Minerals Fund | | Schedule of Portfolio Investments — continued
November 30, 2022 | |
(Amounts in Thousands, Except for Shares) (Unaudited)
Security Description | | Shares | | Value | |
China (2.8%): | |
Materials (2.8%): | |
Shandong Gold Mining Co. Ltd. Class H (e) | | | 950,700 | | | $ | 1,855 | | |
Zhaojin Mining Industry Co. Ltd. Class H (a) (b) | | | 1,459,000 | | | | 1,616 | | |
Zijin Mining Group Co. Ltd. Class H | | | 8,206,000 | | | | 10,653 | | |
| | | | 14,124 | | |
Indonesia (0.5%): | |
Materials (0.5%): | |
Aneka Tambang Tbk | | | 18,415,700 | | | | 2,324 | | |
Jersey (1.0%): | |
Materials (1.0%): | |
Centamin PLC | | | 3,704,746 | | | | 4,765 | | |
Peru (0.1%): | |
Materials (0.1%): | |
Cia de Minas Buenaventura SAA, ADR | | | 68,157 | | | | 556 | | |
Russian Federation (0.4%): | |
Materials (0.4%): | |
Polymetal International PLC (a) (d) (f) (g) | | | 757,840 | | | | 2,155 | | |
Polyus PJSC (a) (c) (d) | | | 62,088 | | | | 83 | | |
| | | | 2,238 | | |
South Africa (7.6%): | |
Materials (7.6%): | |
AngloGold Ashanti Ltd. | | | 786,708 | | | | 14,042 | | |
Gold Fields Ltd., ADR (b) | | | 1,724,650 | | | | 19,230 | | |
Great Basin Gold Ltd. (a) (c) (d) | | | 8,566,400 | | | | — | | |
Harmony Gold Mining Co. Ltd. (b) | | | 1,463,504 | | | | 5,221 | | |
| | | | 38,493 | | |
Turkey (1.2%): | |
Materials (1.2%): | |
Koza Altin Isletmeleri A/S (b) | | | 298,319 | | | | 5,895 | | |
United Kingdom (2.4%): | |
Materials (2.4%): | |
Endeavour Mining PLC (b) | | | 570,692 | | | | 12,114 | | |
United States (16.1%): | |
Materials (16.1%): | |
Coeur Mining, Inc. (a) | | | 370,107 | | | | 1,295 | | |
Newmont Corp. | | | 1,348,430 | | | | 64,010 | | |
Royal Gold, Inc. | | | 141,793 | | | | 15,928 | | |
| | | | 81,233 | | |
Total Common Stocks (Cost $427,151) | | | 503,427 | | |
See notes to financial statements.
4
USAA Mutual Funds Trust
USAA Precious Metals and Minerals Fund | | Schedule of Portfolio Investments — continued
November 30, 2022 | |
(Amounts in Thousands, Except for Shares) (Unaudited)
Security Description | | Shares | | Value | |
Collateral for Securities Loaned (2.8%)^ | |
United States (2.8%): | |
Goldman Sachs Financial Square Government Fund, Institutional Shares,
3.73% (h) | | | 3,565,244 | | | $ | 3,566 | | |
HSBC U.S. Government Money Market Fund, I Shares, 3.75% (h) | | | 3,565,244 | | | | 3,565 | | |
Invesco Government & Agency Portfolio, Institutional Shares, 3.74% (h) | | | 3,565,244 | | | | 3,565 | | |
Morgan Stanley Institutional Liquidity Government Portfolio, Institutional
Shares, 3.62% (h) | | | 3,565,244 | | | | 3,565 | | |
Total Collateral for Securities Loaned (Cost $14,261) | | | 14,261 | | |
Total Investments (Cost $441,412) — 102.7% | | | 517,688 | | |
Liabilities in excess of other assets — (2.7)% | | | (13,500 | ) | |
NET ASSETS — 100.00% | | $ | 504,188 | | |
^ Purchased with cash collateral from securities on loan.
(a) Non-income producing security.
(b) All or a portion of this security is on loan.
(c) Security was fair valued based upon procedures approved by the Board of Trustees and represents less than 0.05% of net assets as of November 30, 2022. This security is classified as Level 3 within the fair value hierarchy. (See Note 2 in the Notes to Financial Statements)
(d) The Fund's Adviser has deemed this security to be illiquid based upon procedures approved by the Board of Trustees. At November 30, 2022, illiquid securities were 0.4% of the Fund's net assets.
(e) Rule 144A security or other security that is restricted as to resale to institutional investors. The Fund's Adviser has deemed this security to be liquid (unless otherwise noted as illiquid) based upon procedures approved by the Board of Trustees. As of November 30, 2022, the fair value of these securities was $1,855 thousands and amounted to 0.4% of net assets.
(f) Restricted security due to trading restrictions. Russian sanctioned entity by the United States Government.
(g) The following table details the acquisition date and cost of the Fund's Russian sanctioned restricted securities at November 30, 2022 (amount in thousand):
Security Name | | Acquisition
Date | | Cost | |
Polymetal International PLC | | 7/11/2019 | | $ | 9,758 | | |
(h) Rate disclosed is the daily yield on November 30, 2022.
ADR — American Depositary Receipt
PLC — Public Limited Company
See notes to financial statements.
5
USAA Mutual Funds Trust | | Statement of Assets and Liabilities
November 30, 2022 | |
(Amounts in Thousands, Except Per Share Amounts) (Unaudited)
| | | USAA Precious Metals
and Minerals Fund | |
Assets: | |
Investments, at value (Cost $441,412) | | $ | 517,688 | (a) | |
Cash | | | 1,248 | | |
Receivables: | |
Interest and dividends | | | 943 | | |
Capital shares issued | | | 159 | | |
From Adviser | | | 8 | | |
Prepaid expenses | | | 38 | | |
Total Assets | | | 520,084 | | |
Liabilities: | |
Payables: | |
Collateral received on loaned securities | | | 14,261 | | |
Capital shares redeemed | | | 242 | | |
Accrued foreign capital gains taxes | | | 877 | | |
Accrued expenses and other payables: | |
Investment advisory fees | | | 269 | | |
Administration fees | | | 57 | | |
Custodian fees | | | 23 | | |
Transfer agent fees | | | 97 | | |
Compliance fees | | | — | (b) | |
Trustees' fees | | | 1 | | |
| 12b-1 fees | | | 2 | | |
Other accrued expenses | | | 67 | | |
Total Liabilities | | | 15,896 | | |
Net Assets: | |
Capital | | | 1,203,835 | | |
Total accumulated earnings/(loss) | | | (699,647 | ) | |
Net Assets | | $ | 504,188 | | |
Net Assets | |
Fund Shares | | $ | 461,385 | | |
Institutional Shares | | | 19,437 | | |
Class A | | | 23,366 | | |
Total | | $ | 504,188 | | |
Shares (unlimited number of shares authorized with no par value): | |
Fund Shares | | | 28,533 | | |
Institutional Shares | | | 1,176 | | |
Class A | | | 1,465 | | |
Total | | | 31,174 | | |
Net asset value, offering and redemption price per share: (c) | |
Fund Shares | | $ | 16.17 | | |
Institutional Shares | | | 16.54 | | |
Class A | | | 15.95 | | |
Maximum Sales Charge — Class A | | | 5.75 | % | |
Maximum offering price
(100%/(100%-maximum sales charge) of net asset value adjusted to
the nearest cent) per share — Class A | | $ | 16.92 | | |
(a) Includes $14,242 thousand of securities on loan.
(b) Rounds to less than $1 thousand.
(c) Per share amount may not recalculate due to rounding of net assets and/or shares outstanding.
See notes to financial statements.
6
USAA Mutual Funds Trust | | Statement of Operations
For the Six Months Ended November 30, 2022 | |
(Amounts in Thousands) (Unaudited)
| | | USAA Precious Metals
and Minerals Fund | |
Investment Income: | |
Dividends | | $ | 7,136 | | |
Interest | | | 6 | | |
Securities lending (net of fees) | | | 135 | | |
Foreign tax withholding | | | (821 | ) | |
Total Income | | | 6,456 | | |
Expenses: | |
Investment advisory fees | | | 1,678 | | |
Administration fees — Fund Shares | | | 324 | | |
Administration fees — Institutional Shares | | | 9 | | |
Administration fees — Class A | | | 16 | | |
Sub-Administration fees | | | 12 | | |
| 12b-1 fees — Class A | | | 27 | | |
Custodian fees | | | 41 | | |
Transfer agent fees — Fund Shares | | | 511 | | |
Transfer agent fees — Institutional Shares | | | 9 | | |
Transfer agent fees — Class A | | | 11 | | |
Trustees' fees | | | 24 | | |
Compliance fees | | | 2 | | |
Legal and audit fees | | | 45 | | |
State registration and filing fees | | | 36 | | |
Other expenses | | | 72 | | |
Total Expenses | | | 2,817 | | |
Expenses waived/reimbursed by Adviser | | | (24 | ) | |
Net Expenses | | | 2,793 | | |
Net Investment Income (Loss) | | | 3,663 | | |
Realized/Unrealized Gains (Losses) from Investments: | |
Net realized gains (losses) from investment securities and foreign currency
transactions | | | (13,561 | ) | |
Net change in unrealized appreciation/depreciation on investment securities
and foreign currency translations | | | (54,472 | ) | |
Net realized/unrealized gains (losses) on investments | | | (68,033 | ) | |
Change in net assets resulting from operations | | $ | (64,370 | ) | |
See notes to financial statements.
7
USAA Mutual Funds Trust | | Statements of Changes in Net Assets | |
(Amounts in Thousands)
| | | USAA Precious Metals
and Minerals Fund | |
| | | Six Months
Ended
November 30,
2022
(Unaudited) | | Year
Ended
May 31,
2022 | |
From Investments: | |
Operations: | |
Net Investment Income (Loss) | | $ | 3,663 | | | $ | 6,075 | | |
Net realized gains (losses) | | | (13,561 | ) | | | 6,161 | | |
Net change in unrealized appreciation/depreciation | | | (54,472 | ) | | | (155,244 | ) | |
Change in net assets resulting from operations | | | (64,370 | ) | | | (143,008 | ) | |
Distributions to Shareholders: | |
Fund Shares | | | — | | | | (4,645 | ) | |
Institutional Shares | | | — | | | | (198 | ) | |
Class A | | | — | | | | (166 | ) | |
Change in net assets resulting from distributions to shareholders | | | — | | | | (5,009 | ) | |
Change in net assets resulting from capital transactions | | | (13,821 | ) | | | (20,193 | ) | |
Change in net assets | | | (78,191 | ) | | | (168,210 | ) | |
Net Assets: | |
Beginning of period | | | 582,379 | | | | 750,589 | | |
End of period | | $ | 504,188 | | | $ | 582,379 | | |
(continues on next page)
See notes to financial statements.
8
USAA Mutual Funds Trust | | Statements of Changes in Net Assets | |
(Amounts in Thousands) (continued)
| | | USAA Precious Metals
and Minerals Fund | |
| | | Six Months
Ended
November 30,
2022
(Unaudited) | | Year
Ended
May 31,
2022 | |
Capital Transactions: | |
Fund Shares | |
Proceeds from shares issued | | $ | 16,656 | | | $ | 71,209 | | |
Distributions reinvested | | | — | | | | 4,526 | | |
Cost of shares redeemed | | | (29,686 | ) | | | (103,473 | ) | |
Total Fund Shares | | $ | (13,030 | ) | | $ | (27,738 | ) | |
Institutional Shares | |
Proceeds from shares issued | | $ | 1,546 | | | $ | 1,422 | | |
Distributions reinvested | | | — | | | | 198 | | |
Cost of shares redeemed | | | (501 | ) | | | (2,089 | ) | |
Total Institutional Shares | | $ | 1,045 | | | $ | (469 | ) | |
Class A | |
Proceeds from shares issued | | $ | 3,262 | | | $ | 18,346 | | |
Distributions reinvested | | | — | | | | 166 | | |
Cost of shares redeemed | | | (5,098 | ) | | | (10,498 | ) | |
Total Class A | | $ | (1,836 | ) | | $ | 8,014 | | |
Change in net assets resulting from capital transactions | | $ | (13,821 | ) | | $ | (20,193 | ) | |
Share Transactions: | |
Fund Shares | |
Issued | | | 1,126 | | | | 3,591 | | |
Reinvested | | | — | | | | 250 | | |
Redeemed | | | (1,999 | ) | | | (5,358 | ) | |
Total Fund Shares | | | (873 | ) | | | (1,517 | ) | |
Institutional Shares | |
Issued | | | 97 | | | | 74 | | |
Reinvested | | | — | | | | 11 | | |
Redeemed | | | (33 | ) | | | (115 | ) | |
Total Institutional Shares | | | 64 | | | | (30 | ) | |
Class A | |
Issued | | | 236 | | | | 922 | | |
Reinvested | | | — | | | | 9 | | |
Redeemed | | | (346 | ) | | | (535 | ) | |
Total Class A | | | (110 | ) | | | 396 | | |
Change in Shares | | | (919 | ) | | | (1,151 | ) | |
See notes to financial statements.
9
USAA Mutual Funds Trust | | Financial Highlights | |
For a Share Outstanding Throughout Each Period
| | | | | Investment Activities | | Distributions to
Shareholders From | |
| | | Net Asset
Value,
Beginning of
Period | | Net
Investment
Income
(Loss) | | Net Realized
and Unrealized
Gains (Losses) | | Total from
Investment
Activities | | Net
Investment
Income | | Total
Distributions | |
USAA Precious Metals and Minerals Fund | | | |
Fund Shares | | | |
Six Months Ended
November 30, 2022
(Unaudited) | | $ | 18.14 | | | | 0.12 | (h) | | | (2.09 | ) | | | (1.97 | ) | | | — | | | | — | | |
Year Ended May 31:
2022 | | $ | 22.57 | | | | 0.19 | (h) | | | (4.46 | ) | | | (4.27 | ) | | | (0.16 | ) | | | (0.16 | ) | |
2021 | | $ | 19.34 | | | | 0.09 | (h) | | | 3.15 | | | | 3.24 | | | | (0.01 | ) | | | (0.01 | ) | |
2020 | | $ | 12.16 | | | | (0.04 | )(h) | | | 7.22 | | | | 7.18 | | | | — | | | | — | | |
2019 | | $ | 12.87 | | | | (0.03 | )(h) | | | (0.68 | ) | | | (0.71 | ) | | | — | | | | — | | |
2018 | | $ | 12.93 | | | | (0.05 | )(h) | | | (0.01 | ) | | | (0.06 | ) | | | — | | | | — | | |
Institutional Shares | | | |
Six Months Ended
November 30, 2022
(Unaudited) | | $ | 18.53 | | | | 0.14 | (h) | | | (2.13 | ) | | | (1.99 | ) | | | — | | | | — | | |
Year Ended May 31:
2022 | | $ | 23.06 | | | | 0.22 | (h) | | | (4.56 | ) | | | (4.34 | ) | | | (0.19 | ) | | | (0.19 | ) | |
2021 | | $ | 19.76 | | | | 0.12 | (h) | | | 3.22 | | | | 3.34 | | | | (0.04 | ) | | | (0.04 | ) | |
2020 | | $ | 12.40 | | | | (0.01 | )(h) | | | 7.37 | | | | 7.36 | | | | — | | | | — | | |
2019 | | $ | 13.06 | | | | 0.01 | (h) | | | (0.67 | ) | | | (0.66 | ) | | | — | | | | — | | |
2018 | | $ | 13.07 | | | | (0.01 | )(h) | | | — | (k) | | | (0.01 | ) | | | — | | | | — | | |
Class A | | | |
Six Months Ended
November 30, 2022
(Unaudited) | | $ | 17.91 | | | | 0.11 | (h) | | | (2.07 | ) | | | (1.96 | ) | | | — | | | | — | | |
Year Ended May 31:
2022 | | $ | 22.29 | | | | 0.14 | (h) | | | (4.39 | ) | | | (4.25 | ) | | | (0.13 | ) | | | (0.13 | ) | |
2021 | | $ | 19.13 | | | | 0.04 | (h) | | | 3.12 | | | | 3.16 | | | | — | | | | — | | |
2020 | | $ | 12.04 | | | | (0.05 | )(h) | | | 7.14 | | | | 7.09 | | | | — | | | | — | | |
2019 | | $ | 12.74 | | | | (0.03 | )(h) | | | (0.67 | ) | | | (0.70 | ) | | | — | | | | — | | |
2018 | | $ | 12.82 | | | | 0.16 | | | | (0.24 | ) | | | (0.08 | ) | | | — | | | | — | | |
(a) Not annualized for periods less than one year.
(b) Assumes reinvestment of all net investment income and realized capital gain distributions, if any, during the period. Includes adjustments in accordance with U.S. Generally Accepted Accounting Principles and could differ from the Lipper reported return.
(c) Annualized for periods less than one year.
(d) The net expense ratio may not correlate to the applicable expense limits in place during the period since the current contractual expense limitation is applied for a period beginning July 1, 2019, and in effect through September 30, 2023, instead of coinciding with the Fund's fiscal year end. Details of the current contractual expense limitation in effect can be found in Note 5 of the accompanying Notes to Financial Statements.
(e) Does not include acquired fund fees and expenses, if any.
(f) From the period beginning July 1, 2019, the amount of any waivers or reimbursements and the amount of any recoupment are calculated without regard to the impact of any performance adjustment to the Fund's management fee.
See notes to financial statements.
10
USAA Mutual Funds Trust | | Financial Highlights — continued | |
For a Share Outstanding Throughout Each Period
| | | | Ratios to Average Net Assets | | Supplemental Data | |
| | | Redemption
Fees Added to
Beneficial
Interests | | Net Asset
Value,
End of
Period | | Total
Return
(Excludes
Sales
Charge)(a)(b) | | Net
Expenses(c)(d)(e)(f) | | Net
Investment
Income
(Loss)(c) | | Gross
Expenses(c)(e) | | Net Assets,
End of
Period
(000's) | | Portfolio
Turnover(a)(g) | |
USAA Precious Metals and Minerals Fund | |
Fund Shares | |
Six Months Ended
November 30, 2022
(Unaudited) | | | — | | | $ | 16.17 | | | | (10.86 | )% | | | 1.19 | % | | | 1.56 | % | | | 1.19 | % | | $ | 461,385 | | | | 2 | % | |
Year Ended May 31:
2022 | | | | $ | 18.14 | | | | (18.93 | )% | | | 1.12 | % | | | 0.97 | % | | | 1.12 | % | | $ | 533,574 | | | | 8 | % | |
2021 | | | | $ | 22.57 | | | | 16.69 | % | | | 1.12 | % | | | 0.41 | % | | | 1.12 | % | | $ | 697,969 | | | | 7 | % | |
2020 | | | — | | | $ | 19.34 | | | | 59.13 | % | | | 1.19 | % | | | (0.25 | )% | | | 1.19 | % | | $ | 660,770 | | | | 47 | %(i) | |
2019 | | | — | | | $ | 12.16 | | | | (5.52 | )% | | | 1.31 | % | | | (0.22 | )% | | | 1.31 | % | | $ | 468,208 | | | | 7 | % | |
2018 | | | — | | | $ | 12.87 | | | | (0.46 | )% | | | 1.23 | % | | | (0.36 | )% | | | 1.23 | % | | $ | 540,952 | | | | 13 | % | |
Institutional Shares | |
Six Months Ended
November 30, 2022
(Unaudited) | | | — | | | $ | 16.54 | | | | (10.74 | )% | | | 0.97 | % | | | 1.78 | % | | | 1.13 | % | | $ | 19,437 | | | | 2 | % | |
Year Ended May 31:
2022 | | | | $ | 18.53 | | | | (18.84 | )% | | | 0.98 | % | | | 1.13 | % | | | 1.05 | % | | $ | 20,602 | | | | 8 | % | |
2021 | | | | $ | 23.06 | | | | 16.90 | % | | | 0.99 | % | | | 0.55 | % | | | 1.05 | % | | $ | 26,338 | | | | 7 | % | |
2020 | | | — | | | $ | 19.76 | | | | 59.35 | % | | | 1.00 | % | | | (0.05 | )% | | | 1.06 | % | | $ | 21,855 | | | | 47 | %(i) | |
2019 | | | — | | | $ | 12.40 | | | | (5.05 | )% | | | 1.00 | %(j) | | | 0.12 | % | | | 1.19 | % | | $ | 21,327 | | | | 7 | % | |
2018 | | | — | | | $ | 13.06 | | | | (0.08 | )% | | | 0.89 | % | | | (0.07 | )% | | | 0.89 | % | | $ | 3,632 | | | | 13 | % | |
Class A | |
Six Months Ended
November 30, 2022
(Unaudited) | | | — | | | $ | 15.95 | | | | (10.94 | )% | | | 1.30 | % | | | 1.44 | % | | | 1.40 | % | | $ | 23,366 | | | | 2 | % | |
Year Ended May 31:
2022 | | | | $ | 17.91 | | | | (19.08 | )% | | | 1.31 | % | | | 0.74 | % | | | 1.34 | % | | $ | 28,203 | | | | 8 | % | |
2021 | | | | $ | 22.29 | | | | 16.52 | % | | | 1.31 | % | | | 0.21 | % | | | 1.34 | % | | $ | 26,282 | | | | 7 | % | |
2020 | | | — | | | $ | 19.13 | | | | 58.89 | % | | | 1.27 | % | | | (0.32 | )% | | | 1.27 | % | | $ | 28,653 | | | | 47 | %(i) | |
2019 | | | — | | | $ | 12.04 | | | | (5.49 | )% | | | 1.38 | % | | | (0.27 | )% | | | 1.38 | % | | $ | 17,744 | | | | 7 | % | |
2018 | | | — | (k) | | $ | 12.74 | | | | (0.62 | )% | | | 1.30 | % | | | (0.43 | )% | | | 1.30 | % | | $ | 16,881 | | | | 13 | % | |
(g) Portfolio turnover is calculated on the basis of the Fund as a whole without distinguishing between the classes of shares issued.
(h) Per share net investment income (loss) has been calculated using the average daily shares method.
(i) Reflects increased trading activity due to current year transition or asset allocation shift.
(j) Effective June 6, 2018, USAA Asset Management Company (previous Adviser) has voluntarily agreed to limit the annual expenses of the Institutional Shares to 1.00% of the Institutional Shares' average daily net assets.
(k) Amount is less than $0.005 per share.
See notes to financial statements.
11
USAA Mutual Funds Trust | | Notes to Financial Statements
November 30, 2022 | |
(Unaudited)
1. Organization:
USAA Mutual Funds Trust (the "Trust") is organized as a Delaware statutory trust and is registered under the Investment Company Act of 1940, as amended (the "1940 Act"), as an open-end investment company. The Trust is comprised of 45 funds and is authorized to issue an unlimited number of shares, which are units of beneficial interest with no par value.
The accompanying financial statements are those of the USAA Precious Metals and Minerals Fund (the "Fund"). The Fund offers three classes of shares: Fund Shares, Institutional Shares, and Class A. The Fund is classified as non-diversified under the 1940 Act.
Each class of shares of the Fund has substantially identical rights and privileges, except with respect to sales charges, fees paid under distribution plans, expenses allocable exclusively to each class of shares, voting rights on matters solely affecting a single class of shares, and the exchange privilege of each class of shares.
Victory Capital Management ("VCM" or the "Adviser"), is an indirect wholly owned subsidiary of Victory Capital Holdings, Inc., a publicly traded Delaware corporation, and a wholly owned direct subsidiary of Victory Capital Operating, LLC.
Under the Trust's organizational documents, its officers and trustees are indemnified against certain liabilities arising out of the performance of their duties to the Fund. In addition, in the normal course of business, the Fund enters into contracts with its vendors and others that provide for general indemnifications. The Fund's maximum exposure under these arrangements is unknown, as this would involve future claims that may be made against the Fund. However, based on experience, the Fund expects that risk of loss to be remote.
2. Significant Accounting Policies:
The following is a summary of significant accounting policies followed by the Trust in the preparation of its financial statements. The policies are in conformity with U.S. Generally Accepted Accounting Principles ("GAAP"). The preparation of financial statements in accordance with GAAP requires management to make estimates and assumptions that affect the reported amounts of assets and liabilities and disclosure of contingent assets and liabilities at the date of the financial statements and the reported amounts of income and expenses for the period. Actual results could differ from those estimates. The Fund follows the specialized accounting and reporting requirements under GAAP that are applicable to investment companies under Accounting Standards Codification Topic 946.
Investment Valuation:
The Fund records investments at fair value. Fair value is defined as the price that would be received to sell an asset or paid to transfer a liability in an orderly transaction between market participants at the measurement date.
The valuation techniques described below maximize the use of observable inputs and minimize the use of unobservable inputs in determining fair value. The inputs used for valuing the Fund's investments are summarized in the three broad levels listed below:
• Level 1 — quoted prices (unadjusted) in active markets for identical securities
• Level 2 — other significant observable inputs (including quoted prices for similar securities, interest rates, or credit spreads, applicable to those securities, etc.)
• Level 3 — significant unobservable inputs (including the Adviser's assumptions in determining the fair value of investments)
Changes in valuation techniques may result in transfers in or out of an assigned level within the disclosure hierarchy. The inputs or methodologies used for valuation techniques are not necessarily an indication of the risks associated with entering into those investments.
The Adviser, acting as the valuation designee has established the Pricing and Liquidity Committee (the "Committee"), and subject to the Trust's Board of Trustees' (the "Board") oversight, the Committee administers and oversees the Fund's valuation policies and procedures, which are approved by the Board.
12
USAA Mutual Funds Trust | | Notes to Financial Statements — continued
November 30, 2022 | |
(Unaudited)
Portfolio securities listed or traded on securities exchanges, including Exchange-Traded Funds ("ETFs"), and American Depositary Receipts ("ADRs"), are valued at the closing price on the exchange or system where the security is principally traded, if available, or at the Nasdaq Official Closing Price. If there have been no sales for that day on the exchange or system, then a security is valued at the last available bid quotation on the exchange or system where the security is principally traded. In each of these situations, valuations are typically categorized as Level 1 in the fair value hierarchy.
Investments in open-end investment companies, other than ETFs, are valued at their net asset value ("NAV"). These valuations are typically categorized as Level 1 in the fair value hierarchy.
In the event that price quotations or valuations are not readily available, investments are valued at fair value in accordance with procedures established by and under the general supervision and responsibility of the Board. These valuations are typically categorized as Level 2 or Level 3 in the fair value hierarchy, based on the observability of inputs used to determine the fair value. The effect of fair value pricing is that securities may not be priced on the basis of quotations from the primary market in which they are traded, and the actual price realized from the sale of a security may differ materially from the fair value price. Valuing these securities at fair value is intended to cause the Fund's NAV to be more reliable than it otherwise would be.
In accordance with procedures adopted by the Board, fair value pricing may be used if events materially affecting the value of foreign securities occur between the time the exchange on which they are traded closes and the time the Fund's NAV is calculated. The Fund uses a systematic valuation model, provided daily by an independent third party to fair value its international equity securities. The valuations are categorized as Level 2 in the fair value hierarchy.
A summary of the valuations as of November 30, 2022, based upon the three levels defined above, is included in the table below while the breakdown, by category, of investments is disclosed on the Schedule of Portfolio Investments (amounts in thousands):
| | | Level 1 | | Level 2 | | Level 3 | | Total | |
Common Stocks | | $ | 437,837 | | | $ | 55,359 | | | $ | 10,231 | | | $ | 503,427 | | |
Collateral for Securities Loaned | | | 14,261 | | | | — | | | | — | | | | 14,261 | | |
Total | | $ | 452,098 | | | $ | 55,359 | | | $ | 10,231 | | | $ | 517,688 | | |
For the six months ended November 30, 2022, there were no transfers into/out of Level 3.
Investment Companies:
Open-End Funds:
The Fund may invest in portfolios of open-end investment companies. These investment companies value securities in their portfolios for which market quotations are readily available at their market values (generally the last reported sale price) and all other securities and assets at their fair value by the methods established by the board of directors of the underlying funds.
Derivative Instruments:
Foreign Exchange Currency Contracts:
The Fund may enter into foreign exchange currency contracts to convert U.S. dollars to and from various foreign currencies. A foreign exchange currency contract is an obligation by the Fund to purchase or sell a specific currency at a future date at a price (in U.S. dollars) set at the time of the contract. The Fund does not engage in "cross-currency" foreign exchange contracts (i.e., contracts to purchase or sell one foreign currency in exchange for another foreign currency). The Fund's foreign exchange currency contracts might be considered spot contracts (typically a contract of one week or less) or forward contracts (typically a contract term over one week). A spot contract is entered into for purposes of hedging against foreign currency fluctuations relating to a specific portfolio transaction, such as the delay between a security transaction trade date and settlement date. Forward contracts
13
USAA Mutual Funds Trust | | Notes to Financial Statements — continued
November 30, 2022 | |
(Unaudited)
are entered into for purposes of hedging portfolio holdings or concentrations of such holdings. Each foreign exchange currency contract is adjusted daily by the prevailing spot or forward rate of the underlying currency, and any appreciation or depreciation is recorded for financial statement purposes as unrealized until the contract settlement date, at which time the Fund records realized gains or losses equal to the difference between the value of a contract at the time it was opened and the value at the time it was closed. The Fund could be exposed to risk if a counterparty is unable to meet the terms of a foreign exchange currency contract or if the value of the foreign currency changes unfavorably. In addition, the use of foreign exchange currency contracts does not eliminate fluctuations in the underlying prices of the securities. As of November 30, 2022, the Fund had no open forward foreign exchange currency contracts.
Investment Transactions and Related Income:
Changes in holdings of investments are accounted for no later than one business day following the trade date. For financial reporting purposes, however, investment transactions are accounted for on trade date or the last business day of the reporting period. Interest income is determined on the basis of coupon interest accrued using the effective interest method which adjusts, where applicable, the amortization of premiums or accretion of discounts. Dividend income is recorded on the ex-dividend date. Gains or losses realized on sales of securities are recorded on the identified cost basis.
Withholding taxes on interest, dividends, and gains as a result of certain investments in ADRs by the Fund have been provided for in accordance with each investment's applicable country's tax rules and rates.
Securities Lending:
The Fund, through a Securities Lending Agreement with Citibank, N.A. ("Citibank"), may lend its securities to qualified financial institutions, such as certain broker-dealers and banks, to earn additional income, net of income retained by Citibank. Borrowers are required to initially secure their loans for collateral in the amount of at least 102% of the value of U.S. securities loaned or at least 105% of the value of non-U.S. securities loaned, marked-to-market daily. Any collateral shortfalls associated with increases in the valuation of the securities loaned are generally cured the next business day. The collateral can be received in the form of cash collateral and/or non-cash collateral. Non-cash collateral can include U.S. Government Securities and other securities as permitted by Securities and Exchange Commission ("SEC") guidelines. The cash collateral is invested in short-term instruments or cash equivalents, primarily open-end investment companies, as noted on the Fund's Schedule of Portfolio Investments. The Fund effectively does not have control of the non-cash collateral and therefore it is not disclosed on the Fund's Schedule of Portfolio Investments. Collateral requirements are determined daily based on the value of the Fund's securities on loan as of the end of the prior business day. During the time portfolio securities are on loan, the borrower will pay the Fund any dividends or interest paid on such securities plus any fee negotiated between the parties to the lending agreement. The Fund also earns a return from the collateral. The Fund pays Citibank various fees in connection with the investment of cash collateral and fees based on the investment income received from securities lending activities. Securities lending income (net of these fees) is disclosed on the Statement of Operations. Loans are terminable upon demand and the borrower must return the loaned securities within the lesser of one standard settlement period or five business days. Although risk is mitigated by the collateral, the Fund could experience a delay in recovering its securities and possible loss of income or value if the borrower fails to return them. In addition, there is a risk that the value of the short-term investments will be less than the amount of cash collateral required to be returned to the borrower.
The Fund's agreement with Citibank does not include master netting provisions. Non-cash collateral received by the Fund may not be sold or repledged, except to satisfy borrower default.
14
USAA Mutual Funds Trust | | Notes to Financial Statements — continued
November 30, 2022 | |
(Unaudited)
The following table (amounts in thousands) is a summary of the Fund's securities lending transactions as of November 30, 2022.
Value of
Securities on Loan | | Non-Cash
Collateral | | Cash
Collateral | |
| $ | 14,242 | | | $ | — | | | $ | 14,261 | | |
Foreign Currency Translations:
The accounting records of the Fund are maintained in U.S. dollars. Investment securities and other assets and liabilities of the Fund denominated in a foreign currency are translated into U.S. dollars at current exchange rates. Purchases and sales of securities, income receipts, and expense payments are translated into U.S. dollars at the exchange rates on the date of the transactions. The Fund does not isolate the portion of the results of operations resulting from changes in foreign exchange rates on investments from fluctuations arising from changes in market prices of securities held. Such fluctuations are disclosed as Net change in unrealized appreciation/depreciation on investment securities and foreign currency translations on the Statement of Operations. Any realized gains or losses from these fluctuations are disclosed as Net realized gains (losses) from investment securities and foreign currency transactions on the Statement of Operations.
Foreign Taxes:
The Fund may be subject to foreign taxes related to foreign income received (a portion of which may be reclaimable), capital gains on the sale of securities, and certain foreign currency transactions. All foreign taxes are recorded in accordance with the applicable regulations and rates that exist in the foreign jurisdictions in which the Fund invests.
Federal Income Taxes:
The Fund intends to continue to qualify as a regulated investment company by complying with the provisions available to certain investment companies, as defined in applicable sections of the Internal Revenue Code, and to make distributions of net investment income and net realized gains sufficient to relieve it from all, or substantially all, federal income taxes. Accordingly, no provision for federal income taxes is required in the financial statements. The Fund has a tax year end of May 31.
For the six months ended November 30, 2022, the Fund did not incur any income tax, interest, or penalties, and has recorded no liability for net unrecognized tax benefits relating to uncertain tax positions.
Management of the Fund has reviewed tax positions taken in tax years that remain subject to examination by all major tax jurisdictions, including federal (i.e., the last four tax years, which includes the current fiscal tax year end). Management believes that there is no tax liability resulting from unrecognized tax benefits related to uncertain tax positions taken.
Allocations:
Expenses directly attributable to the Fund are charged to the Fund, while expenses that are attributable to more than one fund in the Trust, or jointly with an affiliated trust, are allocated among the respective funds in the Trust and/or an affiliated trust based upon net assets or another appropriate basis.
Income, expenses (other than class-specific expenses such as transfer agent fees, state registration fees, printing fees, and 12b-1 fees), and realized and unrealized gains or losses on investments are allocated to each class of shares based on its relative net assets on the date income is earned or expenses and realized and unrealized gains and losses are incurred.
15
USAA Mutual Funds Trust | | Notes to Financial Statements — continued
November 30, 2022 | |
(Unaudited)
3. Purchases and Sales:
Purchases and sales of securities (excluding securities maturing less than one year from acquisition) for the six months ended November 30, 2022, were as follows for the Fund (amounts in thousands):
Excluding
U.S. Government Securities | |
Purchases | | Sales | |
$ | 10,191 | | | $ | 19,233 | | |
4. Affiliated Fund Ownership:
The Fund offers its shares for investment by other USAA Mutual Funds. The fund-of-funds do not invest in the underlying funds for the purpose of exercising management or control, and the affiliated fund-of-funds' annual and semi-annual reports may be viewed at www.vcm.com. As of November 30, 2022, certain fund-of-funds owned total outstanding shares of the Fund as follows:
Affiliated USAA Mutual Funds | | Ownership % | |
USAA Cornerstone Conservative Fund | | | 0.2 | | |
USAA Cornerstone Equity Fund | | | 0.1 | | |
USAA Target Retirement Income Fund | | | 0.4 | | |
USAA Target Retirement 2030 Fund | | | 0.8 | | |
USAA Target Retirement 2040 Fund | | | 0.9 | | |
USAA Target Retirement 2050 Fund | | | 0.5 | | |
USAA Target Retirement 2060 Fund | | | 0.1 | | |
5. Fees and Transactions with Affiliates and Related Parties:
Investment Advisory Fees:
Investment advisory services are provided to the Fund by the Adviser, which is a New York corporation registered as an investment adviser with the SEC.
Under the terms of the Investment Advisory Agreement, the Adviser is entitled to receive a base fee and a performance adjustment. The Fund's base fee is accrued daily and paid monthly at an annualized rate of 0.75% of the Fund's average daily net assets. Amounts incurred and paid to VCM for the six months ended November 30, 2022, are reflected on the Statement of Operations as Investment advisory fees.
The performance adjustment for each share class is accrued daily and calculated monthly by comparing the respective class' performance to that of the Lipper Precious Metals Equity Funds Index. The Lipper Precious Metals Equity Funds Index tracks the total return performance of the largest funds within the Lipper Precious Metals Equity Funds category.
The performance period for each share class consists of the current month plus the previous 35 months. The following table is utilized to determine the extent of the performance adjustment:
Over/Under Performance Relative to Index
(in basis points)(a) | | Annual Adjustment Rate
(in basis points) | |
| | +/- 100 to 400 | | | | +/- 4 | | |
| | +/- 401 to 700 | | | | +/- 5 | | |
| | +/- 701 and greater | | | | +/- 6 | | |
(a) Based on the difference between the average annual performance of the relevant share class of the Fund and its relevant Lipper index, rounded to the nearest basis point.
16
USAA Mutual Funds Trust | | Notes to Financial Statements — continued
November 30, 2022 | |
(Unaudited)
Each class' annual performance adjustment rate is multiplied by the average daily net assets of the respective class over the entire performance period, which is then multiplied by a fraction, the numerator of which is the number of days in the month and the denominator of which is 365 (366 in leap years). The resulting amount is then added to (in the case of overperformance), or subtracted from (in the case of underperformance) the base fee.
Under the performance fee arrangement, each class pays a positive performance fee adjustment for a performance period whenever the class outperforms the Lipper Precious Metals Equity Funds Index over that period, even if the class has overall negative returns during the performance period.
For the period June 1, 2022, to November 30, 2022, performance adjustments were $(81), $(2), and $(4) for Fund Shares, Institutional Shares, and Class A, in thousands, respectively. Performance adjustments were (0.04)%, (0.03)%, and (0.04)% for Fund Shares, Institutional Shares, and Class A, respectively. The performance adjustment rate included in the investment advisory fee may differ from the maximum over/under Annual Adjustment Rate due to differences in average net assets for the reporting period and rolling 36 month performance periods.
The Trust relies on an exemptive order granted to VCM and its affiliated funds by the SEC in March 2019, permitting the use of a "manager-of-managers" structure for certain funds. Under a manager-of-managers structure, the investment adviser may select (with approval of the Board and without shareholder approval) one or more subadvisers to manage the day-to-day investment of a fund's assets. For the six months ended November 30, 2022, the Fund had no subadvisers.
Administration and Servicing Fees:
VCM also serves as the Fund's administrator and fund accountant. Under the Fund Administration, Servicing and Accounting Agreement, VCM is paid an administration and servicing fee that is accrued daily and paid monthly at an annualized rate of 0.15%, 0.10%, and 0.15%, which is based on the Fund's average daily net assets of the Fund Shares, Institutional Shares, and Class A, respectively. Amounts incurred for the six months ended November 30, 2022, are reflected on the Statement of Operations as Administration fees.
Citi Fund Services Ohio, Inc. ("Citi"), an affiliate of Citibank, acts as sub-administrator and sub-fund accountant to the Fund pursuant to a Sub-Administration and Sub-Fund Accounting Services Agreement between VCM and Citi. VCM pays Citi a fee for providing these services. The Fund reimburses VCM and Citi for out-of-pocket expenses incurred in providing these services and certain other expenses specifically allocated to the Fund. Amounts incurred for the six months ended November 30, 2022, are reflected on the Statement of Operations as Sub-Administration fees.
The Fund (as part of the Trust) has entered into an agreement with the Adviser to provide compliance services, pursuant to which the Adviser furnishes its compliance personnel, including the services of the Chief Compliance Officer ("CCO"), and other resources reasonably necessary to provide the Trust with compliance oversight services related to the design, administration, and oversight of a compliance program for the Trust in accordance with Rule 38a-1 under the 1940 Act. The CCO is an employee of the Adviser, which pays the compensation of the CCO and support staff. The funds in the Trust, Victory Variable Insurance Funds, Victory Portfolios, and Victory Portfolios II (collectively, the "Victory Funds Complex") in the aggregate, compensate the Adviser for these services. Amounts incurred for the six months ended November 30, 2022, are reflected on the Statement of Operations as Compliance fees.
Transfer Agency Fees:
Victory Capital Transfer Agency, Inc. ("VCTA"), an affiliate of the Adviser, provides transfer agency services to the Fund. VCTA provides transfer agent services to the Fund Shares based on an annual charge of $23 per shareholder account plus out-of-pocket expenses. VCTA pays a portion of these fees to certain intermediaries for the administration and servicing of accounts that are held with such intermediaries. Transfer agent fees for Institutional Shares and Class A are paid monthly based on a fee accrued daily at an annualized rate of 0.10% and 0.10%, respectively, of average daily net assets,
17
USAA Mutual Funds Trust | | Notes to Financial Statements — continued
November 30, 2022 | |
(Unaudited)
plus out-of-pocket expenses. Amounts incurred and paid to VCTA for the six months ended November 30, 2022, are reflected on the Statement of Operations as Transfer agent fees.
FIS Investor Services LLC serves as sub-transfer agent and dividend disbursing agent for the Fund pursuant to a Sub-Transfer Agent Agreement between VCTA and FIS Investor Services LLC. VCTA provides FIS Investor Services LLC a fee for providing these services.
Distributor/Underwriting Services:
Victory Capital Services, Inc. (the "Distributor"), an affiliate of the Adviser, serves as Distributor for the continuous offering of the shares of the Fund pursuant to a Distribution Agreement between the Distributor and the Trust.
Pursuant to the Distribution and Service Plans adopted in accordance with Rule 12b-1 under the 1940 Act, the Distributor may receive a monthly distribution and service fee, at an annual rate of up to 0.25% of the average daily net assets of Class A. The distribution and service fees paid to the Distributor may be used by the Distributor to pay for activity primarily intended to result in the sale of Class A. Amounts incurred and paid to the Distributor for the six months ended November 30, 2022, are reflected on the Statement of Operations as 12b-1 fees.
In addition, the Distributor is entitled to receive commissions in connection with sales of Class A. For the six months ended November 30, 2022, the Distributor received less than $1 thousand from commissions earned in connection with sales of Class A.
Other Fees:
Citibank serves as the Fund's custodian. The Fund pays Citibank a fee for providing these services. Amounts incurred for the six months ended November 30, 2022, are reflected on the Statement of Operations as Custodian fees.
K&L Gates LLP provides legal services to the Trust.
The Adviser has entered into an expense limitation agreement with the Fund until at least September 30, 2023. Under the terms of the agreement, the Adviser has agreed to waive fees or reimburse certain expenses to the extent that ordinary operating expenses incurred by certain classes of the Fund in any fiscal year exceed the expense limits for such classes of the Fund. Such excess amounts will be the liability of the Adviser. Performance adjustments, acquired fund fees and expenses, interest, taxes, brokerage commissions, other expenditures, which are capitalized in accordance with GAAP, and other extraordinary expenses not incurred in the ordinary course of the Fund's business are excluded from the expense limits. As of November 30, 2022, the expense limits (excluding voluntary waivers) were 1.27%, 1.00%, and 1.34% for Fund Shares, Institutional Shares, and Class A, respectively.
Under the terms of the expense limitation agreement, as amended June 29, 2022, the Fund has agreed to repay fees and expenses that were waived or reimbursed by the Adviser for a period of up to three years (thirty-six (36) months) after the waiver or reimbursement took place, subject to the lesser of any operating expense limits in effect at the time of: (a) the original waiver or expense reimbursement; or (b) the recoupment, after giving effect to the recoupment amount.
As of November 30, 2022, the following amounts are available to be repaid to the Adviser (amounts in thousands). The Fund has not recorded any amounts available to be repaid as a liability due to an assessment that such repayments are not probable at November 30, 2022.
Expires
2023 | | Expires
2024 | | Expires
2025 | | Expires
2026 | | Total | |
| $ | 7 | | | $ | 23 | | | $ | 22 | | | $ | 24 | | | $ | 76 | | |
The Adviser may voluntarily waive or reimburse additional fees to assist the Fund in maintaining competitive expense ratios. Voluntary waivers and reimbursements applicable to the Fund are not available to be recouped at a future time. There were no voluntary waivers or reimbursements for the six months ended November 30, 2022.
18
USAA Mutual Funds Trust | | Notes to Financial Statements — continued
November 30, 2022 | |
(Unaudited)
Certain officers and/or interested trustees of the Fund are also officers and/or employees of the Adviser, administrator, fund accountant, sub-administrator, sub-fund accountant, custodian, and Distributor.
6. Risks:
The Fund may be subject to other risks in addition to these identified risks.
Market Risk — Overall market risks may affect the value of the Fund. Domestic and international factors such as political events, war, terrorism, trade disputes, inflation rates, interest rate levels and other fiscal and monetary policy changes, cybersecurity incidents, pandemics and other public health crises, sanctions against a particular foreign country, its nationals, businesses or industries and related geopolitical events, as well as environmental disasters such as earthquakes, fires, and floods, or other catastrophes, may add to instability in global economies and markets generally, and may lead to increased market volatility. Global economies and financial markets are highly interconnected, which increases the possibility that conditions in one country or region might adversely affect issuers in another country or region. The impact of these and other factors may be short-term or may last for extended periods.
Equity Risk — The values of the equity securities in which the Fund invests may decline in response to developments affecting individual companies and/or general market, economic and political conditions and other factors. A company's earnings or dividends may not increase as expected due to poor management decisions, competitive pressures, breakthroughs in technology, reliance on suppliers, labor problems or shortages, corporate restructurings, fraudulent disclosures, natural disasters, military confrontations, war, terrorism, public health crises, or other events, conditions, and factors. Price changes may be temporary or may last for extended periods.
Foreign Securities Risk — Foreign markets can be more volatile than the U.S. market due to increased risks of adverse issuer, political, regulatory, market, or economic developments and can perform differently from the U.S. market. Global markets, or those in a particular region, may all react in similar fashion to important political, economic, or other developments. Events and evolving conditions in certain economies or markets may alter the risks associated with investments tied to countries or regions that historically were perceived as comparatively stable and make such investments riskier and more volatile.
7. Borrowing and Interfund Lending:
Line of Credit:
The Victory Funds Complex participates in a short-term demand note "Line of Credit" agreement with Citibank. The Line of Credit agreement with Citibank was renewed on June 27, 2022, with a termination date of June 26, 2023. Under the agreement with Citibank, the Victory Funds Complex may borrow up to $600 million, of which $300 million is committed and $300 million is uncommitted. $40 million of the Line of Credit is reserved for use by the Victory Floating Rate Fund, another series of the Victory Funds Complex, with Victory Floating Rate Fund paying the related commitment fees for that amount. The purpose of the Line of Credit is to meet temporary or emergency cash needs. For the six months ended November 30, 2022, Citibank received an annual commitment fee of 0.15% on $300 million for providing the Line of Credit. Each fund in the Victory Funds Complex paid a pro-rata portion of the commitment fees plus any interest on amounts borrowed. For the period from June 1, 2022, through June 27, 2022, interest was based on the one-month London Interbank Offered Rate ("LIBOR") plus one percent. Effective with the renewal, for the period June 28, 2022, through November 30, 2022, interest was based on the one-month Secured Overnight Financing Rate ("SOFR") plus 1.10 percent. Interest charged to the Fund during the period, if applicable, is reflected on the Statement of Operations under Line of credit fees.
The Fund had no borrowings under the Line of Credit agreement during the six months ended November 30, 2022.
19
USAA Mutual Funds Trust | | Notes to Financial Statements — continued
November 30, 2022 | |
(Unaudited)
Interfund Lending:
The Trust and the Adviser rely on an exemptive order granted by the SEC in March 2017 (the "Order"), permitting the establishment and operation of an Interfund Lending Facility (the "Facility"). The Facility allows the Fund to directly lend and borrow money to or from any other fund in the Victory Funds Complex that is permitted to participate in the Facility, relying upon the Order at rates beneficial to both the borrowing and lending funds. Advances under the Facility are allowed for temporary or emergency purposes, including the meeting of redemption requests that otherwise might require the untimely disposition of securities, and are subject to each Fund's borrowing restrictions. The interfund loan rate is determined, as specified in the Order, by averaging the current repurchase agreement rate and the current bank loan rate. As a Borrower, interest charged to the Fund, if any, during the period, is reflected on the Statement of Operations under Interfund lending fees. As a Lender, interest earned by the Fund, if any, during the period, is reflected on the Statement of Operations under Interfund lending.
The Fund did not utilize or participate in the Facility during the six months ended November 30, 2022.
8. Federal Income Tax Information:
The Fund intends to distribute any net investment income annually. Distributable net realized gains, if any, are declared and paid at least annually.
The amounts of dividends from net investment income and distributions from net realized gains (collectively, distributions to shareholders) are determined in accordance with federal income tax regulations, which may differ from GAAP. To the extent these "book/tax" differences are permanent in nature (e.g., net operating loss and distribution reclassification), such amounts are reclassified within the components of net assets based on their federal tax-basis treatment; temporary differences (e.g., wash sales) do not require reclassification. To the extent dividends and distributions exceed net investment income and net realized gains for tax purposes, they are reported as distributions of capital. Net investment losses incurred by the Fund may be reclassified as an offset to capital on the accompanying Statement of Assets and Liabilities.
The tax character of current year distributions paid and the tax basis of the current components of accumulated earnings (loss) will be determined at the end of the current tax year.
At the tax year ended May 31, 2022, the Fund had net capital loss carryforwards as summarized in the table below (amounts in thousands). It is unlikely that the Board will authorize a distribution of capital gains realized in the future until the capital loss carryforwards have been used.
Short-Term
Amount | | Long-Term
Amount | | Total | |
| $ | 10,375 | | | $ | 747,238 | | | $ | 757,613 | | |
20
USAA Mutual Funds Trust | | Supplemental Information
November 30, 2022 | |
(Unaudited)
Proxy Voting and Portfolio Holdings Information
Proxy Voting:
Information regarding the policies and procedures the Fund uses to determine how to vote proxies relating to portfolio securities is available without charge, upon request, by calling (800) 235-8396. The information is also included in the Fund's Statement of Additional Information, which is available on the SEC's website at www.sec.gov.
Information relating to how the Fund voted proxies relating to portfolio securities held during the most recent 12 months ended June 30 is available on the SEC's website at www.sec.gov.
Availability of Schedules of Portfolio Investments:
The Trust files a complete list of Schedules of Portfolio Investments with the SEC for the first and third quarter of each fiscal year on Form N-PORT. Form N-PORT is available on the SEC's website at www.sec.gov.
Expense Examples
As a shareholder of the Fund, you may incur two types of costs: (1) transaction costs, including sales charges (loads) on purchases; and (2) ongoing costs, including management fees and other Fund expenses. These examples are intended to help you understand your ongoing costs (in dollars) of investing in the Fund and to compare these costs with the ongoing costs of investing in other mutual funds.
These examples are based on an investment of $1,000 invested at the beginning of the period and held for the entire period from June 1, 2022, through November 30, 2022.
The Actual Expense figures in the table below provide information about actual account values and actual expenses. You may use the information below, together with the amount you invested, to estimate the expenses that you paid over the period. Simply divide your account value by $1,000 (for example, an $8,600 account value divided by $1,000 = 8.6), then multiply the result by the number in the table under the heading entitled "Actual Expenses Paid During Period" to estimate the expenses you paid on your account during this period.
The Hypothetical Expense figures in the table below provide information about hypothetical account values and hypothetical expenses based on the Fund's actual expense ratio and an assumed rate of return of 5% per year before expenses, which is not the Fund's actual return. The hypothetical account values and expenses may not be used to estimate the actual ending account balance or expenses you paid for the period. You may use this information to compare this 5% hypothetical example with the 5% hypothetical examples that appear in shareholder reports of other funds.
Please note the expenses shown in the table below are meant to highlight your ongoing costs only and do not reflect any transactional costs. Therefore, the hypothetical expenses in the table are useful in comparing ongoing costs only and will not help you determine the relative total costs of owning different funds. In addition, if these transactional costs were included, your costs would have been higher.
| | | Beginning
Account
Value
6/1/22 | | Actual
Ending
Account
Value
11/30/22 | | Hypothetical
Ending
Account
Value
11/30/22 | | Actual
Expenses Paid
During Period
6/1/22-
11/30/22* | | Hypothetical
Expenses Paid
During Period
6/1/22-
11/30/22* | | Annualized
Expense Ratio
During Period
6/1/22-
11/30/22 | |
Fund Shares | | $ | 1,000.00 | | | $ | 891.40 | | | $ | 1,019.10 | | | $ | 5.64 | | | $ | 6.02 | | | | 1.19 | % | |
Institutional Shares | | | 1,000.00 | | | | 892.60 | | | | 1,020.21 | | | | 4.60 | | | | 4.91 | | | | 0.97 | % | |
Class A | | | 1,000.00 | | | | 890.60 | | | | 1,018.55 | | | | 6.16 | | | | 6.58 | | | | 1.30 | % | |
* Expenses are equal to the average account value multiplied by the Fund's annualized expense ratio multiplied by 183/365 (the number of days in the most recent fiscal half-year divided by the number of days in the fiscal year).
21
Privacy Policy
Protecting the Privacy of Information
The Trust respects your right to privacy. We also know that you expect us to conduct and process your business in an accurate and efficient manner. To do so, we must collect and maintain certain personal information about you. This is the information we collect from you on applications or other forms, and from the transactions you make with us or third parties. It may include your name, address, social security number, account transactions and balances, and information about investment goals and risk tolerance.
We do not disclose any information about you or about former customers to anyone except as permitted or required by law. Specifically, we may disclose the information we collect to companies that perform services on our behalf, such as the transfer agent that processes shareholder accounts and printers and mailers that assist us in the distribution of investor materials. We may also disclose this information to companies that perform marketing services on our behalf. This allows us to continue to offer you Victory investment products and services that meet your investing needs, and to effect transactions that you request or authorize. These companies will use this information only in connection with the services for which we hired them. They are not permitted to use or share this information for any other purpose.
To protect your personal information internally, we permit access only by authorized employees and maintain physical, electronic, and procedural safeguards to guard your personal information.*
* You may have received communications regarding information about privacy policies from other financial institutions which gave you the opportunity to "opt-out" of certain information sharing with companies which are not affiliated with that financial institution. The Trust does not share information with other companies for purposes of marketing solicitations for products other than the Trust. Therefore, the Trust does not provide opt-out options to their shareholders.
P.O. Box 182593
Columbus, Ohio 43218-2593

Visit our website at: | | Call | |
www.vcm.com | | (800) 235-8396 | |

NOVEMBER 30, 2022
Semi Annual Report
USAA International Fund
Victory Capital means Victory Capital Management Inc., the investment adviser of the USAA Mutual Funds. USAA Mutual Funds are distributed by Victory Capital Services, Inc., member FINRA, an affiliate of Victory Capital. Victory Capital and its affiliates are not affiliated with United Services Automobile Association or its affiliates. USAA and the USAA logos are registered trademarks and the USAA Mutual Funds and USAA Investments logos are trademarks of United Services Automobile Association and are being used by Victory Capital and its affiliates under license.
www.vcm.com
News, Information And Education 24 Hours A Day, 7 Days A Week
The Victory Capital website gives fund shareholders, prospective shareholders, and investment professionals a convenient way to access fund information, get guidance, and track fund performance anywhere they can access the Internet. The site includes:
• Detailed performance records
• Daily share prices
• The latest fund news
• Investment resources to help you become a better investor
• A section dedicated to investment professionals
Whether you're a potential investor searching for the fund that matches your investment philosophy, a seasoned investor interested in planning tools, or an investment professional, www.vcm.com has what you seek. Visit us anytime. We're always open.
TABLE OF CONTENTS
Investment Objective & Portfolio Holdings | | | 2 | | |
Schedule of Portfolio Investments | | | 3 | | |
Financial Statements | |
Statement of Assets and Liabilities | | | 24 | | |
Statement of Operations | | | 26 | | |
Statements of Changes in Net Assets | | | 27 | | |
Financial Highlights | | | 30 | | |
Notes to Financial Statements | | | 34 | | |
Supplemental Information | | | 44 | | |
Proxy Voting and Portfolio Holdings Information | | | 44 | | |
Expense Examples | | | 44 | | |
Privacy Policy (inside back cover) | | | |
This report is for the information of the shareholders and others who have received a copy of the currently effective prospectus of the Fund, managed by Victory Capital Management Inc. It may be used as sales literature only when preceded or accompanied by a current prospectus, which provides further details about the Fund.
IRA DISTRIBUTION WITHHOLDING DISCLOSURE
We generally must withhold federal income tax at a rate of 10% of the taxable portion of your distribution and, if you live in a state that requires state income tax withholding, at your state's tax rate. However, you may elect not to have withholding apply or to have income tax withheld at a higher rate. Any withholding election that you make will apply to any subsequent distribution unless and until you change or revoke the election. If you wish to make a withholding election, or change or revoke a prior withholding election, call (800) 235-8396, and form W-4P (OMB No. 1545-0074 withholding certificate for pension or annuity payments) will be electronically sent.
If you do not have a withholding election in place by the date of a distribution, federal income tax will be withheld from the taxable portion of your distribution at a rate of 10%. If you must pay estimated taxes, you may be subject to estimated tax penalties if your estimated tax payments are not sufficient and sufficient tax is not withheld from your distribution.
For more specific information, please consult your tax adviser.
• NOT FDIC INSURED • NO BANK GUARANTEE • MAY LOSE VALUE
1
USAA Mutual Funds Trust
USAA International Fund | | November 30, 2022 | |
(Unaudited)
Investment Objective and Portfolio Holdings:
The Fund seeks capital appreciation.
Top 10 Sectors*:
November 30, 2022
(% of Net Assets)
Financials | | | 17.7 | % | |
Industrials | | | 16.4 | % | |
Health Care | | | 12.6 | % | |
Consumer Discretionary | | | 10.8 | % | |
Information Technology | | | 9.7 | % | |
Consumer Staples | | | 7.9 | % | |
Materials | | | 6.6 | % | |
Energy | | | 6.3 | % | |
Communication Services | | | 4.8 | % | |
Utilities | | | 2.8 | % | |
Country Allocation:
November 30, 2022
(% of Net Assets)
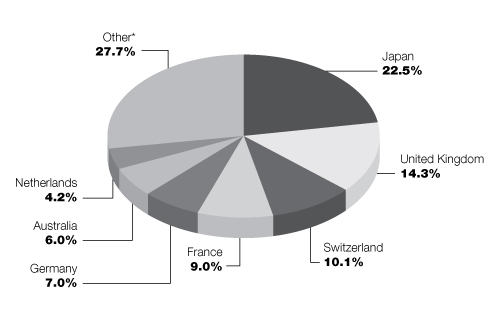
* Includes countries with less than 3.0% of portfolio and short-term investments purchased with cash collateral from securities loaned.
Percentages are of the net assets of the Fund and may not equal 100%.
Refer to the Schedule of Portfolio Investments for a complete list of securities.
2
USAA Mutual Funds Trust
USAA International Fund | | Schedule of Portfolio Investments
November 30, 2022 | |
(Amounts in Thousands, Except for Shares) (Unaudited)
Security Description | | Shares | | Value | |
Common Stocks (98.1%) | |
Argentina (0.0%): (a) | |
Energy (0.0%): | |
YPF SA, ADR (b) | | | 69,275 | | | $ | 581 | | |
Australia (6.0%): | |
Consumer Discretionary (1.0%): | |
ARB Corp. Ltd. (c) | | | 106,337 | | | | 2,080 | | |
Aristocrat Leisure Ltd. | | | 578,452 | | | | 13,897 | | |
Lovisa Holdings Ltd. | | | 226,325 | | | | 3,683 | | |
PWR Holdings Ltd. | | | 602,879 | | | | 4,833 | | |
| | | | 24,493 | | |
Energy (0.2%): | |
Santos Ltd. | | | 385,135 | | | | 1,920 | | |
Woodside Energy Group Ltd. | | | 111,641 | | | | 2,819 | | |
| | | | 4,739 | | |
Financials (1.0%): | |
Macquarie Group Ltd. | | | 162,815 | | | | 20,019 | | |
National Australia Bank Ltd. | | | 217,428 | | | | 4,679 | | |
QBE Insurance Group Ltd. | | | 194,906 | | | | 1,711 | | |
| | | | 26,409 | | |
Health Care (1.1%): | |
Cogstate, Ltd. (b) | | | 630,500 | | | | 839 | | |
CSL Ltd. | | | 122,448 | | | | 25,153 | | |
Nanosonics Ltd. (b) | | | 435,857 | | | | 1,428 | | |
| | | | 27,420 | | |
Industrials (0.4%): | |
Austal Ltd. | | | 1,436,152 | | | | 2,391 | | |
IPH Ltd. | | | 420,261 | | | | 2,621 | | |
Johns Lyng Group Ltd. | | | 860,481 | | | | 4,310 | | |
Qantas Airways Ltd. (b) | | | 478,842 | | | | 2,056 | | |
| | | | 11,378 | | |
Information Technology (0.1%): | |
Appen Ltd. | | | 805,839 | | | | 1,493 | | |
Materials (1.5%): | |
BHP Group Ltd. | | | 961,512 | | | | 29,853 | | |
Imdex Ltd. | | | 1,419,819 | | | | 2,355 | | |
Mineral Resources Ltd. | | | 32,002 | | | | 1,927 | | |
Ramelius Resources Ltd. | | | 2,721,529 | | | | 1,605 | | |
Rio Tinto Ltd. | | | 23,297 | | | | 1,739 | | |
| | | | 37,479 | | |
See notes to financial statements.
3
USAA Mutual Funds Trust
USAA International Fund | | Schedule of Portfolio Investments — continued
November 30, 2022 | |
(Amounts in Thousands, Except for Shares) (Unaudited)
Security Description | | Shares | | Value | |
Real Estate (0.7%): | |
Charter Hall Group | | | 201,686 | | | $ | 1,948 | | |
Goodman Group | | | 124,144 | | | | 1,642 | | |
Scentre Group | | | 6,527,481 | | | | 13,311 | | |
| | | | 16,901 | | |
| | | | 150,312 | | |
Austria (0.3%): | |
Financials (0.1%): | |
Erste Group Bank AG | | | 123,402 | | | | 3,864 | | |
Industrials (0.1%): | |
ANDRITZ AG | | | 45,140 | | | | 2,470 | | |
Information Technology (0.1%): | |
ams-OSRAM AG (b) | | | 168,297 | | | | 1,402 | | |
| | | | 7,736 | | |
Belgium (0.5%): | |
Financials (0.1%): | |
Ageas SA | | | 69,500 | | | | 2,814 | | |
Information Technology (0.4%): | |
Melexis NV | | | 112,739 | | | | 9,932 | | |
| | | | 12,746 | | |
Brazil (0.8%): | |
Communication Services (0.1%): | |
Telefonica Brasil SA | | | 263,906 | | | | 1,935 | | |
Consumer Staples (0.0%): (a) | |
Atacadao SA | | | 260,074 | | | | 801 | | |
Energy (0.2%): | |
Petro Rio SA (b) | | | 390,800 | | | | 2,715 | | |
Ultrapar Participacoes SA | | | 624,507 | | | | 1,709 | | |
| | | | 4,424 | | |
Financials (0.2%): | |
Banco Bradesco SA, ADR | | | 865,419 | | | | 2,571 | | |
Banco do Brasil SA | | | 374,900 | | | | 2,549 | | |
| | | | 5,120 | | |
Materials (0.1%): | |
Gerdau SA Preference Shares | | | 440,100 | | | | 2,678 | | |
Utilities (0.2%): | |
Cia de Saneamento Basico do Estado de Sao Paulo | | | 204,616 | | | | 2,378 | | |
Cia Energetica de Minas Gerais Preference Shares | | | 841,690 | | | | 1,862 | | |
| | | | 4,240 | | |
| | | | 19,198 | | |
See notes to financial statements.
4
USAA Mutual Funds Trust
USAA International Fund | | Schedule of Portfolio Investments — continued
November 30, 2022 | |
(Amounts in Thousands, Except for Shares) (Unaudited)
Security Description | | Shares | | Value | |
Canada (2.1%): | |
Consumer Discretionary (0.1%): | |
BRP, Inc. | | | 28,090 | | | $ | 2,103 | | |
Energy (0.5%): | |
ARC Resources Ltd. | | | 227,878 | | | | 3,385 | | |
Cameco Corp. | | | 68,833 | | | | 1,677 | | |
Headwater Exploration, Inc. (b) | | | 319,016 | | | | 1,537 | | |
Parex Resources, Inc. | | | 83,128 | | | | 1,190 | | |
Pason Systems, Inc. | | | 174,758 | | | | 2,085 | | |
Suncor Energy, Inc. | | | 49,190 | | | | 1,618 | | |
Trican Well Service Ltd. (b) | | | 708,675 | | | | 2,108 | | |
| | | | 13,600 | | |
Financials (0.6%): | |
Element Fleet Management Corp. | | | 228,356 | | | | 3,236 | | |
Fairfax Financial Holdings Ltd. | | | 5,336 | | | | 3,062 | | |
National Bank of Canada | | | 53,422 | | | | 3,810 | | |
Sun Life Financial, Inc. | | | 53,541 | | | | 2,537 | | |
The Toronto-Dominion Bank | | | 48,385 | | | | 3,221 | | |
| | | | 15,866 | | |
Industrials (0.3%): | |
Calian Group Ltd. | | | 50,890 | | | | 2,525 | | |
Finning International, Inc. | | | 70,106 | | | | 1,776 | | |
Savaria Corp. | | | 174,865 | | | | 2,010 | | |
| | | | 6,311 | | |
Materials (0.6%): | |
Barrick Gold Corp. | | | 210,253 | | | | 3,431 | | |
Karora Resources, Inc. (b) | | | 648,651 | | | | 2,141 | | |
Kinross Gold Corp. | | | 147,841 | | | | 611 | | |
Nutrien Ltd. | | | 35,743 | | | | 2,873 | | |
Stella-Jones, Inc. | | | 68,555 | | | | 2,433 | | |
Teck Resources Ltd. Class B | | | 72,475 | | | | 2,687 | | |
Wesdome Gold Mines Ltd. (b) | | | 288,239 | | | | 1,946 | | |
| | | | 16,122 | | |
| | | | 54,002 | | |
Chile (0.1%): | |
Consumer Staples (0.1%): | |
Cencosud SA | | | 1,003,356 | | | | 1,499 | | |
China (1.8%): | |
Communication Services (0.7%): | |
Baidu, Inc. Class A (b) | | | 260,414 | | | | 3,515 | | |
Tencent Holdings Ltd. | | | 343,500 | | | | 12,990 | | |
| | | | 16,505 | | |
See notes to financial statements.
5
USAA Mutual Funds Trust
USAA International Fund | | Schedule of Portfolio Investments — continued
November 30, 2022 | |
(Amounts in Thousands, Except for Shares) (Unaudited)
Security Description | | Shares | | Value | |
Consumer Discretionary (0.5%): | |
Alibaba Group Holding Ltd. (b) | | | 323,440 | | | $ | 3,520 | | |
BYD Co. Ltd. Class H | | | 74,000 | | | | 1,884 | | |
Dongfeng Motor Group Co. Ltd. Class H | | | 3,955,698 | | | | 2,229 | | |
Guangzhou Automobile Group Co. Ltd. Class H | | | 2,246,000 | | | | 1,624 | | |
New Oriental Education & Technology Group, Inc. (b) | | | 499,000 | | | | 1,434 | | |
Yadea Group Holdings Ltd. (d) | | | 852,000 | | | | 1,616 | | |
| | | | 12,307 | | |
Financials (0.3%): | |
Agricultural Bank of China Ltd. Class H | | | 4,094,000 | | | | 1,369 | | |
Bank of China Ltd. Class H | | | 5,779,000 | | | | 2,048 | | |
China Construction Bank Corp. Class H | | | 3,348,000 | | | | 2,026 | | |
PICC Property & Casualty Co. Ltd. Class H | | | 1,400,000 | | | | 1,418 | | |
| | | | 6,861 | | |
Health Care (0.1%): | |
CSPC Pharmaceutical Group Ltd. | | | 1,304,000 | | | | 1,680 | | |
Industrials (0.1%): | |
China Railway Group Ltd. Class H | | | 4,161,000 | | | | 2,349 | | |
COSCO SHIPPING Holdings Co. Ltd. Class H | | | 1,156,200 | | | | 1,264 | | |
| | | | 3,613 | | |
Materials (0.1%): | |
Anhui Conch Cement Co. Ltd. Class H | | | 642,000 | | | | 2,339 | | |
Ganfeng Lithium Group Co. Ltd. Class H (d) | | | 171,000 | | | | 1,513 | | |
| | | | 3,852 | | |
| | | | 44,818 | | |
Denmark (2.6%): | |
Consumer Discretionary (0.5%): | |
Pandora A/S | | | 171,138 | | | | 13,031 | | |
Health Care (1.8%): | |
Novo Nordisk A/S Class B | | | 364,421 | | | | 45,718 | | |
Industrials (0.3%): | |
AP Moller — Maersk A/S Class B | | | 892 | | | | 1,934 | | |
INVISIO AB | | | 188,153 | | | | 2,963 | | |
Per Aarsleff Holding A/S | | | 44,295 | | | | 1,434 | | |
| | | | 6,331 | | |
| | | | 65,080 | | |
Finland (0.6%): | |
Health Care (0.1%): | |
Revenio Group Oyj | | | 64,563 | | | | 2,755 | | |
Industrials (0.1%): | |
Wartsila Oyj Abp | | | 306,154 | | | | 2,652 | | |
See notes to financial statements.
6
USAA Mutual Funds Trust
USAA International Fund | | Schedule of Portfolio Investments — continued
November 30, 2022 | |
(Amounts in Thousands, Except for Shares) (Unaudited)
Security Description | | Shares | | Value | |
Information Technology (0.3%): | |
Admicom Oyj (c) | | | 38,241 | | | $ | 1,860 | | |
Nokia Oyj | | | 1,303,497 | | | | 6,421 | | |
| | | | 8,281 | | |
Utilities (0.1%): | |
Fortum Oyj | | | 132,526 | | | | 2,112 | | |
| | | | 15,800 | | |
France (9.0%): | |
Communication Services (0.3%): | |
Orange SA (c) | | | 339,367 | | | | 3,448 | | |
Publicis Groupe SA | | | 43,837 | | | | 2,885 | | |
| | | | 6,333 | | |
Consumer Discretionary (2.8%): | |
La Francaise des Jeux SAEM (d) | | | 403,018 | | | | 16,158 | | |
LVMH Moet Hennessy Louis Vuitton SE | | | 65,771 | | | | 51,035 | | |
Renault SA (b) | | | 92,210 | | | | 3,355 | | |
| | | | 70,548 | | |
Consumer Staples (0.3%): | |
Carrefour SA (c) | | | 215,993 | | | | 3,697 | | |
Pernod Ricard SA | | | 17,779 | | | | 3,527 | | |
| | | | 7,224 | | |
Energy (0.8%): | |
Gaztransport Et Technigaz SA | | | 67,239 | | | | 8,381 | | |
TotalEnergies SE (c) | | | 189,509 | | | | 11,843 | | |
| | | | 20,224 | | |
Financials (0.8%): | |
AXA SA | | | 301,827 | | | | 8,531 | | |
BNP Paribas SA | | | 138,808 | | | | 7,799 | | |
SCOR SE | | | 42,965 | | | | 826 | | |
Societe Generale SA | | | 164,377 | | | | 4,137 | | |
| | | | 21,293 | | |
Health Care (0.2%): | |
Equasens | | | 20,988 | | | | 1,727 | | |
EssilorLuxottica SA | | | 9,504 | | | | 1,774 | | |
Korian SA | | | 1 | | | | — | (e) | |
Vetoquinol SA | | | 20,263 | | | | 1,813 | | |
| | | | 5,314 | | |
Industrials (1.5%): | |
Cie de Saint-Gobain | | | 163,565 | | | | 7,542 | | |
Dassault Aviation SA | | | 13,738 | | | | 2,184 | | |
Eiffage SA | | | 20,226 | | | | 1,991 | | |
Rexel SA | | | 184,648 | | | | 3,393 | | |
Safran SA | | | 157,306 | | | | 19,439 | | |
See notes to financial statements.
7
USAA Mutual Funds Trust
USAA International Fund | | Schedule of Portfolio Investments — continued
November 30, 2022 | |
(Amounts in Thousands, Except for Shares) (Unaudited)
Security Description | | Shares | | Value | |
Teleperformance | | | 4,856 | | | $ | 1,108 | | |
Thermador Groupe | | | 33,378 | | | | 3,149 | | |
| | | | 38,806 | | |
Information Technology (1.2%): | |
Aubay | | | 36,883 | | | | 1,918 | | |
Capgemini SE | | | 103,127 | | | | 18,643 | | |
Edenred | | | 34,441 | | | | 1,892 | | |
Esker SA | | | 11,966 | | | | 1,909 | | |
Lectra | | | 80,344 | | | | 2,844 | | |
Wavestone | | | 49,964 | | | | 2,312 | | |
| | | | 29,518 | | |
Materials (0.7%): | |
Arkema SA | | | 198,166 | | | | 17,618 | | |
Real Estate (0.1%): | |
Klepierre SA | | | 71,463 | | | | 1,656 | | |
Utilities (0.3%): | |
Engie SA | | | 445,202 | | | | 6,767 | | |
| | | | 225,301 | | |
Germany (7.0%): | |
Communication Services (0.2%): | |
Deutsche Telekom AG | | | 234,490 | | | | 4,770 | | |
Consumer Discretionary (0.9%): | |
Ceconomy AG (c) | | | 220,202 | | | | 519 | | |
Continental AG | | | 35,804 | | | | 2,167 | | |
Mercedes-Benz Group AG | | | 92,018 | | | | 6,251 | | |
Volkswagen AG Preference Shares | | | 83,208 | | | | 12,289 | | |
| | | | 21,226 | | |
Consumer Staples (0.1%): | |
Henkel AG And Co. KGaA | | | 44,484 | | | | 3,181 | | |
Energy (0.2%): | |
CropEnergies AG | | | 180,221 | | | | 2,744 | | |
VERBIO Vereinigte BioEnergie AG | | | 28,329 | | | | 2,225 | | |
| | | | 4,969 | | |
Financials (1.0%): | |
Allianz SE Registered Shares | | | 103,528 | | | | 22,097 | | |
Hannover Rueck SE | | | 13,612 | | | | 2,584 | | |
| | | | 24,681 | | |
Health Care (0.7%): | |
Bayer AG Registered Shares | | | 53,550 | | | | 3,107 | | |
Eckert & Ziegler Strahlen- und Medizintechnik AG | | | 43,282 | | | | 2,458 | | |
Fresenius SE & Co. KGaA | | | 145,001 | | | | 4,040 | | |
Merck KGaA | | | 20,006 | | | | 3,665 | | |
Nexus AG | | | 80,065 | | | | 5,021 | | |
| | | | 18,291 | | |
See notes to financial statements.
8
USAA Mutual Funds Trust
USAA International Fund | | Schedule of Portfolio Investments — continued
November 30, 2022 | |
(Amounts in Thousands, Except for Shares) (Unaudited)
Security Description | | Shares | | Value | |
Industrials (1.8%): | |
| 2G Energy AG (c) | | | 119,672 | | | $ | 2,939 | | |
Amadeus Fire AG | | | 21,626 | | | | 2,571 | | |
Brenntag SE | | | 27,617 | | | | 1,756 | | |
Cewe Stiftung & Co. KGaA | | | 22,217 | | | | 2,230 | | |
Daimler Truck Holding AG (b) | | | 205,419 | | | | 6,770 | | |
Deutsche Post AG Registered Shares | | | 46,035 | | | | 1,839 | | |
| SFC Energy AG (b) | | | 73,375 | | | | 1,860 | | |
Siemens AG Registered Shares | | | 185,466 | | | | 25,719 | | |
| | | | 45,684 | | |
Information Technology (1.3%): | |
Basler AG (c) | | | 81,828 | | | | 2,905 | | |
Infineon Technologies AG | | | 98,650 | | | | 3,313 | | |
PVA TePla AG (b) | | | 101,779 | | | | 1,958 | | |
SAP SE | | | 194,347 | | | | 21,562 | | |
Secunet Security Networks AG (c) | | | 10,116 | | | | 2,339 | | |
| | | | 32,077 | | |
Materials (0.2%): | |
HeidelbergCement AG (c) | | | 84,663 | | | | 4,641 | | |
Utilities (0.6%): | |
RWE AG | | | 345,927 | | | | 15,227 | | |
| | | | 174,747 | | |
Hong Kong (2.0%): | |
Consumer Discretionary (0.0%): (a) | |
Chow Tai Fook Jewellery Group Ltd. | | | — | | | | — | | |
Consumer Staples (0.1%): | |
WH Group Ltd. (d) | | | 4,537,780 | | | | 2,659 | | |
Financials (0.8%): | |
AIA Group Ltd. | | | 1,845,000 | | | | 18,736 | | |
Industrials (0.1%): | |
CK Hutchison Holdings Ltd. | | | 297,500 | | | | 1,729 | | |
Information Technology (0.1%): | |
Lenovo Group Ltd. | | | 4,134,000 | | | | 3,531 | | |
Real Estate (0.8%): | |
CK Asset Holdings Ltd. | | | 3,476,919 | | | | 20,812 | | |
Utilities (0.1%): | |
Kunlun Energy Co. Ltd. | | | 1,954,000 | | | | 1,516 | | |
| | | | 48,983 | | |
India (0.9%): | |
Consumer Discretionary (0.0%): (a) | |
Mahindra & Mahindra Ltd. | | | 97,112 | | | | 1,562 | | |
Consumer Staples (0.1%): | |
Varun Beverages Ltd. | | | 117,706 | | | | 1,810 | | |
See notes to financial statements.
9
USAA Mutual Funds Trust
USAA International Fund | | Schedule of Portfolio Investments — continued
November 30, 2022 | |
(Amounts in Thousands, Except for Shares) (Unaudited)
Security Description | | Shares | | Value | |
Energy (0.2%): | |
Oil & Natural Gas Corp. Ltd. | | | 686,687 | | | $ | 1,203 | | |
Reliance Industries Ltd. | | | 93,879 | | | | 3,158 | | |
| | | | 4,361 | | |
Financials (0.3%): | |
Canara Bank | | | 1,625,090 | | | | 6,329 | | |
ICICI Bank Ltd. | | | 143,620 | | | | 1,683 | | |
| | | | 8,012 | | |
Information Technology (0.1%): | |
LTIMindtree Ltd. (d) | | | 25,402 | | | | 1,528 | | |
Tata Consultancy Services Ltd. | | | 35,067 | | | | 1,473 | | |
| | | | 3,001 | | |
Materials (0.1%): | |
UPL Ltd. | | | 267,163 | | | | 2,603 | | |
Utilities (0.1%): | |
Power Grid Corp. of India Ltd. | | | 823,622 | | | | 2,273 | | |
| | | | 23,622 | | |
Indonesia (0.2%): | |
Communication Services (0.1%): | |
PT Sarana Menara Nusantara Tbk | | | 25,739,600 | | | | 1,855 | | |
Financials (0.1%): | |
PT Bank Mandiri Persero Tbk | | | 3,963,352 | | | | 2,674 | | |
| | | | 4,529 | | |
Ireland (0.2%): | |
Financials (0.2%): | |
AIB Group PLC | | | 672,338 | | | | 2,183 | | |
Bank of Ireland Group PLC | | | 333,679 | | | | 2,767 | | |
| | | | 4,950 | | |
Israel (0.3%): | |
Consumer Discretionary (0.0%): (a) | |
Maytronics Ltd. (c) | | | 134,933 | | | | 1,555 | | |
Financials (0.1%): | |
Bank Leumi Le | | | 175,845 | | | | 1,613 | | |
Health Care (0.1%): | |
Inmode Ltd. (b) | | | 47,626 | | | | 1,829 | | |
Information Technology (0.1%): | |
Nice Ltd. (b) | | | 10,002 | | | | 1,939 | | |
| | | | 6,936 | | |
Italy (2.1%): | |
Consumer Staples (0.1%): | |
Pharmanutra SpA | | | 35,273 | | | | 2,347 | | |
See notes to financial statements.
10
USAA Mutual Funds Trust
USAA International Fund | | Schedule of Portfolio Investments — continued
November 30, 2022 | |
(Amounts in Thousands, Except for Shares) (Unaudited)
Security Description | | Shares | | Value | |
Energy (0.3%): | |
Eni SpA | | | 499,124 | | | $ | 7,441 | | |
Financials (0.5%): | |
Assicurazioni Generali SpA | | | 205,157 | | | | 3,639 | | |
| BPER Banca | | | 973,928 | | | | 2,014 | | |
UniCredit SpA | | | 473,051 | | | | 6,460 | | |
| | | | 12,113 | �� | |
Health Care (0.2%): | |
El.En. SpA | | | 287,648 | | | | 4,358 | | |
Industrials (0.1%): | |
Leonardo SpA | | | 197,721 | | | | 1,586 | | |
Salcef Group SpA | | | 133,821 | | | | 2,426 | | |
| | | | 4,012 | | |
Information Technology (0.2%): | |
Nexi SpA (b) (c) (d) | | | 141,734 | | | | 1,257 | | |
Sesa SpA | | | 30,841 | | | | 3,874 | | |
| | | | 5,131 | | |
Utilities (0.7%): | |
Enel SpA | | | 361,571 | | | | 1,950 | | |
Iren SpA | | | 601,853 | | | | 999 | | |
Snam SpA | | | 2,963,154 | | | | 15,125 | | |
| | | | 18,074 | | |
| | | | 53,476 | | |
Japan (22.5%): | |
Communication Services (1.5%): | |
Capcom Co. Ltd. | | | 399,800 | | | | 12,184 | | |
DeNA Co. Ltd. | | | 109,626 | | | | 1,481 | | |
Fuji Media Holdings, Inc. | | | 70,728 | | | | 557 | | |
Hakuhodo DY Holdings, Inc. | | | 50,030 | | | | 490 | | |
Intage Holdings, Inc. | | | 196,700 | | | | 2,212 | | |
Kakaku.com, Inc. | | | 600,200 | | | | 10,790 | | |
MarkLines Co. Ltd. | | | 133,200 | | | | 2,727 | | |
Nintendo Co. Ltd. | | | 40,100 | | | | 1,720 | | |
Nippon Telegraph & Telephone Corp. | | | 109,200 | | | | 3,028 | | |
Nippon Television Holdings, Inc. | | | 135,405 | | | | 1,047 | | |
ValueCommerce Co. Ltd. | | | 100,500 | | | | 1,552 | | |
| | | | 37,788 | | |
Consumer Discretionary (3.4%): | |
Arcland Service Holdings Co. Ltd. (c) | | | 120,000 | | | | 1,944 | | |
Bandai Namco Holdings, Inc. | | | 22,200 | | | | 1,471 | | |
Benesse Holdings, Inc. | | | 9,022 | | | | 131 | | |
Honda Motor Co. Ltd. | | | 243,412 | | | | 5,933 | | |
Isuzu Motors Ltd. | | | 524,492 | | | | 6,874 | | |
Nikon Corp. | | | 174,780 | | | | 1,709 | | |
Nissan Motor Co. Ltd. | | | 659,212 | | | | 2,379 | | |
Rinnai Corp. | | | 20,300 | | | | 1,517 | | |
See notes to financial statements.
11
USAA Mutual Funds Trust
USAA International Fund | | Schedule of Portfolio Investments — continued
November 30, 2022 | |
(Amounts in Thousands, Except for Shares) (Unaudited)
Security Description | | Shares | | Value | |
Shimamura Co. Ltd. | | | 9,459 | | | $ | 859 | | |
Shoei Co. Ltd. | | | 82,100 | | | | 3,341 | | |
Snow Peak, Inc. (c) | | | 139,500 | | | | 2,327 | | |
Stanley Electric Co. Ltd. | | | 119,311 | | | | 2,454 | | |
Subaru Corp. | | | 288,331 | | | | 4,939 | | |
Sumitomo Electric Industries Ltd. | | | 295,603 | | | | 3,472 | | |
Sumitomo Rubber Industries Ltd. | | | 169,761 | | | | 1,478 | | |
The Furukawa Battery Co. Ltd. | | | 188,500 | | | | 1,552 | | |
Toyota Motor Corp. | | | 1,999,800 | | | | 29,445 | | |
ZOZO, Inc. | | | 510,900 | | | | 12,900 | | |
| | | | 84,725 | | |
Consumer Staples (1.3%): | |
Ajinomoto Co., Inc. | | | 87,200 | | | | 2,761 | | |
Create SD Holdings Co. Ltd. (c) | | �� | 85,700 | | | | 1,922 | | |
Earth Corp. | | | 60,100 | | | | 2,336 | | |
Fancl Corp. | | | 47,100 | | | | 887 | | |
G-7 Holdings, Inc. | | | 131,200 | | | | 1,466 | | |
Kirin Holdings Co. Ltd. | | | 173,967 | | | | 2,747 | | |
Seven & i Holdings Co. Ltd. | | | 50,700 | | | | 2,063 | | |
Toyo Suisan Kaisha Ltd. | | | 342,200 | | | | 14,388 | | |
Transaction Co. Ltd. | | | 274,300 | | | | 2,577 | | |
Tsuruha Holdings, Inc. | | | 32,191 | | | | 2,085 | | |
| | | | 33,232 | | |
Energy (0.1%): | |
Inpex Corp. | | | 267,103 | | | | 2,944 | | |
Financials (3.1%): | |
Dai-ichi Life Holdings, Inc. | | | 210,484 | | | | 3,905 | | |
eGuarantee, Inc. | | | 146,200 | | | | 2,636 | | |
Mitsubishi UFJ Financial Group, Inc. | | | 3,796,340 | | | | 20,706 | | |
Mizuho Financial Group, Inc. | | | 189,050 | | | | 2,360 | | |
MS&AD Insurance Group Holdings, Inc. | | | 133,089 | | | | 3,951 | | |
Nomura Holdings, Inc. | | | 316,606 | | | | 1,156 | | |
ORIX Corp. | | | 201,700 | | | | 3,268 | | |
Resona Holdings, Inc. | | | 924,532 | | | | 4,450 | | |
Sumitomo Mitsui Financial Group, Inc. | | | 179,280 | | | | 6,086 | | |
Sumitomo Mitsui Trust Holdings, Inc. | | | 115,315 | | | | 3,699 | | |
T&D Holdings, Inc. | | | 432,445 | | | | 5,258 | | |
Tokio Marine Holdings, Inc. | | | 984,800 | | | | 20,318 | | |
| | | | 77,793 | | |
Health Care (2.5%): | |
Alfresa Holdings Corp. | | | 114,829 | | | | 1,398 | | |
As One Corp. | | | 46,200 | | | | 2,081 | | |
BML, Inc. | | | 55,200 | | | | 1,399 | | |
Carenet, Inc. (c) | | | 283,900 | | | | 2,473 | | |
Eisai Co. Ltd. | | | 22,637 | | | | 1,547 | | |
EM Systems Co. Ltd. | | | 327,200 | | | | 2,378 | | |
Hoya Corp. | | | 197,400 | | | | 20,430 | | |
Japan Lifeline Co. Ltd. | | | 180,000 | | | | 1,253 | | |
See notes to financial statements.
12
USAA Mutual Funds Trust
USAA International Fund | | Schedule of Portfolio Investments — continued
November 30, 2022 | |
(Amounts in Thousands, Except for Shares) (Unaudited)
Security Description | | Shares | | Value | |
Medical Data Vision Co. Ltd. | | | 353,500 | | | $ | 2,633 | | |
Nakanishi, Inc. | | | 116,100 | | | | 2,434 | | |
Nippon Shinyaku Co. Ltd. | | | 28,900 | | | | 1,715 | | |
Olympus Corp. | | | 96,700 | | | | 1,998 | | |
Ono Pharmaceutical Co. Ltd. | | | 255,884 | | | | 6,559 | | |
Shionogi & Co. Ltd. | | | 230,182 | | | | 11,580 | | |
Takeda Pharmaceutical Co. Ltd. | | | 119,293 | | | | 3,508 | | |
| | | | 63,386 | | |
Industrials (6.1%): | |
Altech Corp. | | | 120,500 | | | | 1,841 | | |
BeNext-Yumeshin Group Co. | | | 156,618 | | | | 2,214 | | |
Creek & River Co. Ltd. | | | 141,400 | | | | 2,139 | | |
CTI Engineering Co. Ltd. | | | 97,100 | | | | 2,310 | | |
Dai-Dan Co. Ltd. | | | 64,700 | | | | 1,038 | | |
Fuji Corp. | | | 108,100 | | | | 1,650 | | |
Fuji Electric Co. Ltd. | | | 453,600 | | | | 18,798 | | |
gremz, Inc. | | | 151,400 | | | | 2,025 | | |
Hino Motors Ltd. (b) | | | 410,353 | | | | 1,865 | | |
Hitachi Ltd. | | | 33,600 | | | | 1,797 | | |
ITOCHU Corp. | | | 128,400 | | | | 4,033 | | |
JAC Recruitment Co. Ltd. | | | 120,200 | | | | 2,279 | | |
Japan Airlines Co. Ltd. Class C (b) | | | 117,001 | | | | 2,339 | | |
Japan Elevator Service Holdings Co. Ltd. | | | 176,400 | | | | 2,280 | | |
JGC Holdings Corp. | | | 154,662 | | | | 2,146 | | |
Komatsu Ltd. | | | 119,900 | | | | 2,786 | | |
Makita Corp. | | | 137,828 | | | | 3,175 | | |
Management Solutions Co. Ltd. (c) | | | 112,900 | | | | 3,207 | | |
METAWATER Co. Ltd. | | | 102,100 | | | | 1,337 | | |
MIRAIT ONE Corp. | | | 140,300 | | | | 1,549 | | |
MISUMI Group, Inc. | | | 436,800 | | | | 10,859 | | |
Mitsubishi Heavy Industries Ltd. | | | 403,364 | | | | 16,057 | | |
Mitsui & Co. Ltd. | | | 110,300 | | | | 3,202 | | |
Nichireki Co. Ltd. | | | 177,800 | | | | 1,681 | | |
NIPPON EXPRESS HOLDINGS, Inc. | | | 34,900 | | | | 2,068 | | |
Nippon Yusen KK | | | 444,600 | | | | 9,898 | | |
OKUMA Corp. | | | 209,800 | | | | 8,040 | | |
Organo Corp. | | | 222,000 | | | | 4,606 | | |
Sanwa Holdings Corp. | | | 1,436,400 | | | | 13,614 | | |
Shinwa Co. Ltd. | | | 122,800 | | | | 1,844 | | |
SHO-BOND Holdings Co. Ltd. | | | 52,900 | | | | 2,343 | | |
Sinko Industries Ltd. | | | 125,400 | | | | 1,418 | | |
S-Pool, Inc. | | | 477,100 | | | | 3,311 | | |
Sumitomo Heavy Industries Ltd. | | | 89,442 | | | | 1,908 | | |
THK Co. Ltd. | | | 118,635 | | | | 2,340 | | |
Tocalo Co. Ltd. | | | 222,000 | | | | 2,030 | | |
Tsurumi Manufacturing Co. Ltd. | | | 111,400 | | | | 1,628 | | |
Weathernews, Inc. | | | 39,700 | | | | 2,223 | | |
Yamato Holdings Co. Ltd. | | | 218,670 | | | | 3,672 | | |
| | | | 153,550 | | |
See notes to financial statements.
13
USAA Mutual Funds Trust
USAA International Fund | | Schedule of Portfolio Investments — continued
November 30, 2022 | |
(Amounts in Thousands, Except for Shares) (Unaudited)
Security Description | | Shares | | Value | |
Information Technology (3.1%): | |
Alps Alpine Co. Ltd. | | | 145,001 | | | $ | 1,391 | | |
Canon, Inc. | | | 65,000 | | | | 1,520 | | |
Comture Corp. | | | 113,400 | | | | 2,182 | | |
Cresco Ltd. | | | 110,100 | | | | 1,400 | | |
Cybozu, Inc. | | | 253,200 | | | | 4,175 | | |
Digital Arts, Inc. | | | 41,600 | | | | 2,003 | | |
Double Standard, Inc. (c) | | | 53,100 | | | | 873 | | |
Fujitsu Ltd. | | | 117,000 | | | | 15,878 | | |
Fukui Computer Holdings, Inc. | | | 130,400 | | | | 2,813 | | |
Future Corp. | | | 241,200 | | | | 2,993 | | |
Horiba Ltd. | | | 51,800 | | | | 2,381 | | |
Justsystems Corp. | | | 89,868 | | | | 2,200 | | |
Kanematsu Electronics Ltd. | | | 56,700 | | | | 1,889 | | |
m-up Holdings, Inc. | | | 227,500 | | | | 2,290 | | |
Oracle Corp. | | | 179,300 | | | | 10,620 | | |
SHIFT, Inc. (b) | | | 16,000 | | | | 3,454 | | |
Softcreate Holdings Corp. | | | 106,400 | | | | 2,746 | | |
TDK Corp. | | | 71,400 | | | | 2,574 | | |
TechMatrix Corp. | | | 128,000 | | | | 1,556 | | |
Tokyo Electron Ltd. | | | 7,500 | | | | 2,546 | | |
Ulvac, Inc. | | | 263,500 | | | | 11,615 | | |
| | | | 79,099 | | |
Materials (0.5%): | |
JCU Corp. | | | 106,300 | | | | 2,643 | | |
Maeda Kosen Co. Ltd. | | | 84,400 | | | | 2,009 | | |
Shin-Etsu Chemical Co. Ltd. | | | 16,600 | | | | 2,148 | | |
Taiheiyo Cement Corp. | | | 88,507 | | | | 1,400 | | |
Toagosei Co., Ltd. | | | 202,400 | | | | 1,746 | | |
Tosoh Corp. | | | 149,100 | | | | 1,771 | | |
| | | | 11,717 | | |
Real Estate (0.6%): | |
Mitsubishi Estate Co. Ltd. | | | 259,608 | | | | 3,666 | | |
Mitsui Fudosan Co. Ltd. | | | 99,300 | | | | 2,014 | | |
Sumitomo Realty & Development Co. Ltd. | | | 335,200 | | | | 9,130 | | |
| | | | 14,810 | | |
Utilities (0.3%): | |
Chubu Electric Power Co., Inc. | | | 789,200 | | | | 7,400 | | |
| | | | 566,444 | | |
Korea, Republic Of (1.5%): | |
Communication Services (0.3%): | |
Cheil Worldwide, Inc. | | | 87,092 | | | | 1,616 | | |
JYP Entertainment Corp. | | | 46,532 | | | | 2,175 | | |
KT Corp. | | | 146,469 | | | | 4,181 | | |
| | | | 7,972 | | |
See notes to financial statements.
14
USAA Mutual Funds Trust
USAA International Fund | | Schedule of Portfolio Investments — continued
November 30, 2022 | |
(Amounts in Thousands, Except for Shares) (Unaudited)
Security Description | | Shares | | Value | |
Consumer Discretionary (0.3%): | |
Coway Co. Ltd. | | | 46,818 | | | $ | 2,061 | | |
Hankook Tire & Technology Co. Ltd. | | | 54,074 | | | | 1,412 | | |
Hyundai Mobis Co. Ltd. | | | 17,521 | | | | 2,868 | | |
Kia Corp. | | | 34,117 | | | | 1,797 | | |
| | | | 8,138 | | |
Financials (0.5%): | |
Hana Financial Group, Inc. | | | 54,972 | | | | 1,880 | | |
KB Financial Group, Inc. | | | 128,804 | | | | 5,115 | | |
Shinhan Financial Group Co. Ltd. | | | 162,202 | | | | 4,702 | | |
| | | | 11,697 | | |
Industrials (0.1%): | |
Samsung Engineering Co. Ltd. (b) | | | 97,747 | | | | 1,848 | | |
Information Technology (0.3%): | |
LG Innotek Co. Ltd. | | | 13,239 | | | | 3,192 | | |
Samsung Electronics Co. Ltd. | | | 42,058 | | | | 2,021 | | |
Samsung SDI Co. Ltd. | | | 3,739 | | | | 2,111 | | |
| | | | 7,324 | | |
| | | | 36,979 | | |
Luxembourg (0.3%): | |
Communication Services (0.1%): | |
RTL Group SA | | | 42,397 | | | | 1,761 | | |
Energy (0.1%): | |
Tenaris SA | | | 144,418 | | | | 2,506 | | |
Health Care (0.0%): (a) | |
Eurofins Scientific SE | | | 23,323 | | | | 1,619 | | |
Materials (0.1%): | |
ArcelorMittal SA | | | 76,634 | | | | 2,101 | | |
| | | | 7,987 | | |
Malaysia (0.3%): | |
Consumer Staples (0.1%): | |
Kuala Lumpur Kepong Bhd | | | 283,200 | | | | 1,334 | | |
Financials (0.2%): | |
CIMB Group Holdings Bhd | | | 1,720,723 | | | | 2,253 | | |
RHB Bank Bhd | | | 2,416,200 | | | | 3,064 | | |
| | | | 5,317 | | |
| | | | 6,651 | | |
Mexico (0.1%): | |
Consumer Staples (0.1%): | |
Arca Continental SAB de CV | | | 301,791 | | | | 2,519 | | |
See notes to financial statements.
15
USAA Mutual Funds Trust
USAA International Fund | | Schedule of Portfolio Investments — continued
November 30, 2022 | |
(Amounts in Thousands, Except for Shares) (Unaudited)
Security Description | | Shares | | Value | |
Netherlands (4.2%): | |
Communication Services (0.8%): | |
Koninklijke KPN NV | | | 6,446,169 | | | $ | 19,828 | | |
VEON Ltd., ADR (b) | | | 825,596 | | | | 496 | | |
| | | | 20,324 | | |
Consumer Staples (0.2%): | |
Heineken NV | | | 20,835 | | | | 1,929 | | |
Koninklijke Ahold Delhaize NV | | | 131,189 | | | | 3,823 | | |
| | | | 5,752 | | |
Financials (1.4%): | |
ABN AMRO Bank NV (d) | | | 391,552 | | | | 5,049 | | |
ING Groep NV | | | 2,200,034 | | | | 26,677 | | |
NN Group NV | | | 48,394 | | | | 2,068 | | |
| | | | 33,794 | | |
Health Care (0.2%): | |
Koninklijke Philips NV | | | 254,120 | | | | 3,808 | | |
QIAGEN NV (b) | | | 44,772 | | | | 2,235 | | |
| | | | 6,043 | | |
Industrials (1.0%): | |
PostNL NV (c) | | | 305,847 | | | | 569 | | |
SIF Holding NV (c) | | | 160,874 | | | | 1,954 | | |
Signify NV (d) | | | 36,431 | | | | 1,244 | | |
Wolters Kluwer NV | | | 186,885 | | | | 20,595 | | |
| | | | 24,362 | | |
Information Technology (0.6%): | |
ASM International NV | | | 44,947 | | | | 12,462 | | |
STMicroelectronics NV | | | 86,535 | | | | 3,349 | | |
| | | | 15,811 | | |
| | | | 106,086 | | |
New Zealand (0.4%): | |
Consumer Staples (0.0%): (a) | |
Scales Corp. Ltd. | | | 441,317 | | | | 1,224 | | |
Health Care (0.4%): | |
Fisher & Paykel Healthcare Corp. Ltd. | | | 661,849 | | | | 9,908 | | |
| | | | 11,132 | | |
Norway (1.1%): | |
Consumer Staples (0.1%): | |
Mowi ASA | | | 99,469 | | | | 1,560 | | |
Energy (0.4%): | |
Aker BP ASA (c) | | | 143,324 | | | | 4,989 | | |
Equinor ASA | | | 48,788 | | | | 1,880 | | |
See notes to financial statements.
16
USAA Mutual Funds Trust
USAA International Fund | | Schedule of Portfolio Investments — continued
November 30, 2022 | |
(Amounts in Thousands, Except for Shares) (Unaudited)
Security Description | | Shares | | Value | |
TGS ASA | | | 215,719 | | | $ | 2,953 | | |
Var Energi ASA (c) | | | 401,525 | | | | 1,483 | | |
| | | | 11,305 | | |
Financials (0.3%): | |
SpareBank 1 SMN | | | 718,089 | | | | 8,561 | | |
Health Care (0.1%): | |
Medistim ASA | | | 80,939 | | | | 2,169 | | |
Information Technology (0.1%): | |
Bouvet ASA | | | 339,486 | | | | 1,966 | | |
Materials (0.1%): | |
Norsk Hydro ASA | | | 84,128 | | | | 634 | | |
Yara International ASA | | | 46,506 | | | | 2,149 | | |
| | | | 2,783 | | |
| | | | 28,344 | | |
Qatar (0.1%): | |
Communication Services (0.1%): | |
Ooredoo QPSC | | | 582,140 | | | | 1,420 | | |
Russian Federation (0.0%): (a) | |
Communication Services (0.0%): | |
Mobile TeleSystems PJSC, ADR (b) (f) (g) | | | 177,615 | | | | 10 | | |
Consumer Staples (0.0%): | |
Magnit PJSC, GDR (f) (g) | | | 94,274 | | | | — | (e) | |
Energy (0.0%): | |
Gazprom PJSC, ADR (b) (f) (g) (h) (i) | | | 153,287 | | | | 8 | | |
LUKOIL PJSC, ADR (f) (g) (h) (i) | | | 34,917 | | | | 4 | | |
| | | | 12 | | |
Financials (0.0%): | |
Sberbank of Russia PJSC, ADR (b) (f) (h) (i) | | | 505,824 | | | | 50 | | |
Sberbank of Russia PJSC (b) (f) (g) (h) (i) | | | 564,350 | | | | 2 | | |
| | | | 52 | | |
| | | | 74 | | |
Saudi Arabia (0.2%): | |
Energy (0.1%): | |
Saudi Arabian Oil Co. (d) | | | 144,525 | | | | 1,293 | | |
Financials (0.1%): | |
Alinma Bank | | | 286,214 | | | | 2,650 | | |
| | | | 3,943 | | |
Singapore (0.6%): | |
Consumer Staples (0.2%): | |
Sheng Siong Group Ltd. | | | 2,026,700 | | | | 2,458 | | |
Wilmar International Ltd. | | | 1,037,000 | | | | 3,147 | | |
| | | | 5,605 | | |
See notes to financial statements.
17
USAA Mutual Funds Trust
USAA International Fund | | Schedule of Portfolio Investments — continued
November 30, 2022 | |
(Amounts in Thousands, Except for Shares) (Unaudited)
Security Description | | Shares | | Value | |
Financials (0.2%): | |
DBS Group Holdings Ltd. | | | 137,300 | | | $ | 3,582 | | |
iFAST Corp. Ltd. | | | 543,900 | | | | 2,142 | | |
| | | | 5,724 | | |
Information Technology (0.1%): | |
AEM Holdings Ltd. | | | 731,200 | | | | 2,032 | | |
Utilities (0.1%): | |
Sembcorp Industries Ltd. | | | 860,300 | | | | 2,036 | | |
| | | | 15,397 | | |
South Africa (0.2%): | |
Communication Services (0.0%): (a) | |
MTN Group Ltd. | | | 75,467 | | | | 619 | | |
Energy (0.1%): | |
Exxaro Resources Ltd. | | | 109,038 | | | | 1,427 | | |
Financials (0.1%): | |
Absa Group Ltd. | | | 157,716 | | | | 1,893 | | |
Old Mutual Ltd. | | | 2,280,800 | | | | 1,466 | | |
| | | | 3,359 | | |
| | | | 5,405 | | |
Spain (1.5%): | |
Financials (1.1%): | |
Banco Bilbao Vizcaya Argentaria SA (c) | | | 3,743,905 | | | | 22,061 | | |
Banco Santander SA | | | 808,852 | | | | 2,413 | | |
Bankinter SA | | | 261,303 | | | | 1,718 | | |
CaixaBank SA | | | 717,604 | | | | 2,668 | | |
| | | | 28,860 | | |
Health Care (0.1%): | |
Faes Farma SA | | | 511,230 | | | | 1,965 | | |
Information Technology (0.1%): | |
Global Dominion Access SA (d) | | | 484,335 | | | | 1,844 | | |
Utilities (0.2%): | |
Corp. ACCIONA Energias Renovables SA | | | 63,939 | | | | 2,535 | | |
Iberdrola SA | | | 213,058 | | | | 2,407 | | |
| | | | 4,942 | | |
| | | | 37,611 | | |
Sweden (2.8%): | |
Consumer Discretionary (0.1%): | |
Evolution AB (d) | | | 26,254 | | | | 2,706 | | |
Health Care (0.4%): | |
BioGaia AB B Shares | | | 227,115 | | | | 1,836 | | |
Biotage AB | | | 194,116 | | | | 3,403 | | |
Cellavision AB | | | 57,570 | | | | 1,216 | | |
See notes to financial statements.
18
USAA Mutual Funds Trust
USAA International Fund | | Schedule of Portfolio Investments — continued
November 30, 2022 | |
(Amounts in Thousands, Except for Shares) (Unaudited)
Security Description | | Shares | | Value | |
Sectra AB Class B (b) | | | 147,792 | | | $ | 2,416 | | |
Xvivo Perfusion AB (b) | | | 109,195 | | | | 1,992 | | |
| | | | 10,863 | | |
Industrials (2.1%): | |
Atlas Copco AB Class A | | | 151,443 | | | | 1,889 | | |
Atlas Copco AB Class B | | | 2,150,189 | | | | 24,424 | | |
BTS Group AB B Shares (c) | | | 95,190 | | | | 2,485 | | |
Eolus Vind AB Class B | | | 139,230 | | | | 1,480 | | |
GARO AB | | | 205,986 | | | | 2,262 | | |
Hexatronic Group AB | | | 333,068 | | | | 4,726 | | |
Nibe Industrier AB Class B | | | 1,107,743 | | | | 10,464 | | |
| SKF AB B Shares | | | 251,110 | | | | 4,183 | | |
Volvo AB Class B | | | 114,459 | | | | 2,104 | | |
| | | | 54,017 | | |
Information Technology (0.1%): | |
HMS Networks AB | | | 54,380 | | | | 1,650 | | |
Materials (0.1%): | |
Boliden AB | | | 51,886 | | | | 1,961 | | |
| | | | 71,197 | | |
Switzerland (10.1%): | |
Consumer Discretionary (0.3%): | |
Cie Financiere Richemont SA Registered Shares | | | 34,435 | | | | 4,566 | | |
The Swatch Group AG | | | 14,475 | | | | 3,874 | | |
| | | | 8,440 | | |
Consumer Staples (2.8%): | |
Coca-Cola HBC AG | | | 580,754 | | | | 14,203 | | |
Nestle SA Registered Shares | | | 474,208 | | | | 56,451 | | |
| | | | 70,654 | | |
Financials (1.9%): | |
Julius Baer Group Ltd. | | | 43,792 | | | | 2,523 | | |
Partners Group Holding AG | | | 15,997 | | | | 15,942 | | |
Swiss Life Holding AG | | | 3,386 | | | | 1,810 | | |
UBS Group AG | | | 1,502,484 | | | | 27,729 | | |
| | | | 48,004 | | |
Health Care (3.7%): | |
Coltene Holding AG Registered Shares | | | 26,804 | | | | 2,128 | | |
Novartis AG Registered Shares | | | 492,431 | | | | 43,811 | | |
Roche Holding AG | | | 144,728 | | | | 47,279 | | |
| | | | 93,218 | | |
Industrials (0.4%): | |
Adecco Group AG | | | 116,187 | | | | 3,950 | | |
Kardex Holding AG Registered Shares | | | 21,372 | | | | 3,543 | | |
Schweiter Technologies AG Class BR | | | 1,498 | | | | 1,204 | | |
Zehnder Group AG Registered Shares | | | 26,839 | | | | 1,596 | | |
| | | | 10,293 | | |
See notes to financial statements.
19
USAA Mutual Funds Trust
USAA International Fund | | Schedule of Portfolio Investments — continued
November 30, 2022 | |
(Amounts in Thousands, Except for Shares) (Unaudited)
Security Description | | Shares | | Value | |
Information Technology (0.4%): | |
Comet Holding AG Class R | | | 13,097 | | | $ | 2,725 | | |
Landis+Gyr Group AG | | | 43,425 | | | | 3,033 | | |
u-blox Holding AG | | | 30,096 | | | | 3,919 | | |
| | | | 9,677 | | |
Materials (0.6%): | |
Glencore PLC | | | 550,942 | | | | 3,759 | | |
Gurit Holding AG (c) | | | 23,810 | | | | 2,448 | | |
Holcim AG | | | 126,930 | | | | 6,632 | | |
Vetropack Holding AG | | | 50,122 | | | | 1,771 | | |
| | | | 14,610 | | |
| | | | 254,896 | | |
Taiwan (1.0%): | |
Financials (0.2%): | |
Chailease Holding Co. Ltd. | | | 256,588 | | | | 1,694 | | |
Fubon Financial Holding Co. Ltd. | | | 1,084,716 | | | | 2,155 | | |
| | | | 3,849 | | |
Health Care (0.1%): | |
Lotus Pharmaceutical Co. Ltd. | | | 466,000 | | | | 3,728 | | |
Information Technology (0.7%): | |
Catcher Technology Co. Ltd. | | | 381,522 | | | | 2,276 | | |
Delta Electronics, Inc. | | | 221,000 | | | | 2,186 | | |
E Ink Holdings, Inc. | | | 229,000 | | | | 1,373 | | |
Hon Hai Precision Industry Co. Ltd. | | | 1,128,036 | | | | 3,694 | | |
Taiwan Semiconductor Manufacturing Co. Ltd. | | | 493,000 | | | | 7,918 | | |
| | | | 17,447 | | |
| | | | 25,024 | | |
Thailand (0.2%): | |
Financials (0.1%): | |
Kasikornbank PCL | | | 920,579 | | | | 3,794 | | |
Health Care (0.1%): | |
Chularat Hospital PCL | | | 21,307,600 | | | | 2,239 | | |
| | | | 6,033 | | |
Turkey (0.1%): | |
Communication Services (0.1%): | |
Turk Telekomunikasyon A/S (c) | | | 1,521,252 | | | | 1,428 | | |
Turkcell Iletisim Hizmetleri A/S | | | 1,057,613 | | | | 1,933 | | |
| | | | 3,361 | | |
United Arab Emirates (0.1%): | |
Real Estate (0.1%): | |
Emaar Development PJSC (b) | | | 1,674,606 | | | | 1,920 | | |
See notes to financial statements.
20
USAA Mutual Funds Trust
USAA International Fund | | Schedule of Portfolio Investments — continued
November 30, 2022 | |
(Amounts in Thousands, Except for Shares) (Unaudited)
Security Description | | Shares | | Value | |
United Kingdom (14.3%): | | | |
Communication Services (0.5%): | | | |
| 4imprint Group PLC | | | 60,328 | | | $ | 3,111 | | |
BT Group PLC | | | 1,651,191 | | | | 2,429 | | |
Informa PLC | | | 247,727 | | | | 1,858 | | |
WPP PLC | | | 583,890 | | | | 6,135 | | |
| | | | 13,533 | | |
Consumer Discretionary (0.9%): | | | |
AB Dynamics PLC (c) | | | 124,343 | | | | 2,338 | | |
Focusrite PLC | | | 262,754 | | | | 2,619 | | |
JD Sports Fashion PLC | | | 1,774,938 | | | | 2,735 | | |
Kingfisher PLC | | | 525,330 | | | | 1,536 | | |
Next PLC | | | 124,302 | | | | 8,882 | | |
Stellantis NV | | | 331,690 | | | | 5,232 | | |
| | | | 23,342 | | |
Consumer Staples (2.3%): | | | |
Diageo PLC | | | 580,848 | | | | 26,819 | | |
Imperial Brands PLC | | | 880,285 | | | | 22,637 | | |
J Sainsbury PLC | | | 905,094 | | | | 2,441 | | |
Marks & Spencer Group PLC (b) | | | 312,675 | | | | 456 | | |
Reckitt Benckiser Group PLC | | | 25,458 | | | | 1,827 | | |
Tesco PLC | | | 923,295 | | | | 2,543 | | |
| | | | 56,723 | | |
Energy (3.1%): | | | |
| BP PLC | | | 5,310,436 | | | | 31,706 | | |
Harbour Energy PLC | | | 373,489 | | | | 1,434 | | |
Shell PLC | | | 1,525,226 | | | | 44,627 | | |
| | | | 77,767 | | |
Financials (2.4%): | | | |
| 3i Group PLC | | | 223,582 | | | | 3,673 | | |
Barclays PLC | | | 9,309,319 | | | | 18,206 | | |
HSBC Holdings PLC | | | 3,437,281 | | | | 21,055 | | |
Legal & General Group PLC | | | 2,659,400 | | | | 8,156 | | |
Standard Chartered PLC | | | 1,243,344 | | | | 9,259 | | |
| | | | 60,349 | | |
Health Care (0.7%): | | | |
Advanced Medical Solutions Group PLC | | | 434,508 | | | | 1,437 | | |
AstraZeneca PLC | | | 42,521 | | | | 5,754 | | |
CVS Group PLC | | | 215,226 | | | | 5,325 | | |
Ergomed PLC (b) | | | 192,616 | | | | 3,082 | | |
GSK PLC | | | 187,387 | | | | 3,186 | | |
Verici Dx PLC (b) (g) | | | 39,782 | | | | 6 | | |
| | | | 18,790 | | |
Industrials (1.9%): | | | |
Ashtead Group PLC | | | 325,333 | | | | 19,852 | | |
Babcock International Group PLC (b) | | | 412,170 | | | | 1,424 | | |
See notes to financial statements.
21
USAA Mutual Funds Trust
USAA International Fund | | Schedule of Portfolio Investments — continued
November 30, 2022 | |
(Amounts in Thousands, Except for Shares) (Unaudited)
Security Description | | Shares | | Value | |
BAE Systems PLC | | | 171,830 | | | $ | 1,701 | | |
Clarkson PLC | | | 68,986 | | | | 2,574 | | |
Concentric AB | | | 121,948 | | | | 2,389 | | |
easyJet PLC (b) | | | 578,167 | | | | 2,778 | | |
Judges Scientific PLC | | | 46,962 | | | | 4,598 | | |
Renew Holdings PLC | | | 343,697 | | | | 2,850 | | |
Robert Walters PLC | | | 328,150 | | | | 2,320 | | |
RS GROUP PLC | | | 145,850 | | | | 1,622 | | |
SThree PLC | | | 680,692 | | | | 3,357 | | |
Volex PLC | | | 498,409 | | | | 1,590 | | |
| | | | 47,055 | | |
Information Technology (0.3%): | |
Aptitude Software Group PLC | | | 350,141 | | | | 1,549 | | |
GB Group PLC | | | 229,590 | | | | 901 | | |
Kainos Group PLC | | | 224,967 | | | | 4,365 | | |
| | | | 6,815 | | |
Materials (1.9%): | |
Anglo American PLC | | | 155,665 | | | | 6,470 | | |
Croda International PLC | | | 168,577 | | | | 13,938 | | |
Endeavour Mining PLC (c) | | | 80,071 | | | | 1,700 | | |
Rio Tinto PLC | | | 359,566 | | | | 24,200 | | |
Treatt PLC | | | 326,954 | | | | 2,630 | | |
| | | | 48,938 | | |
Real Estate (0.2%): | |
Land Securities Group PLC | | | 238,259 | | | | 1,778 | | |
Safestore Holdings PLC | | | 158,923 | | | | 1,754 | | |
The British Land Co. PLC | | | 346,882 | | | | 1,663 | | |
| | | | 5,195 | | |
Utilities (0.1%): | |
Drax Group PLC | | | 244,084 | | | | 1,804 | | |
| | | | 360,311 | | |
Total Common Stocks (Cost $2,205,254) | | | 2,467,050 | | |
Exchange-Traded Funds (0.3%) | |
United States (0.3%): | |
iShares Core MSCI EAFE ETF | | | 70,043 | | | | 4,416 | | |
iShares Core MSCI Emerging Markets ETF | | | 17,932 | | | | 871 | | |
iShares MSCI EAFE Small-Cap ETF | | | 35,822 | | | | 2,042 | | |
| | | | 7,329 | | |
Total Exchange-Traded Funds (Cost $6,879) | | | 7,329 | | |
Collateral for Securities Loaned (2.4%)^ | |
United States (2.4%): | |
Goldman Sachs Financial Square Government Fund, Institutional
Shares, 3.73% (j) | | | 15,019,199 | | | | 15,019 | | |
HSBC U.S. Government Money Market Fund, I Shares, 3.75% (j) | | | 15,019,199 | | | | 15,019 | | |
See notes to financial statements.
22
USAA Mutual Funds Trust
USAA International Fund | | Schedule of Portfolio Investments — continued
November 30, 2022 | |
(Amounts in Thousands, Except for Shares) (Unaudited)
Security Description | | Shares | | Value | |
Invesco Government & Agency Portfolio, Institutional Shares, 3.74% (j) | | | 15,019,199 | | | $ | 15,019 | | |
Morgan Stanley Institutional Liquidity Government Portfolio, Institutional
Shares, 3.62% (j) | | | 15,019,199 | | | | 15,020 | | |
Total Collateral for Securities Loaned (Cost $60,077) | | | 60,077 | | |
Total Investments (Cost $2,272,210) — 100.8% | | | 2,534,456 | | |
Liabilities in excess of other assets — (0.8)% | | | (20,239 | ) | |
NET ASSETS — 100.00% | | $ | 2,514,217 | | |
^ Purchased with cash collateral from securities on loan.
(a) Amount represents less than 0.05% of net assets.
(b) Non-income producing security.
(c) All or a portion of this security is on loan.
(d) Rule 144A security or other security that is restricted as to resale to institutional investors. The Fund's Adviser has deemed this security to be liquid (unless otherwise noted as illiquid) based upon procedures approved by the Board of Trustees. As of November 30, 2022, the fair value of these securities was $36,867 thousands and amounted to 1.5% of net assets.
(e) Rounds to less than $1 thousand.
(f) Security was fair valued based upon procedures approved by the Board of Trustees and represents 0.1% of net assets as of November 30, 2022. This security is classified as Level 3 within the fair value hierarchy. (See Note 2 in the Notes to Financial Statements)
(g) The Fund's Adviser has deemed this security to be illiquid based upon procedures approved by the Board of Trustees. At November 30, 2022, illiquid securities were less than 0.05% of the Fund's net assets.
(h) Restricted security due to trading restrictions. Russian sanctioned entity by the United States Government.
(i) The following table details the acquisition date and cost of the Fund's Russian sanctioned restricted securities at November 30, 2022 (amount in thousand):
Security Name | | Acquisition Date | | Cost | |
Gazprom PJSC, ADR | | 1/21/2016 | | $ | 486 | | |
LUKOIL PJSC, ADR | | 12/29/2015 | | | 430 | | |
Sberbank of Russia PJSC, ADR | | 1/15/2016 | | | 556 | | |
Sberbank of Russia PJSC | | 7/15/2019 | | | 2,134 | | |
(j) Rate disclosed is the daily yield on November 30, 2022.
ADR — American Depositary Receipt
ETF — Exchange-Traded Fund
GDR — Global Depositary Receipt
PCL — Public Company Limited
PLC — Public Limited Company
See notes to financial statements.
23
USAA Mutual Funds Trust | | Statement of Assets and Liabilities
November 30, 2022 | |
(Amounts in Thousands, Except Per Share Amounts) (Unaudited)
| | | USAA International
Fund | |
Assets: | |
Investments, at value (Cost $2,272,210) | | $ | 2,534,456 | (a) | |
Foreign currency, at value (Cost $1,394) | | | 1,394 | | |
| Cash | | | 21,114 | | |
Receivables: | |
Interest and dividends | | | 8,454 | | |
Capital shares issued | | | 336 | | |
Investments sold | | | 13,303 | | |
Reclaims | | | 7,582 | | |
From Adviser | | | 124 | | |
Prepaid expenses | | | 52 | | |
Total Assets | | | 2,586,815 | | |
Liabilities: | |
Payables: | |
Collateral received on loaned securities | | | 60,077 | | |
Investments purchased | | | 7,615 | | |
Capital shares redeemed | | | 2,025 | | |
Accrued foreign capital gains taxes | | | 645 | | |
Accrued expenses and other payables: | |
Investment advisory fees | | | 1,381 | | |
Administration fees | | | 244 | | |
Custodian fees | | | 137 | | |
Transfer agent fees | | | 231 | | |
Compliance fees | | | 1 | | |
| 12b-1 fees | | | — | (b) | |
Other accrued expenses | | | 242 | | |
Total Liabilities | | | 72,598 | | |
Net Assets: | |
Capital | | | 2,316,542 | | |
Total accumulated earnings/(loss) | | | 197,675 | | |
Net Assets | | $ | 2,514,217 | | |
Net Assets | |
Fund Shares | | $ | 1,203,911 | | |
Institutional Shares | | | 1,309,213 | | |
Class A | | | 870 | | |
R6 Shares | | | 223 | | |
Total | | $ | 2,514,217 | | |
Shares (unlimited number of shares authorized with no par value): | |
Fund Shares | | | 50,935 | | |
Institutional Shares | | | 55,560 | | |
Class A | | | 37 | | |
R6 Shares | | | 9 | | |
Total | | | 106,541 | | |
(continues on next page)
See notes to financial statements.
24
USAA Mutual Funds Trust | | Statement of Assets and Liabilities
November 30, 2022 | |
(Amounts in Thousands, Except Per Share Amounts) (Unaudited) (continued)
| | | USAA International
Fund | |
Net asset value, offering and redemption price per share: (c) | |
Fund Shares | | $ | 23.64 | | |
Institutional Shares | | | 23.56 | | |
Class A | | | 23.68 | | |
R6 Shares | | | 24.01 | | |
Maximum Sales Charge — Class A | | | 5.75 | % | |
Maximum offering price
(100%/(100%-maximum sales charge) of net asset value adjusted to
the nearest cent) per share — Class A | | $ | 25.12 | | |
(a) Includes $53,369 thousand of securities on loan.
(b) Rounds to less than $1 thousand.
(c) Per share amount may not recalculate due to rounding of net assets and/or shares outstanding.
See notes to financial statements.
25
USAA Mutual Funds Trust | | Statement of Operations
For the Six Months Ended November 30, 2022 | |
(Amounts in Thousands) (Unaudited)
| | | USAA International
Fund | |
Investment Income: | |
Dividends | | $ | 36,340 | (a) | |
| Interest | | | 1,459 | | |
Securities lending (net of fees) | | | 305 | | |
Foreign tax withholding | | | (3,206 | )(b) | |
Total Income | | | 34,898 | | |
Expenses: | |
Investment advisory fees | | | 8,223 | | |
Administration fees — Fund Shares | | | 863 | | |
Administration fees — Institutional Shares | | | 601 | | |
Administration fees — Class A | | | 1 | | |
Administration fees — R6 Shares | | | — | (c) | |
Sub-Administration fees | | | 39 | | |
| 12b-1 fees — Class A | | | 1 | | |
Custodian fees | | | 270 | | |
Transfer agent fees — Fund Shares | | | 749 | | |
Transfer agent fees — Institutional Shares | | | 601 | | |
Transfer agent fees — Class A | | | — | (c) | |
Transfer agent fees — R6 Shares | | | — | (c) | |
Trustees' fees | | | 25 | | |
Compliance fees | | | 11 | | |
Legal and audit fees | | | 135 | | |
State registration and filing fees | | | 50 | | |
Interfund lending fees | | | 3 | | |
Other expenses | | | 211 | | |
Total Expenses | | | 11,783 | | |
Expenses waived/reimbursed by Adviser | | | (333 | ) | |
Net Expenses | | | 11,450 | | |
Net Investment Income (Loss) | | | 23,448 | | |
Realized/Unrealized Gains (Losses) from Investments: | |
Net realized gains (losses) from investment securities and foreign currency
transactions | | | (91,812 | ) | |
Foreign taxes on realized gains | | | (5 | ) | |
Net change in unrealized appreciation/depreciation on investment securities
and foreign currency translations | | | 4,733 | | |
Net change in accrued foreign taxes on unrealized gains | | | (307 | ) | |
Net realized/unrealized gains (losses) on investments | | | (87,391 | ) | |
Change in net assets resulting from operations | | $ | (63,943 | ) | |
(a) Includes EU reclaims received from France and Sweden of $4,983 thousand and $154 thousand, respectively. See Foreign Taxes in Item 2 of the accompanying Notes to Financial Statements.
(b) Includes EU reclaims and related interest from France of $867 thousand for reclaims that were expensed in previous years. See Foreign Taxes in Item 2 of the accompanying Notes to Financial Statements.
(c) Rounds to less than $1 thousand.
See notes to financial statements.
26
USAA Mutual Funds Trust | | Statements of Changes in Net Assets | |
(Amounts in Thousands)
| | | USAA International Fund | |
| | | Six Months
Ended
November 30,
2022
(Unaudited) | | Year
Ended
May 31,
2022 | |
From Investments: | |
Operations: | |
Net Investment Income (Loss) | | $ | 23,448 | | | $ | 64,637 | | |
Net realized gains (losses) | | | (91,817 | ) | | | 95,128 | | |
Net change in unrealized appreciation/depreciation | | | 4,426 | | | | (458,923 | ) | |
Change in net assets resulting from operations | | | (63,943 | ) | | | (299,158 | ) | |
Distributions to Shareholders: | |
Fund Shares | | | — | | | | (127,097 | ) | |
Institutional Shares | | | — | | | | (122,526 | ) | |
Class A | | | — | | | | (79 | ) | |
R6 Shares | | | — | | | | (22 | ) | |
Change in net assets resulting from distributions to shareholders | | | — | | | | (249,724 | ) | |
Change in net assets resulting from capital transactions | | | (3,701 | ) | | | (123,154 | ) | |
Change in net assets | | | (67,644 | ) | | | (672,036 | ) | |
Net Assets: | |
Beginning of period | | | 2,581,861 | | | | 3,253,897 | | |
End of period | | $ | 2,514,217 | | | $ | 2,581,861 | | |
(continues on next page)
See notes to financial statements.
27
USAA Mutual Funds Trust | | Statements of Changes in Net Assets | |
(Amounts in Thousands) (continued)
| | | USAA International Fund | |
| | | Six Months
Ended
November 30,
2022
(Unaudited) | | Year
Ended
May 31,
2022 | |
Capital Transactions: | |
Fund Shares | |
Proceeds from shares issued | | $ | 20,339 | | | $ | 75,918 | | |
Distributions reinvested | | | — | | | | 125,118 | | |
Cost of shares redeemed | | | (82,226 | ) | | | (224,413 | ) | |
Total Fund Shares | | $ | (61,887 | ) | | $ | (23,377 | ) | |
Institutional Shares | |
Proceeds from shares issued | | $ | 181,029 | | | $ | 179,428 | | |
Distributions reinvested | | | — | | | | 122,400 | | |
Cost of shares redeemed | | | (122,809 | ) | | | (401,879 | ) | |
Total Institutional Shares | | $ | 58,220 | | | $ | (100,051 | ) | |
Class A | |
Proceeds from shares issued | | $ | 16 | | | $ | 106 | | |
Distributions reinvested | | | — | | | | 60 | | |
Cost of shares redeemed | | | (51 | ) | | | (138 | ) | |
Total Class A | | $ | (35 | ) | | $ | 28 | | |
R6 Shares | |
Proceeds from shares issued | | $ | 2 | | | $ | 262 | | |
Distributions reinvested | | | — | | | | 22 | | |
Cost of shares redeemed | | | (1 | ) | | | (38 | ) | |
Total R6 Shares | | $ | 1 | | | $ | 246 | | |
Change in net assets resulting from capital transactions | | $ | (3,701 | ) | | $ | (123,154 | ) | |
Share Transactions: | |
Fund Shares | |
Issued | | | 928 | | | | 2,716 | | |
Reinvested | | | — | | | | 4,549 | | |
Redeemed | | | (3,756 | ) | | | (8,108 | ) | |
Total Fund Shares | | | (2,828 | ) | | | (843 | ) | |
Institutional Shares | |
Issued | | | 8,169 | | | | 6,628 | | |
Reinvested | | | — | | | | 4,466 | | |
Redeemed | | | (5,614 | ) | | | (14,102 | ) | |
Total Institutional Shares | | | 2,555 | | | | (3,008 | ) | |
Class A | |
Issued | | | 1 | | | | 4 | | |
Reinvested | | | — | | | | 2 | | |
Redeemed | | | (2 | ) | | | (5 | ) | |
Total Class A | | | (1 | ) | | | 1 | | |
R6 Shares | |
Issued | | | — | (a) | | | 8 | | |
Reinvested | | | — | | | | 1 | | |
Redeemed | | | — | (a) | | | (1 | ) | |
Total R6 Shares | | | — | (a) | | | 8 | | |
Change in Shares | | | (274 | ) | | | (3,842 | ) | |
(a) Rounds to less than 1 thousand shares.
See notes to financial statements.
28
This page is intentionally left blank.
29
USAA Mutual Funds Trust | | Financial Highlights | |
For a Share Outstanding Throughout Each Period
| | | | | Investment Activities | | Distributions to
Shareholders From | |
| | | Net Asset
Value,
Beginning
of Period | | Net
Investment
Income
(Loss) | | Net
Realized
and
Unrealized
Gains
(Losses) | | Total from
Investment
Activities | | Net
Investment
Income | | Net
Realized
Gains from
Investments | |
USAA International Fund | | | |
Fund Shares | | | |
Six Months Ended
November 30, 2022
(Unaudited) | | $ | 24.21 | | | | 0.22 | (i)(j) | | | (0.79 | ) | | | (0.57 | ) | | | — | | | | — | | |
Year Ended May 31:
2022 | | $ | 29.46 | | | | 0.59 | (i) | | | (3.43 | ) | | | (2.84 | ) | | | (0.51 | ) | | | (1.90 | ) | |
2021 | | $ | 21.53 | | | | 0.49 | (i) | | | 7.94 | | | | 8.43 | | | | (0.50 | ) | | | — | | |
2020 | | $ | 28.70 | | | | 0.44 | (i) | | | (1.12 | ) | | | (0.68 | ) | | | (0.73 | ) | | | (5.76 | ) | |
2019 | | $ | 32.82 | | | | 0.53 | | | | (2.41 | ) | | | (1.88 | ) | | | (0.44 | ) | | | (1.80 | ) | |
2018 | | $ | 31.16 | | | | 0.60 | | | | 2.08 | | | | 2.68 | | | | (0.63 | ) | | | (0.39 | ) | |
Institutional Shares | | | |
Six Months Ended
November 30, 2022
(Unaudited) | | $ | 24.13 | | | | 0.22 | (i)(j) | | | (0.79 | ) | | | (0.57 | ) | | | — | | | | — | | |
Year Ended May 31:
2022 | | $ | 29.36 | | | | 0.61 | (i) | | | (3.41 | ) | | | (2.80 | ) | | | (0.53 | ) | | | (1.90 | ) | |
2021 | | $ | 21.46 | | | | 0.51 | (i) | | | 7.91 | | | | 8.42 | | | | (0.52 | ) | | | — | | |
2020 | | $ | 28.61 | | | | 0.47 | (i) | | | (1.12 | ) | | | (0.65 | ) | | | (0.74 | ) | | | (5.76 | ) | |
2019 | | $ | 32.72 | | | | 0.56 | | | | (2.41 | ) | | | (1.85 | ) | | | (0.46 | ) | | | (1.80 | ) | |
2018 | | $ | 31.07 | | | | 0.64 | | | | 2.06 | | | | 2.70 | | | | (0.66 | ) | | | (0.39 | ) | |
(a) Not annualized for periods less than one year.
(b) Assumes reinvestment of all net investment income and realized capital gain distributions, if any, during the period. Includes adjustments in accordance with U.S. Generally Accepted Accounting Principles and could differ from the Lipper reported return.
(c) Annualized for periods less than one year.
(d) The net expense ratio may not correlate to the applicable expense limits in place during the period since the current contractual expense limitation is applied for a period beginning July 1, 2019 and in effect through September 30, 2023, instead of coinciding with the Fund's fiscal year end. Details of the current contractual expense limitation in effect can be found in Note 5 of the accompanying Notes to Financial Statements.
(e) Reflects total annual operating expenses for reductions of expenses paid indirectly for the May 31 fiscal years ended 2020, 2019, and 2018. Expenses paid indirectly decreased the expense ratio for each of these respective years by less than 0.01%.
(f) Does not include acquired fund fees and expenses, if any.
(g) From the period beginning July 1, 2019, the amount of any waivers or reimbursements and the amount of any recoupment are calculated without regard to the impact of any performance adjustment to the Fund's management fee.
(h) Portfolio turnover is calculated on the basis of the Fund as a whole without distinguishing between the classes of shares issued.
(i) Per share net investment income (loss) has been calculated using the average daily shares method.
See notes to financial statements.
30
USAA Mutual Funds Trust | | Financial Highlights — continued | |
For a Share Outstanding Throughout Each Period
| | | | | Ratios to Average Net Assets | | Supplemental Data | |
| | | Total
Distributions | | Net
Asset
Value,
End of
Period | |
Total
Return(a)(b) | | Net
Expenses(c)(d)(e)(f)(g) | | Net
Investment
Income
(Loss)(c) | | Gross
Expenses(c)(e)(f) | | Net
Assets,
End of
Period
(000's) | | Portfolio
Turnover(a)(h) | |
USAA International Fund | |
Fund Shares | |
Six Months Ended
November 30, 2022
(Unaudited) | | | — | | | $ | 23.64 | | | | (2.35 | )%(j) | | | 1.01 | % | | | 1.97 | %(j) | | | 1.04 | % | | $ | 1,203,911 | | | | 21 | % | |
Year Ended May 31:
2022 | | | (2.41 | ) | | $ | 24.21 | | | | (10.51 | )% | | | 1.02 | % | | | 2.12 | % | | | 1.02 | % | | $ | 1,301,727 | | | | 34 | % | |
2021 | | | (0.50 | ) | | $ | 29.46 | | | | 39.52 | % | | | 1.01 | % | | | 1.94 | % | | | 1.03 | % | | $ | 1,608,436 | | | | 67 | %(k) | |
2020 | | | (6.49 | ) | | $ | 21.53 | | | | (6.13 | )% | | | 1.06 | % | | | 1.68 | % | | | 1.07 | % | | $ | 1,391,279 | | | | 119 | %(l) | |
2019 | | | (2.24 | ) | | $ | 28.70 | | | | (5.14 | )% | | | 1.08 | % | | | 1.76 | % | | | 1.08 | % | | $ | 1,690,782 | | | | 30 | % | |
2018 | | | (1.02 | ) | | $ | 32.82 | | | | 8.61 | % | | | 1.08 | % | | | 1.58 | % | | | 1.08 | % | | $ | 1,876,020 | | | | 36 | % | |
Institutional Shares | |
Six Months Ended
November 30, 2022
(Unaudited) | | | — | | | $ | 23.56 | | | | (2.36 | )%(j) | | | 0.94 | % | | | 2.01 | %(j) | | | 0.96 | % | | $ | 1,309,213 | | | | 21 | % | |
Year Ended May 31:
2022 | | | (2.43 | ) | | $ | 24.13 | | | | (10.43 | )% | | | 0.94 | % | | | 2.20 | % | | | 0.95 | % | | $ | 1,278,976 | | | | 34 | % | |
2021 | | | (0.52 | ) | | $ | 29.36 | | | | 39.61 | % | | | 0.94 | % | | | 2.00 | % | | | 0.95 | % | | $ | 1,644,340 | | | | 67 | %(k) | |
2020 | | | (6.50 | ) | | $ | 21.46 | | | | (6.05 | )% | | | 0.99 | % | | | 1.77 | % | | | 0.99 | % | | $ | 1,431,107 | | | | 119 | %(l) | |
2019 | | | (2.26 | ) | | $ | 28.61 | | | | (5.06 | )% | | | 1.00 | % | | | 1.81 | % | | | 1.00 | % | | $ | 1,979,758 | | | | 30 | % | |
2018 | | | (1.05 | ) | | $ | 32.72 | | | | 8.68 | % | | | 1.00 | % | | | 1.62 | % | | | 1.00 | % | | $ | 2,349,281 | | | | 36 | % | |
(j) Includes dividend and interest income received on French Reclaims and Sweden Reclaims during the six months ended November 30, 2022. Without these amounts the net investment income (loss) per share, net investment income (loss) ratio, and total return for each class would have been less by 0.07, 0.63%, and 0.29%, respectively. (See Foreign Taxes in Item 2 of the accompanying Notes to Financial Statements.)
(k) Reflects a return to normal trading levels after a prior year transition.
(l) Reflects increased trading activity due to current year transition or asset allocation shift.
(continues on next page)
See notes to financial statements.
31
USAA Mutual Funds Trust | | Financial Highlights | |
For a Share Outstanding Throughout Each Period
| | | | | Investment Activities | | Distributions to
Shareholders From | |
| | | Net Asset
Value,
Beginning
of Period | | Net
Investment
Income
(Loss) | | Net
Realized
and
Unrealized
Gains
(Losses) | | Total from
Investment
Activities | | Net
Investment
Income | | Net
Realized
Gains from
Investments | |
USAA International Fund | | | |
Class A | | | |
Six Months Ended
November 30, 2022
(Unaudited) | | $ | 24.27 | | | | 0.20 | (i)(j) | | | (0.79 | ) | | | (0.59 | ) | | | — | | | | — | | |
Year Ended May 31:
2022 | | $ | 29.25 | | | | 0.57 | (i) | | | (3.44 | ) | | | (2.87 | ) | | | (0.21 | ) | | | (1.90 | ) | |
2021 | | $ | 21.39 | | | | 0.37 | (i) | | | 7.93 | | | | 8.30 | | | | (0.44 | ) | | | — | | |
2020 | | $ | 28.58 | | | | 0.36 | (i) | | | (1.10 | ) | | | (0.74 | ) | | | (0.69 | ) | | | (5.76 | ) | |
2019 | | $ | 32.67 | | | | 0.47 | | | | (2.41 | ) | | | (1.94 | ) | | | (0.35 | ) | | | (1.80 | ) | |
2018 | | $ | 31.04 | | | | 0.53 | | | | 2.04 | | | | 2.57 | | | | (0.55 | ) | | | (0.39 | ) | |
R6 Shares | | | |
Six Months Ended
November 30, 2022
(Unaudited) | | $ | 24.53 | | | | 0.28 | (i)(j) | | | (0.80 | ) | | | (0.52 | ) | | | — | | | | — | | |
Year Ended May 31:
2022 | | $ | 29.65 | | | | 0.80 | (i) | | | (3.36 | ) | | | (2.56 | ) | | | (0.66 | ) | | | (1.90 | ) | |
2021 | | $ | 21.52 | | | | 0.49 | (i) | | | 8.19 | | | | 8.68 | | | | (0.55 | ) | | | — | | |
2020 | | $ | 28.66 | | | | 0.49 | (i) | | | (1.12 | ) | | | (0.63 | ) | | | (0.75 | ) | | | (5.76 | ) | |
August 17, 2018 (m)
through May 31, 2019 | | $ | 32.01 | | | | 0.52 | (i) | | | (1.54 | ) | | | (1.02 | ) | | | (0.53 | ) | | | (1.80 | ) | |
(a) Not annualized for periods less than one year.
(b) Assumes reinvestment of all net investment income and realized capital gain distributions, if any, during the period. Includes adjustments in accordance with U.S. Generally Accepted Accounting Principles and could differ from the Lipper reported return.
(c) Annualized for periods less than one year.
(d) The net expense ratio may not correlate to the applicable expense limits in place during the period since the current contractual expense limitation is applied for a period beginning July 1, 2019 and in effect through September 30, 2023, instead of coinciding with the Fund's fiscal year end. Details of the current contractual expense limitation in effect can be found in Note 5 of the accompanying Notes to Financial Statements.
(e) Reflects total annual operating expenses for reductions of expenses paid indirectly for the May 31 fiscal years ended 2020, 2019, and 2018. Expenses paid indirectly decreased the expense ratio for each of these respective years by less than 0.01%.
(f) Does not include acquired fund fees and expenses, if any.
(g) From the period beginning July 1, 2019, the amount of any waivers or reimbursements and the amount of any recoupment are calculated without regard to the impact of any performance adjustment to the Fund's management fee.
(h) Portfolio turnover is calculated on the basis of the Fund as a whole without distinguishing between the classes of shares issued.
(i) Per share net investment income (loss) has been calculated using the average daily shares method.
See notes to financial statements.
32
USAA Mutual Funds Trust | | Financial Highlights — continued | |
For a Share Outstanding Throughout Each Period (continued)
| | | | | Ratios to Average Net Assets | | Supplemental Data | |
| | | Total
Distributions | | Net
Asset
Value,
End of
Period | | Total
Return
(Excludes
Sales
Charge)(a)(b) | | Net
Expenses(c)(d)(e)(f)(g) | | Net
Investment
Income
(Loss)(c) | | Gross
Expenses(c)(e)(f) | | Net
Assets,
End of
Period
(000's) | | Portfolio
Turnover(a)(h) | |
USAA International Fund | |
Class A | |
Six Months Ended
November 30, 2022
(Unaudited) | | | — | | | $ | 23.68 | | | | (2.43 | )%(j) | | | 1.13 | % | | | 1.85 | %(j) | | | 3.42 | % | | $ | 870 | | | | 21 | % | |
Year Ended May 31:
2022 | | | (2.11 | ) | | $ | 24.27 | | | | (10.57 | )% | | | 1.11 | % | | | 2.07 | % | | | 2.17 | % | | $ | 931 | | | | 34 | % | |
2021 | | | (0.44 | ) | | $ | 29.25 | | | | 39.11 | % | | | 1.30 | % | | | 1.47 | % | | | 1.56 | % | | $ | 1,093 | | | | 67 | %(k) | |
2020 | | | (6.45 | ) | | $ | 21.39 | | | | (6.37 | )% | | | 1.35 | % | | | 1.37 | % | | | 1.39 | % | | $ | 6,402 | | | | 119 | %(l) | |
2019 | | | (2.15 | ) | | $ | 28.58 | | | | (5.39 | )% | | | 1.35 | % | | | 1.52 | % | | | 1.41 | % | | $ | 7,715 | | | | 30 | % | |
2018 | | | (0.94 | ) | | $ | 32.67 | | | | 8.29 | % | | | 1.35 | % | | | 1.29 | % | | | 1.42 | % | | $ | 8,101 | | | | 36 | % | |
R6 Shares | |
Six Months Ended
November 30, 2022
(Unaudited) | | | — | | | $ | 24.01 | | | | (2.12 | )%(j) | | | 0.47 | % | | | 2.50 | %(j) | | | 10.16 | % | | $ | 223 | | | | 21 | % | |
Year Ended May 31:
2022 | | | (2.56 | ) | | $ | 24.53 | | | | (9.53 | )% | | | 0.31 | % | | | 2.87 | % | | | 3.83 | % | | $ | 227 | | | | 34 | % | |
2021 | | | (0.55 | ) | | $ | 29.65 | | | | 40.78 | % | | | 0.80 | % | | | 1.95 | % | | | 1.22 | % | | $ | 28 | | | | 67 | %(k) | |
2020 | | | (6.51 | ) | | $ | 21.52 | | | | (5.95 | )% | | | 0.85 | % | | | 1.83 | % | | | 1.18 | % | | $ | 3,365 | | | | 119 | %(l) | |
August 17, 2018 (m)
through May 31, 2019 | | | (2.33 | ) | | $ | 28.66 | | | | (2.55 | )% | | | 0.85 | % | | | 2.19 | % | | | 2.03 | % | | $ | 4,477 | | | | 30 | % | |
(j) Includes dividend and interest income received on French Reclaims and Sweden Reclaims during the six months ended November 30, 2022. Without these amounts the net investment income (loss) per share, net investment income (loss) ratio, and total return for each class would have been less by 0.07, 0.63%, and 0.29%, respectively. (See Foreign Taxes in Item 2 of the accompanying Notes to Financial Statements.)
(k) Reflects a return to normal trading levels after a prior year transition.
(l) Reflects increased trading activity due to current year transition or asset allocation shift.
(m) Commencement of operations.
See notes to financial statements.
33
USAA Mutual Funds Trust | | Notes to Financial Statements
November 30, 2022 | |
(Unaudited)
1. Organization:
USAA Mutual Funds Trust (the "Trust") is organized as a Delaware statutory trust and is registered under the Investment Company Act of 1940, as amended (the "1940 Act"), as an open-end investment company. The Trust is comprised of 45 funds and is authorized to issue an unlimited number of shares, which are units of beneficial interest with no par value.
The accompanying financial statements are those of the USAA International Fund (the "Fund"). The Fund offers four classes of shares: Fund Shares, Institutional Shares, Class A, and R6 Shares. The Fund is classified as diversified under the 1940 Act.
Each class of shares of the Fund has substantially identical rights and privileges, except with respect to sales charges, fees paid under distribution plans, expenses allocable exclusively to each class of shares, voting rights on matters solely affecting a single class of shares, and the exchange privilege of each class of shares.
Victory Capital Management ("VCM" or the "Adviser"), is an indirect wholly owned subsidiary of Victory Capital Holdings, Inc., a publicly traded Delaware corporation, and a wholly owned direct subsidiary of Victory Capital Operating, LLC.
Under the Trust's organizational documents, its officers and trustees are indemnified against certain liabilities arising out of the performance of their duties to the Fund. In addition, in the normal course of business, the Fund enters into contracts with its vendors and others that provide for general indemnifications. The Fund's maximum exposure under these arrangements is unknown, as this would involve future claims that may be made against the Fund. However, based on experience, the Fund expects that risk of loss to be remote.
2. Significant Accounting Policies:
The following is a summary of significant accounting policies followed by the Trust in the preparation of its financial statements. The policies are in conformity with U.S. Generally Accepted Accounting Principles ("GAAP"). The preparation of financial statements in accordance with GAAP requires management to make estimates and assumptions that affect the reported amounts of assets and liabilities and disclosure of contingent assets and liabilities at the date of the financial statements and the reported amounts of income and expenses for the period. Actual results could differ from those estimates. The Fund follows the specialized accounting and reporting requirements under GAAP that are applicable to investment companies under Accounting Standards Codification Topic 946.
Investment Valuation:
The Fund records investments at fair value. Fair value is defined as the price that would be received to sell an asset or paid to transfer a liability in an orderly transaction between market participants at the measurement date.
The valuation techniques described below maximize the use of observable inputs and minimize the use of unobservable inputs in determining fair value. The inputs used for valuing the Fund's investments are summarized in the three broad levels listed below:
• Level 1 — quoted prices (unadjusted) in active markets for identical securities
• Level 2 — other significant observable inputs (including quoted prices for similar securities, interest rates, or credit spreads, applicable to those securities, etc.)
• Level 3 — significant unobservable inputs (including the Adviser's assumptions in determining the fair value of investments)
Changes in valuation techniques may result in transfers in or out of an assigned level within the disclosure hierarchy. The inputs or methodologies used for valuation techniques are not necessarily an indication of the risks associated with entering into those investments.
34
USAA Mutual Funds Trust | | Notes to Financial Statements — continued
November 30, 2022 | |
(Unaudited)
The Adviser, acting as the valuation designee has established the Pricing and Liquidity Committee (the "Committee"), and subject to the Trust's Board of Trustees' (the "Board") oversight, the Committee administers and oversees the Fund's valuation policies and procedures, which are approved by the Board.
Portfolio securities listed or traded on securities exchanges, including Exchange-Traded Funds ("ETFs"), and American Depositary Receipts ("ADRs"), are valued at the closing price on the exchange or system where the security is principally traded, if available, or at the Nasdaq Official Closing Price. If there have been no sales for that day on the exchange or system, then a security is valued at the last available bid quotation on the exchange or system where the security is principally traded. In each of these situations, valuations are typically categorized as Level 1 in the fair value hierarchy.
Investments in open-end investment companies, other than ETFs, are valued at their net asset value ("NAV"). These valuations are typically categorized as Level 1 in the fair value hierarchy.
In the event that price quotations or valuations are not readily available, investments are valued at fair value in accordance with procedures established by and under the general supervision and responsibility of the Board. These valuations are typically categorized as Level 2 or Level 3 in the fair value hierarchy, based on the observability of inputs used to determine the fair value. The effect of fair value pricing is that securities may not be priced on the basis of quotations from the primary market in which they are traded, and the actual price realized from the sale of a security may differ materially from the fair value price. Valuing these securities at fair value is intended to cause the Fund's NAV to be more reliable than it otherwise would be.
In accordance with procedures adopted by the Board, fair value pricing may be used if events materially affecting the value of foreign securities occur between the time the exchange on which they are traded closes and the time the Fund's NAV is calculated. The Fund uses a systematic valuation model, provided daily by an independent third party to fair value its international equity securities. The valuations are categorized as Level 2 in the fair value hierarchy.
A summary of the valuations as of November 30, 2022, based upon the three levels defined above, is included in the table below while the breakdown, by category, of investments is disclosed on the Schedule of Portfolio Investments (amounts in thousands):
| | | Level 1 | | Level 2 | | Level 3 | | Total | |
Common Stocks | | $ | 80,323 | | | $ | 2,386,653 | | | $ | 74 | | | $ | 2,467,050 | | |
Exchange-Traded Funds | | | 7,329 | | | | — | | | | — | | | | 7,329 | | |
Collateral for Securities Loaned | | | 60,077 | | | | — | | | | — | | | | 60,077 | | |
Total | | $ | 147,729 | | | $ | 2,386,653 | | | $ | 74 | | �� | $ | 2,534,456 | | |
For the six months ended November 30, 2022, there were no transfers into/out of Level 3.
Real Estate Investment Trusts ("REITs"):
The Fund may invest in REITs, which report information on the source of their distributions annually. REITs are pooled investment vehicles that invest primarily in income producing real estate or real estate related loans or interests (such as mortgages). Certain distributions received from REITs during the year are recorded as realized gains or return of capital as estimated by the Fund or when such information becomes known.
Investment Companies:
Exchange-Traded Funds:
The Fund may invest in ETFs, the shares of which are bought and sold on a securities exchange. An ETF trades like common stock and represents a fixed portfolio of securities often designed to track the performance and dividend yield of a particular domestic or foreign market index. The Fund may purchase shares of an ETF to temporarily gain exposure to a portion of the U.S. or a foreign market
35
USAA Mutual Funds Trust | | Notes to Financial Statements — continued
November 30, 2022 | |
(Unaudited)
while awaiting purchase of underlying securities. The risks of owning an ETF generally reflect the risks of owning the underlying securities the ETF is designed to track, although the lack of liquidity of an ETF could result in it being more volatile. Additionally, ETFs have fees and expenses that reduce their value.
Open-End Funds:
The Fund may invest in portfolios of open-end investment companies. These investment companies value securities in their portfolios for which market quotations are readily available at their market values (generally the last reported sale price) and all other securities and assets at their fair value by the methods established by the board of directors of the underlying funds.
Derivative Instruments:
Foreign Exchange Currency Contracts:
The Fund may enter into foreign exchange currency contracts to convert U.S. dollars to and from various foreign currencies. A foreign exchange currency contract is an obligation by the Fund to purchase or sell a specific currency at a future date at a price (in U.S. dollars) set at the time of the contract. The Fund does not engage in "cross-currency" foreign exchange contracts (i.e., contracts to purchase or sell one foreign currency in exchange for another foreign currency). The Fund's foreign exchange currency contracts might be considered spot contracts (typically a contract of one week or less) or forward contracts (typically a contract term over one week). A spot contract is entered into for purposes of hedging against foreign currency fluctuations relating to a specific portfolio transaction, such as the delay between a security transaction trade date and settlement date. Forward contracts are entered into for purposes of hedging portfolio holdings or concentrations of such holdings. Each foreign exchange currency contract is adjusted daily by the prevailing spot or forward rate of the underlying currency, and any appreciation or depreciation is recorded for financial statement purposes as unrealized until the contract settlement date, at which time the Fund records realized gains or losses equal to the difference between the value of a contract at the time it was opened and the value at the time it was closed. The Fund could be exposed to risk if a counterparty is unable to meet the terms of a foreign exchange currency contract or if the value of the foreign currency changes unfavorably. In addition, the use of foreign exchange currency contracts does not eliminate fluctuations in the underlying prices of the securities. As of November 30, 2022, the Fund had no open forward foreign exchange currency contracts.
Investment Transactions and Related Income:
Changes in holdings of investments are accounted for no later than one business day following the trade date. For financial reporting purposes, however, investment transactions are accounted for on trade date or the last business day of the reporting period. Interest income is determined on the basis of coupon interest accrued using the effective interest method which adjusts, where applicable, the amortization of premiums or accretion of discounts. Dividend income is recorded on the ex-dividend date. Gains or losses realized on sales of securities are recorded on the identified cost basis.
Withholding taxes on interest, dividends, and gains as a result of certain investments in ADRs by the Fund have been provided for in accordance with each investment's applicable country's tax rules and rates.
Securities Lending:
The Fund, through a Securities Lending Agreement with Citibank, N.A. ("Citibank"), may lend its securities to qualified financial institutions, such as certain broker-dealers and banks, to earn additional income, net of income retained by Citibank. Borrowers are required to initially secure their loans for collateral in the amount of at least 102% of the value of U.S. securities loaned or at least 105% of the value of non-U.S. securities loaned, marked-to-market daily. Any collateral shortfalls associated with increases in the valuation of the securities loaned are generally cured the next business day. The
36
USAA Mutual Funds Trust | | Notes to Financial Statements — continued
November 30, 2022 | |
(Unaudited)
collateral can be received in the form of cash collateral and/or non-cash collateral. Non-cash collateral can include U.S. Government Securities and other securities as permitted by Securities and Exchange Commission ("SEC") guidelines. The cash collateral is invested in short-term instruments or cash equivalents, primarily open-end investment companies, as noted on the Fund's Schedule of Portfolio Investments. The Fund effectively does not have control of the non-cash collateral and therefore it is not disclosed on the Fund's Schedule of Portfolio Investments. Collateral requirements are determined daily based on the value of the Fund's securities on loan as of the end of the prior business day. During the time portfolio securities are on loan, the borrower will pay the Fund any dividends or interest paid on such securities plus any fee negotiated between the parties to the lending agreement. The Fund also earns a return from the collateral. The Fund pays Citibank various fees in connection with the investment of cash collateral and fees based on the investment income received from securities lending activities. Securities lending income (net of these fees) is disclosed on the Statement of Operations. Loans are terminable upon demand and the borrower must return the loaned securities within the lesser of one standard settlement period or five business days. Although risk is mitigated by the collateral, the Fund could experience a delay in recovering its securities and possible loss of income or value if the borrower fails to return them. In addition, there is a risk that the value of the short-term investments will be less than the amount of cash collateral required to be returned to the borrower.
The Fund's agreement with Citibank does not include master netting provisions. Non-cash collateral received by the Fund may not be sold or repledged, except to satisfy borrower default.
The following table (amounts in thousands) is a summary of the Fund's securities lending transactions as of November 30, 2022.
Value of
Securities on Loan | | Non-Cash
Collateral | | Cash
Collateral | |
| $ | 53,369 | | | $ | — | | | $ | 60,077 | | |
Foreign Currency Translations:
The accounting records of the Fund are maintained in U.S. dollars. Investment securities and other assets and liabilities of the Fund denominated in a foreign currency are translated into U.S. dollars at current exchange rates. Purchases and sales of securities, income receipts, and expense payments are translated into U.S. dollars at the exchange rates on the date of the transactions. The Fund does not isolate the portion of the results of operations resulting from changes in foreign exchange rates on investments from fluctuations arising from changes in market prices of securities held. Such fluctuations are disclosed as Net change in unrealized appreciation/depreciation on investment securities and foreign currency translations on the Statement of Operations. Any realized gains or losses from these fluctuations are disclosed as Net realized gains (losses) from investment securities and foreign currency transactions on the Statement of Operations.
Foreign Taxes:
The Fund may be subject to foreign taxes related to foreign income received (a portion of which maybe reclaimable), capital gains on the sale of securities, and certain foreign currency transactions. All foreign taxes are recorded in accordance with the applicable regulations and rates that exist in the foreign jurisdictions in which the Fund invests.
The Fund received European Union reclaims related to prior years. For the six months ended November 30, 2022, the Fund recognized $5,850 thousand related to EU reclaims and $1,575 thousand in related interest and entitlements. These reclaims are reflected on the Statement of Operations as Dividend Income or as a reduction to Foreign tax withholding expense. The related interest entitlements are reflected on the Statement of Operations as Interest income or as a reduction to Foreign tax withholding expense.
37
USAA Mutual Funds Trust | | Notes to Financial Statements — continued
November 30, 2022 | |
(Unaudited)
Federal Income Taxes:
The Fund intends to continue to qualify as a regulated investment company by complying with the provisions available to certain investment companies, as defined in applicable sections of the Internal Revenue Code, and to make distributions of net investment income and net realized gains sufficient to relieve it from all, or substantially all, federal income taxes. Accordingly, no provision for federal income taxes is required in the financial statements. The Fund has a tax year end of May 31.
For the six months ended November 30, 2022, the Fund did not incur any income tax, interest, or penalties, and has recorded no liability for net unrecognized tax benefits relating to uncertain tax positions.
Management of the Fund has reviewed tax positions taken in tax years that remain subject to examination by all major tax jurisdictions, including federal (i.e., the last four tax years, which includes the current fiscal tax year end). Management believes that there is no tax liability resulting from unrecognized tax benefits related to uncertain tax positions taken.
Allocations:
Expenses directly attributable to the Fund are charged to the Fund, while expenses that are attributable to more than one fund in the Trust, or jointly with an affiliated trust, are allocated among the respective funds in the Trust and/or an affiliated trust based upon net assets or another appropriate basis.
Income, expenses (other than class-specific expenses such as transfer agent fees, state registration fees, printing fees, and 12b-1 fees), and realized and unrealized gains or losses on investments are allocated to each class of shares based on its relative net assets on the date income is earned or expenses and realized and unrealized gains and losses are incurred.
3. Purchases and Sales:
Purchases and sales of securities (excluding securities maturing less than one year from acquisition) for the six months ended November 30, 2022, were as follows for the Fund (amounts in thousands):
Excluding
U.S. Government Securities | |
Purchases | | Sales | |
$ | 509,957 | | | $ | 483,678 | | |
4. Affiliated Fund Ownership:
The Fund offers its shares for investment by other USAA Mutual Funds. The fund-of-funds do not invest in the underlying funds for the purpose of exercising management or control, and the affiliated fund-of-funds' annual and semi-annual reports may be viewed at www.vcm.com. As of November 30, 2022, certain fund-of-funds owned total outstanding shares of the Fund as follows:
Affiliated USAA Mutual Funds | | Ownership % | |
USAA Cornerstone Conservative Fund | | | 0.3 | | |
USAA Cornerstone Equity Fund | | | 1.2 | | |
5. Fees and Transactions with Affiliates and Related Parties:
Investment Advisory Fees:
Investment advisory services are provided to the Fund by the Adviser, which is a New York corporation registered as an investment adviser with the SEC.
Under the terms of the Investment Advisory Agreement, the Adviser is entitled to receive a base fee and a performance adjustment. The Fund's base fee is accrued daily and paid monthly at an annualized
38
USAA Mutual Funds Trust | | Notes to Financial Statements — continued
November 30, 2022 | |
(Unaudited)
rate of 0.75% of the Fund's average daily net assets. Amounts incurred and paid to VCM for the six months ended November 30, 2022, are reflected on the Statement of Operations as Investment advisory fees.
The performance adjustment for each share class is accrued daily and calculated monthly by comparing the respective class' performance to that of the Lipper International Funds Index. The Lipper International Funds Index tracks the total return performance of the largest funds within the Lipper International Funds category.
The performance period for each share class consists of the current month plus the previous 35 months. The following table is utilized to determine the extent of the performance adjustment:
Over/Under Performance Relative to Index
(in basis points)(a) | | Annual Adjustment Rate
(in basis points) | |
| | +/- 100 to 400 | | | | +/- 4 | | |
| | +/- 401 to 700 | | | | +/- 5 | | |
| | +/- 701 and greater | | | | +/- 6 | | |
(a) Based on the difference between the average annual performance of the relevant share class of the Fund and its relevant Lipper index, rounded to the nearest basis point.
Each class' annual performance adjustment rate is multiplied by the average daily net assets of the respective class over the entire performance period, which is then multiplied by a fraction, the numerator of which is the number of days in the month and the denominator of which is 365 (366 in leap years). The resulting amount is then added to (in the case of overperformance), or subtracted from (in the case of underperformance) the base fee.
Under the performance fee arrangement, each class pays a positive performance fee adjustment for a performance period whenever the class outperforms the Lipper International Funds Index over that period, even if the class has overall negative returns during the performance period.
For the period June 1, 2022, to November 30, 2022, performance adjustments were $(298), $(302), $(1), and less than $(1) for Fund Shares, Institutional Shares, Class A, and R6 Shares, in thousands, respectively. Performance adjustments were (0.05)%, (0.05)%, (0.22%), and (0.38)% for Fund Shares, Institutional Shares, Class A, and R6 Shares, respectively. The performance adjustment rate included in the investment advisory fee may differ from the maximum over/under Annual Adjustment Rate due to differences in average net assets for the reporting period and rolling 36 month performance periods.
The Trust relies on an exemptive order granted to VCM and its affiliated funds by the SEC in March 2019, permitting the use of a "manager-of-managers" structure for certain funds. Under a manager-of-managers structure, the investment adviser may select (with approval of the Board and without shareholder approval) one or more subadvisers to manage the day-to-day investment of a fund's assets.
VCM entered into an Investment Subadvisory Agreement with Wellington Management Company LLP ("Wellington Management"). Wellington Management directs the investment and reinvestment of a portion of the Fund's assets (as allocated from time to time by VCM). This arrangement provides for monthly fees that are paid by VCM. VCM (not the Fund) pays the subadviser fees.
Administration and Servicing Fees:
VCM also serves as the Fund's administrator and fund accountant. Under the Fund Administration, Servicing and Accounting Agreement, VCM is paid an administration and servicing fee that is accrued daily and paid monthly at an annualized rate of 0.15%, 0.10%, 0.15%, and 0.05%, which is based on the Fund's average daily net assets of the Fund Shares, Institutional Shares, Class A, and R6 Shares, respectively. Amounts incurred for the six months ended November 30, 2022, are reflected on the Statement of Operations as Administration fees.
Citi Fund Services Ohio, Inc. ("Citi"), an affiliate of Citibank, acts as sub-administrator and sub-fund accountant to the Fund pursuant to a Sub-Administration and Sub-Fund Accounting Services Agreement
39
USAA Mutual Funds Trust | | Notes to Financial Statements — continued
November 30, 2022 | |
(Unaudited)
between VCM and Citi. VCM pays Citi a fee for providing these services. The Fund reimburses VCM and Citi for out-of-pocket expenses incurred in providing these services and certain other expenses specifically allocated to the Fund. Amounts incurred for the six months ended November 30, 2022, are reflected on the Statement of Operations as Sub-Administration fees.
The Fund (as part of the Trust) has entered into an agreement with the Adviser to provide compliance services, pursuant to which the Adviser furnishes its compliance personnel, including the services of the Chief Compliance Officer ("CCO"), and other resources reasonably necessary to provide the Trust with compliance oversight services related to the design, administration, and oversight of a compliance program for the Trust in accordance with Rule 38a-1 under the 1940 Act. The CCO is an employee of the Adviser, which pays the compensation of the CCO and support staff. The funds in the Trust, Victory Variable Insurance Funds, Victory Portfolios, and Victory Portfolios II (collectively, the "Victory Funds Complex") in the aggregate, compensate the Adviser for these services. Amounts incurred for the six months ended November 30, 2022, are reflected on the Statement of Operations as Compliance fees.
Transfer Agency Fees:
Victory Capital Transfer Agency, Inc. ("VCTA"), an affiliate of the Adviser, provides transfer agency services to the Fund. VCTA provides transfer agent services to the Fund Shares based on an annual charge of $23 per shareholder account plus out-of-pocket expenses. VCTA pays a portion of these fees to certain intermediaries for the administration and servicing of accounts that are held with such intermediaries. Transfer agent fees for Institutional Shares, Class A, and R6 Shares are paid monthly based on a fee accrued daily at an annualized rate of 0.10%, 0.10% and 0.01%, respectively, of average daily net assets, plus out-of-pocket expenses. Amounts incurred and paid to VCTA for the six months ended November 30, 2022, are reflected on the Statement of Operations as Transfer agent fees.
FIS Investor Services LLC serves as sub-transfer agent and dividend disbursing agent for the Fund pursuant to a Sub-Transfer Agent Agreement between VCTA and FIS Investor Services LLC. VCTA provides FIS Investor Services LLC a fee for providing these services.
Distributor/Underwriting Services:
Victory Capital Services, Inc. (the "Distributor"), an affiliate of the Adviser, serves as Distributor for the continuous offering of the shares of the Fund pursuant to a Distribution Agreement between the Distributor and the Trust.
Pursuant to the Distribution and Service Plans adopted in accordance with Rule 12b-1 under the 1940 Act, the Distributor may receive a monthly distribution and service fee, at an annual rate of up to 0.25% of the average daily net assets of Class A. The distribution and service fees paid to the Distributor may be used by the Distributor to pay for activity primarily intended to result in the sale of Class A. Amounts incurred and paid to the Distributor for the six months ended November 30, 2022, are reflected on the Statement of Operations as 12b-1 fees.
In addition, the Distributor is entitled to receive commissions in connection with sales of Class A. For the six months ended November 30, 2022, the Distributor did not receive any commissions.
Other Fees:
Citibank serves as the Fund's custodian. The Fund pays Citibank a fee for providing these services. Amounts incurred for the six months ended November 30, 2022, are reflected on the Statement of Operations as Custodian fees.
K&L Gates LLP provides legal services to the Trust.
The Adviser has entered into an expense limitation agreement with the Fund until at least September 30, 2023. Under the terms of the agreement, the Adviser has agreed to waive fees or reimburse certain expenses to the extent that ordinary operating expenses incurred by certain classes of the Fund in any fiscal year exceed the expense limits for such classes of the Fund. Such excess amounts will be the liability of the Adviser. Performance adjustments, acquired fund fees and expenses, interest, taxes,
40
USAA Mutual Funds Trust | | Notes to Financial Statements — continued
November 30, 2022 | |
(Unaudited)
brokerage commissions, other expenditures, which are capitalized in accordance with GAAP, and other extraordinary expenses not incurred in the ordinary course of the Fund's business are excluded from the expense limits. As of November 30, 2022, the expense limits (excluding voluntary waivers) were 1.06%, 0.99%, 1.35%, and 0.85% for Fund Shares, Institutional Shares, Class A, and R6 Shares, respectively.
Under the terms of the expense limitation agreement, as amended June 29, 2022, the Fund has agreed to repay fees and expenses that were waived or reimbursed by the Adviser for a period of up to three years (thirty-six (36) months) after the waiver or reimbursement took place, subject to the lesser of any operating expense limits in effect at the time of: (a) the original waiver or expense reimbursement; or (b) the recoupment, after giving effect to the recoupment amount.
As of November 30, 2022, the following amounts are available to be repaid to the Adviser (amounts in thousands). The Fund has not recorded any amounts available to be repaid as a liability due to an assessment that such repayments are not probable at November 30, 2022.
Expires
2023 | | Expires
2024 | | Expires
2025 | | Expires
2026 | | Total | |
| $ | 9 | | | $ | 372 | | | $ | 85 | | | $ | 333 | | | $ | 799 | | |
The Adviser may voluntarily waive or reimburse additional fees to assist the Fund in maintaining competitive expense ratios. Voluntary waivers and reimbursements applicable to the Fund are not available to be recouped at a future time. There were no voluntary waivers or reimbursements for the six months ended November 30, 2022.
Certain officers and/or interested trustees of the Fund are also officers and/or employees of the Adviser, administrator, fund accountant, sub-administrator, sub-fund accountant, custodian, and Distributor.
6. Risks:
The Fund may be subject to other risks in addition to these identified risks.
Market Risk — Overall market risks may affect the value of the Fund. Domestic and international factors such as political events, war, terrorism, trade disputes, inflation rates, interest rate levels and other fiscal and monetary policy changes, cybersecurity incidents, pandemics and other public health crises, sanctions against a particular foreign country, its nationals, businesses or industries and related geopolitical events, as well as environmental disasters such as earthquakes, fires, and floods, or other catastrophes, may add to instability in global economies and markets generally, and may lead to increased market volatility. Global economies and financial markets are highly interconnected, which increases the possibility that conditions in one country or region might adversely affect issuers in another country or region. The impact of these and other factors may be short-term or may last for extended periods.
Equity Risk — The values of the equity securities in which the Fund invests may decline in response to developments affecting individual companies and/or general market, economic and political conditions and other factors. A company's earnings or dividends may not increase as expected due to poor management decisions, competitive pressures, breakthroughs in technology, reliance on suppliers, labor problems or shortages, corporate restructurings, fraudulent disclosures, natural disasters, military confrontations, war, terrorism, public health crises, or other events, conditions, and factors. Price changes may be temporary or may last for extended periods.
Foreign Securities Risk — Foreign markets can be more volatile than the U.S. market due to increased risks of adverse issuer, political, regulatory, market, or economic developments and can perform differently from the U.S. market. Global markets, or those in a particular region, may all react in similar fashion to important political, economic, or other developments. Events and evolving conditions in certain economies or markets may alter the risks associated with investments tied to countries or regions that historically were perceived as comparatively stable and make such investments riskier and more volatile.
41
USAA Mutual Funds Trust | | Notes to Financial Statements — continued
November 30, 2022 | |
(Unaudited)
7. Borrowing and Interfund Lending:
Line of Credit:
The Victory Funds Complex participates in a short-term demand note "Line of Credit" agreement with Citibank. The Line of Credit agreement with Citibank was renewed on June 27, 2022, with a termination date of June 26, 2023. Under the agreement with Citibank, the Victory Funds Complex may borrow up to $600 million, of which $300 million is committed and $300 million is uncommitted. $40 million of the Line of Credit is reserved for use by the Victory Floating Rate Fund, another series of the Victory Funds Complex, with Victory Floating Rate Fund paying the related commitment fees for that amount. The purpose of the Line of Credit is to meet temporary or emergency cash needs. For the six months ended November 30, 2022, Citibank received an annual commitment fee of 0.15% on $300 million for providing the Line of Credit. Each fund in the Victory Funds Complex paid a pro-rata portion of the commitment fees plus any interest on amounts borrowed. For the period from June 1, 2022, through June 27, 2022, interest was based on the one-month London Interbank Offered Rate ("LIBOR") plus one percent. Effective with the renewal, for the period June 28, 2022, through November 30, 2022, interest was based on the one-month Secured Overnight Financing Rate ("SOFR") plus 1.10 percent. Interest charged to the Fund during the period, if applicable, is reflected on the Statement of Operations under Line of credit fees.
The Fund had no borrowings under the Line of Credit agreement during the six months ended November 30, 2022.
Interfund Lending:
The Trust and the Adviser rely on an exemptive order granted by the SEC in March 2017 (the "Order"), permitting the establishment and operation of an Interfund Lending Facility (the "Facility"). The Facility allows the Fund to directly lend and borrow money to or from any other fund in the Victory Funds Complex that is permitted to participate in the Facility, relying upon the Order at rates beneficial to both the borrowing and lending funds. Advances under the Facility are allowed for temporary or emergency purposes, including the meeting of redemption requests that otherwise might require the untimely disposition of securities, and are subject to each Fund's borrowing restrictions. The interfund loan rate is determined, as specified in the Order, by averaging the current repurchase agreement rate and the current bank loan rate. As a Borrower, interest charged to the Fund, if any, during the period, is reflected on the Statement of Operations under Interfund lending fees. As a Lender, interest earned by the Fund, if any, during the period, is reflected on the Statement of Operations under Interfund lending.
The average borrowing or lending for the days outstanding and average interest rate for the Fund during the six months ended November 30, 2022, were as follows (amounts in thousands):
Borrower
or Lender | | Amount
Outstanding at
November 30, 2022 | | Average
Borrowing* | | Days
Borrowing
Outstanding | | Average
Interest
Rate* | | Maximum
Borrowing
During
the Period | |
| Borrower | | $ | — | | | $ | 1,671 | | | | 16 | | | | 3.78 | % | | $ | 3,437 | | |
* For the six months ended November 30, 2022, based on the number of days borrowings were outstanding.
8. Federal Income Tax Information:
The Fund intends to distribute any net investment income annually. Distributable net realized gains, if any, are declared and paid at least annually.
The amounts of dividends from net investment income and distributions from net realized gains (collectively, distributions to shareholders) are determined in accordance with federal income tax regulations, which may differ from GAAP. To the extent these "book/tax" differences are permanent in
42
USAA Mutual Funds Trust | | Notes to Financial Statements — continued
November 30, 2022 | |
(Unaudited)
nature (e.g., net operating loss and distribution reclassification), such amounts are reclassified within the components of net assets based on their federal tax-basis treatment; temporary differences (e.g., wash sales) do not require reclassification. To the extent dividends and distributions exceed net investment income and net realized gains for tax purposes, they are reported as distributions of capital. Net investment losses incurred by the Fund may be reclassified as an offset to capital on the accompanying Statement of Assets and Liabilities.
The tax character of current year distributions paid and the tax basis of the current components of accumulated earnings (loss) will be determined at the end of the current tax year.
At the tax year ended May 31, 2022, the Fund had no capital loss carryforwards for federal income tax purposes.
43
USAA Mutual Funds Trust | | Supplemental Information
November 30, 2022 | |
(Unaudited)
Proxy Voting and Portfolio Holdings Information
Proxy Voting:
Information regarding the policies and procedures the Fund uses to determine how to vote proxies relating to portfolio securities is available without charge, upon request, by calling (800) 235-8396. The information is also included in the Fund's Statement of Additional Information, which is available on the SEC's website at www.sec.gov.
Information relating to how the Fund voted proxies relating to portfolio securities held during the most recent 12 months ended June 30 is available on the SEC's website at www.sec.gov.
Availability of Schedules of Portfolio Investments:
The Trust files a complete list of Schedules of Portfolio Investments with the SEC for the first and third quarter of each fiscal year on Form N-PORT. Form N-PORT is available on the SEC's website at www.sec.gov.
Expense Examples
As a shareholder of the Fund, you may incur two types of costs: (1) transaction costs, including sales charges (loads) on purchases; and (2) ongoing costs, including management fees and other Fund expenses. These examples are intended to help you understand your ongoing costs (in dollars) of investing in the Fund and to compare these costs with the ongoing costs of investing in other mutual funds.
These examples are based on an investment of $1,000 invested at the beginning of the period and held for the entire period from June 1, 2022, through November 30, 2022.
The Actual Expense figures in the table below provide information about actual account values and actual expenses. You may use the information below, together with the amount you invested, to estimate the expenses that you paid over the period. Simply divide your account value by $1,000 (for example, an $8,600 account value divided by $1,000 = 8.6), then multiply the result by the number in the table under the heading entitled "Actual Expenses Paid During Period" to estimate the expenses you paid on your account during this period.
The Hypothetical Expense figures in the table below provide information about hypothetical account values and hypothetical expenses based on the Fund's actual expense ratio and an assumed rate of return of 5% per year before expenses, which is not the Fund's actual return. The hypothetical account values and expenses may not be used to estimate the actual ending account balance or expenses you paid for the period. You may use this information to compare this 5% hypothetical example with the 5% hypothetical examples that appear in shareholder reports of other funds.
Please note the expenses shown in the table below are meant to highlight your ongoing costs only and do not reflect any transactional costs. Therefore, the hypothetical expenses in the table are useful in comparing ongoing costs only and will not help you determine the relative total costs of owning different funds. In addition, if these transactional costs were included, your costs would have been higher.
| | | Beginning
Account
Value
6/1/22 | | Actual
Ending
Account
Value
11/30/22 | | Hypothetical
Ending
Account
Value
11/30/22 | | Actual
Expenses Paid
During Period
6/1/22-
11/30/22* | | Hypothetical
Expenses Paid
During Period
6/1/22-
11/30/22* | | Annualized
Expense Ratio
During Period
6/1/22-
11/30/22 | |
Fund Shares | | $ | 1,000.00 | | | $ | 976.50 | | | $ | 1,020.00 | | | $ | 5.00 | | | $ | 5.11 | | | | 1.01 | % | |
Institutional Shares | | | 1,000.00 | | | | 976.40 | | | | 1,020.36 | | | | 4.66 | | | | 4.76 | | | | 0.94 | % | |
Class A | | | 1,000.00 | | | | 975.70 | | | | 1,019.40 | | | | 5.60 | | | | 5.72 | | | | 1.13 | % | |
R6 Shares | | | 1,000.00 | | | | 978.80 | | | | 1,022.71 | | | | 2.33 | | | | 2.38 | | | | 0.47 | % | |
* Expenses are equal to the average account value multiplied by the Fund's annualized expense ratio multiplied by 183/365 (the number of days in the most recent fiscal half-year divided by the number of days in the fiscal year).
44
Privacy Policy
Protecting the Privacy of Information
The Trust respects your right to privacy. We also know that you expect us to conduct and process your business in an accurate and efficient manner. To do so, we must collect and maintain certain personal information about you. This is the information we collect from you on applications or other forms, and from the transactions you make with us or third parties. It may include your name, address, social security number, account transactions and balances, and information about investment goals and risk tolerance.
We do not disclose any information about you or about former customers to anyone except as permitted or required by law. Specifically, we may disclose the information we collect to companies that perform services on our behalf, such as the transfer agent that processes shareholder accounts and printers and mailers that assist us in the distribution of investor materials. We may also disclose this information to companies that perform marketing services on our behalf. This allows us to continue to offer you Victory investment products and services that meet your investing needs, and to effect transactions that you request or authorize. These companies will use this information only in connection with the services for which we hired them. They are not permitted to use or share this information for any other purpose.
To protect your personal information internally, we permit access only by authorized employees and maintain physical, electronic, and procedural safeguards to guard your personal information.*
* You may have received communications regarding information about privacy policies from other financial institutions which gave you the opportunity to "opt-out" of certain information sharing with companies which are not affiliated with that financial institution. The Trust does not share information with other companies for purposes of marketing solicitations for products other than the Trust. Therefore, the Trust does not provide opt-out options to their shareholders.
P.O. Box 182593
Columbus, Ohio 43218-2593

Visit our website at: | | Call | |
www.vcm.com | | (800) 235-8396 | |

NOVEMBER 30, 2022
Semi Annual Report
USAA Sustainable World Fund
Victory Capital means Victory Capital Management Inc., the investment adviser of the USAA Mutual Funds. USAA Mutual Funds are distributed by Victory Capital Services, Inc., member FINRA, an affiliate of Victory Capital. Victory Capital and its affiliates are not affiliated with United Services Automobile Association or its affiliates. USAA and the USAA logos are registered trademarks and the USAA Mutual Funds and USAA Investments logos are trademarks of United Services Automobile Association and are being used by Victory Capital and its affiliates under license.
www.vcm.com
News, Information And Education 24 Hours A Day, 7 Days A Week
The Victory Capital website gives fund shareholders, prospective shareholders, and investment professionals a convenient way to access fund information, get guidance, and track fund performance anywhere they can access the Internet. The site includes:
• Detailed performance records
• Daily share prices
• The latest fund news
• Investment resources to help you become a better investor
• A section dedicated to investment professionals
Whether you're a potential investor searching for the fund that matches your investment philosophy, a seasoned investor interested in planning tools, or an investment professional, www.vcm.com has what you seek. Visit us anytime. We're always open.
TABLE OF CONTENTS
Investment Objective & Portfolio Holdings | | | 2 | | |
Schedule of Portfolio Investments | | | 3 | | |
Financial Statements | |
Statement of Assets and Liabilities | | | 25 | | |
Statement of Operations | | | 26 | | |
Statements of Changes in Net Assets | | | 27 | | |
Financial Highlights | | | 30 | | |
Notes to Financial Statements | | | 32 | | |
Supplemental Information | | | 41 | | |
Proxy Voting and Portfolio Holdings Information | | | 41 | | |
Expense Examples | | | 41 | | |
Privacy Policy (inside back cover) | | | |
This report is for the information of the shareholders and others who have received a copy of the currently effective prospectus of the Fund, managed by Victory Capital Management Inc. It may be used as sales literature only when preceded or accompanied by a current prospectus, which provides further details about the Fund.
IRA DISTRIBUTION WITHHOLDING DISCLOSURE
We generally must withhold federal income tax at a rate of 10% of the taxable portion of your distribution and, if you live in a state that requires state income tax withholding, at your state's tax rate. However, you may elect not to have withholding apply or to have income tax withheld at a higher rate. Any withholding election that you make will apply to any subsequent distribution unless and until you change or revoke the election. If you wish to make a withholding election, or change or revoke a prior withholding election, call (800) 235-8396, and form W-4P (OMB No. 1545-0074 withholding certificate for pension or annuity payments) will be electronically sent.
If you do not have a withholding election in place by the date of a distribution, federal income tax will be withheld from the taxable portion of your distribution at a rate of 10%. If you must pay estimated taxes, you may be subject to estimated tax penalties if your estimated tax payments are not sufficient and sufficient tax is not withheld from your distribution.
For more specific information, please consult your tax adviser.
• NOT FDIC INSURED • NO BANK GUARANTEE • MAY LOSE VALUE
1
USAA Mutual Funds Trust
USAA Sustainable World Fund | | November 30, 2022 | |
(Unaudited)
Investment Objective and Portfolio Holdings:
The Fund seeks capital appreciation.
Top 10 Sectors*:
November 30, 2022
(% of Net Assets)
Information Technology | | | 20.0 | % | |
Financials | | | 16.0 | % | |
Health Care | | | 13.1 | % | |
Consumer Discretionary | | | 11.8 | % | |
Industrials | | | 10.0 | % | |
Consumer Staples | | | 7.7 | % | |
Communication Services | | | 6.0 | % | |
Energy | | | 5.1 | % | |
Materials | | | 4.0 | % | |
Utilities | | | 3.1 | % | |
Country Allocation:
November 30, 2022
(% of Net Assets)
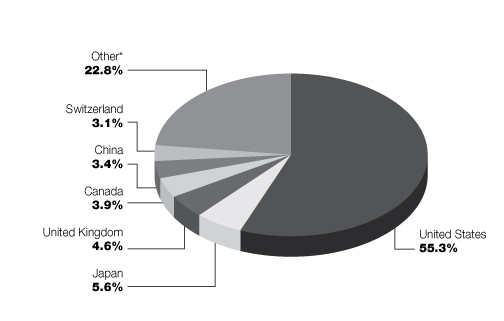
* Includes countries with less than 3.0% of portfolio and short-term investments purchased with cash collateral from securities loaned.
Percentages are of the net assets of the Fund and may not equal 100%.
Refer to the Schedule of Portfolio Investments for a complete list of securities.
2
USAA Mutual Funds Trust
USAA Sustainable World Fund | | Schedule of Portfolio Investments
November 30, 2022 | |
(Amounts in Thousands, Except for Shares) (Unaudited)
Security Description | | Shares | | Value | |
Common Stocks (98.4%) | |
Australia (2.0%): | |
Consumer Discretionary (0.5%): | |
Aristocrat Leisure Ltd. | | | 233,893 | | | $ | 5,619 | | |
Lovisa Holdings Ltd. | | | 30,822 | | | | 502 | | |
PWR Holdings Ltd. | | | 57,235 | | | | 459 | | |
| | | | 6,580 | | |
Energy (0.1%): | |
Santos Ltd. | | | 76,150 | | | | 380 | | |
Woodside Energy Group Ltd. | | | 20,836 | | | | 526 | | |
| | | | 906 | | |
Financials (0.8%): | |
Macquarie Group Ltd. | | | 62,566 | | | | 7,693 | | |
National Australia Bank Ltd. | | | 49,254 | | | | 1,060 | | |
QBE Insurance Group Ltd. | | | 38,439 | | | | 337 | | |
| | | | 9,090 | | |
Health Care (0.3%): | |
CSL Ltd. | | | 19,231 | | | | 3,950 | | |
Industrials (0.1%): | |
Austal Ltd. | | | 248,175 | | | | 413 | | |
IPH Ltd. | | | 41,079 | | | | 256 | | |
Johns Lyng Group Ltd. | | | 97,070 | | | | 486 | | |
Qantas Airways Ltd. (a) | | | 92,361 | | | | 397 | | |
| | | | 1,552 | | |
Information Technology (0.0%): (b) | |
Appen Ltd. | | | 90,756 | | | | 168 | | |
Materials (0.1%): | |
Imdex Ltd. | | | 177,379 | | | | 294 | | |
Mineral Resources Ltd. | | | 6,444 | | | | 388 | | |
Ramelius Resources Ltd. | | | 412,835 | | | | 244 | | |
Rio Tinto Ltd. | | | 5,013 | | | | 374 | | |
| | | | 1,300 | | |
Real Estate (0.1%): | |
Charter Hall Group | | | 38,966 | | | | 376 | | |
Goodman Group | | | 26,369 | | | | 349 | | |
| | | | 725 | | |
| | | | 24,271 | | |
Austria (0.0%): (b) | |
Industrials (0.0%): | |
ANDRITZ AG | | | 8,961 | | | | 490 | | |
Belgium (0.4%): | |
Information Technology (0.4%): | |
Melexis NV | | | 49,752 | | | | 4,383 | | |
See notes to financial statements.
3
USAA Mutual Funds Trust
USAA Sustainable World Fund | | Schedule of Portfolio Investments — continued
November 30, 2022 | |
(Amounts in Thousands, Except for Shares) (Unaudited)
Security Description | | Shares | | Value | |
Bermuda (0.6%): | |
Industrials (0.6%): | |
Triton International Ltd. | | | 101,709 | | | $ | 6,862 | | |
Brazil (0.4%): | |
Consumer Discretionary (0.1%): | |
Grupo SBF SA | | | 73,978 | | | | 208 | | |
Lojas Renner SA | | | 66,400 | | | | 297 | | |
Vibra Energia SA | | | 112,676 | | | | 359 | | |
| | | | 864 | | |
Consumer Staples (0.1%): | |
Sao Martinho SA | | | 64,300 | | | | 355 | | |
Sendas Distribuidora SA | | | 103,522 | | | | 400 | | |
| | | | 755 | | |
Energy (0.0%): (b) | |
Petroleo Brasileiro SA, ADR | | | 36,973 | | | | 432 | | |
Financials (0.1%): | |
Itau Unibanco Holding SA, ADR | | | 169,008 | | | | 842 | | |
Health Care (0.1%): | |
Hypera SA | | | 67,600 | | | | 579 | | |
Industrials (0.0%): (b) | |
SIMPAR SA | | | 122,500 | | | | 180 | | |
Materials (0.0%): (b) | |
Gerdau SA Preference Shares | | | 58,700 | | | | 357 | | |
Real Estate (0.0%): (b) | |
Multiplan Empreendimentos Imobiliarios SA | | | 61,300 | | | | 271 | | |
| | | | 4,280 | | |
Canada (3.9%): | |
Consumer Discretionary (0.2%): | |
Lululemon Athletica, Inc. (a) | | | 6,062 | | | | 2,305 | | |
Consumer Staples (0.7%): | |
Alimentation Couche-Tard, Inc. | | | 181,310 | | | | 8,261 | | |
Energy (0.5%): | |
Parex Resources, Inc. | | | 376,464 | | | | 5,391 | | |
Pason Systems, Inc. | | | 15,950 | | | | 190 | | |
Trican Well Service Ltd. (a) | | | 70,976 | | | | 211 | | |
| | | | 5,792 | | |
Financials (0.4%): | |
Fairfax Financial Holdings Ltd. | | | 9,800 | | | | 5,623 | | |
Industrials (0.7%): | |
Canadian Pacific Railway Ltd. | | | 105,652 | | | | 8,651 | | |
Information Technology (0.9%): | |
Constellation Software, Inc. | | | 6,967 | | | | 11,233 | | |
See notes to financial statements.
4
USAA Mutual Funds Trust
USAA Sustainable World Fund | | Schedule of Portfolio Investments — continued
November 30, 2022 | |
(Amounts in Thousands, Except for Shares) (Unaudited)
Security Description | | Shares | | Value | |
Materials (0.5%): | |
Aginco Eagle Mines Ltd. | | | 100,133 | | | $ | 5,044 | | |
Karora Resources, Inc. (a) | | | 63,952 | | | | 211 | | |
Wesdome Gold Mines Ltd. (a) | | | 60,276 | | | | 407 | | |
| | | | 5,662 | | |
| | | | 47,527 | | |
China (3.4%): | |
Communication Services (1.1%): | |
Baidu, Inc. Class A (a) | | | 42,852 | | | | 578 | | |
Tencent Holdings Ltd. | | | 343,800 | | | | 13,002 | | |
| | | | 13,580 | | |
Consumer Discretionary (0.6%): | |
Alibaba Group Holding Ltd. (a) | | | 167,976 | | | | 1,828 | | |
BYD Co. Ltd. Class H | | | 28,500 | | | | 726 | | |
Hisense Home Appliances Group Co. Ltd. Class A | | | 31,400 | | | | 58 | | |
JD.com, Inc. Class A | | | 57,014 | | | | 1,628 | | |
Meituan Class B (a) (c) | | | 57,500 | | | | 1,239 | | |
Pinduoduo, Inc., ADR (a) | | | 13,272 | | | | 1,089 | | |
Yadea Group Holdings Ltd. (c) | | | 196,000 | | | | 372 | | |
| | | | 6,940 | | |
Consumer Staples (0.5%): | |
Chacha Food Co. Ltd. Class A | | | 73,700 | | | | 484 | | |
Chenguang Biotech Group Co. Ltd. Class A | | | 155,400 | | | | 345 | | |
Foshan Haitian Flavouring & Food Co. Ltd. Class A | | | 400,857 | | | | 3,959 | | |
Inner Mongolia Yili Industrial Group Co. Ltd. Class A | | | 90,400 | | | | 366 | | |
Tongwei Co. Ltd. Class A | | | 73,300 | | | | 448 | | |
| | | | 5,602 | | |
Energy (0.1%): | |
PetroChina Co. Ltd. Class H | | | 1,824,000 | | | | 830 | | |
Financials (0.6%): | |
China Merchants Bank Co. Ltd. Class H | | | 106,500 | | | | 541 | | |
CITIC Securities Co. Ltd. Class A | | | 120,400 | | | | 337 | | |
Industrial & Commercial Bank of China Ltd. Class H | | | 11,822,370 | | | | 5,925 | | |
PICC Property & Casualty Co. Ltd. Class H | | | 454,000 | | | | 460 | | |
| | | | 7,263 | | |
Health Care (0.2%): | |
CSPC Pharmaceutical Group Ltd. | | | 602,000 | | | | 775 | | |
Hygeia Healthcare Holdings Co. Ltd. (a) (c) | | | 69,400 | | | | 445 | | |
Pharmaron Beijing Co. Ltd. Class H (c) | | | 47,300 | | | | 274 | | |
Shenzhen Mindray Bio-Medical Electronics Co. Ltd. Class A | | | 11,700 | | | | 537 | | |
| | | | 2,031 | | |
Industrials (0.1%): | |
China Railway Group Ltd. Class H | | | 865,000 | | | | 488 | | |
Xinte Energy Co. Ltd. Class H | | | 218,000 | | | | 520 | | |
| | | | 1,008 | | |
See notes to financial statements.
5
USAA Mutual Funds Trust
USAA Sustainable World Fund | | Schedule of Portfolio Investments — continued
November 30, 2022 | |
(Amounts in Thousands, Except for Shares) (Unaudited)
Security Description | | Shares | | Value | |
Information Technology (0.1%): | |
Glodon Co. Ltd. Class A | | | 57,900 | | | $ | 455 | | |
Luxshare Precision Industry Co. Ltd. Class A | | | 112,900 | | | | 499 | | |
WUS Printed Circuit Kunshan Co. Ltd. Class A | | | 181,730 | | | | 327 | | |
| | | | 1,281 | | |
Materials (0.1%): | |
Shandong Nanshan Aluminum Co. Ltd. Class A | | | 683,100 | | | | 337 | | |
Tianqi Lithium Corp. Class A (a) | | | 30,600 | | | | 394 | | |
Wanhua Chemical Group Co. Ltd. Class A | | | 38,400 | | | | 484 | | |
| | | | 1,215 | | |
Real Estate (0.0%): (b) | |
Longfor Group Holdings Ltd. (c) | | | 151,000 | | | | 460 | | |
Utilities (0.0%): (b) | |
China Longyuan Power Group Corp. Ltd. Class H | | | 346,000 | | | | 427 | | |
| | | | 40,637 | | |
Denmark (1.7%): | |
Consumer Discretionary (0.5%): | |
Pandora A/S | | | 79,150 | | | | 6,027 | | |
Health Care (1.1%): | |
Novo Nordisk A/S Class B | | | 109,605 | | | | 13,750 | | |
Industrials (0.1%): | |
AP Moller — Maersk A/S Class B | | | 177 | | | | 384 | | |
INVISIO AB | | | 15,234 | | | | 240 | | |
| | | | 624 | | |
| | | | 20,401 | | |
Finland (0.1%): | |
Health Care (0.0%): (b) | |
Revenio Group Oyj | | | 5,527 | | | | 236 | | |
Information Technology (0.1%): | |
Nokia Oyj | | | 85,283 | | | | 420 | | |
Utilities (0.0%): (b) | |
Fortum Oyj | | | 26,295 | | | | 419 | | |
| | | | 1,075 | | |
France (2.7%): | |
Communication Services (0.0%): (b) | |
Publicis Groupe SA | | | 8,460 | | | | 557 | | |
Consumer Discretionary (0.6%): | |
La Francaise des Jeux SAEM (c) | | | 133,626 | | | | 5,357 | | |
LVMH Moet Hennessy Louis Vuitton SE | | | 2,234 | | | | 1,734 | | |
| | | | 7,091 | | |
Consumer Staples (0.1%): | |
Pernod Ricard SA | | | 3,479 | | | | 690 | | |
See notes to financial statements.
6
USAA Mutual Funds Trust
USAA Sustainable World Fund | | Schedule of Portfolio Investments — continued
November 30, 2022 | |
(Amounts in Thousands, Except for Shares) (Unaudited)
Security Description | | Shares | | Value | |
Energy (0.6%): | |
Gaztransport Et Technigaz SA | | | 53,956 | | | $ | 6,726 | | |
Financials (0.1%): | |
AXA SA | | | 22,712 | | | | 642 | | |
BNP Paribas SA | | | 9,993 | | | | 561 | | |
| | | | 1,203 | | |
Health Care (0.1%): | |
Equasens | | | 2,628 | | | | 216 | | |
EssilorLuxottica SA | | | 1,879 | | | | 351 | | |
Vetoquinol SA | | | 2,414 | | | | 216 | | |
| | | | 783 | | |
Industrials (0.6%): | |
Cie de Saint-Gobain | | | 10,405 | | | | 480 | | |
Eiffage SA | | | 4,144 | | | | 408 | | |
Rexel SA | | | 17,346 | | | | 319 | | |
Safran SA | | | 45,393 | | | | 5,609 | | |
Teleperformance | | | 1,113 | | | | 254 | | |
Thermador Groupe | | | 3,146 | | | | 297 | | |
| | | | 7,367 | | |
Information Technology (0.1%): | |
Capgemini SE | | | 3,324 | | | | 601 | | |
Edenred | | | 6,812 | | | | 374 | | |
Lectra | | | 7,367 | | | | 261 | | |
| | | | 1,236 | | |
Materials (0.5%): | |
Arkema SA | | | 68,412 | | | | 6,082 | | |
Real Estate (0.0%): (b) | |
Klepierre SA | | | 12,273 | | | | 284 | | |
| | | | 32,019 | | |
Germany (1.7%): | |
Communication Services (0.1%): | |
Deutsche Telekom AG | | | 49,540 | | | | 1,008 | | |
Consumer Discretionary (0.5%): | |
Mercedes-Benz Group AG | | | 9,484 | | | | 644 | | |
Volkswagen AG Preference Shares | | | 40,257 | | | | 5,946 | | |
| | | | 6,590 | | |
Energy (0.1%): | |
CropEnergies AG | | | 14,189 | | | | 216 | | |
VERBIO Vereinigte BioEnergie AG | | | 5,725 | | | | 450 | | |
| | | | 666 | | |
Financials (0.0%): (b) | |
Hannover Rueck SE | | | 2,545 | | | | 483 | | |
See notes to financial statements.
7
USAA Mutual Funds Trust
USAA Sustainable World Fund | | Schedule of Portfolio Investments — continued
November 30, 2022 | |
(Amounts in Thousands, Except for Shares) (Unaudited)
Security Description | | Shares | | Value | |
Health Care (0.1%): | |
Bayer AG Registered Shares | | | 10,366 | | | $ | 602 | | |
Merck KGaA | | | 4,105 | | | | 752 | | |
Nexus AG | | | 6,019 | | | | 377 | | |
| | | | 1,731 | | |
Industrials (0.2%): | |
| 2G Energy AG (d) | | | 11,912 | | | | 292 | | |
Amadeus Fire AG | | | 1,977 | | | | 235 | | |
Brenntag SE | | | 5,566 | | | | 354 | | |
Daimler Truck Holding AG (a) | | | 10,622 | | | | 350 | | |
Deutsche Post AG Registered Shares | | | 8,802 | | | | 352 | | |
Pfeiffer Vacuum Technology AG | | | 1,340 | | | | 246 | | |
| SFC Energy AG (a) | | | 6,098 | | | | 155 | | |
| | | | 1,984 | | |
Information Technology (0.2%): | |
AIXTRON SE | | | 13,296 | | | | 438 | | |
Basler AG | | | 7,419 | | | | 263 | | |
Infineon Technologies AG | | | 19,311 | | | | 649 | | |
PVA TePla AG (a) | | | 12,535 | | | | 241 | | |
SAP SE | | | 2,771 | | | | 308 | | |
| | | | 1,899 | | |
Utilities (0.5%): | |
RWE AG | | | 127,191 | | | | 5,598 | | |
| | | | 19,959 | | |
Greece (0.1%): | |
Financials (0.1%): | |
National Bank of Greece SA (a) | | | 144,651 | | | | 595 | | |
Industrials (0.0%): (b) | |
Mytilineos SA | | | 28,809 | | | | 544 | | |
| | | | 1,139 | | |
Hong Kong (0.2%): | |
Consumer Discretionary (0.1%): | |
Bosideng International Holdings Ltd. | | | 938,000 | | | | 467 | | |
Consumer Staples (0.0%): (b) | |
WH Group Ltd. (c) | | | 426,000 | | | | 250 | | |
Industrials (0.0%): (b) | |
CK Hutchison Holdings Ltd. | | | 60,000 | | | | 349 | | |
Real Estate (0.1%): | |
China Resources Land Ltd. | | | 132,000 | | | | 613 | | |
CK Asset Holdings Ltd. | | | 65,817 | | | | 394 | | |
| | | | 1,007 | | |
| | | | 2,073 | | |
See notes to financial statements.
8
USAA Mutual Funds Trust
USAA Sustainable World Fund | | Schedule of Portfolio Investments — continued
November 30, 2022 | |
(Amounts in Thousands, Except for Shares) (Unaudited)
Security Description | | Shares | | Value | |
India (0.9%): | |
Communication Services (0.0%): (b) | |
Sun TV Network Ltd. | | | 15,708 | | | $ | 95 | | |
Consumer Discretionary (0.1%): | |
Mahindra & Mahindra Ltd. | | | 65,941 | | | | 1,061 | | |
Raymond Ltd. | | | 29,412 | | | | 497 | | |
| | | | 1,558 | | |
Consumer Staples (0.1%): | |
Dabur India Ltd. | | | 66,287 | | | | 481 | | |
Varun Beverages Ltd. | | | 37,681 | | | | 579 | | |
| | | | 1,060 | | |
Financials (0.3%): | |
Axis Bank Ltd. | | | 48,936 | | | | 544 | | |
Cholamandalam Investment & Finance Co. Ltd. | | | 92,254 | | | | 814 | | |
ICICI Bank Ltd., ADR | | | 91,606 | | | | 2,173 | | |
Manappuram Finance Ltd. | | | 390,039 | | | | 556 | | |
| | | | 4,087 | | |
Health Care (0.1%): | |
Apollo Hospitals Enterprise Ltd. | | | 12,278 | | | | 717 | | |
Industrials (0.1%): | |
Larsen & Toubro Ltd. | | | 48,642 | | | | 1,243 | | |
Information Technology (0.2%): | |
Infosys Ltd., ADR | | | 52,927 | | | | 1,077 | | |
WNS Holdings Ltd., ADR (a) | | | 8,193 | | | | 691 | | |
| | | | 1,768 | | |
Materials (0.0%): (b) | |
JK Paper Ltd. | | | 76,815 | | | | 399 | | |
Utilities (0.0%): (b) | |
Power Grid Corp. of India Ltd. | | | 190,786 | | | | 527 | | |
| | | | 11,454 | | |
Indonesia (0.8%): | |
Communication Services (0.7%): | |
PT Telkom Indonesia Persero Tbk | | | 31,039,938 | | | | 8,008 | | |
Energy (0.0%): (b) | |
PT Adaro Energy Indonesia Tbk | | | 1,688,400 | | | | 418 | | |
Financials (0.1%): | |
PT Bank Mandiri Persero Tbk | | | 1,301,100 | | | | 878 | | |
| | | | 9,304 | | |
Ireland (1.5%): | |
Health Care (0.2%): | |
Medtronic PLC | | | 35,200 | | | | 2,782 | | |
See notes to financial statements.
9
USAA Mutual Funds Trust
USAA Sustainable World Fund | | Schedule of Portfolio Investments — continued
November 30, 2022 | |
(Amounts in Thousands, Except for Shares) (Unaudited)
Security Description | | Shares | | Value | |
Industrials (1.3%): | |
Eaton Corp. PLC | | | 78,318 | | | $ | 12,801 | | |
Johnson Controls International PLC | | | 32,500 | | | | 2,160 | | |
| | | | 14,961 | | |
| | | | 17,743 | | |
Israel (0.1%): | |
Consumer Discretionary (0.0%): (b) | |
Maytronics Ltd. (d) | | | 14,458 | | | | 166 | | |
Financials (0.0%): (b) | |
Bank Leumi Le | | | 35,070 | | | | 322 | | |
Health Care (0.1%): | |
Inmode Ltd. (a) | | | 9,760 | | | | 375 | | |
Information Technology (0.0%): (b) | |
Nice Ltd. (a) | | | 1,859 | | | | 360 | | |
| | | | 1,223 | | |
Italy (0.6%): | |
Consumer Staples (0.0%): (b) | |
Pharmanutra SpA | | | 3,161 | | | | 210 | | |
Health Care (0.0%): (b) | |
El.En. SpA | | | 42,010 | | | | 636 | | |
Industrials (0.0%): (b) | |
Leonardo SpA | | | 37,466 | | | | 301 | | |
Information Technology (0.1%): | |
Nexi SpA (a) (c) (d) | | | 29,191 | | | | 259 | | |
Sesa SpA | | | 3,615 | | | | 454 | | |
| | | | 713 | | |
Utilities (0.5%): | |
Enel SpA | | | 74,946 | | | | 404 | | |
Iren SpA | | | 121,247 | | | | 201 | | |
Snam SpA | | | 978,690 | | | | 4,996 | | |
| | | | 5,601 | | |
| | | | 7,461 | | |
Japan (5.6%): | |
Communication Services (1.0%): | |
Capcom Co. Ltd. | | | 206,208 | | | | 6,284 | | |
Intage Holdings, Inc. | | | 19,700 | | | | 222 | | |
Kakaku.com, Inc. | | | 250,891 | | | | 4,510 | | |
MarkLines Co. Ltd. | | | 14,700 | | | | 301 | | |
Nintendo Co. Ltd. | | | 7,900 | | | | 339 | | |
Nippon Telegraph & Telephone Corp. | | | 27,034 | | | | 750 | | |
| | | | 12,406 | | |
Consumer Discretionary (0.8%): | |
Bandai Namco Holdings, Inc. | | | 4,400 | | | | 292 | | |
Isuzu Motors Ltd. | | | 50,400 | | | | 660 | | |
See notes to financial statements.
10
USAA Mutual Funds Trust
USAA Sustainable World Fund | | Schedule of Portfolio Investments — continued
November 30, 2022 | |
(Amounts in Thousands, Except for Shares) (Unaudited)
Security Description | | Shares | | Value | |
Rinnai Corp. | | | 4,100 | | | $ | 306 | | |
Shoei Co. Ltd. | | | 10,500 | | | | 427 | | |
Snow Peak, Inc. (d) | | | 13,100 | | | | 219 | | |
Subaru Corp. | | | 22,000 | | | | 377 | | |
ZOZO, Inc. | | | 282,800 | | | | 7,141 | | |
| | | | 9,422 | | |
Consumer Staples (0.6%): | |
Ajinomoto Co., Inc. | | | 18,400 | | | | 583 | | |
Create SD Holdings Co. Ltd. (d) | | | 9,100 | | | | 204 | | |
Seven & i Holdings Co. Ltd. | | | 11,216 | | | | 456 | | |
Toyo Suisan Kaisha Ltd. | | | 154,149 | | | | 6,481 | | |
| | | | 7,724 | | |
Financials (0.7%): | |
eGuarantee, Inc. | | | 14,100 | | | | 254 | | |
Mitsubishi UFJ Financial Group, Inc. | | | 1,072,012 | | | | 5,847 | | |
Mizuho Financial Group, Inc. | | | 38,911 | | | | 486 | | |
ORIX Corp. | | | 45,574 | | | | 739 | | |
Sumitomo Mitsui Financial Group, Inc. | | | 14,675 | | | | 498 | | |
Tokio Marine Holdings, Inc. | | | 22,500 | | | | 464 | | |
| | | | 8,288 | | |
Health Care (0.6%): | |
Carenet, Inc. (d) | | | 27,500 | | | | 240 | | |
Hoya Corp. | | | 45,502 | | | | 4,709 | | |
Medical Data Vision Co. Ltd. | | | 35,100 | | | | 262 | | |
Nakanishi, Inc. | | | 10,600 | | | | 222 | | |
Nippon Shinyaku Co. Ltd. | | | 5,400 | | | | 320 | | |
Olympus Corp. | | | 19,300 | | | | 399 | | |
Ono Pharmaceutical Co. Ltd. | | | 21,300 | | | | 546 | | |
| | | | 6,698 | | |
Industrials (1.2%): | |
Altech Corp. | | | 14,900 | | | | 228 | | |
Fuji Electric Co. Ltd. | | | 89,300 | | | | 3,701 | | |
gremz, Inc. | | | 15,200 | | | | 203 | | |
Hitachi Ltd. | | | 6,945 | | | | 371 | | |
ITOCHU Corp. | | | 28,009 | | | | 880 | | |
JAC Recruitment Co. Ltd. | | | 15,100 | | | | 286 | | |
Japan Elevator Service Holdings Co. Ltd. | | | 18,200 | | | | 235 | | |
Komatsu Ltd. | | | 23,700 | | | | 551 | | |
Management Solutions Co. Ltd. (d) | | | 10,400 | | | | 295 | | |
Mitsui & Co. Ltd. | | | 24,820 | | | | 721 | | |
NIPPON EXPRESS HOLDINGS, Inc. | | | 7,300 | | | | 433 | | |
Nippon Yusen KK | | | 222,962 | | | | 4,964 | | |
Organo Corp. | | | 16,400 | | | | 340 | | |
SHO-BOND Holdings Co. Ltd. | | | 5,400 | | | | 239 | | |
S-Pool, Inc. | | | 46,800 | | | | 325 | | |
Weathernews, Inc. | | | 4,400 | | | | 246 | | |
| | | | 14,018 | | |
See notes to financial statements.
11
USAA Mutual Funds Trust
USAA Sustainable World Fund | | Schedule of Portfolio Investments — continued
November 30, 2022 | |
(Amounts in Thousands, Except for Shares) (Unaudited)
Security Description | | Shares | | Value | |
Information Technology (0.6%): | |
Canon, Inc. | | | 13,600 | | | $ | 318 | | |
Cybozu, Inc. | | | 24,200 | | | | 399 | | |
Digital Arts, Inc. | | | 3,700 | | | | 178 | | |
Fujitsu Ltd. | | | 3,759 | | | | 510 | | |
Fukui Computer Holdings, Inc. | | | 11,900 | | | | 257 | | |
Future Corp. | | | 23,900 | | | | 297 | | |
m-up Holdings, Inc. | | | 22,500 | | | | 226 | | |
SHIFT, Inc. (a) | | | 1,500 | | | | 324 | | |
Softcreate Holdings Corp. | | | 11,200 | | | | 289 | | |
TDK Corp. | | | 14,500 | | | | 523 | | |
Tokyo Electron Ltd. | | | 1,501 | | | | 509 | | |
Ulvac, Inc. | | | 80,682 | | | | 3,556 | | |
| | | | 7,386 | | |
Materials (0.1%): | |
JCU Corp. | | | 9,300 | | | | 231 | | |
Maeda Kosen Co. Ltd. | | | 9,100 | | | | 217 | | |
Shin-Etsu Chemical Co. Ltd. | | | 3,143 | | | | 407 | | |
Tosoh Corp. | | | 28,582 | | | | 339 | | |
| | | | 1,194 | | |
Real Estate (0.0%): (b) | |
Mitsui Fudosan Co. Ltd. | | | 20,200 | | | | 409 | | |
| | | | 67,545 | | |
Korea, Republic Of (1.4%): | |
Communication Services (0.1%): | |
JYP Entertainment Corp. | | | 15,232 | | | | 712 | | |
KT Corp. | | | 20,131 | | | | 575 | | |
| | | | 1,287 | | |
Consumer Discretionary (0.1%): | |
Hyundai Mobis Co. Ltd. | | | 2,610 | | | | 427 | | |
Kia Corp. | | | 9,268 | | | | 488 | | |
Shinsegae, Inc. | | | 2,963 | | | | 479 | | |
| | | | 1,394 | | |
Consumer Staples (0.0%): (b) | |
BGF retail Co. Ltd. | | | 1,356 | | | | 213 | | |
Financials (0.2%): | |
Hana Financial Group, Inc. | | | 23,404 | | | | 801 | | |
Samsung Securities Co. Ltd. | | | 18,493 | | | | 500 | | |
Woori Financial Group, Inc. | | | 72,751 | | | | 727 | | |
| | | | 2,028 | | |
Health Care (0.1%): | |
Samsung Biologics Co. Ltd. (a) (c) | | | 1,148 | | | | 781 | | |
Industrials (0.0%): (b) | |
CJ Corp. | | | 5,449 | | | | 320 | | |
See notes to financial statements.
12
USAA Mutual Funds Trust
USAA Sustainable World Fund | | Schedule of Portfolio Investments — continued
November 30, 2022 | |
(Amounts in Thousands, Except for Shares) (Unaudited)
Security Description | | Shares | | Value | |
Information Technology (0.9%): | |
Innox Advanced Materials Co. Ltd. | | | 14,502 | | | $ | 326 | | |
Samsung Electro-Mechanics Co. Ltd. | | | 4,568 | | | | 500 | | |
Samsung Electronics Co. Ltd. | | | 202,727 | | | | 9,741 | | |
SK Hynix, Inc. | | | 12,628 | | | | 834 | | |
| | | | 11,401 | | |
| | | | 17,424 | | |
Luxembourg (0.1%): | |
Energy (0.1%): | |
Tenaris SA | | | 31,670 | | | | 550 | | |
Health Care (0.0%): (b) | |
Eurofins Scientific SE | | | 4,609 | | | | 320 | | |
Materials (0.0%): (b) | |
ArcelorMittal SA | | | 15,557 | | | | 426 | | |
| | | | 1,296 | | |
Malaysia (0.1%): | |
Financials (0.1%): | |
Public Bank Bhd | | | 626,700 | | | | 636 | | |
Materials (0.0%): (b) | |
Petronas Chemicals Group Bhd | | | 210,500 | | | | 406 | | |
| | | | 1,042 | | |
Mexico (0.2%): | |
Consumer Discretionary (0.0%): (b) | |
Alsea SAB de CV (a) | | | 180,386 | | | | 360 | | |
Consumer Staples (0.0%): (b) | |
Fomento Economico Mexicano SAB de CV, ADR | | | 1,820 | | | | 145 | | |
Financials (0.1%): | |
Grupo Financiero Banorte SAB de CV Class O | | | 140,658 | | | | 1,125 | | |
Industrials (0.1%): | |
Grupo Aeroportuario del Pacifico SAB de CV Class B | | | 30,973 | | | | 500 | | |
| | | | 2,130 | | |
Netherlands (0.6%): | |
Consumer Staples (0.1%): | |
Heineken NV | | | 4,466 | | | | 414 | | |
Koninklijke Ahold Delhaize NV | | | 25,928 | | | | 755 | | |
| | | | 1,169 | | |
Financials (0.1%): | |
ING Groep NV | | | 36,578 | | | | 443 | | |
NN Group NV | | | 9,242 | | | | 395 | | |
| | | | 838 | | |
Health Care (0.0%): (b) | |
QIAGEN NV (a) | | | 8,869 | | | | 443 | | |
See notes to financial statements.
13
USAA Mutual Funds Trust
USAA Sustainable World Fund | | Schedule of Portfolio Investments — continued
November 30, 2022 | |
(Amounts in Thousands, Except for Shares) (Unaudited)
Security Description | | Shares | | Value | |
Industrials (0.0%): (b) | |
Signify NV (c) | | | 7,311 | | | $ | 250 | | |
Information Technology (0.4%): | |
ASM International NV | | | 16,169 | | | | 4,483 | | |
STMicroelectronics NV | | | 17,653 | | | | 683 | | |
| | | | 5,166 | | |
| | | | 7,866 | | |
New Zealand (0.4%): | |
Health Care (0.4%): | |
Fisher & Paykel Healthcare Corp. Ltd. | | | 288,995 | | | | 4,327 | | |
Norway (0.8%): | |
Consumer Staples (0.0%): (b) | |
Mowi ASA | | | 19,963 | | | | 313 | | |
Energy (0.5%): | |
Aker BP ASA | | | 127,749 | | | | 4,447 | | |
Equinor ASA | | | 10,197 | | | | 393 | | |
TGS ASA | | | 24,718 | | | | 338 | | |
Var Energi ASA (d) | | | 89,453 | | | | 331 | | |
| | | | 5,509 | | |
Financials (0.3%): | |
SpareBank 1 SMN | | | 239,073 | | | | 2,850 | | |
Information Technology (0.0%): (b) | |
Bouvet ASA | | | 31,371 | | | | 182 | | |
Materials (0.0%): (b) | |
Yara International ASA | | | 9,325 | | | | 431 | | |
| | | | 9,285 | | |
Peru (0.1%): | |
Financials (0.1%): | |
Credicorp Ltd. | | | 5,647 | | | | 867 | | |
Puerto Rico (0.0%): (b) | |
Information Technology (0.0%): | |
EVERTEC, Inc. | | | 15,619 | | | | 527 | | |
Qatar (0.0%): (b) | |
Industrials (0.0%): | |
Industries Qatar QSC | | | 107,646 | | | | 443 | | |
Russian Federation (0.0%): (b) | |
Consumer Staples (0.0%): | |
Magnit PJSC (e) (f) | | | 7,278 | | | | — | (g) | |
Energy (0.0%): | |
Gazprom PJSC (a) (e) (f) (h) (i) | | | 303,950 | | | | 12 | | |
Rosneft Oil Co. PJSC, GDR (a) (e) (f) (h) (i) | | | 124,892 | | | | 6 | | |
| | | | 18 | | |
See notes to financial statements.
14
USAA Mutual Funds Trust
USAA Sustainable World Fund | | Schedule of Portfolio Investments — continued
November 30, 2022 | |
(Amounts in Thousands, Except for Shares) (Unaudited)
Security Description | | Shares | | Value | |
Financials (0.0%): | |
Sberbank of Russia PJSC, ADR (a) (e) (f) (h) (i) | | | 91,313 | | | $ | 1 | | |
| | | | 19 | | |
Saudi Arabia (0.2%): | |
Financials (0.1%): | |
Alinma Bank | | | 57,045 | | | | 528 | | |
The Saudi National Bank | | | 59,391 | | | | 818 | | |
| | | | 1,346 | | |
Materials (0.1%): | |
SABIC Agri-Nutrients Co. | | | 18,672 | | | | 723 | | |
Saudi Arabian Mining Co. (a) | | | 23,157 | | | | 427 | | |
| | | | 1,150 | | |
| | | | 2,496 | | |
Singapore (0.5%): | |
Consumer Staples (0.1%): | |
Sheng Siong Group Ltd. | | | 210,000 | | | | 254 | | |
Wilmar International Ltd. | | | 209,229 | | | | 635 | | |
| | | | 889 | | |
Financials (0.4%): | |
DBS Group Holdings Ltd. | | | 29,005 | | | | 757 | | |
Singapore Exchange Ltd. | | | 537,427 | | | | 3,598 | | |
| | | | 4,355 | | |
Utilities (0.0%): (b) | |
Sembcorp Industries Ltd. | | | 165,200 | | | | 391 | | |
| | | | 5,635 | | |
South Africa (0.5%): | |
Communication Services (0.1%): | |
MTN Group Ltd. | | | 92,392 | | | | 758 | | |
Consumer Discretionary (0.3%): | |
Mr Price Group Ltd. | | | 382,170 | | | | 3,738 | | |
Woolworths Holdings Ltd. | | | 61,603 | | | | 235 | | |
| | | | 3,973 | | |
Financials (0.1%): | |
Absa Group Ltd. | | | 56,067 | | | | 673 | | |
Capitec Bank Holdings Ltd. | | | 2,461 | | | | 292 | | |
| | | | 965 | | |
Industrials (0.0%): (b) | |
The Bidvest Group Ltd. | | | 30,213 | | | | 406 | | |
| | | | 6,102 | | |
See notes to financial statements.
15
USAA Mutual Funds Trust
USAA Sustainable World Fund | | Schedule of Portfolio Investments — continued
November 30, 2022 | |
(Amounts in Thousands, Except for Shares) (Unaudited)
Security Description | | Shares | | Value | |
Spain (0.8%): | |
Financials (0.7%): | |
Banco Bilbao Vizcaya Argentaria SA | | | 1,250,936 | | | $ | 7,371 | | |
Banco Santander SA (d) | | | 160,875 | | | | 480 | | |
Bankinter SA | | | 52,975 | | | | 349 | | |
| | | | 8,200 | | |
Information Technology (0.0%): (b) | |
Global Dominion Access SA (c) | | | 57,640 | | | | 219 | | |
Utilities (0.1%): | |
Corp. ACCIONA Energias Renovables SA | | | 12,220 | | | | 485 | | |
Iberdrola SA | | | 42,777 | | | | 483 | | |
| | | | 968 | | |
| | | | 9,387 | | |
Sweden (1.2%): | |
Consumer Discretionary (0.1%): | |
Evolution AB (c) | | | 5,131 | | | | 529 | | |
Health Care (0.0%): (b) | |
Biotage AB | | | 15,338 | | | | 269 | | |
Industrials (1.1%): | |
Atlas Copco AB Class A | | | 29,985 | | | | 374 | | |
Atlas Copco AB Class B | | | 547,736 | | | | 6,222 | | |
BTS Group AB B Shares (d) | | | 8,659 | | | | 226 | | |
CTT Systems AB | | | 8,920 | | | | 184 | | |
GARO AB | | | 17,621 | | | | 193 | | |
Hexatronic Group AB | | | 32,310 | | | | 458 | | |
Nibe Industrier AB Class B | | | 584,238 | | | | 5,519 | | |
Volvo AB Class B | | | 22,237 | | | | 409 | | |
| | | | 13,585 | | |
Materials (0.0%): (b) | |
Boliden AB | | | 11,022 | | | | 417 | | |
| | | | 14,800 | | |
Switzerland (3.1%): | |
Consumer Discretionary (0.1%): | |
Cie Financiere Richemont SA Registered Shares | | | 6,971 | | | | 924 | | |
Consumer Staples (0.5%): | |
Coca-Cola HBC AG | | | 18,432 | | | | 451 | | |
Nestle SA Registered Shares | | | 52,749 | | | | 6,279 | | |
| | | | 6,730 | | |
Financials (1.2%): | |
Chubb Ltd. | | | 34,590 | | | | 7,596 | | |
Julius Baer Group Ltd. | | | 8,509 | | | | 490 | | |
Partners Group Holding AG | | | 5,202 | | | | 5,184 | | |
Swiss Life Holding AG | | | 840 | | | | 449 | | |
UBS Group AG | | | 25,784 | | | | 476 | | |
| | | | 14,195 | | |
See notes to financial statements.
16
USAA Mutual Funds Trust
USAA Sustainable World Fund | | Schedule of Portfolio Investments — continued
November 30, 2022 | |
(Amounts in Thousands, Except for Shares) (Unaudited)
Security Description | | Shares | | Value | |
Health Care (1.1%): | |
Coltene Holding AG Registered Shares | | | 4,194 | | | $ | 333 | | |
Novartis AG Registered Shares | | | 12,895 | | | | 1,147 | | |
Roche Holding AG | | | 36,677 | | | | 11,982 | | |
| | | | 13,462 | | |
Industrials (0.0%): (b) | |
Kardex Holding AG Registered Shares | | | 1,944 | | | | 322 | | |
Information Technology (0.1%): | |
Landis+Gyr Group AG | | | 5,534 | | | | 387 | | |
u-blox Holding AG | | | 3,050 | | | | 397 | | |
| | | | 784 | | |
Materials (0.1%): | |
Glencore PLC | | | 112,541 | | | | 768 | | |
Gurit Holding AG (d) | | | 2,330 | | | | 239 | | |
Holcim AG | | | 8,516 | | | | 445 | | |
| | | | 1,452 | | |
| | | | 37,869 | | |
Taiwan (1.8%): | |
Consumer Discretionary (0.0%): (b) | |
Fulgent Sun International Holding Co. Ltd. | | | 103,000 | | | | 509 | | |
Financials (0.5%): | |
Cathay Financial Holding Co. Ltd. | | | 4,670,000 | | | | 6,646 | | |
Health Care (0.1%): | |
Lotus Pharmaceutical Co. Ltd. | | | 59,000 | | | | 472 | | |
Universal Vision Biotechnology Co. Ltd. | | | 27,400 | | | | 238 | | |
| | | | 710 | | |
Information Technology (1.2%): | |
Gold Circuit Electronics Ltd. | | | 199,800 | | | | 640 | | |
Hon Hai Precision Industry Co. Ltd. | | | 212,000 | | | | 694 | | |
Lite-On Technology Corp. | | | 2,863,000 | | | | 6,111 | | |
Taiwan Semiconductor Manufacturing Co. Ltd. | | | 338,000 | | | | 5,429 | | |
Unimicron Technology Corp. | | | 64,000 | | | | 329 | | |
Wiwynn Corp. | | | 30,000 | | | | 866 | | |
| | | | 14,069 | | |
Materials (0.0%): (b) | |
Formosa Plastics Corp. | | | 100,000 | | | | 293 | | |
| | | | 22,227 | | |
Thailand (0.1%): | |
Materials (0.1%): | |
Indorama Ventures PCL | | | 420,000 | | | | 510 | | |
Real Estate (0.0%): (b) | |
AP Thailand PCL | | | 1,174,600 | | | | 338 | | |
| | | | 848 | | |
See notes to financial statements.
17
USAA Mutual Funds Trust
USAA Sustainable World Fund | | Schedule of Portfolio Investments — continued
November 30, 2022 | |
(Amounts in Thousands, Except for Shares) (Unaudited)
Security Description | | Shares | | Value | |
United Kingdom (4.6%): | | | |
Communication Services (0.1%): | | | |
| 4imprint Group PLC | | | 6,897 | | | $ | 356 | | |
Informa PLC | | | 49,927 | | | | 374 | | |
WPP PLC | | | 25,164 | | | | 264 | | |
| | | | 994 | | |
Consumer Discretionary (0.4%): | | | |
JD Sports Fashion PLC | | | 380,244 | | | | 586 | | |
Next PLC | | | 49,876 | | | | 3,564 | | |
Stellantis NV | | | 66,665 | | | | 1,051 | | |
| | | | 5,201 | | |
Consumer Staples (0.7%): | | | |
Imperial Brands PLC | | | 286,003 | | | | 7,355 | | |
Reckitt Benckiser Group PLC | | | 5,118 | | | | 367 | | |
Tesco PLC | | | 180,802 | | | | 498 | | |
| | | | 8,220 | | |
Energy (0.1%): | | | |
| BP PLC | | | 164,334 | | | | 981 | | |
Harbour Energy PLC | | | 68,695 | | | | 264 | | |
| | | | 1,245 | | |
Financials (1.0%): | | | |
| 3i Group PLC | | | 44,196 | | | | 726 | | |
Barclays PLC | | | 2,397,613 | | | | 4,689 | | |
HSBC Holdings PLC | | | 819,370 | | | | 5,019 | | |
Legal & General Group PLC | | | 104,657 | | | | 321 | | |
Standard Chartered PLC | | | 92,988 | | | | 692 | | |
| | | | 11,447 | | |
Health Care (0.1%): | | | |
AstraZeneca PLC | | | 8,658 | | | | 1,172 | | |
Ergomed PLC (a) | | | 14,702 | | | | 235 | | |
| | | | 1,407 | | |
Industrials (0.8%): | | | |
Alpha Financial Markets Consulting PLC | | | 49,436 | | | | 286 | | |
Ashtead Group PLC | | | 73,304 | | | | 4,473 | | |
BAE Systems PLC | | | 34,510 | | | | 342 | | |
Concentric AB | | | 11,502 | | | | 225 | | |
Judges Scientific PLC | | | 3,624 | | | | 355 | | |
Mitie Group PLC | | | 227,910 | | | | 210 | | |
Renew Holdings PLC | | | 36,672 | | | | 304 | | |
RS GROUP PLC | | | 29,297 | | | | 326 | | |
Sensata Technologies Holding PLC | | | 47,200 | | | | 2,129 | | |
SThree PLC | | | 69,514 | | | | 343 | | |
| | | | 8,993 | | |
Information Technology (0.0%): (b) | | | |
Kainos Group PLC | | | 22,249 | | | | 432 | | |
See notes to financial statements.
18
USAA Mutual Funds Trust
USAA Sustainable World Fund | | Schedule of Portfolio Investments — continued
November 30, 2022 | |
(Amounts in Thousands, Except for Shares) (Unaudited)
Security Description | | Shares | | Value | |
Materials (1.4%): | |
Anglo American PLC | | | 27,476 | | | $ | 1,142 | | |
Croda International PLC | | | 64,042 | | | | 5,295 | | |
Mondi PLC | | | 25,554 | | | | 483 | | |
Rio Tinto PLC | | | 141,690 | | | | 9,536 | | |
Treatt PLC | | | 34,714 | | | | 279 | | |
| | | | 16,735 | | |
Real Estate (0.0%): (b) | |
Safestore Holdings PLC | | | 30,293 | | | | 334 | | |
Utilities (0.0%): (b) | |
Drax Group PLC | | | 40,694 | | | | 301 | | |
| | | | 55,309 | | |
United States (55.2%): | |
Communication Services (2.8%): | |
Alphabet, Inc. Class C (a) | | | 214,409 | | | | 21,752 | | |
Alphabet, Inc. Class A (a) | | | 14,900 | | | | 1,504 | | |
Meta Platforms, Inc. Class A (a) | | | 76,341 | | | | 9,016 | | |
The Trade Desk, Inc. Class A (a) | | | 31,873 | | | | 1,662 | | |
| | | | 33,934 | | |
Consumer Discretionary (6.8%): | |
Acushnet Holdings Corp. | | | 10,131 | | | | 460 | | |
Airbnb, Inc. Class A (a) | | | 14,108 | | | | 1,441 | | |
Amazon.com, Inc. (a) | | | 161,922 | | | | 15,632 | | |
BJ's Restaurants, Inc. (a) | | | 18,980 | | | | 609 | | |
Brunswick Corp. | | | 3,222 | | | | 239 | | |
Darden Restaurants, Inc. | | | 9,200 | | | | 1,352 | | |
Gentherm, Inc. (a) | | | 4,897 | | | | 351 | | |
Johnson Outdoors, Inc. Class A | | | 7,692 | | | | 435 | | |
LKQ Corp. | | | 36,500 | | | | 1,983 | | |
Mattel, Inc. (a) | | | 22,900 | | | | 418 | | |
McDonald's Corp. | | | 65,460 | | | | 17,857 | | |
Movado Group, Inc. | | | 18,444 | | | | 594 | | |
NIKE, Inc. Class B | | | 17,584 | | | | 1,929 | | |
O'Reilly Automotive, Inc. (a) | | | 4,260 | | | | 3,683 | | |
Overstock.com, Inc. (a) | | | 11,930 | | | | 318 | | |
PulteGroup, Inc. | | | 176,210 | | | | 7,891 | | |
Ross Stores, Inc. | | | 86,217 | | | | 10,145 | | |
Ruth's Hospitality Group, Inc. | | | 27,059 | | | | 474 | | |
Samsonite International SA (a) (c) | | | 142,500 | | | | 386 | | |
Sonos, Inc. (a) | | | 26,143 | | | | 458 | | |
Target Corp. | | | 27,446 | | | | 4,585 | | |
Tesla, Inc. (a) | | | 34,134 | | | | 6,646 | | |
Thor Industries, Inc. | | | 5,714 | | | | 492 | | |
Topgolf Callaway Brands Corp. (a) | | | 20,156 | | | | 422 | | |
Tractor Supply Co. | | | 10,581 | | | | 2,395 | | |
Tri Pointe Homes, Inc. (a) | | | 21,663 | | | | 399 | | |
| | | | 81,594 | | |
See notes to financial statements.
19
USAA Mutual Funds Trust
USAA Sustainable World Fund | | Schedule of Portfolio Investments — continued
November 30, 2022 | |
(Amounts in Thousands, Except for Shares) (Unaudited)
Security Description | | Shares | | Value | |
Consumer Staples (4.2%): | |
Colgate-Palmolive Co. | | | 173,721 | | | $ | 13,460 | | |
Keurig Dr Pepper, Inc. | | | 61,600 | | | | 2,382 | | |
Lamb Weston Holdings, Inc. | | | 14,100 | | | | 1,225 | | |
Mondelez International, Inc. Class A | | | 40,700 | | | | 2,752 | | |
PepsiCo, Inc. | | | 100,860 | | | | 18,710 | | |
The Estee Lauder Cos., Inc. | | | 41,100 | | | | 9,691 | | |
U.S. Foods Holding Corp. (a) | | | 62,600 | | | | 2,290 | | |
| | | | 50,510 | | |
Energy (3.0%): | |
APA Corp. | | | 159,398 | | | | 7,468 | | |
Cactus, Inc. Class A | | | 52,964 | | | | 2,881 | | |
Clean Energy Fuels Corp. (a) | | | 58,959 | | | | 398 | | |
ConocoPhillips | | | 104,164 | | | | 12,865 | | |
Enterprise Products Partners LP | | | 92,300 | | | | 2,290 | | |
Expro Group Holdings NV (a) | | | 20,477 | | | | 356 | | |
Hess Corp. | | | 16,100 | | | | 2,317 | | |
Marathon Oil Corp. | | | 93,100 | | | | 2,852 | | |
Ovintiv, Inc. | | | 42,600 | | | | 2,375 | | |
RPC, Inc. | | | 80,443 | | | | 745 | | |
Select Energy Services, Inc. Class A | | | 59,085 | | | | 484 | | |
Solaris Oilfield Infrastructure, Inc. Class A | | | 42,358 | | | | 465 | | |
TETRA Technologies, Inc. (a) | | | 180,847 | | | | 689 | | |
| | | | 36,185 | | |
Financials (7.9%): | |
Bank of America Corp. | | | 319,464 | | | | 12,092 | | |
Blackstone, Inc. | | | 18,523 | | | | 1,695 | | |
Brown & Brown, Inc. | | | 59,800 | | | | 3,564 | | |
Cboe Global Markets, Inc. | | | 27,400 | | | | 3,475 | | |
Comerica, Inc. | | | 31,900 | | | | 2,289 | | |
Employers Holdings, Inc. | | | 9,819 | | | | 456 | | |
First Busey Corp. | | | 27,938 | | | | 728 | | |
Interactive Brokers Group, Inc. | | | 37,100 | | | | 2,979 | | |
JPMorgan Chase & Co. | | | 105,241 | | | | 14,542 | | |
LPL Financial Holdings, Inc. | | | 40,918 | | | | 9,686 | | |
Markel Corp. (a) | | | 3,800 | | | | 5,034 | | |
MSCI, Inc. | | | 4,434 | | | | 2,252 | | |
OFG Bancorp | | | 18,215 | | | | 528 | | |
S&P Global, Inc. | | | 30,087 | | | | 10,615 | | |
State Street Corp. | | | 24,200 | | | | 1,928 | | |
Synchrony Financial | | | 182,038 | | | | 6,841 | | |
The PNC Financial Services Group, Inc. | | | 26,932 | | | | 4,532 | | |
The Progressive Corp. | | | 30,800 | | | | 4,070 | | |
Unum Group | | | 204,631 | | | | 8,631 | | |
| | | | 95,937 | | |
Health Care (8.4%): | |
AbbVie, Inc. | | | 19,100 | | | | 3,078 | | |
Addus HomeCare Corp. (a) | | | 3,623 | | | | 400 | | |
See notes to financial statements.
20
USAA Mutual Funds Trust
USAA Sustainable World Fund | | Schedule of Portfolio Investments — continued
November 30, 2022 | |
(Amounts in Thousands, Except for Shares) (Unaudited)
Security Description | | Shares | | Value | |
Amgen, Inc. | | | 43,995 | | | $ | 12,600 | | |
Apollo Medical Holdings, Inc. (a) | | | 11,487 | | | | 327 | | |
Artivion, Inc. (a) | | | 13,167 | | | | 168 | | |
Atrion Corp. | | | 633 | | | | 383 | | |
BioLife Solutions, Inc. (a) | | | 16,954 | | | | 359 | | |
Catalyst Pharmaceuticals, Inc. (a) | | | 38,066 | | | | 638 | | |
Cigna Corp. | | | 7,900 | | | | 2,598 | | |
CorVel Corp. (a) | | | 3,184 | | | | 487 | | |
CryoPort, Inc. (a) | | | 12,599 | | | | 249 | | |
CVS Health Corp. | | | 90,405 | | | | 9,210 | | |
Dexcom, Inc. (a) | | | 21,688 | | | | 2,522 | | |
Dynavax Technologies Corp. (a) | | | 28,302 | | | | 351 | | |
Eli Lilly & Co. | | | 41,723 | | | | 15,483 | | |
Humana, Inc. | | | 5,300 | | | | 2,914 | | |
IDEXX Laboratories, Inc. (a) | | | 19,368 | | | | 8,248 | | |
Johnson & Johnson | | | 89,007 | | | | 15,843 | | |
Lantheus Holdings, Inc. (a) | | | 5,183 | | | | 322 | | |
LeMaitre Vascular, Inc. | | | 13,427 | | | | 629 | | |
McKesson Corp. | | | 3,200 | | | | 1,221 | | |
Merck & Co., Inc. | | | 30,900 | | | | 3,403 | | |
Neogen Corp. (a) | | | 15,735 | | | | 261 | | |
Orthofix Medical, Inc. (a) | | | 18,589 | | | | 334 | | |
STAAR Surgical Co. (a) | | | 4,606 | | | | 263 | | |
Tandem Diabetes Care, Inc. (a) | | | 7,550 | | | | 317 | | |
The Joint Corp. (a) | | | 12,112 | | | | 181 | | |
Thermo Fisher Scientific, Inc. | | | 5,242 | | | | 2,937 | | |
U.S. Physical Therapy, Inc. | | | 3,108 | | | | 269 | | |
UFP Technologies, Inc. (a) | | | 5,904 | | | | 709 | | |
UnitedHealth Group, Inc. | | | 16,465 | | | | 9,019 | | |
Veeva Systems, Inc. Class A (a) | | | 11,393 | | | | 2,169 | | |
Vericel Corp. (a) | | | 17,873 | | | | 408 | | |
Zoetis, Inc. | | | 18,091 | | | | 2,789 | | |
| | | | 101,089 | | |
Industrials (3.0%): | |
AAON, Inc. | | | 10,185 | | | | 807 | | |
Allied Motion Technologies, Inc. | | | 13,482 | | | | 478 | | |
CoStar Group, Inc. (a) | | | 29,765 | | | | 2,412 | | |
Delta Air Lines, Inc. (a) | | | 198,922 | | | | 7,036 | | |
Encore Wire Corp. | | | 2,022 | | | | 295 | | |
FedEx Corp. | | | 5,700 | | | | 1,039 | | |
Forward Air Corp. | | | 1,377 | | | | 155 | | |
Honeywell International, Inc. | | | 60,481 | | | | 13,279 | | |
L3Harris Technologies, Inc. | | | 5,600 | | | | 1,272 | | |
Leidos Holdings, Inc. | | | 19,300 | | | | 2,110 | | |
NOW, Inc. (a) | | | 50,891 | | | | 635 | | |
PACCAR, Inc. | | | 8,000 | | | | 847 | | |
Raytheon Technologies Corp. | | | 13,800 | | | | 1,362 | | |
The Greenbrier Cos., Inc. | | | 14,792 | | | | 568 | | |
Transcat, Inc. (a) | | | 9,640 | | | | 771 | | |
See notes to financial statements.
21
USAA Mutual Funds Trust
USAA Sustainable World Fund | | Schedule of Portfolio Investments — continued
November 30, 2022 | |
(Amounts in Thousands, Except for Shares) (Unaudited)
Security Description | | Shares | | Value | |
Uber Technologies, Inc. (a) | | | 59,203 | | | $ | 1,725 | | |
Union Pacific Corp. | | | 5,200 | | | | 1,131 | | |
| | | | 35,922 | | |
Information Technology (14.7%): | |
Adobe, Inc. (a) | | | 6,184 | | | | 2,133 | | |
Advanced Energy Industries, Inc. | | | 5,688 | | | | 527 | | |
Ambarella, Inc. (a) | | | 2,966 | | | | 220 | | |
Apple, Inc. | | | 273,391 | | | | 40,470 | | |
Arista Networks, Inc. (a) | | | 23,710 | | | | 3,303 | | |
Broadcom, Inc. | | | 3,158 | | | | 1,740 | | |
Cadence Design Systems, Inc. (a) | | | 17,160 | | | | 2,952 | | |
CDW Corp. | | | 12,629 | | | | 2,382 | | |
Cisco Systems, Inc. | | | 220,779 | | | | 10,977 | | |
Crowdstrike Holdings, Inc. Class A (a) | | | 11,847 | | | | 1,394 | | |
ePlus, Inc. (a) | | | 15,024 | | | | 746 | | |
Fidelity National Information Services, Inc. | | | 43,600 | | | | 3,164 | | |
FleetCor Technologies, Inc. (a) | | | 6,700 | | | | 1,315 | | |
Fortinet, Inc. (a) | | | 157,535 | | | | 8,375 | | |
Global Payments, Inc. | | | 12,100 | | | | 1,256 | | |
Grid Dynamics Holdings, Inc. (a) | | | 40,021 | | | | 510 | | |
Insight Enterprises, Inc. (a) | | | 5,707 | | | | 593 | | |
Mastercard, Inc. Class A | | | 36,781 | | | | 13,109 | | |
Microsoft Corp. | | | 152,785 | | | | 38,982 | | |
Motorola Solutions, Inc. | | | 8,935 | | | | 2,432 | | |
Napco Security Technologies, Inc. (a) | | | 20,530 | | | | 542 | | |
NVIDIA Corp. | | | 100,480 | | | | 17,004 | | |
Palo Alto Networks, Inc. (a) | | | 11,937 | | | | 2,028 | | |
PayPal Holdings, Inc. (a) | | | 15,796 | | | | 1,239 | | |
Perficient, Inc. (a) | | | 7,798 | | | | 554 | | |
ServiceNow, Inc. (a) | | | 7,005 | | | | 2,916 | | |
Texas Instruments, Inc. | | | 68,572 | | | | 12,374 | | |
Visa, Inc. Class A | | | 20,190 | | | | 4,381 | | |
| | | | 177,618 | | |
Materials (1.0%): | |
Alcoa Corp. | | | 135,564 | | | | 6,796 | | |
Hawkins, Inc. | | | 9,005 | | | | 374 | | |
PPG Industries, Inc. | | | 14,900 | | | | 2,015 | | |
Sealed Air Corp. | | | 48,000 | | | | 2,555 | | |
| | | | 11,740 | | |
Real Estate (1.4%): | |
Alexandria Real Estate Equities, Inc. | | | 9,200 | | | | 1,432 | | |
Equity LifeStyle Properties, Inc. | | | 17,000 | | | | 1,129 | | |
Gladstone Land Corp. | | | 11,050 | | | | 227 | | |
Invitation Homes, Inc. | | | 77,400 | | | | 2,526 | | |
Prologis, Inc. | | | 98,711 | | | | 11,627 | | |
| | | | 16,941 | | |
See notes to financial statements.
22
USAA Mutual Funds Trust
USAA Sustainable World Fund | | Schedule of Portfolio Investments — continued
November 30, 2022 | |
(Amounts in Thousands, Except for Shares) (Unaudited)
Security Description | | Shares | | Value | |
Utilities (2.0%): | |
Constellation Energy Corp. | | | 113,152 | | | $ | 10,876 | | |
Exelon Corp. | | | 46,400 | | | | 1,920 | | |
MGE Energy, Inc. | | | 89,252 | | | | 6,427 | | |
The York Water Co. | | | 7,161 | | | | 327 | | |
Vistra Corp. | | | 171,700 | | | | 4,177 | | |
| | | | 23,727 | | |
| | | | 665,197 | | |
Total Common Stocks (Cost $993,130) | | | 1,184,942 | | |
Exchange-Traded Funds (0.1%) | |
United States (0.1%): | |
iShares Core MSCI EAFE ETF | | | 5,289 | | | | 333 | | |
iShares MSCI EAFE Small-Cap ETF | | | 5,064 | | | | 289 | | |
iShares Russell 2000 ETF (d) | | | 1,610 | | | | 302 | | |
| | | | 924 | | |
Total Exchange-Traded Funds (Cost $929) | | | 924 | | |
Collateral for Securities Loaned (0.2%)^ | |
United States (0.2%): | |
Goldman Sachs Financial Square Government Fund, Institutional Shares,
3.73% (j) | | | 624,328 | | | | 624 | | |
HSBC U.S. Government Money Market Fund, I Shares, 3.75% (j) | | | 624,328 | | | | 624 | | |
Invesco Government & Agency Portfolio, Institutional Shares, 3.74% (j) | | | 624,328 | | | | 624 | | |
Morgan Stanley Institutional Liquidity Government Portfolio, Institutional
Shares, 3.62% (j) | | | 624,328 | | | | 624 | | |
Total Collateral for Securities Loaned (Cost $2,496) | | | 2,496 | | |
Total Investments (Cost $996,555) — 98.7% | | | 1,188,362 | | |
Other assets in excess of liabilities — 1.3% | | | 15,930 | | |
NET ASSETS — 100.00% | | $ | 1,204,292 | | |
^ Purchased with cash collateral from securities on loan.
(a) Non-income producing security.
(b) Amount represents less than 0.05% of net assets.
(c) Rule 144A security or other security that is restricted as to resale to institutional investors. The Fund's Adviser has deemed this security to be liquid (unless otherwise noted as illiquid) based upon procedures approved by the Board of Trustees. As of November 30, 2022, the fair value of these securities was $10,821 thousands and amounted to 0.9% of net assets.
(d) All or a portion of this security is on loan.
(e) Security was fair valued based upon procedures approved by the Board of Trustees and represents less than 0.05% of net assets as of November 30, 2022. This security is classified as Level 3 within the fair value hierarchy. (See Note 2 in the Notes to Financial Statements)
See notes to financial statements.
23
USAA Mutual Funds Trust
USAA Sustainable World Fund | | Schedule of Portfolio Investments — continued
November 30, 2022 | |
(Unaudited)
(f) The Fund's Adviser has deemed this security to be illiquid based upon procedures approved by the Board of Trustees. At November 30, 2022, illiquid securities were less than 0.05% of the Fund's net assets.
(g) Rounds to less than $1 thousand.
(h) Restricted security due to trading restrictions. Russian sanctioned entity by the United States Government.
(i) The following table details the acquisition date and cost of the Fund's Russian sanctioned restricted securities at November 30, 2022 (amount in thousand):
Security Name | | Acquisition Date | | Cost | |
Gazprom PJSC | | 8/13/2021 | | $ | 1,231 | | |
Rosneft Oil Co. PJSC, GDR | | 4/6/2021 | | | 964 | | |
Sberbank of Russia PJSC, ADR | | 3/26/2021 | | | 1,405 | | |
(j) Rate disclosed is the daily yield on November 30, 2022.
ADR — American Depositary Receipt
ETF — Exchange-Traded Fund
GDR — Global Depositary Receipt
LP — Limited Partnership
PCL — Public Company Limited
PLC — Public Limited Company
See notes to financial statements.
24
USAA Mutual Funds Trust | | Statement of Assets and Liabilities
November 30, 2022 | |
(Amounts in Thousands, Except Per Share Amounts) (Unaudited)
| | | USAA Sustainable
World Fund | |
Assets: | |
Investments, at value (Cost $996,555) | | $ | 1,188,362 | (a) | |
Foreign currency, at value (Cost $754) | | | 770 | | |
Cash | | | 12,112 | | |
Receivables: | |
Interest and dividends | | | 2,305 | | |
Capital shares issued | | | 78 | | |
Investments sold | | | 7,428 | | |
Reclaims | | | 2,166 | | |
From Adviser | | | 13 | | |
Prepaid expenses | | | 39 | | |
Total Assets | | | 1,213,273 | | |
Liabilities: | |
Payables: | |
Collateral received on loaned securities | | | 2,496 | | |
Investments purchased | | | 4,813 | | |
Capital shares redeemed | | | 471 | | |
Accrued foreign capital gains taxes | | | 10 | | |
Accrued expenses and other payables: | |
Investment advisory fees | | | 713 | | |
Administration fees | | | 142 | | |
Custodian fees | | | 74 | | |
Transfer agent fees | | | 114 | | |
Compliance fees | | | 1 | | |
Trustees' fees | | | 1 | | |
| 12b-1 fees | | | — | (b) | |
Other accrued expenses | | | 146 | | |
Total Liabilities | | | 8,981 | | |
Net Assets: | |
Capital | | | 1,036,409 | | |
Total accumulated earnings/(loss) | | | 167,883 | | |
Net Assets | | $ | 1,204,292 | | |
Net Assets | |
Fund Shares | | $ | 1,195,419 | | |
Institutional Shares | | | 4,616 | | |
Class A | | | 4,257 | | |
Total | | $ | 1,204,292 | | |
Shares (unlimited number of shares authorized with no par value): | |
Fund Shares | | | 51,573 | | |
Institutional Shares | | | 198 | | |
Class A | | | 183 | | |
Total | | | 51,954 | | |
Net asset value, offering and redemption price per share: (c) | |
Fund Shares | | $ | 23.18 | | |
Institutional Shares | | | 23.27 | | |
Class A | | | 23.22 | | |
Maximum Sales Charge — Class A | | | 5.75 | % | |
Maximum offering price
(100%/(100%-maximum sales charge) of net asset value adjusted to
the nearest cent) per share — Class A | | $ | 24.64 | | |
(a) Includes $2,438 thousand of securities on loan.
(b) Rounds to less than $1 thousand.
(c) Per share amount may not recalculate due to rounding of net assets and/or shares outstanding.
See notes to financial statements.
25
USAA Mutual Funds Trust | | Statement of Operations
For the Six Months Ended November 30, 2022 | |
(Amounts in Thousands) (Unaudited)
| | | USAA Sustainable
World Fund | |
Investment Income: | |
Dividends | | $ | 13,339 | | |
Interest | | | 61 | | |
Securities lending (net of fees) | | | 39 | | |
Foreign tax withholding | | | (976 | ) | |
Total Income | | | 12,463 | | |
Expenses: | |
Investment advisory fees | | | 4,405 | | |
Administration fees — Fund Shares | | | 875 | | |
Administration fees — Institutional Shares | | | 2 | | |
Administration fees — Class A | | | 3 | | |
Sub-Administration fees | | | 53 | | |
| 12b-1 fees — Class A | | | 5 | | |
Custodian fees | | | 138 | | |
Transfer agent fees — Fund Shares | | | 661 | | |
Transfer agent fees — Institutional Shares | | | 2 | | |
Transfer agent fees — Class A | | | 2 | | |
Trustees' fees | | | 24 | | |
Compliance fees | | | 5 | | |
Legal and audit fees | | | 100 | | |
State registration and filing fees | | | 37 | | |
Interfund lending fees | | | — | (a) | |
Other expenses | | | 116 | | |
Total Expenses | | | 6,428 | | |
Expenses waived/reimbursed by Adviser | | | (26 | ) | |
Net Expenses | | | 6,402 | | |
Net Investment Income (Loss) | | | 6,061 | | |
Realized/Unrealized Gains (Losses) from Investments: | |
Net realized gains (losses) from investment securities and foreign currency
transactions | | | (32,713 | ) | |
Foreign taxes on realized gains | | | 26 | | |
Net change in unrealized appreciation/depreciation on investment securities
and foreign currency translations | | | (3,799 | ) | |
Net change in accrued foreign taxes on unrealized gains | | | 34 | | |
Net realized/unrealized gains (losses) on investments | | | (36,452 | ) | |
Change in net assets resulting from operations | | $ | (30,391 | ) | |
(a) Rounds to less than $1 thousand.
See notes to financial statements.
26
USAA Mutual Funds Trust | | Statements of Changes in Net Assets | |
(Amounts in Thousands)
| | | USAA Sustainable World Fund | |
| | | Six Months
Ended
November 30,
2022
(Unaudited) | | Year
Ended
May 31,
2022 | |
From Investments: | |
Operations: | |
Net Investment Income (Loss) | | $ | 6,061 | | | $ | 12,802 | | |
Net realized gains (losses) | | | (32,687 | ) | | | 48,901 | | |
Net change in unrealized appreciation/depreciation | | | (3,765 | ) | | | (186,988 | ) | |
Change in net assets resulting from operations | | | (30,391 | ) | | | (125,285 | ) | |
Distributions to Shareholders: | |
Fund Shares | | | — | | | | (247,859 | ) | |
Institutional Shares | | | — | | | | (505 | ) | |
Class A | | | — | | | | (464 | ) | |
Change in net assets resulting from distributions to shareholders | | | — | | | | (248,828 | ) | |
Change in net assets resulting from capital transactions | | | (47,787 | ) | | | 143,070 | | |
Change in net assets | | | (78,178 | ) | | | (231,043 | ) | |
Net Assets: | |
Beginning of period | | | 1,282,470 | | | | 1,513,513 | | |
End of period | | $ | 1,204,292 | | | $ | 1,282,470 | | |
(continues on next page)
See notes to financial statements.
27
USAA Mutual Funds Trust | | Statements of Changes in Net Assets | |
(Amounts in Thousands) (continued)
| | | USAA Sustainable World Fund | |
| | | Six Months
Ended
November 30,
2022
(Unaudited) | | Year
Ended
May 31,
2022 | |
Capital Transactions: | |
Fund Shares | |
Proceeds from shares issued | | $ | 18,470 | | | $ | 72,669 | | |
Distributions reinvested | | | — | | | | 245,078 | | |
Cost of shares redeemed | | | (65,876 | ) | | | (180,222 | ) | |
Total Fund Shares | | $ | (47,406 | ) | | $ | 137,525 | | |
Institutional Shares | |
Proceeds from shares issued | | $ | 738 | | | $ | 4,067 | | |
Distributions reinvested | | | — | | | | 496 | | |
Cost of shares redeemed | | | (1,293 | ) | | | (1,169 | ) | |
Total Institutional Shares | | $ | (555 | ) | | $ | 3,394 | | |
Class A | |
Proceeds from shares issued | | $ | 345 | | | $ | 2,341 | | |
Distributions reinvested | | | — | | | | 253 | | |
Cost of shares redeemed | | | (171 | ) | | | (443 | ) | |
Total Class A | | $ | 174 | | | $ | 2,151 | | |
Change in net assets resulting from capital transactions | | $ | (47,787 | ) | | $ | 143,070 | | |
Share Transactions: | |
Fund Shares | |
Issued | | | 841 | | | | 2,521 | | |
Reinvested | | | — | | | | 8,958 | | |
Redeemed | | | (2,986 | ) | | | (6,358 | ) | |
Total Fund Shares | | | (2,145 | ) | | | 5,121 | | |
Institutional Shares | |
Issued | | | 34 | | | | 161 | | |
Reinvested | | | — | | | | 18 | | |
Redeemed | | | (59 | ) | | | (42 | ) | |
Total Institutional Shares | | | (25 | ) | | | 137 | | |
Class A | |
Issued | | | 15 | | | | 89 | | |
Reinvested | | | — | | | | 9 | | |
Redeemed | | | (8 | ) | | | (15 | ) | |
Total Class A | | | 7 | | | | 83 | | |
Change in Shares | | | (2,163 | ) | | | 5,341 | | |
See notes to financial statements.
28
This page is intentionally left blank.
29
USAA Mutual Funds Trust | | Financial Highlights | |
For a Share Outstanding Throughout Each Period
| | | | Investment Activities | | Distributions to
Shareholders From | |
| | | Net Asset
Value,
Beginning of
Period | | Net
Investment
Income
(Loss) | | Net
Realized and
Unrealized
Gains
(Losses) | | Total from
Investment
Activities | | Net
Investment
Income | | Net Realized
Gains from
Investments | | Total
Distributions | |
USAA Sustainable World Fund | | | |
Fund Shares | | | |
Six Months Ended
November 30, 2022
(Unaudited) | | $ | 23.70 | | | | 0.11 | (h) | | | (0.63 | ) | | | (0.52 | ) | | | — | | | | — | | | | — | | |
Year Ended May 31:
2022 | | $ | 31.03 | | | | 0.25 | (h) | | | (2.36 | ) | | | (2.11 | ) | | | (0.27 | ) | | | (4.95 | ) | | | (5.22 | ) | |
2021 | | $ | 23.38 | | | | 0.23 | (h) | | | 8.74 | | | | 8.97 | | | | (0.18 | ) | | | (1.14 | ) | | | (1.32 | ) | |
2020 | | $ | 30.71 | | | | 0.27 | (h) | | | 2.87 | | | | 3.14 | | | | (0.32 | ) | | | (10.15 | ) | | | (10.47 | ) | |
2019 | | $ | 31.82 | | | | 0.33 | | | | 0.51 | | | | 0.84 | | | | (0.28 | ) | | | (1.67 | ) | | | (1.95 | ) | |
2018 | | $ | 31.16 | | | | 0.30 | | | | 1.78 | | | | 2.08 | | | | (0.23 | ) | | | (1.19 | ) | | | (1.42 | ) | |
Institutional Shares | | | |
Six Months Ended
November 30, 2022
(Unaudited) | | $ | 23.78 | | | | 0.13 | (h) | | | (0.64 | ) | | | (0.51 | ) | | | — | | | | — | | | | — | | |
Year Ended May 31:
2022 | | $ | 31.10 | | | | 0.31 | (h) | | | (2.41 | ) | | | (2.10 | ) | | | (0.27 | ) | | | (4.95 | ) | | | (5.22 | ) | |
2021 | | $ | 23.42 | | | | 0.24 | (h) | | | 8.77 | | | | 9.01 | | | | (0.19 | ) | | | (1.14 | ) | | | (1.33 | ) | |
2020 | | $ | 30.74 | | | | 0.29 | (h) | | | 2.86 | | | | 3.15 | | | | (0.32 | ) | | | (10.15 | ) | | | (10.47 | ) | |
2019 | | $ | 31.75 | | | | 0.38 | | | | 0.48 | | | | 0.86 | | | | (0.20 | ) | | | (1.67 | ) | | | (1.87 | ) | |
2018 | | $ | 31.14 | | | | 0.29 | | | | 1.80 | | | | 2.09 | | | | (0.29 | ) | | | (1.19 | ) | | | (1.48 | ) | |
Class A | | | |
Six Months Ended
November 30, 2022
(Unaudited) | | $ | 23.77 | | | | 0.09 | (h) | | | (0.64 | ) | | | (0.55 | ) | | | — | | | | — | | | | — | | |
Year Ended May 31:
2022 | | $ | 31.06 | | | | 0.19 | (h) | | | (2.40 | ) | | | (2.21 | ) | | | (0.13 | ) | | | (4.95 | ) | | | (5.08 | ) | |
2021 | | $ | 23.40 | | | | 0.15 | (h) | | | 8.76 | | | | 8.91 | | | | (0.11 | ) | | | (1.14 | ) | | | (1.25 | ) | |
2020 | | $ | 30.77 | | | | 0.19 | (h) | | | 2.86 | | | | 3.05 | | | | (0.27 | ) | | | (10.15 | ) | | | (10.42 | ) | |
2019 | | $ | 31.86 | | | | 0.24 | (h) | | | 0.53 | | | | 0.77 | | | | (0.19 | ) | | | (1.67 | ) | | | (1.86 | ) | |
2018 | | $ | 31.07 | | | | 0.18 | (h) | | | 1.80 | | | | 1.98 | | | | — | (l) | | | (1.19 | ) | | | (1.19 | ) | |
(a) Not annualized for periods less than one year.
(b) Assumes reinvestment of all net investment income and realized capital gain distributions, if any, during the period. Includes adjustments in accordance with U.S. Generally Accepted Accounting Principles and could differ from the Lipper reported return.
(c) Annualized for periods less than one year.
(d) The net expense ratio may not correlate to the applicable expense limits in place during the period since the current contractual expense limitation is applied for a period beginning July 1, 2019 and in effect through September 30, 2023, instead of coinciding with the Fund's fiscal year end. Details of the current contractual expense limitation in effect can be found in Note 4 of the accompanying Notes to Financial Statements.
(e) Does not include acquired fund fees and expenses, if any.
(f) From the period beginning July 1, 2019, the amount of any waivers or reimbursements and the amount of any recoupment are calculated without regard to the impact of any performance adjustment to the Fund's management fee.
See notes to financial statements.
30
USAA Mutual Funds Trust | | Financial Highlights — continued | |
For a Share Outstanding Throughout Each Period
| | | | | Ratios to Average Net Assets | | Supplemental Data | |
| | | Redemption
Fees
Added to
Beneficiary
Interests | | Net
Asset
Value,
End of
Period | | Total
Return
(Excludes
Sales
Charge)(a)(b) | | Net
Expenses(c)(d)(e)(f) | | Net
Investment
Income
(Loss)(c) | | Gross
Expenses(c)(e) | | Net
Assets,
End of
Period
(000's) | | Portfolio
Turnover(a)(g) | |
USAA Sustainable World Fund | |
Fund Shares | |
Six Months Ended
November 30, 2022
(Unaudited) | | | — | | | $ | 23.18 | | | | (2.19 | )% | | | 1.09 | % | | | 1.03 | % | | | 1.09 | % | | $ | 1,195,419 | | | | 18 | % | |
Year Ended May 31:
2022 | | | — | | | $ | 23.70 | | | | (8.90 | )% | | | 1.05 | % | | | 0.87 | % | | | 1.05 | % | | $ | 1,272,993 | | | | 37 | %(i) | |
2021 | | | — | | | $ | 31.03 | | | | 39.07 | % | | | 1.05 | % | | | 0.86 | % | | | 1.05 | % | | $ | 1,507,963 | | | | 88 | % | |
2020 | | | — | | | $ | 23.38 | | | | 7.81 | % | | | 1.07 | % | | | 0.98 | % | | | 1.07 | % | | $ | 1,228,986 | | | | 103 | %(j) | |
2019 | | | — | | | $ | 30.71 | | | | 3.23 | % | | | 1.09 | % | | | 1.09 | % | | | 1.09 | % | | $ | 1,280,661 | | | | 8 | % | |
2018 | | | — | | | $ | 31.82 | | | | 6.68 | % | | | 1.10 | % | | | 0.98 | % | | | 1.10 | % | | $ | 1,353,880 | | | | 10 | % | |
Institutional Shares | |
Six Months Ended
November 30, 2022
(Unaudited) | | | — | | | $ | 23.27 | | | | (2.14 | )% | | | 1.00 | % | | | 1.13 | % | | | 1.50 | % | | $ | 4,616 | | | | 18 | % | |
Year Ended May 31:
2022 | | | — | | | $ | 23.78 | | | | (8.87 | )% | | | 1.00 | % | | | 1.10 | % | | | 1.29 | % | | $ | 5,301 | | | | 37 | %(i) | |
2021 | | | — | | | $ | 31.10 | | | | 39.17 | % | | | 0.99 | % | | | 0.87 | % | | | 1.27 | % | | $ | 2,660 | | | | 88 | % | |
2020 | | | — | | | $ | 23.42 | | | | 7.85 | % | | | 1.00 | % | | | 1.00 | % | | | 1.13 | % | | $ | 6,143 | | | | 103 | %(j) | |
2019 | | | — | | | $ | 30.74 | | | | 3.29 | % | | | 1.05 | %(k) | | | 1.13 | % | | | 1.11 | % | | $ | 12,567 | | | | 8 | % | |
2018 | | | — | | | $ | 31.75 | | | | 6.70 | % | | | 1.10 | % | | | 1.19 | % | | | 1.10 | % | | $ | 30,127 | | | | 10 | % | |
Class A | |
Six Months Ended
November 30, 2022
(Unaudited) | | | — | | | $ | 23.22 | | | | (2.31 | )% | | | 1.35 | % | | | 0.77 | % | | | 1.81 | % | | $ | 4,257 | | | | 18 | % | |
Year Ended May 31:
2022 | | | — | | | $ | 23.77 | | | | (9.18 | )% | | | 1.32 | % | | | 0.67 | % | | | 1.68 | % | | $ | 4,176 | | | | 37 | %(i) | |
2021 | | | — | | | $ | 31.06 | | | | 38.73 | % | | | 1.32 | % | | | 0.53 | % | | | 1.62 | % | | $ | 2,890 | | | | 88 | % | |
2020 | | | — | | | $ | 23.40 | | | | 7.49 | % | | | 1.35 | % | | | 0.68 | % | | | 1.43 | % | | $ | 6,425 | | | | 103 | %(j) | |
2019 | | | — | | | $ | 30.77 | | | | 2.98 | % | | | 1.35 | % | | | 0.76 | % | | | 1.46 | % | | $ | 8,133 | | | | 8 | % | |
2018 | | | — | (l) | | $ | 31.86 | | | | 6.36 | % | | | 1.39 | %(m) | | | 0.57 | % | | | 1.43 | % | | $ | 10,114 | | | | 10 | % | |
(g) Portfolio turnover is calculated on the basis of the Fund as a whole without distinguishing between classes of shares issued.
(h) Per share net investment income (loss) has been calculated using the average daily shares method.
(i) Reflects a return to normal trading levels after a prior year subadviser termination.
(j) Reflects increased trading activity due to current year transition or asset allocation shift.
(k) Effective October 1, 2018, USAA Asset Management Company ("AMCO") (previous Adviser) had voluntarily agreed to limit the annual expenses of the Institutional Shares to 1.00% of the Institutional Shares' average daily net assets.
(l) Amount is less than $0.005 per share.
(m) Effective October 1, 2017, AMCO had voluntarily agreed to limit the annual expenses of the Class A shares to 1.35% of the Class A shares' average daily net assets.
See notes to financial statements.
31
USAA Mutual Funds Trust | | Notes to Financial Statements
November 30, 2022 | |
(Unaudited)
1. Organization:
USAA Mutual Funds Trust (the "Trust") is organized as a Delaware statutory trust and is registered under the Investment Company Act of 1940, as amended (the "1940 Act"), as an open-end investment company. The Trust is comprised of 45 funds and is authorized to issue an unlimited number of shares, which are units of beneficial interest with no par value.
The accompanying financial statements are those of the USAA Sustainable World Fund (the "Fund"). The Fund offers three classes of shares: Fund Shares, Institutional Shares, and Class A. The Fund is classified as diversified under the 1940 Act.
Each class of shares of the Fund has substantially identical rights and privileges, except with respect to sales charges, fees paid under distribution plans, expenses allocable exclusively to each class of shares, voting rights on matters solely affecting a single class of shares, and the exchange privilege of each class of shares.
Victory Capital Management ("VCM" or the "Adviser"), is an indirect wholly owned subsidiary of Victory Capital Holdings, Inc., a publicly traded Delaware corporation, and a wholly owned direct subsidiary of Victory Capital Operating, LLC.
Under the Trust's organizational documents, its officers and trustees are indemnified against certain liabilities arising out of the performance of their duties to the Fund. In addition, in the normal course of business, the Fund enters into contracts with its vendors and others that provide for general indemnifications. The Fund's maximum exposure under these arrangements is unknown, as this would involve future claims that may be made against the Fund. However, based on experience, the Fund expects that risk of loss to be remote.
2. Significant Accounting Policies:
The following is a summary of significant accounting policies followed by the Trust in the preparation of its financial statements. The policies are in conformity with U.S. Generally Accepted Accounting Principles ("GAAP"). The preparation of financial statements in accordance with GAAP requires management to make estimates and assumptions that affect the reported amounts of assets and liabilities and disclosure of contingent assets and liabilities at the date of the financial statements and the reported amounts of income and expenses for the period. Actual results could differ from those estimates. The Fund follows the specialized accounting and reporting requirements under GAAP that are applicable to investment companies under Accounting Standards Codification Topic 946.
Investment Valuation:
The Fund records investments at fair value. Fair value is defined as the price that would be received to sell an asset or paid to transfer a liability in an orderly transaction between market participants at the measurement date.
The valuation techniques described below maximize the use of observable inputs and minimize the use of unobservable inputs in determining fair value. The inputs used for valuing the Fund's investments are summarized in the three broad levels listed below:
• Level 1 — quoted prices (unadjusted) in active markets for identical securities
• Level 2 — other significant observable inputs (including quoted prices for similar securities, interest rates, or credit spreads, applicable to those securities, etc.)
• Level 3 — significant unobservable inputs (including the Adviser's assumptions in determining the fair value of investments)
Changes in valuation techniques may result in transfers in or out of an assigned level within the disclosure hierarchy. The inputs or methodologies used for valuation techniques are not necessarily an indication of the risks associated with entering into those investments.
The Adviser, acting as the valuation designee has established the Pricing and Liquidity Committee (the "Committee"), and subject to the Trust's Board of Trustees' (the "Board") oversight, the Committee
32
USAA Mutual Funds Trust | | Notes to Financial Statements — continued
November 30, 2022 | |
(Unaudited)
administers and oversees the Fund's valuation policies and procedures, which are approved by the Board.
Portfolio securities listed or traded on securities exchanges, including Exchange-Traded Funds ("ETFs"), and American Depositary Receipts ("ADRs"), are valued at the closing price on the exchange or system where the security is principally traded, if available, or at the Nasdaq Official Closing Price. If there have been no sales for that day on the exchange or system, then a security is valued at the last available bid quotation on the exchange or system where the security is principally traded. In each of these situations, valuations are typically categorized as Level 1 in the fair value hierarchy.
Investments in open-end investment companies, other than ETFs, are valued at their net asset value ("NAV"). These valuations are typically categorized as Level 1 in the fair value hierarchy.
In the event that price quotations or valuations are not readily available, investments are valued at fair value in accordance with procedures established by and under the general supervision and responsibility of the Board. These valuations are typically categorized as Level 2 or Level 3 in the fair value hierarchy, based on the observability of inputs used to determine the fair value. The effect of fair value pricing is that securities may not be priced on the basis of quotations from the primary market in which they are traded, and the actual price realized from the sale of a security may differ materially from the fair value price. Valuing these securities at fair value is intended to cause the Fund's NAV to be more reliable than it otherwise would be.
In accordance with procedures adopted by the Board, fair value pricing may be used if events materially affecting the value of foreign securities occur between the time the exchange on which they are traded closes and the time the Fund's NAV is calculated. The Fund uses a systematic valuation model, provided daily by an independent third party to fair value its international equity securities. The valuations are categorized as Level 2 in the fair value hierarchy.
A summary of the valuations as of November 30, 2022, based upon the three levels defined above, is included in the table below while the breakdown, by category, of investments is disclosed on the Schedule of Portfolio Investments (amounts in thousands):
| | | Level 1 | | Level 2 | | Level 3 | | Total | |
Common Stocks | | $ | 759,934 | | | $ | 424,989 | | | $ | 19 | | | $ | 1,184,942 | | |
Exchange-Traded Funds | | | 924 | | | | — | | | | — | | | | 924 | | |
Collateral for Securities Loaned | | | 2,496 | | | | — | | | | — | | | | 2,496 | | |
Total | | $ | 763,354 | | | $ | 424,989 | | | $ | 19 | | | $ | 1,188,362 | | |
For the six months ended November 30, 2022, there were no transfers into/out of Level 3.
Real Estate Investment Trusts ("REITs"):
The Fund may invest in REITs, which report information on the source of their distributions annually. REITs are pooled investment vehicles that invest primarily in income producing real estate or real estate related loans or interests (such as mortgages). Certain distributions received from REITs during the year are recorded as realized gains or return of capital as estimated by the Fund or when such information becomes known.
Investment Companies:
Exchange-Traded Funds:
The Fund may invest in ETFs, the shares of which are bought and sold on a securities exchange. An ETF trades like common stock and represents a fixed portfolio of securities often designed to track the performance and dividend yield of a particular domestic or foreign market index. The Fund may purchase shares of an ETF to temporarily gain exposure to a portion of the U.S. or a foreign market while awaiting purchase of underlying securities. The risks of owning an ETF generally reflect the risks of owning the underlying securities the ETF is designed to track, although the lack of liquidity of an ETF could result in it being more volatile. Additionally, ETFs have fees and expenses that reduce their value.
33
USAA Mutual Funds Trust | | Notes to Financial Statements — continued
November 30, 2022 | |
(Unaudited)
Open-End Funds:
The Fund may invest in portfolios of open-end investment companies. These investment companies value securities in their portfolios for which market quotations are readily available at their market values (generally the last reported sale price) and all other securities and assets at their fair value by the methods established by the board of directors of the underlying funds.
Derivative Instruments:
Foreign Exchange Currency Contracts:
The Fund may enter into foreign exchange currency contracts to convert U.S. dollars to and from various foreign currencies. A foreign exchange currency contract is an obligation by the Fund to purchase or sell a specific currency at a future date at a price (in U.S. dollars) set at the time of the contract. The Fund does not engage in "cross-currency" foreign exchange contracts (i.e., contracts to purchase or sell one foreign currency in exchange for another foreign currency). The Fund's foreign exchange currency contracts might be considered spot contracts (typically a contract of one week or less) or forward contracts (typically a contract term over one week). A spot contract is entered into for purposes of hedging against foreign currency fluctuations relating to a specific portfolio transaction, such as the delay between a security transaction trade date and settlement date. Forward contracts are entered into for purposes of hedging portfolio holdings or concentrations of such holdings. Each foreign exchange currency contract is adjusted daily by the prevailing spot or forward rate of the underlying currency, and any appreciation or depreciation is recorded for financial statement purposes as unrealized until the contract settlement date, at which time the Fund records realized gains or losses equal to the difference between the value of a contract at the time it was opened and the value at the time it was closed. The Fund could be exposed to risk if a counterparty is unable to meet the terms of a foreign exchange currency contract or if the value of the foreign currency changes unfavorably. In addition, the use of foreign exchange currency contracts does not eliminate fluctuations in the underlying prices of the securities. As of November 30, 2022, the Fund had no open forward foreign exchange currency contracts.
Investment Transactions and Related Income:
Changes in holdings of investments are accounted for no later than one business day following the trade date. For financial reporting purposes, however, investment transactions are accounted for on trade date or the last business day of the reporting period. Interest income is determined on the basis of coupon interest accrued using the effective interest method which adjusts, where applicable, the amortization of premiums or accretion of discounts. Dividend income is recorded on the ex-dividend date. Gains or losses realized on sales of securities are recorded on the identified cost basis.
Withholding taxes on interest, dividends, and gains as a result of certain investments in ADRs by the Fund have been provided for in accordance with each investment's applicable country's tax rules and rates.
Securities Lending:
The Fund, through a Securities Lending Agreement with Citibank, N.A. ("Citibank"), may lend its securities to qualified financial institutions, such as certain broker-dealers and banks, to earn additional income, net of income retained by Citibank. Borrowers are required to initially secure their loans for collateral in the amount of at least 102% of the value of U.S. securities loaned or at least 105% of the value of non-U.S. securities loaned, marked-to-market daily. Any collateral shortfalls associated with increases in the valuation of the securities loaned are generally cured the next business day. The collateral can be received in the form of cash collateral and/or non-cash collateral. Non-cash collateral can include U.S. Government Securities and other securities as permitted by Securities and Exchange Commission ("SEC") guidelines. The cash collateral is invested in short-term instruments or cash equivalents, primarily open-end investment companies, as noted on the Fund's Schedule of Portfolio Investments. The Fund effectively does not have control of the non-cash collateral and therefore it is
34
USAA Mutual Funds Trust | | Notes to Financial Statements — continued
November 30, 2022 | |
(Unaudited)
not disclosed on the Fund's Schedule of Portfolio Investments. Collateral requirements are determined daily based on the value of the Fund's securities on loan as of the end of the prior business day. During the time portfolio securities are on loan, the borrower will pay the Fund any dividends or interest paid on such securities plus any fee negotiated between the parties to the lending agreement. The Fund also earns a return from the collateral. The Fund pays Citibank various fees in connection with the investment of cash collateral and fees based on the investment income received from securities lending activities. Securities lending income (net of these fees) is disclosed on the Statement of Operations. Loans are terminable upon demand and the borrower must return the loaned securities within the lesser of one standard settlement period or five business days. Although risk is mitigated by the collateral, the Fund could experience a delay in recovering its securities and possible loss of income or value if the borrower fails to return them. In addition, there is a risk that the value of the short-term investments will be less than the amount of cash collateral required to be returned to the borrower.
The Fund's agreement with Citibank does not include master netting provisions. Non-cash collateral received by the Fund may not be sold or repledged, except to satisfy borrower default.
The following table (amounts in thousands) is a summary of the Fund's securities lending transactions as of November 30, 2022.
Value of
Securities on Loan | | Non-Cash
Collateral | | Cash
Collateral | |
| $ | 2,438 | | | $ | — | | | $ | 2,496 | | |
Foreign Currency Translations:
The accounting records of the Fund are maintained in U.S. dollars. Investment securities and other assets and liabilities of the Fund denominated in a foreign currency are translated into U.S. dollars at current exchange rates. Purchases and sales of securities, income receipts, and expense payments are translated into U.S. dollars at the exchange rates on the date of the transactions. The Fund does not isolate the portion of the results of operations resulting from changes in foreign exchange rates on investments from fluctuations arising from changes in market prices of securities held. Such fluctuations are disclosed as Net change in unrealized appreciation/depreciation on investment securities and foreign currency translations on the Statement of Operations. Any realized gains or losses from these fluctuations are disclosed as Net realized gains (losses) from investment securities and foreign currency transactions on the Statement of Operations.
Foreign Taxes:
The Fund may be subject to foreign taxes related to foreign income received (a portion of which may be reclaimable), capital gains on the sale of securities, and certain foreign currency transactions. All foreign taxes are recorded in accordance with the applicable regulations and rates that exist in the foreign jurisdictions in which the Fund invests.
The Fund filed for additional European Union reclaims related to prior years. In October 2022, the Sweden Tax Authority issued favorable decisions relating to claims for Sweden. These reclaims are recorded when the amount is known and there are no significant uncertainties on collectability. For the six months ended November 30, 2022, the Fund recognized $46 thousand in reclaims. These reclaims are reflected on the Statement of Operations as Dividend Income.
Federal Income Taxes:
The Fund intends to continue to qualify as a regulated investment company by complying with the provisions available to certain investment companies, as defined in applicable sections of the Internal Revenue Code, and to make distributions of net investment income and net realized gains sufficient to relieve it from all, or substantially all, federal income taxes. Accordingly, no provision for federal income taxes is required in the financial statements. The Fund has a tax year end of May 31.
35
USAA Mutual Funds Trust | | Notes to Financial Statements — continued
November 30, 2022 | |
(Unaudited)
For the six months ended November 30, 2022, the Fund did not incur any income tax, interest, or penalties, and has recorded no liability for net unrecognized tax benefits relating to uncertain tax positions.
Management of the Fund has reviewed tax positions taken in tax years that remain subject to examination by all major tax jurisdictions, including federal (i.e., the last four tax years, which includes the current fiscal tax year end). Management believes that there is no tax liability resulting from unrecognized tax benefits related to uncertain tax positions taken.
Allocations:
Expenses directly attributable to the Fund are charged to the Fund, while expenses that are attributable to more than one fund in the Trust, or jointly with an affiliated trust, are allocated among the respective funds in the Trust and/or an affiliated trust based upon net assets or another appropriate basis.
Income, expenses (other than class-specific expenses such as transfer agent fees, state registration fees, printing fees, and 12b-1 fees), and realized and unrealized gains or losses on investments are allocated to each class of shares based on its relative net assets on the date income is earned or expenses and realized and unrealized gains and losses are incurred.
3. Purchases and Sales:
Purchases and sales of securities (excluding securities maturing less than one year from acquisition) for the six months ended November 30, 2022, were as follows for the Fund (amounts in thousands):
Excluding
U.S. Government Securities | |
Purchases | | Sales | |
$ | 214,421 | | | $ | 253,019 | | |
4. Fees and Transactions with Affiliates and Related Parties:
Investment Advisory Fees:
Investment advisory services are provided to the Fund by the Adviser, which is a New York corporation registered as an investment adviser with the SEC.
Under the terms of the Investment Advisory Agreement, the Adviser is entitled to receive a base fee and a performance adjustment. The Fund's base fee is accrued daily and paid monthly at an annualized rate of 0.75% of the Fund's average daily net assets. Amounts incurred and paid to VCM for the six months ended November 30, 2022, are reflected on the Statement of Operations as Investment advisory fees.
The performance adjustment for each share class is accrued daily and calculated monthly by comparing the respective class' performance to that of the Lipper Global Funds Index. The Lipper Global Funds Index tracks the total return performance of the largest funds within the Lipper Global Funds category.
The performance period for each share class consists of the current month plus the previous 35 months. The following table is utilized to determine the extent of the performance adjustment:
Over/Under Performance Relative to Index
(in basis points)(a) | | Annual Adjustment Rate
(in basis points) | |
| | +/- 100 to 400 | | | | +/- 4 | | |
| | +/- 401 to 700 | | | | +/- 5 | | |
| | +/- 701 and greater | | | | +/- 6 | | |
(a) Based on the difference between the average annual performance of the relevant share class of the Fund and its relevant Lipper index, rounded to the nearest basis point.
36
USAA Mutual Funds Trust | | Notes to Financial Statements — continued
November 30, 2022 | |
(Unaudited)
Each class' annual performance adjustment rate is multiplied by the average daily net assets of the respective class over the entire performance period, which is then multiplied by a fraction, the numerator of which is the number of days in the month and the denominator of which is 365 (366 in leap years). The resulting amount is then added to (in the case of overperformance), or subtracted from (in the case of underperformance) the base fee.
Under the performance fee arrangement, each class pays a positive performance fee adjustment for a performance period whenever the class outperforms the Lipper Global Funds Index over that period, even if the class has overall negative returns during the performance period.
For the period June 1, 2022, to November 30, 2022, there were no performance adjustments for Fund Shares, Institutional Shares, and Class A, respectively. The performance adjustment rate included in the investment advisory fee may differ from the maximum over/under Annual Adjustment Rate due to differences in average net assets for the reporting period and rolling 36 month performance periods.
The Trust relies on an exemptive order granted to VCM and its affiliated funds by the SEC in March 2019, permitting the use of a "manager-of-managers" structure for certain funds. Under a manager-of-managers structure, the investment adviser may select (with approval of the Board and without shareholder approval) one or more subadvisers to manage the day-to-day investment of a fund's assets. For the six months ended November 30, 2022, the Fund had no subadvisers.
Administration and Servicing Fees:
VCM also serves as the Fund's administrator and fund accountant. Under the Fund Administration, Servicing and Accounting Agreement, VCM is paid an administration and servicing fee that is accrued daily and paid monthly at an annualized rate of 0.15%, 0.10%, and 0.15%, which is based on the Fund's average daily net assets of the Fund Shares, Institutional Shares, and Class A, respectively. Amounts incurred for the six months ended November 30, 2022, are reflected on the Statement of Operations as Administration fees.
Citi Fund Services Ohio, Inc. ("Citi"), an affiliate of Citibank, acts as sub-administrator and sub-fund accountant to the Fund pursuant to a Sub-Administration and Sub-Fund Accounting Services Agreement between VCM and Citi. VCM pays Citi a fee for providing these services. The Fund reimburses VCM and Citi for out-of-pocket expenses incurred in providing these services and certain other expenses specifically allocated to the Fund. Amounts incurred for the six months ended November 30, 2022, are reflected on the Statement of Operations as Sub-Administration fees.
The Fund (as part of the Trust) has entered into an agreement with the Adviser to provide compliance services, pursuant to which the Adviser furnishes its compliance personnel, including the services of the Chief Compliance Officer ("CCO"), and other resources reasonably necessary to provide the Trust with compliance oversight services related to the design, administration, and oversight of a compliance program for the Trust in accordance with Rule 38a-1 under the 1940 Act. The CCO is an employee of the Adviser, which pays the compensation of the CCO and support staff. The funds in the Trust, Victory Variable Insurance Funds, Victory Portfolios, and Victory Portfolios II (collectively, the "Victory Funds Complex") in the aggregate, compensate the Adviser for these services. Amounts incurred for the six months ended November 30, 2022, are reflected on the Statement of Operations as Compliance fees.
Transfer Agency Fees:
Victory Capital Transfer Agency, Inc. ("VCTA"), an affiliate of the Adviser, provides transfer agency services to the Fund. VCTA provides transfer agent services to the Fund Shares based on an annual charge of $23 per shareholder account plus out-of-pocket expenses. VCTA pays a portion of these fees to certain intermediaries for the administration and servicing of accounts that are held with such intermediaries. Transfer agent fees for Institutional Shares and Class A are paid monthly based on a fee accrued daily at an annualized rate of 0.10% and 0.10%, respectively, of average daily net assets, plus out-of-pocket expenses. Amounts incurred and paid to VCTA for the six months ended November 30, 2022, are reflected on the Statement of Operations as Transfer agent fees.
37
USAA Mutual Funds Trust | | Notes to Financial Statements — continued
November 30, 2022 | |
(Unaudited)
FIS Investor Services LLC serves as sub-transfer agent and dividend disbursing agent for the Fund pursuant to a Sub-Transfer Agent Agreement between VCTA and FIS Investor Services LLC. VCTA provides FIS Investor Services LLC a fee for providing these services.
Distributor/Underwriting Services:
Victory Capital Services, Inc. (the "Distributor"), an affiliate of the Adviser, serves as Distributor for the continuous offering of the shares of the Fund pursuant to a Distribution Agreement between the Distributor and the Trust.
Pursuant to the Distribution and Service Plans adopted in accordance with Rule 12b-1 under the 1940 Act, the Distributor may receive a monthly distribution and service fee, at an annual rate of up to 0.25% of the average daily net assets of Class A, The distribution and service fees paid to the Distributor may be used by the Distributor to pay for activity primarily intended to result in the sale of Class A. Amounts incurred and paid to the Distributor for the six months ended November 30, 2022, are reflected on the Statement of Operations as 12b-1 fees.
In addition, the Distributor is entitled to receive commissions in connection with sales of Class A. For the six months ended November 30, 2022, the Distributor received less than $1 thousand from commissions earned in connection with sales of Class A.
Other Fees:
Citibank serves as the Fund's custodian. The Fund pays Citibank a fee for providing these services. Amounts incurred for the six months ended November 30, 2022, are reflected on the Statement of Operations as Custodian fees.
K&L Gates LLP provides legal services to the Trust.
The Adviser has entered into an expense limitation agreement with the Fund until at least September 30, 2023. Under the terms of the agreement, the Adviser has agreed to waive fees or reimburse certain expenses to the extent that ordinary operating expenses incurred by certain classes of the Fund in any fiscal year exceed the expense limits for such classes of the Fund. Such excess amounts will be the liability of the Adviser. Performance adjustments, acquired fund fees and expenses, interest, taxes, brokerage commissions, other expenditures, which are capitalized in accordance with GAAP, and other extraordinary expenses not incurred in the ordinary course of the Fund's business are excluded from the expense limits. As of November 30, 2022, the expense limits (excluding voluntary waivers) were 1.09%, 1.00%, and 1.35% for Fund Shares, Institutional Shares, and Class A, respectively.
Under the terms of the expense limitation agreement, as amended June 29, 2022, the Fund has agreed to repay fees and expenses that were waived or reimbursed by the Adviser for a period of up to three years (thirty-six (36) months) after the waiver or reimbursement took place, subject to the lesser of any operating expense limits in effect at the time of: (a) the original waiver or expense reimbursement; or (b) the recoupment, after giving effect to the recoupment amount.
As of November 30, 2022, the following amounts are available to be repaid to the Adviser (amounts in thousands). The Fund has not recorded any amounts available to be repaid as a liability due to an assessment that such repayments are not probable at November 30, 2022.
Expires
2023 | | Expires
2024 | | Expires
2025 | | Expires
2026 | | Total | |
| $ | 6 | | | $ | 37 | | | $ | 21 | | | $ | 26 | | | $ | 90 | | |
The Adviser may voluntarily waive or reimburse additional fees to assist the Fund in maintaining competitive expense ratios. Voluntary waivers and reimbursements applicable to the Fund are not available to be recouped at a future time. There were no voluntary waivers or reimbursements for the six months ended November 30, 2022.
Certain officers and/or interested trustees of the Fund are also officers and/or employees of the Adviser, administrator, fund accountant, sub-administrator, sub-fund accountant, custodian, and Distributor.
38
USAA Mutual Funds Trust | | Notes to Financial Statements — continued
November 30, 2022 | |
(Unaudited)
5. Risks:
The Fund may be subject to other risks in addition to these identified risks.
Market Risk — Overall market risks may affect the value of the Fund. Domestic and international factors such as political events, war, terrorism, trade disputes, inflation rates, interest rate levels and other fiscal and monetary policy changes, cybersecurity incidents, pandemics and other public health crises, sanctions against a particular foreign country, its nationals, businesses or industries and related geopolitical events, as well as environmental disasters such as earthquakes, fires, and floods, or other catastrophes, may add to instability in global economies and markets generally, and may lead to increased market volatility. Global economies and financial markets are highly interconnected, which increases the possibility that conditions in one country or region might adversely affect issuers in another country or region. The impact of these and other factors may be short-term or may last for extended periods.
Equity Risk — The values of the equity securities in which the Fund invests may decline in response to developments affecting individual companies and/or general market, economic and political conditions and other factors. A company's earnings or dividends may not increase as expected due to poor management decisions, competitive pressures, breakthroughs in technology, reliance on suppliers, labor problems or shortages, corporate restructurings, fraudulent disclosures, natural disasters, military confrontations, war, terrorism, public health crises, or other events, conditions, and factors. Price changes may be temporary or may last for extended periods.
Foreign Securities Risk — Foreign markets can be more volatile than the U.S. market due to increased risks of adverse issuer, political, regulatory, market, or economic developments and can perform differently from the U.S. market. Global markets, or those in a particular region, may all react in similar fashion to important political, economic, or other developments. Events and evolving conditions in certain economies or markets may alter the risks associated with investments tied to countries or regions that historically were perceived as comparatively stable and make such investments riskier and more volatile.
6. Borrowing and Interfund Lending:
Line of Credit:
The Victory Funds Complex participates in a short-term demand note "Line of Credit" agreement with Citibank. The Line of Credit agreement with Citibank was renewed on June 27, 2022, with a termination date of June 26, 2023. Under the agreement with Citibank, the Victory Funds Complex may borrow up to $600 million, of which $300 million is committed and $300 million is uncommitted. $40 million of the Line of Credit is reserved for use by the Victory Floating Rate Fund, another series of the Victory Funds Complex, with Victory Floating Rate Fund paying the related commitment fees for that amount. The purpose of the Line of Credit is to meet temporary or emergency cash needs. For the six months ended November 30, 2022, Citibank received an annual commitment fee of 0.15% on $300 million for providing the Line of Credit. Each fund in the Victory Funds Complex paid a pro-rata portion of the commitment fees plus any interest on amounts borrowed. For the period from June 1, 2022, through June 27, 2022, interest was based on the one-month London Interbank Offered Rate ("LIBOR") plus one percent. Effective with the renewal, for the period June 28, 2022, through November 30, 2022, interest was based on the one-month Secured Overnight Financing Rate ("SOFR") plus 1.10 percent. Interest charged to the Fund during the period, if applicable, is reflected on the Statement of Operations under Line of credit fees.
39
USAA Mutual Funds Trust | | Notes to Financial Statements — continued
November 30, 2022 | |
(Unaudited)
The average borrowing for the days outstanding and average interest rate for the Fund during the six months ended November 30, 2022, were as follows (amounts in thousands):
Amount
Outstanding at
November 30, 2022 | | Average
Borrowing* | | Days
Borrowing
Outstanding | | Average
Interest
Rate* | | Maximum
Borrowing
During
the Period | |
| $ | — | | | $ | 341 | | | | 2 | | | | 1.95 | % | | $ | 1,363 | | |
* For the six months ended November 30, 2022, based on the number of days borrowings were outstanding.
Interfund Lending:
The Trust and the Adviser rely on an exemptive order granted by the SEC in March 2017 (the "Order"), permitting the establishment and operation of an Interfund Lending Facility (the "Facility"). The Facility allows the Fund to directly lend and borrow money to or from any other fund in the Victory Funds Complex that is permitted to participate in the Facility, relying upon the Order at rates beneficial to both the borrowing and lending funds. Advances under the Facility are allowed for temporary or emergency purposes, including the meeting of redemption requests that otherwise might require the untimely disposition of securities, and are subject to each Fund's borrowing restrictions. The interfund loan rate is determined, as specified in the Order, by averaging the current repurchase agreement rate and the current bank loan rate. As a Borrower, interest charged to the Fund, if any, during the period, is reflected on the Statement of Operations under Interfund lending fees. As a Lender, interest earned by the Fund, if any, during the period, is reflected on the Statement of Operations under Interfund lending.
The average borrowing or lending for the days outstanding and average interest rate for the Fund during the six months ended November 30, 2022, were as follows (amounts in thousands):
Borrower or
Lender | | Amount
Outstanding at
November 30, 2022 | | Average
Borrowing* | | Days
Borrowing
Outstanding | | Average
Interest
Rate* | | Maximum
Borrowing
During
the Period | |
| Borrower | | $ | — | | | $ | 593 | | | | 1 | | | | 2.86 | % | | $ | 593 | | |
* For the six months ended November 30, 2022, based on the number of days borrowings were outstanding.
7. Federal Income Tax Information:
The Fund intends to distribute any net investment income annually. Distributable net realized gains, if any, are declared and paid at least annually.
The amounts of dividends from net investment income and distributions from net realized gains (collectively, distributions to shareholders) are determined in accordance with federal income tax regulations, which may differ from GAAP. To the extent these "book/tax" differences are permanent in nature (e.g., net operating loss and distribution reclassification), such amounts are reclassified within the components of net assets based on their federal tax-basis treatment; temporary differences (e.g., wash sales) do not require reclassification. To the extent dividends and distributions exceed net investment income and net realized gains for tax purposes, they are reported as distributions of capital. Net investment losses incurred by the Fund may be reclassified as an offset to capital on the accompanying Statement of Assets and Liabilities.
The tax character of current year distributions paid and the tax basis of the current components of accumulated earnings (loss) will be determined at the end of the current tax year.
At the tax year ended May 31, 2022, the Fund had no capital loss carryforwards for federal income tax purposes.
40
USAA Mutual Funds Trust | | Supplemental Information
November 30, 2022 | |
(Unaudited)
Proxy Voting and Portfolio Holdings Information
Proxy Voting:
Information regarding the policies and procedures the Fund uses to determine how to vote proxies relating to portfolio securities is available without charge, upon request, by calling (800) 235-8396. The information is also included in the Fund's Statement of Additional Information, which is available on the SEC's website at www.sec.gov.
Information relating to how the Fund voted proxies relating to portfolio securities held during the most recent 12 months ended June 30 is available on the SEC's website at www.sec.gov.
Availability of Schedules of Portfolio Investments:
The Trust files a complete list of Schedules of Portfolio Investments with the SEC for the first and third quarter of each fiscal year on Form N-PORT. Form N-PORT is available on the SEC's website at www.sec.gov.
Expense Examples
As a shareholder of the Fund, you may incur two types of costs: (1) transaction costs, including sales charges (loads) on purchases; and (2) ongoing costs, including management fees and other Fund expenses. These examples are intended to help you understand your ongoing costs (in dollars) of investing in the Fund and to compare these costs with the ongoing costs of investing in other mutual funds.
These examples are based on an investment of $1,000 invested at the beginning of the period and held for the entire period from June 1, 2022, through November 30, 2022.
The Actual Expense figures in the table below provide information about actual account values and actual expenses. You may use the information below, together with the amount you invested, to estimate the expenses that you paid over the period. Simply divide your account value by $1,000 (for example, an $8,600 account value divided by $1,000 = 8.6), then multiply the result by the number in the table under the heading entitled "Actual Expenses Paid During Period" to estimate the expenses you paid on your account during this period.
The Hypothetical Expense figures in the table below provide information about hypothetical account values and hypothetical expenses based on the Fund's actual expense ratio and an assumed rate of return of 5% per year before expenses, which is not the Fund's actual return. The hypothetical account values and expenses may not be used to estimate the actual ending account balance or expenses you paid for the period. You may use this information to compare this 5% hypothetical example with the 5% hypothetical examples that appear in shareholder reports of other funds.
Please note the expenses shown in the table below are meant to highlight your ongoing costs only and do not reflect any transactional costs. Therefore, the hypothetical expenses in the table are useful in comparing ongoing costs only and will not help you determine the relative total costs of owning different funds. In addition, if these transactional costs were included, your costs would have been higher.
| | | Beginning
Account
Value
6/1/22 | | Actual
Ending
Account
Value
11/30/22 | | Hypothetical
Ending
Account
Value
11/30/22 | | Actual
Expenses
Paid During
Period
6/1/22-
11/30/22* | | Hypothetical
Expenses Paid
During Period
6/1/22-
11/30/22* | | Annualized
Expense Ratio
During Period
6/1/22-
11/30/22 | |
Fund Shares | | $ | 1,000.00 | | | $ | 978.10 | | | $ | 1,019.60 | | | $ | 5.41 | | | $ | 5.52 | | | | 1.09 | % | |
Institutional Shares | | | 1,000.00 | | | | 978.60 | | | | 1,020.05 | | | | 4.96 | | | | 5.06 | | | | 1.00 | % | |
Class A | | | 1,000.00 | | | | 976.90 | | | | 1,018.30 | | | | 6.69 | | | | 6.83 | | | | 1.35 | % | |
* Expenses are equal to the average account value multiplied by the Fund's annualized expense ratio multiplied by 183/365 (the number of days in the most recent fiscal half-year divided by the number of days in the fiscal year).
41
Privacy Policy
Protecting the Privacy of Information
The Trust respects your right to privacy. We also know that you expect us to conduct and process your business in an accurate and efficient manner. To do so, we must collect and maintain certain personal information about you. This is the information we collect from you on applications or other forms, and from the transactions you make with us or third parties. It may include your name, address, social security number, account transactions and balances, and information about investment goals and risk tolerance.
We do not disclose any information about you or about former customers to anyone except as permitted or required by law. Specifically, we may disclose the information we collect to companies that perform services on our behalf, such as the transfer agent that processes shareholder accounts and printers and mailers that assist us in the distribution of investor materials. We may also disclose this information to companies that perform marketing services on our behalf. This allows us to continue to offer you Victory investment products and services that meet your investing needs, and to effect transactions that you request or authorize. These companies will use this information only in connection with the services for which we hired them. They are not permitted to use or share this information for any other purpose.
To protect your personal information internally, we permit access only by authorized employees and maintain physical, electronic, and procedural safeguards to guard your personal information.*
* You may have received communications regarding information about privacy policies from other financial institutions which gave you the opportunity to "opt-out" of certain information sharing with companies which are not affiliated with that financial institution. The Trust does not share information with other companies for purposes of marketing solicitations for products other than the Trust. Therefore, the Trust does not provide opt-out options to their shareholders.
P.O. Box 182593
Columbus, Ohio 43218-2593

Visit our website at: | | Call | |
www.vcm.com | | (800) 235-8396 | |

NOVEMBER 30, 2022
Semi Annual Report
USAA Government Securities Fund
Victory Capital means Victory Capital Management Inc., the investment adviser of the USAA Mutual Funds. USAA Mutual Funds are distributed by Victory Capital Services, Inc., member FINRA, an affiliate of Victory Capital. Victory Capital and its affiliates are not affiliated with United Services Automobile Association or its affiliates. USAA and the USAA logos are registered trademarks and the USAA Mutual Funds and USAA Investments logos are trademarks of United Services Automobile Association and are being used by Victory Capital and its affiliates under license.
www.vcm.com
News, Information And Education 24 Hours A Day, 7 Days A Week
The Victory Capital website gives fund shareholders, prospective shareholders, and investment professionals a convenient way to access fund information, get guidance, and track fund performance anywhere they can access the Internet. The site includes:
• Detailed performance records
• Daily share prices
• The latest fund news
• Investment resources to help you become a better investor
• A section dedicated to investment professionals
Whether you're a potential investor searching for the fund that matches your investment philosophy, a seasoned investor interested in planning tools, or an investment professional, www.vcm.com has what you seek. Visit us anytime. We're always open.
TABLE OF CONTENTS
Investment Objective & Portfolio Holdings | | | 2 | | |
Schedule of Portfolio Investments | | | 3 | | |
Financial Statements | |
Statement of Assets and Liabilities | | | 8 | | |
Statement of Operations | | | 9 | | |
Statements of Changes in Net Assets | | | 10 | | |
Financial Highlights | | | 12 | | |
Notes to Financial Statements | | | 16 | | |
Supplemental Information | | | 26 | | |
Proxy Voting and Portfolio Holdings Information | | | 26 | | |
Expense Examples | | | 26 | | |
Privacy Policy (inside back cover) | | | |
This report is for the information of the shareholders and others who have received a copy of the currently effective prospectus of the Fund, managed by Victory Capital Management Inc. It may be used as sales literature only when preceded or accompanied by a current prospectus, which provides further details about the Fund.
IRA DISTRIBUTION WITHHOLDING DISCLOSURE
We generally must withhold federal income tax at a rate of 10% of the taxable portion of your distribution and, if you live in a state that requires state income tax withholding, at your state's tax rate. However, you may elect not to have withholding apply or to have income tax withheld at a higher rate. Any withholding election that you make will apply to any subsequent distribution unless and until you change or revoke the election. If you wish to make a withholding election, or change or revoke a prior withholding election, call (800) 235-8396, and form W-4P (OMB No. 1545-0074 withholding certificate for pension or annuity payments) will be electronically sent.
If you do not have a withholding election in place by the date of a distribution, federal income tax will be withheld from the taxable portion of your distribution at a rate of 10%. If you must pay estimated taxes, you may be subject to estimated tax penalties if your estimated tax payments are not sufficient and sufficient tax is not withheld from your distribution.
For more specific information, please consult your tax adviser.
• NOT FDIC INSURED • NO BANK GUARANTEE • MAY LOSE VALUE
1
USAA Mutual Funds Trust
USAA Government Securities Fund | | November 30, 2022 | |
(Unaudited)
Investment Objective and Portfolio Holdings:
The Fund seeks a high level of current income consistent with preservation of principal.
Asset Allocation:
November 30, 2022
(% of Net Assets)
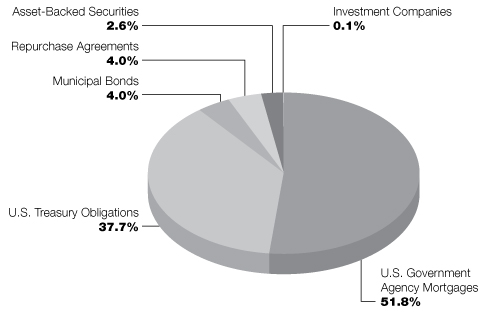
Percentages are of the net assets of the Fund and may not equal 100%.
Refer to the Schedule of Portfolio Investments for a complete list of securities.
2
USAA Mutual Funds Trust
USAA Government Securities Fund | | Schedule of Portfolio Investments
November 30, 2022 | |
(Amounts in Thousands, Except for Shares) (Unaudited)
Security Description | | Principal
Amount | | Value | |
Asset-Backed Securities (2.6%) | |
CenterPoint Energy Transition Bond Co. IV LLC, Series 2012-1, Class A3,
3.03%, 10/15/25 | | $ | 2,797 | | | $ | 2,722 | | |
Montana Higher Education Student Assistance Corp., Series 2012-1, Class A2,
4.94% (LIBOR01M+100bps), 5/20/30 (a) | | | 729 | | | | 727 | | |
Navient Student Loan Trust, Series 2014-1, Class A3, 4.53% (LIBOR01M+51bps),
6/25/31 (a) | | | 1,763 | | | | 1,667 | | |
Nelnet Student Loan Trust, Series 2015-3A, Class A2, 4.62% (LIBOR01M+60bps),
2/27/51, Callable 9/25/30 @100 (a) (b) | | | 2,422 | | | | 2,358 | | |
Nelnet Student Loan Trust, Series 2019-5, Class A, 2.53%, 10/25/67, Callable
12/25/34 @100 (b) | | | 6,688 | | | | 5,833 | | |
Nelnet Student Loan Trust, Series 2006-3, Class B, 3.89% (LIBOR03M+25bps),
6/25/41, Callable 9/25/24 @100 (a) | | | 2,004 | | | | 1,799 | | |
SLM Student Loan Trust, Series 2006-4, Class B, 4.56% (LIBOR03M+20bps),
1/25/70, Callable 10/25/32 @100 (a) | | | 3,044 | | | | 2,877 | | |
SLM Student Loan Trust, Series 2013-6, Class A3, 4.67% (LIBOR01M+65bps),
6/26/28, Callable 11/25/30 @100 (a) | | | 2,434 | | | | 2,318 | | |
SunTrust Student Loan Trust, Series 2006-1A, Class B, 4.64% (LIBOR03M+27bps),
10/28/37, Callable 4/28/24 @100 (a) (b) | | | 774 | | | | 771 | | |
Wepco Environmental Trust Finance I LLC, Series 2021-1, Class A, 1.58%,
12/15/35 | | | 4,179 | | | | 3,523 | | |
Total Asset-Backed Securities (Cost $26,513) | | | 24,595 | | |
Municipal Bonds (4.0%) | |
Hawaii (0.0%): (c) | |
State of Hawaii Department of Business Economic Development & Tourism
Revenue, Series A-2, 3.24%, 1/1/31 | | | 165 | | | | 155 | | |
Kansas (0.3%): | |
Kansas Development Finance Authority Revenue, Series H, 3.94%, 4/15/26 | | | 3,000 | | | | 2,895 | | |
Louisiana (0.5%): | |
Louisiana Local Government Environmental Facilities & Community
Development Authority Revenue | |
Series A, 4.15%, 2/1/33 | | | 3,000 | | | | 2,842 | | |
Series A, 4.28%, 2/1/36 | | | 2,000 | | | | 1,868 | | |
| | | | 4,710 | | |
Ohio (0.3%): | |
State of Ohio, GO, Series A, 1.78%, 8/1/32 | | | 3,000 | | | | 2,327 | | |
Tennessee (0.2%): | |
State of Tennessee, GO, Series B, 1.73%, 11/1/32, Continuously Callable @100 | | | 2,400 | | | | 1,830 | | |
Texas (1.8%): | |
Boerne School District, GO, 1.77%, 2/1/32, Continuously Callable @100 | | | 650 | | | | 505 | | |
City of Abilene, GO
2.41%, 2/15/26 | | | 1,715 | | | | 1,596 | | |
2.54%, 2/15/27 | | | 1,195 | | | | 1,093 | | |
2.64%, 2/15/29 | | | 1,000 | | | | 881 | | |
See notes to financial statements.
3
USAA Mutual Funds Trust
USAA Government Securities Fund | | Schedule of Portfolio Investments — continued
November 30, 2022 | |
(Amounts in Thousands, Except for Shares) (Unaudited)
Security Description | | Principal
Amount | | Value | |
City of Houston Texas Combined Utility System Revenue 3.82%, 11/15/29,
Continuously Callable @100 | | $ | 3,000 | | | $ | 2,789 | | |
Series E, 3.72%, 11/15/28 | | | 1,530 | | | | 1,430 | | |
State of Texas, GO, 2.53%, 10/1/31, Continuously Callable @100 | | | 3,500 | | | | 2,931 | | |
Texas Public Finance Authority Revenue, 0.93%, 2/1/26 | | | 2,000 | | | | 1,779 | | |
Texas Public Finance Authority State of Texas, GO, Series C, 3.01%, 10/1/26,
Continuously Callable @100 | | | 4,000 | | | | 3,787 | | |
| | | | 16,791 | | |
Virginia (0.8%): | |
Virginia Public Building Authority Revenue
Series C, 2.25%, 8/1/26 | | | 1,370 | | | | 1,249 | | |
Series C, 2.40%, 8/1/27 | | | 1,475 | | | | 1,319 | | |
Series C, 2.56%, 8/1/29 | | | 2,700 | | | | 2,320 | | |
Virginia Public School Authority Revenue, Series C, 0.55%, 8/1/23 | | | 3,000 | | | | 2,912 | | |
| | | | 7,800 | | |
Wisconsin (0.1%): | |
State of Wisconsin, GO, Series 4, 1.90%, 5/1/33, Continuously Callable @100 | | | 1,000 | | | | 745 | | |
Total Municipal Bonds (Cost $41,765) | | | 37,253 | | |
U.S. Government Agency Mortgages (51.8%) | |
Federal Home Loan Mortgage Corporation
Series K027, Class A2, 2.64%, 1/25/23 | | | 429 | | | | 429 | | |
Series K029, Class A2, 3.32%, 2/25/23 (d) | | | 2,351 | | | | 2,339 | | |
Series K725, Class A2, 3.00%, 1/25/24 | | | 4,887 | | | | 4,789 | | |
Series K037, Class A2, 3.49%, 1/25/24 | | | 10,030 | | | | 9,884 | | |
Series K038, Class A2, 3.39%, 3/25/24 | | | 3,000 | | | | 2,943 | | |
Series K727, Class A2, 2.95%, 7/25/24 | | | 17,294 | | | | 16,818 | | |
Series K052, Class A1, 2.60%, 1/25/25 | | | 1,344 | | | | 1,318 | | |
Series K045, Class A2, 3.02%, 1/25/25 | | | 2,742 | | | | 2,643 | | |
Series K730, Class A2, 3.59%, 1/25/25 | | | 4,829 | | | | 4,696 | | |
Series K056, Class A1, 2.20%, 7/25/25 | | | 1,698 | | | | 1,645 | | |
Series K049, Class A2, 3.01%, 7/25/25 | | | 4,000 | | | | 3,840 | | |
Series K051, Class A2, 3.31%, 9/25/25 | | | 10,000 | | | | 9,649 | | |
Series K733, Class AM, 3.75%, 9/25/25 | | | 5,000 | | | | 4,866 | | |
Series K056, Class A2, 2.53%, 5/25/26 | | | 5,000 | | | | 4,691 | | |
Series K057, Class A2, 2.57%, 7/25/26 | | | 7,000 | | | | 6,568 | | |
Series K061, Class A1, 3.01%, 8/25/26 | | | 397 | | | | 391 | | |
Series 3987, Class A, 2.00%, 9/15/26 | | | 292 | | | | 286 | | |
Series K059, Class A2, 3.12%, 9/25/26 (d) | | | 4,500 | | | | 4,292 | | |
Series K061, Class A2, 3.35%, 11/25/26 (d) | | | 4,000 | | | | 3,843 | | |
Series K066, Class A2, 3.12%, 6/25/27 | | | 3,000 | | | | 2,848 | | |
Series K067, Class A2, 3.19%, 7/25/27 | | | 9,274 | | | | 8,827 | | |
Series K069, Class A2, 3.19%, 9/25/27 (d) | | | 2,879 | | | | 2,738 | | |
Series K071, Class A2, 3.29%, 11/25/27 | | | 5,000 | | | | 4,773 | | |
Series K078, Class A2, 3.85%, 6/25/28 | | | 12,500 | | | | 12,212 | | |
Series K080, Class A2, 3.93%, 7/25/28 (d) | | | 15,000 | | | | 14,687 | | |
3.00%, 3/1/32 – 6/1/42 | | | 8,154 | | | | 7,685 | | |
3.50%, 10/1/33 – 8/1/48 | | | 14,235 | | | | 13,435 | | |
See notes to financial statements.
4
USAA Mutual Funds Trust
USAA Government Securities Fund | | Schedule of Portfolio Investments — continued
November 30, 2022 | |
(Amounts in Thousands, Except for Shares) (Unaudited)
Security Description | | Principal
Amount | | Value | |
4.00%, 10/1/33 – 9/1/52 | | $ | 18,447 | | | $ | 17,835 | | |
5.50%, 12/1/35 | | | 192 | | | | 200 | | |
Series 3134, Class FA, 4.17% (LIBOR01M+30bps), 3/15/36 (a) | | | 396 | | | | 391 | | |
Series 4023, Class PF, 4.42% (LIBOR01M+55bps), 10/15/41 (a) | | | 333 | | | | 332 | | |
4.50%, 9/1/48 – 10/1/52 | | | 4,868 | | | | 4,748 | | |
4.06% (SOFR30A+227bps), 8/1/52 (a) | | | 7,605 | | | | 7,362 | | |
5.00%, 10/1/52 | | | 4,930 | | | | 4,904 | | |
| | | | 188,907 | | |
Federal National Mortgage Association
Series 2014-M1, Class A2, 3.40%, 7/25/23 (d) | | | 359 | | | | 358 | | |
Series M7, Class AV2, 2.16%, 10/25/23 | | | 1,386 | | | | 1,372 | | |
Series 2015-M13, Class A2, 2.79%, 6/25/25 (d) | | | 1,605 | | | | 1,533 | | |
3.00%, 2/1/27 – 2/1/52 | | | 14,060 | | | | 12,777 | | |
Series 2017-M8, Class A2, 3.06%, 5/25/27 (d) | | | 3,629 | | | | 3,445 | | |
Series 2017-M12, Class A2, 3.16%, 6/25/27 (d) | | | 4,324 | | | | 4,107 | | |
Series 73, Class DC, 1.50%, 7/25/27 – 10/25/27 | | | 1,981 | | | | 1,869 | | |
Series 102, Class GA, 1.38%, 9/25/27 | | | 481 | | | | 449 | | |
Series 2018-M4, Class A2, 3.16%, 3/25/28 (d) | | | 2,549 | | | | 2,413 | | |
Series 2018-M10, Class A2, 3.47%, 7/25/28 (d) | | | 8,049 | | | | 7,693 | | |
1.64%, 9/1/31 | | | 1,250 | | | | 991 | | |
Series 2022-M13, Class A2, 2.70%, 6/25/32 | | | 3,671 | | | | 3,235 | | |
Series 2005-29, Class FY, 4.32% (LIBOR01M+60bps), 4/25/35 – 8/25/37 (a) | | | 1,177 | | | | 1,161 | | |
5.00%, 12/1/35 – 6/1/52 | | | 11,768 | | | | 11,712 | | |
5.50%, 11/1/37 – 10/1/52 | | | 5,727 | | | | 5,799 | | |
6.00%, 5/1/38 | | | 138 | | | | 145 | | |
4.00%, 8/1/39 – 9/1/52 | | | 49,055 | | | | 46,544 | | |
2.50%, 6/1/41 – 11/1/50 | | | 12,941 | | | | 11,195 | | |
3.50%, 1/1/42 – 4/1/52 | | | 20,572 | | | | 19,156 | | |
2.00%, 11/1/51 – 12/1/51 | | | 27,438 | | | | 22,610 | | |
4.50%, 6/1/52 – 9/1/52 | | | 33,153 | | | | 32,231 | | |
3.50%, 7/1/52 (e) | | | 4,958 | | | | 4,538 | | |
| | | | 195,333 | | |
Government National Mortgage Association
8.00%, 6/15/23 – 9/15/30 | | | 183 | | | | 192 | | |
4.50%, 4/20/24 – 3/20/41 | | | 12,448 | | | | 12,494 | | |
7.00%, 5/15/27 – 7/15/32 | | | 588 | | | | 614 | | |
7.50%, 2/15/28 – 11/15/31 | | | 140 | | | | 146 | | |
6.00%, 4/15/28 – 12/15/38 | | | 5,159 | | | | 5,419 | | |
6.50%, 5/15/28 – 8/20/34 | | | 1,496 | | | | 1,571 | | |
6.75%, 5/15/28 | | | 5 | | | | 5 | | |
5.50%, 4/20/33 – 6/15/39 | | | 7,595 | | | | 7,910 | | |
5.00%, 5/20/33 – 2/15/39 | | | 2,189 | | | | 2,245 | | |
4.00%, 7/15/40 – 11/20/49 | | | 7,593 | | | | 7,220 | | |
2.50%, 2/20/50 – 12/20/51 | | | 26,419 | | | | 23,228 | | |
Series 2022-68, Class WQ, 3.54%, 5/20/50 (d) | | | 4,611 | | | | 4,330 | | |
3.00%, 8/20/51 – 10/20/51 | | | 19,735 | | | | 17,865 | | |
| | | | 83,239 | | |
See notes to financial statements.
5
USAA Mutual Funds Trust
USAA Government Securities Fund | | Schedule of Portfolio Investments — continued
November 30, 2022 | |
(Amounts in Thousands, Except for Shares) (Unaudited)
Security Description | | Principal
Amount | | Value | |
Small Business Administration Pools
3.40% (PRIME-285bps), 9/25/31 (a) | | $ | 4,454 | | | $ | 4,404 | | |
5.87% (PRIME-38bps), 2/25/32 (a) | | | 4,533 | | | | 4,714 | | |
7.13% (PRIME+88bps), 2/25/32 (a) | | | 4,118 | | | | 4,379 | | |
7.83% (PRIME+158bps), 2/25/32 (a) | | | 3,660 | | | | 3,974 | | |
3.75% (PRIME-250bps), 9/25/32 (a) | | | 3,940 | | | | 3,927 | | |
4.50% (PRIME-175bps), 10/25/34 (a) | | | 1,631 | | | | 1,655 | | |
| | | | 23,053 | | |
| | | | 490,532 | | |
Total U.S. Government Agency Mortgages (Cost $520,829) | | | 490,532 | | |
U.S. Treasury Obligations (37.7%) | |
U.S. Treasury Bonds
5.25%, 2/15/29 | | | 5,000 | | | | 5,373 | | |
3.38%, 8/15/42 | | | 5,000 | | | | 4,577 | | |
U.S. Treasury Notes
0.13%, 9/15/23 | | | 6,000 | | | | 5,786 | | |
0.38%, 10/31/23 | | | 10,000 | | | | 9,609 | | |
0.25%, 11/15/23 | | | 5,000 | | | | 4,791 | | |
2.00%, 4/30/24 | | | 5,000 | | | | 4,820 | | |
2.00%, 6/30/24 | | | 10,000 | | | | 9,612 | | |
0.38%, 8/15/24 | | | 5,000 | | | | 4,664 | | |
1.88%, 8/31/24 | | | 10,000 | | | | 9,558 | | |
2.25%, 11/15/24 | | | 5,000 | | | | 4,801 | | |
2.13%, 11/30/24 | | | 4,000 | | | | 3,831 | | |
2.50%, 1/31/25 | | | 7,000 | | | | 6,739 | | |
2.00%, 2/15/25 | | | 4,000 | | | | 3,806 | | |
2.13%, 5/15/25 | | | 4,500 | | | | 4,282 | | |
0.25%, 7/31/25 | | | 6,000 | | | | 5,418 | | |
0.25%, 8/31/25 | | | 12,000 | | | | 10,798 | | |
0.25%, 10/31/25 | | | 20,000 | | | | 17,927 | | |
0.38%, 1/31/26 | | | 24,000 | | | | 21,405 | | |
1.38%, 8/31/26 | | | 7,000 | | | | 6,370 | | |
0.88%, 9/30/26 | | | 25,000 | | | | 22,270 | | |
1.63%, 10/31/26 | | | 7,000 | | | | 6,414 | | |
1.13%, 2/29/28 | | | 15,000 | | | | 13,092 | | |
1.25%, 4/30/28 | | | 5,000 | | | | 4,377 | | |
2.88%, 5/15/28 | | | 25,000 | | | | 23,814 | | |
1.25%, 5/31/28 | | | 5,000 | | | | 4,367 | | |
1.00%, 7/31/28 | | | 3,000 | | | | 2,572 | | |
1.13%, 8/31/28 | | | 5,000 | | | | 4,312 | | |
1.38%, 10/31/28 | | | 20,000 | | | | 17,439 | | |
2.38%, 3/31/29 | | | 30,000 | | | | 27,614 | | |
2.38%, 5/15/29 | | | 10,000 | | | | 9,204 | | |
2.75%, 5/31/29 | | | 15,000 | | | | 14,111 | | |
0.88%, 11/15/30 | | | 7,000 | | | | 5,690 | | |
1.63%, 5/15/31 | | | 10,000 | | | | 8,555 | | |
1.25%, 8/15/31 | | | 40,000 | | | | 32,950 | | |
4.13%, 11/15/32 | | | 15,000 | | | | 15,593 | | |
Total U.S. Treasury Obligations (Cost $387,434) | | | 356,541 | | |
See notes to financial statements.
6
USAA Mutual Funds Trust
USAA Government Securities Fund | | Schedule of Portfolio Investments — continued
November 30, 2022 | |
(Amounts in Thousands, Except for Shares) (Unaudited)
Security Description | | Shares or
Principal
Amount | | Value | |
Investment Companies (0.1%) | |
Federated Treasury Obligations Fund Institutional Shares, 3.66% (f) | | | 1,370,581 | | | $ | 1,371 | | |
Total Investment Companies (Cost $1,371) | | | 1,371 | | |
Repurchase Agreements (4.0%) | |
Credit Agricole CIB NY, 3.78%, 12/1/22, purchased on 11/30/22, with a maturity
date of 12/1/22, with a value of $38,000 (collateralized by Federal National
Mortgage Association, 3.00% – 5.50%, due 1/1/39 – 10/1/52, with a value of
$38,760) | | $ | 38,000 | | | | 38,000 | | |
Total Repurchase Agreements (Cost $38,000) | | | 38,000 | | |
Total Investments (Cost $1,015,912) — 100.2% | | | 948,292 | | |
Liabilities in excess of other assets — (0.2)% | | | (1,827 | ) | |
NET ASSETS — 100.00% | | $ | 946,465 | | |
(a) Variable or Floating-Rate Security. Rate disclosed is as of November 30, 2022.
(b) Rule 144A security or other security that is restricted as to resale to institutional investors. The Fund's Adviser has deemed this security to be liquid (unless otherwise noted as illiquid) based upon procedures approved by the Board of Trustees. As of November 30, 2022, the fair value of these securities was $8,962 thousands and amounted to 0.9% of net assets.
(c) Amount represents less than 0.05% of net assets.
(d) The rate for certain asset-backed and mortgage-backed securities may vary based on factors relating to the pool of assets underlying the security. The rate disclosed is the rate in effect at November 30, 2022.
(e) Security or portion of security purchased on a delayed-delivery and/or when-issued basis.
(f) Rate disclosed is the daily yield on November 30, 2022.
bps — Basis points
Continuously callable — Investment is continuously callable or will be continuously callable on any date after the first call date until its maturity.
GO — General Obligation
LIBOR — London Interbank Offered Rate
LIBOR01M — 1 Month US Dollar LIBOR, rate disclosed as of November 30, 2022, based on the last reset date of the security
LIBOR03M — 3 Month US Dollar LIBOR, rate disclosed as of November 30, 2022, based on the last reset date of the security
LLC — Limited Liability Company
PRIME — US Prime rate, rate disclosed as of November 30, 2022.
SOFR30A — 30-day average of SOFR, rate disclosed as of November 30, 2022.
See notes to financial statements.
7
USAA Mutual Funds Trust | | Statement of Assets and Liabilities
November 30, 2022 | |
(Amounts in Thousands, Except Per Share Amounts) (Unaudited)
| | | USAA Government
Securities Fund | |
Assets: | |
Investments, at value (Cost $977,912) | | $ | 910,292 | | |
Repurchase agreements, at value (Cost $38,000) | | | 38,000 | | |
Receivables: | |
Interest | | | 2,965 | | |
Capital shares issued | | | 69 | | |
Investments sold | | | 165 | | |
From Adviser | | | 7 | | |
Prepaid expenses | | | 44 | | |
Total Assets | | | 951,542 | | |
Liabilities: | |
Payables: | |
Distributions | | | 29 | | |
Investments purchased | | | 4,535 | | |
Capital shares redeemed | | | 115 | | |
Accrued expenses and other payables: | |
Investment advisory fees | | | 144 | | |
Administration fees | | | 87 | | |
Custodian fees | | | 11 | | |
Transfer agent fees | | | 84 | | |
Compliance fees | | | 1 | | |
Trustees' fees | | | 1 | | |
| 12b-1 fees | | | — | (a) | |
Other accrued expenses | | | 70 | | |
Total Liabilities | | | 5,077 | | |
Net Assets: | |
Capital | | | 1,028,966 | | |
Total accumulated earnings/(loss) | | | (82,501 | ) | |
Net Assets | | $ | 946,465 | | |
Net Assets | |
Fund Shares | | $ | 255,833 | | |
Institutional Shares | | | 688,678 | | |
Class A | | | 33 | | |
R6 Shares | | | 1,921 | | |
Total | | $ | 946,465 | | |
Shares (unlimited number of shares authorized with no par value): | |
Fund Shares | | | 28,984 | | |
Institutional Shares | | | 77,994 | | |
Class A | | | 4 | | |
R6 Shares | | | 218 | | |
Total | | | 107,200 | | |
Net asset value, offering and redemption price per share: (b) | |
Fund Shares | | $ | 8.83 | | |
Institutional Shares | | | 8.83 | | |
Class A | | | 8.83 | | |
R6 Shares | | | 8.83 | | |
Maximum Sales Charge — Class A | | | 2.25 | % | |
Maximum offering price
(100%/(100%-maximum sales charge) of net asset value adjusted to
the nearest cent) per share — Class A | | $ | 9.03 | | |
(a) Rounds to less than $1 thousand.
(b) Per share amount may not recalculate due to rounding of net assets and/or shares outstanding.
See notes to financial statements.
8
USAA Mutual Funds Trust | | Statement of Operations
For the Six Months Ended November 30, 2022 | |
(Amounts in Thousands) (Unaudited)
| | | USAA Government
Securities Fund | |
Investment Income: | |
Dividends | | $ | 18 | | |
Interest | | | 12,507 | | |
Securities lending (net of fees) | | | 4 | | |
Total Income | | | 12,529 | | |
Expenses: | |
Investment advisory fees | | | 882 | | |
Administration fees — Fund Shares | | | 196 | | |
Administration fees — Institutional Shares | | | 356 | | |
Administration fees — Class A | | | — | (a) | |
Administration fees — R6 Shares | | | — | (a) | |
Sub-Administration fees | | | 12 | | |
| 12b-1 fees — Class A | | | — | (a) | |
Custodian fees | | | 24 | | |
Transfer agent fees — Fund Shares | | | 168 | | |
Transfer agent fees — Institutional Shares | | | 356 | | |
Transfer agent fees — Class A | | | — | (a) | |
Transfer agent fees — R6 Shares | | | — | (a) | |
Trustees' fees | | | 24 | | |
Compliance fees | | | 4 | | |
Legal and audit fees | | | 45 | | |
State registration and filing fees | | | 43 | | |
Other expenses | | | 75 | | |
Total Expenses | | | 2,185 | | |
Expenses waived/reimbursed by Adviser | | | (20 | ) | |
Net Expenses | | | 2,165 | | |
Net Investment Income (Loss) | | | 10,364 | | |
Realized/Unrealized Gains (Losses) from Investments: | |
Net realized gains (losses) from investment securities | | | (7,861 | ) | |
Net change in unrealized appreciation/depreciation on investment securities | | | (30,800 | ) | |
Net realized/unrealized gains (losses) on investments | | | (38,661 | ) | |
Change in net assets resulting from operations | | $ | (28,297 | ) | |
(a) Rounds to less than $1 thousand.
See notes to financial statements.
9
USAA Mutual Funds Trust | | Statements of Changes in Net Assets | |
(Amounts in Thousands)
| | | USAA Government Securities Fund | |
| | | Six Months
Ended
November 30,
2022
(Unaudited) | | Year
Ended
May 31,
2022 | |
From Investments: | |
Operations: | |
Net Investment Income (Loss) | | $ | 10,364 | | | $ | 15,961 | | |
Net realized gains (losses) | | | (7,861 | ) | | | (3,196 | ) | |
Net change in unrealized appreciation/depreciation | | | (30,800 | ) | | | (75,241 | ) | |
Change in net assets resulting from operations | | | (28,297 | ) | | | (62,476 | ) | |
Distributions to Shareholders: | |
Fund Shares | | | (2,870 | ) | | | (8,608 | ) | |
Institutional Shares | | | (8,160 | ) | | | (21,688 | ) | |
Class A | | | — | (a) | | | (11 | ) | |
R6 Shares | | | (12 | ) | | | (13 | ) | |
Change in net assets resulting from distributions to shareholders | | | (11,042 | ) | | | (30,320 | ) | |
Change in net assets resulting from capital transactions | | | (58,104 | ) | | | 263,131 | | |
Change in net assets | | | (97,443 | ) | | | 170,335 | | |
Net Assets: | |
Beginning of period | | | 1,043,908 | | | | 873,573 | | |
End of period | | $ | 946,465 | | | $ | 1,043,908 | | |
(a) Rounds to less than $1 thousand.
(continues on next page)
See notes to financial statements.
10
USAA Mutual Funds Trust | | Statements of Changes in Net Assets | |
(Amounts in Thousands) (continued)
| | | USAA Government Securities Fund | |
| | | Six Months
Ended
November 30,
2022
(Unaudited) | | Year
Ended
May 31,
2022 | |
Capital Transactions: | |
Fund Shares | |
Proceeds from shares issued | | $ | 14,838 | | | $ | 36,461 | | |
Distributions reinvested | | | 2,707 | | | | 8,152 | | |
Cost of shares redeemed | | | (23,184 | ) | | | (74,015 | ) | |
Total Fund Shares | | $ | (5,639 | ) | | $ | (29,402 | ) | |
Institutional Shares | |
Proceeds from shares issued | | $ | 34,324 | | | $ | 300,038 | | |
Distributions reinvested | | | 8,160 | | | | 21,687 | | |
Cost of shares redeemed | | | (96,343 | ) | | | (29,311 | ) | |
Total Institutional Shares | | $ | (53,859 | ) | | $ | 292,414 | | |
Class A | |
Proceeds from shares issued | | $ | — | (a) | | $ | 113 | | |
Distributions reinvested | | | — | (a) | | | 11 | | |
Cost of shares redeemed | | | (5 | ) | | | (413 | ) | |
Total Class A | | $ | (5 | ) | | $ | (289 | ) | |
R6 Shares | |
Proceeds from shares issued | | $ | 1,423 | | | $ | 450 | | |
Distributions reinvested | | | 12 | | | | 13 | | |
Cost of shares redeemed | | | (36 | ) | | | (55 | ) | |
Total R6 Shares | | $ | 1,399 | | | $ | 408 | | |
Change in net assets resulting from capital transactions | | $ | (58,104 | ) | | $ | 263,131 | | |
Share Transactions: | |
Fund Shares | |
Issued | | | 1,663 | | | | 3,749 | | |
Reinvested | | | 304 | | | | 837 | | |
Redeemed | | | (2,592 | ) | | | (7,580 | ) | |
Total Fund Shares | | | (625 | ) | | | (2,994 | ) | |
Institutional Shares | |
Issued | | | 3,905 | | | | 30,328 | | |
Reinvested | | | 914 | | | | 2,234 | | |
Redeemed | | | (10,664 | ) | | | (3,125 | ) | |
Total Institutional Shares | | | (5,845 | ) | | | 29,437 | | |
Class A | |
Issued | | | — | (b) | | | 12 | | |
Reinvested | | | — | (b) | | | 1 | | |
Redeemed | | | — | (b) | | | (45 | ) | |
Total Class A | | | — | (b) | | | (32 | ) | |
R6 Shares | |
Issued | | | 163 | | | | 46 | | |
Reinvested | | | 1 | | | | 1 | | |
Redeemed | | | (4 | ) | | | (6 | ) | |
Total R6 Shares | | | 160 | | | | 41 | | |
Change in Shares | | | (6,310 | ) | | | 26,452 | | |
(a) Rounds to less than $1 thousand.
(b) Rounds to less than 1 thousand shares.
See notes to financial statements.
11
USAA Mutual Funds Trust | | Financial Highlights | |
For a Share Outstanding Throughout Each Period
| | | | | Investment Activities | | Distributions to
Shareholders From | |
| | | Net Asset
Value,
Beginning of
Period | | Net
Investment
Income
(Loss) | | Net
Realized and
Unrealized
Gains
(Losses) | | Total from
Investment
Activities | | Net
Investment
Income | | Net Realized
Gains from
Investments | | Total
Distributions | |
USAA Government Securities Fund | | | |
Fund Shares | | | |
Six Months Ended
November 30, 2022
(Unaudited) | | $ | 9.19 | | | | 0.09 | (h) | | | (0.35 | ) | | | (0.26 | ) | | | (0.10 | ) | | | — | | | | (0.10 | ) | |
Year Ended May 31:
2022 | | $ | 10.03 | | | | 0.15 | (h) | | | (0.71 | ) | | | (0.56 | ) | | | (0.17 | ) | | | (0.11 | ) | | | (0.28 | ) | |
2021 | | $ | 10.23 | | | | 0.21 | (h) | | | (0.15 | ) | | | 0.06 | | | | (0.22 | ) | | | (0.04 | ) | | | (0.26 | ) | |
2020 | | $ | 9.84 | | | | 0.24 | (h) | | | 0.39 | | | | 0.63 | | | | (0.24 | ) | | | — | | | | (0.24 | ) | |
2019 | | $ | 9.55 | | | | 0.23 | | | | 0.29 | | | | 0.52 | | | | (0.23 | ) | | | — | | | | (0.23 | ) | |
2018 | | $ | 9.86 | | | | 0.20 | | | | (0.31 | ) | | | (0.11 | ) | | | (0.20 | ) | | | — | | | | (0.20 | ) | |
Institutional Shares | | | |
Six Months Ended
November 30, 2022
(Unaudited) | | $ | 9.20 | | | | 0.10 | (h) | | | (0.37 | ) | | | (0.27 | ) | | | (0.10 | ) | | | — | | | | (0.10 | ) | |
Year Ended May 31:
2022 | | $ | 10.04 | | | | 0.16 | (h) | | | (0.71 | ) | | | (0.55 | ) | | | (0.18 | ) | | | (0.11 | ) | | | (0.29 | ) | |
2021 | | $ | 10.23 | | | | 0.22 | (h) | | | (0.14 | ) | | | 0.08 | | | | (0.23 | ) | | | (0.04 | ) | | | (0.27 | ) | |
2020 | | $ | 9.85 | | | | 0.24 | (h) | | | 0.39 | | | | 0.63 | | | | (0.25 | ) | | | — | | | | (0.25 | ) | |
2019 | | $ | 9.55 | | | | 0.24 | | | | 0.30 | | | | 0.54 | | | | (0.24 | ) | | | — | | | | (0.24 | ) | |
2018 | | $ | 9.86 | | | | 0.21 | | | | (0.31 | ) | | | (0.10 | ) | | | (0.21 | ) | | | — | | | | (0.21 | ) | |
(a) Not annualized for periods less than one year.
(b) Assumes reinvestment of all net investment income and realized capital gain distributions, if any, during the period. Includes adjustments in accordance with U.S. Generally Accepted Accounting Principles and could differ from the Lipper reported return.
(c) Annualized for periods less than one year.
(d) The net expense ratio may not correlate to the applicable expense limits in place during the period since the current contractual expense limitation is applied for a period beginning July 1, 2019 and in effect through September 30, 2023, instead of coinciding with the Fund's fiscal year end. Details of the current contractual expense limitation in effect can be found in Note 5 of the accompanying Notes to Financial Statements.
(e) Does not include acquired fund fees and expenses, if any.
(f) From the period beginning July 1, 2019, the amount of any waivers or reimbursements and the amount of any recoupment are calculated without regard to the impact of any performance adjustment to the Fund's management fee.
(g) Portfolio turnover is calculated on the basis of the Fund as a whole without distinguishing between the classes of shares issued.
(h) Per share net investment income (loss) has been calculated using the average daily shares method.
See notes to financial statements.
12
USAA Mutual Funds Trust | | Financial Highlights — continued | |
For a Share Outstanding Throughout Each Period
| | | | | | | Ratios to Average Net Assets | | Supplemental Data | |
| | | Net
Asset
Value,
End of
Period | | Total
Return(a)(b) | | Net
Expenses(c)(d)(e)(f) | | Net
Investment
Income
(Loss)(c) | | Gross
Expenses(c)(e) | | Net
Assets,
End of
Period
(000's) | | Portfolio
Turnover(a)(g) | |
USAA Government Securities Fund | |
Fund Shares | |
Six Months Ended
November 30, 2022
(Unaudited) | | $ | 8.83 | | | | (2.85 | )% | | | 0.52 | % | | | 2.06 | % | | | 0.52 | % | | $ | 255,833 | | | | 17 | % | |
Year Ended May 31:
2022 | | $ | 9.19 | | | | (5.71 | )% | | | 0.42 | % | | | 1.56 | % | | | 0.42 | % | | $ | 272,233 | | | | 34 | % | |
2021 | | $ | 10.03 | | | | 0.56 | % | | | 0.41 | % | | | 2.04 | % | | | 0.41 | % | | $ | 327,111 | | | | 15 | % | |
2020 | | $ | 10.23 | | | | 6.49 | % | | | 0.43 | % | | | 2.36 | % | | | 0.43 | % | | $ | 364,077 | | | | 11 | % | |
2019 | | $ | 9.84 | | | | 5.56 | % | | | 0.47 | % | | | 2.42 | % | | | 0.47 | % | | $ | 328,123 | | | | 9 | % | |
2018 | | $ | 9.55 | | | | (1.09 | )% | | | 0.48 | % | | | 2.09 | % | | | 0.48 | % | | $ | 333,464 | | | | 15 | % | |
Institutional Shares | |
Six Months Ended
November 30, 2022
(Unaudited) | | $ | 8.83 | | | | (2.90 | )% | | | 0.42 | % | | | 2.16 | % | | | 0.42 | % | | $ | 688,678 | | | | 17 | % | |
Year Ended May 31:
2022 | | $ | 9.20 | | | | (5.64 | )% | | | 0.35 | % | | | 1.61 | % | | | 0.35 | % | | $ | 771,104 | | | | 34 | % | |
2021 | | $ | 10.04 | | | | 0.75 | % | | | 0.32 | % | | | 2.12 | % | | | 0.32 | % | | $ | 545,930 | | | | 15 | % | |
2020 | | $ | 10.23 | | | | 6.45 | % | | | 0.36 | % | | | 2.43 | % | | | 0.36 | % | | $ | 638,299 | | | | 11 | % | |
2019 | | $ | 9.85 | | | | 5.76 | % | | | 0.38 | % | | | 2.55 | % | | | 0.38 | % | | $ | 742,233 | | | | 9 | % | |
2018 | | $ | 9.55 | | | | (1.01 | )% | | | 0.39 | % | | | 2.18 | % | | | 0.39 | % | | $ | 251,297 | | | | 15 | % | |
(continues on next page)
See notes to financial statements.
13
USAA Mutual Funds Trust | | Financial Highlights | |
For a Share Outstanding Throughout Each Period
| | | | | Investment Activities | | Distributions to
Shareholders From | | | |
| | | Net Asset
Value,
Beginning of
Period | | Net
Investment
Income
(Loss) | | Net
Realized and
Unrealized
Gains
(Losses) | | Total from
Investment
Activities | | Net
Investment
Income | | Net Realized
Gains from
Investments | | Total
Distributions | | Redemption
Fees
Added to
Beneficial
Interests: | |
USAA Government Securities Fund | | | |
Class A | | | |
Six Months Ended
November 30, 2022
(Unaudited) | | $ | 9.19 | | | | 0.09 | (h) | | | (0.36 | ) | | | (0.27 | ) | | | (0.09 | ) | | | — | | | | (0.09 | ) | | $ | — | | |
Year Ended May 31:
2022 | | $ | 10.03 | | | | 0.15 | (h) | | | (0.71 | ) | | | (0.56 | ) | | | (0.17 | ) | | | (0.11 | ) | | | (0.28 | ) | | | — | | |
2021 | | $ | 10.22 | | | | 0.19 | (h) | | | (0.14 | ) | | | 0.05 | | | | (0.20 | ) | | | (0.04 | ) | | | (0.24 | ) | | | — | | |
2020 | | $ | 9.84 | | | | 0.20 | (h) | | | 0.39 | | | | 0.59 | | | | (0.21 | ) | | | — | | | | (0.21 | ) | | | — | | |
2019 | | $ | 9.54 | | | | 0.21 | | | | 0.30 | | | | 0.51 | | | | (0.21 | ) | | | — | | | | (0.21 | ) | | | — | | |
2018 | | $ | 9.85 | | | | 0.18 | | | | (0.31 | ) | | | (0.13 | ) | | | (0.18 | ) | | | — | | | | (0.18 | ) | | | — | (k) | |
R6 Shares | | | |
Six Months Ended
November 30, 2022
(Unaudited) | | $ | 9.20 | | | | 0.10 | (h) | | | (0.36 | ) | | | (0.26 | ) | | | (0.11 | ) | | | — | | | | (0.11 | ) | | | — | | |
Year Ended May 31:
2022 | | $ | 10.01 | | | | 0.16 | (h) | | | (0.67 | ) | | | (0.51 | ) | | | (0.19 | ) | | | (0.11 | ) | | | (0.30 | ) | | | — | | |
2021 | | $ | 10.22 | | | | 0.23 | (h) | | | (0.15 | ) | | | 0.08 | | | | (0.25 | ) | | | (0.04 | ) | | | (0.29 | ) | | | — | | |
2020 | | $ | 9.84 | | | | 0.24 | (h) | | | 0.39 | | | | 0.63 | | | | (0.25 | ) | | | — | | | | (0.25 | ) | | | — | | |
2019 | | $ | 9.55 | | | | 0.24 | | | | 0.29 | | | | 0.53 | | | | (0.24 | ) | | | — | | | | (0.24 | ) | | | — | | |
2018 | | $ | 9.85 | | | | 0.22 | | | | (0.30 | ) | | | (0.08 | ) | | | (0.22 | ) | | | — | | | | (0.22 | ) | | | — | | |
(a) Not annualized for periods less than one year.
(b) Assumes reinvestment of all net investment income and realized capital gain distributions, if any, during the period. Includes adjustments in accordance with U.S. Generally Accepted Accounting Principles and could differ from the Lipper reported return.
(c) Annualized for periods less than one year.
(d) The net expense ratio may not correlate to the applicable expense limits in place during the period since the current contractual expense limitation is applied for a period beginning July 1, 2019 and in effect through September 30, 2023, instead of coinciding with the Fund's fiscal year end. Details of the current contractual expense limitation in effect can be found in Note 5 of the accompanying Notes to Financial Statements.
(e) Does not include acquired fund fees and expenses, if any.
(f) From the period beginning July 1, 2019, the amount of any waivers or reimbursements and the amount of any recoupment are calculated without regard to the impact of any performance adjustment to the Fund's management fee.
See notes to financial statements.
14
USAA Mutual Funds Trust | | Financial Highlights — continued | |
For a Share Outstanding Throughout Each Period (continued)
| | | | | | | Ratios to Average Net Assets | | Supplemental Data | |
| | | Net
Asset
Value,
End of
Period | | Total
Return
(Excludes
Sales
Charge)(a)(b) | | Net
Expenses(c)(d)(e)(f) | | Net
Investment
Income
(Loss)(c) | | Gross
Expenses(c)(e) | | Net
Assets,
End of
Period
(000's) | | Portfolio
Turnover(a)(g) | |
USAA Government Securities Fund | |
Class A | |
Six Months Ended
November 30, 2022
(Unaudited) | | $ | 8.83 | | | | (2.96 | )% | | | 0.61 | %(i) | | | 1.95 | % | | | 53.52 | % | | $ | 33 | | | | 17 | % | |
Year Ended May 31:
2022 | | $ | 9.19 | | | | (5.70 | )% | | | 0.41 | %(j) | | | 1.56 | % | | | 3.28 | % | | $ | 40 | | | | 34 | % | |
2021 | | $ | 10.03 | | | | 0.43 | % | | | 0.70 | % | | | 1.89 | % | | | 1.06 | % | | $ | 365 | | | | 15 | % | |
2020 | | $ | 10.22 | | | | 6.04 | % | | | 0.75 | % | | | 2.03 | % | | | 0.80 | % | | $ | 5,299 | | | | 11 | % | |
2019 | | $ | 9.84 | | | | 5.37 | % | | | 0.75 | % | | | 2.14 | % | | | 0.87 | % | | $ | 5,042 | | | | 9 | % | |
2018 | | $ | 9.54 | | | | (1.36 | )% | | | 0.75 | % | | | 1.82 | % | | | 0.87 | % | | $ | 4,804 | | | | 15 | % | |
R6 Shares | |
Six Months Ended
November 30, 2022
(Unaudited) | | $ | 8.83 | | | | (2.86 | )% | | | 0.33 | %(i) | | | 2.35 | % | | | 2.47 | % | | $ | 1,921 | | | | 17 | % | |
Year Ended May 31:
2022 | | $ | 9.20 | | | | (5.26 | )% | | | 0.26 | %(j) | | | 1.65 | % | | | 3.55 | % | | $ | 531 | | | | 34 | % | |
2021 | | $ | 10.01 | | | | 0.75 | % | | | 0.31 | % | | | 2.30 | % | | | 0.46 | % | | $ | 167 | | | | 15 | % | |
2020 | | $ | 10.22 | | | | 6.46 | % | | | 0.35 | % | | | 2.43 | % | | | 0.39 | % | | $ | 7,903 | | | | 11 | % | |
2019 | | $ | 9.84 | | | | 5.68 | % | | | 0.35 | % | | | 2.54 | % | | | 0.51 | % | | $ | 6,425 | | | | 9 | % | |
2018 | | $ | 9.55 | | | | (0.87 | )% | | | 0.35 | % | | | 2.22 | % | | | 0.64 | % | | $ | 6,345 | | | | 15 | % | |
(g) Portfolio turnover is calculated on the basis of the Fund as a whole without distinguishing between the classes of shares issued.
(h) Per share net investment income (loss) has been calculated using the average daily shares method.
(i) Includes impact of voluntary waiver. Without this voluntary waiver, the net expense ratio would have been 3.95% and 0.24% higher for Class A and R6 Shares, respectively.
(j) Includes impact of voluntary waiver. Without this voluntary waiver, the net expense ratio would have been 0.40% and 0.22% higher for Class A and R6 Shares, respectively.
(k) Amount is less than $0.005 per share.
See notes to financial statements.
15
USAA Mutual Funds Trust | | Notes to Financial Statements
November 30, 2022 | |
(Unaudited)
1. Organization:
USAA Mutual Funds Trust (the "Trust") is organized as a Delaware statutory trust and is registered under the Investment Company Act of 1940, as amended (the "1940 Act"), as an open-end investment company. The Trust is comprised of 45 funds and is authorized to issue an unlimited number of shares, which are units of beneficial interest with no par value.
The accompanying financial statements are those of the USAA Government Securities Fund (the "Fund"). The Fund offers four classes of shares: Fund Shares, Institutional Shares, Class A, and R6 Shares. The Fund is classified as diversified under the 1940 Act.
Each class of shares of the Fund has substantially identical rights and privileges, except with respect to sales charges, fees paid under distribution plans, expenses allocable exclusively to each class of shares, voting rights on matters solely affecting a single class of shares, and the exchange privilege of each class of shares.
Victory Capital Management ("VCM" or the "Adviser"), is an indirect wholly owned subsidiary of Victory Capital Holdings, Inc., a publicly traded Delaware corporation, and a wholly owned direct subsidiary of Victory Capital Operating, LLC.
Under the Trust's organizational documents, its officers and trustees are indemnified against certain liabilities arising out of the performance of their duties to the Fund. In addition, in the normal course of business, the Fund enters into contracts with its vendors and others that provide for general indemnifications. The Fund's maximum exposure under these arrangements is unknown, as this would involve future claims that may be made against the Fund. However, based on experience, the Fund expects that risk of loss to be remote.
2. Significant Accounting Policies:
The following is a summary of significant accounting policies followed by the Trust in the preparation of its financial statements. The policies are in conformity with U.S. Generally Accepted Accounting Principles ("GAAP"). The preparation of financial statements in accordance with GAAP requires management to make estimates and assumptions that affect the reported amounts of assets and liabilities and disclosure of contingent assets and liabilities at the date of the financial statements and the reported amounts of income and expenses for the period. Actual results could differ from those estimates. The Fund follows the specialized accounting and reporting requirements under GAAP that are applicable to investment companies under Accounting Standards Codification Topic 946.
Investment Valuation:
The Fund records investments at fair value. Fair value is defined as the price that would be received to sell an asset or paid to transfer a liability in an orderly transaction between market participants at the measurement date.
The valuation techniques described below maximize the use of observable inputs and minimize the use of unobservable inputs in determining fair value. The inputs used for valuing the Fund's investments are summarized in the three broad levels listed below:
• Level 1 — quoted prices (unadjusted) in active markets for identical securities
• Level 2 — other significant observable inputs (including quoted prices for similar securities, interest rates, or credit spreads, applicable to those securities, etc.)
• Level 3 — significant unobservable inputs (including the Adviser's assumptions in determining the fair value of investments)
Changes in valuation techniques may result in transfers in or out of an assigned level within the disclosure hierarchy. The inputs or methodologies used for valuation techniques are not necessarily an indication of the risks associated with entering into those investments.
16
USAA Mutual Funds Trust | | Notes to Financial Statements — continued
November 30, 2022 | |
(Unaudited)
The Adviser, acting as the valuation designee has established the Pricing and Liquidity Committee (the "Committee"), and subject to the Trust's Board of Trustees' (the "Board") oversight, the Committee administers and oversees the Fund's valuation policies and procedures, which are approved by the Board.
Investments in open-end investment companies, other than ETFs, are valued at their net asset value ("NAV"). These valuations are typically categorized as Level 1 in the fair value hierarchy.
Debt securities are valued each business day by a pricing service approved by the Board. The approved pricing service uses the evaluated bid or the last sale price to value securities. Debt obligations maturing within 60 days may be valued at amortized cost, provided that the amortized cost represents the fair value of such securities. These valuations are typically categorized as Level 2 in the fair value hierarchy.
Repurchase agreements are valued at cost.
In the event that price quotations or valuations are not readily available, investments are valued at fair value in accordance with procedures established by and under the general supervision and responsibility of the Board. These valuations are typically categorized as Level 2 or Level 3 in the fair value hierarchy, based on the observability of inputs used to determine the fair value. The effect of fair value pricing is that securities may not be priced on the basis of quotations from the primary market in which they are traded, and the actual price realized from the sale of a security may differ materially from the fair value price. Valuing these securities at fair value is intended to cause the Fund's NAV to be more reliable than it otherwise would be.
A summary of the valuations as of November 30, 2022, based upon the three levels defined above, is included in the table below while the breakdown, by category, of investments is disclosed on the Schedule of Portfolio Investments (amounts in thousands):
| | | Level 1 | | Level 2 | | Level 3 | | Total | |
Asset-Backed Securities | | $ | — | | | $ | 24,595 | | | $ | — | | | $ | 24,595 | | |
Municipal Bonds | | | — | | | | 37,253 | | | | — | | | | 37,253 | | |
U.S. Government Agency Mortgages | | | — | | | | 490,532 | | | | — | | | | 490,532 | | |
U.S. Treasury Obligations | | | — | | | | 356,541 | | | | — | | | | 356,541 | | |
Investment Companies | | | 1,371 | | | | — | | | | — | | | | 1,371 | | |
Repurchase Agreements | | | — | | | | 38,000 | | | | — | | | | 38,000 | | |
Total | | $ | 1,371 | | | $ | 946,921 | | | $ | — | | | $ | 948,292 | | |
For the six months ended November 30, 2022, there were no transfers into/out of Level 3.
Repurchase Agreements:
The Fund may enter into repurchase agreements with commercial banks or recognized security dealers pursuant to the terms of a Master Repurchase Agreement. A repurchase agreement is an arrangement wherein the Fund purchases securities and the seller agrees to repurchase the securities at an agreed upon time and at an agreed upon price. The purchased securities are marked-to-market daily to ensure their value is equal to at least 102% of principal including accrued interest and are held by the Fund, either through its regular custodian or through a special "tri-party" custodian that maintains separate accounts for both the Fund and its counterparty, until maturity of the repurchase agreement. Master Repurchase Agreements typically contain netting provisions, which provide for the net settlement of all transactions and collateral with the Fund through a single payment in the event of default or termination. Repurchase agreements are subject to credit risk, and the Fund's Adviser monitors the creditworthiness of sellers with which the Fund may enter into repurchase agreements.
Investments in repurchase agreements as presented on the Schedule of Portfolio Investments are not net settlement amounts but gross. At November 30, 2022, the value of the related collateral exceeded the value of the repurchase agreements, reducing the net settlement amount to zero. Details on the collateral are included on the Schedule of Portfolio Investments.
17
USAA Mutual Funds Trust | | Notes to Financial Statements — continued
November 30, 2022 | |
(Unaudited)
Investment Companies:
Open-End Funds:
The Fund may invest in portfolios of open-end investment companies. These investment companies value securities in their portfolios for which market quotations are readily available at their market values (generally the last reported sale price) and all other securities and assets at their fair value by the methods established by the board of directors of the underlying funds.
Securities Purchased on a Delayed-Delivery or When-Issued Basis:
The Fund may purchase securities on a delayed-delivery or when-issued basis. Delivery and payment for securities that have been purchased by the Fund on a delayed-delivery or when-issued basis, or for delayed draws on loans can generally take place within 35 days a month or more after the trade date. Securities that require more than 35 days to settle are considered a senior security and subject to Rule 18F-4. At the time the Fund makes the commitment to purchase a security on a delayed-delivery or when-issued basis, the Fund records the transaction and reflects the value of the security in determining NAV. No interest accrues to the Fund until the transaction settles and payment takes place. A segregated account is established and the Fund maintains cash and/or marketable securities at least equal in value to commitments for delayed-delivery or when-issued securities. If the Fund owns delayed-delivery or when-issued securities, these values are included in Payables for Investments purchased on the accompanying Statement of Assets and Liabilities and the segregated assets are identified on the Schedule of Portfolio Investments.
Municipal Obligations:
The values of municipal obligations can fluctuate and may be affected by adverse tax, legislative, or political changes, and by financial developments affecting municipal issuers. Payments of municipal obligations may depend on a relatively limited source of revenue, resulting in greater credit risk. Future changes in federal tax laws or the activity of an issuer may adversely affect the tax-exempt status of municipal obligations.
Mortgage- and Asset-Backed Securities:
The values of some mortgage-related or asset-backed securities may be particularly sensitive to changes in prevailing interest rates. Early repayment of principal on some mortgage-related securities may expose the Fund to a lower rate of return upon reinvestment of principal. The values of mortgage- and asset-backed securities depend in part on the credit quality and adequacy of the underlying assets or collateral and may fluctuate in response to the market's perception of these factors as well as current and future repayment rates. Some mortgage-backed securities are backed by the full faith and credit of the U.S. government (e.g., mortgage-backed securities issued by the Government National Mortgage Association, commonly known as "Ginnie Mae"), while other mortgage-backed securities (e.g., mortgage-backed securities issued by the Federal National Mortgage Association and the Federal Home Loan Mortgage Corporation, commonly known as "Fannie Mae" and "Freddie Mac," respectively), are backed only by the credit of the government entity issuing them. In addition, some mortgage-backed securities are issued by private entities and, as such, are not guaranteed by the U.S. government or any agency or instrumentality of the U.S. government.
Investment Transactions and Related Income:
Changes in holdings of investments are accounted for no later than one business day following the trade date. For financial reporting purposes, however, investment transactions are accounted for on trade date or the last business day of the reporting period. Interest income is determined on the basis of coupon interest accrued and recorded daily using the effective interest method which adjusts, where applicable, the amortization of premiums or accretion of discounts. Interest income is recorded daily on the accrual basis. Dividend income is recorded on the ex-dividend date. Gains or losses realized on sales of securities are recorded on the identified cost basis. Paydown gains or losses on applicable securities, if any, are recorded as components of Interest income on the Statement of Operations.
18
USAA Mutual Funds Trust | | Notes to Financial Statements — continued
November 30, 2022 | |
(Unaudited)
Securities Lending:
The Fund, through a Securities Lending Agreement with Citibank, N.A. ("Citibank"), may lend its securities to qualified financial institutions, such as certain broker-dealers and banks, to earn additional income, net of income retained by Citibank. Borrowers are required to initially secure their loans for collateral in the amount of at least 102% of the value of U.S. securities loaned or at least 105% of the value of non-U.S. securities loaned, marked-to-market daily. Any collateral shortfalls associated with increases in the valuation of the securities loaned are generally cured the next business day. The collateral can be received in the form of cash collateral and/or non-cash collateral. Non-cash collateral can include U.S. Government Securities and other securities as permitted by Securities and Exchange Commission ("SEC") guidelines. The cash collateral is invested in short-term instruments or cash equivalents, primarily open-end investment companies, as noted on the Fund's Schedule of Portfolio Investments. The Fund effectively does not have control of the non-cash collateral and therefore it is not disclosed on the Fund's Schedule of Portfolio Investments. Collateral requirements are determined daily based on the value of the Fund's securities on loan as of the end of the prior business day. During the time portfolio securities are on loan, the borrower will pay the Fund any dividends or interest paid on such securities plus any fee negotiated between the parties to the lending agreement. The Fund also earns a return from the collateral. The Fund pays Citibank various fees in connection with the investment of cash collateral and fees based on the investment income received from securities lending activities. Securities lending income (net of these fees) is disclosed on the Statement of Operations. Loans are terminable upon demand and the borrower must return the loaned securities within the lesser of one standard settlement period or five business days. Although risk is mitigated by the collateral, the Fund could experience a delay in recovering its securities and possible loss of income or value if the borrower fails to return them. In addition, there is a risk that the value of the short-term investments will be less than the amount of cash collateral required to be returned to the borrower.
The Fund's agreement with Citibank does not include master netting provisions. Non-cash collateral received by the Fund may not be sold or repledged, except to satisfy borrower default.
As of November 30, 2022, the Fund did not have any securities on loan.
Federal Income Taxes:
The Fund intends to continue to qualify as a regulated investment company by complying with the provisions available to certain investment companies, as defined in applicable sections of the Internal Revenue Code, and to make distributions of net investment income and net realized gains sufficient to relieve it from all, or substantially all, federal income taxes. Accordingly, no provision for federal income taxes is required in the financial statements. The Fund has a tax year end of May 31.
For the six months ended November 30, 2022, the Fund did not incur any income tax, interest, or penalties, and has recorded no liability for net unrecognized tax benefits relating to uncertain tax positions.
Management of the Fund has reviewed tax positions taken in tax years that remain subject to examination by all major tax jurisdictions, including federal (i.e., the last four tax years, which includes the current fiscal tax year end). Management believes that there is no tax liability resulting from unrecognized tax benefits related to uncertain tax positions taken.
Allocations:
Expenses directly attributable to the Fund are charged to the Fund, while expenses that are attributable to more than one fund in the Trust, or jointly with an affiliated trust, are allocated among the respective funds in the Trust and/or an affiliated trust based upon net assets or another appropriate basis.
Income, expenses (other than class-specific expenses such as transfer agent fees, state registration fees, printing fees, and 12b-1 fees), and realized and unrealized gains or losses on investments are allocated to each class of shares based on its relative net assets on the date income is earned or expenses and realized and unrealized gains and losses are incurred.
19
USAA Mutual Funds Trust | | Notes to Financial Statements — continued
November 30, 2022 | |
(Unaudited)
3. Purchases and Sales:
Purchases and sales of securities (excluding securities maturing less than one year from acquisition) for the six months ended November 30, 2022, were as follows for the Fund (amounts in thousands):
Excluding
U.S. Government Securities | | U.S. Government Securities | |
| Purchases | | Sales | | Purchases | | Sales | |
$ | 8,993 | | | $ | 26,130 | | | $ | 150,002 | | | $ | 204,883 | | |
4. Affiliated Fund Ownership:
The Fund offers its shares for investment by other USAA Mutual Funds. The fund-of-funds do not invest in the underlying funds for the purpose of exercising management or control, and the affiliated fund-of-funds' annual and semi-annual reports may be viewed at www.vcm.com. As of November 30, 2022, certain fund-of-funds owned total outstanding shares of the Fund as follows:
Affiliated USAA Mutual Funds | | Ownership % | |
USAA Cornerstone Conservative Fund | | | 3.4 | | |
USAA Target Retirement Income Fund | | | 16.3 | | |
USAA Target Retirement 2030 Fund | | | 19.2 | | |
USAA Target Retirement 2040 Fund | | | 9.9 | | |
USAA Target Retirement 2050 Fund | | | 2.3 | | |
USAA Target Retirement 2060 Fund | | | 0.5 | | |
5. Fees and Transactions with Affiliates and Related Parties:
Investment Advisory Fees:
Investment advisory services are provided to the Fund by the Adviser, which is a New York corporation registered as an investment adviser with the SEC.
Under the terms of the Investment Advisory Agreement, the Adviser is entitled to receive a base fee and a performance adjustment. The Fund's base fee is accrued daily and paid monthly at an annualized rate of 0.125% of the Fund's average daily net assets. Amounts incurred and paid to VCM for the six months ended November 30, 2022, are reflected on the Statement of Operations as Investment advisory fees.
The performance adjustment for each share class is accrued daily and calculated monthly by comparing the respective class' performance to that of the Lipper Intermediate U.S. Government Funds Index. The Lipper Intermediate U.S. Government Funds Index tracks the total return performance of the largest funds within the Lipper Intermediate U.S. Government Funds category.
The performance period for each share class consists of the current month plus the previous 35 months. The following table is utilized to determine the extent of the performance adjustment:
Over/Under Performance Relative to Index
(in basis points)(a) | | Annual Adjustment Rate
(in basis points) | |
| | +/- 20 to 50 | | | | +/- 4 | | |
| | +/- 51 to 100 | | | | +/- 5 | | |
| | +/- 101 and greater | | | | +/- 6 | | |
(a) Based on the difference between the average annual performance of the relevant share class of the Fund and its relevant Lipper index, rounded to the nearest basis point.
Each class' annual performance adjustment rate is multiplied by the average daily net assets of the respective class over the entire performance period, which is then multiplied by a fraction, the
20
USAA Mutual Funds Trust | | Notes to Financial Statements — continued
November 30, 2022 | |
(Unaudited)
numerator of which is the number of days in the month and the denominator of which is 365 (366 in leap years). The resulting amount is then added to (in the case of overperformance), or subtracted from (in the case of underperformance) the base fee.
Under the performance fee arrangement, each class pays a positive performance fee adjustment for a performance period whenever the class outperforms the Lipper Intermediate U.S. Government Funds Index over that period, even if the class has overall negative returns during the performance period.
For the period June 1, 2022, to November 30, 2022, performance adjustments were $89, $183, $1, and $1 for Fund Shares, Institutional Shares, Class A, and R6 Shares, in thousands, respectively. Performance adjustments were 0.07%, 0.05%, 3.82%, and 0.22% for Fund Shares, Institutional Shares, Class A, and R6 Shares, respectively. The performance adjustment rate included in the investment advisory fee may differ from the maximum over/under Annual Adjustment Rate due to differences in average net assets for the reporting period and rolling 36 month performance periods.
The Trust relies on an exemptive order granted to VCM and its affiliated funds by the SEC in March 2019, permitting the use of a "manager-of-managers" structure for certain funds. Under a manager-of-managers structure, the investment adviser may select (with approval of the Board and without shareholder approval) one or more subadvisers to manage the day-to-day investment of a fund's assets. For the six months ended November 30, 2022, the Fund had no subadvisers.
Administration and Servicing Fees:
VCM also serves as the Fund's administrator and fund accountant. Under the Fund Administration, Servicing and Accounting Agreement, VCM is paid an administration and servicing fee that is accrued daily and paid monthly at an annualized rate of 0.15%, 0.10%, 0.15%, and 0.05%, which is based on the Fund's average daily net assets of the Fund Shares, Institutional Shares, Class A, and R6 Shares, respectively. Amounts incurred for the six months ended November 30, 2022, are reflected on the Statement of Operations as Administration fees.
Citi Fund Services Ohio, Inc. ("Citi"), an affiliate of Citibank, acts as sub-administrator and sub-fund accountant to the Fund pursuant to a Sub-Administration and Sub-Fund Accounting Services Agreement between VCM and Citi. VCM pays Citi a fee for providing these services. The Fund reimburses VCM and Citi for out-of-pocket expenses incurred in providing these services and certain other expenses specifically allocated to the Fund. Amounts incurred for the six months ended November 30, 2022, are reflected on the Statement of Operations as Sub-Administration fees.
The Fund (as part of the Trust) has entered into an agreement with the Adviser to provide compliance services, pursuant to which the Adviser furnishes its compliance personnel, including the services of the Chief Compliance Officer ("CCO"), and other resources reasonably necessary to provide the Trust with compliance oversight services related to the design, administration, and oversight of a compliance program for the Trust in accordance with Rule 38a-1 under the 1940 Act. The CCO is an employee of the Adviser, which pays the compensation of the CCO and support staff. The funds in the Trust, Victory Variable Insurance Funds, Victory Portfolios, and Victory Portfolios II (collectively, the "Victory Funds Complex") in the aggregate, compensate the Adviser for these services. Amounts incurred for the six months ended November 30, 2022, are reflected on the Statement of Operations as Compliance fees.
Transfer Agency Fees:
Victory Capital Transfer Agency, Inc. ("VCTA"), an affiliate of the Adviser, provides transfer agency services to the Fund. VCTA provides transfer agent services to the Fund Shares based on an annual charge of $25.50 per shareholder account plus out-of-pocket expenses. VCTA pays a portion of these fees to certain intermediaries for the administration and servicing of accounts that are held with such intermediaries. Transfer agent fees for Institutional Shares, Class A, and R6 Shares are paid monthly based on a fee accrued daily at an annualized rate of 0.10%, 0.10% and 0.01%, respectively, of average daily net assets, plus out-of-pocket expenses. Amounts incurred and paid to VCTA for the six months ended November 30, 2022, are reflected on the Statement of Operations as Transfer agent fees.
21
USAA Mutual Funds Trust | | Notes to Financial Statements — continued
November 30, 2022 | |
(Unaudited)
FIS Investor Services LLC serves as sub-transfer agent and dividend disbursing agent for the Fund pursuant to a Sub-Transfer Agent Agreement between VCTA and FIS Investor Services LLC. VCTA provides FIS Investor Services LLC a fee for providing these services.
Distributor/Underwriting Services:
Victory Capital Services, Inc. (the "Distributor"), an affiliate of the Adviser, serves as Distributor for the continuous offering of the shares of the Fund pursuant to a Distribution Agreement between the Distributor and the Trust.
Pursuant to the Distribution and Service Plans adopted in accordance with Rule 12b-1 under the 1940 Act, the Distributor may receive a monthly distribution and service fee, at an annual rate of up to 0.25% of the average daily net assets of Class A. The distribution and service fees paid to the Distributor may be used by the Distributor to pay for activity primarily intended to result in the sale of Class A. Amounts incurred and paid to the Distributor for the six months ended November 30, 2022, are reflected on the Statement of Operations as 12b-1 fees.
In addition, the Distributor is entitled to receive commissions in connection with sales of Class A. For the six months ended November 30, 2022, the Distributor did not receive any commissions.
Other Fees:
Citibank serves as the Fund's custodian. The Fund pays Citibank a fee for providing these services. Amounts incurred for the six months ended November 30, 2022, are reflected on the Statement of Operations as Custodian fees.
K&L Gates LLP provides legal services to the Trust.
The Adviser has entered into an expense limitation agreement with the Fund until at least September 30, 2023. Under the terms of the agreement, the Adviser has agreed to waive fees or reimburse certain expenses to the extent that ordinary operating expenses incurred by certain classes of the Fund in any fiscal year exceed the expense limits for such classes of the Fund. Such excess amounts will be the liability of the Adviser. Performance adjustments, acquired fund fees and expenses, interest, taxes, brokerage commissions, other expenditures, which are capitalized in accordance with GAAP, and other extraordinary expenses not incurred in the ordinary course of the Fund's business are excluded from the expense limits. As of November 30, 2022, the expense limits (excluding voluntary waivers) were 0.48%, 0.39%, 0.75%, and 0.35% for Fund Shares, Institutional Shares, Class A, and R6 Shares, respectively.
Under the terms of the expense limitation agreement, as amended June 29, 2022, the Fund has agreed to repay fees and expenses that were waived or reimbursed by the Adviser for a period of up to three years (thirty-six (36) months) after the waiver or reimbursement took place, subject to the lesser of any operating expense limits in effect at the time of: (a) the original waiver or expense reimbursement; or (b) the recoupment, after giving effect to the recoupment amount.
As of November 30, 2022, the following amounts are available to be repaid to the Adviser (amounts in thousands). The Fund has not recorded any amounts available to be repaid as a liability due to an assessment that such repayments are not probable at November 30, 2022.
Expires
2024 | | Expires
2025 | | Expires
2026 | | Total | |
| $ | 25 | | | $ | 22 | | | $ | 18 | | | $ | 65 | | |
The Adviser may voluntarily waive or reimburse additional fees to assist the Fund in maintaining competitive expense ratios. Voluntary waivers and reimbursements applicable to the Fund are not available to be recouped at a future time. For the six months ended November 30, 2022, the Adviser voluntarily waived fees of $2 thousand.
Certain officers and/or interested trustees of the Fund are also officers and/or employees of the Adviser, administrator, fund accountant, sub-administrator, sub-fund accountant, custodian, and Distributor.
22
USAA Mutual Funds Trust | | Notes to Financial Statements — continued
November 30, 2022 | |
(Unaudited)
6. Risks:
The Fund may be subject to other risks in addition to these identified risks.
Interest Rate Risk — The Fund is subject to the risk that the market value of the bonds in its portfolio will fluctuate because of changes in interest rates, changes in the supply of and demand for debt securities, and other market factors. Bond prices generally are linked to the prevailing market interest rates. In general, when interest rates rise, bond prices fall; conversely, when interest rates fall, bond prices rise. The price volatility of a bond also depends on its duration. Generally, the longer the duration of a bond, the greater is its sensitivity to interest rates. To compensate investors for this higher interest rate risk, bonds with longer durations generally offer higher yields than bonds with shorter durations. The ability of an issuer of a debt security to repay principal prior to a security's maturity can increase the security's sensitivity to interest rate changes.
Decisions by the U.S. Federal Reserve regarding interest rate and monetary policy, which can be difficult to predict and sometimes change direction suddenly in response to economic and market events, can have a significant effect on the value of fixed-income securities as well as the overall strength of the U.S. economy. Precise interest rate predictions are difficult to make, and interest rates may change unexpectedly and dramatically in response to extreme changes in market or economic conditions. As a result, the value of fixed-income securities may vary widely under certain market conditions.
Prepayment and Extension Risk — Mortgage-backed securities make regularly scheduled payments of principal along with interest payments. In addition, mortgagors generally have the option of paying off their mortgages without penalty at any time. For example, when a mortgaged property is sold, the old mortgage is usually prepaid. Also, when interest rates fall, the mortgagor may refinance the mortgage and prepay the old mortgage. A homeowner's default on the mortgage also may cause a prepayment of the mortgage. This unpredictability of the mortgage's cash flow is called prepayment risk. For the investor, prepayment risk usually means that principal is received at the least opportune time. For example, when interest rates fall, homeowners may find it advantageous to refinance their mortgages and prepay principal. In this case, the investor is forced to reinvest the principal at the current lower rate. On the other hand, when interest rates rise, homeowners generally will not refinance their mortgages and prepayments will fall. This causes the average life of the mortgage to extend and be more sensitive to interest rates, which is called extension risk. In addition, the amount of principal the investor has to invest in these higher interest rates is reduced.
Liquidity Risk — Market developments and other factors, including a general rise in interest rates, have the potential to cause investors to move out of fixed-income securities on a large scale, which may increase redemptions from mutual funds that hold large amounts of fixed-income securities. Such a move, coupled with a reduction in the ability or willingness of dealers and other institutional investors to buy or hold fixed-income securities, may result in decreased liquidity and increased volatility in the fixed-income markets. Heavy redemptions of fixed-income mutual funds and decreased liquidity from fixed-income securities could hurt the Fund's performance. In addition, significant securities market disruptions related to outbreaks of COVID-19 have led to dislocation in the market for a variety of fixed-income securities (including municipal obligations), which has decreased liquidity and sharply reduced returns.
LIBOR Discontinuation Risk — The London Interbank Offered Rate ("LIBOR") discontinuation may adversely affect the financial markets generally and the Fund's operations, finances and investments specifically. LIBOR has been the principal floating-rate benchmark in the financial markets. However, LIBOR has been or will be discontinued as a floating rate benchmark. The date of discontinuation depends on the LIBOR currency and tenor. With limited exceptions, no new LIBOR obligations will be entered into after December 31, 2021. Existing LIBOR obligations have transitioned or will transition to another benchmark, depending on the LIBOR currency and tenor. For some existing LIBOR-based obligations, the contractual consequences of the discontinuation of LIBOR may not be clear.
Non-LIBOR floating-rate obligations, including Secured Overnight Financing Rate ("SOFR")-based obligations, may have returns and values that fluctuate more than those of floating-rate debt obligations that are based on LIBOR or other rates. Also, because SOFR and some alternative floating rates are
23
USAA Mutual Funds Trust | | Notes to Financial Statements — continued
November 30, 2022 | |
(Unaudited)
relatively new market indexes, markets for certain non-LIBOR obligations may never develop or may not be liquid. Market terms for non-LIBOR floating rate obligations, such as the spread over the index reflected in interest-rate provisions, may evolve over time, and prices of non-LIBOR floating rate obligations may be different depending on when they are issued and changing views about correct spread levels.
Various SOFR-based rates, including SOFR-based term rates, and various non-SOFR-based rates are expected to develop in response to the discontinuation of U.S. dollar LIBOR, which may create various risks for the Fund and the financial markets more generally. There are non-LIBOR forward-looking floating rates that are not based on SOFR and that may be considered by participants in the financial markets as LIBOR alternatives. Such rates include AMERIBOR (American Interbank Offered Rate), BSBY (Bloomberg Short-Term Bank Yield Index) and BYI (Bank Yield Index). Unlike forward-looking SOFR-based term rates, such rates are intended to reflect a bank credit spread component.
It is not clear how replacement rates for LIBOR — including SOFR-based rates and non-SOFR-based rates — will develop and to what extent they will be used. There is no assurance that these replacement rates will be suitable substitutes for LIBOR, and thus the substitution of such rates for LIBOR could have an adverse effect on the Fund and the financial markets more generally. Concerns about market depth and stability could affect the development of non-SOFR-based term rates, and such rates may create various risks, which may or may not be similar to the risks relating to SOFR.
Market Risk — Overall market risks may affect the value of the Fund. Domestic and international factors such as political events, war, terrorism, trade disputes, inflation rates, interest rate levels and other fiscal and monetary policy changes, cybersecurity incidents, pandemics and other public health crises, sanctions against a particular foreign country, its nationals, businesses or industries and related geopolitical events, as well as environmental disasters such as earthquakes, fires, and floods, or other catastrophes, may add to instability in global economies and markets generally, and may lead to increased market volatility. Global economies and financial markets are highly interconnected, which increases the possibility that conditions in one country or region might adversely affect issuers in another country or region. The impact of these and other factors may be short-term or may last for extended periods.
7. Borrowing and Interfund Lending:
Line of Credit:
The Victory Funds Complex participates in a short-term demand note "Line of Credit" agreement with Citibank. The Line of Credit agreement with Citibank was renewed on June 27, 2022, with a termination date of June 26, 2023. Under the agreement with Citibank, the Victory Funds Complex may borrow up to $600 million, of which $300 million is committed and $300 million is uncommitted. $40 million of the Line of Credit is reserved for use by the Victory Floating Rate Fund, another series of the Victory Funds Complex, with Victory Floating Rate Fund paying the related commitment fees for that amount. The purpose of the Line of Credit is to meet temporary or emergency cash needs. For the six months ended November 30, 2022, Citibank received an annual commitment fee of 0.15% on $300 million for providing the Line of Credit. Each fund in the Victory Funds Complex paid a pro-rata portion of the commitment fees plus any interest on amounts borrowed. For the period from June 1, 2022, through June 27, 2022, interest was based on the one-month LIBOR plus one percent. Effective with the renewal, for the period June 28, 2022, through November 30, 2022, interest was based on the one-month SOFR plus 1.10 percent. Interest charged to the Fund during the period, if applicable, is reflected on the Statement of Operations under Line of credit fees.
The Fund had no borrowings under the Line of Credit agreement during the six months ended November 30, 2022.
24
USAA Mutual Funds Trust | | Notes to Financial Statements — continued
November 30, 2022 | |
(Unaudited)
Interfund Lending:
The Trust and the Adviser rely on an exemptive order granted by the SEC in March 2017 (the "Order"), permitting the establishment and operation of an Interfund Lending Facility (the "Facility"). The Facility allows the Fund to directly lend and borrow money to or from any other fund in the Victory Funds Complex that is permitted to participate in the Facility, relying upon the Order at rates beneficial to both the borrowing and lending funds. Advances under the Facility are allowed for temporary or emergency purposes, including the meeting of redemption requests that otherwise might require the untimely disposition of securities, and are subject to each Fund's borrowing restrictions. The interfund loan rate is determined, as specified in the Order, by averaging the current repurchase agreement rate and the current bank loan rate. As a Borrower, interest charged to the Fund, if any, during the period, is reflected on the Statement of Operations under Interfund lending fees. As a Lender, interest earned by the Fund, if any, during the period, is reflected on the Statement of Operations under Interfund lending.
The Fund did not utilize or participate in the Facility during the six months ended November 30, 2022.
8. Federal Income Tax Information:
Distributable net realized gains, if any, are declared and paid at least annually. Distributions from the Fund's net investment income are accrued daily and distributed on the last business day of each month.
The amounts of dividends from net investment income and distributions from net realized gains (collectively, distributions to shareholders) are determined in accordance with federal income tax regulations, which may differ from GAAP. To the extent these "book/tax" differences are permanent in nature (e.g., net operating loss and distribution reclassification), such amounts are reclassified within the components of net assets based on their federal tax-basis treatment; temporary differences (e.g., wash sales) do not require reclassification. To the extent dividends and distributions exceed net investment income and net realized gains for tax purposes, they are reported as distributions of capital. Net investment losses incurred by the Fund may be reclassified as an offset to capital on the accompanying Statement of Assets and Liabilities.
The tax character of current year distributions paid and the tax basis of the current components of accumulated earnings (loss) will be determined at the end of the current tax year.
At the tax year ended May 31, 2022, the Fund had net capital loss carryforwards as summarized in the table below (amounts in thousands). It is unlikely that the Board will authorize a distribution of capital gains realized in the future until the capital loss carryforwards have been used.
Short-Term
Amount | | Total | |
| $ | 5,027 | | | $ | 5,027 | | |
9. Subsequent Event:
On December 9, 2022, the Board of Trustees of USAA Mutual Funds Trust ("Trust"), upon the recommendation of Victory Capital Management Inc., the Trust's investment adviser, approved a Plan of Liquidation ("Plan") for the USAA Government Securities Fund Class A Shares (the "Share Class"). It is anticipated that the Share Class will liquidate on or about February 22, 2023. On the liquidation date, the Share Class will redeem all its outstanding shares at the net asset value of such shares.
Effective December 19, 2022, the Share Class will be closed to new investors and shareholder accounts. Through the NAV on February 15, 2023, the Share Class will continue to accept additional investments (including through the reinvestment of dividends and capital gains) from existing shareholders. Please note that no other classes of the Fund are affected.
25
USAA Mutual Funds Trust | | Supplemental Information
November 30, 2022 | |
(Unaudited)
Proxy Voting and Portfolio Holdings Information
Proxy Voting:
Information regarding the policies and procedures the Fund uses to determine how to vote proxies relating to portfolio securities is available without charge, upon request, by calling (800) 235-8396. The information is also included in the Fund's Statement of Additional Information, which is available on the SEC's website at www.sec.gov.
Information relating to how the Fund voted proxies relating to portfolio securities held during the most recent 12 months ended June 30 is available on the SEC's website at www.sec.gov.
Availability of Schedules of Portfolio Investments:
The Trust files a complete list of Schedules of Portfolio Investments with the SEC for the first and third quarter of each fiscal year on Form N-PORT. Form N-PORT is available on the SEC's website at www.sec.gov.
Expense Examples
As a shareholder of the Fund, you may incur two types of costs: (1) transaction costs, including sales charges (loads) on purchases; and (2) ongoing costs, including management fees and other Fund expenses. These examples are intended to help you understand your ongoing costs (in dollars) of investing in the Fund and to compare these costs with the ongoing costs of investing in other mutual funds.
These examples are based on an investment of $1,000 invested at the beginning of the period and held for the entire period from June 1, 2022, through November 30, 2022.
The Actual Expense figures in the table below provide information about actual account values and actual expenses. You may use the information below, together with the amount you invested, to estimate the expenses that you paid over the period. Simply divide your account value by $1,000 (for example, an $8,600 account value divided by $1,000 = 8.6), then multiply the result by the number in the table under the heading entitled "Actual Expenses Paid During Period" to estimate the expenses you paid on your account during this period.
The Hypothetical Expense figures in the table below provide information about hypothetical account values and hypothetical expenses based on the Fund's actual expense ratio and an assumed rate of return of 5% per year before expenses, which is not the Fund's actual return. The hypothetical account values and expenses may not be used to estimate the actual ending account balance or expenses you paid for the period. You may use this information to compare this 5% hypothetical example with the 5% hypothetical examples that appear in shareholder reports of other funds.
Please note the expenses shown in the table below are meant to highlight your ongoing costs only and do not reflect any transactional costs. Therefore, the hypothetical expenses in the table are useful in comparing ongoing costs only and will not help you determine the relative total costs of owning different funds. In addition, if these transactional costs were included, your costs would have been higher.
| | | Beginning
Account
Value
6/1/22 | | Actual
Ending
Account
Value
11/30/22 | | Hypothetical
Ending
Account
Value
11/30/22 | | Actual
Expenses Paid
During Period
6/1/22-
11/30/22* | | Hypothetical
Expenses Paid
During Period
6/1/22-
11/30/22* | | Annualized
Expense Ratio
During Period
6/1/22-
11/30/22 | |
Fund Shares | | $ | 1,000.00 | | | $ | 971.50 | | | $ | 1,022.46 | | | $ | 2.57 | | | $ | 2.64 | | | | 0.52 | % | |
Institutional Shares | | | 1,000.00 | | | | 971.00 | | | | 1,022.96 | | | | 2.08 | | | | 2.13 | | | | 0.42 | % | |
Class A | | | 1,000.00 | | | | 970.40 | | | | 1,022.01 | | | | 3.01 | | | | 3.09 | | | | 0.61 | % | |
R6 Shares | | | 1,000.00 | | | | 971.40 | | | | 1,023.41 | | | | 1.63 | | | | 1.67 | | | | 0.33 | % | |
* Expenses are equal to the average account value multiplied by the Fund's annualized expense ratio multiplied by 183/365 (the number of days in the most recent fiscal half-year divided by the number of days in the fiscal year).
26
Privacy Policy
Protecting the Privacy of Information
The Trust respects your right to privacy. We also know that you expect us to conduct and process your business in an accurate and efficient manner. To do so, we must collect and maintain certain personal information about you. This is the information we collect from you on applications or other forms, and from the transactions you make with us or third parties. It may include your name, address, social security number, account transactions and balances, and information about investment goals and risk tolerance.
We do not disclose any information about you or about former customers to anyone except as permitted or required by law. Specifically, we may disclose the information we collect to companies that perform services on our behalf, such as the transfer agent that processes shareholder accounts and printers and mailers that assist us in the distribution of investor materials. We may also disclose this information to companies that perform marketing services on our behalf. This allows us to continue to offer you Victory investment products and services that meet your investing needs, and to effect transactions that you request or authorize. These companies will use this information only in connection with the services for which we hired them. They are not permitted to use or share this information for any other purpose.
To protect your personal information internally, we permit access only by authorized employees and maintain physical, electronic, and procedural safeguards to guard your personal information.*
* You may have received communications regarding information about privacy policies from other financial institutions which gave you the opportunity to "opt-out" of certain information sharing with companies which are not affiliated with that financial institution. The Trust does not share information with other companies for purposes of marketing solicitations for products other than the Trust. Therefore, the Trust does not provide opt-out options to their shareholders.
P.O. Box 182593
Columbus, Ohio 43218-2593

Visit our website at: | | Call | |
www.vcm.com | | (800) 235-8396 | |

NOVEMBER 30, 2022
Semi Annual Report
USAA Treasury Money Market Trust®
Victory Capital means Victory Capital Management Inc., the investment adviser of the USAA Mutual Funds. USAA Mutual Funds are distributed by Victory Capital Services, Inc., member FINRA, an affiliate of Victory Capital. Victory Capital and its affiliates are not affiliated with United Services Automobile Association or its affiliates. USAA and the USAA logos are registered trademarks and the USAA Mutual Funds and USAA Investments logos are trademarks of United Services Automobile Association and are being used by Victory Capital and its affiliates under license.
www.vcm.com
News, Information And Education 24 Hours A Day, 7 Days A Week
The Victory Capital website gives fund shareholders, prospective shareholders, and investment professionals a convenient way to access fund information, get guidance, and track fund performance anywhere they can access the Internet. The site includes:
• Detailed performance records
• Daily share prices
• The latest fund news
• Investment resources to help you become a better investor
• A section dedicated to investment professionals
Whether you're a potential investor searching for the fund that matches your investment philosophy, a seasoned investor interested in planning tools, or an investment professional, www.vcm.com has what you seek. Visit us anytime. We're always open.
TABLE OF CONTENTS
Investment Objective & Portfolio Holdings | | | 2 | | |
Schedule of Portfolio Investments | | | 3 | | |
Financial Statements | |
Statement of Assets and Liabilities | | | 4 | | |
Statement of Operations | | | 5 | | |
Statements of Changes in Net Assets | | | 6 | | |
Financial Highlights | | | 8 | | |
Notes to Financial Statements | | | 10 | | |
Supplemental Information | | | 16 | | |
Proxy Voting and Portfolio Holdings Information | | | 16 | | |
Expense Example | | | 16 | | |
Privacy Policy (inside back cover) | | | |
This report is for the information of the shareholders and others who have received a copy of the currently effective prospectus of the Fund, managed by Victory Capital Management Inc. It may be used as sales literature only when preceded or accompanied by a current prospectus, which provides further details about the Fund.
IRA DISTRIBUTION WITHHOLDING DISCLOSURE
We generally must withhold federal income tax at a rate of 10% of the taxable portion of your distribution and, if you live in a state that requires state income tax withholding, at your state's tax rate. However, you may elect not to have withholding apply or to have income tax withheld at a higher rate. Any withholding election that you make will apply to any subsequent distribution unless and until you change or revoke the election. If you wish to make a withholding election, or change or revoke a prior withholding election, call (800) 235-8396, and form W-4P (OMB No. 1545-0074 withholding certificate for pension or annuity payments) will be electronically sent.
If you do not have a withholding election in place by the date of a distribution, federal income tax will be withheld from the taxable portion of your distribution at a rate of 10%. If you must pay estimated taxes, you may be subject to estimated tax penalties if your estimated tax payments are not sufficient and sufficient tax is not withheld from your distribution.
For more specific information, please consult your tax adviser.
• NOT FDIC INSURED • NO BANK GUARANTEE • MAY LOSE VALUE
1
USAA Mutual Funds Trust
USAA Treasury Money Market Trust | | November 30, 2022 | |
(Unaudited)
Investment Objective and Portfolio Holdings:
The Fund seeks maximum current income while maintaining the highest degree of safety and liquidity.
Portfolio Mix:
November 30, 2022
(% of Net Assets)
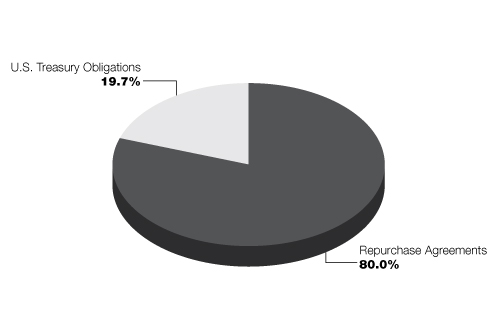
Percentages are of the net assets of the Fund and may not equal 100%.
Refer to the Schedule of Portfolio Investments for a complete list of securities.
2
USAA Mutual Funds Trust
USAA Treasury Money Market Trust | | Schedule of Portfolio Investments
November 30, 2022 | |
(Amounts in Thousands, Except for Shares) (Unaudited)
Security Description | | Principal
Amount | | Value | |
U.S. Treasury Obligations (19.7%) | |
U.S. Treasury Notes
4.37% (USBMMY3M+5bps), 1/31/23 (a) | | $ | 75,000 | | | $ | 75,022 | | |
4.35% (USBMMY3M+3bps), 4/30/23 (a) | | | 50,000 | | | | 50,055 | | |
Total U.S. Treasury Obligations (Cost $125,077) | | | 125,077 | | |
Repurchase Agreements (80.0%) | |
Bank of America Securities, Inc., 3.79%, 12/1/22, purchased on 11/30/22,
with a maturity date of 12/1/22, with a value of $90,000 (collateralized
by U.S. Treasury Notes, 2.38%, due 5/15/29, with a value of $91,800) | | | 90,000 | | | | 90,000 | | |
Fixed Income Clearing Corporation-State Street Bank & Trust Co., 3.77%,
12/1/22, purchased on 11/30/22, with a maturity date of 12/1/22, with
a value of $420,000 (collateralized by U.S. Treasury Inflation Note
Index (b), 0.63% – 2.63%, due 1/31/29 – 7/15/32, with a value
of $428,400) | | | 420,000 | | | | 420,000 | | |
Total Repurchase Agreements (Cost $510,000) | | | 510,000 | | |
Total Investments (Cost $635,077) — 99.7% | | | 635,077 | | |
Other assets in excess of liabilities — 0.3% | | | 2,219 | | |
NET ASSETS — 100.00% | | $ | 637,296 | | |
(a) Variable or Floating-Rate Security. Rate disclosed is as of November 30, 2022.
(b) U.S. Treasury inflation-indexed notes — designed to provide a real rate of return after being adjusted over time to reflect the impact of inflation. Their principal value periodically adjusts to the rate of inflation. They trade at the prevailing real, or after inflation, interest rates. The U.S. Treasury guarantees repayment of these securities of at least their face value in the event of sustained deflation or a drop in prices.
bps — Basis points
USBMMY3M — 3 Month Treasury Bill Rate
See notes to financial statements.
3
USAA Mutual Funds Trust | | Statement of Assets and Liabilities
November 30, 2022 | |
(Amounts in Thousands, Except Per Share Amounts) (Unaudited)
| | | USAA
Treasury Money
Market Trust | |
Assets: | |
Investments, at value (Cost $125,077) | | $ | 125,077 | | |
Repurchase agreements, at value (Cost $510,000) | | | 510,000 | | |
Cash | | | 1,710 | | |
Receivables: | |
Interest | | | 509 | | |
Capital shares issued | | | 268 | | |
From Adviser | | | 25 | | |
Prepaid expenses | | | 23 | | |
Total Assets | | | 637,612 | | |
Liabilities: | |
Payables: | |
Distributions | | | 5 | | |
Capital shares redeemed | | | 83 | | |
Accrued expenses and other payables: | |
Investment advisory fees | | | 67 | | |
Administration fees | | | 53 | | |
Custodian fees | | | 1 | | |
Transfer agent fees | | | 55 | | |
Compliance fees | | | 1 | | |
Trustees' fees | | | 1 | | |
Other accrued expenses | | | 50 | | |
Total Liabilities | | | 316 | | |
Net Assets: | |
Capital | | | 637,296 | | |
Total accumulated earnings/(loss) | | | — | (a) | |
Net Assets | | $ | 637,296 | | |
Shares (unlimited number of shares authorized with no par value): | | | 637,297 | | |
Net asset value, offering and redemption price per share: (b) | | $ | 1.00 | | |
(a) Rounds to less than $1 thousand.
(b) Per share amount may not recalculate due to rounding of net assets and/or shares outstanding.
See notes to financial statements.
4
USAA Mutual Funds Trust | | Statement of Operations
For the Six Months Ended November 30, 2022 | |
(Amounts in Thousands) (Unaudited)
| | | USAA
Treasury Money
Market Trust | |
Investment Income: | |
Interest | | $ | 7,504 | | |
Total Income | | | 7,504 | | |
Expenses: | |
Investment advisory fees | | | 369 | | |
Administration fees | | | 295 | | |
Sub-Administration fees | | | 9 | | |
Custodian fees | | | 2 | | |
Transfer agent fees | | | 295 | | |
Trustees' fees | | | 24 | | |
Compliance fees | | | 3 | | |
Legal and audit fees | | | 32 | | |
State registration and filing fees | | | 26 | | |
Other expenses | | | 44 | | |
Total Expenses | | | 1,099 | | |
Expenses waived/reimbursed by Adviser | | | (66 | ) | |
Net Expenses | | | 1,033 | | |
Net Investment Income | | | 6,471 | | |
Change in net assets resulting from operations | | $ | 6,471 | | |
See notes to financial statements.
5
USAA Mutual Funds Trust | | Statements of Changes in Net Assets | |
(Amounts in Thousands)
| | | USAA
Treasury Money
Market Trust | |
| | | Six Months
Ended
November 30,
2022
(Unaudited) | | Year
Ended
May 31,
2022 | |
From Investments: | |
Operations: | |
Net Investment Income | | $ | 6,471 | | | $ | 198 | | |
Change in net assets resulting from operations | | | 6,471 | | | | 198 | | |
Change in net assets resulting from distributions to shareholders | | | (6,471 | ) | | | (198 | ) | |
Change in net assets resulting from capital transactions | | | 117,315 | | | | 23,204 | | |
Change in net assets | | | 117,315 | | | | 23,204 | | |
Net Assets: | |
Beginning of period | | | 519,981 | | | | 496,777 | | |
End of period | | $ | 637,296 | | | $ | 519,981 | | |
Capital Transactions: | |
Proceeds from shares issued | | $ | 247,533 | | | $ | 145,813 | | |
Distributions reinvested | | | 6,457 | | | | 197 | | |
Cost of shares redeemed | | | (136,675 | ) | | | (122,806 | ) | |
Change in net assets resulting from capital transactions | | $ | 117,315 | | | $ | 23,204 | | |
Share Transactions: | |
Issued | | | 247,533 | | | | 145,813 | | |
Reinvested | | | 6,457 | | | | 197 | | |
Redeemed | | | (136,675 | ) | | | (122,806 | ) | |
Change in Shares | | | 117,315 | | | | 23,204 | | |
See notes to financial statements.
6
This page is intentionally left blank.
7
USAA Mutual Funds Trust | | Financial Highlights | |
For a Share Outstanding Throughout Each Period
| | | | | Investment Activities | | Distributions to
Shareholders From | |
| | | Net Asset
Value,
Beginning of
Period | | Net
Investment
Income | | Net
Realized and
Unrealized
Gains (Losses) | | Total from
Investment
Activities | | Net
Investment
Income | | Total
Distributions | |
Six Months Ended
November 30, 2022
(Unaudited) | | $ | 1.00 | | | | 0.01 | (e) | | | — | | | | 0.01 | | | | (0.01 | ) | | | (0.01 | ) | |
Year Ended May 31:
2022 | | $ | 1.00 | | | | — | (e)(f) | | | — | | | | — | (f) | | | — | (f) | | | — | (f) | |
2021 | | $ | 1.00 | | | | — | (e)(f) | | | — | (f) | | | — | (f) | | | — | (f) | | | — | (f) | |
2020 | | $ | 1.00 | | | | 0.01 | (e) | | | — | | | | 0.01 | | | | (0.01 | ) | | | (0.01 | ) | |
2019 | | $ | 1.00 | | | | 0.02 | | | | — | | | | 0.02 | | | | (0.02 | ) | | | (0.02 | ) | |
2018 | | $ | 1.00 | | | | 0.01 | | | | — | | | | 0.01 | | | | (0.01 | ) | | | (0.01 | ) | |
(a) Not annualized for periods less than one year.
(b) Assumes reinvestment of all net investment income and realized capital gain distributions, if any, during the period. Includes adjustments in accordance with U.S. Generally Accepted Accounting Principles and could differ from the Lipper reported return.
(c) Annualized for periods less than one year.
(d) The net expense ratio may not correlate to the applicable expense limits in place during the period since the current contractual expense limitation is applied for a period beginning July 1, 2019 and in effect through September 30, 2023, instead of coinciding with the Fund's fiscal year end. Details of the current contractual expense limitation in effect can be found in Note 3 of the accompanying Notes to Financial Statements.
(e) Per share net investment income (loss) has been calculated using the average daily shares method.
(f) Amount is less than $0.005 per share.
(g) Prior to August 1, 2017, USAA Asset Management Company (previous Adviser) voluntarily agreed, on a temporary basis, to reimburse management, administrative, or other fees to limit the Fund's expenses and attempt to prevent a negative yield.
See notes to financial statements.
8
USAA Mutual Funds Trust | | Financial Highlights — continued | |
For a Share Outstanding Throughout Each Period
| | | | | Ratios to Average Net Assets | | Supplemental
Data | |
| | | Net Asset
Value,
End of
Period | | Total
Return(a)(b) | | Net
Expenses(c)(d) | | Net
Investment
Income(c) | | Gross
Expenses(c) | | Net Assets,
End of
Period
(000's) | |
Six Months Ended
November 30, 2022
(Unaudited) | | $ | 1.00 | | | | 1.07 | % | | | 0.35 | % | | | 2.19 | % | | | 0.37 | % | | $ | 637,296 | | |
Year Ended May 31:
2022 | | $ | 1.00 | | | | 0.04 | % | | | 0.11 | % | | | 0.04 | % | | | 0.37 | % | | $ | 519,981 | | |
2021 | | $ | 1.00 | | | | 0.03 | % | | | 0.12 | % | | | 0.03 | % | | | 0.38 | % | | $ | 496,777 | | |
2020 | | $ | 1.00 | | | | 1.23 | % | | | 0.33 | % | | | 1.21 | % | | | 0.34 | % | | $ | 543,913 | | |
2019 | | $ | 1.00 | | | | 1.88 | % | | | 0.35 | % | | | 1.88 | % | | | 0.35 | % | | $ | 4,858,998 | | |
2018 | | $ | 1.00 | | | | 0.89 | %(g) | | | 0.35 | %(g) | | | 0.91 | % | | | 0.35 | % | | $ | 3,732,359 | | |
See notes to financial statements.
9
USAA Mutual Funds Trust | | Notes to Financial Statements
November 30, 2022 | |
(Unaudited)
1. Organization:
USAA Mutual Funds Trust (the "Trust") is organized as a Delaware statutory trust and is registered under the Investment Company Act of 1940, as amended (the "1940 Act"), as an open-end investment company. The Trust is comprised of 45 funds and is authorized to issue an unlimited number of shares, which are units of beneficial interest with no par value.
The accompanying financial statements are those of the USAA Treasury Money Market Trust (the "Fund"). The Fund is classified as diversified under the 1940 Act.
The Fund operates as a government money market fund in compliance with the requirements of Rule 2a-7 under the 1940 Act and as a government money market fund, shares of the Fund are available for sale only to accounts that are beneficially owned by natural persons.
The Fund has adopted policies and procedures permitting the Trust's Board of Trustees (the "Board") to impose a liquidity fee or to temporarily suspend redemptions from the Fund (impose a "redemption gate") if the Fund's weekly liquid assets fall below specific thresholds, such as during times of market stress. The imposition of a liquidity fee would reduce the amount you would receive upon redemption of your shares of the Fund. The imposition of a redemption gate would temporarily delay your ability to redeem your investments in the Fund.
Victory Capital Management ("VCM" or the "Adviser"), is an indirect wholly owned subsidiary of Victory Capital Holdings, Inc., a publicly traded Delaware corporation, and a wholly owned direct subsidiary of Victory Capital Operating, LLC.
Under the Trust's organizational documents, its officers and trustees are indemnified against certain liabilities arising out of the performance of their duties to the Fund. In addition, in the normal course of business, the Fund enters into contracts with its vendors and others that provide for general indemnifications. The Fund's maximum exposure under these arrangements is unknown, as this would involve future claims that may be made against the Fund. However, based on experience, the Fund expects that risk of loss to be remote.
2. Significant Accounting Policies:
The following is a summary of significant accounting policies followed by the Trust in the preparation of its financial statements. The policies are in conformity with U.S. Generally Accepted Accounting Principles ("GAAP"). The preparation of financial statements in accordance with GAAP requires management to make estimates and assumptions that affect the reported amounts of assets and liabilities and disclosure of contingent assets and liabilities at the date of the financial statements and the reported amounts of income and expenses for the period. Actual results could differ from those estimates. The Fund follows the specialized accounting and reporting requirements under GAAP that are applicable to investment companies under Accounting Standards Codification Topic 946.
Investment Valuation:
The inputs or methodologies used for valuing securities are not necessarily an indication of the risks associated with investing in those securities. For example, money market securities are valued using amortized cost, in accordance with rules under the 1940 Act. Generally, amortized cost approximates the current fair value of a security, but since the value is not obtained from a quoted price in an active market, such securities are reflected as Level 2.
The Fund records investments at fair value. Fair value is defined as the price that would be received to sell an asset or paid to transfer a liability in an orderly transaction between market participants at the measurement date.
The valuation techniques described below maximize the use of observable inputs and minimize the use of unobservable inputs in determining fair value. The inputs used for valuing the Fund's investments are summarized in the three broad levels listed below:
• Level 1 — quoted prices (unadjusted) in active markets for identical securities
• Level 2 — other significant observable inputs (including quoted prices for similar securities, interest rates, or credit spreads, applicable to those securities, etc.)
10
USAA Mutual Funds Trust | | Notes to Financial Statements — continued
November 30, 2022 | |
(Unaudited)
• Level 3 — significant unobservable inputs (including the Adviser's assumptions in determining the fair value of investments)
The Adviser, acting as the valuation designee has established the Pricing and Liquidity Committee (the "Committee"), and subject to the Board's oversight, the Committee administers and oversees the Fund's valuation policies and procedures, which are approved by the Board.
Repurchase agreements are valued at cost.
All securities held in the Fund are short-term debt securities, which are valued pursuant to Rule 2a-7 under the 1940 Act and the Money Market Funds: Procedures to Stabilize Net Asset Value ("the Procedures"). This method values a security at its purchase price, and thereafter, assumes a constant amortization to maturity of any premiums or discounts. Securities for which amortized cost valuations are considered unreliable or whose values have been materially affected by a significant event are valued in good faith, at fair value, using methods determined by the Committee, under the Procedures to stabilize net assets and valuation procedures approved by the Board.
Repurchase Agreements:
The Fund may enter into repurchase agreements with commercial banks or recognized security dealers pursuant to the terms of a Master Repurchase Agreement. A repurchase agreement is an arrangement wherein the Fund purchases securities and the seller agrees to repurchase the securities at an agreed upon time and at an agreed upon price. The purchased securities are marked-to-market daily to ensure their value is equal to at least 102% of principal including accrued interest and are held by the Fund, either through its regular custodian or through a special "tri-party" custodian that maintains separate accounts for both the Fund and its counterparty, until maturity of the repurchase agreement. Master Repurchase Agreements typically contain netting provisions, which provide for the net settlement of all transactions and collateral with the Fund through a single payment in the event of default or termination. Repurchase agreements are subject to credit risk, and the Fund's Adviser monitors the creditworthiness of sellers with which the Fund may enter into repurchase agreements.
Investments in repurchase agreements as presented on the Schedule of Portfolio Investments are not net settlement amounts but gross. At November 30, 2022, the value of the related collateral exceeded the value of the repurchase agreements, reducing the net settlement amount to zero. Details on the collateral are included on the Schedule of Portfolio Investments.
Investment Transactions and Related Income:
Changes in holdings of investments are accounted for no later than one business day following the trade date. For financial reporting purposes, however, investment transactions are accounted for on trade date or the last business day of the reporting period. Interest income is determined on the basis of coupon interest accrued using the effective interest method which adjusts, where applicable, the amortization of premiums or accretion of discounts. Gains or losses realized on sales of securities are recorded on the identified cost basis.
Federal Income Taxes:
The Fund intends to continue to qualify as a regulated investment company by complying with the provisions available to certain investment companies, as defined in applicable sections of the Internal Revenue Code, and to make distributions of net investment income and net realized gains sufficient to relieve it from all, or substantially all, federal income taxes. Accordingly, no provision for federal income taxes is required in the financial statements. The Fund has a tax year end of May 31.
For the six months ended November 30, 2022, the Fund did not incur any income tax, interest, or penalties, and has recorded no liability for net unrecognized tax benefits relating to uncertain tax positions.
Management of the Fund has reviewed tax positions taken in tax years that remain subject to examination by all major tax jurisdictions, including federal (i.e., the last four tax years, which includes the current fiscal tax year end). Management believes that there is no tax liability resulting from unrecognized tax benefits related to uncertain tax positions taken.
11
USAA Mutual Funds Trust | | Notes to Financial Statements — continued
November 30, 2022 | |
(Unaudited)
Allocations:
Expenses directly attributable to the Fund are charged to the Fund, while expenses that are attributable to more than one fund in the Trust, or jointly with an affiliated trust, are allocated among the respective funds in the Trust and/or an affiliated trust based upon net assets or another appropriate basis.
Fees Paid Indirectly:
Expense offsets to custody fees that arise from credits on cash balances maintained on deposit are reflected on the Statement of Operations, as applicable, as Custodian fees.
3. Fees and Transactions with Affiliates and Related Parties:
Investment Advisory Fees:
Investment advisory services are provided to the Fund by the Adviser, which is a New York corporation registered as an investment adviser with the Securities and Exchange Commission ("SEC").
The Fund's Investment Adviser fee is accrued daily and paid monthly at an annualized rate of 0.125% of the Fund's average daily net assets. Amounts incurred and paid to VCM for the six months ended November 30, 2022, are reflected on the Statement of Operations as Investment advisory fees.
Administration and Servicing Fees:
VCM also serves as the Fund's administrator and fund accountant. Under the Fund Administration, Servicing and Accounting Agreement, VCM is paid an administration and servicing fee that is accrued daily and paid monthly at an annualized rate of 0.10%, which is based on the Fund's average daily net assets. Amounts incurred for the six months ended November 30, 2022, are reflected on the Statement of Operations as Administration fees.
Citi Fund Services Ohio, Inc. ("Citi"), an affiliate of Citibank, acts as sub-administrator and sub-fund accountant to the Fund pursuant to a Sub-Administration and Sub-Fund Accounting Services Agreement between VCM and Citi. VCM pays Citi a fee for providing these services. The Fund reimburses VCM and Citi for out-of-pocket expenses incurred in providing these services and certain other expenses specifically allocated to the Fund. Amounts incurred for the six months ended November 30, 2022, are reflected on the Statement of Operations as Sub-Administration fees.
The Fund (as part of the Trust) has entered into an agreement with the Adviser to provide compliance services, pursuant to which the Adviser furnishes its compliance personnel, including the services of the Chief Compliance Officer ("CCO"), and other resources reasonably necessary to provide the Trust with compliance oversight services related to the design, administration, and oversight of a compliance program for the Trust in accordance with Rule 38a-1 under the 1940 Act. The CCO is an employee of the Adviser, which pays the compensation of the CCO and support staff. The funds in the Trust, Victory Variable Insurance Funds, Victory Portfolios, and Victory Portfolios II (collectively, the "Victory Funds Complex") in the aggregate, compensate the Adviser for these services. Amounts incurred for the six months ended November 30, 2022, are reflected on the Statement of Operations as Compliance fees.
Transfer Agency Fees:
Victory Capital Transfer Agency, Inc. ("VCTA"), an affiliate of the Adviser, provides transfer agency services to the Fund. Transfer agent's fees for the Fund are paid monthly based on a fee accrued daily at an annualized rate of 0.10% of average daily net assets, plus out-of-pocket expenses. VCTA pays a portion of these fees to certain intermediaries for the administration and servicing of accounts that are held with such intermediaries. Amounts incurred and paid to VCTA for the six months ended November 30, 2022, are reflected on the Statement of Operations as Transfer agent fees.
12
USAA Mutual Funds Trust | | Notes to Financial Statements — continued
November 30, 2022 | |
(Unaudited)
FIS Investor Services LLC serves as sub-transfer agent and dividend disbursing agent for the Fund pursuant to a Sub-Transfer Agent Agreement between VCTA and FIS Investor Services LLC. VCTA provides FIS Investor Services LLC a fee for providing these services.
Distributor/Underwriting Services:
Victory Capital Services, Inc. (the "Distributor"), an affiliate of the Adviser, serves as Distributor for the continuous offering of the shares of the Fund pursuant to a Distribution Agreement between the Distributor and the Trust and receives no fee or other compensation for these services.
Other Fees:
Citibank serves as the Fund's custodian. The Fund pays Citibank a fee for providing these services. Amounts incurred for the six months ended November 30, 2022, are reflected on the Statement of Operations as Custodian fees.
K&L Gates LLP provides legal services to the Trust.
The Adviser has entered into an expense limitation agreement with the Fund until at least September 30, 2023. Under the terms of the agreement, the Adviser has agreed to waive fees or reimburse certain expenses to the extent that ordinary operating expenses incurred in any fiscal year exceed the expense limit for the Fund. Such excess amounts will be the liability of the Adviser. Acquired fund fees and expenses, interest, taxes, brokerage commissions, other expenditures, which are capitalized in accordance with GAAP, and other extraordinary expenses not incurred in the ordinary course of the Fund's business are excluded from the expense limits. As of November 30, 2022, the expense limit (excluding voluntary waivers) was 0.35%.
Under the terms of the expense limitation agreement, as amended June 29, 2022, the Fund has agreed to repay fees and expenses that were waived or reimbursed by the Adviser for a period of up to three years (thirty-six (36) months) after the waiver or reimbursement took place, subject to the lesser of any operating expense limits in effect at the time of: (a) the original waiver or expense reimbursement; or (b) the recoupment, after giving effect to the recoupment amount.
In addition, the Adviser agreed to further reimburse fees in excess of the Fund's expense limit of 0.35%. These voluntary reductions, to the extent necessary, are to maintain a certain minimum net yield of the Fund. Under this agreement to reimburse additional fees, the Fund has agreed to repay fees and expenses that were waived or reimbursed by the Adviser for a period of up to three years after the fiscal year in which the waiver or reimbursement took place, to the extent any repayments would not cause the Fund's net yield to fall below the Fund's minimum yield at the time of: (a) the original waiver or expense reimbursement; or (b) the expense limit in effect at the time of the extra waiver.
As of November 30, 2022, the following amounts are available to be repaid to the Adviser (amounts in thousands). The Fund has not recorded any amounts available to be repaid as a liability due to an assessment that such repayments are not probable at November 30, 2022.
Expires
2023 | | Expires
2024 | | Expires
2025 | | Expires
2026 | | Total | |
| $ | 745 | | | $ | 1,348 | | | $ | 1,298 | | | $ | 66 | | | $ | 3,457 | | |
Certain officers and/or interested trustees of the Fund are also officers and/or employees of the Adviser, administrator, fund accountant, sub-administrator, sub-fund accountant, custodian, and Distributor.
4. Risks:
The Fund may be subject to other risks in addition to these identified risks.
Stable Net Asset Value Risk — You could lose money by investing in the Fund. Although the Fund seeks to preserve the value of your investment at $1 per share, it cannot guarantee it will do so. An investment in the Fund is not a deposit in a bank and is not insured or guaranteed by the Federal
13
USAA Mutual Funds Trust | | Notes to Financial Statements — continued
November 30, 2022 | |
(Unaudited)
Deposit Insurance Corporation ("FDIC") or any other government agency. The Fund's sponsor has no legal obligation to provide financial support to the Fund, and you should not expect that the sponsor will provide financial support to the Fund at any time.
Interest Rate Risk — When interest rates rise, debt security prices generally fall. The opposite also generally is true: debt security prices rise when interest rates fall. Interest rate changes are influenced by a number of factors including government policy, monetary policy, inflation expectations, perceptions of risk, and supply and demand of debt securities. The Fund's yield will vary. A sharp and unexpected rise in interest rates could cause the Fund's share price to drop below a dollar. A low interest rate environment may prevent the Fund from providing a positive yield and could also impair the Fund's ability to maintain a stable net asset value.
Large-Shareholders Risk — The actions by one shareholder or multiple shareholders may have an impact on the Fund and, therefore, indirectly on other shareholders. Shareholder purchase and redemption activity may affect the per share amount of the Fund's distributions of its net investment income and net realized capital gains, if any, thereby affecting the tax burden on the Fund's shareholders subject to federal income tax. To the extent a larger shareholder (including, for example, an affiliated fund that operates as a fund-of-funds or 529 college savings plan) is permitted to invest in the Fund, the Fund may experience large inflows or outflows of cash from time to time. This activity could magnify these adverse effects on the Fund.
Market Risk — Overall market risks may affect the value of the Fund. Domestic and international factors such as political events, war, terrorism, trade disputes, inflation rates, interest rate levels and other fiscal and monetary policy changes, cybersecurity incidents, pandemics and other public health crises, sanctions against a particular foreign country, its nationals, businesses or industries and related geopolitical events, as well as environmental disasters such as earthquakes, fires, and floods, or other catastrophes, may add to instability in global economies and markets generally, and may lead to increased market volatility. Global economies and financial markets are highly interconnected, which increases the possibility that conditions in one country or region might adversely affect issuers in another country or region. The impact of these and other factors may be short-term or may last for extended periods.
5. Borrowing:
Line of Credit:
The Victory Funds Complex participates in a short-term demand note "Line of Credit" agreement with Citibank. The Line of Credit agreement with Citibank was renewed on June 27, 2022, with a termination date of June 26, 2023. Under the agreement with Citibank, the Victory Funds Complex may borrow up to $600 million, of which $300 million is committed and $300 million is uncommitted. $40 million of the Line of Credit is reserved for use by the Victory Floating Rate Fund, another series of the Victory Funds Complex, with Victory Floating Rate Fund paying the related commitment fees for that amount. The purpose of the Line of Credit is to meet temporary or emergency cash needs. For the six months ended November 30, 2022, Citibank received an annual commitment fee of 0.15% on $300 million for providing the Line of Credit. Each fund in the Victory Funds Complex paid a pro-rata portion of the commitment fees plus any interest on amounts borrowed. For the period from June 1, 2022, through June 27, 2022, interest was based on the one-month London Interbank Offered Rate ("LIBOR") plus one percent. Effective with the renewal, for the period June 28, 2022, through November 30, 2022, interest was based on the one-month Secured Overnight Financing Rate ("SOFR") plus 1.10 percent. Interest charged to the Fund during the period, if applicable, is reflected on the Statement of Operations under Line of credit fees.
The Fund had no borrowings under the Line of Credit agreement during the six months ended November 30, 2022.
14
USAA Mutual Funds Trust | | Notes to Financial Statements — continued
November 30, 2022 | |
(Unaudited)
6. Federal Income Tax Information:
The Fund intends to declare daily and distribute any net investment income monthly. Distributable net realized gains, if any, are declared and paid at least annually.
The amounts of dividends from net investment income and distributions from net realized gains (collectively, distributions to shareholders) are determined in accordance with federal income tax regulations, which may differ from GAAP. To the extent these "book/tax" differences are permanent in nature (e.g., net operating loss and distribution reclassification), such amounts are reclassified within the components of net assets based on their federal tax-basis treatment; temporary differences (e.g., wash sales) do not require reclassification. To the extent dividends and distributions exceed net investment income and net realized gains for tax purposes, they are reported as distributions of capital. Net investment losses incurred by the Fund may be reclassified as an offset to capital on the accompanying Statement of Assets and Liabilities.
The tax character of current year distributions paid and the tax basis of the current components of accumulated earnings (loss) will be determined at the end of the current tax year.
At the tax year ended May 31, 2022, the Fund had net capital loss carryforwards as summarized in the table below (amounts in thousands). It is unlikely that the Board will authorize a distribution of capital gains realized in the future until the capital loss carryforwards have been used.
| Short-Term Amount | | Total | |
| $ | 1 | | | $ | 1 | | |
15
USAA Mutual Funds Trust | | Supplemental Information
November 30, 2022 | |
(Unaudited)
Proxy Voting and Portfolio Holdings Information
Proxy Voting:
Information regarding the policies and procedures the Fund uses to determine how to vote proxies relating to portfolio securities is available without charge, upon request, by calling (800) 235-8396. The information is also included in the Fund's Statement of Additional Information, which is available on the SEC's website at www.sec.gov.
Information relating to how the Fund voted proxies relating to portfolio securities held during the most recent 12 months ended June 30 is available on the SEC's website at www.sec.gov.
Availability of Schedules of Portfolio Investments:
The Fund makes available on VCM.com a complete list of portfolio holdings no sooner than 5 business days after the end of each month. Form N-MFP is available on the SEC's website at www.sec.gov.
Expense Example
As a shareholder of the Fund, you may incur two types of costs: (1) transaction costs and (2) ongoing costs, including management fees and other Fund expenses. These examples are intended to help you understand your ongoing costs (in dollars) of investing in the Fund and to compare these costs with the ongoing costs of investing in other mutual funds.
These examples are based on an investment of $1,000 invested at the beginning of the period and held for the entire period from June 1, 2022, through November 30, 2022.
The Actual Expense figures in the table below provide information about actual account values and actual expenses. You may use the information below, together with the amount you invested, to estimate the expenses that you paid over the period. Simply divide your account value by $1,000 (for example, an $8,600 account value divided by $1,000 = 8.6), then multiply the result by the number in the table under the heading entitled "Actual Expenses Paid During Period" to estimate the expenses you paid on your account during this period.
The Hypothetical Expense figures in the table below provide information about hypothetical account values and hypothetical expenses based on the Fund's actual expense ratio and an assumed rate of return of 5% per year before expenses, which is not the Fund's actual return. The hypothetical account values and expenses may not be used to estimate the actual ending account balance or expenses you paid for the period. You may use this information to compare this 5% hypothetical example with the 5% hypothetical examples that appear in shareholder reports of other funds.
Please note the expenses shown in the table below are meant to highlight your ongoing costs only and do not reflect any transactional costs. Therefore, the hypothetical expenses in the table are useful in comparing ongoing costs only and will not help you determine the relative total costs of owning different funds. In addition, if these transactional costs were included, your costs would have been higher.
Beginning
Account Value
6/1/22 | | Actual
Ending
Account Value
11/30/22 | | Hypothetical
Ending
Account Value
11/30/22 | | Actual
Expenses Paid
During Period
6/1/22-11/30/22* | | Hypothetical
Expenses Paid
During Period
6/1/22-11/30/22* | | Annualized
Expense Ratio
During Period
6/1/22-11/30/22 | |
| $ | 1,000.00 | | | $ | 1,010.70 | | | $ | 1,023.31 | | | $ | 1.76 | | | $ | 1.78 | | | | 0.35 | % | |
* Expenses are equal to the average account value multiplied by the Fund's annualized expense ratio multiplied by 183/365 (the number of days in the most recent fiscal half-year divided by the number of days in the fiscal year).
16
Privacy Policy
Protecting the Privacy of Information
The Trust respects your right to privacy. We also know that you expect us to conduct and process your business in an accurate and efficient manner. To do so, we must collect and maintain certain personal information about you. This is the information we collect from you on applications or other forms, and from the transactions you make with us or third parties. It may include your name, address, social security number, account transactions and balances, and information about investment goals and risk tolerance.
We do not disclose any information about you or about former customers to anyone except as permitted or required by law. Specifically, we may disclose the information we collect to companies that perform services on our behalf, such as the transfer agent that processes shareholder accounts and printers and mailers that assist us in the distribution of investor materials. We may also disclose this information to companies that perform marketing services on our behalf. This allows us to continue to offer you Victory investment products and services that meet your investing needs, and to effect transactions that you request or authorize. These companies will use this information only in connection with the services for which we hired them. They are not permitted to use or share this information for any other purpose.
To protect your personal information internally, we permit access only by authorized employees and maintain physical, electronic, and procedural safeguards to guard your personal information.*
* You may have received communications regarding information about privacy policies from other financial institutions which gave you the opportunity to "opt-out" of certain information sharing with companies which are not affiliated with that financial institution. The Trust does not share information with other companies for purposes of marketing solicitations for products other than the Trust. Therefore, the Trust does not provide opt-out options to their shareholders.
P.O. Box 182593
Columbus, Ohio 43218-2593

Visit our website at: | | Call | |
www.vcm.com | | (800) 235-8396 | |
Item 2. Code of Ethics.
Not applicable – only for annual reports.
Item 3. Audit Committee Financial Expert.
Not applicable – only for annual reports.
Item 4. Principal Accountant Fees and Services.
Not applicable – only for annual reports.
Item 5. Audit Committee of Listed Registrants.
Not applicable.
Item 6. Investments.
(a) Not applicable.
(b) Not applicable.
Item 7. Disclosure of Proxy Voting Policies and Procedures for Closed-End Management Investment Companies.
Not applicable.
Item 8. Portfolio Managers of Closed-End Management Investment Companies.
Not applicable.
Item 9. Purchases of Equity Securities by Closed-End Management Investment Company and Affiliated Purchasers.
Not applicable.
Item 10. Submission of Matters to a Vote of Security Holders.
Not applicable.
Item 11. Controls and Procedures.
(a)The registrant’s principal executive officer and principal financial officer have concluded, based on their evaluation of the registrant's disclosure controls and procedures as conducted within 90 days of the filing date of this report, that these disclosure controls and procedures are adequately designed and are operating effectively to ensure that information required to be disclosed by the registrant on Form N-CSR is recorded, processed, summarized and reported within the time periods specified in the Securities and Exchange Commission's rules and forms.
(b)There were no changes in the registrant’s internal control over financial reporting (as defined in Rule 30a-3(d) under the Investment Company Act of 1940 (17 CFR 270.30a-3(d)) that occurred during the period covered by this report that have materially affected or are reasonably likely to materially affect, the registrant’s internal control over financial reporting.
Item 12. Disclosure of Securities Lending Activities for Closed-End Management Investment Companies.
(a)(1) Not applicable.
(a)(2) Not applicable.
(a)(3) Not applicable.
(a)(4) Not applicable.
(b) Not applicable.
Item 13. Exhibits.
(a)(1) Not applicable.
(a)(2) Certifications pursuant to Rule 30a-2(a) are attached hereto.
(a)(3) Not applicable.
(a)(4) Not applicable.
(b) Certifications pursuant to Rule 30a-2(b) are furnished herewith.
SIGNATURES
Pursuant to the requirements of the Securities Exchange Act of 1934 and the Investment Company Act of 1940, the registrant has duly caused this report to be signed on its behalf by the undersigned, thereunto duly authorized.
| (Registrant) | USAA Mutual Fund Trust | |
| By (Signature and Title)* | /s/ James K. De Vries | |
| | James K. De Vries, Principal Financial Officer | |
Pursuant to the requirements of the Securities Exchange Act of 1934 and the Investment Company Act of 1940, this report has been signed below by the following persons on behalf of the registrant and in the capacities and on the dates indicated.
| By (Signature and Title)* | /s/ Christopher K. Dyer | |
| | Christopher K. Dyer, Principal Executive Officer | |
| By (Signature and Title)* | /s/ James K. De Vries | |
| | James K. De Vries, Principal Financial Officer | |