UNITED STATES
SECURITIES AND EXCHANGE COMMISSION
Washington, D.C. 20549
FORM N-CSR
CERTIFIED SHAREHOLDER REPORT OF REGISTERED
MANAGEMENT INVESTMENT COMPANIES
Investment Company Act file number: 811-07852
USAA Mutual Funds Trust
(Exact name of registrant as specified in charter)
| 15935 La Cantera Pkwy, Building Two, San Antonio, Texas | 78256 | |
| (Address of principal executive offices) | (Zip code) |
Citi Fund Services Ohio, Inc., 4400 Easton Commons, Suite 200, Columbus, Ohio 43219
(Name and address of agent for service)
Registrant’s telephone number, including area code: 800-235-8396
Date of fiscal year end: July 31
Date of reporting period: January 31, 2023
Item 1. Reports to Stockholders.

January 31, 2023
Semi Annual Report
USAA Capital Growth Fund
Victory Capital means Victory Capital Management Inc., the investment adviser of the USAA Mutual Funds. USAA Mutual Funds are distributed by Victory Capital Services, Inc., member FINRA, an affiliate of Victory Capital. Victory Capital and its affiliates are not affiliated with United Services Automobile Association or its affiliates. USAA and the USAA logos are registered trademarks and the USAA Mutual Funds and USAA Investments logos are trademarks of United Services Automobile Association and are being used by Victory Capital and its affiliates under license.
vcm.com
News, Information And Education 24 Hours A Day, 7 Days A Week
The Victory Capital website gives fund shareholders, prospective shareholders, and investment professionals a convenient way to access fund information, get guidance, and track fund performance anywhere they can access the Internet. The site includes:
• Detailed performance records
• Daily share prices
• The latest fund news
• Investment resources to help you become a better investor
• A section dedicated to investment professionals
Whether you're a potential investor searching for the fund that matches your investment philosophy, a seasoned investor interested in planning tools, or an investment professional, vcm.com has what you seek. Visit us anytime. We're always open.
USAA Mutual Funds Trust
TABLE OF CONTENTS
Investment Objective & Portfolio Holdings | 2 | ||||||
Schedule of Portfolio Investments | 3 | ||||||
Financial Statements | |||||||
Statement of Assets and Liabilities | 23 | ||||||
Statement of Operations | 24 | ||||||
Statements of Changes in Net Assets | 25 | ||||||
Financial Highlights | 26 | ||||||
Notes to Financial Statements | 28 | ||||||
Supplemental Information | 37 | ||||||
Proxy Voting and Portfolio Holdings Information | 37 | ||||||
Expense Examples | 37 | ||||||
Advisory Contract Approval | 38 | ||||||
Privacy Policy (inside back cover) | |||||||
This report is for the information of the shareholders and others who have received a copy of the currently effective prospectus of the Fund, managed by Victory Capital Management Inc. It may be used as sales literature only when preceded or accompanied by a current prospectus, which provides further details about the Fund.
IRA DISTRIBUTION WITHHOLDING DISCLOSURE
We generally must withhold federal income tax at a rate of 10% of the taxable portion of your distribution and, if you live in a state that requires state income tax withholding, at your state's tax rate. However, you may elect not to have withholding apply or to have income tax withheld at a higher rate. Any withholding election that you make will apply to any subsequent distribution unless and until you change or revoke the election. If you wish to make a withholding election, or change or revoke a prior withholding election, call (800) 235-8396, and form W-4P (OMB No. 1545-0074 withholding certificate for pension or annuity payments) will be electronically sent.
If you do not have a withholding election in place by the date of a distribution, federal income tax will be withheld from the taxable portion of your distribution at a rate of 10%. If you must pay estimated taxes, you may be subject to estimated tax penalties if your estimated tax payments are not sufficient and sufficient tax is not withheld from your distribution.
For more specific information, please consult your tax adviser.
• NOT FDIC INSURED • NO BANK GUARANTEE • MAY LOSE VALUE
1
| USAA Mutual Funds Trust USAA Capital Growth Fund | January 31, 2023 | ||||||
(Unaudited)
Investment Objective and Portfolio Holdings:
The Fund seeks capital appreciation.
Top 10 Equity Holdings*:
January 31, 2023
(% of Net Assets)
Apple, Inc. | 3.1 | % | |||||
Microsoft Corp. | 1.3 | % | |||||
Exxon Mobil Corp. | 1.2 | % | |||||
UnitedHealth Group, Inc. | 1.1 | % | |||||
LVMH Moet Hennessy Louis Vuitton SE | 1.1 | % | |||||
Lockheed Martin Corp. | 1.1 | % | |||||
Berkshire Hathaway, Inc. Class B | 1.1 | % | |||||
Amgen, Inc. | 1.0 | % | |||||
Merck & Co., Inc. | 1.0 | % | |||||
Nestle SA Registered Shares | 1.0 | % | |||||
Sector Allocation*:
January 31, 2023
(% of Net Assets)

* Does not include futures contracts, money market instruments, and short-term investments purchased with cash collateral from securities loaned.
Percentages are of the net assets of the Fund and may not equal 100%.
Refer to the Schedule of Portfolio Investments for a complete list of securities.
2
| USAA Mutual Funds Trust USAA Capital Growth Fund | Schedule of Portfolio Investments January 31, 2023 | ||||||
(Amounts in Thousands, Except for Shares) (Unaudited)
Security Description | Shares | Value | |||||||||
Common Stocks (99.2%) | |||||||||||
Australia (2.6%): | |||||||||||
Consumer Discretionary (0.3%): | |||||||||||
Aristocrat Leisure Ltd. | 90,389 | $ | 2,182 | ||||||||
Energy (0.1%): | |||||||||||
Santos Ltd. | 91,595 | 467 | |||||||||
Woodside Energy Group Ltd. | 25,144 | 651 | |||||||||
1,118 | |||||||||||
Financials (0.6%): | |||||||||||
Macquarie Group Ltd. | 23,087 | 3,079 | |||||||||
National Australia Bank Ltd. | 63,689 | 1,437 | |||||||||
QBE Insurance Group Ltd. | 49,478 | 483 | |||||||||
4,999 | |||||||||||
Health Care (0.4%): | |||||||||||
CSL Ltd. | 15,717 | 3,318 | |||||||||
Industrials (0.1%): | |||||||||||
Qantas Airways Ltd. (a) | 119,754 | 540 | |||||||||
Materials (0.7%): | |||||||||||
BHP Group Ltd. | 109,653 | 3,840 | |||||||||
Mineral Resources Ltd. | 11,059 | 700 | |||||||||
Rio Tinto Ltd. | 10,533 | 945 | |||||||||
5,485 | |||||||||||
Real Estate (0.4%): | |||||||||||
Charter Hall Group | 50,365 | 496 | |||||||||
Goodman Group | 34,097 | 486 | |||||||||
Scentre Group | 974,628 | 2,114 | |||||||||
3,096 | |||||||||||
20,738 | |||||||||||
Austria (0.1%): | |||||||||||
Industrials (0.1%): | |||||||||||
ANDRITZ AG | 11,637 | 696 | |||||||||
Belgium (0.2%): | |||||||||||
Information Technology (0.2%): | |||||||||||
Melexis NV | 16,114 | 1,716 | |||||||||
Brazil (0.4%): | |||||||||||
Consumer Discretionary (0.1%): | |||||||||||
Cury Construtora e Incorporadora SA | 122,900 | 327 | |||||||||
Lojas Renner SA | 49,600 | 211 | |||||||||
Vibra Energia SA | 61,400 | 199 | |||||||||
737 | |||||||||||
See notes to financial statements.
3
| USAA Mutual Funds Trust USAA Capital Growth Fund | Schedule of Portfolio Investments — continued January 31, 2023 | ||||||
(Amounts in Thousands, Except for Shares) (Unaudited)
Security Description | Shares | Value | |||||||||
Consumer Staples (0.1%): | |||||||||||
Sao Martinho SA | 43,200 | $ | 213 | ||||||||
Sendas Distribuidora SA | 74,311 | 287 | |||||||||
500 | |||||||||||
Financials (0.0%): (b) | |||||||||||
Banco ABC Brasil SA Preference Shares | 77,000 | 291 | |||||||||
Industrials (0.1%): | |||||||||||
Santos Brasil Participacoes SA | 208,500 | 362 | |||||||||
SIMPAR SA | 137,616 | 211 | |||||||||
573 | |||||||||||
Materials (0.0%): (b) | |||||||||||
Metalurgica Gerdau SA | 96,800 | 276 | |||||||||
Real Estate (0.1%): | |||||||||||
Multiplan Empreendimentos Imobiliarios SA | 83,000 | 389 | |||||||||
Utilities (0.0%): (b) | |||||||||||
Neoenergia SA | 83,200 | 247 | |||||||||
3,013 | |||||||||||
Canada (2.3%): | |||||||||||
Consumer Staples (0.3%): | |||||||||||
Alimentation Couche-Tard, Inc. | 59,430 | 2,714 | |||||||||
Energy (0.1%): | |||||||||||
Parex Resources, Inc. | 64,181 | 1,093 | |||||||||
Financials (0.9%): | |||||||||||
Manulife Financial Corp. | 124,557 | 2,465 | |||||||||
National Bank of Canada | 18,565 | 1,394 | |||||||||
The Toronto-Dominion Bank | 49,536 | 3,428 | |||||||||
7,287 | |||||||||||
Industrials (0.3%): | |||||||||||
Canadian Pacific Railway Ltd. | 31,543 | 2,490 | |||||||||
Information Technology (0.4%): | |||||||||||
Constellation Software, Inc. | 1,786 | 3,156 | |||||||||
Materials (0.3%): | |||||||||||
Aginco Eagle Mines Ltd. | 37,310 | 2,107 | |||||||||
18,847 | |||||||||||
Chile (0.1%): | |||||||||||
Consumer Staples (0.1%): | |||||||||||
SMU SA | 2,182,814 | 339 | |||||||||
Industrials (0.0%): (b) | |||||||||||
Quinenco SA | 46,521 | 162 | |||||||||
Materials (0.0%): (b) | |||||||||||
CAP SA | 36,418 | 337 | |||||||||
See notes to financial statements.
4
| USAA Mutual Funds Trust USAA Capital Growth Fund | Schedule of Portfolio Investments — continued January 31, 2023 | ||||||
(Amounts in Thousands, Except for Shares) (Unaudited)
Security Description | Shares | Value | |||||||||
Real Estate (0.0%): (b) | |||||||||||
Parque Arauco SA | 212,731 | $ | 274 | ||||||||
1,112 | |||||||||||
China (0.5%): | |||||||||||
Communication Services (0.2%): | |||||||||||
Tencent Holdings Ltd. | 32,800 | 1,598 | |||||||||
Consumer Discretionary (0.0%): (b) | |||||||||||
Hisense Home Appliances Group Co. Ltd. Class A | 130,100 | 331 | |||||||||
Meituan Class B (a) (c) | 3,280 | 73 | |||||||||
404 | |||||||||||
Consumer Staples (0.0%): (b) | |||||||||||
Chenguang Biotech Group Co. Ltd. Class A | 90,500 | 249 | |||||||||
Health Care (0.1%): | |||||||||||
Amoy Diagnostics Co. Ltd. Class A | 38,160 | 163 | |||||||||
Hygeia Healthcare Holdings Co. Ltd. (a) (c) | 31,400 | 249 | |||||||||
412 | |||||||||||
Information Technology (0.1%): | |||||||||||
AsiaInfo Technologies Ltd. (c) | 236,000 | 436 | |||||||||
WUS Printed Circuit Kunshan Co. Ltd. Class A | 190,840 | 361 | |||||||||
797 | |||||||||||
Materials (0.0%): (b) | |||||||||||
Fufeng Group Ltd. | 408,000 | 286 | |||||||||
Real Estate (0.1%): | |||||||||||
CIFI Ever Sunshine Services Group Ltd. | 605,117 | 332 | |||||||||
Seazen Group Ltd. (a) | 502,000 | 196 | |||||||||
528 | |||||||||||
4,274 | |||||||||||
Cyprus (0.0%): (b) | |||||||||||
Materials (0.0%): | |||||||||||
Tharisa PLC | 190,445 | 246 | |||||||||
Denmark (1.1%): | |||||||||||
Consumer Discretionary (0.3%): | |||||||||||
Pandora A/S | 25,822 | 2,151 | |||||||||
Health Care (0.8%): | |||||||||||
Novo Nordisk A/S Class B | 47,640 | 6,594 | |||||||||
Industrials (0.0%): (b) | |||||||||||
AP Moller — Maersk A/S Class B | 230 | 500 | |||||||||
9,245 | |||||||||||
Finland (0.1%): | |||||||||||
Information Technology (0.1%): | |||||||||||
Nokia Oyj | 110,671 | 525 | |||||||||
See notes to financial statements.
5
| USAA Mutual Funds Trust USAA Capital Growth Fund | Schedule of Portfolio Investments — continued January 31, 2023 | ||||||
(Amounts in Thousands, Except for Shares) (Unaudited)
Security Description | Shares | Value | |||||||||
Utilities (0.0%): (b) | |||||||||||
Fortum Oyj | 33,887 | $ | 509 | ||||||||
1,034 | |||||||||||
France (3.4%): | |||||||||||
Communication Services (0.1%): | |||||||||||
Publicis Groupe SA | 10,949 | 772 | |||||||||
Consumer Discretionary (1.4%): | |||||||||||
La Francaise des Jeux SAEM (c) | 55,973 | 2,395 | |||||||||
LVMH Moet Hennessy Louis Vuitton SE | 10,457 | 9,127 | |||||||||
11,522 | |||||||||||
Consumer Staples (0.1%): | |||||||||||
Pernod Ricard SA | 4,539 | 940 | |||||||||
Energy (0.1%): | |||||||||||
Gaztransport Et Technigaz SA | 9,957 | 1,101 | |||||||||
Financials (0.2%): | |||||||||||
AXA SA | 29,719 | 927 | |||||||||
BNP Paribas SA | 13,093 | 899 | |||||||||
1,826 | |||||||||||
Health Care (0.1%): | |||||||||||
EssilorLuxottica SA | 2,437 | 447 | |||||||||
Industrials (0.6%): | |||||||||||
Cie de Saint-Gobain | 13,475 | 774 | |||||||||
Eiffage SA | 5,340 | 570 | |||||||||
Rexel SA | 22,768 | 504 | |||||||||
Safran SA | 17,809 | 2,560 | |||||||||
Teleperformance | 1,443 | 401 | |||||||||
4,809 | |||||||||||
Information Technology (0.4%): | |||||||||||
Capgemini SE | 15,234 | 2,891 | |||||||||
Edenred | 8,788 | 479 | |||||||||
3,370 | |||||||||||
Materials (0.3%): | |||||||||||
Arkema SA | 26,142 | 2,645 | |||||||||
Real Estate (0.1%): | |||||||||||
Klepierre SA | 15,972 | 405 | |||||||||
27,837 | |||||||||||
Germany (2.1%): | |||||||||||
Communication Services (0.2%): | |||||||||||
Deutsche Telekom AG | 64,136 | 1,429 | |||||||||
Consumer Discretionary (0.3%): | |||||||||||
Mercedes-Benz Group AG | 12,289 | 914 | |||||||||
Volkswagen AG Preference Shares | 11,755 | 1,630 | |||||||||
2,544 | |||||||||||
See notes to financial statements.
6
| USAA Mutual Funds Trust USAA Capital Growth Fund | Schedule of Portfolio Investments — continued January 31, 2023 | ||||||
(Amounts in Thousands, Except for Shares) (Unaudited)
Security Description | Shares | Value | |||||||||
Energy (0.1%): | |||||||||||
VERBIO Vereinigte BioEnergie AG | 7,379 | $ | 465 | ||||||||
Financials (0.5%): | |||||||||||
Allianz SE Registered Shares | 13,681 | 3,271 | |||||||||
Hannover Rueck SE | 3,331 | 676 | |||||||||
3,947 | |||||||||||
Health Care (0.2%): | |||||||||||
Bayer AG Registered Shares | 13,601 | 847 | |||||||||
Merck KGaA | 5,320 | 1,110 | |||||||||
1,957 | |||||||||||
Industrials (0.2%): | |||||||||||
Brenntag SE | 7,172 | 535 | |||||||||
Daimler Truck Holding AG (a) | 13,782 | 463 | |||||||||
MTU Aero Engines AG | 2,015 | 504 | |||||||||
1,502 | |||||||||||
Information Technology (0.5%): | |||||||||||
Infineon Technologies AG | 25,054 | 902 | |||||||||
SAP SE | 25,882 | 3,068 | |||||||||
3,970 | |||||||||||
Utilities (0.1%): | |||||||||||
RWE AG | 25,742 | 1,146 | |||||||||
16,960 | |||||||||||
Greece (0.1%): | |||||||||||
Financials (0.0%): (b) | |||||||||||
National Bank of Greece SA (a) | 90,733 | 431 | |||||||||
Industrials (0.1%): | |||||||||||
Mytilineos SA | 20,748 | 537 | |||||||||
968 | |||||||||||
Hong Kong (0.9%): | |||||||||||
Consumer Discretionary (0.1%): | |||||||||||
| EC Healthcare | 252,000 | 303 | |||||||||
Tam Jai International Co. Ltd. | 542,000 | 185 | |||||||||
488 | |||||||||||
Consumer Staples (0.0%): (b) | |||||||||||
WH Group Ltd. (c) | 552,000 | 340 | |||||||||
Financials (0.2%): | |||||||||||
AIA Group Ltd. | 126,000 | 1,425 | |||||||||
BOC Hong Kong Holdings Ltd. | 134,500 | 470 | |||||||||
1,895 | |||||||||||
Industrials (0.1%): | |||||||||||
China State Construction Development Holdings Ltd. | 918,000 | 249 | |||||||||
CK Hutchison Holdings Ltd. | 78,000 | 496 | |||||||||
745 | |||||||||||
See notes to financial statements.
7
| USAA Mutual Funds Trust USAA Capital Growth Fund | Schedule of Portfolio Investments — continued January 31, 2023 | ||||||
(Amounts in Thousands, Except for Shares) (Unaudited)
Security Description | Shares | Value | |||||||||
Information Technology (0.1%): | |||||||||||
BOE Varitronix Ltd. | 158,000 | $ | 376 | ||||||||
Materials (0.0%): (b) | |||||||||||
Shougang Fushan Resources Group Ltd. | 818,000 | 296 | |||||||||
Real Estate (0.4%): | |||||||||||
CK Asset Holdings Ltd. | 460,000 | 2,941 | |||||||||
7,081 | |||||||||||
India (0.9%): | |||||||||||
Consumer Discretionary (0.1%): | |||||||||||
Asahi India Glass Ltd. | 56,148 | 350 | |||||||||
Raymond Ltd. | 21,945 | 411 | |||||||||
761 | |||||||||||
Consumer Staples (0.0%): (b) | |||||||||||
Dabur India Ltd. | 49,313 | 337 | |||||||||
Financials (0.2%): | |||||||||||
Cholamandalam Investment & Finance Co. Ltd. | 40,771 | 353 | |||||||||
City Union Bank Ltd. | 164,795 | 320 | |||||||||
Home First Finance Co. India Ltd. (a) (c) | 37,527 | 340 | |||||||||
Manappuram Finance Ltd. | 348,790 | 492 | |||||||||
Ujjivan Small Finance Bank Ltd. (a) (c) | 751,379 | 266 | |||||||||
1,771 | |||||||||||
Health Care (0.1%): | |||||||||||
JB Chemicals & Pharmaceuticals Ltd. | 10,874 | 272 | |||||||||
Narayana Hrudayalaya Ltd. | 30,501 | 271 | |||||||||
543 | |||||||||||
Industrials (0.2%): | |||||||||||
Ashoka Buildcon Ltd. (a) | 444,406 | 452 | |||||||||
Blue Star Ltd. | 18,677 | 281 | |||||||||
Craftsman Automation Ltd. | 12,216 | 476 | |||||||||
GMM Pfaudler Ltd. | 13,450 | 271 | |||||||||
1,480 | |||||||||||
Information Technology (0.1%): | |||||||||||
KPIT Technologies Ltd. | 34,887 | 327 | |||||||||
WNS Holdings Ltd., ADR (a) | 3,666 | 311 | |||||||||
638 | |||||||||||
Materials (0.1%): | |||||||||||
APL Apollo Tubes Ltd. | 22,748 | 319 | |||||||||
Finolex Industries Ltd. | 170,341 | 360 | |||||||||
JK Paper Ltd. | 53,226 | 269 | |||||||||
Supreme Industries Ltd. | 12,200 | 378 | |||||||||
1,326 | |||||||||||
See notes to financial statements.
8
| USAA Mutual Funds Trust USAA Capital Growth Fund | Schedule of Portfolio Investments — continued January 31, 2023 | ||||||
(Amounts in Thousands, Except for Shares) (Unaudited)
Security Description | Shares | Value | |||||||||
Utilities (0.1%): | |||||||||||
CESC Ltd. (a) | 366,779 | $ | 325 | ||||||||
PTC India Ltd. | 276,193 | 325 | |||||||||
650 | |||||||||||
7,506 | |||||||||||
Indonesia (0.2%): | |||||||||||
Consumer Discretionary (0.1%): | |||||||||||
PT Mitra Adiperkasa Tbk (a) | 4,325,100 | 376 | |||||||||
Consumer Staples (0.0%): (b) | |||||||||||
PT Industri Jamu Dan Farmasi Sido Muncul Tbk | 4,680,500 | 236 | |||||||||
Financials (0.1%): | |||||||||||
PT Bank CIMB Niaga Tbk | 4,500,500 | 355 | |||||||||
PT Bank Tabungan Pensiunan Nasional Syariah Tbk | 1,581,900 | 270 | |||||||||
625 | |||||||||||
Real Estate (0.0%): (b) | |||||||||||
PT Puradelta Lestari Tbk | 24,920,300 | 276 | |||||||||
1,513 | |||||||||||
Ireland (0.4%): | |||||||||||
Information Technology (0.4%): | |||||||||||
Accenture PLC Class A | 10,957 | 3,058 | |||||||||
Israel (0.2%): | |||||||||||
Financials (0.0%): (b) | |||||||||||
Bank Leumi Le-Israel BM | 45,744 | 404 | |||||||||
Health Care (0.1%): | |||||||||||
Inmode Ltd. (a) | 12,660 | 444 | |||||||||
Information Technology (0.1%): | |||||||||||
Nice Ltd. (a) | 2,440 | 505 | |||||||||
1,353 | |||||||||||
Italy (0.5%): | |||||||||||
Industrials (0.1%): | |||||||||||
Leonardo SpA | 48,535 | 500 | |||||||||
Utilities (0.4%): | |||||||||||
Enel SpA | 289,205 | 1,702 | |||||||||
Iren SpA | 157,285 | 285 | |||||||||
Snam SpA | 304,401 | 1,550 | |||||||||
3,537 | |||||||||||
4,037 | |||||||||||
Japan (6.2%): | |||||||||||
Communication Services (0.6%): | |||||||||||
Capcom Co. Ltd. | 62,300 | 2,019 | |||||||||
Kakaku.com, Inc. | 64,200 | 1,070 | |||||||||
See notes to financial statements.
9
| USAA Mutual Funds Trust USAA Capital Growth Fund | Schedule of Portfolio Investments — continued January 31, 2023 | ||||||
(Amounts in Thousands, Except for Shares) (Unaudited)
Security Description | Shares | Value | |||||||||
Nintendo Co. Ltd. | 10,600 | $ | 460 | ||||||||
Nippon Telegraph & Telephone Corp. | 34,800 | 1,044 | |||||||||
4,593 | |||||||||||
Consumer Discretionary (0.9%): | |||||||||||
Bandai Namco Holdings, Inc. | 5,700 | 381 | |||||||||
Isuzu Motors Ltd. | 65,500 | 828 | |||||||||
Rinnai Corp. | 5,200 | 411 | |||||||||
Subaru Corp. | 28,700 | 472 | |||||||||
Toyota Motor Corp. | 256,900 | 3,773 | |||||||||
ZOZO, Inc. | 50,600 | 1,312 | |||||||||
7,177 | |||||||||||
Consumer Staples (0.3%): | |||||||||||
Ajinomoto Co., Inc. | 23,800 | 785 | |||||||||
Seven & i Holdings Co. Ltd. | 14,600 | 689 | |||||||||
Toyo Suisan Kaisha Ltd. | 30,600 | 1,265 | |||||||||
2,739 | |||||||||||
Financials (1.0%): | |||||||||||
Mitsubishi UFJ Financial Group, Inc. | 394,200 | 2,888 | |||||||||
Mizuho Financial Group, Inc. | 50,920 | 796 | |||||||||
ORIX Corp. | 30,200 | 531 | |||||||||
Sumitomo Mitsui Financial Group, Inc. | 25,800 | 1,121 | |||||||||
Tokio Marine Holdings, Inc. | 126,700 | 2,654 | |||||||||
7,990 | |||||||||||
Health Care (0.7%): | |||||||||||
Hoya Corp. | 23,000 | 2,529 | |||||||||
Nippon Shinyaku Co. Ltd. | 7,000 | 360 | |||||||||
Olympus Corp. | 25,100 | 472 | |||||||||
Ono Pharmaceutical Co. Ltd. | 27,600 | 599 | |||||||||
Shionogi & Co. Ltd. | 33,400 | 1,592 | |||||||||
5,552 | |||||||||||
Industrials (1.7%): | |||||||||||
Fuji Electric Co. Ltd. | 62,300 | 2,522 | |||||||||
Hitachi Ltd. | 9,000 | 472 | |||||||||
ITOCHU Corp. | 36,200 | 1,170 | |||||||||
Komatsu Ltd. | 30,600 | 752 | |||||||||
MISUMI Group, Inc. | 59,400 | 1,495 | |||||||||
Mitsubishi Heavy Industries Ltd. | 43,700 | 1,714 | |||||||||
Mitsui & Co. Ltd. | 32,200 | 950 | |||||||||
NIPPON EXPRESS HOLDINGS, Inc. | 9,600 | 557 | |||||||||
Nippon Yusen KK (d) | 71,100 | 1,692 | |||||||||
OKUMA Corp. | 20,400 | 827 | |||||||||
Sanwa Holdings Corp. | 191,000 | 2,022 | |||||||||
14,173 | |||||||||||
Information Technology (0.7%): | |||||||||||
Advantest Corp. | 7,700 | 552 | |||||||||
Canon, Inc. | 17,900 | 397 | |||||||||
See notes to financial statements.
10
| USAA Mutual Funds Trust USAA Capital Growth Fund | Schedule of Portfolio Investments — continued January 31, 2023 | ||||||
(Amounts in Thousands, Except for Shares) (Unaudited)
Security Description | Shares | Value | |||||||||
Fujitsu Ltd. | 19,300 | $ | 2,748 | ||||||||
TDK Corp. | 18,800 | 672 | |||||||||
Ulvac, Inc. | 30,500 | 1,427 | |||||||||
5,796 | |||||||||||
Materials (0.1%): | |||||||||||
Shin-Etsu Chemical Co. Ltd. | 4,000 | 590 | |||||||||
Tosoh Corp. | 37,600 | 492 | |||||||||
1,082 | |||||||||||
Real Estate (0.1%): | |||||||||||
Mitsui Fudosan Co. Ltd. | 26,300 | 493 | |||||||||
Utilities (0.1%): | |||||||||||
Tokyo Gas Co. Ltd. | 40,800 | 854 | |||||||||
50,449 | |||||||||||
Korea, Republic Of (0.7%): | |||||||||||
Communication Services (0.1%): | |||||||||||
JYP Entertainment Corp. | 10,074 | 597 | |||||||||
Consumer Discretionary (0.1%): | |||||||||||
Danawa Co. Ltd. (a) | 9,672 | 123 | |||||||||
Handsome Co. Ltd. | 17,216 | 384 | |||||||||
Shinsegae, Inc. | 2,046 | 386 | |||||||||
893 | |||||||||||
Consumer Staples (0.1%): | |||||||||||
BGF retail Co. Ltd. | 2,019 | 306 | |||||||||
Financials (0.1%): | |||||||||||
DGB Financial Group, Inc. | 45,140 | 293 | |||||||||
JB Financial Group Co. Ltd. | 37,633 | 311 | |||||||||
KIWOOM Securities Co. Ltd. | 4,266 | 342 | |||||||||
946 | |||||||||||
Health Care (0.1%): | |||||||||||
Daewoong Pharmaceutical Co. Ltd. | 2,211 | 274 | |||||||||
Hugel, Inc. (a) | 3,487 | 403 | |||||||||
InBody Co. Ltd. | 12,563 | 227 | |||||||||
I-Sens, Inc. | 5,853 | 167 | |||||||||
1,071 | |||||||||||
Industrials (0.1%): | |||||||||||
CJ Corp. | 4,407 | 296 | |||||||||
Hanwha Aerospace Co. Ltd. | 5,402 | 354 | |||||||||
650 | |||||||||||
Information Technology (0.1%): | |||||||||||
Hana Materials, Inc. | 11,168 | 345 | |||||||||
Innox Advanced Materials Co. Ltd. | 14,544 | 371 | |||||||||
Samwha Capacitor Co. Ltd. | 11,147 | 352 | |||||||||
1,068 | |||||||||||
See notes to financial statements.
11
| USAA Mutual Funds Trust USAA Capital Growth Fund | Schedule of Portfolio Investments — continued January 31, 2023 | ||||||
(Amounts in Thousands, Except for Shares) (Unaudited)
Security Description | Shares | Value | |||||||||
Materials (0.0%): (b) | |||||||||||
PI Advanced Materials Co. Ltd. | 9,579 | $ | 267 | ||||||||
5,798 | |||||||||||
Luxembourg (0.2%): | |||||||||||
Energy (0.1%): | |||||||||||
Tenaris SA | 41,547 | 736 | |||||||||
Health Care (0.1%): | |||||||||||
Eurofins Scientific SE | 5,977 | 429 | |||||||||
1,165 | |||||||||||
Malaysia (0.1%): | |||||||||||
Consumer Discretionary (0.0%): (b) | |||||||||||
Bermaz Auto Bhd | 688,800 | 351 | |||||||||
Financials (0.1%): | |||||||||||
Hong Leong Financial Group Bhd | 85,000 | 369 | |||||||||
Materials (0.0%): (b) | |||||||||||
Evergreen Fibreboard Bhd | 2,544,100 | 237 | |||||||||
957 | |||||||||||
Mexico (0.2%): | |||||||||||
Consumer Discretionary (0.1%): | |||||||||||
Alsea SAB de CV (a) | 153,537 | 366 | |||||||||
Financials (0.1%): | |||||||||||
Regional SAB de CV (d) | 66,157 | 571 | |||||||||
Real Estate (0.0%): (b) | |||||||||||
Prologis Property Mexico SA de CV | 110,420 | 359 | |||||||||
1,296 | |||||||||||
Netherlands (1.9%): | |||||||||||
Communication Services (0.3%): | |||||||||||
Koninklijke KPN NV | 795,090 | 2,718 | |||||||||
Consumer Staples (0.2%): | |||||||||||
Heineken NV | 4,869 | 487 | |||||||||
Koninklijke Ahold Delhaize NV | 33,579 | 1,002 | |||||||||
1,489 | |||||||||||
Financials (0.5%): | |||||||||||
ING Groep NV | 244,525 | 3,540 | |||||||||
NN Group NV | 11,972 | 520 | |||||||||
4,060 | |||||||||||
Health Care (0.1%): | |||||||||||
QIAGEN NV (a) | 11,517 | 562 | |||||||||
Industrials (0.0%): (b) | |||||||||||
Signify NV (c) | 9,587 | 347 | |||||||||
See notes to financial statements.
12
| USAA Mutual Funds Trust USAA Capital Growth Fund | Schedule of Portfolio Investments — continued January 31, 2023 | ||||||
(Amounts in Thousands, Except for Shares) (Unaudited)
Security Description | Shares | Value | |||||||||
Information Technology (0.4%): | |||||||||||
ASM International NV | 6,946 | $ | 2,349 | ||||||||
STMicroelectronics NV | 22,867 | 1,076 | |||||||||
3,425 | |||||||||||
Materials (0.4%): | |||||||||||
LyondellBasell Industries NV Class A | 30,821 | 2,980 | |||||||||
Real Estate (0.0%): (b) | |||||||||||
NEPI Rockcastle NV | 1 | — | (e) | ||||||||
15,581 | |||||||||||
New Zealand (0.1%): | |||||||||||
Health Care (0.1%): | |||||||||||
Fisher & Paykel Healthcare Corp. Ltd. | 64,001 | 1,050 | |||||||||
Norway (0.3%): | |||||||||||
Consumer Staples (0.1%): | |||||||||||
Mowi ASA | 25,844 | 478 | |||||||||
Energy (0.1%): | |||||||||||
Aker BP ASA | 16,948 | 516 | |||||||||
Equinor ASA | 13,379 | 408 | |||||||||
924 | |||||||||||
Financials (0.0%): (b) | |||||||||||
SpareBank 1 SMN | 31,558 | 403 | |||||||||
Materials (0.1%): | |||||||||||
Yara International ASA | 12,230 | 544 | |||||||||
2,349 | |||||||||||
Russian Federation (0.0%): (b) | |||||||||||
Consumer Discretionary (0.0%): | |||||||||||
Detsky Mir PJSC (a) (c) (f) (g) | 214,920 | 3 | |||||||||
Financials (0.0%): | |||||||||||
Bank St Petersburg PJSC (f) (g) | 372,110 | 3 | |||||||||
Industrials (0.0%): | |||||||||||
Globaltrans Investment PLC Registered Shares, GDR (a) (f) | 54,896 | 2 | |||||||||
8 | |||||||||||
Saudi Arabia (0.1%): | |||||||||||
Energy (0.1%): | |||||||||||
Aldrees Petroleum and Transport Services Co. | 25,325 | 539 | |||||||||
Singapore (0.3%): | |||||||||||
Consumer Staples (0.1%): | |||||||||||
Wilmar International Ltd. | 272,600 | 848 | |||||||||
Financials (0.1%): | |||||||||||
DBS Group Holdings Ltd. | 29,000 | 794 | |||||||||
See notes to financial statements.
13
| USAA Mutual Funds Trust USAA Capital Growth Fund | Schedule of Portfolio Investments — continued January 31, 2023 | ||||||
(Amounts in Thousands, Except for Shares) (Unaudited)
Security Description | Shares | Value | |||||||||
Utilities (0.1%): | |||||||||||
Sembcorp Industries Ltd. | 215,300 | $ | 594 | ||||||||
2,236 | |||||||||||
South Africa (0.0%): (b) | |||||||||||
Industrials (0.0%): | |||||||||||
The Bidvest Group Ltd. | 27,083 | 350 | |||||||||
Spain (0.8%): | |||||||||||
Energy (0.1%): | |||||||||||
Repsol SA | 28,503 | 468 | |||||||||
Financials (0.5%): | |||||||||||
Banco Bilbao Vizcaya Argentaria SA | 440,500 | 3,111 | |||||||||
Banco Santander SA | 208,261 | 728 | |||||||||
Bankinter SA | 68,533 | 494 | |||||||||
4,333 | |||||||||||
Utilities (0.2%): | |||||||||||
Corp. ACCIONA Energias Renovables SA | 16,040 | 656 | |||||||||
Iberdrola SA | 56,087 | 658 | |||||||||
1,314 | |||||||||||
6,115 | |||||||||||
Sweden (0.9%): | |||||||||||
Consumer Discretionary (0.1%): | |||||||||||
Evolution AB (c) | 6,605 | 743 | |||||||||
Industrials (0.7%): | |||||||||||
Atlas Copco AB Class B | 316,801 | 3,343 | |||||||||
Nibe Industrier AB Class B | 175,340 | 1,895 | |||||||||
Volvo AB Class B | 28,835 | 572 | |||||||||
5,810 | |||||||||||
Materials (0.1%): | |||||||||||
Boliden AB | 14,205 | 638 | |||||||||
7,191 | |||||||||||
Switzerland (3.8%): | |||||||||||
Consumer Discretionary (0.2%): | |||||||||||
Cie Financiere Richemont SA Registered Shares | 9,056 | 1,397 | |||||||||
Consumer Staples (1.2%): | |||||||||||
Coca-Cola HBC AG | 85,720 | 2,083 | |||||||||
Nestle SA Registered Shares | 64,720 | 7,899 | |||||||||
9,982 | |||||||||||
Financials (0.8%): | |||||||||||
Julius Baer Group Ltd. | 11,012 | 707 | |||||||||
Partners Group Holding AG | 1,094 | 1,027 | |||||||||
Swiss Life Holding AG | 1,082 | 640 | |||||||||
UBS Group AG | 176,705 | 3,773 | |||||||||
6,147 | |||||||||||
See notes to financial statements.
14
| USAA Mutual Funds Trust USAA Capital Growth Fund | Schedule of Portfolio Investments — continued January 31, 2023 | ||||||
(Amounts in Thousands, Except for Shares) (Unaudited)
Security Description | Shares | Value | |||||||||
Health Care (1.3%): | |||||||||||
Novartis AG Registered Shares | 61,277 | $ | 5,542 | ||||||||
Roche Holding AG | 17,482 | 5,459 | |||||||||
11,001 | |||||||||||
Industrials (0.1%): | |||||||||||
ABB Ltd. Registered Shares | 14,738 | 513 | |||||||||
Materials (0.2%): | |||||||||||
Glencore PLC | 145,347 | 973 | |||||||||
Holcim AG | 11,117 | 665 | |||||||||
1,638 | |||||||||||
30,678 | |||||||||||
Taiwan (0.7%): | |||||||||||
Consumer Discretionary (0.1%): | |||||||||||
Fulgent Sun International Holding Co. Ltd. | 49,000 | 217 | |||||||||
Tong Yang Industry Co. Ltd. | 204,000 | 308 | |||||||||
525 | |||||||||||
Health Care (0.1%): | |||||||||||
Lotus Pharmaceutical Co. Ltd. | 32,000 | 255 | |||||||||
Pegavision Corp. | 19,000 | 289 | |||||||||
Universal Vision Biotechnology Co. Ltd. | 35,350 | 386 | |||||||||
930 | |||||||||||
Industrials (0.1%): | |||||||||||
Chicony Power Technology Co. Ltd. | 179,000 | 461 | |||||||||
Symtek Automation Asia Co. Ltd. | 87,000 | 269 | |||||||||
Turvo International Co. Ltd. | 62,000 | 209 | |||||||||
939 | |||||||||||
Information Technology (0.3%): | |||||||||||
Gold Circuit Electronics Ltd. | 171,400 | 503 | |||||||||
King Yuan Electronics Co. Ltd. | 338,000 | 434 | |||||||||
Macronix International Co. Ltd. | 378,000 | 454 | |||||||||
Sigurd Microelectronics Corp. | 206,000 | 351 | |||||||||
Tripod Technology Corp. | 101,000 | 334 | |||||||||
Wiwynn Corp. | 15,000 | 377 | |||||||||
Zhen Ding Technology Holding Ltd. | 101,000 | 373 | |||||||||
2,826 | |||||||||||
Materials (0.1%): | |||||||||||
Taiwan Hon Chuan Enterprise Co. Ltd. | 155,000 | 464 | |||||||||
5,684 | |||||||||||
Thailand (0.2%): | |||||||||||
Consumer Discretionary (0.0%): (b) | |||||||||||
AAPICO Hitech PCL | 265,700 | 267 | |||||||||
Financials (0.1%): | |||||||||||
AEON Thana Sinsap Thailand PCL-NVDR | 65,500 | 397 | |||||||||
See notes to financial statements.
15
| USAA Mutual Funds Trust USAA Capital Growth Fund | Schedule of Portfolio Investments — continued January 31, 2023 | ||||||
(Amounts in Thousands, Except for Shares) (Unaudited)
Security Description | Shares | Value | |||||||||
Health Care (0.0%): (b) | |||||||||||
Mega Lifesciences PCL | 173,300 | $ | 275 | ||||||||
Industrials (0.0%): (b) | |||||||||||
STARK Corp. PCL-NVDR (a) | 2,235,300 | 203 | |||||||||
Real Estate (0.1%): | |||||||||||
AP Thailand PCL | 1,756,800 | 635 | |||||||||
1,777 | |||||||||||
United Arab Emirates (0.0%): (b) | |||||||||||
Industrials (0.0%): | |||||||||||
RAS Al Khaimah Ceramics | 365,205 | 278 | |||||||||
United Kingdom (5.3%): | |||||||||||
Communication Services (0.1%): | |||||||||||
Informa PLC | 64,318 | 532 | |||||||||
WPP PLC | 32,723 | 382 | |||||||||
914 | |||||||||||
Consumer Discretionary (0.4%): | |||||||||||
JD Sports Fashion PLC | 492,687 | 993 | |||||||||
Next PLC | 16,141 | 1,321 | |||||||||
Stellantis NV | 86,304 | 1,357 | |||||||||
3,671 | |||||||||||
Consumer Staples (0.8%): | |||||||||||
Diageo PLC | 67,428 | 2,948 | |||||||||
Imperial Brands PLC | 102,261 | 2,565 | |||||||||
Reckitt Benckiser Group PLC | 6,642 | 473 | |||||||||
Tesco PLC | 234,076 | 711 | |||||||||
6,697 | |||||||||||
Energy (1.1%): | |||||||||||
| BP PLC | 699,385 | 4,224 | |||||||||
Harbour Energy PLC | 88,930 | 344 | |||||||||
Shell PLC | 162,224 | 4,761 | |||||||||
9,329 | |||||||||||
Financials (1.0%): | |||||||||||
| 3i Group PLC | 57,221 | 1,116 | |||||||||
Barclays PLC | 840,056 | 1,931 | |||||||||
HSBC Holdings PLC | 376,821 | 2,776 | |||||||||
Legal & General Group PLC | 450,914 | 1,418 | |||||||||
Standard Chartered PLC | 120,238 | 1,010 | |||||||||
8,251 | |||||||||||
Health Care (0.3%): | |||||||||||
AstraZeneca PLC | 13,470 | 1,765 | |||||||||
CVS Group PLC | 24,301 | 604 | |||||||||
2,369 | |||||||||||
Industrials (0.5%): | |||||||||||
Ashtead Group PLC | 48,879 | 3,219 | |||||||||
See notes to financial statements.
16
| USAA Mutual Funds Trust USAA Capital Growth Fund | Schedule of Portfolio Investments — continued January 31, 2023 | ||||||
(Amounts in Thousands, Except for Shares) (Unaudited)
Security Description | Shares | Value | |||||||||
BAE Systems PLC | 44,747 | $ | 473 | ||||||||
RS GROUP PLC | 38,429 | 447 | |||||||||
4,139 | |||||||||||
Information Technology (0.1%): | |||||||||||
The Sage Group PLC | 46,929 | 451 | |||||||||
Materials (0.8%): | |||||||||||
Anglo American PLC | 12,412 | 535 | |||||||||
Croda International PLC | 13,991 | 1,192 | |||||||||
Pan African Resources PLC | 1,432,067 | 292 | |||||||||
Rio Tinto PLC | 59,061 | 4,624 | |||||||||
6,643 | |||||||||||
Real Estate (0.1%): | |||||||||||
Safestore Holdings PLC | 39,370 | 490 | |||||||||
Utilities (0.1%): | |||||||||||
Drax Group PLC | 52,936 | 423 | |||||||||
43,377 | |||||||||||
United States (61.3%): | |||||||||||
Communication Services (4.5%): | |||||||||||
Alphabet, Inc. Class C (a) | 77,771 | 7,767 | |||||||||
AT&T, Inc. | 331,228 | 6,747 | |||||||||
Comcast Corp. Class A | 96,050 | 3,779 | |||||||||
Match Group, Inc. (a) | 45,122 | 2,442 | |||||||||
Meta Platforms, Inc. Class A (a) | 31,550 | 4,700 | |||||||||
Sirius XM Holdings, Inc. (d) | 749,711 | 4,341 | |||||||||
T-Mobile U.S., Inc. (a) | 20,026 | 2,990 | |||||||||
Verizon Communications, Inc. | 88,665 | 3,686 | |||||||||
36,452 | |||||||||||
Consumer Discretionary (4.9%): | |||||||||||
AutoZone, Inc. (a) | 2,173 | 5,300 | |||||||||
Best Buy Co., Inc. | 31,339 | 2,780 | |||||||||
Dollar General Corp. | 10,703 | 2,500 | |||||||||
Ford Motor Co. | 195,359 | 2,639 | |||||||||
General Motors Co. | 69,295 | 2,725 | |||||||||
Genuine Parts Co. | 14,359 | 2,410 | |||||||||
Lennar Corp. Class A | 30,182 | 3,091 | |||||||||
Lowe's Cos., Inc. | 15,013 | 3,126 | |||||||||
McDonald's Corp. | 12,891 | 3,447 | |||||||||
O'Reilly Automotive, Inc. (a) | 6,602 | 5,231 | |||||||||
Samsonite International SA (a) (c) | 108,000 | 322 | |||||||||
Target Corp. | 13,211 | 2,274 | |||||||||
The Home Depot, Inc. | 12,367 | 4,009 | |||||||||
39,854 | |||||||||||
Consumer Staples (3.1%): | |||||||||||
Altria Group, Inc. | 130,276 | 5,868 | |||||||||
Colgate-Palmolive Co. | 35,597 | 2,653 | |||||||||
General Mills, Inc. | 35,678 | 2,796 | |||||||||
See notes to financial statements.
17
| USAA Mutual Funds Trust USAA Capital Growth Fund | Schedule of Portfolio Investments — continued January 31, 2023 | ||||||
(Amounts in Thousands, Except for Shares) (Unaudited)
Security Description | Shares | Value | |||||||||
PepsiCo, Inc. | 20,568 | $ | 3,517 | ||||||||
Philip Morris International, Inc. | 32,449 | 3,382 | |||||||||
The Hershey Co. | 12,465 | 2,800 | |||||||||
Tyson Foods, Inc. Class A | 34,150 | 2,245 | |||||||||
Walgreens Boots Alliance, Inc. | 55,442 | 2,044 | |||||||||
25,305 | |||||||||||
Energy (3.6%): | |||||||||||
Chevron Corp. | 21,714 | 3,779 | |||||||||
ConocoPhillips | 24,961 | 3,042 | |||||||||
Devon Energy Corp. | 34,397 | 2,175 | |||||||||
EOG Resources, Inc. | 18,635 | 2,465 | |||||||||
Exxon Mobil Corp. | 83,307 | 9,665 | |||||||||
Marathon Oil Corp. | 80,025 | 2,198 | |||||||||
Marathon Petroleum Corp. | 23,282 | 2,992 | |||||||||
Valero Energy Corp. | 19,934 | 2,791 | |||||||||
29,107 | |||||||||||
Financials (8.1%): | |||||||||||
American Express Co. | 18,818 | 3,292 | |||||||||
Annaly Capital Management, Inc. | 4,825 | 113 | |||||||||
Aon PLC Class A | 8,957 | 2,854 | |||||||||
Arch Capital Group Ltd. (a) | 46,001 | 2,960 | |||||||||
Berkshire Hathaway, Inc. Class B (a) | 28,080 | 8,747 | |||||||||
Capital One Financial Corp. | 26,130 | 3,109 | |||||||||
Citigroup, Inc. | 61,098 | 3,191 | |||||||||
FactSet Research Systems, Inc. | 5,514 | 2,332 | |||||||||
JPMorgan Chase & Co. | 33,022 | 4,622 | |||||||||
LPL Financial Holdings, Inc. | 10,293 | 2,441 | |||||||||
M&T Bank Corp. | 15,357 | 2,396 | |||||||||
Marsh & McLennan Cos., Inc. | 16,946 | 2,964 | |||||||||
MetLife, Inc. | 38,158 | 2,786 | |||||||||
Morgan Stanley | 34,414 | 3,350 | |||||||||
MSCI, Inc. | 4,862 | 2,584 | |||||||||
Prudential Financial, Inc. | 25,772 | 2,704 | |||||||||
Raymond James Financial, Inc. | 20,694 | 2,334 | |||||||||
Regions Financial Corp. | 110,817 | 2,609 | |||||||||
T. Rowe Price Group, Inc. | 11,129 | 1,296 | |||||||||
The Goldman Sachs Group, Inc. | 8,342 | 3,052 | |||||||||
The Progressive Corp. | 22,801 | 3,109 | |||||||||
W.R. Berkley Corp. | 37,239 | 2,612 | |||||||||
65,457 | |||||||||||
Health Care (11.1%): | |||||||||||
AbbVie, Inc. | 50,312 | 7,434 | |||||||||
AmerisourceBergen Corp. | 17,264 | 2,917 | |||||||||
Amgen, Inc. | 33,754 | 8,520 | |||||||||
Biogen, Inc. (a) | 9,167 | 2,667 | |||||||||
Bristol-Myers Squibb Co. | 87,121 | 6,329 | |||||||||
Cigna Corp. | 19,757 | 6,256 | |||||||||
CVS Health Corp. | 32,485 | 2,866 | |||||||||
See notes to financial statements.
18
| USAA Mutual Funds Trust USAA Capital Growth Fund | Schedule of Portfolio Investments — continued January 31, 2023 | ||||||
(Amounts in Thousands, Except for Shares) (Unaudited)
Security Description | Shares | Value | |||||||||
Elevance Health, Inc. | 12,880 | $ | 6,440 | ||||||||
Eli Lilly & Co. | 21,661 | 7,455 | |||||||||
Gilead Sciences, Inc. | 37,082 | 3,113 | |||||||||
IDEXX Laboratories, Inc. (a) | 5,874 | 2,822 | |||||||||
Johnson & Johnson | 26,235 | 4,287 | |||||||||
McKesson Corp. | 7,880 | 2,984 | |||||||||
Merck & Co., Inc. | 74,978 | 8,053 | |||||||||
Mettler-Toledo International, Inc. (a) | 1,728 | 2,649 | |||||||||
Pfizer, Inc. | 79,789 | 3,523 | |||||||||
UnitedHealth Group, Inc. | 18,658 | 9,314 | |||||||||
Waters Corp. (a) | 7,411 | 2,435 | |||||||||
90,064 | |||||||||||
Industrials (7.0%): | |||||||||||
3M Co. | 22,164 | 2,551 | |||||||||
Carlisle Cos., Inc. | 10,461 | 2,624 | |||||||||
Cintas Corp. | 5,793 | 2,571 | |||||||||
Cummins, Inc. | 10,949 | 2,732 | |||||||||
Fastenal Co. | 48,587 | 2,456 | |||||||||
FedEx Corp. | 12,733 | 2,468 | |||||||||
General Dynamics Corp. | 22,799 | 5,314 | |||||||||
Illinois Tool Works, Inc. | 11,717 | 2,766 | |||||||||
Lockheed Martin Corp. | 19,141 | 8,867 | |||||||||
Masco Corp. | 47,021 | 2,502 | |||||||||
Northrop Grumman Corp. | 5,644 | 2,529 | |||||||||
Otis Worldwide Corp. | 30,668 | 2,522 | |||||||||
PACCAR, Inc. | 52,632 | 5,753 | |||||||||
Republic Services, Inc. | 20,437 | 2,551 | |||||||||
United Parcel Service, Inc. Class B | 17,434 | 3,229 | |||||||||
W.W. Grainger, Inc. | 8,817 | 5,197 | |||||||||
56,632 | |||||||||||
Information Technology (13.0%): | |||||||||||
Adobe, Inc. (a) | 8,799 | 3,259 | |||||||||
Apple, Inc. | 174,384 | 25,162 | |||||||||
Automatic Data Processing, Inc. | 11,775 | 2,659 | |||||||||
Broadcom, Inc. | 6,678 | 3,907 | |||||||||
Cisco Systems, Inc. | 147,817 | 7,194 | |||||||||
Cognizant Technology Solutions Corp. Class A | 45,371 | 3,028 | |||||||||
Enphase Energy, Inc. (a) | 8,900 | 1,970 | |||||||||
Fair Isaac Corp. (a) | 8,046 | 5,358 | |||||||||
HP, Inc. | 167,194 | 4,872 | |||||||||
Intel Corp. | 100,610 | 2,843 | |||||||||
International Business Machines Corp. | 43,390 | 5,846 | |||||||||
Micron Technology, Inc. | 44,358 | 2,675 | |||||||||
Microsoft Corp. | 42,496 | 10,531 | |||||||||
Motorola Solutions, Inc. | 10,704 | 2,751 | |||||||||
ON Semiconductor Corp. (a) | 33,531 | 2,463 | |||||||||
Oracle Corp. | 39,911 | 3,530 | |||||||||
Palo Alto Networks, Inc. (a) | 15,964 | 2,532 | |||||||||
Parade Technologies Ltd. | 13,000 | 402 | |||||||||
See notes to financial statements.
19
| USAA Mutual Funds Trust USAA Capital Growth Fund | Schedule of Portfolio Investments — continued January 31, 2023 | ||||||
(Amounts in Thousands, Except for Shares) (Unaudited)
Security Description | Shares | Value | |||||||||
Paychex, Inc. | 21,665 | $ | 2,510 | ||||||||
QUALCOMM, Inc. | 24,687 | 3,289 | |||||||||
Texas Instruments, Inc. | 35,780 | 6,341 | |||||||||
VeriSign, Inc. (a) | 12,565 | 2,740 | |||||||||
105,862 | |||||||||||
Materials (2.3%): | |||||||||||
CF Industries Holdings, Inc. | 22,490 | 1,905 | |||||||||
Corteva, Inc. | 38,543 | 2,484 | |||||||||
Nucor Corp. | 37,976 | 6,419 | |||||||||
Sealed Air Corp. | 48,519 | 2,657 | |||||||||
Steel Dynamics, Inc. | 25,246 | 3,046 | |||||||||
The Sherwin-Williams Co. | 10,671 | 2,524 | |||||||||
19,035 | |||||||||||
Real Estate (1.7%): | |||||||||||
Alexandria Real Estate Equities, Inc. | 1,930 | 310 | |||||||||
American Homes 4 Rent Class A | 4,295 | 147 | |||||||||
American Tower Corp. | 6,092 | 1,361 | |||||||||
AvalonBay Communities, Inc. | 1,861 | 330 | |||||||||
Boston Properties, Inc. | 1,975 | 147 | |||||||||
Camden Property Trust | 1,344 | 166 | |||||||||
CBRE Group, Inc. Class A (a) | 4,471 | 382 | |||||||||
Crown Castle, Inc. | 5,797 | 859 | |||||||||
Digital Realty Trust, Inc. | 3,771 | 432 | |||||||||
Equinix, Inc. | 1,196 | 883 | |||||||||
Equity LifeStyle Properties, Inc. | 2,333 | 167 | |||||||||
Equity Residential | 4,745 | 302 | |||||||||
Essex Property Trust, Inc. | 867 | 196 | |||||||||
Extra Space Storage, Inc. | 1,782 | 281 | |||||||||
Gaming and Leisure Properties, Inc. | 3,642 | 195 | |||||||||
Healthpeak Properties, Inc. | 7,186 | 197 | |||||||||
Host Hotels & Resorts, Inc. | 9,459 | 178 | |||||||||
Invitation Homes, Inc. | 7,714 | 251 | |||||||||
Iron Mountain, Inc. | 3,875 | 212 | |||||||||
Kimco Realty Corp. | 8,470 | 190 | |||||||||
Medical Properties Trust, Inc. | 7,895 | 102 | |||||||||
Mid-America Apartment Communities, Inc. | 1,549 | 258 | |||||||||
Prologis, Inc. | 12,361 | 1,598 | |||||||||
Public Storage | 2,105 | 641 | |||||||||
Realty Income Corp. | 7,353 | 499 | |||||||||
Regency Centers Corp. | 2,034 | 136 | |||||||||
SBA Communications Corp. | 1,470 | 437 | |||||||||
Simon Property Group, Inc. | 4,380 | 563 | |||||||||
Sun Communities, Inc. | 1,548 | 243 | |||||||||
UDR, Inc. | 3,947 | 168 | |||||||||
Ventas, Inc. | 5,242 | 272 | |||||||||
VICI Properties, Inc. | 13,289 | 454 | |||||||||
Vornado Realty Trust | 2,165 | 53 | |||||||||
Welltower, Inc. | 5,647 | 424 | |||||||||
Weyerhaeuser Co. | 10,027 | 345 | |||||||||
See notes to financial statements.
20
| USAA Mutual Funds Trust USAA Capital Growth Fund | Schedule of Portfolio Investments — continued January 31, 2023 | ||||||
(Amounts in Thousands, Except for Shares) (Unaudited)
Security Description | Shares | Value | |||||||||
WP Carey, Inc. | 2,465 | $ | 211 | ||||||||
Zillow Group, Inc. Class C (a) | 3,049 | 135 | |||||||||
13,725 | |||||||||||
Utilities (2.0%): | |||||||||||
Consolidated Edison, Inc. | 30,028 | 2,862 | |||||||||
DTE Energy Co. | 21,743 | 2,530 | |||||||||
Exelon Corp. | 72,962 | 3,078 | |||||||||
Sempra Energy | 17,651 | 2,830 | |||||||||
The AES Corp. | 88,490 | 2,426 | |||||||||
UGI Corp. | 62,478 | 2,490 | |||||||||
16,216 | |||||||||||
497,709 | |||||||||||
Total Common Stocks (Cost $672,281) | 805,821 | ||||||||||
Exchange-Traded Funds (0.2%) | |||||||||||
United States (0.2%): | |||||||||||
iShares Core MSCI EAFE ETF | 19,061 | 1,278 | |||||||||
Total Exchange-Traded Funds (Cost $1,225) | 1,278 | ||||||||||
Collateral for Securities Loaned (0.5%)^ | |||||||||||
United States (0.5%): | |||||||||||
| Goldman Sachs Financial Square Government Fund, Institutional Shares, 4.22% (h) | 1,129,562 | 1,130 | |||||||||
HSBC U.S. Government Money Market Fund, Institutional Shares, 4.21% (h) | 1,129,562 | 1,129 | |||||||||
Invesco Government & Agency Portfolio, Institutional Shares, 4.31% (h) | 1,129,562 | 1,130 | |||||||||
| Morgan Stanley Institutional Liquidity Government Portfolio, Institutional Shares, 4.14% (h) | 1,129,562 | 1,129 | |||||||||
Total Collateral for Securities Loaned (Cost $4,518) | 4,518 | ||||||||||
Total Investments (Cost $678,024) — 99.9% | 811,617 | ||||||||||
Other assets in excess of liabilities — 0.1% | 524 | ||||||||||
NET ASSETS — 100.00% | $ | 812,141 | |||||||||
^ Purchased with cash collateral from securities on loan.
(a) Non-income producing security.
(b) Amount represents less than 0.05% of net assets.
(c) Rule 144A security or other security that is restricted as to resale to institutional investors. As of January 31, 2023, the fair value of these securities was $5,514 thousands and amounted to 0.7% of net assets.
(d) All or a portion of this security is on loan.
(e) Rounds to less than $1 thousand.
See notes to financial statements.
21
| USAA Mutual Funds Trust USAA Capital Growth Fund | Schedule of Portfolio Investments — continued January 31, 2023 | ||||||
(Unaudited)
(f) Security was fair valued based upon procedures approved by the Board of Trustees and represents less than 0.05% of net assets as of January 31, 2023. This security is classified as Level 3 within the fair value hierarchy. (See Note 2 in the Notes to Financial Statements)
(g) The following table details the earliest acquisition date and cost of the Fund's Russian sanctioned restricted securities at January 31, 2023 (amount in thousand):
Security Name | Acquisition Date | Cost | |||||||||
Bank St Petersburg PJSC | 12/15/2021 | $ | 410 | ||||||||
Detsky Mir PJSC | 9/30/2020 | 348 | |||||||||
(h) Rate disclosed is the daily yield on January 31, 2023.
ADR — American Depositary Receipt
ETF — Exchange-Traded Fund
GDR — Global Depositary Receipt
NVDR — Non-Voting Depository Receipt
PCL — Public Company Limited
PLC — Public Limited Company
See notes to financial statements.
22
USAA Mutual Funds Trust | Statement of Assets and Liabilities January 31, 2023 | ||||||
(Amounts in Thousands, Except Per Share Amounts) (Unaudited)
| USAA Capital Growth Fund | |||||||
Assets: | |||||||
Investments, at value (Cost $678,024) | $ | 811,617 | (a) | ||||
Foreign currency, at value (Cost $494) | 498 | ||||||
Cash | 3,772 | ||||||
Receivables: | |||||||
Interest and dividends | 760 | ||||||
Capital shares issued | 43 | ||||||
Investments sold | 490 | ||||||
Reclaims | 1,054 | ||||||
From Adviser | 3 | ||||||
Prepaid expenses | 11 | ||||||
Total Assets | 818,248 | ||||||
Liabilities: | |||||||
Payables: | |||||||
Collateral received on loaned securities | 4,518 | ||||||
Investments purchased | 155 | ||||||
Capital shares redeemed | 425 | ||||||
Accrued foreign capital gains taxes | 160 | ||||||
Accrued expenses and other payables: | |||||||
Investment advisory fees | 534 | ||||||
Administration fees | 101 | ||||||
Custodian fees | 29 | ||||||
Transfer agent fees | 90 | ||||||
Compliance fees | 1 | ||||||
Trustees' fees | 1 | ||||||
Other accrued expenses | 93 | ||||||
Total Liabilities | 6,107 | ||||||
Net Assets: | |||||||
Capital | 692,013 | ||||||
Total accumulated earnings/(loss) | 120,128 | ||||||
Net Assets | $ | 812,141 | |||||
Net Assets | |||||||
Fund Shares | $ | 809,701 | |||||
Institutional Shares | 2,440 | ||||||
Total | $ | 812,141 | |||||
Shares (unlimited number of shares authorized with no par value): | |||||||
Fund Shares | 74,075 | ||||||
Institutional Shares | 221 | ||||||
Total | 74,296 | ||||||
Net asset value, offering and redemption price per share: (b) | |||||||
Fund Shares | $ | 10.93 | |||||
Institutional Shares | 11.03 | ||||||
(a) Includes $6,034 thousand of securities on loan.
(b) Per share amount may not recalculate due to rounding of net assets and/or shares outstanding.
See notes to financial statements.
23
USAA Mutual Funds Trust | Statement of Operations For the Six Months Ended January 31, 2023 | ||||||
(Amounts in Thousands) (Unaudited)
| USAA Capital Growth Fund | |||||||
Investment Income: | |||||||
Dividends | $ | 9,413 | |||||
Interest | 25 | ||||||
Securities lending (net of fees) | 205 | ||||||
Foreign tax withholding | (480 | ) | |||||
Total Income | 9,163 | ||||||
Expenses: | |||||||
Investment advisory fees | 3,087 | ||||||
Administration fees — Fund Shares | 582 | ||||||
Administration fees — Institutional Shares | 1 | ||||||
Sub-Administration fees | 37 | ||||||
Custodian fees | 74 | ||||||
Transfer agent fees — Fund Shares | 525 | ||||||
Transfer agent fees — Institutional Shares | 1 | ||||||
Trustees' fees | 23 | ||||||
Compliance fees | 4 | ||||||
Legal and audit fees | 78 | ||||||
State registration and filing fees | 28 | ||||||
Other expenses | 85 | ||||||
Recoupment of prior expenses waived/reimbursed by Adviser | 3 | ||||||
Total Expenses | 4,528 | ||||||
Expenses waived/reimbursed by Adviser | (11 | ) | |||||
Net Expenses | 4,517 | ||||||
Net Investment Income (Loss) | 4,646 | ||||||
Realized/Unrealized Gains (Losses) from Investments: | |||||||
Net realized gains (losses) from investment securities and foreign currency transactions | (6,749 | ) | |||||
Foreign taxes on realized gains | (78 | ) | |||||
| Net change in unrealized appreciation/depreciation on investment securities and foreign currency translations | 32,870 | ||||||
Net change in accrued foreign taxes on unrealized gains | (61 | ) | |||||
Net realized/unrealized gains (losses) on investments | 25,982 | ||||||
Change in net assets resulting from operations | $ | 30,628 | |||||
See notes to financial statements.
24
USAA Mutual Funds Trust | Statements of Changes in Net Assets | ||||||
(Amounts in Thousands)
USAA Capital Growth Fund | |||||||||||
| Six Months Ended January 31, 2023 (Unaudited) | Year Ended July 31, 2022 | ||||||||||
From Investments: | |||||||||||
Operations: | |||||||||||
Net Investment Income (Loss) | $ | 4,646 | $ | 13,209 | |||||||
Net realized gains (losses) | (6,827 | ) | 65,519 | ||||||||
Net change in unrealized appreciation/depreciation | 32,809 | (137,565 | ) | ||||||||
Change in net assets resulting from operations | 30,628 | (58,837 | ) | ||||||||
Distributions to Shareholders: | |||||||||||
Fund Shares | (55,813 | ) | (105,732 | ) | |||||||
Institutional Shares | (172 | ) | (271 | ) | |||||||
Change in net assets resulting from distributions to shareholders | (55,985 | ) | (106,003 | ) | |||||||
Change in net assets resulting from capital transactions | 36,037 | 64,768 | |||||||||
Change in net assets | 10,680 | (100,072 | ) | ||||||||
Net Assets: | |||||||||||
Beginning of period | 801,461 | 901,533 | |||||||||
End of period | $ | 812,141 | $ | 801,461 | |||||||
Capital Transactions: | |||||||||||
Fund Shares | |||||||||||
Proceeds from shares issued | $ | 19,894 | $ | 53,698 | |||||||
Distributions reinvested | 55,328 | 105,030 | |||||||||
Cost of shares redeemed | (39,422 | ) | (94,848 | ) | |||||||
Total Fund Shares | $ | 35,800 | $ | 63,880 | |||||||
Institutional Shares | |||||||||||
Proceeds from shares issued | $ | 800 | $ | 1,776 | |||||||
Distributions reinvested | 164 | 264 | |||||||||
Cost of shares redeemed | (727 | ) | (1,152 | ) | |||||||
Total Institutional Shares | $ | 237 | $ | 888 | |||||||
Change in net assets resulting from capital transactions | $ | 36,037 | $ | 64,768 | |||||||
Share Transactions: | |||||||||||
Fund Shares | |||||||||||
Issued | 1,841 | 4,272 | |||||||||
Reinvested | 5,160 | 8,241 | |||||||||
Redeemed | (3,656 | ) | (7,586 | ) | |||||||
Total Fund Shares | 3,345 | 4,927 | |||||||||
Institutional Shares | |||||||||||
Issued | 74 | 144 | |||||||||
Reinvested | 15 | 20 | |||||||||
Redeemed | (66 | ) | (94 | ) | |||||||
Total Institutional Shares | 23 | 70 | |||||||||
Change in Shares | 3,368 | 4,997 | |||||||||
See notes to financial statements.
25
USAA Mutual Funds Trust | Financial Highlights | ||||||
For a Share Outstanding Throughout Each Period
USAA Capital Growth Fund | |||||||||||||||||||||||||||
Fund Shares | |||||||||||||||||||||||||||
| Six Months Ended January 31, 2023 (Unaudited) | Year Ended July 31, 2022 | Year Ended July 31, 2021 | Year Ended July 31, 2020 | Year Ended July 31, 2019 | Year Ended July 31, 2018 | ||||||||||||||||||||||
| Net Asset Value, Beginning of Period | $ | 11.30 | $ | 13.67 | $ | 10.62 | $ | 11.36 | $ | 12.63 | $ | 11.67 | |||||||||||||||
Investment Activities: | |||||||||||||||||||||||||||
Net investment income (loss) | 0.07 | (a) | 0.19 | (a) | 0.13 | (a) | 0.14 | (a) | 0.16 | 0.15 | |||||||||||||||||
| Net realized and unrealized gains (losses) | 0.36 | (0.95 | ) | 3.28 | 0.13 | (0.48 | ) | 1.21 | |||||||||||||||||||
| Total from Investment Activities | 0.43 | (0.76 | ) | 3.41 | 0.27 | (0.32 | ) | 1.36 | |||||||||||||||||||
Distributions to Shareholders from: | |||||||||||||||||||||||||||
Net investment income | (0.11 | ) | (0.16 | ) | (0.12 | ) | (0.17 | ) | (0.17 | ) | (0.12 | ) | |||||||||||||||
Net realized gains | (0.69 | ) | (1.45 | ) | (0.24 | ) | (0.84 | ) | (0.78 | ) | (0.28 | ) | |||||||||||||||
| Total Distributions to Shareholders | (0.80 | ) | (1.61 | ) | (0.36 | ) | (1.01 | ) | (0.95 | ) | (0.40 | ) | |||||||||||||||
Net Asset Value, End of Period | $ | 10.93 | $ | 11.30 | $ | 13.67 | $ | 10.62 | $ | 11.36 | $ | 12.63 | |||||||||||||||
Total Return (b) (c) | 3.96 | % | (6.74 | )% | 32.74 | % | 2.14 | % | (1.82 | )% | 11.76 | % | |||||||||||||||
Ratios to Average Net Assets: | |||||||||||||||||||||||||||
Net Expenses (d) (e) (f) (g) | 1.16 | % | 1.09 | % | 1.07 | % | 1.12 | % | 1.13 | % | 1.15 | % | |||||||||||||||
Net Investment Income (Loss) (d) | 1.19 | % | 1.52 | % | 1.04 | % | 1.35 | % | 1.43 | % | 1.25 | % | |||||||||||||||
Gross Expenses (d) (e) | 1.16 | % | 1.09 | % | 1.07 | % | 1.13 | % | 1.13 | % | 1.15 | % | |||||||||||||||
Supplemental Data: | |||||||||||||||||||||||||||
Net Assets at end of period (000's) | $ | 809,701 | $ | 799,210 | $ | 899,767 | $ | 755,102 | $ | 826,325 | $ | 902,670 | |||||||||||||||
Portfolio Turnover (b) (h) | 24 | % | 58 | % | 67 | %(i) | 152 | %(j) | 54 | %(k) | 22 | %(l) | |||||||||||||||
(a) Per share net investment income (loss) has been calculated using the average daily shares method.
(b) Not annualized for periods less than one year.
(c) Assumes reinvestment of all net investment income and realized capital gain distributions, if any, during the period. Includes adjustments in accordance with U.S. Generally Accepted Accounting Principles and could differ from the Lipper reported return.
(d) Annualized for periods less than one year.
(e) Does not include acquired fund fees and expenses, if any.
(f) The net expense ratio may not correlate to the applicable expense limits in place during the period since the current contractual expense limitation is applied for a period beginning July 1, 2019, and in effect through November 30, 2023, instead of coinciding with the Fund's fiscal year end. Details of the current contractual expense limitation in effect can be found in Note 4 of the accompanying Notes to Financial Statements.
(g) From the period beginning July 1, 2019, the amount of any waivers or reimbursements and the amount of any recoupment are calculated without regard to the impact of any performance adjustment to the Fund's management fee.
(h) Portfolio turnover is calculated on the basis of the Fund as a whole without distinguishing between the classes of shares.
(i) Reflects a return to normal trading levels after a prior year transition.
(j) Reflects increased trading activity due to transition or asset allocation shift.
(k) Reflects overall increase in purchases and sales of securities.
(l) Reflects overall decrease in purchases and sales of securities.
(continues on next page)
See notes to financial statements.
26
USAA Mutual Funds Trust | Financial Highlights — continued | ||||||
For a Share Outstanding Throughout Each Period
USAA Capital Growth Fund | |||||||||||||||||||||||||||
Institutional Shares | |||||||||||||||||||||||||||
| Six Months Ended January 31, 2023 (Unaudited) | Year Ended July 31, 2022 | Year Ended July 31, 2021 | Year Ended July 31, 2020 | Year Ended July 31, 2019 | Year Ended July 31, 2018 | ||||||||||||||||||||||
| Net Asset Value, Beginning of Period | $ | 11.39 | $ | 13.81 | $ | 10.66 | $ | 11.39 | $ | 12.66 | $ | 11.70 | |||||||||||||||
Investment Activities: | |||||||||||||||||||||||||||
Net investment income (loss) | 0.06 | (a) | 0.20 | (a) | 0.15 | (a) | 0.14 | (a) | 0.23 | (a) | 0.17 | ||||||||||||||||
| Net realized and unrealized gains (losses) | 0.36 | (0.95 | ) | 3.35 | 0.14 | (0.55 | ) | 1.20 | |||||||||||||||||||
| Total from Investment Activities | 0.42 | (0.75 | ) | 3.50 | 0.28 | (0.32 | ) | 1.37 | |||||||||||||||||||
Distributions to Shareholders from: | |||||||||||||||||||||||||||
Net investment income | (0.09 | ) | (0.22 | ) | (0.11 | ) | (0.17 | ) | (0.17 | ) | (0.13 | ) | |||||||||||||||
Net realized gains | (0.69 | ) | (1.45 | ) | (0.24 | ) | (0.84 | ) | (0.78 | ) | (0.28 | ) | |||||||||||||||
| Total Distributions to Shareholders | (0.78 | ) | (1.67 | ) | (0.35 | ) | (1.01 | ) | (0.95 | ) | (0.41 | ) | |||||||||||||||
Net Asset Value, End of Period | $ | 11.03 | $ | 11.39 | $ | 13.81 | $ | 10.66 | $ | 11.39 | $ | 12.66 | |||||||||||||||
Total Return (b) (c) | 3.84 | % | (6.68 | )% | 33.45 | % | 2.20 | % | (1.77 | )% | 11.84 | % | |||||||||||||||
Ratios to Average Net Assets: | |||||||||||||||||||||||||||
Net Expenses (d) (e) (f) (g) | 1.29 | % | 1.06 | % | 0.77 | % | 1.01 | % | 1.03 | % | 1.10 | % | |||||||||||||||
Net Investment Income (Loss) (d) | 1.03 | % | 1.58 | % | 1.30 | % | 1.31 | % | 2.04 | % | 1.38 | % | |||||||||||||||
Gross Expenses (d) (e) | 1.93 | % | 1.66 | % | 0.92 | % | 1.01 | % | 1.03 | % | 1.21 | % | |||||||||||||||
Supplemental Data: | |||||||||||||||||||||||||||
Net Assets at end of period (000's) | $ | 2,440 | $ | 2,251 | $ | 1,766 | $ | 11,559 | $ | 110,430 | $ | 7,961 | |||||||||||||||
Portfolio Turnover (b) (h) | 24 | % | 58 | % | 67 | %(i) | 152 | %(j) | 54 | %(k) | 22 | %(l) | |||||||||||||||
(a) Per share net investment income (loss) has been calculated using the average daily shares method.
(b) Not annualized for periods less than one year.
(c) Assumes reinvestment of all net investment income and realized capital gain distributions, if any, during the period. Includes adjustments in accordance with U.S. Generally Accepted Accounting Principles and could differ from the Lipper reported return.
(d) Annualized for periods less than one year.
(e) Does not include acquired fund fees and expenses, if any.
(f) The net expense ratio may not correlate to the applicable expense limits in place during the period since the current contractual expense limitation is applied for a period beginning July 1, 2019, and in effect through November 30, 2023, instead of coinciding with the Fund's fiscal year end. Details of the current contractual expense limitation in effect can be found in Note 4 of the accompanying Notes to Financial Statements.
(g) From the period beginning July 1, 2019, the amount of any waivers or reimbursements and the amount of any recoupment are calculated without regard to the impact of any performance adjustment to the Fund's management fee.
(h) Portfolio turnover is calculated on the basis of the Fund as a whole without distinguishing between the classes of shares.
(i) Reflects a return to normal trading levels after a prior year transition.
(j) Reflects increased trading activity due to transition or asset allocation shift.
(k) Reflects overall increase in purchases and sales of securities.
(l) Reflects overall decrease in purchases and sales of securities.
See notes to financial statements.
27
USAA Mutual Funds Trust | Notes to Financial Statements January 31, 2023 | ||||||
(Unaudited)
1. Organization:
USAA Mutual Funds Trust (the "Trust") is organized as a Delaware statutory trust and is registered under the Investment Company Act of 1940, as amended (the "1940 Act"), as an open-end investment company. The Trust is comprised of 45 funds and is authorized to issue an unlimited number of shares, which are units of beneficial interest with no par value.
The accompanying financial statements are those of the USAA Capital Growth Fund (the "Fund"). The Fund offers two classes of shares: Fund Shares and Institutional Shares. The Fund is classified as diversified under the 1940 Act.
Each class of shares of the Fund has substantially identical rights and privileges, except with respect to fees paid under distribution plans, expenses allocable exclusively to each class of shares, voting rights on matters solely affecting a single class of shares, and the exchange privilege of each class of shares.
Victory Capital Management ("VCM" or the "Adviser") is an indirect wholly owned subsidiary of Victory Capital Holdings, Inc., a publicly traded Delaware corporation, and a wholly owned direct subsidiary of Victory Capital Operating, LLC.
Under the Trust's organizational documents, its officers and trustees are indemnified against certain liabilities arising out of the performance of their duties to the Fund. In addition, in the normal course of business, the Fund enters into contracts with its vendors and others that provide for general indemnifications. The Fund's maximum exposure under these arrangements is unknown, as this would involve future claims that may be made against the Fund. However, based on experience, the Fund expects that risk of loss to be remote.
2. Significant Accounting Policies:
The following is a summary of significant accounting policies followed by the Trust in the preparation of its financial statements. The policies are in conformity with U.S. Generally Accepted Accounting Principles ("GAAP"). The preparation of financial statements in accordance with GAAP requires management to make estimates and assumptions that affect the reported amounts of assets and liabilities and disclosure of contingent assets and liabilities at the date of the financial statements and the reported amounts of income and expenses for the period. Actual results could differ from those estimates. The Fund follows the specialized accounting and reporting requirements under GAAP that are applicable to investment companies under Accounting Standards Codification Topic 946.
Investment Valuation:
The Fund records investments at fair value. Fair value is defined as the price that would be received to sell an asset or paid to transfer a liability in an orderly transaction between market participants at the measurement date.
The valuation techniques described below maximize the use of observable inputs and minimize the use of unobservable inputs in determining fair value. The inputs used for valuing the Fund's investments are summarized in the three broad levels listed below:
• Level 1 — quoted prices (unadjusted) in active markets for identical securities
• Level 2 — other significant observable inputs (including quoted prices for similar securities, interest rates, or credit spreads, applicable to those securities, etc.)
• Level 3 — significant unobservable inputs (including the Adviser's assumptions in determining the fair value of investments)
Changes in valuation techniques may result in transfers in or out of an assigned level within the disclosure hierarchy. The inputs or methodologies used for valuation techniques are not necessarily an indication of the risks associated with entering into those investments.
28
USAA Mutual Funds Trust | Notes to Financial Statements — continued January 31, 2023 | ||||||
(Unaudited)
The Adviser, appointed as the valuation designee by the Trust's Board of Trustees' (the "Board"), has established the Pricing and Liquidity Committee (the "Committee"), and subject to Board oversight, the Committee administers and oversees the Fund's valuation policies and procedures, which are approved by the Board.
Portfolio securities listed or traded on securities exchanges, including Exchange-Traded Funds ("ETFs"), and American Depositary Receipts, are valued at the closing price on the exchange or system where the security is principally traded, if available, or at the Nasdaq Official Closing Price. If there have been no sales for that day on the exchange or system, then a security is valued at the last available bid quotation on the exchange or system where the security is principally traded. In each of these situations, valuations are typically categorized as Level 1 in the fair value hierarchy.
Investments in open-end investment companies, other than ETFs, are valued at their net asset value ("NAV"). These valuations are typically categorized as Level 1 in the fair value hierarchy.
In the event that price quotations or valuations are not readily available, investments are valued at fair value in accordance with procedures established by and under the general supervision and responsibility of the Board. These valuations are typically categorized as Level 2 or Level 3 in the fair value hierarchy, based on the observability of inputs used to determine the fair value. The effect of fair value pricing is that securities may not be priced on the basis of quotations from the primary market in which they are traded, and the actual price realized from the sale of a security may differ materially from the fair value price. Valuing these securities at fair value is intended to cause the Fund's NAV to be more reliable than it otherwise would be.
In accordance with procedures adopted by the Board, fair value pricing may be used if events materially affecting the value of foreign securities occur between the time the exchange on which they are traded closes and the time the Fund's NAV is calculated. The Fund uses a systematic valuation model, provided daily by an independent third party to fair value its international equity securities. The valuations are categorized as Level 2 in the fair value hierarchy.
A summary of the valuations as of January 31, 2023, based upon the three levels defined above, is included in the table below while the breakdown, by category, of investments is disclosed on the Schedule of Portfolio Investments (amounts in thousands):
Level 1 | Level 2 | Level 3 | Total | ||||||||||||||||
Common Stocks | $ | 526,933 | $ | 278,880 | $ | 8 | $ | 805,821 | |||||||||||
Exchange-Traded Funds | 1,278 | — | — | 1,278 | |||||||||||||||
Collateral for Securities Loaned | 4,518 | — | — | 4,518 | |||||||||||||||
Total | $ | 532,729 | $ | 278,880 | $ | 8 | $ | 811,617 | |||||||||||
As of January 31, 2023, there were no transfers into/out of Level 3.
Real Estate Investment Trusts ("REITs"):
The Fund may invest in REITs, which report information on the source of their distributions annually. REITs are pooled investment vehicles that invest primarily in income producing real estate or real estate related loans or interests (such as mortgages). Certain distributions received from REITs during the year are recorded as realized gains or return of capital as estimated by the Fund or when such information becomes known.
Investment Companies:
Exchange-Traded Funds:
The Fund may invest in ETFs, the shares of which are bought and sold on a securities exchange. An ETF trades like common stock and represents a fixed portfolio of securities often designed to track the performance and dividend yield of a particular domestic or foreign market index. The Fund may purchase shares of an ETF to temporarily gain exposure to a portion of the U.S. or a foreign market while awaiting purchase of underlying securities. The risks of owning an ETF generally reflect the
29
USAA Mutual Funds Trust | Notes to Financial Statements — continued January 31, 2023 | ||||||
(Unaudited)
risks of owning the underlying securities the ETF is designed to track, although the lack of liquidity of an ETF could result in it being more volatile. Additionally, ETFs have fees and expenses that reduce their value.
Open-End Funds:
The Fund may invest in portfolios of open-end investment companies. These investment companies value securities in their portfolios for which market quotations are readily available at their market values (generally the last reported sale price) and all other securities and assets at their fair value by the methods established by the board of directors of the underlying funds.
Derivative Instruments:
Foreign Exchange Currency Contracts:
The Fund may enter into foreign exchange currency contracts to convert U.S. dollars to and from various foreign currencies. A foreign exchange currency contract is an obligation by the Fund to purchase or sell a specific currency at a future date at a price (in U.S. dollars) set at the time of the contract. The Fund does not engage in "cross-currency" foreign exchange contracts (i.e., contracts to purchase or sell one foreign currency in exchange for another foreign currency). The Fund's foreign exchange currency contracts might be considered spot contracts (typically a contract of one week or less) or forward contracts (typically a contract term over one week). A spot contract is entered into for purposes of hedging against foreign currency fluctuations relating to a specific portfolio transaction, such as the delay between a security transaction trade date and settlement date. Forward contracts are entered into for purposes of hedging portfolio holdings or concentrations of such holdings. Each foreign exchange currency contract is adjusted daily by the prevailing spot or forward rate of the underlying currency, and any appreciation or depreciation is recorded for financial statement purposes as unrealized until the contract settlement date, at which time the Fund records realized gains or losses equal to the difference between the value of a contract at the time it was opened and the value at the time it was closed. The Fund could be exposed to risk if a counterparty is unable to meet the terms of a foreign exchange currency contract or if the value of the foreign currency changes unfavorably. In addition, the use of foreign exchange currency contracts does not eliminate fluctuations in the underlying prices of the securities. As of January 31, 2023, the Fund had no open forward foreign exchange currency contracts.
Investment Transactions and Related Income:
Changes in holdings of investments are accounted for no later than one business day following the trade date. For financial reporting purposes, however, investment transactions are accounted for on trade date or the last business day of the reporting period. Interest income is determined on the basis of coupon interest accrued using the effective interest method which adjusts, where applicable, the amortization of premiums or accretion of discounts. Dividend income is recorded on the ex-dividend date. Gains or losses realized on sales of securities are recorded on the identified cost basis.
Withholding taxes on interest, dividends, and gains as a result of certain investments by the Fund have been provided for in accordance with each investment's applicable country's tax rules and rates.
Securities Lending:
The Fund, through a Securities Lending Agreement with Citibank, N.A. ("Citibank"), may lend its securities to qualified financial institutions, such as certain broker-dealers and banks, to earn additional income, net of income retained by Citibank. Borrowers are required to initially secure their loans for collateral in the amount of at least 102% of the value of U.S. securities loaned or at least 105% of the value of non-U.S. securities loaned, marked-to-market daily. Any collateral shortfalls associated with increases in the valuation of the securities loaned are generally cured the next business day. The collateral can be received in the form of cash collateral and/or non-cash collateral. Non-cash collateral can include U.S. Government Securities and other securities as permitted by Securities and Exchange
30
USAA Mutual Funds Trust | Notes to Financial Statements — continued January 31, 2023 | ||||||
(Unaudited)
Commission ("SEC") guidelines. The cash collateral is invested in short-term instruments or cash equivalents, primarily open-end investment companies, as noted on the Fund's Schedule of Portfolio Investments. The Fund effectively does not have control of the non-cash collateral and therefore it is not disclosed on the Fund's Schedule of Portfolio Investments. Collateral requirements are determined daily based on the value of the Fund's securities on loan as of the end of the prior business day. During the time portfolio securities are on loan, the borrower will pay the Fund any dividends or interest paid on such securities plus any fee negotiated between the parties to the lending agreement. The Fund also earns a return from the collateral. The Fund pays Citibank various fees in connection with the investment of cash collateral and fees based on the investment income received from securities lending activities. Securities lending income (net of these fees) is disclosed on the Statement of Operations. Loans are terminable upon demand and the borrower must return the loaned securities within the lesser of one standard settlement period or five business days. Although risk is mitigated by the collateral, the Fund could experience a delay in recovering its securities and possible loss of income or value if the borrower fails to return them. In addition, there is a risk that the value of the short-term investments will be less than the amount of cash collateral required to be returned to the borrower.
The Fund's agreement with Citibank does not include master netting provisions. Non-cash collateral received by the Fund may not be sold or repledged, except to satisfy borrower default.
The following table (amounts in thousands) is a summary of the Fund's securities lending transactions as of January 31, 2023.
| Value of Securities on Loan | Non-Cash Collateral | Cash Collateral | |||||||||
| $ | 6,034 | $ | 1,840 | $ | 4,518 | ||||||
Foreign Currency Translations:
The accounting records of the Fund are maintained in U.S. dollars. Investment securities and other assets and liabilities of the Fund denominated in a foreign currency are translated into U.S. dollars at current exchange rates. Purchases and sales of securities, income receipts, and expense payments are translated into U.S. dollars at the exchange rates on the date of the transactions. The Fund does not isolate the portion of the results of operations resulting from changes in foreign exchange rates on investments from fluctuations arising from changes in market prices of securities held. Such fluctuations are disclosed as Net change in unrealized appreciation/depreciation on investment securities and foreign currency translations on the Statement of Operations. Any realized gains or losses from these fluctuations are disclosed as Net realized gains (losses) from investment securities and foreign currency transactions on the Statement of Operations.
Foreign Taxes:
The Fund may be subject to foreign taxes related to foreign income received (a portion of which may be reclaimable), capital gains on the sale of securities, and certain foreign currency transactions. All foreign taxes are recorded in accordance with the applicable regulations and rates that exist in the foreign jurisdictions in which the Fund invests.
Federal Income Taxes:
The Fund intends to continue to qualify as a regulated investment company by complying with the provisions available to certain investment companies, as defined in applicable sections of the Internal Revenue Code, and to make distributions of net investment income and net realized gains sufficient to relieve it from all, or substantially all, federal income taxes. Accordingly, no provision for federal income taxes is required in the financial statements. The Fund has a tax year end of July 31, and effective April 30, 2023, the Fund will change its tax year end to April 30.
For the six months ended January 31, 2023, the Fund did not incur any income tax, interest, or penalties, and has recorded no liability for net unrecognized tax benefits relating to uncertain tax positions.
Management of the Fund has reviewed tax positions taken in tax years that remain subject to examination by all major tax jurisdictions, including federal (i.e., the last four tax years, which includes
31
USAA Mutual Funds Trust | Notes to Financial Statements — continued January 31, 2023 | ||||||
(Unaudited)
the current fiscal tax year end). Management believes that there is no tax liability resulting from unrecognized tax benefits related to uncertain tax positions taken.
Allocations:
Expenses directly attributable to the Fund are charged to the Fund, while expenses that are attributable to more than one fund in the Trust, or jointly with an affiliated trust, are allocated among the respective funds in the Trust and/or an affiliated trust based upon net assets or another appropriate basis.
Income, expenses (other than class-specific expenses such as transfer agent fees, state registration fees, and printing fees), and realized and unrealized gains or losses on investments are allocated to each class of shares based on its relative net assets on the date income is earned or expenses and realized and unrealized gains and losses are incurred.
3. Purchases and Sales:
Purchases and sales of securities (excluding securities maturing less than one year from acquisition) for the six months ended January 31, 2023, were as follows for the Fund (amounts in thousands):
Excluding | |||||||
Purchases | Sales | ||||||
$ | 185,218 | $ | 200,250 | ||||
4. Fees and Transactions with Affiliates and Related Parties:
Investment Advisory Fees:
Investment advisory services are provided to the Fund by the Adviser, which is a New York corporation registered as an investment adviser with the SEC.
Under the terms of the Investment Advisory Agreement, the Adviser is entitled to receive a base fee and a performance adjustment. The Fund's base fee is accrued daily and paid monthly at an annualized rate of 0.75% of the Fund's average daily net assets. Amounts incurred and paid to VCM for the six months ended January 31, 2023, are reflected on the Statement of Operations as Investment advisory fees.
The performance adjustment for each share class is accrued daily and calculated monthly by comparing the respective class' performance to that of the Lipper Global Funds Index. The Lipper Global Funds Index tracks the total return performance of the largest funds within the Lipper Global Funds category.
The performance period for each share class consists of the current month plus the previous 35 months. The following table is utilized to determine the extent of the performance adjustment:
| Over/Under Performance Relative to Index (in basis points)(a) | Annual Adjustment Rate (in basis points) | ||||||
| +/- 100 to 400 | +/- 4 | ||||||
| +/- 401 to 700 | +/- 5 | ||||||
| +/- 701 and greater | +/- 6 | ||||||
(a) Based on the difference between the average annual performance of the relevant share class of the Fund and its relevant Lipper index, rounded to the nearest basis point.
Each class' annual performance adjustment rate is multiplied by the average daily net assets of the respective class over the entire performance period, which is then multiplied by a fraction, the numerator of which is the number of days in the month and the denominator of which is 365 (366 in leap years). The resulting amount is then added to (in the case of overperformance), or subtracted from (in the case of underperformance) the base fee.
32
USAA Mutual Funds Trust | Notes to Financial Statements — continued January 31, 2023 | ||||||
(Unaudited)
Under the performance fee arrangement, each class pays a positive performance fee adjustment for a performance period whenever the class outperforms the Lipper Global Funds Index over that period, even if the class has overall negative returns during the performance period.
For the period August 1, 2022, to January 31, 2023, performance adjustments were $164 and $2 for Fund Shares and Institutional Shares, in thousands, respectively. Performance adjustments were 0.04% and 0.19% for Fund Shares and Institutional Shares, respectively. The performance adjustment rate included in the investment advisory fee may differ from the maximum over/under Annual Adjustment Rate due to differences in average net assets for the reporting period and rolling 36 month performance periods.
The Trust relies on an exemptive order granted to VCM and its affiliated funds by the SEC in March 2019, permitting the use of a "manager-of-managers" structure for certain funds. Under a manager-of-managers structure, the investment adviser may select (with approval of the Board and without shareholder approval) one or more subadvisers to manage the day-to-day investment of a fund's assets. For the six months ended January 31, 2023, the Fund had no subadvisers.
Administration and Servicing Fees:
VCM also serves as the Fund's administrator and fund accountant. Under the Fund Administration, Servicing and Accounting Agreement, VCM is paid an administration and servicing fee that is accrued daily and paid monthly at an annualized rate of 0.15% and 0.10%, which is based on the Fund's average daily net assets of the Fund Shares and Institutional Shares, respectively. Amounts incurred for the six months ended January 31, 2023, are reflected on the Statement of Operations as Administration fees.
Citi Fund Services Ohio, Inc. ("Citi"), an affiliate of Citibank, acts as sub-administrator and sub-fund accountant to the Fund pursuant to a Sub-Administration and Sub-Fund Accounting Services Agreement between VCM and Citi. VCM pays Citi a fee for providing these services. The Fund reimburses VCM and Citi for out-of-pocket expenses incurred in providing these services and certain other expenses specifically allocated to the Fund. Amounts incurred for the six months ended January 31, 2023, are reflected on the Statement of Operations as Sub-Administration fees.
The Fund (as part of the Trust) has entered into an agreement with the Adviser to provide compliance services, pursuant to which the Adviser furnishes its compliance personnel, including the services of the Chief Compliance Officer ("CCO"), and other resources reasonably necessary to provide the Trust with compliance oversight services related to the design, administration, and oversight of a compliance program for the Trust in accordance with Rule 38a-1 under the 1940 Act. The CCO is an employee of the Adviser, which pays the compensation of the CCO and support staff. The funds in the Trust, Victory Variable Insurance Funds, Victory Portfolios, and Victory Portfolios II (collectively, the "Victory Funds Complex") in the aggregate, compensate the Adviser for these services. Amounts incurred for the six months ended January 31, 2023, are reflected on the Statement of Operations as Compliance fees.
Transfer Agency Fees:
Victory Capital Transfer Agency, Inc. ("VCTA"), an affiliate of the Adviser, provides transfer agency services to the Fund. VCTA provides transfer agent services to the Fund Shares based on an annual charge of $23 per shareholder account plus out-of-pocket expenses. VCTA pays a portion of these fees to certain intermediaries for the administration and servicing of accounts that are held with such intermediaries. Transfer agent fees for the Institutional Shares are paid monthly based on a fee accrued daily at an annualized rate of 0.10% of average daily net assets, plus out-of-pocket expenses. Amounts incurred and paid to VCTA for the six months ended January 31, 2023, are reflected on the Statement of Operations as Transfer agent fees.
FIS Investor Services LLC serves as sub-transfer agent and dividend disbursing agent for the Fund pursuant to a Sub-Transfer Agent Agreement between VCTA and FIS Investor Services LLC. VCTA provides FIS Investor Services LLC a fee for providing these services.
33
USAA Mutual Funds Trust | Notes to Financial Statements — continued January 31, 2023 | ||||||
(Unaudited)
Distributor/Underwriting Services:
Victory Capital Services, Inc. (the "Distributor"), an affiliate of the Adviser, serves as Distributor for the continuous offering of the shares of the Fund pursuant to a Distribution Agreement between the Distributor and the Trust and receives no fee or other compensation for these services.
Other Fees:
Citibank serves as the Fund's custodian. The Fund pays Citibank a fee for providing these services. Amounts incurred for the six months ended January 31, 2023, are reflected on the Statement of Operations as Custodian fees.
K&L Gates LLP provides legal services to the Trust.
The Adviser has entered into an expense limitation agreement with the Fund until at least November 30, 2023. Under the terms of the agreement, the Adviser has agreed to waive fees or reimburse certain expenses to the extent that ordinary operating expenses incurred by certain classes of the Fund in any fiscal year exceed the expense limits for such classes of the Fund. Such excess amounts will be the liability of the Adviser. Performance adjustments, acquired fund fees and expenses, interest, taxes, brokerage commissions, other expenditures, which are capitalized in accordance with GAAP, and other extraordinary expenses not incurred in the ordinary course of the Fund's business are excluded from the expense limits. As of January 31, 2023, the expense limits (excluding voluntary waivers) were 1.12% and 1.10% for Fund Shares and Institutional Shares, respectively.
Under the terms of the expense limitation agreement, the Fund has agreed to repay fees and expenses that were waived or reimbursed by the Adviser for a period of up to three years (thirty-six (36) months) after the waiver or reimbursement took place, subject to the lesser of any operating expense limits in effect at the time of: (a) the original waiver or expense reimbursement; or (b) the recoupment, after giving effect to the recoupment amount.
As of January 31, 2023, the following amounts are available to be repaid to the Adviser (amounts in thousands). The Fund has not recorded any amounts available to be repaid as a liability due to an assessment that such repayments are not probable at January 31, 2023.
| Expires 2024 | Expires 2025 | Expires 2026 | Total | ||||||||||||
| $ | 9 | $ | 13 | $ | 8 | $ | 30 | ||||||||
The Adviser may voluntarily waive or reimburse additional fees to assist the Fund in maintaining competitive expense ratios. Voluntary waivers and reimbursements applicable to the Fund are not available to be recouped at a future time. There were no voluntary waivers or reimbursements for the six months ended January 31, 2023.
Certain officers and/or interested trustees of the Fund are also officers and/or employees of the Adviser, administrator, fund accountant, sub-administrator, sub-fund accountant, custodian, and Distributor.
5. Risks:
The Fund may be subject to other risks in addition to these identified risks.
Market Risk — Overall market risks may affect the value of the Fund. Domestic and international factors such as political events, war, terrorism, trade disputes, inflation rates, interest rate levels and other fiscal and monetary policy changes, cybersecurity incidents, pandemics and other public health crises, sanctions against a particular foreign country, its nationals, businesses or industries and related geopolitical events, as well as environmental disasters such as earthquakes, fires, and floods, or other catastrophes, may add to instability in global economies and markets generally, and may lead to increased market volatility. Global economies and financial markets are highly interconnected, which increases the possibility that conditions in one country or region might adversely affect issuers in another country or region. The impact of these and other factors may be short-term or may last for extended periods.
34
USAA Mutual Funds Trust | Notes to Financial Statements — continued January 31, 2023 | ||||||
(Unaudited)
Equity Risk — The values of the equity securities in which the Fund invests may decline in response to developments affecting individual companies and/or general market, economic and political conditions and other factors. A company's earnings or dividends may not increase as expected due to poor management decisions, competitive pressures, breakthroughs in technology, reliance on suppliers, labor problems or shortages, corporate restructurings, fraudulent disclosures, natural disasters, military confrontations, war, terrorism, public health crises, or other events, conditions, and factors. Price changes may be temporary or may last for extended periods.
Foreign Securities Risk — Foreign markets can be more volatile than the U.S. market due to increased risks of adverse issuer, political, regulatory, market, or economic developments and can perform differently from the U.S. market. Global markets, or those in a particular region, may all react in similar fashion to important political, economic, or other developments. Events and evolving conditions in certain economies or markets may alter the risks associated with investments tied to countries or regions that historically were perceived as comparatively stable and make such investments riskier and more volatile.
6. Borrowing and Interfund Lending:
Line of Credit:
The Victory Funds Complex participates in a short-term demand note "Line of Credit" agreement with Citibank. The Line of Credit agreement with Citibank was renewed on June 27, 2022, with a termination date of June 26, 2023. Under the agreement with Citibank, the Victory Funds Complex may borrow up to $600 million, of which $300 million is committed and $300 million is uncommitted. $40 million of the Line of Credit is reserved for use by the Victory Floating Rate Fund, another series of the Victory Funds Complex, with Victory Floating Rate Fund paying the related commitment fees for that amount. The purpose of the Line of Credit is to meet temporary or emergency cash needs. For the six months ended January 31, 2023, Citibank received an annual commitment fee of 0.15% on $300 million for providing the Line of Credit. Each fund in the Victory Funds Complex paid a pro-rata portion of the commitment fees plus any interest (one-month Secured Overnight Financing Rate ("SOFR") plus 1.10 percent) on amounts borrowed. Interest charged to the Fund during the period, if applicable, is reflected on the Statement of Operations under Line of credit fees.
The Fund had no borrowings under the Line of Credit agreement during the six months ended January 31, 2023.
Interfund Lending:
The Trust and the Adviser rely on an exemptive order granted by the SEC in March 2017 (the "Order"), permitting the establishment and operation of an Interfund Lending Facility (the "Facility"). The Facility allows the Fund to directly lend and borrow money to or from any other fund in the Victory Funds Complex that is permitted to participate in the Facility, relying upon the Order at rates beneficial to both the borrowing and lending funds. Advances under the Facility are allowed for temporary or emergency purposes, including the meeting of redemption requests that otherwise might require the untimely disposition of securities, and are subject to each Fund's borrowing restrictions. The interfund loan rate is determined, as specified in the Order, by averaging the current repurchase agreement rate and the current bank loan rate. As a Borrower, interest charged to the Fund, if any, during the period, is reflected on the Statement of Operations under Interfund lending fees. As a Lender, interest earned by the Fund, if any, during the period, is reflected on the Statement of Operations under Interfund lending.
The Fund did not utilize or participate in the Facility during the six months ended January 31, 2023.
7. Federal Income Tax Information:
The Fund intends to distribute any net investment income annually. Distributable net realized gains, if any, are declared and paid at least annually.
35
USAA Mutual Funds Trust | Notes to Financial Statements — continued January 31, 2023 | ||||||
(Unaudited)
The amounts of dividends from net investment income and distributions from net realized gains (collectively, distributions to shareholders) are determined in accordance with federal income tax regulations, which may differ from GAAP. To the extent these "book/tax" differences are permanent in nature (e.g., net operating loss and distribution reclassification), such amounts are reclassified within the components of net assets based on their federal tax-basis treatment; temporary differences (e.g., wash sales) do not require reclassification. To the extent dividends and distributions exceed net investment income and net realized gains for tax purposes, they are reported as distributions of capital. Net investment losses incurred by the Fund may be reclassified as an offset to capital on the accompanying Statement of Assets and Liabilities.
The tax character of current year distributions paid and the tax basis of the current components of accumulated earnings (loss) will be determined at the end of the current tax year.
At the tax year ended July 31, 2022, the Fund had no capital loss carryforwards for federal income tax purposes.
8. Subsequent Events:
On June 29, 2022, the Board approved a change to the Fund's fiscal year-end from July 31 to April 30, with an effective date of April 30, 2023.
The Board, upon recommendation of the Adviser, has approved a change in the name of the Trust and each individual fund within the Trust. On February 23, 2023, an initial filing was made with the SEC to commence the process to effectuate the following changes.
Effective at the start of business on April 24, 2023 (the "Effective Date"), the name of the Trust will change from USAA Mutual Funds Trust to Victory Portfolios III, and all references to USAA Mutual Funds Trust in the summary prospectus, statutory prospectus, and statement of additional information ("SAI") will be replaced by the new name.
Also on the Effective Date, references to the current name of the Fund in the summary prospectus, statutory prospectus, and SAI will be replaced with the new name as follows:
| Current Name | New Name | ||||||
USAA Capital Growth Fund | Victory Capital Growth Fund | ||||||
In addition, on the Effective Date, USAA Investments, a Victory Capital Management Inc. Investment Franchise, that currently manages the USAA Fixed Income Funds, will change its name to Victory Income Investors, and all references to USAA Investments in the summary prospectus, statutory prospectus, and SAI, will be replaced.
Please note that there will be no changes in the management of the Fund or to the Fund's ticker symbols.
36
USAA Mutual Funds Trust | Supplemental Information January 31, 2023 | ||||||
(Unaudited)
Proxy Voting and Portfolio Holdings Information
Proxy Voting:
Information regarding the policies and procedures the Fund uses to determine how to vote proxies relating to portfolio securities is available without charge, upon request, by calling (800) 235-8396. The information is also included in the Fund's Statement of Additional Information, which is available on the SEC's website at sec.gov.
Information relating to how the Fund voted proxies relating to portfolio securities held during the most recent 12 months ended June 30 is available on the SEC's website at sec.gov.
Availability of Schedules of Portfolio Investments:
The Trust files a complete list of Schedules of Portfolio Investments with the SEC for the first and third quarter of each fiscal year on Form N-PORT. Form N-PORT is available on the SEC's website at sec.gov.
Expense Examples
As a shareholder of the Fund, you may incur two types of costs: (1) transaction costs and (2) ongoing costs, including management fees and other Fund expenses. These examples are intended to help you understand your ongoing costs (in dollars) of investing in the Fund and to compare these costs with the ongoing costs of investing in other mutual funds.
These examples are based on an investment of $1,000 invested at the beginning of the period and held for the entire period from August 1, 2022, through January 31, 2023.
The Actual Expense figures in the table below provide information about actual account values and actual expenses. You may use the information below, together with the amount you invested, to estimate the expenses that you paid over the period. Simply divide your account value by $1,000 (for example, an $8,600 account value divided by $1,000 = 8.6), then multiply the result by the number in the table under the heading entitled "Actual Expenses Paid During Period" to estimate the expenses you paid on your account during this period.
The Hypothetical Expense figures in the table below provide information about hypothetical account values and hypothetical expenses based on the Fund's actual expense ratio and an assumed rate of return of 5% per year before expenses, which is not the Fund's actual return. The hypothetical account values and expenses may not be used to estimate the actual ending account balance or expenses you paid for the period. You may use this information to compare this 5% hypothetical example with the 5% hypothetical examples that appear in shareholder reports of other funds.
Please note the expenses shown in the table below are meant to highlight your ongoing costs only and do not reflect any transactional costs. Therefore, the hypothetical expenses in the table are useful in comparing ongoing costs only and will not help you determine the relative total costs of owning different funds. In addition, if these transactional costs were included, your costs would have been higher.
| Beginning Account Value 8/1/22 | Actual Ending Account Value 1/31/23 | Hypothetical Ending Account Value 1/31/23 | Actual Expenses Paid During Period 8/1/22- 1/31/23* | Hypothetical Expenses Paid During Period 8/1/22- 1/31/23* | Annualized Expense Ratio During Period 8/1/22- 1/31/23 | ||||||||||||||||||||||
Fund Shares | $ | 1,000.00 | $ | 1,039.60 | $ | 1,019.36 | $ | 5.96 | $ | 5.90 | 1.16 | % | |||||||||||||||
Institutional Shares | 1,000.00 | 1,038.40 | 1,018.70 | 6.63 | 6.56 | 1.29 | % | ||||||||||||||||||||
* Expenses are equal to the average account value multiplied by the Fund's annualized expense ratio multiplied by 184/365 (the number of days in the most recent fiscal half-year divided by the number of days in the fiscal year).
37
USAA Mutual Funds Trust | Supplemental Information — continued January 31, 2023 | ||||||
(Unaudited)
Considerations of the Board in Continuing the Investment Advisory Agreement
USAA Capital Growth Fund (the "Fund")
At a meeting of the Board of Trustees (the "Board") of USAA Mutual Funds Trust (the "Trust") held on December 8-9, 2022, the Board, including the Trustees who are not "interested persons" (as that term is defined in the Investment Company Act of 1940, as amended) of the Trust (the "Independent Trustees"), approved for an annual period the continuance of the Investment Advisory Agreement (the "Advisory Agreement") between the Trust and Victory Capital Management Inc. (the "Adviser") with respect to the Fund. Prior to the December 8-9, 2022 meeting at which the Advisory Agreement was approved, the Independent Trustees also discussed and considered information regarding the proposed continuation of the Advisory Agreement at a meeting held on November 21, 2022.
In advance of the foregoing meetings, the Trustees received and considered a variety of information relating to the Advisory Agreement and the Adviser, and were given the opportunity to ask questions and request additional information from management. The information provided to the Board included, among other things: (i) a separate report prepared by an independent third party of mutual fund data, which provided a statistical analysis comparing the Fund's investment performance, expenses, and fees to comparable investment companies; (ii) information concerning the services rendered to the Fund, as well as information regarding the Adviser's revenues and costs of providing services to the Fund and compensation paid to affiliates of the Adviser; and (iii) information about the Adviser's operations and personnel. Prior to voting, the Independent Trustees reviewed the proposed continuance of the Advisory Agreement with management and with experienced independent counsel retained by the Independent Trustees ("Independent Counsel") and received materials from such Independent Counsel discussing the legal standards for their consideration of the proposed continuation of the Advisory Agreement with respect to the Fund. The Independent Trustees also reviewed the proposed continuation of the Advisory Agreement with respect to the Fund in private sessions with Independent Counsel at which no representatives of management were present.
At each regularly scheduled meeting of the Board and its committees, the Board receives and reviews, among other things, information concerning the Fund's performance and related services provided by the Adviser. At the meeting at which the renewal of the Advisory Agreement is considered, particular focus is given to information concerning Fund performance, fees and total expenses as compared to comparable investment companies, and the Adviser's profitability with respect to the Fund. However, the Board noted that the evaluation process with respect to the Adviser is an ongoing one. In this regard, the Board's and its committees' consideration of the Advisory Agreement included information previously received at such meetings. The Board also recognized that the contractual arrangements for the Fund have been reviewed by the Board and discussed with the Adviser in prior years and that the Board's conclusions may be based, in part, on its consideration of these same arrangements in prior years.
Advisory Agreement
After full consideration of a variety of factors, the Board, including the Independent Trustees, voted to approve the Advisory Agreement. In approving the Advisory Agreement, the Trustees did not identify any single factor as controlling, and each Trustee may have attributed different weights to various factors. Throughout their deliberations, the Independent Trustees were represented and assisted by Independent Counsel.
Nature, Extent, and Quality of Services — In considering the nature, extent, and quality of the services provided by the Adviser under the Advisory Agreement, the Board reviewed information provided by the Adviser relating to its operations and personnel. The Board also took into account its knowledge of the Adviser's management and the quality of the performance of the Adviser's duties through Board meetings, discussions, and reports during the preceding year. The Board considered the fees paid to the Adviser and the services provided to the Fund by the Adviser under the Advisory Agreement, as well as other services provided by the Adviser and its affiliates under other agreements, and the personnel who provide these services. In addition to the investment advisory services provided to the Fund, the Adviser and its affiliates provide administrative services, shareholder services, oversight of Fund accounting, marketing services, assistance in meeting legal and regulatory requirements, and other services necessary for the operation of the Fund and the Trust.
38
USAA Mutual Funds Trust | Supplemental Information — continued January 31, 2023 | ||||||
(Unaudited)
The Board considered the scope of services provided by, and the undertakings required of, the Adviser in connection with those services, including, among other things, maintaining (i) its own and the Fund's compliance programs, (ii) risk management programs, (iii) liquidity risk management program, (iv) derivatives risk management program, and (v) cybersecurity programs, each of which had expanded over time as a result of regulatory, market, and other developments. The Board also considered the significant risks assumed by the Adviser in connection with the services provided to the Fund, including investment, operational, enterprise, litigation, regulatory and compliance risks.
The Board considered the Adviser's management style and the performance of the Adviser's duties under the Advisory Agreement. The Board considered the level and depth of knowledge of the Adviser, including the professional experience and qualifications of its senior and investment personnel, as well as current staffing levels. The allocation of the Fund's brokerage, including the Adviser's process for monitoring "best execution," also was considered. The Adviser's role in coordinating the activities of the Fund's other service providers was also considered. The Board also considered the Adviser's risk management processes. The Board considered the Adviser's financial condition and that it had the financial wherewithal to continue to provide the same scope and high quality of services under the Advisory Agreement. In reviewing the Advisory Agreement, the Board focused on the experience, resources, and strengths of the Adviser and its affiliates in managing the Fund, as well as the other funds in the Trust.
The Board also reviewed the compliance and administrative services provided to the Fund by the Adviser and its affiliates, including the Adviser's oversight of the Fund's day-to-day operations and oversight of Fund accounting. The Trustees, guided also by information obtained from their experiences as Trustees of the Trust, also focused on the quality of the Adviser's compliance and administrative staff.
Expenses and Performance — In connection with its consideration of the Advisory Agreement, the Board evaluated the Fund's advisory fees and total expense ratio as compared to other open-end investment companies deemed to be comparable to the Fund as determined by the independent third party in its report. The Fund's expenses were compared to (i) a group of investment companies chosen by the independent third party to be comparable to the Fund based upon certain factors, including fund type, comparability of investment objective and classification, sales load type, asset size, and expense components (the "expense group") and (ii) a larger group of investment companies with the same investment classification/objective as the Fund regardless of asset size, excluding outliers (the "expense universe"). Among other data, the Board noted that the Fund's net management fee rate, which includes advisory and administrative services and the effects of any performance adjustment, was above the median of its expense group and its expense universe. The data indicated that the Fund's total expenses were below the median of its expense group and were equal to the median of its expense universe. The Board also took into account the Adviser's current undertakings to maintain expense limitations for the Fund. The Board took into account the various other services provided to the Fund by the Adviser and its affiliates, and noted the high quality of services received by the Fund.
In considering the Fund's performance, the Board noted that it reviews at its regularly scheduled meetings information about the Fund's performance results. The Trustees also reviewed various comparative data provided to them in connection with their consideration of the renewal of the Advisory Agreement, including, among other information, a comparison of the Fund's average annual total returns relative to its Lipper index and other mutual funds deemed to be in its peer group by the independent third party in its report (the "performance universe"). The Fund's performance universe consisted of the Fund and all retail and institutional open-end investment companies with the same classification/objective as the Fund regardless of asset size or primary channel of distribution. This comparison indicated that, among other data, the Fund's performance was above the average of its performance universe and its Lipper index for the one-, three-, five- and ten-year periods ended June 30, 2022.
Compensation and Profitability — The Board took into consideration the level and method of computing the management fee. The information considered by the Board included operating profit margin information for the Adviser's business as a whole. The Board also received and considered profitability information related to the management revenues from the Fund. This information included a review of the methodology used in the allocation of certain costs to the Fund. The Trustees reviewed the profitability of the Adviser's relationship with the Fund before tax expenses. The Board was also provided with a profitability analysis of other publicly traded asset managers prepared by an independent information service. In reviewing the overall profitability of the
39
USAA Mutual Funds Trust | Supplemental Information — continued January 31, 2023 | ||||||
(Unaudited)
management fee to the Adviser, the Board also considered the fact that the Adviser and its affiliates provide shareholder servicing and administrative services to the Fund for which they receive compensation. The Board also considered the possible direct and indirect benefits to the Adviser from its relationship with the Trust, including that the Adviser may derive reputational and other benefits from its association with the Fund. The Trustees recognized that the Adviser should be entitled to earn a reasonable level of profits in exchange for the level of services it provides to the Fund and the entrepreneurial and other risks that it assumes as Adviser.
Economies of Scale — The Board considered whether there should be changes in the management fee rate or structure in order to enable the Fund to participate in any economies of scale. The Board also considered the fee waiver and expense reimbursement arrangements by the Adviser. The Board also considered the effect of the change in size, if any, of each of the Fund's classes on its performance and fees, noting that the Fund may realize other economies of scale if assets increase proportionally more than expenses. The Board determined that the current investment management fee structure was reasonable.
Conclusions — The Board reached the following conclusions regarding the Fund's Advisory Agreement with the Adviser: (i) the Adviser has demonstrated that it possesses the capability and resources to perform the duties required of it under the Advisory Agreement; (ii) the Adviser maintains an appropriate compliance program; (iii) the overall performance of the Fund is reasonable in relation to the performance of funds with similar investment objectives and to relevant indices; (iv) the Fund's advisory expenses are reasonable in relation to those of similar funds and to the services to be provided by the Adviser; and (v) the Adviser's and its affiliates' level of profitability from their relationship with the Fund is reasonable in light of the nature and high quality of services provided by the Adviser and its affiliates and the type of fund. Based on its conclusions, the Board determined that continuation of the Advisory Agreement would be in the best interests of the Fund and its shareholders.
40
Privacy Policy
Protecting the Privacy of Information
The Trust respects your right to privacy. We also know that you expect us to conduct and process your business in an accurate and efficient manner. To do so, we must collect and maintain certain personal information about you. This is the information we collect from you on applications or other forms, and from the transactions you make with us or third parties. It may include your name, address, social security number, account transactions and balances, and information about investment goals and risk tolerance.
We do not disclose any information about you or about former customers to anyone except as permitted or required by law. Specifically, we may disclose the information we collect to companies that perform services on our behalf, such as the transfer agent that processes shareholder accounts and printers and mailers that assist us in the distribution of investor materials. We may also disclose this information to companies that perform marketing services on our behalf. This allows us to continue to offer you Victory investment products and services that meet your investing needs, and to effect transactions that you request or authorize. These companies will use this information only in connection with the services for which we hired them. They are not permitted to use or share this information for any other purpose.
To protect your personal information internally, we permit access only by authorized employees and maintain physical, electronic, and procedural safeguards to guard your personal information.*
* You may have received communications regarding information about privacy policies from other financial institutions which gave you the opportunity to "opt-out" of certain information sharing with companies which are not affiliated with that financial institution. The Trust does not share information with other companies for purposes of marketing solicitations for products other than the Trust. Therefore, the Trust does not provide opt-out options to their shareholders.
P.O. Box 182593
Columbus, Ohio 43218-2593

Visit our website at: | Call | ||||||
vcm.com | (800) 235-8396 | ||||||
36843-0323

January 31, 2023
Semi Annual Report
USAA Aggressive Growth Fund
Victory Capital means Victory Capital Management Inc., the investment adviser of the USAA Mutual Funds. USAA Mutual Funds are distributed by Victory Capital Services, Inc., member FINRA, an affiliate of Victory Capital. Victory Capital and its affiliates are not affiliated with United Services Automobile Association or its affiliates. USAA and the USAA logos are registered trademarks and the USAA Mutual Funds and USAA Investments logos are trademarks of United Services Automobile Association and are being used by Victory Capital and its affiliates under license.
vcm.com
News, Information And Education 24 Hours A Day, 7 Days A Week
The Victory Capital website gives fund shareholders, prospective shareholders, and investment professionals a convenient way to access fund information, get guidance, and track fund performance anywhere they can access the Internet. The site includes:
• Detailed performance records
• Daily share prices
• The latest fund news
• Investment resources to help you become a better investor
• A section dedicated to investment professionals
Whether you're a potential investor searching for the fund that matches your investment philosophy, a seasoned investor interested in planning tools, or an investment professional, vcm.com has what you seek. Visit us anytime. We're always open.
USAA Mutual Funds Trust
TABLE OF CONTENTS
Investment Objective & Portfolio Holdings | 2 | ||||||
Schedule of Portfolio Investments | 3 | ||||||
Financial Statements | |||||||
Statement of Assets and Liabilities | 6 | ||||||
Statement of Operations | 7 | ||||||
Statements of Changes in Net Assets | 8 | ||||||
Financial Highlights | 9 | ||||||
Notes to Financial Statements | 11 | ||||||
Supplemental Information | 19 | ||||||
Proxy Voting and Portfolio Holdings Information | 19 | ||||||
Expense Examples | 19 | ||||||
Advisory Contract Approval | 20 | ||||||
Privacy Policy (inside back cover) | |||||||
This report is for the information of the shareholders and others who have received a copy of the currently effective prospectus of the Fund, managed by Victory Capital Management Inc. It may be used as sales literature only when preceded or accompanied by a current prospectus, which provides further details about the Fund.
IRA DISTRIBUTION WITHHOLDING DISCLOSURE
We generally must withhold federal income tax at a rate of 10% of the taxable portion of your distribution and, if you live in a state that requires state income tax withholding, at your state's tax rate. However, you may elect not to have withholding apply or to have income tax withheld at a higher rate. Any withholding election that you make will apply to any subsequent distribution unless and until you change or revoke the election. If you wish to make a withholding election, or change or revoke a prior withholding election, call (800) 235-8396, and form W-4P (OMB No. 1545-0074 withholding certificate for pension or annuity payments) will be electronically sent.
If you do not have a withholding election in place by the date of a distribution, federal income tax will be withheld from the taxable portion of your distribution at a rate of 10%. If you must pay estimated taxes, you may be subject to estimated tax penalties if your estimated tax payments are not sufficient and sufficient tax is not withheld from your distribution.
For more specific information, please consult your tax adviser.
• NOT FDIC INSURED • NO BANK GUARANTEE • MAY LOSE VALUE
1
| USAA Mutual Funds Trust USAA Aggressive Growth Fund | January 31, 2023 | ||||||
(Unaudited)
Investment Objective and Portfolio Holdings:
The Fund seeks capital appreciation.
Top 10 Equity Holdings*:
January 31, 2023
(% of Net Assets)
Microsoft Corp. | 7.1 | % | |||||
Apple, Inc. | 5.6 | % | |||||
Visa, Inc. Class A | 5.3 | % | |||||
Alphabet, Inc. Class C | 5.0 | % | |||||
Amazon.com, Inc. | 4.5 | % | |||||
NVIDIA Corp. | 4.2 | % | |||||
ServiceNow, Inc. | 3.1 | % | |||||
UnitedHealth Group, Inc. | 2.8 | % | |||||
Tractor Supply Co. | 2.4 | % | |||||
Dexcom, Inc. | 2.1 | % | |||||
Sector Allocation*:
January 31, 2023
(% of Net Assets)
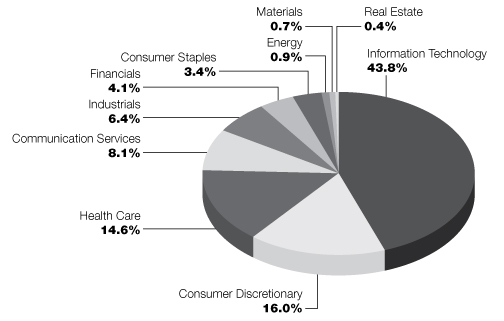
* Does not include futures contracts, money market instruments, and short-term investments purchased with cash collateral from securities loaned.
Percentages are of the net assets of the Fund and may not equal 100%.
Refer to the Schedule of Portfolio Investments for a complete list of securities.
2
| USAA Mutual Funds Trust USAA Aggressive Growth Fund | Schedule of Portfolio Investments January 31, 2023 | ||||||
(Amounts in Thousands, Except for Shares) (Unaudited)
Security Description | Shares | Value | |||||||||
Common Stocks (98.4%) | |||||||||||
Communication Services (8.1%): | |||||||||||
Alphabet, Inc. Class C (a) | 757,572 | $ | 75,659 | ||||||||
Meta Platforms, Inc. Class A (a) | 125,961 | 18,764 | |||||||||
Netflix, Inc. (a) | 39,335 | 13,919 | |||||||||
The Trade Desk, Inc. Class A (a) | 279,507 | 14,171 | |||||||||
122,513 | |||||||||||
Communications Equipment (3.1%): | |||||||||||
Arista Networks, Inc. (a) | 207,683 | 26,172 | |||||||||
Motorola Solutions, Inc. | 77,589 | 19,941 | |||||||||
46,113 | |||||||||||
Consumer Discretionary (16.0%): | |||||||||||
Airbnb, Inc. Class A (a) | 91,620 | 10,180 | |||||||||
Amazon.com, Inc. (a) | 664,448 | 68,525 | |||||||||
Booking Holdings, Inc. (a) | 3,908 | 9,512 | |||||||||
Chipotle Mexican Grill, Inc. (a) | 3,769 | 6,205 | |||||||||
Dollar Tree, Inc. (a) | 95,804 | 14,388 | |||||||||
Lululemon Athletica, Inc. (a) | 53,397 | 16,387 | |||||||||
NIKE, Inc. Class B | 178,872 | 22,776 | |||||||||
O'Reilly Automotive, Inc. (a) | 33,469 | 26,519 | |||||||||
Tesla, Inc. (a) | 102,981 | 17,838 | |||||||||
Tractor Supply Co. | 158,557 | 36,149 | |||||||||
Ulta Beauty, Inc. (a) | 19,417 | 9,980 | |||||||||
Yum! Brands, Inc. | 24,089 | 3,144 | |||||||||
241,603 | |||||||||||
Consumer Staples (3.4%): | |||||||||||
Constellation Brands, Inc. Class A | 95,711 | 22,159 | |||||||||
Costco Wholesale Corp. | 35,546 | 18,169 | |||||||||
The Hershey Co. | 49,139 | 11,037 | |||||||||
51,365 | |||||||||||
Electronic Equipment, Instruments & Components (1.4%): | |||||||||||
CDW Corp. | 110,368 | 21,636 | |||||||||
Energy (0.9%): | |||||||||||
Cheniere Energy, Inc. | 32,198 | 4,919 | |||||||||
Diamondback Energy, Inc. | 54,337 | 7,940 | |||||||||
12,859 | |||||||||||
Financials (4.1%): | |||||||||||
Blackstone, Inc. | 162,546 | 15,598 | |||||||||
LPL Financial Holdings, Inc. | 17,289 | 4,100 | |||||||||
MSCI, Inc. | 54,399 | 28,916 | |||||||||
The Progressive Corp. | 94,062 | 12,825 | |||||||||
61,439 | |||||||||||
Health Care (14.6%): | |||||||||||
Agilent Technologies, Inc. | 73,931 | 11,244 | |||||||||
BioMarin Pharmaceutical, Inc. (a) | 88,213 | 10,175 | |||||||||
See notes to financial statements.
3
| USAA Mutual Funds Trust USAA Aggressive Growth Fund | Schedule of Portfolio Investments — continued January 31, 2023 | ||||||
(Amounts in Thousands, Except for Shares) (Unaudited)
Security Description | Shares | Value | |||||||||
Dexcom, Inc. (a) | 297,940 | $ | 31,907 | ||||||||
Intuitive Surgical, Inc. (a) | 60,751 | 14,926 | |||||||||
Jazz Pharmaceuticals PLC (a) | 95,125 | 14,902 | |||||||||
Tenet Healthcare Corp. (a) | 135,293 | 7,421 | |||||||||
Thermo Fisher Scientific, Inc. | 45,660 | 26,041 | |||||||||
UnitedHealth Group, Inc. | 85,517 | 42,689 | |||||||||
Veeva Systems, Inc. Class A (a) | 99,514 | 16,972 | |||||||||
Vertex Pharmaceuticals, Inc. (a) | 88,765 | 28,680 | |||||||||
Zoetis, Inc. | 92,905 | 15,375 | |||||||||
220,332 | |||||||||||
Industrials (6.4%): | |||||||||||
CoStar Group, Inc. (a) | 351,178 | 27,357 | |||||||||
Deere & Co. | 15,670 | 6,626 | |||||||||
HEICO Corp. Class A | 105,649 | 14,123 | |||||||||
Old Dominion Freight Line, Inc. | 24,300 | 8,098 | |||||||||
Quanta Services, Inc. | 84,176 | 12,811 | |||||||||
Uber Technologies, Inc. (a) | 619,918 | 19,174 | |||||||||
Verisk Analytics, Inc. | 49,858 | 9,063 | |||||||||
97,252 | |||||||||||
IT Services (8.0%): | |||||||||||
Block, Inc. (a) | 55,049 | 4,499 | |||||||||
Gartner, Inc. (a) | 27,286 | 9,226 | |||||||||
PayPal Holdings, Inc. (a) | 138,532 | 11,289 | |||||||||
Snowflake, Inc. Class A (a) | 54,194 | 8,478 | |||||||||
Toast, Inc. Class A (a) | 289,147 | 6,451 | |||||||||
Visa, Inc. Class A | 347,911 | 80,093 | |||||||||
120,036 | |||||||||||
Materials (0.7%): | |||||||||||
Graphic Packaging Holding Co. | 457,255 | 11,015 | |||||||||
Real Estate (0.4%): | |||||||||||
SBA Communications Corp. | 18,641 | 5,546 | |||||||||
Semiconductors & Semiconductor Equipment (8.3%): | |||||||||||
Advanced Micro Devices, Inc. (a) | 80,544 | 6,053 | |||||||||
Broadcom, Inc. | 27,695 | 16,202 | |||||||||
Enphase Energy, Inc. (a) | 34,977 | 7,743 | |||||||||
KLA Corp. | 17,252 | 6,771 | |||||||||
Lam Research Corp. | 27,397 | 13,701 | |||||||||
Monolithic Power Systems, Inc. | 26,862 | 11,458 | |||||||||
NVIDIA Corp. | 321,832 | 62,877 | |||||||||
124,805 | |||||||||||
Software (17.4%): | |||||||||||
Adobe, Inc. (a) | 54,068 | 20,023 | |||||||||
Cadence Design Systems, Inc. (a) | 149,521 | 27,337 | |||||||||
Intuit, Inc. | 24,052 | 10,166 | |||||||||
Microsoft Corp. | 432,775 | 107,246 | |||||||||
Palo Alto Networks, Inc. (a) | 162,934 | 25,848 | |||||||||
Salesforce, Inc. (a) | 40,309 | 6,771 | |||||||||
See notes to financial statements.
4
| USAA Mutual Funds Trust USAA Aggressive Growth Fund | Schedule of Portfolio Investments — continued January 31, 2023 | ||||||
(Amounts in Thousands, Except for Shares) (Unaudited)
Security Description | Shares | Value | |||||||||
ServiceNow, Inc. (a) | 102,607 | $ | 46,699 | ||||||||
Synopsys, Inc. (a) | 32,330 | 11,437 | |||||||||
Workday, Inc. Class A (a) | 35,341 | 6,412 | |||||||||
261,939 | |||||||||||
Technology Hardware, Storage & Peripherals (5.6%): | |||||||||||
Apple, Inc. | 585,746 | 84,517 | |||||||||
Total Common Stocks (Cost $1,031,332) | 1,482,970 | ||||||||||
Total Investments (Cost $1,031,332) — 98.4% | 1,482,970 | ||||||||||
Other assets in excess of liabilities — 1.6% | 24,672 | ||||||||||
NET ASSETS — 100.00% | $ | 1,507,642 | |||||||||
(a) Non-income producing security.
PLC — Public Limited Company
See notes to financial statements.
5
USAA Mutual Funds Trust | Statement of Assets and Liabilities January 31, 2023 | ||||||
(Amounts in Thousands, Except Per Share Amounts) (Unaudited)
| USAA Aggressive Growth Fund | |||||||
Assets: | |||||||
Investments, at value (Cost $1,031,332) | $ | 1,482,970 | |||||
Cash | 25,762 | ||||||
Receivables: | |||||||
Interest and dividends | 55 | ||||||
Capital shares issued | 194 | ||||||
Investments sold | 7,149 | ||||||
From Adviser | 4 | ||||||
Prepaid expenses | 12 | ||||||
Total Assets | 1,516,146 | ||||||
Liabilities: | |||||||
Payables: | |||||||
Investments purchased | 6,747 | ||||||
Capital shares redeemed | 865 | ||||||
Accrued expenses and other payables: | |||||||
Investment advisory fees | 487 | ||||||
Administration fees | 183 | ||||||
Custodian fees | 12 | ||||||
Transfer agent fees | 127 | ||||||
Compliance fees | 1 | ||||||
Trustees' fees | 1 | ||||||
Other accrued expenses | 81 | ||||||
Total Liabilities | 8,504 | ||||||
Net Assets: | |||||||
Capital | 1,126,378 | ||||||
Total accumulated earnings/(loss) | 381,264 | ||||||
Net Assets | $ | 1,507,642 | |||||
Net Assets | |||||||
Fund Shares | $ | 1,504,913 | |||||
Institutional Shares | 2,729 | ||||||
Total | $ | 1,507,642 | |||||
Shares (unlimited number of shares authorized with no par value): | |||||||
Fund Shares | 38,887 | ||||||
Institutional Shares | 69 | ||||||
Total | 38,956 | ||||||
Net asset value, offering and redemption price per share: (a) | |||||||
Fund Shares | $ | 38.70 | |||||
Institutional Shares | 39.49 | ||||||
(a) Per share amount may not recalculate due to rounding of net assets and/or shares outstanding.
See notes to financial statements.
6
USAA Mutual Funds Trust | Statement of Operations For the Six Months Ended January 31, 2023 | ||||||
(Amounts in Thousands) (Unaudited)
| USAA Aggressive Growth Fund | |||||||
Investment Income: | |||||||
Dividends | $ | 4,028 | |||||
Interest | 184 | ||||||
Securities lending (net of fees) | 1 | ||||||
Total Income | 4,213 | ||||||
Expenses: | |||||||
Investment advisory fees | 2,994 | ||||||
Administration fees — Fund Shares | 1,127 | ||||||
Administration fees — Institutional Shares | 2 | ||||||
Sub-Administration fees | 20 | ||||||
Custodian fees | 32 | ||||||
Transfer agent fees — Fund Shares | 757 | ||||||
Transfer agent fees — Institutional Shares | 2 | ||||||
Trustees' fees | 23 | ||||||
Compliance fees | 7 | ||||||
Legal and audit fees | 44 | ||||||
State registration and filing fees | 32 | ||||||
Interfund lending fees | — | (a) | |||||
Other expenses | 109 | ||||||
Total Expenses | 5,149 | ||||||
Expenses waived/reimbursed by Adviser | (12 | ) | |||||
Net Expenses | 5,137 | ||||||
Net Investment Income (Loss) | (924 | ) | |||||
Realized/Unrealized Gains (Losses) from Investments: | |||||||
Net realized gains (losses) from investment securities | (45,131 | ) | |||||
Net change in unrealized appreciation/depreciation on investment securities | (43,885 | ) | |||||
Net realized/unrealized gains (losses) on investments | (89,016 | ) | |||||
Change in net assets resulting from operations | $ | (89,940 | ) | ||||
(a) Rounds to less than $1 thousand.
See notes to financial statements.
7
USAA Mutual Funds Trust | Statements of Changes in Net Assets | ||||||
(Amounts in Thousands)
USAA Aggressive Growth Fund | |||||||||||
| Six Months Ended January 31, 2023 (Unaudited) | Year Ended July 31, 2022 | ||||||||||
From Investments: | |||||||||||
Operations: | |||||||||||
Net Investment Income (Loss) | $ | (924 | ) | $ | (5,838 | ) | |||||
Net realized gains (losses) | (45,131 | ) | 77,353 | ||||||||
Net change in unrealized appreciation/depreciation | (43,885 | ) | (606,328 | ) | |||||||
Change in net assets resulting from operations | (89,940 | ) | (534,813 | ) | |||||||
Distributions to Shareholders: | |||||||||||
Fund Shares | (32,252 | ) | (234,710 | ) | |||||||
Institutional Shares | (65 | ) | (2,113 | ) | |||||||
Change in net assets resulting from distributions to shareholders | (32,317 | ) | (236,823 | ) | |||||||
Change in net assets resulting from capital transactions | (21,885 | ) | 95,752 | ||||||||
Change in net assets | (144,142 | ) | (675,884 | ) | |||||||
Net Assets: | |||||||||||
Beginning of period | 1,651,784 | 2,327,668 | |||||||||
End of period | $ | 1,507,642 | $ | 1,651,784 | |||||||
Capital Transactions: | |||||||||||
Fund Shares | |||||||||||
Proceeds from shares issued | $ | 35,147 | $ | 126,323 | |||||||
Distributions reinvested | 31,799 | 231,580 | |||||||||
Cost of shares redeemed | (88,149 | ) | (252,897 | ) | |||||||
Total Fund Shares | $ | (21,203 | ) | $ | 105,006 | ||||||
Institutional Shares | |||||||||||
Proceeds from shares issued | $ | 238 | $ | 2,762 | |||||||
Distributions reinvested | 58 | 2,069 | |||||||||
Cost of shares redeemed | (978 | ) | (14,085 | ) | |||||||
Total Institutional Shares | $ | (682 | ) | $ | (9,254 | ) | |||||
Change in net assets resulting from capital transactions | $ | (21,885 | ) | $ | 95,752 | ||||||
Share Transactions: | |||||||||||
Fund Shares | |||||||||||
Issued | 926 | 2,442 | |||||||||
Reinvested | 846 | 4,259 | |||||||||
Redeemed | (2,321 | ) | (4,951 | ) | |||||||
Total Fund Shares | (549 | ) | 1,750 | ||||||||
Institutional Shares | |||||||||||
Issued | 6 | 47 | |||||||||
Reinvested | 2 | 37 | |||||||||
Redeemed | (26 | ) | (325 | ) | |||||||
Total Institutional Shares | (18 | ) | (241 | ) | |||||||
Change in Shares | (567 | ) | 1,509 | ||||||||
See notes to financial statements.
8
USAA Mutual Funds Trust | Financial Highlights | ||||||
For a Share Outstanding Throughout Each Period
USAA Aggressive Growth Fund | |||||||||||||||||||||||||||
Fund Shares | |||||||||||||||||||||||||||
| Six Months Ended January 31, 2023 (Unaudited) | Year Ended July 31, 2022 | Year Ended July 31, 2021 | Year Ended July 31, 2020 | Year Ended July 31, 2019 | Year Ended July 31, 2018 | ||||||||||||||||||||||
| Net Asset Value, Beginning of Period | $ | 41.79 | $ | 61.22 | $ | 46.02 | $ | 43.91 | $ | 48.92 | $ | 43.96 | |||||||||||||||
Investment Activities: | |||||||||||||||||||||||||||
Net investment income (loss) | (0.02 | )(a) | (0.15 | )(a) | (0.15 | )(a) | (0.07 | )(a) | 0.13 | 0.19 | |||||||||||||||||
| Net realized and unrealized gains (losses) | (2.23 | ) | (12.92 | ) | 15.45 | 9.82 | 1.72 | 8.79 | |||||||||||||||||||
| Total from Investment Activities | (2.25 | ) | (13.07 | ) | 15.30 | 9.75 | 1.85 | 8.98 | |||||||||||||||||||
Distributions to Shareholders from: | |||||||||||||||||||||||||||
Net investment income | — | — | — | (0.04 | ) | (0.08 | ) | (0.19 | ) | ||||||||||||||||||
Net realized gains | (0.84 | ) | (6.36 | ) | (0.10 | ) | (7.60 | ) | (6.78 | ) | (3.83 | ) | |||||||||||||||
Total Distributions | (0.84 | ) | (6.36 | ) | (0.10 | ) | (7.64 | ) | (6.86 | ) | (4.02 | ) | |||||||||||||||
Net Asset Value, End of Period | $ | 38.70 | $ | 41.79 | $ | 61.22 | $ | 46.02 | $ | 43.91 | $ | 48.92 | |||||||||||||||
Total Return (b) (c) | (5.32 | )% | (23.75 | )% | 33.27 | % | 26.30 | % | 5.53 | % | 21.57 | % | |||||||||||||||
Ratios to Average Net Assets: | |||||||||||||||||||||||||||
Net Expenses (d) (e) (f) (g) | 0.68 | % | 0.63 | % | 0.63 | % | 0.72 | % | 0.72 | % | 0.75 | %(h) | |||||||||||||||
Net Investment Income (Loss) (d) | (0.12 | )% | (0.29 | )% | (0.28 | )% | (0.17 | )% | 0.30 | % | 0.32 | % | |||||||||||||||
Gross Expenses (d) (e) | 0.68 | % | 0.63 | % | 0.63 | % | 0.72 | % | 0.72 | % | 0.75 | %(h) | |||||||||||||||
Supplemental Data: | |||||||||||||||||||||||||||
Net Assets at end of period (000's) | $ | 1,504,913 | $ | 1,648,078 | $ | 2,307,263 | $ | 1,861,282 | $ | 1,624,319 | $ | 1,592,944 | |||||||||||||||
Portfolio Turnover (b) (i) | 27 | % | 65 | % | 46 | % | 64 | % | 78 | % | 57 | % | |||||||||||||||
(a) Per share net investment income (loss) has been calculated using the average daily shares method.
(b) Not annualized for periods less than one year.
(c) Assumes reinvestment of all net investment income and realized capital gain distributions, if any, during the period. Includes adjustments in accordance with U.S. Generally Accepted Accounting Principles and could differ from the reported total return.
(d) Annualized for periods less than one year.
(e) Does not include acquired fund fees and expenses, if any.
(f) The net expense ratio may not correlate to the applicable expense limits in place during the period since the current contractual expense limitation is applied for a period beginning July 1, 2019 and in effect through November 30, 2023, instead of coinciding with the Fund's fiscal year end. Details of the current contractual expense limitation in effect can be found in Note 4 of the accompanying Notes to Financial Statements.
(g) From the period beginning July 1, 2019, the amount of any waivers or reimbursements and the amount of any recoupment is calculated without regard to the impact of any performance adjustment to the Fund's management fee.
(h) Reflects total annual operating expenses before reduction of any expenses paid indirectly. The share's expenses paid indirectly decreased the expense ratio by less than 0.01%.
(i) Portfolio turnover is calculated on the basis of the Fund as a whole without distinguishing between the classes of shares.
(continues on next page)
See notes to financial statements.
9
USAA Mutual Funds Trust | Financial Highlights — continued | ||||||
For a Share Outstanding Throughout Each Period
USAA Aggressive Growth Fund | |||||||||||||||||||||||||||
Institutional Shares | |||||||||||||||||||||||||||
| Six Months Ended January 31, 2023 (Unaudited) | Year Ended July 31, 2022 | Year Ended July 31, 2021 | Year Ended July 31, 2020 | Year Ended July 31, 2019 | Year Ended July 31, 2018 | ||||||||||||||||||||||
| Net Asset Value, Beginning of Period | $ | 42.60 | $ | 62.27 | $ | 46.82 | $ | 44.54 | $ | 49.55 | $ | 44.36 | |||||||||||||||
Investment Activities: | |||||||||||||||||||||||||||
Net investment income (loss) (a) | 0.01 | (0.18 | ) | (0.17 | ) | (0.05 | ) | 0.14 | 0.14 | ||||||||||||||||||
| Net realized and unrealized gains (losses) | (2.28 | ) | (13.13 | ) | 15.72 | 9.98 | 1.75 | 8.93 | |||||||||||||||||||
| Total from Investment Activities | (2.27 | ) | (13.31 | ) | 15.55 | 9.93 | 1.89 | 9.07 | |||||||||||||||||||
Distributions to Shareholders from: | |||||||||||||||||||||||||||
Net investment income | — | — | — | (0.05 | ) | (0.12 | ) | (0.05 | ) | ||||||||||||||||||
Net realized gains | (0.84 | ) | (6.36 | ) | (0.10 | ) | (7.60 | ) | (6.78 | ) | (3.83 | ) | |||||||||||||||
Total Distributions | (0.84 | ) | (6.36 | ) | (0.10 | ) | (7.65 | ) | (6.90 | ) | (3.88 | ) | |||||||||||||||
Net Asset Value, End of Period | $ | 39.49 | $ | 42.60 | $ | 62.27 | $ | 46.82 | $ | 44.54 | $ | 49.55 | |||||||||||||||
Total Return (b) (c) | (5.27 | )% | (23.73 | )% | 33.24 | % | 26.33 | % | 5.56 | % | 21.54 | % | |||||||||||||||
Ratios to Average Net Assets: | |||||||||||||||||||||||||||
Net Expenses (d) (e) (f) (g) | 0.53 | % | 0.66 | % | 0.66 | % | 0.70 | % | 0.70 | % | 0.75 | %(h)(i) | |||||||||||||||
Net Investment Income (Loss) (d) | 0.04 | % | (0.33 | )% | (0.32 | )% | (0.13 | )% | 0.32 | % | 0.30 | % | |||||||||||||||
Gross Expenses (d) (e) | 1.30 | % | 0.72 | % | 0.73 | % | 0.81 | % | 0.83 | % | 0.94 | %(h) | |||||||||||||||
Supplemental Data: | |||||||||||||||||||||||||||
Net Assets at end of period (000's) | $ | 2,729 | $ | 3,706 | $ | 20,405 | $ | 12,287 | $ | 11,841 | $ | 11,379 | |||||||||||||||
Portfolio Turnover (b) (j) | 27 | % | 65 | % | 46 | % | 64 | % | 78 | % | 57 | % | |||||||||||||||
(a) Per share net investment income (loss) has been calculated using the average daily shares method.
(b) Not annualized for periods less than one year.
(c) Assumes reinvestment of all net investment income and realized capital gain distributions, if any, during the period. Includes adjustments in accordance with U.S. Generally Accepted Accounting Principles and could differ from the reported total return.
(d) Annualized for periods less than one year.
(e) Does not include acquired fund fees and expenses, if any.
(f) The net expense ratio may not correlate to the applicable expense limits in place during the period since the current contractual expense limitation is applied for a period beginning July 1, 2019 and in effect through November 30, 2023, instead of coinciding with the Fund's fiscal year end. Details of the current contractual expense limitation in effect can be found in Note 4 of the accompanying Notes to Financial Statements.
(g) From the period beginning July 1, 2019, the amount of any waivers or reimbursements and the amount of any recoupment is calculated without regard to the impact of any performance adjustment to the Fund's management fee.
(h) Reflects total annual operating expenses before reduction of any expenses paid indirectly. The share's expenses paid indirectly decreased the expense ratio by less than 0.01%.
(i) Prior to December 1, 2017, USAA Asset Management Company (previous Investment Adviser) had voluntarily agreed to limit the annual expenses of Institutional Shares to 0.70% of the Institutional Shares' average daily net assets.
(j) Portfolio turnover is calculated on the basis of the Fund as a whole without distinguishing between the classes of shares.
See notes to financial statements.
10
USAA Mutual Funds Trust | Notes to Financial Statements January 31, 2023 | ||||||
(Unaudited)
1. Organization:
USAA Mutual Funds Trust (the "Trust") is organized as a Delaware statutory trust and is registered under the Investment Company Act of 1940, as amended (the "1940 Act"), as an open-end investment company. The Trust is comprised of 45 funds and is authorized to issue an unlimited number of shares, which are units of beneficial interest with no par value.
The accompanying financial statements are those of the USAA Aggressive Growth Fund (the "Fund"). The Fund offers two classes of shares: Fund Shares and Institutional Shares. The Fund is classified as diversified under the 1940 Act.
Each class of shares of the Fund has substantially identical rights and privileges, except with respect to fees paid under distribution plans, expenses allocable exclusively to each class of shares, voting rights on matters solely affecting a single class of shares, and the exchange privilege of each class of shares.
Victory Capital Management ("VCM" or the "Adviser") is an indirect wholly owned subsidiary of Victory Capital Holdings, Inc., a publicly traded Delaware corporation, and a wholly owned direct subsidiary of Victory Capital Operating, LLC.
Under the Trust's organizational documents, its officers and trustees are indemnified against certain liabilities arising out of the performance of their duties to the Fund. In addition, in the normal course of business, the Fund enters into contracts with its vendors and others that provide for general indemnifications. The Fund's maximum exposure under these arrangements is unknown, as this would involve future claims that may be made against the Fund. However, based on experience, the Fund expects that risk of loss to be remote.
2. Significant Accounting Policies:
The following is a summary of significant accounting policies followed by the Trust in the preparation of its financial statements. The policies are in conformity with U.S. Generally Accepted Accounting Principles ("GAAP"). The preparation of financial statements in accordance with GAAP requires management to make estimates and assumptions that affect the reported amounts of assets and liabilities and disclosure of contingent assets and liabilities at the date of the financial statements and the reported amounts of income and expenses for the period. Actual results could differ from those estimates. The Fund follows the specialized accounting and reporting requirements under GAAP that are applicable to investment companies under Accounting Standards Codification Topic 946.
Investment Valuation:
The Fund records investments at fair value. Fair value is defined as the price that would be received to sell an asset or paid to transfer a liability in an orderly transaction between market participants at the measurement date.
The valuation techniques described below maximize the use of observable inputs and minimize the use of unobservable inputs in determining fair value. The inputs used for valuing the Fund's investments are summarized in the three broad levels listed below:
• Level 1 — quoted prices (unadjusted) in active markets for identical securities
• Level 2 — other significant observable inputs (including quoted prices for similar securities, interest rates, or credit spreads, applicable to those securities, etc.)
• Level 3 — significant unobservable inputs (including the Adviser's assumptions in determining the fair value of investments)
Changes in valuation techniques may result in transfers in or out of an assigned level within the disclosure hierarchy. The inputs or methodologies used for valuation techniques are not necessarily an indication of the risks associated with entering into those investments.
11
USAA Mutual Funds Trust | Notes to Financial Statements — continued January 31, 2023 | ||||||
(Unaudited)
The Adviser, appointed as the valuation designee by the Trust's Board of Trustees' (the "Board"), has established the Pricing and Liquidity Committee (the "Committee"), and subject to Board oversight, the Committee administers and oversees the Fund's valuation policies and procedures, which are approved by the Board.
Portfolio securities listed or traded on securities exchanges, including Exchange-Traded Funds ("ETFs"), are valued at the closing price on the exchange or system where the security is principally traded, if available, or at the Nasdaq Official Closing Price. If there have been no sales for that day on the exchange or system, then a security is valued at the last available bid quotation on the exchange or system where the security is principally traded. In each of these situations, valuations are typically categorized as Level 1 in the fair value hierarchy.
Investments in open-end investment companies, other than ETFs, are valued at their net asset value ("NAV"). These valuations are typically categorized as Level 1 in the fair value hierarchy.
In the event that price quotations or valuations are not readily available, investments are valued at fair value in accordance with procedures established by and under the general supervision and responsibility of the Board. These valuations are typically categorized as Level 2 or Level 3 in the fair value hierarchy, based on the observability of inputs used to determine the fair value. The effect of fair value pricing is that securities may not be priced on the basis of quotations from the primary market in which they are traded, and the actual price realized from the sale of a security may differ materially from the fair value price. Valuing these securities at fair value is intended to cause the Fund's NAV to be more reliable than it otherwise would be.
A summary of the valuations as of January 31, 2023, based upon the three levels defined above, is included in the table below while the breakdown, by category, of investments is disclosed on the Schedule of Portfolio Investments (amounts in thousands):
Level 1 | Level 2 | Level 3 | Total | ||||||||||||||||
Common Stocks | $ | 1,482,970 | $ | — | $ | — | $ | 1,482,970 | |||||||||||
Total | $ | 1,482,970 | $ | — | $ | — | $ | 1,482,970 | |||||||||||
As of January 31, 2023, there were no transfers into/out of Level 3.
Real Estate Investment Trusts ("REITs"):
The Fund may invest in REITs, which report information on the source of their distributions annually. REITs are pooled investment vehicles that invest primarily in income producing real estate or real estate related loans or interests (such as mortgages). Certain distributions received from REITs during the year are recorded as realized gains or return of capital as estimated by the Fund or when such information becomes known.
Investment Companies:
Open-End Funds:
The Fund may invest in portfolios of open-end investment companies. These investment companies value securities in their portfolios for which market quotations are readily available at their market values (generally the last reported sale price) and all other securities and assets at their fair value by the methods established by the board of directors of the underlying funds.
Investment Transactions and Related Income:
Changes in holdings of investments are accounted for no later than one business day following the trade date. For financial reporting purposes, however, investment transactions are accounted for on trade date or the last business day of the reporting period. Interest income is determined on the basis of coupon interest accrued using the effective interest method which adjusts, where applicable, the amortization of premiums or accretion of discounts. Dividend income is recorded on the ex-dividend date. Gains or losses realized on sales of securities are recorded on the identified cost basis.
12
USAA Mutual Funds Trust | Notes to Financial Statements — continued January 31, 2023 | ||||||
(Unaudited)
Securities Lending:
The Fund, through a Securities Lending Agreement with Citibank, N.A. ("Citibank"), may lend its securities to qualified financial institutions, such as certain broker-dealers and banks, to earn additional income, net of income retained by Citibank. Borrowers are required to initially secure their loans for collateral in the amount of at least 102% of the value of U.S. securities loaned or at least 105% of the value of non-U.S. securities loaned, marked-to-market daily. Any collateral shortfalls associated with increases in the valuation of the securities loaned are generally cured the next business day. The collateral can be received in the form of cash collateral and/or non-cash collateral. Non-cash collateral can include U.S. Government Securities and other securities as permitted by Securities and Exchange Commission ("SEC") guidelines. The cash collateral is invested in short-term instruments or cash equivalents, primarily open-end investment companies, as noted on the Fund's Schedule of Portfolio Investments. The Fund effectively does not have control of the non-cash collateral and therefore it is not disclosed on the Fund's Schedule of Portfolio Investments. Collateral requirements are determined daily based on the value of the Fund's securities on loan as of the end of the prior business day. During the time portfolio securities are on loan, the borrower will pay the Fund any dividends or interest paid on such securities plus any fee negotiated between the parties to the lending agreement. The Fund also earns a return from the collateral. The Fund pays Citibank various fees in connection with the investment of cash collateral and fees based on the investment income received from securities lending activities. Securities lending income (net of these fees) is disclosed on the Statement of Operations. Loans are terminable upon demand and the borrower must return the loaned securities within the lesser of one standard settlement period or five business days. Although risk is mitigated by the collateral, the Fund could experience a delay in recovering its securities and possible loss of income or value if the borrower fails to return them. In addition, there is a risk that the value of the short-term investments will be less than the amount of cash collateral required to be returned to the borrower.
The Fund's agreement with Citibank does not include master netting provisions. Non-cash collateral received by the Fund may not be sold or repledged, except to satisfy borrower default.
As of January 31, 2023, the Fund did not have any securities on loan.
Federal Income Taxes:
The Fund intends to continue to qualify as a regulated investment company by complying with the provisions available to certain investment companies, as defined in applicable sections of the Internal Revenue Code, and to make distributions of net investment income and net realized gains sufficient to relieve it from all, or substantially all, federal income taxes. Accordingly, no provision for federal income taxes is required in the financial statements. The Fund has a tax year end of July 31, and effective April 30, 2023, the Fund will change its tax year end to April 30.
For the six months ended January 31, 2023, the Fund did not incur any income tax, interest, or penalties, and has recorded no liability for net unrecognized tax benefits relating to uncertain tax positions.
Management of the Fund has reviewed tax positions taken in tax years that remain subject to examination by all major tax jurisdictions, including federal (i.e., the last four tax years, which includes the current fiscal tax year end). Management believes that there is no tax liability resulting from unrecognized tax benefits related to uncertain tax positions taken.
Allocations:
Expenses directly attributable to the Fund are charged to the Fund, while expenses that are attributable to more than one fund in the Trust, or jointly with an affiliated trust, are allocated among the respective funds in the Trust and/or an affiliated trust based upon net assets or another appropriate basis.
Income, expenses (other than class-specific expenses such as transfer agent fees, state registration fees, and printing fees), and realized and unrealized gains or losses on investments are allocated to each class of shares based on its relative net assets on the date income is earned or expenses and realized and unrealized gains and losses are incurred.
13
USAA Mutual Funds Trust | Notes to Financial Statements — continued January 31, 2023 | ||||||
(Unaudited)
3. Purchases and Sales:
Purchases and sales of securities (excluding securities maturing less than one year from acquisition) for the six months ended January 31, 2023, were as follows for the Fund (amounts in thousands):
| Excluding U.S. Government Securities | |||||||
Purchases | Sales | ||||||
| $ | 396,581 | $ | 433,071 | ||||
4. Fees and Transactions with Affiliates and Related Parties:
Investment Advisory Fees:
Investment advisory services are provided to the Fund by the Adviser, which is a New York corporation registered as an investment adviser with the SEC.
Under the terms of the Investment Advisory Agreement, the Adviser is entitled to receive a base fee and a performance adjustment. The Fund's base fee is accrued daily and paid monthly at an annualized rate of 0.50% of the first $750 million of the Fund's average daily net assets, 0.40% of that portion of the Fund's average daily net assets over $750 million but not over $1.5 billion, and 0.33% of that portion of the Fund's average daily net assets over $1.5 billion. Amounts incurred and paid to VCM for the six months ended January 31, 2023, are reflected on the Statement of Operations as Investment advisory fees.
The performance adjustment for each share class is accrued daily and calculated monthly by comparing the respective class' performance to that of the Lipper Large-Cap Growth Funds Index. The Lipper Large-Cap Growth Funds Index tracks the total return performance of the largest funds within the Lipper Large-Cap Growth Funds category.
The performance period for each share class consists of the current month plus the previous 35 months. The following table is utilized to determine the extent of the performance adjustment:
| Over/Under Performance Relative to Index (in basis points)(a) | Annual Adjustment Rate (in basis points) | ||||||
| +/- 100 to 400 | +/- 4 | ||||||
| +/- 401 to 700 | +/- 5 | ||||||
| +/- 701 and greater | +/- 6 | ||||||
(a) Based on the difference between the average annual performance of the relevant share class of the Fund and its relevant Lipper index, rounded to the nearest basis point.
Each class' annual performance adjustment rate is multiplied by the average daily net assets of the respective class over the entire performance period, which is then multiplied by a fraction, the numerator of which is the number of days in the month and the denominator of which is 365 (366 in leap years). The resulting amount is then added to (in the case of overperformance), or subtracted from (in the case of underperformance) the base fee.
Under the performance fee arrangement, each class pays a positive performance fee adjustment for a performance period whenever the class outperforms the Lipper Large-Cap Growth Funds Index over that period, even if the class has overall negative returns during the performance period.
For the period August 1, 2022, to January 31, 2023, performance adjustments were $(380) and $(3) for Fund Shares and Institutional Shares, in thousands, respectively. Performance adjustments were (0.05)% and (0.17)% for Fund Shares and Institutional Shares, respectively. The performance adjustment rate included in the investment advisory fee may differ from the maximum over/under Annual Adjustment Rate due to differences in average net assets for the reporting period and rolling 36 month performance periods.
14
USAA Mutual Funds Trust | Notes to Financial Statements — continued January 31, 2023 | ||||||
(Unaudited)
The Trust relies on an exemptive order granted to VCM and its affiliated funds by the SEC in March 2019, permitting the use of a "manager-of-managers" structure for certain funds. Under a manager-of-managers structure, the investment adviser may select (with approval of the Board and without shareholder approval) one or more subadvisers to manage the day-to-day investment of a fund's assets. For the six months ended January 31, 2023, the Fund had no subadvisers.
Administration and Servicing Fees:
VCM also serves as the Fund's administrator and fund accountant. Under the Fund Administration, Servicing and Accounting Agreement, VCM is paid an administration and servicing fee that is accrued daily and paid monthly at an annualized rate of 0.15% and 0.10%, which is based on the Fund's average daily net assets of the Fund Shares and Institutional Shares, respectively. Amounts incurred for the six months ended January 31, 2023, are reflected on the Statement of Operations as Administration fees.
Citi Fund Services Ohio, Inc. ("Citi"), an affiliate of Citibank, acts as sub-administrator and sub-fund accountant to the Fund pursuant to a Sub-Administration and Sub-Fund Accounting Services Agreement between VCM and Citi. VCM pays Citi a fee for providing these services. The Fund reimburses VCM and Citi for out-of-pocket expenses incurred in providing these services and certain other expenses specifically allocated to the Fund. Amounts incurred for the six months ended January 31, 2023, are reflected on the Statement of Operations as Sub-Administration fees.
The Fund (as part of the Trust) has entered into an agreement with the Adviser to provide compliance services, pursuant to which the Adviser furnishes its compliance personnel, including the services of the Chief Compliance Officer ("CCO"), and other resources reasonably necessary to provide the Trust with compliance oversight services related to the design, administration, and oversight of a compliance program for the Trust in accordance with Rule 38a-1 under the 1940 Act. The CCO is an employee of the Adviser, which pays the compensation of the CCO and support staff. The funds in the Trust, Victory Variable Insurance Funds, Victory Portfolios, and Victory Portfolios II (collectively, the "Victory Funds Complex") in the aggregate, compensate the Adviser for these services. Amounts incurred for the six months ended January 31, 2023, are reflected on the Statement of Operations as Compliance fees.
Transfer Agency Fees:
Victory Capital Transfer Agency, Inc. ("VCTA"), an affiliate of the Adviser, provides transfer agency services to the Fund. VCTA provides transfer agent services to the Fund Shares based on an annual charge of $23 per shareholder account plus out-of-pocket expenses. VCTA pays a portion of these fees to certain intermediaries for the administration and servicing of accounts that are held with such intermediaries. Transfer agent fees for the Institutional Shares are paid monthly based on a fee accrued daily at an annualized rate of 0.10% of average daily net assets, plus out-of-pocket expenses. Amounts incurred and paid to VCTA for the six months ended January 31, 2023, are reflected on the Statement of Operations as Transfer agent fees.
FIS Investor Services LLC serves as sub-transfer agent and dividend disbursing agent for the Fund pursuant to a Sub-Transfer Agent Agreement between VCTA and FIS Investor Services LLC. VCTA provides FIS Investor Services LLC a fee for providing these services.
Distributor/Underwriting Services:
Victory Capital Services, Inc. (the "Distributor"), an affiliate of the Adviser, serves as Distributor for the continuous offering of the shares of the Fund pursuant to a Distribution Agreement between the Distributor and the Trust and receives no fee or other compensation for these services.
Other Fees:
Citibank serves as the Fund's custodian. The Fund pays Citibank a fee for providing these services. Amounts incurred for the six months ended January 31, 2023, are reflected on the Statement of Operations as Custodian fees.
K&L Gates LLP provides legal services to the Trust.
15
USAA Mutual Funds Trust | Notes to Financial Statements — continued January 31, 2023 | ||||||
(Unaudited)
The Adviser has entered into an expense limitation agreement with the Fund until at least November 30, 2023. Under the terms of the agreement, the Adviser has agreed to waive fees or reimburse certain expenses to the extent that ordinary operating expenses incurred by certain classes of the Fund in any fiscal year exceed the expense limits for such classes of the Fund. Such excess amounts will be the liability of the Adviser. Performance adjustments, acquired fund fees and expenses, interest, taxes, brokerage commissions, other expenditures, which are capitalized in accordance with GAAP, and other extraordinary expenses not incurred in the ordinary course of the Fund's business are excluded from the expense limits. As of January 31, 2023, the expense limits (excluding voluntary waivers) were 0.75% and 0.70% for Fund Shares and Institutional Shares, respectively.
Under the terms of the expense limitation agreement, the Fund has agreed to repay fees and expenses that were waived or reimbursed by the Adviser for a period of up to three years (thirty-six (36) months) after the waiver or reimbursement took place, subject to the lesser of any operating expense limits in effect at the time of: (a) the original waiver or expense reimbursement; or (b) the recoupment, after giving effect to the recoupment amount.
As of January 31, 2023, the following amounts are available to be repaid to the Adviser (amounts in thousands). The Fund has not recorded any amounts available to be repaid as a liability due to an assessment that such repayments are not probable at January 31, 2023.
| Expires 2023 | Expires 2024 | Expires 2025 | Expires 2026 | Total | |||||||||||||||
| $ | 2 | $ | 10 | $ | 10 | $ | 12 | $ | 34 | ||||||||||
The Adviser may voluntarily waive or reimburse additional fees to assist the Fund in maintaining competitive expense ratios. Voluntary waivers and reimbursements applicable to the Fund are not available to be recouped at a future time. There were no voluntary waivers or reimbursements for the six months ended January 31, 2023.
Certain officers and/or interested trustees of the Fund are also officers and/or employees of the Adviser, administrator, fund accountant, sub-administrator, sub-fund accountant, custodian, and Distributor.
5. Risks:
The Fund may be subject to other risks in addition to these identified risks.
Market Risk — Overall market risks may affect the value of the Fund. Domestic and international factors such as political events, war, terrorism, trade disputes, inflation rates, interest rate levels and other fiscal and monetary policy changes, cybersecurity incidents, pandemics and other public health crises, sanctions against a particular foreign country, its nationals, businesses or industries and related geopolitical events, as well as environmental disasters such as earthquakes, fires, and floods, or other catastrophes, may add to instability in global economies and markets generally, and may lead to increased market volatility. Global economies and financial markets are highly interconnected, which increases the possibility that conditions in one country or region might adversely affect issuers in another country or region. The impact of these and other factors may be short-term or may last for extended periods.
Equity Risk — The values of the equity securities in which the Fund invests may decline in response to developments affecting individual companies and/or general market, economic and political conditions and other factors. A company's earnings or dividends may not increase as expected due to poor management decisions, competitive pressures, breakthroughs in technology, reliance on suppliers, labor problems or shortages, corporate restructurings, fraudulent disclosures, natural disasters, military confrontations, war, terrorism, public health crises, or other events, conditions, and factors. Price changes may be temporary or may last for extended periods.
Large-Capitalization Stock Risk — The Fund invests in large-capitalization companies. Such investments may go in and out of favor based on market and economic conditions and may underperform other market segments. Some large-capitalization companies may be unable to respond quickly to new competitive challenges and attain the high growth rate of successful smaller companies,
16
USAA Mutual Funds Trust | Notes to Financial Statements — continued January 31, 2023 | ||||||
(Unaudited)
especially during extended periods of economic expansion. As such, returns on investments in stocks of large-capitalization companies could trail the returns on investments in stocks of small- and mid-capitalization companies.
6. Borrowing and Interfund Lending:
Line of Credit:
The Victory Funds Complex participates in a short-term demand note "Line of Credit" agreement with Citibank. The Line of Credit agreement with Citibank was renewed on June 27, 2022, with a termination date of June 26, 2023. Under the agreement with Citibank, the Victory Funds Complex may borrow up to $600 million, of which $300 million is committed and $300 million is uncommitted. $40 million of the Line of Credit is reserved for use by the Victory Floating Rate Fund, another series of the Victory Funds Complex, with Victory Floating Rate Fund paying the related commitment fees for that amount. The purpose of the Line of Credit is to meet temporary or emergency cash needs. For the six months ended January 31, 2023, Citibank received an annual commitment fee of 0.15% on $300 million for providing the Line of Credit. Each fund in the Victory Funds Complex paid a pro-rata portion of the commitment fees plus any interest (one-month Secured Overnight Financing Rate ("SOFR") plus 1.10 percent) on amounts borrowed. Interest charged to the Fund during the period, if applicable, is reflected on the Statement of Operations under Line of credit fees.
The Fund had no borrowings under the Line of Credit agreement during the six months ended January 31, 2023.
Interfund Lending:
The Trust and the Adviser rely on an exemptive order granted by the SEC in March 2017 (the "Order"), permitting the establishment and operation of an Interfund Lending Facility (the "Facility"). The Facility allows the Fund to directly lend and borrow money to or from any other fund in the Victory Funds Complex that is permitted to participate in the Facility, relying upon the Order at rates beneficial to both the borrowing and lending funds. Advances under the Facility are allowed for temporary or emergency purposes, including the meeting of redemption requests that otherwise might require the untimely disposition of securities, and are subject to each Fund's borrowing restrictions. The interfund loan rate is determined, as specified in the Order, by averaging the current repurchase agreement rate and the current bank loan rate. As a Borrower, interest charged to the Fund, if any, during the period, is reflected on the Statement of Operations under Interfund lending fees. As a Lender, interest earned by the Fund, if any, during the period, is reflected on the Statement of Operations under Interfund lending.
The average borrowing or lending for the days outstanding and average interest rate for the Fund during the six months ended January 31, 2023, were as follows (amounts in thousands):
| Borrower or Lender | Amount Outstanding at January 31, 2023 | Average Borrowing* | Days Borrowing Outstanding | Average Interest Rate* | Maximum Borrowing During the Period | ||||||||||||||||||
| Borrower | $ | — | $ | 897 | 2 | 4.21 | % | $ | 992 | ||||||||||||||
* Based on the number of days borrowings were outstanding for the six months ended January 31, 2023.
7. Federal Income Tax Information:
The Fund intends to distribute any net investment income annually. Distributable net realized gains, if any, are declared and paid at least annually.
The amounts of dividends from net investment income and distributions from net realized gains (collectively, distributions to shareholders) are determined in accordance with federal income tax regulations, which may differ from GAAP. To the extent these "book/tax" differences are permanent in nature (e.g., net operating loss and distribution reclassification), such amounts are reclassified within
17
USAA Mutual Funds Trust | Notes to Financial Statements — continued January 31, 2023 | ||||||
(Unaudited)
the components of net assets based on their federal tax-basis treatment; temporary differences (e.g., wash sales) do not require reclassification. To the extent dividends and distributions exceed net investment income and net realized gains for tax purposes, they are reported as distributions of capital. Net investment losses incurred by the Fund may be reclassified as an offset to capital on the accompanying Statement of Assets and Liabilities.
The tax character of current year distributions paid and the tax basis of the current components of accumulated earnings (loss) will be determined at the end of the current tax year.
At the tax year ended July 31, 2022, the Fund had no capital loss carryforwards for federal income tax purposes.
8. Subsequent Events:
On June 29, 2022, the Board approved a change to the Fund's fiscal year-end from July 31 to April 30, with an effective date of April 30, 2023.
The Board, upon recommendation of the Adviser, has approved a change in the name of the Trust and each individual fund within the Trust. On February 23, 2023, an initial filing was made with the SEC to commence the process to effectuate the following changes.
Effective at the start of business on April 24, 2023 (the "Effective Date"), the name of the Trust will change from USAA Mutual Funds Trust to Victory Portfolios III, and all references to USAA Mutual Funds Trust in the summary prospectus, statutory prospectus, and statement of additional information ("SAI") will be replaced by the new name.
Also on the Effective Date, references to the current name of the Fund in the summary prospectus, statutory prospectus, and SAI will be replaced with the new name as follows:
| Current Name | New Name | ||||||
USAA Aggressive Growth Fund | Victory Aggressive Growth Fund | ||||||
In addition, on the Effective Date, USAA Investments, a Victory Capital Management Inc. Investment Franchise, that currently manages the USAA Fixed Income Funds, will change its name to Victory Income Investors, and all references to USAA Investments in the summary prospectus, statutory prospectus, and SAI, will be replaced.
Please note that there will be no changes in the management of the Fund or to the Fund's ticker symbols.
18
USAA Mutual Funds Trust | Supplemental Information January 31, 2023 | ||||||
(Unaudited)
Proxy Voting and Portfolio Holdings Information
Proxy Voting:
Information regarding the policies and procedures the Fund uses to determine how to vote proxies relating to portfolio securities is available without charge, upon request, by calling (800) 235-8396. The information is also included in the Fund's Statement of Additional Information, which is available on the SEC's website at sec.gov.
Information relating to how the Fund voted proxies relating to portfolio securities held during the most recent 12 months ended June 30 is available on the SEC's website at sec.gov.
Availability of Schedules of Portfolio Investments:
The Trust files a complete list of Schedules of Portfolio Investments with the SEC for the first and third quarter of each fiscal year on Form N-PORT. Form N-PORT is available on the SEC's website at sec.gov.
Expense Examples
As a shareholder of the Fund, you may incur two types of costs: (1) transaction costs and (2) ongoing costs, including management fees and other Fund expenses. These examples are intended to help you understand your ongoing costs (in dollars) of investing in the Fund and to compare these costs with the ongoing costs of investing in other mutual funds.
These examples are based on an investment of $1,000 invested at the beginning of the period and held for the entire period from August 1, 2022, through January 31, 2023.
The Actual Expense figures in the table below provide information about actual account values and actual expenses. You may use the information below, together with the amount you invested, to estimate the expenses that you paid over the period. Simply divide your account value by $1,000 (for example, an $8,600 account value divided by $1,000 = 8.6), then multiply the result by the number in the table under the heading entitled "Actual Expenses Paid During Period" to estimate the expenses you paid on your account during this period.
The Hypothetical Expense figures in the table below provide information about hypothetical account values and hypothetical expenses based on the Fund's actual expense ratio and an assumed rate of return of 5% per year before expenses, which is not the Fund's actual return. The hypothetical account values and expenses may not be used to estimate the actual ending account balance or expenses you paid for the period. You may use this information to compare this 5% hypothetical example with the 5% hypothetical examples that appear in shareholder reports of other funds.
Please note the expenses shown in the table below are meant to highlight your ongoing costs only and do not reflect any transactional costs. Therefore, the hypothetical expenses in the table are useful in comparing ongoing costs only and will not help you determine the relative total costs of owning different funds. In addition, if these transactional costs were included, your costs would have been higher.
| Beginning Account Value 8/1/22 | Actual Ending Account Value 1/31/23 | Hypothetical Ending Account Value 1/31/23 | Actual Expenses Paid During Period 8/1/22- 1/31/23* | Hypothetical Expenses Paid During Period 8/1/22- 1/31/23* | Annualized Expense Ratio During Period 8/1/22- 1/31/23 | ||||||||||||||||||||||
Fund Shares | $ | 1,000.00 | $ | 946.80 | $ | 1,021.78 | $ | 3.34 | $ | 3.47 | 0.68 | % | |||||||||||||||
Institutional Shares | 1,000.00 | 947.30 | 1,022.53 | 2.60 | 2.70 | 0.53 | % | ||||||||||||||||||||
* Expenses are equal to the average account value multiplied by the Fund's annualized expense ratio multiplied by 184/365 (the number of days in the most recent fiscal half-year divided by the number of days in the fiscal year).
19
USAA Mutual Funds Trust | Supplemental Information — continued January 31, 2023 | ||||||
(Unaudited)
Considerations of the Board in Continuing the Investment Advisory Agreement
USAA Aggressive Growth Fund (the "Fund")
At a meeting of the Board of Trustees (the "Board") of USAA Mutual Funds Trust (the "Trust") held on December 8-9, 2022, the Board, including the Trustees who are not "interested persons" (as that term is defined in the Investment Company Act of 1940, as amended) of the Trust (the "Independent Trustees"), approved for an annual period the continuance of the Investment Advisory Agreement (the "Advisory Agreement") between the Trust and Victory Capital Management Inc. (the "Adviser") with respect to the Fund. Prior to the December 8-9, 2022 meeting at which the Advisory Agreement was approved, the Independent Trustees also discussed and considered information regarding the proposed continuation of the Advisory Agreement at a meeting held on November 21, 2022.
In advance of the foregoing meetings, the Trustees received and considered a variety of information relating to the Advisory Agreement and the Adviser, and were given the opportunity to ask questions and request additional information from management. The information provided to the Board included, among other things: (i) a separate report prepared by an independent third party of mutual fund data, which provided a statistical analysis comparing the Fund's investment performance, expenses, and fees to comparable investment companies; (ii) information concerning the services rendered to the Fund, as well as information regarding the Adviser's revenues and costs of providing services to the Fund and compensation paid to affiliates of the Adviser; and (iii) information about the Adviser's operations and personnel. Prior to voting, the Independent Trustees reviewed the proposed continuance of the Advisory Agreement with management and with experienced independent counsel retained by the Independent Trustees ("Independent Counsel") and received materials from such Independent Counsel discussing the legal standards for their consideration of the proposed continuation of the Advisory Agreement with respect to the Fund. The Independent Trustees also reviewed the proposed continuation of the Advisory Agreement with respect to the Fund in private sessions with Independent Counsel at which no representatives of management were present.
At each regularly scheduled meeting of the Board and its committees, the Board receives and reviews, among other things, information concerning the Fund's performance and related services provided by the Adviser. At the meeting at which the renewal of the Advisory Agreement is considered, particular focus is given to information concerning Fund performance, fees and total expenses as compared to comparable investment companies, and the Adviser's profitability with respect to the Fund. However, the Board noted that the evaluation process with respect to the Adviser is an ongoing one. In this regard, the Board's and its committees' consideration of the Advisory Agreement included information previously received at such meetings. The Board also recognized that the contractual arrangements for the Fund have been reviewed by the Board and discussed with the Adviser in prior years and that the Board's conclusions may be based, in part, on its consideration of these same arrangements in prior years.
Advisory Agreement
After full consideration of a variety of factors, the Board, including the Independent Trustees, voted to approve the Advisory Agreement. In approving the Advisory Agreement, the Trustees did not identify any single factor as controlling, and each Trustee may have attributed different weights to various factors. Throughout their deliberations, the Independent Trustees were represented and assisted by Independent Counsel.
Nature, Extent, and Quality of Services — In considering the nature, extent, and quality of the services provided by the Adviser under the Advisory Agreement, the Board reviewed information provided by the Adviser relating to its operations and personnel. The Board also took into account its knowledge of the Adviser's management and the quality of the performance of the Adviser's duties through Board meetings, discussions, and reports during the preceding year. The Board considered the fees paid to the Adviser and the services provided to the Fund by the Adviser under the Advisory Agreement, as well as other services provided by the Adviser and its affiliates under other agreements, and the personnel who provide these services. In addition to the investment advisory services provided to the Fund, the Adviser and its affiliates provide administrative services, shareholder
20
USAA Mutual Funds Trust | Supplemental Information — continued January 31, 2023 | ||||||
(Unaudited)
services, oversight of Fund accounting, marketing services, assistance in meeting legal and regulatory requirements, and other services necessary for the operation of the Fund and the Trust.
The Board considered the scope of services provided by, and the undertakings required of, the Adviser in connection with those services, including, among other things, maintaining (i) its own and the Fund's compliance programs, (ii) risk management programs, (iii) liquidity risk management program, (iv) derivatives risk management program, and (v) cybersecurity programs, each of which had expanded over time as a result of regulatory, market, and other developments. The Board also considered the significant risks assumed by the Adviser in connection with the services provided to the Fund, including investment, operational, enterprise, litigation, regulatory and compliance risks.
The Board considered the Adviser's management style and the performance of the Adviser's duties under the Advisory Agreement. The Board considered the level and depth of knowledge of the Adviser, including the professional experience and qualifications of its senior and investment personnel, as well as current staffing levels. The allocation of the Fund's brokerage, including the Adviser's process for monitoring "best execution," also was considered. The Adviser's role in coordinating the activities of the Fund's other service providers was also considered. The Board also considered the Adviser's risk management processes. The Board considered the Adviser's financial condition and that it had the financial wherewithal to continue to provide the same scope and high quality of services under the Advisory Agreement. In reviewing the Advisory Agreement, the Board focused on the experience, resources, and strengths of the Adviser and its affiliates in managing the Fund, as well as the other funds in the Trust.
The Board also reviewed the compliance and administrative services provided to the Fund by the Adviser and its affiliates, including the Adviser's oversight of the Fund's day-to-day operations and oversight of Fund accounting. The Trustees, guided also by information obtained from their experiences as Trustees of the Trust, also focused on the quality of the Adviser's compliance and administrative staff.
Expenses and Performance — In connection with its consideration of the Advisory Agreement, the Board evaluated the Fund's advisory fees and total expense ratio as compared to other open-end investment companies deemed to be comparable to the Fund as determined by the independent third party in its report. The Fund's expenses were compared to (i) a group of investment companies chosen by the independent third party to be comparable to the Fund based upon certain factors, including fund type, comparability of investment objective and classification, sales load type, asset size, and expense components (the "expense group") and (ii) a larger group of investment companies with the same investment classification/objective as the Fund regardless of asset size, excluding outliers (the "expense universe"). Among other data, the Board noted that the Fund's net management fee rate — which includes advisory and administrative services and the effects of any performance adjustment, as well as any fee waivers and reimbursements — was below the median of its expense group and its expense universe. The data indicated that the Fund's total expenses, including after any reimbursements, were below the median of its expense group and its expense universe. The Board also took into account the Adviser's current undertakings to maintain expense limitations for the Fund. The Board took into account the various other services provided to the Fund by the Adviser and its affiliates, and noted the high quality of services received by the Fund.
In considering the Fund's performance, the Board noted that it reviews at its regularly scheduled meetings information about the Fund's performance results. The Trustees also reviewed various comparative data provided to them in connection with their consideration of the renewal of the Advisory Agreement, including, among other information, a comparison of the Fund's average annual total returns relative to its Lipper index and other mutual funds deemed to be in its peer group by the independent third party in its report (the "performance universe"). The Fund's performance universe consisted of the Fund and all retail and institutional open-end investment companies with the same classification/objective as the Fund regardless of asset size or primary channel of distribution. This comparison indicated that, among other data, the Fund's performance was below the average of its performance universe and its Lipper index for the one-, three-, five- and ten-year periods ended June 30, 2022. The Board took into account management's discussion of the Fund's performance, including the reasons for the Fund's underperformance.
Compensation and Profitability — The Board took into consideration the level and method of computing the management fee. The information considered by the Board included operating profit margin information for
21
USAA Mutual Funds Trust | Supplemental Information — continued January 31, 2023 | ||||||
(Unaudited)
the Adviser's business as a whole. The Board also received and considered profitability information related to the management revenues from the Fund. This information included a review of the methodology used in the allocation of certain costs to the Fund. In considering the profitability data with respect to the Fund, the Trustees noted that the Adviser reimbursed or waived a portion of its management fees to the Fund. The Trustees reviewed the profitability of the Adviser's relationship with the Fund before tax expenses. The Board was also provided with a profitability analysis of other publicly traded asset managers prepared by an independent information service. In reviewing the overall profitability of the management fee to the Adviser, the Board also considered the fact that the Adviser and its affiliates provide shareholder servicing and administrative services to the Fund for which they receive compensation. The Board also considered the possible direct and indirect benefits to the Adviser from its relationship with the Trust, including that the Adviser may derive reputational and other benefits from its association with the Fund. The Trustees recognized that the Adviser should be entitled to earn a reasonable level of profits in exchange for the level of services it provides to the Fund and the entrepreneurial and other risks that it assumes as Adviser.
Economies of Scale — The Board noted that the Fund has advisory fee breakpoints that allow the Fund to participate in economies of scale and that such economies of scale were currently reflected in the advisory fee. The Board also considered the fee waiver and expense reimbursement arrangements by the Adviser. The Board also considered the effect of the change in size, if any, of each of the Fund's classes on its performance and fees, noting that the Fund may realize other economies of scale if assets increase proportionally more than expenses. The Board determined that the current investment management fee structure was reasonable.
Conclusions — The Board reached the following conclusions regarding the Fund's Advisory Agreement with the Adviser: (i) the Adviser has demonstrated that it possesses the capability and resources to perform the duties required of it under the Advisory Agreement; (ii) the Adviser maintains an appropriate compliance program; (iii) the overall performance of the Fund is reasonable in relation to the performance of funds with similar investment objectives and to relevant indices and the Adviser is appropriately monitoring the Fund's performance; (iv) the Fund's advisory expenses are reasonable in relation to those of similar funds and to the services to be provided by the Adviser; and (v) the Adviser's and its affiliates' level of profitability from their relationship with the Fund is reasonable in light of the nature and high quality of services provided by the Adviser and its affiliates and the type of fund. Based on its conclusions, the Board determined that continuation of the Advisory Agreement would be in the best interests of the Fund and its shareholders.
22
Privacy Policy
Protecting the Privacy of Information
The Trust respects your right to privacy. We also know that you expect us to conduct and process your business in an accurate and efficient manner. To do so, we must collect and maintain certain personal information about you. This is the information we collect from you on applications or other forms, and from the transactions you make with us or third parties. It may include your name, address, social security number, account transactions and balances, and information about investment goals and risk tolerance.
We do not disclose any information about you or about former customers to anyone except as permitted or required by law. Specifically, we may disclose the information we collect to companies that perform services on our behalf, such as the transfer agent that processes shareholder accounts and printers and mailers that assist us in the distribution of investor materials. We may also disclose this information to companies that perform marketing services on our behalf. This allows us to continue to offer you Victory investment products and services that meet your investing needs, and to effect transactions that you request or authorize. These companies will use this information only in connection with the services for which we hired them. They are not permitted to use or share this information for any other purpose.
To protect your personal information internally, we permit access only by authorized employees and maintain physical, electronic, and procedural safeguards to guard your personal information.*
* You may have received communications regarding information about privacy policies from other financial institutions which gave you the opportunity to "opt-out" of certain information sharing with companies which are not affiliated with that financial institution. The Trust does not share information with other companies for purposes of marketing solicitations for products other than the Trust. Therefore, the Trust does not provide opt-out options to their shareholders.
P.O. Box 182593
Columbus, Ohio 43218-2593
Visit our website at: | Call | ||||||
vcm.com | (800) 235-8396 | ||||||
23418-0323

JANUARY 31, 2023
Semi Annual Report
USAA Growth Fund
Victory Capital means Victory Capital Management Inc., the investment adviser of the USAA Mutual Funds. USAA Mutual Funds are distributed by Victory Capital Services, Inc., member FINRA, an affiliate of Victory Capital. Victory Capital and its affiliates are not affiliated with United Services Automobile Association or its affiliates. USAA and the USAA logos are registered trademarks and the USAA Mutual Funds and USAA Investments logos are trademarks of United Services Automobile Association and are being used by Victory Capital and its affiliates under license.
vcm.com
News, Information And Education 24 Hours A Day, 7 Days A Week
The Victory Capital website gives fund shareholders, prospective shareholders, and investment professionals a convenient way to access fund information, get guidance, and track fund performance anywhere they can access the Internet. The site includes:
• Detailed performance records
• Daily share prices
• The latest fund news
• Investment resources to help you become a better investor
• A section dedicated to investment professionals
Whether you're a potential investor searching for the fund that matches your investment philosophy, a seasoned investor interested in planning tools, or an investment professional, vcm.com has what you seek. Visit us anytime. We're always open.
USAA Mutual Funds Trust
TABLE OF CONTENTS
Investment Objective & Portfolio Holdings | 2 | ||||||
Schedule of Portfolio Investments | 3 | ||||||
Financial Statements | |||||||
Statement of Assets and Liabilities | 6 | ||||||
Statement of Operations | 7 | ||||||
Statements of Changes in Net Assets | 8 | ||||||
Financial Highlights | 9 | ||||||
Notes to Financial Statements | 11 | ||||||
Supplemental Information | 20 | ||||||
Proxy Voting and Portfolio Holdings Information | 20 | ||||||
Expense Examples | 20 | ||||||
Advisory Contract Approval | 21 | ||||||
Privacy Policy (inside back cover) | |||||||
This report is for the information of the shareholders and others who have received a copy of the currently effective prospectus of the Fund, managed by Victory Capital Management Inc. It may be used as sales literature only when preceded or accompanied by a current prospectus, which provides further details about the Fund.
IRA DISTRIBUTION WITHHOLDING DISCLOSURE
We generally must withhold federal income tax at a rate of 10% of the taxable portion of your distribution and, if you live in a state that requires state income tax withholding, at your state's tax rate. However, you may elect not to have withholding apply or to have income tax withheld at a higher rate. Any withholding election that you make will apply to any subsequent distribution unless and until you change or revoke the election. If you wish to make a withholding election, or change or revoke a prior withholding election, call (800) 235-8396, and form W-4P (OMB No. 1545-0074 withholding certificate for pension or annuity payments) will be electronically sent.
If you do not have a withholding election in place by the date of a distribution, federal income tax will be withheld from the taxable portion of your distribution at a rate of 10%. If you must pay estimated taxes, you may be subject to estimated tax penalties if your estimated tax payments are not sufficient and sufficient tax is not withheld from your distribution.
For more specific information, please consult your tax adviser.
• NOT FDIC INSURED • NO BANK GUARANTEE • MAY LOSE VALUE
1
| USAA Mutual Funds Trust USAA Growth Fund | January 31, 2023 | ||||||
(Unaudited)
Investment Objective and Portfolio Holdings:
The Fund seeks long-term growth of capital.
Top 10 Equity Holdings*:
January 31, 2023
(% of Net Assets)
Microsoft Corp. | 7.2 | % | |||||
Visa, Inc. Class A | 5.6 | % | |||||
Apple, Inc. | 5.0 | % | |||||
NVIDIA Corp. | 4.6 | % | |||||
Amazon.com, Inc. | 4.3 | % | |||||
Alphabet, Inc. Class C | 3.7 | % | |||||
Meta Platforms, Inc. Class A | 3.4 | % | |||||
The Boeing Co. | 3.3 | % | |||||
Tesla, Inc. | 3.2 | % | |||||
Netflix, Inc. | 3.0 | % | |||||
Sector Allocation*:
January 31, 2023
(% of Net Assets)

* Does not include futures contracts, money market instruments, and short-term investments purchased with cash collateral from securities loaned.
Percentages are of the net assets of the Fund and may not equal 100%.
Refer to the Schedule of Portfolio Investments for a complete list of securities.
2
| USAA Mutual Funds Trust USAA Growth Fund | Schedule of Portfolio Investments January 31, 2023 | ||||||
(Amounts in Thousands, Except for Shares) (Unaudited)
Security Description | Shares | Value | |||||||||
Common Stocks (98.0%) | |||||||||||
Communication Services (13.5%): | |||||||||||
Alphabet, Inc. Class A (a) | 320,380 | $ | 31,666 | ||||||||
Alphabet, Inc. Class C (a) | 730,867 | 72,992 | |||||||||
Meta Platforms, Inc. Class A (a) | 450,311 | 67,083 | |||||||||
Netflix, Inc. (a) | 165,574 | 58,590 | |||||||||
The Walt Disney Co. (a) | 310,137 | 33,647 | |||||||||
263,978 | |||||||||||
Consumer Discretionary (14.2%): | |||||||||||
Alibaba Group Holding Ltd., ADR (a) | 149,190 | 16,441 | |||||||||
Amazon.com, Inc. (a) | 820,854 | 84,655 | |||||||||
Booking Holdings, Inc. (a) | 4,021 | 9,788 | |||||||||
Chipotle Mexican Grill, Inc. (a) | 3,863 | 6,360 | |||||||||
Dollar Tree, Inc. (a) | 98,825 | 14,842 | |||||||||
Starbucks Corp. | 252,574 | 27,566 | |||||||||
Tesla, Inc. (a) | 362,489 | 62,790 | |||||||||
Tractor Supply Co. | 76,645 | 17,474 | |||||||||
Ulta Beauty, Inc. (a) | 20,118 | 10,340 | |||||||||
Yum China Holdings, Inc. | 133,281 | 8,211 | |||||||||
Yum! Brands, Inc. | 141,371 | 18,450 | |||||||||
276,917 | |||||||||||
Consumer Staples (4.5%): | |||||||||||
Constellation Brands, Inc. Class A | 86,579 | 20,045 | |||||||||
Costco Wholesale Corp. | 36,717 | 18,768 | |||||||||
Monster Beverage Corp. (a) | 360,838 | 37,556 | |||||||||
The Hershey Co. | 50,567 | 11,357 | |||||||||
87,726 | |||||||||||
Energy (0.7%): | |||||||||||
Cheniere Energy, Inc. | 33,181 | 5,070 | |||||||||
Diamondback Energy, Inc. | 56,204 | 8,212 | |||||||||
13,282 | |||||||||||
Financials (3.2%): | |||||||||||
FactSet Research Systems, Inc. | 44,524 | 18,831 | |||||||||
LPL Financial Holdings, Inc. | 17,901 | 4,245 | |||||||||
MSCI, Inc. | 20,316 | 10,799 | |||||||||
SEI Investments Co. | 252,780 | 15,781 | |||||||||
The Progressive Corp. | 97,296 | 13,266 | |||||||||
62,922 | |||||||||||
Health Care (13.4%): | |||||||||||
Agilent Technologies, Inc. | 76,104 | 11,574 | |||||||||
BioMarin Pharmaceutical, Inc. (a) | 91,225 | 10,523 | |||||||||
Dexcom, Inc. (a) | 125,336 | 13,422 | |||||||||
Illumina, Inc. (a) | 94,070 | 20,150 | |||||||||
Intuitive Surgical, Inc. (a) | 88,945 | 21,853 | |||||||||
Jazz Pharmaceuticals PLC (a) | 97,920 | 15,340 | |||||||||
Novartis AG, ADR | 242,531 | 21,978 | |||||||||
See notes to financial statements.
3
| USAA Mutual Funds Trust USAA Growth Fund | Schedule of Portfolio Investments — continued January 31, 2023 | ||||||
(Amounts in Thousands, Except for Shares) (Unaudited)
Security Description | Shares | Value | |||||||||
NOVO Nordisk A/S, ADR | 122,807 | $ | 17,043 | ||||||||
Regeneron Pharmaceuticals, Inc. (a) | 32,679 | 24,786 | |||||||||
Roche Holdings Ltd., ADR | 401,264 | 15,710 | |||||||||
Tenet Healthcare Corp. (a) | 118,216 | 6,484 | |||||||||
UnitedHealth Group, Inc. | 48,448 | 24,185 | |||||||||
Vertex Pharmaceuticals, Inc. (a) | 181,258 | 58,564 | |||||||||
261,612 | |||||||||||
Industrials (7.9%): | |||||||||||
CoStar Group, Inc. (a) | 121,065 | 9,431 | |||||||||
Deere & Co. | 37,411 | 15,819 | |||||||||
Expeditors International of Washington, Inc. | 165,303 | 17,877 | |||||||||
HEICO Corp. Class A | 115,345 | 15,419 | |||||||||
Old Dominion Freight Line, Inc. | 25,109 | 8,367 | |||||||||
Quanta Services, Inc. | 86,650 | 13,187 | |||||||||
The Boeing Co. (a) | 304,059 | 64,765 | |||||||||
Verisk Analytics, Inc. | 51,211 | 9,310 | |||||||||
154,175 | |||||||||||
IT Services (9.6%): | |||||||||||
Block, Inc. (a) | 244,497 | 19,980 | |||||||||
Gartner, Inc. (a) | 28,113 | 9,506 | |||||||||
PayPal Holdings, Inc. (a) | 185,984 | 15,156 | |||||||||
Shopify, Inc. Class A (a) | 376,553 | 18,553 | |||||||||
Snowflake, Inc. Class A (a) | 56,068 | 8,771 | |||||||||
Toast, Inc. Class A (a) | 299,128 | 6,674 | |||||||||
Visa, Inc. Class A | 477,730 | 109,978 | |||||||||
188,618 | |||||||||||
Materials (0.6%): | |||||||||||
Graphic Packaging Holding Co. | 468,303 | 11,281 | |||||||||
Real Estate (0.3%): | |||||||||||
SBA Communications Corp. | 18,550 | 5,519 | |||||||||
Semiconductors & Semiconductor Equipment (8.1%): | |||||||||||
Advanced Micro Devices, Inc. (a) | 82,725 | 6,217 | |||||||||
Enphase Energy, Inc. (a) | 36,057 | 7,982 | |||||||||
KLA Corp. | 17,790 | 6,982 | |||||||||
Lam Research Corp. | 28,097 | 14,052 | |||||||||
Monolithic Power Systems, Inc. | 27,699 | 11,815 | |||||||||
NVIDIA Corp. | 458,536 | 89,584 | |||||||||
QUALCOMM, Inc. | 160,387 | 21,365 | |||||||||
157,997 | |||||||||||
Software (17.0%): | |||||||||||
Autodesk, Inc. (a) | 173,694 | 37,372 | |||||||||
Intuit, Inc. | 24,708 | 10,443 | |||||||||
Microsoft Corp. | 565,962 | 140,251 | |||||||||
Oracle Corp. | 516,239 | 45,667 | |||||||||
Palo Alto Networks, Inc. (a) | 54,248 | 8,606 | |||||||||
Salesforce, Inc. (a) | 224,985 | 37,791 | |||||||||
ServiceNow, Inc. (a) | 48,521 | 22,083 | |||||||||
See notes to financial statements.
4
| USAA Mutual Funds Trust USAA Growth Fund | Schedule of Portfolio Investments — continued January 31, 2023 | ||||||
(Amounts in Thousands, Except for Shares) (Unaudited)
Security Description | Shares | Value | |||||||||
Synopsys, Inc. (a) | 33,329 | $ | 11,790 | ||||||||
Workday, Inc. Class A (a) | 100,083 | 18,158 | |||||||||
332,161 | |||||||||||
Technology Hardware, Storage & Peripherals (5.0%): | |||||||||||
Apple, Inc. | 678,485 | 97,899 | |||||||||
Total Common Stocks (Cost $1,144,826) | 1,914,087 | ||||||||||
Exchange-Traded Funds (1.1%) | |||||||||||
iShares Russell 1000 Growth ETF | 91,406 | 21,214 | |||||||||
Total Exchange-Traded Funds (Cost $19,226) | 21,214 | ||||||||||
Total Investments (Cost $1,164,052) — 99.1% | 1,935,301 | ||||||||||
Other assets in excess of liabilities — 0.9% | 17,367 | ||||||||||
NET ASSETS — 100.00% | $ | 1,952,668 | |||||||||
At January 31, 2023, the Fund's investments in foreign securities were 5.8% of net assets.
(a) Non-income producing security.
ADR — American Depositary Receipt
ETF — Exchange-Traded Fund
PLC — Public Limited Company
See notes to financial statements.
5
USAA Mutual Funds Trust | Statement of Assets and Liabilities January 31, 2023 | ||||||
(Amounts in Thousands, Except Per Share Amounts) (Unaudited)
| USAA Growth Fund | |||||||
Assets: | |||||||
Investments, at value (Cost $1,164,052) | $ | 1,935,301 | |||||
Cash | 18,000 | ||||||
Receivables: | |||||||
Interest and dividends | 50 | ||||||
Capital shares issued | 310 | ||||||
Investments sold | 861 | ||||||
Reclaims | 261 | ||||||
From Adviser | 15 | ||||||
Prepaid expenses | 17 | ||||||
Total Assets | 1,954,815 | ||||||
Liabilities: | |||||||
Payables: | |||||||
Capital shares redeemed | 716 | ||||||
Accrued expenses and other payables: | |||||||
Investment advisory fees | 939 | ||||||
Administration fees | 221 | ||||||
Custodian fees | 22 | ||||||
Transfer agent fees | 145 | ||||||
Compliance fees | 2 | ||||||
Trustees' fees | 1 | ||||||
Other accrued expenses | 101 | ||||||
Total Liabilities | 2,147 | ||||||
Net Assets: | |||||||
Capital | 1,150,696 | ||||||
Total accumulated earnings/(loss) | 801,972 | ||||||
Net Assets | $ | 1,952,668 | |||||
Net Assets | |||||||
Fund Shares | $ | 1,509,756 | |||||
Institutional Shares | 442,912 | ||||||
Total | $ | 1,952,668 | |||||
Shares (unlimited number of shares authorized with no par value): | |||||||
Fund Shares | 58,890 | ||||||
Institutional Shares | 17,319 | ||||||
Total | 76,209 | ||||||
Net asset value, offering and redemption price per share: (a) | |||||||
Fund Shares | $ | 25.64 | |||||
Institutional Shares | 25.57 | ||||||
(a) Per share amount may not recalculate due to rounding of net assets and/or shares outstanding.
See notes to financial statements.
6
USAA Mutual Funds Trust | Statement of Operations For the Six Months Ended January 31, 2023 | ||||||
(Amounts in Thousands) (Unaudited)
| USAA Growth Fund | |||||||
Investment Income: | |||||||
Dividends | $ | 5,403 | |||||
Interest | 131 | ||||||
Securities lending (net of fees) | 1 | ||||||
Foreign tax withholding | (10 | ) | |||||
Total Income | 5,525 | ||||||
Expenses: | |||||||
Investment advisory fees | 6,285 | ||||||
Administration fees — Fund Shares | 1,103 | ||||||
Administration fees — Institutional Shares | 325 | ||||||
Sub-Administration fees | 36 | ||||||
Custodian fees | 51 | ||||||
Transfer agent fees — Fund Shares | 609 | ||||||
Transfer agent fees — Institutional Shares | 325 | ||||||
Trustees' fees | 24 | ||||||
Compliance fees | 11 | ||||||
Legal and audit fees | 45 | ||||||
State registration and filing fees | 37 | ||||||
Interfund lending fees | 6 | ||||||
Other expenses | 156 | ||||||
Total Expenses | 9,013 | ||||||
Expenses waived/reimbursed by Adviser | (39 | ) | |||||
Net Expenses | 8,974 | ||||||
Net Investment Income (Loss) | (3,449 | ) | |||||
Realized/Unrealized Gains (Losses) from Investments: | |||||||
Net realized gains (losses) from investment securities | 128,988 | ||||||
Net change in unrealized appreciation/depreciation on investment securities | (177,946 | ) | |||||
Net realized/unrealized gains (losses) on investments | (48,958 | ) | |||||
Change in net assets resulting from operations | $ | (52,407 | ) | ||||
See notes to financial statements.
7
USAA Mutual Funds Trust | Statements of Changes in Net Assets | ||||||
(Amounts in Thousands)
USAA Growth Fund | |||||||||||
| Six Months Ended January 31, 2023 (Unaudited) | Year Ended July 31, 2022 | ||||||||||
From Investments: | |||||||||||
Operations: | |||||||||||
Net Investment Income (Loss) | $ | (3,449 | ) | $ | (13,472 | ) | |||||
Net realized gains (losses) | 128,988 | 148,621 | |||||||||
Net change in unrealized appreciation/depreciation | (177,946 | ) | (932,308 | ) | |||||||
Change in net assets resulting from operations | (52,407 | ) | (797,159 | ) | |||||||
Distributions to Shareholders: | |||||||||||
Fund Shares | (90,169 | ) | (207,204 | ) | |||||||
Institutional Shares | (31,795 | ) | (139,551 | ) | |||||||
Change in net assets resulting from distributions to shareholders | (121,964 | ) | (346,755 | ) | |||||||
Change in net assets resulting from capital transactions | (679,190 | ) | 387,328 | ||||||||
Change in net assets | (853,561 | ) | (756,586 | ) | |||||||
Net Assets: | |||||||||||
Beginning of period | 2,806,229 | 3,562,815 | |||||||||
End of period | $ | 1,952,668 | $ | 2,806,229 | |||||||
Capital Transactions: | |||||||||||
Fund Shares | |||||||||||
Proceeds from shares issued | $ | 26,730 | $ | 91,044 | |||||||
Distributions reinvested | 88,787 | 204,327 | |||||||||
Cost of shares redeemed | (97,823 | ) | (234,982 | ) | |||||||
Total Fund Shares | $ | 17,694 | $ | 60,389 | |||||||
Institutional Shares | |||||||||||
Proceeds from shares issued | $ | 34,958 | $ | 509,954 | |||||||
Distributions reinvested | 31,707 | 139,296 | |||||||||
Cost of shares redeemed | (763,549 | ) | (322,311 | ) | |||||||
Total Institutional Shares | $ | (696,884 | ) | $ | 326,939 | ||||||
Change in net assets resulting from capital transactions | $ | (679,190 | ) | $ | 387,328 | ||||||
Share Transactions: | |||||||||||
Fund Shares | |||||||||||
Issued | 1,061 | 2,757 | |||||||||
Reinvested | 3,642 | 5,764 | |||||||||
Redeemed | (3,884 | ) | (7,091 | ) | |||||||
Total Fund Shares | 819 | 1,430 | |||||||||
Institutional Shares | |||||||||||
Issued | 1,485 | 14,873 | |||||||||
Reinvested | 1,304 | 3,940 | |||||||||
Redeemed | (28,964 | ) | (9,492 | ) | |||||||
Total Institutional Shares | (26,175 | ) | 9,321 | ||||||||
Change in Shares | (25,356 | ) | 10,751 | ||||||||
See notes to financial statements.
8
USAA Mutual Funds Trust | Financial Highlights | ||||||
For a Share Outstanding Throughout Each Period
USAA Growth Fund | |||||||||||||||||||||||||||
Fund Shares | |||||||||||||||||||||||||||
| Six Months Ended January 31, 2023 (Unaudited) | Year Ended July 31, 2022 | Year Ended July 31, 2021 | Year Ended July 31, 2020 | Year Ended July 31, 2019 | Year Ended July 31, 2018 | ||||||||||||||||||||||
| Net Asset Value, Beginning of Period | $ | 27.66 | $ | 39.27 | $ | 30.85 | $ | 31.54 | $ | 32.15 | $ | 28.65 | |||||||||||||||
Investment Activities: | |||||||||||||||||||||||||||
Net investment income (loss) | (0.05 | )(a) | (0.14 | )(a) | (0.13 | )(a) | (0.05 | )(a) | 0.12 | 0.07 | |||||||||||||||||
| Net realized and unrealized gains (losses) | (0.37 | ) | (7.72 | ) | 10.03 | 6.18 | 2.80 | 4.18 | |||||||||||||||||||
| Total from Investment Activities | (0.42 | ) | (7.86 | ) | 9.90 | 6.13 | 2.92 | 4.25 | |||||||||||||||||||
Distributions to Shareholders from: | |||||||||||||||||||||||||||
Net investment income | — | — | — | (0.08 | ) | (0.09 | ) | (0.05 | ) | ||||||||||||||||||
Net realized gains | (1.60 | ) | (3.75 | ) | (1.48 | ) | (6.74 | ) | (3.44 | ) | (0.70 | ) | |||||||||||||||
Total Distributions | (1.60 | ) | (3.75 | ) | (1.48 | ) | (6.82 | ) | (3.53 | ) | (0.75 | ) | |||||||||||||||
Net Asset Value, End of Period | $ | 25.64 | $ | 27.66 | $ | 39.27 | $ | 30.85 | $ | 31.54 | $ | 32.15 | |||||||||||||||
Total Return (b) (c) | (1.21 | )% | (22.11 | )% | 32.87 | % | 23.71 | % | 10.90 | % | 14.99 | % | |||||||||||||||
Ratios to Average Net Assets: | |||||||||||||||||||||||||||
Net Expenses (d) (e) (f) (g) | 0.87 | % | 0.84 | % | 0.84 | % | 0.91 | % | 0.90 | %(h) | 0.97 | %(h) | |||||||||||||||
Net Investment Income (Loss) (d) | (0.36 | )% | (0.43 | )% | (0.38 | )% | (0.16 | )% | 0.41 | % | 0.33 | % | |||||||||||||||
Gross Expenses (d) (e) | 0.87 | % | 0.84 | % | 0.84 | % | 0.91 | % | 0.90 | %(h) | 0.97 | %(h) | |||||||||||||||
Supplemental Data: | |||||||||||||||||||||||||||
Net Assets at end of period (000's) | $ | 1,509,756 | $ | 1,606,239 | $ | 2,224,130 | $ | 1,841,547 | $ | 1,676,470 | $ | 1,581,693 | |||||||||||||||
Portfolio Turnover (b) (i) | 25 | % | 62 | % | 40 | % | 59 | % | 70 | %(j) | 19 | % | |||||||||||||||
(a) Per share net investment income (loss) has been calculated using the average daily shares method.
(b) Not annualized for periods less than one year.
(c) Assumes reinvestment of all net investment income and realized capital gain distributions, if any, during the period. Includes adjustments in accordance with U.S. Generally Accepted Accounting Principles and could differ from the Lipper reported return.
(d) Annualized for periods less than one year.
(e) Does not include acquired fund fees and expenses, if any.
(f) The net expense ratio may not correlate to the applicable expense limits in place during the period since the current contractual expense limitation is applied for a period beginning July 1, 2019 and in effect through November 30, 2023, instead of coinciding with the Fund's fiscal year end. Details of the current contractual expense limitation in effect can be found in Note 5 of the accompanying Notes to Financial Statements.
(g) From the period beginning July 1, 2019, the amount of any waivers or reimbursements and the amount of any recoupment are calculated without regard to the impact of any performance adjustment to the Fund's management fee.
(h) Reflects total annual operating expenses before reduction of any expenses paid indirectly. The share's expenses paid indirectly decreased the expense ratio by less than 0.01%.
(i) Portfolio turnover is calculated on the basis of the Fund as a whole without distinguishing between the classes of shares.
(j) Reflects increased trading activity due to transition or asset allocation shift.
(continues on next page)
See notes to financial statements.
9
USAA Mutual Funds Trust | Financial Highlights — continued | ||||||
For a Share Outstanding Throughout Each Period
USAA Growth Fund | |||||||||||||||||||||||||||
Institutional Shares | |||||||||||||||||||||||||||
| Six Months Ended January 31, 2023 (Unaudited) | Year Ended July 31, 2022 | Year Ended July 31, 2021 | Year Ended July 31, 2020 | Year Ended July 31, 2019 | Year Ended July 31, 2018 | ||||||||||||||||||||||
| Net Asset Value, Beginning of Period | $ | 27.59 | $ | 39.17 | $ | 30.77 | $ | 31.47 | $ | 32.08 | $ | 28.59 | |||||||||||||||
Investment Activities: | |||||||||||||||||||||||||||
Net investment income (loss) | (0.03 | )(a) | (0.13 | )(a) | (0.13 | )(a) | (0.04 | )(a) | 0.15 | 0.09 | |||||||||||||||||
| Net realized and unrealized gains (losses) | (0.39 | ) | (7.70 | ) | 10.01 | 6.16 | 2.78 | 4.18 | |||||||||||||||||||
| Total from Investment Activities | (0.42 | ) | (7.83 | ) | 9.88 | 6.12 | 2.93 | 4.27 | |||||||||||||||||||
Distributions to Shareholders from: | |||||||||||||||||||||||||||
Net investment income | — | — | — | (0.08 | ) | (0.10 | ) | (0.08 | ) | ||||||||||||||||||
Net realized gains | (1.60 | ) | (3.75 | ) | (1.48 | ) | (6.74 | ) | (3.44 | ) | (0.70 | ) | |||||||||||||||
Total Distributions | (1.60 | ) | (3.75 | ) | (1.48 | ) | (6.82 | ) | (3.54 | ) | (0.78 | ) | |||||||||||||||
Net Asset Value, End of Period | $ | 25.57 | $ | 27.59 | $ | 39.17 | $ | 30.77 | $ | 31.47 | $ | 32.08 | |||||||||||||||
Total Return (b) (c) | (1.21 | )% | (22.09 | )% | 32.89 | % | 23.75 | % | 10.94 | % | 15.07 | % | |||||||||||||||
Ratios to Average Net Assets: | |||||||||||||||||||||||||||
Net Expenses (d) (e) (f) (g) | 0.81 | % | 0.83 | % | 0.83 | % | 0.87 | % | 0.85 | %(h) | 0.92 | %(h) | |||||||||||||||
Net Investment Income (Loss) (d) | (0.25 | )% | (0.41 | )% | (0.36 | )% | (0.13 | )% | 0.47 | % | 0.39 | % | |||||||||||||||
Gross Expenses (d) (e) | 0.82 | % | 0.83 | % | 0.83 | % | 0.87 | % | 0.85 | %(h) | 0.92 | %(h) | |||||||||||||||
Supplemental Data: | |||||||||||||||||||||||||||
Net Assets at end of period (000's) | $ | 442,912 | $ | 1,199,990 | $ | 1,338,685 | $ | 1,175,311 | $ | 1,083,799 | $ | 1,324,054 | |||||||||||||||
Portfolio Turnover (b) (i) | 25 | % | 62 | % | 40 | % | 59 | % | 70 | %(j) | 19 | % | |||||||||||||||
(a) Per share net investment income (loss) has been calculated using the average daily shares method.
(b) Not annualized for periods less than one year.
(c) Assumes reinvestment of all net investment income and realized capital gain distributions, if any, during the period. Includes adjustments in accordance with U.S. Generally Accepted Accounting Principles and could differ from the Lipper reported return.
(d) Annualized for periods less than one year.
(e) Does not include acquired fund fees and expenses, if any.
(f) The net expense ratio may not correlate to the applicable expense limits in place during the period since the current contractual expense limitation is applied for a period beginning July 1, 2019 and in effect through November 30, 2023, instead of coinciding with the Fund's fiscal year end. Details of the current contractual expense limitation in effect can be found in Note 5 of the accompanying Notes to Financial Statements.
(g) From the period beginning July 1, 2019, the amount of any waivers or reimbursements and the amount of any recoupment are calculated without regard to the impact of any performance adjustment to the Fund's management fee.
(h) Reflects total annual operating expenses before reduction of any expenses paid indirectly. The share's expenses paid indirectly decreased the expense ratio by less than 0.01%.
(i) Portfolio turnover is calculated on the basis of the Fund as a whole without distinguishing between the classes of shares.
(j) Reflects increased trading activity due to transition or asset allocation shift.
See notes to financial statements.
10
USAA Mutual Funds Trust | Notes to Financial Statements January 31, 2023 | ||||||
(Unaudited)
1. Organization:
USAA Mutual Funds Trust (the "Trust") is organized as a Delaware statutory trust and is registered under the Investment Company Act of 1940, as amended (the "1940 Act"), as an open-end investment company. The Trust is comprised of 45 funds and is authorized to issue an unlimited number of shares, which are units of beneficial interest with no par value.
The accompanying financial statements are those of the USAA Growth Fund (the "Fund"). The Fund offers two classes of shares: Fund Shares and Institutional Shares. The Fund is classified as diversified under the 1940 Act.
Each class of shares of the Fund has substantially identical rights and privileges, except with respect to fees paid under distribution plans, expenses allocable exclusively to each class of shares, voting rights on matters solely affecting a single class of shares, and the exchange privilege of each class of shares.
Victory Capital Management ("VCM" or the "Adviser") is an indirect wholly owned subsidiary of Victory Capital Holdings, Inc., a publicly traded Delaware corporation, and a wholly owned direct subsidiary of Victory Capital Operating, LLC.
Under the Trust's organizational documents, its officers and trustees are indemnified against certain liabilities arising out of the performance of their duties to the Fund. In addition, in the normal course of business, the Fund enters into contracts with its vendors and others that provide for general indemnifications. The Fund's maximum exposure under these arrangements is unknown, as this would involve future claims that may be made against the Fund. However, based on experience, the Fund expects that risk of loss to be remote.
2. Significant Accounting Policies:
The following is a summary of significant accounting policies followed by the Trust in the preparation of its financial statements. The policies are in conformity with U.S. Generally Accepted Accounting Principles ("GAAP"). The preparation of financial statements in accordance with GAAP requires management to make estimates and assumptions that affect the reported amounts of assets and liabilities and disclosure of contingent assets and liabilities at the date of the financial statements and the reported amounts of income and expenses for the period. Actual results could differ from those estimates. The Fund follows the specialized accounting and reporting requirements under GAAP that are applicable to investment companies under Accounting Standards Codification Topic 946.
Investment Valuation:
The Fund records investments at fair value. Fair value is defined as the price that would be received to sell an asset or paid to transfer a liability in an orderly transaction between market participants at the measurement date.
The valuation techniques described below maximize the use of observable inputs and minimize the use of unobservable inputs in determining fair value. The inputs used for valuing the Fund's investments are summarized in the three broad levels listed below:
• Level 1 — quoted prices (unadjusted) in active markets for identical securities
• Level 2 — other significant observable inputs (including quoted prices for similar securities, interest rates, or credit spreads, applicable to those securities, etc.)
• Level 3 — significant unobservable inputs (including the Adviser's assumptions in determining the fair value of investments)
Changes in valuation techniques may result in transfers in or out of an assigned level within the disclosure hierarchy. The inputs or methodologies used for valuation techniques are not necessarily an indication of the risks associated with entering into those investments.
11
USAA Mutual Funds Trust | Notes to Financial Statements — continued January 31, 2023 | ||||||
(Unaudited)
The Adviser, appointed as the valuation designee by the Trust's Board of Trustees' (the "Board"), has established the Pricing and Liquidity Committee (the "Committee"), and subject to Board oversight, the Committee administers and oversees the Fund's valuation policies and procedures, which are approved by the Board.
Portfolio securities listed or traded on securities exchanges, including Exchange-Traded Funds ("ETFs"), and American Depositary Receipts, are valued at the closing price on the exchange or system where the security is principally traded, if available, or at the Nasdaq Official Closing Price. If there have been no sales for that day on the exchange or system, then a security is valued at the last available bid quotation on the exchange or system where the security is principally traded. In each of these situations, valuations are typically categorized as Level 1 in the fair value hierarchy.
Investments in open-end investment companies, other than ETFs, are valued at their net asset value ("NAV"). These valuations are typically categorized as Level 1 in the fair value hierarchy.
In the event that price quotations or valuations are not readily available, investments are valued at fair value in accordance with procedures established by and under the general supervision and responsibility of the Board. These valuations are typically categorized as Level 2 or Level 3 in the fair value hierarchy, based on the observability of inputs used to determine the fair value. The effect of fair value pricing is that securities may not be priced on the basis of quotations from the primary market in which they are traded, and the actual price realized from the sale of a security may differ materially from the fair value price. Valuing these securities at fair value is intended to cause the Fund's NAV to be more reliable than it otherwise would be.
A summary of the valuations as of January 31, 2023, based upon the three levels defined above, is included in the table below while the breakdown, by category, of investments is disclosed on the Schedule of Portfolio Investments (amounts in thousands):
Level 1 | Level 2 | Level 3 | Total | ||||||||||||||||
Common Stocks | $ | 1,914,087 | $ | — | $ | — | $ | 1,914,087 | |||||||||||
Exchange-Traded Funds | 21,214 | — | — | 21,214 | |||||||||||||||
Total | $ | 1,935,301 | $ | — | $ | — | $ | 1,935,301 | |||||||||||
As of January 31, 2023, there were no transfers into/out of Level 3.
Real Estate Investment Trusts ("REITs"):
The Fund may invest in REITs, which report information on the source of their distributions annually. REITs are pooled investment vehicles that invest primarily in income producing real estate or real estate related loans or interests (such as mortgages). Certain distributions received from REITs during the year are recorded as realized gains or return of capital as estimated by the Fund or when such information becomes known.
Investment Companies:
Exchange-Traded Funds:
The Fund may invest in ETFs, the shares of which are bought and sold on a securities exchange. An ETF trades like common stock and represents a fixed portfolio of securities often designed to track the performance and dividend yield of a particular domestic or foreign market index. The Fund may purchase shares of an ETF to temporarily gain exposure to a portion of the U.S. or a foreign market while awaiting purchase of underlying securities. The risks of owning an ETF generally reflect the risks of owning the underlying securities the ETF is designed to track, although the lack of liquidity of an ETF could result in it being more volatile. Additionally, ETFs have fees and expenses that reduce their value.
12
USAA Mutual Funds Trust | Notes to Financial Statements — continued January 31, 2023 | ||||||
(Unaudited)
Open-End Funds:
The Fund may invest in portfolios of open-end investment companies. These investment companies value securities in their portfolios for which market quotations are readily available at their market values (generally the last reported sale price) and all other securities and assets at their fair value by the methods established by the board of directors of the underlying funds.
Investment Transactions and Related Income:
Changes in holdings of investments are accounted for no later than one business day following the trade date. For financial reporting purposes, however, investment transactions are accounted for on trade date or the last business day of the reporting period. Interest income is determined on the basis of coupon interest accrued using the effective interest method which adjusts, where applicable, the amortization of premiums or accretion of discounts. Dividend income is recorded on the ex-dividend date. Gains or losses realized on sales of securities are recorded on the identified cost basis.
Securities Lending:
The Fund, through a Securities Lending Agreement with Citibank, N.A. ("Citibank"), may lend its securities to qualified financial institutions, such as certain broker-dealers and banks, to earn additional income, net of income retained by Citibank. Borrowers are required to initially secure their loans for collateral in the amount of at least 102% of the value of U.S. securities loaned or at least 105% of the value of non-U.S. securities loaned, marked-to-market daily. Any collateral shortfalls associated with increases in the valuation of the securities loaned are generally cured the next business day. The collateral can be received in the form of cash collateral and/or non-cash collateral. Non-cash collateral can include U.S. Government Securities and other securities as permitted by Securities and Exchange Commission ("SEC") guidelines. The cash collateral is invested in short-term instruments or cash equivalents, primarily open-end investment companies, as noted on the Fund's Schedule of Portfolio Investments. The Fund effectively does not have control of the non-cash collateral and therefore it is not disclosed on the Fund's Schedule of Portfolio Investments. Collateral requirements are determined daily based on the value of the Fund's securities on loan as of the end of the prior business day. During the time portfolio securities are on loan, the borrower will pay the Fund any dividends or interest paid on such securities plus any fee negotiated between the parties to the lending agreement. The Fund also earns a return from the collateral. The Fund pays Citibank various fees in connection with the investment of cash collateral and fees based on the investment income received from securities lending activities. Securities lending income (net of these fees) is disclosed on the Statement of Operations. Loans are terminable upon demand and the borrower must return the loaned securities within the lesser of one standard settlement period or five business days. Although risk is mitigated by the collateral, the Fund could experience a delay in recovering its securities and possible loss of income or value if the borrower fails to return them. In addition, there is a risk that the value of the short-term investments will be less than the amount of cash collateral required to be returned to the borrower.
The Fund's agreement with Citibank does not include master netting provisions. Non-cash collateral received by the Fund may not be sold or repledged, except to satisfy borrower default.
As of January 31, 2023, the Fund did not have any securities on loan.
Foreign Taxes:
The Fund may be subject to foreign taxes related to foreign income received (a portion of which may be reclaimable), capital gains on the sale of securities, and certain foreign currency transactions. All foreign taxes are recorded in accordance with the applicable regulations and rates that exist in the foreign jurisdictions in which the Fund invests.
Federal Income Taxes:
The Fund intends to continue to qualify as a regulated investment company by complying with the provisions available to certain investment companies, as defined in applicable sections of the Internal
13
USAA Mutual Funds Trust | Notes to Financial Statements — continued January 31, 2023 | ||||||
(Unaudited)
Revenue Code, and to make distributions of net investment income and net realized gains sufficient to relieve it from all, or substantially all, federal income taxes. Accordingly, no provision for federal income taxes is required in the financial statements. The Fund has a tax year end of July 31, and effective April 30, 2023, the Fund will change its tax year end to April 30.
For the six months ended January 31, 2023, the Fund did not incur any income tax, interest, or penalties, and has recorded no liability for net unrecognized tax benefits relating to uncertain tax positions.
Management of the Fund has reviewed tax positions taken in tax years that remain subject to examination by all major tax jurisdictions, including federal (i.e., the last four tax years, which includes the current fiscal tax year end). Management believes that there is no tax liability resulting from unrecognized tax benefits related to uncertain tax positions taken.
Allocations:
Expenses directly attributable to the Fund are charged to the Fund, while expenses that are attributable to more than one fund in the Trust, or jointly with an affiliated trust, are allocated among the respective funds in the Trust and/or an affiliated trust based upon net assets or another appropriate basis.
Income, expenses (other than class-specific expenses such as transfer agent fees, state registration fees, and printing fees), and realized and unrealized gains or losses on investments are allocated to each class of shares based on its relative net assets on the date income is earned or expenses and realized and unrealized gains and losses are incurred.
3. Purchases and Sales:
Purchases and sales of securities (excluding securities maturing less than one year from acquisition) for the six months ended January 31, 2023, were as follows for the Fund (amounts in thousands):
Excluding | |||||||
Purchases | Sales | ||||||
$ | 529,673 | $ | 1,329,710 | ||||
4. Affiliated Fund Ownership:
The Fund offers shares for investment by other funds. The fund-of-funds do not invest in the underlying funds for the purpose of exercising management or control, and the affiliated fund-of-funds' annual and semi-annual reports may be viewed at vcm.com. As of January 31, 2023, certain fund-of-funds owned total outstanding shares of the Fund as follows:
Affiliated USAA Mutual Funds | Ownership % | ||||||
USAA Cornerstone Conservative Fund | 0.1 | ||||||
USAA Cornerstone Equity Fund | 0.2 | ||||||
USAA Target Retirement Income Fund | 0.4 | ||||||
USAA Target Retirement 2030 Fund | 1.3 | ||||||
USAA Target Retirement 2040 Fund | 2.2 | ||||||
USAA Target Retirement 2050 Fund | 1.4 | ||||||
USAA Target Retirement 2060 Fund | 0.2 | ||||||
5. Fees and Transactions with Affiliates and Related Parties:
Investment Advisory Fees:
Investment advisory services are provided to the Fund by the Adviser, which is a New York corporation registered as an investment adviser with the SEC.
Under the terms of the Investment Advisory Agreement, the Adviser is entitled to receive a base fee and a performance adjustment. The Fund's base fee is accrued daily and paid monthly at an annualized
14
USAA Mutual Funds Trust | Notes to Financial Statements — continued January 31, 2023 | ||||||
(Unaudited)
rate of 0.65% of the Fund's average daily net assets. Amounts incurred and paid to VCM for the six months ended January 31, 2023, are reflected on the Statement of Operations as Investment advisory fees.
The performance adjustment for each share class is accrued daily and calculated monthly by comparing the respective class' performance to that of the Lipper Large-Cap Growth Funds Index. The Lipper Large-Cap Growth Funds Index tracks the total return performance of the largest funds within the Lipper Large-Cap Growth Funds category.
The performance period for each share class consists of the current month plus the previous 35 months. The following table is utilized to determine the extent of the performance adjustment:
| Over/Under Performance Relative to Index (in basis points)(a) | Annual Adjustment Rate (in basis points) | ||||||
| +/- 100 to 400 | +/- 4 | ||||||
| +/- 401 to 700 | +/- 5 | ||||||
| +/- 701 and greater | +/- 6 | ||||||
(a) Based on the difference between the average annual performance of the relevant share class of the Fund and its relevant Lipper index, rounded to the nearest basis point.
Each class' annual performance adjustment rate is multiplied by the average daily net assets of the respective class over the entire performance period, which is then multiplied by a fraction, the numerator of which is the number of days in the month and the denominator of which is 365 (366 in leap years). The resulting amount is then added to (in the case of overperformance), or subtracted from (in the case of underperformance) the base fee.
Under the performance fee arrangement, each class pays a positive performance fee adjustment for a performance period whenever the class outperforms the Lipper Large-Cap Growth Funds Index over that period, even if the class has overall negative returns during the performance period.
For the period August 1, 2022, to January 31, 2023, performance adjustments were $(374) and $(234) for Fund Shares and Institutional Shares, in thousands, respectively. Performance adjustments were (0.05)% and (0.07)% for Fund Shares and Institutional Shares, respectively. The performance adjustment rate included in the investment advisory fee may differ from the maximum over/under Annual Adjustment Rate due to differences in average net assets for the reporting period and rolling 36 month performance periods.
The Trust relies on an exemptive order granted to VCM and its affiliated funds by the SEC in March 2019, permitting the use of a "manager-of-managers" structure for certain funds. Under a manager-of-managers structure, the investment adviser may select (with approval of the Board and without shareholder approval) one or more subadvisers to manage the day-to-day investment of a fund's assets.
VCM entered into a Subadvisory Agreement with Loomis, Sayles & Company, L.P. ("Loomis Sayles") under which Loomis Sayles directs the investment and reinvestment of a portion of the Fund's assets (as allocated from time to time by VCM). This arrangement provides for monthly fees that are paid by VCM. VCM (not the Fund) pays the subadviser fees.
Administration and Servicing Fees:
VCM also serves as the Fund's administrator and fund accountant. Under the Fund Administration, Servicing and Accounting Agreement, VCM is paid an administration and servicing fee that is accrued daily and paid monthly at an annualized rate of 0.15% and 0.10%, which is based on the Fund's average daily net assets of the Fund Shares and Institutional Shares, respectively. Amounts incurred for the six months ended January 31, 2023, are reflected on the Statement of Operations as Administration fees.
Citi Fund Services Ohio, Inc. ("Citi"), an affiliate of Citibank, acts as sub-administrator and sub-fund accountant to the Fund pursuant to a Sub-Administration and Sub-Fund Accounting Services Agreement between VCM and Citi. VCM pays Citi a fee for providing these services. The Fund reimburses VCM and
15
USAA Mutual Funds Trust | Notes to Financial Statements — continued January 31, 2023 | ||||||
(Unaudited)
Citi for out-of-pocket expenses incurred in providing these services and certain other expenses specifically allocated to the Fund. Amounts incurred for the six months ended January 31, 2023, are reflected on the Statement of Operations as Sub-Administration fees.
The Fund (as part of the Trust) has entered into an agreement with the Adviser to provide compliance services, pursuant to which the Adviser furnishes its compliance personnel, including the services of the Chief Compliance Officer ("CCO"), and other resources reasonably necessary to provide the Trust with compliance oversight services related to the design, administration, and oversight of a compliance program for the Trust in accordance with Rule 38a-1 under the 1940 Act. The CCO is an employee of the Adviser, which pays the compensation of the CCO and support staff. The funds in the Trust, Victory Variable Insurance Funds, Victory Portfolios, and Victory Portfolios II (collectively, the "Victory Funds Complex") in the aggregate, compensate the Adviser for these services. Amounts incurred for the six months ended January 31, 2023, are reflected on the Statement of Operations as Compliance fees.
Transfer Agency Fees:
Victory Capital Transfer Agency, Inc. ("VCTA"), an affiliate of the Adviser, provides transfer agency services to the Fund. VCTA provides transfer agent services to the Fund Shares based on an annual charge of $23 per shareholder account plus out-of-pocket expenses. VCTA pays a portion of these fees to certain intermediaries for the administration and servicing of accounts that are held with such intermediaries. Transfer agent fees for the Institutional Shares are paid monthly based on a fee accrued daily at an annualized rate of 0.10% of average daily net assets, plus out-of-pocket expenses. Amounts incurred and paid to VCTA for the six months ended January 31, 2023, are reflected on the Statement of Operations as Transfer agent fees.
FIS Investor Services LLC serves as sub-transfer agent and dividend disbursing agent for the Fund pursuant to a Sub-Transfer Agent Agreement between VCTA and FIS Investor Services LLC. VCTA provides FIS Investor Services LLC a fee for providing these services.
Distributor/Underwriting Services:
Victory Capital Services, Inc. (the "Distributor"), an affiliate of the Adviser, serves as Distributor for the continuous offering of the shares of the Fund pursuant to a Distribution Agreement between the Distributor and the Trust and receives no fee or other compensation for these services.
Other Fees:
Citibank serves as the Fund's custodian. The Fund pays Citibank a fee for providing these services. Amounts incurred for the six months ended January 31, 2023, are reflected on the Statement of Operations as Custodian fees.
K&L Gates LLP provides legal services to the Trust.
The Adviser has entered into an expense limitation agreement with the Fund until at least November 30, 2023. Under the terms of the agreement, the Adviser has agreed to waive fees or reimburse certain expenses to the extent that ordinary operating expenses incurred by certain classes of the Fund in any fiscal year exceed the expense limits for such classes of the Fund. Such excess amounts will be the liability of the Adviser. Performance adjustments, acquired fund fees and expenses, interest, taxes, brokerage commissions, other expenditures, which are capitalized in accordance with GAAP, and other extraordinary expenses not incurred in the ordinary course of the Fund's business are excluded from the expense limits. As of January 31, 2023, the expense limits (excluding voluntary waivers) were 0.92% and 0.88% for Fund Shares and Institutional Shares, respectively.
Under the terms of the expense limitation agreement, the Fund has agreed to repay fees and expenses that were waived or reimbursed by the Adviser for a period of up to three years (thirty-six (36) months) after the waiver or reimbursement took place, subject to the lesser of any operating expense limits in effect at the time of: (a) the original waiver or expense reimbursement; or (b) the recoupment, after giving effect to the recoupment amount.
16
USAA Mutual Funds Trust | Notes to Financial Statements — continued January 31, 2023 | ||||||
(Unaudited)
As of January 31, 2023, the following amounts are available to be repaid to the Adviser (amounts in thousands). The Fund has not recorded any amounts available to be repaid as a liability due to an assessment that such repayments are not probable at January 31, 2023.
| Expires 2026 | Total | ||||||
| $ | 39 | $ | 39 | ||||
The Adviser may voluntarily waive or reimburse additional fees to assist the Fund in maintaining competitive expense ratios. Voluntary waivers and reimbursements applicable to the Fund are not available to be recouped at a future time. There were no voluntary waivers or reimbursements for the six months ended January 31, 2023.
Certain officers and/or interested trustees of the Fund are also officers and/or employees of the Adviser, administrator, fund accountant, sub-administrator, sub-fund accountant, custodian, and Distributor.
6. Risks:
The Fund may be subject to other risks in addition to these identified risks.
Market Risk — Overall market risks may affect the value of the Fund. Domestic and international factors such as political events, war, terrorism, trade disputes, inflation rates, interest rate levels and other fiscal and monetary policy changes, cybersecurity incidents, pandemics and other public health crises, sanctions against a particular foreign country, its nationals, businesses or industries and related geopolitical events, as well as environmental disasters such as earthquakes, fires, and floods, or other catastrophes, may add to instability in global economies and markets generally, and may lead to increased market volatility. Global economies and financial markets are highly interconnected, which increases the possibility that conditions in one country or region might adversely affect issuers in another country or region. The impact of these and other factors may be short-term or may last for extended periods.
Equity Risk — The values of the equity securities in which the Fund invests may decline in response to developments affecting individual companies and/or general market, economic and political conditions and other factors. A company's earnings or dividends may not increase as expected due to poor management decisions, competitive pressures, breakthroughs in technology, reliance on suppliers, labor problems or shortages, corporate restructurings, fraudulent disclosures, natural disasters, military confrontations, war, terrorism, public health crises, or other events, conditions, and factors. Price changes may be temporary or may last for extended periods.
Foreign Securities Risk — Foreign markets can be more volatile than the U.S. market due to increased risks of adverse issuer, political, regulatory, market, or economic developments and can perform differently from the U.S. market. Global markets, or those in a particular region, may all react in similar fashion to important political, economic, or other developments. Events and evolving conditions in certain economies or markets may alter the risks associated with investments tied to countries or regions that historically were perceived as comparatively stable and make such investments riskier and more volatile.
7. Borrowing and Interfund Lending:
Line of Credit:
The Victory Funds Complex participates in a short-term demand note "Line of Credit" agreement with Citibank. The Line of Credit agreement with Citibank was renewed on June 27, 2022, with a termination date of June 26, 2023. Under the agreement with Citibank, the Victory Funds Complex may borrow up to $600 million, of which $300 million is committed and $300 million is uncommitted. $40 million of the Line of Credit is reserved for use by the Victory Floating Rate Fund, another series of the Victory Funds Complex, with Victory Floating Rate Fund paying the related commitment fees for that amount.
17
USAA Mutual Funds Trust | Notes to Financial Statements — continued January 31, 2023 | ||||||
(Unaudited)
The purpose of the Line of Credit is to meet temporary or emergency cash needs. For the six months ended January 31, 2023, Citibank received an annual commitment fee of 0.15% on $300 million for providing the Line of Credit. Each fund in the Victory Funds Complex paid a pro-rata portion of the commitment fees plus any interest (one-month Secured Overnight Financing Rate ("SOFR") plus 1.10 percent) on amounts borrowed. Interest charged to the Fund during the period, if applicable, is reflected on the Statement of Operations under Line of credit fees.
The Fund had no borrowings under the Line of Credit agreement during the six months ended January 31, 2023.
Interfund Lending:
The Trust and the Adviser rely on an exemptive order granted by the SEC in March 2017 (the "Order"), permitting the establishment and operation of an Interfund Lending Facility (the "Facility"). The Facility allows the Fund to directly lend and borrow money to or from any other fund in the Victory Funds Complex that is permitted to participate in the Facility, relying upon the Order at rates beneficial to both the borrowing and lending funds. Advances under the Facility are allowed for temporary or emergency purposes, including the meeting of redemption requests that otherwise might require the untimely disposition of securities, and are subject to each Fund's borrowing restrictions. The interfund loan rate is determined, as specified in the Order, by averaging the current repurchase agreement rate and the current bank loan rate. As a Borrower, interest charged to the Fund, if any, during the period, is reflected on the Statement of Operations under Interfund lending fees. As a Lender, interest earned by the Fund, if any, during the period, is reflected on the Statement of Operations under Interfund lending.
The average borrowing or lending for the days outstanding and average interest rate for the Fund during the six months ended January 31, 2023, were as follows (amounts in thousands):
| Borrower or Lender | Amount Outstanding at January 31, 2023 | Average Borrowing* | Days Borrowing Outstanding | Average Interest Rate* | Maximum Borrowing During the Period | ||||||||||||||||||
| Borrower | $ | — | $ | 4,306 | 11 | 4.14 | % | $ | 8,405 | ||||||||||||||
* Based on the number of days borrowings were outstanding for the six months ended January 31, 2023.
8. Federal Income Tax Information:
The Fund intends to distribute any net investment income annually. Distributable net realized gains, if any, are declared and paid at least annually.
The amounts of dividends from net investment income and distributions from net realized gains (collectively, distributions to shareholders) are determined in accordance with federal income tax regulations, which may differ from GAAP. To the extent these "book/tax" differences are permanent in nature (e.g., net operating loss and distribution reclassification), such amounts are reclassified within the components of net assets based on their federal tax-basis treatment; temporary differences (e.g., wash sales) do not require reclassification. To the extent dividends and distributions exceed net investment income and net realized gains for tax purposes, they are reported as distributions of capital. Net investment losses incurred by the Fund may be reclassified as an offset to capital on the accompanying Statement of Assets and Liabilities.
The tax character of current year distributions paid and the tax basis of the current components of accumulated earnings (loss) will be determined at the end of the current tax year.
At the tax year ended July 31, 2022, the Fund had no capital loss carryforwards for federal income tax purposes.
18
USAA Mutual Funds Trust | Notes to Financial Statements — continued January 31, 2023 | ||||||
(Unaudited)
9. Subsequent Events:
On June 29, 2022, the Board approved a change to the Fund's fiscal year-end from July 31 to April 30, with an effective date of April 30, 2023.
The Board, upon recommendation of the Adviser, has approved a change in the name of the Trust and each individual fund within the Trust. On February 23, 2023, an initial filing was made with the SEC to commence the process to effectuate the following changes.
Effective at the start of business on April 24, 2023 (the "Effective Date"), the name of the Trust will change from USAA Mutual Funds Trust to Victory Portfolios III, and all references to USAA Mutual Funds Trust in the summary prospectus, statutory prospectus, and statement of additional information ("SAI") will be replaced by the new name.
Also on the Effective Date, references to the current name of the Fund in the summary prospectus, statutory prospectus, and SAI will be replaced with the new name as follows:
| Current Name | New Name | ||||||
USAA Growth Fund | Victory Growth Fund | ||||||
In addition, on the Effective Date, USAA Investments, a Victory Capital Management Inc. Investment Franchise, that currently manages the USAA Fixed Income Funds, will change its name to Victory Income Investors, and all references to USAA Investments in the summary prospectus, statutory prospectus, and SAI, will be replaced.
Please note that there will be no changes in the management of the Fund or to the Fund's ticker symbols.
19
USAA Mutual Funds Trust | Supplemental Information January 31, 2023 | ||||||
(Unaudited)
Proxy Voting and Portfolio Holdings Information
Proxy Voting:
Information regarding the policies and procedures the Fund uses to determine how to vote proxies relating to portfolio securities is available without charge, upon request, by calling (800) 235-8396. The information is also included in the Fund's Statement of Additional Information, which is available on the SEC's website at sec.gov.
Information relating to how the Fund voted proxies relating to portfolio securities held during the most recent 12 months ended June 30 is available on the SEC's website at sec.gov.
Availability of Schedules of Portfolio Investments:
The Trust files a complete list of Schedules of Portfolio Investments with the SEC for the first and third quarter of each fiscal year on Form N-PORT. Form N-PORT is available on the SEC's website at sec.gov.
Expense Examples
As a shareholder of the Fund, you may incur two types of costs: (1) transaction costs and (2) ongoing costs, including management fees and other Fund expenses. These examples are intended to help you understand your ongoing costs (in dollars) of investing in the Fund and to compare these costs with the ongoing costs of investing in other mutual funds.
These examples are based on an investment of $1,000 invested at the beginning of the period and held for the entire period from August 1, 2022, through January 31, 2023.
The Actual Expense figures in the table below provide information about actual account values and actual expenses. You may use the information below, together with the amount you invested, to estimate the expenses that you paid over the period. Simply divide your account value by $1,000 (for example, an $8,600 account value divided by $1,000 = 8.6), then multiply the result by the number in the table under the heading entitled "Actual Expenses Paid During Period" to estimate the expenses you paid on your account during this period.
The Hypothetical Expense figures in the table below provide information about hypothetical account values and hypothetical expenses based on the Fund's actual expense ratio and an assumed rate of return of 5% per year before expenses, which is not the Fund's actual return. The hypothetical account values and expenses may not be used to estimate the actual ending account balance or expenses you paid for the period. You may use this information to compare this 5% hypothetical example with the 5% hypothetical examples that appear in shareholder reports of other funds.
Please note the expenses shown in the table below are meant to highlight your ongoing costs only and do not reflect any transactional costs. Therefore, the hypothetical expenses in the table are useful in comparing ongoing costs only and will not help you determine the relative total costs of owning different funds. In addition, if these transactional costs were included, your costs would have been higher.
| Beginning Account Value 8/1/22 | Actual Ending Account Value 1/31/23 | Hypothetical Ending Account Value 1/31/23 | Actual Expenses Paid During Period 8/1/22- 1/31/23* | Hypothetical Expenses Paid During Period 8/1/22- 1/31/23* | Annualized Expense Ratio During Period 8/1/22- 1/31/23 | ||||||||||||||||||||||
Fund Shares | $ | 1,000.00 | $ | 987.90 | $ | 1,020.82 | $ | 4.36 | $ | 4.43 | 0.87 | % | |||||||||||||||
Institutional Shares | 1,000.00 | 987.90 | 1,021.12 | 4.06 | 4.13 | 0.81 | % | ||||||||||||||||||||
* Expenses are equal to the average account value multiplied by the Fund's annualized expense ratio multiplied by 184/365 (the number of days in the most recent fiscal half-year divided by the number of days in the fiscal year).
20
USAA Mutual Funds Trust | Supplemental Information — continued January 31, 2023 | ||||||
(Unaudited)
Considerations of the Board in Continuing the Investment Advisory Agreement
USAA Growth Fund (the "Fund")
At a meeting of the Board of Trustees (the "Board") of USAA Mutual Funds Trust (the "Trust") held on December 8-9, 2022, the Board, including the Trustees who are not "interested persons" (as that term is defined in the Investment Company Act of 1940, as amended) of the Trust (the "Independent Trustees"), approved for an annual period the continuance of the Investment Advisory Agreement (the "Advisory Agreement") between the Trust and Victory Capital Management Inc. (the "Adviser") and the Subadvisory Agreement between the Adviser and Loomis, Sayles & Company, LP (the "Subadviser") with respect to the Fund. Prior to the December 8-9, 2022 meeting at which the Advisory Agreement and Subadvisory Agreement were approved, the Independent Trustees also discussed and considered information regarding the proposed continuation of the Advisory Agreement and Subadvisory Agreement at a meeting held on November 21, 2022.
In advance of the foregoing meetings, the Trustees received and considered a variety of information relating to the Advisory Agreement and Subadvisory Agreement and the Adviser and the Subadviser, and were given the opportunity to ask questions and request additional information from management. The information provided to the Board included, among other things: (i) a separate report prepared by an independent third party of mutual fund data, which provided a statistical analysis comparing the Fund's investment performance, expenses, and fees to comparable investment companies; (ii) information concerning the services rendered to the Fund, as well as information regarding the Adviser's revenues and costs of providing services to the Fund and compensation paid to affiliates of the Adviser; and (iii) information about the Adviser's and the Subadviser's operations and personnel. Prior to voting, the Independent Trustees reviewed the proposed continuance of the Advisory Agreement and Subadvisory Agreement with management and with experienced independent counsel retained by the Independent Trustees ("Independent Counsel") and received materials from such Independent Counsel discussing the legal standards for their consideration of the proposed continuation of the Advisory Agreement and the Subadvisory Agreement with respect to the Fund. The Independent Trustees also reviewed the proposed continuation of the Advisory Agreement and the Subadvisory Agreement with respect to the Fund in private sessions with Independent Counsel at which no representatives of management were present.
The Board considered the Advisory Agreement and the Subadvisory Agreement separately in the course of its review. In doing so, the Board noted the respective roles of the Adviser and the Subadviser in providing services to the Fund.
At each regularly scheduled meeting of the Board and its committees, the Board receives and reviews, among other things, information concerning the Fund's performance and related services provided by the Adviser and the Subadviser. At the meeting at which the renewal of the Advisory Agreement and Subadvisory Agreement is considered, particular focus is given to information concerning Fund performance, fees and total expenses as compared to comparable investment companies, and the Adviser's profitability with respect to the Fund. However, the Board noted that the evaluation process with respect to the Adviser and the Subadviser is an ongoing one. In this regard, the Board's and its committees' consideration of the Advisory Agreement and Subadvisory Agreement included information previously received at such meetings. The Board also recognized that the contractual arrangements for the Fund have been reviewed by the Board and discussed with the Adviser and Subadviser in prior years and that the Board's conclusions may be based, in part, on its consideration of these same arrangements in prior years.
Advisory Agreement
After full consideration of a variety of factors, the Board, including the Independent Trustees, voted to approve the Advisory Agreement. In approving the Advisory Agreement, the Trustees did not identify any single factor as controlling, and each Trustee may have attributed different weights to various factors. Throughout their deliberations, the Independent Trustees were represented and assisted by Independent Counsel.
Nature, Extent, and Quality of Services — In considering the nature, extent, and quality of the services provided by the Adviser under the Advisory Agreement, the Board reviewed information provided by the Adviser relating to its operations and personnel. The Board also took into account its knowledge of the Adviser's management and the quality of the performance of the Adviser's duties through Board meetings, discussions, and reports
21
USAA Mutual Funds Trust | Supplemental Information — continued January 31, 2023 | ||||||
(Unaudited)
during the preceding year. The Board considered the fees paid to the Adviser and the services provided to the Fund by the Adviser under the Advisory Agreement, as well as other services provided by the Adviser and its affiliates under other agreements, and the personnel who provide these services. In addition to the investment advisory services provided to the Fund, the Adviser and its affiliates provide administrative services, shareholder services, oversight of Fund accounting, marketing services, assistance in meeting legal and regulatory requirements, and other services necessary for the operation of the Fund and the Trust.
The Board considered the scope of services provided by, and the undertakings required of, the Adviser in connection with those services, including, among other things, maintaining (i) its own and the Fund's compliance programs, (ii) risk management programs, (iii) liquidity risk management program, (iv) derivatives risk management program, and (v) cybersecurity programs, each of which had expanded over time as a result of regulatory, market, and other developments. The Board also considered the significant risks assumed by the Adviser in connection with the services provided to the Fund, including investment, operational, enterprise, litigation, regulatory and compliance risks.
The Board considered the Adviser's management style and the performance of the Adviser's duties under the Advisory Agreement. The Board considered the level and depth of knowledge of the Adviser, including the professional experience and qualifications of its senior and investment personnel, as well as current staffing levels. The Board considered the Adviser's process for monitoring the performance of the Subadviser and the Adviser's timeliness in responding to performance issues. The allocation of the Fund's brokerage, including the Adviser's process for monitoring "best execution," also was considered. The Adviser's role in coordinating the activities of the Fund's other service providers was also considered. The Board also considered the Adviser's risk management processes. The Board considered the Adviser's financial condition and that it had the financial wherewithal to continue to provide the same scope and high quality of services under the Advisory Agreement. In reviewing the Advisory Agreement, the Board focused on the experience, resources, and strengths of the Adviser and its affiliates in managing the Fund, as well as the other funds in the Trust.
The Board also reviewed the compliance and administrative services provided to the Fund by the Adviser and its affiliates, including the Adviser's oversight of the Fund's day-to-day operations and oversight of Fund accounting. The Trustees, guided also by information obtained from their experiences as Trustees of the Trust, also focused on the quality of the Adviser's compliance and administrative staff.
Expenses and Performance — In connection with its consideration of the Advisory Agreement, the Board evaluated the Fund's advisory fees and total expense ratio as compared to other open-end investment companies deemed to be comparable to the Fund as determined by the independent third party in its report. The Fund's expenses were compared to (i) a group of investment companies chosen by the independent third party to be comparable to the Fund based upon certain factors, including fund type, comparability of investment objective and classification, sales load type, asset size, and expense components (the "expense group") and (ii) a larger group of investment companies with the same investment classification/objective as the Fund regardless of asset size, excluding outliers (the "expense universe"). Among other data, the Board noted that the Fund's net management fee rate, which includes advisory and administrative services and the effects of any performance adjustment was below the median of its expense group and was above the median of its expense universe. The data indicated that the Fund's total expenses were above the median of its expense group and were below the median of its expense universe. The Board also took into account the Adviser's current undertakings to maintain expense limitations for the Fund. The Board took into account the various other services provided to the Fund by the Adviser and its affiliates, and noted the high quality of services received by the Fund. The Board also took into account that the subadvisory fees under the Subadvisory Agreement are paid by the Adviser. The Board also considered and discussed information about the Subadviser's fees, including the amount of management fees retained by the Adviser after payment of the subadvisory fees.
In considering the Fund's performance, the Board noted that it reviews at its regularly scheduled meetings information about the Fund's performance results. The Trustees also reviewed various comparative data provided to them in connection with their consideration of the renewal of the Advisory Agreement, including, among other information, a comparison of the Fund's average annual total returns relative to its Lipper index and other mutual funds deemed to be in its peer group by the independent third party in its report (the "performance universe"). The Fund's performance universe consisted of the Fund and all retail and institutional open-end investment companies with the same classification/objective as the Fund regardless of asset size or primary channel of distribution. This comparison indicated that, among other data, the Fund's performance was below the average of its performance universe and its Lipper index for the one-, three-, five- and ten-year periods
22
USAA Mutual Funds Trust | Supplemental Information — continued January 31, 2023 | ||||||
(Unaudited)
ended June 30, 2022. The Board took into account management's discussion of the Fund's performance, including the reasons for the Fund's underperformance.
Compensation and Profitability — The Board took into consideration the level and method of computing the management fee. The information considered by the Board included operating profit margin information for the Adviser's business as a whole. The Board also received and considered profitability information related to the management revenues from the Fund. This information included a review of the methodology used in the allocation of certain costs to the Fund. In considering the profitability data with respect to the Fund, the Trustees noted that the Adviser pays the Fund's subadvisory fees. The Trustees reviewed the profitability of the Adviser's relationship with the Fund before tax expenses. The Board was also provided with a profitability analysis of other publicly traded asset managers prepared by an independent information service. In reviewing the overall profitability of the management fee to the Adviser, the Board also considered the fact that the Adviser and its affiliates provide shareholder servicing and administrative services to the Fund for which they receive compensation. The Board also considered the possible direct and indirect benefits to the Adviser from its relationship with the Trust, including that the Adviser may derive reputational and other benefits from its association with the Fund. The Trustees recognized that the Adviser should be entitled to earn a reasonable level of profits in exchange for the level of services it provides to the Fund and the entrepreneurial and other risks that it assumes as Adviser.
Economies of Scale — The Board considered whether there should be changes in the management fee rate or structure in order to enable the Fund to participate in any economies of scale. The Board took into account management's discussion of the current advisory fee structure. The Board also considered the fee waiver and expense reimbursement arrangements by the Adviser. The Board considered the fact that the Adviser also pays the Fund's subadvisory fees. The Board also considered the effect of the change in size, if any, of each of the Fund's classes on its performance and fees, noting that the Fund may realize other economies of scale if assets increase proportionally more than expenses. The Board determined that the current investment management fee structure was reasonable.
Conclusions — The Board reached the following conclusions regarding the Fund's Advisory Agreement with the Adviser: (i) the Adviser has demonstrated that it possesses the capability and resources to perform the duties required of it under the Advisory Agreement; (ii) the Adviser maintains an appropriate compliance program; (iii) the overall performance of the Fund is reasonable in relation to the performance of funds with similar investment objectives and to relevant indices and the Adviser is appropriately monitoring the Fund's performance; (iv) the Fund's advisory expenses are reasonable in relation to those of similar funds and to the services to be provided by the Adviser; and (v) the Adviser's and its affiliates' level of profitability from their relationship with the Fund is reasonable in light of the nature and high quality of services provided by the Adviser and its affiliates and the type of fund. Based on its conclusions, the Board determined that continuation of the Advisory Agreement would be in the best interests of the Fund and its shareholders.
Subadvisory Agreement
In approving the Subadvisory Agreement with respect to the Fund, the Board considered various factors, among them: (i) the nature, extent, and quality of services provided to the Fund by the Subadviser, including the personnel providing services; (ii) the Subadviser's compensation and any other benefits derived from the subadvisory relationship; (iii) comparisons, to the extent applicable, of subadvisory fees and performance to comparable investment companies; and (iv) the terms of the Subadvisory Agreement. A summary of the Board's analysis of these factors is set forth below. After full consideration of a variety of factors, the Board, including the Independent Trustees, voted to approve the Subadvisory Agreement. In approving the Subadvisory Agreement, the Trustees did not identify any single factor as controlling, and each Trustee may have attributed different weights to various factors. Throughout their deliberations, the Independent Trustees were represented and assisted by Independent Counsel.
Nature, Extent, and Quality of Services Provided; Investment Personnel — The Trustees considered information provided to them regarding the services provided by the Subadviser, including information presented periodically throughout the previous year. The Board considered the Subadviser's level of knowledge and investment style. The Board reviewed the experience and credentials of the investment personnel who are responsible for managing the investment of portfolio securities with respect to the Fund and the Subadviser's level of staffing. The Trustees considered, based on the materials provided to them by the Subadviser, whether the method of compensating portfolio managers is reasonable and includes mechanisms to prevent a manager with
23
USAA Mutual Funds Trust | Supplemental Information — continued January 31, 2023 | ||||||
(Unaudited)
underperformance from taking undue risks. The Trustees also noted the Subadviser's brokerage practices. The Board also considered the Subadviser's regulatory and compliance history. The Board also took into account the Subadviser's risk management processes. The Board noted that the Adviser's monitoring processes of the Subadviser include: (i) regular telephonic meetings to discuss, among other matters, investment strategies, and to review portfolio performance; (ii) quarterly portfolio compliance checklists and quarterly compliance certifications to the Board; and (iii) due diligence visits to the Subadviser.
Subadviser Compensation — The Board also took into consideration the financial condition of the Subadviser. In considering the cost of services to be provided by the Subadviser and the profitability to the Subadviser of its relationship with the Fund, the Trustees noted that the fees under the Subadvisory Agreement were paid by the Adviser. The Trustees also relied on the ability of the Adviser to negotiate the Subadvisory Agreement and the fees thereunder at arm's length. For the above reasons, the Board determined that the profitability of the Subadviser from its relationship with the Fund was not a material factor in its deliberations with respect to the consideration of the approval of the Subadvisory Agreement. For similar reasons, the Board concluded that the potential for economies of scale in the Subadviser's management of the Fund was not a material factor in considering the Subadvisory Agreement.
Subadvisory Fees and Fund Performance — The Board compared the subadvisory fees for the Fund with the fees that the Subadviser charges to comparable clients, as applicable. The Board considered that the Fund pays a management fee to the Adviser and that, in turn, the Adviser pays a subadvisory fee to the Subadviser. As noted above, the Board considered the Fund's performance during the one-, three-, five-, and ten-year periods ended June 30, 2022, as compared to the Fund's peer group and noted that the Board reviews at its regularly scheduled meetings information about the Fund's performance results. The Board also considered the performance of the Subadviser. The Board noted the Adviser's experience and resources in monitoring the performance, investment style, and risk-adjusted performance of the Subadviser. The Board was mindful of the Adviser's focus on the Subadviser's performance. The Board also noted the Subadviser's performance record for similar accounts, as applicable.
Conclusions — The Board reached the following conclusions regarding the Subadvisory Agreement: (i) the Subadviser is qualified to manage the Fund's assets in accordance with its investment objectives and policies; (ii) the Subadviser maintains an appropriate compliance program; (iii) the overall performance of the Fund is reasonable in relation to the performance of funds with similar investment objectives and relevant indices and the Adviser is appropriately monitoring the Fund's performamce; and (iv) the Fund's advisory expenses are reasonable in relation to those of similar funds and to the services to be provided by the Adviser and the Subadviser. Based on its conclusions, the Board determined that approval of the Subadvisory Agreement with respect to the Fund would be in the best interests of the Fund and its shareholders.
24
Privacy Policy
Protecting the Privacy of Information
The Trust respects your right to privacy. We also know that you expect us to conduct and process your business in an accurate and efficient manner. To do so, we must collect and maintain certain personal information about you. This is the information we collect from you on applications or other forms, and from the transactions you make with us or third parties. It may include your name, address, social security number, account transactions and balances, and information about investment goals and risk tolerance.
We do not disclose any information about you or about former customers to anyone except as permitted or required by law. Specifically, we may disclose the information we collect to companies that perform services on our behalf, such as the transfer agent that processes shareholder accounts and printers and mailers that assist us in the distribution of investor materials. We may also disclose this information to companies that perform marketing services on our behalf. This allows us to continue to offer you Victory investment products and services that meet your investing needs, and to effect transactions that you request or authorize. These companies will use this information only in connection with the services for which we hired them. They are not permitted to use or share this information for any other purpose.
To protect your personal information internally, we permit access only by authorized employees and maintain physical, electronic, and procedural safeguards to guard your personal information.*
* You may have received communications regarding information about privacy policies from other financial institutions which gave you the opportunity to "opt-out" of certain information sharing with companies which are not affiliated with that financial institution. The Trust does not share information with other companies for purposes of marketing solicitations for products other than the Trust. Therefore, the Trust does not provide opt-out options to their shareholders.
P.O. Box 182593
Columbus, Ohio 43218-2593

Visit our website at: | Call | ||||||
vcm.com | (800) 235-8396 | ||||||
23420-0323

January 31, 2023
Semi Annual Report
USAA Growth & Income Fund
Victory Capital means Victory Capital Management Inc., the investment adviser of the USAA Mutual Funds. USAA Mutual Funds are distributed by Victory Capital Services, Inc., member FINRA, an affiliate of Victory Capital. Victory Capital and its affiliates are not affiliated with United Services Automobile Association or its affiliates. USAA and the USAA logos are registered trademarks and the USAA Mutual Funds and USAA Investments logos are trademarks of United Services Automobile Association and are being used by Victory Capital and its affiliates under license.
vcm.com
News, Information And Education 24 Hours A Day, 7 Days A Week
The Victory Capital website gives fund shareholders, prospective shareholders, and investment professionals a convenient way to access fund information, get guidance, and track fund performance anywhere they can access the Internet. The site includes:
• Detailed performance records
• Daily share prices
• The latest fund news
• Investment resources to help you become a better investor
• A section dedicated to investment professionals
Whether you're a potential investor searching for the fund that matches your investment philosophy, a seasoned investor interested in planning tools, or an investment professional, vcm.com has what you seek. Visit us anytime. We're always open.
USAA Mutual Funds Trust
TABLE OF CONTENTS
Investment Objective & Portfolio Holdings | 2 | ||||||
Schedule of Portfolio Investments | 3 | ||||||
Financial Statements | |||||||
Statement of Assets and Liabilities | 9 | ||||||
Statement of Operations | 10 | ||||||
Statements of Changes in Net Assets | 11 | ||||||
Financial Highlights | 13 | ||||||
Notes to Financial Statements | 16 | ||||||
Supplemental Information | 24 | ||||||
Proxy Voting and Portfolio Holdings Information | 24 | ||||||
Expense Examples | 24 | ||||||
Advisory Contract Approval | 25 | ||||||
Privacy Policy (inside back cover) | |||||||
This report is for the information of the shareholders and others who have received a copy of the currently effective prospectus of the Fund, managed by Victory Capital Management Inc. It may be used as sales literature only when preceded or accompanied by a current prospectus, which provides further details about the Fund.
IRA DISTRIBUTION WITHHOLDING DISCLOSURE
We generally must withhold federal income tax at a rate of 10% of the taxable portion of your distribution and, if you live in a state that requires state income tax withholding, at your state's tax rate. However, you may elect not to have withholding apply or to have income tax withheld at a higher rate. Any withholding election that you make will apply to any subsequent distribution unless and until you change or revoke the election. If you wish to make a withholding election, or change or revoke a prior withholding election, call (800) 235-8396, and form W-4P (OMB No. 1545-0074 withholding certificate for pension or annuity payments) will be electronically sent.
If you do not have a withholding election in place by the date of a distribution, federal income tax will be withheld from the taxable portion of your distribution at a rate of 10%. If you must pay estimated taxes, you may be subject to estimated tax penalties if your estimated tax payments are not sufficient and sufficient tax is not withheld from your distribution.
For more specific information, please consult your tax adviser.
• NOT FDIC INSURED • NO BANK GUARANTEE • MAY LOSE VALUE
1
| USAA Mutual Funds Trust USAA Growth & Income Fund | January 31, 2023 | ||||||
(Unaudited)
Investment Objective and Portfolio Holdings:
The Fund seeks capital growth with a secondary investment objective of current income.
Top 10 Equity Holdings*:
January 31, 2023
(% of Net Assets)
Apple, Inc. | 5.6 | % | |||||
Microsoft Corp. | 5.3 | % | |||||
Visa, Inc. Class A | 2.1 | % | |||||
Alphabet, Inc. Class C | 2.0 | % | |||||
Amazon.com, Inc. | 1.9 | % | |||||
NVIDIA Corp. | 1.7 | % | |||||
UnitedHealth Group, Inc. | 1.7 | % | |||||
Vertex Pharmaceuticals, Inc. | 1.5 | % | |||||
Johnson & Johnson | 1.3 | % | |||||
Exxon Mobil Corp. | 1.3 | % | |||||
Sector Allocation*:
January 31, 2023
(% of Net Assets)

* Does not include futures contracts, money market instruments, and short-term investments purchased with cash collateral from securities loaned.
Percentages are of the net assets of the Fund and may not equal 100%.
Refer to the Schedule of Portfolio Investments for a complete list of securities.
2
| USAA Mutual Funds Trust USAA Growth & Income Fund | Schedule of Portfolio Investments January 31, 2023 | ||||||
(Amounts in Thousands, Except for Shares) (Unaudited)
Security Description | Shares | Value | |||||||||
Common Stocks (99.7%) | |||||||||||
Communication Services (6.8%): | |||||||||||
Alphabet, Inc. Class C (a) | 330,474 | $ | 33,004 | ||||||||
AT&T, Inc. | 576,332 | 11,740 | |||||||||
Comcast Corp. Class A | 274,253 | 10,792 | |||||||||
Fox Corp. Class A | 75,364 | 2,558 | |||||||||
Meta Platforms, Inc. Class A (a) | 57,358 | 8,545 | |||||||||
Netflix, Inc. (a) | 33,711 | 11,929 | |||||||||
Omnicom Group, Inc. | 138,769 | 11,933 | |||||||||
Sirius XM Holdings, Inc. (b) | 1,477,792 | 8,556 | |||||||||
The Interpublic Group of Cos., Inc. | 240,887 | 8,783 | |||||||||
Verizon Communications, Inc. | 41,772 | 1,736 | |||||||||
109,576 | |||||||||||
Communications Equipment (1.4%): | |||||||||||
Cisco Systems, Inc. | 363,797 | 17,706 | |||||||||
Motorola Solutions, Inc. | 16,630 | 4,274 | |||||||||
21,980 | |||||||||||
Consumer Discretionary (10.2%): | |||||||||||
Amazon.com, Inc. (a) | 291,054 | 30,016 | |||||||||
Best Buy Co., Inc. | 87,194 | 7,736 | |||||||||
Booking Holdings, Inc. (a) | 3,339 | 8,127 | |||||||||
Chipotle Mexican Grill, Inc. (a) | 3,209 | 5,283 | |||||||||
Dollar Tree, Inc. (a) | 82,533 | 12,395 | |||||||||
Genuine Parts Co. | 21,823 | 3,662 | |||||||||
H&R Block, Inc. | 145,522 | 5,672 | |||||||||
Lennar Corp. Class A | 31,413 | 3,217 | |||||||||
Lowe's Cos., Inc. | 46,676 | 9,720 | |||||||||
McDonald's Corp. | 24,308 | 6,500 | |||||||||
PulteGroup, Inc. | 57,892 | 3,294 | |||||||||
Starbucks Corp. | 26,594 | 2,903 | |||||||||
Target Corp. | 47,451 | 8,168 | |||||||||
Tesla, Inc. (a) | 88,539 | 15,337 | |||||||||
The Home Depot, Inc. | 22,189 | 7,193 | |||||||||
Toll Brothers, Inc. | 34,407 | 2,047 | |||||||||
Tractor Supply Co. | 56,190 | 12,811 | |||||||||
Ulta Beauty, Inc. (a) | 16,673 | 8,569 | |||||||||
Williams-Sonoma, Inc. | 18,301 | 2,470 | |||||||||
Yum! Brands, Inc. | 77,798 | 10,153 | |||||||||
165,273 | |||||||||||
Consumer Staples (7.1%): | |||||||||||
Altria Group, Inc. | 359,755 | 16,203 | |||||||||
Campbell Soup Co. | 68,955 | 3,581 | |||||||||
Colgate-Palmolive Co. | 71,391 | 5,321 | |||||||||
Constellation Brands, Inc. Class A | 65,082 | 15,068 | |||||||||
Costco Wholesale Corp. | 30,443 | 15,561 | |||||||||
General Mills, Inc. | 62,311 | 4,883 | |||||||||
Kimberly-Clark Corp. | 24,081 | 3,131 | |||||||||
See notes to financial statements.
3
| USAA Mutual Funds Trust USAA Growth & Income Fund | Schedule of Portfolio Investments — continued January 31, 2023 | ||||||
(Amounts in Thousands, Except for Shares) (Unaudited)
Security Description | Shares | Value | |||||||||
PepsiCo, Inc. | 29,950 | $ | 5,122 | ||||||||
Philip Morris International, Inc. | 123,785 | 12,903 | |||||||||
The Coca-Cola Co. | 55,340 | 3,393 | |||||||||
The Hershey Co. | 53,935 | 12,114 | |||||||||
The Procter & Gamble Co. | 88,878 | 12,654 | |||||||||
Walmart, Inc. | 27,175 | 3,910 | |||||||||
113,844 | |||||||||||
Energy (4.2%): | |||||||||||
Cheniere Energy, Inc. | 27,654 | 4,225 | |||||||||
Chevron Corp. | 66,307 | 11,539 | |||||||||
Devon Energy Corp. | 122,260 | 7,732 | |||||||||
Diamondback Energy, Inc. | 46,506 | 6,796 | |||||||||
EOG Resources, Inc. | 62,480 | 8,263 | |||||||||
Exxon Mobil Corp. | 174,692 | 20,266 | |||||||||
Marathon Petroleum Corp. | 32,471 | 4,173 | |||||||||
Valero Energy Corp. | 40,094 | 5,614 | |||||||||
68,608 | |||||||||||
Financials (10.1%): | |||||||||||
Aflac, Inc. | 80,256 | 5,899 | |||||||||
American Express Co. | 56,988 | 9,969 | |||||||||
American Financial Group, Inc. | 20,705 | 2,952 | |||||||||
Ameriprise Financial, Inc. | 31,097 | 10,888 | |||||||||
Capital One Financial Corp. | 11,426 | 1,360 | |||||||||
Discover Financial Services | 34,322 | 4,006 | |||||||||
East West Bancorp, Inc. | 31,994 | 2,512 | |||||||||
Everest Re Group Ltd. | 8,853 | 3,096 | |||||||||
FactSet Research Systems, Inc. | 5,000 | 2,115 | |||||||||
Fidelity National Financial, Inc. | 205,312 | 9,040 | |||||||||
Jefferies Financial Group, Inc. | 186,551 | 7,328 | |||||||||
JPMorgan Chase & Co. | 45,678 | 6,393 | |||||||||
LPL Financial Holdings, Inc. | 14,834 | 3,517 | |||||||||
M&T Bank Corp. | 35,146 | 5,483 | |||||||||
MetLife, Inc. | 54,457 | 3,976 | |||||||||
Morgan Stanley | 37,781 | 3,677 | |||||||||
MSCI, Inc. | 13,426 | 7,137 | |||||||||
Popular, Inc. | 28,672 | 1,968 | |||||||||
Principal Financial Group, Inc. | 83,972 | 7,772 | |||||||||
Regions Financial Corp. | 684,477 | 16,113 | |||||||||
Synchrony Financial | 207,783 | 7,632 | |||||||||
Synovus Financial Corp. | 42,250 | 1,772 | |||||||||
The Goldman Sachs Group, Inc. | 22,871 | 8,366 | |||||||||
The Hanover Insurance Group, Inc. | 20,591 | 2,771 | |||||||||
The Hartford Financial Services Group, Inc. | 67,231 | 5,218 | |||||||||
The Progressive Corp. | 80,508 | 10,977 | |||||||||
The Travelers Cos., Inc. | 26,181 | 5,004 | |||||||||
U.S. Bancorp | 132,173 | 6,582 | |||||||||
163,523 | |||||||||||
See notes to financial statements.
4
| USAA Mutual Funds Trust USAA Growth & Income Fund | Schedule of Portfolio Investments — continued January 31, 2023 | ||||||
(Amounts in Thousands, Except for Shares) (Unaudited)
Security Description | Shares | Value | |||||||||
Health Care (14.9%): | |||||||||||
Abbott Laboratories | 20,636 | $ | 2,281 | ||||||||
AbbVie, Inc. | 23,865 | 3,526 | |||||||||
Agilent Technologies, Inc. | 63,203 | 9,612 | |||||||||
Amgen, Inc. | 52,972 | 13,370 | |||||||||
BioMarin Pharmaceutical, Inc. (a) | 75,409 | 8,698 | |||||||||
Bristol-Myers Squibb Co. | 85,272 | 6,195 | |||||||||
Cardinal Health, Inc. | 67,721 | 5,232 | |||||||||
Chemed Corp. | 6,392 | 3,229 | |||||||||
Cigna Corp. | 23,956 | 7,586 | |||||||||
CVS Health Corp. | 76,570 | 6,755 | |||||||||
Dexcom, Inc. (a) | 86,351 | 9,247 | |||||||||
Elevance Health, Inc. | 12,564 | 6,282 | |||||||||
Eli Lilly & Co. | 25,930 | 8,924 | |||||||||
Gilead Sciences, Inc. | 151,549 | 12,721 | |||||||||
Intuitive Surgical, Inc. (a) | 28,345 | 6,964 | |||||||||
Jazz Pharmaceuticals PLC (a) | 81,321 | 12,740 | |||||||||
Johnson & Johnson | 133,154 | 21,760 | |||||||||
McKesson Corp. | 16,715 | 6,330 | |||||||||
Merck & Co., Inc. | 129,048 | 13,861 | |||||||||
Pfizer, Inc. | 170,278 | 7,520 | |||||||||
Quest Diagnostics, Inc. | 32,016 | 4,754 | |||||||||
Tenet Healthcare Corp. (a) | 90,928 | 4,987 | |||||||||
Thermo Fisher Scientific, Inc. | 12,164 | 6,938 | |||||||||
UnitedHealth Group, Inc. | 53,904 | 26,908 | |||||||||
Vertex Pharmaceuticals, Inc. (a) | 76,240 | 24,633 | |||||||||
241,053 | |||||||||||
Industrials (9.8%): | |||||||||||
3M Co. | 47,514 | 5,468 | |||||||||
Cintas Corp. | 14,782 | 6,559 | |||||||||
CoStar Group, Inc. (a) | 76,412 | 5,953 | |||||||||
CSX Corp. | 90,521 | 2,799 | |||||||||
Cummins, Inc. | 16,514 | 4,121 | |||||||||
Deere & Co. | 13,376 | 5,656 | |||||||||
Expeditors International of Washington, Inc. | 26,266 | 2,841 | |||||||||
Fastenal Co. | 178,830 | 9,040 | |||||||||
General Dynamics Corp. | 29,272 | 6,822 | |||||||||
HEICO Corp. Class A | 90,547 | 12,104 | |||||||||
Huntington Ingalls Industries, Inc. | 12,598 | 2,778 | |||||||||
Illinois Tool Works, Inc. | 21,648 | 5,110 | |||||||||
Lennox International, Inc. | 14,191 | 3,698 | |||||||||
Lockheed Martin Corp. | 22,592 | 10,466 | |||||||||
ManpowerGroup, Inc. | 35,316 | 3,078 | |||||||||
Masco Corp. | 150,349 | 7,999 | |||||||||
Northrop Grumman Corp. | 9,276 | 4,156 | |||||||||
Old Dominion Freight Line, Inc. | 29,077 | 9,690 | |||||||||
Owens Corning | 35,247 | 3,407 | |||||||||
Quanta Services, Inc. | 71,967 | 10,953 | |||||||||
Republic Services, Inc. | 24,194 | 3,020 | |||||||||
Snap-on, Inc. | 20,079 | 4,994 | |||||||||
See notes to financial statements.
5
| USAA Mutual Funds Trust USAA Growth & Income Fund | Schedule of Portfolio Investments — continued January 31, 2023 | ||||||
(Amounts in Thousands, Except for Shares) (Unaudited)
Security Description | Shares | Value | |||||||||
Union Pacific Corp. | 34,457 | $ | 7,036 | ||||||||
United Parcel Service, Inc. Class B | 46,231 | 8,563 | |||||||||
Verisk Analytics, Inc. | 42,485 | 7,723 | |||||||||
W.W. Grainger, Inc. | 5,677 | 3,346 | |||||||||
157,380 | |||||||||||
IT Services (5.3%): | |||||||||||
Accenture PLC Class A | 26,441 | 7,378 | |||||||||
Automatic Data Processing, Inc. | 13,069 | 2,951 | |||||||||
Block, Inc. (a) | 47,074 | 3,847 | |||||||||
Gartner, Inc. (a) | 23,402 | 7,913 | |||||||||
International Business Machines Corp. | 44,262 | 5,963 | |||||||||
Mastercard, Inc. Class A | 18,091 | 6,705 | |||||||||
Paychex, Inc. | 34,915 | 4,045 | |||||||||
Snowflake, Inc. Class A (a) | 46,404 | 7,260 | |||||||||
Toast, Inc. Class A (a) | 247,574 | 5,523 | |||||||||
Visa, Inc. Class A | 147,576 | 33,974 | |||||||||
85,559 | |||||||||||
Materials (3.1%): | |||||||||||
Avery Dennison Corp. | 9,145 | 1,732 | |||||||||
CF Industries Holdings, Inc. | 54,418 | 4,609 | |||||||||
Graphic Packaging Holding Co. | 388,442 | 9,358 | |||||||||
LyondellBasell Industries NV Class A | 129,939 | 12,564 | |||||||||
Nucor Corp. | 51,973 | 8,785 | |||||||||
Packaging Corp. of America | 40,390 | 5,764 | |||||||||
Reliance Steel & Aluminum Co. | 10,353 | 2,355 | |||||||||
Steel Dynamics, Inc. | 29,919 | 3,609 | |||||||||
Westlake Corp. | 13,519 | 1,659 | |||||||||
50,435 | |||||||||||
Real Estate (3.1%): | |||||||||||
AvalonBay Communities, Inc. | 17,172 | 3,047 | |||||||||
Boston Properties, Inc. | 27,309 | 2,036 | |||||||||
Digital Realty Trust, Inc. | 56,533 | 6,480 | |||||||||
Equinix, Inc. | 4,490 | 3,314 | |||||||||
Equity Residential | 33,576 | 2,137 | |||||||||
National Retail Properties, Inc. | 43,884 | 2,078 | |||||||||
Prologis, Inc. | 37,376 | 4,832 | |||||||||
Realty Income Corp. | 74,143 | 5,029 | |||||||||
Regency Centers Corp. | 22,544 | 1,502 | |||||||||
SBA Communications Corp. | 23,731 | 7,061 | |||||||||
VICI Properties, Inc. | 329,360 | 11,257 | |||||||||
Vornado Realty Trust | 69,695 | 1,700 | |||||||||
50,473 | |||||||||||
Semiconductors & Semiconductor Equipment (5.4%): | |||||||||||
Advanced Micro Devices, Inc. (a) | 68,708 | 5,164 | |||||||||
Enphase Energy, Inc. (a) | 29,876 | 6,614 | |||||||||
Intel Corp. | 84,231 | 2,380 | |||||||||
KLA Corp. | 24,766 | 9,720 | |||||||||
Lam Research Corp. | 23,345 | 11,675 | |||||||||
See notes to financial statements.
6
| USAA Mutual Funds Trust USAA Growth & Income Fund | Schedule of Portfolio Investments — continued January 31, 2023 | ||||||
(Amounts in Thousands, Except for Shares) (Unaudited)
Security Description | Shares | Value | |||||||||
Monolithic Power Systems, Inc. | 23,101 | $ | 9,854 | ||||||||
NVIDIA Corp. | 138,733 | 27,104 | |||||||||
QUALCOMM, Inc. | 30,313 | 4,038 | |||||||||
Skyworks Solutions, Inc. | 23,784 | 2,608 | |||||||||
Texas Instruments, Inc. | 43,027 | 7,625 | |||||||||
86,782 | |||||||||||
Software (8.5%): | |||||||||||
Intuit, Inc. | 20,526 | 8,676 | |||||||||
Microsoft Corp. | 342,790 | 84,947 | |||||||||
Palo Alto Networks, Inc. (a) | 35,252 | 5,592 | |||||||||
Salesforce, Inc. (a) | 34,657 | 5,821 | |||||||||
ServiceNow, Inc. (a) | 35,375 | 16,100 | |||||||||
Synopsys, Inc. (a) | 27,617 | 9,770 | |||||||||
Workday, Inc. Class A (a) | 30,394 | 5,514 | |||||||||
136,420 | |||||||||||
Technology Hardware, Storage & Peripherals (6.7%): | |||||||||||
Apple, Inc. | 621,615 | 89,693 | |||||||||
Hewlett Packard Enterprise Co. | 183,562 | 2,961 | |||||||||
HP, Inc. | 367,834 | 10,718 | |||||||||
NetApp, Inc. | 63,533 | 4,208 | |||||||||
107,580 | |||||||||||
Utilities (3.1%): | |||||||||||
American Electric Power Co., Inc. | 47,863 | 4,497 | |||||||||
DTE Energy Co. | 32,563 | 3,789 | |||||||||
Duke Energy Corp. | 80,035 | 8,200 | |||||||||
Evergy, Inc. | 82,622 | 5,176 | |||||||||
Exelon Corp. | 143,366 | 6,049 | |||||||||
Sempra Energy | 26,615 | 4,267 | |||||||||
The Southern Co. | 182,996 | 12,385 | |||||||||
UGI Corp. | 139,191 | 5,544 | |||||||||
49,907 | |||||||||||
Total Common Stocks (Cost $1,260,528) | 1,608,393 | ||||||||||
Collateral for Securities Loaned (0.5%)^ | |||||||||||
| Goldman Sachs Financial Square Government Fund, Institutional Shares, 4.22% (c) | 2,194,521 | 2,195 | |||||||||
HSBC U.S. Government Money Market Fund, Institutional Shares, 4.21% (c) | 2,194,521 | 2,194 | |||||||||
Invesco Government & Agency Portfolio, Institutional Shares, 4.31% (c) | 2,194,521 | 2,194 | |||||||||
| Morgan Stanley Institutional Liquidity Government Portfolio, Institutional Shares, 4.14% (c) | 2,194,521 | 2,195 | |||||||||
Total Collateral for Securities Loaned (Cost $8,778) | 8,778 | ||||||||||
Total Investments (Cost $1,269,306) — 100.2% | 1,617,171 | ||||||||||
Liabilities in excess of other assets — (0.2)% | (3,958 | ) | |||||||||
NET ASSETS — 100.00% | $ | 1,613,213 | |||||||||
See notes to financial statements.
7
| USAA Mutual Funds Trust USAA Growth & Income Fund | Schedule of Portfolio Investments — continued January 31, 2023 | ||||||
(Unaudited)
^ Purchased with cash collateral from securities on loan.
(a) Non-income producing security.
(b) All or a portion of this security is on loan.
(c) Rate disclosed is the daily yield on January 31, 2023.
PLC — Public Limited Company
See notes to financial statements.
8
USAA Mutual Funds Trust | Statement of Assets and Liabilities January 31, 2023 | ||||||
(Amounts in Thousands, Except Per Share Amounts) (Unaudited)
| USAA Growth & Income Fund | |||||||
Assets: | |||||||
Investments, at value (Cost $1,269,306) | $ | 1,617,171 | (a) | ||||
Cash | 3,826 | ||||||
Receivables: | |||||||
Interest and dividends | 1,007 | ||||||
Capital shares issued | 155 | ||||||
Investments sold | 1,446 | ||||||
From Adviser | 7 | ||||||
Prepaid expenses | 12 | ||||||
Total Assets | 1,623,624 | ||||||
Liabilities: | |||||||
Payables: | |||||||
Collateral received on loaned securities | 8,778 | ||||||
Capital shares redeemed | 470 | ||||||
Accrued expenses and other payables: | |||||||
Investment advisory fees | 735 | ||||||
Administration fees | 199 | ||||||
Custodian fees | 13 | ||||||
Transfer agent fees | 108 | ||||||
Compliance fees | 1 | ||||||
Trustees' fees | 1 | ||||||
| 12b-1 fees | — | (b) | |||||
Other accrued expenses | 106 | ||||||
Total Liabilities | 10,411 | ||||||
Net Assets: | |||||||
Capital | 1,315,453 | ||||||
Total accumulated earnings/(loss) | 297,760 | ||||||
Net Assets | $ | 1,613,213 | |||||
Net Assets | |||||||
Fund Shares | $ | 1,607,697 | |||||
Institutional Shares | 4,761 | ||||||
Class A | 755 | ||||||
Total | $ | 1,613,213 | |||||
Shares (unlimited number of shares authorized with no par value): | |||||||
Fund Shares | 81,549 | ||||||
Institutional Shares | 240 | ||||||
Class A | 39 | ||||||
Total | 81,828 | ||||||
Net asset value, offering and redemption price per share: (c) | |||||||
Fund Shares | $ | 19.71 | |||||
Institutional Shares | 19.80 | ||||||
Class A | 19.62 | ||||||
Maximum Sales Charge — Class A | 5.75 | % | |||||
| Maximum offering price (100%/(100%-maximum sales charge) of net asset value adjusted to the nearest cent) per share — Class A | $ | 20.82 | |||||
(a) Includes $8,471 thousand of securities on loan.
(b) Rounds to less than $1 thousand.
(c) Per share amount may not recalculate due to rounding of net assets and/or shares outstanding.
See notes to financial statements.
9
USAA Mutual Funds Trust | Statement of Operations For the Six Months Ended January 31, 2023 | ||||||
(Amounts in Thousands) (Unaudited)
| USAA Growth & Income Fund | |||||||
Investment Income: | |||||||
Dividends | $ | 16,102 | |||||
Interest | 63 | ||||||
Securities lending (net of fees) | 406 | ||||||
Foreign tax withholding | (3 | ) | |||||
Total Income | 16,568 | ||||||
Expenses: | |||||||
Investment advisory fees | 4,416 | ||||||
Administration fees — Fund Shares | 1,192 | ||||||
Administration fees — Institutional Shares | 2 | ||||||
Administration fees — Class A | 1 | ||||||
Sub-Administration fees | 20 | ||||||
| 12b-1 fees — Class A | 1 | ||||||
Custodian fees | 35 | ||||||
Transfer agent fees — Fund Shares | 628 | ||||||
Transfer agent fees — Institutional Shares | 2 | ||||||
Transfer agent fees — Class A | — | (a) | |||||
Trustees' fees | 23 | ||||||
Compliance fees | 8 | ||||||
Legal and audit fees | 50 | ||||||
State registration and filing fees | 36 | ||||||
Other expenses | 113 | ||||||
Total Expenses | 6,527 | ||||||
Expenses waived/reimbursed by Adviser | (21 | ) | |||||
Net Expenses | 6,506 | ||||||
Net Investment Income (Loss) | 10,062 | ||||||
Realized/Unrealized Gains (Losses) from Investments: | |||||||
Net realized gains (losses) from investment securities | (5,867 | ) | |||||
Net change in unrealized appreciation/depreciation on investment securities | (11,579 | ) | |||||
Net realized/unrealized gains (losses) on investments | (17,446 | ) | |||||
Change in net assets resulting from operations | $ | (7,384 | ) | ||||
(a) Rounds to less than $1 thousand.
See notes to financial statements.
10
USAA Mutual Funds Trust | Statements of Changes in Net Assets | ||||||
(Amounts in Thousands)
USAA Growth & Income Fund | |||||||||||
| Six Months Ended January 31, 2023 (Unaudited) | Year Ended July 31, 2022 | ||||||||||
From Investments: | |||||||||||
Operations: | |||||||||||
Net Investment Income (Loss) | $ | 10,062 | $ | 15,736 | |||||||
Net realized gains (losses) | (5,867 | ) | 193,593 | ||||||||
Net change in unrealized appreciation/depreciation | (11,579 | ) | (335,138 | ) | |||||||
Change in net assets resulting from operations | (7,384 | ) | (125,809 | ) | |||||||
Distributions to Shareholders: | |||||||||||
Fund Shares | (165,578 | ) | (218,056 | ) | |||||||
Institutional Shares | (491 | ) | (1,013 | ) | |||||||
Class A | (87 | ) | (96 | ) | |||||||
Change in net assets resulting from distributions to shareholders | (166,156 | ) | (219,165 | ) | |||||||
Change in net assets resulting from capital transactions | 108,169 | (124,503 | ) | ||||||||
Change in net assets | (65,371 | ) | (469,477 | ) | |||||||
Net Assets: | |||||||||||
Beginning of period | 1,678,584 | 2,148,061 | |||||||||
End of period | $ | 1,613,213 | $ | 1,678,584 | |||||||
(continues on next page)
See notes to financial statements.
11
USAA Mutual Funds Trust | Statements of Changes in Net Assets | ||||||
(Amounts in Thousands) (continued)
USAA Growth & Income Fund | |||||||||||
| Six Months Ended January 31, 2023 (Unaudited) | Year Ended July 31, 2022 | ||||||||||
Capital Transactions: | |||||||||||
Fund Shares | |||||||||||
Proceeds from shares issued | $ | 29,226 | $ | 81,304 | |||||||
Distributions reinvested | 162,839 | 214,656 | |||||||||
Cost of shares redeemed | (84,098 | ) | (203,002 | ) | |||||||
Total Fund Shares | $ | 107,967 | $ | 92,958 | |||||||
Institutional Shares | |||||||||||
Proceeds from shares issued | $ | 1,445 | $ | 4,436 | |||||||
Distributions reinvested | 488 | 1,011 | |||||||||
Cost of shares redeemed | (1,844 | ) | (223,014 | ) | |||||||
Total Institutional Shares | $ | 89 | $ | (217,567 | ) | ||||||
Class A | |||||||||||
Proceeds from shares issued | $ | 142 | $ | 157 | |||||||
Distributions reinvested | 83 | 81 | |||||||||
Cost of shares redeemed | (112 | ) | (132 | ) | |||||||
Total Class A | $ | 113 | $ | 106 | |||||||
Change in net assets resulting from capital transactions | $ | 108,169 | $ | (124,503 | ) | ||||||
Share Transactions: | |||||||||||
Fund Shares | |||||||||||
Issued | 1,429 | 3,313 | |||||||||
Reinvested | 8,388 | 8,617 | |||||||||
Redeemed | (4,135 | ) | (8,279 | ) | |||||||
Total Fund Shares | 5,682 | 3,651 | |||||||||
Institutional Shares | |||||||||||
Issued | 68 | 177 | |||||||||
Reinvested | 25 | 40 | |||||||||
Redeemed | (88 | ) | (7,945 | ) | |||||||
Total Institutional Shares | 5 | (7,728 | ) | ||||||||
Class A | |||||||||||
Issued | 8 | 7 | |||||||||
Reinvested | 4 | 3 | |||||||||
Redeemed | (6 | ) | (6 | ) | |||||||
Total Class A | 6 | 4 | |||||||||
Change in Shares | 5,693 | (4,073 | ) | ||||||||
See notes to financial statements.
12
USAA Mutual Funds Trust | Financial Highlights | ||||||
For a Share Outstanding Throughout Each Period
USAA Growth & Income Fund | |||||||||||||||||||||||||||
Fund Shares | |||||||||||||||||||||||||||
| Six Months Ended January 31, 2023 (Unaudited) | Year Ended July 31, 2022 | Year Ended July 31, 2021 | Year Ended July 31, 2020 | Year Ended July 31, 2019 | Year Ended July 31, 2018 | ||||||||||||||||||||||
| Net Asset Value, Beginning of Period | $ | 22.05 | $ | 26.78 | $ | 20.41 | $ | 23.70 | $ | 26.19 | $ | 24.25 | |||||||||||||||
Investment Activities: | |||||||||||||||||||||||||||
Net investment income (loss) | 0.13 | (a) | 0.21 | (a) | 0.15 | (a) | 0.22 | (a) | 0.25 | 0.19 | |||||||||||||||||
| Net realized and unrealized gains (losses) | (0.25 | ) | (1.86 | ) | 6.40 | 1.45 | (0.24 | ) | 3.03 | ||||||||||||||||||
| Total from Investment Activities | (0.12 | ) | (1.65 | ) | 6.55 | 1.67 | 0.01 | 3.22 | |||||||||||||||||||
Distributions to Shareholders from: | |||||||||||||||||||||||||||
Net investment income | (0.07 | ) | (0.22 | ) | (0.18 | ) | (0.23 | ) | (0.24 | ) | (0.18 | ) | |||||||||||||||
Net realized gains | (2.15 | ) | (2.86 | ) | — | (4.73 | ) | (2.26 | ) | (1.10 | ) | ||||||||||||||||
Total Distributions | (2.22 | ) | (3.08 | ) | (0.18 | ) | (4.96 | ) | (2.50 | ) | (1.28 | ) | |||||||||||||||
Net Asset Value, End of Period | $ | 19.71 | $ | 22.05 | $ | 26.78 | $ | 20.41 | $ | 23.70 | $ | 26.19 | |||||||||||||||
Total Return (b) (c) | (0.33 | )% | (7.41 | )% | 32.24 | % | 7.81 | % | 0.89 | % | 13.59 | % | |||||||||||||||
Ratios to Average Net Assets: | |||||||||||||||||||||||||||
Net Expenses (d) (e) (f) (g) | 0.82 | % | 0.81 | % | 0.81 | % | 0.87 | % | 0.88 | % | 0.88 | % | |||||||||||||||
Net Investment Income (Loss) (d) | 1.26 | % | 0.84 | % | 0.63 | % | 1.05 | % | 1.04 | % | 0.80 | % | |||||||||||||||
Gross Expenses (d) (e) | 0.82 | % | 0.81 | % | 0.81 | % | 0.87 | % | 0.88 | % | 0.88 | % | |||||||||||||||
Supplemental Data: | |||||||||||||||||||||||||||
Net Assets at end of period (000's) | $ | 1,607,697 | $ | 1,672,669 | $ | 1,934,246 | $ | 1,605,020 | $ | 1,673,033 | $ | 1,756,259 | |||||||||||||||
Portfolio Turnover (b) (h) | 27 | % | 71 | % | 62 | % | 74 | % | 93 | %(i) | 23 | % | |||||||||||||||
(a) Per share net investment income (loss) has been calculated using the average daily shares method.
(b) Not annualized for periods less than one year.
(c) Assumes reinvestment of all net investment income and realized capital gain distributions, if any, during the period. Includes adjustments in accordance with U.S. Generally Accepted Accounting Principles and could differ from the Lipper reported return.
(d) Annualized for periods less than one year.
(e) Does not include acquired fund fees and expenses, if any.
(f) The net expense ratio may not correlate to the applicable expense limits in place during the period since the current contractual expense limitation is applied for a period beginning July 1, 2019 and in effect through November 30, 2023, instead of coinciding with the Fund's fiscal year end. Details of the current contractual expense limitation in effect can be found in Note 4 of the accompanying Notes to Financial Statements.
(g) From the period beginning July 1, 2019, the amount of any waivers or reimbursements and the amount of any recoupment are calculated without regard to the impact of any performance adjustment to the Fund's management fee.
(h) Portfolio turnover is calculated on the basis of the Fund as a whole without distinguishing between the classes of shares.
(i) Reflects increased trading activity due to transition or asset allocation shift.
(continues on next page)
See notes to financial statements.
13
USAA Mutual Funds Trust | Financial Highlights — continued | ||||||
For a Share Outstanding Throughout Each Period
USAA Growth & Income Fund | |||||||||||||||||||||||||||
Institutional Shares | |||||||||||||||||||||||||||
| Six Months Ended January 31, 2023 (Unaudited) | Year Ended July 31, 2022 | Year Ended July 31, 2021 | Year Ended July 31, 2020 | Year Ended July 31, 2019 | Year Ended July 31, 2018 | ||||||||||||||||||||||
| Net Asset Value, Beginning of Period | $ | 22.12 | $ | 26.75 | $ | 20.38 | $ | 23.68 | $ | 26.17 | $ | 24.23 | |||||||||||||||
Investment Activities: | |||||||||||||||||||||||||||
Net investment income (loss) | 0.22 | (a) | 0.16 | (a) | 0.15 | (a) | 0.23 | (a) | 0.26 | 0.20 | |||||||||||||||||
| Net realized and unrealized gains (losses) | (0.23 | ) | (1.67 | ) | 6.40 | 1.44 | (0.24 | ) | 3.03 | ||||||||||||||||||
| Total from Investment Activities | (0.01 | ) | (1.51 | ) | 6.55 | 1.67 | 0.02 | 3.23 | |||||||||||||||||||
Distributions to Shareholders from: | |||||||||||||||||||||||||||
Net investment income | (0.16 | ) | (0.26 | ) | (0.18 | ) | (0.24 | ) | (0.25 | ) | (0.19 | ) | |||||||||||||||
Net realized gains | (2.15 | ) | (2.86 | ) | — | (4.73 | ) | (2.26 | ) | (1.10 | ) | ||||||||||||||||
Total Distributions | (2.31 | ) | (3.12 | ) | (0.18 | ) | (4.97 | ) | (2.51 | ) | (1.29 | ) | |||||||||||||||
Net Asset Value, End of Period | $ | 19.80 | $ | 22.12 | $ | 26.75 | $ | 20.38 | $ | 23.68 | $ | 26.17 | |||||||||||||||
Total Return (b) (c) | 0.18 | % | (6.77 | )% | 32.32 | % | 7.86 | % | 0.94 | % | 13.66 | % | |||||||||||||||
Ratios to Average Net Assets: | |||||||||||||||||||||||||||
Net Expenses (d) (e) (f) (g) | (0.02 | )%(h) | 0.72 | % | 0.79 | % | 0.83 | % | 0.83 | %(i) | 0.84 | % | |||||||||||||||
Net Investment Income (Loss) (d) | 2.10 | % | 0.59 | % | 0.65 | % | 1.09 | % | 1.09 | % | 0.85 | % | |||||||||||||||
Gross Expenses (d) (e) | 0.44 | %(h) | 0.74 | % | 0.79 | % | 0.83 | % | 0.83 | % | 0.84 | % | |||||||||||||||
Supplemental Data: | |||||||||||||||||||||||||||
Net Assets at end of period (000's) | $ | 4,761 | $ | 5,193 | $ | 213,041 | $ | 172,787 | $ | 165,137 | $ | 159,148 | |||||||||||||||
Portfolio Turnover (b) (j) | 27 | % | 71 | % | 62 | % | 74 | % | 93 | %(k) | 23 | % | |||||||||||||||
(a) Per share net investment income (loss) has been calculated using the average daily shares method.
(b) Not annualized for periods less than one year.
(c) Assumes reinvestment of all net investment income and realized capital gain distributions, if any, during the period. Includes adjustments in accordance with U.S. Generally Accepted Accounting Principles and could differ from the Lipper reported return.
(d) Annualized for periods less than one year.
(e) Does not include acquired fund fees and expenses, if any.
(f) The net expense ratio may not correlate to the applicable expense limits in place during the period since the current contractual expense limitation is applied for a period beginning July 1, 2019 and in effect through November 30, 2023, instead of coinciding with the Fund's fiscal year end. Details of the current contractual expense limitation in effect can be found in Note 4 of the accompanying Notes to Financial Statements.
(g) From the period beginning July 1, 2019, the amount of any waivers or reimbursements and the amount of any recoupment are calculated without regard to the impact of any performance adjustment to the Fund's management fee.
(h) For the six months ended January 31, 2023, the net expense ratio and gross expense ratio include the impact of performance fee adjustments. If the performance fee adjustment of (0.86)% was not applied, the net expense ratio and gross expense ratio would have been 0.84% and 1.30%, respectively.
(i) Prior to December 1, 2018, USAA Asset Management Company ("AMCO") (previous Investment Adviser) voluntarily agreed to limit the annual expenses of the Institutional Shares to 0.85% of the Institutional Shares' average daily net assets.
(j) Portfolio turnover is calculated on the basis of the Fund as a whole without distinguishing between the classes of shares.
(k) Reflects increased trading activity due to transition or asset allocation shift.
(continues on next page)
See notes to financial statements.
14
USAA Mutual Funds Trust | Financial Highlights — continued | ||||||
For a Share Outstanding Throughout Each Period
USAA Growth & Income Fund | |||||||||||||||||||||||||||
Class A | |||||||||||||||||||||||||||
| Six Months Ended January 31, 2023 (Unaudited) | Year Ended July 31, 2022 | Year Ended July 31, 2021 | Year Ended July 31, 2020 | Year Ended July 31, 2019 | Year Ended July 31, 2018 | ||||||||||||||||||||||
| Net Asset Value, Beginning of Period | $ | 21.96 | $ | 26.69 | $ | 20.31 | $ | 23.61 | $ | 26.10 | $ | 24.17 | |||||||||||||||
Investment Activities: | |||||||||||||||||||||||||||
Net investment income (loss) | 0.12 | (a) | 0.21 | (a) | 0.08 | (a) | 0.16 | (a) | 0.19 | 0.12 | |||||||||||||||||
| Net realized and unrealized gains (losses) | (0.24 | ) | (1.85 | ) | 6.40 | 1.45 | (0.25 | ) | 3.02 | ||||||||||||||||||
| Total from Investment Activities | (0.12 | ) | (1.64 | ) | 6.48 | 1.61 | (0.06 | ) | 3.14 | ||||||||||||||||||
Distributions to Shareholders from: | |||||||||||||||||||||||||||
Net investment income | (0.07 | ) | (0.23 | ) | (0.10 | ) | (0.18 | ) | (0.17 | ) | (0.11 | ) | |||||||||||||||
Net realized gains | (2.15 | ) | (2.86 | ) | — | (4.73 | ) | (2.26 | ) | (1.10 | ) | ||||||||||||||||
Total Distributions | (2.22 | ) | (3.09 | ) | (0.10 | ) | (4.91 | ) | (2.43 | ) | (1.21 | ) | |||||||||||||||
Net Asset Value, End of Period | $ | 19.62 | $ | 21.96 | $ | 26.69 | $ | 20.31 | $ | 23.61 | $ | 26.10 | |||||||||||||||
| Total Return (excludes sales charge) (b) (c) | (0.35 | )% | (7.38 | )% | 32.04 | % | 7.52 | % | 0.62 | % | 13.28 | % | |||||||||||||||
Ratios to Average Net Assets: | |||||||||||||||||||||||||||
Net Expenses (d) (e) (f) (g) | 0.90 | % | 0.78 | % | 1.09 | % | 1.14 | % | 1.15 | % | 1.17 | %(h) | |||||||||||||||
Net Investment Income (Loss) (d) | 1.17 | % | 0.87 | % | 0.35 | % | 0.79 | % | 0.77 | % | 0.52 | % | |||||||||||||||
Gross Expenses (d) (e) | 3.45 | % | 3.01 | % | 1.49 | % | 1.14 | % | 1.23 | % | 1.20 | % | |||||||||||||||
Supplemental Data: | |||||||||||||||||||||||||||
Net Assets at end of period (000's) | $ | 755 | $ | 722 | $ | 774 | $ | 8,514 | $ | 9,912 | $ | 10,858 | |||||||||||||||
Portfolio Turnover (b) (i) | 27 | % | 71 | % | 62 | % | 74 | % | 93 | %(j) | 23 | % | |||||||||||||||
(a) Per share net investment income (loss) has been calculated using the average daily shares method.
(b) Not annualized for periods less than one year.
(c) Assumes reinvestment of all net investment income and realized capital gain distributions, if any, during the period. Includes adjustments in accordance with U.S. Generally Accepted Accounting Principles and could differ from the Lipper reported return.
(d) Annualized for periods less than one year.
(e) Does not include acquired fund fees and expenses, if any.
(f) The net expense ratio may not correlate to the applicable expense limits in place during the period since the current contractual expense limitation is applied for a period beginning July 1, 2019 and in effect through November 30, 2023, instead of coinciding with the Fund's fiscal year end. Details of the current contractual expense limitation in effect can be found in Note 4 of the accompanying Notes to Financial Statements.
(g) From the period beginning July 1, 2019, the amount of any waivers or reimbursements and the amount of any recoupment are calculated without regard to the impact of any performance adjustment to the Fund's management fee.
(h) Prior to December 1, 2017, AMCO voluntarily agreed to limit the annual expenses of Class A to 1.20% of the Class A average daily net assets.
(i) Portfolio turnover is calculated on the basis of the Fund as a whole without distinguishing between the classes of shares.
(j) Reflects increased trading activity due to transition or asset allocation shift.
See notes to financial statements.
15
USAA Mutual Funds Trust | Notes to Financial Statements January 31, 2023 | ||||||
(Unaudited)
1. Organization:
USAA Mutual Funds Trust (the "Trust") is organized as a Delaware statutory trust and is registered under the Investment Company Act of 1940, as amended (the "1940 Act"), as an open-end investment company. The Trust is comprised of 45 funds and is authorized to issue an unlimited number of shares, which are units of beneficial interest with no par value.
The accompanying financial statements are those of the USAA Growth & Income Fund (the "Fund"). The Fund offers three classes of shares: Fund Shares, Institutional Shares, and Class A. The Fund is classified as diversified under the 1940 Act.
Each class of shares of the Fund has substantially identical rights and privileges, except with respect to sales charges, fees paid under distribution plans, expenses allocable exclusively to each class of shares, voting rights on matters solely affecting a single class of shares, and the exchange privilege of each class of shares.
Victory Capital Management ("VCM" or the "Adviser") is an indirect wholly owned subsidiary of Victory Capital Holdings, Inc., a publicly traded Delaware corporation, and a wholly owned direct subsidiary of Victory Capital Operating, LLC.
Under the Trust's organizational documents, its officers and trustees are indemnified against certain liabilities arising out of the performance of their duties to the Fund. In addition, in the normal course of business, the Fund enters into contracts with its vendors and others that provide for general indemnifications. The Fund's maximum exposure under these arrangements is unknown, as this would involve future claims that may be made against the Fund. However, based on experience, the Fund expects that risk of loss to be remote.
2. Significant Accounting Policies:
The following is a summary of significant accounting policies followed by the Trust in the preparation of its financial statements. The policies are in conformity with U.S. Generally Accepted Accounting Principles ("GAAP"). The preparation of financial statements in accordance with GAAP requires management to make estimates and assumptions that affect the reported amounts of assets and liabilities and disclosure of contingent assets and liabilities at the date of the financial statements and the reported amounts of income and expenses for the period. Actual results could differ from those estimates. The Fund follows the specialized accounting and reporting requirements under GAAP that are applicable to investment companies under Accounting Standards Codification Topic 946.
Investment Valuation:
The Fund records investments at fair value. Fair value is defined as the price that would be received to sell an asset or paid to transfer a liability in an orderly transaction between market participants at the measurement date.
The valuation techniques described below maximize the use of observable inputs and minimize the use of unobservable inputs in determining fair value. The inputs used for valuing the Fund's investments are summarized in the three broad levels listed below:
• Level 1 — quoted prices (unadjusted) in active markets for identical securities
• Level 2 — other significant observable inputs (including quoted prices for similar securities, interest rates, or credit spreads, applicable to those securities, etc.)
• Level 3 — significant unobservable inputs (including the Adviser's assumptions in determining the fair value of investments)
Changes in valuation techniques may result in transfers in or out of an assigned level within the disclosure hierarchy. The inputs or methodologies used for valuation techniques are not necessarily an indication of the risks associated with entering into those investments.
16
USAA Mutual Funds Trust | Notes to Financial Statements — continued January 31, 2023 | ||||||
(Unaudited)
The Adviser, appointed as the valuation designee by the Trust's Board of Trustees' (the "Board"), has established the Pricing and Liquidity Committee (the "Committee"), and subject to Board oversight, the Committee administers and oversees the Fund's valuation policies and procedures, which are approved by the Board.
Portfolio securities listed or traded on securities exchanges, including Exchange-Traded Funds ("ETFs"), are valued at the closing price on the exchange or system where the security is principally traded, if available, or at the Nasdaq Official Closing Price. If there have been no sales for that day on the exchange or system, then a security is valued at the last available bid quotation on the exchange or system where the security is principally traded. In each of these situations, valuations are typically categorized as Level 1 in the fair value hierarchy.
Investments in open-end investment companies, other than ETFs, are valued at their net asset value ("NAV"). These valuations are typically categorized as Level 1 in the fair value hierarchy.
In the event that price quotations or valuations are not readily available, investments are valued at fair value in accordance with procedures established by and under the general supervision and responsibility of the Board. These valuations are typically categorized as Level 2 or Level 3 in the fair value hierarchy, based on the observability of inputs used to determine the fair value. The effect of fair value pricing is that securities may not be priced on the basis of quotations from the primary market in which they are traded, and the actual price realized from the sale of a security may differ materially from the fair value price. Valuing these securities at fair value is intended to cause the Fund's NAV to be more reliable than it otherwise would be.
A summary of the valuations as of January 31, 2023, based upon the three levels defined above, is included in the table below while the breakdown, by category, of investments is disclosed on the Schedule of Portfolio Investments (amounts in thousands):
Level 1 | Level 2 | Level 3 | Total | ||||||||||||||||
Common Stocks | $ | 1,608,393 | $ | — | $ | — | $ | 1,608,393 | |||||||||||
Collateral for Securities Loaned | 8,778 | — | — | 8,778 | |||||||||||||||
Total | $ | 1,617,171 | $ | — | $ | — | $ | 1,617,171 | |||||||||||
As of January 31, 2023, there were no transfers into/out of Level 3.
Real Estate Investment Trusts ("REITs"):
The Fund may invest in REITs, which report information on the source of their distributions annually. REITs are pooled investment vehicles that invest primarily in income producing real estate or real estate related loans or interests (such as mortgages). Certain distributions received from REITs during the year are recorded as realized gains or return of capital as estimated by the Fund or when such information becomes known.
Investment Companies:
Open-End Funds:
The Fund may invest in portfolios of open-end investment companies. These investment companies value securities in their portfolios for which market quotations are readily available at their market values (generally the last reported sale price) and all other securities and assets at their fair value by the methods established by the board of directors of the underlying funds.
Investment Transactions and Related Income:
Changes in holdings of investments are accounted for no later than one business day following the trade date. For financial reporting purposes, however, investment transactions are accounted for on trade date or the last business day of the reporting period. Interest income is determined on the basis of coupon interest accrued using the effective interest method which adjusts, where applicable, the amortization of premiums or accretion of discounts. Dividend income is recorded on the ex-dividend date. Gains or losses realized on sales of securities are recorded on the identified cost basis.
17
USAA Mutual Funds Trust | Notes to Financial Statements — continued January 31, 2023 | ||||||
(Unaudited)
Withholding taxes on interest, dividends, and gains as a result of certain investments by the Fund have been provided for in accordance with each investment's applicable country's tax rules and rates.
Securities Lending:
The Fund, through a Securities Lending Agreement with Citibank, N.A. ("Citibank"), may lend its securities to qualified financial institutions, such as certain broker-dealers and banks, to earn additional income, net of income retained by Citibank. Borrowers are required to initially secure their loans for collateral in the amount of at least 102% of the value of U.S. securities loaned or at least 105% of the value of non-U.S. securities loaned, marked-to-market daily. Any collateral shortfalls associated with increases in the valuation of the securities loaned are generally cured the next business day. The collateral can be received in the form of cash collateral and/or non-cash collateral. Non-cash collateral can include U.S. Government Securities and other securities as permitted by Securities and Exchange Commission ("SEC") guidelines. The cash collateral is invested in short-term instruments or cash equivalents, primarily open-end investment companies, as noted on the Fund's Schedule of Portfolio Investments. The Fund effectively does not have control of the non-cash collateral and therefore it is not disclosed on the Fund's Schedule of Portfolio Investments. Collateral requirements are determined daily based on the value of the Fund's securities on loan as of the end of the prior business day. During the time portfolio securities are on loan, the borrower will pay the Fund any dividends or interest paid on such securities plus any fee negotiated between the parties to the lending agreement. The Fund also earns a return from the collateral. The Fund pays Citibank various fees in connection with the investment of cash collateral and fees based on the investment income received from securities lending activities. Securities lending income (net of these fees) is disclosed on the Statement of Operations. Loans are terminable upon demand and the borrower must return the loaned securities within the lesser of one standard settlement period or five business days. Although risk is mitigated by the collateral, the Fund could experience a delay in recovering its securities and possible loss of income or value if the borrower fails to return them. In addition, there is a risk that the value of the short-term investments will be less than the amount of cash collateral required to be returned to the borrower.
The Fund's agreement with Citibank does not include master netting provisions. Non-cash collateral received by the Fund may not be sold or repledged, except to satisfy borrower default.
The following table (amounts in thousands) is a summary of the Fund's securities lending transactions as of January 31, 2023.
| Value of Securities on Loan | Non-Cash Collateral | Cash Collateral | |||||||||
| $ | 8,471 | $ | — | $ | 8,778 | ||||||
Federal Income Taxes:
The Fund intends to continue to qualify as a regulated investment company by complying with the provisions available to certain investment companies, as defined in applicable sections of the Internal Revenue Code, and to make distributions of net investment income and net realized gains sufficient to relieve it from all, or substantially all, federal income taxes. Accordingly, no provision for federal income taxes is required in the financial statements. The Fund has a tax year end of July 31, and effective April 30, 2023, the Fund will change its tax year end to April 30.
For the six months ended January 31, 2023, the Fund did not incur any income tax, interest, or penalties, and has recorded no liability for net unrecognized tax benefits relating to uncertain tax positions.
Management of the Fund has reviewed tax positions taken in tax years that remain subject to examination by all major tax jurisdictions, including federal (i.e., the last four tax years, which includes the current fiscal tax year end). Management believes that there is no tax liability resulting from unrecognized tax benefits related to uncertain tax positions taken.
18
USAA Mutual Funds Trust | Notes to Financial Statements — continued January 31, 2023 | ||||||
(Unaudited)
Allocations:
Expenses directly attributable to the Fund are charged to the Fund, while expenses that are attributable to more than one fund in the Trust, or jointly with an affiliated trust, are allocated among the respective funds in the Trust and/or an affiliated trust based upon net assets or another appropriate basis.
Income, expenses (other than class-specific expenses such as transfer agent fees, state registration fees, printing fees, and 12b-1 fees), and realized and unrealized gains or losses on investments are allocated to each class of shares based on its relative net assets on the date income is earned or expenses and realized and unrealized gains and losses are incurred.
3. Purchases and Sales:
Purchases and sales of securities (excluding securities maturing less than one year from acquisition) for the six months ended January 31, 2023, were as follows for the Fund (amounts in thousands):
Excluding | |||||||
Purchases | Sales | ||||||
$ | 428,018 | $ | 470,066 | ||||
4. Fees and Transactions with Affiliates and Related Parties:
Investment Advisory Fees:
Investment advisory services are provided to the Fund by the Adviser, which is a New York corporation registered as an investment adviser with the SEC.
Under the terms of the Investment Advisory Agreement, the Adviser is entitled to receive a base fee and a performance adjustment. The Fund's base fee is accrued daily and paid monthly at an annualized rate of 0.60% of the Fund's average daily net assets. Amounts incurred and paid to VCM for the six months ended January 31, 2023, are reflected on the Statement of Operations as Investment advisory fees.
The performance adjustment for each share class is accrued daily and calculated monthly by comparing the respective class' performance to that of the Lipper Multi-Cap Core Funds Index. The Lipper Multi-Cap Core Funds Index tracks the total return performance of the largest funds within the Lipper Multi-Cap Core Funds category.
The performance period for each share class consists of the current month plus the previous 35 months. The following table is utilized to determine the extent of the performance adjustment:
| Over/Under Performance Relative to Index (in basis points)(a) | Annual Adjustment Rate (in basis points) | ||||||
| +/- 100 to 400 | +/- 4 | ||||||
| +/- 401 to 700 | +/- 5 | ||||||
| +/- 701 and greater | +/- 6 | ||||||
(a) Based on the difference between the average annual performance of the relevant share class of the Fund and its relevant Lipper index, rounded to the nearest basis point.
Each class' annual performance adjustment rate is multiplied by the average daily net assets of the respective class over the entire performance period, which is then multiplied by a fraction, the numerator of which is the number of days in the month and the denominator of which is 365 (366 in leap years). The resulting amount is then added to (in the case of overperformance), or subtracted from (in the case of underperformance) the base fee.
19
USAA Mutual Funds Trust | Notes to Financial Statements — continued January 31, 2023 | ||||||
(Unaudited)
Under the performance fee arrangement, each class pays a positive performance fee adjustment for a performance period whenever the class outperforms the Lipper Multi-Cap Core Funds Index over that period, even if the class has overall negative returns during the performance period.
For the period August 1, 2022, to January 31, 2023, performance adjustments were $(347), $(21), and $(1) for Fund Shares, Institutional Shares, and Class A, in thousands, respectively. Performance adjustments were (0.04)%, (0.86)%, and (0.25)% for Fund Shares, Institutional Shares, and Class A, respectively. The performance adjustment rate included in the investment advisory fee may differ from the maximum over/under Annual Adjustment Rate due to differences in average net assets for the reporting period and rolling 36 month performance periods.
The Trust relies on an exemptive order granted to VCM and its affiliated funds by the SEC in March 2019, permitting the use of a "manager-of-managers" structure for certain funds. Under a manager-of-managers structure, the investment adviser may select (with approval of the Board and without shareholder approval) one or more subadvisers to manage the day-to-day investment of a fund's assets. For the six months ended January 31, 2023, the Fund had no subadvisers.
Administration and Servicing Fees:
VCM also serves as the Fund's administrator and fund accountant. Under the Fund Administration, Servicing and Accounting Agreement, VCM is paid an administration and servicing fee that is accrued daily and paid monthly at an annualized rate of 0.15%, 0.10%, and 0.15%, which is based on the Fund's average daily net assets of the Fund Shares, Institutional Shares, and Class A, respectively. Amounts incurred for the six months ended January 31, 2023, are reflected on the Statement of Operations as Administration fees.
Citi Fund Services Ohio, Inc. ("Citi"), an affiliate of Citibank, acts as sub-administrator and sub-fund accountant to the Fund pursuant to a Sub-Administration and Sub-Fund Accounting Services Agreement between VCM and Citi. VCM pays Citi a fee for providing these services. The Fund reimburses VCM and Citi for out-of-pocket expenses incurred in providing these services and certain other expenses specifically allocated to the Fund. Amounts incurred for the six months ended January 31, 2023, are reflected on the Statement of Operations as Sub-Administration fees.
The Fund (as part of the Trust) has entered into an agreement with the Adviser to provide compliance services, pursuant to which the Adviser furnishes its compliance personnel, including the services of the Chief Compliance Officer ("CCO"), and other resources reasonably necessary to provide the Trust with compliance oversight services related to the design, administration, and oversight of a compliance program for the Trust in accordance with Rule 38a-1 under the 1940 Act. The CCO is an employee of the Adviser, which pays the compensation of the CCO and support staff. The funds in the Trust, Victory Variable Insurance Funds, Victory Portfolios, and Victory Portfolios II (collectively, the "Victory Funds Complex") in the aggregate, compensate the Adviser for these services. Amounts incurred for the six months ended January 31, 2023, are reflected on the Statement of Operations as Compliance fees.
Transfer Agency Fees:
Victory Capital Transfer Agency, Inc. ("VCTA"), an affiliate of the Adviser, provides transfer agency services to the Fund. VCTA provides transfer agent services to the Fund Shares based on an annual charge of $23 per shareholder account plus out-of-pocket expenses. VCTA pays a portion of these fees to certain intermediaries for the administration and servicing of accounts that are held with such intermediaries. Transfer agent fees for Institutional Shares and Class A are paid monthly based on a fee accrued daily at an annualized rate of 0.10% and 0.10%, respectively, of average daily net assets, plus out-of-pocket expenses. Amounts incurred and paid to VCTA for the six months ended January 31, 2023, are reflected on the Statement of Operations as Transfer agent fees.
FIS Investor Services LLC serves as sub-transfer agent and dividend disbursing agent for the Fund pursuant to a Sub-Transfer Agent Agreement between VCTA and FIS Investor Services LLC. VCTA provides FIS Investor Services LLC a fee for providing these services.
20
USAA Mutual Funds Trust | Notes to Financial Statements — continued January 31, 2023 | ||||||
(Unaudited)
Distributor/Underwriting Services:
Victory Capital Services, Inc. (the "Distributor"), an affiliate of the Adviser, serves as Distributor for the continuous offering of the shares of the Fund pursuant to a Distribution Agreement between the Distributor and the Trust.
Pursuant to the Distribution and Service Plans adopted in accordance with Rule 12b-1 under the 1940 Act, the Distributor may receive a monthly distribution and service fee, at an annual rate of up to 0.25% of the average daily net assets of Class A. The distribution and service fees paid to the Distributor may be used by the Distributor to pay for activity primarily intended to result in the sale of Class A. Amounts incurred and paid to the Distributor for the six months ended January 31, 2023, are reflected on the Statement of Operations as 12b-1 fees.
In addition, the Distributor is entitled to receive commissions in connection with sales of Class A. For the six months ended January 31, 2023, the Distributor did not receive any commissions.
Other Fees:
Citibank serves as the Fund's custodian. The Fund pays Citibank a fee for providing these services. Amounts incurred for the six months ended January 31, 2023, are reflected on the Statement of Operations as Custodian fees.
K&L Gates LLP provides legal services to the Trust.
The Adviser has entered into an expense limitation agreement with the Fund until at least November 30, 2023. Under the terms of the agreement, the Adviser has agreed to waive fees or reimburse certain expenses to the extent that ordinary operating expenses incurred by certain classes of the Fund in any fiscal year exceed the expense limits for such classes of the Fund. Such excess amounts will be the liability of the Adviser. Performance adjustments, acquired fund fees and expenses, interest, taxes, brokerage commissions, other expenditures, which are capitalized in accordance with GAAP, and other extraordinary expenses not incurred in the ordinary course of the Fund's business are excluded from the expense limits. As of January 31, 2023, the expense limits (excluding voluntary waivers) were 0.88%, 0.84%, and 1.15% for Fund Shares, Institutional Shares, and Class A, respectively.
Under the terms of the expense limitation agreement, the Fund has agreed to repay fees and expenses that were waived or reimbursed by the Adviser for a period of up to three years (thirty-six (36) months) after the waiver or reimbursement took place, subject to the lesser of any operating expense limits in effect at the time of: (a) the original waiver or expense reimbursement; or (b) the recoupment, after giving effect to the recoupment amount.
As of January 31, 2023, the following amounts are available to be repaid to the Adviser (amounts in thousands). The Fund has not recorded any amounts available to be repaid as a liability due to an assessment that such repayments are not probable at January 31, 2023.
| Expires 2024 | Expires 2025 | Expires 2026 | Total | ||||||||||||
| $ | 29 | $ | 31 | $ | 21 | $ | 81 | ||||||||
The Adviser may voluntarily waive or reimburse additional fees to assist the Fund in maintaining competitive expense ratios. Voluntary waivers and reimbursements applicable to the Fund are not available to be recouped at a future time. There were no voluntary waivers or reimbursements for the six months ended January 31, 2023.
Certain officers and/or interested trustees of the Fund are also officers and/or employees of the Adviser, administrator, fund accountant, sub-administrator, sub-fund accountant, custodian, and Distributor.
5. Risks:
The Fund may be subject to other risks in addition to these identified risks.
21
USAA Mutual Funds Trust | Notes to Financial Statements — continued January 31, 2023 | ||||||
(Unaudited)
Market Risk — Overall market risks may affect the value of the Fund. Domestic and international factors such as political events, war, terrorism, trade disputes, inflation rates, interest rate levels and other fiscal and monetary policy changes, cybersecurity incidents, pandemics and other public health crises, sanctions against a particular foreign country, its nationals, businesses or industries and related geopolitical events, as well as environmental disasters such as earthquakes, fires, and floods, or other catastrophes, may add to instability in global economies and markets generally, and may lead to increased market volatility. Global economies and financial markets are highly interconnected, which increases the possibility that conditions in one country or region might adversely affect issuers in another country or region. The impact of these and other factors may be short-term or may last for extended periods.
Equity Risk — The values of the equity securities in which the Fund invests may decline in response to developments affecting individual companies and/or general market, economic and political conditions and other factors. A company's earnings or dividends may not increase as expected due to poor management decisions, competitive pressures, breakthroughs in technology, reliance on suppliers, labor problems or shortages, corporate restructurings, fraudulent disclosures, natural disasters, military confrontations, war, terrorism, public health crises, or other events, conditions, and factors. Price changes may be temporary or may last for extended periods.
Foreign Securities Risk — Foreign markets can be more volatile than the U.S. market due to increased risks of adverse issuer, political, regulatory, market, or economic developments and can perform differently from the U.S. market. Global markets, or those in a particular region, may all react in similar fashion to important political, economic, or other developments. Events and evolving conditions in certain economies or markets may alter the risks associated with investments tied to countries or regions that historically were perceived as comparatively stable and make such investments riskier and more volatile.
6. Borrowing and Interfund Lending:
Line of Credit:
The Victory Funds Complex participates in a short-term demand note "Line of Credit" agreement with Citibank. The Line of Credit agreement with Citibank was renewed on June 27, 2022, with a termination date of June 26, 2023. Under the agreement with Citibank, the Victory Funds Complex may borrow up to $600 million, of which $300 million is committed and $300 million is uncommitted. $40 million of the Line of Credit is reserved for use by the Victory Floating Rate Fund, another series of the Victory Funds Complex, with Victory Floating Rate Fund paying the related commitment fees for that amount. The purpose of the Line of Credit is to meet temporary or emergency cash needs. For the six months ended January 31, 2023, Citibank received an annual commitment fee of 0.15% on $300 million for providing the Line of Credit. Each fund in the Victory Funds Complex paid a pro-rata portion of the commitment fees plus any interest (one-month Secured Overnight Financing Rate ("SOFR") plus 1.10 percent) on amounts borrowed. Interest charged to the Fund during the period, if applicable, is reflected on the Statement of Operations under Line of credit fees.
The Fund had no borrowings under the Line of Credit agreement during the six months ended January 31, 2023.
Interfund Lending:
The Trust and the Adviser rely on an exemptive order granted by the SEC in March 2017 (the "Order"), permitting the establishment and operation of an Interfund Lending Facility (the "Facility"). The Facility allows the Fund to directly lend and borrow money to or from any other fund in the Victory Funds Complex that is permitted to participate in the Facility, relying upon the Order at rates beneficial to both the borrowing and lending funds. Advances under the Facility are allowed for temporary or emergency purposes, including the meeting of redemption requests that otherwise might require the untimely disposition of securities, and are subject to each Fund's borrowing restrictions. The interfund
22
USAA Mutual Funds Trust | Notes to Financial Statements — continued January 31, 2023 | ||||||
(Unaudited)
loan rate is determined, as specified in the Order, by averaging the current repurchase agreement rate and the current bank loan rate. As a Borrower, interest charged to the Fund, if any, during the period, is reflected on the Statement of Operations under Interfund lending fees. As a Lender, interest earned by the Fund, if any, during the period, is reflected on the Statement of Operations under Interfund lending.
The Fund did not utilize or participate in the Facility during the six months ended January 31, 2023.
7. Federal Income Tax Information:
The Fund intends to distribute any net investment income quarterly. Distributable net realized gains, if any, are declared and paid at least annually.
The amounts of dividends from net investment income and distributions from net realized gains (collectively, distributions to shareholders) are determined in accordance with federal income tax regulations, which may differ from GAAP. To the extent these "book/tax" differences are permanent in nature (e.g., net operating loss and distribution reclassification), such amounts are reclassified within the components of net assets based on their federal tax-basis treatment; temporary differences (e.g., wash sales) do not require reclassification. To the extent dividends and distributions exceed net investment income and net realized gains for tax purposes, they are reported as distributions of capital. Net investment losses incurred by the Fund may be reclassified as an offset to capital on the accompanying Statement of Assets and Liabilities.
The tax character of current year distributions paid and the tax basis of the current components of accumulated earnings (loss) will be determined at the end of the current tax year.
At the tax year ended July 31, 2022, the Fund had no capital loss carryforwards for federal income tax purposes.
8. Subsequent Events:
On June 29, 2022, the Board approved a change to the Fund's fiscal year-end from July 31 to April 30, with an effective date of April 30, 2023.
The Board, upon recommendation of the Adviser, has approved a change in the name of the Trust and each individual fund within the Trust. On February 23, 2023, an initial filing was made with the SEC to commence the process to effectuate the following changes.
Effective at the start of business on April 24, 2023 (the "Effective Date"), the name of the Trust will change from USAA Mutual Funds Trust to Victory Portfolios III, and all references to USAA Mutual Funds Trust in the summary prospectus, statutory prospectus, and statement of additional information ("SAI") will be replaced by the new name.
Also on the Effective Date, references to the current name of the Fund in the summary prospectus, statutory prospectus, and SAI will be replaced with the new name as follows:
| Current Name | New Name | ||||||
USAA Growth & Income Fund | Victory Growth & Income Fund | ||||||
In addition, on the Effective Date, USAA Investments, a Victory Capital Management Inc. Investment Franchise, that currently manages the USAA Fixed Income Funds, will change its name to Victory Income Investors, and all references to USAA Investments in the summary prospectus, statutory prospectus, and SAI, will be replaced.
Please note that there will be no changes in the management of the Fund or to the Fund's ticker symbols.
23
USAA Mutual Funds Trust | Supplemental Information January 31, 2023 | ||||||
(Unaudited)
Proxy Voting and Portfolio Holdings Information
Proxy Voting:
Information regarding the policies and procedures the Fund uses to determine how to vote proxies relating to portfolio securities is available without charge, upon request, by calling (800) 235-8396. The information is also included in the Fund's Statement of Additional Information, which is available on the SEC's website at sec.gov.
Information relating to how the Fund voted proxies relating to portfolio securities held during the most recent 12 months ended June 30 is available on the SEC's website at sec.gov.
Availability of Schedules of Portfolio Investments:
The Trust files a complete list of Schedules of Portfolio Investments with the SEC for the first and third quarter of each fiscal year on Form N-PORT. Form N-PORT is available on the SEC's website at sec.gov.
Expense Examples
As a shareholder of the Fund, you may incur two types of costs: (1) transaction costs, including sales charges (loads) on purchases; and (2) ongoing costs, including management fees and other Fund expenses. These examples are intended to help you understand your ongoing costs (in dollars) of investing in the Fund and to compare these costs with the ongoing costs of investing in other mutual funds.
These examples are based on an investment of $1,000 invested at the beginning of the period and held for the entire period from August 1, 2022, through January 31, 2023.
The Actual Expense figures in the table below provide information about actual account values and actual expenses. You may use the information below, together with the amount you invested, to estimate the expenses that you paid over the period. Simply divide your account value by $1,000 (for example, an $8,600 account value divided by $1,000 = 8.6), then multiply the result by the number in the table under the heading entitled "Actual Expenses Paid During Period" to estimate the expenses you paid on your account during this period.
The Hypothetical Expense figures in the table below provide information about hypothetical account values and hypothetical expenses based on the Fund's actual expense ratio and an assumed rate of return of 5% per year before expenses, which is not the Fund's actual return. The hypothetical account values and expenses may not be used to estimate the actual ending account balance or expenses you paid for the period. You may use this information to compare this 5% hypothetical example with the 5% hypothetical examples that appear in shareholder reports of other funds.
Please note the expenses shown in the table below are meant to highlight your ongoing costs only and do not reflect any transactional costs. Therefore, the hypothetical expenses in the table are useful in comparing ongoing costs only and will not help you determine the relative total costs of owning different funds. In addition, if these transactional costs were included, your costs would have been higher.
| Beginning Account Value 8/1/22 | Actual Ending Account Value 1/31/23 | Hypothetical Ending Account Value 1/31/23 | Actual Expenses Paid During Period 8/1/22- 1/31/23* | Hypothetical Expenses Paid During Period 8/1/22- 1/31/23* | Annualized Expense Ratio During Period 8/1/22- 1/31/23 | ||||||||||||||||||||||
Fund Shares | $ | 1,000.00 | $ | 996.70 | $ | 1,021.07 | $ | 4.13 | $ | 4.18 | 0.82 | % | |||||||||||||||
Institutional Shares** | 1,000.00 | 1,001.80 | 1,020.97 | 4.24 | 4.28 | 0.84 | % | ||||||||||||||||||||
Class A | 1,000.00 | 996.50 | 1,020.67 | 4.53 | 4.58 | 0.90 | % | ||||||||||||||||||||
* Expenses are equal to the average account value multiplied by the Fund's annualized expense ratio multiplied by 184/365 (the number of days in the most recent fiscal half-year divided by the number of days in the fiscal year).
** The expense ratio for the six-month period could potentially change due to performance fee adjustments.
24
USAA Mutual Funds Trust | Supplemental Information — continued January 31, 2023 | ||||||
(Unaudited)
Considerations of the Board in Continuing the Investment Advisory Agreement
USAA Growth & Income Fund (the "Fund")
At a meeting of the Board of Trustees (the "Board") of USAA Mutual Funds Trust (the "Trust") held on December 8-9, 2022, the Board, including the Trustees who are not "interested persons" (as that term is defined in the Investment Company Act of 1940, as amended) of the Trust (the "Independent Trustees"), approved for an annual period the continuance of the Investment Advisory Agreement (the "Advisory Agreement") between the Trust and Victory Capital Management Inc. (the "Adviser") with respect to the Fund. Prior to the December 8-9, 2022 meeting at which the Advisory Agreement was approved, the Independent Trustees also discussed and considered information regarding the proposed continuation of the Advisory Agreement at a meeting held on November 21, 2022.
In advance of the foregoing meetings, the Trustees received and considered a variety of information relating to the Advisory Agreement and the Adviser, and were given the opportunity to ask questions and request additional information from management. The information provided to the Board included, among other things: (i) a separate report prepared by an independent third party of mutual fund data, which provided a statistical analysis comparing the Fund's investment performance, expenses, and fees to comparable investment companies; (ii) information concerning the services rendered to the Fund, as well as information regarding the Adviser's revenues and costs of providing services to the Fund and compensation paid to affiliates of the Adviser; and (iii) information about the Adviser's operations and personnel. Prior to voting, the Independent Trustees reviewed the proposed continuance of the Advisory Agreement with management and with experienced independent counsel retained by the Independent Trustees ("Independent Counsel") and received materials from such Independent Counsel discussing the legal standards for their consideration of the proposed continuation of the Advisory Agreement with respect to the Fund. The Independent Trustees also reviewed the proposed continuation of the Advisory Agreement with respect to the Fund in private sessions with Independent Counsel at which no representatives of management were present.
At each regularly scheduled meeting of the Board and its committees, the Board receives and reviews, among other things, information concerning the Fund's performance and related services provided by the Adviser. At the meeting at which the renewal of the Advisory Agreement is considered, particular focus is given to information concerning Fund performance, fees and total expenses as compared to comparable investment companies, and the Adviser's profitability with respect to the Fund. However, the Board noted that the evaluation process with respect to the Adviser is an ongoing one. In this regard, the Board's and its committees' consideration of the Advisory Agreement included information previously received at such meetings. The Board also recognized that the contractual arrangements for the Fund have been reviewed by the Board and discussed with the Adviser in prior years and that the Board's conclusions may be based, in part, on its consideration of these same arrangements in prior years.
Advisory Agreement
After full consideration of a variety of factors, the Board, including the Independent Trustees, voted to approve the Advisory Agreement. In approving the Advisory Agreement, the Trustees did not identify any single factor as controlling, and each Trustee may have attributed different weights to various factors. Throughout their deliberations, the Independent Trustees were represented and assisted by Independent Counsel.
Nature, Extent, and Quality of Services — In considering the nature, extent, and quality of the services provided by the Adviser under the Advisory Agreement, the Board reviewed information provided by the Adviser relating to its operations and personnel. The Board also took into account its knowledge of the Adviser's management and the quality of the performance of the Adviser's duties through Board meetings, discussions, and reports during the preceding year. The Board considered the fees paid to the Adviser and the services provided to the Fund by the Adviser under the Advisory Agreement, as well as other services provided by the Adviser and its affiliates under other agreements, and the personnel who provide these services. In addition to the investment advisory services provided to the Fund, the Adviser and its affiliates provide administrative services, shareholder services, oversight of Fund accounting, marketing services, assistance in meeting legal and regulatory requirements, and other services necessary for the operation of the Fund and the Trust.
25
USAA Mutual Funds Trust | Supplemental Information — continued January 31, 2023 | ||||||
(Unaudited)
The Board considered the scope of services provided by, and the undertakings required of, the Adviser in connection with those services, including, among other things, maintaining (i) its own and the Fund's compliance programs, (ii) risk management programs, (iii) liquidity risk management program, (iv) derivatives risk management program, and (v) cybersecurity programs, each of which had expanded over time as a result of regulatory, market, and other developments. The Board also considered the significant risks assumed by the Adviser in connection with the services provided to the Fund, including investment, operational, enterprise, litigation, regulatory and compliance risks.
The Board considered the Adviser's management style and the performance of the Adviser's duties under the Advisory Agreement. The Board considered the level and depth of knowledge of the Adviser, including the professional experience and qualifications of its senior and investment personnel, as well as current staffing levels. The allocation of the Fund's brokerage, including the Adviser's process for monitoring "best execution," also was considered. The Adviser's role in coordinating the activities of the Fund's other service providers was also considered. The Board also considered the Adviser's risk management processes. The Board considered the Adviser's financial condition and that it had the financial wherewithal to continue to provide the same scope and high quality of services under the Advisory Agreement. In reviewing the Advisory Agreement, the Board focused on the experience, resources, and strengths of the Adviser and its affiliates in managing the Fund, as well as the other funds in the Trust.
The Board also reviewed the compliance and administrative services provided to the Fund by the Adviser and its affiliates, including the Adviser's oversight of the Fund's day-to-day operations and oversight of Fund accounting. The Trustees, guided also by information obtained from their experiences as Trustees of the Trust, also focused on the quality of the Adviser's compliance and administrative staff.
Expenses and Performance — In connection with its consideration of the Advisory Agreement, the Board evaluated the Fund's advisory fees and total expense ratio as compared to other open-end investment companies deemed to be comparable to the Fund as determined by the independent third party in its report. The Fund's expenses were compared to (i) a group of investment companies chosen by the independent third party to be comparable to the Fund based upon certain factors, including fund type, comparability of investment objective and classification, sales load type, asset size, and expense components (the "expense group") and (ii) a larger group of investment companies with the same investment classification/objective as the Fund regardless of asset size, excluding outliers (the "expense universe"). Among other data, the Board noted that the Fund's net management fee rate — which includes advisory and administrative services and the effects of any performance adjustment, as well as any fee waivers and reimbursements — was equal to the median of its expense group and was below the median of its expense universe. The data indicated that the Fund's total expenses, including after any reimbursements, were below the medians of its expense group and its expense universe. The Board also took into account the Adviser's current undertakings to maintain expense limitations for the Fund. The Board took into account the various other services provided to the Fund by the Adviser and its affiliates, and noted the high quality of services received by the Fund.
In considering the Fund's performance, the Board noted that it reviews at its regularly scheduled meetings information about the Fund's performance results. The Trustees also reviewed various comparative data provided to them in connection with their consideration of the renewal of the Advisory Agreement, including, among other information, a comparison of the Fund's average annual total returns relative to its Lipper index and other mutual funds deemed to be in its peer group by the independent third party in its report (the "performance universe"). The Fund's performance universe consisted of the Fund and all retail and institutional open-end investment companies with the same classification/objective as the Fund regardless of asset size or primary channel of distribution. This comparison indicated that, among other data, the Fund's performance was above the average of its performance universe and its Lipper index for the one-year period ended June 30, 2022, and was below the average of its performance universe and its Lipper index for the three-, five- and ten-year periods ended June 30, 2022. The Board took into account management's discussion of the Fund's performance, including the reasons for the Fund's underperformance for certain periods, and also took into account the Fund's more recent improved performance.
Compensation and Profitability — The Board took into consideration the level and method of computing the management fee. The information considered by the Board included operating profit margin information for the Adviser's business as a whole. The Board also received and considered profitability information related to the management revenues from the Fund. This information included a review of the methodology used in the
26
USAA Mutual Funds Trust | Supplemental Information — continued January 31, 2023 | ||||||
(Unaudited)
allocation of certain costs to the Fund. In considering the profitability data with respect to the Fund, the Trustees noted that the Adviser reimbursed or waived a portion of its management fees to the Fund. The Trustees reviewed the profitability of the Adviser's relationship with the Fund before tax expenses. The Board was also provided with a profitability analysis of other publicly traded asset managers prepared by an independent information service. In reviewing the overall profitability of the management fee to the Adviser, the Board also considered the fact that the Adviser and its affiliates provide shareholder servicing and administrative services to the Fund for which they receive compensation. The Board also considered the possible direct and indirect benefits to the Adviser from its relationship with the Trust, including that the Adviser may derive reputational and other benefits from its association with the Fund. The Trustees recognized that the Adviser should be entitled to earn a reasonable level of profits in exchange for the level of services it provides to the Fund and the entrepreneurial and other risks that it assumes as Adviser.
Economies of Scale — The Board considered whether there should be changes in the management fee rate or structure in order to enable the Fund to participate in any economies of scale. The Board also considered the fee waiver and expense reimbursement arrangements by the Adviser. The Board also considered the effect of the change in size, if any, of each of the Fund's classes on its performance and fees, noting that the Fund may realize other economies of scale if assets increase proportionally more than expenses. The Board determined that the current investment management fee structure was reasonable.
Conclusions — The Board reached the following conclusions regarding the Fund's Advisory Agreement with the Adviser: (i) the Adviser has demonstrated that it possesses the capability and resources to perform the duties required of it under the Advisory Agreement; (ii) the Adviser maintains an appropriate compliance program; (iii) the overall performance of the Fund is reasonable in relation to the performance of funds with similar investment objectives and to relevant indices and the Adviser is appropriately monitoring the Fund's performance; (iv) the Fund's advisory expenses are reasonable in relation to those of similar funds and to the services to be provided by the Adviser; and (v) the Adviser's and its affiliates' level of profitability from their relationship with the Fund is reasonable in light of the nature and high quality of services provided by the Adviser and its affiliates and the type of fund. Based on its conclusions, the Board determined that continuation of the Advisory Agreement would be in the best interests of the Fund and its shareholders.
27
Privacy Policy
Protecting the Privacy of Information
The Trust respects your right to privacy. We also know that you expect us to conduct and process your business in an accurate and efficient manner. To do so, we must collect and maintain certain personal information about you. This is the information we collect from you on applications or other forms, and from the transactions you make with us or third parties. It may include your name, address, social security number, account transactions and balances, and information about investment goals and risk tolerance.
We do not disclose any information about you or about former customers to anyone except as permitted or required by law. Specifically, we may disclose the information we collect to companies that perform services on our behalf, such as the transfer agent that processes shareholder accounts and printers and mailers that assist us in the distribution of investor materials. We may also disclose this information to companies that perform marketing services on our behalf. This allows us to continue to offer you Victory investment products and services that meet your investing needs, and to effect transactions that you request or authorize. These companies will use this information only in connection with the services for which we hired them. They are not permitted to use or share this information for any other purpose.
To protect your personal information internally, we permit access only by authorized employees and maintain physical, electronic, and procedural safeguards to guard your personal information.*
* You may have received communications regarding information about privacy policies from other financial institutions which gave you the opportunity to "opt-out" of certain information sharing with companies which are not affiliated with that financial institution. The Trust does not share information with other companies for purposes of marketing solicitations for products other than the Trust. Therefore, the Trust does not provide opt-out options to their shareholders.
P.O. Box 182593
Columbus, Ohio 43218-2593

Visit our website at: | Call | ||||||
vcm.com | (800) 235-8396 | ||||||
23432-0323

January 31, 2023
Semi Annual Report
USAA Income Stock Fund
Victory Capital means Victory Capital Management Inc., the investment adviser of the USAA Mutual Funds. USAA Mutual Funds are distributed by Victory Capital Services, Inc., member FINRA, an affiliate of Victory Capital. Victory Capital and its affiliates are not affiliated with United Services Automobile Association or its affiliates. USAA and the USAA logos are registered trademarks and the USAA Mutual Funds and USAA Investments logos are trademarks of United Services Automobile Association and are being used by Victory Capital and its affiliates under license.
vcm.com
News, Information And Education 24 Hours A Day, 7 Days A Week
The Victory Capital website gives fund shareholders, prospective shareholders, and investment professionals a convenient way to access fund information, get guidance, and track fund performance anywhere they can access the Internet. The site includes:
• Detailed performance records
• Daily share prices
• The latest fund news
• Investment resources to help you become a better investor
• A section dedicated to investment professionals
Whether you're a potential investor searching for the fund that matches your investment philosophy, a seasoned investor interested in planning tools, or an investment professional, vcm.com has what you seek. Visit us anytime. We're always open.
USAA Mutual Funds Trust
TABLE OF CONTENTS
Investment Objective & Portfolio Holdings | 2 | ||||||
Schedule of Portfolio Investments | 3 | ||||||
Financial Statements | |||||||
Statement of Assets and Liabilities | 7 | ||||||
Statement of Operations | 8 | ||||||
Statements of Changes in Net Assets | 9 | ||||||
Financial Highlights | 11 | ||||||
Notes to Financial Statements | 13 | ||||||
Supplemental Information | 22 | ||||||
Proxy Voting and Portfolio Holdings Information | 22 | ||||||
Expense Examples | 22 | ||||||
Advisory Contract Approval | 23 | ||||||
Privacy Policy (inside back cover) | |||||||
This report is for the information of the shareholders and others who have received a copy of the currently effective prospectus of the Fund, managed by Victory Capital Management Inc. It may be used as sales literature only when preceded or accompanied by a current prospectus, which provides further details about the Fund.
IRA DISTRIBUTION WITHHOLDING DISCLOSURE
We generally must withhold federal income tax at a rate of 10% of the taxable portion of your distribution and, if you live in a state that requires state income tax withholding, at your state's tax rate. However, you may elect not to have withholding apply or to have income tax withheld at a higher rate. Any withholding election that you make will apply to any subsequent distribution unless and until you change or revoke the election. If you wish to make a withholding election, or change or revoke a prior withholding election, call (800) 235-8396, and form W-4P (OMB No. 1545-0074 withholding certificate for pension or annuity payments) will be electronically sent.
If you do not have a withholding election in place by the date of a distribution, federal income tax will be withheld from the taxable portion of your distribution at a rate of 10%. If you must pay estimated taxes, you may be subject to estimated tax penalties if your estimated tax payments are not sufficient and sufficient tax is not withheld from your distribution.
For more specific information, please consult your tax adviser.
• NOT FDIC INSURED • NO BANK GUARANTEE • MAY LOSE VALUE
1
| USAA Mutual Funds Trust USAA Income Stock Fund | January 31, 2023 | ||||||
(Unaudited)
Investment Objective and Portfolio Holdings:
The Fund seeks current income with the prospect of increasing dividend income and the potential for capital appreciation.
Top 10 Equity Holdings*:
January 31, 2023
(% of Net Assets)
Johnson & Johnson | 2.4 | % | |||||
Exxon Mobil Corp. | 2.2 | % | |||||
Cisco Systems, Inc. | 1.9 | % | |||||
Altria Group, Inc. | 1.8 | % | |||||
Regions Financial Corp. | 1.8 | % | |||||
Amgen, Inc. | 1.5 | % | |||||
Philip Morris International, Inc. | 1.4 | % | |||||
The Procter & Gamble Co. | 1.4 | % | |||||
Gilead Sciences, Inc. | 1.4 | % | |||||
LyondellBasell Industries NV Class A | 1.4 | % | |||||
Sector Allocation*:
January 31, 2023
(% of Net Assets)

* Does not include futures contracts, money market instruments, and short-term investments purchased with cash collateral from securities loaned.
Percentages are of the net assets of the Fund and may not equal 100%.
Refer to the Schedule of Portfolio Investments for a complete list of securities.
2
| USAA Mutual Funds Trust USAA Income Stock Fund | Schedule of Portfolio Investments January 31, 2023 | ||||||
(Amounts in Thousands, Except for Shares) (Unaudited)
Security Description | Shares | Value | |||||||||
Common Stocks (99.6%) | |||||||||||
Communication Services (6.3%): | |||||||||||
AT&T, Inc. | 1,605,353 | $ | 32,702 | ||||||||
Comcast Corp. Class A | 771,823 | 30,371 | |||||||||
Fox Corp. Class A | 214,091 | 7,266 | |||||||||
Omnicom Group, Inc. | 390,536 | 33,582 | |||||||||
Sirius XM Holdings, Inc. (a) | 4,158,916 | 24,080 | |||||||||
The Interpublic Group of Cos., Inc. | 686,410 | 25,027 | |||||||||
Verizon Communications, Inc. | 116,418 | 4,839 | |||||||||
157,867 | |||||||||||
Consumer Discretionary (7.7%): | |||||||||||
Best Buy Co., Inc. | 243,007 | 21,560 | |||||||||
Genuine Parts Co. | 60,820 | 10,207 | |||||||||
H&R Block, Inc. | 330,992 | 12,902 | |||||||||
Lennar Corp. Class A | 89,418 | 9,156 | |||||||||
Lowe's Cos., Inc. | 130,086 | 27,090 | |||||||||
McDonald's Corp. | 68,495 | 18,316 | |||||||||
PulteGroup, Inc. | 164,964 | 9,385 | |||||||||
Starbucks Corp. | 74,078 | 8,085 | |||||||||
Target Corp. | 132,175 | 22,753 | |||||||||
The Home Depot, Inc. | 59,739 | 19,366 | |||||||||
Toll Brothers, Inc. | 101,299 | 6,026 | |||||||||
Williams-Sonoma, Inc. | 52,149 | 7,037 | |||||||||
Yum! Brands, Inc. | 162,247 | 21,174 | |||||||||
193,057 | |||||||||||
Consumer Staples (8.2%): | |||||||||||
Altria Group, Inc. | 1,012,450 | 45,601 | |||||||||
Campbell Soup Co. | 118,635 | 6,161 | |||||||||
Colgate-Palmolive Co. | 198,964 | 14,829 | |||||||||
General Mills, Inc. | 173,658 | 13,608 | |||||||||
Kimberly-Clark Corp. | 69,141 | 8,989 | |||||||||
PepsiCo, Inc. | 86,176 | 14,738 | |||||||||
Philip Morris International, Inc. | 344,984 | 35,961 | |||||||||
The Coca-Cola Co. | 160,548 | 9,845 | |||||||||
The Hershey Co. | 33,800 | 7,591 | |||||||||
The Procter & Gamble Co. | 250,129 | 35,613 | |||||||||
Walmart, Inc. | 76,479 | 11,003 | |||||||||
203,939 | |||||||||||
Energy (6.4%): | |||||||||||
Chevron Corp. | 186,606 | 32,473 | |||||||||
Devon Energy Corp. | 340,735 | 21,548 | |||||||||
EOG Resources, Inc. | 175,838 | 23,255 | |||||||||
Exxon Mobil Corp. | 477,819 | 55,431 | |||||||||
Marathon Petroleum Corp. | 90,447 | 11,624 | |||||||||
Valero Energy Corp. | 112,838 | 15,801 | |||||||||
160,132 | |||||||||||
See notes to financial statements.
3
| USAA Mutual Funds Trust USAA Income Stock Fund | Schedule of Portfolio Investments — continued January 31, 2023 | ||||||
(Amounts in Thousands, Except for Shares) (Unaudited)
Security Description | Shares | Value | |||||||||
Financials (15.8%): | |||||||||||
Aflac, Inc. | 226,138 | $ | 16,621 | ||||||||
American Express Co. | 160,379 | 28,056 | |||||||||
American Financial Group, Inc. | 57,674 | 8,224 | |||||||||
Ameriprise Financial, Inc. | 86,621 | 30,327 | |||||||||
Capital One Financial Corp. | 33,823 | 4,025 | |||||||||
Discover Financial Services | 97,801 | 11,416 | |||||||||
East West Bancorp, Inc. | 90,040 | 7,070 | |||||||||
Everest Re Group Ltd. | 24,661 | 8,624 | |||||||||
FactSet Research Systems, Inc. | 14,741 | 6,235 | |||||||||
Fidelity National Financial, Inc. | 577,805 | 25,441 | |||||||||
Jefferies Financial Group, Inc. | 525,645 | 20,647 | |||||||||
JPMorgan Chase & Co. | 129,922 | 18,184 | |||||||||
M&T Bank Corp. | 98,912 | 15,430 | |||||||||
MetLife, Inc. | 151,771 | 11,082 | |||||||||
Morgan Stanley | 103,964 | 10,119 | |||||||||
Popular, Inc. | 79,864 | 5,482 | |||||||||
Principal Financial Group, Inc. | 234,237 | 21,679 | |||||||||
Regions Financial Corp. | 1,880,526 | 44,268 | |||||||||
Synchrony Financial | 591,458 | 21,724 | |||||||||
Synovus Financial Corp. | 120,266 | 5,045 | |||||||||
The Goldman Sachs Group, Inc. | 63,743 | 23,318 | |||||||||
The Hanover Insurance Group, Inc. | 56,661 | 7,625 | |||||||||
The Hartford Financial Services Group, Inc. | 187,271 | 14,534 | |||||||||
The Travelers Cos., Inc. | 73,681 | 14,082 | |||||||||
U.S. Bancorp | 376,233 | 18,736 | |||||||||
397,994 | |||||||||||
Health Care (15.9%): | |||||||||||
Abbott Laboratories | 57,514 | 6,358 | |||||||||
AbbVie, Inc. | 67,164 | 9,923 | |||||||||
Amgen, Inc. | 145,748 | 36,787 | |||||||||
Bristol-Myers Squibb Co. | 242,729 | 17,634 | |||||||||
Cardinal Health, Inc. | 192,379 | 14,861 | |||||||||
Chemed Corp. | 18,013 | 9,099 | |||||||||
Cigna Corp. | 67,419 | 21,350 | |||||||||
CVS Health Corp. | 215,753 | 19,034 | |||||||||
Elevance Health, Inc. | 33,087 | 16,543 | |||||||||
Eli Lilly & Co. | 71,037 | 24,447 | |||||||||
Gilead Sciences, Inc. | 422,360 | 35,453 | |||||||||
Johnson & Johnson | 367,229 | 60,012 | |||||||||
McKesson Corp. | 46,586 | 17,641 | |||||||||
Merck & Co., Inc. | 262,001 | 28,142 | |||||||||
Pfizer, Inc. | 479,210 | 21,162 | |||||||||
Quest Diagnostics, Inc. | 89,228 | 13,249 | |||||||||
Thermo Fisher Scientific, Inc. | 34,664 | 19,770 | |||||||||
UnitedHealth Group, Inc. | 52,791 | 26,352 | |||||||||
397,817 | |||||||||||
See notes to financial statements.
4
| USAA Mutual Funds Trust USAA Income Stock Fund | Schedule of Portfolio Investments — continued January 31, 2023 | ||||||
(Amounts in Thousands, Except for Shares) (Unaudited)
Security Description | Shares | Value | |||||||||
Industrials (12.0%): | |||||||||||
3M Co. | 135,392 | $ | 15,581 | ||||||||
Cintas Corp. | 41,600 | 18,460 | |||||||||
CSX Corp. | 255,061 | 7,886 | |||||||||
Cummins, Inc. | 46,001 | 11,479 | |||||||||
Expeditors International of Washington, Inc. | 73,163 | 7,913 | |||||||||
Fastenal Co. | 498,392 | 25,193 | |||||||||
General Dynamics Corp. | 83,325 | 19,420 | |||||||||
Huntington Ingalls Industries, Inc. | 35,899 | 7,917 | |||||||||
Illinois Tool Works, Inc. | 61,688 | 14,561 | |||||||||
Lennox International, Inc. | 39,939 | 10,409 | |||||||||
Lockheed Martin Corp. | 62,964 | 29,168 | |||||||||
ManpowerGroup, Inc. | 100,528 | 8,762 | |||||||||
Masco Corp. | 427,970 | 22,768 | |||||||||
Northrop Grumman Corp. | 13,826 | 6,195 | |||||||||
Old Dominion Freight Line, Inc. | 33,460 | 11,150 | |||||||||
Owens Corning | 98,233 | 9,494 | |||||||||
Republic Services, Inc. | 70,678 | 8,822 | |||||||||
Snap-on, Inc. | 55,961 | 13,919 | |||||||||
Union Pacific Corp. | 96,973 | 19,802 | |||||||||
United Parcel Service, Inc. Class B | 130,108 | 24,099 | |||||||||
W.W. Grainger, Inc. | 16,178 | 9,537 | |||||||||
302,535 | |||||||||||
Information Technology (11.8%): | |||||||||||
Accenture PLC Class A | 75,345 | 21,025 | |||||||||
Apple, Inc. | 192,134 | 27,723 | |||||||||
Automatic Data Processing, Inc. | 38,153 | 8,615 | |||||||||
Cisco Systems, Inc. | 997,727 | 48,560 | |||||||||
Hewlett Packard Enterprise Co. | 517,225 | 8,343 | |||||||||
HP, Inc. | 1,025,137 | 29,872 | |||||||||
Intel Corp. | 194,196 | 5,488 | |||||||||
International Business Machines Corp. | 123,358 | 16,620 | |||||||||
KLA Corp. | 27,839 | 10,926 | |||||||||
Mastercard, Inc. Class A | 50,419 | 18,686 | |||||||||
Microsoft Corp. | 101,460 | 25,143 | |||||||||
Motorola Solutions, Inc. | 47,338 | 12,166 | |||||||||
NetApp, Inc. | 177,066 | 11,727 | |||||||||
Paychex, Inc. | 99,492 | 11,527 | |||||||||
QUALCOMM, Inc. | 85,310 | 11,364 | |||||||||
Skyworks Solutions, Inc. | 66,250 | 7,266 | |||||||||
Texas Instruments, Inc. | 121,090 | 21,458 | |||||||||
296,509 | |||||||||||
Materials (4.6%): | |||||||||||
Avery Dennison Corp. | 26,059 | 4,937 | |||||||||
CF Industries Holdings, Inc. | 153,336 | 12,988 | |||||||||
LyondellBasell Industries NV Class A | 365,685 | 35,358 | |||||||||
Nucor Corp. | 140,617 | 23,767 | |||||||||
Packaging Corp. of America | 115,094 | 16,424 | |||||||||
Reliance Steel & Aluminum Co. | 28,840 | 6,560 | |||||||||
See notes to financial statements.
5
| USAA Mutual Funds Trust USAA Income Stock Fund | Schedule of Portfolio Investments — continued January 31, 2023 | ||||||
(Amounts in Thousands, Except for Shares) (Unaudited)
Security Description | Shares | Value | |||||||||
Steel Dynamics, Inc. | 83,383 | $ | 10,059 | ||||||||
Westlake Corp. | 38,048 | 4,670 | |||||||||
114,763 | |||||||||||
Real Estate (5.1%): | |||||||||||
AvalonBay Communities, Inc. | 47,254 | 8,385 | |||||||||
Boston Properties, Inc. | 76,111 | 5,673 | |||||||||
Digital Realty Trust, Inc. | 153,947 | 17,645 | |||||||||
Equinix, Inc. | 12,509 | 9,233 | |||||||||
Equity Residential | 92,392 | 5,881 | |||||||||
National Retail Properties, Inc. | 120,758 | 5,718 | |||||||||
Prologis, Inc. | 104,109 | 13,459 | |||||||||
Realty Income Corp. | 211,273 | 14,331 | |||||||||
Regency Centers Corp. | 62,035 | 4,133 | |||||||||
SBA Communications Corp. | 23,999 | 7,140 | |||||||||
VICI Properties, Inc. | 900,578 | 30,783 | |||||||||
Vornado Realty Trust | 194,237 | 4,737 | |||||||||
127,118 | |||||||||||
Utilities (5.8%): | |||||||||||
American Electric Power Co., Inc. | 133,322 | 12,527 | |||||||||
DTE Energy Co. | 90,704 | 10,555 | |||||||||
Duke Energy Corp. | 223,056 | 22,852 | |||||||||
Evergy, Inc. | 350,857 | 21,981 | |||||||||
Exelon Corp. | 397,904 | 16,788 | |||||||||
Sempra Energy | 75,840 | 12,160 | |||||||||
The Southern Co. | 502,331 | 33,998 | |||||||||
UGI Corp. | 399,647 | 15,918 | |||||||||
146,779 | |||||||||||
Total Common Stocks (Cost $2,020,070) | 2,498,510 | ||||||||||
Collateral for Securities Loaned (1.0%)^ | |||||||||||
| Goldman Sachs Financial Square Government Fund, Institutional Shares, 4.22% (b) | 6,175,989 | 6,176 | |||||||||
HSBC U.S. Government Money Market Fund, Institutional Shares, 4.21% (b) | 6,175,989 | 6,176 | |||||||||
Invesco Government & Agency Portfolio, Institutional Shares, 4.31% (b) | 6,175,989 | 6,176 | |||||||||
| Morgan Stanley Institutional Liquidity Government Portfolio, Institutional Shares, 4.14% (b) | 6,175,989 | 6,176 | |||||||||
Total Collateral for Securities Loaned (Cost $24,704) | 24,704 | ||||||||||
Total Investments (Cost $2,044,774) — 100.6% | 2,523,214 | ||||||||||
Liabilities in excess of other assets — (0.6)% | (15,353 | ) | |||||||||
NET ASSETS — 100.00% | $ | 2,507,861 | |||||||||
^ Purchased with cash collateral from securities on loan.
(a) All or a portion of this security is on loan.
(b) Rate disclosed is the daily yield on January 31, 2023.
PLC — Public Limited Company
See notes to financial statements.
6
USAA Mutual Funds Trust | Statement of Assets and Liabilities January 31, 2023 | ||||||
(Amounts in Thousands, Except Per Share Amounts) (Unaudited)
| USAA Income Stock Fund | |||||||
Assets: | |||||||
Investments, at value (Cost $2,044,774) | $ | 2,523,214 | (a) | ||||
Cash | 7,794 | ||||||
Receivables: | |||||||
Interest and dividends | 2,778 | ||||||
Capital shares issued | 789 | ||||||
Reclaims | 338 | ||||||
From Adviser | 19 | ||||||
Prepaid expenses | 16 | ||||||
Total Assets | 2,534,948 | ||||||
Liabilities: | |||||||
Payables: | |||||||
Collateral received on loaned securities | 24,704 | ||||||
Capital shares redeemed | 750 | ||||||
Accrued expenses and other payables: | |||||||
Investment advisory fees | 1,059 | ||||||
Administration fees | 282 | ||||||
Custodian fees | 20 | ||||||
Transfer agent fees | 156 | ||||||
Compliance fees | 2 | ||||||
Trustees' fees | — | (b) | |||||
Other accrued expenses | 114 | ||||||
Total Liabilities | 27,087 | ||||||
Net Assets: | |||||||
Capital | 2,005,384 | ||||||
Total accumulated earnings/(loss) | 502,477 | ||||||
Net Assets | $ | 2,507,861 | |||||
Net Assets | |||||||
Fund Shares | $ | 1,683,706 | |||||
Institutional Shares | 824,155 | ||||||
Total | $ | 2,507,861 | |||||
Shares (unlimited number of shares authorized with no par value): | |||||||
Fund Shares | 93,402 | ||||||
Institutional Shares | 45,798 | ||||||
Total | 139,200 | ||||||
Net asset value, offering and redemption price per share: (c) | |||||||
Fund Shares | $ | 18.03 | |||||
Institutional Shares | 18.00 | ||||||
(a) Includes $23,839 thousand of securities on loan.
(b) Rounds to less than $1 thousand.
(c) Per share amount may not recalculate due to rounding of net assets and/or shares outstanding.
See notes to financial statements.
7
USAA Mutual Funds Trust | Statement of Operations For the Six Months Ended January 31, 2023 | ||||||
(Amounts in Thousands) (Unaudited)
| USAA Income Stock Fund | |||||||
Investment Income: | |||||||
Dividends | $ | 39,406 | |||||
Interest | 50 | ||||||
Securities lending (net of fees) | 1,158 | ||||||
Foreign tax withholding | (16 | ) | |||||
Total Income | 40,598 | ||||||
Expenses: | |||||||
Investment advisory fees | 6,394 | ||||||
Administration fees — Fund Shares | 1,236 | ||||||
Administration fees — Institutional Shares | 455 | ||||||
Sub-Administration fees | 12 | ||||||
Custodian fees | 55 | ||||||
Transfer agent fees — Fund Shares | 491 | ||||||
Transfer agent fees — Institutional Shares | 455 | ||||||
Trustees' fees | 24 | ||||||
Compliance fees | 13 | ||||||
Legal and audit fees | 57 | ||||||
State registration and filing fees | 35 | ||||||
Interfund lending fees | 1 | ||||||
Other expenses | 160 | ||||||
Total Expenses | 9,388 | ||||||
Expenses waived/reimbursed by Adviser | (49 | ) | |||||
Net Expenses | 9,339 | ||||||
Net Investment Income (Loss) | 31,259 | ||||||
Realized/Unrealized Gains (Losses) from Investments: | |||||||
Net realized gains (losses) from investment securities | 19,124 | ||||||
Net change in unrealized appreciation/depreciation on investment securities | 58,951 | ||||||
Net realized/unrealized gains (losses) on investments | 78,075 | ||||||
Change in net assets resulting from operations | $ | 109,334 | |||||
See notes to financial statements.
8
USAA Mutual Funds Trust | Statements of Changes in Net Assets | ||||||
(Amounts in Thousands)
USAA Income Stock Fund | |||||||||||
| Six Months Ended January 31, 2023 (Unaudited) | Year Ended July 31, 2022 | ||||||||||
From Investments: | |||||||||||
Operations: | |||||||||||
Net Investment Income (Loss) | $ | 31,259 | $ | 57,445 | |||||||
Net realized gains (losses) | 19,124 | 255,926 | |||||||||
Net change in unrealized appreciation/depreciation | 58,951 | (234,853 | ) | ||||||||
Change in net assets resulting from operations | 109,334 | 78,518 | |||||||||
Distributions to Shareholders: | |||||||||||
Fund Shares | (137,786 | ) | (173,892 | ) | |||||||
Institutional Shares | (72,821 | ) | (115,113 | ) | |||||||
R6 Shares | — | (3 | )(a) | ||||||||
Change in net assets resulting from distributions to shareholders | (210,607 | ) | (289,008 | ) | |||||||
Change in net assets resulting from capital transactions | (15,148 | ) | 15,459 | ||||||||
Change in net assets | (116,421 | ) | (195,031 | ) | |||||||
Net Assets: | |||||||||||
Beginning of period | 2,624,282 | 2,819,313 | |||||||||
End of period | $ | 2,507,861 | $ | 2,624,282 | |||||||
(a) R6 Shares activity is for the period August 1, 2021, to February 28, 2022 (date of termination).
(continues on next page)
See notes to financial statements.
9
USAA Mutual Funds Trust | Statements of Changes in Net Assets | ||||||
(Amounts in Thousands) (continued)
USAA Income Stock Fund | |||||||||||
| Six Months Ended January 31, 2023 (Unaudited) | Year Ended July 31, 2022 | ||||||||||
Capital Transactions: | |||||||||||
Fund Shares | |||||||||||
Proceeds from shares issued | $ | 32,644 | $ | 83,412 | |||||||
Distributions reinvested | 133,407 | 168,003 | |||||||||
Cost of shares redeemed | (89,695 | ) | (196,041 | ) | |||||||
Total Fund Shares | $ | 76,356 | $ | 55,374 | |||||||
Institutional Shares | |||||||||||
Proceeds from shares issued | $ | 111,296 | $ | 238,151 | |||||||
Distributions reinvested | 72,711 | 115,011 | |||||||||
Cost of shares redeemed | (275,511 | ) | (393,052 | ) | |||||||
Total Institutional Shares | $ | (91,504 | ) | $ | (39,890 | ) | |||||
R6 Shares | |||||||||||
Proceeds from shares issued | $ | — | $ | 3 | (a) | ||||||
Distributions reinvested | — | 3 | (a) | ||||||||
Cost of shares redeemed | — | (31 | )(a) | ||||||||
Total R6 Shares | $ | — | $ | (25 | ) | ||||||
Change in net assets resulting from capital transactions | $ | (15,148 | ) | $ | 15,459 | ||||||
Share Transactions: | |||||||||||
Fund Shares | |||||||||||
Issued | 1,793 | 4,240 | |||||||||
Reinvested | 7,449 | 8,564 | |||||||||
Redeemed | (4,935 | ) | (9,964 | ) | |||||||
Total Fund Shares | 4,307 | 2,840 | |||||||||
Institutional Shares | |||||||||||
Issued | 6,031 | 11,749 | |||||||||
Reinvested | 4,066 | 5,867 | |||||||||
Redeemed | (15,221 | ) | (20,215 | ) | |||||||
Total Institutional Shares | (5,124 | ) | (2,599 | ) | |||||||
R6 Shares | |||||||||||
Issued | — | — | (a)(b) | ||||||||
Reinvested | — | — | (a)(b) | ||||||||
Redeemed | — | (1 | )(a) | ||||||||
Total R6 Shares | — | (1 | ) | ||||||||
Change in Shares | (817 | ) | 240 | ||||||||
(a) R6 Shares activity is for the period August 1, 2021, to February 28, 2022 (date of termination).
(b) Rounds to less than 1 thousand shares.
See notes to financial statements.
10
USAA Mutual Funds Trust | Financial Highlights | ||||||
For a Share Outstanding Throughout Each Period
USAA Income Stock Fund | |||||||||||||||||||||||||||
Fund Shares | |||||||||||||||||||||||||||
| Six Months Ended January 31, 2023 (Unaudited) | Year Ended July 31, 2022 | Year Ended July 31, 2021 | Year Ended July 31, 2020 | Year Ended July 31, 2019 | Year Ended July 31, 2018 | ||||||||||||||||||||||
| Net Asset Value, Beginning of Period | $ | 18.75 | $ | 20.18 | $ | 15.73 | $ | 19.78 | $ | 20.24 | $ | 19.68 | |||||||||||||||
Investment Activities: | |||||||||||||||||||||||||||
Net investment income (loss) | 0.22 | (a) | 0.40 | (a) | 0.34 | (a) | 0.40 | (a) | 0.43 | 0.40 | |||||||||||||||||
| Net realized and unrealized gains (losses) | 0.62 | 0.21 | 4.45 | (0.87 | ) | 0.70 | 1.74 | ||||||||||||||||||||
| Total from Investment Activities | 0.84 | 0.61 | 4.79 | (0.47 | ) | 1.13 | 2.14 | ||||||||||||||||||||
Distributions to Shareholders from: | |||||||||||||||||||||||||||
Net investment income | (0.19 | ) | (0.43 | ) | (0.33 | ) | (0.36 | ) | (0.44 | ) | (0.40 | ) | |||||||||||||||
Net realized gains | (1.37 | ) | (1.61 | ) | (0.01 | ) | (3.22 | ) | (1.15 | ) | (1.18 | ) | |||||||||||||||
Total Distributions | (1.56 | ) | (2.04 | ) | (0.34 | ) | (3.58 | ) | (1.59 | ) | (1.58 | ) | |||||||||||||||
Net Asset Value, End of Period | $ | 18.03 | $ | 18.75 | $ | 20.18 | $ | 15.73 | $ | 19.78 | $ | 20.24 | |||||||||||||||
Total Return (b) (c) | 4.65 | % | 2.75 | % | 30.75 | % | (3.84 | )% | 6.26 | % | 11.16 | % | |||||||||||||||
Ratios to Average Net Assets: | |||||||||||||||||||||||||||
Net Expenses (d) (e) (f) (g) | 0.74 | % | 0.70 | % | 0.70 | % | 0.74 | % | 0.75 | % | 0.76 | %(h) | |||||||||||||||
Net Investment Income (Loss) (d) | 2.44 | % | 2.04 | % | 1.90 | % | 2.31 | % | 2.44 | % | 2.19 | % | |||||||||||||||
Gross Expenses (d) (e) | 0.74 | % | 0.70 | % | 0.70 | % | 0.74 | % | 0.75 | % | 0.76 | %(h) | |||||||||||||||
Supplemental Data: | |||||||||||||||||||||||||||
Net Assets at end of period (000's) | $ | 1,683,706 | $ | 1,670,838 | $ | 1,740,731 | $ | 1,482,959 | $ | 1,707,034 | $ | 1,713,558 | |||||||||||||||
Portfolio Turnover (b) (i) | 17 | % | 50 | % | 53 | % | 64 | % | 86 | %(j) | 23 | % | |||||||||||||||
(a) Per share net investment income (loss) has been calculated using the average daily shares method.
(b) Not annualized for periods less than one year.
(c) Assumes reinvestment of all net investment income and realized capital gain distributions, if any, during the period. Includes adjustments in accordance with U.S. Generally Accepted Accounting Principles and could differ from the Lipper reported return.
(d) Annualized for periods less than one year.
(e) Does not include acquired fund fees and expenses, if any.
(f) The net expense ratio may not correlate to the applicable expense limits in place during the period since the current contractual expense limitation is applied for a period beginning July 1, 2019, and in effect through November 30, 2023, instead of coinciding with the Fund's fiscal year end. Details of the current contractual expense limitation in effect can be found in Note 5 of the accompanying Notes to Financial Statements.
(g) From the period beginning July 1, 2019, the amount of any waivers or reimbursements and the amount of any recoupment are calculated without regard to the impact of any performance adjustment to the Fund's management fee.
(h) Reflects total annual operating expenses before reduction of any expenses paid indirectly. The share's expenses paid indirectly decreased the expense ratio by less than 0.01%.
(i) Portfolio turnover is calculated on the basis of the Fund as a whole without distinguishing between the classes of shares.
(j) Reflects increased trading activity due to transition or asset allocation shift.
(continues on next page)
See notes to financial statements.
11
USAA Mutual Funds Trust | Financial Highlights — continued | ||||||
For a Share Outstanding Throughout Each Period
USAA Income Stock Fund | |||||||||||||||||||||||||||
Institutional Shares | |||||||||||||||||||||||||||
| Six Months Ended January 31, 2023 (Unaudited) | Year Ended July 31, 2022 | Year Ended July 31, 2021 | Year Ended July 31, 2020 | Year Ended July 31, 2019 | Year Ended July 31, 2018 | ||||||||||||||||||||||
| Net Asset Value, Beginning of Period | $ | 18.72 | $ | 20.15 | $ | 15.71 | $ | 19.76 | $ | 20.22 | $ | 19.66 | |||||||||||||||
Investment Activities: | |||||||||||||||||||||||||||
Net investment income (loss) | 0.23 | (a) | 0.40 | (a) | 0.34 | (a) | 0.40 | (a) | 0.43 | 0.41 | |||||||||||||||||
| Net realized and unrealized gains (losses) | 0.62 | 0.21 | 4.44 | (0.86 | ) | 0.70 | 1.73 | ||||||||||||||||||||
| Total from Investment Activities | 0.85 | 0.61 | 4.78 | (0.46 | ) | 1.13 | 2.14 | ||||||||||||||||||||
Distributions to Shareholders from: | |||||||||||||||||||||||||||
Net investment income | (0.20 | ) | (0.43 | ) | (0.33 | ) | (0.37 | ) | (0.44 | ) | (0.40 | ) | |||||||||||||||
Net realized gains | (1.37 | ) | (1.61 | ) | (0.01 | ) | (3.22 | ) | (1.15 | ) | (1.18 | ) | |||||||||||||||
Total Distributions | (1.57 | ) | (2.04 | ) | (0.34 | ) | (3.59 | ) | (1.59 | ) | (1.58 | ) | |||||||||||||||
Net Asset Value, End of Period | $ | 18.00 | $ | 18.72 | $ | 20.15 | $ | 15.71 | $ | 19.76 | $ | 20.22 | |||||||||||||||
Total Return (b) (c) | 4.66 | % | 2.77 | % | 30.75 | % | (3.81 | )% | 6.30 | % | 11.21 | % | |||||||||||||||
Ratios to Average Net Assets: | |||||||||||||||||||||||||||
Net Expenses (d) (e) (f) (g) | 0.72 | % | 0.68 | % | 0.68 | % | 0.72 | % | 0.73 | % | 0.72 | %(h) | |||||||||||||||
Net Investment Income (Loss) (d) | 2.46 | % | 2.05 | % | 1.91 | % | 2.34 | % | 2.47 | % | 2.22 | % | |||||||||||||||
Gross Expenses (d) (e) | 0.73 | % | 0.69 | % | 0.69 | % | 0.72 | % | 0.73 | % | 0.72 | %(h) | |||||||||||||||
Supplemental Data: | |||||||||||||||||||||||||||
Net Assets at end of period (000's) | $ | 824,155 | $ | 953,444 | $ | 1,078,555 | $ | 1,028,803 | $ | 1,088,446 | $ | 1,034,842 | |||||||||||||||
Portfolio Turnover (b) (i) | 17 | % | 50 | % | 53 | % | 64 | % | 86 | %(j) | 23 | % | |||||||||||||||
(a) Per share net investment income (loss) has been calculated using the average daily shares method.
(b) Not annualized for periods less than one year.
(c) Assumes reinvestment of all net investment income and realized capital gain distributions, if any, during the period. Includes adjustments in accordance with U.S. Generally Accepted Accounting Principles and could differ from the Lipper reported return.
(d) Annualized for periods less than one year.
(e) Does not include acquired fund fees and expenses, if any.
(f) The net expense ratio may not correlate to the applicable expense limits in place during the period since the current contractual expense limitation is applied for a period beginning July 1, 2019, and in effect through November 30, 2023, instead of coinciding with the Fund's fiscal year end. Details of the current contractual expense limitation in effect can be found in Note 5 of the accompanying Notes to Financial Statements.
(g) From the period beginning July 1, 2019, the amount of any waivers or reimbursements and the amount of any recoupment are calculated without regard to the impact of any performance adjustment to the Fund's management fee.
(h) Reflects total annual operating expenses before reduction of any expenses paid indirectly. The share's expenses paid indirectly decreased the expense ratio by less than 0.01%.
(i) Portfolio turnover is calculated on the basis of the Fund as a whole without distinguishing between the classes of shares.
(j) Reflects increased trading activity due to transition or asset allocation shift.
See notes to financial statements.
12
USAA Mutual Funds Trust | Notes to Financial Statements January 31, 2023 | ||||||
(Unaudited)
1. Organization:
USAA Mutual Funds Trust (the "Trust") is organized as a Delaware statutory trust and is registered under the Investment Company Act of 1940, as amended (the "1940 Act"), as an open-end investment company. The Trust is comprised of 45 funds and is authorized to issue an unlimited number of shares, which are units of beneficial interest with no par value.
The accompanying financial statements are those of the USAA Income Stock Fund (the "Fund"). The Fund offers two classes of shares: Fund Shares and Institutional Shares. Effective February 28, 2022, the R6 Shares were liquidated. The Fund is classified as diversified under the 1940 Act.
Each class of shares of the Fund has substantially identical rights and privileges, except with respect to fees paid under distribution plans, expenses allocable exclusively to each class of shares, voting rights on matters solely affecting a single class of shares, and the exchange privilege of each class of shares.
Victory Capital Management ("VCM" or the "Adviser") is an indirect wholly owned subsidiary of Victory Capital Holdings, Inc., a publicly traded Delaware corporation, and a wholly owned direct subsidiary of Victory Capital Operating, LLC.
Under the Trust's organizational documents, its officers and trustees are indemnified against certain liabilities arising out of the performance of their duties to the Fund. In addition, in the normal course of business, the Fund enters into contracts with its vendors and others that provide for general indemnifications. The Fund's maximum exposure under these arrangements is unknown, as this would involve future claims that may be made against the Fund. However, based on experience, the Fund expects that risk of loss to be remote.
2. Significant Accounting Policies:
The following is a summary of significant accounting policies followed by the Trust in the preparation of its financial statements. The policies are in conformity with U.S. Generally Accepted Accounting Principles ("GAAP"). The preparation of financial statements in accordance with GAAP requires management to make estimates and assumptions that affect the reported amounts of assets and liabilities and disclosure of contingent assets and liabilities at the date of the financial statements and the reported amounts of income and expenses for the period. Actual results could differ from those estimates. The Fund follows the specialized accounting and reporting requirements under GAAP that are applicable to investment companies under Accounting Standards Codification Topic 946.
Investment Valuation:
The Fund records investments at fair value. Fair value is defined as the price that would be received to sell an asset or paid to transfer a liability in an orderly transaction between market participants at the measurement date.
The valuation techniques described below maximize the use of observable inputs and minimize the use of unobservable inputs in determining fair value. The inputs used for valuing the Fund's investments are summarized in the three broad levels listed below:
• Level 1 — quoted prices (unadjusted) in active markets for identical securities
• Level 2 — other significant observable inputs (including quoted prices for similar securities, interest rates, or credit spreads, applicable to those securities, etc.)
• Level 3 — significant unobservable inputs (including the Adviser's assumptions in determining the fair value of investments)
Changes in valuation techniques may result in transfers in or out of an assigned level within the disclosure hierarchy. The inputs or methodologies used for valuation techniques are not necessarily an indication of the risks associated with entering into those investments.
The Adviser, appointed as the valuation designee by the Trust's Board of Trustees' (the "Board"), has established the Pricing and Liquidity Committee (the "Committee"), and subject to Board oversight, the
13
USAA Mutual Funds Trust | Notes to Financial Statements — continued January 31, 2023 | ||||||
(Unaudited)
Committee administers and oversees the Fund's valuation policies and procedures, which are approved by the Board.
Portfolio securities listed or traded on securities exchanges, including Exchange-Traded Funds ("ETFs"), are valued at the closing price on the exchange or system where the security is principally traded, if available, or at the Nasdaq Official Closing Price. If there have been no sales for that day on the exchange or system, then a security is valued at the last available bid quotation on the exchange or system where the security is principally traded. In each of these situations, valuations are typically categorized as Level 1 in the fair value hierarchy.
Investments in open-end investment companies, other than ETFs, are valued at their net asset value ("NAV"). These valuations are typically categorized as Level 1 in the fair value hierarchy.
In the event that price quotations or valuations are not readily available, investments are valued at fair value in accordance with procedures established by and under the general supervision and responsibility of the Board. These valuations are typically categorized as Level 2 or Level 3 in the fair value hierarchy, based on the observability of inputs used to determine the fair value. The effect of fair value pricing is that securities may not be priced on the basis of quotations from the primary market in which they are traded, and the actual price realized from the sale of a security may differ materially from the fair value price. Valuing these securities at fair value is intended to cause the Fund's NAV to be more reliable than it otherwise would be.
A summary of the valuations as of January 31, 2023, based upon the three levels defined above, is included in the table below while the breakdown, by category, of investments is disclosed on the Schedule of Portfolio Investments (amounts in thousands):
Level 1 | Level 2 | Level 3 | Total | ||||||||||||||||
Common Stocks | $ | 2,498,510 | $ | — | $ | — | $ | 2,498,510 | |||||||||||
Collateral for Securities Loaned | 24,704 | — | — | 24,704 | |||||||||||||||
Total | $ | 2,523,214 | $ | — | $ | — | $ | 2,523,214 | |||||||||||
As of January 31, 2023, there were no transfers into/out of Level 3.
Real Estate Investment Trusts ("REITs"):
The Fund may invest in REITs, which report information on the source of their distributions annually. REITs are pooled investment vehicles that invest primarily in income producing real estate or real estate related loans or interests (such as mortgages). Certain distributions received from REITs during the year are recorded as realized gains or return of capital as estimated by the Fund or when such information becomes known.
Investment Companies:
Open-End Funds:
The Fund may invest in portfolios of open-end investment companies. These investment companies value securities in their portfolios for which market quotations are readily available at their market values (generally the last reported sale price) and all other securities and assets at their fair value by the methods established by the board of directors of the underlying funds.
Investment Transactions and Related Income:
Changes in holdings of investments are accounted for no later than one business day following the trade date. For financial reporting purposes, however, investment transactions are accounted for on trade date or the last business day of the reporting period. Interest income is determined on the basis of coupon interest accrued using the effective interest method which adjusts, where applicable, the amortization of premiums or accretion of discounts. Dividend income is recorded on the ex-dividend date. Gains or losses realized on sales of securities are recorded on the identified cost basis.
14
USAA Mutual Funds Trust | Notes to Financial Statements — continued January 31, 2023 | ||||||
(Unaudited)
Withholding taxes on interest, dividends, and gains as a result of certain investments by the Fund have been provided for in accordance with each investment's applicable country's tax rules and rates.
Securities Lending:
The Fund, through a Securities Lending Agreement with Citibank, N.A. ("Citibank"), may lend its securities to qualified financial institutions, such as certain broker-dealers and banks, to earn additional income, net of income retained by Citibank. Borrowers are required to initially secure their loans for collateral in the amount of at least 102% of the value of U.S. securities loaned or at least 105% of the value of non-U.S. securities loaned, marked-to-market daily. Any collateral shortfalls associated with increases in the valuation of the securities loaned are generally cured the next business day. The collateral can be received in the form of cash collateral and/or non-cash collateral. Non-cash collateral can include U.S. Government Securities and other securities as permitted by Securities and Exchange Commission ("SEC") guidelines. The cash collateral is invested in short-term instruments or cash equivalents, primarily open-end investment companies, as noted on the Fund's Schedule of Portfolio Investments. The Fund effectively does not have control of the non-cash collateral and therefore it is not disclosed on the Fund's Schedule of Portfolio Investments. Collateral requirements are determined daily based on the value of the Fund's securities on loan as of the end of the prior business day. During the time portfolio securities are on loan, the borrower will pay the Fund any dividends or interest paid on such securities plus any fee negotiated between the parties to the lending agreement. The Fund also earns a return from the collateral. The Fund pays Citibank various fees in connection with the investment of cash collateral and fees based on the investment income received from securities lending activities. Securities lending income (net of these fees) is disclosed on the Statement of Operations. Loans are terminable upon demand and the borrower must return the loaned securities within the lesser of one standard settlement period or five business days. Although risk is mitigated by the collateral, the Fund could experience a delay in recovering its securities and possible loss of income or value if the borrower fails to return them. In addition, there is a risk that the value of the short-term investments will be less than the amount of cash collateral required to be returned to the borrower.
The Fund's agreement with Citibank does not include master netting provisions. Non-cash collateral received by the Fund may not be sold or repledged, except to satisfy borrower default.
The following table (amounts in thousands) is a summary of the Fund's securities lending transactions as of January 31, 2023.
| Value of Securities on Loan | Non-Cash Collateral | Cash Collateral | |||||||||
| $ | 23,839 | $ | — | $ | 24,704 | ||||||
Foreign Taxes:
The Fund may be subject to foreign taxes related to foreign income received (a portion of which may be reclaimable), capital gains on the sale of securities, and certain foreign currency transactions. All foreign taxes are recorded in accordance with the applicable regulations and rates that exist in the foreign jurisdictions in which the Fund invests.
Federal Income Taxes:
The Fund intends to continue to qualify as a regulated investment company by complying with the provisions available to certain investment companies, as defined in applicable sections of the Internal Revenue Code, and to make distributions of net investment income and net realized gains sufficient to relieve it from all, or substantially all, federal income taxes. Accordingly, no provision for federal income taxes is required in the financial statements. The Fund has a tax year end of July 31, and effective April 30, 2023, the Fund will change its tax year end to April 30.
For the six months ended January 31, 2023, the Fund did not incur any income tax, interest, or penalties, and has recorded no liability for net unrecognized tax benefits relating to uncertain tax positions.
15
USAA Mutual Funds Trust | Notes to Financial Statements — continued January 31, 2023 | ||||||
(Unaudited)
Management of the Fund has reviewed tax positions taken in tax years that remain subject to examination by all major tax jurisdictions, including federal (i.e., the last four tax years, which includes the current fiscal tax year end). Management believes that there is no tax liability resulting from unrecognized tax benefits related to uncertain tax positions taken.
Allocations:
Expenses directly attributable to the Fund are charged to the Fund, while expenses that are attributable to more than one fund in the Trust, or jointly with an affiliated trust, are allocated among the respective funds in the Trust and/or an affiliated trust based upon net assets or another appropriate basis.
Income, expenses (other than class-specific expenses such as transfer agent fees, state registration fees, and printing fees), and realized and unrealized gains or losses on investments are allocated to each class of shares based on its relative net assets on the date income is earned or expenses and realized and unrealized gains and losses are incurred.
3. Purchases and Sales:
Purchases and sales of securities (excluding securities maturing less than one year from acquisition) for the six months ended January 31, 2023, were as follows for the Fund (amounts in thousands):
Excluding | |||||||
Purchases | Sales | ||||||
$ | 424,669 | $ | 619,896 | ||||
4. Affiliated Fund Ownership:
The Fund offers shares for investment by other funds. The fund-of-funds do not invest in the underlying funds for the purpose of exercising management or control, and the affiliated fund-of-funds' annual and semi-annual reports may be viewed at vcm.com. As of January 31, 2023, certain fund-of-funds owned total outstanding shares of the Fund as follows:
Affiliated USAA Mutual Funds | Ownership % | ||||||
USAA Cornerstone Conservative Fund | 0.1 | ||||||
USAA Cornerstone Equity Fund | 0.3 | ||||||
USAA Target Retirement Income Fund | 0.2 | ||||||
USAA Target Retirement 2030 Fund | 0.6 | ||||||
USAA Target Retirement 2040 Fund | 1.0 | ||||||
USAA Target Retirement 2050 Fund | 0.7 | ||||||
USAA Target Retirement 2060 Fund | 0.1 | ||||||
5. Fees and Transactions with Affiliates and Related Parties:
Investment Advisory Fees:
Investment advisory services are provided to the Fund by the Adviser, which is a New York corporation registered as an investment adviser with the SEC.
Under the terms of the Investment Advisory Agreement, the Adviser is entitled to receive a base fee and a performance adjustment. The Fund's base fee is accrued daily and paid monthly at an annualized rate of 0.50% of the Fund's average daily net assets. Amounts incurred and paid to VCM for the six months ended January 31, 2023, are reflected on the Statement of Operations as Investment advisory fees.
The performance adjustment for each share class is accrued daily and calculated monthly by comparing the respective class' performance to that of the Lipper Equity Income Funds Index. The Lipper Equity Income Funds Index tracks the total return performance of the largest funds within the Lipper Equity Income Funds category.
16
USAA Mutual Funds Trust | Notes to Financial Statements — continued January 31, 2023 | ||||||
(Unaudited)
The performance period for each share class consists of the current month plus the previous 35 months. The following table is utilized to determine the extent of the performance adjustment:
| Over/Under Performance Relative to Index (in basis points)(a) | Annual Adjustment Rate (in basis points) | ||||||
| +/- 100 to 400 | +/- 4 | ||||||
| +/- 401 to 700 | +/- 5 | ||||||
| +/- 701 and greater | +/- 6 | ||||||
(a) Based on the difference between the average annual performance of the relevant share class of the Fund and its relevant Lipper index, rounded to the nearest basis point.
Each class' annual performance adjustment rate is multiplied by the average daily net assets of the respective class over the entire performance period, which is then multiplied by a fraction, the numerator of which is the number of days in the month and the denominator of which is 365 (366 in leap years). The resulting amount is then added to (in the case of overperformance), or subtracted from (in the case of underperformance) the base fee.
Under the performance fee arrangement, each class pays a positive performance fee adjustment for a performance period whenever the class outperforms the Lipper Equity Income Funds Index over that period, even if the class has overall negative returns during the performance period.
For the period August 1, 2022, to January 31, 2023, there were no performance fee adjustments. The performance adjustment rate included in the investment advisory fee may differ from the maximum over/under Annual Adjustment Rate due to differences in average net assets for the reporting period and rolling 36 month performance periods.
The Trust relies on an exemptive order granted to VCM and its affiliated funds by the SEC in March 2019, permitting the use of a "manager-of-managers" structure for certain funds. Under a manager-of-managers structure, the investment adviser may select (with approval of the Board and without shareholder approval) one or more subadvisers to manage the day-to-day investment of a fund's assets. For the six months ended January 31, 2023, the Fund had no subadvisers.
Administration and Servicing Fees:
VCM also serves as the Fund's administrator and fund accountant. Under the Fund Administration, Servicing and Accounting Agreement, VCM is paid an administration and servicing fee that is accrued daily and paid monthly at an annualized rate of 0.15% and 0.10%, which is based on the Fund's average daily net assets of the Fund Shares and Institutional Shares, respectively. Amounts incurred for the six months ended January 31, 2023, are reflected on the Statement of Operations as Administration fees.
Citi Fund Services Ohio, Inc. ("Citi"), an affiliate of Citibank, acts as sub-administrator and sub-fund accountant to the Fund pursuant to a Sub-Administration and Sub-Fund Accounting Services Agreement between VCM and Citi. VCM pays Citi a fee for providing these services. The Fund reimburses VCM and Citi for out-of-pocket expenses incurred in providing these services and certain other expenses specifically allocated to the Fund. Amounts incurred for the six months ended January 31, 2023, are reflected on the Statement of Operations as Sub-Administration fees.
The Fund (as part of the Trust) has entered into an agreement with the Adviser to provide compliance services, pursuant to which the Adviser furnishes its compliance personnel, including the services of the Chief Compliance Officer ("CCO"), and other resources reasonably necessary to provide the Trust with compliance oversight services related to the design, administration, and oversight of a compliance program for the Trust in accordance with Rule 38a-1 under the 1940 Act. The CCO is an employee of the Adviser, which pays the compensation of the CCO and support staff. The funds in the Trust, Victory Variable Insurance Funds, Victory Portfolios, and Victory Portfolios II (collectively, the "Victory Funds Complex") in the aggregate, compensate the Adviser for these services. Amounts incurred for the six months ended January 31, 2023, are reflected on the Statement of Operations as Compliance fees.
17
USAA Mutual Funds Trust | Notes to Financial Statements — continued January 31, 2023 | ||||||
(Unaudited)
Transfer Agency Fees:
Victory Capital Transfer Agency, Inc. ("VCTA"), an affiliate of the Adviser, provides transfer agency services to the Fund. VCTA provides transfer agent services to the Fund Shares based on an annual charge of $23 per shareholder account plus out-of-pocket expenses. VCTA pays a portion of these fees to certain intermediaries for the administration and servicing of accounts that are held with such intermediaries. Transfer agent fees for Institutional Shares are paid monthly based on a fee accrued daily at an annualized rate of 0.10%, of average daily net assets, plus out-of-pocket expenses. Amounts incurred and paid to VCTA for the six months ended January 31, 2023, are reflected on the Statement of Operations as Transfer agent fees.
FIS Investor Services LLC serves as sub-transfer agent and dividend disbursing agent for the Fund pursuant to a Sub-Transfer Agent Agreement between VCTA and FIS Investor Services LLC. VCTA provides FIS Investor Services LLC a fee for providing these services.
Distributor/Underwriting Services:
Victory Capital Services, Inc. (the "Distributor"), an affiliate of the Adviser, serves as Distributor for the continuous offering of the shares of the Fund pursuant to a Distribution Agreement between the Distributor and the Trust and receives no fee or other compensation for these services.
Other Fees:
Citibank serves as the Fund's custodian. The Fund pays Citibank a fee for providing these services. Amounts incurred for the six months ended January 31, 2023, are reflected on the Statement of Operations as Custodian fees.
K&L Gates LLP provides legal services to the Trust.
The Adviser has entered into an expense limitation agreement with the Fund until at least November 30, 2023. Under the terms of the agreement, the Adviser has agreed to waive fees or reimburse certain expenses to the extent that ordinary operating expenses incurred by certain classes of the Fund in any fiscal year exceed the expense limits for such classes of the Fund. Such excess amounts will be the liability of the Adviser. Performance adjustments, acquired fund fees and expenses, interest, taxes, brokerage commissions, other expenditures, which are capitalized in accordance with GAAP, and other extraordinary expenses not incurred in the ordinary course of the Fund's business are excluded from the expense limits. As of January 31, 2023, the expense limits (excluding voluntary waivers) were 0.76% and 0.72% for Fund Shares and Institutional Shares, respectively.
Under the terms of the expense limitation agreement, the Fund has agreed to repay fees and expenses that were waived or reimbursed by the Adviser for a period of up to three years (thirty-six (36) months) after the waiver or reimbursement took place, subject to the lesser of any operating expense limits in effect at the time of: (a) the original waiver or expense reimbursement; or (b) the recoupment, after giving effect to the recoupment amount.
As of January 31, 2023, the following amounts are available to be repaid to the Adviser (amounts in thousands). The Fund has not recorded any amounts available to be repaid as a liability due to an assessment that such repayments are not probable at January 31, 2023.
| Expires 2023 | Expires 2024 | Expires 2025 | Expires 2026 | Total | |||||||||||||||
| $ | 2 | $ | 38 | $ | 33 | $ | 49 | $ | 122 | ||||||||||
The Adviser may voluntarily waive or reimburse additional fees to assist the Fund in maintaining competitive expense ratios. Voluntary waivers and reimbursements applicable to the Fund are not available to be recouped at a future time. There were no voluntary waivers or reimbursements for the six months ended January 31, 2023.
Certain officers and/or interested trustees of the Fund are also officers and/or employees of the Adviser, administrator, fund accountant, sub-administrator, sub-fund accountant, custodian, and Distributor.
18
USAA Mutual Funds Trust | Notes to Financial Statements — continued January 31, 2023 | ||||||
(Unaudited)
6. Risks:
The Fund may be subject to other risks in addition to these identified risks.
Market Risk — Overall market risks may affect the value of the Fund. Domestic and international factors such as political events, war, terrorism, trade disputes, inflation rates, interest rate levels and other fiscal and monetary policy changes, cybersecurity incidents, pandemics and other public health crises, sanctions against a particular foreign country, its nationals, businesses or industries and related geopolitical events, as well as environmental disasters such as earthquakes, fires, and floods, or other catastrophes, may add to instability in global economies and markets generally, and may lead to increased market volatility. Global economies and financial markets are highly interconnected, which increases the possibility that conditions in one country or region might adversely affect issuers in another country or region. The impact of these and other factors may be short-term or may last for extended periods.
Equity Risk — The values of the equity securities in which the Fund invests may decline in response to developments affecting individual companies and/or general market, economic and political conditions and other factors. A company's earnings or dividends may not increase as expected due to poor management decisions, competitive pressures, breakthroughs in technology, reliance on suppliers, labor problems or shortages, corporate restructurings, fraudulent disclosures, natural disasters, military confrontations, war, terrorism, public health crises, or other events, conditions, and factors. Price changes may be temporary or may last for extended periods.
Financials Sectors Risk — The Fund's investments in companies within the financials sector means that market or economic factors impacting that sector could have a significant effect on the value of the Fund's investments and could make the Fund's performance more volatile. Financial companies, such as retail and commercial banks, insurance companies, and financial services companies, are especially subject to the adverse effects of economic recession, currency exchange rates, extensive government regulation, decreases in the availability of capital, volatile interest rates, portfolio concentrations in geographic markets, industries or products (such as commercial and residential real estate loans), and competition from new entrants in their fields of business.
7. Borrowing and Interfund Lending:
Line of Credit:
The Victory Funds Complex participates in a short-term demand note "Line of Credit" agreement with Citibank. The Line of Credit agreement with Citibank was renewed on June 27, 2022, with a termination date of June 26, 2023. Under the agreement with Citibank, the Victory Funds Complex may borrow up to $600 million, of which $300 million is committed and $300 million is uncommitted. $40 million of the Line of Credit is reserved for use by the Victory Floating Rate Fund, another series of the Victory Funds Complex, with Victory Floating Rate Fund paying the related commitment fees for that amount. The purpose of the Line of Credit is to meet temporary or emergency cash needs. For the six months ended January 31, 2023, Citibank received an annual commitment fee of 0.15% on $300 million for providing the Line of Credit. Each fund in the Victory Funds Complex paid a pro-rata portion of the commitment fees plus any interest (one-month Secured Overnight Financing Rate ("SOFR") plus 1.10 percent) on amounts borrowed. Interest charged to the Fund during the period, if applicable, is reflected on the Statement of Operations under Line of credit fees.
The Fund had no borrowings under the Line of Credit agreement during the six months ended January 31, 2023.
Interfund Lending:
The Trust and the Adviser rely on an exemptive order granted by the SEC in March 2017 (the "Order"), permitting the establishment and operation of an Interfund Lending Facility (the "Facility"). The Facility allows the Fund to directly lend and borrow money to or from any other fund in the Victory Funds Complex that is permitted to participate in the Facility, relying upon the Order at rates beneficial to
19
USAA Mutual Funds Trust | Notes to Financial Statements — continued January 31, 2023 | ||||||
(Unaudited)
both the borrowing and lending funds. Advances under the Facility are allowed for temporary or emergency purposes, including the meeting of redemption requests that otherwise might require the untimely disposition of securities, and are subject to each Fund's borrowing restrictions. The interfund loan rate is determined, as specified in the Order, by averaging the current repurchase agreement rate and the current bank loan rate. As a Borrower, interest charged to the Fund, if any, during the period, is reflected on the Statement of Operations under Interfund lending fees. As a Lender, interest earned by the Fund, if any, during the period, is reflected on the Statement of Operations under Interfund lending.
The average borrowing or lending for the days outstanding and average interest rate for the Fund during the six months ended January 31, 2023, were as follows (amounts in thousands):
| Borrower or Lender | Amount Outstanding at January 31, 2023 | Average Borrowing* | Days Borrowing Outstanding | Average Interest Rate* | Maximum Borrowing During the Period | ||||||||||||||||||
| Borrower | $ | — | $ | 7,809 | 1 | 4.31 | % | $ | 7,809 | ||||||||||||||
* Based on the number of days borrowings were outstanding for the six months ended January 31, 2023.
8. Federal Income Tax Information:
The Fund intends to distribute any net investment income quarterly. Distributable net realized gains, if any, are declared and paid at least annually.
The amounts of dividends from net investment income and distributions from net realized gains (collectively, distributions to shareholders) are determined in accordance with federal income tax regulations, which may differ from GAAP. To the extent these "book/tax" differences are permanent in nature (e.g., net operating loss and distribution reclassification), such amounts are reclassified within the components of net assets based on their federal tax-basis treatment; temporary differences (e.g., wash sales) do not require reclassification. To the extent dividends and distributions exceed net investment income and net realized gains for tax purposes, they are reported as distributions of capital. Net investment losses incurred by the Fund may be reclassified as an offset to capital on the accompanying Statement of Assets and Liabilities.
The tax character of current year distributions paid and the tax basis of the current components of accumulated earnings (loss) will be determined at the end of the current tax year.
At the tax year ended July 31, 2022, the Fund had no capital loss carryforwards for federal income tax purposes.
9. Subsequent Events:
On June 29, 2022, the Board approved a change to the Fund's fiscal year-end from July 31 to April 30, with an effective date of April 30, 2023.
The Board, upon recommendation of the Adviser, has approved a change in the name of the Trust and each individual fund within the Trust. On February 23, 2023, an initial filing was made with the SEC to commence the process to effectuate the following changes.
Effective at the start of business on April 24, 2023 (the "Effective Date"), the name of the Trust will change from USAA Mutual Funds Trust to Victory Portfolios III, and all references to USAA Mutual Funds Trust in the summary prospectus, statutory prospectus, and statement of additional information ("SAI") will be replaced by the new name.
Also on the Effective Date, references to the current name of the Fund in the summary prospectus, statutory prospectus, and SAI will be replaced with the new name as follows:
| Current Name | New Name | ||||||
USAA Income Stock Fund | Victory Income Stock Fund | ||||||
20
USAA Mutual Funds Trust | Notes to Financial Statements — continued January 31, 2023 | ||||||
(Unaudited)
In addition, on the Effective Date, USAA Investments, a Victory Capital Management Inc. Investment Franchise, that currently manages the USAA Fixed Income Funds, will change its name to Victory Income Investors, and all references to USAA Investments in the summary prospectus, statutory prospectus, and SAI, will be replaced.
Please note that there will be no changes in the management of the Fund or to the Fund's ticker symbols.
21
USAA Mutual Funds Trust | Supplemental Information January 31, 2023 | ||||||
(Unaudited)
Proxy Voting and Portfolio Holdings Information
Proxy Voting:
Information regarding the policies and procedures the Fund uses to determine how to vote proxies relating to portfolio securities is available without charge, upon request, by calling (800) 235-8396. The information is also included in the Fund's Statement of Additional Information, which is available on the SEC's website at sec.gov.
Information relating to how the Fund voted proxies relating to portfolio securities held during the most recent 12 months ended June 30 is available on the SEC's website at sec.gov.
Availability of Schedules of Portfolio Investments:
The Trust files a complete list of Schedules of Portfolio Investments with the SEC for the first and third quarter of each fiscal year on Form N-PORT. Form N-PORT is available on the SEC's website at sec.gov.
Expense Examples
As a shareholder of the Fund, you may incur two types of costs: (1) transaction costs and (2) ongoing costs, including management fees and other Fund expenses. These examples are intended to help you understand your ongoing costs (in dollars) of investing in the Fund and to compare these costs with the ongoing costs of investing in other mutual funds.
These examples are based on an investment of $1,000 invested at the beginning of the period and held for the entire period from August 1, 2022, through January 31, 2023.
The Actual Expense figures in the table below provide information about actual account values and actual expenses. You may use the information below, together with the amount you invested, to estimate the expenses that you paid over the period. Simply divide your account value by $1,000 (for example, an $8,600 account value divided by $1,000 = 8.6), then multiply the result by the number in the table under the heading entitled "Actual Expenses Paid During Period" to estimate the expenses you paid on your account during this period.
The Hypothetical Expense figures in the table below provide information about hypothetical account values and hypothetical expenses based on the Fund's actual expense ratio and an assumed rate of return of 5% per year before expenses, which is not the Fund's actual return. The hypothetical account values and expenses may not be used to estimate the actual ending account balance or expenses you paid for the period. You may use this information to compare this 5% hypothetical example with the 5% hypothetical examples that appear in shareholder reports of other funds.
Please note the expenses shown in the table below are meant to highlight your ongoing costs only and do not reflect any transactional costs. Therefore, the hypothetical expenses in the table are useful in comparing ongoing costs only and will not help you determine the relative total costs of owning different funds. In addition, if these transactional costs were included, your costs would have been higher.
| Beginning Account Value 8/1/22 | Actual Ending Account Value 1/31/23 | Hypothetical Ending Account Value 1/31/23 | Actual Expenses Paid During Period 8/1/22- 1/31/23* | Hypothetical Expenses Paid During Period 8/1/22- 1/31/23* | Annualized Expense Ratio During Period 8/1/22- 1/31/23 | ||||||||||||||||||||||
Fund Shares | $ | 1,000.00 | $ | 1,046.50 | $ | 1,021.48 | $ | 3.82 | $ | 3.77 | 0.74 | % | |||||||||||||||
Institutional Shares | 1,000.00 | 1,046.60 | 1,021.58 | 3.71 | 3.67 | 0.72 | % | ||||||||||||||||||||
* Expenses are equal to the average account value multiplied by the Fund's annualized expense ratio multiplied by 184/365 (the number of days in the most recent fiscal half-year divided by the number of days in the fiscal year).
22
USAA Mutual Funds Trust | Supplemental Information — continued January 31, 2023 | ||||||
(Unaudited)
Considerations of the Board in Continuing the Investment Advisory Agreement
USAA Income Stock Fund (the "Fund")
At a meeting of the Board of Trustees (the "Board") of USAA Mutual Funds Trust (the "Trust") held on December 8-9, 2022, the Board, including the Trustees who are not "interested persons" (as that term is defined in the Investment Company Act of 1940, as amended) of the Trust (the "Independent Trustees"), approved for an annual period the continuance of the Investment Advisory Agreement (the "Advisory Agreement") between the Trust and Victory Capital Management Inc. (the "Adviser") with respect to the Fund. Prior to the December 8-9, 2022 meeting at which the Advisory Agreement was approved, the Independent Trustees also discussed and considered information regarding the proposed continuation of the Advisory Agreement at a meeting held on November 21, 2022.
In advance of the foregoing meetings, the Trustees received and considered a variety of information relating to the Advisory Agreement and the Adviser, and were given the opportunity to ask questions and request additional information from management. The information provided to the Board included, among other things: (i) a separate report prepared by an independent third party of mutual fund data, which provided a statistical analysis comparing the Fund's investment performance, expenses, and fees to comparable investment companies; (ii) information concerning the services rendered to the Fund, as well as information regarding the Adviser's revenues and costs of providing services to the Fund and compensation paid to affiliates of the Adviser; and (iii) information about the Adviser's operations and personnel. Prior to voting, the Independent Trustees reviewed the proposed continuance of the Advisory Agreement with management and with experienced independent counsel retained by the Independent Trustees ("Independent Counsel") and received materials from such Independent Counsel discussing the legal standards for their consideration of the proposed continuation of the Advisory Agreement with respect to the Fund. The Independent Trustees also reviewed the proposed continuation of the Advisory Agreement with respect to the Fund in private sessions with Independent Counsel at which no representatives of management were present.
At each regularly scheduled meeting of the Board and its committees, the Board receives and reviews, among other things, information concerning the Fund's performance and related services provided by the Adviser. At the meeting at which the renewal of the Advisory Agreement is considered, particular focus is given to information concerning Fund performance, fees and total expenses as compared to comparable investment companies, and the Adviser's profitability with respect to the Fund. However, the Board noted that the evaluation process with respect to the Adviser is an ongoing one. In this regard, the Board's and its committees' consideration of the Advisory Agreement included information previously received at such meetings. The Board also recognized that the contractual arrangements for the Fund have been reviewed by the Board and discussed with the Adviser in prior years and that the Board's conclusions may be based, in part, on its consideration of these same arrangements in prior years.
Advisory Agreement
After full consideration of a variety of factors, the Board, including the Independent Trustees, voted to approve the Advisory Agreement. In approving the Advisory Agreement, the Trustees did not identify any single factor as controlling, and each Trustee may have attributed different weights to various factors. Throughout their deliberations, the Independent Trustees were represented and assisted by Independent Counsel.
Nature, Extent, and Quality of Services — In considering the nature, extent, and quality of the services provided by the Adviser under the Advisory Agreement, the Board reviewed information provided by the Adviser relating to its operations and personnel. The Board also took into account its knowledge of the Adviser's management and the quality of the performance of the Adviser's duties through Board meetings, discussions, and reports during the preceding year. The Board considered the fees paid to the Adviser and the services provided to the Fund by the Adviser under the Advisory Agreement, as well as other services provided by the Adviser and its affiliates under other agreements, and the personnel who provide these services. In addition to the investment advisory services provided to the Fund, the Adviser and its affiliates provide administrative services, shareholder
23
USAA Mutual Funds Trust | Supplemental Information — continued January 31, 2023 | ||||||
(Unaudited)
services, oversight of Fund accounting, marketing services, assistance in meeting legal and regulatory requirements, and other services necessary for the operation of the Fund and the Trust.
The Board considered the scope of services provided by, and the undertakings required of, the Adviser in connection with those services, including, among other things, maintaining (i) its own and the Fund's compliance programs, (ii) risk management programs, (iii) liquidity risk management program, (iv) derivatives risk management program, and (v) cybersecurity programs, each of which had expanded over time as a result of regulatory, market, and other developments. The Board also considered the significant risks assumed by the Adviser in connection with the services provided to the Fund, including investment, operational, enterprise, litigation, regulatory and compliance risks.
The Board considered the Adviser's management style and the performance of the Adviser's duties under the Advisory Agreement. The Board considered the level and depth of knowledge of the Adviser, including the professional experience and qualifications of its senior and investment personnel, as well as current staffing levels. The allocation of the Fund's brokerage, including the Adviser's process for monitoring "best execution," also was considered. The Adviser's role in coordinating the activities of the Fund's other service providers was also considered. The Board also considered the Adviser's risk management processes. The Board considered the Adviser's financial condition and that it had the financial wherewithal to continue to provide the same scope and high quality of services under the Advisory Agreement. In reviewing the Advisory Agreement, the Board focused on the experience, resources, and strengths of the Adviser and its affiliates in managing the Fund, as well as the other funds in the Trust.
The Board also reviewed the compliance and administrative services provided to the Fund by the Adviser and its affiliates, including the Adviser's oversight of the Fund's day-to-day operations and oversight of Fund accounting. The Trustees, guided also by information obtained from their experiences as Trustees of the Trust, also focused on the quality of the Adviser's compliance and administrative staff.
Expenses and Performance — In connection with its consideration of the Advisory Agreement, the Board evaluated the Fund's advisory fees and total expense ratio as compared to other open-end investment companies deemed to be comparable to the Fund as determined by the independent third party in its report. The Fund's expenses were compared to (i) a group of investment companies chosen by the independent third party to be comparable to the Fund based upon certain factors, including fund type, comparability of investment objective and classification, sales load type, asset size, and expense components (the "expense group") and (ii) a larger group of investment companies with the same investment classification/objective as the Fund regardless of asset size, excluding outliers (the "expense universe"). Among other data, the Board noted that the Fund's net management fee rate — which includes advisory and administrative services and the effects of any performance adjustment, as well as any fee waivers and reimbursements — was below the medians of its expense group and its expense universe. The data indicated that the Fund's total expenses, including after any reimbursements, were below the medians of its expense group and its expense universe. The Board also took into account the Adviser's current undertakings to maintain expense limitations for the Fund. The Board took into account the various other services provided to the Fund by the Adviser and its affiliates, and noted the high quality of services received by the Fund.
In considering the Fund's performance, the Board noted that it reviews at its regularly scheduled meetings information about the Fund's performance results. The Trustees also reviewed various comparative data provided to them in connection with their consideration of the renewal of the Advisory Agreement, including, among other information, a comparison of the Fund's average annual total returns relative to its Lipper index and other mutual funds deemed to be in its peer group by the independent third party in its report (the "performance universe"). The Fund's performance universe consisted of the Fund and all retail and institutional open-end investment companies with the same classification/objective as the Fund regardless of asset size or primary channel of distribution. This comparison indicated that, among other data, the Fund's performance was above the average of its performance universe for the one-, five- and ten-year periods ended June 30, 2022, and was below the average of its performance universe for the three-year period ended June 30, 2022, and that the Fund's performance was above its Lipper index for the one-year period ended June 30, 2022, and was below its Lipper index for the three-, five- and ten-year periods ended June 30, 2022. The Board took into account management's discussion of the Fund's performance, including the reasons for the Fund's underperformance for certain periods, and also took into account the Fund's more recent improved performance.
24
USAA Mutual Funds Trust | Supplemental Information — continued January 31, 2023 | ||||||
(Unaudited)
Compensation and Profitability — The Board took into consideration the level and method of computing the management fee. The information considered by the Board included operating profit margin information for the Adviser's business as a whole. The Board also received and considered profitability information related to the management revenues from the Fund. This information included a review of the methodology used in the allocation of certain costs to the Fund. In considering the profitability data with respect to the Fund, the Trustees noted that the Adviser reimbursed or waived a portion of its management fees to the Fund. The Trustees reviewed the profitability of the Adviser's relationship with the Fund before tax expenses. The Board was also provided with a profitability analysis of other publicly traded asset managers prepared by an independent information service. In reviewing the overall profitability of the management fee to the Adviser, the Board also considered the fact that the Adviser and its affiliates provide shareholder servicing and administrative services to the Fund for which they receive compensation. The Board also considered the possible direct and indirect benefits to the Adviser from its relationship with the Trust, including that the Adviser may derive reputational and other benefits from its association with the Fund. The Trustees recognized that the Adviser should be entitled to earn a reasonable level of profits in exchange for the level of services it provides to the Fund and the entrepreneurial and other risks that it assumes as Adviser.
Economies of Scale — The Board considered whether there should be changes in the management fee rate or structure in order to enable the Fund to participate in any economies of scale. The Board also considered the fee waiver and expense reimbursement arrangements by the Adviser. The Board also considered the effect of the change in size, if any, of each of the Fund's classes on its performance and fees, noting that the Fund may realize other economies of scale if assets increase proportionally more than some expenses. The Board determined that the current investment management fee structure was reasonable.
Conclusions — The Board reached the following conclusions regarding the Fund's Advisory Agreement with the Adviser: (i) the Adviser has demonstrated that it possesses the capability and resources to perform the duties required of it under the Advisory Agreement; (ii) the Adviser maintains an appropriate compliance program; (iii) the overall performance of the Fund is reasonable in relation to the performance of funds with similar investment objectives and to relevant indices and the Adviser is appropriately monitoring the Fund's performance; (iv) the Fund's advisory expenses are reasonable in relation to those of similar funds and to the services to be provided by the Adviser; and (v) the Adviser's and its affiliates' level of profitability from their relationship with the Fund is reasonable in light of the nature and high quality of services provided by the Adviser and its affiliates and the type of fund. Based on its conclusions, the Board determined that continuation of the Advisory Agreement would be in the best interests of the Fund and its shareholders.
25
Privacy Policy
Protecting the Privacy of Information
The Trust respects your right to privacy. We also know that you expect us to conduct and process your business in an accurate and efficient manner. To do so, we must collect and maintain certain personal information about you. This is the information we collect from you on applications or other forms, and from the transactions you make with us or third parties. It may include your name, address, social security number, account transactions and balances, and information about investment goals and risk tolerance.
We do not disclose any information about you or about former customers to anyone except as permitted or required by law. Specifically, we may disclose the information we collect to companies that perform services on our behalf, such as the transfer agent that processes shareholder accounts and printers and mailers that assist us in the distribution of investor materials. We may also disclose this information to companies that perform marketing services on our behalf. This allows us to continue to offer you Victory investment products and services that meet your investing needs, and to effect transactions that you request or authorize. These companies will use this information only in connection with the services for which we hired them. They are not permitted to use or share this information for any other purpose.
To protect your personal information internally, we permit access only by authorized employees and maintain physical, electronic, and procedural safeguards to guard your personal information.*
* You may have received communications regarding information about privacy policies from other financial institutions which gave you the opportunity to "opt-out" of certain information sharing with companies which are not affiliated with that financial institution. The Trust does not share information with other companies for purposes of marketing solicitations for products other than the Trust. Therefore, the Trust does not provide opt-out options to their shareholders.
P.O. Box 182593
Columbus, Ohio 43218-2593

Visit our website at: | Call | ||||||
vcm.com | (800) 235-8396 | ||||||
23422-0323

January 31, 2023
Semi Annual Report
USAA Science & Technology Fund
Victory Capital means Victory Capital Management Inc., the investment adviser of the USAA Mutual Funds. USAA Mutual Funds are distributed by Victory Capital Services, Inc., member FINRA, an affiliate of Victory Capital. Victory Capital and its affiliates are not affiliated with United Services Automobile Association or its affiliates. USAA and the USAA logos are registered trademarks and the USAA Mutual Funds and USAA Investments logos are trademarks of United Services Automobile Association and are being used by Victory Capital and its affiliates under license.
vcm.com
News, Information And Education 24 Hours A Day, 7 Days A Week
The Victory Capital website gives fund shareholders, prospective shareholders, and investment professionals a convenient way to access fund information, get guidance, and track fund performance anywhere they can access the Internet. The site includes:
• Detailed performance records
• Daily share prices
• The latest fund news
• Investment resources to help you become a better investor
• A section dedicated to investment professionals
Whether you're a potential investor searching for the fund that matches your investment philosophy, a seasoned investor interested in planning tools, or an investment professional, vcm.com has what you seek. Visit us anytime. We're always open.
USAA Mutual Funds Trust
TABLE OF CONTENTS
Investment Objective & Portfolio Holdings | 2 | ||||||
Schedule of Portfolio Investments | 3 | ||||||
Financial Statements | |||||||
Statement of Assets and Liabilities | 11 | ||||||
Statement of Operations | 12 | ||||||
Statements of Changes in Net Assets | 13 | ||||||
Financial Highlights | 14 | ||||||
Notes to Financial Statements | 16 | ||||||
Supplemental Information | 25 | ||||||
Proxy Voting and Portfolio Holdings Information | 25 | ||||||
Expense Examples | 25 | ||||||
Advisory Contract Approval | 26 | ||||||
Privacy Policy (inside back cover) | |||||||
This report is for the information of the shareholders and others who have received a copy of the currently effective prospectus of the Fund, managed by Victory Capital Management Inc. It may be used as sales literature only when preceded or accompanied by a current prospectus, which provides further details about the Fund.
IRA DISTRIBUTION WITHHOLDING DISCLOSURE
We generally must withhold federal income tax at a rate of 10% of the taxable portion of your distribution and, if you live in a state that requires state income tax withholding, at your state's tax rate. However, you may elect not to have withholding apply or to have income tax withheld at a higher rate. Any withholding election that you make will apply to any subsequent distribution unless and until you change or revoke the election. If you wish to make a withholding election, or change or revoke a prior withholding election, call (800) 235-8396, and form W-4P (OMB No. 1545-0074 withholding certificate for pension or annuity payments) will be electronically sent.
If you do not have a withholding election in place by the date of a distribution, federal income tax will be withheld from the taxable portion of your distribution at a rate of 10%. If you must pay estimated taxes, you may be subject to estimated tax penalties if your estimated tax payments are not sufficient and sufficient tax is not withheld from your distribution.
For more specific information, please consult your tax adviser.
• NOT FDIC INSURED • NO BANK GUARANTEE • MAY LOSE VALUE
1
| USAA Mutual Funds Trust USAA Science & Technology Fund | January 31, 2023 | ||||||
(Unaudited)
Investment Objective and Portfolio Holdings:
The Fund seeks long-term capital appreciation.
Top 10 Equity Holdings*:
January 31, 2023
(% of Net Assets)
Microsoft Corp. | 8.8 | % | |||||
Amazon.com, Inc. | 4.4 | % | |||||
Vertex Pharmaceuticals, Inc. | 3.8 | % | |||||
MACOM Technology Solutions Holdings, Inc. | 2.7 | % | |||||
Visa, Inc. Class A | 2.5 | % | |||||
Impinj, Inc. | 2.2 | % | |||||
Lattice Semiconductor Corp. | 2.1 | % | |||||
ServiceNow, Inc. | 2.1 | % | |||||
Varonis Systems, Inc. | 1.8 | % | |||||
Meta Platforms, Inc. Class A | 1.8 | % | |||||
Sector Allocation*:
January 31, 2023
(% of Net Assets)

* Does not include futures contracts, money market instruments, and short-term investments purchased with cash collateral from securities loaned.
Percentages are of the net assets of the Fund and may not equal 100%.
Refer to the Schedule of Portfolio Investments for a complete list of securities.
2
| USAA Mutual Funds Trust USAA Science & Technology Fund | Schedule of Portfolio Investments January 31, 2023 | ||||||
(Amounts in Thousands, Except for Shares) (Unaudited)
Security Description | Shares | Value | |||||||||
Common Stocks (98.6%) | |||||||||||
Australia (0.2%): | |||||||||||
Health Care (0.2%): | |||||||||||
Opthea Ltd., ADR (a) | 305,881 | $ | 1,667 | ||||||||
Belgium (0.0%): (b) | |||||||||||
Health Care (0.0%): | |||||||||||
UCB SA | 2,705 | 222 | |||||||||
Brazil (0.0%): (b) | |||||||||||
Health Care (0.0%): | |||||||||||
Hapvida Participacoes E Investimentos SA (a) (c) | 73,848 | 75 | |||||||||
Canada (0.3%): | |||||||||||
Health Care (0.3%): | |||||||||||
Xenon Pharmaceuticals, Inc. (a) | 75,626 | 2,956 | |||||||||
Cayman Islands (0.5%): | |||||||||||
Health Care (0.5%): | |||||||||||
Theravance Biopharma, Inc. (a) | 432,234 | 4,672 | |||||||||
China (0.6%): | |||||||||||
Consumer Discretionary (0.4%): | |||||||||||
Alibaba Group Holding Ltd. (a) | 142,300 | 1,957 | |||||||||
Trip.com Group Ltd. (a) | 57,150 | 2,102 | |||||||||
4,059 | |||||||||||
Health Care (0.1%): | |||||||||||
Everest Medicines Ltd. (a) (c) | 23,000 | 73 | |||||||||
InnoCare Pharma Ltd. (a) (c) | 18,000 | 31 | |||||||||
Zai Lab Ltd. (a) | 28,600 | 120 | |||||||||
224 | |||||||||||
Information Technology (0.1%): | |||||||||||
Glodon Co. Ltd. Class A | 112,700 | 1,094 | |||||||||
5,377 | |||||||||||
Denmark (0.0%): (b) | |||||||||||
Health Care (0.0%): | |||||||||||
Ascendis Pharma A/S, ADR (a) | 929 | 115 | |||||||||
Genmab A/S (a) | 287 | 113 | |||||||||
228 | |||||||||||
Finland (0.4%): | |||||||||||
Information Technology (0.4%): | |||||||||||
Nokia Oyj, ADR | 786,517 | 3,744 | |||||||||
Ireland (1.8%): | |||||||||||
Health Care (1.8%): | |||||||||||
Alkermes PLC (a) | 4,400 | 126 | |||||||||
ICON PLC (a) | 100 | 23 | |||||||||
See notes to financial statements.
3
| USAA Mutual Funds Trust USAA Science & Technology Fund | Schedule of Portfolio Investments — continued January 31, 2023 | ||||||
(Amounts in Thousands, Except for Shares) (Unaudited)
Security Description | Shares | Value | |||||||||
Jazz Pharmaceuticals PLC (a) | 105,431 | $ | 16,517 | ||||||||
Prothena Corp. PLC (a) | 26,878 | 1,520 | |||||||||
18,186 | |||||||||||
Israel (1.3%): | |||||||||||
Information Technology (1.3%): | |||||||||||
Monday.com Ltd. (a) (d) | 60,710 | 7,904 | |||||||||
Wix.com Ltd. (a) | 60,975 | 5,303 | |||||||||
13,207 | |||||||||||
Italy (0.0%): (b) | |||||||||||
Health Care (0.0%): | |||||||||||
DiaSorin SpA | 1,056 | 137 | |||||||||
Japan (0.7%): | |||||||||||
Health Care (0.5%): | |||||||||||
Astellas Pharma, Inc. | 3,500 | 52 | |||||||||
Chugai Pharmaceutical Co. Ltd. | 5,900 | 153 | |||||||||
Daiichi Sankyo Co. Ltd. | 9,050 | 284 | |||||||||
Eisai Co. Ltd. | 3,765 | 233 | |||||||||
Hoya Corp. | 37,000 | 4,069 | |||||||||
Ono Pharmaceutical Co. Ltd. | 5,030 | 109 | |||||||||
4,900 | |||||||||||
Information Technology (0.2%): | |||||||||||
Rohm Co. Ltd. | 30,850 | 2,473 | |||||||||
7,373 | |||||||||||
Netherlands (0.0%): (b) | |||||||||||
Health Care (0.0%): | |||||||||||
Argenx SE, ADR (a) | 305 | 117 | |||||||||
Merus NV (a) | 3,685 | 57 | |||||||||
174 | |||||||||||
Singapore (0.6%): | |||||||||||
Information Technology (0.6%): | |||||||||||
Flex Ltd. (a) | 255,952 | 5,977 | |||||||||
Switzerland (0.0%): (b) | |||||||||||
Health Care (0.0%): | |||||||||||
Novartis AG Registered Shares | 1,358 | 123 | |||||||||
Tecan Group AG Class R | 254 | 106 | |||||||||
229 | |||||||||||
Taiwan (0.8%): | |||||||||||
Information Technology (0.8%): | |||||||||||
ASPEED Technology, Inc. | 18,600 | 1,317 | |||||||||
Hon Hai Precision Industry Co. Ltd. | 722,000 | 2,408 | |||||||||
Silicon Motion Technology Corp., ADR | 71,494 | 4,583 | |||||||||
8,308 | |||||||||||
See notes to financial statements.
4
| USAA Mutual Funds Trust USAA Science & Technology Fund | Schedule of Portfolio Investments — continued January 31, 2023 | ||||||
(Amounts in Thousands, Except for Shares) (Unaudited)
Security Description | Shares | Value | |||||||||
United Kingdom (0.5%): | |||||||||||
Consumer Discretionary (0.2%): | |||||||||||
Trainline PLC (a) (c) | 436,293 | $ | 1,527 | ||||||||
Health Care (0.3%): | |||||||||||
Abcam PLC, ADR (a) | 8,819 | 123 | |||||||||
AstraZeneca PLC, ADR | 5,521 | 361 | |||||||||
Genus PLC | 3,913 | 140 | |||||||||
GSK PLC | 8,133 | 143 | |||||||||
Hikma Pharmaceuticals PLC | 4,996 | 106 | |||||||||
Immunocore Holdings PLC, ADR (a) | 39,365 | 2,412 | |||||||||
Smith & Nephew PLC | 9,795 | 135 | |||||||||
Verona Pharma PLC, ADR (a) | 4,637 | 102 | |||||||||
3,522 | |||||||||||
5,049 | |||||||||||
United States (90.9%): | |||||||||||
Communication Services (6.0%): | |||||||||||
Alphabet, Inc. Class A (a) | 104,690 | 10,348 | |||||||||
Bandwidth, Inc. Class A (a) | 139,600 | 3,473 | |||||||||
Cargurus, Inc. (a) | 93,728 | 1,654 | |||||||||
Meta Platforms, Inc. Class A (a) | 119,816 | 17,849 | |||||||||
Netflix, Inc. (a) | 32,811 | 11,611 | |||||||||
Take-Two Interactive Software, Inc. (a) | 78,583 | 8,898 | |||||||||
ZoomInfo Technologies, Inc. (a) | 265,904 | 7,506 | |||||||||
61,339 | |||||||||||
Consumer Discretionary (6.4%): | |||||||||||
2U, Inc. (a) | 603,160 | 5,205 | |||||||||
Airbnb, Inc. Class A (a) | 19,456 | 2,162 | |||||||||
Amazon.com, Inc. (a) | 432,983 | 44,654 | |||||||||
Booking Holdings, Inc. (a) | 3,175 | 7,728 | |||||||||
Etsy, Inc. (a) | 17,767 | 2,444 | |||||||||
Peloton Interactive, Inc. Class A (a) | 198,799 | 2,571 | |||||||||
64,764 | |||||||||||
Health Care (23.0%): | |||||||||||
Abbott Laboratories | 3,085 | 341 | |||||||||
Aclaris Therapeutics, Inc. (a) | 5,344 | 90 | |||||||||
AdaptHealth Corp. (a) | 3,045 | 65 | |||||||||
Addus HomeCare Corp. (a) | 1,179 | 127 | |||||||||
Agilent Technologies, Inc. | 50,061 | 7,613 | |||||||||
Agilon Health, Inc. (a) | 5,609 | 122 | |||||||||
Agios Pharmaceuticals, Inc. (a) | 194,257 | 5,727 | |||||||||
Aldeyra Therapeutics, Inc. (a) | 487,758 | 2,878 | |||||||||
Alnylam Pharmaceuticals, Inc. (a) | 505 | 114 | |||||||||
Amedisys, Inc. (a) | 812 | 78 | |||||||||
AmerisourceBergen Corp. | 1,100 | 186 | |||||||||
Amicus Therapeutics, Inc. (a) | 496,772 | 6,478 | |||||||||
Apellis Pharmaceuticals, Inc. (a) | 113,389 | 5,979 | |||||||||
Ardelyx, Inc. (a) | 738,059 | 2,162 | |||||||||
See notes to financial statements.
5
| USAA Mutual Funds Trust USAA Science & Technology Fund | Schedule of Portfolio Investments — continued January 31, 2023 | ||||||
(Amounts in Thousands, Except for Shares) (Unaudited)
Security Description | Shares | Value | |||||||||
Athenex, Inc. (a) | 2,812,296 | $ | 514 | ||||||||
AtriCure, Inc. (a) | 2,686 | 116 | |||||||||
Avantor, Inc. (a) | 4,546 | 109 | |||||||||
Baxter International, Inc. | 1,102 | 50 | |||||||||
Becton Dickinson and Co. | 1,822 | 460 | |||||||||
Biogen, Inc. (a) | 691 | 201 | |||||||||
Biohaven Ltd. (a) | 160,900 | 3,072 | |||||||||
BioMarin Pharmaceutical, Inc. (a) | 62,691 | 7,231 | |||||||||
Bio-Techne Corp. | 1,233 | 98 | |||||||||
Blueprint Medicines Corp. (a) | 777 | 36 | |||||||||
Boston Scientific Corp. (a) | 12,617 | 584 | |||||||||
Bristol-Myers Squibb Co. | 7,167 | 521 | |||||||||
Cara Therapeutics, Inc. (a) | 321,160 | 3,751 | |||||||||
Celldex Therapeutics, Inc. (a) | 1,926 | 85 | |||||||||
Centene Corp. (a) | 8,736 | 666 | |||||||||
Chinook Therapeutics, Inc. (a) | 237,927 | 6,012 | |||||||||
Cytokinetics, Inc. (a) | 3,193 | 136 | |||||||||
Danaher Corp. | 3,917 | 1,036 | |||||||||
Day One Biopharmaceuticals, Inc. (a) | 62,456 | 1,360 | |||||||||
Dexcom, Inc. (a) | 3,216 | 344 | |||||||||
Edwards Lifesciences Corp. (a) | 5,423 | 416 | |||||||||
Elanco Animal Health, Inc. (a) | 2,797 | 38 | |||||||||
Eli Lilly & Co. | 4,687 | 1,613 | |||||||||
Encompass Health Corp. | 3,024 | 189 | |||||||||
Equillium, Inc. (a) | 991,921 | 1,022 | |||||||||
Exact Sciences Corp. (a) | 61,073 | 4,124 | |||||||||
FibroGen, Inc. (a) | 151,684 | 3,580 | |||||||||
Glaukos Corp. (a) | 2,586 | 127 | |||||||||
HCA Healthcare, Inc. | 2,041 | 521 | |||||||||
Hologic, Inc. (a) | 2,773 | 226 | |||||||||
Humana, Inc. | 1,438 | 736 | |||||||||
Ideaya Biosciences, Inc. (a) | 81,737 | 1,392 | |||||||||
IGM Biosciences, Inc. (a) | 281,720 | 6,403 | |||||||||
Illumina, Inc. (a) | 1,298 | 278 | |||||||||
Immunovant, Inc. (a) | 150,765 | 2,679 | |||||||||
Inari Medical, Inc. (a) | 1,777 | 101 | |||||||||
Inhibrx, Inc. (a) | 66,252 | 1,656 | |||||||||
Insulet Corp. (a) | 833 | 239 | |||||||||
Intra-Cellular Therapies, Inc. (a) | 2,720 | 130 | |||||||||
Ironwood Pharmaceuticals, Inc. (a) | 9,908 | 114 | |||||||||
Karuna Therapeutics, Inc. (a) | 705 | 141 | |||||||||
Krystal Biotech, Inc. (a) | 86,780 | 7,213 | |||||||||
Kura Oncology, Inc. (a) | 86,077 | 1,190 | |||||||||
Laboratory Corp. of America Holdings | 920 | 232 | |||||||||
Madrigal Pharmaceuticals, Inc. (a) | 7,319 | 2,110 | |||||||||
Merck & Co., Inc. | 10,927 | 1,174 | |||||||||
Mettler-Toledo International, Inc. (a) | 2,505 | 3,840 | |||||||||
Moderna, Inc. (a) | 70,952 | 12,492 | |||||||||
Molina Healthcare, Inc. (a) | 1,424 | 444 | |||||||||
NanoString Technologies, Inc. (a) | 11,144 | 118 | |||||||||
See notes to financial statements.
6
| USAA Mutual Funds Trust USAA Science & Technology Fund | Schedule of Portfolio Investments — continued January 31, 2023 | ||||||
(Amounts in Thousands, Except for Shares) (Unaudited)
Security Description | Shares | Value | |||||||||
Nuvalent, Inc. Class A (a) | 86,822 | $ | 2,626 | ||||||||
ORIC Pharmaceuticals, Inc. (a) | 370,967 | 2,100 | |||||||||
Owens & Minor, Inc. (a) | 3,374 | 67 | |||||||||
Pacific Biosciences of California, Inc. (a) | 147,257 | 1,633 | |||||||||
Pfizer, Inc. | 30,239 | 1,335 | |||||||||
Pliant Therapeutics, Inc. (a) | 58,076 | 2,035 | |||||||||
Prometheus Biosciences, Inc. (a) | 38,161 | 4,337 | |||||||||
Provention Bio, Inc. (a) | 138,732 | 1,201 | |||||||||
PTC Therapeutics, Inc. (a) | 33,877 | 1,555 | |||||||||
QuidelOrtho Corp. (a) | 821 | 70 | |||||||||
Rain Oncology, Inc. (a) | 149,555 | 1,343 | |||||||||
Reata Pharmaceuticals, Inc. Class A (a) | 29,015 | 1,257 | |||||||||
Regeneron Pharmaceuticals, Inc. (a) | 335 | 254 | |||||||||
Regulus Therapeutics, Inc. (a) | 627,009 | 903 | |||||||||
Repligen Corp. (a) | 100 | 19 | |||||||||
Replimune Group, Inc. (a) | 192,003 | 5,347 | |||||||||
Revance Therapeutics, Inc. (a) | 201,250 | 6,979 | |||||||||
REVOLUTION Medicines, Inc. (a) | 149,946 | 4,010 | |||||||||
Rocket Pharmaceuticals, Inc. (a) | 139,305 | 3,027 | |||||||||
Sage Therapeutics, Inc. (a) | 36,225 | 1,606 | |||||||||
Sarepta Therapeutics, Inc. (a) | 82,228 | 10,276 | |||||||||
Seagen, Inc. (a) | 970 | 135 | |||||||||
SpringWorks Therapeutics, Inc. (a) | 161,298 | 5,065 | |||||||||
Stryker Corp. | 2,416 | 613 | |||||||||
Surgery Partners, Inc. (a) | 4,928 | 164 | |||||||||
Syndax Pharmaceuticals, Inc. (a) | 69,084 | 1,983 | |||||||||
Syneos Health, Inc. (a) | 6,209 | 223 | |||||||||
Teleflex, Inc. | 812 | 198 | |||||||||
Ultragenyx Pharmaceutical, Inc. (a) | 979 | 44 | |||||||||
UnitedHealth Group, Inc. | 4,296 | 2,144 | |||||||||
Vaxcyte, Inc. (a) | 142,322 | 6,454 | |||||||||
Veeva Systems, Inc. Class A (a) | 35,108 | 5,988 | |||||||||
Ventyx Biosciences, Inc. (a) | 84,307 | 3,541 | |||||||||
Veracyte, Inc. (a) | 3,568 | 90 | |||||||||
Vertex Pharmaceuticals, Inc. (a) | 120,020 | 38,778 | |||||||||
Waters Corp. (a) | 568 | 187 | |||||||||
Zoetis, Inc. | 3,548 | 587 | |||||||||
Zymeworks, Inc. (a) (d) | 153,669 | 1,452 | |||||||||
232,506 | |||||||||||
Information Technology (55.5%): | |||||||||||
Advanced Micro Devices, Inc. (a) | 84,615 | 6,359 | |||||||||
Ambarella, Inc. (a) | 145,553 | 13,076 | |||||||||
Applied Materials, Inc. | 119,911 | 13,369 | |||||||||
AppLovin Corp. Class A (a) (d) | 179,058 | 2,274 | |||||||||
Arista Networks, Inc. (a) | 39,108 | 4,928 | |||||||||
Backblaze, Inc. Class A (a) | 141,376 | 1,009 | |||||||||
Bentley Systems, Inc. Class B | 27,598 | 1,078 | |||||||||
Block, Inc. (a) | 66,781 | 5,457 | |||||||||
Calix, Inc. (a) | 76,868 | 4,046 | |||||||||
Ceridian HCM Holding, Inc. (a) | 84,500 | 6,108 | |||||||||
See notes to financial statements.
7
| USAA Mutual Funds Trust USAA Science & Technology Fund | Schedule of Portfolio Investments — continued January 31, 2023 | ||||||
(Amounts in Thousands, Except for Shares) (Unaudited)
Security Description | Shares | Value | |||||||||
Dropbox, Inc. Class A (a) | 163,775 | $ | 3,805 | ||||||||
Dynatrace, Inc. (a) | 168,061 | 6,459 | |||||||||
Extreme Networks, Inc. (a) | 393,268 | 7,091 | |||||||||
F5, Inc. (a) | 26,798 | 3,957 | |||||||||
Fair Isaac Corp. (a) | 17,000 | 11,321 | |||||||||
Five9, Inc. (a) | 16,122 | 1,270 | |||||||||
FleetCor Technologies, Inc. (a) | 17,076 | 3,566 | |||||||||
Genpact Ltd. | 85,051 | 4,021 | |||||||||
Gitlab, Inc. Class A (a) | 97,715 | 4,828 | |||||||||
Global Payments, Inc. | 47,830 | 5,391 | |||||||||
GoDaddy, Inc. Class A (a) | 177,704 | 14,595 | |||||||||
Guidewire Software, Inc. (a) | 24,375 | 1,785 | |||||||||
Harmonic, Inc. (a) | 422,037 | 5,558 | |||||||||
HashiCorp, Inc. Class A (a) | 64,992 | 2,091 | |||||||||
HubSpot, Inc. (a) | 5,595 | 1,942 | |||||||||
Impinj, Inc. (a) | 173,619 | 22,532 | |||||||||
Intel Corp. | 74,002 | 2,091 | |||||||||
KLA Corp. | 15,763 | 6,187 | |||||||||
Lam Research Corp. | 24,309 | 12,157 | |||||||||
Lattice Semiconductor Corp. (a) | 284,383 | 21,553 | |||||||||
MACOM Technology Solutions Holdings, Inc. (a) | 406,178 | 27,222 | |||||||||
Marvell Technology, Inc. | 291,706 | 12,587 | |||||||||
MaxLinear, Inc. (a) | 177,197 | 7,301 | |||||||||
Micron Technology, Inc. | 74,416 | 4,487 | |||||||||
Microsoft Corp. | 361,036 | 89,468 | |||||||||
Monolithic Power Systems, Inc. | 35,850 | 15,292 | |||||||||
NVIDIA Corp. | 78,268 | 15,291 | |||||||||
Okta, Inc. (a) | 17,621 | 1,297 | |||||||||
ON Semiconductor Corp. (a) | 185,913 | 13,655 | |||||||||
Palo Alto Networks, Inc. (a) | 18,123 | 2,875 | |||||||||
Paycom Software, Inc. (a) | 47,358 | 15,341 | |||||||||
PayPal Holdings, Inc. (a) | 41,327 | 3,368 | |||||||||
Qualtrics International, Inc. Class A (a) | 100,764 | 1,589 | |||||||||
RingCentral, Inc. Class A (a) | 110,066 | 4,296 | |||||||||
Salesforce, Inc. (a) | 81,346 | 13,664 | |||||||||
Samsara, Inc. Class A (a) | 345,797 | 4,717 | |||||||||
Semtech Corp. (a) | 155,185 | 5,126 | |||||||||
SentinelOne, Inc. Class A (a) | 63,006 | 951 | |||||||||
ServiceNow, Inc. (a) | 46,939 | 21,363 | |||||||||
Shift4 Payments, Inc. Class A (a) | 106,448 | 6,817 | |||||||||
Snowflake, Inc. Class A (a) | 65,212 | 10,202 | |||||||||
Sprout Social, Inc. Class A (a) | 128,696 | 8,233 | |||||||||
Squarespace, Inc. Class A (a) | 73,546 | 1,745 | |||||||||
Texas Instruments, Inc. | 67,755 | 12,007 | |||||||||
Twilio, Inc. Class A (a) | 82,594 | 4,942 | |||||||||
Varonis Systems, Inc. (a) | 693,805 | 17,928 | |||||||||
VeriSign, Inc. (a) | 10,390 | 2,266 | |||||||||
Visa, Inc. Class A | 110,334 | 25,400 | |||||||||
WEX, Inc. (a) | 25,557 | 4,727 | |||||||||
See notes to financial statements.
8
| USAA Mutual Funds Trust USAA Science & Technology Fund | Schedule of Portfolio Investments — continued January 31, 2023 | ||||||
(Amounts in Thousands, Except for Shares) (Unaudited)
Security Description | Shares | Value | |||||||||
Wolfspeed, Inc. (a) | 45,431 | $ | 3,499 | ||||||||
Workday, Inc. Class A (a) | 23,344 | 4,235 | |||||||||
561,795 | |||||||||||
920,404 | |||||||||||
Total Common Stocks (Cost $752,118) | 997,985 | ||||||||||
Rights (0.0%) (b) | |||||||||||
United States (0.0%): | |||||||||||
Health Care (0.0%): | |||||||||||
Abiomed, Inc. (a) (e) | 145 | — | (f) | ||||||||
Contra Clementia Pharmaceuticals (a) (e) | 14,251 | — | (f) | ||||||||
— | (f) | ||||||||||
Total Rights (Cost $19) | — | (f) | |||||||||
Warrants (0.0%) (b) | |||||||||||
United States (0.0%): | |||||||||||
Health Care (0.0%): | |||||||||||
Athenex, Inc. (a) | 5,153,482 | — | (f) | ||||||||
Nuvation Bio, Inc. (a) | 163,420 | 26 | |||||||||
Regulus Therapeutics, Inc. (a) (g) (i) | 470,257 | — | (f) | ||||||||
26 | |||||||||||
Total Warrants (Cost $640) | 26 | ||||||||||
Collateral for Securities Loaned (0.2%)^ | |||||||||||
United States (0.2%): | |||||||||||
| Goldman Sachs Financial Square Government Fund, Institutional Shares, 4.22% (h) | 534,235 | 535 | |||||||||
HSBC U.S. Government Money Market Fund, Institutional Shares, 4.21% (h) | 534,235 | 534 | |||||||||
Invesco Government & Agency Portfolio, Institutional Shares, 4.31% (h) | 534,235 | 534 | |||||||||
| Morgan Stanley Institutional Liquidity Government Portfolio, Institutional Shares, 4.14% (h) | 534,235 | 534 | |||||||||
Total Collateral for Securities Loaned (Cost $2,137) | 2,137 | ||||||||||
Total Investments (Cost $754,914) — 98.8% | 1,000,148 | ||||||||||
Other assets in excess of liabilities — 1.2% | 12,301 | ||||||||||
NET ASSETS — 100.00% | $ | 1,012,449 | |||||||||
At January 31, 2023, the Fund's investments in foreign securities were 7.7% of net assets.
^ Purchased with cash collateral from securities on loan.
(a) Non-income producing security.
(b) Amount represents less than 0.05% of net assets.
See notes to financial statements.
9
| USAA Mutual Funds Trust USAA Science & Technology Fund | Schedule of Portfolio Investments — continued January 31, 2023 | ||||||
(Unaudited)
(c) Rule 144A security or other security that is restricted as to resale to institutional investors. As of January 31, 2023, the fair value of these securities was $1,706 thousands and amounted to 0.2% of net assets.
(d) All or a portion of this security is on loan.
(e) Security was fair valued based upon procedures approved by the Board of Trustees and represents less than 0.05% of net assets as of January 31, 2023. This security is classified as Level 3 within the fair value hierarchy. (See Note 2 in the Notes to Financial Statements)
(f) Rounds to less than $1 thousand.
(g) Restricted security that is not registered under the Securities Act of 1933.
(h) Rate disclosed is the daily yield on January 31, 2023.
(i) The following table details the earliest acquisition date and cost of the Fund's restricted securities at January 31, 2023 (amount in thousand):
Security Name | Acquisition Date | Cost | |||||||||
Regulus Therapeutics, Inc. | 12/03/2020 | $ | 588 | ||||||||
ADR — American Depositary Receipt
PLC — Public Limited Company
See notes to financial statements.
10
USAA Mutual Funds Trust | Statement of Assets and Liabilities January 31, 2023 | ||||||
(Amounts in Thousands, Except Per Share Amounts) (Unaudited)
| USAA Science & Technology Fund | |||||||
Assets: | |||||||
Investments, at value (Cost $754,914) | $ | 1,000,148 | (a) | ||||
Foreign currency, at value (Cost $188) | 196 | ||||||
Cash | 11,466 | ||||||
Receivables: | |||||||
Interest and dividends | 120 | ||||||
Capital shares issued | 98 | ||||||
Investments sold | 4,165 | ||||||
Reclaims | 8 | ||||||
From Adviser | 17 | ||||||
Prepaid expenses | 9 | ||||||
Total Assets | 1,016,227 | ||||||
Liabilities: | |||||||
Payables: | |||||||
Collateral received on loaned securities | 2,137 | ||||||
Investments purchased | 525 | ||||||
Capital shares redeemed | 250 | ||||||
Accrued expenses and other payables: | |||||||
Investment advisory fees | 536 | ||||||
Administration fees | 123 | ||||||
Custodian fees | 13 | ||||||
Transfer agent fees | 100 | ||||||
Compliance fees | 1 | ||||||
Trustees' fees | 1 | ||||||
| 12b-1 fees | 5 | ||||||
Other accrued expenses | 87 | ||||||
Total Liabilities | 3,778 | ||||||
Net Assets: | |||||||
Capital | 959,032 | ||||||
Total accumulated earnings/(loss) | 53,417 | ||||||
Net Assets | $ | 1,012,449 | |||||
Net Assets | |||||||
Fund Shares | $ | 963,069 | |||||
Class A | 49,380 | ||||||
Total | $ | 1,012,449 | |||||
Shares (unlimited number of shares authorized with no par value): | |||||||
Fund Shares | 50,631 | ||||||
Class A | 2,760 | ||||||
Total | 53,391 | ||||||
Net asset value, offering and redemption price per share: (b) | |||||||
Fund Shares | $ | 19.02 | |||||
Class A | 17.89 | ||||||
Maximum Sales Charge — Class A | 5.75 | % | |||||
| Maximum offering price (100%/(100%-maximum sales charge) of net asset value adjusted to the nearest cent) per share — Class A | $ | 18.98 | |||||
(a) Includes $1,507 thousand of securities on loan.
(b) Per share amount may not recalculate due to rounding of net assets and/or shares outstanding.
See notes to financial statements.
11
USAA Mutual Funds Trust | Statement of Operations For the Six Months Ended January 31, 2023 | ||||||
(Amounts in Thousands) (Unaudited)
| USAA Science & Technology Fund | |||||||
Investment Income: | |||||||
Dividends | $ | 1,479 | |||||
Interest | 159 | ||||||
Securities lending (net of fees) | 163 | ||||||
Foreign tax withholding | (8 | ) | |||||
Total Income | 1,793 | ||||||
Expenses: | |||||||
Investment advisory fees | 3,347 | ||||||
Administration fees — Fund Shares | 726 | ||||||
Administration fees — Class A | 38 | ||||||
Sub-Administration fees | 20 | ||||||
| 12b-1 fees — Class A | 63 | ||||||
Custodian fees | 34 | ||||||
Transfer agent fees — Fund Shares | 564 | ||||||
Transfer agent fees — Class A | 25 | ||||||
Trustees' fees | 23 | ||||||
Compliance fees | 5 | ||||||
Legal and audit fees | 51 | ||||||
State registration and filing fees | 30 | ||||||
Interfund lending fees | 3 | ||||||
Other expenses | 93 | ||||||
Total Expenses | 5,022 | ||||||
Expenses waived/reimbursed by Adviser | (26 | ) | |||||
Net Expenses | 4,996 | ||||||
Net Investment Income (Loss) | (3,203 | ) | |||||
Realized/Unrealized Gains (Losses) from Investments: | |||||||
| Net realized gains (losses) from investment securities and foreign currency transactions | (73,205 | ) | |||||
| Net change in unrealized appreciation/depreciation on investment securities and foreign currency translations | 25,153 | ||||||
Net realized/unrealized gains (losses) on investments | (48,052 | ) | |||||
Change in net assets resulting from operations | $ | (51,255 | ) | ||||
See notes to financial statements.
12
USAA Mutual Funds Trust | Statements of Changes in Net Assets | ||||||
(Amounts in Thousands)
USAA Science & Technology Fund | |||||||||||
| Six Months Ended January 31, 2023 (Unaudited) | Year Ended July 31, 2022 | ||||||||||
From Investments: | |||||||||||
Operations: | |||||||||||
Net Investment Income (Loss) | $ | (3,203 | ) | $ | (10,212 | ) | |||||
Net realized gains (losses) | (73,205 | ) | (89,350 | ) | |||||||
Net change in unrealized appreciation/depreciation | 25,153 | (608,567 | ) | ||||||||
Change in net assets resulting from operations | (51,255 | ) | (708,129 | ) | |||||||
Distributions to Shareholders: | |||||||||||
Fund Shares | — | (232,742 | ) | ||||||||
Class A | — | (13,315 | ) | ||||||||
Change in net assets resulting from distributions to shareholders | — | (246,057 | ) | ||||||||
Change in net assets resulting from capital transactions | (59,662 | ) | 44,830 | ||||||||
Change in net assets | (110,917 | ) | (909,356 | ) | |||||||
Net Assets: | |||||||||||
Beginning of period | 1,123,366 | 2,032,722 | |||||||||
End of period | $ | 1,012,449 | $ | 1,123,366 | |||||||
Capital Transactions: | |||||||||||
Fund Shares | |||||||||||
Proceeds from shares issued | $ | 22,061 | $ | 82,344 | |||||||
Distributions reinvested | — | 228,857 | |||||||||
Cost of shares redeemed | (77,440 | ) | (263,314 | ) | |||||||
Total Fund Shares | $ | (55,379 | ) | $ | 47,887 | ||||||
Class A | |||||||||||
Proceeds from shares issued | $ | 434 | $ | 2,968 | |||||||
Distributions reinvested | — | 12,974 | |||||||||
Cost of shares redeemed | (4,717 | ) | (18,999 | ) | |||||||
Total Class A | $ | (4,283 | ) | $ | (3,057 | ) | |||||
Change in net assets resulting from capital transactions | $ | (59,662 | ) | $ | 44,830 | ||||||
Share Transactions: | |||||||||||
Fund Shares | |||||||||||
Issued | 1,198 | 3,009 | |||||||||
Reinvested | — | 7,988 | |||||||||
Redeemed | (4,255 | ) | (9,756 | ) | |||||||
Total Fund Shares | (3,057 | ) | 1,241 | ||||||||
Class A | |||||||||||
Issued | 25 | 113 | |||||||||
Reinvested | — | 480 | |||||||||
Redeemed | (275 | ) | (710 | ) | |||||||
Total Class A | (250 | ) | (117 | ) | |||||||
Change in Shares | (3,307 | ) | 1,124 | ||||||||
See notes to financial statements.
13
USAA Mutual Funds Trust | Financial Highlights | ||||||
For a Share Outstanding Throughout Each Period
USAA Science & Technology Fund | |||||||||||||||||||||||||||
Fund Shares | |||||||||||||||||||||||||||
| Six Months Ended January 31, 2023 (Unaudited) | Year Ended July 31, 2022 | Year Ended July 31, 2021 | Year Ended July 31, 2020 | Year Ended July 31, 2019 | Year Ended July 31, 2018 | ||||||||||||||||||||||
| Net Asset Value, Beginning of Period | $ | 19.87 | $ | 36.68 | $ | 28.93 | $ | 28.39 | $ | 29.19 | $ | 26.89 | |||||||||||||||
Investment Activities: | |||||||||||||||||||||||||||
Net investment income (loss) | (0.06 | )(a) | (0.17 | )(a) | (0.26 | )(a) | (0.17 | )(a) | 0.01 | — | (b) | ||||||||||||||||
| Net realized and unrealized gains (losses) | (0.79 | ) | (12.03 | ) | 9.92 | 7.26 | 2.83 | 4.50 | |||||||||||||||||||
| Total from Investment Activities | (0.85 | ) | (12.20 | ) | 9.66 | 7.09 | 2.84 | 4.50 | |||||||||||||||||||
Distributions to Shareholders from: | |||||||||||||||||||||||||||
Net realized gains | — | (4.61 | ) | (1.91 | ) | (6.55 | ) | (3.64 | ) | (2.20 | ) | ||||||||||||||||
Total Distributions | — | (4.61 | ) | (1.91 | ) | (6.55 | ) | (3.64 | ) | (2.20 | ) | ||||||||||||||||
Net Asset Value, End of Period | $ | 19.02 | $ | 19.87 | $ | 36.68 | $ | 28.93 | $ | 28.39 | $ | 29.19 | |||||||||||||||
Total Return (c) (d) | (4.33 | )% | (37.07 | )% | 33.71 | % | 30.85 | % | 12.79 | % | 17.55 | % | |||||||||||||||
Ratios to Average Net Assets: | |||||||||||||||||||||||||||
Net Expenses (e) (f) (g) (h) | 0.97 | % | 0.95 | % | 0.99 | % | 1.04 | % | 1.02 | %(i) | 1.04 | %(i) | |||||||||||||||
Net Investment Income (Loss) (e) | (0.62 | )% | (0.64 | )% | (0.76 | )% | (0.66 | )% | (0.39 | )% | (0.31 | )% | |||||||||||||||
Gross Expenses (e) (f) | 0.97 | % | 0.95 | % | 0.99 | % | 1.04 | % | 1.02 | %(i) | 1.04 | %(i) | |||||||||||||||
Supplemental Data: | |||||||||||||||||||||||||||
Net Assets at end of period (000's) | $ | 963,069 | $ | 1,067,016 | $ | 1,923,477 | $ | 1,559,222 | $ | 1,383,956 | $ | 1,328,080 | |||||||||||||||
Portfolio Turnover (c) (j) | 34 | % | 46 | % | 43 | % | 44 | % | 109 | %(k) | 56 | % | |||||||||||||||
(a) Per share net investment income (loss) has been calculated using the average daily shares method.
(b) Amount is less than $0.005 per share.
(c) Not annualized for periods less than one year.
(d) Assumes reinvestment of all net investment income and realized capital gain distributions, if any, during the period. Includes adjustments in accordance with U.S. Generally Accepted Accounting Principles and could differ from the Lipper reported return.
(e) Annualized for periods less than one year.
(f) Does not include acquired fund fees and expenses, if any.
(g) The net expense ratio may not correlate to the applicable expense limits in place during the period since the current contractual expense limitation is applied for a period beginning July 1, 2019 and in effect through November 30, 2023, instead of coinciding with the Fund's fiscal year end. Details of the current contractual expense limitation in effect can be found in Note 4 of the accompanying Notes to Financial Statements.
(h) From the period beginning July 1, 2019, the amount of any waivers or reimbursements and the amount of any recoupment is calculated without regard to the impact of any performance adjustment to the Fund's management fee.
(i) Reflects total annual operating expenses before reduction of any expenses paid indirectly. The share's expenses paid indirectly decreased the expense ratio by less than 0.01%.
(j) Portfolio turnover is calculated on the basis of the Fund as a whole without distinguishing between the classes of shares.
(k) Reflects increased trading activity due to transition or asset allocation shift.
(continues on next page)
See notes to financial statements.
14
USAA Mutual Funds Trust | Financial Highlights — continued | ||||||
For a Share Outstanding Throughout Each Period
USAA Science & Technology Fund | |||||||||||||||||||||||||||
Class A | |||||||||||||||||||||||||||
| Six Months Ended January 31, 2023 (Unaudited) | Year Ended July 31, 2022 | Year Ended July 31, 2021 | Year Ended July 31, 2020 | Year Ended July 31, 2019 | Year Ended July 31, 2018 | ||||||||||||||||||||||
| Net Asset Value, Beginning of Period | $ | 18.72 | $ | 34.93 | $ | 27.71 | $ | 27.53 | $ | 28.49 | $ | 26.36 | |||||||||||||||
Investment Activities: | |||||||||||||||||||||||||||
Net investment income (loss) | (0.08 | )(a) | (0.24 | )(a) | (0.35 | )(a) | (0.23 | )(a) | (0.07 | ) | (0.08 | ) | |||||||||||||||
| Net realized and unrealized gains (losses) | (0.75 | ) | (11.36 | ) | 9.48 | 6.96 | 2.75 | 4.41 | |||||||||||||||||||
| Total from Investment Activities | (0.83 | ) | (11.60 | ) | 9.13 | 6.73 | 2.68 | 4.33 | |||||||||||||||||||
Distributions to Shareholders from: | |||||||||||||||||||||||||||
Net realized gains | — | (4.61 | ) | (1.91 | ) | (6.55 | ) | (3.64 | ) | (2.20 | ) | ||||||||||||||||
Total Distributions | — | (4.61 | ) | (1.91 | ) | (6.55 | ) | (3.64 | ) | (2.20 | ) | ||||||||||||||||
Net Asset Value, End of Period | $ | 17.89 | $ | 18.72 | $ | 34.93 | $ | 27.71 | $ | 27.53 | $ | 28.49 | |||||||||||||||
| Total Return (excludes sales charge) (b) (c) | (4.43 | )% | (37.26 | )% | 33.27 | % | 30.47 | % | 12.52 | % | 17.24 | % | |||||||||||||||
Ratios to Average Net Assets: | |||||||||||||||||||||||||||
Net Expenses (d) (e) (f) (g) | 1.24 | % | 1.24 | % | 1.30 | % | 1.33 | % | 1.29 | %(h)(i) | 1.31 | %(h)(j) | |||||||||||||||
Net Investment Income (Loss) (e) | (0.89 | )% | (0.93 | )% | (1.07 | )% | (0.94 | )% | (0.65 | )% | (0.57 | )% | |||||||||||||||
Gross Expenses (d) (e) | 1.25 | % | 1.24 | % | 1.30 | % | 1.33 | % | 1.29 | %(h) | 1.31 | %(h) | |||||||||||||||
Supplemental Data: | |||||||||||||||||||||||||||
Net Assets at end of period (000's) | $ | 49,380 | $ | 56,350 | $ | 109,245 | $ | 93,813 | $ | 104,773 | $ | 115,229 | |||||||||||||||
Portfolio Turnover (c) (k) | 34 | % | 46 | % | 43 | % | 44 | % | 109 | %(l) | 56 | % | |||||||||||||||
(a) Per share net investment income (loss) has been calculated using the average daily shares method.
(b) Not annualized for periods less than one year.
(c) Assumes reinvestment of all net investment income and realized capital gain distributions, if any, during the period. Includes adjustments in accordance with U.S. Generally Accepted Accounting Principles and could differ from the Lipper reported return.
(d) Annualized for periods less than one year.
(e) Does not include acquired fund fees and expenses, if any.
(f) The net expense ratio may not correlate to the applicable expense limits in place during the period since the current contractual expense limitation is applied for a period beginning July 1, 2019 and in effect through November 30, 2023, instead of coinciding with the Fund's fiscal year end. Details of the current contractual expense limitation in effect can be found in Note 4 of the accompanying Notes to Financial Statements.
(g) From the period beginning July 1, 2019, the amount of any waivers or reimbursements and the amount of any recoupment is calculated without regard to the impact of any performance adjustment to the Fund's management fee.
(h) Reflects total annual operating expenses before reductions of any expenses paid indirectly. The share's expenses paid indirectly decreased the expense ratio by less than 0.01%.
(i) Prior to December 1, 2018, USAA Asset Management Company ("AMCO") (previous Investment Adviser) voluntarily agreed to limit the annual expenses of Class A to 1.35% of the Class A average daily net assets.
(j) Prior to December 1, 2017, AMCO voluntarily agreed to limit the annual expenses of Class A to 1.35% of the Class A average daily net assets.
(k) Portfolio turnover is calculated on the basis of the Fund as a whole without distinguishing between the classes of shares.
(l) Reflects increased trading activity due to transition or asset allocation shift.
See notes to financial statements.
15
USAA Mutual Funds Trust | Notes to Financial Statements January 31, 2023 | ||||||
(Unaudited)
1. Organization:
USAA Mutual Funds Trust (the "Trust") is organized as a Delaware statutory trust and is registered under the Investment Company Act of 1940, as amended (the "1940 Act"), as an open-end investment company. The Trust is comprised of 45 funds and is authorized to issue an unlimited number of shares, which are units of beneficial interest with no par value.
The accompanying financial statements are those of the USAA Science & Technology Fund (the "Fund"). The Fund offers two classes of shares: Fund Shares and Class A. The Fund is classified as diversified under the 1940 Act.
Each class of shares of the Fund has substantially identical rights and privileges, except with respect to sales charges, fees paid under distribution plans, expenses allocable exclusively to each class of shares, voting rights on matters solely affecting a single class of shares, and the exchange privilege of each class of shares.
Victory Capital Management ("VCM" or the "Adviser") is an indirect wholly owned subsidiary of Victory Capital Holdings, Inc., a publicly traded Delaware corporation, and a wholly owned direct subsidiary of Victory Capital Operating, LLC.
Under the Trust's organizational documents, its officers and trustees are indemnified against certain liabilities arising out of the performance of their duties to the Fund. In addition, in the normal course of business, the Fund enters into contracts with its vendors and others that provide for general indemnifications. The Fund's maximum exposure under these arrangements is unknown, as this would involve future claims that may be made against the Fund. However, based on experience, the Fund expects that risk of loss to be remote.
2. Significant Accounting Policies:
The following is a summary of significant accounting policies followed by the Trust in the preparation of its financial statements. The policies are in conformity with U.S. Generally Accepted Accounting Principles ("GAAP"). The preparation of financial statements in accordance with GAAP requires management to make estimates and assumptions that affect the reported amounts of assets and liabilities and disclosure of contingent assets and liabilities at the date of the financial statements and the reported amounts of income and expenses for the period. Actual results could differ from those estimates. The Fund follows the specialized accounting and reporting requirements under GAAP that are applicable to investment companies under Accounting Standards Codification Topic 946.
Investment Valuation:
The Fund records investments at fair value. Fair value is defined as the price that would be received to sell an asset or paid to transfer a liability in an orderly transaction between market participants at the measurement date.
The valuation techniques described below maximize the use of observable inputs and minimize the use of unobservable inputs in determining fair value. The inputs used for valuing the Fund's investments are summarized in the three broad levels listed below:
• Level 1 — quoted prices (unadjusted) in active markets for identical securities
• Level 2 — other significant observable inputs (including quoted prices for similar securities, interest rates, or credit spreads, applicable to those securities, etc.)
• Level 3 — significant unobservable inputs (including the Adviser's assumptions in determining the fair value of investments)
Changes in valuation techniques may result in transfers in or out of an assigned level within the disclosure hierarchy. The inputs or methodologies used for valuation techniques are not necessarily an indication of the risks associated with entering into those investments.
16
USAA Mutual Funds Trust | Notes to Financial Statements — continued January 31, 2023 | ||||||
(Unaudited)
The Adviser, appointed as the valuation designee by the Trust's Board of Trustees' (the "Board"), has established the Pricing and Liquidity Committee (the "Committee"), and subject to the Board oversight, the Committee administers and oversees the Fund's valuation policies and procedures, which are approved by the Board.
Portfolio securities listed or traded on securities exchanges, including Exchange-Traded Funds ("ETFs"), American Depositary Receipts, and Rights, are valued at the closing price on the exchange or system where the security is principally traded, if available, or at the Nasdaq Official Closing Price. If there have been no sales for that day on the exchange or system, then a security is valued at the last available bid quotation on the exchange or system where the security is principally traded. In each of these situations, valuations are typically categorized as Level 1 in the fair value hierarchy.
Investments in open-end investment companies, other than ETFs, are valued at their net asset value ("NAV"). These valuations are typically categorized as Level 1 in the fair value hierarchy.
In the event that price quotations or valuations are not readily available, investments are valued at fair value in accordance with procedures established by and under the general supervision and responsibility of the Board. These valuations are typically categorized as Level 2 or Level 3 in the fair value hierarchy, based on the observability of inputs used to determine the fair value. The effect of fair value pricing is that securities may not be priced on the basis of quotations from the primary market in which they are traded, and the actual price realized from the sale of a security may differ materially from the fair value price. Valuing these securities at fair value is intended to cause the Fund's NAV to be more reliable than it otherwise would be.
In accordance with procedures adopted by the Board, fair value pricing may be used if events materially affecting the value of foreign securities occur between the time the exchange on which they are traded closes and the time the Fund's NAV is calculated. The Fund uses a systematic valuation model, provided daily by an independent third party to fair value its international equity securities. The valuations are categorized as Level 2 in the fair value hierarchy.
A summary of the valuations as of January 31, 2023, based upon the three levels defined above, is included in the table below while the breakdown, by category, of investments is disclosed on the Schedule of Portfolio Investments (amounts in thousands):
Level 1 | Level 2 | Level 3 | Total | ||||||||||||||||
Common Stocks | $ | 978,758 | $ | 19,227 | $ | — | $ | 997,985 | |||||||||||
Rights | — | — | — | (a) | — | (a) | |||||||||||||
Warrants | 26 | — | — | 26 | |||||||||||||||
Collateral for Securities Loaned | 2,137 | — | — | 2,137 | |||||||||||||||
Total | $ | 980,921 | $ | 19,227 | $ | — | (a) | $ | 1,000,148 | ||||||||||
(a) Zero market value securities.
As of January 31, 2023, there were no significant transfers into/out of Level 3.
Investment Companies:
Open-End Funds:
The Fund may invest in portfolios of open-end investment companies. These investment companies value securities in their portfolios for which market quotations are readily available at their market values (generally the last reported sale price) and all other securities and assets at their fair value by the methods established by the board of directors of the underlying funds.
17
USAA Mutual Funds Trust | Notes to Financial Statements — continued January 31, 2023 | ||||||
(Unaudited)
Derivative Instruments:
Foreign Exchange Currency Contracts:
The Fund may enter into foreign exchange currency contracts to convert U.S. dollars to and from various foreign currencies. A foreign exchange currency contract is an obligation by the Fund to purchase or sell a specific currency at a future date at a price (in U.S. dollars) set at the time of the contract. The Fund does not engage in "cross-currency" foreign exchange contracts (i.e., contracts to purchase or sell one foreign currency in exchange for another foreign currency). The Fund's foreign exchange currency contracts might be considered spot contracts (typically a contract of one week or less) or forward contracts (typically a contract term over one week). A spot contract is entered into for purposes of hedging against foreign currency fluctuations relating to a specific portfolio transaction, such as the delay between a security transaction trade date and settlement date. Forward contracts are entered into for purposes of hedging portfolio holdings or concentrations of such holdings. Each foreign exchange currency contract is adjusted daily by the prevailing spot or forward rate of the underlying currency, and any appreciation or depreciation is recorded for financial statement purposes as unrealized until the contract settlement date, at which time the Fund records realized gains or losses equal to the difference between the value of a contract at the time it was opened and the value at the time it was closed. The Fund could be exposed to risk if a counterparty is unable to meet the terms of a foreign exchange currency contract or if the value of the foreign currency changes unfavorably. In addition, the use of foreign exchange currency contracts does not eliminate fluctuations in the underlying prices of the securities. As of January 31, 2023, the Fund had no open forward foreign exchange currency contracts.
Investment Transactions and Related Income:
Changes in holdings of investments are accounted for no later than one business day following the trade date. For financial reporting purposes, however, investment transactions are accounted for on trade date or the last business day of the reporting period. Interest income is determined on the basis of coupon interest accrued using the effective interest method which adjusts, where applicable, the amortization of premiums or accretion of discounts. Dividend income is recorded on the ex-dividend date. Gains or losses realized on sales of securities are recorded on the identified cost basis.
Withholding taxes on interest, dividends, and gains as a result of certain investments by the Fund have been provided for in accordance with each investment's applicable country's tax rules and rates.
Securities Lending:
The Fund, through a Securities Lending Agreement with Citibank, N.A. ("Citibank"), may lend its securities to qualified financial institutions, such as certain broker-dealers and banks, to earn additional income, net of income retained by Citibank. Borrowers are required to initially secure their loans for collateral in the amount of at least 102% of the value of U.S. securities loaned or at least 105% of the value of non-U.S. securities loaned, marked-to-market daily. Any collateral shortfalls associated with increases in the valuation of the securities loaned are generally cured the next business day. The collateral can be received in the form of cash collateral and/or non-cash collateral. Non-cash collateral can include U.S. Government Securities and other securities as permitted by Securities and Exchange Commission ("SEC") guidelines. The cash collateral is invested in short-term instruments or cash equivalents, primarily open-end investment companies, as noted on the Fund's Schedule of Portfolio Investments. The Fund effectively does not have control of the non-cash collateral and therefore it is not disclosed on the Fund's Schedule of Portfolio Investments. Collateral requirements are determined daily based on the value of the Fund's securities on loan as of the end of the prior business day. During the time portfolio securities are on loan, the borrower will pay the Fund any dividends or interest paid on such securities plus any fee negotiated between the parties to the lending agreement. The Fund also earns a return from the collateral. The Fund pays Citibank various fees in connection with the investment of cash collateral and fees based on the investment income received from securities lending
18
USAA Mutual Funds Trust | Notes to Financial Statements — continued January 31, 2023 | ||||||
(Unaudited)
activities. Securities lending income (net of these fees) is disclosed on the Statement of Operations. Loans are terminable upon demand and the borrower must return the loaned securities within the lesser of one standard settlement period or five business days. Although risk is mitigated by the collateral, the Fund could experience a delay in recovering its securities and possible loss of income or value if the borrower fails to return them. In addition, there is a risk that the value of the short-term investments will be less than the amount of cash collateral required to be returned to the borrower.
The Fund's agreement with Citibank does not include master netting provisions. Non-cash collateral received by the Fund may not be sold or repledged, except to satisfy borrower default.
The following table (amounts in thousands) is a summary of the Fund's securities lending transactions as of January 31, 2023.
| Value of Securities on Loan | Non-Cash Collateral | Cash Collateral | |||||||||
| $ | 1,507 | $ | — | $ | 2,137 | ||||||
Foreign Currency Translations:
The accounting records of the Fund are maintained in U.S. dollars. Investment securities and other assets and liabilities of the Fund denominated in a foreign currency are translated into U.S. dollars at current exchange rates. Purchases and sales of securities, income receipts, and expense payments are translated into U.S. dollars at the exchange rates on the date of the transactions. The Fund does not isolate the portion of the results of operations resulting from changes in foreign exchange rates on investments from fluctuations arising from changes in market prices of securities held. Such fluctuations are disclosed as Net change in unrealized appreciation/depreciation on investment securities and foreign currency translations on the Statement of Operations. Any realized gains or losses from these fluctuations are disclosed as Net realized gains (losses) from investment securities and foreign currency transactions on the Statement of Operations.
Foreign Taxes:
The Fund may be subject to foreign taxes related to foreign income received (a portion of which may be reclaimable), capital gains on the sale of securities, and certain foreign currency transactions. All foreign taxes are recorded in accordance with the applicable regulations and rates that exist in the foreign jurisdictions in which the Fund invests.
Federal Income Taxes:
The Fund intends to continue to qualify as a regulated investment company by complying with the provisions available to certain investment companies, as defined in applicable sections of the Internal Revenue Code, and to make distributions of net investment income and net realized gains sufficient to relieve it from all, or substantially all, federal income taxes. Accordingly, no provision for federal income taxes is required in the financial statements. The Fund has a tax year end of July 31, and effective April 30, 2023, the Fund will change its tax year end to April 30.
For the six months ended January 31, 2023, the Fund did not incur any income tax, interest, or penalties, and has recorded no liability for net unrecognized tax benefits relating to uncertain tax positions.
Management of the Fund has reviewed tax positions taken in tax years that remain subject to examination by all major tax jurisdictions, including federal (i.e., the last four tax years, which includes the current fiscal tax year end). Management believes that there is no tax liability resulting from unrecognized tax benefits related to uncertain tax positions taken.
Allocations:
Expenses directly attributable to the Fund are charged to the Fund, while expenses that are attributable to more than one fund in the Trust, or jointly with an affiliated trust, are allocated among the respective funds in the Trust and/or an affiliated trust based upon net assets or another appropriate basis.
19
USAA Mutual Funds Trust | Notes to Financial Statements — continued January 31, 2023 | ||||||
(Unaudited)
Income, expenses (other than class-specific expenses such as transfer agent fees, state registration fees, printing fees, and 12b-1 fees), and realized and unrealized gains or losses on investments are allocated to each class of shares based on its relative net assets on the date income is earned or expenses and realized and unrealized gains and losses are incurred.
3. Purchases and Sales:
Purchases and sales of securities (excluding securities maturing less than one year from acquisition) for the six months ended January 31, 2023, were as follows for the Fund (amounts in thousands):
Excluding | |||||||
Purchases | Sales | ||||||
$ | 336,508 | $ | 402,564 | ||||
4. Fees and Transactions with Affiliates and Related Parties:
Investment Advisory Fees:
Investment advisory services are provided to the Fund by the Adviser, which is a New York corporation registered as an investment adviser with the SEC.
Under the terms of the Investment Advisory Agreement, the Adviser is entitled to receive a base fee and a performance adjustment. The Fund's base fee is accrued daily and paid monthly at an annualized rate of 0.75% of the Fund's average daily net assets. Amounts incurred and paid to VCM for the six months ended January 31, 2023, are reflected on the Statement of Operations as Investment advisory fees.
The performance adjustment for each share class is accrued daily and calculated monthly by comparing the respective class' performance to that of the Lipper Science & Technology Funds Index. The Lipper Science & Technology Funds Index tracks the total return performance of the largest funds within the Lipper Science & Technology Funds category.
The performance period for each share class consists of the current month plus the previous 35 months. The following table is utilized to determine the extent of the performance adjustment:
| Over/Under Performance Relative to Index (in basis points)(a) | Annual Adjustment Rate (in basis points) | ||||||
| +/- 100 to 400 | +/- 4 | ||||||
| +/- 401 to 700 | +/- 5 | ||||||
| +/- 701 and greater | +/- 6 | ||||||
(a) Based on the difference between the average annual performance of the relevant share class of the Fund and its relevant Lipper index, rounded to the nearest basis point.
Each class' annual performance adjustment rate is multiplied by the average daily net assets of the respective class over the entire performance period, which is then multiplied by a fraction, the numerator of which is the number of days in the month and the denominator of which is 365 (366 in leap years). The resulting amount is then added to (in the case of overperformance), or subtracted from (in the case of underperformance) the base fee.
Under the performance fee arrangement, each class pays a positive performance fee adjustment for a performance period whenever the class outperforms the Lipper Science & Technology Funds Index over that period, even if the class has overall negative returns during the performance period.
For the period August 1, 2022, to January 31, 2023, performance adjustments were $(448) and $(26) for Fund Shares and Class A, in thousands, respectively. Performance adjustments were (0.09)% and (0.10)% for Fund Shares and Class A, respectively. The performance adjustment rate included in the
20
USAA Mutual Funds Trust | Notes to Financial Statements — continued January 31, 2023 | ||||||
(Unaudited)
investment advisory fee may differ from the maximum over/under Annual Adjustment Rate due to differences in average net assets for the reporting period and rolling 36 month performance periods.
The Trust relies on an exemptive order granted to VCM and its affiliated funds by the SEC in March 2019, permitting the use of a "manager-of-managers" structure for certain funds. Under a manager-of-managers structure, the investment adviser may select (with approval of the Board and without shareholder approval) one or more subadvisers to manage the day-to-day investment of a fund's assets.
VCM has entered into a Subadvisory Agreement with Wellington Management Company LLP ("Wellington Management"), under which Wellington directs the investment and reinvestment of a portion of the Fund's assets (as allocated from time to time by VCM). This arrangement provides for monthly fees that are paid by VCM. VCM (not the Fund) pays the subadviser fees.
Administration and Servicing Fees:
VCM also serves as the Fund's administrator and fund accountant. Under the Fund Administration, Servicing and Accounting Agreement, VCM is paid an administration and servicing fee that is accrued daily and paid monthly at an annualized rate of 0.15% and 0.15%, which is based on the Fund's average daily net assets of the Fund Shares and Class A, respectively. Amounts incurred for the six months ended January 31, 2023, are reflected on the Statement of Operations as Administration fees.
Citi Fund Services Ohio, Inc. ("Citi"), an affiliate of Citibank, acts as sub-administrator and sub-fund accountant to the Fund pursuant to a Sub-Administration and Sub-Fund Accounting Services Agreement between VCM and Citi. VCM pays Citi a fee for providing these services. The Fund reimburses VCM and Citi for out-of-pocket expenses incurred in providing these services and certain other expenses specifically allocated to the Fund. Amounts incurred for the six months ended January 31, 2023, are reflected on the Statement of Operations as Sub-Administration fees.
The Fund (as part of the Trust) has entered into an agreement with the Adviser to provide compliance services, pursuant to which the Adviser furnishes its compliance personnel, including the services of the Chief Compliance Officer ("CCO"), and other resources reasonably necessary to provide the Trust with compliance oversight services related to the design, administration, and oversight of a compliance program for the Trust in accordance with Rule 38a-1 under the 1940 Act. The CCO is an employee of the Adviser, which pays the compensation of the CCO and support staff. The funds in the Trust, Victory Variable Insurance Funds, Victory Portfolios, and Victory Portfolios II (collectively, the "Victory Funds Complex") in the aggregate, compensate the Adviser for these services. Amounts incurred for the six months ended January 31, 2023, are reflected on the Statement of Operations as Compliance fees.
Transfer Agency Fees:
Victory Capital Transfer Agency, Inc. ("VCTA"), an affiliate of the Adviser, provides transfer agency services to the Fund. VCTA provides transfer agent services to the Fund Shares based on an annual charge of $23 per shareholder account plus out-of-pocket expenses. VCTA pays a portion of these fees to certain intermediaries for the administration and servicing of accounts that are held with such intermediaries. Transfer agent fees for Class A are paid monthly based on a fee accrued daily at an annualized rate of 0.10% of average daily net assets, plus out-of-pocket expenses. Amounts incurred and paid to VCTA for the six months ended January 31, 2023, are reflected on the Statement of Operations as Transfer agent fees.
FIS Investor Services LLC serves as sub-transfer agent and dividend disbursing agent for the Fund pursuant to a Sub-Transfer Agent Agreement between VCTA and FIS Investor Services LLC. VCTA provides FIS Investor Services LLC a fee for providing these services.
Distributor/Underwriting Services:
Victory Capital Services, Inc. (the "Distributor"), an affiliate of the Adviser, serves as Distributor for the continuous offering of the shares of the Fund pursuant to a Distribution Agreement between the Distributor and the Trust.
21
USAA Mutual Funds Trust | Notes to Financial Statements — continued January 31, 2023 | ||||||
(Unaudited)
Pursuant to the Distribution and Service Plans adopted in accordance with Rule 12b-1 under the 1940 Act, the Distributor may receive a monthly distribution and service fee, at an annual rate of up to 0.25% of the average daily net assets of Class A. The distribution and service fees paid to the Distributor may be used by the Distributor to pay for activity primarily intended to result in the sale of Class A. Amounts incurred and paid to the Distributor for the six months ended January 31, 2023, are reflected on the Statement of Operations as 12b-1 fees.
In addition, the Distributor is entitled to receive commissions in connection with sales of Class A. For the six months ended January 31, 2023, the Distributor did not receive any commissions from commissions earned in connection with sales of Class A.
Other Fees:
Citibank serves as the Fund's custodian. The Fund pays Citibank a fee for providing these services. Amounts incurred for the six months ended January 31, 2023, are reflected on the Statement of Operations as Custodian fees.
K&L Gates LLP provides legal services to the Trust.
The Adviser has entered into an expense limitation agreement with the Fund until at least November 30, 2023. Under the terms of the agreement, the Adviser has agreed to waive fees or reimburse certain expenses to the extent that ordinary operating expenses incurred by certain classes of the Fund in any fiscal year exceed the expense limits for such classes of the Fund. Such excess amounts will be the liability of the Adviser. Performance adjustments, acquired fund fees and expenses, interest, taxes, brokerage commissions, other expenditures, which are capitalized in accordance with GAAP, and other extraordinary expenses not incurred in the ordinary course of the Fund's business are excluded from the expense limits. As of January 31, 2023, the expense limits (excluding voluntary waivers) were 1.06%, and 1.34% for Fund Shares and Class A, respectively.
Under the terms of the expense limitation agreement, the Fund has agreed to repay fees and expenses that were waived or reimbursed by the Adviser for a period of up to three years (thirty-six (36) months) after the waiver or reimbursement took place, subject to the lesser of any operating expense limits in effect at the time of: (a) the original waiver or expense reimbursement; or (b) the recoupment, after giving effect to the recoupment amount.
As of January 31, 2023, the following amounts are available to be repaid to the Adviser (amounts in thousands). The Fund has not recorded any amounts available to be repaid as a liability due to an assessment that such repayments are not probable at January 31, 2023.
| Expires 2026 | Total | ||||||
| $ | 26 | $ | 26 | ||||
The Adviser may voluntarily waive or reimburse additional fees to assist the Fund in maintaining competitive expense ratios. Voluntary waivers and reimbursements applicable to the Fund are not available to be recouped at a future time. There were no voluntary waivers or reimbursements for the six months ended January 31, 2023.
Certain officers and/or interested trustees of the Fund are also officers and/or employees of the Adviser, administrator, fund accountant, sub-administrator, sub-fund accountant, custodian, and Distributor.
5. Risks:
The Fund may be subject to other risks in addition to these identified risks.
Sector Risk — A mutual fund portfolio consisting of investments related to the fields of science and technology is likely to be more volatile than a portfolio that is more widely diversified in other economic sectors. There is a possibility that the Fund's investments in companies whose values are highly dependent on scientific and technological developments may be more volatile because of the short life cycles and competitive pressures of many of the products or services of these companies. Because of
22
USAA Mutual Funds Trust | Notes to Financial Statements — continued January 31, 2023 | ||||||
(Unaudited)
the competitiveness and rapid changes in the fields of science and technology, many of the companies in the Fund's portfolio are subject to distinctive risks. The products and services of these companies may not be economically successful or may quickly become outdated. Additionally, many of these companies must comply with significant governmental regulations and may need governmental approval of their products and services.
Market Risk — Overall market risks may affect the value of the Fund. Domestic and international factors such as political events, war, terrorism, trade disputes, inflation rates, interest rate levels and other fiscal and monetary policy changes, cybersecurity incidents, pandemics and other public health crises, sanctions against a particular foreign country, its nationals, businesses or industries and related geopolitical events, as well as environmental disasters such as earthquakes, fires, and floods, or other catastrophes, may add to instability in global economies and markets generally, and may lead to increased market volatility. Global economies and financial markets are highly interconnected, which increases the possibility that conditions in one country or region might adversely affect issuers in another country or region. The impact of these and other factors may be short-term or may last for extended periods.
Equity Risk — The values of the equity securities in which the Fund invests may decline in response to developments affecting individual companies and/or general market, economic and political conditions and other factors. A company's earnings or dividends may not increase as expected due to poor management decisions, competitive pressures, breakthroughs in technology, reliance on suppliers, labor problems or shortages, corporate restructurings, fraudulent disclosures, natural disasters, military confrontations, war, terrorism, public health crises, or other events, conditions, and factors. Price changes may be temporary or may last for extended periods.
6. Borrowing and Interfund Lending:
Line of Credit:
The Victory Funds Complex participates in a short-term demand note "Line of Credit" agreement with Citibank. The Line of Credit agreement with Citibank was renewed on June 27, 2022, with a termination date of June 26, 2023. Under the agreement with Citibank, the Victory Funds Complex may borrow up to $600 million, of which $300 million is committed and $300 million is uncommitted. $40 million of the Line of Credit is reserved for use by the Victory Floating Rate Fund, another series of the Victory Funds Complex, with Victory Floating Rate Fund paying the related commitment fees for that amount. The purpose of the Line of Credit is to meet temporary or emergency cash needs. For the six months ended January 31, 2023, Citibank received an annual commitment fee of 0.15% on $300 million for providing the Line of Credit. Each fund in the Victory Funds Complex paid a pro-rata portion of the commitment fees plus any interest (one-month Secured Overnight Financing Rate ("SOFR") plus 1.10 percent) on amounts borrowed. Interest charged to the Fund during the period, if applicable, is reflected on the Statement of Operations under Line of credit fees.
The Fund had no borrowings under the Line of Credit agreement during the six months ended January 31, 2023.
Interfund Lending:
The Trust and the Adviser rely on an exemptive order granted by the SEC in March 2017 (the "Order"), permitting the establishment and operation of an Interfund Lending Facility (the "Facility"). The Facility allows the Fund to directly lend and borrow money to or from any other fund in the Victory Funds Complex that is permitted to participate in the Facility, relying upon the Order at rates beneficial to both the borrowing and lending funds. Advances under the Facility are allowed for temporary or emergency purposes, including the meeting of redemption requests that otherwise might require the untimely disposition of securities, and are subject to each Fund's borrowing restrictions. The interfund loan rate is determined, as specified in the Order, by averaging the current repurchase agreement rate and the current bank loan rate. As a Borrower, interest charged to the Fund, if any, during the period,
23
USAA Mutual Funds Trust | Notes to Financial Statements — continued January 31, 2023 | ||||||
(Unaudited)
is reflected on the Statement of Operations under Interfund lending fees. As a Lender, interest earned by the Fund, if any, during the period, is reflected on the Statement of Operations under Interfund lending.
The average borrowing or lending for the days outstanding and average interest rate for the Fund during the six months ended January 31, 2023, were as follows (amounts in thousands):
| Borrower or Lender | Amount Outstanding at January 31, 2023 | Average Borrowing* | Days Borrowing Outstanding | Average Interest Rate* | Maximum Borrowing During the Period | ||||||||||||||||||
| Borrower | $ | — | $ | 1,246 | 20 | 3.84 | % | $ | 1,950 | ||||||||||||||
* Based on the number of days borrowings were outstanding for the six months ended January 31, 2023.
7. Federal Income Tax Information:
The Fund intends to distribute any net investment income annually. Distributable net realized gains, if any, are declared and paid at least annually.
The amounts of dividends from net investment income and distributions from net realized gains (collectively, distributions to shareholders) are determined in accordance with federal income tax regulations, which may differ from GAAP. To the extent these "book/tax" differences are permanent in nature (e.g., net operating loss and distribution reclassification), such amounts are reclassified within the components of net assets based on their federal tax-basis treatment; temporary differences (e.g., wash sales) do not require reclassification. To the extent dividends and distributions exceed net investment income and net realized gains for tax purposes, they are reported as distributions of capital. Net investment losses incurred by the Fund may be reclassified as an offset to capital on the accompanying Statement of Assets and Liabilities.
The tax character of current year distributions paid and the tax basis of the current components of accumulated earnings (loss) will be determined at the end of the current tax year.
At the tax year ended July 31, 2022, the Fund had no capital loss carryforwards for federal income tax purposes.
8. Subsequent Events:
On June 29, 2022, the Board approved a change to the Fund's fiscal year-end from July 31 to April 30, with an effective date of April 30, 2023.
The Board, upon recommendation of the Adviser, has approved a change in the name of the Trust and each individual fund within the Trust. On February 23, 2023, an initial filing was made with the SEC to commence the process to effectuate the following changes.
Effective at the start of business on April 24, 2023 (the "Effective Date"), the name of the Trust will change from USAA Mutual Funds Trust to Victory Portfolios III, and all references to USAA Mutual Funds Trust in the summary prospectus, statutory prospectus, and statement of additional information ("SAI") will be replaced by the new name.
Also on the Effective Date, references to the current name of the Fund in the summary prospectus, statutory prospectus, and SAI will be replaced with the new name as follows:
| Current Name | New Name | ||||||
USAA Science & Technology Fund | Victory Science & Technology Fund | ||||||
In addition, on the Effective Date, USAA Investments, a Victory Capital Management Inc. Investment Franchise, that currently manages the USAA Fixed Income Funds, will change its name to Victory Income Investors, and all references to USAA Investments in the summary prospectus, statutory prospectus, and SAI, will be replaced.
Please note that there will be no changes in the management of the Fund or to the Fund's ticker symbols.
24
USAA Mutual Funds Trust | Supplemental Information January 31, 2023 | ||||||
(Unaudited)
Proxy Voting and Portfolio Holdings Information
Proxy Voting:
Information regarding the policies and procedures the Fund uses to determine how to vote proxies relating to portfolio securities is available without charge, upon request, by calling (800) 235-8396. The information is also included in the Fund's Statement of Additional Information, which is available on the SEC's website at sec.gov.
Information relating to how the Fund voted proxies relating to portfolio securities held during the most recent 12 months ended June 30 is available on the SEC's website at sec.gov.
Availability of Schedules of Portfolio Investments:
The Trust files a complete list of Schedules of Portfolio Investments with the SEC for the first and third quarter of each fiscal year on Form N-PORT. Form N-PORT is available on the SEC's website at sec.gov.
Expense Examples
As a shareholder of the Fund, you may incur two types of costs: (1) transaction costs, including sales charges (loads) on purchases; and (2) ongoing costs, including management fees and other Fund expenses. These examples are intended to help you understand your ongoing costs (in dollars) of investing in the Fund and to compare these costs with the ongoing costs of investing in other mutual funds.
These examples are based on an investment of $1,000 invested at the beginning of the period and held for the entire period from August 1, 2022, through January 31, 2023.
The Actual Expense figures in the table below provide information about actual account values and actual expenses. You may use the information below, together with the amount you invested, to estimate the expenses that you paid over the period. Simply divide your account value by $1,000 (for example, an $8,600 account value divided by $1,000 = 8.6), then multiply the result by the number in the table under the heading entitled "Actual Expenses Paid During Period" to estimate the expenses you paid on your account during this period.
The Hypothetical Expense figures in the table below provide information about hypothetical account values and hypothetical expenses based on the Fund's actual expense ratio and an assumed rate of return of 5% per year before expenses, which is not the Fund's actual return. The hypothetical account values and expenses may not be used to estimate the actual ending account balance or expenses you paid for the period. You may use this information to compare this 5% hypothetical example with the 5% hypothetical examples that appear in shareholder reports of other funds.
Please note the expenses shown in the table below are meant to highlight your ongoing costs only and do not reflect any transactional costs. Therefore, the hypothetical expenses in the table are useful in comparing ongoing costs only and will not help you determine the relative total costs of owning different funds. In addition, if these transactional costs were included, your costs would have been higher.
| Beginning Account Value 8/1/22 | Actual Ending Account Value 1/31/23 | Hypothetical Ending Account Value 1/31/23 | Actual Expenses Paid During Period 8/1/22 - 1/31/23* | Hypothetical Expenses Paid During Period 8/1/22 - 1/31/23* | Annualized Expense Ratio During Period 8/1/22 - 1/31/23 | ||||||||||||||||||||||
Fund Shares | $ | 1,000.00 | $ | 956.70 | $ | 1,020.32 | $ | 4.78 | $ | 4.94 | 0.97 | % | |||||||||||||||
Class A | 1,000.00 | 955.70 | 1,018.95 | 6.11 | 6.31 | 1.24 | % | ||||||||||||||||||||
* Expenses are equal to the average account value multiplied by the Fund's annualized expense ratio multiplied by 184/365 (the number of days in the most recent fiscal half-year divided by the number of days in the fiscal year).
25
USAA Mutual Funds Trust | Supplemental Information — continued January 31, 2023 | ||||||
(Unaudited)
Considerations of the Board in Continuing the Investment Advisory Agreement
USAA Science & Technology Fund (the "Fund")
At a meeting of the Board of Trustees (the "Board") of USAA Mutual Funds Trust (the "Trust") held on December 8-9, 2022, the Board, including the Trustees who are not "interested persons" (as that term is defined in the Investment Company Act of 1940, as amended) of the Trust (the "Independent Trustees"), approved for an annual period the continuance of the Investment Advisory Agreement (the "Advisory Agreement") between the Trust and Victory Capital Management Inc. (the "Adviser") and the Subadvisory Agreement between the Adviser and Wellington Management Company LLP (the "Subadviser") with respect to the Fund. Prior to the December 8-9, 2022 meeting at which the Advisory Agreement and Subadvisory Agreement were approved, the Independent Trustees also discussed and considered information regarding the proposed continuation of the Advisory Agreement and Subadvisory Agreement at a meeting held on November 21, 2022.
In advance of the foregoing meetings, the Trustees received and considered a variety of information relating to the Advisory Agreement and Subadvisory Agreement and the Adviser and the Subadviser, and were given the opportunity to ask questions and request additional information from management. The information provided to the Board included, among other things: (i) a separate report prepared by an independent third party of mutual fund data, which provided a statistical analysis comparing the Fund's investment performance, expenses, and fees to comparable investment companies; (ii) information concerning the services rendered to the Fund, as well as information regarding the Adviser's revenues and costs of providing services to the Fund and compensation paid to affiliates of the Adviser; and (iii) information about the Adviser's and the Subadviser's operations and personnel. Prior to voting, the Independent Trustees reviewed the proposed continuance of the Advisory Agreement and Subadvisory Agreement with management and with experienced independent counsel retained by the Independent Trustees ("Independent Counsel") and received materials from such Independent Counsel discussing the legal standards for their consideration of the proposed continuation of the Advisory Agreement and the Subadvisory Agreement with respect to the Fund. The Independent Trustees also reviewed the proposed continuation of the Advisory Agreement and the Subadvisory Agreement with respect to the Fund in private sessions with Independent Counsel at which no representatives of management were present.
The Board considered the Advisory Agreement and the Subadvisory Agreement separately in the course of its review. In doing so, the Board noted the respective roles of the Adviser and the Subadviser in providing services to the Fund.
At each regularly scheduled meeting of the Board and its committees, the Board receives and reviews, among other things, information concerning the Fund's performance and related services provided by the Adviser and the Subadviser. At the meeting at which the renewal of the Advisory Agreement and Subadvisory Agreement is considered, particular focus is given to information concerning Fund performance, fees and total expenses as compared to comparable investment companies, and the Adviser's profitability with respect to the Fund. However, the Board noted that the evaluation process with respect to the Adviser and the Subadviser is an ongoing one. In this regard, the Board's and its committees' consideration of the Advisory Agreement and Subadvisory Agreement included information previously received at such meetings. The Board also recognized that the contractual arrangements for the Fund have been reviewed by the Board and discussed with the Adviser in prior years and that the Board's conclusions may be based, in part, on its consideration of these same arrangements in prior years.
Advisory Agreement
After full consideration of a variety of factors, the Board, including the Independent Trustees, voted to approve the Advisory Agreement. In approving the Advisory Agreement, the Trustees did not identify any single factor as controlling, and each Trustee may have attributed different weights to various factors. Throughout their deliberations, the Independent Trustees were represented and assisted by Independent Counsel.
Nature, Extent, and Quality of Services — In considering the nature, extent, and quality of the services provided by the Adviser under the Advisory Agreement, the Board reviewed information provided by the Adviser relating to its operations and personnel. The Board also took into account its knowledge of the Adviser's management and the quality of the performance of the Adviser's duties through Board meetings, discussions, and reports
26
USAA Mutual Funds Trust | Supplemental Information — continued January 31, 2023 | ||||||
(Unaudited)
during the preceding year. The Board considered the fees paid to the Adviser and the services provided to the Fund by the Adviser under the Advisory Agreement, as well as other services provided by the Adviser and its affiliates under other agreements, and the personnel who provide these services. In addition to the investment advisory services provided to the Fund, the Adviser and its affiliates provide administrative services, shareholder services, oversight of Fund accounting, marketing services, assistance in meeting legal and regulatory requirements, and other services necessary for the operation of the Fund and the Trust.
The Board considered the scope of services provided by, and the undertakings required of, the Adviser in connection with those services, including, among other things, maintaining (i) its own and the Fund's compliance programs, (ii) risk management programs, (iii) liquidity risk management program, (iv) derivatives risk management program, and (v) cybersecurity programs, each of which had expanded over time as a result of regulatory, market, and other developments. The Board also considered the significant risks assumed by the Adviser in connection with the services provided to the Fund, including investment, operational, enterprise, litigation, regulatory and compliance risks.
The Board considered the Adviser's management style and the performance of the Adviser's duties under the Advisory Agreement. The Board considered the level and depth of knowledge of the Adviser, including the professional experience and qualifications of its senior and investment personnel, as well as current staffing levels. The Board considered the Adviser's process for monitoring the performance of the Subadviser and the Adviser's timeliness in responding to performance issues. The allocation of the Fund's brokerage, including the Adviser's process for monitoring "best execution," also was considered. The Adviser's role in coordinating the activities of the Fund's other service providers was also considered. The Board also considered the Adviser's risk management processes. The Board considered the Adviser's financial condition and that it had the financial wherewithal to continue to provide the same scope and high quality of services under the Advisory Agreement. In reviewing the Advisory Agreement, the Board focused on the experience, resources, and strengths of the Adviser and its affiliates in managing the Fund, as well as the other funds in the Trust.
The Board also reviewed the compliance and administrative services provided to the Fund by the Adviser and its affiliates, including the Adviser's oversight of the Fund's day-to-day operations and oversight of Fund accounting. The Trustees, guided also by information obtained from their experiences as Trustees of the Trust, also focused on the quality of the Adviser's compliance and administrative staff.
Expenses and Performance — In connection with its consideration of the Advisory Agreement, the Board evaluated the Fund's advisory fees and total expense ratio as compared to other open-end investment companies deemed to be comparable to the Fund as determined by the independent third party in its report. The Fund's expenses were compared to (i) a group of investment companies chosen by the independent third party to be comparable to the Fund based upon certain factors, including fund type, comparability of investment objective and classification, sales load type, asset size, and expense components (the "expense group") and (ii) a larger group of investment companies with the same investment classification/objective as the Fund regardless of asset size, excluding outliers (the "expense universe"). Among other data, the Board noted that the Fund's net management fee rate — which includes advisory and administrative services and the effects of any performance adjustment was above the median of its expense group and below the median of its expense universe. The data indicated that the Fund's total expenses were above the medians of its expense group and its expense universe. The Board also took into account the Adviser's current undertakings to maintain expense limitations for the Fund. The Board took into account the various other services provided to the Fund by the Adviser and its affiliates, and noted the high quality of services received by the Fund. The Board also took into account that the subadvisory fees under the Subadvisory Agreement are paid by the Adviser. The Board also considered and discussed information about the Subadviser's fees, including the amount of management fees retained by the Adviser after payment of the subadvisory fees.
In considering the Fund's performance, the Board noted that it reviews at its regularly scheduled meetings information about the Fund's performance results. The Trustees also reviewed various comparative data provided to them in connection with their consideration of the renewal of the Advisory Agreement, including, among other information, a comparison of the Fund's average annual total returns relative to its Lipper index and other mutual funds deemed to be in its peer group by the independent third party in its report (the "performance universe"). The Fund's performance universe consisted of the Fund and all retail and institutional open-end investment companies with the same classification/objective as the Fund regardless of asset size or primary
27
USAA Mutual Funds Trust | Supplemental Information — continued January 31, 2023 | ||||||
(Unaudited)
channel of distribution. This comparison indicated that, among other data, the Fund's performance was below the average of its performance universe and its Lipper index for the one-, three-, five- and ten-year periods ended June 30, 2022. The Board took into account management's discussion of the Fund's performance, including the reasons for the Fund's underperformance.
Compensation and Profitability — The Board took into consideration the level and method of computing the management fee. The information considered by the Board included operating profit margin information for the Adviser's business as a whole. The Board also received and considered profitability information related to the management revenues from the Fund. This information included a review of the methodology used in the allocation of certain costs to the Fund. In considering the profitability data with respect to the Fund, the Trustees noted that the Adviser pays the Fund's subadvisory fees. The Trustees reviewed the profitability of the Adviser's relationship with the Fund before tax expenses. The Board was also provided with a profitability analysis of other publicly traded asset managers prepared by an independent information service. In reviewing the overall profitability of the management fee to the Adviser, the Board also considered the fact that the Adviser and its affiliates provide shareholder servicing and administrative services to the Fund for which they receive compensation. The Board also considered the possible direct and indirect benefits to the Adviser from its relationship with the Trust, including that the Adviser may derive reputational and other benefits from its association with the Fund. The Trustees recognized that the Adviser should be entitled to earn a reasonable level of profits in exchange for the level of services it provides to the Fund and the entrepreneurial and other risks that it assumes as Adviser.
Economies of Scale — The Board considered whether there should be changes in the management fee rate or structure in order to enable the Fund to participate in any economies of scale. The Board took into account management's discussion of the current advisory fee structure. The Board also considered the fee waiver and expense reimbursement arrangements by the Adviser. The Board considered the fact that the Adviser also pays the Fund's subadvisory fees. The Board also considered the effect of the change in size, if any, of each of the Fund's classes on its performance and fees, noting that the Fund may realize other economies of scale if assets increase proportionally more than expenses. The Board determined that the current investment management fee structure was reasonable.
Conclusions — The Board reached the following conclusions regarding the Fund's Advisory Agreement with the Adviser: (i) the Adviser has demonstrated that it possesses the capability and resources to perform the duties required of it under the Advisory Agreement; (ii) the Adviser maintains an appropriate compliance program; (iii) the overall performance of the Fund is reasonable in relation to the performance of funds with similar investment objectives and to relevant indices and the Adviser is appropriately monitoring the Fund's performance; (iv) the Fund's advisory expenses are reasonable in relation to those of similar funds and to the services to be provided by the Adviser; and (v) the Adviser's and its affiliates' level of profitability from their relationship with the Fund is reasonable in light of the nature and high quality of services provided by the Adviser and its affiliates and the type of fund. Based on its conclusions, the Board determined that continuation of the Advisory Agreement would be in the best interests of the Fund and its shareholders.
Subadvisory Agreement
In approving the Subadvisory Agreement with respect to the Fund, the Board considered various factors, among them: (i) the nature, extent, and quality of services provided to the Fund by the Subadviser, including the personnel providing services; (ii) the Subadviser's compensation and any other benefits derived from the subadvisory relationship; (iii) comparisons, to the extent applicable, of subadvisory fees and performance to comparable investment companies; and (iv) the terms of the Subadvisory Agreement. A summary of the Board's analysis of these factors is set forth below. After full consideration of a variety of factors, the Board, including the Independent Trustees, voted to approve the Subadvisory Agreement. In approving the Subadvisory Agreement, the Trustees did not identify any single factor as controlling, and each Trustee may have attributed different weights to various factors. Throughout their deliberations, the Independent Trustees were represented and assisted by Independent Counsel.
28
USAA Mutual Funds Trust | Supplemental Information — continued January 31, 2023 | ||||||
(Unaudited)
Nature, Extent, and Quality of Services Provided; Investment Personnel — The Trustees considered information provided to them regarding the services provided by the Subadviser, including information presented periodically throughout the previous year. The Board considered the Subadviser's level of knowledge and investment style. The Board reviewed the experience and credentials of the investment personnel who are responsible for managing the investment of portfolio securities with respect to the Fund and the Subadviser's level of staffing. The Trustees considered, based on the materials provided to them by the Subadviser, whether the method of compensating portfolio managers is reasonable and includes mechanisms to prevent a manager with underperformance from taking undue risks. The Trustees also noted the Subadviser's brokerage practices. The Board also considered the Subadviser's regulatory and compliance history. The Board also took into account the Subadviser's risk management processes. The Board noted that the Adviser's monitoring processes of the Subadviser include: (i) regular telephonic meetings to discuss, among other matters, investment strategies, and to review portfolio performance; (ii) quarterly portfolio compliance checklists and quarterly compliance certifications to the Board; and (iii) due diligence visits to the Subadviser.
Subadviser Compensation — The Board also took into consideration the financial condition of the Subadviser. In considering the cost of services to be provided by the Subadviser and the profitability to the Subadviser of its relationship with the Fund, the Trustees noted that the fees under the Subadvisory Agreement were paid by the Adviser. The Trustees also relied on the ability of the Adviser to negotiate the Subadvisory Agreement and the fees thereunder at arm's length. For the above reasons, the Board determined that the profitability of the Subadviser from its relationship with the Fund was not a material factor in its deliberations with respect to the consideration of the approval of the Subadvisory Agreement. For similar reasons, the Board concluded that the potential for economies of scale in the Subadviser's management of the Fund was not a material factor in considering the Subadvisory Agreement.
Subadvisory Fees and Fund Performance — The Board compared the subadvisory fees for the Fund with the fees that the Subadviser charges to comparable clients, as applicable. The Board considered that the Fund pays a management fee to the Adviser and that, in turn, the Adviser pays a subadvisory fee to the Subadviser. As noted above, the Board considered the Fund's performance during the one-, three-, five-, and ten-year periods ended June 30, 2022, as compared to the Fund's peer group and noted that the Board reviews at its regularly scheduled meetings information about the Fund's performance results. The Board also considered the performance of the Subadviser. The Board noted the Adviser's experience and resources in monitoring the performance, investment style, and risk-adjusted performance of the Subadviser. The Board was mindful of the Adviser's focus on the Subadviser's performance. The Board also noted the Subadviser's performance record for similar accounts, as applicable.
Conclusions — The Board reached the following conclusions regarding the Subadvisory Agreement: (i) the Subadviser is qualified to manage the Fund's assets in accordance with its investment objectives and policies; (ii) the Subadviser maintains an appropriate compliance program; (iii) the overall performance of the Fund is reasonable in relation to the performance of funds with similar investment objectives and relevant indices and the Adviser is appropriately monitoring the Fund's performance; and (iv) the Fund's advisory expenses are reasonable in relation to those of similar funds and to the services to be provided by the Adviser and the Subadviser. Based on its conclusions, the Board determined that approval of the Subadvisory Agreement with respect to the Fund would be in the best interests of the Fund and its shareholders.
29
Privacy Policy
Protecting the Privacy of Information
The Trust respects your right to privacy. We also know that you expect us to conduct and process your business in an accurate and efficient manner. To do so, we must collect and maintain certain personal information about you. This is the information we collect from you on applications or other forms, and from the transactions you make with us or third parties. It may include your name, address, social security number, account transactions and balances, and information about investment goals and risk tolerance.
We do not disclose any information about you or about former customers to anyone except as permitted or required by law. Specifically, we may disclose the information we collect to companies that perform services on our behalf, such as the transfer agent that processes shareholder accounts and printers and mailers that assist us in the distribution of investor materials. We may also disclose this information to companies that perform marketing services on our behalf. This allows us to continue to offer you Victory investment products and services that meet your investing needs, and to effect transactions that you request or authorize. These companies will use this information only in connection with the services for which we hired them. They are not permitted to use or share this information for any other purpose.
To protect your personal information internally, we permit access only by authorized employees and maintain physical, electronic, and procedural safeguards to guard your personal information.*
* You may have received communications regarding information about privacy policies from other financial institutions which gave you the opportunity to "opt-out" of certain information sharing with companies which are not affiliated with that financial institution. The Trust does not share information with other companies for purposes of marketing solicitations for products other than the Trust. Therefore, the Trust does not provide opt-out options to their shareholders.
P.O. Box 182593
Columbus, Ohio 43218-2593

Visit our website at: | Call | ||||||
vcm.com | (800) 235-8396 | ||||||
31704-0323

January 31, 2023
Semi Annual Report
USAA Small Cap Stock Fund
Victory Capital means Victory Capital Management Inc., the investment adviser of the USAA Mutual Funds. USAA Mutual Funds are distributed by Victory Capital Services, Inc., member FINRA, an affiliate of Victory Capital. Victory Capital and its affiliates are not affiliated with United Services Automobile Association or its affiliates. USAA and the USAA logos are registered trademarks and the USAA Mutual Funds and USAA Investments logos are trademarks of United Services Automobile Association and are being used by Victory Capital and its affiliates under license.
vcm.com
News, Information And Education 24 Hours A Day, 7 Days A Week
The Victory Capital website gives fund shareholders, prospective shareholders, and investment professionals a convenient way to access fund information, get guidance, and track fund performance anywhere they can access the Internet. The site includes:
• Detailed performance records
• Daily share prices
• The latest fund news
• Investment resources to help you become a better investor
• A section dedicated to investment professionals
Whether you're a potential investor searching for the fund that matches your investment philosophy, a seasoned investor interested in planning tools, or an investment professional, vcm.com has what you seek. Visit us anytime. We're always open.
USAA Mutual Funds Trust
TABLE OF CONTENTS
Investment Objective & Portfolio Holdings | 2 | ||||||
Schedule of Portfolio Investments | 3 | ||||||
Financial Statements | |||||||
Statement of Assets and Liabilities | 16 | ||||||
Statement of Operations | 17 | ||||||
Statements of Changes in Net Assets | 18 | ||||||
Financial Highlights | 19 | ||||||
Notes to Financial Statements | 21 | ||||||
Supplemental Information | 30 | ||||||
Proxy Voting and Portfolio Holdings Information | 30 | ||||||
Expense Examples | 30 | ||||||
Advisory Contract Approval | 31 | ||||||
Privacy Policy (inside back cover) | |||||||
This report is for the information of the shareholders and others who have received a copy of the currently effective prospectus of the Fund, managed by Victory Capital Management Inc. It may be used as sales literature only when preceded or accompanied by a current prospectus, which provides further details about the Fund.
IRA DISTRIBUTION WITHHOLDING DISCLOSURE
We generally must withhold federal income tax at a rate of 10% of the taxable portion of your distribution and, if you live in a state that requires state income tax withholding, at your state's tax rate. However, you may elect not to have withholding apply or to have income tax withheld at a higher rate. Any withholding election that you make will apply to any subsequent distribution unless and until you change or revoke the election. If you wish to make a withholding election, or change or revoke a prior withholding election, call (800) 235-8396, and form W-4P (OMB No. 1545-0074 withholding certificate for pension or annuity payments) will be electronically sent.
If you do not have a withholding election in place by the date of a distribution, federal income tax will be withheld from the taxable portion of your distribution at a rate of 10%. If you must pay estimated taxes, you may be subject to estimated tax penalties if your estimated tax payments are not sufficient and sufficient tax is not withheld from your distribution.
For more specific information, please consult your tax adviser.
• NOT FDIC INSURED • NO BANK GUARANTEE • MAY LOSE VALUE
1
| USAA Mutual Funds Trust USAA Small Cap Stock Fund | January 31, 2023 | ||||||
(Unaudited)
Investment Objective and Portfolio Holdings:
The Fund seeks long-term growth of capital.
Top 10 Equity Holdings*:
January 31, 2023
(% of Net Assets)
Halozyme Therapeutics, Inc. | 0.8 | % | |||||
EMCOR Group, Inc. | 0.8 | % | |||||
Topgolf Callaway Brands Corp. | 0.7 | % | |||||
Perficient, Inc. | 0.7 | % | |||||
Magnite, Inc. | 0.7 | % | |||||
RBC Bearings, Inc. | 0.7 | % | |||||
Stifel Financial Corp. | 0.7 | % | |||||
Diodes, Inc. | 0.7 | % | |||||
CorVel Corp. | 0.6 | % | |||||
ExlService Holdings, Inc. | 0.6 | % | |||||
Sector Allocation*:
January 31, 2023
(% of Net Assets)

* Does not include futures contracts, money market instruments, and short-term investments purchased with cash collateral from securities loaned.
Percentages are of the net assets of the Fund and may not equal 100%.
Refer to the Schedule of Portfolio Investments for a complete list of securities.
2
| USAA Mutual Funds Trust USAA Small Cap Stock Fund | Schedule of Portfolio Investments January 31, 2023 | ||||||
(Amounts in Thousands, Except for Shares) (Unaudited)
Security Description | Shares | Value | |||||||||
Common Stocks (98.3%) | |||||||||||
Communication Services (2.7%): | |||||||||||
Bumble, Inc. Class A (a) | 6,903 | $ | 178 | ||||||||
Cargurus, Inc. (a) | 63,262 | 1,117 | |||||||||
Chicken Soup For The Soul Entertainment, Inc. (a) (b) | 75,266 | 468 | |||||||||
Cian PLC, ADR (a) (c) | 914 | — | (d) | ||||||||
Cinemark Holdings, Inc. (a) | 140,555 | 1,678 | |||||||||
Cogent Communications Holdings, Inc. | 26,364 | 1,808 | |||||||||
EverQuote, Inc. Class A (a) | 12,600 | 196 | |||||||||
Gray Television, Inc. | 136,195 | 1,765 | |||||||||
IDT Corp. Class B (a) | 28,366 | 834 | |||||||||
Iridium Communications, Inc. (a) | 22,038 | 1,319 | |||||||||
Lions Gate Entertainment Corp. Class B (a) | 117,966 | 899 | |||||||||
Madison Square Garden Sports Corp. | 11,960 | 2,175 | |||||||||
Magnite, Inc. (a) | 597,836 | 7,222 | |||||||||
Shutterstock, Inc. | 25,562 | 1,924 | |||||||||
TechTarget, Inc. (a) | 34,123 | 1,690 | |||||||||
The Marcus Corp. | 7,348 | 111 | |||||||||
Thryv Holdings, Inc. (a) | 61,704 | 1,380 | |||||||||
World Wrestling Entertainment, Inc. Class A | 10,400 | 880 | |||||||||
ZipRecruiter, Inc. (a) | 50,104 | 984 | |||||||||
26,628 | |||||||||||
Consumer Discretionary (10.8%): | |||||||||||
Acushnet Holdings Corp. | 55,675 | 2,614 | |||||||||
Adient PLC (a) | 14,800 | 666 | |||||||||
Asbury Automotive Group, Inc. (a) | 13,706 | 3,015 | |||||||||
Big 5 Sporting Goods Corp. (b) | 68,005 | 679 | |||||||||
BJ's Restaurants, Inc. (a) | 141,779 | 4,476 | |||||||||
Bloomin' Brands, Inc. | 135,298 | 3,281 | |||||||||
Brinker International, Inc. (a) | 36,500 | 1,440 | |||||||||
Brunswick Corp. | 54,925 | 4,632 | |||||||||
Carter's, Inc. | 15,900 | 1,326 | |||||||||
Century Communities, Inc. | 27,186 | 1,664 | |||||||||
Chegg, Inc. (a) | 15,650 | 325 | |||||||||
Columbia Sportswear Co. | 13,800 | 1,323 | |||||||||
Dave & Buster's Entertainment, Inc. (a) | 25,958 | 1,125 | |||||||||
Dillard's, Inc. Class A | 2,348 | 923 | |||||||||
Etsy, Inc. (a) | 6,518 | 897 | |||||||||
First Watch Restaurant Group, Inc. (a) | 9,772 | 158 | |||||||||
Foot Locker, Inc. | 79,966 | 3,479 | |||||||||
Fox Factory Holding Corp. (a) | 24,948 | 2,946 | |||||||||
Frontdoor, Inc. (a) | 42,095 | 1,144 | |||||||||
Genius Sports Ltd. (a) | 79,986 | 439 | |||||||||
Gentherm, Inc. (a) | 50,302 | 3,744 | |||||||||
G-III Apparel Group Ltd. (a) | 64,461 | 1,091 | |||||||||
Group 1 Automotive, Inc. | 7,895 | 1,688 | |||||||||
Hibbett, Inc. | 15,259 | 1,013 | |||||||||
Installed Building Products, Inc. | 15,590 | 1,716 | |||||||||
Kontoor Brands, Inc. | 28,561 | 1,364 | |||||||||
See notes to financial statements.
3
| USAA Mutual Funds Trust USAA Small Cap Stock Fund | Schedule of Portfolio Investments — continued January 31, 2023 | ||||||
(Amounts in Thousands, Except for Shares) (Unaudited)
Security Description | Shares | Value | |||||||||
Life Time Group Holdings, Inc. (a) | 4,364 | $ | 82 | ||||||||
Light & Wonder, Inc. (a) | 45,080 | 2,941 | |||||||||
Lithia Motors, Inc. | 3,859 | 1,016 | |||||||||
Macy's, Inc. | 69,277 | 1,637 | |||||||||
MarineMax, Inc. (a) | 40,272 | 1,259 | |||||||||
Marriott Vacations Worldwide Corp. | 10,800 | 1,728 | |||||||||
Meritage Homes Corp. (a) | 25,500 | 2,746 | |||||||||
Movado Group, Inc. | 58,874 | 2,082 | |||||||||
Perdoceo Education Corp. (a) | 88,648 | 1,327 | |||||||||
Porch Group, Inc. (a) (b) | 417,245 | 1,231 | |||||||||
Portillo's, Inc. Class A (a) | 68,160 | 1,538 | |||||||||
PVH Corp. | 23,549 | 2,117 | |||||||||
Rent-A-Center, Inc. | 53,955 | 1,451 | |||||||||
Signet Jewelers Ltd. | 39,700 | 3,049 | |||||||||
Skyline Champion Corp. (a) | 22,361 | 1,318 | |||||||||
Smith & Wesson Brands, Inc. | 130,013 | 1,441 | |||||||||
Sonic Automotive, Inc. Class A | 28,836 | 1,549 | |||||||||
Sonos, Inc. (a) | 215,066 | 3,966 | |||||||||
Steven Madden Ltd. | 49,041 | 1,758 | |||||||||
Stoneridge, Inc. (a) | 28,448 | 702 | |||||||||
Taylor Morrison Home Corp. (a) | 83,854 | 3,002 | |||||||||
The Lovesac Co. (a) | 10,410 | 268 | |||||||||
The Wendy's Co. | 65,930 | 1,470 | |||||||||
Thor Industries, Inc. | 36,858 | 3,514 | |||||||||
ThredUp, Inc. Class A (a) (b) | 510,715 | 884 | |||||||||
Topgolf Callaway Brands Corp. (a) | 297,342 | 7,282 | |||||||||
Tri Pointe Homes, Inc. (a) | 118,233 | 2,612 | |||||||||
Under Armour, Inc. Class C (a) | 151,270 | 1,649 | |||||||||
Visteon Corp. (a) | 15,139 | 2,367 | |||||||||
Winnebago Industries, Inc. | 20,602 | 1,312 | |||||||||
YETI Holdings, Inc. (a) | 22,661 | 1,014 | |||||||||
107,480 | |||||||||||
Consumer Staples (2.2%): | |||||||||||
Central Garden & Pet Co. Class A (a) | 36,784 | 1,458 | |||||||||
Coty, Inc. Class A (a) | 208,320 | 2,075 | |||||||||
Grocery Outlet Holding Corp. (a) | 35,950 | 1,092 | |||||||||
Herbalife Nutrition Ltd. (a) | 48,392 | 850 | |||||||||
Ingles Markets, Inc. Class A | 15,478 | 1,470 | |||||||||
MGP Ingredients, Inc. | 9,188 | 896 | |||||||||
Sprouts Farmers Market, Inc. (a) | 32,790 | 1,048 | |||||||||
The Andersons, Inc. | 35,282 | 1,298 | |||||||||
The Beauty Health Co. (a) (b) | 107,300 | 1,223 | |||||||||
The Simply Good Foods Co. (a) | 37,400 | 1,358 | |||||||||
The Vita Coco Co., Inc. (a) | 128,944 | 1,750 | |||||||||
U.S. Foods Holding Corp. (a) | 68,030 | 2,594 | |||||||||
United Natural Foods, Inc. (a) | 30,006 | 1,249 | |||||||||
USANA Health Sciences, Inc. (a) | 23,238 | 1,358 | |||||||||
Vector Group Ltd. | 147,731 | 1,913 | |||||||||
21,632 | |||||||||||
See notes to financial statements.
4
| USAA Mutual Funds Trust USAA Small Cap Stock Fund | Schedule of Portfolio Investments — continued January 31, 2023 | ||||||
(Amounts in Thousands, Except for Shares) (Unaudited)
Security Description | Shares | Value | |||||||||
Energy (5.4%): | |||||||||||
Arch Resources, Inc. (b) | 7,599 | $ | 1,125 | ||||||||
Cactus, Inc. Class A | 103,757 | 5,614 | |||||||||
California Resources Corp. | 26,610 | 1,137 | |||||||||
Chord Energy Corp. | 9,858 | 1,413 | |||||||||
Civitas Resources, Inc. | 55,353 | 3,684 | |||||||||
Clean Energy Fuels Corp. (a) | 113,659 | 643 | |||||||||
CONSOL Energy, Inc. | 30,768 | 1,779 | |||||||||
Crescent Energy Co. Class A (b) | 100,048 | 1,207 | |||||||||
CVR Energy, Inc. | 27,597 | 916 | |||||||||
DHT Holdings, Inc. | 103,220 | 885 | |||||||||
Diamond Offshore Drilling, Inc. (a) | 121,424 | 1,392 | |||||||||
Dorian LPG Ltd. | 57,151 | 1,134 | |||||||||
Earthstone Energy, Inc. Class A (a) (b) | 55,554 | 772 | |||||||||
Expro Group Holdings NV (a) | 247,398 | 4,673 | |||||||||
Green Plains, Inc. (a) | 111,425 | 3,874 | |||||||||
International Seaways, Inc. | 50,696 | 1,969 | |||||||||
Magnolia Oil & Gas Corp. Class A | 59,498 | 1,405 | |||||||||
Matador Resources Co. | 28,568 | 1,890 | |||||||||
Northern Oil and Gas, Inc. | 71,100 | 2,383 | |||||||||
Patterson-UTI Energy, Inc. | 41,456 | 697 | |||||||||
PBF Energy, Inc. Class A | 34,157 | 1,434 | |||||||||
PDC Energy, Inc. | 15,910 | 1,078 | |||||||||
Permian Resources Corp. | 118,854 | 1,292 | |||||||||
Plains GP Holdings LP Class A (b) | 129,900 | 1,700 | |||||||||
RPC, Inc. | 540,286 | 5,360 | |||||||||
SM Energy Co. | 46,985 | 1,544 | |||||||||
Solaris Oilfield Infrastructure, Inc. Class A | 197,990 | 2,097 | |||||||||
Teekay Corp. (a) | 239,216 | 1,163 | |||||||||
54,260 | |||||||||||
Financials (16.3%): | |||||||||||
Ameris Bancorp | 50,420 | 2,378 | |||||||||
Arbor Realty Trust, Inc. | 56,514 | 844 | |||||||||
Ares Commercial Real Estate Corp. | 53,210 | 653 | |||||||||
Artisan Partners Asset Management, Inc. Class A | 92,816 | 3,418 | |||||||||
Assured Guaranty Ltd. | 23,950 | 1,499 | |||||||||
Atlantic Union Bankshares Corp. | 54,722 | 2,117 | |||||||||
Banc of California, Inc. | 91,300 | 1,590 | |||||||||
Bank of Hawaii Corp. | 24,320 | 1,860 | |||||||||
BankUnited, Inc. | 54,243 | 2,042 | |||||||||
Banner Corp. | 11,300 | 733 | |||||||||
Blackstone Mortgage Trust, Inc. Class A | 78,100 | 1,862 | |||||||||
Bread Financial Holdings, Inc. | 30,222 | 1,240 | |||||||||
Cathay General Bancorp | 44,467 | 1,955 | |||||||||
Chimera Investment Corp. | 112,309 | 819 | |||||||||
Claros Mortgage Trust, Inc. (b) | 33,102 | 554 | |||||||||
Customers Bancorp, Inc. (a) | 43,644 | 1,325 | |||||||||
Donnelley Financial Solutions, Inc. (a) | 26,998 | 1,231 | |||||||||
Eastern Bankshares, Inc. | 77,800 | 1,258 | |||||||||
Employers Holdings, Inc. | 59,892 | 2,627 | |||||||||
See notes to financial statements.
5
| USAA Mutual Funds Trust USAA Small Cap Stock Fund | Schedule of Portfolio Investments — continued January 31, 2023 | ||||||
(Amounts in Thousands, Except for Shares) (Unaudited)
Security Description | Shares | Value | |||||||||
Enova International, Inc. (a) | 35,904 | $ | 1,639 | ||||||||
Essent Group Ltd. | 54,607 | 2,404 | |||||||||
FB Financial Corp. | 43,170 | 1,621 | |||||||||
Federated Hermes, Inc. | 121,810 | 4,787 | |||||||||
First Bancorp | 201,980 | 2,717 | |||||||||
First Bancorp/Southern Pines NC | 31,970 | 1,274 | |||||||||
First Busey Corp. | 164,175 | 3,919 | |||||||||
First Merchants Corp. | 51,750 | 2,207 | |||||||||
Genworth Financial, Inc. (a) | 283,876 | 1,567 | |||||||||
Globe Life, Inc. | 29,910 | 3,615 | |||||||||
Hagerty, Inc. Class A (a) (b) | 85,890 | 825 | |||||||||
Heartland Financial USA, Inc. | 27,882 | 1,379 | |||||||||
Heritage Financial Corp. | 20,473 | 584 | |||||||||
Home BancShares, Inc. | 154,494 | 3,688 | |||||||||
Houlihan Lokey, Inc. | 25,920 | 2,568 | |||||||||
International Bancshares Corp. | 40,659 | 1,906 | |||||||||
James River Group Holdings Ltd. | 128,543 | 2,913 | |||||||||
Kemper Corp. | 87,332 | 5,129 | |||||||||
Kinsale Capital Group, Inc. | 11,004 | 3,064 | |||||||||
Ladder Capital Corp. | 116,880 | 1,309 | |||||||||
LendingTree, Inc. (a) | 24,488 | 971 | |||||||||
MGIC Investment Corp. | 114,238 | 1,613 | |||||||||
Moelis & Co. Class A | 28,763 | 1,345 | |||||||||
Mr. Cooper Group, Inc. (a) | 37,212 | 1,711 | |||||||||
New York Community Bancorp, Inc. | 117,045 | 1,169 | |||||||||
New York Mortgage Trust, Inc. | 229,486 | 716 | |||||||||
NMI Holdings, Inc. Class A (a) | 61,581 | 1,431 | |||||||||
Northwest Bancshares, Inc. (b) | 109,000 | 1,541 | |||||||||
OFG Bancorp | 113,171 | 3,204 | |||||||||
Pacific Premier Bancorp, Inc. | 67,050 | 2,168 | |||||||||
PennyMac Financial Services, Inc. | 27,610 | 1,861 | |||||||||
PJT Partners, Inc. Class A | 24,790 | 1,984 | |||||||||
Primerica, Inc. | 32,280 | 5,221 | |||||||||
Prosperity Bancshares, Inc. | 28,248 | 2,143 | |||||||||
RLI Corp. | 24,637 | 3,263 | |||||||||
Safety Insurance Group, Inc. | 7,060 | 596 | |||||||||
Sandy Spring Bancorp, Inc. | 42,200 | 1,426 | |||||||||
Selective Insurance Group, Inc. | 28,700 | 2,727 | |||||||||
ServisFirst Bancshares, Inc. | 24,721 | 1,686 | |||||||||
Silvergate Capital Corp. Class A (a) (b) | 30,300 | 431 | |||||||||
SouthState Corp. | 63,107 | 5,023 | |||||||||
StepStone Group, Inc. Class A | 70,865 | 2,069 | |||||||||
Stewart Information Services Corp. | 49,917 | 2,385 | |||||||||
Stifel Financial Corp. | 102,955 | 6,940 | |||||||||
SVB Financial Group (a) | 6,850 | 2,072 | |||||||||
Synovus Financial Corp. | 69,472 | 2,914 | |||||||||
Texas Capital Bancshares, Inc. (a) | 84,407 | 5,577 | |||||||||
The Bancorp, Inc. (a) | 49,162 | 1,668 | |||||||||
The Bank of NT Butterfield & Son Ltd. | 74,000 | 2,365 | |||||||||
The Hanover Insurance Group, Inc. | 7,928 | 1,067 | |||||||||
See notes to financial statements.
6
| USAA Mutual Funds Trust USAA Small Cap Stock Fund | Schedule of Portfolio Investments — continued January 31, 2023 | ||||||
(Amounts in Thousands, Except for Shares) (Unaudited)
Security Description | Shares | Value | |||||||||
UMB Financial Corp. | 38,865 | $ | 3,505 | ||||||||
United Community Banks, Inc. | 78,100 | 2,541 | |||||||||
Valley National Bancorp | 248,120 | 2,948 | |||||||||
Virtus Investment Partners, Inc. | 6,620 | 1,423 | |||||||||
White Mountains Insurance Group Ltd. | 1,990 | 3,041 | |||||||||
Wintrust Financial Corp. | 17,230 | 1,576 | |||||||||
163,441 | |||||||||||
Health Care (16.8%): | |||||||||||
ACADIA Pharmaceuticals, Inc. (a) | 55,547 | 1,057 | |||||||||
Affimed NV (a) | 48,483 | 63 | |||||||||
Akoya Biosciences, Inc. (a) | 86,219 | 970 | |||||||||
Alector, Inc. (a) | 133,480 | 1,177 | |||||||||
Alkermes PLC (a) | 53,036 | 1,519 | |||||||||
American Well Corp. Class A (a) | 184,972 | 734 | |||||||||
AMN Healthcare Services, Inc. (a) | 14,968 | 1,435 | |||||||||
Amneal Pharmaceuticals, Inc. (a) | 324,238 | 713 | |||||||||
Apellis Pharmaceuticals, Inc. (a) | 28,109 | 1,482 | |||||||||
Arcus Biosciences, Inc. (a) | 106,935 | 2,313 | |||||||||
Arrowhead Pharmaceuticals, Inc. (a) | 29,171 | 1,021 | |||||||||
Avanos Medical, Inc. (a) | 51,821 | 1,588 | |||||||||
Azenta, Inc. (a) | 88,929 | 4,971 | |||||||||
Beam Therapeutics, Inc. (a) | 37,236 | 1,618 | |||||||||
BioLife Solutions, Inc. (a) | 73,382 | 1,720 | |||||||||
Biomerica, Inc. (a) (b) | 102,984 | 309 | |||||||||
bluebird bio, Inc. (a) | 123,150 | 782 | |||||||||
Blueprint Medicines Corp. (a) | 33,380 | 1,560 | |||||||||
Brookdale Senior Living, Inc. (a) | 221,286 | 637 | |||||||||
CareDx, Inc. (a) | 57,509 | 859 | |||||||||
Castle Biosciences, Inc. (a) | 86,425 | 2,340 | |||||||||
Catalyst Pharmaceuticals, Inc. (a) | 62,425 | 967 | |||||||||
Codiak Biosciences, Inc. (a) | 66,385 | 47 | |||||||||
Collegium Pharmaceutical, Inc. (a) | 44,980 | 1,263 | |||||||||
Computer Programs and Systems, Inc. (a) | 14,437 | 424 | |||||||||
Corcept Therapeutics, Inc. (a) | 92,957 | 2,125 | |||||||||
CorVel Corp. (a) | 36,000 | 6,414 | |||||||||
CryoPort, Inc. (a) | 18,764 | 428 | |||||||||
CytoSorbents Corp. (a) (b) | 201,182 | 575 | |||||||||
Definitive Healthcare Corp. (a) (b) | 95,053 | 1,177 | |||||||||
Dynavax Technologies Corp. (a) | 76,719 | 873 | |||||||||
Eagle Pharmaceuticals, Inc. (a) | 26,354 | 895 | |||||||||
Edgewise Therapeutics, Inc. (a) | 59,000 | 604 | |||||||||
Emergent BioSolutions, Inc. (a) | 74,216 | 979 | |||||||||
Encompass Health Corp. | 61,170 | 3,820 | |||||||||
Evolent Health, Inc. Class A (a) | 87,397 | 2,816 | |||||||||
Figs, Inc. Class A (a) | 120,700 | 1,080 | |||||||||
Fulgent Genetics, Inc. (a) | 36,489 | 1,233 | |||||||||
Gamida Cell Ltd. (a) (b) | 105,374 | 169 | |||||||||
Globus Medical, Inc. (a) | 20,162 | 1,522 | |||||||||
Haemonetics Corp. (a) | 34,057 | 2,881 | |||||||||
See notes to financial statements.
7
| USAA Mutual Funds Trust USAA Small Cap Stock Fund | Schedule of Portfolio Investments — continued January 31, 2023 | ||||||
(Amounts in Thousands, Except for Shares) (Unaudited)
Security Description | Shares | Value | |||||||||
Halozyme Therapeutics, Inc. (a) | 153,348 | $ | 7,939 | ||||||||
Harmony Biosciences Holdings, Inc. (a) | 15,538 | 749 | |||||||||
Health Catalyst, Inc. (a) | 79,788 | 1,109 | |||||||||
HealthEquity, Inc. (a) | 6,587 | 401 | |||||||||
Heska Corp. (a) | 10,500 | 939 | |||||||||
iCAD, Inc. (a) | 166,911 | 382 | |||||||||
ICU Medical, Inc. (a) | 5,814 | 1,123 | |||||||||
ImmunoGen, Inc. (a) | 190,444 | 876 | |||||||||
Inmode Ltd. (a) | 3,318 | 116 | |||||||||
Innoviva, Inc. (a) | 76,455 | 967 | |||||||||
Insmed, Inc. (a) | 49,000 | 1,055 | |||||||||
Integer Holdings Corp. (a) | 52,827 | 3,477 | |||||||||
Intellia Therapeutics, Inc. (a) | 52,766 | 2,239 | |||||||||
Iovance Biotherapeutics, Inc. (a) | 26,568 | 212 | |||||||||
Ironwood Pharmaceuticals, Inc. (a) | 129,700 | 1,494 | |||||||||
iTeos Therapeutics, Inc. (a) | 38,423 | 803 | |||||||||
Kezar Life Sciences, Inc. (a) | 122,900 | 881 | |||||||||
Kiniksa Pharmaceuticals Ltd. Class A (a) | 75,254 | 1,088 | |||||||||
LivaNova PLC (a) | 30,860 | 1,734 | |||||||||
Maxcyte, Inc. (a) | 103,794 | 606 | |||||||||
Medpace Holdings, Inc. (a) | 24,703 | 5,461 | |||||||||
Merit Medical Systems, Inc. (a) | 22,919 | 1,635 | |||||||||
Mesa Laboratories, Inc. | 5,734 | 1,116 | |||||||||
Mirati Therapeutics, Inc. (a) | 19,850 | 1,060 | |||||||||
ModivCare, Inc. (a) | 9,949 | 1,067 | |||||||||
Multiplan Corp. (a) | 363,298 | 480 | |||||||||
Myriad Genetics, Inc. (a) | 41,637 | 821 | |||||||||
Natera, Inc. (a) | 38,928 | 1,671 | |||||||||
Neogen Corp. (a) | 170,680 | 3,654 | |||||||||
Nupathe, Inc. (a) (c) | 133,709 | — | (d) | ||||||||
NuVasive, Inc. (a) | 34,990 | 1,596 | |||||||||
Olink Holding AB, ADR (a) (b) | 66,466 | 1,301 | |||||||||
Omniab, Inc. (a) (c) | 14,208 | — | |||||||||
Omnicell, Inc. (a) | 23,308 | 1,293 | |||||||||
OrthoPediatrics Corp. (a) | 45,231 | 2,132 | |||||||||
Owens & Minor, Inc. (a) | 63,036 | 1,244 | |||||||||
Pacific Biosciences of California, Inc. (a) | 118,174 | 1,311 | |||||||||
Pacira BioSciences, Inc. (a) | 29,387 | 1,154 | |||||||||
Patterson Cos., Inc. | 49,100 | 1,482 | |||||||||
Perrigo Co. PLC | 35,361 | 1,323 | |||||||||
Phreesia, Inc. (a) | 8,082 | 303 | |||||||||
Pliant Therapeutics, Inc. (a) | 58,998 | 2,067 | |||||||||
Prestige Consumer Healthcare, Inc. (a) | 44,681 | 2,938 | |||||||||
Prothena Corp. PLC (a) | 25,711 | 1,454 | |||||||||
Quanterix Corp. (a) | 124,860 | 1,764 | |||||||||
Repligen Corp. (a) | 9,800 | 1,816 | |||||||||
Revance Therapeutics, Inc. (a) | 46,936 | 1,628 | |||||||||
Select Medical Holdings Corp. | 99,422 | 2,890 | |||||||||
Shockwave Medical, Inc. (a) | 4,900 | 921 | |||||||||
SI-BONE, Inc. (a) | 118,244 | 2,014 | |||||||||
See notes to financial statements.
8
| USAA Mutual Funds Trust USAA Small Cap Stock Fund | Schedule of Portfolio Investments — continued January 31, 2023 | ||||||
(Amounts in Thousands, Except for Shares) (Unaudited)
Security Description | Shares | Value | |||||||||
SIGA Technologies, Inc. | 118,935 | $ | 872 | ||||||||
STAAR Surgical Co. (a) | 64,872 | 4,577 | |||||||||
Stoke Therapeutics, Inc. (a) | 98,475 | 981 | |||||||||
Supernus Pharmaceuticals, Inc. (a) | 49,110 | 2,014 | |||||||||
Tandem Diabetes Care, Inc. (a) | 38,608 | 1,573 | |||||||||
TCR2 Therapeutics, Inc. (a) | 70,792 | 103 | |||||||||
Tenet Healthcare Corp. (a) | 37,674 | 2,066 | |||||||||
The Ensign Group, Inc. | 54,068 | 5,042 | |||||||||
TransMedics Group, Inc. (a) | 12,350 | 778 | |||||||||
U.S. Physical Therapy, Inc. | 12,466 | 1,236 | |||||||||
UFP Technologies, Inc. (a) | 21,854 | 2,486 | |||||||||
Vanda Pharmaceuticals, Inc. (a) | 127,610 | 980 | |||||||||
Veracyte, Inc. (a) | 96,476 | 2,425 | |||||||||
Vericel Corp. (a) | 128,443 | 3,528 | |||||||||
Vir Biotechnology, Inc. (a) | 36,436 | 1,077 | |||||||||
Xencor, Inc. (a) | 17,123 | 564 | |||||||||
Xenon Pharmaceuticals, Inc. (a) | 36,583 | 1,430 | |||||||||
Zimvie, Inc. (a) | 81,360 | 798 | |||||||||
Zymeworks, Inc. (a) (b) | 83,369 | 788 | |||||||||
168,264 | |||||||||||
Industrials (16.4%): | |||||||||||
AAON, Inc. | 47,437 | 3,620 | |||||||||
AAR Corp. (a) | 35,850 | 1,844 | |||||||||
ACCO Brands Corp. | 171,888 | 1,092 | |||||||||
Alta Equipment Group, Inc. | 58,969 | 1,000 | |||||||||
Ameresco, Inc. Class A (a) | 14,218 | 917 | |||||||||
Applied Industrial Technologies, Inc. | 12,470 | 1,786 | |||||||||
ArcBest Corp. | 28,641 | 2,390 | |||||||||
Array Technologies, Inc. (a) | 193,402 | 4,299 | |||||||||
Atkore, Inc. (a) | 29,694 | 3,868 | |||||||||
Axon Enterprise, Inc. (a) | 13,047 | 2,550 | |||||||||
Boise Cascade Co. | 21,839 | 1,637 | |||||||||
BWX Technologies, Inc. | 21,246 | 1,293 | |||||||||
CACI International, Inc. Class A (a) | 6,282 | 1,935 | |||||||||
Cadre Holdings, Inc. | 41,409 | 948 | |||||||||
Casella Waste Systems, Inc. (a) | 35,020 | 2,806 | |||||||||
Chart Industries, Inc. (a) | 12,672 | 1,698 | |||||||||
Clean Harbors, Inc. (a) | 13,747 | 1,791 | |||||||||
Columbus McKinnon Corp. | 44,829 | 1,612 | |||||||||
CoreCivic, Inc. (a) | 67,112 | 714 | |||||||||
CRA International, Inc. | 12,148 | 1,444 | |||||||||
Crane Holdings Co. | 18,600 | 2,156 | |||||||||
Curtiss-Wright Corp. | 9,895 | 1,641 | |||||||||
Daseke, Inc. (a) | 82,159 | 573 | |||||||||
Deluxe Corp. | 52,084 | 1,041 | |||||||||
EMCOR Group, Inc. | 51,979 | 7,706 | |||||||||
Encore Wire Corp. | 18,388 | 2,968 | |||||||||
Enovix Corp. (a) (b) | 123,685 | 982 | |||||||||
EnPro Industries, Inc. | 13,873 | 1,680 | |||||||||
See notes to financial statements.
9
| USAA Mutual Funds Trust USAA Small Cap Stock Fund | Schedule of Portfolio Investments — continued January 31, 2023 | ||||||
(Amounts in Thousands, Except for Shares) (Unaudited)
Security Description | Shares | Value | |||||||||
Esab Corp. | 28,065 | $ | 1,622 | ||||||||
ESCO Technologies, Inc. | 15,900 | 1,565 | |||||||||
Exponent, Inc. | 57,558 | 5,902 | |||||||||
Federal Signal Corp. | 34,340 | 1,829 | |||||||||
Finning International, Inc. | 50,360 | 1,421 | |||||||||
Fiverr International Ltd. (a) | 146 | 5 | |||||||||
Fluor Corp. (a) | 44,200 | 1,624 | |||||||||
Forward Air Corp. | 30,279 | 3,266 | |||||||||
FTI Consulting, Inc. (a) | 9,751 | 1,555 | |||||||||
Gibraltar Industries, Inc. (a) | 57,996 | 3,107 | |||||||||
Golden Ocean Group Ltd. (b) | 117,286 | 1,124 | |||||||||
Granite Construction, Inc. | 36,210 | 1,542 | |||||||||
H&E Equipment Services, Inc. | 32,740 | 1,666 | |||||||||
Hawaiian Holdings, Inc. (a) | 87,300 | 1,076 | |||||||||
Hexcel Corp. | 63,240 | 4,463 | |||||||||
Hub Group, Inc. Class A (a) | 21,450 | 1,829 | |||||||||
Hudson Technologies, Inc. (a) | 86,561 | 884 | |||||||||
ICF International, Inc. | 11,280 | 1,153 | |||||||||
JELD-WEN Holding, Inc. (a) | 104,701 | 1,324 | |||||||||
Kirby Corp. (a) | 20,542 | 1,454 | |||||||||
Korn Ferry | 27,810 | 1,501 | |||||||||
Kornit Digital Ltd. (a) | 164,297 | 4,142 | |||||||||
Landstar System, Inc. | 24,430 | 4,222 | |||||||||
Matson, Inc. | 21,519 | 1,423 | |||||||||
Maxar Technologies, Inc. | 21,694 | 1,121 | |||||||||
McGrath RentCorp | 6,310 | 628 | |||||||||
Mueller Industries, Inc. | 21,515 | 1,410 | |||||||||
Mueller Water Products, Inc. Class A | 103,070 | 1,304 | |||||||||
MYR Group, Inc. (a) | 17,119 | 1,696 | |||||||||
NOW, Inc. (a) | 435,867 | 6,120 | |||||||||
RBC Bearings, Inc. (a) | 29,594 | 7,220 | |||||||||
Ritchie Bros Auctioneers, Inc. | 9,200 | 556 | |||||||||
Rush Enterprises, Inc. Class A | 29,151 | 1,569 | |||||||||
Ryder System, Inc. | 9,931 | 938 | |||||||||
Saia, Inc. (a) | 13,252 | 3,615 | |||||||||
The Timken Co. | 39,813 | 3,279 | |||||||||
Triton International Ltd. | 35,605 | 2,515 | |||||||||
UFP Industries, Inc. | 57,653 | 5,393 | |||||||||
UniFirst Corp. | 10,892 | 2,161 | |||||||||
Univar Solutions, Inc. (a) | 41,858 | 1,443 | |||||||||
Vicor Corp. (a) | 20,234 | 1,405 | |||||||||
Wabash National Corp. | 65,390 | 1,684 | |||||||||
Watts Water Technologies, Inc. Class A | 12,342 | 2,018 | |||||||||
Werner Enterprises, Inc. | 39,745 | 1,867 | |||||||||
WESCO International, Inc. (a) | 11,150 | 1,661 | |||||||||
WillScot Mobile Mini Holdings Corp. (a) | 119,239 | 5,778 | |||||||||
Zurn Elkay Water Solutions Corp. | 53,644 | 1,173 | |||||||||
164,244 | |||||||||||
See notes to financial statements.
10
| USAA Mutual Funds Trust USAA Small Cap Stock Fund | Schedule of Portfolio Investments — continued January 31, 2023 | ||||||
(Amounts in Thousands, Except for Shares) (Unaudited)
Security Description | Shares | Value | |||||||||
Information Technology (17.6%): | |||||||||||
908 Devices, Inc. (a) (b) | 135,340 | $ | 1,261 | ||||||||
A10 Networks, Inc. | 60,235 | 932 | |||||||||
ACI Worldwide, Inc. (a) | 56,659 | 1,582 | |||||||||
Adeia, Inc. | 103,750 | 1,136 | |||||||||
Advanced Energy Industries, Inc. | 55,669 | 5,163 | |||||||||
Airgain, Inc. (a) | 146,399 | 1,171 | |||||||||
Akoustis Technologies, Inc. (a) (b) | 207,138 | 764 | |||||||||
Allegro MicroSystems, Inc. (a) | 124,794 | 4,763 | |||||||||
Ambarella, Inc. (a) | 40,361 | 3,626 | |||||||||
Appian Corp. (a) | 692 | 29 | |||||||||
Arteris, Inc. (a) | 113,368 | 712 | |||||||||
Avid Technology, Inc. (a) | 28,998 | 879 | |||||||||
Axcelis Technologies, Inc. (a) | 11,500 | 1,264 | |||||||||
AXT, Inc. (a) | 238,217 | 1,403 | |||||||||
Badger Meter, Inc. | 14,191 | 1,645 | |||||||||
Belden, Inc. | 37,510 | 3,042 | |||||||||
Canadian Solar, Inc. (a) | 7,450 | 313 | |||||||||
CEVA, Inc. (a) | 77,961 | 2,582 | |||||||||
Ciena Corp. (a) | 42,567 | 2,214 | |||||||||
Conduent, Inc. (a) | 200,155 | 955 | |||||||||
Confluent, Inc. Class A (a) | 25,650 | 593 | |||||||||
Consensus Cloud Solutions, Inc. (a) | 14,240 | 837 | |||||||||
CyberArk Software Ltd. (a) | 7,295 | 1,028 | |||||||||
Digital Turbine, Inc. (a) | 209,978 | 3,645 | |||||||||
Diodes, Inc. (a) | 77,183 | 6,884 | |||||||||
Domo, Inc. Class B (a) | 9,859 | 153 | |||||||||
Ebix, Inc. | 32,358 | 617 | |||||||||
ePlus, Inc. (a) | 83,866 | 4,175 | |||||||||
Euronet Worldwide, Inc. (a) | 40,928 | 4,612 | |||||||||
EVERTEC, Inc. | 161,839 | 5,978 | |||||||||
ExlService Holdings, Inc. (a) | 36,830 | 6,283 | |||||||||
First Solar, Inc. (a) | 7,951 | 1,412 | |||||||||
FormFactor, Inc. (a) | 172,441 | 4,852 | |||||||||
Globant SA (a) | 1,561 | 253 | |||||||||
Grid Dynamics Holdings, Inc. (a) | 107,965 | 1,352 | |||||||||
Guidewire Software, Inc. (a) | 27,260 | 1,997 | |||||||||
Harmonic, Inc. (a) | 211,062 | 2,780 | |||||||||
HubSpot, Inc. (a) | 2,200 | 763 | |||||||||
indie Semiconductor, Inc. Class A (a) (b) | 411,736 | 3,282 | |||||||||
Infinera Corp. (a) | 246,582 | 1,805 | |||||||||
Insight Enterprises, Inc. (a) | 41,935 | 4,727 | |||||||||
Knowles Corp. (a) | 94,840 | 1,824 | |||||||||
Limelight Networks, Inc. (a) | 1,244,858 | 1,954 | |||||||||
LivePerson, Inc. (a) | 12,217 | 157 | |||||||||
Methode Electronics, Inc. | 30,257 | 1,444 | |||||||||
Monolithic Power Systems, Inc. | 2,485 | 1,060 | |||||||||
NetScout Systems, Inc. (a) | 39,544 | 1,269 | |||||||||
Nutanix, Inc. Class A (a) | 72,484 | 2,020 | |||||||||
Okta, Inc. (a) | 2,750 | 202 | |||||||||
See notes to financial statements.
11
| USAA Mutual Funds Trust USAA Small Cap Stock Fund | Schedule of Portfolio Investments — continued January 31, 2023 | ||||||
(Amounts in Thousands, Except for Shares) (Unaudited)
Security Description | Shares | Value | |||||||||
Onto Innovation, Inc. (a) | 24,168 | $ | 1,901 | ||||||||
OSI Systems, Inc. (a) | 19,982 | 1,892 | |||||||||
PAR Technology Corp. (a) (b) | 19,028 | 647 | |||||||||
Paycom Software, Inc. (a) | 1,650 | 534 | |||||||||
Paylocity Holding Corp. (a) | 3,634 | 757 | |||||||||
Perficient, Inc. (a) | 97,920 | 7,260 | |||||||||
Photronics, Inc. (a) | 63,721 | 1,155 | |||||||||
Plexus Corp. (a) | 18,812 | 1,806 | |||||||||
Power Integrations, Inc. | 56,704 | 4,882 | |||||||||
Progress Software Corp. | 27,713 | 1,470 | |||||||||
PROS Holdings, Inc. (a) | 90,360 | 2,277 | |||||||||
PTC, Inc. (a) | 16,749 | 2,259 | |||||||||
Pure Storage, Inc. Class A (a) | 101,683 | 2,943 | |||||||||
Qualys, Inc. (a) | 24,810 | 2,862 | |||||||||
Radware Ltd. (a) | 85,814 | 1,828 | |||||||||
Rapid7, Inc. (a) | 59,615 | 2,377 | |||||||||
Riskified Ltd. Class A (a) | 36,916 | 224 | |||||||||
Sanmina Corp. (a) | 51,117 | 3,115 | |||||||||
ShotSpotter, Inc. (a) | 12,501 | 482 | |||||||||
Silicon Laboratories, Inc. (a) | 9,071 | 1,423 | |||||||||
SiTime Corp. (a) | 6,230 | 718 | |||||||||
SolarWinds Corp. (a) | 66,345 | 674 | |||||||||
Sprout Social, Inc. Class A (a) | 23,602 | 1,510 | |||||||||
SPS Commerce, Inc. (a) | 23,045 | 3,136 | |||||||||
Squarespace, Inc. Class A (a) | 37,326 | 885 | |||||||||
Stratasys Ltd. (a) | 10,311 | 148 | |||||||||
Synaptics, Inc. (a) | 20,246 | 2,531 | |||||||||
Toast, Inc. Class A (a) | 52,311 | 1,167 | |||||||||
TTEC Holdings, Inc. | 25,565 | 1,300 | |||||||||
Varonis Systems, Inc. (a) | 53,996 | 1,395 | |||||||||
Veeco Instruments, Inc. (a) | 205,900 | 4,089 | |||||||||
Verint Systems, Inc. (a) | 112,320 | 4,265 | |||||||||
Veritone, Inc. (a) (b) | 68,249 | 577 | |||||||||
Verra Mobility Corp. (a) | 81,240 | 1,254 | |||||||||
Vishay Intertechnology, Inc. | 77,534 | 1,775 | |||||||||
WNS Holdings Ltd., ADR (a) | 30,732 | 2,604 | |||||||||
Workiva, Inc. (a) | 7,340 | 635 | |||||||||
Xerox Holdings Corp. | 87,233 | 1,429 | |||||||||
Zeta Global Holdings Corp. Class A (a) | 76,068 | 691 | |||||||||
176,271 | |||||||||||
Materials (3.1%): | |||||||||||
AdvanSix, Inc. | 36,980 | 1,599 | |||||||||
Alpha Metallurgical Resources, Inc. | 7,700 | 1,239 | |||||||||
ATI, Inc. (a) | 44,000 | 1,601 | |||||||||
Avient Corp. | 37,995 | 1,540 | |||||||||
Axalta Coating Systems Ltd. (a) | 47,880 | 1,441 | |||||||||
Balchem Corp. | 15,160 | 1,980 | |||||||||
Commercial Metals Co. | 40,019 | 2,172 | |||||||||
Constellium SE (a) | 108,310 | 1,574 | |||||||||
Ecovyst, Inc. (a) | 128,527 | 1,348 | |||||||||
See notes to financial statements.
12
| USAA Mutual Funds Trust USAA Small Cap Stock Fund | Schedule of Portfolio Investments — continued January 31, 2023 | ||||||
(Amounts in Thousands, Except for Shares) (Unaudited)
Security Description | Shares | Value | |||||||||
Graphic Packaging Holding Co. | 91,510 | $ | 2,204 | ||||||||
Greif, Inc. Class A | 25,020 | 1,787 | |||||||||
Intrepid Potash, Inc. (a) | 18,450 | 604 | |||||||||
Materion Corp. | 26,655 | 2,406 | |||||||||
O-I Glass, Inc. (a) | 98,240 | 1,891 | |||||||||
Olin Corp. | 32,460 | 2,097 | |||||||||
Summit Materials, Inc. Class A (a) | 43,175 | 1,419 | |||||||||
Sylvamo Corp. | 16,493 | 784 | |||||||||
TimkenSteel Corp. (a) | 57,489 | 1,131 | |||||||||
Tronox Holdings PLC | 74,755 | 1,282 | |||||||||
Warrior Met Coal, Inc. | 34,453 | 1,305 | |||||||||
31,404 | |||||||||||
Real Estate (5.1%): | |||||||||||
Alexander & Baldwin, Inc. | 92,012 | 1,842 | |||||||||
Anywhere Real Estate, Inc. (a) | 44,273 | 375 | |||||||||
Apartment Investment and Management Co. | 80,372 | 604 | |||||||||
Armada Hoffler Properties, Inc. | 50,611 | 642 | |||||||||
Brandywine Realty Trust | 104,813 | 688 | |||||||||
CareTrust REIT, Inc. | 73,000 | 1,513 | |||||||||
Corporate Office Properties Trust | 72,090 | 2,024 | |||||||||
CTO Realty Growth, Inc. | 31,845 | 625 | |||||||||
DiamondRock Hospitality Co. | 157,000 | 1,512 | |||||||||
DigitalBridge Group, Inc. | 58,634 | 868 | |||||||||
Douglas Elliman, Inc. | 62,267 | 290 | |||||||||
Easterly Government Properties, Inc. | 84,813 | 1,377 | |||||||||
Equity Commonwealth | 95,780 | 2,444 | |||||||||
Essential Properties Realty Trust, Inc. | 74,000 | 1,886 | |||||||||
Four Corners Property Trust, Inc. | 91,550 | 2,633 | |||||||||
Gladstone Commercial Corp. | 32,630 | 554 | |||||||||
Gladstone Land Corp. | 31,338 | 612 | |||||||||
Hudson Pacific Properties, Inc. | 82,300 | 937 | |||||||||
Independence Realty Trust, Inc. | 53,343 | 1,004 | |||||||||
Innovative Industrial Properties, Inc. | 6,880 | 618 | |||||||||
Kennedy-Wilson Holdings, Inc. | 71,610 | 1,280 | |||||||||
Kite Realty Group Trust | 46,758 | 1,015 | |||||||||
LXP Industrial Trust | 189,700 | 2,191 | |||||||||
National Health Investors, Inc. | 14,337 | 843 | |||||||||
Office Properties Income Trust | 43,583 | 748 | |||||||||
Outfront Media, Inc. | 45,654 | 909 | |||||||||
Pebblebrook Hotel Trust | 48,920 | 802 | |||||||||
Physicians Realty Trust | 112,100 | 1,778 | |||||||||
PotlatchDeltic Corp. | 61,813 | 3,026 | |||||||||
Redfin Corp. (a) (b) | 115,963 | 867 | |||||||||
Ryman Hospitality Properties, Inc. | 11,618 | 1,079 | |||||||||
Sabra Health Care REIT, Inc. | 132,000 | 1,782 | |||||||||
Service Properties Trust | 88,545 | 789 | |||||||||
SITE Centers Corp. | 150,165 | 2,050 | |||||||||
STAG Industrial, Inc. | 103,201 | 3,674 | |||||||||
Summit Hotel Properties, Inc. | 161,400 | 1,375 | |||||||||
Sunstone Hotel Investors, Inc. | 43,000 | 473 | |||||||||
See notes to financial statements.
13
| USAA Mutual Funds Trust USAA Small Cap Stock Fund | Schedule of Portfolio Investments — continued January 31, 2023 | ||||||
(Amounts in Thousands, Except for Shares) (Unaudited)
Security Description | Shares | Value | |||||||||
The Howard Hughes Corp. (a) | 17,840 | $ | 1,525 | ||||||||
The Macerich Co. | 66,909 | 919 | |||||||||
Veris Residential, Inc. (a) | 67,855 | 1,174 | |||||||||
51,347 | |||||||||||
Utilities (1.9%): | |||||||||||
ALLETE, Inc. | 43,830 | 2,710 | |||||||||
Black Hills Corp. | 52,260 | 3,783 | |||||||||
Brookfield Infrastructure Corp. Class A | 32,705 | 1,446 | |||||||||
Clearway Energy, Inc. Class C | 44,136 | 1,492 | |||||||||
Montauk Renewables, Inc. (a) | 65,798 | 731 | |||||||||
NorthWestern Corp. | 26,570 | 1,509 | |||||||||
ONE Gas, Inc. | 37,303 | 3,072 | |||||||||
Otter Tail Corp. | 29,602 | 1,899 | |||||||||
Portland General Electric Co. | 36,800 | 1,751 | |||||||||
18,393 | |||||||||||
Total Common Stocks (Cost $972,134) | 983,364 | ||||||||||
Rights (0.0%) (e) | |||||||||||
Health Care (0.0%): | |||||||||||
Flexion Therapeutics, Inc. (a) (c) | 58,207 | 1 | (d) | ||||||||
Total Rights (Cost $36) | 1 | (d) | |||||||||
Exchange-Traded Funds (0.2%) | |||||||||||
iShares Russell 2000 ETF | 10,705 | 2,050 | |||||||||
Total Exchange-Traded Funds (Cost $1,977) | 2,050 | ||||||||||
Collateral for Securities Loaned (1.8%)^ | |||||||||||
| Goldman Sachs Financial Square Government Fund, Institutional Shares, 4.22% (f) | 4,535,888 | 4,536 | |||||||||
HSBC U.S. Government Money Market Fund, Institutional Shares, 4.21% (f) | 4,535,888 | 4,536 | |||||||||
Invesco Government & Agency Portfolio, Institutional Shares, 4.31% (f) | 4,535,888 | 4,536 | |||||||||
| Morgan Stanley Institutional Liquidity Government Portfolio, Institutional Shares, 4.14% (f) | 4,535,888 | 4,536 | |||||||||
Total Collateral for Securities Loaned (Cost $18,144) | 18,144 | ||||||||||
Total Investments (Cost $992,291) — 100.3% | 1,003,559 | ||||||||||
Liabilities in excess of other assets — (0.3)% | (2,612 | ) | |||||||||
NET ASSETS — 100.00% | $ | 1,000,947 | |||||||||
At January 31, 2023, the Fund's investments in foreign securities were 5.4% of net assets.
^ Purchased with cash collateral from securities on loan.
(a) Non-income producing security.
(b) All or a portion of this security is on loan.
See notes to financial statements.
14
| USAA Mutual Funds Trust USAA Small Cap Stock Fund | Schedule of Portfolio Investments — continued January 31, 2023 | ||||||
(Unaudited)
(c) Security was fair valued based upon procedures approved by the Board of Trustees and represents less than 0.05% of net assets as of January 31, 2023. This security is classified as Level 3 within the fair value hierarchy. (See Note 2 in the Notes to Financial Statements)
(d) Rounds to less than $1 thousand.
(e) Amount represents less than 0.05% of net assets.
(f) Rate disclosed is the daily yield on January 31, 2023.
ADR — American Depositary Receipt
ETF — Exchange-Traded Fund
LP — Limited Partnership
PLC — Public Limited Company
REIT — Real Estate Investment Trust
See notes to financial statements.
15
USAA Mutual Funds Trust | Statement of Assets and Liabilities January 31, 2023 | ||||||
(Amounts in Thousands, Except Per Share Amounts) (Unaudited)
| USAA Small Cap Stock Fund | |||||||
Assets: | |||||||
Investments, at value (Cost $992,291) | $ | 1,003,559 | (a) | ||||
Cash | 14,400 | ||||||
Receivables: | |||||||
Interest and dividends | 166 | ||||||
Capital shares issued | 131 | ||||||
Investments sold | 4,051 | ||||||
From Adviser | 20 | ||||||
Prepaid expenses | 11 | ||||||
Total Assets | 1,022,338 | ||||||
Liabilities: | |||||||
Payables: | |||||||
Collateral received on loaned securities | 18,144 | ||||||
Investments purchased | 2,060 | ||||||
Capital shares redeemed | 286 | ||||||
Accrued expenses and other payables: | |||||||
Investment advisory fees | 607 | ||||||
Administration fees | 106 | ||||||
Custodian fees | 10 | ||||||
Transfer agent fees | 96 | ||||||
Compliance fees | 1 | ||||||
Trustees' fees | 1 | ||||||
Other accrued expenses | 80 | ||||||
Total Liabilities | 21,391 | ||||||
Net Assets: | |||||||
Capital | 926,658 | ||||||
Total accumulated earnings/(loss) | 74,289 | ||||||
Net Assets | $ | 1,000,947 | |||||
Net Assets | |||||||
Fund Shares | $ | 619,436 | |||||
Institutional Shares | 381,511 | ||||||
Total | $ | 1,000,947 | |||||
Shares (unlimited number of shares authorized with no par value): | |||||||
Fund Shares | 49,599 | ||||||
Institutional Shares | 29,898 | ||||||
Total | 79,497 | ||||||
Net asset value, offering and redemption price per share: (b) | |||||||
Fund Shares | $ | 12.49 | |||||
Institutional Shares | 12.76 | ||||||
(a) Includes $17,895 thousand of securities on loan.
(b) Per share amount may not recalculate due to rounding of net assets and/or shares outstanding.
See notes to financial statements.
16
USAA Mutual Funds Trust | Statement of Operations For the Six Months Ended January 31, 2023 | ||||||
(Amounts in Thousands) (Unaudited)
| USAA Small Cap Stock Fund | |||||||
Investment Income: | |||||||
Dividends | $ | 6,110 | |||||
Interest | 78 | ||||||
Securities lending (net of fees) | 155 | ||||||
Foreign tax withholding | (13 | ) | |||||
Total Income | 6,330 | ||||||
Expenses: | |||||||
Investment advisory fees | 3,580 | ||||||
Administration fees — Fund Shares | 446 | ||||||
Administration fees — Institutional Shares | 180 | ||||||
Sub-Administration fees | 55 | ||||||
Custodian fees | 28 | ||||||
Transfer agent fees — Fund Shares | 377 | ||||||
Transfer agent fees — Institutional Shares | 180 | ||||||
Trustees' fees | 23 | ||||||
Compliance fees | 5 | ||||||
Legal and audit fees | 44 | ||||||
State registration and filing fees | 31 | ||||||
Other expenses | 91 | ||||||
Total Expenses | 5,040 | ||||||
Expenses waived/reimbursed by Adviser | (60 | ) | |||||
Net Expenses | 4,980 | ||||||
Net Investment Income (Loss) | 1,350 | ||||||
Realized/Unrealized Gains (Losses) from Investments: | |||||||
| Net realized gains (losses) from investment securities and foreign currency transactions | 88,988 | ||||||
Net change in unrealized appreciation/depreciation on investment securities | (46,791 | ) | |||||
Net realized/unrealized gains (losses) on investments | 42,197 | ||||||
Change in net assets resulting from operations | $ | 43,547 | |||||
See notes to financial statements.
17
USAA Mutual Funds Trust | Statements of Changes in Net Assets | ||||||
(Amounts in Thousands)
USAA Small Cap Stock Fund | |||||||||||
| Six Months Ended January 31, 2023 (Unaudited) | Year Ended July 31, 2022 | ||||||||||
From Investments: | |||||||||||
Operations: | |||||||||||
Net Investment Income (Loss) | $ | 1,350 | $ | (900 | ) | ||||||
Net realized gains (losses) | 88,988 | 141,932 | |||||||||
Net change in unrealized appreciation/depreciation | (46,791 | ) | (279,245 | ) | |||||||
Change in net assets resulting from operations | 43,547 | (138,213 | ) | ||||||||
Distributions to Shareholders: | |||||||||||
Fund Shares | (33,366 | ) | (241,242 | ) | |||||||
Institutional Shares | (19,905 | ) | (116,892 | ) | |||||||
Change in net assets resulting from distributions to shareholders | (53,271 | ) | (358,134 | ) | |||||||
Change in net assets resulting from capital transactions | 35,111 | 8,529 | |||||||||
Change in net assets | 25,387 | (487,818 | ) | ||||||||
Net Assets: | |||||||||||
Beginning of period | 975,560 | 1,463,378 | |||||||||
End of period | $ | 1,000,947 | $ | 975,560 | |||||||
Capital Transactions: | |||||||||||
Fund Shares | |||||||||||
Proceeds from shares issued | $ | 13,282 | $ | 43,857 | |||||||
Distributions reinvested | 33,025 | 238,354 | |||||||||
Cost of shares redeemed | (44,497 | ) | (131,418 | ) | |||||||
Total Fund Shares | $ | 1,810 | $ | 150,793 | |||||||
Institutional Shares | |||||||||||
Proceeds from shares issued | $ | 42,781 | $ | 102,131 | |||||||
Distributions reinvested | 19,887 | 116,737 | |||||||||
Cost of shares redeemed | (29,367 | ) | (361,132 | ) | |||||||
Total Institutional Shares | $ | 33,301 | $ | (142,264 | ) | ||||||
Change in net assets resulting from capital transactions | $ | 35,111 | $ | 8,529 | |||||||
Share Transactions: | |||||||||||
Fund Shares | |||||||||||
Issued | 1,094 | 2,739 | |||||||||
Reinvested | 2,818 | 16,656 | |||||||||
Redeemed | (3,690 | ) | (8,545 | ) | |||||||
Total Fund Shares | 222 | 10,850 | |||||||||
Institutional Shares | |||||||||||
Issued | 3,324 | 6,818 | |||||||||
Reinvested | 1,661 | 8,001 | |||||||||
Redeemed | (2,394 | ) | (17,462 | ) | |||||||
Total Institutional Shares | 2,591 | (2,643 | ) | ||||||||
Change in Shares | 2,813 | 8,207 | |||||||||
See notes to financial statements.
18
USAA Mutual Funds Trust | Financial Highlights | ||||||
For a Share Outstanding Throughout Each Period
USAA Small Cap Stock Fund | |||||||||||||||||||||||||||
Fund Shares | |||||||||||||||||||||||||||
| Six Months Ended January 31, 2023 (Unaudited) | Year Ended July 31, 2022 | Year Ended July 31, 2021 | Year Ended July 31, 2020 | Year Ended July 31, 2019 | Year Ended July 31, 2018 | ||||||||||||||||||||||
| Net Asset Value, Beginning of Period | $ | 12.63 | $ | 21.25 | $ | 14.88 | $ | 16.74 | $ | 19.33 | $ | 18.02 | |||||||||||||||
Investment Activities: | |||||||||||||||||||||||||||
Net investment income (loss) | 0.02 | (a) | (0.01 | )(a) | (0.01 | )(a) | 0.05 | (a) | 0.07 | 0.05 | |||||||||||||||||
| Net realized and unrealized gains (losses) | 0.54 | (2.14 | ) | 7.95 | (0.28 | ) | (0.71 | ) | 3.19 | ||||||||||||||||||
| Total from Investment Activities | 0.56 | (2.15 | ) | 7.94 | (0.23 | ) | (0.64 | ) | 3.24 | ||||||||||||||||||
Distributions to Shareholders from: | |||||||||||||||||||||||||||
Net investment income | — | — | (0.14 | ) | (0.03 | ) | (0.04 | ) | (0.07 | ) | |||||||||||||||||
Net realized gains | (0.70 | ) | (6.47 | ) | (1.43 | ) | (1.60 | ) | (1.91 | ) | (1.86 | ) | |||||||||||||||
Total Distributions | (0.70 | ) | (6.47 | ) | (1.57 | ) | (1.63 | ) | (1.95 | ) | (1.93 | ) | |||||||||||||||
Net Asset Value, End of Period | $ | 12.49 | $ | 12.63 | $ | 21.25 | $ | 14.88 | $ | 16.74 | $ | 19.33 | |||||||||||||||
Total Return (b) (c) | 4.80 | % | (13.71 | )% | 55.25 | % | (2.21 | )% | (2.07 | )% | 19.21 | % | |||||||||||||||
Ratios to Average Net Assets: | |||||||||||||||||||||||||||
Net Expenses (d) (e) (f) (g) | 1.08 | % | 1.08 | % | 1.10 | % | 1.10 | % | 1.06 | %(h) | 1.06 | %(h) | |||||||||||||||
Net Investment Income (Loss) (d) | 0.25 | % | (0.09 | )% | (0.04 | )% | 0.33 | % | 0.58 | % | 0.31 | % | |||||||||||||||
Gross Expenses (d) (e) | 1.08 | % | 1.08 | % | 1.10 | % | 1.10 | % | 1.06 | %(h) | 1.06 | %(h) | |||||||||||||||
Supplemental Data: | |||||||||||||||||||||||||||
Net Assets at end of period (000's) | $ | 619,436 | $ | 623,725 | $ | 818,576 | $ | 595,019 | $ | 694,015 | $ | 758,065 | |||||||||||||||
Portfolio Turnover (b) (i) | 41 | % | 77 | % | 85 | % | 71 | % | 84 | % | 68 | % | |||||||||||||||
(a) Per share net investment income (loss) has been calculated using the average daily shares method.
(b) Not annualized for periods less than one year.
(c) Assumes reinvestment of all net investment income and realized capital gain distributions, if any, during the period. Includes adjustments in accordance with U.S. Generally Accepted Accounting Principles and could differ from the Lipper reported return.
(d) Annualized for periods less than one year.
(e) Does not include acquired fund fees and expenses, if any.
(f) The net expense ratio may not correlate to the applicable expense limits in place during the period since the current contractual expense limitation is applied for a period beginning July 1, 2019 and in effect through November 30, 2023, instead of coinciding with the Fund's fiscal year end. Details of the current contractual expense limitation in effect can be found in Note 5 of the accompanying Notes to Financial Statements.
(g) From the period beginning July 1, 2019, the amount of any waivers or reimbursements and the amount of any recoupment are calculated without regard to the impact of any performance adjustment to the Fund's management fee.
(h) Reflects total annual operating expenses before reduction of any expenses paid indirectly. The share's expenses paid indirectly decreased the expense ratio by less than 0.01%.
(i) Portfolio turnover is calculated on the basis of the Fund as a whole without distinguishing between the classes of shares.
(continues on next page)
See notes to financial statements.
19
USAA Mutual Funds Trust | Financial Highlights — continued | ||||||
For a Share Outstanding Throughout Each Period
USAA Small Cap Stock Fund | |||||||||||||||||||||||||||
Institutional Shares | |||||||||||||||||||||||||||
| Six Months Ended January 31, 2023 (Unaudited) | Year Ended July 31, 2022 | Year Ended July 31, 2021 | Year Ended July 31, 2020 | Year Ended July 31, 2019 | Year Ended July 31, 2018 | ||||||||||||||||||||||
| Net Asset Value, Beginning of Period | $ | 12.88 | $ | 21.53 | $ | 15.06 | $ | 16.91 | $ | 19.50 | $ | 18.16 | |||||||||||||||
Investment Activities: | |||||||||||||||||||||||||||
Net investment income (loss) | 0.02 | (a) | (0.01 | )(a) | — | (a)(b) | 0.07 | (a) | 0.08 | 0.07 | |||||||||||||||||
| Net realized and unrealized gains (losses) | 0.56 | (2.17 | ) | 8.04 | (0.28 | ) | (0.71 | ) | 3.22 | ||||||||||||||||||
| Total from Investment Activities | 0.58 | (2.18 | ) | 8.04 | (0.21 | ) | (0.63 | ) | 3.29 | ||||||||||||||||||
Distributions to Shareholders from: | |||||||||||||||||||||||||||
Net investment income | — | — | (0.14 | ) | (0.04 | ) | (0.05 | ) | (0.09 | ) | |||||||||||||||||
Net realized gains | (0.70 | ) | (6.47 | ) | (1.43 | ) | (1.60 | ) | (1.91 | ) | (1.86 | ) | |||||||||||||||
Total Distributions | (0.70 | ) | (6.47 | ) | (1.57 | ) | (1.64 | ) | (1.96 | ) | (1.95 | ) | |||||||||||||||
Net Asset Value, End of Period | $ | 12.76 | $ | 12.88 | $ | 21.53 | $ | 15.06 | $ | 16.91 | $ | 19.50 | |||||||||||||||
Total Return (c) (d) | 4.79 | % | (13.60 | )% | 55.30 | % | (2.08 | )% | (1.98 | )% | 19.36 | % | |||||||||||||||
Ratios to Average Net Assets: | |||||||||||||||||||||||||||
Net Expenses (e) (f) (g) (h) | 0.98 | % | 1.03 | % | 1.04 | % | 0.98 | % | 0.96 | %(i) | 0.95 | %(i) | |||||||||||||||
Net Investment Income (Loss) (e) | 0.34 | % | (0.06 | )% | 0.02 | % | 0.45 | % | 0.67 | % | 0.42 | % | |||||||||||||||
Gross Expenses (e) (f) | 1.01 | % | 1.04 | % | 1.05 | % | 0.99 | % | 0.96 | %(i) | 0.95 | %(i) | |||||||||||||||
Supplemental Data: | |||||||||||||||||||||||||||
Net Assets at end of period (000's) | $ | 381,511 | $ | 351,835 | $ | 644,802 | $ | 557,173 | $ | 904,981 | $ | 996,393 | |||||||||||||||
Portfolio Turnover (c) (j) | 41 | % | 77 | % | 85 | % | 71 | % | 84 | % | 68 | % | |||||||||||||||
(a) Per share net investment income (loss) has been calculated using the average daily shares method.
(b) Amount is less than $0.005 per share.
(c) Not annualized for periods less than one year.
(d) Assumes reinvestment of all net investment income and realized capital gain distributions, if any, during the period. Includes adjustments in accordance with U.S. Generally Accepted Accounting Principles and could differ from the Lipper reported return.
(e) Annualized for periods less than one year.
(f) Does not include acquired fund fees and expenses, if any.
(g) The net expense ratio may not correlate to the applicable expense limits in place during the period since the current contractual expense limitation is applied for a period beginning July 1, 2019 and in effect through November 30, 2023, instead of coinciding with the Fund's fiscal year end. Details of the current contractual expense limitation in effect can be found in Note 5 of the accompanying Notes to Financial Statements.
(h) From the period beginning July 1, 2019, the amount of any waivers or reimbursements and the amount of any recoupment are calculated without regard to the impact of any performance adjustment to the Fund's management fee.
(i) Reflects total annual operating expenses before reduction of any expenses paid indirectly. The share's expenses paid indirectly decreased the expense ratio by less than 0.01%.
(j) Portfolio turnover is calculated on the basis of the Fund as a whole without distinguishing between the classes of shares.
See notes to financial statements.
20
USAA Mutual Funds Trust | Notes to Financial Statements January 31, 2023 | ||||||
(Unaudited)
1. Organization:
USAA Mutual Funds Trust (the "Trust") is organized as a Delaware statutory trust and is registered under the Investment Company Act of 1940, as amended (the "1940 Act"), as an open-end investment company. The Trust is comprised of 45 funds and is authorized to issue an unlimited number of shares, which are units of beneficial interest with no par value.
The accompanying financial statements are those of the USAA Small Cap Stock Fund (the "Fund"). The Fund offers two classes of shares: Fund Shares and Institutional Shares. The Fund is classified as diversified under the 1940 Act.
Each class of shares of the Fund has substantially identical rights and privileges, except with respect to fees paid under distribution plans, expenses allocable exclusively to each class of shares, voting rights on matters solely affecting a single class of shares, and the exchange privilege of each class of shares.
Victory Capital Management ("VCM" or the "Adviser") is an indirect wholly owned subsidiary of Victory Capital Holdings, Inc., a publicly traded Delaware corporation, and a wholly owned direct subsidiary of Victory Capital Operating, LLC.
Under the Trust's organizational documents, its officers and trustees are indemnified against certain liabilities arising out of the performance of their duties to the Fund. In addition, in the normal course of business, the Fund enters into contracts with its vendors and others that provide for general indemnifications. The Fund's maximum exposure under these arrangements is unknown, as this would involve future claims that may be made against the Fund. However, based on experience, the Fund expects that risk of loss to be remote.
2. Significant Accounting Policies:
The following is a summary of significant accounting policies followed by the Trust in the preparation of its financial statements. The policies are in conformity with U.S. Generally Accepted Accounting Principles ("GAAP"). The preparation of financial statements in accordance with GAAP requires management to make estimates and assumptions that affect the reported amounts of assets and liabilities and disclosure of contingent assets and liabilities at the date of the financial statements and the reported amounts of income and expenses for the period. Actual results could differ from those estimates. The Fund follows the specialized accounting and reporting requirements under GAAP that are applicable to investment companies under Accounting Standards Codification Topic 946.
Investment Valuation:
The Fund records investments at fair value. Fair value is defined as the price that would be received to sell an asset or paid to transfer a liability in an orderly transaction between market participants at the measurement date.
The valuation techniques described below maximize the use of observable inputs and minimize the use of unobservable inputs in determining fair value. The inputs used for valuing the Fund's investments are summarized in the three broad levels listed below:
• Level 1 — quoted prices (unadjusted) in active markets for identical securities
• Level 2 — other significant observable inputs (including quoted prices for similar securities, interest rates, or credit spreads, applicable to those securities, etc.)
• Level 3 — significant unobservable inputs (including the Adviser's assumptions in determining the fair value of investments)
Changes in valuation techniques may result in transfers in or out of an assigned level within the disclosure hierarchy. The inputs or methodologies used for valuation techniques are not necessarily an indication of the risks associated with entering into those investments.
21
USAA Mutual Funds Trust | Notes to Financial Statements — continued January 31, 2023 | ||||||
(Unaudited)
The Adviser, appointed as the valuation designee by the Trust's Board of Trustees' (the "Board"), has established the Pricing and Liquidity Committee (the "Committee"), and subject to Board oversight, the Committee administers and oversees the Fund's valuation policies and procedures, which are approved by the Board.
Portfolio securities listed or traded on securities exchanges, including Exchange-Traded Funds ("ETFs"), American Depositary Receipts, and Rights, are valued at the closing price on the exchange or system where the security is principally traded, if available, or at the Nasdaq Official Closing Price. If there have been no sales for that day on the exchange or system, then a security is valued at the last available bid quotation on the exchange or system where the security is principally traded. In each of these situations, valuations are typically categorized as Level 1 in the fair value hierarchy.
Investments in open-end investment companies, other than ETFs, are valued at their net asset value ("NAV"). These valuations are typically categorized as Level 1 in the fair value hierarchy.
In the event that price quotations or valuations are not readily available, investments are valued at fair value in accordance with procedures established by and under the general supervision and responsibility of the Board. These valuations are typically categorized as Level 2 or Level 3 in the fair value hierarchy, based on the observability of inputs used to determine the fair value. The effect of fair value pricing is that securities may not be priced on the basis of quotations from the primary market in which they are traded, and the actual price realized from the sale of a security may differ materially from the fair value price. Valuing these securities at fair value is intended to cause the Fund's NAV to be more reliable than it otherwise would be.
A summary of the valuations as of January 31, 2023, based upon the three levels defined above, is included in the table below while the breakdown, by category, of investments is disclosed on the Schedule of Portfolio Investments (amounts in thousands):
Level 1 | Level 2 | Level 3 | Total | ||||||||||||||||
Common Stocks | $ | 983,364 | $ | — | $ | — | (a) | $ | 983,364 | ||||||||||
Rights | — | — | 1 | 1 | |||||||||||||||
Exchange-Traded Funds | 2,050 | — | — | 2,050 | |||||||||||||||
Collateral for Securities Loaned | 18,144 | — | — | 18,144 | |||||||||||||||
Total | $ | 1,003,558 | $ | — | $ | 1 | $ | 1,003,559 | |||||||||||
(a) Rounds to less than $1 thousand.
As of January 31, 2023, there were no transfers into/out of Level 3.
Real Estate Investment Trusts ("REITs"):
The Fund may invest in REITs, which report information on the source of their distributions annually. REITs are pooled investment vehicles that invest primarily in income producing real estate or real estate related loans or interests (such as mortgages). Certain distributions received from REITs during the year are recorded as realized gains or return of capital as estimated by the Fund or when such information becomes known.
Investment Companies:
Exchange-Traded Funds:
The Fund may invest in ETFs, the shares of which are bought and sold on a securities exchange. An ETF trades like common stock and represents a fixed portfolio of securities often designed to track the performance and dividend yield of a particular domestic or foreign market index. The Fund may purchase shares of an ETF to temporarily gain exposure to a portion of the U.S. or a foreign market while awaiting purchase of underlying securities. The risks of owning an ETF generally reflect the risks of owning the underlying securities the ETF is designed to track, although the lack of liquidity of an ETF could result in it being more volatile. Additionally, ETFs have fees and expenses that reduce their value.
22
USAA Mutual Funds Trust | Notes to Financial Statements — continued January 31, 2023 | ||||||
(Unaudited)
Open-End Funds:
The Fund may invest in portfolios of open-end investment companies. These investment companies value securities in their portfolios for which market quotations are readily available at their market values (generally the last reported sale price) and all other securities and assets at their fair value by the methods established by the board of directors of the underlying funds.
Derivative Instruments:
Foreign Exchange Currency Contracts:
The Fund may enter into foreign exchange currency contracts to convert U.S. dollars to and from various foreign currencies. A foreign exchange currency contract is an obligation by the Fund to purchase or sell a specific currency at a future date at a price (in U.S. dollars) set at the time of the contract. The Fund does not engage in "cross-currency" foreign exchange contracts (i.e., contracts to purchase or sell one foreign currency in exchange for another foreign currency). The Fund's foreign exchange currency contracts might be considered spot contracts (typically a contract of one week or less) or forward contracts (typically a contract term over one week). A spot contract is entered into for purposes of hedging against foreign currency fluctuations relating to a specific portfolio transaction, such as the delay between a security transaction trade date and settlement date. Forward contracts are entered into for purposes of hedging portfolio holdings or concentrations of such holdings. Each foreign exchange currency contract is adjusted daily by the prevailing spot or forward rate of the underlying currency, and any appreciation or depreciation is recorded for financial statement purposes as unrealized until the contract settlement date, at which time the Fund records realized gains or losses equal to the difference between the value of a contract at the time it was opened and the value at the time it was closed. The Fund could be exposed to risk if a counterparty is unable to meet the terms of a foreign exchange currency contract or if the value of the foreign currency changes unfavorably. In addition, the use of foreign exchange currency contracts does not eliminate fluctuations in the underlying prices of the securities. As of January 31, 2023, the Fund had no open forward foreign exchange currency contracts.
Investment Transactions and Related Income:
Changes in holdings of investments are accounted for no later than one business day following the trade date. For financial reporting purposes, however, investment transactions are accounted for on trade date or the last business day of the reporting period. Interest income is determined on the basis of coupon interest accrued using the effective interest method which adjusts, where applicable, the amortization of premiums or accretion of discounts. Dividend income is recorded on the ex-dividend date. Gains or losses realized on sales of securities are recorded on the identified cost basis.
Withholding taxes on interest, dividends, and gains as a result of certain investments by the Fund have been provided for in accordance with each investment's applicable country's tax rules and rates.
Securities Lending:
The Fund, through a Securities Lending Agreement with Citibank, N.A. ("Citibank"), may lend its securities to qualified financial institutions, such as certain broker-dealers and banks, to earn additional income, net of income retained by Citibank. Borrowers are required to initially secure their loans for collateral in the amount of at least 102% of the value of U.S. securities loaned or at least 105% of the value of non-U.S. securities loaned, marked-to-market daily. Any collateral shortfalls associated with increases in the valuation of the securities loaned are generally cured the next business day. The collateral can be received in the form of cash collateral and/or non-cash collateral. Non-cash collateral can include U.S. Government Securities and other securities as permitted by Securities and Exchange Commission ("SEC") guidelines. The cash collateral is invested in short-term instruments or cash equivalents, primarily open-end investment companies, as noted on the Fund's Schedule of Portfolio Investments. The Fund effectively does not have control of the non-cash collateral and therefore it is not disclosed on the Fund's Schedule of Portfolio Investments. Collateral requirements are determined
23
USAA Mutual Funds Trust | Notes to Financial Statements — continued January 31, 2023 | ||||||
(Unaudited)
daily based on the value of the Fund's securities on loan as of the end of the prior business day. During the time portfolio securities are on loan, the borrower will pay the Fund any dividends or interest paid on such securities plus any fee negotiated between the parties to the lending agreement. The Fund also earns a return from the collateral. The Fund pays Citibank various fees in connection with the investment of cash collateral and fees based on the investment income received from securities lending activities. Securities lending income (net of these fees) is disclosed on the Statement of Operations. Loans are terminable upon demand and the borrower must return the loaned securities within the lesser of one standard settlement period or five business days. Although risk is mitigated by the collateral, the Fund could experience a delay in recovering its securities and possible loss of income or value if the borrower fails to return them. In addition, there is a risk that the value of the short-term investments will be less than the amount of cash collateral required to be returned to the borrower.
The Fund's agreement with Citibank does not include master netting provisions. Non-cash collateral received by the Fund may not be sold or repledged, except to satisfy borrower default.
The following table (amounts in thousands) is a summary of the Fund's securities lending transactions as of January 31, 2023.
| Value of Securities on Loan | Non-Cash Collateral | Cash Collateral | |||||||||
| $ | 17,895 | $ | — | $ | 18,144 | ||||||
Foreign Currency Translations:
The accounting records of the Fund are maintained in U.S. dollars. Investment securities and other assets and liabilities of the Fund denominated in a foreign currency are translated into U.S. dollars at current exchange rates. Purchases and sales of securities, income receipts, and expense payments are translated into U.S. dollars at the exchange rates on the date of the transactions. The Fund does not isolate the portion of the results of operations resulting from changes in foreign exchange rates on investments from fluctuations arising from changes in market prices of securities held. Such fluctuations are disclosed as Net change in unrealized appreciation/depreciation on investment securities and foreign currency translations on the Statement of Operations. Any realized gains or losses from these fluctuations are disclosed as Net realized gains (losses) from investment securities and foreign currency transactions on the Statement of Operations.
Federal Income Taxes:
The Fund intends to continue to qualify as a regulated investment company by complying with the provisions available to certain investment companies, as defined in applicable sections of the Internal Revenue Code, and to make distributions of net investment income and net realized gains sufficient to relieve it from all, or substantially all, federal income taxes. Accordingly, no provision for federal income taxes is required in the financial statements. The Fund has a tax year end of July 31, and effective April 30, 2023, the Fund will change its tax year end to April 30.
For the six months ended January 31, 2023, the Fund did not incur any income tax, interest, or penalties, and has recorded no liability for net unrecognized tax benefits relating to uncertain tax positions.
Management of the Fund has reviewed tax positions taken in tax years that remain subject to examination by all major tax jurisdictions, including federal (i.e., the last four tax years, which includes the current fiscal tax year end). Management believes that there is no tax liability resulting from unrecognized tax benefits related to uncertain tax positions taken.
Allocations:
Expenses directly attributable to the Fund are charged to the Fund, while expenses that are attributable to more than one fund in the Trust, or jointly with an affiliated trust, are allocated among the respective funds in the Trust and/or an affiliated trust based upon net assets or another appropriate basis.
Income, expenses (other than class-specific expenses such as transfer agent fees, state registration fees, and printing fees), and realized and unrealized gains or losses on investments are allocated to
24
USAA Mutual Funds Trust | Notes to Financial Statements — continued January 31, 2023 | ||||||
(Unaudited)
each class of shares based on its relative net assets on the date income is earned or expenses and realized and unrealized gains and losses are incurred.
3. Purchases and Sales:
Purchases and sales of securities (excluding securities maturing less than one year from acquisition) for the six months ended January 31, 2023, were as follows for the Fund (amounts in thousands):
Excluding | |||||||
Purchases | Sales | ||||||
$ | 384,140 | $ | 407,499 | ||||
4. Affiliated Fund Ownership:
The Fund offers shares for investment by other funds. The fund-of-funds do not invest in the underlying funds for the purpose of exercising management or control, and the affiliated fund-of-funds' annual and semi-annual reports may be viewed at vcm.com. As of January 31, 2023, certain fund-of-funds owned total outstanding shares of the Fund as follows:
Affiliated USAA Mutual Funds | Ownership % | ||||||
USAA Cornerstone Conservative Fund | 0.1 | ||||||
USAA Cornerstone Equity Fund | 0.6 | ||||||
USAA Target Retirement Income Fund | 0.9 | ||||||
USAA Target Retirement 2030 Fund | 2.4 | ||||||
USAA Target Retirement 2040 Fund | 3.4 | ||||||
USAA Target Retirement 2050 Fund | 2.3 | ||||||
USAA Target Retirement 2060 Fund | 0.3 | ||||||
5. Fees and Transactions with Affiliates and Related Parties:
Investment Advisory Fees:
Investment advisory services are provided to the Fund by the Adviser, which is a New York corporation registered as an investment adviser with the SEC.
Under the terms of the Investment Advisory Agreement, the Adviser is entitled to receive a base fee and a performance adjustment. The Fund's base fee is accrued daily and paid monthly at an annualized rate of 0.75% of the Fund's average daily net assets. Amounts incurred and paid to VCM for the six months ended January 31, 2023, are reflected on the Statement of Operations as Investment advisory fees.
The performance adjustment for each share class is accrued daily and calculated monthly by comparing the respective class' performance to that of the Lipper Small-Cap Core Funds Index. The Lipper Small-Cap Core Funds Index tracks the total return performance of the largest funds within the Lipper Small-Cap Core Funds category.
The performance period for each share class consists of the current month plus the previous 35 months. The following table is utilized to determine the extent of the performance adjustment:
| Over/Under Performance Relative to Index (in basis points)(a) | Annual Adjustment Rate (in basis points) | ||||||
| +/- 100 to 400 | +/- 4 | ||||||
| +/- 401 to 700 | +/- 5 | ||||||
| +/- 701 and greater | +/- 6 | ||||||
(a) Based on the difference between the average annual performance of the relevant share class of the Fund and its relevant Lipper index, rounded to the nearest basis point.
25
USAA Mutual Funds Trust | Notes to Financial Statements — continued January 31, 2023 | ||||||
(Unaudited)
Each class' annual performance adjustment rate is multiplied by the average daily net assets of the respective class over the entire performance period, which is then multiplied by a fraction, the numerator of which is the number of days in the month and the denominator of which is 365 (366 in leap years). The resulting amount is then added to (in the case of overperformance), or subtracted from (in the case of underperformance) the base fee.
Under the performance fee arrangement, each class pays a positive performance fee adjustment for a performance period whenever the class outperforms the Lipper Small-Cap Core Funds Index over that period, even if the class has overall negative returns during the performance period.
For the period August 1, 2022, to January 31, 2023, there were no performance fee adjustments. The performance adjustment rate included in the investment advisory fee may differ from the maximum over/under Annual Adjustment Rate due to differences in average net assets for the reporting period and rolling 36 month performance periods.
The Trust relies on an exemptive order granted to VCM and its affiliated funds by the SEC in March 2019, permitting the use of a "manager-of-managers" structure for certain funds. Under a manager-of-managers structure, the investment adviser may select (with approval of the Board and without shareholder approval) one or more subadvisers to manage the day-to-day investment of a fund's assets.
VCM has entered into a Subadvisory Agreement with Granahan Investment Management, Inc. ("GIMI"), under which GIMI directs the investment and reinvestment of a portion of the Fund's assets (as allocated from time to time by VCM). This arrangement provides for monthly fees that are paid by VCM. VCM (not the Fund) pays the subadviser fees.
Administration and Servicing Fees:
VCM also serves as the Fund's administrator and fund accountant. Under the Fund Administration, Servicing and Accounting Agreement, VCM is paid an administration and servicing fee that is accrued daily and paid monthly at an annualized rate of 0.15% and 0.10%, which is based on the Fund's average daily net assets of the Fund Shares and Institutional Shares, respectively. Amounts incurred for the six months ended January 31, 2023, are reflected on the Statement of Operations as Administration fees.
Citi Fund Services Ohio, Inc. ("Citi"), an affiliate of Citibank, acts as sub-administrator and sub-fund accountant to the Fund pursuant to a Sub-Administration and Sub-Fund Accounting Services Agreement between VCM and Citi. VCM pays Citi a fee for providing these services. The Fund reimburses VCM and Citi for out-of-pocket expenses incurred in providing these services and certain other expenses specifically allocated to the Fund. Amounts incurred for the six months ended January 31, 2023, are reflected on the Statement of Operations as Sub-Administration fees.
The Fund (as part of the Trust) has entered into an agreement with the Adviser to provide compliance services, pursuant to which the Adviser furnishes its compliance personnel, including the services of the Chief Compliance Officer ("CCO"), and other resources reasonably necessary to provide the Trust with compliance oversight services related to the design, administration, and oversight of a compliance program for the Trust in accordance with Rule 38a-1 under the 1940 Act. The CCO is an employee of the Adviser, which pays the compensation of the CCO and support staff. The funds in the Trust, Victory Variable Insurance Funds, Victory Portfolios, and Victory Portfolios II (collectively, the "Victory Funds Complex") in the aggregate, compensate the Adviser for these services. Amounts incurred for the six months ended January 31, 2023, are reflected on the Statement of Operations as Compliance fees.
Transfer Agency Fees:
Victory Capital Transfer Agency, Inc. ("VCTA"), an affiliate of the Adviser, provides transfer agency services to the Fund. VCTA provides transfer agent services to the Fund Shares based on an annual charge of $23 per shareholder account plus out-of-pocket expenses. VCTA pays a portion of these fees to certain intermediaries for the administration and servicing of accounts that are held with such intermediaries. Transfer agent fees for the Institutional Shares are paid monthly based on a fee accrued daily at an annualized rate of 0.10% of average daily net assets, plus out-of-pocket expenses. Amounts
26
USAA Mutual Funds Trust | Notes to Financial Statements — continued January 31, 2023 | ||||||
(Unaudited)
incurred and paid to VCTA for the six months ended January 31, 2023, are reflected on the Statement of Operations as Transfer agent fees.
FIS Investor Services LLC serves as sub-transfer agent and dividend disbursing agent for the Fund pursuant to a Sub-Transfer Agent Agreement between VCTA and FIS Investor Services LLC. VCTA provides FIS Investor Services LLC a fee for providing these services.
Distributor/Underwriting Services:
Victory Capital Services, Inc. (the "Distributor"), an affiliate of the Adviser, serves as Distributor for the continuous offering of the shares of the Fund pursuant to a Distribution Agreement between the Distributor and the Trust and receives no fee or other compensation for these services.
Other Fees:
Citibank serves as the Fund's custodian. The Fund pays Citibank a fee for providing these services. Amounts incurred for the six months ended January 31, 2023, are reflected on the Statement of Operations as Custodian fees.
K&L Gates LLP provides legal services to the Trust.
The Adviser has entered into an expense limitation agreement with the Fund until at least November 30, 2023. Under the terms of the agreement, the Adviser has agreed to waive fees or reimburse certain expenses to the extent that ordinary operating expenses incurred by certain classes of the Fund in any fiscal year exceed the expense limits for such classes of the Fund. Such excess amounts will be the liability of the Adviser. Performance adjustments, acquired fund fees and expenses, interest, taxes, brokerage commissions, other expenditures, which are capitalized in accordance with GAAP, and other extraordinary expenses not incurred in the ordinary course of the Fund's business are excluded from the expense limits. As of January 31, 2023, the expense limits (excluding voluntary waivers) were 1.10% and 0.98% for Fund Shares and Institutional Shares, respectively.
Under the terms of the expense limitation agreement, the Fund has agreed to repay fees and expenses that were waived or reimbursed by the Adviser for a period of up to three years (thirty-six (36) months) after the waiver or reimbursement took place, subject to the lesser of any operating expense limits in effect at the time of: (a) the original waiver or expense reimbursement; or (b) the recoupment, after giving effect to the recoupment amount.
As of January 31, 2023, the following amounts are available to be repaid to the Adviser (amounts in thousands). The Fund has not recorded any amounts available to be repaid as a liability due to an assessment that such repayments are not probable at January 31, 2023.
| Expires 2023 | Expires 2024 | Expires 2025 | Expires 2026 | Total | |||||||||||||||
| $ | 42 | $ | 67 | $ | 73 | $ | 60 | $ | 242 | ||||||||||
The Adviser may voluntarily waive or reimburse additional fees to assist the Fund in maintaining competitive expense ratios. Voluntary waivers and reimbursements applicable to the Fund are not available to be recouped at a future time. There were no voluntary waivers or reimbursements for the six months ended January 31, 2023.
Certain officers and/or interested trustees of the Fund are also officers and/or employees of the Adviser, administrator, fund accountant, sub-administrator, sub-fund accountant, custodian, and Distributor.
6. Risks:
The Fund may be subject to other risks in addition to these identified risks.
Small-Capitalization Stock Risk — The Fund is subject to small-cap company risk, which is the greater risk of investing in smaller, less well-known companies, as opposed to investing in established companies with proven track records. Small-cap companies also may have limited product lines, markets, or
27
USAA Mutual Funds Trust | Notes to Financial Statements — continued January 31, 2023 | ||||||
(Unaudited)
financial resources. Securities of such companies may be less liquid and more volatile than securities of larger companies or the market in general and, therefore, may involve greater risk than investing in the securities of larger companies.
Market Risk — Overall market risks may affect the value of the Fund. Domestic and international factors such as political events, war, terrorism, trade disputes, inflation rates, interest rate levels and other fiscal and monetary policy changes, cybersecurity incidents, pandemics and other public health crises, sanctions against a particular foreign country, its nationals, businesses or industries and related geopolitical events, as well as environmental disasters such as earthquakes, fires, and floods, or other catastrophes, may add to instability in global economies and markets generally, and may lead to increased market volatility. Global economies and financial markets are highly interconnected, which increases the possibility that conditions in one country or region might adversely affect issuers in another country or region. The impact of these and other factors may be short-term or may last for extended periods.
Equity Risk — The values of the equity securities in which the Fund invests may decline in response to developments affecting individual companies and/or general market, economic and political conditions and other factors. A company's earnings or dividends may not increase as expected due to poor management decisions, competitive pressures, breakthroughs in technology, reliance on suppliers, labor problems or shortages, corporate restructurings, fraudulent disclosures, natural disasters, military confrontations, war, terrorism, public health crises, or other events, conditions, and factors. Price changes may be temporary or may last for extended periods.
7. Borrowing and Interfund Lending:
Line of Credit:
The Victory Funds Complex participates in a short-term demand note "Line of Credit" agreement with Citibank. The Line of Credit agreement with Citibank was renewed on June 27, 2022, with a termination date of June 26, 2023. Under the agreement with Citibank, the Victory Funds Complex may borrow up to $600 million, of which $300 million is committed and $300 million is uncommitted. $40 million of the Line of Credit is reserved for use by the Victory Floating Rate Fund, another series of the Victory Funds Complex, with Victory Floating Rate Fund paying the related commitment fees for that amount. The purpose of the Line of Credit is to meet temporary or emergency cash needs. For the six months ended January 31, 2023, Citibank received an annual commitment fee of 0.15% on $300 million for providing the Line of Credit. Each fund in the Victory Funds Complex paid a pro-rata portion of the commitment fees plus any interest (one-month Secured Overnight Financing Rate ("SOFR") plus 1.10 percent) on amounts borrowed. Interest charged to the Fund during the period, if applicable, is reflected on the Statement of Operations under Line of credit fees.
The average borrowing for the days outstanding and average interest rate for the Fund during the six months ended January 31, 2023, were as follows (amounts in thousands):
| Amount Outstanding at January 31, 2023 | Average Borrowing* | Days Borrowing Outstanding | Average Interest Rate* | Maximum Borrowing During the Period | |||||||||||||||
| $ | — | $ | 1,250 | 1 | 5.44 | % | $ | 1,250 | |||||||||||
* For the six months ended January 31, 2023, based on the number of days borrowings were outstanding.
Interfund Lending:
The Trust and the Adviser rely on an exemptive order granted by the SEC in March 2017 (the "Order"), permitting the establishment and operation of an Interfund Lending Facility (the "Facility"). The Facility allows the Fund to directly lend and borrow money to or from any other fund in the Victory Funds Complex that is permitted to participate in the Facility, relying upon the Order at rates beneficial to both the borrowing and lending funds. Advances under the Facility are allowed for temporary or
28
USAA Mutual Funds Trust | Notes to Financial Statements — continued January 31, 2023 | ||||||
(Unaudited)
emergency purposes, including the meeting of redemption requests that otherwise might require the untimely disposition of securities, and are subject to each Fund's borrowing restrictions. The interfund loan rate is determined, as specified in the Order, by averaging the current repurchase agreement rate and the current bank loan rate. As a Borrower, interest charged to the Fund, if any, during the period, is reflected on the Statement of Operations under Interfund lending fees. As a Lender, interest earned by the Fund, if any, during the period, is reflected on the Statement of Operations under Interfund lending.
The Fund did not utilize or participate in the Facility during the six months ended January 31, 2023.
8. Federal Income Tax Information:
The Fund intends to distribute any net investment income annually. Distributable net realized gains, if any, are declared and paid at least annually.
The amounts of dividends from net investment income and distributions from net realized gains (collectively, distributions to shareholders) are determined in accordance with federal income tax regulations, which may differ from GAAP. To the extent these "book/tax" differences are permanent in nature (e.g., net operating loss and distribution reclassification), such amounts are reclassified within the components of net assets based on their federal tax-basis treatment; temporary differences (e.g., wash sales) do not require reclassification. To the extent dividends and distributions exceed net investment income and net realized gains for tax purposes, they are reported as distributions of capital. Net investment losses incurred by the Fund may be reclassified as an offset to capital on the accompanying Statement of Assets and Liabilities.
The tax character of current year distributions paid and the tax basis of the current components of accumulated earnings (loss) will be determined at the end of the current tax year.
At the tax year ended July 31, 2022, the Fund had no capital loss carryforwards for federal income tax purposes.
9. Subsequent Events:
On June 29, 2022, the Board approved a change to the Fund's fiscal year-end from July 31 to April 30, with an effective date of April 30, 2023.
The Board, upon recommendation of the Adviser, has approved a change in the name of the Trust and each individual fund within the Trust. On February 23, 2023, an initial filing was made with the SEC to commence the process to effectuate the following changes.
Effective at the start of business on April 24, 2023 (the "Effective Date"), the name of the Trust will change from USAA Mutual Funds Trust to Victory Portfolios III, and all references to USAA Mutual Funds Trust in the summary prospectus, statutory prospectus, and statement of additional information ("SAI") will be replaced by the new name.
Also on the Effective Date, references to the current name of the Fund in the summary prospectus, statutory prospectus, and SAI will be replaced with the new name as follows:
| Current Name | New Name | ||||||
USAA Small Cap Stock Fund | Victory Small Cap Stock Fund | ||||||
In addition, on the Effective Date, USAA Investments, a Victory Capital Management Inc. Investment Franchise, that currently manages the USAA Fixed Income Funds, will change its name to Victory Income Investors, and all references to USAA Investments in the summary prospectus, statutory prospectus, and SAI, will be replaced.
Please note that there will be no changes in the management of the Fund or to the Fund's ticker symbols.
29
USAA Mutual Funds Trust | Supplemental Information January 31, 2023 | ||||||
(Unaudited)
Proxy Voting and Portfolio Holdings Information
Proxy Voting:
Information regarding the policies and procedures the Fund uses to determine how to vote proxies relating to portfolio securities is available without charge, upon request, by calling (800) 235-8396. The information is also included in the Fund's Statement of Additional Information, which is available on the SEC's website at sec.gov.
Information relating to how the Fund voted proxies relating to portfolio securities held during the most recent 12 months ended June 30 is available on the SEC's website at sec.gov.
Availability of Schedules of Portfolio Investments:
The Trust files a complete list of Schedules of Portfolio Investments with the SEC for the first and third quarter of each fiscal year on Form N-PORT. Form N-PORT is available on the SEC's website at sec.gov.
Expense Examples
As a shareholder of the Fund, you may incur two types of costs: (1) transaction costs and (2) ongoing costs, including management fees and other Fund expenses. These examples are intended to help you understand your ongoing costs (in dollars) of investing in the Fund and to compare these costs with the ongoing costs of investing in other mutual funds.
These examples are based on an investment of $1,000 invested at the beginning of the period and held for the entire period from August 1, 2022, through January 31, 2023.
The Actual Expense figures in the table below provide information about actual account values and actual expenses. You may use the information below, together with the amount you invested, to estimate the expenses that you paid over the period. Simply divide your account value by $1,000 (for example, an $8,600 account value divided by $1,000 = 8.6), then multiply the result by the number in the table under the heading entitled "Actual Expenses Paid During Period" to estimate the expenses you paid on your account during this period.
The Hypothetical Expense figures in the table below provide information about hypothetical account values and hypothetical expenses based on the Fund's actual expense ratio and an assumed rate of return of 5% per year before expenses, which is not the Fund's actual return. The hypothetical account values and expenses may not be used to estimate the actual ending account balance or expenses you paid for the period. You may use this information to compare this 5% hypothetical example with the 5% hypothetical examples that appear in shareholder reports of other funds.
Please note the expenses shown in the table below are meant to highlight your ongoing costs only and do not reflect any transactional costs. Therefore, the hypothetical expenses in the table are useful in comparing ongoing costs only and will not help you determine the relative total costs of owning different funds. In addition, if these transactional costs were included, your costs would have been higher.
| Beginning Account Value 8/1/22 | Actual Ending Account Value 1/31/23 | Hypothetical Ending Account Value 1/31/23 | Actual Expenses Paid During Period 8/1/22- 1/31/23* | Hypothetical Expenses Paid During Period 8/1/22- 1/31/23* | Annualized Expense Ratio During Period 8/1/22- 1/31/23 | ||||||||||||||||||||||
Fund Shares | $ | 1,000.00 | $ | 1,048.00 | $ | 1,019.76 | $ | 5.58 | $ | 5.50 | 1.08 | % | |||||||||||||||
Institutional Shares | 1,000.00 | 1,047.90 | 1,020.27 | 5.06 | 4.99 | 0.98 | % | ||||||||||||||||||||
* Expenses are equal to the average account value multiplied by the Fund's annualized expense ratio multiplied by 184/365 (the number of days in the most recent fiscal half-year divided by the number of days in the fiscal year).
30
USAA Mutual Funds Trust | Supplemental Information — continued January 31, 2023 | ||||||
(Unaudited)
Considerations of the Board in Continuing the Investment Advisory Agreement
USAA Small Cap Stock Fund (the "Fund")
At a meeting of the Board of Trustees (the "Board") of USAA Mutual Funds Trust (the "Trust") held on December 8-9, 2022, the Board, including the Trustees who are not "interested persons" (as that term is defined in the Investment Company Act of 1940, as amended) of the Trust (the "Independent Trustees"), approved for an annual period the continuance of the Investment Advisory Agreement (the "Advisory Agreement") between the Trust and Victory Capital Management Inc. (the "Adviser") and the Subadvisory Agreement between the Adviser and Granahan Investment Management, Inc. (the "Subadviser") with respect to the Fund. Prior to the December 8-9, 2022 meeting at which the Advisory Agreement and Subadvisory Agreement was approved, the Independent Trustees also discussed and considered information regarding the proposed continuation of the Advisory Agreement and Subadvisory Agreement at a meeting held on November 21, 2022.
In advance of the foregoing meetings, the Trustees received and considered a variety of information relating to the Advisory Agreement and Subadvisory Agreement and the Adviser and the Subadviser, and were given the opportunity to ask questions and request additional information from management. The information provided to the Board included, among other things: (i) a separate report prepared by an independent third party of mutual fund data, which provided a statistical analysis comparing the Fund's investment performance, expenses, and fees to comparable investment companies; (ii) information concerning the services rendered to the Fund, as well as information regarding the Adviser's revenues and costs of providing services to the Fund and compensation paid to affiliates of the Adviser; and (iii) information about the Adviser's and the Subadviser's operations and personnel. Prior to voting, the Independent Trustees reviewed the proposed continuance of the Advisory Agreement and Subadvisory Agreement with management and with experienced independent counsel retained by the Independent Trustees ("Independent Counsel") and received materials from such Independent Counsel discussing the legal standards for their consideration of the proposed continuation of the Advisory Agreement and the Subadvisory Agreement with respect to the Fund. The Independent Trustees also reviewed the proposed continuation of the Advisory Agreement and the Subadvisory Agreement with respect to the Fund in private sessions with Independent Counsel at which no representatives of management were present.
The Board considered the Advisory Agreement and the Subadvisory Agreement separately in the course of its review. In doing so, the Board noted the respective roles of the Adviser and the Subadviser in providing services to the Fund.
At each regularly scheduled meeting of the Board and its committees, the Board receives and reviews, among other things, information concerning the Fund's performance and related services provided by the Adviser and the Subadviser. At the meeting at which the renewal of the Advisory Agreement and Subadvisory Agreement is considered, particular focus is given to information concerning Fund performance, fees and total expenses as compared to comparable investment companies, and the Adviser's profitability with respect to the Fund. However, the Board noted that the evaluation process with respect to the Adviser and the Subadviser is an ongoing one. In this regard, the Board's and its committees' consideration of the Advisory Agreement and Subadvisory Agreement included information previously received at such meetings. The Board also recognized that the contractual arrangements for the Fund have been reviewed by the Board and discussed with the Adviser and Subadviser in prior years and that the Board's conclusions may be based, in part, on its consideration of these same arrangements in prior years.
Advisory Agreement
After full consideration of a variety of factors, the Board, including the Independent Trustees, voted to approve the Advisory Agreement. In approving the Advisory Agreement, the Trustees did not identify any single factor as controlling, and each Trustee may have attributed different weights to various factors. Throughout their deliberations, the Independent Trustees were represented and assisted by Independent Counsel.
Nature, Extent, and Quality of Services — In considering the nature, extent, and quality of the services provided by the Adviser under the Advisory Agreement, the Board reviewed information provided by the Adviser relating to its operations and personnel. The Board also took into account its knowledge of the Adviser's management
31
USAA Mutual Funds Trust | Supplemental Information — continued January 31, 2023 | ||||||
(Unaudited)
and the quality of the performance of the Adviser's duties through Board meetings, discussions, and reports during the preceding year. The Board considered the fees paid to the Adviser and the services provided to the Fund by the Adviser under the Advisory Agreement, as well as other services provided by the Adviser and its affiliates under other agreements, and the personnel who provide these services. In addition to the investment advisory services provided to the Fund, the Adviser and its affiliates provide administrative services, shareholder services, oversight of Fund accounting, marketing services, assistance in meeting legal and regulatory requirements, and other services necessary for the operation of the Fund and the Trust.
The Board considered the scope of services provided by, and the undertakings required of, the Adviser in connection with those services, including, among other things, maintaining (i) its own and the Fund's compliance programs, (ii) risk management programs, (iii) liquidity risk management program, (iv) derivatives risk management program, and (v) cybersecurity programs, each of which had expanded over time as a result of regulatory, market, and other developments. The Board also considered the significant risks assumed by the Adviser in connection with the services provided to the Fund, including investment, operational, enterprise, litigation, regulatory and compliance risks.
The Board considered the Adviser's management style and the performance of the Adviser's duties under the Advisory Agreement. The Board considered the level and depth of knowledge of the Adviser, including the professional experience and qualifications of its senior and investment personnel, as well as current staffing levels. The Board considered the Adviser's process for monitoring the performance of the Subadviser and the Adviser's timeliness in responding to performance issues. The allocation of the Fund's brokerage, including the Adviser's process for monitoring "best execution," also was considered. The Adviser's role in coordinating the activities of the Fund's other service providers was also considered. The Board also considered the Adviser's risk management processes. The Board considered the Adviser's financial condition and that it had the financial wherewithal to continue to provide the same scope and high quality of services under the Advisory Agreement. In reviewing the Advisory Agreement, the Board focused on the experience, resources, and strengths of the Adviser and its affiliates in managing the Fund, as well as the other funds in the Trust.
The Board also reviewed the compliance and administrative services provided to the Fund by the Adviser and its affiliates, including the Adviser's oversight of the Fund's day-to-day operations and oversight of Fund accounting. The Trustees, guided also by information obtained from their experiences as Trustees of the Trust, also focused on the quality of the Adviser's compliance and administrative staff.
Expenses and Performance — In connection with its consideration of the Advisory Agreement, the Board evaluated the Fund's advisory fees and total expense ratio as compared to other open-end investment companies deemed to be comparable to the Fund as determined by the independent third party in its report. The Fund's expenses were compared to (i) a group of investment companies chosen by the independent third party to be comparable to the Fund based upon certain factors, including fund type, comparability of investment objective and classification, sales load type, asset size, and expense components (the "expense group") and (ii) a larger group of investment companies with the same investment classification/objective as the Fund regardless of asset size, excluding outliers (the "expense universe"). Among other data, the Board noted that the Fund's net management fee rate — which includes advisory and administrative services and the effects of any performance adjustment, as well as any fee waivers and reimbursements — was below the medians of its expense group and its expense universe. The data indicated that the Fund's total expenses, including after any reimbursements, were below the medians of its expense group and expense universe. The Board also took into account the Adviser's current undertakings to maintain expense limitations for the Fund. The Board took into account the various other services provided to the Fund by the Adviser and its affiliates, and noted the high quality of services received by the Fund. The Board also took into account that the subadvisory fees under the Subadvisory Agreement are paid by the Adviser. The Board also considered and discussed information about the Subadviser's fees, including the amount of management fees retained by the Adviser after payment of the subadvisory fees.
In considering the Fund's performance, the Board noted that it reviews at its regularly scheduled meetings information about the Fund's performance results. The Trustees also reviewed various comparative data provided to them in connection with their consideration of the renewal of the Advisory Agreement, including, among other information, a comparison of the Fund's average annual total returns relative to its Lipper index and other mutual funds deemed to be in its peer group by the independent third party in its report (the "performance universe"). The Fund's performance universe consisted of the Fund and all retail and institutional open-end
32
USAA Mutual Funds Trust | Supplemental Information — continued January 31, 2023 | ||||||
(Unaudited)
investment companies with the same classification/objective as the Fund regardless of asset size or primary channel of distribution. This comparison indicated that, among other data, the Fund's performance was above the average of its performance universe and its Lipper index for the one- and three-year periods ended June 30, 2022, and was below the average of its performance universe and its Lipper index for the five- and ten-year periods ended June 30, 2022.
Compensation and Profitability — The Board took into consideration the level and method of computing the management fee. The information considered by the Board included operating profit margin information for the Adviser's business as a whole. The Board also received and considered profitability information related to the management revenues from the Fund. This information included a review of the methodology used in the allocation of certain costs to the Fund. In considering the profitability data with respect to the Fund, the Trustees noted that the Adviser pays the Fund's subadvisory fees and also noted that the Adviser reimbursed or waived a portion of its management fees to the Fund. The Trustees reviewed the profitability of the Adviser's relationship with the Fund before tax expenses. The Board was also provided with a profitability analysis of other publicly traded asset managers prepared by an independent information service. In reviewing the overall profitability of the management fee to the Adviser, the Board also considered the fact that the Adviser and its affiliates provide shareholder servicing and administrative services to the Fund for which they receive compensation. The Board also considered the possible direct and indirect benefits to the Adviser from its relationship with the Trust, including that the Adviser may derive reputational and other benefits from its association with the Fund. The Trustees recognized that the Adviser should be entitled to earn a reasonable level of profits in exchange for the level of services it provides to the Fund and the entrepreneurial and other risks that it assumes as Adviser.
Economies of Scale — The Board considered whether there should be changes in the management fee rate or structure in order to enable the Fund to participate in any economies of scale. The Board took into account management's discussion of the current advisory fee structure. The Board also considered the fee waiver and expense reimbursement arrangements by the Adviser. The Board considered the fact that the Adviser also pays the Fund's subadvisory fees. The Board also considered the effect of the change in size, if any, of each of the Fund's classes on its performance and fees, noting that the Fund may realize other economies of scale if assets increase proportionally more than expenses. The Board determined that the current investment management fee structure was reasonable.
Conclusions — The Board reached the following conclusions regarding the Fund's Advisory Agreement with the Adviser: (i) the Adviser has demonstrated that it possesses the capability and resources to perform the duties required of it under the Advisory Agreement; (ii) the Adviser maintains an appropriate compliance program; (iii) the overall performance of the Fund is reasonable in relation to the performance of funds with similar investment objectives and to relevant indices and the Adviser is appropriately monitoring the Fund's performance; (iv) the Fund's advisory expenses are reasonable in relation to those of similar funds and to the services to be provided by the Adviser; and (v) the Adviser's and its affiliates' level of profitability from their relationship with the Fund is reasonable in light of the nature and high quality of services provided by the Adviser and its affiliates and the type of fund. Based on its conclusions, the Board determined that continuation of the Advisory Agreement would be in the best interests of the Fund and its shareholders.
Subadvisory Agreement
In approving the Subadvisory Agreement with respect to the Fund, the Board considered various factors, among them: (i) the nature, extent, and quality of services provided to the Fund by the Subadviser, including the personnel providing services; (ii) the Subadviser's compensation and any other benefits derived from the subadvisory relationship; (iii) comparisons, to the extent applicable, of subadvisory fees and performance to comparable investment companies; and (iv) the terms of the Subadvisory Agreement. A summary of the Board's analysis of these factors is set forth below. After full consideration of a variety of factors, the Board, including the Independent Trustees, voted to approve the Subadvisory Agreement. In approving the Subadvisory Agreement, the Trustees did not identify any single factor as controlling, and each Trustee may have attributed different weights to various factors. Throughout their deliberations, the Independent Trustees were represented and assisted by Independent Counsel.
33
USAA Mutual Funds Trust | Supplemental Information — continued January 31, 2023 | ||||||
(Unaudited)
Nature, Extent, and Quality of Services Provided; Investment Personnel — The Trustees considered information provided to them regarding the services provided by the Subadviser, including information presented periodically throughout the previous year. The Board considered the Subadviser's level of knowledge and investment style. The Board reviewed the experience and credentials of the investment personnel who are responsible for managing the investment of portfolio securities with respect to the Fund and the Subadviser's level of staffing. The Trustees considered, based on the materials provided to them by the Subadviser, whether the method of compensating portfolio managers is reasonable and includes mechanisms to prevent a manager with underperformance from taking undue risks. The Trustees also noted the Subadviser's brokerage practices. The Board also considered the Subadviser's regulatory and compliance history. The Board also took into account the Subadviser's risk management processes. The Board noted that the Adviser's monitoring processes of the Subadviser include: (i) regular telephonic meetings to discuss, among other matters, investment strategies, and to review portfolio performance; (ii) quarterly portfolio compliance checklists and quarterly compliance certifications to the Board; and (iii) due diligence visits to the Subadviser.
Subadviser Compensation — The Board also took into consideration the financial condition of the Subadviser. In considering the cost of services to be provided by the Subadviser and the profitability to the Subadviser of its relationship with the Fund, the Trustees noted that the fees under the Subadvisory Agreement were paid by the Adviser. The Trustees also relied on the ability of the Adviser to negotiate the Subadvisory Agreement and the fees thereunder at arm's length. For the above reasons, the Board determined that the profitability of the Subadviser from its relationship with the Fund was not a material factor in its deliberations with respect to the consideration of the approval of the Subadvisory Agreement. For similar reasons, the Board concluded that the potential for economies of scale in the Subadviser's management of the Fund was not a material factor in considering the Subadvisory Agreement.
Subadvisory Fees and Fund Performance — The Board compared the subadvisory fees for the Fund with the fees that the Subadviser charges to comparable clients, as applicable. The Board considered that the Fund pays a management fee to the Adviser and that, in turn, the Adviser pays a subadvisory fee to the Subadviser. As noted above, the Board considered the Fund's performance during the one-, three-, five-, and ten-year periods ended June 30, 2022, as compared to the Fund's peer group and noted that the Board reviews at its regularly scheduled meetings information about the Fund's performance results. The Board also considered the performance of the Subadviser. The Board noted the Adviser's experience and resources in monitoring the performance, investment style, and risk-adjusted performance of the Subadviser. The Board was mindful of the Adviser's focus on the Subadviser's performance. The Board also noted the Subadviser's performance record for similar accounts, as applicable.
Conclusions — The Board reached the following conclusions regarding the Subadvisory Agreement: (i) the Subadviser is qualified to manage the Fund's assets in accordance with its investment objectives and policies; (ii) the Subadviser maintains an appropriate compliance program; (iii) the overall performance of the Fund is reasonable in relation to the performance of funds with similar investment objectives and relevant indices; and (iv) the Fund's advisory expenses are reasonable in relation to those of similar funds and to the services to be provided by the Adviser and the Subadviser. Based on its conclusions, the Board determined that approval of the Subadvisory Agreement with respect to the Fund would be in the best interests of the Fund and its shareholders.
34
Privacy Policy
Protecting the Privacy of Information
The Trust respects your right to privacy. We also know that you expect us to conduct and process your business in an accurate and efficient manner. To do so, we must collect and maintain certain personal information about you. This is the information we collect from you on applications or other forms, and from the transactions you make with us or third parties. It may include your name, address, social security number, account transactions and balances, and information about investment goals and risk tolerance.
We do not disclose any information about you or about former customers to anyone except as permitted or required by law. Specifically, we may disclose the information we collect to companies that perform services on our behalf, such as the transfer agent that processes shareholder accounts and printers and mailers that assist us in the distribution of investor materials. We may also disclose this information to companies that perform marketing services on our behalf. This allows us to continue to offer you Victory investment products and services that meet your investing needs, and to effect transactions that you request or authorize. These companies will use this information only in connection with the services for which we hired them. They are not permitted to use or share this information for any other purpose.
To protect your personal information internally, we permit access only by authorized employees and maintain physical, electronic, and procedural safeguards to guard your personal information.*
* You may have received communications regarding information about privacy policies from other financial institutions which gave you the opportunity to "opt-out" of certain information sharing with companies which are not affiliated with that financial institution. The Trust does not share information with other companies for purposes of marketing solicitations for products other than the Trust. Therefore, the Trust does not provide opt-out options to their shareholders.
P.O. Box 182593
Columbus, Ohio 43218-2593

Visit our website at: | Call | ||||||
vcm.com | (800) 235-8396 | ||||||
40053-0323

January 31, 2023
Semi Annual Report
USAA Value Fund
Victory Capital means Victory Capital Management Inc., the investment adviser of the USAA Mutual Funds. USAA Mutual Funds are distributed by Victory Capital Services, Inc., member FINRA, an affiliate of Victory Capital. Victory Capital and its affiliates are not affiliated with United Services Automobile Association or its affiliates. USAA and the USAA logos are registered trademarks and the USAA Mutual Funds and USAA Investments logos are trademarks of United Services Automobile Association and are being used by Victory Capital and its affiliates under license.
vcm.com
News, Information And Education 24 Hours A Day, 7 Days A Week
The Victory Capital website gives fund shareholders, prospective shareholders, and investment professionals a convenient way to access fund information, get guidance, and track fund performance anywhere they can access the Internet. The site includes:
• Detailed performance records
• Daily share prices
• The latest fund news
• Investment resources to help you become a better investor
• A section dedicated to investment professionals
Whether you're a potential investor searching for the fund that matches your investment philosophy, a seasoned investor interested in planning tools, or an investment professional, vcm.com has what you seek. Visit us anytime. We're always open.
USAA Mutual Funds Trust
TABLE OF CONTENTS
Investment Objective & Portfolio Holdings | 2 | ||||||
Schedule of Portfolio Investments | 3 | ||||||
Financial Statements | |||||||
Statement of Assets and Liabilities | 8 | ||||||
Statement of Operations | 9 | ||||||
Statements of Changes in Net Assets | 10 | ||||||
Financial Highlights | 12 | ||||||
Notes to Financial Statements | 16 | ||||||
Supplemental Information | 24 | ||||||
Proxy Voting and Portfolio Holdings Information | 24 | ||||||
Expense Examples | 24 | ||||||
Advisory Contract Approval | 25 | ||||||
Privacy Policy (inside back cover) | |||||||
This report is for the information of the shareholders and others who have received a copy of the currently effective prospectus of the Fund, managed by Victory Capital Management Inc. It may be used as sales literature only when preceded or accompanied by a current prospectus, which provides further details about the Fund.
IRA DISTRIBUTION WITHHOLDING DISCLOSURE
We generally must withhold federal income tax at a rate of 10% of the taxable portion of your distribution and, if you live in a state that requires state income tax withholding, at your state's tax rate. However, you may elect not to have withholding apply or to have income tax withheld at a higher rate. Any withholding election that you make will apply to any subsequent distribution unless and until you change or revoke the election. If you wish to make a withholding election, or change or revoke a prior withholding election, call (800) 235-8396, and form W-4P (OMB No. 1545-0074 withholding certificate for pension or annuity payments) will be electronically sent.
If you do not have a withholding election in place by the date of a distribution, federal income tax will be withheld from the taxable portion of your distribution at a rate of 10%. If you must pay estimated taxes, you may be subject to estimated tax penalties if your estimated tax payments are not sufficient and sufficient tax is not withheld from your distribution.
For more specific information, please consult your tax adviser.
• NOT FDIC INSURED • NO BANK GUARANTEE • MAY LOSE VALUE
1
| USAA Mutual Funds Trust USAA Value Fund | January 31, 2023 | ||||||
(Unaudited)
Investment Objective and Portfolio Holdings:
The Fund seeks long-term growth of capital.
Top 10 Equity Holdings*:
January 31, 2023
(% of Net Assets)
Fairfax Financial Holdings Ltd. | 2.6 | % | |||||
Markel Corp. | 2.1 | % | |||||
The Progressive Corp. | 1.9 | % | |||||
Merck & Co., Inc. | 1.7 | % | |||||
JPMorgan Chase & Co. | 1.7 | % | |||||
Alphabet, Inc. Class A | 1.6 | % | |||||
Johnson & Johnson | 1.6 | % | |||||
Vistra Corp. | 1.6 | % | |||||
Brown & Brown, Inc. | 1.4 | % | |||||
Marathon Oil Corp. | 1.4 | % | |||||
Sector Allocation*:
January 31, 2023
(% of Net Assets)

* Does not include futures contracts, money market instruments, and short-term investments purchased with cash collateral from securities loaned.
Percentages are of the net assets of the Fund and may not equal 100%.
Refer to the Schedule of Portfolio Investments for a complete list of securities.
2
| USAA Mutual Funds Trust USAA Value Fund | Schedule of Portfolio Investments January 31, 2023 | ||||||
(Amounts in Thousands, Except for Shares) (Unaudited)
Security Description | Shares | Value | |||||||||
Common Stocks (98.7%) | |||||||||||
Communication Services (5.3%): | |||||||||||
Alphabet, Inc. Class A (a) | 192,294 | $ | 19,006 | ||||||||
AT&T, Inc. | 249,936 | 5,091 | |||||||||
Charter Communications, Inc. Class A (a) | 8,219 | 3,159 | |||||||||
Comcast Corp. Class A | 153,454 | 6,039 | |||||||||
Match Group, Inc. (a) | 59,391 | 3,214 | |||||||||
Meta Platforms, Inc. Class A (a) | 86,104 | 12,827 | |||||||||
Omnicom Group, Inc. | 29,223 | 2,513 | |||||||||
Playtika Holding Corp. (a) | 270,464 | 2,837 | |||||||||
Verizon Communications, Inc. | 142,826 | 5,937 | |||||||||
World Wrestling Entertainment, Inc. Class A | 36,819 | 3,116 | |||||||||
63,739 | |||||||||||
Consumer Discretionary (6.3%): | |||||||||||
AutoNation, Inc. (a) | 23,290 | 2,951 | |||||||||
Bath & Body Works, Inc. | 67,752 | 3,117 | |||||||||
Best Buy Co., Inc. | 57,943 | 5,141 | |||||||||
Darden Restaurants, Inc. | 42,500 | 6,289 | |||||||||
Deckers Outdoor Corp. (a) | 4,545 | 1,943 | |||||||||
Dick's Sporting Goods, Inc. | 29,670 | 3,880 | |||||||||
Ford Motor Co. | 240,545 | 3,250 | |||||||||
LKQ Corp. | 223,510 | 13,178 | |||||||||
Mattel, Inc. (a) | 272,300 | 5,571 | |||||||||
PulteGroup, Inc. | 68,756 | 3,912 | |||||||||
Target Corp. | 28,023 | 4,824 | |||||||||
The Home Depot, Inc. | 17,585 | 5,701 | |||||||||
Ulta Beauty, Inc. (a) | 7,291 | 3,747 | |||||||||
Whirlpool Corp. | 25,846 | 4,021 | |||||||||
Williams-Sonoma, Inc. | 30,438 | 4,107 | |||||||||
Yum! Brands, Inc. | 28,492 | 3,718 | |||||||||
75,350 | |||||||||||
Consumer Staples (5.9%): | |||||||||||
Altria Group, Inc. | 142,258 | 6,407 | |||||||||
Colgate-Palmolive Co. | 36,905 | 2,751 | |||||||||
Keurig Dr Pepper, Inc. | 339,992 | 11,995 | |||||||||
Lamb Weston Holdings, Inc. | 35,800 | 3,576 | |||||||||
Mondelez International, Inc. Class A | 190,700 | 12,479 | |||||||||
Philip Morris International, Inc. | 83,924 | 8,748 | |||||||||
The Kroger Co. | 75,536 | 3,371 | |||||||||
The Procter & Gamble Co. | 41,865 | 5,961 | |||||||||
Tyson Foods, Inc. Class A | 38,127 | 2,507 | |||||||||
U.S. Foods Holding Corp. (a) | 286,700 | 10,932 | |||||||||
Walmart, Inc. | 17,637 | 2,537 | |||||||||
71,264 | |||||||||||
Energy (7.1%): | |||||||||||
Chevron Corp. | 25,352 | 4,412 | |||||||||
ConocoPhillips | 55,560 | 6,771 | |||||||||
Enterprise Products Partners LP | 442,624 | 11,331 | |||||||||
See notes to financial statements.
3
| USAA Mutual Funds Trust USAA Value Fund | Schedule of Portfolio Investments — continued January 31, 2023 | ||||||
(Amounts in Thousands, Except for Shares) (Unaudited)
Security Description | Shares | Value | |||||||||
EOG Resources, Inc. | 30,489 | $ | 4,032 | ||||||||
Exxon Mobil Corp. | 123,591 | 14,338 | |||||||||
Hess Corp. | 71,500 | 10,736 | |||||||||
Marathon Oil Corp. | 599,961 | 16,481 | |||||||||
Ovintiv, Inc. | 192,600 | 9,482 | |||||||||
PDC Energy, Inc. | 45,330 | 3,070 | |||||||||
Pioneer Natural Resources Co. | 20,435 | 4,707 | |||||||||
85,360 | |||||||||||
Financials (21.0%): | |||||||||||
Affiliated Managers Group, Inc. | 15,904 | 2,747 | |||||||||
American Financial Group, Inc. | 18,691 | 2,665 | |||||||||
Ameriprise Financial, Inc. | 14,761 | 5,168 | |||||||||
Brown & Brown, Inc. | 282,200 | 16,526 | |||||||||
Capital One Financial Corp. | 47,810 | 5,689 | |||||||||
Cboe Global Markets, Inc. | 107,400 | 13,197 | |||||||||
Citigroup, Inc. | 107,819 | 5,630 | |||||||||
Credit Acceptance Corp. (a) (b) | 2,523 | 1,167 | |||||||||
Discover Financial Services | 41,658 | 4,863 | |||||||||
East West Bancorp, Inc. | 61,134 | 4,800 | |||||||||
Evercore, Inc. | 39,259 | 5,096 | |||||||||
Everest Re Group Ltd. | 6,900 | 2,413 | |||||||||
Fairfax Financial Holdings Ltd. | 46,400 | 30,722 | |||||||||
Fidelity National Financial, Inc. | 140,865 | 6,202 | |||||||||
Interactive Brokers Group, Inc. | 179,100 | 14,317 | |||||||||
JPMorgan Chase & Co. | 142,652 | 19,966 | |||||||||
Markel Corp. (a) | 17,700 | 24,939 | |||||||||
MGIC Investment Corp. | 325,334 | 4,594 | |||||||||
Primerica, Inc. | 21,971 | 3,554 | |||||||||
Regions Financial Corp. | 221,417 | 5,212 | |||||||||
SEI Investments Co. | 102,039 | 6,370 | |||||||||
Signature Bank | 24,614 | 3,174 | |||||||||
State Street Corp. | 117,200 | 10,704 | |||||||||
Synchrony Financial | 95,223 | 3,498 | |||||||||
The Goldman Sachs Group, Inc. | 19,801 | 7,244 | |||||||||
The Hartford Financial Services Group, Inc. | 98,942 | 7,679 | |||||||||
The Progressive Corp. | 167,987 | 22,905 | |||||||||
The Travelers Cos., Inc. | 25,081 | 4,794 | |||||||||
U.S. Bancorp | 80,528 | 4,010 | |||||||||
Wells Fargo & Co. | 49,159 | 2,304 | |||||||||
252,149 | |||||||||||
Health Care (16.9%): | |||||||||||
AbbVie, Inc. | 89,800 | 13,268 | |||||||||
Amgen, Inc. | 13,160 | 3,322 | |||||||||
Biogen, Inc. (a) | 10,469 | 3,045 | |||||||||
Bristol-Myers Squibb Co. | 62,016 | 4,506 | |||||||||
Cigna Corp. | 48,231 | 15,273 | |||||||||
CVS Health Corp. | 37,719 | 3,328 | |||||||||
Elevance Health, Inc. | 11,791 | 5,895 | |||||||||
Eli Lilly & Co. | 7,637 | 2,628 | |||||||||
See notes to financial statements.
4
| USAA Mutual Funds Trust USAA Value Fund | Schedule of Portfolio Investments — continued January 31, 2023 | ||||||
(Amounts in Thousands, Except for Shares) (Unaudited)
Security Description | Shares | Value | |||||||||
GE Healthcare Technologies, Inc. (a) | 76,800 | $ | 5,339 | ||||||||
Gilead Sciences, Inc. | 41,151 | 3,454 | |||||||||
HCA Healthcare, Inc. | 21,580 | 5,504 | |||||||||
Hologic, Inc. (a) | 61,566 | 5,010 | |||||||||
Humana, Inc. | 20,295 | 10,385 | |||||||||
IDEXX Laboratories, Inc. (a) | 9,704 | 4,663 | |||||||||
Johnson & Johnson | 114,696 | 18,744 | |||||||||
Laboratory Corp. of America Holdings | 12,959 | 3,267 | |||||||||
McKesson Corp. | 22,963 | 8,696 | |||||||||
Medtronic PLC | 166,400 | 13,926 | |||||||||
Merck & Co., Inc. | 189,493 | 20,353 | |||||||||
Mettler-Toledo International, Inc. (a) | 3,167 | 4,855 | |||||||||
Moderna, Inc. (a) | 25,423 | 4,476 | |||||||||
Organon & Co. | 99,038 | 2,984 | |||||||||
Pfizer, Inc. | 128,706 | 5,684 | |||||||||
Quest Diagnostics, Inc. | 26,978 | 4,006 | |||||||||
Regeneron Pharmaceuticals, Inc. (a) | 3,671 | 2,784 | |||||||||
Royalty Pharma PLC Class A | 79,945 | 3,133 | |||||||||
Thermo Fisher Scientific, Inc. | 3,837 | 2,188 | |||||||||
UnitedHealth Group, Inc. | 31,985 | 15,967 | |||||||||
Universal Health Services, Inc. Class B | 20,395 | 3,023 | |||||||||
Waters Corp. (a) | 10,446 | 3,432 | |||||||||
203,138 | |||||||||||
Industrials (11.9%): | |||||||||||
3M Co. | 52,046 | 5,989 | |||||||||
Booz Allen Hamilton Holding Corp. | 35,736 | 3,382 | |||||||||
Builders FirstSource, Inc. (a) | 62,315 | 4,966 | |||||||||
CACI International, Inc. Class A (a) | 12,607 | 3,884 | |||||||||
Cintas Corp. | 11,245 | 4,990 | |||||||||
Cummins, Inc. | 19,716 | 4,920 | |||||||||
Eaton Corp. PLC | 40,200 | 6,521 | |||||||||
Emerson Electric Co. | 50,291 | 4,537 | |||||||||
Fastenal Co. | 84,705 | 4,282 | |||||||||
FedEx Corp. | 44,523 | 8,631 | |||||||||
Honeywell International, Inc. | 12,669 | 2,641 | |||||||||
Johnson Controls International PLC | 153,300 | 10,665 | |||||||||
Leidos Holdings, Inc. | 90,800 | 8,975 | |||||||||
Lennox International, Inc. | 14,122 | 3,680 | |||||||||
Lockheed Martin Corp. | 6,269 | 2,904 | |||||||||
ManpowerGroup, Inc. | 33,492 | 2,919 | |||||||||
Masco Corp. | 69,861 | 3,717 | |||||||||
MSC Industrial Direct Co., Inc. | 41,171 | 3,405 | |||||||||
Otis Worldwide Corp. | 69,621 | 5,725 | |||||||||
PACCAR, Inc. | 42,300 | 4,624 | |||||||||
Parker-Hannifin Corp. | 25,100 | 8,183 | |||||||||
Raytheon Technologies Corp. | 66,167 | 6,607 | |||||||||
Robert Half International, Inc. | 33,699 | 2,829 | |||||||||
Sensata Technologies Holding PLC | 223,200 | 11,350 | |||||||||
Union Pacific Corp. | 23,447 | 4,788 | |||||||||
See notes to financial statements.
5
| USAA Mutual Funds Trust USAA Value Fund | Schedule of Portfolio Investments — continued January 31, 2023 | ||||||
(Amounts in Thousands, Except for Shares) (Unaudited)
Security Description | Shares | Value | |||||||||
United Parcel Service, Inc. Class B | 27,127 | $ | 5,025 | ||||||||
W.W. Grainger, Inc. | 5,319 | 3,135 | |||||||||
143,274 | |||||||||||
Information Technology (8.6%): | |||||||||||
Adobe, Inc. (a) | 7,544 | 2,794 | |||||||||
Amdocs Ltd. | 39,040 | 3,589 | |||||||||
Autodesk, Inc. (a) | 18,793 | 4,043 | |||||||||
Cadence Design Systems, Inc. (a) | 24,486 | 4,477 | |||||||||
CDW Corp. | 20,031 | 3,927 | |||||||||
Cisco Systems, Inc. | 171,607 | 8,352 | |||||||||
Cognizant Technology Solutions Corp. Class A | 49,529 | 3,306 | |||||||||
Dell Technologies, Inc. Class C | 53,963 | 2,192 | |||||||||
Fidelity National Information Services, Inc. | 205,900 | 15,451 | |||||||||
FleetCor Technologies, Inc. (a) | 47,194 | 9,855 | |||||||||
Fortinet, Inc. (a) | 39,501 | 2,067 | |||||||||
Global Payments, Inc. | 27,300 | 3,077 | |||||||||
Intel Corp. | 142,253 | 4,020 | |||||||||
International Business Machines Corp. | 14,427 | 1,944 | |||||||||
Mastercard, Inc. Class A | 9,140 | 3,387 | |||||||||
Micron Technology, Inc. | 47,347 | 2,855 | |||||||||
PayPal Holdings, Inc. (a) | 42,153 | 3,435 | |||||||||
Qorvo, Inc. (a) | 32,414 | 3,522 | |||||||||
QUALCOMM, Inc. | 19,967 | 2,660 | |||||||||
Skyworks Solutions, Inc. | 35,716 | 3,917 | |||||||||
Texas Instruments, Inc. | 29,499 | 5,228 | |||||||||
The Western Union Co. | 143,357 | 2,031 | |||||||||
Ubiquiti, Inc. | 7,481 | 2,186 | |||||||||
VeriSign, Inc. (a) | 15,106 | 3,294 | |||||||||
Vontier Corp. | 90,196 | 2,077 | |||||||||
103,686 | |||||||||||
Materials (4.5%): | |||||||||||
Cleveland-Cliffs, Inc. (a) | 114,403 | 2,443 | |||||||||
Dow, Inc. | 129,671 | 7,696 | |||||||||
Louisiana-Pacific Corp. | 50,857 | 3,463 | |||||||||
LyondellBasell Industries NV Class A | 72,877 | 7,046 | |||||||||
Nucor Corp. | 37,029 | 6,259 | |||||||||
PPG Industries, Inc. | 71,000 | 9,254 | |||||||||
Sealed Air Corp. | 225,829 | 12,366 | |||||||||
Steel Dynamics, Inc. | 47,373 | 5,715 | |||||||||
54,242 | |||||||||||
Real Estate (5.1%): | |||||||||||
Alexandria Real Estate Equities, Inc. | 92,527 | 14,873 | |||||||||
AvalonBay Communities, Inc. | 19,184 | 3,404 | |||||||||
Brixmor Property Group, Inc. | 170,045 | 4,001 | |||||||||
Equity LifeStyle Properties, Inc. | 82,800 | 5,943 | |||||||||
Gaming and Leisure Properties, Inc. | 76,584 | 4,102 | |||||||||
Healthpeak Properties, Inc. | 110,587 | 3,039 | |||||||||
Invitation Homes, Inc. | 252,000 | 8,190 | |||||||||
Prologis, Inc. | 47,151 | 6,096 | |||||||||
Realty Income Corp. | 70,309 | 4,769 | |||||||||
See notes to financial statements.
6
| USAA Mutual Funds Trust USAA Value Fund | Schedule of Portfolio Investments — continued January 31, 2023 | ||||||
(Amounts in Thousands, Except for Shares) (Unaudited)
Security Description | Shares | Value | |||||||||
Ventas, Inc. | 47,506 | $ | 2,461 | ||||||||
VICI Properties, Inc. | 134,917 | 4,612 | |||||||||
61,490 | |||||||||||
Utilities (6.1%): | |||||||||||
Constellation Energy Corp. | 61,499 | 5,250 | |||||||||
DTE Energy Co. | 40,929 | 4,763 | |||||||||
Duke Energy Corp. | 84,926 | 8,701 | |||||||||
Evergy, Inc. | 72,193 | 4,523 | |||||||||
Exelon Corp. | 299,412 | 12,632 | |||||||||
PPL Corp. | 170,457 | 5,046 | |||||||||
The AES Corp. | 148,386 | 4,067 | |||||||||
The Southern Co. | 75,607 | 5,117 | |||||||||
UGI Corp. | 126,468 | 5,037 | |||||||||
Vistra Corp. | 808,686 | 18,648 | |||||||||
73,784 | |||||||||||
Total Common Stocks (Cost $1,033,689) | 1,187,476 | ||||||||||
Collateral for Securities Loaned (0.1%)^ | |||||||||||
| Goldman Sachs Financial Square Government Fund, Institutional Shares, 4.22% (c) | 285,782 | 286 | |||||||||
HSBC U.S. Government Money Market Fund, Institutional Shares, 4.21% (c) | 285,782 | 285 | |||||||||
Invesco Government & Agency Portfolio, Institutional Shares, 4.31% (c) | 285,782 | 286 | |||||||||
| Morgan Stanley Institutional Liquidity Government Portfolio, Institutional Shares, 4.14% (c) | 285,782 | 286 | |||||||||
Total Collateral for Securities Loaned (Cost $1,143) | 1,143 | ||||||||||
Total Investments (Cost $1,034,832) — 98.8% | 1,188,619 | ||||||||||
Other assets in excess of liabilities — 1.2% | 14,822 | ||||||||||
NET ASSETS — 100.00% | $ | 1,203,441 | |||||||||
At January 31, 2023, the Fund's investments in foreign securities were 7.7% of net assets.
^ Purchased with cash collateral from securities on loan.
(a) Non-income producing security.
(b) All or a portion of this security is on loan.
(c) Rate disclosed is the daily yield on January 31, 2023.
LP — Limited Partnership
PLC — Public Limited Company
See notes to financial statements.
7
USAA Mutual Funds Trust | Statement of Assets and Liabilities January 31, 2023 | ||||||
(Amounts in Thousands, Except Per Share Amounts) (Unaudited)
| USAA Value Fund | |||||||
Assets: | |||||||
Investments, at value (Cost $1,034,832) | $ | 1,188,619 | (a) | ||||
Cash | 17,965 | ||||||
Receivables: | |||||||
Interest and dividends | 910 | ||||||
Capital shares issued | 17 | ||||||
From Adviser | 9 | ||||||
Prepaid expenses | 13 | ||||||
Total Assets | 1,207,533 | ||||||
Liabilities: | |||||||
Payables: | |||||||
Collateral received on loaned securities | 1,143 | ||||||
Investments purchased | 1,868 | ||||||
Capital shares redeemed | 148 | ||||||
Accrued expenses and other payables: | |||||||
Investment advisory fees | 611 | ||||||
Administration fees | 131 | ||||||
Custodian fees | 9 | ||||||
Transfer agent fees | 102 | ||||||
Compliance fees | 1 | ||||||
Trustees' fees | 1 | ||||||
| 12b-1 fees | — | (b) | |||||
Other accrued expenses | 78 | ||||||
Total Liabilities | 4,092 | ||||||
Net Assets: | |||||||
Capital | 1,055,534 | ||||||
Total accumulated earnings/(loss) | 147,907 | ||||||
Net Assets | $ | 1,203,441 | |||||
Net Assets | |||||||
Fund Shares | $ | 763,396 | |||||
Institutional Shares | 439,936 | ||||||
Class A | 109 | ||||||
Total | $ | 1,203,441 | |||||
Shares (unlimited number of shares authorized with no par value): | |||||||
Fund Shares | 44,535 | ||||||
Institutional Shares | 25,646 | ||||||
Class A | 6 | ||||||
Total | 70,187 | ||||||
Net asset value, offering and redemption price per share: (c) | |||||||
Fund Shares | $ | 17.14 | |||||
Institutional Shares | 17.15 | ||||||
Class A | 17.45 | ||||||
Maximum Sales Charge — Class A | 5.75 | % | |||||
| Maximum offering price (100%/(100%-maximum sales charge) of net asset value adjusted to the nearest cent) per share — Class A | $ | 18.51 | |||||
(a) Includes $1,155 thousand of securities on loan.
(b) Rounds to less than $1 thousand.
(c) Per share amount may not recalculate due to rounding of net assets and/or shares outstanding.
See notes to financial statements.
8
USAA Mutual Funds Trust | Statement of Operations For the Six Months Ended January 31, 2023 | ||||||
(Amounts in Thousands) (Unaudited)
| USAA Value Fund | |||||||
Investment Income: | |||||||
Dividends | $ | 14,039 | |||||
Interest | 104 | ||||||
Securities lending (net of fees) | 12 | ||||||
Foreign tax withholding | (70 | ) | |||||
Total Income | 14,085 | ||||||
Expenses: | |||||||
Investment advisory fees | 3,592 | ||||||
Administration fees — Fund Shares | 556 | ||||||
Administration fees — Institutional Shares | 204 | ||||||
Administration fees — Class A | — | (a) | |||||
Sub-Administration fees | 21 | ||||||
| 12b-1 fees — Class A | — | (a) | |||||
Custodian fees | 26 | ||||||
Transfer agent fees — Fund Shares | 386 | ||||||
Transfer agent fees — Institutional Shares | 204 | ||||||
Transfer agent fees — Class A | — | (a) | |||||
Trustees' fees | 23 | ||||||
Compliance fees | 6 | ||||||
Legal and audit fees | 48 | ||||||
State registration and filing fees | 35 | ||||||
Other expenses | 78 | ||||||
Total Expenses | 5,179 | ||||||
Expenses waived/reimbursed by Adviser | (28 | ) | |||||
Net Expenses | 5,151 | ||||||
Net Investment Income (Loss) | 8,934 | ||||||
Realized/Unrealized Gains (Losses) from Investments: | |||||||
| Net realized gains (losses) from investment securities and foreign currency transactions | (1,401 | ) | |||||
Net change in unrealized appreciation/depreciation on investment securities | 38,674 | ||||||
Net realized/unrealized gains (losses) on investments | 37,273 | ||||||
Change in net assets resulting from operations | $ | 46,207 | |||||
(a) Rounds to less than $1 thousand.
See notes to financial statements.
9
USAA Mutual Funds Trust | Statements of Changes in Net Assets | ||||||
(Amounts in Thousands)
USAA Value Fund | |||||||||||
| Six Months Ended January 31, 2023 (Unaudited) | Year Ended July 31, 2022 | ||||||||||
From Investments: | |||||||||||
Operations: | |||||||||||
Net Investment Income (Loss) | $ | 8,934 | $ | 14,966 | |||||||
Net realized gains (losses) | (1,401 | ) | 122,544 | ||||||||
Net change in unrealized appreciation/depreciation | 38,674 | (125,131 | ) | ||||||||
Change in net assets resulting from operations | 46,207 | 12,379 | |||||||||
Distributions to Shareholders: | |||||||||||
Fund Shares | (55,837 | ) | (48,312 | ) | |||||||
Institutional Shares | (31,668 | ) | (23,853 | ) | |||||||
Class A | (8 | ) | (6 | ) | |||||||
Change in net assets resulting from distributions to shareholders | (87,513 | ) | (72,171 | ) | |||||||
Change in net assets resulting from capital transactions | 124,729 | 73,080 | |||||||||
Change in net assets | 83,423 | 13,288 | |||||||||
Net Assets: | |||||||||||
Beginning of period | 1,120,018 | 1,106,730 | |||||||||
End of period | $ | 1,203,441 | $ | 1,120,018 | |||||||
(continues on next page)
See notes to financial statements.
10
USAA Mutual Funds Trust | Statements of Changes in Net Assets | ||||||
(Amounts in Thousands) (continued)
USAA Value Fund | |||||||||||
| Six Months Ended January 31, 2023 (Unaudited) | Year Ended July 31, 2022 | ||||||||||
Capital Transactions: | |||||||||||
Fund Shares | |||||||||||
Proceeds from shares issued | $ | 15,817 | $ | 45,234 | |||||||
Distributions reinvested | 55,308 | 47,728 | |||||||||
Cost of shares redeemed | (48,391 | ) | (121,375 | ) | |||||||
Total Fund Shares | $ | 22,734 | $ | (28,413 | ) | ||||||
Institutional Shares | |||||||||||
Proceeds from shares issued | $ | 81,140 | $ | 135,197 | |||||||
Distributions reinvested | 31,654 | 23,841 | |||||||||
Cost of shares redeemed | (10,809 | ) | (57,515 | ) | |||||||
Total Institutional Shares | $ | 101,985 | $ | 101,523 | |||||||
Class A | |||||||||||
Proceeds from shares issued | $ | 5 | $ | 62 | |||||||
Distributions reinvested | 5 | 4 | |||||||||
Cost of shares redeemed | — | (a) | (96 | ) | |||||||
Total Class A | $ | 10 | $ | (30 | ) | ||||||
Change in net assets resulting from capital transactions | $ | 124,729 | $ | 73,080 | |||||||
Share Transactions: | |||||||||||
Fund Shares | |||||||||||
Issued | 928 | 2,456 | |||||||||
Reinvested | 3,319 | 2,599 | |||||||||
Redeemed | (2,840 | ) | (6,602 | ) | |||||||
Total Fund Shares | 1,407 | (1,547 | ) | ||||||||
Institutional Shares | |||||||||||
Issued | 4,571 | 6,987 | |||||||||
Reinvested | 1,898 | 1,297 | |||||||||
Redeemed | (632 | ) | (3,124 | ) | |||||||
Total Institutional Shares | 5,837 | 5,160 | |||||||||
Class A | |||||||||||
Issued | 1 | 3 | |||||||||
Reinvested | — | (b) | — | (b) | |||||||
Redeemed | — | (b) | (5 | ) | |||||||
Total Class A | 1 | (2 | ) | ||||||||
Change in Shares | 7,245 | 3,611 | |||||||||
(a) Rounds to less than $1 thousand.
(b) Rounds to less than 1 thousand shares.
See notes to financial statements.
11
USAA Mutual Funds Trust | Financial Highlights | ||||||
For a Share Outstanding Throughout Each Period
USAA Value Fund | |||||||||||||||||||||||||||
Fund Shares | |||||||||||||||||||||||||||
| Six Months Ended January 31, 2023 (Unaudited) | Year Ended July 31, 2022 | Year Ended July 31, 2021 | Year Ended July 31, 2020 | Year Ended July 31, 2019 | Year Ended July 31, 2018 | ||||||||||||||||||||||
| Net Asset Value, Beginning of Period | $ | 17.79 | $ | 18.65 | $ | 13.57 | $ | 19.32 | $ | 22.01 | $ | 21.55 | |||||||||||||||
Investment Activities: | |||||||||||||||||||||||||||
Net investment income (loss) | 0.13 | (a) | 0.23 | (a) | 0.21 | (a) | 0.26 | (a) | 0.25 | 0.21 | |||||||||||||||||
| Net realized and unrealized gains (losses) | 0.54 | 0.03 | (b) | 5.12 | (1.39 | ) | (0.54 | ) | 1.84 | ||||||||||||||||||
| Total from Investment Activities | 0.67 | 0.26 | 5.33 | (1.13 | ) | (0.29 | ) | 2.05 | |||||||||||||||||||
Distributions to Shareholders from: | |||||||||||||||||||||||||||
Net investment income | (0.19 | ) | (0.24 | ) | (0.19 | ) | (0.21 | ) | (0.24 | ) | (0.21 | ) | |||||||||||||||
Net realized gains | (1.13 | ) | (0.88 | ) | (0.06 | ) | (4.41 | ) | (2.16 | ) | (1.38 | ) | |||||||||||||||
Total Distributions | (1.32 | ) | (1.12 | ) | (0.25 | ) | (4.62 | ) | (2.40 | ) | (1.59 | ) | |||||||||||||||
Net Asset Value, End of Period | $ | 17.14 | $ | 17.79 | $ | 18.65 | $ | 13.57 | $ | 19.32 | $ | 22.01 | |||||||||||||||
Total Return (c) (d) | 4.06 | % | 1.23 | % | 39.66 | % | (9.43 | )% | (0.11 | )% | 9.69 | % | |||||||||||||||
Ratios to Average Net Assets: | |||||||||||||||||||||||||||
Net Expenses (e) (f) (g) (h) | 0.91 | % | 0.91 | % | 0.92 | % | 0.96 | % | 0.96 | % | 0.99 | % | |||||||||||||||
Net Investment Income (Loss) (e) | 1.53 | % | 1.28 | % | 1.29 | % | 1.69 | % | 1.35 | % | 1.10 | % | |||||||||||||||
Gross Expenses (e) (f) | 0.91 | % | 0.91 | % | 0.92 | % | 0.97 | % | 0.96 | % | 0.99 | % | |||||||||||||||
Supplemental Data: | |||||||||||||||||||||||||||
Net Assets at end of period (000's) | $ | 763,396 | $ | 767,351 | $ | 833,149 | $ | 711,182 | $ | 940,515 | $ | 1,007,712 | |||||||||||||||
Portfolio Turnover (c) (i) | 30 | % | 69 | % | 55 | % | 74 | % | 108 | %(j) | 29 | % | |||||||||||||||
(a) Per share net investment income (loss) has been calculated using the average daily shares method.
(b) The amount shown reflects a net realized and unrealized gain per share, whereas the Statement of Operations reflected a net realized and unrealized loss for the period for the Fund in total. The difference in realized and unrealized gains and losses for the Fund versus the class is due to the timing of sales and repurchases of the class in relation to fluctuating market values during the period.
(c) Not annualized for periods less than one year.
(d) Assumes reinvestment of all net investment income and realized capital gain distributions, if any, during the period. Includes adjustments in accordance with U.S. Generally Accepted Accounting Principles and could differ from the Lipper reported return.
(e) Annualized for periods less than one year.
(f) Does not include acquired fund fees and expenses, if any.
(g) The net expense ratio may not correlate to the applicable expense limits in place during the period since the current contractual expense limitation is applied for a period beginning July 1, 2019 and in effect through November 30, 2023, instead of coinciding with the Fund's fiscal year end. Details of the current contractual expense limitation in effect can be found in Note 5 of the accompanying Notes to Financial Statements.
(h) From the period beginning July 1, 2019, the amount of any waivers or reimbursements and the amount of any recoupment are calculated without regard to the impact of any performance adjustment to the Fund's management fee.
(i) Portfolio turnover is calculated on the basis of the Fund as a whole without distinguishing between the classes of shares.
(j) Reflects increased trading activity due to transition or asset allocation shift.
(continues on next page)
See notes to financial statements.
12
USAA Mutual Funds Trust | Financial Highlights — continued | ||||||
For a Share Outstanding Throughout Each Period
USAA Value Fund | |||||||||||||||||||||||||||
Institutional Shares | |||||||||||||||||||||||||||
| Six Months Ended January 31, 2023 (Unaudited) | Year Ended July 31, 2022 | Year Ended July 31, 2021 | Year Ended July 31, 2020 | Year Ended July 31, 2019 | Year Ended July 31, 2018 | ||||||||||||||||||||||
| Net Asset Value, Beginning of Period | $ | 17.80 | $ | 18.67 | $ | 13.58 | $ | 19.33 | $ | 22.00 | $ | 21.54 | |||||||||||||||
Investment Activities: | |||||||||||||||||||||||||||
Net investment income (loss) | 0.14 | (a) | 0.24 | (a) | 0.22 | (a) | 0.27 | (a) | 0.28 | (a) | 0.23 | ||||||||||||||||
| Net realized and unrealized gains (losses) | 0.53 | 0.03 | (b) | 5.13 | (1.39 | ) | (0.55 | ) | 1.84 | ||||||||||||||||||
| Total from Investment Activities | 0.67 | 0.27 | 5.35 | (1.12 | ) | (0.27 | ) | 2.07 | |||||||||||||||||||
Distributions to Shareholders from: | |||||||||||||||||||||||||||
Net investment income | (0.19 | ) | (0.26 | ) | (0.20 | ) | (0.22 | ) | (0.24 | ) | (0.23 | ) | |||||||||||||||
Net realized gains | (1.13 | ) | (0.88 | ) | (0.06 | ) | (4.41 | ) | (2.16 | ) | (1.38 | ) | |||||||||||||||
Total Distributions | (1.32 | ) | (1.14 | ) | (0.26 | ) | (4.63 | ) | (2.40 | ) | (1.61 | ) | |||||||||||||||
Net Asset Value, End of Period | $ | 17.15 | $ | 17.80 | $ | 18.67 | $ | 13.58 | $ | 19.33 | $ | 22.00 | |||||||||||||||
Total Return (c) (d) | 4.06 | % | 1.28 | % | 39.83 | % | (9.40 | )% | (0.02 | )% | 9.79 | % | |||||||||||||||
Ratios to Average Net Assets: | |||||||||||||||||||||||||||
Net Expenses (e) (f) (g) (h) | 0.86 | % | 0.86 | % | 0.84 | % | 0.88 | % | 0.88 | % | 0.91 | % | |||||||||||||||
Net Investment Income (Loss) (e) | 1.59 | % | 1.33 | % | 1.36 | % | 1.75 | % | 1.42 | % | 1.18 | % | |||||||||||||||
Gross Expenses (e) (f) | 0.87 | % | 0.86 | % | 0.85 | % | 0.89 | % | 0.88 | % | 0.91 | % | |||||||||||||||
Supplemental Data: | |||||||||||||||||||||||||||
Net Assets at end of period (000's) | $ | 439,936 | $ | 352,564 | $ | 273,446 | $ | 215,830 | $ | 222,701 | $ | 640,281 | |||||||||||||||
Portfolio Turnover (c) (i) | 30 | % | 69 | % | 55 | % | 74 | % | 108 | %(j) | 29 | % | |||||||||||||||
(a) Per share net investment income (loss) has been calculated using the average daily shares method.
(b) The amount shown reflects a net realized and unrealized gain per share, whereas the Statement of Operations reflected a net realized and unrealized loss for the period for the Fund in total. The difference in realized and unrealized gains and losses for the Fund versus the class is due to the timing of sales and repurchases of the class in relation to fluctuating market values during the period.
(c) Not annualized for periods less than one year.
(d) Assumes reinvestment of all net investment income and realized capital gain distributions, if any, during the period. Includes adjustments in accordance with U.S. Generally Accepted Accounting Principles and could differ from the Lipper reported return.
(e) Annualized for periods less than one year.
(f) Does not include acquired fund fees and expenses, if any.
(g) The net expense ratio may not correlate to the applicable expense limits in place during the period since the current contractual expense limitation is applied for a period beginning July 1, 2019 and in effect through November 30, 2023, instead of coinciding with the Fund's fiscal year end. Details of the current contractual expense limitation in effect can be found in Note 5 of the accompanying Notes to Financial Statements.
(h) From the period beginning July 1, 2019, the amount of any waivers or reimbursements and the amount of any recoupment are calculated without regard to the impact of any performance adjustment to the Fund's management fee.
(i) Portfolio turnover is calculated on the basis of the Fund as a whole without distinguishing between the classes of shares.
(j) Reflects increased trading activity due to transition or asset allocation shift.
(continues on next page)
See notes to financial statements.
13
USAA Mutual Funds Trust | Financial Highlights — continued | ||||||
For a Share Outstanding Throughout Each Period
USAA Value Fund | |||||||||||||||||||||||||||
Class A | |||||||||||||||||||||||||||
| Six Months Ended January 31, 2023 (Unaudited) | Year Ended July 31, 2022 | Year Ended July 31, 2021 | Year Ended July 31, 2020 | Year Ended July 31, 2019 | Year Ended July 31, 2018 | ||||||||||||||||||||||
| Net Asset Value, Beginning of Period | $ | 18.12 | $ | 18.59 | $ | 13.48 | $ | 19.24 | $ | 21.91 | $ | 21.46 | |||||||||||||||
Investment Activities: | |||||||||||||||||||||||||||
Net investment income (loss) | 0.10 | (a) | 0.40 | (a) | 0.16 | (a) | 0.23 | (a) | 0.20 | 0.15 | |||||||||||||||||
| Net realized and unrealized gains (losses) | 0.55 | 0.01 | (b) | 5.17 | (1.39 | ) | (0.55 | ) | 1.83 | ||||||||||||||||||
| Total from Investment Activities | 0.65 | 0.41 | 5.33 | (1.16 | ) | (0.35 | ) | 1.98 | |||||||||||||||||||
Distributions to Shareholders from: | |||||||||||||||||||||||||||
Net investment income | (0.19 | ) | — | (0.16 | ) | (0.19 | ) | (0.16 | ) | (0.15 | ) | ||||||||||||||||
Net realized gains | (1.13 | ) | (0.88 | ) | (0.06 | ) | (4.41 | ) | (2.16 | ) | (1.38 | ) | |||||||||||||||
Total Distributions | (1.32 | ) | (0.88 | ) | (0.22 | ) | (4.60 | ) | (2.32 | ) | (1.53 | ) | |||||||||||||||
Net Asset Value, End of Period | $ | 17.45 | $ | 18.12 | $ | 18.59 | $ | 13.48 | $ | 19.24 | $ | 21.91 | |||||||||||||||
| Total Return (excludes sales charges) (c) (d) | 3.88 | % | 2.09 | % | 39.88 | % | (9.66 | )% | (0.44 | )% | 9.41 | % | |||||||||||||||
Ratios to Average Net Assets: | |||||||||||||||||||||||||||
Net Expenses (e) (f) (g) (h) | 1.27 | % | 0.03 | %(i) | 1.21 | % | 1.21 | % | 1.27 | %(j) | 1.30 | % | |||||||||||||||
Net Investment Income (Loss) (e) | 1.18 | % | 2.16 | % | 1.02 | % | 1.45 | % | 1.03 | % | 0.79 | % | |||||||||||||||
Gross Expenses (e) (f) | 20.58 | % | 13.91 | %(k) | 1.65 | % | 1.21 | % | 1.31 | % | 1.30 | % | |||||||||||||||
Supplemental Data: | |||||||||||||||||||||||||||
Net Assets at end of period (000's) | $ | 109 | $ | 103 | $ | 135 | $ | 6,027 | $ | 8,613 | $ | 9,807 | |||||||||||||||
Portfolio Turnover (c) (l) | 30 | % | 69 | % | 55 | % | 74 | % | 108 | %(m) | 29 | % | |||||||||||||||
(a) Per share net investment income (loss) has been calculated using the average daily shares method.
(b) The amount shown reflects a net realized and unrealized gain per share, whereas the Statement of Operations reflected a net realized and unrealized loss for the period for the Fund in total. The difference in realized and unrealized gains and losses for the Fund versus the class is due to the timing of sales and repurchases of the class in relation to fluctuating market values during the period.
(c) Not annualized for periods less than one year.
(d) Assumes reinvestment of all net investment income and realized capital gain distributions, if any, during the period. Includes adjustments in accordance with U.S. Generally Accepted Accounting Principles and could differ from the Lipper reported return.
(e) Annualized for periods less than one year.
(f) Does not include acquired fund fees and expenses, if any.
(g) The net expense ratio may not correlate to the applicable expense limits in place during the period since the current contractual expense limitation is applied for a period beginning July 1, 2019 and in effect through November 30, 2023, instead of coinciding with the Fund's fiscal year end. Details of the current contractual expense limitation in effect can be found in Note 5 of the accompanying Notes to Financial Statements.
(continues on next page)
See notes to financial statements.
14
USAA Mutual Funds Trust | Financial Highlights — continued | ||||||
(h) From the period beginning July 1, 2019, the amount of any waivers or reimbursements and the amount of any recoupment are calculated without regard to the impact of any performance adjustment to the Fund's management fee.
(i) For the year ended July 31, 2022, the Class A net expense ratio includes the impact of the performance fee adjustment. If the performance fee adjustment of (1.24)% was not applied to the Class A net expense ratio, the Class A net expense ratio would have been 1.27%.
(j) Prior to December 1, 2018, USAA Asset Management Company (previous Investment Adviser) voluntarily agreed to limit the annual expenses of Class A to 1.30% of the Class A average daily net assets.
(k) The class specific expenses have significantly impacted the gross expense ratio due to fluctuations in Class A net assets.
(l) Portfolio turnover is calculated on the basis of the Fund as a whole without distinguishing between the classes of shares.
(m) Reflects increased trading activity due to transition or asset allocation shift.
See notes to financial statements.
15
USAA Mutual Funds Trust | Notes to Financial Statements January 31, 2023 | ||||||
(Unaudited)
1. Organization:
USAA Mutual Funds Trust (the "Trust") is organized as a Delaware statutory trust and is registered under the Investment Company Act of 1940, as amended (the "1940 Act"), as an open-end investment company. The Trust is comprised of 45 funds and is authorized to issue an unlimited number of shares, which are units of beneficial interest with no par value.
The accompanying financial statements are those of the USAA Value Fund (the "Fund"). The Fund offers three classes of shares: Fund Shares, Institutional Shares, and Class A. The Fund is classified as diversified under the 1940 Act.
Each class of shares of the Fund has substantially identical rights and privileges, except with respect to sales charges, fees paid under distribution plans, expenses allocable exclusively to each class of shares, voting rights on matters solely affecting a single class of shares, and the exchange privilege of each class of shares.
Victory Capital Management ("VCM" or the "Adviser") is an indirect wholly owned subsidiary of Victory Capital Holdings, Inc., a publicly traded Delaware corporation, and a wholly owned direct subsidiary of Victory Capital Operating, LLC.
Under the Trust's organizational documents, its officers and trustees are indemnified against certain liabilities arising out of the performance of their duties to the Fund. In addition, in the normal course of business, the Fund enters into contracts with its vendors and others that provide for general indemnifications. The Fund's maximum exposure under these arrangements is unknown, as this would involve future claims that may be made against the Fund. However, based on experience, the Fund expects that risk of loss to be remote.
2. Significant Accounting Policies:
The following is a summary of significant accounting policies followed by the Trust in the preparation of its financial statements. The policies are in conformity with U.S. Generally Accepted Accounting Principles ("GAAP"). The preparation of financial statements in accordance with GAAP requires management to make estimates and assumptions that affect the reported amounts of assets and liabilities and disclosure of contingent assets and liabilities at the date of the financial statements and the reported amounts of income and expenses for the period. Actual results could differ from those estimates. The Fund follows the specialized accounting and reporting requirements under GAAP that are applicable to investment companies under Accounting Standards Codification Topic 946.
Investment Valuation:
The Fund records investments at fair value. Fair value is defined as the price that would be received to sell an asset or paid to transfer a liability in an orderly transaction between market participants at the measurement date.
The valuation techniques described below maximize the use of observable inputs and minimize the use of unobservable inputs in determining fair value. The inputs used for valuing the Fund's investments are summarized in the three broad levels listed below:
• Level 1 — quoted prices (unadjusted) in active markets for identical securities
• Level 2 — other significant observable inputs (including quoted prices for similar securities, interest rates, or credit spreads, applicable to those securities, etc.)
• Level 3 — significant unobservable inputs (including the Adviser's assumptions in determining the fair value of investments)
Changes in valuation techniques may result in transfers in or out of an assigned level within the disclosure hierarchy. The inputs or methodologies used for valuation techniques are not necessarily an indication of the risks associated with entering into those investments.
16
USAA Mutual Funds Trust | Notes to Financial Statements — continued January 31, 2023 | ||||||
(Unaudited)
The Adviser, appointed as the valuation designee by the Trust's Board of Trustees' (the "Board"), has established the Pricing and Liquidity Committee (the "Committee"), and subject to Board oversight, the Committee administers and oversees the Fund's valuation policies and procedures, which are approved by the Board.
Portfolio securities listed or traded on securities exchanges, including Exchange-Traded Funds ("ETFs"), and American Depositary Receipts, are valued at the closing price on the exchange or system where the security is principally traded, if available, or at the Nasdaq Official Closing Price. If there have been no sales for that day on the exchange or system, then a security is valued at the last available bid quotation on the exchange or system where the security is principally traded. In each of these situations, valuations are typically categorized as Level 1 in the fair value hierarchy.
Investments in open-end investment companies, other than ETFs, are valued at their net asset value ("NAV"). These valuations are typically categorized as Level 1 in the fair value hierarchy.
In the event that price quotations or valuations are not readily available, investments are valued at fair value in accordance with procedures established by and under the general supervision and responsibility of the Board. These valuations are typically categorized as Level 2 or Level 3 in the fair value hierarchy, based on the observability of inputs used to determine the fair value. The effect of fair value pricing is that securities may not be priced on the basis of quotations from the primary market in which they are traded, and the actual price realized from the sale of a security may differ materially from the fair value price. Valuing these securities at fair value is intended to cause the Fund's NAV to be more reliable than it otherwise would be.
A summary of the valuations as of January 31, 2023, based upon the three levels defined above, is included in the table below while the breakdown, by category, of investments is disclosed on the Schedule of Portfolio Investments (amounts in thousands):
Level 1 | Level 2 | Level 3 | Total | ||||||||||||||||
Common Stocks | $ | 1,187,476 | $ | — | $ | — | $ | 1,187,476 | |||||||||||
Collateral for Securities Loaned | 1,143 | 1,143 | |||||||||||||||||
Total | $ | 1,188,619 | $ | — | $ | — | $ | 1,188,619 | |||||||||||
As of January 31, 2023, there were no transfers into/out of Level 3.
Real Estate Investment Trusts ("REITs"):
The Fund may invest in REITs, which report information on the source of their distributions annually. REITs are pooled investment vehicles that invest primarily in income producing real estate or real estate related loans or interests (such as mortgages). Certain distributions received from REITs during the year are recorded as realized gains or return of capital as estimated by the Fund or when such information becomes known.
Investment Companies:
Open-End Funds:
The Fund may invest in portfolios of open-end investment companies. These investment companies value securities in their portfolios for which market quotations are readily available at their market values (generally the last reported sale price) and all other securities and assets at their fair value by the methods established by the board of directors of the underlying funds.
Investment Transactions and Related Income:
Changes in holdings of investments are accounted for no later than one business day following the trade date. For financial reporting purposes, however, investment transactions are accounted for on trade date or the last business day of the reporting period. Interest income is determined on the basis of coupon interest accrued using the effective interest method which adjusts, where applicable, the
17
USAA Mutual Funds Trust | Notes to Financial Statements — continued January 31, 2023 | ||||||
(Unaudited)
amortization of premiums or accretion of discounts. Dividend income is recorded on the ex-dividend date. Gains or losses realized on sales of securities are recorded on the identified cost basis.
Withholding taxes on interest, dividends, and gains as a result of certain investments by the Fund have been provided for in accordance with each investment's applicable country's tax rules and rates.
Securities Lending:
The Fund, through a Securities Lending Agreement with Citibank, N.A. ("Citibank"), may lend its securities to qualified financial institutions, such as certain broker-dealers and banks, to earn additional income, net of income retained by Citibank. Borrowers are required to initially secure their loans for collateral in the amount of at least 102% of the value of U.S. securities loaned or at least 105% of the value of non-U.S. securities loaned, marked-to-market daily. Any collateral shortfalls associated with increases in the valuation of the securities loaned are generally cured the next business day. The collateral can be received in the form of cash collateral and/or non-cash collateral. Non-cash collateral can include U.S. Government Securities and other securities as permitted by Securities and Exchange Commission ("SEC") guidelines. The cash collateral is invested in short-term instruments or cash equivalents, primarily open-end investment companies, as noted on the Fund's Schedule of Portfolio Investments. The Fund effectively does not have control of the non-cash collateral and therefore it is not disclosed on the Fund's Schedule of Portfolio Investments. Collateral requirements are determined daily based on the value of the Fund's securities on loan as of the end of the prior business day. During the time portfolio securities are on loan, the borrower will pay the Fund any dividends or interest paid on such securities plus any fee negotiated between the parties to the lending agreement. The Fund also earns a return from the collateral. The Fund pays Citibank various fees in connection with the investment of cash collateral and fees based on the investment income received from securities lending activities. Securities lending income (net of these fees) is disclosed on the Statement of Operations. Loans are terminable upon demand and the borrower must return the loaned securities within the lesser of one standard settlement period or five business days. Although risk is mitigated by the collateral, the Fund could experience a delay in recovering its securities and possible loss of income or value if the borrower fails to return them. In addition, there is a risk that the value of the short-term investments will be less than the amount of cash collateral required to be returned to the borrower.
The Fund's agreement with Citibank does not include master netting provisions. Non-cash collateral received by the Fund may not be sold or repledged, except to satisfy borrower default.
The following table (amounts in thousands) is a summary of the Fund's securities lending transactions as of January 31, 2023.
| Value of Securities on Loan | Non-Cash Collateral | Cash Collateral | |||||||||
| $ | 1,155 | $ | — | $ | 1,143 | ||||||
Federal Income Taxes:
The Fund intends to continue to qualify as a regulated investment company by complying with the provisions available to certain investment companies, as defined in applicable sections of the Internal Revenue Code, and to make distributions of net investment income and net realized gains sufficient to relieve it from all, or substantially all, federal income taxes. Accordingly, no provision for federal income taxes is required in the financial statements. The Fund has a tax year end of July 31, and effective April 30, 2023, the Fund will change its tax year end to April 30.
For the six months ended January 31, 2023, the Fund did not incur any income tax, interest, or penalties, and has recorded no liability for net unrecognized tax benefits relating to uncertain tax positions.
Management of the Fund has reviewed tax positions taken in tax years that remain subject to examination by all major tax jurisdictions, including federal (i.e., the last four tax years, which includes the current fiscal tax year end). Management believes that there is no tax liability resulting from unrecognized tax benefits related to uncertain tax positions taken.
18
USAA Mutual Funds Trust | Notes to Financial Statements — continued January 31, 2023 | ||||||
(Unaudited)
Allocations:
Expenses directly attributable to the Fund are charged to the Fund, while expenses that are attributable to more than one fund in the Trust, or jointly with an affiliated trust, are allocated among the respective funds in the Trust and/or an affiliated trust based upon net assets or another appropriate basis.
Income, expenses (other than class-specific expenses such as transfer agent fees, state registration fees, printing fees, and 12b-1 fees), and realized and unrealized gains or losses on investments are allocated to each class of shares based on its relative net assets on the date income is earned or expenses and realized and unrealized gains and losses are incurred.
3. Purchases and Sales:
Purchases and sales of securities (excluding securities maturing less than one year from acquisition) for the six months ended January 31, 2023, were as follows for the Fund (amounts in thousands):
Excluding | |||||||
Purchases | Sales | ||||||
$ | 379,972 | $ | 334,971 | ||||
4. Affiliated Fund Ownership:
The Fund offers shares for investment by other funds. The fund-of-funds do not invest in the underlying funds for the purpose of exercising management or control, and the affiliated fund-of-funds' annual and semi-annual reports may be viewed at vcm.com. As of January 31, 2023, certain fund-of-funds owned a percentage of total outstanding shares of the Fund as follows:
Affiliated USAA Mutual Funds | Ownership % | ||||||
USAA Cornerstone Conservative Fund | 0.2 | ||||||
USAA Cornerstone Equity Fund | 0.3 | ||||||
5. Fees and Transactions with Affiliates and Related Parties:
Investment Advisory Fees:
Investment advisory services are provided to the Fund by the Adviser, which is a New York corporation registered as an investment adviser with the SEC.
Under the terms of the Investment Advisory Agreement, the Adviser is entitled to receive a base fee and a performance adjustment. The Fund's base fee is accrued daily and paid monthly at an annualized rate of 0.65% of the Fund's average daily net assets. Amounts incurred and paid to VCM for the six months ended January 31, 2023, are reflected on the Statement of Operations as Investment advisory fees.
The performance adjustment for each share class is accrued daily and calculated monthly by comparing the respective class' performance to that of the Lipper Multi-Cap Value Funds Index. The Lipper Multi-Cap Value Funds Index tracks the total return performance of the largest funds within the Lipper Multi-Cap Value Funds category.
The performance period for each share class consists of the current month plus the previous 35 months. The following table is utilized to determine the extent of the performance adjustment:
| Over/Under Performance Relative to Index (in basis points)(a) | Annual Adjustment Rate (in basis points) | ||||||
| +/- 100 to 400 | +/- 4 | ||||||
| +/- 401 to 700 | +/- 5 | ||||||
| +/- 701 and greater | +/- 6 | ||||||
(a) Based on the difference between the average annual performance of the relevant share class of the Fund and its relevant Lipper index, rounded to the nearest basis point.
19
USAA Mutual Funds Trust | Notes to Financial Statements — continued January 31, 2023 | ||||||
(Unaudited)
Each class' annual performance adjustment rate is multiplied by the average daily net assets of the respective class over the entire performance period, which is then multiplied by a fraction, the numerator of which is the number of days in the month and the denominator of which is 365 (366 in leap years). The resulting amount is then added to (in the case of overperformance), or subtracted from (in the case of underperformance) the base fee.
Under the performance fee arrangement, each class pays a positive performance fee adjustment for a performance period whenever the class outperforms the Lipper Multi-Cap Value Funds Index over that period, even if the class has overall negative returns during the performance period.
For the period August 1, 2022, to January 31, 2023, performance adjustments were $(106), $(39), and $0 for Fund Shares, Institutional Shares, and Class A, in thousands, respectively. Performance adjustments were (0.03)%, (0.02)%, and 0.00% for Fund Shares, Institutional Shares, and Class A, respectively. The performance adjustment rate included in the investment advisory fee may differ from the maximum over/under Annual Adjustment Rate due to differences in average net assets for the reporting period and rolling 36 month performance periods.
The Trust relies on an exemptive order granted to VCM and its affiliated funds by the SEC in March 2019, permitting the use of a "manager-of-managers" structure for certain funds. Under a manager-of-managers structure, the investment adviser may select (with approval of the Board and without shareholder approval) one or more subadvisers to manage the day-to-day investment of a fund's assets. For the six months ended January 31, 2023, the Fund had no subadvisers.
Administration and Servicing Fees:
VCM also serves as the Fund's administrator and fund accountant. Under the Fund Administration, Servicing and Accounting Agreement, VCM is paid an administration and servicing fee that is accrued daily and paid monthly at an annualized rate of 0.15%, 0.10%, and 0.15%, which is based on the Fund's average daily net assets of the Fund Shares, Institutional Shares, and Class A, respectively. Amounts incurred for the six months ended January 31, 2023, are reflected on the Statement of Operations as Administration fees.
Citi Fund Services Ohio, Inc. ("Citi"), an affiliate of Citibank, acts as sub-administrator and sub-fund accountant to the Fund pursuant to a Sub-Administration and Sub-Fund Accounting Services Agreement between VCM and Citi. VCM pays Citi a fee for providing these services. The Fund reimburses VCM and Citi for out-of-pocket expenses incurred in providing these services and certain other expenses specifically allocated to the Fund. Amounts incurred for the six months ended January 31, 2023, are reflected on the Statement of Operations as Sub-Administration fees.
The Fund (as part of the Trust) has entered into an agreement with the Adviser to provide compliance services, pursuant to which the Adviser furnishes its compliance personnel, including the services of the Chief Compliance Officer ("CCO"), and other resources reasonably necessary to provide the Trust with compliance oversight services related to the design, administration, and oversight of a compliance program for the Trust in accordance with Rule 38a-1 under the 1940 Act. The CCO is an employee of the Adviser, which pays the compensation of the CCO and support staff. The funds in the Trust, Victory Variable Insurance Funds, Victory Portfolios, and Victory Portfolios II (collectively, the "Victory Funds Complex") in the aggregate, compensate the Adviser for these services. Amounts incurred for the six months ended January 31, 2023, are reflected on the Statement of Operations as Compliance fees.
Transfer Agency Fees:
Victory Capital Transfer Agency, Inc. ("VCTA"), an affiliate of the Adviser, provides transfer agency services to the Fund. VCTA provides transfer agent services to the Fund Shares based on an annual charge of $23 per shareholder account plus out-of-pocket expenses. VCTA pays a portion of these fees to certain intermediaries for the administration and servicing of accounts that are held with such intermediaries. Transfer agent fees for Institutional Shares and Class A are paid monthly based on a fee accrued daily at an annualized rate of 0.10% and 0.10%, respectively, of average daily net assets,
20
USAA Mutual Funds Trust | Notes to Financial Statements — continued January 31, 2023 | ||||||
(Unaudited)
plus out-of-pocket expenses. Amounts incurred and paid to VCTA for the six months ended January 31, 2023, are reflected on the Statement of Operations as Transfer agent fees.
FIS Investor Services LLC serves as sub-transfer agent and dividend disbursing agent for the Fund pursuant to a Sub-Transfer Agent Agreement between VCTA and FIS Investor Services LLC. VCTA provides FIS Investor Services LLC a fee for providing these services.
Distributor/Underwriting Services:
Victory Capital Services, Inc. (the "Distributor"), an affiliate of the Adviser, serves as Distributor for the continuous offering of the shares of the Fund pursuant to a Distribution Agreement between the Distributor and the Trust.
Pursuant to the Distribution and Service Plans adopted in accordance with Rule 12b-1 under the 1940 Act, the Distributor may receive a monthly distribution and service fee, at an annual rate of up to 0.25% of the average daily net assets of Class A. The distribution and service fees paid to the Distributor may be used by the Distributor to pay for activity primarily intended to result in the sale of Class A. Amounts incurred and paid to the Distributor for the six months ended January 31, 2023, are reflected on the Statement of Operations as 12b-1 fees.
In addition, the Distributor is entitled to receive commissions in connection with sales of Class A. For the six months ended January 31, 2023, the Distributor received less than $1 thousand from commissions earned in connection with sales of Class A.
Other Fees:
Citibank serves as the Fund's custodian. The Fund pays Citibank a fee for providing these services. Amounts incurred for the six months ended January 31, 2023, are reflected on the Statement of Operations as Custodian fees.
K&L Gates LLP provides legal services to the Trust.
The Adviser has entered into an expense limitation agreement with the Fund until at least November 30, 2023. Under the terms of the agreement, the Adviser has agreed to waive fees or reimburse certain expenses to the extent that ordinary operating expenses incurred by certain classes of the Fund in any fiscal year exceed the expense limits for such classes of the Fund. Such excess amounts will be the liability of the Adviser. Performance adjustments, acquired fund fees and expenses, interest, taxes, brokerage commissions, other expenditures, which are capitalized in accordance with GAAP, and other extraordinary expenses not incurred in the ordinary course of the Fund's business are excluded from the expense limits. As of January 31, 2023, the expense limits (excluding voluntary waivers) were 0.96%, 0.88%, and 1.27% for Fund Shares, Institutional Shares, and Class A, respectively.
Under the terms of the expense limitation agreement, the Fund has agreed to repay fees and expenses that were waived or reimbursed by the Adviser for a period of up to three years (thirty-six (36) months) after the waiver or reimbursement took place, subject to the lesser of any operating expense limits in effect at the time of: (a) the original waiver or expense reimbursement; or (b) the recoupment, after giving effect to the recoupment amount.
As of January 31, 2023, the following amounts are available to be repaid to the Adviser (amounts in thousands). The Fund has not recorded any amounts available to be repaid as a liability due to an assessment that such repayments are not probable at January 31, 2023.
| Expires 2023 | Expires 2024 | Expires 2025 | Expires 2026 | Total | |||||||||||||||
| $ | 17 | $ | 32 | $ | 33 | $ | 28 | $ | 110 | ||||||||||
The Adviser may voluntarily waive or reimburse additional fees to assist the Fund in maintaining competitive expense ratios. Voluntary waivers and reimbursements applicable to the Fund are not available to be recouped at a future time. There were no voluntary waivers or reimbursements for the six months ended January 31, 2023.
21
USAA Mutual Funds Trust | Notes to Financial Statements — continued January 31, 2023 | ||||||
(Unaudited)
Certain officers and/or interested trustees of the Fund are also officers and/or employees of the Adviser, administrator, fund accountant, sub-administrator, sub-fund accountant, custodian, and Distributor.
6. Risks:
The Fund may be subject to other risks in addition to these identified risks.
Investment Style Risk — The Fund uses a value-oriented investment strategy to select investments. The strategy may be out of favor or may not produce the intended results over short or longer time periods. The strategy may, at times, substantially underperform funds that utilize other investment strategies, such as growth.
Market Risk — Overall market risks may affect the value of the Fund. Domestic and international factors such as political events, war, terrorism, trade disputes, inflation rates, interest rate levels and other fiscal and monetary policy changes, cybersecurity incidents, pandemics and other public health crises, sanctions against a particular foreign country, its nationals, businesses or industries and related geopolitical events, as well as environmental disasters such as earthquakes, fires, and floods, or other catastrophes, may add to instability in global economies and markets generally, and may lead to increased market volatility. Global economies and financial markets are highly interconnected, which increases the possibility that conditions in one country or region might adversely affect issuers in another country or region. The impact of these and other factors may be short-term or may last for extended periods.
Equity Risk — The values of the equity securities in which the Fund invests may decline in response to developments affecting individual companies and/or general market, economic and political conditions and other factors. A company's earnings or dividends may not increase as expected due to poor management decisions, competitive pressures, breakthroughs in technology, reliance on suppliers, labor problems or shortages, corporate restructurings, fraudulent disclosures, natural disasters, military confrontations, war, terrorism, public health crises, or other events, conditions, and factors. Price changes may be temporary or may last for extended periods.
7. Borrowing and Interfund Lending:
Line of Credit:
The Victory Funds Complex participates in a short-term demand note "Line of Credit" agreement with Citibank. The Line of Credit agreement with Citibank was renewed on June 27, 2022, with a termination date of June 26, 2023. Under the agreement with Citibank, the Victory Funds Complex may borrow up to $600 million, of which $300 million is committed and $300 million is uncommitted. $40 million of the Line of Credit is reserved for use by the Victory Floating Rate Fund, another series of the Victory Funds Complex, with Victory Floating Rate Fund paying the related commitment fees for that amount. The purpose of the Line of Credit is to meet temporary or emergency cash needs. For the six months ended January 31, 2023, Citibank received an annual commitment fee of 0.15% on $300 million for providing the Line of Credit. Each fund in the Victory Funds Complex paid a pro-rata portion of the commitment fees plus any interest (one-month Secured Overnight Financing Rate ("SOFR") plus 1.10 percent) on amounts borrowed. Interest charged to the Fund during the period, if applicable, is reflected on the Statement of Operations under Line of credit fees.
The Fund had no borrowings under the Line of Credit agreement during the six months ended January 31, 2023.
Interfund Lending:
The Trust and the Adviser rely on an exemptive order granted by the SEC in March 2017 (the "Order"), permitting the establishment and operation of an Interfund Lending Facility (the "Facility"). The Facility allows the Fund to directly lend and borrow money to or from any other fund in the Victory Funds Complex that is permitted to participate in the Facility, relying upon the Order at rates beneficial to
22
USAA Mutual Funds Trust | Notes to Financial Statements — continued January 31, 2023 | ||||||
(Unaudited)
both the borrowing and lending funds. Advances under the Facility are allowed for temporary or emergency purposes, including the meeting of redemption requests that otherwise might require the untimely disposition of securities, and are subject to each Fund's borrowing restrictions. The interfund loan rate is determined, as specified in the Order, by averaging the current repurchase agreement rate and the current bank loan rate. As a Borrower, interest charged to the Fund, if any, during the period, is reflected on the Statement of Operations under Interfund lending fees. As a Lender, interest earned by the Fund, if any, during the period, is reflected on the Statement of Operations under Interfund lending.
The Fund did not utilize or participate in the Facility during the six months ended January 31, 2023.
8. Federal Income Tax Information:
The Fund intends to distribute any net investment income annually. Distributable net realized gains, if any, are declared and paid at least annually.
The amounts of dividends from net investment income and distributions from net realized gains (collectively, distributions to shareholders) are determined in accordance with federal income tax regulations, which may differ from GAAP. To the extent these "book/tax" differences are permanent in nature (e.g., net operating loss and distribution reclassification), such amounts are reclassified within the components of net assets based on their federal tax-basis treatment; temporary differences (e.g., wash sales) do not require reclassification. To the extent dividends and distributions exceed net investment income and net realized gains for tax purposes, they are reported as distributions of capital. Net investment losses incurred by the Fund may be reclassified as an offset to capital on the accompanying Statement of Assets and Liabilities.
The tax character of current year distributions paid and the tax basis of the current components of accumulated earnings (loss) will be determined at the end of the current tax year.
At the tax year ended July 31, 2022, the Fund had no capital loss carryforwards for federal income tax purposes.
9. Subsequent Events:
On June 29, 2022, the Board approved a change to the Fund's fiscal year-end from July 31 to April 30, with an effective date of April 30, 2023.
The Board, upon recommendation of the Adviser, has approved a change in the name of the Trust and each individual fund within the Trust. On February 23, 2023, an initial filing was made with the SEC to commence the process to effectuate the following changes.
Effective at the start of business on April 24, 2023 (the "Effective Date"), the name of the Trust will change from USAA Mutual Funds Trust to Victory Portfolios III, and all references to USAA Mutual Funds Trust in the summary prospectus, statutory prospectus, and statement of additional information ("SAI") will be replaced by the new name.
Also on the Effective Date, references to the current name of the Fund in the summary prospectus, statutory prospectus, and SAI will be replaced with the new name as follows:
| Current Name | New Name | ||||||
USAA Value Fund | Victory Value Fund | ||||||
In addition, on the Effective Date, USAA Investments, a Victory Capital Management Inc. Investment Franchise, that currently manages the USAA Fixed Income Funds, will change its name to Victory Income Investors, and all references to USAA Investments in the summary prospectus, statutory prospectus, and SAI, will be replaced.
Please note that there will be no changes in the management of the Fund or to the Fund's ticker symbols.
23
USAA Mutual Funds Trust | Supplemental Information January 31, 2023 | ||||||
(Unaudited)
Proxy Voting and Portfolio Holdings Information
Proxy Voting:
Information regarding the policies and procedures the Fund uses to determine how to vote proxies relating to portfolio securities is available without charge, upon request, by calling (800) 235-8396. The information is also included in the Fund's Statement of Additional Information, which is available on the SEC's website at sec.gov.
Information relating to how the Fund voted proxies relating to portfolio securities held during the most recent 12 months ended June 30 is available on the SEC's website at sec.gov.
Availability of Schedules of Portfolio Investments:
The Trust files a complete list of Schedules of Portfolio Investments with the SEC for the first and third quarter of each fiscal year on Form N-PORT. Form N-PORT is available on the SEC's website at sec.gov.
Expense Examples
As a shareholder of the Fund, you may incur two types of costs: (1) transaction costs, including sales charges (loads) on purchases; and (2) ongoing costs, including management fees and other Fund expenses. These examples are intended to help you understand your ongoing costs (in dollars) of investing in the Fund and to compare these costs with the ongoing costs of investing in other mutual funds.
These examples are based on an investment of $1,000 invested at the beginning of the period and held for the entire period from August 1, 2022, through January 31, 2023.
The Actual Expense figures in the table below provide information about actual account values and actual expenses. You may use the information below, together with the amount you invested, to estimate the expenses that you paid over the period. Simply divide your account value by $1,000 (for example, an $8,600 account value divided by $1,000 = 8.6), then multiply the result by the number in the table under the heading entitled "Actual Expenses Paid During Period" to estimate the expenses you paid on your account during this period.
The Hypothetical Expense figures in the table below provide information about hypothetical account values and hypothetical expenses based on the Fund's actual expense ratio and an assumed rate of return of 5% per year before expenses, which is not the Fund's actual return. The hypothetical account values and expenses may not be used to estimate the actual ending account balance or expenses you paid for the period. You may use this information to compare this 5% hypothetical example with the 5% hypothetical examples that appear in shareholder reports of other funds.
Please note the expenses shown in the table below are meant to highlight your ongoing costs only and do not reflect any transactional costs. Therefore, the hypothetical expenses in the table are useful in comparing ongoing costs only and will not help you determine the relative total costs of owning different funds. In addition, if these transactional costs were included, your costs would have been higher.
| Beginning Account Value 8/1/22 | Actual Ending Account Value 1/31/23 | Hypothetical Ending Account Value 1/31/23 | Actual Expenses Paid During Period 8/1/22- 1/31/23* | Hypothetical Expenses Paid During Period 8/1/22- 1/31/23* | Annualized Expense Ratio During Period 8/1/22- 1/31/23 | ||||||||||||||||||||||
Fund Shares | $ | 1,000.00 | $ | 1,040.60 | $ | 1,020.62 | $ | 4.68 | $ | 4.63 | 0.91 | % | |||||||||||||||
Institutional Shares | 1,000.00 | 1,040.60 | 1,020.87 | 4.42 | 4.38 | 0.86 | % | ||||||||||||||||||||
Class A | 1,000.00 | 1,038.80 | 1,018.80 | 6.53 | 6.46 | 1.27 | % | ||||||||||||||||||||
* Expenses are equal to the average account value multiplied by the Fund's annualized expense ratio multiplied by 184/365 (the number of days in the most recent fiscal half-year divided by the number of days in the fiscal year).
24
USAA Mutual Funds Trust | Supplemental Information — continued January 31, 2023 | ||||||
(Unaudited)
Considerations of the Board in Continuing the Investment Advisory Agreement
USAA Value Fund (the "Fund")
At a meeting of the Board of Trustees (the "Board") of USAA Mutual Funds Trust (the "Trust") held on December 8-9, 2022, the Board, including the Trustees who are not "interested persons" (as that term is defined in the Investment Company Act of 1940, as amended) of the Trust (the "Independent Trustees"), approved for an annual period the continuance of the Investment Advisory Agreement (the "Advisory Agreement") between the Trust and Victory Capital Management Inc. (the "Adviser") with respect to the Fund. Prior to the December 8-9, 2022 meeting at which the Advisory Agreement was approved, the Independent Trustees also discussed and considered information regarding the proposed continuation of the Advisory Agreement at a meeting held on November 21, 2022.
In advance of the foregoing meetings, the Trustees received and considered a variety of information relating to the Advisory Agreement and the Adviser, and were given the opportunity to ask questions and request additional information from management. The information provided to the Board included, among other things: (i) a separate report prepared by an independent third party of mutual fund data, which provided a statistical analysis comparing the Fund's investment performance, expenses, and fees to comparable investment companies; (ii) information concerning the services rendered to the Fund, as well as information regarding the Adviser's revenues and costs of providing services to the Fund and compensation paid to affiliates of the Adviser; and (iii) information about the Adviser's operations and personnel. Prior to voting, the Independent Trustees reviewed the proposed continuance of the Advisory Agreement with management and with experienced independent counsel retained by the Independent Trustees ("Independent Counsel") and received materials from such Independent Counsel discussing the legal standards for their consideration of the proposed continuation of the Advisory Agreement with respect to the Fund. The Independent Trustees also reviewed the proposed continuation of the Advisory Agreement with respect to the Fund in private sessions with Independent Counsel at which no representatives of management were present.
At each regularly scheduled meeting of the Board and its committees, the Board receives and reviews, among other things, information concerning the Fund's performance and related services provided by the Adviser. At the meeting at which the renewal of the Advisory Agreement is considered, particular focus is given to information concerning Fund performance, fees and total expenses as compared to comparable investment companies, and the Adviser's profitability with respect to the Fund. However, the Board noted that the evaluation process with respect to the Adviser is an ongoing one. In this regard, the Board's and its committees' consideration of the Advisory Agreement included information previously received at such meetings. The Board also recognized that the contractual arrangements for the Fund have been reviewed by the Board and discussed with the Adviser in prior years and that the Board's conclusions may be based, in part, on its consideration of these same arrangements in prior years.
Advisory Agreement
After full consideration of a variety of factors, the Board, including the Independent Trustees, voted to approve the Advisory Agreement. In approving the Advisory Agreement, the Trustees did not identify any single factor as controlling, and each Trustee may have attributed different weights to various factors. Throughout their deliberations, the Independent Trustees were represented and assisted by Independent Counsel.
Nature, Extent, and Quality of Services — In considering the nature, extent, and quality of the services provided by the Adviser under the Advisory Agreement, the Board reviewed information provided by the Adviser relating to its operations and personnel. The Board also took into account its knowledge of the Adviser's management and the quality of the performance of the Adviser's duties through Board meetings, discussions, and reports during the preceding year. The Board considered the fees paid to the Adviser and the services provided to the Fund by the Adviser under the Advisory Agreement, as well as other services provided by the Adviser and its affiliates under other agreements, and the personnel who provide these services. In addition to the investment advisory services provided to the Fund, the Adviser and its affiliates provide administrative services, shareholder services, oversight of Fund accounting, marketing services, assistance in meeting legal and regulatory requirements, and other services necessary for the operation of the Fund and the Trust.
25
USAA Mutual Funds Trust | Supplemental Information — continued January 31, 2023 | ||||||
(Unaudited)
The Board considered the scope of services provided by, and the undertakings required of, the Adviser in connection with those services, including, among other things, maintaining (i) its own and the Fund's compliance programs, (ii) risk management programs, (iii) liquidity risk management program, (iv) derivatives risk management program, and (v) cybersecurity programs, each of which had expanded over time as a result of regulatory, market, and other developments. The Board also considered the significant risks assumed by the Adviser in connection with the services provided to the Fund, including investment, operational, enterprise, litigation, regulatory and compliance risks.
The Board considered the Adviser's management style and the performance of the Adviser's duties under the Advisory Agreement. The Board considered the level and depth of knowledge of the Adviser, including the professional experience and qualifications of its senior and investment personnel, as well as current staffing levels. The allocation of the Fund's brokerage, including the Adviser's process for monitoring "best execution," also was considered. The Adviser's role in coordinating the activities of the Fund's other service providers was also considered. The Board also considered the Adviser's risk management processes. The Board considered the Adviser's financial condition and that it had the financial wherewithal to continue to provide the same scope and high quality of services under the Advisory Agreement. In reviewing the Advisory Agreement, the Board focused on the experience, resources, and strengths of the Adviser and its affiliates in managing the Fund, as well as the other funds in the Trust.
The Board also reviewed the compliance and administrative services provided to the Fund by the Adviser and its affiliates, including the Adviser's oversight of the Fund's day-to-day operations and oversight of Fund accounting. The Trustees, guided also by information obtained from their experiences as Trustees of the Trust, also focused on the quality of the Adviser's compliance and administrative staff.
Expenses and Performance — In connection with its consideration of the Advisory Agreement, the Board evaluated the Fund's advisory fees and total expense ratio as compared to other open-end investment companies deemed to be comparable to the Fund as determined by the independent third party in its report. The Fund's expenses were compared to (i) a group of investment companies chosen by the independent third party to be comparable to the Fund based upon certain factors, including fund type, comparability of investment objective and classification, sales load type, asset size, and expense components (the "expense group") and (ii) a larger group of investment companies with the same investment classification/objective as the Fund regardless of asset size, excluding outliers (the "expense universe"). Among other data, the Board noted that the Fund's net management fee rate, which includes advisory and administrative services and the effects of any performance adjustment, was above the medians of its expense group and its expense universe. The data indicated that the Fund's total expenses were above the median of its expense group and were below the median of its expense universe. The Board also took into account the Adviser's current undertakings to maintain expense limitations for the Fund. The Board took into account the various other services provided to the Fund by the Adviser and its affiliates, and noted the high quality of services received by the Fund.
In considering the Fund's performance, the Board noted that it reviews at its regularly scheduled meetings information about the Fund's performance results. The Trustees also reviewed various comparative data provided to them in connection with their consideration of the renewal of the Advisory Agreement, including, among other information, a comparison of the Fund's average annual total returns relative to its Lipper index and other mutual funds deemed to be in its peer group by the independent third party in its report (the "performance universe"). The Fund's performance universe consisted of the Fund and all retail and institutional open-end investment companies with the same classification/objective as the Fund regardless of asset size or primary channel of distribution. This comparison indicated that, among other data, the Fund's performance was above the average of its performance universe and its Lipper index for the one-year period ended June 30, 2022, and was below the average of its performance universe and its Lipper index for the three-, five- and ten-year periods ended June 30, 2022. The Board took into account management's discussion of the Fund's performance, including the reasons for the Fund's underperformance for certain periods, and also took into account the Fund's more recent improved performance.
Compensation and Profitability — The Board took into consideration the level and method of computing the management fee. The information considered by the Board included operating profit margin information for the Adviser's business as a whole. The Board also received and considered profitability information related to the management revenues from the Fund. This information included a review of the methodology used in the
26
USAA Mutual Funds Trust | Supplemental Information — continued January 31, 2023 | ||||||
(Unaudited)
allocation of certain costs to the Fund. The Trustees reviewed the profitability of the Adviser's relationship with the Fund before tax expenses. The Board was also provided with a profitability analysis of other publicly traded asset managers prepared by an independent information service. In reviewing the overall profitability of the management fee to the Adviser, the Board also considered the fact that the Adviser and its affiliates provide shareholder servicing and administrative services to the Fund for which they receive compensation. The Board also considered the possible direct and indirect benefits to the Adviser from its relationship with the Trust, including that the Adviser may derive reputational and other benefits from its association with the Fund. The Trustees recognized that the Adviser should be entitled to earn a reasonable level of profits in exchange for the level of services it provides to the Fund and the entrepreneurial and other risks that it assumes as Adviser.
Economies of Scale — The Board considered whether there should be changes in the management fee rate or structure in order to enable the Fund to participate in any economies of scale. The Board also considered the fee waiver and expense reimbursement arrangements by the Adviser. The Board also considered the effect of the change in size, if any, of each of the Fund's classes on its performance and fees, noting that the Fund may realize other economies of scale if assets increase proportionally more than some expenses. The Board determined that the current investment management fee structure was reasonable.
Conclusions — The Board reached the following conclusions regarding the Fund's Advisory Agreement with the Adviser: (i) the Adviser has demonstrated that it possesses the capability and resources to perform the duties required of it under the Advisory Agreement; (ii) the Adviser maintains an appropriate compliance program; (iii) the overall performance of the Fund is reasonable in relation to the performance of funds with similar investment objectives and to relevant indices and the Adviser is appropriately monitoring the Fund's performance; (iv) the Fund's advisory expenses are reasonable in relation to those of similar funds and to the services to be provided by the Adviser; and (v) the Adviser's and its affiliates' level of profitability from their relationship with the Fund is reasonable in light of the nature and high quality of services provided by the Adviser and its affiliates and the type of fund. Based on its conclusions, the Board determined that continuation of the Advisory Agreement would be in the best interests of the Fund and its shareholders.
27
Privacy Policy
Protecting the Privacy of Information
The Trust respects your right to privacy. We also know that you expect us to conduct and process your business in an accurate and efficient manner. To do so, we must collect and maintain certain personal information about you. This is the information we collect from you on applications or other forms, and from the transactions you make with us or third parties. It may include your name, address, social security number, account transactions and balances, and information about investment goals and risk tolerance.
We do not disclose any information about you or about former customers to anyone except as permitted or required by law. Specifically, we may disclose the information we collect to companies that perform services on our behalf, such as the transfer agent that processes shareholder accounts and printers and mailers that assist us in the distribution of investor materials. We may also disclose this information to companies that perform marketing services on our behalf. This allows us to continue to offer you Victory investment products and services that meet your investing needs, and to effect transactions that you request or authorize. These companies will use this information only in connection with the services for which we hired them. They are not permitted to use or share this information for any other purpose.
To protect your personal information internally, we permit access only by authorized employees and maintain physical, electronic, and procedural safeguards to guard your personal information.*
* You may have received communications regarding information about privacy policies from other financial institutions which gave you the opportunity to "opt-out" of certain information sharing with companies which are not affiliated with that financial institution. The Trust does not share information with other companies for purposes of marketing solicitations for products other than the Trust. Therefore, the Trust does not provide opt-out options to their shareholders.
P.O. Box 182593
Columbus, Ohio 43218-2593

Visit our website at: | Call | ||||||
vcm.com | (800) 235-8396 | ||||||
40847-0323

January 31, 2023
Semi Annual Report
USAA Income Fund
Victory Capital means Victory Capital Management Inc., the investment adviser of the USAA Mutual Funds. USAA Mutual Funds are distributed by Victory Capital Services, Inc., member FINRA, an affiliate of Victory Capital. Victory Capital and its affiliates are not affiliated with United Services Automobile Association or its affiliates. USAA and the USAA logos are registered trademarks and the USAA Mutual Funds and USAA Investments logos are trademarks of United Services Automobile Association and are being used by Victory Capital and its affiliates under license.
vcm.com
News, Information And Education 24 Hours A Day, 7 Days A Week
The Victory Capital website gives fund shareholders, prospective shareholders, and investment professionals a convenient way to access fund information, get guidance, and track fund performance anywhere they can access the Internet. The site includes:
• Detailed performance records
• Daily share prices
• The latest fund news
• Investment resources to help you become a better investor
• A section dedicated to investment professionals
Whether you're a potential investor searching for the fund that matches your investment philosophy, a seasoned investor interested in planning tools, or an investment professional, vcm.com has what you seek. Visit us anytime. We're always open.
USAA Mutual Funds Trust
TABLE OF CONTENTS
Investment Objective & Portfolio Holdings | 2 | ||||||
Schedule of Portfolio Investments | 3 | ||||||
Financial Statements | |||||||
Statement of Assets and Liabilities | 33 | ||||||
Statement of Operations | 34 | ||||||
Statements of Changes in Net Assets | 35 | ||||||
Financial Highlights | 37 | ||||||
Notes to Financial Statements | 41 | ||||||
Supplemental Information | 53 | ||||||
Proxy Voting and Portfolio Holdings Information | 53 | ||||||
Expense Examples | 53 | ||||||
Advisory Contract Approval | 54 | ||||||
Privacy Policy (inside back cover) | |||||||
This report is for the information of the shareholders and others who have received a copy of the currently effective prospectus of the Fund, managed by Victory Capital Management Inc. It may be used as sales literature only when preceded or accompanied by a current prospectus, which provides further details about the Fund.
IRA DISTRIBUTION WITHHOLDING DISCLOSURE
We generally must withhold federal income tax at a rate of 10% of the taxable portion of your distribution and, if you live in a state that requires state income tax withholding, at your state's tax rate. However, you may elect not to have withholding apply or to have income tax withheld at a higher rate. Any withholding election that you make will apply to any subsequent distribution unless and until you change or revoke the election. If you wish to make a withholding election, or change or revoke a prior withholding election, call (800) 235-8396, and form W-4P (OMB No. 1545-0074 withholding certificate for pension or annuity payments) will be electronically sent.
If you do not have a withholding election in place by the date of a distribution, federal income tax will be withheld from the taxable portion of your distribution at a rate of 10%. If you must pay estimated taxes, you may be subject to estimated tax penalties if your estimated tax payments are not sufficient and sufficient tax is not withheld from your distribution.
For more specific information, please consult your tax adviser.
• NOT FDIC INSURED • NO BANK GUARANTEE • MAY LOSE VALUE
1
| USAA Mutual Funds Trust USAA Income Fund | January 31, 2023 | ||||||
(Unaudited)
Investment Objective and Portfolio Holdings:
The Fund seeks maximum current income without undue risk to principal.
Asset Allocation*:
January 31, 2023
(% of Net Assets)

* Does not include futures contracts, money market instruments, and short-term investments purchased with cash collateral from securities loaned.
Percentages are of the net assets of the Fund and may not equal 100%.
Refer to the Schedule of Portfolio Investments for a complete list of securities.
2
| USAA Mutual Funds Trust USAA Income Fund | Schedule of Portfolio Investments January 31, 2023 | ||||||
(Amounts in Thousands, Except for Shares) (Unaudited)
Security Description | Principal Amount | Value | |||||||||
Asset-Backed Securities (6.6%) | |||||||||||
| Aligned Data Centers Issuer LLC, Series 2021-1A, Class A2, 1.94%, 8/15/46, Callable 8/15/24 @ 100 (a) | $ | 8,500 | $ | 7,523 | |||||||
| American Credit Acceptance Receivables Trust, Series 2022-1, Class B, 1.68%, 9/14/26, Callable 11/13/24 @ 100 (a) | 2,500 | 2,447 | |||||||||
| American Credit Acceptance Receivables Trust, Series 2022-1, Class C, 2.12%, 3/13/28, Callable 11/13/24 @ 100 (a) | 3,500 | 3,365 | |||||||||
| ARI Fleet Lease Trust, Series 2022-A, Class B, 3.79%, 1/15/31, Callable 5/15/25 @ 100 (a) | 1,400 | 1,322 | |||||||||
| ARI Fleet Lease Trust, Series 2022-A, Class A3, 3.43%, 1/15/31, Callable 5/15/25 @ 100 (a) | 2,286 | 2,210 | |||||||||
| Avis Budget Rental Car Funding AESOP LLC, Series 2018-2A, Class B, 4.27%, 3/20/25, Callable 4/20/24 @ 100 (a) | 5,250 | 5,166 | |||||||||
| Avis Budget Rental Car Funding AESOP LLC, Series 2022-5A, Class B, 7.09%, 4/20/27 (a) | 3,500 | 3,595 | |||||||||
| Avis Budget Rental Car Funding AESOP LLC, Series 2019-2A, Class B, 3.55%, 9/22/25, Callable 10/20/24 @ 100 (a) | 7,500 | 7,249 | |||||||||
| CarMax Auto Owner Trust, Series 2020-2, Class B, 2.90%, 8/15/25, Callable 4/15/24 @ 100 | 3,611 | 3,506 | |||||||||
| CarMax Auto Owner Trust, Series 2019-1, Class B, 3.45%, 11/15/24, Callable 3/15/23 @ 100 | 1,924 | 1,920 | |||||||||
| Carvana Auto Receivables Trust, Series 2021-N4, Class A2, 1.80%, 9/11/28, Callable 9/10/26 @ 100 | 2,750 | 2,527 | |||||||||
| CCG Receivables Trust, Series 2020-1, Class C, 1.84%, 12/14/27, Callable 12/14/23 @ 100 (a) | 2,000 | 1,887 | |||||||||
| CF Hippolyta Issuer LLC, Series 2021-1A, Class A1, 1.53%, 3/15/61, Callable 3/15/24 @ 100 (a) | 2,837 | 2,500 | |||||||||
| CIT Education Loan Trust, Series 2007-1, Class B, 5.02% (LIBOR03M+30bps), 6/25/42, Callable 9/25/30 @ 100 (a) (b) | 3,183 | 2,730 | |||||||||
| CNH Equipment Trust, Series 2020-A, Class B, 2.30%, 10/15/27, Callable 2/15/24 @ 100 | 1,100 | 1,059 | |||||||||
| Conn's Receivables Funding LLC, Series 2022-A, Class B, 9.52%, 12/15/26, Callable 4/15/24 @ 100 (a) | 5,000 | 4,994 | |||||||||
| CPS Auto Receivables Trust, Series 2022-D, Class B, 6.84%, 1/16/29, Callable 11/15/27 @ 100 (a) | 2,360 | 2,442 | |||||||||
| Credit Acceptance Auto Loan Trust, Series 2021-3A, Class A, 1.00%, 5/15/30, Callable 11/15/24 @ 100 (a) | 2,327 | 2,236 | |||||||||
| Credit Acceptance Auto Loan Trust, Series 2022-3A, Class B, 7.52%, 12/15/32, Callable 10/15/26 @ 100 (a) | 3,500 | 3,651 | |||||||||
| Credit Acceptance Auto Loan Trust, Series 2020-1A, Class B, 2.39%, 4/16/29, Callable 6/15/23 @ 100 (a) | 1,497 | 1,492 | |||||||||
| Credit Acceptance Auto Loan Trust, Series 2021-2A, Class B, 1.26%, 4/15/30, Callable 12/15/24 @ 100 (a) | 5,885 | 5,428 | |||||||||
Crossroads Asset Trust, Series 2021-A, Class A2, 0.82%, 3/20/24 (a) | 170 | 169 | |||||||||
| Diamond Infrastructure Funding LLC, Series 2021-1A, Class A, 1.76%, 4/15/49, Callable 9/20/25 @ 100 (a) | 5,667 | 4,862 | |||||||||
| Diamond Issuer, Series 2021-1A, Class A, 2.31%, 11/20/51, Callable 11/20/25 @ 100 (a) | 4,875 | 4,214 | |||||||||
| Encina Equipment Finance LLC, Series 2021-1A, Class A2, 0.74%, 12/15/26, Callable 2/15/24 @ 100 (a) | 894 | 881 | |||||||||
See notes to financial statements.
3
| USAA Mutual Funds Trust USAA Income Fund | Schedule of Portfolio Investments — continued January 31, 2023 | ||||||
(Amounts in Thousands, Except for Shares) (Unaudited)
Security Description | Principal Amount | Value | |||||||||
| Enterprise Fleet Financing LLC, Series 2022-4, Class A3, 5.65%, 10/22/29, Callable 8/20/26 @ 100 (a) | $ | 4,000 | $ | 4,087 | |||||||
Evergreen Credit Card Trust, Series 2022-CRT1, Class C, 6.19%, 7/15/26 (a) | 4,500 | 4,409 | |||||||||
Evergreen Credit Card Trust, Series 2022-CRT2, Class C, 7.44%, 11/15/26 (a) | 3,750 | 3,760 | |||||||||
| Exeter Automobile Receivables Trust, Series 2019-2A, Class D, 3.71%, 3/17/25, Callable 12/15/23 @ 100 (a) | 7,266 | 7,184 | |||||||||
ExteNet LLC, Series 2019-1A, Class A2, 3.20%, 7/26/49, Callable 2/25/23 @ 100 (a) | 5,625 | 5,306 | |||||||||
| First Investors Auto Owner Trust, Series 2018-2A, Class F, 7.31%, 9/15/25, Callable 2/15/23 @ 100 (a) | 3,150 | 3,149 | |||||||||
| First Investors Auto Owner Trust, Series 2019-2A, Class C, 2.71%, 12/15/25, Callable 11/15/23 @ 100 (a) | 2,110 | 2,098 | |||||||||
FirstKey Homes Trust, Series 2021-SFR2, Class B, 1.61%, 9/17/38 (a) | 6,538 | 5,741 | |||||||||
| Flagship Credit Auto Trust, Series 2020-2, Class D, 5.75%, 4/15/26, Callable 2/15/25 @ 100 (a) | 3,898 | 3,882 | |||||||||
| Flagship Credit Auto Trust, Series 2018-3, Class D, 4.15%, 12/16/24, Callable 3/15/24 @ 100 (a) | 859 | 854 | |||||||||
| Ford Credit Auto Owner Trust, Series 2020-1, Class A, 2.04%, 8/15/31, Callable 2/15/25 @ 100 (a) | 5,333 | 5,042 | |||||||||
| Ford Credit Auto Owner Trust, Series 2020-1, Class C, 2.54%, 8/15/31, Callable 2/15/25 @ 100 (a) | 4,000 | 3,671 | |||||||||
| Foursight Capital Automobile Receivables Trust, Series 2021-1, Class B, 0.87%, 1/15/26, Callable 5/15/24 @ 100 (a) | 3,281 | 3,216 | |||||||||
| GLS Auto Receivables Issuer Trust, Series 2021-3A, Class B, 0.78%, 11/17/25, Callable 8/15/25 @ 100 (a) | 5,500 | 5,372 | |||||||||
| GM Financial Consumer Automobile Receivables Trust, Series 2019-3, Class B, 2.32%, 12/16/24, Callable 4/16/23 @ 100 | 1,685 | 1,674 | |||||||||
| GM Financial Consumer Automobile Receivables Trust, Series 2020-2, Class B, 2.54%, 8/18/25, Callable 1/16/24 @ 100 | 1,500 | 1,459 | |||||||||
Golden Credit Card Trust, Series 2021-1A, Class B, 1.44%, 8/15/28 (a) | 9,000 | 7,940 | |||||||||
Golden Credit Card Trust, Series 2021-1A, Class C, 1.74%, 8/15/28 (a) | 4,467 | 3,943 | |||||||||
Hertz Vehicle Financing III LP, Series 2021-2A, Class C, 2.52%, 12/27/27 (a) | 3,667 | 3,151 | |||||||||
| Hertz Vehicle Financing LLC, Series 2022-4A, Class B, 4.12%, 9/25/26, Callable 9/25/25 @ 100 (a) | 2,000 | 1,909 | |||||||||
Hertz Vehicle Financing LLC, Series 2021-1A, Class C, 2.05%, 12/26/25 (a) | 2,000 | 1,835 | |||||||||
| Hertz Vehicle Financing LLC, Series 2022-2A, Class C, 2.95%, 6/26/28, Callable 6/25/27 @ 100 (a) | 3,500 | 3,001 | |||||||||
| HPEFS Equipment Trust, Series 2022-1A, Class C, 1.96%, 5/21/29, Callable 6/20/25 @ 100 (a) | 1,000 | 939 | |||||||||
| HPEFS Equipment Trust, Series 2021-2A, Class C, 0.88%, 9/20/28, Callable 7/20/24 @ 100 (a) | 7,686 | 7,308 | |||||||||
| JPMorgan Chase Bank NA, Series 2021-3, Class C, 0.86%, 2/26/29, Callable 4/25/25 @ 100 (a) | 2,480 | 2,343 | |||||||||
| JPMorgan Chase Bank NA, Series 2021-1, Class B, 0.88%, 9/25/28, Callable 3/25/25 @ 100 (a) | 3,048 | 2,941 | |||||||||
| LAD Auto Receivables Trust, Series 2021-1A, Class C, 2.35%, 4/15/27, Callable 5/15/25 @ 100 (a) | 1,500 | 1,368 | |||||||||
Master Credit Card Trust, Series 2022-2A, Class C, 2.73%, 7/21/28 (a) | 2,344 | 2,108 | |||||||||
Master Credit Card Trust, Series 2021-1A, Class B, 0.79%, 11/21/25 (a) | 1,615 | 1,514 | |||||||||
Master Credit Card Trust, Series 2021-1A, Class C, 1.06%, 11/21/25 (a) | 4,500 | 4,209 | |||||||||
Master Credit Card Trust II, Series 2022-1A, Class C, 2.27%, 7/21/26 (a) | 3,000 | 2,817 | |||||||||
See notes to financial statements.
4
| USAA Mutual Funds Trust USAA Income Fund | Schedule of Portfolio Investments — continued January 31, 2023 | ||||||
(Amounts in Thousands, Except for Shares) (Unaudited)
Security Description | Principal Amount | Value | |||||||||
Master Credit Card Trust II, Series 2020-1A, Class B, 2.27%, 9/21/24 (a) | $ | 834 | $ | 830 | |||||||
MMAF Equipment Finance LLC, Series 2017-AA, Class A5, 2.68%, 7/16/27 (a) | 418 | 417 | |||||||||
MMAF Equipment Finance LLC, Series 2022-A, Class A4, 3.32%, 6/13/44 (a) | 1,500 | 1,431 | |||||||||
MVW LLC, Series 2021-1WA, Class A, 1.14%, 1/22/41, Callable 3/20/26 @ 100 (a) | 1,044 | 953 | |||||||||
| Navient Student Loan Trust, Series 2018-2A, Class B, 5.66% (LIBOR01M+115bps), 3/25/67, Callable 9/25/34 @ 100 (a) (b) | 3,500 | 3,133 | |||||||||
| Navient Student Loan Trust, Series 2015-2, Class B, 6.01% (LIBOR01M+150bps), 8/25/50, Callable 6/25/31 @ 100 (b) | 3,000 | 2,654 | |||||||||
| Nelnet Student Loan Trust, Series 2005-4, Class B, 5.03% (LIBOR03M+28bps), 9/22/35, Callable 6/22/26 @ 100 (b) | 873 | 766 | |||||||||
| NP SPE II LLC, Series 2019-2A, Class C1, 6.44%, 11/19/49, Callable 11/19/23 @ 100 (a) | 6,571 | 5,858 | |||||||||
| NP SPE II LLC, Series 2017-1A, Class A2, 4.22%, 10/21/47, Callable 4/20/23 @ 100 (a) | 15,625 | 14,457 | |||||||||
| OSCAR U.S. Funding Trust LLC, Series 2018-1A, Class A4, 3.50%, 5/12/25, Callable 2/10/23 @ 100 (a) | 175 | 175 | |||||||||
| Progress Residential Trust, Series 2021-SFR6, Class A, 1.52%, 7/17/38, Callable 7/17/26 @ 100 (a) | 4,395 | 3,852 | |||||||||
| Progress Residential Trust, Series 2021-SFR6, Class B, 1.75%, 7/17/38, Callable 7/17/26 @ 100 (a) | 3,938 | 3,432 | |||||||||
PSNH Funding LLC, Series 2018-1, Class A3, 3.81%, 2/1/35 | 15,545 | 14,757 | |||||||||
| Santander Bank Auto Credit-Linked Notes, Series 2022-B, Class C, 5.92%, 8/16/32, Callable 2/15/26 @ 100 (a) | 2,244 | 2,231 | |||||||||
| Santander Bank Auto Credit-Linked Notes, Series 2022-A, Class B, 5.28%, 5/15/32, Callable 11/15/25 @ 100 (a) | 3,373 | 3,295 | |||||||||
| Santander Consumer Auto Receivables Trust, Series 2020-AA, Class D, 5.49%, 4/15/26, Callable 9/15/24 @ 100 (a) | 1,500 | 1,485 | |||||||||
| Santander Drive Auto Receivables Trust, Series 2022-3, Class B, 4.13%, 8/16/27, Callable 5/15/25 @ 100 | 3,188 | 3,129 | |||||||||
| Santander Retail Auto Lease Trust, Series 2021-C, Class B, 0.83%, 3/20/26, Callable 6/20/24 @ 100 (a) | 3,500 | 3,311 | |||||||||
| SCF Equipment Leasing LLC, Series 2022-2A, Class B, 6.50%, 2/20/32, Callable 10/20/29 @ 100 (a) | 1,071 | 1,095 | |||||||||
| SCF Equipment Leasing LLC, Series 2020-1A, Class B, 2.02%, 3/20/28, Callable 9/20/24 @ 100 (a) | 3,824 | 3,655 | |||||||||
| SCF Equipment Leasing LLC, Series 2020-1A, Class A3, 1.19%, 10/20/27, Callable 9/20/24 @ 100 (a) | 3,979 | 3,898 | |||||||||
| SLM Student Loan Trust, Series 2007-1, Class B, 5.04% (LIBOR03M+22bps), 1/27/42, Callable 7/25/29 @ 100 (b) | 4,631 | 4,112 | |||||||||
| SLM Student Loan Trust, Series 2005-9, Class B, 5.12% (LIBOR03M+30bps), 1/25/41, Callable 10/25/30 @ 100 (b) | 1,078 | 973 | |||||||||
| SLM Student Loan Trust, Series 2006-9, Class B, 5.05% (LIBOR03M+23bps), 1/25/41, Callable 7/25/33 @ 100 (b) | 3,624 | 3,432 | |||||||||
| SLM Student Loan Trust, Series 2007-7, Class B, 5.57% (LIBOR03M+75bps), 10/27/70, Callable 7/25/24 @ 100 (b) | 5,740 | 5,504 | |||||||||
| SLM Student Loan Trust, Series 2006-10, Class B, 5.04% (LIBOR03M+22bps), 3/25/44, Callable 4/25/32 @ 100 (b) | 1,320 | 1,201 | |||||||||
| SLM Student Loan Trust, Series 2003-14, Class B, 5.37% (LIBOR03M+55bps), 10/25/65, Callable 4/25/29 @ 100 (b) | 1,081 | 988 | |||||||||
| SLM Student Loan Trust, Series 2012-6, Class B, 5.51% (LIBOR01M+100bps), 4/27/43, Callable 10/25/29 @ 100 (b) | 20,862 | 18,703 | |||||||||
See notes to financial statements.
5
| USAA Mutual Funds Trust USAA Income Fund | Schedule of Portfolio Investments — continued January 31, 2023 | ||||||
(Amounts in Thousands, Except for Shares) (Unaudited)
Security Description | Principal Amount | Value | |||||||||
Synchrony Credit Card Master Note Trust, Series 2018-2, Class C, 3.87%, 5/15/26 | $ | 10,417 | $ | 10,367 | |||||||
| Toyota Auto Loan Extended Note Trust, Series 2021-1A, Class A, 1.07%, 2/27/34, Callable 2/25/26 @ 100 (a) (c) | 5,500 | 4,957 | |||||||||
| VB-S1 Issuer LLC — VBTEL, Series 2022-1A, Class D, 4.29%, 2/15/52, Callable 2/15/26 @ 100 (a) | 938 | 845 | |||||||||
| VB-S1 Issuer LLC — VBTEL, Series 2022-1A, Class C2I, 3.16%, 2/15/52, Callable 2/15/26 @ 100 (a) | 4,000 | 3,614 | |||||||||
| WEPCO Environmental Trust Finance I LLC, Series 2021-1, Class A, 1.58%, 12/15/35 | 8,024 | 6,907 | |||||||||
| Westlake Automobile Receivables Trust, Series 2021-2A, Class B, 0.62%, 7/15/26, Callable 3/15/25 @ 100 (a) | 6,500 | 6,323 | |||||||||
Total Asset-Backed Securities (Cost $350,556) | 330,345 | ||||||||||
Collateralized Mortgage Obligations (4.6%) | |||||||||||
Aventura Mall Trust, Series 2018-AVM, Class D, 4.11%, 7/5/40 (a) (c) | 4,000 | 3,382 | |||||||||
| BAMLL Commercial Mortgage Securities Trust, Series 2015-200P, Class B, 3.49%, 4/14/33, Callable 4/14/25 @ 100 (a) | 9,027 | 8,432 | |||||||||
BANK, Series 2019-BN24, Class ASB, 2.93%, 11/15/62, Callable 12/15/29 @ 100 | 7,123 | 6,625 | |||||||||
BANK, Series 2017-BNK4, Class B, 4.00%, 5/15/50, Callable 4/15/27 @ 100 | 5,600 | 5,039 | |||||||||
| BBCMS Mortgage Trust, Series 2022-C16, Class AS, 4.60%, 6/15/55, Callable 6/15/32 @ 100 (c) | 2,703 | 2,540 | |||||||||
BPR Trust, Series 2021-TY, Class A, 5.51% (LIBOR01M+105bps), 9/15/38 (a) (b) | 4,904 | 4,688 | |||||||||
BPR Trust, Series 2022-OANA, Class D, 8.17% (TSFR1M+370bps), 4/15/37 (a) (b) | 5,000 | 4,854 | |||||||||
BPR Trust, Series 2021-TY, Class C, 6.16% (LIBOR01M+170bps), 9/15/38 (a) (b) | 1,538 | 1,445 | |||||||||
BPR Trust, Series 2022-STAR, Class A, 7.71% (TSFR1M+323bps), 8/15/24 (a) (b) | 3,726 | 3,714 | |||||||||
BPR Trust, Series 2022-OANA, Class B, 6.93% (TSFR1M+245bps), 4/15/37 (a) (b) | 6,000 | 5,894 | |||||||||
| BX Commercial Mortgage Trust, Series 2019-XL, Class B, 5.67% (LIBOR01M+108bps), 10/15/36 (a) (b) | 5,246 | 5,195 | |||||||||
| BX Commercial Mortgage Trust, Series 2020-VIV4, Class A, 2.84%, 3/9/44, Callable 3/9/30 @ 100 (a) | 1,875 | 1,597 | |||||||||
| BX Commercial Mortgage Trust, Series 2019-XL, Class D, 6.04% (LIBOR01M+145bps), 10/15/36 (a) (b) | 1,275 | 1,251 | |||||||||
| BX Commercial Mortgage Trust, Series 2022-CSMO, Class B, 7.62% (TSFR1M+314bps), 6/15/27 (a) (b) | 5,000 | 4,982 | |||||||||
BX Trust, Series 2019-OC11, Class A, 3.20%, 12/9/41, Callable 12/9/29 @ 100 (a) | 9,231 | 8,139 | |||||||||
BX Trust, Series 2022-CLS, Class B, 6.30%, 10/13/27 (a) | 4,000 | 3,969 | |||||||||
BXP Trust, Series 2021-601L, Class C, 2.78%, 1/15/44 (a) (c) | 6,500 | 4,763 | |||||||||
BXP Trust, Series 2021-601L, Class D, 2.78%, 1/15/44 (a) (c) | 3,500 | 2,279 | |||||||||
| Cantor Commercial Real Estate Lending, Series 2019-CF3, Class ASB, 2.94%, 1/15/53, Callable 12/15/29 @ 100 | 6,000 | 5,561 | |||||||||
| Citigroup Commercial Mortgage Trust, Series 2014-GC23, Class AS, 3.86%, 7/10/47, Callable 7/10/24 @ 100 | 4,000 | 3,870 | |||||||||
| Citigroup Commercial Mortgage Trust, Series 2019-SMRT, Class C, 4.68%, 1/10/36 (a) | 8,100 | 7,915 | |||||||||
| Citigroup Commercial Mortgage Trust, Series 2014-GC23, Class A3, 3.36%, 7/10/47, Callable 7/10/24 @ 100 | 5,531 | 5,385 | |||||||||
| Citigroup Commercial Mortgage Trust, Series 2020-555, Class A, 2.65%, 12/10/41 (a) | 10,000 | 8,419 | |||||||||
| COMM Mortgage Trust, Series 2015-PC1, Class AM, 4.29%, 7/10/50, Callable 6/10/25 @ 100 (c) | 3,500 | 3,370 | |||||||||
See notes to financial statements.
6
| USAA Mutual Funds Trust USAA Income Fund | Schedule of Portfolio Investments — continued January 31, 2023 | ||||||
(Amounts in Thousands, Except for Shares) (Unaudited)
Security Description | Principal Amount | Value | |||||||||
COMM Mortgage Trust, Series 2012-CR3, Class AM, 3.42%, 10/15/45 (a) | $ | 3,092 | $ | 2,854 | |||||||
| COMM Mortgage Trust, Series 2012-CR4, Class XA, 1.23%, 10/15/45, Callable 2/15/23 @ 100 (c) (d) | 13,056 | 1 | |||||||||
| COMM Mortgage Trust, Series 2012-CR4, Class AM, 3.25%, 10/15/45, Callable 10/15/23 @ 100 | 8,600 | 7,924 | |||||||||
| COMM Mortgage Trust, Series 2014-277P, Class A, 3.61%, 8/10/49, Callable 8/10/24 @ 100 (a) (c) | 11,500 | 11,000 | |||||||||
| COMM Mortgage Trust, Series 2015-LC23, Class AM, 4.16%, 10/10/48, Callable 11/10/25 @ 100 (c) | 6,300 | 5,930 | |||||||||
| COMM Mortgage Trust, Series 2015-PC1, Class B, 4.29%, 7/10/50, Callable 6/10/25 @ 100 (c) | 2,500 | 2,346 | |||||||||
| COMM Mortgage Trust, Series 2020-CX, Class A, 2.17%, 11/10/46, Callable 11/10/30 @ 100 (a) | 3,500 | 2,858 | |||||||||
CSMC Trust, Series 2020-WEST, Class A, 3.04%, 2/15/35, Callable 2/15/30 @ 100 (a) | 2,500 | 2,010 | |||||||||
| DBJPM Mortgage Trust, Series 2016-SFC, Class B, 3.24%, 8/10/36, Callable 8/10/26 @ 100 (a) | 2,500 | 2,017 | |||||||||
| DBJPM Mortgage Trust, Series 2016-SFC, Class A, 2.83%, 8/10/36, Callable 8/10/26 @ 100 (a) | 6,250 | 5,322 | |||||||||
| Extended Stay America Trust, Series 2021-ESH, Class B, 5.84% (LIBOR01M+138bps), 7/15/38 (a) (b) | 4,935 | 4,824 | |||||||||
| GS Mortgage Securities Corp. II, Series 2005-ROCK, Class X1, 0.21%, 5/3/32 (a) (c) (d) | 190,667 | 1,053 | |||||||||
| GS Mortgage Securities Corp. Trust, Series 2017-GPTX, Class A, 2.86%, 5/10/34 (a) | 2,000 | 1,904 | |||||||||
| GS Mortgage Securities Trust, Series 2020-GC45, Class A5, 2.91%, 2/13/53, Callable 1/13/30 @ 100 | 4,231 | 3,778 | |||||||||
Houston Galleria Mall Trust, Series 2015-HGLR, Class A1A2, 3.09%, 3/5/37 (a) | 2,730 | 2,539 | |||||||||
Hudson Yards Mortgage Trust, Series 2019-55HY, Class A, 2.94%, 12/10/41 (a) (c) | 2,000 | 1,749 | |||||||||
ILPT Commercial Mortgage Trust, Series 2022-LPFX, Class A, 3.38%, 3/15/32 (a) | 6,000 | 5,115 | |||||||||
| J.P. Morgan Chase Commercial Mortgage Securities Trust, Series 2021-2NU, Class B, 2.08%, 1/5/40 (a) (c) | 2,500 | 1,976 | |||||||||
| JPMBB Commercial Mortgage Securities Trust, Series 2014-C18, Class AS, 4.44%, 2/15/47, Callable 1/15/29 @ 100 (c) | 9,000 | 8,770 | |||||||||
| Magnetite XXXV Ltd., Series 2022-35A, Class A1, 6.71% (TSFR3M+205bps), 10/25/35, Callable 7/25/28 @ 100 (a) (b) | 4,000 | 3,982 | |||||||||
Manhattan West Mortgage Trust, Series 2020-1MW, Class C, 2.33%, 9/10/39 (a) (c) | 1,000 | 850 | |||||||||
Manhattan West Mortgage Trust, Series 2020-1MW, Class A, 2.13%, 9/10/39 (a) | 8,000 | 7,014 | |||||||||
| Morgan Stanley Bank of America Merrill Lynch Trust, Series 2013-C9, Class AS, 3.46%, 5/15/46, Callable 4/15/23 @ 100 | 3,200 | 3,170 | |||||||||
| Morgan Stanley Capital Trust, Series 2015-MS1, Class AS, 4.02%, 5/15/48, Callable 7/15/25 @ 100 (c) | 7,000 | 6,646 | |||||||||
| Palmer Square Loan Funding Ltd., Series 2022-5A, Class A1, 6.22% (TSFR3M+156bps), 1/15/31, Callable 10/15/23 @ 100 (a) (b) | 2,894 | 2,882 | |||||||||
SLG Office Trust, Series 2021-OVA, Class A, 2.59%, 7/15/41 (a) | 5,200 | 4,339 | |||||||||
SMRT, Series 2022-MINI, Class B, 5.83% (TSFR1M+135bps), 1/15/39 (a) (b) | 6,500 | 6,336 | |||||||||
| WFRBS Commercial Mortgage Trust, Series 2012-C10, 3.24%, 12/15/45, Callable 2/15/23 @ 100 | 1,467 | 1,405 | |||||||||
| WFRBS Commercial Mortgage Trust, Series 2013-C13, Class AS, 3.35%, 5/15/45, Callable 5/15/23 @ 100 | 5,000 | 4,968 | |||||||||
Total Collateralized Mortgage Obligations (Cost $249,548) | 228,870 | ||||||||||
See notes to financial statements.
7
| USAA Mutual Funds Trust USAA Income Fund | Schedule of Portfolio Investments — continued January 31, 2023 | ||||||
(Amounts in Thousands, Except for Shares) (Unaudited)
Security Description | Shares or Principal Amount | Value | |||||||||
Preferred Stocks (1.0%) | |||||||||||
Communication Services (0.2%): | |||||||||||
Qwest Corp., 6.50%, 9/1/56 | 360,000 | $ | 7,416 | ||||||||
Consumer Staples (0.1%): | |||||||||||
CHS, Inc., cumulative redeemable, Series 1, 7.88% (e) | 190,818 | 4,946 | |||||||||
Financials (0.0%): (f) | |||||||||||
Citigroup Capital XIII, 11.17% (LIBOR03M+637bps), 10/30/40 (b) | 40,000 | 1,149 | |||||||||
Real Estate (0.7%): | |||||||||||
Equity Residential, cumulative redeemable, Series K, 8.29% (e) | 111,611 | 5,861 | |||||||||
| Mid-America Apartment Communities, Inc., cumulative redeemable, Series I, 8.50% (e) | 219,731 | 12,386 | |||||||||
Prologis, Inc., cumulative redeemable, Series Q, 8.54% (e) | 283,503 | 16,298 | |||||||||
34,545 | |||||||||||
Total Preferred Stocks (Cost $43,327) | 48,056 | ||||||||||
Senior Secured Loans (0.1%) | |||||||||||
| CSC Holdings LLC, 2017 Term Loan, First Lien, 6.82% (LIBOR01M+225bps), 7/17/25 (b) | $ | 2,320 | 2,235 | ||||||||
Total Senior Secured Loans (Cost $2,311) | 2,235 | ||||||||||
Corporate Bonds (45.8%) | |||||||||||
Communication Services (2.3%): | |||||||||||
| AT&T, Inc. 4.50%, 5/15/35, Callable 11/15/34 @ 100 | 3,000 | 2,851 | |||||||||
3.10%, 2/1/43, Callable 8/1/42 @ 100 | 8,000 | 5,975 | |||||||||
| CCO Holdings LLC/CCO Holdings Capital Corp., 7.38%, 3/1/31, Callable 3/1/26 @ 103.69 (a) | 5,125 | 3,121 | |||||||||
| Charter Communications Operating LLC/Charter Communications Operating Capital 2.30%, 2/1/32, Callable 11/1/31 @ 100 | 2,500 | 1,918 | |||||||||
6.38%, 10/23/35, Callable 4/23/35 @ 100 | 5,000 | 5,094 | |||||||||
3.50%, 6/1/41, Callable 12/1/40 @ 100 | 10,000 | 7,003 | |||||||||
| Comcast Corp. 3.90%, 3/1/38, Callable 9/1/37 @ 100 | 3,000 | 2,745 | |||||||||
2.89%, 11/1/51, Callable 5/1/51 @ 100 | 3,500 | 2,442 | |||||||||
CSC Holdings LLC, 5.50%, 4/15/27, Callable 3/13/23 @ 102.75 (a) | 3,000 | 2,641 | |||||||||
Discovery Communications LLC, 3.95%, 3/20/28, Callable 12/20/27 @ 100 | 10,000 | 9,345 | |||||||||
Fox Corp., 4.71%, 1/25/29, Callable 10/25/28 @ 100 | 4,000 | 3,953 | |||||||||
| Paramount Global 3.38%, 2/15/28, Callable 11/15/27 @ 100 | 3,111 | 2,860 | |||||||||
4.20%, 6/1/29, Callable 3/1/29 @ 100 | 8,000 | 7,421 | |||||||||
Rogers Communications, Inc., 4.50%, 3/15/42, Callable 9/15/41 @ 100 (a) | 9,500 | 8,264 | |||||||||
| T-Mobile USA, Inc. 4.75%, 2/1/28, Callable 2/21/23 @ 102.38 | 2,857 | 2,838 | |||||||||
3.88%, 4/15/30, Callable 1/15/30 @ 100 | 15,000 | 14,047 | |||||||||
2.55%, 2/15/31, Callable 11/15/30 @ 100 | 10,000 | 8,496 | |||||||||
See notes to financial statements.
8
| USAA Mutual Funds Trust USAA Income Fund | Schedule of Portfolio Investments — continued January 31, 2023 | ||||||
(Amounts in Thousands, Except for Shares) (Unaudited)
Security Description | Principal Amount | Value | |||||||||
| Verizon Communications, Inc. 2.10%, 3/22/28, Callable 1/22/28 @ 100 | $ | 3,500 | $ | 3,123 | |||||||
4.40%, 11/1/34, Callable 5/1/34 @ 100 | 3,500 | 3,348 | |||||||||
3.40%, 3/22/41, Callable 9/22/40 @ 100 | 8,000 | 6,441 | |||||||||
4.13%, 8/15/46 | 5,000 | 4,340 | |||||||||
2.88%, 11/20/50, Callable 5/20/50 @ 100 | 3,000 | 2,041 | |||||||||
Warnermedia Holdings, Inc., 5.05%, 3/15/42, Callable 9/15/41 @ 100 (a) | 3,759 | 3,209 | |||||||||
113,516 | |||||||||||
Consumer Discretionary (2.4%): | |||||||||||
Advance Auto Parts, Inc., 3.50%, 3/15/32, Callable 12/15/31 @ 100 | 7,750 | 6,596 | |||||||||
American Honda Finance Corp., 1.30%, 9/9/26 | 5,000 | 4,483 | |||||||||
| AutoNation, Inc. 2.40%, 8/1/31, Callable 5/1/31 @ 100 | 3,750 | 2,860 | |||||||||
3.85%, 3/1/32, Callable 12/1/31 @ 100 | 4,500 | 3,807 | |||||||||
BMW U.S. Capital LLC, 3.70%, 4/1/32, Callable 1/1/32 @ 100 (a) (g) | 3,000 | 2,787 | |||||||||
Brunswick Corp., 2.40%, 8/18/31, Callable 5/18/31 @ 100 | 6,500 | 4,919 | |||||||||
| Genting New York LLC/GENNY Capital, Inc., 3.30%, 2/15/26, Callable 1/15/26 @ 100 (a) | 2,000 | 1,787 | |||||||||
Genuine Parts Co., 2.75%, 2/1/32, Callable 11/1/31 @ 100 | 3,833 | 3,198 | |||||||||
| Hasbro, Inc. 3.55%, 11/19/26, Callable 9/19/26 @ 100 | 4,500 | 4,287 | |||||||||
3.90%, 11/19/29, Callable 8/19/29 @ 100 | 7,500 | 6,855 | |||||||||
Kohl's Corp., 3.63%, 5/1/31, Callable 2/1/31 @ 100 | 6,250 | 4,634 | |||||||||
| Marriott International, Inc. 4.63%, 6/15/30, Callable 3/15/30 @ 100 | 2,333 | 2,275 | |||||||||
2.85%, 4/15/31, Callable 1/15/31 @ 100 | 8,000 | 6,831 | |||||||||
3.50%, 10/15/32, Callable 7/15/32 @ 100 | 3,500 | 3,089 | |||||||||
Mattel, Inc., 3.38%, 4/1/26, Callable 4/1/23 @ 101.69 (a) | 500 | 468 | |||||||||
| Murphy Oil USA, Inc. 4.75%, 9/15/29, Callable 9/15/24 @ 102.38 | 2,000 | 1,833 | |||||||||
3.75%, 2/15/31, Callable 2/15/26 @ 101.88 (a) | 1,332 | 1,118 | |||||||||
| Nordstrom, Inc. 4.38%, 4/1/30, Callable 1/1/30 @ 100 (g) | 2,000 | 1,606 | |||||||||
4.25%, 8/1/31, Callable 5/1/31 @ 100 (g) | 4,250 | 3,193 | |||||||||
Novant Health, Inc., 2.64%, 11/1/36, Callable 8/1/36 @ 100 | 13,000 | 10,187 | |||||||||
O'Reilly Automotive, Inc., 4.20%, 4/1/30, Callable 1/1/30 @ 100 | 5,000 | 4,834 | |||||||||
| Resorts World Las Vegas LLC/RWLV Capital, Inc., 4.63%, 4/6/31, Callable 1/6/31 @ 100 (a) | 5,367 | 4,147 | |||||||||
Smithsonian Institution, 2.65%, 9/1/39 | 2,000 | 1,563 | |||||||||
Sodexo, Inc., 2.72%, 4/16/31, Callable 1/16/31 @ 100 (a) | 10,750 | 8,940 | |||||||||
Toll Brothers Finance Corp., 3.80%, 11/1/29, Callable 8/1/29 @ 100 | 2,863 | 2,567 | |||||||||
Trustees of Tufts College, 3.10%, 8/15/51, Callable 2/15/51 @ 100 (g) | 9,500 | 6,741 | |||||||||
University of Notre Dame du Lac, 3.44%, 2/15/45 | 5,000 | 4,252 | |||||||||
Vanderbilt University Medical Center, 4.17%, 7/1/37, Callable 1/1/37 @ 100 | 1,000 | 897 | |||||||||
| Volkswagen Group of America Finance LLC, 4.60%, 6/8/29, Callable 4/8/29 @ 100 (a) | 6,000 | 5,880 | |||||||||
Warnermedia Holdings, Inc., 3.76%, 3/15/27, Callable 2/15/27 @ 100 (a) | 5,000 | 4,685 | |||||||||
121,319 | |||||||||||
See notes to financial statements.
9
| USAA Mutual Funds Trust USAA Income Fund | Schedule of Portfolio Investments — continued January 31, 2023 | ||||||
(Amounts in Thousands, Except for Shares) (Unaudited)
Security Description | Principal Amount | Value | |||||||||
Consumer Staples (2.5%): | |||||||||||
| 7-Eleven, Inc. 1.80%, 2/10/31, Callable 11/10/30 @ 100 (a) | $ | 6,500 | $ | 5,179 | |||||||
2.80%, 2/10/51, Callable 8/2/50 @ 100 (a) | 2,000 | 1,321 | |||||||||
Altria Group, Inc., 2.45%, 2/4/32, Callable 11/4/31 @ 100 | 6,500 | 5,061 | |||||||||
| Anheuser-Busch Cos. LLC/Anheuser-Busch InBev Worldwide, Inc., 4.70%, 2/1/36, Callable 8/1/35 @ 100 | 10,000 | 9,915 | |||||||||
| Anheuser-Busch InBev Worldwide, Inc. 4.38%, 4/15/38, Callable 10/15/37 @ 100 | 6,500 | 6,175 | |||||||||
3.75%, 7/15/42 | 5,000 | 4,289 | |||||||||
| BAT Capital Corp. 7.75%, 10/19/32, Callable 7/19/32 @ 100 | 2,000 | 2,232 | |||||||||
4.39%, 8/15/37, Callable 2/15/37 @ 100 | 15,000 | 12,357 | |||||||||
Bunge Ltd. Finance Corp., 2.75%, 5/14/31, Callable 2/14/31 @ 100 | 12,000 | 10,284 | |||||||||
| Cargill, Inc. 2.13%, 11/10/31, Callable 8/10/31 @ 100 (a) | 6,000 | 4,924 | |||||||||
5.13%, 10/11/32, Callable 7/11/32 @ 100 (a) (g) | 3,500 | 3,645 | |||||||||
Church & Dwight Co., Inc., 2.30%, 12/15/31, Callable 9/15/31 @ 100 | 3,750 | 3,137 | |||||||||
Constellation Brands, Inc., 2.25%, 8/1/31, Callable 5/1/31 @ 100 | 13,645 | 11,249 | |||||||||
General Mills, Inc., 4.55%, 4/17/38, Callable 10/17/37 @ 100 | 4,667 | 4,397 | |||||||||
| JBS USA LUX SA/JBS USA Food Co./JBS USA Finance, Inc. 2.50%, 1/15/27, Callable 12/15/26 @ 100 (a) | 6,500 | 5,798 | |||||||||
5.75%, 4/1/33, Callable 1/1/33 @ 100 (a) | 3,000 | 2,952 | |||||||||
Keurig Dr Pepper, Inc., 4.50%, 4/15/52, Callable 10/15/51 @ 100 | 10,000 | 9,048 | |||||||||
Kraft Heinz Foods Co., 5.00%, 6/4/42 | 6,000 | 5,777 | |||||||||
| McCormick & Co., Inc. 2.50%, 4/15/30, Callable 1/15/30 @ 100 | 2,000 | 1,715 | |||||||||
1.85%, 2/15/31, Callable 11/15/30 @ 100 | 2,000 | 1,602 | |||||||||
SC Johnson & Son, Inc., 4.35%, 9/30/44, Callable 3/30/44 @ 100 (a) | 7,000 | 6,116 | |||||||||
Smithfield Foods, Inc., 4.25%, 2/1/27, Callable 11/1/26 @ 100 (a) | 5,000 | 4,676 | |||||||||
Sysco Corp., 2.45%, 12/14/31, Callable 9/14/31 @ 100 | 5,000 | 4,191 | |||||||||
126,040 | |||||||||||
Energy (3.4%): | |||||||||||
Boardwalk Pipelines LP, 4.45%, 7/15/27, Callable 4/15/27 @ 100 | 8,000 | 7,796 | |||||||||
Buckeye Partners LP, 5.60%, 10/15/44, Callable 4/15/44 @ 100 | 10,000 | 7,629 | |||||||||
Cameron LNG LLC, 3.30%, 1/15/35, Callable 9/15/34 @ 100 (a) | 12,364 | 10,800 | |||||||||
ConocoPhillips Co., 4.15%, 11/15/34, Callable 5/15/34 @ 100 | 4,500 | 4,156 | |||||||||
| DCP Midstream Operating LP, 5.85% (LIBOR03M+385bps), 5/21/43, Callable 5/21/23 @ 100 (a) (b) (g) | 10,000 | 9,890 | |||||||||
| Energy Transfer LP 4.15%, 9/15/29, Callable 6/15/29 @ 100 | 6,000 | 5,635 | |||||||||
7.83% (LIBOR03M+302bps), 11/1/66, Callable 3/13/23 @ 100 (b) | 8,510 | 6,879 | |||||||||
| Enterprise TE Partners LP, 7.54% (LIBOR03M+278bps), 6/1/67, Callable 3/13/23 @ 100 (b) | 3,000 | 2,562 | |||||||||
EOG Resources, Inc., 3.90%, 4/1/35, Callable 10/1/34 @ 100 | 2,000 | 1,889 | |||||||||
| EQM Midstream Partners LP 4.00%, 8/1/24, Callable 5/1/24 @ 100 | 1,286 | 1,246 | |||||||||
4.13%, 12/1/26, Callable 9/1/26 @ 100 | 8,000 | 7,263 | |||||||||
EQT Corp., 7.00%, 2/1/30, Callable 11/1/29 @ 100 | 2,594 | 2,759 | |||||||||
See notes to financial statements.
10
| USAA Mutual Funds Trust USAA Income Fund | Schedule of Portfolio Investments — continued January 31, 2023 | ||||||
(Amounts in Thousands, Except for Shares) (Unaudited)
Security Description | Principal Amount | Value | |||||||||
Exxon Mobil Corp., 2.61%, 10/15/30, Callable 7/15/30 @ 100 | $ | 4,750 | $ | 4,283 | |||||||
Florida Gas Transmission Co. LLC, 2.55%, 7/1/30, Callable 4/1/30 @ 100 (a) | 6,500 | 5,522 | |||||||||
Gray Oak Pipeline LLC, 3.45%, 10/15/27, Callable 8/15/27 @ 100 (a) | �� | 5,333 | 4,802 | ||||||||
HF Sinclair Corp., 4.50%, 10/1/30, Callable 7/1/30 @ 100 | 8,000 | 7,261 | |||||||||
| Hilcorp Energy I LP/Hilcorp Finance Co. 6.25%, 11/1/28, Callable 11/1/23 @ 103.13 (a) | 4,000 | 3,840 | |||||||||
6.00%, 2/1/31, Callable 2/1/26 @ 103 (a) | 3,000 | 2,762 | |||||||||
Marathon Petroleum Corp., 4.75%, 9/15/44, Callable 3/15/44 @ 100 | 5,000 | 4,485 | |||||||||
Midwest Connector Capital Co. LLC, 4.63%, 4/1/29, Callable 1/1/29 @ 100 (a) | 14,500 | 13,516 | |||||||||
Murphy Oil Corp., 5.75%, 8/15/25, Callable 3/13/23 @ 101.44 | 2,770 | 2,760 | |||||||||
Northwest Pipeline LLC, 4.00%, 4/1/27, Callable 1/1/27 @ 100 | 5,067 | 4,907 | |||||||||
Occidental Petroleum Corp., 4.40%, 8/15/49, Callable 2/15/49 @ 100 | 5,000 | 4,010 | |||||||||
Phillips 66, 4.65%, 11/15/34, Callable 5/15/34 @ 100 | 1,000 | 987 | |||||||||
Pioneer Natural Resources Co., 1.90%, 8/15/30, Callable 5/15/30 @ 100 | 5,000 | 4,100 | |||||||||
| Plains All American Pipeline LP/PAA Finance Corp., 3.55%, 12/15/29, Callable 9/15/29 @ 100 | 13,750 | 12,367 | |||||||||
| Rockies Express Pipeline LLC 4.95%, 7/15/29, Callable 4/15/29 @ 100 (a) | 6,500 | 5,878 | |||||||||
4.80%, 5/15/30, Callable 2/15/30 @ 100 (a) | 3,000 | 2,686 | |||||||||
Sabal Trail Transmission LLC, 4.68%, 5/1/38, Callable 11/1/37 @ 100 (a) | 5,000 | 4,762 | |||||||||
Southwestern Energy Co., 5.70%, 1/23/25, Callable 10/23/24 @ 100 | 2,000 | 1,984 | |||||||||
| Targa Resources Partners LP/Targa Resources Partners Finance Corp., 5.50%, 3/1/30, Callable 3/1/25 @ 102.75 | 3,500 | 3,430 | |||||||||
| TransCanada PipeLines Ltd., 6.82% (LIBOR03M+221bps), 5/15/67, Callable 3/13/23 @ 100 (b) (g) | 10,124 | 8,317 | |||||||||
171,163 | |||||||||||
Financials (12.5%): | |||||||||||
Ally Financial, Inc., 7.10%, 11/15/27, Callable 10/15/27 @ 100 (g) | 2,222 | 2,345 | |||||||||
American Express Co., 4.99% (SOFR+226bps), 5/26/33, Callable 2/26/32 @ 100 (b) | 6,000 | 5,945 | |||||||||
American International Group, Inc., 3.88%, 1/15/35, Callable 7/15/34 @ 100 | 7,000 | 6,460 | |||||||||
AmTrust Financial Services, Inc., 6.13%, 8/15/23 | 10,000 | 9,972 | |||||||||
Assurant, Inc., 4.90%, 3/27/28, Callable 12/27/27 @ 100 (g) | 5,000 | 4,928 | |||||||||
Athene Holding Ltd., 3.50%, 1/15/31, Callable 10/15/30 @ 100 | 9,000 | 7,686 | |||||||||
Banc of California, Inc., 5.25%, 4/15/25, Callable 1/15/25 @ 100 | 10,000 | 9,876 | |||||||||
| Bank of America Corp. 4.20%, 8/26/24, MTN | 5,000 | 4,947 | |||||||||
1.53% (SOFR+65bps), 12/6/25, Callable 12/6/24 @ 100, MTN (b) | 4,000 | 3,736 | |||||||||
2.57% (SOFR+121bps), 10/20/32, Callable 10/20/31 @ 100 (b) | 2,500 | 2,070 | |||||||||
3.85% (H15T5Y+200bps), 3/8/37, Callable 3/8/32 @ 100 (b) | 2,500 | 2,182 | |||||||||
4.38% (H15T5Y+276bps), 12/31/99, Callable 1/27/27 @ 100 (b) (e) | 3,500 | 3,184 | |||||||||
BankUnited, Inc., 4.88%, 11/17/25, Callable 8/17/25 @ 100 | 10,000 | 9,916 | |||||||||
Blackstone Private Credit Fund, 2.63%, 12/15/26, Callable 11/15/26 @ 100 | 10,248 | 8,816 | |||||||||
BMW U.S. Capital LLC, 4.15%, 4/9/30, Callable 1/9/30 @ 100 (a) | 7,000 | 6,814 | |||||||||
Brown & Brown, Inc., 4.20%, 3/17/32, Callable 12/17/31 @ 100 | 5,000 | 4,578 | |||||||||
| Cadence Bank, 4.13% (LIBOR03M+247bps), 11/20/29, Callable 11/20/24 @ 100 (b) (g) | 3,000 | 2,863 | |||||||||
| Capital One Financial Corp. 3.75%, 3/9/27, Callable 2/9/27 @ 100 | 7,500 | 7,218 | |||||||||
5.82%, 2/1/34, Callable 2/1/33 @ 100 | 3,500 | 3,530 | |||||||||
See notes to financial statements.
11
| USAA Mutual Funds Trust USAA Income Fund | Schedule of Portfolio Investments — continued January 31, 2023 | ||||||
(Amounts in Thousands, Except for Shares) (Unaudited)
Security Description | Principal Amount | Value | |||||||||
| Citizens Financial Group, Inc. 2.64%, 9/30/32, Callable 7/2/32 @ 100 | $ | 5,500 | $ | 4,307 | |||||||
5.64% (H15T5Y+275bps), 5/21/37, Callable 5/21/32 @ 100 (b) | 5,000 | 4,823 | |||||||||
| Compeer Financial FLCA/Compeer Financial PCA, 3.38% (SOFR+197bps), 6/1/36, Callable 6/1/31 @ 100 (a) (b) | 4,000 | 3,147 | |||||||||
Credit Acceptance Corp., 6.63%, 3/15/26, Callable 2/21/23 @ 103.31 (g) | 4,875 | 4,460 | |||||||||
Cullen/Frost Bankers, Inc., 4.50%, 3/17/27, Callable 2/17/27 @ 100 | 3,500 | 3,379 | |||||||||
| Cullen/Frost Capital Trust II, 6.31% (LIBOR03M+155bps), 3/1/34, Callable 3/13/23 @ 100 (b) | 10,000 | 8,788 | |||||||||
Equitable Holdings, Inc., 4.35%, 4/20/28, Callable 1/20/28 @ 100 | 2,000 | 1,951 | |||||||||
F&G Global Funding, 2.00%, 9/20/28 (a) | 7,250 | 6,153 | |||||||||
Fells Point Funding Trust, 3.05%, 1/31/27, Callable 12/31/26 @ 100 (a) | 6,500 | 6,048 | |||||||||
Fifth Third Bancorp, 4.34% (SOFR+166bps), 4/25/33, Callable 4/25/32 @ 100 (b) | 5,218 | 4,966 | |||||||||
Fifth Third Bank NA, 3.85%, 3/15/26, Callable 2/15/26 @ 100 | 5,000 | 4,828 | |||||||||
First American Financial Corp., 2.40%, 8/15/31, Callable 5/15/31 @ 100 | 9,225 | 7,178 | |||||||||
| First Citizens BancShares, Inc., 3.37% (SOFR+247bps), 3/15/30, Callable 3/15/25 @ 100 (b) | 12,097 | 11,461 | |||||||||
First Horizon Bank, 5.75%, 5/1/30, Callable 2/1/30 @ 100 | 8,000 | 8,096 | |||||||||
| First-Citizens Bank & Trust Co., 4.13% (H15T5Y+237bps), 11/13/29, Callable 11/13/24 @ 100 (b) | 14,000 | 13,200 | |||||||||
| Ford Motor Credit Co. LLC 4.06%, 11/1/24, Callable 10/1/24 @ 100 | 5,000 | 4,848 | |||||||||
4.54%, 8/1/26, Callable 6/1/26 @ 100 | 3,400 | 3,230 | |||||||||
Fulton Financial Corp., 3.25% (SOFR+230bps), 3/15/30, Callable 3/15/25 @ 100 (b) | 2,932 | 2,794 | |||||||||
GA Global Funding Trust, 1.63%, 1/15/26 (a) | 2,250 | 2,032 | |||||||||
Global Atlantic Fin Co., 4.40%, 10/15/29, Callable 7/15/29 @ 100 (a) | 10,000 | 8,670 | |||||||||
| Huntington Bancshares, Inc., 2.49% (H15T5Y+117bps), 8/15/36, Callable 8/15/31 @ 100 (b) | 15,676 | 11,860 | |||||||||
| Huntington Capital Trust I, 5.53% (US0003M+70bps), 2/1/27, Callable 3/13/23 @ 100 (b) | 2,300 | 2,156 | |||||||||
ILFC E-Capital Trust I, 6.29%, 12/21/65, Callable 3/13/23 @ 100 (a) | 10,000 | 6,436 | |||||||||
| JPMorgan Chase & Co. 4.60% (SOFR+313bps), Callable 2/1/25 @ 100 (b) (e) | 5,000 | 4,689 | |||||||||
2.95%, 10/1/26, Callable 7/1/26 @ 100 | 5,000 | 4,762 | |||||||||
5.31% (LIBOR03M+50bps), 2/1/27, Callable 3/13/23 @ 100 (b) | 4,000 | 3,709 | |||||||||
4.32% (SOFR+156bps), 4/26/28, Callable 4/26/27 @ 100 (b) | 5,000 | 4,891 | |||||||||
1.95% (SOFR+1bps), 2/4/32, Callable 2/4/31 @ 100 (b) | 10,000 | 8,036 | |||||||||
| KeyBank NA 3.40%, 5/20/26, MTN | 2,500 | 2,377 | |||||||||
3.90%, 4/13/29 | 3,000 | 2,775 | |||||||||
| KeyCorp. 2.25%, 4/6/27, MTN | 2,000 | 1,828 | |||||||||
4.79% (SOFR+206bps), 6/1/33, Callable 6/1/32 @ 100, MTN (b) | 3,784 | 3,710 | |||||||||
| Level 3 Financing, Inc. 3.75%, 7/15/29, Callable 1/15/24 @ 101.88 (a) | 9,500 | 6,953 | |||||||||
3.88%, 11/15/29, Callable 8/15/29 @ 100 (a) | 19,000 | 15,393 | |||||||||
| Lincoln National Corp., 7.01% (LIBOR03M+236bps), 5/17/66, Callable 8/11/26 @ 100 (b) | 7,500 | 6,001 | |||||||||
Loews Corp., 3.20%, 5/15/30, Callable 2/15/30 @ 100 | 5,000 | 4,575 | |||||||||
Main Street Capital Corp., 3.00%, 7/14/26, Callable 6/14/26 @ 100 | 4,000 | 3,524 | |||||||||
See notes to financial statements.
12
| USAA Mutual Funds Trust USAA Income Fund | Schedule of Portfolio Investments — continued January 31, 2023 | ||||||
(Amounts in Thousands, Except for Shares) (Unaudited)
Security Description | Principal Amount | Value | |||||||||
Manufacturers & Traders Trust Co., 3.40%, 8/17/27 | $ | 4,380 | $ | 4,112 | |||||||
Mercury General Corp., 4.40%, 3/15/27, Callable 12/15/26 @ 100 | 5,000 | 4,827 | |||||||||
MetLife, Inc., 4.13%, 8/13/42 | 10,000 | 9,085 | |||||||||
| Morgan Stanley 2.51% (SOFR+120bps), 10/20/32, Callable 10/20/31 @ 100, MTN (b) | 7,000 | 5,784 | |||||||||
2.48% (SOFR+136bps), 9/16/36, Callable 9/16/31 @ 100 (b) | 8,000 | 6,191 | |||||||||
| National Rural Utilities Cooperative Finance Corp., 4.75% (LIBOR03M+291bps), 4/30/43, Callable 4/30/23 @ 100 (b) | 9,500 | 9,155 | |||||||||
| Nationwide Mutual Insurance Co., 7.06% (LIBOR03M+229bps), 12/15/24, Callable 3/13/23 @ 100 (a) (b) | 20,000 | 20,114 | |||||||||
| New York Community Bancorp, Inc., 5.90% (LIBOR03M+278bps), 11/6/28, Callable 11/6/23 @ 100 (b) | 7,000 | 6,902 | |||||||||
Northern Trust Corp., 6.13%, 11/2/32, Callable 8/2/32 @ 100 | 3,500 | 3,846 | |||||||||
| OWL Rock Core Income Corp. 5.50%, 3/21/25 (a) | 1,500 | 1,464 | |||||||||
3.13%, 9/23/26, Callable 8/23/26 @ 100 | 500 | 437 | |||||||||
4.70%, 2/8/27, Callable 1/8/27 @ 100 | 4,500 | 4,102 | |||||||||
7.75%, 9/16/27, Callable 8/16/27 @ 100 (a) | 1,818 | 1,831 | |||||||||
Pine Street Trust I, 4.57%, 2/15/29, Callable 11/15/28 @ 100 (a) | 10,000 | 9,665 | |||||||||
PNC Bank NA, 2.70%, 10/22/29 | 6,000 | 5,262 | |||||||||
| PPL Capital Funding, Inc., 7.39% (LIBOR03M+267bps), 3/30/67, Callable 3/13/23 @ 100 (b) | 6,130 | 5,388 | |||||||||
Primerica, Inc., 2.80%, 11/19/31, Callable 8/19/31 @ 100 | 4,000 | 3,395 | |||||||||
| Prudential Financial, Inc. 5.63% (LIBOR03M+392bps), 6/15/43, Callable 6/15/23 @ 100 (b) | 19,000 | 18,890 | |||||||||
3.94%, 12/7/49, Callable 6/7/49 @ 100 | 2,500 | 2,130 | |||||||||
6.00% (H15T5Y+323bps), 9/1/52, Callable 6/1/32 @ 100 (b) | 6,000 | 5,973 | |||||||||
Raymond James Financial, Inc., 4.95%, 7/15/46 | 4,000 | 3,856 | |||||||||
Regions Bank, 6.45%, 6/26/37 | 7,409 | 7,999 | |||||||||
| Regions Financial Corp., 5.75% (H15T5Y+543bps), Callable 6/15/25 @ 100 (b) (e) (g) | 3,989 | 3,956 | |||||||||
Santander Holdings USA, Inc., 4.40%, 7/13/27, Callable 4/14/27 @ 100 | 5,818 | 5,660 | |||||||||
Signature Bank, 4.13% (LIBOR03M+256bps), 11/1/29, Callable 11/1/24 @ 100 (b) | 6,000 | 5,654 | |||||||||
Stellantis Finance U.S., Inc., 2.69%, 9/15/31, Callable 6/15/31 @ 100 (a) | 13,800 | 11,118 | |||||||||
Stewart Information Services Corp., 3.60%, 11/15/31, Callable 8/15/31 @ 100 | 8,500 | 6,740 | |||||||||
Synchrony Bank, 5.63%, 8/23/27, Callable 7/23/27 @ 100 | 4,500 | 4,480 | |||||||||
Synovus Bank, 4.00% (H15T5Y+363bps), 10/29/30, Callable 10/29/25 @ 100 (b) | 4,500 | 4,095 | |||||||||
| Synovus Financial Corp., 5.90% (USSW5+338bps), 2/7/29, Callable 2/7/24 @ 100 (b) | 10,000 | 9,905 | |||||||||
| Texas Capital Bancshares, Inc., 4.00% (H15T5Y+315bps), 5/6/31, Callable 5/6/26 @ 100 (b) | 2,450 | 2,227 | |||||||||
Texas Capital Bank NA, 5.25%, 1/31/26 (g) | 9,335 | 9,043 | |||||||||
The Allstate Corp., 5.75% (LIBOR03M+294bps), 8/15/53, Callable 8/15/23 @ 100 (b) | 5,000 | 4,923 | |||||||||
| The Bank of New York Mellon Corp. 4.70% (H15T5Y+436bps), Callable 9/20/25 @ 100 (b) (e) | 3,250 | 3,180 | |||||||||
3.75% (H15T5Y+263bps), Callable 12/20/26 @ 100 (b) (e) | 7,000 | 6,080 | |||||||||
| The Charles Schwab Corp., 5.38% (H15T5Y+497bps), Callable 6/1/25 @ 100 (b) (e) (g) | 5,000 | 4,978 | |||||||||
| The Hartford Financial Services Group, Inc., 6.73% (LIBOR03M+213bps), 2/12/47, Callable 3/13/23 @ 100 (a) (b) (g) | 14,000 | 11,968 | |||||||||
See notes to financial statements.
13
| USAA Mutual Funds Trust USAA Income Fund | Schedule of Portfolio Investments — continued January 31, 2023 | ||||||
(Amounts in Thousands, Except for Shares) (Unaudited)
Security Description | Principal Amount | Value | |||||||||
| The PNC Financial Services Group, Inc., 4.63% (SOFR+185bps), 6/6/33, Callable 6/6/32 @ 100 (b) | $ | 2,500 | $ | 2,409 | |||||||
TIAA FSB Holdings, Inc., 5.75%, 7/2/25, Callable 6/2/25 @ 100 | 10,000 | 9,823 | |||||||||
Truist Bank, 2.25%, 3/11/30, Callable 12/11/29 @ 100 | 2,450 | 2,061 | |||||||||
| Truist Financial Corp., 1.89% (SOFR+63bps), 6/7/29, MTN, Callable 6/7/28 @ 100 (b) | 5,000 | 4,322 | |||||||||
UMB Financial Corp., 3.70% (H15T5Y+344bps), 9/17/30, Callable 9/17/25 @ 100 (b) | 7,125 | 6,548 | |||||||||
W R Berkley Corp., 3.55%, 3/30/52, Callable 9/30/51 @ 100 | 5,588 | 4,180 | |||||||||
| Webster Financial Corp. 4.38%, 2/15/24, Callable 1/16/24 @ 100 | 6,285 | 6,163 | |||||||||
4.00% (SOFR+253bps), 12/30/29, Callable 12/30/24 @ 100 (b) | 5,750 | 5,388 | |||||||||
Wells Fargo & Co., 3.00%, 10/23/26 | 10,000 | 9,434 | |||||||||
West Loop, 6.63% (LIBOR03M+187bps), 12/1/27, Callable 3/1/23 @ 100 (b) | 10,417 | 10,410 | |||||||||
Zions Bancorp NA, 3.25%, 10/29/29, Callable 7/29/29 @ 100 | 10,000 | 8,488 | |||||||||
618,741 | |||||||||||
Health Care (4.0%): | |||||||||||
| AbbVie, Inc. 4.55%, 3/15/35, Callable 9/15/34 @ 100 | 4,000 | 3,928 | |||||||||
4.25%, 11/21/49, Callable 5/21/49 @ 100 | 2,500 | 2,239 | |||||||||
| Amgen, Inc. 3.00%, 1/15/52, Callable 7/15/51 @ 100 | 4,500 | 3,111 | |||||||||
4.20%, 2/22/52, Callable 8/22/51 @ 100 | 3,500 | 2,995 | |||||||||
Baxter International, Inc., 3.13%, 12/1/51, Callable 6/1/51 @ 100 | 10,000 | 6,873 | |||||||||
Bio-Rad Laboratories, Inc., 3.30%, 3/15/27, Callable 2/15/27 @ 100 | 3,500 | 3,312 | |||||||||
Bon Secours Charity Health System, Inc., 5.25%, 11/1/25 | 3,000 | 2,904 | |||||||||
Bon Secours Mercy Health, Inc., 3.38%, 11/1/25 | 8,000 | 7,685 | |||||||||
Centene Corp., 2.50%, 3/1/31, Callable 12/1/30 @ 100 | 4,000 | 3,274 | |||||||||
Cigna Corp., 3.40%, 3/1/27, Callable 12/1/26 @ 100 | 5,000 | 4,787 | |||||||||
Community Health Network, Inc., 4.24%, 5/1/25 | 5,000 | 4,859 | |||||||||
| CVS Health Corp. 4.30%, 3/25/28, Callable 12/25/27 @ 100 | 3,000 | 2,950 | |||||||||
1.75%, 8/21/30, Callable 5/21/30 @ 100 | 6,966 | 5,634 | |||||||||
| CVS Pass-Through Trust 6.04%, 12/10/28 | 4,024 | 4,071 | |||||||||
5.93%, 1/10/34 (a) | 3,284 | 3,304 | |||||||||
DENTSPLY SIRONA, Inc., 3.25%, 6/1/30, Callable 3/1/30 @ 100 | 15,750 | 13,948 | |||||||||
Eastern Maine Healthcare Systems, 5.02%, 7/1/36 | 17,000 | 16,386 | |||||||||
Elevance Health, Inc., 2.55%, 3/15/31, Callable 12/15/30 @ 100 | 8,000 | 6,916 | |||||||||
| Fresenius Medical Care U.S. Finance III, Inc., 2.38%, 2/16/31, Callable 11/16/30 @ 100 (a) | 13,000 | 9,910 | |||||||||
| HCA, Inc. 4.38%, 3/15/42, Callable 9/15/41 @ 100 (a) | 2,156 | 1,834 | |||||||||
5.50%, 6/15/47, Callable 12/15/46 @ 100 | 2,000 | 1,906 | |||||||||
Illumina, Inc., 2.55%, 3/23/31, Callable 12/23/30 @ 100 | 15,000 | 12,444 | |||||||||
Northwell Healthcare, Inc., 3.39%, 11/1/27, Callable 8/1/27 @ 100 | 3,900 | 3,623 | |||||||||
NYU Langone Hospitals, 4.17%, 7/1/37 | 6,500 | 5,955 | |||||||||
Orlando Health Obligated Group, 2.89%, 10/1/35 | 1,660 | 1,335 | |||||||||
| PerkinElmer, Inc. 2.55%, 3/15/31, Callable 12/15/30 @ 100 | 8,500 | 7,091 | |||||||||
2.25%, 9/15/31, Callable 6/15/31 @ 100 | 4,500 | 3,645 | |||||||||
See notes to financial statements.
14
| USAA Mutual Funds Trust USAA Income Fund | Schedule of Portfolio Investments — continued January 31, 2023 | ||||||
(Amounts in Thousands, Except for Shares) (Unaudited)
Security Description | Principal Amount | Value | |||||||||
Piedmont Healthcare, Inc., 2.72%, 1/1/42, Callable 7/1/41 @ 100 | $ | 5,000 | $ | 3,631 | |||||||
Roche Holdings, Inc., 1.93%, 12/13/28, Callable 10/13/28 @ 100 (a) | 8,000 | 7,069 | |||||||||
| Royalty Pharma PLC 2.20%, 9/2/30, Callable 6/2/30 @ 100 | 10,167 | 8,297 | |||||||||
2.15%, 9/2/31, Callable 6/2/31 @ 100 | 8,500 | 6,764 | |||||||||
| Southern Illinois Healthcare Enterprises, Inc., 3.97%, 5/15/50, Callable 11/15/49 @ 100 | 9,000 | 7,289 | |||||||||
Tenet Healthcare Corp., 6.13%, 6/15/30, Callable 6/15/25 @ 103.06 (a) | 1,500 | 1,457 | |||||||||
Trinity Health Corp., 2.63%, 12/1/40, Callable 6/1/40 @ 100 | 3,000 | 2,221 | |||||||||
Universal Health Services, Inc., 2.65%, 1/15/32, Callable 10/15/31 @ 100 | 9,827 | 7,942 | |||||||||
Utah Acquisition Sub, Inc., 3.95%, 6/15/26, Callable 3/15/26 @ 100 | 5,000 | 4,765 | |||||||||
Viatris, Inc., 2.30%, 6/22/27, Callable 4/22/27 @ 100 | 4,000 | 3,528 | |||||||||
199,882 | |||||||||||
Industrials (7.2%): | |||||||||||
Acuity Brands Lighting, Inc., 2.15%, 12/15/30, Callable 9/15/30 @ 100 | 10,000 | 8,017 | |||||||||
Air Lease Corp., 2.88%, 1/15/32, Callable 10/15/31 @ 100 | 4,750 | 3,907 | |||||||||
| American Airlines Pass Through Trust 3.70%, 10/1/26 | 5,757 | 5,091 | |||||||||
4.00%, 9/22/27 | 6,921 | 5,779 | |||||||||
4.00%, 2/15/29 | 3,669 | 3,063 | |||||||||
3.60%, 10/15/29 | 7,564 | 6,344 | |||||||||
American Airlines, Inc./AAdvantage Loyalty IP Ltd., 5.50%, 4/20/26 (a) | 1,923 | 1,886 | |||||||||
| Ashtead Capital, Inc. 4.00%, 5/1/28, Callable 5/1/23 @ 102 (a) | 2,500 | 2,349 | |||||||||
4.25%, 11/1/29, Callable 11/1/24 @ 102.13 (a) | 3,937 | 3,671 | |||||||||
2.45%, 8/12/31, Callable 5/12/31 @ 100 (a) | 6,000 | 4,841 | |||||||||
5.50%, 8/11/32, Callable 5/11/32 @ 100 (a) | 3,750 | 3,778 | |||||||||
| BNSF Funding Trust I, 6.61% (LIBOR03M+235bps), 12/15/55, Callable 1/15/26 @ 100 (b) | 8,325 | 8,076 | |||||||||
| British Airways Pass Through Trust 3.35%, 6/15/29 (a) | 5,094 | 4,429 | |||||||||
3.80%, 9/20/31 (a) (g) | 2,955 | 2,722 | |||||||||
Builders FirstSource, Inc., 6.38%, 6/15/32, Callable 6/15/27 @ 103.19 (a) | 2,500 | 2,448 | |||||||||
| Burlington Northern Santa Fe LLC 3.65%, 9/1/25, Callable 6/1/25 @ 100 | 7,000 | 6,850 | |||||||||
3.90%, 8/1/46, Callable 2/1/46 @ 100 | 5,000 | 4,340 | |||||||||
Carlisle Cos., Inc., 2.75%, 3/1/30, Callable 12/1/29 @ 100 | 7,927 | 6,850 | |||||||||
Carrier Global Corp., 3.38%, 4/5/40, Callable 10/5/39 @ 100 | 9,500 | 7,647 | |||||||||
Continental Airlines Pass Through Trust, 4.00%, 10/29/24 | 2,760 | 2,651 | |||||||||
CoStar Group, Inc., 2.80%, 7/15/30, Callable 4/15/30 @ 100 (a) | 10,354 | 8,742 | |||||||||
Daimler Truck Finance North America LLC, 2.38%, 12/14/28 (a) | 5,600 | 4,884 | |||||||||
Delta Air Lines Pass Through Trust, 3.88%, 7/30/27 | 6,060 | 5,586 | |||||||||
Delta Air Lines, Inc./SkyMiles IP Ltd., 4.75%, 10/20/28 (a) | 2,000 | 1,945 | |||||||||
| FedEx Corp. 3.90%, 2/1/35 | 2,000 | 1,801 | |||||||||
4.05%, 2/15/48, Callable 8/15/47 @ 100 | 6,500 | 5,329 | |||||||||
Fluor Corp., 4.25%, 9/15/28, Callable 6/15/28 @ 100 (g) | 8,000 | 7,464 | |||||||||
Fortune Brands Innovations, Inc., 4.00%, 3/25/32, Callable 12/25/31 @ 100 | 5,500 | 4,986 | |||||||||
| General Electric Co., 8.10% (LIBOR03M+333bps), 12/31/99, Callable 3/15/23 @ 100 (b) (e) | 11,842 | 11,800 | |||||||||
See notes to financial statements.
15
| USAA Mutual Funds Trust USAA Income Fund | Schedule of Portfolio Investments — continued January 31, 2023 | ||||||
(Amounts in Thousands, Except for Shares) (Unaudited)
Security Description | Principal Amount | Value | |||||||||
GXO Logistics, Inc., 2.65%, 7/15/31, Callable 4/15/31 @ 100 | $ | 13,000 | $ | 10,185 | |||||||
Hawaiian Airlines Pass Through Certificates, 3.90%, 1/15/26 | 9,249 | 8,140 | |||||||||
| Hillenbrand, Inc. 5.00%, 9/15/26, Callable 7/15/26 @ 100 | 10,000 | 9,727 | |||||||||
3.75%, 3/1/31, Callable 3/1/26 @ 101.88 | 3,150 | 2,655 | |||||||||
Howmet Aerospace, Inc., 3.00%, 1/15/29, Callable 11/15/28 @ 100 | 8,500 | 7,417 | |||||||||
| Hubbell, Inc. 3.50%, 2/15/28, Callable 11/15/27 @ 100 | 1,500 | 1,422 | |||||||||
2.30%, 3/15/31, Callable 12/15/30 @ 100 | 8,500 | 7,023 | |||||||||
IDEX Corp., 3.00%, 5/1/30, Callable 2/1/30 @ 100 | 3,500 | 3,119 | |||||||||
JetBlue Pass Through Trust, 2.95%, 5/15/28 | 8,448 | 7,130 | |||||||||
Kennametal, Inc., 4.63%, 6/15/28, Callable 3/15/28 @ 100 | 5,295 | 5,121 | |||||||||
Leidos, Inc., 2.30%, 2/15/31, Callable 11/15/30 @ 100 | 15,000 | 12,102 | |||||||||
| Lincoln Center for the Performing Arts, Inc., 3.71%, 12/1/35, Callable 9/1/35 @ 100 | 3,935 | 3,515 | |||||||||
Molex Electronic Technologies LLC, 3.90%, 4/15/25, Callable 1/15/25 @ 100 (a) | 10,000 | 9,600 | |||||||||
Otis Worldwide Corp., 3.11%, 2/15/40, Callable 8/15/39 @ 100 | 7,000 | 5,497 | |||||||||
| Penske Truck Leasing Co. LP/PTL Finance Corp., 4.00%, 7/15/25, Callable 6/15/25 @ 100 (a) | 5,000 | 4,830 | |||||||||
Pentair Finance Sarl, 5.90%, 7/15/32, Callable 4/15/32 @ 100 | 7,500 | 7,762 | |||||||||
Quanta Services, Inc., 2.35%, 1/15/32, Callable 10/15/31 @ 100 | 5,250 | 4,199 | |||||||||
Raytheon Technologies Corp., 4.20%, 12/15/44, Callable 6/15/44 @ 100 | 10,000 | 8,556 | |||||||||
Regal Rexnord Corp., 6.40%, 4/15/33, Callable 1/15/33 @ 100 (a) | 1,465 | 1,500 | |||||||||
Ryder System, Inc., 3.35%, 9/1/25, MTN, Callable 8/1/25 @ 100 | 5,000 | 4,778 | |||||||||
| Spirit Airlines Pass Through Trust 4.45%, 4/1/24 | 1,784 | 1,716 | |||||||||
4.10%, 4/1/28 | 9,173 | 8,366 | |||||||||
3.38%, 2/15/30 | 7,538 | 6,403 | |||||||||
| The Boeing Co. 3.25%, 2/1/28, Callable 12/1/27 @ 100 | 4,000 | 3,774 | |||||||||
3.63%, 2/1/31, Callable 11/1/30 @ 100 | 4,000 | 3,665 | |||||||||
5.71%, 5/1/40, Callable 11/1/39 @ 100 | 15,000 | 15,353 | |||||||||
5.81%, 5/1/50, Callable 11/1/49 @ 100 | 4,500 | 4,596 | |||||||||
| The Conservation Fund A Nonprofit Corp., 3.47%, 12/15/29, Callable 9/15/29 @ 100 | 7,000 | 6,197 | |||||||||
The Timken Co., 4.13%, 4/1/32, Callable 1/1/32 @ 100 | 6,400 | 5,910 | |||||||||
| TOTE Maritime Alaska LLC (NBGA — United States Government), 6.37%, 4/15/28 | 5,175 | 5,282 | |||||||||
TTX Co., 3.60%, 1/15/25 (a) | 7,000 | 6,798 | |||||||||
| U.S. Airways Pass Through Trust 6.25%, 4/22/23 | 1,288 | 1,280 | |||||||||
3.95%, 11/15/25 | 4,438 | 4,127 | |||||||||
| Union Pacific Corp. 3.38%, 2/1/35, Callable 8/1/34 @ 100 | 2,000 | 1,781 | |||||||||
4.25%, 4/15/43, Callable 10/15/42 @ 100 | 5,000 | 4,465 | |||||||||
| United Airlines Pass Through Trust 4.30%, 8/15/25 | 3,016 | 2,869 | |||||||||
2.90%, 5/1/28 | 4,394 | 3,694 | |||||||||
357,830 | |||||||||||
See notes to financial statements.
16
| USAA Mutual Funds Trust USAA Income Fund | Schedule of Portfolio Investments — continued January 31, 2023 | ||||||
(Amounts in Thousands, Except for Shares) (Unaudited)
Security Description | Principal Amount | Value | |||||||||
Information Technology (2.7%): | |||||||||||
Amphenol Corp., 2.20%, 9/15/31, Callable 6/15/31 @ 100 | $ | 8,875 | $ | 7,334 | |||||||
| Broadcom, Inc. 4.00%, 4/15/29, Callable 2/15/29 @ 100 (a) | 2,000 | 1,872 | |||||||||
2.45%, 2/15/31, Callable 11/15/30 @ 100 (a) | 8,500 | 6,981 | |||||||||
2.60%, 2/15/33, Callable 11/15/32 @ 100 (a) | 10,000 | 7,861 | |||||||||
4.93%, 5/15/37, Callable 2/15/37 @ 100 (a) | 2,000 | 1,836 | |||||||||
| Dell International LLC/EMC Corp. 5.75%, 2/1/33, Callable 11/1/32 @ 100 (g) | 700 | 700 | |||||||||
3.38%, 12/15/41, Callable 6/15/41 @ 100 (a) | 9,500 | 6,834 | |||||||||
| Global Payments, Inc. 2.90%, 11/15/31, Callable 8/15/31 @ 100 | 6,500 | 5,420 | |||||||||
5.40%, 8/15/32, Callable 5/15/32 @ 100 | 1,750 | 1,757 | |||||||||
| HP, Inc. 3.40%, 6/17/30, Callable 3/17/30 @ 100 | 10,000 | 8,861 | |||||||||
5.50%, 1/15/33, Callable 10/15/32 @ 100 | 3,000 | 2,947 | |||||||||
Jabil, Inc., 3.00%, 1/15/31, Callable 10/15/30 @ 100 | 4,776 | 4,107 | |||||||||
Marvell Technology, Inc., 2.45%, 4/15/28, Callable 2/15/28 @ 100 | 5,950 | 5,216 | |||||||||
| Microsoft Corp. 3.45%, 8/8/36, Callable 2/8/36 @ 100 | 5,000 | 4,636 | |||||||||
2.53%, 6/1/50, Callable 12/1/49 @ 100 | 2,000 | 1,426 | |||||||||
| Motorola Solutions, Inc. 2.75%, 5/24/31, Callable 2/24/31 @ 100 | 10,000 | 8,297 | |||||||||
5.60%, 6/1/32, Callable 3/1/32 @ 100 | 4,000 | 4,066 | |||||||||
| Oracle Corp. 2.95%, 4/1/30, Callable 1/1/30 @ 100 | 7,000 | 6,163 | |||||||||
3.85%, 7/15/36, Callable 1/15/36 @ 100 | 9,250 | 7,977 | |||||||||
3.60%, 4/1/50, Callable 10/1/49 @ 100 | 4,750 | 3,497 | |||||||||
Qorvo, Inc., 3.38%, 4/1/31, Callable 4/1/26 @ 101.69 (a) | 15,985 | 13,250 | |||||||||
Skyworks Solutions, Inc., 3.00%, 6/1/31, Callable 3/1/31 @ 100 | 8,800 | 7,251 | |||||||||
TSMC Arizona Corp., 2.50%, 10/25/31, Callable 7/25/31 @ 100 | 9,000 | 7,703 | |||||||||
Western Digital Corp., 3.10%, 2/1/32, Callable 11/1/31 @ 100 | 7,750 | 5,951 | |||||||||
Workday, Inc., 3.70%, 4/1/29, Callable 2/1/29 @ 100 | 3,000 | 2,830 | |||||||||
134,773 | |||||||||||
Materials (2.7%): | |||||||||||
Albemarle Corp., 4.65%, 6/1/27, Callable 5/1/27 @ 100 | 6,000 | 5,968 | |||||||||
AptarGroup, Inc., 3.60%, 3/15/32, Callable 12/15/31 @ 100 | 7,071 | 6,182 | |||||||||
Avery Dennison Corp., 2.25%, 2/15/32, Callable 11/15/31 @ 100 | 11,500 | 9,193 | |||||||||
Ball Corp., 3.13%, 9/15/31, Callable 6/15/31 @ 100 | 8,500 | 6,967 | |||||||||
Bayport Polymers LLC, 4.74%, 4/14/27, Callable 3/14/27 @ 100 (a) | 6,000 | 5,664 | |||||||||
Celanese U.S. Holdings LLC, 6.33%, 7/15/29, Callable 5/15/29 @ 100 | 2,564 | 2,604 | |||||||||
Colonial Enterprises, Inc., 3.25%, 5/15/30, Callable 2/15/30 @ 100 (a) | 4,000 | 3,583 | |||||||||
| Commercial Metals Co. 3.88%, 2/15/31, Callable 2/15/26 @ 101.94 | 4,500 | 3,915 | |||||||||
4.38%, 3/15/32, Callable 3/15/27 @ 102.19 | 2,500 | 2,199 | |||||||||
Eagle Materials, Inc., 2.50%, 7/1/31, Callable 4/1/31 @ 100 | 11,601 | 9,479 | |||||||||
| Ecolab, Inc. 2.13%, 8/15/50, Callable 2/15/50 @ 100 | 5,000 | 3,047 | |||||||||
2.70%, 12/15/51, Callable 6/15/51 @ 100 | 500 | 339 | |||||||||
See notes to financial statements.
17
| USAA Mutual Funds Trust USAA Income Fund | Schedule of Portfolio Investments — continued January 31, 2023 | ||||||
(Amounts in Thousands, Except for Shares) (Unaudited)
Security Description | Principal Amount | Value | |||||||||
| Freeport-McMoRan, Inc. 4.38%, 8/1/28, Callable 8/1/23 @ 102.19 | $ | 3,500 | $ | 3,345 | |||||||
4.63%, 8/1/30, Callable 8/1/25 @ 102.31 | 2,000 | 1,921 | |||||||||
| Glencore Funding LLC 1.63%, 4/27/26, Callable 3/27/26 @ 100 (a) | 1,500 | 1,352 | |||||||||
2.50%, 9/1/30, Callable 6/1/30 @ 100 (a) (g) | 6,500 | 5,510 | |||||||||
| LYB International Finance III LLC 3.38%, 10/1/40, Callable 4/1/40 @ 100 | 1,500 | 1,153 | |||||||||
4.20%, 5/1/50, Callable 11/1/49 @ 100 | 2,500 | 2,028 | |||||||||
Martin Marietta Materials, Inc., 2.40%, 7/15/31, Callable 4/15/31 @ 100 | 5,000 | 4,165 | |||||||||
| Monsanto Co. 3.38%, 7/15/24, Callable 4/15/24 @ 100 | 5,000 | 4,823 | |||||||||
3.95%, 4/15/45, Callable 10/15/44 @ 100 | 5,000 | 3,508 | |||||||||
NewMarket Corp., 2.70%, 3/18/31, Callable 12/18/30 @ 100 | 7,500 | 6,208 | |||||||||
Packaging Corp. of America, 3.05%, 10/1/51, Callable 4/1/51 @ 100 | 10,875 | 7,626 | |||||||||
Reliance Steel & Aluminum Co., 2.15%, 8/15/30, Callable 5/15/30 @ 100 | 9,937 | 8,232 | |||||||||
| The Dow Chemical Co. 6.30%, 3/15/33, Callable 12/15/32 @ 100 (g) | 4,000 | 4,409 | |||||||||
4.25%, 10/1/34, Callable 4/1/34 @ 100 | 4,750 | 4,453 | |||||||||
Vulcan Materials Co., 3.50%, 6/1/30, Callable 3/1/30 @ 100 | 5,000 | 4,569 | |||||||||
Worthington Industries, Inc., 4.30%, 8/1/32, Callable 5/1/32 @ 100 | 5,890 | 5,288 | |||||||||
WRKCo, Inc., 3.00%, 6/15/33, Callable 3/15/33 @ 100 | 6,000 | 5,092 | |||||||||
132,822 | |||||||||||
Real Estate (1.7%): | |||||||||||
Alexander Funding Trust, 1.84%, 11/15/23 (a) | 6,000 | 5,786 | |||||||||
Alexandria Real Estate Equities, Inc., 1.88%, 2/1/33, Callable 11/1/32 @ 100 | 4,000 | 3,096 | |||||||||
| AvalonBay Communities, Inc. 3.20%, 1/15/28, Callable 10/15/27 @ 100, MTN | 2,679 | 2,523 | |||||||||
2.45%, 1/15/31, Callable 10/17/30 @ 100, MTN | 2,000 | 1,728 | |||||||||
| Boston Properties LP 2.55%, 4/1/32, Callable 1/1/32 @ 100 | 4,000 | 3,161 | |||||||||
2.45%, 10/1/33, Callable 7/1/33 @ 100 | 5,000 | 3,805 | |||||||||
| Crown Castle, Inc. 2.25%, 1/15/31, Callable 10/15/30 @ 100 | 1,250 | 1,043 | |||||||||
2.90%, 4/1/41, Callable 10/1/40 @ 100 | 5,000 | 3,667 | |||||||||
ERP Operating LP, 2.85%, 11/1/26, Callable 8/1/26 @ 100 | 9,000 | 8,466 | |||||||||
Essex Portfolio LP, 2.65%, 3/15/32, Callable 12/15/31 @ 100 | 5,000 | 4,127 | |||||||||
| GLP Capital LP/GLP Financing II, Inc. 4.00%, 1/15/31, Callable 10/15/30 @ 100 | 4,000 | 3,542 | |||||||||
3.25%, 1/15/32, Callable 10/15/31 @ 100 | 3,617 | 3,011 | |||||||||
| Host Hotels & Resorts LP 3.38%, 12/15/29, Callable 9/15/29 @ 100 | 3,500 | 3,047 | |||||||||
3.50%, 9/15/30, Callable 6/15/30 @ 100 | 4,150 | 3,560 | |||||||||
| Hudson Pacific Properties LP 3.95%, 11/1/27, Callable 8/1/27 @ 100 | 5,000 | 4,392 | |||||||||
4.65%, 4/1/29, Callable 1/1/29 @ 100 | 1,979 | 1,720 | |||||||||
3.25%, 1/15/30, Callable 10/15/29 @ 100 | 9,629 | 7,497 | |||||||||
Kilroy Realty LP, 2.65%, 11/15/33, Callable 8/15/33 @ 100 | 8,500 | 6,140 | |||||||||
See notes to financial statements.
18
| USAA Mutual Funds Trust USAA Income Fund | Schedule of Portfolio Investments — continued January 31, 2023 | ||||||
(Amounts in Thousands, Except for Shares) (Unaudited)
Security Description | Principal Amount | Value | |||||||||
Physicians Realty LP, 4.30%, 3/15/27, Callable 12/15/26 @ 100 | $ | 5,000 | $ | 4,843 | |||||||
SBA Tower Trust, 6.60%, 1/15/28, Callable 1/15/27 @ 100 (a) | 1,158 | 1,206 | |||||||||
VICI Properties LP, 5.13%, 5/15/32, Callable 2/15/32 @ 100 | 8,000 | 7,700 | |||||||||
84,060 | |||||||||||
Utilities (4.4%): | |||||||||||
AEP Texas, Inc., 4.70%, 5/15/32, Callable 2/15/32 @ 100 | 6,000 | 5,979 | |||||||||
Alabama Power Co., 3.85%, 12/1/42 | 3,000 | 2,553 | |||||||||
| Ameren Corp. 1.75%, 3/15/28, Callable 1/15/28 @ 100 | 5,600 | 4,890 | |||||||||
3.50%, 1/15/31, Callable 10/15/30 @ 100 | 4,250 | 3,902 | |||||||||
Atmos Energy Corp., 4.13%, 10/15/44, Callable 4/15/44 @ 100 | 10,000 | 8,795 | |||||||||
Berkshire Hathaway Energy Co., 4.50%, 2/1/45, Callable 8/1/44 @ 100 | 12,000 | 11,192 | |||||||||
Black Hills Corp., 3.88%, 10/15/49, Callable 4/15/49 @ 100 | 10,000 | 7,676 | |||||||||
CenterPoint Energy, Inc., 2.65%, 6/1/31, Callable 3/1/31 @ 100 | 8,500 | 7,284 | |||||||||
Delmarva Power & Light Co., 4.15%, 5/15/45, Callable 11/15/44 @ 100 | 5,000 | 4,393 | |||||||||
Dominion Energy South Carolina, Inc., 4.10%, 6/15/46, Callable 12/15/45 @ 100 | 5,000 | 4,105 | |||||||||
Duke Energy Carolinas LLC, 3.88%, 3/15/46, Callable 9/15/45 @ 100 | 5,000 | 4,210 | |||||||||
Duke Energy Indiana LLC, 3.75%, 5/15/46, Callable 11/15/45 @ 100 | 5,000 | 4,101 | |||||||||
Duke Energy Progress LLC, 4.15%, 12/1/44, Callable 6/1/44 @ 100 | 7,000 | 6,219 | |||||||||
Duquesne Light Holdings, Inc., 2.78%, 1/7/32, Callable 10/7/31 @ 100 (a) | 3,967 | 3,228 | |||||||||
Entergy Louisiana LLC, 4.95%, 1/15/45, Callable 1/15/25 @ 100 | 7,000 | 6,613 | |||||||||
Entergy Mississippi LLC, 3.25%, 12/1/27, Callable 9/1/27 @ 100 | 5,000 | 4,657 | |||||||||
| Entergy Texas, Inc. 3.45%, 12/1/27, Callable 9/1/27 @ 100 | 8,000 | 7,559 | |||||||||
3.55%, 9/30/49, Callable 3/30/49 @ 100 | 5,000 | 3,930 | |||||||||
| Florida Power & Light Co. 3.15%, 10/1/49, Callable 4/1/49 @ 100 | 8,750 | 6,790 | |||||||||
2.88%, 12/4/51, Callable 6/4/51 @ 100 | 4,500 | 3,274 | |||||||||
Gulf Power Co., 3.30%, 5/30/27, Callable 2/28/27 @ 100 | 5,000 | 4,793 | |||||||||
IPALCO Enterprises, Inc., 4.25%, 5/1/30, Callable 2/1/30 @ 100 | 5,475 | 5,069 | |||||||||
| ITC Holdings Corp. 4.95%, 9/22/27, Callable 8/22/27 @ 100 (a) | 4,000 | 4,051 | |||||||||
3.35%, 11/15/27, Callable 8/15/27 @ 100 | 2,000 | 1,896 | |||||||||
| MidAmerican Energy Co. 3.15%, 4/15/50, Callable 10/15/49 @ 100 | 7,000 | 5,379 | |||||||||
2.70%, 8/1/52, Callable 2/1/52 @ 100 | 2,500 | 1,744 | |||||||||
Mississippi Power Co., 4.25%, 3/15/42 | 3,168 | 2,745 | |||||||||
NRG Energy, Inc., 4.45%, 6/15/29, Callable 3/15/29 @ 100 (a) | 2,907 | 2,669 | |||||||||
Oglethorpe Power Corp., 4.50%, 4/1/47, Callable 10/1/46 @ 100 (a) | 3,750 | 3,211 | |||||||||
Oncor Electric Delivery Co. LLC, 3.75%, 4/1/45, Callable 10/1/44 @ 100 | 5,000 | 4,292 | |||||||||
PECO Energy Co., 3.00%, 9/15/49, Callable 3/15/49 @ 100 | 7,000 | 5,131 | |||||||||
Potomac Electric Power Co., 4.15%, 3/15/43, Callable 9/15/42 @ 100 | 5,000 | 4,538 | |||||||||
Public Service Co. of Colorado, 2.70%, 1/15/51, Callable 7/15/50 @ 100 | 7,000 | 4,874 | |||||||||
Public Service Electric & Gas Co., 3.80%, 3/1/46, MTN, Callable 9/1/45 @ 100 | 8,000 | 6,845 | |||||||||
Rayburn Country Securitization LLC, 2.31%, 12/1/30 (a) | 5,732 | 5,202 | |||||||||
South Jersey Industries, Inc., 5.02%, 4/15/31 | 9,000 | 7,167 | |||||||||
Southwestern Public Service Co., 3.15%, 5/1/50, Callable 11/1/49 @ 100 | 10,000 | 7,460 | |||||||||
The AES Corp., 2.45%, 1/15/31, Callable 10/15/30 @ 100 | 9,000 | 7,447 | |||||||||
See notes to financial statements.
19
| USAA Mutual Funds Trust USAA Income Fund | Schedule of Portfolio Investments — continued January 31, 2023 | ||||||
(Amounts in Thousands, Except for Shares) (Unaudited)
Security Description | Principal Amount | Value | |||||||||
| Tri-State Generation & Transmission Association, Inc. 4.70%, 11/1/44, Callable 5/1/44 @ 100 | $ | 5,000 | $ | 4,093 | |||||||
4.25%, 6/1/46, Callable 12/1/45 @ 100 | 10,000 | 7,800 | |||||||||
| WEC Energy Group, Inc., 6.72% (US0003M+211bps), 5/15/67, Callable 3/13/23 @ 100 (b) | 13,000 | 11,092 | |||||||||
218,848 | |||||||||||
Total Corporate Bonds (Cost $2,537,642) | 2,278,994 | ||||||||||
Yankee Dollars (11.6%) | |||||||||||
Communication Services (0.2%): | |||||||||||
British Telecommunications PLC, 3.25%, 11/8/29, Callable 8/8/29 @ 100 (a) | 7,000 | 6,252 | |||||||||
Rogers Communications, Inc., 3.20%, 3/15/27, Callable 2/15/27 @ 100 (a) | 5,000 | 4,705 | |||||||||
10,957 | |||||||||||
Consumer Discretionary (0.9%): | |||||||||||
Ascot Group Ltd., 4.25%, 12/15/30, Callable 12/15/25 @ 100 (a) | 7,802 | 6,821 | |||||||||
Bacardi Ltd., 4.70%, 5/15/28, Callable 2/15/28 @ 100 (a) | 22,000 | 21,545 | |||||||||
GENM Capital Labuan Ltd., 3.88%, 4/19/31, Callable 1/19/31 @ 100 (a) | 8,500 | 7,008 | |||||||||
| International Game Technology PLC, 5.25%, 1/15/29, Callable 1/15/24 @ 102.63 (a) | 5,500 | 5,274 | |||||||||
Nemak SAB de CV, 3.63%, 6/28/31, Callable 3/28/31 @ 100 (a) | 7,192 | 5,786 | |||||||||
46,434 | |||||||||||
Consumer Staples (0.4%): | |||||||||||
Alimentation Couche-Tard, Inc., 2.95%, 1/25/30, Callable 10/25/29 @ 100 (a) | 9,333 | 8,160 | |||||||||
| Imperial Brands Finance PLC 4.25%, 7/21/25, Callable 4/21/25 @ 100 (a) | 5,000 | 4,872 | |||||||||
3.88%, 7/26/29, Callable 4/26/29 @ 100 (a) | 5,000 | 4,424 | |||||||||
| JBS USA LUX SA/JBS USA Food Co./JBS USA Finance, Inc., 3.00%, 2/2/29, Callable 12/2/28 @ 100 (a) | 3,250 | 2,801 | |||||||||
20,257 | |||||||||||
Energy (0.9%): | |||||||||||
Aker BP ASA, 4.00%, 1/15/31, Callable 10/15/30 @ 100 (a) | 9,250 | 8,438 | |||||||||
| BP Capital Markets PLC 4.88% (H15T5Y+440bps), Callable 3/22/30 @ 100 (b) (e) | 4,000 | 3,736 | |||||||||
4.38% (H15T5Y+404bps), Callable 6/22/25 @ 100 (b) (e) | 9,500 | 9,214 | |||||||||
Korea National Oil Corp., 2.63%, 4/18/32 (a) | 6,000 | 5,042 | |||||||||
| Petroleos Mexicanos 5.95%, 1/28/31, Callable 10/28/30 @ 100 | 6,667 | 5,334 | |||||||||
6.70%, 2/16/32, Callable 11/16/31 @ 100 | 1,500 | 1,246 | |||||||||
Shell International Finance BV, 3.63%, 8/21/42 | 7,000 | 6,033 | |||||||||
Var Energi ASA, 8.00%, 11/15/32, Callable 8/15/32 @ 100 (a) | 3,750 | 4,107 | |||||||||
43,150 | |||||||||||
Financials (6.0%): | |||||||||||
| ABN AMRO Bank NV 4.75%, 7/28/25 (a) | 6,000 | 5,893 | |||||||||
4.80%, 4/18/26 (a) | 8,000 | 7,807 | |||||||||
See notes to financial statements.
20
| USAA Mutual Funds Trust USAA Income Fund | Schedule of Portfolio Investments — continued January 31, 2023 | ||||||
(Amounts in Thousands, Except for Shares) (Unaudited)
Security Description | Principal Amount | Value | |||||||||
ANZ Bank New Zealand Ltd., 5.55%, 8/11/32, Callable 8/11/27 @ 100 (a) (g) | $ | 4,167 | $ | 4,162 | |||||||
| Banco Santander Mexico SA Institucion de Banca Multiple Grupo Financiero Santand, 5.95% (H15T5Y+300bps), 10/1/28, Callable 10/1/23 @ 100 (a) (b) | 1,000 | 1,000 | |||||||||
Bank of Montreal, 3.09% (H15T5Y+140bps), 1/10/37, Callable 1/10/32 @ 100 (b) | 6,500 | 5,280 | |||||||||
Bank of New Zealand, 1.00%, 3/3/26 (a) | 10,400 | 9,275 | |||||||||
| Barclays PLC 7.38% (H15T1Y+330bps), 11/2/28, Callable 11/2/27 @ 100 (b) | 5,000 | 5,416 | |||||||||
5.75% (H15T1Y+300bps), 8/9/33, Callable 8/9/32 @ 100 (b) | 5,000 | 5,043 | |||||||||
| BNP Paribas SA 4.38%, 5/12/26 (a) | 5,500 | 5,375 | |||||||||
4.63%, 3/13/27 (a) | 4,500 | 4,390 | |||||||||
| BPCE SA 3.50%, 10/23/27 (a) | 5,000 | 4,628 | |||||||||
3.25%, 1/11/28 (a) | 6,000 | 5,540 | |||||||||
Brookfield Finance, Inc., 4.85%, 3/29/29, Callable 12/29/28 @ 100 | 7,000 | 6,971 | |||||||||
Canadian Imperial Bank of Commerce, 7.26%, 4/10/32 (a) (g) | 2,276 | 2,634 | |||||||||
| Commonwealth Bank of Australia 2.69%, 3/11/31 (a) | 9,000 | 7,250 | |||||||||
3.78%, 3/14/32 (a) | 3,000 | 2,586 | |||||||||
| Cooperatieve Rabobank UA, 4.00% (USSW5+189bps), 4/10/29, MTN, Callable 4/10/24 @ 100 (b) | 5,000 | 4,826 | |||||||||
Credit Agricole SA, 4.13%, 1/10/27 (a) | 15,000 | 14,562 | |||||||||
| Credit Suisse Group AG 4.55%, 4/17/26 | 5,000 | 4,614 | |||||||||
3.87% (US0003M+141bps), 1/12/29, Callable 1/12/28 @ 100 (a) (b) | 4,445 | 3,790 | |||||||||
6.54% (SOFR+392bps), 8/12/33, Callable 8/12/32 @ 100 (a) (b) | 1,608 | 1,550 | |||||||||
9.02% (SOFR+502bps), 11/15/33, Callable 11/15/32 @ 100 (a) (b) | 750 | 843 | |||||||||
| Deutsche Bank AG 4.88% (USISDA05+255bps), 12/1/32, Callable 12/1/27 @ 100 (b) | 10,000 | 8,945 | |||||||||
3.74% (SOFR+226bps), 1/7/33, Callable 10/7/31 @ 100 (b) | 5,000 | 3,953 | |||||||||
HSBC Holdings PLC, 2.21% (SOFR+129bps), 8/17/29, Callable 8/17/28 @ 100 (b) | 8,500 | 7,200 | |||||||||
ING Groep NV, 3.95%, 3/29/27 | 14,100 | 13,634 | |||||||||
| Lloyds Banking Group PLC 3.75%, 1/11/27 | 9,000 | 8,579 | |||||||||
3.57% (LIBOR03M+121bps), 11/7/28, Callable 11/7/27 @ 100 (b) | 5,000 | 4,675 | |||||||||
7.95% (H15T1Y+375bps), 11/15/33, Callable 8/15/32 @ 100 (b) | 2,121 | 2,423 | |||||||||
| Macquarie Bank Ltd., 3.05% (H15T5Y+170bps), 3/3/36, Callable 3/3/31 @ 100 (a) (b) | 8,750 | 6,808 | |||||||||
| Macquarie Group Ltd., 4.10% (SOFR+213bps), 6/21/28, Callable 6/21/27 @ 100 (a) (b) | 5,000 | 4,783 | |||||||||
| Mitsubishi UFJ Financial Group, Inc., 5.02% (H15T1Y+195bps), 7/20/28, Callable 7/20/27 @ 100 (b) | 5,000 | 5,006 | |||||||||
| Mizuho Financial Group, Inc. 3.17%, 9/11/27 | 5,000 | 4,676 | |||||||||
2.56%, 9/13/31 | 5,000 | 4,015 | |||||||||
2.17% (H15T1Y+87bps), 5/22/32, Callable 5/22/31 @ 100 (b) | 5,000 | 3,975 | |||||||||
Nationwide Building Society, 4.00%, 9/14/26 (a) | 7,058 | 6,616 | |||||||||
| NatWest Group PLC 4.80%, 4/5/26 | 5,000 | 4,985 | |||||||||
5.08% (LIBOR03M+191bps), 1/27/30, Callable 1/27/29 @ 100 (b) | 6,000 | 5,914 | |||||||||
See notes to financial statements.
21
| USAA Mutual Funds Trust USAA Income Fund | Schedule of Portfolio Investments — continued January 31, 2023 | ||||||
(Amounts in Thousands, Except for Shares) (Unaudited)
Security Description | Principal Amount | Value | |||||||||
Nomura Holdings, Inc., 5.61%, 7/6/29 (g) | $ | 5,000 | $ | 5,083 | |||||||
Phoenix Group Holdings PLC, 5.38%, 7/6/27, MTN | 3,750 | 3,650 | |||||||||
| Port of Newcastle Investments Financing Pty Ltd., 5.90%, 11/24/31, Callable 8/24/31 @ 100 (a) (g) | 6,000 | 5,212 | |||||||||
| Santander UK Group Holdings PLC, 2.90% (SOFR+148bps), 3/15/32, Callable 3/15/31 @ 100 (b) | 3,000 | 2,447 | |||||||||
| Societe Generale SA 1.49% (H15T1Y+1bps), 12/14/26, Callable 12/14/25 @ 100 (a) (b) | 8,500 | 7,580 | |||||||||
6.22% (H15T1Y+320bps), 6/15/33, Callable 6/15/32 @ 100 (a) (b) | 9,000 | 8,939 | |||||||||
| Standard Chartered PLC 7.77% (H15T1Y+345bps), 11/16/28, Callable 11/16/27 @ 100 (a) (b) | 2,500 | 2,763 | |||||||||
4.87% (LIBOR03M+197bps), 3/15/33, Callable 3/15/28 @ 100 (a) (b) (g) | 7,500 | 6,900 | |||||||||
Sumitomo Mitsui Financial Group, Inc., 2.22%, 9/17/31 (g) | 8,500 | 6,925 | |||||||||
| The Bank of Nova Scotia 4.50%, 12/16/25 | 6,000 | 5,940 | |||||||||
1.30%, 9/15/26 | 7,000 | 6,209 | |||||||||
| The Toronto-Dominion Bank 2.00%, 9/10/31 | 8,500 | 6,935 | |||||||||
3.62% (USSW5+221bps), 9/15/31, Callable 9/15/26 @ 100 (b) | 10,000 | 9,440 | |||||||||
| Washington Aircraft 1 Co. DAC, Title XI (NBGA — United States Government), 2.64%, 9/15/26 | 2,323 | 2,313 | |||||||||
| Westpac Banking Corp. 4.32% (USISDA05+224bps), 11/23/31, Callable 11/23/26 @ 100 (b) | 5,000 | 4,799 | |||||||||
2.67% (H15T5Y+2bps), 11/15/35, Callable 11/15/30 @ 100 (b) | 4,000 | 3,137 | |||||||||
3.02% (H15T5Y+153bps), 11/18/36, Callable 11/18/31 @ 100 (b) | 2,000 | 1,566 | |||||||||
299,460 | |||||||||||
Health Care (0.5%): | |||||||||||
Olympus Corp., 2.14%, 12/8/26, Callable 11/8/26 @ 100 (a) | 3,939 | 3,548 | |||||||||
Smith & Nephew PLC, 2.03%, 10/14/30, Callable 7/14/30 @ 100 | 10,240 | 8,362 | |||||||||
| STERIS Irish FinCo Unlimited Co. 2.70%, 3/15/31, Callable 12/15/30 @ 100 | 3,000 | 2,567 | |||||||||
3.75%, 3/15/51, Callable 9/15/50 @ 100 | 8,000 | 6,272 | |||||||||
Teva Pharmaceutical Finance Netherlands III BV, 3.15%, 10/1/26 | 5,000 | 4,484 | |||||||||
25,233 | |||||||||||
Industrials (1.5%): | |||||||||||
| Air Canada Pass Through Trust 4.13%, 5/15/25 (a) | 14,563 | 13,478 | |||||||||
3.60%, 3/15/27 (a) | 6,707 | 6,104 | |||||||||
3.75%, 12/15/27 (a) | 4,119 | 3,644 | |||||||||
BAE Systems PLC, 3.40%, 4/15/30, Callable 1/15/30 @ 100 (a) | 3,500 | 3,215 | |||||||||
Canadian National Railway Co., 2.75%, 3/1/26, Callable 12/1/25 @ 100 | 7,000 | 6,671 | |||||||||
Canadian Pacific Railway Co., 2.45%, 12/2/31, Callable 9/2/31 @ 100 | 4,167 | 3,598 | |||||||||
CK Hutchison International 17 II Ltd., 3.25%, 9/29/27 (a) | 7,000 | 6,613 | |||||||||
| Ferguson Finance PLC 3.25%, 6/2/30, Callable 3/2/30 @ 100 (a) | 6,000 | 5,273 | |||||||||
4.65%, 4/20/32, Callable 1/20/32 @ 100 (a) | 3,000 | 2,853 | |||||||||
Rolls-Royce PLC, 3.63%, 10/14/25, Callable 7/14/25 @ 100 (a) | 5,000 | 4,666 | |||||||||
Siemens Financieringsmaatschappij NV, 3.40%, 3/16/27 (a) | 6,000 | 5,765 | |||||||||
See notes to financial statements.
22
| USAA Mutual Funds Trust USAA Income Fund | Schedule of Portfolio Investments — continued January 31, 2023 | ||||||
(Amounts in Thousands, Except for Shares) (Unaudited)
Security Description | Principal Amount | Value | |||||||||
Sydney Airport Finance Co. Pty Ltd., 3.63%, 4/28/26, Callable 1/28/26 @ 100 (a) | $ | 7,000 | $ | 6,643 | |||||||
Turkish Airlines Pass Through Trust, 4.20%, 3/15/27 (a) | 5,541 | 4,821 | |||||||||
73,344 | |||||||||||
Information Technology (0.2%): | |||||||||||
| NXP BV/NXP Funding LLC/NXP USA, Inc., 2.65%, 2/15/32, Callable 11/15/31 @ 100 | 7,000 | 5,733 | |||||||||
Open Text Corp., 6.90%, 12/1/27, Callable 11/1/27 @ 100 (a) | 1,765 | 1,809 | |||||||||
7,542 | |||||||||||
Materials (0.7%): | |||||||||||
Anglo American Capital PLC, 4.00%, 9/11/27 (a) | 6,667 | 6,424 | |||||||||
| ArcelorMittal SA 6.80%, 11/29/32, Callable 8/29/32 @ 100 | 3,250 | 3,418 | |||||||||
7.00%, 10/15/39 | 4,000 | 4,311 | |||||||||
Braskem Netherlands Finance BV, 4.50%, 1/31/30 (a) | 13,000 | 11,459 | |||||||||
CCL Industries, Inc., 3.05%, 6/1/30, Callable 3/1/30 @ 100 (a) | 7,235 | 6,161 | |||||||||
Teck Resources Ltd., 6.13%, 10/1/35 | 5,000 | 5,230 | |||||||||
37,003 | |||||||||||
Real Estate (0.1%): | |||||||||||
| Ontario Teachers' Cadillac Fairview Properties Trust, 2.50%, 10/15/31, Callable 7/15/31 @ 100 (a) | 3,000 | 2,348 | |||||||||
Utilities (0.2%): | |||||||||||
Enel Chile SA, 4.88%, 6/12/28, Callable 3/12/28 @ 100 | 5,000 | 4,939 | |||||||||
| Enel Finance International NV 2.25%, 7/12/31, Callable 4/12/31 @ 100 (a) | 5,000 | 3,891 | |||||||||
7.50%, 10/14/32, Callable 7/14/32 @ 100 (a) | 3,000 | 3,370 | |||||||||
12,200 | |||||||||||
Total Yankee Dollars (Cost $630,383) | 577,928 | ||||||||||
Municipal Bonds (8.0%) | |||||||||||
Arizona (0.1%): | |||||||||||
| City of Phoenix Civic Improvement Corp. Revenue 1.16%, 7/1/26 | 910 | 818 | |||||||||
1.59%, 7/1/29 | 1,000 | 843 | |||||||||
1.84%, 7/1/31, Continuously Callable @100 | 2,000 | 1,642 | |||||||||
3,303 | |||||||||||
California (0.6%): | |||||||||||
| City of El Cajon Revenue Series A, 2.09%, 4/1/29 | 425 | 364 | |||||||||
Series A, 2.19%, 4/1/30 | 425 | 357 | |||||||||
Series A, 2.29%, 4/1/31, Continuously Callable @100 | 550 | 454 | |||||||||
| City of Riverside Revenue Series A, 2.49%, 6/1/26 | 1,800 | 1,687 | |||||||||
Series A, 2.64%, 6/1/27 | 1,400 | 1,294 | |||||||||
San Jose Financing Authority Revenue, 1.71%, 6/1/28 | 2,000 | 1,694 | |||||||||
See notes to financial statements.
23
| USAA Mutual Funds Trust USAA Income Fund | Schedule of Portfolio Investments — continued January 31, 2023 | ||||||
(Amounts in Thousands, Except for Shares) (Unaudited)
Security Description | Principal Amount | Value | |||||||||
| San Jose Redevelopment Agency Successor Agency Tax Allocation, Series A-T, 3.13%, 8/1/28, Continuously Callable @100 | $ | 10,000 | $ | 9,385 | |||||||
| San Marcos Redevelopment Agency Successor Agency Tax Allocation Series B, 4.02%, 10/1/25 | 5,250 | 5,130 | |||||||||
Series B, 4.47%, 10/1/29 | 6,500 | 6,310 | |||||||||
| Vista Redevelopment Agency Successor Agency Tax Allocation (INS — Assured Guaranty Municipal Corp.), Series A, 4.13%, 9/1/30, Continuously Callable @100 | 2,590 | 2,463 | |||||||||
29,138 | |||||||||||
Colorado (0.3%): | |||||||||||
| City & County of Denver Co. Airport System Revenue Series C, 2.14%, 11/15/29 | 4,500 | 3,871 | |||||||||
Series C, 2.24%, 11/15/30 | 5,000 | 4,237 | |||||||||
County of El Paso Revenue, 4.47%, 10/1/35 | 5,000 | 4,699 | |||||||||
12,807 | |||||||||||
Connecticut (0.5%): | |||||||||||
City of Bridgeport, GO, Series A, 4.08%, 8/15/29, Continuously Callable @100 | 7,380 | 7,157 | |||||||||
City of New Haven, GO, Series B, 4.68%, 8/1/31, Continuously Callable @100 | 10,000 | 9,883 | |||||||||
| State of Connecticut, GO Series A, 2.35%, 7/1/26 | 2,415 | 2,266 | |||||||||
Series A, 3.43%, 4/15/28 | 1,500 | 1,438 | |||||||||
Series A, 2.55%, 7/1/28 | 2,000 | 1,830 | |||||||||
Town of Hamden, GO, 4.93%, 8/15/30, Continuously Callable @100 | 3,845 | 3,654 | |||||||||
26,228 | |||||||||||
Florida (0.7%): | |||||||||||
| County of Broward Florida Airport System Revenue, Series C, 2.91%, 10/1/32, Continuously Callable @100 | 9,500 | 8,175 | |||||||||
| County of Miami-Dade Aviation Revenue, Series B, 3.38%, 10/1/30, Continuously Callable @100 | 2,500 | 2,288 | |||||||||
| County of Miami-Dade Seaport Department Revenue, Series B-3, 2.34%, 10/1/33, Continuously Callable @100 | 3,300 | 2,570 | |||||||||
| Florida Development Finance Corp. Revenue, Series B, 3.22%, 2/1/32, Continuously Callable @100 | 4,080 | 3,526 | |||||||||
Hillsborough County IDA Revenue, 3.58%, 8/1/35, Continuously Callable @100 | 13,500 | 11,915 | |||||||||
| Hillsborough County School Board Certificate of Participation, Series B, 1.92%, 7/1/25 | 4,250 | 3,991 | |||||||||
| St. Johns County IDA Revenue (INS — Assured Guaranty Municipal Corp.), Series B, 2.54%, 10/1/30, Continuously Callable @100 | 2,500 | 2,102 | |||||||||
34,567 | |||||||||||
Georgia (0.3%): | |||||||||||
| Athens Housing Authority Revenue 2.54%, 12/1/27 | 3,405 | 3,116 | |||||||||
2.59%, 12/1/28 | 4,585 | 4,124 | |||||||||
| Atlanta & Fulton County Recreation Authority Revenue 3.80%, 12/15/37 | 2,000 | 1,781 | |||||||||
4.00%, 12/15/46 | 1,500 | 1,292 | |||||||||
See notes to financial statements.
24
| USAA Mutual Funds Trust USAA Income Fund | Schedule of Portfolio Investments — continued January 31, 2023 | ||||||
(Amounts in Thousands, Except for Shares) (Unaudited)
Security Description | Principal Amount | Value | |||||||||
| City of Atlanta GA Water & Wastewater Revenue, 2.26%, 11/1/35, Continuously Callable @100 | $ | 2,500 | $ | 2,041 | |||||||
Savannah Hospital Authority Revenue, Series B, 3.99%, 7/1/38 | 5,000 | 3,986 | |||||||||
16,340 | |||||||||||
Hawaii (0.2%): | |||||||||||
State of Hawaii Airports System Revenue, Series E, 1.81%, 7/1/27 | 1,370 | 1,196 | |||||||||
| State of Hawaii Department of Business Economic Development & Tourism Revenue, Series A-2, 3.24%, 1/1/31 | 10,725 | 10,115 | |||||||||
11,311 | |||||||||||
Idaho (0.1%): | |||||||||||
| Idaho State Building Authority Revenue Series A, 3.78%, 9/1/30, Continuously Callable @100 | 2,500 | 2,370 | |||||||||
Series A, 3.93%, 9/1/31, Continuously Callable @100 | 2,120 | 2,016 | |||||||||
Series A, 3.98%, 9/1/32, Continuously Callable @100 | 2,000 | 1,894 | |||||||||
6,280 | |||||||||||
Illinois (0.4%): | |||||||||||
Chicago O'hare International Airport Revenue, Series D, 2.17%, 1/1/28 | 3,000 | 2,676 | |||||||||
City of Chicago Wastewater Transmission Revenue, 5.84%, 1/1/35 | 6,500 | 6,886 | |||||||||
| Illinois Finance Authority Revenue 3.55%, 8/15/29 | 2,025 | 1,855 | |||||||||
3.60%, 8/15/30 | 3,000 | 2,732 | |||||||||
| State of Illinois Sales Tax Revenue Series B, 2.51%, 6/15/32, Continuously Callable @100 | 2,000 | 1,612 | |||||||||
Series B, 2.66%, 6/15/33, Continuously Callable @100 | 1,500 | 1,201 | |||||||||
| Winnebago & Boone Counties School District No. 205 Rockford, GO, 3.80%, 12/1/26, Continuously Callable @100 | 4,500 | 4,375 | |||||||||
21,337 | |||||||||||
Indiana (0.2%): | |||||||||||
| Indiana Finance Authority Revenue Series A, 3.62%, 7/1/36 | 1,500 | 1,319 | |||||||||
Series C, 4.36%, 7/15/29 | 4,955 | 4,949 | |||||||||
Series C, 4.53%, 7/15/31 | 4,260 | 4,270 | |||||||||
10,538 | |||||||||||
Kansas (0.0%): (f) | |||||||||||
| Wyandotte County-Kansas City Unified Government Utility System Revenue, Series B, 1.66%, 9/1/27 | 2,000 | 1,775 | |||||||||
Louisiana (0.2%): | |||||||||||
| Louisiana Local Government Environmental Facilities & Community Development Authority Revenue 1.55%, 2/1/27 | 2,005 | 1,791 | |||||||||
Series A, 4.48%, 8/1/39 | 3,775 | 3,670 | |||||||||
Louisiana Public Facilities Authority Revenue, 2.28%, 6/1/30 | 3,500 | 2,865 | |||||||||
8,326 | |||||||||||
See notes to financial statements.
25
| USAA Mutual Funds Trust USAA Income Fund | Schedule of Portfolio Investments — continued January 31, 2023 | ||||||
(Amounts in Thousands, Except for Shares) (Unaudited)
Security Description | Principal Amount | Value | |||||||||
Maryland (0.4%): | |||||||||||
| Maryland Economic Development Corp. Revenue Series B, 4.05%, 6/1/27 | $ | 2,290 | $ | 2,170 | |||||||
Series B, 4.15%, 6/1/28 | 2,390 | 2,243 | |||||||||
Series B, 4.25%, 6/1/29 | 2,495 | 2,321 | |||||||||
Series B, 4.35%, 6/1/30 | 1,325 | 1,227 | |||||||||
Series B, 4.40%, 6/1/31 | 1,385 | 1,274 | |||||||||
| Maryland Stadium Authority Revenue Series C, 2.33%, 5/1/34 | 3,010 | 2,388 | |||||||||
Series C, 2.36%, 5/1/35 | 3,050 | 2,382 | |||||||||
Series C, 2.81%, 5/1/40 | 7,000 | 5,489 | |||||||||
19,494 | |||||||||||
Massachusetts (0.1%): | |||||||||||
| Massachusetts School Building Authority Revenue, Series B, 2.97%, 10/15/32, Continuously Callable @100 | 6,500 | 5,697 | |||||||||
Michigan (0.2%): | |||||||||||
Michigan Finance Authority Revenue, 3.08%, 12/1/34 | 13,000 | 11,270 | |||||||||
Missouri (0.1%): | |||||||||||
| The Curators of the University of Missouri, 2.01%, 11/1/27, Continuously Callable @100 | 3,000 | 2,695 | |||||||||
New Jersey (0.6%): | |||||||||||
| City of Atlantic, GO Series A, 4.23%, 9/1/25 | 2,525 | 2,455 | |||||||||
Series A, 4.29%, 9/1/26 | 2,415 | 2,333 | |||||||||
| New Jersey Economic Development Authority Revenue Series C, 5.71%, 6/15/30 | 2,500 | 2,542 | |||||||||
Series NNN, 3.77%, 6/15/31 | 10,000 | 9,088 | |||||||||
New Jersey Educational Facilities Authority Revenue, Series E, 4.02%, 7/1/39 | 3,000 | 2,417 | |||||||||
New Jersey Transportation Trust Fund Authority Revenue, 4.08%, 6/15/39 | 3,845 | 3,404 | |||||||||
| New Jersey Transportation Trust Fund Authority Revenue, Build America Bond, Series C, 5.75%, 12/15/28 | 1,810 | 1,855 | |||||||||
Rutgers The State University of New Jersey Revenue, Series S, 1.91%, 5/1/31 | 2,750 | 2,211 | |||||||||
South Jersey Transportation Authority Revenue, Series B, 2.38%, 11/1/27 | 1,030 | 910 | |||||||||
27,215 | |||||||||||
New York (0.5%): | |||||||||||
| Long Island Power Authority Revenue Series B, 3.98%, 9/1/25 | 2,500 | 2,443 | |||||||||
Series B, 4.13%, 9/1/26 | 2,500 | 2,434 | |||||||||
| New York State Dormitory Authority Revenue Series A, 2.46%, 7/1/32 | 9,250 | 7,658 | |||||||||
Series A, 2.51%, 7/1/33 | 5,000 | 4,079 | |||||||||
Series B, 2.83%, 7/1/31 | 5,000 | 4,346 | |||||||||
| New York State Urban Development Corp. Revenue 1.88%, 3/15/30 | 2,600 | 2,182 | |||||||||
2.03%, 3/15/31, Continuously Callable @100 | 3,500 | 2,902 | |||||||||
26,044 | |||||||||||
See notes to financial statements.
26
| USAA Mutual Funds Trust USAA Income Fund | Schedule of Portfolio Investments — continued January 31, 2023 | ||||||
(Amounts in Thousands, Except for Shares) (Unaudited)
Security Description | Principal Amount | Value | |||||||||
Ohio (0.1%): | |||||||||||
| Cleveland Department of Public Utilities Division of Public Power Revenue, 5.50%, 11/15/38, Pre-refunded 11/15/24 @ 100 | $ | 5,000 | $ | 5,074 | |||||||
Oklahoma (0.2%): | |||||||||||
Oklahoma Development Finance Authority Revenue, Series C, 5.45%, 8/15/28 | 9,750 | 7,999 | |||||||||
| The University of Oklahoma Revenue Series C, 2.15%, 7/1/30 | 750 | 625 | |||||||||
Series C, 2.30%, 7/1/31, Continuously Callable @100 | 1,000 | 823 | |||||||||
9,447 | |||||||||||
Pennsylvania (0.9%): | |||||||||||
City of Pittsburgh, GO, Series B, 1.19%, 9/1/26 | 4,000 | 3,586 | |||||||||
Commonwealth Financing Authority Revenue, Series A, 3.86%, 6/1/38 | 5,045 | 4,622 | |||||||||
| Pennsylvania Economic Development Financing Authority Revenue, Series B, 3.20%, 11/15/27 | 1,375 | 1,276 | |||||||||
Pennsylvania Higher Educational Facilities Authority Revenue, 3.73%, 7/15/43 | 3,000 | 2,236 | |||||||||
Pennsylvania IDA Revenue, 3.56%, 7/1/24 (a) | 3,743 | 3,686 | |||||||||
| Public Parking Authority of Pittsburgh Revenue 2.33%, 12/1/29 | 895 | 764 | |||||||||
2.58%, 12/1/31, Continuously Callable @100 | 825 | 691 | |||||||||
| Scranton School District, GO Series A, 3.15%, 6/15/34, (Put Date 6/15/24) (a) (h) | 2,800 | 2,743 | |||||||||
Series B, 3.15%, 6/15/34, (Put Date 6/15/24) (a) (h) | 1,410 | 1,381 | |||||||||
| Scranton School District, GO (INS — Build America Mutual Assurance Co.) 3.05%, 4/1/29 | 800 | 733 | |||||||||
3.10%, 4/1/30 | 950 | 861 | |||||||||
3.15%, 4/1/31 | 250 | 224 | |||||||||
| State Public School Building Authority Revenue 3.05%, 4/1/28 | 2,000 | 1,844 | |||||||||
3.15%, 4/1/30 | 6,460 | 5,751 | |||||||||
| State Public School Building Authority Revenue (INS — Build America Mutual Assurance Co.), Series B-1, 4.08%, 12/1/23 | 1,300 | 1,287 | |||||||||
The School District of Philadelphia, GO, 5.06%, 9/1/42 | 10,000 | 9,202 | |||||||||
| University of Pittsburgh-of the Commonwealth System of Higher Education Revenue Series C, 2.53%, 9/15/31 | 2,000 | 1,735 | |||||||||
Series C, 2.58%, 9/15/32 | 1,000 | 856 | |||||||||
Series C, 2.63%, 9/15/33 | 2,000 | 1,693 | |||||||||
45,171 | |||||||||||
Tennessee (0.3%): | |||||||||||
| Jackson Energy Authority Revenue 3.05%, 4/1/23 | 2,745 | 2,737 | |||||||||
Series E, 3.20%, 4/1/24, Continuously Callable @100 | 3,915 | 3,850 | |||||||||
| Metropolitan Government Nashville & Davidson County Health & Educational Facilities Board Revenue, Series B, 4.05%, 7/1/26, Continuously Callable @100 | 8,000 | 7,734 | |||||||||
14,321 | |||||||||||
See notes to financial statements.
27
| USAA Mutual Funds Trust USAA Income Fund | Schedule of Portfolio Investments — continued January 31, 2023 | ||||||
(Amounts in Thousands, Except for Shares) (Unaudited)
Security Description | Principal Amount | Value | |||||||||
Texas (0.8%): | |||||||||||
| Central Texas Regional Mobility Authority Revenue Series C, 1.74%, 1/1/26 | $ | 1,000 | $ | 930 | |||||||
Series C, 1.84%, 1/1/27 | 1,000 | 908 | |||||||||
Series C, 2.09%, 1/1/28 | 1,000 | 893 | |||||||||
| City of Corpus Christi TX Utility System Revenue Series B, 1.49%, 7/15/27 | 2,000 | 1,771 | |||||||||
Series B, 1.71%, 7/15/28 | 2,220 | 1,931 | |||||||||
City of Houston TX Combined Utility System Revenue, Series D, 1.62%, 11/15/30 | 2,250 | 1,833 | |||||||||
County of Bexar Revenue, 2.53%, 8/15/34, Continuously Callable @100 | 2,800 | 2,197 | |||||||||
| Dallas Fort Worth International Airport Revenue Series C, 1.65%, 11/1/26 | 1,500 | 1,358 | |||||||||
Series C, 1.95%, 11/1/28 | 1,000 | 870 | |||||||||
Series C, 2.05%, 11/1/29 | 1,250 | 1,075 | |||||||||
Series C, 2.10%, 11/1/30 | 1,000 | 838 | |||||||||
| Harris County Cultural Education Facilities Finance Corp. Revenue 3.34%, 11/15/37 | 2,000 | 1,690 | |||||||||
Series B, 2.17%, 5/15/23 | 1,000 | 991 | |||||||||
Series B, 2.57%, 5/15/26 | 1,000 | 927 | |||||||||
Series D, 2.28%, 7/1/34 | 6,785 | 5,125 | |||||||||
| McLennan County Public Facility Corp. Revenue, 3.90%, 6/1/29, Continuously Callable @100 | 2,000 | 1,920 | |||||||||
Port of Corpus Christi Authority of Nueces County Revenue, 3.49%, 12/1/25 | 1,000 | 971 | |||||||||
| San Antonio Education Facilities Corp. Revenue 2.38%, 4/1/28 | 1,500 | 1,276 | |||||||||
2.65%, 4/1/30 | 1,150 | 939 | |||||||||
2.73%, 4/1/31 | 750 | 601 | |||||||||
| Tarrant County Cultural Education Facilities Finance Corp. Revenue 2.08%, 9/1/28 | 600 | 522 | |||||||||
2.57%, 9/1/32, Continuously Callable @100 | 1,000 | 820 | |||||||||
2.69%, 9/1/33, Continuously Callable @100 | 1,000 | 813 | |||||||||
| Texas Public Finance Authority Revenue 1.62%, 2/1/31 | 2,000 | 1,616 | |||||||||
1.78%, 2/1/32, Continuously Callable @100 | 1,500 | 1,196 | |||||||||
Texas Tech University System Revenue, 1.55%, 2/15/28 | 2,000 | 1,745 | |||||||||
| Waco Educational Finance Corp. Revenue 1.53%, 3/1/27 | 1,340 | 1,193 | |||||||||
1.69%, 3/1/28 | 1,500 | 1,305 | |||||||||
2.06%, 3/1/31, Continuously Callable @100 | 1,500 | 1,228 | |||||||||
39,482 | |||||||||||
Washington (0.1%): | |||||||||||
| Washington State University Revenue Series A, 2.24%, 10/1/28 | 1,800 | 1,573 | |||||||||
Series A, 2.31%, 10/1/29 | 5,915 | 5,068 | |||||||||
6,641 | |||||||||||
Wisconsin (0.1%): | |||||||||||
Public Finance Authority Revenue, Series WI, 3.63%, 6/1/51 | 6,575 | 4,420 | |||||||||
Total Municipal Bonds (Cost $447,216) | 398,921 | ||||||||||
See notes to financial statements.
28
| USAA Mutual Funds Trust USAA Income Fund | Schedule of Portfolio Investments — continued January 31, 2023 | ||||||
(Amounts in Thousands, Except for Shares) (Unaudited)
Security Description | Principal Amount | Value | |||||||||
U.S. Government Agency Mortgages (3.2%) | |||||||||||
| Federal Home Loan Mortgage Corp. Series K045, Class A2, 3.02%, 1/25/25 | $ | 9,110 | $ | 8,846 | |||||||
Series KPLB, Class A, 2.77%, 5/25/25 | 17,000 | 16,376 | |||||||||
Series KIR1, Class A2, 2.85%, 3/25/26 | 12,000 | 11,518 | |||||||||
Series S8FX, Class A1, 3.02%, 3/25/27 | 11,911 | 11,551 | |||||||||
Series K068, Class A2, 3.24%, 8/25/27 | 4,533 | 4,385 | |||||||||
Series K075, Class A2, 3.65%, 2/25/28 (c) | 3,000 | 2,951 | |||||||||
Series K095, Class A2, 2.79%, 6/25/29 | 8,750 | 8,141 | |||||||||
Series K097, Class A2, 2.51%, 7/25/29 | 8,000 | 7,307 | |||||||||
Series K096, Class A2, 2.52%, 7/25/29 | 9,000 | 8,231 | |||||||||
Series KG02, Class A2, 2.41%, 8/25/29 | 9,091 | 8,244 | |||||||||
Series K100, Class A2, 2.67%, 9/25/29 | 5,455 | 5,022 | |||||||||
5.50%, 12/1/35 – 4/1/36 | 388 | 405 | |||||||||
3.50%, 5/1/42 – 5/1/47 | 8,041 | 7,730 | |||||||||
5.00%, 9/1/52 | 4,824 | 4,841 | |||||||||
105,548 | |||||||||||
| Federal National Mortgage Association Series 2017-M15, Class AV2, 2.56%, 11/25/24 (c) | 2,878 | 2,806 | |||||||||
Series 2017-M2, Class A2, 2.77%, 2/25/27 (c) | 2,281 | 2,178 | |||||||||
Series 2017-M7, Class A2, 2.96%, 2/25/27 (c) | 2,192 | 2,101 | |||||||||
2.50%, 2/1/28-11/1/34 | 4,897 | 4,636 | |||||||||
Series 2018-M4, Class A2, 3.06%, 3/25/28 (c) | 6,361 | 6,112 | |||||||||
6.50%, 4/1/31 – 3/1/32 | 240 | 258 | |||||||||
5.00%, 6/1/33 | 535 | 547 | |||||||||
5.50%, 9/1/35 – 5/1/38 | 2,799 | 2,924 | |||||||||
6.00%, 5/1/36 – 8/1/37 | 1,009 | 1,075 | |||||||||
3.50%, 4/1/48 – 2/1/50 | 10,719 | 10,202 | |||||||||
4.00%, 4/1/48 – 2/1/50 | 11,154 | 10,915 | |||||||||
3.00%, 2/1/50 | 4,878 | 4,488 | |||||||||
48,242 | |||||||||||
| Government National Mortgage Association 7.00%, 5/15/23 – 7/15/32 | 293 | 305 | |||||||||
6.50%, 6/15/23 – 10/15/31 | 365 | 380 | |||||||||
7.50%, 6/15/26 – 8/15/29 | 164 | 170 | |||||||||
6.00%, 9/15/28 – 1/15/33 | 1,011 | 1,044 | |||||||||
5.50%, 4/20/33 | 183 | 192 | |||||||||
5.00%, 8/15/33 | 1,100 | 1,132 | |||||||||
3,223 | |||||||||||
157,013 | |||||||||||
Total U.S. Government Agency Mortgages (Cost $168,463) | 157,013 | ||||||||||
U.S. Treasury Obligations (17.6%) | |||||||||||
| U.S. Treasury Bonds 1.13%, 5/15/40 | 10,000 | 6,664 | |||||||||
3.88%, 8/15/40 | 15,000 | 15,445 | |||||||||
1.38%, 11/15/40 | 30,000 | 20,742 | |||||||||
See notes to financial statements.
29
| USAA Mutual Funds Trust USAA Income Fund | Schedule of Portfolio Investments — continued January 31, 2023 | ||||||
(Amounts in Thousands, Except for Shares) (Unaudited)
Security Description | Principal Amount | Value | |||||||||
1.88%, 2/15/41 | $ | 9,000 | $ | 6,760 | |||||||
2.25%, 5/15/41 | 40,000 | 31,887 | |||||||||
2.75%, 8/15/42 | 55,000 | 47,076 | |||||||||
2.75%, 11/15/42 | 10,000 | 8,541 | |||||||||
3.13%, 2/15/43 | 20,000 | 18,134 | |||||||||
2.88%, 5/15/43 | 10,000 | 8,702 | |||||||||
3.38%, 5/15/44 | 5,000 | 4,692 | |||||||||
3.00%, 11/15/44 | 25,000 | 22,047 | |||||||||
2.50%, 2/15/45 | 55,000 | 44,344 | |||||||||
2.50%, 2/15/46 | 15,000 | 12,052 | |||||||||
2.25%, 8/15/46 | 42,950 | 32,796 | |||||||||
2.88%, 11/15/46 | 10,000 | 8,609 | |||||||||
2.75%, 11/15/47 | 12,000 | 10,086 | |||||||||
3.13%, 5/15/48 | 10,000 | 9,027 | |||||||||
3.38%, 11/15/48 | 10,000 | 9,452 | |||||||||
3.00%, 2/15/49 | 10,000 | 8,845 | |||||||||
1.25%, 5/15/50 | 30,000 | 17,634 | |||||||||
1.63%, 11/15/50 | 35,000 | 22,652 | |||||||||
| U.S. Treasury Inflation Indexed Bonds 2.38%, 1/15/25 | 63,178 | 63,451 | |||||||||
0.88%, 1/15/29 | 11,791 | 11,474 | |||||||||
| U.S. Treasury Notes 0.13%, 7/15/23 | 10,000 | 9,793 | |||||||||
0.25%, 9/30/23 | 60,000 | 58,235 | |||||||||
0.13%, 10/15/23 | 20,000 | 19,359 | |||||||||
0.13%, 12/15/23 | 50,000 | 48,033 | |||||||||
2.50%, 5/15/24 | 5,000 | 4,867 | |||||||||
3.00%, 7/31/24 | 25,000 | 24,460 | |||||||||
2.50%, 1/31/25 | 5,000 | 4,838 | |||||||||
2.00%, 2/15/25 | 70,000 | 67,031 | |||||||||
2.75%, 5/15/25 | 20,000 | 19,427 | |||||||||
0.38%, 1/31/26 | 30,000 | 27,070 | |||||||||
1.63%, 2/15/26 | 30,000 | 28,080 | |||||||||
0.75%, 8/31/26 | 5,000 | 4,498 | |||||||||
2.38%, 5/15/27 | 10,000 | 9,487 | |||||||||
0.50%, 10/31/27 | 30,000 | 25,929 | |||||||||
1.25%, 3/31/28 | 25,000 | 22,236 | |||||||||
1.25%, 9/30/28 | 25,000 | 22,002 | |||||||||
2.38%, 3/31/29 | 20,000 | 18,655 | |||||||||
4.13%, 11/15/32 | 20,000 | 21,050 | |||||||||
Total U.S. Treasury Obligations (Cost $969,146) | 876,162 | ||||||||||
Commercial Paper (0.7%) (i) | |||||||||||
Alliant Energy, 4.57%, 2/2/23 (a) | 10,000 | 9,998 | |||||||||
Cabot Corp., 4.54%, 2/1/23 (a) | 5,000 | 4,999 | |||||||||
CenterPoint Energy Resources Corp., 4.56%, 2/1/23 (a) | 10,000 | 9,999 | |||||||||
Southwestern Public Service Co., 4.57%, 2/2/23 (a) | 10,147 | 10,144 | |||||||||
Total Commercial Paper (Cost $35,144) | 35,140 | ||||||||||
See notes to financial statements.
30
| USAA Mutual Funds Trust USAA Income Fund | Schedule of Portfolio Investments — continued January 31, 2023 | ||||||
(Amounts in Thousands, Except for Shares) (Unaudited)
Security Description | Shares | Value | |||||||||
Collateral for Securities Loaned (0.7%)^ | |||||||||||
| Goldman Sachs Financial Square Government Fund, Institutional Shares, 4.22% (j) | 8,035,672 | $ | 8,036 | ||||||||
HSBC U.S. Government Money Market Fund, Institutional Shares, 4.21% (j) | 8,035,672 | 8,035 | |||||||||
Invesco Government & Agency Portfolio, Institutional Shares, 4.31% (j) | 8,035,672 | 8,036 | |||||||||
| Morgan Stanley Institutional Liquidity Government Portfolio, Institutional Shares, 4.14% (j) | 8,035,672 | 8,036 | |||||||||
Total Collateral for Securities Loaned (Cost $32,143) | 32,143 | ||||||||||
Total Investments (Cost $5,465,879) — 99.9% | 4,965,807 | ||||||||||
Other assets in excess of liabilities — 0.1% | 5,605 | ||||||||||
NET ASSETS — 100.00% | $ | 4,971,412 | |||||||||
At January 31, 2023, the Fund's investments in foreign securities were 12.0% of net assets.
^ Purchased with cash collateral from securities on loan.
(a) Rule 144A security or other security that is restricted as to resale to institutional investors. As of January 31, 2023, the fair value of these securities was $1,199,420 thousands and amounted to 24.1% of net assets.
(b) Variable or Floating-Rate Security. Rate disclosed is as of January 31, 2023.
(c) The rate for certain asset-backed and mortgage-backed securities may vary based on factors relating to the pool of assets underlying the security. The rate disclosed is the rate in effect at January 31, 2023.
(d) Security is interest only.
(e) Security is perpetual and has no final maturity date but may be subject to calls at various dates in the future.
(f) Amount represents less than 0.05% of net assets.
(g) All or a portion of this security is on loan.
(h) Put Bond.
(i) Rate represents the effective yield at January 31, 2023.
(j) Rate disclosed is the daily yield on January 31, 2023.
bps — Basis points
Continuously callable — Investment is continuously callable or will be continuously callable on any date after the first call date until its maturity.
GO — General Obligation
H15T1Y — 1 Year Treasury Constant Maturity Rate
H15T5Y — 5 Year Treasury Constant Maturity Rate
IDA — Industrial Development Authority
LIBOR — London Interbank Offered Rate
See notes to financial statements.
31
| USAA Mutual Funds Trust USAA Income Fund | Schedule of Portfolio Investments — continued January 31, 2023 | ||||||
(Unaudited)
LIBOR01M — 1 Month US Dollar LIBOR, rate disclosed as of January 31, 2023, based on the last reset date of the security
LIBOR03M — 3 Month US Dollar LIBOR, rate disclosed as of January 31, 2023, based on the last reset date of the security
LLC — Limited Liability Company
LP — Limited Partnership
MTN — Medium Term Note
PLC — Public Limited Company
SOFR — Secured Overnight Financing Rate
Title XI — The Title XI Guarantee Program provides a guarantee of payment of principal and interest of debt obligations issued by U.S. merchant marine and U.S. shipyards by enabling owners of eligible vessels and shipyards to obtain financing at attractive terms. The guarantee carries the full faith and credit of the U.S. government.
TSFR1M — 1 month Term SOFR, rate disclosed as of January 31, 2023.
TSFR3M — 3 month Term SOFR, rate disclosed as of January 31, 2023.
US0003M — 3 Month US Dollar LIBOR, rate disclosed as of January 31, 2023, based on the last reset date of the security
USISDA05 — 5 Year ICE Swap Rate, rate disclosed as of January 31, 2023.
USSW5 — USD 5 Year Swap Rate, rate disclosed as of January 31, 2023.
Credit Enhancements — Adds the financial strength of the provider of the enhancement to support the issuer's ability to repay the principal and interest payments when due. The enhancement may be provided by a high-quality bank, insurance company or other corporation, or a collateral trust. The enhancements do not guarantee the market values of the securities.
INS Principal and interest payments are insured by the name listed. Although bond insurance reduces the risk of loss due to default by an issuer, such bonds remain subject to the risk that value may fluctuate for other reasons, and there is no assurance that the insurance company will meet its obligations.
NBGA Principal and interest payments or, under certain circumstances, underlying mortgages are guaranteed by a nonbank guaranteed agreement from the name listed.
See notes to financial statements.
32
USAA Mutual Funds Trust | Statement of Assets and Liabilities January 31, 2023 | ||||||
(Amounts in Thousands, Except Per Share Amounts) (Unaudited)
| USAA Income Fund | |||||||
Assets: | |||||||
Investments, at value (Cost $5,465,879) | $ | 4,965,807 | (a) | ||||
Foreign currency, at value (Cost $366) | 366 | ||||||
Deposit with broker for futures contracts | 2,168 | ||||||
Receivables: | |||||||
Interest and dividends | 43,584 | ||||||
Capital shares issued | 3,181 | ||||||
Investments sold | 476 | ||||||
From Adviser | 70 | ||||||
Prepaid expenses | 45 | ||||||
Total Assets | 5,015,697 | ||||||
Liabilities: | |||||||
Payables: | |||||||
Collateral received on loaned securities | 32,143 | ||||||
Investments purchased | 6,635 | ||||||
Capital shares redeemed | 3,049 | ||||||
Accrued expenses and other payables: | |||||||
Investment advisory fees | 1,244 | ||||||
Administration fees | 518 | ||||||
Custodian fees | 41 | ||||||
Transfer agent fees | 452 | ||||||
Compliance fees | 4 | ||||||
| 12b-1 fees | 6 | ||||||
Other accrued expenses | 193 | ||||||
Total Liabilities | 44,285 | ||||||
Net Assets: | |||||||
Capital | 5,506,775 | ||||||
Total accumulated earnings/(loss) | (535,363 | ) | |||||
Net Assets | $ | 4,971,412 | |||||
Net Assets | |||||||
Fund Shares | $ | 2,303,965 | |||||
Institutional Shares | 2,607,897 | ||||||
Class A | 53,743 | ||||||
R6 Shares | 5,807 | ||||||
Total | $ | 4,971,412 | |||||
Shares (unlimited number of shares authorized with no par value): | |||||||
Fund Shares | 200,146 | ||||||
Institutional Shares | 226,701 | ||||||
Class A | 4,685 | ||||||
R6 Shares | 504 | ||||||
Total | 432,036 | ||||||
Net asset value, offering and redemption price per share: (b) | |||||||
Fund Shares | $ | 11.51 | |||||
Institutional Shares | 11.50 | ||||||
Class A | 11.47 | ||||||
R6 Shares | 11.51 | ||||||
Maximum Sales Charge — Class A | 2.25 | % | |||||
| Maximum offering price (100%/(100%-maximum sales charge) of net asset value adjusted to the nearest cent) per share — Class A | $ | 11.74 | |||||
(a) Includes $31,104 thousand of securities on loan.
(b) Per share amount may not recalculate due to rounding of net assets and/or shares outstanding.
See notes to financial statements.
33
USAA Mutual Funds Trust | Statement of Operations For the Six Months Ended January 31, 2023 | ||||||
(Amounts in Thousands) (Unaudited)
| USAA Income Fund | |||||||
Investment Income: | |||||||
Dividends | $ | 1,835 | |||||
Interest | 95,506 | ||||||
Securities lending (net of fees) | 239 | ||||||
Total Income | 97,580 | ||||||
Expenses: | |||||||
Investment advisory fees | 7,803 | ||||||
Administration fees — Fund Shares | 1,747 | ||||||
Administration fees — Institutional Shares | 1,320 | ||||||
Administration fees — Class A | 41 | ||||||
Administration fees — R6 Shares | 2 | ||||||
Sub-Administration fees | 14 | ||||||
| 12b-1 fees — Class A | 68 | ||||||
Custodian fees | 111 | ||||||
Transfer agent fees — Fund Shares | 1,330 | ||||||
Transfer agent fees — Institutional Shares | 1,320 | ||||||
Transfer agent fees — Class A | 27 | ||||||
Transfer agent fees — R6 Shares | — | (a) | |||||
Trustees' fees | 25 | ||||||
Compliance fees | 25 | ||||||
Legal and audit fees | 53 | ||||||
State registration and filing fees | 84 | ||||||
Other expenses | 335 | ||||||
Total Expenses | 14,305 | ||||||
Expenses waived/reimbursed by Adviser | (197 | ) | |||||
Net Expenses | 14,108 | ||||||
Net Investment Income (Loss) | 83,472 | ||||||
Realized/Unrealized Gains (Losses) from Investments: | |||||||
| Net realized gains (losses) from investment securities and foreign currency transactions | (40,964 | ) | |||||
Net change in unrealized appreciation/depreciation on investment securities | (98,539 | ) | |||||
Net realized/unrealized gains (losses) on investments | (139,503 | ) | |||||
Change in net assets resulting from operations | $ | (56,031 | ) | ||||
(a) Rounds to less than $1 thousand.
See notes to financial statements.
34
USAA Mutual Funds Trust | Statements of Changes in Net Assets | ||||||
(Amounts in Thousands)
USAA Income Fund | |||||||||||
| Six Months Ended January 31, 2023 (Unaudited) | Year Ended July 31, 2022 | ||||||||||
From Investments: | |||||||||||
Operations: | |||||||||||
Net Investment Income (Loss) | $ | 83,472 | $ | 183,503 | |||||||
Net realized gains (losses) | (40,964 | ) | 86,461 | ||||||||
Net change in unrealized appreciation/depreciation | (98,539 | ) | (967,789 | ) | |||||||
Change in net assets resulting from operations | (56,031 | ) | (697,825 | ) | |||||||
Distributions to Shareholders: | |||||||||||
Fund Shares | (37,902 | ) | (138,655 | ) | |||||||
Institutional Shares | (43,396 | ) | (177,468 | ) | |||||||
Class A | (822 | ) | (3,221 | ) | |||||||
Class C | — | (1 | )(a) | ||||||||
R6 Shares | (100 | ) | (386 | ) | |||||||
Change in net assets resulting from distributions to shareholders | (82,220 | ) | (319,731 | ) | |||||||
Change in net assets resulting from capital transactions | (342,959 | ) | (1,603,627 | ) | |||||||
Change in net assets | (481,210 | ) | (2,621,183 | ) | |||||||
Net Assets: | |||||||||||
Beginning of period | 5,452,622 | 8,073,805 | |||||||||
End of period | $ | 4,971,412 | $ | 5,452,622 | |||||||
(a) Class C activity is for the period August 1, 2021, to February 28, 2022 (date of termination).
(continues on next page)
See notes to financial statements.
35
USAA Mutual Funds Trust | Statements of Changes in Net Assets | ||||||
(Amounts in Thousands) (continued)
USAA Income Fund | |||||||||||
| Six Months Ended January 31, 2023 (Unaudited) | Year Ended July 31, 2022 | ||||||||||
Capital Transactions: | |||||||||||
Fund Shares | |||||||||||
Proceeds from shares issued | $ | 69,729 | $ | 207,181 | |||||||
Distributions reinvested | 36,371 | 133,855 | |||||||||
Cost of shares redeemed | (212,519 | ) | (513,299 | ) | |||||||
Total Fund Shares | $ | (106,419 | ) | $ | (172,263 | ) | |||||
Institutional Shares | |||||||||||
Proceeds from shares issued | $ | 240,648 | $ | 865,124 | |||||||
Distributions reinvested | 43,317 | 177,229 | |||||||||
Cost of shares redeemed | (516,667 | ) | (2,465,421 | ) | |||||||
Total Institutional Shares | $ | (232,702 | ) | $ | (1,423,068 | ) | |||||
Class A | |||||||||||
Proceeds from shares issued | $ | 320 | $ | 1,188 | |||||||
Distributions reinvested | 803 | 3,151 | |||||||||
Cost of shares redeemed | (3,959 | ) | (12,697 | ) | |||||||
Total Class A | $ | (2,836 | ) | $ | (8,358 | ) | |||||
Class C | |||||||||||
Distributions reinvested | $ | — | $ | 1 | (a) | ||||||
Cost of shares redeemed | — | (18 | )(a) | ||||||||
Total Class C | $ | — | $ | (17 | ) | ||||||
R6 Shares | |||||||||||
Proceeds from shares issued | $ | 1,031 | $ | 3,186 | |||||||
Distributions reinvested | 99 | 383 | |||||||||
Cost of shares redeemed | (2,132 | ) | (3,490 | ) | |||||||
Total R6 Shares | $ | (1,002 | ) | $ | 79 | ||||||
Change in net assets resulting from capital transactions | $ | (342,959 | ) | $ | (1,603,627 | ) | |||||
Share Transactions: | |||||||||||
Fund Shares | |||||||||||
Issued | 6,169 | 16,135 | |||||||||
Reinvested | 3,252 | 10,327 | |||||||||
Redeemed | (18,850 | ) | (40,248 | ) | |||||||
Total Fund Shares | (9,429 | ) | (13,786 | ) | |||||||
Institutional Shares | |||||||||||
Issued | 21,323 | 65,642 | |||||||||
Reinvested | 3,874 | 13,649 | |||||||||
Redeemed | (45,670 | ) | (186,510 | ) | |||||||
Total Institutional Shares | (20,473 | ) | (107,219 | ) | |||||||
Class A | |||||||||||
Issued | 28 | 90 | |||||||||
Reinvested | 72 | 244 | |||||||||
Redeemed | (352 | ) | (996 | ) | |||||||
Total Class A | (252 | ) | (662 | ) | |||||||
Class C | |||||||||||
Reinvested | — | — | (a)(b) | ||||||||
Redeemed | — | (1 | )(a) | ||||||||
Total Class C | — | (1 | ) | ||||||||
R6 Shares | |||||||||||
Issued | 91 | 254 | |||||||||
Reinvested | 9 | 30 | |||||||||
Redeemed | (187 | ) | (278 | ) | |||||||
Total R6 Shares | (87 | ) | 6 | ||||||||
Change in Shares | (30,241 | ) | (121,662 | ) | |||||||
(a) Class C activity is for the period August 1, 2021, to February 28, 2022 (date of termination).
(b) Rounds to less than 1 thousand shares.
See notes to financial statements.
36
USAA Mutual Funds Trust | Financial Highlights | ||||||
For a Share Outstanding Throughout Each Period
USAA Income Fund | |||||||||||||||||||||||||||
Fund Shares | |||||||||||||||||||||||||||
| Six Months Ended January 31, 2023 (Unaudited) | Year Ended July 31, 2022 | Year Ended July 31, 2021 | Year Ended July 31, 2020 | Year Ended July 31, 2019 | Year Ended July 31, 2018 | ||||||||||||||||||||||
| Net Asset Value, Beginning of Period | $ | 11.80 | $ | 13.83 | $ | 13.95 | $ | 13.28 | $ | 12.68 | $ | 13.20 | |||||||||||||||
Investment Activities: | |||||||||||||||||||||||||||
Net investment income (loss) | 0.19 | (a) | 0.36 | (a) | 0.40 | (a) | 0.43 | (a) | 0.45 | 0.45 | |||||||||||||||||
| Net realized and unrealized gains (losses) | (0.29 | ) | (1.76 | ) | 0.11 | 0.69 | 0.60 | (0.51 | ) | ||||||||||||||||||
| Total from Investment Activities | (0.10 | ) | (1.40 | ) | 0.51 | 1.12 | 1.05 | (0.06 | ) | ||||||||||||||||||
Distributions to Shareholders from: | |||||||||||||||||||||||||||
Net investment income | (0.19 | ) | (0.36 | ) | (0.40 | ) | (0.41 | ) | (0.45 | ) | (0.44 | ) | |||||||||||||||
Net realized gains | — | (0.27 | ) | (0.23 | ) | (0.04 | ) | — | (b) | (0.02 | ) | ||||||||||||||||
Total Distributions | (0.19 | ) | (0.63 | ) | (0.63 | ) | (0.45 | ) | (0.45 | ) | (0.46 | ) | |||||||||||||||
Net Asset Value, End of Period | $ | 11.51 | $ | 11.80 | $ | 13.83 | $ | 13.95 | $ | 13.28 | $ | 12.68 | |||||||||||||||
Total Return (c) (d) | (0.83 | )% | (10.41 | )% | 3.75 | % | 8.64 | % | 8.50 | % | (0.47 | )% | |||||||||||||||
Ratios to Average Net Assets: | |||||||||||||||||||||||||||
Net Expenses (e) (f) (g) (h) | 0.58 | % | 0.46 | % | 0.44 | % | 0.50 | % | 0.55 | % | 0.52 | % | |||||||||||||||
Net Investment Income (Loss) (e) | 3.30 | % | 2.78 | % | 2.90 | % | 3.22 | % | 3.49 | % | 3.40 | % | |||||||||||||||
Gross Expenses (e) (f) | 0.59 | % | 0.46 | % | 0.44 | % | 0.50 | % | 0.55 | % | 0.52 | % | |||||||||||||||
Supplemental Data: | |||||||||||||||||||||||||||
Net Assets at end of period (000's) | $ | 2,303,965 | $ | 2,472,982 | $ | 3,089,682 | $ | 3,292,322 | $ | 3,214,507 | $ | 3,055,739 | |||||||||||||||
Portfolio Turnover (c) (i) | 7 | % | 29 | % | 20 | % | 25 | % | 13 | % | 8 | % | |||||||||||||||
(a) Per share net investment income (loss) has been calculated using the average daily shares method.
(b) Amount is less than $0.005 per share.
(c) Not annualized for periods less than one year.
(d) Assumes reinvestment of all net investment income and realized capital gain distributions, if any, during the period. Includes adjustments in accordance with U.S. Generally Accepted Accounting Principles and could differ from the Lipper reported return.
(e) Annualized for periods less than one year.
(f) Does not include acquired fund fees and expenses, if any.
(g) The net expense ratio may not correlate to the applicable expense limits in place during the period since the current contractual expense limitation is applied for a period beginning July 1, 2019, and in effect through November 30, 2023, instead of coinciding with the Fund's fiscal year end. Details of the current contractual expense limitation in effect can be found in Note 5 of the accompanying Notes to Financial Statements.
(h) From the period beginning July 1, 2019, the amount of any waivers or reimbursements and the amount of any recoupment are calculated without regard to the impact of any performance adjustment to the Fund's management fee.
(i) Portfolio turnover is calculated on the basis of the Fund as a whole without distinguishing between the classes of shares.
(continues on next page)
See notes to financial statements.
37
USAA Mutual Funds Trust | Financial Highlights — continued | ||||||
For a Share Outstanding Throughout Each Period
USAA Income Fund | |||||||||||||||||||||||||||
Institutional Shares | |||||||||||||||||||||||||||
| Six Months Ended January 31, 2023 (Unaudited) | Year Ended July 31, 2022 | Year Ended July 31, 2021 | Year Ended July 31, 2020 | Year Ended July 31, 2019 | Year Ended July 31, 2018 | ||||||||||||||||||||||
| Net Asset Value, Beginning of Period | $ | 11.79 | $ | 13.82 | $ | 13.94 | $ | 13.27 | $ | 12.67 | $ | 13.19 | |||||||||||||||
Investment Activities: | |||||||||||||||||||||||||||
Net investment income (loss) | 0.19 | (a) | 0.36 | (a) | 0.41 | (a) | 0.44 | (a) | 0.45 | 0.44 | |||||||||||||||||
| Net realized and unrealized gains (losses) | (0.29 | ) | (1.75 | ) | 0.11 | 0.69 | 0.61 | (0.50 | ) | ||||||||||||||||||
| Total from Investment Activities | (0.10 | ) | (1.39 | ) | 0.52 | 1.13 | 1.06 | (0.06 | ) | ||||||||||||||||||
Distributions to Shareholders from: | |||||||||||||||||||||||||||
Net investment income | (0.19 | ) | (0.37 | ) | (0.41 | ) | (0.42 | ) | (0.46 | ) | (0.44 | ) | |||||||||||||||
Net realized gains | — | (0.27 | ) | (0.23 | ) | (0.04 | ) | — | (b) | (0.02 | ) | ||||||||||||||||
Total Distributions | (0.19 | ) | (0.64 | ) | (0.64 | ) | (0.46 | ) | (0.46 | ) | (0.46 | ) | |||||||||||||||
Net Asset Value, End of Period | $ | 11.50 | $ | 11.79 | $ | 13.82 | $ | 13.94 | $ | 13.27 | $ | 12.67 | |||||||||||||||
Total Return (c) (d) | (0.82 | )% | (10.37 | )% | 3.80 | % | 8.78 | % | 8.58 | % | (0.41 | )% | |||||||||||||||
Ratios to Average Net Assets: | |||||||||||||||||||||||||||
Net Expenses (e) (f) (g) (h) | 0.54 | % | 0.41 | % | 0.40 | % | 0.45 | % | 0.48 | % | 0.47 | % | |||||||||||||||
Net Investment Income (Loss) (e) | 3.34 | % | 2.81 | % | 2.95 | % | 3.28 | % | 3.56 | % | 3.46 | % | |||||||||||||||
Gross Expenses (e) (f) | 0.54 | % | 0.41 | % | 0.40 | % | 0.45 | % | 0.48 | % | 0.47 | % | |||||||||||||||
Supplemental Data: | |||||||||||||||||||||||||||
Net Assets at end of period (000's) | $ | 2,607,897 | $ | 2,914,607 | $ | 4,898,801 | $ | 4,978,740 | $ | 5,048,203 | $ | 4,629,713 | |||||||||||||||
Portfolio Turnover (c) (i) | 7 | % | 29 | % | 20 | % | 25 | % | 13 | % | 8 | % | |||||||||||||||
(a) Per share net investment income (loss) has been calculated using the average daily shares method.
(b) Amount is less than $0.005 per share.
(c) Not annualized for periods less than one year.
(d) Assumes reinvestment of all net investment income and realized capital gain distributions, if any, during the period. Includes adjustments in accordance with U.S. Generally Accepted Accounting Principles and could differ from the Lipper reported return.
(e) Annualized for periods less than one year.
(f) Does not include acquired fund fees and expenses, if any.
(g) The net expense ratio may not correlate to the applicable expense limits in place during the period since the current contractual expense limitation is applied for a period beginning July 1, 2019, and in effect through November 30, 2023, instead of coinciding with the Fund's fiscal year end. Details of the current contractual expense limitation in effect can be found in Note 5 of the accompanying Notes to Financial Statements.
(h) From the period beginning July 1, 2019, the amount of any waivers or reimbursements and the amount of any recoupment are calculated without regard to the impact of any performance adjustment to the Fund's management fee.
(i) Portfolio turnover is calculated on the basis of the Fund as a whole without distinguishing between the classes of shares.
(continues on next page)
See notes to financial statements.
38
USAA Mutual Funds Trust | Financial Highlights — continued | ||||||
For a Share Outstanding Throughout Each Period
USAA Income Fund | |||||||||||||||||||||||||||
Class A | |||||||||||||||||||||||||||
| Six Months Ended January 31, 2023 (Unaudited) | Year Ended July 31, 2022 | Year Ended July 31, 2021 | Year Ended July 31, 2020 | Year Ended July 31, 2019 | Year Ended July 31, 2018 | ||||||||||||||||||||||
| Net Asset Value, Beginning of Period | $ | 11.76 | $ | 13.79 | $ | 13.91 | $ | 13.24 | $ | 12.65 | $ | 13.16 | |||||||||||||||
Investment Activities: | |||||||||||||||||||||||||||
Net investment income (loss) | 0.17 | (a) | 0.32 | (a) | 0.36 | (a) | 0.40 | (a) | 0.42 | 0.41 | |||||||||||||||||
| Net realized and unrealized gains (losses) | (0.29 | ) | (1.75 | ) | 0.11 | 0.69 | 0.59 | (0.49 | ) | ||||||||||||||||||
| Total from Investment Activities | (0.12 | ) | (1.43 | ) | 0.47 | 1.09 | 1.01 | (0.08 | ) | ||||||||||||||||||
Distributions to Shareholders from: | |||||||||||||||||||||||||||
Net investment income | (0.17 | ) | (0.33 | ) | (0.36 | ) | (0.38 | ) | (0.42 | ) | (0.41 | ) | |||||||||||||||
Net realized gains | — | (0.27 | ) | (0.23 | ) | (0.04 | ) | — | (b) | (0.02 | ) | ||||||||||||||||
Total Distributions | (0.17 | ) | (0.60 | ) | (0.59 | ) | (0.42 | ) | (0.42 | ) | (0.43 | ) | |||||||||||||||
Net Asset Value, End of Period | $ | 11.47 | $ | 11.76 | $ | 13.79 | $ | 13.91 | $ | 13.24 | $ | 12.65 | |||||||||||||||
| Total Return (excludes sales charges) (c) (d) | (0.95 | )% | (10.65 | )% | 3.50 | % | 8.40 | % | 8.20 | % | (0.61 | )% | |||||||||||||||
Ratios to Average Net Assets: | |||||||||||||||||||||||||||
Net Expenses (e) (f) (g) (h) | 0.82 | % | 0.71 | % | 0.70 | % | 0.77 | % | 0.77 | % | 0.74 | % | |||||||||||||||
Net Investment Income (Loss) (e) | 3.06 | % | 2.53 | % | 2.64 | % | 2.96 | % | 3.28 | % | 3.18 | % | |||||||||||||||
Gross Expenses (e) (f) | 0.86 | % | 0.72 | % | 0.71 | % | 0.77 | % | 0.77 | % | 0.74 | % | |||||||||||||||
Supplemental Data: | |||||||||||||||||||||||||||
Net Assets at end of period (000's) | $ | 53,743 | $ | 58,054 | $ | 77,209 | $ | 87,216 | $ | 95,026 | $ | 105,072 | |||||||||||||||
Portfolio Turnover (c) (i) | 7 | % | 29 | % | 20 | % | 25 | % | 13 | % | 8 | % | |||||||||||||||
(a) Per share net investment income (loss) has been calculated using the average daily shares method.
(b) Amount is less than $0.005 per share.
(c) Not annualized for periods less than one year.
(d) Assumes reinvestment of all net investment income and realized capital gain distributions, if any, during the period. Includes adjustments in accordance with U.S. Generally Accepted Accounting Principles and could differ from the Lipper reported return.
(e) Annualized for periods less than one year.
(f) Does not include acquired fund fees and expenses, if any.
(g) The net expense ratio may not correlate to the applicable expense limits in place during the period since the current contractual expense limitation is applied for a period beginning July 1, 2019, and in effect through November 30, 2023, instead of coinciding with the Fund's fiscal year end. Details of the current contractual expense limitation in effect can be found in Note 5 of the accompanying Notes to Financial Statements.
(h) From the period beginning July 1, 2019, the amount of any waivers or reimbursements and the amount of any recoupment are calculated without regard to the impact of any performance adjustment to the Fund's management fee.
(i) Portfolio turnover is calculated on the basis of the Fund as a whole without distinguishing between the classes of shares.
(continues on next page)
See notes to financial statements.
39
USAA Mutual Funds Trust | Financial Highlights — continued | ||||||
For a Share Outstanding Throughout Each Period
USAA Income Fund | |||||||||||||||||||||||||||
| R6 Shares | ||||||||||||||||||||||||||
| Six Months Ended January 31, 2023 (Unaudited) | Year Ended July 31, 2022 | Year Ended July 31, 2021 | Year Ended July 31, 2020 | Year Ended July 31, 2019 | Year Ended July 31, 2018 | ||||||||||||||||||||||
| Net Asset Value, Beginning of Period | $ | 11.80 | $ | 13.83 | $ | 13.95 | $ | 13.27 | $ | 12.67 | $ | 13.19 | |||||||||||||||
Investment Activities: | |||||||||||||||||||||||||||
Net investment income (loss) | 0.19 | (a) | 0.38 | (a) | 0.42 | (a) | 0.45 | (a) | 0.47 | 0.45 | |||||||||||||||||
| Net realized and unrealized gains (losses) | (0.29 | ) | (1.76 | ) | 0.11 | 0.70 | 0.60 | (0.49 | ) | ||||||||||||||||||
| Total from Investment Activities | (0.10 | ) | (1.38 | ) | 0.53 | 1.15 | 1.07 | (0.04 | ) | ||||||||||||||||||
Distributions to Shareholders from: | |||||||||||||||||||||||||||
Net investment income | (0.19 | ) | (0.38 | ) | (0.42 | ) | (0.43 | ) | (0.47 | ) | (0.46 | ) | |||||||||||||||
Net realized gains | — | (0.27 | ) | (0.23 | ) | (0.04 | ) | — | (b) | (0.02 | ) | ||||||||||||||||
Total Distributions | (0.19 | ) | (0.65 | ) | (0.65 | ) | (0.47 | ) | (0.47 | ) | (0.48 | ) | |||||||||||||||
Net Asset Value, End of Period | $ | 11.51 | $ | 11.80 | $ | 13.83 | $ | 13.95 | $ | 13.27 | $ | 12.67 | |||||||||||||||
Total Return (c) (d) | (0.80 | )% | (10.28 | )% | 3.90 | % | 8.86 | % | 8.68 | % | (0.32 | )% | |||||||||||||||
Ratios to Average Net Assets: | |||||||||||||||||||||||||||
Net Expenses (e) (f) (g) (h) | 0.50 | % | 0.32 | % | 0.30 | % | 0.37 | % | 0.39 | % | 0.39 | % | |||||||||||||||
Net Investment Income (Loss) (e) | 3.38 | % | 2.93 | % | 3.07 | % | 3.35 | % | 3.65 | % | 3.56 | % | |||||||||||||||
Gross Expenses (e) (f) | 0.77 | % | 0.45 | % | 0.35 | % | 0.37 | % | 0.43 | % | 0.58 | % | |||||||||||||||
Supplemental Data: | |||||||||||||||||||||||||||
Net Assets at end of period (000's) | $ | 5,807 | $ | 6,979 | $ | 8,094 | $ | 21,794 | $ | 20,840 | $ | 18,874 | |||||||||||||||
Portfolio Turnover (c) (i) | 7 | % | 29 | % | 20 | % | 25 | % | 13 | % | 8 | % | |||||||||||||||
(a) Per share net investment income (loss) has been calculated using the average daily shares method.
(b) Amount is less than $0.005 per share.
(c) Not annualized for periods less than one year.
(d) Assumes reinvestment of all net investment income and realized capital gain distributions, if any, during the period. Includes adjustments in accordance with U.S. Generally Accepted Accounting Principles and could differ from the Lipper reported return.
(e) Annualized for periods less than one year.
(f) Does not include acquired fund fees and expenses, if any.
(g) The net expense ratio may not correlate to the applicable expense limits in place during the period since the current contractual expense limitation is applied for a period beginning July 1, 2019, and in effect through November 30, 2023, instead of coinciding with the Fund's fiscal year end. Details of the current contractual expense limitation in effect can be found in Note 5 of the accompanying Notes to Financial Statements.
(h) From the period beginning July 1, 2019, the amount of any waivers or reimbursements and the amount of any recoupment are calculated without regard to the impact of any performance adjustment to the Fund's management fee.
(i) Portfolio turnover is calculated on the basis of the Fund as a whole without distinguishing between the classes of shares.
See notes to financial statements.
40
USAA Mutual Funds Trust | Notes to Financial Statements January 31, 2023 | ||||||
(Unaudited)
1. Organization:
USAA Mutual Funds Trust (the "Trust") is organized as a Delaware statutory trust and is registered under the Investment Company Act of 1940, as amended (the "1940 Act"), as an open-end investment company. The Trust is comprised of 45 funds and is authorized to issue an unlimited number of shares, which are units of beneficial interest with no par value.
The accompanying financial statements are those of the USAA Income Fund (the "Fund"). The Fund offers four classes of shares: Fund Shares, Institutional Shares, Class A, and R6 Shares. Effective February 28, 2022, Class C was liquidated. The Fund is classified as diversified under the 1940 Act.
Each class of shares of the Fund has substantially identical rights and privileges, except with respect to sales charges, fees paid under distribution plans, expenses allocable exclusively to each class of shares, voting rights on matters solely affecting a single class of shares, and the exchange privilege of each class of shares.
Victory Capital Management ("VCM" or the "Adviser") is an indirect wholly owned subsidiary of Victory Capital Holdings, Inc., a publicly traded Delaware corporation, and a wholly owned direct subsidiary of Victory Capital Operating, LLC.
Under the Trust's organizational documents, its officers and trustees are indemnified against certain liabilities arising out of the performance of their duties to the Fund. In addition, in the normal course of business, the Fund enters into contracts with its vendors and others that provide for general indemnifications. The Fund's maximum exposure under these arrangements is unknown, as this would involve future claims that may be made against the Fund. However, based on experience, the Fund expects that risk of loss to be remote.
2. Significant Accounting Policies:
The following is a summary of significant accounting policies followed by the Trust in the preparation of its financial statements. The policies are in conformity with U.S. Generally Accepted Accounting Principles ("GAAP"). The preparation of financial statements in accordance with GAAP requires management to make estimates and assumptions that affect the reported amounts of assets and liabilities and disclosure of contingent assets and liabilities at the date of the financial statements and the reported amounts of income and expenses for the period. Actual results could differ from those estimates. The Fund follows the specialized accounting and reporting requirements under GAAP that are applicable to investment companies under Accounting Standards Codification Topic 946.
Investment Valuation:
The Fund records investments at fair value. Fair value is defined as the price that would be received to sell an asset or paid to transfer a liability in an orderly transaction between market participants at the measurement date.
The valuation techniques described below maximize the use of observable inputs and minimize the use of unobservable inputs in determining fair value. The inputs used for valuing the Fund's investments are summarized in the three broad levels listed below:
• Level 1 — quoted prices (unadjusted) in active markets for identical securities
• Level 2 — other significant observable inputs (including quoted prices for similar securities, interest rates, or credit spreads, applicable to those securities, etc.)
• Level 3 — significant unobservable inputs (including the Adviser's assumptions in determining the fair value of investments)
Changes in valuation techniques may result in transfers in or out of an assigned level within the disclosure hierarchy. The inputs or methodologies used for valuation techniques are not necessarily an indication of the risks associated with entering into those investments.
41
USAA Mutual Funds Trust | Notes to Financial Statements — continued January 31, 2023 | ||||||
(Unaudited)
The Adviser, appointed as the valuation designee by the Trust's Board of Trustees' (the "Board"), has established the Pricing and Liquidity Committee (the "Committee"), and subject to Board oversight, the Committee administers and oversees the Fund's valuation policies and procedures, which are approved by the Board.
Portfolio securities listed or traded on securities exchanges, are valued at the closing price on the exchange or system where the security is principally traded, if available, or at the Nasdaq Official Closing Price. If there have been no sales for that day on the exchange or system, then a security is valued at the last available bid quotation on the exchange or system where the security is principally traded. In each of these situations, valuations are typically categorized as Level 1 in the fair value hierarchy.
Investments in open-end investment companies, other than ETFs, are valued at their net asset value ("NAV"). These valuations are typically categorized as Level 1 in the fair value hierarchy.
Debt securities are valued each business day by a pricing service approved by the valuation designee and subject to the oversight of the Board. The pricing service uses the evaluated bid or the last sale price to value securities. Debt obligations maturing within 60 days may be valued at amortized cost, provided that the amortized cost represents the fair value of such securities. These valuations are typically categorized as Level 2 in the fair value hierarchy.
In the event that price quotations or valuations are not readily available, investments are valued at fair value in accordance with procedures established by and under the general supervision and responsibility of the Board. These valuations are typically categorized as Level 2 or Level 3 in the fair value hierarchy, based on the observability of inputs used to determine the fair value. The effect of fair value pricing is that securities may not be priced on the basis of quotations from the primary market in which they are traded, and the actual price realized from the sale of a security may differ materially from the fair value price. Valuing these securities at fair value is intended to cause the Fund's NAV to be more reliable than it otherwise would be.
A summary of the valuations as of January 31, 2023, based upon the three levels defined above, is included in the table below while the breakdown, by category, of investments is disclosed on the Schedule of Portfolio Investments (amounts in thousands):
Level 1 | Level 2 | Level 3 | Total | ||||||||||||||||
Asset-Backed Securities | $ | — | $ | 330,345 | $ | — | $ | 330,345 | |||||||||||
Collateralized Mortgage Obligations | — | 228,870 | — | 228,870 | |||||||||||||||
Preferred Stocks | 48,056 | — | — | 48,056 | |||||||||||||||
Senior Secured Loans | — | 2,235 | — | 2,235 | |||||||||||||||
Corporate Bonds | — | 2,278,994 | — | 2,278,994 | |||||||||||||||
Yankee Dollars | — | 577,928 | — | 577,928 | |||||||||||||||
Municipal Bonds | — | 398,921 | — | 398,921 | |||||||||||||||
U.S. Government Agency Mortgages | — | 157,013 | — | 157,013 | |||||||||||||||
U.S. Treasury Obligations | — | 876,162 | — | 876,162 | |||||||||||||||
Commercial Paper | — | 35,140 | — | 35,140 | |||||||||||||||
Collateral for Securities Loaned | 32,143 | — | — | 32,143 | |||||||||||||||
Total | $ | 80,199 | $ | 4,885,608 | $ | — | $ | 4,965,807 | |||||||||||
As of January 31, 2023, there were no transfers into/out of Level 3.
Real Estate Investment Trusts ("REITs"):
The Fund may invest in REITs, which report information on the source of their distributions annually. REITs are pooled investment vehicles that invest primarily in income producing real estate or real estate related loans or interests (such as mortgages). Certain distributions received from REITs during the year are recorded as realized gains or return of capital as estimated by the Fund or when such information becomes known.
42
USAA Mutual Funds Trust | Notes to Financial Statements — continued January 31, 2023 | ||||||
(Unaudited)
Investment Companies:
Open-End Funds:
The Fund may invest in portfolios of open-end investment companies. These investment companies value securities in their portfolios for which market quotations are readily available at their market values (generally the last reported sale price) and all other securities and assets at their fair value by the methods established by the board of directors of the underlying funds.
Securities Purchased on a Delayed-Delivery or When-Issued Basis:
The Fund may purchase securities on a delayed-delivery or when-issued basis. Delivery and payment for securities that have been purchased by the Fund on a delayed-delivery or when-issued basis, or for delayed draws on loans can generally take place within 35 days a month or more after the trade date. Securities that require more than 35 days to settle are considered a senior security and subject to Rule 18f-4. At the time the Fund makes the commitment to purchase a security on a delayed-delivery or when-issued basis, the Fund records the transaction and reflects the value of the security in determining NAV. No interest accrues to the Fund until the transaction settles and payment takes place. If the Fund owns delayed-delivery or when-issued securities, these values are included in Payables for Investments purchased on the accompanying Statement of Assets and Liabilities.
Municipal Obligations:
The values of municipal obligations can fluctuate and may be affected by adverse tax, legislative, or political changes, and by financial developments affecting municipal issuers. Payments of municipal obligations may depend on a relatively limited source of revenue, resulting in greater credit risk. Future changes in federal tax laws or the activity of an issuer may adversely affect the tax-exempt status of municipal obligations.
Mortgage- and Asset-Backed Securities:
The values of some mortgage-related or asset-backed securities may be particularly sensitive to changes in prevailing interest rates. Early repayment of principal on some mortgage-related securities may expose the Fund to a lower rate of return upon reinvestment of principal. The values of mortgage- and asset-backed securities depend in part on the credit quality and adequacy of the underlying assets or collateral and may fluctuate in response to the market's perception of these factors as well as current and future repayment rates. Some mortgage-backed securities are backed by the full faith and credit of the U.S. government (e.g., mortgage-backed securities issued by the Government National Mortgage Association, commonly known as "Ginnie Mae"), while other mortgage-backed securities (e.g., mortgage-backed securities issued by the Federal National Mortgage Association and the Federal Home Loan Mortgage Corporation, commonly known as "Fannie Mae" and "Freddie Mac," respectively), are backed only by the credit of the government entity issuing them. In addition, some mortgage-backed securities are issued by private entities and, as such, are not guaranteed by the U.S. government or any agency or instrumentality of the U.S. government.
Leveraged Loans:
The Fund may invest in leveraged loans, a type of bank loan. Leveraged loans are adjustable-rate bank loans made to companies rated below investment grade. The interest rates on leveraged loans are reset periodically based upon the fluctuations of a base interest rate such as the Secured Overnight Financing Rate ("SOFR") or London Interbank Offered Rate ("LIBOR") and a "spread" above that base interest rate that represents a risk premium to the lending banks and/or other participating investors. Many bank loans bear an adjustable rate of interest; however, leveraged loans provide for a greater "spread" over the base interest rate than other bank loans because they are considered to represent a greater credit risk. Because they are perceived to represent a greater credit risk, leveraged loans possess certain attributes that are similar to high-yield securities. However, because they are often
43
USAA Mutual Funds Trust | Notes to Financial Statements — continued January 31, 2023 | ||||||
(Unaudited)
secured by collateral of the borrower, leveraged loans possess certain attributes that are similar to other bank loans.
Below-Investment-Grade Securities:
The Fund may invest in below-investment-grade securities (i.e., lower-quality, "junk" debt), which are subject to various risks. Lower-quality debt is considered to be speculative because it is less certain that the issuer will be able to pay interest or repay the principal than in the case of investment-grade debt. These securities can involve a substantially greater risk of default than higher-rated securities, and their values can decline significantly over short periods of time. Lower-quality debt securities tend to be more sensitive to adverse news about their issuers, the market and the economy in general, than higher-quality debt securities. The market for these securities can be less liquid, especially during periods of recession or general market decline.
Derivative Instruments:
Futures Contracts:
The Fund may enter into contracts for the future delivery of securities or foreign currencies and futures contracts based on a specific security, class of securities, foreign currency or an index, and purchase or sell options on any such futures contracts. A futures contract on a securities index is an agreement obligating either party to pay, and entitling the other party to receive, while the contract is outstanding, cash payments based on the level of a specified securities index. No physical delivery of the underlying asset is made. The Fund may enter into futures contracts in an effort to hedge against market risks. The acquisition of put and call options on futures contracts will give the Fund the right (but not the obligation), for a specified price, to sell or to purchase the underlying futures contract, upon exercise of the option, at any time during the option period. Futures transactions involve brokerage costs and require the Fund to segregate assets to cover contracts that would require it to purchase securities or currencies. A good faith margin deposit, known as initial margin, of cash or government securities with a broker or custodian is required to initiate and maintain open positions in futures contracts. Subsequent payments, known as variation margin, are made or received by the Fund based on the change in the market value of the position and are recorded as unrealized appreciation or depreciation until the contract is closed out, at which time the gain or loss is realized. The Fund may lose the expected benefit of futures transactions if interest rates, exchange rates or securities prices change in an unanticipated manner. Such unanticipated changes may also result in lower overall performance than if the Fund had not entered into any futures transactions. In addition, the value of the Fund's futures positions may not prove to be perfectly or even highly correlated with the value of its portfolio securities or foreign currencies, limiting the Fund's ability to hedge effectively against interest rate, exchange rate and/or market risk and giving rise to additional risks. There is no assurance of liquidity in the secondary market for purposes of closing out futures positions. The collateral held by the Fund is reflected on the Statement of Assets and Liabilities under Deposit with broker for futures contracts.
The Fund did not hold futures contracts as of January 31, 2023.
Foreign Exchange Currency Contracts:
The Fund may enter into foreign exchange currency contracts to convert U.S. dollars to and from various foreign currencies. A foreign exchange currency contract is an obligation by the Fund to purchase or sell a specific currency at a future date at a price (in U.S. dollars) set at the time of the contract. The Fund does not engage in "cross-currency" foreign exchange contracts (i.e., contracts to purchase or sell one foreign currency in exchange for another foreign currency). The Fund's foreign exchange currency contracts might be considered spot contracts (typically a contract of one week or less) or forward contracts (typically a contract term over one week). A spot contract is entered into for purposes of hedging against foreign currency fluctuations relating to a specific portfolio transaction, such as the delay between a security transaction trade date and settlement date. Forward contracts
44
USAA Mutual Funds Trust | Notes to Financial Statements — continued January 31, 2023 | ||||||
(Unaudited)
are entered into for purposes of hedging portfolio holdings or concentrations of such holdings. Each foreign exchange currency contract is adjusted daily by the prevailing spot or forward rate of the underlying currency, and any appreciation or depreciation is recorded for financial statement purposes as unrealized until the contract settlement date, at which time the Fund records realized gains or losses equal to the difference between the value of a contract at the time it was opened and the value at the time it was closed. The Fund could be exposed to risk if a counterparty is unable to meet the terms of a foreign exchange currency contract or if the value of the foreign currency changes unfavorably. In addition, the use of foreign exchange currency contracts does not eliminate fluctuations in the underlying prices of the securities. As of January 31, 2023, the Fund had no open forward foreign exchange currency contracts.
Investment Transactions and Related Income:
Changes in holdings of investments are accounted for no later than one business day following the trade date. For financial reporting purposes, however, investment transactions are accounted for on trade date or the last business day of the reporting period. Interest income is determined on the basis of coupon interest accrued using the effective interest method which adjusts, where applicable, the amortization of premiums or accretion of discounts. Dividend income is recorded on the ex-dividend date. Gains or losses realized on sales of securities are recorded on the identified cost basis. Paydown gains or losses on applicable securities, if any, are recorded as components of Interest income on the Statement of Operations.
The Fund may receive other income from investments in loan assignments and/or unfunded commitments, including amendment fees, consent fees, and commitment fees. These fees are recorded as income when received. These amounts, if received, are included in Interest income on the Statement of Operations.
Securities Lending:
The Fund, through a Securities Lending Agreement with Citibank, N.A. ("Citibank"), may lend its securities to qualified financial institutions, such as certain broker-dealers and banks, to earn additional income, net of income retained by Citibank. Borrowers are required to initially secure their loans for collateral in the amount of at least 102% of the value of U.S. securities loaned or at least 105% of the value of non-U.S. securities loaned, marked-to-market daily. Any collateral shortfalls associated with increases in the valuation of the securities loaned are generally cured the next business day. The collateral can be received in the form of cash collateral and/or non-cash collateral. Non-cash collateral can include U.S. Government Securities and other securities as permitted by Securities and Exchange Commission ("SEC") guidelines. The cash collateral is invested in short-term instruments or cash equivalents, primarily open-end investment companies, as noted on the Fund's Schedule of Portfolio Investments. The Fund effectively does not have control of the non-cash collateral and therefore it is not disclosed on the Fund's Schedule of Portfolio Investments. Collateral requirements are determined daily based on the value of the Fund's securities on loan as of the end of the prior business day. During the time portfolio securities are on loan, the borrower will pay the Fund any dividends or interest paid on such securities plus any fee negotiated between the parties to the lending agreement. The Fund also earns a return from the collateral. The Fund pays Citibank various fees in connection with the investment of cash collateral and fees based on the investment income received from securities lending activities. Securities lending income (net of these fees) is disclosed on the Statement of Operations. Loans are terminable upon demand and the borrower must return the loaned securities within the lesser of one standard settlement period or five business days. Although risk is mitigated by the collateral, the Fund could experience a delay in recovering its securities and possible loss of income or value if the borrower fails to return them. In addition, there is a risk that the value of the short-term investments will be less than the amount of cash collateral required to be returned to the borrower.
The Fund's agreement with Citibank does not include master netting provisions. Non-cash collateral received by the Fund may not be sold or repledged, except to satisfy borrower default.
45
USAA Mutual Funds Trust | Notes to Financial Statements — continued January 31, 2023 | ||||||
(Unaudited)
The following table (amounts in thousands) is a summary of the Fund's securities lending transactions as of January 31, 2023.
| Value of Securities on Loan | Non-Cash Collateral | Cash Collateral | |||||||||
| $ | 31,104 | $ | — | $ | 32,143 | ||||||
Federal Income Taxes:
The Fund intends to continue to qualify as a regulated investment company by complying with the provisions available to certain investment companies, as defined in applicable sections of the Internal Revenue Code, and to make distributions of net investment income and net realized gains sufficient to relieve it from all, or substantially all, federal income taxes. Accordingly, no provision for federal income taxes is required in the financial statements. The Fund has a tax year end of July 31, and effective April 30, 2023, the Fund will change its tax year end to April 30.
For the six months ended January 31, 2023, the Fund did not incur any income tax, interest, or penalties, and has recorded no liability for net unrecognized tax benefits relating to uncertain tax positions.
Management of the Fund has reviewed tax positions taken in tax years that remain subject to examination by all major tax jurisdictions, including federal (i.e., the last four tax years, which includes the current fiscal tax year end). Management believes that there is no tax liability resulting from unrecognized tax benefits related to uncertain tax positions taken.
Allocations:
Expenses directly attributable to the Fund are charged to the Fund, while expenses that are attributable to more than one fund in the Trust, or jointly with an affiliated trust, are allocated among the respective funds in the Trust and/or an affiliated trust based upon net assets or another appropriate basis.
Income, expenses (other than class-specific expenses such as transfer agent fees, state registration fees, printing fees, and 12b-1 fees), and realized and unrealized gains or losses on investments are allocated to each class of shares based on its relative net assets on the date income is earned or expenses and realized and unrealized gains and losses are incurred.
Cross-Trade Transactions:
Pursuant to Rule 17a-7 under the 1940 Act, the Fund may engage in cross-trades, which are securities transactions with affiliated investment companies and advisory accounts managed by the Adviser and any applicable sub-adviser under specified conditions outlined in the valuation policies and procedures adopted by the Board. In addition, as defined under the valuation policies and procedures, each transaction must be effected at the independent current market price. For the six months ended January 31, 2023, the Fund engaged in the following securities transactions with affiliated funds, which resulted in the following net realized gains (losses) (amounts in thousands):
| Purchases | Sales | Net Realized Gains (Losses) | |||||||||
| $ | 1,306 | $ | — | $ | — | ||||||
3. Purchases and Sales:
Purchases and sales of securities (excluding securities maturing less than one year from acquisition) for the six months ended January 31, 2023, were as follows for the Fund (amounts in thousands):
| Excluding U.S. Government Securities | U.S. Government Securities | ||||||||||||||
Purchases | Sales | Purchases | Sales | ||||||||||||
$ | 221,563 | $ | 458,341 | $ | 110,206 | $ | 50,555 | ||||||||
46
USAA Mutual Funds Trust | Notes to Financial Statements — continued January 31, 2023 | ||||||
(Unaudited)
4. Affiliated Fund Ownership:
The Fund offers shares for investment by other funds. The fund-of-funds do not invest in the underlying funds for the purpose of exercising management or control, and the affiliated fund-of-funds' annual and semi-annual reports may be viewed at vcm.com. As of January 31, 2023, certain fund-of-funds owned total outstanding shares of the Fund as follows:
Affiliated USAA Mutual Funds | Ownership % | ||||||
USAA Cornerstone Conservative Fund | 0.4 | ||||||
USAA Target Retirement Income Fund | 0.0 | * | |||||
USAA Target Retirement 2030 Fund | 0.0 | * | |||||
* Amount is less than 0.05%.
5. Fees and Transactions with Affiliates and Related Parties:
Investment Advisory Fees:
Investment advisory services are provided to the Fund by the Adviser, which is a New York corporation registered as an investment adviser with the SEC.
Under the terms of the Investment Advisory Agreement, the Adviser is entitled to receive a base fee and a performance adjustment. The Fund's base fee is accrued daily and paid monthly at an annualized rate of 0.24% of the Fund's average daily net assets. Amounts incurred and paid to VCM for the six months ended January 31, 2023, are reflected on the Statement of Operations as Investment advisory fees.
The performance adjustment for each share class is accrued daily and calculated monthly by comparing the respective class' performance to that of the Lipper A Rated Bond Funds Index. The Lipper A Rated Bond Funds Index tracks the total return performance of the largest funds within the Lipper A Rated Bond Funds category.
The performance period for each share class consists of the current month plus the previous 35 months. The following table is utilized to determine the extent of the performance adjustment:
| Over/Under Performance Relative to Index (in basis points)(a) | Annual Adjustment Rate (in basis points) | ||||||
| +/- 20 to 50 | +/- 4 | ||||||
| +/- 51 to 100 | +/- 5 | ||||||
| +/- 101 and greater | +/- 6 | ||||||
(a) Based on the difference between the average annual performance of the relevant share class of the Fund and its relevant Lipper index, rounded to the nearest basis point.
Each class' annual performance adjustment rate is multiplied by the average daily net assets of the respective class over the entire performance period, which is then multiplied by a fraction, the numerator of which is the number of days in the month and the denominator of which is 365 (366 in leap years). The resulting amount is then added to (in the case of overperformance), or subtracted from (in the case of underperformance) the base fee.
Under the performance fee arrangement, each class pays a positive performance fee adjustment for a performance period whenever the class outperforms the Lipper A Rated Bond Funds Index over that period, even if the class has overall negative returns during the performance period.
For the period August 1, 2022, to January 31, 2023, performance adjustments were $703, $1,047, $14, and $3 for Fund Shares, Institutional Shares, Class A, and R6 Shares, in thousands, respectively. Performance adjustments were 0.06%, 0.08%, 0.05%, and 0.11% for Fund Shares, Institutional Shares, Class A, and R6 Shares, respectively. The performance adjustment rate included in the investment advisory fee may differ from the maximum over/under Annual Adjustment Rate due to differences in average net assets for the reporting period and rolling 36 month performance periods.
47
USAA Mutual Funds Trust | Notes to Financial Statements — continued January 31, 2023 | ||||||
(Unaudited)
The Trust relies on an exemptive order granted to VCM and its affiliated funds by the SEC in March 2019, permitting the use of a "manager-of-managers" structure for certain funds. Under a manager-of-managers structure, the investment adviser may select (with approval of the Board and without shareholder approval) one or more subadvisers to manage the day-to-day investment of a fund's assets. For the six months ended January 31, 2023, the Fund had no subadvisers.
Administration and Servicing Fees:
VCM also serves as the Fund's administrator and fund accountant. Under the Fund Administration, Servicing and Accounting Agreement, VCM is paid an administration and servicing fee that is accrued daily and paid monthly at an annualized rate of 0.15%, 0.10%, 0.15%, and 0.05%, which is based on the Fund's average daily net assets of the Fund Shares, Institutional Shares, Class A, and R6 Shares, respectively. Amounts incurred for the six months ended January 31, 2023, are reflected on the Statement of Operations as Administration fees.
Citi Fund Services Ohio, Inc. ("Citi"), an affiliate of Citibank, acts as sub-administrator and sub-fund accountant to the Fund pursuant to a Sub-Administration and Sub-Fund Accounting Services Agreement between VCM and Citi. VCM pays Citi a fee for providing these services. The Fund reimburses VCM and Citi for out-of-pocket expenses incurred in providing these services and certain other expenses specifically allocated to the Fund. Amounts incurred for the six months ended January 31, 2023, are reflected on the Statement of Operations as Sub-Administration fees.
The Fund (as part of the Trust) has entered into an agreement with the Adviser to provide compliance services, pursuant to which the Adviser furnishes its compliance personnel, including the services of the Chief Compliance Officer ("CCO"), and other resources reasonably necessary to provide the Trust with compliance oversight services related to the design, administration, and oversight of a compliance program for the Trust in accordance with Rule 38a-1 under the 1940 Act. The CCO is an employee of the Adviser, which pays the compensation of the CCO and support staff. The funds in the Trust, Victory Variable Insurance Funds, Victory Portfolios, and Victory Portfolios II (collectively, the "Victory Funds Complex") in the aggregate, compensate the Adviser for these services. Amounts incurred for the six months ended January 31, 2023, are reflected on the Statement of Operations as Compliance fees.
Transfer Agency Fees:
Victory Capital Transfer Agency, Inc. ("VCTA"), an affiliate of the Adviser, provides transfer agency services to the Fund. VCTA provides transfer agent services to the Fund Shares based on an annual charge of $25.50 per shareholder account plus out-of-pocket expenses. VCTA pays a portion of these fees to certain intermediaries for the administration and servicing of accounts that are held with such intermediaries. Transfer agent fees for Institutional Shares, Class A and R6 Shares and are paid monthly based on a fee accrued daily at an annualized rate of 0.10%, 0.10% and 0.01%, respectively, of average daily net assets, plus out-of-pocket expenses. Amounts incurred and paid to VCTA for the six months ended January 31, 2023, are reflected on the Statement of Operations as Transfer agent fees.
FIS Investor Services LLC serves as sub-transfer agent and dividend disbursing agent for the Fund pursuant to a Sub-Transfer Agent Agreement between VCTA and FIS Investor Services LLC. VCTA provides FIS Investor Services LLC a fee for providing these services.
Distributor/Underwriting Services:
Victory Capital Services, Inc. (the "Distributor"), an affiliate of the Adviser, serves as Distributor for the continuous offering of the shares of the Fund pursuant to a Distribution Agreement between the Distributor and the Trust.
Pursuant to the Distribution and Service Plans adopted in accordance with Rule 12b-1 under the 1940 Act, the Distributor may receive a monthly distribution and service fee, at an annual rate of up to 0.25% of the average daily net assets of Class A. The distribution and service fees paid to the Distributor may be used by the Distributor to pay for activity primarily intended to result in the sale of Class A.
48
USAA Mutual Funds Trust | Notes to Financial Statements — continued January 31, 2023 | ||||||
(Unaudited)
Amounts incurred and paid to the Distributor for the six months ended January 31, 2023, are reflected on the Statement of Operations as 12b-1 fees.
In addition, the Distributor is entitled to receive commissions in connection with sales of Class A. For the six months ended January 31, 2023, the Distributor did not receive any commissions.
Other Fees:
Citibank serves as the Fund's custodian. The Fund pays Citibank a fee for providing these services. Amounts incurred for the six months ended January 31, 2023, are reflected on the Statement of Operations as Custodian fees.
K&L Gates LLP provides legal services to the Trust.
The Adviser has entered into an expense limitation agreement with the Fund until at least November 30, 2023. Under the terms of the agreement, the Adviser has agreed to waive fees or reimburse certain expenses to the extent that ordinary operating expenses incurred by certain classes of the Fund in any fiscal year exceed the expense limits for such classes of the Fund. Such excess amounts will be the liability of the Adviser. Performance adjustments, acquired fund fees and expenses, interest, taxes, brokerage commissions, other expenditures, which are capitalized in accordance with GAAP, and other extraordinary expenses not incurred in the ordinary course of the Fund's business are excluded from the expense limits. As of January 31, 2023, the expense limits (excluding voluntary waivers) were 0.52%, 0.46%, 0.77%, and 0.39% for Fund Shares, Institutional Shares, Class A, and R6 Shares, respectively.
Under the terms of the expense limitation agreement, the Fund has agreed to repay fees and expenses that were waived or reimbursed by the Adviser for a period of up to three years (thirty-six (36) months) after the waiver or reimbursement took place, subject to the lesser of any operating expense limits in effect at the time of: (a) the original waiver or expense reimbursement; or (b) the recoupment, after giving effect to the recoupment amount.
As of January 31, 2023, the following amounts are available to be repaid to the Adviser (amounts in thousands). The Fund has not recorded any amounts available to be repaid as a liability due to an assessment that such repayments are not probable at January 31, 2023.
| Expires 2024 | Expires 2025 | Expires 2026 | Total | ||||||||||||
| $ | 15 | $ | 19 | $ | 197 | $ | 231 | ||||||||
The Adviser may voluntarily waive or reimburse additional fees to assist the Fund in maintaining competitive expense ratios. Voluntary waivers and reimbursements applicable to the Fund are not available to be recouped at a future time. There were no voluntary waivers or reimbursements for the six months ended January 31, 2023.
Certain officers and/or interested trustees of the Fund are also officers and/or employees of the Adviser, administrator, fund accountant, sub-administrator, sub-fund accountant, custodian, and Distributor.
6. Risks:
The Fund may be subject to other risks in addition to these identified risks.
Market Risk — Overall market risks may affect the value of the Fund. Domestic and international factors such as political events, war, terrorism, trade disputes, inflation rates, interest rate levels and other fiscal and monetary policy changes, cybersecurity incidents, pandemics and other public health crises, sanctions against a particular foreign country, its nationals, businesses or industries and related geopolitical events, as well as environmental disasters such as earthquakes, fires, and floods, or other catastrophes, may add to instability in global economies and markets generally, and may lead to increased market volatility. Global economies and financial markets are highly interconnected, which increases the possibility that conditions in one country or region might adversely affect issuers in
49
USAA Mutual Funds Trust | Notes to Financial Statements — continued January 31, 2023 | ||||||
(Unaudited)
another country or region. The impact of these and other factors may be short-term or may last for extended periods.
Debt Securities Risk — The value of a debt security or other income-producing security changes in response to various factors including, for example, market-related factors (such as changes in interest rates or changes in the risk appetite of investors generally) and changes in the actual or perceived ability of the issuer (or of issuers generally) to meet its (or their) obligations. Other factors that may affect the value of debt securities include, among others, public health crises and responses by governments and companies to such crises. These and other events may affect the creditworthiness of the issuer of a debt security and may impair an issuer's ability to timely meet its debt obligations as they come due.
Interest Rate Risk — The Fund is subject to the risk that the market value of the bonds in its portfolio will fluctuate because of changes in interest rates, changes in the supply of and demand for tax-exempt securities, and other market factors. Bond prices generally are linked to the prevailing market interest rates. In general, when interest rates rise, bond prices fall; conversely, when interest rates fall, bond prices rise. The price volatility of a bond also depends on its duration. Generally, the longer the duration of a bond, the greater is its sensitivity to interest rates. To compensate investors for this higher interest rate risk, bonds with longer durations generally offer higher yields than bonds with shorter durations. The ability of an issuer of a debt security to repay principal prior to a security's maturity can increase the security's sensitivity to interest rate changes.
Decisions by the U.S. Federal Reserve regarding interest rate and monetary policy, which can be difficult to predict and sometimes change direction suddenly in response to economic and market events, can have a significant effect on the value of fixed-income securities as well as the overall strength of the U.S. economy. Precise interest rate predictions are difficult to make, and interest rates may change unexpectedly and dramatically in response to extreme changes in market or economic conditions. As a result, the value of fixed-income securities may vary widely under certain market conditions.
LIBOR Discontinuation Risk — The LIBOR discontinuation may adversely affect the financial markets generally and the Fund's operations, finances and investments specifically. LIBOR has been the principal floating-rate benchmark in the financial markets. However, LIBOR has been or will be discontinued as a floating rate benchmark. The date of discontinuation depends on the LIBOR currency and tenor. With limited exceptions, no new LIBOR obligations will be entered into after December 31, 2021. Existing LIBOR obligations have transitioned or will transition to another benchmark, depending on the LIBOR currency and tenor. For some existing LIBOR-based obligations, the contractual consequences of the discontinuation of LIBOR may not be clear.
Non-LIBOR floating-rate obligations, including SOFR-based obligations, may have returns and values that fluctuate more than those of floating-rate debt obligations that are based on LIBOR or other rates. Also, because SOFR and some alternative floating rates are relatively new market indexes, markets for certain non-LIBOR obligations may never develop or may not be liquid. Market terms for non-LIBOR floating rate obligations, such as the spread over the index reflected in interest-rate provisions, may evolve over time, and prices of non-LIBOR floating rate obligations may be different depending on when they are issued and changing views about correct spread levels.
Various SOFR-based rates, including SOFR-based term rates, and various non-SOFR-based rates are expected to develop in response to the discontinuation of U.S. dollar LIBOR, which may create various risks for the Fund and the financial markets more generally. There are non-LIBOR forward-looking floating rates that are not based on SOFR and that may be considered by participants in the financial markets as LIBOR alternatives. Such rates include AMERIBOR (American Interbank Offered Rate), BSBY (Bloomberg Short-Term Bank Yield Index) and BYI (Bank Yield Index). Unlike forward-looking SOFR-based term rates, such rates are intended to reflect a bank credit spread component.
It is not clear how replacement rates for LIBOR — including SOFR-based rates and non-SOFR-based rates — will develop and to what extent they will be used. There is no assurance that these replacement rates will be suitable substitutes for LIBOR, and thus the substitution of such rates for LIBOR could
50
USAA Mutual Funds Trust | Notes to Financial Statements — continued January 31, 2023 | ||||||
(Unaudited)
have an adverse effect on the Fund and the financial markets more generally. Concerns about market depth and stability could affect the development of non-SOFR-based term rates, and such rates may create various risks, which may or may not be similar to the risks relating to SOFR.
7. Borrowing and Interfund Lending:
Line of Credit:
The Victory Funds Complex participates in a short-term demand note "Line of Credit" agreement with Citibank. The Line of Credit agreement with Citibank was renewed on June 27, 2022, with a termination date of June 26, 2023. Under the agreement with Citibank, the Victory Funds Complex may borrow up to $600 million, of which $300 million is committed and $300 million is uncommitted. $40 million of the Line of Credit is reserved for use by the Victory Floating Rate Fund, another series of the Victory Funds Complex, with Victory Floating Rate Fund paying the related commitment fees for that amount. The purpose of the Line of Credit is to meet temporary or emergency cash needs. For the six months ended January 31, 2023, Citibank received an annual commitment fee of 0.15% on $300 million for providing the Line of Credit. Each fund in the Victory Funds Complex paid a pro-rata portion of the commitment fees plus any interest (one-month SOFR plus 1.10 percent) on amounts borrowed. Interest charged to the Fund during the period, if applicable, is reflected on the Statement of Operations under Line of credit fees.
The Fund had no borrowings under the Line of Credit agreement during the six months ended January 31, 2023.
Interfund Lending:
The Trust and the Adviser rely on an exemptive order granted by the SEC in March 2017 (the "Order"), permitting the establishment and operation of an Interfund Lending Facility (the "Facility"). The Facility allows the Fund to directly lend and borrow money to or from any other fund in the Victory Funds Complex that is permitted to participate in the Facility, relying upon the Order at rates beneficial to both the borrowing and lending funds. Advances under the Facility are allowed for temporary or emergency purposes, including the meeting of redemption requests that otherwise might require the untimely disposition of securities, and are subject to each Fund's borrowing restrictions. The interfund loan rate is determined, as specified in the Order, by averaging the current repurchase agreement rate and the current bank loan rate. As a Borrower, interest charged to the Fund, if any, during the period, is reflected on the Statement of Operations under Interfund lending fees. As a Lender, interest earned by the Fund, if any, during the period, is reflected on the Statement of Operations under Interfund lending.
The Fund did not utilize or participate in the Facility during the six months ended January 31, 2023.
8. Federal Income Tax Information:
The Fund intends to distribute any net investment income monthly. Distributable net realized gains, if any, are declared and paid at least annually.
The amounts of dividends from net investment income and distributions from net realized gains (collectively, distributions to shareholders) are determined in accordance with federal income tax regulations, which may differ from GAAP. To the extent these "book/tax" differences are permanent in nature (e.g., net operating loss and distribution reclassification), such amounts are reclassified within the components of net assets based on their federal tax-basis treatment; temporary differences (e.g., wash sales) do not require reclassification. To the extent dividends and distributions exceed net investment income and net realized gains for tax purposes, they are reported as distributions of capital. Net investment losses incurred by the Fund may be reclassified as an offset to capital on the accompanying Statement of Assets and Liabilities.
51
USAA Mutual Funds Trust | Notes to Financial Statements — continued January 31, 2023 | ||||||
(Unaudited)
The tax character of current year distributions paid and the tax basis of the current components of accumulated earnings (loss) will be determined at the end of the current tax year.
At the tax year ended July 31, 2022, the Fund had no capital loss carryforwards for federal income tax purposes.
9. Subsequent Events:
On June 29, 2022, the Board approved a change to the Fund's fiscal year-end from July 31 to April 30, with an effective date of April 30, 2023.
The Board, upon recommendation of the Adviser, has approved a change in the name of the Trust and each individual fund within the Trust. On February 23, 2023, an initial filing was made with the SEC to commence the process to effectuate the following changes.
Effective at the start of business on April 24, 2023 (the "Effective Date"), the name of the Trust will change from USAA Mutual Funds Trust to Victory Portfolios III, and all references to USAA Mutual Funds Trust in the summary prospectus, statutory prospectus, and statement of additional information ("SAI") will be replaced by the new name.
Also on the Effective Date, references to the current name of the Fund in the summary prospectus, statutory prospectus, and SAI will be replaced with the new name as follows:
| Current Name | New Name | ||||||
USAA Income Fund | Victory Income Fund | ||||||
In addition, on the Effective Date, USAA Investments, a Victory Capital Management Inc. Investment Franchise, that currently manages the USAA Fixed Income Funds, will change its name to Victory Income Investors, and all references to USAA Investments in the summary prospectus, statutory prospectus, and SAI, will be replaced.
Please note that there will be no changes in the management of the Fund or to the Fund's ticker symbols.
52
USAA Mutual Funds Trust | Supplemental Information January 31, 2023 | ||||||
(Unaudited)
Proxy Voting and Portfolio Holdings Information
Proxy Voting:
Information regarding the policies and procedures the Fund uses to determine how to vote proxies relating to portfolio securities is available without charge, upon request, by calling (800) 235-8396. The information is also included in the Fund's Statement of Additional Information, which is available on the SEC's website at sec.gov.
Information relating to how the Fund voted proxies relating to portfolio securities held during the most recent 12 months ended June 30 is available on the SEC's website at sec.gov.
Availability of Schedules of Portfolio Investments:
The Trust files a complete list of Schedules of Portfolio Investments with the SEC for the first and third quarter of each fiscal year on Form N-PORT. Form N-PORT is available on the SEC's website at sec.gov.
Expense Examples
As a shareholder of the Fund, you may incur two types of costs: (1) transaction costs, including sales charges (loads) on purchases; and (2) ongoing costs, including management fees and other Fund expenses. These examples are intended to help you understand your ongoing costs (in dollars) of investing in the Fund and to compare these costs with the ongoing costs of investing in other mutual funds.
These examples are based on an investment of $1,000 invested at the beginning of the period and held for the entire period from August 1, 2022, through January 31, 2023.
The Actual Expense figures in the table below provide information about actual account values and actual expenses. You may use the information below, together with the amount you invested, to estimate the expenses that you paid over the period. Simply divide your account value by $1,000 (for example, an $8,600 account value divided by $1,000 = 8.6), then multiply the result by the number in the table under the heading entitled "Actual Expenses Paid During Period" to estimate the expenses you paid on your account during this period.
The Hypothetical Expense figures in the table below provide information about hypothetical account values and hypothetical expenses based on the Fund's actual expense ratio and an assumed rate of return of 5% per year before expenses, which is not the Fund's actual return. The hypothetical account values and expenses may not be used to estimate the actual ending account balance or expenses you paid for the period. You may use this information to compare this 5% hypothetical example with the 5% hypothetical examples that appear in shareholder reports of other funds.
Please note the expenses shown in the table below are meant to highlight your ongoing costs only and do not reflect any transactional costs. Therefore, the hypothetical expenses in the table are useful in comparing ongoing costs only and will not help you determine the relative total costs of owning different funds. In addition, if these transactional costs were included, your costs would have been higher.
| Beginning Account Value 8/1/22 | Actual Ending Account Value 1/31/23 | Hypothetical Ending Account Value 1/31/23 | Actual Expenses Paid During Period 8/1/22- 1/31/23* | Hypothetical Expenses Paid During Period 8/1/22- 1/31/23* | Annualized Expense Ratio During Period 8/1/22- 1/31/23 | ||||||||||||||||||||||
Fund Shares | $ | 1,000.00 | $ | 991.70 | $ | 1,022.28 | $ | 2.91 | $ | 2.96 | 0.58 | % | |||||||||||||||
Institutional Shares | 1,000.00 | 991.80 | 1,022.48 | 2.71 | 2.75 | 0.54 | % | ||||||||||||||||||||
Class A | 1,000.00 | 990.50 | 1,021.07 | 4.11 | 4.18 | 0.82 | % | ||||||||||||||||||||
R6 Shares | 1,000.00 | 992.00 | 1,022.68 | 2.51 | 2.55 | 0.50 | % | ||||||||||||||||||||
* Expenses are equal to the average account value multiplied by the Fund's annualized expense ratio multiplied by 184/365 (the number of days in the most recent fiscal half-year divided by the number of days in the fiscal year).
53
USAA Mutual Funds Trust | Supplemental Information — continued January 31, 2023 | ||||||
(Unaudited)
Considerations of the Board in Continuing the Investment Advisory Agreement
USAA Income Fund (the "Fund")
At a meeting of the Board of Trustees (the "Board") of USAA Mutual Funds Trust (the "Trust") held on December 8-9, 2022, the Board, including the Trustees who are not "interested persons" (as that term is defined in the Investment Company Act of 1940, as amended) of the Trust (the "Independent Trustees"), approved for an annual period the continuance of the Investment Advisory Agreement (the "Advisory Agreement") between the Trust and Victory Capital Management Inc. (the "Adviser") with respect to the Fund. Prior to the December 8-9, 2022 meeting at which the Advisory Agreement was approved, the Independent Trustees also discussed and considered information regarding the proposed continuation of the Advisory Agreement at a meeting held on November 21, 2022.
In advance of the foregoing meetings, the Trustees received and considered a variety of information relating to the Advisory Agreement and the Adviser, and were given the opportunity to ask questions and request additional information from management. The information provided to the Board included, among other things: (i) a separate report prepared by an independent third party of mutual fund data, which provided a statistical analysis comparing the Fund's investment performance, expenses, and fees to comparable investment companies; (ii) information concerning the services rendered to the Fund, as well as information regarding the Adviser's revenues and costs of providing services to the Fund and compensation paid to affiliates of the Adviser; and (iii) information about the Adviser's operations and personnel. Prior to voting, the Independent Trustees reviewed the proposed continuance of the Advisory Agreement with management and with experienced independent counsel retained by the Independent Trustees ("Independent Counsel") and received materials from such Independent Counsel discussing the legal standards for their consideration of the proposed continuation of the Advisory Agreement with respect to the Fund. The Independent Trustees also reviewed the proposed continuation of the Advisory Agreement with respect to the Fund in private sessions with Independent Counsel at which no representatives of management were present.
At each regularly scheduled meeting of the Board and its committees, the Board receives and reviews, among other things, information concerning the Fund's performance and related services provided by the Adviser. At the meeting at which the renewal of the Advisory Agreement is considered, particular focus is given to information concerning Fund performance, fees and total expenses as compared to comparable investment companies, and the Adviser's profitability with respect to the Fund. However, the Board noted that the evaluation process with respect to the Adviser is an ongoing one. In this regard, the Board's and its committees' consideration of the Advisory Agreement included information previously received at such meetings. The Board also recognized that the contractual arrangements for the Fund have been reviewed by the Board and discussed with the Adviser in prior years and that the Board's conclusions may be based, in part, on its consideration of these same arrangements in prior years.
Advisory Agreement
After full consideration of a variety of factors, the Board, including the Independent Trustees, voted to approve the Advisory Agreement. In approving the Advisory Agreement, the Trustees did not identify any single factor as controlling, and each Trustee may have attributed different weights to various factors. Throughout their deliberations, the Independent Trustees were represented and assisted by Independent Counsel.
Nature, Extent, and Quality of Services — In considering the nature, extent, and quality of the services provided by the Adviser under the Advisory Agreement, the Board reviewed information provided by the Adviser relating to its operations and personnel. The Board also took into account its knowledge of the Adviser's management and the quality of the performance of the Adviser's duties through Board meetings, discussions, and reports during the preceding year. The Board considered the fees paid to the Adviser and the services provided to the Fund by the Adviser under the Advisory Agreement, as well as other services provided by the Adviser and its affiliates under other agreements, and the personnel who provide these services. In addition to the investment advisory services provided to the Fund, the Adviser and its affiliates provide administrative services, shareholder services, oversight of Fund accounting, marketing services, assistance in meeting legal and regulatory requirements, and other services necessary for the operation of the Fund and the Trust.
54
USAA Mutual Funds Trust | Supplemental Information — continued January 31, 2023 | ||||||
(Unaudited)
The Board considered the scope of services provided by, and the undertakings required of, the Adviser in connection with those services, including, among other things, maintaining (i) its own and the Fund's compliance programs, (ii) risk management programs, (iii) liquidity risk management program, (iv) derivatives risk management program, and (v) cybersecurity programs, each of which had expanded over time as a result of regulatory, market, and other developments. The Board also considered the significant risks assumed by the Adviser in connection with the services provided to the Fund, including investment, operational, enterprise, litigation, regulatory and compliance risks.
The Board considered the Adviser's management style and the performance of the Adviser's duties under the Advisory Agreement. The Board considered the level and depth of knowledge of the Adviser, including the professional experience and qualifications of its senior and investment personnel, as well as current staffing levels. The allocation of the Fund's brokerage, including the Adviser's process for monitoring "best execution," also was considered. The Adviser's role in coordinating the activities of the Fund's other service providers was also considered. The Board also considered the Adviser's risk management processes. The Board considered the Adviser's financial condition and that it had the financial wherewithal to continue to provide the same scope and high quality of services under the Advisory Agreement. In reviewing the Advisory Agreement, the Board focused on the experience, resources, and strengths of the Adviser and its affiliates in managing the Fund, as well as the other funds in the Trust.
The Board also reviewed the compliance and administrative services provided to the Fund by the Adviser and its affiliates, including the Adviser's oversight of the Fund's day-to-day operations and oversight of Fund accounting. The Trustees, guided also by information obtained from their experiences as Trustees of the Trust, also focused on the quality of the Adviser's compliance and administrative staff.
Expenses and Performance — In connection with its consideration of the Advisory Agreement, the Board evaluated the Fund's advisory fees and total expense ratio as compared to other open-end investment companies deemed to be comparable to the Fund as determined by the independent third party in its report. The Fund's expenses were compared to (i) a group of investment companies chosen by the independent third party to be comparable to the Fund based upon certain factors, including fund type, comparability of investment objective and classification, sales load type, asset size, and expense components (the "expense group") and (ii) a larger group of investment companies with the same investment classification/objective as the Fund regardless of asset size, excluding outliers (the "expense universe"). Among other data, the Board noted that the Fund's net management fee rate — which includes advisory and administrative services and the effects of any performance adjustment, as well as any fee waivers and reimbursements — was below the medians of its expense group and its expense universe. The data indicated that the Fund's total expenses, including after any reimbursements, were below the medians of its expense group and its expense universe. The Board also took into account the Adviser's current undertakings to maintain expense limitations for the Fund. The Board took into account the various other services provided to the Fund by the Adviser and its affiliates, and noted the high quality of services received by the Fund.
In considering the Fund's performance, the Board noted that it reviews at its regularly scheduled meetings information about the Fund's performance results. The Trustees also reviewed various comparative data provided to them in connection with their consideration of the renewal of the Advisory Agreement, including, among other information, a comparison of the Fund's average annual total returns relative to its Lipper index and other mutual funds deemed to be in its peer group by the independent third party in its report (the "performance universe"). The Fund's performance universe consisted of the Fund and all retail and institutional open-end investment companies with the same classification/objective as the Fund regardless of asset size or primary channel of distribution. This comparison indicated that, among other data, the Fund's performance was above the average of its performance universe for the one-, three-, five- and ten-year periods ended June 30, 2022, and was above its Lipper index for the one-year period and below its Lipper index for the three-, five- and ten-year periods ended June 30, 2022.
Compensation and Profitability — The Board took into consideration the level and method of computing the management fee. The information considered by the Board included operating profit margin information for the Adviser's business as a whole. The Board also received and considered profitability information related to the management revenues from the Fund. This information included a review of the methodology used in the allocation of certain costs to the Fund. In considering the profitability data with respect to the Fund, the Trustees
55
USAA Mutual Funds Trust | Supplemental Information — continued January 31, 2023 | ||||||
(Unaudited)
noted that the Adviser reimbursed or waived a portion of its management fees to the Fund. The Trustees reviewed the profitability of the Adviser's relationship with the Fund before tax expenses. The Board was also provided with a profitability analysis of other publicly traded asset managers prepared by an independent information service. In reviewing the overall profitability of the management fee to the Adviser, the Board also considered the fact that the Adviser and its affiliates provide shareholder servicing and administrative services to the Fund for which they receive compensation. The Board also considered the possible direct and indirect benefits to the Adviser from its relationship with the Trust, including that the Adviser may derive reputational and other benefits from its association with the Fund. The Trustees recognized that the Adviser should be entitled to earn a reasonable level of profits in exchange for the level of services it provides to the Fund and the entrepreneurial and other risks that it assumes as Adviser.
Economies of Scale — The Board considered whether there should be changes in the management fee rate or structure in order to enable the Fund to participate in any economies of scale. The Board also considered the fee waiver and expense reimbursement arrangements by the Adviser. The Board also considered the effect of the change in size, if any, of each of the Fund's classes on its performance and fees, noting that the Fund may realize other economies of scale if assets increase proportionally more than expenses. The Board determined that the current investment management fee structure was reasonable.
Conclusions — The Board reached the following conclusions regarding the Fund's Advisory Agreement with the Adviser: (i) the Adviser has demonstrated that it possesses the capability and resources to perform the duties required of it under the Advisory Agreement; (ii) the Adviser maintains an appropriate compliance program; (iii) the overall performance of the Fund is reasonable in relation to the performance of funds with similar investment objectives and to relevant indices; (iv) the Fund's advisory expenses are reasonable in relation to those of similar funds and to the services to be provided by the Adviser; and (v) the Adviser's and its affiliates' level of profitability from their relationship with the Fund is reasonable in light of the nature and high quality of services provided by the Adviser and its affiliates and the type of fund. Based on its conclusions, the Board determined that continuation of the Advisory Agreement would be in the best interests of the Fund and its shareholders.
56
Privacy Policy
Protecting the Privacy of Information
The Trust respects your right to privacy. We also know that you expect us to conduct and process your business in an accurate and efficient manner. To do so, we must collect and maintain certain personal information about you. This is the information we collect from you on applications or other forms, and from the transactions you make with us or third parties. It may include your name, address, social security number, account transactions and balances, and information about investment goals and risk tolerance.
We do not disclose any information about you or about former customers to anyone except as permitted or required by law. Specifically, we may disclose the information we collect to companies that perform services on our behalf, such as the transfer agent that processes shareholder accounts and printers and mailers that assist us in the distribution of investor materials. We may also disclose this information to companies that perform marketing services on our behalf. This allows us to continue to offer you Victory investment products and services that meet your investing needs, and to effect transactions that you request or authorize. These companies will use this information only in connection with the services for which we hired them. They are not permitted to use or share this information for any other purpose.
To protect your personal information internally, we permit access only by authorized employees and maintain physical, electronic, and procedural safeguards to guard your personal information.*
* You may have received communications regarding information about privacy policies from other financial institutions which gave you the opportunity to "opt-out" of certain information sharing with companies which are not affiliated with that financial institution. The Trust does not share information with other companies for purposes of marketing solicitations for products other than the Trust. Therefore, the Trust does not provide opt-out options to their shareholders.
P.O. Box 182593
Columbus, Ohio 43218-2593

Visit our website at: | Call | ||||||
vcm.com | (800) 235-8396 | ||||||
23424-0323

January 31, 2023
Semi Annual Report
USAA Short-Term Bond Fund
Victory Capital means Victory Capital Management Inc., the investment adviser of the USAA Mutual Funds. USAA Mutual Funds are distributed by Victory Capital Services, Inc., member FINRA, an affiliate of Victory Capital. Victory Capital and its affiliates are not affiliated with United Services Automobile Association or its affiliates. USAA and the USAA logos are registered trademarks and the USAA Mutual Funds and USAA Investments logos are trademarks of United Services Automobile Association and are being used by Victory Capital and its affiliates under license.
vcm.com
News, Information And Education 24 Hours A Day, 7 Days A Week
The Victory Capital website gives fund shareholders, prospective shareholders, and investment professionals a convenient way to access fund information, get guidance, and track fund performance anywhere they can access the Internet. The site includes:
• Detailed performance records
• Daily share prices
• The latest fund news
• Investment resources to help you become a better investor
• A section dedicated to investment professionals
Whether you're a potential investor searching for the fund that matches your investment philosophy, a seasoned investor interested in planning tools, or an investment professional, vcm.com has what you seek. Visit us anytime. We're always open.
USAA Mutual Funds Trust
TABLE OF CONTENTS
Investment Objective & Portfolio Holdings | 2 | ||||||
Schedule of Portfolio Investments | 3 | ||||||
Financial Statements | |||||||
Statement of Assets and Liabilities | 31 | ||||||
Statement of Operations | 32 | ||||||
Statements of Changes in Net Assets | 33 | ||||||
Financial Highlights | 35 | ||||||
Notes to Financial Statements | 39 | ||||||
Supplemental Information | 51 | ||||||
Proxy Voting and Portfolio Holdings Information | 51 | ||||||
Expense Examples | 51 | ||||||
Advisory Contract Approval | 52 | ||||||
Privacy Policy (inside back cover) | |||||||
This report is for the information of the shareholders and others who have received a copy of the currently effective prospectus of the Fund, managed by Victory Capital Management Inc. It may be used as sales literature only when preceded or accompanied by a current prospectus, which provides further details about the Fund.
IRA DISTRIBUTION WITHHOLDING DISCLOSURE
We generally must withhold federal income tax at a rate of 10% of the taxable portion of your distribution and, if you live in a state that requires state income tax withholding, at your state's tax rate. However, you may elect not to have withholding apply or to have income tax withheld at a higher rate. Any withholding election that you make will apply to any subsequent distribution unless and until you change or revoke the election. If you wish to make a withholding election, or change or revoke a prior withholding election, call (800) 235-8396, and form W-4P (OMB No. 1545-0074 withholding certificate for pension or annuity payments) will be electronically sent.
If you do not have a withholding election in place by the date of a distribution, federal income tax will be withheld from the taxable portion of your distribution at a rate of 10%. If you must pay estimated taxes, you may be subject to estimated tax penalties if your estimated tax payments are not sufficient and sufficient tax is not withheld from your distribution.
For more specific information, please consult your tax adviser.
• NOT FDIC INSURED • NO BANK GUARANTEE • MAY LOSE VALUE
1
| USAA Mutual Funds Trust USAA Short-Term Bond Fund | January 31, 2023 | ||||||
(Unaudited)
Investment Objective and Portfolio Holdings:
The Fund seeks high current income consistent with preservation of principal.
Asset Allocation*:
January 31, 2023
(% of Net Assets)

* Does not include futures contracts, money market instruments, and short-term investments purchased with cash collateral from securities loaned.
Percentages are of the net assets of the Fund and may not equal 100%.
Refer to the Schedule of Portfolio Investments for a complete list of securities.
2
| USAA Mutual Funds Trust USAA Short-Term Bond Fund | Schedule of Portfolio Investments January 31, 2023 | ||||||
(Amounts in Thousands, Except for Shares) (Unaudited)
Security Description | Principal Amount | Value | |||||||||
Asset-Backed Securities (29.6%) | |||||||||||
| Aligned Data Centers Issuer LLC, Series 2021-1A, Class A2, 1.94%, 8/15/46, Callable 8/15/24 @ 100 (a) | $ | 5,500 | $ | 4,868 | |||||||
| American Credit Acceptance Receivables Trust, Series 2020-3, Class C, 1.85%, 6/15/26, Callable 1/13/24 @ 100 (a) | 1,187 | 1,176 | |||||||||
| American Credit Acceptance Receivables Trust, Series 2019-2, Class D, 3.41%, 6/12/25, Callable 5/12/23 @ 100 (a) | 883 | 880 | |||||||||
| American Credit Acceptance Receivables Trust, Series 2019-3, Class D, 2.89%, 9/12/25, Callable 8/12/23 @ 100 (a) | 286 | 284 | |||||||||
| American Credit Acceptance Receivables Trust, Series 2019-2, Class E, 4.29%, 6/12/25, Callable 5/12/23 @ 100 (a) | 5,375 | 5,352 | |||||||||
AMSR Trust, Series 2021-SFR1, Class C, 2.35%, 6/17/38 (a) | 1,200 | 995 | |||||||||
AMSR Trust, Series 2021-SFR1, Class B, 2.15%, 6/17/38 (a) | 2,000 | 1,649 | |||||||||
AMSR Trust, Series 2021-SFR1, Class A, 1.95%, 6/17/38 (a) | 2,000 | 1,670 | |||||||||
| Amur Equipment Finance Receivables IX LLC, Series 2021-1A, Class C, 1.75%, 6/21/27, Callable 11/20/24 @ 100 (a) | 1,000 | 936 | |||||||||
| Amur Equipment Finance Receivables X LLC, Series 2022-1A, Class A2, 1.64%, 10/20/27, Callable 9/20/25 @ 100 (a) | 1,832 | 1,750 | |||||||||
| Amur Equipment Finance Receivables X LLC, Series 2022-1A, Class B, 2.20%, 1/20/28, Callable 9/20/25 @ 100 (a) | 2,162 | 1,994 | |||||||||
| Amur Equipment Finance Receivables XI LLC, Series 2022-2A, Class A2, 5.30%, 6/21/28, Callable 6/20/26 @ 100 (a) | 1,400 | 1,393 | |||||||||
| Amur Equipment Finance Receivables XI LLC, Series 2022-2A, Class B, 5.65%, 10/20/28, Callable 6/20/26 @ 100 (a) | 2,000 | 2,019 | |||||||||
| ARI Fleet Lease Trust, Series 2022-A, Class A3, 3.43%, 1/15/31, Callable 5/15/25 @ 100 (a) | 1,524 | 1,473 | |||||||||
| ARI Fleet Lease Trust, Series 2021-A, Class B, 1.13%, 3/15/30, Callable 5/15/24 @ 100 (a) | 2,650 | 2,386 | |||||||||
| ARI Fleet Lease Trust, Series 2021-A, Class A3, 0.68%, 3/15/30, Callable 5/15/24 @ 100 (a) | 2,550 | 2,405 | |||||||||
| ARI Fleet Lease Trust, Series 2020-A, Class B, 2.06%, 11/15/28, Callable 3/15/23 @ 100 (a) | 1,470 | 1,464 | |||||||||
| ARI Fleet Lease Trust, Series 2020-A, Class A3, 1.80%, 8/15/28, Callable 3/15/23 @ 100 (a) | 1,650 | 1,646 | |||||||||
| ARI Fleet Lease Trust, Series 2022-A, Class A2, 3.12%, 1/15/31, Callable 5/15/25 @ 100 (a) | 2,000 | 1,970 | |||||||||
| ARI Fleet Lease Trust, Series 2019-A, Class A3, 2.53%, 11/15/27, Callable 3/15/23 @ 100 (a) | 4,234 | 4,226 | |||||||||
| Atalaya Equipment Leasing Trust, Series 2022-1A, Class B, 2.08%, 2/15/27, Callable 10/15/24 @ 100 (a) | 2,467 | 2,304 | |||||||||
| Avis Budget Rental Car Funding AESOP LLC, Series 2022-5A, Class B, 7.09%, 4/20/27 (a) | 2,500 | 2,568 | |||||||||
| Avis Budget Rental Car Funding AESOP LLC, Series 2020-1A, Class B, 2.68%, 8/20/26, Callable 9/20/25 @ 100 (a) | 4,000 | 3,704 | |||||||||
| Avis Budget Rental Car Funding AESOP LLC, Series 2018-1A, Class B, 4.00%, 9/20/24, Callable 10/20/23 @ 100 (a) | 2,000 | 1,984 | |||||||||
| Avis Budget Rental Car Funding AESOP LLC, Series 2019-2A, Class A, 3.35%, 9/22/25, Callable 10/20/24 @ 100 (a) | 3,300 | 3,201 | |||||||||
| Avis Budget Rental Car Funding AESOP LLC, Series 2019-3A, Class A, 2.36%, 3/20/26, Callable 4/20/25 @ 100 (a) | 5,000 | 4,726 | |||||||||
See notes to financial statements.
3
| USAA Mutual Funds Trust USAA Short-Term Bond Fund | Schedule of Portfolio Investments — continued January 31, 2023 | ||||||
(Amounts in Thousands, Except for Shares) (Unaudited)
Security Description | Principal Amount | Value | |||||||||
| Avis Budget Rental Car Funding AESOP LLC, Series 2017-2A, Class B, 3.33%, 3/20/24, Callable 4/20/23 @ 100 (a) | $ | 1,715 | $ | 1,711 | |||||||
| Avis Budget Rental Car Funding AESOP LLC, Series 2018-1A, Class A, 3.70%, 9/20/24, Callable 10/20/23 @ 100 (a) | 4,000 | 3,967 | |||||||||
| Avis Budget Rental Car Funding AESOP LLC, Series 2018-1A, Class C, 4.73%, 9/20/24, Callable 10/20/23 @ 100 (a) | 2,500 | 2,471 | |||||||||
| Bank of The West Auto Trust, Series 2019-1, Class B, 2.76%, 1/15/25, Callable 8/15/23 @ 100 (a) | 3,300 | 3,252 | |||||||||
| Bank of The West Auto Trust, Series 2019-1, Class C, 2.90%, 4/15/25, Callable 8/15/23 @ 100 (a) | 1,400 | 1,380 | |||||||||
| Bank of The West Auto Trust, Series 2019-1, Class A4, 2.51%, 10/15/24, Callable 8/15/23 @ 100 (a) | 4,150 | 4,126 | |||||||||
| Canadian Pacer Auto Receivables Trust, Series 2020-1A, Class B, 2.00%, 7/21/25, Callable 10/19/23 @ 100 (a) | 2,000 | 1,947 | |||||||||
| Canadian Pacer Auto Receivables Trust, Series 2021-1A, Class C, 1.46%, 12/20/27, Callable 2/19/25 @ 100 (a) | 3,594 | 3,253 | |||||||||
| Canadian Pacer Auto Receivables Trust, Series 2019-1A, Class C, 3.75%, 7/21/25, Callable 2/19/23 @ 100 (a) | 1,000 | 999 | |||||||||
| Canadian Pacer Auto Receivables Trust, Series 2020-1A, Class C, 2.49%, 5/19/26, Callable 10/19/23 @ 100 (a) | 5,905 | 5,755 | |||||||||
CARDS II Trust, Series 2021-1A, Class A, 0.60%, 4/15/27 (a) | 9,200 | 8,720 | |||||||||
| CarMax Auto Owner Trust, Series 2021-4, Class D, 1.48%, 3/15/28, Callable 11/15/25 @ 100 | 4,719 | 4,180 | |||||||||
| CarMax Auto Owner Trust, Series 2020-2, Class D, 5.75%, 5/17/27, Callable 4/15/24 @ 100 | 3,127 | 3,111 | |||||||||
| CarMax Auto Owner Trust, Series 2019-4, Class C, 2.60%, 9/15/25, Callable 12/15/23 @ 100 | 5,163 | 5,034 | |||||||||
| CarMax Auto Owner Trust, Series 2020-1, Class B, 2.21%, 9/15/25, Callable 2/15/24 @ 100 | 3,188 | 3,084 | |||||||||
| CarMax Auto Owner Trust, Series 2019-1, Class B, 3.45%, 11/15/24, Callable 3/15/23 @ 100 | 1,923 | 1,919 | |||||||||
| CarMax Auto Owner Trust, Series 2020-2, Class B, 2.90%, 8/15/25, Callable 4/15/24 @ 100 | 1,806 | 1,753 | |||||||||
| CarMax Auto Owner Trust, Series 2020-1, Class C, 2.34%, 11/17/25, Callable 2/15/24 @ 100 | 3,270 | 3,166 | |||||||||
| CarMax Auto Owner Trust, Series 2022-A3, Class A3, 3.49%, 2/16/27, Callable 1/15/26 @ 100 | 2,000 | 1,957 | |||||||||
| CarNow Auto Receivables Trust, Series 2023-1A, Class A, 6.62%, 12/16/24, Callable 1/15/26 @ 100 (a) | 1,350 | 1,350 | |||||||||
| CarNow Auto Receivables Trust, Series 2021-1A, Class B, 1.38%, 2/17/26, Callable 12/15/23 @ 100 (a) | 425 | 423 | |||||||||
CARS LP, Series 2020-1A, Class A1, 2.69%, 2/15/50, Callable 2/15/23 @ 100 (a) | 3,882 | 3,668 | |||||||||
| CARS-DB5 LP, Series 2021-1A, Class A1, 1.44%, 8/15/51, Callable 8/15/24 @ 100 (a) | 1,888 | 1,643 | |||||||||
| Carvana Auto Receivables Trust, Series 2021-N1, Class B, 1.09%, 1/10/28, Callable 9/10/25 @ 100 | 956 | 888 | |||||||||
| Carvana Auto Receivables Trust, Series 2021-N1, Class D, 1.50%, 1/10/28, Callable 9/10/25 @ 100 | 1,878 | 1,800 | |||||||||
| Carvana Auto Receivables Trust, Series 2019-3A, Class D, 3.04%, 4/15/25, Callable 5/15/25 @ 100 (a) | 2,242 | 2,217 | |||||||||
See notes to financial statements.
4
| USAA Mutual Funds Trust USAA Short-Term Bond Fund | Schedule of Portfolio Investments — continued January 31, 2023 | ||||||
(Amounts in Thousands, Except for Shares) (Unaudited)
Security Description | Principal Amount | Value | |||||||||
| Carvana Auto Receivables Trust, Series 2021-N2, Class D, 1.27%, 3/10/28, Callable 9/10/26 @ 100 | $ | 3,752 | $ | 3,588 | |||||||
| Carvana Auto Receivables Trust, Series 2021-N2, Class C, 1.07%, 3/10/28, Callable 9/10/26 @ 100 | 624 | 573 | |||||||||
| Carvana Auto Receivables Trust, Series 2019-2A, Class D, 3.28%, 1/15/25, Callable 1/15/25 @ 100 (a) | 943 | 937 | |||||||||
| Carvana Auto Receivables Trust, Series 2020-P1, Class D, 1.82%, 9/8/27, Callable 12/8/25 @ 100 | 1,318 | 1,113 | |||||||||
| Carvana Auto Receivables Trust, Series 2021-N2, Class B, 0.75%, 3/10/28, Callable 9/10/26 @ 100 | 636 | 586 | |||||||||
| Carvana Auto Receivables Trust, Series 2021-N2, Class A2, 0.97%, 3/10/28, Callable 9/10/26 @ 100 | 1,250 | 1,156 | |||||||||
| Carvana Auto Receivables Trust, Series 2021-N3, Class A2, 1.11%, 6/12/28, Callable 8/10/26 @ 100 | 3,500 | 3,160 | |||||||||
| Carvana Auto Receivables Trust, Series 2021-N1, Class C, 1.30%, 1/10/28, Callable 9/10/25 @ 100 | 729 | 675 | |||||||||
| Carvana Auto Receivables Trust, Series 2021-N3, Class C, 1.02%, 6/12/28, Callable 8/10/26 @ 100 | 1,349 | 1,286 | |||||||||
| Carvana Auto Receivables Trust, Series 2021-N3, Class B, 0.66%, 6/12/28, Callable 8/10/26 @ 100 | 1,117 | 1,020 | |||||||||
| Carvana Auto Receivables Trust, Series 2021-N1, Class A, 0.70%, 1/10/28, Callable 9/10/25 @ 100 | 792 | 743 | |||||||||
| CCG Receivables Trust, Series 2019-2, Class B, 2.55%, 3/15/27, Callable 5/14/23 @ 100 (a) | 3,500 | 3,473 | |||||||||
| CF Hippolyta LLC, Series 2021-1A, Class A1, 1.53%, 3/15/61, Callable 3/15/24 @ 100 (a) | 2,837 | 2,500 | |||||||||
| Chase Auto Credit Linked Notes, Series 2020-1, Class C, 1.39%, 1/25/28, Callable 5/25/24 @ 100 (a) | 353 | 348 | |||||||||
| Chase Auto Credit Linked Notes, Series 2020-1, Class B, 0.99%, 1/25/28, Callable 5/25/24 @ 100 (a) | 905 | 893 | |||||||||
| Chesapeake Funding II LLC, Series 1A, Class A1, 0.47%, 4/15/33, Callable 10/15/23 @ 100 (a) | 1,523 | 1,489 | |||||||||
| CNH Equipment Trust, Series 2022-A, Class A3, 2.94%, 7/15/27, Callable 11/15/25 @ 100 | 1,000 | 968 | |||||||||
| College Loan Corp. Trust, Series 2005-2, Class B, 5.32% (LIBOR03M+49bps), 1/15/37, Callable 4/15/28 @ 100 (b) | 788 | 721 | |||||||||
| Conn's Receivables Funding LLC, Series 2021-A, Class B, 2.87%, 5/15/26, Callable 9/15/23 @ 100.25 (a) | 1,115 | 1,100 | |||||||||
| Conn's Receivables Funding LLC, Series 2022-A, Class B, 9.52%, 12/15/26, Callable 4/15/24 @ 100 (a) | 5,000 | 4,994 | |||||||||
| Conn's Receivables Funding LLC, Series 2022-A, Class A, 5.87%, 12/15/26, Callable 4/15/24 @ 100 (a) | 3,630 | 3,629 | |||||||||
| CP EF Asset Securitization I LLC, Series 2022-1A, Class A, 5.96%, 4/15/30, Callable 11/15/25 @ 100 (a) | 3,503 | 3,454 | |||||||||
| CPS Auto Receivables Trust, Series 2022-B, Class B, 3.88%, 8/15/28, Callable 10/15/26 @ 100 (a) | 2,000 | 1,954 | |||||||||
| CPS Auto Receivables Trust, Series 2022-D, Class B, 6.84%, 1/16/29, Callable 11/15/27 @ 100 (a) | 2,000 | 2,070 | |||||||||
| CPS Auto Receivables Trust, Series 2018-D, Class E, 5.82%, 6/16/25, Callable 5/15/23 @ 100 (a) | 4,557 | 4,557 | |||||||||
See notes to financial statements.
5
| USAA Mutual Funds Trust USAA Short-Term Bond Fund | Schedule of Portfolio Investments — continued January 31, 2023 | ||||||
(Amounts in Thousands, Except for Shares) (Unaudited)
Security Description | Principal Amount | Value | |||||||||
| CPS Auto Receivables Trust, Series 2021-C, Class B, 0.84%, 7/15/25, Callable 7/15/25 @ 100 (a) | $ | 2,750 | $ | 2,726 | |||||||
| Credit Acceptance Auto Loan Trust, Series 2022-3A, Class C, 8.45%, 2/15/33, Callable 10/15/26 @ 100 (a) | 1,000 | 1,028 | |||||||||
| Credit Acceptance Auto Loan Trust, Series 2021-4, Class C, 1.94%, 2/18/31, Callable 4/15/25 @ 100 (a) | 1,000 | 895 | |||||||||
| Credit Acceptance Auto Loan Trust, Series 2019-3A, Class C, 3.06%, 3/15/29, Callable 3/15/23 @ 100 (a) | 2,625 | 2,615 | |||||||||
| Credit Acceptance Auto Loan Trust, Series 2021-2A, Class A, 0.96%, 2/15/30, Callable 12/15/24 @ 100 (a) | 2,000 | 1,931 | |||||||||
| Credit Acceptance Auto Loan Trust, Series 2019-3A, Class B, 2.86%, 1/16/29, Callable 3/15/23 @ 100 (a) | 410 | 409 | |||||||||
| Credit Acceptance Auto Loan Trust, Series 2021-3A, Class A, 1.00%, 5/15/30, Callable 11/15/24 @ 100 (a) | 1,455 | 1,398 | |||||||||
| Credit Acceptance Auto Loan Trust, Series 2021-3A, Class B, 1.38%, 7/15/30, Callable 11/15/24 @ 100 (a) | 1,000 | 926 | |||||||||
| Credit Acceptance Auto Loan Trust, Series 2021-3A, Class C, 1.63%, 9/16/30, Callable 11/15/24 @ 100 (a) | 3,000 | 2,715 | |||||||||
| Credit Acceptance Auto Loan Trust, Series 2020-1A, Class C, 2.59%, 6/15/29, Callable 6/15/23 @ 100 (a) | 4,000 | 3,945 | |||||||||
| Credit Acceptance Auto Loan Trust, Series 2020-3A, Class B, 1.77%, 12/17/29, Callable 4/15/24 @ 100 (a) | 750 | 710 | |||||||||
| Credit Acceptance Auto Loan Trust, Series 2021-4, Class B, 1.74%, 12/16/30, Callable 4/15/25 @ 100 (a) | 640 | 585 | |||||||||
| Credit Acceptance Auto Loan Trust, Series 2022-1A, Class B, 4.95%, 8/16/32, Callable 4/15/26 @ 100 (a) | 1,000 | 971 | |||||||||
| Credit Acceptance Auto Loan Trust, Series 2021-4, Class A, 1.26%, 10/15/30, Callable 4/15/25 @ 100 (a) | 667 | 630 | |||||||||
| Credit Acceptance Auto Loan Trust, Series 2020-1A, Class B, 2.39%, 4/16/29, Callable 6/15/23 @ 100 (a) | 748 | 746 | |||||||||
| Crossroads Asset Trust, Series 2021-A, Class A2, 0.82%, 3/20/24, Callable 4/20/24 @ 100 (a) | 122 | 121 | |||||||||
| Crossroads Asset Trust, Series 2021-A, Class B, 1.12%, 6/20/25, Callable 4/20/24 @ 100 (a) | 1,350 | 1,324 | |||||||||
| Dell Equipment Finance Trust, Series 2020-2, Class D, 1.92%, 3/23/26, Callable 6/22/23 @ 100 (a) | 2,125 | 2,092 | |||||||||
| Dell Equipment Finance Trust, Series 2022-1, Class B, 2.72%, 8/23/27, Callable 8/22/24 @ 100 (a) | 1,550 | 1,486 | |||||||||
| Dell Equipment Finance Trust, Series 2021-2, Class D, 1.21%, 6/22/27, Callable 2/22/24 @ 100 (a) | 2,188 | 2,073 | |||||||||
| Dell Equipment Finance Trust, Series 2020-2, Class C, 1.37%, 1/22/24, Callable 6/22/23 @ 100 (a) | 4,000 | 3,933 | |||||||||
| Dell Equipment Finance Trust, Series 2020-2, Class B, 0.92%, 11/22/23, Callable 6/22/23 @ 100 (a) | 3,000 | 2,948 | |||||||||
| Dell Equipment Finance Trust, Series 2020-2, Class A3, 0.57%, 10/23/23, Callable 6/22/23 @ 100 (a) | 331 | 329 | |||||||||
| Diamond Infrastructure Funding LLC, Series 2021-1A, Class B, 2.36%, 4/15/49, Callable 9/20/25 @ 100 (a) | 3,000 | 2,517 | |||||||||
| Diamond Infrastructure Funding LLC, Series 2021-1A, Class A, 1.76%, 4/15/49, Callable 9/20/25 @ 100 (a) | 3,333 | 2,859 | |||||||||
See notes to financial statements.
6
| USAA Mutual Funds Trust USAA Short-Term Bond Fund | Schedule of Portfolio Investments — continued January 31, 2023 | ||||||
(Amounts in Thousands, Except for Shares) (Unaudited)
Security Description | Principal Amount | Value | |||||||||
| Diamond Issuer, Series 2021-1A, Class B, 2.70%, 11/20/51, Callable 11/20/25 @ 100 (a) | $ | 3,273 | $ | 2,741 | |||||||
| Diamond Resorts Owner Trust, Series 2021-1A, Class A, 1.51%, 11/21/33, Callable 1/20/25 @ 100 (a) | 1,299 | 1,194 | |||||||||
| Diamond Resorts Owner Trust, Series 2021-1A, Class B, 2.05%, 11/21/33, Callable 1/20/25 @ 100 (a) | 749 | 683 | |||||||||
DLLST LLC, Series 2022-1A, Class A4, 3.69%, 9/20/28, Callable 7/20/25 @ 100 (a) | 3,000 | 2,924 | |||||||||
Donlen Fleet Lease Funding 2 LLC, Series 2021-2, Class B, 0.98%, 12/11/34 (a) | 4,423 | 4,163 | |||||||||
Donlen Fleet Lease Funding LLC, Series 2, Class C, 1.20%, 12/11/34 (a) | 5,000 | 4,703 | |||||||||
| Drive Auto Receivables Trust, Series 2021-1, Class C, 1.02%, 6/15/27, Callable 9/15/24 @ 100 | 3,308 | 3,240 | |||||||||
| DT Auto Owner Trust, Series 2022-2A, Class D, 5.46%, 3/15/28, Callable 7/15/25 @ 100 (a) | 2,000 | 1,955 | |||||||||
| DT Auto Owner Trust, Series 2021-3A, Class B, 0.58%, 11/17/25, Callable 4/15/25 @ 100 (a) | 5,350 | 5,202 | |||||||||
| DT Auto Owner Trust, Series 2022-2A, Class B, 4.22%, 1/15/27, Callable 7/15/25 @ 100 (a) | 2,000 | 1,967 | |||||||||
| DT Auto Owner Trust, Series 2021-3A, Class C, 0.87%, 5/17/27, Callable 4/15/25 @ 100 (a) | 3,125 | 2,943 | |||||||||
| Encina Equipment Finance LLC, Series 2022-1A, Class B, 5.15%, 1/16/29, Callable 5/15/25 @ 100 (a) | 1,000 | 983 | |||||||||
| Encina Equipment Finance LLC, Series 2021-1A, Class A2, 0.74%, 12/15/26, Callable 2/15/24 @ 100 (a) | 383 | 378 | |||||||||
| Encina Equipment Finance LLC, Series 2021-1A, Class D, 1.69%, 11/15/27, Callable 2/15/24 @ 100 (a) | 1,538 | 1,450 | |||||||||
| Encina Equipment Finance LLC, Series 2021-1A, Class B, 1.21%, 2/16/27, Callable 2/15/24 @ 100 (a) | 713 | 690 | |||||||||
| Encina Equipment Finance LLC, Series 2021-1A, Class C, 1.39%, 6/15/27, Callable 2/15/24 @ 100 (a) | 846 | 803 | |||||||||
| Enterprise Fleet Financing LLC, Series 2020-1, Class A3, 1.86%, 12/22/25, Callable 6/20/23 @ 100 (a) | 2,050 | 2,012 | |||||||||
| Enterprise Fleet Financing LLC, Series 2021-1, Class A2, 0.44%, 12/21/26, Callable 6/20/24 @ 100 (a) | 1,425 | 1,384 | |||||||||
| Enterprise Fleet Financing LLC, Series 2022-2, Class A2, 4.65%, 5/21/29, Callable 3/20/26 @ 100 (a) | 2,000 | 1,984 | |||||||||
| Enterprise Fleet Financing LLC, Series 2022-4, Class A3, 5.65%, 10/22/29, Callable 8/20/26 @ 100 (a) | 2,000 | 2,043 | |||||||||
| Enterprise Fleet Financing LLC, Series 2022-1, Class A2, 3.03%, 1/20/28, Callable 5/20/25 @ 100 (a) | 1,409 | 1,375 | |||||||||
Evergreen Credit Card Trust, Series 2022-CRT1, Class C, 6.19%, 7/15/26 (a) | 3,000 | 2,939 | |||||||||
Evergreen Credit Card Trust, Series 2022-CRT1, Class B, 5.61%, 7/15/26 (a) | 2,000 | 1,973 | |||||||||
Evergreen Credit Card Trust, Series 2021-1A, Class A, 0.90%, 10/15/26 (a) | 3,500 | 3,281 | |||||||||
Evergreen Credit Card Trust, Series 2022-CRT2, Class C, 7.44%, 11/15/26 (a) | 3,750 | 3,760 | |||||||||
| Exeter Automobile Receivables Trust, Series 2018-3, Class D, 4.35%, 6/17/24, Callable 5/15/23 @ 100 (a) | 165 | 165 | |||||||||
| Exeter Automobile Receivables Trust, Series 2020-3A, Class C, 1.32%, 7/15/25, Callable 12/15/24 @ 100 | 1,022 | 1,012 | |||||||||
| Exeter Automobile Receivables Trust, Series 2019-3A, Class D, 3.11%, 8/15/25, Callable 2/15/24 @ 100 (a) | 3,157 | 3,112 | |||||||||
See notes to financial statements.
7
| USAA Mutual Funds Trust USAA Short-Term Bond Fund | Schedule of Portfolio Investments — continued January 31, 2023 | ||||||
(Amounts in Thousands, Except for Shares) (Unaudited)
Security Description | Principal Amount | Value | |||||||||
| Exeter Automobile Receivables Trust, Series 2021-2A, Class C, 0.98%, 6/15/26, Callable 2/15/25 @ 100 | $ | 3,000 | $ | 2,902 | |||||||
| Exeter Automobile Receivables Trust, Series 2022-2A, Class B, 3.65%, 10/15/26, Callable 11/15/25 @ 100 | 2,000 | 1,963 | |||||||||
| Exeter Automobile Receivables Trust, Series 2022-5A, Class C, 6.51%, 12/15/27, Callable 9/15/27 @ 100 | 1,000 | 1,016 | |||||||||
| First Investors Auto Owner Trust, Series 2020-1A, Class C, 2.55%, 2/17/26, Callable 12/15/23 @ 100 (a) | 2,537 | 2,521 | |||||||||
| First Investors Auto Owner Trust, Series 2018-2A, Class F, 7.31%, 9/15/25, Callable 2/15/23 @ 100 (a) | 3,900 | 3,899 | |||||||||
| First Investors Auto Owner Trust, Series 2019-2A, Class C, 2.71%, 12/15/25, Callable 11/15/23 @ 100 (a) | 3,499 | 3,481 | |||||||||
| First Investors Auto Owner Trust, Series 2019-1A, Class D, 3.55%, 4/15/25, Callable 5/15/23 @ 100 (a) | 1,099 | 1,096 | |||||||||
FirstKey Homes Trust, Series 2021-SFR1, Class C, 1.89%, 8/17/38 (a) | 3,000 | 2,611 | |||||||||
FirstKey Homes Trust, Series 2021-SFR3, Class C, 2.54%, 12/17/38 (a) | 1,750 | 1,536 | |||||||||
FirstKey Homes Trust, Series 2021-SFR1, Class B, 1.79%, 8/17/38 (a) | 3,000 | 2,661 | |||||||||
FirstKey Homes Trust, Series 2021-SFR2, Class B, 1.61%, 9/17/38 (a) | 2,308 | 2,026 | |||||||||
FirstKey Homes Trust, Series 2021-SFR3, Class A, 2.14%, 12/17/38 (a) | 989 | 887 | |||||||||
FirstKey Homes Trust, Series 2021-SFR3, Class B, 2.44%, 12/17/38 (a) | 1,000 | 902 | |||||||||
| Flagship Credit Auto Trust, Series 2019-4, Class E, 4.11%, 3/15/27, Callable 12/15/24 @ 100 (a) | 2,765 | 2,573 | |||||||||
| Flagship Credit Auto Trust, Series 2021-3, Class B, 0.95%, 7/15/27, Callable 11/15/25 @ 100 (a) | 3,300 | 3,114 | |||||||||
| Flagship Credit Auto Trust, Series 2020-4, Class B, 1.00%, 10/15/25, Callable 4/15/25 @ 100 (a) | 3,352 | 3,316 | |||||||||
| Flagship Credit Auto Trust, Series 2019-2, Class D, 3.53%, 5/15/25, Callable 7/15/24 @ 100 (a) | 3,000 | 2,941 | |||||||||
| Flagship Credit Auto Trust, Series 2020-2, Class D, 5.75%, 4/15/26, Callable 2/15/25 @ 100 (a) | 5,000 | 4,980 | |||||||||
| Flagship Credit Auto Trust, Series 2021-1, Class B, 0.68%, 2/16/27, Callable 6/15/25 @ 100 (a) | 3,100 | 3,026 | |||||||||
| Flagship Credit Auto Trust, Series 2021-1, Class C, 0.91%, 3/15/27, Callable 6/15/25 @ 100 (a) | 2,700 | 2,533 | |||||||||
| Flagship Credit Auto Trust, Series 2022-2, Class B, 4.76%, 5/17/27, Callable 5/15/26 @ 100 (a) | 2,000 | 1,971 | |||||||||
| Flexential Issuer, Series 2021-1A, Class A2, 3.25%, 11/27/51, Callable 11/25/25 @ 100 (a) | 5,000 | 4,526 | |||||||||
| Ford Credit Auto Lease Trust, Series 2023-A, Class C, 5.54%, 12/15/26, Callable 8/15/25 @ 100 | 720 | 718 | |||||||||
| Ford Credit Auto Lease Trust, Series 2021-A, Class C, 0.78%, 9/15/25, Callable 6/15/23 @ 100 | 1,250 | 1,225 | |||||||||
| Ford Credit Auto Lease Trust, Series 2022-A, Class B, 3.81%, 8/15/25, Callable 11/15/24 @ 100 | 1,286 | 1,253 | |||||||||
| Ford Credit Auto Owner Trust, Series 2020-1, Class B, 2.29%, 8/15/31, Callable 2/15/25 @ 100 (a) | 5,000 | 4,676 | |||||||||
| Ford Credit Auto Owner Trust, Series 2020-1, Class C, 2.54%, 8/15/31, Callable 2/15/25 @ 100 (a) | 5,000 | 4,588 | |||||||||
| Ford Credit Auto Owner Trust, Series 2020-1, Class A, 2.04%, 8/15/31, Callable 2/15/25 @ 100 (a) | 2,667 | 2,521 | |||||||||
See notes to financial statements.
8
| USAA Mutual Funds Trust USAA Short-Term Bond Fund | Schedule of Portfolio Investments — continued January 31, 2023 | ||||||
(Amounts in Thousands, Except for Shares) (Unaudited)
Security Description | Principal Amount | Value | |||||||||
Ford Credit Floorplan Master Owner Trust, Series 2020-1, Class B, 0.98%, 9/15/25 | $ | 3,500 | $ | 3,401 | |||||||
| Foursight Capital Automobile Receivables Trust, Series 2021-1, Class B, 0.87%, 1/15/26, Callable 5/15/24 @ 100 (a) | 2,344 | 2,298 | |||||||||
| Foursight Capital Automobile Receivables Trust, Series 2022-1, Class A3, 1.83%, 12/15/26, Callable 4/15/25 @ 100 (a) | 1,200 | 1,158 | |||||||||
| Foursight Capital Automobile Receivables Trust, Series 2022-2, Class B, 5.19%, 10/15/27, Callable 11/15/25 @ 100 (a) | 2,500 | 2,491 | |||||||||
| Foursight Capital Automobile Receivables Trust, Series 2021-1, Class A3, 0.64%, 7/15/25, Callable 5/15/24 @ 100 (a) | 179 | 178 | |||||||||
| Foursight Capital Automobile Receivables Trust, Series 2021-1, Class C, 1.02%, 9/15/26, Callable 5/15/24 @ 100 (a) | 1,325 | 1,268 | |||||||||
| Foursight Capital Automobile Receivables Trust, Series 2021-2, Class B, 1.31%, 7/15/27, Callable 11/15/24 @ 100 (a) | 5,749 | 5,416 | |||||||||
| Foursight Capital Automobile Receivables Trust, Series 2023-1, Class C, 5.72%, 8/15/28, Callable 1/15/25 @ 100 (a) | 2,000 | 1,999 | |||||||||
| Foursight Capital Automobile Receivables Trust, Series 2021-2, Class A3, 0.81%, 5/15/26, Callable 11/15/24 @ 100 (a) | 4,270 | 4,168 | |||||||||
| Foursight Capital Automobile Receivables Trust, Series 2022-1, Class B, 2.15%, 5/17/27, Callable 4/15/25 @ 100 (a) | 2,000 | 1,900 | |||||||||
| Foursight Capital Automobile Receivables Trust, Series 2023-1, Class B, 5.35%, 3/15/28, Callable 4/15/25 @ 100 (a) | 1,253 | 1,253 | |||||||||
FRTKL, Series 2021-SFR1, Class B, 1.72%, 9/17/38 (a) | 1,500 | 1,306 | |||||||||
| GLS Auto Receivables Issuer Trust, Series 2019-3A, Class D, 3.84%, 5/15/26, Callable 2/15/24 @ 100 (a) | 1,000 | 977 | |||||||||
| GLS Auto Receivables Issuer Trust, Series 2020-2A, Class D, 7.48%, 4/15/27, Callable 8/15/24 @ 100 (a) | 1,560 | 1,581 | |||||||||
| GLS Auto Receivables Issuer Trust, Series 2A, Class C, 4.57%, 4/15/26, Callable 8/15/24 @ 100 (a) | 1,250 | 1,233 | |||||||||
| GLS Auto Receivables Issuer Trust, Series 2021-1A, Class B, 0.82%, 4/15/25, Callable 2/15/25 @ 100 (a) | 50 | 49 | |||||||||
| GLS Auto Receivables Issuer Trust, Series 2021-3A, Class B, 0.78%, 11/17/25, Callable 8/15/25 @ 100 (a) | 2,750 | 2,686 | |||||||||
| GLS Auto Receivables Issuer Trust, Series 4A, Class B, 1.53%, 4/15/26, Callable 4/15/26 @ 100 (a) | 1,000 | 966 | |||||||||
| GLS Auto Receivables Issuer Trust, Series 2022-2A, Class B, 4.70%, 9/15/26, Callable 12/15/26 @ 100 (a) | 2,000 | 1,974 | |||||||||
| GLS Auto Receivables Issuer Trust, Series 4A, Class A, 0.84%, 7/15/25, Callable 4/15/26 @ 100 (a) | 584 | 576 | |||||||||
| GLS Auto Receivables Issuer Trust, Series 2021-3A, Class C, 1.11%, 9/15/26, Callable 8/15/25 @ 100 (a) | 3,611 | 3,422 | |||||||||
| GLS Auto Receivables Issuer Trust, Series 2020-4A, Class C, 1.14%, 11/17/25, Callable 2/15/25 @ 100 (a) | 1,409 | 1,388 | |||||||||
| GLS Auto Receivables Trust, Series 2021-2A, Class C, 1.08%, 6/15/26, Callable 6/15/25 @ 100 (a) | 3,043 | 2,909 | |||||||||
| GLS Auto Receivables Trust, Series 2021-2A, Class B, 0.77%, 9/15/25, Callable 6/15/25 @ 100 (a) | 3,493 | 3,454 | |||||||||
| GLS Auto Receivables Trust, Series 2022-1A, Class B, 2.84%, 5/15/26, Callable 5/15/26 @ 100 (a) | 1,000 | 974 | |||||||||
| GM Financial Automobile Leasing Trust, Series 2022-2, Class B, 4.02%, 5/20/26, Callable 11/20/24 @ 100 | 1,250 | 1,224 | |||||||||
See notes to financial statements.
9
| USAA Mutual Funds Trust USAA Short-Term Bond Fund | Schedule of Portfolio Investments — continued January 31, 2023 | ||||||
(Amounts in Thousands, Except for Shares) (Unaudited)
Security Description | Principal Amount | Value | |||||||||
| GM Financial Automobile Leasing Trust, Series 2020-3, Class B, 0.76%, 10/21/24, Callable 4/20/23 @ 100 | $ | 2,000 | $ | 1,991 | |||||||
| GM Financial Automobile Leasing Trust, Series 2020-3, Class C, 1.11%, 10/21/24, Callable 4/20/23 @ 100 | 1,786 | 1,768 | |||||||||
| GM Financial Consumer Automobile Receivables Trust, Series 2020-2, Class B, 2.54%, 8/18/25, Callable 1/16/24 @ 100 | 1,500 | 1,459 | |||||||||
GMF Floorplan Owner Revolving Trust, Series 2020-2, Class B, 0.96%, 10/15/25 (a) | 1,750 | 1,687 | |||||||||
GMF Floorplan Owner Revolving Trust, Series 2020-2, Class C, 1.31%, 10/15/25 (a) | 2,250 | 2,170 | |||||||||
Golden Credit Card Trust, Series 2021-1A, Class A, 1.14%, 8/15/28 (a) | 5,000 | 4,448 | |||||||||
| GreatAmerica Leasing Receivables Funding LLC, Series 2020-1, Class B, 2.00%, 2/16/26, Callable 12/15/23 @ 100 (a) | 1,090 | 1,055 | |||||||||
| Hertz Vehicle Financing III LLC, Series 2022-1A, Class B, 2.19%, 6/25/26, Callable 6/25/25 @ 100 (a) | 4,250 | 3,908 | |||||||||
| Hertz Vehicle Financing III LLC, Series 2022-1A, Class A, 1.99%, 6/25/26, Callable 6/25/25 @ 100 (a) | 1,000 | 930 | |||||||||
| Hertz Vehicle Financing III LLC, Series 2022-1A, Class C, 2.63%, 6/25/26, Callable 6/25/25 @ 100 (a) | 2,700 | 2,468 | |||||||||
| Hertz Vehicle Financing III LLC, Series 2022-3A, Class A, 3.37%, 3/25/25, Callable 3/25/24 @ 100 (a) | 2,000 | 1,957 | |||||||||
| Hertz Vehicle Financing LLC, Series 2022-4A, Class A, 3.73%, 9/25/26, Callable 9/25/25 @ 100 (a) | 4,000 | 3,848 | |||||||||
| Hpefs Equipment Trust, Series 2022-2A, Class D, 4.94%, 3/20/30, Callable 11/20/25 @ 100 (a) | 1,200 | 1,178 | |||||||||
| HPEFS Equipment Trust, Series 2021-2A, Class D, 1.29%, 3/20/29, Callable 7/20/24 @ 100 (a) | 2,719 | 2,540 | |||||||||
| HPEFS Equipment Trust, Series 2020-1A, Class C, 2.03%, 2/20/30, Callable 3/20/23 @ 100 (a) | 354 | 354 | |||||||||
| HPEFS Equipment Trust, Series 2020-1A, Class D, 2.26%, 2/20/30, Callable 3/20/23 @ 100 (a) | 2,000 | 1,990 | |||||||||
| HPEFS Equipment Trust, Series 2020-2A, Class C, 2.00%, 7/22/30, Callable 5/20/23 @ 100 (a) | 1,909 | 1,901 | |||||||||
| HPEFS Equipment Trust, Series 2021-1A, Class C, 0.75%, 3/20/31, Callable 2/20/24 @ 100 (a) | 2,500 | 2,414 | |||||||||
| HPEFS Equipment Trust, Series 2021-1A, Class D, 1.03%, 3/20/31, Callable 2/20/24 @ 100 (a) | 4,700 | 4,465 | |||||||||
| HPEFS Equipment Trust, Series 2021-2A, Class C, 0.88%, 9/20/28, Callable 7/20/24 @ 100 (a) | 3,843 | 3,654 | |||||||||
| JPMorgan Chase Bank NA, Series 2021-2, Class D, 1.14%, 12/26/28, Callable 4/25/25 @ 100 (a) | 473 | 453 | |||||||||
| JPMorgan Chase Bank NA, Series 2021-2, Class B, 0.89%, 12/26/28, Callable 4/25/25 @ 100 (a) | 926 | 890 | |||||||||
| JPMorgan Chase Bank NA, Series 2021-1, Class B, 0.88%, 9/25/28, Callable 3/25/25 @ 100 (a) | 2,709 | 2,614 | |||||||||
| JPMorgan Chase Bank NA, Series 2020-1, Class D, 1.89%, 1/25/28, Callable 5/25/24 @ 100 (a) | 144 | 142 | |||||||||
| JPMorgan Chase Bank NA, Series 2021-3, Class D, 1.01%, 2/26/29, Callable 4/25/25 @ 100 (a) | 2,142 | 2,019 | |||||||||
| JPMorgan Chase Bank NA, Series 2020-2, Class C, 1.14%, 2/25/28, Callable 10/25/24 @ 100 (a) | 386 | 378 | |||||||||
See notes to financial statements.
10
| USAA Mutual Funds Trust USAA Short-Term Bond Fund | Schedule of Portfolio Investments — continued January 31, 2023 | ||||||
(Amounts in Thousands, Except for Shares) (Unaudited)
Security Description | Principal Amount | Value | |||||||||
| JPMorgan Chase Bank NA, Series 2021-1, Class C, 1.02%, 9/25/28, Callable 3/25/25 @ 100 (a) | $ | 1,016 | $ | 979 | |||||||
| JPMorgan Chase Bank NA, Series 2020-2, Class B, 0.84%, 2/25/28, Callable 10/25/24 @ 100 (a) | 773 | 755 | |||||||||
| JPMorgan Chase Bank NA, Series 2020-2, Class D, 1.49%, 2/25/28, Callable 10/25/24 @ 100 (a) | 1,360 | 1,331 | |||||||||
| JPMorgan Chase Bank NA, Series 2021-1, Class D, 1.17%, 9/25/28, Callable 3/25/25 @ 100 (a) | 1,348 | 1,296 | |||||||||
| Kubota Credit Owner Trust, Series 2022-1A, Class A3, 2.67%, 10/15/26, Callable 2/15/26 @ 100 (a) | 2,000 | 1,904 | |||||||||
| Kubota Credit Owner Trust, Series 2020-1A, Class A3, 1.96%, 3/15/24, Callable 9/15/23 @ 100 (a) | 798 | 794 | |||||||||
| LAD Auto Receivables Trust, Series 2022-1A, Class B, 5.87%, 9/15/27, Callable 2/15/26 @ 100 (a) | 1,600 | 1,568 | |||||||||
| LAD Auto Receivables Trust, Series 2021-1A, Class A, 1.30%, 8/17/26, Callable 5/15/25 @ 100 (a) | 1,136 | 1,097 | |||||||||
| LAD Auto Receivables Trust, Series 2021-1A, Class C, 2.35%, 4/15/27, Callable 5/15/25 @ 100 (a) | 5,000 | 4,561 | |||||||||
| LAD Auto Receivables Trust, Series 2022-1A, Class C, 6.85%, 4/15/30, Callable 2/15/26 @ 100 (a) | 2,000 | 1,961 | |||||||||
| LAD Auto Receivables Trust, Series 2022-1A, Class A, 5.21%, 6/15/27, Callable 2/15/26 @ 100 (a) | 1,528 | 1,505 | |||||||||
| LAD Auto Receivables Trust, Series 2021-1A, Class B, 1.94%, 11/16/26, Callable 5/15/25 @ 100 (a) | 4,500 | 4,188 | |||||||||
Master Credit Card Trust, Series 2020-1A, Class C, 2.59%, 9/21/24 (a) | 2,125 | 2,114 | |||||||||
Master Credit Card Trust, Series 2021-1A, Class B, 0.79%, 11/21/25 (a) | 1,346 | 1,262 | |||||||||
Master Credit Card Trust, Series 2020-1A, Class B, 2.27%, 9/21/24 (a) | 833 | 830 | |||||||||
Master Credit Card Trust, Series 2021-1A, Class C, 1.06%, 11/21/25 (a) | 4,151 | 3,883 | |||||||||
Master Credit Card Trust II, Series 2023-1A, Class C, 5.87%, 6/21/27 (a) | 1,200 | 1,196 | |||||||||
MMAF Equipment Finance LLC, Series 2022-A, Class A3, 3.20%, 1/13/28 (a) | 2,000 | 1,921 | |||||||||
| MMAF Equipment Finance LLC, Series 2020-BA, Class A5, 0.85%, 4/14/42, Callable 1/14/25 @ 100 (a) | 5,000 | 4,598 | |||||||||
MVW LLC, Series 2021-1WA, Class B, 1.44%, 1/22/41, Callable 3/20/26 @ 100 (a) | 1,176 | 1,078 | |||||||||
MVW LLC, Series 2021-1WA, Class A, 1.14%, 1/22/41, Callable 3/20/26 @ 100 (a) | 1,124 | 1,026 | |||||||||
| MVW Owner Trust, Series 2017-1A, Class A, 2.42%, 12/20/34, Callable 8/20/23 @ 100 (a) | 308 | 291 | |||||||||
| MVW Owner Trust, Series 2018-1A, Class A, 3.45%, 1/21/36, Callable 5/20/24 @ 100 (a) | 3,315 | 3,225 | |||||||||
| Nelnet Student Loan Trust, Series 2005-3, Class B, 5.03% (LIBOR03M+28bps), 9/22/37, Callable 3/22/23 @ 100 (b) | 1,048 | 950 | |||||||||
| New Economy Assets Phase 1 Sponsor LLC, Series 2021-1, Class B1, 2.41%, 10/20/61, Callable 10/20/24 @ 100 (a) | 1,466 | 1,224 | |||||||||
| New Economy Assets Phase 1 Sponsor LLC, Series 2021-1, Class A1, 1.91%, 10/20/61, Callable 10/20/24 @ 100 (a) | 4,516 | 3,933 | |||||||||
| NMEF Funding LLC, Series 2022-B, Class A2, 6.07%, 6/15/29, Callable 10/15/26 @ 100 (a) | 1,000 | 1,005 | |||||||||
| NMEF Funding LLC, Series 2021-A, Class A2, 0.81%, 12/15/27, Callable 8/15/24 @ 100 (a) | 1,223 | 1,208 | |||||||||
| NMEF Funding LLC, Series 2021-A, Class B, 1.85%, 12/15/27, Callable 8/15/24 @ 100 (a) | 4,000 | 3,824 | |||||||||
See notes to financial statements.
11
| USAA Mutual Funds Trust USAA Short-Term Bond Fund | Schedule of Portfolio Investments — continued January 31, 2023 | ||||||
(Amounts in Thousands, Except for Shares) (Unaudited)
Security Description | Principal Amount | Value | |||||||||
| NMEF Funding LLC, Series 2022-B, Class B, 7.12%, 6/15/29, Callable 10/15/26 @ 100 (a) | $ | 1,000 | $ | 1,021 | |||||||
| NP SPE II LLC, Series 2017-1A, Class A1, 3.37%, 10/21/47, Callable 2/20/23 @ 100 (a) | 1,486 | 1,404 | |||||||||
| NP SPE II LLC, Series 2019-2A, Class C1, 6.44%, 11/19/49, Callable 11/19/23 @ 100 (a) | 3,466 | 3,090 | |||||||||
| Oscar U.S. Funding XII LLC, Series 1A, Class A3, 0.70%, 4/10/25, Callable 2/10/25 @ 100 (a) | 3,245 | 3,154 | |||||||||
| Oscar U.S. Funding XII LLC, Series 1A, Class A4, 1.00%, 4/10/28, Callable 2/10/25 @ 100 (a) | 7,500 | 6,931 | |||||||||
| Oscar U.S. Funding XIII LLC, Series 2021-2A, Class A3, 0.86%, 9/10/25, Callable 5/10/25 @ 100 (a) | 5,600 | 5,343 | |||||||||
| Oscar U.S. Funding XIII LLC, Series 2021-2A, Class A4, 1.27%, 9/11/28, Callable 5/10/25 @ 100 (a) | 8,100 | 7,467 | |||||||||
| Oscar U.S. Funding XIV LLC, Series 2022-1A, Class A3, 2.30%, 4/10/26, Callable 3/10/26 @ 100 (a) | 2,340 | 2,236 | |||||||||
| Oscar US Funding XIV LLC, Series 2022-1A, Class A4, 2.82%, 4/10/29, Callable 3/10/26 @ 100 (a) | 900 | 850 | |||||||||
| Pawnee Equipment Receivables LLC, Series 2021-1, Class A2, 1.10%, 7/15/27, Callable 9/15/25 @ 100 (a) | 1,567 | 1,503 | |||||||||
| Pawnee Equipment Receivables LLC, Series 2020-1, Class B, 1.84%, 1/15/26, Callable 3/15/24 @ 100 (a) | 930 | 903 | |||||||||
| Pawnee Equipment Receivables LLC, Series 2021-1, Class B, 1.82%, 7/15/27, Callable 9/15/25 @ 100 (a) | 1,637 | 1,508 | |||||||||
| Pawnee Equipment Receivables LLC, Series 2020-1, Class A, 1.37%, 11/17/25, Callable 3/15/24 @ 100 (a) | 857 | 848 | |||||||||
| Pawneee Equipment Receivables LLC, Series 2022-1, Class A3, 5.17%, 2/15/28, Callable 10/15/26 @ 100 (a) | 1,000 | 994 | |||||||||
| Pawneee Equipment Receivables Series LLC, Series 2022-1, Class B, 5.40%, 7/17/28, Callable 10/15/26 @ 100 (a) | 1,000 | 1,002 | |||||||||
| PenFed Auto Receivables Owner Trust, Series 2022-A, Class A4, 4.18%, 12/15/28, Callable 3/15/26 @ 100 (a) | 1,000 | 989 | |||||||||
| PenFed Auto Receivables Owner Trust, Series 2022-A, Class C, 4.83%, 12/15/28, Callable 3/15/26 @ 100 (a) | 1,333 | 1,320 | |||||||||
| PenFed Auto Receivables Owner Trust, Series 2022-A, Class B, 4.60%, 12/15/28, Callable 3/15/26 @ 100 (a) | 1,549 | 1,530 | |||||||||
| PenFed Auto Receivables Owner Trust, Series 2022-A, Class D, 5.85%, 6/17/30, Callable 3/15/26 @ 100 (a) | 912 | 902 | |||||||||
| Prestige Auto Receivables Trust, Series 2018-1A, Class D, 4.14%, 10/15/24, Callable 3/15/23 @ 100 (a) | 1,778 | 1,775 | |||||||||
| Prestige Auto Receivables Trust, Series 2020-1A, Class C, 1.31%, 11/16/26, Callable 11/15/23 @ 100 (a) | 2,440 | 2,423 | |||||||||
| Prestige Auto Receivables Trust, Series 2019-1A, Class D, 3.01%, 8/15/25, Callable 5/15/23 @ 100 (a) | 5,000 | 4,968 | |||||||||
Progress Residential Trust, Series 2021-SFR5, Class B, 1.66%, 7/17/38 (a) | 2,400 | 2,119 | |||||||||
Progress Residential Trust, Series 2021-SFR4, Class B, 1.81%, 5/17/38 (a) | 4,500 | 4,019 | |||||||||
Progress Residential Trust, Series 2021-SFR5, Class C, 1.81%, 7/17/38 (a) | 1,500 | 1,314 | |||||||||
| Progress Residential Trust, Series 2021-SFR2, Class B, 1.80%, 4/19/38, Callable 4/17/24 @ 100 (a) | 6,850 | 6,084 | |||||||||
| Progress Residential Trust, Series 2021-SFR6, Class B, 1.75%, 7/17/38, Callable 7/17/26 @ 100 (a) | 2,813 | 2,451 | |||||||||
See notes to financial statements.
12
| USAA Mutual Funds Trust USAA Short-Term Bond Fund | Schedule of Portfolio Investments — continued January 31, 2023 | ||||||
(Amounts in Thousands, Except for Shares) (Unaudited)
Security Description | Principal Amount | Value | |||||||||
| Santander Bank Auto Credit-Linked Notes, Series 2022-C, Class B, 6.45%, 12/15/32, Callable 11/15/26 @ 100 (a) | $ | 958 | $ | 958 | |||||||
| Santander Bank Auto Credit-Linked Notes, Series 2022-C, Class C, 6.99%, 12/15/32, Callable 11/15/26 @ 100 (a) | 2,874 | 2,875 | |||||||||
| Santander Bank Auto Credit-Linked Notes, Series 2022-C, Class D, 8.20%, 12/15/32, Callable 11/15/26 @ 100 (a) | 2,812 | 2,813 | |||||||||
| Santander Bank Auto Credit-Linked Notes, Series 2022-B, Class D, 6.79%, 8/16/32, Callable 2/15/26 @ 100 (a) | 1,621 | 1,607 | |||||||||
| Santander Bank Auto Credit-Linked Notes, Series 2022-B, Class E, 8.68%, 8/16/32, Callable 2/15/26 @ 100 (a) | 1,499 | 1,472 | |||||||||
| Santander Bank Auto Credit-Linked Notes, Series 2022-A, Class B, 5.28%, 5/15/32, Callable 11/15/25 @ 100 (a) | 2,699 | 2,636 | |||||||||
| Santander Bank Auto Credit-Linked Notes, Series 2022-A, Class C, 7.38%, 5/15/32, Callable 11/15/25 @ 100 (a) | 3,373 | 3,297 | |||||||||
| Santander Bank Auto Credit-Linked Notes, Series 2022-B, Class C, 5.92%, 8/16/32, Callable 2/15/26 @ 100 (a) | 1,497 | 1,488 | |||||||||
| Santander Bank NA, Series 2021-1A, Class C, 3.27%, 12/15/31, Callable 7/15/25 @ 100 (a) | 373 | 361 | |||||||||
| Santander Bank NA, Series 2021-1A, Class B, 1.83%, 12/15/31, Callable 7/15/25 @ 100 (a) | 1,478 | 1,429 | |||||||||
| Santander Consumer Auto Receivables Trust, Series 2020-BA, Class C, 1.29%, 4/15/26, Callable 4/15/25 @ 100 (a) | 7,400 | 7,112 | |||||||||
| Santander Retail Auto Lease Trust, Series 2021-C, Class B, 0.83%, 3/20/26, Callable 6/20/24 @ 100 (a) | 1,750 | 1,655 | |||||||||
| Santander Retail Auto Lease Trust, Series 2021-C, Class C, 1.11%, 3/20/26, Callable 6/20/24 @ 100 (a) | 2,188 | 2,056 | |||||||||
| Santander Retail Auto Lease Trust, Series 2021-B, Class B, 0.84%, 6/20/25, Callable 4/20/24 @ 100 (a) | 5,000 | 4,747 | |||||||||
| Santander Retail Auto Lease Trust, Series 2020-B, Class C, 1.18%, 12/20/24, Callable 2/20/24 @ 100 (a) | 4,000 | 3,830 | |||||||||
| SCF Equipment Leasing LLC, Series 2022-2A, Class B, 6.50%, 2/20/32, Callable 10/20/29 @ 100 (a) | 429 | 438 | |||||||||
| SCF Equipment Leasing LLC, Series 2022-2A, Class C, 6.50%, 8/20/32, Callable 10/20/29 @ 100 (a) | 785 | 794 | |||||||||
| SCF Equipment Leasing LLC, Series 2022-2A, Class D, 6.50%, 10/20/32, Callable 10/20/29 @ 100 (a) | 1,319 | 1,261 | |||||||||
| SCF Equipment Leasing LLC, Series 2020-1A, Class A3, 1.19%, 10/20/27, Callable 9/20/24 @ 100 (a) | 3,489 | 3,418 | |||||||||
| SCF Equipment Leasing LLC, Series 2020-1A, Class B, 2.02%, 3/20/28, Callable 9/20/24 @ 100 (a) | 3,824 | 3,655 | |||||||||
| SCF Equipment Leasing LLC, Series 2020-1A, Class C, 2.60%, 8/21/28, Callable 9/20/24 @ 100 (a) | 2,900 | 2,692 | |||||||||
| SCF Equipment Leasing LLC, Series 2019-2, Class B, 2.76%, 8/20/26, Callable 11/20/24 @ 100 (a) | 2,000 | 1,934 | |||||||||
| Securitized Term Auto Receivables Trust, Series 2019-CRTA, Class B, 2.45%, 3/25/26, Callable 4/25/23 @ 100 (a) | 214 | 213 | |||||||||
| Securitized Term Auto Receivables Trust, Series 2019-CRTA, Class C, 2.85%, 3/25/26, Callable 4/25/23 @ 100 (a) | 306 | 304 | |||||||||
| Sierra Timeshare Receivables Funding LLC, Series 1A, Class A, 3.20%, 1/20/36, Callable 12/20/23 @ 100 (a) | 1,190 | 1,140 | |||||||||
| Sierra Timeshare Receivables Funding LLC, Series 3A, Class A, 2.34%, 8/20/36, Callable 6/20/24 @ 100 (a) | 2,432 | 2,336 | |||||||||
See notes to financial statements.
13
| USAA Mutual Funds Trust USAA Short-Term Bond Fund | Schedule of Portfolio Investments — continued January 31, 2023 | ||||||
(Amounts in Thousands, Except for Shares) (Unaudited)
Security Description | Principal Amount | Value | |||||||||
| Synchrony Card Funding LLC, Series 2022-A1, Class A, 3.37%, 4/15/28, Callable 4/15/25 @ 100 | $ | 880 | $ | 857 | |||||||
Synchrony Credit Card Master Note Trust, Series 2018-2, Class B, 3.67%, 5/15/26 | 510 | 508 | |||||||||
Synchrony Credit Card Master Note Trust, Series 2018-2, Class C, 3.87%, 5/15/26 | 5,000 | 4,976 | |||||||||
| Tesla Auto Lease Trust, Series 2020-A, Class B, 1.18%, 1/22/24, Callable 3/20/23 @ 100 (a) | 2,750 | 2,744 | |||||||||
| Transportation Finance Equipment Trust, Series 2019-1, Class A4, 1.88%, 3/25/24, Callable 5/23/23 @ 100 (a) | 1,507 | 1,497 | |||||||||
| Tricolor Auto Securitization Trust, Series 2021-1A, Class B, 1.00%, 6/17/24, Callable 5/15/24 @ 100 (a) | 2,176 | 2,172 | |||||||||
Tricon Residential Trust, Series 2022-SFR1, Class B, 4.20%, 4/17/39 (a) | 1,000 | 949 | |||||||||
| Trinity Rail Leasing LLC, Series 2019-2A, Class A1, 2.39%, 10/18/49, Callable 2/17/23 @ 100 (a) | 1,355 | 1,266 | |||||||||
| Unify Auto Receivables Trust, Series 2021-1A, Class B, 1.29%, 11/16/26, Callable 1/15/25 @ 100 (a) | 3,000 | 2,809 | |||||||||
| Unify Auto Receivables Trust, Series 2021-1A, Class A4, 0.98%, 7/15/26, Callable 1/15/25 @ 100 (a) | 3,000 | 2,876 | |||||||||
| United Auto Credit Securitization Trust, Series 2023-1, Class C, 6.28%, 7/10/28, Callable 2/10/27 @ 100 (a) | 4,000 | 3,996 | |||||||||
| Vantage Data Centers LLC, Series 2020-1A, Class A2, 1.65%, 9/15/45, Callable 9/15/23 @ 100 (a) | 6,500 | 5,807 | |||||||||
| Volvo Financial Equipment LLC, Series 2020-1A, Class A4, 0.60%, 3/15/28, Callable 6/15/24 @ 100 (a) | 1,750 | 1,656 | |||||||||
| VSE VOI Mortgage LLC, Series 2017-A, Class B, 2.63%, 3/20/35, Callable 1/20/24 @ 100 (a) | 2,034 | 1,904 | |||||||||
| Westlake Automobile Receivables Trust, Series 2022-3A, Class C, 6.44%, 12/15/27, Callable 7/15/26 @ 100 (a) | 2,000 | 2,035 | |||||||||
| Westlake Automobile Receivables Trust, Series 2019-2A, Class E, 4.02%, 4/15/25, Callable 5/15/23 @ 100 (a) | 4,000 | 3,979 | |||||||||
| Westlake Automobile Receivables Trust, Series 2020-1A, Class C, 2.52%, 4/15/25, Callable 12/15/23 @ 100 (a) | 1,305 | 1,301 | |||||||||
| Westlake Automobile Receivables Trust, Series 2021-3A, Class D, 2.12%, 1/15/27, Callable 5/15/25 @ 100 (a) | 1,000 | 918 | |||||||||
| Westlake Automobile Receivables Trust, Series 2022-2A, Class C, 4.85%, 9/15/27, Callable 12/15/25 @ 100 (a) | 1,429 | 1,401 | |||||||||
| Westlake Automobile Receivables Trust, Series 2022-2A, Class B, 4.31%, 9/15/27, Callable 12/15/25 @ 100 (a) | 800 | 784 | |||||||||
| Westlake Automobile Receivables Trust, Series 2023-1A, Class B, 5.41%, 1/18/28, Callable 2/15/26 @ 100 (a) | 1,000 | 1,001 | |||||||||
| Wheels Fleet Lease Funding 1 LLC, Series 2022-1A, Class A, 2.47%, 10/18/36, Callable 9/18/24 @ 100 (a) | 1,672 | 1,632 | |||||||||
| Wheels SPV 2 LLC, Series 2020-1A, Class A3, 0.62%, 8/20/29, Callable 3/20/24 @ 100 (a) | 3,250 | 3,121 | |||||||||
| World Omni Automobile Lease Securitization Trust, Series 2022-A, Class A4, 3.34%, 6/15/27 | 1,500 | 1,468 | |||||||||
| World Omni Select Auto Trust, Series 2021-A, Class D, 1.44%, 11/15/27, Callable 3/15/25 @ 100 | 2,750 | 2,490 | |||||||||
| World Omni Select Auto Trust, Series 2020-A, Class B, 0.84%, 6/15/26, Callable 7/15/24 @ 100 | 5,750 | 5,576 | |||||||||
Total Asset-Backed Securities (Cost $728,979) | 697,046 | ||||||||||
See notes to financial statements.
14
| USAA Mutual Funds Trust USAA Short-Term Bond Fund | Schedule of Portfolio Investments — continued January 31, 2023 | ||||||
(Amounts in Thousands, Except for Shares) (Unaudited)
Security Description | Principal Amount | Value | |||||||||
Collateralized Mortgage Obligations (7.1%) | |||||||||||
| Annisa CLO Ltd., Series 2016-2, Class AR, 5.91% (LIBOR03M+110bps), 7/20/31, Callable 4/20/29 @ 100 (a) (b) | $ | 3,000 | $ | 2,973 | |||||||
Aventura Mall Trust, Series 2018-AVM, Class C, 4.11%, 7/5/40 (a) (c) | 2,000 | 1,759 | |||||||||
| BBCMS Mortgage Trust, Series 2020-BID, Class B, 7.00% (LIBOR01M+254bps), 10/15/37 (a) (b) | 5,000 | 4,837 | |||||||||
| BBCMS Mortgage Trust, Series 2020-BID, Class A, 6.60% (LIBOR01M+214bps), 10/15/37 (a) (b) | 3,000 | 2,929 | |||||||||
BPR Trust, Series 2021-TY, Class A, 5.51% (LIBOR01M+105bps), 9/15/38 (a) (b) | 3,731 | 3,567 | |||||||||
BPR Trust, Series 2021-TY, Class D, 6.81% (LIBOR01M+235bps), 9/15/38 (a) (b) | 1,313 | 1,234 | |||||||||
BPR Trust, Series 2021-TY, Class C, 6.16% (LIBOR01M+170bps), 9/15/38 (a) (b) | 2,712 | 2,547 | |||||||||
BPR Trust, Series 2022-OANA, Class B, 6.93% (TSFR1M+245bps), 4/15/37 (a) (b) | 3,000 | 2,947 | |||||||||
BPR Trust, Series 2022-STAR, Class A, 7.71% (TSFR1M+323bps), 8/15/24 (a) (b) | 1,000 | 997 | |||||||||
BPR Trust, Series 2021-TY, Class B, 5.61% (LIBOR01M+115bps), 9/15/38 (a) (b) | 750 | 704 | |||||||||
| BX Commercial Mortgage Trust, Series 2021-VOLT, Class B, 5.41% (LIBOR01M+85bps), 9/15/36 (a) (b) | 2,500 | 2,411 | |||||||||
| BX Commercial Mortgage Trust, Series 2019-XL, Class C, 5.84% (LIBOR01M+125bps), 10/15/36 (a) (b) | 566 | 559 | |||||||||
| BX Commercial Mortgage Trust, Series 2019-XL, Class D, 6.04% (LIBOR01M+145bps), 10/15/36 (a) (b) | 2,601 | 2,551 | |||||||||
BX Trust, Series 2022-CLS, Class B, 6.30%, 10/13/27 (a) | 2,750 | 2,728 | |||||||||
| Citigroup Commercial Mortgage Trust, Series 2019-SMRT, Class B, 4.38%, 1/10/36 (a) | 7,600 | 7,439 | |||||||||
| Columbia Cent CLO 32 Ltd., Series 2022-32A, Class BF, 5.20%, 7/24/34, Callable 7/24/29 @ 100 (a) | 1,000 | 924 | |||||||||
| COMM Mortgage Trust, Series 2015-PC1, Class B, 4.29%, 7/10/50, Callable 6/10/25 @ 100 (c) | 3,366 | 3,159 | |||||||||
| COMM Mortgage Trust, Series 2012-CR4, Class XA, 1.23%, 10/15/45, Callable 2/15/23 @ 100 (c) (d) | 13,056 | 1 | |||||||||
| COMM Mortgage Trust, Series 2014-277P, Class A, 3.61%, 8/10/49, Callable 8/10/24 @ 100 (a) (c) | 14,610 | 13,975 | |||||||||
| COMM Mortgage Trust, Series 2015-PC1, Class AM, 4.29%, 7/10/50, Callable 6/10/25 @ 100 (c) | 6,550 | 6,307 | |||||||||
| COMM Mortgage Trust, Series 2020-CBM, Class A2, 2.90%, 2/10/37, Callable 2/10/25 @ 100 (a) | 5,620 | 5,251 | |||||||||
| COMM Mortgage Trust, Series 2020-CBM, Class B, 3.10%, 2/10/37, Callable 2/10/25 @ 100 (a) | 5,000 | 4,627 | |||||||||
| COMM Mortgage Trust, Series 2020-CBM, Class C, 3.40%, 2/10/37, Callable 2/10/25 @ 100 (a) | 6,875 | 6,309 | |||||||||
| Credit Suisse Mortgage Capital Certificates, Series 2021-980M, Class A, 2.39%, 7/15/31 (a) | 2,500 | 2,172 | |||||||||
| Extended Stay America Trust, Series 2021-ESH, Class A, 5.54% (LIBOR01M+108bps), 7/15/38 (a) (b) | 1,952 | 1,919 | |||||||||
| Extended Stay America Trust, Series 2021-ESH, Class C, 6.16% (LIBOR01M+170bps), 7/15/38 (a) (b) | 2,440 | 2,384 | |||||||||
| Extended Stay America Trust, Series 2021-ESH, Class B, 5.84% (LIBOR01M+138bps), 7/15/38 (a) (b) | 759 | 742 | |||||||||
| FREMF Mortgage Trust, Series 2017-K724, Class B, 3.50%, 12/25/49, Callable 12/25/23 @ 100 (a) (c) | 4,935 | 4,829 | |||||||||
See notes to financial statements.
15
| USAA Mutual Funds Trust USAA Short-Term Bond Fund | Schedule of Portfolio Investments — continued January 31, 2023 | ||||||
(Amounts in Thousands, Except for Shares) (Unaudited)
Security Description | Principal Amount | Value | |||||||||
| GS Mortgage Securities Corp. Trust, Series 2017-SLP, Class A, 3.42%, 10/10/32 (a) | $ | 1,028 | $ | 991 | |||||||
| GS Mortgage Securities Corp. Trust, Series 2017-GPTX, Class A, 2.86%, 5/10/34 (a) | 13,530 | 12,882 | |||||||||
| GS Mortgage Securities Corp. Trust, Series 2020-UPTN, Class A, 2.75%, 2/10/37, Callable 2/10/25 @ 100 (a) | 2,000 | 1,852 | |||||||||
Houston Galleria Mall Trust, Series 2015-HGLR, Class A1A2, 3.09%, 3/5/37 (a) | 11,824 | 10,996 | |||||||||
| Hudson Yards Mortgage Trust, Series 2016-10HY, Class A, 2.84%, 8/10/38, Callable 8/10/26 @ 100 (a) | 2,000 | 1,815 | |||||||||
| JP Morgan Chase Commercial Mortgage Securities Trust, Series 2013-C13, Class B, 4.12%, 1/15/46, Callable 7/15/23 @ 100 (c) | 4,212 | 4,160 | |||||||||
| JP Morgan Chase Commercial Mortgage Securities Trust, Series 2013-C10, Class AS, 3.37%, 12/15/47 | 1,748 | 1,739 | |||||||||
| JPMorgan Chase Commercial Mortgage Securities Trust, Series 2013-C10, Class B, 3.67%, 12/15/47 (c) | 4,550 | 4,486 | |||||||||
| JPMorgan Chase Commercial Mortgage Securities Trust, Series 2013-C13, Class C, 4.12%, 1/15/46, Callable 7/15/23 @ 100 (c) | 1,132 | 1,111 | |||||||||
| KNDL Mortgage Trust, Series 2019-KNSQ, Class B, 5.41% (LIBOR01M+95bps), 5/15/36 (a) (b) | 2,000 | 1,978 | |||||||||
| Life Mortgage Trust, Series 2021-BMR, Class B, 5.34% (LIBOR01M+88bps), 3/15/38 (a) (b) | 2,949 | 2,856 | |||||||||
| Morgan Stanley Capital I Trust, Series 2019-NUGS, Class B, 5.76% (LIBOR01M+130bps), 12/15/36 (a) (b) | 3,846 | 3,525 | |||||||||
| Palmer Square Loan Funding Ltd., Series 2020-1A, Class A1, 5.48% (LIBOR03M+80bps), 2/20/28, Callable 2/20/23 @ 100 (a) (b) | 1,369 | 1,363 | |||||||||
| Palmer Square Loan Funding Ltd., Series 2020-1A, Class A2, 6.03% (LIBOR03M+135bps), 2/20/28, Callable 2/20/23 @ 100 (a) (b) | 4,600 | 4,553 | |||||||||
| Palmer Square Loan Funding Ltd., Series 2021-1A, Class A1, 5 .71% (LIBOR03M+90bps), 4/20/29, Callable 4/20/23 @ 100 (a) (b) | 803 | 797 | |||||||||
| Race Point CLO Ltd., Series 2016-10A, Class A1R, 5.92% (LIBOR03M+110bps), 7/25/31, Callable 1/25/29 @ 100 (a) (b) | 4,437 | 4,377 | |||||||||
| Sequoia Mortgage Trust, Series 2013-5, Class A2, 3.00%, 5/25/43, Callable 6/25/24 @ 100 (a) (c) | 597 | 540 | |||||||||
| SREIT Trust, Series 2021-MFP2, Class C, 5.83% (US0001M+137bps), 11/15/36 (a) (b) | 2,000 | 1,929 | |||||||||
| SREIT Trust, Series 2021-MFP2, Class B, 5.63% (LIBOR01M+117bps), 11/15/36 (a) (b) | 2,000 | 1,940 | |||||||||
| Stratus CLO Ltd., Series 2021-3A, Class A, 5.76% (LIBOR03M+95bps), 12/29/29, Callable 4/20/27 @ 100 (a) (b) | 1,720 | 1,705 | |||||||||
| Stratus CLO Ltd., Series 2021-3A, Class B, 6.36% (LIBOR03M+155bps), 12/29/29, Callable 4/20/27 @ 100 (a) (b) | 1,643 | 1,602 | |||||||||
TTAN, Series 2021-MHC, Class C, 5.81% (LIBOR01M+140bps), 3/15/38 (a) (b) | 2,958 | 2,877 | |||||||||
TTAN, Series 2021-MHC, Class D, 6.21% (LIBOR01M+180bps), 3/15/38 (a) (b) | 1,183 | 1,145 | |||||||||
TTAN, Series 2021-MHC, Class B, 5.56% (LIBOR01M+115bps), 3/15/38 (a) (b) | 2,197 | 2,142 | |||||||||
| WFRBS Commercial Mortgage Trust, Series 2013-C12, Class B, 3.86%, 3/15/48, Callable 3/15/23 @ 100 (c) | 2,000 | 1,990 | |||||||||
Total Collateralized Mortgage Obligations (Cost $176,892) | 168,132 | ||||||||||
See notes to financial statements.
16
| USAA Mutual Funds Trust USAA Short-Term Bond Fund | Schedule of Portfolio Investments — continued January 31, 2023 | ||||||
(Amounts in Thousands, Except for Shares) (Unaudited)
Security Description | Shares or Principal Amount | Value | |||||||||
Preferred Stocks (0.2%) | |||||||||||
Financials (0.2%): | |||||||||||
Citigroup Capital XIII, 11.17% (LIBOR03M+637bps), 10/30/40 (b) | 200,000 | $ | 5,744 | ||||||||
Total Preferred Stocks (Cost $5,470) | 5,744 | ||||||||||
Senior Secured Loans (0.7%) | |||||||||||
Celanese US Holdings LLC, Delayed Term Loan, First Lien, 10/31/23 (e) | $ | 4,000 | 3,990 | ||||||||
Delos Finance S.A.R.L., Loans, First Lien, 6.48% (LIBOR03M+175bps), 10/6/23 (b) | 10,000 | 9,997 | |||||||||
| Delta Air Lines, Inc. and SkyMiles IP Ltd., Initial Term Loan, First Lien, 8.56% (LIBOR03M+375bps), 10/20/27 (b) | 1,425 | 1,472 | |||||||||
Total Senior Secured Loans (Cost $15,458) | 15,459 | ||||||||||
Corporate Bonds (40.1%) | |||||||||||
Communication Services (0.8%): | |||||||||||
Endeavor Energy Resources LP, 5.75%, 1/30/28, Callable 3/13/23 @ 102.88 (a) | 1,000 | 988 | |||||||||
Magallanes, Inc., 3.64%, 3/15/25 (a) | 4,000 | 3,858 | |||||||||
Sprint Corp., 7.88%, 9/15/23 | 4,000 | 4,059 | |||||||||
| Sprint Spectrum Co. LLC/Sprint Spectrum Co. II LLC/Sprint Spectrum Co. III LLC, 4.74%, 3/20/25, Callable 3/20/24 @ 100 (a) | 5,821 | 5,770 | |||||||||
TEGNA, Inc., 4.75%, 3/15/26, Callable 3/15/23 @ 102.38 (a) | 3,000 | 2,914 | |||||||||
T-Mobile USA, Inc., 4.75%, 2/1/28, Callable 2/21/23 @ 102.38 | 2,641 | 2,623 | |||||||||
20,212 | |||||||||||
Consumer Discretionary (2.9%): | |||||||||||
| Association of American Medical Colleges 2.27%, 10/1/25 | 4,145 | 3,809 | |||||||||
2.39%, 10/1/26 | 4,275 | 3,828 | |||||||||
BMW US Capital LLC, 3.25%, 4/1/25 (a) (f) | 2,000 | 1,944 | |||||||||
Duke University Health System, Inc., 2.26%, 6/1/26 | 700 | 639 | |||||||||
Expedia Group, Inc., 6.25%, 5/1/25, Callable 2/1/25 @ 100 (a) | 5,000 | 5,087 | |||||||||
| Genting New York LLC/GENNY Capital, Inc., 3.30%, 2/15/26, Callable 1/15/26 @ 100 (a) | 2,300 | 2,056 | |||||||||
| Howard University 2.80%, 10/1/23 | 1,000 | 972 | |||||||||
2.42%, 10/1/24 | 1,350 | 1,267 | |||||||||
Lithia Motors, Inc., 4.63%, 12/15/27, Callable 3/13/23 @ 103.47 (a) | 5,718 | 5,320 | |||||||||
Murphy Oil USA, Inc., 5.63%, 5/1/27, Callable 3/13/23 @ 102.81 | 4,970 | 4,880 | |||||||||
Newell Brands, Inc., 4.45%, 4/1/26, Callable 1/1/26 @ 100 | 1,800 | 1,710 | |||||||||
Nissan Motor Acceptance Co. LLC, 2.00%, 3/9/26, Callable 2/9/26 @ 100 (a) | 6,717 | 5,955 | |||||||||
Nordstrom, Inc., 2.30%, 4/8/24, Callable 2/27/23 @ 100 | 10,000 | 9,484 | |||||||||
QVC, Inc., 4.45%, 2/15/25, Callable 11/15/24 @ 100 | 10,450 | 8,910 | |||||||||
Smithsonian Institution, 0.97%, 9/1/23 | 1,400 | 1,366 | |||||||||
| Toll Brothers Finance Corp. 4.38%, 4/15/23, Callable 3/13/23 @ 100 | 5,169 | 5,154 | |||||||||
4.88%, 3/15/27, Callable 12/15/26 @ 100 | 250 | 244 | |||||||||
Volkswagen Group of America Finance LLC, 3.13%, 5/12/23 (a) | 5,000 | 4,974 | |||||||||
67,599 | |||||||||||
See notes to financial statements.
17
| USAA Mutual Funds Trust USAA Short-Term Bond Fund | Schedule of Portfolio Investments — continued January 31, 2023 | ||||||
(Amounts in Thousands, Except for Shares) (Unaudited)
Security Description | Principal Amount | Value | |||||||||
Consumer Staples (1.1%): | |||||||||||
7-Eleven, Inc., 0.80%, 2/10/24, Callable 3/13/23 @ 100 (a) | $ | 5,000 | $ | 4,782 | |||||||
Central Garden & Pet Co., 5.13%, 2/1/28, Callable 3/13/23 @ 102.56 (f) | 3,000 | 2,858 | |||||||||
Darling Ingredients, Inc., 5.25%, 4/15/27, Callable 2/21/23 @ 102.63 (a) | 6,885 | 6,714 | |||||||||
| JBS USA LUX SA/JBS USA Food Co./JBS USA Finance, Inc., 6.50%, 4/15/29, Callable 4/15/24 @ 103.25 (a) | 1,643 | 1,654 | |||||||||
| Walmart, Inc. 2.85%, 7/8/24, Callable 6/8/24 @ 100 | 5,000 | 4,893 | |||||||||
3.55%, 6/26/25, Callable 4/26/25 @ 100 | 5,000 | 4,941 | |||||||||
25,842 | |||||||||||
Energy (8.0%): | |||||||||||
Buckeye Partners LP, 4.15%, 7/1/23, Callable 4/1/23 @ 100 | 4,250 | 4,212 | |||||||||
| Continental Resources, Inc. 4.50%, 4/15/23, Callable 3/13/23 @ 100 | 6,482 | 6,465 | |||||||||
3.80%, 6/1/24, Callable 3/1/24 @ 100 | 9,171 | 8,994 | |||||||||
| DCP Midstream Operating LP 3.88%, 3/15/23, Callable 3/13/23 @ 100 | 4,814 | 4,805 | |||||||||
5.38%, 7/15/25, Callable 4/15/25 @ 100 | 3,000 | 3,000 | |||||||||
5.85% (LIBOR03M+385bps), 5/21/43, Callable 5/21/23 @ 100 (a) (b) (f) | 3,500 | 3,461 | |||||||||
Devon Energy Corp., 5.25%, 10/15/27, Callable 2/21/23 @ 102.63 | 13,330 | 13,418 | |||||||||
Enable Midstream Partners LP, 3.90%, 5/15/24, Callable 2/15/24 @ 100 | 10,000 | 9,830 | |||||||||
| Energy Transfer LP 6.75%, Callable 5/15/25 @ 100 (g) | 333 | 314 | |||||||||
7.13% (H15T5Y+531bps), Callable 5/15/30 @ 100 (b) (g) | 2,300 | 2,091 | |||||||||
6.50% (H15T5Y+569bps), Callable 11/15/26 @ 100 (b) (f) (g) | 1,567 | 1,477 | |||||||||
4.90%, 2/1/24, Callable 11/1/23 @ 100 | 5,326 | 5,306 | |||||||||
Exxon Mobil Corp., 2.99%, 3/19/25, Callable 2/19/25 @ 100 | 5,000 | 4,864 | |||||||||
| Gray Oak Pipeline LLC 2.00%, 9/15/23 (a) | 8,334 | 8,131 | |||||||||
2.60%, 10/15/25, Callable 9/15/25 @ 100 (a) | 1,171 | 1,073 | |||||||||
| HF Sinclair Corp. 2.63%, 10/1/23 (f) | 3,803 | 3,730 | |||||||||
5.88%, 4/1/26, Callable 1/1/26 @ 100 | 6,990 | 7,047 | |||||||||
Laredo Petroleum, Inc., 9.50%, 1/15/25, Callable 3/13/23 @ 102.38 | 5,000 | 5,045 | |||||||||
Midwest Connector Capital Co. LLC, 3.90%, 4/1/24, Callable 3/1/24 @ 100 (a) | 12,200 | 11,916 | |||||||||
MPLX LP, 6.88% (LIBOR03M+465bps), Callable 2/15/23 @ 100 (b) (g) | 9,850 | 9,845 | |||||||||
Murphy Oil Corp., 5.88%, 12/1/27, Callable 3/13/23 @ 102.94 | 8,000 | 7,888 | |||||||||
Ovintiv Exploration, Inc., 5.38%, 1/1/26, Callable 10/1/25 @ 100 | 5,272 | 5,307 | |||||||||
| Parsley Energy LLC/Parsley Finance Corp., 4.13%, 2/15/28, Callable 3/13/23 @ 102.06 (a) | 8,699 | 8,324 | |||||||||
| PBF Holding Co. LLC/PBF Finance Corp., 7.25%, 6/15/25, Callable 3/13/23 @ 101.81 | 2,270 | 2,262 | |||||||||
| PDC Energy, Inc. 6.13%, 9/15/24, Callable 3/13/23 @ 100 | 2,498 | 2,485 | |||||||||
5.75%, 5/15/26, Callable 3/13/23 @ 102.88 | 4,002 | 3,870 | |||||||||
SM Energy Co., 5.63%, 6/1/25, Callable 3/13/23 @ 100.94 | 5,000 | 4,902 | |||||||||
Southwestern Energy Co., 5.70%, 1/23/25, Callable 10/23/24 @ 100 | 4,829 | 4,791 | |||||||||
Talos Production, Inc., 12.00%, 1/15/26, Callable 2/27/23 @ 106 | 2,000 | 2,121 | |||||||||
| Targa Resources Partners LP/Targa Resources Partners Finance Corp., 6.50%, 7/15/27, Callable 3/13/23 @ 104.88 | 7,772 | 7,947 | |||||||||
See notes to financial statements.
18
| USAA Mutual Funds Trust USAA Short-Term Bond Fund | Schedule of Portfolio Investments — continued January 31, 2023 | ||||||
(Amounts in Thousands, Except for Shares) (Unaudited)
Security Description | Principal Amount | Value | |||||||||
Transocean Proteus Ltd., 6.25%, 12/1/24, Callable 2/16/23 @ 101.04 (a) | $ | 1,676 | $ | 1,693 | |||||||
Viper Energy Partners LP, 5.38%, 11/1/27, Callable 3/13/23 @ 102.69 (a) | 6,350 | 6,148 | |||||||||
Western Midstream Operating LP, 3.35%, 2/1/25, Callable 1/1/25 @ 100 | 11,953 | 11,412 | |||||||||
WPX Energy, Inc., 8.25%, 8/1/23, Callable 6/1/23 @ 100 | 5,263 | 5,324 | |||||||||
189,498 | |||||||||||
Financials (15.6%): | |||||||||||
Ally Financial, Inc., 7.10%, 11/15/27, Callable 10/15/27 @ 100 (f) | 3,111 | 3,283 | |||||||||
AmTrust Financial Services, Inc., 6.13%, 8/15/23 | 14,342 | 14,301 | |||||||||
| Antares Holdings LP 6.00%, 8/15/23, Callable 7/15/23 @ 100 (a) | 3,500 | 3,490 | |||||||||
8.50%, 5/18/25, Callable 4/18/25 @ 100 (a) | 2,265 | 2,311 | |||||||||
| Ares Capital Corp. 3.50%, 2/10/23 (f) | 2,309 | 2,308 | |||||||||
3.25%, 7/15/25, Callable 6/15/25 @ 100 | 5,000 | 4,707 | |||||||||
Assurant, Inc., 4.20%, 9/27/23, Callable 8/27/23 @ 100 | 3,800 | 3,770 | |||||||||
Athene Global Funding, 1.20%, 10/13/23 (a) | 5,000 | 4,857 | |||||||||
Aviation Capital Group LLC, 5.50%, 12/15/24, Callable 11/15/24 @ 100 (a) | 7,495 | 7,434 | |||||||||
| Blackstone Private Credit Fund 1.75%, 9/15/24 | 3,500 | 3,268 | |||||||||
2.35%, 11/22/24 | 5,000 | 4,685 | |||||||||
4.70%, 3/24/25 (f) | 2,000 | 1,941 | |||||||||
7.05%, 9/29/25 (a) | 4,000 | 4,057 | |||||||||
2.63%, 12/15/26, Callable 11/15/26 @ 100 | 2,308 | 1,985 | |||||||||
| Cadence Bancorp, 4.75% (LIBOR03M+303bps), 6/30/29, Callable 6/30/24 @ 100 (b) | 10,000 | 9,797 | |||||||||
| Cadence Bank, 4.13% (LIBOR03M+247bps), 11/20/29, Callable 11/20/24 @ 100 (b) | 11,196 | 10,685 | |||||||||
Capital One Financial Corp., 5.47%, 2/1/29, Callable 2/1/28 @ 100 | 2,000 | 2,012 | |||||||||
CIT Group, Inc., 4.13% (H15T5Y+237bps), 11/13/29, Callable 11/13/24 @ 100 (b) | 1,000 | 943 | |||||||||
DAE Funding LLC, 1.55%, 8/1/24, Callable 7/1/24 @ 100 (a) | 1,250 | 1,180 | |||||||||
Entergy Texas Restoration Funding II LLC, 3.05%, 12/15/27 | 1,170 | 1,119 | |||||||||
F&G Global Funding, 5.15%, 7/7/25 (a) | 2,000 | 1,971 | |||||||||
Fifth Third Bancorp, 4.50%, Callable 9/30/25 @ 100 (f) (g) | 2,000 | 1,936 | |||||||||
| First Citizens BancShares, Inc., 3.37% (SOFR+247bps), 3/15/30, Callable 3/15/25 @ 100 (b) | 10,871 | 10,300 | |||||||||
First Financial Bancorp, 5.13%, 8/25/25 | 9,000 | 8,709 | |||||||||
First Horizon National Corp., 3.55%, 5/26/23, Callable 4/26/23 @ 100 | 5,000 | 4,970 | |||||||||
FNB Corp., 2.20%, 2/24/23 | 9,994 | 9,956 | |||||||||
| Ford Motor Credit Co. LLC 3.38%, 11/13/25, Callable 10/13/25 @ 100 | 3,000 | 2,794 | |||||||||
6.95%, 3/6/26, Callable 2/6/26 @ 100 | 3,000 | 3,068 | |||||||||
| FS KKR Capital Corp. 4.63%, 7/15/24, Callable 6/15/24 @ 100 (f) | 2,250 | 2,211 | |||||||||
1.65%, 10/12/24 | 2,119 | 1,965 | |||||||||
4.25%, 2/14/25, Callable 1/14/25 @ 100 (a) | 5,600 | 5,299 | |||||||||
3.40%, 1/15/26, Callable 12/15/25 @ 100 | 4,000 | 3,655 | |||||||||
| Fulton Financial Corp., 3.25% (SOFR+230bps), 3/15/30, Callable 3/15/25 @ 100 (b) | 9,318 | 8,880 | |||||||||
GA Global Funding Trust, 1.63%, 1/15/26 (a) | 2,500 | 2,258 | |||||||||
See notes to financial statements.
19
| USAA Mutual Funds Trust USAA Short-Term Bond Fund | Schedule of Portfolio Investments — continued January 31, 2023 | ||||||
(Amounts in Thousands, Except for Shares) (Unaudited)
Security Description | Principal Amount | Value | |||||||||
| Hilltop Holdings, Inc. 5.00%, 4/15/25, Callable 1/15/25 @ 100 | $ | 5,000 | $ | 4,841 | |||||||
5.75% (SOFR+568bps), 5/15/30, Callable 5/15/25 @ 100 (b) | 5,000 | 4,986 | |||||||||
Luther Burbank Corp., 6.50%, 9/30/24, Callable 8/31/24 @ 100 (a) (f) | 2,500 | 2,507 | |||||||||
| Main Street Capital Corp. 5.20%, 5/1/24 | 11,700 | 11,642 | |||||||||
3.00%, 7/14/26, Callable 6/14/26 @ 100 | 3,500 | 3,084 | |||||||||
| MB Financial Bank NA, 6.63% (LIBOR03M+187bps), 12/1/27, Callable 3/1/23 @ 100 (b) | 3,000 | 2,998 | |||||||||
Mobr-04 LLC (LOC — Compass Bank), 5.28%, 9/1/24 (h) | 2,900 | 2,900 | |||||||||
National General Holdings Corp., 6.75%, 5/15/24 (a) | 4,000 | 4,140 | |||||||||
| New York Community Bancorp, Inc., 5.90% (LIBOR03M+278bps), 11/6/28, Callable 11/6/23 @ 100 (b) (f) | 8,242 | 8,127 | |||||||||
| OneMain Finance Corp. 5.63%, 3/15/23 | 1,000 | 999 | |||||||||
8.25%, 10/1/23 | 2,555 | 2,593 | |||||||||
| OWL Rock Core Income Corp. 5.50%, 3/21/25 (a) | 3,000 | 2,929 | |||||||||
5.50%, 3/21/25 | 2,000 | 1,952 | |||||||||
7.75%, 9/16/27, Callable 8/16/27 @ 100 (a) | 2,677 | 2,696 | |||||||||
PRA Group, Inc., 8.38%, 2/1/28, Callable 2/1/25 @ 104.19 (a) | 3,167 | 3,184 | |||||||||
ProAssurance Corp., 5.30%, 11/15/23 | 14,000 | 13,925 | |||||||||
| Prudential Financial, Inc., 5.63% (LIBOR03M+392bps), 6/15/43, Callable 6/15/23 @ 100 (b) | 11,014 | 10,950 | |||||||||
| Radian Group, Inc. 4.50%, 10/1/24, Callable 7/1/24 @ 100 | 6,349 | 6,164 | |||||||||
6.63%, 3/15/25, Callable 9/15/24 @ 100 | 2,744 | 2,748 | |||||||||
| Regions Financial Corp., 5.75% (H15T5Y+543bps), Callable 6/15/25 @ 100 (b) (f) (g) | 7,786 | 7,721 | |||||||||
Reliance Standard Life Global Funding II, 3.85%, 9/19/23 (a) | 5,000 | 4,947 | |||||||||
RLI Corp., 4.88%, 9/15/23 | 3,000 | 2,991 | |||||||||
SCE Recovery Funding LLC, 0.86%, 11/15/31 | 8,663 | 7,384 | |||||||||
Signature Bank, 4.13% (LIBOR03M+256bps), 11/1/29, Callable 11/1/24 @ 100 (b) | 11,650 | 10,979 | |||||||||
Starwood Property Trust, Inc., 3.63%, 7/15/26, Callable 1/15/26 @ 100 (a) | 1,500 | 1,346 | |||||||||
Sterling Bancorp, 4.00% (SOFR+253bps), 12/30/29, Callable 12/30/24 @ 100 (b) | 8,750 | 8,200 | |||||||||
Stewart Information Services Corp., 3.60%, 11/15/31, Callable 8/15/31 @ 100 | 1,291 | 1,024 | |||||||||
Synchrony Bank, 5.40%, 8/22/25, Callable 7/22/25 @ 100 | 3,000 | 2,987 | |||||||||
| Synchrony Financial 4.88%, 6/13/25, Callable 5/13/25 @ 100 | 2,000 | 1,962 | |||||||||
3.95%, 12/1/27, Callable 9/1/27 @ 100 | 2,000 | 1,850 | |||||||||
| Synovus Financial Corp., 5.90% (USSW5+338bps), 2/7/29, Callable 2/7/24 @ 100 (b) | 6,188 | 6,129 | |||||||||
| Texas Capital Bancshares, Inc., 4.00% (H15T5Y+315bps), 5/6/31, Callable 5/6/26 @ 100 (b) | 6,000 | 5,454 | |||||||||
| The Bank of New York Mellon Corp., 4.70% (H15T5Y+436bps), Callable 9/20/25 @ 100 (b) (g) | 4,000 | 3,914 | |||||||||
| The Huntington National Bank, 5.50% (LIBOR03M+509bps), 5/6/30, Callable 5/6/25 @ 100 (b) | 13,590 | 13,281 | |||||||||
| TIAA FSB Holdings, Inc., 9.47% (LIBOR03M+470bps), 3/15/26, Callable 3/13/23 @ 100 (b) | 5,718 | 5,719 | |||||||||
See notes to financial statements.
20
| USAA Mutual Funds Trust USAA Short-Term Bond Fund | Schedule of Portfolio Investments — continued January 31, 2023 | ||||||
(Amounts in Thousands, Except for Shares) (Unaudited)
Security Description | Principal Amount | Value | |||||||||
Toyota Motor Credit Corp., 4.80%, 1/10/25 | $ | 2,000 | $ | 2,007 | |||||||
| Truist Financial Corp. 4.95% (H15T5Y+461bps), Callable 9/1/25 @ 100 (b) (g) | 8,000 | 7,921 | |||||||||
4.25%, 9/30/24 | 1,955 | 1,918 | |||||||||
| UMB Financial Corp., 3.70% (H15T5Y+344bps), 9/17/30, Callable 9/17/25 @ 100 (b) | 6,500 | 5,973 | |||||||||
United Financial Bancorp, Inc., 5.75%, 10/1/24 | 8,120 | 7,885 | |||||||||
| WEA Finance LLC/Westfield UK & Europe Finance PLC, 3.75%, 9/17/24, Callable 6/17/24 @ 100 (a) | 1,058 | 1,009 | |||||||||
Webster Financial Corp., 4.38%, 2/15/24, Callable 1/16/24 @ 100 | 5,500 | 5,393 | |||||||||
367,464 | |||||||||||
Health Care (0.6%): | |||||||||||
CommonSpirit Health, 6.07%, 11/1/27, Callable 8/1/27 @ 100 | 2,500 | 2,609 | |||||||||
HCA, Inc., 7.50%, 12/15/23 | 2,131 | 2,163 | |||||||||
Hikma Finance USA LLC, 3.25%, 7/9/25 | 10,000 | 9,394 | |||||||||
14,166 | |||||||||||
Industrials (3.8%): | |||||||||||
| American Airlines Pass Through Trust 4.40%, 9/22/23 | 5,706 | 5,585 | |||||||||
4.38%, 6/15/24 (a) | 3,910 | 3,676 | |||||||||
American Airlines, Inc./AAdvantage Loyalty IP Ltd., 5.50%, 4/20/26 (a) | 5,000 | 4,903 | |||||||||
Ashtead Capital, Inc., 4.38%, 8/15/27, Callable 2/27/23 @ 102.19 (a) | 11,245 | 10,777 | |||||||||
Continental Airlines Pass Through Trust, 4.00%, 10/29/24 (f) | 8,768 | 8,421 | |||||||||
Daimler Trucks Finance North America LLC, 3.50%, 4/7/25 (a) | 3,000 | 2,907 | |||||||||
Delta Air Lines Pass Through Trust, 2.00%, 6/10/28 | 4,253 | 3,707 | |||||||||
Hexcel Corp., 4.95%, 8/15/25, Callable 5/15/25 @ 100 | 3,000 | 2,935 | |||||||||
Huntington Ingalls Industries, Inc., 0.67%, 8/16/23, Callable 2/21/23 @ 100 (f) | 2,500 | 2,439 | |||||||||
| Mileage Plus Holdings LLC/Mileage Plus Intellectual Property Assets Ltd., 6.50%, 6/20/27, Callable 6/30/23 @ 103.25 (a) | 9,000 | 9,097 | |||||||||
| Regal Rexnord Corp. 6.05%, 2/15/26 (a) | 3,000 | 3,045 | |||||||||
6.05%, 4/15/28, Callable 3/15/28 @ 100 (a) | 2,000 | 2,028 | |||||||||
Southern Power Co., 2.75%, 9/20/23, Callable 7/20/23 @ 100 | 9,500 | 9,340 | |||||||||
Spirit Airlines Pass Through Trust, 4.45%, 4/1/24 | 10,018 | 9,634 | |||||||||
U.S. Airways Pass Through Trust, 3.95%, 11/15/25 | 3,142 | 2,922 | |||||||||
| United Airlines Pass Through Trust 4.15%, 4/11/24 | 4,523 | 4,409 | |||||||||
4.88%, 1/15/26 | 744 | 722 | |||||||||
XPO Escrow Sub LLC, 7.50%, 11/15/27, Callable 11/15/24 @ 103.75 (a) | 2,100 | 2,158 | |||||||||
88,705 | |||||||||||
Information Technology (0.6%): | |||||||||||
| Global Payments, Inc. 3.75%, 6/1/23, Callable 3/13/23 @ 100 | 1,401 | 1,393 | |||||||||
1.50%, 11/15/24, Callable 10/15/24 @ 100 | 3,000 | 2,815 | |||||||||
| Skyworks Solutions, Inc. 0.90%, 6/1/23, Callable 2/27/23 @ 100 | 5,000 | 4,922 | |||||||||
1.80%, 6/1/26, Callable 5/1/26 @ 100 | 5,000 | 4,463 | |||||||||
Western Digital Corp., 4.75%, 2/15/26, Callable 11/15/25 @ 100 | 1,500 | 1,449 | |||||||||
15,042 | |||||||||||
See notes to financial statements.
21
| USAA Mutual Funds Trust USAA Short-Term Bond Fund | Schedule of Portfolio Investments — continued January 31, 2023 | ||||||
(Amounts in Thousands, Except for Shares) (Unaudited)
Security Description | Principal Amount | Value | |||||||||
Materials (2.2%): | |||||||||||
Amcor Flexibles North America, Inc., 4.00%, 5/17/25, Callable 4/17/25 @ 100 | $ | 1,000 | $ | 979 | |||||||
Bayport Polymers LLC, 4.74%, 4/14/27, Callable 3/14/27 @ 100 (a) | 3,000 | 2,832 | |||||||||
Berry Global, Inc., 4.88%, 7/15/26, Callable 3/13/23 @ 102.44 (a) | 13,784 | 13,420 | |||||||||
| Celanese US Holdings LLC 5.90%, 7/5/24 | 2,000 | 2,012 | |||||||||
6.05%, 3/15/25 (f) | 2,000 | 2,015 | |||||||||
Cleveland-Cliffs, Inc., 6.75%, 3/15/26, Callable 3/13/23 @ 105.06 (a) | 1,000 | 1,015 | |||||||||
| Freeport-McMoRan, Inc. 5.00%, 9/1/27, Callable 3/13/23 @ 102.5 | 8,808 | 8,735 | |||||||||
4.38%, 8/1/28, Callable 8/1/23 @ 102.19 | 14,000 | 13,378 | |||||||||
Glencore Funding LLC, 1.63%, 4/27/26, Callable 3/27/26 @ 100 (a) | 5,000 | 4,507 | |||||||||
Nucor Corp., 3.95%, 5/23/25 | 2,000 | 1,972 | |||||||||
Steel Dynamics, Inc., 5.00%, 12/15/26, Callable 3/13/23 @ 101.67 | 1,000 | 992 | |||||||||
51,857 | |||||||||||
Real Estate (3.5%): | |||||||||||
Alexander Funding Trust, 1.84%, 11/15/23 (a) | 11,745 | 11,326 | |||||||||
American Tower Trust, 3.07%, 3/15/23, Callable 3/13/23 @ 100 (a) | 3,760 | 3,744 | |||||||||
Boston Properties LP, 6.75%, 12/1/27, Callable 11/1/27 @ 100 | 2,000 | 2,119 | |||||||||
GLP Capital, LP GLP Financing II, Inc., 5.38%, 11/1/23 | 6,000 | 6,006 | |||||||||
LXP Industrial Trust, 4.40%, 6/15/24, Callable 3/15/24 @ 100 (f) | 4,000 | 3,914 | |||||||||
| MPT Operating Partnership LP/MPT Finance Corp., 5.00%, 10/15/27, Callable 3/13/23 @ 102.5 (f) | 21,401 | 18,096 | |||||||||
Nationwide Health Properties, Inc., 6.90%, 10/1/37, (Put Date 10/1/27), MTN (i) | 2,950 | 3,210 | |||||||||
Newmark Group, Inc., 6.13%, 11/15/23, Callable 10/15/23 @ 100 | 14,000 | 14,037 | |||||||||
Omega Healthcare Investors, Inc., 4.38%, 8/1/23, Callable 6/1/23 @ 100 | 1,472 | 1,464 | |||||||||
Realty Income Corp., 5.05%, 1/13/26, Callable 1/13/24 @ 100 | 2,000 | 2,004 | |||||||||
| Retail Opportunity Investments Partnership LP, 5.00%, 12/15/23, Callable 9/15/23 @ 100 | 2,200 | 2,180 | |||||||||
| SBA Tower Trust 2.84%, 1/15/25, Callable 1/15/24 @ 100 (a) | 6,923 | 6,544 | |||||||||
1.88%, 1/15/26, Callable 1/15/25 @ 100 (a) | 3,500 | 3,146 | |||||||||
6.60%, 1/15/28, Callable 1/15/27 @ 100 (a) | 842 | 877 | |||||||||
| VICI Properties LP/VICI Note Co., Inc., 3.50%, 2/15/25, Callable 3/13/23 @ 100.88 (a) | 4,136 | 3,936 | |||||||||
82,603 | |||||||||||
Utilities (1.0%): | |||||||||||
National Fuel Gas Co., 5.50%, 1/15/26, Callable 12/15/25 @ 100 | 5,000 | 5,021 | |||||||||
Sierra Pacific Power Co., 3.38%, 8/15/23, Callable 5/15/23 @ 100 | 4,299 | 4,262 | |||||||||
System Energy Resources, Inc., 4.10%, 4/1/23, Callable 3/13/23 @ 100 | 3,630 | 3,624 | |||||||||
| Vistra Operations Co. LLC 3.55%, 7/15/24, Callable 6/15/24 @ 100 (a) | 8,675 | 8,381 | |||||||||
5.13%, 5/13/25 (a) | 2,000 | 1,964 | |||||||||
23,252 | |||||||||||
Total Corporate Bonds (Cost $981,176) | 946,240 | ||||||||||
See notes to financial statements.
22
| USAA Mutual Funds Trust USAA Short-Term Bond Fund | Schedule of Portfolio Investments — continued January 31, 2023 | ||||||
(Amounts in Thousands, Except for Shares) (Unaudited)
Security Description | Principal Amount | Value | |||||||||
Yankee Dollars (9.1%) | |||||||||||
Communication Services (0.4%): | |||||||||||
Bharti Airtel International Netherlands BV, 5.35%, 5/20/24 (a) | $ | 8,000 | $ | 8,003 | |||||||
Consumer Discretionary (0.4%): | |||||||||||
Nissan Motor Co. Ltd., 3.04%, 9/15/23 (a) | 4,000 | 3,933 | |||||||||
Stellantis NV, 5.25%, 4/15/23 | 6,352 | 6,348 | |||||||||
10,281 | |||||||||||
Consumer Staples (0.2%): | |||||||||||
Imperial Brands Finance PLC, 4.25%, 7/21/25, Callable 4/21/25 @ 100 (a) | 1,075 | 1,048 | |||||||||
Leviathan Bond Ltd., 5.75%, 6/30/23, Callable 3/30/23 @ 100 (a) | 4,500 | 4,490 | |||||||||
5,538 | |||||||||||
Energy (1.3%): | |||||||||||
BP Capital Markets PLC, 4.38% (H15T5Y+404bps), Callable 6/22/25 @ 100 (b) (g) | 4,500 | 4,364 | |||||||||
| Galaxy Pipeline Assets Bidco Ltd. 1.75%, 9/30/27 (a) | 2,030 | 1,886 | |||||||||
2.16%, 3/31/34 (a) (f) | 693 | 600 | |||||||||
Harbour Energy PLC, 5.50%, 10/15/26, Callable 10/15/23 @ 102.75 (a) | 5,396 | 4,965 | |||||||||
Lundin Energy Finance BV, 2.00%, 7/15/26, Callable 6/15/26 @ 100 (a) | 5,000 | 4,536 | |||||||||
Petroleos Mexicanos, 8.63%, 12/1/23 | 1,500 | 1,514 | |||||||||
| Var Energi ASA 5.00%, 5/18/27, Callable 4/18/27 @ 100 (a) | 3,000 | 2,893 | |||||||||
7.50%, 1/15/28, Callable 12/15/27 @ 100 (a) | 7,333 | 7,726 | |||||||||
Woodside Finance Ltd., 3.65%, 3/5/25, Callable 12/5/24 @ 100 (a) | 1,240 | 1,203 | |||||||||
29,687 | |||||||||||
Financials (3.7%): | |||||||||||
| AerCap Ireland Capital DAC/AerCap Global Aviation Trust, 3.15%, 2/15/24, Callable 1/15/24 @ 100 | 5,000 | 4,875 | |||||||||
| Avolon Holdings Funding Ltd. 2.88%, 2/15/25, Callable 1/15/25 @ 100 (a) | 10,000 | 9,373 | |||||||||
2.13%, 2/21/26, Callable 1/21/26 @ 100 (a) | 4,250 | 3,797 | |||||||||
| Banco Santander Mexico SA Institucion de Banca Multiple Groupo Financiero Santander, 5.95% (H15T5Y+300bps), 10/1/28, Callable 10/1/23 @ 100 (a) (b) | 5,130 | 5,131 | |||||||||
| Banco Santander Mexico SA Institucion de Banca Multiple Grupo Financiero Santand, 5.38%, 4/17/25 (a) | 10,085 | 10,104 | |||||||||
| Banco Santander Mexico SA Institucion de Banca Multiple Grupo Financiero Santander, 5.95% (H15T5Y+300bps), 10/1/28, Callable 10/1/23 @ 100 (b) | 4,199 | 4,199 | |||||||||
Barclays PLC, 7.33% (H15T1Y+305bps), 11/2/26, Callable 11/2/25 @ 100 (b) | 2,000 | 2,100 | |||||||||
| BAT International Finance PLC 1.67%, 3/25/26, Callable 2/25/26 @ 100 | 6,000 | 5,416 | |||||||||
4.45%, 3/16/28, Callable 2/16/28 @ 100 | 4,000 | 3,830 | |||||||||
Federation des Caisses Desjardins du Quebec, 4.40%, 8/23/25 (a) | 3,000 | 2,959 | |||||||||
Lloyds Banking Group PLC, 4.58%, 12/10/25 | 1,000 | 979 | |||||||||
| NatWest Group PLC 6.10%, 6/10/23 | 1,640 | 1,637 | |||||||||
7.47% (H15T1Y+285bps), 11/10/26, Callable 11/10/25 @ 100 (b) | 3,000 | 3,174 | |||||||||
| Ontario Teachers' Cadillac Fairview Properties Trust, 3.88%, 3/20/27, Callable 12/20/26 @ 100 (a) | 2,000 | 1,869 | |||||||||
ORIX Corp., 5.00%, 9/13/27 (f) | 3,000 | 3,060 | |||||||||
Phoenix Group Holdings PLC, 5.38%, 7/6/27, MTN | 9,087 | 8,843 | |||||||||
See notes to financial statements.
23
| USAA Mutual Funds Trust USAA Short-Term Bond Fund | Schedule of Portfolio Investments — continued January 31, 2023 | ||||||
(Amounts in Thousands, Except for Shares) (Unaudited)
Security Description | Principal Amount | Value | |||||||||
Santander UK Group Holdings PLC, 6.53%, 1/10/29, Callable 1/10/28 @ 100 | $ | 4,000 | $ | 4,174 | |||||||
Standard Chartered PLC, 6.30%, 1/9/29, Callable 1/9/28 @ 100 (a) | 2,000 | 2,083 | |||||||||
VEON Holdings BV, 5.95%, 2/13/23 | 10,000 | 9,613 | |||||||||
87,216 | |||||||||||
Industrials (1.3%): | |||||||||||
| Air Canada Pass Through Trust 5.00%, 12/15/23 (a) | 787 | 762 | |||||||||
4.13%, 5/15/25 (a) | 12,895 | 11,935 | |||||||||
Aircastle Ltd., 4.40%, 9/25/23, Callable 8/25/23 @ 100 | 5,000 | 4,960 | |||||||||
Avolon Holdings Funding Ltd., 3.95%, 7/1/24, Callable 6/1/24 @ 100 (a) | 5,000 | 4,849 | |||||||||
The Weir Group PLC, 2.20%, 5/13/26, Callable 4/13/26 @ 100 (a) | 10,000 | 8,949 | |||||||||
31,455 | |||||||||||
Information Technology (0.3%): | |||||||||||
Open Text Corp., 6.90%, 12/1/27, Callable 11/1/27 @ 100 (a) | 4,677 | 4,794 | |||||||||
SK Hynix, Inc., 6.25%, 1/17/26 (a) | 3,000 | 3,036 | |||||||||
7,830 | |||||||||||
Materials (1.4%): | |||||||||||
Alcoa Nederland Holding BV, 5.50%, 12/15/27, Callable 6/15/23 @ 102.75 (a) | 4,333 | 4,287 | |||||||||
ArcelorMittal SA, 6.55%, 11/29/27, Callable 10/29/27 @ 100 | 3,500 | 3,653 | |||||||||
OCI NV, 4.63%, 10/15/25, Callable 3/13/23 @ 102.31 (a) | 6,740 | 6,566 | |||||||||
| POSCO 4.38%, 8/4/25 (a) | 2,000 | 1,958 | |||||||||
5.75%, 1/17/28 (a) | 250 | 258 | |||||||||
| Syngenta Finance NV 4.44%, 4/24/23, Callable 3/24/23 @ 100 (a) | 7,835 | 7,812 | |||||||||
4.89%, 4/24/25, Callable 2/24/25 @ 100 (a) | 5,839 | 5,735 | |||||||||
West Fraser Timber Co. Ltd., 4.35%, 10/15/24, Callable 7/15/24 @ 100 (a) | 2,000 | 1,958 | |||||||||
32,227 | |||||||||||
Utilities (0.1%): | |||||||||||
Enel SpA, 8.75% (USSW5+588bps), 9/24/73, Callable 9/24/23 @ 100 (a) (b) | 2,000 | 2,020 | |||||||||
Total Yankee Dollars (Cost $220,348) | 214,257 | ||||||||||
Municipal Bonds (5.5%) | |||||||||||
Alabama (0.1%): | |||||||||||
| The Water Works Board of The City of Birmingham Revenue 2.20%, 1/1/24 | 1,000 | 975 | |||||||||
2.36%, 1/1/25 | 2,000 | 1,917 | |||||||||
2,892 | |||||||||||
Alaska (0.1%): | |||||||||||
University of Alaska Revenue, Series W, 1.83%, 10/1/23 | 1,000 | 976 | |||||||||
Arizona (0.2%): | |||||||||||
Arizona Board of Regents Certificate participation, 0.77%, 6/1/24 | 1,500 | 1,419 | |||||||||
City of Phoenix Civic Improvement Corp. Revenue, 0.68%, 7/1/23 | 1,000 | 982 | |||||||||
City of Tempe AZ Certificate participation, 0.62%, 7/1/24 | 2,500 | 2,355 | |||||||||
4,756 | |||||||||||
See notes to financial statements.
24
| USAA Mutual Funds Trust USAA Short-Term Bond Fund | Schedule of Portfolio Investments — continued January 31, 2023 | ||||||
(Amounts in Thousands, Except for Shares) (Unaudited)
Security Description | Principal Amount | Value | |||||||||
California (0.4%): | |||||||||||
| California Statewide Communities Development Authority Revenue 1.03%, 4/1/24 | $ | 1,250 | $ | 1,186 | |||||||
1.31%, 4/1/25 | 915 | 839 | |||||||||
2.15%, 11/15/30, Continuously Callable @100 | 4,295 | 3,587 | |||||||||
| California Statewide Communities Development Authority Revenue (NBGA — California Health Insurance Construction Loan Insurance Program), 2.05%, 8/1/30 | 2,505 | 2,226 | |||||||||
Golden State Tobacco Securitization Corp. Revenue, 1.85%, 6/1/31 | 355 | 353 | |||||||||
8,191 | |||||||||||
Colorado (0.2%): | |||||||||||
City of Loveland Electric & Communications Enterprise Revenue, 2.97%, 12/1/24 | 2,280 | 2,209 | |||||||||
| Colorado Health Facilities Authority Revenue Series B, 2.40%, 11/1/23 | 1,250 | 1,224 | |||||||||
Series B, 2.50%, 11/1/24 | 1,250 | 1,197 | |||||||||
Series B, 2.80%, 12/1/26 | 590 | 548 | |||||||||
Park Creek Metropolitan District Revenue, Series B, 2.53%, 12/1/24 | 500 | 479 | |||||||||
5,657 | |||||||||||
Florida (0.4%): | |||||||||||
City of Gainesville Florida Revenue, 0.82%, 10/1/23 | 750 | 730 | |||||||||
County of Lee Florida Water & Sewer Revenue, 2.01%, 10/1/24 | 1,360 | 1,302 | |||||||||
| Hillsborough County IDA Revenue 2.01%, 8/1/24 | 5,000 | 4,811 | |||||||||
2.16%, 8/1/25 | 2,910 | 2,747 | |||||||||
9,590 | |||||||||||
Georgia (0.2%): | |||||||||||
| Athens Housing Authority Revenue 2.13%, 12/1/24 | 1,850 | 1,768 | |||||||||
2.32%, 12/1/25 | 3,215 | 3,028 | |||||||||
4,796 | |||||||||||
Guam (0.0%): (j) | |||||||||||
| Antonio B Won Pat International Airport Authority Revenue, Series A, 2.70%, 10/1/26 | 610 | 555 | |||||||||
Illinois (0.3%): | |||||||||||
| Chicago Transit Authority Sales Tax Receipts Fund Revenue, Series B, 1.84%, 12/1/23 | 1,500 | 1,463 | |||||||||
Illinois Finance Authority Revenue, 2.11%, 5/15/26 | 1,000 | 908 | |||||||||
| State of Illinois Sales Tax Revenue Series B, 0.94%, 6/15/24 | 3,500 | 3,306 | |||||||||
Series B, 1.25%, 6/15/25 | 2,500 | 2,295 | |||||||||
7,972 | |||||||||||
Indiana (0.2%): | |||||||||||
| Indiana Finance Authority Revenue 2.66%, 3/1/25 | 1,675 | 1,589 | |||||||||
2.76%, 3/1/26 | 1,850 | 1,725 | |||||||||
Series B, 1.99%, 11/15/24 | 350 | 331 | |||||||||
Series B, 2.45%, 11/15/25 | 360 | 335 | |||||||||
Lake Central Multi-District School Building Corp. Revenue, 0.85%, 1/15/24 | 1,275 | 1,224 | |||||||||
5,204 | |||||||||||
See notes to financial statements.
25
| USAA Mutual Funds Trust USAA Short-Term Bond Fund | Schedule of Portfolio Investments — continued January 31, 2023 | ||||||
(Amounts in Thousands, Except for Shares) (Unaudited)
Security Description | Principal Amount | Value | |||||||||
Kansas (0.0%): (j) | |||||||||||
| Wyandotte County-Kansas City Unified Government Utility System Revenue, Series B, 1.13%, 9/1/24 | $ | 1,000 | $ | 952 | |||||||
Kentucky (0.1%): | |||||||||||
County of Warren Revenue, 1.07%, 4/1/26 | 1,385 | 1,238 | |||||||||
Maryland (0.6%): | |||||||||||
| Maryland Health & Higher Educational Facilities Authority Revenue 1.23%, 1/1/24 | 5,185 | 4,969 | |||||||||
1.81%, 1/1/25 | 2,780 | 2,584 | |||||||||
1.89%, 1/1/26 | 4,135 | 3,718 | |||||||||
| Maryland Stadium Authority Revenue Series C, 1.13%, 5/1/23 | 1,535 | 1,521 | |||||||||
Series C, 1.32%, 5/1/24 | 1,000 | 960 | |||||||||
13,752 | |||||||||||
Michigan (0.3%): | |||||||||||
Ecorse Public School District, GO, 2.09%, 5/1/25 | 2,200 | 2,091 | |||||||||
| Michigan Finance Authority Revenue 2.21%, 12/1/23 | 1,565 | 1,527 | |||||||||
2.31%, 12/1/24 | 895 | 854 | |||||||||
Series A-1, 2.33%, 6/1/30 | 2,489 | 2,405 | |||||||||
Ypsilanti School District, GO, 2.02%, 5/1/25 | 575 | 537 | |||||||||
7,414 | |||||||||||
Minnesota (0.1%): | |||||||||||
| Western Minnesota Municipal Power Agency Revenue Series A, 2.28%, 1/1/25 | 1,000 | 958 | |||||||||
Series A, 2.38%, 1/1/26 | 1,000 | 944 | |||||||||
1,902 | |||||||||||
Missouri (0.1%): | |||||||||||
| Bi-State Development Agency of the Missouri-Illinois Metropolitan District Revenue Series B, 1.02%, 10/1/23 | 2,000 | 1,950 | |||||||||
Series B, 1.22%, 10/1/24 | 1,250 | 1,183 | |||||||||
3,133 | |||||||||||
Nebraska (0.0%): (j) | |||||||||||
| Papio-Missouri River Natural Resource District Special Tax, 2.09%, 12/15/24, Continuously Callable @100 | 785 | 749 | |||||||||
New Jersey (0.3%): | |||||||||||
Franklin Township Board of Education/Somerset County, GO, 0.65%, 2/1/24 | 655 | 629 | |||||||||
| North Hudson Sewerage Authority Revenue 2.43%, 6/1/24 | 1,200 | 1,157 | |||||||||
2.59%, 6/1/25 | 1,000 | 947 | |||||||||
| South Jersey Transportation Authority Revenue Series B, 2.10%, 11/1/24 | 1,750 | 1,655 | |||||||||
Series B, 2.20%, 11/1/25 | 3,515 | 3,239 | |||||||||
7,627 | |||||||||||
See notes to financial statements.
26
| USAA Mutual Funds Trust USAA Short-Term Bond Fund | Schedule of Portfolio Investments — continued January 31, 2023 | ||||||
(Amounts in Thousands, Except for Shares) (Unaudited)
Security Description | Principal Amount | Value | |||||||||
New York (0.2%): | |||||||||||
| Buffalo & Erie County Industrial Land Development Corp. Revenue, Series B, 3.35%, 11/1/25 | $ | 940 | $ | 903 | |||||||
| Long Island Power Authority Revenue, Series C, 0.76%, 3/1/23, Continuously Callable @100 | 500 | 498 | |||||||||
New York State Dormitory Authority Revenue, Series C, 0.89%, 3/15/25 | 2,000 | 1,860 | |||||||||
New York State Thruway Authority Revenue, Series M, 2.26%, 1/1/25 | 1,000 | 958 | |||||||||
4,219 | |||||||||||
Oregon (0.1%): | |||||||||||
| Medford Hospital Facilities Authority Revenue Series B, 1.73%, 8/15/23 | 1,400 | 1,372 | |||||||||
Series B, 1.83%, 8/15/24 | 1,700 | 1,614 | |||||||||
2,986 | |||||||||||
Pennsylvania (0.8%): | |||||||||||
City of Pittsburgh PA, GO, Series B, 0.84%, 9/1/24 | 1,715 | 1,617 | |||||||||
County of Bucks PA, GO, 0.98%, 6/1/24 | 2,025 | 1,921 | |||||||||
| Montgomery County IDA Revenue Series D, 2.45%, 11/15/23 | 1,250 | 1,222 | |||||||||
Series D, 2.60%, 11/15/24 | 4,050 | 3,879 | |||||||||
| Scranton School District, GO Series A, 3.15%, 6/15/34, (Put Date 6/15/24) (a) (i) | 2,805 | 2,748 | |||||||||
Series B, 3.15%, 6/15/34, (Put Date 6/15/24) (a) (i) | 1,415 | 1,386 | |||||||||
| Scranton School District, GO (INS — Build America Mutual Assurance Co.) 2.60%, 4/1/24 | 1,730 | 1,683 | |||||||||
2.72%, 4/1/25 | 900 | 863 | |||||||||
2.82%, 4/1/26 | 1,000 | 947 | |||||||||
State Public School Building Authority Revenue, 2.75%, 4/1/25 | 1,500 | 1,445 | |||||||||
17,711 | |||||||||||
South Dakota (0.1%): | |||||||||||
| South Dakota Health & Educational Facilities Authority Revenue Series B, 2.31%, 7/1/23 | 1,500 | 1,480 | |||||||||
Series B, 2.38%, 7/1/24 | 1,350 | 1,297 | |||||||||
2,777 | |||||||||||
Texas (0.5%): | |||||||||||
| Central Texas Regional Mobility Authority Revenue Series C, 1.45%, 1/1/25 | 400 | 379 | |||||||||
Series D, 1.65%, 1/1/24 | 500 | 484 | |||||||||
Series D, 1.80%, 1/1/25 | 750 | 705 | |||||||||
City of Lubbock Water & Wastewater System Revenue, 2.06%, 2/15/25 | 5,000 | 4,767 | |||||||||
City of San Antonio TX Electric & Gas Systems Revenue, 2.41%, 2/1/23 | 800 | 800 | |||||||||
| Dallas/Fort Worth International Airport Revenue Series C, 1.04%, 11/1/23 | 500 | 486 | |||||||||
Series C, 1.23%, 11/1/24 | 750 | 709 | |||||||||
| Harris County Cultural Education Facilities Finance Corp. Revenue, Series B, 2.47%, 5/15/25 | 1,000 | 945 | |||||||||
| San Antonio Education Facilities Corp. Revenue 1.74%, 4/1/25 | 505 | 465 | |||||||||
1.99%, 4/1/26 | 860 | 769 | |||||||||
2.19%, 4/1/27 | 525 | 457 | |||||||||
10,966 | |||||||||||
See notes to financial statements.
27
| USAA Mutual Funds Trust USAA Short-Term Bond Fund | Schedule of Portfolio Investments — continued January 31, 2023 | ||||||
(Amounts in Thousands, Except for Shares) (Unaudited)
Security Description | Principal Amount | Value | |||||||||
Wisconsin (0.2%): | |||||||||||
| Public Finance Authority Revenue Series S, 0.81%, 2/1/23 | $ | 750 | $ | 750 | |||||||
Series S, 1.14%, 2/1/24 | 1,445 | 1,368 | |||||||||
Series S, 1.48%, 2/1/25 | 820 | 742 | |||||||||
State of Wisconsin Revenue, Series A, 2.10%, 5/1/26 | 1,000 | 933 | |||||||||
3,793 | |||||||||||
Total Municipal Bonds (Cost $137,179) | 129,808 | ||||||||||
U.S. Government Agency Mortgages (0.3%) | |||||||||||
| Federal Home Loan Mortgage Corp. 2.35% (LIBOR12M+163bps), 4/1/35 (b) | 109 | 107 | |||||||||
| Federal National Mortgage Association 5.50%, 2/1/23 – 6/1/24 | 16 | 15 | |||||||||
4.50%, 5/1/23 – 2/1/24 | 5 | 5 | |||||||||
5.00%, 6/1/23 – 2/1/24 | 18 | 18 | |||||||||
6.00%, 7/1/23 | 4 | 4 | |||||||||
2.50%, 4/1/27 – 8/1/27 | 5,490 | 5,258 | |||||||||
Series 2012-104, Class HC, 1.25%, 9/25/27 | 662 | 628 | |||||||||
5,928 | |||||||||||
6,035 | |||||||||||
Total U.S. Government Agency Mortgages (Cost $6,313) | 6,035 | ||||||||||
U.S. Treasury Obligations (2.0%) | |||||||||||
| U.S. Treasury Notes 0.13%, 8/31/23 | 5,000 | 4,868 | |||||||||
2.50%, 5/31/24 | 3,000 | 2,918 | |||||||||
0.38%, 7/15/24 | 5,000 | 4,711 | |||||||||
3.00%, 7/31/24 | 10,000 | 9,784 | |||||||||
0.38%, 8/15/24 | 15,000 | 14,091 | |||||||||
4.50%, 11/30/24 | 3,000 | 3,010 | |||||||||
3.00%, 7/15/25 | 5,000 | 4,882 | |||||||||
4.25%, 10/15/25 | 4,000 | 4,031 | |||||||||
Total U.S. Treasury Obligations (Cost $49,793) | 48,295 | ||||||||||
Commercial Paper (6.2%) (k) | |||||||||||
| Autonation, Inc. 4.84%, 2/1/23 (a) | 17,400 | 17,398 | |||||||||
4.87%, 2/2/23 (a) | 5,900 | 5,898 | |||||||||
Aviation Capital Group LLC, 4.44%, 2/1/23 (a) | 14,300 | 14,298 | |||||||||
| Constellation Brands, Inc. 4.84%, 2/1/23 (a) | 3,000 | 3,000 | |||||||||
5.01%, 2/7/23 (a) | 3,000 | 2,997 | |||||||||
FMC Corp., 4.84%, 2/1/23 (a) | 10,000 | 9,999 | |||||||||
| Jabil, Inc. 5.04%, 2/1/23 (a) | 12,600 | 12,598 | |||||||||
5.09%, 2/3/23 (a) | 10,700 | 10,696 | |||||||||
See notes to financial statements.
28
| USAA Mutual Funds Trust USAA Short-Term Bond Fund | Schedule of Portfolio Investments — continued January 31, 2023 | ||||||
(Amounts in Thousands, Except for Shares) (Unaudited)
Security Description | Shares or Principal Amount | Value | |||||||||
| Newell Brands, Inc. 4.84%, 2/1/23 (a) | $ | 4,800 | $ | 4,799 | |||||||
4.90%, 2/3/23 (a) | 8,000 | 7,997 | |||||||||
5.02%, 2/9/23 (a) | 8,800 | 8,789 | |||||||||
Ovintiv, Inc., 5.04%, 2/13/23 (a) | 5,200 | 5,190 | |||||||||
Quanta Services, Inc., 4.90%, 2/2/23 (a) | 17,900 | 17,895 | |||||||||
Rogers Communications, Inc., 4.71%, 2/7/23 (a) | 8,600 | 8,592 | |||||||||
| Targa Resources Corp. 4.24%, 2/1/23 (a) | 1,250 | 1,250 | |||||||||
4.27%, 2/2/23 (a) | 6,500 | 6,498 | |||||||||
Walgreens Boots Alliance, Inc., 4.78%, 2/6/23 (a) | 8,800 | 8,793 | |||||||||
Total Commercial Paper (Cost $146,706) | 146,687 | ||||||||||
Collateral for Securities Loaned (0.9%)^ | |||||||||||
| Goldman Sachs Financial Square Government Fund, Institutional Shares, 4.22% (l) | 5,425,679 | 5,426 | |||||||||
HSBC U.S. Government Money Market Fund, Institutional Shares, 4.21% (l) | 5,425,679 | 5,425 | |||||||||
Invesco Government & Agency Portfolio, Institutional Shares, 4.31% (l) | 5,425,679 | 5,426 | |||||||||
| Morgan Stanley Institutional Liquidity Government Portfolio, Institutional Shares, 4.14% (l) | 5,425,679 | 5,426 | |||||||||
Total Collateral for Securities Loaned (Cost $21,703) | 21,703 | ||||||||||
Total Investments (Cost $2,490,017) — 101.7% | 2,399,406 | ||||||||||
Liabilities in excess of other assets — (1.7)% | (40,603 | ) | |||||||||
NET ASSETS — 100.00% | $ | 2,358,803 | |||||||||
At January 31, 2023, the Fund's investments in foreign securities were 11.6% of net assets.
^ Purchased with cash collateral from securities on loan.
(a) Rule 144A security or other security that is restricted as to resale to institutional investors. As of January 31, 2023, the fair value of these securities was $1,300,746 thousands and amounted to 55.1% of net assets.
(b) Variable or Floating-Rate Security. Rate disclosed is as of January 31, 2023.
(c) The rate for certain asset-backed and mortgage-backed securities may vary based on factors relating to the pool of assets underlying the security. The rate disclosed is the rate in effect at January 31, 2023.
(d) Security is interest only.
(e) The rates for this senior secured loan will be known on settlement date of the loan, subsequent to this report date. Senior secured loans have rates that will fluctuate over time in line with prevailing interest rates.
(f) All or a portion of this security is on loan.
(g) Security is perpetual and has no final maturity date but may be subject to calls at various dates in the future.
(h) Variable Rate Demand Notes that provide the rights to sell the security at face value on either that day or within the rate-reset period. The interest rate is reset on the put date at a stipulated daily, weekly, monthly, quarterly, or other specified time interval to reflect current market conditions. These securities do not indicate a reference rate and spread in their description.
See notes to financial statements.
29
| USAA Mutual Funds Trust USAA Short-Term Bond Fund | Schedule of Portfolio Investments — continued January 31, 2023 | ||||||
(Unaudited)
(i) Put Bond.
(j) Amount represents less than 0.05% of net assets.
(k) Rate represents the effective yield at January 31, 2023.
(l) Rate disclosed is the daily yield on January 31, 2023.
bps — Basis points
Continuously callable — Investment is continuously callable or will be continuously callable on any date after the first call date until its maturity.
GO — General Obligation
H15T1Y — 1 Year Treasury Constant Maturity Rate
H15T5Y — 5 Year Treasury Constant Maturity Rate
IDA — Industrial Development Authority
LIBOR — London Interbank Offered Rate
LIBOR01M — 1 Month US Dollar LIBOR, rate disclosed as of January 31, 2023, based on the last reset date of the security
LIBOR03M — 3 Month US Dollar LIBOR, rate disclosed as of January 31, 2023, based on the last reset date of the security
LIBOR12M — 12 Month US Dollar LIBOR, rate disclosed as of January 31, 2023, based on the last reset date of the security
LLC — Limited Liability Company
LOC — Letter of Credit
LP — Limited Partnership
MTN — Medium Term Note
PLC — Public Limited Company
SOFR — Secured Overnight Financing Rate
TSFR1M — 1 month Term SOFR, rate disclosed as of January 31, 2023.
US0001M — 1 Month US Dollar LIBOR, rate disclosed as of January 31, 2023, based on the last reset date of the security
USSW5 — USD 5 Year Swap Rate, rate disclosed as of January 31, 2023.
Credit Enhancements — Adds the financial strength of the provider of the enhancement to support the issuer's ability to repay the principal and interest payments when due. The enhancement may be provided by a high-quality bank, insurance company or other corporation, or a collateral trust. The enhancements do not guarantee the market values of the securities.
INS Principal and interest payments are insured by the name listed. Although bond insurance reduces the risk of loss due to default by an issuer, such bonds remain subject to the risk that value may fluctuate for other reasons, and there is no assurance that the insurance company will meet its obligations.
LOC Principal and interest payments are guaranteed by a bank letter of credit or other bank credit agreement.
NBGA Principal and interest payments or, under certain circumstances, underlying mortgages are guaranteed by a nonbank guaranteed agreement from the name listed.
See notes to financial statements.
30
USAA Mutual Funds Trust | Statement of Assets and Liabilities January 31, 2023 | ||||||
(Amounts in Thousands, Except Per Share Amounts) (Unaudited)
| USAA Short-Term Bond Fund | |||||||
Assets: | |||||||
Investments, at value (Cost $2,490,017) | $ | 2,399,406 | (a) | ||||
Foreign currency, at value (Cost $12,578) | 12,578 | ||||||
Deposit with broker for futures contracts | 1,752 | ||||||
Receivables: | |||||||
Interest and dividends | 16,153 | ||||||
Capital shares issued | 10,957 | ||||||
Investments sold | 2,127 | ||||||
From Adviser | 10 | ||||||
Prepaid expenses | 60 | ||||||
Total Assets | 2,443,043 | ||||||
Liabilities: | |||||||
Payables: | |||||||
Collateral received on loaned securities | 21,703 | ||||||
Distributions | 173 | ||||||
Investments purchased | 54,950 | ||||||
Capital shares redeemed | 6,302 | ||||||
Accrued expenses and other payables: | |||||||
Investment advisory fees | 526 | ||||||
Administration fees | 234 | ||||||
Custodian fees | 28 | ||||||
Transfer agent fees | 230 | ||||||
Compliance fees | 2 | ||||||
Trustees' fees | — | (b) | |||||
| 12b-1 fees | 2 | ||||||
Other accrued expenses | 90 | ||||||
Total Liabilities | 84,240 | ||||||
Net Assets: | |||||||
Capital | 2,464,653 | ||||||
Total accumulated earnings/(loss) | (105,850 | ) | |||||
Net Assets | $ | 2,358,803 | |||||
Net Assets | |||||||
Fund Shares | $ | 878,814 | |||||
Institutional Shares | 1,297,690 | ||||||
Class A | 14,414 | ||||||
R6 Shares | 167,885 | ||||||
Total | $ | 2,358,803 | |||||
Shares (unlimited number of shares authorized with no par value): | |||||||
Fund Shares | 99,758 | ||||||
Institutional Shares | 147,409 | ||||||
Class A | 1,636 | ||||||
R6 Shares | 19,048 | ||||||
Total | 267,851 | ||||||
Net asset value, offering and redemption price per share: (c) | |||||||
Fund Shares | $ | 8.81 | |||||
Institutional Shares | 8.80 | ||||||
Class A | 8.81 | ||||||
R6 Shares | 8.81 | ||||||
Maximum Sales Charge — Class A | 2.25 | % | |||||
| Maximum offering price (100%/(100%-maximum sales charge) of net asset value adjusted to the nearest cent) per share — Class A | $ | 9.01 | |||||
(a) Includes $21,011 thousand of securities on loan.
(b) Rounds to less than $1 thousand.
(c) Per share amount may not recalculate due to rounding of net assets and/or shares outstanding.
See notes to financial statements.
31
USAA Mutual Funds Trust | Statement of Operations For the Six Months Ended January 31, 2023 | ||||||
(Amounts in Thousands) (Unaudited)
| USAA Short-Term Bond Fund | |||||||
Investment Income: | |||||||
Dividends | $ | 321 | |||||
Interest | 39,991 | ||||||
Securities lending (net of fees) | 68 | ||||||
Total Income | 40,380 | ||||||
Expenses: | |||||||
Investment advisory fees | 3,214 | ||||||
Administration fees — Fund Shares | 682 | ||||||
Administration fees — Institutional Shares | 715 | ||||||
Administration fees — Class A | 11 | ||||||
Administration fees — R6 Shares | 34 | ||||||
Sub-Administration fees | 15 | ||||||
| 12b-1 fees — Class A | 18 | ||||||
Custodian fees | 74 | ||||||
Transfer agent fees — Fund Shares | 619 | ||||||
Transfer agent fees — Institutional Shares | 715 | ||||||
Transfer agent fees — Class A | 7 | ||||||
Transfer agent fees — R6 Shares | 7 | ||||||
Trustees' fees | 24 | ||||||
Compliance fees | 12 | ||||||
Legal and audit fees | 52 | ||||||
State registration and filing fees | 88 | ||||||
Other expenses | 180 | ||||||
Total Expenses | 6,467 | ||||||
Expenses waived/reimbursed by Adviser | (25 | ) | |||||
Net Expenses | 6,442 | ||||||
Net Investment Income (Loss) | 33,938 | ||||||
Realized/Unrealized Gains (Losses) from Investments: | |||||||
| Net realized gains (losses) from investment securities and foreign currency transactions | (5,412 | ) | |||||
Net change in unrealized appreciation/depreciation on investment securities | 1,328 | ||||||
Net realized/unrealized gains (losses) on investments | (4,084 | ) | |||||
Change in net assets resulting from operations | $ | 29,854 | |||||
See notes to financial statements.
32
USAA Mutual Funds Trust | Statements of Changes in Net Assets | ||||||
(Amounts in Thousands)
USAA Short-Term Bond Fund | |||||||||||
| Six Months Ended January 31, 2023 (Unaudited) | Year Ended July 31, 2022 | ||||||||||
From Investments: | |||||||||||
Operations: | |||||||||||
Net Investment Income (Loss) | $ | 33,938 | $ | 57,408 | |||||||
Net realized gains (losses) | (5,412 | ) | 2,068 | ||||||||
Net change in unrealized appreciation/depreciation | 1,328 | (149,177 | ) | ||||||||
Change in net assets resulting from operations | 29,854 | (89,701 | ) | ||||||||
Distributions to Shareholders: | |||||||||||
Fund Shares | (13,059 | ) | (25,749 | ) | |||||||
Institutional Shares | (21,069 | ) | (49,351 | ) | |||||||
Class A | (192 | ) | (355 | ) | |||||||
R6 Shares | (2,182 | ) | (1,535 | ) | |||||||
Change in net assets resulting from distributions to shareholders | (36,502 | ) | (76,990 | ) | |||||||
Change in net assets resulting from capital transactions | (369,931 | ) | (161,391 | ) | |||||||
Change in net assets | (376,579 | ) | (328,082 | ) | |||||||
Net Assets: | |||||||||||
Beginning of period | 2,735,382 | 3,063,464 | |||||||||
End of period | $ | 2,358,803 | $ | 2,735,382 | |||||||
(continues on next page)
See notes to financial statements.
33
USAA Mutual Funds Trust | Statements of Changes in Net Assets | ||||||
(Amounts in Thousands) (continued)
USAA Short-Term Bond Fund | |||||||||||
| Six Months Ended January 31, 2023 (Unaudited) | Year Ended July 31, 2022 | ||||||||||
Capital Transactions: | |||||||||||
Fund Shares | |||||||||||
Proceeds from shares issued | $ | 89,972 | $ | 199,454 | |||||||
Distributions reinvested | 12,759 | 25,206 | |||||||||
Cost of shares redeemed | (149,478 | ) | (254,707 | ) | |||||||
Total Fund Shares | $ | (46,747 | ) | $ | (30,047 | ) | |||||
Institutional Shares | |||||||||||
Proceeds from shares issued | $ | 338,034 | $ | 585,031 | |||||||
Distributions reinvested | 20,485 | 48,501 | |||||||||
Cost of shares redeemed | (737,299 | ) | (867,535 | ) | |||||||
Total Institutional Shares | $ | (378,780 | ) | $ | (234,003 | ) | |||||
Class A | |||||||||||
Proceeds from shares issued | $ | 3,068 | $ | 9,789 | |||||||
Distributions reinvested | 177 | 324 | |||||||||
Cost of shares redeemed | (4,284 | ) | (5,790 | ) | |||||||
Total Class A | $ | (1,039 | ) | $ | 4,323 | ||||||
R6 Shares | |||||||||||
Proceeds from shares issued | $ | 88,515 | $ | 128,820 | |||||||
Distributions reinvested | 2,181 | 1,535 | |||||||||
Cost of shares redeemed | (34,061 | ) | (32,019 | ) | |||||||
Total R6 Shares | $ | 56,635 | $ | 98,336 | |||||||
Change in net assets resulting from capital transactions | $ | (369,931 | ) | $ | (161,391 | ) | |||||
Share Transactions: | |||||||||||
Fund Shares | |||||||||||
Issued | 10,306 | 21,926 | |||||||||
Reinvested | 1,463 | 2,769 | |||||||||
Redeemed | (17,123 | ) | (28,109 | ) | |||||||
Total Fund Shares | (5,354 | ) | (3,414 | ) | |||||||
Institutional Shares | |||||||||||
Issued | 38,735 | 63,496 | |||||||||
Reinvested | 2,350 | 5,329 | |||||||||
Redeemed | (84,311 | ) | (94,288 | ) | |||||||
Total Institutional Shares | (43,226 | ) | (25,463 | ) | |||||||
Class A | |||||||||||
Issued | 351 | 1,078 | |||||||||
Reinvested | 20 | 36 | |||||||||
Redeemed | (490 | ) | (645 | ) | |||||||
Total Class A | (119 | ) | 469 | ||||||||
R6 Shares | |||||||||||
Issued | 10,129 | 14,258 | |||||||||
Reinvested | 250 | 171 | |||||||||
Redeemed | (3,900 | ) | (3,581 | ) | |||||||
Total R6 Shares | 6,479 | 10,848 | |||||||||
Change in Shares | (42,220 | ) | (17,560 | ) | |||||||
See notes to financial statements.
34
USAA Mutual Funds Trust | Financial Highlights | ||||||
For a Share Outstanding Throughout Each Period
USAA Short-Term Bond Fund | |||||||||||||||||||||||||||
Fund Shares | |||||||||||||||||||||||||||
| Six Months Ended January 31, 2023 (Unaudited) | Year Ended July 31, 2022 | Year Ended July 31, 2021 | Year Ended July 31, 2020 | Year Ended July 31, 2019 | Year Ended July 31, 2018 | ||||||||||||||||||||||
| Net Asset Value, Beginning of Period | $ | 8.82 | $ | 9.35 | $ | 9.29 | $ | 9.21 | $ | 9.06 | $ | 9.21 | |||||||||||||||
Investment Activities: | |||||||||||||||||||||||||||
Net investment income (loss) | 0.12 | (a) | 0.17 | (a) | 0.23 | (a) | 0.26 | (a) | 0.24 | 0.20 | |||||||||||||||||
| Net realized and unrealized gains (losses) | — | (b) | (0.46 | ) | 0.10 | 0.08 | 0.15 | (0.15 | ) | ||||||||||||||||||
| Total from Investment Activities | 0.12 | (0.29 | ) | 0.33 | 0.34 | 0.39 | 0.05 | ||||||||||||||||||||
Distributions to Shareholders from: | |||||||||||||||||||||||||||
Net investment income | (0.13 | ) | (0.19 | ) | (0.23 | ) | (0.26 | ) | (0.24 | ) | (0.20 | ) | |||||||||||||||
Net realized gains | — | (0.05 | ) | (0.04 | ) | — | (b) | — | (b) | — | (b) | ||||||||||||||||
Total Distributions | (0.13 | ) | (0.24 | ) | (0.27 | ) | (0.26 | ) | (0.24 | ) | (0.20 | ) | |||||||||||||||
Net Asset Value, End of Period | $ | 8.81 | $ | 8.82 | $ | 9.35 | $ | 9.29 | $ | 9.21 | $ | 9.06 | |||||||||||||||
Total Return (c) (d) | 1.35 | % | (3.18 | )% | 3.60 | % | 3.79 | % | 4.43 | % | 0.54 | % | |||||||||||||||
Ratios to Average Net Assets: | |||||||||||||||||||||||||||
Net Expenses (e) (f) (g) (h) | 0.58 | % | 0.56 | % | 0.54 | % | 0.52 | % | 0.57 | % | 0.59 | % | |||||||||||||||
Net Investment Income (Loss) (e) | 2.67 | % | 1.92 | % | 2.44 | % | 2.82 | % | 2.68 | % | 2.18 | % | |||||||||||||||
Gross Expenses (e) (f) | 0.58 | % | 0.56 | % | 0.54 | % | 0.52 | % | 0.57 | % | 0.59 | % | |||||||||||||||
Supplemental Data: | |||||||||||||||||||||||||||
Net Assets at end of period (000's) | $ | 878,814 | $ | 927,583 | $ | 1,015,085 | $ | 1,040,688 | $ | 1,167,973 | $ | 1,188,259 | |||||||||||||||
Portfolio Turnover (c) (i) | 18 | % | 49 | % | 62 | % | 66 | % | 48 | % | 39 | % | |||||||||||||||
(a) Per share net investment income (loss) has been calculated using the average daily shares method.
(b) Amount is less than $0.005 per share.
(c) Not annualized for periods less than one year.
(d) Assumes reinvestment of all net investment income and realized capital gain distributions, if any, during the period. Includes adjustments in accordance with U.S. Generally Accepted Accounting Principles and could differ from the Lipper reported return.
(e) Annualized for periods less than one year.
(f) Does not include acquired fund fees and expenses, if any.
(g) The net expense ratio may not correlate to the applicable expense limits in place during the period since the current contractual expense limitation is applied for a period beginning July 1, 2019 and in effect through November 30, 2023, instead of coinciding with the Fund's fiscal year end. Details of the current contractual expense limitation in effect can be found in Note 5 of the accompanying Notes to Financial Statements.
(h) From the period beginning July 1, 2019, the amount of any waivers or reimbursements and the amount of any recoupment are calculated without regard to the impact of any performance adjustment to the Fund's management fee.
(i) Portfolio turnover is calculated on the basis of the Fund as a whole without distinguishing between the classes of shares.
(continues on next page)
See notes to financial statements.
35
USAA Mutual Funds Trust | Financial Highlights — continued | ||||||
For a Share Outstanding Throughout Each Period
USAA Short-Term Bond Fund | |||||||||||||||||||||||||||
Institutional Shares | |||||||||||||||||||||||||||
| Six Months Ended January 31, 2023 (Unaudited) | Year Ended July 31, 2022 | Year Ended July 31, 2021 | Year Ended July 31, 2020 | Year Ended July 31, 2019 | Year Ended July 31, 2018 | ||||||||||||||||||||||
| Net Asset Value, Beginning of Period | $ | 8.82 | $ | 9.35 | $ | 9.29 | $ | 9.20 | $ | 9.06 | $ | 9.21 | |||||||||||||||
Investment Activities: | |||||||||||||||||||||||||||
Net investment income (loss) | 0.12 | (a) | 0.18 | (a) | 0.23 | (a) | 0.27 | (a) | 0.25 | 0.21 | |||||||||||||||||
| Net realized and unrealized gains (losses) | (0.01 | ) | (0.46 | ) | 0.11 | 0.09 | 0.14 | (0.15 | ) | ||||||||||||||||||
| Total from Investment Activities | 0.11 | (0.28 | ) | 0.34 | 0.36 | 0.39 | 0.06 | ||||||||||||||||||||
Distributions to Shareholders from: | |||||||||||||||||||||||||||
Net investment income | (0.13 | ) | (0.20 | ) | (0.24 | ) | (0.27 | ) | (0.25 | ) | (0.21 | ) | |||||||||||||||
Net realized gains | — | (0.05 | ) | (0.04 | ) | — | (b) | — | (b) | — | (b) | ||||||||||||||||
Total Distributions | (0.13 | ) | (0.25 | ) | (0.28 | ) | (0.27 | ) | (0.25 | ) | (0.21 | ) | |||||||||||||||
Net Asset Value, End of Period | $ | 8.80 | $ | 8.82 | $ | 9.35 | $ | 9.29 | $ | 9.20 | $ | 9.06 | |||||||||||||||
Total Return (c) (d) | 1.28 | % | (3.09 | )% | 3.68 | % | 4.01 | % | 4.42 | % | 0.65 | % | |||||||||||||||
Ratios to Average Net Assets: | |||||||||||||||||||||||||||
Net Expenses (e) (f) (g) (h) | 0.49 | % | 0.48 | % | 0.46 | % | 0.42 | % | 0.47 | % | 0.48 | % | |||||||||||||||
Net Investment Income (Loss) (e) | 2.75 | % | 2.00 | % | 2.51 | % | 2.92 | % | 2.78 | % | 2.29 | % | |||||||||||||||
Gross Expenses (e) (f) | 0.50 | % | 0.48 | % | 0.46 | % | 0.42 | % | 0.47 | % | 0.48 | % | |||||||||||||||
Supplemental Data: | |||||||||||||||||||||||||||
Net Assets at end of period (000's) | $ | 1,297,690 | $ | 1,681,332 | $ | 2,020,237 | $ | 1,777,916 | $ | 1,822,756 | $ | 2,025,651 | |||||||||||||||
Portfolio Turnover (c) (i) | 18 | % | 49 | % | 62 | % | 66 | % | 48 | % | 39 | % | |||||||||||||||
(a) Per share net investment income (loss) has been calculated using the average daily shares method.
(b) Amount is less than $0.005 per share.
(c) Not annualized for periods less than one year.
(d) Assumes reinvestment of all net investment income and realized capital gain distributions, if any, during the period. Includes adjustments in accordance with U.S. Generally Accepted Accounting Principles and could differ from the Lipper reported return.
(e) Annualized for periods less than one year.
(f) Does not include acquired fund fees and expenses, if any.
(g) The net expense ratio may not correlate to the applicable expense limits in place during the period since the current contractual expense limitation is applied for a period beginning July 1, 2019 and in effect through November 30, 2023, instead of coinciding with the Fund's fiscal year end. Details of the current contractual expense limitation in effect can be found in Note 5 of the accompanying Notes to Financial Statements.
(h) From the period beginning July 1, 2019, the amount of any waivers or reimbursements and the amount of any recoupment are calculated without regard to the impact of any performance adjustment to the Fund's management fee.
(i) Portfolio turnover is calculated on the basis of the Fund as a whole without distinguishing between the classes of shares.
(continues on next page)
See notes to financial statements.
36
USAA Mutual Funds Trust | Financial Highlights — continued | ||||||
For a Share Outstanding Throughout Each Period
USAA Short-Term Bond Fund | |||||||||||||||||||||||||||
Class A | |||||||||||||||||||||||||||
| Six Months Ended January 31, 2023 (Unaudited) | Year Ended July 31, 2022 | Year Ended July 31, 2021 | Year Ended July 31, 2020 | Year Ended July 31, 2019 | Year Ended July 31, 2018 | ||||||||||||||||||||||
| Net Asset Value, Beginning of Period | $ | 8.82 | $ | 9.35 | $ | 9.29 | $ | 9.21 | $ | 9.06 | $ | 9.21 | |||||||||||||||
Investment Activities: | |||||||||||||||||||||||||||
Net investment income (loss) | 0.11 | (a) | 0.16 | (a) | 0.21 | (a) | 0.24 | (a) | 0.22 | 0.18 | |||||||||||||||||
| Net realized and unrealized gains (losses) | — | (b) | (0.47 | ) | 0.10 | 0.08 | 0.15 | (0.15 | ) | ||||||||||||||||||
| Total from Investment Activities | 0.11 | (0.31 | ) | 0.31 | 0.32 | 0.37 | 0.03 | ||||||||||||||||||||
Distributions to Shareholders from: | |||||||||||||||||||||||||||
Net investment income | (0.12 | ) | (0.17 | ) | (0.21 | ) | (0.24 | ) | (0.22 | ) | (0.18 | ) | |||||||||||||||
Net realized gains | — | (0.05 | ) | (0.04 | ) | — | (b) | — | (b) | — | (b) | ||||||||||||||||
Total Distributions | (0.12 | ) | (0.22 | ) | (0.25 | ) | (0.24 | ) | (0.22 | ) | (0.18 | ) | |||||||||||||||
Net Asset Value, End of Period | $ | 8.81 | $ | 8.82 | $ | 9.35 | $ | 9.29 | $ | 9.21 | $ | 9.06 | |||||||||||||||
| Total Return (excludes sales charges) (c) (d) | 1.25 | % | (3.37 | )% | 3.38 | % | 3.58 | % | 4.17 | % | 0.38 | % | |||||||||||||||
Ratios to Average Net Assets: | |||||||||||||||||||||||||||
Net Expenses (e) (f) (g) (h) | 0.77 | % | 0.76 | % | 0.74 | % | 0.73 | % | 0.82 | % | 0.74 | % | |||||||||||||||
Net Investment Income (Loss) (e) | 2.47 | % | 1.73 | % | 2.24 | % | 2.61 | % | 2.43 | % | 2.02 | % | |||||||||||||||
Gross Expenses (e) (f) | 0.91 | % | 0.89 | % | 1.03 | % | 0.74 | % | 0.82 | % | 0.74 | % | |||||||||||||||
Supplemental Data: | |||||||||||||||||||||||||||
Net Assets at end of period (000's) | $ | 14,414 | $ | 15,489 | $ | 12,031 | $ | 11,236 | $ | 15,222 | $ | 23,030 | |||||||||||||||
Portfolio Turnover (c) (i) | 18 | % | 49 | % | 62 | % | 66 | % | 48 | % | 39 | % | |||||||||||||||
(a) Per share net investment income (loss) has been calculated using the average daily shares method.
(b) Amount is less than $0.005 per share.
(c) Not annualized for periods less than one year.
(d) Assumes reinvestment of all net investment income and realized capital gain distributions, if any, during the period. Includes adjustments in accordance with U.S. Generally Accepted Accounting Principles and could differ from the Lipper reported return.
(e) Annualized for periods less than one year.
(f) Does not include acquired fund fees and expenses, if any.
(g) The net expense ratio may not correlate to the applicable expense limits in place during the period since the current contractual expense limitation is applied for a period beginning July 1, 2019 and in effect through November 30, 2023, instead of coinciding with the Fund's fiscal year end. Details of the current contractual expense limitation in effect can be found in Note 5 of the accompanying Notes to Financial Statements.
(h) From the period beginning July 1, 2019, the amount of any waivers or reimbursements and the amount of any recoupment are calculated without regard to the impact of any performance adjustment to the Fund's management fee.
(i) Portfolio turnover is calculated on the basis of the Fund as a whole without distinguishing between the classes of shares.
(continues on next page)
See notes to financial statements.
37
USAA Mutual Funds Trust | Financial Highlights — continued | ||||||
For a Share Outstanding Throughout Each Period
USAA Short-Term Bond Fund | |||||||||||||||||||||||||||
R6 Shares | |||||||||||||||||||||||||||
| Six Months Ended January 31, 2023 (Unaudited) | Year Ended July 31, 2022 | Year Ended July 31, 2021 | Year Ended July 31, 2020 | Year Ended July 31, 2019 | Year Ended July 31, 2018 | ||||||||||||||||||||||
| Net Asset Value, Beginning of Period | $ | 8.83 | $ | 9.36 | $ | 9.30 | $ | 9.21 | $ | 9.07 | $ | 9.21 | |||||||||||||||
Investment Activities: | |||||||||||||||||||||||||||
Net investment income (loss) | 0.13 | (a) | 0.20 | (a) | 0.23 | (a) | 0.27 | (a) | 0.26 | 0.22 | |||||||||||||||||
| Net realized and unrealized gains (losses) | (0.01 | ) | (0.47 | ) | 0.11 | 0.09 | 0.14 | (0.14 | ) | ||||||||||||||||||
| Total from Investment Activities | 0.12 | (0.27 | ) | 0.34 | 0.36 | 0.40 | 0.08 | ||||||||||||||||||||
Distributions to Shareholders from: | |||||||||||||||||||||||||||
Net investment income | (0.14 | ) | (0.21 | ) | (0.24 | ) | (0.27 | ) | (0.26 | ) | (0.22 | ) | |||||||||||||||
Net realized gains | — | (0.05 | ) | (0.04 | ) | — | (b) | — | (b) | — | (b) | ||||||||||||||||
Total Distributions | (0.14 | ) | (0.26 | ) | (0.28 | ) | (0.27 | ) | (0.26 | ) | (0.22 | ) | |||||||||||||||
Net Asset Value, End of Period | $ | 8.81 | $ | 8.83 | $ | 9.36 | $ | 9.30 | $ | 9.21 | $ | 9.07 | |||||||||||||||
Total Return (c) (d) | 1.36 | % | (2.98 | )% | 3.71 | % | 4.04 | % | 4.50 | % | 0.85 | % | |||||||||||||||
Ratios to Average Net Assets: | |||||||||||||||||||||||||||
Net Expenses (e) (f) (g) (h) | 0.33 | % | 0.36 | % | 0.42 | % | 0.39 | % | 0.39 | % | 0.39 | % | |||||||||||||||
Net Investment Income (Loss) (e) | 2.95 | % | 2.20 | % | 2.50 | % | 2.96 | % | 2.86 | % | 2.38 | % | |||||||||||||||
Gross Expenses (e) (f) | 0.33 | % | 0.36 | % | 0.49 | % | 0.45 | % | 0.71 | % | 0.67 | % | |||||||||||||||
Supplemental Data: | |||||||||||||||||||||||||||
Net Assets at end of period (000's) | $ | 167,885 | $ | 110,978 | $ | 16,111 | $ | 7,950 | $ | 5,456 | $ | 5,142 | |||||||||||||||
Portfolio Turnover (c) (i) | 18 | % | 49 | % | 62 | % | 66 | % | 48 | % | 39 | % | |||||||||||||||
(a) Per share net investment income (loss) has been calculated using the average daily shares method.
(b) Amount is less than $0.005 per share.
(c) Not annualized for periods less than one year.
(d) Assumes reinvestment of all net investment income and realized capital gain distributions, if any, during the period. Includes adjustments in accordance with U.S. Generally Accepted Accounting Principles and could differ from the Lipper reported return.
(e) Annualized for periods less than one year.
(f) Does not include acquired fund fees and expenses, if any.
(g) The net expense ratio may not correlate to the applicable expense limits in place during the period since the current contractual expense limitation is applied for a period beginning July 1, 2019 and in effect through November 30, 2023, instead of coinciding with the Fund's fiscal year end. Details of the current contractual expense limitation in effect can be found in Note 5 of the accompanying Notes to Financial Statements.
(h) From the period beginning July 1, 2019, the amount of any waivers or reimbursements and the amount of any recoupment are calculated without regard to the impact of any performance adjustment to the Fund's management fee.
(i) Portfolio turnover is calculated on the basis of the Fund as a whole without distinguishing between the classes of shares.
See notes to financial statements.
38
USAA Mutual Funds Trust | Notes to Financial Statements January 31, 2023 | ||||||
(Unaudited)
1. Organization:
USAA Mutual Funds Trust (the "Trust") is organized as a Delaware statutory trust and is registered under the Investment Company Act of 1940, as amended (the "1940 Act"), as an open-end investment company. The Trust is comprised of 45 funds and is authorized to issue an unlimited number of shares, which are units of beneficial interest with no par value.
The accompanying financial statements are those of the USAA Short-Term Bond Fund (the "Fund"). The Fund offers four classes of shares: Fund Shares, Institutional Shares, Class A, and R6 Shares. The Fund is classified as diversified under the 1940 Act.
Each class of shares of the Fund has substantially identical rights and privileges, except with respect to sales charges, fees paid under distribution plans, expenses allocable exclusively to each class of shares, voting rights on matters solely affecting a single class of shares, and the exchange privilege of each class of shares.
Victory Capital Management ("VCM" or the "Adviser") is an indirect wholly owned subsidiary of Victory Capital Holdings, Inc., a publicly traded Delaware corporation, and a wholly owned direct subsidiary of Victory Capital Operating, LLC.
Under the Trust's organizational documents, its officers and trustees are indemnified against certain liabilities arising out of the performance of their duties to the Fund. In addition, in the normal course of business, the Fund enters into contracts with its vendors and others that provide for general indemnifications. The Fund's maximum exposure under these arrangements is unknown, as this would involve future claims that may be made against the Fund. However, based on experience, the Fund expects that risk of loss to be remote.
2. Significant Accounting Policies:
The following is a summary of significant accounting policies followed by the Trust in the preparation of its financial statements. The policies are in conformity with U.S. Generally Accepted Accounting Principles ("GAAP"). The preparation of financial statements in accordance with GAAP requires management to make estimates and assumptions that affect the reported amounts of assets and liabilities and disclosure of contingent assets and liabilities at the date of the financial statements and the reported amounts of income and expenses for the period. Actual results could differ from those estimates. The Fund follows the specialized accounting and reporting requirements under GAAP that are applicable to investment companies under Accounting Standards Codification Topic 946.
Investment Valuation:
The Fund records investments at fair value. Fair value is defined as the price that would be received to sell an asset or paid to transfer a liability in an orderly transaction between market participants at the measurement date.
The valuation techniques described below maximize the use of observable inputs and minimize the use of unobservable inputs in determining fair value. The inputs used for valuing the Fund's investments are summarized in the three broad levels listed below:
• Level 1 — quoted prices (unadjusted) in active markets for identical securities
• Level 2 — other significant observable inputs (including quoted prices for similar securities, interest rates, or credit spreads, applicable to those securities, etc.)
• Level 3 — significant unobservable inputs (including the Adviser's assumptions in determining the fair value of investments)
Changes in valuation techniques may result in transfers in or out of an assigned level within the disclosure hierarchy. The inputs or methodologies used for valuation techniques are not necessarily an indication of the risks associated with entering into those investments.
39
USAA Mutual Funds Trust | Notes to Financial Statements — continued January 31, 2023 | ||||||
(Unaudited)
The Adviser, appointed as the valuation designee by the Trust's Board of Trustees' (the "Board"), has established the Pricing and Liquidity Committee (the "Committee"), and subject to Board oversight, the Committee administers and oversees the Fund's valuation policies and procedures, which are approved by the Board.
Portfolio securities listed or traded on securities exchanges, including Exchange-Traded Funds ("ETFs"), are valued at the closing price on the exchange or system where the security is principally traded, if available, or at the Nasdaq Official Closing Price. If there have been no sales for that day on the exchange or system, then a security is valued at the last available bid quotation on the exchange or system where the security is principally traded. In each of these situations, valuations are typically categorized as Level 1 in the fair value hierarchy.
Investments in open-end investment companies, other than ETFs, are valued at their net asset value ("NAV"). These valuations are typically categorized as Level 1 in the fair value hierarchy.
Debt securities are valued each business day by a pricing service approved by the valuation designee and subject to the oversight of the Board. The pricing service uses the evaluated bid or the last sale price to value securities. Debt obligations maturing within 60 days may be valued at amortized cost, provided that the amortized cost represents the fair value of such securities. These valuations are typically categorized as Level 2 in the fair value hierarchy.
Futures contracts are valued at the settlement price established each day by the board of trade or an exchange on which they are traded. These valuations are typically categorized as Level 1 in the fair value hierarchy.
In the event that price quotations or valuations are not readily available, investments are valued at fair value in accordance with procedures established by and under the general supervision and responsibility of the Board. These valuations are typically categorized as Level 2 or Level 3 in the fair value hierarchy, based on the observability of inputs used to determine the fair value. The effect of fair value pricing is that securities may not be priced on the basis of quotations from the primary market in which they are traded, and the actual price realized from the sale of a security may differ materially from the fair value price. Valuing these securities at fair value is intended to cause the Fund's NAV to be more reliable than it otherwise would be.
A summary of the valuations as of January 31, 2023, based upon the three levels defined above, is included in the table below while the breakdown, by category, of investments is disclosed on the Schedule of Portfolio Investments (amounts in thousands):
Level 1 | Level 2 | Level 3 | Total | ||||||||||||||||
Asset-Backed Securities | $ | — | $ | 697,046 | $ | — | $ | 697,046 | |||||||||||
Collateralized Mortgage Obligations | — | 168,132 | — | 168,132 | |||||||||||||||
Preferred Stocks | 5,744 | — | — | 5,744 | |||||||||||||||
Senior Secured Loans | — | 15,459 | — | 15,459 | |||||||||||||||
Corporate Bonds | — | 946,240 | — | 946,240 | |||||||||||||||
Yankee Dollars | — | 214,257 | — | 214,257 | |||||||||||||||
Municipal Bonds | — | 129,808 | — | 129,808 | |||||||||||||||
U.S. Government Agency Mortgages | — | 6,035 | — | 6,035 | |||||||||||||||
U.S. Treasury Obligations | — | 48,295 | — | 48,295 | |||||||||||||||
Commercial Paper | — | 146,687 | — | 146,687 | |||||||||||||||
Collateral for Securities Loaned | 21,703 | — | — | 21,703 | |||||||||||||||
Total | $ | 27,447 | $ | 2,371,959 | $ | — | $ | 2,399,406 | |||||||||||
As of January 31, 2023, there were no transfers into/out of Level 3.
Real Estate Investment Trusts ("REITs"):
The Fund may invest in REITs, which report information on the source of their distributions annually. REITs are pooled investment vehicles that invest primarily in income producing real estate or real estate related loans or interests (such as mortgages). Certain distributions received from REITs during the year are recorded as realized gains or return of capital as estimated by the Fund or when such information becomes known.
40
USAA Mutual Funds Trust | Notes to Financial Statements — continued January 31, 2023 | ||||||
(Unaudited)
Investment Companies:
Open-End Funds:
The Fund may invest in portfolios of open-end investment companies. These investment companies value securities in their portfolios for which market quotations are readily available at their market values (generally the last reported sale price) and all other securities and assets at their fair value by the methods established by the board of directors of the underlying funds.
Securities Purchased on a Delayed-Delivery or When-Issued Basis:
The Fund may purchase securities on a delayed-delivery or when-issued basis. Delivery and payment for securities that have been purchased by the Fund on a delayed-delivery or when-issued basis, or for delayed draws on loans can generally take place within 35 days a month or more after the trade date. Securities that require more than 35 days to settle are considered a senior security and subject to Rule 18f-4. At the time the Fund makes the commitment to purchase a security on a delayed-delivery or when-issued basis, the Fund records the transaction and reflects the value of the security in determining NAV. No interest accrues to the Fund until the transaction settles and payment takes place. If the Fund owns delayed-delivery or when-issued securities, these values are included in Payables for Investments purchased on the accompanying Statement of Assets and Liabilities.
Municipal Obligations:
The values of municipal obligations can fluctuate and may be affected by adverse tax, legislative, or political changes, and by financial developments affecting municipal issuers. Payments of municipal obligations may depend on a relatively limited source of revenue, resulting in greater credit risk. Future changes in federal tax laws or the activity of an issuer may adversely affect the tax-exempt status of municipal obligations.
Mortgage- and Asset-Backed Securities:
The values of some mortgage-related or asset-backed securities may be particularly sensitive to changes in prevailing interest rates. Early repayment of principal on some mortgage-related securities may expose the Fund to a lower rate of return upon reinvestment of principal. The values of mortgage- and asset-backed securities depend in part on the credit quality and adequacy of the underlying assets or collateral and may fluctuate in response to the market's perception of these factors as well as current and future repayment rates. Some mortgage-backed securities are backed by the full faith and credit of the U.S. government (e.g., mortgage-backed securities issued by the Government National Mortgage Association, commonly known as "Ginnie Mae"), while other mortgage-backed securities (e.g., mortgage-backed securities issued by the Federal National Mortgage Association and the Federal Home Loan Mortgage Corporation, commonly known as "Fannie Mae" and "Freddie Mac," respectively), are backed only by the credit of the government entity issuing them. In addition, some mortgage-backed securities are issued by private entities and, as such, are not guaranteed by the U.S. government or any agency or instrumentality of the U.S. government.
Leveraged Loans:
The Fund may invest in leveraged loans, a type of bank loan. Leveraged loans are adjustable-rate bank loans made to companies rated below investment grade. The interest rates on leveraged loans are reset periodically based upon the fluctuations of a base interest rate such as the Secured Overnight Financing Rate ("SOFR") or London Interbank Offered Rate ("LIBOR") and a "spread" above that base interest rate that represents a risk premium to the lending banks and/or other participating investors. Many bank loans bear an adjustable rate of interest; however, leveraged loans provide for a greater "spread" over the base interest rate than other bank loans because they are considered to represent a greater credit risk. Because they are perceived to represent a greater credit risk, leveraged loans possess certain attributes that are similar to high-yield securities. However, because they are often secured by collateral of the borrower, leveraged loans possess certain attributes that are similar to other bank loans.
41
USAA Mutual Funds Trust | Notes to Financial Statements — continued January 31, 2023 | ||||||
(Unaudited)
Below-Investment-Grade Securities:
The Fund may invest in below-investment-grade securities (i.e., lower-quality, "junk" debt), which are subject to various risks. Lower-quality debt is considered to be speculative because it is less certain that the issuer will be able to pay interest or repay the principal than in the case of investment-grade debt. These securities can involve a substantially greater risk of default than higher-rated securities, and their values can decline significantly over short periods of time. Lower-quality debt securities tend to be more sensitive to adverse news about their issuers, the market and the economy in general, than higher-quality debt securities. The market for these securities can be less liquid, especially during periods of recession or general market decline.
Derivative Instruments:
Futures Contracts:
The Fund may enter into contracts for the future delivery of securities or foreign currencies and futures contracts based on a specific security, class of securities, foreign currency or an index, and purchase or sell options on any such futures contracts. A futures contract on a securities index is an agreement obligating either party to pay, and entitling the other party to receive, while the contract is outstanding, cash payments based on the level of a specified securities index. No physical delivery of the underlying asset is made. The Fund may enter into futures contracts in an effort to hedge against market risks. The acquisition of put and call options on futures contracts will give the Fund the right (but not the obligation), for a specified price, to sell or to purchase the underlying futures contract, upon exercise of the option, at any time during the option period. Futures transactions involve brokerage costs and require the Fund to segregate assets to cover contracts that would require it to purchase securities or currencies. A good faith margin deposit, known as initial margin, of cash or government securities with a broker or custodian is required to initiate and maintain open positions in futures contracts. Subsequent payments, known as variation margin, are made or received by the Fund based on the change in the market value of the position and are recorded as unrealized appreciation or depreciation until the contract is closed out, at which time the gain or loss is realized. The Fund may lose the expected benefit of futures transactions if interest rates, exchange rates or securities prices change in an unanticipated manner. Such unanticipated changes may also result in lower overall performance than if the Fund had not entered into any futures transactions. In addition, the value of the Fund's futures positions may not prove to be perfectly or even highly correlated with the value of its portfolio securities or foreign currencies, limiting the Fund's ability to hedge effectively against interest rate, exchange rate and/or market risk and giving rise to additional risks. There is no assurance of liquidity in the secondary market for purposes of closing out futures positions. The collateral held by the Fund is presented on the Statement of Assets and Liabilities under Deposit with broker for futures contracts.
The Fund did not hold futures contracts as of January 31, 2023.
Investment Transactions and Related Income:
Changes in holdings of investments are accounted for no later than one business day following the trade date. For financial reporting purposes, however, investment transactions are accounted for on trade date or the last business day of the reporting period. Interest income is determined on the basis of coupon interest accrued using the effective interest method which adjusts, where applicable, the amortization of premiums or accretion of discounts. Dividend income is recorded on the ex-dividend date. Gains or losses realized on sales of securities are recorded on the identified cost basis. Paydown gains or losses on applicable securities, if any, are recorded as components of Interest income on the Statement of Operations.
The Fund may receive other income from investments in loan assignments and/or unfunded commitments, including amendment fees, consent fees, and commitment fees. These fees are recorded as income when received. These amounts, if received, are included in Interest income on the Statement of Operations.
42
USAA Mutual Funds Trust | Notes to Financial Statements — continued January 31, 2023 | ||||||
(Unaudited)
Securities Lending:
The Fund, through a Securities Lending Agreement with Citibank, N.A. ("Citibank"), may lend its securities to qualified financial institutions, such as certain broker-dealers and banks, to earn additional income, net of income retained by Citibank. Borrowers are required to initially secure their loans for collateral in the amount of at least 102% of the value of U.S. securities loaned or at least 105% of the value of non-U.S. securities loaned, marked-to-market daily. Any collateral shortfalls associated with increases in the valuation of the securities loaned are generally cured the next business day. The collateral can be received in the form of cash collateral and/or non-cash collateral. Non-cash collateral can include U.S. Government Securities and other securities as permitted by Securities and Exchange Commission ("SEC") guidelines. The cash collateral is invested in short-term instruments or cash equivalents, primarily open-end investment companies, as noted on the Fund's Schedule of Portfolio Investments. The Fund effectively does not have control of the non-cash collateral and therefore it is not disclosed on the Fund's Schedule of Portfolio Investments. Collateral requirements are determined daily based on the value of the Fund's securities on loan as of the end of the prior business day. During the time portfolio securities are on loan, the borrower will pay the Fund any dividends or interest paid on such securities plus any fee negotiated between the parties to the lending agreement. The Fund also earns a return from the collateral. The Fund pays Citibank various fees in connection with the investment of cash collateral and fees based on the investment income received from securities lending activities. Securities lending income (net of these fees) is disclosed on the Statement of Operations. Loans are terminable upon demand and the borrower must return the loaned securities within the lesser of one standard settlement period or five business days. Although risk is mitigated by the collateral, the Fund could experience a delay in recovering its securities and possible loss of income or value if the borrower fails to return them. In addition, there is a risk that the value of the short-term investments will be less than the amount of cash collateral required to be returned to the borrower.
The Fund's agreement with Citibank does not include master netting provisions. Non-cash collateral received by the Fund may not be sold or repledged, except to satisfy borrower default.
The following table (amounts in thousands) is a summary of the Fund's securities lending transactions as of January 31, 2023.
| Value of Securities on Loan | Non-Cash Collateral | Cash Collateral | |||||||||
| $ | 21,011 | $ | — | $ | 21,703 | ||||||
Foreign Currency Translations:
The accounting records of the Fund are maintained in U.S. dollars. Investment securities and other assets and liabilities of the Fund denominated in a foreign currency are translated into U.S. dollars at current exchange rates. Purchases and sales of securities, income receipts, and expense payments are translated into U.S. dollars at the exchange rates on the date of the transactions. The Fund does not isolate the portion of the results of operations resulting from changes in foreign exchange rates on investments from fluctuations arising from changes in market prices of securities held. Such fluctuations are disclosed as Net change in unrealized appreciation/depreciation on investment securities and foreign currency translations on the Statement of Operations. Any realized gains or losses from these fluctuations are disclosed as Net realized gains (losses) from investment securities and foreign currency transactions on the Statement of Operations.
Federal Income Taxes:
The Fund intends to continue to qualify as a regulated investment company by complying with the provisions available to certain investment companies, as defined in applicable sections of the Internal Revenue Code, and to make distributions of net investment income and net realized gains sufficient to relieve it from all, or substantially all, federal income taxes. Accordingly, no provision for federal income taxes is required in the financial statements. The Fund has a tax year end of July 31, and effective April 30, 2023, the Fund will change its tax year end to April 30.
For the six months ended January 31, 2023, the Fund did not incur any income tax, interest, or penalties, and has recorded no liability for net unrecognized tax benefits relating to uncertain tax positions.
43
USAA Mutual Funds Trust | Notes to Financial Statements — continued January 31, 2023 | ||||||
(Unaudited)
Management of the Fund has reviewed tax positions taken in tax years that remain subject to examination by all major tax jurisdictions, including federal (i.e., the last four tax years, which includes the current fiscal tax year end). Management believes that there is no tax liability resulting from unrecognized tax benefits related to uncertain tax positions taken.
Allocations:
Expenses directly attributable to the Fund are charged to the Fund, while expenses that are attributable to more than one fund in the Trust, or jointly with an affiliated trust, are allocated among the respective funds in the Trust and/or an affiliated trust based upon net assets or another appropriate basis.
Income, expenses (other than class-specific expenses such as transfer agent fees, state registration fees, printing fees, and 12b-1 fees), and realized and unrealized gains or losses on investments are allocated to each class of shares based on its relative net assets on the date income is earned or expenses and realized and unrealized gains and losses are incurred.
Cross-Trade Transactions:
Pursuant to Rule 17a-7 under the 1940 Act, the Fund may engage in cross-trades, which are securities transactions with affiliated investment companies and advisory accounts managed by the Adviser and any applicable sub-adviser under specified conditions outlined in the valuation policies and procedures adopted by the Board. In addition, as defined under the valuation policies and procedures, each transaction must be effected at the independent current market price. For the six months ended January 31, 2023, the Fund engaged in the following securities transactions with affiliated funds, which resulted in the following net realized gains (losses) (amounts in thousands):
| Purchases | Sales | Net Realized Gains (Losses) | |||||||||
| $ | 4,950 | $ | — | $ | — | ||||||
3. Purchases and Sales:
Purchases and sales of securities (excluding securities maturing less than one year from acquisition) for the six months ended January 31, 2023, were as follows for the Fund (amounts in thousands):
| Excluding U.S. Government Securities | U.S. Government Securities | ||||||||||||||
Purchases | Sales | Purchases | Sales | ||||||||||||
$ | 380,968 | $ | 541,537 | $ | 25,783 | $ | 3,170 | ||||||||
4. Affiliated Fund Ownership:
The Fund offers shares for investment by other funds. The fund-of-funds do not invest in the underlying funds for the purpose of exercising management or control, and the affiliated fund-of-funds' annual and semi-annual reports may be viewed at vcm.com. As of January 31, 2023, certain fund-of-funds owned total outstanding shares of the Fund as follows:
Affiliated USAA Mutual Funds | Ownership % | ||||||
Cornerstone Conservative Fund | 0.3 | ||||||
Target Retirement Income Fund | 4.7 | ||||||
Target Retirement 2030 Fund | 2.5 | ||||||
Target Retirement 2040 Fund | 0.9 | ||||||
Target Retirement 2050 Fund | 0.0 | * | |||||
Target Retirement 2060 Fund | 0.0 | * | |||||
* Amount is less than 0.05%.
44
USAA Mutual Funds Trust | Notes to Financial Statements — continued January 31, 2023 | ||||||
(Unaudited)
5. Fees and Transactions with Affiliates and Related Parties:
Investment Advisory Fees:
Investment advisory services are provided to the Fund by the Adviser, which is a New York corporation registered as an investment adviser with the SEC.
Under the terms of the Investment Advisory Agreement, the Adviser is entitled to receive a base fee and a performance adjustment. The Fund's base fee is accrued daily and paid monthly at an annualized rate of 0.20% of the Fund's average daily net assets. Amounts incurred and paid to VCM for the six months ended January 31, 2023, are reflected on the Statement of Operations as Investment advisory fees.
The performance adjustment for each share class is accrued daily and calculated monthly by comparing the respective class' performance to that of the Lipper Short Investment Grade Debt Funds Index. The Lipper Short Investment Grade Debt Funds Index tracks the total return performance of the largest funds within the Lipper Short Investment Grade Debt Funds category.
The performance period for each share class consists of the current month plus the previous 35 months. The following table is utilized to determine the extent of the performance adjustment:
| Over/Under Performance Relative to Index (in basis points)(a) | Annual Adjustment Rate (in basis points) | ||||||
| +/- 20 to 50 | +/- 4 | ||||||
| +/- 51 to 100 | +/- 5 | ||||||
| +/- 101 and greater | +/- 6 | ||||||
(a) Based on the difference between the average annual performance of the relevant share class of the Fund and its relevant Lipper index, rounded to the nearest basis point.
Each class' annual performance adjustment rate is multiplied by the average daily net assets of the respective class over the entire performance period, which is then multiplied by a fraction, the numerator of which is the number of days in the month and the denominator of which is 365 (366 in leap years). The resulting amount is then added to (in the case of overperformance), or subtracted from (in the case of underperformance) the base fee.
Under the performance fee arrangement, each class pays a positive performance fee adjustment for a performance period whenever the class outperforms the Lipper Short Investment Grade Debt Funds Index over that period, even if the class has overall negative returns during the performance period.
For the period August 1, 2022, to January 31, 2023, performance adjustments were $256, $455, $3, and $10 for Fund Shares, Institutional Shares, Class A, and R6 Shares, in thousands, respectively. Performance adjustments were 0.06%, 0.06%, 0.04%, and 0.01% for Fund Shares, Institutional Shares, Class A, and R6 Shares, respectively. The performance adjustment rate included in the investment advisory fee may differ from the maximum over/under Annual Adjustment Rate due to differences in average net assets for the reporting period and rolling 36 month performance periods.
The Trust relies on an exemptive order granted to VCM and its affiliated funds by the SEC in March 2019, permitting the use of a "manager-of-managers" structure for certain funds. Under a manager-of-managers structure, the investment adviser may select (with approval of the Board and without shareholder approval) one or more subadvisers to manage the day-to-day investment of a fund's assets. For the six months ended January 31, 2023, the Fund had no subadvisers.
Administration and Servicing Fees:
VCM also serves as the Fund's administrator and fund accountant. Under the Fund Administration, Servicing and Accounting Agreement, VCM is paid an administration and servicing fee that is accrued daily and paid monthly at an annualized rate of 0.15%, 0.10%, 0.15%, and 0.05%, which is based on the Fund's average daily net assets of the Fund Shares, Institutional Shares, Class A, and R6 Shares, respectively. Amounts incurred for the six months ended January 31, 2023, are reflected on the Statement of Operations as Administration fees.
45
USAA Mutual Funds Trust | Notes to Financial Statements — continued January 31, 2023 | ||||||
(Unaudited)
Citi Fund Services Ohio, Inc. ("Citi"), an affiliate of Citibank, acts as sub-administrator and sub-fund accountant to the Fund pursuant to a Sub-Administration and Sub-Fund Accounting Services Agreement between VCM and Citi. VCM pays Citi a fee for providing these services. The Fund reimburses VCM and Citi for out-of-pocket expenses incurred in providing these services and certain other expenses specifically allocated to the Fund. Amounts incurred for the six months ended January 31, 2023, are reflected on the Statement of Operations as Sub-Administration fees.
The Fund (as part of the Trust) has entered into an agreement with the Adviser to provide compliance services, pursuant to which the Adviser furnishes its compliance personnel, including the services of the Chief Compliance Officer ("CCO"), and other resources reasonably necessary to provide the Trust with compliance oversight services related to the design, administration, and oversight of a compliance program for the Trust in accordance with Rule 38a-1 under the 1940 Act. The CCO is an employee of the Adviser, which pays the compensation of the CCO and support staff. The funds in the Trust, Victory Variable Insurance Funds, Victory Portfolios, and Victory Portfolios II (collectively, the "Victory Funds Complex") in the aggregate, compensate the Adviser for these services. Amounts incurred for the six months ended January 31, 2023, are reflected on the Statement of Operations as Compliance fees.
Transfer Agency Fees:
Victory Capital Transfer Agency, Inc. ("VCTA"), an affiliate of the Adviser, provides transfer agency services to the Fund. VCTA provides transfer agent services to the Fund Shares based on an annual charge of $25.50 per shareholder account plus out-of-pocket expenses. VCTA pays a portion of these fees to certain intermediaries for the administration and servicing of accounts that are held with such intermediaries. Transfer agent fees for Institutional Shares, Class A, and R6 Shares, are paid monthly based on a fee accrued daily at an annualized rate of 0.10% and 0.10%, and 0.01%, respectively, of average daily net assets, plus out-of-pocket expenses. Amounts incurred and paid to VCTA for the six months ended January 31, 2023, are reflected on the Statement of Operations as Transfer agent fees.
FIS Investor Services LLC serves as sub-transfer agent and dividend disbursing agent for the Fund pursuant to a Sub-Transfer Agent Agreement between VCTA and FIS Investor Services LLC. VCTA provides FIS Investor Services LLC a fee for providing these services.
Distributor/Underwriting Services:
Victory Capital Services, Inc. (the "Distributor"), an affiliate of the Adviser, serves as Distributor for the continuous offering of the shares of the Fund pursuant to a Distribution Agreement between the Distributor and the Trust.
Pursuant to the Distribution and Service Plans adopted in accordance with Rule 12b-1 under the 1940 Act, the Distributor may receive a monthly distribution and service fee, at an annual rate of up to 0.25% of the average daily net assets of Class A. The distribution and service fees paid to the Distributor may be used by the Distributor to pay for activity primarily intended to result in the sale of Class A. Amounts incurred and paid to the Distributor for the six months ended January 31, 2023, are reflected on the Statement of Operations as 12b-1 fees.
In addition, the Distributor is entitled to receive commissions in connection with sales of Class A. For the six months ended January 31, 2023, the Distributor received less than $1 thousand from commissions earned in connection with sales of Class A.
Other Fees:
Citibank serves as the Fund's custodian. The Fund pays Citibank a fee for providing these services. Amounts incurred for the six months ended January 31, 2023, are reflected on the Statement of Operations as Custodian fees.
K&L Gates LLP provides legal services to the Trust.
The Adviser has entered into an expense limitation agreement with the Fund until at least November 30, 2023. Under the terms of the agreement, the Adviser has agreed to waive fees or reimburse certain expenses to the extent that ordinary operating expenses incurred by certain classes of the Fund in any fiscal year exceed the expense limits for such classes of the Fund. Such excess amounts will be the
46
USAA Mutual Funds Trust | Notes to Financial Statements — continued January 31, 2023 | ||||||
(Unaudited)
liability of the Adviser. Performance adjustments, acquired fund fees and expenses, interest, taxes, brokerage commissions, other expenditures, which are capitalized in accordance with GAAP, and other extraordinary expenses not incurred in the ordinary course of the Fund's business are excluded from the expense limits. As of January 31, 2023, the expense limits (excluding voluntary waivers) were 0.53%, 0.43%, 0.73%, and 0.39% for Fund Shares, Institutional Shares, Class A, and R6 Shares, respectively.
Under the terms of the expense limitation agreement, the Fund has agreed to repay fees and expenses that were waived or reimbursed by the Adviser for a period of up to three years (thirty-six (36) months) after the waiver or reimbursement took place, subject to the lesser of any operating expense limits in effect at the time of: (a) the original waiver or expense reimbursement; or (b) the recoupment, after giving effect to the recoupment amount.
As of January 31, 2023, the following amounts are available to be repaid to the Adviser (amounts in thousands). The Fund has not recorded any amounts available to be repaid as a liability due to an assessment that such repayments are not probable at January 31, 2023.
| Expires 2024 | Expires 2025 | Expires 2026 | Total | ||||||||||||
| $ | 31 | $ | 19 | $ | 25 | $ | 75 | ||||||||
The Adviser may voluntarily waive or reimburse additional fees to assist the Fund in maintaining competitive expense ratios. Voluntary waivers and reimbursements applicable to the Fund are not available to be recouped at a future time. There were no voluntary waivers or reimbursements for the six months ended January 31, 2023.
Certain officers and/or interested trustees of the Fund are also officers and/or employees of the Adviser, administrator, fund accountant, sub-administrator, sub-fund accountant, custodian, and Distributor.
6. Risks:
The Fund may be subject to other risks in addition to these identified risks.
Debt Securities Risk — The value of a debt security or other income-producing security changes in response to various factors including, for example, market-related factors (such as changes in interest rates or changes in the risk appetite of investors generally) and changes in the actual or perceived ability of the issuer (or of issuers generally) to meet its (or their) obligations. Other factors that may affect the value of debt securities include, among others, public health crises and responses by governments and companies to such crises. These and other events may affect the creditworthiness of the issuer of a debt security and may impair an issuer's ability to timely meet its debt obligations as they come due.
Interest Rate Risk — The Fund is subject to the risk that the market value of the bonds in its portfolio will fluctuate because of changes in interest rates, changes in the supply of and demand for tax-exempt securities, and other market factors. Bond prices generally are linked to the prevailing market interest rates. In general, when interest rates rise, bond prices fall; conversely, when interest rates fall, bond prices rise. The price volatility of a bond also depends on its duration. Generally, the longer the duration of a bond, the greater is its sensitivity to interest rates. To compensate investors for this higher interest rate risk, bonds with longer durations generally offer higher yields than bonds with shorter durations. The ability of an issuer of a debt security to repay principal prior to a security's maturity can increase the security's sensitivity to interest rate changes.
Decisions by the U.S. Federal Reserve regarding interest rate and monetary policy, which can be difficult to predict and sometimes change direction suddenly in response to economic and market events, can have a significant effect on the value of fixed-income securities as well as the overall strength of the U.S. economy. Precise interest rate predictions are difficult to make, and interest rates may change unexpectedly and dramatically in response to extreme changes in market or economic conditions. As a result, the value of fixed-income securities may vary widely under certain market conditions.
47
USAA Mutual Funds Trust | Notes to Financial Statements — continued January 31, 2023 | ||||||
(Unaudited)
Credit Risk — The fixed-income securities in the Fund's portfolio are subject to credit risk, which is the possibility that an issuer of a fixed-income security will fail to make timely interest and/or principal payments on its securities or that negative market perceptions of the issuer's ability to make such payments will cause the price of that security to decline. The Fund accepts some credit risk as a recognized means to enhance an investor's return. All fixed-income securities, varying from the highest quality to the very speculative, have some degree of credit risk.
LIBOR Discontinuation Risk — The LIBOR discontinuation may adversely affect the financial markets generally and the Fund's operations, finances and investments specifically. LIBOR has been the principal floating-rate benchmark in the financial markets. However, LIBOR has been or will be discontinued as a floating rate benchmark. The date of discontinuation depends on the LIBOR currency and tenor. With limited exceptions, no new LIBOR obligations will be entered into after December 31, 2021. Existing LIBOR obligations have transitioned or will transition to another benchmark, depending on the LIBOR currency and tenor. For some existing LIBOR-based obligations, the contractual consequences of the discontinuation of LIBOR may not be clear.
Non-LIBOR floating-rate obligations, including SOFR-based obligations, may have returns and values that fluctuate more than those of floating-rate debt obligations that are based on LIBOR or other rates. Also, because SOFR and some alternative floating rates are relatively new market indexes, markets for certain non-LIBOR obligations may never develop or may not be liquid. Market terms for non-LIBOR floating rate obligations, such as the spread over the index reflected in interest-rate provisions, may evolve over time, and prices of non-LIBOR floating rate obligations may be different depending on when they are issued and changing views about correct spread levels.
Various SOFR-based rates, including SOFR-based term rates, and various non-SOFR-based rates are expected to develop in response to the discontinuation of U.S. dollar LIBOR, which may create various risks for the Fund and the financial markets more generally. There are non-LIBOR forward-looking floating rates that are not based on SOFR and that may be considered by participants in the financial markets as LIBOR alternatives. Such rates include AMERIBOR (American Interbank Offered Rate), BSBY (Bloomberg Short-Term Bank Yield Index) and BYI (Bank Yield Index). Unlike forward-looking SOFR-based term rates, such rates are intended to reflect a bank credit spread component.
It is not clear how replacement rates for LIBOR — including SOFR-based rates and non-SOFR-based rates — will develop and to what extent they will be used. There is no assurance that these replacement rates will be suitable substitutes for LIBOR, and thus the substitution of such rates for LIBOR could have an adverse effect on the Fund and the financial markets more generally. Concerns about market depth and stability could affect the development of non-SOFR-based term rates, and such rates may create various risks, which may or may not be similar to the risks relating to SOFR.
Market Risk — Overall market risks may affect the value of the Fund. Domestic and international factors such as political events, war, terrorism, trade disputes, inflation rates, interest rate levels and other fiscal and monetary policy changes, cybersecurity incidents, pandemics and other public health crises, sanctions against a particular foreign country, its nationals, businesses or industries and related geopolitical events, as well as environmental disasters such as earthquakes, fires, and floods, or other catastrophes, may add to instability in global economies and markets generally, and may lead to increased market volatility. Global economies and financial markets are highly interconnected, which increases the possibility that conditions in one country or region might adversely affect issuers in another country or region. The impact of these and other factors may be short-term or may last for extended periods.
7. Borrowing and Interfund Lending:
Line of Credit:
The Victory Funds Complex participates in a short-term demand note "Line of Credit" agreement with Citibank. The Line of Credit agreement with Citibank was renewed on June 27, 2022, with a termination date of June 26, 2023. Under the agreement with Citibank, the Victory Funds Complex may borrow up to $600 million, of which $300 million is committed and $300 million is uncommitted. $40 million of
48
USAA Mutual Funds Trust | Notes to Financial Statements — continued January 31, 2023 | ||||||
(Unaudited)
the Line of Credit is reserved for use by the Victory Floating Rate Fund, another series of the Victory Funds Complex, with Victory Floating Rate Fund paying the related commitment fees for that amount. The purpose of the Line of Credit is to meet temporary or emergency cash needs. For the six months ended January 31, 2023, Citibank received an annual commitment fee of 0.15% on $300 million for providing the Line of Credit. Each fund in the Victory Funds Complex paid a pro-rata portion of the commitment fees plus any interest (one-month SOFR plus 1.10 percent) on amounts borrowed. Interest charged to the Fund during the period, if applicable, is reflected on the Statement of Operations under Line of credit fees.
The Fund had no borrowings under the Line of Credit agreement during the six months ended January 31, 2023.
Interfund Lending:
The Trust and the Adviser rely on an exemptive order granted by the SEC in March 2017 (the "Order"), permitting the establishment and operation of an Interfund Lending Facility (the "Facility"). The Facility allows the Fund to directly lend and borrow money to or from any other fund in the Victory Funds Complex that is permitted to participate in the Facility, relying upon the Order at rates beneficial to both the borrowing and lending funds. Advances under the Facility are allowed for temporary or emergency purposes, including the meeting of redemption requests that otherwise might require the untimely disposition of securities, and are subject to each Fund's borrowing restrictions. The interfund loan rate is determined, as specified in the Order, by averaging the current repurchase agreement rate and the current bank loan rate. As a Borrower, interest charged to the Fund, if any, during the period, is reflected on the Statement of Operations under Interfund lending fees. As a Lender, interest earned by the Fund, if any, during the period, is reflected on the Statement of Operations under Interfund lending.
The Fund did not utilize or participate in the Facility during the six months ended January 31, 2023.
8. Federal Income Tax Information:
Distributable net realized gains, if any, are declared and paid at least annually. Distributions from the Fund's net investment income are accrued daily and distributed on the last business day of each month.
The amounts of dividends from net investment income and distributions from net realized gains (collectively, distributions to shareholders) are determined in accordance with federal income tax regulations, which may differ from GAAP. To the extent these "book/tax" differences are permanent in nature (e.g., net operating loss and distribution reclassification), such amounts are reclassified within the components of net assets based on their federal tax-basis treatment; temporary differences (e.g., wash sales) do not require reclassification. To the extent dividends and distributions exceed net investment income and net realized gains for tax purposes, they are reported as distributions of capital. Net investment losses incurred by the Fund may be reclassified as an offset to capital on the accompanying Statement of Assets and Liabilities.
The tax character of current year distributions paid and the tax basis of the current components of accumulated earnings (loss) will be determined at the end of the current tax year.
At the tax year ended July 31, 2022, the Fund had no capital loss carryforwards for federal income tax purposes.
9. Subsequent Events:
On June 29, 2022, the Board approved a change to the Fund's fiscal year-end from July 31 to April 30, with an effective date of April 30,2023.
The Board, upon recommendation of the Adviser, has approved a change in the name of the Trust and each individual fund within the Trust. On February 23, 2023, an initial filing was made with the SEC to commence the process to effectuate the following changes.
49
USAA Mutual Funds Trust | Notes to Financial Statements — continued January 31, 2023 | ||||||
(Unaudited)
Effective at the start of business on April 24, 2023 (the "Effective Date"), the name of the Trust will change from USAA Mutual Funds Trust to Victory Portfolios III, and all references to USAA Mutual Funds Trust in the summary prospectus, statutory prospectus, and statement of additional information ("SAI") will be replaced by the new name.
Also on the Effective Date, references to the current name of the Fund in the summary prospectus, statutory prospectus, and SAI will be replaced with the new name as follows:
| Current Name | New Name | ||||||
USAA Short-Term Bond Fund | Victory Short-Term Bond Fund | ||||||
In addition, on the Effective Date, USAA Investments, a Victory Capital Management Inc. Investment Franchise, that currently manages the USAA Fixed Income Funds, will change its name to Victory Income Investors, and all references to USAA Investments in the summary prospectus, statutory prospectus, and SAI, will be replaced.
Please note that there will be no changes in the management of the Fund or to the Fund's ticker symbols.
50
USAA Mutual Funds Trust | Supplemental Information January 31, 2023 | ||||||
(Unaudited)
Proxy Voting and Portfolio Holdings Information
Proxy Voting:
Information regarding the policies and procedures the Fund uses to determine how to vote proxies relating to portfolio securities is available without charge, upon request, by calling (800) 235-8396. The information is also included in the Fund's Statement of Additional Information, which is available on the SEC's website at sec.gov.
Information relating to how the Fund voted proxies relating to portfolio securities held during the most recent 12 months ended June 30 is available on the SEC's website at sec.gov.
Availability of Schedules of Portfolio Investments:
The Trust files a complete list of Schedules of Portfolio Investments with the SEC for the first and third quarter of each fiscal year on Form N-PORT. Form N-PORT is available on the SEC's website at sec.gov.
Expense Examples
As a shareholder of the Fund, you may incur two types of costs: (1) transaction costs, including sales charges (loads) on purchases; and (2) ongoing costs, including management fees and other Fund expenses. These examples are intended to help you understand your ongoing costs (in dollars) of investing in the Fund and to compare these costs with the ongoing costs of investing in other mutual funds.
These examples are based on an investment of $1,000 invested at the beginning of the period and held for the entire period from August 1, 2022, through January 31, 2023.
The Actual Expense figures in the table below provide information about actual account values and actual expenses. You may use the information below, together with the amount you invested, to estimate the expenses that you paid over the period. Simply divide your account value by $1,000 (for example, an $8,600 account value divided by $1,000 = 8.6), then multiply the result by the number in the table under the heading entitled "Actual Expenses Paid During Period" to estimate the expenses you paid on your account during this period.
The Hypothetical Expense figures in the table below provide information about hypothetical account values and hypothetical expenses based on the Fund's actual expense ratio and an assumed rate of return of 5% per year before expenses, which is not the Fund's actual return. The hypothetical account values and expenses may not be used to estimate the actual ending account balance or expenses you paid for the period. You may use this information to compare this 5% hypothetical example with the 5% hypothetical examples that appear in shareholder reports of other funds.
Please note the expenses shown in the table below are meant to highlight your ongoing costs only and do not reflect any transactional costs. Therefore, the hypothetical expenses in the table are useful in comparing ongoing costs only and will not help you determine the relative total costs of owning different funds. In addition, if these transactional costs were included, your costs would have been higher.
| Beginning Account Value 8/1/22 | Actual Ending Account Value 1/31/23 | Hypothetical Ending Account Value 1/31/23 | Actual Expenses Paid During Period 8/1/22- 1/31/23* | Hypothetical Expenses Paid During Period 8/1/22- 1/31/23* | Annualized Expense Ratio During Period 8/1/22- 1/31/23 | ||||||||||||||||||||||
Fund Shares | $ | 1,000.00 | $ | 1,013.50 | $ | 1,022.28 | $ | 2.94 | $ | 2.96 | 0.58 | % | |||||||||||||||
Institutional Shares | 1,000.00 | 1,012.80 | 1,022.74 | 2.49 | 2.50 | 0.49 | % | ||||||||||||||||||||
Class A | 1,000.00 | 1,012.50 | 1,021.32 | 3.91 | 3.92 | 0.77 | % | ||||||||||||||||||||
R6 Shares | 1,000.00 | 1,013.60 | 1,023.54 | 1.67 | 1.68 | 0.33 | % | ||||||||||||||||||||
* Expenses are equal to the average account value multiplied by the Fund's annualized expense ratio multiplied by 184/365 (the number of days in the most recent fiscal half-year divided by the number of days in the fiscal year).
51
USAA Mutual Funds Trust | Supplemental Information — continued January 31, 2023 | ||||||
(Unaudited)
Considerations of the Board in Continuing the Investment Advisory Agreement
USAA Short-Term Bond Fund (the "Fund")
At a meeting of the Board of Trustees (the "Board") of USAA Mutual Funds Trust (the "Trust") held on December 8-9, 2022, the Board, including the Trustees who are not "interested persons" (as that term is defined in the Investment Company Act of 1940, as amended) of the Trust (the "Independent Trustees"), approved for an annual period the continuance of the Investment Advisory Agreement (the "Advisory Agreement") between the Trust and Victory Capital Management Inc. (the "Adviser") with respect to the Fund. Prior to the December 8-9, 2022 meeting at which the Advisory Agreement was approved, the Independent Trustees also discussed and considered information regarding the proposed continuation of the Advisory Agreement at a meeting held on November 21, 2022.
In advance of the foregoing meetings, the Trustees received and considered a variety of information relating to the Advisory Agreement and the Adviser, and were given the opportunity to ask questions and request additional information from management. The information provided to the Board included, among other things: (i) a separate report prepared by an independent third party of mutual fund data, which provided a statistical analysis comparing the Fund's investment performance, expenses, and fees to comparable investment companies; (ii) information concerning the services rendered to the Fund, as well as information regarding the Adviser's revenues and costs of providing services to the Fund and compensation paid to affiliates of the Adviser; and (iii) information about the Adviser's operations and personnel. Prior to voting, the Independent Trustees reviewed the proposed continuance of the Advisory Agreement with management and with experienced independent counsel retained by the Independent Trustees ("Independent Counsel") and received materials from such Independent Counsel discussing the legal standards for their consideration of the proposed continuation of the Advisory Agreement with respect to the Fund. The Independent Trustees also reviewed the proposed continuation of the Advisory Agreement with respect to the Fund in private sessions with Independent Counsel at which no representatives of management were present.
At each regularly scheduled meeting of the Board and its committees, the Board receives and reviews, among other things, information concerning the Fund's performance and related services provided by the Adviser. At the meeting at which the renewal of the Advisory Agreement is considered, particular focus is given to information concerning Fund performance, fees and total expenses as compared to comparable investment companies, and the Adviser's profitability with respect to the Fund. However, the Board noted that the evaluation process with respect to the Adviser is an ongoing one. In this regard, the Board's and its committees' consideration of the Advisory Agreement included information previously received at such meetings. The Board also recognized that the contractual arrangements for the Fund have been reviewed by the Board and discussed with the Adviser in prior years and that the Board's conclusions may be based, in part, on its consideration of these same arrangements in prior years.
Advisory Agreement
After full consideration of a variety of factors, the Board, including the Independent Trustees, voted to approve the Advisory Agreement. In approving the Advisory Agreement, the Trustees did not identify any single factor as controlling, and each Trustee may have attributed different weights to various factors. Throughout their deliberations, the Independent Trustees were represented and assisted by Independent Counsel.
Nature, Extent, and Quality of Services — In considering the nature, extent, and quality of the services provided by the Adviser under the Advisory Agreement, the Board reviewed information provided by the Adviser relating to its operations and personnel. The Board also took into account its knowledge of the Adviser's management and the quality of the performance of the Adviser's duties through Board meetings, discussions, and reports during the preceding year. The Board considered the fees paid to the Adviser and the services provided to the Fund by the Adviser under the Advisory Agreement, as well as other services provided by the Adviser and its affiliates under other agreements, and the personnel who provide these services. In addition to the investment advisory services provided to the Fund, the Adviser and its affiliates provide administrative services, shareholder services, oversight of Fund accounting, marketing services, assistance in meeting legal and regulatory requirements, and other services necessary for the operation of the Fund and the Trust.
52
USAA Mutual Funds Trust | Supplemental Information — continued January 31, 2023 | ||||||
(Unaudited)
The Board considered the scope of services provided by, and the undertakings required of, the Adviser in connection with those services, including, among other things, maintaining (i) its own and the Fund's compliance programs, (ii) risk management programs, (iii) liquidity risk management program, (iv) derivatives risk management program, and (v) cybersecurity programs, each of which had expanded over time as a result of regulatory, market, and other developments. The Board also considered the significant risks assumed by the Adviser in connection with the services provided to the Fund, including investment, operational, enterprise, litigation, regulatory and compliance risks.
The Board considered the Adviser's management style and the performance of the Adviser's duties under the Advisory Agreement. The Board considered the level and depth of knowledge of the Adviser, including the professional experience and qualifications of its senior and investment personnel, as well as current staffing levels. The allocation of the Fund's brokerage, including the Adviser's process for monitoring "best execution," also was considered. The Adviser's role in coordinating the activities of the Fund's other service providers was also considered. The Board also considered the Adviser's risk management processes. The Board considered the Adviser's financial condition and that it had the financial wherewithal to continue to provide the same scope and high quality of services under the Advisory Agreement. In reviewing the Advisory Agreement, the Board focused on the experience, resources, and strengths of the Adviser and its affiliates in managing the Fund, as well as the other funds in the Trust.
The Board also reviewed the compliance and administrative services provided to the Fund by the Adviser and its affiliates, including the Adviser's oversight of the Fund's day-to-day operations and oversight of Fund accounting. The Trustees, guided also by information obtained from their experiences as Trustees of the Trust, also focused on the quality of the Adviser's compliance and administrative staff.
Expenses and Performance — In connection with its consideration of the Advisory Agreement, the Board evaluated the Fund's advisory fees and total expense ratio as compared to other open-end investment companies deemed to be comparable to the Fund as determined by the independent third party in its report. The Fund's expenses were compared to (i) a group of investment companies chosen by the independent third party to be comparable to the Fund based upon certain factors, including fund type, comparability of investment objective and classification, sales load type, asset size, and expense components (the "expense group") and (ii) a larger group of investment companies with the same investment classification/objective as the Fund regardless of asset size, excluding outliers (the "expense universe"). Among other data, the Board noted that the Fund's net management fee rate — which includes advisory and administrative services and the effects of any performance adjustment, as well as any fee waivers and reimbursements — was below the median of its expense group and its expense universe. The data indicated that the Fund's total expenses, including after any reimbursements, were below the median of its expense group and its expense universe. The Board also took into account the Adviser's current undertakings to maintain expense limitations for the Fund. The Board took into account the various other services provided to the Fund by the Adviser and its affiliates, and noted the high quality of services received by the Fund.
In considering the Fund's performance, the Board noted that it reviews at its regularly scheduled meetings information about the Fund's performance results. The Trustees also reviewed various comparative data provided to them in connection with their consideration of the renewal of the Advisory Agreement, including, among other information, a comparison of the Fund's average annual total returns relative to its Lipper index and other mutual funds deemed to be in its peer group by the independent third party in its report (the "performance universe"). The Fund's performance universe consisted of the Fund and all retail and institutional open-end investment companies with the same classification/objective as the Fund regardless of asset size or primary channel of distribution. This comparison indicated that, among other data, the Fund's performance was above the average of its performance universe and its Lipper index for the one-, three-, five- and ten-year periods ended June 30, 2022.
Compensation and Profitability — The Board took into consideration the level and method of computing the management fee. The information considered by the Board included operating profit margin information for the Adviser's business as a whole. The Board also received and considered profitability information related to the management revenues from the Fund. This information included a review of the methodology used in the allocation of certain costs to the Fund. In considering the profitability data with respect to the Fund, the Trustees noted that the Adviser reimbursed or waived a portion of its management fees to the Fund. The Trustees reviewed
53
USAA Mutual Funds Trust | Supplemental Information — continued January 31, 2023 | ||||||
(Unaudited)
the profitability of the Adviser's relationship with the Fund before tax expenses. The Board was also provided with a profitability analysis of other publicly traded asset managers prepared by an independent information service. In reviewing the overall profitability of the management fee to the Adviser, the Board also considered the fact that the Adviser and its affiliates provide shareholder servicing and administrative services to the Fund for which they receive compensation. The Board also considered the possible direct and indirect benefits to the Adviser from its relationship with the Trust, including that the Adviser may derive reputational and other benefits from its association with the Fund. The Trustees recognized that the Adviser should be entitled to earn a reasonable level of profits in exchange for the level of services it provides to the Fund and the entrepreneurial and other risks that it assumes as Adviser.
Economies of Scale — The Board considered whether there should be changes in the management fee rate or structure in order to enable the Fund to participate in any economies of scale. The Board also considered the fee waiver and expense reimbursement arrangements by the Adviser. The Board also considered the effect of the change in size, if any, of each of the Fund's classes on its performance and fees, noting that the Fund may realize other economies of scale if assets increase proportionally more than some expenses. The Board determined that the current investment management fee structure was reasonable.
Conclusions — The Board reached the following conclusions regarding the Fund's Advisory Agreement with the Adviser: (i) the Adviser has demonstrated that it possesses the capability and resources to perform the duties required of it under the Advisory Agreement; (ii) the Adviser maintains an appropriate compliance program; (iii) the overall performance of the Fund is reasonable in relation to the performance of funds with similar investment objectives and to relevant indices; (iv) the Fund's advisory expenses are reasonable in relation to those of similar funds and to the services to be provided by the Adviser; and (v) the Adviser's and its affiliates' level of profitability from their relationship with the Fund is reasonable in light of the nature and high quality of services provided by the Adviser and its affiliates and the type of fund. Based on its conclusions, the Board determined that continuation of the Advisory Agreement would be in the best interests of the Fund and its shareholders.
54
Privacy Policy
Protecting the Privacy of Information
The Trust respects your right to privacy. We also know that you expect us to conduct and process your business in an accurate and efficient manner. To do so, we must collect and maintain certain personal information about you. This is the information we collect from you on applications or other forms, and from the transactions you make with us or third parties. It may include your name, address, social security number, account transactions and balances, and information about investment goals and risk tolerance.
We do not disclose any information about you or about former customers to anyone except as permitted or required by law. Specifically, we may disclose the information we collect to companies that perform services on our behalf, such as the transfer agent that processes shareholder accounts and printers and mailers that assist us in the distribution of investor materials. We may also disclose this information to companies that perform marketing services on our behalf. This allows us to continue to offer you Victory investment products and services that meet your investing needs, and to effect transactions that you request or authorize. These companies will use this information only in connection with the services for which we hired them. They are not permitted to use or share this information for any other purpose.
To protect your personal information internally, we permit access only by authorized employees and maintain physical, electronic, and procedural safeguards to guard your personal information.*
* You may have received communications regarding information about privacy policies from other financial institutions which gave you the opportunity to "opt-out" of certain information sharing with companies which are not affiliated with that financial institution. The Trust does not share information with other companies for purposes of marketing solicitations for products other than the Trust. Therefore, the Trust does not provide opt-out options to their shareholders.
P.O. Box 182593
Columbus, Ohio 43218-2593

Visit our website at: | Call | ||||||
vcm.com | (800) 235-8396 | ||||||
23426-0323

January 31, 2023
Semi Annual Report
USAA Intermediate-Term Bond Fund
Victory Capital means Victory Capital Management Inc., the investment adviser of the USAA Mutual Funds. USAA Mutual Funds are distributed by Victory Capital Services, Inc., member FINRA, an affiliate of Victory Capital. Victory Capital and its affiliates are not affiliated with United Services Automobile Association or its affiliates. USAA and the USAA logos are registered trademarks and the USAA Mutual Funds and USAA Investments logos are trademarks of United Services Automobile Association and are being used by Victory Capital and its affiliates under license.
vcm.com
News, Information And Education 24 Hours A Day, 7 Days A Week
The Victory Capital website gives fund shareholders, prospective shareholders, and investment professionals a convenient way to access fund information, get guidance, and track fund performance anywhere they can access the Internet. The site includes:
• Detailed performance records
• Daily share prices
• The latest fund news
• Investment resources to help you become a better investor
• A section dedicated to investment professionals
Whether you're a potential investor searching for the fund that matches your investment philosophy, a seasoned investor interested in planning tools, or an investment professional, vcm.com has what you seek. Visit us anytime. We're always open.
USAA Mutual Funds Trust
TABLE OF CONTENTS
Investment Objective & Portfolio Holdings | 2 | ||||||
Schedule of Portfolio Investments | 3 | ||||||
Financial Statements | |||||||
Statement of Assets and Liabilities | 32 | ||||||
Statement of Operations | 34 | ||||||
Statements of Changes in Net Assets | 35 | ||||||
Financial Highlights | 37 | ||||||
Notes to Financial Statements | 42 | ||||||
Supplemental Information | 54 | ||||||
Proxy Voting and Portfolio Holdings Information | 54 | ||||||
Expense Examples | 54 |
| |||||
Advisory Contract Approval | 55 | ||||||
Privacy Policy (inside back cover) | |||||||
This report is for the information of the shareholders and others who have received a copy of the currently effective prospectus of the Fund, managed by Victory Capital Management Inc. It may be used as sales literature only when preceded or accompanied by a current prospectus, which provides further details about the Fund.
IRA DISTRIBUTION WITHHOLDING DISCLOSURE
We generally must withhold federal income tax at a rate of 10% of the taxable portion of your distribution and, if you live in a state that requires state income tax withholding, at your state's tax rate. However, you may elect not to have withholding apply or to have income tax withheld at a higher rate. Any withholding election that you make will apply to any subsequent distribution unless and until you change or revoke the election. If you wish to make a withholding election, or change or revoke a prior withholding election, call (800) 235-8396, and form W-4P (OMB No. 1545-0074 withholding certificate for pension or annuity payments) will be electronically sent.
If you do not have a withholding election in place by the date of a distribution, federal income tax will be withheld from the taxable portion of your distribution at a rate of 10%. If you must pay estimated taxes, you may be subject to estimated tax penalties if your estimated tax payments are not sufficient and sufficient tax is not withheld from your distribution.
For more specific information, please consult your tax adviser.
• NOT FDIC INSURED • NO BANK GUARANTEE • MAY LOSE VALUE
1
| USAA Mutual Funds Trust USAA Intermediate-Term Bond Fund | January 31, 2023 | ||||||
(Unaudited)
Investment Objective and Portfolio Holdings:
The Fund seeks high current income without undue risk to principal.
Asset Allocation*:
January 31, 2023
(% of Net Assets)

* Does not include futures contracts, money market instruments, and short-term investments purchased with cash collateral from securities loaned.
Percentages are of the net assets of the Fund and may not equal 100%.
Refer to the Schedule of Portfolio Investments for a complete list of securities.
2
| USAA Mutual Funds Trust USAA Intermediate-Term Bond Fund | Schedule of Portfolio Investments January 31, 2023 | ||||||
(Amounts in Thousands, Except for Shares) (Unaudited)
Security Description | Principal Amount | Value | |||||||||
Asset-Backed Securities (15.0%) | |||||||||||
| Aligned Data Centers Issuer LLC, Series 2021-1A, Class B, 2.48%, 8/15/46, Callable 8/15/24 @ 100 (a) | $ | 1,500 | $ | 1,313 | |||||||
| Aligned Data Centers Issuer LLC, Series 2021-1A, Class A2, 1.94%, 8/15/46, Callable 8/15/24 @ 100 (a) | 3,000 | 2,655 | |||||||||
| American Credit Acceptance Receivables Trust, Series 2019-3, Class D, 2.89%, 9/12/25, Callable 8/12/23 @ 100 (a) | 304 | 302 | |||||||||
AMSR Trust, Series 2021-SFR1, Class D, 2.60%, 6/17/38 (a) | 1,500 | 1,193 | |||||||||
AMSR Trust, Series 2021-SFR1, Class C, 2.35%, 6/17/38 (a) | 1,800 | 1,493 | |||||||||
| Amur Equipment Finance Receivables IX LLC, Series 2021-1A, Class C, 1.75%, 6/21/27, Callable 11/20/24 @ 100 (a) | 1,700 | 1,590 | |||||||||
| Amur Equipment Finance Receivables X LLC, Series 2022-1A, Class B, 2.20%, 1/20/28, Callable 9/20/25 @ 100 (a) | 1,216 | 1,122 | |||||||||
| Amur Equipment Finance Receivables XI LLC, Series 2022-2A, Class A2, 5.30%, 6/21/28, Callable 6/20/26 @ 100 (a) | 500 | 497 | |||||||||
| ARI Fleet Lease Trust, Series 2022-A, Class A3, 3.43%, 1/15/31, Callable 5/15/25 @ 100 (a) | 2,476 | 2,394 | |||||||||
| ARI Fleet Lease Trust, Series 2022-A, Class C, 4.17%, 1/15/31, Callable 5/15/25 @ 100 (a) | 2,200 | 2,077 | |||||||||
| ARI Fleet Lease Trust, Series 2022-A, Class B, 3.79%, 1/15/31, Callable 5/15/25 @ 100 (a) | 1,517 | 1,433 | |||||||||
| ARI Fleet Lease Trust, Series 2020-A, Class B, 2.06%, 11/15/28, Callable 3/15/23 @ 100 (a) | 1,470 | 1,464 | |||||||||
| Avis Budget Rental Car Funding AESOP LLC, Series 2020-1A, Class B, 2.68%, 8/20/26, Callable 9/20/25 @ 100 (a) | 4,000 | 3,704 | |||||||||
| Avis Budget Rental Car Funding AESOP LLC, Series 2022-5A, Class B, 7.09%, 4/20/27 (a) | 3,250 | 3,339 | |||||||||
| Ballyrock CLO Ltd., Series 2020-14A, Class B, 7.11% (LIBOR03M+230bps), 1/20/34, Callable 4/20/29 @ 100 (a) (b) | 1,000 | 955 | |||||||||
| Bank of The West Auto Trust, Series 2019-1, Class C, 2.90%, 4/15/25, Callable 8/15/23 @ 100 (a) | 3,790 | 3,735 | |||||||||
| Canadian Pacer Auto Receivables Trust, Series 2020-1A, Class C, 2.49%, 5/19/26, Callable 10/19/23 @ 100 (a) | 2,000 | 1,949 | |||||||||
| Canadian Pacer Auto Receivables Trust, Series 2021-1A, Class C, 1.46%, 12/20/27, Callable 2/19/25 @ 100 (a) | 2,156 | 1,952 | |||||||||
| Canadian Pacer Auto Receivables Trust, Series 2019-1A, Class C, 3.75%, 7/21/25, Callable 2/19/23 @ 100 (a) | 3,000 | 2,997 | |||||||||
CARDS II Trust, Series 2021-1A, Class C, 1.20%, 4/15/27 (a) | 7,750 | 7,309 | |||||||||
| CarMax Auto Owner Trust, Series 2020-4, Class C, 1.30%, 8/17/26, Callable 12/15/24 @ 100 | 3,450 | 3,214 | |||||||||
| CarMax Auto Owner Trust, Series 2020-1, Class C, 2.34%, 11/17/25, Callable 2/15/24 @ 100 | 4,230 | 4,095 | |||||||||
| CarMax Auto Owner Trust, Series 2020-2, Class B, 2.90%, 8/15/25, Callable 4/15/24 @ 100 | 1,083 | 1,051 | |||||||||
| CarMax Auto Owner Trust, Series 2021-4, Class D, 1.48%, 3/15/28, Callable 11/15/25 @ 100 | 2,831 | 2,508 | |||||||||
| CarMax Auto Owner Trust, Series 2021-3, Class D, 1.50%, 1/18/28, Callable 6/15/25 @ 100 | 2,760 | 2,464 | |||||||||
| CarMax Auto Owner Trust, Series 2019-1, Class B, 3.45%, 11/15/24, Callable 3/15/23 @ 100 | 1,923 | 1,919 | |||||||||
See notes to financial statements.
3
| USAA Mutual Funds Trust USAA Intermediate-Term Bond Fund | Schedule of Portfolio Investments — continued January 31, 2023 | ||||||
(Amounts in Thousands, Except for Shares) (Unaudited)
Security Description | Principal Amount | Value | |||||||||
| CarMax Auto Owner Trust, Series 2019-4, Class C, 2.60%, 9/15/25, Callable 12/15/23 @ 100 | $ | 5,162 | $ | 5,033 | |||||||
| CarMax Auto Owner Trust, Series 2020-3, Class C, 1.69%, 4/15/26, Callable 7/15/24 @ 100 | 2,500 | 2,370 | |||||||||
| CarNow Auto Receivables Trust, Series 2021-1A, Class B, 1.38%, 2/17/26, Callable 12/15/23 @ 100 (a) | 255 | 254 | |||||||||
| CARS-DB5 LP, Series 2021-1A, Class A2, 2.28%, 8/15/51, Callable 8/15/28 @ 100 (a) | 2,124 | 1,694 | |||||||||
| Carvana Auto Receivables Trust, Series 2020-P1, Class C, 1.32%, 11/9/26, Callable 12/8/25 @ 100 | 551 | 481 | |||||||||
| Carvana Auto Receivables Trust, Series 2021-N2, Class D, 1.27%, 3/10/28, Callable 9/10/26 @ 100 | 3,991 | 3,817 | |||||||||
| Carvana Auto Receivables Trust, Series 2021-N4, Class D, 2.30%, 9/11/28, Callable 9/10/26 @ 100 | 876 | 806 | |||||||||
| Carvana Auto Receivables Trust, Series 2021-P2, Class C, 1.60%, 6/10/27, Callable 2/10/27 @ 100 | 10,000 | 8,500 | |||||||||
| Carvana Auto Receivables Trust, Series 2021-N1, Class D, 1.50%, 1/10/28, Callable 9/10/25 @ 100 | 1,878 | 1,800 | |||||||||
| CCG Receivables Trust, Series 2021-2, Class C, 1.50%, 3/14/29, Callable 6/14/25 @ 100 (a) | 3,000 | 2,743 | |||||||||
| CCG Receivables Trust, Series 2020-1, Class C, 1.84%, 12/14/27, Callable 12/14/23 @ 100 (a) | 5,786 | 5,460 | |||||||||
| CF Hippolyta LLC, Series 2021-1A, Class B1, 1.98%, 3/15/61, Callable 3/15/24 @ 100 (a) | 1,891 | 1,625 | |||||||||
| CNH Equipment Trust, Series 2020-A, Class B, 2.30%, 10/15/27, Callable 2/15/24 @ 100 | 1,100 | 1,059 | |||||||||
| Conn's Receivables Funding LLC, Series 2022-A, Class B, 9.52%, 12/15/26, Callable 4/15/24 @ 100 (a) | 2,500 | 2,497 | |||||||||
| CPS Auto Receivables Trust, Series 2018-D, Class E, 5.82%, 6/16/25, Callable 5/15/23 @ 100 (a) | 1,823 | 1,823 | |||||||||
| Credit Acceptance Auto Loan Trust, Series 2020-1A, Class C, 2.59%, 6/15/29, Callable 6/15/23 @ 100 (a) | 5,000 | 4,932 | |||||||||
| Credit Acceptance Auto Loan Trust, Series 2021-2A, Class B, 1.26%, 4/15/30, Callable 12/15/24 @ 100 (a) | 2,077 | 1,916 | |||||||||
| Credit Acceptance Auto Loan Trust, Series 2021-4, Class B, 1.74%, 12/16/30, Callable 4/15/25 @ 100 (a) | 720 | 659 | |||||||||
| DB Master Finance LLC, Series 2021-1A, Class A2II, 2.49%, 11/20/51, Callable 11/20/25 @ 100 (a) | 7,704 | 6,606 | |||||||||
| Dell Equipment Finance Trust, Series 2020-2, Class D, 1.92%, 3/23/26, Callable 6/22/23 @ 100 (a) | 2,125 | 2,092 | |||||||||
| Dell Equipment Finance Trust, Series 2021-2, Class D, 1.21%, 6/22/27, Callable 2/22/24 @ 100 (a) | 1,312 | 1,243 | |||||||||
| Diamond Infrastructure Funding LLC, Series 2021-1A, Class B, 2.36%, 4/15/49, Callable 9/20/25 @ 100 (a) | 6,000 | 5,035 | |||||||||
| Diamond Infrastructure Funding LLC, Series 2021-1A, Class C, 3.48%, 4/15/49, Callable 9/20/25 @ 100 (a) | 3,000 | 2,388 | |||||||||
| Diamond Issuer, Series 2021-1A, Class B, 2.70%, 11/20/51, Callable 11/20/25 @ 100 (a) | 4,418 | 3,700 | |||||||||
| Diamond Resorts Owner Trust, Series 2021-1A, Class B, 2.05%, 11/21/33, Callable 1/20/25 @ 100 (a) | 749 | 683 | |||||||||
See notes to financial statements.
4
| USAA Mutual Funds Trust USAA Intermediate-Term Bond Fund | Schedule of Portfolio Investments — continued January 31, 2023 | ||||||
(Amounts in Thousands, Except for Shares) (Unaudited)
Security Description | Principal Amount | Value | |||||||||
| Drive Auto Receivables Trust, Series 2020-2, Class C, 2.28%, 8/17/26, Callable 4/15/24 @ 100 | $ | 874 | $ | 867 | |||||||
| DT Auto Owner Trust, Series 2020-2A, Class D, 4.73%, 3/16/26, Callable 7/15/24 @ 100 (a) | 500 | 492 | |||||||||
| DT Auto Owner Trust, Series 2021-3A, Class C, 0.87%, 5/17/27, Callable 4/15/25 @ 100 (a) | 1,875 | 1,766 | |||||||||
| Encina Equipment Finance LLC, Series 2021-1A, Class D, 1.69%, 11/15/27, Callable 2/15/24 @ 100 (a) | 2,562 | 2,416 | |||||||||
| Encina Equipment Finance LLC, Series 2021-1A, Class C, 1.39%, 6/15/27, Callable 2/15/24 @ 100 (a) | 1,409 | 1,337 | |||||||||
| Enterprise Fleet Financing LLC, Series 2022-4, Class A3, 5.65%, 10/22/29, Callable 8/20/26 @ 100 (a) | 2,750 | 2,810 | |||||||||
| Enterprise Fleet Financing LLC, Series 2022-3, Class A3, 4.29%, 7/20/29, Callable 5/20/26 @ 100 (a) | 1,125 | 1,101 | |||||||||
| Enterprise Fleet Financing LLC, Series 2019-3, Class A2, 2.06%, 5/20/25, Callable 3/20/23 @ 100 (a) | 25 | 25 | |||||||||
Evergreen Credit Card Trust, Series 2022-CRT1, Class B, 5.61%, 7/15/26 (a) | 3,000 | 2,959 | |||||||||
Evergreen Credit Card Trust, Series 2021-1, Class B, 1.15%, 10/15/26 (a) | 7,500 | 7,012 | |||||||||
Evergreen Credit Card Trust, Series 2022-CRT2, Class C, 7.44%, 11/15/26 (a) | 6,600 | 6,617 | |||||||||
Evergreen Credit Card Trust, Series 2022-CRT2, Class B, 6.56%, 11/15/26 (a) | 2,750 | 2,757 | |||||||||
Evergreen Credit Card Trust, Series 2021-1, Class C, 1.42%, 10/15/26 (a) | 6,300 | 5,884 | |||||||||
| Exeter Automobile Receivables Trust, Series 2020-3A, Class C, 1.32%, 7/15/25, Callable 12/15/24 @ 100 | 614 | 607 | |||||||||
ExteNet LLC, Series 2019-1A, Class A2, 3.20%, 7/26/49, Callable 2/25/23 @ 100 (a) | 1,875 | 1,769 | |||||||||
| First Investors Auto Owner Trust, Series 2018-2A, Class F, 7.31%, 9/15/25, Callable 2/15/23 @ 100 (a) | 1,000 | 1,000 | |||||||||
FirstKey Homes Trust, Series 2021-SFR2, Class D, 2.06%, 9/17/26 (a) | 4,500 | 3,823 | |||||||||
FirstKey Homes Trust, Series 2021-SFR3, Class A, 2.14%, 12/17/38 (a) | 2,473 | 2,217 | |||||||||
FirstKey Homes Trust, Series 2021-SFR2, Class C, 1.71%, 9/17/26 (a) | 6,512 | 5,581 | |||||||||
| Flagship Credit Auto Trust, Series 2019-2, Class D, 3.53%, 5/15/25, Callable 7/15/24 @ 100 (a) | 2,943 | 2,885 | |||||||||
| Flagship Credit Auto Trust, Series 2019-4, Class E, 4.11%, 3/15/27, Callable 12/15/24 @ 100 (a) | 2,500 | 2,326 | |||||||||
| Flagship Credit Auto Trust, Series 2018-2, Class E, 5.51%, 11/17/25, Callable 4/15/23 @ 100 (a) | 550 | 550 | |||||||||
| Ford Credit Auto Lease Trust, Series 2023-A, Class C, 5.54%, 12/15/26, Callable 8/15/25 @ 100 | 1,080 | 1,077 | |||||||||
| Ford Credit Auto Owner Trust, Series 2021-1, Class D, 2.31%, 10/17/33, Callable 4/15/26 @ 100 (a) | 1,650 | 1,450 | |||||||||
| Ford Credit Auto Owner Trust, Series 2021-1, Class C, 1.91%, 10/17/33, Callable 4/15/26 @ 100 (a) | 1,708 | 1,514 | |||||||||
| Ford Credit Auto Owner Trust, Series 2022-1, Class C, 4.67%, 11/15/34, Callable 5/15/27 @ 100 (a) | 2,000 | 1,955 | |||||||||
| Ford Credit Auto Owner Trust, Series 2021-2, Class C, 2.11%, 5/15/34, Callable 11/15/26 @ 100 (a) | 2,250 | 1,968 | |||||||||
| Foursight Capital Automobile Receivables Trust, Series 2021-1, Class C, 1.02%, 9/15/26, Callable 5/15/24 @ 100 (a) | 1,325 | 1,268 | |||||||||
| Foursight Capital Automobile Receivables Trust, Series 2023-1, Class B, 5.35%, 3/15/28, Callable 4/15/25 @ 100 (a) | 4,385 | 4,384 | |||||||||
FRTKL, Series 2021-SFR1, Class D, 2.17%, 9/17/38 (a) | 1,500 | 1,273 | |||||||||
See notes to financial statements.
5
| USAA Mutual Funds Trust USAA Intermediate-Term Bond Fund | Schedule of Portfolio Investments — continued January 31, 2023 | ||||||
(Amounts in Thousands, Except for Shares) (Unaudited)
Security Description | Principal Amount | Value | |||||||||
| GLS Auto Receivables Issuer Trust, Series 2020-4A, Class C, 1.14%, 11/17/25, Callable 2/15/25 @ 100 (a) | $ | 2,349 | $ | 2,314 | |||||||
| GLS Auto Receivables Issuer Trust, Series 2020-3A, Class C, 1.92%, 5/15/25, Callable 10/15/24 @ 100 (a) | 972 | 963 | |||||||||
| GLS Auto Receivables Issuer Trust, Series 2021-3A, Class C, 1.11%, 9/15/26, Callable 8/15/25 @ 100 (a) | 2,167 | 2,054 | |||||||||
| GLS Auto Receivables Issuer Trust, Series 2A, Class C, 4.57%, 4/15/26, Callable 8/15/24 @ 100 (a) | 1,250 | 1,233 | |||||||||
| GM Financial Automobile Leasing Trust, Series 2020-3, Class C, 1.11%, 10/21/24, Callable 4/20/23 @ 100 | 4,464 | 4,419 | |||||||||
| GM Financial Revolving Receivables Trust, Series 2021-1, Class C, 1.67%, 6/12/34, Callable 9/11/26 @ 100 (a) | 1,000 | 851 | |||||||||
Golden Credit Card Trust, Series 2021-1A, Class B, 1.44%, 8/15/28 (a) | 4,500 | 3,970 | |||||||||
Golden Credit Card Trust, Series 2021-1A, Class C, 1.74%, 8/15/28 (a) | 2,233 | 1,971 | |||||||||
Golden Credit Card Trust, Series 2021-1A, Class A, 1.14%, 8/15/28 (a) | 5,000 | 4,448 | |||||||||
| Golub Capital Partners CLO Ltd., Series 2020-52A, Class A2, 6.61% (LIBOR03M+180bps), 1/20/34, Callable 10/20/28 @ 100 (a) (b) | 5,000 | 4,891 | |||||||||
| Hertz Vehicle Financing III LLC, Series 2022-1A, Class B, 2.19%, 6/25/26, Callable 6/25/25 @ 100 (a) | 1,900 | 1,747 | |||||||||
Hertz Vehicle Financing III LP, Series 2021-2A, Class C, 2.52%, 12/27/27 (a) | 1,833 | 1,575 | |||||||||
| Hertz Vehicle Financing LLC, Series 2022-2A, Class A, 2.33%, 6/26/28, Callable 6/25/27 @ 100 (a) | 3,750 | 3,353 | |||||||||
| Hertz Vehicle Financing LLC, Series 2022-2A, Class B, 2.65%, 6/26/28, Callable 6/25/27 @ 100 (a) | 2,480 | 2,192 | |||||||||
| Hertz Vehicle Financing LLC, Series 2022-4A, Class B, 4.12%, 9/25/26, Callable 9/25/25 @ 100 (a) | 5,000 | 4,773 | |||||||||
| Hertz Vehicle Financing LLC, Series 2022-4A, Class A, 3.73%, 9/25/26, Callable 9/25/25 @ 100 (a) | 3,000 | 2,886 | |||||||||
Hertz Vehicle Financing LLC, Series 2021-1A, Class C, 2.05%, 12/26/25 (a) | 1,667 | 1,529 | |||||||||
| Hertz Vehicle Financing LLC, Series 2022-2A, Class C, 2.95%, 6/26/28, Callable 6/25/27 @ 100 (a) | 3,500 | 3,000 | |||||||||
| HPEFS Equipment Trust, Series 2020-1A, Class C, 2.03%, 2/20/30, Callable 3/20/23 @ 100 (a) | 354 | 353 | |||||||||
| HPEFS Equipment Trust, Series 2020-2A, Class C, 2.00%, 7/22/30, Callable 5/20/23 @ 100 (a) | 1,909 | 1,901 | |||||||||
| HPEFS Equipment Trust, Series 2021-2A, Class D, 1.29%, 3/20/29, Callable 7/20/24 @ 100 (a) | 4,531 | 4,233 | |||||||||
| HPEFS Equipment Trust, Series 2021-1A, Class D, 1.03%, 3/20/31, Callable 2/20/24 @ 100 (a) | 5,180 | 4,920 | |||||||||
| JPMorgan Chase Bank NA, Series 2021-2, Class D, 1.14%, 12/26/28, Callable 4/25/25 @ 100 (a) | 473 | 453 | |||||||||
| JPMorgan Chase Bank NA, Series 2020-2, Class C, 1.14%, 2/25/28, Callable 10/25/24 @ 100 (a) | 246 | 241 | |||||||||
| JPMorgan Chase Bank NA, Series 2021-1, Class D, 1.17%, 9/25/28, Callable 3/25/25 @ 100 (a) | 1,693 | 1,629 | |||||||||
| JPMorgan Chase Bank NA, Series 2021-1, Class B, 0.88%, 9/25/28, Callable 3/25/25 @ 100 (a) | 847 | 817 | |||||||||
| JPMorgan Chase Bank NA, Series 2021-3, Class D, 1.01%, 2/26/29, Callable 4/25/25 @ 100 (a) | 1,526 | 1,438 | |||||||||
See notes to financial statements.
6
| USAA Mutual Funds Trust USAA Intermediate-Term Bond Fund | Schedule of Portfolio Investments — continued January 31, 2023 | ||||||
(Amounts in Thousands, Except for Shares) (Unaudited)
Security Description | Principal Amount | Value | |||||||||
| JPMorgan Chase Bank NA, Series 2020-1, Class D, 1.89%, 1/25/28, Callable 5/25/24 @ 100 (a) | $ | 144 | $ | 142 | |||||||
| JPMorgan Chase Bank NA, Series 2021-2, Class C, 0.97%, 12/26/28, Callable 4/25/25 @ 100 (a) | 801 | 768 | |||||||||
| JPMorgan Chase Commercial Mortgage Securities Trust, Series 2021-2NU, Class D, 2.08%, 1/5/40 (a) | 2,700 | 2,053 | |||||||||
| Kubota Credit Owner Trust, Series 2022-1A, Class A3, 2.67%, 10/15/26, Callable 2/15/26 @ 100 (a) | 2,000 | 1,904 | |||||||||
| LAD Auto Receivables Trust, Series 2021-1A, Class B, 1.94%, 11/16/26, Callable 5/15/25 @ 100 (a) | 1,750 | 1,629 | |||||||||
| LAD Auto Receivables Trust, Series 2021-1A, Class C, 2.35%, 4/15/27, Callable 5/15/25 @ 100 (a) | 2,500 | 2,281 | |||||||||
Master Credit Card Trust, Series 2022-2A, Class C, 2.73%, 7/21/28 (a) | 1,719 | 1,546 | |||||||||
Master Credit Card Trust, Series 2021-1A, Class C, 1.06%, 11/21/25 (a) | 5,775 | 5,402 | |||||||||
Master Credit Card Trust, Series 2020-1A, Class C, 2.59%, 9/21/24 (a) | 2,125 | 2,114 | |||||||||
Master Credit Card Trust II, Series 2023-1A, Class C, 5.87%, 6/21/27 (a) | 1,800 | 1,794 | |||||||||
Master Credit Card Trust II, Series 2020-1A, Class B, 2.27%, 9/21/24 (a) | 833 | 829 | |||||||||
MVW LLC, Series 2021-1WA, Class B, 1.44%, 1/22/41, Callable 3/20/26 @ 100 (a) | 735 | 674 | |||||||||
| MVW Owner Trust, Series 2018-1A, Class A, 3.45%, 1/21/36, Callable 5/20/24 @ 100 (a) | 1,560 | 1,517 | |||||||||
| New Economy Assets Phase 1 Sponsor LLC, Series 2021-1, Class B1, 2.41%, 10/20/61, Callable 10/20/24 @ 100 (a) | 1,832 | 1,530 | |||||||||
| New Economy Assets Phase 1 Sponsor LLC, Series 2021-1, Class A1, 1.91%, 10/20/61, Callable 10/20/24 @ 100 (a) | 6,097 | 5,310 | |||||||||
| NP SPE II LLC, Series 2019-2A, Class C1, 6.44%, 11/19/49, Callable 11/19/23 @ 100 (a) | 3,466 | 3,090 | |||||||||
| NP SPE II LLC, Series 2019-2A, Class A2, 3.10%, 11/19/49, Callable 5/19/23 @ 100 (a) | 3,591 | 3,189 | |||||||||
| NP SPE II LLC, Series 2017-1A, Class A2, 4.22%, 10/21/47, Callable 4/20/23 @ 100 (a) | 5,875 | 5,436 | |||||||||
| Oscar U.S. Funding XII LLC, Series 1A, Class A4, 1.00%, 4/10/28, Callable 2/10/25 @ 100 (a) | 930 | 859 | |||||||||
| Oscar US Funding XIV LLC, Series 2022-1A, Class A4, 2.82%, 4/10/29, Callable 3/10/26 @ 100 (a) | 2,000 | 1,888 | |||||||||
| Pawnee Equipment Receivables LLC, Series 2021-1, Class B, 1.82%, 7/15/27, Callable 9/15/25 @ 100 (a) | 1,637 | 1,508 | |||||||||
| PenFed Auto Receivables Owner Trust, Series 2022-A, Class A4, 4.18%, 12/15/28, Callable 3/15/26 @ 100 (a) | 3,000 | 2,968 | |||||||||
| PenFed Auto Receivables Owner Trust, Series 2022-A, Class D, 5.85%, 6/17/30, Callable 3/15/26 @ 100 (a) | 912 | 902 | |||||||||
| Prestige Auto Receivables Trust, Series 2019-1A, Class D, 3.01%, 8/15/25, Callable 5/15/23 @ 100 (a) | 5,750 | 5,713 | |||||||||
Progress Residential, Series 2021-SFR4, Class C, 2.04%, 5/17/38 (a) | 2,351 | 2,092 | |||||||||
Progress Residential, Series 2021-SFR4, Class D, 2.31%, 5/17/38 (a) | 2,500 | 2,218 | |||||||||
| Progress Residential Trust, Series 2021-SFR6, Class D, 2.23%, 7/17/38, Callable 7/17/26 @ 100 (a) | 3,000 | 2,581 | |||||||||
Progress Residential Trust, Series 2021-SFR3, Class D, 2.29%, 5/17/26 (a) | 2,000 | 1,725 | |||||||||
Progress Residential Trust, Series 2021-SFR5, Class D, 2.11%, 7/16/26 (a) | 2,000 | 1,703 | |||||||||
Progress Residential Trust, Series 2021-SFR7, Class B, 1.94%, 8/17/40 (a) | 3,250 | 2,684 | |||||||||
See notes to financial statements.
7
| USAA Mutual Funds Trust USAA Intermediate-Term Bond Fund | Schedule of Portfolio Investments — continued January 31, 2023 | ||||||
(Amounts in Thousands, Except for Shares) (Unaudited)
Security Description | Principal Amount | Value | |||||||||
| Santander Bank Auto Credit-Linked Notes, Series 2022-B, Class C, 5.92%, 8/16/32, Callable 2/15/26 @ 100 (a) | $ | 3,442 | $ | 3,421 | |||||||
| Santander Bank Auto Credit-Linked Notes, Series 2022-C, Class D, 8.20%, 12/15/32, Callable 11/15/26 @ 100 (a) | 2,812 | 2,813 | |||||||||
| Santander Bank Auto Credit-Linked Notes, Series 2022-A, Class C, 7.38%, 5/15/32, Callable 11/15/25 @ 100 (a) | 3,373 | 3,297 | |||||||||
| Santander Bank Auto Credit-Linked Notes, Series 2022-A, Class B, 5.28%, 5/15/32, Callable 11/15/25 @ 100 (a) | 3,036 | 2,966 | |||||||||
| Santander Bank Auto Credit-Linked Notes, Series 2022-B, Class D, 6.79%, 8/16/32, Callable 2/15/26 @ 100 (a) | 4,457 | 4,419 | |||||||||
| Santander Bank NA, Series 2021-1A, Class B, 1.83%, 12/15/31, Callable 7/15/25 @ 100 (a) | 853 | 824 | |||||||||
| Santander Consumer Auto Receivables Trust, Series 2020-BA, Class C, 1.29%, 4/15/26, Callable 4/15/25 @ 100 (a) | 2,500 | 2,403 | |||||||||
| Santander Consumer Auto Receivables Trust, Series 2020-BA, Class E, 4.13%, 1/15/27, Callable 4/15/25 @ 100 (a) | 1,000 | 969 | |||||||||
| Santander Consumer Auto Receivables Trust, Series 2020-AA, Class D, 5.49%, 4/15/26, Callable 9/15/24 @ 100 (a) | 2,000 | 1,981 | |||||||||
| Santander Consumer Auto Receivables Trust, Series 2020-BA, Class D, 2.14%, 12/15/26, Callable 4/15/25 @ 100 (a) | 5,000 | 4,772 | |||||||||
| Santander Drive Auto Receivables Trust, Series 2020-3, Class C, 1.12%, 1/15/26, Callable 7/15/24 @ 100 | 721 | 716 | |||||||||
| Santander Retail Auto Lease Trust, Series 2021-C, Class C, 1.11%, 3/20/26, Callable 6/20/24 @ 100 (a) | 1,312 | 1,233 | |||||||||
| Santander Retail Auto Lease Trust, Series 2020-B, Class C, 1.18%, 12/20/24, Callable 2/20/24 @ 100 (a) | 2,750 | 2,633 | |||||||||
| SCF Equipment Leasing LLC, Series 2020-1A, Class B, 2.02%, 3/20/28, Callable 9/20/24 @ 100 (a) | 3,823 | 3,654 | |||||||||
| SCF Equipment Leasing LLC, Series 2019-2, Class C, 3.11%, 6/21/27, Callable 11/20/24 @ 100 (a) | 6,500 | 6,155 | |||||||||
| SCF Equipment Leasing LLC, Series 2022-2A, Class C, 6.50%, 8/20/32, Callable 10/20/29 @ 100 (a) | 2,356 | 2,382 | |||||||||
| SCF Equipment Leasing LLC, Series 2022-2A, Class D, 6.50%, 10/20/32, Callable 10/20/29 @ 100 (a) | 2,144 | 2,049 | |||||||||
| SCF Equipment Leasing LLC, Series 1A, Class B, 1.37%, 8/20/29, Callable 11/20/24 @ 100 (a) | 500 | 453 | |||||||||
| SCF Equipment Leasing LLC, Series 2020-1A, Class C, 2.60%, 8/21/28, Callable 9/20/24 @ 100 (a) | 3,800 | 3,528 | |||||||||
| SLM Student Loan Trust, Series 2003-14, Class B, 5.37% (LIBOR03M+55bps), 10/25/65, Callable 4/25/29 @ 100 (b) | 432 | 395 | |||||||||
| SLM Student Loan Trust, Series 2012-6, Class B, 5.51% (LIBOR01M+100bps), 4/27/43, Callable 10/25/29 @ 100 (b) | 2,500 | 2,241 | |||||||||
| Stack Infrastructure Issuer LLC, Series 2019-2A, Class A2, 3.08%, 10/25/44, Callable 4/25/23 @ 100 (a) | 2,000 | 1,901 | |||||||||
| Synchrony Card Funding LLC, Series 2022-A1, Class A, 3.37%, 4/15/28, Callable 4/15/25 @ 100 | 2,200 | 2,142 | |||||||||
Synchrony Credit Card Master Note Trust, Series 2018-2, Class C, 3.87%, 5/15/26 | 7,583 | 7,547 | |||||||||
| Tesla Auto Lease Trust, Series 2020-A, Class C, 1.68%, 2/20/24, Callable 3/20/23 @ 100 (a) | 2,000 | 1,989 | |||||||||
See notes to financial statements.
8
| USAA Mutual Funds Trust USAA Intermediate-Term Bond Fund | Schedule of Portfolio Investments — continued January 31, 2023 | ||||||
(Amounts in Thousands, Except for Shares) (Unaudited)
Security Description | Principal Amount | Value | |||||||||
| Transportation Finance Equipment Trust, Series 2019-1, Class C, 2.19%, 8/23/24, Callable 5/23/23 @ 100 (a) | $ | 1,250 | $ | 1,236 | |||||||
Tricon Residential Trust, Series 2022-SFR1, Class A, 3.86%, 4/17/39 (a) | 1,500 | 1,433 | |||||||||
| Tricon Residential Trust, Series 2022-SFR2, Class B, 5.24%, 7/17/40, Callable 7/17/28 @ 100 (a) | 1,800 | 1,782 | |||||||||
Trillium Credit Card Trust II, Series 2021-1A, Class C, 2.42%, 10/26/29 (a) | 9,300 | 8,274 | |||||||||
| Trinity Rail Leasing LLC, Series 2021-1A, Class A, 2.26%, 7/19/51, Callable 1/19/24 @ 100 (a) | 940 | 813 | |||||||||
| Trinity Rail Leasing LLC, Series 2022-1, Class A, 4.55%, 5/20/52, Callable 10/21/24 @ 100 (a) | 2,457 | 2,326 | |||||||||
| Trinity Rail Leasing LLC, Series 2019-1, Class A, 3.82%, 4/17/49, Callable 4/17/23 @ 100 (a) | 3,315 | 3,119 | |||||||||
| United Auto Credit Securitization Trust, Series 2023-1, Class C, 6.28%, 7/10/28, Callable 2/10/27 @ 100 (a) | 7,000 | 6,993 | |||||||||
| United Auto Credit Securitization Trust, Series 2022-1, Class C, 2.61%, 6/10/27, Callable 3/10/25 @ 100 (a) | 3,250 | 3,153 | |||||||||
| Vantage Data Centers LLC, Series 2020-2A, Class A2, 1.99%, 9/15/45, Callable 9/15/25 @ 100 (a) | 9,000 | 7,650 | |||||||||
| VB-S1 Issuer LLC — VBTEL, Series 2022-1A, Class D, 4.29%, 2/15/52, Callable 2/15/26 @ 100 (a) | 563 | 507 | |||||||||
| VB-S1 Issuer LLC — VBTEL, Series 2022-1A, Class F, 5.27%, 2/15/52, Callable 2/15/26 @ 100 (a) | 2,500 | 2,133 | |||||||||
| VB-S1 Issuer LLC — VBTEL, Series 2022-1A, Class C2II, 3.71%, 2/15/52, Callable 2/15/30 @ 100 (a) | 4,500 | 3,796 | |||||||||
| Verizon Owner Trust, Series 2020-A, Class C, 2.06%, 7/22/24, Callable 5/20/23 @ 100 | 5,000 | 4,949 | |||||||||
| Volvo Financial Equipment LLC, Series 2019-2A, Class A4, 2.14%, 9/16/24, Callable 8/15/23 @ 100 (a) | 1,812 | 1,795 | |||||||||
| Wells Fargo Commercial Mortgage Trust, Series 2021-SAVE, Class D, 6.96% (LIBOR01M+250bps), 2/15/40 (a) (b) | 1,364 | 1,226 | |||||||||
| Westlake Automobile Receivables Trust, Series 2019-2A, Class D, 3.20%, 11/15/24, Callable 5/15/23 @ 100 (a) | 662 | 660 | |||||||||
| World Omni Auto Receivables Trust, Series 2021-C, Class C, 1.06%, 4/17/28, Callable 7/15/25 @ 100 | 5,000 | 4,550 | |||||||||
| World Omni Select Auto Trust, Series 2020-A, Class C, 1.25%, 10/15/26, Callable 7/15/24 @ 100 | 3,750 | 3,551 | |||||||||
| World Omni Select Auto Trust, Series 2021-A, Class C, 1.09%, 11/15/27, Callable 3/15/25 @ 100 | 1,250 | 1,146 | |||||||||
Total Asset-Backed Securities (Cost $492,015) | 459,808 | ||||||||||
Collateralized Mortgage Obligations (18.8%) | |||||||||||
| 37 Capital CLO I, Series 2021-1A, Class C, 7.04% (LIBOR03M+225bps), 10/15/34, Callable 4/15/30 @ 100 (a) (b) | 2,750 | 2,562 | |||||||||
| 720 East CLO Ltd., Series 2022-1A, Class B, 7.82% (TSFR3M+325bps), 1/20/36, Callable 1/20/30 @ 100 (a) (b) | 4,650 | 4,637 | |||||||||
| 720 East CLO Ltd., Series 2022-1A, Class C, 8.82% (TSFR3M+425bps), 1/20/36, Callable 1/20/30 @ 100 (a) (b) | 6,000 | 5,950 | |||||||||
| AB BSL CLO 1 Ltd., Series 2020-1A, Class A2AR, 6.28% (TSFR3M+165bps), 1/15/35, Callable 10/15/29 @ 100 (a) (b) | 3,500 | 3,348 | |||||||||
See notes to financial statements.
9
| USAA Mutual Funds Trust USAA Intermediate-Term Bond Fund | Schedule of Portfolio Investments — continued January 31, 2023 | ||||||
(Amounts in Thousands, Except for Shares) (Unaudited)
Security Description | Principal Amount | Value | |||||||||
| AB BSL CLO 1 Ltd., Series 2020-1A, Class BR, 6.63% (TSFR3M+200bps), 1/15/35, Callable 10/15/29 @ 100 (a) (b) | $ | 3,000 | $ | 2,931 | |||||||
| AB BSL CLO 1 Ltd., Series 2020-1A, Class CR, 7.13% (TSFR3M+250bps), 1/15/35, Callable 10/15/29 @ 100 (a) (b) | 3,000 | 2,801 | |||||||||
| AIMCO CLO 17 Ltd., Series 2022-17A, Class B, 6.74% (TSFR3M+210bps), 7/20/35, Callable 4/20/29 @ 100 (a) (b) | 3,000 | 3,000 | |||||||||
| AOA Mortgage Trust, Series 2021-1177, Class D, 6.28% (LIBOR01M+182bps), 10/15/36 (a) (b) | 10,600 | 9,546 | |||||||||
| AOA Mortgage Trust, Series 2021-1177, Class B, 5.63% (LIBOR01M+117bps), 10/15/36 (a) (b) | 3,000 | 2,776 | |||||||||
| Arbor Multifamily Mortgage Securities Trust, Series 2021-MF2, Class B, 2.56%, 6/15/54, Callable 7/15/31 @ 100 (a) (c) | 3,200 | 2,506 | |||||||||
| Arbor Multifamily Mortgage Securities Trust, Series 2020-MF1, Class C, 3.60%, 5/15/53, Callable 5/15/30 @ 100 (a) (c) | 1,500 | 1,221 | |||||||||
| Austin Fairmont Hotel Trust, Series 2019-FAIR, Class D, 6.26% (LIBOR01M+180bps), 9/15/32 (a) (b) | 3,585 | 3,455 | |||||||||
Aventura Mall Trust, Series 2018-AVM, Class D, 4.11%, 7/5/40 (a) (c) | 12,420 | 10,501 | |||||||||
Aventura Mall Trust, Series 2018-AVM, Class A, 4.11%, 7/5/40 (a) (c) | 1,450 | 1,361 | |||||||||
Aventura Mall Trust, Series 2018-AVM, Class C, 4.11%, 7/5/40 (a) (c) | 1,310 | 1,152 | |||||||||
| Ballyrock CLO, Series 2020-2A, Class A2R, 6.36% (LIBOR03M+155bps), 10/20/31, Callable 7/20/28 @ 100 (a) (b) | 4,000 | 3,894 | |||||||||
| Ballyrock CLO 15 Ltd., Series 2021-1A, Class B, 6.84% (LIBOR03M+205bps), 4/15/34, Callable 4/15/29 @ 100 (a) (b) | 5,000 | 4,729 | |||||||||
| Ballyrock CLO 18 Ltd., Series 2021-18A, Class A2, 6.44% (LIBOR03M+165bps), 1/15/35, Callable 1/15/30 @ 100 (a) (b) | 2,750 | 2,657 | |||||||||
| Ballyrock CLO 20 Ltd., Series 2022-20A, Class A2A, 7.71% (TSFR3M+305bps), 7/15/34, Callable 4/15/29 @ 100 (a) (b) | 3,000 | 2,994 | |||||||||
| BAMLL Commercial Mortgage Securities Trust, Series 2015-200P, Class D, 3.60% (LIBOR01M+105bps), 4/14/33, Callable 4/14/25 @ 100 (a) (b) | 12,485 | 11,271 | |||||||||
| BAMLL Commercial Mortgage Securities Trust, Series 2020-BOC, Class C, 3.03%, 1/15/32 (a) | 5,000 | 4,342 | |||||||||
BANK, Series 2017-BNK4, Class AS, 3.78%, 5/15/50, Callable 4/15/27 @ 100 | 5,000 | 4,650 | |||||||||
| BBCMS Mortgage Trust, Series 2020-BID, Class B, 7.00% (LIBOR01M+254bps), 10/15/37 (a) (b) | 5,000 | 4,837 | |||||||||
| BBCMS Mortgage Trust, Series 2022-C16, Class AS, 4.60%, 6/15/55, Callable 6/15/32 @ 100 (c) | 1,622 | 1,524 | |||||||||
| BBCMS Mortgage Trust, Series 2020-BID, Class C, 8.10% (LIBOR01M+364bps), 10/15/37 (a) (b) | 5,000 | 4,793 | |||||||||
| BBCMS Mortgage Trust, Series 2020-BID, Class D, 9.09% (LIBOR01M+463bps), 10/15/37 (a) (b) | 14,600 | 14,290 | |||||||||
| BBCRE Trust, Series 2015-GTP, Class A, 3.97%, 8/10/33, Callable 5/10/25 @ 100 (a) | 5,935 | 5,634 | |||||||||
| Benchmark Mortgage Trust, Series 2019-B14, Class AS, 3.35%, 12/15/61, Callable 11/15/29 @ 100 | 5,000 | 4,479 | |||||||||
| Benchmark Mortgage Trust, Series 2021-B25, Class 300D, 2.99%, 4/15/54, Callable 4/15/31 @ 100 (a) (c) | 2,417 | 1,626 | |||||||||
| Benchmark Mortgage Trust, Series 2022-B36, Class XA, 0.64%, 7/15/55, Callable 6/15/32 @ 100 (c) (d) | 40,630 | 2,044 | |||||||||
BPR Trust, Series 2021-TY, Class D, 6.81% (LIBOR01M+235bps), 9/15/38 (a) (b) | 5,688 | 5,347 | |||||||||
BPR Trust, Series 2021-TY, Class B, 5.61% (LIBOR01M+115bps), 9/15/38 (a) (b) | 750 | 704 | |||||||||
See notes to financial statements.
10
| USAA Mutual Funds Trust USAA Intermediate-Term Bond Fund | Schedule of Portfolio Investments — continued January 31, 2023 | ||||||
(Amounts in Thousands, Except for Shares) (Unaudited)
Security Description | Principal Amount | Value | |||||||||
BPR Trust, Series 2022-OANA, Class A, 6.38% (TSFR1M+190bps), 4/15/37 (a) (b) | $ | 4,500 | $ | 4,450 | |||||||
BPR Trust, Series 2022-OANA, Class D, 8.17% (TSFR1M+370bps), 4/15/37 (a) (b) | 9,500 | 9,223 | |||||||||
BX Commercial Mortgage Trust, Series 2020-VIV2, Class C, 3.54%, 3/9/44 (a) (c) | 5,640 | 4,759 | |||||||||
| BX Commercial Mortgage Trust, Series 2019-XL, Class C, 5.84% (LIBOR01M+125bps), 10/15/36 (a) (b) | 7,367 | 7,270 | |||||||||
| BX Commercial Mortgage Trust, Series 2021-SOAR, Class D, 5.86% (LIBOR01M+140bps), 6/15/38 (a) (b) | 2,288 | 2,202 | |||||||||
| BX Commercial Mortgage Trust, Series 2019-XL, Class B, 5.67% (LIBOR01M+108bps), 10/15/36 (a) (b) | 7,766 | 7,690 | |||||||||
| BX Commercial Mortgage Trust, Series 2019-XL, Class D, 6.04% (LIBOR01M+145bps), 10/15/36 (a) (b) | 3,400 | 3,335 | |||||||||
| BX Commercial Mortgage Trust, Series 2022-CSMO, Class D, 8.82% (TSFR1M+434bps), 6/15/27 (a) (b) | 7,000 | 6,955 | |||||||||
BX Commercial Mortgage Trust, Series 2021-VIVA, Class D, 3.55%, 3/11/44 (a) (c) | 5,000 | 3,979 | |||||||||
| BX Commercial Mortgage Trust, Series 2021-VOLT, Class B, 5.41% (LIBOR01M+85bps), 9/15/36 (a) (b) | 1,500 | 1,447 | |||||||||
| BX Commercial Mortgage Trust, Series 2022-CSMO, Class C, 8.37% (TSFR1M+389bps), 6/15/27 (a) (b) | 15,000 | 14,932 | |||||||||
| BX Commercial Mortgage Trust, Series 2020-VIV4, Class X, 0.70%, 11/10/42, Callable 9/9/29 @ 100 (a) (c) (d) | 144,200 | 5,940 | |||||||||
| BX Mortgage Trust, Series 2021-PAC, Class B, 5.36% (LIBOR01M+90bps), 10/15/36 (a) (b) | 3,250 | 3,127 | |||||||||
BX Trust, Series 2021-ARIA, Class D, 6.35% (LIBOR01M+190bps), 10/15/36 (a) (b) | 3,000 | 2,849 | |||||||||
BX Trust, Series 2022-CLS, Class C, 6.79%, 10/13/27 (a) | 2,500 | 2,492 | |||||||||
BX Trust, Series 2022-CLS, Class B, 6.30%, 10/13/27 (a) | 3,000 | 2,976 | |||||||||
BXP Trust, Series 2021-601L, Class C, 2.78%, 1/15/44 (a) (c) | 3,750 | 2,748 | |||||||||
BXP Trust, Series 2021-601L, Class D, 2.78%, 1/15/44 (a) (c) | 5,750 | 3,743 | |||||||||
BXP Trust, Series 2021-601L, Class B, 2.78%, 1/15/44 (a) (c) | 5,545 | 4,252 | |||||||||
| CAMB Commercial Mortgage Trust, Series 2021-CX2, Class A, 2.70%, 11/10/46, Callable 11/10/31 @ 100 (a) | 2,500 | 2,082 | |||||||||
| Citigroup Commercial Mortgage Trust, Series 2019-SMRT, Class D, 4.74%, 1/10/36 (a) (c) | 1,250 | 1,215 | |||||||||
| Citigroup Commercial Mortgage Trust, Series 2020-555, Class D, 3.23%, 12/10/41 (a) | 5,000 | 3,854 | |||||||||
| Citigroup Commercial Mortgage Trust, Series 2020-555, Class B, 2.83%, 12/10/41 (a) | 4,000 | 3,347 | |||||||||
| Columbia Cent CLO 29 Ltd., Series 2020-29A, Class BR, 6.51% (LIBOR03M+170bps), 10/20/34, Callable 4/20/30 @ 100 (a) (b) | 3,000 | 2,885 | |||||||||
| Columbia Cent CLO 32 Ltd., Series 2022-32A, Class BF, 5.20%, 7/24/34, Callable 7/24/29 @ 100 (a) | 3,750 | 3,466 | |||||||||
| COMM Mortgage Trust, Series 2013-CCRE11, Class AM, 4.72%, 8/10/50, Callable 10/10/23 @ 100 (c) | 5,000 | 4,940 | |||||||||
| COMM Mortgage Trust, Series 2020-CX, Class A, 2.17%, 11/10/46, Callable 11/10/30 @ 100 (a) | 13,000 | 10,617 | |||||||||
| COMM Mortgage Trust, Series 2020-CBM, Class C, 3.40%, 2/10/37, Callable 2/10/25 @ 100 (a) | 9,700 | 8,902 | |||||||||
| COMM Mortgage Trust, Series 2020-CBM, Class A2, 2.90%, 2/10/37, Callable 2/10/25 @ 100 (a) | 2,660 | 2,486 | |||||||||
| COMM Mortgage Trust, Series 2014-277P, Class A, 3.61%, 8/10/49, Callable 8/10/24 @ 100 (a) (c) | 11,600 | 11,096 | |||||||||
See notes to financial statements.
11
| USAA Mutual Funds Trust USAA Intermediate-Term Bond Fund | Schedule of Portfolio Investments — continued January 31, 2023 | ||||||
(Amounts in Thousands, Except for Shares) (Unaudited)
Security Description | Principal Amount | Value | |||||||||
| COMM Mortgage Trust, Series 2015-PC1, Class AM, 4.29%, 7/10/50, Callable 6/10/25 @ 100 (c) | $ | 3,000 | $ | 2,889 | |||||||
| COMM Mortgage Trust, Series 2015-PC1, Class B, 4.29%, 7/10/50, Callable 6/10/25 @ 100 (c) | 3,399 | 3,190 | |||||||||
CSMC, Series 2019-UVIL, Class A, 3.16%, 12/15/41 (a) | 1,950 | 1,688 | |||||||||
| CSMC Trust, Series 2020-WEST, Class A, 3.04%, 2/15/35, Callable 2/15/30 @ 100 (a) | 2,500 | 2,010 | |||||||||
CSMC Trust, Series 2019-UVIL, Class C, 3.28%, 12/15/41 (a) (c) | 5,000 | 4,008 | |||||||||
| DBJPM Mortgage Trust, Series 2016-SFC, Class A, 2.83%, 8/10/36, Callable 8/10/26 @ 100 (a) | 5,000 | 4,258 | |||||||||
| DBJPM Mortgage Trust, Series 2016-SFC, Class B, 3.24%, 8/10/36, Callable 8/10/26 @ 100 (a) | 2,500 | 2,017 | |||||||||
| Dryden 109 CLO Ltd., Series 2022-112A, Class C, 6.73% (TSFR3M+400bps), 8/15/34, Callable 2/15/29 @ 100 (a) (b) | 3,000 | 2,952 | |||||||||
| Extended Stay America Trust, Series 2021-ESH, Class D, 6.71% (LIBOR01M+225bps), 7/15/38 (a) (b) | 4,393 | 4,274 | |||||||||
| Flatiron CLO 18 Ltd., Series 2018-1A, Class A, 5.87% (LIBOR03M+95bps), 4/17/31, Callable 1/17/29 @ 100 (a) (b) | 3,500 | 3,472 | |||||||||
| Flatiron CLO 20 Ltd., Series 2020-1A, Class B, 6.43% (LIBOR03M+175bps), 11/20/33, Callable 11/20/28 @ 100 (a) (b) | 750 | 735 | |||||||||
| Flatiron RR CLO 22 LLC, Series 2021-2A, Class B, 6.39% (LIBOR03M+160bps), 10/15/34, Callable 10/15/30 @ 100 (a) (b) | 3,000 | 2,903 | |||||||||
| Golub Capital Partners 48 LP, Series 2020-48A, Class B1, 6.59% (LIBOR03M+180bps), 4/17/33, Callable 1/17/29 @ 100 (a) (b) | 4,350 | 4,188 | |||||||||
| Golub Capital Partners CLO Ltd., Series 2020-52A, Class C, 7.61% (LIBOR03M+280bps), 1/20/34, Callable 10/20/28 @ 100 (a) (b) | 3,500 | 3,379 | |||||||||
| GS Mortgage Securities Corp. Trust, Series 2022-SHIP, Class D, 6.08% (TSFR1M+161bps), 8/15/24 (a) (b) | 1,000 | 972 | |||||||||
| GS Mortgage Securities Corp. Trust, Series 2022-SHIP, Class C, 6.40% (TSFR1M+192bps), 8/15/24 (a) (b) | 1,000 | 987 | |||||||||
| GS Mortgage Securities Corp. Trust, Series 2020-UPTN, Class B, 2.95%, 12/10/39, Callable 2/10/25 @ 100 (a) | 1,735 | 1,596 | |||||||||
| GS Mortgage Securities Trust, Series 2019-GSA1, Class AS, 3.34%, 11/10/52, Callable 11/10/29 @ 100 | 5,000 | 4,411 | |||||||||
| GS Mortgage Securities Trust, Series 2019-GSA1, Class A4, 3.05%, 11/10/52, Callable 11/10/29 @ 100 | 4,000 | 3,603 | |||||||||
Hilton USA Trust, Series 2016-HHV, Class C, 4.19%, 11/5/38 (a) (c) | 824 | 760 | |||||||||
Hilton USA Trust, Series 2016-HHV, Class B, 4.19%, 11/5/38 (a) (c) | 4,650 | 4,332 | |||||||||
Houston Galleria Mall Trust, Series 2015-HGLR, Class A1A2, 3.09%, 3/5/37 (a) | 7,924 | 7,369 | |||||||||
Hudson Yards Mortgage Trust, Series 2019-55HY, Class D, 2.94%, 12/10/41 (a) (c) | 10,672 | 8,130 | |||||||||
Hudson Yards Mortgage Trust, Series 2019-55HY, Class A, 2.94%, 12/10/41 (a) (c) | 6,960 | 6,088 | |||||||||
| Hudson Yards Mortgage Trust, Series 2016-10HY, Class A, 2.84%, 8/10/38, Callable 8/10/26 @ 100 (a) | 5,020 | 4,555 | |||||||||
Hudson Yards Mortgage Trust, Series 2019-30HY, Class A, 3.23%, 7/10/39 (a) | 1,245 | 1,111 | |||||||||
Hudson Yards Mortgage Trust, Series 2019-30HY, Class D, 3.44%, 7/10/39 (a) (c) | 9,947 | 7,958 | |||||||||
| ILPT Commercial Mortgage Trust, Series 2022-LPF2, Class C, 7.97% (TSFR1M+349bps), 10/15/39 (a) (b) | 1,900 | 1,930 | |||||||||
| ILPT Commercial Mortgage Trust, Series 2022-LPFX, Class A, 3.82%, 3/15/32 (a) (c) | 2,500 | 2,017 | |||||||||
Jackson Park Trust, Series 2019-LIC, Class A, 2.77%, 10/14/39 (a) | 5,000 | 4,227 | |||||||||
See notes to financial statements.
12
| USAA Mutual Funds Trust USAA Intermediate-Term Bond Fund | Schedule of Portfolio Investments — continued January 31, 2023 | ||||||
(Amounts in Thousands, Except for Shares) (Unaudited)
Security Description | Principal Amount | Value | |||||||||
Jackson Park Trust, Series 2019-LIC, Class C, 3.13%, 10/14/39 (a) (c) | $ | 5,000 | $ | 4,085 | |||||||
| JPMorgan Chase Commercial Mortgage Securities Trust, Series 2021-2NU, Class XA, 0.09%, 1/5/40 (a) (c) (d) | 226,300 | 969 | |||||||||
| JPMorgan Chase Commercial Mortgage Securities Trust, Series 2013-C13, Class C, 4.12%, 1/15/46, Callable 7/15/23 @ 100 (c) | 468 | 459 | |||||||||
| JPMorgan Chase Commercial Mortgage Securities Trust, Series 2013-C10, Class C, 4.17%, 12/15/47 (c) | 3,045 | 2,773 | |||||||||
| JPMorgan Chase Commercial Mortgage Securities Trust, Series 2013-C10, Class B, 3.67%, 12/15/47 (c) | 2,250 | 2,218 | |||||||||
| JPMorgan Chase Commercial Mortgage Securities Trust, Series 2019-OSB, Class C, 3.75%, 6/5/39, Callable 6/5/29 @ 100 (a) (c) | 1,886 | 1,648 | |||||||||
| JPMorgan Chase Commercial Mortgage Securities Trust, Series 2019-OSB, Class D, 3.78%, 6/5/39, Callable 6/5/29 @ 100 (a) (c) | 2,000 | 1,665 | |||||||||
| JPMorgan Chase Commercial Mortgage Securities Trust, Series 2019-OSB, Class A, 3.40%, 6/5/39, Callable 6/5/29 @ 100 (a) | 5,000 | 4,498 | |||||||||
| KNDL Mortgage Trust, Series 2019-KNSQ, Class B, 5.41% (LIBOR01M+95bps), 5/15/36 (a) (b) | 2,250 | 2,225 | |||||||||
| KNDL Mortgage Trust, Series 2019-KNSQ, Class E, 6.26% (LIBOR01M+180bps), 5/15/36 (a) (b) | 2,500 | 2,464 | |||||||||
| LCM Ltd., Series 2032A, Class B, 6.51% (LIBOR03M+170bps), 7/20/34, Callable 7/20/29 @ 100 (a) (b) | 2,500 | 2,405 | |||||||||
| LCM Ltd., Series 36A, Class A2, 6.19% (LIBOR03M+140bps), 1/15/34, Callable 4/15/30 @ 100 (a) (b) | 3,000 | 2,888 | |||||||||
| Life BMR Mortgage Trust, Series 2021-BMR, Class D, 5.86% (LIBOR01M+140bps), 3/15/38 (a) (b) | 4,423 | 4,252 | |||||||||
| Life Mortgage Trust, Series 2022-BMR2, Class C, 6.57% (TSFR1M+209bps), 5/15/39, Callable 5/15/24 @ 100 (a) (b) | 2,250 | 2,216 | |||||||||
Manhattan West, Series 2020-1MW, Class D, 2.33%, 9/10/40 (a) (c) | 4,250 | 3,492 | |||||||||
Manhattan West Mortgage Trust, Series 2020-1MW, Class A, 2.13%, 9/10/39 (a) | 6,500 | 5,698 | |||||||||
Manhattan West Mortgage Trust, Series 2020-1MW, Class C, 2.33%, 9/10/39 (a) (c) | 5,000 | 4,252 | |||||||||
| MHC Commercial Mortgage Trust, Series MHC, Class D, 6.06% (LIBOR01M+160bps), 4/15/26 (a) (b) | 2,000 | 1,934 | |||||||||
| MHC Trust, Series 2021-MHC2, Class D, 5.96% (LIBOR01M+150bps), 5/15/23 (a) (b) | 1,900 | 1,830 | |||||||||
MHP, Series 2022-MHIL, Class D, 6.09% (SOFR30A+161bps), 1/15/27 (a) (b) | 2,429 | 2,305 | |||||||||
| Morgan Stanley Capital I Trust, Series 2021-PLZA, Class C, 2.81%, 11/9/31, Callable 5/9/31 @ 100 (a) | 2,750 | 1,993 | |||||||||
| Morgan Stanley Eaton Vance CLO, Series 2021-1A, Class B, 6.47% (LIBOR03M+165bps), 10/20/34, Callable 4/23/29 @ 100 (a) (b) | 2,500 | 2,407 | |||||||||
| Mountain View CLO Ltd., Series 2013-1A, Class CRR, 7.01% (LIBOR03M+220bps), 10/12/30, Callable 1/12/29 @ 100 (a) (b) | 4,000 | 3,718 | |||||||||
| MTN Commercial Mortgage Trust, Series 2022-LPFL, Class C, 6.87% (TSFR1M+239bps), 3/15/39 (a) (b) | 3,000 | 2,929 | |||||||||
| Neuberger Berman Loan Advisers CLO 44 Ltd., Series 2021-44A, Class B, 6.39% (LIBOR03M+160bps), 10/16/34, Callable 10/16/29 @ 100 (a) (b) | 2,500 | 2,436 | |||||||||
| Neuberger Berman Loan Advisers CLO Ltd., Series 2018-29A, Class B2, 4.60%, 10/19/31, Callable 1/19/29 @ 100 (a) | 5,000 | 4,714 | |||||||||
| Oaktree CLO Ltd., Series 2022-3A, Class B1, 7.76% (TSFR3M+310bps), 7/15/35, Callable 4/15/30 @ 100 (a) (b) | 3,000 | 2,989 | |||||||||
See notes to financial statements.
13
| USAA Mutual Funds Trust USAA Intermediate-Term Bond Fund | Schedule of Portfolio Investments — continued January 31, 2023 | ||||||
(Amounts in Thousands, Except for Shares) (Unaudited)
Security Description | Principal Amount | Value | |||||||||
| Oaktree CLO Ltd., Series 2022-3A, Class C, 8.81% (TSFR3M+415bps), 7/15/35, Callable 4/15/30 @ 100 (a) (b) | $ | 3,000 | $ | 2,992 | |||||||
| Oaktree CLO Ltd., Series 2022-2A, Class B, 7.41% (TSFR3M+275bps), 7/15/33, Callable 7/15/28 @ 100 (a) (b) | 6,500 | 6,430 | |||||||||
| Oaktree CLO Ltd., Series 2022-1A, Class B, 6.22% (TSFR3M+195bps), 5/15/33, Callable 11/15/28 @ 100 (a) (b) | 1,667 | 1,624 | |||||||||
| Octagon 57 Ltd., Series 2021-1A, Class B1, 6.44% (LIBOR03M+165bps), 10/15/34, Callable 10/15/29 @ 100 (a) (b) | 3,000 | 2,922 | |||||||||
| Octagon Investment Partners 48 Ltd., Series 2020-3A, Class BR, 6.41% (LIBOR03M+160bps), 10/20/34, Callable 7/20/30 @ 100 (a) (b) | 1,200 | 1,164 | |||||||||
One Bryant Park Trust, Series 2019-OBP, Class A, 2.52%, 9/13/49 (a) | 11,040 | 9,376 | |||||||||
| One New York Plaza Trust, Series 2020-1NYP, Class A, 5.41% (LIBOR01M+95bps), 1/15/26 (a) (b) | 2,625 | 2,506 | |||||||||
| ONE PARK Mortgage Trust, Series 2021-PARK, Class D, 6.09% (LIBOR01M+150bps), 3/15/36 (a) (b) | 5,000 | 4,642 | |||||||||
| Palmer Square Loan Funding Ltd., Series 2020-4A, Class B, 7.06% (LIBOR03M+230bps), 11/25/28, Callable 2/25/23 @ 100 (a) (b) | 5,000 | 4,911 | |||||||||
| Palmer Square Loan Funding Ltd., Series 2022-5A, Class C, 8.57% (TSFR3M+391bps), 7/15/35, Callable 10/15/23 @ 100 (a) (b) | 3,250 | 3,142 | |||||||||
| Palmer Square Loan Funding Ltd., Series 2022-2A, Class A2, 6.56% (TSFR3M+190bps), 10/15/30, Callable 7/15/23 @ 100 (a) (b) | 3,000 | 2,914 | |||||||||
| Palmer Square Loan Funding Ltd., Series 2020-1A, Class B, 6.58% (LIBOR03M+190bps), 2/20/28, Callable 2/20/23 @ 100 (a) (b) | 2,000 | 1,952 | |||||||||
SLG Office Trust, Series 2021-OVA, Class C, 2.85%, 7/15/41 (a) | 4,000 | 3,185 | |||||||||
SLG Office Trust, Series 2021-OVA, Class B, 2.71%, 7/15/41 (a) | 4,000 | 3,253 | |||||||||
SMRT, Series 2022-MINI, Class E, 7.18% (SOFR30A+270bps), 1/15/24 (a) (b) | 2,000 | 1,875 | |||||||||
| Sound Point CLO XVIII Ltd., Series 2017-4A, Class B, 6.61% (LIBOR03M+180bps), 1/21/31, Callable 4/20/28 @ 100 (a) (b) | 1,000 | 922 | |||||||||
| SREIT Trust, Series 2021-MFP2, Class D, 6.03% (LIBOR01M+157bps), 11/15/36 (a) (b) | 1,000 | 961 | |||||||||
| Stewart Park CLO Ltd., Series 2015-1A, Class A2R, 6.04% (LIBOR03M+125bps), 1/15/30, Callable 10/15/28 @ 100 (a) (b) | 2,000 | 1,972 | |||||||||
| Stratus CLO Ltd., Series 2021-3A, Class B, 6.36% (LIBOR03M+155bps), 12/29/29, Callable 4/20/27 @ 100 (a) (b) | 2,259 | 2,202 | |||||||||
| Stratus CLO Ltd., Series 2022-1A, Class B, 6.99% (TSFR3M+235bps), 7/20/30, Callable 10/20/28 @ 100 (a) (b) | 5,000 | 4,909 | |||||||||
| Stratus CLO Ltd., Series 2022-2A, Class C, 8.64% (TSFR3M+400bps), 7/20/30, Callable 10/20/28 @ 100 (a) (b) | 2,750 | 2,699 | |||||||||
| Structured Asset Mortgage Investments II Trust, Series 2005-AR5, Class B1, 5.22% (LIBOR01M+50bps), 7/19/35, Callable 2/19/23 @ 100 (b) | 689 | 646 | |||||||||
| SUMIT Mortgage Trust, Series 2022-BVUE, Class D, 2.89%, 2/12/41, Callable 2/12/29 @ 100 (a) (c) | 1,636 | 1,245 | |||||||||
| TRESTLES CLO Ltd., Series 2021-4A, Class B2, 2.72%, 7/21/34, Callable 4/21/29 @ 100 (a) | 1,000 | 833 | |||||||||
| Trimaran Cavu Ltd., Series 2019-1A, Class A2, 6.71% (LIBOR03M+190bps), 7/20/32, Callable 10/20/28 @ 100 (a) (b) | 7,000 | 6,864 | |||||||||
| Trimaran Cavu Ltd., Series 2021-2A, Class B1, 6.57% (LIBOR03M+175bps), 10/25/34, Callable 7/25/29 @ 100 (a) (b) | 2,500 | 2,385 | |||||||||
| Trimaran Cavu Ltd., Series 2021-3A, Class C1, 7.26% (LIBOR03M+247bps), 1/18/35, Callable 10/18/29 @ 100 (a) (b) | 5,000 | 4,712 | |||||||||
See notes to financial statements.
14
| USAA Mutual Funds Trust USAA Intermediate-Term Bond Fund | Schedule of Portfolio Investments — continued January 31, 2023 | ||||||
(Amounts in Thousands, Except for Shares) (Unaudited)
Security Description | Shares or Principal Amount | Value | |||||||||
| TSTAT Ltd., Series 2022-1A, Class A2, 7.59% (TSFR3M+295bps), 7/20/31, Callable 1/20/29 @ 100 (a) (b) | $ | 3,000 | $ | 2,932 | |||||||
TTAN, Series 2021-MHC, Class D, 6.21% (LIBOR01M+180bps), 3/15/38 (a) (b) | 1,775 | 1,717 | |||||||||
| Venture 46 CLO Ltd., Series 2022-46A, Class BN, 7.64% (TSFR3M+300bps), 7/20/35, Callable 1/20/31 @ 100 (a) (b) | 3,000 | 2,951 | |||||||||
| Venture 46 CLO Ltd., Series 2022-46A, Class A2F, 5.02%, 7/20/35, Callable 1/20/31 @ 100 (a) | 4,500 | 4,078 | |||||||||
| Voya CLO, Series 2017-4A, Class A2, 6.04% (LIBOR03M+125bps), 10/15/30, Callable 1/15/29 @ 100 (a) (b) | 2,000 | 1,959 | |||||||||
| Voya CLO Ltd., Series 2015-3A, Class BR, 7.01% (LIBOR03M+220bps), 10/20/31, Callable 1/20/29 @ 100 (a) (b) | 1,250 | 1,175 | |||||||||
| Wells Fargo Commercial Mortgage Trust, Series 2020-C56, Class AS, 3.11%, 6/15/53, Callable 4/15/30 @ 100 | 2,000 | 1,717 | |||||||||
| Wells Fargo Commercial Mortgage Trust, Series 2015-NXS4, Class B, 4.22%, 12/15/48, Callable 11/15/25 @ 100 (c) | 5,000 | 4,646 | |||||||||
| Wells Fargo Commercial Mortgage Trust, Series 2015-NXS4, Class AS, 3.97%, 12/15/48, Callable 11/15/25 @ 100 | 3,500 | 3,284 | |||||||||
| Wells Fargo Commercial Mortgage Trust, Series 2015-NXS3, Class B, 4.50%, 9/15/57, Callable 10/15/25 @ 100 (c) | 2,000 | 1,868 | |||||||||
| Wells Fargo Commercial Mortgage Trust, Series 2018-AUS, Class A, 4.06%, 7/17/36 (a) (c) | 4,200 | 3,842 | |||||||||
| WFRBS Commercial Mortgage Trust, Series 2012-C10, Class XA, 1.15%, 12/15/45, Callable 2/15/23 @ 100 (c) (d) | 2,875 | — | (e) | ||||||||
Total Collateralized Mortgage Obligations (Cost $630,193) | 577,699 | ||||||||||
Preferred Stocks (0.5%) | |||||||||||
Consumer Staples (0.3%): | |||||||||||
CHS, Inc., cumulative redeemable, Series 2, 7.10% (LIBOR03M+429bps) (b) (f) | 400,000 | 10,224 | |||||||||
Financials (0.2%): | |||||||||||
Citigroup Capital XIII, 11.17% (LIBOR03M+637bps), 10/30/40 (b) | 87,500 | 2,513 | |||||||||
U.S. Bancorp, non-cumulative, Series A, 4.42% (LIBOR03M+102bps) (b) (f) (g) | 5,000 | 4,005 | |||||||||
6,518 | |||||||||||
Total Preferred Stocks (Cost $15,932) | 16,742 | ||||||||||
Senior Secured Loans (2.5%) | |||||||||||
| Academy Ltd., Refinancing Term Loans, First Lien, 8.12% (LIBOR01M+375bps), 11/6/27 (b) | 242 | 241 | |||||||||
| Alterra Mountain Co., Facility 2028 Term Loan B, First Lien, 8.07% (LIBOR01M+350bps), 8/17/28 (b) | 436 | 434 | |||||||||
Assuredpartners, Inc., 8.81% (SOFR01M+425bps), 2/13/27 (b) | 499 | 498 | |||||||||
| AssuredPartners, Inc., 2021 Term Loan, First Lien, 8.07% (LIBOR01M+350bps), 2/13/27 (b) | 2,925 | 2,888 | |||||||||
| Bausch + Lomb Corp., Initial Term Loans, First Lien, 7.82% (SOFR03M+325bps), 5/10/27 (b) | 3,487 | 3,391 | |||||||||
| Berlin Packaging LLC, Tranche B-4 Term Loans, First Lien, 7.62% (LIBOR01M+325bps), 3/11/28 (b) | 450 | 436 | |||||||||
See notes to financial statements.
15
| USAA Mutual Funds Trust USAA Intermediate-Term Bond Fund | Schedule of Portfolio Investments — continued January 31, 2023 | ||||||
(Amounts in Thousands, Except for Shares) (Unaudited)
Security Description | Principal Amount | Value | |||||||||
| Berlin Packaging LLC, Tranche B-4 Term Loans, First Lien, 7.98% (LIBOR03M+325bps), 3/11/28 (b) | $ | 41 | $ | 40 | |||||||
| Blackstone CQP Holdco LP, Initial Term Loans, First Lien, 8.48% (LIBOR03M+375bps), 5/26/28 (b) | 985 | 986 | |||||||||
Carnival Corp., 7.82% (LIBOR01M+325bps), 10/18/28 (b) | 497 | 485 | |||||||||
| Central Parent, Inc., Initial Term Loan, First Lien, 9.16% (SOFR03M+450bps), 7/6/29 (b) | 1,750 | 1,745 | |||||||||
Cincinnati Bell, Inc., Term B2, First Lien, 7.81% (SOFR01M+325bps), 11/17/28 (b) | 495 | 492 | |||||||||
| ClubCorp Holdings, Inc., Term B Loans, First Lien, 7.48% (LIBOR03M+275bps), 9/18/24 (b) | 2 | 2 | |||||||||
Delta 2 Lux S A R L, 7.81% (SOFR01M+325bps), 1/15/30 (b) (h) | 500 | 501 | |||||||||
| Delta Air Lines, Inc. and SkyMiles IP Ltd., Initial Term Loan, First Lien, 8.56% (LIBOR03M+375bps), 10/20/27 (b) | 12,350 | 13,113 | |||||||||
| Directv Financing LLC, Closing Date Term Loans, First Lien, 9.58% (LIBOR01M+500bps), 8/2/27 (b) | 2,502 | 2,457 | |||||||||
| Fertitta Entertainment LLC, Initial B Term Loan, First Lien, 8.56% (SOFR01M+400bps), 1/27/29 (b) | 2,486 | 2,455 | |||||||||
| Foundation Building Materials, Initial Term Loans, First Lien, 7.82% (LIBOR01M+325bps), 1/29/28 (b) | 1 | 1 | |||||||||
| Foundation Building Materials, Initial Term Loans, First Lien, 8.08% (LIBOR03M+325bps), 1/29/28 (b) | 491 | 476 | |||||||||
| Graham Packaging Co., Inc., New Term Loans, First Lien, 7.57% (LIBOR01M+300bps), 8/4/27 (b) | 461 | 459 | |||||||||
| Great Outdoors Group LLC, Term B1, First Lien, 8.27% (LIBOR01M+375bps), 3/5/28 (b) | 2,970 | 2,916 | |||||||||
| H-Food Holdings LLC, 2020 Incremental Term B-3 Loan, First Lien, 9.57% (LIBOR01M+500bps), 5/31/25 (b) | 488 | 454 | |||||||||
| Hilton Grand Vacations Borrower LLC, Initial Term Loan, First Lien, 7.57% (LIBOR01M+300bps), 8/2/28 (b) | 75 | 75 | |||||||||
Hub International Ltd., 8.22% (SOFR03M+400bps), 11/10/29 (b) (h) | 375 | 375 | |||||||||
| Hub International Ltd., B-3 Incremental Term Loans, First Lien, 8.06% (LIBOR03M+325bps), 4/25/25 (b) | 116 | 116 | |||||||||
IRB Holding Corp., TLB, First Lien, 7.59% (SOFR03M+300bps), 12/15/27 (b) | 149 | 147 | |||||||||
| Kronos Acquisition Holdings, Inc., Tranche B-1 Term Loans, First Lien, 8.48% (LIBOR03M+375bps), 12/22/26 (b) | 4 | 4 | |||||||||
| Life Time, Inc., 2021 Refinancing Term Loan, First Lien, 9.57% (LIBOR03M+475bps), 12/15/24 (b) | 3,000 | 3,000 | |||||||||
| Medline Borrower LP, Initial Dollar Term Loans, First Lien, 7.76% (LIBOR01M+325bps), 10/21/28 (b) | 2,978 | 2,888 | |||||||||
| Mileage Plus Holdings LLC, Initial Term Loan, First Lien, 10.02% (LIBOR03M+525bps), 6/20/27 (b) | 10,847 | 11,298 | |||||||||
| MoneyGram International, Inc., Term Loan, First Lien, 9.07% (LIBOR01M+450bps), 7/21/26 (b) | 2,474 | 2,465 | |||||||||
| Oculus Acquisition Corp., Initial Term Loan, First Lien, 8.13% (SOFR03M+350bps), 11/8/27 (b) | 2,219 | 2,188 | |||||||||
| OEG Borrower LLC, Initial Term Loans, First Lien, 9.50% (SOFR03M+500bps), 6/18/29 (b) | 499 | 494 | |||||||||
Open Text Corp., Term Loan B, 11/16/29 (i) | 1,000 | 998 | |||||||||
| Osmosis Buyer Limited, Term Loan B, First Lien, 7.84% (SOFR03M+375bps), 7/30/28 (b) | 850 | 831 | |||||||||
See notes to financial statements.
16
| USAA Mutual Funds Trust USAA Intermediate-Term Bond Fund | Schedule of Portfolio Investments — continued January 31, 2023 | ||||||
(Amounts in Thousands, Except for Shares) (Unaudited)
Security Description | Principal Amount | Value | |||||||||
Osmosis Buyer Limited, Term Loan B, First Lien, 8.29% (SOFR01M+375bps) (b) (f) | $ | 148 | $ | 143 | |||||||
Osmosis Buyer Ltd., DD, First Lien, 7/30/28 (i) | 222 | 217 | |||||||||
| Pactiv Evergreen Group Holdings, Inc., Tranche B-3 US Term Loans, First Lien, 7.82% (LIBOR01M+325bps), 9/17/28 (b) | 987 | 983 | |||||||||
| Petco Health & Wellness Co., Inc., Initial Term Loans, First Lien, 7.68% (SOFR03M+325bps), 3/4/28 (b) | 2,955 | 2,921 | |||||||||
| Polaris Newco LLC, Dollar Term Loan, First Lien, 8.73% (LIBOR03M+400bps), 6/4/28 (b) | 239 | 227 | |||||||||
| Proofpoint, Inc., Initial Term Loans, First Lien, 7.98% (LIBOR03M+325bps), 8/31/28 (b) | 1,485 | 1,455 | |||||||||
| Scientific Games International, Inc., Initial Term B Loans, First Lien, 7.48% (SOFR01M+300bps), 4/16/29 (b) | 990 | 986 | |||||||||
Sophia LP, Term Loan B, First Lien, 8.23% (LIBOR03M+350bps), 10/7/27 (b) | 980 | 965 | |||||||||
| Sotheby's, 2021 2nd Refin Term Loan, First Lien, 9.33% (LIBOR03M+450bps), 1/15/27 (b) | 1,176 | 1,170 | |||||||||
| Sunshine Luxembourg VII Sarl, Facility B3 Commitments, First Lien, 8.52% (LIBOR03M+375bps), 10/2/26 (b) | 429 | 419 | |||||||||
| TIBCO Software, Inc., Term A Loan, First Lien, 9.09% (SOFR03M+450bps), 9/30/28 (b) (h) | 5,000 | 4,570 | |||||||||
Travel+Leisure Co., 8.51% (SOFR03M+400bps), 12/9/29 (b) (h) | 1,000 | 1,000 | |||||||||
| TricorBraun Holdings, Inc., Closing Date Initial Term Loans, First Lien, 7.82% (LIBOR01M+325bps), 3/3/28 (b) | 1,478 | 1,435 | |||||||||
| UKG, Inc., Incremental Term Loans, First Lien, 8.03% (LIBOR03M+325bps), 5/3/26 (b) | 476 | 468 | |||||||||
| Whatabrands LLC, Initial Term B Loans, First Lien, 7.82% (LIBOR01M+325bps), 8/3/28 (b) | 2,185 | 2,160 | |||||||||
Total Senior Secured Loans (Cost $77,744) | 78,468 | ||||||||||
Corporate Bonds (27.7%) | |||||||||||
Communication Services (1.7%): | |||||||||||
AT&T, Inc., 4.50%, 5/15/35, Callable 11/15/34 @ 100 | 2,500 | 2,376 | |||||||||
| CCO Holdings LLC/CCO Holdings Capital Corp. 4.25%, 2/1/31, Callable 7/1/25 @ 102.13 (a) | 1,000 | 833 | |||||||||
4.25%, 1/15/34, Callable 1/15/28 @ 102.13 (a) | 4,000 | 3,126 | |||||||||
| Charter Communications Operating LLC/Charter Communications Operating Capital 5.38%, 4/1/38, Callable 10/1/37 @ 100 | 2,500 | 2,237 | |||||||||
5.25%, 4/1/53, Callable 10/1/52 @ 100 | 3,000 | 2,514 | |||||||||
Comcast Corp., 3.20%, 7/15/36, Callable 1/15/36 @ 100 | 750 | 643 | |||||||||
DISH Network Corp., 11.75%, 11/15/27, Callable 5/15/25 @ 105.88 (a) | 4,500 | 4,667 | |||||||||
Fox Corp., 5.48%, 1/25/39, Callable 7/25/38 @ 100 | 1,500 | 1,453 | |||||||||
Gray Television, Inc., 4.75%, 10/15/30, Callable 10/15/25 @ 102.38 (a) | 6,340 | 4,735 | |||||||||
Lamar Media Corp., 3.63%, 1/15/31, Callable 1/15/26 @ 101.81 | 259 | 220 | |||||||||
Netflix, Inc., 4.88%, 6/15/30, Callable 3/15/30 @ 100 (a) | 2,100 | 2,078 | |||||||||
Sprint Spectrum Co. LLC, 5.15%, 9/20/29, Callable 3/20/27 @ 100 (a) | 4,887 | 4,876 | |||||||||
T-Mobile USA, Inc., 3.50%, 4/15/31, Callable 4/15/26 @ 101.75 | 8,041 | 7,209 | |||||||||
| Verizon Communications, Inc. 2.55%, 3/21/31, Callable 12/21/30 @ 100 | 5,000 | 4,259 | |||||||||
2.88%, 11/20/50, Callable 5/20/50 @ 100 | 4,250 | 2,891 | |||||||||
See notes to financial statements.
17
| USAA Mutual Funds Trust USAA Intermediate-Term Bond Fund | Schedule of Portfolio Investments — continued January 31, 2023 | ||||||
(Amounts in Thousands, Except for Shares) (Unaudited)
Security Description | Principal Amount | Value | |||||||||
| Warnermedia Holdings, Inc. 4.28%, 3/15/32, Callable 12/15/31 @ 100 (a) | $ | 6,500 | $ | 5,781 | |||||||
5.14%, 3/15/52, Callable 9/15/51 @ 100 (a) | 2,900 | 2,409 | |||||||||
| ZoomInfo Technologies LLC/ZoomInfo Finance Corp., 3.88%, 2/1/29, Callable 2/1/24 @ 101.94 (a) (g) | 1,250 | 1,078 | |||||||||
53,385 | |||||||||||
Consumer Discretionary (2.7%): | |||||||||||
Asbury Automotive Group, Inc., 4.63%, 11/15/29, Callable 11/15/24 @ 102.31 (a) | 1,250 | 1,104 | |||||||||
| AutoNation, Inc. 2.40%, 8/1/31, Callable 5/1/31 @ 100 | 7,250 | 5,530 | |||||||||
3.85%, 3/1/32, Callable 12/1/31 @ 100 | 4,000 | 3,384 | |||||||||
Boston Medical Center Corp., 3.91%, 7/1/28 | 3,000 | 2,784 | |||||||||
Caesars Entertainment, Inc., 7.00%, 2/15/30, Callable 2/15/26 @ 103.5 (a) | 250 | 255 | |||||||||
Carnival Corp., 9.88%, 8/1/27, Callable 2/1/24 @ 104.94 (a) | 5,750 | 5,910 | |||||||||
Choice Hotels International, Inc., 3.70%, 1/15/31, Callable 10/15/30 @ 100 | 4,000 | 3,547 | |||||||||
Churchill Downs, Inc., 4.75%, 1/15/28, Callable 3/13/23 @ 102.38 (a) | 1,400 | 1,310 | |||||||||
Dollar Tree, Inc., 2.65%, 12/1/31, Callable 9/1/31 @ 100 | 2,500 | 2,100 | |||||||||
Hilton Domestic Operating Co., Inc., 3.63%, 2/15/32, Callable 8/15/26 @ 101.81 (a) | 780 | 653 | |||||||||
Kohl's Corp., 3.63%, 5/1/31, Callable 2/1/31 @ 100 | 2,500 | 1,854 | |||||||||
| Lithia Motors, Inc. 3.88%, 6/1/29, Callable 6/1/24 @ 101.94 (a) | 5,689 | 4,837 | |||||||||
4.38%, 1/15/31, Callable 10/15/25 @ 102.19 (a) | 1,750 | 1,490 | |||||||||
| Marriott International, Inc. 3.50%, 10/15/32, Callable 7/15/32 @ 100 | 2,000 | 1,765 | |||||||||
2.75%, 10/15/33, Callable 7/15/33 @ 100 | 3,000 | 2,434 | |||||||||
Marriott Ownership Resorts, Inc., 4.50%, 6/15/29, Callable 6/15/24 @ 102.25 (a) | 750 | 654 | |||||||||
Murphy Oil USA, Inc., 3.75%, 2/15/31, Callable 2/15/26 @ 101.88 (a) | 612 | 514 | |||||||||
NCL Corp. Ltd., 8.38%, 2/1/28, Callable 2/1/25 @ 104.19 (a) | 1,000 | 1,017 | |||||||||
Newell Brands, Inc., 6.63%, 9/15/29, Callable 6/15/29 @ 100 (g) | 2,727 | 2,765 | |||||||||
Nordstrom, Inc., 4.25%, 8/1/31, Callable 5/1/31 @ 100 (g) | 370 | 278 | |||||||||
NVR, Inc., 3.00%, 5/15/30, Callable 11/15/29 @ 100 | 3,687 | 3,223 | |||||||||
PulteGroup, Inc., 6.00%, 2/15/35 | 7,010 | 7,129 | |||||||||
| Resorts World Las Vegas LLC/RWLV Capital, Inc., 4.63%, 4/6/31, Callable 1/6/31 @ 100 (a) | 13,000 | 10,044 | |||||||||
Sodexo, Inc., 2.72%, 4/16/31, Callable 1/16/31 @ 100 (a) | 5,600 | 4,657 | |||||||||
Sotheby's, 7.38%, 10/15/27, Callable 2/21/23 @ 103.69 (a) | 2,625 | 2,538 | |||||||||
Toll Brothers Finance Corp., 3.80%, 11/1/29, Callable 8/1/29 @ 100 | 5,437 | 4,875 | |||||||||
Tractor Supply Co., 1.75%, 11/1/30, Callable 8/1/30 @ 100 | 2,750 | 2,189 | |||||||||
Vanderbilt University Medical Center, 4.17%, 7/1/37, Callable 1/1/37 @ 100 | 1,445 | 1,296 | |||||||||
Volkswagen Group of America Finance LLC, 3.75%, 5/13/30 (a) | 4,000 | 3,646 | |||||||||
83,782 | |||||||||||
Consumer Staples (0.9%): | |||||||||||
| 7-Eleven, Inc. 1.80%, 2/10/31, Callable 11/10/30 @ 100 (a) | 3,000 | 2,390 | |||||||||
2.80%, 2/10/51, Callable 8/2/50 @ 100 (a) | 14,805 | 9,778 | |||||||||
| Albertsons Cos., Inc./Safeway, Inc./New Albertsons LP/Albertsons LLC, 4.88%, 2/15/30, Callable 2/15/25 @ 103.66 (a) | 3,250 | 2,996 | |||||||||
Anheuser-Busch InBev Worldwide, Inc., 3.75%, 7/15/42 | 500 | 429 | |||||||||
See notes to financial statements.
18
| USAA Mutual Funds Trust USAA Intermediate-Term Bond Fund | Schedule of Portfolio Investments — continued January 31, 2023 | ||||||
(Amounts in Thousands, Except for Shares) (Unaudited)
Security Description | Principal Amount | Value | |||||||||
| BAT Capital Corp. 7.75%, 10/19/32, Callable 7/19/32 @ 100 | $ | 500 | $ | 558 | |||||||
3.73%, 9/25/40, Callable 3/25/40 @ 100 | 3,000 | 2,172 | |||||||||
| JBS USA LUX SA/JBS USA Food Co./JBS USA Finance, Inc. 3.63%, 1/15/32, Callable 1/15/27 @ 101.81 (a) | 500 | 418 | |||||||||
6.50%, 12/1/52, Callable 6/1/52 @ 100 (a) | 2,000 | 2,046 | |||||||||
Kraft Heinz Foods Co., 5.00%, 6/4/42 | 4,000 | 3,851 | |||||||||
Pilgrim's Pride Corp., 3.50%, 3/1/32, Callable 9/1/26 @ 101.75 (a) | 2,000 | 1,628 | |||||||||
Post Holdings, Inc., 4.50%, 9/15/31, Callable 9/15/26 @ 102.25 (a) | 85 | 73 | |||||||||
Smithfield Foods, Inc., 2.63%, 9/13/31, Callable 6/13/31 @ 100 (a) | 1,000 | 746 | |||||||||
Walgreens Boots Alliance, Inc., 4.10%, 4/15/50, Callable 10/15/49 @ 100 | 1,250 | 958 | |||||||||
28,043 | |||||||||||
Energy (1.4%): | |||||||||||
Boardwalk Pipelines LP, 3.40%, 2/15/31, Callable 11/15/30 @ 100 | 3,000 | 2,672 | |||||||||
Cameron LNG LLC, 3.30%, 1/15/35, Callable 9/15/34 @ 100 (a) | 4,727 | 4,129 | |||||||||
Cheniere Energy, Inc., 4.63%, 10/15/28, Callable 10/15/23 @ 102.31 | 3,000 | 2,859 | |||||||||
Enterprise Products Operating LLC, 3.30%, 2/15/53, Callable 8/15/52 @ 100 | 250 | 181 | |||||||||
Gray Oak Pipeline LLC, 3.45%, 10/15/27, Callable 8/15/27 @ 100 (a) | 3,333 | 3,001 | |||||||||
Helmerich & Payne, Inc., 2.90%, 9/29/31, Callable 6/29/31 @ 100 | 2,500 | 2,111 | |||||||||
| Hilcorp Energy I LP/Hilcorp Finance Co., 6.25%, 4/15/32, Callable 5/15/27 @ 103.13 (a) | 1,000 | 924 | |||||||||
Magellan Midstream Partners LP, 5.15%, 10/15/43, Callable 4/15/43 @ 100 | 6,905 | 6,426 | |||||||||
Marathon Petroleum Corp., 4.75%, 9/15/44, Callable 3/15/44 @ 100 | 1,000 | 897 | |||||||||
Midwest Connector Capital Co. LLC, 4.63%, 4/1/29, Callable 1/1/29 @ 100 (a) | 10,000 | 9,321 | |||||||||
Northwest Pipeline LLC, 4.00%, 4/1/27, Callable 1/1/27 @ 100 | 4,455 | 4,314 | |||||||||
Viper Energy Partners LP, 5.38%, 11/1/27, Callable 3/13/23 @ 102.69 (a) | 7,500 | 7,262 | |||||||||
44,097 | |||||||||||
Financials (7.4%): | |||||||||||
Assurant, Inc., 2.65%, 1/15/32, Callable 10/15/31 @ 100 | 3,000 | 2,319 | |||||||||
Athene Global Funding, 2.67%, 6/7/31 (a) | 6,000 | 4,789 | |||||||||
Aviation Capital Group LLC, 5.50%, 12/15/24, Callable 11/15/24 @ 100 (a) | 3,000 | 2,976 | |||||||||
| Bank of America Corp. 2.30% (SOFR+122bps), 7/21/32, Callable 7/21/31 @ 100 (b) | 4,000 | 3,256 | |||||||||
3.85% (H15T5Y+200bps), 3/8/37, Callable 3/8/32 @ 100 (b) | 4,750 | 4,145 | |||||||||
BankUnited, Inc., 5.13%, 6/11/30, Callable 3/11/30 @ 100 | 2,000 | 1,935 | |||||||||
| Blackstone Holdings Finance Co. LLC 1.60%, 3/30/31, Callable 12/30/30 @ 100 (a) | 3,000 | 2,260 | |||||||||
6.20%, 4/22/33, Callable 1/22/33 @ 100 (a) | 4,500 | 4,763 | |||||||||
| Blackstone Private Credit Fund 7.05%, 9/29/25 (a) | 1,750 | 1,775 | |||||||||
2.63%, 12/15/26, Callable 11/15/26 @ 100 | 2,308 | 1,985 | |||||||||
Blue Owl Finance LLC, 3.13%, 6/10/31, Callable 3/10/31 @ 100 (a) | 12,100 | 9,489 | |||||||||
Brown & Brown, Inc., 4.20%, 3/17/32, Callable 12/17/31 @ 100 | 8,667 | 7,935 | |||||||||
| Capital One Financial Corp., 2.36% (SOFR+134bps), 7/29/32, Callable 7/29/31 @ 100 (b) | 5,000 | 3,816 | |||||||||
Citizens Financial Group, Inc., 2.64%, 9/30/32, Callable 7/2/32 @ 100 | 3,000 | 2,349 | |||||||||
| Compeer Financial FLCA/Compeer Financial PCA, 3.38% (SOFR+197bps), 6/1/36, Callable 6/1/31 @ 100 (a) (b) | 978 | 769 | |||||||||
Cullen/Frost Bankers, Inc., 4.50%, 3/17/27, Callable 2/17/27 @ 100 | 1,000 | 965 | |||||||||
See notes to financial statements.
19
| USAA Mutual Funds Trust USAA Intermediate-Term Bond Fund | Schedule of Portfolio Investments — continued January 31, 2023 | ||||||
(Amounts in Thousands, Except for Shares) (Unaudited)
Security Description | Principal Amount | Value | |||||||||
F&G Global Funding, 2.00%, 9/20/28 (a) | $ | 1,000 | $ | 849 | |||||||
| Fifth Third Bancorp 4.50%, Callable 9/30/25 @ 100 (f) (g) | 2,750 | 2,662 | |||||||||
4.34% (SOFR+166bps), 4/25/33, Callable 4/25/32 @ 100 (b) | 4,076 | 3,879 | |||||||||
| First Citizens BancShares, Inc., 3.37% (SOFR+247bps), 3/15/30, Callable 3/15/25 @ 100 (b) | 3,000 | 2,842 | |||||||||
First Horizon Bank, 5.75%, 5/1/30, Callable 2/1/30 @ 100 | 3,000 | 3,036 | |||||||||
FNB Corp., 2.20%, 2/24/23 | 1,175 | 1,171 | |||||||||
| Ford Motor Credit Co. LLC 2.90%, 2/10/29, Callable 12/10/28 @ 100 | 2,000 | 1,670 | |||||||||
7.35%, 3/6/30, Callable 1/6/30 @ 100 | 5,000 | 5,251 | |||||||||
Global Atlantic Fin Co., 4.40%, 10/15/29, Callable 7/15/29 @ 100 (a) | 6,472 | 5,611 | |||||||||
Gray Escrow II, Inc., 5.38%, 11/15/31, Callable 11/15/26 @ 102.69 (a) (g) | 1,000 | 769 | |||||||||
| Huntington Bancshares, Inc., 2.49% (H15T5Y+117bps), 8/15/36, Callable 8/15/31 @ 100 (b) | 7,175 | 5,428 | |||||||||
| JPMorgan Chase & Co. 2.96% (SOFR+252bps), 5/13/31, Callable 5/13/30 @ 100 (b) | 13,601 | 11,751 | |||||||||
5.72% (SOFR+258bps), 9/14/33, Callable 9/14/32 @ 100 (b) | 3,000 | 3,082 | |||||||||
KeyBank NA, 3.90%, 4/13/29 | 3,000 | 2,775 | |||||||||
KeyCorp Capital II, 6.88%, 3/17/29 | 750 | 779 | |||||||||
KeyCorp., 4.79% (SOFR+206bps), 6/1/33, MTN, Callable 6/1/32 @ 100 (b) | 2,270 | 2,226 | |||||||||
Level 3 Financing, Inc., 3.88%, 11/15/29, Callable 8/15/29 @ 100 (a) | 3,000 | 2,431 | |||||||||
Main Street Capital Corp., 3.00%, 7/14/26, Callable 6/14/26 @ 100 | 3,000 | 2,643 | |||||||||
Medline Borrower LP, 3.88%, 4/1/29, Callable 10/1/24 @ 101.94 (a) | 2,000 | 1,711 | |||||||||
MetLife, Inc., 9.25%, 4/8/68, Callable 4/8/33 @ 100 (a) | 5,961 | 7,223 | |||||||||
| Morgan Stanley 1.93% (SOFR+102bps), 4/28/32, Callable 4/28/31 @ 100, MTN (b) | 5,000 | 3,976 | |||||||||
2.48% (SOFR+136bps), 9/16/36, Callable 9/16/31 @ 100 (b) | 17,500 | 13,544 | |||||||||
Neptune Bidco US, Inc., 9.29%, 4/15/29, Callable 10/15/25 @ 104.65 (a) | 2,000 | 1,946 | |||||||||
| New York Community Bancorp, Inc., 5.90% (LIBOR03M+278bps), 11/6/28, Callable 11/6/23 @ 100 (b) | 4,000 | 3,944 | |||||||||
New York Life Global Funding, 1.85%, 8/1/31 (a) | 7,750 | 6,365 | |||||||||
Northern Trust Corp., 6.13%, 11/2/32, Callable 8/2/32 @ 100 | 2,750 | 3,022 | |||||||||
| OWL Rock Core Income Corp. 5.50%, 3/21/25 (a) | 4,000 | 3,904 | |||||||||
3.13%, 9/23/26, Callable 8/23/26 @ 100 | 750 | 656 | |||||||||
4.70%, 2/8/27, Callable 1/8/27 @ 100 | 1,875 | 1,709 | |||||||||
7.75%, 9/16/27, Callable 8/16/27 @ 100 (a) | 1,818 | 1,831 | |||||||||
Pine Street Trust I, 4.57%, 2/15/29, Callable 11/15/28 @ 100 (a) | 1,750 | 1,691 | |||||||||
| Regions Financial Corp., 5.75% (H15T5Y+543bps), Callable 6/15/25 @ 100 (b) (f) (g) | 6,786 | 6,730 | |||||||||
Santander Holdings USA, Inc., 4.40%, 7/13/27, Callable 4/14/27 @ 100 | 3,318 | 3,228 | |||||||||
| Texas Capital Bancshares, Inc., 4.00% (H15T5Y+315bps), 5/6/31, Callable 5/6/26 @ 100 (b) | 1,837 | 1,670 | |||||||||
| The Bank of New York Mellon Corp., 4.70% (H15T5Y+436bps), Callable 9/20/25 @ 100 (b) (f) | 6,750 | 6,604 | |||||||||
The Charles Schwab Corp., 5.38% (H15T5Y+497bps), Callable 6/1/25 @ 100 (b) (f) | 12,750 | 12,694 | |||||||||
| The Hartford Financial Services Group, Inc., 6.73% (LIBOR03M+213bps), 2/12/47, Callable 3/13/23 @ 100 (a) (b) | 5,500 | 4,702 | |||||||||
See notes to financial statements.
20
| USAA Mutual Funds Trust USAA Intermediate-Term Bond Fund | Schedule of Portfolio Investments — continued January 31, 2023 | ||||||
(Amounts in Thousands, Except for Shares) (Unaudited)
Security Description | Principal Amount | Value | |||||||||
| The PNC Financial Services Group, Inc., 4.63% (SOFR+185bps), 6/6/33, Callable 6/6/32 @ 100 (b) | $ | 7,000 | $ | 6,746 | |||||||
| Truist Financial Corp. 5.10% (H15T10Y+435bps), Callable 3/1/30 @ 100 (b) (f) | 5,250 | 5,111 | |||||||||
4.95% (H15T5Y+461bps), Callable 9/1/25 @ 100 (b) (f) | 4,000 | 3,961 | |||||||||
| U.S. Bancorp 4.97% (SOFR+211bps), 7/22/33, Callable 7/22/32 @ 100 (b) | 3,000 | 2,974 | |||||||||
4.84%, 2/1/34, Callable 2/1/33 @ 100 | 3,000 | 2,992 | |||||||||
Willis North America, Inc., 2.95%, 9/15/29, Callable 6/15/29 @ 100 | 5,000 | 4,418 | |||||||||
227,733 | |||||||||||
Health Care (2.8%): | |||||||||||
Alcon Finance Corp., 5.75%, 12/6/52, Callable 6/6/52 @ 100 (a) | 2,750 | 2,967 | |||||||||
Amgen, Inc., 3.00%, 1/15/52, Callable 7/15/51 @ 100 | 500 | 346 | |||||||||
Bayer U.S. Finance II LLC, 4.63%, 6/25/38, Callable 12/25/37 @ 100 (a) | 5,000 | 4,636 | |||||||||
Bio-Rad Laboratories, Inc., 3.70%, 3/15/32, Callable 12/15/31 @ 100 | 3,000 | 2,725 | |||||||||
Bon Secours Charity Health System, Inc., 5.25%, 11/1/25 | 5,000 | 4,840 | |||||||||
Centene Corp., 2.50%, 3/1/31, Callable 12/1/30 @ 100 | 16,679 | 13,650 | |||||||||
| CHS/Community Health System, Inc., 4.75%, 2/15/31, Callable 2/15/26 @ 102.38 (a) | 2,600 | 1,997 | |||||||||
| CVS Health Corp. 1.88%, 2/28/31, Callable 11/28/30 @ 100 (g) | 250 | 203 | |||||||||
4.88%, 7/20/35, Callable 1/20/35 @ 100 | 5,000 | 4,974 | |||||||||
CVS Pass-Through Trust, 5.93%, 1/10/34 (a) | 6,568 | 6,609 | |||||||||
DENTSPLY SIRONA, Inc., 3.25%, 6/1/30, Callable 3/1/30 @ 100 | 8,250 | 7,306 | |||||||||
Eastern Maine Healthcare Systems, 3.71%, 7/1/26 | 10,645 | 10,188 | |||||||||
| Fresenius Medical Care U.S. Finance III, Inc., 3.75%, 6/15/29, Callable 3/15/29 @ 100 (a) | 3,000 | 2,611 | |||||||||
GE HealthCare Technologies, Inc., 5.91%, 11/22/32, Callable 8/22/32 @ 100 (a) | 5,000 | 5,414 | |||||||||
HCA, Inc., 3.50%, 9/1/30, Callable 3/1/30 @ 100 | 7,000 | 6,275 | |||||||||
Illumina, Inc., 2.55%, 3/23/31, Callable 12/23/30 @ 100 | 3,250 | 2,696 | |||||||||
Prestige Brands, Inc., 3.75%, 4/1/31, Callable 4/1/26 @ 101.88 (a) | 941 | 798 | |||||||||
Tenet Healthcare Corp., 4.25%, 6/1/29, Callable 6/1/24 @ 102.13 | 200 | 178 | |||||||||
Universal Health Services, Inc., 2.65%, 1/15/32, Callable 10/15/31 @ 100 | 7,104 | 5,742 | |||||||||
84,155 | |||||||||||
Industrials (4.0%): | |||||||||||
Acuity Brands Lighting, Inc., 2.15%, 12/15/30, Callable 9/15/30 @ 100 | 5,000 | 4,008 | |||||||||
| Air Lease Corp. 3.13%, 12/1/30, Callable 9/1/30 @ 100 | 2,500 | 2,142 | |||||||||
2.88%, 1/15/32, Callable 10/15/31 @ 100 | 2,000 | 1,645 | |||||||||
| Alaska Airlines Pass Through Trust 8.00%, 2/15/27 (a) | 3,178 | 3,230 | |||||||||
4.80%, 2/15/29 (a) | 5,059 | 4,924 | |||||||||
| American Airlines Pass Through Trust 4.00%, 1/15/27 | 4,132 | 3,759 | |||||||||
3.60%, 10/15/29 | 1,513 | 1,269 | |||||||||
American Airlines, Inc./AAdvantage Loyalty IP Ltd., 5.75%, 4/20/29 (a) | 1,200 | 1,162 | |||||||||
| Ashtead Capital, Inc. 2.45%, 8/12/31, Callable 5/12/31 @ 100 (a) | 2,833 | 2,286 | |||||||||
5.50%, 8/11/32, Callable 5/11/32 @ 100 (a) | 3,000 | 3,022 | |||||||||
See notes to financial statements.
21
| USAA Mutual Funds Trust USAA Intermediate-Term Bond Fund | Schedule of Portfolio Investments — continued January 31, 2023 | ||||||
(Amounts in Thousands, Except for Shares) (Unaudited)
Security Description | Principal Amount | Value | |||||||||
| British Airways Pass Through Trust 4.63%, 12/20/25 (a) | $ | 5,571 | $ | 5,468 | |||||||
3.35%, 6/15/29 (a) | 1,819 | 1,582 | |||||||||
CDI Escrow Issuer, Inc., 5.75%, 4/1/30, Callable 4/1/25 @ 102.88 (a) | 1,000 | 948 | |||||||||
CoStar Group, Inc., 2.80%, 7/15/30, Callable 4/15/30 @ 100 (a) | 9,000 | 7,599 | |||||||||
Delta Air Lines Pass Through Trust, 2.50%, 12/10/29 | 4,258 | 3,611 | |||||||||
Delta Air Lines, Inc./SkyMiles IP Ltd., 4.75%, 10/20/28 (a) | 1,532 | 1,489 | |||||||||
FedEx Corp., 4.05%, 2/15/48, Callable 8/15/47 @ 100 | 3,000 | 2,460 | |||||||||
GXO Logistics, Inc., 2.65%, 7/15/31, Callable 4/15/31 @ 100 | 11,000 | 8,618 | |||||||||
Hawaiian Airlines Pass Through Certificates, 3.90%, 1/15/26 | 5,280 | 4,647 | |||||||||
JetBlue Pass Through Trust, 7.75%, 5/15/30 (g) | 3,957 | 3,893 | |||||||||
Kennametal, Inc., 4.63%, 6/15/28, Callable 3/15/28 @ 100 | 4,360 | 4,217 | |||||||||
| Lincoln Center for the Performing Arts, Inc., 3.71%, 12/1/35, Callable 9/1/35 @ 100 | 1,475 | 1,318 | |||||||||
Pentair Finance Sarl, 5.90%, 7/15/32, Callable 4/15/32 @ 100 | 250 | 259 | |||||||||
Regal Rexnord Corp., 6.40%, 4/15/33, Callable 1/15/33 @ 100 (a) | 2,954 | 3,025 | |||||||||
Southwest Airlines Co., 2.63%, 2/10/30, Callable 11/10/29 @ 100 (g) | 1,250 | 1,089 | |||||||||
| Spirit Loyalty Cayman Ltd./Spirit IP Cayman Ltd., 8.00%, 9/20/25, Callable 9/20/23 @ 104 (a) | 3,874 | 3,949 | |||||||||
| The Boeing Co. 5.15%, 5/1/30, Callable 2/1/30 @ 100 | 2,500 | 2,521 | |||||||||
5.81%, 5/1/50, Callable 11/1/49 @ 100 | 11,500 | 11,745 | |||||||||
The Timken Co., 4.13%, 4/1/32, Callable 1/1/32 @ 100 | 5,000 | 4,617 | |||||||||
| U.S. Airways Pass Through Trust 6.25%, 4/22/23 | 1,288 | 1,280 | |||||||||
7.13%, 4/22/25 | 962 | 960 | |||||||||
3.95%, 11/15/25 | 4,438 | 4,127 | |||||||||
| United Airlines Pass Through Trust 4.15%, 4/11/24 | 5,857 | 5,709 | |||||||||
4.30%, 8/15/25 | 3,016 | 2,869 | |||||||||
3.50%, 11/1/29 | 3,576 | 3,176 | |||||||||
XPO Escrow Sub LLC, 7.50%, 11/15/27, Callable 11/15/24 @ 103.75 (a) | 4,000 | 4,111 | |||||||||
122,734 | |||||||||||
Information Technology (2.0%): | |||||||||||
| Broadcom, Inc. 2.60%, 2/15/33, Callable 11/15/32 @ 100 (a) | 7,000 | 5,503 | |||||||||
3.42%, 4/15/33, Callable 1/15/33 @ 100 (a) | 5,000 | 4,196 | |||||||||
Dell International LLC/EMC Corp., 5.30%, 10/1/29, Callable 7/1/29 @ 100 | 2,000 | 2,019 | |||||||||
| Fidelity National Information Services, Inc., 5.10%, 7/15/32, Callable 4/15/32 @ 100 | 5,000 | 5,020 | |||||||||
Fiserv, Inc., 4.40%, 7/1/49, Callable 1/1/49 @ 100 | 5,000 | 4,289 | |||||||||
Global Payments, Inc., 4.15%, 8/15/49, Callable 2/15/49 @ 100 | 4,000 | 3,119 | |||||||||
Micron Technology, Inc., 2.70%, 4/15/32, Callable 1/15/32 @ 100 | 2,000 | 1,596 | |||||||||
Open Text Holdings, Inc., 4.13%, 12/1/31, Callable 12/1/26 @ 102.06 (a) | 2,500 | 2,032 | |||||||||
| Oracle Corp. 3.85%, 7/15/36, Callable 1/15/36 @ 100 | 9,000 | 7,762 | |||||||||
3.60%, 4/1/50, Callable 10/1/49 @ 100 | 3,500 | 2,576 | |||||||||
Qorvo, Inc., 3.38%, 4/1/31, Callable 4/1/26 @ 101.69 (a) | 9,000 | 7,460 | |||||||||
Seagate HDD Cayman, 9.63%, 12/1/32, Callable 12/1/27 @ 104.81 (a) | 4,398 | 4,981 | |||||||||
ServiceNow, Inc., 1.40%, 9/1/30, Callable 6/1/30 @ 100 | 2,000 | 1,585 | |||||||||
See notes to financial statements.
22
| USAA Mutual Funds Trust USAA Intermediate-Term Bond Fund | Schedule of Portfolio Investments — continued January 31, 2023 | ||||||
(Amounts in Thousands, Except for Shares) (Unaudited)
Security Description | Principal Amount | Value | |||||||||
Teledyne Technologies, Inc., 2.75%, 4/1/31, Callable 1/1/31 @ 100 | $ | 1,500 | $ | 1,274 | |||||||
Western Digital Corp., 3.10%, 2/1/32, Callable 11/1/31 @ 100 | 4,300 | 3,302 | |||||||||
Workday, Inc., 3.80%, 4/1/32, Callable 1/1/32 @ 100 | 3,750 | 3,429 | |||||||||
60,143 | |||||||||||
Materials (1.7%): | |||||||||||
Amcor Flexibles North America, Inc., 2.69%, 5/25/31, Callable 2/25/31 @ 100 | 5,663 | 4,789 | |||||||||
AptarGroup, Inc., 3.60%, 3/15/32, Callable 12/15/31 @ 100 | 8,732 | 7,634 | |||||||||
Avery Dennison Corp., 2.25%, 2/15/32, Callable 11/15/31 @ 100 | 5,281 | 4,222 | |||||||||
Berry Global, Inc., 4.88%, 7/15/26, Callable 3/13/23 @ 102.44 (a) | 2,111 | 2,055 | |||||||||
Celanese U.S. Holdings LLC, 6.33%, 7/15/29, Callable 5/15/29 @ 100 | 1,539 | 1,563 | |||||||||
Eagle Materials, Inc., 2.50%, 7/1/31, Callable 4/1/31 @ 100 | 7,278 | 5,947 | |||||||||
LYB International Finance III LLC, 3.38%, 10/1/40, Callable 4/1/40 @ 100 | 4,808 | 3,694 | |||||||||
Olin Corp., 5.00%, 2/1/30, Callable 2/1/24 @ 102.5 | 1,000 | 945 | |||||||||
Reliance Steel & Aluminum Co., 2.15%, 8/15/30, Callable 5/15/30 @ 100 | 1,300 | 1,077 | |||||||||
The Dow Chemical Co., 6.90%, 5/15/53, Callable 11/15/52 @ 100 | 2,769 | 3,285 | |||||||||
| Vulcan Materials Co. 3.50%, 6/1/30, Callable 3/1/30 @ 100 | 10,700 | 9,777 | |||||||||
4.50%, 6/15/47, Callable 12/15/46 @ 100 | 7,000 | 6,282 | |||||||||
51,270 | |||||||||||
Real Estate (2.2%): | |||||||||||
Alexandria Real Estate Equities, Inc., 1.88%, 2/1/33, Callable 11/1/32 @ 100 | 3,000 | 2,322 | |||||||||
Boston Properties LP, 2.45%, 10/1/33, Callable 7/1/33 @ 100 | 17,700 | 13,471 | |||||||||
CBRE Services, Inc., 2.50%, 4/1/31, Callable 1/1/31 @ 100 | 3,000 | 2,537 | |||||||||
Crown Castle, Inc., 2.90%, 4/1/41, Callable 10/1/40 @ 100 | 5,465 | 4,008 | |||||||||
Federal Realty Investment Trust, 3.50%, 6/1/30, Callable 3/1/30 @ 100 | 3,000 | 2,681 | |||||||||
| GLP Capital LP/GLP Financing II, Inc. 4.00%, 1/15/30, Callable 10/15/29 @ 100 | 3,726 | 3,379 | |||||||||
3.25%, 1/15/32, Callable 10/15/31 @ 100 | 4,100 | 3,413 | |||||||||
Healthpeak Properties, Inc., 2.88%, 1/15/31, Callable 10/15/30 @ 100 | 250 | 217 | |||||||||
Host Hotels & Resorts LP, 3.50%, 9/15/30, Callable 6/15/30 @ 100 | 6,143 | 5,269 | |||||||||
| Invitation Homes Operating Partnership LP, 2.70%, 1/15/34, Callable 10/15/33 @ 100 | 3,250 | 2,520 | |||||||||
| Keenan Development Associates of Tennessee LLC (INS — XL Capital Assurance), 5.02%, 7/15/28 (a) | 252 | 242 | |||||||||
Kilroy Realty LP, 2.50%, 11/15/32, Callable 8/15/32 @ 100 | 4,500 | 3,321 | |||||||||
| RHP Hotel Properties LP/RHP Finance Corp., 4.50%, 2/15/29, Callable 2/15/24 @ 102.25 (a) | 575 | 512 | |||||||||
RLJ Lodging Trust LP, 3.75%, 7/1/26, Callable 7/1/23 @ 101.88 (a) | 511 | 469 | |||||||||
| SBA Tower Trust 6.60%, 1/15/28, Callable 1/15/27 @ 100 (a) | 2,947 | 3,070 | |||||||||
2.33%, 7/15/52, Callable 7/15/26 @ 100 (a) | 3,000 | 2,564 | |||||||||
2.59%, 10/15/56 (a) | 5,000 | 4,033 | |||||||||
Simon Property Group LP, 2.25%, 1/15/32, Callable 10/15/31 @ 100 | 2,500 | 2,034 | |||||||||
The Howard Hughes Corp., 4.38%, 2/1/31, Callable 2/1/26 @ 102.19 (a) | 500 | 416 | |||||||||
| VICI Properties LP/VICI Note Co., Inc., 4.13%, 8/15/30, Callable 2/15/25 @ 102.06 (a) | 9,434 | 8,498 | |||||||||
Vornado Realty LP, 3.40%, 6/1/31, Callable 3/1/31 @ 100 | 2,000 | 1,548 | |||||||||
66,524 | |||||||||||
See notes to financial statements.
23
| USAA Mutual Funds Trust USAA Intermediate-Term Bond Fund | Schedule of Portfolio Investments — continued January 31, 2023 | ||||||
(Amounts in Thousands, Except for Shares) (Unaudited)
Security Description | Principal Amount | Value | |||||||||
Utilities (0.9%): | |||||||||||
Ameren Corp., 3.50%, 1/15/31, Callable 10/15/30 @ 100 | $ | 500 | $ | 459 | |||||||
Duquesne Light Holdings, Inc., 2.78%, 1/7/32, Callable 10/7/31 @ 100 (a) | 2,333 | 1,898 | |||||||||
Entergy Corp., 2.40%, 6/15/31, Callable 3/5/31 @ 100 | 3,000 | 2,481 | |||||||||
| NRG Energy, Inc. 2.45%, 12/2/27, Callable 10/2/27 @ 100 (a) | 7,550 | 6,478 | |||||||||
4.45%, 6/15/29, Callable 3/15/29 @ 100 (a) | 4,657 | 4,277 | |||||||||
South Jersey Industries, Inc., 5.02%, 4/15/31 | 3,000 | 2,389 | |||||||||
| Vistra Operations Co. LLC 3.70%, 1/30/27, Callable 11/30/26 @ 100 (a) | 5,395 | 5,017 | |||||||||
4.30%, 7/15/29, Callable 4/15/29 @ 100 (a) | 5,997 | 5,551 | |||||||||
28,550 | |||||||||||
Total Corporate Bonds (Cost $901,600) | 850,416 | ||||||||||
Yankee Dollars (5.8%) | |||||||||||
Communication Services (0.2%): | |||||||||||
| Rogers Communications, Inc. 3.80%, 3/15/32, Callable 12/15/31 @ 100 (a) | 3,500 | 3,150 | |||||||||
4.55%, 3/15/52, Callable 9/15/51 @ 100 (a) | 1,750 | 1,471 | |||||||||
4,621 | |||||||||||
Consumer Discretionary (0.5%): | |||||||||||
Bacardi Ltd., 2.75%, 7/15/26, Callable 4/15/26 @ 100 (a) | 2,000 | 1,845 | |||||||||
GENM Capital Labuan Ltd., 3.88%, 4/19/31, Callable 1/19/31 @ 100 (a) | 5,000 | 4,122 | |||||||||
IHO Verwaltungs GmbH 6.38%, 5/15/29, Callable 5/15/24 @ 103.19 (a) (m) | 6,077 | 5,316 | |||||||||
Nissan Motor Co. Ltd., 4.81%, 9/17/30, Callable 6/17/30 @ 100 (a) | 2,000 | 1,808 | |||||||||
Royal Caribbean Cruises Ltd., 5.50%, 4/1/28, Callable 10/1/27 @ 100 (a) | 2,000 | 1,720 | |||||||||
Sands China Ltd., 3.75%, 8/8/31, Callable 5/8/31 @ 100 | 2,000 | 1,675 | |||||||||
16,486 | |||||||||||
Consumer Staples (0.1%): | |||||||||||
Becle SAB de CV, 2.50%, 10/14/31, Callable 7/14/31 @ 100 (a) | 3,000 | 2,418 | |||||||||
Energy (0.7%): | |||||||||||
| BP Capital Markets PLC 4.38% (H15T5Y+404bps), Callable 6/22/25 @ 100 (b) (f) | 7,250 | 7,031 | |||||||||
4.88% (H15T5Y+440bps), Callable 3/22/30 @ 100 (b) (f) | 10,000 | 9,340 | |||||||||
Harbour Energy PLC, 5.50%, 10/15/26, Callable 10/15/23 @ 102.75 (a) | 1,000 | 920 | |||||||||
Petroleos Mexicanos, 10.00%, 2/7/33, Callable 11/7/32 @ 100 (a) | 1,000 | 977 | |||||||||
Var Energi ASA, 7.50%, 1/15/28, Callable 12/15/27 @ 100 (a) | 3,333 | 3,512 | |||||||||
21,780 | |||||||||||
Financials (2.2%): | |||||||||||
Banco Santander SA, 2.96%, 3/25/31 | 3,000 | 2,520 | |||||||||
Bank of Montreal, 3.09% (H15T5Y+140bps), 1/10/37, Callable 1/10/32 @ 100 (b) | 3,000 | 2,437 | |||||||||
Barclays PLC, 3.56% (H15T5Y+3bps), 9/23/35, Callable 9/23/30 @ 100 (b) | 5,000 | 4,116 | |||||||||
BNP Paribas, 2.87% (SOFR+1bps), 4/19/32, Callable 4/19/31 @ 100 (a) (b) | 3,000 | 2,515 | |||||||||
Brookfield Finance I UK PLC, 2.34%, 1/30/32, Callable 10/30/31 @ 100 (g) | 4,000 | 3,227 | |||||||||
| Credit Suisse Group AG 2.19% (SOFR+204bps), 6/5/26, Callable 6/5/25 @ 100 (a) (b) | 4,000 | 3,516 | |||||||||
3.09% (SOFR+173bps), 5/14/32, Callable 5/14/31 @ 100 (a) (b) | 4,000 | 3,040 | |||||||||
See notes to financial statements.
24
| USAA Mutual Funds Trust USAA Intermediate-Term Bond Fund | Schedule of Portfolio Investments — continued January 31, 2023 | ||||||
(Amounts in Thousands, Except for Shares) (Unaudited)
Security Description | Principal Amount | Value | |||||||||
Deutsche Bank AG, 3.74% (SOFR+226bps), 1/7/33, Callable 10/7/31 @ 100 (b) | $ | 10,500 | $ | 8,302 | |||||||
| HSBC Holdings PLC 8.11% (SOFR+425bps), 11/3/33, Callable 11/3/32 @ 100 (b) | 3,000 | 3,438 | |||||||||
6.80%, 6/1/38 | 4,000 | 4,258 | |||||||||
JAB Holdings BV, 3.75%, 5/28/51, Callable 11/28/50 @ 100 (a) | 8,000 | 5,239 | |||||||||
| Lloyds Banking Group PLC 3.57% (LIBOR03M+121bps), 11/7/28, Callable 11/7/27 @ 100 (b) | 2,000 | 1,870 | |||||||||
7.95% (H15T1Y+375bps), 11/15/33, Callable 8/15/32 @ 100 (b) | 1,818 | 2,077 | |||||||||
| Macquarie Bank Ltd., 3.05% (H15T5Y+170bps), 3/3/36, Callable 3/3/31 @ 100 (a) (b) | 6,350 | 4,940 | |||||||||
Mizuho Financial Group, Inc., 2.56%, 9/13/31 | 3,000 | 2,409 | |||||||||
Nationwide Building Society, 4.00%, 9/14/26 (a) | 2,118 | 1,985 | |||||||||
Natwest Group PLC, 3.07% (H15T1Y+255bps), 5/22/28, Callable 5/22/27 @ 100 (b) | 3,000 | 2,773 | |||||||||
| Santander UK Group Holdings PLC, 2.90% (SOFR+148bps), 3/15/32, Callable 3/15/31 @ 100 (b) | 2,000 | 1,631 | |||||||||
| Societe Generale SA 6.22% (H15T1Y+320bps), 6/15/33, Callable 6/15/32 @ 100 (a) (b) | 3,000 | 2,980 | |||||||||
4.03% (H15T1Y+190bps), 1/21/43, Callable 1/21/42 @ 100 (a) (b) | 1,250 | 924 | |||||||||
| Standard Chartered PLC, 4.87% (LIBOR03M+197bps), 3/15/33, Callable 3/15/28 @ 100 (a) (b) | 3,000 | 2,760 | |||||||||
| Westpac Banking Corp., 4.11% (H15T5Y+200bps), 7/24/34, Callable 7/24/29 @ 100 (b) | 2,000 | 1,807 | |||||||||
68,764 | |||||||||||
Health Care (0.1%): | |||||||||||
STERIS Irish FinCo Unlimited Co., 2.70%, 3/15/31, Callable 12/15/30 @ 100 | 3,000 | 2,567 | |||||||||
Industrials (0.9%): | |||||||||||
| Air Canada Pass Through Trust 3.88%, 9/15/24 (a) | 4,704 | 4,672 | |||||||||
4.13%, 5/15/25 (a) | 9,992 | 9,247 | |||||||||
3.75%, 12/15/27 (a) | 4,119 | 3,644 | |||||||||
| Avolon Holdings Funding Ltd. 5.50%, 1/15/26, Callable 12/15/25 @ 100 (a) | 3,000 | 2,938 | |||||||||
3.25%, 2/15/27, Callable 12/15/26 @ 100 (a) | 2,550 | 2,300 | |||||||||
Ferguson Finance PLC, 4.65%, 4/20/32, Callable 1/20/32 @ 100 (a) | 4,000 | 3,804 | |||||||||
Sydney Airport Finance Co. Pty Ltd., 3.63%, 4/28/26, Callable 1/28/26 @ 100 (a) | 2,000 | 1,898 | |||||||||
28,503 | |||||||||||
Information Technology (0.3%): | |||||||||||
| NXP BV/NXP Funding LLC/NXP USA, Inc., 2.65%, 2/15/32, Callable 11/15/31 @ 100 | 1,750 | 1,433 | |||||||||
Open Text Corp., 6.90%, 12/1/27, Callable 11/1/27 @ 100 (a) | 3,529 | 3,617 | |||||||||
SK Hynix, Inc., 6.50%, 1/17/33 (a) (g) | 3,036 | 3,079 | |||||||||
8,129 | |||||||||||
Materials (0.3%): | |||||||||||
ArcelorMittal SA, 6.80%, 11/29/32, Callable 8/29/32 @ 100 | 3,000 | 3,155 | |||||||||
Freeport Indonesia PT, 5.32%, 4/14/32, Callable 1/1/32 @ 100 (a) | 2,000 | 1,912 | |||||||||
Yara International ASA, 7.38%, 11/14/32, Callable 8/14/32 @ 100 (a) | 4,750 | 5,229 | |||||||||
10,296 | |||||||||||
See notes to financial statements.
25
| USAA Mutual Funds Trust USAA Intermediate-Term Bond Fund | Schedule of Portfolio Investments — continued January 31, 2023 | ||||||
(Amounts in Thousands, Except for Shares) (Unaudited)
Security Description | Principal Amount | Value | |||||||||
Real Estate (0.4%): | |||||||||||
| Ontario Teachers' Cadillac Fairview Properties Trust, 2.50%, 10/15/31, Callable 7/15/31 @ 100 (a) | $ | 14,750 | $ | 11,546 | |||||||
Sovereign Bond (0.1%): | |||||||||||
| Bermuda Government International Bond, 2.38%, 8/20/30, Callable 5/20/30 @ 100 (a) | 3,000 | 2,572 | |||||||||
Total Yankee Dollars (Cost $188,081) | 177,682 | ||||||||||
Municipal Bonds (2.6%) | |||||||||||
Alabama (0.1%): | |||||||||||
Auburn University Revenue, Series C, 1.85%, 6/1/31, Continuously Callable @100 | 750 | 596 | |||||||||
City of Homewood AL, GO, Series B, 1.89%, 9/1/32, Continuously Callable @100 | 1,850 | 1,437 | |||||||||
City of Trussville AL, GO, Series B, 1.78%, 10/1/31, Continuously Callable @100 | 1,000 | 790 | |||||||||
2,823 | |||||||||||
Arizona (0.2%): | |||||||||||
| City of Phoenix Civic Improvement Corp. Revenue 1.59%, 7/1/29 | 2,000 | 1,686 | |||||||||
1.84%, 7/1/31, Continuously Callable @100 | 1,000 | 821 | |||||||||
The University of Arizona Revenue, Series A, 1.82%, 6/1/30 | 3,070 | 2,551 | |||||||||
5,058 | |||||||||||
California (0.0%): (j) | |||||||||||
| City of Los Angeles Department of Airports Revenue, Series C, 1.96%, 5/15/33, Continuously Callable @100 | 675 | 524 | |||||||||
Colorado (0.1%): | |||||||||||
| City & County of Denver Co. Airport System Revenue, Series C, 2.52%, 11/15/32, Continuously Callable @100 | 5,000 | 4,164 | |||||||||
District of Columbia (0.1%): | |||||||||||
| District of Columbia Revenue 2.25%, 4/1/27 | 800 | 699 | |||||||||
2.68%, 4/1/31 | 1,500 | 1,210 | |||||||||
1,909 | |||||||||||
Florida (0.2%): | |||||||||||
City of Gainesville Florida Revenue, 2.04%, 10/1/30 | 2,500 | 2,078 | |||||||||
| County of Miami-Dade Florida Aviation Revenue, Series B, 2.61%, 10/1/32, Continuously Callable @100 | 1,000 | 837 | |||||||||
| County of Miami-Dade Seaport Department Revenue, Series B-3, 2.34%, 10/1/33, Continuously Callable @100 | 5,000 | 3,893 | |||||||||
6,808 | |||||||||||
Illinois (0.1%): | |||||||||||
Chicago O'Hare International Airport Revenue, Series D, 2.45%, 1/1/31 | 2,000 | 1,696 | |||||||||
| Chicago Transit Authority Sales Tax Receipts Fund Revenue, Series B, 3.10%, 12/1/30 | 750 | 683 | |||||||||
Illinois Finance Authority Revenue, 5.45%, 8/1/38 | 1,500 | 1,406 | |||||||||
3,785 | |||||||||||
See notes to financial statements.
26
| USAA Mutual Funds Trust USAA Intermediate-Term Bond Fund | Schedule of Portfolio Investments — continued January 31, 2023 | ||||||
(Amounts in Thousands, Except for Shares) (Unaudited)
Security Description | Principal Amount | Value | |||||||||
Indiana (0.1%): | |||||||||||
| Indiana Finance Authority Revenue Series B, 3.08%, 9/15/27 | $ | 1,130 | $ | 1,023 | |||||||
Series B, 3.18%, 9/15/28 | 1,000 | 891 | |||||||||
1,914 | |||||||||||
Louisiana (0.1%): | |||||||||||
| Louisiana Local Government Environmental Facilities & Community Development Authority Revenue, Series A, 4.48%, 8/1/39 | 2,245 | 2,183 | |||||||||
Louisiana Public Facilities Authority Revenue, 2.28%, 6/1/30 | 1,750 | 1,432 | |||||||||
3,615 | |||||||||||
Maryland (0.3%): | |||||||||||
| Maryland Economic Development Corp. Revenue Series B, 4.05%, 6/1/27 | 2,295 | 2,175 | |||||||||
Series B, 4.15%, 6/1/28 | 2,390 | 2,243 | |||||||||
Series B, 4.25%, 6/1/29 | 2,490 | 2,317 | |||||||||
Series B, 4.35%, 6/1/30 | 1,330 | 1,231 | |||||||||
Series B, 4.40%, 6/1/31 | 1,385 | 1,274 | |||||||||
9,240 | |||||||||||
Massachusetts (0.0%): (j) | |||||||||||
Massachusetts State College Building Authority Revenue, Series A, 1.80%, 5/1/29 | 5 | 4 | |||||||||
New Jersey (0.4%): | |||||||||||
| City of Atlantic, GO Series A, 4.23%, 9/1/25 | 2,525 | 2,455 | |||||||||
Series A, 4.29%, 9/1/26 | 2,410 | 2,328 | |||||||||
New Jersey Economic Development Authority Revenue, Series C, 5.71%, 6/15/30 | 2,500 | 2,543 | |||||||||
| New Jersey Transportation Trust Fund Authority Revenue, Build America Bond, Series C, 5.75%, 12/15/28 | 3,000 | 3,074 | |||||||||
Rutgers The State University of New Jersey Revenue, Series S, 1.76%, 5/1/29 | 2,000 | 1,677 | |||||||||
South Jersey Transportation Authority Revenue, Series B, 3.12%, 11/1/26 | 450 | 417 | |||||||||
12,494 | |||||||||||
New York (0.3%): | |||||||||||
| Metropolitan Transportation Authority Revenue, Build America Bond, Series E, 6.73%, 11/15/30 | 5,000 | 5,329 | |||||||||
| New York City IDA Revenue 2.68%, 3/1/33 | 1,000 | 804 | |||||||||
2.34%, 1/1/35 | 1,000 | 734 | |||||||||
2.44%, 1/1/36 | 1,250 | 901 | |||||||||
New York State Dormitory Authority Revenue, 2.01%, 7/1/28 | 750 | 658 | |||||||||
8,426 | |||||||||||
Oklahoma (0.0%): (j) | |||||||||||
| The University of Oklahoma Revenue, Series C, 2.45%, 7/1/32, Continuously Callable @100 | 1,200 | 979 | |||||||||
Pennsylvania (0.3%): | |||||||||||
| City of Philadelphia PA Water & Wastewater Revenue Series B, 1.73%, 11/1/28 | 1,000 | 854 | |||||||||
Series B, 1.88%, 11/1/29 | 1,000 | 837 | |||||||||
See notes to financial statements.
27
| USAA Mutual Funds Trust USAA Intermediate-Term Bond Fund | Schedule of Portfolio Investments — continued January 31, 2023 | ||||||
(Amounts in Thousands, Except for Shares) (Unaudited)
Security Description | Principal Amount | Value | |||||||||
City of Philadelphia, GO, Series A, 2.71%, 7/15/29 | $ | 1,000 | $ | 880 | |||||||
| City of Pittsburgh PA, GO Series B, 1.62%, 9/1/29 | 1,570 | 1,315 | |||||||||
Series B, 1.80%, 9/1/31, Continuously Callable @100 | 1,200 | 963 | |||||||||
| Pennsylvania Economic Development Financing Authority Revenue 2.62%, 3/1/29 | 1,855 | 1,646 | |||||||||
Series B, 3.20%, 11/15/27 | 1,000 | 928 | |||||||||
Public Parking Authority of Pittsburgh Revenue, 2.23%, 12/1/28 | 730 | 633 | |||||||||
8,056 | |||||||||||
Tennessee (0.0%): (j) | |||||||||||
| Metropolitan Government Nashville & Davidson County Sports Authority Revenue, Series C, 2.45%, 8/1/32, Continuously Callable @100 | 1,500 | 1,242 | |||||||||
Texas (0.3%): | |||||||||||
Central Texas Regional Mobility Authority Revenue, Series C, 2.19%, 1/1/29 | 855 | 745 | |||||||||
| City of Houston TX Airport System Revenue, Series C, 2.39%, 7/1/31, Continuously Callable @100 | 2,000 | 1,673 | |||||||||
County of Bexar TX Revenue, 2.43%, 8/15/33, Continuously Callable @100 | 1,500 | 1,188 | |||||||||
| Dallas/Fort Worth International Airport Revenue, Series C, 2.25%, 11/1/31, Continuously Callable @100 | 2,585 | 2,150 | |||||||||
| Harris County Cultural Education Facilities Finance Corp. Revenue 2.79%, 11/15/29 | 1,385 | 1,208 | |||||||||
Series D, 2.30%, 7/1/35 | 500 | 368 | |||||||||
| Tarrant County Cultural Education Facilities Finance Corp. Revenue, 2.41%, 9/1/31, Continuously Callable @100 | 1,000 | 827 | |||||||||
| Uptown Development Authority Tax Allocation, Series B, 2.68%, 9/1/32, Continuously Callable @100 | 400 | 333 | |||||||||
Waco Educational Finance Corp. Revenue, 1.79%, 3/1/29 | 1,500 | 1,272 | |||||||||
9,764 | |||||||||||
Total Municipal Bonds (Cost $92,054) | 80,805 | ||||||||||
U.S. Government Agency Mortgages (3.8%) | |||||||||||
| Federal Home Loan Mortgage Corp. 5.50%, 4/1/36 | 30 | 31 | |||||||||
5.00%, 9/1/52 – 10/1/52 | 8,198 | 8,228 | |||||||||
8,259 | |||||||||||
| Federal National Mortgage Association Series 2017-M7, Class A2, 2.96%, 2/25/27 (c) | 2,192 | 2,101 | |||||||||
2.50%, 7/1/27 – 11/1/34 | 6,611 | 6,244 | |||||||||
4.00%, 9/1/42 – 9/1/52 | 30,281 | 29,419 | |||||||||
3.50%, 9/1/47 – 2/1/50 | 23,352 | 22,268 | |||||||||
4.50%, 6/1/52 – 9/1/52 | 22,136 | 21,858 | |||||||||
5.00%, 6/1/52 | 9,476 | 9,511 | |||||||||
5.50%, 6/1/52 – 10/1/52 | 9,632 | 9,785 | |||||||||
6.00%, 7/1/52 | 5,803 | 5,961 | |||||||||
107,147 | |||||||||||
Total U.S. Government Agency Mortgages (Cost $122,514) | 115,406 | ||||||||||
See notes to financial statements.
28
| USAA Mutual Funds Trust USAA Intermediate-Term Bond Fund | Schedule of Portfolio Investments — continued January 31, 2023 | ||||||
(Amounts in Thousands, Except for Shares) (Unaudited)
Security Description | Shares or Principal Amount | Value | |||||||||
U.S. Treasury Obligations (19.0%) | |||||||||||
| U.S. Treasury Bonds 1.13%, 5/15/40 | $ | 80,000 | $ | 53,313 | |||||||
2.38%, 2/15/42 | 100,000 | 80,859 | |||||||||
3.25%, 5/15/42 | 28,000 | 25,970 | |||||||||
2.50%, 2/15/45 | 26,000 | 20,962 | |||||||||
3.38%, 11/15/48 | 10,000 | 9,452 | |||||||||
1.25%, 5/15/50 | 10,000 | 5,878 | |||||||||
2.88%, 5/15/52 | 17,500 | 15,091 | |||||||||
| U.S. Treasury Notes 0.63%, 8/15/30 | 65,000 | 52,924 | |||||||||
0.88%, 11/15/30 | 48,300 | 39,923 | |||||||||
1.13%, 2/15/31 | 80,000 | 67,375 | |||||||||
1.88%, 2/15/32 | 133,000 | 116,770 | |||||||||
2.75%, 8/15/32 | 100,000 | 94,141 | |||||||||
Total U.S. Treasury Obligations (Cost $641,523) | 582,658 | ||||||||||
Commercial Paper (4.3%) (k) | |||||||||||
| AutoNation, Inc. 4.84%, 2/1/23 (a) | 3,100 | 3,100 | |||||||||
4.87%, 2/2/23 (a) | 10,000 | 9,997 | |||||||||
Aviation Capital Group LLC, 4.44%, 2/1/23 (a) | 27,200 | 27,197 | |||||||||
Constellation Brands, Inc., 5.01%, 2/7/23 (a) | 10,000 | 9,990 | |||||||||
FMC Corp., 4.84%, 2/1/23 (a) | 9,000 | 8,999 | |||||||||
| Jabil, Inc. 5.04%, 2/1/23 (a) | 12,100 | 12,099 | |||||||||
5.07%, 2/2/23 (a) | 13,500 | 13,496 | |||||||||
5.18%, 2/6/23 (a) | 4,600 | 4,596 | |||||||||
| Newell Brands, Inc. 4.84%, 2/1/23 (a) | 10,000 | 9,999 | |||||||||
4.87%, 2/2/23 (a) | 8,500 | 8,498 | |||||||||
4.90%, 2/3/23 (a) | 8,600 | 8,596 | |||||||||
Quanta Services, Inc., 4.93%, 2/3/23 (a) | 7,000 | 6,997 | |||||||||
Targa Resources Corp., 4.30%, 2/3/23 (a) | 10,000 | 9,996 | |||||||||
Total Commercial Paper (Cost $133,576) | 133,560 | ||||||||||
Collateral for Securities Loaned (0.4%)^ | |||||||||||
| Goldman Sachs Financial Square Government Fund, Institutional Shares, 4.22% (l) | 2,765,327 | 2,765 | |||||||||
HSBC U.S. Government Money Market Fund, Institutional Shares, 4.21% (l) | 2,765,327 | 2,765 | |||||||||
Invesco Government & Agency Portfolio, Institutional Shares, 4.31% (l) | 2,825,264 | 2,825 | |||||||||
| Morgan Stanley Institutional Liquidity Government Portfolio, Institutional Shares, 4.14% (l) | 2,705,390 | 2,706 | |||||||||
Total Collateral for Securities Loaned (Cost $11,061) | 11,061 | ||||||||||
Total Investments (Cost $3,306,293) — 100.4% | 3,084,305 | ||||||||||
Liabilities in excess of other assets — (0.4)% | (13,380 | ) | |||||||||
NET ASSETS — 100.00% | $ | 3,070,925 | |||||||||
See notes to financial statements.
29
| USAA Mutual Funds Trust USAA Intermediate-Term Bond Fund | Schedule of Portfolio Investments — continued January 31, 2023 | ||||||
(Unaudited)
At January 31, 2023, the Fund's investments in foreign securities were 11.2% of net assets.
^ Purchased with cash collateral from securities on loan.
(a) Rule 144A security or other security that is restricted as to resale to institutional investors. As of January 31, 2023, the fair value of these securities was $1,475,875 thousands and amounted to 48.1% of net assets.
(b) Variable or Floating-Rate Security. Rate disclosed is as of January 31, 2023.
(c) The rate for certain asset-backed and mortgage-backed securities may vary based on factors relating to the pool of assets underlying the security. The rate disclosed is the rate in effect at January 31, 2023.
(d) Security is interest only.
(e) Rounds to less than $1 thousand.
(f) Security is perpetual and has no final maturity date but may be subject to calls at various dates in the future.
(g) All or a portion of this security is on loan.
(h) Security or portion of security purchased on a delayed-delivery and/or when-issued basis.
(i) The rates for this senior secured loan will be known on settlement date of the loan, subsequent to this report date. Senior secured loans have rates that will fluctuate over time in line with prevailing interest rates.
(j) Amount represents less than 0.05% of net assets.
(k) Rate represents the effective yield at January 31, 2023.
(l) Rate disclosed is the daily yield on January 31, 2023.
(m) Up to 7.13% of the coupon may be PIK.
bps — Basis points
Continuously callable — Investment is continuously callable or will be continuously callable on any date after the first call date until its maturity.
GO — General Obligation
H15T1Y — 1 Year Treasury Constant Maturity Rate
H15T5Y — 5 Year Treasury Constant Maturity Rate
H15T10Y — 10 Year Treasury Constant Maturity Rate
IDA — Industrial Development Authority
LIBOR — London Interbank Offered Rate
LIBOR01M — 1 Month US Dollar LIBOR, rate disclosed as of January 31, 2023, based on the last reset date of the security
LIBOR03M — 3 Month US Dollar LIBOR, rate disclosed as of January 31, 2023, based on the last reset date of the security
LLC — Limited Liability Company
LP — Limited Partnership
See notes to financial statements.
30
| USAA Mutual Funds Trust USAA Intermediate-Term Bond Fund | Schedule of Portfolio Investments — continued January 31, 2023 | ||||||
(Unaudited)
MTN — Medium Term Note
PIK — Payment in-kind
PLC — Public Limited Company
SOFR — Secured Overnight Financing Rate
SOFR30A — 30-day average of SOFR, rate disclosed as of January 31, 2023.
SOFR01M — 1 Month SOFR, rate disclosed as of January 31, 2023.
SOFR03M — 3 Month SOFR, rate disclosed as of January 31, 2023.
TSFR1M — 1 month Term SOFR, rate disclosed as of January 31, 2023.
TSFR3M — 3 month Term SOFR, rate disclosed as of January 31, 2023.
Credit Enhancements — Adds the financial strength of the provider of the enhancement to support the issuer's ability to repay the principal and interest payments when due. The enhancement may be provided by a high-quality bank, insurance company or other corporation, or a collateral trust. The enhancements do not guarantee the market values of the securities.
INS Principal and interest payments are insured by the name listed. Although bond insurance reduces the risk of loss due to default by an issuer, such bonds remain subject to the risk that value may fluctuate for other reasons, and there is no assurance that the insurance company will meet its obligations.
Futures Contracts Purchased | |||||||||||||||||||||||
(Amounts not in thousands) | |||||||||||||||||||||||
| Number of Contracts | Expiration Date | Notional Amount | Value | Unrealized Appreciation/ (Depreciation) | |||||||||||||||||||
10-Year U.S. Treasury Note Futures | 630 | 3/22/23 | $ | 70,992,463 | $ | 72,144,844 | $ | 1,152,381 | |||||||||||||||
30-Year U.S. Treasury Bond Futures | 660 | 3/22/23 | 82,745,808 | 85,717,500 | 2,971,692 | ||||||||||||||||||
5-Year U.S. Treasury Note Futures | 180 | 3/31/23 | 19,451,032 | 19,663,594 | 212,562 | ||||||||||||||||||
$ | 4,336,635 | ||||||||||||||||||||||
Total unrealized appreciation | $ | 4,336,635 | |||||||||||||||||||||
Total unrealized depreciation | — | ||||||||||||||||||||||
Total net unrealized appreciation (depreciation) | $ | 4,336,635 | |||||||||||||||||||||
See notes to financial statements.
31
USAA Mutual Funds Trust | Statement of Assets and Liabilities January 31, 2023 | ||||||
(Amounts in Thousands, Except Per Share Amounts) (Unaudited)
| USAA Intermediate- Term Bond Fund | |||||||
Assets: | |||||||
Investments, at value (Cost $3,306,293) | $ | 3,084,305 | (a) | ||||
Cash | 4,715 | ||||||
Deposit with broker for futures contracts | 15,241 | ||||||
Receivables: | |||||||
Interest and dividends | 21,001 | ||||||
Capital shares issued | 4,785 | ||||||
Investments sold | 7,092 | ||||||
Variation margin on open futures contracts | 248 | ||||||
From Adviser | 103 | ||||||
Prepaid expenses | 29 | ||||||
Total Assets | 3,137,519 | ||||||
Liabilities: | |||||||
Payables: | |||||||
Collateral received on loaned securities | 11,061 | ||||||
Distributions | 308 | ||||||
Investments purchased | 49,986 | ||||||
Capital shares redeemed | 3,509 | ||||||
Accrued expenses and other payables: | |||||||
Investment advisory fees | 948 | ||||||
Administration fees | 311 | ||||||
Custodian fees | 56 | ||||||
Transfer agent fees | 250 | ||||||
Compliance fees | 3 | ||||||
Trustees' fees | — | (b) | |||||
| 12b-1 fees | 7 | ||||||
Other accrued expenses | 155 | ||||||
Total Liabilities | 66,594 | ||||||
(continues on next page)
See notes to financial statements.
32
USAA Mutual Funds Trust | Statement of Assets and Liabilities January 31, 2023 | ||||||
(Amounts in Thousands, Except Per Share Amounts) (Unaudited) (continued)
| USAA Intermediate- Term Bond Fund | |||||||
Net Assets: | |||||||
Capital | $ | 3,466,137 | |||||
Total accumulated earnings/(loss) | (395,212 | ) | |||||
Net Assets | $ | 3,070,925 | |||||
Net Assets | |||||||
Fund Shares | $ | 1,453,849 | |||||
Institutional Shares | 1,318,889 | ||||||
Class A | 55,188 | ||||||
Class C | 1,575 | ||||||
R6 Shares | 241,424 | ||||||
Total | $ | 3,070,925 | |||||
Shares (unlimited number of shares authorized with no par value): | |||||||
Fund Shares | 156,681 | ||||||
Institutional Shares | 142,103 | ||||||
Class A | 5,955 | ||||||
Class C | 170 | ||||||
R6 Shares | 26,010 | ||||||
Total | 330,919 | ||||||
Net asset value, offering and redemption price per share: (c) | |||||||
Fund Shares | $ | 9.28 | |||||
Institutional Shares | 9.28 | ||||||
Class A | 9.27 | ||||||
Class C (d) | 9.27 | ||||||
R6 Shares | 9.28 | ||||||
Maximum Sales Charge — Class A | 2.25 | % | |||||
| Maximum offering price (100%/(100%-maximum sales charge) of net asset value adjusted to the nearest cent) per share — Class A | $ | 9.48 | |||||
(a) Includes $8,519 thousand of securities on loan.
(b) Rounds to less than $1 thousand.
(c) Per share amount may not recalculate due to rounding of net assets and/or shares outstanding.
(d) Redemption price per share varies by the length of time shares are held.
See notes to financial statements.
33
USAA Mutual Funds Trust | Statement of Operations For the Six Months Ended January 31, 2023 | ||||||
(Amounts in Thousands) (Unaudited)
| USAA Intermediate- Term Bond Fund | |||||||
Investment Income: | |||||||
Dividends | $ | 577 | |||||
Interest | 65,222 | ||||||
Securities lending (net of fees) | 42 | ||||||
Total Income | 65,841 | ||||||
Expenses: | |||||||
Investment advisory fees | 5,714 | ||||||
Administration fees — Fund Shares | 1,095 | ||||||
Administration fees — Institutional Shares | 681 | ||||||
Administration fees — Class A | 39 | ||||||
Administration fees — Class C | 1 | ||||||
Administration fees — R6 Shares | 45 | ||||||
Sub-Administration fees | 15 | ||||||
| 12b-1 fees — Class A | 65 | ||||||
| 12b-1 fees — Class C | 9 | ||||||
Custodian fees | 147 | ||||||
Transfer agent fees — Fund Shares | 816 | ||||||
Transfer agent fees — Institutional Shares | 681 | ||||||
Transfer agent fees — Class A | 26 | ||||||
Transfer agent fees — Class C | 1 | ||||||
Transfer agent fees — R6 Shares | 9 | ||||||
Trustees' fees | 24 | ||||||
Compliance fees | 15 | ||||||
Legal and audit fees | 53 | ||||||
State registration and filing fees | 78 | ||||||
Other expenses | 258 | ||||||
Total Expenses | 9,772 | ||||||
Expenses waived/reimbursed by Adviser | (284 | ) | |||||
Net Expenses | 9,488 | ||||||
Net Investment Income (Loss) | 56,353 | ||||||
Realized/Unrealized Gains (Losses) from Investments: | |||||||
Net realized gains (losses) from investment securities | (74,646 | ) | |||||
Net realized gains (losses) from futures contracts | (11,942 | ) | |||||
Net change in unrealized appreciation/depreciation on investment securities | (3,225 | ) | |||||
Net change in unrealized appreciation/depreciation on futures contracts | 759 | ||||||
Net realized/unrealized gains (losses) on investments | (89,054 | ) | |||||
Change in net assets resulting from operations | $ | (32,701 | ) | ||||
See notes to financial statements.
34
USAA Mutual Funds Trust | Statements of Changes in Net Assets | ||||||
(Amounts in Thousands)
| USAA Intermediate- Term Bond Fund | |||||||||||
| Six Months Ended January 31, 2023 (Unaudited) | Year Ended July 31, 2022 | ||||||||||
From Investments: | |||||||||||
Operations: | |||||||||||
Net Investment Income (Loss) | $ | 56,353 | $ | 86,872 | |||||||
Net realized gains (losses) | (86,588 | ) | (78,278 | ) | |||||||
Net change in unrealized appreciation/depreciation | (2,466 | ) | (361,948 | ) | |||||||
Change in net assets resulting from operations | (32,701 | ) | (353,354 | ) | |||||||
Distributions to Shareholders: | |||||||||||
Fund Shares | (26,760 | ) | (89,596 | ) | |||||||
Institutional Shares | (25,323 | ) | (84,811 | ) | |||||||
Class A | (891 | ) | (2,286 | ) | |||||||
Class C | (24 | ) | (90 | ) | |||||||
R6 Shares | (3,528 | ) | (7,269 | ) | |||||||
| Change in net assets resulting from distributions to shareholders | (56,526 | ) | (184,052 | ) | |||||||
Change in net assets resulting from capital transactions | (106,717 | ) | (143,545 | ) | |||||||
Change in net assets | (195,944 | ) | (680,951 | ) | |||||||
Net Assets: | |||||||||||
Beginning of period | 3,266,869 | 3,947,820 | |||||||||
End of period | $ | 3,070,925 | $ | 3,266,869 | |||||||
Capital Transactions: | |||||||||||
Fund Shares | |||||||||||
Proceeds from shares issued | $ | 78,174 | $ | 180,520 | |||||||
Distributions reinvested | 25,869 | 87,208 | |||||||||
Cost of shares redeemed | (158,044 | ) | (365,222 | ) | |||||||
Total Fund Shares | $ | (54,001 | ) | $ | (97,494 | ) | |||||
Institutional Shares | |||||||||||
Proceeds from shares issued | $ | 157,729 | $ | 523,253 | |||||||
Distributions reinvested | 24,455 | 82,792 | |||||||||
Cost of shares redeemed | (319,738 | ) | (761,725 | ) | |||||||
Total Institutional Shares | $ | (137,554 | ) | $ | (155,680 | ) | |||||
Class A | |||||||||||
Proceeds from shares issued | $ | 8,795 | $ | 21,469 | |||||||
Distributions reinvested | 861 | 2,213 | |||||||||
Cost of shares redeemed | (5,341 | ) | (11,138 | ) | |||||||
Total Class A | $ | 4,315 | $ | 12,544 | |||||||
Class C | |||||||||||
Proceeds from shares issued | $ | — | (a) | $ | 947 | ||||||
Distributions reinvested | 24 | 89 | |||||||||
Cost of shares redeemed | (446 | ) | (1,188 | ) | |||||||
Total Class C | $ | (422 | ) | $ | (152 | ) | |||||
R6 Shares | |||||||||||
Proceeds from shares issued | $ | 101,400 | $ | 135,288 | |||||||
Distributions reinvested | 3,512 | 7,221 | |||||||||
Cost of shares redeemed | (23,967 | ) | (45,272 | ) | |||||||
Total R6 Shares | $ | 80,945 | $ | 97,237 | |||||||
Change in net assets resulting from capital transactions | $ | (106,717 | ) | $ | (143,545 | ) | |||||
(continues on next page)
See notes to financial statements.
35
USAA Mutual Funds Trust | Statements of Changes in Net Assets | ||||||
(Amounts in Thousands) (continued)
| USAA Intermediate- Term Bond Fund | |||||||||||
| Six Months Ended January 31, 2023 (Unaudited) | Year Ended July 31, 2022 | ||||||||||
Share Transactions: | |||||||||||
Fund Shares | |||||||||||
Issued | 8,634 | 17,357 | |||||||||
Reinvested | 2,864 | 8,379 | |||||||||
Redeemed | (17,392 | ) | (35,775 | ) | |||||||
Total Fund Shares | (5,894 | ) | (10,039 | ) | |||||||
Institutional Shares | |||||||||||
Issued | 17,331 | 49,628 | |||||||||
Reinvested | 2,709 | 7,963 | |||||||||
Redeemed | (35,144 | ) | (72,261 | ) | |||||||
Total Institutional Shares | (15,104 | ) | (14,670 | ) | |||||||
Class A | |||||||||||
Issued | 968 | 2,111 | |||||||||
Reinvested | 95 | 214 | |||||||||
Redeemed | (589 | ) | (1,090 | ) | |||||||
Total Class A | 474 | 1,235 | |||||||||
Class C | |||||||||||
Issued | — | (b) | 90 | ||||||||
Reinvested | 3 | 9 | |||||||||
Redeemed | (49 | ) | (113 | ) | |||||||
Total Class C | (46 | ) | (14 | ) | |||||||
R6 Shares | |||||||||||
Issued | 11,104 | 13,129 | |||||||||
Reinvested | 389 | 700 | |||||||||
Redeemed | (2,642 | ) | (4,597 | ) | |||||||
Total R6 Shares | 8,851 | 9,232 | |||||||||
Change in Shares | (11,719 | ) | (14,256 | ) | |||||||
(a) Rounds to less than $1 thousand.
(b) Rounds to less than 1 thousand shares.
See notes to financial statements.
36
USAA Mutual Funds Trust | Financial Highlights | ||||||
For a Share Outstanding Throughout Each Period
USAA Intermediate-Term Bond Fund | |||||||||||||||||||||||||||
Fund Shares | |||||||||||||||||||||||||||
| Six Months Ended January 31, 2023 (Unaudited) | Year Ended July 31, 2022 | Year Ended July 31, 2021 | Year Ended July 31, 2020 | Year Ended July 31, 2019 | Year Ended July 31, 2018 | ||||||||||||||||||||||
| Net Asset Value, Beginning of Period | $ | 9.53 | $ | 11.06 | $ | 11.21 | $ | 10.78 | $ | 10.33 | $ | 10.70 | |||||||||||||||
Investment Activities: | |||||||||||||||||||||||||||
Net investment income (loss) | 0.17 | (a) | 0.25 | (a) | 0.28 | (a) | 0.36 | (a) | 0.38 | 0.37 | |||||||||||||||||
| Net realized and unrealized gains (losses) | (0.25 | ) | (1.25 | ) | 0.25 | 0.58 | 0.46 | (0.37 | ) | ||||||||||||||||||
| Total from Investment Activities | (0.08 | ) | (1.00 | ) | 0.53 | 0.94 | 0.84 | — | |||||||||||||||||||
Distributions to Shareholders from: | |||||||||||||||||||||||||||
Net investment income | (0.17 | ) | (0.25 | ) | (0.28 | ) | (0.36 | ) | (0.39 | ) | (0.37 | ) | |||||||||||||||
Net realized gains | — | (0.28 | ) | (0.40 | ) | (0.15 | ) | — | — | ||||||||||||||||||
Total Distributions | (0.17 | ) | (0.53 | ) | (0.68 | ) | (0.51 | ) | (0.39 | ) | (0.37 | ) | |||||||||||||||
Net Asset Value, End of Period | $ | 9.28 | $ | 9.53 | $ | 11.06 | $ | 11.21 | $ | 10.78 | $ | 10.33 | |||||||||||||||
Total Return (b) (c) | (0.80 | )% | (9.39 | )% | 4.83 | % | 8.94 | % | 8.28 | % | (0.03 | )% | |||||||||||||||
Ratios to Average Net Assets: | |||||||||||||||||||||||||||
Net Expenses (d) (e) (f) (g) | 0.66 | % | 0.65 | % | 0.63 | % | 0.58 | % | 0.64 | % | 0.63 | % | |||||||||||||||
Net Investment Income (Loss) (d) | 3.65 | % | 2.39 | % | 2.50 | % | 3.32 | % | 3.71 | % | 3.50 | % | |||||||||||||||
Gross Expenses (d) (e) | 0.67 | % | 0.65 | % | 0.63 | % | 0.58 | % | 0.64 | % | 0.63 | % | |||||||||||||||
Supplemental Data: | |||||||||||||||||||||||||||
Net Assets at end of period (000's) | $ | 1,453,849 | $ | 1,549,932 | $ | 1,909,199 | $ | 1,960,334 | $ | 1,949,989 | $ | 1,907,941 | |||||||||||||||
Portfolio Turnover (b) (h) | 24 | % | 65 | % | 69 | % | 73 | %(i) | 35 | % | 15 | % | |||||||||||||||
(a) Per share net investment income (loss) has been calculated using the average daily shares method.
(b) Not annualized for periods less than one year.
(c) Assumes reinvestment of all net investment income and realized capital gain distributions, if any, during the period. Includes adjustments in accordance with U.S. Generally Accepted Accounting Principles and could differ from the Lipper reported return.
(d) Annualized for periods less than one year.
(e) Does not include acquired fund fees and expenses, if any.
(f) The net expense ratio may not correlate to the applicable expense limits in place during the period since the current contractual expense limitation is applied for a period beginning July 1, 2019 and in effect through November 30, 2023, instead of coinciding with the Fund's fiscal year end. Details of the current contractual expense limitation in effect can be found in Note 5 of the accompanying Notes to Financial Statements.
(g) From the period beginning July 1, 2019, the amount of any waivers or reimbursements and the amount of any recoupment is calculated without regard to the impact of any performance adjustment to the Fund's management fee.
(h) Portfolio turnover is calculated on the basis of the Fund as a whole without distinguishing between the classes of shares.
(i) Reflects increased trading activity due to transition or asset allocation shift.
(continues on next page)
See notes to financial statements.
37
USAA Mutual Funds Trust | Financial Highlights — continued | ||||||
For a Share Outstanding Throughout Each Period
USAA Intermediate-Term Bond Fund | |||||||||||||||||||||||||||
Institutional Shares | |||||||||||||||||||||||||||
| Six Months Ended January 31, 2023 (Unaudited) | Year Ended July 31, 2022 | Year Ended July 31, 2021 | Year Ended July 31, 2020 | Year Ended July 31, 2019 | Year Ended July 31, 2018 | ||||||||||||||||||||||
| Net Asset Value, Beginning of Period | $ | 9.54 | $ | 11.06 | $ | 11.22 | $ | 10.78 | $ | 10.33 | $ | 10.70 | |||||||||||||||
Investment Activities: | |||||||||||||||||||||||||||
Net investment income (loss) | 0.17 | (a) | 0.25 | (a) | 0.28 | (a) | 0.37 | (a) | 0.39 | 0.38 | |||||||||||||||||
| Net realized and unrealized gains (losses) | (0.26 | ) | (1.24 | ) | 0.24 | 0.59 | 0.45 | (0.37 | ) | ||||||||||||||||||
| Total from Investment Activities | (0.09 | ) | (0.99 | ) | 0.52 | 0.96 | 0.84 | 0.01 | |||||||||||||||||||
Distributions to Shareholders from: | |||||||||||||||||||||||||||
Net investment income | (0.17 | ) | (0.25 | ) | (0.28 | ) | (0.37 | ) | (0.39 | ) | (0.38 | ) | |||||||||||||||
Net realized gains | — | (0.28 | ) | (0.40 | ) | (0.15 | ) | — | — | ||||||||||||||||||
Total Distributions | (0.17 | ) | (0.53 | ) | (0.68 | ) | (0.52 | ) | (0.39 | ) | (0.38 | ) | |||||||||||||||
Net Asset Value, End of Period | $ | 9.28 | $ | 9.54 | $ | 11.06 | $ | 11.22 | $ | 10.78 | $ | 10.33 | |||||||||||||||
Total Return (b) (c) | (0.87 | )% | (9.24 | )% | 4.80 | % | 9.11 | % | 8.35 | % | 0.04 | % | |||||||||||||||
Ratios to Average Net Assets: | |||||||||||||||||||||||||||
Net Expenses (d) (e) (f) (g) | 0.60 | % | 0.58 | % | 0.57 | % | 0.51 | % | 0.58 | % | 0.56 | % | |||||||||||||||
Net Investment Income (Loss) (d) | 3.71 | % | 2.46 | % | 2.56 | % | 3.39 | % | 3.77 | % | 3.57 | % | |||||||||||||||
Gross Expenses (d) (e) | 0.62 | % | 0.60 | % | 0.59 | % | 0.52 | % | 0.58 | % | 0.56 | % | |||||||||||||||
Supplemental Data: | |||||||||||||||||||||||||||
Net Assets at end of period (000's) | $ | 1,318,889 | $ | 1,499,048 | $ | 1,901,458 | $ | 1,791,887 | $ | 1,798,154 | $ | 1,964,377 | |||||||||||||||
Portfolio Turnover (b) (h) | 24 | % | 65 | % | 69 | % | 73 | %(i) | 35 | % | 15 | % | |||||||||||||||
(a) Per share net investment income (loss) has been calculated using the average daily shares method.
(b) Not annualized for periods less than one year.
(c) Assumes reinvestment of all net investment income and realized capital gain distributions, if any, during the period. Includes adjustments in accordance with U.S. Generally Accepted Accounting Principles and could differ from the Lipper reported return.
(d) Annualized for periods less than one year.
(e) Does not include acquired fund fees and expenses, if any.
(f) The net expense ratio may not correlate to the applicable expense limits in place during the period since the current contractual expense limitation is applied for a period beginning July 1, 2019 and in effect through November 30, 2023, instead of coinciding with the Fund's fiscal year end. Details of the current contractual expense limitation in effect can be found in Note 5 of the accompanying Notes to Financial Statements.
(g) From the period beginning July 1, 2019, the amount of any waivers or reimbursements and the amount of any recoupment is calculated without regard to the impact of any performance adjustment to the Fund's management fee.
(h) Portfolio turnover is calculated on the basis of the Fund as a whole without distinguishing between the classes of shares.
(i) Reflects increased trading activity due to transition or asset allocation shift.
(continues on next page)
See notes to financial statements.
38
USAA Mutual Funds Trust | Financial Highlights — continued | ||||||
For a Share Outstanding Throughout Each Period
USAA Intermediate-Term Bond Fund | |||||||||||||||||||||||||||
Class A | |||||||||||||||||||||||||||
| Six Months Ended January 31, 2023 (Unaudited) | Year Ended July 31, 2022 | Year Ended July 31, 2021 | Year Ended July 31, 2020 | Year Ended July 31, 2019 | Year Ended July 31, 2018 | |||||||||||||||||||||
| Net Asset Value, Beginning of Period | $ | 9.52 | $ | 11.05 | $ | 11.20 | $ | 10.77 | $ | 10.32 | $ | 10.69 | |||||||||||||||
Investment Activities: | |||||||||||||||||||||||||||
Net investment income (loss) | 0.16 | (a) | 0.22 | (a) | 0.25 | (a) | 0.33 | (a) | 0.35 | 0.34 | |||||||||||||||||
| Net realized and unrealized gains (losses) | (0.25 | ) | (1.25 | ) | 0.25 | 0.58 | 0.45 | (0.37 | ) | ||||||||||||||||||
| Total from Investment Activities | (0.09 | ) | (1.03 | ) | 0.50 | 0.91 | 0.80 | (0.03 | ) | ||||||||||||||||||
Distributions to Shareholders from: | |||||||||||||||||||||||||||
Net investment income | (0.16 | ) | (0.22 | ) | (0.25 | ) | (0.33 | ) | (0.35 | ) | (0.34 | ) | |||||||||||||||
Net realized gains | — | (0.28 | ) | (0.40 | ) | (0.15 | ) | — | — | ||||||||||||||||||
Total Distributions | (0.16 | ) | (0.50 | ) | (0.65 | ) | (0.48 | ) | (0.35 | ) | (0.34 | ) | |||||||||||||||
Net Asset Value, End of Period | $ | 9.27 | $ | 9.52 | $ | 11.05 | $ | 11.20 | $ | 10.77 | $ | 10.32 | |||||||||||||||
| Total Return (excludes sales charges) (b) (c) | (0.93 | )% | (9.64 | )% | 4.55 | % | 8.66 | % | 7.97 | % | (0.31 | )% | |||||||||||||||
Ratios to Average Net Assets: | |||||||||||||||||||||||||||
Net Expenses (d) (e) (f) (g) | 0.92 | % | 0.92 | % | 0.91 | % | 0.86 | % | 0.93 | % | 0.90 | % | |||||||||||||||
Net Investment Income (Loss) (d) | 3.41 | % | 2.16 | % | 2.22 | % | 3.06 | % | 3.42 | % | 3.22 | % | |||||||||||||||
Gross Expenses (d) (e) | 0.92 | % | 0.92 | % | 0.92 | % | 0.86 | % | 0.93 | % | 0.90 | % | |||||||||||||||
Supplemental Data: | |||||||||||||||||||||||||||
Net Assets at end of period (000's) | $ | 55,188 | $ | 52,190 | $ | 46,911 | $ | 45,991 | $ | 50,892 | $ | 53,308 | |||||||||||||||
Portfolio Turnover (b) (h) | 24 | % | 65 | % | 69 | % | 73 | %(i) | 35 | % | 15 | % | |||||||||||||||
(a) Per share net investment income (loss) has been calculated using the average daily shares method.
(b) Not annualized for periods less than one year.
(c) Assumes reinvestment of all net investment income and realized capital gain distributions, if any, during the period. Includes adjustments in accordance with U.S. Generally Accepted Accounting Principles and could differ from the Lipper reported return.
(d) Annualized for periods less than one year.
(e) Does not include acquired fund fees and expenses, if any.
(f) The net expense ratio may not correlate to the applicable expense limits in place during the period since the current contractual expense limitation is applied for a period beginning July 1, 2019 and in effect through November 30, 2023, instead of coinciding with the Fund's fiscal year end. Details of the current contractual expense limitation in effect can be found in Note 5 of the accompanying Notes to Financial Statements.
(g) From the period beginning July 1, 2019, the amount of any waivers or reimbursements and the amount of any recoupment is calculated without regard to the impact of any performance adjustment to the Fund's management fee.
(h) Portfolio turnover is calculated on the basis of the Fund as a whole without distinguishing between the classes of shares.
(i) Reflects increased trading activity due to transition or asset allocation shift.
(continues on next page)
See notes to financial statements.
39
USAA Mutual Funds Trust | Financial Highlights — continued | ||||||
For a Share Outstanding Throughout Each Period
USAA Intermediate-Term Bond Fund | |||||||||||||||||||
Class C Shares | |||||||||||||||||||
| Six Months Ended January 31, 2023 (Unaudited) | Year Ended July 31, 2022 | Year Ended July 31, 2021 | June 29, 2020(a) through July 31, 2020 | ||||||||||||||||
| Net Asset Value, Beginning of Period | $ | 9.53 | $ | 11.05 | $ | 11.20 | $ | 10.99 | |||||||||||
Investment Activities: | |||||||||||||||||||
Net investment income (loss) (b) | 0.13 | 0.15 | 0.16 | 0.02 | |||||||||||||||
| Net realized and unrealized gains (losses) | (0.25 | ) | (1.23 | ) | 0.27 | 0.21 | |||||||||||||
| Total from Investment Activities | (0.12 | ) | (1.08 | ) | 0.43 | 0.23 | |||||||||||||
Distributions to Shareholders from: | |||||||||||||||||||
Net investment income | (0.14 | ) | (0.16 | ) | (0.18 | ) | (0.02 | ) | |||||||||||
Net realized gains | — | (0.28 | ) | (0.40 | ) | — | |||||||||||||
Total Distributions | (0.14 | ) | (0.44 | ) | (0.58 | ) | (0.02 | ) | |||||||||||
Net Asset Value, End of Period | $ | 9.27 | $ | 9.53 | $ | 11.05 | $ | 11.20 | |||||||||||
| Total Return (excludes contingent deferred sales charge) (c) (d) | (1.35 | )% | (10.11 | )% | 3.90 | % | 2.09 | % | |||||||||||
Ratios to Average Net Assets: | |||||||||||||||||||
Net Expenses (e) (f) (g) (h) | 1.55 | % | 1.54 | % | 1.53 | % | 1.53 | % | |||||||||||
Net Investment Income (Loss) (e) | 2.75 | % | 1.51 | % | 1.50 | % | 2.06 | % | |||||||||||
Gross Expenses (e) (f) | 2.79 | % | 1.99 | % | 2.60 | % | 175.78 | % | |||||||||||
Supplemental Data: | |||||||||||||||||||
Net Assets at end of period (000's) | $ | 1,575 | $ | 2,059 | $ | 2,544 | $ | 19 | |||||||||||
Portfolio Turnover (c) (i) | 24 | % | 65 | % | 69 | % | 73 | %(j) | |||||||||||
(a) Commencement of operations.
(b) Per share net investment income (loss) has been calculated using the average daily shares method.
(c) Not annualized for periods less than one year.
(d) Assumes reinvestment of all net investment income and realized capital gain distributions, if any, during the period. Includes adjustments in accordance with U.S. Generally Accepted Accounting Principles and could differ from the Lipper reported return.
(e) Annualized for periods less than one year.
(f) Does not include acquired fund fees and expenses, if any.
(g) The net expense ratio may not correlate to the applicable expense limits in place during the period since the current contractual expense limitation is applied for a period beginning June 29, 2020 and in effect through November 30, 2023, instead of coinciding with the Fund's fiscal year end. Details of the current contractual expense limitation in effect can be found in Note 5 of the accompanying Notes to Financial Statements.
(h) The amount of any waivers or reimbursements and the amount of any recoupment is calculated without regard to the impact of any performance adjustment to the Fund's management fee.
(i) Portfolio turnover is calculated on the basis of the Fund as a whole without distinguishing between the classes of shares.
(j) Reflects increased trading activity due to transition or asset allocation shift.
(continues on next page)
See notes to financial statements.
40
USAA Mutual Funds Trust | Financial Highlights — continued | ||||||
For a Share Outstanding Throughout Each Period
USAA Intermediate-Term Bond Fund | |||||||||||||||||||||||||||
R6 Shares | |||||||||||||||||||||||||||
| Six Months Ended January 31, 2023 (Unaudited) | Year Ended July 31, 2022 | Year Ended July 31, 2021 | Year Ended July 31, 2020 | Year Ended July 31, 2019 | Year Ended July 31, 2018 | ||||||||||||||||||||||
| Net Asset Value, Beginning of Period | $ | 9.54 | $ | 11.06 | $ | 11.22 | $ | 10.79 | $ | 10.33 | $ | 10.71 | |||||||||||||||
Investment Activities: | |||||||||||||||||||||||||||
Net investment income (loss) | 0.18 | (a) | 0.27 | (a) | 0.29 | (a) | 0.37 | (a) | 0.41 | 0.39 | |||||||||||||||||
| Net realized and unrealized gains (losses) | (0.26 | ) | (1.24 | ) | 0.25 | 0.59 | 0.46 | (0.38 | ) | ||||||||||||||||||
| Total from Investment Activities | (0.08 | ) | (0.97 | ) | 0.54 | 0.96 | 0.87 | 0.01 | |||||||||||||||||||
Distributions to Shareholders from: | |||||||||||||||||||||||||||
Net investment income | (0.18 | ) | (0.27 | ) | (0.30 | ) | (0.38 | ) | (0.41 | ) | (0.39 | ) | |||||||||||||||
Net realized gains | — | (0.28 | ) | (0.40 | ) | (0.15 | ) | — | — | ||||||||||||||||||
Total Distributions | (0.18 | ) | (0.55 | ) | (0.70 | ) | (0.53 | ) | (0.41 | ) | (0.39 | ) | |||||||||||||||
Net Asset Value, End of Period | $ | 9.28 | $ | 9.54 | $ | 11.06 | $ | 11.22 | $ | 10.79 | $ | 10.33 | |||||||||||||||
Total Return (b) (c) | (0.78 | )% | (9.08 | )% | 4.97 | % | 9.14 | % | 8.66 | % | 0.12 | % | |||||||||||||||
Ratios to Average Net Assets: | |||||||||||||||||||||||||||
Net Expenses (d) (e) (f) (g) | 0.42 | % | 0.41 | % | 0.42 | % | 0.39 | % | 0.39 | % | 0.39 | % | |||||||||||||||
Net Investment Income (Loss) (d) | 3.91 | % | 2.70 | % | 2.65 | % | 3.45 | % | 3.96 | % | 3.74 | % | |||||||||||||||
Gross Expenses (d) (e) | 0.44 | % | 0.43 | % | 0.46 | % | 0.46 | % | 0.74 | % | 0.80 | % | |||||||||||||||
Supplemental Data: | |||||||||||||||||||||||||||
Net Assets at end of period (000's) | $ | 241,424 | $ | 163,640 | $ | 87,708 | $ | 26,359 | $ | 5,513 | $ | 4,994 | |||||||||||||||
Portfolio Turnover (b) (h) | 24 | % | 65 | % | 69 | % | 73 | %(i) | 35 | % | 15 | % | |||||||||||||||
(a) Per share net investment income (loss) has been calculated using the average daily shares method.
(b) Not annualized for periods less than one year.
(c) Assumes reinvestment of all net investment income and realized capital gain distributions, if any, during the period. Includes adjustments in accordance with U.S. Generally Accepted Accounting Principles and could differ from the Lipper reported return.
(d) Annualized for periods less than one year.
(e) Does not include acquired fund fees and expenses, if any.
(f) The net expense ratio may not correlate to the applicable expense limits in place during the period since the current contractual expense limitation is applied for a period beginning July 1, 2019 and in effect through November 30, 2023, instead of coinciding with the Fund's fiscal year end. Details of the current contractual expense limitation in effect can be found in Note 5 of the accompanying Notes to Financial Statements.
(g) From the period beginning July 1, 2019, the amount of any waivers or reimbursements and the amount of any recoupment is calculated without regard to the impact of any performance adjustment to the Fund's management fee.
(h) Portfolio turnover is calculated on the basis of the Fund as a whole without distinguishing between the classes of shares.
(i) Reflects increased trading activity due to transition or asset allocation shift.
See notes to financial statements.
41
USAA Mutual Funds Trust | Notes to Financial Statements January 31, 2023 | ||||||
(Unaudited)
1. Organization:
USAA Mutual Funds Trust (the "Trust") is organized as a Delaware statutory trust and is registered under the Investment Company Act of 1940, as amended (the "1940 Act"), as an open-end investment company. The Trust is comprised of 45 funds and is authorized to issue an unlimited number of shares, which are units of beneficial interest with no par value.
The accompanying financial statements are those of the USAA Intermediate-Term Bond Fund (the "Fund"). The Fund offers five classes of shares: Fund Shares, Institutional Shares, Class A, Class C, and R6 Shares. The Fund is classified as diversified under the 1940 Act.
Each class of shares of the Fund has substantially identical rights and privileges, except with respect to sales charges, fees paid under distribution plans, expenses allocable exclusively to each class of shares, voting rights on matters solely affecting a single class of shares, and the exchange privilege of each class of shares.
Victory Capital Management ("VCM" or the "Adviser") is an indirect wholly owned subsidiary of Victory Capital Holdings, Inc., a publicly traded Delaware corporation, and a wholly owned direct subsidiary of Victory Capital Operating, LLC.
Under the Trust's organizational documents, its officers and trustees are indemnified against certain liabilities arising out of the performance of their duties to the Fund. In addition, in the normal course of business, the Fund enters into contracts with its vendors and others that provide for general indemnifications. The Fund's maximum exposure under these arrangements is unknown, as this would involve future claims that may be made against the Fund. However, based on experience, the Fund expects that risk of loss to be remote.
2. Significant Accounting Policies:
The following is a summary of significant accounting policies followed by the Trust in the preparation of its financial statements. The policies are in conformity with U.S. Generally Accepted Accounting Principles ("GAAP"). The preparation of financial statements in accordance with GAAP requires management to make estimates and assumptions that affect the reported amounts of assets and liabilities and disclosure of contingent assets and liabilities at the date of the financial statements and the reported amounts of income and expenses for the period. Actual results could differ from those estimates. The Fund follows the specialized accounting and reporting requirements under GAAP that are applicable to investment companies under Accounting Standards Codification Topic 946.
Investment Valuation:
The Fund records investments at fair value. Fair value is defined as the price that would be received to sell an asset or paid to transfer a liability in an orderly transaction between market participants at the measurement date.
The valuation techniques described below maximize the use of observable inputs and minimize the use of unobservable inputs in determining fair value. The inputs used for valuing the Fund's investments are summarized in the three broad levels listed below:
• Level 1 — quoted prices (unadjusted) in active markets for identical securities
• Level 2 — other significant observable inputs (including quoted prices for similar securities, interest rates, or credit spreads, applicable to those securities, etc.)
• Level 3 — significant unobservable inputs (including the Adviser's assumptions in determining the fair value of investments)
Changes in valuation techniques may result in transfers in or out of an assigned level within the disclosure hierarchy. The inputs or methodologies used for valuation techniques are not necessarily an indication of the risks associated with entering into those investments.
The Adviser, appointed as the valuation designee by the Trust's Board of Trustees' (the "Board"), has established the Pricing and Liquidity Committee (the "Committee"), and subject to Board oversight, the
42
USAA Mutual Funds Trust | Notes to Financial Statements — continued January 31, 2023 | ||||||
(Unaudited)
Committee administers and oversees the Fund's valuation policies and procedures, which are approved by the Board.
Portfolio securities listed or traded on securities exchanges, including Exchange Traded Funds ("ETFs") are valued at the closing price on the exchange or system where the security is principally traded, if available, or at the Nasdaq Official Closing Price. If there have been no sales for that day on the exchange or system, then a security is valued at the last available bid quotation on the exchange or system where the security is principally traded. In each of these situations, valuations are typically categorized as Level 1 in the fair value hierarchy.
Investments in open-end investment companies, other than ETFs, are valued at their net asset value ("NAV"). These valuations are typically categorized as Level 1 in the fair value hierarchy.
Debt securities are valued each business day by a pricing service approved by the valuation designee and subject to the oversight of the Board. The pricing service uses the evaluated bid or the last sale price to value securities. Debt obligations maturing within 60 days may be valued at amortized cost, provided that the amortized cost represents the fair value of such securities. These valuations are typically categorized as Level 2 in the fair value hierarchy.
Futures contracts are valued at the settlement price established each day by the board of trade or an exchange on which they are traded. These valuations are typically categorized as Level 1 in the fair value hierarchy.
In the event that price quotations or valuations are not readily available, investments are valued at fair value in accordance with procedures established by and under the general supervision and responsibility of the Board. These valuations are typically categorized as Level 2 or Level 3 in the fair value hierarchy, based on the observability of inputs used to determine the fair value. The effect of fair value pricing is that securities may not be priced on the basis of quotations from the primary market in which they are traded, and the actual price realized from the sale of a security may differ materially from the fair value price. Valuing these securities at fair value is intended to cause the Fund's NAV to be more reliable than it otherwise would be.
A summary of the valuations as of January 31, 2023, based upon the three levels defined above, is included in the table below while the breakdown, by category, of investments is disclosed on the Schedule of Portfolio Investments (amounts in thousands):
Level 1 | Level 2 | Level 3 | Total | ||||||||||||||||
Asset-Backed Securities | $ | — | $ | 459,808 | $ | — | $ | 459,808 | |||||||||||
Collateralized Mortgage Obligations | — | 577,699 | — | 577,699 | |||||||||||||||
Preferred Stocks | 16,742 | — | — | 16,742 | |||||||||||||||
Senior Secured Loans | — | 78,468 | — | 78,468 | |||||||||||||||
Corporate Bonds | — | 850,416 | — | 850,416 | |||||||||||||||
Yankee Dollars | — | 177,682 | — | 177,682 | |||||||||||||||
Municipal Bonds | — | 80,805 | — | 80,805 | |||||||||||||||
U.S. Government Agency Mortgages | — | 115,406 | — | 115,406 | |||||||||||||||
U.S. Treasury Obligations | — | 582,658 | — | 582,658 | |||||||||||||||
Commercial Paper | — | 133,560 | — | 133,560 | |||||||||||||||
Collateral for Securities Loaned | 11,061 | — | — | 11,061 | |||||||||||||||
Total | �� | $ | 27,803 | $ | 3,056,502 | $ | — | $ | 3,084,305 | ||||||||||
Other Financial Investments* | |||||||||||||||||||
Assets: | |||||||||||||||||||
Futures Contracts | $ | 4,337 | $ | — | $ | — | $ | 4,337 | |||||||||||
Total | $ | 4,337 | $ | — | $ | — | $ | 4,337 | |||||||||||
* Futures contracts are valued at the unrealized appreciation (depreciation) on the investment.
As of January 31, 2023, there were no transfers into/out of Level 3.
43
USAA Mutual Funds Trust | Notes to Financial Statements — continued January 31, 2023 | ||||||
(Unaudited)
Real Estate Investment Trusts ("REITs"):
The Fund may invest in REITs, which report information on the source of their distributions annually. REITs are pooled investment vehicles that invest primarily in income producing real estate or real estate related loans or interests (such as mortgages). Certain distributions received from REITs during the year are recorded as realized gains or return of capital as estimated by the Fund or when such information becomes known.
Investment Companies:
Open-End Funds:
The Fund may invest in portfolios of open-end investment companies. These investment companies value securities in their portfolios for which market quotations are readily available at their market values (generally the last reported sale price) and all other securities and assets at their fair value by the methods established by the board of directors of the underlying funds.
Securities Purchased on a Delayed-Delivery or When-Issued Basis:
The Fund may purchase securities on a delayed-delivery or when-issued basis. Delivery and payment for securities that have been purchased by the Fund on a delayed-delivery or when-issued basis, or for delayed draws on loans can generally take place within 35 days a month or more after the trade date. Securities that require more than 35 days to settle are considered a senior security and subject to Rule 18f-4. At the time the Fund makes the commitment to purchase a security on a delayed-delivery or when-issued basis, the Fund records the transaction and reflects the value of the security in determining NAV. No interest accrues to the Fund until the transaction settles and payment takes place. If the Fund owns delayed-delivery or when-issued securities, these values are included in Payables for Investments purchased on the accompanying Statement of Assets and Liabilities.
Municipal Obligations:
The values of municipal obligations can fluctuate and may be affected by adverse tax, legislative, or political changes, and by financial developments affecting municipal issuers. Payments of municipal obligations may depend on a relatively limited source of revenue, resulting in greater credit risk. Future changes in federal tax laws or the activity of an issuer may adversely affect the tax-exempt status of municipal obligations.
Mortgage- and Asset-Backed Securities:
The values of some mortgage-related or asset-backed securities may be particularly sensitive to changes in prevailing interest rates. Early repayment of principal on some mortgage-related securities may expose the Fund to a lower rate of return upon reinvestment of principal. The values of mortgage- and asset-backed securities depend in part on the credit quality and adequacy of the underlying assets or collateral and may fluctuate in response to the market's perception of these factors as well as current and future repayment rates. Some mortgage-backed securities are backed by the full faith and credit of the U.S. government (e.g., mortgage-backed securities issued by the Government National Mortgage Association, commonly known as "Ginnie Mae"), while other mortgage-backed securities (e.g., mortgage-backed securities issued by the Federal National Mortgage Association and the Federal Home Loan Mortgage Corporation, commonly known as "Fannie Mae" and "Freddie Mac," respectively), are backed only by the credit of the government entity issuing them. In addition, some mortgage-backed securities are issued by private entities and, as such, are not guaranteed by the U.S. government or any agency or instrumentality of the U.S. government.
44
USAA Mutual Funds Trust | Notes to Financial Statements — continued January 31, 2023 | ||||||
(Unaudited)
Leveraged Loans:
The Fund may invest in leveraged loans, a type of bank loan. Leveraged loans are adjustable-rate bank loans made to companies rated below investment grade. The interest rates on leveraged loans are reset periodically based upon the fluctuations of a base interest rate such as the Secured Overnight Financing Rate ("SOFR") or London Interbank Offered Rate ("LIBOR") and a "spread" above that base interest rate that represents a risk premium to the lending banks and/or other participating investors. Many bank loans bear an adjustable rate of interest; however, leveraged loans provide for a greater "spread" over the base interest rate than other bank loans because they are considered to represent a greater credit risk. Because they are perceived to represent a greater credit risk, leveraged loans possess certain attributes that are similar to high-yield securities. However, because they are often secured by collateral of the borrower, leveraged loans possess certain attributes that are similar to other bank loans.
Below-Investment-Grade Securities:
The Fund may invest in below-investment-grade securities (i.e., lower-quality, "junk" debt), which are subject to various risks. Lower-quality debt is considered to be speculative because it is less certain that the issuer will be able to pay interest or repay the principal than in the case of investment-grade debt. These securities can involve a substantially greater risk of default than higher-rated securities, and their values can decline significantly over short periods of time. Lower-quality debt securities tend to be more sensitive to adverse news about their issuers, the market and the economy in general, than higher-quality debt securities. The market for these securities can be less liquid, especially during periods of recession or general market decline.
Derivative Instruments:
Futures Contracts:
The Fund may enter into contracts for the future delivery of securities or foreign currencies and futures contracts based on a specific security, class of securities, foreign currency or an index, and purchase or sell options on any such futures contracts. A futures contract on a securities index is an agreement obligating either party to pay, and entitling the other party to receive, while the contract is outstanding, cash payments based on the level of a specified securities index. No physical delivery of the underlying asset is made. The Fund may enter into futures contracts in an effort to hedge against market risks. The acquisition of put and call options on futures contracts will give the Fund the right (but not the obligation), for a specified price, to sell or to purchase the underlying futures contract, upon exercise of the option, at any time during the option period. Futures transactions involve brokerage costs and require the Fund to segregate assets to cover contracts that would require it to purchase securities or currencies. A good faith margin deposit, known as initial margin, of cash or government securities with a broker or custodian is required to initiate and maintain open positions in futures contracts. Subsequent payments, known as variation margin, are made or received by the Fund based on the change in the market value of the position and are recorded as unrealized appreciation or depreciation until the contract is closed out, at which time the gain or loss is realized. The Fund may lose the expected benefit of futures transactions if interest rates, exchange rates or securities prices change in an unanticipated manner. Such unanticipated changes may also result in lower overall performance than if the Fund had not entered into any futures transactions. In addition, the value of the Fund's futures positions may not prove to be perfectly or even highly correlated with the value of its portfolio securities or foreign currencies, limiting the Fund's ability to hedge effectively against interest rate, exchange rate and/or market risk and giving rise to additional risks. There is no assurance of liquidity in the secondary market for purposes of closing out futures positions. The collateral held by the Fund is reflected on the Statement of Assets and Liabilities under Deposit with broker for futures contracts.
Management has determined that no offsetting requirements exist as a result of their conclusion that the Fund is not subject to master netting agreements for futures contracts. During the six months ended January 31, 2023, the Fund entered into futures contracts primarily for the strategy of gaining exposure to a particular asset class or securities market.
45
USAA Mutual Funds Trust | Notes to Financial Statements — continued January 31, 2023 | ||||||
(Unaudited)
Summary of Derivative Instruments:
The following table summarizes the fair values of derivative instruments on the Statement of Assets and Liabilities, categorized by risk exposure, as of January 31, 2023 (amounts in thousands):
Assets | |||||||
| Variation Margin Receivable on Open Futures Contracts* | |||||||
Interest Rate Exposure | $ | 4,337 | |||||
* Includes cumulative unrealized appreciation (depreciation) of futures contracts as reported on the Schedule of Portfolio Investments. Only current day's variation margin for futures contracts is reported within the Statement of Assets and Liabilities.
The following table presents the effect of derivative instruments on the Statement of Operations, categorized by risk exposure, for the year ended January 31, 2023 (amounts in thousands):
| Net Realized Gains (Losses) on Derivatives Recognized as a Result of Operations | Net Change in Unrealized Appreciation/Depreciation on Derivatives Recognized as a Result of Operations | ||||||||||
| Net Realized Gains (Losses) from Futures Contracts | Net Change in Unrealized Appreciation/Depreciation on Futures Contracts | ||||||||||
Interest Rate Exposure | $ | (11,942 | ) | $ | 759 | ||||||
All open derivative positions at period end are reflected on the Fund's Schedule of Portfolio Investments. The underlying face value of open derivative positions relative to the Fund's net assets at period end is generally representative of the notional amount of open positions to net assets throughout the period.
Investment Transactions and Related Income:
Changes in holdings of investments are accounted for no later than one business day following the trade date. For financial reporting purposes, however, investment transactions are accounted for on trade date or the last business day of the reporting period. Interest income is determined on the basis of coupon interest accrued using the effective interest method which adjusts, where applicable, the amortization of premiums or accretion of discounts. Dividend income is recorded on the ex-dividend date. Gains or losses realized on sales of securities are recorded on the identified cost basis. Paydown gains or losses on applicable securities, if any, are recorded as components of Interest income on the Statement of Operations.
The Fund may receive other income from investments in loan assignments and/or unfunded commitments, including amendment fees, consent fees, and commitment fees. These fees are recorded as income when received. These amounts, if received, are included in Interest income on the Statement of Operations.
Securities Lending:
The Fund, through a Securities Lending Agreement with Citibank, N.A. ("Citibank"), may lend its securities to qualified financial institutions, such as certain broker-dealers and banks, to earn additional income, net of income retained by Citibank. Borrowers are required to initially secure their loans for collateral in the amount of at least 102% of the value of U.S. securities loaned or at least 105% of the value of non-U.S. securities loaned, marked-to-market daily. Any collateral shortfalls associated with increases in the valuation of the securities loaned are generally cured the next business day. The collateral can be received in the form of cash collateral and/or non-cash collateral. Non-cash collateral can include U.S. Government Securities and other securities as permitted by Securities and Exchange Commission ("SEC") guidelines. The cash collateral is invested in short-term instruments or cash equivalents, primarily open-end investment companies, as noted on the Fund's Schedule of Portfolio Investments. The Fund effectively does not have control of the non-cash collateral and therefore it is not disclosed on the Fund's Schedule of Portfolio Investments. Collateral requirements are determined
46
USAA Mutual Funds Trust | Notes to Financial Statements — continued January 31, 2023 | ||||||
(Unaudited)
daily based on the value of the Fund's securities on loan as of the end of the prior business day. During the time portfolio securities are on loan, the borrower will pay the Fund any dividends or interest paid on such securities plus any fee negotiated between the parties to the lending agreement. The Fund also earns a return from the collateral. The Fund pays Citibank various fees in connection with the investment of cash collateral and fees based on the investment income received from securities lending activities. Securities lending income (net of these fees) is disclosed on the Statement of Operations. Loans are terminable upon demand and the borrower must return the loaned securities within the lesser of one standard settlement period or five business days. Although risk is mitigated by the collateral, the Fund could experience a delay in recovering its securities and possible loss of income or value if the borrower fails to return them. In addition, there is a risk that the value of the short-term investments will be less than the amount of cash collateral required to be returned to the borrower.
The Fund's agreement with Citibank does not include master netting provisions. Non-cash collateral received by the Fund may not be sold or repledged, except to satisfy borrower default.
The following table (amounts in thousands) is a summary of the Fund's securities lending transactions as of January 31, 2023.
| Value of Securities on Loan | Non-Cash Collateral | Cash Collateral | |||||||||
| $ | 8,519 | $ | — | $ | 11,061 | ||||||
Federal Income Taxes:
The Fund intends to continue to qualify as a regulated investment company by complying with the provisions available to certain investment companies, as defined in applicable sections of the Internal Revenue Code, and to make distributions of net investment income and net realized gains sufficient to relieve it from all, or substantially all, federal income taxes. Accordingly, no provision for federal income taxes is required in the financial statements. The Fund has a tax year end of July 31, and effective April 30, 2023, the Fund will change its tax year end to April 30.
For the six months ended January 31, 2023, the Fund did not incur any income tax, interest, or penalties, and has recorded no liability for net unrecognized tax benefits relating to uncertain tax positions.
Management of the Fund has reviewed tax positions taken in tax years that remain subject to examination by all major tax jurisdictions, including federal (i.e., the last four tax years, which includes the current fiscal tax year end). Management believes that there is no tax liability resulting from unrecognized tax benefits related to uncertain tax positions taken.
Allocations:
Expenses directly attributable to the Fund are charged to the Fund, while expenses that are attributable to more than one fund in the Trust, or jointly with an affiliated trust, are allocated among the respective funds in the Trust and/or an affiliated trust based upon net assets or another appropriate basis.
Income, expenses (other than class-specific expenses such as transfer agent fees, state registration fees, printing fees, and 12b-1 fees), and realized and unrealized gains or losses on investments are allocated to each class of shares based on its relative net assets on the date income is earned or expenses and realized and unrealized gains and losses are incurred.
3. Purchases and Sales:
Purchases and sales of securities (excluding securities maturing less than one year from acquisition) for the six months ended January 31, 2023, were as follows for the Fund (amounts in thousands):
| Excluding U.S. Government Securities | U.S. Government Securities | ||||||||||||||
Purchases | Sales | Purchases | Sales | ||||||||||||
$ | 477,469 | $ | 723,496 | $ | 242,421 | $ | 179,428 | ||||||||
47
USAA Mutual Funds Trust | Notes to Financial Statements — continued January 31, 2023 | ||||||
(Unaudited)
4. Affiliated Fund Ownership:
The Fund offers shares for investment by other funds. The fund-of-funds do not invest in the underlying funds for the purpose of exercising management or control, and the affiliated fund-of-funds' annual and semi-annual reports may be viewed at vcm.com. As of January 31, 2023, certain fund-of-funds owned total outstanding shares of the Fund as follows:
Affiliated USAA Mutual Funds | Ownership % | ||||||
USAA Cornerstone Conservative Fund | 1.4 | ||||||
USAA Target Retirement Income Fund | 1.3 | ||||||
USAA Target Retirement 2030 Fund | 1.9 | ||||||
USAA Target Retirement 2040 Fund | 1.1 | ||||||
USAA Target Retirement 2050 Fund | 0.6 | ||||||
USAA Target Retirement 2060 Fund | 0.1 | ||||||
5. Fees and Transactions with Affiliates and Related Parties:
Investment Advisory Fees:
Investment advisory services are provided to the Fund by the Adviser, which is a New York corporation registered as an investment adviser with the SEC.
Under the terms of the Investment Advisory Agreement, the Adviser is entitled to receive a base fee and a performance adjustment. The Fund's base fee is accrued daily and paid monthly at an annualized rate of 0.50% of the first $50 million of the Fund's average daily net assets, 0.40% of that portion of the Fund's average daily net assets over $50 million but not over $100 million, and 0.30% of that portion of the Fund's average daily net assets over $100 million. Amounts incurred and paid to VCM for the six months ended January 31, 2023, are reflected on the Statement of Operations as Investment advisory fees.
The performance adjustment for each share class is accrued daily and calculated monthly by comparing the respective class' performance to that of the Lipper Core Plus Bond Funds Index. The Lipper Core Plus Bond Funds Index tracks the total return performance of the largest funds within the Lipper Core Plus Bond Funds category.
The performance period for each share class consists of the current month plus the previous 35 months. The following table is utilized to determine the extent of the performance adjustment:
| Over/Under Performance Relative to Index (in basis points)(a) | Annual Adjustment Rate (in basis points) | ||||||
+/- 20 to 50 | +/- 4 | ||||||
+/- 51 to 100 | +/- 5 | ||||||
+/- 101 and greater | +/- 6 | ||||||
(a) Based on the difference between the average annual performance of the relevant share class of the Fund and its relevant Lipper index, rounded to the nearest basis point.
Each class' annual performance adjustment rate is multiplied by the average daily net assets of the respective class over the entire performance period, which is then multiplied by a fraction, the numerator of which is the number of days in the month and the denominator of which is 365 (366 in leap years). The resulting amount is then added to (in the case of overperformance), or subtracted from (in the case of underperformance) the base fee.
Under the performance fee arrangement, each class pays a positive performance fee adjustment for a performance period whenever the class outperforms the Lipper Core Plus Bond Funds Index over that period, even if the class has overall negative returns during the performance period.
For the period August 1, 2022, to January 31, 2023, performance adjustments were $507, $513, $12, less than $1, and $25 for Fund Shares, Institutional Shares, Class A, Class C, and R6 Shares, in thousands, respectively. Performance adjustments were 0.07%, 0.08%, 0.05%, 0.02%, and 0.03% for Fund Shares,
48
USAA Mutual Funds Trust | Notes to Financial Statements — continued January 31, 2023 | ||||||
(Unaudited)
Institutional Shares, Class A, Class C, and R6 Shares, respectively. The performance adjustment rate included in the investment advisory fee may differ from the maximum over/under Annual Adjustment Rate due to differences in average net assets for the reporting period and rolling 36 month performance periods.
The Trust relies on an exemptive order granted to VCM and its affiliated funds by the SEC in March 2019, permitting the use of a "manager-of-managers" structure for certain funds. Under a manager-of-managers structure, the investment adviser may select (with approval of the Board and without shareholder approval) one or more subadvisers to manage the day-to-day investment of a fund's assets. For the six months ended January 31, 2023, the Fund had no subadvisers.
Administration and Servicing Fees:
VCM also serves as the Fund's administrator and fund accountant. Under the Fund Administration, Servicing and Accounting Agreement, VCM is paid an administration and servicing fee that is accrued daily and paid monthly at an annualized rate of 0.15%, 0.10%, 0.15%, 0.15%, and 0.05%, which is based on the Fund's average daily net assets of the Fund Shares, Institutional Shares, Class A, Class C, and R6 Shares, respectively. Amounts incurred for the six months ended January 31, 2023, are reflected on the Statement of Operations as Administration fees.
Citi Fund Services Ohio, Inc. ("Citi"), an affiliate of Citibank, acts as sub-administrator and sub-fund accountant to the Fund pursuant to a Sub-Administration and Sub-Fund Accounting Services Agreement between VCM and Citi. VCM pays Citi a fee for providing these services. The Fund reimburses VCM and Citi for out-of-pocket expenses incurred in providing these services and certain other expenses specifically allocated to the Fund. Amounts incurred for the six months ended January 31, 2023, are reflected on the Statement of Operations as Sub-Administration fees.
The Fund (as part of the Trust) has entered into an agreement with the Adviser to provide compliance services, pursuant to which the Adviser furnishes its compliance personnel, including the services of the Chief Compliance Officer ("CCO"), and other resources reasonably necessary to provide the Trust with compliance oversight services related to the design, administration, and oversight of a compliance program for the Trust in accordance with Rule 38a-1 under the 1940 Act. The CCO is an employee of the Adviser, which pays the compensation of the CCO and support staff. The funds in the Trust, Victory Variable Insurance Funds, Victory Portfolios, and Victory Portfolios II (collectively, the "Victory Funds Complex") in the aggregate, compensate the Adviser for these services. Amounts incurred for the six months ended January 31, 2023, are reflected on the Statement of Operations as Compliance fees.
Transfer Agency Fees:
Victory Capital Transfer Agency, Inc. ("VCTA"), an affiliate of the Adviser, provides transfer agency services to the Fund. VCTA provides transfer agent services to the Fund Shares based on an annual charge of $25.50 per shareholder account plus out-of-pocket expenses. VCTA pays a portion of these fees to certain intermediaries for the administration and servicing of accounts that are held with such intermediaries. Transfer agent fees for Class C, R6 Shares, Class A and Institutional Shares are paid monthly based on a fee accrued daily at an annualized rate of 0.10%, 0.10%, 0.10%, and 0.01%, respectively, of average daily net assets, plus out-of-pocket expenses. Amounts incurred and paid to VCTA for the six months ended January 31, 2023, are reflected on the Statement of Operations as Transfer agent fees.
FIS Investor Services LLC serves as sub-transfer agent and dividend disbursing agent for the Fund pursuant to a Sub-Transfer Agent Agreement between VCTA and FIS Investor Services LLC. VCTA provides FIS Investor Services LLC a fee for providing these services.
Distributor/Underwriting Services:
Victory Capital Services, Inc. (the "Distributor"), an affiliate of the Adviser, serves as Distributor for the continuous offering of the shares of the Fund pursuant to a Distribution Agreement between the Distributor and the Trust.
49
USAA Mutual Funds Trust | Notes to Financial Statements — continued January 31, 2023 | ||||||
(Unaudited)
Pursuant to the Distribution and Service Plans adopted in accordance with Rule 12b-1 under the 1940 Act, the Distributor may receive a monthly distribution and service fee, at an annual rate of up to 0.25% of the average daily net assets of Class A and 1.00% of the average daily net assets of Class C. The distribution and service fees paid to the Distributor may be used by the Distributor to pay for activity primarily intended to result in the sale of Class A and Class C. Amounts incurred and paid to the Distributor for the six months ended January 31, 2023, are reflected on the Statement of Operations as 12b-1 fees.
In addition, the Distributor is entitled to receive commissions in connection with sales of Class A and Class C. For the six months ended January 31, 2023, the Distributor received less than $1 thousand from commissions earned in connection with sales of Class A.
Other Fees:
Citibank serves as the Fund's custodian. The Fund pays Citibank a fee for providing these services. Amounts incurred for the six months ended January 31, 2023, are reflected on the Statement of Operations as Custodian fees.
K&L Gates LLP provides legal services to the Trust.
The Adviser has entered into an expense limitation agreement with the Fund until at least November 30, 2023. Under the terms of the agreement, the Adviser has agreed to waive fees or reimburse certain expenses to the extent that ordinary operating expenses incurred by certain classes of the Fund in any fiscal year exceed the expense limits for such classes of the Fund. Such excess amounts will be the liability of the Adviser. Performance adjustments, acquired fund fees and expenses, interest, taxes, brokerage commissions, other expenditures, which are capitalized in accordance with GAAP, and other extraordinary expenses not incurred in the ordinary course of the Fund's business are excluded from the expense limits. As of January 31, 2023, the expense limits (excluding voluntary waivers) were 0.59%, 0.52%, 0.87%, 1.53%, and 0.39% for Fund Shares, Institutional Shares, Class A, Class C, and R6 Shares, respectively.
Under the terms of the expense limitation agreement, the Fund has agreed to repay fees and expenses that were waived or reimbursed by the Adviser for a period of up to three years (thirty-six (36) months) after the waiver or reimbursement took place, subject to the lesser of any operating expense limits in effect at the time of: (a) the original waiver or expense reimbursement; or (b) the recoupment, after giving effect to the recoupment amount.
As of January 31, 2023, the following amounts are available to be repaid to the Adviser (amounts in thousands). The Fund has not recorded any amounts available to be repaid as a liability due to an assessment that such repayments are not probable at January 31, 2023.
| Expires 2023 | Expires 2024 | Expires 2025 | Expires 2026 | Total | |||||||||||||||
| $ | 48 | $ | 280 | $ | 276 | $ | 284 | $ | 888 | ||||||||||
The Adviser may voluntarily waive or reimburse additional fees to assist the Fund in maintaining competitive expense ratios. Voluntary waivers and reimbursements applicable to the Fund are not available to be recouped at a future time. There were no voluntary waivers or reimbursements for the six months ended January 31, 2023.
Certain officers and/or interested trustees of the Fund are also officers and/or employees of the Adviser, administrator, fund accountant, sub-administrator, sub-fund accountant, custodian, and Distributor.
6. Risks:
The Fund may be subject to other risks in addition to these identified risks.
Debt Securities Risk — The value of a debt security or other income-producing security changes in response to various factors including, for example, market-related factors (such as changes in interest
50
USAA Mutual Funds Trust | Notes to Financial Statements — continued January 31, 2023 | ||||||
(Unaudited)
rates or changes in the risk appetite of investors generally) and changes in the actual or perceived ability of the issuer (or of issuers generally) to meet its (or their) obligations. Other factors that may affect the value of debt securities include, among others, public health crises and responses by governments and companies to such crises. These and other events may affect the creditworthiness of the issuer of a debt security and may impair an issuer's ability to timely meet its debt obligations as they come due.
Interest Rate Risk — The Fund is subject to the risk that the market value of the bonds in its portfolio will fluctuate because of changes in interest rates, changes in the supply of and demand for tax-exempt securities, and other market factors. Bond prices generally are linked to the prevailing market interest rates. In general, when interest rates rise, bond prices fall; conversely, when interest rates fall, bond prices rise. The price volatility of a bond also depends on its duration. Generally, the longer the duration of a bond, the greater is its sensitivity to interest rates. To compensate investors for this higher interest rate risk, bonds with longer durations generally offer higher yields than bonds with shorter durations. The ability of an issuer of a debt security to repay principal prior to a security's maturity can increase the security's sensitivity to interest rate changes.
Decisions by the U.S. Federal Reserve regarding interest rate and monetary policy, which can be difficult to predict and sometimes change direction suddenly in response to economic and market events, can have a significant effect on the value of fixed-income securities as well as the overall strength of the U.S. economy. Precise interest rate predictions are difficult to make, and interest rates may change unexpectedly and dramatically in response to extreme changes in market or economic conditions. As a result, the value of fixed-income securities may vary widely under certain market conditions.
Credit Risk — The fixed-income securities in the Fund's portfolio are subject to credit risk, which is the possibility that an issuer of a fixed-income security will fail to make timely interest and/or principal payments on its securities or that negative market perceptions of the issuer's ability to make such payments will cause the price of that security to decline. The Fund accepts some credit risk as a recognized means to enhance an investor's return. All fixed-income securities, varying from the highest quality to the very speculative, have some degree of credit risk.
LIBOR Discontinuation Risk — The LIBOR discontinuation may adversely affect the financial markets generally and the Fund's operations, finances and investments specifically. LIBOR has been the principal floating-rate benchmark in the financial markets. However, LIBOR has been or will be discontinued as a floating rate benchmark. The date of discontinuation depends on the LIBOR currency and tenor. With limited exceptions, no new LIBOR obligations will be entered into after December 31, 2021. Existing LIBOR obligations have transitioned or will transition to another benchmark, depending on the LIBOR currency and tenor. For some existing LIBOR-based obligations, the contractual consequences of the discontinuation of LIBOR may not be clear.
Non-LIBOR floating-rate obligations, including SOFR-based obligations, may have returns and values that fluctuate more than those of floating-rate debt obligations that are based on LIBOR or other rates. Also, because SOFR and some alternative floating rates are relatively new market indexes, markets for certain non-LIBOR obligations may never develop or may not be liquid. Market terms for non-LIBOR floating rate obligations, such as the spread over the index reflected in interest-rate provisions, may evolve over time, and prices of non-LIBOR floating rate obligations may be different depending on when they are issued and changing views about correct spread levels.
Various SOFR-based rates, including SOFR-based term rates, and various non-SOFR-based rates are expected to develop in response to the discontinuation of U.S. dollar LIBOR, which may create various risks for the Fund and the financial markets more generally. There are non-LIBOR forward-looking floating rates that are not based on SOFR and that may be considered by participants in the financial markets as LIBOR alternatives. Such rates include AMERIBOR (American Interbank Offered Rate), BSBY (Bloomberg Short-Term Bank Yield Index) and BYI (Bank Yield Index). Unlike forward-looking SOFR-based term rates, such rates are intended to reflect a bank credit spread component.
51
USAA Mutual Funds Trust | Notes to Financial Statements — continued January 31, 2023 | ||||||
(Unaudited)
It is not clear how replacement rates for LIBOR — including SOFR-based rates and non-SOFR-based rates — will develop and to what extent they will be used. There is no assurance that these replacement rates will be suitable substitutes for LIBOR, and thus the substitution of such rates for LIBOR could have an adverse effect on the Fund and the financial markets more generally. Concerns about market depth and stability could affect the development of non-SOFR-based term rates, and such rates may create various risks, which may or may not be similar to the risks relating to SOFR.
Market Risk — Overall market risks may affect the value of the Fund. Domestic and international factors such as political events, war, terrorism, trade disputes, inflation rates, interest rate levels and other fiscal and monetary policy changes, cybersecurity incidents, pandemics and other public health crises, sanctions against a particular foreign country, its nationals, businesses or industries and related geopolitical events, as well as environmental disasters such as earthquakes, fires, and floods, or other catastrophes, may add to instability in global economies and markets generally, and may lead to increased market volatility. Global economies and financial markets are highly interconnected, which increases the possibility that conditions in one country or region might adversely affect issuers in another country or region. The impact of these and other factors may be short-term or may last for extended periods.
7. Borrowing and Interfund Lending:
Line of Credit:
The Victory Funds Complex participates in a short-term demand note "Line of Credit" agreement with Citibank. The Line of Credit agreement with Citibank was renewed on June 27, 2022, with a termination date of June 26, 2023. Under the agreement with Citibank, the Victory Funds Complex may borrow up to $600 million, of which $300 million is committed and $300 million is uncommitted. $40 million of the Line of Credit is reserved for use by the Victory Floating Rate Fund, another series of the Victory Funds Complex, with Victory Floating Rate Fund paying the related commitment fees for that amount. The purpose of the Line of Credit is to meet temporary or emergency cash needs. For the six months ended January 31, 2023, Citibank received an annual commitment fee of 0.15% on $300 million for providing the Line of Credit. Each fund in the Victory Funds Complex paid a pro-rata portion of the commitment fees plus any interest (one-month SOFR plus 1.10 percent) on amounts borrowed. Interest charged to the Fund during the period, if applicable, is reflected on the Statement of Operations under Line of credit fees.
The Fund had no borrowings under the Line of Credit agreement during the six months ended January 31, 2023.
Interfund Lending:
The Trust and the Adviser rely on an exemptive order granted by the SEC in March 2017 (the "Order"), permitting the establishment and operation of an Interfund Lending Facility (the "Facility"). The Facility allows the Fund to directly lend and borrow money to or from any other fund in the Victory Funds Complex that is permitted to participate in the Facility, relying upon the Order at rates beneficial to both the borrowing and lending funds. Advances under the Facility are allowed for temporary or emergency purposes, including the meeting of redemption requests that otherwise might require the untimely disposition of securities, and are subject to each Fund's borrowing restrictions. The interfund loan rate is determined, as specified in the Order, by averaging the current repurchase agreement rate and the current bank loan rate. As a Borrower, interest charged to the Fund, if any, during the period, is reflected on the Statement of Operations under Interfund lending fees. As a Lender, interest earned by the Fund, if any, during the period, is reflected on the Statement of Operations under Interfund lending.
The Fund did not utilize or participate in the Facility during the six months ended January 31, 2023.
52
USAA Mutual Funds Trust | Notes to Financial Statements — continued January 31, 2023 | ||||||
(Unaudited)
8. Federal Income Tax Information:
Distributions from the Fund's net investment income are accrued daily and distributed on the last business day of each month. Distributable net realized gains, if any, are declared and paid at least annually.
The amounts of dividends from net investment income and distributions from net realized gains (collectively, distributions to shareholders) are determined in accordance with federal income tax regulations, which may differ from GAAP. To the extent these "book/tax" differences are permanent in nature (e.g., net operating loss and distribution reclassification), such amounts are reclassified within the components of net assets based on their federal tax-basis treatment; temporary differences (e.g., wash sales) do not require reclassification. To the extent dividends and distributions exceed net investment income and net realized gains for tax purposes, they are reported as distributions of capital. Net investment losses incurred by the Fund may be reclassified as an offset to capital on the accompanying Statement of Assets and Liabilities.
The tax character of current year distributions paid and the tax basis of the current components of accumulated earnings (loss) will be determined at the end of the current tax year.
At the tax year ended July 31, 2022, the Fund had no capital loss carryforwards for federal income tax purposes.
9. Subsequent Events:
On June 29, 2022, the Board approved a change to the Fund's fiscal year-end from July 31 to April 30, with an effective date of April 30, 2023.
The Board, upon recommendation of the Adviser, has approved a change in the name of the Trust and each individual fund within the Trust. On February 23, 2023, an initial filing was made with the SEC to commence the process to effectuate the following changes.
Effective at the start of business on April 24, 2023 (the "Effective Date"), the name of the Trust will change from USAA Mutual Funds Trust to Victory Portfolios III, and all references to USAA Mutual Funds Trust in the summary prospectus, statutory prospectus, and statement of additional information ("SAI") will be replaced by the new name.
Also on the Effective Date, references to the current name of the Fund in the summary prospectus, statutory prospectus, and SAI will be replaced with the new name as follows:
| Current Name | New Name | ||||||
USAA Intermediate-Term Bond Fund | Victory Core Plus Intermediate Bond Fund | ||||||
In connection with the name changes above, the Board also, upon recommendation of the Adviser, approved a change in the name of the Fund to "Victory Core Plus Intermediate Bond Fund" to create a more clear and uniform naming convention relative to competitor offerings and other Adviser products.
In addition, on the Effective Date, USAA Investments, a Victory Capital Management Inc. Investment Franchise, that currently manages the USAA Fixed Income Funds, will change its name to Victory Income Investors, and all references to USAA Investments in the summary prospectus, statutory prospectus, and SAI, will be replaced.
Please note that there will be no changes in the management of the Fund or to the Fund's ticker symbols.
53
USAA Mutual Funds Trust | Supplemental Information January 31, 2023 | ||||||
(Unaudited)
Proxy Voting and Portfolio Holdings Information
Proxy Voting:
Information regarding the policies and procedures the Fund uses to determine how to vote proxies relating to portfolio securities is available without charge, upon request, by calling (800) 235-8396. The information is also included in the Fund's Statement of Additional Information, which is available on the SEC's website at sec.gov.
Information relating to how the Fund voted proxies relating to portfolio securities held during the most recent 12 months ended June 30 is available on the SEC's website at sec.gov.
Availability of Schedules of Portfolio Investments:
The Trust files a complete list of Schedules of Portfolio Investments with the SEC for the first and third quarter of each fiscal year on Form N-PORT. Form N-PORT is available on the SEC's website at sec.gov.
Expense Examples
As a shareholder of the Fund, you may incur two types of costs: (1) transaction costs including sales charges (loads) on purchases; and (2) ongoing costs, including management fees and other Fund expenses. These examples are intended to help you understand your ongoing costs (in dollars) of investing in the Fund and to compare these costs with the ongoing costs of investing in other mutual funds.
These examples are based on an investment of $1,000 invested at the beginning of the period and held for the entire period from August 1, 2022, through January 31, 2023.
The Actual Expense figures in the table below provide information about actual account values and actual expenses. You may use the information below, together with the amount you invested, to estimate the expenses that you paid over the period. Simply divide your account value by $1,000 (for example, an $8,600 account value divided by $1,000 = 8.6), then multiply the result by the number in the table under the heading entitled "Actual Expenses Paid During Period" to estimate the expenses you paid on your account during this period.
The Hypothetical Expense figures in the table below provide information about hypothetical account values and hypothetical expenses based on the Fund's actual expense ratio and an assumed rate of return of 5% per year before expenses, which is not the Fund's actual return. The hypothetical account values and expenses may not be used to estimate the actual ending account balance or expenses you paid for the period. You may use this information to compare this 5% hypothetical example with the 5% hypothetical examples that appear in shareholder reports of other funds.
Please note the expenses shown in the table below are meant to highlight your ongoing costs only and do not reflect any transactional costs. Therefore, the hypothetical expenses in the table are useful in comparing ongoing costs only and will not help you determine the relative total costs of owning different funds. In addition, if these transactional costs were included, your costs would have been higher.
| Beginning Account Value 8/1/22 | Actual Ending Account Value 1/31/23 | Hypothetical Ending Account Value 1/31/23 | Actual Expenses Paid During Period 8/1/22- 1/31/23* | Hypothetical Expenses Paid During Period 8/1/22- 1/31/23* | Annualized Expense Ratio During Period 8/1/22- 1/31/23 | ||||||||||||||||||||||
Fund Shares | $ | 1,000.00 | $ | 992.00 | $ | 1,021.88 | $ | 3.31 | $ | 3.36 | 0.66 | % | |||||||||||||||
Institutional Shares | 1,000.00 | 991.30 | 1,022.18 | 3.01 | 3.06 | 0.60 | % | ||||||||||||||||||||
Class A | 1,000.00 | 990.70 | 1,020.57 | 4.62 | 4.69 | 0.92 | % | ||||||||||||||||||||
Class C | 1,000.00 | 986.50 | 1,017.39 | 7.76 | 7.88 | 1.55 | % | ||||||||||||||||||||
R6 Shares | 1,000.00 | 992.20 | 1,023.09 | 2.11 | 2.14 | 0.42 | % | ||||||||||||||||||||
* Expenses are equal to the average account value multiplied by the Fund's annualized expense ratio multiplied by 184/365 (the number of days in the most recent fiscal half-year divided by the number of days in the fiscal year).
54
USAA Mutual Funds Trust | Supplemental Information — continued January 31, 2023 | ||||||
(Unaudited)
Considerations of the Board in Continuing the Investment Advisory Agreement
USAA Intermediate-Term Bond Fund (the "Fund")
At a meeting of the Board of Trustees (the "Board") of USAA Mutual Funds Trust (the "Trust") held on December 8-9, 2022, the Board, including the Trustees who are not "interested persons" (as that term is defined in the Investment Company Act of 1940, as amended) of the Trust (the "Independent Trustees"), approved for an annual period the continuance of the Investment Advisory Agreement (the "Advisory Agreement") between the Trust and Victory Capital Management Inc. (the "Adviser") with respect to the Fund. Prior to the December 8-9, 2022 meeting at which the Advisory Agreement was approved, the Independent Trustees also discussed and considered information regarding the proposed continuation of the Advisory Agreement at a meeting held on November 21, 2022.
In advance of the foregoing meetings, the Trustees received and considered a variety of information relating to the Advisory Agreement and the Adviser, and were given the opportunity to ask questions and request additional information from management. The information provided to the Board included, among other things: (i) a separate report prepared by an independent third party of mutual fund data, which provided a statistical analysis comparing the Fund's investment performance, expenses, and fees to comparable investment companies; (ii) information concerning the services rendered to the Fund, as well as information regarding the Adviser's revenues and costs of providing services to the Fund and compensation paid to affiliates of the Adviser; and (iii) information about the Adviser's operations and personnel. Prior to voting, the Independent Trustees reviewed the proposed continuance of the Advisory Agreement with management and with experienced independent counsel retained by the Independent Trustees ("Independent Counsel") and received materials from such Independent Counsel discussing the legal standards for their consideration of the proposed continuation of the Advisory Agreement with respect to the Fund. The Independent Trustees also reviewed the proposed continuation of the Advisory Agreement with respect to the Fund in private sessions with Independent Counsel at which no representatives of management were present.
At each regularly scheduled meeting of the Board and its committees, the Board receives and reviews, among other things, information concerning the Fund's performance and related services provided by the Adviser. At the meeting at which the renewal of the Advisory Agreement is considered, particular focus is given to information concerning Fund performance, fees and total expenses as compared to comparable investment companies, and the Adviser's profitability with respect to the Fund. However, the Board noted that the evaluation process with respect to the Adviser is an ongoing one. In this regard, the Board's and its committees' consideration of the Advisory Agreement included information previously received at such meetings. The Board also recognized that the contractual arrangements for the Fund have been reviewed by the Board and discussed with the Adviser in prior years and that the Board's conclusions may be based, in part, on its consideration of these same arrangements in prior years.
Advisory Agreement
After full consideration of a variety of factors, the Board, including the Independent Trustees, voted to approve the Advisory Agreement. In approving the Advisory Agreement, the Trustees did not identify any single factor as controlling, and each Trustee may have attributed different weights to various factors. Throughout their deliberations, the Independent Trustees were represented and assisted by Independent Counsel.
Nature, Extent, and Quality of Services — In considering the nature, extent, and quality of the services provided by the Adviser under the Advisory Agreement, the Board reviewed information provided by the Adviser relating to its operations and personnel. The Board also took into account its knowledge of the Adviser's management and the quality of the performance of the Adviser's duties through Board meetings, discussions, and reports during the preceding year. The Board considered the fees paid to the Adviser and the services provided to the Fund by the Adviser under the Advisory Agreement, as well as other services provided by the Adviser and its affiliates under other agreements, and the personnel who provide these services. In addition to the investment advisory services provided to the Fund, the Adviser and its affiliates provide administrative services, shareholder services, oversight of Fund accounting, marketing services, assistance in meeting legal and regulatory requirements, and other services necessary for the operation of the Fund and the Trust.
55
USAA Mutual Funds Trust | Supplemental Information — continued January 31, 2023 | ||||||
(Unaudited)
The Board considered the scope of services provided by, and the undertakings required of, the Adviser in connection with those services, including, among other things, maintaining (i) its own and the Fund's compliance programs, (ii) risk management programs, (iii) liquidity risk management program, (iv) derivatives risk management program, and (v) cybersecurity programs, each of which had expanded over time as a result of regulatory, market, and other developments. The Board also considered the significant risks assumed by the Adviser in connection with the services provided to the Fund, including investment, operational, enterprise, litigation, regulatory and compliance risks.
The Board considered the Adviser's management style and the performance of the Adviser's duties under the Advisory Agreement. The Board considered the level and depth of knowledge of the Adviser, including the professional experience and qualifications of its senior and investment personnel, as well as current staffing levels. The allocation of the Fund's brokerage, including the Adviser's process for monitoring "best execution," also was considered. The Adviser's role in coordinating the activities of the Fund's other service providers was also considered. The Board also considered the Adviser's risk management processes. The Board considered the Adviser's financial condition and that it had the financial wherewithal to continue to provide the same scope and high quality of services under the Advisory Agreement. In reviewing the Advisory Agreement, the Board focused on the experience, resources, and strengths of the Adviser and its affiliates in managing the Fund, as well as the other funds in the Trust.
The Board also reviewed the compliance and administrative services provided to the Fund by the Adviser and its affiliates, including the Adviser's oversight of the Fund's day-to-day operations and oversight of Fund accounting. The Trustees, guided also by information obtained from their experiences as Trustees of the Trust, also focused on the quality of the Adviser's compliance and administrative staff.
Expenses and Performance — In connection with its consideration of the Advisory Agreement, the Board evaluated the Fund's advisory fees and total expense ratio as compared to other open-end investment companies deemed to be comparable to the Fund as determined by the independent third party in its report. The Fund's expenses were compared to (i) a group of investment companies chosen by the independent third party to be comparable to the Fund based upon certain factors, including fund type, comparability of investment objective and classification, sales load type, asset size, and expense components (the "expense group") and (ii) a larger group of investment companies with the same investment classification/objective as the Fund regardless of asset size, excluding outliers (the "expense universe"). Among other data, the Board noted that the Fund's net management fee rate — which includes advisory and administrative services and the effects of any performance adjustment, as well as any fee waivers and reimbursements — was above the medians of its expense group and its expense universe. The data indicated that the Fund's total expenses, including after any reimbursements, were equal to the median of its expense group and below the median of its expense universe. The Board also took into account the Adviser's current undertakings to maintain expense limitations for the Fund. The Board took into account the various other services provided to the Fund by the Adviser and its affiliates, and noted the high quality of services received by the Fund.
In considering the Fund's performance, the Board noted that it reviews at its regularly scheduled meetings information about the Fund's performance results. The Trustees also reviewed various comparative data provided to them in connection with their consideration of the renewal of the Advisory Agreement, including, among other information, a comparison of the Fund's average annual total returns relative to its Lipper index and other mutual funds deemed to be in its peer group by the independent third party in its report (the "performance universe"). The Fund's performance universe consisted of the Fund and all retail and institutional open-end investment companies with the same classification/objective as the Fund regardless of asset size or primary channel of distribution. This comparison indicated that, among other data, the Fund's performance was above the average of its performance universe and its Lipper index for the one-, three-, five- and ten-year periods ended June 30, 2022.
Compensation and Profitability — The Board took into consideration the level and method of computing the management fee. The information considered by the Board included operating profit margin information for the Adviser's business as a whole. The Board also received and considered profitability information related to the management revenues from the Fund. This information included a review of the methodology used in the allocation of certain costs to the Fund. In considering the profitability data with respect to the Fund, the Trustees noted that the Adviser reimbursed or waived a portion of its management fees to the Fund. The Trustees reviewed
56
USAA Mutual Funds Trust | Supplemental Information — continued January 31, 2023 | ||||||
(Unaudited)
the profitability of the Adviser's relationship with the Fund before tax expenses. The Board was also provided with a profitability analysis of other publicly traded asset managers prepared by an independent information service. In reviewing the overall profitability of the management fee to the Adviser, the Board also considered the fact that the Adviser and its affiliates provide shareholder servicing and administrative services to the Fund for which they receive compensation. The Board also considered the possible direct and indirect benefits to the Adviser from its relationship with the Trust, including that the Adviser may derive reputational and other benefits from its association with the Fund. The Trustees recognized that the Adviser should be entitled to earn a reasonable level of profits in exchange for the level of services it provides to the Fund and the entrepreneurial and other risks that it assumes as Adviser.
Economies of Scale — The Board noted that the Fund has advisory fee breakpoints that allow the Fund to participate in economies of scale and that such economies of scale were currently reflected in the advisory fee. The Board also considered the fee waiver and expense reimbursement arrangements by the Adviser. The Board also considered the effect of the change in size, if any, of each of the Fund's classes on its performance and fees, noting that the Fund may realize other economies of scale if assets increase proportionally more than expenses. The Board determined that the current investment management fee structure was reasonable.
Conclusions — The Board reached the following conclusions regarding the Fund's Advisory Agreement with the Adviser: (i) the Adviser has demonstrated that it possesses the capability and resources to perform the duties required of it under the Advisory Agreement; (ii) the Adviser maintains an appropriate compliance program; (iii) the overall performance of the Fund is reasonable in relation to the performance of funds with similar investment objectives and to relevant indices; (iv) the Fund's advisory expenses are reasonable in relation to those of similar funds and to the services to be provided by the Adviser; and (v) the Adviser's and its affiliates' level of profitability from their relationship with the Fund is reasonable in light of the nature and high quality of services provided by the Adviser and its affiliates and the type of fund. Based on its conclusions, the Board determined that continuation of the Advisory Agreement would be in the best interests of the Fund and its shareholders.
57
Privacy Policy
Protecting the Privacy of Information
The Trust respects your right to privacy. We also know that you expect us to conduct and process your business in an accurate and efficient manner. To do so, we must collect and maintain certain personal information about you. This is the information we collect from you on applications or other forms, and from the transactions you make with us or third parties. It may include your name, address, social security number, account transactions and balances, and information about investment goals and risk tolerance.
We do not disclose any information about you or about former customers to anyone except as permitted or required by law. Specifically, we may disclose the information we collect to companies that perform services on our behalf, such as the transfer agent that processes shareholder accounts and printers and mailers that assist us in the distribution of investor materials. We may also disclose this information to companies that perform marketing services on our behalf. This allows us to continue to offer you Victory investment products and services that meet your investing needs, and to effect transactions that you request or authorize. These companies will use this information only in connection with the services for which we hired them. They are not permitted to use or share this information for any other purpose.
To protect your personal information internally, we permit access only by authorized employees and maintain physical, electronic, and procedural safeguards to guard your personal information.*
* You may have received communications regarding information about privacy policies from other financial institutions which gave you the opportunity to "opt-out" of certain information sharing with companies which are not affiliated with that financial institution. The Trust does not share information with other companies for purposes of marketing solicitations for products other than the Trust. Therefore, the Trust does not provide opt-out options to their shareholders.
P.O. Box 182593
Columbus, Ohio 43218-2593

Visit our website at: | Call | ||||||
vcm.com | (800) 235-8396 | ||||||
40049-0323

January 31, 2023
Semi Annual Report
USAA High Income Fund
Victory Capital means Victory Capital Management Inc., the investment adviser of the USAA Mutual Funds. USAA Mutual Funds are distributed by Victory Capital Services, Inc., member FINRA, an affiliate of Victory Capital. Victory Capital and its affiliates are not affiliated with United Services Automobile Association or its affiliates. USAA and the USAA logos are registered trademarks and the USAA Mutual Funds and USAA Investments logos are trademarks of United Services Automobile Association and are being used by Victory Capital and its affiliates under license.
vcm.com
News, Information And Education 24 Hours A Day, 7 Days A Week
The Victory Capital website gives fund shareholders, prospective shareholders, and investment professionals a convenient way to access fund information, get guidance, and track fund performance anywhere they can access the Internet. The site includes:
• Detailed performance records
• Daily share prices
• The latest fund news
• Investment resources to help you become a better investor
• A section dedicated to investment professionals
Whether you're a potential investor searching for the fund that matches your investment philosophy, a seasoned investor interested in planning tools, or an investment professional, vcm.com has what you seek. Visit us anytime. We're always open.
USAA Mutual Funds Trust
TABLE OF CONTENTS
Investment Objective & Portfolio Holdings | 2 | ||||||
Schedule of Portfolio Investments | 3 | ||||||
Financial Statements | |||||||
Statement of Assets and Liabilities | 18 | ||||||
Statement of Operations | 19 | ||||||
Statements of Changes in Net Assets | 20 | ||||||
Financial Highlights | 22 | ||||||
Notes to Financial Statements | 26 | ||||||
Supplemental Information | 37 | ||||||
Proxy Voting and Portfolio Holdings Information | 37 | ||||||
Expense Examples | 37 | ||||||
Advisory Contract Approval | 38 | ||||||
Privacy Policy (inside back cover) | |||||||
This report is for the information of the shareholders and others who have received a copy of the currently effective prospectus of the Fund, managed by Victory Capital Management Inc. It may be used as sales literature only when preceded or accompanied by a current prospectus, which provides further details about the Fund.
IRA DISTRIBUTION WITHHOLDING DISCLOSURE
We generally must withhold federal income tax at a rate of 10% of the taxable portion of your distribution and, if you live in a state that requires state income tax withholding, at your state's tax rate. However, you may elect not to have withholding apply or to have income tax withheld at a higher rate. Any withholding election that you make will apply to any subsequent distribution unless and until you change or revoke the election. If you wish to make a withholding election, or change or revoke a prior withholding election, call (800) 235-8396, and form W-4P (OMB No. 1545-0074 withholding certificate for pension or annuity payments) will be electronically sent.
If you do not have a withholding election in place by the date of a distribution, federal income tax will be withheld from the taxable portion of your distribution at a rate of 10%. If you must pay estimated taxes, you may be subject to estimated tax penalties if your estimated tax payments are not sufficient and sufficient tax is not withheld from your distribution.
For more specific information, please consult your tax adviser.
• NOT FDIC INSURED • NO BANK GUARANTEE • MAY LOSE VALUE
1
| USAA Mutual Funds Trust USAA High Income Fund | January 31, 2023 | ||||||
(Unaudited)
Investment Objective and Portfolio Holdings:
The Fund seeks an attractive total return primarily through high current income and secondarily through capital appreciation.
Sector Allocation*:
January 31, 2023
(% of Net Assets)

* Does not include futures contracts, money market instruments, and short-term investments purchased with cash collateral from securities loaned.
Percentages are of the net assets of the Fund and may not equal 100%.
Refer to the Schedule of Portfolio Investments for a complete list of securities.
2
| USAA Mutual Funds Trust USAA High Income Fund | Schedule of Portfolio Investments January 31, 2023 | ||||||
(Amounts in Thousands, Except for Shares) (Unaudited)
Security Description | Shares or Principal Amount | Value | |||||||||
Asset-Backed Securities (1.4%) | |||||||||||
Evergreen Credit Card Trust, Series 2022-CRT1, Class C, 6.19%, 7/15/26 (a) | $ | 3,000 | $ | 2,939 | |||||||
Evergreen Credit Card Trust, Series 2022-CRT2, Class C, 7.44%, 11/15/26 (a) | 3,000 | 3,008 | |||||||||
| Hertz Vehicle Financing LLC, Series 2022-4A, Class B, 4.12%, 9/25/26, Callable 9/25/25 @ 100 (a) | 1,070 | 1,021 | |||||||||
| NP SPE II LLC, Series 2019-2A, Class C1, 6.44%, 11/19/49, Callable 11/19/23 @ 100 (a) | 2,327 | 2,075 | |||||||||
| Santander Bank Auto Credit-Linked Notes, Series 2022-B, Class E, 8.68%, 8/16/32, Callable 2/15/26 @ 100 (a) | 2,431 | 2,388 | |||||||||
| SCF Equipment Leasing LLC, Series 2022-2A, Class D, 6.50%, 10/20/32, Callable 10/20/29 @ 100 (a) | 989 | 946 | |||||||||
| United Auto Credit Securitization Trust, Series 2023-1, Class C, 6.28%, 7/10/28, Callable 2/10/27 @ 100 (a) | 2,500 | 2,497 | |||||||||
Total Asset-Backed Securities (Cost $15,096) | 14,874 | ||||||||||
Collateralized Mortgage Obligations (1.5%) | |||||||||||
| 720 East CLO Ltd., Series 2022-1A, Class D, 10.72% (TSFR3M+615bps), 1/20/36, Callable 1/20/30 @ 100 (a) (b) | 9,500 | 9,258 | |||||||||
Aventura Mall Trust, Series 2018-AVM, Class C, 4.11%, 7/5/40 (a) (c) | 3,000 | 2,638 | |||||||||
BPR Trust, Series 2022-STAR, Class A, 7.71% (TSFR1M+323bps), 8/15/24 (a) (b) | 2,536 | 2,528 | |||||||||
BXP Trust, Series 2021-601L, Class D, 2.78%, 1/15/44 (a) (c) | 2,000 | 1,302 | |||||||||
| CHL Mortgage Pass-Through Trust, Series 2004-25, Class 1A6, 5.47% (LIBOR01M+96bps), 2/25/35, Callable 2/25/23 @ 100 (b) | 641 | 125 | |||||||||
| Credit Suisse First Boston Mortgage Securities Corp., Series 1998-C1, Class AX, 1.76%, 5/17/40, Callable 2/17/23 @ 100 (c) (d) | — | (e) | — | (e) | |||||||
Total Collateralized Mortgage Obligations (Cost $16,119) | 15,851 | ||||||||||
Common Stocks (0.4%) | |||||||||||
Communication Services (0.1%): | |||||||||||
AT&T, Inc. | 39,101 | 797 | |||||||||
Energy (0.2%): | |||||||||||
| BP PLC, ADR | 9,808 | 355 | |||||||||
GenOn Energy, Inc. | 16,168 | 1,779 | |||||||||
Nine Point Energy (f) | 2,678,202 | — | (e) | ||||||||
Sabine Oil & Gas Holdings, Inc. (f) | 2,824 | — | (e) | ||||||||
Shell PLC, ADR | 1,159 | 68 | |||||||||
2,202 | |||||||||||
Real Estate (0.1%): | |||||||||||
Crown Castle, Inc. | 6,253 | 926 | |||||||||
Total Common Stocks (Cost $6,818) | 3,925 | ||||||||||
Preferred Stocks (2.0%) | |||||||||||
Communication Services (0.3%): | |||||||||||
Qwest Corp., 6.50%, 9/1/56 | 135,286 | 2,787 | |||||||||
See notes to financial statements.
3
| USAA Mutual Funds Trust USAA High Income Fund | Schedule of Portfolio Investments — continued January 31, 2023 | ||||||
(Amounts in Thousands, Except for Shares) (Unaudited)
Security Description | Shares or Principal Amount | Value | |||||||||
Consumer Staples (0.4%): | |||||||||||
CHS, Inc., cumulative redeemable, Series 1, 7.88% (g) | 87,180 | $ | 2,259 | ||||||||
CHS, Inc., cumulative redeemable, Series 2, 7.10% (LIBOR03M+429bps) (b) (g) | 76,204 | 1,948 | |||||||||
4,207 | |||||||||||
Energy (1.1%): | |||||||||||
NuStar Logistics LP, 11.53% (LIBOR03M+673bps), 1/15/43 (b) | 437,747 | 10,974 | |||||||||
Real Estate (0.2%): | |||||||||||
Equity Residential, cumulative redeemable, Series K, 8.29% (g) | 45,314 | 2,380 | |||||||||
Prologis, Inc., cumulative redeemable, Series Q, 8.54% (g) | 5,310 | 305 | |||||||||
2,685 | |||||||||||
Total Preferred Stocks (Cost $21,675) | 20,653 | ||||||||||
Senior Secured Loans (6.5%) | |||||||||||
| AAdvantage Loyalty IP Ltd., Initial Term Loan, First Lien, 9.48% (LIBOR03M+475bps), 4/20/28 (b) | $ | 750 | 770 | ||||||||
| Asurion LLC, New B-10 Term Loans, First Lien, 8.30% (SOFR03M+400bps), 8/19/28 (b) | 499 | 471 | |||||||||
| Bausch + Lomb Corp., Initial Term Loans, First Lien, 7.82% (SOFR03M+325bps), 5/10/27 (b) | 1,995 | 1,940 | |||||||||
| Bausch Health Cos., Inc., Second Amendment Term Loan, First Lien, 9.82% (SOFR01M+525bps), 2/1/27 (b) | 2,407 | 1,846 | |||||||||
| Central Parent, Inc., Initial Term Loan, First Lien, 9.16% (SOFR03M+450bps), 7/6/29 (b) | 2,000 | 1,994 | |||||||||
| Clydesdale Acquisition Holdings, Inc., Term B Loans, First Lien, 8.74% (SOFR01M+418bps), 4/13/29 (b) | 995 | 976 | |||||||||
| CNT Holdings I Corp., Second Lien Initial Term Loans, Second Lien, 11.32% (SOFR03M+675bps), 11/6/28 (b) | 2,000 | 1,912 | |||||||||
| Directv Financing LLC, Closing Date Term Loans, First Lien, 9.58% (LIBOR01M+500bps), 8/2/27 (b) | 2,811 | 2,761 | |||||||||
| Fertitta Entertainment LLC, Initial B Term Loan, First Lien, 8.56% (SOFR01M+400bps), 1/27/29 (b) | 3,977 | 3,927 | |||||||||
| Great Outdoors Group LLC, Term B1, First Lien, 8.27% (LIBOR01M+375bps), 3/5/28 (b) | 1,995 | 1,959 | |||||||||
| H-Food Holdings LLC, Initial Term Loan, First Lien, 8.47% (LIBOR01M+369bps), 5/31/25 (b) | 2,493 | 2,312 | |||||||||
Latam Airlines Group SA, 14.13% (SOFR03M+950bps), 10/12/27 (b) | 3,000 | 3,032 | |||||||||
| Lealand Finance Co. BV, Make Whole Term Loan, First Lien, 7.57% (LIBOR01M+300bps), 6/30/24 (b) | 39 | 24 | |||||||||
| Lealand Finance Co. BV, Take-Back Term Loan, First Lien (3.00% PIK), 8.57% (LIBOR01M+100bps), 6/30/25 (b) | 347 | 186 | |||||||||
| Life Time, Inc., 2021 Refinancing Term Loan, First Lien, 9.57% (LIBOR03M+475bps), 12/15/24 (b) | 4,000 | 4,000 | |||||||||
Mauser Packaging Solutions, 8/30/26 (h) | 1,000 | 980 | |||||||||
| Mauser Packaging Solutions Holding Co., Initial Term Loan, First Lien, 8.01% (LIBOR01M+325bps), 4/3/24 (b) | 2,493 | 2,468 | |||||||||
| Medline Borrower LP, Initial Dollar Term Loans, First Lien, 7.76% (LIBOR01M+325bps), 10/21/28 (b) | 1,496 | 1,451 | |||||||||
See notes to financial statements.
4
| USAA Mutual Funds Trust USAA High Income Fund | Schedule of Portfolio Investments — continued January 31, 2023 | ||||||
(Amounts in Thousands, Except for Shares) (Unaudited)
Security Description | Principal Amount | Value | |||||||||
| Mileage Plus Holdings LLC, Initial Term Loan, First Lien, 10.02% (LIBOR03M+525bps), 6/20/27 (b) | $ | 1,800 | $ | 1,875 | |||||||
| Neptune Bidco US, Inc., Dollar Term B Loan, First Lien, 9.57% (SOFR03M+500bps), 4/11/29 (b) (j) | 3,000 | 2,745 | |||||||||
Paya, Inc., TLB, First Lien, 7.77% (LIBOR01M+325bps), 6/25/28 (b) | 988 | 986 | |||||||||
| Petco Health & Wellness Co., Inc., Initial Term Loans, First Lien, 7.68% (SOFR03M+325bps), 3/4/28 (b) | 1,496 | 1,479 | |||||||||
| Polaris Newco LLC, Dollar Term Loan, First Lien, 8.73% (LIBOR03M+400bps), 6/4/28 (b) | 1,234 | 1,171 | |||||||||
| Pregis TopCo LLC, Initial Term Loan, First Lien, 8.80% (SOFR01M+400bps), 8/1/26 (b) | 1,455 | 1,436 | |||||||||
Quicksilver Resources, Inc., Loans, Second Lien, 7.00%, 6/21/19 (f) (h) | 3,914 | 6 | |||||||||
| Sunshine Luxembourg VII Sarl, Facility B3 Commitments, First Lien, 8.52% (LIBOR03M+375bps), 10/2/26 (b) | 3,928 | 3,844 | |||||||||
| Team Health Holdings, Inc., Facility Extending Term Loan B, First Lien, 9.82% (SOFR01M+525bps), 2/2/27 (b) | 3,941 | 3,261 | |||||||||
| The Michaels Cos., Inc., Term B Loans, First Lien, 9.04% (LIBOR03M+425bps), 4/15/28 (b) (h) | 2,000 | 1,834 | |||||||||
| TIBCO Software, Inc., Term A Loan, First Lien, 9.09% (SOFR03M+450bps), 9/30/28 (b) (j) | 9,500 | 8,683 | |||||||||
| UKG, Inc., 2021 Incremental Term Loan, Second Lien, 10.03% (LIBOR03M+525bps), 5/3/27 (b) | 2,000 | 1,907 | |||||||||
| WaterBridge Midstream Operating LLC, Term Loan B, First Lien, 10.91% (LIBOR03M+575bps), 6/21/26 (b) | — | (e) | — | (e) | |||||||
| Whatabrands LLC, Initial Term B Loans, First Lien, 7.82% (LIBOR01M+325bps), 8/3/28 (b) | 3,471 | 3,431 | |||||||||
| Wok Holdings, Inc., Initial Term Loans, First Lien, 11.27% (LIBOR03M+650bps), 3/1/26 (b) | 1,893 | 1,642 | |||||||||
Total Senior Secured Loans (Cost $71,414) | 67,309 | ||||||||||
Corporate Bonds (65.1%) | |||||||||||
Communication Services (12.5%): | |||||||||||
AMC Networks, Inc., 4.25%, 2/15/29, Callable 2/15/24 @ 102.13 | 4,000 | 2,455 | |||||||||
Cable One, Inc., 4.00%, 11/15/30, Callable 11/15/25 @ 102 (a) (k) | 4,421 | 3,656 | |||||||||
Cablevision Lightpath LLC, 5.63%, 9/15/28, Callable 9/15/23 @ 102.81 (a) | 2,797 | 2,144 | |||||||||
| CCO Holdings LLC/CCO Holdings Capital Corp. 4.75%, 3/1/30, Callable 9/1/24 @ 102.38 (a) | 3,500 | 3,061 | |||||||||
4.50%, 8/15/30, Callable 2/15/25 @ 102.25 (a) | 2,500 | 2,137 | |||||||||
7.38%, 3/1/31, Callable 3/1/26 @ 103.69 (a) | 1,875 | 1,873 | |||||||||
4.50%, 6/1/33, Callable 6/1/27 @ 102.25 (a) | 5,000 | 4,063 | |||||||||
4.25%, 1/15/34, Callable 1/15/28 @ 102.13 (a) | 4,000 | 3,126 | |||||||||
| Clear Channel Outdoor Holdings, Inc. 5.13%, 8/15/27, Callable 3/13/23 @ 102.56 (a) | 4,500 | 4,099 | |||||||||
7.50%, 6/1/29, Callable 6/1/24 @ 103.75 (a) | 1,000 | 814 | |||||||||
| CSC Holdings LLC 7.50%, 4/1/28, Callable 4/1/23 @ 103.75 (a) | 3,000 | 2,192 | |||||||||
6.50%, 2/1/29, Callable 2/1/24 @ 103.25 (a) | 4,500 | 3,898 | |||||||||
5.75%, 1/15/30, Callable 1/15/25 @ 102.88 (a) | 5,500 | 3,468 | |||||||||
4.13%, 12/1/30, Callable 12/1/25 @ 102.06 (a) | 2,000 | 1,468 | |||||||||
5.00%, 11/15/31, Callable 11/15/26 @ 102.5 (a) | 2,500 | 1,495 | |||||||||
See notes to financial statements.
5
| USAA Mutual Funds Trust USAA High Income Fund | Schedule of Portfolio Investments — continued January 31, 2023 | ||||||
(Amounts in Thousands, Except for Shares) (Unaudited)
Security Description | Principal Amount | Value | |||||||||
| Cumulus Media New Holdings, Inc., 6.75%, 7/1/26, Callable 3/13/23 @ 103.38 (a) (k) | $ | 5,975 | $ | 4,988 | |||||||
| Directv Financing LLC/Directv Financing Co.-Obligor, Inc., 5.88%, 8/15/27, Callable 8/15/23 @ 104.41 (a) | 4,000 | 3,623 | |||||||||
| DISH DBS Corp. 7.75%, 7/1/26 | 3,000 | 2,434 | |||||||||
5.25%, 12/1/26, Callable 6/1/26 @ 100 (a) | 2,500 | 2,154 | |||||||||
DISH Network Corp., 11.75%, 11/15/27, Callable 5/15/25 @ 105.88 (a) | 11,750 | 12,186 | |||||||||
Embarq Corp., 8.00%, 6/1/36 | 2,500 | 1,205 | |||||||||
| Frontier Communications Holdings LLC 5.88%, 10/15/27, Callable 10/15/23 @ 102.94 (a) | 2,500 | 2,386 | |||||||||
5.00%, 5/1/28, Callable 5/1/24 @ 102.5 (a) | 2,000 | 1,814 | |||||||||
6.75%, 5/1/29, Callable 5/1/24 @ 103.38 (a) | 3,000 | 2,571 | |||||||||
Gray Television, Inc., 4.75%, 10/15/30, Callable 10/15/25 @ 102.38 (a) | 4,000 | 2,987 | |||||||||
iHeartCommunications, Inc., 8.38%, 5/1/27, Callable 2/27/23 @ 104.19 (k) | 4,000 | 3,586 | |||||||||
| Lumen Technologies, Inc. 4.00%, 2/15/27, Callable 3/13/23 @ 102 (a) | 1,000 | 844 | |||||||||
5.38%, 6/15/29, Callable 6/15/24 @ 102.69 (a) (k) | 3,400 | 2,369 | |||||||||
7.65%, 3/15/42 | 4,621 | 3,042 | |||||||||
Match Group Holdings II LLC, 4.63%, 6/1/28, Callable 6/1/23 @ 102.31 (a) | 2,000 | 1,839 | |||||||||
News Corp., 5.13%, 2/15/32, Callable 2/15/27 @ 102.56 (a) | 1,000 | 941 | |||||||||
| Nexstar Media, Inc. 5.63%, 7/15/27, Callable 2/21/23 @ 104.22 (a) | 4,000 | 3,811 | |||||||||
4.75%, 11/1/28, Callable 11/1/23 @ 102.38 (a) | 2,000 | 1,800 | |||||||||
| Radiate Holdco LLC/Radiate Finance, Inc. 4.50%, 9/15/26, Callable 9/15/23 @ 102.25 (a) | 2,000 | 1,532 | |||||||||
6.50%, 9/15/28, Callable 9/15/23 @ 103.25 (a) | 1,000 | 520 | |||||||||
Salem Media Group, Inc., 6.75%, 6/1/24, Callable 3/13/23 @ 100 (a) | 1,484 | 1,436 | |||||||||
| Scripps Escrow II, Inc. 3.88%, 1/15/29, Callable 1/15/24 @ 101.94 (a) | 1,500 | 1,258 | |||||||||
5.38%, 1/15/31, Callable 1/15/26 @ 102.69 (a) (k) | 4,000 | 3,227 | |||||||||
Sinclair Television Group, Inc., 5.50%, 3/1/30, Callable 12/1/24 @ 102.75 (a) (k) | 4,250 | 3,389 | |||||||||
| Sirius XM Radio, Inc. 4.13%, 7/1/30, Callable 7/1/25 @ 102.06 (a) | 4,000 | 3,428 | |||||||||
3.88%, 9/1/31, Callable 9/1/26 @ 101.94 (a) | 2,000 | 1,645 | |||||||||
TEGNA, Inc., 5.00%, 9/15/29, Callable 9/15/24 @ 102.5 | 2,500 | 2,354 | |||||||||
Townsquare Media, Inc., 6.88%, 2/1/26, Callable 3/13/23 @ 103.44 (a) | 4,000 | 3,751 | |||||||||
Univision Communications, Inc., 7.38%, 6/30/30, Callable 6/30/25 @ 103.69 (a) | 4,000 | 3,921 | |||||||||
Urban One, Inc., 7.38%, 2/1/28, Callable 2/1/24 @ 103.69 (a) | 1,866 | 1,685 | |||||||||
| Zayo Group Holdings, Inc. 4.00%, 3/1/27, Callable 3/13/23 @ 100 (a) | 1,500 | 1,192 | |||||||||
6.13%, 3/1/28, Callable 3/13/23 @ 103.06 (a) (k) | 500 | 344 | |||||||||
| ZoomInfo Technologies LLC/ZoomInfo Finance Corp., 3.88%, 2/1/29, Callable 2/1/24 @ 101.94 (a) (k) | 4,500 | 3,882 | |||||||||
128,093 | |||||||||||
Consumer Discretionary (14.5%): | |||||||||||
APX Group, Inc., 5.75%, 7/15/29, Callable 7/15/24 @ 102.88 (a) | 4,600 | 3,984 | |||||||||
| Asbury Automotive Group, Inc. 4.75%, 3/1/30, Callable 3/1/25 @ 102.38 | 1,500 | 1,320 | |||||||||
5.00%, 2/15/32, Callable 11/15/26 @ 102.5 (a) | 3,000 | 2,591 | |||||||||
See notes to financial statements.
6
| USAA Mutual Funds Trust USAA High Income Fund | Schedule of Portfolio Investments — continued January 31, 2023 | ||||||
(Amounts in Thousands, Except for Shares) (Unaudited)
Security Description | Principal Amount | Value | |||||||||
| Ashton Woods USA LLC/Ashton Woods Finance Co., 4.63%, 4/1/30, Callable 4/1/25 @ 102.31 (a) | $ | 3,000 | $ | 2,505 | |||||||
AutoNation, Inc., 2.40%, 8/1/31, Callable 5/1/31 @ 100 | 1,000 | 763 | |||||||||
| Avis Budget Car Rental LLC/Avis Budget Finance, Inc., 5.38%, 3/1/29, Callable 3/1/24 @ 102.69 (a) (k) | 3,000 | 2,684 | |||||||||
Beazer Homes USA, Inc., 7.25%, 10/15/29, Callable 10/15/24 @ 103.63 | 4,000 | 3,697 | |||||||||
Boyd Gaming Corp., 4.75%, 6/15/31, Callable 6/15/26 @ 102.38 (a) | 2,000 | 1,796 | |||||||||
Boyne USA, Inc., 4.75%, 5/15/29, Callable 5/15/24 @ 102.38 (a) | 2,015 | 1,827 | |||||||||
| Caesars Entertainment, Inc. 8.13%, 7/1/27, Callable 7/1/23 @ 104.06 (a) | 1,500 | 1,522 | |||||||||
4.63%, 10/15/29, Callable 10/15/24 @ 102.31 (a) | 3,960 | 3,383 | |||||||||
| Carnival Corp. 9.88%, 8/1/27, Callable 2/1/24 @ 104.94 (a) | 11,500 | 11,820 | |||||||||
6.00%, 5/1/29, Callable 11/1/24 @ 103 (a) | 4,500 | 3,555 | |||||||||
| Clarios Global LP/Clarios US Finance Co., 8.50%, 5/15/27, Callable 3/13/23 @ 104.25 (a) | 2,000 | 1,994 | |||||||||
Everi Holdings, Inc., 5.00%, 7/15/29, Callable 7/15/24 @ 102.5 (a) | 1,000 | 904 | |||||||||
| Fertitta Entertainment LLC/Fertitta Entertainment Finance Co., Inc., 6.75%, 1/15/30, Callable 1/15/25 @ 103.38 (a) | 500 | 415 | |||||||||
| Ford Motor Co. 6.63%, 10/1/28 | 4,000 | 4,167 | |||||||||
4.75%, 1/15/43 | 2,000 | 1,562 | |||||||||
Graham Packaging Co., Inc., 7.13%, 8/15/28, Callable 8/15/23 @ 103.56 (a) | 1,500 | 1,318 | |||||||||
Group 1 Automotive, Inc., 4.00%, 8/15/28, Callable 8/15/23 @ 102 (a) | 1,000 | 878 | |||||||||
Hilton Domestic Operating Co., Inc., 4.00%, 5/1/31, Callable 5/1/26 @ 102 (a) | 2,000 | 1,736 | |||||||||
KB Home, 4.80%, 11/15/29, Callable 5/15/29 @ 100 | 2,000 | 1,797 | |||||||||
Lindblad Expeditions LLC, 6.75%, 2/15/27, Callable 2/15/24 @ 103.38 (a) | 1,000 | 979 | |||||||||
| Lithia Motors, Inc. 3.88%, 6/1/29, Callable 6/1/24 @ 101.94 (a) (k) | 10,000 | 8,502 | |||||||||
4.38%, 1/15/31, Callable 10/15/25 @ 102.19 (a) | 1,000 | 851 | |||||||||
M/I Homes, Inc., 4.95%, 2/1/28, Callable 2/27/23 @ 103.71 | 5,000 | 4,617 | |||||||||
Macy's Retail Holdings LLC, 5.88%, 3/15/30, Callable 3/15/25 @ 102.94 (a) | 4,000 | 3,654 | |||||||||
| Marriott Ownership Resorts, Inc. 4.75%, 1/15/28, Callable 3/13/23 @ 102.38 | 2,000 | 1,825 | |||||||||
4.50%, 6/15/29, Callable 6/15/24 @ 102.25 (a) | 2,000 | 1,745 | |||||||||
MGM Resorts International, 4.75%, 10/15/28, Callable 7/15/28 @ 100 | 3,000 | 2,719 | |||||||||
Murphy Oil USA, Inc., 3.75%, 2/15/31, Callable 2/15/26 @ 101.88 (a) | 2,000 | 1,679 | |||||||||
| NCL Corp. Ltd. 5.88%, 3/15/26, Callable 12/15/25 @ 100 (a) | 6,400 | 5,536 | |||||||||
8.38%, 2/1/28, Callable 2/1/25 @ 104.19 (a) | 3,750 | 3,812 | |||||||||
NCL Corp., Ltd., 5.88%, 2/15/27, Callable 2/15/24 @ 102.94 (a) | 2,000 | 1,862 | |||||||||
Newell Brands, Inc., 5.63%, 4/1/36, Callable 10/1/35 @ 100 | 3,000 | 2,671 | |||||||||
| Nordstrom, Inc. 4.38%, 4/1/30, Callable 1/1/30 @ 100 (k) | 2,000 | 1,606 | |||||||||
4.25%, 8/1/31, Callable 5/1/31 @ 100 | 1,500 | 1,127 | |||||||||
| Northwest Fiber LLC/Northwest Fiber Finance Sub, Inc. 6.00%, 2/15/28, Callable 2/15/24 @ 103 (a) (k) | 2,000 | 1,652 | |||||||||
10.75%, 6/1/28, Callable 6/1/23 @ 105.38 (a) (k) | 1,000 | 937 | |||||||||
| PulteGroup, Inc. 7.88%, 6/15/32 | 500 | 576 | |||||||||
6.00%, 2/15/35 | 1,000 | 1,017 | |||||||||
See notes to financial statements.
7
| USAA Mutual Funds Trust USAA High Income Fund | Schedule of Portfolio Investments — continued January 31, 2023 | ||||||
(Amounts in Thousands, Except for Shares) (Unaudited)
Security Description | Principal Amount | Value | |||||||||
| Resorts World Las Vegas LLC/RWLV Capital, Inc., 4.63%, 4/6/31, Callable 1/6/31 @ 100 (a) | $ | 4,200 | $ | 3,245 | |||||||
| Royal Caribbean Cruises Ltd. 11.63%, 8/15/27, Callable 8/15/24 @ 105.81 (a) | 5,000 | 5,308 | |||||||||
9.25%, 1/15/29, Callable 4/1/25 @ 104.63 (a) | 1,500 | 1,585 | |||||||||
| Scientific Games Holdings LP/Scientific Games US FinCo., Inc., 6.63%, 3/1/30, Callable 3/1/25 @ 103.31 (a) | 3,000 | 2,675 | |||||||||
| Scientific Games International, Inc., 7.25%, 11/15/29, Callable 11/15/24 @ 103.63 (a) | 2,000 | 2,004 | |||||||||
| SeaWorld Parks & Entertainment, Inc., 5.25%, 8/15/29, Callable 8/15/24 @ 102.63 (a) | 250 | 227 | |||||||||
Sotheby's, 7.38%, 10/15/27, Callable 2/21/23 @ 103.69 (a) (k) | 6,500 | 6,285 | |||||||||
| Taylor Morrison Communities, Inc., 5.75%, 1/15/28, Callable 10/15/27 @ 100 (a) | 5,000 | 4,852 | |||||||||
| The Gap, Inc. 3.63%, 10/1/29, Callable 10/1/24 @ 101.81 (a) | 1,500 | 1,152 | |||||||||
3.88%, 10/1/31, Callable 10/1/26 @ 101.94 (a) | 1,500 | 1,123 | |||||||||
The Hertz Corp., 5.00%, 12/1/29, Callable 12/1/24 @ 102.5 (a) | 1,500 | 1,226 | |||||||||
The Michaels Cos., Inc., 5.25%, 5/1/28, Callable 11/1/23 @ 102.63 (a) | 500 | 419 | |||||||||
Toll Brothers Finance Corp., 3.80%, 11/1/29, Callable 8/1/29 @ 100 | 500 | 448 | |||||||||
Travel + Leisure Co., 4.50%, 12/1/29, Callable 9/1/29 @ 100 (a) | 2,000 | 1,726 | |||||||||
Trident TPI Holdings, Inc., 6.63%, 11/1/25, Callable 2/21/23 @ 100 (a) | 3,000 | 2,706 | |||||||||
| USA Compression Partners LP/USA Compression Finance, 6.88%, 4/1/26, Callable 3/13/23 @ 103.44 | 500 | 491 | |||||||||
VOC Escrow Ltd., 5.00%, 2/15/28, Callable 3/13/23 @ 102.5 (a) | 3,500 | 3,080 | |||||||||
| Weekley Homes LLC/Weekley Finance Corp., 4.88%, 9/15/28, Callable 9/15/23 @ 102.44 (a) | 2,085 | 1,814 | |||||||||
| Wyndham Hotels & Resorts, Inc., 4.38%, 8/15/28, Callable 8/15/23 @ 102.19 (a) | 2,000 | 1,855 | |||||||||
| Wynn Las Vegas LLC/Wynn Las Vegas Capital Corp. 5.50%, 3/1/25, Callable 12/1/24 @ 100 (a) | 1,500 | 1,459 | |||||||||
5.25%, 5/15/27, Callable 2/15/27 @ 100 (a) | 1,500 | 1,417 | |||||||||
| Wynn Resorts Finance LLC/Wynn Resorts Capital Corp., 5.13%, 10/1/29, Callable 7/1/29 @ 100 (a) | 1,000 | 892 | |||||||||
149,574 | |||||||||||
Consumer Staples (3.3%): | |||||||||||
| Albertsons Cos., Inc./Safeway, Inc./New Albertsons LP/Albertsons LLC, 4.88%, 2/15/30, Callable 2/15/25 @ 103.66 (a) | 7,500 | 6,913 | |||||||||
Edgewell Personal Care Co., 4.13%, 4/1/29, Callable 4/1/24 @ 102.06 (a) | 2,500 | 2,178 | |||||||||
| H-Food Holdings LLC/Hearthside Finance Co., Inc., 8.50%, 6/1/26, Callable 2/21/23 @ 102.13 (a) | 2,000 | 1,369 | |||||||||
Lamb Weston Holdings, Inc., 4.38%, 1/31/32, Callable 1/31/27 @ 102.19 (a) | 2,000 | 1,790 | |||||||||
NBM US Holdings, Inc., 6.63%, 8/6/29, Callable 8/6/24 @ 103.31 (a) | 3,000 | 2,921 | |||||||||
Performance Food Group, Inc., 4.25%, 8/1/29, Callable 8/1/24 @ 102.13 (a) | 2,500 | 2,230 | |||||||||
Pilgrim's Pride Corp., 3.50%, 3/1/32, Callable 9/1/26 @ 101.75 (a) | 1,000 | 814 | |||||||||
| Post Holdings, Inc. 5.50%, 12/15/29, Callable 12/15/24 @ 102.75 (a) | 2,500 | 2,320 | |||||||||
4.63%, 4/15/30, Callable 4/15/25 @ 102.31 (a) | 4,000 | 3,520 | |||||||||
See notes to financial statements.
8
| USAA Mutual Funds Trust USAA High Income Fund | Schedule of Portfolio Investments — continued January 31, 2023 | ||||||
(Amounts in Thousands, Except for Shares) (Unaudited)
Security Description | Principal Amount | Value | |||||||||
Spectrum Brands, Inc., 3.88%, 3/15/31, Callable 3/15/26 @ 101.94 (a) (k) | $ | 3,000 | $ | 2,419 | |||||||
Triton Water Holdings, Inc., 6.25%, 4/1/29, Callable 4/1/24 @ 103.13 (a) | 2,000 | 1,586 | |||||||||
U.S. Foods, Inc., 4.75%, 2/15/29, Callable 2/15/24 @ 102.38 (a) | 6,000 | 5,499 | |||||||||
33,559 | |||||||||||
Energy (5.3%): | |||||||||||
| Blue Racer Midstream LLC/Blue Racer Finance Corp., 7.63%, 12/15/25, Callable 3/13/23 @ 103.81 (a) | 1,500 | 1,523 | |||||||||
Buckeye Partners LP, 4.50%, 3/1/28, Callable 12/1/27 @ 100 (a) | 1,000 | 917 | |||||||||
California Resources Corp., 7.13%, 2/1/26, Callable 3/13/23 @ 103.57 (a) | 1,500 | 1,460 | |||||||||
| Callon Petroleum Co. 8.25%, 7/15/25, Callable 3/13/23 @ 102.06 | 3,000 | 3,000 | |||||||||
8.00%, 8/1/28, Callable 8/1/24 @ 104 (a) (k) | 3,000 | 2,997 | |||||||||
7.50%, 6/15/30, Callable 6/15/25 @ 103.75 (a) (k) | 500 | 484 | |||||||||
CONSOL Energy, Inc., 11.00%, 11/15/25, Callable 3/13/23 @ 102.75 (a) | 1,194 | 1,221 | |||||||||
| CQP Holdco LP/BIP-V Chinook Holdco LLC, 5.50%, 6/15/31, Callable 6/15/26 @ 102.75 (a) | 2,500 | 2,279 | |||||||||
| Crestwood Midstream Partners, LP/Crestwood Midstream Finance Corp. 6.00%, 2/1/29, Callable 2/1/24 @ 103 (a) | 750 | 712 | |||||||||
8.00%, 4/1/29, Callable 4/1/24 @ 104 (a) | 1,000 | 1,021 | |||||||||
Earthstone Energy Holdings LLC, 8.00%, 4/15/27, Callable 4/15/24 @ 106 (a) | 1,000 | 975 | |||||||||
Energy Transfer LP, 7.13% (H15T5Y+531bps), Callable 5/15/30 @ 100 (b) (g) | 1,000 | 909 | |||||||||
| Enterprise TE Partners LP, 7.54% (LIBOR03M+278bps), 6/1/67, Callable 3/13/23 @ 100 (b) | 3,000 | 2,562 | |||||||||
| EQM Midstream Partners LP 7.50%, 6/1/27, Callable 6/1/24 @ 103.75 (a) | 2,000 | 2,005 | |||||||||
5.50%, 7/15/28, Callable 4/15/28 @ 100 | 1,000 | 923 | |||||||||
| Hilcorp Energy I LP/Hilcorp Finance Co., 6.25%, 11/1/28, Callable 11/1/23 @ 103.13 (a) | 7,000 | 6,721 | |||||||||
PDC Energy, Inc., 5.75%, 5/15/26, Callable 3/13/23 @ 102.88 | 1,500 | 1,451 | |||||||||
Petroleos Mexicanos, 6.63%, 6/15/35 | 2,000 | 1,570 | |||||||||
SM Energy Co., 5.63%, 6/1/25, Callable 3/13/23 @ 100.94 | 3,000 | 2,941 | |||||||||
| Sunoco LP/Sunoco Finance Corp. 4.50%, 5/15/29, Callable 5/15/24 @ 102.25 | 3,000 | 2,720 | |||||||||
4.50%, 4/30/30, Callable 4/30/25 @ 102.25 | 2,000 | 1,783 | |||||||||
| Tallgrass Energy Partners LP/Tallgras Energy Finance Corp., 6.00%, 3/1/27, Callable 3/13/23 @ 103 (a) | 3,000 | 2,853 | |||||||||
Talos Production, Inc., 12.00%, 1/15/26, Callable 2/27/23 @ 106 | 1,000 | 1,060 | |||||||||
| Targa Resources Partners LP/Targa Resources Partners Finance Corp., 5.00%, 1/15/28, Callable 3/13/23 @ 102.5 | 2,000 | 1,956 | |||||||||
Transocean Pontus Ltd., 6.13%, 8/1/25, Callable 2/16/23 @ 103.06 (a) | 280 | 288 | |||||||||
Transocean Titan Financing, Ltd., 8.38%, 2/1/28, Callable 2/1/25 @ 104.19 (a) | 1,000 | 1,038 | |||||||||
Transocean, Inc., 8.75%, 2/15/30, Callable 2/15/26 @ 104.38 (a) | 1,000 | 1,033 | |||||||||
Vital Energy, Inc., 10.13%, 1/15/28, Callable 3/13/23 @ 107.59 (k) | 6,000 | 5,976 | |||||||||
54,378 | |||||||||||
Financials (7.0%): | |||||||||||
Adient Global Holdings Ltd., 4.88%, 8/15/26, Callable 3/13/23 @ 101.63 (a) | 1,000 | 949 | |||||||||
AssuredPartners, Inc., 5.63%, 1/15/29, Callable 12/15/23 @ 102.81 (a) | 6,500 | 5,551 | |||||||||
See notes to financial statements.
9
| USAA Mutual Funds Trust USAA High Income Fund | Schedule of Portfolio Investments — continued January 31, 2023 | ||||||
(Amounts in Thousands, Except for Shares) (Unaudited)
Security Description | Principal Amount | Value | |||||||||
| Blackstone Private Credit Fund 7.05%, 9/29/25 (a) | $ | 1,000 | $ | 1,014 | |||||||
2.63%, 12/15/26, Callable 11/15/26 @ 100 | 3,000 | 2,581 | |||||||||
3.25%, 3/15/27, Callable 2/15/27 @ 100 | 3,000 | 2,628 | |||||||||
CEC Entertainment LLC, 6.75%, 5/1/26, Callable 5/1/23 @ 103.38 (a) | 866 | 802 | |||||||||
| Ford Motor Credit Co. LLC 3.38%, 11/13/25, Callable 10/13/25 @ 100 | 2,000 | 1,863 | |||||||||
4.13%, 8/17/27, Callable 6/17/27 @ 100 | 6,250 | 5,759 | |||||||||
5.11%, 5/3/29, Callable 2/3/29 @ 100 | 8,500 | 8,053 | |||||||||
Gray Escrow II, Inc., 5.38%, 11/15/31, Callable 11/15/26 @ 102.69 (a) (k) | 10,000 | 7,691 | |||||||||
HUB International Ltd., 5.63%, 12/1/29, Callable 12/1/24 @ 102.81 (a) | 40 | 36 | |||||||||
Hunt Cos., Inc., 5.25%, 4/15/29, Callable 4/15/24 @ 102.63 (a) | 2,000 | 1,698 | |||||||||
| Jefferies Finance LLC/JFIN Co-Issuer Corp., 5.00%, 8/15/28, Callable 8/15/24 @ 102.5 (a) | 2,500 | 2,135 | |||||||||
| LABL, Inc. 6.75%, 7/15/26, Callable 2/21/23 @ 103.38 (a) | 1,000 | 969 | |||||||||
10.50%, 7/15/27, Callable 2/21/23 @ 105.25 (a) | 3,000 | 2,853 | |||||||||
Lehman Brothers Holdings, 5.75%, 4/25/11, MTN | 1,000 | 3 | |||||||||
Lehman Brothers Treasury Co. BV, MTN (g) (i) | 1,447 | 4 | |||||||||
Level 3 Financing, Inc., 4.25%, 7/1/28, Callable 7/1/23 @ 102.13 (a) | 2,000 | 1,584 | |||||||||
Lions Gate Capital Holdings LLC, 5.50%, 4/15/29, Callable 4/15/24 @ 102.75 (a) | 3,500 | 2,273 | |||||||||
| Medline Borrower LP 3.88%, 4/1/29, Callable 10/1/24 @ 101.94 (a) | 4,500 | 3,851 | |||||||||
5.25%, 10/1/29, Callable 10/1/24 @ 102.63 (a) (k) | 1,000 | 839 | |||||||||
MetLife, Inc., 10.75%, 8/1/39, Callable 8/1/34 @ 100 | 1,000 | 1,375 | |||||||||
| NFP Corp. 6.88%, 8/15/28, Callable 8/15/23 @ 103.44 (a) | 1,886 | 1,633 | |||||||||
7.50%, 10/1/30, Callable 10/1/25 @ 103.75 (a) | 2,500 | 2,386 | |||||||||
| Olympus Water US Holding Corp., 4.25%, 10/1/28, Callable 10/1/24 @ 102.13 (a) | 2,000 | 1,672 | |||||||||
OneMain Finance Corp., 7.13%, 3/15/26 | 2,000 | 1,989 | |||||||||
OWL Rock Core Income Corp., 5.50%, 3/21/25 | 1,000 | 976 | |||||||||
| Park Intermediate Holdings LLC/PK Domestic Property LLC/PK Finance Co-Issuer, 4.88%, 5/15/29, Callable 5/15/24 @ 102.44 (a) | 3,500 | 3,043 | |||||||||
PRA Group, Inc., 8.38%, 2/1/28, Callable 2/1/25 @ 104.19 (a) | 2,333 | 2,345 | |||||||||
| Regions Financial Corp., 5.75% (H15T5Y+543bps), Callable 6/15/25 @ 100 (b) (g) | 1,042 | 1,033 | |||||||||
Starwood Property Trust, Inc., 4.38%, 1/15/27, Callable 7/15/26 @ 100 (a) | 1,000 | 900 | |||||||||
Summer BC Bidco B LLC, 5.50%, 10/31/26, Callable 7/15/23 @ 102.75 (a) | 2,000 | 1,671 | |||||||||
72,159 | |||||||||||
Health Care (4.7%): | |||||||||||
Centene Corp., 4.63%, 12/15/29, Callable 12/15/24 @ 102.31 | 4,000 | 3,799 | |||||||||
| CHS/Community Health Systems, Inc. 8.00%, 3/15/26, Callable 3/13/23 @ 104 (a) | 7,800 | 7,573 | |||||||||
5.25%, 5/15/30, Callable 5/15/25 @ 102.63 (a) | 2,000 | 1,612 | |||||||||
| Cloud Software Group Holdings, Inc., 6.50%, 3/31/29, Callable 9/30/25 @ 103.25 (a) | 2,000 | 1,755 | |||||||||
DaVita, Inc., 3.75%, 2/15/31, Callable 2/15/26 @ 101.88 (a) | 5,000 | 3,887 | |||||||||
Eastern Maine Healthcare Systems, 5.02%, 7/1/36 | 3,000 | 2,892 | |||||||||
Embecta Corp., 6.75%, 2/15/30, Callable 2/15/27 @ 101.69 (a) | 1,000 | 900 | |||||||||
See notes to financial statements.
10
| USAA Mutual Funds Trust USAA High Income Fund | Schedule of Portfolio Investments — continued January 31, 2023 | ||||||
(Amounts in Thousands, Except for Shares) (Unaudited)
Security Description | Principal Amount | Value | |||||||||
Encompass Health Corp., 4.63%, 4/1/31, Callable 4/1/26 @ 102.31 | $ | 500 | $ | 442 | |||||||
Global Medical Response, Inc., 6.50%, 10/1/25, Callable 2/14/23 @ 101.63 (a) | 3,000 | 2,113 | |||||||||
| Organon & Co./Organon Foreign Debt Co-Issuer BV, 4.13%, 4/30/28, Callable 4/30/24 @ 102.06 (a) | 500 | 454 | |||||||||
| Pediatrix Medical Group, Inc., 5.38%, 2/15/30, Callable 2/15/25 @ 102.69 (a) (k) | 4,000 | 3,539 | |||||||||
Prestige Brands, Inc., 3.75%, 4/1/31, Callable 4/1/26 @ 101.88 (a) | 3,500 | 2,969 | |||||||||
Select Medical Corp., 6.25%, 8/15/26, Callable 3/13/23 @ 103.13 (a) | 2,500 | 2,441 | |||||||||
| Tenet Healthcare Corp. 6.13%, 10/1/28, Callable 10/1/23 @ 103.06 (k) | 5,500 | 5,122 | |||||||||
6.88%, 11/15/31 | 5,000 | 4,619 | |||||||||
US Acute Care Solutions LLC, 6.38%, 3/1/26, Callable 3/13/23 @ 103.19 (a) | 5,000 | 4,528 | |||||||||
48,645 | |||||||||||
Industrials (8.3%): | |||||||||||
Allegiant Travel Co., 7.25%, 8/15/27, Callable 8/15/24 @ 103.63 (a) | 2,500 | 2,448 | |||||||||
American Airlines, Inc./AAdvantage Loyalty IP Ltd., 5.75%, 4/20/29 (a) | 5,150 | 4,986 | |||||||||
Builders FirstSource, Inc., 4.25%, 2/1/32, Callable 8/1/26 @ 102.13 (a) | 1,100 | 947 | |||||||||
BWX Technologies, Inc., 4.13%, 4/15/29, Callable 4/15/24 @ 102.06 (a) | 1,000 | 904 | |||||||||
CDI Escrow Issuer, Inc., 5.75%, 4/1/30, Callable 4/1/25 @ 102.88 (a) | 3,000 | 2,844 | |||||||||
Gates Global LLC/Gates Corp., 6.25%, 1/15/26, Callable 3/13/23 @ 101.56 (a) | 3,000 | 2,955 | |||||||||
Griffon Corp., 5.75%, 3/1/28, Callable 3/13/23 @ 102.88 | 1,500 | 1,420 | |||||||||
H&E Equipment Services, Inc., 3.88%, 12/15/28, Callable 12/15/23 @ 101.94 (a) | 2,000 | 1,764 | |||||||||
| Hawaiian Brand Intellectual Property Ltd./HawaiianMiles Loyalty Ltd., 5.75%, 1/20/26, Callable 1/20/24 @ 102.88 (a) | 1,250 | 1,195 | |||||||||
Howmet Aerospace, Inc., 5.95%, 2/1/37 | 1,000 | 1,009 | |||||||||
JB Poindexter & Co., Inc., 7.13%, 4/15/26, Callable 3/13/23 @ 103.56 (a) | 4,500 | 4,443 | |||||||||
Matthews International Corp., 5.25%, 12/1/25, Callable 3/13/23 @ 101.31 (a) | 3,500 | 3,340 | |||||||||
| Prime Security Services Borrower LLC/Prime Finance, Inc. 3.38%, 8/31/27, Callable 8/31/26 @ 100 (a) | 1,000 | 889 | |||||||||
6.25%, 1/15/28, Callable 3/13/23 @ 103.13 (a) | 6,000 | 5,690 | |||||||||
Regal Rexnord Corp., 6.40%, 4/15/33, Callable 1/15/33 @ 100 (a) | 2,686 | 2,751 | |||||||||
| Roller Bearing Co. of America, Inc., 4.38%, 10/15/29, Callable 10/15/24 @ 102.19 (a) | 1,000 | 900 | |||||||||
| Spirit AeroSystems, Inc. 7.50%, 4/15/25, Callable 3/13/23 @ 103.75 (a) | 3,500 | 3,512 | |||||||||
9.38%, 11/30/29, Callable 11/30/25 @ 104.69 (a) | 500 | 543 | |||||||||
Spirit Airlines Pass Through Trust, 4.10%, 4/1/28 | 1,835 | 1,673 | |||||||||
| Spirit Loyalty Cayman Ltd./Spirit IP Cayman Ltd. 8.00%, 9/20/25, Callable 9/20/23 @ 104 (a) | 2,075 | 2,114 | |||||||||
8.00%, 9/20/25, Callable 9/20/23 @ 104 (a) | 1,500 | 1,535 | |||||||||
| Standard Industries, Inc. 4.38%, 7/15/30, Callable 7/15/25 @ 102.19 (a) | 3,000 | 2,572 | |||||||||
3.38%, 1/15/31, Callable 7/15/25 @ 101.69 (a) | 5,000 | 3,978 | |||||||||
Terex Corp., 5.00%, 5/15/29, Callable 5/15/24 @ 102.5 (a) | 2,000 | 1,867 | |||||||||
| The ADT Security Corp. 4.13%, 8/1/29, Callable 8/1/28 @ 100 (a) | 2,000 | 1,781 | |||||||||
4.88%, 7/15/32 (a) | 3,000 | 2,682 | |||||||||
The Hertz Corp., 4.63%, 12/1/26, Callable 12/1/23 @ 102.31 (a) | 2,000 | 1,777 | |||||||||
See notes to financial statements.
11
| USAA Mutual Funds Trust USAA High Income Fund | Schedule of Portfolio Investments — continued January 31, 2023 | ||||||
(Amounts in Thousands, Except for Shares) (Unaudited)
Security Description | Principal Amount | Value | |||||||||
| TransDigm, Inc. 7.50%, 3/15/27, Callable 3/13/23 @ 103.75 | $ | 5,000 | $ | 5,038 | |||||||
5.50%, 11/15/27, Callable 3/13/23 @ 102.75 | 3,500 | 3,343 | |||||||||
4.88%, 5/1/29, Callable 5/1/24 @ 102.44 | 3,000 | 2,713 | |||||||||
U.S. Airways Pass Through Trust, 3.95%, 11/15/25 | 1,897 | 1,764 | |||||||||
Uber Technologies, Inc., 7.50%, 9/15/27, Callable 3/13/23 @ 105.63 (a) | 2,000 | 2,030 | |||||||||
United Airlines Pass Through Trust, 4.88%, 1/15/26 | 20 | 20 | |||||||||
United Rentals North America, Inc., 4.00%, 7/15/30, Callable 7/15/25 @ 102 | 3,000 | 2,700 | |||||||||
Waste Pro USA, Inc., 5.50%, 2/15/26, Callable 3/13/23 @ 101.38 (a) | 2,000 | 1,860 | |||||||||
WESCO Distribution, Inc., 7.25%, 6/15/28, Callable 6/15/23 @ 103.63 (a) | 1,000 | 1,028 | |||||||||
XPO Escrow Sub LLC, 7.50%, 11/15/27, Callable 11/15/24 @ 103.75 (a) | 2,000 | 2,055 | |||||||||
85,070 | |||||||||||
Information Technology (3.3%): | |||||||||||
| Acuris Finance US, Inc./Acuris Finance SARL, 5.00%, 5/1/28, Callable 5/1/24 @ 102.5 (a) | 2,000 | 1,633 | |||||||||
AthenaHealth Group, Inc., 6.50%, 2/15/30, Callable 2/15/25 @ 103.25 (a) (k) | 4,500 | 3,714 | |||||||||
| Central Parent, Inc./CDK Global, Inc., 7.25%, 6/15/29, Callable 6/15/25 @ 103.63 (a) | 4,000 | 3,992 | |||||||||
CommScope Technologies LLC, 6.00%, 6/15/25, Callable 2/21/23 @ 101 (a) | 2,000 | 1,894 | |||||||||
Entegris, Inc., 3.63%, 5/1/29, Callable 5/1/24 @ 102.72 (a) (k) | 1,000 | 856 | |||||||||
Gen Digital, Inc., 7.13%, 9/30/30, Callable 9/30/25 @ 103.56 (a) | 2,000 | 2,030 | |||||||||
NCR Corp., 5.13%, 4/15/29, Callable 4/15/24 @ 102.56 (a) | 1,500 | 1,305 | |||||||||
Open Text Holdings, Inc., 4.13%, 12/1/31, Callable 12/1/26 @ 102.06 (a) | 5,000 | 4,064 | |||||||||
Sabre GLBL, Inc., 11.25%, 12/15/27, Callable 6/15/25 @ 105.63 (a) | 2,000 | 2,120 | |||||||||
Seagate HDD Cayman, 9.63%, 12/1/32, Callable 12/1/27 @ 104.81 (a) | 5,590 | 6,332 | |||||||||
Twilio, Inc., 3.88%, 3/15/31, Callable 3/15/26 @ 101.94 | 3,000 | 2,487 | |||||||||
Unisys Corp., 6.88%, 11/1/27, Callable 11/1/23 @ 103.44 (a) | 2,000 | 1,516 | |||||||||
Western Digital Corp., 3.10%, 2/1/32, Callable 11/1/31 @ 100 | 2,250 | 1,728 | |||||||||
33,671 | |||||||||||
Materials (3.3%): | |||||||||||
Arconic Corp., 6.13%, 2/15/28, Callable 3/13/23 @ 103.06 (a) | 1,200 | 1,157 | |||||||||
| Ardagh Metal Packaging Finance USA LLC/Ardagh Metal Packaging Finance PLC, 4.00%, 9/1/29, Callable 5/15/24 @ 102 (a) | 1,000 | 828 | |||||||||
| Ardagh Packaging Finance PLC/Ardagh Holdings USA, Inc., 5.25%, 8/15/27, Callable 3/13/23 @ 102.63 (a) | 3,500 | 2,885 | |||||||||
Axalta Coating Systems LLC, 3.38%, 2/15/29, Callable 2/15/24 @ 101.69 (a) | 2,000 | 1,719 | |||||||||
Commercial Metals Co., 4.38%, 3/15/32, Callable 3/15/27 @ 102.19 | 2,000 | 1,759 | |||||||||
Glatfelter Corp., 4.75%, 11/15/29, Callable 11/1/24 @ 102.38 (a) (k) | 2,500 | 1,752 | |||||||||
Kaiser Aluminum Corp., 4.50%, 6/1/31, Callable 6/1/26 @ 102.25 (a) | 3,000 | 2,539 | |||||||||
Louisiana-Pacific Corp., 3.63%, 3/15/29, Callable 3/15/24 @ 101.81 (a) | 3,250 | 2,825 | |||||||||
| Mauser Packaging Solutions Holding Co., 7.88%, 8/15/26, Callable 8/15/24 @ 103.94 (a) | 500 | 504 | |||||||||
Novelis Corp., 4.75%, 1/30/30, Callable 1/30/25 @ 102.38 (a) | 3,000 | 2,742 | |||||||||
Olin Corp., 5.00%, 2/1/30, Callable 2/1/24 @ 102.5 | 2,500 | 2,363 | |||||||||
| Owens-Brockway Glass Container, Inc., 6.63%, 5/13/27, Callable 5/15/23 @ 103.31 (a) | 2,500 | 2,458 | |||||||||
| Pactiv Evergreen Group Issuer LLC/Pactiv Evergreen Group Issuer, Inc., 4.38%, 10/15/28, Callable 10/15/24 @ 102.19 (a) | 2,000 | 1,778 | |||||||||
See notes to financial statements.
12
| USAA Mutual Funds Trust USAA High Income Fund | Schedule of Portfolio Investments — continued January 31, 2023 | ||||||
(Amounts in Thousands, Except for Shares) (Unaudited)
Security Description | Principal Amount | Value | |||||||||
| Pactiv Evergreen Group Issuer, Inc./Pactiv Evergreen Group Issuer LLC, 4.00%, 10/15/27, Callable 10/15/23 @ 102 (a) | $ | 1,000 | $ | 898 | |||||||
SCIH Salt Holdings, Inc., 4.88%, 5/1/28, Callable 5/1/24 @ 102.44 (a) | 2,000 | 1,760 | |||||||||
| The Chemours Co. 5.75%, 11/15/28, Callable 11/15/23 @ 102.88 (a) | 1,000 | 911 | |||||||||
4.63%, 11/15/29, Callable 11/15/24 @ 102.31 (a) | 2,000 | 1,671 | |||||||||
Tronox, Inc., 4.63%, 3/15/29, Callable 3/15/24 @ 102.31 (a) | 2,000 | 1,710 | |||||||||
United States Steel Corp., 6.88%, 3/1/29, Callable 3/1/24 @ 103.44 (k) | 903 | 913 | |||||||||
Valvoline, Inc., 3.63%, 6/15/31, Callable 6/15/26 @ 101.81 (a) | 1,000 | 841 | |||||||||
34,013 | |||||||||||
Real Estate (1.2%): | |||||||||||
| Outfront Media Capital LLC/Outfront Media Capital Corp. 6.25%, 6/15/25, Callable 3/13/23 @ 103.13 (a) | 1,400 | 1,409 | |||||||||
4.63%, 3/15/30, Callable 3/15/25 @ 102.31 (a) | 2,500 | 2,148 | |||||||||
SBA Tower Trust, 6.60%, 1/15/28, Callable 1/15/27 @ 100 (a) | 1,053 | 1,097 | |||||||||
The Howard Hughes Corp., 4.38%, 2/1/31, Callable 2/1/26 @ 102.19 (a) | 4,261 | 3,547 | |||||||||
TK Elevator US Newco, Inc., 5.25%, 7/15/27, Callable 7/15/23 @ 102.63 (a) | 2,000 | 1,848 | |||||||||
| VICI Properties LP/VICI Note Co., Inc., 4.13%, 8/15/30, Callable 2/15/25 @ 102.06 (a) | 2,676 | 2,411 | |||||||||
12,460 | |||||||||||
Utilities (1.7%): | |||||||||||
Calpine Corp., 4.63%, 2/1/29, Callable 2/1/24 @ 102.31 (a) | 7,000 | 6,084 | |||||||||
| NRG Energy, Inc. 5.75%, 1/15/28, Callable 2/27/23 @ 102.88 | 2,500 | 2,387 | |||||||||
3.63%, 2/15/31, Callable 2/15/26 @ 101.81 (a) | 4,000 | 3,171 | |||||||||
| Vistra Operations Co. LLC 5.00%, 7/31/27, Callable 2/21/23 @ 102.5 (a) | 5,000 | 4,703 | |||||||||
4.38%, 5/1/29, Callable 5/1/24 @ 102.19 (a) | 1,000 | 880 | |||||||||
17,225 | |||||||||||
Total Corporate Bonds (Cost $710,921) | 668,847 | ||||||||||
Yankee Dollars (13.8%) | |||||||||||
Communication Services (1.7%): | |||||||||||
Altice France Holding SA, 6.00%, 2/15/28, Callable 3/13/23 @ 103 (a) (k) | 6,500 | 4,392 | |||||||||
| Altice France SA 8.13%, 2/1/27, Callable 2/21/23 @ 104.06 (a) | 3,000 | 2,812 | |||||||||
5.50%, 10/15/29, Callable 10/15/24 @ 102.75 (a) | 3,000 | 2,369 | |||||||||
| LCPR Senior Secured Financing DAC, 5.13%, 7/15/29, Callable 7/15/24 @ 102.56 (a) | 1,500 | 1,319 | |||||||||
Telecom Italia Capital SA, 7.20%, 7/18/36 | 5,000 | 4,259 | |||||||||
Videotron Ltd., 3.63%, 6/15/29, Callable 6/15/24 @ 101.81 (a) (k) | 2,500 | 2,184 | |||||||||
17,335 | |||||||||||
Consumer Discretionary (1.9%): | |||||||||||
IHO Verwaltungs GmbH 6.38%, 5/15/29, Callable 5/15/24 @ 103.19 (a) (n) | 6,024 | 5,269 | |||||||||
| International Game Technology PLC, 6.25%, 1/15/27, Callable 7/15/26 @ 100 (a) | 2,000 | 2,008 | |||||||||
See notes to financial statements.
13
| USAA Mutual Funds Trust USAA High Income Fund | Schedule of Portfolio Investments — continued January 31, 2023 | ||||||
(Amounts in Thousands, Except for Shares) (Unaudited)
Security Description | Principal Amount | Value | |||||||||
| Jaguar Land Rover Automotive PLC, 5.88%, 1/15/28, Callable 1/15/24 @ 102.94 (a) | $ | 3,500 | $ | 2,977 | |||||||
Mattamy Group Corp., 4.63%, 3/1/30, Callable 3/1/25 @ 102.31 (a) | 4,000 | 3,377 | |||||||||
| Melco Resorts Finance Ltd. 5.75%, 7/21/28, Callable 7/21/23 @ 102.88 (a) | 1,000 | 901 | |||||||||
5.38%, 12/4/29, Callable 12/4/24 @ 102.69 (a) | 2,000 | 1,724 | |||||||||
| Royal Caribbean Cruises Ltd. 5.50%, 8/31/26, Callable 2/28/26 @ 100 (a) | 2,000 | 1,789 | |||||||||
5.50%, 4/1/28, Callable 10/1/27 @ 100 (a) | 2,000 | 1,721 | |||||||||
19,766 | |||||||||||
Energy (1.8%): | |||||||||||
Baytex Energy Corp., 8.75%, 4/1/27, Callable 4/1/23 @ 106.56 (a) (k) | 1,750 | 1,811 | |||||||||
Harbour Energy PLC, 5.50%, 10/15/26, Callable 10/15/23 @ 102.75 (a) | 2,000 | 1,840 | |||||||||
Ithaca Energy North Sea PLC, 9.00%, 7/15/26, Callable 7/15/23 @ 104.5 (a) | 2,000 | 1,973 | |||||||||
| Northriver Midstream Finance LP, 5.63%, 2/15/26, Callable 3/13/23 @ 102.81 (a) | 2,000 | 1,920 | |||||||||
Petrobras Global Finance BV, 5.50%, 6/10/51, Callable 12/10/50 @ 100 (k) | 2,000 | 1,565 | |||||||||
Petroleos Mexicanos, 6.84%, 1/23/30, Callable 10/23/29 @ 100 | 3,000 | 2,613 | |||||||||
Var Energi ASA, 8.00%, 11/15/32, Callable 8/15/32 @ 100 (a) | 3,000 | 3,286 | |||||||||
Vermilion Energy, Inc., 6.88%, 5/1/30, Callable 5/1/25 @ 103.44 (a) | 3,000 | 2,766 | |||||||||
17,774 | |||||||||||
Financials (2.8%): | |||||||||||
| Altice Financing SA 5.00%, 1/15/28, Callable 3/13/23 @ 102.5 (a) | 4,000 | 3,401 | |||||||||
5.75%, 8/15/29, Callable 8/15/24 @ 102.88 (a) | 5,000 | 4,211 | |||||||||
Credit Suisse AG, 6.50%, 8/8/23 (a) | 2,250 | 2,221 | |||||||||
| Deutsche Bank AG 4.88% (USISDA05+255bps), 12/1/32, Callable 12/1/27 @ 100 (b) | 3,000 | 2,683 | |||||||||
3.74% (SOFR+226bps), 1/7/33, Callable 10/7/31 @ 100 (b) | 4,850 | 3,835 | |||||||||
Iris Holding, Inc., 10.00%, 12/15/28, Callable 6/15/25 @ 105 (a) | 3,500 | 2,748 | |||||||||
| Macquarie Bank Ltd., 3.05% (H15T5Y+170bps), 3/3/36, Callable 3/3/31 @ 100 (a) (b) | 2,000 | 1,556 | |||||||||
UniCredit SpA, 5.86%, 6/19/32, Callable 6/19/27 @ 100 (a) | 5,000 | 4,612 | |||||||||
| Virgin Media Vendor Financing Notes IV DAC, 5.00%, 7/15/28, Callable 7/15/23 @ 102.5 (a) | 2,000 | 1,815 | |||||||||
| Vmed O2 UK Financing I PLC, 4.25%, 1/31/31, Callable 1/31/26 @ 102.13 (a) | 2,000 | 1,678 | |||||||||
28,760 | |||||||||||
Health Care (0.4%): | |||||||||||
Bausch Health Cos., Inc., 4.88%, 6/1/28, Callable 6/1/24 @ 102.44 (a) | 2,000 | 1,284 | |||||||||
| Teva Pharmaceutical Finance Netherlands III BV, 6.75%, 3/1/28, Callable 12/1/27 @ 100 (k) | 3,000 | 3,015 | |||||||||
4,299 | |||||||||||
Industrials (2.7%): | |||||||||||
Air Canada Pass Through Trust, 4.13%, 5/15/25 (a) | 4,537 | 4,199 | |||||||||
ATS Corp., 4.13%, 12/15/28, Callable 12/15/23 @ 102.06 (a) | 1,000 | 896 | |||||||||
| Bombardier, Inc. 7.50%, 3/15/25, Callable 3/13/23 @ 101.25 (a) | 1,934 | 1,936 | |||||||||
See notes to financial statements.
14
| USAA Mutual Funds Trust USAA High Income Fund | Schedule of Portfolio Investments — continued January 31, 2023 | ||||||
(Amounts in Thousands, Except for Shares) (Unaudited)
Security Description | Principal Amount | Value | |||||||||
7.88%, 4/15/27, Callable 3/13/23 @ 103.94 (a) | $ | 6,000 | $ | 6,000 | |||||||
7.50%, 2/1/29, Callable 2/1/26 @ 103.75 (a) | 500 | 500 | |||||||||
| Latam Airlines Group SA 13.38%, 10/15/27, Callable 10/15/24 @ 110.03 (a) | 3,000 | 3,213 | |||||||||
13.38%, 10/15/29, Callable 10/15/25 @ 110.03 (a) (k) | 2,000 | 2,152 | |||||||||
NES Fircroft Bondco AS, 11.75%, 9/29/26, Callable 9/29/24 @ 105.88 (a) | 5,000 | 5,085 | |||||||||
Rolls-Royce PLC, 5.75%, 10/15/27, Callable 7/15/27 @ 100 (a) | 2,967 | 2,886 | |||||||||
Seaspan Corp., 5.50%, 8/1/29, Callable 8/1/24 @ 102.75 (a) | 1,500 | 1,139 | |||||||||
28,006 | |||||||||||
Information Technology (0.2%): | |||||||||||
Open Text Corp., 6.90%, 12/1/27, Callable 11/1/27 @ 100 (a) | 2,059 | 2,110 | |||||||||
Materials (1.9%): | |||||||||||
Alcoa Nederland Holding BV, 6.13%, 5/15/28, Callable 5/15/23 @ 103.06 (a) | 1,300 | 1,303 | |||||||||
Diamond BC BV, 4.63%, 10/1/29, Callable 10/1/24 @ 102.31 (a) | 2,000 | 1,680 | |||||||||
Eldorado Gold Corp., 6.25%, 9/1/29, Callable 9/1/24 @ 103.13 (a) | 2,000 | 1,842 | |||||||||
Endeavour Mining PLC, 5.00%, 10/14/26, Callable 10/14/23 @ 102.5 (a) | 4,320 | 3,840 | |||||||||
First Quantum Minerals Ltd., 7.50%, 4/1/25, Callable 2/21/23 @ 101.88 (a) | 3,000 | 2,972 | |||||||||
Infrabuild Australia Pty Ltd., 12.00%, 10/1/24, Callable 3/13/23 @ 106 (a) | 2,000 | 1,900 | |||||||||
Methanex Corp., 5.25%, 12/15/29, Callable 9/15/29 @ 100 | 3,931 | 3,633 | |||||||||
Mineral Resources, Ltd., 8.00%, 11/1/27, Callable 11/1/24 @ 104 (a) | 1,000 | 1,027 | |||||||||
NOVA Chemicals Corp., 4.25%, 5/15/29, Callable 5/15/24 @ 102.13 (a) (k) | 500 | 429 | |||||||||
Trivium Packaging Finance BV, 8.50%, 8/15/27, Callable 2/20/23 @ 104.25 (a) | 1,000 | 962 | |||||||||
19,588 | |||||||||||
Real Estate (0.1%): | |||||||||||
TK Elevator Holdco GmbH, 7.63%, 7/15/28, Callable 7/15/23 @ 103.81 (a) (k) | 1,000 | 888 | |||||||||
Sovereign Bond (0.1%): | |||||||||||
| Bahamas Government International Bond, 6.00%, 11/21/28, Callable 8/21/28 @ 100 (a) | 1,500 | 1,215 | |||||||||
Utilities (0.2%): | |||||||||||
Empresa Electrica Cochrane SpA, 5.50%, 5/14/27 (a) | 1,991 | 1,900 | |||||||||
Total Yankee Dollars (Cost $149,724) | 141,641 | ||||||||||
Commercial Paper (7.5%) (l) | |||||||||||
Arrow Electronics, Inc., 5.04%, 2/9/23 (a) | 10,000 | 9,987 | |||||||||
AutoNation, Inc., 4.99%, 2/6/23 (a) | 9,100 | 9,093 | |||||||||
Aviation Capital Group LLC, 4.44%, 2/1/23 (a) | 10,100 | 10,099 | |||||||||
Constellation Brands, Inc., 5.01%, 2/7/23 (a) | 5,000 | 4,995 | |||||||||
Crown Castle International Corp., 5.01%, 2/8/23 (a) | 3,000 | 2,997 | |||||||||
FMC Corp., 4.84%, 2/1/23 (a) | 10,000 | 9,999 | |||||||||
Jabil, Inc., 5.07%, 2/2/23 (a) | 10,000 | 9,997 | |||||||||
Newell Brands, Inc., 4.90%, 2/3/23 (a) | 7,100 | 7,097 | |||||||||
| Quanta Services, Inc. 4.87%, 2/1/23 (a) | 8,000 | 7,999 | |||||||||
4.90%, 2/2/23 (a) | 2,100 | 2,099 | |||||||||
Targa Resources Corp., 4.30%, 2/3/23 (a) | 3,000 | 2,999 | |||||||||
Total Commercial Paper (Cost $77,371) | 77,361 | ||||||||||
See notes to financial statements.
15
| USAA Mutual Funds Trust USAA High Income Fund | Schedule of Portfolio Investments — continued January 31, 2023 | ||||||
(Amounts in Thousands, Except for Shares) (Unaudited)
| Security Description | Shares | Value | |||||||||
Exchange-Traded Funds (2.0%) | |||||||||||
iShares BB Rated Corporate Bond ETF | 180,000 | $ | 8,234 | ||||||||
iShares iBoxx High Yield Corporate Bond ETF (k) | 70,599 | 5,389 | |||||||||
SPDR Bloomberg High Yield Bond ETF (k) | 70,315 | 6,584 | |||||||||
Total Exchange-Traded Funds (Cost $19,976) | 20,207 | ||||||||||
Collateral for Securities Loaned (4.9%)^ | |||||||||||
| Goldman Sachs Financial Square Government Fund, Institutional Shares, 4.22% (m) | 12,499,994 | 12,500 | |||||||||
HSBC U.S. Government Money Market Fund, Institutional Shares, 4.21% (m) | 12,499,994 | 12,500 | |||||||||
Invesco Government & Agency Portfolio, Institutional Shares, 4.31% (m) | 12,499,994 | 12,500 | |||||||||
| Morgan Stanley Institutional Liquidity Government Portfolio, Institutional Shares, 4.14% (m) | 12,499,994 | 12,500 | |||||||||
Total Collateral for Securities Loaned (Cost $50,000) | 50,000 | ||||||||||
Total Investments (Cost $1,139,114) — 105.1% | 1,080,668 | ||||||||||
Liabilities in excess of other assets — (5.1)% | (52,527 | ) | |||||||||
NET ASSETS — 100.00% | $ | 1,028,141 | |||||||||
At January 31, 2023, the Fund's investments in foreign securities were 15.7% of net assets.
^ Purchased with cash collateral from securities on loan.
(a) Rule 144A security or other security that is restricted as to resale to institutional investors. As of January 31, 2023, the fair value of these securities was $750,062 thousands and amounted to 73.0% of net assets.
(b) Variable or Floating-Rate Security. Rate disclosed is as of January 31, 2023.
(c) The rate for certain asset-backed and mortgage-backed securities may vary based on factors relating to the pool of assets underlying the security. The rate disclosed is the rate in effect at January 31, 2023.
(d) Security is interest only.
(e) Rounds to less than $1 thousand.
(f) Security was fair valued based upon procedures approved by the Board of Trustees and represents less than 0.05% of net assets as of January 31, 2023. This security is classified as Level 3 within the fair value hierarchy. (See Note 2 in the Notes to Financial Statements)
(g) Security is perpetual and has no final maturity date but may be subject to calls at various dates in the future.
(h) The rates for this senior secured loan will be known on settlement date of the loan, subsequent to this report date. Senior secured loans have rates that will fluctuate over time in line with prevailing interest rates.
(i) Zero-coupon bond.
(j) Security or portion of security purchased on a delayed-delivery and/or when-issued basis.
(k) All or a portion of this security is on loan.
See notes to financial statements.
16
| USAA Mutual Funds Trust USAA High Income Fund | Schedule of Portfolio Investments — continued January 31, 2023 | ||||||
(Unaudited)
(l) Rate represents the effective yield at January 31, 2023.
(m) Rate disclosed is the daily yield on January 31, 2023.
(n) Up to 7.13% of the coupon may be PIK.
ADR — American Depositary Receipt
bps — Basis points
ETF — Exchange-Traded Fund
H15T5Y — 5 Year Treasury Constant Maturity Rate
LIBOR — London Interbank Offered Rate
LIBOR01M — 1 Month US Dollar LIBOR, rate disclosed as of January 31, 2023, based on the last reset date of the security
LIBOR03M — 3 Month US Dollar LIBOR, rate disclosed as of January 31, 2023, based on the last reset date of the security
LLC — Limited Liability Company
LP — Limited Partnership
MTN — Medium Term Note
PIK — Payment-in-Kind
PLC — Public Limited Company
SOFR — Secured Overnight Financing Rate
SOFR01M — 1 Month SOFR, rate disclosed as of January 31, 2023.
SOFR03M — 3 Month SOFR, rate disclosed as of January 31, 2023.
TSFR1M — 1 month Term SOFR, rate disclosed as of January 31, 2023.
TSFR3M — 3 month Term SOFR, rate disclosed as of January 31, 2023.
USISDA05 — 5 Year ICE Swap Rate, rate disclosed as of January 31, 2023.
See notes to financial statements.
17
USAA Mutual Funds Trust | Statement of Assets and Liabilities January 31, 2023 | ||||||
(Amounts in Thousands, Except Per Share Amounts) (Unaudited)
| USAA High Income Fund | |||||||
Assets: | |||||||
Investments, at value (Cost $1,139,114) | $ | 1,080,668 | (a) | ||||
Cash | 3,878 | ||||||
Deposit with broker for futures contracts | 92 | ||||||
Receivables: | |||||||
Interest and dividends | 14,662 | ||||||
Capital shares issued | 144 | ||||||
Investments sold | 2,087 | ||||||
From Adviser | 25 | ||||||
Prepaid expenses | 17 | ||||||
Total Assets | 1,101,573 | ||||||
Liabilities: | |||||||
Payables: | |||||||
Collateral received on loaned securities | 50,000 | ||||||
Investments purchased | 22,580 | ||||||
Capital shares redeemed | 125 | ||||||
Accrued expenses and other payables: | |||||||
Investment advisory fees | 371 | ||||||
Administration fees | 119 | ||||||
Custodian fees | 17 | ||||||
Transfer agent fees | 117 | ||||||
Compliance fees | 1 | ||||||
Trustees' fees | 1 | ||||||
| 12b-1 fees | — | (b) | |||||
Other accrued expenses | 101 | ||||||
Total Liabilities | 73,432 | ||||||
Net Assets: | |||||||
Capital | 1,302,411 | ||||||
Total accumulated earnings/(loss) | (274,270 | ) | |||||
Net Assets | $ | 1,028,141 | |||||
Net Assets | |||||||
Fund Shares | $ | 760,063 | |||||
Institutional Shares | 265,265 | ||||||
Class A | 2,165 | ||||||
R6 Shares | 648 | ||||||
Total | $ | 1,028,141 | |||||
Shares (unlimited number of shares authorized with no par value): | |||||||
Fund Shares | 111,492 | ||||||
Institutional Shares | 38,964 | ||||||
Class A | 317 | ||||||
R6 Shares | 95 | ||||||
Total | 150,868 | ||||||
Net asset value, offering and redemption price per share: (c) | |||||||
Fund Shares | $ | 6.82 | |||||
Institutional Shares | 6.81 | ||||||
Class A | 6.84 | ||||||
R6 Shares | 6.82 | ||||||
Maximum Sales Charge — Class A | 2.25 | % | |||||
Maximum offering price | |||||||
| (100%/(100%-maximum sales charge) of net asset value adjusted to the nearest cent) per share — Class A | $ | 7.00 | |||||
(a) Includes $48,452 thousand of securities on loan.
(b) Rounds to less than $1 thousand.
(c) Per share amount may not recalculate due to rounding of net assets and/or shares outstanding.
See notes to financial statements.
18
USAA Mutual Funds Trust | Statement of Operations For the Six Months Ended January 31, 2023 | ||||||
(Amounts in Thousands) (Unaudited)
| USAA High Income Fund | |||||||
Investment Income: | |||||||
Dividends | $ | 1,678 | |||||
Interest | 34,710 | ||||||
Securities lending (net of fees) | 390 | ||||||
Total Income | 36,778 | ||||||
Expenses: | |||||||
Investment advisory fees | 2,176 | ||||||
Administration fees — Fund Shares | 568 | ||||||
Administration fees — Institutional Shares | 134 | ||||||
Administration fees — Class A | 2 | ||||||
Administration fees — R6 Shares | — | (a) | |||||
Sub-Administration fees | 12 | ||||||
| 12b-1 fees — Class A | 3 | ||||||
Custodian fees | 55 | ||||||
Transfer agent fees — Fund Shares | 525 | ||||||
Transfer agent fees — Institutional Shares | 134 | ||||||
Transfer agent fees — Class A | 1 | ||||||
Transfer agent fees — R6 Shares | — | (a) | |||||
Trustees' fees | 23 | ||||||
Compliance fees | 5 | ||||||
Legal and audit fees | 50 | ||||||
State registration and filing fees | 44 | ||||||
Other expenses | 84 | ||||||
Total Expenses | 3,816 | ||||||
Expenses waived/reimbursed by Adviser | (77 | ) | |||||
Net Expenses | 3,739 | ||||||
Net Investment Income (Loss) | 33,039 | ||||||
Realized/Unrealized Gains (Losses) from Investments: | |||||||
Net realized gains (losses) from investment securities and foreign currency transactions | (36,967 | ) | |||||
Net change in unrealized appreciation/depreciation on investment securities | 20,827 | ||||||
Net realized/unrealized gains (losses) on investments | (16,140 | ) | |||||
Change in net assets resulting from operations | $ | 16,899 | |||||
(a) Rounds to less than $1 thousand.
See notes to financial statements.
19
USAA Mutual Funds Trust | Statements of Changes in Net Assets | ||||||
(Amounts in Thousands)
USAA High Income Fund | |||||||||||
| Six Months Ended January 31, 2023 (Unaudited) | Year Ended July 31, 2022 | ||||||||||
From Investments: | |||||||||||
Operations: | |||||||||||
Net Investment Income (Loss) | $ | 33,039 | $ | 63,520 | |||||||
Net realized gains (losses) | (36,967 | ) | 34,234 | ||||||||
Net change in unrealized appreciation/depreciation | 20,827 | (198,527 | ) | ||||||||
Change in net assets resulting from operations | 16,899 | (100,773 | ) | ||||||||
Distributions to Shareholders: | |||||||||||
Fund Shares | (23,582 | ) | (44,394 | ) | |||||||
Institutional Shares | (8,517 | ) | (20,502 | ) | |||||||
Class A | (66 | ) | (118 | ) | |||||||
R6 Shares | (26 | ) | (26 | ) | |||||||
Change in net assets resulting from distributions to shareholders | (32,191 | ) | (65,040 | ) | |||||||
Change in net assets resulting from capital transactions | (59,726 | ) | (498,274 | ) | |||||||
Change in net assets | (75,018 | ) | (664,087 | ) | |||||||
Net Assets: | |||||||||||
Beginning of period | 1,103,159 | 1,767,246 | |||||||||
End of period | $ | 1,028,141 | $ | 1,103,159 | |||||||
Capital Transactions: | |||||||||||
Fund Shares | |||||||||||
Proceeds from shares issued | $ | 32,080 | $ | 64,024 | |||||||
Distributions reinvested | 21,720 | 41,155 | |||||||||
Cost of shares redeemed | (64,968 | ) | (168,670 | ) | |||||||
Total Fund Shares | $ | (11,168 | ) | $ | (63,491 | ) | |||||
Institutional Shares | |||||||||||
Proceeds from shares issued | $ | 1,921 | $ | 22,776 | |||||||
Distributions reinvested | 8,505 | 20,474 | |||||||||
Cost of shares redeemed | (58,841 | ) | (478,339 | ) | |||||||
Total Institutional Shares | $ | (48,415 | ) | $ | (435,089 | ) | |||||
Class A | |||||||||||
Proceeds from shares issued | $ | 6 | $ | 122 | |||||||
Distributions reinvested | 59 | 101 | |||||||||
Cost of shares redeemed | (98 | ) | (264 | ) | |||||||
Total Class A | $ | (33 | ) | $ | (41 | ) | |||||
R6 Shares | |||||||||||
Proceeds from shares issued | $ | 135 | $ | 850 | |||||||
Distributions reinvested | 26 | 26 | |||||||||
Cost of shares redeemed | (271 | ) | (529 | ) | |||||||
Total R6 Shares | $ | (110 | ) | $ | 347 | ||||||
Change in net assets resulting from capital transactions | $ | (59,726 | ) | $ | (498,274 | ) | |||||
(continues on next page)
See notes to financial statements.
20
USAA Mutual Funds Trust | Statements of Changes in Net Assets | ||||||
(Amounts in Thousands) (continued)
USAA High Income Fund | |||||||||||
| Six Months Ended January 31, 2023 (Unaudited) | Year Ended July 31, 2022 | ||||||||||
Share Transactions: | |||||||||||
Fund Shares | |||||||||||
Issued | 4,827 | 8,498 | |||||||||
Reinvested | 3,255 | 5,550 | |||||||||
Redeemed | (9,756 | ) | (22,457 | ) | |||||||
Total Fund Shares | (1,674 | ) | (8,409 | ) | |||||||
Institutional Shares | |||||||||||
Issued | 288 | 3,067 | |||||||||
Reinvested | 1,275 | 2,747 | |||||||||
Redeemed | (8,651 | ) | (61,041 | ) | |||||||
Total Institutional Shares | (7,088 | ) | (55,227 | ) | |||||||
Class A | |||||||||||
Issued | 2 | 16 | |||||||||
Reinvested | 9 | 14 | |||||||||
Redeemed | (15 | ) | (35 | ) | |||||||
Total Class A | (4 | ) | (5 | ) | |||||||
R6 Shares | |||||||||||
Issued | 21 | 122 | |||||||||
Reinvested | 4 | 4 | |||||||||
Redeemed | (40 | ) | (74 | ) | |||||||
Total R6 Shares | (15 | ) | 52 | ||||||||
Change in Shares | (8,781 | ) | (63,589 | ) | |||||||
See notes to financial statements.
21
USAA Mutual Funds Trust | Financial Highlights | ||||||
For a Share Outstanding Throughout Each Period
USAA High Income Fund | |||||||||||||||||||||||||||
Fund Shares | |||||||||||||||||||||||||||
| Six Months Ended January 31, 2023 (Unaudited) | Year Ended July 31, 2022 | Year Ended July 31, 2021 | Year Ended July 31, 2020 | Year Ended July 31, 2019 | Year Ended July 31, 2018 | ||||||||||||||||||||||
| Net Asset Value, Beginning of Period | $ | 6.91 | $ | 7.92 | $ | 7.44 | $ | 7.91 | $ | 8.01 | $ | 8.27 | |||||||||||||||
Investment Activities: | |||||||||||||||||||||||||||
Net investment income (loss) | 0.22 | (a) | 0.37 | (a) | 0.39 | (a) | 0.44 | (a) | 0.47 | 0.47 | |||||||||||||||||
| Net realized and unrealized gains (losses) | (0.10 | ) | (1.00 | ) | 0.47 | (0.47 | ) | (0.10 | ) | (0.26 | ) | ||||||||||||||||
| Total from Investment Activities | 0.12 | (0.63 | ) | 0.86 | (0.03 | ) | 0.37 | 0.21 | |||||||||||||||||||
Distributions to Shareholders from: | |||||||||||||||||||||||||||
Net investment income | (0.21 | ) | (0.38 | ) | (0.38 | ) | (0.44 | ) | (0.47 | ) | (0.47 | ) | |||||||||||||||
Total Distributions | (0.21 | ) | (0.38 | ) | (0.38 | ) | (0.44 | ) | (0.47 | ) | (0.47 | ) | |||||||||||||||
| Redemption Fees Added to Beneficial Interests | — | — | — | — | — | (b) | — | (b) | |||||||||||||||||||
Net Asset Value, End of Period | $ | 6.82 | $ | 6.91 | $ | 7.92 | $ | 7.44 | $ | 7.91 | $ | 8.01 | |||||||||||||||
Total Return (c) (d) | 1.85 | % | (8.17 | )% | 11.84 | % | (0.27 | )% | 4.85 | % | 2.65 | % | |||||||||||||||
Ratios to Average Net Assets: | |||||||||||||||||||||||||||
Net Expenses (e) (f) (g) (h) | 0.77 | % | 0.75 | % | 0.75 | % | 0.81 | % | 0.85 | % | 0.81 | % | |||||||||||||||
Net Investment Income (Loss) (e) | 6.39 | % | 4.93 | % | 5.01 | % | 5.82 | % | 5.93 | % | 5.79 | % | |||||||||||||||
Gross Expenses (e) (f) | 0.78 | % | 0.75 | % | 0.75 | % | 0.81 | % | 0.85 | % | 0.81 | % | |||||||||||||||
Supplemental Data: | |||||||||||||||||||||||||||
Net Assets at end of period (000's) | $ | 760,063 | $ | 782,254 | $ | 962,971 | $ | 1,027,510 | $ | 1,212,711 | $ | 1,207,790 | |||||||||||||||
Portfolio Turnover (c) (i) | 46 | % | 35 | % | 30 | % | 48 | % | 31 | % | 22 | % | |||||||||||||||
(a) Per share net investment income (loss) has been calculated using the average daily shares method.
(b) Amount is less than $0.005 per share.
(c) Not annualized for periods less than one year.
(d) Assumes reinvestment of all net investment income and realized capital gain distributions, if any, during the period. Includes adjustments in accordance with U.S. Generally Accepted Accounting Principles and could differ from the Lipper reported return.
(e) Annualized for periods less than one year.
(f) Does not include acquired fund fees and expenses, if any.
(g) The net expense ratio may not correlate to the applicable expense limits in place during the period since the current contractual expense limitation is applied for a period beginning July 1, 2019 and in effect through November 30, 2023, instead of coinciding with the Fund's fiscal year end. Details of the current contractual expense limitation in effect can be found in Note 5 of the accompanying Notes to Financial Statements.
(h) From the period beginning July 1, 2019, the amount of any waivers or reimbursements and the amount of any recoupment is calculated without regard to the impact of any performance adjustment to the Fund's management fee.
(i) Portfolio turnover is calculated on the basis of the Fund as a whole without distinguishing between the classes of shares.
(continues on next page)
See notes to financial statements.
22
USAA Mutual Funds Trust | Financial Highlights — continued | ||||||
For a Share Outstanding Throughout Each Period
USAA High Income Fund | |||||||||||||||||||||||||||
Institutional Shares | |||||||||||||||||||||||||||
| Six Months Ended January 31, 2023 (Unaudited) | Year Ended July 31, 2022 | Year Ended July 31, 2021 | Year Ended July 31, 2020 | Year Ended July 31, 2019 | Year Ended July 31, 2018 | ||||||||||||||||||||||
| Net Asset Value, Beginning of Period | $ | 6.90 | $ | 7.91 | $ | 7.43 | $ | 7.90 | $ | 8.00 | $ | 8.26 | |||||||||||||||
Investment Activities: | |||||||||||||||||||||||||||
Net investment income (loss) | 0.22 | (a) | 0.38 | (a) | 0.39 | (a) | 0.44 | (a) | 0.47 | 0.48 | |||||||||||||||||
| Net realized and unrealized gains (losses) | (0.09 | ) | (1.00 | ) | 0.48 | (0.47 | ) | (0.09 | ) | (0.26 | ) | ||||||||||||||||
| Total from Investment Activities | 0.13 | (0.62 | ) | 0.87 | (0.03 | ) | 0.38 | 0.22 | |||||||||||||||||||
Distributions to Shareholders from: | |||||||||||||||||||||||||||
Net investment income | (0.22 | ) | (0.39 | ) | (0.39 | ) | (0.44 | ) | (0.48 | ) | (0.48 | ) | |||||||||||||||
Total Distributions | (0.22 | ) | (0.39 | ) | (0.39 | ) | (0.44 | ) | (0.48 | ) | (0.48 | ) | |||||||||||||||
| Redemption Fees Added to Beneficial Interests | — | — | — | — | — | (b) | — | (b) | |||||||||||||||||||
Net Asset Value, End of Period | $ | 6.81 | $ | 6.90 | $ | 7.91 | $ | 7.43 | $ | 7.90 | $ | 8.00 | |||||||||||||||
Total Return (c) (d) | 1.93 | % | (8.08 | )% | 11.93 | % | (0.19 | )% | 4.94 | % | 2.74 | % | |||||||||||||||
Ratios to Average Net Assets: | |||||||||||||||||||||||||||
Net Expenses (e) (f) (g) (h) | 0.61 | % | 0.64 | % | 0.67 | % | 0.72 | % | 0.78 | % | 0.72 | % | |||||||||||||||
Net Investment Income (Loss) (e) | 6.52 | % | 5.00 | % | 5.08 | % | 5.91 | % | 6.00 | % | 5.88 | % | |||||||||||||||
Gross Expenses (e) (f) | 0.63 | % | 0.65 | % | 0.68 | % | 0.73 | % | 0.78 | % | 0.72 | % | |||||||||||||||
Supplemental Data: | |||||||||||||||||||||||||||
Net Assets at end of period (000's) | $ | 265,265 | $ | 317,913 | $ | 801,226 | $ | 798,688 | $ | 913,599 | $ | 966,124 | |||||||||||||||
Portfolio Turnover (c) (i) | 46 | % | 35 | % | 30 | % | 48 | % | 31 | % | 22 | % | |||||||||||||||
(a) Per share net investment income (loss) has been calculated using the average daily shares method.
(b) Amount is less than $0.005 per share.
(c) Not annualized for periods less than one year.
(d) Assumes reinvestment of all net investment income and realized capital gain distributions, if any, during the period. Includes adjustments in accordance with U.S. Generally Accepted Accounting Principles and could differ from the Lipper reported return.
(e) Annualized for periods less than one year.
(f) Does not include acquired fund fees and expenses, if any.
(g) The net expense ratio may not correlate to the applicable expense limits in place during the period since the current contractual expense limitation is applied for a period beginning July 1, 2019 and in effect through November 30, 2023, instead of coinciding with the Fund's fiscal year end. Details of the current contractual expense limitation in effect can be found in Note 5 of the accompanying Notes to Financial Statements.
(h) From the period beginning July 1, 2019, the amount of any waivers or reimbursements and the amount of any recoupment is calculated without regard to the impact of any performance adjustment to the Fund's management fee.
(i) Portfolio turnover is calculated on the basis of the Fund as a whole without distinguishing between the classes of shares.
(continues on next page)
See notes to financial statements.
23
USAA Mutual Funds Trust | Financial Highlights — continued | ||||||
For a Share Outstanding Throughout Each Period
USAA High Income Fund | |||||||||||||||||||||||||||
Class A | |||||||||||||||||||||||||||
| Six Months Ended January 31, 2023 (Unaudited) | Year Ended July 31, 2022 | Year Ended July 31, 2021 | Year Ended July 31, 2020 | Year Ended July 31, 2019 | Year Ended July 31, 2018 | ||||||||||||||||||||||
| Net Asset Value, Beginning of Period | $ | 6.93 | $ | 7.94 | $ | 7.46 | $ | 7.93 | $ | 8.03 | $ | 8.28 | |||||||||||||||
Investment Activities: | |||||||||||||||||||||||||||
Net investment income (loss) | 0.21 | (a) | 0.36 | (a) | 0.38 | (a) | 0.43 | (a) | 0.46 | 0.46 | |||||||||||||||||
| Net realized and unrealized gains (losses) | (0.09 | ) | (1.00 | ) | 0.47 | (0.48 | ) | (0.10 | ) | (0.26 | ) | ||||||||||||||||
| Total from Investment Activities | 0.12 | (0.64 | ) | 0.85 | (0.05 | ) | 0.36 | 0.20 | |||||||||||||||||||
Distributions to Shareholders from: | |||||||||||||||||||||||||||
Net investment income | (0.21 | ) | (0.37 | ) | (0.37 | ) | (0.42 | ) | (0.46 | ) | (0.45 | ) | |||||||||||||||
Total Distributions | (0.21 | ) | (0.37 | ) | (0.37 | ) | (0.42 | ) | (0.46 | ) | (0.45 | ) | |||||||||||||||
| Redemption Fees Added to Beneficial Interests | — | — | — | — | — | (b) | — | (b) | |||||||||||||||||||
Net Asset Value, End of Period | $ | 6.84 | $ | 6.93 | $ | 7.94 | $ | 7.46 | $ | 7.93 | $ | 8.03 | |||||||||||||||
| Total Return (excludes sales charges) (c) (d) | 1.80 | % | (8.22 | )% | 11.58 | % | (0.44 | )% | 4.69 | % | 2.55 | % | |||||||||||||||
Ratios to Average Net Assets: | |||||||||||||||||||||||||||
Net Expenses (e) (f) (g) (h) | 0.87 | % | 0.83 | % | 0.92 | % | 0.98 | % | 1.00 | % | 1.02 | %(j) | |||||||||||||||
Net Investment Income (Loss) (e) | 6.29 | % | 4.85 | % | 4.89 | % | 5.63 | % | 5.78 | % | 5.58 | % | |||||||||||||||
Gross Expenses (e) (f) | 1.78 | % | 1.58 | % | 1.37 | % | 1.09 | % | 1.21 | % | 1.13 | % | |||||||||||||||
Supplemental Data: | |||||||||||||||||||||||||||
Net Assets at end of period (000's) | $ | 2,165 | $ | 2,229 | $ | 2,586 | $ | 7,184 | $ | 10,021 | $ | 10,019 | |||||||||||||||
Portfolio Turnover (c) (i) | 46 | % | 35 | % | 30 | % | 48 | % | 31 | % | 22 | % | |||||||||||||||
(a) Per share net investment income (loss) has been calculated using the average daily shares method.
(b) Amount is less than $0.005 per share.
(c) Not annualized for periods less than one year.
(d) Assumes reinvestment of all net investment income and realized capital gain distributions, if any, during the period. Includes adjustments in accordance with U.S. Generally Accepted Accounting Principles and could differ from the Lipper reported return.
(e) Annualized for periods less than one year.
(f) Does not include acquired fund fees and expenses, if any.
(g) The net expense ratio may not correlate to the applicable expense limits in place during the period since the current contractual expense limitation is applied for a period beginning July 1, 2019 and in effect through November 30, 2023, instead of coinciding with the Fund's fiscal year end. Details of the current contractual expense limitation in effect can be found in Note 5 of the accompanying Notes to Financial Statements.
(h) From the period beginning July 1, 2019, the amount of any waivers or reimbursements and the amount of any recoupment is calculated without regard to the impact of any performance adjustment to the Fund's management fee.
(i) Portfolio turnover is calculated on the basis of the Fund as a whole without distinguishing between the classes of shares.
(j) Prior to December 1, 2017, USAA Asset Management Company (previous Investment Adviser) voluntarily agreed to limit the annual expenses of Class A to 1.05% of the Class A average daily net assets.
(continues on next page)
See notes to financial statements.
24
USAA Mutual Funds Trust | Financial Highlights — continued | ||||||
For a Share Outstanding Throughout Each Period
USAA High Income Fund | |||||||||||||||||||||||||||
R6 Shares | |||||||||||||||||||||||||||
| Six Months Ended January 31, 2023 (Unaudited) | Year Ended July 31, 2022 | Year Ended July 31, 2021 | Year Ended July 31, 2020 | Year Ended July 31, 2019 | Year Ended July 31, 2018 | ||||||||||||||||||||||
| Net Asset Value, Beginning of Period | $ | 6.91 | $ | 7.92 | $ | 7.43 | $ | 7.90 | $ | 8.01 | $ | 8.26 | |||||||||||||||
Investment Activities: | |||||||||||||||||||||||||||
Net investment income (loss) | 0.23 | (a) | 0.41 | (a) | 0.40 | (a) | 0.45 | (a) | 0.48 | 0.48 | |||||||||||||||||
| Net realized and unrealized gains (losses) | (0.10 | ) | (1.00 | ) | 0.49 | (0.47 | ) | (0.10 | ) | (0.25 | ) | ||||||||||||||||
| Total from Investment Activities | 0.13 | (0.59 | ) | 0.89 | (0.02 | ) | 0.38 | 0.23 | |||||||||||||||||||
Distributions to Shareholders from: | |||||||||||||||||||||||||||
Net investment income | (0.22 | ) | (0.42 | ) | (0.40 | ) | (0.45 | ) | (0.49 | ) | (0.48 | ) | |||||||||||||||
Total Distributions | (0.22 | ) | (0.42 | ) | (0.40 | ) | (0.45 | ) | (0.49 | ) | (0.48 | ) | |||||||||||||||
Net Asset Value, End of Period | $ | 6.82 | $ | 6.91 | $ | 7.92 | $ | 7.43 | $ | 7.90 | $ | 8.01 | |||||||||||||||
Total Return (b) (c) | 1.98 | % | (7.65 | )% | 12.25 | % | (0.12 | )% | 4.95 | % | 2.94 | % | |||||||||||||||
Ratios to Average Net Assets: | |||||||||||||||||||||||||||
Net Expenses (d) (e) (f) (g) | 0.50 | % | 0.22 | % | 0.58 | % | 0.64 | % | 0.65 | % | 0.65 | % | |||||||||||||||
Net Investment Income (Loss) (d) | 6.69 | % | 5.51 | % | 5.25 | % | 5.98 | % | 6.13 | % | 5.95 | % | |||||||||||||||
Gross Expenses (d) (e) | 2.95 | % | 4.07 | % | 0.92 | % | 0.82 | % | 0.96 | % | 0.92 | % | |||||||||||||||
Supplemental Data: | |||||||||||||||||||||||||||
Net Assets at end of period (000's) | $ | 648 | $ | 763 | $ | 463 | $ | 5,323 | $ | 5,214 | $ | 5,055 | |||||||||||||||
Portfolio Turnover (b) (h) | 46 | % | 35 | % | 30 | % | 48 | % | 31 | % | 22 | % | |||||||||||||||
(a) Per share net investment income (loss) has been calculated using the average daily shares method.
(b) Not annualized for periods less than one year.
(c) Assumes reinvestment of all net investment income and realized capital gain distributions, if any, during the period. Includes adjustments in accordance with U.S. Generally Accepted Accounting Principles and could differ from the Lipper reported return.
(d) Annualized for periods less than one year.
(e) Does not include acquired fund fees and expenses, if any.
(f) The net expense ratio may not correlate to the applicable expense limits in place during the period since the current contractual expense limitation is applied for a period beginning July 1, 2019 and in effect through November 30, 2023, instead of coinciding with the Fund's fiscal year end. Details of the current contractual expense limitation in effect can be found in Note 5 of the accompanying Notes to Financial Statements.
(g) From the period beginning July 1, 2019, the amount of any waivers or reimbursements and the amount of any recoupment is calculated without regard to the impact of any performance adjustment to the Fund's management fee.
(h) Portfolio turnover is calculated on the basis of the Fund as a whole without distinguishing between the classes of shares.
See notes to financial statements.
25
USAA Mutual Funds Trust | Notes to Financial Statements January 31, 2023 | ||||||
(Unaudited)
1. Organization:
USAA Mutual Funds Trust (the "Trust") is organized as a Delaware statutory trust and is registered under the Investment Company Act of 1940, as amended (the "1940 Act"), as an open-end investment company. The Trust is comprised of 45 funds and is authorized to issue an unlimited number of shares, which are units of beneficial interest with no par value.
The accompanying financial statements are those of the USAA High Income Fund (the "Fund"). The Fund offers four classes of shares: Fund Shares, Institutional Shares, Class A, and R6 Shares. The Fund is classified as diversified under the 1940 Act.
Each class of shares of the Fund has substantially identical rights and privileges, except with respect to sales charges, fees paid under distribution plans, expenses allocable exclusively to each class of shares, voting rights on matters solely affecting a single class of shares, and the exchange privilege of each class of shares.
Victory Capital Management ("VCM" or the "Adviser") is an indirect wholly owned subsidiary of Victory Capital Holdings, Inc., a publicly traded Delaware corporation, and a wholly owned direct subsidiary of Victory Capital Operating, LLC.
Under the Trust's organizational documents, its officers and trustees are indemnified against certain liabilities arising out of the performance of their duties to the Fund. In addition, in the normal course of business, the Fund enters into contracts with its vendors and others that provide for general indemnifications. The Fund's maximum exposure under these arrangements is unknown, as this would involve future claims that may be made against the Fund. However, based on experience, the Fund expects that risk of loss to be remote.
2. Significant Accounting Policies:
The following is a summary of significant accounting policies followed by the Trust in the preparation of its financial statements. The policies are in conformity with U.S. Generally Accepted Accounting Principles ("GAAP"). The preparation of financial statements in accordance with GAAP requires management to make estimates and assumptions that affect the reported amounts of assets and liabilities and disclosure of contingent assets and liabilities at the date of the financial statements and the reported amounts of income and expenses for the period. Actual results could differ from those estimates. The Fund follows the specialized accounting and reporting requirements under GAAP that are applicable to investment companies under Accounting Standards Codification Topic 946.
Investment Valuation:
The Fund records investments at fair value. Fair value is defined as the price that would be received to sell an asset or paid to transfer a liability in an orderly transaction between market participants at the measurement date.
The valuation techniques described below maximize the use of observable inputs and minimize the use of unobservable inputs in determining fair value. The inputs used for valuing the Fund's investments are summarized in the three broad levels listed below:
• Level 1 — quoted prices (unadjusted) in active markets for identical securities
• Level 2 — other significant observable inputs (including quoted prices for similar securities, interest rates, or credit spreads, applicable to those securities, etc.)
• Level 3 — significant unobservable inputs (including the Adviser's assumptions in determining the fair value of investments)
Changes in valuation techniques may result in transfers in or out of an assigned level within the disclosure hierarchy. The inputs or methodologies used for valuation techniques are not necessarily an indication of the risks associated with entering into those investments.
The Adviser, appointed as the valuation designee by the Trust's Board of Trustees' (the "Board"), has established the Pricing and Liquidity Committee (the "Committee"), and subject to Board oversight, the Committee administers and oversees the Fund's valuation policies and procedures, which are approved by the Board.
26
USAA Mutual Funds Trust | Notes to Financial Statements — continued January 31, 2023 | ||||||
(Unaudited)
Portfolio securities listed or traded on securities exchanges, including Exchange-Traded Funds ("ETFs"), and American Depositary Receipts, are valued at the closing price on the exchange or system where the security is principally traded, if available, or at the Nasdaq Official Closing Price. If there have been no sales for that day on the exchange or system, then a security is valued at the last available bid quotation on the exchange or system where the security is principally traded. In each of these situations, valuations are typically categorized as Level 1 in the fair value hierarchy.
Investments in open-end investment companies, other than ETFs, are valued at their net asset value ("NAV"). These valuations are typically categorized as Level 1 in the fair value hierarchy.
Debt securities are valued each business day by the valuation designee and subject to the oversight of the Board. The pricing service uses the evaluated bid or the last sale price to value securities. Debt obligations maturing within 60 days may be valued at amortized cost, provided that the amortized cost represents the fair value of such securities. These valuations are typically categorized as Level 2 in the fair value hierarchy.
In the event that price quotations or valuations are not readily available, investments are valued at fair value in accordance with procedures established by and under the general supervision and responsibility of the Board. These valuations are typically categorized as Level 2 or Level 3 in the fair value hierarchy, based on the observability of inputs used to determine the fair value. The effect of fair value pricing is that securities may not be priced on the basis of quotations from the primary market in which they are traded, and the actual price realized from the sale of a security may differ materially from the fair value price. Valuing these securities at fair value is intended to cause the Fund's NAV to be more reliable than it otherwise would be.
A summary of the valuations as of January 31, 2023, based upon the three levels defined above, is included in the table below while the breakdown, by category, of investments is disclosed on the Schedule of Portfolio Investments (amounts in thousands):
Level 1 | Level 2 | Level 3 | Total | ||||||||||||||||
Asset-Backed Securities | $ | — | $ | 14,874 | $ | — | $ | 14,874 | |||||||||||
Collateralized Mortgage Obligations | — | 15,851 | — | 15,851 | |||||||||||||||
Common Stocks | 2,146 | 1,779 | — | (a) | 3,925 | ||||||||||||||
Preferred Stocks | 20,653 | — | — | 20,653 | |||||||||||||||
Senior Secured Loans | — | 67,303 | 6 | 67,309 | |||||||||||||||
Corporate Bonds | — | 668,847 | — | 668,847 | |||||||||||||||
Yankee Dollars | — | 141,641 | — | 141,641 | |||||||||||||||
Commercial Paper | — | 77,361 | — | 77,361 | |||||||||||||||
Exchange-Traded Funds | 20,207 | — | — | 20,207 | |||||||||||||||
Collateral for Securities Loaned | 50,000 | — | — | 50,000 | |||||||||||||||
Total | $ | 93,006 | $ | 987,656 | $ | 6 | $ | 1,080,668 | |||||||||||
(a) Rounds to less than $1 thousand.
As of January 31, 2023, there were no transfers into/out of Level 3.
Real Estate Investment Trusts ("REITs"):
The Fund may invest in REITs, which report information on the source of their distributions annually. REITs are pooled investment vehicles that invest primarily in income producing real estate or real estate related loans or interests (such as mortgages). Certain distributions received from REITs during the year are recorded as realized gains or return of capital as estimated by the Fund or when such information becomes known.
Investment Companies:
Exchange-Traded Funds:
The Fund may invest in ETFs, the shares of which are bought and sold on a securities exchange. An ETF trades like common stock and represents a fixed portfolio of securities often designed to track the
27
USAA Mutual Funds Trust | Notes to Financial Statements — continued January 31, 2023 | ||||||
(Unaudited)
performance and dividend yield of a particular domestic or foreign market index. The Fund may purchase shares of an ETF to temporarily gain exposure to a portion of the U.S. or a foreign market while awaiting purchase of underlying securities. The risks of owning an ETF generally reflect the risks of owning the underlying securities the ETF is designed to track, although the lack of liquidity of an ETF could result in it being more volatile. Additionally, ETFs have fees and expenses that reduce their value.
Open-End Funds:
The Fund may invest in portfolios of open-end investment companies. These investment companies value securities in their portfolios for which market quotations are readily available at their market values (generally the last reported sale price) and all other securities and assets at their fair value by the methods established by the board of directors of the underlying funds.
Securities Purchased on a Delayed-Delivery or When-Issued Basis:
The Fund may purchase securities on a delayed-delivery or when-issued basis. Delivery and payment for securities that have been purchased by the Fund on a delayed-delivery or when-issued basis, or for delayed draws on loans can generally take place within 35 days a month or more after the trade date. Securities that require more than 35 days to settle are considered a senior security and subject to Rule 18f-4. At the time the Fund makes the commitment to purchase a security on a delayed-delivery or when-issued basis, the Fund records the transaction and reflects the value of the security in determining NAV. No interest accrues to the Fund until the transaction settles and payment takes place. If the Fund owns delayed-delivery or when-issued securities, these values are included in Payables for Investments purchased on the accompanying Statement of Assets and Liabilities.
Municipal Obligations:
The values of municipal obligations can fluctuate and may be affected by adverse tax, legislative, or political changes, and by financial developments affecting municipal issuers. Payments of municipal obligations may depend on a relatively limited source of revenue, resulting in greater credit risk. Future changes in federal tax laws or the activity of an issuer may adversely affect the tax-exempt status of municipal obligations.
Mortgage- and Asset-Backed Securities:
The values of some mortgage-related or asset-backed securities may be particularly sensitive to changes in prevailing interest rates. Early repayment of principal on some mortgage-related securities may expose the Fund to a lower rate of return upon reinvestment of principal. The values of mortgage- and asset-backed securities depend in part on the credit quality and adequacy of the underlying assets or collateral and may fluctuate in response to the market's perception of these factors as well as current and future repayment rates. Some mortgage-backed securities are backed by the full faith and credit of the U.S. government (e.g., mortgage-backed securities issued by the Government National Mortgage Association, commonly known as "Ginnie Mae"), while other mortgage-backed securities (e.g., mortgage-backed securities issued by the Federal National Mortgage Association and the Federal Home Loan Mortgage Corporation, commonly known as "Fannie Mae" and "Freddie Mac," respectively), are backed only by the credit of the government entity issuing them. In addition, some mortgage-backed securities are issued by private entities and, as such, are not guaranteed by the U.S. government or any agency or instrumentality of the U.S. government.
Leveraged Loans:
The Fund may invest in leveraged loans, a type of bank loan. Leveraged loans are adjustable-rate bank loans made to companies rated below investment grade. The interest rates on leveraged loans are reset periodically based upon the fluctuations of a base interest rate such as the Secured Overnight Financing Rate ("SOFR") or London Interbank Offered Rate ("LIBOR") and a "spread" above that base interest rate that represents a risk premium to the lending banks and/or other participating investors. Many bank loans bear an adjustable rate of interest; however, leveraged loans provide for a greater
28
USAA Mutual Funds Trust | Notes to Financial Statements — continued January 31, 2023 | ||||||
(Unaudited)
"spread" over the base interest rate than other bank loans because they are considered to represent a greater credit risk. Because they are perceived to represent a greater credit risk, leveraged loans possess certain attributes that are similar to high-yield securities. However, because they are often secured by collateral of the borrower, leveraged loans possess certain attributes that are similar to other bank loans.
Below-Investment-Grade Securities:
The Fund invests in below-investment-grade securities (i.e., lower-quality, "junk" debt), which are subject to various risks. Lower-quality debt is considered to be speculative because it is less certain that the issuer will be able to pay interest or repay the principal than in the case of investment-grade debt. These securities can involve a substantially greater risk of default than higher-rated securities, and their values can decline significantly over short periods of time. Lower-quality debt securities tend to be more sensitive to adverse news about their issuers, the market and the economy in general, than higher-quality debt securities. The market for these securities can be less liquid, especially during periods of recession or general market decline.
Derivative Instruments:
Futures Contracts:
The Fund may enter into contracts for the future delivery of securities or foreign currencies and futures contracts based on a specific security, class of securities, foreign currency or an index, and purchase or sell options on any such futures contracts. A futures contract on a securities index is an agreement obligating either party to pay, and entitling the other party to receive, while the contract is outstanding, cash payments based on the level of a specified securities index. No physical delivery of the underlying asset is made. The Fund may enter into futures contracts in an effort to hedge against market risks. The acquisition of put and call options on futures contracts will give the Fund the right (but not the obligation), for a specified price, to sell or to purchase the underlying futures contract, upon exercise of the option, at any time during the option period. Futures transactions involve brokerage costs and require the Fund to segregate assets to cover contracts that would require it to purchase securities or currencies. A good faith margin deposit, known as initial margin, of cash or government securities with a broker or custodian is required to initiate and maintain open positions in futures contracts. Subsequent payments, known as variation margin, are made or received by the Fund based on the change in the market value of the position and are recorded as unrealized appreciation or depreciation until the contract is closed out, at which time the gain or loss is realized. The Fund may lose the expected benefit of futures transactions if interest rates, exchange rates or securities prices change in an unanticipated manner. Such unanticipated changes may also result in lower overall performance than if the Fund had not entered into any futures transactions. In addition, the value of the Fund's futures positions may not prove to be perfectly or even highly correlated with the value of its portfolio securities or foreign currencies, limiting the Fund's ability to hedge effectively against interest rate, exchange rate and/or market risk and giving rise to additional risks. There is no assurance of liquidity in the secondary market for purposes of closing out futures positions. The collateral held by the Fund is reflected on the Statement of Assets and Liabilities under Deposit with broker for futures contracts.
The Fund did not hold futures contracts as of January 31, 2023.
Investment Transactions and Related Income:
Changes in holdings of investments are accounted for no later than one business day following the trade date. For financial reporting purposes, however, investment transactions are accounted for on trade date or the last business day of the reporting period. Interest income is determined on the basis of coupon interest accrued using the effective interest method which adjusts, where applicable, the amortization of premiums or accretion of discounts. Dividend income is recorded on the ex-dividend date. Gains or losses realized on sales of securities are recorded on the identified cost basis. Paydown gains or losses on applicable securities, if any, are recorded as components of Interest income on the Statement of Operations.
29
USAA Mutual Funds Trust | Notes to Financial Statements — continued January 31, 2023 | ||||||
(Unaudited)
The Fund may receive other income from investments in loan assignments and/or unfunded commitments, including amendment fees, consent fees, and commitment fees. These fees are recorded as income when received. These amounts, if received, are included in Interest income on the Statement of Operations.
Securities Lending:
The Fund, through a Securities Lending Agreement with Citibank, N.A. ("Citibank"), may lend its securities to qualified financial institutions, such as certain broker-dealers and banks, to earn additional income, net of income retained by Citibank. Borrowers are required to initially secure their loans for collateral in the amount of at least 102% of the value of U.S. securities loaned or at least 105% of the value of non-U.S. securities loaned, marked-to-market daily. Any collateral shortfalls associated with increases in the valuation of the securities loaned are generally cured the next business day. The collateral can be received in the form of cash collateral and/or non-cash collateral. Non-cash collateral can include U.S. Government Securities and other securities as permitted by Securities and Exchange Commission ("SEC") guidelines. The cash collateral is invested in short-term instruments or cash equivalents, primarily open-end investment companies, as noted on the Fund's Schedule of Portfolio Investments. The Fund effectively does not have control of the non-cash collateral and therefore it is not disclosed on the Fund's Schedule of Portfolio Investments. Collateral requirements are determined daily based on the value of the Fund's securities on loan as of the end of the prior business day. During the time portfolio securities are on loan, the borrower will pay the Fund any dividends or interest paid on such securities plus any fee negotiated between the parties to the lending agreement. The Fund also earns a return from the collateral. The Fund pays Citibank various fees in connection with the investment of cash collateral and fees based on the investment income received from securities lending activities. Securities lending income (net of these fees) is disclosed on the Statement of Operations. Loans are terminable upon demand and the borrower must return the loaned securities within the lesser of one standard settlement period or five business days. Although risk is mitigated by the collateral, the Fund could experience a delay in recovering its securities and possible loss of income or value if the borrower fails to return them. In addition, there is a risk that the value of the short-term investments will be less than the amount of cash collateral required to be returned to the borrower.
The Fund's agreement with Citibank does not include master netting provisions. Non-cash collateral received by the Fund may not be sold or repledged, except to satisfy borrower default.
The following table (amounts in thousands) is a summary of the Fund's securities lending transactions as of January 31, 2023.
| Value of Securities on Loan | Non-Cash Collateral | Cash Collateral | |||||||||
| $ | 48,452 | $ | — | $ | 50,000 | ||||||
Federal Income Taxes:
The Fund intends to continue to qualify as a regulated investment company by complying with the provisions available to certain investment companies, as defined in applicable sections of the Internal Revenue Code, and to make distributions of net investment income and net realized gains sufficient to relieve it from all, or substantially all, federal income taxes. Accordingly, no provision for federal income taxes is required in the financial statements. The Fund has a tax year end of July 31, and effective April 30, 2023, the Fund will change its tax year end to April 30.
For the six months ended January 31, 2023, the Fund did not incur any income tax, interest, or penalties, and has recorded no liability for net unrecognized tax benefits relating to uncertain tax positions.
Management of the Fund has reviewed tax positions taken in tax years that remain subject to examination by all major tax jurisdictions, including federal (i.e., the last four tax years, which includes the current fiscal tax year end). Management believes that there is no tax liability resulting from unrecognized tax benefits related to uncertain tax positions taken.
30
USAA Mutual Funds Trust | Notes to Financial Statements — continued January 31, 2023 | ||||||
(Unaudited)
Allocations:
Expenses directly attributable to the Fund are charged to the Fund, while expenses that are attributable to more than one fund in the Trust, or jointly with an affiliated trust, are allocated among the respective funds in the Trust and/or an affiliated trust based upon net assets or another appropriate basis.
Income, expenses (other than class-specific expenses such as transfer agent fees, state registration fees, printing fees, and 12b-1 fees), and realized and unrealized gains or losses on investments are allocated to each class of shares based on its relative net assets on the date income is earned or expenses and realized and unrealized gains and losses are incurred.
Cross-Trade Transactions:
Pursuant to Rule 17a-7 under the 1940 Act, the Fund may engage in cross-trades, which are securities transactions with affiliated investment companies and advisory accounts managed by the Adviser and any applicable sub-adviser under specified conditions outlined in the valuation policies and procedures adopted by the Board. In addition, as defined under the valuation policies and procedures, each transaction must be effected at the independent current market price. For the six months ended January 31, 2023, the Fund engaged in the following securities transactions with affiliated funds, which resulted in the following net realized gains (losses) (amounts in thousands):
| Purchases | Sales | Net Realized Gains (Losses) | |||||||||
| $ | — | $ | 4,950 | $ | 50 | ||||||
3. Purchases and Sales:
Purchases and sales of securities (excluding securities maturing less than one year from acquisition) for the six months ended January 31, 2023, were as follows for the Fund (amounts in thousands):
Excluding | |||||||
Purchases | Sales | ||||||
$ | 440,798 | $ | 508,313 | ||||
4. Affiliated Fund Ownership:
The Fund offers shares for investment by other funds. The fund-of-funds do not invest in the underlying funds for the purpose of exercising management or control, and the affiliated fund-of-funds' annual and semi-annual reports may be viewed at vcm.com. As of January 31, 2023, certain fund-of-funds owned total outstanding shares of the Fund as follows:
Affiliated USAA Mutual Funds | Ownership % | ||||||
USAA Cornerstone Conservative Fund | 1.1 | ||||||
USAA Target Retirement Income Fund | 3.5 | ||||||
USAA Target Retirement 2030 Fund | 4.5 | ||||||
USAA Target Retirement 2040 Fund | 4.7 | ||||||
USAA Target Retirement 2050 Fund | 1.0 | ||||||
5. Fees and Transactions with Affiliates and Related Parties:
Investment Advisory Fees:
Investment advisory services are provided to the Fund by the Adviser, which is a New York corporation registered as an investment adviser with the SEC.
31
USAA Mutual Funds Trust | Notes to Financial Statements — continued January 31, 2023 | ||||||
(Unaudited)
Under the terms of the Investment Advisory Agreement, the Adviser is entitled to receive a base fee and a performance adjustment. The Fund's base fee is accrued daily and paid monthly at an annualized rate of 0.50% of the Fund's average daily net assets. Amounts incurred and paid to VCM for the six months ended January 31, 2023, are reflected on the Statement of Operations as Investment advisory fees.
The performance adjustment for each share class is accrued daily and calculated monthly by comparing the respective class' performance to that of the Lipper High Yield Bond Funds Index. The Lipper High Yield Bond Funds Index tracks the total return performance of the largest funds within the Lipper High Yield Bond Funds category.
The performance period for each share class consists of the current month plus the previous 35 months. The following table is utilized to determine the extent of the performance adjustment:
| Over/Under Performance Relative to Index (in basis points)(a) | Annual Adjustment Rate (in basis points) | ||||||
| +/- 20 to 50 | +/- 4 | ||||||
| +/- 51 to 100 | +/- 5 | ||||||
| +/- 101 and greater | +/- 6 | ||||||
(a) Based on the difference between the average annual performance of the relevant share class of the Fund and its relevant Lipper index, rounded to the nearest basis point.
Each class' annual performance adjustment rate is multiplied by the average daily net assets of the respective class over the entire performance period, which is then multiplied by a fraction, the numerator of which is the number of days in the month and the denominator of which is 365 (366 in leap years). The resulting amount is then added to (in the case of overperformance), or subtracted from (in the case of underperformance) the base fee.
Under the performance fee arrangement, each class pays a positive performance fee adjustment for a performance period whenever the class outperforms the Lipper High Yield Bond Funds Index over that period, even if the class has overall negative returns during the performance period.
For the period August 1, 2022, to January 31, 2023, performance adjustments were $(240), $(154), $(1), and $(1) for Fund Shares, Institutional Shares, Class A, and R6 Shares, in thousands, respectively. Performance adjustments were (0.06)%, (0.12)%, (0.13)%, and (0.15)% for Fund Shares, Institutional Shares, Class A, and R6 Shares, respectively. The performance adjustment rate included in the investment advisory fee may differ from the maximum over/under Annual Adjustment Rate due to differences in average net assets for the reporting period and rolling 36 month performance periods.
The Trust relies on an exemptive order granted to VCM and its affiliated funds by the SEC in March 2019, permitting the use of a "manager-of-managers" structure for certain funds. Under a manager-of-managers structure, the investment adviser may select (with approval of the Board and without shareholder approval) one or more subadvisers to manage the day-to-day investment of a fund's assets. For the six months ended January 31, 2023, the Fund had no subadvisers.
Administration and Servicing Fees:
VCM also serves as the Fund's administrator and fund accountant. Under the Fund Administration, Servicing and Accounting Agreement, VCM is paid an administration and servicing fee that is accrued daily and paid monthly at an annualized rate of 0.15%, 0.10%, 0.15%, and 0.05%, which is based on the Fund's average daily net assets of the Fund Shares, Institutional Shares, Class A, and R6 Shares, respectively. Amounts incurred for the six months ended January 31, 2023, are reflected on the Statement of Operations as Administration fees.
Citi Fund Services Ohio, Inc. ("Citi"), an affiliate of Citibank, acts as sub-administrator and sub-fund accountant to the Fund pursuant to a Sub-Administration and Sub-Fund Accounting Services Agreement between VCM and Citi. VCM pays Citi a fee for providing these services. The Fund reimburses VCM and Citi for out-of-pocket expenses incurred in providing these services and certain other expenses specifically allocated to the Fund. Amounts incurred for the six months ended January 31, 2023, are reflected on the Statement of Operations as Sub-Administration fees.
32
USAA Mutual Funds Trust | Notes to Financial Statements — continued January 31, 2023 | ||||||
(Unaudited)
The Fund (as part of the Trust) has entered into an agreement with the Adviser to provide compliance services, pursuant to which the Adviser furnishes its compliance personnel, including the services of the Chief Compliance Officer ("CCO"), and other resources reasonably necessary to provide the Trust with compliance oversight services related to the design, administration, and oversight of a compliance program for the Trust in accordance with Rule 38a-1 under the 1940 Act. The CCO is an employee of the Adviser, which pays the compensation of the CCO and support staff. The funds in the Trust, Victory Variable Insurance Funds, Victory Portfolios, and Victory Portfolios II (collectively, the "Victory Funds Complex") in the aggregate, compensate the Adviser for these services. Amounts incurred for the six months ended January 31, 2023, are reflected on the Statement of Operations as Compliance fees.
Transfer Agency Fees:
Victory Capital Transfer Agency, Inc. ("VCTA"), an affiliate of the Adviser, provides transfer agency services to the Fund. VCTA provides transfer agent services to the Fund Shares based on an annual charge of $25.50 per shareholder account plus out-of-pocket expenses. VCTA pays a portion of these fees to certain intermediaries for the administration and servicing of accounts that are held with such intermediaries. Transfer agent fees for Institutional Shares, Class A and R6 Shares, are paid monthly based on a fee accrued daily at an annualized rate of 0.10% 0.10%, and 0.01%,respectively, of average daily net assets, plus out-of-pocket expenses. Amounts incurred and paid to VCTA for the six months ended January 31, 2023, are reflected on the Statement of Operations as Transfer agent fees.
FIS Investor Services LLC serves as sub-transfer agent and dividend disbursing agent for the Fund pursuant to a Sub-Transfer Agent Agreement between VCTA and FIS Investor Services LLC. VCTA provides FIS Investor Services LLC a fee for providing these services.
Distributor/Underwriting Services:
Victory Capital Services, Inc. (the "Distributor"), an affiliate of the Adviser, serves as Distributor for the continuous offering of the shares of the Fund pursuant to a Distribution Agreement between the Distributor and the Trust.
Pursuant to the Distribution and Service Plans adopted in accordance with Rule 12b-1 under the 1940 Act, the Distributor may receive a monthly distribution and service fee, at an annual rate of up to 0.25% of the average daily net assets of Class A. The distribution and service fees paid to the Distributor may be used by the Distributor to pay for activity primarily intended to result in the sale of Class A. Amounts incurred and paid to the Distributor for the six months ended January 31, 2023, are reflected on the Statement of Operations as 12b-1 fees.
In addition, the Distributor is entitled to receive commissions in connection with sales of Class A. For the six months ended January 31, 2023, the Distributor did not receive any commissions.
Other Fees:
Citibank serves as the Fund's custodian. The Fund pays Citibank a fee for providing these services. Amounts incurred for the six months ended January 31, 2023, are reflected on the Statement of Operations as Custodian fees.
K&L Gates LLP provides legal services to the Trust.
The Adviser has entered into an expense limitation agreement with the Fund until at least November 30, 2023. Under the terms of the agreement, the Adviser has agreed to waive fees or reimburse certain expenses to the extent that ordinary operating expenses incurred by certain classes of the Fund in any fiscal year exceed the expense limits for such classes of the Fund. Such excess amounts will be the liability of the Adviser. Performance adjustments, acquired fund fees and expenses, interest, taxes, brokerage commissions, other expenditures, which are capitalized in accordance with GAAP, and other extraordinary expenses not incurred in the ordinary course of the Fund's business are excluded from the expense limits. As of January 31, 2023, the expense limits (excluding voluntary waivers) were 0.83%, 0.73%, 1.00%, and 0.65% for Fund Shares, Institutional Shares, Class A, and R6 Shares, respectively.
33
USAA Mutual Funds Trust | Notes to Financial Statements — continued January 31, 2023 | ||||||
(Unaudited)
Under the terms of the expense limitation agreement, the Fund has agreed to repay fees and expenses that were waived or reimbursed by the Adviser for a period of up to three years (thirty-six (36) months) after the waiver or reimbursement took place, subject to the lesser of any operating expense limits in effect at the time of: (a) the original waiver or expense reimbursement; or (b) the recoupment, after giving effect to the recoupment amount.
As of January 31, 2023, the following amounts are available to be repaid to the Adviser (amounts in thousands). The Fund has not recorded any amounts available to be repaid as a liability due to an assessment that such repayments are not probable at January 31, 2023.
| Expires 2023 | Expires 2024 | Expires 2025 | Expires 2026 | Total | |||||||||||||||
| $ | 9 | $ | 114 | $ | 95 | $ | 77 | $ | 295 | ||||||||||
The Adviser may voluntarily waive or reimburse additional fees to assist the Fund in maintaining competitive expense ratios. Voluntary waivers and reimbursements applicable to the Fund are not available to be recouped at a future time. There were no voluntary waivers or reimbursements for the six months ended January 31, 2023.
Certain officers and/or interested trustees of the Fund are also officers and/or employees of the Adviser, administrator, fund accountant, sub-administrator, sub-fund accountant, custodian, and Distributor.
6. Risks:
The Fund may be subject to other risks in addition to these identified risks.
Debt Securities Risk — The value of a debt security or other income-producing security changes in response to various factors including, for example, market-related factors (such as changes in interest rates or changes in the risk appetite of investors generally) and changes in the actual or perceived ability of the issuer (or of issuers generally) to meet its (or their) obligations. Other factors that may affect the value of debt securities include, among others, public health crises and responses by governments and companies to such crises. These and other events may affect the creditworthiness of the issuer of a debt security and may impair an issuer's ability to timely meet its debt obligations as they come due.
Credit Risk — The fixed-income securities in the Fund's portfolio are subject to credit risk, which is the possibility that an issuer of a fixed-income security will fail to make timely interest and/or principal payments on its securities or that negative market perceptions of the issuer's ability to make such payments will cause the price of that security to decline. The Fund accepts some credit risk as a recognized means to enhance an investor's return. All fixed-income securities, varying from the highest quality to the very speculative, have some degree of credit risk.
High-Yield/Junk Bond Risk — Fixed-income securities rated below investment grade, also known as "junk" or high-yield bonds, generally entail greater economic, credit, and liquidity risk than investment-grade securities. Their prices may be more volatile, especially during economic downturns, financial setbacks, or liquidity events. High-yield securities also can involve a substantially greater risk of default than higher quality debt securities, and their values can decline significantly over short and longer periods of time.
LIBOR Discontinuation Risk — The LIBOR discontinuation may adversely affect the financial markets generally and the Fund's operations, finances and investments specifically. LIBOR has been the principal floating-rate benchmark in the financial markets. However, LIBOR has been or will be discontinued as a floating rate benchmark. The date of discontinuation depends on the LIBOR currency and tenor. With limited exceptions, no new LIBOR obligations will be entered into after December 31, 2021. Existing LIBOR obligations have transitioned or will transition to another benchmark, depending on the LIBOR currency and tenor. For some existing LIBOR-based obligations, the contractual consequences of the discontinuation of LIBOR may not be clear.
Non-LIBOR floating-rate obligations, including SOFR-based obligations, may have returns and values that fluctuate more than those of floating-rate debt obligations that are based on LIBOR or other rates. Also, because SOFR and some alternative floating rates are relatively new market indexes, markets for
34
USAA Mutual Funds Trust | Notes to Financial Statements — continued January 31, 2023 | ||||||
(Unaudited)
certain non-LIBOR obligations may never develop or may not be liquid. Market terms for non-LIBOR floating rate obligations, such as the spread over the index reflected in interest-rate provisions, may evolve over time, and prices of non-LIBOR floating rate obligations may be different depending on when they are issued and changing views about correct spread levels.
Various SOFR-based rates, including SOFR-based term rates, and various non-SOFR-based rates are expected to develop in response to the discontinuation of U.S. dollar LIBOR, which may create various risks for the Fund and the financial markets more generally. There are non-LIBOR forward-looking floating rates that are not based on SOFR and that may be considered by participants in the financial markets as LIBOR alternatives. Such rates include AMERIBOR (American Interbank Offered Rate), BSBY (Bloomberg Short-Term Bank Yield Index) and BYI (Bank Yield Index). Unlike forward-looking SOFR-based term rates, such rates are intended to reflect a bank credit spread component.
It is not clear how replacement rates for LIBOR — including SOFR-based rates and non-SOFR-based rates — will develop and to what extent they will be used. There is no assurance that these replacement rates will be suitable substitutes for LIBOR, and thus the substitution of such rates for LIBOR could have an adverse effect on the Fund and the financial markets more generally. Concerns about market depth and stability could affect the development of non-SOFR-based term rates, and such rates may create various risks, which may or may not be similar to the risks relating to SOFR.
Market Risk — Overall market risks may affect the value of the Fund. Domestic and international factors such as political events, war, terrorism, trade disputes, inflation rates, interest rate levels and other fiscal and monetary policy changes, cybersecurity incidents, pandemics and other public health crises, sanctions against a particular foreign country, its nationals, businesses or industries and related geopolitical events, as well as environmental disasters such as earthquakes, fires, and floods, or other catastrophes, may add to instability in global economies and markets generally, and may lead to increased market volatility. Global economies and financial markets are highly interconnected, which increases the possibility that conditions in one country or region might adversely affect issuers in another country or region. The impact of these and other factors may be short-term or may last for extended periods.
7. Borrowing and Interfund Lending:
Line of Credit:
The Victory Funds Complex participates in a short-term demand note "Line of Credit" agreement with Citibank. The Line of Credit agreement with Citibank was renewed on June 27, 2022, with a termination date of June 26, 2023. Under the agreement with Citibank, the Victory Funds Complex may borrow up to $600 million, of which $300 million is committed and $300 million is uncommitted. $40 million of the Line of Credit is reserved for use by the Victory Floating Rate Fund, another series of the Victory Funds Complex, with Victory Floating Rate Fund paying the related commitment fees for that amount. The purpose of the Line of Credit is to meet temporary or emergency cash needs. For the six months ended January 31, 2023, Citibank received an annual commitment fee of 0.15% on $300 million for providing the Line of Credit. Each fund in the Victory Funds Complex paid a pro-rata portion of the commitment fees plus any interest (one-month SOFR plus 1.10 percent) on amounts borrowed. Interest charged to the Fund during the period, if applicable, is reflected on the Statement of Operations under Line of credit fees.
The Fund had no borrowings under the Line of Credit agreement during the six months ended January 31, 2023.
Interfund Lending:
The Trust and the Adviser rely on an exemptive order granted by the SEC in March 2017 (the "Order"), permitting the establishment and operation of an Interfund Lending Facility (the "Facility"). The Facility allows the Fund to directly lend and borrow money to or from any other fund in the Victory Funds Complex that is permitted to participate in the Facility, relying upon the Order at rates beneficial to both the borrowing and lending funds. Advances under the Facility are allowed for temporary or emergency purposes, including the meeting of redemption requests that otherwise might require the
35
USAA Mutual Funds Trust | Notes to Financial Statements — continued January 31, 2023 | ||||||
(Unaudited)
untimely disposition of securities, and are subject to each Fund's borrowing restrictions. The interfund loan rate is determined, as specified in the Order, by averaging the current repurchase agreement rate and the current bank loan rate. As a Borrower, interest charged to the Fund, if any, during the period, is reflected on the Statement of Operations under Interfund lending fees. As a Lender, interest earned by the Fund, if any, during the period, is reflected on the Statement of Operations under Interfund lending.
The Fund did not utilize or participate in the Facility during the six months ended January 31, 2023.
8. Federal Income Tax Information:
The Fund intends to distribute any net investment income monthly. Distributable net realized gains, if any, are declared and paid at least annually.
The amounts of dividends from net investment income and distributions from net realized gains (collectively, distributions to shareholders) are determined in accordance with federal income tax regulations, which may differ from GAAP. To the extent these "book/tax" differences are permanent in nature (e.g., net operating loss and distribution reclassification), such amounts are reclassified within the components of net assets based on their federal tax-basis treatment; temporary differences (e.g., wash sales) do not require reclassification. To the extent dividends and distributions exceed net investment income and net realized gains for tax purposes, they are reported as distributions of capital. Net investment losses incurred by the Fund may be reclassified as an offset to capital on the accompanying Statement of Assets and Liabilities.
The tax character of current year distributions paid and the tax basis of the current components of accumulated earnings (loss) will be determined at the end of the current tax year.
At the tax year ended July 31, 2022, the Fund had net capital loss carryforwards as summarized in the table below (amounts in thousands). It is unlikely that the Board will authorize a distribution of capital gains realized in the future until the capital loss carryforwards have been used.
| Short-Term Amount | Long-Term Amount | Total | |||||||||
| $ | 30,816 | $ | 151,239 | $ | 182,055 | ||||||
9. Subsequent Events:
On June 29, 2022, the Board approved a change to the Fund's fiscal year-end from July 31 to April 30, with an effective date of April 30, 2023.
The Board, upon recommendation of the Adviser, has approved a change in the name of the Trust and each individual fund within the Trust. On February 23, 2023, an initial filing was made with the SEC to commence the process to effectuate the following changes.
Effective at the start of business on April 24, 2023 (the "Effective Date"), the name of the Trust will change from USAA Mutual Funds Trust to Victory Portfolios III, and all references to USAA Mutual Funds Trust in the summary prospectus, statutory prospectus, and statement of additional information ("SAI") will be replaced by the new name.
Also on the Effective Date, references to the current name of the Fund in the summary prospectus, statutory prospectus, and SAI will be replaced with the new name as follows:
| Current Name | New Name | ||||||
USAA High Income Fund | Victory High Income Fund | ||||||
In addition, on the Effective Date, USAA Investments, a Victory Capital Management Inc. Investment Franchise, that currently manages the USAA Fixed Income Funds, will change its name to Victory Income Investors, and all references to USAA Investments in the summary prospectus, statutory prospectus, and SAI, will be replaced.
Please note that there will be no changes in the management of the Fund or to the Fund's ticker symbols.
36
USAA Mutual Funds Trust | Supplemental Information January 31, 2023 | ||||||
(Unaudited)
Proxy Voting and Portfolio Holdings Information
Proxy Voting:
Information regarding the policies and procedures the Fund uses to determine how to vote proxies relating to portfolio securities is available without charge, upon request, by calling (800) 235-8396. The information is also included in the Fund's Statement of Additional Information, which is available on the SEC's website at sec.gov.
Information relating to how the Fund voted proxies relating to portfolio securities held during the most recent 12 months ended June 30 is available on the SEC's website at sec.gov.
Availability of Schedules of Portfolio Investments:
The Trust files a complete list of Schedules of Portfolio Investments with the SEC for the first and third quarter of each fiscal year on Form N-PORT. Form N-PORT is available on the SEC's website at sec.gov.
Expense Examples
As a shareholder of the Fund, you may incur two types of costs: (1) transaction costs, including sales charges (loads) on purchases; and (2) ongoing costs, including management fees and other Fund expenses. These examples are intended to help you understand your ongoing costs (in dollars) of investing in the Fund and to compare these costs with the ongoing costs of investing in other mutual funds.
These examples are based on an investment of $1,000 invested at the beginning of the period and held for the entire period from August 1, 2022, through January 31, 2023.
The Actual Expense figures in the table below provide information about actual account values and actual expenses. You may use the information below, together with the amount you invested, to estimate the expenses that you paid over the period. Simply divide your account value by $1,000 (for example, an $8,600 account value divided by $1,000 = 8.6), then multiply the result by the number in the table under the heading entitled "Actual Expenses Paid During Period" to estimate the expenses you paid on your account during this period.
The Hypothetical Expense figures in the table below provide information about hypothetical account values and hypothetical expenses based on the Fund's actual expense ratio and an assumed rate of return of 5% per year before expenses, which is not the Fund's actual return. The hypothetical account values and expenses may not be used to estimate the actual ending account balance or expenses you paid for the period. You may use this information to compare this 5% hypothetical example with the 5% hypothetical examples that appear in shareholder reports of other funds.
Please note the expenses shown in the table below are meant to highlight your ongoing costs only and do not reflect any transactional costs. Therefore, the hypothetical expenses in the table are useful in comparing ongoing costs only and will not help you determine the relative total costs of owning different funds. In addition, if these transactional costs were included, your costs would have been higher.
| Beginning Account Value 8/1/22 | Actual Ending Account Value 1/31/23 | Hypothetical Ending Account Value 1/31/23 | Actual Expenses Paid During Period 8/1/22- 1/31/23* | Hypothetical Expenses Paid During Period 8/1/22- 1/31/23* | Annualized Expense Ratio During Period 8/1/22- 1/31/23 | ||||||||||||||||||||||
Fund Shares | $ | 1,000.00 | $ | 1,018.50 | $ | 1,021.32 | $ | 3.92 | $ | 3.92 | 0.77 | % | |||||||||||||||
Institutional Shares | 1,000.00 | 1,019.30 | 1,022.13 | 3.10 | 3.11 | 0.61 | % | ||||||||||||||||||||
Class A | 1,000.00 | 1,018.00 | 1,020.82 | 4.43 | 4.43 | 0.87 | % | ||||||||||||||||||||
R6 Shares | 1,000.00 | 1,019.80 | 1,022.68 | 2.55 | 2.55 | 0.50 | % | ||||||||||||||||||||
* Expenses are equal to the average account value multiplied by the Fund's annualized expense ratio multiplied by 184/365 (the number of days in the most recent fiscal half-year divided by the number of days in the fiscal year).
37
USAA Mutual Funds Trust | Supplemental Information — continued January 31, 2023 | ||||||
(Unaudited)
Considerations of the Board in Continuing the Investment Advisory Agreement
USAA High Income Fund (the "Fund")
At a meeting of the Board of Trustees (the "Board") of USAA Mutual Funds Trust (the "Trust") held on December 8-9, 2022, the Board, including the Trustees who are not "interested persons" (as that term is defined in the Investment Company Act of 1940, as amended) of the Trust (the "Independent Trustees"), approved for an annual period the continuance of the Investment Advisory Agreement (the "Advisory Agreement") between the Trust and Victory Capital Management Inc. (the "Adviser") with respect to the Fund. Prior to the December 8-9, 2022 meeting at which the Advisory Agreement was approved, the Independent Trustees also discussed and considered information regarding the proposed continuation of the Advisory Agreement at a meeting held on November 21, 2022.
In advance of the foregoing meetings, the Trustees received and considered a variety of information relating to the Advisory Agreement and the Adviser, and were given the opportunity to ask questions and request additional information from management. The information provided to the Board included, among other things: (i) a separate report prepared by an independent third party of mutual fund data, which provided a statistical analysis comparing the Fund's investment performance, expenses, and fees to comparable investment companies; (ii) information concerning the services rendered to the Fund, as well as information regarding the Adviser's revenues and costs of providing services to the Fund and compensation paid to affiliates of the Adviser; and (iii) information about the Adviser's operations and personnel. Prior to voting, the Independent Trustees reviewed the proposed continuance of the Advisory Agreement with management and with experienced independent counsel retained by the Independent Trustees ("Independent Counsel") and received materials from such Independent Counsel discussing the legal standards for their consideration of the proposed continuation of the Advisory Agreement with respect to the Fund. The Independent Trustees also reviewed the proposed continuation of the Advisory Agreement with respect to the Fund in private sessions with Independent Counsel at which no representatives of management were present.
At each regularly scheduled meeting of the Board and its committees, the Board receives and reviews, among other things, information concerning the Fund's performance and related services provided by the Adviser. At the meeting at which the renewal of the Advisory Agreement is considered, particular focus is given to information concerning Fund performance, fees and total expenses as compared to comparable investment companies, and the Adviser's profitability with respect to the Fund. However, the Board noted that the evaluation process with respect to the Adviser is an ongoing one. In this regard, the Board's and its committees' consideration of the Advisory Agreement included information previously received at such meetings. The Board also recognized that the contractual arrangements for the Fund have been reviewed by the Board and discussed with the Adviser in prior years and that the Board's conclusions may be based, in part, on its consideration of these same arrangements in prior years.
Advisory Agreement
After full consideration of a variety of factors, the Board, including the Independent Trustees, voted to approve the Advisory Agreement. In approving the Advisory Agreement, the Trustees did not identify any single factor as controlling, and each Trustee may have attributed different weights to various factors. Throughout their deliberations, the Independent Trustees were represented and assisted by Independent Counsel.
Nature, Extent, and Quality of Services — In considering the nature, extent, and quality of the services provided by the Adviser under the Advisory Agreement, the Board reviewed information provided by the Adviser relating to its operations and personnel. The Board also took into account its knowledge of the Adviser's management and the quality of the performance of the Adviser's duties through Board meetings, discussions, and reports during the preceding year. The Board considered the fees paid to the Adviser and the services provided to the Fund by the Adviser under the Advisory Agreement, as well as other services provided by the Adviser and its affiliates under other agreements, and the personnel who provide these services. In addition to the investment advisory services provided to the Fund, the Adviser and its affiliates provide administrative services, shareholder services, oversight of Fund accounting, marketing services, assistance in meeting legal and regulatory requirements, and other services necessary for the operation of the Fund and the Trust.
38
USAA Mutual Funds Trust | Supplemental Information — continued January 31, 2023 | ||||||
(Unaudited)
The Board considered the scope of services provided by, and the undertakings required of, the Adviser in connection with those services, including, among other things, maintaining (i) its own and the Fund's compliance programs, (ii) risk management programs, (iii) liquidity risk management program, (iv) derivatives risk management program, and (v) cybersecurity programs, each of which had expanded over time as a result of regulatory, market, and other developments. The Board also considered the significant risks assumed by the Adviser in connection with the services provided to the Fund, including investment, operational, enterprise, litigation, regulatory and compliance risks.
The Board considered the Adviser's management style and the performance of the Adviser's duties under the Advisory Agreement. The Board considered the level and depth of knowledge of the Adviser, including the professional experience and qualifications of its senior and investment personnel, as well as current staffing levels. The allocation of the Fund's brokerage, including the Adviser's process for monitoring "best execution," also was considered. The Adviser's role in coordinating the activities of the Fund's other service providers was also considered. The Board also considered the Adviser's risk management processes. The Board considered the Adviser's financial condition and that it had the financial wherewithal to continue to provide the same scope and high quality of services under the Advisory Agreement. In reviewing the Advisory Agreement, the Board focused on the experience, resources, and strengths of the Adviser and its affiliates in managing the Fund, as well as the other funds in the Trust.
The Board also reviewed the compliance and administrative services provided to the Fund by the Adviser and its affiliates, including the Adviser's oversight of the Fund's day-to-day operations and oversight of Fund accounting. The Trustees, guided also by information obtained from their experiences as Trustees of the Trust, also focused on the quality of the Adviser's compliance and administrative staff.
Expenses and Performance — In connection with its consideration of the Advisory Agreement, the Board evaluated the Fund's advisory fees and total expense ratio as compared to other open-end investment companies deemed to be comparable to the Fund as determined by the independent third party in its report. The Fund's expenses were compared to (i) a group of investment companies chosen by the independent third party to be comparable to the Fund based upon certain factors, including fund type, comparability of investment objective and classification, sales load type, asset size, and expense components (the "expense group") and (ii) a larger group of investment companies with the same investment classification/objective as the Fund regardless of asset size, excluding outliers (the "expense universe"). Among other data, the Board noted that the Fund's net management fee rate — which includes advisory and administrative services and the effects of any performance adjustment, as well as any fee waivers and reimbursements — was below the medians of its expense group and its expense universe. The data indicated that the Fund's total expenses, including after any reimbursements, were below the medians of its expense group and its expense universe. The Board also took into account the Adviser's current undertakings to maintain expense limitations for the Fund. The Board took into account the various other services provided to the Fund by the Adviser and its affiliates, and noted the high quality of services received by the Fund.
In considering the Fund's performance, the Board noted that it reviews at its regularly scheduled meetings information about the Fund's performance results. The Trustees also reviewed various comparative data provided to them in connection with their consideration of the renewal of the Advisory Agreement, including, among other information, a comparison of the Fund's average annual total returns relative to its Lipper index and other mutual funds deemed to be in its peer group by the independent third party in its report (the "performance universe"). The Fund's performance universe consisted of the Fund and all retail and institutional open-end investment companies with the same classification/objective as the Fund regardless of asset size or primary channel of distribution. This comparison indicated that, among other data, the Fund's performance was below the average of its performance universe and its Lipper index for the one-, three- and five-year periods ended June 30, 2022, and was above the average of its performance universe and was below its Lipper index for the ten-year period ended June 30, 2022. The Board took into account management's discussion of the Fund's performance, including the Fund's more recent improved performance.
Compensation and Profitability — The Board took into consideration the level and method of computing the management fee. The information considered by the Board included operating profit margin information for the Adviser's business as a whole. The Board also received and considered profitability information related to the management revenues from the Fund. This information included a review of the methodology used in the allocation of certain costs to the Fund. In considering the profitability data with respect to the Fund, the Trustees
39
USAA Mutual Funds Trust | Supplemental Information — continued January 31, 2023 | ||||||
(Unaudited)
noted that the Adviser reimbursed or waived a portion of its management fees to the Fund. The Trustees reviewed the profitability of the Adviser's relationship with the Fund before tax expenses. The Board was also provided with a profitability analysis of other publicly traded asset managers prepared by an independent information service. In reviewing the overall profitability of the management fee to the Adviser, the Board also considered the fact that the Adviser and its affiliates provide shareholder servicing and administrative services to the Fund for which they receive compensation. The Board also considered the possible direct and indirect benefits to the Adviser from its relationship with the Trust, including that the Adviser may derive reputational and other benefits from its association with the Fund. The Trustees recognized that the Adviser should be entitled to earn a reasonable level of profits in exchange for the level of services it provides to the Fund and the entrepreneurial and other risks that it assumes as Adviser.
Economies of Scale — The Board considered whether there should be changes in the management fee rate or structure in order to enable the Fund to participate in any economies of scale. The Board also considered the fee waiver and expense reimbursement arrangements by the Adviser. The Board also considered the effect of the change in size, if any, of each of the Fund's classes on its performance and fees, noting that the Fund may realize other economies of scale if assets increase proportionally more than expenses. The Board determined that the current investment management fee structure was reasonable.
Conclusions — The Board reached the following conclusions regarding the Fund's Advisory Agreement with the Adviser: (i) the Adviser has demonstrated that it possesses the capability and resources to perform the duties required of it under the Advisory Agreement; (ii) the Adviser maintains an appropriate compliance program; (iii) the overall performance of the Fund is reasonable in relation to the performance of funds with similar investment objectives and to relevant indices and the Adviser is appropriately monitoring the Fund's performance; (iv) the Fund's advisory expenses are reasonable in relation to those of similar funds and to the services to be provided by the Adviser; and (v) the Adviser's and its affiliates' level of profitability from their relationship with the Fund is reasonable in light of the nature and high quality of services provided by the Adviser and its affiliates and the type of fund. Based on its conclusions, the Board determined that continuation of the Advisory Agreement would be in the best interests of the Fund and its shareholders.
40
Privacy Policy
Protecting the Privacy of Information
The Trust respects your right to privacy. We also know that you expect us to conduct and process your business in an accurate and efficient manner. To do so, we must collect and maintain certain personal information about you. This is the information we collect from you on applications or other forms, and from the transactions you make with us or third parties. It may include your name, address, social security number, account transactions and balances, and information about investment goals and risk tolerance.
We do not disclose any information about you or about former customers to anyone except as permitted or required by law. Specifically, we may disclose the information we collect to companies that perform services on our behalf, such as the transfer agent that processes shareholder accounts and printers and mailers that assist us in the distribution of investor materials. We may also disclose this information to companies that perform marketing services on our behalf. This allows us to continue to offer you Victory investment products and services that meet your investing needs, and to effect transactions that you request or authorize. These companies will use this information only in connection with the services for which we hired them. They are not permitted to use or share this information for any other purpose.
To protect your personal information internally, we permit access only by authorized employees and maintain physical, electronic, and procedural safeguards to guard your personal information.*
* You may have received communications regarding information about privacy policies from other financial institutions which gave you the opportunity to "opt-out" of certain information sharing with companies which are not affiliated with that financial institution. The Trust does not share information with other companies for purposes of marketing solicitations for products other than the Trust. Therefore, the Trust does not provide opt-out options to their shareholders.
P.O. Box 182593
Columbus, Ohio 43218-2593

Visit our website at: | Call | ||||||
vcm.com | (800) 235-8396 | ||||||
40051-0323

January 31, 2023
Semi Annual Report
USAA Money Market Fund
Victory Capital means Victory Capital Management Inc., the investment adviser of the USAA Mutual Funds. USAA Mutual Funds are distributed by Victory Capital Services, Inc., member FINRA, an affiliate of Victory Capital. Victory Capital and its affiliates are not affiliated with United Services Automobile Association or its affiliates. USAA and the USAA logos are registered trademarks and the USAA Mutual Funds and USAA Investments logos are trademarks of United Services Automobile Association and are being used by Victory Capital and its affiliates under license.
vcm.com
News, Information And Education 24 Hours A Day, 7 Days A Week
The Victory Capital website gives fund shareholders, prospective shareholders, and investment professionals a convenient way to access fund information, get guidance, and track fund performance anywhere they can access the Internet. The site includes:
• Detailed performance records
• Daily share prices
• The latest fund news
• Investment resources to help you become a better investor
• A section dedicated to investment professionals
Whether you're a potential investor searching for the fund that matches your investment philosophy, a seasoned investor interested in planning tools, or an investment professional, vcm.com has what you seek. Visit us anytime. We're always open.
USAA Mutual Funds Trust
TABLE OF CONTENTS
Investment Objective & Portfolio Holdings | 2 | ||||||
Schedule of Portfolio Investments | 3 | ||||||
Financial Statements | |||||||
Statement of Assets and Liabilities | 6 | ||||||
Statement of Operations | 7 | ||||||
Statements of Changes in Net Assets | 8 | ||||||
Financial Highlights | 9 | ||||||
Notes to Financial Statements | 10 | ||||||
Supplemental Information | 17 | ||||||
Proxy Voting and Portfolio Holdings Information | 17 | ||||||
Expense Example | 17 | ||||||
Advisory Contract Approval | 18 | ||||||
Privacy Policy (inside back cover) | |||||||
This report is for the information of the shareholders and others who have received a copy of the currently effective prospectus of the Fund, managed by Victory Capital Management Inc. It may be used as sales literature only when preceded or accompanied by a current prospectus, which provides further details about the Fund.
IRA DISTRIBUTION WITHHOLDING DISCLOSURE
We generally must withhold federal income tax at a rate of 10% of the taxable portion of your distribution and, if you live in a state that requires state income tax withholding, at your state's tax rate. However, you may elect not to have withholding apply or to have income tax withheld at a higher rate. Any withholding election that you make will apply to any subsequent distribution unless and until you change or revoke the election. If you wish to make a withholding election, or change or revoke a prior withholding election, call (800) 235-8396, and form W-4P (OMB No. 1545-0074 withholding certificate for pension or annuity payments) will be electronically sent.
If you do not have a withholding election in place by the date of a distribution, federal income tax will be withheld from the taxable portion of your distribution at a rate of 10%. If you must pay estimated taxes, you may be subject to estimated tax penalties if your estimated tax payments are not sufficient and sufficient tax is not withheld from your distribution.
For more specific information, please consult your tax adviser.
• NOT FDIC INSURED • NO BANK GUARANTEE • MAY LOSE VALUE
1
| USAA Mutual Funds Trust USAA Money Market Fund | January 31, 2023 | ||||||
(Unaudited)
Investment Objective and Portfolio Holdings:
The Fund seeks the highest income consistent with preservation of capital and the maintenance of liquidity.
Portfolio Mix
January 31, 2023
(% of Net Assets)

Percentages are of the net assets of the Fund and may not equal 100%.
Refer to the Schedule of Portfolio Investments for a complete list of securities.
2
| USAA Mutual Funds Trust USAA Money Market Fund | Schedule of Portfolio Investments January 31, 2023 | ||||||
(Amounts in Thousands, Except for Shares) (Unaudited)
Security Description | Principal Amount | Value | |||||||||
Corporate Bonds (3.5%) | |||||||||||
Financials (3.5%): | |||||||||||
| Bass Pro Rossford Development Co. LLC (LOC — Fifth Third Bank), 4.42%, 11/1/27 (a) | $ | 15,580 | $ | 15,580 | |||||||
| Carol Allen Family Liquidity Trust (LOC — Comerica Bank, N.A.), 4.43%, 3/1/48, Callable 3/13/23 @ 100 (a) | 25,000 | 25,000 | |||||||||
| NLS Irrevocable Trust (LOC — Bank of Oklahoma, N.A.), 4.47%, 12/1/39, Callable 3/13/23 @ 100 (a) | 11,260 | 11,260 | |||||||||
| Opler Irrevocable Trust (LOC — Bank of Oklahoma, N.A.), 4.47%, 11/1/39, Callable 3/13/23 @ 100 (a) | 9,280 | 9,280 | |||||||||
Stobro Co. LP (LOC — Federal Home Loan Bank of Pittsburgh), 4.45%, 1/1/32 (a) | 8,330 | 8,330 | |||||||||
69,450 | |||||||||||
Total Corporate Bonds (Cost $69,450) | 69,450 | ||||||||||
Municipal Bonds (1.0%) | |||||||||||
Arizona (1.0%): | |||||||||||
| Yavapai County IDA Revenue (LOC — Bank of Nova Scotia), 4.40%, 9/1/35, Continuously Callable @100 (a) | 20,000 | 20,000 | |||||||||
Total Municipal Bonds (Cost $20,000) | 20,000 | ||||||||||
U.S. Treasury Obligations (5.0%) | |||||||||||
| U.S. Treasury Notes 4.66% (USBMMY3M+3bps), 4/30/23 (b) | 50,000 | 50,024 | |||||||||
4.66% (USBMMY3M+3bps), 7/31/23 (b) | 50,000 | 49,997 | |||||||||
Total U.S. Treasury Obligations (Cost $100,021) | 100,021 | ||||||||||
Commercial Paper (55.7%) | |||||||||||
American Honda Finance, 4.04%, 2/7/23 (c) (d) | 20,000 | 19,984 | |||||||||
Amphenol Corp., 2.23%, 2/2/23 (c) (d) | 40,000 | 39,995 | |||||||||
AT&T, Inc., 4.37%, 2/13/23 (c) (d) | 40,000 | 39,937 | |||||||||
Aviation Capital Group LLC, 4.44%, 2/1/23 (c) (d) | 95,000 | 95,000 | |||||||||
Barton Capital SA, 4.30%, 2/15/23 (c) (d) | 20,000 | 19,964 | |||||||||
CAFCO LLC (c) | |||||||||||
| 4.66%, 3/2/23 (d) | 20,000 | 19,923 | |||||||||
4.70%, 3/10/23 (d) | 20,000 | 19,901 | |||||||||
4.76%, 3/14/23 (d) | 20,000 | 19,890 | |||||||||
Canadian Natural Resources Ltd., 4.78%, 2/15/23 (c) (d) | 25,000 | 24,950 | |||||||||
CenterPoint Energy Resources Corp., 4.56%, 2/1/23 (c) (d) | 90,000 | 90,000 | |||||||||
Dairy Farmers of America, Inc., 4.62%, 2/1/23 (c) (d) | 95,000 | 95,000 | |||||||||
Enbridge Gas Distribution, 4.45%, 2/13/23 (c) (d) | 20,000 | 19,968 | |||||||||
Energy Transfer LP, 5.00%, 2/1/23 (c) (d) | 10,000 | 10,000 | |||||||||
Evergy Kansas Central (c) | |||||||||||
2.34%, 2/2/23 (d) | 20,000 | 19,998 | |||||||||
4.12%, 2/8/23 (d) | 25,000 | 24,977 | |||||||||
Gotham Funding Corp., 4.37%, 2/14/23 (c) (d) | 20,000 | 19,966 | |||||||||
| Hannover Funding Co. LLC (c) 2.31%, 2/2/23 (d) | 35,000 | 34,996 | |||||||||
4.09%, 2/6/23 (d) | 20,000 | 19,986 | |||||||||
See notes to financial statements.
3
| USAA Mutual Funds Trust USAA Money Market Fund | Schedule of Portfolio Investments — continued January 31, 2023 | ||||||
(Amounts in Thousands, Except for Shares) (Unaudited)
Security Description | Shares or Principal Amount | Value | |||||||||
| Hyundai Capital America (c) 4.47%, 2/1/23 (d) | $ | 60,000 | $ | 60,000 | |||||||
3.03%, 2/3/23 (d) | 20,000 | 19,995 | |||||||||
Ingredion, Inc., 2.27%, 2/2/23 (c) (d) | 30,000 | 29,996 | |||||||||
Jabil, Inc., 5.04%, 2/1/23 (c) (d) | 25,000 | 25,000 | |||||||||
Landesbk Baden Württemberg, 3.86%, 2/7/23 (c) (d) | 90,000 | 89,933 | |||||||||
| Liberty Street Funding LLC (c) 4.71%, 3/14/23 (d) | 25,000 | 24,863 | |||||||||
4.80%, 3/29/23 (d) | 20,000 | 19,849 | |||||||||
| LMA-Americas LLC (c) 4.18%, 2/9/23 (d) | 20,000 | 19,979 | |||||||||
5.07%, 4/24/23 (d) | 20,000 | 19,769 | |||||||||
Nutrien Financial US LLC, 4.47%, 2/13/23 (d) | 10,000 | 9,984 | |||||||||
Nutrien Ltd., 4.07%, 2/7/23 (c) (d) | 15,000 | 14,988 | |||||||||
| Ovintiv, Inc. (c) 5.10%, 2/1/23 (d) | 70,000 | 70,000 | |||||||||
4.34%, 2/6/23 (d) | 10,000 | 9,993 | |||||||||
Ridgefield Funding Co. LLC, 4.65%, 3/14/23 (c) (d) | 20,000 | 19,892 | |||||||||
Sheffield Receivables, 4.25%, 2/13/23 (c) (d) | 20,000 | 19,969 | |||||||||
Vw Credit, Inc., 4.12%, 2/8/23 (c) (d) | 20,000 | 19,982 | |||||||||
Total Commercial Paper (Cost $1,108,627) | 1,108,627 | ||||||||||
Certificates of Deposit (11.3%) | |||||||||||
Bank of Montreal Chicago, 4.55% (SOFR+25bps), 2/24/23 (b) | 20,000 | 20,000 | |||||||||
Bank of Nova Scotia, 4.55% (SOFR+25bps), 2/28/23 (b) | 20,000 | 20,000 | |||||||||
Barclays Bank PLC, 4.59% (SOFR+29bps), 2/9/23 (b) | 20,000 | 20,000 | |||||||||
Canadian Imperial Bank of Commerce, 4.55% (SOFR+25bps), 2/10/23 (b) | 20,000 | 20,000 | |||||||||
Citibank NA, 4.99%, 9/25/23 | 20,000 | 20,000 | |||||||||
Citigroup, Inc., 3.65%, 3/7/23 | 20,000 | 20,000 | |||||||||
Goldman Sachs Bank USA, 4.61% (SOFR+30bps), 2/17/23 (b) | 25,000 | 25,000 | |||||||||
Sumitomo Mitsui Banking Corp., 4.58% (SOFR+28bps), 2/1/23 (b) | 20,000 | 20,000 | |||||||||
Svenska Handelsbanken, 4.54% (SOFR+24bps), 2/15/23 (b) | 20,000 | 20,000 | |||||||||
| Toronto Dominion Bank 4.53%, 2/1/23 (SOFR+23bps) (b) | 20,000 | 20,000 | |||||||||
4.90%, 9/22/23 | 20,000 | 20,000 | |||||||||
Total Certificates of Deposit (Cost $225,000) | 225,000 | ||||||||||
Repurchase Agreements (23.2%) | |||||||||||
| Fixed Income Clearing Corporation-State Street Bank & Trust Co., 4.28%, 2/1/23, purchased on 01/31/23, with a maturity date of 2/1/23, with a value of $463,000 (collateralized by U.S. Treasury Inflation Bond Index (e), 1.88%-2.38%, due 2/15/51-5/15/51, with a value of $472,260) | 463,000 | 463,000 | |||||||||
Total Repurchase Agreements (Cost $463,000) | 463,000 | ||||||||||
Total Investments (Cost $1,986,098) — 99.7% | 1,986,098 | ||||||||||
Other assets in excess of liabilities — 0.3% | 5,732 | ||||||||||
NET ASSETS — 100.00% | $ | 1,991,830 | |||||||||
See notes to financial statements.
4
| USAA Mutual Funds Trust USAA Money Market Fund | Schedule of Portfolio Investments — continued January 31, 2023 | ||||||
(Unaudited)
At January 31, 2023, the Fund's investments in foreign securities were 9.0% of net assets.
(a) Variable Rate Demand Notes that provide the rights to sell the security at face value on either that day or within the rate-reset period. The interest rate is reset on the put date at a stipulated daily, weekly, monthly, quarterly, or other specified time interval to reflect current market conditions. These securities do not indicate a reference rate and spread in their description.
(b) Variable or Floating-Rate Security. Rate disclosed is as of January 31, 2023.
(c) Rate represents the effective yield at January 31, 2023.
(d) Rule 144A security or other security that is restricted as to resale to institutional investors. As of January 31, 2023, the fair value of these securities was $1,108,627 thousands and amounted to 55.7% of net assets.
(e) U.S. Treasury inflation-indexed notes — designed to provide a real rate of return after being adjusted over time to reflect the impact of inflation. Their principal value periodically adjusts to the rate of inflation. They trade at the prevailing real, or after inflation, interest rates. The U.S. Treasury guarantees repayment of these securities of at least their face value in the event of sustained deflation or a drop in prices.
bps — Basis points
Continuously callable — Investment is continuously callable or will be continuously callable on any date after the first call date until its maturity.
IDA — Industrial Development Authority
LLC — Limited Liability Company
LOC — Letter of Credit
LP — Limited Partnership
PLC — Public Limited Company
SOFR — Secured Overnight Financing Rate
USBMMY3M — 3 Month Treasury Bill Rate
Credit Enhancements — Adds the financial strength of the provider of the enhancement to support the issuer's ability to repay the principal and interest payments when due. The enhancement may be provided by a high-quality bank, insurance company or other corporation, or a collateral trust. The enhancements do not guarantee the market values of the securities.
LOC Principal and interest payments are guaranteed by a bank letter of credit or other bank credit agreement.
See notes to financial statements.
5
USAA Mutual Funds Trust | Statement of Assets and Liabilities January 31, 2023 | ||||||
(Amounts in Thousands, Except Per Share Amounts) (Unaudited)
| USAA Money Market Fund | |||||||
Assets: | |||||||
Investments, at value (Cost $1,523,098) | $ | 1,523,098 | |||||
Repurchase agreements, at value (Cost $463,000) | 463,000 | ||||||
Cash | 3,595 | ||||||
Receivables: | |||||||
Interest | 2,105 | ||||||
Capital shares issued | 3,706 | ||||||
From Adviser | 17 | ||||||
Prepaid expenses | 20 | ||||||
Total Assets | 1,995,541 | ||||||
Liabilities: | |||||||
Payables: | |||||||
Distributions | 65 | ||||||
Capital shares redeemed | 2,542 | ||||||
Accrued expenses and other payables: | |||||||
Investment advisory fees | 402 | ||||||
Administration fees | 168 | ||||||
Custodian fees | 26 | ||||||
Transfer agent fees | 421 | ||||||
Compliance fees | 2 | ||||||
Trustees' fees | 1 | ||||||
Other accrued expenses | 84 | ||||||
Total Liabilities | 3,711 | ||||||
Net Assets: | |||||||
Capital | 1,991,826 | ||||||
Total accumulated earnings/(loss) | 4 | ||||||
Net Assets | $ | 1,991,830 | |||||
Shares (unlimited number of shares authorized with no par value): | 1,992,350 | ||||||
Net asset value, offering and redemption price per share: (a) | $ | 1.00 | |||||
(a) Per share amount may not recalculate due to rounding of net assets and/or shares outstanding.
See notes to financial statements.
6
USAA Mutual Funds Trust | Statement of Operations For the Six Months Ended January 31, 2023 | ||||||
(Amounts in Thousands) (Unaudited)
| USAA Money Market Fund | |||||||
Investment Income: | |||||||
Interest | $ | 36,620 | |||||
Total Income | 36,620 | ||||||
Expenses: | |||||||
Investment advisory fees | 2,319 | ||||||
Administration fees | 966 | ||||||
Sub-Administration fees | 13 | ||||||
Custodian fees | 66 | ||||||
Transfer agent fees | 2,416 | ||||||
Trustees' fees | 23 | ||||||
Compliance fees | 9 | ||||||
Legal and audit fees | 39 | ||||||
State registration and filing fees | 50 | ||||||
Other expenses | 136 | ||||||
Total Expenses | 6,037 | ||||||
Expenses waived/reimbursed by Adviser | (47 | ) | |||||
Net Expenses | 5,990 | ||||||
Net Investment Income | 30,630 | ||||||
See notes to financial statements.
7
USAA Mutual Funds Trust | Statements of Changes in Net Assets | ||||||
(Amounts in Thousands)
USAA Money Market Fund | |||||||||||
| Six Months Ended January 31, 2023 (Unaudited) | Year Ended July 31, 2022 | ||||||||||
From Investments: | |||||||||||
Operations: | |||||||||||
Net Investment Income | $ | 30,630 | $ | 4,566 | |||||||
Net realized gains | — | 2 | |||||||||
Change in net assets resulting from operations | 30,630 | 4,568 | |||||||||
Change in net assets resulting from distributions to shareholders | (30,630 | ) | (4,563 | ) | |||||||
Change in net assets resulting from capital transactions | 112,791 | (71,735 | ) | ||||||||
Change in net assets | 112,791 | (71,730 | ) | ||||||||
Net Assets: | |||||||||||
Beginning of period | 1,879,039 | 1,950,769 | |||||||||
End of period | $ | 1,991,830 | $ | 1,879,039 | |||||||
Capital Transactions: | |||||||||||
Proceeds from shares issued | $ | 374,449 | $ | 587,931 | |||||||
Distributions reinvested | 30,377 | 4,525 | |||||||||
Cost of shares redeemed | (292,035 | ) | (664,191 | ) | |||||||
Change in net assets resulting from capital transactions | $ | 112,791 | $ | (71,735 | ) | ||||||
Share Transactions: | |||||||||||
Issued | 374,449 | 587,933 | |||||||||
Reinvested | 30,377 | 4,525 | |||||||||
Redeemed | (292,035 | ) | (664,191 | ) | |||||||
Change in Shares | 112,791 | (71,733 | ) | ||||||||
See notes to financial statements.
8
USAA Mutual Funds Trust | Financial Highlights | ||||||
For a Share Outstanding Throughout Each Period
USAA Money Market Fund | |||||||||||||||||||||||||||
| Six Months Ended January 31, 2023 (Unaudited) | Year Ended July 31, 2022 | Year Ended July 31, 2021 | Year Ended July 31, 2020 | Year Ended July 31, 2019 | Year Ended July 31, 2018 | ||||||||||||||||||||||
| Net Asset Value, Beginning of Period | $ | 1.00 | $ | 1.00 | $ | 1.00 | $ | 1.00 | $ | 1.00 | $ | 1.00 | |||||||||||||||
Investment Activities: | |||||||||||||||||||||||||||
Net investment income | 0.02 | (a) | — | (a)(b) | — | (a)(b) | 0.01 | (a) | 0.02 | 0.01 | |||||||||||||||||
| Net realized and unrealized gains | — | — | (b) | — | — | (b) | — | (b) | — | (b) | |||||||||||||||||
| Total from Investment Activities | 0.02 | — | (b) | — | (b) | 0.01 | 0.02 | 0.01 | |||||||||||||||||||
Distributions to Shareholders from: | |||||||||||||||||||||||||||
Net investment income | (0.02 | ) | — | (b) | — | (b) | (0.01 | ) | (0.02 | ) | (0.01 | ) | |||||||||||||||
Net realized gains | — | — | (b) | — | (b) | — | — | — | |||||||||||||||||||
Total Distributions | (0.02 | ) | — | (b) | — | (b) | (0.01 | ) | (0.02 | ) | (0.01 | ) | |||||||||||||||
Net Asset Value, End of Period | $ | 1.00 | $ | 1.00 | $ | 1.00 | $ | 1.00 | $ | 1.00 | $ | 1.00 | |||||||||||||||
Total Return (c) (d) | 1.60 | % | 0.24 | % | 0.01 | % | 1.04 | % | 1.97 | % | 1.13 | % | |||||||||||||||
Ratios to Average Net Assets: | |||||||||||||||||||||||||||
Net Expenses (e) (f) | 0.62 | % | 0.35 | % | 0.23 | % | 0.58 | % | 0.62 | % | 0.62 | % | |||||||||||||||
Net Investment Income (Loss) (e) | 3.17 | % | 0.24 | % | 0.01 | % | 1.15 | % | 1.95 | % | 1.12 | % | |||||||||||||||
Gross Expenses (e) | 0.62 | % | 0.62 | % | 0.61 | % | 0.61 | % | 0.62 | % | 0.62 | % | |||||||||||||||
Supplemental Data: | |||||||||||||||||||||||||||
| Net Assets at end of period (000's) | $ | 1,991,830 | $ | 1,879,039 | $ | 1,950,769 | $ | 2,344,619 | $ | 4,878,643 | $ | 4,623,610 | |||||||||||||||
(a) Per share net investment income (loss) has been calculated using the average daily shares method.
(b) Amount is less than $0.005 per share.
(c) Assumes reinvestment of all net investment income and realized capital gain distributions, if any, during the period. Includes adjustments in accordance with U.S. Generally Accepted Accounting Principles and could differ from the Lipper reported return.
(d) Not annualized for periods less than one year.
(e) Annualized for periods less than one year.
(f) The net expense ratio may not correlate to the applicable expense limits in place during the period since the current contractual expense limitation is applied for a period beginning July 1, 2019, and in effect through November 30, 2023, instead of coinciding with the Fund's fiscal year end. Details of the current contractual expense limitation in effect can be found in Note 3 of the accompanying Notes to Financial Statements.
See notes to financial statements.
9
USAA Mutual Funds Trust | Notes to Financial Statements January 31, 2023 | ||||||
(Unaudited)
1. Organization:
USAA Mutual Funds Trust (the "Trust") is organized as a Delaware statutory trust and is registered under the Investment Company Act of 1940, as amended (the "1940 Act"), as an open-end investment company. The Trust is comprised of 45 funds and is authorized to issue an unlimited number of shares, which are units of beneficial interest with no par value.
The accompanying financial statements are those of the USAA Money Market Fund (the "Fund"). The Fund is classified as diversified under the 1940 Act.
The Fund operates as a retail money market fund in compliance with the requirements of Rule 2a-7 under the 1940 Act and as a retail money market fund, shares of the Fund are available for sale only to accounts that are beneficially owned by natural persons.
The Fund has adopted policies and procedures permitting the Trust's Board of Trustees (the "Board") to impose a liquidity fee or to temporarily suspend redemptions from the Fund (impose a "redemption gate") if the Fund's weekly liquid assets fall below specific thresholds, such as during times of market stress. The imposition of a liquidity fee would reduce the amount you would receive upon redemption of your shares of the Fund. The imposition of a redemption gate would temporarily delay your ability to redeem your investments in the Fund.
Victory Capital Management ("VCM" or the "Adviser") is an indirect wholly owned subsidiary of Victory Capital Holdings, Inc., a publicly traded Delaware corporation, and a wholly owned direct subsidiary of Victory Capital Operating, LLC.
Under the Trust's organizational documents, its officers and trustees are indemnified against certain liabilities arising out of the performance of their duties to the Fund. In addition, in the normal course of business, the Fund enters into contracts with its vendors and others that provide for general indemnifications. The Fund's maximum exposure under these arrangements is unknown, as this would involve future claims that may be made against the Fund. However, based on experience, the Fund expects that risk of loss to be remote.
2. Significant Accounting Policies:
The following is a summary of significant accounting policies followed by the Trust in the preparation of its financial statements. The policies are in conformity with U.S. Generally Accepted Accounting Principles ("GAAP"). The preparation of financial statements in accordance with GAAP requires management to make estimates and assumptions that affect the reported amounts of assets and liabilities and disclosure of contingent assets and liabilities at the date of the financial statements and the reported amounts of income and expenses for the period. Actual results could differ from those estimates. The Fund follows the specialized accounting and reporting requirements under GAAP that are applicable to investment companies under Accounting Standards Codification Topic 946.
Investment Valuation:
The inputs or methodologies used for valuing securities are not necessarily an indication of the risks associated with investing in those securities. For example, money market securities are valued using amortized cost, in accordance with rules under the 1940 Act. Generally, amortized cost approximates the current fair value of a security, but since the value is not obtained from a quoted price in an active market, such securities are reflected as Level 2.
The Fund records investments at fair value. Fair value is defined as the price that would be received to sell an asset or paid to transfer a liability in an orderly transaction between market participants at the measurement date.
10
USAA Mutual Funds Trust | Notes to Financial Statements — continued January 31, 2023 | ||||||
(Unaudited)
The valuation techniques described below maximize the use of observable inputs and minimize the use of unobservable inputs in determining fair value. The inputs used for valuing the Fund's investments are summarized in the three broad levels listed below:
• Level 1 — quoted prices (unadjusted) in active markets for identical securities
• Level 2 — other significant observable inputs (including quoted prices for similar securities, interest rates, or credit spreads, applicable to those securities, etc.)
• Level 3 — significant unobservable inputs (including the Adviser's assumptions in determining the fair value of investments)
The Adviser, appointed as the valuation designee by the Trust's Board of Trustees' (the "Board"), has established the Pricing and Liquidity Committee (the "Committee"), and subject to Board oversight, the Committee administers and oversees the Fund's valuation policies and procedures, which are approved by the Board.
Repurchase agreements are valued at cost.
All securities held in the Fund are short-term debt securities, which are valued pursuant to Rule 2a-7 under the 1940 Act and the Money Market Funds: Procedures to Stabilize Net Asset Value (" the Procedures"). This method values a security at its purchase price, and thereafter, assumes a constant amortization to maturity of any premiums or discounts. Securities for which amortized cost valuations are considered unreliable or whose values have been materially affected by a significant event are valued in good faith, at fair value, using methods determined by the Committee, under the Procedures to stabilize net assets and valuation procedures approved by the Board.
Repurchase Agreements:
The Fund may enter into repurchase agreements with commercial banks or recognized security dealers pursuant to the terms of a Master Repurchase Agreement. A repurchase agreement is an arrangement wherein the Fund purchases securities and the seller agrees to repurchase the securities at an agreed upon time and at an agreed upon price. The purchased securities are marked-to-market daily to ensure their value is equal to at least 102% of principal including accrued interest and are held by the Fund, either through its regular custodian or through a special "tri-party" custodian that maintains separate accounts for both the Fund and its counterparty, until maturity of the repurchase agreement. Master Repurchase Agreements typically contain netting provisions, which provide for the net settlement of all transactions and collateral with the Fund through a single payment in the event of default or termination. Repurchase agreements are subject to credit risk, and the Fund's Adviser monitors the creditworthiness of sellers with which the Fund may enter into repurchase agreements.
Municipal Obligations:
The values of municipal obligations can fluctuate and may be affected by adverse tax, legislative, or political changes, and by financial developments affecting municipal issuers. Payments of municipal obligations may depend on a relatively limited source of revenue, resulting in greater credit risk. Future changes in federal tax laws or the activity of an issuer may adversely affect the tax-exempt status of municipal obligations.
Investment Transactions and Related Income:
Changes in holdings of investments are accounted for no later than one business day following the trade date. For financial reporting purposes, however, investment transactions are accounted for on trade date or the last business day of the reporting period. Interest income is determined on the basis of coupon interest accrued using the effective interest method which adjusts, where applicable, the amortization of premiums or accretion of discounts. Gains or losses realized on sales of securities are recorded on the identified cost basis.
11
USAA Mutual Funds Trust | Notes to Financial Statements — continued January 31, 2023 | ||||||
(Unaudited)
Federal Income Taxes:
The Fund intends to continue to qualify as a regulated investment company by complying with the provisions available to certain investment companies, as defined in applicable sections of the Internal Revenue Code, and to make distributions of net investment income and net realized gains sufficient to relieve it from all, or substantially all, federal income taxes. Accordingly, no provision for federal income taxes is required in the financial statements. The Fund has a tax year end of July 31, and effective April 30, 2023, the Fund will change its tax year end to April 30.
For the six months ended January 31, 2023, the Fund did not incur any income tax, interest, or penalties, and has recorded no liability for net unrecognized tax benefits relating to uncertain tax positions.
Management of the Fund has reviewed tax positions taken in tax years that remain subject to examination by all major tax jurisdictions, including federal (i.e., the last four tax years, which includes the current fiscal tax year end). Management believes that there is no tax liability resulting from unrecognized tax benefits related to uncertain tax positions taken.
Allocations:
Expenses directly attributable to the Fund are charged to the Fund, while expenses that are attributable to more than one fund in the Trust, or jointly with an affiliated trust, are allocated among the respective funds in the Trust and/or an affiliated trust based upon net assets or another appropriate basis.
Fees Paid Indirectly:
Expense offsets to custody fees that arise from credits on cash balances maintained on deposit are reflected on the Statement of Operations, as applicable, as Custodian fees.
3. Fees and Transactions with Affiliates and Related Parties:
Investment Advisory Fees:
Investment advisory services are provided to the Fund by the Adviser, which is a New York corporation registered as an investment adviser with the Securities and Exchange Commission ("SEC").
The Fund's Investment Adviser fee is accrued daily and paid monthly at an annualized rate of 0.24% of the Fund's average daily net assets. Amounts incurred and paid to VCM for the six months ended January 31, 2023, are reflected on the Statement of Operations as Investment advisory fees.
The Trust relies on an exemptive order granted to VCM and its affiliated funds by the SEC in March 2019, permitting the use of a "manager-of-managers" structure for certain funds. Under a manager-of-managers structure, the investment adviser may select (with approval of the Board and without shareholder approval) one or more subadvisers to manage the day-to-day investment of a fund's assets. For the six months ended January 31, 2023, the Fund had no subadvisers.
Administration and Servicing Fees:
VCM also serves as the Fund's administrator and fund accountant. Under the Fund Administration, Servicing and Accounting Agreement, VCM is paid an administration and servicing fee that is accrued daily and paid monthly at an annualized rate of 0.10%, which is based on the Fund's average daily net assets. Amounts incurred for the six months ended January 31, 2023, are reflected on the Statement of Operations as Administration fees.
Citi Fund Services Ohio, Inc. ("Citi"), an affiliate of Citibank, acts as sub-administrator and sub-fund accountant to the Fund pursuant to a Sub-Administration and Sub-Fund Accounting Services Agreement between VCM and Citi. VCM pays Citi a fee for providing these services. The Fund reimburses VCM and Citi for out-of-pocket expenses incurred in providing these services and certain other expenses specifically allocated to the Fund. Amounts incurred for the six months ended January 31, 2023, are reflected on the Statement of Operations as Sub-Administration fees.
12
USAA Mutual Funds Trust | Notes to Financial Statements — continued January 31, 2023 | ||||||
(Unaudited)
The Fund (as part of the Trust) has entered into an agreement with the Adviser to provide compliance services, pursuant to which the Adviser furnishes its compliance personnel, including the services of the Chief Compliance Officer ("CCO"), and other resources reasonably necessary to provide the Trust with compliance oversight services related to the design, administration, and oversight of a compliance program for the Trust in accordance with Rule 38a-1 under the 1940 Act. The CCO is an employee of the Adviser, which pays the compensation of the CCO and support staff. The funds in the Trust, Victory Variable Insurance Funds, Victory Portfolios, and Victory Portfolios II (collectively, the "Victory Funds Complex") in the aggregate, compensate the Adviser for these services. Amounts incurred for the six months ended January 31, 2023, are reflected on the Statement of Operations as Compliance fees.
Transfer Agency Fees:
Victory Capital Transfer Agency, Inc. ("VCTA"), an affiliate of the Adviser, provides transfer agency services to the Fund. Transfer agent fees for the Fund are paid monthly based on a fee accrued daily at an annualized rate of 0.25% of average daily net assets, plus out-of-pocket expenses. VCTA pays a portion of these fees to certain intermediaries for the administration and servicing of accounts that are held with such intermediaries. Amounts incurred and paid to VCTA for the six months ended January 31, 2023, are reflected on the Statement of Operations as Transfer agent fees.
FIS Investor Services LLC serves as sub-transfer agent and dividend disbursing agent for the Fund pursuant to a Sub-Transfer Agent Agreement between VCTA and FIS Investor Services LLC. VCTA provides FIS Investor Services LLC a fee for providing these services.
Distributor/Underwriting Services:
Victory Capital Services, Inc. (the "Distributor"), an affiliate of the Adviser, serves as Distributor for the continuous offering of the shares of the Fund pursuant to a Distribution Agreement between the Distributor and the Trust and receives no fee or other compensation for these services.
Other Fees:
Citibank serves as the Fund's custodian. The Fund pays Citibank a fee for providing these services. Amounts incurred for the six months ended January 31, 2023, are reflected on the Statement of Operations as Custodian fees.
K&L Gates LLP provides legal services to the Trust.
The Adviser has entered into an expense limitation agreement with the Fund until at least November 30, 2023. Under the terms of the agreement, the Adviser has agreed to waive fees or reimburse certain expenses to the extent that ordinary operating expenses incurred in any fiscal year exceed the expense limit for the Fund. Such excess amounts will be the liability of the Adviser. Acquired fund fees and expenses, interest, taxes, brokerage commissions, other expenditures, which are capitalized in accordance with GAAP, and other extraordinary expenses not incurred in the ordinary course of the Fund's business are excluded from the expense limit. As of January 31, 2023, the expense limit (excluding voluntary waivers) is 0.62%.
Under the terms of the expense limitation agreement, the Fund has agreed to repay fees and expenses that were waived or reimbursed by the Adviser for a period of up to three years (thirty-six (36) months) after the waiver or reimbursement took place, subject to the lesser of any operating expense limit in effect at the time of: (a) the original waiver or expense reimbursement; or (b) the recoupment, after giving effect to the recoupment amount.
In addition, the Adviser agreed to further reimburse fees in excess of the Fund's expense limit of 0.62%. These voluntary reductions, to the extent necessary, are to maintain a certain minimum net yield of the Fund. Under this agreement to reimburse additional fees, the Fund has agreed to repay fees and expenses that were waived or reimbursed by the Adviser for a period of up to three years after the fiscal year in which the waiver or reimbursement took place, to the extent any repayments would not cause the Fund's net yield to fall below the Fund's minimum yield at the time of: (a) the original waiver or expense reimbursement; or (b) the expense limit in effect at the time of the extra waiver.
13
USAA Mutual Funds Trust | Notes to Financial Statements — continued January 31, 2023 | ||||||
(Unaudited)
As of January 31, 2023, the following amounts are available to be repaid to the Adviser (amounts in thousands). The Fund has not recorded any amounts available to be repaid as a liability due to an assessment that such repayments are not probable at January 31, 2023.
| Expires 2023 | Expires 2024 | Expires 2025 | Expires 2026 | Total | |||||||||||||||
| $ | 1,299 | $ | 8,192 | $ | 5,162 | $ | 47 | $ | 14,700 | ||||||||||
Certain officers and/or interested trustees of the Fund are also officers and/or employees of the Adviser, administrator, fund accountant, sub-administrator, sub-fund accountant, custodian, and Distributor.
4. Risks:
The Fund may be subject to other risks in addition to these identified risks.
Stable Net Asset Value Risk — You could lose money by investing in the Fund. Although the Fund seeks to preserve the value of your investment at $1 per share, it cannot guarantee it will do so. The Fund may impose a fee upon the sale of your shares or may temporarily suspend your ability to sell shares if the Fund's liquidity falls below required minimums because of market conditions or other factors. An investment in the Fund is not a deposit in a bank and is not insured or guaranteed by the Federal Deposit Insurance Corporation ("FDIC") or any other government agency. The Fund's sponsor has no legal obligation to provide financial support to the Fund, and you should not expect that the sponsor will provide financial support to the Fund at any time.
Liquidity Fees and Gates — The Fund may impose liquidity fees on redemptions and/or temporarily suspend redemptions (gates) if the Fund's weekly liquid assets fall below certain thresholds, such as during times of market stress. The imposition of a liquidity fee would reduce the amount you would receive upon redemption of your shares of the Fund. The imposition of a redemption gate would temporarily delay your ability to redeem your investments in the Fund.
Credit Risk — Credit risk is expected to be low for the Fund because it invests primarily in securities that are considered to be of high quality. However, there is the possibility that an issuer will fail to make timely interest and principal payments on its securities or that negative perceptions of the issuer's ability to make such payments will cause the price of that security to decline.
LIBOR Discontinuation Risk — The London Interbank Offered Rate ("LIBOR") discontinuation may adversely affect the financial markets generally and the Fund's operations, finances and investments specifically. LIBOR has been the principal floating-rate benchmark in the financial markets. However, LIBOR has been or will be discontinued as a floating rate benchmark. The date of discontinuation depends on the LIBOR currency and tenor. With limited exceptions, no new LIBOR obligations will be entered into after December 31, 2021. Existing LIBOR obligations have transitioned or will transition to another benchmark, depending on the LIBOR currency and tenor. For some existing LIBOR-based obligations, the contractual consequences of the discontinuation of LIBOR may not be clear.
Non-LIBOR floating-rate obligations, including Secured Overnight Financing Rate ("SOFR")-based obligations, may have returns and values that fluctuate more than those of floating-rate debt obligations that are based on LIBOR or other rates. Also, because SOFR and some alternative floating rates are relatively new market indexes, markets for certain non-LIBOR obligations may never develop or may not be liquid. Market terms for non-LIBOR floating rate obligations, such as the spread over the index reflected in interest-rate provisions, may evolve over time, and prices of non-LIBOR floating rate obligations may be different depending on when they are issued and changing views about correct spread levels.
Various SOFR-based rates, including SOFR-based term rates, and various non-SOFR-based rates are expected to develop in response to the discontinuation of U.S. dollar LIBOR, which may create various risks for the Fund and the financial markets more generally. There are non-LIBOR forward-looking floating rates that are not based on SOFR and that may be considered by participants in the financial markets as LIBOR alternatives. Such rates include AMERIBOR (American Interbank Offered Rate),
14
USAA Mutual Funds Trust | Notes to Financial Statements — continued January 31, 2023 | ||||||
(Unaudited)
BSBY (Bloomberg Short-Term Bank Yield Index) and BYI (Bank Yield Index). Unlike forward-looking SOFR-based term rates, such rates are intended to reflect a bank credit spread component.
It is not clear how replacement rates for LIBOR — including SOFR-based rates and non-SOFR-based rates — will develop and to what extent they will be used. There is no assurance that these replacement rates will be suitable substitutes for LIBOR, and thus the substitution of such rates for LIBOR could have an adverse effect on the Fund and the financial markets more generally. Concerns about market depth and stability could affect the development of non-SOFR-based term rates, and such rates may create various risks, which may or may not be similar to the risks relating to SOFR.
Market Risk — Overall market risks may affect the value of the Fund. Domestic and international factors such as political events, war, terrorism, trade disputes, inflation rates, interest rate levels and other fiscal and monetary policy changes, cybersecurity incidents, pandemics and other public health crises, sanctions against a particular foreign country, its nationals, businesses or industries and related geopolitical events, as well as environmental disasters such as earthquakes, fires, and floods, or other catastrophes, may add to instability in global economies and markets generally, and may lead to increased market volatility. Global economies and financial markets are highly interconnected, which increases the possibility that conditions in one country or region might adversely affect issuers in another country or region. The impact of these and other factors may be short-term or may last for extended periods.
5. Borrowing:
Line of Credit:
The Victory Funds Complex participates in a short-term demand note "Line of Credit" agreement with Citibank. The Line of Credit agreement with Citibank was renewed on June 27, 2022, with a termination date of June 26, 2023. Under the agreement with Citibank, the Victory Funds Complex may borrow up to $600 million, of which $300 million is committed and $300 million is uncommitted. $40 million of the Line of Credit is reserved for use by the Victory Floating Rate Fund, another series of the Victory Funds Complex, with Victory Floating Rate Fund paying the related commitment fees for that amount. The purpose of the Line of Credit is to meet temporary or emergency cash needs. For the six months ended January 31, 2023, Citibank received an annual commitment fee of 0.15% on $300 million for providing the Line of Credit. Each fund in the Victory Funds Complex paid a pro-rata portion of the commitment fees plus any interest (one-month SOFR plus 1.10 percent) on amounts borrowed. Interest charged to the Fund during the period, if applicable, is reflected on the Statement of Operations under Line of credit fees.
The Fund had no borrowings under the Line of Credit agreement during the six months ended January 31, 2023.
6. Federal Income Tax Information:
Distributions from the Fund's net investment income are accrued daily and distributed on the last business day of each month. Distributable net realized gains, if any, are declared and paid at least annually.
The amounts of dividends from net investment income and distributions from net realized gains (collectively, distributions to shareholders) are determined in accordance with federal income tax regulations, which may differ from GAAP. To the extent these "book/tax" differences are permanent in nature (e.g., net operating loss and distribution reclassification), such amounts are reclassified within the components of net assets based on their federal tax-basis treatment; temporary differences (e.g., wash sales) do not require reclassification. To the extent dividends and distributions exceed net investment income and net realized gains for tax purposes, they are reported as distributions of capital. Net investment losses incurred by the Fund may be reclassified as an offset to capital on the accompanying Statement of Assets and Liabilities.
15
USAA Mutual Funds Trust | Notes to Financial Statements — continued January 31, 2023 | ||||||
(Unaudited)
The tax character of current year distributions paid and the tax basis of the current components of accumulated earnings (loss) will be determined at the end of the current tax year.
At the tax year ended July 31, 2022, the Fund had no capital loss carryforwards for federal income tax purposes.
7. Subsequent Events:
On June 29, 2022, the Board approved a change to the Fund's fiscal year-end from July 31 to April 30, with an effective date of April 30, 2023.
The Board, upon recommendation of the Adviser, has approved a change in the name of the Trust and each individual fund within the Trust. On February 23, 2023, an initial filing was made with the SEC to commence the process to effectuate the following changes.
Effective at the start of business on April 24, 2023 (the "Effective Date"), the name of the Trust will change from USAA Mutual Funds Trust to Victory Portfolios III, and all references to USAA Mutual Funds Trust in the summary prospectus, statutory prospectus, and statement of additional information ("SAI") will be replaced by the new name.
Also on the Effective Date, references to the current name of the Fund in the summary prospectus, statutory prospectus, and SAI will be replaced with the new name as follows:
| Current Name | New Name | ||||||
USAA Money Market Fund | Victory Money Market Fund | ||||||
In addition, on the Effective Date, USAA Investments, a Victory Capital Management Inc. Investment Franchise, that currently manages the USAA Fixed Income Funds, will change its name to Victory Income Investors, and all references to USAA Investments in the summary prospectus, statutory prospectus, and SAI, will be replaced.
Please note that there will be no changes in the management of the Fund or to the Fund's ticker symbols.
16
USAA Mutual Funds Trust | Supplemental Information January 31, 2023 | ||||||
(Unaudited)
Proxy Voting and Portfolio Holdings Information
Proxy Voting:
Information regarding the policies and procedures the Fund uses to determine how to vote proxies relating to portfolio securities is available without charge, upon request, by calling (800) 235-8396. The information is also included in the Fund's Statement of Additional Information, which is available on the SEC's website at sec.gov.
Information relating to how the Fund voted proxies relating to portfolio securities held during the most recent 12 months ended June 30 is available on the SEC's website at sec.gov.
Availability of Schedules of Portfolio Investments:
The Fund makes available on VCM.com a complete list of portfolio holdings no sooner than 5 business days after the end of each month. Form N-MFP is available on the SEC's website at sec.gov.
Expense Example
As a shareholder of the Fund, you may incur two types of costs: (1) transaction costs and (2) ongoing costs, including management fees and other Fund expenses. These examples are intended to help you understand your ongoing costs (in dollars) of investing in the Fund and to compare these costs with the ongoing costs of investing in other mutual funds.
These examples are based on an investment of $1,000 invested at the beginning of the period and held for the entire period from August 1, 2022, through January 31, 2023.
The Actual Expense figures in the table below provide information about actual account values and actual expenses. You may use the information below, together with the amount you invested, to estimate the expenses that you paid over the period. Simply divide your account value by $1,000 (for example, an $8,600 account value divided by $1,000 = 8.6), then multiply the result by the number in the table under the heading entitled "Actual Expenses Paid During Period" to estimate the expenses you paid on your account during this period.
The Hypothetical Expense figures in the table below provide information about hypothetical account values and hypothetical expenses based on the Fund's actual expense ratio and an assumed rate of return of 5% per year before expenses, which is not the Fund's actual return. The hypothetical account values and expenses may not be used to estimate the actual ending account balance or expenses you paid for the period. You may use this information to compare this 5% hypothetical example with the 5% hypothetical examples that appear in shareholder reports of other funds.
Please note the expenses shown in the table below are meant to highlight your ongoing costs only and do not reflect any transactional costs. Therefore, the hypothetical expenses in the table are useful in comparing ongoing costs only and will not help you determine the relative total costs of owning different funds. In addition, if these transactional costs were included, your costs would have been higher.
| Beginning Account Value 8/1/22 | Actual Ending Account Value 1/31/23 | Hypothetical Ending Account Value 1/31/23 | Actual Expenses Paid During Period 8/1/22-1/31/23* | Hypothetical Expenses Paid During Period 8/1/22-1/31/23* | Annualized Expense Ratio During Period 8/1/22-1/31/23 | ||||||||||||||||||
| $ | 1,000.00 | $ | 1,016.00 | $ | 1,022.08 | $ | 3.15 | $ | 3.16 | 0.62 | % | ||||||||||||
* Expenses are equal to the average account value multiplied by the Fund's annualized expense ratio multiplied by 184/365 (the number of days in the most recent fiscal half-year divided by the number of days in the fiscal year).
17
USAA Mutual Funds Trust | Supplemental Information — continued January 31, 2023 | ||||||
(Unaudited)
Considerations of the Board in Continuing the Investment Advisory Agreement
USAA Money Market Fund (the "Fund")
At a meeting of the Board of Trustees (the "Board") of USAA Mutual Funds Trust (the "Trust") held on December 8-9, 2022, the Board, including the Trustees who are not "interested persons" (as that term is defined in the Investment Company Act of 1940, as amended) of the Trust (the "Independent Trustees"), approved for an annual period the continuance of the Investment Advisory Agreement (the "Advisory Agreement") between the Trust and Victory Capital Management Inc. (the "Adviser") with respect to the Fund. Prior to the December 8-9, 2022 meeting at which the Advisory Agreement was approved, the Independent Trustees also discussed and considered information regarding the proposed continuation of the Advisory Agreement at a meeting held on November 21, 2022.
In advance of the foregoing meetings, the Trustees received and considered a variety of information relating to the Advisory Agreement and the Adviser, and were given the opportunity to ask questions and request additional information from management. The information provided to the Board included, among other things: (i) a separate report prepared by an independent third party of mutual fund data, which provided a statistical analysis comparing the Fund's investment performance, expenses, and fees to comparable investment companies; (ii) information concerning the services rendered to the Fund, as well as information regarding the Adviser's revenues and costs of providing services to the Fund and compensation paid to affiliates of the Adviser; and (iii) information about the Adviser's operations and personnel. Prior to voting, the Independent Trustees reviewed the proposed continuance of the Advisory Agreement with management and with experienced independent counsel retained by the Independent Trustees ("Independent Counsel") and received materials from such Independent Counsel discussing the legal standards for their consideration of the proposed continuation of the Advisory Agreement with respect to the Fund. The Independent Trustees also reviewed the proposed continuation of the Advisory Agreement with respect to the Fund in private sessions with Independent Counsel at which no representatives of management were present.
At each regularly scheduled meeting of the Board and its committees, the Board receives and reviews, among other things, information concerning the Fund's performance and related services provided by the Adviser. At the meeting at which the renewal of the Advisory Agreement is considered, particular focus is given to information concerning Fund performance, fees and total expenses as compared to comparable investment companies, and the Adviser's profitability with respect to the Fund. However, the Board noted that the evaluation process with respect to the Adviser is an ongoing one. In this regard, the Board's and its committees' consideration of the Advisory Agreement included information previously received at such meetings. The Board also recognized that the contractual arrangements for the Fund have been reviewed by the Board and discussed with the Adviser in prior years and that the Board's conclusions may be based, in part, on its consideration of these same arrangements in prior years.
Advisory Agreement
After full consideration of a variety of factors, the Board, including the Independent Trustees, voted to approve the Advisory Agreement. In approving the Advisory Agreement, the Trustees did not identify any single factor as controlling, and each Trustee may have attributed different weights to various factors. Throughout their deliberations, the Independent Trustees were represented and assisted by Independent Counsel.
Nature, Extent, and Quality of Services — In considering the nature, extent, and quality of the services provided by the Adviser under the Advisory Agreement, the Board reviewed information provided by the Adviser relating to its operations and personnel. The Board also took into account its knowledge of the Adviser's management and the quality of the performance of the Adviser's duties through Board meetings, discussions, and reports during the preceding year. The Board considered the fees paid to the Adviser and the services provided to the Fund by the Adviser under the Advisory Agreement, as well as other services provided by the Adviser and its affiliates under other agreements, and the personnel who provide these services. In addition to the investment advisory services provided to the Fund, the Adviser and its affiliates provide administrative services, shareholder services, oversight of Fund accounting, marketing services, assistance in meeting legal and regulatory requirements, and other services necessary for the operation of the Fund and the Trust.
18
USAA Mutual Funds Trust | Supplemental Information — continued January 31, 2023 | ||||||
(Unaudited)
The Board considered the scope of services provided by, and the undertakings required of, the Adviser in connection with those services, including, among other things, maintaining (i) its own and the Fund's compliance programs, (ii) risk management programs, (iii) liquidity risk management program, (iv) derivatives risk management program, and (v) cybersecurity programs, each of which had expanded over time as a result of regulatory, market, and other developments. The Board also considered the significant risks assumed by the Adviser in connection with the services provided to the Fund, including investment, operational, enterprise, litigation, regulatory and compliance risks.
The Board considered the Adviser's management style and the performance of the Adviser's duties under the Advisory Agreement. The Board considered the level and depth of knowledge of the Adviser, including the professional experience and qualifications of its senior and investment personnel, as well as current staffing levels. The allocation of the Fund's brokerage, including the Adviser's process for monitoring "best execution," also was considered. The Adviser's role in coordinating the activities of the Fund's other service providers was also considered. The Board also considered the Adviser's risk management processes. The Board considered the Adviser's financial condition and that it had the financial wherewithal to continue to provide the same scope and high quality of services under the Advisory Agreement. In reviewing the Advisory Agreement, the Board focused on the experience, resources, and strengths of the Adviser and its affiliates in managing the Fund, as well as the other funds in the Trust.
The Board also reviewed the compliance and administrative services provided to the Fund by the Adviser and its affiliates, including the Adviser's oversight of the Fund's day-to-day operations and oversight of Fund accounting. The Trustees, guided also by information obtained from their experiences as Trustees of the Trust, also focused on the quality of the Adviser's compliance and administrative staff.
Expenses and Performance — In connection with its consideration of the Advisory Agreement, the Board evaluated the Fund's advisory fees and total expense ratio as compared to other open-end investment companies deemed to be comparable to the Fund as determined by the independent third party in its report. The Fund's expenses were compared to (i) a group of investment companies chosen by the independent third party to be comparable to the Fund based upon certain factors, including fund type, comparability of investment objective and classification, sales load type, asset size, and expense components (the "expense group") and (ii) a larger group of investment companies with the same investment classification/objective as the Fund regardless of asset size, excluding outliers (the "expense universe"). Among other data, the Board noted that the Fund's net management fee rate — which includes advisory and administrative services, as well as any fee waivers and reimbursements — was below the medians of its expense group and expense universe. The data indicated that the Fund's total expenses, including after any reimbursements, were below the medians of its expense group and its expense universe. The Board also took into account the Adviser's current undertakings to maintain expense limitations for the Fund, which include voluntary waiver support to preserve a minimum daily yield. The Board took into account the various other services provided to the Fund by the Adviser and its affiliates, and noted the high quality of services received by the Fund.
In considering the Fund's performance, the Board noted that it reviews at its regularly scheduled meetings information about the Fund's performance results. The Trustees also reviewed various comparative data provided to them in connection with their consideration of the renewal of the Advisory Agreement, including, among other information, a comparison of the Fund's average annual total returns relative to its Lipper index and other mutual funds deemed to be in its peer group by the independent third party in its report (the "performance universe"). The Fund's performance universe consisted of the Fund and all retail and institutional open-end investment companies with the same classification/objective as the Fund regardless of asset size or primary channel of distribution. This comparison indicated that, among other data, the Fund's performance was above the average of its performance universe for the one-, three- and five-year periods ended June 30, 2022, and was below the average of its performance universe for the ten-year period ended June 30, 2022, and was below its Lipper index for the one-, three-, five- and ten-year periods ended June 30, 2022. The Board noted the relatively narrow range of returns of the funds in the Fund's peer group.
Compensation and Profitability — The Board took into consideration the level and method of computing the management fee. The information considered by the Board included operating profit margin information for the Adviser's business as a whole. The Board also received and considered profitability information related to the management revenues from the Fund. This information included a review of the methodology used in the
19
USAA Mutual Funds Trust | Supplemental Information — continued January 31, 2023 | ||||||
(Unaudited)
allocation of certain costs to the Fund. In considering the profitability data with respect to the Fund, the Trustees noted that the Adviser reimbursed or waived a portion of its management fees to the Fund. The Trustees reviewed the profitability of the Adviser's relationship with the Fund before tax expenses. The Board was also provided with a profitability analysis of other publicly traded asset managers prepared by an independent information service. In reviewing the overall profitability of the management fee to the Adviser, the Board also considered the fact that the Adviser and its affiliates provide shareholder servicing and administrative services to the Fund for which they receive compensation. The Board also considered the possible direct and indirect benefits to the Adviser from its relationship with the Trust, including that the Adviser may derive reputational and other benefits from its association with the Fund. The Trustees recognized that the Adviser should be entitled to earn a reasonable level of profits in exchange for the level of services it provides to the Fund and the entrepreneurial and other risks that it assumes as Adviser.
Economies of Scale — The Board considered whether there should be changes in the management fee rate or structure in order to enable the Fund to participate in any economies of scale. The Board also considered the fee waiver and expense reimbursement arrangements by the Adviser. The Board also considered the effect of the Fund's change in size, if any, on its performance and fees, noting that the Fund may realize other economies of scale if assets increase proportionally more than expenses. The Board determined that the current investment management fee structure was reasonable.
Conclusions — The Board reached the following conclusions regarding the Fund's Advisory Agreement with the Adviser: (i) the Adviser has demonstrated that it possesses the capability and resources to perform the duties required of it under the Advisory Agreement; (ii) the Adviser maintains an appropriate compliance program; (iii) the overall performance of the Fund is reasonable in relation to the performance of funds with similar investment objectives and to relevant indices; (iv) the Fund's advisory expenses are reasonable in relation to those of similar funds and to the services to be provided by the Adviser; and (v) the Adviser's and its affiliates' level of profitability from their relationship with the Fund is reasonable in light of the nature and high quality of services provided by the Adviser and its affiliates and the type of fund. Based on its conclusions, the Board determined that continuation of the Advisory Agreement would be in the best interests of the Fund and its shareholders.
20
Privacy Policy
Protecting the Privacy of Information
The Trust respects your right to privacy. We also know that you expect us to conduct and process your business in an accurate and efficient manner. To do so, we must collect and maintain certain personal information about you. This is the information we collect from you on applications or other forms, and from the transactions you make with us or third parties. It may include your name, address, social security number, account transactions and balances, and information about investment goals and risk tolerance.
We do not disclose any information about you or about former customers to anyone except as permitted or required by law. Specifically, we may disclose the information we collect to companies that perform services on our behalf, such as the transfer agent that processes shareholder accounts and printers and mailers that assist us in the distribution of investor materials. We may also disclose this information to companies that perform marketing services on our behalf. This allows us to continue to offer you Victory investment products and services that meet your investing needs, and to effect transactions that you request or authorize. These companies will use this information only in connection with the services for which we hired them. They are not permitted to use or share this information for any other purpose.
To protect your personal information internally, we permit access only by authorized employees and maintain physical, electronic, and procedural safeguards to guard your personal information.*
* You may have received communications regarding information about privacy policies from other financial institutions which gave you the opportunity to "opt-out" of certain information sharing with companies which are not affiliated with that financial institution. The Trust does not share information with other companies for purposes of marketing solicitations for products other than the Trust. Therefore, the Trust does not provide opt-out options to their shareholders.
P.O. Box 182593
Columbus, Ohio 43218-2593

Visit our website at: | Call | ||||||
vcm.com | (800) 235-8396 | ||||||
23428-0323
Item 2. Code of Ethics.
Not applicable – only for annual reports
Item 3. Audit Committee Financial Expert.
Not applicable – only for annual reports
Item 4. Principal Accountant Fees and Services.
Not applicable – only for annual reports
Item 5. Audit Committee of Listed Registrants.
Not applicable.
Item 6. Investments.
(a) Not applicable.
(b) Not applicable.
Item 7. Disclosure of Proxy Voting Policies and Procedures for Closed-End Management Investment Companies.
Not applicable.
Item 8. Portfolio Managers of Closed-End Management Investment Companies.
Not applicable.
Item 9. Purchases of Equity Securities by Closed-End Management Investment Company and Affiliated Purchasers.
Not applicable.
Item 10. Submission of Matters to a Vote of Security Holders.
Not applicable.
Item 11. Controls and Procedures.
(a)The registrant’s principal executive officer and principal financial officer have concluded, based on their evaluation of the registrant's disclosure controls and procedures as conducted within 90 days of the filing date of this report, that these disclosure controls and procedures are adequately designed and are operating effectively to ensure that information required to be disclosed by the registrant on Form N-CSR is recorded, processed, summarized and reported within the time periods specified in the Securities and Exchange Commission's rules and forms.
(b)There were no changes in the registrant’s internal control over financial reporting (as defined in Rule 30a-3(d) under the Investment Company Act of 1940 (17 CFR 270.30a-3(d)) that occurred during the period covered by this report that have materially affected or are reasonably likely to materially affect, the registrant’s internal control over financial reporting.
Item 12. Disclosure of Securities Lending Activities for Closed-End Management Investment Companies.
(a)(1) Not applicable.
(a)(2) Not applicable.
(a)(3) Not applicable.
(a)(4) Not applicable.
(b) Not applicable.
Item 13. Exhibits.
(a)(1) Not applicable.
(a)(2) Certifications pursuant to Rule 30a-2(a) are attached hereto.
(a)(3) Not applicable.
(a)(4) Not applicable.
(b) Certifications pursuant to Rule 30a-2(b) are attached hereto.
SIGNATURES
Pursuant to the requirements of the Securities Exchange Act of 1934 and the Investment Company Act of 1940, the registrant has duly caused this report to be signed on its behalf by the undersigned, thereunto duly authorized.
| (Registrant) | USAA Mutual Fund Trust |
| By (Signature and Title)* | /s/ James K. De Vries | |
| James K. De Vries, Principal Financial Officer |
| Date | April 3, 2023 |
Pursuant to the requirements of the Securities Exchange Act of 1934 and the Investment Company Act of 1940, this report has been signed below by the following persons on behalf of the registrant and in the capacities and on the dates indicated.
| By (Signature and Title)* | /s/ Christopher K. Dyer | |
| Christopher K. Dyer, Principal Executive Officer |
| Date | March 29, 2023 |
| By (Signature and Title)* | /s/ James K. De Vries | |
| James K. De Vries, Principal Financial Officer |
| Date | April 3, 2023 |