Table of Contents
Exhibit 99.1
Table of Contents
| 2 | ||||
| 4 | ||||
| 5 | ||||
| 6 | ||||
| 11 | ||||
| 13 | ||||
| 23 | ||||
| 40 | ||||
| 44 | ||||
Corporate Governance Report (Prepared in accordance with the Hong Kong Listing Rules) | 48 | |||
| 74 | ||||
| 145 | ||||
(A) Financial statements prepared under International Financial Reporting Standards | 150 | |||
| 150 | ||||
| 152 | ||||
| 153 | ||||
| 155 | ||||
| 157 | ||||
| 159 | ||||
| 273 | ||||
(B) Financial statements prepared under China Accounting Standards for Business Enterprises | 278 | |||
| 278 | ||||
| 280 | ||||
| 282 | ||||
| 284 | ||||
| 286 | ||||
| 287 | ||||
| 415 | ||||
Written Confirmation Issued by Directors, Supervisors and Senior Management | 417 | |||
| 418 | ||||
| 420 | ||||
Table of Contents
| I. | The Board of Directors (the “Directors”) (the “Board”) and the Supervisory Committee of Sinopec Shanghai Petrochemical Company Limited (the “Company” or “SPC”) as well as its Directors, Supervisors and senior management warrant the truthfulness, accuracy and completeness of the information contained in the 2019 annual report, and warrant that there are no false representations or misleading statements contained in, or material omissions from, the 2019 annual report of the Company, and severally and jointly accept responsibility. |
| II. | Director(s) who has/have not attended the Board meeting for approving the 2019 annual report of the Company is/are: |
Name of Director | Position | Reasons for Absence | Name of Proxy | |||
| Lei Dianwu | Non-Executive Director | Business Engagement | Wu Haijun |
| III. | The financial statements for the year ended 31 December 2019 (the “Reporting Period”), prepared under the People’s Republic of China (“PRC” or “China”)’s Accounting Standards (“CAS”) as well as the International Financial Reporting Standards (“IFRS”), were audited by PricewaterhouseCoopers Zhong Tian LLP and PricewaterhouseCoopers, respectively, and both firms have issued unqualified opinions on the financial statements in their auditors’ reports. |
| IV. | Mr. Wu Haijun, Chairman and the responsible person of the Company; Mr. Zhou Meiyun, Director, Vice President and Chief Financial Officer overseeing the accounting department; and Ms Yang Yating, person in charge of the Accounting Department (Accounting Chief) and Director of Finance Department hereby warrant the truthfulness and completeness of the financial statements contained in the 2019 annual report. |
| V. | Plan for Profit Appropriation or Capital Reserve Capitalisation reviewed by the Board |
In 2019, the net profit attributable to shareholders of the Company amounted to RMB2,213,716 thousand under CAS (net profit of RMB2,215,728 thousand under IFRS). According to the 2019 profit distribution plan approved by the Board on 25 March 2020, the Board proposed to distribute a dividend of RMB0.12 per share (including tax) (the “Final Dividend”) based on the total number of issued shares of the Company as at the record date for distributing dividend. The 2019 profit distribution plan will be implemented subject to approval of the Company’s 2019 annual general meeting (the “AGM”). The date and time of the AGM and book closure arrangement will be announced later. The notice of the AGM will be announced separately in accordance with the provisions of the Articles of Association of the Company. The notice of the AGM, the accompanying circular and proxy form will be despatched to holders of H shares in accordance with the Rules Governing the Listing of Securities on The Stock Exchange of Hong Kong Limited (“Hong Kong Listing Rules”).

2
Table of Contents
Subject to the passing of the resolution by the shareholders of the Company at the AGM, the Final Dividend is expected to be distributed on or around Tuesday, 21 July 2020 to shareholders whose names appear on the register of members of the Company’s H shares at the close of business on Monday, 29 June 2020. The Final Dividend is denominated and declared in Renminbi. The Final Dividend payable to the holders of the Company’s A shares shall be paid in Renminbi while those payable to the holders of the Company’s H shares shall be paid in Hong Kong dollars. The amount of Hong Kong dollars payable shall be calculated on the basis of the average closing exchange rates for Hong Kong dollars as announced by the Foreign Exchange Trading Centre of the PRC one calendar week prior to the approval of the Final Dividend at the AGM.
The Company is expected to close the register of members of the Company’s H shares from Wednesday, 24 June 2020 to Monday, 29 June 2020 (both days inclusive), during which period no transfer of H shares will be registered in order to confirm the shareholders’ entitlement to receive the Final Dividend. The holders of the Company’s H shares who wish to receive the Final Dividend should lodge the transfer documents and relevant share certificates with the Company’s H shares share registrar, Hong Kong Registrars Limited, at Room 1712- 1716, 17/F, Hopewell Centre, 183 Queen’s Road East, Wanchai, Hong Kong on or before 4:30 p.m. on Tuesday, 23 June 2020.
The record date for dividend distribution, distribution procedures and time for the distribution of dividends applicable to holders of the Company’s A shares will be announced separately.
| VI. | Declaration of Risks Involved in the Forward-looking Statements |
Forward-looking statements such as future plans and development strategies contained in this report do not constitute any substantive commitments of the Company to investors. The Company has alerted investors on the relevant investment risks.
| VII. | There was no appropriation of funds by the controlling shareholder of the Company and its connected parties for non-operation purposes. |
| VIII. | The Company did not provide any external guarantees in violation of the required decision-making procedures. |
| IX. | Major Risk Warning |
Potential risks are elaborated in this report. Please refer to Section II “Management Discussion and Analysis” under “Report of the Directors” for details of the potential risks arising from the future development of the Company.
| X. | The Annual Report is published in both Chinese and English. In the event of any discrepancy between the Chinese and English versions, the Chinese version shall prevail. |

3
Table of Contents
In this report, unless the context otherwise specifies, the following terms shall have the following meanings:
| “Company” or “SPC” | Sinopec Shanghai Petrochemical Company Limited | |
| “Board” | the board of directors of the Company | |
| “Director(s)” | the Director(s) of the Company | |
| “Supervisory Committee” | the Supervisory Committee of the Company | |
| “Supervisor(s)” | the Supervisor(s) of the Company | |
| “PRC” or “China” or “State” | the People’s Republic of China | |
| “Reporting Period” | the year ended 31 December 2019 | |
| “Hong Kong Stock Exchange” | The Stock Exchange of Hong Kong Limited | |
| “Shanghai Stock Exchange” | The Shanghai Stock Exchange | |
| “Group” | the Company and its subsidiaries | |
| “Sinopec Group” | China Petrochemical Corporation | |
| “Sinopec Corp.” | China Petroleum & Chemical Corporation | |
| “Hong Kong Listing Rules” | The Rules Governing the Listing of Securities on the Hong Kong | |
Stock Exchange | ||
| “Shanghai Listing Rules” | The Rules Governing the Listing of Securities on the Shanghai | |
Stock Exchange | ||
| “Model Code for Securities Transactions” | the Model Code for Securities Transactions by Directors of Listed | |
Issuers set out in Appendix 10 to the Hong Kong Listing Rules | ||
| “Securities Law” | the PRC Securities Law | |
| “Company Law” | the PRC Company Law | |
| “CSRC” | China Securities Regulatory Commission | |
| “Articles of Association” | the articles of association of the Company | |
| “Hong Kong Stock Exchange website” | www.hkexnews.hk | |
| “Shanghai Stock Exchange website” | www.sse.com.cn | |
| “website of the Company” | www.spc.com.cn | |
| “HSSE” | Health, Safety, Security and Environment | |
| “LDAR” | Leak Detection and Repair | |
| “COD” | Chemical Oxygen Demand | |
| “VOCs” | Volatile Organic Compounds | |
| “SFO” | the Securities and Futures Ordinance of Hong Kong (Chapter 571 | |
of the Laws of Hong Kong) | ||
| “Corporate Governance Code” | the Corporate Governance Code set out in Appendix 14 to the | |
Hong Kong Listing Rules | ||
| “Share Option Incentive Scheme” | the A Share Option Incentive Scheme of the Company | |
| “International auditors” | PricewaterhouseCoopers | |
| Certified Public Accountants Registered Public Interest Entity | ||
Auditor* | ||
| “PRC auditors” | PricewaterhouseCoopers Zhong Tian LLP |
4
Table of Contents
Sinopec Shanghai Petrochemical Limited is one of the largest Petrochemical companies in China based on the 2019’s Sales volume and has quite competitive overall scale strength. It is also a significant production enterprise of refined oil, intermediate petrochemical products, resins & plastics, and synthetic fibers in China, with private independent utilities, environmental protection system, sea transportation, inland navigation, railway and highway transportation related supporting infrastructures.
Located at Jinshanwei in the southwest of Shanghai, the Company is a highly integrated petrochemical enterprise which mainly processes crude oil into a broad range of petroleum products, intermediate petrochemical products, resins and plastics and synthetic fibers. The Company sells most of its products within the PRC domestic market and derives most of its revenues from customers in Eastern China, one of the fastest growing regions in the PRC.
The Company’s high-quality development is supported by the ever-increasing demand in the PRC for petrochemical products. Relying on the competitive advantage of its high degree of integration, the Company is optimizing its product mix, improving the quality and variety of its existing products, upgrading technology and increasing the capacity of its key upstream plants.
In July 1993, the Company became the first company incorporated under the laws of the PRC to make a global equity offering, and its shares were listed on the Shanghai Stock Exchange, the Hong Kong Stock Exchange and the New York Stock Exchange.
Since the listing of its shares, the Company has strived to continuously improve and enhance its operation and management efficiency with an aim to become a world-class petrochemical enterprise.
5
Table of Contents
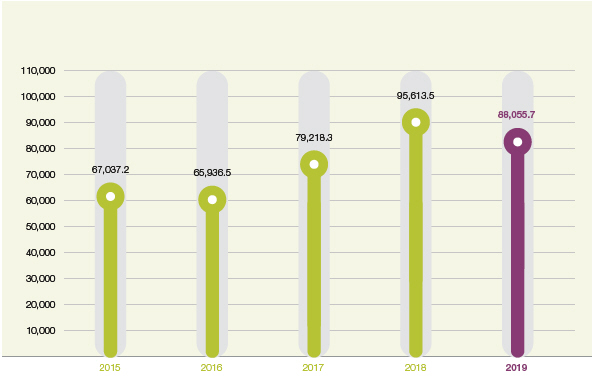
| (I) | Financial information prepared under IFRS (for the past five years) |
| Unit: RMB million | ||||||||||||||||||||
Year ended 31 December | 2019 | 2018 | 2017 | 2016 | 2015 | |||||||||||||||
Net sales | 88,055.7 | 95,613.5 | 79,218.3 | 65,936.5 | 67,037.2 | |||||||||||||||
Profit before income tax | 2,656.1 | 6,808.1 | 7,852.9 | 7,778.3 | 4,237.2 | |||||||||||||||
Profit for the year | 2,227.2 | 5,336.2 | 6,154.2 | 5,981.5 | 3,310.4 | |||||||||||||||
Profit attributable to owners of the Company | 2,215.7 | 5,336.3 | 6,143.2 | 5,968.5 | 3,274.3 | |||||||||||||||
Basic earnings per share (RMB/share) | 0.205 | 0.493 | 0.569 | 0.553 | 0.303 | |||||||||||||||
Diluted earnings per share (RMB/share) | 0.205 | 0.493 | 0.568 | 0.552 | 0.303 | |||||||||||||||
As at 31 December: | ||||||||||||||||||||
Total equity attributable to owners of the Company | 29,863.3 | 30,346.1 | 28,230.2 | 24,722.0 | 19,797.3 | |||||||||||||||
Total assets | 45,494.1 | 44,385.9 | 39,443.5 | 33,945.6 | 27,820.6 | |||||||||||||||
Total liabilities | 15,500.2 | 13,923.5 | 10,927.9 | 8,942.4 | 7,726.3 | |||||||||||||||
6
Table of Contents
Financial Highlights(continued)
| (II) | Main accounting data and financial indicators in the past three years (Prepared under CAS) |
| Unit:RMB ’000 | ||||||||||||||||
| Increase/ | ||||||||||||||||
| decrease | ||||||||||||||||
| compared to | ||||||||||||||||
| the previous year | ||||||||||||||||
Major accounting data | 2019 | 2018 | (%) | 2017 | ||||||||||||
Revenue | 100,346,048 | 107,764,908 | -6.88 | 92,013,569 | ||||||||||||
Total profit | 2,654,116 | 6,748,976 | -60.67 | 7,851,234 | ||||||||||||
Net profit attributable to shareholders of the Company | 2,213,716 | 5,277,186 | -58.05 | 6,141,558 | ||||||||||||
Net profit attributable to shareholders of the Company excluding non-recurring items | 2,073,020 | 5,067,583 | -59.09 | 6,293,745 | ||||||||||||
Net cash flow from operating activities | 5,121,209 | 6,695,099 | -23.51 | 7,078,482 | ||||||||||||
| Increase/ | ||||||||||||||||
| decrease | ||||||||||||||||
| compared to | ||||||||||||||||
| the previous year | ||||||||||||||||
| End of 2019 | End of 2018 | end (%) | End of 2017 | |||||||||||||
Total equity attributable to equity shareholders of the Company | 29,885,341 | 30,370,126 | -1.60 | 28,256,306 | ||||||||||||
Total assets | 45,636,128 | 44,539,960 | 2.46 | 39,609,536 | ||||||||||||
7
Table of Contents
Financial Highlights(continued)
| Increase/ decrease | ||||||||||||||||
| compared to the | ||||||||||||||||
Major financial indicators | 2019 | 2018 | previous year (%) | 2017 | ||||||||||||
Basic earnings per share (RMB/share) | 0.205 | 0.488 | -57.99 | 0.568 | ||||||||||||
Diluted earnings per share (RMB/share) | 0.205 | 0.488 | -57.99 | 0.568 | ||||||||||||
Basic earnings per share excluding non-recurring items (RMB/share) | 0.192 | 0.468 | -58.97 | 0.583 | ||||||||||||
Return on net assets (weighted average) (%)* | 7.143 | 16.211 | | Decreased by 9.07 percentage points |
| 20.840 | ||||||||||
Return on net assets excluding non-recurring items (weighted average) (%)* | 6.726 | 15.567 | | Decreased by 8.84 percentage points | | 21.356 | ||||||||||
Net cash flow per share generated from operating activities (RMB/share) | 0.473 | 0.619 | -23.59 | 0.655 | ||||||||||||
| Increase/ decrease | ||||||||||||||||
| compared to the | ||||||||||||||||
| End of 2019 | End of 2018 | previous year end (%) | End of 2017 | |||||||||||||
Net assets per share attributable to equity shareholders of the Company (RMB/share)* | 2.761 | 2.806 | -1.60 | 2.613 | ||||||||||||
| Increased by 2.68 | ||||||||||||||||
Gearing ratio (%) | 34.228 | 31.553 | percentage points | 27.943 | ||||||||||||
| * | The above-mentioned net assets do not include minority shareholders’ interests. |
8
Table of Contents
Financial Highlights(continued)
| (III) | Non-recurring items (Prepared under CAS) |
| Unit: RMB ’000 | ||||||||||||
Non-recurring items | 2019 | 2018 | 2017 | |||||||||
Gains/(losses) on disposal of non-current assets | 158,551 | 172,508 | -13,017 | |||||||||
Losses/(gains) on disposal of long-term equity investment | -60,951 | 1,622 | 10,339 | |||||||||
Employee reduction expenses | -45,394 | -34,450 | -176,954 | |||||||||
Government grants recognised through profit or loss (excluding government grants pursuant to the State’s unified standard sum and quota to closely related corporate business) | 79,678 | 126,329 | 75,703 | |||||||||
Income from external entrusted lendings | — | 11 | 1,164 | |||||||||
Net (losses)/gains on settlement of foreign exchange option and forward foreign exchange contracts | -15,316 | 14,520 | –1,516 | |||||||||
Income from structured deposit | 86,848 | — | — | |||||||||
Payments for sale of financial assets at fair value through other comprehensive income | -19,513 | — | — | |||||||||
Gains from derivative financial assets and fair value changes of liabilities | 1,597 | — | — | |||||||||
Other non-revenue and expenses other than those mentioned above | -42,322 | -55,092 | –44,159 | |||||||||
Effect on non-controlling interests (after tax) | 3,515 | -7,079 | –1,526 | |||||||||
Tax effect for the above items | -5,997 | –8,766 | –2,221 | |||||||||
|
|
|
|
|
| |||||||
Total | 140,696 | 209,603 | -152,187 | |||||||||
|
|
|
|
|
| |||||||
| (IV) | Differences between financial statements prepared under CAS and IFRS |
| Unit: RMB ’000 | ||||||||||||||||
| Net profit | Net asset | |||||||||||||||
| The Reporting | Corresponding period | At the of the | At the beginning of | |||||||||||||
| Period | of the previous year | Reporting Period | the Reporting Period | |||||||||||||
Prepared under CAS | 2,225,153 | 5,277,073 | 30,015,901 | 30,486,504 | ||||||||||||
Prepared under IFRS | 2,227,165 | 5,336,218 | 29,993,848 | 30,462,441 | ||||||||||||
For detailed differences between the financial statements prepared under CAS and IFRS, please refer to supplements to the financial statements prepared under CAS.
9
Table of Contents
Financial Highlights(continued)
| (V) | Major quarterly financial data in 2019 (Prepared under CAS) |
| Unit:RMB ’000 | ||||||||||||||||
| Fourth | ||||||||||||||||
| First Quarter | Second | Third Quarter | Quarter | |||||||||||||
| (January to | Quarter | (July to | (October to | |||||||||||||
| March) | (April to June) | September) | December) | |||||||||||||
Revenue | 25,136,233 | 26,856,350 | 23,377,016 | 24,976,449 | ||||||||||||
Net profit attributable to shareholders of the Company | 610,653 | 526,588 | 534,891 | 541,584 | ||||||||||||
Net profit attributable to shareholders of the Company excluding non-recurring items | 624,529 | 513,200 | 384,523 | 550,768 | ||||||||||||
Net cash flows (used)/generated from operating activities | -1,089,708 | 1,335,682 | -660,602 | 5,535,837 | ||||||||||||
10
Table of Contents
The Company is a highly vertically integrated petrochemical company. Most of the petroleum products and intermediate petrochemical products produced by the Company are used in the production of the Company’s downstream products.
The following table sets forth the net sales of the Group’s major products in 2019 as a percentage of total net sales and their typical uses.
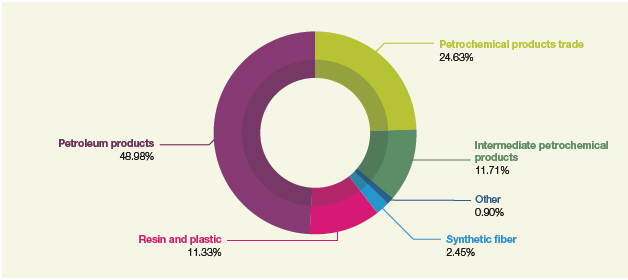
Major products sold by the Company | % of 2019 net sales | Typical use | ||||
Manufactured products | ||||||
Synthetic Fibres | ||||||
Polyester staple | 0.22 | Textiles and apparel | ||||
Acrylic staple | 2.08 | Cotton type fabrics, wool type fabrics | ||||
Others | 0.15 | |||||
|
| |||||
Subtotal: | 2.45 | |||||
|
| |||||
11
Table of Contents
Principal Products(continued)
Major products sold by the Company | % of 2019 net sales | Typical use | ||||
Resins and Plastics | ||||||
Polyester chips | 1.99 | Polyester fibres, films and containers | ||||
PE pellets | 4.72 | Films, ground sheeting, wire and cable compound and other injection moulding products such as housewares and toys | ||||
PP pellets | 4.10 | Films or sheets, injection moulding products such as housewares, toys and household electrical appliances and automobile parts | ||||
PVA | 0.12 | PVA fibres, building coating materials and textile starch | ||||
Others | 0.40 | |||||
|
| |||||
Subtotal: | 11.33 | |||||
Intermediate Petrochemical Products | ||||||
Ethylene | 0.01 | Feedstock for PE, EG, PVC and other intermediate petrochemical products which can be further processed into resins and plastics and synthetic fibre | ||||
Ethylene Oxide | 1.99 | Intermediate for chemical and pharmaceutical industry, dyes, detergents and adjuvant | ||||
Benzene | 1.61 | Intermediate petrochemical products, styrene, plastics, explosives, dyes, detergents, epoxies and polyamide fibre | ||||
PX | 3.19 | Intermediate petrochemical, polyester | ||||
Butadiene | 0.90 | Synthetic rubber and plastics | ||||
Ethylene Glycol | 0.87 | Fine chemicals | ||||
Others | 3.14 | |||||
|
| |||||
Subtotal: | 11.71 | |||||
Petroleum Products | ||||||
Gasoline | 19.37 | Transportation fuels | ||||
Diesel | 18.21 | Transportation and agricultural machinery fuels | ||||
Jet fuel | 6.38 | Transportation fuels | ||||
Others | 5.02 | |||||
|
| |||||
Subtotal: | 48.98 | |||||
Trading of petrochemical products | 24.63 | Import and export trade of petrochemical products (purchased from domestic and overseas suppliers) | ||||
|
| |||||
Others | 0.90 | |||||
|
| |||||
TOTAL: | 100 | |||||
|
| |||||
12
Table of Contents
Change in Share Capital of Ordinary Shares and Shareholders
| (I) | Changes in share capital of ordinary shares during the Reporting Period |
The Company had no changes in share capital of ordinary shares during the Reporting Period.
| (II) | Issue of shares |
| 1. | Issue of shares during the Reporting Period |
The Company issued no shares during the Reporting Period.
| 2. | Changes in the Company’s total number of ordinary shares, shareholding structure and the Company’s assets and liabilities |
The Company had no changes in the Company’s total number of ordinary shares, shareholding structure and the Company’s assets and liabilities during the Reporting Period.
| 3. | Employees shares |
The Company had no employees shares as at the end of the Reporting Period.
| (III) | Shareholders and de facto controller |
| 1. | Total number of shareholders |
Number of shareholders of ordinary shares as at the end of the Reporting Period | 87,549 | |
Number of shareholders of ordinary shares as at the end of the month immediately preceding the publication date of the annual report | 90,981 |
13
Table of Contents
Change in Share Capital of Ordinary Shares and Shareholders(continued)
| 2. | Shareholding of the top ten shareholders as at the end of the reporting period |
| Shareholding of the top ten shareholders | ||||||||||||||||||||||||||||||||
| Number | Pledged/Frozen | |||||||||||||||||||||||||||||||
| Increase/ | of shares | |||||||||||||||||||||||||||||||
| Increase/decrease | decrease of | held at the | ||||||||||||||||||||||||||||||
| of shareholding | shareholding | end of the | Percentage | |||||||||||||||||||||||||||||
| during the | during the | Reporting | of | |||||||||||||||||||||||||||||
| Reporting Period | Reporting | Period | shareholding | Status of | Number of | Nature of | ||||||||||||||||||||||||||
Full name of shareholder | Class of shares | (Shares) | Period (Shares) | (Shares) | (%) | Shares | Shares | shareholder | ||||||||||||||||||||||||
China Petroleum & Chemical Corporation | A shares | 0 | 5,460,000,000 | 50.44 | 0 | None | 0 | State-owned | ||||||||||||||||||||||||
| legal person | ||||||||||||||||||||||||||||||||
HKSCC (Nominees) Limited | H shares | -3,457,074 | 3,454,683,747 | 31.92 | 0 | Unknown | – | Overseas legal | ||||||||||||||||||||||||
| person | ||||||||||||||||||||||||||||||||
China Securities Finance Corporation Limited | A shares | 0 | 324,111,018 | 2.99 | 0 | None | 0 | Others | ||||||||||||||||||||||||
HKSCC Limited | A shares | -1,021,789 | 77,677,135 | 0.72 | 0 | None | 0 | Others | ||||||||||||||||||||||||
Central Huijin Investment Ltd. | A shares | 0 | 67,655,800 | 0.63 | 0 | None | 0 | Others | ||||||||||||||||||||||||
GF Fund – Agricultural Bank of China – GF CSI Financial Asset Management Plan | A shares | 0 | 45,222,300 | 0.42 | 0 | None | 0 | Others | ||||||||||||||||||||||||
China Universal Asset Management Co., Ltd. – 1103 Combination of Social Security | A shares | +45,000,620 | 45,000,620 | 0.42 | 0 | None | 0 | Others | ||||||||||||||||||||||||
Dacheng Fund – Agricultural Bank of China – Dacheng CSI Financial Asset Management Plan | A shares | 0 | 43,531,469 | 0.40 | 0 | None | 0 | Others | ||||||||||||||||||||||||
China Asset Fund – Agricultural Bank of China – China Asset CSI Financial Asset Management Plan | A shares | 0 | 43,083,750 | 0.40 | 0 | None | 0 | Others | ||||||||||||||||||||||||
Bosera Fund – Agricultural Bank of China – Bosera CSI Financial Asset Management Plan | A shares | 0 | 43,083,700 | 0.40 | 0 | None | 0 | Others | ||||||||||||||||||||||||
Note on connected relationship or acting in concert of the above shareholders: | | Among the above-mentioned shareholders, China Petroleum & Chemical Corporation (“Sinopec Corp.”), a State-owned legal person, does not have any connected relationship with the other shareholders, and does not constitute an act-in-concert party under the Administrative Measures on Acquisition of Listed Companies. Among the above-mentioned shareholders, HKSCC (Nominees) Limited is a nominee and HKSCC Limited is the nominal holder of the company’s Shanghai-Hong Kong Stock Connect. Apart from the above, the Company is not aware of any connected relationships among the other shareholders, or whether any other shareholder constitutes an act-in-concert party under the Administrative Measures on Acquisition of Listed Companies. | | |||||||||||||||||||||||||||||
14
Table of Contents
Change in Share Capital of Ordinary Shares and Shareholders(continued)
| (IV) | Details of the controlling shareholder and the de facto controller |
| 1. | Details of the controlling shareholder |
| (1) | Legal person |
| Name | China Petroleum & Chemical Corporation | |
Responsible person or legal representative | Zhang Yuzhuo | |
Date of incorporation | 25 February 2000 | |
Major business operations | Oil and natural gas exploration and extraction, pipeline transmission and sales; oil refining production, sales, storage and transportation of petrochemicals, chemical fibres, chemical fertilizers and other chemical products; import, export and import/export agency business of crude oil, natural gas, refined petroleum products, petrochemicals, chemicals, and other chemical products and other commodities and technologies; research, development and application of technology and information. | |
Shareholdings in other domestic and overseas companies during the Reporting Period | Details of shareholding of Sinopec Corp. in other listed companies: | |
Company Name | Number of shares held | Percentage of shareholding | ||||||
Sinopec Shandong Taishan Petroleum Co., Ltd. | 118,140,120 | 24.57 | % | |||||
15
Table of Contents
Change in Share Capital of Ordinary Shares and Shareholders(continued)
| 2. | Details of the de facto controller |
| (1) | Legal person |
| Name | China Petrochemical Corporation | |
| Responsible person or legal representative | Zhang Yuzhuo | |
| Date of incorporation | 24 July 1998 | |
| Major businesses operations | According to Sinopec Group’s restructuring in 2000, China Petrochemical Corporation injected its main petrochemical business into Sinopec Corp. Sinopec Group continues to operate several petrochemical facilities and small refining plants. Its services include: provision of drilling, logging and downhole operation services, production and maintenance of manufacturing equipment; engineering construction service and water, electricity and other public utilities and social services. | |
| Shareholdings in other domestic and overseas companies during the Reporting Period | Details of shareholding of Sinopec Group in other listed companies: | |
Company Name | Number of shares held | Percentage of shareholding | ||||||
China Petroleum & Chemical Corporation (Note 1)* | 82,709,227,393 | 68.31 | % | |||||
Sinopec Engineering (Group) Co., Ltd. | 2,907,856,000 | 65.67 | % | |||||
Sinopec Oilfield Service Corporation (Note 2) | 10,727,896,364 | 56.51 | % | |||||
Sinopec Oilfield Equipment Corporation | 351,351,000 | 58.74 | % | |||||
China Merchants Energy Shipping Co., Ltd. | 912,886,426 | 15.05 | % | |||||
Note 1: The 553,150,000 H shares held by Sinopec Century Bright Capital Investment Limited, an overseas wholly-owned subsidiary of Sinopec Group are included in the total number of shares held by HKSCC (Nominees) Limited. |
| |||||||
Note 2: The 2,595,786,987 H shares held by Sinopec Century Bright Capital Investment Limited, an overseas wholly-owned subsidiary of Sinopec Group are included in the total number of shares held by HKSCC (Nominees) Limited. |
| |||||||
16
Table of Contents
Change in Share Capital of Ordinary Shares and Shareholders(continued)
| 3. | Diagram of the ownership and controlling relationship between the Company and the controlling shareholder and the de facto controller |
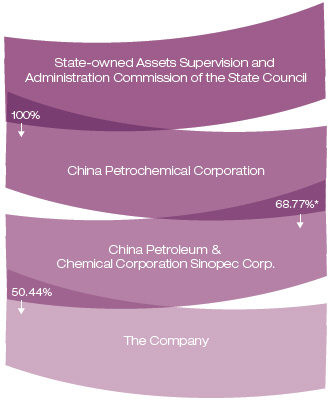
| * | Including 553,150,000 H shares in Sinopec Corp. held by Sinopec Century Bright Capital Investment Limited, an overseas wholly-owned subsidiary of Sinopec Group, through HKSCC (Nominees) Limited. |
| (V) | Other legal person shareholders holding more than 10% of the Company’s shares |
As at 31 December 2019, HKSCC (Nominees) Limited held 3,454,683,747 H shares of the Company, representing 31.92% of the total number of issued shares of the Company.
| (VI) | Public float |
Based on the public information available to the Board, as at 25 March 2020, the Company had a public float which is in compliance with the minimum requirement under the Hong Kong Listing Rules.
17
Table of Contents
Change in Share Capital of Ordinary Shares and Shareholders(continued)
| (VII) | Interests and short positions of the substantial shareholders of the Company in shares and underlying shares of the Company |
As at 31 December 2019, so far as was known to the Directors or chief executive of the Company, the interests and short positions of the Company’s substantial shareholders (being those who are entitled to exercise or control the exercise of 5% or more of the voting power at any general meeting of the Company but excluding the Directors, chief executive and Supervisors) in the shares and underlying shares of the Company who are required to disclose their interests pursuant to Divisions 2 and 3 of Part XV of the Securities and Futures Ordinance (the “SFO”) or as recorded in the register of interests required to be kept under section 336 of the SFO were as set out below:
Interests in ordinary shares of the Company
Name of shareholders | Interests held or deemed as held (shares) | Note | Percentage of total issued shares of the Company (%) | Percentage of total issued shares of the relevant class (%) | Capacity | |||||||||||
China Petroleum & Chemical | 5,460,000,000 A shares (L) | (1 | ) | 50.44 | (L) | 74.50 | (L) | Beneficial owner | ||||||||
The Bank of New York Mellon Corporation | 436,867,031 H shares (L) | (2 | ) | 4.04 | (L) | 12.50 | (L) | Interests of controlled corporation | ||||||||
| 367,331,900 H shares (S) | 3.39 | (S) | 10.51 | (S) | ||||||||||||
| 61,158,279 H shares (P) | 0.57 | (P) | 1.75 | (P) | ||||||||||||
BlackRock, Inc. | 310,415,788 H shares (L) | (3 | ) | 2.87 | (L) | 8.88 | (L) | Interests of controlled corporation | ||||||||
Corn Capital Company Limited | 211,008,000 H shares (L) | (4 | ) | 1.95 | (L) | 6.04 | (L) | Beneficial owner | ||||||||
| 200,020,000 H shares (S) | 1.85 | (S) | 5.72 | (S) | ||||||||||||
Hung Hin Fai | 211,008,000 H shares (L) | (4 | ) | 1.95 | (L) | 6.04 | (L) | Interests of controlled | ||||||||
| 200,020,000 H shares (S)(4) | 1.85 | (S) | 5.72 | (S) | corporation | |||||||||||
Yardley Finance Limited | 200,020,000 H shares (L) | (5 | ) | 1.85 | (L) | 5.72 | (L) | Secured equity holders | ||||||||
Chan Kin Sun | 200,020,000 H shares (L) | (5 | ) | 1.85 | (L) | 5.72 | (L) | Interests of controlled | ||||||||
| corporation | ||||||||||||||||
Citigroup Inc. | 247,632,514 H shares (L) | (6 | ) | 2.29 | (L) | 7.08 | (L) | Secured equity holders, | ||||||||
| 382,000 H shares (S) | 0.01 | (S) | 0.01 | (S) | Interests of controlled | |||||||||||
| 228,109,392 H shares (P) | 2.11 | (P) | 6.52 | (P) | corporation, and | |||||||||||
| approved lending | ||||||||||||||||
| agents | ||||||||||||||||
(L): Long position; (S): Short position; (P): Lending Pool
18
Table of Contents
Change in Share Capital of Ordinary Shares and Shareholders(continued)
Note:
| (1) | Based on the information obtained by the Directors from the website of the Hong Kong Stock Exchange and as far as the Directors are aware, Sinopec Group directly and indirectly owned 68.77% of the issued share capital of Sinopec Corp. as at 31 December 2019. By virtue of such relationship, Sinopec Group is deemed to have an interest in the 5,460,000,000 A shares of the Company directly owned by Sinopec Corp. |
| (2) | All the 436,867,031 H shares (long position) and 367,331,900 H shares (short position) are deemed to be held by The Bank of New York Mellon Corporation, due to control of multiple companies (among which 367,331,900 H shares (short position) are held through physical-settlement unlisted derivatives) Below are the companies indirectly or wholly owned by The Bank of New York Mellon Corporation: |
| (2.1) | All the 436,861,231 H shares (long position) and 367,331,900 H shares (short position) are held by The Bank of New York Mellon. Since The Bank of New York Mellon is wholly owned by The Bank of New York Mellon Corporation, The Bank of New York Mellon Corporation is deemed to have an interest in the 436,861,231 H shares (long position) and 367,331,900 H shares (short position) of the Company held by The Bank of New York Mellon. |
| (2.2) | All the 2,900 H shares (long position) are held by BNY MELLON, NATIONAL ASSOCIATION. Since BNY MELLON NATIONAL ASSOCIATION is wholly owned by The Bank of New York Mellon Corporation, The Bank of New York Mellon Corporation is deemed to have an interest in the 2,900 H shares (long position) of the Company held by BNY MELLON, NATIONAL ASSOCIATION. |
| (2.3) | All the 2,900 H shares (long position) were held by BNY Mellon Corporate Trustee Services Limited. Since BNY Mellon Corporate Trustee Services Limited is indirectly wholly owned by The Bank of New York Mellon Corporation, The Bank of New York Mellon Corporation is deemed to have an interest in the 2,900 H shares (long position) of the Company held by BNY Mellon Corporate Trustee Services Limited. |
| (3) | All the 310,415,788 H shares (long position) are deemed to be held by BlackRock, Inc., due to control of multiple companies.(among which 944,000 H shares (long position) are held through cash settled unlisted derivatives) Below are the companies indirectly wholly owned by BlackRock, Inc: |
| (3.1) | All the 7,210,900 H shares (long position) are held by BlackRock Investment Management, LLC. Since BlackRock Investment Management, LLC is indirectly wholly owned by BlackRock, Inc. through Trident Merger, LLC, BlackRock, Inc. is deemed to have an interest in the 7,210,900 H shares (long position) of the Company held by BlackRock Investment Management, LLC. |
19
Table of Contents
Change in Share Capital of Ordinary Shares and Shareholders(continued)
| (3.2) | All the 23,766,700 H shares (long position) are held by BlackRock Financial Management, Inc. Since BlackRock Financial Management, Inc. is indirectly wholly owned by BlackRock, Inc. through BlackRock Holdco 2, Inc., BlackRock, Inc. is deemed to have an interest in the 23,766,700 H shares (long position) of the Company held by BlackRock Financial Management, Inc. In addition, BlackRock Financial Management, Inc. is interested in the shares of the Company through the following companies: |
| (3.2.1) | 6,906,000 H shares (long position) are held by BlackRock Advisors, LLC. |
| (3.2.2) | BlackRock Holdco 4, LLC is wholly owned by BlackRock Financial Management, Inc. BlackRock Holdco 4, LLC is interested in the shares of the Company through the following companies: |
| (3.2.2.1) | 83,718,659 H shares (long position) are held by BlackRock Institutional Trust Company, National Association. |
| (3.2.2.2) | 93,172,000 H shares (long position) are held by BlackRock Fund Advisors. |
| (3.3) | 86% of interest in BR Jersey International Holdings L.P. are indirectly held by BlackRock, Inc. BR Jersey International Holdings L.P. is interested in the shares of the Company through the following companies: |
| (3.3.1) | 9,689,963 H shares (long position) are held by BlackRock Japan Co., Ltd. (which is indirectly wholly owned by BR Jersey International Holdings L.P.) |
| (3.3.2) | 938,000 H shares (long position) are held by BlackRock Asset Management Canada Limited (which is 99.9% indirectly held by BR Jersey International Holdings L.P.) |
| (3.3.3) | 4,112,300 H shares (long position) are held by BlackRock Investment Management (Australia) Limited (which is indirectly wholly owned by BR Jersey International Holdings L.P.) |
| (3.3.4) | 1,930,089 H shares (long position) are held by BlackRock Asset Management North Asia Limited (which is indirectly wholely owned by BR Jersey International Holdings L.P.) |
| (3.3.5) | 1,732,000 H shares (long position) are held by BlackRock (Singapore) Limited (which is indirectly wholly owned by BR Jersey International Holdings L.P.) |
20
Table of Contents
Change in Share Capital of Ordinary Shares and Shareholders(continued)
| (3.4) | 90% of interest in BlackRock Group Limited is indirectly held by BR Jersey International Holdings L.P. (See (3.3) above). BlackRock Group Limited is interested in the shares of the Company through the following companies, which are directly or indirectly wholly owned by BlackRock Group Limited: |
| (3.4.1) | 552,000 H shares (long position) are held by BlackRock (Netherlands) B.V. |
| (3.4.2) | 988,000 H shares (long position) are held by BlackRock Advisors (UK) Limited. |
| (3.4.3) | 23,357,362 H shares (long position) are held by BlackRock Investment Management (UK) Limited. |
| (3.4.4) | 9,401,425 H shares (long position) are held by BlackRock Fund Managers Limited. |
| (3.4.5) | 372,000 H shares (long position) are held by BlackRock International Limited. |
| (3.4.6) | 6,021,390 H shares (long position) are held by BlackRock Life Limited. |
| (3.4.7) | 33,675,000 H shares (long position) are held by BlackRock Asset Management Ireland Limited. |
| (3.4.8) | 2,844,000 H shares (long position) are held by BLACKROCK (Luxembourg) S.A. |
| (3.4.9) | 28,000 H shares (long position) are held by BlackRock Asset Management (Schweiz) AG. |
| (4) | These shares were held by Corn Capital Company Limited. Hung Hin Fai held 100% interests in Corn Capital Company Limited. Pursuant to the SFO, Hung Hin Fai was deemed to be interested in the shares held by Corn Capital Company Limited. |
| (5) | These shares were held by Yardley Finance Limited. Chan Kin Sun held 100% interests in Yardley Finance Limited. Pursuant to the SFO, Chan Kin Sun was deemed to be interested in the shares held by Yardley Finance Limited. |
21
Table of Contents
Change in Share Capital of Ordinary Shares and Shareholders(continued)
| (6) | Of the H shares (long position) held by Citigroup Inc., 4,081,000 H shares (long position) are held through physical-settlement listed derivatives and 226,000 H shares (long position) are held through cash settled unlisted derivatives. Of the H shares (short position) held by Citigroup Inc., 382,000 H shares (short position) are held through cash settled unlisted derivatives. In addition, Citigroup Inc. is deemed to hold a total of 3,181,122 H shares (long position) and 382,000 H shares (short position) of the Company, due to control of multiple companies. The following companies are indirectly owned by Citigroup Inc.: |
| (6.1) | All the 228,109,392 H shares (long position) are held by Citibank, N.A. Since Citibank, N.A. is wholly owned by Citigroup Inc., Citigroup Inc. is deemed to have an interest in the 228,109,392 H shares (long position) of the Company held by Citibank, N.A. |
| (6.2) | All the 29,000 H shares (long position) are held by Citigroup Global Markets Inc. Since Citigroup Global Markets Inc. is indirectly wholly owned by Citigroup Inc., Citigroup Inc. is deemed to have an interest in the 29,000 H shares (long position) of the Company held by Citigroup Global Markets Inc. |
| (6.3) | All the 19,493,122 H shares (long position) and 382,000 H shares (short position) are held by Citigroup Global Markets Limited. Since 90% of interest in Citigroup Global Markets Limited are indirectly held by Citigroup Inc., Citigroup Inc. is deemed to have an interest in the 19,493,122 H shares (long position) and 382,000 H shares (short position) of the Company held by Citigroup Global Markets Limited. |
| (6.4) | All the 1,000 H shares (long position) are held by Citicorp Trust South Dakota. Since Citicorp Trust South Dakota is indirectly wholly owned by Citigroup Inc., Citigroup Inc. is deemed to have an interest in the 1,000 H shares (long position) of the Company held by Citicorp Trust South Dakota. |
Save as disclosed above, as at 31 December 2019, the Directors have not been notified by any person (other than the Directors, chief executive and Supervisors) who had interests or short positions in the shares and underlying shares of the Company which would fall to be disclosed to the Company pursuant to Divisions 2 and 3 of Part XV of the SFO or as recorded in the register of interests required to be kept by the Company under section 336 of the SFO.
22
Table of Contents
Directors, Supervisors, Senior Management and Employees
| (I) | Changes in shareholdings and remuneration |
| 1. | Changes in shareholdings and remuneration of Directors, Supervisors and senior management who hold the position currently or left the office during the Reporting Period |
Name | Former | Position | Sex | Age | Date of commencement of service term | End date of service term | Number of shares held at the beginning of the Reporting Period (ten thousand shares) | Number of shares held at the end of the Reporting Period | Change in number of shares during the Reporting Period | Total remuneration received from the Company during the Reporting Period (before taxation) (RMB’ ten thousand) | Whether received remuneration from connected person(s) of the Company | |||||||||||||||||||||||||||||
Wu Haijun | None | Executive Director, Chairman, Acting Secretary to the Board | M | 57 | June 2017 | June 2020 | 0 | 0 | 0 | 92.54 | No | |||||||||||||||||||||||||||||
Jin Qiang | None | Executive Director & Vice President | M | 54 | June 2017 | June 2020 | 30.1 | 30.1 | 0 | 105.96 | No | |||||||||||||||||||||||||||||
Zhou Meiyun | None | Executive Director, Vice President & Chief Financial Officer | M | 50 | June 2017 | June 2020 | 0 | 0 | 0 | 98.22 | No | |||||||||||||||||||||||||||||
Jin Wenmin | None | Executive Director & Vice President | M | 55 | June 2018 | June 2020 | 17.5 | 17.5 | 0 | 100.64 | No | |||||||||||||||||||||||||||||
Lei Dianwu | None | Non-executive Director | M | 57 | June 2017 | June 2020 | 0 | 0 | 0 | 0 | Yes | |||||||||||||||||||||||||||||
Mo Zhenglin | None | Non-executive Director | M | 55 | June 2017 | June 2020 | 0 | 0 | 0 | 0 | Yes | |||||||||||||||||||||||||||||
Zhang Yimin | None | Independent Non-executive Director | M | 65 | June 2017 | June 2020 | 0 | 0 | 0 | 15.00 | No | |||||||||||||||||||||||||||||
Liu Yunhong | None | Independent Non-executive Director | M | 43 | June 2017 | June 2020 | 0 | 0 | 0 | 15.00 | No | |||||||||||||||||||||||||||||
Du Weifeng | None | Independent Non-executive Director | M | 43 | June 2017 | June 2020 | 0 | 0 | 0 | 15.00 | No | |||||||||||||||||||||||||||||
Li Yuanqin | None | Independent Non-executive Director | F | 46 | August 2017 | June 2020 | 0 | 0 | 0 | 15.00 | No | |||||||||||||||||||||||||||||
Ma Yanhui | None | Supervisor, Chairman of the Supervisory Committee | M | 49 | June 2017 | June 2020 | 0 | 0 | 0 | 97.33 | No | |||||||||||||||||||||||||||||
Zhang Feng* | None | Supervisor | M | 50 | October 2019 | June 2020 | 7 | 1 | -6 | 14.78 | No | |||||||||||||||||||||||||||||
Chen Hongjun* | None | Supervisor | M | 49 | October 2019 | June 2020 | 13.35 | 3.1 | -10.25 | 15.32 | No | |||||||||||||||||||||||||||||
Zhai Yalin | None | Supervisor | M | 55 | June 2017 | June 2020 | 0 | 0 | 0 | 0 | Yes | |||||||||||||||||||||||||||||
Zheng Yunrui | None | Independent Supervisor | M | 54 | June 2017 | June 2020 | 0 | 0 | 0 | 10.00 | No | |||||||||||||||||||||||||||||
Choi Ting Ki | None | Independent Supervisor | M | 65 | June 2017 | June 2020 | 0 | 0 | 0 | 10.00 | No | |||||||||||||||||||||||||||||
Guan Zemin* | None | President | M | 55 | February 2020 | June 2020 | — | — | — | — | No | |||||||||||||||||||||||||||||
Huang Xiangyu* | None | Vice President | M | 51 | February 2020 | June 2020 | — | — | — | — | No | |||||||||||||||||||||||||||||
Huang Fei* | None | Vice President | M | 43 | February 2020 | June 2020 | — | — | — | — | No | |||||||||||||||||||||||||||||
Shi Wei* | None | Former Executive Director & President | M | 60 | | September 2018 | | | December 2019 | | 0 | 0 | 0 | 115.13 | No | |||||||||||||||||||||||||
Guo Xiaojun* | None | Former Executive Director, Vice President, Secretary to the Board & Joint Company Secretary | M | 50 | June 2017 | | December 2019 | | 30.1 | 30.1 | 0 | 106.00 | No | |||||||||||||||||||||||||||
Zuo Qiang* | None | Former Supervisor | M | 57 | June 2017 | | September 2019 | | 0 | 0 | 0 | 44.08 | No | |||||||||||||||||||||||||||
Li Xiaoxia* | None | Former Supervisor | F | 50 | June 2017 | October 2019 | 0 | 0 | 0 | 64.56 | No | |||||||||||||||||||||||||||||
Fan Qingyong* | None | Former Supervisor | M | 55 | June 2017 | | December 2019 | | 0 | 0 | 0 | 0 | Yes | |||||||||||||||||||||||||||
|
|
|
|
|
|
|
|
|
|
|
|
|
|
|
|
|
|
|
| |||||||||||||||||||||
Total | / | / | / | / | / | / | 98.05 | 81.8 | -16.25 | 934.56 | / | |||||||||||||||||||||||||||||
|
|
|
|
|
|
|
|
|
|
|
|
|
|
|
|
|
|
|
| |||||||||||||||||||||
23
Table of Contents
Directors, Supervisors, Senior Management and Employees(continued)
| * | On 11 October 2019, the staff association of the Company through democratic election procedure elected Mr. Zhang Feng and Mr. Chen Hongjun as employee representative supervisors of the Company. The changes in shareholdings of Mr. Zhang Feng and Mr. Chen Hongjun occurred before serving as employee representative supervisors. |
| * | Mr. Guan Zemin was appointed as President of the Company at the 20th meeting of the Ninth Session of the Board on 3 February 2020. Mr. Huang Xiangyu and Mr. Huang Fei were appointed as the Company’s Vice Presidents on the same day. |
| * | On 19 December 2019, Mr. Shi Wei submitted to the Board a request to cease serving as an Executive Director and Vice President due to his age at retirement. On 19 December 2019, Mr. Guo Xiaojun submitted to the Board a request to cease serving as Executive Director, Vice President and Secretary to the Board due to other work arrangements. Mr. Shi Wei’s and Mr. Guo Xiaojun’s resignation took effect when their resignation reports were submitted to the Board on 19 December 2019. |
| * | On 2 September 2019, Mr. Zuo Qiang submitted a request to the Supervisory Committee to cease serving as a supervisor due to other work arrangements. Mr. Zuo Qiang’s resignation took effect when his resignation report was submitted to the Supervisory Committee on 2 September 2019. |
| * | On 30 September 2019, Ms. Li Xiaoxia submitted a request to the Supervisory Committee to cease serving as a supervisor due to other work arrangements. Given that the resignation of Ms. Li resulted in the proportion of employee supervisors in the Supervisory Committee falling below the statutory requirement, according to regulations in the Company Law and the Articles of Association, Ms. Li Xiaoxia’s resignation took effect after Mr. Zhang Feng and Mr. Chen Hongjun were elected as employee representative supervisors of the Company through employee democratic election procedure on 11 October 2019. |
| * | On 27 December 2019, Mr. Fan Qingyong submitted a request to the Supervisory Committee to cease serving as a supervisor due to other work arrangements. Mr. Fan Qingyong’s resignation took effect when his resignation report was submitted to the Supervisory Committee on 27 December 2019. |
24
Table of Contents
Directors, Supervisors, Senior Management and Employees(continued)
| (II) | Profiles of Directors, Supervisors and senior management |
Directors:
Wu Haijun, aged 57, is an Executive Director, Chairman, Chairman of the Strategy Committee, member of the Nomination Committee of the Company, Acting Secretary to the Board, Director of Shanghai SECCO and Chairman of Shanghai Chemical Industry Park Development Co., Ltd. Mr. Wu joined the Shanghai Petrochemical Complex (the “Complex”) in 1984 and has held various positions, including Deputy Director and Director of the Company’s No. 2 Chemical Plant, as well as manager of the Chemical Division. He was Vice President of the Company from May 1999 to March 2006 and Director of the Company from June 2004 to June 2006. Mr. Wu was manager and Secretary of the Communist Party Committee of the Chemical Sales Branch of Sinopec Corp from December 2005 to March 2008. From December 2005 to April 2010, he was Director of the Chemical Business Department of Sinopec Corp. From April 2010 to August 2018, he was appointed as a Director of Shanghai SECCO. From April 2010 to February 2011, Mr. Wu was President of Shanghai SECCO. From April 2010 to August 2018, he was appointed Secretary of the Communist Party Committee of Shanghai SECCO and in June 2010 he was appointed Director of the Company. From June 2010 to December 2017, he served as Vice President of the Company. From February 2011 to March 2015, he acted as Vice President of Shanghai SECCO, and was President of Shanghai SECCO from March 2015 to December 2017. From December 2017 to January 2019, Mr. Wu was appointed Chairman of Shanghai SECCO. He has served as President and Secretary of the Communist Party Committee of the Company from December 2017 to September 2018. In December 2017, he was appointed as Chairman of the Company. In January 2018, he was appointed as Chairman of Shanghai Chemical Industry Park Development Co, Ltd. and was appointed as Secretary to the Communist Party Committee of the Company in August 2018. In December 2019, he was appointed as Acting Secretary to the Board. Mr. Wu graduated from the East China Institute of Chemical Technology in 1984, majoring in chemical engineering, and obtained a bachelor’s degree in engineering. In 1997, he obtained a master’s degree in business administration from the China Europe International Business School. He is a professor-grade senior engineer by professional title.
Jin Qiang, aged 54, is an Executive Director and Vice President of the Company. Mr. Jin joined Zhenhai General Petrochemical Works in 1986 and has held various positions, including Deputy Chief of the Utilities Department, Deputy Director and Director of the Machinery and Power Division of SINOPEC Zhenhai Refining & Chemical Co., Ltd., and Director of the Machinery and Power Division of SINOPEC Zhenhai Refining & Chemical Company. Mr. Jin was Deputy Chief Engineer of SINOPEC Zhenhai Refining & Chemical Company from March 2007 to October 2011, and was appointed Vice President of the Company in October 2011. In June 2014, Mr. Jin was appointed Executive Director of the Company. Mr. Jin graduated from the East China Institute of Chemical Technology in 1986 majoring in chemical machinery, and graduated from the Graduate School of Central Party School in 2007 majoring in economic management. He is a professor-grade senior engineer by professional title.
25
Table of Contents
Directors, Supervisors, Senior Management and Employees(continued)
(II) Profiles of Directors, Supervisors and senior management(Continued)
Zhou Meiyun, aged 50, is an Executive Director, Vice President, Chief Financial Officer, member of the Remuneration and Appraisal Committee and the Strategy Committee of the Company. Mr. Zhou joined the Complex in 1991 and has held various positions, including Officer, Assistant to Manager, Deputy Manager and Manager of the Finance Department of the Company. He served as Manager of the Finance Department of Shanghai SECCO from May 2011 to March 2017, and was appointed Vice President and Chief Financial Officer of the Company in February 2017. He has served as Executive Director of the Company since June 2017 and Chairman of China Jinshan Associated Trading Corporation (“Jinshan Associated Trading”) since July 2017. In May 2019, Mr. Zhou served as General Counsel of the Group. Mr. Zhou graduated from the Shanghai University of Finance and Economics in 1991 majoring in accounting, and obtained a master’s degree in economics from the Huazhong University of Science and Technology majoring in western economics in 1997. He is a senior accountant by professional title.
Jin Wenmin, aged 55, is an Executive Director and Vice President of the Company. Mr. Jin joined the Complex in 1985 and served as the Secretary of the Communist Party Committee of the Company’s No. 1 Oil Refining Device of Refining Unit, Head of Butadiene Device, Manager of the storage and transportation, branch company, manager and Deputy Secretary of the Communist Party Committee of Storage and Transportation Department, manager and Deputy Secretary of the Communist Party Committee of Oil Refining Department etc. From April 2013 to February 2017, Mr. Jin was appointed as Head of Production Department of the Company. From May 2013 to August 2016, Mr. Jin was appointed as Assistant to the President of the Company and was appointed as Vice President of the Company in September 2016. He was appointed Executive Director of the Company in June 2018. Mr. Jin graduated from the Shanghai Second Polytechnic University in July 2003, majoring in business administration. He is a senior engineer by professional title.
Lei Dianwu, aged 57 is a Non-executive Director, member of the Strategy Committee of the Company and, Senior Vice President of Sinopec Corp., the controlling shareholder of the Company. From June 2005, Mr. Lei has served as Non-executive Director of the Company. Mr. Lei has held various positions, including Deputy Director of Planning Division and Director of the Preparation Office of the Joint Venture of Yangzi Petrochemical Company, and Vice President and manager of the Production Division of Yangzi BASF Stylene Company Limited. He acted as Deputy Manager of Yangzi Petrochemical Company and Deputy Director of its Joint Venture Office, Director of the Development and Planning Division of China Dong Lian Petrochemical Limited Liabilities Company, Deputy General Manager of Yangzi Petrochemical Limited Liabilities Company and Deputy Director of the Development and Planning Division of Sinopec Corp. From March 2001 to August 2013, he was Director of Development and Planning Division of Sinopec Corp. From March 2009 to October 2018, Mr. Lei was Assistant to the President of Sinopec Group. From March 2009 to October 2018, he was Vice President of Sinopec Corp. From August 2013 to October 2018, he was Chief Economist of Sinopec Group. From October 2015 to October 2018, Mr. Lei acted as the Secretary to the board of directors of Sinopec Group. From June 2018 to December 2018, he was Director general of Department of International Cooperation of the Sinopec Group, Director of the Foreign Affairs Office, Director of Office of Hong Kong, Macau and Taiwan Affairs, and Director general of Department of International Cooperation of China Petroleum & Chemical Corporation. From October 2018, he has served as Senior Vice President of Sinopec Corp. Mr. Lei has rich experience in enterprise planning and investment development management. In 1984, Mr. Lei graduated from the East China Petroleum Institute majoring in basic organic chemicals and obtained a bachelor’s degree in engineering. He is a professor-grade senior engineer by professional title.
26
Table of Contents
Directors, Supervisors, Senior Management and Employees(continued)
| (II) | Profiles of Directors, Supervisors and senior management(Continued) |
Mo Zhenglin, aged 55, is a Non-Executive Director and member of the Strategy Committee of the Company, Deputy Director of the Finance Division of Sinopec Corp., controlling shareholder of the Company. In June 2014, Mr. Mo was appointed as Non-executive Director of the Company. Mr. Mo began his career in August 1986 and has held various positions, including Deputy Director of the Finance Department and Head of the Accounting Department of Beijing Yanshan Petrochemical Corporation and Chief Accountant and Director of the Finance Department of its Refinery Division, and Deputy Chief Accountant of SINOPEC Beijing Yanshan Company and Chief Accountant of its Refinery Division, Director of Beijing Yanshan Petrochemical Company Limited and Chief Accountant of SINOPEC Beijing Yanshan Company. Mr. Mo has been Chief Accountant of the Chemical Division of Sinopec Corp. from August 2008 to August 2017, and Director of Shanghai SECCO from November 2008 to October 2017. From March 2015 to August 2017, he was Deputy Director of the Chemical Division of Sinopec Corp. In August 2017, Mr. Mo was appointed as Deputy Director of the Finance Division of Sinopec Corp. Mr. Mo obtained a bachelor’s degree in management from Zhongnan University of Economics in 1986, majoring in finance and accounting. He is a senior accountant by professional title.
Zhang Yimin, aged 65, is an Independent Non-executive Director, Chairman of the Remuneration and Appraisal Committee and the Nomination Committee of the Company and an Emeritus Professor of Economics and Finance at the China Europe International Business School. He has been an Independent Non-Executive Director of the Company since October 2013. Mr. Zhang has been an independent director of Shanghai Huayi Group Corporation Ltd. (listed on the Shanghai Stock Exchange, stock code: 600623) since April 2015. Mr. Zhang obtained a doctorate’s degree majoring in finance and political studies at the Business School of the University of British Columbia, Canada, and has held various positions, including a Post-doctoral Fellow at the Business School of the University of British Columbia, Canada, Assistant Professor at the Business School of the University of New Brunswick, Canada, and Associate Professor of Economics and Finance Department at the City University of Hong Kong. He was appointed as Professor of the China Europe International Business School in September 2004, and as Emeritus Professor of Finance of the China Europe International Business School since January 2010. His major area of research is in operations, financing and industrial economic studies. He possesses a wealth of professional expertise and experience.
27
Table of Contents
Directors, Supervisors, Senior Management and Employees(continued)
| (II) | Profiles of Directors, Supervisors and senior management(Continued) |
Liu Yunhong, aged 43, is an Independent Non-executive Director and member of Audit Committee of the Company, Assistant to General Manager of Hwabao Securities Co. Ltd., and the Deputy Head of the Institute of International M&A and Investment, Renmin University of China. He has been an Independent Non-executive Director of the Company since June 2015. From 13 May 2014 to 24 March 2018, Mr. Liu was an independent director of Guangdong HEC Technology Holding Co., Ltd. (listed on the Shanghai Stock Exchange, stock code: 600673), and currently is an Independent Director of Shanghai Aerospace Automobile Electromechanical Co., Ltd. (listed on the Shanghai Stock Exchange, stock code: 600151), Shenergy Company Limited (listed on the Shanghai Stock Exchange, stock code: 600642) and Bank of Guiyang Co., Ltd. (listed on the Shanghai Stock Exchange, stock code: 601997). From June 2008 to August 2010, Mr. Liu has been the Head of Legal and Compliance Division of Guotai Asset Management Co., Ltd. From October 2008 to August 2010, Mr. Liu conducted post-doctoral research in economics at Guanghua School of Management, Peking University and was conferred as an assistant professor and master postgraduate instructor. From October 2010 to July 2012, he worked for fund product development and supervision of listed companies at the Shanghai Stock Exchange. From August 2012 to September 2013, Mr. Liu was General Manager of Investment Banking Department of Aerospace Securities Co., Ltd. Since October 2013, Mr. Liu has been the General Manager of the Institutional Business Department (Renamed as Investment Banking Department since May 2015) of Hwabao Securities Co. Ltd. From May 2015 to November 2017, Mr. Liu was the General Manager of the Investment Banking Department of Hwabao Securities Co. Ltd. From September 2015 to May 2019, He was the Assistant to General Manager of Hwabao Securities Co. Ltd. Since May 2014, he has been Deputy Head of the Institute of International M&A and Investment, Renmin University of China. In May 2019, he served as Institute Director of Foresea Life Insurance (Shanghai). Mr. Liu obtained a doctorate’s degree in law from Renmin University of China, majoring in civil and commercial Law in 2008. Mr. Liu is a research fellow by professional title.
Du Weifeng, aged 43, is an Independent Non-executive Director, member of the Audit Committee, the Remuneration and Appraisal Committee and the Nomination Committee of the Company, and a Partner of Beijing JunZeJun (Shanghai) Law Offices. He has served as the Company’s Independent Non-executive Director since June 2015. Mr. Du began his career in July 1998. He has held various positions, including Clerk and Assistant Judge of Shanghai Pudong New Area People’s Court and worked as a lawyer at Watson & Band Law Offices in Shanghai and at Wintell& Co Law Firm in Shanghai. He has been a Partner of the Shanghai branch of Beijing JunZeJun Law Offices since February 2009. With extensive experience as a lawyer, Mr. Du is the designated lawyer of some banks’ headquarters, Shanghai branches, Shanghai branch of the state-owned asset management companies and private asset management companies. Mr. Du obtained a bachelor’s degree in Commercial Law from Shanghai University in July 1998, and a master’s degree in commercial law from Bristol University in September 2005. He also obtained a master’s degree in business administration from China Europe International Business School in 2013.
28
Table of Contents
Directors, Supervisors, Senior Management and Employees(continued)
| (II) | Profiles of Directors, Supervisors and senior management(Continued) |
Li Yuanqin, aged 46, is an Independent Non-executive Director, Chairman of the Audit Committee and member of the Strategy Committee of the Company, Professor of the School of Management and the associate head of the Department of Accountancy at Shanghai University. She is currently the independent director of Shanghai New World Co., Ltd. (listed on Shanghai Stock Exchange, stock code: 600628). From April 2000 to March 2003, she served at the Settlement Department at the headquarters of ICBC. From June 2006 to September 2009, she was the lecturer at the School of Management at Shanghai University. From September 2009 to March 2019, she was the associate professor of the School of Management at Shanghai University. She has been the professor of the School of Management and the associate head of the Department of Accountancy of Shanghai University since March 2019 and May 2011 respectively. During that period, she was also a visiting scholar at Foster School of Business, University of Washington in the United States between February 2012 and February 2013. She also serves as a member of the eighth session of the Shanghai Baoshan Committee of the Chinese People’s Political Consultative Conference and a non-executive member of the Chinese Institute of Certified Public Accountants. She received a PhD in Management from Antai College of Economics and Management (ACEM) at Shanghai Jiao Tong University.
Supervisors:
Ma Yanhui, aged 49, is a Supervisor, Chairman of Supervisory Committee, Deputy Secretary of the Communist Party Committee, Secretary of the Communist Party Discipline Supervisory Committee and Chairman of the Labour Union of the Company. Mr. Ma started his career in 1996. He served as Secretary of Office of Yanhua Refinery, Secretary and Deputy Director of Yanhua Office of Great Wall Lubricant Oil, Supervisor and Acting Director and Deputy Director of Integrated Corporate Reform Department of China Petrochemical Corporation, and Deputy Director and Director of Structure Reform Sector, Corporate Reform Department of Sinopec Assets Management Co., Ltd., etc. From June 2008 to August 2017, Mr. Ma was Director of Integrated Corporate Reform Department of China Petrochemical Corporation. In August 2017, Mr. Ma was appointed as Deputy Secretary of the Communist Party Committee and Secretary of the Communist Party Discipline Supervisory Committee of the Company. He was appointed as Supervisor, Chairman of Supervisory Committee and Chairman of the Labour Union of the Company in October 2017. Mr. Ma graduated from East China University of Science and Technology in July 1996, majoring in petroleum processing, and obtained a bachelor’s degree in engineering. In June 2006, he obtained a master’s degree in corporate management from Renmin University of China. Mr. Ma is a senior economist by professional title.
29
Table of Contents
Directors, Supervisors, Senior Management and Employees(continued)
| (II) | Profiles of Directors, Supervisors and senior management(Continued) |
Zhang Feng, aged 50, is currently Supervisor and Auditing Director of the Company. Mr. Zhang started his career in the Complex in 1991. He served as Assistant of Chief and Deputy Chief of Finance Section of Polyester II Factory, Deputy Chief of Finance Section of Polyester Department, Deputy Chief and Chief of Cost Section of Finance Division of Polyester Department, Deputy Chief and Chief of Finance Division, Director Assistant, Deputy Director, Deputy Director (Hosting Work), Director of Finance Department and Chief of Finance Division. He was appointed as Auditing Director of the Company in December 2018 and Supervisor in October 2019. Mr. Zhang graduated from Shanghai University of Finance and Economics in 1991, majoring in Accounting, and obtained a bachelor’s degree in Economics. Mr. Zhang is a senior accountant by professional title.
Chen Hongjun, aged 49, is currently Supervisor, Vice-President of Labour Union, Director of the Public Affairs Department and Vice-President of the Association of Science and Technology of the Company. Mr. Chen started his career in the Company in 1996. He served as Vice Party Branch Secretary of Fibre Polymer Office, Deputy Director of Spinning Office, Director of Simulation Office, Section Manager of Scientific Research Management Department, Deputy Secretary and Secretary of Youth League Committee of the Company, Party Secretary and Deputy Director of the Chemical Engineering Department, Party Secretary and Assistant Manager of Fine Chemicals Department and Director of Public Affairs Department. Mr. Chen was appointed as Vice-President of Labour Union of the Company in November 2013. He was appointed as Vice President of the Association of Science and Technology in December 2017. He served as Director of the Public Affairs Department of the Company in April 2018, and he was elected as Supervisor of the Company in October 2019. In 1993, Mr. Chen graduated from Chengdu University of Science and Technology, majoring in Dyeing and Finishing Engineering, and obtained a bachelor’s degree in Engineering. In 1996, he obtained a master’s degree in Chemical Fibre from Sichuan Unite University. Mr. Chen is a senior engineer by professional title.
Zhai Yalin, aged 55, is an External Supervisor of the Company, and Chief of Team One of the Sinopec Group Party Committee Discipline Inspection Group. Mr. Zhai has been an External Supervisor of the Company since June 2008. Mr. Zhai started his career in 1986 and successively served as Deputy Head of the Head Office and Director of the Auditing Department of Qianguo Refinery, Deputy Director of the General Office of Sinopec Huaxia Auditing Company, Deputy Director of the General Administrative Office of the Auditing Bureau of China Petrochemical Corporation, Director of the General Administrative Office of the Auditing Bureau of Sinopec Group, and Director of the General Administrative Office of the Auditing Bureau of Sinopec Group (Auditing Department of Sinopec Corp.). From December 2001 to December 2019, Mr. Zhai held concurrently the posts of Deputy Director of the Auditing Bureau of Sinopec Group and Deputy Director of Auditing Department of Sinopec Corp. From April 2018 to March 2019, he was appointed Chief of Team Nine of the Sinopec Group Party Committee Discipline Inspection Group. He has served as Chief of Team One of the Sinopec Group Party Committee Discipline Inspection Group since April 2019. In June 2019, he served as Supervisor of Sinopec Oilfield Service Corporation (listed on the main board of the Hong Kong Stock Exchange, stock code: 1033; listed on the Shanghai Stock Exchange, stock code: 600871). Mr. Zhai graduated from the Jilin Siping Normal College in 1986 and is a senior economist by professional title.
30
Table of Contents
Directors, Supervisors, Senior Management and Employees(continued)
| (II) | Profiles of Directors, Supervisors and senior management(Continued) |
Zheng Yunrui, aged 54, is an Independent Supervisor of the Company and a professor in civil and commercial law at the Faculty of Law of the East China University of Political Science and Law in the PRC and Member of Expert Consultation Committee of Shanghai Yangpu District People’s Procuratorate and Mediator of Shanghai Second Intermediate People’s Court. He has served as the Company’s Independent Supervisor since December 2014. From April 2013 to May 2019, Mr. Zheng was an independent director of Hangzhou Innover Technology Co., Ltd. (listed on the Shenzhen Stock Exchange, stock code: 002767). He is currently an independent director of Jiangxi XinyuGuoke Technology Co., Ltd. (listed on the Shenzhen Stock Exchange, stock code: 300722) , independent director of Fuxin Dare Automotive Parts Co, Ltd. (listed on the Shenzhen Stock Exchange, stock code: 300473) and Dalian Insulator Group Co., Ltd (listed on the Shenzhen Stock Exchange, stock code: 002606), and External Supervisor of Zhejiang Reclaim Construction Group Co., Ltd (listed on the Shenzhen Stock Exchange, stock code: 002586). Mr. Zheng graduated from the Shangrao Normal University in Jiangxi Province, majoring in English Language. Mr. Zheng obtained a master’s degree in law and a doctorate’s degree in law from the Faculty of Law of Peking University in July 1993 and July 1998, respectively. Mr. Zheng previously worked at the Education Bureau of Shangrao County, Jiangxi Province, Hainan Airport Limited, China Township Enterprise Investment and Development Company Limited and the Legal Affairs Office of the Shanghai Municipal People’s Government. He has been teaching at East China University of Political Science and Law since August 2001. He was a visiting scholar at the Faculty of Law of National University of Singapore between July 2002 and December 2002. Mr. Zheng has been engaged in trials, teaching and research relating to civil law, property law, contract law, company law, insurance law, social insurance law and government procurement law. He is experienced in the legal affairs on corporate governance and has great academic achievements. He is also an arbitrator at the Arbitration Commission of Shenzhen, Shenyang, Xuzhou and Wuxi. Mr. Zheng was appointed as member of Expert Advisory Committee of the People’s Procuratorate of Shanghai Yangpu District and mediator of Shanghai No. 2 intermediate People’s Court on 24 March 2017 and 26 June 2017, respectively.
Choi Ting Ki, aged 65, is an Independent Supervisor of the Company and a Fellow of the Hong Kong Institute of Certified Public Accountants. He joined the Company in June 2011. Mr. Choi served as Independent Non-executive Director of the Company from June 2011 to June 2017, and has been Independent Supervisor since June 2017. Mr. Choi has been an independent non-executive director of Yangtzekiang Garment Limited (listed on the Main Board of the Hong Kong Stock Exchange, stock code: 00294) and YGM Trading Limited (listed on the Main Board of the Hong Kong Stock Exchange, stock code: 00375) since December 2012. Mr. Choi graduated from the Department of Accounting, Hong Kong Polytechnic in 1978. He joined KPMG in the same year and has held various positions, including Partner of the audit department of KPMG Hong Kong Office, Executive Partner of KPMG Shanghai Office, Senior Partner of KPMG Huazhen Shanghai Office as well as Senior Partner of KPMG Huazhen in Eastern and Western China. Mr. Choi retired from KPMG Huazhen in April 2010.
31
Table of Contents
Directors, Supervisors, Senior Management and Employees(continued)
| (II) | Profiles of Directors, Supervisors and senior management(Continued) |
Senior Management:
Guan Zemin, aged 55, is serving as President of the Company. Mr. Guan started to work in 1990, and he has successively served as Section Manager of Technology Development Section, Technology Development Department, and Deputy Chief Engineer of Wuhan Petrochemical Works, and Director of Catalyzing Workshop, Deputy Director and Director of Production Scheduling Department, and Deputy Chief Engineer of the Wuhan branch of Sinopec Corp. (“Wuhan Branch”). From December 2012 to December 2018, he served as Deputy President of Wuhan Branch. From May 2016 to December 2019, he served as President and Director of Sinopec-SK (Wuhan) Petrochemical Company Limited. From December 2018 to December 2019, he served as the Director and Deputy Party Secretary and President of Wuhan Branch. Mr. Guan graduated from the Fine Chemical Major of School of Chemical Engineering, East China University of Science and Technology with a master’s degree in Engineering in July 1990. He is a senior engineer by professional title.
Huang Xiangyu, aged 52, is serving as the Deputy President of the Company. Mr. Huang started his career in 1990 and joined the Complex in 1992. He served as the Deputy Director of the chemical workshop of Shanghai Jinyang Acrylic Plant, Deputy Director of Jinyang Equipment, Director and Deputy Director of Jinyang Acrylic Equipment of Acrylic Business Unit and Chief Engineer of Acrylic Business Unit. From July 2011 to January 2020, he served as the Director of the Acrylic Fiber Research Institute. From November 2011 to January 2020, he served as the Chief Engineer of the Acrylic Fiber Department. From February 2019 to January 2020, he served as Deputy Chief Engineer of the Company. Mr. Huang graduated from the Organic Chemical Major of School of Chemical Engineering, East China University of Science and Technology with a bachelor’s degree in Engineering in July 1990. He obtained a master’s degree in Engineering from Donghua University in May 2004. He graduated from Polymeric Chemistry and Physics Major of Fudan University with a doctor’s degree in Engineering in June 2013. He is a senior engineer by professional title.
Huang Fei, aged 43, is serving as Deputy President of the Company. Mr. Huang joined Sinopec Shanghai Petrochemical Company Limited in 2000, and he has successively served as Polyolefin Plant Deputy Director of Plastic Business Unit and Manager Assistant and Polyolefin Plant Director of Plastic Department. From August 2012 to June 2014, he served as Deputy Manager of the Plastic Department. From June 2014 to February 2017, he served as Director of Statistical Center and Vice Party Secretary. From February 2017 to December 2018, he served as Manager of Olefin Department and Deputy Party Secretary. From December 2018 to January 2019, he served as President Assistant and the Director of Production Department. From January 2019 to December 2019, Mr. Huang served as President Assistant and Manager of Production Department of Shanghai SECCO Petrochemical Company Limited. Mr. Huang graduated from the Polymer Materials and Engineering Major of East China University of Science and Technology with a bachelor’s degree of Engineering in July 2000. He graduated from Chemical Engineering Major of East China University of Science and Technology with a master’s degree in April 2008. He is a senior engineer by professional title.
32
Table of Contents
Directors, Supervisors, Senior Management and Employees(continued)
| (III) | Share options held by the Directors, Supervisors and senior management during the Reporting Period |
There were no share options held by the Directors, Supervisors and senior management during the Reporting Period.
| (IV) | Positions held in the Company’s shareholders during the Reporting Period |
Name | Name of shareholder | Position held | Commencement of term of service | End of term of service | ||||
Lei Dianwu | Sinopec Corp. | Senior Vice President | October 2018 | May 2021 | ||||
Mo Zhenglin | Sinopec Corp. | Deputy Director of the Finance Division Department | May 2018 | May 2021 | ||||
Zhai Yalin | Sinopec Corp. | Deputy Director of the Auditing Department | May 2018 | May 2021 | ||||
Fan Qingyong | Sinopec Corp. | Deputy Director of the Supervisory Department | May 2018 | May 2021 |
| (V) | Positions held in other companies during the Reporting Period |
Name | Name of other company | Position held | Commencement of term of service | End of term of service | ||||
Wu Haijun | Shanghai SECCO | Director | October 2017 | October 2020 | ||||
Wu Haijun | Shanghai SECCO | Chairman | December 2017 | January 2019 | ||||
Wu Haijun | Shanghai chemical industrial zone development co. LTD | Chairman | September 2018 | September 2021 | ||||
Zhou Meiyun | Jinshan Associated Trading | Chairman | July 2017 | July 2020 |
Apart from the information set out in the tables above and in section (2) “Profile of Directors, Supervisors and Senior Management”, no Director, Supervisor or senior management of the Company holds any other position at any other company.
33
Table of Contents
Directors, Supervisors, Senior Management and Employees(continued)
| (VI) | Remuneration of Directors, Supervisors and senior management during the Reporting Period |
Procedures for determining the remuneration of Directors, Supervisors and senior management | Remuneration for Independent Non-executive Directors are determined in accordance with the Remuneration System for Independent Directors approved at the 2007 Annual General Meeting. Remuneration for Independent Supervisors are determined in accordance with the Remuneration Payment Method for Independent Supervisors approved at the 2016 Annual General Meeting. Remuneration of the other Directors, Employee Representative Supervisors and External Supervisors and senior management are determined in accordance with the Remuneration System for Directors, Supervisors and Senior Management approved at the 2002 Annual General Meeting. | |
For details of the remuneration of the Directors and Supervisors of the Company, please refer to Note 12 and Note 36 to the consolidated financial statements prepared under IFRS. | ||
Basis for determining the remuneration of Directors, Supervisors and senior management | The remuneration of Directors, Supervisors and senior management of the Company is determined on the principles of “efficiency, motivation and fairness” and in accordance with the Remuneration System for Directors, Supervisors and Senior Management. | |
Remuneration paid to Directors, Supervisors and senior management | Please refer to item (1) “Changes in shareholdings and remuneration” of this chapter. | |
Total remuneration received by all Directors, Supervisors and senior management for the Reporting Period | RMB9,345,600 | |
The five highest paid individuals | Please refer to note 36(i) to the consolidated financial statements prepared under IFRS. The five individuals are the Directors and Supervisors of the Company. | |
Pension scheme | Please refer to Notes 2.25 and 30(f) to the consolidated financial statements prepared under IFRS. | |
34
Table of Contents
Directors, Supervisors, Senior Management and Employees(continued)
(VII) Changes in Directors, Supervisors and senior management during the Reporting Period
Name | Position held | Change | Reason | |||
| Shi Wei | Executive Director & President | Resigned | Age at retirement | |||
| Guo Xiaojun | Executive Director, Vice President & Secretary to the Board | Resigned | Change of work arrangements | |||
| Zuo Qiang | Supervisor | Resigned | Change of work arrangements | |||
| Li Xiaoxia | Supervisor | Resigned | Change of work arrangements | |||
| Fan Qingyong | Supervisor | Resigned | Change of work arrangements | |||
| Zhang Feng | Supervisor | Elected | — | |||
| Chen Hongjun | Supervisor | Elected | — |
| (VIII) | Interests and short positions of Directors, chief executives and Supervisors in the shares, underlying shares and debentures of the Company or associated corporations |
As at 31 December 2019, the interests and short positions of the Directors, chief executive and Supervisors of the Company in the shares, underlying shares and debentures of the Company or its associated corporations (within the meaning of Part XV of the SFO) which were required to be notified to the Company and the Hong Kong Stock Exchange pursuant to Divisions 7 and 8 of Part XV of the SFO (including interests and short positions which they were taken or deemed to have under such provisions of the SFO); or to be recorded in the register of interests required to be kept under section 352 of the SFO; or as otherwise notified to the Company and the Hong Kong Stock Exchange pursuant to the Model Code for Securities Transactions set out in Appendix 10 to the Hong Kong Listing Rules were as follows:
Interests in the shares and underlying shares of the Company:
Name | Position held | Number of | Number of underlying A shares share options held according to the Share Option Incentive Scheme (Shares) | Percentage of the total issued shares of the Company (%) | Percentage of the total issued A shares (%) | |||||||
Jin Qiang | Executive Director and Vice President | 301,000 A Share (L) | 0.002781 | 0.00411 | Beneficial owner | |||||||
Jin Wenmin | Executive Director and Vice President | 175,000 A Share (L) | 0.001617 | 0.00239 | Beneficial owner | |||||||
Zhang Feng | Supervisor | 10,000 A Share(L) | 0.000092 | 0.00014 | Beneficial owner | |||||||
Chen Hongjun | Supervisor | 31,400 A Share (L) | 0.000290 | 0.00043 | Beneficial owner | |||||||
(L): Long position
Save as disclosed above, as at 31 December 2019, so far as was known to the Directors, chief executive and Supervisors of the Company, none of the Directors, chief executive or Supervisors of the Company had any interests or short positions in the shares, underlying shares or debentures of the Company or its associated corporations which were required to be disclosed or recorded pursuant to the SFO and the Hong Kong Listing Rules as mentioned above.
35
Table of Contents
Directors, Supervisors, Senior Management and Employees(continued)
| (IX) | Changes in Directors’ and Supervisors’ information |
Save as disclosed in the 2019 interim report, disclosure of changes in Directors’ and Supervisors’ information pursuant to Rule 13.51B(1) of the Hong Kong Listing Rules during the Reporting Period are set out as below:
| (1) | Mr. Wu Haijun, an Executive Director, has been serving as Acting Secretary to the Board of Directors of the Company since December 2019. |
| (2) | Mr. Zhang Yimin, an Independent Non-executive Director, has been serving as Emeritus Professor of Finance in China Europe International Business School since January 2020. |
| (3) | Mr. Zhai Yalin, an external Supervisor of the Company, has ceased to serve as Deputy Director of Audit Bureau of Sinopec Group and Deputy Director of Audit Department of Sinopec Corp since December 2019, and has been serving as Supervisor of Sinopec Oilfield Service Corporation (listed on the main board of Hong Kong Stock Exchange, stock code: 1033; listed on Shanghai Stock Exchange, stock code: 600871) since June 2019. |
| (4) | Mr. Zheng Yunrui, an Independent Supervisor of the Company, has been serving as external Supervisor of Zhejiang Reclaim Construction Group Co., Ltd. (listed on Shenzhen Stock Exchange, stock code: 002586) since December 2019. |
| (X) | Transactions, arrangements or interests of Directors and Supervisors |
None of the Directors or Supervisors of the Company had any material interests, either directly or indirectly, in any material contract which was entered into by the Company or any of its subsidiaries and subsisted during the year or at the end of the year.
None of the Directors or Supervisors had any interests in any businesses (other than the Group’s businesses) that competed directly or indirectly with the Group’s business.
None of the Directors or Supervisors of the Company has entered into any service contracts with the Company which are not terminable by the Company within one year without payment of compensation other than statutory compensation.
| (XI) | Directors’ rights to acquire shares or debentures |
During the Reporting Period, the Company did not grant the Directors the rights to acquire shares or debentures.
36
Table of Contents
Directors, Supervisors, Senior Management and Employees(continued)
| (XII) | Compliance of Model Code for Securities Transactions |
The Company has adopted and implemented the Model Code for Securities Transactions to regulate securities transactions of the Directors and Supervisors. After making specific enquiries with all the Directors and Supervisors, the Company obtained written confirmations from each Director and Supervisor that they have fully complied with the Model Code for Securities Transactions during the Reporting Period.
The Model Code for Securities Transactions is also applicable to the senior management of the Company who are in possession of unpublished price sensitive information of the Company. No incident of non-compliance of the Model Code for Securities Transaction by the senior management was noted by the Company.
| (XIII) | Management contracts |
During the Reporting Period, the Company did not enter into any management and administration contract regarding the whole or any substantial part of its businesses (other than the service contracts with the Directors or any full-time employee of the Company).
| (XIV) | Permitted indemnity provision |
Appropriate Directors’ liability insurance has been arranged to indemnify the Directors for liabilities arising out of corporate activities. Such liability insurance is currently in force.
| (XV) | Punishment by securities regulatory authorities in the recent three years |
Nil.
37
Table of Contents
Directors, Supervisors, Senior Management and Employees(continued)
(XVI) Employees
| 1. | Employees of the Group |
| Number (Person) | ||||
Number of employees of the Company | 8,790 | |||
Number of employees of the subsidiaries | 88 | |||
Total number of employees of the Group | 8,878 | |||
Number of retired workers whose retirement costs are borne by the Group | 18,750 | |||
Professionals | ||||
Category of professionals | ||||
Production personnel | 5,430 | |||
Sales staff | 86 | |||
Technical staff | 2,190 | |||
Financial staff | 91 | |||
Administrative staff | 1,081 | |||
|
| |||
Total | 8,878 | |||
|
| |||
Education level | ||||
Educational attainment | ||||
Specialist college graduate and below | 6,265 | |||
Bachelor’s degree | 2,255 | |||
Master’s degree and above | 358 | |||
|
| |||
Total | 8,878 | |||
|
| |||
| 2. | Remuneration policy |
Remuneration packages of the Company’s staff include salary, share options and allowances. In accordance with the relevant regulations of the PRC, the Company also participates in the social security scheme implemented by the relevant government authorities, and makes contribution for the employees in proportion to their monthly salary. Employees of the Company can also enjoy supplementary medical insurance, enterprise annuity, retirement and other benefits.
During the Reporting Period, the staff remuneration of the Company amounted to RMB3,147,372.16 thousand.
| 3. | Training programs |
According to the Company’s plan of boosting the enterprise through talents, the annual key work requirements and the provisions of “Management Measures for Staff Training of Sinopec Shanghai”, the Company took the “problem-oriented, scientific management, and efficiency improvement” as the main task, through continuously improving the relevance and effectiveness of training, to strengthen the construction of the talent team, promote the development of employees, and help the Company fight a “talent reserve war”. The Company organized staff training at three levels of the Company, all units and dispatched personnel to participate in the headquarters and external institutions, so as to improve the quality of staff.
38
Table of Contents
Directors, Supervisors, Senior Management and Employees(continued)
| 4. | Professional structure chart |
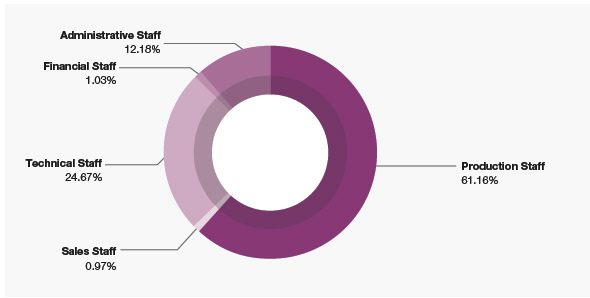
| 5 | Statistics on the education level |
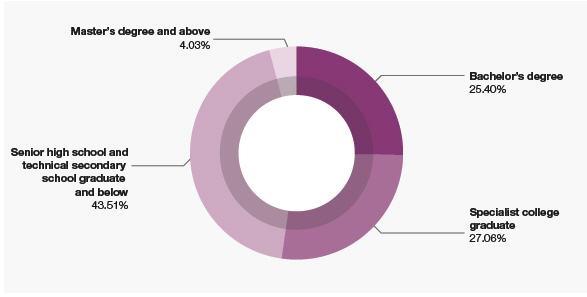
| 6. | Outsourcing services |
The total remuneration paid for outsourcing services of the Company during the Reporting Period was RMB144,239.57 thousand.
39
Table of Contents
| (I) | Notes for corporate governance and insider registration management |
| 1. | Corporate governance |
In 2019, the Company strictly complied with the regulatory legislation such as Company Law, Securities Law and the Corporate Governance Principles for Listed Companies issued by the CSRC, as well as the relevant provisions and requirements of the Shanghai Stock Exchange, the Hong Kong Stock Exchange and the New York Stock Exchange. It continued to improve its corporate governance structure, developed its corporate system, standardized the corporate operations and enhanced its overall corporate image.
Improving governance policies: During the Reporting Period, in accordance with the requirements of the relevant laws and regulations of the places where the Company’s shares are listed, the Company formulated the Nomination Policy for Directors, which was reviewed and approved at the 15th meeting of the Ninth Session of the Board. The Company also amended and improved the Company’s “Internal Control Manual” (2019 Edition).
Accomplishing appropriately specific corporate governance activities for listed companies: During the Reporting Period, the Company was committed to ensuring the compliance of relevant regulatory rules regarding corporate governance and continued to consolidate its achievements in specific areas of corporate governance. None of the Company, its Directors, Supervisors, senior management, shareholders and de facto controllers of the Company has been investigated by the CSRC, or punished or publicly criticized by the CSRC, the Securities and Futures Commission of Hong Kong or the U.S. Securities and Exchange Commission, or publicly censured by the Shanghai Stock Exchange, the Hong Kong Stock Exchange or the New York Stock Exchange.
Through continuous conduction of specific corporate governance activities and improvements of its governance system, the Company further enhanced its corporate governance level. The Company’s internal system also became more robust and standardized. Under the guidance of the relevant regulatory authorities, the Company will operate in strict compliance with the relevant laws and regulations and will further strengthen the establishment of standardized and institutionalized corporate governance so as to ensure the lawful, robust and sustainable development of the Company.
| 2 | Registration and management of insiders |
In order to administer the registration and management of persons with access to the Company’s inside information, strengthen confidentiality of inside information and safeguard fairness of information disclosure, during the Reporting Period, the Company enhanced the confidentiality of inside information and the registration, management and reporting of the persons with access to the Company’s inside information according to “System for the Registration and Management of Inside Information”, so as to prevent the Company from suffering unusual stock price fluctuations due to leakage of inside information and the resulting legal risks, and further standardize the Company’s operation.
40
Table of Contents
Corporate Governance(continued)
| (II) | Brief introduction of general meeting |
Session of the | Convening date | Title of the motions | Status of the resolutions | Designated websites for | Date of publication of resolutions | |||||||||
The Company’s 2018 annual general meeting | 20 June 2019 | 1. 2018 Work Report of the Board of the Company 2. 2018 Work Report of the Supervisory Committee of the Company 3. 2018 Audited Financial Statements of the Company 4. 2018 Profit Distribution Plan of the Company 5. 2019 Financial Budget Report of the Company 6. The re- appointment of PricewaterhouseCoopers Zhong Tian LLP and PricewaterhouseCoopers as the domestic and international auditors, respectively, of the Company for the year 2019 and authorization to the Board to fix their remunerations | Passed | Websites of the Shanghai Stock Exchange, the Hong Kong Stock Exchange and the Company | 20 June 2019 | |||||||||
The first extraordinary general meeting for 2019 of the Company | 10 December 2019 | 1. To consider and approve the Mutual Product Supply and Sales Services Framework Agreement (2020- 2022) and the continuing connected transactions contemplated thereunder, and the annual caps for each of the three years ending 31 December 2020, 2021 and 2022. To approve and confirm generally and unconditionally that all directors of the Company have been authorized to do things and act necessary or desirable to implement and give effect to any of the matters relating to, or incidental to, the Mutual Product Supply and Sales Services Framework Agreement (2020-2022), and to make changes thereto which may in his or her opinion be necessary or desirable. 2. To consider and approve the Comprehensive Services Framework Agreement (2020-2022) and the continuing connected transactions contemplated thereunder, including the annual caps for the three years ended 31 December 2020, 2021 and 2022. To approve and confirm generally and unconditionally that all directors of the Company have been authorized to do things and act necessary or desirable to implement and give effect to any of the matters relating to, or incidental to, the Comprehensive Services Framework Agreement (2020-2022), and to make changes thereto which may in his or her opinion be necessary or desirable. | Passed | Websites of the Shanghai Stock Exchange, the Hong Kong Stock Exchange and the Company | 10 December 2019 | |||||||||
41
Table of Contents
Corporate Governance(continued)
| (III) | Performance of duties by the directors |
| 1. | Directors’ attendance at the Board meetings and general meetings |
| Participation in the Board Meeting | Participation in General Meetings | |||||||||||||||||||||||||||||||
Name of Director | Independent Director or not | Attendance at the Board meetings during the year (number of times) | Attendance in person (number of times) | Attendance by correspondence (number of times) | Attendance by proxy (number of times) | Absence (number of times) | Failure to attend the meeting in person for two consecutive times or not | Attendance at general meetings (number of times) | ||||||||||||||||||||||||
Wu Haijun | No | 5 | 5 | 3 | 0 | 0 | No | 2 | ||||||||||||||||||||||||
Shi Wei | No | 4 | 4 | 2 | 0 | 0 | No | 2 | ||||||||||||||||||||||||
Jin Qiang | No | 5 | 4 | 3 | 1 | 0 | No | 2 | ||||||||||||||||||||||||
Guo Xiaojun | No | 4 | 4 | 2 | 0 | 0 | No | 2 | ||||||||||||||||||||||||
Zhou Meiyun | No | 5 | 5 | 3 | 0 | 0 | No | 2 | ||||||||||||||||||||||||
Jin Wenmin | No | 5 | 5 | 3 | 0 | 0 | No | 2 | ||||||||||||||||||||||||
Lei Dianwu | No | 5 | 3 | 3 | 2 | 0 | No | 0 | ||||||||||||||||||||||||
Mo Zhenglin | No | 5 | 4 | 3 | 1 | 0 | No | 1 | ||||||||||||||||||||||||
Zhang Yimin | Yes | 5 | 5 | 3 | 0 | 0 | No | 1 | ||||||||||||||||||||||||
Liu Yunhong | Yes | 5 | 5 | 4 | 0 | 0 | No | 1 | ||||||||||||||||||||||||
Du Weifeng | Yes | 5 | 5 | 3 | 0 | 0 | No | 2 | ||||||||||||||||||||||||
Li Yuanqin | Yes | 5 | 5 | 3 | 0 | 0 | No | 2 | ||||||||||||||||||||||||
Number of Board meetings held during the year | 5 | |||||
including: | number of meetings held on site | 1 | ||||
number of meetings held by correspondence | 3 | |||||
number of meetings held on site and by correspondence concurrently | 1 | |||||
| 2. | Disagreements of the Independent Non-executive Directors on relevant issues of the Company |
During the Reporting Period, none of the Independent Non-executive Directors of the Company raised any disagreements on any Board resolutions or other issues of the Company.
42
Table of Contents
Corporate Governance(continued)
| (IV) | Major comments and recommendations put forward by the specific Board committees under the Board while discharging their duties during the Reporting Period |
On 18 March 2019, the Audit Committee reviewed together with the management the accounting principles and standards adopted by the Company and discussed matters regarding audit, risk management, internal control and financial reporting, including the review of the financial statements for the year ended 31 December 2018.
On 18 March 2019, the Remuneration and Appraisal Committee reviewed the remuneration of Directors, Supervisors and senior management set out in the Company’s annual report for the year ended 31 December 2018.
On 18 March 2019, the Nomination Committee has reviewed the structure, number and composition of the Board for the year ended 31 December 2018 and reviewed the Company’s Nomination Policy for Directors.
| (V) | Information on Supervisory Committee’s identification of risks in the Company |
The Company’s Supervisory Committee had no disagreements to the matters under their supervision during the Reporting Period.
| (VI) | Information on whether the Company fails to guarantee independence from its controlling shareholder or maintain autonomous operational ability in respect of business, personnel, assets, organization and finances, etc. |
The Company is independent of the controlling shareholder with regard to its business, personnel, assets, organizations and finances. The Company has full ability to conduct its business independently and has the ability to operate autonomously.
| (VII) | Evaluation mechanism for senior management as well as the establishment and implementation of incentive mechanism during the Reporting Period |
The Remuneration System for the senior management was considered and approved at the 2002 annual general meeting of the Company on 18 June 2003. In 2019, the Company continued to implement this system as the basis of appraising and rewarding the Company’s senior management.
43
Table of Contents
| (I) | Statement of responsibility for internal control and the establishment of the internal control system |
| 1. | Statement of responsibility for internal control |
The Board of the Company is responsible for establishing and maintaining a comprehensive internal control system pertinent to financial reporting.
The objectives of internal control pertinent to financial reporting are to ensure that the financial information reported is true, complete and reliable and to prevent the risk of material misstatements. However, due to inherent limitations of the internal control, the Company can only provide reasonable level of assurance for the achievement of the objectives mentioned above.
The Board has evaluated the internal controls pertinent to financial reporting in accordance with the requirements under the Basic Standards for Enterprise Internal Control, and is of the view that such internal control was effective in the year 2019.
| 2. | Establishment of internal control system |
| Overall plan of internal control establishment | Since 2004, the Company has established and implemented a comprehensive internal control system which covers aspects such as production, operations, finance, investment, human resources and information disclosure, and amends the Internal Control Manual annually in accordance with domestic and overseas regulatory requirements, risk prevention needs and recommendations by external auditors on internal control review. | |
| The Company’s internal control system has been established primarily for the following basic objectives: (a) to standardize the enterprise’s business operation, prevent operational and managerial risks, ensure that financial statements and relevant information are truthful and complete, improve operational efficiency and effectiveness, and facilitate the achievement of the Company’s development strategy; (b) to plug loopholes and eliminate potential hazards so as to prevent, detect and correct mistakes and fraudulent acts in a timely manner, thereby ensuring that the Company’s assets are secure and integral; and (c) to ensure that the relevant state laws and regulations, the Articles of Association and internal rules and regulations are thoroughly enforced so as to fulfill the regulatory requirements for listed companies in both domestic and overseas capital markets. | ||
44
Table of Contents
Internal Control(continued)
| (I) | Statement of responsibility for internal control and the establishment of the internal control system(Continued) |
| Work plan on establishing and improving the internal control system and implementation thereof | The Internal Control Manual (2019 Edition) comprises 22 categories, 55 operation process and sets out 1,539 control points and 215 authorization control indicators. The scope of control covers the major areas of the Company’s production, operations and development, as well as the key procedures of relevant business such as financial management, accounting and auditing, procurement of resources, product sales, capital expenditures, human resources and information management. The scope of control also includes reviewing the sufficiency of the Company’s resources of accounting, financial management and reporting functions as well as employee qualifications and experience and the adequacy of the training courses attended by the employees and the relevant budget. | |
| In 2019, the Company conscientiously enforced the Internal Control Manual approved by the Board, and conducted self-assessment, walk-through test on procedures and integrated inspection on internal control in accordance with the relevant rules and regulations. PricewaterhouseCoopers Zhong Tian LLP, external auditor of the Company also reviewed the status of the Company’s internal control. The management of the Company considers that the internal control of the Company was effective during the Reporting Period. | ||
45
Table of Contents
Internal Control(continued)
| (I) | Statement of responsibility for internal control and the establishment of the internal control system(Continued) |
| Establishment of the department inspecting and supervising internal control | The Company has established an internal control task force, with the Chairman, the President and the Chief Financial Officer as its chief and deputy chief, respectively. As the leading organ of the Company’s overall internal control system, the guidance group is mainly responsible for approving interim amendments to the Internal Control Manual during the year, considering updates to the Internal Control Manual, reviewing the annual self-assessment report on internal control, handling and rectifying issues identified during an internal control inspection and reporting major issues to the Board for consideration and approval. | |
An internal control office was established under the internal control task force as the department in charge of internal control inspection and supervision. This office is responsible for directing or organizing daily inspections and evaluation, organizing annual comprehensive inspections and evaluation of the Company, organizing specific inspections and evaluation as needed, supervising and rectifying, drafting assessment proposals and reporting them to the internal control task force, and submitting regular reports on internal control inspection and supervision to the Audit Committee of the Board.
The Company has established an internal control supervisor working network consisting of 38 members. These internal control supervisors, representing their respective departments, and administrative heads of second-tier units, conduct internal control work and activities within their respective supervisory scope and functionally report to the internal control office of the Company. | ||
| The Board’s work arrangements for internal control | Control reports on the establishment of the internal control system of the Company and the findings of the implementation and inspection of the internal control on a regular basis. The Board also considers and publishes a self-assessment report on the internal control of the Company on an annual basis, and considers and approves the revised Internal Control Manual of the Company annually.
PricewaterhouseCoopers, the Company’s external auditor, issued an auditor’s report on internal control over financial reporting according to the “Sarbanes-Oxley Act”. PricewaterhouseCoopers Zhong Tian LLP, the Company’s external auditor, issued an auditor’s report on internal control over financial reporting according to “Audit Guidelines for Enterprise Internal Control” in 2019. | |
46
Table of Contents
Internal Control(continued)
| (I) | Statement of responsibility for internal control and the establishment of the internal control system (continued) |
| Improvements in the internal control system in relation to financial audit | The Company took the lead for the assessment of the rules and regulations and fully assessed the compliance and effectiveness of each system. A total of 63 amendments were made, 52 systems were amended and 11 systems were added. | |
| Deficiencies in internal control and the relevant rectification | The Company conducted a self-assessment on its internal control work in 2019. The results of the assessment are: no material deficiencies were detected in the design or implementation of the internal control of the Company from 1 January 2019 to 31 December 2019. | |
| (II) | Disclosure of the self-assessment report on internal control |
The Company has disclosed the self-assessment report of the Board on the Company’s internal control.
| (III) | Auditor’s report on internal control |
The Auditor’s report on internal control is disclosed or not: Disclosed
The Company has engaged PricewaterhouseCoopers Zhong Tian LLP to conduct an audit on the effectiveness of the internal control over financial reporting of the Company for the year ended 31 December 2019 pursuant to the requirements of the Audit Guidelines for Enterprise Internal Control and an auditor’s report on internal control has been issued.
| (IV) | The Company’s establishment of an accountability system for major errors in the disclosure of information in annual reports |
The Company’s Information Disclosure Management System (2017 Revised Version) sets out specific regulations for the accountability of major errors in the disclosure of information in its annual reports. During the Reporting Period, there were no major errors in the disclosure of information in the Company’s annual report, which required amendments to major accounting errors, supplements to material omission of information or amendments to results forecasts.
47
Table of Contents
(under the Hong Kong Listing Rules)
The Company is committed to operating in compliance with corporate governance standards by implementing stringent corporate governance measures and enhancing accountability and transparency to deliver higher returns to shareholders. It is the Board’s belief that maintaining a good corporate governance system and a world-class governance model are essential in providing a framework for the Company to safeguard the interests of shareholders, enhance corporate value, formulate its business strategies and policies and to develop the Company into a competitive international petrochemical enterprise.
| (1) | Corporate Governance Practices |
During the Reporting Period, the Company applied all applicable code provisions set out in the Corporate Governance Code contained in Appendix 14 to the Hong Kong Listing Rules.
The Directors are of the opinion that, during the Reporting Period, the Company complied with all applicable code provisions set out in the Corporate Governance Code.
The Directors are of the opinion that, during the Reporting Period, the Company complied with all applicable code provisions set out in the Environmental, Social and Governance Reporting Guide contained in Appendix 27 to the Hong Kong Listing Rules. Please refer to the 2019 Corporate Social Responsibility Report of the Company for more details.
| (2) | Securities Transactions by Directors and Supervisors |
The Company has adopted the Model Code for Securities Transactions as set out in Appendix 10 to the Hong Kong Listing Rules.
Specific enquiry has been made with all the Directors and Supervisors and the Directors and Supervisors have confirmed that they have fully complied with the Model Code for Securities Transactions throughout the Reporting Period.
The Model Code for Securities Transactions is also applicable to the senior management of the Company who are in possession of unpublished price sensitive information of the Company. No incident of non-compliance of the Model Code for Securities Transactions by the senior management was discovered by the Company.
48
Table of Contents
Corporate Governance Report(continued)
(under the Hong Kong Listing Rules)
| (3) | Board of Directors |
| 1. | Composition of the Board |
The Board currently consists of 10 Directors, including 4 Executive Directors, 2 Non-executive Directors and 4 Independent Non-executive Directors, among whom there is one Chairman and three Vice Presidents. Details of the current Board composition are as follows:
Executive Directors:
Wu Haijun, Chairman, Chairman of the Strategy Committee and member of the Nomination Committee
Jin Qiang, Vice President
Jin Wenmin,Vice President
Zhou Meiyun, Vice President, Chief Financial Officer, member of the Remuneration and Appraisal Committee and the Strategy Committee
Non-executive Directors:
Lei Dianwu,member of the Strategy Committee
Mo Zhenglin,member of the Strategy Committee
Independent Non-executive Directors:
Zhang Yimin,Chairmen of the Remuneration and Appraisal Committee and the Nomination Committee
Liu Yunhong,member of the Audit Committee
Du Weifeng, member of the Audit Committee, the Remuneration and Appraisal Committee and the Nomination Committee
Li Yuanqin,Chairman of the Audit Committee and member of the Strategy Committee
During the Reporting Period, Mr. Shi Wei and Mr. Guo Xiaojun resigned as Executive Director on 19 December 2019.
The biographical information of the Directors are set out in the section headed “Directors, Supervisors, Senior Management and Employees” on pages 23 to 39 of this annual report. The Directors (including the Chairman and the President (equivalent to the chief executive officer) have no financial, business, family or other material relationship with each other.
49
Table of Contents
Corporate Governance Report(continued)
(under the Hong Kong Listing Rules)
| 2. | Attendance Records of the Directors |
The Board meets at least once per quarter. In 2019, the Board held five meetings. Most of the Directors entitled to attend the meetings had actively attended the five meetings held this year in person or by alternates. Before each Board meeting, the joint company secretary would consult each Director on matters to be tabled at the Board meeting. Any matters raised by the Directors would be included in the agenda of the Board meeting. During the Reporting Period, notices and draft agenda of Board meetings were sent to all Directors at least 14 days before the date of the meeting.
To facilitate the Directors in performing their duties effectively and obtaining relevant information to make informed decisions, the agenda of all meetings of the Board or Board committees, together with all relevant documents, are sent to each Board member at least five days before the date of the relevant meetings. The Directors may hold formal or informal meetings with the senior management before any Board meeting. The Directors and members of the Board committees have access to the papers and minutes of meetings of the Board or the Board committees.
50
Table of Contents
Corporate Governance Report(continued)
(under the Hong Kong Listing Rules)
The attendance records of each director at the Board meetings and the general meetings of the Company held during the Reporting Period are set out in the table below:
| Annual | Extraordinary | |||||||||||||||
| Board Meeting | General Meeting | General Meeting | ||||||||||||||
| Attendance in Person/Number of | Attendance by proxy/Number of | Attendance/ Number | Attendance/ Number | |||||||||||||
Name of Director | Meetings | Meetings | of Meetings | of Meetings | ||||||||||||
Executive Directors: | ||||||||||||||||
Wu Haijun | 5/5 | — | 1/1 | 1/1 | ||||||||||||
Shi Wei(1) | 4/4 | — | 1/1 | 1/1 | ||||||||||||
Jin Qiang | 4/5 | 1/5 | 1/1 | 1/1 | ||||||||||||
Guo Xiaojun(2) | 4/4 | — | 1/1 | 1/1 | ||||||||||||
Jin Wenmin | 5/5 | — | 1/1 | 1/1 | ||||||||||||
Zhou Meiyun | 5/5 | — | 1/1 | 1/1 | ||||||||||||
Non-executive Directors: | ||||||||||||||||
Lei Dianwu | 3/5 | 2/5 | 0/1 | 0/1 | ||||||||||||
Mo Zhenglin | 4/5 | 1/5 | 0/1 | 1/1 | ||||||||||||
Independent Non-executive Directors: | ||||||||||||||||
Zhang Yimin | 5/5 | — | 0/1 | 1/1 | ||||||||||||
Liu Yunhong | 5/5 | — | 0/1 | 1/1 | ||||||||||||
Du Weifeng | 5/5 | — | 1/1 | 1/1 | ||||||||||||
Li Yuanqin | 5/5 | — | 1/1 | 1/1 | ||||||||||||
| (1) | Mr. Shi Wei resigned as Executive Director on 19 December 2019. |
| (2) | Mr. Guo Xiaojun resigned as Executive Director on 19 December 2019. |
Apart from the abovementioned Board meetings, the Chairman also held 1 meeting with the Independent Non-executive Directors during the Reporting Period to discuss the Board’s annual work plan and the implementation of such plans and to review the state of the Company’s productions and operations and its development prospects.
51
Table of Contents
Corporate Governance Report(continued)
(under the Hong Kong Listing Rules)
| 3. | Chairman and President (equivalent to Chief Executive Officer) |
The duties and responsibilities of the Chairman and the President are separated and the scope of their respective duties and responsibilities is set out in the Articles of Association.
The Chairman of the Company is responsible for providing to all Directors all information concerning the performance of Board duties. He is also committed to improving the quality of the information and timeliness of the delivery of information to the Directors. The Chairman of the Company plays an important role in promoting good corporate governance within the Company. He is to lead the Board, encourage the Directors to carry out their duties in good faith with mutual support and close cooperation, and make an active contribution to the production, operations, reform and development of the Company. The President is accountable to the Board. With the authorization of the Board, the President shall have the power to fully manage the Company’s business, deal with all internal and external affairs of the Company including presiding over the management of the Company’s production and operations, developing basic rules and regulations of the Company, organizing and implementing the annual business plan and investment proposals of the Company, etc.
Code provision A.2.1 of the Corporate Governance Code stipulates that the roles of chairman and chief executive should be separate and should not be performed by the same individual.
During the Reporting Period, the positions of the Chairman and the President were held by Mr. Wu Haijun and Mr. Shi Wei respectively. Mr. Shi Wei resigned as the President on 19 December 2019 and Mr. Guan Zemin was appointed as the President on 3 February 2020.
| 4. | Independent Non-executive Directors |
During the Reporting Period, the Board at all times has four Independent Non-executive Directors representing one-third of the Board, meeting the requirements of the Hong Kong Listing Rules relating to the appointment of at least three Independent Non-executive Directors representing at least one-third of the Board with one of whom possessing appropriate professional qualifications, or accounting or related financial management expertise.
The Independent Non-executive Directors possess extensive experience as well as academic and professional qualifications in various areas that include management, accounting and finance thereby ensuring the Board’s ability to protect the interests of the Company’s shareholders as a whole. During the Reporting Period, the Independent Non-executive Directors contributed significantly in improving the Company’s corporate governance structure and protecting the interests of the Company’s minority shareholders.
The Company has received written annual confirmation from each of the Independent Non-executive Directors in respect of his independence in accordance with the independence guidelines set out in Rule 3.13 of the Hong Kong Listing Rules. The Company considers all Independent Non-executive Directors independent.
52
Table of Contents
| Corporate | Governance Report(continued) |
(under the Hong Kong Listing Rules)
| 5. | Appointment and Re-election of Directors |
All Directors (including Non-executive Directors and Independent Non-executive Directors) are appointed for a specific term. According to the Articles of Association, Directors shall be elected by shareholders at a general meeting for a term of three years, and shall be eligible for re-election upon expiry of their term of office. However, the term of an Independent Non-executive Director may not exceed a total of six years.
| 6. | Responsibilities of the Directors |
The Board is primarily responsible for formulating and supervising the strategic development of the Company, setting the objectives, strategies, policies and business plans of the Company, reviewing and monitoring the Company’s operations and financial performance directly and indirectly through its committees, as well as devising the appropriate risk management and internal control policies and systems, thereby ensuring the achievement of the Company’s strategic objectives.
All Directors, including Non-executive Directors and Independent Non-executive Directors, have brought a wide spectrum of valuable business experience, knowledge and professionalism to the Board for its efficient and effective functioning. The functions of the Non-executive Directors include participating in Board meetings to provide independent opinions, taking a lead at Board meetings where potential conflict of interests arises, serving as members of the Board committees when invited, scrutinizing the Company’s performance and providing a balance in the Board for bringing effective independent judgement on corporate actions and operations.
All Directors have full and timely access to all the information of the Company and may, upon request, seek independent professional advice in appropriate circumstances, at the Company’s expenses for discharging their duties to the Company. When the Directors are required to give opinions on matters such as external guarantees, financing and connected transactions, the Company will appoint relevant independent professionals such as auditors, financial advisers and lawyers to provide independent opinions to help the Directors discharging their duties.
The Board reserves the power to make decisions relating to all major matters including policy matters, strategies and budgets, internal control and risk management, material transactions (in particular those that may involve conflict of interests), financial information, appointment of directors and other significant operational matters of the Company. Responsibilities relating to implementing decisions of the Board, directing and co-ordinating the daily operation and management of the Company are delegated to the management.
The Rules of Procedures for the Board, an appendix to the Articles of Association, contains detailed provisions on the terms of reference, authorization, meeting policies and rules of discussion of the Board. The Company has also developed the Work Rules for the President which contains detailed provisions on the duties and responsibilities as well as the rules of procedure for the management.
53
Table of Contents
Corporate Governance Report(continued)
(under the Hong Kong Listing Rules)
The Directors shall disclose to the Company details of other offices held by them and the Board regularly reviews the contribution required from each Director to perform his responsibilities to the Company.
The Company has purchased Directors’ and officers’ liabilities insurance in respect of any possible legal action against its Directors and officers arising out of corporate activities.
| 7. | Continuous Professional Development of Directors & Company Secretary |
Directors shall keep abreast of regulatory developments and changes in order to effectively perform their responsibilities and to ensure that their contribution to the Board remains informed and relevant.
To ensure that the Directors adequately understand the operations and businesses of the Company, every newly-appointed Director will receive a comprehensive set of introductory materials after his/her appointment which includes an introduction to the Group’s business, the duties and responsibilities of a Director and other legal requirements. Relevant on-going professional training sessions will also be organized for newly-appointed Directors to help them fully understand the duties that a Director should fulfill as stipulated in the relevant requirements of the laws and regulations, including the Hong Kong Listing Rules, and to enable them to have a timely and comprehensive understanding of the operations of the Company.
In addition, all Non-executive Directors will receive updated information from the management regularly, including strategic plans, business reports and analyses on economic activities etc. with a view to assist them to perform their duties effectively.
All Directors should participate in continuous professional development to upgrade their expertise and skills and to refresh their knowledge to ensure that they perform their duties better in contributing to the Board. Each of the Directors has provided to the Company records of their participation in the relevant training in 2019. The Company has also committed to organizing training programs for its Directors. Internally-facilitated briefings for Directors would be arranged and reading material on relevant topics would be provided to Directors where appropriate.
During the Reporting Period, Mr. Zhou Meiyun participated in the 49th Affiliated Persons Enhanced Continuing Professional Development Seminar organized by the Hong Kong Institute of Chartered Secretaries. Mr. Jin Qiang and Mr. Jin Wenmin participated in the second session of training course in 2019 for directors and supervisors of listed companies in Shanghai. Ms. Li Yuanqin participated in follow-up training of the independent directors of the listed companies in the second session of training courses in 2019. Mr. Zheng Yunrui participated in the third session of the training courses for directors and supervisors of listed companies in Shanghai in 2019.
During the Reporting Period, Ms. Chan Sze Ting, company secretary of the Company, has received no less than 15 hours of relevant professional training.
54
Table of Contents
Corporate Governance Report(continued)
(under the Hong Kong Listing Rules)
| (4) | Board Committees |
The Board has established four committees, namely, the Audit Committee, the Remuneration and Appraisal Committee, the Nomination Committee and the Strategy Committee, for overseeing particular aspects of the Company’s affairs. All Board committees stipulate their terms of reference. The Rules of Procedures of the Board committees are posted on the websites of the Hong Kong Stock Exchange, the Shanghai Stock Exchange and the Company and are available to shareholders upon request. The Board committees submit minutes, resolutions and reports to the Board subsequent to their meetings in respect of the progress of work and results of discussion.
| 1. | The Remuneration and Appraisal Committee |
| (i) | Role and Functions of the Remuneration and Appraisal Committee |
The principal duties of the Remuneration and Appraisal Committee are to formulate and review the remuneration policies and proposals for the Directors and senior management of the Company, to set performance appraisal standards and conduct performance appraisals of the Directors and senior management of the Company, and to establish transparent procedures for developing such remuneration policy and structure to ensure that no Director or any of his directly interested parties is involved in deciding his own remuneration.
The committee may seek advice from independent professionals if required in accordance with the applicable procedures at the expense of the Company.
| (ii) | Members of the Remuneration and Appraisal Committee |
The Remuneration and Appraisal Committee of the Board comprises one Executive Director and two Independent Non-executive Directors.
Members of the Remuneration and Appraisal Committee during the Reporting Period are as follows:
| Chairman: | Zhang Yimin,Independent Non-executive Director | |
| Members: | Du Weifeng,Independent Non-executive Director | |
| Zhou Meiyun,Executive Director | ||
55
Table of Contents
Corporate Governance Report(continued)
(under the Hong Kong Listing Rules)
| (iii) | Meetings of the Remuneration and Appraisal Committee |
The Remuneration and Appraisal Committee convenes at least one meeting each year. In 2019, the Remuneration and Appraisal Committee held one meeting with a record of attendance as follows:
Name of Director | Attendance in Person/Number of Meetings | Attendance by Alternate/Number of Meetings | ||||||
Zhang Yimin | 1/1 | — | ||||||
Du Weifeng | 1/1 | — | ||||||
Zhou Meiyun | 1/1 | — | ||||||
| (iv) | Procedures and Basis for the Determination of Remuneration of Directors, Supervisors and Senior Management |
The remuneration of Independent Non-executive Directors is determined in accordance with the “Remuneration System for Independent Directors” amended at the 2007 annual general meeting held in June 2008. The remuneration of other Directors, Staff Supervisors, External Supervisors and senior management is determined according to the “Remuneration System for Directors, Supervisors and Senior Management” passed at the 2002 annual general meeting held in June 2003. The remuneration of Independent Supervisors is determined in accordance with the “Remuneration Payment Method for Independent Supervisors” approved at the 2016 annual general meeting held in June 2017.
The Remuneration and Appraisal Committee reviews the implementation of the remuneration evaluation every year. It also appraises the annual performance of the Directors and senior management of the Company, and makes recommendations to the Board on their remuneration according to the results of the appraisal.
| (v) | The Work of the Remuneration and Appraisal Committee during the Reporting Period |
During the Report Period, the Remuneration and Appraisal Committee reviewed the remuneration policy of the Directors and conducted annual appraisals with the Directors and the senior management. The committee also reviewed the remuneration structure of the Directors, Supervisors and senior management.
56
Table of Contents
Corporate Governance Report(continued)
(under the Hong Kong Listing Rules)
| 2. | The Audit Committee |
| (i) | Role and Functions of the Audit Committee |
The Audit Committee is principally responsible for advising the Board on the appointment, dismissal, remuneration and terms of engagement of external auditors, reviewing the effectiveness of the Company’s internal audit function, supervising the internal audit system and its implementation, reviewing the financial information of the Company and its disclosure including verifying the completeness of financial statements, annual reports and interim reports of the Company, reviewing the major opinions stated in the financial statements and reports of the Company, reviewing the financial control, internal control and risk management systems of the Company, reviewing arrangements to enable employees of the Company to raise concerns about possible improprieties in financial reporting, internal control or other matters of the Company and examining connected transactions of the Company.
The establishment of the Audit Committee reflects the Company’s determination to improve the transparency of its financial reporting system and its financial arrangements. The Company pays close attention to the minutes and reports prepared by the Audit Committee. The committee may seek advice from independent professionals in accordance with the applicable procedures at the expense of the Company.
| (ii) | Members of the Audit Committee |
The Audit Committee of the Board comprises three Independent Non-executive Directors.
Members of the Audit Committee during the Reporting Period are as follows:
| Chairman: | Li Yuanqin,Independent Non-executive Director | |
| Members: | Liu Yunhong,Independent Non-executive Director | |
| Du Weifeng,Independent Non-executive Director | ||
57
Table of Contents
Corporate Governance Report(continued)
(under the Hong Kong Listing Rules)
| (iii) | Meetings of the Audit Committee |
The Audit Committee should convene at least two meetings each year. In 2019, the Audit Committee held two meetings without the presence of the Executive Directors with a record of attendance as follows:
| Attendance in | Attendance by | |||||||
Name of Director | Person/Number of Meetings | Alternate/Number of Meetings | ||||||
Liu Yunhong | 2/2 | — | ||||||
Du Weifeng | 2/2 | — | ||||||
Li Yuanqin | 2/2 | — | ||||||
| (iv) | The Work of the Audit Committee during the Reporting Period |
During the Reporting Period, the Audit Committee reviewed the accounting principles and standards adopted by the Company, the interim and annual financial results and reports and significant issues on the financial reporting, operational and compliance controls, the effectiveness of the risk management and internal control systems, appointment of external auditors and relevant scope of works, and continuing connected transactions of the Company.
| 3. | The Nomination Committee |
| (i) | Role and Functions of the Nomination Committee |
The Nomination Committee is accountable to the Board, and is mainly responsible for reviewing the Board composition, making recommendations to the Board on the procedures and criteria for the selection and appointment of Directors and senior management of the Company and on their qualifications to hold office, and assessing the independence of Independent Non-executive Directors.
In assessing the Board composition, the Nomination Committee would take into account various aspects as well as factors concerning Board diversity as set out in the Company’s Board Diversity Policy, including but not limited to gender, age, cultural and educational background, professional qualifications, experience, skills, knowledge, length of service, etc. The Nomination Committee would discuss and agree on measurable objectives for achieving diversity on the Board, where necessary, and recommend them to the Board for adoption.
In identifying and selecting suitable candidates for directorships, the Nomination Committee would consider the candidate’s relevant criteria as set out in the Nomination Policy such as character, qualifications, experience, independence and other relevant criteria necessary to complement the corporate strategy and achieve Board diversity, where appropriate, before making recommendation to the Board.
58
Table of Contents
Corporate Governance Report(continued)
(under the Hong Kong Listing Rules)
The Company provides adequate resources to the Nomination Committee for the performance of its duties. The committee may seek independent professional advice during the performance of its duties at the Company’s expense.
| (ii) | Members of the Nomination Committee |
The Nomination Committee of the Board comprised one Executive Director and two Independent Non-executive Directors.
Members of the Nomination Committee during the Reporting Period are as follows:
| Chairman: | Zhang Yimin,IndependentNon-executive Director | |
| Members: | Du Weifeng,IndependentNon-executive Director | |
| Wu Haijun,Executive Director | ||
| (iii) | Meetings of the Nomination Committee |
The Nomination Committee should convene at least one meeting each year. In 2019, the Nomination Committee held one meeting during the Reporting Period. The attendance record of the meetings of the Nomination Committee is set out in the table below:
| Attendance in | Attendance by | |||||||
Name of Director | Person/Number of Meetings | Alternate/Number of Meetings | ||||||
Zhang Yimin | 1/1 | — | ||||||
Du Weifeng | 1/1 | — | ||||||
Wu Haijun | 0/1 | 1/1 | ||||||
| (iv) | The Work of the Nomination Committee during the Reporting Period |
During the Reporting Period, the Nomination Committee reviewed the structure and number of members and composition of the Board, and reviewed, and approved the Company’s Nomination Policy for Directors. The Nomination Committee also assessed the independence of the Independent Non-executive Directors.
59
Table of Contents
Corporate Governance Report(continued)
(under the Hong Kong Listing Rules)
The Nomination Committee also reviewed the composition of the Board from a diversity perspective. At present, the Board has a total of ten Directors, including four Executive Directors, two Non-executive Directors, and four Independent Non-executive Directors. The four Executive Directors worked in state-owned enterprises before serving as Chairman, President, Vice President, Chief Financial Officer and other important positions with extensive experience in enterprise management. The two Non-executive Directors were professor-grade senior engineer in organic chemistry and senior accountant by professional title, with extensive experience in enterprise management, finance, finance and investment development management. Moreover, they have a deep understanding of the chemical industry. The four Independent Non-executive Directors were professor in finance, legal researcher, lawyer, and scholar in accounting and management. They have extensive professional experience. The Board has one female Director who provides professional advice for the Company in different areas. The diversified composition of the Board provides the Board with professional opinions from multiple perspectives to ensure that the Board effectively performs its duties, promotes the Company’s corporate performance, and maintains sustainable development. The Nomination Committee believes that the Board has sufficient diversification in terms of age, cultural and educational background, professional experience, skills, and knowledge. The Nomination Committee will pay particular attention to other aspects such as gender and ethnicity when selecting Directors, so as to achieve diversity of the Board. For details of gender, age and service term of the members of the Board, please refer to Chapter V “Directors, Supervisors, Senior Management and Employees”.
60
Table of Contents
Corporate Governance Report(continued)
(under the Hong Kong Listing Rules)
| (v) | Board Diversity Policy |
The Company has adopted a Board Diversity Policy which sets out the approach to achieve diversity of the Board. The Company recognizes and embraces the benefits of having a diverse Board and sees increasing diversity at the Board level as an essential element in maintaining the Company’s competitive advantage.
Pursuant to the Board Diversity Policy, with a view to achieving a sustainable and balanced development, the Company sees increasing diversity at the Board level as an essential element in supporting the attainment of its strategic objectives and its sustainable development. In designing the Board’s composition, Board diversity has been considered from a number of aspects, including but not limited to gender, age, cultural and educational background, ethnicity, professional experience, skills, knowledge and length of service. All Board appointments will be based on meritocracy, according to the Company’s specific needs and business model, and candidates will be considered against objective criteria, having due regard for the benefits of diversity on the Board. Selection of candidates will be based on a range of diversity perspectives, including but not limited to gender, age, cultural and educational background, ethnicity, professional experience, skills, knowledge and length of service. The ultimate decision will be based on merit and contribution that the selected candidates will bring to the Board. The Board’s composition (including gender, ethnicity, age, length of service) will be disclosed in the Corporate Governance Report annually.
The Nomination Committee will report on the composition of the Board on its diversity in the Corporate Governance Report annually, and monitor the implementation of the Board Diversity Policy.
61
Table of Contents
Corporate Governance Report(continued)
(under the Hong Kong Listing Rules)
| (vi) | Nomination Policy |
The Board has delegated its responsibilities and authority for selection and appointment of Directors to the Nomination Committee of the Company.
The Company has adopted the Nomination Policy which sets out the selection criteria and process and the Board succession planning considerations in relation to nomination and appointment of Directors of the Company and aims to ensure that the Board has a balance of skills, experience and diversity of perspectives appropriate to the Company and the continuity of the Board and appropriate leadership at Board level.
The Nomination Policy sets out the factors for assessing the suitability and the potential contribution to the Board of a proposed candidate, including the following:
| • | Character and integrity; |
| • | Qualifications including professional qualifications, skills, knowledge, experience and diversity aspects under the Board Diversity Policy that are relevant to the Company’s business and corporate strategy; |
| • | Any measurable objectives adopted for achieving diversity on the Board; |
| • | Requirement for the Board to have independent non-executive directors in accordance with the Hong Kong Listing Rules and whether the candidate would be considered independent with reference to the independence guidelines set out in the Hong Kong Listing Rules; |
| • | Any potential contributions the candidate can bring to the Board in terms of qualifications, skills, experience, independence and gender diversity; |
| • | Willingness and ability to devote adequate time to discharge duties as a member of the Board and/or Board committee(s) of the Company; |
| • | Such other perspectives that are appropriate to the Company’s business and succession plan and where applicable, may be adopted and/or amended by the Board and/or the Nomination Committee from time to time for nomination of directors and succession planning; |
| • | Other conditions asset out in the Company’s articles of association (if any). |
The Nomination Policy also sets out the procedures for the selection and appointment of new Directors and re-election of Directors at general meetings. During the Reporting Period and up to the date of this Annual Report, there were changes in the composition of the Board and details of the changes are set out in the section headed “Composition of the Board” of this Corporate Governance Report.
62
Table of Contents
Corporate Governance Report(continued)
(under the Hong Kong Listing Rules)
The Nomination Committee will review the Nomination Policy, as appropriate, to ensure its effectiveness.
| 4. | The Strategy Committee |
| (i) | Role and Functions of the Strategy Committee |
The major duties of the Strategy Committee are to conduct researches and give recommendations to the Board on major investment decisions, projects and major issues that affect the Company’s development, and to monitor the Company’s long-term development strategic plan.
| (ii) | Members of the Strategy Committee |
The Strategy Committee comprises two Executive Directors, two Non-executive Directors and one Independent Non-executive Director.
| Chairman: | Wu Haijun,Executive Director | |
| Members: | Zhou Meiyun,Executive Director | |
| Lei Dianwu,Non-executive Director | ||
| Mo Zhenglin,Non-executive Director | ||
| Li Yuanqin,IndependentNon-executive Director | ||
| (iii) | Meetings of the Strategy Committee |
In 2019, the Strategy Committee held one meeting during the Reporting Period. The attendance record of the meeting of the Strategy Committee is set out in the table below:
Name of Director | Attendance in Person/Number of Meetings | Attendance by Alternate/Number of Meetings | ||||||
Wu Haijun | 1/1 | — | ||||||
Shi Wei(1) | 1/1 | — | ||||||
Guo Xiaojun(2) | 1/1 | — | ||||||
Zhou Meiyun | 1/1 | — | ||||||
Lei Dianwu | 0/1 | — | ||||||
Mo Zhenglin | 1/1 | — | ||||||
Li Yuanqin | 1/1 | — | ||||||
| (1) | Mr. Shi Wei resigned as Executive Director on 19 December 2019. |
| (2) | Mr. Guo Xiaojun resigned as Executive Director on 19 December 2019. |
63
Table of Contents
Corporate Governance Report(continued)
(under the Hong Kong Listing Rules)
| (iv) | The Work of the Strategy Committee during the Reporting Period |
During the Reporting Period, the Strategic Committee, aiming at building a “leading domestic and world-class” refining and chemical enterprise and relying on the internal and external forces of the enterprise, carried out strategic research on cracking the bottleneck of development, carried out research on the Company’s phased strategic direction and implementation plan, the promotion of new material industry, the development of fine chemical business and other topics, and improved the Company’s recent planning projects and specified the medium and long-term development ideas and objectives of the Company, striving to gradually build Shanghai Petrochemical into an internationally competitive refining and chemical enterprise in “two three-year periods” and “two ten-year periods”.
| 5. | Corporate Governance Functions |
The Board is responsible for performing the functions set out in code provision D.3.1 of the Corporate Governance Code.
The Board reviewed the Company’s corporate governance policies and practices, training and continuous professional development of Directors and senior management, the Company’s policies and practices on compliance with legal and regulatory requirements, the compliance of the Model Code for Securities Transactions, and the Company’s compliance with the Corporate Governance Code and disclosure in this Corporate Governance Report.
| 6. | Supervisory Committee |
As at 1 January 2019, the Company’s Ninth Session of the Supervisory Committee comprised six supervisors, including three Employee Representative Supervisors (one of whom had served as Chairperson of the committee), one External Supervisor and two Independent Supervisors.
The Supervisors are appointed for a fixed term of office and the term of office of each Supervisor during the Reporting Period are set out in the section headed “Directors, Supervisors, Senior Management and Employees” on pages 23 to 39 of this annual report.
64
Table of Contents
Corporate Governance Report(continued)
(under the Hong Kong Listing Rules)
In 2019, the Supervisory Committee convened 4 meetings with a record of attendance as follows:
Name of Supervisor | Position | Attendance in Person/ Number of Meetings | Attendance by alternate/Number of Meetings | |||||||
Ma Yanhui | Employee Representative Supervisor and Chairperson | 4/4 | — | |||||||
Zuo Qiang(1) | Employee Representative Supervisor | 2/3 | 1/3 | |||||||
Li Xiaoxia(2) | Employee Representative Supervisor | 3/3 | — | |||||||
Zhang Feng(3) | Employee Representative Supervisor | 1/1 | — | |||||||
Chen Hongjun(4) | Employee Representative Supervisor | 1/1 | — | |||||||
Zhai Yalin | External Supervisor | 3/4 | 1/4 | |||||||
Fan Qingyong(5) | External Supervisor | 2/4 | 2/4 | |||||||
Zheng Yunrui | Independent Supervisor | 4/4 | — | |||||||
Choi Ting Ki | Independent Supervisor | 4/4 | — | |||||||
Notes:
| (1) | Mr. Zuo Qiang resigned as Employee Representative Supervisor on 2 September 2019. |
| (2) | Ms. Li Xiaoxia resigned as Employee Representative Supervisor on 30 September 2019. Resignation took effect from 11 October 2019. |
| (3) | Mr. Zhang Feng was appointed as Employee Representative Supervisor on 11 October 2019. |
| (4) | Mr. Chen Hongjun was appointed as Employee Representative Supervisor on 11 October 2019. |
| (5) | Mr. Fan Qingyong resigned as External Supervisor on 27 December 2019. |
The Company’s Supervisory Committee established and refined the check-and-balance system of the Company and promoted and regulated the corporate governance structure in accordance with the relevant laws and regulations, including the Company Law of the PRC and the Code of Corporate Governance for Listed Companies of the PRC. The Supervisory Committee diligently discharges its supervisory duties and exercises supervision over the management’s compliance with the relevant laws and regulations, including the Company Law and the Code of Corporate Governance for Listed Companies of the PRC. It also supervises the enforcement of the resolutions passed at general meetings and Board meetings, compliance with decision-making procedures and the implementation of the internal control system. The Supervisory Committee also examines the financial system and the financial situation of the Company in a conscientious manner, thereby ensuring the orderly operations of the Company and safeguarding shareholders’ interests.
65
Table of Contents
Corporate Governance Report(continued)
(under the Hong Kong Listing Rules)
| (5) | Risk Management and Internal Controls |
The Board acknowledges its responsibility for the risk management and internal control systems and the review of their effectiveness. Such systems are designed to manage rather than eliminate the risk of failure to achieve business objectives, and can only provide reasonable and not absolute assurance against material misstatement or loss.
The Board ensures that risk management and internal control systems of the Company are sound and effective to safeguard the shareholders’ interests and its assets. The Board has the overall responsibility for evaluating and determining the nature and extent of the risks it is willing to take in achieving the Company’s strategic objectives, and establishing and maintaining appropriate and effective risk management and internal control systems.
The Audit Committee assists the Board in leading the management and overseeing their design, implementation and monitoring of the risk management and internal control systems.
The Company has developed and adopted various internal control and risk management procedures and guidelines including the Internal Control Manual, the Sinopec Comprehensive Risk Management Procedures and Sinopec Comprehensive Risk Management Implementation Programme with defined authority for implementation by key business processes and office functions, including project management, sales, financial reporting, human resources and information technology.
All divisions conducted internal control assessment regularly to identify risks that potentially impact the business of the Group and various aspects including key operational and financial processes, regulatory compliance and information security etc.
The management, in coordination with division heads, assessed the likelihood of risk occurrence, provided treatment plans, monitored the risk management progress, and reported to the Audit Committee and the Board on all findings and the effectiveness of the systems.
The Internal Audit Department is responsible for performing independent review of the adequacy and effectiveness of the risk management and internal control systems. The Internal Audit Department examined key issues in relation to the accounting practices and all material controls and provided its findings and recommendations for improvement to the Audit Committee. The Company has engaged PricewaterhouseCoopers Zhong Tian LLP to conduct an audit on the effectiveness of the internal control over financial reporting of the Company according to the guidelines set out in the Audit Guidelines for Enterprise Internal Control (the “Guidelines”) and the Report on Internal Control over Financial Reporting was issued pursuant to the Guidelines.
66
Table of Contents
Corporate Governance Report(continued)
(under the Hong Kong Listing Rules)
The Company has developed its disclosure policy which provides a general guide to the Directors, officers, senior management and relevant employees in handling confidential information, monitoring information disclosure and responding to enquiries. The Company has in place a “System for the Registration and Management of Inside Information” and an “Information Disclosure Management System” which were regularly reviewed by the Board to administer the registration and management of persons with access to the Company’s insider information including but not limited to the Directors, Supervisors and senior management, strengthen the confidentially of the flow of inside information, monitoring information disclosure to safeguard the leakage of inside information and responding to enquiries. Control procedures have been implemented to ensure that unauthorized access and use of inside information are strictly prohibited.
| 1. | Implementation of internal control |
Internal control task force is the leading unit of the internal control work of the Company with the President and the Chief Financial Officer as chief and deputy chief, respectively, and an internal control office was established under the task force. It is responsible for organizing and coordinating the establishment, implementation and daily operation of internal control, as well as the submission of work reports on the inspection and supervision of internal control to the Audit Committee on a regular basis. A supervisory working network consisting of special personnel of each department (unit) responsible for internal control function was established within the Company. The internal control supervisors, on behalf of their own departments, and administrative heads each carry out internal control work within their own scope.
Since the implementation of the internal control system of the Company in 2004, the Company has strictly complied with the requirements of internal control regulations of the CSRC. Combined with corporate management and internal controls, the Internal Control Manual was reviewed annually so as to improve the internal control business process, to specify responsibilities of different departments and positions in charge of the respective control processes, and to urge staff to perform internal control responsibility. The 2019 version of the Internal Control Manual specifies 22 categories, 55 processes and a total of 1,539 control points.
In 2011, the Company launched an internal control management information system and built a dynamic validation and correction system of system data to continuously improve the internal control management information system annually. At the same time, the internal control office actively guides the respective departments responsible for different processes and the secondary units for the online management of internal control and gradually enforces online enquiry and online quarterly testing under the Internal Control Manual.
67
Table of Contents
Corporate Governance Report(continued)
(under the Hong Kong Listing Rules)
| 2. | Implementation of comprehensive risk management |
In 2011, the Company set up a comprehensive risk management task force with key heads of the Company as leaders. The task force has set up an office in the Corporate Management Department of the Company and functions as the daily risk managing organ of the Company.
In 2013, based on the then “Integrated Management System” and other professional management systems, the Company extensively carried out risk management status research, arranged and analysed existing issues and learnt from the successful experience and typical practices of domestic and overseas advanced enterprises and prepared the Sinopec Comprehensive Risk Management Procedures, which are included in the Integrated Management System. The risk management procedures specify five basic processes of comprehensive risk management, namely risk information collection, risk evaluation, risk response, monitoring and warning, and supervisory assessment and improvement. Through risk identification and assessment, the Company conducts analysis of the effectiveness of the existing internal control system and professional management and creates foundation system of the Company for the establishment of the risk warning system and risk response strategy and measures.
In 2016, the Company developed the Sinopec Comprehensive Risk Management Implementation Programme according to control capability, management strength and company management conditions, and standardized assessment methods and standards. The Company launched resources management, interest rate and Forex rate special risk identification, and evaluation work to enhance the comprehensive risk management of the Company.
Pursuant to the planning and requirements of State-Owned Assets Supervision and Administration Commission of the State Council, the Company is focusing on its goal of establishing a refining and petrochemical enterprise which is “leading domestically, first-class globally”. The Company vigorously implements annual risk assessment work, organizes some of the Company’s leaders, key department heads to participate in the material and significant online risk identification evaluation to start and perform comprehensive risk management of the Company to provide foundation for the establishment of the risk warning system and risk response strategy and measures. On the basis of the revised Internal Control Manual, the Company organized the persons in charge of the business process to comprehensively identify, analyse and assess material and significant tier 3 risks and attend to tier 4 risks. The Company has preliminary set up the “Sinopec Risk Database” and improved the key information maintenance of “Risk Level Rating” and “Risk Response Measures” in the system.
The Company set up a comprehensive risk management office which is responsible for collecting and organizing risk information regarding the Company as well as domestic and foreign industry. It sorts out, analyzes and summarizes, forms a risk list, and regularly completes and updates the risk list. The Company set up an internal control office to establish risk assessment work standards, procedures and management rules, formulate company risk assessment plans, and organize risk assessment task.
68
Table of Contents
Corporate Governance Report(continued)
(under the Hong Kong Listing Rules)
Through the implementation of effective supervision and evaluation and improved supervision, the Company effectively promotes the Company’s overall risk management, and forms a closed-loop management mechanism for self-improvement and continuous optimization. Internal supervision of the Company is divided into daily supervision and special supervision. Daily supervision refers to the routine and continuous supervision and inspection of the Company’s establishment and implementation of internal control; special supervision refers to the situation where the Company undergoes major adjustments or changes in its development strategy, organizational structure, business activities, business processes, and key positions, there will be a targeted supervision and inspection of one or more aspects of internal control. The scope and frequency of special supervision depends on the impact of the risk and the effectiveness of the control.
The Company has established a comprehensive internal inspection and evaluation mechanism, designating internal audit as the Company’s responsible division to supervise and improve risk management, and the audit department is responsible for the independent supervision and evaluation of the setting up of the risk management system and the effectiveness of implementation, reporting according to prescribed procedures and monitoring the progress. The Board is responsible for the supervision of the Company’s internal control evaluation work, identifies the Company’s major internal control deficiencies, reviews the relevant rectification measures and oversees the management in the implementation of the measures, reviews and approves the internal control evaluation report. The Supervisory Committee supervises the Board’s establishment and implementation of internal control.
The management has reported to the Board and the Audit Committee on the effectiveness of the risk management and internal control systems during the Reporting Period. The Board, as supported by the Audit Committee as well as the management report on the internal audit findings, reviewed the risk management and internal control systems, including the financial, operational and compliance controls, for the Reporting Period, and considered that such systems are effective and adequate. The annual review also covered the financial reporting and internal audit function and staff qualifications, experiences and relevant resources.
For further details of the risk management and internal controls of the Company, please refer to the section headed “Internal Control” on pages 62 to 63 of this annual report.
69
Table of Contents
Corporate Governance Report(continued)
(under the Hong Kong Listing Rules)
| (6) | Directors’ Responsibilities in relation to the Financial Statements |
The Directors acknowledge their responsibilities for preparing the financial statements of the Company for the year ended 31 December 2019.
The Directors are not aware of any material uncertainties relating to events or conditions that may cast significant doubt upon the Company’s ability to continue as a going concern.
All Directors regularly receive comprehensive reports from the management covering strategic proposals, operations updates, financial objectives, plans and initiatives. The Board presents a balanced, clear and understandable assessment of the affairs and prospects of the Group in the Company’s annual and interim reports, announcements relating to inside information and other financial disclosures as required under the Hong Kong Listing Rules.
During the Reporting Period, the management provided to members of the Board with monthly information on the Company’s production and financial analysis, as well as Xinjinshan Post (《新金山報》), a newspaper published by the Company that covers recent developments in the Company’s production and operations. In addition, Directors including Independent Non-executive Directors were also able to learn about the latest updates on the Company’s business and information disclosure on the Company’s website in a timely manner.
The statements of the independent auditor of the Company (both international and domestic) about their reporting responsibilities on the financial statements are set out in the respective Report of the Independent Auditor and Report of the PRC Auditor on pages 213 to 216 and pages 78 to 80, respectively of this annual report.
| (7) | Auditors’ Remuneration |
An analysis of the remuneration paid to the external auditors of the Company, Messrs. PricewaterhouseCoopers and PricewaterhouseCoopers Zhong Tian LLP, in respect of audit services and non-audit services for the Reporting Period is set out in the table below:
Auditor | Service Category | Fees Paid/Payable | ||||
PricewaterhouseCoopers | – Audit services | RMB | 3,000,000 | |||
| – Non-audit services | RMB | 0 | ||||
PricewaterhouseCoopers Zhong Tian LLP | – Audit services | RMB | 4,800,000 | |||
| – Non-audit services | RMB | 0 | ||||
70
Table of Contents
Corporate Governance Report(continued)
(under the Hong Kong Listing Rules)
| (8) | Company Secretary |
Mr. Guo Xiaojun resigned as the Secretary to the Board on 19 December 2019. Currently, Ms. Chan Sze Ting of Tricor Services Limited, external service provider, is the company secretary of the Company and she was appointed as the company secretary on 26 April 2018. Ms. Chan’s primary contact person in the Company is Mr. Wu Haijun, Executive Director and Chairman of the Board.
All Directors have access to the advice and services of the company secretary on corporate governance and board practices and matters.
| (9) | Shareholders’ Rights |
The Company engages shareholders through various communication channels and the “Work System of Investor Relations” is in place to ensure that shareholders’ views and concerns are appropriately addressed.
To safeguard shareholder interests and rights, separate resolution should be proposed for each substantially separate issue at general meetings, including the election of individual Director. All resolutions put forward at general meetings will be voted on by poll and poll results will be posted on the websites of the Hong Kong Stock Exchange, the Shanghai Stock Exchange and the Company after each general meeting.
The rights of shareholders holding ordinary shares of the Company are also set out in the Articles of Association. Upon written requests of the shareholders and verification of their identities and shareholding by the Company, they will be allowed to access to relevant information as permitted by law, administrative regulations and the Articles of Association.
| 1. | Convening an Extraordinary General Meeting |
Pursuant to Article 63(3) of the Articles of Association, the Board shall convene an extraordinary general meeting within two months upon written requisition by the shareholders individually or jointly holding 10% or more of the issued and outstanding voting shares of the Company.
| 2. | Putting Forward Proposals at General Meeting |
Pursuant to Article 65 of the Articles of Association, when the Company convenes a shareholders’ general meeting, the Board, the Supervisory Committee and shareholders who individually or jointly hold shares with 3% or more of the total voting rights of the Company shall have the right to move motions in writing for shareholders’ meetings. Shareholders who individually or jointly hold 3% or more of the shares of the Company may propose and submit in writing an extraordinary motion to the convener ten (10) days prior to the convening of the shareholders’ general meeting. The convener shall issue a supplementary notice of the shareholders’ general meeting within two (2) days upon receipt of such motion and shall make an announcement on the content of the extraordinary motion.
71
Table of Contents
Corporate Governance Report(continued)
(under the Hong Kong Listing Rules)
| 3. | Putting Forward Enquiries to the Board |
For putting forward any enquiries to the Board of the Company, shareholders may send written enquiries to the Company. The Company will not normally deal with verbal or anonymous enquiries.
| 4. | Contact Details |
Shareholders may send their enquiries or requests as mentioned above to the Company’s registered address as follows:
48 Jinyi Road
Jinshan District
Shanghai
The People’s Republic of China
For the attention of Mr. Wu Haijun, Chairman of the Board
For the avoidance of doubt, shareholder(s) must deposit and send the original duly signed written requisition, notice or statement, or enquiry (as the case may be) to the above address and provide their full name, contact details and identification in order to give effect thereto. Shareholders’ information may be disclosed as required by law.
72
Table of Contents
Corporate Governance Report(continued)
(under the Hong Kong Listing Rules)
| (10) | Investor Relations |
The Company considers that effective communication with shareholders is essential for enhancing investor relations and investors’ understanding of the Group’s business performance and strategies. The Company maintains communications with its shareholders. The Company’s major communication channels include annual general meeting, other general meetings, the Company’s website, email, fax and telephone numbers of the Secretary Office of the Board. Through the above communication channels, shareholders may adequately express their opinions or exercise their rights.
The Company is committed to enhancing its relationship with investors. The Chairman presides over and participates in major investor relations activities (including general meetings, results presentations, press conferences, significant events and roadshows, important domestic and overseas capital market conferences and major financial media interviews, etc.) and maintains contact with shareholders to ensure that the views of the shareholders can be conveyed to the entire Board.
During the Reporting Period, the Company continued to strengthen the management of investor relations, implement in good faith the “Work System of Investor Relations”, engage in active interaction and communications with investors and submit investors’ opinions and suggestions to the Company’s management in a timely manner.
In principle, the Company convenes results briefings every six months after the release of its annual and interim results. In 2019, the Company held two large-scale results briefings and press conferences in Hong Kong while several “one-to-one” meetings were held within and outside China. The Company has also welcomed hundreds of domestic and foreign investors to its headquarters, and replied to telephone queries and letters from investors, intermediaries and fund managers. In addition, the Directors and senior management also actively attended capital market meetings organized by securities research companies and investment banks.
The information on the Company’s website is updated regularly to keep the investors and the public informed of the Company’s latest developments.
| (11) | Relevant policies of shareholders |
The Company has formulated a shareholder communication policy to ensure that the opinions and concerns of shareholders are properly addressed, and the policy is regularly reviewed to ensure its effectiveness.
The Company has formulated a dividend policy. According to the Articles of Association, the Company’s net profit attributable to the parent company was positive and the accumulated undistributed profit was positive. While the Company’s cash flow can meet its normal operation and sustainable development, the Company shall carry out cash dividends, and the annual cash distribution shall not be less than 30% of the net profit attributable to the parent company realized in that year. For details, please refer to the formulation, implementation or adjustment of cash dividend policy in Section IV of Chapter III.
73
Table of Contents
Section I Business Overview
| (I) | Description of the principal business, operating model and industry in which the Company operated during the Reporting Period |
Located at Jinshanwei in the southwest of Shanghai, the Company is a highly integrated petrochemical enterprise which mainly processes crude oil into a broad range of petroleum products, intermediate petrochemical products, resins and plastics and synthetic fibres. The Company sells most of its products within the PRC domestic market and derives most of its revenues from customers in Eastern China, one of the fastest growing regions in the PRC.
The Company’s high-quality development is supported by the ever-increasing demand in the PRC for petrochemical products. Relying on the competitive advantage of its high degree of integration, the Company is optimizing its product mix, improving the quality and variety of its existing products, upgrading technology and increasing the capacity of its key upstream plants.
For details on the industry in which the Company operates its business, please refer to Section III of this chapter “Analysis on Operational Information of the Chemical Industry”.
| (II) | Analysis of core competitiveness during the Reporting Period |
As one of the largest integrated petrochemical enterprises in China with an integrated refinery and petrochemical capacity, the Company possesses competitive business scale and strength, which have made it a major manufacturer of refined oil, intermediate petrochemical products, synthetic resins and synthetic fibres. It also has self-owned utilities and environmental protection systems, as well as sea transport, inland shipping, rail transport and road transport ancillary facilities.
The Company’s major competitive advantages include quality, geographical location and its vertically integrated production. The Company has over 40 years of petrochemical production and management experience, and has accumulated extensive resources in the petrochemical industry, which has garnered multiple quality product awards from the central and local governments. Located at the core region of Yangtze River Delta, the most economically active region in China with a strong demand for petrochemical products, the Company built a comprehensive logistics system and supporting facilities to tap its geographic proximity with most of its clients and the convenient coastal and inland shipping. This gave it a competitive edge in terms of transportation costs and timely delivery. The Company has leveraged its advantages in integrated refinery and petrochemical capacity to actively strengthen product structure, while continuously improving products quality and variety. It has also improved production technology and boosted capacity of key upstream equipment to maximize the use and the efficiency in the utilisation of its corporate resources, and is therefore able to achieve strong and sustainable development.
74
Table of Contents
Report of the Directors(continued)
| (III) | Material events after the Reporting Period |
The new coronavirus pneumonia epidemic (“COVID-19”) broke out in early 2020 and has evolved into a global public health emergency. Affected by COVID-19, the Spring Festival holiday was prolonged nationwide, enterprises delayed the resumption of work, transportation was restricted, logistics efficiency decreased, consumer demand fell sharply, and the demand for petroleum and petrochemical products experienced a higher degree in its decrease, which had a significant impact on the Group’s sales of refined oil and chemical products. The load of major equipment has fallen.
In response to the impact brought by COVID-19, the Company adopted the following measures to offset the negative impact as much as possible:
| 1. | In terms of operation and production, the Company optimized the final-period plan of crude oil procurement and production and marketing in a timely manner, reduced the equipment load and adjusted the maintenance plan based on the actual situation of the market to avoid excess inventory. |
| 2. | In terms of sales of products, the Company cooperated with professional sales companies, established hotlines and immediately coordinated with multiple parties when facing difficulties, which effectively addressed challenges in management and control. During the special time, the Company adopted a flexible sales model and temporarily implemented a case-by-case policy for specific emergency users to promote product delivery and ensure safe and stable operation of the equipment. |
| 3. | In terms of product transportation, the Company focused on logistics management and actively coordinated with government departments to provide convenience for users. |
Since 2020, the Group’s crude oil processing volume has decreased as compared with the same period last year. Combining with the sharp decline of international oil prices, the Company’s short-term performance faces a relatively big challenge. As of the date of approval of the financial statements, the specific details and monetary amount on the Group’s financial position are still being evaluated.
75
Table of Contents
Report of the Directors(continued)
Section II Management Discussion and Analysis
| (I) | Management Discussion and Analysis |
(Unless otherwise specified, the financial information included in this “Management Discussion and Analysis” section was extracted from the financial statements prepared under IFRS.)
| 1. | General – Review of the Company’s operations during the Reporting Period |
In 2019, the global economy faced severe challenges. Uncertain factors brought about by trade frictions and geopolitical tensions have slowed down the economic growth of advanced and developing economies and emerging markets. In the face of increasingly complex and severe domestic and international situations, our country adhered to the guideline of making progress while maintaining stability, and focused on supply-side structural reforms to promote high-quality development. In 2019, the economic operation was generally stable but continued to slow down. Gross domestic product (GDP) increased by 6.1%, representing a decrease of 0.5% year-on-year. Under the influences of Sino-US trade friction, frequent security accidents, industrial zone closures and enterprises’ suspension and rectification, China’s petrochemical industry faced greater downward pressure on economic operation. The performance of enterprises declined significantly as the market continued to be weak.
In 2019, the Group actively responded to the complicated and severe domestic and international economic and industry situations, and focused on safety and environmental protection, operational optimization, cost reduction, transformational development, reforms in difficult areas and team development. All work was advanced in an orderly manner.
76
Table of Contents
Report of the Directors(continued)
| (i) | Strengthening safety and environmental protection to ensure smooth operation of the devices |
In 2019, the Group implemented the new HSSE management system to deepen process safety management; continued to carry out the activity of “I Make Diagnosis for Safety” to investigate and discover hidden dangers; launched LDAR Full Coverage and “10,000 Employees Checking Odor” to discover and repair leaking point in time; and strengthened the daily management of flare gas and emission control of equipment maintenance during driving and halt. The Group successfully passed the reexamination of Environmentally Friendly Enterprises in China, passed the review of Sinopec Group and Cleanser Production in Shanghai, and won the title of Sinopec Group Green Enterprise. As the Group strengthened production and operation management and intensified the management and examination of unplanned halt, 7 unplanned halts occurred in 2019, with the number and duration of unplanned halt decreasing by 22.20% and 73.30% respectively. The operation of devices maintained smooth. Among the 59 major technological and economic indicators monitored, 34 items were better than the annual level of last year, with a year-on-year progress rate of 57.63%.
In 2019, due to the stable operation of the Group’s devices and the increasing total volume of processing crude oil, the production volume of the Group increased, with the total main production volume reaching 13,910,400 tons, up by 4.60% year-on-year. The Group’s turnover reached RMB100,270 million, representing a decrease of 6.89% year-on-year. The product sales rate and payment return rate of the Group were 100.02% and 100% respectively. The products continued to remain high-quality.
| (ii) | Price of the products fell under weak oil and petrochemical markets |
In 2019, under the severe and complicated domestic and international economic situations, oil and petrochemical industries faced great downward pressure. Price of petrochemical products fell under the sluggish market. As the demand for refined oil products slowed down and supplies increased, product competition became increasingly fierce. As of 31 December 2019, the weighted average prices (excluding tax) of synthetic fibers, resins and plastics, intermediate petrochemical products and petroleum products of the Group decreased by 13.24%, 11.48%, 17.48% and 4.28% year-on-year respectively.
77
Table of Contents
Report of the Directors(continued)
| (iii) | International crude oil prices fluctuated and average price fell throughout the year, while crude oil processing volume increased |
The international crude oil market fluctuated in 2019. From the initial concerns about tightening supply gradually to the global economic slowdown, dragging down oil demand, international crude oil prices have shown a trend of rising and then declining, moving in a wide range. The crude oil price went up unilaterally in the first quarter, shock fell in the second quarter, moved in a wide range in the third quarter, and went up unilaterally again in the fourth quarter. Brent crude oil futures basically ran between USD53-73/barrel throughout the year, within which the futures fluctuated in the range of USD58-65/barrel most of the time. By the end of 2019, the Brent crude oil price increased by 23.00% year-on-year, while the West Texas Intermediate crude oil (WTI) increased by 34.50% year-on-year. However, the average price of crude oil in 2019 was still lower than that in 2018. The average price of WTI crude oil in 2019 was USD57.01/barrel, down by 11.23% from USD64.22/barrel in 2018; the average price of Brent crude oil in 2019 was USD64.16/ barrel, down by 10.38% from USD71.59/barrel in 2018; the average price of Dubai crude oil in 2019 was USD63.95/barrel, down by 8.47% from USD69.87/barrel in 2018.
As of 31 December 2019, the Group processed 15,199,400 tons of crude oil (including 1,064,600 tons of crude oil processing on given materials), up by 5.71% or 820,400 tons year-on-year. The average unit cost of crude oil processed by the Group (proprietary part) was RMB3,330.63/ton (2018: RMB3,382.38/ton), down by 1.53%. In 2019, the total cost of the Group’s crude oil processing was RMB47,077 million, an increase of 1.97% over the previous year’s RMB46,168 million, accounting for 54.54% of the total cost of sales.
| (iv) | Further optimized operation and improved the ability to increase efficiency |
In 2019, the Group actively promoted the optimization of structure of crude oil, controlled crude oil stock and reduced costs of crude oil procurement. The Group optimized the structure of oil products, increased the output of gasoline, jet fuel and petrochemicals and raised the proportion of high value-added products with a growth rate of 7.41% in gasoline production and 27.95% in jet fuel production as well as a decrease of 0.05 in diesel to gasoline ratio. In addition, the Group encouraged market expansion and boosted sales with the annual exports of heavy low-sulfur marine fuel oil reaching 37,800 tons. The black polyethylene pipe plastic products successfully entered China Gas Holdings with sales increasing by 13.55% year-on-year. Moreover, the Group arranged field visits for technical experts and carried out the establishment of intelligent marketing service system to improve service quality. The Group implemented costs reduction by cutting the annual financial expenses to RMB363 million, a fall of RMB25.6 million year-on-year, strengthened the management of cash flow with a year-on-year decrease of 16.71% in the inventory balance, and controlled the key expenses including repairs, reducing nearly RMB100 million in the actual expenses compared to the goal.
78
Table of Contents
Report of the Directors(continued)
| (v) | Continued to deepen energy conservation and emission reduction |
In 2019, to meet the national requirements of energy conservation and emission reduction, the Group implemented a series of measures to achieve the goal set by the government. In 2019, the Company’s accumulated comprehensive energy consumption was 7.150 million tons of standard coal, and the comprehensive energy consumption was 0.745 tons of standard coal per RMB10,000 (unchanged price in 2010), representing a decrease of 1.97% compared with the annual total of 0.760 tons of standard coal per RMB10,000 last year. Compared to last year, the annual emissions of COD, sulfur dioxide and nitrogen oxides decreased by 9.02%, 7.14% and 12.70%, respectively. The average concentration of VOCs at the boundary of the plant decreased by 3.83% year-on-year. The Group achieved 100% wastewater discharge compliance rate, 100% controlled waste gas discharge compliance rate and 100% hazardous waste disposal compliance rate. The average heat efficiency of heating furnaces was 92.60%, basically the same as last year.
| (vi) | Accelerated development and pushed forward the scientific R&D and informatization |
In 2019, the Group started the 400,000 tons/year oil cleaning project, achieved mid-term delivery of the precursor part of the second stage of PAN (Polyacrylonitrile) based carbon fiber project with annual production of 1,500 tons, and completed the Sinopec’s demonstration of 48K large tow carbon fiber. The Group vigorously promoted regional cooperation with neighboring SCIP and Zhejiang Dushan Port Economic Development Zone to reach a development consensus on new materials. The Group strengthened technical researches in the field of new energy, made technical improvements on carbon fiber equipment technologies, deepened the updated technology applications of the whole process of refineries, and strived to promote researches on key technologies for low-sulfur marine fuel oil production and fuel cell-level hydrogen supply. The Group boosted the carbon fiber industry by signing a strategic cooperation framework agreement on carbon fiber and composites with Jinshan District in Shanghai to establish Shanghai Carbon Fiber and Composites Innovation Research Institute. The Innovative High-Efficient Mechanical Oil Production System with Carbon Fibers and CFRP Continuous Sucker Rods as the Core, which involved the Company’s research and development, won the 21st CIIF Award with 65 patent applications and 26 patent licensing. The Group sped up the integration of informatization and industrialization, accomplished various projects such as energy management system, self-service delivery system, piloting of geographic information platform, information integration of process and upgrades of integrated services platform, and promoted projects of intelligent warehousing and crude oil blending and optimizing, thus raising the level of intelligent plants.
79
Table of Contents
Report of the Directors(continued)
| (vii) | Reinforced corporate management and overcame difficulties in reform |
In 2019, the Group actively promoted internal restructuring, and based on the business development of petrochemicals, new materials and joint venture cooperation, established the Carbon Fiber Business Unit to streamline the management units in the Company. The Group pushed forward the market-oriented pilot reform of the first professional manager in the Carbon Fiber Business Unit and initially built the management system of professional managers. The Group completed the pilot reform of incremental power distribution business and established Shanghai Shidian Energy Co., Ltd, which was then put into operation. The Group actively adopted the “immediately-do” attitude to raise the efficiency of management and service, advanced the reform of personnel system and the project of “talents to make enterprises strong”, increased the intensity of training and selection of outstanding young cadres, implemented the policy of introducing graduates, strengthened cooperation on intern training with targeted colleges and universities as well as higher vocational colleges, and formed a new mechanism for introducing and training students of vocational colleges to continuously improve the cadre team structure. The Group strengthened staff training, increased the application of the intelligent training system and promoted the “one position with multiple functions” training with the theme of whole process operation and the “large-scale training, extensive competition” activities to develop staff’s ability to fulfill duty, solve on-site difficulties, innovate and increase efficiency.
As of 31 December 2019, the net reduction of employees of the Group reached 719 (including voluntary resignation and retirees), accounting for 7.49% of the total 9,597 employees registered at the beginning of the year.
| (viii) | Continued to strengthen Party building and integrated Party and government to promote enterprise development |
In 2019, the Communist Party Committee of the Company adhered to the principle of focusing on the central task and serving the overall interests. Taking the opportunity of carrying out the themed education of “Do not forget the initial heart and keep the mission in mind”, the Communist Party Committee of the Company vigorously strengthened the capacity building of “controlling the direction, managing the overall situation and guranteeing implementation”, deepened compliance operations and risk prevention and control, strengthened the establishment of leaders and executive teams, strengthened the establishment of the clean government and anti-corruption work, effectively promoted the building of grass-rooted Party organizations and Party members, continued to enhance the ideological and cultural propaganda in the new circumstances and work effectiveness of the public, and actively created a harmonious and stable atmosphere for reform and development which provided strong ideology, politics and organisation guarantee for Shanghai Petrochemical to achieve sustainable development in an all-round way and establish the Company as “Leading domestically, First-class globally” energy and chemical and new material enterprise.
80
Table of Contents
Report of the Directors(continued)
Specific measures include:
Strengthening transformation of the old mindset, establishing firmly the philosophy of innovative and green development, standardizing decision and policy-making procedures, and continuously promoting the development path and innovation of management mode.
Strengthening the building of talent teams, training and developing of outstanding human resources, and building high-quality professional cadre team and a “multi-talented” staff team.
Intensifying our efforts to combat corruption and build clean government, conducting the mechanism of Party Committee Inspector, effectively carrying out the overall function of monitoring resources, creatively carrying out mutual support in family and partnership to combat corruption, and continuously improving the level of corporate governance and risk management.
Strengthening the construction of grass-rooted Party organization, fulfilling social responsibilities, carrying out co-construction with 52 village Party branches in the surrounding “four towns and one street”, and carrying out activities based in aspects such as mutual support, business exchanges, and enterprise-local win-win cooperation across different segments and classes. The Company’s performance in fulfilling social responsibility has steadily improved.
Strengthening the construction of corporate culture, constructing a good community relationship, vigorously propagating the concept of “Dedicate in clean energy and green development” and making the public aware of the effectiveness of corporate green development through 34 public open days.
81
Table of Contents
Report of the Directors(continued)
| 2. | Accounting judgements and estimates |
The Group’s financial conditions and the results of its operations are susceptible to accounting methods, assumptions and estimates applied in preparing the financial statements. Such assumptions and estimates are based on the historical experience of the management of the Group and on various other assumptions that the management believes to be reasonable, and form the basis for the management to make judgements about matters that cannot be confirmed by other sources. On an on-going basis, the management evaluates its estimates. Actual results may differ from those estimates as the actual circumstances, environment and conditions change.
The selection of accounting policies, judgements and other uncertainties in the course of applying of those policies and the sensitivity of reported results to changes in conditions and assumptions are factors to be considered when reviewing the financial statements. The principal accounting policies are set forth in the financial statements. The Company’s management believes that the following critical accounting policies involve the most significant judgements and estimates used in the preparation of the financial statements.
| (i) | Inventory Provision |
Any excess of the cost over the net realisable value of each item of inventories is recognised as a provision for diminution in the value of inventories. Net realisable value represents the estimated selling price in the ordinary course of business, less the estimated costs of completion and the estimated costs necessary to make the sale. Management bases the estimates on all available information, including the current market prices of the finished goods and raw materials, and historical cost of sales. If the actual selling prices were to be lower or the costs of completion were to be higher than estimated, the actual allowance for diminution in value of inventories could be higher than estimated.
| (ii) | Impairment of long-term assets |
Long-term assets are reviewed for impairment at each balance sheet date when events or changes in circumstance have indicated that their carrying amounts may not be recoverable. If any such evidence indicated that their carrying amounts may not be recoverable, the carrying amounts exceed the recoverable amounts would be recognized as impairment loss and accounted in current profit or loss.
The recoverable amount of an asset (or an asset group) is the greater of its net selling price and its present value of expected future cash flows. In assessing value in use, significant judgements are exercised over the assets’ (or the asset group’s) production and sales, selling prices, related operating expenses and discount rate to calculate the present value. All relevant materials which can be obtained are used for estimation of the recoverable amount, including the estimation of the production, selling prices and related operating expenses based on reasonable and supportable assumptions.
82
Table of Contents
Report of the Directors(continued)
| (iii) | Estimated useful life and residual value of fixed assets |
The Group assessed the reasonableness of estimated useful life of fixed assets in line with the historical experience on the basis of similar function or characteristic for the assets. If there are significant changes in estimated useful lives and residual value from previous years, the depreciation expenses for future periods are adjusted.
The Group reviews and adjusts the useful lives and estimated residual value of the assets regularly at the end of each year end.
| 3. | Comparison and analysis of results of the Company’s operations (Prepared under IFRS) |
| 3.1 | Summary |
The following table sets forth the Group’s sales volumes and net sales (net of sales taxes and surcharges) for the years indicated:
| For the years ended 31 December | ||||||||||||||||||||||||||||||||||||
| 2019 | 2018 | 2017 | ||||||||||||||||||||||||||||||||||
| Sales volume (’000 tons) | Net sales (RMB million) | % | Sales volume (’000 tons) | Net sales (RMB million) | % | Sales volume (’000 tons) | Net sales (RMB million) | % | ||||||||||||||||||||||||||||
Synthetic fibres | 177.9 | 2,158.9 | 2.5 | 156.0 | 2,182.4 | 2.3 | 172.6 | 2,005.3 | 2.5 | |||||||||||||||||||||||||||
Resins and plastics | 1,292.4 | 9,979.9 | 11.3 | 1,208.6 | 10,542.1 | 11.0 | 1,262.4 | 10,218.4 | 12.9 | |||||||||||||||||||||||||||
Intermediate petrochemical products | 2,193.7 | 10,313.6 | 11.7 | 2,134.4 | 12,160.6 | 12.7 | 1,938.5 | 10,070.2 | 12.7 | |||||||||||||||||||||||||||
Petroleum products | 10,294.6 | 43,125.9 | 49.0 | 9,917.3 | 43,403.0 | 45.4 | 9,233.5 | 32,400.6 | 40.9 | |||||||||||||||||||||||||||
Trading of petrochemical products | — | 21,690.7 | 24.6 | — | 26,544.0 | 27.8 | — | 23,697.3 | 29.9 | |||||||||||||||||||||||||||
Other segments | — | 786.7 | 0.9 | — | 781.4 | 0.8 | — | 826.5 | 1.1 | |||||||||||||||||||||||||||
|
|
|
|
|
|
|
|
|
|
|
|
|
|
|
|
|
| |||||||||||||||||||
Total | 13,958.6 | 88,055.7 | 100.0 | 13,416.3 | 95,613.5 | 100.0 | 12,607.0 | 79,218.3 | 100.0 | |||||||||||||||||||||||||||
|
|
|
|
|
|
|
|
|
|
|
|
|
|
|
|
|
| |||||||||||||||||||
83
Table of Contents
Report of the Directors(continued)
The following table sets forth a summary of the Group’s consolidated income statement for the years indicated (prepared under IFRS):
| For the years ended 31 December | ||||||||||||||||||||||||
| 2019 | 2018 | 2017 | ||||||||||||||||||||||
| RMB million | % of net sales | RMB million | % of net sales | RMB million | % of net sales | |||||||||||||||||||
Synthetic fibres | ||||||||||||||||||||||||
Net sales | 2,158.9 | 2.5 | 2,182.4 | 2.3 | 2,005.3 | 2.5 | ||||||||||||||||||
Cost of sales and operating expenses | (2,699.2 | ) | (3.1 | ) | (2,755.9 | ) | (2.9 | ) | (2,480.6 | ) | (3.1 | ) | ||||||||||||
|
|
|
|
|
| |||||||||||||||||||
Segment loss from operations | (540.3 | ) | (0.6 | ) | (573.5 | ) | (0.6 | ) | (475.3 | ) | (0.6 | ) | ||||||||||||
|
|
|
|
|
| |||||||||||||||||||
Resins and plastics | ||||||||||||||||||||||||
Net sales | 9,979.9 | 11.3 | 10,542.1 | 11.0 | 10,218.4 | 12.9 | ||||||||||||||||||
Cost of sales and expenses | (9,578.5 | ) | (10.9 | ) | (9,641.7 | ) | (10.1 | ) | (8,862.5 | ) | (11.2 | ) | ||||||||||||
|
|
|
|
|
| |||||||||||||||||||
Segment profit from operations | 401.4 | 0.4 | 900.4 | 0.9 | 1,355.9 | 1.7 | ||||||||||||||||||
|
|
|
|
|
| |||||||||||||||||||
Intermediate petrochemical products | ||||||||||||||||||||||||
Net sales | 10,313.6 | 11.7 | 12,160.6 | 12.7 | 10,070.2 | 12.7 | ||||||||||||||||||
Cost of sales and expenses | (9,899.6 | ) | (11.2 | ) | (10,225.7 | ) | (10.7 | ) | (7,864.1 | ) | (9.9 | ) | ||||||||||||
|
|
|
|
|
| |||||||||||||||||||
Segment profit from operations | 414.0 | 0.5 | 1,934.9 | 2.0 | 2,206.1 | 2.8 | ||||||||||||||||||
|
|
|
|
|
| |||||||||||||||||||
Petroleum products | ||||||||||||||||||||||||
Net sales | 43,125.9 | 49.0 | 43,403.0 | 45.4 | 32,400.6 | 40.9 | ||||||||||||||||||
Cost of sales and expenses | (42,420.4 | ) | (48.2 | ) | (40,493.0 | ) | (42.4 | ) | (29,280.6 | ) | (37.0 | ) | ||||||||||||
|
|
|
|
|
| |||||||||||||||||||
Segment profit from operations | 705.5 | 0.8 | 2,910.0 | 3.0 | 3,120.0 | 3.9 | ||||||||||||||||||
|
|
|
|
|
| |||||||||||||||||||
Trading of petrochemical products | ||||||||||||||||||||||||
Net sales | 21,690.7 | 24.6 | 26,544.0 | 27.8 | 23,697.3 | 29.9 | ||||||||||||||||||
Cost of sales and expenses | (21,637.5 | ) | (24.5 | ) | (26,439.1 | ) | (27.7 | ) | (23,636.7 | ) | (29.8 | ) | ||||||||||||
|
|
|
|
|
| |||||||||||||||||||
Segment profit from operations | 53.2 | 0.1 | 104.9 | 0.1 | 60.6 | 0.1 | ||||||||||||||||||
|
|
|
|
|
| |||||||||||||||||||
Other segments | ||||||||||||||||||||||||
Net sales | 786.7 | 0.9 | 781.4 | 0.8 | 826.5 | 1.1 | ||||||||||||||||||
Cost of sales and expenses | (500.0 | ) | (0.6 | ) | (473.0 | ) | (0.5 | ) | (691.9 | ) | (0.9 | ) | ||||||||||||
|
|
|
|
|
| |||||||||||||||||||
| 286.7 | 0.3 | 308.4 | 0.3 | 134.6 | 0.2 | |||||||||||||||||||
|
|
|
|
|
| |||||||||||||||||||
84
Table of Contents
Report of the Directors(continued)
| For the years ended 31 December | ||||||||||||||||||||||||
| 2019 | 2018 | 2017 | ||||||||||||||||||||||
| RMB million | % of net sales | RMB million | % of net sales | RMB million | % of net sales | |||||||||||||||||||
Total | ||||||||||||||||||||||||
Net sales | 88,055.7 | 100.0 | 95,613.5 | 100.0 | 79,218.3 | 100.0 | ||||||||||||||||||
Cost of sales and expenses | (86,735.2 | ) | (98.5 | ) | (90,028.4 | ) | (94.2 | ) | (72,816.4 | ) | (91.9 | ) | ||||||||||||
|
|
|
|
|
| |||||||||||||||||||
Operating profit | 1,320.5 | 1.5 | 5,585.1 | 5.8 | 6,401.9 | 8.1 | ||||||||||||||||||
|
|
|
|
|
| |||||||||||||||||||
Net finance income | 363.0 | 0.4 | 337.4 | 0.4 | 207.3 | 0.3 | ||||||||||||||||||
Investment income | — | — | — | — | — | — | ||||||||||||||||||
Share of profit of associates and joint ventures | 972.6 | 1.1 | 885.6 | 0.9 | 1,243.7 | 1.6 | ||||||||||||||||||
|
|
|
|
|
| |||||||||||||||||||
Profit before income tax | 2,656.1 | 3.0 | 6,808.1 | 7.1 | 7,852.9 | 10.0 | ||||||||||||||||||
Income tax | (429.0 | ) | (0.5 | ) | (1,471.9 | ) | (1.5 | ) | (1,698.7 | ) | (2.2 | ) | ||||||||||||
|
|
|
|
|
| |||||||||||||||||||
Profit for the year | 2,227.1 | 2.5 | 5,336.2 | 5.6 | 6,154.2 | 7.8 | ||||||||||||||||||
|
|
|
|
|
| |||||||||||||||||||
Attributable to: | ||||||||||||||||||||||||
Shareholders of the Company | 2,215.7 | 2.5 | 5,336.3 | 5.6 | 6,143.2 | 7.8 | ||||||||||||||||||
Non-controlling interests | 11.4 | 0.0 | (0.1 | ) | 0.0 | 11.0 | 0.0 | |||||||||||||||||
|
|
|
|
|
| |||||||||||||||||||
Profit for the year | 2,227.1 | 2.5 | 5,336.2 | 5.6 | 6,154.2 | 7.8 | ||||||||||||||||||
|
|
|
|
|
| |||||||||||||||||||
85
Table of Contents
Report of the Directors(continued)
| 3.2 | Comparison and analysis |
Comparison between the year ended 31 December 2019 and the year ended 31 December 2018 is as follows:
| 3.2.A | Operating results |
| (1) | Net sales |
In 2019, net sales of the Group amounted to RMB88,055.7 million, a decrease of 7.90% from the previous year’s RMB95,613.5 million. As of 31 December 2019, the weighted average prices (excluding tax) of synthetic fibers, resins and plastics, intermediate petrochemical products and petroleum products of the Group decreased by 13.24%, 11.48%, 17.48% and 4.28% year-on-year respectively.
| (i) | Synthetic fibres |
In 2019, the Group’s net sales of synthetic fiber products amounted to RMB2,158.9 million, a decrease of 1.08% from the previous year’s RMB2,182.4 million, which was mainly due to the downturn in the downstream market this year. The general decline in the sales price of synthetic fiber products led to the sales decline during the reporting period. Sales volume of synthetic fibers increased by 14.02% year-on-year, while the weighted average sales price decreased by 13.24%. Meanwhile, the weighted average sales price of acrylic fibers, the main product of the synthetic fibers segment, decreased by 14.44% year-on-year, and the weighted average sales price of polyester fibers decreased by 14.13% year-on-year. Net sales of acrylic fibers, polyester fibers and other products accounted for 84.83%, 9.03% and 6.14% of the total sales of synthetic fibers segment respectively.
Net sales of synthetic fibers accounted for 2.50% of the Group’s net sales in the current year, a decrease of 0.2 percentage points from the previous year.
86
Table of Contents
Report of the Directors(continued)
| (ii) | Resins and plastics |
In 2019, the Group’s net sales of resins and plastics products amounted to RMB9,979.9 million, a decrease of 5.33% from the previous year’s RMB10,542.1 million, which was mainly due to the downturn in the downstream market this year. The general decline in the sales price of resins and plastics products led to the sales decline during the reporting period. The weighted average sales price of resins and plastics decreased by 11.48%, while the sales volume of resins and plastics products increased by 6.94% year-on-year. Meanwhile, the weighted average sales price of polyethylene and polypropylene decreased by 17.94% and 4.08%, and the weighted polyester chips decreased by 15.91% year-on-year. The sales of polyethylene, polypropylene, polyester chips and other products accounted for 31.92%, 36.21%, 17.55% and 14.32% of the total sales of resins and plastics segment respectively.
The net sales of resins and plastics accounted for 11.30% of the Group’s net sales in the current year, a decrease of 0.3 percentage points from the previous year.
| (iii) | Intermediate petrochemical products |
In 2019, the Group’s net sales of intermediate petrochemical products amounted to RMB10,313.6 million, a decrease of 15.19% from the previous year’s RMB12,160.6 million. The decline in raw material costs this year has driven down the unit price of intermediate petrochemical products. The weighted average sales price of intermediate petrochemical products decreased by 17.48% year-on-year, and its sales volume increased by 2.78% year-on-year. The sales of p-xylene, ethylene oxide, pure benzene, ethylene glycol and other products accounted for 27.26%, 16.97%, 13.72%, 7.40% and 34.67% of the total sales of intermediate petrochemical products respectively.
The net sales of intermediate petrochemical products accounted for 11.70% of the Group’s net sales in the current year, a decrease of 1.01 percentage points from the previous year.
87
Table of Contents
Report of the Directors(continued)
| (iv) | Petroleum products |
In 2019, the Group’s net sales of petroleum products amounted to RMB43,125.9 million, a decrease of 0.64% from the previous year’s RMB43,403 million, representing a slight change. The weighted average sales price of major products decreased by 4.28% year-on-year, and sales volume increased by 3.80%.
The net sales of petroleum products accounted for 49.00% of the Group’s net sales in the current year, an increase of 3.6 percentage points from the previous year.
| (v) | Trading of petrochemical products |
In 2019, the Group’s net sales of trading of petrochemical products amounted to RMB21,690.7 million, a decrease of 18.28% from the previous year’s RMB26,544 million. Mainly due to the decrease in customer purchase demand of the subsidiary Jinshan Trading Corporation, the sales of this year decreased by RMB4,513 million.
The net sales of petrochemical products accounted for 24.60% of the Group’s net sales in the current year, a decrease of 3.2 percentage points from the previous year.
| (vi) | Others |
In 2019, the Group’s net sales of other products amounted to RMB786.7 million, an increase of 0.68% from the previous year’s RMB781.4 million.
The net sales of other products accounted for 0.90% of the Group’s net sales in the current year, an increase of 0.1 percentage points from the previous year.
88
Table of Contents
Report of the Directors(continued)
| (2) | Cost of sales and operating expenses |
Cost of sales and expense consist of cost of sales, sales and management expenses, other operating expenses and other operating income, etc.
In 2019, the Group’s cost of sales and expenses amounted to RMB86,735.2 million, a decrease of 3.66% from RMB90,028.4 million in 2018. Cost of sales and expenses of synthetic fibers, resins and plastics, intermediate petrochemical products, petroleum products, petrochemical products and other products amounted to RMB2,699.2 million, RMB9,578.5 million, RMB9,899.6 million, RMB42,420.4 million, RMB21,637.5 million and RMB500 million respectively. Meanwhile, cost of sales and expenses of synthetic fibers and petroleum products increased by 4.48% and 4.76% year-on-year respectively, while cost of sales and expenses of resins and plastics, intermediate petrochemical products, petrochemical products and other products decreased by 0.66%, 3.19%, 18.16% and 22.54% year-on-year respectively.
Compared with the last year, the cost of sales and expenses of the petrochemical products decreased this year, which was mainly due to the decrease in sales of the subsidiary Jinshan Trading Corporation and thus the decrease in corresponding costs.
| • | Cost of sales |
In 2019, the Group’s cost of sales amounted to RMB86,468.0 million, a decrease of 3.75% from previous year’s RMB89,839.0 million. Cost of sales accounted for 98.02% of the net sales this year.
| • | Selling and administrative expenses |
In 2019, the Group’s sales and management expenses amounted to RMB549.9 million, an increase of 2.57% from the previous year’s RMB536.1 million, which was mainly due to the increase in transportation fee by RMB13.5 million.
| • | Other operating income |
In 2019, the Group’s revenue of other businesses amounted to RMB150.7 million, a decrease of 25.62% from previous year’s RMB202.6 million. This was mainly due to the decrease of RMB22.1 million in tax refunds and RMB12.9 million in subsidies of R&D projects, leading to a reduction in the revenue of other businesses.
89
Table of Contents
Report of the Directors(continued)
| • | Other operating expenses |
In 2019, the Group’s other business expenses amounted to RMB21.9 million, a decrease of 32.62% from previous year’s RMB32.5 million. This was mainly due to the decrease of RMB10.9 million in compromise and compensation expenses this year, leading to a reduction in expenses of other businesses.
| (3) | Profit from operations |
In 2019, the Group’s operating profit amounted to RMB1,320.6 million, a decrease of RMB4,264.5 million from the operating profit of RMB5,585.1 million in the previous year. The sharp decrease was mainly due to impacts of the increase in crude oil prices and the production cycle in 2019. Affected by the overall economic environment and the demands of downstream manufacturers, the price of the Company’s products fell sharply, while the Company’s raw material purchase prices and processing costs fell less, resulting in a significant reduction in profits.
| (i) | Synthetic fibres |
In 2019, the operating loss of synthetic fibers amounted to RMB540.3 million, a decrease of RMB33.2 million from the operating loss of RMB573.5 million in the previous year. The overall poor performance of the textile industry, the downstream market of synthetic fibers segment, together with the impact of the external trade situation resulted in weak market demand and an increase in losses in the synthetic fibers sector during the Reporting Period.
| (ii) | Resins and plastics |
In 2019, the operating profit of resins and plastics amounted to RMB401.5 million, a decrease of RMB499.0 million from the operating profit of RMB900.4 million in the previous year. The decrease was mainly due to the increase in the cost of raw materials and the market downturn, which led to a significant decline in sales prices.
90
Table of Contents
Report of the Directors(continued)
| (iii) | Intermediate petrochemical products |
In 2019, the operating profit of intermediate petrochemical products amounted to RMB413.9 million, a decrease of RMB1,521.0 million from the operating profit of RMB1,934.9 million in the previous year. The decrease in gross profit of chemical products was due to the increase in the cost of crude oil, which made the average unit cost of intermediate petrochemical products rise more, and the sales affected by the needs of downstream manufacturers and the overall economic environment, hence the gross profit dropped significantly.
| (iv) | Petroleum products |
In 2019, the operating profit of petroleum products amounted to RMB705.5 million, a decrease of RMB2,204.5 million from the operating profit of RMB2,910.0 million in the previous year. The decrease was mainly due to the increase of RMB1,927.4 million in the cost and expenses of sales of petroleum products and the decrease of RMB277.1 million in net sales during the Reporting Period.
| (v) | Trading of petrochemical products |
In 2019, the operating profit of the trading of petrochemical products amounted to RMB53.2 million, a decrease of RMB51.7 million from the operating profit of RMB104.9 million in the previous year. The decrease was mainly due to the decrease of RMB4,853.3 million in net sales of the trading of petrochemical products and the decrease of RMB4,801.6 million in the cost and expenses of trading, which resulted in a year-on-year decrease in profits.
| (vi) | Others |
In 2019, the Group’s other operating profit amounted to RMB286.8 million, a decrease of RMB21.6 million from RMB308.4 million in the previous year, which was mainly due to the decrease in the amount of job provision subsidies issued this year and the increase in the amount of asset disposal income.
91
Table of Contents
Report of the Directors(continued)
| (4) | Net finance income |
In 2019, the Group’s net financial income amounted to RMB363.0 million, a change of RMB25.6 million from the net financial income of RMB337.4 million in the previous year, which was mainly due to the sharp decline in the average balance of bank loans by Jinshan Associated Trading Corporation and Jinmao International, two subsidiaries of the Group, leading to a decrease of RMB52.4 million in interest expenses from RMB106.2 million in 2018 to RMB53.8 million in 2019.
| (5) | Profit before taxation |
In 2019, the Group’s profit before tax amounted to RMB2,656.1 million, a decrease of RMB4,152.0 million from the profit before tax of RMB6,808.1 million in the previous year.
| (6) | Income tax |
The income tax of the Group amounted to RMB429.0 million in 2019 and RMB1,471.9 million in 2018, which was mainly due to the decrease in the profit before tax of the Company, resulting in a decrease of the current income tax payable.
In accordance with The Enterprise Income Tax Law of the PRC (as amended) which became effective from 1 January 2008, the income tax rate applicable to the Group in 2019 is 25% (2018: 25%).
| (7) | Profit for the year |
In 2019, the Group’s profit after tax amounted to RMB2,227.1 million, a decrease of RMB3,109.1 million from the profit after tax of RMB5,336.2 million in the previous year.
92
Table of Contents
Report of the Directors(continued)
| 3.2.B | Liquidity and capital sources |
The Group’s primary sources of capital are operating cash inflows and loans from unaffiliated banks. The Group’s primary uses of capital are costs of goods sold, other operating expenses and capital expenditure.
| (1) | Capital sources |
| (i) | Net cash flow generated from operating activities |
In 2019, the Group’s net cash inflows generated from operating activities amounted to RMB5,057.8 million, a decrease of RMB1,601.6 million from the net cash inflows of RMB6,659.4 million in the previous year. During the Reporting Period, with profitability in operating, the Group’s cash inflows generated from operating activities in 2019 amounted to RMB5,655.7 million, a decrease of RMB2,845.8 million from the cash inflows generated from operating activities of RMB8,501.5 million. The income tax payable in 2019 amounted to RMB534.5 million, a decease of RMB1,271.9 million from the income tax payable of RMB1,806.4 million in the previous year.
| (ii) | Borrowings |
By the end of 2019, the Group’s total borrowings increased by RMB1,050.4 million to RMB1,547.6 million as compared to the same period of last year, mainly due to the increase of short-term borrowings by RMB1,050.4 million.
The Group managed to maintain its gearing ratio at a safe level by strengthening its management of liabilities (such as borrowings) and enhancing its control over financial risks. The Group generally does not experience any seasonality in borrowings. However, due to the fact that the Group’s capital expenditure is, by nature, planned in advance, long-term bank loans can be suitably arranged in advance of expenditures, while short-term borrowings are used to meet operational needs. The terms of the Group’s existing borrowings do not restrict its ability to distribute dividends for its shares.
| (2) | Gearing ratio |
As of 31 December 2019, the Group’s gearing ratio was 34.07% (2018: 31.37%). The ratio is calculated using this formula: total liabilities/total assets multiply by 100%.
93
Table of Contents
Report of the Directors(continued)
| 3.2.C | Research and development, patents and licenses |
The Group owns various technology development departments, including Petrochemical Research Institute, Plastic Research Institute, Polyester Research Institute, Acrylic Fiber Research Institute and Environmental Protection Research Institute, which are responsible for research and development of new technologies, products, processes, equipment and environmental protection. The Group’s research and development expenses for 2017, 2018 and 2019 amounted to RMB36.7 million, RMB37.3 million and RMB93.0 million, respectively. The increase was mainly due to the increase in research and development investment in projects related to the control of potential safety hazards.
The Group does not rely on any patents, licenses, industrial, commercial or financial contracts or new production processes in any material respect.
| 3.2.D | Off-Balance Sheet Arrangements |
Please refer to note 33 to the financial statements prepared under IFRS in the full text of the 2019 annual report for details of the Group’s capital commitments. The Group did not provide any guarantee to external parties during the Reporting Period.
| 3.2.E | Contractual obligations |
The following table sets forth the Group’s obligations to repay loan principal in future as at 31 December 2019:
| Payment due and payable by the following period as at 31 December 2019 | ||||||||||||||||||||
| Total (RMB’000) | Within 1 year (RMB’000) | After 1 year but within 2 years (RMB’000) | After 2 years but within 5 years (RMB’000) | Over 5 years (RMB’000) | ||||||||||||||||
Contractual obligations | ||||||||||||||||||||
Short term borrowings | 1,547,600 | 1,547,600 | — | — | — | |||||||||||||||
Long term borrowings | — | — | — | — | — | |||||||||||||||
|
|
|
|
|
|
|
|
|
| |||||||||||
Total contractual obligations | 1,547,600 | 1,547,600 | — | — | — | |||||||||||||||
|
|
|
|
|
|
|
|
|
| |||||||||||
94
Table of Contents
Report of the Directors(continued)
| 3.2.F | Analysis of performance and results of in which the Company has controlling interests or investment interests during the Reporting Period |
As at 31 December 2019, the Company had more than 50% equity interest in the following principal subsidiaries:
Company name | Place of registration | Principal activities | Place for principal activities | Type of legal person | Percentage of equity held by the Company (%) | Percentage of equity held by the Group (%) | Registered capital | Net profit/ (loss) for the year 2018 (RMB’000) | ||||||||||||||||||||||||
Shanghai Petrochemical Investment Development Company Limited (“Shanghai Investment Development”) | China | | Investment management | | China | | Limited company | | 100.00 | 100.00 | RMB | 1,000,000 | 19,948 | |||||||||||||||||||
China Jinshan Associated Trading Corporation (Jinshan Associated Trading) | China | | Import and export of petrochemical products and equipment | | China | | Limited company | | 67.33 | 67.33 | RMB | 25,000 | 27,675 | |||||||||||||||||||
Shanghai Jinchang Engineering Plastics Company Limited (“Shanghai Jinchang”) | China | | Production of polypropylene compound products | | China | | Limited company | | — | 74.25 | US$ | 9,154 | -6,015 | |||||||||||||||||||
Shanghai Golden Phillips Petrochemical Company Limited (“Shanghai Golden Phillips”) | China | | Production of polypropylene products | | China | | Limited company | | — | 100.00 | US$ | 50,000 | 70,662 | |||||||||||||||||||
Shanghai Jinmao International Trade Company Limited (“Jinmao International”) | China | | Import and export of petrochemical products and equipment | | China | | Limited company | | — | 67.33 | RMB | 100,000 | 27,073 | |||||||||||||||||||
Note: None of the subsidiaries have issued any debt securities. |
The Group’s equity interests in its associates comprised an equity interest of 38.26%, amounting to RMB1,917.2 million, in Shanghai Chemical Industry Park Development Co., Ltd. (“Chemical Industry Park”), a company incorporated in the PRC; and an equity interest of 20%, amounting to RMB2,724.4 million, in Shanghai SECCO Petrochemical Company Limited (“Shanghai SECCO”), a company incorporated in the PRC. The principal business of Shanghai Chemical Industry Park Development Co., Ltd. includes planning, developing and operating the Chemical Industry Park in Shanghai, while the principal business of Shanghai SECCO is the production and distribution of petrochemicals.
95
Table of Contents
Report of the Directors(continued)
| (1) | Explanation of profits of major controlling companies and investing companies affecting more than 10% of the net profit of the Group |
In 2019, Shanghai SECCO recorded a revenue of RMB28,341.0 million, and its profit after tax reached RMB3,338.6 million, among which RMB676.7 million was attributed to the Company.
In 2019, the Chemical Industrial Park recorded a revenue of RMB1,936.5 million and its profit after tax reached RMB583.4 million, among which RMB223.2 million was attributed to the Company.
| (2) | Analysis of operational performance of major controlling companies and investing companies with a 30% or more year-on-year change |
| (a) | In 2019, net profit of Shanghai Investment Development amounted to RMB19.9 million, and operating performance decreased by RMB22.4 million from the previous year’s RMB42.3 million, mainly because of the operating underperformance in 2019, resulting in a decrease of RMB15.5 million in return on investment and a decline of operational performance. |
| (b) | In 2019, net income of Jinshan Associated Trading amounted to RMB27.7 million, and operating performance increased by RMB22.6 million compared with the previous year, mainly because of the steady changes in the exchange rate of the US dollar in 2019 and the relatively stable price of chemical products. Gross profit margin of Jinshan Associated Trading was relatively stable throughout the year, and its operating performance returned to normal level. In addition, Jinshan Associated Trading vigorously reduced costs and fees this year, with net income amounting to RMB44 million. |
| (c) | In 2019, net loss of Shanghai Jinchang amounted to RMB6 million, and operating performance decreased by RMB6.1 million, mainly because of the increasing price of polypropylene of Shanghai Jinchang and the sluggish downstream industry, resulting in a remarkable decrease in operational performance in 2019. |
| (d) | In 2019, net profit of Shanghai Golden Phillips amounted to RMB70.7 million, up by RMB64.9 million from the previous year’s RMB5.8 million, mainly because of the revenue increase of 9.45% year-on-year, and the decrease of average purchasing price of raw materials, which resulted in a significant increase in net profit when the annual cost only increased by 0.94%. |
96
Table of Contents
Report of the Directors(continued)
| 3.2.G | Major suppliers and customers |
The Group’s top five suppliers in 2019 were China International United Petroleum & Chemical Co., Ltd., Materials and Equipment Department of China Petroleum and Chemical Corporation, Shengyuan Ji (Jiangsu) Industrial Co., Ltd., Shanghai Gas Co., Ltd. and Shanghai International Holding Co. Total procurement costs involving these five suppliers, which amounted to RMB49,147.6 million, accounted for 51.59% of the total procurement costs of the Group for the year. The procurement from the largest supplier amounted to RMB43,887 million, representing 46.07% of the total costs of purchases by the Group for the year.
The Group’s top five customers in 2019 were East China Branch of Sinopec Sales Company Limited, Jiaxing Petrochemical Co., Ltd., Hengli Petrochemical (Dalian) Co., Ltd., Macau New Solar Co., Ltd., and Zhongtuo (Fujian) Industry Limited. Total sales to these five customers amounted to RMB48,734.6 million, representing 48.57% of the Group’s total turnover for the year. Sales to the Group’s largest customer amounted to RMB42,658 million, representing 42.51% of the Group’s total turnover for the year.
To the knowledge of the Board, among the suppliers and customers listed above, none of the Directors or shareholders of the Company (and their respective close associates) had any interests in Shengyuan Ji (Jiangsu) Industrial Co., Ltd., Shanghai Gas Co., Ltd., Shanghai International Holding Co, Jiaxing Petrochemical Co., Ltd., Hengli Petrochemical (Dalian) Co., Ltd., Macau New Solar Co., Ltd., and Zhongtuo (Fujian) Industry Co., Ltd. China International United Petroleum & Chemical Co. Ltd., Materials and Equipment Department of China Petroleum and Chemical Corporation, and East China Branch of Sinopec Sales Company Limited are subsidiaries of Sinopec Corp., the controlling shareholder of the Company.
97
Table of Contents
Report of the Directors(continued)
| (II) | The Principal Operations of the Company during the Reporting Period |
Discussion and analysis of the Company’s operation (Prepared under CAS)
| 1. | Analysis of the Company’s major businesses |
| 1.1 | Analysis of changes in the Consolidated Income Statement and the Consolidated Cash Flow Statement |
| Unit: RMB’000 | ||||||||||||
Item | Amount for the year ended 31 December 2019 | Amount for the year ended 31 December 2018 | Increase/decrease (%) | |||||||||
Revenue | 100,346,048 | 107,764,908 | -6.88 | |||||||||
Cost of sales | 83,781,040 | 87,029,575 | -3.73 | |||||||||
Selling and distribution expenses | 532,455 | 536,914 | -0.83 | |||||||||
General and administrative expenses | 2,500,287 | 2,616,798 | -4.45 | |||||||||
Financial expenses (“-” for financial income) | -348,181 | -293,429 | 18.66 | |||||||||
Research and Development Expenditure | 92,964 | 37,261 | 149.49 | |||||||||
Net cash inflow generated from operating activities (“-” for net outflow) | 5,121,209 | 6,695,099 | | Inflow decreased by 23.51 | % | |||||||
Net cash inflow used in investing activities (“-” for net outflow) | -4,623,209 | -1,928,369 | | Outflow increased by 139.75 | % | |||||||
Net cash inflow used in financing activities (“-” for net outflow) | -1,800,792 | -3,542,874 | | Outflow decreased by 49.17 | % | |||||||
98
Table of Contents
Report of the Directors(continued)
Analysis of major changes in the Consolidated Income Statement
| For the years ended 31 December | Increase/ decrease | Increase/ decrease | Unit: RMB’000 | |||||||||||||||
Item | 2019 | 2018 | amount | (%) | Major reason for change | |||||||||||||
Financial expenses-net (“-” for income) | -348,181 | -293,429 | -54,752 | 18.66 | Gain from exchange increased this year. | |||||||||||||
Investment income | 953,661 | 878,213 | 75,448 | 8.59 | Associated company Secco and Chemical Industrial Park’s net profit for the period increased by RMB263 million, resulting in investment accounted under the equity method increasing | |||||||||||||
Operating profit | 2,698,359 | 6,766,774 | -4,068,415 | -60.12 | Affected by the overall | |||||||||||||
Total profit | 2,654,116 | 6,748,976 | -4,094,860 | -60.67 | economic environment | |||||||||||||
Net profit | 2,225,153 | 5,277,073 | -3,051,920 | -57.83 | and the demands of downstream manufacturers, the price of the Company’s products fell sharply, while the Company’s raw material purchase prices and processing costs fell less, resulting in a significant reduction in profits. | |||||||||||||
Income tax expenses | 428,963 | 1,471,903 | -1,042,940 | -70.86 | The profit before tax decreased during the reporting period | |||||||||||||
99
Table of Contents
Report of the Directors(continued)
Analysis of major changes in the Cash Flow Statement
| For the years ended 31 December | Increase/ decrease | Increase/ decrease | Unit: RMB’000 | |||||||||||||||
Item | 2019 | 2018 | amount | (%) | Major reason for change | |||||||||||||
Net cash inflow generated from operating activities (“-” for net outflow) | 5,121,209 | 6,695,099 | | Inflow decreased by 1,573,890 | | | Inflow decreased by 23.51% | | The decline in the Company’s operating profit led to a decrease in net cash inflows. | |||||||||
Net cash inflow used in investing activities (“-” for net outflow) | -4,623,209 | -1,928,369 | | Outflow increased by 2,694,840 |
| | Outflow increased by 139.75% | | The Company’s total capital amount increased this year compared with the previous year, and the amount of structured deposits and fixed deposits increased, resulting in an increase in net cash outflows from investment activities. | |||||||||
Net cash inflow used in financing activities (“-” for net outflow) | -1,800,792 | -3,542,874 | | Outflow decreased by 1,742,082 |
| | Outflow decreased by 49.17% | | The amount of dividends distributed this year decreased by RMB541 million over the previous year, and the net growth of borrowings this year reached RMB1,050 million, resulting in a decrease in net cash outflows generated from financing activities. | |||||||||
100
Table of Contents
Report of the Directors(continued)
| 1.2 | Revenue |
| (1) | Analysis of factors causing the changes in revenue |
The weighted average prices (exclude VAT) of the Group’s synthetic fibres, resins and plastics, intermediate petrochemical products and petroleum products reduced by 13.24%, 11.48%, 17.48% and 4.28% respectively, bringing a lower revenue in 2019 compared with the previous year. |
| (2) | Major customers |
Please refer to 3.2.G for details of major customers of the Group. |
| 1.3 | Cost of sales |
| (1) | Analysis of cost of sales |
In 2019, the Group’s costs of sales were RMB83,781 million, a decrease of 3.73% from the previous year’s RMB87,029.6 million, which was mainly due to the decrease in the price of the Group’s main raw materials. |
The following table sets forth the details of the cost of sales of the Group during the Reporting Period: |
| For the years ended 31 December | ||||||||||||||||||||
| 2019 | 2018 | |||||||||||||||||||
| Amount (RMB million) | % of total cost of sales | Amount (RMB million) | % of total cost of sales | Increase/ decrease (%) | ||||||||||||||||
Cost of raw materials | ||||||||||||||||||||
Crude oil | 47,077.7 | 56.20 | 46,168.7 | 53.05 | 1.97 | |||||||||||||||
Ancillary materials | 10,024.3 | 11.96 | 10,420.5 | 11.97 | -3.80 | |||||||||||||||
Depreciation and amortisation | 1,413.3 | 1.69 | 1,465.6 | 1.68 | -3.57 | |||||||||||||||
Staff costs | 2,086.6 | 2.49 | 1,869.4 | 2.15 | 11.62 | |||||||||||||||
Costs of trade | 21,566.4 | 25.74 | 26,370.0 | 30.30 | -18.22 | |||||||||||||||
Others | 1,612.7 | 1.92 | 735.4 | 0.85 | 119.30 | |||||||||||||||
|
|
|
|
|
|
|
|
|
| |||||||||||
Total | 83,781.0 | 100.00 | 87,029.6 | 100.00 | -3.73 | |||||||||||||||
|
|
|
|
|
|
|
|
|
| |||||||||||
101
Table of Contents
Report of the Directors(continued)
| (2) | Major suppliers |
Please refer to 3.2.G for details of major suppliers of the Group. |
| 1.4 | Expenses |
Please refer to “Analysis of changes in the Consolidated Income Statement and the Consolidated Cash Flow Statement” set forth in the “Discussion and Analysis of the Company’s Operations” for details of the changes in expenses of the Group. |
| 1.5 | Research and development (“R&D”) expenditure |
| Unit: RMB’000 | ||||
Expensed R&D expenditure during the Reporting Period | 92,963.55 | |||
Capitalised R&D expenditure during the Reporting Period | — | |||
|
| |||
Total R&D expenditure | 92,963.55 | |||
|
| |||
% of R&D expenditure to revenue | 0.093 | |||
Number of R&D personnel | 160 | |||
% of number of R&D personnel to total number of staff | 0.02 | |||
% of capitalised R&D expenditures | — | |||
Please refer to 3.2.C for details of R&D, patents and licences of the Group. |
| 1.6 | Cash Flow |
Please refer to “Analysis of Changes in the Consolidated Income Statement and the Consolidated Cash Flow Statement” in this section for details of the changes in cash flow statement. |
102
Table of Contents
Report of the Directors(continued)
| 2. | Analysis of business operations by industry, product or geographical location segment |
| 2.1 | Principal operations by industry or product |
| Unit: RMB’000 | ||||||||||||||||||||||||
By industry | Revenue | Cost of sales | Gross profit/ (loss) margin (%) | Increase/ decrease of revenue as compared to the previous year | Increase/ decrease of cost of sales as compared to the previous year | Change of gross profit margin as compared to the previous year (percentage point) | ||||||||||||||||||
Synthetic fibres | 2,200,229 | 2,486,042 | -12.99 | -1.14 | % | -1.37 | % | | Increased by 0.27 percentage points |
| ||||||||||||||
Resins and plastics | 10,163,711 | 8,790,918 | 13.51 | -5.28 | % | -0.95 | % | | Decreased by 3.78 percentage points |
| ||||||||||||||
Intermediate petrochemical products | 10,511,143 | 9,095,702 | 13.47 | -15.25 | % | -2.49 | % | | Decreased by 11.33 percentage points |
| ||||||||||||||
Petroleum products(Note) | 54,886,705 | 41,156,331 | 25.02 | -0.16 | % | 4.93 | % | | Decreased by 3.63 percentage points |
| ||||||||||||||
Trading of petrochemical products | 21,706,014 | 21,566,364 | 0.64 | -18.28 | % | -18.29 | % | | Increased by 0.01 percentage points |
| ||||||||||||||
Others | 429,292 | 370,132 | 13.78 | -1.75 | % | 2.31 | % | | Decreased by 3.42 percentage points |
| ||||||||||||||
| Note: | Gross profit margin is calculated according to the price of petroleum products, which includes consumption tax. Gross profit margin of petroleum products after deducting consumption tax amounted to 5.47%. |
| 2.2 | Revenue by geographical location |
| Unit: RMB’000 | ||||||||
Geographical location | Revenue | Increase/decrease of revenue compared with the previous year (%) | ||||||
Eastern China | 78,623,268 | -7.22 | ||||||
Other regions in China | 3,375,019 | -12.89 | ||||||
Exports | 18,347,761 | -4.18 | ||||||
103
Table of Contents
Report of the Directors(continued)
| 3. | Analysis of assets and liabilities |
| Unit: RMB’000 | ||||||||||||||||||||||
| As at 31 December 2019 | As at 31 December 2018 | Change of amount on 31 December 2019 compared to | ||||||||||||||||||||
| % of total | % of total | 31 December | ||||||||||||||||||||
Item | Amount | assets | Amount | assets | 2018 (%) | Major reason of the change | ||||||||||||||||
Inventories | 6,754,434 | 14.80 | 8,120,875 | 18.23 | -16.83 | During the year, the Company strengthened its inventory control and achieved effective results in reducing inventory funds. The average inventory balance for the whole year decreased significantly. | ||||||||||||||||
Short-term borrowings | 1,547,600 | 3.39 | 497,249 | 1.12 | 211.23 | The Company’s new borrowings with lower financing costs were used to support daily operating funds. | ||||||||||||||||
Other non-current assets | 3,511,234 | 7.69 | — | — | 100.00 | The non-current assets added during the period was the three-year time deposits purchased by the Company. | ||||||||||||||||
104
Table of Contents
Report of the Directors(continued)
| 4. | Others |
| (1) | Directors, Supervisors, senior management and employees |
Please refer to the Chapter 5 “Directors, Supervisors, Senior Management and Employees” in this annual report. |
| (2) | Purchase, sale and investment |
Save as disclosed in this annual report, there was no material purchase or sale of the Group’s subsidiaries, associates or joint ventures or any other material investments in 2019. |
| (3) | Pledge of assets |
As at 31 December 2019, no fixed assets were pledged by the Group (31 December 2018: Nil). |
| (4) | Material events after the Reporting Period |
Please refer to Chapter 3 “Report of the Directors” for the disclosure of the impact brought by COVID-19. Apart from the above disclosure, the Board of directors is not aware of any material events affecting the Group since the end of the Reporting Period. |
| 5. | Financial assets and financial liabilities held in foreign currencies |
| As | at 31 December 2019, bank deposits denominated in foreign currencies held by the Group are equivalent to RMB336,078,000. |
105
Table of Contents
Report of the Directors(continued)
| 6. | Investment of the Company |
| 6.1 | Entrusted wealth management and entrusted loans |
| (1) | Entrusted wealth management |
The Company did not engage in any entrusted wealth management during the Reporting Period. |
| (2) | Entrusted loans |
The Company did not engage in any Entrusted loans during the Reporting Period. |
| 6.2 | Analysis of the companies in which the Company has controlling interests or investment interests |
Please refer to 3.2.F “Analysis of performance and results of major companies in which the Company has controlling interests or investment interests during the Reporting Period” contained in section II “Management Discussion and Analysis” of this chapter for details on the analysis of the major companies in which the Company has controlling interests or investment interests.
106
Table of Contents
Report of the Directors(continued)
| 6.3 | Non-fundraising projects |
In 2019, the capital expenditures of the Group amounted to RMB1,820 million, representing a increase of 80.02% as compared with RMB1,011 million in 2018. Major projects include the following:
Major Project | Total amount of project investment RMB’ 00,000,000 | Amount of project investment during the Reporting Period RMB’ 00,000,000 | Project progress as at 31 December 2019 | |||||||||
Oil cleaning project 400,000 tons/year clean gasoline components units | 7.82 | 4.20 | | Under construction | | |||||||
Second stage of PAN (Polyacrylonitrile) based carbon fiber project with annual production of 1500 tons | 3.23 | 2.10 | | Under construction | | |||||||
Function Reconstruction of Emergency Shut-off Valve in the Tank Area of the Storage and Transportation Department | 0.77 | 0.54 | | Under construction | | |||||||
Separation of Waste and Clear Water Project in the Tank Area of Storage and Transportation Department | 0.64 | 0.38 | | Under construction | | |||||||
Upgraded Factory Facilities Reconstruction of Bunker Fuel Oil | 0.48 | 0.38 | In Operation | |||||||||
Equity Investment in Power Distribution Companies | 4.00 | 3.20 | In Progress | |||||||||
| Note: | In addition to the major capital expenditure items disclosed in the above table, the total capital expenditure of other projects of the company is RMB740 million. |
The Group’s capital expenditures for 2020 are estimated at approximately RMB1,500 million.
107
Table of Contents
Report of the Directors(continued)
| (III) | Discussion and analysis on future development of the Company |
| 1. | Industry competition and development trends |
At present, the world economy is still undergoing in-depth adjustments in the wake of the international financial crisis and with the sudden outbreak of COVID-19 in multiple localities, it is expected that the global turmoil and risks will increase in 2020. Although the progress of trade negotiations between China and the United States has turned around, the global trade frictions have not been fundamentally improved. International direct investment remains sluggish, the room for global policy adjustment is limited, and the overall economic situation is still not optimistic.
China’s economy is facing an interlacing of increasing unstable and uncertain factors in the external environment as well as internal structural, institutional, and cyclical issues. There are still many risks and challenges faced by the economic operation and rising downward pressure on the economy. However, the basic trend of China’s economy maintaining a steady and long-term growth remains unchanged. China will continue to implement proactive fiscal policy and prudent monetary policy, further deepen the reform of economic system and promote high-quality development; therefore, it is estimated that China’s economic operation will be kept within a reasonable range.
In 2020, the world oil market witnesses more uncertainties. The easing trade tension and more proactive fiscal policies and loose monetary policies adopted by countries will bring a boost to oil demand to some extent. In terms of supply, the non-OPEC oil supply increment will still exceed the demand increment. In general, the fundamentals of the world oil market still face excessive pressure: geopolitical events may increase the volatility of oil prices; the impact of the US dollar on oil prices may continue to decline; and factors such as the Sino-US trade relations, Brexit and the US general election may also materially bear on the trend of oil prices. The outbreak of COVID-19 at the beginning of the year and the sudden increase in crude oil production by Saudi Arabia has greatly affected oil prices. It is expected that the overall international crude oil prices will face greater downward pressure in 2020.
The domestic petrochemical industry is facing the challenge of a downturn cycle. In 2020, a number of large projects integrating refinery and petrochemical capacity will enter the production capacity launch period, directly affecting the market pattern and product prices. The more stringent national requirements for the safety and environmental protection of the petrochemical industry, the establishment of China Oil & Gas Piping Network Corporation, the full implementation of new regulations for low-sulfur marine fuel oil and other in-depth advancement of industry reforms will have a direct and long-term impact on the industry. The outbreak of COVID-19 at the beginning of the year weakened industry demand, and there may be recoverable growth after the epidemic, while the industry situation is expected to be more complicated throughout the year.
108
Table of Contents
Report of the Directors(continued)
| 2. | Development strategies of the Company |
The Company aims to build itself into a “leading domestically, first-class globally” energy and chemical and new material enterprise. In accordance with the current situation and development trend of the world petrochemical industry, as well as the development trend of the domestic oil and petrochemical products market, especially in East China, the Company sets its development strategy as: to take into account both low cost and differentiation and to focus on both scale and refinement to realize low cost and large scale of the upstream and high added value and refinement of the downstream. The Company will give full play to its advantages of wide product chain, diversified products and close monitoring of the market to enhance competitiveness. Under the guidance of the development strategy, the Company further integrates the existing three processing chains of oil refining, olefin and aromatics with the development idea of “One Leader, One Core and One Base”, enterprise resource optimization and development plan in Shanghai. The Company also innovates the new development mode integrated refinery and petrochemical capacity with the concept of molecular refining and petrochemicals, further advances industrial integration, selectively develops the downstream petrochemical product chain with cost and logistics advantages as well as market support, and builds a green energy, fine petrochemical, and high-end materials industrial base with world-scale and first-class competitiveness on the northern shore of Hangzhou Bay, forming an unparalleled industrial complex with a stable profit model.
| 3. | Business plans |
In 2020, the Group will continue to adhere to the market-oriented and efficiency-centered strategy, constantly improve the level of safety and environmental protection, further strengthen system optimization and cost reduction and promote industrial restructuring, reform and innovation as well as the establishment of leader teams to strive to overcome the impact caused by COVID-19, weather the global economic downturn, ease the pressure of the sharp decline of crude oil prices on the Company’s short-term performance, and maintain stable production and operation.
In 2020, the Company plans to process a total of 15.30 million tons of crude oil and produce a total of 9.27 million tons of refined oil, 0.82 million tons of ethylene, 0.66 million tons of paraxylene, 0.92 million tons of plastic resin, 0.65 million tons of raw materials of synthetic fibers, 0.44 million tons of synthetic fiber polymers and 0.20 million tons of synthetic fibers.
In order to realize the operation goal of 2020, the Group will conscientiously do the following work:
109
Table of Contents
Report of the Directors(continued)
| (1) | Improve the level of safety and environmental protection |
The Group will promote the effective operation of HSSE management system and fully implement the responsibilities of a HSSE management entity; strengthen learning to promote employees to consciously develop habits of safety and environmental protection, establish a sound linking mechanism of employees’ production safety behaviors and assessment and incentives, and form the long-term and effective HSSE management culture. In order to promote centralized management of safe production, the Group will fully promote process safety management, strengthen the management of contractor and direct operation, and formally establish the ledger of dangerous chemicals (major hazard sources). Furthermore, the Group will continuously strengthen management of of environmental protection facilities to achieve consistent compliance and operation, and promote programs such as LDAR Full Coverage and “10,000 Employees Checking Odor” to ensure a declining concentration of VOCs at the plant boundary. The Group will strengthen carbon emission management, continue to promote energy efficiency and energy conservation to continuously reduce energy and resource consumption.
| (2) | Keep smooth operation of production devices |
Based on the reinforcing of unplanned halt control, the Group will strictly control “three minors”, namely, minor fluctuation, minor anomaly and minor deviation, and resolutely guard against “three unplanneds”, namely, unplanned halt, unplanned shutdown and unplanned closedown in an attempt to improve the level of stable operation. The Group will promote the construction of equipment integrity management system, strengthen preventive maintenance and overhaul, ensure the quality management system of the whole process, and focus on the device maintenance mainly for B series replacement of RDS device. Besides, the Group will reinforce alert management, change management, self-control rate management and intelligent inspection, organize labor competitions to improve the reliability of devices, and continuously improve the level of automation control and long-term operation of devices.
| (3) | Improve system optimization and tap potential for cost reduction and efficiency improvement |
The Group will reinforce the analysis of the crude oil market situation, and research and apply hedging tools to reduce crude oil costs. To improve the level of system optimization, the Group will deepen the concept of whole process optimization, promote the construction of crude oil online reconciliation system, and timely carry out the outsourcing of resources such as raw oil and MTBE. Meanwhile, the Group will further advance the implementation of a number of strategies including increasing the production of gasoline and aviation fuel, reducing the production of diesel and coke, ensuring profitability in petrochemical sector and expanding marine fuel oil. The Group will adhere to dynamic adjustment, strengthen the tracking of marginal contribution of chemical equipment in each product chain, and optimize product structure timely. Besides, the Group will attach great importance to mutual supply of raw materials with Shanghai Secco, actively strive for Sinopec’s internal
110
Table of Contents
Report of the Directors(continued)
and social high-quality resources, to ensure the efficient high load operation of devices. In addition, the Group will strictly control inventory and reduce costs, adhere to the low inventory strategy, strengthen comprehensive dynamic management, purchase crude oil reasonably, so as to control crude oil inventory. Meanwhile, the Group will pay attention to material reserve management, optimize material reserve manner, ensure the inventory control management of raw material, intermediate material and finished products at a reasonable level. As a result, the inventory structure can be further optimized. Furthermore, the Group will vigorously promote the standardized material procurement, and improve procurement quality and efficiency, so as to control procurement costs. The Group will continue to focus on the evaluating of major costs and expenses and increase the budget and final account management of major costs such as inspection and maintenance, to achieve overall control of costs and expenses.
| (4) | Accelerate the adjustment of industrial structure and make breakthrough in core technologies |
The group will fully launch the establishment work of “14th Five-Year Plan”, actively promote refining clean-up transformation, the construction of 48K large tow carbon fiber, and the third loop of 220kv power supply engineering. The company will ensure the pre-commissioning and full production of the projects like the refining clean-up project and the 2nd phase of the carbon fiber project on time. Besides, the company will also establish new materials innovation research centers, promote the R&D of carbon fiber composite and industrial cultivation, accelerate the formation of industrial cluster advantages, and give great impetus to the domestication of key devices like oxidation furnaces and carbonization furnaces.
111
Table of Contents
Report of the Directors(continued)
| (5) | Further strengthen corporate management and advance the reform of management system |
In accordance with the development needs of the industry, the Company will explore the development models of its four major sectors, namely, oil refining, petrochemical, new materials and capital operations, adjust and optimize capabilities and settings of functional departments, sort out problems and difficulties of the existing management process, and study methods for system improvement to promote management optimization. In addition, the Company will improve the performance evaluation system based on the balanced scorecard, highlighting value unleash, benefit orientation, innovation and vitality, and effectively transforming strategic goals into action goals. The Company will promote the strategy of “boosting enterprises through talents”, actively advance the establishment of competence system for management leaders and the implementation of fault tolerance and error correction systems, intensify the training and recruitment of medium- and high-level technical and skilled personnel, improve the cultivation and incentive mechanism of scientific and technological talents, and carry out and strengthen staff training to improve the comprehensive quality, operational skills and emergency response capabilities of skilled personnel in an all-round way.
| 4. | Risk exposure |
| (1) | The cyclical characteristics of the petroleum and petrochemicals market and price volatility in crude oil and petrochemical products may have an adverse impact on the Group’s operations |
A large part of the Group’s revenue is derived from the sales of refined oil and petrochemical products. Historically, such products have been cyclical in nature and relatively sensitive to macroeconomic changes. Additionally, changes in regional and global economic conditions, productivity and output, prices and supply of raw materials, consumer demand and prices and supply of substitutes also have an effect. From time to time, these factors have a material impact on the prices of the Group’s products in regional and global markets. Given the reduction of tariffs and other import restrictions as well as the relaxation of control by the PRC government over the distribution and pricing of products, a substantial number of the Group’s products will increasingly be subject to the cyclical impact in the regional and global markets. In addition, the prices of crude oil and petrochemical products will remain volatile, and uncertain. Higher crude oil prices and lower petrochemical products prices are likely to have a negative impact on the Group’s business, operating results and financial condition.
112
Table of Contents
Report of the Directors(continued)
| (2) | The Group may be exposed to risks associated with the procurement of imported crude oil and may not be able to pass on all increased costs due to rising crude oil price |
At present, the Group consumes a significant amount of crude oil for the production of petrochemical products. More than 95% of the crude oil consumption is imported. In recent years, crude oil prices have been subject to significant fluctuations due to a variety of factors, and the Group cannot rule out the possibility of any major unexpected event which may cause a suspension in crude oil supply. The Group has attempted to mitigate the effects of increased costs from rising crude oil prices by passing them on to the customers, but the ability to do so is limited because of market conditions and government control over the pricing of refined oil products. Since there is a time-lag between increases in crude oil prices and increases in petrochemical product prices, higher costs cannot be totally offset by raising the selling prices. In addition, the State also imposes control over the distribution of some petroleum products within China. For instance, some of the Group’s petroleum products are required to be sold to designated customers (such as subsidiaries of Sinopec Corp). Hence, when crude oil prices are high, the higher costs cannot be totally offset by raising the selling prices of the Group’s petroleum products.
| (3) | Modest capital expenditures and financing requirements are required for the Group’s development plans, presenting a number of risks and uncertainties |
The petrochemical industry is a capital-intensive industry. The Group’s ability to maintain and raise income, net income and cash flows is closely connected with ongoing capital expenditures. The Group’s capital expenditures are estimated to amount to approximately RMB1,500 million in 2020, which will be met by financing activities and by internal funding. The Group’s effective capital expenditures may vary significantly due to the Group’s ability to generate sufficient cash flows from operations, investments and other factors that are beyond control. Furthermore, there is no assurance as to the completion, cost or outcome of the Group’s fund-raising projects.
The Group’s ability to secure external financing in the future is subject to a number of uncertainties which include the Company’s operating results, financial conditions and cash flow in the future; China’s economic conditions and the market conditions for the Group’s products; financing costs and conditions of the financial market, and issuance of government approval documents, as well as other risks associated with the development of infrastructure projects in China and so forth. The Group’s failure to secure sufficient financing required for its operations or development plans may have a negative impact on the Group’s business, operating results and financial condition.
113
Table of Contents
Report of the Directors(continued)
| (4) | The Group’s business operations may be affected by existing or future environmental protection regulations |
The Group is subject to a number of environmental protection laws and regulations in China. Waste products (waste water, waste gas and waste residue) are generated during the Group’s production operations. Currently the Group’s operations fully comply with all applicable Chinese environmental protection laws and regulations. However, the Chinese government may further enforce stricter environmental standards, and the Group cannot assure that the central or local governments will not issue more regulations or enforce stricter regulations which may cause the Group to incur additional expenses on environmental protection measures.
| (5) | Changes in the monetary policy and fluctuations in the value of Renminbi may have an adverse impact on the Group’s business and operating results |
The exchange rate of the Renminbi against the US Dollar and other foreign currencies may fluctuate and is subject to alterations due to changes on the Chinese political and economic situations. In July 2005, the PRC government overhauled its policy of pegging the value of the Renminbi to the US dollar by permitting the Renminbi to fluctuate within a certain band against a basket of foreign currencies. Since the adoption of this new policy, the value of the Renminbi against the US dollar fluctuates daily. In addition, the Chinese government has been under international pressure to further ease its exchange rate policy, and may as a result further change its currency policy. A small portion of our cash and cash equivalents are denominated in foreign currencies, including the US dollar. Any increase in the value of Renminbi against other currencies, including the US dollar, may decrease the Renminbi value of our cash and cash equivalents that are denominated in foreign currencies. On the other hand, most of our revenue is denominated in Renminbi, but a major part of our procurement of crude oil, certain equipment and certain debt repayments are denominated in foreign currencies. Any devaluation of Renminbi in the future will increase our costs and jeopardize profitability. Any devaluation of Renminbi may also have an adverse impact on the value of dividends payable in foreign currencies by the Group for H shares and American Depository Securities.
114
Table of Contents
Report of the Directors(continued)
| (6) | Connected transactions may have an adverse impact on the Group’s business and economic efficiency |
The Group will, from time to time, continue to conduct transactions with the Group’s controlling shareholder Sinopec Corp. and Sinopec Corp.’s controlling shareholder Sinopec Group as well as their connected parties (subsidiaries or associates). These connected transactions include the provision of the following services by such connected parties to the Group: raw materials purchases, agency sale of petrochemical products, construction, installation and engineering design services, petrochemicals industry insurance services and financial services, and the sale of petroleum and petrochemical products by the Group to Sinopec Corp. and its connected parties. These connected transactions and services conducted by the Group are carried out under normal commercial terms and in accordance with the relevant agreements. However, if Sinopec Corp. and Sinopec Group refuse to conduct such transactions or revise the agreements between the Group and itself in a manner unfavorable to the Group, the Group’s business and business efficiency will be adversely impacted. Furthermore, Sinopec Corp. has an interest in certain sectors that are directly or indirectly competing with or which may compete with the Group’s business. Since Sinopec Corp. is the controlling shareholder of the Group and its own interests may conflict with those of the Group, it may act for its own benefit regardless of the Group’s interests.
| (7) | Risks associated with control by the majority shareholder |
Sinopec Corp., the controlling shareholder of the Company, owns 5,460,000,000 shares of the Company, which represents 50.44% of the total number of shares of the Company and gives it an absolute controlling position. Sinopec Corp. may, by using its controlling position, exercise influence over the Group’s production operations, fund allocations, appointment or removal of senior staff and so forth, thereby adversely affecting the Group’s production operations as well as minority shareholders’ interests.
115
Table of Contents
Report of the Directors(continued)
Section III Analysis of Operating Information in Chemical Industry
| (I) | Basic information of the industry |
| 1. | Industry policy and changes |
In 2019, with the formation of large regulatory landscape of soil, water, solid waste and gas, various environmental protection policies have moved from era of beginning to era of comprehensive implementation, and various environmental protection indicators have gradually been refined, and environmental protection inspections have become more normalized. At the same time, the state’s market-oriented reform of the oil and gas industry has continued. By the end of the year, the entire industrial chain has been liberalized to social capital, providing new impetus for petrochemical industry adjustment and moving forward to large-scale, high-end development and opening up. However, the continuous development will also put competitive pressure on traditional petrochemical companies.
116
Table of Contents
Report of the Directors(continued)
In terms of safety and environmental protection policies, on 19 January, the Ministry of Ecology and Environment issued Administrative Licensing on Canceling Construction Projects Environmental Impact Assessment and cancelled licensing items on construction projects environmental impact assessment. On 17 February, State Administration of Work Safety issued Regulation on Emergency Responses to Work Safety Accidents, which came into effect on 1 April. This Regulation clearly stipulates the responsibilities and necessary measures to be taken by local governments at all levels, Ministry of Emergency Management, accident units and their principals in emergency handling and rescue, as well as their corresponding legal liabilities. On 1 March, the Risk Criteria for Hazardous Chemicals Production Unit and Storage Installations, issued by State Administration for Market Regulation, came into effect. The Criteria specifies acceptable risk benchmark for personal and social risks in hazardous chemicals production units and storage installations, and the risk determination applicable to the location of hazardous chemicals production unit and storage installations and surrounding land use planning. On 1 March, the Identification of Major Hazard Installations, revised by the State Administration of Work Safety, came into effect. The basis of the Identification was changed from the original List of Dangerous Goods (GB12268) and Safety Rules for Classification, Precautionary Labelling and Precautionary Statements of Chemicals (GB20592-2006) to Regulations for Classification and Labelling of Chemicals, a series of national standards, such as GB30000.2, GB30000.5. On 29 May, Ministry of Ecology and Environment issued Standard for Fugitive Emission of Volatile Organic Compounds. The Standard specifies the requirements for fugitive emission control for storage of VOCs materials, the fugitive emission control requirements for VOCs material transfer and transportation, the fugitive emission control requirements for VOCs during the technological process, the VOCs leakage control requirements for equipment and pipeline components, fugitive emission control requirements for uncovered liquid surface VOCs, requirements for VOCs fugitive emission and exhaust gas collection and treatment system, and the pollution monitoring requirements for the company’s plant area and surrounding areas. On 11 July, State Administration of Work Safety revised Measures for the Administration of Contingency Plans for Work Safety Incidents, which came into effect on 1 September. The Measures adjusted preliminary plan assessment and filing of enterprises, added hazardous chemical transportation enterprises, and removed construction enterprises; added “hazardous chemical transportation enterprises” to the production-operation units, which should conduct emergency plan assessment every three years. If the production-operation units failed to file emergency plan in accordance with the provisions and failed to make corrections within the time limit after the time limit was ordered, the amount and scope of punishment will be increased and widened. Penalties can be imposed not only on production-operation units, but also on directly responsible supervisors and other directly responsible persons. On 27 August, Ministry of Public Health revised Occupational Exposure Limits for Hazardous Agents in the Workplace for Chemical Hazardous Agents, which came into effect on 1 April, 2020. Six normative references and nine concepts or definitions related to occupational exposure limits were added. The revision clearly listed the adverse health effects on which occupational exposure limits were formulated, and added the principles of occupational exposure limits for hazardous agents in the workplace and requirements for occupational exposure classification control, etc.
117
Table of Contents
Report of the Directors(continued)
In terms of industrial policies, on 18 January, National Energy Administration issued Opinions on the Energy Industry’s Promotion of Legal Governance. According to the Opinions, by 2020, new breakthroughs should be made in in key energy legislation projects, and energy regulation system should be fundamentally established. By 2025, energy industry should be governed by law, and a system of energy laws and regulations has been formed to modernize the law-based governance system and governance capabilities. On 25 January, Ministry of Commerce issued “Ruling of the Final Review of the Anti-dumping Measures against Imports of Ethylene Glycol Monobutylether and Diethylene Glycol Monobutylether Originated in the United States and the EU (關於對原產於美國和歐盟的乙二醇和二甘醇的單丁醚反傾銷措施期終複審裁定的公告)”, deciding to continue to impose anti-dumping duties on imported ethylene glycol and diethylene glycol monobutyl ether originating in the United States and the European Union from 28 January. On 30 June, State Development & Reform Commission and Ministry of Commerce issued Catalogue of Industries for Encouraging Foreign Investment (2019 Version), which came into effect on 1 July. The Catalogue (2019 Version) covers the production of high-tech chemical fibers such as carbon fibers and HSHMPE, high-end Polyolefin such as mPE continuous copolymerization modification of differentiated and functional polyester (PET), production, storage, transportation, liquefaction of hydrogen fuel, and comprehensive utilization, treatment, and disposal of waste gas, waste liquid, waste residue, etc. On 30 June, State Development & Reform Commission and Ministry of Commerce issued Special Administrative Measures (Negative List) for the Access of Foreign Investment (2019), which came into effect on 30 July. The Measures eliminate the requirement that the exploration and development of oil and natural gas (excluding coalbed methane, oil shale, oil sands, shale gas, etc.) be limited to joint ventures and cooperation. On 27 August, General Office of the State Council issued Opinions on Accelerating the Development of Circulation Industry and Promoting Consumer Spending. The Opinions propose to cancel the approval of the wholesale storage of refined oil products, decentralize the retail qualification to prefecture-level cities, and use the collective land for gas stations that are under township level. On 6 November, State Development & Reform Commission issued Amending the Relevant Entries under the Catalogue for Guiding Industrial Restructuring (2019 version), which came into effect on 1 January, 2020. Within the petrochemical chemical industry, the development and application of high-standard oil production technology, coal to MPX, and the development and production of biopolymer materials are included in the encouraged category. Newly built atmospheric and vacuum below 10 million tons/year, catalytic cracking below 1.5 million tons/year, continuous reforming below 1 million tons/ year (including aromatics hydrocarbon extraction), and hydrocracking production units below 1.5 million tons/year are included in the restricted category. On 9 December, the long-awaited National Petroleum and Natural Gas Pipe Network Group Co., Ltd was officially listed. On 22 December, the Central Committee of the Communist Party of China and State Council issued Opinions on Creating a Better Development Environment and Supporting the Reform and Development of Private Enterprises. The Opinions propose to support private enterprises to participate in the fields of oil and gas exploration and production, refining and sales, and to build infrastructures for crude oil, natural gas, refined oil storage and transportation and pipeline transportation, and to support qualified enterprises to participate in crude oil imports and refined oil exports.
118
Table of Contents
Report of the Directors(continued)
| 2. | Basic situation of major segments and the Company’s industry status |
The 2019 Economic Operation Report of China Petroleum and Chemical Industry released by China Petroleum and Chemical Industry Federation showed that the development features of the petrochemical industry in China in 2019 could be summarized by “one stable, three ups and downs and four unseen in many years”, the details of which were as follows:
In 2019, China’s crude oil output increased by 0.8% year-on-year to 191 million tons, the first positive growth in the past four years; the total output of major chemicals increased by about 4.6% year-on-year.
The operating revenue increased, and the total profit decreased. In 2019, there were about 26,300 enterprises above designated size in the petroleum and chemical industry, with total assets of RMB13.4 trillion, an increase of 7.7%, and asset liability ratio of 55.9%, which was lower than the debt ratio of 56.56% in the national industry. The operating revenue of the entire petroleum and chemical industry reached RMB12.27 trillion, a year-on-year increase of 1.3%, the lowest in four years. The total profit amounted to RMB668.37 billion, a decrease of 14.9%, which was not seen in the past four years. The profit margin of operating revenue of the entire industry was 45%, down 1.04 percentage points year on year. Among all, the profit of refining industry decreased by
42.1%, the biggest drop in the past five years; the profit of chemical industry decreased by 13.9% (mainly concentrated in fertilizers and basic chemicals), the biggest drop in the past decade. The industry’s operating profit margin was 45%, a year-on-year decrease of 1.04 percentage points.
The main reasons for the decline of industry-wide revenues were the increase of operating costs and the decrease of product prices. In 2019, the industry-wide operating costs increased by 3.1%. Of the 84 organic chemicals monitored, only 14 rose in average prices throughout the year.
The volume of foreign trade increased, and the volume of import and export decreased. In 2019, the total imports and exports reached USD722.21 billion, down 2.8% year on year, the first negative growth in recent three years. Imports of crude oil, natural gas, organic chemicals, synthetic resins as well as exports of refined oil, fertilizers and polyesters all increased year on year, but the total annual import and export volume of decreased by 2.8%. Among them, the exports amounted to USD226.95 billion, down 1.8%; the imports amounted to USD495.26 billion, down 3.3%.
119
Table of Contents
Report of the Directors(continued)
At present, severe overcapacity has become a prominent problem in the development of petroleum and chemical industry. In 2019, China’s refining capacity has exceeded 850 million tons/year, with a capacity utilization rate of about 76%, a relatively low level. In terms of market demand, there is still a shortage of ethylene and polyethylene in the domestic market, yet the global polyethylene market has been in the predicament of oversupply and will face greater excess pressure in 2020. According to statistics from the China Petroleum and Chemical Industry Federation, in 2019, the global ethylene production capacity will increase by 6.1 million tons; the polyethylene production capacity will increase by 6.95 million tons with an additional 8.34 million tons in 2020.
The Group is one of the major large-scale enterprises integrating refining and petrochemical capacity in China. As its production capacity of main products remained unchanged in recent years, while other domestic enterprises focused on expanding their capacity, the production of ethylene, paraxylene, glycol and other products of the Group accounted for significantly less market share domestically of similar products in 2019. In 2019, the output of the Group’s main products accounted for 2%-3% of the corresponding national output.
| (II) | Products and production |
| 1. | Main operating model |
The Company’s main operating models are: crude oil procurement; processing and production of synthetic fibre, resin, plastic, intermediate petrochemical products and petroleum products; realizing profit through product sales.
| 2. | Main products |
Product | Industry segment | Primary upstream | Transport/storage method | Primary downstream | Key price-influencing factors | |||||
| Diesel | Petroleum products | Petroleum | Pipeline transportation and shipping/ storage tank | Transportation fuel, agricultural machinery fuel | International crude oil price, government control | |||||
| Gasoline | Petroleum products | Petroleum | Pipeline transportation and shipping/ storage tank | Transportation fuel | International crude oil price, government control | |||||
| Jet Fuel | Petroleum products | Petroleum | Pipeline transportation and shipping/ storage tank | Transportation fuel | International crude oil price, supply-demand balance | |||||
| PX | Intermediate petrochemical products | Naphtha | Road transportation/ storage tank | Intermediate petrochemical products and polyester | Raw material price, supply-demand balance | |||||
120
Table of Contents
Report of the Directors(continued)
Product | Industry segment | Primary upstream | Transport/storage method | Primary downstream | Key price-influencing factors | |||||
| Benzene | Intermediate petrochemical products | Naphtha | Road transportation, shipping, rail transportation/ storage tank | Intermediate petrochemical products, styrene, plastic, explosive, dye, detergent, epoxy resin, chinlon | International crude oil price, market supply-demand condition | |||||
| Ethylene Glycol | Intermediate petrochemical products | Naphtha | Road transportation/ storage tank | Fine Chemicals engineering | International crude oil price, market supply-demand condition | |||||
| Ethylene Oxide | Intermediate petrochemical products | Naphtha | Road transportation, pipeline transportation/ storage tank | Chemical and medical industry intermediate products, including dyes, detergents and auxiliary | International crude oil price, market supply-demand condition | |||||
| Ethylene | Intermediate petrochemical products | Naphtha | Road transportation, pipeline transportation, shipping/storage tank | PE, EG, PVC and other raw material for further processing of intermediate petrochemical products such as resins, plastics and synthetic fibres | International crude oil price, supply- demand balance | |||||
| PE | Resins and plastics | Ethylene | Road transportation, shipping and rail transportation/ warehousing | Film, mulching film, cable insulation material and housewares, toys injection moulding products | Raw material price and market supply-demand condition | |||||
PP | Resins and plastics | Propylene | Road transportation, shipping and rail transportation/ warehousing | Film, mulching film, housewares, toys, household appliances and auto parts injection moulding products | Raw material price and market supply-demand condition | |||||
| Polyester chips | Resins and plastics | PTA, EG | Road transportation, shipping and rail transportation/ warehousing | Polyester fibre or film, container | Raw material price and market supply-demand condition | |||||
| Acrylics | Synthetic fibres | Acrylonitrile | Road transportation, shipping and rail transportation/ warehousing | Simple spinning or blend with other material for texture or acrylic top | Raw material price and market supply-demand condition | |||||
| Polyester | Synthetic fibres | Polyester | Road transportation, shipping and rail transportation/ warehousing | Texture, apparel | Raw material price and market supply-demand condition | |||||
121
Table of Contents
Report of the Directors(continued)
| Production | Sales | |||||||||||||||||||||||
| 2019 | 2018 | Year-on-year | 2019 | 2018 | Year-on-year | |||||||||||||||||||
Products | (10,000 tons) | (10,000 tons) | change | (10,000 tons) | (10,000 tons) | change | ||||||||||||||||||
DieselNote1 | 384.50 | 373.08 | 3.06 | % | 384.14 | 372.70 | 3.07 | % | ||||||||||||||||
Gasoline | 346.84 | 322.92 | 7.41 | % | 345.31 | 325.67 | 6.03 | % | ||||||||||||||||
Jet FuelNote1 | 187.86 | 146.82 | 27.95 | % | 135.39 | 100.37 | 34.89 | % | ||||||||||||||||
Paraxylene | 66.68 | 67.30 | -0.92 | % | 45.55 | 49.82 | –8.57 | % | ||||||||||||||||
BenzeneNote2 | 37.33 | 34.86 | 7.09 | % | 32.98 | 31.02 | 6.32 | % | ||||||||||||||||
Ethylene Glycol | 28.67 | 41.52 | -30.95 | % | 18.23 | 30.65 | –40.52 | % | ||||||||||||||||
Ethylene Oxide | 27.55 | 19.43 | 41.79 | % | 26.69 | 18.48 | 44.43 | % | ||||||||||||||||
EthyleneNote2 | 84.13 | 77.78 | 8.16 | % | 0.19 | 2.90 | -93.45 | % | ||||||||||||||||
Polyethylene | 53.73 | 41.79 | 28.57 | % | 53.58 | 41.62 | 28.74 | % | ||||||||||||||||
Polypropylene | 46.96 | 49.36 | -4.86 | % | 43.36 | 49.37 | –12.17 | % | ||||||||||||||||
Polyester PelletNote2 | 35.90 | 40.65 | -11.69 | % | 28.09 | 27.18 | –3.35 | % | ||||||||||||||||
Acrylic | 13.69 | 11.32 | 20.94 | % | 13.70 | 11.33 | 20.92 | % | ||||||||||||||||
Polyester Staple | 3.94 | 4.77 | -17.40 | % | 3.94 | 4.16 | –5.29 | % | ||||||||||||||||
Note 1: Sales volume does not include the processing business.
Note 2: The difference between production and sales is internal sales.
The above-mentioned sales volume does not include the trading of petrochemical products of the Group.
| 3. | R&D and Innovation |
Please refer to 3.2.C of the section Management Discussion and Analysis in this chapter for details of the R&D and innovation of the Group.
| 4. | Production techniques and processes |
The key component of the vertically integrated production facility of the Company is the ethylene facility producing ethylene and propylene and aromatics facility mainly producing paraxylene and benzene. Ethylene is the main raw material for the production of polyethylene and ethylene glycol, while ethylene glycol and PTA polymerization produces polyester. Propylene is the main raw material for the production of acrylics and polypropylene. The above-mentioned products all use crude oil as raw material and are processed through a series of petrochemical facilities. The chart below illustrates in brief the production processes of the Company.
122
Table of Contents
Report of the Directors(continued)
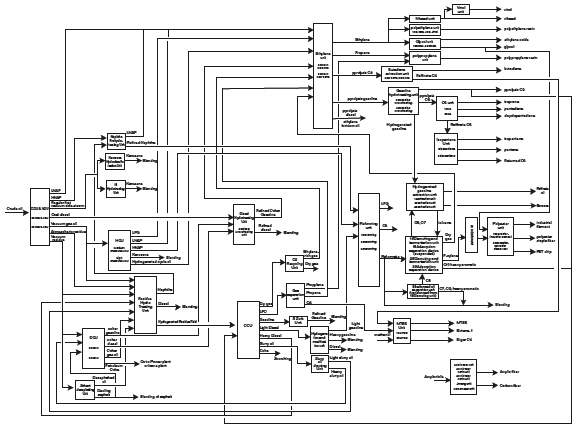
123
Table of Contents
Report of the Directors(continued)
| 5. | Capacity and operation status |
Key production facilities (number of sets) | Designed capacity (tons) | Capacity Utilization (%) | ||||||
Crude oil distillation facility (2) | 14,000,000 | 99.15 | ||||||
Hydrocracking facility (2) | 3,000,000 | 90.18 | ||||||
Ethylene facility | 700,000 | 109.76 | ||||||
* Aromatics facility (2) | 835,000 | 98.91 | ||||||
PTA facility | 400,000 | 81.40 | ||||||
Ethylene oxide/Ethylene glycol facility (2) | 525,000 | 91.04 | ||||||
Catalytic cracking | 3,500,000 | 102.32 | ||||||
Delayed coking (2) | 2,200,000 | 87.94 | ||||||
** Diesel hydrogenation (2) | 3,850,000 | 96.20 | ||||||
** Acrylonitrile facility | 650,000 | 101.37 | ||||||
C-5 Separation (2) | 205,000 | 137.85 | ||||||
*** Polyester facility (3) | 550,000 | 88.11 | ||||||
**** Polyester staple fibre facility (2) | 158,000 | 88.39 | ||||||
Polyester filament facility | 21,000 | 82.47 | ||||||
Acrylics staple fibre facility (3) | 141,000 | 113.58 | ||||||
Polyethylene facility (3) | 408,000 | 97.80 | ||||||
Polypropylene facility (3) | 400,000 | 98.48 | ||||||
Vinyl acetate facility | 86,000 | 93.54 | ||||||
| * | No. 1 PX facility (235,000 tons/year) was suspended for the whole year. |
| ** | No. 2 Diesel hydrogenation facility (1,200,000 tons/year) was revamped into acrylonitrile facility by the end of 2016. Annual production is 650,000 tons/year. |
| *** | No. 3 polyester fibre facility (100,000 tons/year) was discontinued on 1 September 2013. |
| **** | No. 1 Polyester staple fibre facility (4,000 tons/year) was suspended for the whole year. |
For capital expenditure items, please refer to “Non-fundraising projects” in the section headed “Discussion and analysis of the Company’s operations” in Section II Management Discussion and Analysis of this chapter.
124
Table of Contents
Report of the Directors(continued)
| (III) | Raw material procurement |
| 1. | Basic information of major raw materials |
The major raw material of the Company is crude oil, hence the fluctuations of crude oil prices substantially affect the Company’s results. The Company purchases most of its crude oil from international markets through agents.
Please refer to “Review of the Company’s operations during the Reporting Period” in Section II Management Discussion and Analysis of this chapter for details of the crude oil procurement of the Company in 2019.
| (IV) | Sales of products |
| 1. | Sales model |
The Company’s sales models are mainly direct sales and agency sales. The products are mostly sold to large trading companies and industrial users, including Sinopec Group and its designated clients. The Company has established long-term relationships with these clients.
| 2. | Pricing strategy and change in prices of major products |
Most of the products of the Company are sold at market price. However, sales of the Company’s major petroleum products (gasoline, diesel and jet fuel) are also subject to different extent of government pricing (guided-price).
The prices of products of the Company that are not subject to price control are fixed with reference to the market price in the main chemical products market of Shanghai and other places in China. The Company keeps monitoring major international commodity markets, especially the price trend in Southeast Asian markets. In most cases, the Company revises product prices monthly while more frequent price revisions will be made during periods of intense price fluctuations.
| 3. | Basic information of main businesses of the Company by industry segment |
Please refer to “Comparison and analysis of results of the Company’s operations” in Section II Management Discussion and Analysis of this chapter for basic information of main business of the Group by industry segment.
125
Table of Contents
Report of the Directors(continued)
| 4. | Basic information of main businesses of the Company by sales channel |
| Unit: RMB’000 | ||||||||
Sales Channel | Revenue | Year-on-year increase/ decrease in revenue (%) | ||||||
Direct sales | 52,640,259 | 1.06 | ||||||
Agency sales | 24,547,450 | -9.39 | ||||||
| 5. | Basic information of joint products, side products, semi-finished products, waste, residual heat utilization products during the production process of the Company |
The Company owns a power plant which provides power and steam resources mainly to the Company while the surplus is sold to external parties. In 2019, the Company sold 696 million kilowatt-hour of power, generating revenue of RMB420 million, and sold 462,000 giga joules of steam, generating revenue of RMB41.21 million.
| (V) | Environmental protection and safety |
| 1. | Major safety production accident of the Company during the Reporting Period |
Nil.
| 2. | Environmental protection investment of the Company during the Reporting Period |
| Unit: RMB100 million | ||||
Environmental protection investment | Percentage of invested capital in operating revenue (%) | |||
6.59 | 0.66 | |||
126
Table of Contents
Report of the Directors(continued)
Section IV Major Events
| (I) | Plan for profit distribution of ordinary shares or capital reserve capitalization |
| 1. | Cash Dividend Policy and its formulation, implementation or adjustment |
In 2016, the Company made amendments to its cash dividend policy in the Articles of Association of Sinopec Shanghai Petrochemical Company Limited (the “Articles of Association”) and its appendices. The proposed amendments to the Articles of Association were considered and approved at the annual general meeting of 2015 held on 15 June 2016. According to Article 207 of the Articles of Association:
| 1. | The Company should place emphasis on delivering reasonable return on investments to the investors. The Company shall pay due attention to the opinions of minority shareholders through various channels when allocating its profits. The profits distribution policy of the Company shall be consistent and stable, taking into account the long-term interests of the Company, the overall interests of all shareholders and the Company’s sustainable development. |
| 2. | The Company may distribute dividends in the following forms: cash, shares or other forms permitted by laws, administrative rules, regulations of competent authorities and regulatory provisions in the place where the Company’s shares are listed. The Company shall give priority to the distribution of dividends in cash. The Company may make interim dividends distribution. |
| 3. | The Company shall distribute cash dividends when the Company’s net profit and retained earnings, in separate financial statement, are positive and the Company has adequate cash inflows over the requirements of cash flows for its operation and sustainable development. The cash dividends per annum should not be less than thirty (30) percent of the net profit of the Company in the current year. |
127
Table of Contents
Report of the Directors(continued)
| 4. | The Company may adjust its profits distribution policy referred to in sub-paragraphs (2) and (3) of this Article in case of war, natural disasters or other force majeure, or where changes to the external environment of the Company result in material impact on the production and operation of the Company, or where there are significant changes in the Company’s own operations or financial conditions, or where the Board considers it necessary. Independent directors shall issue independent opinions on the adjustment of the profits distribution policy whilst the Board shall discuss the rationality of such adjustment in detail and form a resolution which shall be submitted to shareholders’ meeting for approval by way of special resolution. The convening of the shareholders’ meeting shall comply with regulatory provisions in the place where the Company’s shares are listed. |
| 5. | The management of the Company shall formulate the annual profits distribution plan and submit such plan to the Board for consideration. Independent directors shall issue independent opinions on such plan and Board shall form a resolution which shall be submitted for approval by shareholders’ meeting. If the conditions for the distribution of cash dividends have been satisfied and the Company does not propose a cash dividends distribution plan or does not propose such plan in compliance with the sub-paragraph (3) of this Article, independent directors shall issue independent opinions whilst the Board shall give specific explanation regarding such arrangement and form a resolution which shall be submitted to shareholders’ meeting for approval and make relevant disclosures. The plan for half-yearly dividends distribution of the Company shall comply with Article 215 of the Articles of Association. |
128
Table of Contents
Report of the Directors(continued)
| 2. | Plan for profit distribution or capitalisation of capital reserves for the Reporting Period |
In 2019, the net profit attributable to equity shareholders of the Company amounted to RMB2,213,716 thousand under CAS (net profit of RMB2,215,728 thousand under IFRS). In accordance with the 2019 Profit Distribution Plan approved by the Board on 25 March 2020, the Company proposed to distribute a Final Dividend of RMB0.12 per share (including tax) based on the total issued share as at dividend payout date. The 2019 Profit Distribution Plan will be implemented subject to approval at the AGM. The date and time of the AGM and the book closure arrangement will be announced later. The Notice of the AGM will be announced separately in accordance with the Articles of Association of the Company. The Notice of the AGM, the accompanying circular and proxy form will be despatched to holders of H shares in accordance with the Hong Kong Listing Rules.
Subject to the passing of the resolution by the shareholders of the Company at the AGM, the Final Dividend is expected to be distributed on or around Tuesday, 21 July 2020 to shareholders whose names appear on the register of members of the Company’s H shares at the close of business on Monday, 29 June 2020. The Final Dividend is denominated and declared in Renminbi. The Final Dividend payable to the holders of the Company’s A shares shall be paid in Renminbi while those payable to the holders of the Company’s H shares shall be paid in Hong Kong dollars. The amount of Hong Kong dollars payable shall be calculated on the basis of the average closing exchange rates for Hong Kong dollars as announced by the Foreign Exchange Trading Centre of the PRC one calendar week prior to the approval of the Final Dividend at the AGM.
The Company is expected to close the register of members of the Company’s H shares from Wednesday, 24 June 2020 to Monday, 29 June 2020 (both days inclusive), during which period no transfer of H shares will be registered in order to confirm the shareholders’ entitlement to receive the Final Dividend. The holders of the Company’s H shares who wish to receive the Final Dividend should lodge the transfer documents and relevant share certificates with the Company’s H shares share registrar, Hong Kong Registrars Limited, at Room 1712-1716, 17/F, Hopewell Centre, 183 Queen’s Road East, Wanchai, Hong Kong on or before 4:30 p.m. on Tuesday, 23 June 2020.
The record date for dividend distribution, distribution procedures and time for the distribution of dividends applicable to holders of the Company’s A shares will be announced separately.
129
Table of Contents
Report of the Directors(continued)
| 3. | Plan or scheme of dividends distribution of ordinary shares, plan or scheme of capitalization of capital reserves of the Company in the past three years (including the Reporting Period) |
| Unit: RMB’000 | ||||||||||||||||||||||||
Year of dividend payment | Amount of bonus shares for every 10 shares (share) | Amount of dividend for every 10 shares (RMB) (including tax) | Amount of capitalization for every 10 shares (share) | Amount of cash dividend (including tax) | Net profit attributable to owners of the Company in the consolidated statement for the year | Percentage of net profit attributable to owners of the Company in the consolidated statement (%) | ||||||||||||||||||
2019 | 0 | 1.2 | 0 | 1,298,857.62 | 2,213,716 | 58.67 | ||||||||||||||||||
2018 | 0 | 2.5 | 0 | 2,705,953.38 | 5,277,186 | 51.28 | ||||||||||||||||||
2017 | 0 | 3.0 | 0 | 3,247,144.05 | 6,141,558 | 52.87 | ||||||||||||||||||
| (II) | Fulfilment of undertakings |
| 1. | Undertakings made by the de facto controller, shareholders, connected parties and purchasers of the Company and the Company itself during the Reporting Period or continuing up to the Reporting Period |
Undertakings about share reform
The Company disclosed The Explanatory Memorandum for the Share Reform Scheme of the Company (the Revised Draft) on 20 June 2013, in which the Company’s controlling shareholder, Sinopec Corp., made the following major undertakings that continued up to the Reporting Period:
Sinopec Corp. shall continue to support the development of the Company upon the completion of the share reform scheme, and shall use the Company as a platform for the development of related businesses in the future.
For details, please refer to “The Explanatory Memorandum for the Share Reform Scheme of the Company” (the Revised Draft) (Full Version) published in Shanghai Securities News and China Securities Journal on 20 June 2013, as well as the relevant announcements published to the websites of the Shanghai Stock Exchange, the Hong Kong Stock Exchange and the Company.
130
Table of Contents
Report of the Directors(continued)
The share reform scheme was reviewed and approved at the A shares shareholders’ meeting held on 8 July 2013. After the implementation of the share reform scheme on 20 August 2013, the Company’s A shares resumed trading, and non-circulating shares previously held by non-circulating shares shareholders attained the right of circulation. For details of the implementation of the share reform scheme, please refer to the “Implementation Report of Sinopec Shanghai Petrochemical Company Limited Share Reform Scheme” published on China Securities Journal and Shanghai Securities News on 14 August 2013 and the relevant announcement published on the websites of the Shanghai Stock Exchange and the Hong Kong Stock Exchange.
With regard to the aforementioned undertakings, the Company is not aware of any violation in fulfilling the above undertakings by Sinopec Corp.
| (III) | Events regarding capital occupation and repay during the Reporting Period |
Nil.
| (IV) | Explanation on the reasons and impact for the Company’s changes in accounting policies, accounting estimates, or correction of previous significant accounting errors |
| 1. | New standards adopted by the Company and revision and explanation of the standards |
The Group has applied the following standards and amendments for the first time for their annual reporting period commencing 1 January 2019:
| • | IFRS 16 ‘Leases’ |
| • | IFRIC 23 ‘Uncertainty over Income Tax Treatments’ |
| • | Annual Improvements to IFRS Standards 2015-2017 cycle |
| • | Amendments to IFRS 9 ‘Prepayment Features with Negative Compensation’ |
| • | Amendments to IAS 28 ‘Long-team interests in Associated and Joint Ventures’, and |
| • | Amendments to IAS 19 ‘Plan Amendment, Curtailment or Settlement’. |
No other standards or interpretation revisions with major impact on the Group’s combined financial statements was first effective for the financial year started on 1 January 2019.
131
Table of Contents
Report of the Directors(continued)
| (V) | Appointment and dismissal of auditors |
During the Reporting Period, the Company did not change the auditors.
Details of the auditors appointed by the Company during the Reporting Period and the appointment details are as below:
| Current appointment | ||||
Name of the domestic auditors | | PricewaterhouseCoopers Zhong Tian LLP | | |
Remuneration of the domestic auditors | RMB4,800,000 | |||
Duration of audit of the domestic auditors | 7 Years | |||
Name of the international auditors | PricewaterhouseCoopers | |||
Remuneration of the international auditors | RMB3,000,000 | |||
Duration of audit of the international auditors | 7 Years | |||
| (VI) | Material litigation or arbitration |
The Company was not involved in any material litigation or arbitration during the Reporting Period.
| (VII) | Punishment and Reprimand of the Company and its Directors, Supervisors, Senior Management, Controlling Shareholders, De Facto Controller and Purchaser |
During the Reporting Period, the Company and its Directors, Supervisors, senior management, controlling shareholder, de facto controller and purchasers had not been investigated, administratively punished, publicly criticized by the CSRC nor publicly censured by the stock exchanges.
| (VIII) | Credit status of the Company and its controlling shareholder and de facto controller during the Reporting Period |
During the Reporting Period, the Company and its controlling shareholder and de facto controller of the Company were not involved in any events regarding failure to perform obligations under a judgement of courts, nor have they had any relatively large amount of debts which have become due and outstanding.
132
Table of Contents
Report of the Directors(continued)
| (IX) | The Share Option Incentive Scheme of the Company |
The Share Option Incentive Scheme of the Company has been effective since 23 December 2014, with a validity period of 10 years until 22 December 2024. The initial grant of A-share share options under the Share Option Incentive Scheme was on 6 January 2015. For details, please refer to the relevant announcements published on the websites of the Shanghai Stock Exchange, Hong Kong Stock Exchange and the Company on 6 January 2015. All the exercise periods of the initial grant have ended on 28 December 2018. For details, please refer to the relevant announcements published on the websites of the Shanghai Stock Exchange, Hong Kong Stock Exchange and the Company on 28 December 2018. Currently, there is no other share option grant plan.
During the Reporting Period, the Company did not grant any A-share share options under the Share Option Incentive Scheme, nor did the grantees exercise any A-share share options, and no A-share share options were cancelled or lapsed.
| (X) | Major connected transactions |
| 1. | Connected transactions in relation to daily operations |
Continuing connected transactions under Chapter 14A of the Hong Kong Listing Rules
During the Reporting Period, pursuant to the Mutual Product Supply and Sales Services Framework Agreement entered into with the controlling shareholder of the Company on 23 August 2016, Sinopec Corp., and the de facto controller, Sinopec Group, the Company purchased raw materials from Sinopec Group, Sinopec Corp. and their associates and sold petroleum products and petrochemicals and leased properties to Sinopec Corp. and its associates, and Sinopec Corp. and its associates provided agency sales services for petrochemical products to the Company. Pursuant to the Comprehensive Services Framework Agreement entered into with the Company’s de facto controller, Sinopec Group, on 23 August 2016, the Company obtained construction and installation, engineering design, petrochemical industry insurance and financial services from Sinopec Group and its associates. The transactions under the above mentioned Mutual Product Supply and Sales Services Framework Agreement and the Comprehensive Services Framework Agreement constituted continuing connected transactions under Chapter 14A of the Hong Kong Listing Rules and constituted ongoing related party transactions under the Shanghai Listing Rules. The Company disclosed the two agreements and the respective continuing connected transactions (i.e. ongoing related party transactions, same below) under the agreements in an announcement dated 23 August 2016 and a circular dated 2 September 2016. These two agreements and the respective continuing connected transactions under the agreements together with the associated annual caps from 2017 to 2019 were considered and approved at the first extraordinary general meeting for 2016 held on 18 October 2016.
133
Table of Contents
Report of the Directors(continued)
During the Reporting Period, the relevant continuing connected transactions were conducted in accordance with the terms of the Mutual Product Supply and Sales Services Framework Agreement and the Comprehensive Services Framework Agreement. The transaction amounts of the relevant connected transactions did not exceed the annual caps in relation to the respective continuing connected transactions approved at the first extraordinary general meeting for 2016.
As the above-mentioned framework agreement expired on 31 December 2019, to ensure that the normal operation of the Company is not affected, the Company renewed the Mutual Product Supply and Sales Services Framework Agreement with Sinopec Group and Sinopec Corp. and the Comprehensive Services Framework Agreement with Sinopec Group on 23 October 2019, and intended to continue the above-mentioned continuing connected transactions from 2020 to 2022, valid for three years until 31 December 2022. The Company disclosed the two agreements and the respective continuing connected transactions under the agreements in an announcement dated 23 October 2019 and a circular dated 13 November 2019. These two agreements and the respective continuing connected transactions under the agreements together with the associated annual caps from 2020 to 2022 were considered and approved at the first extraordinary general meeting for 2019 held on 10 December 2019.
The table below sets out the transaction amounts of the Company’s continuing connected transactions with Sinopec Corp. and Sinopec Group during the Reporting Period:
| Unit: RMB’000 | ||||||||
Type of connected transaction | Connected person | Annual cap | Transaction | Percentage | ||||
Mutual Product Supply and Sales Services Framework Agreement | ||||||||
Purchases of raw materials | Sinopec Group, Sinopec Corp. and their associates | 80,286,000 | 55,385,078 | 78.63% | ||||
Sales of petroleum products and petrochemicals | Sinopec Corp. and its associates | 102,914,000 | 58,996,676 | 58.79% | ||||
Property leasing | Sinopec Corp. and its associates | 36,000 | 31,972 | 41.86% | ||||
Agency sales of petrochemical products | Sinopec Corp. and its associates | 240,000 | 125,619 | 100.00% | ||||
Comprehensive Services Framework Agreement | ||||||||
Construction, installation and engineering design services | Sinopec Group and its associates | 3,444,000 | 143,560 | 23.92% | ||||
Petrochemical industry insurance services | Sinopec Group | 180,000 | 108,223 | 100.00% | ||||
Financial services | Associate of Sinopec Group (Sinopec Finance) | 200,000 | 1,295 | 0.33% | ||||
134
Table of Contents
Report of the Directors(continued)
On 31 December 2018, the Company entered into an asset leasing agreement (the “Lease Agreement”) with Baishawan branch of Sinopec Petroleum Reserve Company Limited (the “Baishawan Branch”), a wholly owned subsidiary of the Company’s de facto controller, Sinopec Group. Pursuant to the Lease Agreement, the Company rents the oil tanks and ancillary equipment from the Baishawan Branch at an annual rent up to RMB95.0 million (including VAT) with the leasing period from 1 January 2019 to 31 December 2019. The Lease Agreement was considered and approved at the 14th meeting of the Ninth Session of the Board on 28 December 2018. Related announcements were published on the websites of the Shanghai Stock Exchange, the Hong Kong Stock Exchange and the Company on 28 December 2018, as well as on “Shanghai Securities News” and “China Securities Journal” on 29 December 2018. During the Reporting Period, the Company incurred leasing costs of RMB82.00 million (including VAT).
On 27 December 2019, a storage service agreement among the Company, Sinopec Petroleum Reserve Company Limited of Sinopec Group and Baishawan Branch (the “Storage Service Agreement”) was considered and approved at the 19th meeting of the Ninth Session of the Board and was entered into on 31 December 2019. Pursuant to the Storage Service Agreement, the Baishawan Branch provides storage services to the Company for one year, with leasing period from 1 January 2020 to 31 December 2020 and the annual maximum storage fees of RMB114.0 million (including VAT). Related announcements were published on the official websites of the Shanghai Stock Exchange, the Hong Kong Stock Exchange and the Company on 27 December 2019, as well as on “Shanghai Securities News” and “China Securities Journal” on 28 December 2019.
Connected transactions under Chapter 14A of the Hong Kong Listing Rules
On 28 December 2018, the Company entered into a technical service agreement with Petro-CyberWorks Information Technology Co., Ltd. (“PCITC”), a non wholly-owned subsidiary of the Company’s de facto controller, Sinopec Group. Pursuant to the technical service agreement, the Company appointed PCITC to implement the design, construction, operation and maintenance of smart plant project for a total amount of RMB30,580,000 (inclusive of tax). The term of the technical service agreement starts from the date of signing by both parties, and the main function construction was completed in February 2020. Related announcements were published on the official websites of the Shanghai Stock Exchange, the Hong Kong Stock Exchange and the Company on 28 December 2018, as well as on “Shanghai Securities News” and “China Securities Journal” on 29 December 2018.
The transactions between the Company and Sinopec Group, Sinopec Corp. and their associates as disclosed in Note 28 to the financial statements prepared under IFRS in the 2019 annual report of the Company constituted continuing connected transactions under Chapter 14A of the Hong Kong Listing Rules. The above-mentioned continuing connected transactions have been disclosed in accordance with Chapter 14A of the Hong Kong Listing Rules.
135
Table of Contents
Report of the Directors(continued)
| 2. | Connected parties’ liabilities |
| Unit: RMB’000 | ||||||||||||||||||||||||||
| Funds provided to | Funds provided by connected parties | |||||||||||||||||||||||||
| Connected party | Connected relationship | connected parties | to the Company | |||||||||||||||||||||||
| Balance as at the beginning of the period | Transaction amount | Balance as at the end of the period | Balance as at the beginning of the period | Transaction amount | Balance as at the end of the period | |||||||||||||||||||||
Sinopec Corp., its subsidiaries, joint ventures and associates & Sinopec Group and its subsidiaries | Controlling shareholder, de facto controller and their related parties | 3,183 | -1,173 | 2,010 | 89,567 | 31,267 | 120,834 | |||||||||||||||||||
| Note 1: | The period-end balance of the funds provided by the Group to the connected parties was mainly unsettled receivables arising from the provision of services and pipeline leases to Sinopec Corp., its subsidiaries and associates. |
| Note 2: | The period-end balance of the funds provided by the connected parties to the Group was mainly unsettled payables arising from the provision of construction, installation and engineering design services by Sinopec Group and its subsidiaries. |
The prices of the continuing connected transactions conducted by the Company with Sinopec Group, Sinopec Corp. and their associates were determined, upon negotiations between both parties, on the basis of (i) state tariffs, (ii) state guidance prices; or (iii) market prices. Such connected transactions were entered into in line with the Company’s production and operational needs. Accordingly, the aforementioned continuing connected transactions did not have a significant adverse impact on the Company’s independence.
Independent Non-executive Directors of the Company have reviewed the continuing connected transactions of the Group and confirmed that:
| • | The above continuing connected transactions have been entered into in the ordinary and usual course of business of the Company; |
| • | The above continuing connected transactions have been entered into on normal commercial terms or better; |
| • | The above continuing connected transactions have been entered into according to the agreements governing them on terms that are fair and reasonable and in the interests of the Company’s shareholders as a whole; and |
136
Table of Contents
Report of the Directors(continued)
| • | The transaction amounts of the above continuing connected transactions during the Reporting Period were within the annual caps. |
| 3. | The international auditor of the Company, PricewaterhouseCoopers, was engaged to report their conclusions regarding the above continuing connected transactions of the Company to the Board in accordance with Hong Kong Standard on Assurance Engagements 3000 “Assurance Engagements Other Than Audits or Reviews of Historical Financial Information”, with reference to Practice Note 740 “Auditor’s Letter on Continuing Connected Transactions under the Hong Kong Listing Rules” issued by the Hong Kong Institute of Certified Public Accountants. The auditors has, in accordance with Chapter 14A.56 of the Hong Kong Listing Rules came to the conclusion that: |
| • | Nothing has come to their attention that causes them to believe that the disclosed continuing connected transactions have not been approved by the Board; |
| • | For transactions involving the provision of goods or services by the Group, nothing has come to their attention that causes them to believe that the transactions were not, in all material respects, in accordance with the pricing policies of the Group; |
| • | Nothing has come to their attention that causes them to believe that the transactions were not entered into, in all material respects, in accordance with the relevant agreements governing such transactions; and |
| • | With respect to the aggregate amount of each of the continuing connected transactions, nothing has come to their attention that causes them to believe that the amount has exceeded the annual cap set by the Company as disclosed in the announcements in respect of each of the continuing connected transactions. |
137
Table of Contents
Report of the Directors(continued)
| (XI) | Material contracts and their performance |
| 1. | Entrustments, sub-contracts and lease arrangements |
During the Reporting Period, the Company had no entrustments, sub-contracts or lease arrangements that generated 10% or more (including 10%) of the gross profit of the Company for the period.
| 2. | Guarantees |
There were no guarantees provided by the Company during the Reporting Period.
| 3. | Entrusting others to conduct wealth management |
Please refer to “Investment of the Company” in the section headed “Discussion and analysis of the Company’s operations” in Section II “Management Discussion and Analysis” of this chapter.
| 4. | Other major contracts |
There were no major contracts of the Company during the Reporting Period.
| (XII) | The Company’s disclosure on the fulfillment of its corporate social responsibility |
| 1. | Fulfillment of corporate social responsibility |
For the Company’s performance of corporate social responsibility in 2019 and the Company’s 2019 Environmental, Social and Governance Report, please refer to the “2019 Corporate Social Responsibility Report of Sinopec Shanghai Petrochemical Company Limited” published by the Company on the websites of the Shanghai Stock Exchange, the Hong Kong Stock Exchange and the Company.
138
Table of Contents
Report of the Directors(continued)
| 2. | Environmental protection situation of key pollutant-discharging companies and their subsidiaries as announced by the Ministry of Environmental Protection |
The Company is one of the contaminating enterprises under Intensive Monitoring and Control by the State proclaimed by the Ministry of Environmental Protection. According to Measures for Self-Monitoring and Information Disclosure by the Enterprises subject to Intensive Monitoring and Control of the State (Trial Implementation), the Company has disclosed to the public on the website of the Shanghai Environmental Protection Bureau the sites of the source of pollution, pollutant types and concentration of pollution which are subject to intensive monitoring and control of the State.
The Company, as a manufacturing enterprise in the petrochemical industry, consistently places environmental protection as its priority. It continues to receive ISO14001 Environmental Management System Certification. In January 2013, it received certifications from the Shanghai Audit Center of Quality including quality (GB/T19001: 2008), environment (GB/T24001: 2004) and occupational health and safety (GB/T28001: 2011). On 16 September 2019, the continued use of the title “All-China Environmentally Friendly Enterprise” was approved.
In 2019, the Group continued to improve the management of environmental protection system in an effort to build a green enterprise. By actively fulfilling the main responsibility of environmental protection, the Group comprehensively promoted green development and conscientiously implemented the requirements of “the Seventh Environmental Protection Three-Year Action Plan”, “Shanghai Clean Air Action Plan (2018-2022)” and “Jinshan District Environmental Comprehensive Remediation Action Plan”. The Group also improved its goal and short- and long-term development direction based on the regional VOCs concentration, addressed root causes and advanced environmental protection rectification, the establishment of green enterprise and verification and check-and-accept of clean production to fight resolutely against pollution and win the battle of defending the blue sky.
In 2019, the Company actively organized and implemented the environmental protection potential hazard management projects. Emission volume of sulfur dioxide, nitrogen oxides and VOCs decreased by 7.14%, 12.70% and 7.21%, respectively compared to last year.
In 2019, both the compliance rate on waste water and waste gas emission were 100%, and all hazardous wastes were disposed of properly with a rate of 100%. The Company continuously implemented LDAR work and achieved continuous emission reduction of VOCs, meeting the emission reduction standard set by Shanghai Environmental Protection Bureau. In 2019, the Company had inspected a total of 2,077,440 points/times for the sealing points in production equipment, and the number of leaking points detected was 5,952, of which 5,709 points were repaired, achieving a repair rate of 95.90%.
139
Table of Contents
Report of the Directors(continued)
In 2019, the Company paid RMB18.04 million of environmental tax to Tax Bureau of Jinshan District.
In 2019, the Company received 3 administrative penalty decisions (all happened in 2018) issued by the Shanghai Municipal Bureau of Ecology and Environment, involving a total fine of RMB2.15 million. The main reason for the penalties was that the monitored emissions of on-site organized exhaust outlets exceeded standard.
No. | Event | Rectification | ||
| 1 | On 24 July 2018, the monitored emissions of the Acrylic Fiber Department carbon fiber device surface treatment exhaust gas discharge port and the RTO exhaust gas discharge port exceeded standard | (1) Process optimization. Bring together production department, safety and environmental department, equipment department, device, technology supplier and design unit to adjust and optimize process and control fluctuation in oriented precursors production process. | ||
(2) The volatile gas of the electrolyte in the electrolyzer is collected and transported to the pickling tower for pickling, and discharged after meeting standard. At the same time, based on the source control, table tennis is added in the electrolyzer to reduce material evaporation and reduce the concentration of ammonia pollutants. | ||||
(3) After the rectification, self-test, third-party inspection and re-testing by the team leader were up to standard. | ||||
| 2 | On 5 December 2018, the monitored emissions of the polymerization waste gas collection tower outlet of Acrylic Fiber south unit exceeded standard | Optimize the maintenance method of plate heat exchanger. Before disassembling the plate heat exchanger, rinse the plate gap with pure water to prevent the acrylonitrile monomer from being carried out with the heat exchanger and strictly control the volatilization of unreacted materials. After the rectification, self-test, third-party inspection and retesting by the team leader were up to standard. | ||
| 3 | On 11 December 2018, the monitored emissions of the exhaust gas discharge port of the Acrylic Fiber Station, Environment Water Department exceeded standard | (1) Strengthen communication with the Acrylic Fiber Department, control the discharge of high-concentration acrylonitrile wastewater, and ensure that the concentration of acrylonitrile in the acrylic wastewater station is stable within a certain range. | ||
(2) Carry out research on improvement of acrylic fiber wastewater treatment process. The anaerobic biochemical, ultraviolet photolysis or catalytic oxidation process is used to achieve acrylonitrile digestion in the wastewater tank, thereby effectively reducing the amount of acrylonitrile entering the exhaust system and achieving stable compliance with the exhaust gas treatment device. | ||||
(3) After the rectification, self-test, third-party inspection and re-testing by the team leader were up to standard. | ||||
140
Table of Contents
Report of the Directors(continued)
| 3. | Environmental Impact Assessment and Other Environmental Protection Administrative Licensing of Construction Projects |
According to relevant national and local government requirements such as the Environmental Impact Assessment Law and the Classified Administration Catalogue of Environmental Impact Assessments for Construction Projects, the “three simultaneous” inspection and acceptance of “Hidden Danger Management Project of Wet Oxidation Section of Chenjin Refined Oil Pipeline” was completed on 19 July 2019, and the public inspection and acceptance were completed on 17 October 2019, successfully implementing the special environmental protection inspection and acceptance of the Construction Project.
According to the requirements of “Catalogue of Classified Management of Pollutant Discharge Permitted by Fixed Pollution Sources” (2017 Version) by the Ministry of Ecology and Environment of the PRC, “Notice on the Issuance and Management of Pollutant Discharge Permits for the Steel, Cement and Petrochemical Industries of this City” ([2017] No.318) by Shanghai Municipal Bureau of Ecology and Environment and “Notice on Declaration of Pollutant Discharge Permit in Petrochemical Industry” ([2017] No.42) by the Energy and Environment Unit of the Group, the Company obtained the national sewage discharge licence (petrochemical industry) on 31 December 2017. The licence is valid from 1 January 2018 to 31 December 2020. In 2019, the Company strictly carried out self-monitoring, reporting of pollutant discharge permit execution reports and information disclosure in strict accordance with the management requirements of the sewage discharge licence. In 2019, the Company carried out a series of waste water and waste gas collection and treatment reconstruction projects, leading to partial adjustments of the destination of pollutants generation, adjustments of exhaust funnels and rain drain, addition of 5 sets of waste gas treatment equipment and change of outlet standards, therefore the Company applied to Shanghai Municipal Bureau of Ecology and Environment on 11 April 2019 for a change to the sewage discharge licence, which was later reviewed and approved on 28 September 2019.
| 4. | Emergency response plan for emergent environmental incidents |
According to the three-year validity in the “Administrative Measures for Emergency Preparedness for Environmental Incidents of Sinopec”, the Company completed the revision of the “Comprehensive Emergency Response Plan for Environmental Emergencies” and filed a report to Shanghai Municipal Bureau of Ecology and Environment in December 2019. The Company continued to carry out assessment of major environmental risks. In 2019, in accordance with the requirements of the Energy and Environment Unit and “Sinopec Environmental Risk Assessment Guide”, the Company organized 14 secondary units to carry out environmental risk identification and assessment. A total of 113 environmental risk sources were assessed, of which none was level I environmental risk source, 37 were level II environmental risk sources (20 in the equipment, 16 in the tank area and 1 in the wharf), and 76 were level III environmental risk sources (59 in the equipment, 11 in the tank area, 4 in the land pipelines and 2 in the wharf).
141
Table of Contents
Report of the Directors(continued)
The Company carried out regular environmental protection emergency drills. On 25 June 2019, the Company carried out “V-532 tank leak and fire accident in the third storage and transportation workshop”; on 3 December 2019, the Company carried out “Emergency drill of Shanghai Petrochemical’s dangerous chemical pipeline leakage accident” to further enhance the capability of emergency response. Through the drills, the staff’s ability to correctly handle the abnormal situation in tank areas and long-distance pipeline in the field was improved. In addition, the drills examined the ability of Sinopec Shanghai and relevant units such as the local fire brigade to handle emergencies and communicate, verified the practicability and operability of emergency plans, improved the decision-making and execution ability of relevant personnel in dealing with emergencies quickly, improved the emergency disposal of environmental pollution and timeliness of environmental monitoring response, and further strengthened the emergency linkage with local governments.
| 5. | Environmental self-monitoring programme |
In accordance with the requirements of Self-monitoring Scheme for Pollutant Discharge Permits, Regulations on Environmental Monitoring Management of Sinopec and Regulations on Environmental Monitoring Management of Shanghai Petrochemical issued by Shanghai Petrochemical, the annual environmental monitoring plan and emission implementation standards of Shanghai Petrochemical were compiled and issued in early 2019. The monitoring content includes: Water Quality (Clear Water) monitoring plan, atmospheric monitoring plan (atmosphere PM10, fugitive emission monitoring), exhaust gas monitoring plan, noise monitoring plan, radioactive instrument monitoring plan, water quality (sewage) monitoring plan, groundwater monitoring plan, etc. covering 7 parts of the Company’s wastewater. Monitoring of pollution sources such as sewage, waste gas, noise, and radioactivity, and monitoring of environmental quality such as atmospheric and groundwater, and daily environmental monitoring, according to the monitoring plan. At the same time, the Group timely organized personnel to update the monitoring plan once the Pollutant Discharge Permit and environmental protection standards were revised and updated, so as to ensure openness of the environmental monitoring data and government information as well as consistency of the environmental protection tax reporting requirements, thereby providing data support for the Company’s various pollution indexes to meet the emission standards.
142
Table of Contents
Report of the Directors(continued)
| (XIII) | Equity-linked agreements |
Apart from the Share Option Incentive Scheme disclosed in item (VIII) under Section IV “Major Events” of Chapter 3 of this report, the Company does not have any equity-linked agreements during the year.
| (XIV) | Tax rate |
The income tax rate currently applicable to the Company is 25% (2018: 25%).
| (XV) | Deposits |
The Company did not have any entrusted deposits during the Reporting Period. As at 31 December 2019, the Group did not have any term deposits which could not be collected upon maturity.
| (XVI) | Reserves |
Details of changes in reserves are set out in note 28 to the consolidated financial statements prepared under IFRS.
| (XVII) | Financial summary |
A summary of the results, total assets, total liabilities and shareholders’ equity of the Group as at 31 December 2019 are set out on page 7-8 of this annual report.
| (XVIII) | Bank loans and other borrowings |
Details of bank loans and other borrowings of the Company and the Group for the year ended 31 December 2019 are set out in note 23 to the consolidated financial statements prepared under IFRS.
143
Table of Contents
Report of the Directors(continued)
| (XIX) | Interest capitalized |
Details of interest capitalized during the year are set out in note 10 to the consolidated financial statements prepared under IFRS.
| (XX) | Property, plant and equipment |
Changes in property, plant and equipment during the year are set out in note 17 to the consolidated financial statements prepared under IFRS.
| (XXI) | Purchase, sale and redemption of the Company’s securities |
During the Reporting Period, the Group did not purchase, sell or redeem any of the Company’s listed securities.
| (XXII) | Pre-emptive rights |
According to the Articles of Association and the laws of the PRC, there is no pre-emptive right which requires the Company to offer new shares to the existing shareholders of the Company in proportion to their shareholdings.
| (XXIII) | Donations |
During the Reporting Period, the Company donated RMB1.9 million to the Shanghai Jinshan Education Development Foundation to support educational reform and development projects in Jinshan District, as well as award projects for excellent educators. The Company donated RMB400,000 to the poor areas of Guizhou for the construction of honey production upgrading projects.
| (XXIV) | Tax relief |
During the Reporting Period, the holders of listed securities of the Company were not entitled to tax relief due to the holding of listed securities of the Company in accordance with the PRC laws.
Section V Business review and outlook
Please refer to Section II “Management Discussion and Analysis” of this chapter for the business review of the Group for the year ended 31 December 2019 and the outlook for 2020.
144
Table of Contents
 |  |
To the Shareholders of Sinopec Shanghai Petrochemical Company Limited
(Incorporated in the People’s Republic of China with limited liability)
Opinion
What we have audited
The consolidated financial statements of Sinopec Shanghai Petrochemical Company Limited (the “Company”) and its subsidiaries (the “Group”) set out on pages 150 to 272, which comprise:
| • | the consolidated balance sheet as at 31 December 2019; |
| • | the consolidated income statement for the year then ended; |
| • | the consolidated statement of comprehensive income for the year then ended; • the consolidated statement of changes in equity for the year then ended; • the consolidated statement of cash flows for the year then ended; and |
| • | the notes to the consolidated financial statements, which include a summary of significant accounting policies. |
Our opinion
In our opinion, the consolidated financial statements give a true and fair view of the consolidated financial position of the Group as at 31 December 2019, and of its consolidated financial performance and its consolidated cash flows for the year then ended in accordance with International Financial Reporting Standards (“IFRSs”) and have been properly prepared in compliance with the disclosure requirements of the Hong Kong Companies Ordinance.
Basis for Opinion
We conducted our audit in accordance with Hong Kong Standards on Auditing (“HKSAs”) issued by the Hong Kong Institute of Certified Public Accountants (“HKICPA”). Our responsibilities under those standards are further described in the Auditor’s Responsibilities for the Audit of the Consolidated Financial Statements section of our report.
We believe that the audit evidence we have obtained is sufficient and appropriate to provide a basis for our opinion.
Independence
We are independent of the Group in accordance with the HKICPA’s Code of Ethics for Professional Accountants (“the Code”), and we have fulfilled our other ethical responsibilities in accordance with the Code.
145
Table of Contents
Independent Auditor’s Report(continued)
 |  |
Key Audit Matters
Key audit matters are those matters that, in our professional judgment, were of most significance in our audit of the consolidated financial statements of the current period. These matters were addressed in the context of our audit of the consolidated financial statements as a whole, and in forming our opinion thereon, and we do not provide a separate opinion on these matters.
Key audit matter identified in our audit was related to net realizable value (“NRV”) of raw materials, work in progress and finished goods.
Key Audit Matter | How our audit addressed the Key Audit Matter | |
NRV of raw materials, work in progress and finished goods
Refer to Notes 2.16 “Inventories”, 5 “Critical accounting estimates and assumptions” and 22 “Inventories” to the consolidated financial statements.
The Group is principally engaged in processing of crude oil into petroleum products and other chemical products. The crude oil can be processed into various finished goods by different processing procedures. Inventories are valued at the lower of cost and NRV.
As at 31 December 2019, the gross balances of raw materials, work in progress and finished goods were RMB6,662,023 thousands, against which NRV provision of RMB112,744 thousands were set aside.
The NRV is determined based on the estimated selling prices less the estimated costs to completion, if relevant, other costs necessary to make the sale, and the related taxes.
Determination of estimated selling prices of work in progress and finished goods, estimated costs to completion, other costs necessary to make the sale and the related taxes requires significant management judgement, taking into consideration of historical information and future market trend.
We focused on this area because of the magnitude of the amounts and the significance of management judgements involved. | We understood, evaluated and tested the controls over the determination of NRV of raw materials, work in progress and finished goods.
We evaluated the estimates of selling price for work in progress and finished goods on a sample basis including:
(i) For work in progress and finished goods that had been sold after 31 December 2019, we compared the actual selling prices against the estimated selling prices;
(ii) For work in progress and finished goods that had not been sold after 31 December 2019 but with available selling prices in the domestic market, we performed independent research of the market price information and compared them against the estimated selling prices;
(iii) For work in progress and finished goods that had not been sold after 31 December 2019 but with no available selling prices in the domestic market, we compared the estimated selling prices against the recent selling prices. We also independently evaluated the future market trend factors which management considered in determining the estimated selling prices, including changes in market supplies, customer demands, technology developments, the relevant State tariffs and the State’s guidance prices by corroborating with public data or research information and referencing to our industry knowledge.
We assessed the reasonableness and accuracy of estimated costs to completion, other costs necessary to make the sale and related taxes by comparing with the historical costs to completion, other costs necessary to make the sale and the related taxes for the similar inventories.
We found that management’s judgements in determining the NRV were supported by the evidence we gathered. | |
146
Table of Contents
Independent Auditor’s Report(continued)
| |
Other Information
The directors of the Company are responsible for the other information. The other information comprises all of the information included in the annual report other than the consolidated financial statements and our auditor’s report thereon.
Our opinion on the consolidated financial statements does not cover the other information and we do not express any form of assurance conclusion thereon.
In connection with our audit of the consolidated financial statements, our responsibility is to read the other information and, in doing so, consider whether the other information is materially inconsistent with the consolidated financial statements or our knowledge obtained in the audit or otherwise appears to be materially misstated.
If, based on the work we have performed, we conclude that there is a material misstatement of this other information, we are required to report that fact. We have nothing to report in this regard.
Responsibilities of Directors and Those Charged with Governance for the Consolidated Financial Statements
The directors of the Company are responsible for the preparation of the consolidated financial statements that give a true and fair view in accordance with IFRSs and the disclosure requirements of the Hong Kong Companies Ordinance, and for such internal control as the directors determine is necessary to enable the preparation of consolidated financial statements that are free from material misstatement, whether due to fraud or error.
In preparing the consolidated financial statements, the directors are responsible for assessing the Group’s ability to continue as a going concern, disclosing, as applicable, matters related to going concern and using the going concern basis of accounting unless the directors either intend to liquidate the Group or to cease operations, or have no realistic alternative but to do so.
Those charged with governance are responsible for overseeing the Group’s financial reporting process.
147
Table of Contents
Independent Auditor’s Report(continued)
| |
Auditor’s Responsibilities for the Audit of the Consolidated Financial Statements
Our objectives are to obtain reasonable assurance about whether the consolidated financial statements as a whole are free from material misstatement, whether due to fraud or error, and to issue an auditor’s report that includes our opinion. We report our opinion solely to you, as a body, and for no other purpose. We do not assume responsibility towards or accept liability to any other person for the contents of this report. Reasonable assurance is a high level of assurance, but is not a guarantee that an audit conducted in accordance with HKSAs will always detect a material misstatement when it exists. Misstatements can arise from fraud or error and are considered material if, individually or in the aggregate, they could reasonably be expected to influence the economic decisions of users taken on the basis of these consolidated financial statements.
As part of an audit in accordance with HKSAs, we exercise professional judgment and maintain professional scepticism throughout the audit. We also:
| • | Identify and assess the risks of material misstatement of the consolidated financial statements, whether due to fraud or error, design and perform audit procedures responsive to those risks, and obtain audit evidence that is sufficient and appropriate to provide a basis for our opinion. The risk of not detecting a material misstatement resulting from fraud is higher than for one resulting from error, as fraud may involve collusion, forgery, intentional omissions, misrepresentations, or the override of internal control. |
| • | Obtain an understanding of internal control relevant to the audit in order to design audit procedures that are appropriate in the circumstances, but not for the purpose of expressing an opinion on the effectiveness of the Group’s internal control. |
| • | Evaluate the appropriateness of accounting policies used and the reasonableness of accounting estimates and related disclosures made by the directors. |
| • | Conclude on the appropriateness of the directors’ use of the going concern basis of accounting and, based on the audit evidence obtained, whether a material uncertainty exists related to events or conditions that may cast significant doubt on the Group’s ability to continue as a going concern. If we conclude that a material uncertainty exists, we are required to draw attention in our auditor’s report to the related disclosures in the consolidated financial statements or, if such disclosures are inadequate, to modify our opinion. Our conclusions are based on the audit evidence obtained up to the date of our auditor’s report. However, future events or conditions may cause the Group to cease to continue as a going concern. |
148
Table of Contents
Independent Auditor’s Report(continued)
| |
Auditor’s Responsibilities for the Audit of the Consolidated Financial Statements(Continued)
| • | Evaluate the overall presentation, structure and content of the consolidated financial statements, including the disclosures, and whether the consolidated financial statements represent the underlying transactions and events in a manner that achieves fair presentation. |
| • | Obtain sufficient appropriate audit evidence regarding the financial information of the entities or business activities within the Group to express an opinion on the consolidated financial statements. We are responsible for the direction, supervision and performance of the group audit. We remain solely responsible for our audit opinion. |
We communicate with those charged with governance regarding, among other matters, the planned scope and timing of the audit and significant audit findings, including any significant deficiencies in internal control that we identify during our audit.
We also provide those charged with governance with a statement that we have complied with relevant ethical requirements regarding independence, and to communicate with them all relationships and other matters that may reasonably be thought to bear on our independence, and where applicable, related safeguards.
From the matters communicated with those charged with governance, we determine those matters that were of most significance in the audit of the consolidated financial statements of the current period and are therefore the key audit matters. We describe these matters in our auditor’s report unless law or regulation precludes public disclosure about the matter or when, in extremely rare circumstances, we determine that a matter should not be communicated in our report because the adverse consequences of doing so would reasonably be expected to outweigh the public interest benefits of such communication.
The engagement partner on the audit resulting in this independent auditor’s report is CHAN KWONG TAK.
PricewaterhouseCoopers
Certified Public Accountants
Hong Kong, 25 March 2020
149
Table of Contents
| A. | Financial Statements Prepared Under International Financial Reporting Standards |
For the year ended 31 December 2019
| Year ended 31 December | ||||||||||||
| Note | 2019 RMB’000 | 2018 RMB’000 | ||||||||||
Revenue | 6 | 100,269,667 | 107,688,907 | |||||||||
Taxes and surcharges | (12,213,927 | ) | (12,075,424 | ) | ||||||||
|
|
|
| |||||||||
Net sales | 88,055,740 | 95,613,483 | ||||||||||
Cost of sales | 11 | (86,467,995 | ) | (89,838,977 | ) | |||||||
|
|
|
| |||||||||
Gross profit | 1,587,745 | 5,774,506 | ||||||||||
|
|
|
| |||||||||
Selling and administrative expenses | 11 | (549,885 | ) | (536,114 | ) | |||||||
Net impairment losses on financial assets | 4 | 59 | (39 | ) | ||||||||
Other operating income | 7 | 150,714 | 202,617 | |||||||||
Other operating expenses | 8 | (21,925 | ) | (32,548 | ) | |||||||
Other gains – net | 9 | 153,864 | 176,690 | |||||||||
|
|
|
| |||||||||
Operating profit | 1,320,572 | 5,585,112 | ||||||||||
|
|
|
| |||||||||
Finance income | 10 | 416,747 | 443,661 | |||||||||
Finance expenses | 10 | (53,784 | ) | (106,249 | ) | |||||||
|
|
|
| |||||||||
Finance income – net | 362,963 | 337,412 | ||||||||||
|
|
|
| |||||||||
Share of net profit of associates and joint ventures accounted for using the equity method | 21 | 972,593 | 885,597 | |||||||||
|
|
|
| |||||||||
150
Table of Contents
Consolidated Income Statement (continued)
For the year ended 31 December 2019
| Year ended 31 December | ||||||||||||
| Note | 2019 RMB’000 | 2018 RMB’000 | ||||||||||
Profit before income tax | 2,656,128 | 6,808,121 | ||||||||||
Income tax expense | 13 | (428,963 | ) | (1,471,903 | ) | |||||||
|
|
|
| |||||||||
Profit for the year | 2,227,165 | 5,336,218 | ||||||||||
|
|
|
| |||||||||
Profit attributable to: | ||||||||||||
– Owners of the Company | 2,215,728 | 5,336,331 | ||||||||||
–Non-controlling interests | 11,437 | (113 | ) | |||||||||
|
|
|
| |||||||||
| 2,227,165 | 5,336,218 | |||||||||||
|
|
|
| |||||||||
Earnings per share attributable to owners of the Company for the year (expressed in RMB per share) | ||||||||||||
Basic earnings per share | 14 | RMB 0.205 | RMB 0.493 | |||||||||
|
|
|
| |||||||||
Diluted earnings per share | 14 | RMB 0.205 | RMB 0.493 | |||||||||
|
|
|
| |||||||||
The above consolidated income statement should be read in conjunction with the accompanying notes.
| Wu Haijun | Zhou Meiyun | |
| Chairman | Director, Vice General Manager and Chief Financial Officer |
151
Table of Contents
Consolidated Statement of Comprehensive Income
For the year ended 31 December 2019
| Year ended 31 December | ||||||||||||
| Note | 2019 RMB’000 | 2018 RMB’000 | ||||||||||
Profit for the year | 2,227,165 | 5,336,218 | ||||||||||
Other comprehensive income/(loss) | ||||||||||||
Items that may be reclassified to profit or loss | ||||||||||||
Share of other comprehensive income/(loss) of associates and joint ventures accounted for using the equity method | 28 | 7,449 | (7,014 | ) | ||||||||
|
|
|
| |||||||||
Other comprehensive income/(loss) for the year, net of tax | 7,449 | (7,014 | ) | |||||||||
|
|
|
| |||||||||
Total comprehensive income for the year | 2,234,614 | 5,329,204 | ||||||||||
|
|
|
| |||||||||
Attributable to: | ||||||||||||
– Owners of the Company | 2,223,177 | 5,329,317 | ||||||||||
–Non-controlling interests | 11,437 | (113 | ) | |||||||||
|
|
|
| |||||||||
Total comprehensive income for the year | 2,234,614 | 5,329,204 | ||||||||||
|
|
|
| |||||||||
The above consolidated statement of comprehensive income should be read in conjunction with the accompanying notes.
| Wu Haijun | Zhou Meiyun | |
| Chairman | Director, Vice General Manager and Chief Financial Officer |
152
Table of Contents
As at 31 December 2019
| As at 31 December | ||||||||||||
| Note | 2019 RMB’000 | 2018 RMB’000 | ||||||||||
Assets | ||||||||||||
Non-current assets | ||||||||||||
Lease prepayments and othernon-current assets | 15 | 481,414 | 858,283 | |||||||||
Property, plant and equipment | 17 | 11,300,797 | 11,646,390 | |||||||||
Right-of-use assets | 3,16 | 343,860 | — | |||||||||
Investment properties | 18 | 367,468 | 376,739 | |||||||||
Construction in progress | 19 | 1,815,549 | 1,559,401 | |||||||||
Investments accounted for using the equity method | 21 | 5,208,758 | 4,527,133 | |||||||||
Deferred income tax assets | 13 | 150,832 | 119,075 | |||||||||
Financial assets at fair value through other comprehensive income | 23(d) | 5,000 | — | |||||||||
Time deposits with banks | 23(c) | 3,511,234 | — | |||||||||
|
|
|
| |||||||||
| 23,184,912 | 19,087,021 | |||||||||||
|
|
|
| |||||||||
Current assets | ||||||||||||
Inventories | 22 | 6,754,434 | 8,120,875 | |||||||||
Financial assets at fair value through other comprehensive income | 23(d) | 1,540,921 | 1,672,431 | |||||||||
Financial assets at fair value through profit or loss | 23(e) | 3,318,670 | 2,727,279 | |||||||||
Trade receivables | 23(a) | 120,739 | 81,990 | |||||||||
Other receivables | 23(a) | 26,101 | 105,803 | |||||||||
Prepayments | 24 | 23,767 | 38,025 | |||||||||
Amounts due from related parties | 23(a),30(c) | 1,565,993 | 2,286,249 | |||||||||
Cash and cash equivalents | 23(b) | 7,449,699 | 8,741,893 | |||||||||
Time deposits with banks | 23(c) | 1,508,839 | 1,500,000 | |||||||||
Assets classified as held for sale | 24 | — | 24,331 | |||||||||
|
|
|
| |||||||||
| 22,309,163 | 25,298,876 | |||||||||||
|
|
|
| |||||||||
Total assets | 45,494,075 | 44,385,897 | ||||||||||
|
|
|
| |||||||||
153
Table of Contents
Consolidated Balance Sheet(continued)
As at 31 December 2019
| As at 31 December | ||||||||||||
| Note | 2019 RMB’000 | 2018 RMB’000 | ||||||||||
Equity and liabilities | ||||||||||||
Equity attributable to owners of the Company | ||||||||||||
Share capital | 27 | 10,823,814 | 10,823,814 | |||||||||
Reserves | 28 | 19,039,474 | 19,522,249 | |||||||||
|
|
|
| |||||||||
| 29,863,288 | 30,346,063 | |||||||||||
Non-controlling interests | 130,560 | 116,378 | ||||||||||
|
|
|
| |||||||||
Total equity | 29,993,848 | 30,462,441 | ||||||||||
|
|
|
| |||||||||
Liabilities | ||||||||||||
Non-current liabilities | ||||||||||||
Lease liabilities | 16 | 10,593 | — | |||||||||
Deferred income | 26 | 10,005 | 10,442 | |||||||||
|
|
|
| |||||||||
| 20,598 | 10,442 | |||||||||||
|
|
|
| |||||||||
Current liabilities | ||||||||||||
Borrowings | 23(f) | 1,547,600 | 497,249 | |||||||||
Lease liabilities | 16 | 11,450 | — | |||||||||
Financial liabilities at fair value through profit or loss | 799 | 11,005 | ||||||||||
Contract liabilities | 25 | 655,117 | 446,702 | |||||||||
Trade and other payables | 23(g) | 7,330,000 | 8,090,228 | |||||||||
Amounts due to related parties | 23(g),30(c) | 5,708,394 | 4,567,814 | |||||||||
Income tax payable | 226,269 | 300,016 | ||||||||||
|
|
|
| |||||||||
| 15,479,629 | 13,913,014 | |||||||||||
|
|
|
| |||||||||
Total liabilities | 15,500,227 | 13,923,456 | ||||||||||
|
|
|
| |||||||||
Total equity and liabilities | 45,494,075 | 44,385,897 | ||||||||||
|
|
|
| |||||||||
The above consolidated balance sheet should be read in conjunction with the accompanying notes.
| Wu Haijun | Zhou Meiyun | |
| Chairman | Director, Vice General Manager and Chief Financial Officer |
154
Table of Contents
Consolidated Statement of Changes in Equity
For the year ended 31 December 2019
| Attributable to owners of the Company | ||||||||||||||||||||||||||||
| Note | Share capital RMB’000 | Other reserves RMB’000 | Retained earnings RMB’000 | Total RMB’000 | Non- controlling interests RMB’000 | Total equity RMB’000 | ||||||||||||||||||||||
Balance at 1 January 2018 | 10,814,177 | 4,287,799 | 13,128,257 | 28,230,233 | 285,307 | 28,515,540 | ||||||||||||||||||||||
|
|
|
|
|
|
|
|
|
|
|
| |||||||||||||||||
Profit/(loss) for the year | — | — | 5,336,331 | 5,336,331 | (113 | ) | 5,336,218 | |||||||||||||||||||||
Other comprehensive loss | 28 | — | (7,014 | ) | — | (7,014 | ) | — | (7,014 | ) | ||||||||||||||||||
|
|
|
|
|
|
|
|
|
|
|
| |||||||||||||||||
Total comprehensive income for the year | — | (7,014 | ) | 5,336,331 | 5,329,317 | (113 | ) | 5,329,204 | ||||||||||||||||||||
|
|
|
|
|
|
|
|
|
|
|
| |||||||||||||||||
Dividends proposed and approved | — | — | (3,247,144 | ) | (3,247,144 | ) | — | (3,247,144 | ) | |||||||||||||||||||
Forfeit of share option scheme | 28, 29 | — | (13,004 | ) | — | (13,004 | ) | — | (13,004 | ) | ||||||||||||||||||
Exercise of share option | 28, 29 | 9,637 | 27,465 | — | 37,102 | — | 37,102 | |||||||||||||||||||||
Dividends paid by subsidiaries tonon-controlling interests | — | — | — | — | (6,457 | ) | (6,457 | ) | ||||||||||||||||||||
Appropriation of safety production fund | 28 | — | 57,135 | (57,135 | ) | — | — | — | ||||||||||||||||||||
Transactions withnon-controlling interests | 20 | — | 9,559 | — | 9,559 | (162,359 | ) | (152,800 | ) | |||||||||||||||||||
|
|
|
|
|
|
|
|
|
|
|
| |||||||||||||||||
Balance at 31 December 2018 | 10,823,814 | 4,361,940 | 15,160,309 | 30,346,063 | 116,378 | 30,462,441 | ||||||||||||||||||||||
|
|
|
|
|
|
|
|
|
|
|
| |||||||||||||||||
155
Table of Contents
Consolidated Statement of Changes in Equity (continued)
For the year ended 31 December 2019
| Attributable to owners of the Company | ||||||||||||||||||||||||||
| Non- | ||||||||||||||||||||||||||
| Share | Other | Retained | controlling | Total | ||||||||||||||||||||||
| capital | reserves | earnings | Total | interests | equity | |||||||||||||||||||||
| Note | RMB’000 | RMB’000 | RMB’000 | RMB’000 | RMB’000 | RMB’000 | ||||||||||||||||||||
Balance at 1 January 2019 | 10,823,814 | 4,361,940 | 15,160,309 | 30,346,063 | 116,378 | 30,462,441 | ||||||||||||||||||||
Change in accounting policy | 3 | — | — | — | — | — | — | |||||||||||||||||||
|
|
|
|
|
|
|
|
|
|
|
| |||||||||||||||
Restated total equity at the beginning of 2019 | 10,823,814 | 4,361,940 | 15,160,309 | 30,346,063 | 116,378 | 30,462,441 | ||||||||||||||||||||
|
|
|
|
|
|
|
|
|
|
|
| |||||||||||||||
Profit for the year | — | — | 2,215,728 | 2,215,728 | 11,437 | 2,227,165 | ||||||||||||||||||||
Other comprehensive income | 28 | — | 7,449 | — | 7,449 | — | 7,449 | |||||||||||||||||||
|
|
|
|
|
|
|
|
|
|
|
| |||||||||||||||
Total comprehensive income for the year | — | 7,449 | 2,215,728 | 2,223,177 | 11,437 | 2,234,614 | ||||||||||||||||||||
|
|
|
|
|
|
|
|
|
|
|
| |||||||||||||||
Dividends proposed and approved | 31 | — | — | (2,705,952 | ) | (2,705,952 | ) | — | (2,705,952 | ) | ||||||||||||||||
Dividends paid by subsidiaries tonon-controlling interests | — | — | — | — | (3,266 | ) | (3,266 | ) | ||||||||||||||||||
Appropriation of safety production fund | 28 | — | 2 | (2 | ) | — | — | — | ||||||||||||||||||
Non-controlling interests of disposed subsidiary | — | — | — | — | 6,011 | 6,011 | ||||||||||||||||||||
|
|
|
|
|
|
|
|
|
|
|
| |||||||||||||||
Balance at 31 December 2019 | 10,823,814 | 4,369,391 | 14,670,083 | 29,863,288 | 130,560 | 29,993,848 | ||||||||||||||||||||
|
|
|
|
|
|
|
|
|
|
|
| |||||||||||||||
The above consolidated statement of changes in equity should be read in conjunction with the accompanying notes.
| Wu Haijun | Zhou Meiyun | |
| Chairman | Director, Vice General Manager and Chief Financial Officer |
156
Table of Contents
Consolidated Statement of Cash Flows
For the year ended 31 December 2019
| Year ended 31 December | ||||||||||||
| 2019 | 2018 | |||||||||||
| Note | RMB’000 | RMB’000 | ||||||||||
Cash flows from operating activities | ||||||||||||
Cash generated from operations | 32 | 5,655,676 | 8,501,499 | |||||||||
Interest paid to related parties | (2,126 | ) | (1,326 | ) | ||||||||
Interest paid | (61,304 | ) | (34,339 | ) | ||||||||
Income tax paid | (534,467 | ) | (1,806,400 | ) | ||||||||
|
|
|
| |||||||||
Net cash generated from operating activities | 5,057,779 | 6,659,434 | ||||||||||
|
|
|
| |||||||||
Cash flows from investing activities | ||||||||||||
Dividends received from joint ventures and associates | 594,868 | 811,473 | ||||||||||
Interest received from related parties | 1,295 | 610 | ||||||||||
Interest received from banks excluded structured deposits | 445,105 | 393,671 | ||||||||||
Interest received from structured deposits | 86,848 | 23,149 | ||||||||||
Net (losses)/proceeds from settlement of derivative financial instrument | (15,316 | ) | 16,540 | |||||||||
Net proceeds from disposal of property, plant and equipment | 32 | 67,503 | 210,122 | |||||||||
Proceeds from disposal of a subsidiary | 21 | — | 9,600 | |||||||||
Cash received from structured deposits | 3,200,000 | 12,000 | ||||||||||
Cash received from time deposits within one year | 4,100,000 | 4,000,000 | ||||||||||
Cash payment for time deposits above one year | (3,500,000 | ) | — | |||||||||
Cash payment for time deposits within one year | (4,100,000 | ) | (3,500,000 | ) | ||||||||
Cash payment for structured deposits | (3,800,000 | ) | (2,700,000 | ) | ||||||||
Cash payment for acquisition of associate | 21 | (248,184 | ) | — | ||||||||
Cash payment for equity instruments | (5,000 | ) | — | |||||||||
Payments for sale of financial assets at fair value through other comprehensive income | (19,513 | ) | — | |||||||||
Cash held by the subsidiary before disposal | 20 | (404 | ) | (18,529 | ) | |||||||
Purchases of property, plant and equipment and other long-term assets from related parties | (83,447 | ) | (143,554 | ) | ||||||||
Purchases of property, plant and equipment and other long-term assets from third parties | (1,346,964 | ) | (1,043,451 | ) | ||||||||
|
|
|
| |||||||||
Net cash used in investing activities | (4,623,209 | ) | (1,928,369 | ) | ||||||||
|
|
|
| |||||||||
157
Table of Contents
Consolidated Statement of Cash Flows (continued)
For the year ended 31 December 2019
| Year ended 31 December | ||||||||||||
| 2019 | 2018 | |||||||||||
| Note | RMB’000 | RMB’000 | ||||||||||
Cash flows from financing activities | ||||||||||||
Proceeds from borrowings from related parties | — | 50,000 | ||||||||||
Proceeds from borrowings from banks | 4,755,100 | 2,486,759 | ||||||||||
Proceeds from exercising share option scheme | — | 37,102 | ||||||||||
Repayments of borrowings to related parties | — | (50,000 | ) | |||||||||
Repayments of borrowings to banks | (3,695,208 | ) | (2,596,157 | ) | ||||||||
Cash payment of acquisition ofnon-controlling interests | — | (152,800 | ) | |||||||||
Dividends paid to the Company’s shareholders | (2,704,864 | ) | (3,275,656 | ) | ||||||||
Dividends paid by subsidiaries tonon-controlling interests | (3,266 | ) | (6,457 | ) | ||||||||
Principal elements of lease payments | (89,124 | ) | — | |||||||||
|
|
|
| |||||||||
Net cash used in financing activities | (1,737,362 | ) | (3,507,209 | ) | ||||||||
|
|
|
| |||||||||
Net (decrease)/increase in cash and cash equivalents | (1,302,792 | ) | 1,223,856 | |||||||||
Cash and cash equivalents at the beginning of the year | 23 | (b) | 8,741,893 | 7,504,266 | ||||||||
Exchange gains on cash and cash equivalents | 10,598 | 13,771 | ||||||||||
|
|
|
| |||||||||
Cash and cash equivalents at the end of the year | 23 | (b) | 7,449,699 | 8,741,893 | ||||||||
|
|
|
| |||||||||
The above consolidated statement of cash flows should be read in conjunction with the accompanying notes.
| Wu Haijun | Zhou Meiyun | |
| Chairman | Director, Vice General Manager and Chief Financial Officer |
158
Table of Contents
Notes to the Consolidated Financial Statements
For the year ended 31 December 2019
| 1 | General information |
Sinopec Shanghai Petrochemical Company Limited (“the Company”), formerly known as Shanghai Petrochemical Company Limited, was established in the People’s Republic of China (“the PRC”) on 29 June 1993 as a joint stock limited company to hold the assets and liabilities of the production divisions and certain other units of Shanghai Petrochemical Complex (“SPC”), a state-owned enterprise. The Company was under the direct supervision of China Petrochemical Corporation (“Sinopec Group”) at that time.
The Company completed its initial public offerings in 1993. Its shares were listed on the Stock Exchange of Hong Kong Limited (“H shares”) and the New York Stock Exchange in the form of American Depositary Shares (“ADS”) on 26 July 1993, and were also listed on the Shanghai Stock Exchange (“ordinary A shares”) on 8 November 1993.
Sinopec Group completed its reorganization on 25 February 2000. After the reorganization, China Petroleum & Chemical Corporation (“Sinopec Corp.”) was established. As part of the reorganization, Sinopec Group transferred its 4,000,000,000 of the Company’s state-owned legal shares, which represented 55.56 percent of the issued share capital of the Company, to Sinopec Corp.
The Company changed its name to Sinopec Shanghai Petrochemical Company Limited on 12 October 2000, and Sinopec Corp. was the largest shareholder of the Company.
Pursuant to the “Approval on matters relating to the Share Segregation Reform of Sinopec Shanghai Petrochemical Company Limited” issued by the State-owned Assets Supervision and Administration Commission of the State Council (State Owned Property [2013] No.443), a General Meeting of A share shareholders was held on 8 July 2013 and passed the resolution of “Share Segregation Reform of Sinopec Shanghai Petrochemical Company Limited (Amendment)” (“the Share Segregation Reform Resolution”) which was published by the Company on Shanghai Stock Exchange (“SSE”) website on 20 June 2013.
According to the Share Segregation Reform Resolution, the controlling shareholder of the Company, Sinopec Corp., offered shareholders of circulating A shares 5 shares for every 10 circulating A shares they held on 16 August 2013, aggregating 360,000,000 A shares, for the purpose of obtaining the listing rights of itsnon-circulating shares in the A Shares market. From 20 August 2013 (“the circulation date”), all the Company’snon-circulating A shares have been granted circulating rights on Shanghai Stock Exchange (“SSE”). As part of the restricted conditions, Sinopec Corp. committed that all the 3,640,000,000 A shares held were not allowed to be traded on SSE or transferred within 12 months from the circulation date (“the restriction period”). After the restriction period, Sinopec Corp. can only sell no more than 5 and 10 percent of its total shares within 12 and 24 months, respectively. The former 150,000,000non-circulating A shares held by social legal persons were also prohibited to be traded on SSE or transferred within 12 months from the circulation date. Meanwhile, Sinopec Corp. also committed in the Share Segregation Reform Resolution that a scheme of converting surplus to share capital (no less than 4 shares for every 10 shares) will be proposed on the board of directors and shareholders meetings within 6 months after the circulation date.
159
Table of Contents
Notes to the Consolidated Financial Statements(continued)
For the year ended 31 December 2019
| 1 | General information(continued) |
The 15th meeting of the 7th term of Board of Directors was held on 28 August 2013 and the Company proposed and passed a resolution regarding interim cash dividend for the first half of 2013 and the conversion of share premium and surplus reserve to share capital. The resolution included a distribution of 5 shares and a cash dividend distribution of RMB0.5 (tax included) for every 10 shares based on the 7,200,000 thousands ordinary shares as at 30 June 2013. Among the 5 shares distributed, 3.36 shares were converted from share premium of RMB2,420,841 thousands and 1.64 shares were converted from surplus reserves of RMB1,179,159 thousands. The resolution was approved by the extraordinary general meeting of shareholders, A share class shareholders meeting and H share class shareholders meeting on 22 October 2013, respectively.
The first tranche of the Share Option Incentive Scheme was exercised on 29 August 2017, and the Company received cash payment of RMB54,580 thousands from 199 grantees. As a result, ordinary A shares of 14,177 thousands were registered on 27 September 2017.
The second tranche of the Share Option Incentive Scheme was exercised on 12 January 2018, and the Company received cash payment of RMB37,102 thousands from 185 grantees, led to an increase of RMB9,637 thousands in share capital.
According to the board resolution of the Company on 28 December 2018, the third tranche was not exercised due to the failure on satisfying thenon-market exercise conditions.
As at 31 December 2019, total shares of the Company were 10,823,814 thousands (31 December 2018: 10,823,814 thousands).
The Company and its subsidiaries (“the Group”) are principally engaged in processing crude oil into synthetic fibers, resins and plastics, intermediate petrochemicals and petroleum products.
These consolidated financial statements are presented in thousands of Renminbi Yuan (RMB), unless otherwise stated. These financial statements have been approved for issue by the Board of Directors on 25 March 2020.
| 2 | Summary of significant accounting policies |
The principal accounting policies applied in the preparation of these consolidated financial statements are set out below. These policies have been consistently applied to all the years presented, unless otherwise stated.
| 2.1 | Basis of preparation |
The consolidated financial statements of the Group have been prepared in accordance with all applicable International Financial Reporting Standards (“IFRS”) as issued by International Accounting Standards Board (“IASB”). The consolidated financial statements have been prepared under the historical cost convention, as modified by the revaluation of financial assets and financial liabilities measured at fair value.
The preparation of financial statements in conformity with IFRS requires the use of certain critical accounting estimates. It also requires management to exercise its judgment in the process of applying the Group’s accounting policies. The areas involving a higher degree of judgment or complexity, or areas where assumptions and estimates are significant to the consolidated financial statements are disclosed in Note 5.
160
Table of Contents
Notes to the Consolidated Financial Statements(continued)
For the year ended 31 December 2019
| 2 | Summary of significant accounting policies(continued) |
| 2.1 | Basis of preparation(continued) |
| 2.1.1 | Changes in accounting policy and disclosures |
| (a) | New and amended standards adopted by the Group |
The Group has applied the following standards and amendments for the first time for their annual reporting period commencing 1 January 2019:
| • | IFRS 16 ‘Leases’ |
| • | IFRIC 23 ‘Uncertainty over Income Tax Treatments’ |
| • | Annual Improvements to IFRS Standards 2015-2017 cycle |
| • | Amendments to IFRS 9 ‘Prepayment Features with Negative Compensation’ |
| • | Amendments to IAS 28 ‘Long-team interests in Associates and Joint Ventures’, and |
| • | Amendments to IAS 19 ‘Plan Amendment, Curtailment or Settlement’. |
The Group had to change its accounting policies as a result of adopting IFRS 16. The Group elected to adopt the new rules retrospectively but recognized the cumulative effect of initially applying the new standard on 1 January 2019, which was disclosed in Note 3. The other amendments listed above did not have any significant impact on the amounts recognized in prior periods and are not expected to significantly affect the current or future periods.
161
Table of Contents
Notes to the Consolidated Financial Statements(continued)
For the year ended 31 December 2019
| 2 | Summary of significant accounting policies(continued) |
| 2.1 | Basis of preparation(continued) |
| 2.1.1 | Changes in accounting policy and disclosures(continued) |
| (b) | New standards and interpretations not yet adopted |
Certain new accounting standards and interpretations have been published that are not mandatory for 31 December 2019 reporting periods and have not been early adopted by the Group:
| • | Amendments to IFRS 3 ‘Business Combinations’, effective for the accounting period beginning on or after 1 January 2020; |
| • | Amendments to conceptual Framework of IASB, effective for the accounting period beginning on or after 1 January 2020; |
| • | Amendments to IAS 1 ‘Presentation of Financial Statements’ and IAS 8 ‘Accounting Policies, Changes in Accounting Estimates and Errors’, effective for the accounting period beginning on or after 1 January 2020; |
| • | IFRS 17 ‘Insurance Contracts’, effective for the accounting period beginning on or after 1 January 2021; |
| • | Amendments to IFRS 10 and IAS 28 ‘Sale or contribution of assets between an investor and its associate or joint venture’. |
The new standards and interpretations that are not yet effective are not expected to have a material impact on the Group in the current or future reporting periods and on foreseeable future transactions.
162
Table of Contents
Notes to the Consolidated Financial Statements(continued)
For the year ended 31 December 2019
| 2 | Summary of significant accounting policies(continued) |
| 2.2 | Subsidiaries |
| 2.2.1 | Consolidation |
A subsidiary is an entity (including a structured entity) over which the Group has control. The Group controls an entity when the Group is exposed to, or has rights to, variable returns from its involvement with the entity and has the ability to affect those returns through its power over the entity. Subsidiaries are consolidated from the date on which control is transferred to the Group. They are deconsolidated from the date that control ceases.
| (a) | Business combinations |
The Group applies the acquisition method to account for business combinations. The consideration transferred for the acquisition of a subsidiary is the fair values of the assets transferred, the liabilities incurred to the former owners of the acquiree and the equity interests issued by the Group. The consideration transferred includes the fair value of any asset or liability resulting from a contingent consideration arrangement. Identifiable assets acquired and liabilities and contingent liabilities assumed in a business combination are measured initially at their fair values at the acquisition date.
The Group recognizes anynon-controlling interest in the acquiree on anacquisition-by-acquisition basis.Non-controlling interests in the acquiree that are present ownership interests and entitle their holders to a proportionate share of the entity’s net assets in the event of liquidation are measured at either fair value or the present ownership interests’ proportionate share in the recognized amounts of the acquiree’s identifiable net assets. All other components ofnon-controlling interests are measured at their acquisition date fair value, unless another measurement basis is required by IFRS.
Acquisition-related costs are expensed as incurred.
If the business combination is achieved in stages, the acquisition date carrying value of the acquirer’s previously held equity interest in the acquiree isre-measured to fair value at the acquisition date; any gains or losses arising from suchre-measurement are recognized in profit or loss.
163
Table of Contents
Notes to the Consolidated Financial Statements(continued)
For the year ended 31 December 2019
| 2 | Summary of significant accounting policies(continued) |
| 2.2 | Subsidiaries(continued) |
| 2.2.1 | Consolidation(continued) |
| (a) | Business combinations(continued) |
Any contingent consideration to be transferred by the Group is recognized at fair value at the acquisition date. Subsequent changes to the fair value of the contingent consideration that is deemed to be an asset or liability is recognized in profit or loss. Contingent consideration that is classified as equity is not remeasured, and its subsequent settlement is accounted for within equity.
The excess of the consideration transferred, the amount of anynon-controlling interest in the acquiree and the acquisition-date fair value of any previous equity interest in the acquiree over the fair value of the identifiable net assets acquired, is recorded as goodwill. If the total consideration transferred,non-controlling interest recognized and previously held interest measured is less than the fair value of the identifiable net assets of the subsidiary acquired in the case of a bargain purchase, the difference is recognized directly in the income statement.
Intra-Group transactions, balances and unrealized gains on transactions between group companies are eliminated. Unrealized losses are also eliminated unless the transaction provides evidence of an impairment of the transferred asset. When necessary, amounts reported by subsidiaries have been adjusted to conform with the Group’s accounting policies.
| (b) | Changes in ownership interests in subsidiaries without change of control |
Transactions withnon-controlling interests that do not result in loss of control are accounted for as equity transactions – that is, as transactions with the owners of the subsidiary in their capacity as owners. The difference between fair value of any consideration paid and the relevant share acquired of the carrying amount of net assets of the subsidiary is recorded in equity. Gains or losses on disposals tonon-controlling interests are also recorded in equity.
164
Table of Contents
Notes to the Consolidated Financial Statements(continued)
For the year ended 31 December 2019
| 2 | Summary of significant accounting policies(continued) |
| 2.2 | Subsidiaries(continued) |
| 2.2.1 | Consolidation(continued) |
| (c) | Disposal of subsidiaries |
When the Group ceases to have control, any retained interest in the entity isre-measured to its fair value at the date when control is lost, with the change in carrying amount recognized in profit or loss. The fair value is the initial carrying amount for the purposes of subsequent accounting for the retained interest as an associate, joint venture or financial asset. In addition, any amounts previously recognized in other comprehensive income in respect of that entity are accounted for as if the Group had directly disposed of the related assets or liabilities. It means the amounts previously recognized in other comprehensive income are reclassified to profit or loss or transferred to another category of equity as specified by applicable IFRSs.
| 2.2.2 | Separate financial statements |
Investments in subsidiaries are accounted for at cost less impairment. Cost includes direct attributable costs of investment. The results of subsidiaries are accounted for by the Company on the basis of dividend received and receivable.
Impairment testing of the investments in subsidiaries is required upon receiving a dividend from these investments if the dividend exceeds the total comprehensive income of the subsidiary in the period the dividend is declared or if the carrying amount of the investment in the separate financial statements exceeds the carrying amount in the consolidated financial statements of the investee’s net assets including goodwill.
Investments in joint ventures and associates are accounted for using the equity method of accounting.
165
Table of Contents
Notes to the Consolidated Financial Statements(continued)
For the year ended 31 December 2019
| 2 | Summary of significant accounting policies (continued) |
| 2.3 | Associates |
An associate is an entity over which the Group has significant influence but not control, generally accompanying a shareholding of between 20% and 50% of the voting rights. Investments in associates are accounted for using the equity method of accounting. Under the equity method, the investment is initially recognized at cost, and the carrying amount is increased or decreased to recognize the investor’s share of the profit or loss of the investee after the date of acquisition. The Group’s investments in associates include goodwill identified on acquisition. Upon the acquisition of the ownership interest in an associate, any difference between the cost of the associate and the Group’s share of the net fair value of the associate’s identifiable assets and liabilities is accounted for as goodwill.
If the ownership interest in an associate is reduced but significant influence is retained, only a proportionate share of the amounts previously recognized in other comprehensive income is reclassified to profit or loss where appropriate.
The Group’s share of post-acquisition profit or loss is recognized in the income statement, and its share of post-acquisition movements in other comprehensive income is recognized in other comprehensive income with a corresponding adjustment to the carrying amount of the investment. When the Group’s share of losses in an associate equals or exceeds its interest in the associate, including any other unsecured receivables, the Group does not recognize further losses, unless it has incurred legal or constructive obligations or made payments on behalf of the associate.
The Group determines at each reporting date whether there is any objective evidence that the investment in the associate is impaired. If this is the case, the Group calculates the amount of impairment as the difference between the recoverable amount of the associate and its carrying value and recognizes the amount adjacent to share of net profit of associates and joint ventures accounted for using the equity method in the income statement.
Profits and losses resulting from upstream and downstream transactions between the Group and its associates are recognized in the Group’s financial statements only to the extent of unrelated investor’s interests in the associates. Unrealized losses are eliminated unless the transaction provides evidence of an impairment of the asset transferred. Accounting policies of associates have been changed where necessary to ensure consistency with the policies adopted by the Group.
Gain or losses on dilution of equity interest in associates are recognized in the income statement.
166
Table of Contents
Notes to the Consolidated Financial Statements(continued)
For the year ended 31 December 2019
| 2 | Summary of significant accounting policies(continued) |
| 2.4 | Joint arrangements |
The Group has applied IFRS 11 to all joint arrangements. Under IFRS 11, investments in joint arrangements are classified as either joint operations or joint ventures depending on the contractual rights and obligations of each investor. The Group has assessed the nature of its joint arrangements and determined them to be joint ventures. Joint ventures are accounted for using the equity method.
Under the equity method of accounting, interests in joint ventures are initially recognized at cost and adjusted thereafter to recognize the Group’s share of the post-acquisition profits or losses and movements in other comprehensive income. The Group’s investments in joint ventures include goodwill identified on acquisition. Upon the acquisition of the ownership interest in a joint venture, any difference between the cost of the joint venture and the Group’s share of the net fair value of the joint venture’s identifiable assets and liabilities is accounted for as goodwill. When the Group’s share of losses in a joint venture equals or exceeds its interests in the joint ventures, including any other unsecured receivables, the Group does not recognize further losses, unless it has incurred obligations or made payments on behalf of the joint ventures.
Unrealized gains on transactions between the Group and its joint ventures are eliminated to the extent of the Group’s interest in the joint ventures. Unrealized losses are also eliminated unless the transaction provides evidence of an impairment of the asset transferred. Accounting policies of the joint ventures have been changed where necessary to ensure consistency with the policies adopted by the Group.
| 2.5 | Segment reporting |
Operating segments are reported in a manner consistent with the internal reporting provided to the chief operating decision-maker. The chief operating decision-maker, who is responsible for allocating resources and assessing performance of the operating segments, has been identified as the Board of Directors that makes strategic decisions.
167
Table of Contents
Notes to the Consolidated Financial Statements(continued)
For the year ended 31 December 2019
| 2 | Summary of significant accounting policies(continued) |
| 2.6 | Foreign currency translation |
| (a) | Functional and presentation currency |
Items included in the financial statements of each of the Group’s entities are measured using the currency of the primary economic environment in which the entity operates (“the functional currency”).
The consolidated financial statements are presented in RMB, which is the Company’s functional and the Group’s presentation currency.
| (b) | Transactions and balances |
Foreign currency transactions are translated into the functional currency using the exchange rates prevailing at the dates of the transactions. Foreign exchange gains and losses resulting from the settlement of such transactions and from the translation atyear-end exchange rates of monetary assets and liabilities denominated in foreign currencies are recognized in the income statement, except when deferred in other comprehensive income as qualifying cash flow hedges and qualifying net investment hedges.
Foreign exchange gains and losses that relate to borrowings and cash and cash equivalents are presented in the income statement within finance income or expenses. All other foreign exchange gains and losses are presented in the income statement within Other gains – net.
| 2.7 | Property, plant and equipment |
Property, plant and equipment is stated at historical cost less depreciation and impairment losses. Historical cost includes expenditure that is directly attributable to the acquisition of the items.
Subsequent costs are included in the asset’s carrying amount or recognized as a separate asset, as appropriate, only when it is probable that future economic benefits associated with the item will flow to the Group and the cost of the item can be measured reliably. The carrying amount of the replaced part is derecognized. All other repairs and maintenance are charged to the income statement during the financial period in which they are incurred.
168
Table of Contents
Notes to the Consolidated Financial Statements(continued)
For the year ended 31 December 2019
| 2 | Summary of significant accounting policies(continued) |
| 2.7 | Property, plant and equipment(continued) |
Depreciation on property, plant and equipment is calculated using the straight-line method to allocate their cost to their residual values over their estimated useful lives, as follows:
Buildings | 12-40 years | |||
Plant and machinery | 12-20 years | |||
Vehicles and other equipment | 4-20 years | |||
The assets’ residual values and useful lives are reviewed, and adjusted if appropriate, at the end of each reporting period.
An asset’s carrying amount is written down immediately to its recoverable amount if the asset’s carrying amount is greater than its estimated recoverable amount (Note 2.11).
Gains and losses on disposals are determined by comparing the proceeds with the carrying amount and are recognized within Other gains – net in the income statement.
| 2.8 | Construction in progress |
Construction in progress represents buildings, various plant and equipment under construction and pending installation, and is stated at cost less government grants that compensate the Company for the cost of construction, and impairment losses. Cost comprises direct costs of construction as well as interest charges, and foreign exchange differences on related borrowed funds to the extent that they are regarded as an adjustment to interest charges, during the period of construction. Construction in progress is transferred to property, plant and equipment when the asset is substantially ready for its intended use. No depreciation is provided in respect of construction in progress.
| 2.9 | Investment properties |
Investment properties are properties which are owned either to earn rental income and/or for capital appreciation.
Investment properties are stated in the balance sheet at cost less accumulated depreciation and impairment losses (Note 2.11). Depreciation is provided over their estimated useful lives on a straight-line basis, after taking into account their estimated residual values. Estimated useful lives of the Group’s investment properties are30-40 years.
169
Table of Contents
Notes to the Consolidated Financial Statements(continued)
For the year ended 31 December 2019
| 2 | Summary of significant accounting policies(continued) |
| 2.10 | Lease prepayments and othernon-current assets |
From 1 January 2019, lease prepayments and othernon-current assets mainly include catalysts used in production and patents. These assets are carried at cost less accumulated amortization and impairment losses. Lease prepayments and othernon-current assets are amortized on a straight-line basis over the respective periods of the rights and the estimated useful lives of the catalysts and patents, as follows:
Patents | 10-28 years | |||
Catalyst | 2-5 years | |||
Accounting policies applied until 1 January 2019
Lease prepayments and othernon-current assets mainly represent prepayments for land use rights and catalysts used in production. These assets are carried at cost less accumulated amortization and impairment losses. Lease prepayments and othernon-current assets are amortized on a straight-line basis over the respective periods of the rights and the estimated useful lives of the catalysts, as follows:
Land use rights | 30-50 years | |||
Patents | 10-28 years | |||
Catalyst | 2-5 years | |||
170
Table of Contents
Notes to the Consolidated Financial Statements(continued)
For the year ended 31 December 2019
| 2 | Summary of significant accounting policies(continued) |
| 2.11 | Impairment ofnon-financial assets |
Intangible assets that have an indefinite useful life or intangible assets not ready to use are not subject to amortization and are tested annually for impairment. Assets that are subject to amortization are reviewed for impairment whenever events or changes in circumstances indicate that the carrying amount may not be recoverable. An impairment loss is recognized for the amount by which the asset’s carrying amount exceeds its recoverable amount. The recoverable amount is the higher of an asset’s fair value less costs of disposal and value in use. For the purposes of assessing impairment, assets are grouped at the lowest levels for which there are separately identifiable cash flows (cash-generating units).Non-financial assets other than goodwill that suffered an impairment are reviewed for possible reversal of the impairment at each reporting date.
| 2.12 | Investments and financial assets |
| 2.12.1 | Classification |
The Group classifies its financial assets in the following measurement categories:
| • | those to be measured subsequently at fair value (either through other comprehensive income or through profit or loss), and |
| • | those to be measured at amortized cost. |
The classification depends on the Group’s business model for managing the financial assets and the contractual terms of the cash flows.
For assets measured at fair value, gains and losses will either be recorded in profit or loss or other comprehensive income (“OCI”). For investments in equity instruments that are not held for trading, this will depend on whether the Group has made an irrevocable election at the time of initial recognition to account for the equity investment at fair value through other comprehensive income (“FVOCI”).
The Group reclassifies debt investments when and only when its business model for managing those assets changes.
171
Table of Contents
Notes to the Consolidated Financial Statements(continued)
For the year ended 31 December 2019
| 2 | Summary of significant accounting policies(continued) |
| 2.12 | Investments and financial assets(continued) |
| 2.12.2 | Recognition and derecognition |
Regular way purchases and sales of financial assets are recognized on trade-date, the date on which the Group commits to purchase or sell the asset. Financial assets are derecognized when the rights to receive cash flows from the financial assets have expired or have been transferred and the Group has transferred substantially all the risks and rewards of ownership.
| 2.12.3 | Measurement |
At initial recognition, the Group measures a financial asset at its fair value plus, in the case of a financial asset not at fair value through profit or loss (“FVPL”), transaction costs that are directly attributable to the acquisition of the financial asset. Transaction costs of financial assets carried at FVPL are expensed in profit or loss.
Financial assets with embedded derivatives are considered in their entirety when determining whether their cash flows are solely payment of principal and interest.
Debt instruments
Subsequent measurement of debt instruments depends on the Group’s business model for managing the asset and the cash flow characteristics of the asset. There are three measurement categories into which the Group classifies its debt instruments:
| • | Amortized cost: Assets that are held for collection of contractual cash flows where those cash flows represent solely payments of principal and interest are measured at amortized cost. Interest income from these financial assets is included in finance income using the effective interest rate method. Any gain or loss arising on derecognition is recognized directly in profit or loss and presented in Other gains – net, together with foreign exchange gains and losses. Impairment losses are presented as separate line item in the consolidated income statement. |
172
Table of Contents
Notes to the Consolidated Financial Statements(continued)
For the year ended 31 December 2019
| 2 | Summary of significant accounting policies(continued) |
| 2.12 | Investments and financial assets(continued) |
| 2.12.3 | Measurement(continued) |
Debt instruments (continued)
| • | FVOCI: Assets that are held for collection of contractual cash flows and for selling the financial assets, where the assets’ cash flows represent solely payments of principal and interest, are measured at FVOCI. Movements in the carrying amount are taken through OCI, except for the recognition of impairment gains or losses, interest revenue and foreign exchange gains and losses which are recognized in profit or loss. When the financial asset is derecognized, the cumulative gains or losses previously recognized in OCI is reclassified from equity to profit or loss and recognized in Other gains – net. Interest income from these financial assets is included in finance income using the effective interest rate method. Foreign exchange gains and losses are presented in Other gains – net and impairment expenses are presented as separate line item in the consolidated income statement. |
| • | FVPL: Assets that do not meet the criteria for amortized cost or FVOCI are measured at FVPL. A gain or loss on a debt investment that is subsequently measured at FVPL is recognized in profit or loss and presented net within Other gains – net in the period in which it arises. |
Equity instruments
The Group subsequently measures all equity investments at fair value. Where the Group’s management has elected to present fair value gains and losses on equity investments in OCI, there is no subsequent reclassification of fair value gains and losses to profit or loss following the derecognition of the investment. Dividends from such investments continue to be recognized in profit or loss when the Group’s right to receive payments is established.
Changes in the fair value of financial assets at FVPL are recognized in Other gains – net in the consolidated income statement as applicable. Impairment losses (and reversal of impairment losses) on equity investments measured at FVOCI are not reported separately from other changes in fair value.
173
Table of Contents
Notes to the Consolidated Financial Statements(continued)
For the year ended 31 December 2019
| 2 | Summary of significant accounting policies(continued) |
| 2.12 | Investments and financial assets(continued) |
| 2.12.4 | Impairment |
The Group assesses on a forward-looking basis the expected credit losses associated with its debt instruments carried at amortized cost and FVOCI. The impairment methodology applied depends on whether there has been a significant increase in credit risk.
For financial instruments that have low credit risk at the balance sheet date, except for receivables related to revenue, the Group assumes that there is no significant increase in credit risk since the initial recognition, on first stage, and measures the loss allowance at an amount equal to12-month expected credit losses. If there has been a significant increase in credit risk or credit impairment has occurred since the initial recognition of a financial instrument, on second stage, the Group recognizes a loss allowance at an amount equal to lifetime expected credit losses. If credit impairment has occurred since the initial recognition of a financial instrument, on third stage, the Group recognizes a loss allowance at an amount equal to lifetime expected credit losses.
For trade receivables, the Group applies the simplified approach permitted by IFRS 9, which requires expected lifetime losses to be recognized from initial recognition of the receivables, see Note 4.1(b) for further details.
| 2.13 | Offsetting financial instruments |
Financial assets and liabilities are offset and the net amount reported in the balance sheet when there is a legally enforceable right to offset the recognized amounts and there is an intention to settle on a net basis or realize the asset and settle the liability simultaneously. The legally enforceable right must not be contingent on future events and must be enforceable in the normal course of business and in the event of default, insolvency or bankruptcy of the company or the counterparty.
| 2.14 | Derivative financial instruments |
Derivative financial instruments of the Group are foreign exchange forward contracts, which are not designated as hedges.
Derivatives are initially recognized at fair value on the date a derivative contract is entered into and are subsequently remeasured to their fair value at the end of each reporting period.
Fair values are obtained from quoted market prices in active markets, including recent market transactions, and through the use of valuation techniques, including discounted cash flow models and options pricing models, as appropriate. All derivatives are carried as assets when fair value is positive and as liabilities when fair value is negative.
174
Table of Contents
Notes to the Consolidated Financial Statements(continued)
For the year ended 31 December 2019
| 2 | Summary of significant accounting policies(continued) |
| 2.14 | Derivative financial instruments(continued) |
The best evidence of the fair value of a derivative at initial recognition is the transaction price (i.e., the fair value of the consideration given or received) unless the fair value of that instrument is evidenced by comparison with other observable current market transactions in the same instrument or based on a valuation technique whose variables include only data from observable markets. When such evidence exists, the Group recognizes profits (losses) on that day.
| 2.15 | Assets classified as held for sale |
Assets, includingnon-current assets (or disposal groups) are classified as held for sale if their carrying amount will be recovered principally through a sale transaction rather than through continuing use and a sale is considered highly probable within 12 months. They are measured at the lower of their carrying amount and fair value less costs to sell, except for assets such as deferred tax assets, assets arising from employee benefits, financial assets and investment property that are carried at fair value and contractual rights under insurance contracts, which are specifically exempt from this requirement.
An impairment loss is recognized for any initial or subsequent write-down of the asset (or disposal group) to fair value less costs to sell. A gain is recognized for any subsequent increases in fair value less costs to sell of an asset (or disposal group), but not in excess of any cumulative impairment loss previously recognized. A gain or loss not previously recognized by the date of the sale of the asset that is classified as held for sale (or disposal group) is recognized at the date of derecognition.
The assets (including those that are part of a disposal group) are not depreciated or amortized while they are classified as held for sale. Interest and other expenses attributable to the liabilities of a disposal group classified as held for sale continue to be recognized.
Assets classified as held for sale are presented separately in current assets of the balance sheet.
| 2.16 | Inventories |
Inventories are stated at the lower of cost and net realizable value. Cost is determined using the weighted average cost method. The cost of finished goods and work in progress comprises raw materials, direct labor, other direct costs and related production overheads (based on normal operating capacity). It excludes borrowing costs. Net realizable value is the estimated selling price in the ordinary course of business less the estimated costs of completion, the estimated costs necessary to make the sale and the related taxes.
175
Table of Contents
Notes to the Consolidated Financial Statements(continued)
For the year ended 31 December 2019
| 2 | Summary of significant accounting policies(continued) |
| 2.17 | Trade receivables, bills receivable and other receivables |
Trade receivables and bills receivable are amounts due from customers for merchandise sold or services performed in the ordinary course of business. If collection of trade receivables, bills receivable and other receivables is expected in one year or less (or in the normal operating cycle of the business if longer), they are classified as current assets. If not, they are presented asnon-current assets.
Trade receivables, bills receivable and other receivables are recognized initially at fair value plus transaction costs and subsequently measured at amortized cost using the effective interest method, less allowance for impairment. See Note 2.12.4 for a description of the Group’s impairment policies.
| 2.18 | Cash and cash equivalents |
In the consolidated statement of cash flows, cash and cash equivalents include cash in hand, deposits held at call with banks, other short-term, highly liquid investments with original maturities of three months or less that are readily convertible to known amounts of cash and which are subject to an insignificant risk of changes in value, and bank overdrafts. Bank overdrafts are presented within borrowings in current liabilities in the balance sheet.
| 2.19 | Share capital |
Ordinary shares are classified as equity.
Incremental costs directly attributable to the issue of new shares are shown in equity as a deduction, net of tax, from the proceeds.
| 2.20 | Safety production fund |
Under China’s law and regulation, the Group is required to accrue safety production fund at a certain percentage of the sales of dangerous goods. The fund is earmarked for improving the safety of production. The fund is accrued from retained earnings to other reserves and converted back to retained earnings when used.
| 2.21 | Trade and other payables |
Trade and other payables are obligations to pay for goods or services that have been acquired in the ordinary course of business from suppliers. Trade and other payables are classified as current liabilities if payment is due within one year or less (or in the normal operating cycle of the business if longer). If not, they are presented asnon-current liabilities.
Trade and other payables are recognized initially at fair value plus transaction costs and subsequently measured at amortized cost using the effective interest method.
176
Table of Contents
Notes to the Consolidated Financial Statements(continued)
For the year ended 31 December 2019
| 2 | Summary of significant accounting policies(continued) |
| 2.22 | Borrowings |
Borrowings are initially recognized at fair value, net of transaction costs incurred. Borrowings are subsequently measured at amortized cost; any difference between the proceeds (net of transaction costs) and the redemption value is recognized in the income statement over the period of the borrowings using the effective interest method.
Fees paid on the establishment of loan facilities are recognized as transaction costs of the loan to the extent that it is probable that some or all of the facility will be drawn down. In this case, the fee is deferred until the draw-down occurs. To the extent there is no evidence that it is probable that some or all of the facility will be drawn down, the fee is capitalized as apre-payment for liquidity services and amortized over the period of the facility to which it relates.
Borrowings are classified as current liabilities unless the Group has an unconditional right to defer settlement of the liability for at least 12 months after the end of the reporting period.
| 2.23 | Borrowing costs |
General and specific borrowing costs directly attributable to the acquisition, construction or production of qualifying assets, which are assets that necessarily take a substantial period of time to get ready for their intended use or sale, are added to the cost of those assets, until such time as the assets are substantially ready for their intended use or sale.
Investment income earned on the temporary investment of specific borrowings pending their expenditure on qualifying assets is deducted from the borrowing costs eligible for capitalization.
All other borrowing costs are recognized in profit or loss in the period in which they are incurred.
Borrowing costs include interest expense, finance charges in respect of exchange differences arising from foreign currency borrowings to the extent that they are regarded as an adjustment to interest costs. The exchange gains and losses that are an adjustment to interest costs include the interest rate differential between borrowing costs that would be incurred if the entity had borrowed funds in its functional currency, and the borrowing costs actually incurred on foreign currency borrowings.
| 2.24 | Current and deferred income tax |
The tax expense for the period comprises current and deferred tax. Tax is recognized in the income statement, except to the extent that it relates to items recognized in other comprehensive income or directly in equity. In this case, the tax is also recognized in other comprehensive income or directly in equity, respectively.
177
Table of Contents
Notes to the Consolidated Financial Statements(continued)
For the year ended 31 December 2019
| 2 | Summary of significant accounting policies(continued) |
| 2.24 | Current and deferred income tax(continued) |
| (a) | Current income tax |
The current income tax charge is calculated on the basis of the tax laws enacted or substantively enacted at the balance sheet date in the countries where the Company’s subsidiaries, associates and joint ventures operate and generate taxable income. Management periodically evaluates positions taken in tax returns with respect to situations in which applicable tax regulation is subject to interpretation. It establishes provisions where appropriate on the basis of amounts expected to be paid to the tax authorities.
| (b) | Deferred income tax |
Inside basis differences
Deferred income tax is recognized, using the liability method, on temporary differences arising between the tax bases of assets and liabilities and their carrying amounts in the consolidated financial statements. However, deferred tax liabilities are not recognized if they arise from the initial recognition of goodwill, the deferred income tax is not accounted for if it arises from initial recognition of an asset or liability in a transaction other than a business combination that at the time of the transaction affects neither accounting nor taxable profit or loss. Deferred income tax is determined using tax rates (and laws) that have been enacted or substantively enacted by the balance sheet date and are expected to apply when the related deferred income tax asset is realized or the deferred income tax liability is settled.
Deferred income tax assets are recognized only to the extent that it is probable that future taxable profit will be available against which the temporary differences can be utilized.
Outside basis differences
Deferred income tax liabilities are provided on taxable temporary differences arising from investments in subsidiaries, associates and joint arrangements, except for deferred income tax liability where the timing of the reversal of the temporary difference is controlled by the Group and it is probable that the temporary difference will not reverse in the foreseeable future. Generally the Group is unable to control the reversal of the temporary difference for associates. Only when there is an agreement in place that gives the Group the ability to control the reversal of the temporary difference in the foreseeable future, deferred tax liability in relation to taxable temporary differences arising from the associate’s undistributed profits is not recognized.
Deferred income tax assets are recognized on deductible temporary differences arising from investments in subsidiaries, associates and joint arrangements only to the extent that it is probable the temporary difference will reverse in the future and there is sufficient taxable profit available against which the temporary difference can be utilized.
178
Table of Contents
Notes to the Consolidated Financial Statements(continued)
For the year ended 31 December 2019
| 2 | Summary of significant accounting policies(continued) |
| 2.24 | Current and deferred income tax(continued) |
| (c) | Offsetting |
Deferred income tax assets and liabilities are offset when there is a legally enforceable right to offset current tax assets against current tax liabilities and when the deferred income tax assets and liabilities relate to income taxes levied by the same taxation authority on either the taxable entity or different taxable entities where there is an intention to settle the balances on a net basis.
| 2.25 | Employee benefits |
| (a) | Pension obligations |
The PRC employees of the Group are covered by various PRC government-sponsored defined-contribution pension plans under which the employees are entitled to a monthly pension based on certain formulas. The relevant government agencies are responsible for the pension liability to these employees when they retire. The Group contributes on a monthly basis to these pension plans for the employees which are determined at a certain percentage of their salaries. Under these plans, the Group has no obligation for post-retirement benefits beyond the contribution made. Contributions to these plans are expensed as incurred and contributions paid to the defined contribution pension plans for a staff are not available to reduce the Group’s future obligations to such defined-contribution pension plans even if the staff leaves the Group.
| (b) | Termination benefits |
Termination benefits are payable when employment is terminated by the Group before the normal retirement date, or whenever an employee accepts voluntary redundancy in exchange for these benefits. The Group recognizes termination benefits at the earlier of the following dates: when Group demonstrably commits itself to terminate employment or to provide benefits as a result of voluntary redundancy by having a detailed formal plan which is without realistic possibility of withdrawal. Benefits falling due more than 12 months after the end of the reporting period are discounted to their present value.
179
Table of Contents
Notes to the Consolidated Financial Statements(continued)
For the year ended 31 December 2019
| 2 | Summary of significant accounting policies(continued) |
| 2.26 | Share-based payment |
| (a) | Equity-settled share-based payment transactions |
The Group operates a number of equity-settled, share-based compensation plans, under which the entity receives services from employees as consideration for equity instruments (options) of the Group. The fair value of the employee services received in exchange for the grant of the options is recognized as an expense. The total amount to be expensed is determined by reference to the fair value of the options granted:
| • | including any market performance conditions such as an entity’s share price; |
| • | excluding the impact of any service andnon-market performance vesting conditions such as profitability, sales growth targets and remaining an employee of the entity over a specified time period; and |
| • | including the impact of anynon-vesting conditions such as the requirement for employees to save or holding shares for a specified period of time. |
At the end of each reporting period, the Group revises its estimates of the number of options that are expected to vest based on thenon-marketing performance and service conditions. It recognizes the impact of the revision to original estimates, if any, in the income statement, with a corresponding adjustment to equity.
In addition, in some circumstances employees may provide services in advance of the grant date and therefore the grant date fair value is estimated for the purposes of recognizing the expense during the period between service commencement period and grant date.
When the options are exercised, the Company issues new shares. The proceeds received net of any directly attributable transaction costs are credited to share capital.
| (b) | Share-based payment transactions among Group entities |
The grant by the Company of options over its equity instruments to the employees of subsidiary undertakings in the Group is treated as a capital contribution. The fair value of employee services received, measured by reference to the grant date fair value, is recognized over the vesting period as an increase to investment in subsidiary undertakings, with a corresponding credit to equity in the parent entity accounts.
180
Table of Contents
Notes to the Consolidated Financial Statements(continued)
For the year ended 31 December 2019
| 2 | Summary of significant accounting policies(continued) |
| 2.27 | Provisions |
Provisions for environmental restoration, restructuring costs and legal claims are recognized when: the Group has a present legal or constructive obligation as a result of past events; it is probable that an outflow of resources will be required to settle the obligation; and the amount has been reliably estimated. Restructuring provisions comprise lease termination penalties and employee termination payments. Provisions are not recognized for future operating losses.
Where there are a number of similar obligations, the likelihood that an outflow will be required in settlement is determined by considering the class of obligations as a whole. A provision is recognized even if the likelihood of an outflow with respect to any one item included in the same class of obligations may be small.
Provisions are measured at the present value of the expenditures expected to be required to settle the obligation using apre-tax rate that reflects current market assessments of the time value of money and the risks specific to the obligation. The increase in the provision due to passage of time is recognized as interest expense.
| 2.28 | Revenue recognition |
| (a) | Sales of petroleum and chemical products |
The Group manufactures and sells petroleum and chemical products. Sales are recognized when control of the products has transferred, being when the products are delivered to and accepted by the customer. Delivery occurs when the products have been shipped to the specific location, the risks of obsolescence and loss have been transferred to the customer, and either the customer has accepted the products in accordance with the sales contract, or the Group has objective evidence that all criteria for acceptance have been satisfied. Advance from customers but goods not yet delivered is recorded as contract liabilities and is recognized as revenues when a customer obtains control over the relevant goods.
Revenue excludes value added tax and is after deduction of any estimated trade discounts.
The Group has elected to apply the practical expedient that contract costs incurred related to contracts with an amortization period of less than one year have been expensed as incurred. The Group also applies the practical expedient in paragraph 121 of IFRS 15 and does not disclose information about remaining performance obligations that have original expected durations of one year or less.
| (b) | Rental income |
Rental income from investment property is recognized in the income statement on a straight-line basis over the term of the lease.
181
Table of Contents
Notes to the Consolidated Financial Statements(continued)
For the year ended 31 December 2019
| 2 | Summary of significant accounting policies(continued) |
| 2.28 | Revenue recognition(continued) |
| (c) | Overseas shipping services |
The Group arranges overseas shipping services for the customer and revenue is recognized over time and based on the actual shipping service provided to the end of the reporting period as a proportion of the total services to be provided, because the customer receives and uses the benefits simultaneously. This is determined based on the actual passages of time (days) relative to the total expected shipping days.
| 2.29 | Interest income |
Interest income from financial assets at FVPL is included in Other gains – net, see Note 9 below. Interest income on financial assets at amortized cost and financial assets at FVOCI calculated using the effective interest method is recognized in the consolidated income statement as part of other income.
Interest income is calculated by applying the effective interest rate to the gross carrying amount of a financial asset except for financial assets that subsequently become credit-impaired. For credit-impaired financial assets the effective interest rate is applied to the net carrying amount of the financial asset (after deduction of the loss allowance).
Interest income is presented as finance income where it is earned from financial assets that are held for cash management purposes, see Note 10 below.
| 2.30 | Dividend income |
Dividend income is recognized when the right to receive payment is established.
| 2.31 | Government grants |
Grants from the government are recognized at their fair value where there is a reasonable assurance that the grant will be received and the Group will comply with all attached conditions.
Government grants relating to costs are deferred and recognized in the income statement over the period necessary to match them with the costs that they are intended to compensate.
Grants that compensate the Group for the cost of an asset are deducted from the carrying amount of the asset and consequently are effectively recognized in the income statement over the useful life of the asset by way of reduced depreciation expense.
182
Table of Contents
Notes to the Consolidated Financial Statements(continued)
For the year ended 31 December 2019
| 2 | Summary of significant accounting policies(continued) |
| 2.32 | Leases |
As explained in Note 2.1.1 (a) above, the Group has changed its accounting policy for leases. The new policy and the impact of the change are described in Note 3.
Until 31 December 2018, leases in which a significant portion of the risks and rewards of ownership were not transferred to the Group as lessee were classified as operating leases. Payments made under operating leases (net of any incentives received from the lessor) were charged to the income statement on a straight-line basis over the period of the lease.
Lease income from operating leases where the Group is a lessor is recognized in income on a straight-line basis over the lease term. Initial direct costs incurred in obtaining an operating lease are added to the carrying amount of the underlying asset and recognized as expense over the lease term on the same basis as lease income. The respective leased assets are included in the balance sheet based on their nature. The Group did not need to make any adjustments to the accounting for assets held as lessor as a result of adopting the new leasing standard. The respective leased assets are included in the balance sheet bases on their nature.
| 2.33 | Dividend distribution |
Dividend distribution to the Company’s shareholders is recognized as a liability in the Group’s financial statements in the period in which the dividends are approved by the Company’s shareholders.
| 2.34 | Research and development costs |
Research and development costs comprise all costs that are directly attributable to research and development activities or that can be allocated on a reasonable basis to such activities. Research and development costs are recognized as intangible assets when the following criteria are met:
| • | it is technically feasible to complete the research and development project so that it will be available for use or sale; |
| • | management intends to complete the research and development project, and use or sell it; |
| • | it can be demonstrated how the research and development project will generate economic benefits; |
| • | there are adequate technical, financial and other resources to complete the development and the ability to use or sell the research and development project; and |
| • | the expenditure attributable to the research and development project during its development phase can be reliably measured. |
183
Table of Contents
Notes to the Consolidated Financial Statements(continued)
For the year ended 31 December 2019
| 2 | Summary of significant accounting policies(continued) |
| 2.34 | Research and development costs(continued) |
Other research and development expenditure that do not meet these criteria are recognized as an expense as incurred. Research and development costs previously recognized as an expense are not recognized as an asset in a subsequent period.
| 2.35 | Related parties |
| (a) | A person, or a close member of that person’s family, is related to the Group if that person: |
| (1) | has control or joint control over the Group; |
| (2) | has significant influence over the Group; or |
| (3) | is a member of the key management personnel of the Group or the Group’s parent. |
| (b) | An entity is related to the Group if any of the following conditions applies: |
| (1) | The entity and the Group are members of the same group (which means that each parent, subsidiary and fellow subsidiary is related to the others). |
| (2) | One entity is an associate or joint venture of the other entity (or an associate or joint venture of a member of a group of which the other entity is a member). |
| (3) | Both entities are joint ventures of the same third party. |
| (4) | One entity is a joint venture of a third entity and the other entity is an associate of the third entity. |
| (5) | The entity is a post-employment benefit plan for the benefit of employees of either the Group or an entity related to the Group. |
| (6) | The entity is controlled or jointly controlled by a person identified in (i). |
| (7) | A person identified in (i)(1) has significant influence over the entity or is a member of the key management personnel of the entity (or of a parent of the entity). |
Close members of the family of a person are those family members who may be expected to influence, or be influenced by, that person in their dealings with the entity.
184
Table of Contents
Notes to the Consolidated Financial Statements(continued)
For the year ended 31 December 2019
| 3 | Changes in accounting policies |
This note explains the impact of the adoption of IFRS 16 ‘Leases’ on the Group’s financial statements.
As indicated in Note 2.1.1 (a) above, the Group has adopted IFRS 16 ‘Leases’ retrospectively from 1 January 2019, but has not restated comparatives for the 2018 reporting period, as permitted under the specific transition provisions in the standard. The reclassifications and the adjustments arising from the new leasing rules are therefore recognized in the opening balance sheet on 1 January 2019. The new accounting policies are disclosed in Note 3.3 below.
| 3.1 | Impact of adoption |
On adoption of IFRS 16, the Group recognized lease liabilities in relation to leases which had previously been classified as ‘operating leases’ under the principles of IAS 17 ‘Leases’. These liabilities were measured at the present value of the remaining lease payments, discounted using the lessee’s incremental borrowing rate as of 1 January 2019. The lessee’s incremental borrowing rate applied to the lease liabilities on 1 January 2019 was from 4.35% to 4.90%.
| (a) | Measurement of lease liabilities |
| RMB’000 | ||||
Operating lease commitments disclosed as at 31 December 2018 | 84,746 | |||
Discounted using the lessee’s incremental borrowing rate of at the date of initial application | 77,046 | |||
(Less): short-term leases recognized on a straight-line basis as expense | (315 | ) | ||
|
| |||
Lease liability recognized as at 1 January 2019 | 76,731 | |||
|
| |||
Of which are: | ||||
Current lease liabilities | 74,093 | |||
Non-current lease liabilities | 2,638 | |||
| (b) | Measurement ofright-of-use assets |
Right-of-use assets were measured at the amount equal to the lease liability, adjusted by the amount of any prepaid or accrued lease payments relating to that lease recognized in the balance sheet as at 31 December 2018. There were no onerous lease contracts that would have required an adjustment to theright-of-use assets at the date of initial application.
185
Table of Contents
Notes to the Consolidated Financial Statements(continued)
For the year ended 31 December 2019
| 3 | Changes in accounting policies(continued) |
| 3.1 | Impact of adoption(continued) |
| (c) | Adjustments recognized in the balance sheet on 1 January 2019 |
The change in accounting policy affected the following items in the balance sheet on 1 January 2019:
| • | right-of-use assets – increase by RMB411,878 thousands (Note 16) |
| • | lease prepayment and othernon-current assets – decreased by RMB335,026 thousands (Note 15) |
| • | prepayments – decrease by RMB121 thousands |
| • | lease liabilities – increase by RMB76,731 thousands |
| (d) | Impact on segment disclosures |
As at 31 December 2019, allocated assets and allocated liabilities increased as a result of the change in accounting policy.Right-of-use assets and lease liabilities are now included in segment assets and liabilities. The following segments were affected by the change in policy:
| Addition to | Addition to | |||||||
| allocated assets | allocated liabilities | |||||||
| RMB’000 | RMB’000 | |||||||
Synthetic fibres | 9,047 | 536 | ||||||
Resins and plastics | 50,006 | 5,177 | ||||||
Intermediate petrochemicals | 46,320 | 2,738 | ||||||
Petroleum products | 236,531 | 13,371 | ||||||
Trading of petrochemical products | 13 | – | ||||||
Others | 1,943 | 221 | ||||||
|
|
|
| |||||
| 343,860 | 22,043 | |||||||
|
|
|
| |||||
186
Table of Contents
Notes to the Consolidated Financial Statements(continued)
For the year ended 31 December 2019
| 3 | Changes in accounting policies(continued) |
| 3.1 | Impact of adoption(continued) |
| (e) | Practical expedients applied |
In applying IFRS 16 for the first time, the Group has used the following practical expedients permitted by the standard:
| • | applying a single discount rate to a portfolio of leases with reasonably similar characteristics, and |
| • | accounting for operating leases with a remaining lease term of less than 12 months as at 1 January 2019 as short-term leases. |
The Group has also elected not to reassess whether a contract is, or contains a lease at the date of initial application. Instead, for contracts entered into before the transition date the Group relied on its assessment made applying IAS 17 and IFRIC 4 ‘Determining whether an Arrangement contains a Lease’.
| 3.2 | Lessor accounting |
The Group did not need to make any adjustments to the accounting for assets held as lessor under operating leases as a result of the adoption of IFRS 16.
| 3.3 | The Group’s leasing activities and how these are accounted for |
The Group leases various land, buildings, equipment, vehicles and others. Rental contracts of buildings, equipment, vehicles and others are typically made for fixed periods of 1 to 30 years. Rental contracts of land use rights are typically made for fixed periods of 30 to 50 years. Lease terms are negotiated on an individual basis and contain a wide range of different terms and conditions. The lease agreements do not impose any covenants, but leased assets may not be used as security for borrowing purposes.
Until the 2018 financial year, leases were classified as either finance leases or operating leases. From 1 January 2019, leases are recognized as aright-of-use asset and a corresponding liability at the date at which the leased asset is available for use by the Group.
187
Table of Contents
Notes to the Consolidated Financial Statements(continued)
For the year ended 31 December 2019
| 3 | Changes in accounting policies(continued) |
| 3.3 | The Group’s leasing activities and how these are accounted for(continued) |
Assets and liabilities arising from a lease are initially measured on a present value basis. Lease liabilities include the net present value of the following lease payments:
| • | fixed payments (includingin-substance fixed payments), less any lease incentives receivable, |
| • | variable lease payment that are based on an index or a rate, initially measured using the index or rate as at the commencement date, |
| • | amounts expected to be payable by the Group under residual value guarantees, |
| • | the exercise price of a purchase option if the Group is reasonably certain to exercise that option, and |
| • | payments of penalties for terminating the lease, if the lease term reflects the Group exercising that option. |
The lease payments are discounted using the interest rate implicit in the lease. If that rate cannot be readily determined, which is generally the case for leases in the Group, the lessee’s incremental borrowing rate is used, being the rate that the individual lessee would have to pay to borrow the funds necessary to obtain an asset of similar value to theright-of-use asset in a similar economic environment with similar terms, security and conditions.
To determine the incremental borrowing rate, the Group:
| • | where possible, uses recent third-party financing received by the individual lessee as a starting point, adjusted to reflect changes in financing conditions since third party financing was received |
| • | uses abuild-up approach that starts with a risk-free interest rate adjusted for credit risk for leases held by the Group, which does not have recent third party financing, and |
| • | makes adjustments specific to the lease, eg term, country, currency and security. |
Lease payments are allocated between principal and finance cost. The finance cost is charged to profit or loss over the lease period so as to produce a constant periodic rate of interest on the remaining balance of the liability for each period.
188
Table of Contents
Notes to the Consolidated Financial Statements(continued)
For the year ended 31 December 2019
| 3 | Changes in accounting policies(continued) |
| 3.3 | The Group’s leasing activities and how these are accounted for(continued) |
Right-of-use assets are measured at cost comprising the following:
| • | the amount of the initial measurement of lease liability, |
| • | any lease payments made at or before the commencement date less any lease incentives received, |
| • | any initial direct costs, and |
| • | restoration costs. |
Right-of-use assets are generally depreciated over the shorter of the asset’s useful life and the lease term on a straight- line basis, as follows:
Land use rights | 30-50 years | |||
Buildings | 1-30 years | |||
Equipment | 1-2 years | |||
Vehicles and others | 1-5 years | |||
Payments associated with short-term leases of equipment and vehicles are recognized on a straight-line basis as an expense in profit or loss. Short-term leases are leases with a lease term of 12 months or less.
| 4 | Financial risk management |
| 4.1 | Financial risk factors |
The Group’s activities exposed it to a variety of financial risks: market risk (including foreign exchange risk, cash flow and fair value interest rate risk and commodity price risk), credit risk and liquidity risk. The Group’s overall risk management programmer focuses on the unpredictability of financial markets and seeks to minimize potential adverse effects on the Group’s financial performance.
189
Table of Contents
Notes to the Consolidated Financial Statements(continued)
For the year ended 31 December 2019
| 4 | Financial risk management(continued) |
| 4.1 | Financial risk factors(continued) |
| (a) | Market risk |
| (i) | Foreign exchange risk |
The Group’s major operational activities are carried out in Mainland China and a majority of the transactions are denominated in RMB. Nevertheless the Group is exposed to foreign exchange risk arising from the recognized assets and liabilities (mainly trade payables), and future transactions denominated in foreign currencies, primarily with respect to US dollar. The Group’s finance department at its headquarter is responsible for monitoring the amount of assets and liabilities, and transactions denominated in foreign currencies to minimize the foreign exchange risk. For the year ended 31 December 2019 and 31 December 2018, the Group uses forward foreign exchange contracts and foreign exchange option contracts to mitigate its exposure to foreign exchange risk respect to US dollar. The forward and option contracts the Group used are not designed as hedging instrument. As at 31 December 2019, the nominal amount of US dollar foreign exchange options were amounted to RMB40,754 thousands (31 December 2018: RMB571,476 thousands), which would be matured within six months.
As at 31 December 2019, if the foreign currencies had weakened/strengthened by 5% against RMB with all other variables held constant, the Group’s net profit for the year would have been RMB13,699 thousands increased/decreased before considering the impact of forward and option contracts as a result of foreign exchange gains/losses on translation of foreign currencies denominated trade payables and borrowings (31 December 2018: RMB30,713 thousands).
| (ii) | Cash flow and fair value interest rate risk |
The Group’s interest rate risk arises from short-term interest bearing borrowings. Borrowings obtained at variable rates expose the Group to cash flow interest rate risk. Borrowings obtained at fixed rates expose the Group to fair value interest rate risk. The Group determines the relative proportions of its fixed rate and floating rate contracts depending on the prevailing market conditions. As at 31 December 2019, the Group’s short-term borrowings denominated with floating rates amounted to RMB47,600 thousands, which represented 3% of total borrowing balance (31 December 2018: RMB497,249 thousands, representing 100% of total borrowing balance).
190
Table of Contents
Notes to the Consolidated Financial Statements(continued)
For the year ended 31 December 2019
| 4 | Financial risk management(continued) |
| 4.1 | Financial risk factors(continued) |
| (a) | Market risk(continued) |
| (ii) | Cash flow and fair value interest rate risk(continued) |
The Group’s finance department at its headquarter continuously monitors the interest rate position of the Group. Increases in interest rates will increase the cost of new borrowing and the interest expenses with respect to the Group’s outstanding floating rate borrowings, and therefore could have a material adverse effect on the Group’s financial position. The Group makes adjustments timely with reference to the latest market conditions and may enter into interest rate swap agreements to mitigate its exposure to interest rate risk. For the years ended 31 December 2019 and 31 December 2018, the Group did not enter into any interest rate swap agreements.
As at 31 December 2019, if interest rates on the floating rate borrowings had risen/fallen by 50 basis points while all other variables had been held constant, the Group’s net profit would have decreased/ increased by approximately RMB179 thousands (31 December 2018: RMB1,865 thousands), mainly as a result of higher/lower interest expense on floating rate borrowings.
| (iii) | Commodity price risk |
The Group principally engages in processing crude oil into synthetic fibers, resins and plastics, intermediate petrochemicals and petroleum products. The selling price of petroleum products is periodically adjusted by government department based on the market price adjustment mechanism, and generally in connection with the crude oil price. The selling prices of synthetic fibers, resins and plastics and intermediate petrochemicals are market prices. The Group didn’t have any derivative financial instrument such as commodity futures and swaps, therefore the fluctuation of crude oil price could have significant impact on the Group.
| (b) | Credit risk |
| (i) | Risk management |
Credit risk is managed on group basis. It mainly arises from cash and cash equivalents, time deposits with banks, structured deposits, trade receivables, other receivables, bills receivable, etc.
Group expects that there is no significant credit risk associated with cash at bank (including time deposits and structured deposits) and bills receivable since they are deposits and bank acceptance bills at state-owned banks and other medium or large size listed banks. Management does not expect that there will be any significant losses from non-performance by these counterparties.
191
Table of Contents
Notes to the Consolidated Financial Statements(continued)
For the year ended 31 December 2019
| 4 | Financial risk management(continued) |
| 4.1 | Financial risk factors(continued) |
| (b) | Credit risk(continued) |
| (i) | Risk management(continued) |
In addition, the Group has policies to limit the credit exposure on trade receivables, other receivables and bills receivable. The Group assesses the credit quality of and sets credit limits on its customers by taking into account their financial position, the availability of guarantee from third parties, their credit history and other factors such as current market conditions. The credit history of the customers is regularly monitored by the Group. In respect of customers with a poor credit history, the Group will use written payment reminders, or shorten or cancel credit periods, to ensure the overall credit risk of the Group is limited to a controllable extent.
The Group considers the probability of default upon initial recognition of a financial asset and whether there has been a significant increase in credit risk on an ongoing basis throughout each reporting period. To assess whether there is a significant increase in credit risk the Group compares the risk of a default occurring on the asset as at the reporting date with the risk of default as at the date of initial recognition. It considers available reasonable and supportive forward-looking information. Especially the following indicators are incorporated:
| • | internal credit rating; |
| • | external credit rating (as far as available); |
| • | actual or expected significant adverse changes in business, financial or economic conditions that are expected to cause a significant change to the debtors’ ability to meet its obligations; |
| • | actual or expected significant changes in the operating results of the debtors; |
| • | significant increases in credit risk on other financial instruments of the same debtors; |
| • | significant changes in the value of the collateral supporting the obligation or in the quality of third-party guarantees or credit enhancements; |
| • | significant changes in the expected performance and behavior of the debtors, including changes in the payment status of debtors, etc. |
192
Table of Contents
Notes to the Consolidated Financial Statements(continued)
For the year ended 31 December 2019
| 4 | Financial risk management(continued) |
| 4.1 | Financial risk factors(continued) |
| (b) | Credit risk(continued) |
| (i) | Risk management(continued) |
Regardless of the analysis above, a significant increase in credit risk is presumed if a debtor is more than 30 days past due in making a contractual payment.
It has other monitoring procedures to ensure that follow-up action is taken to recover overdue debts. In addition, the Group reviews regularly the recoverable amount of each individual trade receivables to ensure that adequate impairment losses are made for irrecoverable amounts. The Group has no significant concentrations of credit risk, with exposure spread over a large number of counterparties and costumers.
For other receivables, management makes periodic collective assessment as well as individual assessment on the recoverability of other receivables based on historical settlement records and forward-looking information. The management believe that there is no material credit risk inherent in the Group’s outstanding balance of other receivable.
| (ii) | Impairment of financial assets |
The Group has three types of financial assets that are subject to the expected credit loss model:
| • | Trade receivables for sales of goods and from the providing services, |
| • | Other financial assets carried at amortised cost, and |
| • | Debt instruments carried at FVOCI |
While cash and cash equivalents, time deposits with banks and bills receivable are also subject to the impairment requirements of IFRS 9, the identified impairment loss was immaterial.
Trade receivables
The Group applies the IFRS 9 simplified approach to measuring expected credit losses which uses a lifetime expected loss allowance for all trade receivables (including trade receivables with related parties and those carried at FVOCI).
193
Table of Contents
Notes to the Consolidated Financial Statements(continued)
For the year ended 31 December 2019
| 4 | Financial risk management(continued) |
| 4.1 | Financial risk factors(continued) |
| (b) | Credit risk (continued) |
| (ii) | Impairment of financial assets(continued) |
Trade receivables(continued)
To measure the expected credit losses, trade receivables have been grouped based on shared credit risk characteristics and the days past due.
The expected credit loss rates are based on the payment profiles of sales over a period of 36 months before 31 December 2019 and 31 December 2018 respectively and the corresponding historical credit losses experienced within this period. The historical loss rates are adjusted to reflect current and forward-looking information on macroeconomic factors affecting the ability of the customers to settle the receivables.
The loss allowances for trade receivables as at 31 December 2019 and 31 December 2018 reconcile to the opening loss allowances as follows:
| Trade receivables (including receivables from related parties) | ||||||||
| 2019 RMB’000 | 2018 RMB’000 | |||||||
Opening loss allowance as at 1 January | 54 | 37 | ||||||
Provision for loss allowance recognized in profit or loss | — | 17 | ||||||
Reversal of previous impairment losses | (54 | ) | — | |||||
|
|
|
| |||||
Closing loss allowance at 31 December | — | 54 | ||||||
|
|
|
| |||||
For the year ended 31 December 2019 and 31 December 2018, the (reversal)/provision for loss allowance were recognized in profit or loss in net impairment losses on financial assets.
Impairment losses on trade receivables are presented as net impairment losses within operating profit. Subsequent recoveries of amounts previously written off are credited against the same line item.
194
Table of Contents
Notes to the Consolidated Financial Statements(continued)
For the year ended 31 December 2019
| 4 | Financial risk management(continued) |
| 4.1 | Financial risk factors(continued) |
| (b) | Credit risk(continued) |
| (ii) | Impairment of financial assets(continued) |
Other financial assets at amortised cost
Other financial assets at amortized cost include other receivables.
As at 31 December 2019 and 31 December 2018, the internal credit rating of other receivables were performing. The Group has assessed that the expected credit losses for these receivables are not material under the 12 months expected losses method.
The loss allowance provision for other receivables as at 31 December 2019 and 31 December 2018 reconciles to the opening loss allowance provision as follows:
| Other receivables (including receivables from related parties) | ||||||||
| 2019 RMB’000 | 2018 RMB’000 | |||||||
Opening loss allowance as at 1 January | 144 | 1,016 | ||||||
Provision for loss allowance recognized in profit or loss | — | 56 | ||||||
Reversal of previous impairment losses | (5 | ) | (34 | ) | ||||
Receivables written off during the year as uncollectible | — | (894 | ) | |||||
|
|
|
| |||||
Closing loss allowance at 31 December | 139 | 144 | ||||||
|
|
|
| |||||
Management considered the internal credit risk of other receivable including receivables from related parties were performing as they have a low risk of default and the counterparties have a strong capacity to meet its contractual cash flow obligations in the near term, and thus the impairment provision recognized during the period was limited to 12 months expected losses.
For year ended 31 December 2019, the (reversal)/provision for loss allowance were recognized in profit or loss in net impairment losses on financial assets in relation to the impaired other receivables.
195
Table of Contents
Notes to the Consolidated Financial Statements(continued)
For the year ended 31 December 2019
| 4 | Financial risk management(continued) |
| 4.1 | Financial risk factors(continued) |
| (b) | Credit risk(continued) |
| (ii) | Impairment of financial assets(continued) |
Debt instruments carried at FVOCI
Debt instruments carried at FVOCI include trade receivables and bills receivable with a business model which is achieved both by collecting contractual cash flows and selling of these assets. The loss allowance for debt instruments is recognized in profit or loss and reduces the fair value loss otherwise recognized in OCI.
While bills receivable carried at FVOCI are also subject to the impairment requirements of IFRS 9, the identified impairment loss was immaterial. The above Note 4 (b)(ii) provides the details about the loss allowance for trade receivables carried at FVOCI.
As at 31 December 2019 and 31 December 2018, no loss allowance was provided for financial assets at FVOCI.
| (iii) | Net impairment losses on financial assets recognized in profit or loss |
During the year, the following gains/(losses) were recognized in profit or loss in relation to impaired financial assets:
| 2019 RMB’000 | 2018 RMB’000 | |||||||
Impairment losses – movement in loss allowance for trade and other receivables | — | (73 | ) | |||||
Reversal of previous impairment losses | 59 | 34 | ||||||
|
|
|
| |||||
Net impairment losses on financial assets | 59 | (39 | ) | |||||
|
|
|
| |||||
196
Table of Contents
Notes to the Consolidated Financial Statements(continued)
For the year ended 31 December 2019
| 4 | Financial risk management(continued) |
| 4.1 | Financial risk factors(continued) |
| (b) | Credit risk(continued) |
| (iv) | Financial assets at fair value through profit or loss |
The Group is also exposed to credit risk in relation to investments such as structured deposits and derivative financial instruments, which are measured at fair value through profit or loss. The maximum exposure at the end of the reporting period is the carrying amount of these investments.
| (c) | Liquidity risk |
Cash flow forecast is performed by the operating entities of the Group and aggregated by Group finance. Group finance monitors rolling forecasts of the Group’s liquidity requirements to ensure it has sufficient cash to meet operational needs while maintaining sufficient headroom on its undrawn committed borrowing facilities from major financial institution so that the Group does not breach borrowing limits or covenants on any of its borrowing facilities to meet the short-term and long-term liquidity requirements.
The liquidity of the Group is primarily dependent on its ability to maintain adequate cash inflow from operations, the renewal of its short-term bank loans and its ability to obtain adequate external financing to support its working capital and meet its debt obligation when they become due. As at 31 December 2019, the Group had credit facilities with several PRC financial institutions which provided the Group to draw down or to guarantee the issuance of the bills of lading to RMB21,258,288 thousands, within which amounted to RMB17,601,233 thousands were unused. The maturity dates of the unused facility amounted to RMB15,101,233 thousands will be after 31 December 2020 as disclosed in Note 23(f). Management assessed that all the facilities could be renewed upon the expiration dates.
Surplus cash held by the operating entities over and above balance required for working capital management are transferred to the Group treasury. As at 31 December 2019, the Group held cash and cash equivalents of RMB7,449,699 thousands (31 December 2018: RMB8,741,893 thousands) (Note 23 (b)) and trade receivables (including trade receivables with related parties and those carried at FVOCI) of RMB2,376,098 thousands (31 December 2018: RMB3,181,196 thousands), that are expected to readily generate cash inflows for managing liquidity risk.
The table below analyses the Group’s financial liabilities into relevant maturity groupings based on the remaining period at the balance sheet date to the contractual maturity date. The amounts disclosed in the table are the contractual undiscounted cash flows.
197
Table of Contents
Notes to the Consolidated Financial Statements(continued)
For the year ended 31 December 2019
| 4 | Financial risk management(continued) |
| 4.1 | Financial risk factors(continued) |
| (c) | Liquidity risk(continued) |
Contractual maturities of financial liabilities 31 December 2019 | Less than 1 year RMB’000 | Between 1 and 2 years RMB’000 | Between 2 and 5 years RMB’000 | Over 5 years RMB’000 | Total RMB’000 | |||||||||||||||
Non-derivatives | ||||||||||||||||||||
Borrowings | 1,575,176 | — | — | — | 1,575,176 | |||||||||||||||
Lease liabilities | 11,700 | 8,846 | 2,435 | 495 | 23,476 | |||||||||||||||
Bills payables | 673,900 | — | — | — | 673,900 | |||||||||||||||
Trade payables | 2,142,402 | — | — | — | 2,142,402 | |||||||||||||||
Other payables | 747,133 | — | — | — | 747,133 | |||||||||||||||
Amounts due to related parties | 5,702,728 | — | — | — | 5,702,728 | |||||||||||||||
|
|
|
|
|
|
|
|
|
| |||||||||||
| 10,853,039 | 8,846 | 2,435 | 495 | 10,864,815 | ||||||||||||||||
|
|
|
|
|
|
|
|
|
| |||||||||||
Derivatives | ||||||||||||||||||||
Derivative financial instruments | 799 | — | — | — | 799 | |||||||||||||||
|
|
|
|
|
|
|
|
|
| |||||||||||
Contractual maturities of financial liabilities 31 December 2018 | Less than 1 year RMB’000 | Between 1 and 2 years RMB’000 | Between 2 and 5 years RMB’000 | Over 5 years RMB’000 | Total RMB’000 | |||||||||||||||
Non-derivatives | ||||||||||||||||||||
Borrowings | 501,435 | — | — | — | 501,435 | |||||||||||||||
Trade payables | 2,922,998 | — | — | — | 2,922,998 | |||||||||||||||
Other payables | 695,693 | — | — | — | 695,693 | |||||||||||||||
Amounts due to related parties | 4,560,952 | — | — | — | 4,560,952 | |||||||||||||||
|
|
|
|
|
|
|
|
|
| |||||||||||
| 8,681,078 | — | — | — | 8,681,078 | ||||||||||||||||
|
|
|
|
|
|
|
|
|
| |||||||||||
Derivatives | ||||||||||||||||||||
Derivative financial instruments | 11,005 | — | — | — | 11,005 | |||||||||||||||
|
|
|
|
|
|
|
|
|
| |||||||||||
198
Table of Contents
Notes to the Consolidated Financial Statements(continued)
For the year ended 31 December 2019
| 4 | Financial risk management(continued) |
| 4.2 | Capital management |
The Group’s objectives when managing capital are to safeguard the Group’s ability to continue as a going concern in order to provide returns for shareholders and benefits for other stakeholders and to maintain an optimal capital structure to reduce the cost of capital.
In order to maintain or adjust the capital structure, the Group may adjust the amount of dividends paid to shareholders, return capital to shareholders, issue new shares or sell assets to reduce debt.
Consistent with others in the industry, the Group monitors capital on the basis of the gearing ratio. This ratio is calculated as net debt divided by total capital. Net debt is calculated as total borrowings (including current andnon-current borrowings as shown in the consolidated balance sheet) less cash and cash equivalents. Total capital is calculated as equity as shown in the consolidated balance sheet plus net debt.
As cash and cash equivalents exceed total borrowings, which was resulted primarily from profitability, there was no net debt as at 31 December 2019 and 31 December 2018.
| 4.3 | Fair value estimation |
The table below analyses the Group’s financial instruments carried at fair value as at 31 December 2019 and 31 December 2018 by level of the inputs to valuation techniques used to measure fair value. Such inputs are categorized into three levels within a fair value hierarchy as follows:
| • | The fair value of financial instruments traded in active markets (such as publicly traded derivatives, and equity securities) is based on quoted market prices at the end of the reporting period. The quoted market price used for financial assets held by the Group is the current bid price. These instruments are included in level 1. |
| • | The fair value of financial instruments that are not traded in an active market (for example,over-the-counter derivatives) is determined using valuation techniques which maximize the use of observable market data and rely as little as possible on entity-specific estimates. If all significant inputs required to fair value an instrument are observable, the instrument is included in level 2. |
| • | If one or more of the significant inputs is not based on observable market data, the instrument is included in level 3. This is the case for unlisted equity securities. |
199
Table of Contents
Notes to the Consolidated Financial Statements(continued)
For the year ended 31 December 2019
| 4 | Financial risk management(continued) |
| 4.3 | Fair value estimation(continued) |
Recurring fair value measurements As at 31 December 2019 | Level 1 RMB’000 | Level 2 RMB’000 | Level 3 RMB’000 | Total RMB’000 | ||||||||||||
Financial assets | ||||||||||||||||
Financial assets at fair value through other comprehensive income | ||||||||||||||||
Trade and bill receivables | — | 1,540,921 | — | 1,540,921 | ||||||||||||
Equity investments | — | — | 5,000 | 5,000 | ||||||||||||
Structured deposits | — | — | 3,318,407 | 3,318,407 | ||||||||||||
Foreign exchange options | — | 263 | — | 263 | ||||||||||||
|
|
|
|
|
|
|
| |||||||||
| — | 1,541,184 | 3,323,407 | 4,864,591 | |||||||||||||
|
|
|
|
|
|
|
| |||||||||
Financial liabilities | ||||||||||||||||
Foreign exchange options | — | 799 | — | 799 | ||||||||||||
|
|
|
|
|
|
|
| |||||||||
Recurring fair value measurements As at 31 December 2018 | Level 1 RMB’000 | Level 2 RMB’000 | Level 3 RMB’000 | Total RMB’000 | ||||||||||||
Financial assets | ||||||||||||||||
Financial assets at fair value through other comprehensive income | — | 1,672,431 | — | 1,672,431 | ||||||||||||
Structured deposits | — | — | 2,719,811 | 2,719,811 | ||||||||||||
Foreign exchange options | — | 7,468 | — | 7,468 | ||||||||||||
|
|
|
|
|
|
|
| |||||||||
| — | 1,679,899 | 2,719,811 | 4,399,710 | |||||||||||||
|
|
|
|
|
|
|
| |||||||||
Financial liabilities | ||||||||||||||||
Foreign exchange options | — | 11,005 | — | 11,005 | ||||||||||||
|
|
|
|
|
|
|
| |||||||||
The Group uses discounted cash flow model with inputted interest rate, which were influenced by historical fluctuation and the probability of market fluctuation, to evaluate the fair value of the structured deposits classified as Level 3 financial assets.
200
Table of Contents
Notes to the Consolidated Financial Statements(continued)
For the year ended 31 December 2019
| 4 | Financial risk management(continued) |
| 4.3 | Fair value estimation(continued) |
Fair value measurements using significant unobservable inputs (level 3)
The following table presents the changes in level 3 items for the periods ended 31 December 2019:
| Equity | Structured | |||||||||||
| investments | deposits | Total | ||||||||||
| RMB’000 | RMB’000 | RMB’000 | ||||||||||
Closing balance 31 December 2018 | — | 2,719,811 | 2,719,811 | |||||||||
|
|
|
|
|
| |||||||
Acquisitions | 5,000 | 3,800,000 | 3,805,000 | |||||||||
Disposals | — | (3,200,000 | ) | (3,000,000 | ) | |||||||
Fair value change | — | (1,404 | ) | (1,404 | ) | |||||||
|
|
|
|
|
| |||||||
Closing balance 31 December 2019 | 5,000 | 3,318,407 | 3,323,407 | |||||||||
|
|
|
|
|
| |||||||
Financial assets and financial liabilities not measured at fair value mainly represent time deposits, trade receivables and other receivables, trade and other payables (except for the staff salaries and welfare payables and taxes payables) and borrowings. As at 31 December 2019 and 31 December 2018, these financial assets are expected to be collected in one year or less and these financial liabilities are due within one year or less. As a result, the carrying amounts of these financial assets and liabilities not measured at fair value are a reasonable approximation of their fair value.
| 5 | Critical accounting estimates and assumptions |
Estimates and assumptions are continually evaluated and are based on historical experience and other factors, including expectations of future events that are believed to be reasonable under the circumstances.
The Group makes estimates and assumptions concerning the future. The resulting accounting estimates will, by definition, seldom equal the related actual results. The estimates and assumptions that have a significant risk of causing a material adjustment to the carrying amounts of assets and liabilities within the next financial year are addressed below.
201
Table of Contents
Notes to the Consolidated Financial Statements(continued)
For the year ended 31 December 2019
| 5 | Critical accounting estimates and assumptions(continued) |
| (a) | Net realizable value (“NRV”) of inventories |
The NRV is determined based on the estimated selling prices less the estimated costs to completion, if relevant, other costs necessary to make the sale, and the related taxes. Determination of estimated selling prices requires significant management judgement, taking into consideration of historical selling prices and future market trend. If the actual selling prices were to be lower or the costs of completion were to be higher than estimated, the actual allowance for diminution in value of inventories could be higher than the estimate.
| (b) | Impairments fornon-financial assets |
In determining the value in use, expected cash flows generated by thenon-financial assets or the cash-generating unit are discounted to their present value. Management uses all readily available information in determining an amount that is a reasonable approximation of recoverable amount, including estimates based on reasonable and supportable assumptions and projections of sale volume, selling price and amount of operating costs.
| (c) | Useful life and residual value of property, plant and equipment |
Property, plant and equipment, are depreciated on a straight-line basis over the estimated useful lives of the assets, after taking into account the estimated residual value. Management reviews the estimated useful lives of the assets annually in order to determine the amount of depreciation expense to be recorded during any reporting period. The useful lives are based on the Group’s historical experience with similar assets, taking into account anticipated technological changes. The depreciation expense for future periods is adjusted if there are significant changes from previous estimates.
| 6 | Segment information |
The Group manages its business by divisions, which are organized by business lines. In view of the fact that the Company and its subsidiaries operate mainly in the PRC, no geographical segment information is presented.
In a manner consistent with the way in which information is reported internally to the Group’s chief operating decision maker, Board of Directors, for the purposes of resource allocation and performance assessment, the Group has identified the following five reportable segments. No operating segments have been aggregated to form the following reportable segments.
Segment results, assets and liabilities include items directly attributable to a segment as well as those that can be allocated on a reasonable basis. Unallocated items mainly comprise investments accounted for using the equity method, deferred income tax assets, cash and cash equivalents, time deposits, structured deposits, entrusted lending and incomes relating to these assets (such as share of profit of investments accounted for using equity method and interest income) and borrowings and interest expenses.
202
Table of Contents
Notes to the Consolidated Financial Statements(continued)
For the year ended 31 December 2019
| 6 | Segment information(continued) |
The Group principally operates in five operating segments: synthetic fibers, resins and plastics, intermediate petrochemicals, petroleum products and trading of petrochemical products. Synthetic fibers, resins and plastics, intermediate petrochemicals and petroleum products are produced through intermediate steps from the principal raw material of crude oil. The specific products of each segment are as follows:
| (i) | The synthetic fibers segment produces primarily polyester, acrylic fibers and carbon fibers, which are mainly used in the textile and apparel industries. |
| (ii) | The resins and plastics segment produces primarily polyester chips, polyethylene resins, polypropylene resins and PVA granules. The polyester chips are used to produce polyester fibers, coating and containers. Polyethylene resins and plastics are used to produce insulated cable, mulching films and molded products such as housewares and toys. Polypropylene resins are used for films, sheets and molded products such as housewares, toys, consumer electronics and automobile parts. |
| (iii) | The intermediate petrochemicals segment primarily producesp-xylene, benzene and ethylene oxide. The intermediate petrochemicals produced by the Group are both served as raw materials in the production of other petrochemicals, resins, plastics and synthetic fibers, and sold to external customers. |
| (iv) | The petroleum products segment is equipped with crude oil refinery facilities used to produce qualified refined gasoline, fuel, diesel oil, heavy oil and liquefied petroleum gas, and provide raw materials for the Group’s downstream petrochemical processing facilities. |
| (v) | The trading of petrochemical products segment is primarily engaged in importing and exporting of petrochemical products. The products are sourced from international and domestic suppliers. |
| (vi) | Other operating segments represent the operating segments which do not meet the quantitative threshold for determining reportable segments. These include investment property leasing, service provision and a variety of other commercial activities. |
203
Table of Contents
Notes to the Consolidated Financial Statements(continued)
For the year ended 31 December 2019
| 6 | Segment information(continued) |
2019 | Synthetic fibers RMB’000 | Resins and plastics RMB’000 | Intermediate petrochemicals RMB’000 | Petroleum products RMB’000 | Trading of petrochemical products RMB’000 | Other segments RMB’000 | Total RMB’000 | |||||||||||||||||||||
Total segment revenue | 2,200,229 | 10,304,812 | 24,698,643 | 66,754,731 | 21,881,214 | 1,502,840 | 127,342,469 | |||||||||||||||||||||
Inter – segment revenue | — | (141,101 | ) | (14,187,500 | ) | (11,868,026 | ) | (175,200 | ) | (700,975 | ) | (27,072,802 | ) | |||||||||||||||
|
|
|
|
|
|
|
|
|
|
|
|
|
| |||||||||||||||
Revenue from external customers | 2,200,229 | 10,163,711 | 10,511,143 | 54,886,705 | 21,706,014 | 801,865 | 100,269,667 | |||||||||||||||||||||
|
|
|
|
|
|
|
|
|
|
|
|
|
| |||||||||||||||
Timing of revenue recognition | ||||||||||||||||||||||||||||
At a point in time | 2,200,229 | 10,163,711 | 10,511,143 | 54,886,705 | 21,695,864 | 801,865 | 100,259,517 | |||||||||||||||||||||
Over time | — | — | — | — | 10,150 | — | 10,150 | |||||||||||||||||||||
|
|
|
|
|
|
|
|
|
|
|
|
|
| |||||||||||||||
| 2,200,229 | 10,163,711 | 10,511,143 | 54,886,705 | 21,706,014 | 801,865 | 100,269,667 | ||||||||||||||||||||||
|
|
|
|
|
|
|
|
|
|
|
|
|
| |||||||||||||||
Total gross (loss)/profit | (501,062 | ) | 542,015 | 649,435 | 750,850 | 121,193 | 25,314 | 1,587,745 | ||||||||||||||||||||
|
|
|
|
|
|
|
|
|
|
|
|
|
| |||||||||||||||
2018 | Synthetic fibers RMB’000 | Resins and plastics RMB’000 | Intermediate petrochemicals RMB’000 | Petroleum products RMB’000 | Trading of petrochemical products RMB’000 | Other segments RMB’000 | Total RMB’000 | |||||||||||||||||||||
Total segment revenue | 2,225,594 | 10,868,758 | 26,327,039 | 66,009,608 | 27,650,410 | 1,488,856 | 134,570,265 | |||||||||||||||||||||
Inter – segment revenue | — | (138,481 | ) | (13,923,959 | ) | (11,037,010 | ) | (1,090,056 | ) | (691,852 | ) | (26,881,358 | ) | |||||||||||||||
|
|
|
|
|
|
|
|
|
|
|
|
|
| |||||||||||||||
Revenue from external customers | 2,225,594 | 10,730,277 | 12,403,080 | 54,972,598 | 26,560,354 | 797,004 | 107,688,907 | |||||||||||||||||||||
|
|
|
|
|
|
|
|
|
|
|
|
|
| |||||||||||||||
Timing of revenue recognition | ||||||||||||||||||||||||||||
At a point in time | 2,225,594 | 10,730,277 | 12,403,080 | 54,972,598 | 26,537,983 | 797,004 | 107,666,536 | |||||||||||||||||||||
Over time | — | — | — | — | 22,371 | — | 22,371 | |||||||||||||||||||||
|
|
|
|
|
|
|
|
|
|
|
|
|
| |||||||||||||||
| 2,225,594 | 10,730,277 | 12,403,080 | 54,972,598 | 26,560,354 | 797,004 | 107,688,907 | ||||||||||||||||||||||
|
|
|
|
|
|
|
|
|
|
|
|
|
| |||||||||||||||
Total gross (loss)/profit | (537,590 | ) | 1,081,206 | 2,135,060 | 2,936,678 | 149,236 | 9,916 | 5,774,506 | ||||||||||||||||||||
|
|
|
|
|
|
|
|
|
|
|
|
|
| |||||||||||||||
204
Table of Contents
Notes to the Consolidated Financial Statements(continued)
For the year ended 31 December 2019
| 6 | Segment information(continued) |
| 2019 RMB’000 | 2018 RMB’000 | |||||||
Segment result – profit/(loss) from operations | ||||||||
Petroleum products | 705,469 | 2,910,063 | ||||||
Resins and plastics | 401,454 | 900,440 | ||||||
Intermediate petrochemicals | 413,914 | 1,934,926 | ||||||
Trading of petrochemical products | 53,214 | 104,900 | ||||||
Synthetic fibers | (540,280 | ) | (573,503 | ) | ||||
Others | 286,801 | 308,286 | ||||||
|
|
|
| |||||
Profit from operations | 1,320,572 | 5,585,112 | ||||||
Net finance income | 362,963 | 337,412 | ||||||
Share of profit of investments accounted for using the equity method | 972,593 | 885,597 | ||||||
|
|
|
| |||||
Profit before income tax | 2,656,128 | 6,808,121 | ||||||
|
|
|
| |||||
Other profit and loss disclosures
| 2019 | 2018 | |||||||||||||||||||||||
| Depreciation and amortization RMB’000 | Impairment loss RMB’000 | Inventory write- down RMB’000 | Depreciation and amortization RMB’000 | Impairment loss RMB’000 | Inventory write down RMB’000 | |||||||||||||||||||
Synthetic fibers | (68,589 | ) | 7 | (48,844 | ) | (68,428 | ) | (47,937 | ) | (35,945 | ) | |||||||||||||
Resins and plastics | (125,464 | ) | 6 | (12,073 | ) | (139,447 | ) | (9 | ) | (19,219 | ) | |||||||||||||
Intermediate petrochemicals | (497,469 | ) | (478 | ) | (9,094 | ) | (575,025 | ) | (34,695 | ) | (8,630 | ) | ||||||||||||
Petroleum products | (972,688 | ) | 38 | (167 | ) | (862,659 | ) | (50 | ) | (22,209 | ) | |||||||||||||
Trading of petrochemical products | (211 | ) | — | — | (111 | ) | — | — | ||||||||||||||||
Others | (174,367 | ) | — | — | (161,943 | ) | — | — | ||||||||||||||||
|
|
|
|
|
|
|
|
|
|
|
| |||||||||||||
| (1,838,788 | ) | (427 | ) | (70,178 | ) | (1,807,613 | ) | (82,691 | ) | (86,003 | ) | |||||||||||||
|
|
|
|
|
|
|
|
|
|
|
| |||||||||||||
205
Table of Contents
Notes to the Consolidated Financial Statements(continued)
For the year ended 31 December 2019
| 6 | Segment information(continued) |
| As at 31 December | ||||||||
| 2019 Total assets RMB’000 | 2018 Total assets RMB’000 | |||||||
Allocated assets | ||||||||
Synthetic fibres | 997,650 | 1,114,911 | ||||||
Resins and plastics | 1,802,681 | 1,924,863 | ||||||
Intermediate petrochemicals | 3,721,337 | 4,176,850 | ||||||
Petroleum products | 14,014,403 | 15,567,239 | ||||||
Trading of petrochemical products | 1,492,405 | 1,807,433 | ||||||
Others | 2,294,668 | 2,067,698 | ||||||
|
|
|
| |||||
Allocated assets | 24,323,144 | 26,658,994 | ||||||
|
|
|
| |||||
Unallocated assets | ||||||||
Investments accounted for using the equity method | 5,208,758 | 4,527,133 | ||||||
Cash and cash equivalents | 7,449,699 | 8,741,893 | ||||||
Time deposits with banks | 5,020,073 | 1,500,000 | ||||||
Deferred income tax assets | 150,832 | 119,075 | ||||||
Financial assets at fair value through profit or loss | 3,318,670 | 2,727,279 | ||||||
Others | 22,899 | 111,523 | ||||||
|
|
|
| |||||
Unallocated assets | 21,170,931 | 17,726,903 | ||||||
|
|
|
| |||||
Total assets | 45,494,075 | 44,385,897 | ||||||
|
|
|
| |||||
206
Table of Contents
Notes to the Consolidated Financial Statements(continued)
For the year ended 31 December 2019
| 6 | Segment information(continued) |
| As at 31 December | ||||||||
| 2019 Total liabilities RMB’000 | 2018 Total liabilities RMB’000 | |||||||
Allocated liabilities | ||||||||
Synthetic fibers | 340,034 | 427,005 | ||||||
Resins and plastics | 1,372,574 | 1,404,499 | ||||||
Intermediate petrochemicals | 1,736,967 | 1,767,232 | ||||||
Petroleum products | 8,482,596 | 7,813,381 | ||||||
Trading of petrochemical products | 1,946,530 | 1,923,373 | ||||||
Others | 73,127 | 79,712 | ||||||
|
|
|
| |||||
Allocated liabilities | 13,951,828 | 13,415,202 | ||||||
|
|
|
| |||||
Unallocated liabilities | ||||||||
Borrowings | 1,547,600 | 497,249 | ||||||
Financial liabilities at fair value through profit or loss | 799 | 11,005 | ||||||
|
|
|
| |||||
Unallocated liabilities | 1,548,399 | 508,254 | ||||||
|
|
|
| |||||
Total liabilities | 15,500,227 | 13,923,456 | ||||||
|
|
|
| |||||
207
Table of Contents
Notes to the Consolidated Financial Statements(continued)
For the year ended 31 December 2019
| 6 | Segment information(continued) |
| 2019 RMB’000 | 2018 RMB’000 | |||||||
Additions to property, plant and equipment, construction in progress,right-of-use assets, lease prepayments and othernon-current assets | ||||||||
Synthetic fibres | 294,515 | 124,188 | ||||||
Resins and plastics | 74,633 | 112,638 | ||||||
Intermediate petrochemicals | 204,021 | 246,857 | ||||||
Petroleum products | 1,024,626 | 806,833 | ||||||
Trading of petrochemical products | 89 | — | ||||||
Others | 103,418 | 98,737 | ||||||
|
|
|
| |||||
| 1,701,302 | 1,389,253 | |||||||
|
|
|
| |||||
Entity-wide information
The Group’s revenue from external customers are mainly within Mainland China in 2019 and 2018. As at 31 December 2019 and 31 December 2018, assets are also mainly within Mainland China.
Revenue of approximate RMB42,657,975 thousands (2018: RMB42,492,816 thousands) are derived from a single customer.
These revenues are attributable to the petroleum products and others segments.
208
Table of Contents
Notes to the Consolidated Financial Statements(continued)
For the year ended 31 December 2019
| 7 | Other operating income |
| 2019 RMB’000 | 2018 RMB’000 | |||||||
Government grants (i) | 69,678 | 116,330 | ||||||
Rental income from investment property (Note 18) | 76,381 | 76,001 | ||||||
Others | 4,655 | 10,286 | ||||||
|
|
|
| |||||
| 150,714 | 202,617 | |||||||
|
|
|
| |||||
| (i) | Government grants |
Grants related to R&D, other tax refund and subsidies of RMB69,241 thousands (2018: RMB115,893 thousands) are included in the government grants line item. There are no unfulfilled conditions or other contingencies attaching to these grants. The Group did not benefit directly from any other forms of government assistance.
Deferral and presentation of government grants
Government grants relating to the purchase of property, plant and equipment are included innon-current liabilities as deferred income and are credited to profit or loss on a straight-line basis over the expected lives of the related assets. See Note 26 for further details. For the year ended 31 December 2019, RMB437 thousands were included in the government grants line item (As at 31 December 2018: RMB437 thousands).
209
Table of Contents
Notes to the Consolidated Financial Statements(continued)
For the year ended 31 December 2019
| 8 | Other operating expenses |
| 2019 RMB’000 | 2018 RMB’000 | |||||||
Cost related to lease of investment properties | (16,199 | ) | (19,367 | ) | ||||
Others | (5,726 | ) | (13,181 | ) | ||||
|
|
|
| |||||
| (21,925 | ) | (32,548 | ) | |||||
|
|
|
| |||||
| 9 | Other gains – net |
| 2019 RMB’000 | 2018 RMB’000 | |||||||
Net gains on disposal of land, property, plant and equipment (i) | 158,551 | 172,508 | ||||||
Income from structured deposits | 85,444 | 19,811 | ||||||
Fair value gains/(losses) on foreign exchange option and forward exchange contracts | 3,001 | (2,021 | ) | |||||
(Losses)/gains from disposal of subsidiaries (Note 20) | (60,951 | ) | 1,622 | |||||
Net foreign exchange gains/(losses) | 2,648 | (31,770 | ) | |||||
Net (losses)/gains on settlement of foreign exchange option and forward foreign exchange contracts | (15,316 | ) | 16,540 | |||||
Others | (19,513 | ) | — | |||||
|
|
|
| |||||
| 153,864 | 176,690 | |||||||
|
|
|
| |||||
| (i) | The net gains on disposal of land, property, plant and equipment were mainly composed of gains on disposal of land of Zhejiang Jin Yong Acrylic Fiber Company Limited (“Jinyong”) which amounted to RMB126,817 thousands. |
210
Table of Contents
Notes to the Consolidated Financial Statements(continued)
For the year ended 31 December 2019
| 10 | Finance income and expenses |
| 2019 RMB’000 | 2018 RMB’000 | |||||||
Net foreign exchange gains | 18,571 | — | ||||||
Interest income | 398,176 | 443,661 | ||||||
|
|
|
| |||||
Finance income | 416,747 | 443,661 | ||||||
|
|
|
| |||||
Interest on bank and other borrowings | (59,378 | ) | (84,425 | ) | ||||
Less: amounts capitalized on qualifying assets | 5,594 | 5,179 | ||||||
|
|
|
| |||||
Net interest expenses | (53,784 | ) | (79,246 | ) | ||||
Net foreign exchange losses | — | (27,003 | ) | |||||
|
|
|
| |||||
Finance expenses | (53,784 | ) | (106,249 | ) | ||||
|
|
|
| |||||
Finance income – net | 362,963 | 337,412 | ||||||
|
|
|
| |||||
| 11 | Expense by nature |
| 2019 RMB’000 | 2018 RMB’000 | |||||||
Cost of raw material | 57,101,961 | 56,601,977 | ||||||
Cost of trading products | 21,566,364 | 26,392,366 | ||||||
Employee benefit expenses (Note 12) | 3,147,372 | 2,888,572 | ||||||
Depreciation and amortization (Note 15,17,18) | 1,736,790 | 1,807,613 | ||||||
Repairs and maintenance expenses | 1,089,829 | 1,265,919 | ||||||
Change of goods in process and finished goods | 446,779 | (277,403 | ) | |||||
Transportation costs | 297,416 | 326,553 | ||||||
External processing fee | 215,288 | 185,164 | ||||||
Sales commissions (Note 30) | 125,641 | 139,954 | ||||||
Depreciation charge ofright-of-use assets (Note 16) | 101,998 | — | ||||||
Inventory write-down (Note 22) | 70,178 | 86,003 | ||||||
Auditors’ remuneration – audit services | 7,800 | 7,800 | ||||||
Leasing expenses | 2,961 | 96,520 | ||||||
Impairment loss (Note 19) | 486 | 82,652 | ||||||
Other expenses | 1,107,017 | 771,401 | ||||||
|
|
|
| |||||
Total cost of sales, selling and administrative expenses | 87,017,880 | 90,375,091 | ||||||
|
|
|
| |||||
211
Table of Contents
Notes to the Consolidated Financial Statements(continued)
For the year ended 31 December 2019
| 12 | Employee benefit expenses |
| 2019 RMB’000 | 2018 RMB’000 | |||||||
Wages and salaries | 1,931,121 | 1,814,991 | ||||||
Social welfare costs | 782,789 | 712,556 | ||||||
Others | 433,462 | 374,029 | ||||||
Share-based payments granted to directors and employees (Note 28,29) | — | (13,004 | ) | |||||
|
|
|
| |||||
Total employee benefit expense | 3,147,372 | 2,888,572 | ||||||
|
|
|
| |||||
| (i) | Five highest paid individuals |
For the years ended 31 December 2019 and 31 December 2018, all 5 individuals with the highest emoluments are directors and supervisors whose emoluments are disclosed in Note 36(i).
| 13 | Income tax |
| 2019 RMB’000 | 2018 RMB’000 | |||||||
– Current income tax | 460,720 | 1,471,671 | ||||||
– Deferred taxation | (31,757 | ) | 232 | |||||
|
|
|
| |||||
Income tax expense | 428,963 | 1,471,903 | ||||||
|
|
|
| |||||
212
Table of Contents
Notes to the Consolidated Financial Statements(continued)
For the year ended 31 December 2019
| 13 | Income tax(continued) |
A reconciliation of the expected income tax calculated at the applicable tax rate and total profit, with the actual income tax is as follows:
| 2019 RMB’000 | 2018 RMB’000 | |||||||
Profit before income tax | 2,656,128 | 6,808,121 | ||||||
|
|
|
| |||||
Expected PRC income tax at the statutory tax rate of 25% | 664,032 | 1,702,032 | ||||||
Tax effect of share of profit of investments accounted for using the equity method | (239,562 | ) | (218,024 | ) | ||||
Tax effect of othernon-taxable income | (14,959 | ) | (17,270 | ) | ||||
Tax effect ofnon-deductible loss, expenses and costs | 42,906 | 20,123 | ||||||
True up for final settlement of enterprise income taxes in respect of previous years | (2,618 | ) | 12,678 | |||||
Tax losses for which no deferred income tax asset was recognized | 9,578 | 10,017 | ||||||
Utilization of previously unrecognized tax losses | (30,414 | ) | (37,653 | ) | ||||
|
|
|
| |||||
Actual income tax | 428,963 | 1,471,903 | ||||||
|
|
|
| |||||
The provision for PRC income tax is calculated at the rate of 25% (2018: 25%) on the estimated taxable income of the year ended 31 December 2019 determined in accordance with relevant income tax rules and regulations. The Group did not carry out business overseas and therefore does not incur overseas income taxes.
| (i) | The analysis of deferred tax assets and deferred tax liabilities is as follows: |
| 2019 RMB’000 | 2018 RMB’000 | |||||||
Deferred tax assets: | ||||||||
– Deferred tax asset to be recovered after more than 12 months | 25,195 | 72,875 | ||||||
– Deferred tax asset to be recovered within 12 months | 133,187 | 50,049 | ||||||
|
|
|
| |||||
| 158,382 | 122,924 | |||||||
|
|
|
| |||||
Deferred tax liabilities: | ||||||||
– Deferred tax liabilities to be recovered after more than 12 months | (2,946 | ) | (2,611 | ) | ||||
– Deferred tax liabilities to be recovered within 12 months | (4,604 | ) | (1,238 | ) | ||||
|
|
|
| |||||
| (7,550 | ) | (3,849 | ) | |||||
|
|
|
| |||||
Deferred tax assets – net | 150,832 | 119,075 | ||||||
|
|
|
| |||||
213
Table of Contents
Notes to the Consolidated Financial Statements(continued)
For the year ended 31 December 2019
| 13 | Income tax(continued) |
| (ii) | Movements in deferred tax assets and liabilities are as follows: |
| Balance as at 1 January 2019 RMB’000 | (Charged)/ deducted to profit or loss RMB’000 | Balance as at 31 December 2019 RMB’000 | ||||||||||
Deferred tax assets | ||||||||||||
Impairment for bad and doubtful debts and provision for inventories | 39,606 | (705 | ) | 38,901 | ||||||||
Provision for impairment losses in fixed assets and construction in progress | 219,610 | (11,978 | ) | 207,632 | ||||||||
Difference in depreciation | (145,709 | ) | (33,091 | ) | (178,800 | ) | ||||||
Others | 9,417 | 81,232 | 90,649 | |||||||||
|
|
|
|
|
| |||||||
| 122,924 | 35,458 | 158,382 | ||||||||||
|
|
|
|
|
| |||||||
Deferred tax liabilities | ||||||||||||
Gains of financial assets at fair value | — | (4,604 | ) | (4,604 | ) | |||||||
Capitalization of borrowing costs and others | (3,849 | ) | 903 | (2,946 | ) | |||||||
|
|
|
|
|
| |||||||
| (3,849 | ) | (3,701 | ) | (7,550 | ) | |||||||
|
|
|
|
|
| |||||||
Deferred tax assets – net | 119,075 | 31,757 | 150,832 | |||||||||
|
|
|
|
|
| |||||||
214
Table of Contents
Notes to the Consolidated Financial Statements(continued)
For the year ended 31 December 2019
| 13 | Income tax(continued) |
| (ii) | Movements in deferred tax assets and liabilities are as follows:(continued) |
| (Charged)/ | ||||||||||||
| Balance as at | deducted to | Balance as at | ||||||||||
| 1 January 2018 | profit or loss | 31 December 2018 | ||||||||||
| RMB’000 | RMB’000 | RMB’000 | ||||||||||
Deferred tax assets | ||||||||||||
Impairment for bad and doubtful debts and provision for inventories | 24,507 | 15,099 | 39,606 | |||||||||
Provision for impairment losses in fixed assets and construction in progress | 202,988 | 16,622 | 219,610 | |||||||||
Difference in depreciation | (115,495 | ) | (30,214 | ) | (145,709 | ) | ||||||
Share-based payments | 3,816 | (3,816 | ) | — | ||||||||
Others | 8,578 | 839 | 9,417 | |||||||||
|
|
|
|
|
| |||||||
| 124,394 | (1,470 | ) | 122,924 | |||||||||
|
|
|
|
|
| |||||||
Deferred tax liabilities | ||||||||||||
Capitalization of borrowing costs and others | (5,087 | ) | 1,238 | (3,849 | ) | |||||||
|
|
|
|
|
| |||||||
Deferred tax assets – net | 119,307 | (232 | ) | 119,075 | ||||||||
|
|
|
|
|
| |||||||
The Group recognizes deferred tax assets only to the extent that it is probable that future taxable income will be available against which the assets can be utilized. Based on the level of historical taxable income and projections for future taxable income over the periods which the deferred tax assets will be utilized, management believes that it is probable the Group will realize the benefits of these temporary differences for which deferred tax assets have been recognized.
215
Table of Contents
Notes to the Consolidated Financial Statements(continued)
For the year ended 31 December 2019
| 13 | Income tax(continued) |
| (iii) | Deferred tax assets not recognized |
As at 31 December 2019, certain subsidiaries of the Company did not recognize the deferred tax assets in respect of the impairment losses on property, plant and equipment amounting to RMB29,969 thousands (31 December 2018: RMB29,969 thousands), because it was not probable that the related tax benefit would be realized.
As at 31 December 2019, certain subsidiaries of the Company did not recognize the deferred tax assets in respect of unused tax losses of RMB121,723 thousands (31 December 2018: RMB89,713 thousands) carried forward for PRC income tax purpose because it was not probable that the related tax benefit would be realized.
Tax losses carried forward that are not recognized as deferred tax assets will expire in the following years:
| 2019 | 2018 | |||||||
| RMB’000 | RMB’000 | |||||||
2019 | — | 6,132 | ||||||
2020 | 17,775 | 17,945 | ||||||
2021 | 12,880 | 12,880 | ||||||
2022 | 12,687 | 12,687 | ||||||
2023 | 40,069 | 40,069 | ||||||
2024 | 38,312 | — | ||||||
|
|
|
| |||||
| 121,723 | 89,713 | |||||||
|
|
|
| |||||
216
Table of Contents
Notes to the Consolidated Financial Statements(continued)
For the year ended 31 December 2019
| 14 | Earnings per share |
| (a) | Basic |
Basic earnings per share is calculated by dividing the profit attributable to owners of the Company by the weighted average number of ordinary shares in issue during the year.
| 2019 | 2018 | |||||||
| RMB’000 | RMB’000 | |||||||
Net profit attributable to owners of the Company | 2,215,728 | 5,336,331 | ||||||
|
|
|
| |||||
Weighted average number of ordinary shares in issue (thousands of shares) | 10,823,814 | 10,823,497 | ||||||
|
|
|
| |||||
Basic earnings per share (RMB per share) | RMB0.205 | RMB0.493 | ||||||
|
|
|
| |||||
| (b) | Diluted |
Diluted earnings per share is calculated by adjusting the weighted average number of ordinary shares outstanding to assume conversion of all dilutive potential ordinary shares.
As at 31 December 2019 and 31 December 2018, there were no potential dilutive ordinary share due to no outstanding share option.
217
Table of Contents
Notes to the Consolidated Financial Statements(continued)
For the year ended 31 December 2019
| 15 | Lease prepayments and othernon-current assets |
| Other | Long-term | |||||||||||||||
| Land | Intangible | prepaid | ||||||||||||||
| use rights | assets | expense | Total | |||||||||||||
| RMB’000 | RMB’000 | RMB’000 | RMB’000 | |||||||||||||
As at 1 January 2018 | ||||||||||||||||
Cost | 725,152 | 81,085 | 349,588 | 1,155,825 | ||||||||||||
Accumulated amortization | (350,980 | ) | (57,596 | ) | — | (408,576 | ) | |||||||||
|
|
|
|
|
|
|
| |||||||||
Net book amount | 374,172 | 23,489 | 349,588 | 747,249 | ||||||||||||
|
|
|
|
|
|
|
| |||||||||
Year ended 31 December 2018 | ||||||||||||||||
Opening net book amount | 374,172 | 23,489 | 349,588 | 747,249 | ||||||||||||
Additions | — | 3,008 | 374,519 | 377,527 | ||||||||||||
Charge for the year | (14,815 | ) | (5,929 | ) | (221,418 | ) | (242,162 | ) | ||||||||
Transferred to assets classified as held for sale | (24,331 | ) | — | — | (24,331 | ) | ||||||||||
|
|
|
|
|
|
|
| |||||||||
Closing net book amount | 335,026 | 20,568 | 502,689 | 858,283 | ||||||||||||
|
|
|
|
|
|
|
| |||||||||
As at 31 December 2018 | 335,026 | 20,568 | 502,689 | 858,283 | ||||||||||||
Change in accounting policy (Note 3) | (335,026 | ) | — | — | (335,026 | ) | ||||||||||
|
|
|
|
|
|
|
| |||||||||
Restated opening amount as at 1 January 2019 | — | 20,568 | 502,689 | 523,257 | ||||||||||||
|
|
|
|
|
|
|
| |||||||||
Cost | — | 84,093 | 502,689 | 586,782 | ||||||||||||
Accumulated amortization | — | (63,525 | ) | — | (63,525 | ) | ||||||||||
|
|
|
|
|
|
|
| |||||||||
Net book amount | — | 20,568 | 502,689 | 523,257 | ||||||||||||
|
|
|
|
|
|
|
| |||||||||
Year ended 31 December 2019 | ||||||||||||||||
Opening net book amount | — | 20,568 | 502,689 | 523,257 | ||||||||||||
Additions | — | 1,762 | 170,687 | 172,449 | ||||||||||||
Charge for the year | — | (4,695 | ) | (209,597 | ) | (214,292 | ) | |||||||||
|
|
|
|
|
|
|
| |||||||||
Closing net book amount | — | 17,635 | 463,779 | 481,414 | ||||||||||||
|
|
|
|
|
|
|
| |||||||||
As at 31 December 2019 | ||||||||||||||||
Cost | — | 85,855 | 463,779 | 549,634 | ||||||||||||
Accumulated amortization | — | (68,220 | ) | — | (68,220 | ) | ||||||||||
|
|
|
|
|
|
|
| |||||||||
Net book amount | — | 17,635 | 463,779 | 481,414 | ||||||||||||
|
|
|
|
|
|
|
| |||||||||
For the year ended 31 December 2019, the amortization of RMB214,292 thousands (2018: RMB242,162 thousands) has been charged in Cost of sales.
218
Table of Contents
Notes to the Consolidated Financial Statements(continued)
For the year ended 31 December 2019
| 16 | Leases |
| (a) | Amounts recognized in the balance sheet |
The balance sheet shows the following amounts relating to leases:
| As at | As at | |||||||
| 31 December 2019 | 1 January 2019 | |||||||
| RMB’000 | RMB’000 | |||||||
Right-of-use assets | ||||||||
Land use rights | 320,212 | 335,026 | ||||||
Buildings | 22,205 | 12,233 | ||||||
Equipment | 168 | 63,471 | ||||||
Others | 1,275 | 1,148 | ||||||
|
|
|
| |||||
| 343,860 | 411,878 | |||||||
|
|
|
| |||||
Lease liabilities | ||||||||
Current | 11,450 | 74,093 | ||||||
Non-current | 10,593 | 2,638 | ||||||
|
|
|
| |||||
| 22,043 | 76,731 | |||||||
|
|
|
| |||||
For the year ended 31 December 2019, additions to theright-of-use assets were RMB33,980 thousands.
| (b) | Amounts recognized in the income statement |
The income statement shows the following amounts relating to leases:
| 2019 | 2018 | |||||||
| RMB’000 | RMB’000 | |||||||
Depreciation charge ofright-of-use assets | ||||||||
Land use rights | (14,814 | ) | — | |||||
Buildings | (12,541 | ) | — | |||||
Equipment | (74,025 | ) | — | |||||
Others | (618 | ) | — | |||||
|
|
|
| |||||
| (101,998 | ) | — | ||||||
|
|
|
| |||||
Interest expense (included in finance cost) | (2,570 | ) | — | |||||
Expense relating to short-term leases (included in Cost of sales) | (2,961 | ) | — | |||||
|
|
|
| |||||
The total cash outflow for leases in 2019 was RMB94,441 thousands.
219
Table of Contents
Notes to the Consolidated Financial Statements(continued)
For the year ended 31 December 2019
| 17 | Property, plant and equipment |
| Buildings | Plant and machinery | Vehicles and other equipment | Total | |||||||||||||
| RMB’000 | RMB’000 | RMB’000 | RMB’000 | |||||||||||||
As at 1 January 2018 | ||||||||||||||||
Cost | 3,641,220 | 41,661,819 | 1,907,177 | 47,210,216 | ||||||||||||
Accumulated depreciation | (2,239,728 | ) | (29,299,129 | ) | (1,516,564 | ) | (33,055,421 | ) | ||||||||
Impairment loss | (279,099 | ) | (948,041 | ) | (61,227 | ) | (1,288,367 | ) | ||||||||
|
|
|
|
|
|
|
| |||||||||
Net book amount | 1,122,393 | 11,414,649 | 329,386 | 12,866,428 | ||||||||||||
|
|
|
|
|
|
|
| |||||||||
Year ended 31 December 2018 | ||||||||||||||||
Opening net book amount | 1,122,393 | 11,414,649 | 329,386 | 12,866,428 | ||||||||||||
Additions | — | 58,906 | 25,602 | 84,508 | ||||||||||||
Disposals | (10,069 | ) | (25,141 | ) | (2,404 | ) | (37,614 | ) | ||||||||
Disposal of subsidiaries | — | — | (2,291 | ) | (2,291 | ) | ||||||||||
Reclassification | 775 | (13,904 | ) | 13,129 | — | |||||||||||
Transferred from construction in progress (Note 19) | 7,260 | 309,346 | 28,329 | 344,935 | ||||||||||||
Charge for the year | (87,129 | ) | (1,398,681 | ) | (65,114 | ) | (1,550,924 | ) | ||||||||
Impairment loss | — | (58,652 | ) | — | (58,652 | ) | ||||||||||
|
|
|
|
|
|
|
| |||||||||
Closing net book amount | 1,033,230 | 10,286,523 | 326,637 | 11,646,390 | ||||||||||||
|
|
|
|
|
|
|
| |||||||||
As at 31 December 2018 | ||||||||||||||||
Cost | 3,229,642 | 41,007,229 | 1,785,889 | 46,022,760 | ||||||||||||
Accumulated depreciation | (2,142,540 | ) | (29,905,377 | ) | (1,451,131 | ) | (33,499,048 | ) | ||||||||
Impairment loss | (53,872 | ) | (815,329 | ) | (8,121 | ) | (877,322 | ) | ||||||||
|
|
|
|
|
|
|
| |||||||||
Net book amount | 1,033,230 | 10,286,523 | 326,637 | 11,646,390 | ||||||||||||
|
|
|
|
|
|
|
| |||||||||
Year ended 31 December 2019 | ||||||||||||||||
Opening net book amount | 1,033,230 | 10,286,523 | 326,637 | 11,646,390 | ||||||||||||
Additions | — | 99,041 | 15,578 | 114,619 | ||||||||||||
Disposals | (4,114 | ) | (60,503 | ) | (5,988 | ) | (70,605 | ) | ||||||||
Reclassification | 16,395 | (82,604 | ) | 66,209 | — | |||||||||||
Transferred from construction in progress (Note 19) | 26,655 | 999,412 | 97,553 | 1,123,620 | ||||||||||||
Transferred from investment properties (Note 18) | 6,924 | — | — | 6,924 | ||||||||||||
Transferred to investment properties (Note 18) | (12,347 | ) | — | — | (12,347 | ) | ||||||||||
Charge for the year | (92,123 | ) | (1,346,725 | ) | (68,956 | ) | (1,507,804 | ) | ||||||||
|
|
|
|
|
|
|
| |||||||||
Closing net book amount | 974,620 | 9,895,144 | 431,033 | 11,300,797 | ||||||||||||
|
|
|
|
|
|
|
| |||||||||
As at 31 December 2019 | ||||||||||||||||
Cost | 3,336,375 | 41,455,159 | 1,871,684 | 46,663,218 | ||||||||||||
Accumulated depreciation | (2,310,970 | ) | (30,793,083 | ) | (1,432,530 | ) | (34,536,583 | ) | ||||||||
Impairment loss | (50,785 | ) | (766,932 | ) | (8,121 | ) | (825,838 | ) | ||||||||
|
|
|
|
|
|
|
| |||||||||
Net book amount | 974,620 | 9,895,144 | 431,033 | 11,300,797 | ||||||||||||
|
|
|
|
|
|
|
| |||||||||
220
Table of Contents
Notes to the Consolidated Financial Statements(continued)
For the year ended 31 December 2019
| 17 | Property, plant and equipment(continued) |
For the year ended 31 December 2019, the amount of depreciation expense charged to cost of sales and selling and administrative expense were RMB1,498,625 thousands and RMB9,179 thousands, respectively (2018: RMB1,541,799 thousands and RMB9,125 thousands, respectively).
For the year ended 31 December 2019, the written off of impairment loss of the Group amounted to RMB51,484 thousands due to the disposal of property, plant and equipment.
For the year ended 31 December 2019, the Group made impairment provision of RMB58,652 thousands against these property, plant and equipment with schemes of technology upgrades and replacement in the coming years.
| 18 | Investment properties |
| RMB’000 | ||||
As at 1 January 2018 As at 1 January 2018 | ||||
Cost | 594,135 | |||
Accumulated depreciation | (202,869 | ) | ||
|
| |||
Net book amount | 391,266 | |||
|
| |||
Year ended 31 December 2018 | ||||
Opening net book amount | 391,266 | |||
Charge for the year | (14,527 | ) | ||
|
| |||
Closing net book amount | 376,739 | |||
|
| |||
As at 31 December 2018 | ||||
Cost | 594,135 | |||
Accumulated depreciation | (217,396 | ) | ||
|
| |||
Net book amount | 376,739 | |||
|
| |||
Year ended 31 December 2019 | ||||
Opening net book amount | 376,739 | |||
Transferred from property plant and equipment (Note 17) | 12,347 | |||
Transferred to property plant and equipment (Note 17) | (6,924 | ) | ||
Charge for the year | (14,694 | ) | ||
|
| |||
Closing net book amount | 367,468 | |||
|
| |||
As at 31 December 2019 | ||||
Cost | 602,659 | |||
Accumulated depreciation | (235,191 | ) | ||
|
| |||
Net book amount | 367,468 | |||
|
| |||
221
Table of Contents
Notes to the Consolidated Financial Statements(continued)
For the year ended 31 December 2019
| 18 | Investment properties(continued) |
As at 31 December 2019, the Group had no contractual obligations for future repairs and maintenance (31 December 2018: Nil).
Investment properties represent certain floors of an office building leased to other entities including related parties.
| (a) | The fair value of the investment properties of the Group as at 31 December 2019 was estimated by the directors to be approximately RMB1,230,191 thousands by reference to market values of similar properties in the nearby area (31 December 2018: RMB1,436,852 thousands). This fair value estimation was at level 3 of fair value hierarchy by using market observable inputs. The investment properties have not been valued by external independent appraisers. |
| (b) | Rental income of RMB76,381 thousands was recognized by the Group for the year ended 31 December 2019 (2018: RMB76,001 thousands). |
| (c) | Leasing arrangements |
The investment properties are leased to tenants under operating leases with rentals payable monthly. There are no variable lease payments that depend on an index or rate. Where considered necessary to reduce credit risk, the Group may obtain bank guarantees for the term of the lease.
Although the Group is exposed to changes in the residual value at the end of the current leases, the Group typically enters into new operating leases and therefore will not immediately realize any reduction in residual value at the end of these leases. Expectations about the future residual values are reflected in the fair value of the properties.
Minimum lease payments receivable on leases of investment properties are as follows:
| 2019 | 2018 | |||||||
| RMB’000 | RMB’000 | |||||||
Within 1 year | 43,322 | 48,386 | ||||||
Between 1 and 2 years | 1,517 | 3,715 | ||||||
Above 2 years | — | — | ||||||
|
|
|
| |||||
222
Table of Contents
Notes to the Consolidated Financial Statements(continued)
For the year ended 31 December 2019
| 19 | Construction in progress |
| 2019 | 2018 | |||||||
| RMB’000 | RMB’000 | |||||||
As at 1 January | 1,559,401 | 1,001,118 | ||||||
Additions | 1,380,254 | 927,218 | ||||||
Transferred to property plant and equipment (Note 17) | (1,123,620 | ) | (344,935 | ) | ||||
Impairment loss | (486 | ) | (24,000 | ) | ||||
|
|
|
| |||||
As at 31 December | 1,815,549 | 1,559,401 | ||||||
|
|
|
| |||||
As at 31 December 2019, the impairment loss in construction in progress were RMB34,661 thousands (31 December 2018: RMB34,175 thousands).
For the year ended 31 December 2019, the Group capitalized borrowing costs amounting to RMB5,594 thousands (2018: RMB5,179 thousands) on qualifying assets. Borrowing costs were capitalized at the weighted average rate of its general borrowings of 3.35% (2018: 3.63%).
223
Table of Contents
Notes to the Consolidated Financial Statements(continued)
For the year ended 31 December 2019
| 20 | Subsidiaries |
The following list contains the particulars of major subsidiaries of the Group, all of which are limited companies established and operated in the PRC.
Company | Registered capital ’000 | Percentage of equity directly held by the Company % | Percentage of equity held by the Group % | Percentage of equity held by non-controlling interests % | Principal activities | |||||||||||||||
As at 31 December 2019 | ||||||||||||||||||||
Shanghai Petrochemical Investment Development Company Limited | RMB | 1,000,000 | 100.00 | 100.00 | — | Investment management | ||||||||||||||
China Jinshan Associated Trading Corporation | RMB | 25,000 | 67.33 | 67.33 | 32.67 | | Import and export of petrochemical products and equipment | | ||||||||||||
Shanghai Jinchang Engineering Plastics Company Limited | USD | 9,154 | — | 74.25 | 25.75 | | Production of polypropylene compound products | | ||||||||||||
Shanghai Golden Phillips Petrochemical Company Limited | USD | 50,000 | — | 100.00 | — | | Production of polyethylene products | | ||||||||||||
Shanghai Jinshan Trading Corporation | RMB | 100,000 | — | 67.33 | 32.67 | | Import and export of petrochemical products | | ||||||||||||
224
Table of Contents
Notes to the Consolidated Financial Statements(continued)
For the year ended 31 December 2019
| 20 | Subsidiaries(continued) |
Company | Registered capital ’000 | Percentage of equity directly held by the Company % | Percentage of equity held by the Group % | Percentage of equity held by non-controlling interests % | Principal activities | |||||||||||||||
As at 31 December 2018 | ||||||||||||||||||||
Shanghai Petrochemical Investment Development Company Limited | RMB | 1,000,000 | 100.00 | 100.00 | — | Investment management | ||||||||||||||
China Jinshan Associated Trading Corporation | RMB | 25,000 | 67.33 | 67.33 | 32.67 | | Import and export of petrochemical products and equipment | | ||||||||||||
Shanghai Jinchang Engineering Plastics Company Limited | USD | 9,154 | — | 74.25 | 25.75 | | Production of polypropylene compound products | | ||||||||||||
Shanghai Golden Phillips Petrochemical Company Limited (b) | USD | 50,000 | — | 100.00 | — | | Production of polyethylene products | | ||||||||||||
Jinyong (a) | RMB | 250,000 | 75.00 | 75.00 | 25.00 | | Production of acrylic fibre products | | ||||||||||||
Shanghai Jinshan Trading Corporation | RMB | 100,000 | — | 67.33 | 32.67 | | Import and export of petrochemical products | | ||||||||||||
The total comprehensive income attributable tonon-controlling interests for the year ended 31 December 2019 is RMB11,437 thousands (2018: comprehensive loss amounted RMB113 thousands).
225
Table of Contents
Notes to the Consolidated Financial Statements(continued)
For the year ended 31 December 2019
| 20 | Subsidiaries(continued) |
| (a) | On 23 August 2019, the Group disposed 75% share of Jinyong, a former subsidiary of the Group, due to its bankruptcy and liquidation. The disposal loss amounted RMB60,951 thousands was included in Other gains – net (Note 9). |
| 2019 RMB’000 | ||||
Carrying amount of net assets at the date of disposal | 54,940 | |||
Non-controlling interests derecognized | 6,011 | |||
|
| |||
Loss on disposal of subsidiary | 60,951 | |||
|
| |||
The carrying amounts of total assets and liabilities as at the date of disposal were:
| As at 23 August 2019 RMB’000 | ||||
Total assets | 141,121 | |||
Total liabilities | (86,181 | ) | ||
|
| |||
Net assets | 54,940 | |||
|
| |||
| (b) | In July 2018, the Company’s subsidiary, Shanghai Petrochemical Investment Development Company Limited (“Toufa”), reached an agreement with the other investor, Philips Petroleum International Investment Company (“Philips Petroleum”), to acquire the remaining 40% share from Philips Petroleum in Shanghai Golden Phillips Petrochemical Company Limited (“Golden Phillips”), at a cash consideration of RMB152,800 thousands. The transaction was approved and completed in October 2018. Upon completion, Golden Phillips became a wholly owned subsidiary of Toufa. |
| 2018 RMB’000 | ||||
Carrying amount ofnon-controlling interests acquired | 162,359 | |||
Consideration paid tonon-controlling interests | (152,800 | ) | ||
|
| |||
Gains recognized in the transactions withnon-controlling interests within equity – other reserves | 9,559 | |||
|
| |||
226
Table of Contents
Notes to the Consolidated Financial Statements(continued)
For the year ended 31 December 2019
| 21 | Investments accounted for using the equity method |
The amounts recognized in the balance sheet are as follows:
| As at 31 December | ||||||||
| 2019 RMB’000 | 2018 RMB’000 | |||||||
Associates | ||||||||
– Share of net assets | 4,973,464 | 4,297,265 | ||||||
Joint ventures | ||||||||
– Share of net assets | 235,294 | 229,868 | ||||||
|
|
|
| |||||
| 5,208,758 | 4,527,133 | |||||||
|
|
|
| |||||
The amounts recognized in the share of profit of investments accounted for using the equity method are as follows:
| 2019 RMB’000 | 2018 RMB’000 | |||||||
Associates | 927,814 | 839,425 | ||||||
Joint ventures | 44,779 | 46,172 | ||||||
|
|
|
| |||||
| 972,593 | 885,597 | |||||||
|
|
|
| |||||
Investment in associates
| 2019 RMB’000 | 2018 RMB’000 | |||||||
As at 1 January | 4,297,265 | 4,239,795 | ||||||
Additions (Note 30) | 320,000 | — | ||||||
Share of profit | 904,265 | 839,425 | ||||||
Other comprehensive income/(loss) | 7,449 | (7,014 | ) | |||||
Cash dividends distribution | (555,515 | ) | (774,941 | ) | ||||
|
|
|
| |||||
As at 31 December | 4,973,464 | 4,297,265 | ||||||
|
|
|
| |||||
Set out below are the material associates of the Group as at 31 December 2019. The associates as listed below have share capital consisting solely of ordinary shares, which are held directly by the Group; the country of incorporation or registration is also their principal place of business.
227
Table of Contents
Notes to the Consolidated Financial Statements(continued)
For the year ended 31 December 2019
| 21 | Investments accounted for using the equity method(continued) |
| Investment | in associates(continued) |
Principal activities of material associates as at 31 December 2019.
Name of entity | Place of business/country of incorporation | % of ownership interest | Principal activities | Measurement method | ||||||||||
Shanghai Secco Petrochemical Company Limited (“Shanghai Secco”) | PRC | 20.00 | Manufacturing and distribution of chemical products | Equity | ||||||||||
Shanghai Chemical Industry Park Development Company Limited (“Chemical Industry”) | PRC | 38.26 | Planning, development and operation of the Chemical Industry Park in Shanghai, PRC | Equity | ||||||||||
Shanghai Jinsen Hydrocarbon Resins Company Limited (“Jinsen”) | PRC | 40.00 | Production of resins products | Equity | ||||||||||
Shanghai Azbil Automation Company Limited (“Azbil”) | PRC | 40.00 | Service and maintenance of building automation systems and products | Equity | ||||||||||
Shanghai Shidian Energy Company Limited (“Shidian Energy”) (i) | PRC | 40.00 | Electric power supply | Equity | ||||||||||
228
Table of Contents
Notes to the Consolidated Financial Statements(continued)
For the year ended 31 December 2019
| 21 | Investments accounted for using the equity method(continued) |
| Investment | in associates(continued) |
Principal activities of material associates as at 31 December 2018.
Name of entity | Place of business/ country of incorporation | % of ownership interest | Principal activities | Measurement method | ||||||||||
Shanghai Secco | PRC | 20.00 | Manufacturing and distribution of chemical products | Equity | ||||||||||
Chemical Industry | PRC | 38.26 | Planning, development and operation of the Chemical Industry Park in Shanghai, PRC | Equity | ||||||||||
Jinsen | PRC | 40.00 | Production of resins products | Equity | ||||||||||
Azbil | PRC | 40.00 | Service and maintenance of building automation systems and products | Equity | ||||||||||
Shanghai Secco, Chemical Industry, Jinsen, Azbil and Shidian Energy are private companies and there are no quoted market prices available for their shares.
There are no contingent liabilities relating to the Group’s interest in the associates.
| (i) | In 2019, Toufa invested RMB320,000 thousands to acquire 40% share of Shidian Energy, of which RMB71,816 thousands was contributed by property, plant and equipment at fair market price. |
229
Table of Contents
Notes to the Consolidated Financial Statements(continued)
For the year ended 31 December 2019
| 21 | Investments accounted for using the equity method(continued) |
Investment in associates(continued)
Summarized financial information for material associates
Set out below are the summarized financial information for the above associates.
Summarized balance sheet for material associates
| Shanghai Secco | Chemical Industry | Jinsen | Azbil | Shidian Energy | ||||||||||||||||
As at 31 December 2019 | RMB’000 | RMB’000 | RMB’000 | RMB’000 | RMB’000 | |||||||||||||||
Current | ||||||||||||||||||||
– Current assets | 11,858,124 | 4,356,339 | 85,302 | 204,965 | 745,425 | |||||||||||||||
– Current liabilities | (3,196,334 | ) | (1,468,162 | ) | (18,114 | ) | (75,572 | ) | (9,849 | ) | ||||||||||
Non-current | ||||||||||||||||||||
–Non-current assets | 5,020,292 | 3,153,858 | 69,154 | 3,049 | 69,588 | |||||||||||||||
–Non-current liabilities | (12,730 | ) | (485,735 | ) | — | — | — | |||||||||||||
|
|
|
|
|
|
|
|
|
| |||||||||||
Net Assets | 13,669,352 | 5,556,300 | 136,342 | 132,442 | 805,164 | |||||||||||||||
|
|
|
|
|
|
|
|
|
| |||||||||||
Shanghai Secco | Chemical Industry | Jinsen | Azbil | |||||||||||||||||
As at 31 December 2018 | RMB’000 | RMB’000 | RMB’000 | RMB’000 | ||||||||||||||||
Current | ||||||||||||||||||||
– Current assets | 9,537,354 | 3,785,819 | 100,065 | 189,514 | ||||||||||||||||
– Current liabilities | (2,232,583 | ) | (1,433,001 | ) | (14,855 | ) | (68,106 | ) | ||||||||||||
Non-current | ||||||||||||||||||||
–Non-current assets | 5,517,999 | 3,219,257 | 68,128 | 2,586 | ||||||||||||||||
–Non-current liabilities | — | (514,254 | ) | — | — | |||||||||||||||
|
|
|
|
|
|
|
| |||||||||||||
Net Assets | 12,822,770 | 5,057,821 | 153,338 | 123,994 | ||||||||||||||||
|
|
|
|
|
|
|
| |||||||||||||
230
Table of Contents
Notes to the Consolidated Financial Statements(continued)
For the year ended 31 December 2019
| 21 | Investments accounted for using the equity method(continued) |
| Investment | in associates(continued) |
Summarized statement of comprehensive income for material associates
2019 | Shanghai Secco RMB’000 | Chemical Industry RMB’000 | Jinsen RMB’000 | Azbil RMB’000 | Shidian Energy RMB’000 | |||||||||||||||
Revenue | 28,341,032 | 1,936,537 | 197,199 | 297,694 | 112,143 | |||||||||||||||
Post-tax profit/(loss) from continuing operations | 3,383,582 | 609,540 | (16,996 | ) | 38,448 | 5,166 | ||||||||||||||
Other comprehensive income | — | 19,470 | — | — | — | |||||||||||||||
|
|
|
|
|
|
|
|
|
| |||||||||||
Total comprehensive income/(loss) | 3,383,582 | 629,010 | (16,996 | ) | 38,448 | 5,166 | ||||||||||||||
|
|
|
|
|
|
|
|
|
| |||||||||||
Dividends declared by associate | 2,537,000 | 79,000 | — | 30,000 | — | |||||||||||||||
|
|
|
|
|
|
|
|
|
| |||||||||||
2018 | Shanghai Secco RMB’000 | Chemical Industry RMB’000 | Jinsen RMB’000 | Azbil RMB’000 | ||||||||||||||||
Revenue | 26,319,957 | 1,880,004 | 208,901 | 255,554 | ||||||||||||||||
Post-tax profit/(loss) from continuing operations | 3,228,682 | 472,804 | (12,845 | ) | 30,119 | |||||||||||||||
Other comprehensive loss | — | (18,331 | ) | — | — | |||||||||||||||
|
|
|
|
|
|
|
| |||||||||||||
Total comprehensive income/(loss) | 3,228,682 | 454,473 | (12,845 | ) | 30,119 | |||||||||||||||
|
|
|
|
|
|
|
| |||||||||||||
Dividends declared by associate | 3,675,840 | 61,001 | — | 25,900 | ||||||||||||||||
|
|
|
|
|
|
|
| |||||||||||||
The information above reflects the amounts presented in the financial statements of the associates (and not the Group’s share of those amounts) adjusted for differences in accounting policies between the Group and the associates.
231
Table of Contents
Notes to the Consolidated Financial Statements(continued)
For the year ended 31 December 2019
| 21 | Investments accounted for using the equity method(continued) |
| Investment | in associates(continued) |
Reconciliation of summarized financial information
Reconciliation of the summarized financial information presented to the carrying amount of its interest in material associates
2019 | Shanghai Secco RMB’000 | Chemical Industry RMB’000 | Jinsen RMB’000 | Azbil RMB’000 | Shidian Energy RMB’000 | |||||||||||||||
Opening net assets 1 January | 12,822,770 | 5,057,821 | 153,338 | 123,994 | — | |||||||||||||||
Profit/(loss) for the year | 3,383,582 | 609,540 | (16,996 | ) | 38,448 | 5,166 | ||||||||||||||
Increase in share capital | — | — | — | — | 800,000 | |||||||||||||||
Other comprehensive Income | — | 19,470 | — | — | — | |||||||||||||||
Decrease in reserves | — | (51,535 | ) | — | — | — | ||||||||||||||
Declared dividends | (2,537,000 | ) | (79,000 | ) | — | (30,000 | ) | — | ||||||||||||
|
|
|
|
|
|
|
|
|
| |||||||||||
Closing net assets | 13,669,352 | 5,556,296 | 136,342 | 132,442 | 805,166 | |||||||||||||||
|
|
|
|
|
|
|
|
|
| |||||||||||
% of ownership interest | 20.00 | % | 38.26 | % | 40.00 | % | 40.00 | % | 40.00 | % | ||||||||||
Interest in associates | 2,733,872 | 2,125,839 | 54,537 | 52,977 | 322,066 | |||||||||||||||
Unrealized upstream and downstream transaction | (9,512 | ) | — | — | — | (22,708 | ) | |||||||||||||
Unentitled portion (Note a) | — | (328,629 | ) | — | — | — | ||||||||||||||
|
|
|
|
|
|
|
|
|
| |||||||||||
Carrying value | 2,724,360 | 1,797,210 | 54,537 | 52,977 | 299,358 | |||||||||||||||
|
|
|
|
|
|
|
|
|
| |||||||||||
2018 | Shanghai Secco RMB’000 | Chemical Industry RMB’000 | Jinsen RMB’000 | Azbil RMB’000 | ||||||||||||||||
Opening net assets 1 January | 13,269,928 | 4,664,349 | 166,183 | 119,775 | ||||||||||||||||
Profit/(loss) for the year | 3,228,682 | 472,804 | (12,845 | ) | 30,119 | |||||||||||||||
Other comprehensive loss | — | (18,331 | ) | — | — | |||||||||||||||
Declared dividends | (3,675,840 | ) | (61,001 | ) | — | (25,900 | ) | |||||||||||||
|
|
|
|
|
|
|
| |||||||||||||
Closing net assets | 12,822,770 | 5,057,821 | 153,338 | 123,994 | ||||||||||||||||
|
|
|
|
|
|
|
| |||||||||||||
% of ownership interest | 20.00 | % | 38.26 | % | 40.00 | % | 40.00 | % | ||||||||||||
Interest in associates | 2,564,556 | 1,935,122 | 61,335 | 49,598 | ||||||||||||||||
Unrealized upstream and downstream transaction | (9,512 | ) | — | — | — | |||||||||||||||
Unentitled portion (Note a) | — | (348,346 | ) | — | — | |||||||||||||||
|
|
|
|
|
|
|
| |||||||||||||
Carrying value | 2,555,044 | 1,586,776 | 61,335 | 49,598 | ||||||||||||||||
|
|
|
|
|
|
|
| |||||||||||||
Note a: Unentitled portion represented the earnings from sales of the lands injected by Government in Chemical Industry that cannot be shared by other shareholders.
232
Table of Contents
Notes to the Consolidated Financial Statements(continued)
For the year ended 31 December 2019
| 21 | Investments accounted for using the equity method(continued) |
Investment in associates(continued) |
Summarized financial information for other associates
| 2019 RMB’000 | 2018 RMB’000 | |||||||
Aggregate carrying value of investments at 31 December | 45,022 | 44,512 | ||||||
|
|
|
| |||||
Aggregate amounts of the group’s share of: | ||||||||
Profit for the year | 6,400 | 5,884 | ||||||
|
|
|
| |||||
Total comprehensive income | 6,400 | 5,884 | ||||||
|
|
|
| |||||
Investment in joint ventures
| 2019 RMB’000 | 2018 RMB’000 | |||||||
As at 1 January | 229,868 | 212,249 | ||||||
Investment addition | — | 7,979 | ||||||
Share of profit | 44,779 | 46,172 | ||||||
Cash dividends distribution | (39,353 | ) | (36,532 | ) | ||||
|
|
|
| |||||
As at 31 December | 235,294 | 229,868 | ||||||
|
|
|
| |||||
233
Table of Contents
Notes to the Consolidated Financial Statements(continued)
For the year ended 31 December 2019
| 21 | Investments accounted for using the equity method(continued) |
Investment in joint ventures(continued) |
The joint venture listed below has share capital consisting solely of ordinary shares, which is held directly by the Group as at 31 December 2019 and 31 December 2018.
As at 31 December 2019 and 31 December 2018 | Place of business/country of incorporation | % of ownership interest | Principal activities | Measurement method | ||||||||||
BOC | PRC | 50.00 | Production and sales of industrial gases | Equity | ||||||||||
Shanghai Petrochemical Pressure Vessel Testing Center (“JYJC”) | PRC | 50.00 | Provide inspection and testing service | Equity | ||||||||||
Shanghai Petrochemical Yangu Gas Development Company Limited (“Yangu Gas”) | PRC | 50.00 | Production and sales of industrial gases | Equity | ||||||||||
BOC, JYJC and Yangu Gas are private companies and there are no quoted market prices available for their shares.
Summarized financial information for joint ventures
Set out below are the summarized financial information for joint ventures which are accounted for using the equity method.
234
Table of Contents
Notes to the Consolidated Financial Statements(continued)
For the year ended 31 December 2019
| 21 | Investments accounted for using the equity method(continued) |
Investment in joint ventures(continued) |
Summarized balance sheet for joint ventures
As at 31 December 2019 | BOC RMB’000 | JYJC RMB’000 | Yangu Gas RMB’000 | |||||||||
Current | ||||||||||||
Cash and cash equivalents | 182,548 | 11,200 | 51,386 | |||||||||
Other current assets (excluding cash) | 64,837 | 9,557 | 12,565 | |||||||||
|
|
|
|
|
| |||||||
Total current assets | 247,385 | 20,757 | 63,951 | |||||||||
|
|
|
|
|
| |||||||
Total current liabilities | (37,444 | ) | (3,993 | ) | (3,460 | ) | ||||||
|
|
|
|
|
| |||||||
Non-current | ||||||||||||
Totalnon-current assets | 181,372 | 1,937 | 36,972 | |||||||||
Totalnon-current liabilities | (26,378 | ) | — | — | ||||||||
|
|
|
|
|
| |||||||
Net assets | 364,935 | 18,701 | 97,463 | |||||||||
|
|
|
|
|
| |||||||
As at 31 December 2018 | BOC RMB’000 | JYJC RMB’000 | Yangu Gas RMB’000 | |||||||||
Current | ||||||||||||
Cash and cash equivalents | 137,505 | 8,086 | 42,415 | |||||||||
Other current assets (excluding cash) | 68,454 | 11,441 | 14,164 | |||||||||
|
|
|
|
|
| |||||||
Total current assets | 205,959 | 19,527 | 56,579 | |||||||||
|
|
|
|
|
| |||||||
Total current liabilities | (41,962 | ) | (4,607 | ) | (3,745 | ) | ||||||
|
|
|
|
|
| |||||||
Non-current | ||||||||||||
Totalnon-current assets | 198,555 | 2,357 | 44,589 | |||||||||
Totalnon-current liabilities | — | — | — | |||||||||
|
|
|
|
|
| |||||||
Net assets | 362,552 | 17,277 | 97,423 | |||||||||
|
|
|
|
|
| |||||||
235
Table of Contents
Notes to the Consolidated Financial Statements(continued)
For the year ended 31 December 2019
| 21 | Investments accounted for using the equity method(continued) |
Investment in joint ventures(continued) |
Summarized statement of comprehensive income for joint ventures
2019 | BOC RMB’000 | JYJC RMB’000 | Yangu Gas RMB’000 | |||||||||
Revenue | 414,374 | 29,290 | 55,302 | |||||||||
Depreciation and amortization | (50,199 | ) | — | (11,272 | ) | |||||||
Interest income | 636 | 308 | 1,119 | |||||||||
Interest expense | — | — | — | |||||||||
Profit from continuing operations | 108,565 | 3,107 | 40 | |||||||||
Income tax expense | (28,382 | ) | (777 | ) | — | |||||||
Post-tax profit from continuing operations | 80,183 | 2,330 | 40 | |||||||||
Other comprehensive income | — | — | — | |||||||||
|
|
|
|
|
| |||||||
Total comprehensive income | 80,183 | 2,330 | 40 | |||||||||
|
|
|
|
|
| |||||||
Dividends declared by joint venture | 77,800 | 906 | — | |||||||||
|
|
|
|
|
| |||||||
2018 | BOC RMB’000 | JYJC RMB’000 | Yangu Gas RMB’000 | |||||||||
Revenue | 423,160 | 21,542 | 58,679 | |||||||||
Depreciation and amortization | (46,456 | ) | — | (2,245 | ) | |||||||
Interest income | 1,154 | 27 | 541 | |||||||||
Interest expense | — | — | — | |||||||||
Profit/(loss) from continuing operations | 114,275 | 1,833 | (2,518 | ) | ||||||||
Income tax expense | (27,799 | ) | (450 | ) | — | |||||||
Post-tax profit/(loss) from continuing operations | 86,476 | 1,383 | (2,518 | ) | ||||||||
Other comprehensive income | — | — | — | |||||||||
|
|
|
|
|
| |||||||
Total comprehensive income/(loss) | 86,476 | 1,383 | (2,518 | ) | ||||||||
|
|
|
|
|
| |||||||
Dividends declared by joint venture | 73,000 | 64 | — | |||||||||
|
|
|
|
|
| |||||||
The information above reflects the amounts presented in the financial statements of the joint ventures (and not the Group’s share of those amounts) adjusted for differences in accounting policies between the Group and the joint ventures.
236
Table of Contents
Notes to the Consolidated Financial Statements(continued)
For the year ended 31 December 2019
| 21 | Investments accounted for using the equity method(continued) |
Investment in joint ventures(continued) |
Reconciliation of summarized financial information
Reconciliation of the summarized financial information presented to the carrying amount of its interest in material joint ventures
2019 | BOC RMB’000 | JYJC RMB’000 | Yangu Gas RMB’000 | |||||||||
Opening net assets 1 January | 362,552 | 17,277 | 97,423 | |||||||||
Profit for the year | 80,183 | 2,330 | 40 | |||||||||
Other comprehensive income | — | — | — | |||||||||
Declared dividends | (77,800 | ) | (906 | ) | — | |||||||
|
|
|
|
|
| |||||||
Closing net assets | 364,935 | 18,701 | 97,463 | |||||||||
% of ownership interest | 50.00 | % | 50.00 | % | 50.00 | % | ||||||
Interest in joint ventures | 182,467 | 9,350 | 48,733 | |||||||||
Unrealized downstream transactions | (5,256 | ) | — | — | ||||||||
|
|
|
|
|
| |||||||
Carrying value | 177,211 | 9,350 | 48,733 | |||||||||
|
|
|
|
|
| |||||||
2018 | BOC RMB’000 | JYJC RMB’000 | Yangu Gas RMB’000 | |||||||||
Opening net assets 1 January | 349,076 | — | 99,941 | |||||||||
Net assets as at 31 March | — | 15,958 | — | |||||||||
Profit/(loss) for the year | 86,476 | 1,383 | (2,518 | ) | ||||||||
Other comprehensive income | — | — | — | |||||||||
Declared dividends | (73,000 | ) | (64 | ) | — | |||||||
|
|
|
|
|
| |||||||
Closing net assets (a) | 362,552 | 17,277 | 97,423 | |||||||||
% of ownership interest | 50.00 | % | 50.00 | % | 50.00 | % | ||||||
Interest in joint ventures | 181,276 | 8,638 | 48,713 | |||||||||
Unrealized downstream transactions | (8,759 | ) | — | — | ||||||||
|
|
|
|
|
| |||||||
Carrying value | 172,517 | 8,638 | 48,713 | |||||||||
|
|
|
|
|
| |||||||
| (a) | JYJC was a former wholly owned subsidiary of Toufa. On 31 March 2018, a third party investor injected RMB9,600 thousands to acquire 50% share of JYJC, and JYJC became a joint venture of Toufa upon completion. For the year ended 31 December 2018, the related disposal gain of RMB1,622 thousands was included in Other gains — net. |
237
Table of Contents
Notes to the Consolidated Financial Statements(continued)
For the year ended 31 December 2019
| 22 | Inventories |
| As at 31 December 2019 | As at 31 December 2018 | |||||||||||||||||||||||
| Gross carrying amount RMB’000 | Provision for declines in the value of inventories RMB’000 | Carrying amount RMB’000 | Gross carrying amount RMB’000 | Provision for declines in the value of inventories RMB’000 | Carrying amount RMB’000 | |||||||||||||||||||
Raw materials | 4,567,648 | — | 4,567,648 | 5,529,241 | — | 5,529,241 | ||||||||||||||||||
Work in progress | 1,072,040 | (78,981 | ) | 993,059 | 1,099,235 | (55,098 | ) | 1,044,137 | ||||||||||||||||
Finished goods | 1,022,335 | (33,763 | ) | 988,572 | 1,440,721 | (56,448 | ) | 1,384,273 | ||||||||||||||||
Spare parts and consumables | 247,873 | (42,718 | ) | 205,155 | 209,907 | (46,683 | ) | 163,224 | ||||||||||||||||
|
|
|
|
|
|
|
|
|
|
|
| |||||||||||||
| 6,909,896 | (155,462 | ) | 6,754,434 | 8,279,104 | (158,229 | ) | 8,120,875 | |||||||||||||||||
|
|
|
|
|
|
|
|
|
|
|
| |||||||||||||
The cost of inventories recognized in Cost of sales amounted to RMB78,595,380 thousands for the year ended 31 December 2019 (2018: RMB82,981,590 thousands) which excluded an inventory provision of RMB70,178 thousands (2018: RMB86,003 thousands).
As at 31 December 2019, the provision for inventory write-down was RMB155,462 thousands (31 December 2018: RMB158,229 thousands). For the year ended 31 December 2019, the Group sold certain finished goods and utilized certain spare parts and consumables which were previously provided for. The related provision of RMB72,945 thousands was reversed and included in Cost of sales in the consolidated income statement (2018: RMB73,266 thousands).
238
Table of Contents
Notes to the Consolidated Financial Statements(continued)
For the year ended 31 December 2019
| 23 | Financial assets and financial liabilities |
The Group holds the following financial instruments:
| As at 31 December | ||||||||||
Financial assets | Note | 2019 RMB’000 | 2018 RMB’000 | |||||||
Financial assets at amortized cost | ||||||||||
Trade receivables | (a) | 120,739 | 81,990 | |||||||
Other receivables | (a) | 26,101 | 105,803 | |||||||
Amounts due from related parties excluded prepayments | (a),30(c) | 1,521,187 | 2,219,007 | |||||||
Cash and cash equivalents | (b) | 7,449,699 | 8,741,893 | |||||||
Time deposits with financial banks | (c) | 5,020,073 | 1,500,000 | |||||||
Financial assets at fair value through other comprehensive income | (d) | 1,545,921 | 1,672,431 | |||||||
Financial assets at fair value through profit or loss | (e) | 3,318,670 | 2,727,279 | |||||||
|
|
|
| |||||||
| 19,002,390 | 17,048,403 | |||||||||
|
|
|
| |||||||
| As at 31 December | ||||||||||
Financial liabilities | Note | 2019 RMB’000 | 2018 RMB’000 | |||||||
Financial liabilities at amortized cost | ||||||||||
Borrowings | (f) | 1,547,600 | 497,249 | |||||||
Trade payables | (g) | 2,142,402 | 2,922,998 | |||||||
Other payables | (g) | 4,513,698 | 5,167,230 | |||||||
Bills payables | (g) | 673,900 | — | |||||||
Amounts due to related parties | (g),30(c) | 5,708,394 | 4,567,814 | |||||||
Lease liabilities | 22,043 | — | ||||||||
Financial liabilities at fair value through profit or loss | 799 | 11,005 | ||||||||
|
|
|
| |||||||
| 14,608,836 | 13,166,296 | |||||||||
|
|
|
| |||||||
The Company’s exposure to various risks associated with the financial instruments is discussed in Note 4. The maximum
exposure to credit risk at the end of the reporting period is the carrying amount of each class of financial assets mentioned above.
239
Table of Contents
Notes to the Consolidated Financial Statements(continued)
For the year ended 31 December 2019
| 23 | Financial assets and financial liabilities(continued) |
| (a) | Trade and other receivables |
| As at 31 December | ||||||||
| 2019 RMB’000 | 2018 RMB’000 | |||||||
Trade receivables | 120,739 | 82,044 | ||||||
Less: impairment provision | — | (54 | ) | |||||
|
|
|
| |||||
| 120,739 | 81,990 | |||||||
|
|
|
| |||||
Amounts due from related parties excluded prepayments | 1,521,187 | 2,219,007 | ||||||
|
|
|
| |||||
| 1,641,926 | 2,300,997 | |||||||
|
|
|
| |||||
Other receivables | 26,101 | 105,803 | ||||||
|
|
|
| |||||
| 1,668,027 | 2,406,800 | |||||||
|
|
|
| |||||
For the year ended 31 December 2019, certain associates and joint ventures of the Group declared dividends with
total amount of RMB594,868 thousands to the Group (2018: RMB811,473 thousands). As at 31 December 2019 and
31 December 2018, all these declared dividends had been received by the Group.
As at 31��December 2019, interest receivable amounted RMB10,927 thousands was included in the balance of other
receivables (31 December 2018: RMB79,224 thousands).
Amounts due from related parties mainly represent trade-related balances, unsecured in nature and bear no interest.
240
Table of Contents
Notes to the Consolidated Financial Statements(continued)
For the year ended 31 December 2019
| 23 | Financial assets and financial liabilities(continued) |
| (a) | Trade and other receivables(continued) |
The aging analysis based on invoice date of trade receivables and amounts due from related parties excluded prepayments (net of allowance for doubtful debts) is as follows:
| As at 31 December | ||||||||
| 2019 RMB’000 | 2018 RMB’000 | |||||||
Within 1 year | 1,641,926 | 2,300,957 | ||||||
1-2 year | — | 29 | ||||||
2-3 year | — | 11 | ||||||
|
|
|
| |||||
| 1,641,926 | 2,300,997 | |||||||
|
|
|
| |||||
Movements of the Group’s impairment provision for trade and other receivables are as follows:
| 2019 RMB’000 | 2018 RMB’000 | |||||||
As at 1 January | 198 | 1,053 | ||||||
(Reversal)/provision for receivables impairment | (59 | ) | 39 | |||||
Receivables written off during the year as uncollectible | — | (894 | ) | |||||
|
|
|
| |||||
As at 31 December | 139 | 198 | ||||||
|
|
|
| |||||
As at 31 December 2019 and 31 December 2018, no trade receivable was pledged as collateral.
Sales to third parties are generally on cash basis or on letter of credit. Subject to negotiation, credit is generally only
available for major customers with well-established trading records.
241
Table of Contents
Notes to the Consolidated Financial Statements(continued)
For the year ended 31 December 2019
| 23 | Financial assets and financial liabilities(continued) |
| (b) | Cash and cash equivalents |
| As at 31 December | ||||||||
| 2019 RMB’000 | 2018 RMB’000 | |||||||
Cash deposits with a related party (i) | 67,015 | 22,082 | ||||||
Cash at bank and on hand | 7,382,684 | 8,719,811 | ||||||
|
|
|
| |||||
| 7,449,699 | 8,741,893 | |||||||
|
|
|
| |||||
| (i) | Cash deposits with a related party were cash deposits at Sinopec Finance Company Limited (“Sinopec Finance”), which is a financial institution. |
| (c) | Time deposits with banks |
| As at 31 December | ||||||||
| 2019 RMB’000 | 2018 RMB’000 | |||||||
Time deposits with banks within one year | 1,508,839 | 1,500,000 | ||||||
Time deposits with banks above one year | 3,511,234 | — | ||||||
|
|
|
| |||||
| 5,020,073 | 1,500,000 | |||||||
|
|
|
| |||||
As at 31 December 2019, time deposits with banks within one year were time deposits within six months with the interest rates from 3.95% to 4.10% per annum (31 December 2018: 4.5% per annum), which were presented as current assets. Time deposits with banks above one year were time deposits of three years with the interest rates from 4.13% to 4.18% per annum, which were presented asnon-current assets in the balance sheet (31 December 2018: Nil).
242
Table of Contents
Notes to the Consolidated Financial Statements(continued)
For the year ended 31 December 2019
| 23 | Financial assets and financial liabilities(continued) |
| (d) | Financial assets at fair value through other comprehensive income |
| As at 31 December | ||||||||
| 2019 RMB’000 | 2018 RMB’000 | |||||||
Trade and bill receivables (i) | 1,540,921 | 1,672,431 | ||||||
Equity investments (ii) | 5,000 | — | ||||||
|
|
|
| |||||
| 1,545,921 | 1,672,431 | |||||||
|
|
|
| |||||
| (i) | As at 31 December 2019, certain trade receivables and bills receivable were classified as financial assets at FVOCI, as the Group’s business model is achieved both by collecting contractual cash flows and selling of these assets. |
| (ii) | In July 2019, Toufa invested RMB5,000 thousands in Shanghai Carbon Fiber Composites Innovation Research Institute Co. Ltd to acquire 16.67% of its share. |
| (e) | Financial assets at fair value through profit or loss |
| As at 31 December | ||||||||
| 2019 RMB’000 | 2018 RMB’000 | |||||||
Structured deposits | 3,318,407 | 2,719,811 | ||||||
Foreign exchange options | 263 | 7,468 | ||||||
|
|
|
| |||||
| 3,318,670 | 2,727,279 | |||||||
|
|
|
| |||||
As at 31 December 2019, financial assets at fair value through profit or loss are mainly structured deposits with banks, which are presented as current assets since they are expected to be collected within six months from the end of the reporting period.
243
Table of Contents
Notes to the Consolidated Financial Statements(continued)
For the year ended 31 December 2019
| 23 | Financial assets and financial liabilities(continued) |
| (f) | Borrowings |
| As at 31 December | ||||||||
| 2019 RMB’000 | 2018 RMB’000 | |||||||
Credit loans due within one year | ||||||||
– Short term bank loans | 1,547,600 | 497,249 | ||||||
|
|
|
| |||||
The weighted average interest rate for the Group’s borrowings was 3.35% for the year ended 31 December 2019 (2018: 3.63%).
As at 31 December 2019, no borrowings were secured by property, plant and equipment (31 December 2018: Nil).
| (g) | Trade and other payables |
| As at 31 December | ||||||||
| 2019 RMB’000 | 2018 RMB’000 | |||||||
Trade payables | 2,142,402 | 2,922,998 | ||||||
Bills payables | 673,900 | — | ||||||
Amounts due to related parties | 5,708,394 | 4,567,814 | ||||||
|
|
|
| |||||
| 8,524,696 | 7,490,812 | |||||||
|
|
|
| |||||
Staff salaries and welfares payable | 189,547 | 128,861 | ||||||
Taxes payable (exclude income tax payable) | 3,577,018 | 4,342,676 | ||||||
Interest payable | 1,686 | 5,952 | ||||||
Dividends payable | 29,144 | 26,488 | ||||||
Construction payable | 277,184 | 334,249 | ||||||
Other liabilities | 439,119 | 329,004 | ||||||
|
|
|
| |||||
| 4,513,698 | 5,167,230 | |||||||
|
|
|
| |||||
| 13,038,394 | 12,658,042 | |||||||
|
|
|
| |||||
As at 31 December 2019 and 31 December 2018, all trade and other payables of the Group werenon-interest bearing, and their fair value approximated their carrying amounts due to their short maturities.
244
Table of Contents
Notes to the Consolidated Financial Statements(continued)
For the year ended 31 December 2019
| 23 | Financial assets and financial liabilities(continued) |
| (g) | Trade and other payables(continued) |
Majority of amount due to related parties were trade payable for purchasing crude oil from related parties.
As at 31 December 2019 and 31 December 2018, the ageing analysis of the trade payables (including bills payables and amounts due to related parties with trading nature) based on invoice date was as follows:
| As at 31 December | ||||||||
| 2019 RMB’000 | 2018 RMB’000 | |||||||
Within one year | 8,509,327 | 7,451,168 | ||||||
Between one and two years | 11,209 | 25,231 | ||||||
Over two years | 4,160 | 14,413 | ||||||
|
|
|
| |||||
| 8,524,696 | 7,490,812 | |||||||
|
|
|
| |||||
| 24 | Other assets and assets classified as held for sale |
| 2019 RMB’000 | 2018 RMB’000 | |||||||
Other current assets | ||||||||
Prepayments | 23,767 | 38,025 | ||||||
Prepayments to related parties | 44,806 | 67,242 | ||||||
|
|
|
| |||||
| 68,573 | 105,267 | |||||||
|
|
|
| |||||
Assets classified as held for sale | — | 24,331 | ||||||
|
|
|
| |||||
245
Table of Contents
Notes to the Consolidated Financial Statements(continued)
For the year ended 31 December 2019
| 25 | Contract liabilities |
| 2019 RMB’000 | 2018 RMB’000 | |||||||
Contract liabilities | 655,117 | 446,702 | ||||||
|
|
|
| |||||
The contract liabilities of the Group are advance for goods from customers. Revenue amounted to RMB446,702 thousands has been recognized in the current year relates to carried – forward contract liabilities (2018: RMB465,706 thousands).
| 26 | Deferred income |
| 2019 RMB’000 | 2018 RMB’000 | |||||||
As at 1 January | 10,442 | 5,679 | ||||||
Government grants received during the year to compensate the cost related to the project of energy efficiency renovations of thermoelectric unit | — | 5,200 | ||||||
Amortization | (437 | ) | (437 | ) | ||||
|
|
|
| |||||
As at 31 December | 10,005 | 10,442 | ||||||
|
|
|
| |||||
| 27 | Share capital |
| Ordinary A shares listed in PRC RMB’000 | Foreign invested H shares listed overseas RMB’000 | Total RMB’000 | ||||||||||
As at 1 January 2018 | 7,319,177 | 3,495,000 | 10,814,177 | |||||||||
Exercise of employee share options – proceeds received (Note 29) | 9,637 | — | 9,637 | |||||||||
|
|
|
|
|
| |||||||
As at 31 December 2018 | 7,328,814 | 3,495,000 | 10,823,814 | |||||||||
|
|
|
|
|
| |||||||
As at 1 January 2019 and 31 December 2019 | 7,328,814 | 3,495,000 | 10,823,814 | |||||||||
|
|
|
|
|
| |||||||
246
Table of Contents
Notes to the Consolidated Financial Statements(continued)
For the year ended 31 December 2019
| 28 | Reserves |
| Legal surplus RMB’000 | Capital surplus RMB’000 | Surplus reserve RMB’000 | Other reserve RMB’000 | Share premium RMB’000 | Safety production fund RMB’000 | Retained earnings RMB’000 | Total RMB’000 | |||||||||||||||||||||||||
Balance at 1 January 2018 | 4,072,476 | 4,180 | 101,355 | 47,469 | 62,319 | — | 13,128,257 | 17,416,056 | ||||||||||||||||||||||||
Net profit attributable to shareholders of the Company | — | — | — | — | — | — | 5,336,331 | 5,336,331 | ||||||||||||||||||||||||
Dividends proposed and approved | — | — | — | — | — | — | (3,247,144 | ) | (3,247,144 | ) | ||||||||||||||||||||||
Appropriation of safety production fund | — | — | — | — | — | 57,135 | (57,135 | ) | — | |||||||||||||||||||||||
Forfeit of share option scheme (Note 29) | — | — | — | (13,004 | ) | — | — | — | (13,004 | ) | ||||||||||||||||||||||
Exercise of share option | — | — | — | (17,062 | ) | 44,527 | — | — | 27,465 | |||||||||||||||||||||||
Share of other comprehensive loss of investments accounted for using the equity method | — | — | — | (7,014 | ) | — | — | — | (7,014 | ) | ||||||||||||||||||||||
Transactions withnon-controlling interests | — | 9,559 | — | — | — | — | — | 9,559 | ||||||||||||||||||||||||
|
|
|
|
|
|
|
|
|
|
|
|
|
|
|
| |||||||||||||||||
Balance at 31 December 2018 | 4,072,476 | 13,739 | 101,355 | 10,389 | 106,846 | 57,135 | 15,160,309 | 19,522,249 | ||||||||||||||||||||||||
|
|
|
|
|
|
|
|
|
|
|
|
|
|
|
| |||||||||||||||||
Net profit attributable to shareholders of the Company | — | — | — | — | — | — | 2,215,728 | 2,215,728 | ||||||||||||||||||||||||
Dividends proposed and approved | — | — | — | — | — | — | (2,705,952 | ) | (2,705,952 | ) | ||||||||||||||||||||||
Appropriation of safety production fund | — | — | — | — | — | 2 | (2 | ) | — | |||||||||||||||||||||||
Share of other comprehensive income of investments accounted for using the equity method | — | — | — | 7,449 | — | — | — | 7,449 | ||||||||||||||||||||||||
|
|
|
|
|
|
|
|
|
|
|
|
|
|
|
| |||||||||||||||||
Balance at 31 December 2019 | 4,072,476 | 13,739 | 101,355 | 17,838 | 106,846 | 57,137 | 14,670,083 | 19,039,474 | ||||||||||||||||||||||||
|
|
|
|
|
|
|
|
|
|
|
|
|
|
|
| |||||||||||||||||
247
Table of Contents
Notes to the Consolidated Financial Statements(continued)
For the year ended 31 December 2019
| 29 | Share-based payments |
Pursuant to the resolution of the fifth meeting of the eighth session of the Board of Directors of the Company on 6 January 2015, the proposal regarding the list of participants and the number of share options under the share option incentive scheme was approved.
According to the Company’s share option incentive scheme, the grant date of share options was 6 January 2015, and there were a total of 38,760 thousand share options granted to 214 participants (0.359% of the total ordinary share capital issued). Each share option has a right to purchase an ordinary A share listed in PRC on vesting date at the exercise price under vesting conditions. The options were divided by three tranches of 40%, 30% and 30% of the total share options granted, respectively. Each tranche had independent vesting conditions relevant to year 2015, 2016 and 2017, respectively, which were listed as following:
| • | weighted average rate of return on equity of the Group should be no less than 9% for 2015, 9.5% for 2016 and 10% for 2017 in respect to the three tranche; |
| • | for each year of 2015, 2016 and 2017, the compound annual growth rate in net profit based on the net profit of 2013 should achieve 5%; |
| • | for each year of 2015, 2016 and 2017, proportion of the main business revenue in the total revenue should be no less than 99%; |
| • | for each year of 2015, 2016 and 2017, each of the above three conditions should be no lower than the 75% level of peer companies; and |
| • | achieving the target budget set by the Sinopec Corp. in 2015, 2016 and 2017, respectively. |
The participant should serve the Group at the required position from the grant date. Exercisable amount of each tranche depended on the time for which the participant served the Group during each year of 2015, 2016 and 2017. Upon the fulfilment of relevant vesting conditions, the share options of each tranche shall become exercisable at its exercisable date.
The fair value of the employee services received in exchange for the grant of this equity-settled, share-based compensation plan is recognized as an expense on a straight-line basis over the vesting period of each tranche. The total amount to be expensed is determined by reference to the fair value of the options granted excluding the impact of any service andnon-market performance vesting conditions. When the options are exercised, the Company issues new shares. The proceeds received net of any directly attributable transaction costs are credited to share capital and share premium.
As at the grand date, the exercise price of each option was RMB4.2. During the vesting period, the exercise price would be adjusted according to the declaration of dividends or any changes of total shares.
248
Table of Contents
Notes to the Consolidated Financial Statements(continued)
For the year ended 31 December 2019
| 29 | Share-based payments(continued) |
The total fair value of share options at the grant date was RMB65,412 thousands, which has been estimated by the Company
using Black-Scholes valuation model with the support from an external valuation expert.
The significant inputs into the model were as follows:
| Granting date | ||||
Spot share price | RMB4.51 | |||
Exercise price | RMB4.20 | |||
Expected volatility | 41.20 | % | ||
Maturity (years) | 5.00 | |||
Risk-free interest rate | 3.39%~3.67% | |||
Dividend yield | 1.00 | % | ||
The options of first tranche and second tranche were exercised at RMB3.85 in August 2017 and January 2018. According to the Group’s board resolution on 28 December 2018, the third tranche was not exercised due to the failure on satisfying thenon-market exercise conditions.
249
Table of Contents
Notes to the Consolidated Financial Statements(continued)
For the year ended 31 December 2019
| 29 | Share-based payments(continued) |
Set out below are summaries of options granted under the plan:
| Number of share options 2018 | ||||
As at 1 January | 19,104,500 | |||
Exercised during the year | (9,636,900 | ) | ||
Forfeited during the year | (9,467,600 | ) | ||
|
| |||
As at 31 December | — | |||
|
| |||
The first tranche of the Share Option Incentive Scheme was exercised at RMB3.85 per share option on 29 August 2017, and the Company received cash payment of RMB54,580 thousands from 199 grantees, out of which, RMB14,177 thousands were in share capital and RMB40,403 thousands were in reserve as share premium.
The second tranche of the Share Option Incentive Scheme was exercised at RMB3.85 per share option on 12 January 2018, and the Company received cash payment of RMB37,102 thousands from 185 grantees, out of which, RMB9,637 thousands were in share capital (Note 27) and RMB27,465 thousands were in reserve as share premium (Note 28).
Due to the forfeit of the third tranche of Share Option Incentive Scheme, share option expenses of RMB13,004 thousands was reversed in Selling and administrative expenses of the consolidated income statement for the year ended 31 December 2018.
As at 31 December 2019 and 31 December 2018, there were no outstanding share options.
250
Table of Contents
Notes to the Consolidated Financial Statements(continued)
For the year ended 31 December 2019
| 30 | Related party transactions |
The following is a list of the Group’s major related parties:
Names of related parties | Relationship with the Company | |
Sinopec Group | Ultimate parent company | |
JYJC | Joint venture of the Group | |
BOC | Joint venture of the Group | |
Jinpu | Joint venture of the Group | |
Yangu Gas | Joint venture of the Group | |
Azbil | Associate of the Group | |
Chemical Industry | Associate of the Group | |
Jinsen | Associate of the Group | |
Secco | Associate of the Group | |
Shanghai Carbon Fiber Composites Innovation Research Institute Energy | Associate of the Group | |
Shanghai Chemical Industry Park Logistics Company Limited | Associate of the Group | |
Shanghai Jinhuan Petroleum Naphthalene Development Company Limited | Associate of the Group | |
Shanghai Nam Kwong Petro-Chemical Company Limited | Associate of the Group | |
Shidian Energy | Associate of the Group |
251
Table of Contents
Notes to the Consolidated Financial Statements(continued)
For the year ended 31 December 2019
| 30 | Related party transactions(continued) |
The following is a list of the Group’s major related parties:
Names of related parties | Relationship with the Company | |
Anqing Refinery Shuguang Oxo Company Limited | Subsidiary of the immediate parent company | |
BASFGao-Qiao Performance Chemicals (Shanghai) Company Limited | Subsidiary of the immediate parent company | |
China International United Petroleum and Chemical Company Limited | Subsidiary of the immediate parent company | |
China Petrochemical International (Nanjing) Company Limited | Subsidiary of the immediate parent company | |
China Petrochemical International Beijing Company Limited | Subsidiary of the immediate parent company | |
China Petrochemical International Ningbo Company Limited | Subsidiary of the immediate parent company | |
China Petrochemical International Tianjin Company Limited | Subsidiary of the immediate parent company | |
China Petrochemical International Wuhan Company Limited | Subsidiary of the immediate parent company | |
China Petrochemical Technology Company Limited | Subsidiary of the immediate parent company | |
Dalian Frip Science and Technology Company Limited | Subsidiary of the immediate parent company | |
Epec Commercial Factoring Company Limited | Subsidiary of the immediate parent company | |
Fujian Gulei Petrochemical Company Limited | Subsidiary of the immediate parent company | |
Fujian Refining & Petrochemical Company Limited (FREP) | Subsidiary of the immediate parent company | |
Nanjing Yangzi Petrochemical Rubber Company Limited | Subsidiary of the immediate parent company | |
Ningbo Eastsea Linefan Technology Company Limited | Subsidiary of the immediate parent company |
252
Table of Contents
Notes to the Consolidated Financial Statements(continued)
For the year ended 31 December 2019
| 30 | Related party transactions(continued) |
The following is a list of the Group’s major related parties:
Names of related parties | Relationship with the Company | |
Sinopec International (Singapore) Pte. Ltd | Subsidiary of the immediate parent company | |
Petro-CyberWorks Information Technology Company Limited | Subsidiary of the immediate parent company | |
Qingdao Sinosun Management System Certification Center Company Limited | Subsidiary of the immediate parent company | |
Shanghai Jinshan Trading Corporation | Subsidiary of the immediate parent company | |
Shanghai KSD Bulk Solids Engineering Company Limited | Subsidiary of the immediate parent company | |
Shanghai Leader Catalyst Company Limited | Subsidiary of the immediate parent company | |
Shengli Oil Field Exploration And Development Research Institute | Subsidiary of the immediate parent company | |
Sinopec Beijing Research Institute of Chemical Industry | Subsidiary of the immediate parent company | |
Sinopec Catalyst Company Limited | Subsidiary of the immediate parent company | |
Sinopec Chemical Commercial Holding (Hong Kong) Company Limited | Subsidiary of the immediate parent company | |
Sinopec Chemical Commercial Holding Company Limited | Subsidiary of the immediate parent company | |
Sinopec Dalian (Fushun) Research Institute of Petroleum and Petrochemicals | Subsidiary of the immediate parent company | |
Sinopec Europe Company Limited | Subsidiary of the immediate parent company | |
Sinopec Group Beijing Yanshan Petrochemical Company Limited | Subsidiary of the immediate parent company | |
Sinopec Honeywell (Tianjin) Company Limited | Subsidiary of the immediate parent company | |
Sinopec Japan Company Limited | Subsidiary of the immediate parent company |
253
Table of Contents
Notes to the Consolidated Financial Statements(continued)
For the year ended 31 December 2019
| 30 | Related party transactions(continued) |
The following is a list of the Group’s major related parties:
Names of related parties | Relationship with the Company | |
Sinopec Lubricating Oil Shanghai Research Institute Company Limited | Subsidiary of the immediate parent company | |
Sinopec Materials & Equipment (East China) Company Limited | Subsidiary of the immediate parent company | |
Sinopec Refinery Product Sales Company Limited | Subsidiary of the immediate parent company | |
Sinopec Research Institute of Petroleum Processing | Subsidiary of the immediate parent company | |
Sinopec Safety Engineering Institute | Subsidiary of the immediate parent company | |
Sinopec Shanghai Research Institute of Petrochemical Technology | Subsidiary of the immediate parent company | |
Sinopec Shanghai Gaoqiao Petrochemical Company Limited | Subsidiary of the immediate parent company | |
Sinopec Yangzi Petrochemical Company Limited | Subsidiary of the immediate parent company | |
Sinopec Yizheng Chemical Fibre Company Limited | Subsidiary of the immediate parent company | |
Sinopec International Company Limited | Subsidiary of the immediate parent company | |
Sinopec Nanjing valve supply reserve centers | Subsidiary of the immediate parent company | |
Sinopec Qingdao Refining & Chemical Company Limited | Subsidiary of the immediate parent company | |
Storage And Transportation Installation Company of Ningbo Engineering Company Limited | Subsidiary of the immediate parent company | |
Unipec (Ningbo) International Logistics Company Limited | Subsidiary of the immediate parent company | |
Unipec America, Inc | Subsidiary of the immediate parent company | |
Unipec Singapore | Subsidiary of the immediate parent company | |
Zhoushan Shihua Crude Oil Terminal Company Limited | Subsidiary of the immediate parent company |
254
Table of Contents
Notes to the Consolidated Financial Statements(continued)
For the year ended 31 December 2019
| 30 | Related party transactions(continued) |
The following is a list of the Group’s major related parties:
Names of related parties | Relationship with the Company | |
BASF-YPC Company Limited | Joint venture of the immediate parent company | |
Zhejiang Baling Hengyi Caprolactam Limited Company | Joint venture of the immediate parent company | |
Beijing Petrochemical Engineering Consulting Company Limited | Subsidiary of the ultimate parent company | |
Beijing Shihua Hotel | Subsidiary of the ultimate parent company | |
Beijing Victory Hotel Company Limited | Subsidiary of the ultimate parent company | |
China Petrochemical Press Company Limited | Subsidiary of the ultimate parent company | |
Jiangsu Jinling Opta Polymer Company Limited | Subsidiary of the ultimate parent company | |
National Petrochemical Project Risk Assessment Technology Center | Subsidiary of the ultimate parent company | |
Petrochemical Engineering Quality Supervision Centre | Subsidiary of the ultimate parent company | |
Shanghai Petrochemical Machinery Manufacture Limited Company | Subsidiary of the ultimate parent company | |
Shanghai Petrochemical Seawall Management Office | Subsidiary of the ultimate parent company | |
Shanghai Sanopec Company Limited | Subsidiary of the ultimate parent company | |
Sinopec Assets Management Corporation | Subsidiary of the ultimate parent company | |
Sinopec Consulting Company Limited | Subsidiary of the ultimate parent company | |
Sinopec Economics & Development Research Institute | Subsidiary of the ultimate parent company | |
Sinopec Energy Saving Technology Service Company Limited | Subsidiary of the ultimate parent company | |
Sinopec Engineering Incorporation | Subsidiary of the ultimate parent company |
255
Table of Contents
Notes to the Consolidated Financial Statements(continued)
For the year ended 31 December 2019
| 30 | Related party transactions(continued) |
The following is a list of the Group’s major related parties:
Names of related parties | Relationship with the Company | |
Sinopec Finance | Subsidiary of the ultimate parent company | |
Sinopec Group Shanghai Training Center | Subsidiary of the ultimate parent company | |
Sinopec International Travel Service Company Limited | Subsidiary of the ultimate parent company | |
Sinopec Luoyang Engineering Company Limited | Subsidiary of the ultimate parent company | |
Sinopec Management Institute | Subsidiary of the ultimate parent company | |
Sinopec Nanjing Chemical Industries Company Limited | Subsidiary of the ultimate parent company | |
Sinopec Nanjing Engineering Company Limited | Subsidiary of the ultimate parent company | |
Sinopec News | Subsidiary of the ultimate parent company | |
Sinopec Ningbo Engineering Company Limited | Subsidiary of the ultimate parent company | |
Sinopec Petroleum Commercial Reserve Company Limited | Subsidiary of the ultimate parent company | |
Sinopec Shanghai Engineering Company Limited | Subsidiary of the ultimate parent company | |
Sinopec Shared Services Company Limited | Subsidiary of the ultimate parent company | |
Sinopec Tendering Company Limited | Subsidiary of the ultimate parent company | |
Sinopec Zhongyuan Oilfield | Subsidiary of the ultimate parent company | |
Sinopec (Shenzhen)E-Commerce Company Limited | Subsidiary of the ultimate parent company | |
The Fifth Construction Company of Sinopec | Subsidiary of the ultimate parent company | |
The Fourth Construction Company of Sinopec | Subsidiary of the ultimate parent company | |
The Tenth Construction Company of Sinopec | Subsidiary of the ultimate parent company | |
Yihua Tory Polyester Film Company Limited | Subsidiary of the ultimate parent company |
256
Table of Contents
Notes to the Consolidated Financial Statements(continued)
For the year ended 31 December 2019
| 30 | Related party transactions (continued) |
The following is a summary of significant balances and transactions between the Group and its related parties except for the dividends received as disclosed in the forgoing Note 23.
| (a) | Most of the transactions undertaken by the Group during the year ended 31 December 2019 have been affected on such terms as determined by Sinopec Corp. and relevant PRC authorities. |
Sinopec Corp. negotiates and agrees the terms of crude oil supply with suppliers on a group basis, which is then allocated among its subsidiaries, including the Group, on a discretionary basis. Sinopec Corp. also owns a widespread petroleum products sales network and possesses a fairly high market share in domestic petroleum products market, which is subject to extensive regulation by the PRC government.
The Group has entered into a mutual product supply and sales services framework agreement with Sinopec Corp. Pursuant to the agreement, Sinopec Corp. provides the Group with crude oil, other petrochemical raw materials and agent services. On the other hand, the Group provides Sinopec Corp. with petroleum products, petrochemical products and property leasing services.
The pricing policy for these services and products provided under the agreement is as follows:
If there are applicable State (central and local government) tariffs, the pricing shall follow the State tariffs;
If there are no State tariffs, but there are applicable State’s guidance prices, the pricing shall follow the State’s guidance prices; or
If there are no State tariffs or State’s guidance prices, the pricing shall be determined in accordance with the prevailing
market prices (including any bidding prices).
Transactions between the Group and Sinopec Corp., its subsidiaries and joint ventures were as follows:
| 2019 | 2018 | |||||||
| RMB’000 | RMB’000 | |||||||
Sales of petroleum products | 50,354,162 | 49,209,765 | ||||||
Sales other than petroleum products | 8,642,514 | 7,112,332 | ||||||
Purchases of crude oil | 43,886,966 | 44,175,644 | ||||||
Purchases other than crude oil | 9,579,239 | 8,996,814 | ||||||
Sales commissions | 125,619 | 139,837 | ||||||
Rental income | 31,972 | 29,551 | ||||||
257
Table of Contents
Notes to the Consolidated Financial Statements(continued)
For the year ended 31 December 2019
| 30 | Related party transactions (continued) |
| (b) | Other transactions between the Group and Sinopec Group and its subsidiaries, associates and joint ventures of the Group were as follows: |
| 2019 | 2018 | |||||||
| RMB’000 | RMB’000 | |||||||
Sales of goods and service fee income | ||||||||
– Sinopec Group and its subsidiaries | 7,724 | 11,486 | ||||||
– Associates and joint ventures of the Group | 2,843,909 | 4,130,295 | ||||||
|
|
|
| |||||
| 2,851,633 | 4,141,781 | |||||||
|
|
|
| |||||
Purchase | ||||||||
– Sinopec Group and its subsidiaries | 1,918,873 | 2,253,446 | ||||||
– Associates and joint ventures of the Group | 4,579,969 | 3,982,729 | ||||||
|
|
|
| |||||
| 6,498,842 | 6,236,175 | |||||||
|
|
|
| |||||
Insurance premiums expenses | ||||||||
– Sinopec Group and its subsidiaries | 108,223 | 121,329 | ||||||
|
|
|
| |||||
Lease expenses | ||||||||
– Sinopec Group and its subsidiaries | — | 59,160 | ||||||
|
|
|
| |||||
Depreciation ofright-of-use assets | ||||||||
– Sinopec Group and its subsidiaries | 80,552 | — | ||||||
– Joint ventures of the Group | 88 | — | ||||||
|
|
|
| |||||
| 80,640 | — | |||||||
|
|
|
| |||||
Interest expense of lease liabilities | ||||||||
– Sinopec Group and its subsidiaries | 2,285 | — | ||||||
– Joint ventures of the Group | 19 | — | ||||||
|
|
|
| |||||
| 2,304 | — | |||||||
|
|
|
| |||||
Loans borrowed | ||||||||
– Sinopec Finance | — | 50,000 | ||||||
|
|
|
| |||||
258
Table of Contents
Notes to the Consolidated Financial Statements(continued)
For the year ended 31 December 2019
| 30 | Related party transactions (continued) |
| (b) | Other transactions between the Group and Sinopec Group and its subsidiaries, associates and joint ventures of the Group were as follows (continued): |
| 2019 | 2018 | |||||||
| RMB’000 | RMB’000 | |||||||
Interest income | ||||||||
– Sinopec Finance | 1,295 | 610 | ||||||
|
|
|
| |||||
Loans repayment | ||||||||
– Sinopec Finance | — | 50,000 | ||||||
|
|
|
| |||||
Interest expense | ||||||||
– Sinopec Finance | — | 1,326 | ||||||
|
|
|
| |||||
Construction and installation cost | ||||||||
– Sinopec Group and its subsidiaries | 143,560 | 109,146 | ||||||
|
|
|
| |||||
Rental income | ||||||||
– Associates and joint ventures of the Group | 11,370 | — | ||||||
– Sinopec Group and its subsidiaries | 461 | — | ||||||
|
|
|
| |||||
| 11,831 | — | |||||||
|
|
|
| |||||
The directors of the Company are of the opinion that the transactions with Sinopec Corp., its subsidiaries and joint ventures, Sinopec Group and its subsidiaries, associates and joint ventures of the Group as disclosed in Note 30(a) and 30(b) were conducted in the ordinary course of business, on normal commercial terms and in accordance with the agreements governing such transactions.
259
Table of Contents
Notes to the Consolidated Financial Statements(continued)
For the year ended 31 December 2019
| 30 | Related party transactions(continued) |
| (c) | The relevant amounts due from/to Sinopec Corp., its subsidiaries and joint venture, Sinopec Group and its subsidiaries, associates and joint ventures of the Group, arising from purchases, sales and other transactions as disclosed in Note 30(a) and 30(b), are summarized as follows: |
| As at 31 December | ||||||||
| 2019 RMB’000 | 2018 RMB’000 | |||||||
Amounts due from related parties | ||||||||
– Sinopec Corp., its subsidiaries and joint ventures | 1,505,836 | 2,142,731 | ||||||
– Sinopec Group and its subsidiaries | — | 457 | ||||||
– Associates and joint ventures of the Group | 60,157 | 143,061 | ||||||
|
|
|
| |||||
| 1,565,993 | 2,286,249 | |||||||
|
|
|
| |||||
Amounts due to related parties | ||||||||
– Sinopec Corp., its subsidiaries and joint ventures | 4,756,382 | 4,238,963 | ||||||
– Associates and joint ventures of the Group | 749,459 | 283,717 | ||||||
– Sinopec Group and its subsidiaries | 202,553 | 45,134 | ||||||
|
|
|
| |||||
| 5,708,394 | 4,567,814 | |||||||
|
|
|
| |||||
Lease liabilities | ||||||||
– Sinopec Group and its subsidiaries | 15,571 | — | ||||||
– Joint ventures of the Group | 698 | — | ||||||
|
|
|
| |||||
| 16,269 | — | |||||||
|
|
|
| |||||
Cash deposits, maturing within 3 months | ||||||||
– Sinopec Finance | 67,015 | 22,082 | ||||||
|
|
|
| |||||
| (d) | As at 31 December 2019 and 31 December 2018, cash deposits with Sinopec Finance were at an interest rate of 0.35% per annum. |
260
Table of Contents
Notes to the Consolidated Financial Statements(continued)
For the year ended 31 December 2019
| 30 | Related party transactions(continued) |
| (e) | Key management personnel compensation and post-employment benefit plans |
Key management personnel are those persons having authority and responsibility for planning, directing and controlling the activities of the Group, directly or indirectly, including directors and supervisors of the Group. The key personnel compensations are as follows:
| Year ended 31 December | ||||||||
| 2019 RMB’000 | 2018 RMB’000 | |||||||
Short-term employee benefits | 9,120 | 7,561 | ||||||
Post-employment benefits | 225 | 159 | ||||||
|
|
|
| |||||
| 9,345 | 7,720 | |||||||
|
|
|
| |||||
| (f) | Contributions to defined contribution retirement plans |
The Group participates in defined contribution retirement plans organized by municipal governments for its staff. The contributions to defined contribution retirement plans are as follows:
| Year ended 31 December | ||||||||
| 2019 RMB’000 | 2018 RMB’000 | |||||||
Municipal retirement scheme costs | 258,328 | 262,728 | ||||||
Supplementary retirement scheme costs | 125,370 | 75,312 | ||||||
|
|
|
| |||||
As at 31 December 2019 and 31 December 2018, there was no material outstanding contribution to the above defined contribution retirement plans.
261
Table of Contents
Notes to the Consolidated Financial Statements(continued)
For the year ended 31 December 2019
| 30 | Related party transactions(continued) |
| (g) | Transactions with other state-owned entities in the PRC |
The Group is a state-controlled enterprise and operates in an economic regime currently dominated by entities directly or indirectly controlled by the PRC government (collectively referred to as “state-controlled entities”) through its government authorities, agencies, affiliations and other organizations.
Apart from transactions with related parties, the Group has transactions with other state-controlled entities which include, but are not limited to, the following:
| • | sales and purchases of goods and ancillary materials; |
| • | rendering and receiving services; |
| • | lease of assets, purchase of property, plant and equipment; |
| • | placing deposits and obtaining finance; and |
| • | use of public utilities |
These transactions are conducted in the ordinary course of the Group’s business on terms comparable to those with other entities that are not state controlled. The Group has established its procurement policies, pricing strategy and approval process for purchases and sales of products and services which do not depend on whether the counterparties are state-controlled entities or not.
| (h) | Commitments with related parties |
Construction and installation cost
| As at 31 December | ||||||||
| 2019 RMB’000 | 2018 RMB’000 | |||||||
Sinopec Group and its subsidiaries | 156,309 | 16,011 | ||||||
|
|
|
| |||||
262
Table of Contents
Notes to the Consolidated Financial Statements(continued)
For the year ended 31 December 2019
| 30 | Related party transactions(continued) |
| (i) | Investment commitments with related parties |
| As at 31 December | ||||||||
| 2019 RMB’000 | 2018 RMB’000 | |||||||
Capital contribution to Shanghai Secco (i) | 111,263 | 111,263 | ||||||
Capital contribution to Shidian Energy (ii) | 80,000 | — | ||||||
|
|
|
| |||||
| 191,263 | 111,263 | |||||||
|
|
|
| |||||
| (i) | Pursuant to the resolution of the 18th meeting of the 7th term of Board of Directors on 5 December 2013, the Group was approved to make capital contribution of USD30,017 thousands (RMB182,804 thousands equivalent) to Shanghai Secco, an associate of the Group. As at 31 December 2019, the Company has contributed RMB71,541 thousands to Shanghai Secco. According to the approval by Shanghai Municipal Commission of Commerce as issued on 19 October 2015, the rest of the capital contribution to Shanghai Secco should be within 50 years starting from its registration date. |
| (ii) | Pursuant to the articles of association of Shidian Energy in August 2019, Toufa agreed to make capital contribution of RMB400,000 thousands to acquire 40% share of Shidian Energy. As at 31 December 2019, Toufa has contributed RMB320,000 thousands to Shidian Energy, and the rest of the capital contribution to Shidian Energy should be paid before January 2022 in accordance with the agreement. |
Except for the above disclosed in Note 30 (h) and 30 (i), the Group had no other material commitments with related parties as at 31 December 2019, which are contracted, but not included in the financial statements.
| 31 | Dividend |
An annual dividend in respect of the year ended 31 December 2019 of RMB0.12 per share, amounting to a total dividend of RMB1,298,858 thousands, was approved by the Board of Directors on 25 March 2020. This financial statement has not reflected such dividend payable.
An annual dividend in respect of the year ended 31 December 2018 of RMB0.25 per share, amounting to a total dividend of RMB2,705,952 thousands, was approved by the Board of Directors on 19 March 2019.
263
Table of Contents
Notes to the Consolidated Financial Statements(continued)
For the year ended 31 December 2019
| 32 | Cash generated from operations |
Reconciliation of profit before income tax to cash used in operation:
| Year ended 31 December | ||||||||
| 2019 RMB’000 | 2018 RMB’000 | |||||||
Profit before income tax | 2,656,128 | 6,808,121 | ||||||
|
|
|
| |||||
Adjustment items: | ||||||||
Interest income | (398,176 | ) | (443,661 | ) | ||||
Share of profit of investments accounted for using the equity method | (972,593 | ) | (885,597 | ) | ||||
Losses/(gains) on disposal of subsidiary | 60,951 | (1,622 | ) | |||||
Fair value (gains)/losses of foreign exchange option and forward exchange contracts | (3,001 | ) | 2,021 | |||||
Gains from structured deposits | (85,444 | ) | (19,811 | ) | ||||
Payments for sale of financial assets at fair value through other comprehensive income | 19,513 | — | ||||||
Interest expense | 53,784 | 35,574 | ||||||
Foreign exchange (gains)/losses | (18,571 | ) | 18,034 | |||||
Depreciation of property, plant and equipment | 1,507,804 | 1,550,924 | ||||||
Depreciation of investment property | 14,694 | 14,527 | ||||||
Depreciation ofright-of-use assets | 101,998 | — | ||||||
Amortization of lease prepayments and othernon-current assets | 214,292 | 242,162 | ||||||
Impairment loss on property, plant, equipment and construction in progress | 486 | 82,652 | ||||||
Gains on disposal of property, plant and equipment and other long-term assets – net | (158,551 | ) | (172,508 | ) | ||||
(Losses)/gains on exercise of foreign exchange option | (1,155 | ) | (6,411 | ) | ||||
Net (losses)/gains on settlement of foreign exchange contracts | 16,471 | (10,129 | ) | |||||
Share-based payment | — | (13,004 | ) | |||||
|
|
|
| |||||
Profit on operation before change of working capital | 3,008,630 | 7,201,272 | ||||||
|
|
|
| |||||
Decrease/(increase) in inventories | 1,366,441 | (1,523,277 | ) | |||||
Increase in operation receivables | (92,354 | ) | (469,339 | ) | ||||
(Decrease)/increase in operation payables | (487,877 | ) | 2,767,557 | |||||
Increase in balances to related parties – net | 1,860,836 | 525,286 | ||||||
|
|
|
| |||||
Cash generated from operating activities | 5,655,676 | 8,501,499 | ||||||
|
|
|
| |||||
264
Table of Contents
Notes to the Consolidated Financial Statements(continued)
For the year ended 31 December 2019
| 32 | Cash generated from operations(continued) |
| (a) | Reconciliation of liabilities arising from financing activities |
| As at 1 January 2019 | Financing cash flows | Addition of lease liabilities | Foreign exchange movements | As at 31 December 2019 | ||||||||||||||||
| RMB’000 | RMB’000 | RMB’000 | RMB’000 | RMB’000 | ||||||||||||||||
Bank loans | 497,249 | 1,059,892 | — | (9,541 | ) | 1,547,600 | ||||||||||||||
|
|
|
|
|
|
|
|
|
| |||||||||||
Lease liabilities | 76,731 | (89,124 | ) | 34,436 | — | 22,043 | ||||||||||||||
|
|
|
|
|
|
|
|
|
| |||||||||||
| (b) | In the statement of cash flows, proceeds from sale of property, plant and equipment comprise: |
| Year ended 31 December | ||||||||
| 2019 RMB’000 | 2018 RMB’000 | |||||||
Net book amount | 23,113 | 37,614 | ||||||
Losses on disposal of property, plant and equipment – net | 44,390 | 172,508 | ||||||
|
|
|
| |||||
Net proceeds from disposal of property, plant and equipment | 67,503 | 210,122 | ||||||
|
|
|
| |||||
| (c) | Non-cash investing activities |
| Year ended 31 December | ||||||||
| 2019 RMB’000 | 2018 RMB’000 | |||||||
Purchase ofnon-current assets settled by bills | 73,812 | 50,110 | ||||||
|
|
|
| |||||
265
Table of Contents
Notes to the Consolidated Financial Statements(continued)
For the year ended 31 December 2019
| 33 | Commitments |
Capital commitments
| As at 31 December | ||||||||
| 2019 RMB’000 | 2018 RMB��000 | |||||||
Property, plant and equipment | ||||||||
Contracted but not provided for | 247,220 | 69,210 | ||||||
|
|
|
| |||||
| 34 | Subsequent event |
A dividend in respect of the year ended 31 December 2019 of RMB0.12 per share, amounting to a total dividend of RMB1,298,858 thousands, was proposed by the Board of Directors on 25 March 2020.
Following the outbreak of Coronavirus Disease 2019 (“theCOVID-19 outbreak”) in early 2020, a series of precautionary and control measures have been and continued to be implemented across the country, including extension of the Chinese New Year holiday nationwide, postponement of work resumption after the Chinese New Year holiday in some regions, certain level of restrictions and controls over the travelling of people and traffic arrangements, quarantine of certain residents, heightening of hygiene and epidemic prevention requirements in factories and offices and encouraged social distancing.
Due to theCOVID-19 outbreak and corresponding control measures, the refinery processing volumes of the Group up to date of this report dropped compared with same period of prior year. Due to theCOVID-19 outbreak and failing negotiation on reduction output of OPEC, global crude oil price decreased significantly and caused corresponding impact on operation of the Group.
As at the reporting date, the overall impact of theCOVID-19 outbreak on the macro-economy was still unclear and the Group was not able to estimate its specific impact on the Group’s financial position. The Group will pay sustained attention to thefollow-up status ofCOVID-19 outbreak, and take corresponding measures to further assess the impact on financial position and operating result.
266
Table of Contents
Notes to the Consolidated Financial Statements(continued)
For the year ended 31 December 2019
| 35 | Balance sheet and reserve movement of the Company |
| As at 31 December 2019 | As at 31 December 2018 | |||||||
| RMB’000 | RMB’000 | |||||||
Assets | ||||||||
Non-current assets | ||||||||
Lease prepayments and othernon-current assets | 455,391 | 813,119 | ||||||
Property, plant and equipment | 11,101,389 | 11,435,270 | ||||||
Right-of-use assets | 319,434 | — | ||||||
Investment properties | 397,573 | 408,366 | ||||||
Construction in progress | 1,814,985 | 1,559,401 | ||||||
Investments in subsidiaries | 1,848,328 | 1,718,007 | ||||||
Investments in associates | 4,476,683 | 3,869,433 | ||||||
Deferred income tax assets | 138,648 | 109,137 | ||||||
Time deposits with banks | 3,511,234 | — | ||||||
|
|
|
| |||||
| 24,063,665 | 19,912,733 | |||||||
|
|
|
| |||||
Current assets | ||||||||
Inventories | 6,368,389 | 7,500,683 | ||||||
Financial assets at fair value through other comprehensive income | 669,889 | 714,599 | ||||||
Financial assets at fair value through profit or loss | 3,318,407 | 2,526,053 | ||||||
Trade receivables | 2,114 | 170,205 | ||||||
Other receivables | 12,627 | 92,999 | ||||||
Prepayments | 3,099 | 1,862 | ||||||
Amounts due from related parties | 1,354,793 | 1,953,459 | ||||||
Cash and cash equivalents | 5,754,440 | 7,619,013 | ||||||
Time deposits with banks | 1,508,839 | 1,500,000 | ||||||
|
|
|
| |||||
| 18,992,597 | 22,078,873 | |||||||
|
|
|
| |||||
Total assets | 43,056,262 | 41,991,606 | ||||||
|
|
|
| |||||
Equity and liabilities | ||||||||
Equity attributable to owners of the Company | ||||||||
Share capital | 10,823,814 | 10,823,814 | ||||||
Reserves (a) | 18,620,152 | 19,318,245 | ||||||
|
|
|
| |||||
Total equity | 29,443,966 | 30,142,059 | ||||||
|
|
|
| |||||
267
Table of Contents
Notes to the Consolidated Financial Statements(continued)
For the year ended 31 December 2019
| 35 | Balance sheet and reserve movement of the Company(continued) |
| As at 31 December 2019 | As at 31 December 2018 | |||||||
| RMB’000 | RMB’000 | |||||||
Liabilities | ||||||||
Non-current liabilities | ||||||||
Deferred income | 10,005 | 10,442 | ||||||
Lease liabilities | 8,860 | — | ||||||
|
|
|
| |||||
| 18,865 | 10,442 | |||||||
|
|
|
| |||||
Current liabilities | ||||||||
Borrowings | 1,500,000 | 431,649 | ||||||
Lease liabilities | 10,059 | — | ||||||
Financial liabilities at fair value through profit or loss | — | 9,799 | ||||||
Contract liabilities | 597,688 | 403,967 | ||||||
Bills payables | 655,000 | — | ||||||
Trade payables and other payables | 5,508,265 | 6,388,081 | ||||||
Amounts due to related parties | 5,104,639 | 4,310,659 | ||||||
Income tax payable | 217,780 | 294,950 | ||||||
|
|
|
| |||||
| 13,593,431 | 11,839,105 | |||||||
|
|
|
| |||||
Total liabilities | 13,612,296 | 11,849,547 | ||||||
|
|
|
| |||||
Total equity and liabilities | 43,056,262 | 41,991,606 | ||||||
|
|
|
| |||||
The balance sheet of the Company was approved by the Board of Directors on 25 March 2020 and were signed on its behalf.
| Wu Haijun | Zhou Meiyun | |
Chairman | Director, Vice General Manager and Chief Financial Officer |
268
Table of Contents
Notes to the Consolidated Financial Statements(continued)
For the year ended 31 December 2019
| 35 | Balance sheet and reserve movement of the Company(continued) |
| (a) | Reserve movement of the Company |
| Legal surplus | Capital surplus | Surplus reserve | Other reserve | Share premium | Safety production fund | Retained earnings | Total | |||||||||||||||||||||||||
| RMB’000 | RMB’000 | RMB’000 | RMB’000 | RMB’000 | RMB’000 | RMB’000 | RMB’000 | |||||||||||||||||||||||||
Balance at 1 January 2018 | 4,072,476 | 4,180 | 101,355 | 47,469 | 62,319 | — | 13,115,540 | 17,403,339 | ||||||||||||||||||||||||
|
|
|
|
|
|
|
|
|
|
|
|
|
|
|
| |||||||||||||||||
Net profit attributable to shareholders of the Company | — | — | — | — | — | — | 5,154,603 | 5,154,603 | ||||||||||||||||||||||||
Dividends proposed and approved | — | — | — | — | — | — | (3,247,144 | ) | (3,247,144 | ) | ||||||||||||||||||||||
Appropriation of safety production fund | — | — | — | — | — | 57,135 | (57,135 | ) | — | |||||||||||||||||||||||
Forfeit of share option scheme (Note 29) | — | — | — | (13,004 | ) | — | — | — | (13,004 | ) | ||||||||||||||||||||||
Exercise of share option | — | — | — | (17,062 | ) | 44,527 | — | — | 27,465 | |||||||||||||||||||||||
Share of other comprehensive loss of investments accounted for using the equity method | — | — | — | (7,014 | ) | — | — | — | (7,014 | ) | ||||||||||||||||||||||
|
|
|
|
|
|
|
|
|
|
|
|
|
|
|
| |||||||||||||||||
Balance at 31 December 2018 | 4,072,476 | 4,180 | 101,355 | 10,389 | 106,846 | 57,135 | 14,965,864 | 19,318,245 | ||||||||||||||||||||||||
|
|
|
|
|
|
|
|
|
|
|
|
|
|
|
| |||||||||||||||||
Net profit attributable to shareholders of the Company | — | — | — | — | — | — | 2,000,410 | 2,000,410 | ||||||||||||||||||||||||
Dividends proposed and approved | — | — | — | — | — | — | (2,705,952 | ) | (2,705,952 | ) | ||||||||||||||||||||||
Share of other comprehensive income of investments accounted for using the equity method | — | — | — | 7,449 | — | — | — | 7,449 | ||||||||||||||||||||||||
|
|
|
|
|
|
|
|
|
|
|
|
|
|
|
| |||||||||||||||||
Balance at 31 December 2019 | 4,072,476 | 4,180 | 101,355 | 17,838 | 106,846 | 57,135 | 14,260,322 | 18,620,152 | ||||||||||||||||||||||||
|
|
|
|
|
|
|
|
|
|
|
|
|
|
|
| |||||||||||||||||
269
Table of Contents
Notes to the Consolidated Financial Statements(continued)
For the year ended 31 December 2019
| 36 | Benefits and interests of directors and supervisors |
| (i) | Directors’ and supervisors’ emoluments: |
| 2019 | ||||||||||||||||||||
| Retirement | ||||||||||||||||||||
| Salaries and | scheme | Discretionary | ||||||||||||||||||
| other benefits | contributions | bonus | Fees | Total | ||||||||||||||||
| RMB’000 | RMB’000 | RMB’000 | RMB’000 | RMB’000 | ||||||||||||||||
Executive Directors | ||||||||||||||||||||
Wu Haijun | 343 | 26 | 557 | — | 926 | |||||||||||||||
Shi Wei (a) | 329 | 26 | 797 | — | 1,152 | |||||||||||||||
Jin Qiang | 289 | 26 | 745 | — | 1,060 | |||||||||||||||
Guo Xiaojun (b) | 283 | 26 | 751 | — | 1,060 | |||||||||||||||
Zhou Meiyun | 248 | 26 | 709 | — | 983 | |||||||||||||||
Jin Wenmin | 260 | 26 | 721 | — | 1,007 | |||||||||||||||
Independentnon- executive directors | ||||||||||||||||||||
Zhang Yimin | — | — | — | 150 | 150 | |||||||||||||||
Liu Yunhong | — | — | — | 150 | 150 | |||||||||||||||
Du Weifeng | — | — | — | 150 | 150 | |||||||||||||||
Li Yuanqin | — | — | — | 150 | 150 | |||||||||||||||
Supervisors | ||||||||||||||||||||
Ma Yanhui | 267 | 22 | 685 | — | 974 | |||||||||||||||
Zuo Qiang (c) | 102 | 15 | 324 | — | 441 | |||||||||||||||
Li Xiaoxia (d) | 102 | 14 | 529 | — | 645 | |||||||||||||||
Zhang Feng (e) | 31 | 9 | 107 | — | 147 | |||||||||||||||
Chen Hongjun (f) | 34 | 9 | 110 | — | 153 | |||||||||||||||
Zheng Yunrui | 100 | — | — | — | 100 | |||||||||||||||
Cai Yanji | 100 | — | — | — | 100 | |||||||||||||||
|
|
|
|
|
|
|
|
|
| |||||||||||
| 2,488 | 225 | 6,035 | 600 | 9,348 | ||||||||||||||||
|
|
|
|
|
|
|
|
|
| |||||||||||
| (a) | Resigned in December 2019. |
| (b) | Resigned in December 2019. |
| (c) | Resigned in September 2019. |
| (d) | Resigned in September 2019. |
| (e) | Appointed in October 2019. |
| (f) | Appointed in October 2019. |
270
Table of Contents
Notes to the Consolidated Financial Statements(continued)
For the year ended 31 December 2019
| 36 | Benefits and interests of directors and supervisors(continued) |
| (i) | Directors’ and supervisors’ emoluments(continued): |
| 2018 | ||||||||||||||||||||
| Retirement | ||||||||||||||||||||
| Salaries and | scheme | Discretionary | ||||||||||||||||||
| other benefits | contributions | bonus | Fees | Total | ||||||||||||||||
| RMB’000 | RMB’000 | RMB’000 | RMB’000 | RMB’000 | ||||||||||||||||
Executive Directors | ||||||||||||||||||||
Wu Haijun (a) | 393 | 19 | 910 | — | 1,322 | |||||||||||||||
Shi Wei (b) | 84 | 6 | 58 | — | 148 | |||||||||||||||
Jin Qiang | 226 | 19 | 523 | — | 768 | |||||||||||||||
Guo Xiaojun | 216 | 19 | 518 | — | 753 | |||||||||||||||
Zhou Meiyun | 185 | 19 | 498 | — | 702 | |||||||||||||||
Jin Wenmin (c) | 187 | 19 | 528 | — | 734 | |||||||||||||||
Gao Jinping (d) | 215 | 12 | 549 | — | 776 | |||||||||||||||
Independentnon-executive directors | ||||||||||||||||||||
Zhang Yimin | — | — | — | 150 | 150 | |||||||||||||||
Liu Yunhong | — | — | — | 150 | 150 | |||||||||||||||
Du Weifeng | — | — | — | 150 | 150 | |||||||||||||||
Li Yuanqin | — | — | — | 150 | 150 | |||||||||||||||
Supervisors | ||||||||||||||||||||
Ma Yanhui | 274 | 14 | 288 | — | 576 | |||||||||||||||
Zuo Qiang | 135 | 17 | 411 | — | 563 | |||||||||||||||
Li Xiaoxia | 143 | 16 | 418 | — | 577 | |||||||||||||||
Zheng Yunrui | 100 | — | — | — | 100 | |||||||||||||||
Cai Tingji | 100 | — | — | — | 100 | |||||||||||||||
|
|
|
|
|
|
|
|
|
| |||||||||||
| 2,258 | 160 | 4,701 | 600 | 7,719 | ||||||||||||||||
|
|
|
|
|
|
|
|
|
| |||||||||||
| (a) | Resigned general manager in September 2018 while other titles remained. |
| (b) | Appointed in September 2018. |
| (c) | Appointed in June 2018. |
| (d) | Resigned in September 2018. |
271
Table of Contents
Notes to the Consolidated Financial Statements(continued)
For the year ended 31 December 2019
| 36 | Benefits and interests of directors and supervisors(continued) |
| (ii) | Directors’ retirement benefits |
No specific retirement benefits were paid to directors in respect of services in connection with the management of the affairs of the company or its subsidiary undertaking (2018: Nil).
| (iii) | Directors’ material interests in transactions, arrangements or contracts |
No significant transactions, arrangements and contracts in relation to the Group’s business to which the Company was a party and in which a director of the Company had a material interest, whether directly or indirectly, subsisted at the end of the year or at any time during the year.
272
Table of Contents
 |  |
PwC ZT Shen Zi (2020) No.10008
(Page 1 of 5)
To the Shareholders of Sinopec Shanghai Petrochemical Company Limited
(Incorporated in the People’s Republic of China with limited liability)
Opinion
What we have audited
We have audited the accompanying financial statements of Sinopec Shanghai Petrochemical Company Limited (hereinafter “SPC”), which comprise:
| • | the consolidated and company balance sheets as at 31 December 2019; |
| • | the consolidated and company income statements for the year then ended; • the consolidated and company cash flow statements for the year then ended; |
| • | the consolidated and company statements of changes in shareholders’ equity for the year then ended; |
| • | notes to the financial statements. |
Our opinion
In our opinion, the accompanying financial statements present fairly, in all material respects, the consolidated and company’s financial position of SPC as at 31 December 2019, and their financial performance and cash flows for the year then ended in accordance with the requirements of Accounting Standards for Business Enterprises (“CASs”).
Basis for Opinion
We conducted our audit in accordance with China Standards on Auditing (“CSAs”). Our responsibilities under those standards are further described in the Auditor’s Responsibilities for the Audit of the Consolidated Financial Statements section of our report. We believe that the audit evidence we have obtained is sufficient and appropriate to provide a basis for our opinion.
We are independent of SPC in accordance with the Code of Ethics for Professional Accountants of the Chinese Institute of Certified
Public Accountants (“CICPA Code”), and we have fulfilled our other ethical responsibilities in accordance with the CICPA Code.
273
Table of Contents
Independent Auditor’s Report(continued)
| |
PwC ZT Shen Zi (2020) No.10008
(Page 2 of 5)
Key Audit Matters
Key audit matters are those matters that, in our professional judgment, were of most significance in our audit of the financial statements of the current period. These matters were addressed in the context of our audit of the financial statements as a whole, and in forming our opinion thereon, and we do not provide a separate opinion on these matters.
Key audit matter identified in our audit was related to net realizable value (“NRV”) of raw materials, work in progress and finished goods:
Key Audit Matter | How our audit addressed the Key Audit Matter | |
NRV of material, work in progress and finished goods Refer to Notes 2.10 “Inventories”, 2.31 “Critical accounting estimates and assumptions” and 4.8 “Inventories” to the consolidated financial statements.
The Group is principally engaged in processing of crude oil into petroleum products and other chemical products. The crude oil can be processed into various finished goods by different processing procedures. Inventories are valued at the lower of cost and NRV.
As at 31 December 2019, the gross balances of raw materials, work in progress and finished goods were RMB6,662,023 thousand, against which provisions of RMB112,744 thousand were set aside.
The NRV is determined based on the estimated selling prices less the estimated costs to completion, if relevant, other costs necessary to make the sale, and the related taxes.
Determination of estimated selling prices of work in progress and finished goods, estimated costs to completion, other costs necessary to make the sale and the related taxes requires significant management judgement, taking into consideration of historical information and future market trend.
We focused on this area because of the magnitude of the amounts and the significance of management judgements involved. | We understood, evaluated and tested the controls over the determination of net realisable value of raw materials, work in progress and finished goods.
For work in progress and finished goods that had been sold after 31 December 2019, we compared on a sample basis the actual selling prices against the estimated selling prices.
For work in progress and finished goods that had not been sold after 31 December 2019:
if the selling prices were available in the domestic market, we performed independent research of the market price information and compared them against the estimated selling prices.
if there were no selling prices available in the domestic market, we compared the estimated selling prices against the recent selling prices. We also independently evaluated the future market trend factors which management considered in determining the estimated selling prices, including possible changes in market supplies, customer demands, technology developments, the relevant State tariffs and the State’s guidance prices by corroborating with public data or research information, checking subsequent outcomes of these factors and reference to our industry knowledge.
We assessed the reasonableness and the accuracy of the estimated costs to completion, other costs necessary to make the sale and the related taxes by comparing with the historical costs to completion, other costs necessary to make the sale and the related taxes for the similar inventories.
We found that management’s judgements in determining the NRV were supported by the evidence we gathered. | |
274
Table of Contents
Independent Auditor’s Report(continued)
| |
PwC ZT Shen Zi (2020) No.10008
(Page 3 of 5)
Other Information
The directors of SPC are responsible for the other information. The other information comprises all of the information included in the annual report other than the consolidated financial statements and our auditor’s report thereon.
Our opinion on the consolidated financial statements does not cover the other information and we do not express any form of assurance conclusion thereon.
In connection with our audit of the consolidated financial statements, our responsibility is to read the other information and, in doing so, consider whether the other information is materially inconsistent with the consolidated financial statements or our knowledge obtained in the audit or otherwise appears to be materially misstated. If, based on the work we have performed, we conclude that there is a material misstatement of this other information, we are required to report that fact. We have nothing to report in this regard.
Responsibilities of Directors and Those Charged with Governance for the Consolidated Financial Statements
The directors of SPC are responsible for the preparation of the consolidated financial statements that give a true and fair view in accordance with IFRSs and the disclosure requirements of the Hong Kong Companies Ordinance, and for such internal control as the directors determine is necessary to enable the preparation of consolidated financial statements that are free from material misstatement, whether due to fraud or error.
In preparing the consolidated financial statements, the directors are responsible for assessing the SPC’s ability to continue as a going concern, disclosing, as applicable, matters related to going concern and using the going concern basis of accounting unless the directors either intend to liquidate the SPC or to cease operations, or have no realistic alternative but to do so.
Those charged with governance are responsible for overseeing the SPC’s financial reporting process.
275
Table of Contents
Independent Auditor’s Report(continued)
| |
PwC ZT Shen Zi (2020) No.10008
(Page 4 of 5)
Auditor’s Responsibilities for the Audit of the Consolidated Financial Statements
Our objectives are to obtain reasonable assurance about whether these financial statements as a whole are free from material misstatement, whether due to fraud or error, and to issue an auditor’s report that includes our opinion. Reasonable assurance is a high level of assurance, but is not a guarantee that an audit conducted in accordance with CSAs will always detect a material misstatement when it exists. Misstatements can arise from fraud or error and are considered material if, individually or in the aggregate, they could reasonably be expected to influence the economic decisions of users taken on the basis of these financial statements.
As part of an audit in accordance with CSAs, we exercise professional judgment and maintain professional scepticism throughout the audit. We also:
| • | Identify and assess the risks of material misstatement of the financial statements, whether due to fraud or error, design and perform audit procedures responsive to those risks, and obtain audit evidence that is sufficient and appropriate to provide a basis for our opinion. The risk of not detecting a material misstatement resulting from fraud is higher than for one resulting from error, as fraud may involve collusion, forgery, intentional omissions, misrepresentations, or the override of internal control. |
| • | Obtain an understanding of internal control relevant to the audit in order to design audit procedures that are appropriate in the circumstances. |
| • | Evaluate the appropriateness of accounting policies used and the reasonableness of accounting estimates and related disclosures made by management. |
| • | Conclude on the appropriateness of the directors’ use of the going concern basis of accounting and, based on the audit evidence obtained, whether a material uncertainty exists related to events or conditions that may cast significant doubt on the SPC’s ability to continue as a going concern. If we conclude that a material uncertainty exists, we are required to draw attention in our auditor’s report to the related disclosures in the consolidated financial statements or, if such disclosures are inadequate, to modify our opinion. Our conclusions are based on the audit evidence obtained up to the date of our auditor’s report. However, future events or conditions may cause the SPC to cease to continue as a going concern. |
| • | Evaluate the overall presentation, structure and content of the financial statements, including the disclosures, and whether the financial statements represent the underlying transactions and events in a manner that achieves fair presentation. |
| • | Obtain sufficient appropriate audit evidence regarding the financial information of the entities or business activities within the SPC to express an opinion on the consolidated financial statements. We are responsible for the direction, supervision and performance of the SPC audit. We remain solely responsible for our audit opinion. |
276
Table of Contents
Independent Auditor’s Report(continued)
| |
PwC ZT Shen Zi (2020) No.10008
(Page 5 of 5)
Auditor’s Responsibilities for the Audit of the Consolidated Financial Statements(continued)
We communicate with those charged with governance regarding, among other matters, the planned scope and timing of the audit and significant audit findings, including any significant deficiencies in internal control that we identify during our audit.
We also provide those charged with governance with a statement that we have complied with relevant ethical requirements regarding independence, and to communicate with them all relationships and other matters that may reasonably be thought to bear on our independence, and where applicable, related safeguards.
From the matters communicated with those charged with governance, we determine those matters that were of most significance in the audit of the financial statements of the current period and are therefore the key audit matters. We describe these matters in our auditor’s report unless law or regulation precludes public disclosure about the matter or when, in extremely rare circumstances, we determine that a matter should not be communicated in our report because the adverse consequences of doing so would reasonably be expected to outweigh the public interest benefits of such communication.
| PricewaterhouseCoopers Zhong Tian LLP | Signing CPA | |
Huang, Zhe Jun (Engagement Partner) | ||
| Shanghai, the People’s Republic of China | Signing CPA | |
Chen, Jiao Jiao | ||
| 25 March 2020 | ||
277
Table of Contents
| B. | Financial Statements prepared under China Accounting Standards for Business Enterprises |
Consolidated and Company Balance Sheets
As at 31 December 2019
(All amounts in thousands of Renminbi Yuan unless otherwise stated)
[English translation for reference only]
| 31 December 2019 | 31 December 2018 | 31 December 2019 | 31 December 2018 | |||||||||||||||
Assets | Note | Consolidated | Consolidated | Company | Company | |||||||||||||
Current Assets | ||||||||||||||||||
Cash at bank and on hand | 4(1) | 8,958,538 | 10,241,893 | 7,263,279 | 9,119,013 | |||||||||||||
Derivative financial instruments | 4(2) | 263 | 7,468 | – | 6,953 | |||||||||||||
Financial assets at fair value through profit or loss | 4(3),12(1) | 3,318,407 | 2,719,811 | 3,318,407 | 2,519,100 | |||||||||||||
Accounts receivable | 4(4),12(2) | 1,639,916 | 2,297,814 | 1,310,449 | 2,053,409 | |||||||||||||
Financial assets at fair value through other comprehensive income | 4(5) | 1,540,921 | 1,672,431 | 669,889 | 714,599 | |||||||||||||
Advances to suppliers | 4(6) | 56,602 | 72,968 | 47,547 | 68,934 | |||||||||||||
Other receivables | 4(7),12(3) | 28,111 | 108,986 | 14,637 | 96,182 | |||||||||||||
Inventories | 4(8) | 6,754,434 | 8,120,875 | 6,368,389 | 7,500,683 | |||||||||||||
Assets hold for sale | 4(9) | – | 24,331 | – | – | |||||||||||||
Other current asset | 4(10) | 11,971 | 32,299 | – | – | |||||||||||||
|
|
|
|
|
|
|
| |||||||||||
Total Current Assets | 22,309,163 | 25,298,876 | 18,992,597 | 22,078,873 | ||||||||||||||
|
|
|
|
|
|
|
| |||||||||||
Non-Current Assets | ||||||||||||||||||
Long-term equity investments | 4(11),12(4) | 5,328,758 | 4,657,133 | 6,489,898 | 5,762,327 | |||||||||||||
Other equity instrument investments | 5,000 | – | – | – | ||||||||||||||
Investment properties | 4(12) | 367,468 | 376,739 | 397,573 | 408,366 | |||||||||||||
Property, plant and equipment | 4(13),12(5) | 11,322,850 | 11,670,453 | 11,123,442 | 11,459,333 | |||||||||||||
Construction in progress | 4(14) | 1,815,549 | 1,559,401 | 1,814,985 | 1,559,401 | |||||||||||||
Right-of-use assets | 4(15) | 23,648 | — | 20,520 | — | |||||||||||||
Intangible assets | 4(16) | 337,846 | 355,594 | 298,914 | 319,877 | |||||||||||||
Long-term prepaid expenses | 4(17) | 463,780 | 502,689 | 455,391 | 493,242 | |||||||||||||
Deferred tax assets | 4(18) | 150,832 | 119,075 | 138,648 | 109,137 | |||||||||||||
Othernon-current assets | 4(19) | 3,511,234 | – | 3,511,234 | – | |||||||||||||
|
|
|
|
|
|
|
| |||||||||||
TotalNon-Current Assets | 23,326,965 | 19,241,084 | 24,250,605 | 20,111,683 | ||||||||||||||
|
|
|
|
|
|
|
| |||||||||||
Total Assets | 45,636,128 | 44,539,960 | 43,243,202 | 42,190,556 | ||||||||||||||
|
|
|
|
|
|
|
| |||||||||||
278
Table of Contents
Consolidated and Company Balance Sheets (continued)
As at 31 December 2019
(All amounts in thousands of Renminbi Yuan unless otherwise stated)
[English translation for reference only]
| 31 December 2019 | 31 December 2018 | 31 December 2019 | 31 December 2018 | |||||||||||||||||
Liabilities & Equity | Note | Consolidated | Consolidated | Company | Company | |||||||||||||||
Current Liabilities | ||||||||||||||||||||
Short term loan | 4(21) | 1,547,600 | 497,249 | 1,500,000 | 431,649 | |||||||||||||||
Derivative financial liability | 4(2) | 799 | 11,005 | — | 9,799 | |||||||||||||||
Accounts payable | 4(22) | 733,900 | — | 715,000 | — | |||||||||||||||
Advances from customers | 4(23) | 7,664,296 | 7,394,383 | 5,951,568 | 5,535,625 | |||||||||||||||
Contract liabilities | 4(24) | 660,783 | 453,564 | 601,912 | 411,796 | |||||||||||||||
Employee benefits payable | 4(25) | 189,547 | 128,861 | 183,912 | 123,157 | |||||||||||||||
Taxes payable | 4(26) | 3,803,287 | 4,642,692 | 3,776,221 | 4,608,232 | |||||||||||||||
Other payable | 4(27) | 867,967 | 785,260 | 854,759 | 718,847 | |||||||||||||||
Non-current liabilities within one year | 4(28) | 11,450 | — | 10,059 | — | |||||||||||||||
|
|
|
|
|
|
|
| |||||||||||||
Total Current Liabilities | 15,479,629 | 13,913,014 | 13,593,431 | 11,839,105 | ||||||||||||||||
|
|
|
|
|
|
|
| |||||||||||||
Non-Current Liabilities | ||||||||||||||||||||
Lease liabilities | 4(29) | 10,593 | — | 8,860 | — | |||||||||||||||
Deferred revenue | 4(30) | 130,005 | 140,442 | 130,005 | 140,442 | |||||||||||||||
|
|
|
|
|
|
|
| |||||||||||||
TotalNon-Current Liabilities | 140,598 | 140,442 | 138,865 | 140,442 | ||||||||||||||||
|
|
|
|
|
|
|
| |||||||||||||
Total Liabilities | 15,620,227 | 14,053,456 | 13,732,296 | 11,979,547 | ||||||||||||||||
|
|
|
|
|
|
|
| |||||||||||||
Equity | ||||||||||||||||||||
Share capital | 1,4(31) | 10,823,814 | 10,823,814 | 10,823,814 | 10,823,814 | |||||||||||||||
Capital surplus | 4(32) | 610,327 | 610,327 | 600,768 | 600,768 | |||||||||||||||
Other comprehensive income | 4(33) | 17,838 | 10,389 | 17,838 | 10,389 | |||||||||||||||
Specific reserve | 4(34) | 57,137 | 57,135 | 57,135 | 57,135 | |||||||||||||||
Surplus reserve | 4(35) | 6,437,010 | 6,237,170 | 6,437,010 | 6,237,170 | |||||||||||||||
Undistributed profits | 4(36) | 11,939,215 | 12,631,291 | 11,574,341 | 12,481,733 | |||||||||||||||
|
|
|
|
|
|
|
| |||||||||||||
Total equity attributable to equity shareholders of the Company | 29,885,341 | 30,370,126 | 29,510,906 | 30,211,009 | ||||||||||||||||
|
|
|
|
|
|
|
| |||||||||||||
Non-Controlling Interests | 4(37) | 130,560 | 116,378 | — | — | |||||||||||||||
|
|
|
|
|
|
|
| |||||||||||||
Total Equity | 30,015,901 | 30,486,504 | 29,510,906 | 30,211,009 | ||||||||||||||||
|
|
|
|
|
|
|
| |||||||||||||
Total Liabilities and Shareholders’ Equity | 45,636,128 | 44,539,960 | 43,243,202 | 42,190,556 | ||||||||||||||||
|
|
|
|
|
|
|
| |||||||||||||
The accompanying notes form an integral part of these financial statements.
|
|
| ||
| Wu Haijun | Zhou Meiyun | Yang Yating | ||
| Chairman | Director Chief Financial Officer and Vice General Manager | Accounting Chief |
279
Table of Contents
Consolidated and Company Income Statements
For the year ended 31 December 2019
(All amounts in thousands of Renminbi Yuan unless otherwise stated)
[English translation for reference only]
| 2019 | 2018 | 2019 | 2018 | |||||||||||||||||
Items | Note | Consolidated | Consolidated | Company | Company | |||||||||||||||
Revenue | 4(38),12(6) | 100,346,048 | 107,764,908 | 78,110,863 | 80,116,103 | |||||||||||||||
Less: Cost of sales | 4(38),12(6) | 83,781,040 | 87,029,575 | 61,858,808 | 59,641,027 | |||||||||||||||
Taxes and surcharges | 4(39) | 12,213,927 | 12,075,424 | 12,192,123 | 12,051,253 | |||||||||||||||
Selling and distribution expenses | 4(40) | 532,455 | 536,914 | 438,545 | 437,909 | |||||||||||||||
General and administrative expenses | 4(41) | 2,500,287 | 2,616,798 | 2,380,251 | 2,460,912 | |||||||||||||||
R&D expenses | 4(42) | 92,964 | 37,261 | 84,404 | 29,500 | |||||||||||||||
Finance income – net | 4(43) | (348,181) | (293,429) | (311,456) | (334,897) | |||||||||||||||
Including: finance expense | 53,784 | 79,246 | 51,429 | 41,850 | ||||||||||||||||
finance income | (398,176) | (443,650) | (363,282) | (410,655) | ||||||||||||||||
Add: Other income | 4(45) | 63,826 | 89,035 | 60,325 | 84,679 | |||||||||||||||
Investment income | 4(46),12(7) | 953,661 | 878,213 | 972,758 | 826,730 | |||||||||||||||
Including: Share of profits of associates and joint ventures | 962,593 | 875,597 | 899,926 | 816,631 | ||||||||||||||||
Gain from changes in fair values | 4(47) | 1,597 | 33,347 | 2,153 | 16,254 | |||||||||||||||
Credit impairment losses | 4(48) | 59 | (39) | 54 | (73) | |||||||||||||||
Asset impairment losses | 4(49) | (70,664) | (168,655) | (70,248) | (153,247) | |||||||||||||||
Asset disposal benefits/losses | 4(50) | 176,324 | 172,508 | 14,267 | (24,648) | |||||||||||||||
|
|
|
|
|
|
|
| |||||||||||||
Operating profit | 2,698,359 | 6,766,774 | 2,447,497 | 6,580,094 | ||||||||||||||||
|
|
|
|
|
|
|
| |||||||||||||
Add:Non-operating income | 4(51) | 20,507 | 47,581 | 14,509 | 19,763 | |||||||||||||||
Less:Non-operating expenses | 4(52) | 64,750 | 65,379 | 64,744 | 42,799 | |||||||||||||||
|
|
|
|
|
|
|
| |||||||||||||
Total profit | 2,654,116 | 6,748,976 | 2,397,262 | 6,557,058 | ||||||||||||||||
|
|
|
|
|
|
|
| |||||||||||||
Less: Income tax expenses | 4(53) | 428,963 | 1,471,903 | 398,862 | 1,461,600 | |||||||||||||||
|
|
|
|
|
|
|
| |||||||||||||
Net profit | 2,225,153 | 5,277,073 | 1,998,400 | 5,095,458 | ||||||||||||||||
|
|
|
|
|
|
|
| |||||||||||||
Attributable to shareholders of the Company | 2,213,716 | 5,277,186 | — | — | ||||||||||||||||
Non-controlling interests | 11,437 | (113) | — | — | ||||||||||||||||
Profit from continuing operations | 2,225,153 | 5,277,073 | 1,998,400 | 5,095,458 | ||||||||||||||||
Profit from discontinued operations | — | — | — | — | ||||||||||||||||
|
|
|
|
|
|
|
| |||||||||||||
280
Table of Contents
Consolidated and Company Income Statements(continued)
For the year ended 31 December 2019
(All amounts in thousands of Renminbi Yuan unless otherwise stated)
[English translation for reference only]
| 2019 | 2018 | 2019 | 2018 | |||||||||||||||||
Items | Note | Consolidated | Consolidated | Company | Company | |||||||||||||||
Other comprehensive income | 7,449 | (7,014) | 7,449 | (7,014) | ||||||||||||||||
|
|
|
|
|
|
|
| |||||||||||||
Total comprehensive income | 2,232,602 | 5,270,059 | 2,005,849 | 5,088,444 | ||||||||||||||||
|
|
|
|
|
|
|
| |||||||||||||
Attributable to shareholders of the Company | 2,221,165 | 5,270,172 | — | — | ||||||||||||||||
Non-controlling interests | 11,437 | (113) | — | — | ||||||||||||||||
|
|
|
|
|
|
|
| |||||||||||||
Earnings per share | ||||||||||||||||||||
Basic earnings per share (RMB Yuan) | 4(54) | 0.205 | 0.488 | — | — | |||||||||||||||
Diluted earnings per share (RMB Yuan) | 4(54) | 0.205 | 0.488 | — | — | |||||||||||||||
|
|
|
|
|
|
|
| |||||||||||||
The accompanying notes form an integral part of these financial statements.
|
|
| ||
| Wu Haijun | Zhou Meiyun | Yang Yating | ||
| Chairman | Director Chief Financial Officer and Vice General Manager | Accounting Chief |
281
Table of Contents
Consolidated and Company Cash Flow Statements
For the year ended 31 December 2019
(All amounts in thousands of Renminbi Yuan unless otherwise stated)
[English translation for reference only]
| 2019 | 2018 | 2019 | 2018 | |||||||||||||||
Items | Note | Consolidated | Consolidated | Company | Company | |||||||||||||
Cash flows from operating activities | ||||||||||||||||||
Cash received from sales of goods or rendering of services | 110,126,469 | 118,881,819 | 86,465,346 | 89,564,633 | ||||||||||||||
Refund of taxes and surcharges | 31,470 | 53,532 | 29,972 | 51,462 | ||||||||||||||
Cash received relating to other operating activities | 4(55) | 42,075 | 75,081 | 34,281 | 105,577 | |||||||||||||
|
|
|
|
|
|
|
| |||||||||||
Sub-total of cash inflows | 110,200,014 | 119,010,432 | 86,529,599 | 89,721,672 | ||||||||||||||
|
|
|
|
|
|
|
| |||||||||||
Cash paid for goods and services | (86,975,385 | ) | (94,892,094 | ) | (63,816,421 | ) | (65,801,807 | ) | ||||||||||
Cash paid to and on behalf of employees | (3,092,019 | ) | (2,901,628 | ) | (2,911,994 | ) | (2,624,396 | ) | ||||||||||
Payments of taxes and surcharges | (14,580,917 | ) | (14,079,772 | ) | (14,490,704 | ) | (14,015,067 | ) | ||||||||||
Cash paid relating to other operating activities | 4(55) | (430,484 | ) | (441,839 | ) | (437,534 | ) | (534,356 | ) | |||||||||
|
|
|
|
|
|
|
| |||||||||||
Sub-total of cash outflows | (105,078,805 | ) | (112,315,333 | ) | (81,656,653 | ) | (82,975,626 | ) | ||||||||||
|
|
|
|
|
|
|
| |||||||||||
Net cash flows generated from operating activities | 4(56),12(8) | 5,121,209 | 6,695,099 | 4,872,946 | 6,746,046 | |||||||||||||
|
|
|
|
|
|
|
| |||||||||||
Cash flows from investing activities | ||||||||||||||||||
Cash received from entrusted lendings | — | 12,000 | — | — | ||||||||||||||
Cash received from returns on investments | 594,868 | 811,473 | 544,358 | 768,605 | ||||||||||||||
Net cash received from disposal of fixed assets | 67,503 | 210,122 | 62,728 | 3,243 | ||||||||||||||
Cash received relating to other investing activities | — | 9,600 | — | — | ||||||||||||||
Cash received relating to other investing activities | 4(55) | 7,833,248 | 4,433,970 | 7,593,709 | 4,382,656 | |||||||||||||
|
|
|
|
|
|
|
| |||||||||||
Sub-total of cash inflows | 8,495,619 | 5,477,165 | 8,200,795 | 5,154,504 | ||||||||||||||
|
|
|
|
|
|
|
| |||||||||||
Cash paid to acquire fixed assets, intangible assets and other long-term assets | (1,430,411 | ) | (1,187,005 | ) | (1,421,904 | ) | (1,191,643 | ) | ||||||||||
Net cash received from subsidiaries | (253,184 | ) | — | (327,943 | ) | — | ||||||||||||
Cash held by the Company on the day of loss of control | (404 | ) | (18,529 | ) | — | — | ||||||||||||
Cash paid relating to other investing activities | 4(55) | (11,434,829 | ) | (6,200,000 | ) | (11,415,904 | ) | (6,000,000 | ) | |||||||||
|
|
|
|
|
|
|
| |||||||||||
Sub-total of cash outflows | (13,118,828 | ) | (7,405,534 | ) | (13,165,751 | ) | (7,191,643 | ) | ||||||||||
|
|
|
|
|
|
|
| |||||||||||
Net cash flows used in investing activities | (4,623,209 | ) | (1,928,369 | ) | (4,964,956 | ) | (2,037,139 | ) | ||||||||||
|
|
|
|
|
|
|
| |||||||||||
282
Table of Contents
Consolidated and Company Cash Flow Statements(continued)
For the year ended 31 December 2019
(All amounts in thousands of Renminbi Yuan unless otherwise stated)
[English translation for reference only]
| 2019 | 2018 | 2019 | 2018 | |||||||||||||||
Items | Note | Consolidated | Consolidated | Company | Company | |||||||||||||
Cash flows from financing activities | ||||||||||||||||||
Cash received relating to other financing activities | — | 37,102 | — | 37,102 | ||||||||||||||
Cash received from borrowings | 4,755,100 | 2,536,759 | 4,700,000 | 2,421,159 | ||||||||||||||
|
|
|
|
|
|
|
| |||||||||||
Sub-total of cash inflows | 4,755,100 | 2,573,861 | 4,700,000 | 2,458,261 | ||||||||||||||
|
|
|
|
|
|
|
| |||||||||||
Cash repayments of borrowings | (3,695,208 | ) | (2,646,157 | ) | (3,621,775 | ) | (2,508,000 | ) | ||||||||||
Cash paid for distribution of dividends or profits and interest expenses | (2,771,560 | ) | (3,317,778 | ) | (2,764,402 | ) | (3,308,648 | ) | ||||||||||
Including: cash payments for dividends or profits tonon-controlling shareholders of subsidiaries | (3,266 | ) | (6,457 | ) | — | — | ||||||||||||
Cash from minority shareholder | — | (152,800 | ) | — | — | |||||||||||||
Principal elements of lease payments | 4(55) | (89,124 | ) | — | (86,386 | ) | — | |||||||||||
|
|
|
|
|
|
|
| |||||||||||
Sub-total of cash outflows | (6,555,892 | ) | (6,116,735 | ) | (6,472,563 | ) | (5,816,648 | ) | ||||||||||
|
|
|
|
|
|
|
| |||||||||||
Net cash flows used in financing activities | (1,800,792 | ) | (3,542,874 | ) | (1,772,563 | ) | (3,358,387 | ) | ||||||||||
|
|
|
|
|
|
|
| |||||||||||
Exchange gains on cash and cash equivalents | 10,598 | 13,771 | — | — | ||||||||||||||
|
|
|
|
|
|
|
| |||||||||||
Net (decrease)/increase in cash and cash equivalents | (1,292,194 | ) | 1,237,627 | (1,864,573 | ) | 1,350,520 | ||||||||||||
Add: Cash and cash equivalents at the beginning of the year | 4(56) | 8,741,893 | 7,504,266 | 7,619,013 | 6,268,493 | |||||||||||||
|
|
|
|
|
|
|
| |||||||||||
Cash and cash equivalents at the end of the year | 4(56) | 7,449,699 | 8,741,893 | 5,754,440 | 7,619,013 | |||||||||||||
|
|
|
|
|
|
|
| |||||||||||
The accompanying notes form an integral part of these financial statements.
|
|
| ||
| Wu Haijun | Zhou Meiyun | Yang Yating | ||
| Chairman | Director Chief Financial Officer and Vice General Manager | Accounting Chief |
283
Table of Contents
Consolidated Statement of Changes in Shareholders’ Equity
For the year ended 31 December 2019
(All amounts in thousands of Renminbi Yuan unless otherwise stated)
[English translation for reference only]
| Attributable to equity shareholders of the Company | Non- controlling interests | Total equity | ||||||||||||||||||||||||||||||||
Items | Note | Share capital | Capital surplus | Other comprehensive income | Specific reserve | Surplus reserve | Undistributed profits | |||||||||||||||||||||||||||
Balance at 1 January 2018 | 10,814,177 | 586,307 | 17,403 | — | 5,727,624 | 11,110,795 | 285,307 | 28,541,613 | ||||||||||||||||||||||||||
|
|
|
|
|
|
|
|
|
|
|
|
|
|
|
| |||||||||||||||||||
Movements for the year ended 31 December 2018 | ||||||||||||||||||||||||||||||||||
Total comprehensive income | ||||||||||||||||||||||||||||||||||
Net profit for the year | — | — | — | — | — | 5,277,186 | (113 | ) | 5,277,073 | |||||||||||||||||||||||||
Other comprehensive loss | 4(33) | — | — | (7,014 | ) | — | — | — | — | (7,014 | ) | |||||||||||||||||||||||
Contributions of equity | ||||||||||||||||||||||||||||||||||
Employees share option scheme | 4(31),4(32) | 9,637 | 27,465 | — | — | — | — | — | 37,102 | |||||||||||||||||||||||||
Exercise of share option | 4(32) | — | (13,004 | ) | — | — | — | — | — | (13,004 | ) | |||||||||||||||||||||||
Appropriation of profits | ||||||||||||||||||||||||||||||||||
Appropriation to surplus reserves | 4(35) | — | — | — | — | 509,546 | (509,546 | ) | — | — | ||||||||||||||||||||||||
Distributions to shareholders | 4(36) | — | — | — | — | — | (3,247,144 | ) | (6,457 | ) | (3,253,601 | ) | ||||||||||||||||||||||
Specific reserve | ||||||||||||||||||||||||||||||||||
Accrued | 4(34) | — | — | — | 112,870 | — | — | — | 112,870 | |||||||||||||||||||||||||
Utilised | 4(34) | — | — | — | (55,735 | ) | — | — | — | (55,735 | ) | |||||||||||||||||||||||
Equity change of minority shareholder | — | 9,559 | — | — | — | — | (162,359 | ) | (152,800 | ) | ||||||||||||||||||||||||
|
|
|
|
|
|
|
|
|
|
|
|
|
|
|
| |||||||||||||||||||
Balance at 31 December 2018 | 10,823,814 | 610,327 | 10,389 | 57,135 | 6,237,170 | 12,631,291 | 116,378 | 30,486,504 | ||||||||||||||||||||||||||
|
|
|
|
|
|
|
|
|
|
|
|
|
|
|
| |||||||||||||||||||
284
Table of Contents
Consolidated Statement of Changes in Shareholders’ Equity(continued)
For the year ended 31 December 2019
(All amounts in thousands of Renminbi Yuan unless otherwise stated)
[English translation for reference only]
| Attributable to equity shareholders of the Company | Non- controlling interests | Total equity | ||||||||||||||||||||||||||||||||
Items | Note | Share capital | Capital surplus | Other comprehensive income | Specific reserve | Surplus reserve | Undistributed profits | |||||||||||||||||||||||||||
Balance at 1 January 2019 | 10,823,814 | 610,327 | 10,389 | 57,135 | 6,237,170 | 12,631,291 | 116,378 | 30,486,504 | ||||||||||||||||||||||||||
|
|
|
|
|
|
|
|
|
|
|
|
|
|
|
| |||||||||||||||||||
Movements for the year ended 31 December 201 | ||||||||||||||||||||||||||||||||||
Total comprehensive income | ||||||||||||||||||||||||||||||||||
Net profit for the year | — | — | — | — | — | 2,213,716 | 11,437 | 2,225,153 | ||||||||||||||||||||||||||
Other comprehensive income | 4(33) | — | — | 7,449 | — | — | — | — | 7,449 | |||||||||||||||||||||||||
Appropriation of profits | ||||||||||||||||||||||||||||||||||
Appropriation to surplus reserves | 4(35) | — | — | — | — | 199,840 | (199,840 | ) | — | — | ||||||||||||||||||||||||
Distributions to shareholders | 4(36) | — | — | — | — | — | (2,705,952 | ) | (3,266 | ) | (2,709,218 | ) | ||||||||||||||||||||||
Specific reserve | ||||||||||||||||||||||||||||||||||
Accrued | 4(34) | — | — | — | 138,028 | — | — | — | 138,028 | |||||||||||||||||||||||||
Utilised | 4(34) | — | — | — | (138,026 | ) | — | — | — | (138,026 | ) | |||||||||||||||||||||||
Equity change of minority shareholder | — | — | — | — | — | — | 6,011 | 6,011 | ||||||||||||||||||||||||||
|
|
|
|
|
|
|
|
|
|
|
|
|
|
|
| |||||||||||||||||||
Balance at 31 December 2019 | 10,823,814 | 610,327 | 17,838 | 57,137 | 6,437,010 | 11,939,215 | 130,560 | 30,015,901 | ||||||||||||||||||||||||||
|
|
|
|
|
|
|
|
|
|
|
|
|
|
|
| |||||||||||||||||||
The accompanying notes form an integral part of these financial statements.
|
|
| ||
| Wu Haijun | Zhou Meiyun | Yang Yating | ||
| Chairman | Director Chief Financial Officer and Vice General Manager | Accounting Chief |
285
Table of Contents
Statement of Changes in Shareholders’ Equity
For the year ended 31 December 2019
(All amounts in thousands of Renminbi Yuan unless otherwise stated)
[English translation for reference only]
Items | Note | Share capital | Capital surplus | Other comprehensive income | Specific reserve | Surplus reserve | Undistributed profits | Total equity | ||||||||||||||||||||||||
Balance at 1 January 2018 | 10,814,177 | 586,307 | 17,403 | — | 5,727,624 | 11,142,965 | 28,288,476 | |||||||||||||||||||||||||
|
|
|
|
|
|
|
|
|
|
|
|
|
| |||||||||||||||||||
Movements for the year ended 31 December 2018 | ||||||||||||||||||||||||||||||||
Total comprehensive income | ||||||||||||||||||||||||||||||||
Net profit for the year | — | — | — | — | — | 5,095,458 | 5,095,458 | |||||||||||||||||||||||||
Other comprehensive loss | — | — | (7,014 | ) | — | — | — | (7,014 | ) | |||||||||||||||||||||||
Contributions of equity | ||||||||||||||||||||||||||||||||
Employees share option scheme | 9,637 | 27,465 | — | — | — | — | 37,102 | |||||||||||||||||||||||||
Exercise of share option | — | (13,004 | ) | — | — | — | — | (13,004 | ) | |||||||||||||||||||||||
Appropriation of profits | ||||||||||||||||||||||||||||||||
Appropriation to surplus reserves | — | — | — | — | 509,546 | (509,546 | ) | — | ||||||||||||||||||||||||
Distributions to shareholders | — | — | — | — | — | (3,247,144 | ) | (3,247,144 | ) | |||||||||||||||||||||||
Specific reserve | ||||||||||||||||||||||||||||||||
Accrued | — | — | — | 112,870 | — | — | 112,870 | |||||||||||||||||||||||||
Utilised | — | — | — | (55,735 | ) | — | — | (55,735 | ) | |||||||||||||||||||||||
|
|
|
|
|
|
|
|
|
|
|
|
|
| |||||||||||||||||||
Balance at 31 December 2018 | 10,823,814 | 600,768 | 10,389 | 57,135 | 6,237,170 | 12,481,733 | 30,211,009 | |||||||||||||||||||||||||
|
|
|
|
|
|
|
|
|
|
|
|
|
| |||||||||||||||||||
Balance at 1 January 2019 | 10,823,814 | 600,768 | 10,389 | 57,135 | 6,237,170 | 12,481,733 | 30,211,009 | |||||||||||||||||||||||||
|
|
|
|
|
|
|
|
|
|
|
|
|
| |||||||||||||||||||
Movements for the year ended 31 December 2019 | ||||||||||||||||||||||||||||||||
Total comprehensive income | ||||||||||||||||||||||||||||||||
Net profit for the year | — | — | — | — | — | 1,998,400 | 1,998,400 | |||||||||||||||||||||||||
Other comprehensive income | — | — | 7,449 | — | — | — | 7,449 | |||||||||||||||||||||||||
Appropriation of profits | ||||||||||||||||||||||||||||||||
Appropriation to surplus reserves | — | — | — | — | 199,840 | (199,840 | ) | — | ||||||||||||||||||||||||
Distributions to shareholders | — | — | — | — | — | (2,705,952 | ) | (2,705,952 | ) | |||||||||||||||||||||||
Specific reserve | ||||||||||||||||||||||||||||||||
Accrued | — | — | — | 131,763 | — | — | 131,763 | |||||||||||||||||||||||||
Utilised | — | — | — | (131,763 | ) | — | — | (131,763 | ) | |||||||||||||||||||||||
|
|
|
|
|
|
|
|
|
|
|
|
|
| |||||||||||||||||||
Balance at 31 December 2019 | 10,823,814 | 600,768 | 17,838 | 57,135 | 6,437,010 | 11,574,341 | 29,510,906 | |||||||||||||||||||||||||
|
|
|
|
|
|
|
|
|
|
|
|
|
| |||||||||||||||||||
The accompanying notes form an integral part of these financial statements.
|
|
| ||
| Wu Haijun | Zhou Meiyun | Yang Yating | ||
| Chairman | Director Chief Financial Officer and Vice General Manager | Accounting Chief |
286
Table of Contents
Notes to the Financial Statements
For the year ended 31 December 2019
(All amounts in thousands of Renminbi Yuan unless otherwise stated)
[English translation for reference only]
1 General information
Sinopec Shanghai Petrochemical Company Limited (“the Company”), formerly Shanghai Petrochemical Company Limited, was established in the People’s Republic of China (“the PRC”) on 29 June 1993 with registered capital of RMB4,000,000,000, invested by its holding company-China National Petrochemical Corporation; these shares were converted from assets of former Shanghai Petrochemical Complex.
H shares were listed on the Hong Kong Stock Exchange on 26 July 1993, and listed on the New York Stock Exchange in the form of American Depositary Shares at the same time; the A shares were listed on the Shanghai Stock Exchange on 8 November 1993.
Sinopec Group completed its reorganization on 25 February 2000. After the reorganization, China Petroleum & Chemical Corporation (“Sinopec Corp.”) was established. As part of the reorganization, Sinopec Group transferred its 4,000,000,000 of the Company’s state-owned legal shares, which represented 55.56 percent of the issued share capital of the Company, to Sinopec Corp.. Sinopec Corp. became the largest shareholder of the Company. The Company changed its name to Sinopec Shanghai Petrochemical Company Limited on 12 October 2000.
Ordinary A shares of RMB14,176,600 and 9,636,900 were registered on 27 September 2017 and 12 January 2018.
As at 31 December 2019, total shares of the Company were 10,823,813,500, 1 Yuan per share. Detailed changes to share capital refers to Note 4(31).
The Company and its subsidiaries (“the Group”) is a highly integrated entity which processes crude oil into synthetic fibres, resins and plastics, intermediate petrochemicals and petroleum products.
Details of the Company’s principal subsidiaries are set out in Note 5. The Company which no longer combined is Zhejiang Jin Yong Acrylic Fiber Company Limited (“Jinyong”) and the details is set out in Note 5(1).
These financial statements were authorised for issue by the Board of Directors on 25 March 2020.
287
Table of Contents
Notes to the Financial Statements(continued)
For the year ended 31 December 2019
(All amounts in thousands of Renminbi Yuan unless otherwise stated)
[English translation for reference only]
2 Summary of significant accounting policies and accounting estimates
The Group determines the accounting policies and accounting estimates based on its production and management features, mainly reflecting in the provision of inventories (Note 2(10)), depreciation of fixed assets (Note 2(13)), and impairment of long-term assets (Note 2(18)).
The key assumptions adopted by the Group in evaluating significant accounting policies and accounting estimate are listed in Note 2(31).
(1) Basis of preparation
The financial statements are prepared in accordance with the Accounting Standard for Business Enterprises – Basic Standard, and the specific accounting standards and other relevant regulations issued by the Ministry of Finance on 15 February 2006 and in subsequent periods (hereafter collectively referred to as “the Accounting Standard for Business Enterprises” or “CAS”).
The financial statements are prepared on a going concern basis.
(2) Statement of compliance with the Accounting Standards for Business Enterprises
The financial statements of the Company for the year ended 31 December 2019 are in compliance with the Accounting Standards for Business Enterprises, and truly and completely present the financial position as at 31 December 2019 and the operating results, cash flows and other information for the year then ended of the Group and the Company.
(3) Accounting period
The Company’s accounting year starts on 1 January and ends on 31 December.
(4) Recording currency
The recording currency is Renminbi (RMB).
288
Table of Contents
Notes to the Financial Statements(continued)
For the year ended 31 December 2019
(All amounts in thousands of Renminbi Yuan unless otherwise stated)
[English translation for reference only]
2 Summary of significant accounting policies and accounting estimates(continued)
(5) Business combinations
(a) Business combinations involving enterprises under common control
The consideration paid and net assets obtained by the absorbing party in a business combination are measured at the carrying amount. The difference between the carrying amount of the net assets obtained from and the carrying amount of the consideration paid for the combination is treated as an adjustment to capital surplus (capital premium). If the capital surplus (capital premium) is not sufficient to absorb the difference, the remaining balance is adjusted against undistributed profits. Costs directly attributable to the combination are included in profit or loss in the period in which they are incurred. Transaction costs associated with the issue of equity or debt securities for the business combination are included in the initially recognised amounts of the equity or debt securities.
(b) Business combinations involving enterprises not under common control
The cost of combination and identifiable net assets obtained by the acquirer in a business combination are measured at fair value at the acquisition date. Where the cost of the combination exceeds the acquirer’s interest in the fair value of the acquiree’s identifiable net assets, the difference is recognised as goodwill; where the cost of combination is lower than the acquirer’s interest in the fair value of the acquiree’s identifiable net assets, the difference is recognised in profit or loss for the current period. Costs directly attributable to the combination are included in profit or loss in the period in which they are incurred. Transaction costs associated with the issue of equity or debt securities for the business combination are included in the initially recognised amounts of the equity or debt securities.
289
Table of Contents
Notes to the Financial Statements(continued)
For the year ended 31 December 2019
(All amounts in thousands of Renminbi Yuan unless otherwise stated)
[English translation for reference only]
2 Summary of significant accounting policies and accounting estimates(continued)
| (6) | Preparation of consolidated financial statements |
The consolidated financial statements comprise the financial statements of the Company and all of its subsidiaries.
Subsidiaries are consolidated from the date on which the Group obtains control and arede-consolidated from the date that such control ceases. For a subsidiary that is acquired in a business combination involving enterprises under common control, it is included in the consolidated financial statements from the date when it, together with the Company, comes under common control of the ultimate controlling party. The portion of the net profits realised before the combination date is presented separately in the consolidated income statement.
In preparing the consolidated financial statements, where the accounting policies and the accounting periods are inconsistent between the Company and subsidiaries, the financial statements of the subsidiaries are adjusted in accordance with the accounting policies and the accounting period of the Company. For subsidiaries acquired from business combinations involving enterprises not under common control, the individual financial statements of the subsidiaries are adjusted based on the fair value of the identifiable net assets at the acquisition date.
All significant intra-group balances, transactions and unrealised profits are eliminated in the consolidated financial statements. The portion of subsidiaries’ owners’ equity and the portion of subsidiaries’ net profits and losses and comprehensive incomes for the period not attributable to the Company are recognised asnon-controlling interests, net profit attributed tonon-controlling interests and total comprehensive incomes attributed tonon-controlling interests and presented separately in the consolidated financial statements under owners’ equity, net profits and total comprehensive income respectively. Unrealised profits and losses resulting from the sale of assets by the Company to its subsidiaries are fully eliminated against net profit attributable to owners of the parent. Unrealized profits and losses resulting from the sale of assets by a subsidiary to the Company are eliminated and allocated between net profit attributable to owners of the parent andnon-controlling interests in accordance with the allocation proportion of the parent in the subsidiary. Unrealized profits and losses resulting from the sale of assets by one subsidiary to another are eliminated and allocated between net profit attributable to owners of the parent andnon-controlling interests in accordance with the allocation proportion of the parent in the subsidiary.
If the accounting treatment of a transaction which considers the Group as an accounting entity is different from that considers the Company or its subsidiaries as an accounting entity, it is adjusted from the perspective of the Group.
290
Table of Contents
Notes to the Financial Statements(continued)
For the year ended 31 December 2019
(All amounts in thousands of Renminbi Yuan unless otherwise stated)
[English translation for reference only]
| 2 | Summary of significant accounting policies and accounting estimates(continued) |
| (7) | Cash and cash equivalents |
Cash and cash equivalents comprise cash on hand, deposits that can be readily drawn on demand, and short-term and highly liquid investments that are readily convertible to known amounts of cash and which are subject to an insignificant risk of changes in value.
| (8) | Foreign currency translation |
Foreign currency transactions
Foreign currency transactions are translated into RMB using the exchange rates prevailing at the dates of the transactions.
At the balance sheet date, monetary items denominated in foreign currencies are translated into RMB using the spot exchange rates on the balance sheet date. Exchange differences arising from these translations are recognised in profit or loss for the current period, except for those attributable to foreign currency borrowings that have been taken out specifically for the acquisition or construction of qualifying assets, which are capitalised as part of the cost of those assets.Non-monetary items denominated in foreign currencies that are measured at historical costs are translated into RMB at the balance sheet date using the spot exchange rates at the date of the transactions. The effect of exchange rate changes on cash is presented separately in the cash flow statement.
| (9) | Financial Instruments |
Financial assets refers to contracts when one side forms a financial asset while the other forms a financial liability or equity instrument. When the Group becomes one side of a financial instrument contract, the Group recognize a financial asset or a financial liability.
| (a) | Financial assets |
| (i) | Financial assets classification and measurement |
According to the business model of financial assets management and the characteristics of contract cash flow of financial assets, the Group divides financial assets into: (1) financial assets measured by amortized cost; (2) financial assets measured at fair value and recorded into other comprehensive income; (3) financial assets measured at fair value and recorded in current profit and loss.
Financial assets are measured at fair value at the time of initial recognition. For financial assets measured at fair value and whose changes are included in the current profit and loss, relevant transaction costs are directly included in the current profit and loss; For other categories of financial assets, the relevant transaction costs are included in the initial recognition amount. Accounts receivable or notes receivable arising from the sale of products or the provision of services, which do not contain or take no account of material financing elements, shall be initially recognized by the Group in accordance with the amount of consideration to which the Group is entitled to receive as expected.
291
Table of Contents
Notes to the Financial Statements(continued)
For the year ended 31 December 2019
(All amounts in thousands of Renminbi Yuan unless otherwise stated)
[English translation for reference only]
| 2 | Summary of significant accounting policies and accounting estimates(continued) |
| (9) | Financial Instruments(continued) |
| (a) | Financial assets(continued) |
| (i) | Financial assets classification and measurement(continued) |
Debt instruments
The debt instruments held by the Group refer to the instruments that meet the definition of financial liabilities from the perspective of the issuer and are measured in the following three ways:
Measured at amortized cost:
The Group’s business model for managing such financial assets is to collect contract cash flow, and the contract cash flow characteristics of such financial assets are consistent with the basic lending arrangement, that is, the cash flow generated on a specific date is only the payment of principal and interest based on the amount of outstanding principal. The Group recognizes interest income for such financial assets in accordance with the real interest rate method. Such financial assets mainly include monetary funds, notes receivable and accounts receivable, other receivables and creditor’s rights investment, etc. The Group shall list the creditor’s rights investment that is due within one year (including one year) from the date of balance sheet asnon-current assets that are due within one year; The creditor’s right investment within one year (including one year) at the time of acquisition is listed as other current assets.
Measured at fair value and recorded into other comprehensive income:
The Group’s business model for managing such financial assets is both to collect contract cash flow and to sell, and the contract cash flow characteristics of such financial assets are consistent with the basic lending arrangements. Such financial assets are measured at fair value and their changes are included in other comprehensive income, but impairment losses or gains, exchange gains and losses and interest income calculated according to the real interest rate method are included in current profit and loss. Such financial assets are listed as other creditor’s rights investments, and other creditor’s rights investments that are due within one year (including one year) from the date of balance sheet are listed asnon-current assets that are due within one year; Other creditor’s rights investments with a maturity of one year (including one year) at the time of acquisition are listed as other current assets.
Measured at fair value and recorded in current profit and loss:
The Group will not be held in the amortized cost measurement and measurement at fair value and its changes into other comprehensive income of the debt instruments, measured at fair value and its changes into the current profits and losses, listed as a transactional
292
Table of Contents
Notes to the Financial Statements(continued)
For the year ended 31 December 2019
(All amounts in thousands of Renminbi Yuan unless otherwise stated)
[English translation for reference only]
| 2 | Summary of significant accounting policies and accounting estimates(continued) |
| (9) | Financial Instruments (continued) |
| (a) | Financial assets(continued) |
| (i) | Financial assets classification and measurement(continued) |
Equity instruments
The Group will measure the equity instrument investment without its control, common control and significant influence according to the fair value and record its changes into the current profit and loss, and list it as a transactional financial asset; The assets that are expected to be held for more than one year from the balance sheet date are listed as othernon-current financial assets.
In addition, the Group has designated somenon-tradable equity instrument investments as financial assets measured at fair value and their changes included in other comprehensive income, and listed them as other equity instrument investments. The relevant dividend income of such financial assets is included in the current profit and loss.
| (ii) | Impairment |
The Group recognizes loss provisions on the basis of expected credit losses for financial assets measured at amortized cost, debt instrument investments measured at fair value and their changes included in other comprehensive income, etc.
The Group calculates and confirms expected credit losses, taking into account reasonable and well-
founded information on past events, current conditions and projections of future economic conditions.
At each balance sheet date, the Group measures the expected credit losses of financial instruments at different stages. If the credit risk of the financial instrument does not increase significantly after the initial confirmation, it is in the first stage. The Group shall measure the loss reserve according to the expected credit loss in the next 12 months. Where the credit risk of a financial instrument has increased significantly since the initial confirmation but no credit impairment has occurred, it is in the second stage and the Group shall measure the loss reserve in accordance with the expected credit loss of the entire duration of the instrument; Where a credit impairment has occurred since the initial confirmation of the financial instrument, it is in the third stage and the Group shall measure the loss reserve according to the expected credit loss of the entire duration of the instrument.
For financial instruments with low credit risk on the balance sheet date, the Group assumes that the credit risk has not increased significantly since the initial recognition and measures the loss provision according to the expected credit loss in the next 12 months.
293
Table of Contents
Notes to the Financial Statements(continued)
For the year ended 31 December 2019
(All amounts in thousands of Renminbi Yuan unless otherwise stated)
[English translation for reference only]
| 2 | Summary of significant accounting policies and accounting estimates(continued) |
| (9) | Financial Instruments (continued) |
| (a) | Financial assets(continued) |
| (ii) | Impairment(continued) |
For the financial instruments in the first and second stages and with low credit risks, the Group shall calculate the interest income according to the book balance and the actual interest rate before deducting the impairment provisions. For financial instruments in the third stage, the interest income shall be calculated according to the amortized cost and the real interest rate after the book balance is deducted and the provision for impairment is drawn.
For notes receivable and accounts receivable other than financial assets which are measured at fair value and recorded in other comprehensive income, whether there is significant financing component or not, the Group shall measure the loss reserve according to the expected credit loss of the whole duration.
For other receivables, the Group calculates the expected credit loss by referring to the experience of historical credit loss, combining the current situation and the forecast of future economic situation, through the default risk exposure and the expected credit loss rate in the next 12 months or the whole duration.
The Group shall record the provision for loss accrued or brought back into the current profit and loss. For the debt instruments held by the Group, which are measured at fair value and whose changes are included in other comprehensive income, the Group shall adjust other comprehensive income when the impairment loss or profit is included in the current profit and loss.
| (iii) | Derecognition |
Financial assets are derecognized when meet one of the following situations:(1) the right to receive cash flows has been ceased; (2) financial assets have been transferred and the Group has transferred substantially all the risks and rewards of ownership; (3) financial assets have been transferred. Although the Group neither transfers nor retains nearly all the risks and rewards in the ownership of the financial asset, it has relinquished control over the financial asset.
When the investment of other equity instruments is recognized after termination, the difference between the book value and the consideration received and the accumulated amount of the fair value change directly included in other comprehensive income shall be recorded into retained earnings.When the remaining financial assets are recognized, the difference between their book value and the sum of the consideration they received and the accumulated amount of the fair value change directly recorded in other comprehensive income shall be recorded into the current profit and loss.
294
Table of Contents
Notes to the Financial Statements(continued)
For the year ended 31 December 2019
(All amounts in thousands of Renminbi Yuan unless otherwise stated)
[English translation for reference only]
| 2 | Summary of significant accounting policies and accounting estimates(continued) |
| (9) | Financial Instruments(continued) |
| (b) | Financial liabilities |
At the time of initial recognition, financial liabilities are classified into financial liabilities measured at amortized
cost and financial liabilities measured at fair value and their changes are included in the current profit and loss.
The financial liabilities of the Group are mainly financial liabilities measured by amortized cost, including notes payable and accounts payable, other payables, loans, etc. Such financial liabilities are initially measured according to their fair value after deducting transaction costs, and are subsequently measured by the effective interest rate method. Where the term is less than one year (including one year), it shall be listed as current liabilities; If the term is more than one year, but the term is due within one year (including one year) from the balance sheet date, it shall be listed asnon-current liabilities that are due within one year; The rest are shown asnon-current liabilities.
When the current obligation of the financial liability has been discharged in whole or in part, the Group shall terminate the recognition of the discharged part of the financial liability or obligation. The difference between the carrying amount of the part to be recognized and the consideration paid shall be recorded into the profit and loss of the current period.
| (c) | The determination of the fair value of financial instruments |
The fair value of a financial instrument with an active market is determined by the quoted price in the active market. There is no active market for financial instruments, the use of valuation technology to determine their fair value. In valuation, the Group adopts valuation techniques that are applicable in the current situation and have sufficient data and other information available to support them, selects input values that are consistent with the characteristics of assets or liabilities considered by market participants in transactions of related assets or liabilities, and gives priority to relevant observable input values as far as possible. Use unobservable input values in cases where the relevant observable input values cannot be obtained or are not feasible to obtain.
295
Table of Contents
Notes to the Financial Statements(continued)
For the year ended 31 December 2019
(All amounts in thousands of Renminbi Yuan unless otherwise stated)
[English translation for reference only]
| 2 | Summary of significant accounting policies and accounting estimates(continued) |
| (10) | Inventories |
Inventories include raw materials, products in process, goods in stock, spare parts andlow-value consumables, etc., which are measured at the lower cost and net realizable value.
| (a) | Categories of inventories |
Inventories include raw materials, work in progress, finished goods, spare parts and consumables, and are measured at the lower of cost and net realisable value.
| (b) | Measurement of cost of inventories |
Cost is determined using the weighted average method. The cost of finished goods and work in progress comprise raw materials, direct labour and systematically allocated production overhead based on the normal production capacity.
| (c) | Basis for determining net realisable value of inventories and method of provision for impairment of inventories |
Provision for decline in the value of inventories is determined at the excess amount of the carrying amounts of the inventories over their net realisable value. Net realisable value is determined based on the estimated selling price in the ordinary course of business, less the estimated costs to completion and estimated costs necessary to make the sale and related taxes.
| (d) | The Group adopts the perpetual inventory system. |
| (e) | Amortisation methods forlow-value consumables |
Low value consumables are expensed upon issuance.
296
Table of Contents
Notes to the Financial Statements(continued)
For the year ended 31 December 2019
(All amounts in thousands of Renminbi Yuan unless otherwise stated)
[English translation for reference only]
| 2 | Summary of significant accounting policies and accounting estimates(continued) |
| (11) | Long-term equity investments |
Long-term equity investments comprise the Company’s long-term equity investments in its subsidiaries, and the Group’s long-term equity investments in its joint ventures and associates.
Subsidiaries are the investees over which the Company is able to exercise control. A joint venture is a joint arrangement which is structured through a separate vehicle over which the Group has joint control together with other parties and only has rights to the net assets of the arrangement based on legal forms, contractual terms and other facts and circumstances. An associates is the investee over which the Group has significant influence by participating in the financial and operating policy decisions.
Investments in subsidiaries are presented in the Company’s financial statements using the cost method, and are adjusted to the equity method when preparing the consolidated financial statements. Investments in joint ventures and associates are accounted for using the equity method.
| (a) | Initial recognition |
For long-term equity investments acquired through a business combination: The initial investment cost of a long-term equity investment obtained through a business combination involving enterprises under common control is the Company’s share of the carrying amount of the subsidiary’s equity at the combination date. For a long-term equity investment obtained through a business combination not involving enterprises under common control, the initial investment cost is the combined cost issued by the Company, in exchange for control of the acquire.
For long-term equity investment acquired other than through a business combination, the initial investment cost is recognised at the actual consideration paid if the Group acquires the investment by cash, or at the fair value of the equity securities issued if an investment is acquired by issuing equity securities.
297
Table of Contents
Notes to the Financial Statements(continued)
For the year ended 31 December 2019
(All amounts in thousands of Renminbi Yuan unless otherwise stated)
[English translation for reference only]
| 2 | Summary of significant accounting policies and accounting estimates(continued) |
| (11) | Long-term equity investments(continued) |
| (b) | Subsequent measurement |
Under the cost method of accounting, long-term equity investments are measured at initial investment cost, investment income is recognised in profit or loss for the cash dividends or profit distribution declared by the investee.
For long-term equity investments accounted for using the equity method, where the initial investment cost exceeds the fair value of the Group’s share of the investee’s identifiable net assets at the time of acquisition, the investment is initially measured at cost; Where the initial investment cost is less than the fair value of the Group’s share of the investee’s identifiable net assets at the time of acquisition, the difference is included in profit or loss for the current period and the cost of the long-term equity investment is adjusted upwards accordingly.
Under the equity method of accounting, the Group recognises the investment income according to its share of net profit or loss of the investee. The Group discontinues recognising its share of net losses of an investee after the carrying amount of the long-term equity investment together with any long-term interests that, in substance, form part of the investor’s net investment in the investee are reduced to zero. However, if the Group has obligations for additional losses and the criteria with respect to recognition of provisions under the accounting standards on contingencies are satisfied, the Group continues recognising the investment losses and the provisions. For changes in shareholders’ equity of the investee other than those arising from its net profit or loss, the Group records its proportionate share directly into capital surplus, provided that the Group’s proportion of shareholding in the investee remains unchanged. The carrying amount of the investment is reduced by the Group’s share of the profit distribution or cash dividends declared by an investee. The unrealised profits or losses arising from the intra-group transactions amongst the Group and its investees are eliminated in proportion to the Group’s equity interest in the investees, and then based on which the investment gain or losses are recognised. For the loss on the intra-group transaction amongst the Group and its investees attributable to asset impairment, and the related unrealised loss is not eliminated.
298
Table of Contents
Notes to the Financial Statements(continued)
For the year ended 31 December 2019
(All amounts in thousands of Renminbi Yuan unless otherwise stated)
[English translation for reference only]
| 2 | Summary of significant accounting policies and accounting estimates(continued) |
| (11) | Long-term equity investments(continued) |
| (c) | Definition of control, joint control or significant influence over the investees |
Control refers to the power to govern the financial and operating policies of an investee, so as to obtain benefits from their operating activities. In determining whether the Company is able to exercise control over the investee, the effect of potential voting rights of the investee shall be considered, such as convertible debts and warrants currently exercisable.
Joint control is the contractually agreed sharing of control over an economic activity, and exists only when the strategic financial and operating decisions relating to the activity require the unanimous consent of the parties sharing control.
Significant influence refers to the power to participate in making decisions on the financial and operating policies of an enterprise, but not the power to control, or jointly control, the formulation of such policies with other parties.
| (d) | Impairment of Long-term equity investments |
The carrying amount of long-term equity investments in subsidiaries, joint ventures and associates shall be reduced to the recoverable amount if the recoverable amount is below the carrying amount (Note 2(18)).
299
Table of Contents
Notes to the Financial Statements(continued)
For the year ended 31 December 2019
(All amounts in thousands of Renminbi Yuan unless otherwise stated)
[English translation for reference only]
| 2 | Summary of significant accounting policies and accounting estimates(continued) |
| (12) | Investment properties |
Investment properties, including land use rights that have already been leased out, buildings that are held for the purpose of leasing and buildings that is being constructed or developed for future use for leasing, are measured initially at cost. Subsequent expenditures incurred in relation to an investment property are included in the cost of the investment property when it is probable that the associated economic benefits will flow to the Group and their costs can be reliably measured; otherwise, the expenditures are recognised in profit or loss in the period in which they are incurred.
The Group adopts the cost model for subsequent measurement of investment properties. Buildings and land use rights are depreciated or amortised to their estimated net residual values over their estimated useful lives. The estimated useful lives, the estimated net residual values that are expressed as a percentage of cost and the annual depreciation rates of investment properties are as follows:
| Estimated useful lives | Estimated net residual values | Annual depreciation rates | ||||||||||
Buildings | | 30-40 years | | 3 | % | 2.43%-3.23% | ||||||
When an investment property is transferred to owner-occupied properties, it is reclassified as fixed asset or intangible asset at the date of the transfer. When an owner-occupied property is transferred out for earning rentals or for capital appreciation, the fixed asset or intangible asset is reclassified as investment properties at its carrying amount at the date of the transfer.
The investment property’s estimated useful life, net residual value and depreciation (amortisation) method applied are reviewed and adjusted as appropriate at eachyear-end.
An investment property is derecognised on disposal or when the investment property is permanently withdrawn from use and no future economic benefits are expected from its disposal. The net amount of proceeds from sale, transfer, retirement or damage of an investment property after its carrying amount and related taxes and expenses is recognised in profit or loss for the current period.
When the recoverable amount of investment properties is less than its carrying amount, a provision for impairment and an impairment loss are recognised for the amount by which the asset’s carrying amount exceeds its recoverable amount (Note 2(18)).
300
Table of Contents
Notes to the Financial Statements(continued)
For the year ended 31 December 2019
(All amounts in thousands of Renminbi Yuan unless otherwise stated)
[English translation for reference only]
| 2 | Summary of significant accounting policies and accounting estimates(continued) |
| (13) | Property, plant and equipment |
| (a) | Recognition and initial measurement of fixed assets |
Property, plant and equipment comprise buildings, plant and machinery, vehicles, other equipment, etc.
Property, plant and equipment is recognized when it is probable that the associated economic benefits will flow to the Group and the related cost can be reliably measured. Fixed assets purchased or constructed by the Group are initially measured at cost at the time of acquisition. The fixed assets injected by the state-owned shareholder during the restructuring were initially recorded at the valuated amount approved by the relevant authorities managing state-owned assets.
Subsequent expenditures incurred for a property, plant and equipment are included in the cost of the fixed asset when it is probable that the associated economic benefits will flow to the Group and the related cost can be reliably measured. The carrying amount of the replaced part is derecognised. All the other subsequent expenditures are recognised in profit or loss in the period in which they are incurred.
| (b) | Depreciation of fixed assets |
Property, plant and equipment are depreciated using the straight-line method to allocate the cost of the assets to their estimated residual values over their estimated useful lives. For the fixed assets that have been provided for impairment loss, the related depreciation charge is prospectively determined based upon the adjusted carrying amounts over their remaining useful lives.
The estimated useful lives, the estimated residual values expressed as a percentage of cost and the annual depreciation rates of fixed assets are as follows:
| Estimated useful lives | Estimated residual values | Annual depreciation rates | ||||||
Buildings | | 12-40 years | | 0% to 5% | 2.4% to 8.3% | |||
Plant and machinery | | 12-20 years | | 0% to 5% | 4.8% to 8.3% | |||
Vehicles and other equipment | | 4-20 years | | 0% to 5% | 4.8% to 25.0% | |||
The estimated useful life, the estimated net residual value of a fixed asset and the depreciation method applied to the asset are reviewed, and adjusted as appropriate at eachyear-end.
301
Table of Contents
Notes to the Financial Statements(continued)
For the year ended 31 December 2019
(All amounts in thousands of Renminbi Yuan unless otherwise stated)
[English translation for reference only]
| 2 | Summary of significant accounting policies and accounting estimates(continued) |
| (13) | Property, plant and equipment(continued) |
| (c) | When the recoverable amount of fixed assets is less than its carrying amount, a provision for impairment and an impairment loss are recognised for the amount by which the asset’s carrying amount exceeds its recoverable amount (Note 2(18)). |
| (d) | Disposal of fixed assets |
A fixed asset is derecognised on disposal or when no future economic benefits are expected from its use or disposal. The amount of proceeds from disposals on sale, transfer, retirement or damage of a fixed asset net of its carrying amount and related taxes and expenses is recognised in profit or loss for the current period.
| (14) | Construction in progress |
Construction in progress is measured at actual cost. Actual cost comprises construction costs, installation costs, borrowing costs that are eligible for capitalisation and other costs necessary to bring the fixed assets ready for their intended use. Construction in progress is transferred to fixed assets when the assets are ready for their intended use, and depreciation begins from the following month. When the recoverable amount of construction in progress is less than its carrying amount, a provision for impairment and an impairment loss are recognised for the amount by which the asset’s carrying amount exceeds its recoverable amount (Note 2(18)).
302
Table of Contents
Notes to the Financial Statements(continued)
For the year ended 31 December 2019
(All amounts in thousands of Renminbi Yuan unless otherwise stated)
[English translation for reference only]
| 2 | Summary of significant accounting policies and accounting estimates(continued) |
| (15) | Borrowing costs |
The borrowing costs that are directly attributable to the acquisition and construction of a fixed asset that needs a substantially long period of time for its intended use commence to be capitalised and recorded as part of the cost of the asset when expenditures for the asset and borrowing costs have been incurred, and the activities relating to the acquisition and construction that are necessary to prepare the asset for its intended use have commenced. The capitalisation of borrowing costs ceases when the asset under acquisition or construction becomes ready for its intended use and the borrowing costs incurred thereafter are recognised in profit or loss for the current period. Capitalisation of borrowing costs is suspended during periods in which the acquisition or construction of a fixed asset is interrupted abnormally and the interruption lasts for more than 3 months, until the acquisition or construction is resumed.
For the specific borrowings obtained for the acquisition or construction of a qualifying fixed asset, the amount of borrowing costs eligible for capitalisation is determined by deducting any interest earned from depositing the unused specific borrowings in the banks or any investment income arising on the temporary investment of those borrowing during the capitalisation period.
For the general borrowings obtained for the acquisition or construction of a qualifying fixed asset, the amount of borrowing costs eligible for capitalisation is determined by applying the weighted average effective interest rate of general borrowings used, to the weighted average of the excess amount of cumulative expenditures on the asset over the amount of specific borrowings. The effective interest rate is the rate at which estimated future cash flows during the period of expected duration or shorter period applied discounted to the initial amount of the borrowings.
| (16) | Intangible assets |
Intangible assets include land use rights and patents, and are measured at cost. The intangible assets injected by the state-owned shareholder during the restructuring were initially recorded at the valuated amount approved by the relevant authorities managing state-owned assets.
| (a) | Land use rights |
Land use rights are amortised on the straight-line basis over their approved use period of30-50 years. If the acquisition costs of the land use rights and the buildings located thereon cannot be reasonably allocated between the land use rights and the buildings, all of the acquisition costs are recognised as fixed assets.
| (b) | Patents |
Patents are amortised on a straight-line basis over the patent protection of 28 years as stipulated by the laws.
303
Table of Contents
Notes to the Financial Statements(continued)
For the year ended 31 December 2019
(All amounts in thousands of Renminbi Yuan unless otherwise stated)
[English translation for reference only]
| 2 | Summary of significant accounting policies and accounting estimates(continued) |
| (16) | Intangible assets(continued) |
| (c) | Periodical review of useful life and amortisation method |
For an intangible asset with a finite useful life, review of its useful life and amortisation method is performed at each year-end, with adjustment made as appropriate.
| (d) | Research and development |
The expenditure on an internal research and development project is classified into expenditure on the research phase and expenditure on the development phase based on its nature and whether there is material uncertainty that the research and development activities can form an intangible asset at end of the project.
Expenditure on the research phase is recognised in profit or loss in the period in which it is incurred. Expenditure on the development phase is capitalised only if all of the following conditions are satisfied:
| • | it is technically feasible to complete the research and development project so that it will be available for use or sale; |
| • | management intends to complete the research and development project, and use or sell it; |
| • | it can be demonstrated how the research and development project will generate economic benefits; |
| • | there are adequate technical, financial and other resources to complete the development and the ability to use or sell the research and development project; and |
| • | the expenditure attributable to the research and development project during its development phase can be reliably measured. |
Other development expenditures that do not meet the conditions above are recognised in profit or loss in the period in which they are incurred. Development costs previously recognised as expenses are not recognised as an asset in a subsequent period. Capitalised expenditure on the development phase is presented as development costs in the balance sheet and transferred to intangible assets at the date that the asset is ready for its intended use.
| (e) | Impairment of intangible assets |
When the recoverable amount of an intangible asset is less than its carrying amount, a provision for impairment and an impairment loss are recognised for the amount by which the asset’s carrying amount exceeds its recoverable amount (Note 2 (18)).
304
Table of Contents
Notes to the Financial Statements(continued)
For the year ended 31 December 2019
(All amounts in thousands of Renminbi Yuan unless otherwise stated)
[English translation for reference only]
| 2 | Summary of significant accounting policies and accounting estimates(continued) |
| (17) | Long-term prepaid expenses |
Long-term prepaid expenses mainly include the catalyst expenditures, leasehold improvements and other expenditures that have been incurred but should be recognised as expenses over more than one year in the current and subsequent periods. Long-term prepaid expenses with the book value net of estimated residual value are amortised on the straight-line basis over the expected beneficial periods and are presented at actual expenditure net of accumulated amortisation.
Catalyst expenditures are amortized on a straight-line method within 2 to 5 years.
The leasehold improvement of the rented fixed assets through commercial lease is amortized according to the average duration of 5 years
| (18) | Impairment of long-term assets |
Fixed assets, construction in progress, intangible assets with finite useful lives, long-term prepaid expenses, investment properties measured using the cost model and long-term equity investments in subsidiaries, joint ventures and associates are tested for impairment if there is any indication that the assets may be impaired at the balance sheet date. If the result of the impairment test indicates that the recoverable amount of an asset is less than its carrying amount, a provision for impairment and an impairment loss are recognised for the amount by which the asset’s carrying amount exceeds its recoverable amount. The recoverable amount is the higher of an asset’s fair value less costs to sell and the present value of the future cash flows expected to be derived from the asset. Provision for asset impairment is determined and recognised on the individual asset basis. If it is not possible to estimate the recoverable amount of an individual asset, the recoverable amount of a group of assets to which the asset belongs is determined. A group of assets is the smallest group of assets that is able to generate independent cash inflows.
Once the above asset impairment loss is recognised, it will not be reversed for the value recovered in the subsequent periods.
| (19) | Safety production costs |
According to the decision of the State Council on Further Strengthening the work of production safety (Guofa No.2 2004), Shanghai Municipal Government to implement the State Council on Further Strengthening corporate safety work notice (Hufufa No.35 2010) and Safe production costs extraction and use of management practices (Caiqi No.16 2012) issued by the Ministry of Finance and the national production safety supervision administration on 2 February 2012, The Group extracted safety production costs in a certain percentage of sales revenue from the dangerous goods in previous year, which is used for safety costs.
The safety production costs, accrued in accordance with the above regulations, shall be charged in relevant costs or profit and loss, and in the specific reserve. Safety production costs, which belong to expenses, directly offset the special reserves. If the costs formed into fixed assets, the special reserves shall be offset according to the cost forming into fixed assets, and recognize the same amount of accumulated depreciation. This fixed asset shall no longer accrue depreciation in the following period.
305
Table of Contents
Notes to the Financial Statements(continued)
For the year ended 31 December 2019
(All amounts in thousands of Renminbi Yuan unless otherwise stated)
[English translation for reference only]
| 2 | Summary of significant accounting policies and accounting estimates(continued) |
| (20) | Employee benefits |
Employee benefits include short-term employee benefits, post-employment benefit and termination benefits provided in various forms of consideration in exchange for service rendered by employees or compensations for the termination of employment relationship.
| (a) | Short-term employee benefits |
Short-term employee benefits include employee wages or salaries, bonus, allowances and subsidies, staff welfare, premiums or contributions on medical insurance, work injury insurance and maternity insurance, housing funds, union running costs and employee education costs, short-term paid absences. The employee benefit liabilities are recognised in the accounting period in which the service is rendered by the employees, with a corresponding charge to the profit or loss for the current period or the cost of relevant assets. Employee benefits which arenon-monetary benefits are measured at fair value.
| (b) | Post-employment benefits |
The Group classifies post-employment benefit plans as either defined contribution plans or defined benefit plans. Defined contribution plans are post-employment benefit plans under which the Group pays fixed contributions into a separate fund and will have no obligation to pay further contributions; and Defined benefit plans are post-employment benefit plans other than defined contribution plans. During the reporting period, the Group’s post-employment benefits mainly include basic pensions, unemployment insurance and supplemental basic pensions, all of which belong to the defined contribution plans.
Basic pensions
The Group’s employees participate in the basic pension plan set up and administered by local authorities of Ministry of Human Resource and Social Security. Monthly payments of premiums on the basic pensions are calculated according to prescribed bases and percentage by the relevant local authorities. When employees retire, the relevant local authorities are obliged to pay the basic pensions to them. The amounts based on the above calculations are recognised as liabilities in the accounting period in which the service has been rendered by the employees, with a corresponding charge to the profit or loss for the current period or the cost of relevant assets.
306
Table of Contents
Notes to the Financial Statements(continued)
For the year ended 31 December 2019
(All amounts in thousands of Renminbi Yuan unless otherwise stated)
[English translation for reference only]
| 2 | Summary of significant accounting policies and accounting estimates(continued) |
| (20) | Employee benefits(continued) |
| (c) | Termination benefits |
The Group provides compensation for terminating the employment relationship with employees before the end of the employment contracts or as an offer to encourage employees to accept voluntary redundancy before the end of the employment contracts. The Group recognises a liability arising from compensation for termination of the employment relationship with employees, with a corresponding charge to profit or loss for the current period at the earlier of the following dates: 1) when the Group cannot unilaterally withdraw an employment termination plan or a curtailment proposal; 2) when the Group recognises costs or expenses for a restructuring that involves the payment of termination benefits.
Termination benefits expected to be paid in one year are listed as current liabilities.
| (21) | Profit distribution |
Proposed profit distribution is recognised as a liability in the period in which it is approved by the Shareholders’ meeting.
| (22) | Share-based payments |
| (a) | Types of Share-based payment |
The term “share-based payment” refers to a transaction in which an enterprise grants equity instruments or undertakes equity-instrument-based liabilities in return for services from employee or other parties. Equity instruments include equity instruments of the Company itself or its subsidiaries.
Equity-settled share-based payment transactions
The Group’s stock option incentive plans are equity-settled share-based payments and are measured at fair value of equity instruments granted to employees on the date of the grant. If the right cannot be exercised until the vesting period comes to an end and until the prescribed performance conditions are met, then within the vesting period, the services obtained in the current period shall, based on the best estimate of the number of vested equity instruments, be included in the relevant costs or expenses and the capital reserves shall be increased accordingly at the fair value of the equity instruments on the date of the grant. If the subsequent information indicates that the number of vested equity instruments is different from the previous estimate, an adjustment shall be made and on the vesting date, and the estimate shall be adjusted to equal the number of the actually vested equity instruments. On the vesting date, an enterprise shall, based on the number of the equity instruments of which the right is actually exercised, confirm share capital and share premium, and carry forward the capital surplus recognised within the vesting period.
307
Table of Contents
Notes to the Financial Statements(continued)
For the year ended 31 December 2019
(All amounts in thousands of Renminbi Yuan unless otherwise stated)
[English translation for reference only]
| 2 | Summary of significant accounting policies and accounting estimates(continued) |
| (22) | Share-based payments(continued) |
| (b) | Method for determining the fair value of share options |
The Group uses Black-Scholes valuation model to determine the fair value of the share options.
| (c) | Estimate basis of the the number of options |
At the end of each reporting period, the Group revises its estimates of the number of options that are expected to vest based on thenon-marketing performance and service conditions. It recognises the impact of the revision to original estimates, if any, in the income statement, with a corresponding adjustment to equity. As at the vesting date, the estimates of the number of options should be same with the actual exercised number.
| (d) | Accounting treatment for share-based payments exercise |
When the options are exercised at the vesting date, the Company issues new shares. At the same time, carry forward the capital reserve confirmed in the waiting period.
| (23) | Provisions |
Provisions for contingent liabilities etc. are recognised when the Group has a present obligation, it is probable that an outflow of economic benefits will be required to settle the obligation, and the amount of the obligation can be measured reliably.
A provision is initially measured at the best estimate of the expenditure required to settle the related present obligation. Factors surrounding a contingency, such as the risks, uncertainties and the time value of money, are taken into account as a whole in reaching the best estimate of a provision. Where the effect of the time value of money is material, the best estimate is determined by discounting the related future cash outflows. The increase in the discounted amount of the provision arising from passage of time is recognised as interest expense.
The carrying amount of provisions is reviewed at each balance sheet date and adjusted to reflect the current best estimate.
Provisions expected to be paid in one year are listed as other current liabilities.
308
Table of Contents
Notes to the Financial Statements(continued)
For the year ended 31 December 2019
(All amounts in thousands of Renminbi Yuan unless otherwise stated)
[English translation for reference only]
| 2 | Summary of significant accounting policies and accounting estimates(continued) |
| (24) | Revenue recognition |
The group shall recognize revenue when control of the products or service has transferred. Revenue is recognized based on the expected consideration to be obtained.
| (a) | Sale of goods |
Sales are recognized when control of the products has transferred, being when the products are delivered to and accepted by the customer. Delivery occurs when the products have been shipped to the specific location, the risks of obsolescence and loss have been transferred to the customer, and either the customer has accepted the products in accordance with the sales contract, or the Group has objective evidence that all criteria for acceptance have been satisfied. Revenue excludes value added tax and is after deduction of any estimated trade discounts.
The Group provides discounts based on the sales amount, and recognizes revenue based on the contract value exclude expected discounts.
| (b) | Overseas shipping services |
The Group arranges overseas shipping services for the customer and revenue is recognized over time and based on the actual shipping service provided to the end of the reporting period as a proportion of the total services to be provided, because the customer receives and uses the benefits simultaneously. This is determined based on the actual passages of time (days) relative to the total expected shipping days.
309
Table of Contents
Notes to the Financial Statements(continued)
For the year ended 31 December 2019
(All amounts in thousands of Renminbi Yuan unless otherwise stated)
[English translation for reference only]
| 2 | Summary of significant accounting policies and accounting estimates(continued) |
| (25) | Government grants |
Government grants are transfers of monetary assets ornon-monetary assets from the government to the Group at no consideration, including tax refund, financial subsidies etc.
A government grant is recognised when there is reasonable assurance that the grant will be received and that the Group will comply with the conditions attaching to the grant. If a government grant is in the form of a transfer of a monetary asset, it is measured at the amount that is received or receivable. If a government grant is in the form of a transfer of anon-monetary asset, it is measured at its fair value, or nominal amount when fair value not reliably measured.
A government grant related to an asset means grant that used for acquisition, construction or otherwise to form long- term assets. A government grant related to income is grant in addition to government grant related to an asset.
Government subsidies related to assets,write-off the book value of related assets, or recognized as deferred income and amortized into profit and loss within the service life of related assets in a reasonable and systematic way;
And benefits related to government subsidies for compensating the related expenses or losses during the later, recognized as deferred income, cost and upon confirmation of the related expenses or losses, recorded into the profits and losses of the current or write-downs related cost, used for compensating the related expenses or losses incurred, directly recorded into the profits and losses of the current or write-downs related cost.
The Group uses the same reporting method for similar government subsidies.
Government subsidies related to daily activities are included in operating profit, while government subsidies unrelated to daily activities are included innon-operating income and expenditure.
310
Table of Contents
Notes to the Financial Statements(continued)
For the year ended 31 December 2019
(All amounts in thousands of Renminbi Yuan unless otherwise stated)
[English translation for reference only]
| 2 | Summary of significant accounting policies and accounting estimates(continued) |
| (26) | Deferred tax assets and deferred tax liabilities |
Deferred tax assets and deferred tax liabilities are calculated and recognised based on the differences arising between the tax bases of assets and liabilities and their carrying amounts (temporary differences). Deferred tax asset is recognised for the deductible losses that can be carried forward to subsequent years for deduction of the taxable profit in accordance with the tax laws. No deferred tax liability is recognised for a temporary difference arising from the initial recognition of goodwill. No deferred tax asset or deferred tax liability is recognised for the temporary differences resulting from the initial recognition of assets or liabilities due to a transaction other than a business combination, which affects neither accounting profit nor taxable profit (or deductible loss). At the balance sheet date, deferred tax assets and deferred tax liabilities are measured at the tax rates that are expected to apply to the period when the asset is realised or the liability is settled.
Deferred tax assets are only recognised for deductible temporary differences, deductible losses and tax credits to the extent that it is probable that taxable profit will be available in the future against which the deductible temporary differences, deductible losses and tax credits can be utilised.
Deferred tax liabilities are recognised for temporary differences arising from investments in subsidiaries, associates and joint ventures, except where the Group is able to control the timing of reversal of the temporary difference, and it is probable that the temporary difference will not reverse in the foreseeable future. When it is probable that the temporary differences arising from investments in subsidiaries, associates and joint ventures will be reversed in the foreseeable future and that the taxable profit will be available in the future against which the temporary differences can be utilised, the corresponding deferred tax assets are recognised.
Deferred tax assets and liabilities are offset when:
| • | the deferred taxes are related to the same tax payer within the Group and the same taxation authority; and |
| • | that tax payer within the Group has a legally enforceable right to offset current tax assets against current tax liabilities. |
311
Table of Contents
Notes to the Financial Statements(continued)
For the year ended 31 December 2019
(All amounts in thousands of Renminbi Yuan unless otherwise stated)
[English translation for reference only]
| 2 | Summary of significant accounting policies and accounting estimates(continued) |
| (27) | Leases |
Lease is a kind of contract whereby, within a certain period of time, the lessor transfers the right of use of assets to lessee in order to obtain benefits.
The Group as the lessee
The Group recognized the right of use assets at the beginning of the lease period and the lease liabilities at the present value of the outstanding lease payments. Lease payments include fixed payments and payments to be made if it is reasonably determined that the option to buy or to terminate the lease option will be exercised. The variable rent, which is determined by a certain percentage of sales, is not included in the lease payment and is recorded into the current profit and loss when it actually occurs. The Group will be paid from the balance sheet date within one year (including one year) of the lease liabilities, as anon-current liabilities due within one year.
The right of use assets of the Group include leased houses and buildings, plant and machinery equipment, means of transport and others. The right of use assets are initially measured at cost, which includes the initial measurement of the lease liability, the lease payment paid on or before the lease period, the initial direct expenses, etc., and deducts the lease incentive received. Where the Group is able to reasonably determine the ownership of the leased assets upon the expiration of the lease term, depreciation of the leased assets shall be calculated and withdrawn within the remaining service life of the leased assets; If it is not reasonable to determine whether the ownership of the leased asset can be acquired at the end of the lease term, the depreciation shall be calculated within the shorter period between the lease term and the remaining useful life of the leased asset. When the recoverable amount is lower than the book value of the asset, the Group writes down the book value to the recoverable amount.
For short-term leases with a lease term of no more than 12 months, the Group chooses not to recognize the right of use assets and lease liabilities, and records the relevant rental expenses into the current profits and losses or related asset costs according to the straight-line method during each period of the lease term.
The Group as the lessor
Essentially, a lease that transfers almost all the risks and rewards associated with the ownership of the leased asset is a financial lease. Other leases are operating leases.
When the Group operates leased premises and buildings, the rental income from operating leases shall be recognized in accordance with the straight-line method during the lease term.
312
Table of Contents
Notes to the Financial Statements(continued)
For the year ended 31 December 2019
(All amounts in thousands of Renminbi Yuan unless otherwise stated)
[English translation for reference only]
| 2 | Summary of significant accounting policies and accounting estimates(continued) |
| (28) | Hold for sale and terminate operations |
Non-current assets or disposal groups that meet the following conditions are classified as held for sale: (i) according to usual practice in similar sales transactions, the assets can be sold immediately under current circumstances, (ii) the Group has entered into a legally binding sale agreement with other parties and has obtained the relevant approval. And it is expected that the sale will be completed within one year.
Conform to the conditions of sale ofnon-current assets (not including financial assets, to the fair value of an investment real estate and deferred income tax assets), with the book value and the fair value minus the net amount after sale cost and what is low measurement, the fair value minus the net amount after sale cost is lower than the amount of the original book value, shall be recognized as asset impairment losses.
The assets and liabilities in thenon-current assets and disposal group held for sale are classified as current assets and current liabilities and are separately listed in the balance sheet.
| (29) | Related parties |
If a party has the power to control, jointly control or exercise significant influence over another party, or vice versa, or where two or more parties are subject to common control or joint control from another party, they are considered to be related parties. Related parties may be individuals or enterprises. Enterprises with which the Company is under common control only from the State and that have no other related party relationships are not regarded as related parties of the Group. Related parties of the Group and the Company include, but are not limited to:
| (a) | the Company’s parent; |
| (b) | the Company’s subsidiaries; |
| (c) | enterprises that are controlled by the Company’s parent; |
| (d) | investors that have joint control or exercise significant influence over the Group; |
| (e) | enterprises or individuals if a party has control or joint control over both the enterprises or individuals and the Group; |
| (f) | joint ventures of the Group, including subsidiaries of joint ventures; |
| (g) | associates of the Group, including subsidiaries of associates; |
| (h) | principal individual investors of the Group and close family members of such individuals; |
313
Table of Contents
Notes to the Financial Statements(continued)
For the year ended 31 December 2019
(All amounts in thousands of Renminbi Yuan unless otherwise stated)
[English translation for reference only]
| 2 | Summary of significant accounting policies and accounting estimates(continued) |
| (29) | Related parties(continued) |
| (i) | key management personnel of the Group and close family members of such individuals; |
| (j) | key management personnel of the Company’s parent company; |
| (k) | close family members of key management personnel of the Company’s parents; and |
| (l) | other enterprises that are controlled or jointly controlled by principal individual investors, key management personnel of the Group, or close family members of such individuals. |
In addition to the related parties stated above determined in accordance with the requirements of CAS, the following enterprises and individuals (but not limited to) are considered as related parties based on the disclosure requirements of Administrative Procedures on the Information Disclosures of Listed Companies issued by the CSRC:
| (m) | enterprises or individuals that act a concert, that hold 5% or more of the Company’s shares; |
| (n) | individuals who directly or indirectly hold more than 5% of the Company’s shares and their close family members, supervisors of the listed companies and their close family members; |
| (o) | enterprises that satisfied any of the aforesaid conditions in (a), (c) or (m) during the past 12 months or will satisfy them within the next 12 months pursuant to a relevant agreement; |
| (p) | individuals who satisfied any of the aforesaid conditions in (i), (j) or (n) during the past 12 months or will satisfy them within the next 12 months pursuant to a relevant agreement; and |
| (q) | enterprises, other than the Company and the subsidiaries controlled by the Company, which are controlled directly or indirectly by an individual defined in (i), (j), (n) or (p), or in which such an individual assumes the position of a director or senior executive. |
314
Table of Contents
Notes to the Financial Statements(continued)
For the year ended 31 December 2019
(All amounts in thousands of Renminbi Yuan unless otherwise stated)
[English translation for reference only]
| 2 | Summary of significant accounting policies and accounting estimates(continued) |
| (30) | Segment information |
The Group identifies operating segments based on the internal organisation structure, management requirements and internal reporting system, and discloses segment information of reportable segments which is determined on the basis of operating segments.
An operating segment is a component of the Group that satisfies all of the following conditions: (1) the component is able to earn revenues and incur expenses from its ordinary activities; (2) whose operating results are regularly reviewed by the Group’s management to make decisions about resources to be allocated to the segment and to assess its performance, and (3) for which the information on financial position, operating results and cash flows is available to the Group. If two or more operating segments have similar economic characteristics and satisfy certain conditions, they are aggregated into one single operating segment.
| (31) | Significant accounting policies and accounting estimates |
The Group continuously evaluates important accounting estimates and key judgments based on historical experience and other factors, including reasonable expectations of future events.
| (a) | Important accounting estimates and their key assumptions |
The following important accounting estimates and key assumptions have important risks that will lead to significant adjustments in the book value of assets and liabilities in the next accounting year:
| (i) | Inventory provision |
Any excess of the cost over the net realisable value of each item of inventories is recognised as a provision for diminution in the value of inventories. Net realisable value represents the estimated selling price in the ordinary course of business, less the estimated costs of completion and the estimated costs necessary to make the sale. Management bases the estimates on all available information, including the current market prices of the finished goods and raw materials, and historical cost of sales. If the actual selling prices were to be lower or the costs of completion were to be higher than estimated, the actual allowance for diminution in value of inventories could be higher than estimated.
315
Table of Contents
Notes to the Financial Statements(continued)
For the year ended 31 December 2019
(All amounts in thousands of Renminbi Yuan unless otherwise stated)
[English translation for reference only]
| 2 | Summary of significant accounting policies and accounting estimates(continued) |
| (31) | Significant accounting policies and accounting estimates(continued) |
| (a) | Important accounting estimates and their key assumptions(continued) |
| (ii) | Impairment of long-term assets |
Long-term assets are reviewed for impairment at each balance sheet date when events or changes in circumstance have indicated that their carrying amounts may not be recoverable. If any such evidence indicated that their carrying amounts may not be recoverable, the carrying amounts exceed the recoverable amounts would be recognized as impairment loss and accounted in current profit or loss.
The recoverable amount of an asset (or an asset group) is the greater of its net selling price and its present value of expected future cash flows. In assessing value in use, significant judgements are exercised over the assets’ (or the asset group’s) production and sales, selling prices, related operating expenses and discount rate to calculate the present value. All relevant materials which can be obtained are used for estimation of the recoverable amount, including the estimation of the production, selling prices and related operating expenses based on reasonable and supportable assumptions.
| (iii) | Estimated useful life and residual value of fixed assets |
The Group assessed the reasonableness of estimated useful life of fixed assets in line with the historical experience on the basis of similar function or characteristic for the assets. If there are significant changes in estimated useful lives and residual value from previous years, the depreciation expenses for future periods are adjusted.
The Group reviews and adjusts the useful lives and estimated residual value of the assets regularly at the end of each year end.
316
Table of Contents
Notes to the Financial Statements(continued)
For the year ended 31 December 2019
(All amounts in thousands of Renminbi Yuan unless otherwise stated)
[English translation for reference only]
| 2 | Summary of significant accounting policies and accounting estimates(continued) |
| (31) | Significant accounting policies and accounting estimates(continued) |
| (b) | The adoption of critical judgments in accounting policy |
| (i) | Classification of financial assets |
The Group in determining the classification of financial assets involved in the major judgments including business model and contract cash flow characteristics of the analysis.
The Group determines the business model of managing financial assets at the level of financial asset portfolio, taking into account such factors as the way of evaluating and reporting the performance of financial assets to key managers, the risk and management methods that affect the performance of financial assets, and the ways in which relevant business managers are paid, etc..
When the Group evaluates whether the contract cash flow of financial assets is consistent with the basic loan arrangement, there are the following main judgments: whether the time distribution or amount of principal may change within the duration due to prepayment or other reasons; Does interest include only the time value of money, credit risk, other basic lending risks, and consideration of costs and profits? For example, does the prepayment amount reflect only the principal outstanding and the interest based on the principal outstanding, as well as the reasonable compensation paid for the early termination of the contract?
| (ii) | Judgment of significant increase in credit risk |
The main criteria for the Group to judge the significant increase in credit risk are the number of overdue days over 30, or the significant change in one or more of the following indicators: the operating environment of the debtor, internal and external credit rating, significant change in actual or expected operating results, the value of the collateral or the significant decline in the credit rating of the guarantor, etc.
317
Table of Contents
Notes to the Financial Statements(continued)
For the year ended 31 December 2019
(All amounts in thousands of Renminbi Yuan unless otherwise stated)
[English translation for reference only]
| 2 | Summary of significant accounting policies and accounting estimates(continued) |
| (32) | Significant accounting policies change |
In 2018, the Ministry of Finance issued the revised CAS 21 leasing (“the new CAS 21”) and in 2019 issued the “Circular on the Amendment to the Formats of Corporate Financial Statements for the Year of 2019” (Cai Kuai [2019] 06), the revised CAS 7 Exchange ofNon-Monetary Assets (“the revised CAS 7”) and the revised CAS 12 Debt Restructuring (“the revised CAS 12”). The financial statements are prepared in accordance with the above circular and standards. The revised CAS 7 and the revised CAS 12 have no significant impact on the Group and the Company. The impact of other amendments on the statements of the Group and the Company is listed as follow:
| (a) | General enterprise report format modification |
| (i) | The impact on the consolidated balance sheet is shown as follow: |
| Influenced amount Increase/(Decrease) | ||||||||||
The content and reason of accounting policy | Influenced accounts | 31 December 2018 | 1 January 2018 | |||||||
The Group divides the notes and accounts receivable into accounts receivable and notes receivable | Accounts receivable | 3,181,142 | 2,275,386 | |||||||
| Notes receivable | 789,103 | 1,151,053 | ||||||||
| Notes and accounts receivable | (3,970,245 | ) | (3,426,439 | ) | ||||||
The Group divides the notes and accounts payable into accounts payable and notes payable | Accounts payable Notes payable Notes and accounts payable | | 7,394,383 – (7,394,383 | ) | | 5,573,281 – (5,573,281 | ) | |||
The Group reclassifies the notes receivable and accounts receivable, which are measured at fair value and changes in other comprehensive income, into financial assets at fair value through other comprehensive income | Financial assets at fair value through other comprehensive income(“FVOCI”) Notes receivable Accounts receivable | | 1,672,431 (789,103 (883,328 | ) ) | | 1,460,571 (1,151,053 (309,518 | ) ) | |||
318
Table of Contents
Notes to the Financial Statements(continued)
For the year ended 31 December 2019
(All amounts in thousands of Renminbi Yuan unless otherwise stated)
[English translation for reference only]
| 2 | Summary of significant accounting policies and accounting estimates(continued) |
| (32) | Significant accounting policies change(continued) |
| (a) | General enterprise report format modification(continued) |
| (ii) | The impact on the Company balance sheet is shown as follow: |
| Influenced amount Increase/ (Decrease) | ||||||||||
The content and reason of accounting policy | Influenced accounts | 31 December 2018 | 1 January 2018 | |||||||
The Company divides the notes and accounts receivable into accounts receivable and notes receivable | Accounts receivable | 2,053,409 | 1,757,945 | |||||||
| Notes receivable | 714,599 | 815,227 | ||||||||
| Notes and accounts receivable | (2,768,008 | ) | (2,573,172 | ) | ||||||
The Company divides the notes and accounts payable into accounts payable and notes payable | Accounts payable | 5,535,625 | 4,129,720 | |||||||
| Notes payable | – | – | ||||||||
| Notes and accounts payable | (5,535,625 | ) | (4,129,720 | ) | ||||||
The Company reclassifies the notes receivable and accounts receivable, which are measured at fair value and changes in other comprehensive income, into financial assets at fair value through other comprehensive income | FVOCI | 714,599 | �� | 815,227 | ||||||
| Notes receivable | (714,599 | ) | (815,227 | ) | ||||||
| (b) | Leasing |
The Group and the Company adopted the new lease criteria retrospectively from 1 January 2019, but has not restated comparatives for the 2018 reporting period, as permitted under the specific transition provisions in the standard. The reclassifications and the adjustments arising from the new leasing rules are therefore recognized in the opening balance sheet on 1 January 2019.
319
Table of Contents
Notes to the Financial Statements(continued)
For the year ended 31 December 2019
(All amounts in thousands of Renminbi Yuan unless otherwise stated)
[English translation for reference only]
| 2 | Summary of significant accounting policies and accounting estimates(continued) |
| (32) | Significant accounting policies change(continued) |
| (b) | Leasing(continued) |
(i)
| Influenced amount Increase/(Decrease) | ||||||||||
The content and reason of accounting policy change | Influenced accounts | 1 January 2019 | ||||||||
| The Group | The Company | |||||||||
For the existing operating lease contracts before the first implementation of the new lease criteria, the Group and the Company have different linkage methods according to the remaining lease period: | Right-of-use assets | 76,852 | 74,112 | |||||||
| Prepayments | (121 | ) | (109 | ) | ||||||
| Lease liabilities | 2,638 | 136 | ||||||||
| Non-current liabilities mature within one year | 74,093 | 73,867 | ||||||||
For the remaining lease term is more than 12 months, the Group and the Company shall recognize the lease liability based on the remaining lease payment and incremental borrowing rate on 1 January, 2019, and assume that the new lease criteria shall be adopted on the beginning date of the lease term, and the book value of theright-of-use assets shall be determined based on the incremental borrowing rate on 1 January, 2019. | ||||||||||
For the remaining lease period does not exceed 12 months, the Group and the Company adopt the simplified method and do not confirm theright-of-use the assets and lease liabilities, which has no significant impact on the financial statements. | ||||||||||
As at 1 January 2019, the Group and the Company adopted the same discount rate for leasing contracts with similar characteristics to measure lease liabilities. The weighted average of the incremental borrowing interest rate adopted is 4.39%.
320
Table of Contents
Notes to the Financial Statements (continued)
For the year ended 31 December 2019
(All amounts in thousands of Renminbi Yuan unless otherwise stated)
[English translation for reference only]
| 2 | Summary of significant accounting policies and accounting estimates(continued) |
| (32) | Significant accounting policies change(continued) |
| (b) | Leasing(continued) |
| (ii) | As at 1 January 2019, the Group and the Company adjusted the unpaid minimum operating lease payments disclosed under the original lease criteria to the adjustment table of lease liabilities recognized under the new lease criteria as follows: |
| The Group | The Company | |||||||
As at 31 December 2018 the minimum future operating lease payments | 84,746 | 81,073 | ||||||
The present value of the above minimum operating lease payments discounted at the incremental borrowing rate | 77,046 | 74,108 | ||||||
Less: the present value of payments under lease contracts within 12 months | (315 | ) | (105 | ) | ||||
|
|
|
| |||||
As at 1 January 2019, lease liabilities includingnon-current liabilities mature within one year (Note 2 (32)(b)(i)) | 76,731 | 74,003 | ||||||
|
|
|
| |||||
321
Table of Contents
Notes to the Financial Statements(continued)
For the year ended 31 December 2019
(All amounts in thousands of Renminbi Yuan unless otherwise stated)
[English translation for reference only]
| 3 | Taxation |
The main categories and rates of taxes applicable to the Group are set out below:
Category | Tax base | Tax rate | ||||
Enterprise income tax (a) | Taxable income | 25 | % | |||
Value added tax (“VAT”) (b) | Taxable value added amount (Tax payable is calculated using the taxable sales amount multiplied by the applicable tax rate less deductible VAT input of current year) | | 5%, 6%, 9%,10%, 11%, 13% and 16% | | ||
Consumption tax | Taxable sales amount | | Gasoline: RMB2,110 per ton; Diesel oil: RMB1,411 per ton | | ||
City maintenance and construction tax | Consumption tax payable, business tax payable and VAT payable | 1% and 7% | ||||
| (a) | Pursuant to the ‘Circular on Enterprise Income Tax Policy concerning Deductions for Equipment and Appliances’ (Cai Shui [2018] 54) issued by the State Administration of Taxation, during the period from 1 January 2018 to 31 December 2020, the cost of newly purchased equipment with the original cost less than RMB5 million can be fully deducted against taxable profit in the next month after the asset is put into use, instead of being depreciated annually for tax filing. |
| (b) | Pursuant to the ‘Announcement of Deepening the Value Added Tax Reform Policy’ (Cai Shui [2019] 39) jointly issued by the Ministry of Finance and the State Administration of Taxation and General Administration of Customs, the applicable VAT rate of taxable sales behaviour, importing of goods and tangible movable property leasing is 13% and 9% respectively from 1 April 2019, while it was 16% and 10% before then. |
322
Table of Contents
Notes to the Financial Statements(continued)
For the year ended 31 December 2019
(All amounts in thousands of Renminbi Yuan unless otherwise stated)
[English translation for reference only]
| 4 | Notes to the consolidated financial statements |
| (1) | Cash at bank and on hand |
| 31 December 2019 | 31 December 2018 | |||||||
Cash on hand | – | 7 | ||||||
Cash at bank | 7,449,699 | 8,741,883 | ||||||
Other cash balances | 1,508,839 | 1,500,003 | ||||||
|
|
|
| |||||
| 8,958,538 | 10,241,893 | |||||||
|
|
|
| |||||
As at 31 December 2019, other cash balances of RMB1,500,000 thousand issix-month deposits (31 December 2018: RMB1,500,000 thousand). The interest rates from 3.95% to 4.10% per annum (31 December 2018: 4.5%).
(2) Derivative financial assets and derivative financial liabilities
| 31 December 2019 | 31 December 2018 | |||||||
Derivative financial assets | ||||||||
Foreign exchange option contract | 263 | 7,468 | ||||||
|
|
|
| |||||
Derivative financial Liability | ||||||||
Foreign exchange option contract | (799 | ) | (11,005 | ) | ||||
|
|
|
| |||||
As at December 31 2019, the derivative financial assets and derivative financial liabilities are mainly foreign exchange option contracts, with the total nominal amount of equivalent RMB40,754 thousand (As at 31 December 2018: RMB571,476 thousand).
323
Table of Contents
Notes to the Financial Statements(continued)
For the year ended 31 December 2019
(All amounts in thousands of Renminbi Yuan unless otherwise stated)
[English translation for reference only]
| 4 | Notes to the consolidated financial statements(continued) |
| (3) | Financial assets at fair value through profit or loss |
| 31 December 2019 | 31 December 2018 | |||||||
Structured deposit | 3,318,407 | 2,719,811 | ||||||
As at 31 December 2019 and 2018, financial assets at fair value through profit or loss are structured deposits deposited by the Group with the bank for a period of up to six months.The contract guarantees the principal, and the yield is linked to the performance of thedollar-yen exchange rate, the euro-dollar exchange rate and the three-month dollar libor in the international market.
| (4) | Accounts receivable |
| 31 December 2019 | 31 December 2018 | |||||||
Amounts due from related parties (Note 7(6)) | 1,519,177 | 2,215,824 | ||||||
Amounts due from third parties | 120,739 | 82,044 | ||||||
|
|
|
| |||||
| 1,639,916 | 2,297,868 | |||||||
Less: provision for bad debts | – | (54 | ) | |||||
|
|
|
| |||||
| 1,639,916 | 2,297,814 | |||||||
|
|
|
| |||||
| (a) | The ageing of accounts receivable is analysed as follows: |
| 31 December 2019 | 31 December 2018 | |||||||
Within one year | 1,639,916 | 2,297,774 | ||||||
Over one year but within two years | – | 42 | ||||||
Over two years but within three years | – | 27 | ||||||
Over three years | – | 25 | ||||||
|
|
|
| |||||
| 1,639,916 | 2,297,868 | |||||||
|
|
|
| |||||
324
Table of Contents
Notes to the Financial Statements(continued)
For the year ended 31 December 2019
(All amounts in thousands of Renminbi Yuan unless otherwise stated)
[English translation for reference only]
| 4 | Notes to the consolidated financial statements(continued) |
| (4) | Accounts receivable(continued) |
| (b) | As at 31 December 2019, the top five receivables collected by the arrears are summarized and analyzed as follows: |
| Amount | Provision | Percent of total amount | ||||||||||
The total amount of accounts receivable in the top five accounts | 1,508,265 | – | 92 | % | ||||||||
(c) Provision
| 31 December 2019 | 31 December 2018 | |||||||
Provision of Accounts receivable | – | 54 | ||||||
For notes receivable and accounts receivable, whether or not there is significant financing component, the Group shall measure the loss reserve according to the expected credit loss of the whole duration.
| (i) | As at 31 December 2019, the Group has no notes receivable and accounts receivable of single provision for bad debts. |
| (ii) | As at 31 December 2019, the Group has no pledged accounts receivable (As at 31 December 2018: Nil)). |
| (iii) | In the year of 2019, the Group does not have a large proportion of bad debt provision that has been fully withdrawn or withdrawn in previous years, but the accounts receivable that have been fully recovered or transferred in this year, or a large proportion of accounts receivable that have been recovered or transferred in this year (2018: Nil). |
| (d) | Significant unwritten accounts receivable of the Group for the year 2019 (2018: Nil). |
325
Table of Contents
Notes to the Financial Statements(continued)
For the year ended 31 December 2019
(All amounts in thousands of Renminbi Yuan unless otherwise stated)
[English translation for reference only]
| 4 | Notes to the consolidated financial statements(continued) |
| (5) | Financial assets at fair value through other comprehensive income |
| 31 December 2019 | 31 December 2018 | |||||
Financial assets at fair value through other comprehensive income | 1,540,921 | 1,672,431 | ||||
| (a) | Due to the requirement of cash management, the Group discounted and endorsed part of the bank acceptance notes. The business model of bank acceptance notes management is for the purpose of collecting cash flow of contracts and sales. Therefore, as at 31 December 2018, the Group classified RMB804,739 thousand notes receivable to financial assets measured at fair value and whose changes are included in other comprehensive income and disclosed in notes receivable and accounts receivable (as at 31 December 2018, RMB789,103 thousand). |
| (b) | The Group has no single provision for impairment of the bank acceptance notes, with all provision was accrued by their expected credit loss. As at 31 December 2019 and 2018, the Group considers that no bank acceptance notes has significant credit risk, and will not suffer significant loss due to the violation of banks. |
| (c) | As at 31 December 2019, the Group had no pledged bank acceptance notes to issue letters of credit(31 December 2018:Nil). |
| (d) | As at 31 December 2019, unmatured notes receivable that have been endorsed or discounted by the Group is as follows: |
| Derecognized | Not derecognized | |||||
Bank acceptance notes | 441,721 | – | ||||
| (e) | The Group’s subsidiaries Shanghai Jinshan Trading Corporation (“JMGJ”) derecognized part of the accounts receivable for thenon-recourse forfaiting business based on the requirement of daily cash management. The business model of accounts receivable management is for the purpose of collecting cash flow of contracts and sales. l, including a sale contract as the goal. Therefore, as at 31 December 2019, the Group classified RMB736,182 thousand third party accounts receivable of subsidiaries to financial assets measured at fair value and whose changes are included in other comprehensive income and disclosed in notes receivable and accounts receivable (as at 31 December 2018, RMB883,328 thousand). |
| (f) | The analysis of accounts receivable terminated due to the transfer of financial assets is as follows: |
In the year of 2019, the Group’s subsidiaries China Jinshan Associated Trading Corporation (“Jinmao”) and JMGJ derecognized RMB3,095,035 thousand accounts receivable due to thenon-recourse forfaiting (2018: RMB5,665,160 thousand), which including the financial expense of RMB11,137 thousand (2018: RMB25,391 thousand).
326
Table of Contents
Notes to the Financial Statements(continued)
For the year ended 31 December 2019
(All amounts in thousands of Renminbi Yuan unless otherwise stated)
[English translation for reference only]
| 4 | Notes to the consolidated financial statements(continued) |
| (6) | Advances to suppliers |
| 31 December 2019 | 31 December 2018 | |||||||
Amounts advance to related parties (Note 7(6)) | 44,806 | 67,242 | ||||||
Amounts advance to third parties | 11,796 | 5,726 | ||||||
|
|
|
| |||||
| 56,602 | 72,968 | |||||||
|
|
|
| |||||
| (a) | The aging of advances to suppliers is analysed as follows: |
| 31 December 2019 | 31 December 2018 | |||||||||||||||
| Amount | % of total balance | Amount | % of total balance | |||||||||||||
Within one year | 56,602 | 100 | % | 72,968 | 100 | % | ||||||||||
| (b) | As at 31 December 2019, the total amount of the top five advances to suppliers are summarized as follows: |
| Amount | Percentage of total advances to suppliers (%) | |||||||
Total amount of the top five advances to suppliers | 46,468 | 82 | % | |||||
327
Table of Contents
Notes to the Financial Statements(continued)
For the year ended 31 December 2019
(All amounts in thousands of Renminbi Yuan unless otherwise stated)
[English translation for reference only]
| 4 | Notes to the consolidated financial statements(continued) |
| (7) | Other receivable |
| 31 December 2019 | 31 December 2018 | |||||||
Amounts due from related parties (Note 7(6)) | 2,010 | 3,183 | ||||||
Amounts due from third parties | 26,240 | 105,947 | ||||||
|
|
|
| |||||
| 28,250 | 109,130 | |||||||
Less: provision for bad debts | (139 | ) | (144 | ) | ||||
|
|
|
| |||||
| 28,111 | 108,986 | |||||||
|
|
|
| |||||
| (a) | The aging of other receivable is analysed as follows: |
| 31 December 2019 | 31 December 2018 | |||||||
Within one year | 28,111 | 108,986 | ||||||
Over one year but within three years | – | – | ||||||
Over three years | 139 | 144 | ||||||
|
|
|
| |||||
| 28,250 | 109,130 | |||||||
|
|
|
| |||||
| (b) | Provision movement |
| First Stage | Third Stage | |||||||||||||||||||||||||||||||
| Expected credit loss in the next 12 months (Combined) | Expected credit loss in the next 12 months (Single) | Total | Expected credit loss over the duration (credit impairment has occurred) | Total | ||||||||||||||||||||||||||||
| Book value | Provision | Book value | Provision | Provision | Book value | Provision | Provision | |||||||||||||||||||||||||
31 December 2018 | 108,986 | — | — | — | — | 144 | (144 | ) | (144 | ) | ||||||||||||||||||||||
Add | — | — | — | — | — | — | — | — | ||||||||||||||||||||||||
Reverse | — | — | — | — | — | — | 5 | 5 | ||||||||||||||||||||||||
|
|
|
|
|
|
|
|
|
|
|
|
|
|
|
| |||||||||||||||||
31 December 2019 | 28,111 | — | — | — | — | 139 | (139 | ) | (139 | ) | ||||||||||||||||||||||
|
|
|
|
|
|
|
|
|
|
|
|
|
|
|
| |||||||||||||||||
328
Table of Contents
Notes to the Financial Statements(continued)
For the year ended 31 December 2019
(All amounts in thousands of Renminbi Yuan unless otherwise stated)
[English translation for reference only]
| 4 | Notes to the consolidated financial statements(continued) |
| (7) | Other receivable(continued) |
| (c) | In 2019, the Group does not have a large or full proportion of bad debt provision in previous years, but have been fully recovered or transferred in this year, or a large proportion of other accounts receivable that have been recovered or transferred in this year (2018: Nil). |
| (d) | In 2019, there is no balance of other receivables written off by the Group (2018: the balance of other receivables written off by the Group is RMB894 thousand, and the bad debt reserve is RMB894 thousand). |
| (e) | As at 31 December 2019, the top five other receivables are as follows: |
| Nature | Amount | Ageing | Percentage of total other receivables | Provision for bad debts | ||||||||||||||||
State Taxation Administration, Shanghai Jinshan Bureau | Export tax rebates | 8,957 | Within one year | 32 | % | – | ||||||||||||||
Shanghai Bank Co., Ltd. Jinshan Branch | Interest receivables | 6,372 | Within one year | 23 | % | – | ||||||||||||||
Shanghai Yufan Logistics Co., Ltd. | Reimbursed expenses | 3,988 | Within one year | 14 | % | – | ||||||||||||||
China CITIC Bank Co., LTD. Shanghai Branch | Interest receivables | 3,255 | Within one year | 12 | % | – | ||||||||||||||
BOC-SPC Gases Company Limited “BOC” | Business transaction | 1,830 | Within one year | 6 | % | – | ||||||||||||||
|
|
|
| |||||||||||||||||
| 24,402 | 87 | % | – | |||||||||||||||||
|
|
|
| |||||||||||||||||
329
Table of Contents
Notes to the Financial Statements(continued)
For the year ended 31 December 2019
(All amounts in thousands of Renminbi Yuan unless otherwise stated)
[English translation for reference only]
| 4 | Notes to the consolidated financial statements(continued) |
| (8) | Inventories |
| (a) | Inventories by categories are as follows: |
| 31 December 2019 | 31 December 2018 | |||||||||||||||||||||
| Book value | Provision for declines in the value of inventories | Carrying amount | Book value | Provision for | Carrying amount | |||||||||||||||||
Raw materials | 4,567,648 | — | 4,567,648 | 5,529,241 | — | 5,529,241 | ||||||||||||||||
Work in progress | 1,072,040 | (78,981 | ) | 993,059 | 1,099,235 | (55,098) | 1,044,137 | |||||||||||||||
Finished goods | 1,022,335 | (33,763 | ) | 988,572 | 1,440,721 | (56,448) | 1,384,273 | |||||||||||||||
Spare parts and consumables | 247,873 | (42,718 | ) | 205,155 | 209,907 | (46,683) | 163,224 | |||||||||||||||
|
|
|
|
|
|
|
|
|
|
| ||||||||||||
| 6,909,896 | (155,462) | 6,754,434 | 8,279,104 | (158,229) | 8,120,875 | |||||||||||||||||
|
|
|
|
|
|
|
|
|
|
| ||||||||||||
| (b) | Provision for declines in the value of inventories is analysed as follows: |
| 31 December 2018 | Increases | Decreases | 31 December 2019 | |||||||||||||
Work in progress | 55,098 | 45,002 | (21,119 | ) | 78,981 | |||||||||||
Finished goods | 56,448 | 25,176 | (47,861 | ) | 33,763 | |||||||||||
Spare parts and consumables | 46,683 | – | (3,965 | ) | 42,718 | |||||||||||
|
|
|
|
|
|
|
| |||||||||
| 158,229 | 70,178 | (72,945 | ) | 155,462 | ||||||||||||
|
|
|
|
|
|
|
| |||||||||
330
Table of Contents
Notes to the Financial Statements(continued)
For the year ended 31 December 2019
(All amounts in thousands of Renminbi Yuan unless otherwise stated)
[English translation for reference only]
| 4 | Notes to the consolidated financial statements (continued) |
| (8) | Inventories (continued) |
| (c) | Provision for declines in the value of inventories are analysed as follows: |
Basis for determining net realisable value | Main reasons forreversal/write-off | |||
| Raw materials | The estimated selling price in the ordinary course of business, less the estimated costs to completion and estimated costs to make the sale and related taxes. | NA | ||
| Work in progress | Same as above | Sold in current year | ||
| Spare parts and consumables | The estimated selling price in the ordinary course of business, less the estimated costs to make the sale and related taxes. | Sold in current year | ||
| Finished goods | Same as above | Disposed | ||
| (9) | Assets hold for sale |
| 31 December 2018 | ||||||||||||
| Book value before divided to assets hold for sale | Provision | Book value | ||||||||||
Land use right | 24,331 | – | 24,331 | |||||||||
In the year of 2018, Jinyong, which was a subsidiary of the Group, signed an irrevocable assignment agreement with Municipal Land Reserve Center of Ningbo Zhenhai, to transfer the land use right and buildings above on with the price of 344,275 thousand. The Group recognized 197,138 thousand gains from disposal ofnon-current assets after finished the transfer formality of buildings in 2018. In the year of 2019, the Group recognized 126,817 thousand gains from disposal ofnon-current assets after finished all the transfer formality (Note 4(50)).
331
Table of Contents
Notes to the Financial Statements(continued)
For the year ended 31 December 2019
(All amounts in thousands of Renminbi Yuan unless otherwise stated)
[English translation for reference only]
| 4 | Notes to the consolidated financial statements(continued) |
| (10) | Other current assets |
| 31 December 2019 | 31 December 2018 | |||||||
VAT deductible | 11,971 | 32,299 | ||||||
| (11) | Long-term equity investments |
| 31 December 2019 | 31 December 2018 | |||||||
Joint ventures (a) | 235,294 | 229,868 | ||||||
Associates (b) | 5,093,464 | 4,427,265 | ||||||
|
|
|
| |||||
| 5,328,758 | 4,657,133 | |||||||
Less: provision for impairment of long-term equity investment | — | — | ||||||
|
|
|
| |||||
| 5,328,758 | 4,657,133 | |||||||
|
|
|
| |||||
| (a) | Joint Ventures |
| Current year movement | ||||||||||||||||||||||||||||
| 31 December 2018 | Additional/ negative investment | Net profit adjusted by equity method | Cash dividends declared in current year | Impairment provision | 31 December 2019 | Impairment provision | ||||||||||||||||||||||
Joint ventures of subsidiaries | ||||||||||||||||||||||||||||
Inspection and testing company “JYJC” | 8,638 | — | 1,165 | (453 | ) | — | 9,350 | — | ||||||||||||||||||||
Shanghai Petrochemical Yangu Gas Development Company Limited “Yangu Gas” | 48,713 | — | 20 | — | — | 48,733 | — | |||||||||||||||||||||
BOC | 172,517 | — | 43,594 | (38,900 | ) | — | 177,211 | — | ||||||||||||||||||||
|
|
|
|
|
|
|
|
|
|
|
|
|
| |||||||||||||||
| 229,868 | — | 44,779 | (39,353 | ) | — | 235,294 | — | |||||||||||||||||||||
|
|
|
|
|
|
|
|
|
|
|
|
|
| |||||||||||||||
Interests in joint ventures, refer to Note 5(2).
332
Table of Contents
Notes to the Financial Statements(continued)
For the year ended 31 December 2019
(All amounts in thousands of Renminbi Yuan unless otherwise stated)
[English translation for reference only]
| 4 | Notes to the consolidated financial statements(continued) |
| (11) | Long-term equity investments(continued) |
| (b) | Associates |
| Current year movement | ||||||||||||||||||||||||||||||||||||
| 31 December 2018 | Additional/ negative investment | Net profit/ (loss) adjusted by equity method | Cash dividends declared in current year | Impairment provision | Change in other equity | Others | 31 December 2019 | Impairment provision | ||||||||||||||||||||||||||||
Associates of the Company | ||||||||||||||||||||||||||||||||||||
Shanghai Secco Petrochemical Company Limited “Shanghai Secco” | 2,555,044 | — | 676,716 | (507,400 | ) | — | — | — | 2,724,360 | — | ||||||||||||||||||||||||||
Shanghai Chemical Industry Park Development Company Limited “Chemical Industry” | 1,716,776 | — | 223,210 | (30,225 | ) | — | 7,449 | — | 1,917,210 | — | ||||||||||||||||||||||||||
Associates of subsidiaries | ||||||||||||||||||||||||||||||||||||
Shanghai Jinsen Hydrocarbon Resins Company Limited “Jinsen” | 61,335 | — | (6,798 | ) | — | — | — | — | 54,537 | — | ||||||||||||||||||||||||||
Shanghai Azbil Automation Company Limited “Azbil” | 49,598 | — | 15,379 | (12,000 | ) | — | — | — | 52,977 | — | ||||||||||||||||||||||||||
Shanghai Shidian Energy Company Limited “Shidian Energy” | — | 320,000 | 2,907 | — | — | — | (23,549 | ) | 299,358 | — | ||||||||||||||||||||||||||
Others | 44,512 | — | 6,400 | (5,890 | ) | — | — | — | 45,022 | — | ||||||||||||||||||||||||||
|
|
|
|
|
|
|
|
|
|
|
|
|
|
|
|
|
| |||||||||||||||||||
| 4,427,265 | 320,000 | 917,814 | (555,515 | ) | — | 7,449 | (23,549 | ) | 5,093,464 | — | ||||||||||||||||||||||||||
|
|
|
|
|
|
|
|
|
|
|
|
|
|
|
|
|
| |||||||||||||||||||
Interests in associates, refer to Note 5(2).
333
Table of Contents
Notes to the Financial Statements(continued)
For the year ended 31 December 2019
(All amounts in thousands of Renminbi Yuan unless otherwise stated)
[English translation for reference only]
| 4 | Notes to the consolidated financial statements(continued) |
| (12) | Investment properties |
| Buildings | ||||
Cost | ||||
31 December 2018 | 594,135 | |||
Transfer from fixed assets (Note 4(13)) | 19,071 | |||
Transfer to fixed assets (Note 4(13)) | (10,547 | ) | ||
|
| |||
31 December 2019 | 602,659 | |||
|
| |||
Accumulated depreciation | ||||
31 December 2018 | 217,396 | |||
Depreciation charged in current year | 14,694 | |||
Transfer from fixed assets (Note 4(13)) | 6,724 | |||
Transfer to fixed assets (Note 4(13)) | (3,623 | ) | ||
|
| |||
31 December 2019 | 235,191 | |||
|
| |||
Carrying amount | ||||
31 December 2019 | 367,468 | |||
|
| |||
31 December 2018 | 376,739 | |||
|
| |||
In 2019, the depreciation amount of investment real estate is RMB14,694 thousand (2018: RMB14,527 thousand) without provision for impairment (31 December, 2018: Nil).
334
Table of Contents
Notes to the Financial Statements(continued)
For the year ended 31 December 2019
(All amounts in thousands of Renminbi Yuan unless otherwise stated)
[English translation for reference only]
| 4 | Notes to the consolidated financial statements(continued) |
| (13) | Property, plant and equipment |
| Buildings | Plant and machinery | Vehicles and other equipment | Total | |||||||||||||
Cost | ||||||||||||||||
31 December 2018 | 3,338,284 | 41,679,350 | 1,802,997 | 46,820,631 | ||||||||||||
Reclassification in current year | 23,103 | (96,394 | ) | 73,291 | — | |||||||||||
Increase in current period | ||||||||||||||||
Purchase | — | 99,041 | 15,578 | 114,619 | ||||||||||||
Transfer from CIP (Note 4(14)) | 26,655 | 999,412 | 97,553 | 1,123,620 | ||||||||||||
Transfer from investment properties (Note 4(12)) | 10,547 | — | — | 10,547 | ||||||||||||
Decrease in current period | ||||||||||||||||
Disposal | (41,165 | ) | (815,858 | ) | (117,665 | ) | (974,688 | ) | ||||||||
Transfer to investment properties | ||||||||||||||||
(Note 4(12)) | (19,071 | ) | — | — | (19,071 | ) | ||||||||||
31 December 2019 | 3,338,353 | 41,865,551 | 1,871,754 | 47,075,658 | ||||||||||||
|
|
|
|
|
|
|
| |||||||||
Accumulated depreciation | ||||||||||||||||
31 December 2018 | 2,249,636 | 30,555,005 | 1,468,215 | 34,272,856 | ||||||||||||
Reclassification in current year | 6,708 | (13,790 | ) | 7,082 | — | |||||||||||
Increase in current year | ||||||||||||||||
Current year charges | 92,187 | 1,348,667 | 68,960 | 1,509,814 | ||||||||||||
Transfer from investment properties (Note 4(12)) | 3,623 | — | — | 3,623 | ||||||||||||
Decrease in current year | ||||||||||||||||
Disposal | (33,964 | ) | (706,958 | ) | (111,677 | ) | (852,599 | ) | ||||||||
Transfer to investment properties | ||||||||||||||||
(Note 4(12)) | (6,724 | ) | — | — | (6,724 | ) | ||||||||||
31 December 2019 | 2,311,466 | 31,182,924 | 1,432,580 | 34,926,970 | ||||||||||||
|
|
|
|
|
|
|
| |||||||||
Provision for impairment | ||||||||||||||||
31 December 2018 | 53,872 | 815,329 | 8,121 | 877,322 | ||||||||||||
Decrease in current year | ||||||||||||||||
Disposal | (3,087 | ) | (48,397 | ) | — | (51,484 | ) | |||||||||
31 December 2019 | 50,785 | 766,932 | 8,121 | 825,838 | ||||||||||||
|
|
|
|
|
|
|
| |||||||||
Carrying amount | ||||||||||||||||
31 December 2019 | 976,102 | 9,915,695 | 431,053 | 11,322,850 | ||||||||||||
|
|
|
|
|
|
|
| |||||||||
31 December 2018 | 1,034,776 | 10,309,016 | 326,661 | 11,670,453 | ||||||||||||
|
|
|
|
|
|
|
| |||||||||
335
Table of Contents
Notes to the Financial Statements(continued)
For the year ended 31 December 2019
(All amounts in thousands of Renminbi Yuan unless otherwise stated)
[English translation for reference only]
| 4 | Notes to the consolidated financial statements(continued) |
| (13) | Property, plant and equipment(continued) |
In the year of 2019, no impairment provision was made of the Group. In the year of 2018, the Group made impairment provision of RMB58,652 thousand against these property, plant and equipment which will be redundant and replaced by new facilities.
For the year ended 31 December 2019, the written off of impairment loss of the Group amounted to RMB51,484 thousands due to the disposal of property, plant and equipment.
As at 31 December 2019 and 31 December 2018, the Group had no pledged fixed assets.
In the year of 2019, the depreciation expenses amounted to RMB1,509,814 thousand (2018: RMB1,552,934 thousand). The depreciation expenses charged to cost of sales, selling and distribution expenses, general and administrative expenses were RMB1,413,314 thousand, RMB9,179 thousand, and RMB81,787 thousand, respectively (2018: RMB1,465,586 thousand, RMB9,126 thousand, and RMB77,636 thousand, respectively).
The amount of fixed assets transferred from construction in progress was RMB1,123,620 thousand (2018: RMB344,935 thousand).
| (14) | Construction in progress |
| 31 December 2019 | 31 December 2018 | |||||||||||||||||||||||
| Original cost | Provision for impairment | Carrying amount | Original cost | Provision for impairment | Carrying amount | |||||||||||||||||||
Construction in progress | 1,850,210 | (34,661 | ) | 1,815,549 | 1,593,576 | (34,175 | ) | 1,559,401 | ||||||||||||||||
336
Table of Contents
Notes to the Financial Statements(continued)
For the year ended 31 December 2019
(All amounts in thousands of Renminbi Yuan unless otherwise stated)
[English translation for reference only]
| 4 | Notes to the consolidated financial statements(continued) |
| (14) | Construction in progress(continued) |
| (a) | The movement of the Group’s major construction in progress is listed as follows: |
| Budget | 31 December 2018 | Increase in current year | Transferred to fixed assets in current year (Note 4(13)) | 31 December 2019 | Percentage of actual cost to budget | Project progress | Accumulative capitalized borrowing costs | Current year capitalized borrowing costs | Current year borrowing cost capitalizing rate | Source of funds | ||||||||||||||||||||||||||||||||||
Oil cleaning project | 781,657 | 57,984 | 419,993 | — | 477,977 | 61.15 | % | 60.00 | % | 1,685 | 1,685 | 3.35 | % | | Equity funds and borrowings | | ||||||||||||||||||||||||||||
100,000 tons/year EVA production equipment | 1,131,520 | 239,332 | — | — | 239,332 | 21.15 | % | 20.00 | % | 1,081 | — | — | | Equity funds and borrowings | | |||||||||||||||||||||||||||||
PAN carbon fiber project | 847,794 | 45,695 | 209,994 | (108,226 | ) | 147,463 | 30.16 | % | 30.00 | % | 3,100 | 3,100 | 3.35 | % | | Equity funds and borrowings | | |||||||||||||||||||||||||||
Shanghai petrochemical third circuit 220KV power supply line project | 283,000 | 112,887 | — | — | 112,887 | 46.89 | % | 46.89 | % | — | — | — | Equity funds | |||||||||||||||||||||||||||||||
Emergencycut-off function renovation project of tank area of storage department | 76,766 | — | 54,351 | — | 54,351 | 70.80 | % | 70.00 | % | — | — | — | Equity funds | |||||||||||||||||||||||||||||||
Tank area decontamination and diversion improvement project of storage and transportation department | 64,474 | — | 37,944 | — | 37,944 | 58.85 | % | 60.00 | % | — | — | — | Equity funds | |||||||||||||||||||||||||||||||
2# 3# aromatics joint unit energy saving renovation | 954,240 | 29,940 | — | — | 29,940 | 3.14 | % | 3.14 | % | — | — | — | Equity funds | |||||||||||||||||||||||||||||||
337
Table of Contents
Notes to the Financial Statements(continued)
For the year ended 31 December 2019
(All amounts in thousands of Renminbi Yuan unless otherwise stated)
[English translation for reference only]
| 4 | Notes to the consolidated financial statements (Continued) |
| (14) | Construction in progress (continued) |
| (a) | The movement of the Group’s major construction in progress is listed as follows:(continued) |
| Budget | 31 December 2018 | Increase in current year | Transferred to fixed assets in current year (Note 4(13)) | 31 December 2019 | Percentage of actual cost to budget | Project progress | Accumulative capitalized borrowing costs | Current year capitalized borrowing costs | Current year borrowing cost capitalizing rate | Source of funds | ||||||||||||||||||||||||||||||||||
35KV cable hidden trouble control project | 29,240 | — | 24,873 | — | 24,873 | 85.06 | % | 80.00 | % | — | — | — | Equity funds | |||||||||||||||||||||||||||||||
Oil blending and optimization system project of storage and transportation department | 26,191 | 20,000 | 3,000 | — | 23,000 | 87.82 | % | 87.82 | % | — | — | — | Equity funds | |||||||||||||||||||||||||||||||
No. 3 and no. 4 fire emission reconstruction project for the thermal power section | 98,820 | 84,994 | 2,600 | (87,594 | ) | — | 88.71 | % | 100.00 | % | 610 | — | — | | Equity funds and borrowings | | ||||||||||||||||||||||||||||
2# delayed coking device is safe and environment-friendly sealed coke removal transportation and waste gas treatment | 69,737 | 65,000 | 3,000 | (68,000 | ) | — | 97.51 | % | 100.00 | % | — | — | — | Equity funds | ||||||||||||||||||||||||||||||
Optimization and reconstruction project of high-sulfur torch system in the storage and transportation department | 44,234 | 38,986 | 1,798 | (40,784 | ) | — | 92.20 | % | 100.00 | % | — | — | — | Equity funds | ||||||||||||||||||||||||||||||
Light oil storage tank and trestle oil and gas recovery project of ministry of storage and transportation | 65,257 | 52,988 | 10,999 | (63,987 | ) | — | 98.05 | % | 100.00 | % | — | — | — | Equity funds | ||||||||||||||||||||||||||||||
338
Table of Contents
Notes to the Financial Statements(continued)
For the year ended 31 December 2019
(All amounts in thousands of Renminbi Yuan unless otherwise stated)
[English translation for reference only]
| 4 | Notes to the consolidated financial statements(continued) |
| (14) | Construction in progress(continued) |
| (a) | The movement of the Group’s major construction in progress is listed as follows:(continued) |
| Budget | 31 December 2018 | Increase in current year | Transferred to fixed assets in current year (Note 4(13)) | 31 December 2019 | Percentage of actual cost to budget | Project progress | Accumulative capitalized borrowing costs | Current year capitalized borrowing costs | Current year borrowing cost capitalizing rate | Source of funds | ||||||||||||||||||||||||||||||||||
Shanghai petrochemical cogeneration unit standard emission renovation project | 221,566 | 17,340 | 12,861 | (30,201 | ) | — | 100.17 | % | 100.00 | % | 3,779 | — | — | | Equity funds and borrowings | | ||||||||||||||||||||||||||||
No.2 alkene cracking furnace low nitrogen combustion renovation project | 120,929 | 4,428 | 6,994 | (11,422 | ) | — | 85.54 | % | 100.00 | % | 2,090 | 809 | 3.35 | % | | Equity funds and borrowings | | |||||||||||||||||||||||||||
Equipment update of thermoelectric department | — | 50,085 | 28,168 | (2,579 | ) | 75,674 | — | — | — | — | — | | Equity funds | | ||||||||||||||||||||||||||||||
Oil refining equipment update | — | 45,577 | 31,185 | (20,200 | ) | 56,562 | — | — | — | — | — | | Equity funds | | ||||||||||||||||||||||||||||||
Storage department production operation | — | 55,473 | 10,439 | (23,270 | ) | 42,642 | — | — | — | — | — | | Equity funds | | ||||||||||||||||||||||||||||||
Aromatics department energy conservation and environmental protection | — | 46,588 | 12,457 | (28,600 | ) | 30,445 | — | — | — | — | — | | Equity funds | | ||||||||||||||||||||||||||||||
Aromatics department equipment update | — | 8,539 | 18,004 | – | 26,543 | — | — | — | — | — | | Equity funds | | |||||||||||||||||||||||||||||||
Refining department operations | — | 46,299 | 12,070 | (33,606 | ) | 24,763 | — | — | — | — | — | | Equity funds | | ||||||||||||||||||||||||||||||
Informatization project of the ministry of information | — | 17,412 | 17,787 | (12,836 | ) | 22,363 | — | — | — | — | — | | Equity funds | | ||||||||||||||||||||||||||||||
339
Table of Contents
Notes to the Financial Statements(continued)
For the year ended 31 December 2019
(All amounts in thousands of Renminbi Yuan unless otherwise stated)
[English translation for reference only]
| 4 | Notes to the consolidated financial statements(continued) |
| (14) | Construction in progress(continued) |
| (a) | The movement of the Group’s major construction in progress is listed as follows:(continued) |
| Budget | 31 December 2018 | Increase in current year | Transferred to fixed assets in current year (Note 4(13)) | 31 December 2019 | Percentage of actual cost to budget | Project progress | Accumulative capitalized borrowing costs | Current year capitalized borrowing costs | Current year borrowing cost capitalizing rate | Source of funds | ||||||||||||||||||||||||||||||||||
Storage and transportation department security management | — | 32,446 | 4,808 | (16,242 | ) | 21,012 | — | — | — | — | — | Equity funds | ||||||||||||||||||||||||||||||||
Utility equipment updates | — | 27,235 | 15,482 | (26,353 | ) | 16,364 | — | — | — | — | — | Equity funds | ||||||||||||||||||||||||||||||||
Acrylic department production and operation | — | 8,958 | 12,094 | (5,164 | ) | 15,888 | — | — | — | — | — | Equity funds | ||||||||||||||||||||||||||||||||
Company headquarters other | — | – | 17,017 | (2,003 | ) | 15,014 | — | — | — | — | — | Equity funds | ||||||||||||||||||||||||||||||||
Polyester department purchase update | — | 14,925 | 1,363 | (1,379 | ) | 14,909 | — | — | — | — | — | Equity funds | ||||||||||||||||||||||||||||||||
Technical renovation of oil refining department | — | – | 54,773 | (39,966 | ) | 14,807 | — | — | — | — | — | Equity funds | ||||||||||||||||||||||||||||||||
Technical renovation of environmental water department | — | – | 16,896 | (2,306 | ) | 14,590 | — | — | — | — | — | Equity funds | ||||||||||||||||||||||||||||||||
Company headquarters other purchase update | — | 11,414 | 6,788 | (3,655 | ) | 14,547 | — | — | — | — | — | Equity funds | ||||||||||||||||||||||||||||||||
Energy conservation and environmental protection project of storage and transportation department | — | 4,465 | 18,348 | (8,381 | ) | 14,432 | — | — | — | — | — | Equity funds | ||||||||||||||||||||||||||||||||
Storage and transportation department equipment update | — | 13,077 | 11,118 | (11,548 | ) | 12,647 | — | — | — | — | — | Equity funds | ||||||||||||||||||||||||||||||||
340
Table of Contents
Notes to the Financial Statements(continued)
For the year ended 31 December 2019
(All amounts in thousands of Renminbi Yuan unless otherwise stated)
[English translation for reference only]
| 4 | Notes to the consolidated financial statements(continued) |
| (14) | Construction in progress(continued) |
| (a) | The movement of the Group’s major construction in progress is listed as follows:(continued) |
| Budget | 31 December 2018 | Increase in current year | Transferred to fixed assets in current year (Note 4(13)) | 31 December 2019 | Percentage of actual cost to budget | Project progress | Accumulative capitalized borrowing costs | Current year capitalized borrowing costs | Current year borrowing cost capitalizing rate | Source of funds | ||||||||||||||||||||||||||||||||||
Aromatic department production operations | — | 16,326 | 9,182 | (13,567 | ) | 11,941 | — | — | — | — | — | Equity funds | ||||||||||||||||||||||||||||||||
Aromatics department other purchase update | — | 3,736 | 7,683 | — | 11,419 | — | — | — | — | — | Equity funds | |||||||||||||||||||||||||||||||||
Acrylic department equipment update | — | 14,827 | 12,630 | (16,399 | ) | 11,058 | — | — | — | — | — | Equity funds | ||||||||||||||||||||||||||||||||
Olefin production operations | — | 19,647 | 8,883 | (18,221 | ) | 10,309 | — | — | — | — | — | Equity funds | ||||||||||||||||||||||||||||||||
Other miscellaneous items | — | 386,973 | 264,672 | (427,131 | ) | 224,514 | — | — | — | — | — | Equity funds | ||||||||||||||||||||||||||||||||
|
|
|
|
|
|
|
| |||||||||||||||||||||||||||||||||||||
| 1,593,576 | 1,380,254 | (1,123,620 | ) | 1,850,210 | ||||||||||||||||||||||||||||||||||||||||
|
|
|
|
|
|
|
| |||||||||||||||||||||||||||||||||||||
Less: provision for impairment | (34,175 | ) | (486 | ) | — | (34,661 | ) | |||||||||||||||||||||||||||||||||||||
|
|
|
|
|
|
|
|
|
| |||||||||||||||||||||||||||||||||||
| 1,559,401 | 1,379,768 | (1,123,620 | ) | 1,815,549 | 5,594 | |||||||||||||||||||||||||||||||||||||||
|
|
|
|
|
|
|
|
|
| |||||||||||||||||||||||||||||||||||
341
Table of Contents
Notes to the Financial Statements(continued)
For the year ended 31 December 2019
(All amounts in thousands of Renminbi Yuan unless otherwise stated)
[English translation for reference only]
| 4 | Notes to the consolidated financial statements(continued) |
| (14) | Construction in progress(continued) |
| (a) | The movement of the Group’s major construction in progress is listed as follows:(continued) |
In 2019, the capitalized amount of the Group’s borrowing expenses is RMB5,594 thousand (in 2018: RMB5,179 thousand).
As at December 31 2019, the balance of the impairment provision for the Group’s construction in progress is the impairment provision for the long-term suspended50,000-ton/year ethanolamine project and the energy saving transformation of no. 2 and no. 3 aromatics combined plant with the amount of RMB34,175 thousand (As at December 31 2018: RMB34,175 thousand).
| (15) | Right-of-use assets |
| Buildings | Plant and machinery | Vehicles and other equipment | Total | |||||||||||||
Cost | ||||||||||||||||
31 December 2018 | — | — | — | — | ||||||||||||
Change of policy | 12,233 | 63,471 | 1,148 | 76,852 | ||||||||||||
1 January 2019 | 12,233 | 63,471 | 1,148 | 76,852 | ||||||||||||
Increase in current period | 22,512 | 10,723 | 745 | 33,980 | ||||||||||||
Decrease in current period | (1,468 | ) | (108 | ) | (113 | ) | (1,689 | ) | ||||||||
|
|
|
|
|
|
|
| |||||||||
31 December 2019 | 33,277 | 74,086 | 1,780 | 109,143 | ||||||||||||
|
|
|
|
|
|
|
| |||||||||
Accumulated depreciation | ||||||||||||||||
31 December 2018 | — | — | — | — | ||||||||||||
Change of policy | — | – | — | — | ||||||||||||
1 January 2019 | — | — | — | — | ||||||||||||
Increase in current period | 12,541 | 74,025 | 618 | 87,184 | ||||||||||||
Decrease in current period | (1,469 | ) | (107 | ) | (113 | ) | (1,689 | ) | ||||||||
|
|
|
|
|
|
|
| |||||||||
31 December 2019 | 11,072 | 73,918 | 505 | 85,495 | ||||||||||||
|
|
|
|
|
|
|
| |||||||||
Carrying amount | ||||||||||||||||
31 December 2019 | 22,205 | 168 | 1,275 | 23,648 | ||||||||||||
|
|
|
|
|
|
|
| |||||||||
31 December 2018 | — | — | — | — | ||||||||||||
|
|
|
|
|
|
|
| |||||||||
342
Table of Contents
Notes to the Financial Statements(continued)
For the year ended 31 December 2019
(All amounts in thousands of Renminbi Yuan unless otherwise stated)
[English translation for reference only]
| 4 | Notes to the consolidated financial statements(continued) |
| (16) | Intangible assets |
| Land use rights | Other intangible assets | Total | ||||||||||
Cost | ||||||||||||
31 December 2018 | 700,821 | 98,378 | 799,199 | |||||||||
Purchase | — | 1,762 | 1,762 | |||||||||
|
|
|
|
|
| |||||||
31 December 2019 | 700,821 | 100,140 | 800,961 | |||||||||
|
|
|
|
|
| |||||||
Accumulated amortization | ||||||||||||
31 December 2018 | 365,795 | 77,810 | 443,605 | |||||||||
Charge in current year | 14,814 | 4,696 | 19,510 | |||||||||
|
|
|
|
|
| |||||||
31 December 2019 | 380,609 | 82,506 | 463,115 | |||||||||
|
|
|
|
|
| |||||||
Carrying amount | ||||||||||||
31 December 2019 | 320,212 | 17,634 | 337,846 | |||||||||
|
|
|
|
|
| |||||||
31 December 2018 | 335,026 | 20,568 | 355,594 | |||||||||
|
|
|
|
|
| |||||||
In the year of 2019, amortization expenses of intangible assets amounted to RMB19,510 thousand (2018: RMB20,744 thousand).
| (17) | Long-term prepaid expenses |
| 31 December 2018 | Increase | Amortisation | 31 December 2019 | |||||||||||||
Catalysts | 493,241 | 170,500 | (208,351 | ) | 455,390 | |||||||||||
Leaseholding improvements | 8,987 | — | (1,109 | ) | 7,878 | |||||||||||
Others | 461 | 187 | (136 | ) | 512 | |||||||||||
|
|
|
|
|
|
|
| |||||||||
| 502,689 | 170,687 | (209,596 | ) | 463,780 | ||||||||||||
|
|
|
|
|
|
|
| |||||||||
343
Table of Contents
Notes to the Financial Statements(continued)
For the year ended 31 December 2019
(All amounts in thousands of Renminbi Yuan unless otherwise stated)
[English translation for reference only]
| 4 | Notes to the consolidated financial statements(continued) |
| (18) | Deferred tax assets and deferred tax liabilities |
| (a) | Deferred tax assets before offsetting |
| 31 December 2019 | 31 December 2018 | |||||||||||||||
| Deductible temporary differences and deductible losses | Deferred tax assets | Deductible temporary differences and deductible losses | Deferred tax assets | |||||||||||||
Provision for bad debts and inventory | 155,601 | 38,901 | 158,427 | 39,606 | ||||||||||||
Provision for impairment of fixed assets | 795,869 | 198,967 | 844,266 | 211,066 | ||||||||||||
Difference in depreciation | (715,201 | ) | (178,800 | ) | (582,838 | ) | (145,709 | ) | ||||||||
Provision for impairment of construction in progress | 34,661 | 8,665 | 34,175 | 8,544 | ||||||||||||
Accrued expenses | 316,378 | 79,095 | — | — | ||||||||||||
Deductible loss | 7,944 | 1,986 | 14,939 | 3,735 | ||||||||||||
Change in fair value | 546 | 137 | — | — | ||||||||||||
Other deferred tax assets | 37,731 | 9,431 | 22,734 | 5,682 | ||||||||||||
|
|
|
|
|
|
|
| |||||||||
| 633,529 | 158,382 | 491,703 | 122,924 | |||||||||||||
|
|
|
|
|
|
|
| |||||||||
Including: | ||||||||||||||||
To be recovered within 12 | ||||||||||||||||
months | 133,187 | 50,049 | ||||||||||||||
To be recovered over 12 months | 25,195 | 72,875 | ||||||||||||||
|
|
|
| |||||||||||||
| 158,382 | 122,924 | |||||||||||||||
|
|
|
| |||||||||||||
344
Table of Contents
Notes to the Financial Statements(continued)
For the year ended 31 December 2019
(All amounts in thousands of Renminbi Yuan unless otherwise stated)
[English translation for reference only]
| 4 | Notes to the consolidated financial statements(continued) |
| (18) | Deferred tax assets and deferred tax liabilities(continued) |
| (b) | Deferred tax liabilities before offsetting |
| 31 December 2019 | 31 December 2018 | |||||||||||||||
| Taxable temporary differences | Deferred tax liabilities | Taxable temporary differences | Deferred tax liabilities | |||||||||||||
Capitalized borrowing costs | (11,784 | ) | (2,946 | ) | (15,394 | ) | (3,849 | ) | ||||||||
Change in fair value | (18,417 | ) | (4,604 | ) | — | — | ||||||||||
|
|
|
|
|
|
|
| |||||||||
| (30,201 | ) | (7,550 | ) | (15,394 | ) | (3,849 | ) | |||||||||
|
|
|
|
|
|
|
| |||||||||
Including: | ||||||||||||||||
To be recovered within 12 months | (4,604 | ) | (1,238 | ) | ||||||||||||
To be recovered over 12 months | (2,946 | ) | (2,611 | ) | ||||||||||||
|
|
|
| |||||||||||||
| (7,550 | ) | (3,849 | ) | |||||||||||||
|
|
|
| |||||||||||||
| (c) | Deductible temporary differences and deductible losses that are not recognised as deferred tax assets are analysed as follows: |
| 31 December 2019 | 31 December 2018 | |||||||
Deductible temporary differences | 29,969 | 29,969 | ||||||
Deductible losses | 121,723 | 89,713 | ||||||
|
|
|
| |||||
| 151,692 | 119,682 | |||||||
|
|
|
| |||||
In accordance with the accounting policy set out in note 2 (26), it is unlikely that some of the Group’s subsidiaries will obtain sufficient future taxable profits to be used to offset the relevant future deductible losses. Therefore, the Group has not recognised deferred income tax assets for the cumulative deductible losses of the following subsidiaries. Under current tax law, these deductible losses expire between 2020 and 2024.
345
Table of Contents
Notes to the Financial Statements(continued)
For the year ended 31 December 2019
(All amounts in thousands of Renminbi Yuan unless otherwise stated)
[English translation for reference only]
| 4 | Notes to the consolidated financial statements(continued) |
| (18) | Deferred tax assets and deferred tax liabilities(continued) |
| (c) | Deductible temporary differences and deductible losses that are not recognised as deferred tax assets are analysed as follows: (continued) |
| 31 December 2019 | 31 December 2018 | |||||||
Shanghai Petrochemical Investment Development Company Limited (“Toufa”) | 93,361 | 55,049 | ||||||
Shanghai Jinshan Hotel Company Limited (“Jinshan Hotel”) | 28,362 | 34,664 | ||||||
|
|
|
| |||||
| 121,723 | 89,713 | |||||||
|
|
|
| |||||
| (d) | Deductible losses that are not recognised as deferred tax assets will expire in the following years: |
| 31 December 2019 | 31 December 2018 | |||||||
2019 | — | 6,132 | ||||||
2020 | 17,775 | 17,945 | ||||||
2021 | 12,880 | 12,880 | ||||||
2022 | 12,687 | 12,687 | ||||||
2023 | 40,069 | 40,069 | ||||||
2024 | 38,312 | — | ||||||
|
|
|
| |||||
| 121,723 | 89,713 | |||||||
|
|
|
| |||||
346
Table of Contents
Notes to the Financial Statements(continued)
For the year ended 31 December 2019
(All amounts in thousands of Renminbi Yuan unless otherwise stated)
[English translation for reference only]
| 4 | Notes to the consolidated financial statements(continued) |
| (18) | Deferred tax assets and deferred tax liabilities(continued) |
| (e) | The net balance of deferred tax assets and liabilities after offsetting is as follows: |
| 31 December 2019 | 31 December 2018 | |||||||||||||||
| Offsetting amount of deferred tax assets and deferred tax liabilities | Deferred tax assets -net | Offsetting amount of deferred tax assets and deferred tax liabilities | Deferred tax assets - net | |||||||||||||
Deferred tax assets | (7,550 | ) | 150,832 | (3,849 | ) | 119,075 | ||||||||||
Deferred tax liabilities | 7,550 | — | 3,849 | — | ||||||||||||
|
|
|
|
|
|
|
| |||||||||
| (19) | Othernon-current assets |
| 31 December 2019 | 31 December 2018 | |||||||
Three-year fixed deposit | 3,511,234 | — | ||||||
|
|
|
| |||||
As at 31 December 2019, othernon-current assets of the Group is three year fixed deposit with interest rate range from 4.125% to 4.18% per annum (As at 31 December 2018, Nil).
347
Table of Contents
Notes to the Financial Statements(continued)
For the year ended 31 December 2019
(All amounts in thousands of Renminbi Yuan unless otherwise stated)
[English translation for reference only]
| 4 | Notes to the consolidated financial statements(continued) |
| (20) | Provision for assets impairment |
| Decrease | ||||||||||||||||||||||||
| 31 December 2018 | Increase | Reverse | Sold | Written off | 31 December 2019 | |||||||||||||||||||
Notes receivable and accounts receivable provision (4(4)) | 54 | 16 | (70 | ) | — | — | — | |||||||||||||||||
Include: Single provision | — | — | — | — | — | — | ||||||||||||||||||
Group provision | 54 | 16 | (70 | ) | — | — | — | |||||||||||||||||
Provision for other receivable (4(7)) | 144 | — | (5 | ) | — | — | 139 | |||||||||||||||||
|
|
|
|
|
|
|
|
|
|
|
| |||||||||||||
| 198 | 16 | (75 | ) | — | — | 139 | ||||||||||||||||||
|
|
|
|
|
|
|
|
|
|
|
| |||||||||||||
Provision for inventory (4(8)) | 158,229 | 70,178 | — | (68,980 | ) | (3,965 | ) | 155,462 | ||||||||||||||||
Provision for PPE (4(13)) | 877,322 | — | — | — | (51,484 | ) | 825,838 | |||||||||||||||||
Provision for CIP (4(14)) | 34,175 | 486 | — | — | — | 34,661 | ||||||||||||||||||
|
|
|
|
|
|
|
|
|
|
|
| |||||||||||||
| 1,069,726 | 70,664 | — | (68,980 | ) | (55,449 | ) | 1,015,961 | |||||||||||||||||
|
|
|
|
|
|
|
|
|
|
|
| |||||||||||||
| 1,069,924 | 70,680 | (75 | ) | (68,980 | ) | (55,449 | ) | 1,016,100 | ||||||||||||||||
|
|
|
|
|
|
|
|
|
|
|
| |||||||||||||
| (21) | Short-term borrowings |
Classification of short-term borrowings
| Currency | 31 December 2019 | 31 December 2018 | ||||||||||
Unsecured – bank borrowings | RMB | 1,547,600 | 65,600 | |||||||||
| USD | — | 431,649 | ||||||||||
|
|
|
| |||||||||
| 1,547,600 | 497,249 | |||||||||||
|
|
|
| |||||||||
As at 31 December 2019, the weighted average interest rate of short-term borrowings ranged from 2.92% to 4.35%per annum (31 December 2018: from 3.34% to 4.70% per annum).
As at 31 December 2019 and 2018, there are no short-term borrowings which are due but have not been repaid.
348
Table of Contents
Notes to the Financial Statements(continued)
For the year ended 31 December 2019
(All amounts in thousands of Renminbi Yuan unless otherwise stated)
[English translation for reference only]
| 4 | Notes to the consolidated financial statements(continued) |
| (22) | Notes payable |
| 31 December 2019 | 31 December 2018 | |||||||
Accounts payable | 733,900 | — | ||||||
|
|
|
| |||||
| (23) | Accounts payable |
| 31 December 2019 | 31 December 2018 | |||||||
Related parties (Note 7(6)) | 5,521,894 | 4,471,385 | ||||||
Third parties | 2,142,402 | 2,922,998 | ||||||
|
|
|
| |||||
| 7,664,296 | 7,394,383 | |||||||
|
|
|
| |||||
As at 31 December 2019 and 31 December 2018, there are no individually significant accounts payable aged over one year.
| (24) | Contract liabilities |
| 31 December 2019 | 31 December 2018 | |||||||
Related parties (Note 7(6)) | 5,666 | 6,862 | ||||||
Third parties | 655,117 | 446,702 | ||||||
|
|
|
| |||||
| 660,783 | 453,564 | |||||||
|
|
|
| |||||
As at 31 December 2019 and 2018, there are no individually significant contract liabilities aged over one year.
In the year of 2019, the contract liabilities including the beginning balance amount RMB453,563 thousand (2018: RMB477,273 thousand), of which RMB453,564 thousand has been transferred to the main business income in this year.
349
Table of Contents
Notes to the Financial Statements(continued)
For the year ended 31 December 2019
(All amounts in thousands of Renminbi Yuan unless otherwise stated)
[English translation for reference only]
| 4 | Notes to the consolidated financial statements(continued) |
| (25) | Employee benefits payable |
| 31 December 2019 | 31 December 2018 | |||||||
Short-term employee benefits payable (a) | 168,995 | 106,768 | ||||||
Defined contribution plans payable (b) | 20,552 | 22,093 | ||||||
|
|
|
| |||||
| 189,547 | 128,861 | |||||||
|
|
|
| |||||
| (a) | Short-term employee benefits payable |
| 31 December 2018 | Increase in current year | Decrease in current year | 31 December 2019 | |||||||||||||
Wages and salaries, bonuses, allowances and subsidies | 90,620 | 1,931,121 | (1,871,174 | ) | 150,567 | |||||||||||
Staff welfare | 3,569 | 211,792 | (211,792 | ) | 3,569 | |||||||||||
Social insurances | 11,999 | 179,792 | (177,451 | ) | 14,340 | |||||||||||
Including: Medical insurance | 10,242 | 142,632 | (141,036 | ) | 11,838 | |||||||||||
Work injury insurance | 680 | 13,324 | (12,747 | ) | 1,257 | |||||||||||
Maternity insurance | 1,077 | 15,009 | (14,841 | ) | 1,245 | |||||||||||
Supplementary medical insurance | — | 8,827 | (8,827 | ) | — | |||||||||||
Housing funds | — | 179,299 | (179,299 | ) | — | |||||||||||
Compensation forlay-off | — | 45,394 | (45,394 | ) | — | |||||||||||
Others | 580 | 208,769 | (208,830 | ) | 519 | |||||||||||
|
|
|
|
|
|
|
| |||||||||
| 106,768 | 2,756,167 | (2,693,940 | ) | 168,995 | ||||||||||||
|
|
|
|
|
|
|
| |||||||||
350
Table of Contents
Notes to the Financial Statements(continued)
For the year ended 31 December 2019
(All amounts in thousands of Renminbi Yuan unless otherwise stated)
[English translation for reference only]
| 4 | Notes to the consolidated financial statements(continued) |
| (25) | Employee benefits payable(continued) |
| (b) | Defined contribution plans payable |
| 31 December 2018 | Increase in current year | Decrease in current year | 31 December 2019 | |||||||||||||
Basic pensions | 21,554 | 258,328 | (259,953 | ) | 19,929 | |||||||||||
Unemployment insurance | 539 | 7,507 | (7,423 | ) | 623 | |||||||||||
Supplemental basic pensions | — | 125,370 | (125,370 | ) | — | |||||||||||
|
|
|
|
|
|
|
| |||||||||
| 22,093 | 391,205 | (392,746 | ) | 20,552 | ||||||||||||
|
|
|
|
|
|
|
| |||||||||
As stipulated by the regulations of the PRC, the Group participates in a defined contribution retirement plan organised by the Shanghai Municipal Government for its staff.
In addition, pursuant to the document “Order of the Ministry of Labour and Social Security No.20” dated 6 January 2004 issued by the Ministry of Labour of the PRC, the Group has set up a supplementary defined contribution retirement plan for the benefit of employees. Employees who have served the Group for more than one year may participate in this plan. The Group and participating employees make defined contributions to their pension saving accounts according to the plan. The assets of this plan are held separately from those of the Group in an independent fund administered by a committee consisting of representatives from the employees and the Group.
The Group has no other material obligation for the payment of pension benefits associated with these plans beyond the annual contributions described above. In 2019, the Group’s contribution to the above two plans amounted to RMB258,328 thousand and RMB125,370 thousand respectively (2018: RMB262,728 thousand and RMB75,312 thousand respectively).
351
Table of Contents
Notes to the Financial Statements(continued)
For the year ended 31 December 2019
(All amounts in thousands of Renminbi Yuan unless otherwise stated)
[English translation for reference only]
| 4 | Notes to the consolidated financial statements(continued) |
| (26) | Taxes payable |
| 31 December 2019 | 31 December 2018 | |||||||
Consumption tax payable | 2,935,211 | 3,386,367 | ||||||
City maintenance and construction tax payable | 231,537 | 246,060 | ||||||
Enterprise income tax payable | 226,269 | 300,016 | ||||||
Value added tax payable | 221,932 | 507,119 | ||||||
Educational surcharge payable | 144,124 | 160,554 | ||||||
Individual income tax payable | 23,580 | 28,913 | ||||||
Land use tax payable | 12,326 | 1,768 | ||||||
Others | 8,308 | 11,895 | ||||||
|
|
|
| |||||
| 3,803,287 | 4,642,692 | |||||||
|
|
|
| |||||
| (27) | Other payables |
| 31 December 2019 | 31 December 2018 | |||||||
Related parties (Note 7(6)) | 120,834 | 89,567 | ||||||
Third parties | 716,303 | 663,253 | ||||||
A ordinary share dividend | 29,144 | 26,488 | ||||||
Short-term loan interest | 1,686 | 5,952 | ||||||
|
|
|
| |||||
| 867,967 | 785,260 | |||||||
|
|
|
| |||||
| (a) | As at 31 December 2019, there are no other payables that are individually significant aged over 1 year except unpaid project guaranty deposit. |
352
Table of Contents
Notes to the Financial Statements(continued)
For the year ended 31 December 2019
(All amounts in thousands of Renminbi Yuan unless otherwise stated)
[English translation for reference only]
| 4 | Notes to the consolidated financial statements(continued) |
| (27) | Other payables(continued) |
| (b) | Other payables by categories are analysed as follows: |
| 31 December 2019 | 31 December 2018 | |||||||
Accrued expenses | 340,733 | 166,575 | ||||||
Equipment project | 277,184 | 334,249 | ||||||
Payable to related parties (Note 7(6)) | 120,834 | 89,567 | ||||||
Guaranty deposit | 32,098 | 25,624 | ||||||
A ordinary share dividend | 29,144 | 26,488 | ||||||
Sales discount | 25,092 | 32,648 | ||||||
Social insurance withholding | 11,694 | 9,998 | ||||||
Deposits | 8,305 | 12,227 | ||||||
Others | 22,883 | 87,884 | ||||||
|
|
|
| |||||
| 867,967 | 785,260 | |||||||
|
|
|
| |||||
| (28) | Non-current liabilities maturing within one year |
| 31 December 2019 | 31 December 2018 | |||||||
Lease liabilities maturing within one year (Note 4 (29)) | 11,450 | — | ||||||
|
|
|
| |||||
| (29) | Lease liabilities |
| 31 December 2019 | 31 December 2018 | |||||||
Lease liabilities | 22,043 | — | ||||||
Less:Non-current liabilities maturing within one year (Note 4 (28)) | (11,450 | ) | — | |||||
|
|
|
| |||||
| 10,593 | — | |||||||
|
|
|
| |||||
353
Table of Contents
Notes to the Financial Statements(continued)
For the year ended 31 December 2019
(All amounts in thousands of Renminbi Yuan unless otherwise stated)
[English translation for reference only]
| 4 | Notes to the consolidated financial statements(continued) |
| (30) | Deferred income |
| 31 December 2018 | Increase in current year | Decrease in current year | 31 December 2019 | Related to assets/ related to income | ||||||||||||||||
Government grants project | 140,442 | — | (10,437 | ) | 130,005 | Related to assets | ||||||||||||||
|
|
|
|
|
|
|
|
|
| |||||||||||
| Decrease | ||||||||||||||||||||||||||||||||||||||||
| 31 December 2018 | Increase | Deduct from Property plant and Equipment | Include in other income | Deduct from general and administrative expenses | Deduct from financial expenses | Include in non- operting income | Deduct from non- operating expense | 31 December 2019 | Related to assets/ income | |||||||||||||||||||||||||||||||
Investment subsidy for Chemical industry park | 130,000 | — | — | — | — | — | (10,000 | ) | — | 120,000 | | related to assets | | |||||||||||||||||||||||||||
Huang gu tang pipeline relocation subsidy | 5,242 | — | — | — | — | — | (437 | ) | — | 4,805 | | related to assets | | |||||||||||||||||||||||||||
Power units energy saving reconstruction subsidies | 5,200 | — | — | — | — | — | — | — | 5,200 | | related to assets | | ||||||||||||||||||||||||||||
|
|
|
|
|
|
|
|
|
|
|
|
|
|
|
|
|
| |||||||||||||||||||||||
| 140,442 | — | — | — | — | — | (10,437 | ) | — | 130,005 | |||||||||||||||||||||||||||||||
|
|
|
|
|
|
|
|
|
|
|
|
|
|
|
|
|
| |||||||||||||||||||||||
| (31) | Share capital |
| Increase or decrease in current year | ||||||||||||||||||||||||||||
| 31 December 2018 | Issue new share | Stock dividend | Transfer from capital surplus topaid-in capital | Other | Subtotal | 31 December 2019 | ||||||||||||||||||||||
Non-restricted Shares – Domestic legal persons shares | 7,328,814 | — | — | — | — | — | 7,328,814 | |||||||||||||||||||||
Foreign investment H shared listed overseas | 3,495,000 | — | — | — | — | — | 3,495,000 | |||||||||||||||||||||
|
|
|
|
|
|
|
|
|
|
|
|
|
| |||||||||||||||
| 10,823,814 | — | — | — | — | — | 10,823,814 | ||||||||||||||||||||||
|
|
|
|
|
|
|
|
|
|
|
|
|
| |||||||||||||||
354
Table of Contents
Notes to the Financial Statements(continued)
For the year ended 31 December 2019
(All amounts in thousands of Renminbi Yuan unless otherwise stated)
[English translation for reference only]
| 4 | Notes to the consolidated financial statements(continued) |
| (31) | Share capital(continued) |
The Company was founded in Shanghai, PRC on 29 June 1993 with registered capital of RMB4,000,000,000 invested by its holding company-China National Petrochemical Corporation; these shares were converted from assets of former Shanghai Petrochemical Complex.
Approved by Zheng Wei Fa No. [1993]30 issued by the State Council Securities Committee, the Company launched its Initial Public Offering (“IPO”) in July 1993 and September 1993 in Hong Kong, New York and Shanghai to issue 2.23 billion shares, including 1.68 billion H shares and 550 million A shares. The 550 million A shares included 400 million individual shares (including 150 million shares issued to SPC employees) and 150 million legal person shares. H shares were listed on the Hong Kong Stock Exchange on 26 July 1993, and listed on the New York Stock Exchange in the form of American Depositary Shares at the same time; the A shares were listed on the Shanghai Stock Exchange on 8 November 1993.
After the IPO, the total quantity of shares issued by the Company was 6.23 billion, including 4 billion state-owned shares, 150 million legal person shares, 400 million individual shares, and 1.68 billion H shares.
According to the plan stated in the prospectus issued in July 1993, and approved by the China Securities Regulatory Commission, the Company issued 320 million ordinary A shares with a par value of RMB1 each at an issuing price of RMB2.4 each during the period from 5 April to 10 June 1994. These shares were listed on the Shanghai Stock Exchange on 4 July 1994. By then, the total quantity of shares issued was expanded from 6.23 billion to 6.55 billion.
On 22 August 1996, the Company issued 500 million H shares to overseas investors; on 6 January 1997, another 150 million H shares were issued to overseas investors. By then, the total quantity of shares issued was expanded to 7.2 billion, including 2.33 billion H shares.
In 1998, China National Petrochemical Corporation was restructured to Sinopec Group.
Sinopec Corp. was founded on 28 February 2000 based on the approved assets restructuring of Sinopec Group. As part of the restructuring, the shares of the Company held by the Sinopec Group were injected in Sinopec Corp.; after the restructuring, the ownership of 4 billion state-owned shares of the Company held by the Sinopec Group were transferred to Sinopec Corp., and the shares were changed to state-owned legal person shares in nature.
All the A and H shares rank pari passu in all respects.
355
Table of Contents
Notes to the Financial Statements(continued)
For the year ended 31 December 2019
(All amounts in thousands of Renminbi Yuan unless otherwise stated)
[English translation for reference only]
| 4 | Notes to the consolidated financial statements(continued) |
| (31) | Share capital(continued) |
Pursuant to the ‘Approval on matters relating to the Share Segregation Reform of Sinopec Shanghai Petrochemical Company Limited’ issued by the State-owned Assets Supervision and Administration Commission of the State Council (State Owned Property [2013] No.443), a General Meeting of A share shareholders was held on 8 July 2013 and passed the resolution of ‘Share Segregation Reform of Sinopec Shanghai Petrochemical Company Limited (Amendment)’ (“the share segregation reform resolution”) which was published by the Company on Shanghai Stock Exchange (“SSE”) website on 20 June 2013. According to the Share Segregation Reform Resolution, the controlling shareholder of the Company, Sinopec Corp., offered shareholders of circulating A shares 5 shares for every 10 circulating A shares they held on 16 August 2013, aggregating 360,000,000 A shares, for the purpose of obtaining the listing rights of itsnon-circulating shares in the A Shares market. From 20 August 2013 (“the circulation date”), all the Company’snon-circulating A shares have been granted circulating rights on Shanghai Stock Exchange(“SSE”). As part of the restricted conditions, Sinopec Corp. committed that all the 3,640,000,000 A shares held were not allowed to be traded on SSE or transferred within 12 months from the circulation date (“the restriction period”). After the restriction period, Sinopec Corp. can only sell no more than 5 and 10 percent of its total shares within 12 and 24 months, respectively. The former 150,000,000non-circulating A shares held by social legal persons were also prohibited to be traded on SSE or transferred within 12 months from the circulation date. Meanwhile, Sinopec Corp. also committed in the Share Segregation Reform Resolution that a scheme of converting surplus to share capital (no less than 4 shares for every 10 shares) will be proposed on the board of directors and shareholders meetings within 6 months after the circulation date.
Sinopec Corp. passed the Share Reform Commitment Scheme added up to 3,600,000 shares, after deliberation of temporary shareholders’ meeting, A share class shareholders’ meeting and H share class shareholders’ meeting.
Since the Company’s share reform scheme, which was executed after 20 August 2013, the Company’snon-circulating A shares have been granted circulating rights on Shanghai Stock Exchange (“SSE”). As part of the restricted conditions, all the 5,460,000,000 A shares held by Sinopec Corp. and 225,000,000 A shares held by social legal persons had been in circulation as at 31 December 2016.
On 23 August 2017, the first Share Option Incentive Scheme of A shares was passed according to the Company’s board resolution. On 27 September 2017, the Company increased its registered capital of RMB14,16,600, which was paid in cash amounting to RMB54,579,910 by 199 grantees. The difference between actual capital contribution and registered capital amount to RMB40,403,310 was included in share premium (Note (28)). As to 31 December 2017, total equity capital was 10,814,176,600 shares.
On January 8, 2018, according to the Company’s board resolution, the second exercise period exercise plan of the Company’s commonA-share stock option incentive plan was adopted. On January 12, 2018, the Company increased its registered capital by RMB9,637,000, which was fully paid in cash by 185 equity incentive candidates who met the conditions for exercise. The difference between the actual capital contribution and the subscribed registered capital was RMB27,465 thousand, which is included in the Company’s capital reserve — equity premium, and the confirmed capital reserve — employee equity option plan in the waiting period is RMB17,062 thousand, which is transferred to the capital reserve — equity premium (note 4 (32)).
356
Table of Contents
Notes to the Financial Statements(continued)
For the year ended 31 December 2019
(All amounts in thousands of Renminbi Yuan unless otherwise stated)
[English translation for reference only]
| 4 | Notes to the consolidated financial statements(continued) |
| (31) | Share capital(continued) |
According to the board resolution of the Company on December 28, 2018, the third exercise period of the stock option incentive plan for A shares of the common stock of the Company will not be exercised because thenon-market exercise conditions are not met. As at 31 December 2019 and 2018, the total share capital of the Company was 10,823,813,500 shares.
| Increase or decrease in current year | ||||||||||||||||||||||||||||
| 31 December 2017 | Issue new share | Stock dividend | Transfer from capital surplus topaid-in capital | Other | Subtotal | 31 December 2018 | ||||||||||||||||||||||
Non-restricted Shares – RMB ordinary A shares listed in PRC | 7,319,177 | 9,637 | — | — | — | 9,637 | 7,328,814 | |||||||||||||||||||||
Foreign investment H shared listed overseas | 3,495,000 | — | — | — | — | — | 3,495,000 | |||||||||||||||||||||
|
|
|
|
|
|
|
|
|
|
|
|
|
| |||||||||||||||
| 10,814,177 | 9,637 | — | — | — | 9,637 | 10,823,814 | ||||||||||||||||||||||
|
|
|
|
|
|
|
|
|
|
|
|
|
| |||||||||||||||
| (32) | Capital surplus |
| 31 December 2018 | Increase in current year | Decrease in current year | 31 December 2019 | |||||||||||||
Government grants | 412,370 | — | — | 412,370 | ||||||||||||
Refund of harbor construction charge | 32,485 | — | — | 32,485 | ||||||||||||
Share premium (4(31)) | 106,846 | — | — | 106,846 | ||||||||||||
Others | 58,626 | — | — | 58,626 | ||||||||||||
|
|
|
|
|
|
|
| |||||||||
| 610,327 | — | — | 610,327 | |||||||||||||
|
|
|
|
|
|
|
| |||||||||
357
Table of Contents
Notes to the Financial Statements(continued)
For the year ended 31 December 2019
(All amounts in thousands of Renminbi Yuan unless otherwise stated)
[English translation for reference only]
| 4 | Notes to the consolidated financial statements(continued) |
| (32) | Capital surplus(continued) |
| 31 December 2017 | Increase in current year | Decrease in current Year | 31 December 2018 | |||||||||||||
Government grants | 412,370 | — | — | 412,370 | ||||||||||||
Refund of harbor construction charge | 32,485 | — | — | 32,485 | ||||||||||||
Share-based payments (a) | 30,066 | — | (30,066 | ) | — | |||||||||||
Share premium (4(31)) | 62,319 | 44,527 | — | 106,846 | ||||||||||||
Others | 49,067 | 9,559 | — | 58,626 | ||||||||||||
|
|
|
|
|
|
|
| |||||||||
| 586,307 | 54,086 | (30,066 | ) | 610,327 | ||||||||||||
|
|
|
|
|
|
|
| |||||||||
| (a) | Summary |
Pursuant to the resolution of the fifth meeting of the eighth session of the Board of Directors of the Company on 6 January 2015, the proposal regarding the list of participants and the number of share options under the share option incentive scheme was approved.
According to the Company’s share option incentive scheme, the grant date of share options was 6 January 2015, and there were a total of 38,760 thousand share options granted to 214 participants (0.359% of the total ordinary share capital issued). Each share option has a right to purchase an ordinary A share listed in PRC on vesting date at the exercise price under vesting conditions. The options were divided by three tranches of 40%, 30% and 30% of the total share options granted, respectively. Each tranche had independent vesting conditions relevant to year 2015, 2016 and 2017, respectively, which were listed as following:
| • | weighted average rate of return on equity of the Group should be no less than 9% for 2015, 9.5% for 2016 and 10% for 2017 in respect to the three tranche; |
| • | for each year of 2015, 2016 and 2017, the compound annual growth rate in net profit based on the net profit of 2013 should achieve 5%; |
| • | for each year of 2015, 2016 and 2017, proportion of the main business revenue in the total revenue should be no less than 99%; for each year of 2015, 2016 and 2017, each of the above three conditions should be no lower than the 75% level of peer companies; and achieving the target budget set by the Sinopec Corp. in 2015, 2016 and 2017, respectively. |
358
Table of Contents
Notes to the Financial Statements(continued)
For the year ended 31 December 2019
(All amounts in thousands of Renminbi Yuan unless otherwise stated)
[English translation for reference only]
| 4 | Notes to the consolidated financial statements(continued) |
| (32) | Capital surplus(continued) |
| (a) | Summary(continued) |
The participant should serve the Group at the required position from the grant date. Exercisable amount of each tranche depended on the time for which the participant served the Group during each year of 2015, 2016 and 2017. Upon the fulfilment of relevant vesting conditions, the share options of each tranche shall become exercisable at its exercisable date.
On the grant date, the agreed exercise price is RMB4.2 per share. During the waiting period, the right price of the bank will be adjusted according to the Company’s dividend, capital reserve to increase the share capital, the distribution of stock dividends, stock split, rights issue or share reduction and other matters.
According to the resolution of the board of directors on December 28, 2018, the Company will not exercise the third batch of stock options due to thenon-market exercise conditions. The first and second tranches of stock options were exercised in September 2017 and January 2018 at rmb3.85 per share (note 4 (24)).
As at 31 December 2019 and 31 December 2018, there were no outstanding share options.
| (33) | Other comprehensive income |
| Other comprehensive income in Balance Sheet | Other comprehensive income in 2019 Income Statement | |||||||||||||||||||||||||||||||
| 31 December 2018 | After-tax attributable to the parent company | 31 December 2019 | Current year before income tax amount | Less: Pre- included other comprehensive income transferred out this year | Less: income tax expense | After-tax attributable to the parent company | After-tax attributable to minority shareholders | |||||||||||||||||||||||||
Other comprehensive income reclassificated in the future Under the equity method after the invested entity will be reclassified into the share of profits/(losses) of other comprehensive income | 10,389 | 7,449 | 17,838 | 7,449 | — | — | 7,449 | — | ||||||||||||||||||||||||
359
Table of Contents
Notes to the Financial Statements(continued)
For the year ended 31 December 2019
(All amounts in thousands of Renminbi Yuan unless otherwise stated)
[English translation for reference only]
| 4 | Notes to the consolidated financial statements(continued) |
| (33) | Other comprehensive income(continued) |
| Other comprehensive income in Balance Sheet | Other comprehensive income in 2018 Income Statement | |||||||||||||||||||||||||||||||
| 31 December 2017 | After-tax attributable to the parent company | 31 December 2018 | Current year before income tax amount | Less: Pre- included other comprehensive income transferred out this year | Less: income tax expense | After-tax attributable to the parent company | After-tax attributable to minority shareholders | |||||||||||||||||||||||||
Other comprehensive income reclassificated in the future Under the equity method after the invested entity will be reclassified into the share of profits/(losses) of other comprehensive income | 17,403 | (7,014 | ) | 10,389 | (7,014 | ) | — | — | (7,014 | ) | — | |||||||||||||||||||||
| (34) | Specific reserve |
| 31 December 2018 | Accrued during the year | Utilised during the year | 31 December 2019 | |||||||||||||
Safety production costs | 57,135 | 138,028 | (138,026 | ) | 57,137 | |||||||||||
| 31 December 2017 | Accrued during the year | Utilised during the year | 31 December 2018 | |||||||||||||
Safety production costs | — | 112,870 | (55,735 | ) | 57,135 | |||||||||||
Specific reserve represents unutilised safety production costs accrued in accordance with state regulations (Note 2(19)).
360
Table of Contents
Notes to the Financial Statements(continued)
For the year ended 31 December 2019
(All amounts in thousands of Renminbi Yuan unless otherwise stated)
[English translation for reference only]
| 4 | Notes to the consolidated financial statements(continued) |
| (35) | Surplus reserve |
| 31 December 2018 | Increase in current year | Decrease in current year | 31 December 2019 | |||||||||||||
| Statutory surplus reserve | 6,135,815 | 199,840 | — | 6,335,655 | ||||||||||||
| Discretionary surplus reserve | 101,355 | — | — | 101,355 | ||||||||||||
|
|
|
|
|
|
|
| |||||||||
| 6,237,170 | 199,840 | — | 6,437,010 | |||||||||||||
|
|
|
|
|
|
|
| |||||||||
| 31 December 2017 | Increase in current year | Decrease in current year | 31 December 2018 | |||||||||||||
| Statutory surplus reserve | 5,626,269 | 509,546 | — | 6,135,815 | ||||||||||||
| Discretionary surplus reserve | 101,355 | — | — | 101,355 | ||||||||||||
|
|
|
|
|
|
|
| |||||||||
| 5,727,624 | 509,546 | — | 6,237,170 | |||||||||||||
|
|
|
|
|
|
|
| |||||||||
In accordance with the Company Law and the Company’s Articles of Association, the Company should appropriate 10% of net profit for the year to the statutory surplus reserve, and the Company can cease appropriation when the statutory surplus reserve accumulated to more than 50% of the registered capital. The statutory surplus reserve can be used to make up for the loss or increase the share capital after approval from the appropriate authorities. Statutory surplus reserve amounted to RMB199,840 thousand was provided in current year (2018: RMB509,546 thousand).
The Company appropriates for the discretionary surplus reserve should be proposed by the board of directors and approved by the General Meeting of Shareholders. The discretionary surplus reserve can be used to make up for the loss or increase the share capital after approval from the appropriate authorities. No discretionary surplus reserve was provided in current year (2018: Nil).
361
Table of Contents
Notes to the Financial Statements(continued)
For the year ended 31 December 2019
(All amounts in thousands of Renminbi Yuan unless otherwise stated)
[English translation for reference only]
| 4 | Notes to the consolidated financial statements(continued) |
| (36) | Undistributed profits |
| 2019 | 2018 | |||||||
Undistributed profits at the beginning of the year | 12,631,291 | 11,110,795 | ||||||
Add: Net profit attributable to equity shareholders of the Company | 2,213,716 | 5,277,186 | ||||||
Less: Appropriation to statutory reserve (Note 4(35)) | (199,840 | ) | (509,546 | ) | ||||
Less: Ordinary shares dividend payable (a) | (2,705,952 | ) | (3,247,144 | ) | ||||
|
|
|
| |||||
Undistributed profits at the end of the year | 11,939,215 | 12,631,291 | ||||||
|
|
|
| |||||
| (a) | Pursuant to the resolution of the shareholders’ meeting on 20 June 2019, a dividend in respect of the year ended 31 December 2018 of RMB0.25 per share, amounting to a total dividend of RMB2,705,952 thousand was declared (2018: RMB0.3 per share (including tax), amounting to a total dividend of RMB3,247,144 thousand). |
Pursuant to the resolution of the shareholders’ meeting on 25 March 2020, the Company proposed cash dividend to all the shareholders, RMB0.12 per share (including tax), based on 10,823,813,500 shares outstanding, amounting to a total dividend of RMB1,298,858 thousand. The proposal remains to be approved.
| (37) | Non-controlling interests |
Attributable to thenon-controlling interests of the Group:
| 31 December 2019 | 31 December 2018 | |||||||
Jinmao | 89,808 | 80,089 | ||||||
Shanghai Jinchang Engineering Plastics Company Limited (“Jinchang”) | 40,752 | 42,300 | ||||||
Zhejiang Jinyong Acrylic Company limited (“Jinyong”) | — | (6,011 | ) | |||||
|
|
|
| |||||
| 130,560 | 116,378 | |||||||
|
|
|
| |||||
362
Table of Contents
Notes to the Financial Statements(continued)
For the year ended 31 December 2019
(All amounts in thousands of Renminbi Yuan unless otherwise stated)
[English translation for reference only]
| 4 | Notes to the consolidated financial statements(continued) |
| (38) | Revenue and cost of sales |
| 2019 | 2018 | |||||||
Main operations revenue (a) | 99,897,094 | 107,328,852 | ||||||
Other operating revenue | 448,954 | 436,056 | ||||||
|
|
|
| |||||
| 100,346,048 | 107,764,908 | |||||||
|
|
|
| |||||
| 2019 | 2018 | |||||||
Main operations cost (a) | 83,465,489 | 86,698,902 | ||||||
Other operating cost | 315,551 | 330,673 | ||||||
|
|
|
| |||||
| 83,781,040 | 87,029,575 | |||||||
|
|
|
| |||||
| (a) | Main operations revenue and main operations cost |
The principal business of the Group mainly belongs to the petrochemical industry.
Analysis by product is as follows:
| 2019 | 2018 | |||||||||||||||
| Main operations revenue | Main operations cost | Main operations revenue | Main operations cost | |||||||||||||
Synthetic fibres | 2,200,229 | 2,486,042 | 2,225,594 | 2,520,678 | ||||||||||||
Resins and plastics | 10,163,711 | 8,790,918 | 10,730,277 | 8,875,478 | ||||||||||||
Intermediate petrochemicals | 10,511,143 | 9,095,702 | 12,403,080 | 9,327,686 | ||||||||||||
Petroleum products | 54,886,705 | 41,156,331 | 54,972,598 | 39,220,903 | ||||||||||||
Trading of petrochemical products | 21,706,014 | 21,566,364 | 26,560,354 | 26,392,366 | ||||||||||||
Others | 429,292 | 370,132 | 436,949 | 361,791 | ||||||||||||
|
|
|
|
|
|
|
| |||||||||
| 99,897,094 | 83,465,489 | 107,328,852 | 86,698,902 | |||||||||||||
|
|
|
|
|
|
|
| |||||||||
363
Table of Contents
Notes to the Financial Statements(continued)
For the year ended 31 December 2019
(All amounts in thousands of Renminbi Yuan unless otherwise stated)
[English translation for reference only]
| 4 | Notes to the consolidated financial statements(continued) |
| (38) | Revenue and cost of sales(continued) |
| (b) | Analysis of group revenue as follow: |
| 2019 | ||||||||||||||||||||||||||||
| Synthetic fibres | Resins and plastics | Intermediate petrochemicals | Petroleum products | Trading of petrochemical products | Others | Total | ||||||||||||||||||||||
Revenue | 2,200,229 | 10,163,711 | 10,511,143 | 54,886,705 | 21,706,014 | 429,292 | 99,897,094 | |||||||||||||||||||||
Recognized at a point | 2,200,229 | 10,163,711 | 10,511,143 | 54,886,705 | 21,695,864 | 429,292 | 99,886,944 | |||||||||||||||||||||
Recognized during a period | — | — | — | — | 10,150 | — | 10,150 | |||||||||||||||||||||
|
|
|
|
|
|
|
|
|
|
|
|
|
| |||||||||||||||
Other business revenue | — | — | — | — | — | 448,954 | 448,954 | |||||||||||||||||||||
|
|
|
|
|
|
|
|
|
|
|
|
|
| |||||||||||||||
| 2,200,229 | 10,163,711 | 10,511,143 | 54,886,705 | 21,706,014 | 878,246 | 100,346,048 | ||||||||||||||||||||||
|
|
|
|
|
|
|
|
|
|
|
|
|
| |||||||||||||||
| 2018 | ||||||||||||||||||||||||||||
| Synthetic fibres | Resins and plastics | Intermediate petrochemicals | Petroleum products | Trading of petrochemical products | Others | Total | ||||||||||||||||||||||
Revenue | 2,225,594 | 10,730,277 | 12,403,080 | 54,972,598 | 26,560,354 | 436,949 | 107,328,852 | |||||||||||||||||||||
Recognized at a point | 2,225,594 | 10,730,277 | 12,403,080 | 54,972,598 | 26,537,983 | 436,949 | 107,306,481 | |||||||||||||||||||||
Recognized during a period | — | — | — | — | 22,371 | — | 22,371 | |||||||||||||||||||||
|
|
|
|
|
|
|
|
|
|
|
|
|
| |||||||||||||||
Other business revenue | — | — | — | — | — | 436,056 | 436,056 | |||||||||||||||||||||
|
|
|
|
|
|
|
|
|
|
|
|
|
| |||||||||||||||
| 2,225,594 | 10,730,277 | 12,403,080 | 54,972,598 | 26,560,354 | 873,005 | 107,764,908 | ||||||||||||||||||||||
|
|
|
|
|
|
|
|
|
|
|
|
|
| |||||||||||||||
364
Table of Contents
Notes to the Financial Statements(continued)
For the year ended 31 December 2019
(All amounts in thousands of Renminbi Yuan unless otherwise stated)
[English translation for reference only]
| 4 | Notes to the consolidated financial statements(continued) |
| (39) | Taxes and surcharges |
| 2019 | 2018 | Tax base and rate | ||||||||
Consumption tax | 10,729,174 | 10,503,275 | According to relevant PRC tax regulations, since 1 January 2009, the Group is required to pay consumption tax based on the Group’s sales of gasoline and diesel rate according to the applicable tax rate (Note 3) | |||||||
City maintenance and construction tax | 829,630 | 875,162 | 1% or 7% of actual payments of consumption, business tax and VAT during the year | |||||||
Educational surcharge and others | 556,562 | 578,270 | 3% of actual payments of consumption, business tax and VAT during the year | |||||||
Stamp tax | 31,440 | 30,299 | Applicable tax rate | |||||||
Property tax | 25,951 | 28,752 | 1.2% of taxable property value or 12% of rental expense | |||||||
Land use tax | 22,816 | 42,486 | Applicable tax rate | |||||||
Vehicle and vessel use tax | 112 | 218 | ||||||||
Others | 18,242 | 16,962 | ||||||||
|
|
|
| |||||||
| 12,213,927 | 12,075,424 | |||||||||
|
|
|
| |||||||
| (40) | Selling and distribution expenses |
| 2019 | 2018 | |||||||
Transportation fee | 246,804 | 233,272 | ||||||
Sales commission | 125,641 | 139,954 | ||||||
Staff costs | 72,759 | 67,204 | ||||||
Storage and logistics expenses | 50,612 | 70,911 | ||||||
Others | 36,639 | 25,573 | ||||||
|
|
|
| |||||
| 532,455 | 536,914 | |||||||
|
|
|
| |||||
365
Table of Contents
Notes to the Financial Statements(continued)
For the year ended 31 December 2019
(All amounts in thousands of Renminbi Yuan unless otherwise stated)
[English translation for reference only]
| 4 | Notes to the consolidated financial statements(continued) |
| (41) | General and administrative expenses |
| 2019 | 2018 | |||||||
Repair and maintenance expense | 1,089,829 | 1,265,919 | ||||||
Staff costs | 988,026 | 964,956 | ||||||
Depreciation and amortisation | 101,716 | 95,342 | ||||||
Information system operation maintenance | 57,928 | 48,567 | ||||||
Security and fire extinguishment expenses | 50,010 | 48,981 | ||||||
Depreciation ofright-of-use assets | 11,061 | — | ||||||
Administrative expenses | 1,584 | 1,534 | ||||||
Others | 200,133 | 191,499 | ||||||
|
|
|
| |||||
| 2,500,287 | 2,616,798 | |||||||
|
|
|
| |||||
| (42) | R&D expenses |
| 2019 | 2018 | |||||||
Equipment process and product technology research and development | 80,648 | 30,214 | ||||||
Depreciation | 5,534 | 586 | ||||||
System application development | — | 1,224 | ||||||
Others | 6,782 | 5,237 | ||||||
|
|
|
| |||||
| 92,964 | 37,261 | |||||||
|
|
|
| |||||
| (43) | Financial expenses – net |
| 2019 | 2018 | |||||||
Interest paid | 56,808 | 84,425 | ||||||
Less: Capitalized borrowing costs | (5,594 | ) | (5,179 | ) | ||||
Add: Lease liabilities costs | 2,570 | — | ||||||
|
|
|
| |||||
Interest expenses | 53,784 | 79,246 | ||||||
Less: Interest income | (398,176 | ) | (443,650 | ) | ||||
Exchange losses net | (21,219 | ) | 58,773 | |||||
Others | 17,430 | 12,202 | ||||||
|
|
|
| |||||
| (348,181 | ) | (293,429 | ) | |||||
|
|
|
| |||||
366
Table of Contents
Notes to the Financial Statements(continued)
For the year ended 31 December 2019
(All amounts in thousands of Renminbi Yuan unless otherwise stated)
[English translation for reference only]
| 4 | Notes to the consolidated financial statements(continued) |
| (44) | Expenses by nature |
The cost of sales, selling and administrative expenses, general and administrative expenses and R&D expenses in the income statements are listed as follows by nature:
| 2019 | 2018 | |||||||
Consumed raw materials and low value consumables, etc. | 57,101,961 | 56,601,977 | ||||||
Cost of trading products | 21,566,364 | 26,392,366 | ||||||
Employee benefits | 3,147,372 | 2,888,572 | ||||||
Depreciation and amortization expenses | 1,753,614 | 1,809,623 | ||||||
Repair and maintenance expenses | 1,089,829 | 1,265,919 | ||||||
Changes in inventories of finished goods and work in progress | 446,779 | (277,403 | ) | |||||
Transportation expenses | 297,416 | 304,183 | ||||||
External processing fee | 215,288 | 185,164 | ||||||
Agency commission | 125,641 | 139,954 | ||||||
R&D expense | 92,964 | 37,261 | ||||||
Depreciation ofright-of-use assets | 87,184 | — | ||||||
Environmental protection | 70,082 | 51,704 | ||||||
Safety | 50,010 | 48,981 | ||||||
Property insurance premium | 10,308 | 41,539 | ||||||
Audit fee | 7,800 | 7,800 | ||||||
Rental fee | 2,961 | 96,520 | ||||||
Administrative expenses | 1,584 | 1,534 | ||||||
Others | 839,589 | 624,854 | ||||||
|
|
|
| |||||
| 86,906,746 | 90,220,548 | |||||||
|
|
|
| |||||
The Group attributed the expense of short-term rent to profits or losses in current period directly as stated in Note 2(27), the amount is RMB2,961 thousand.
367
Table of Contents
Notes to the Financial Statements(continued)
For the year ended 31 December 2019
(All amounts in thousands of Renminbi Yuan unless otherwise stated)
[English translation for reference only]
| 4 | Notes to the consolidated financial statements(continued) |
| (45) | Other income |
| 2019 | 2018 | Related to asset/ related to income | ||||||||||
Scientific research expenditures subsidy | 31,470 | 53,532 | related to income | |||||||||
Tax refunds | 11,140 | 24,009 | related to income | |||||||||
Energy saving and environmental protection subsidy | — | 216 | related to income | |||||||||
Others | 21,216 | 11,278 | related to income | |||||||||
|
|
|
| |||||||||
| 63,826 | 89,035 | |||||||||||
|
|
|
| |||||||||
| (46) | Investment income |
| 2019 | 2018 | |||||||
Investment income accounted for using the equity method | 962,593 | 875,597 | ||||||
Structured deposit income | 86,848 | — | ||||||
Investment (loss)/income accounted for foreign exchange option contracts and foreign exchange forward contracts | (15,316 | ) | 983 | |||||
Discount loss of accounts receivable | (19,513 | ) | — | |||||
Investment (loss)/income accounted for disposal of long-term equity investments (Note 5(1)) | (60,951 | ) | 1,622 | |||||
Other | — | 11 | ||||||
|
|
|
| |||||
| 953,661 | 878,213 | |||||||
|
|
|
| |||||
The Group does not have significant restrictions on repatriation of investment proceeds.
368
Table of Contents
Notes to the Financial Statements(continued)
For the year ended 31 December 2019
(All amounts in thousands of Renminbi Yuan unless otherwise stated)
[English translation for reference only]
| 4 | Notes to the consolidated financial statements(continued) |
| (47) | Fair value change income/loss |
| 2019 | 2018 | |||||||
Financial assets measured at fair value through profits or losses — Structured deposit income | (1,404 | ) | 19,811 | |||||
Derivative financial assets and derivative financial liabilities — Foreign exchange option | 3,001 | 8,830 | ||||||
Forward foreign exchange contract | — | 4,706 | ||||||
|
|
|
| |||||
| 1,597 | 33,347 | |||||||
|
|
|
| |||||
| (48) | Credit impairment loss |
| 2019 | 2018 | |||||||
Notes receivable and Accounts receivable provision revise/(loss) | 54 | (17 | ) | |||||
Other receivable provision revise/(loss) | 5 | (22 | ) | |||||
|
|
|
| |||||
| 59 | (39 | ) | ||||||
|
|
|
| |||||
| (49) | Assets Impairment loss |
| 2019 | 2018 | |||||||
Provision for decline in value of inventories | (70,178 | ) | (86,003 | ) | ||||
Provision for construction in progress | (486 | ) | (24,000 | ) | ||||
Provision for impairment of fixed assets | — | (58,652 | ) | |||||
|
|
|
| |||||
| (70,664 | ) | (168,655 | ) | |||||
|
|
|
| |||||
369
Table of Contents
Notes to the Financial Statements(continued)
For the year ended 31 December 2019
(All amounts in thousands of Renminbi Yuan unless otherwise stated)
[English translation for reference only]
| 4 | Notes to the consolidated financial statements(continued) |
| (50) | Gains on disposal of fixed assets |
Recognized as | ||||||||||||
| non-recurring | ||||||||||||
| profits or losses | ||||||||||||
| 2019 | 2018 | in current year | ||||||||||
Gains on disposal of fixed assets (a) | 207,607 | 206,259 | 207,607 | |||||||||
Loss on disposal of fixed assets | (31,283 | ) | (33,751 | ) | (31,283 | ) | ||||||
|
|
|
|
|
| |||||||
| 176,324 | 172,508 | 176,324 | ||||||||||
|
|
|
|
|
| |||||||
| (a) | In the year of 2019, Jinyong company, a former subsidiary of the Group, disposed land use right with a gain of RMB126,817 thousand (2018: Jinyong disposed some of its houses and buildings with gain of RMB197,138 thousand). |
| (51) | Non-operating income |
| 2019 | 2018 | Recognized as extraordinary profit and loss in current year | ||||||||||
Government grants (a) | 15,852 | 37,294 | 15,852 | |||||||||
Others | 4,655 | 10,287 | 4,655 | |||||||||
|
|
|
|
|
| |||||||
| 20,507 | 47,581 | 20,507 | ||||||||||
|
|
|
|
|
| |||||||
| (a) | Government grants mainly include: |
| 2019 | 2018 | |||||||
Amortization of deferred income (Note4(30)) | 10,437 | 10,437 | ||||||
Others | 5,415 | 26,857 | ||||||
|
|
|
| |||||
| 15,852 | 37,294 | |||||||
|
|
|
| |||||
370
Table of Contents
Notes to the Financial Statements(continued)
For the year ended 31 December 2019
(All amounts in thousands of Renminbi Yuan unless otherwise stated)
[English translation for reference only]
| 4 | Notes to the consolidated financial statements(continued) |
| (52) | Non-operating expenses |
| 2019 | 2018 | Recognized as extraordinary profit and loss in current year | ||||||||||
Allowances | 41,251 | 52,198 | 41,251 | |||||||||
Others | 23,499 | 13,181 | 23,499 | |||||||||
|
|
|
|
|
| |||||||
| 64,750 | 65,379 | 64,750 | ||||||||||
|
|
|
|
|
| |||||||
| (53) | Income tax expenses |
| 2019 | 2018 | |||||||
Current tax expense for the year based on tax law and regulations | 460,720 | 1,471,671 | ||||||
Movement of deferred tax | (31,757 | ) | 232 | |||||
|
|
|
| |||||
| 428,963 | 1,471,903 | |||||||
|
|
|
| |||||
The reconciliation from income tax calculated based on the applicable tax rates and total profit presented in the consolidated financial statements to the income tax expenses is listed below:
| 2019 | 2018 | |||||||
Total profit | 2,654,116 | 6,748,976 | ||||||
Income tax expenses calculated at applicable tax rates | 663,529 | 1,687,245 | ||||||
Tax effect of share of profit of investments accounted for using the equity method | (239,562 | ) | (218,024 | ) | ||||
Othernon-taxable profit | (14,456 | ) | (16,767 | ) | ||||
Tax effect ofnon-deductible expenses | 42,906 | 34,407 | ||||||
Under provision for income tax expense in respect of preceding years | (2,618 | ) | 12,678 | |||||
Utilisation of previously unrecognized tax losses | (30,414 | ) | (37,653 | ) | ||||
Tax losses for which no deferred income tax asset was recognized in the year | 9,578 | 10,017 | ||||||
|
|
|
| |||||
Income tax expenses | 428,963 | 1,471,903 | ||||||
|
|
|
| |||||
371
Table of Contents
Notes to the Financial Statements(continued)
For the year ended 31 December 2019
(All amounts in thousands of Renminbi Yuan unless otherwise stated)
[English translation for reference only]
| 4 | Notes to the consolidated financial statements(continued) |
| (54) | Earnings per share |
| (a) | Basic earnings per share |
Basic earnings per share is calculated by dividing the consolidated net profit attributable to ordinary shareholders of the Company by the weighted average number of ordinary shares outstanding:
| 2019 | 2018 | |||||||
Consolidated net profit attributable to ordinary shareholders of the | ||||||||
Company | 2,213,716 | 5,277,186 | ||||||
Weighted average number of the Company’s ordinary shares outstanding (thousand) | 10,823,814 | 10,823,497 | ||||||
Basic earnings per share | 0.205 | 0.488 | ||||||
| (b) | Diluted earnings per share: |
Diluted earnings per share is calculated by adjusting the weighted average number of ordinary shares outstanding to assume conversion of all dilutive potential ordinary shares. In the year of 2019, there were no potential dilutive ordinary share due to no outstanding share option (2018: Nil). Diluted earnings per share is equal to basic earnings per share.
| (55) | Notes to consolidated cash flow statement |
| (a) | Cash received from other operating activities |
| 2019 | 2018 | |||||||
Subsidy income | 37,771 | 64,765 | ||||||
Others | 4,304 | 10,316 | ||||||
|
|
|
| |||||
| 42,075 | 75,081 | |||||||
|
|
|
| |||||
372
Table of Contents
Notes to the Financial Statements(continued)
For the year ended 31 December 2019
(All amounts in thousands of Renminbi Yuan unless otherwise stated)
[English translation for reference only]
| 4 | Notes to the consolidated financial statements(continued) |
| (55) | Notes to consolidated cash flow statement(continued) |
| (b) | Cash paid from other operating activities |
| 2019 | 2018 | |||||||
Sales commissions | (125,641 | ) | (139,954 | ) | ||||
Sales commissions | (87,430 | ) | (36,675 | ) | ||||
Information system operation and maintenance expenses | (57,928 | ) | (48,567 | ) | ||||
Storage and logistics expenses | (50,612 | ) | (70,911 | ) | ||||
Security and fire extinguishment expenses | (50,010 | ) | (48,981 | ) | ||||
Administrative expenses | (1,584 | ) | (1,534 | ) | ||||
Others | (57,279 | ) | (95,217 | ) | ||||
|
|
|
| |||||
| (430,484 | ) | (441,839 | ) | |||||
|
|
|
| |||||
| (c) | Cash received from other investment activities |
| 2019 | 2018 | |||||||
Six-month deposit receipts | 4,100,000 | 4,000,000 | ||||||
Structured deposit receipts | 3,200,000 | — | ||||||
Interest income | 533,248 | 417,430 | ||||||
Derivative financial instrument investment income | — | 16,540 | ||||||
|
|
|
| |||||
| 7,833,248 | 4,433,970 | |||||||
|
|
|
| |||||
| (d) | Cash paid from other investment activities |
| 2019 | 2018 | |||||||
Six-month deposit payment | (7,600,000 | ) | (3,500,000 | ) | ||||
Structure deposit payment | (3,800,000 | ) | (2,700,000 | ) | ||||
Accounts receivable discount loss | (19,513 | ) | — | |||||
Derivative financial instrument investment loss | (15,316 | ) | — | |||||
|
|
|
| |||||
| (11,434,829 | ) | (6,200,000 | ) | |||||
|
|
|
| |||||
373
Table of Contents
Notes to the Financial Statements(continued)
For the year ended 31 December 2019
(All amounts in thousands of Renminbi Yuan unless otherwise stated)
[English translation for reference only]
| 4 | Notes to the consolidated financial statements(continued) |
| (55) | Notes to consolidated cash flow statement(continued) |
| (e) | Cash paid from to other financial activities |
| 2019 | 2018 | |||||||
Lease liabilities payment | (89,124 | ) | — | |||||
In the year of 2019, cash payment of the Group related to lease activities is RMB94,441 thousand, beside which, the rest of cash payment attributed in operating activities.
| (56) | Supplementary materials to consolidated cash flow statement |
| (a) | Supplementary materials to consolidated cash flow statement |
Adjust net profit to cash flows from operating activities
| 2019 | 2018 | |||||||
Net profit | 2,225,153 | 5,277,073 | ||||||
Add: Provisions for assets impairment | 70,664 | 168,655 | ||||||
Credit impairment losses | (59 | ) | 39 | |||||
Depreciation of investment properties | 14,694 | 14,527 | ||||||
Depreciation of fixed assets | 1,509,814 | 1,552,934 | ||||||
Depreciation ofright-of-use assets | 87,184 | — | ||||||
Amortisation of intangible assets | 19,510 | 20,744 | ||||||
Amortisation of long-term prepaid expenses | 209,596 | 221,418 | ||||||
Losses on disposal of fixed assets | (158,551 | ) | (172,508 | ) | ||||
Losses arising from changes in fair value | (1,597 | ) | (33,347 | ) | ||||
Financialexpenses-net | (362,964 | ) | (390,042 | ) | ||||
Investment income | (953,661 | ) | (878,213 | ) | ||||
(Increase)/decrease in deferred tax assets | (31,757 | ) | 232 | |||||
Decrease in deferred income | (10,437 | ) | (10,437 | ) | ||||
Decrease/(increase) in inventories | 1,296,263 | (1,609,280 | ) | |||||
Decrease/(increase) in operating receivables | 554,214 | (780,222 | ) | |||||
Increase in operating payables | 653,141 | 3,269,395 | ||||||
Increase in specific reserve | 2 | 57,135 | ||||||
Share-based payments expense | — | (13,004 | ) | |||||
|
|
|
| |||||
Net cash flows generated from operating activities | 5,121,209 | 6,695,099 | ||||||
|
|
|
| |||||
374
Table of Contents
Notes to the Financial Statements(continued)
For the year ended 31 December 2019
(All amounts in thousands of Renminbi Yuan unless otherwise stated)
[English translation for reference only]
| 4 | Notes to the consolidated financial statements(continued) |
| (56) | Supplementary materials to consolidated cash flow statement(continued) |
| (a) | Supplementary materials to consolidated cash flow statement(continued) |
Major operational and investment activities that do not involve cash receipts and payments
| 2019 | 2018 | |||||||
Inventory purchases paid with bank acceptance | 733,915 | 1,512,238 | ||||||
Payment by bank acceptance bill of long-term assets procurement | 73,812 | 50,110 | ||||||
Increaseright-of-use assets | 33,980 | — | ||||||
|
|
|
| |||||
| 841,707 | 1,562,348 | |||||||
|
|
|
| |||||
Movement of cash and cash equivalent
| 2019 | 2018 | |||||||
Year end balance of cash and cash equivalent | 7,449,699 | 8,741,893 | ||||||
Less: beginning balance of cash and cash equivalent | (8,741,893 | ) | (7,504,266 | ) | ||||
|
|
|
| |||||
Movement of cash and cash equivalent | (1,292,194 | ) | 1,237,627 | |||||
|
|
|
| |||||
| (b) | Disposal of subsidiary |
Carrying amount of net assets at the date of disposal
| 23 August 2019 | ||||
Current assets | 141,114 | |||
Non-current assets | 7 | |||
Current liabilities | (86,181 | ) | ||
|
| |||
| 54,940 | ||||
|
| |||
375
Table of Contents
Notes to the Financial Statements(continued)
For the year ended 31 December 2019
(All amounts in thousands of Renminbi Yuan unless otherwise stated)
[English translation for reference only]
| 4 | Notes to the consolidated financial statements(continued) |
| (56) | Supplementary materials to consolidated cash flow statement(continued) |
| (c) | Cash and cash equivalents |
| 31 December 2019 | 31 December 2018 | |||||||
Cash | ||||||||
Including: Cash on hand | — | 7 | ||||||
Bank deposits available on demand | 7,449,699 | 8,741,883 | ||||||
Other monetary fund available on demand | — | 3 | ||||||
|
|
|
| |||||
Cash and cash equivalents at the end of the year | 7,449,699 | 8,741,893 | ||||||
|
|
|
| |||||
| (57) | Foreign monetary items |
| 31 December 2019 | ||||||||||||
| Foreign currency | Exchange rate | RMB currency | ||||||||||
Cash at bank and on hand – USD | 48,175 | 6.9762 | 336,078 | |||||||||
Accounts receivable – USD | 20,952 | 6.9762 | 146,165 | |||||||||
Accounts Receivable Financing – USD | 105,286 | 6.9762 | 734,496 | |||||||||
|
| |||||||||||
Accounts payables – USD | (226,777 | ) | 6.9762 | (1,582,042 | ) | |||||||
376
Table of Contents
Notes to the Financial Statements(continued)
For the year ended 31 December 2019
(All amounts in thousands of Renminbi Yuan unless otherwise stated)
[English translation for reference only]
| 5 | Interests in other entities |
| (1) | Interests in subsidiaries |
| (a) | Main components of the Group |
| Main business | Place of | Principal | Percentage of equity | Way of | ||||||||||||||||||||
| area | registry | activities | directly held | indirectly | acquisition | |||||||||||||||||||
Toufa | Shanghai | Shanghai | Investment | 100.00 | % | — | Establish | |||||||||||||||||
Jinmao | Shanghai | Shanghai | Trading | 67.33 | % | — | Establish | |||||||||||||||||
Jinchang | Shanghai | Shanghai | Manufacturing | — | 74.25 | % | Establish | |||||||||||||||||
Shanghai Golden | ||||||||||||||||||||||||
Phillips | ||||||||||||||||||||||||
Petrochemical | ||||||||||||||||||||||||
Company | ||||||||||||||||||||||||
Limited (“Jinfei”) Shanghai | Shanghai | Manufacturing | — | 100.00 | % | Establish | ||||||||||||||||||
JMGJ | Shanghai | Shanghai | Trading | — | 67.33 | % | Establish | |||||||||||||||||
| (b) | As at 31 December 2019 and 31 December 2018, attributable tonon-controlling interests of subsidiaries’non- controlling shareholders were not significant (Note 4(37)). |
| (c) | On August 23, 2019, Ningbo Intermediate People’s Court ruled Jinyong the former subsidiary of the Group application for bankruptcy and liquidation, and assigned Zhejiang Haitai Law Firm and Zhejiang Dewei Certified Public Accountants Co., LTD. as manager. At the stage of bankruptcy liquidation, the Group no longer has the control right of Jinyong, while Jinyong companies were no longer included in the consolidation range of the Group financial statements with the investment losses of RMB60,951 thousand. |
| (d) | In July 2018, the subsidiary Toufa has concluded the equity transfer agreement which confirmed transfer 40% stock of Jinfei with the cost of RMB152,800 thousand with Phillips Petroleum International Investment Co., Ltd. After this transaction which has been completed in September 2018, Jinfei became a wholly-owned subsidiary of Toufa with its 100% stok held by the latter. |
| (e) | In 2018, the Group’s former subsidiary was merged by Toufa. As at December 31 2018, the former subsidiary Jindi has completed the cancellation of their business and tax registration. |
377
Table of Contents
Notes to the Financial Statements(continued)
For the year ended 31 December 2019
(All amounts in thousands of Renminbi Yuan unless otherwise stated)
[English translation for reference only]
| 5 | Interests in other entities(continued) |
| (2) | Interests in joint ventures and associates |
| (a) | Nature of interest in major joint ventures and associates |
| Place of main | Place of | Whether it is strategic to | % of ownership interest | |||||||||||||||||||||
| business | registry | Principal activities | group activities | Directly | Indirectly | |||||||||||||||||||
Joint ventures – | ||||||||||||||||||||||||
BOC | Shanghai | Shanghai | | Production and sales of industrial gases | | Yes | — | 50.00 | % | |||||||||||||||
Inspection and Testing company (ii) | Shanghai | Shanghai | | Inspect and test chemical equipment | | Yes | — | 50.00 | % | |||||||||||||||
Yangu Gas | Shanghai | Shanghai | | Production and sales of industrial gases | | Yes | — | 50.00 | % | |||||||||||||||
Associates – | ||||||||||||||||||||||||
Shanghai Secco | Shanghai | Shanghai | | Manufacturing and distribution of chemical products | | Yes | 20.00 | % | — | |||||||||||||||
Chemical Industry | Shanghai | Shanghai | | Planning, development and operation of the Chemical Industry Park | | Yes | 38.26 | % | — | |||||||||||||||
Jinsen | Shanghai | Shanghai | Production of resins products | Yes | — | 40.00 | % | |||||||||||||||||
Shidian Energy (i) | Shanghai | Shanghai | Electricity supply | Yes | — | 40.00 | % | |||||||||||||||||
Azbil | Shanghai | Shanghai | | Service and maintenance of building automation systems and products | | Yes | — | 40.00 | % | |||||||||||||||
The Group adopts the equity accounting method for the above equity investments.
| (i) | As at July 2019, with the permission of the Group and Toufa board, Toufa invested Shidian Energy with RMB71,816 thousand fixed assets and RMB248,184 thousand cash, to get 40% shares and vote and three board seats of the latter. |
| (ii) | As at April 2018, Toufa the subsidiary of the Group sold the 50% equity of its former subsidiary Inspection and Testing company with the transfer price of RMB9,600 thousand and RMB1,622 investment income. After the transfer Inspection and Testing company becomes a joint venture of Toufa. |
378
Table of Contents
Notes to the Financial Statements (continued)
For the year ended 31 December 2019
(All amounts in thousands of Renminbi Yuan unless otherwise stated)
[English translation for reference only]
| 5 | Interests in other entities (continued) |
| (2) | Interests in joint ventures and associates(continued) |
| (b) | Summarised financial information for major joint ventures |
| At 31 December 2019 | At 31 December 2018 | |||||||||||||||||||||||
| Inspection | ||||||||||||||||||||||||
| and testing | ||||||||||||||||||||||||
| BOC | company | Yangu Gas | BOC | Jinpu | Yangu Gas | |||||||||||||||||||
Current Assets | 247,385 | 20,757 | 63,951 | 205,959 | 19,527 | 56,579 | ||||||||||||||||||
Including: Cash and cash equivalents | 182,548 | 11,200 | 51,386 | 137,505 | 8,086 | 42,415 | ||||||||||||||||||
Non-current Assets | 181,372 | 1,937 | 36,972 | 198,555 | 2,357 | 44,589 | ||||||||||||||||||
Total Assets | 428,757 | 22,694 | 100,923 | 404,514 | 21,884 | 101,168 | ||||||||||||||||||
Current liabilities | (37,444 | ) | (3,993 | ) | (3,460 | ) | (41,962 | ) | (4,607 | ) | (3,745 | ) | ||||||||||||
Non-current liabilities | (26,378 | ) | — | — | — | — | — | |||||||||||||||||
Total liabilities | (63,822 | ) | (3,993 | ) | (3,460 | ) | (41,962 | ) | (4,607 | ) | (3,745 | ) | ||||||||||||
Net Assets | 364,935 | 18,701 | 97,463 | 362,552 | 17,277 | 97,423 | ||||||||||||||||||
Net assets calculated by proportion of shareholding (i) | 182,467 | 9,350 | 48,733 | 181,276 | 8,638 | 48,713 | ||||||||||||||||||
Adjustment – unrealized downstream transactions | (5,256 | ) | — | — | (8,759 | ) | — | — | ||||||||||||||||
Book value of joint ventures | 177,211 | 9,350 | 48,733 | 172,517 | 8,638 | 48,713 | ||||||||||||||||||
379
Table of Contents
Notes to the Financial Statements (continued)
For the year ended 31 December 2019
(All amounts in thousands of Renminbi Yuan unless otherwise stated)
[English translation for reference only]
| 5 | Interests in other entities(continued) |
| (2) | Interests in joint ventures and associates(continued) |
| (b) | Summarised financial information for major joint ventures(continued) |
| 2019 | 2018 | |||||||||||||||||||||||
| Inspection | ||||||||||||||||||||||||
| and testing | ||||||||||||||||||||||||
| BOC | company | Yangu Gas | Jinpu | Yangu Gas | BOC | |||||||||||||||||||
Revenue | 414,374 | 29,290 | 55,302 | 423,160 | 21,542 | 58,679 | ||||||||||||||||||
Financial (expense)/ income | (636 | ) | (308 | ) | (1,119 | ) | (1,114 | ) | (27 | ) | (352 | ) | ||||||||||||
Income tax | 28,382 | 777 | — | 27,799 | 450 | — | ||||||||||||||||||
Net profit/(loss) | 80,183 | 2,330 | 40 | 86,476 | 1,382 | (2,518 | ) | |||||||||||||||||
Other comprehensive income | — | — | — | — | — | — | ||||||||||||||||||
Total comprehensive income/(loss) | 80,183 | 2,330 | 40 | 86,476 | 1,382 | (2,518 | ) | |||||||||||||||||
Dividends declared by joint venture | 38,900 | 453 | — | 36,500 | 32 | — | ||||||||||||||||||
| (i) | The Group calculated shares of assets by its shareholding ratio, based on the amount from financial statements in joint ventures. The amount in financial statements of joint ventures based on the impacts of identifiable assets when obtained investment, fair value of liabilities, and consistency of accounting policies. |
380
Table of Contents
Notes to the Financial Statements (continued)
For the year ended 31 December 2019
(All amounts in thousands of Renminbi Yuan unless otherwise stated)
[English translation for reference only]
| 5 | Interests in other entities(continued) |
| (2) | Interests in joint ventures and associates(continued) |
| (c) | Summarised financial information for major associates |
| As at 31 December 2019 | As at 31 December 2018 | |||||||||||||||||||||||||||||||||||
| Shanghai Secco | Chemical Industry | Jinsen | Azbil | Shidian Energy | Shanghai Secco | Chemical Industry | Jinsen | Azbil | ||||||||||||||||||||||||||||
Current Assets | 11,858,124 | 4,356,339 | 85,302 | 204,965 | 745,425 | 9,537,354 | 3,785,819 | 100,065 | 189,514 | |||||||||||||||||||||||||||
Including: Cash and cash equivalents | 9,368,484 | 2,750,355 | 35,763 | 119,677 | 723,469 | 6,817,297 | 2,169,119 | 37,171 | 110,718 | |||||||||||||||||||||||||||
Non-current Assets | 5,020,292 | 3,467,498 | 69,154 | 3,049 | 69,588 | 5,517,999 | 3,559,033 | 68,128 | 2,586 | |||||||||||||||||||||||||||
Total Assets | 16,878,416 | 7,823,837 | 154,456 | 208,014 | 815,013 | 15,055,353 | 7,344,852 | 168,193 | 192,100 | |||||||||||||||||||||||||||
Current Liabilities | (3,196,334 | ) | (1,468,162 | ) | (18,114 | ) | (75,572 | ) | (9,849 | ) | (2,232,583 | ) | (1,433,001 | ) | (14,855 | ) | (68,106 | ) | ||||||||||||||||||
Non-current liabilities | (12,730 | ) | (485,735 | ) | — | — | — | — | (514,254 | ) | — | — | ||||||||||||||||||||||||
Total liabilities | (3,209,064 | ) | (1,953,897 | ) | (18,114 | ) | (75,572 | ) | (9,849 | ) | (2,232,583 | ) | (1,947,255 | ) | (14,855 | ) | (68,106 | ) | ||||||||||||||||||
Net Assets | 13,669,352 | 5,869,940 | 136,342 | 132,442 | 805,164 | 12,822,770 | 5,397,597 | 153,338 | 123,994 | |||||||||||||||||||||||||||
Net assets calculated by proportion of shareholding (i) | 2,733,872 | 2,245,839 | 54,537 | 52,977 | 322,066 | 2,564,556 | 2,065,122 | 61,335 | 49,598 | |||||||||||||||||||||||||||
Adjustment-internal unrealized transaction offset | (9,512 | ) | — | — | — | (22,708 | ) | (9,512 | ) | — | — | — | ||||||||||||||||||||||||
Adjustment (ii) | — | (328,629 | ) | — | — | — | — | (348,346 | ) | — | — | |||||||||||||||||||||||||
Book value of associates | 2,724,360 | 1,917,210 | 54,537 | 52,977 | 299,358 | 2,555,044 | 1,716,776 | 61,335 | 49,598 | |||||||||||||||||||||||||||
| (i) | The Group calculated shares of assets by its shareholding ratio, based on the amount from financial statements in associates. The amount in financial statements of associates based on the impacts of identifiable assets when obtained investment, fair value of liabilities, and consistency of accounting policies. |
| (ii) | Unentitled portion represented some piece of lands injected by Government in Chemical Industry as capital reserve and the earnings from this land cannot be shared by other shareholders. |
381
Table of Contents
Notes to the Financial Statements (continued)
For the year ended 31 December 2019
(All amounts in thousands of Renminbi Yuan unless otherwise stated)
[English translation for reference only]
| 5 | Interests in other entities(continued) |
| (2) | Interests in associates(continued) |
| (c) | Summarised financial information for major associates(continued) |
| 2019 | 2018 | |||||||||||||||||||||||||||||||||||
| Shanghai Secco | Chemical Industry | Jinsen | Azbil | Shidian Energy | Shanghai Secco | Chemical Industry | Jinsen | Azbil | ||||||||||||||||||||||||||||
Revenue | 28,341,032 | 1,936,537 | 197,199 | 297,694 | 112,143 | 26,319,957 | 1,880,004 | 208,901 | 255,554 | |||||||||||||||||||||||||||
Net profit/(loss) | 3,383,582 | 583,403 | (16,996 | ) | 38,448 | 5,166 | 3,228,682 | 446,667 | (12,845 | ) | 30,119 | |||||||||||||||||||||||||
Other comprehensive income | — | 19,469 | — | — | — | — | (18,331 | ) | — | — | ||||||||||||||||||||||||||
Total comprehensive income | 3,383,582 | 602,872 | (16,996 | ) | 38,448 | 5,166 | 3,228,682 | 428,336 | (12,845 | ) | 30,119 | |||||||||||||||||||||||||
Dividends declared by associates | 507,400 | 30,225 | — | 12,000 | — | 735,167 | 23,339 | — | 10,360 | |||||||||||||||||||||||||||
| (d) | Summarised financial information for immaterial associates |
| 2019 | 2018 | |||||||
Total net book value of long-term investment as at 31 December | 45,022 | 44,512 | ||||||
Total amount calculated by proportion of shareholding | ||||||||
Net profit (i) | 6,400 | 5,884 | ||||||
Other comprehensive income (i) | — | — | ||||||
|
|
|
| |||||
Total comprehensive income | 6,400 | 5,884 | ||||||
|
|
|
| |||||
| (i) | Net profit and other comprehensive income had considered the fair value of assets and liabilities at the acquisition date and the adjustment for differences in accounting policies between the Group and the associates. |
| (e) | Unconfirmed commitments to joint venture investments are shown in Note 8. |
382
Table of Contents
Notes to the Financial Statements (continued)
For the year ended 31 December 2019
(All amounts in thousands of Renminbi Yuan unless otherwise stated)
[English translation for reference only]
| 6 | Segment information |
Segment information is presented in respect of the Group’s business segments, the format of which is based on the structure of the Group’s internal organisation, management requirement, and internal reporting system.
In a manner consistent with the way in which information is reported internally to the Group’s chief operating decision maker for the purposes of resource allocation and performance assessment, the Group identified the following five reportable segments. No operating segments have been aggregated to form the following reportable segments.
The Group evaluates the performance and allocates resources to its operating segments on an operating income basis, without considering the effects of finance expenses, investment income,non-operating income andnon-operating expenses. The accounting policies adopted by the operating segments are the same with the policies in summary of significant accounting policies and accounting estimates. The transfer price of intersegment is recognised with cost plus profit method.
The Group principally operates in five operating segments: petroleum products, intermediate petrochemicals, synthetic fibres, resins and plastics and trading of petrochemical products. Petroleum products, intermediate petrochemicals, synthetic fibres and resins and plastics are produced through intermediate steps from crude oil, the principal raw material. The specific products of each segment are as follows:
| (i) | The Group’s petroleum products segment is equipped with crude oil distillation facilities used to produce vacuum and atmospheric gas oils used as feedstocks of the Group’s downstream processing facilities. Residual oil and low octane gasoline fuels areco-products of the crude oil distillation process. Part of the residual oil is further processed into qualified refined gasoline and diesel oil. In addition, the Group produces a variety of fuels for transportation, industry and household heating usage, such as diesel oil, jet fuel, heavy oil and liquefied petroleum gas. |
| (ii) | The intermediate petrochemicals segment primarily producesp-xylene, benzene and ethylene oxide. Most of the intermediate petrochemicals produced by the Group are used by the Group as raw materials in the production of other petrochemicals, resins, plastics and synthetic fibres. A portion of the intermediate petrochemicals as well as certainby-products of the production process are sold to outside customers. |
| (iii) | The synthetic fibres segment produces primarily polyester and acrylic fibres, which are mainly used in the textile and apparel industries. |
| (iv) | The resins and plastics segment produces primarily polyester chips,low-density polyethylene resins and films, polypropylene resins and PVA granules. The polyester chips are used to produce polyester fibres, coating and containers. Polyethylene resins and plastics are used to produce insulated cable, mulching films and moulded products such as housewares and toys. Polypropylene resins are used for films, sheets and moulded products such as housewares, toys, consumer electronics and automobile parts. |
| (v) | The Group’s trading of petrochemical products segment primarily engages in importing and exporting of petrochemical products. |
| (vi) | All other operating segments represent the operating segments which do not meet the quantitative threshold for determining reportable segments. These include rental, providing services and a variety of other commercial activities, which are not allocated to the above five operating segments. |
383
Table of Contents
Notes to the Financial Statements (continued)
For the year ended 31 December 2019
(All amounts in thousands of Renminbi Yuan unless otherwise stated)
[English translation for reference only]
| 6 | Segment information(continued) |
Segment results, assets and liabilities include items directly attributable to a segment as well as those that can be allocated on a reasonable basis. Unallocated items mainly comprise long-term equity investments, deferred tax assets, cash and cash equivalents and its related interest income, investment properties and related depreciation expense, interest-bearing borrowings, interest expenses, and corporate assets and related expenses.
| (a) | Segment information as at and for the year ended 31 December 2019 is as follows: |
| Synthetic fibres | Resins and plastics | Intermediate petrochemical | Petroleum products | Trading of petrochemical products | Others | Unallocated | Elimination | Total | ||||||||||||||||||||||||||||
Revenue from external customers | 2,200,229 | 10,163,711 | 10,511,143 | 54,886,705 | 21,706,014 | 878,246 | — | — | 100,346,048 | |||||||||||||||||||||||||||
Inter-segment revenue | — | 141,101 | 14,187,500 | 11,868,026 | 175,200 | 700,975 | — | (27,072,802 | ) | — | ||||||||||||||||||||||||||
Cost of sales | (2,486,042 | ) | (8,790,918 | ) | (9,095,702 | ) | (41,156,331 | ) | (21,566,364 | ) | (685,683 | ) | — | — | (83,781,040 | ) | ||||||||||||||||||||
Interest income | — | — | — | — | — | — | 398,176 | — | 398,176 | |||||||||||||||||||||||||||
Interest expenses | — | — | — | — | — | — | (53,784 | ) | — | (53,784 | ) | |||||||||||||||||||||||||
Investment income from associates and joint ventures | — | — | — | — | — | — | 953,661 | — | 953,661 | |||||||||||||||||||||||||||
Asset impairment losses | (48,844 | ) | (12,073 | ) | (9,580 | ) | (167 | ) | — | — | — | — | (70,664 | ) | ||||||||||||||||||||||
Credit impairment losses | 7 | 6 | 8 | 38 | — | — | — | — | 59 | |||||||||||||||||||||||||||
Loss arising from changes in fair value | — | — | — | — | — | — | (1,597 | ) | — | (1,597 | ) | |||||||||||||||||||||||||
Depreciation and amortisation | (70,360 | ) | (122,163 | ) | (495,947 | ) | (892,937 | ) | (179 | ) | (172,028 | ) | — | — | (1,753,614 | ) | ||||||||||||||||||||
Depreciation ofright-of-use assets | (235 | ) | (3,301 | ) | (1,522 | ) | (79,755 | ) | (32 | ) | (2,339 | ) | — | — | (87,184 | ) | ||||||||||||||||||||
Total (loss)/profit | (542,619 | ) | 401,185 | 413,881 | 705,308 | 57,836 | 122,968 | 1,495,557 | — | 2,654,116 | ||||||||||||||||||||||||||
Income tax expenses | — | — | — | — | — | — | (428,963 | ) | — | (428,963 | ) | |||||||||||||||||||||||||
Net (loss)/profit | (542,619 | ) | 401,185 | 413,881 | 705,308 | 57,836 | 122,968 | 1,066,594 | — | 2,225,153 | ||||||||||||||||||||||||||
Total assets | 1,008,090 | 1,802,681 | 3,732,928 | 14,014,425 | 1,492,405 | 2,294,668 | 21,290,931 | — | 45,636,128 | |||||||||||||||||||||||||||
Total liabilities | 340,034 | 1,372,574 | 1,736,967 | 8,482,596 | 1,936,525 | 73,127 | 1,678,404 | — | 15,620,227 | |||||||||||||||||||||||||||
Investment in associates and joint ventures | — | — | — | — | — | — | 5,328,758 | — | 5,328,758 | |||||||||||||||||||||||||||
Non-current assets increase (i) | 294,515 | 74,633 | 204,021 | 1,024,626 | 89 | 103,418 | — | — | 1,701,302 | |||||||||||||||||||||||||||
| (i) | Non-current assets do not include financial assets and investment, and deferred income tax assets. |
384
Table of Contents
Notes to the Financial Statements (continued)
For the year ended 31 December 2019
(All amounts in thousands of Renminbi Yuan unless otherwise stated)
[English translation for reference only]
| 6 | Segment information(continued) |
| (b) | Segment information as at and for the year ended 31 December 2018 is as follows: |
| Synthetic fibres | Resins and plastics | Intermediate petrochemicals | Petroleum products | Trading of petrochemical products | Others | Unallocated | Elimination | Total | ||||||||||||||||||||||||||||
Revenue from external customers | 2,225,594 | 10,730,277 | 12,403,080 | 54,972,598 | 26,560,354 | 873,005 | — | — | 107,764,908 | |||||||||||||||||||||||||||
Inter-segment revenue | — | 138,481 | 13,923,959 | 11,037,010 | 1,090,056 | 691,852 | — | (26,881,358 | ) | — | ||||||||||||||||||||||||||
Cost of sales | (2,520,678 | ) | (8,875,478 | ) | (9,327,686 | ) | (39,220,903 | ) | (26,392,366 | ) | (692,464 | ) | — | — | (87,029,575 | ) | ||||||||||||||||||||
Interest income | — | — | — | — | — | — | 443,650 | — | 443,650 | |||||||||||||||||||||||||||
Interest expenses | — | — | — | — | — | — | (79,246 | ) | — | (79,246 | ) | |||||||||||||||||||||||||
Investment income from associates and joint ventures | — | — | — | — | — | — | 878,213 | — | 878,213 | |||||||||||||||||||||||||||
Asset impairment losses | (83,913 | ) | (19,219 | ) | (43,314 | ) | (22,209 | ) | — | — | — | — | (168,655 | ) | ||||||||||||||||||||||
Gain arising from changes in fair value | — | — | — | — | — | — | 33,347 | — | 33,347 | |||||||||||||||||||||||||||
Depreciation and amortisation | (70,434 | ) | (139,447 | ) | (575,025 | ) | (862,663 | ) | (111 | ) | (161,943 | ) | — | — | (1,809,623 | ) | ||||||||||||||||||||
Total (loss)/profit | (577,073 | ) | 892,890 | 1,926,199 | 2,871,380 | 85,089 | 115,292 | 1,435,199 | — | 6,748,976 | ||||||||||||||||||||||||||
Income tax expenses | — | — | — | — | — | — | (1,471,903 | ) | — | (1,471,903 | ) | |||||||||||||||||||||||||
Net (loss)/profit | (577,073 | ) | 892,890 | 1,926,199 | 2,871,380 | 85,089 | 115,292 | (36,704 | ) | — | 5,277,073 | |||||||||||||||||||||||||
Total assets | 1,127,357 | 1,924,863 | 4,188,441 | 15,567,265 | 1,807,433 | 2,067,698 | 17,856,903 | — | 44,539,960 | |||||||||||||||||||||||||||
Total liabilities | 427,005 | 1,404,499 | 1,767,232 | 7,813,381 | 1,912,931 | 79,713 | 648,695 | — | 14,053,456 | |||||||||||||||||||||||||||
Investment in associates and joint ventures | — | — | — | — | — | — | 4,657,133 | — | 4,657,133 | |||||||||||||||||||||||||||
Non-current assets increase (i) | 117,495 | 82,804 | 213,240 | 662,639 | — | 100,149 | — | — | 1,176,327 | |||||||||||||||||||||||||||
| (i) | Non-current assets do not include financial assets and investment, and deferred income tax assets. |
In view of the fact that the Group operates mainly in the PRC, no geographical segment information is presented.
In 2019, revenue from the same customer accounted for 46% of total Group revenue (2018: 39%). The revenue from the customer derived from the following segments: petroleum products and other segment.
385
Table of Contents
Notes to the Financial Statements (continued)
For the year ended 31 December 2019
(All amounts in thousands of Renminbi Yuan unless otherwise stated)
[English translation for reference only]
| 7 | Related parties and related party transactions |
| (1) | Information on the parent company |
| (a) | General information of the parent company |
Place of registration | Business nature | |||
| China Petroleum & Chemical Corporation | No.22 Chaoyangmen North Street, Chaoyang District, Beijing | Exploring for, extracting and selling crude oil and natural gas; oil refining; production, sale and transport of petrochemical, chemical fibres and other chemical products; pipe transport of crude oil and natural gas; research and development and application of new technologies and information. |
The Company’s ultimate controlling party is China Petrochemical Corporation.
| (b) | Registered capital and changes in registered capital of the parent company |
| 31 December 2018 | Increase in current year | Decrease in current year | 31 December 2019 | |||||||||||||
China Petroleum & Chemical Corporation | RMB121.1 billion | — | — | RMB121.1 billion | ||||||||||||
| (c) | The percentages of share holding and voting rights in the Company held by the parent company |
| 31 December 2019 | 31 December 2018 | |||||||||||||||
| Share holding | Voting rights | Share holding | Voting rights | |||||||||||||
China Petroleum & Chemical Corporation | 50.44 | % | 50.44 | % | 50.44 | % | 50.44 | % | ||||||||
| (2) | Information on the Company’s subsidiaries |
The general information and other related information of the subsidiaries is set out in Note 5.
386
Table of Contents
Notes to the Financial Statements(continued)
For the year ended 31 December 2019
(All amounts in thousands of Renminbi Yuan unless otherwise stated)
[English translation for reference only]
| 7 | Related parties and related party transactions(continued) |
| (3) | Basic information of associate and joint venture |
In addition to the major joint ventures and associates disclosed in Note 5(2), related transactions between the Group and other associates are as follows:
Place of business/country | Place of | Whether it is strategic for | % of ownership interest | |||||||||||||||||||
| of incorporation | registry | Business nature | group activities | Directly | Indirectly | |||||||||||||||||
Shanghai Nanguang Petrochemical Co., Ltd. | Shanghai | Shanghai | Petrochemical products import and export | Yes | — | 35 | % | |||||||||||||||
Shanghai Jinhuan Petroleum Naphthalene Development Company Limited | Shanghai | Shanghai | Production of petrochemical products | Yes | — | 25 | % | |||||||||||||||
Shanghai Chemical Industry Park Logistics Company Limited | Shanghai | Shanghai | Products freight | Yes | — | 33.33 | % | |||||||||||||||
387
Table of Contents
Notes to the Financial Statements(continued)
For the year ended 31 December 2019
(All amounts in thousands of Renminbi Yuan unless otherwise stated)
[English translation for reference only]
| 7 | Related parties and related party transactions(continued) |
| (4) | Information on other related parties |
Names of other related parties | Relationship with the Company | |
Anqing Refinery Shuguang Oxo Company Limited | Subsidiary of the immediate parent company | |
BASFGao-Qiao Performance Chemicals (Shanghai) Company Limited | Subsidiary of the immediate parent company | |
China International United Petroleum and Chemical Company Limited | Subsidiary of the immediate parent company | |
China Petrochemical International (Nanjing) Company Limited | Subsidiary of the immediate parent company | |
China Petrochemical International Beijing Company Limited | Subsidiary of the immediate parent company | |
China Petrochemical International Ningbo Company Limited | Subsidiary of the immediate parent company | |
China Petrochemical International Tianjin Company Limited | Subsidiary of the immediate parent company | |
China Petrochemical International Wuhan Company Limited | Subsidiary of the immediate parent company | |
China Petrochemical Technology Company Limited | Subsidiary of the immediate parent company | |
Dalian Frip Science and Technology Company Limited | Subsidiary of the immediate parent company | |
Epec Commercial Factoring Company Limited | Subsidiary of the immediate parent company | |
Fujian Gulei Petrochemical Company Limited | Subsidiary of the immediate parent company | |
Fujian Refining & Petrochemical Company Limited (FREP) | Subsidiary of the immediate parent company | |
Nanjing Yangzi Petrochemical Rubber Company Limited | Subsidiary of the immediate parent company | |
Ningbo Eastsea Linefan Technology Company Limited | Subsidiary of the immediate parent company | |
PetroChina International (Singapore) Pte. Ltd | Subsidiary of the immediate parent company | |
Petro-Cyber Works Information Technology Company Limited | Subsidiary of the immediate parent company | |
Qingdao Sinosun Management System Certification Center | Subsidiary of the immediate parent company | |
Company Limited | ||
Shanghai KSD Bulk Solids Engineering Company Limited | Subsidiary of the immediate parent company | |
Shanghai Leader Catalyst Company Limited | Subsidiary of the immediate parent company | |
Shengli Oil Field Exploration And Development Research Institute | Subsidiary of the immediate parent company | |
Sinopec Beijing Research Institute of Chemical Industry | Subsidiary of the immediate parent company | |
Sinopec Catalyst Company Limited | Subsidiary of the immediate parent company | |
Sinopec Chemical Commercial Holding (Hong Kong) Company Limited | Subsidiary of the immediate parent company | |
Sinopec Chemical Commercial Holding Company Limited | Subsidiary of the immediate parent company | |
Sinopec Dalian (Fushun) Research Institute of Petroleum and | Subsidiary of the immediate parent company | |
Petrochemicals | ||
Sinopec Europe Company Limited | Subsidiary of the immediate parent company | |
Sinopec Group Beijing Yanshan Petrochemical Company Limited | Subsidiary of the immediate parent company | |
Sinopec Honeywell (Tianjin) Company Limited | Subsidiary of the immediate parent company | |
Sinopec Japan Company Limited | Subsidiary of the immediate parent company | |
Sinopec Lubricating Oil Shanghai Research Institute Company Limited | Subsidiary of the immediate parent company | |
Sinopec Materials & Equipment (East China) Company Limited | Subsidiary of the immediate parent company | |
Sinopec Refinery Product Sales Company Limited | Subsidiary of the immediate parent company | |
Sinopec Research Institute of Petroleum Processing | Subsidiary of the immediate parent company | |
Sinopec Safety Engineering Institute | Subsidiary of the immediate parent company |
388
Table of Contents
Notes to the Financial Statements(continued)
For the year ended 31 December 2019
(All amounts in thousands of Renminbi Yuan unless otherwise stated)
[English translation for reference only]
| 7 | Related parties and related party transactions(continued) |
| (4) | Information on other related parties(continued) |
Names of other related parties | Relationship with the Company | |
Sinopec Shanghai Research Institute of Petrochemical Technology | Subsidiary of the immediate parent company | |
Sinopec Shanghai Gaoqiao Petrochemical Company Limited | Subsidiary of the immediate parent company | |
Sinopec Yangzi Petrochemical Company Limited | Subsidiary of the immediate parent company | |
Sinopec Yizheng Chemical Fibre Company Limited | Subsidiary of the immediate parent company | |
Sinopec International Company Limited | Subsidiary of the immediate parent company | |
Sinopec Nanjing valve supply reserve centers | Subsidiary of the immediate parent company | |
Sinopec Qingdao Refining & Chemical Company Limited | Subsidiary of the immediate parent company | |
Storage And Transportation Installation Company of Ningbo Engineering Company Limited | Subsidiary of the immediate parent company | |
Unipec (Ningbo) International Logistics Company Limited | Subsidiary of the immediate parent company | |
Unipec America, Inc | Subsidiary of the immediate parent company | |
Unipec Singapore | Subsidiary of the immediate parent company | |
Zhoushan Shihua Crude Oil Terminal Company Limited | Subsidiary of the immediate parent company | |
BASF-YPC Company Limited | Joint venture of the immediate parent company | |
Zhejiang Baling Hengyi Caprolactam Limited Company | Joint venture of the immediate parent company | |
Beijing Petrochemical Engineering Consulting Company Limited | Subsidiary of the ultimate parent company | |
Beijing Shihua Hotel | Subsidiary of the ultimate parent company | |
Beijing Victory Hotel Company Limited | Subsidiary of the ultimate parent company | |
China Petrochemical Press Company Limited | Subsidiary of the ultimate parent company | |
Jiangsu Jinling Opta Polymer Company Limited | Subsidiary of the ultimate parent company | |
National Petrochemical Project Risk Assessment Technology Center | Subsidiary of the ultimate parent company | |
Petrochemical Engineering Quality Supervision Centre | Subsidiary of the ultimate parent company | |
Shanghai Petrochemical Machinery Manufacture Limited Company | Subsidiary of the ultimate parent company | |
Shanghai Petrochemical Seawall Management Office | Subsidiary of the ultimate parent company | |
Shanghai Sanopec Company Limited | Subsidiary of the ultimate parent company | |
Sinopec Assets Management Corporation | Subsidiary of the ultimate parent company | |
Sinopec Consulting Company Limited | Subsidiary of the ultimate parent company | |
Sinopec Economics & Development Research Institute | Subsidiary of the ultimate parent company | |
Sinopec Energy Saving Technology Service Company Limited | Subsidiary of the ultimate parent company | |
Sinopec Engineering Incorporation | Subsidiary of the ultimate parent company | |
Sinopec Finance | Subsidiary of the ultimate parent company | |
Sinopec Group Shanghai Training Center | Subsidiary of the ultimate parent company | |
Sinopec International Travel Service Company Limited | Subsidiary of the ultimate parent company | |
Sinopec Luoyang Engineering Company Limited | Subsidiary of the ultimate parent company | |
Sinopec Management Institute | Subsidiary of the ultimate parent company | |
Sinopec Nanjing Chemical Industries Company Limited | Subsidiary of the ultimate parent company | |
Sinopec Nanjing Engineering Company Limited | Subsidiary of the ultimate parent company |
389
Table of Contents
Notes to the Financial Statements(continued)
For the year ended 31 December 2019
(All amounts in thousands of Renminbi Yuan unless otherwise stated)
[English translation for reference only]
| 7 | Related parties and related party transactions(continued) |
| (4) | Information on other related parties(continued) |
Names of other related parties | Relationship with the Company | |
Sinopec News | Subsidiary of the ultimate parent company | |
Sinopec Ningbo Engineering Company Limited | Subsidiary of the ultimate parent company | |
Sinopec Petroleum Commercial Reserve Company Limited | Subsidiary of the ultimate parent company | |
Sinopec Shanghai Engineering Company Limited | Subsidiary of the ultimate parent company | |
Sinopec Shared Services Company Limited | Subsidiary of the ultimate parent company | |
Sinopec Tendering Company Limited | Subsidiary of the ultimate parent company | |
Sinopec Zhongyuan Oilfield | Subsidiary of the ultimate parent company | |
Sinopec (Shenzhen)E-Commerce Company Limited | Subsidiary of the ultimate parent company | |
The Fifth Construction Company of Sinopec | Subsidiary of the ultimate parent company | |
The Fourth Construction Company of Sinopec | Subsidiary of the ultimate parent company | |
The Tenth Construction Company of Sinopec | Subsidiary of the ultimate parent company | |
Yihua Tory Polyester Film Company Limited | Subsidiary of the ultimate parent company |
| (5) | Major related party transactions |
Most of the transactions undertaken by the Group during the year ended 31 December 2019 have been affected on such terms as determined by Sinopec Corp. and relevant PRC authorities.
Sinopec Corp. negotiates and agrees the terms of crude oil supply with suppliers on a group basis, which is then allocated among its subsidiaries, including the Group, on a discretionary basis. Sinopec Corp. also owns a widespread petroleum products sales network and possesses a fairly high market share in domestic petroleum products market, which is subject to extensive regulation by the PRC government.
The Group has entered into a mutual product supply and sales services framework agreement with Sinopec Corp. Pursuant to the agreement, Sinopec Corp. provides the Group with crude oil, other petrochemical raw materials and agent services. On the other hand, the Group provides Sinopec Corp. with petroleum products, petrochemical products and property leasing services.
390
Table of Contents
Notes to the Financial Statements(continued)
For the year ended 31 December 2019
(All amounts in thousands of Renminbi Yuan unless otherwise stated)
[English translation for reference only]
| 7 | Related parties and related party transactions(continued) |
| (5) | Major related party transactions(continued) |
The pricing policy for these services and products provided under the agreement is as follows:
| • | If there are applicable State (central and local government) tariffs, the pricing shall follow the State tariffs; |
| • | If there are no State tariffs, but there are applicable State’s guidance prices, the pricing shall follow the State’s guidance prices; or |
| • | If there are no State tariffs or State’s guidance prices, the pricing shall be determined in accordance with the prevailing market prices (including any bidding prices). |
In addition to the related transaction disclosed in Note4(11), Note4(36), Note4(46), other major related transactions between the Group and its related parties are as follows:
| (a) | Purchases and sales of goods, rendering and receiving services |
Purchases of goods and receiving services:
| 2019 | 2018 | |||||||||||||||||||||
Name of Related Parties | Category | Transaction type | Amount | Percentage of the same category | Amount | Percentage of the same category | ||||||||||||||||
Sinopec Corp., its subsidiaries and joint ventures | Purchases | Trade | 53,466,205 | 75.91 | % | 53,172,457 | 74.80 | % | ||||||||||||||
Sinopec Group and its subsidiaries | Purchases | Trade | 1,918,873 | 2.72 | % | 2,253,446 | 3.17 | % | ||||||||||||||
Associates of the Group | Purchases | Trade | 4,176,261 | 5.93 | % | 3,598,746 | 5.06 | % | ||||||||||||||
Joint ventures of the Group | Purchases | Trade | 403,708 | 0.57 | % | 383,983 | 0.54 | % | ||||||||||||||
Key management personnel | Short-term employee benefits | | Compensation for services | | 9,120 | 0.50 | % | 7,561 | 0.42 | % | ||||||||||||
Key management personnel | Retirement scheme contributions | | Compensation for services | | 225 | 0.01 | % | 159 | 0.01 | % | ||||||||||||
391
Table of Contents
Notes to the Financial Statements(continued)
For the year ended 31 December 2019
(All amounts in thousands of Renminbi Yuan unless otherwise stated)
[English translation for reference only]
| 7 | Related parties and related party transactions(continued) |
| (5) | Major related party transactions(continued) |
| (a) | Purchases and sales of goods, rendering and receiving services(continued) |
Sales of goods, rendering services:
| 2019 | 2018 | |||||||||||||||||||||
Name of Related Parties | Category | Transaction type | Amount | Percentage of the same category | Amount | Percentage of the same category | ||||||||||||||||
Sinopec Corp., its subsidiaries and joint ventures | Sales/Service income | Trade | 58,996,676 | 58.79 | % | 56,322,097 | 52.26 | % | ||||||||||||||
Sinopec Group and its subsidiaries | Sales/Service income | Trade | 7,724 | 0.01 | % | 11,486 | 0.01 | % | ||||||||||||||
Associates of the Group | Sales/Service income | Trade | 2,661,405 | 2.05 | % | 3,896,689 | 3.62 | % | ||||||||||||||
Joint ventures of the Group | Sales | Trade | 182,504 | 0.18 | % | 233,606 | 0.22 | % | ||||||||||||||
| (b) | Lease |
The Group as lessor:
Related Parties as leasee | Type of leasing | Rental income 2019 | Rental income 2018 | |||||||
Sinopec Corp., its subsidiaries and joint ventures | Properties and equipments | 31,972 | 29,551 | |||||||
Associates of the Group | Equipments | 5,985 | — | |||||||
Joint ventures of the Group | Equipments | 5,385 | — | |||||||
Sinopec Group and its subsidiaries | Properties | 461 | — | |||||||
|
|
|
| |||||||
| 43,803 | 29,551 | |||||||||
|
|
|
| |||||||
392
Table of Contents
Notes to the Financial Statements(continued)
For the year ended 31 December 2019
(All amounts in thousands of Renminbi Yuan unless otherwise stated)
[English translation for reference only]
| 7 | Related parties and related party transactions(continued) |
| (5) | Major related party transactions(continued) |
| (b) | Lease(continued) |
The addedright-of-use assets of the Group as leasee in the current year:
Related Parties as lessor | Type of leasing | 2019 | 2018 | |||||||
Sinopec Group and its subsidiaries | Properties, lands and equipments | 25,935 | — | |||||||
Associates of the Group | Properties | 702 | — | |||||||
|
|
|
| |||||||
| 26,637 | — | |||||||||
|
|
|
| |||||||
Lease liabilities intereset expense of the Group as lessor: | ||||||||||
| 2019 | 2018 | |||||||||
Sinopec Group and its subsidiaries | 2,285 | — | ||||||||
Associates of the Group | 19 | — | ||||||||
|
|
|
| |||||||
| 2,304 | — | |||||||||
|
|
|
| |||||||
| (c) | Related party funding |
In the year of 2019, there has no borrowing of the Group from Sinopec Finance Co., Ltd. (year of 2018: RMB50,000 thousand).
In the year of 2019, there has no repayment of the Group to Sinopec Finance Co., Ltd. (year of 2018: RMB50,000 thousand).
393
Table of Contents
Notes to the Financial Statements(continued)
For the year ended 31 December 2019
(All amounts in thousands of Renminbi Yuan unless otherwise stated)
[English translation for reference only]
| 7 | Related parties and related party transactions(continued) |
| (5) | Major related party transactions(continued) |
| (d) | Other related transactions |
Transaction Type | 2019 | 2018 | ||||||||
Sinopec Group and its subsidiaries | Insurance premiums | 108,223 | 121,329 | |||||||
Sinopec Group and its subsidiaries | Rental cost | — | 59,160 | |||||||
Sinopec Group and its subsidiaries | Depreciation ofright-of-use assets | 80,552 | — | |||||||
Associates of the Group | Depreciation ofright-of-use assets | 88 | — | |||||||
Sinopec Finance Company Limited | Interests received and receivable | 1,295 | 610 | |||||||
Sinopec Finance Company Limited | Interests paid and payable | — | 1,326 | |||||||
Sinopec Group and its subsidiaries | Construction and installation cost | 143,560 | 109,146 | |||||||
Sinopec Corp., its subsidiaries and joint ventures | Sales commission | 125,619 | 139,838 | |||||||
394
Table of Contents
Notes to the Financial Statements(continued)
For the year ended 31 December 2019
(All amounts in thousands of Renminbi Yuan unless otherwise stated)
[English translation for reference only]
| 7 | Related parties and related party transactions(continued) |
| (6) | Receivables from and payables to related parties |
Receivables from related parties:
| 31 December 2019 | 31 December 2018 | |||||||||
Cash at bank and on hand | Sinopec Finance Company Limited | 67,015 | 22,082 | |||||||
|
|
|
| |||||||
Accounts receivable | Sinopec Corp., its subsidiaries and joint ventures | 1,461,030 | 2,074,344 | |||||||
Associates of the Group | 57,664 | 121,847 | ||||||||
Joint ventures of the Group | 483 | 19,176 | ||||||||
Sinopec Group and its subsidiaries | — | 457 | ||||||||
|
|
|
| |||||||
| 1,519,177 | 2,215,824 | |||||||||
|
|
|
| |||||||
Other receivables | Associates of the Group | 1,831 | 1,859 | |||||||
Joint ventures of the Group | 179 | 179 | ||||||||
Sinopec Corp., its subsidiaries and joint ventures | — | 1,145 | ||||||||
|
|
|
| |||||||
| 2,010 | 3,183 | |||||||||
|
|
|
| |||||||
Advances to suppliers | Sinopec Corp., its subsidiaries | 44,806 | 67,242 | |||||||
|
|
|
| |||||||
395
Table of Contents
Notes to the Financial Statements(continued)
For the year ended 31 December 2019
(All amounts in thousands of Renminbi Yuan unless otherwise stated)
[English translation for reference only]
| 7 | Related parties and related party transactions(continued) |
| (6) | Receivables from and payables to related parties(continued) |
Payables to related parties:
| 31 December 2019 | 31 December 2018 | |||||||||
Accounts payable | Sinopec Corp., its subsidiaries and joint ventures | 4,649,328 | 4,180,882 | |||||||
Sinopec Group and its subsidiaries | 670,389 | 10,442 | ||||||||
Joint ventures of the Group | 155,322 | 223,204 | ||||||||
Associates of the Group | 46,855 | 56,857 | ||||||||
|
|
|
| |||||||
| 5,521,894 | 4,471,385 | |||||||||
|
|
|
| |||||||
Notes payable | Sinopec Finance Company Limited | 60,000 | — | |||||||
|
|
|
| |||||||
Other payables | Sinopec Group and its subsidiaries | 78,743 | 34,566 | |||||||
Sinopec Corp., its subsidiaries and joint ventures | 42,028 | 51,826 | ||||||||
Joint ventures of the Group | 63 | 150 | ||||||||
Associates of the Group | — | 3,025 | ||||||||
|
|
|
| |||||||
| 120,834 | 89,567 | |||||||||
|
|
|
| |||||||
Contract liabilities | Sinopec Corp., its subsidiaries and joint ventures | 5,026 | 6,255 | |||||||
Sinopec Group and its subsidiaries | 327 | 126 | ||||||||
Joint ventures of the Group | 313 | 481 | ||||||||
|
|
|
| |||||||
| 5,666 | 6,862 | |||||||||
|
|
|
| |||||||
Lease liabilities | Sinopec Group and its subsidiaries | 15,571 | — | |||||||
Joint ventures of the Group | 698 | — | ||||||||
|
|
|
| |||||||
| 16,269 | — | |||||||||
|
|
|
| |||||||
396
Table of Contents
Notes to the Financial Statements(continued)
For the year ended 31 December 2019
(All amounts in thousands of Renminbi Yuan unless otherwise stated)
[English translation for reference only]
| 7 | Related parties and related party transactions(continued) |
| (7) | Commitments with related parties |
Commitments with related parties contracted for by the Group at the balance sheet date but are not yet necessary to be recognized on the balance sheet are as follows:
| (a) | Construction and installation cost: |
| 31 December 2019 | 31 December 2018 | |||||||
Sinopec Group and its subsidiaries | 156,309 | 16,011 | ||||||
| (b) | Investment commitments with related parties |
| 31 December 2019 | 31 December 2018 | |||||||
Capital contribution to Shanghai Secco (Note 8 (2)(i)) | 111,263 | 111,263 | ||||||
Capital contribution to Shidian Energy (Note 8 (2)(ii)) | 80,000 | — | ||||||
|
|
|
| |||||
| 191,263 | 111,263 | |||||||
|
|
|
| |||||
As at 31 December 2019 and 2018, except for the above disclosed, the Group and the Company had no other material commitments with related parties, which are contracted, but not included in the financial statements.
| 8 | Commitments |
| (1) | Capital commitments |
Capital expenditures contracted for by the Group at the balance sheet date but are not yet necessary to be recognised on the balance sheet are as follows:
| 31 December 2019 | 31 December 2018 | |||||||
Purchase of fixed assets contracted but not provided for | 247,220 | 69,210 | ||||||
397
Table of Contents
Notes to the Financial Statements(continued)
For the year ended 31 December 2019
(All amounts in thousands of Renminbi Yuan unless otherwise stated)
[English translation for reference only]
| 8 | Commitments(continued) |
| (2) | Investment commitments |
| (i) | The Company held the 18th meeting of the seventh board of directors on 5 December 2013, and reviewed and approved the capital increase of USD30,017,124 (about RMB182,804 thousand) for Shanghai secco based on the equity ratio of the affiliated company held by the Company. The Company will make capital contribution to Shanghai secco in equal amounts in stages. |
As at 31 December 2019 and 2018, the Company has completed the first phase of its investment in Shanghai secco with totally RMB71,541 thousand. In accordance with the approval of Shanghai municipal commission of commerce received by Shanghai secco on 19 October 2015, the remaining capital contribution of the Company and other shareholders of Shanghai secco can be paid within the term of the joint venture of Shanghai secco.
| (ii) | Pursuant to the resolution of the board of directors of Toufa on 9 July 2019, Toufa agreed to make capital contribution of RMB400,000 thousands to acquire 40% share of Shidian Energy. |
As at 31 December 2019, Toufa has contributed RMB320,000 thousands to Shidian Energy, and the rest of the capital contribution to Shidian Energy should be paid before January 2022 in accordance with the agreement.
| 9 | Financial instrument and risk |
The Group’s activities expose it to a variety of financial risks: market risk (primarily currency risk and interest rate risk), credit risk and liquidity risk. The Group’s overall risk management programme focuses on the unpredictability of financial markets and seeks to minimise potential adverse effects on the Group’s financial performance.
| (1) | Market risk |
| (a) | Foreign exchange risk |
The Group’s major operational activities are carried out in Mainland China and a majority of the transactions are denominated in RMB. Neverthless the Group is exposed to foreign exchange risk arising from the recognised assets and liabilities, and future transactions denominated in foreign currencies, primarily with respect to US dollars. The Group’s finance department at its headquarters is responsible for monitoring the amount of assets and liabilities, and transactions denominated in foreign currencies to minimise the foreign exchange risk.
Therefore, the Group may sign forward foreign exchange contracts or foreign exchange option contracts to avoid foreign exchange risks. As at 31 December 2019 and 2018, the Group has not signed any currency swaps. As at 31 December 2019, Jinmao, a subsidiary of the group held 2 unexpired foreign exchange contracts which have the same value of RMB40,754 thousand. In comparison, as at 31 December 2018, the Company held 2 unexpired foreign exchange contracts which have the same value of RMB438,836 thousand. And Jinmao held 10 unexpired foreign exchange contracts which have the same value of RMB132,640 thousand.
398
Table of Contents
Notes to the Financial Statements(continued)
For the year ended 31 December 2019
(All amounts in thousands of Renminbi Yuan unless otherwise stated)
[English translation for reference only]
| 9 | Financial instrument and risk(continued) |
| (1) | Market risk(continued) |
| (a) | Foreign exchange risk(continued) |
As at 31 December 2019, the amount of foreign currency financial assets and foreign currency financial liabilities held by the Group converted into RMB is listed as follows:
| 31 December 2019 | ||||||||||||
| USD | Others | Total | ||||||||||
Financial assets in foreign currencies – | ||||||||||||
Cash at bank and on hand | 336,078 | — | 336,078 | |||||||||
FVOCI | 734,496 | — | 734,496 | |||||||||
Accounts receivable | 146,165 | — | 146,165 | |||||||||
|
|
|
|
|
| |||||||
| 1,216,739 | — | 1,216,739 | ||||||||||
|
|
|
|
|
| |||||||
Financial liabilities in foreign currencies – | ||||||||||||
Accounts payable | 1,582,042 | — | 1,582,042 | |||||||||
|
|
|
|
|
| |||||||
As at 31 December 2018, the amount of foreign currency financial assets and financial liabilities held by the Group coverted to RMB are listed below:
| 31 December 2018 | ||||||||||||
| USD | Others | Total | ||||||||||
Financial assets in foreign currencies – | ||||||||||||
Cash at bank and on hand | 351,931 | — | 351,931 | |||||||||
FVOCI | 883,102 | — | 883,102 | |||||||||
Accounts receivable | 94,046 | — | 94,046 | |||||||||
|
|
|
|
|
| |||||||
| 1,329,079 | — | 1,329,079 | ||||||||||
|
|
|
|
|
| |||||||
Financial liabilities in foreign currencies – | ||||||||||||
Short term loan | 431,649 | — | 431,649 | |||||||||
Accounts payable | 1,716,226 | — | 1,716,226 | |||||||||
Other payables | 226 | — | 226 | |||||||||
|
|
|
|
|
| |||||||
| 2,148,101 | — | 2,148,101 | ||||||||||
|
|
|
|
|
| |||||||
399
Table of Contents
Notes to the Financial Statements(continued)
For the year ended 31 December 2019
(All amounts in thousands of Renminbi Yuan unless otherwise stated)
[English translation for reference only]
| 9 | Financial instrument and risk(continued) |
| (1) | Market risk(continued) |
| (a) | Foreign exchange risk(continued) |
As at 31 December 2019, if the foreign currencies had strengthened/weakened by 5% against RMB with all other variables held constant, the Group’s net profit for the year would have been 13,699 thousand increased/ decreased (As at 31 December 2018, RMB30,713 thousand).
| (b) | Interest rate risk |
The interest rate risk of the Group is mainly generated by short-term borrowing. Financial liabilities with floating interest rate make the Group face interest rate risk of cash flow, while financial liabilities with fixed interest rate make the Group face interest rate risk of fair value. The Group determines the relative proportions of fixed and floating rate contracts in accordance with prevailing market conditions. As at 31 December 2019, the total amount of the floating rate contract in the Group’s borrowing is RMB47,600 thousand(As at 31 December 2018: RMB497,249 thousand).
The financial department of the Group headquarters continuously monitors the interest rate level of the Group. Higher interest rates would increase the cost of the new interest-bearing debt and the Group has not yet been paid to the floating interest at apre-determined rate of interest-bearing debt payments, and our group’s financial performance have a significant adverse impact, management is on the basis of the latest market situation to adjust in time, the adjustment of interest rate swap arrangements may be carried out to reduce the interest rate risk. There is no interest rate swap arrangement for the Group in 2019 and 2018.
As at 31 December 2019, if interest rates on the floating rate borrowings had risen/fallen by 50 basis points while all other variables had been held constant, the Group’s net profit would have decreased/increased by approximately RMB179 thousand(As at 31 December 2018, RMB1,865 thousand).
| (2) | Credit risk |
Credit risk is managed on the Grouping basis. Credit risk mainly arises from cash at bank, accounts receivable, other receivables, notes receivable etc.
The Group expects that there is no significant credit risk associated with cash at bank since they are deposited at state-owned banks and other medium or large size listed banks. Management does not expect that there will be any significant losses fromnon-performance by these counterparties.
400
Table of Contents
Notes to the Financial Statements(continued)
For the year ended 31 December 2019
(All amounts in thousands of Renminbi Yuan unless otherwise stated)
[English translation for reference only]
| 9 | Financial instrument and risk(continued) |
| (2) | Credit risk(continued) |
In addition, the Group has policies to limit the credit exposure on accounts receivable, other receivables and notes receivable. The Group assesses the credit quality of and sets credit limits on its customers by taking into account their financial position, the availability of guarantee from third parties, their credit history and other factors such as current market conditions. The credit history of the customers is regularly monitored by the Group. In respect of customers with a poor credit history, the Group will use written payment reminders, or shorten or cancel credit periods, to ensure the overall credit risk of the Group is limited to a controllable extent.
As at 31 December 2019 and 2018, the Group has no collateral or other credit enhancement held as a result of a material debtor’s mortgage.
| (3) | Liquidity risk |
Cash flow forecasting is performed by each subsidiary of the Group and aggregated by the Group’s finance department in its headquarters. The Group’s finance department at its headquarters monitors rolling forecasts of the Group’s short-term and long-term liquidity requirements to ensure it has sufficient cash and securities that are readily convertible to cash to meet operational needs, while maintaining sufficient headroom on its undrawn committed borrowing facilities from major financial institutions so that the Group does not breach borrowing limits or covenants on any of its borrowing facilities to meet the short-term and long-term liquidity requirements.
As at 31 December 2019, the Group had facilities up to RMB21,258,288 thousand to issue letters of credit, of which RMB17,601,233 thousand was unutilised.
401
Table of Contents
Notes to the Financial Statements(continued)
For the year ended 31 December 2019
(All amounts in thousands of Renminbi Yuan unless otherwise stated)
[English translation for reference only]
| 9 | Financial instrument and risk(continued) |
| (3) | Liquidity risk(continued) |
The financial assets and liabilities of the Group at the balance sheet date are analysed by their maturity date below at their undiscounted contractual cash flows:
| 31 December 2019 | ||||||||||||||||||||
| Within 1 year | 1 to 2 years | 2 to 5 years | Over 5 years | Total | ||||||||||||||||
Short-term borrowings | 1,575,176 | — | — | — | 1,575,176 | |||||||||||||||
Lease liabilities | 11,700 | 8,846 | 2,435 | 495 | 23,476 | |||||||||||||||
Derivative financial liability | 799 | — | — | — | 799 | |||||||||||||||
Accounts payable | 7,664,296 | — | — | — | 7,664,296 | |||||||||||||||
Notes payable | 733,900 | — | — | — | 733,900 | |||||||||||||||
Other payables | 867,967 | — | — | — | 867,967 | |||||||||||||||
|
|
|
|
|
|
|
|
|
| |||||||||||
| 10,853,838 | 8,846 | 2,435 | 495 | 10,865,614 | ||||||||||||||||
|
|
|
|
|
|
|
|
|
| |||||||||||
| 31 December 2018 | ||||||||||||||||||||
| Within 1 year | 1 to 2 years | 2 to 5 years | Over 5 years | Total | ||||||||||||||||
Short-term borrowings | 501,435 | — | — | — | 501,435 | |||||||||||||||
Derivative financial liability | 11,005 | — | — | — | 11,005 | |||||||||||||||
Accounts payable | 7,394,383 | — | — | — | 7,394,383 | |||||||||||||||
Other payables | 785,260 | — | — | — | 785,260 | |||||||||||||||
|
|
|
|
|
|
|
|
|
| |||||||||||
| 8,692,083 | — | — | — | 8,692,083 | ||||||||||||||||
|
|
|
|
|
|
|
|
|
| |||||||||||
402
Table of Contents
Notes to the Financial Statements(continued)
For the year ended 31 December 2019
(All amounts in thousands of Renminbi Yuan unless otherwise stated)
[English translation for reference only]
| 10 | Fair value estimation |
The level in which fair value measurement is categorised is determined by the level of the fair value hierarchy of the lowest level input that is significant to the entire fair value measurement:
Level 1: Quoted prices (unadjusted) in active markets for identical assets or liabilities.
Level 2: Inputs other than quoted prices included within Level 1 that are observable for the asset or liability, either directly or indirectly.
Level 3: Unobservable inputs for the asset or liability.
| (1) | Financial assets measured at fair value |
As at 31 December 2019, continuing assets and liabilities measured at fair value are presented in the above three levels as follows:
| Level 1 | Level 2 | Level 3 | Total | |||||||||||||
Financial assets | ||||||||||||||||
Trading financial assets – Structured deposit | — | — | 3,318,407 | 3,318,407 | ||||||||||||
Financial assets at fair value through other comprehensive income | ||||||||||||||||
– FVOCI | — | 1,540,921 | — | 1,540,921 | ||||||||||||
– Other equity instrument investments | — | — | 5,000 | 5,000 | ||||||||||||
Derivative financial asset – Foreign exchange option contract | — | 263 | — | 263 | ||||||||||||
|
|
|
|
|
|
|
| |||||||||
| — | 1,541,184 | 3,323,407 | 4,864,591 | |||||||||||||
|
|
|
|
|
|
|
| |||||||||
Financial liabilities | ||||||||||||||||
Derivative financial liability – Foreign exchange option contracts | — | 799 | — | 799 | ||||||||||||
|
|
|
|
|
|
|
| |||||||||
403
Table of Contents
Notes to the Financial Statements(continued)
For the year ended 31 December 2019
(All amounts in thousands of Renminbi Yuan unless otherwise stated)
[English translation for reference only]
| 10 | Fair value estimation(continued) |
| (1) | Financial assets measured at fair value(continued) |
As at 31 December 2018, the assets and liabilities continuously measured at fair value are listed as follows according to the above three levels:
| Level 1 | Level 2 | Level 3 | Total | |||||||||||||
Financial assets | ||||||||||||||||
Trading financial assets – Structured deposit | — | — | 2,719,811 | 2,719,811 | ||||||||||||
Financial assets at fair value through other comprehensive income | ||||||||||||||||
– FVOCI | — | 1,672,431 | — | 1,672,431 | ||||||||||||
Derivative financial asset – Foreign exchange option contract | — | 7,468 | — | 7,468 | ||||||||||||
|
|
|
|
|
|
|
| |||||||||
| — | 1,679,899 | 2,719,811 | 4,399,710 | |||||||||||||
|
|
|
|
|
|
|
| |||||||||
Financial Liability | ||||||||||||||||
Derivative financial liability – Forward foreign exchange contracts | — | 11,005 | — | 11,005 | ||||||||||||
|
|
|
|
|
|
|
| |||||||||
In the year of 2019, there is no transition between levels of the Group (2018: Nil).
The Group uses discounted cash flow model with inputted interest rate, which were influenced by historical fluctuation and the probability of market fluctuation, to evaluate the fair value of the structured deposits classified as Level 3 financial assets.
| (2) | Financial assets and financial liabilities not measured at fair value but disclosed it |
Financial assets and liabilities measured at amortised cost mainly include notes receivable, trade receivables and other receivables, current portion of entrust lendings, short-term borrowings, trade and other payables, notes payable.
As at 31 December 2019 and 2018, the carrying amount of these financial assets and financial liabilities not measured at fair value are a reasonable approximation of their fair value.
404
Table of Contents
Notes to the Financial Statements(continued)
For the year ended 31 December 2019
(All amounts in thousands of Renminbi Yuan unless otherwise stated)
[English translation for reference only]
| 11 | Capital management |
The Group’s objectives when managing capital are to safeguard the Group’s ability to continue as a going concern in order to provide returns for shareholders and benefits for other stakeholders and to maintain an optimal capital structure to reduce the cost of capital.
In order to maintain or adjust the capital structure, the Group may adjust the amount of dividends paid to shareholders, return capital to shareholders, issue new shares or sell assets to reduce debt.
The Group’s total capital is calculated as ‘shareholder’s equity’ and ‘total liabilities’ as shown in the consolidated balance sheet. The Group is not subject to external mandatory capital requirements, and monitors capital on the basis of gearing ratio.
As cash and cash equivalents exceed total borrowings, which was resulted primarily from the significantly improved profitability and the early repayment of some bank loans before its maturity, there was no net debt as at 31 December 2019 and 2018.
| 12 | Notes to financial statement |
| (1) | Trading financial asset |
| 31 December 2019 | 31 December 2018 | |||||||
Structured deposit | 3,318,407 | 2,519,100 | ||||||
| (2) | Accounts receivable |
| 31 December 2019 | 31 December 2018 | |||||||
Amounts due from related parties | 1,308,335 | 2,051,539 | ||||||
Amounts due from third parties | 2,114 | 1,924 | ||||||
|
|
|
| |||||
| 1,310,449 | 2,053,463 | |||||||
Less: provision for bad debts | — | (54 | ) | |||||
|
|
|
| |||||
| 1,310,449 | 2,053,409 | |||||||
|
|
|
| |||||
405
Table of Contents
Notes to the Financial Statements(continued)
For the year ended 31 December 2019
(All amounts in thousands of Renminbi Yuan unless otherwise stated)
[English translation for reference only]
| 12 | Notes to financial statement(continued) |
| (2) | Accounts receivable(continued) |
| (a) | The ageing of accounts receivable is analysed as follows: |
| 31 December 2019 | 31 December 2018 | |||||||
Within one year | 1,310,449 | 2,053,369 | ||||||
Over one year but within two years | — | 42 | ||||||
Over two years but within three years | — | 27 | ||||||
Over three years | — | 25 | ||||||
|
|
|
| |||||
| 1,310,449 | 2,053,463 | |||||||
|
|
|
| |||||
| (b) | As at 31 December 2019, the top five receivables collected by the arrears are summarized and analyzed as follows: |
| Amount | Provision | Percent of total amount | ||||||||||
The total amount of accounts receivable in the top five accounts | 1,296,025 | — | 99 | % | ||||||||
| (c) | In the year of 2019, the Company has no accounts receivable that are terminated due to the transfer of financial assets. |
406
Table of Contents
Notes to the Financial Statements(continued)
For the year ended 31 December 2019
(All amounts in thousands of Renminbi Yuan unless otherwise stated)
[English translation for reference only]
| 12 | Notes to financial statement(continued) |
| (2) | Accounts receivable(continued) |
| (d) | Provision |
| 31 December 2019 | 31 December 2018 | |||||||
Provision of Accounts receivable | — | 54 | ||||||
For notes receivable and accounts receivable, whether or not there is significant financing component, the Group shall measure the loss reserve according to the expected credit loss of the whole duration.
| (i) | As at 31 December 2019, the Group has no notes receivable and accounts receivable of single provision for bad debts. |
| (ii) | As at 31 December 2019, the Group has no pledged accounts receivable (As at 31December 2018: Nil). |
| (iii) | In the year of 2019, the Group does not have a large proportion of bad debt provision that has been fully withdrawn or withdrawn in previous years, but the accounts receivable that have been fully recovered or transferred in this year, or a large proportion of accounts receivable that have been recovered or transferred in this year (2018: Nil). |
| (e) | Significant unwritten accounts receivable of the Group for the year 2019 (2018: Nil). |
| (3) | Other receivables |
| 31 December 2019 | 31 December 2018 | |||||||
Amounts due from related parties | 2,010 | 860,974 | ||||||
Amounts due from third parties | 870,558 | 93,139 | ||||||
|
|
|
| |||||
| 872,568 | 954,113 | |||||||
Less: provision for bad debts | (857,931 | ) | (857,931 | ) | ||||
|
|
|
| |||||
| 14,637 | 96,182 | |||||||
|
|
|
| |||||
407
Table of Contents
Notes to the Financial Statements(continued)
For the year ended 31 December 2019
(All amounts in thousands of Renminbi Yuan unless otherwise stated)
[English translation for reference only]
| 12 | Notes to financial statement(continued) |
| (3) | Other receivables(continued) |
| (a) | Provision movement |
| First Stage | Third Stage | Total | ||||||||||||||||||||||||||||||
| Expected credit loss | ||||||||||||||||||||||||||||||||
| Expected credit loss | Expected credit loss | over the duration | ||||||||||||||||||||||||||||||
| in the next 12 months | in the next 12 months | (credit impairment has | ||||||||||||||||||||||||||||||
| (Combined) | (Single) | Total | occurred) | |||||||||||||||||||||||||||||
| Book value | Provision | Book value | Provision | Provision | Book value | Provision | Provision | |||||||||||||||||||||||||
31 December 2018 | 96,182 | — | — | — | — | 857,931 | (857,931 | ) | (857,931 | ) | ||||||||||||||||||||||
Add | — | — | — | — | — | — | — | — | ||||||||||||||||||||||||
Less | — | — | — | — | — | — | — | — | ||||||||||||||||||||||||
|
|
|
|
|
|
|
|
|
|
|
|
|
|
|
| |||||||||||||||||
31 December 2019 | 14,637 | — | — | — | — | 857,931 | (857,931 | ) | (857,931 | ) | ||||||||||||||||||||||
|
|
|
|
|
|
|
|
|
|
|
|
|
|
|
| |||||||||||||||||
As at 31 December 2019, the Company’s receivable from Jinyong Co., Ltd, a subsidiary within the scope of merger, is RMB857,791 thousand. Jinyong Co., Ltd began to stop production in August 2008 and started bankruptcy and liquidation procedure in August 2019. The Company believes that these other receivables are difficult to recover, and hence the full provision for bad debt.
| (b) | In the year of 2019, the Group does not have a large proportion of bad debt provision that has been fully withdrawn or withdrawn in previous years, but other accounts receivable that have been fully recovered or transferred in in this financial year, or a large proportion of other accounts receivable that have been recovered or transferred in in this financial year (2018: Nil) |
| (c) | As at 31 December 2019, the top five other receivables are as follows: |
Nature | Amount | Ageing | Percentage of total other receivables | Provision for bad debts | ||||||||||||
Jinyong Co.,Ltd | Reimbursed expenses | 857,791 | More than 3 years | 98.3 | % | (857,791 | ) | |||||||||
Shanghai Bank Co., Ltd. Jinshan branch | Interest receivables | 6,372 | Within one year | 0.7 | % | — | ||||||||||
China CITIC Bank Co., Ltd. Shanghai branch | Interest receivables | 3,255 | Within one year | 0.4 | % | — | ||||||||||
BOC | Accounts balance | 1,830 | Within one year | 0.2 | % | — | ||||||||||
China Nuclear Industry Fifth Construction Co., Ltd | Accounts balance | 648 | Within one year | 0.1 | % | — | ||||||||||
|
|
|
|
|
| |||||||||||
| 869,896 | 99.7 | % | (857,791 | ) | ||||||||||||
|
|
|
|
|
| |||||||||||
408
Table of Contents
Notes to the Financial Statements(continued)
For the year ended 31 December 2019
(All amounts in thousands of Renminbi Yuan unless otherwise stated)
[English translation for reference only]
| 12 | Notes to financial statement(continued) |
| (4) | Long-term equity investment |
| 31 December 2019 | 31 December 2018 | |||||||
Subsidiaries (a) | 1,848,328 | 1,718,007 | ||||||
Associates (b) | 4,641,570 | 4,271,820 | ||||||
|
|
|
| |||||
| 6,489,898 | 5,989,827 | |||||||
Minus: Provision for Long-term equity investment | — | (227,500 | ) | |||||
|
|
|
| |||||
| 6,489,898 | 5,762,327 | |||||||
|
|
|
| |||||
| (a) | Subsidiaries |
| 31 December 2018 | Additional/ negative investment | 31 December 2019 | Impairment provision | Cash dividends declared in current year | ||||||||||||||||
Toufa (i) | 1,473,675 | 357,821 | 1,831,496 | — | — | |||||||||||||||
Jinyong (Note 5(1)) | 227,500 | (227,500 | ) | — | — | — | ||||||||||||||
Jinmao | 16,832 | — | 16,832 | — | 10,000 | |||||||||||||||
|
|
|
|
|
|
|
|
|
| |||||||||||
| 1,718,007 | 130,321 | 1,848,328 | — | 10,000 | ||||||||||||||||
|
|
|
|
|
|
|
|
|
| |||||||||||
| (i) | Pursuant to the resolution of the shareholders’ meeting on 25 June 2019, the Company has contributed long-term assets which equal to RMB29,878 thousand and RMB327,943 thousand cash to Toufa. |
| (b) | Associates |
The information relating to the associates of the Company is disclosed in Note 4(11)(b).
409
Table of Contents
Notes to the Financial Statements(continued)
For the year ended 31 December 2019
(All amounts in thousands of Renminbi Yuan unless otherwise stated)
[English translation for reference only]
| 12 | Notes to financial statement(continued) |
| (5) | Property, plant and equipment |
| Buildings | Plant and machinery | Vehicles and other equipment | Total | |||||||||||||
Cost | ||||||||||||||||
31 December 2018 | 3,124,185 | 40,496,125 | 1,733,409 | 45,353,719 | ||||||||||||
Reclassification in current year | 23,103 | (96,394 | ) | 73,291 | — | |||||||||||
Increase | ||||||||||||||||
Purchase | — | 98,598 | 13,150 | 111,748 | ||||||||||||
Transfer from investment properties | 10,547 | — | — | 10,547 | ||||||||||||
Transfer from construction in progress | 26,655 | 999,388 | 96,228 | 1,122,271 | ||||||||||||
Decrease | ||||||||||||||||
Transfer to investment properties | (33,017 | ) | (848,788 | ) | (112,749 | ) | (994,554 | ) | ||||||||
Disposal | (18,076 | ) | — | — | (18,076 | ) | ||||||||||
31 December 2019 | 3,133,397 | 40,648,929 | 1,803,329 | 45,585,655 | ||||||||||||
Accumulated depreciation | ||||||||||||||||
31 December 2018 | 2,131,208 | 29,496,930 | 1,413,019 | 33,041,157 | ||||||||||||
Reclassification in current year | 6,708 | (13,790 | ) | 7,082 | — | |||||||||||
Increase | ||||||||||||||||
Current year charges | 82,948 | 1,341,228 | 66,015 | 1,490,191 | ||||||||||||
Transfer from investment properties Decrease | 3,623 | — | — | 3,623 | ||||||||||||
Current year disposal | (31,174 | ) | (731,112 | ) | (109,097 | ) | (871,383 | ) | ||||||||
Transfer to investment properties | (6,207 | ) | — | — | (6,207 | ) | ||||||||||
31 December 2019 | 2,187,106 | 30,093,256 | 1,377,019 | 33,657,381 | ||||||||||||
Provision for impairment | ||||||||||||||||
31 December 2018 | 50,785 | 794,370 | 8,074 | 853,229 | ||||||||||||
Current year charges | ||||||||||||||||
Decrease in current year | — | (48,397 | ) | — | (48,397 | ) | ||||||||||
31 December 2019 | 50,785 | 745,973 | 8,074 | 804,832 | ||||||||||||
Carrying amount | ||||||||||||||||
31 December 2019 | 895,506 | 9,809,700 | 418,236 | 11,123,442 | ||||||||||||
31 December 2018 | 942,192 | 10,204,825 | 312,316 | 11,459,333 | ||||||||||||
410
Table of Contents
Notes to the Financial Statements(continued)
For the year ended 31 December 2019
(All amounts in thousands of Renminbi Yuan unless otherwise stated)
[English translation for reference only]
| 12 | Notes to financial statement(continued) |
| (5) | Property, plant and equipment(continued) |
In 2019, no provision for impairment of the Company was made. In the year of 2018, the Company and its subsidiaries made impairment provision of RMB58,652 thousand against these property, plant and equipment which will be redundant and replaced by new facilities.
In 2019, the Companywrite-off RMB48,397 thousand provision for impairment by disposing acrylonitrile and sodium cyanide equipment which has impairment (2018: Nil).
As at 31 December 2019 and 2018, the Company has no fixed assets as collateral.
In 2019, depreciation of fixed assets depreciation amount of RMB1,490,191 thousand (2018: RMB1,532,232 thousand), which included in the cost of sales, selling and administrative expenses, general and administrative expenses and R&D expenses of depreciation expense is RMB1,398,124 thousand, RMB9,145 thousand, RMB77,977 thousand and RMB4,945 thousand respectively (2018: RMB1,448,173 thousand, RMB9,092 thousand, RMB74,967 thousand and RMB0 respectively).
In 2019, the costs of fixed assets transferred from construction in progress is RMB1,122,271 thousand (2018: RMB340,957 thousand).
| (6) | Revenue and cost of sales |
| 2019 | 2018 | |||||||
Main operation revenue (a) | 77,660,191 | 79,667,886 | ||||||
Other operation revenue | 450,672 | 448,217 | ||||||
|
|
|
| |||||
| 78,110,863 | 80,116,103 | |||||||
|
|
|
| |||||
| 2019 | 2018 | |||||||
Main operation cost (a) | 61,533,595 | 59,296,153 | ||||||
Other operation cost | 325,213 | 344,874 | ||||||
|
|
|
| |||||
| 61,858,808 | 59,641,027 | |||||||
|
|
|
| |||||
411
Table of Contents
Notes to the Financial Statements(continued)
For the year ended 31 December 2019
(All amounts in thousands of Renminbi Yuan unless otherwise stated)
[English translation for reference only]
| 12 | Notes to financial statement(continued) |
| (6) | Revenue and cost of sales(continued) |
| (a) | Revenue and cost of sales |
The Company’s main business belongs to the petrochemical industry.
Product analysis as follows:
| 2019 | 2018 | |||||||||||||||
| Revenue | Cost of sales | Revenue | Cost of sales | |||||||||||||
Synthetic fiber | 2,200,229 | 2,486,042 | 2,225,594 | 2,519,148 | ||||||||||||
Resin and plastic | 8,861,740 | 7,723,686 | 9,500,495 | 7,749,846 | ||||||||||||
Intermediate petrochemical products | 11,239,062 | 9,765,538 | 12,483,945 | 9,405,844 | ||||||||||||
Petroleum products | 54,886,705 | 41,145,034 | 54,972,598 | 39,211,220 | ||||||||||||
Other products | 472,455 | 413,295 | 485,254 | 410,095 | ||||||||||||
|
|
|
|
|
|
|
| |||||||||
| 77,660,191 | 61,533,595 | 79,667,886 | 59,296,153 | |||||||||||||
|
|
|
|
|
|
|
| |||||||||
| (7) | Investment income |
| 2019 | 2018 | |||||||
Investment accounted for using the cost method (a) | 6,733 | 10,099 | ||||||
Investment accounted for using the equity method (b) | 899,926 | 816,631 | ||||||
Structured deposit income | 84,848 | — | ||||||
Foreign exchange option contract loss | (18,749 | ) | — | |||||
|
|
|
| |||||
| 972,758 | 826,730 | |||||||
|
|
|
| |||||
There are no severe restrictions on the investee’s ability to transfer investment income to the Company.
| (a) | Income from long-term equity investments accounted for using the cost method is as follow: |
| 2019 | 2018 | |||||||
Jinmao | 6,733 | 10,099 | ||||||
412
Table of Contents
Notes to the Financial Statements(continued)
For the year ended 31 December 2019
(All amounts in thousands of Renminbi Yuan unless otherwise stated)
[English translation for reference only]
| 12 | Notes to financial statement(continued) |
| (7) | Investment income(continued) |
| (b) | Income from long-term equity investments accounted for using the equity method is as follow: |
| 2019 | 2018 | |||||||
Shanghai Secco Petrochemical Company Limited | 676,717 | 645,736 | ||||||
Shanghai Chemical Industrial Park Development Company Limited | 223,209 | 170,895 | ||||||
|
|
|
| |||||
| 899,926 | 816,631 | |||||||
|
|
|
| |||||
| (8) | Supplementary information on cash flow statements |
| (a) | Reconciliation from net profit to cash flow from operating activities |
| 2019 | 2018 | |||||||
Net profit | 1,998,400 | 5,095,458 | ||||||
Add: Provisions for assets impairment | 70,248 | 153,247 | ||||||
Provisions for credit impairment | (54 | ) | 73 | |||||
Depreciation of investment properties | 15,738 | 15,575 | ||||||
Depreciation of fixed assets | 1,490,191 | 1,532,232 | ||||||
Depreciation ofright-of-use assets | 84,472 | — | ||||||
Amortisation of intangible assets | 6,546 | 15,648 | ||||||
Amortization of long-term deferred expense | 208,351 | 220,115 | ||||||
Losses on disposal of fixed assets | 3,506 | 24,648 | ||||||
Gains from fair value changes | (2,153 | ) | (16,254 | ) | ||||
Financial income net | (320,160 | ) | (347,551 | ) | ||||
Investment income | (972,758 | ) | (826,730 | ) | ||||
(Increase)/decrease in deferred tax assets | (29,511 | ) | 2,790 | |||||
Decrease in deferred income | (10,437 | ) | (10,437 | ) | ||||
Decrease/(increase) in inventories | 1,062,532 | (1,599,773 | ) | |||||
Decrease/(increase) in operating receivables | 546,668 | (341,034 | ) | |||||
Increase in operating payables | 721,367 | 2,783,908 | ||||||
Increase of reserve | — | 57,135 | ||||||
Share-based payments expense | — | (13,004 | ) | |||||
|
|
|
| |||||
Net cash inflow generated from operating activities | 4,872,946 | 6,746,046 | ||||||
|
|
|
| |||||
413
Table of Contents
Notes to the Financial Statements(continued)
For the year ended 31 December 2019
(All amounts in thousands of Renminbi Yuan unless otherwise stated)
[English translation for reference only]
| 12 | Notes to financial statement(continued) |
| (8) | Supplementary information on cash flow statements(continued) |
| (b) | Net increase in cash and cash equivalents |
| 2019 | 2018 | |||||||
Cash and cash equivalents balance at the end of the year | 5,754,440 | 7,619,013 | ||||||
Less: cash and cash equivalents balance at the beginning of the year | (7,619,013 | ) | (6,268,493 | ) | ||||
|
|
|
| |||||
Net (decrease)/increase in cash and cash equivalents | (1,864,573 | ) | 1,350,520 | |||||
|
|
|
| |||||
| 13 | Subsequent event |
| (1) | Profit distribution |
According to the resolution of the board of directors on 25 March 2020, the board of directors proposed that the Company should pay a cash dividend of RMB0.12 per share (tax included) to all shareholders, and the total cash dividend should be RMB1,298,858 thousand based on the number of 10,823,813,500 shares already issued. The above proposal is subject to the approval of the general meeting of shareholders.
| (2) | Impact assessment ofCOVID-19 outbreaks |
Following the outbreak of Coronavirus Disease 2019 (“theCOVID-19 outbreak”) in early 2020, a series of precautionary and control measures have been and continued to be implemented across the country, including extension of the Chinese New Year holiday nationwide, postponement of work resumption after the Chinese New Year holiday in some regions, certain level of restrictions and controls over the travelling of people and traffic arrangements, quarantine of certain residents, heightening of hygiene and epidemic prevention requirements in factories and offices and encouraged social distancing.
Due to theCOVID-19 outbreak and corresponding control measures, the refinery processing volumes of the Group up to date of this report dropped compared with same period of prior year. Due to theCOVID-19 outbreak and failing negotiation on reduction output of OPEC, global crude oil price decreased significantly and caused corresponding impact on operation of the Group.
As at the reporting date, the overall impact of theCOVID-19 outbreak on the macro-economy was still unclear and the Group was not able to estimate its specific impact on the Group’s financial position. The Group will pay sustained attention to thefollow-up status ofCOVID-19 outbreak, and take corresponding measures to further assess the impact on financial position and operating result.
414
Table of Contents
SUPPLEMENTARY INFORMATION TO THE FINANCIAL STATEMENTS
For the year ended 31 December 2019
(All amounts in thousands of Renminbi Yuan unless otherwise stated)
[English translation for reference only]
| 1 | Non-recurring items |
| 2019 | 2018 | |||||||
Gains on disposal ofnon-current assets | 158,551 | 172,508 | ||||||
Government grants recognised through profits or losses | 79,678 | 126,329 | ||||||
Structured deposit income | 86,848 | — | ||||||
Accounts receivable discount loss | (19,513 | ) | — | |||||
Losses/(gains) on disposal of long-term equity investment | (60,951 | ) | 1,622 | |||||
Employee reduction expenses | (45,394 | ) | (34,450 | ) | ||||
Gain from changes in fair values of derivative financial assets and liabilities | 1,597 | 13,537 | ||||||
Income from external entrusted lendings | — | 11 | ||||||
Foreign exchange options and foreign exchange forward contract (losses)/gains | (15,316 | ) | 983 | |||||
Othernon-operating expenses other than those mentioned above | (42,322 | ) | (55,092 | ) | ||||
Tax effect for the above items | (5,997 | ) | (8,766 | ) | ||||
Effect onnon-controlling interests after tax | 3,515 | (7,079 | ) | |||||
|
|
|
| |||||
| 140,696 | 209,603 | |||||||
|
|
|
| |||||
Basis of preparation for extraordinary profit and loss
Pursuant to Announcement [2008] Explanatory Announcement No.1 on Information Disclosure for Companies Offering Their Securities to the Public issued by China Securities regulatory commission (CSRC), extraordinary profit and loss arises in various trading and issues that have no direct relation with the normal operations of a company, or that are related with normal operations but affect the users of the statement to make reasonable judgment of the Company’s operation performance and profitability due to the special and occasional nature of such trading and issues.
| 2 | Reconciliation between financial statements prepared under CAS and IFRS |
The Company is listed on the Hong Kong Stock Exchange. The Group prepared financial statements under International Financial Reporting Standards (“IFRS”) which are audited by PricewaterhouseCoopers. There are reconciliation items in the consolidated financial report prepared under CAS and IFRS, the reconciliation items and the amount are listed as follows:
| Net profit | Net assets | |||||||||||||||
| 2019 | 2018 | 31 December 2019 | 31 December 2018 | |||||||||||||
Under CAS | 2,225,153 | 5,277,073 | 30,015,901 | 30,486,504 | ||||||||||||
Adjustments under IFRS – | ||||||||||||||||
Government grants (a) | 2,010 | 2,010 | (22,053 | ) | (24,063 | ) | ||||||||||
Safety production costs (b) | 2 | 57,135 | — | — | ||||||||||||
|
|
|
|
|
|
|
| |||||||||
Under IFRS | 2,227,165 | 5,336,218 | 29,993,848 | 30,462,441 | ||||||||||||
|
|
|
|
|
|
|
| |||||||||
415
Table of Contents
Supplementary Information to the Financial Statements(continued)
For the year ended 31 December 2019
(All amounts in thousands of Renminbi Yuan unless otherwise stated)
[English translation for reference only]
| 2 | Reconciliation between financial statements prepared under CAS and IFRS(continued) |
Notes in relation to the reconciliation items:
| (a) | Government grants |
Under CAS, government subsidies defined as capital contributions according to the relevant government requirements are not considered a government grant, but instead should be recorded as an increase in capital reserves.
Under IFRS, such grants are offset against the cost of asset to which the grants are related. Upon transfer to property, plant and equipment, the grant is recognised as income over the useful life of the property, plant and equipment by way of a reduced depreciation charge.
| (b) | Safety production costs |
Under CAS, safety production costs should be recognised in profit or loss with a corresponding increase in reserve according to PRC regulations. Such reserve is reduced for expenses incurred for safety production purposes or, when safety production related fixed assets are purchased, is reduced by the purchased cost with a corresponding increase in the accumulated depreciation. Such fixed assets are not depreciated thereafter. Under IFRS, expenses are recognised in profit or loss when incurred, and property, plant and equipment are depreciated with applicable methods.
| 3 | Return on net assets and earnings per share |
| Weighted average return | Earnings per share | |||||||||||||||||||||||
| on net assets (%) | Basic (RMB) | Diluted (RMB) | ||||||||||||||||||||||
| 2019 | 2018 | 2019 | 2018 | 2019 | 2018 | |||||||||||||||||||
Net profit attributable to shareholders of the Company | 7.143 | 16.211 | 0.205 | 0.488 | 0.205 | 0.488 | ||||||||||||||||||
Net profit attributable to shareholders of the Company excluding non-recurring items | 6.726 | 15.567 | 0.193 | 0.468 | 0.193 | 0.468 | ||||||||||||||||||
416
Table of Contents
Written Confirmation Issued by Directors, Supervisors and Senior Management
Pursuant to the requirements of Article 68 of the Securities Law and the relevant requirements of the Regulation on the Preparation of Information Disclosure Contents and Formats of Information Disclosure by Listed Companies No. 2 – Contents and Formats of Annual Reports (Revised in 2017) (《公開發行證券的公司信息披露內容與格式準則第2號〈年度報告的內容與格式〉》 (2017年修訂)), we, being Directors, Supervisors and senior management of the Company, having carefully studied and reviewed the Company’s 2019 annual report, are in the opinion that the Company was in strict compliance with the standardised regulations of financial system of joint stock companies. The 2019 annual report gave a true account of the financial position and operating results of the Company. The 2019 Auditor’s Reports of Sinopec Shanghai Petrochemical Company Limited issued by PricewaterhouseCoopers and PricewaterhouseCoopers Zhong Tian LLP, respectively, are true and fair. We warrant that the information contained in the 2019 annual report is true, accurate and complete, and that there are no false or misleading statements contained in or material omissions from the report. We jointly and severally accept full responsibility for the authenticity, accuracy and completeness of the information contained in the report.
Signature:
Directors:
 |  |  |  | |||
| Wu Haijun | Jin Qiang | Zhou Meiyun | Jin Wenmin | |||
 |  |  |  | |||
| Lei Dianwu | Mo Zhenglin | Zhang Yimin | Liu Yunhong | |||
 |  | |||||
| Du Weifeng | Li Yuanqin | |||||
| Supervisors: | ||||||
 |  |  |  | |||
| Ma Yanhui | Chen Hongjun | Zhang Feng | Zhai Yalin | |||
 |  | |||||
| Zheng Yunrui | Choi Ting Ki | |||||
| Senior Management: | ||||||
 |  |  | ||||
| Guan Zemin | Huang Xiangyu | Huang Fei | ||||
417
Table of Contents
| (I) | Corporate Information |
| Chinese Name of the Company | 中國石化上海石油化工股���有限公司 | |||
| Chinese Short Name of the Company | 上海石化 | |||
| English Name of the Company | Sinopec Shanghai Petrochemical Company Limited | |||
| Abbreviation of the English Name of the Company | SPC | |||
| Legal Representative of the Company | Wu Haijun |
| (II) | Contact Persons and Contact Details |
President, Acting Secretary to the Board | Securities Affairs Representative | |||||
| Name | Wu Haijun | Yu Guangxian | ||||
| Address | 48 Jinyi Road, Jinshan | 48 Jinyi Road, Jinshan | ||||
| District, Shanghai, PRC, | District, Shanghai, PRC, | |||||
| Postal Code: 200540 | Postal Code: 200540 | |||||
| Tel | 8621-57943143 | 8621-57933728 | ||||
| Fax | 8621-57940050 | 8621-57940050 | ||||
| wuhaijun@spc.com.cn | yuguangxian@spc.com.cn | |||||
| (III) | Basic Information |
| Registered Address | 48 Jinyi Road, Jinshan District, Shanghai, PRC | |
| Postal Code of Registered Address | 200540 | |
| Business Address | 48 Jinyi Road, Jinshan District, Shanghai, PRC | |
| Postal Code of Business Address | 200540 | |
| Principal Place of Business in Hong Kong | Room 605, Island Place Tower, 510 King’s Road, Hong Kong | |
| Website of the Company | www.spc.com.cn | |
| E-mail address | spc@spc.com.cn |
| (IV) | Information Disclosure and Access |
Designated newspapers for the publication of the Company’s announcements | “Shanghai Securities News”, “China Securities Journal” and “Securities Times” | |
Websites for the publication of the Company’s annual reports | Shanghai Stock Exchange website, Hong Kong Stock Exchange website and the website of the Company | |
Place for access to the Company’s annual reports | Secretariat Office to the Board, 48 Jinyi Road, Jinshan District, Shanghai, PRC |
| (V) | Shares Profile of the Company |
Share Type | Place of Listing | Stock Short Name | Stock Code | |||||
| A Shares | Shanghai Stock Exchange | 上海石化 | 600688 | |||||
| H Shares | Hong Kong Stock Exchange | SHANGHAI PECHEM | 00338 | |||||
| American Depository | New York Stock Exchange | SHI | – | |||||
| Receipts (“ADR”) |
418
Table of Contents
Corporate Information(continued)
| (VI) | Other Relevant Information |
Auditors Engaged by the Company (Domestic) | ||
Name | PricewaterhouseCoopers Zhong Tian LLP | |
Address | 11/F, PricewaterhouseCoopers Center, 2 Corporate Avenue, 202 | |
| Hu Bin Road, Huangpu District, Shanghai 200021, PRC | ||
Signing Auditors | Huang Zhejun, Chen Jiaojiao | |
Auditors Engaged by the Company (International) | ||
Name | PricewaterhouseCoopers | |
Address | 22/F, Prince’s Building, 10 Chater Road, Central, Hong Kong | |
Signing Auditors | Chen Guangde | |
Legal Advisors: | ||
PRC Law: | Haiwen & Partners | |
| 20th Floor, Fortune & Finance Center | ||
| No.5 Dong San Huan Central Road | ||
| Chaoyang District, Beijing, PRC | ||
| Postal Code: 100020 | ||
Hong Kong Law: | Freshfields Bruckhaus Deringer | |
| 55th Floor, One Island East, Taikoo Place | ||
| Quarry Bay, Hong Kong | ||
United States Law: | Morrison & Foerster | |
| 425 Market Street | ||
| San Francisco, California 94105-2482 | ||
| U.S.A. | ||
Company Secretary: | Chan Sze Ting | |
Authorised Representatives for Hong | Wu Haijun, Chan Sze Ting | |
Kong Stock Exchange: | ||
H Shares Share Registrar: | Hong Kong Registrars Limited | |
| Shops 1712-1716, 17th Floor, Hopewell Centre, 183 Queen’s Road | ||
| East, Wanchai, Hong Kong | ||
ADR Depositary: | The Bank of New York Mellon | |
| Computershare | ||
| P.O. Box 30170 | ||
| College Station, TX 77842-3170 | ||
| U.S.A. | ||
| Number for International Calls:1-201-680-6921 | ||
| Email: shrrelations@cpushareownerservices.com | ||
| Website: www.mybnymdr.com | ||
419
Table of Contents
| 1. | Financial statements signed and sealed by the Chairman, the Chief Financial Officer and the Deputy Director of the Finance Department. |
| 2. | Original signed auditor’s report of the Certified Public Accountant. |
| 3. | Originals of all documents and announcements of the Company which were disclosed in the newspapers designated by CSRC during the Reporting Period. |
| 4. | Written confirmation of the annual report signed by the Directors, Supervisors and senior management. |
Chairman: Wu Haijun
Date of approval by the Board: 25 March 2020
420
Table of Contents