UNITED STATES
SECURITIES AND EXCHANGE COMMISSION
Washington, D.C. 20549
FORM N-CSR
CERTIFIED SHAREHOLDER REPORT OF REGISTERED
MANAGEMENT INVESTMENT COMPANIES
Investment Company Act file number 811-07870
Pioneer Real Estate Shares
(Exact name of registrant as specified in charter)
60 State Street, Boston, MA 02109
(Address of principal executive offices) (ZIP code)
Terrence J. Cullen, Amundi Pioneer Asset Management, Inc.,
60 State Street, Boston, MA 02109
(Name and address of agent for service)
Registrant’s telephone number, including area code: (617) 742-7825
Date of fiscal year end: December 31, 2020
Date of reporting period: January 1, 2020 through June 30, 2020
Form N-CSR is to be used by management investment companies to file reports with the Commission not later than 10 days after the transmission to stockholders of any report that is required to be transmitted to stockholders under Rule 30e-1 under the Investment Company Act of 1940 (17 CFR 270.30e-1). The Commission may use the information provided on Form N-CSR in its regulatory, disclosure review, inspection, and policymaking roles.
A registrant is required to disclose the information specified by Form N-CSR, and the Commission will make this information public. A registrant is not required to respond to the collection of information contained in Form N-CSR unless the Form displays a currently valid Office of Management and Budget (“OMB”) control number. Please direct comments concerning the accuracy of the information collection burden estimate and any suggestions for reducing the burden to Secretary, Securities and Exchange Commission, 450 Fifth Street, NW, Washington, DC 20549-0609. The OMB has reviewed this collection of information under the clearance requirements of 44 U.S.C. ss. 3507.
Pioneer Real
Estate Shares
Semiannual Report | June 30, 2020
Ticker Symbols:
Class A | PWREX |
Class C | PCREX |
Class Y | PYREX |
Beginning in February 2021, as permitted by regulations adopted by the Securities and Exchange Commission, paper copies of the Fund’s shareholder reports like this one will no longer be sent by mail, unless you specifically request paper copies of the reports from the Fund or from your financial intermediary, such as a broker-dealer, bank or insurance company. Instead, the reports will be made available on the Fund’s website, and you will be notified by mail each time a report is posted and provided with a website link to access the report.
If you already elected to receive shareholder reports electronically, you will not be affected by this change and you need not take any action. You may elect to receive shareholder reports and other communications electronically by contacting your financial intermediary or, if you invest directly with the Fund, by calling 1-800-225-6292.
You may elect to receive all future reports in paper free of charge. If you invest directly with the Fund, you can inform the Fund that you wish to continue receiving paper copies of your shareholder reports by calling 1-800-225-6292. If you invest through a financial intermediary, you can contact your financial intermediary to request that you continue to receive paper copies of your shareholder reports. Your election to receive reports in paper will apply to all funds held in your account if you invest through your financial intermediary or all funds held within the Pioneer Fund complex if you invest directly.
visit us: www.amundipioneer.com/us
| |
|
| 2 |
| | |
| 4 |
| | |
| 10 |
| | |
| 11 |
| | |
| 12 |
| | |
| 15 |
| | |
| 17 |
| | |
| 20 |
| | |
| 27 |
| | |
| 36 |
| | |
| 38 |
Pioneer Real Estate Shares | Semiannual Report | 6/30/20 1
Dear Shareholders,
The new decade has arrived delivering a half-year that will go down in the history books. The beginning of 2020 seemed to extend the positive market environment of 2019. Then, March roared in like a lion and the COVID-19 pandemic became a global crisis impacting lives and life as we know it. The long-term impact on the global economy from the COVID-19 virus pandemic, while currently unknown, is likely to be considerable. It is clear that several industries have already felt greater effects than others. And the markets, which do not thrive on uncertainty, have been volatile, delivering significantly negative performance in the first quarter, and then staging a strong rally in the opening weeks of the second quarter. Our business continuity plan was implemented given the new COVID-19 guidelines, and most of our employees are working remotely. To date, our operating environment has faced no interruption. I am proud of the careful planning that has taken place and confident we can maintain this environment for as long as is prudent. History in the making for a company that first opened its doors way back in 1928.
Since 1928, Amundi Pioneer’s investment process has been built on a foundation of fundamental research and active management, principles which have guided our investment decisions for more than 90 years. We believe active management – that is, making active investment decisions – can help mitigate the potential risks during periods of market volatility. As the first several months of 2020 have reminded us, investment risk can arise from a number of factors in today’s global economy, including slower or stagnating growth, changing U.S. Federal Reserve policy, oil price shocks, political and geopolitical factors and, unfortunately, major public health concerns such as a viral pandemic.
At Amundi Pioneer, active management begins with our own fundamental, bottom-up research process. Our team of dedicated research analysts and portfolio managers analyzes each security under consideration, communicating directly with the management teams of the companies issuing the securities and working together to identify those securities that best meet our investment criteria for our family of funds. Our risk management approach begins with each and every security, as we strive to carefully understand the potential opportunity, while considering any and all risk factors.
2 Pioneer Real Estate Shares | Semiannual Report | 6/30/20
Today, as investors, we have many options. It is our view that active management can serve shareholders well, not only when markets are thriving, but also during periods of market stress. As you consider your long-term investment goals, we encourage you to work with your financial advisor to develop an investment plan that paves the way for you to pursue both your short-term and long-term goals.
We remain confident that the current crisis, like others in human history, will pass, and we greatly appreciate the trust you have placed in us and look forward to continuing to serve you in the future.
Sincerely,
Lisa M. Jones
Head of the Americas, President and CEO of U.S.
Amundi Pioneer Asset Management USA, Inc.
June 30, 2020
Any information in this shareowner report regarding market or economic trends or the factors influencing the Fund’s historical or future performance are statements of opinion as of the date of this report. Past performance is no guarantee of future results.
Pioneer Real Estate Shares | Semiannual Report | 6/30/20 3
Portfolio Management Discussion |
6/30/20 In the following interview, Raymond Haddad discusses the market environment for real estate investment trusts (REITs) and other real estate-related investments and the factors that influenced the performance of Pioneer Real Estate Shares during the six-month reporting period ended June 30, 2020. Mr. Haddad, a vice president and portfolio manager at Amundi Pioneer Asset Management, Inc. (Amundi Pioneer), is responsible for the day-to-day management of the Fund.
Q How did the Fund perform during the six-month period ended June 30, 2020?
A Pioneer Real Estate Shares Class A shares returned -18.36% at net asset value during the six-month period ended June 30, 2020, while the Fund’s benchmark, the Morgan Stanley Capital International (MSCI) U.S. REIT Index1, returned -18.45%. During the same six-month period, the average return of the 258 mutual funds in Morningstar’s Real Estate Funds Category was -16.19%.
Q How would you describe the market environment for REIT investors during the six-month period ended June 30, 2020?
A The six-month reporting period represented a tale of two quarters. When 2020 began, investors were in an upbeat mood due to a thawing of U.S.-China trade relations and a favorable outlook for the gradual reacceleration of the U.S. economy. However, the COVID-19 virus, which emerged in China in late 2019, spread to Europe and the United States during the winter, and reached pandemic levels by March, completely disrupted global economic activity in the first quarter of 2020. In an effort to stem the spread of the virus, governments at every level and in almost every country issued shelter-in-place and lockdown orders. The virus-containment measures had the effect of bringing the domestic economy almost to a standstill, and the U.S. effectively entered a recession in March, bringing the longest-ever U.S. expansion to an abrupt halt.
1 The MSCI information may only be used for your internal use, may not be reproduced or re-disseminated in any form and may not be used as a basis for or a component of any financial instruments or products or indices. None of the MSCI information is intended to constitute investment advice or a recommendation to make (or refrain from making) any kind of investment decision and may not be relied on as such. Historical data and analysis should not be taken as an indication or guarantee of any future performance analysis, forecast or prediction. The MSCI information is provided on an “as is” basis and the user of this information assumes the entire risk of any use made of this information. MSCI, each of its affiliates and each other person involved in or related to compiling, computing or creating any MSCI information (collectively, the “MSCI Parties”) expressly disclaims all warranties (including, without limitation, any warranties of originality, accuracy, completeness, timeliness, non-infringement, merchantability and fitness for a particular purpose) with respect to this information. Without limiting any of the foregoing, in no event shall any MSCI Party have any liability for any direct, indirect, special, incidental, punitive, consequential (including, without limitation, lost profits) or any other damages.
4 Pioneer Real Estate Shares | Semiannual Report | 6/30/20
Amid the uncertainty, investors sold higher-risk assets and moved into so-called “safe havens” such as U.S. Treasuries. After peaking on February 19, 2020, U.S. equities plummeted by more than 33% from February 19 through March 23, as measured by the Standard & Poor’s 500 Index (the S&P 500). In addition, a “liquidity freeze” rattled the market for riskier fixed-income assets as investors fled into Treasuries.
With economic conditions deteriorating rapidly and unemployment soaring, the Federal Reserve (Fed) lowered the target range for the federal funds rate to zero and announced the implementation of several programs aimed at injecting liquidity into the financial markets through various channels. Those moves helped to reassure the fixed-income and currency markets. Policy makers in the U.S. government followed the Fed’s lead and introduced multiple, large-scale fiscal stimulus programs to help soften the economic toll from what essentially amounted to the shuttering of the U.S. economy.
As the markets developed a better understanding of the pandemic and its repercussions, and as the massive monetary and fiscal stimulus measures assuaged some economic concerns, equity markets rebounded in the second quarter, recouping much of their earlier losses in the process. The rally was especially strong in April, led by many of the stocks that struggled the most during the first-quarter sell-off. However, the social-distancing and lockdown mandates designed to help curb the spread of COVID-19 continued to present new challenges for many sectors of the economy, especially those businesses dependent on face-to-face contact between employees and customers.
With the COVID-19 situation raising concerns about the resilience of the commercial real estate market practically overnight, REITs that had been flourishing prior to the pandemic declined sharply during the first quarter. The asset class rallied in the second quarter, but not as much as other equity sectors. As a result, REITs underperformed the broader equity market, as measured by the S&P 500, by a wide margin over the six-month period. The MSCI U.S. REIT Index (the MSCI Index), the Fund’s benchmark, returned -18.45% for the six-month period, while the S&P 500 was down by just 3.08%.
Within the MSCI Index, most subsectors finished the six-month period in negative territory, with industrials, data centers, and apartments holding up best, while retail, lodging, and diversified (triple-net) REITs struggled the most.
Pioneer Real Estate Shares | Semiannual Report | 6/30/20 5
Q Which of your investment decisions aided the Fund’s benchmark-relative performance during the six-month period ended June 30, 2020?
A The Fund’s returns were essentially in line with the MSCI Index for the six-month period, with positive benchmark-relative performance results driven by allocations to apartment, warehouse, and data-center REITs.
Within the apartment subsector, the portfolio’s investment in Mid-American Apartment Communities was the top positive contributor to the Fund’s relative performance for the six-month period. Mid-American focuses on the housing rental markets in the southeastern and southwestern U.S., areas that were not as exposed to the more severe pandemic outbreaks that afflicted the coastal regions, particularly the northeast Atlantic coast, during most of the six-month period.
Within industrials, we focused on owning warehouse REITs, which have continued to benefit from the closure of many brick-and-mortar stores and from the social-distancing measures that have been affecting how consumers shop and receive their goods. In past recessions, the subsector had struggled due to declining demand, which in turn had led to overcapacity and falling rents. However, the COVID-19 pandemic has produced the opposite effect. The Fund’s investments in Prologis and Duke Realty benefited from the trend and were standout performers over the six-month period.
Prologis’s warehouses are strategically located in urban areas to facilitate same-day or two-day shipping. During the second quarter, the company benefited from its exposure to industries that have held up well in the COVID-19 environment, such as consumer products, food and beverages, and construction. Duke Realty owns and operates industrial assets in 20 major logistics markets across the southern and mid-western U.S. The company’s “last-mile” properties reside in high-income urban areas, which have been seeing elevated demand for same-day deliveries.
With the continued migration to cloud computing, the portfolio’s allocation to data-center REITs also aided the Fund’s benchmark-relative returns over the six-month period. A position in QTS Realty Trust was the leading performance contributor within the subsector. QTS owns mega-scale data-center space throughout North America, and those facilities house the network and computer equipment of multiple customers and provide access to a range of information technology/ infrastructure solutions.
Finally, our decision to limit the Fund’s exposures to malls, office, and apartments located in the non-coastal areas of the U.S. aided returns relative to the MSCI Index over the six-month period.
6 Pioneer Real Estate Shares | Semiannual Report | 6/30/20
Q Which of your investment decisions detracted from the Fund’s benchmark-relative performance during the six-month period ended June 30, 2020?
A With regard to individual positions, the Fund’s investments in Hilton Worldwide Holdings and Monarch Casinos were the largest detractors from benchmark-relative returns during the six-month period. Hotels and casinos have struggled as COVID-19 has shut down economies. Meanwhile, social-distancing requirements as well as many consumers’ reluctance to gather in large groups have effectively reduced capacity at the properties that did reopen. As the magnitude of the pandemic became more apparent, we exited both positions in March 2020, but not before the two holdings had a negative effect on the Fund’s performance.
The stock of Redfin also faced challenges during the six-month period. Redfin is a tech-enabled residential real estate brokerage firm that utilizes rebates/refunds on the “buy” side of the transaction, and a lower commission rate on the “sell” side of the transaction. We sold the portfolio’s position in February 2020 after the company experienced profit-margin pressures.
Finally, our decision to avoid the stock of Digital Realty Trust, a solid performer during the six-month period, weighed on the Fund’s benchmark-relative results. As with the portfolio’s existing data-center holdings, Digital Realty offers information technology services and provides its clients with co-location and interconnection capabilities to enhance access to the cloud, which enables them to store data. The lack of exposure to Digital Realty stemmed purely from our decision to invest in other competitors in the data-center subsector.
Q Did the Fund have exposure to any derivative securities during the six-month period ended June 30, 2020?
A No, the Fund had no exposure to derivative investments during the six-month period.
Q What is your view on the REIT market as we head into the second half of 2020, and how have you positioned the Fund’s portfolio?
A With so much uncertainty about the path of the pandemic and any potential economic recovery still prevalent, we believe investing in resilient businesses with an eye for relative-value opportunities may be key to reducing risk and weathering market volatility. A focus on companies with strong balance sheets, ample liquidity, and the flexibility to meet the challenges posed by what is essentially a health care crisis is paramount, in our opinion.
Pioneer Real Estate Shares | Semiannual Report | 6/30/20 7
We believe the pandemic has upended some well-entrenched demographic consumption trends, while accelerating other longer-term secular trends. REIT subsectors with higher fixed costs and that promote close contact between individuals, such as retail, office, lodging, and senior housing, or businesses that are non-essential, appear to be the most vulnerable in the current environment. In our opinion, those REIT subsectors may not bounce back quickly from COVID-19, as companies in those subsectors may not be able to recoup lost demand. On the other hand, we believe REITs that are more flexible in adapting their models to comply with social-distancing guidelines and stay-at-home orders could fare better. The latter category would include industrial REITs, residential REITs, and select REITs within health care.
Ultimately, we believe our over-arching, secular investment themes focused on e-commerce, remote working, urbanization, and cloud computing could help the Fund to weather the challenges posed by the pandemic. In our view, investors have been underestimating those secular shifts, and their potential significance.
With regard to positioning, the Fund began the six-month period with underweight exposures to retail, lodging, and office REITs. However, given the heightened market volatility and economic uncertainty, we thought it would be prudent to bring those weightings more in line with those of the MSCI Index. Accordingly, in March and April 2020, we increased the portfolio’s allocations to office, lodging, and strip malls within retail. Meanwhile, the Fund has remained overweight to specialized, industrial, and residential REITs, for the reasons mentioned above.
8 Pioneer Real Estate Shares | Semiannual Report | 6/30/20
Please refer to the Schedule of Investments on pages 17–19 for a full listing of Fund securities.
All investments are subject to risk, including the possible loss of principal. In the past several years, financial markets have experienced increased volatility and heightened uncertainty. The market prices of securities may go up or down, sometimes rapidly or unpredictably, due to general market conditions, such as real or perceived adverse economic, political, or regulatory conditions, recessions, inflation, changes in interest or currency rates, lack of liquidity in the bond markets, the spread of infectious illness or other public health issues or adverse investor sentiment. These conditions may continue, recur, worsen or spread.
The Fund invests in REIT securities, the value of which can fall for a variety of reasons, such as declines in rental income, fluctuating interest rates, poor property management, environmental liabilities, uninsured damage, increased competition, or changes in real estate tax laws.
The Fund invests in a limited number of securities and, as a result, the Fund’s performance may be more volatile than the performance of other funds holding more securities.
Investing in foreign and/or emerging markets securities involves risks relating to interest rates, currency exchange rates, economic, and political conditions.
When interest rates rise, the prices of fixed-income securities in the Fund will generally fall. Conversely, when interest rates fall, the prices of fixed-income securities in the Fund will generally rise.
At times, the Fund’s investments may represent industries or industry sectors that are interrelated or have common risks, making the Fund more susceptible to any economic, political, or regulatory developments or other risks affecting those industries or sectors.
These risks may increase share price volatility.
Before investing, consider the product’s investment objectives, risks, charges and expenses. Contact your advisor or Amundi Pioneer Asset Management, Inc., for a prospectus or summary prospectus containing this information. Read it carefully.
Any information in this shareholder report regarding market or economic trends or the factors influencing the Fund’s historical or future performance are statements of opinion as of the date of this report. Past performance is no guarantee of future results.
Pioneer Real Estate Shares | Semiannual Report | 6/30/20 9
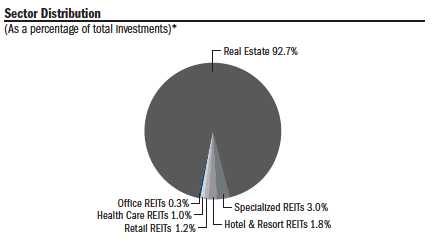
Portfolio Summary |
6/30/20
| 10 Largest Holdings | |
(As a percentage of total investments)* | |
| | |
| 1. | Equinix, Inc. | 8.73% |
| 2. | Prologis, Inc. | 8.70 |
| 3. | Equity LifeStyle Properties, Inc. | 4.79 |
| 4. | Sun Communities, Inc. | 4.47 |
| 5. | Hannon Armstrong Sustainable Infrastructure Capital, Inc. | 4.10 |
| 6. | Alexandria Real Estate Equities, Inc. | 3.91 |
| 7. | Simon Property Group, Inc. | 2.98 |
| 8. | Agree Realty Corp. | 2.68 |
| 9. | Healthpeak Properties, Inc. | 2.53 |
| 10. | QTS Realty Trust, Inc. | 2.22 |
* | Excludes temporary cash investments and all derivative contracts except for options purchased. The Fund is actively managed, and current holdings may be different. The holdings listed should not be considered recommendations to buy or sell any securities. |
10 Pioneer Real Estate Shares | Semiannual Report | 6/30/20
Prices and Distributions | 6/30/20 | |
|
| Net Asset Value per Share | | |
|
| Class | 6/30/20 | 12/31/19 |
| A | $11.77 | $14.56 |
| C | $11.25 | $13.92 |
| Y | $11.73 | $14.52 |
| Distributions per Share: 1/1/20 – 6/30/20 | | |
|
| Net | | |
| Investment | Short-Term | Long-Term |
| Class | Income | Capital Gains | Capital Gains |
| A | $0.1100 | $ — | $ — |
| C | $0.0500 | $ — | $ — |
| Y | $0.1300 | $ — | $ — |
The MSCI U.S. REIT Index is an unmanaged, widely used index comprising a broad representation of the most actively traded real estate trusts, and is designed to be a measure of real estate equity performance. Index returns are calculated monthly, assume reinvestment of dividends and, unlike Fund returns, do not reflect any fees, expenses or sales charges. It is not possible to invest directly in an index.
The index defined here pertains to the “Value of $10,000 Investment” and “Value of $5 Million Investment” charts on pages 12–14.
Pioneer Real Estate Shares | Semiannual Report | 6/30/20 11
| | |
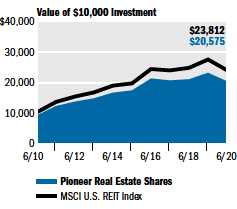
Performance Update | 6/30/20 | Class A Shares |
Investment Returns
The mountain chart on the right shows the change in value of a $10,000 investment made in Class A shares of Pioneer Real Estate Shares at public offering price during the periods shown, compared to that of the Morgan Stanley Capital International (MSCI) U.S. REIT Index.
| Average Annual Total Returns | |
(As of June 30, 2020) | | |
| Net | Public | MSCI |
| Asset | Offering | U.S. |
| Value | Price | REIT |
| Period | (NAV) | (POP) | Index |
10 years | 8.12% | 7.48% | 9.06% |
5 years | 3.18 | 1.96 | 4.08 |
1 year | -11.95 | -17.01 | -12.87 |
|
| Expense Ratio | | |
(Per prospectus dated May 1, 2020) |
| Gross | Net | | |
1.59% | 1.50% | |
Call 1-800-225-6292 or visit www.amundipioneer.com/us for the most recent month-end performance results. Current performance may be lower or higher than the performance data quoted.
The performance data quoted represents past performance, which is no guarantee of future results. Investment return and principal value will fluctuate, and shares, when redeemed, may be worth more or less than their original cost.
NAV results represent the percent change in net asset value per share. NAV returns would have been lower had sales charges been reflected. POP returns reflect deduction of maximum 5.75% sales charge. All results are historical and assume the reinvestment of dividends and capital gains. Other share classes are available for which performance and expenses will differ.
Performance results reflect any applicable expense waivers in effect during the periods shown. Without such waivers Fund performance would be lower. Waivers may not be in effect for all funds. Certain fee waivers are contractual through a specified period. Otherwise, fee waivers can be rescinded at any time. See the prospectus and financial statements for more information.
The net expense ratio reflects the contractual expense limitation currently in effect through May 1, 2021, for Class A shares. There can be no assurance that Amundi Pioneer will extend the expense limitation beyond such time. Please see the prospectus and financial statements for more information.
The performance table and graph do not reflect the deduction of fees and taxes that a shareowner would pay on Fund distributions or the redemption of Fund shares.
Effective January 1, 2018, Amundi Pioneer became directly responsible for the day-to-day management of the Fund. The performance shown for periods prior to January 1, 2018, reflects the investment strategies employed during those periods.
Please refer to the financial highlights for more current expense ratios.
12 Pioneer Real Estate Shares | Semiannual Report | 6/30/20
| | |
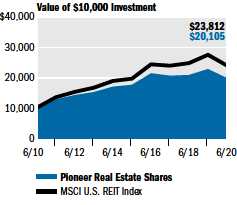
Performance Update | 6/30/20 | Class C Shares |
Investment Returns
The mountain chart on the right shows the change in value of a $10,000 investment made in Class C shares of Pioneer Real Estate Shares during the periods shown, compared to that of the Morgan Stanley Capital International (MSCI) U.S. REIT Index.
| Average Annual Total Returns | |
(As of June 30, 2020) | |
| | | MSCI |
| | | U.S. |
| If | If | REIT |
| Period | Held | Redeemed | Index |
10 years | 7.23% | 7.23% | 9.06% |
5 years | 2.36 | 2.36 | 4.08 |
1 year | -12.78 | -12.78 | -12.87 |
|
| Expense Ratio | | |
(Per prospectus dated May 1, 2020) |
| Gross | | | |
2.39% | | | |
Call 1-800-225-6292 or visit www.amundipioneer.com/us for the most recent month-end performance results. Current performance may be lower or higher than the performance data quoted.
The performance data quoted represents past performance, which is no guarantee of future results. Investment return and principal value will fluctuate, and shares, when redeemed, may be worth more or less than their original cost.
Class C shares held for less than one year are also subject to a 1.00% contingent deferred sales charge (CDSC). If you paid a 1.00% sales charge, your returns would be lower than those shown above. “If Held” results represent the percent change in net asset value per share. NAV returns would have been lower had sales charges been reflected. All results are historical and assume the reinvestment of dividends and capital gains. Other share classes are available for which performance and expenses will differ.
Performance results reflect any applicable expense waivers in effect during the periods shown. Without such waivers Fund performance would be lower. Waivers may not be in effect for all funds. Certain fee waivers are contractual through a specified period. Otherwise, fee waivers can be rescinded at any time. See the prospectus and financial statements for more information.
The performance table and graph do not reflect the deduction of fees and taxes that a shareowner would pay on Fund distributions or the redemption of Fund shares.
Effective January 1, 2018, Amundi Pioneer became directly responsible for the day-to-day management of the Fund. The performance shown for periods prior to January 1, 2018, reflects the investment strategies employed during those periods.
Please refer to the financial highlights for a more current expense ratio.
Pioneer Real Estate Shares | Semiannual Report | 6/30/20 13
| | |
Performance Update | 6/30/20 | Class Y Shares |
Investment Returns
The mountain chart on the right shows the change in value of a $5 million investment made in Class Y shares of Pioneer Real Estate Shares during the periods shown, compared to that of the Morgan Stanley Capital International (MSCI) U.S. REIT Index.
| Average Annual Total Returns |
(As of June 30, 2020) |
| Net | MSCI |
| Asset | U.S. |
| Value | REIT |
| Period | (NAV) | Index |
10 years | 8.59% | 9.06% |
5 years | 3.55 | 4.08 |
1 year | -11.66 | -12.87 |
|
| Expense Ratio | |
(Per prospectus dated May 1, 2020) |
| Gross | Net | |
1.21% | 1.20% |
Call 1-800-225-6292 or visit www.amundipioneer.com/us for the most recent month-end performance results. Current performance may be lower or higher than the performance data quoted.
The performance data quoted represents past performance, which is no guarantee of future results. Investment return and principal value will fluctuate, and shares, when redeemed, may be worth more or less than their original cost.
Class Y shares are not subject to sales charges and are available for limited groups of eligible investors, including institutional investors. All results are historical and assume the reinvestment of dividends and capital gains. Other share classes are available for which performance and expenses will differ.
Performance results reflect any applicable expense waivers in effect during the periods shown. Without such waivers Fund performance would be lower. Waivers may not be in effect for all funds. Certain fee waivers are contractual through a specified period. Otherwise, fee waivers can be rescinded at any time. See the prospectus and financial statements for more information.
The net expense ratio reflects the contractual expense limitation currently in effect through May 1, 2021, for Class Y shares. There can be no assurance that Amundi Pioneer will extend the expense limitation beyond such time. Please see the prospectus and financial statements for more information.
The performance table and graph do not reflect the deduction of fees and taxes that a shareowner would pay on Fund distributions or the redemption of Fund shares.
Effective January 1, 2018, Amundi Pioneer became directly responsible for the day-to-day management of the Fund. The performance shown for periods prior to January 1, 2018, reflects the investment strategies employed during those periods.
Please refer to the financial highlights for a more current expense ratio.
14 Pioneer Real Estate Shares | Semiannual Report | 6/30/20
Comparing Ongoing Fund Expenses
As a shareowner in the Fund, you incur two types of costs:
(1) | ongoing costs, including management fees, distribution and/or service (12b-1) fees, and other Fund expenses; and |
| | |
(2) | transaction costs, including sales charges (loads) on purchase payments. |
This example is intended to help you understand your ongoing expenses (in dollars) of investing in the Fund and to compare these costs with the ongoing costs of investing in other mutual funds. The example is based on an investment of $1,000 at the beginning of the Fund’s latest six-month period and held throughout the six months.
Using the Tables
Actual Expenses
The first table below provides information about actual account values and actual expenses. You may use the information in this table, together with the amount you invested, to estimate the expenses that you paid over the period as follows:
(1) | Divide your account value by $1,000 |
| Example: an $8,600 account value ÷ $1,000 = 8.6 |
| | |
(2) | Multiply the result in (1) above by the corresponding share class’s number in the third row under the heading entitled “Expenses Paid During Period” to estimate the expenses you paid on your account during this period. |
Expenses Paid on a $1,000 Investment in Pioneer Real Estate Shares
Based on actual returns from January 1, 2020 through June 30, 2020.
| Share Class | A | C | Y |
Beginning Account | $1,000.00 | $1,000.00 | $1,000.00 |
Value on 1/1/20 | | | |
Ending Account | $816.40 | $812.00 | $817.40 |
Value on 6/30/20 | | | |
Expenses Paid | $6.77 | $11.04
| $5.42 |
During Period* | | | |
* | Expenses are equal to the Fund’s annualized expense ratio of 1.50%, 2.45%, and 1.20% for Class A, Class C, and Class Y shares, respectively, multiplied by the average account value over the period, multiplied by 182/366 (to reflect the one-half year period). |
Pioneer Real Estate Shares | Semiannual Report | 6/30/20 15
Hypothetical Example for Comparison Purposes
The table below provides information about hypothetical account values and hypothetical expenses based on the Fund’s actual expense ratio and an assumed rate of return of 5% per year before expenses, which is not the Fund’s actual return. The hypothetical account values and expenses may not be used to estimate the actual ending account balance or expenses you paid for the period.
You may use this information to compare the ongoing costs of investing in the Fund and other funds. To do so, compare this 5% hypothetical example with the 5% hypothetical examples that appear in the shareholder reports of the other funds.
Please note that the expenses shown in the tables are meant to highlight your ongoing costs only and do not reflect any transaction costs, such as sales charges (loads) that are charged at the time of the transaction. Therefore, the table below is useful in comparing ongoing costs only and will not help you determine the relative total costs of owning different funds. In addition, if these transaction costs were included, your costs would have been higher.
Expenses Paid on a $1,000 Investment in Pioneer Real Estate Shares
Based on a hypothetical 5% per year return before expenses, reflecting the period from January 1, 2020 through June 30, 2020.
| Share Class | A | C | Y |
Beginning Account | $1,000.00 | $1,000.00 | $1,000.00 |
Value on 1/1/20 | | | |
Ending Account | $1,017.40 | $1,012.68
| $1,018.90 |
Value on 6/30/20 | | | |
Expenses Paid | $7.52 | $12.26
| $6.02 |
During Period* | | | |
* | Expenses are equal to the Fund’s annualized expense ratio of 1.50%, 2.45%, and 1.20% for Class A, Class C, and Class Y shares, respectively, multiplied by the average account value over the period, multiplied by 182/366 (to reflect the one-half year period). |
16 Pioneer Real Estate Shares | Semiannual Report | 6/30/20
Schedule of Investments | 6/30/20 (unaudited) |
|
| Shares | | | Value |
| | UNAFFILIATED ISSUERS — 100.1% | |
| | COMMON STOCKS — 100.1% of Net Assets | |
| | Equity Real Estate Investment Trusts (REITs) — 99.7% | |
| 27,822 | | Agree Realty Corp. | $ 1,828,184 |
| 14,241 | | Alexander & Baldwin, Inc. | 173,598 |
| 16,431 | | Alexandria Real Estate Equities, Inc. | 2,665,930 |
| 50,017 | | American Homes 4 Rent | 1,345,457 |
| 1,400 | | American Tower Corp. | 361,956 |
| 20,167 | | Americold Realty Trust | 732,062 |
| 25,920 | | Apple Hospitality REIT, Inc. | 250,387 |
| 67,899 | | Brandywine Realty Trust | 739,420 |
| 70,715 | | Brixmor Property Group, Inc. | 906,566 |
| 14,712 | | Camden Property Trust | 1,342,029 |
| 20,407 | | CareTrust Real Estate Investment Trust, Inc. | 350,184 |
| 16,712 | | Community Healthcare Trust, Inc. | 683,521 |
| 7,342 | | CoreSite Realty Corp. | 888,823 |
| 18,870 | | Corporate Office Properties Trust | 478,166 |
| 41,908 | | Duke Realty Corp. | 1,483,124 |
| 9,644 | | EastGroup Properties, Inc. | 1,143,875 |
| 13,626 | | EPR Properties | 451,429 |
| 8,478 | | Equinix, Inc. | 5,954,099 |
| 52,283 | | Equity LifeStyle Properties, Inc. | 3,266,642 |
| 9,275 | | Federal Realty Investment Trust | 790,323 |
| 33,094 | | Global Medical REIT, Inc. | 374,955 |
| 20,657 | | Global Net Lease, Inc. | 345,591 |
| 98,308 | | Hannon Armstrong Sustainable Infrastructure Capital, Inc. | 2,797,846 |
| 62,577 | | Healthpeak Properties, Inc. | 1,724,622 |
| 61,896 | | Host Hotels & Resorts, Inc. | 667,858 |
| 39,139 | | Independence Realty Trust, Inc. | 449,707 |
| 26,524 | | Industrial Logistics Properties Trust | 545,068 |
| 9,006 | | Innovative Industrial Properties, Inc. | 792,708 |
| 3,983 | | Kilroy Realty Corp. | 233,802 |
| 61,278 | | Kimco Realty Corp. | 786,809 |
| 9,260 | | Lamar Advertising Co. | 618,198 |
| 32,479 | | Lexington Realty Trust, Class B | 342,654 |
| 6,705 | | Life Storage, Inc. | 636,640 |
| 10,429 | | LTC Properties, Inc. | 392,861 |
| 80,009 | | Medical Properties Trust, Inc. | 1,504,169 |
| 29,554 | | MGM Growth Properties LLC | 804,164 |
| 12,420 | | Mid-America Apartment Communities, Inc. | 1,424,201 |
| 49,830 | | National Storage Affiliates Trust | 1,428,128 |
| 11,625 | | Office Properties Income Trust | 301,901 |
| 58,538 | | Park Hotels & Resorts, Inc. | 578,941 |
| 40,000 | | Physicians Realty Trust | 700,800 |
| 63,607 | | Prologis, Inc. | 5,936,441 |
The accompanying notes are an integral part of these financial statements.
Pioneer Real Estate Shares | Semiannual Report | 6/30/20 17
Schedule of Investments | 6/30/20 (unaudited) (continued) | |
|
| Shares | | | Value |
| | | Equity Real Estate Investment Trusts (REITs) — (continued) | |
| 23,603 | | QTS Realty Trust, Inc. | $ 1,512,716 |
| 10,206 | | Realty Income Corp. | 607,257 |
| 18,149 | | Regency Centers Corp. | 832,858 |
| 77,991 | | Retail Opportunity Investments Corp. | 883,638 |
| 23,493 | | Rexford Industrial Realty, Inc. | 973,315 |
| 50,984 | | Sabra Health Care Real Estate Investment Trust, Inc. | 735,699 |
| 17,279 | | Safehold, Inc. | 993,370 |
| 29,719 | | Simon Property Group, Inc. | 2,032,185 |
| 8,086 | | SL Green Realty Corp. | 398,559 |
| 54,203 | | Summit Hotel Properties, Inc. | 321,424 |
| 22,486 | | Sun Communities, Inc. | 3,050,900 |
| 14,618 | | Terreno Realty Corp. | 769,492 |
| 15,696 | | UDR, Inc. | 586,717 |
| 30,752 | | Ventas, Inc. | 1,126,138 |
| 55,912 | | VICI Properties, Inc. | 1,128,863 |
| 18,143 | | Vornado Realty Trust | 693,244 |
| 16,468 | | Welltower, Inc. | 852,219 |
| 18,238 | | WP Carey, Inc. | 1,233,801 |
| | Total Equity Real Estate Investment Trusts (REITs) | $67,956,234 |
| | Real Estate Management & Development — 0.4% | |
| 6,178(a) | | CBRE Group, Inc. | $ 279,369 |
| | Total Real Estate Management & Development | $ 279,369 |
| | TOTAL COMMON STOCKS | |
| | (Cost $58,004,952) | $68,235,603 |
| | | TOTAL INVESTMENTS IN UNAFFILIATED ISSUERS — 100.1% | |
| | (Cost $58,004,952) | $68,235,603 |
| | OTHER ASSETS AND LIABILITIES — (0.1)% | $ (54,888) |
| | NET ASSETS — 100.0% | $68,180,715 |
REIT | Real Estate Investment Trust. | |
(a) | Non-income producing security. | |
Purchases and sales of securities (excluding temporary cash investments) for the six months ended June 30, 2020, aggregated $69,079,612 and $74,065,249, respectively.
The Fund is permitted to engage in purchase and sale transactions (“cross trades”) with certain funds and accounts for which Amundi Pioneer Asset Management, Inc. (the “Adviser”) serves as the Fund’s investment adviser, as set forth in Rule 17a-7 under the Investment Company Act of 1940, pursuant to procedures adopted by the Board of Trustees. Under these procedures, cross trades are effected at current market prices. During the six months ended June 30, 2020, the Fund did not engage in any cross trade activity.
The accompanying notes are an integral part of these financial statements.
18 Pioneer Real Estate Shares | Semiannual Report | 6/30/20
At June 30, 2020, the net unrealized appreciation on investments based on cost for federal tax purposes of $58,143,704 was as follows:
| Aggregate gross unrealized appreciation for all investments in which | |
| there is an excess of value over tax cost | $11,915,747 |
| Aggregate gross unrealized depreciation for all investments in which | |
| there is an excess of tax cost over value | (1,823,848) |
| Net unrealized appreciation | $10,091,899 |
Various inputs are used in determining the value of the Fund’s investments. These inputs are summarized in the three broad levels below.
Level 1 – quoted prices in active markets for identical securities.
Level 2 – other significant observable inputs (including quoted prices for similar securities, interest rates, prepayment speeds, credit risks, etc.). See Notes to Financial Statements — Note 1A.
Level 3 – significant unobservable inputs (including the Fund’s own assumptions in determining fair value of investments). See Notes to Financial Statements — Note 1A.
The following is a summary of the inputs used as of June 30, 2020, in valuing the Fund’s investments:
| | Level 1 | | | Level 2 | | | Level 3 | | | Total | |
Common Stocks | | $ | 68,235,603 | | | $ | — | | | $ | — | | | $ | 68,235,603 | |
| Total Investments in Securities | | $ | 68,235,603 | | | $ | — | | | $ | — | | | $ | 68,235,603 | |
During the six months ended June 30, 2020, there were no transfers between Levels 1, 2 and 3.
The accompanying notes are an integral part of these financial statements.
Pioneer Real Estate Shares | Semiannual Report | 6/30/20 19
Statement of Assets and Liabilities | 6/30/20 (unaudited) | |
|
| ASSETS: | | | |
| Investments in unaffiliated issuers, at value (cost $58,004,952) | | $ | 68,235,603 | |
| Receivables — | | | | |
| Investment securities sold | | | 1,384,577 | |
| Fund shares sold | | | 48,217 | |
| Dividends | | | 256,236 | |
| Due from the Adviser | | | 18,554 | |
| Other assets | | | 43,206 | |
| Total assets | | $ | 69,986,393 | |
| LIABILITIES: | | | | |
| Due to custodian | | $ | 157,959 | |
| Payables — | | | | |
| Investment securities purchased | | | 1,362,782 | |
| Fund shares repurchased | | | 203,163 | |
| Trustees’ fees | | | 392 | |
| Due to affiliates | | | 8,467 | |
| Accrued expenses | | | 72,915 | |
| Total liabilities | | $ | 1,805,678 | |
| NET ASSETS: | | | | |
| Paid-in capital | | $ | 68,236,007 | |
| Distributable earnings (loss) | | | (55,292 | ) |
| Net assets | | $ | 68,180,715 | |
| NET ASSET VALUE PER SHARE: | | | | |
No par value (unlimited number of shares authorized) | | | | |
| Class A (based on $60,908,823/5,175,749 shares) | | $ | 11.77 | |
| Class C (based on $3,740,339/332,442 shares) | | $ | 11.25 | |
| Class Y (based on $3,531,553/301,117 shares) | | $ | 11.73 | |
| MAXIMUM OFFERING PRICE PER SHARE: | | | | |
| Class A (based on $11.77 net asset value per share/100%-5.75% | | | | |
| maximum sales charge) | | $ | 12.49 | |
The accompanying notes are an integral part of these financial statements.
20 Pioneer Real Estate Shares | Semiannual Report | 6/30/20
Statement of Operations (unaudited) | | |
| FOR THE SIX MONTHS ENDED 6/30/20 | | |
|
| INVESTMENT INCOME: | | | | | | |
| Dividends from unaffiliated issuers | | $ | 1,254,365 | | | | |
| Interest from unaffiliated issuers | | | 1,630 | | | | |
| Total investment income | | | | | | $ | 1,255,995 | |
| EXPENSES: | | | | | | | | |
| Management fees | | $ | 307,201 | | | | | |
| Administrative expense | | | 46,810 | | | | | |
| Transfer agent fees | | | | | | | | |
| Class A | | | 59,426 | | | | | |
| Class C | | | 4,015 | | | | | |
| Class Y | | | 3,809 | | | | | |
| Distribution fees | | | | | | | | |
| Class A | | | 84,746 | | | | | |
| Class C | | | 21,839 | | | | | |
| Shareowner communications expense | | | 21,329 | | | | | |
| Custodian fees | | | 3,934 | | | | | |
| Registration fees | | | 23,591 | | | | | |
| Professional fees | | | 21,912 | | | | | |
| Printing expense | | | 21,422 | | | | | |
| Trustees’ fees | | | 4,648 | | | | | |
| Miscellaneous | | | 9,871 | | | | | |
| Total expenses | | | | | | $ | 634,553 | |
| Less fees waived and expenses reimbursed by the Adviser | | | | | | | (44,854 | ) |
| Net expenses | | | | | | $ | 589,699 | |
| Net investment income | | | | | | $ | 666,296 | |
| REALIZED AND UNREALIZED GAIN (LOSS) ON INVESTMENTS: | | | | | | | | |
| Net realized gain (loss) on: | | | | | | | | |
| Investments in unaffiliated issuers | | | | | | $ | (10,625,334 | ) |
| Change in net unrealized appreciation (depreciation) on: | | | | | | | | |
| Investments in unaffiliated issuers | | $ | (6,581,757 | ) | | | | |
| Other assets and liabilities denominated in | | | | | | | | |
| foreign currencies | | | (36 | ) | | $ | (6,581,793 | ) |
| Net realized and unrealized gain (loss) on investments | | | | | | $ | (17,207,127 | ) |
| Net decrease in net assets resulting from operations | | | | | | $ | (16,540,831 | ) |
The accompanying notes are an integral part of these financial statements.
Pioneer Real Estate Shares | Semiannual Report | 6/30/20 21
Statements of Changes in Net Assets
| | Six Months | | | | |
| | Ended | | | Year | |
| | 6/30/20 | | | Ended | |
| | (unaudited) | | | 12/31/19 | |
| FROM OPERATIONS: | | | | | | |
Net investment income (loss) | | $ | 666,296 | | | $ | 898,844 | |
Net realized gain (loss) on investments | | | (10,625,334 | ) | | | 18,946,950 | |
Change in net unrealized appreciation (depreciation) | | | | | | | | |
| on investments | | | (6,581,793 | ) | | | 1,601,616 | |
| Net increase (decrease) in net assets resulting | | | | | | | | |
| from operations | | $ | (16,540,831 | ) | | $ | 21,447,410 | |
| DISTRIBUTIONS TO SHAREOWNERS: | | | | | | | | |
| Class A ($0.11 and $3.36 per share, respectively) | | $ | (576,623 | ) | | $ | (15,559,984 | ) |
| Class C ($0.05 and $3.26 per share, respectively) | | | (17,514 | ) | | | (1,032,470 | ) |
| Class Y ($0.13 and $3.41 per share, respectively) | | | (42,982 | ) | | | (1,259,971 | ) |
| Total distributions to shareowners | | $ | (637,119 | ) | | $ | (17,852,425 | ) |
| FROM FUND SHARE TRANSACTIONS: | | | | | | | | |
Net proceeds from sales of shares | | $ | 2,341,247 | | | $ | 12,646,046 | |
Reinvestment of distributions | | | 620,874 | | | | 17,529,634 | |
Cost of shares repurchased | | | (8,903,509 | ) | | | (22,330,487 | ) |
| Net increase (decrease) in net assets resulting from | | | | | | | | |
| Fund share transactions | | $ | (5,941,388 | ) | | $ | 7,845,193 | |
| Net increase (decrease) in net assets | | $ | (23,119,338 | ) | | $ | 11,440,178 | |
| NET ASSETS: | | | | | | | | |
Beginning of period | | $ | 91,300,053 | | | $ | 79,859,875 | |
End of period | | $ | 68,180,715 | | | $ | 91,300,053 | |
The accompanying notes are an integral part of these financial statements.
22 Pioneer Real Estate Shares | Semiannual Report | 6/30/20
| | Six Months | | | Six Months | | | | | | | |
| | Ended | | | Ended | | | | | | | |
| | 6/30/20 | | | 6/30/20 | | | Year Ended | | | Year Ended | |
| | Shares | | | Amount | | | 12/31/19 | | | 12/31/19 | |
| | (unaudited) | | | (unaudited) | | | Shares | | | Amount | |
| Class A | | | | | | | | | | | | |
Shares sold | | | 140,975 | | | $ | 1,816,336 | | | | 398,267 | | | $ | 6,651,634 | |
Reinvestment of distributions | | | 50,862 | | | | 563,347 | | | | 1,021,379 | | | | 15,290,770 | |
Less shares repurchased | | | (498,646 | ) | | | (6,289,878 | ) | | | (863,233 | ) | | | (13,983,560 | ) |
| Net increase/(decrease) | | | (306,809 | ) | | $ | (3,910,195 | ) | | | 556,413 | | | $ | 7,958,844 | |
| Class C | | | | | | | | | | | | | | | | |
Shares sold | | | 20,916 | | | $ | 255,598 | | | | 93,487 | | | $ | 1,438,478 | |
Reinvestment of distributions | | | 1,603 | | | | 17,137 | | | | 71,348 | | | | 1,018,455 | |
Less shares repurchased | | | (72,016 | ) | | | (852,819 | ) | | | (137,760 | ) | | | (2,157,628 | ) |
| Net increase/(decrease) | | | (49,497 | ) | | $ | (580,084 | ) | | | 27,075 | | | $ | 299,305 | |
| Class Y | | | | | | | | | | | | | | | | |
Shares sold | | | 21,464 | | | $ | 269,313 | | | | 279,444 | | | $ | 4,555,934 | |
Reinvestment of distributions | | | 3,690 | | | | 40,390 | | | | 81,621 | | | | 1,220,409 | |
Less shares repurchased | | | (147,181 | ) | | | (1,760,812 | ) | | | (386,217 | ) | | | (6,189,299 | ) |
| Net decrease | | | (122,027 | ) | | $ | (1,451,109 | ) | | | (25,152 | ) | | $ | (412,956 | ) |
The accompanying notes are an integral part of these financial statements.
Pioneer Real Estate Shares | Semiannual Report | 6/30/20 23
| | Six Months | | | | | | | | | | | | | | | | |
| | Ended | | | Year | | | Year | | | Year | | | Year | | | Year | |
| | 6/30/20 | | | Ended | | | Ended | | | Ended | | | Ended | | | Ended | |
| | (unaudited) | | | 12/31/19 | | | 12/31/18 | | | 12/31/17 | | | 12/31/16* | | | 12/31/15* | |
| Class A | | | | | | | | | | | | | | | | | | |
Net asset value, beginning of period | | $ | 14.56 | | | $ | 13.97 | | | $ | 24.59 | | | $ | 25.79 | | | $ | 26.83 | | | $ | 29.58 | |
Increase (decrease) from investment operations: | | | | | | | | | | | | | | | | | | | | | | | | |
| Net investment income (loss) (a) | | $ | 0.11 | | | $ | 0.17 | | | $ | 0.30 | | | $ | 0.33 | | | $ | 0.30 | | | $ | 0.31 | |
| Net realized and unrealized gain (loss) on investments | | | (2.79 | ) | | | 3.78 | | | | (1.52 | ) | | | 0.48 | | | | 1.26 | | | | 0.85 | |
Net increase (decrease) from investment operations | | $ | (2.68 | ) | | $ | 3.95 | | | $ | (1.22 | ) | | $ | 0.81 | | | $ | 1.56 | | | $ | 1.16 | |
Distributions to shareowners: | | | | | | | | | | | | | | | | | | | | | | | | |
| Net investment income | | $ | (0.11 | ) | | $ | (0.18 | ) | | $ | (0.28 | ) | | $ | (0.33 | ) | | $ | (0.29 | ) | | $ | (0.31 | ) |
| Net realized gain | | | — | | | | (3.18 | ) | | | (9.10 | ) | | | (1.68 | ) | | | (2.31 | ) | | | (3.60 | ) |
| Tax return of capital | | | — | | | | — | | | | (0.02 | ) | | | — | | | | — | | | | — | |
Total distributions | | $ | (0.11 | ) | | $ | (3.36 | ) | | $ | (9.40 | ) | | $ | (2.01 | ) | | $ | (2.60 | ) | | $ | (3.91 | ) |
Net increase (decrease) in net asset value | | $ | (2.79 | ) | | $ | 0.59 | | | $ | (10.62 | ) | | $ | (1.20 | ) | | $ | (1.04 | ) | | $ | (2.75 | ) |
Net asset value, end of period | | $ | 11.77 | | | $ | 14.56 | | | $ | 13.97 | | | $ | 24.59 | | | $ | 25.79 | | | $ | 26.83 | |
Total return (b) | | | (18.36 | )%(c) | | | 28.04 | % | | | (7.55 | )% | | | 3.20 | % | | | 6.10 | % | | | 4.27 | % |
Ratio of net expenses to average net assets | | | 1.50 | %(d) | | | 1.59 | % | | | 1.68 | % | | | 1.48 | % | | | 1.41 | % | | | 1.41 | % |
Ratio of net investment income (loss) to average net assets | | | 1.77 | %(d) | | | 1.03 | % | | | 1.35 | % | | | 1.29 | % | | | 1.09 | % | | | 1.06 | % |
Portfolio turnover rate | | | 90 | %(c) | | | 126 | % | | | 155 | % | | | 8 | % | | | 15 | % | | | 22 | % |
Net assets, end of period (in thousands) | | $ | 60,909 | | | $ | 79,841 | | | $ | 68,829 | | | $ | 85,681 | | | $ | 98,007 | | | $ | 100,842 | |
Ratios with no waiver of fees and assumption of expenses by | | | | | | | | | | | | | | | | | | | | | | | | |
| the Adviser and no reduction for fees paid indirectly: | | | | | | | | | | | | | | | | | | | | | | | | |
| Total expenses to average net assets | | | 1.62 | %(d) | | | 1.59 | % | | | 1.68 | % | | | 1.48 | % | | | 1.41 | % | | | 1.41 | % |
| Net investment income (loss) to average net assets | | | 1.65 | %(d) | | | 1.03 | % | | | 1.35 | % | | | 1.29 | % | | | 1.09 | % | | | 1.06 | % |
* | The Fund was audited by an independent registered public accounting firm other than Ernst & Young LLP. |
(a) | The per-share data presented above is based on the average shares outstanding for the period presented. |
(b) | Assumes initial investment at net asset value at the beginning of each period, reinvestment of all distributions, the complete redemption of the investment at net asset value at the end of each period and no sales charges. Total return would be reduced if sales charges were taken into account. |
(c) | Not annualized. |
(d) | Annualized. |
The accompanying notes are an integral part of these financial statements.
24 Pioneer Real Estate Shares | Semiannual Report | 6/30/20
| | Six Months | | | | | | | | | | | | | | | | |
| | Ended | | | Year | | | Year | | | Year | | | Year | | | Year | |
| | 6/30/20 | | | Ended | | | Ended | | | Ended | | | Ended | | | Ended | |
| | (unaudited) | | | 12/31/19 | | | 12/31/18 | | | 12/31/17 | | | 12/31/16* | | | 12/31/15* | |
| Class C | | | | | | | | | | | | | | | | | | |
Net asset value, beginning of period | | $ | 13.92 | | | $ | 13.49 | | | $ | 24.09 | | | $ | 25.30 | | | $ | 26.38 | | | $ | 29.15 | |
Increase (decrease) from investment operations: | | | | | | | | | | | | | | | | | | | | | | | | |
| Net investment income (loss) (a) | | $ | 0.05 | | | $ | 0.03 | | | $ | 0.19 | | | $ | 0.13 | | | $ | 0.08 | | | $ | 0.06 | |
| Net realized and unrealized gain (loss) on investments | | | (2.67 | ) | | | 3.66 | | | | (1.52 | ) | | | 0.48 | | | | 1.23 | | | | 0.84 | |
Net increase (decrease) from investment operations | | $ | (2.62 | ) | | $ | 3.69 | | | $ | (1.33 | ) | | $ | 0.61 | | | $ | 1.31 | | | $ | 0.90 | |
Distributions to shareowners: | | | | | | | | | | | | | | | | | | | | | | | | |
| Net investment income | | $ | (0.05 | ) | | $ | (0.08 | ) | | $ | (0.15 | ) | | $ | (0.14 | ) | | $ | (0.08 | ) | | $ | (0.07 | ) |
| Net realized gain | | | — | | | | (3.18 | ) | | | (9.10 | ) | | | (1.68 | ) | | | (2.31 | ) | | | (3.60 | ) |
| Tax return of capital | | | — | | | | — | | | | (0.02 | ) | | | — | | | | — | | | | — | |
Total distributions | | $ | (0.05 | ) | | $ | (3.26 | ) | | $ | (9.27 | ) | | $ | (1.82 | ) | | $ | (2.39 | ) | | $ | (3.67 | ) |
Net increase (decrease) in net asset value | | $ | (2.67 | ) | | $ | 0.43 | | | $ | (10.60 | ) | | $ | (1.21 | ) | | $ | (1.08 | ) | | $ | (2.77 | ) |
Net asset value, end of period | | $ | 11.25 | | | $ | 13.92 | | | $ | 13.49 | | | $ | 24.09 | | | $ | 25.30 | | | $ | 26.38 | |
Total return (b) | | | (18.80 | )%(c) | | | 27.05 | % | | | (8.17 | )% | | | 2.46 | % | | | 5.22 | % | | | 3.39 | % |
Ratio of net expenses to average net assets | | | 2.45 | %(d) | | | 2.39 | % | | | 2.35 | % | | | 2.23 | % | | | 2.22 | % | | | 2.24 | % |
Ratio of net investment income (loss) to average net assets | | | 0.82 | %(d) | | | 0.21 | % | | | 0.83 | % | | | 0.50 | % | | | 0.29 | % | | | 0.21 | % |
Portfolio turnover rate | | | 90 | %(c) | | | 126 | % | | | 155 | % | | | 8 | % | | | 15 | % | | | 22 | % |
Net assets, end of period (in thousands) | | $ | 3,740 | | | $ | 5,316 | | | $ | 4,788 | | | $ | 10,347 | | | $ | 13,317 | | | $ | 12,540 | |
* | The Fund was audited by an independent registered public accounting firm other than Ernst & Young LLP. |
(a) | The per-share data presented above is based on the average shares outstanding for the period presented. |
(b) | Assumes initial investment at net asset value at the beginning of each period, reinvestment of all distributions, the complete redemption of the investment at net asset value at the end of each period and no sales charges. Total return would be reduced if sales charges were taken into account. |
(c) | Not annualized. |
(d) | Annualized. |
The accompanying notes are an integral part of these financial statements.
Pioneer Real Estate Shares | Semiannual Report | 6/30/20 25
Financial Highlights (continued) | | | | | | | | | |
|
| | Six Months | | | | | | | | | | | | | | | | |
| | Ended | | | Year | | | Year | | | Year | | | Year | | | Year | |
| | 6/30/20 | | | Ended | | | Ended | | | Ended | | | Ended | | | Ended | |
| | (unaudited) | | | 12/31/19 | | | 12/31/18 | | | 12/31/17 | | | 12/31/16* | | | 12/31/15* | |
| Class Y | | | | | | | | | | | | | | | | | | |
Net asset value, beginning of period | | $ | 14.52 | | | $ | 13.93 | | | $ | 24.55 | | | $ | 25.76 | | | $ | 26.79 | | | $ | 29.54 | |
Increase (decrease) from investment operations: | | | | | | | | | | | | | | | | | | | | | | | | |
| Net investment income (loss) (a) | | $ | 0.13 | | | $ | 0.22 | | | $ | 0.50 | | | $ | 0.39 | | | $ | 0.37 | | | $ | 0.42 | |
| Net realized and unrealized gain (loss) on investments | | | (2.79 | ) | | | 3.78 | | | | (1.61 | ) | | | 0.50 | | | | 1.29 | | | | 0.84 | |
Net increase (decrease) from investment operations | | $ | (2.66 | ) | | $ | 4.00 | | | $ | (1.11 | ) | | $ | 0.89 | | | $ | 1.66 | | | $ | 1.26 | |
Distributions to shareowners: | | | | | | | | | | | | | | | | | | | | | | | | |
| Net investment income | | $ | (0.13 | ) | | $ | (0.23 | ) | | $ | (0.39 | ) | | $ | (0.42 | ) | | $ | (0.38 | ) | | $ | (0.41 | ) |
| Net realized gain | | | — | | | | (3.18 | ) | | | (9.10 | ) | | | (1.68 | ) | | | (2.31 | ) | | | (3.60 | ) |
| Tax return of capital | | | — | | | | — | | | | (0.02 | ) | | | — | | | | — | | | | — | |
Total distributions | | $ | (0.13 | ) | | $ | (3.41 | ) | | $ | (9.51 | ) | | $ | (2.10 | ) | | $ | (2.69 | ) | | $ | (4.01 | ) |
Net increase (decrease) in net asset value | | $ | (2.79 | ) | | $ | 0.59 | | | $ | (10.62 | ) | | $ | (1.21 | ) | | $ | (1.03 | ) | | $ | (2.75 | ) |
Net asset value, end of period | | $ | 11.73 | | | $ | 14.52 | | | $ | 13.93 | | | $ | 24.55 | | | $ | 25.76 | | | $ | 26.79 | |
Total return (b) | | | (18.26 | )%(c) | | | 28.52 | % | | | (7.11 | )% | | | 3.54 | % | | | 6.47 | % | | | 4.65 | % |
Ratio of net expenses to average net assets | | | 1.20 | %(d) | | | 1.21 | % | | | 1.23 | % | | | 1.12 | % | | | 1.07 | % | | | 1.02 | % |
Ratio of net investment income (loss) to average net assets | | | 1.96 | %(d) | | | 1.36 | % | | | 2.20 | % | | | 1.50 | % | | | 1.34 | % | | | 1.43 | % |
Portfolio turnover rate | | | 90 | %(c) | | | 126 | % | | | 155 | % | | | 8 | % | | | 15 | % | | | 22 | % |
Net assets, end of period (in thousands) | | $ | 3,532 | | | $ | 6,143 | | | $ | 6,243 | | | $ | 17,298 | | | $ | 33,655 | | | $ | 48,644 | |
Ratios with no waiver of fees and assumption of expenses by | | | | | | | | | | | | | | | | | | | | | | | | |
| the Adviser and no reduction for fees paid indirectly: | | | | | | | | | | | | | | | | | | | | | | | | |
| Total expenses to average net assets | | | 1.32 | %(d) | | | 1.21 | % | | | 1.23 | % | | | 1.12 | % | | | 1.07 | % | | | 1.02 | % |
| Net investment income (loss) to average net assets | | | 1.84 | %(d) | | | 1.36 | % | | | 2.20 | % | | | 1.50 | % | | | 1.34 | % | | | 1.43 | % |
* | The Fund was audited by an independent registered public accounting firm other than Ernst & Young LLP. |
(a) | The per-share data presented above is based on the average shares outstanding for the period presented. |
(b) | Assumes initial investment at net asset value at the beginning of each period, reinvestment of all distributions and the complete redemption of the investment at net asset value at the end of each period. |
(c) | Not annualized. |
(d) | Annualized. |
The accompanying notes are an integral part of these financial statements.
26 Pioneer Real Estate Shares | Semiannual Report | 6/30/20
Notes to Financial Statements |
6/30/20 (unaudited) 1. Organization and Significant Accounting Policies
Pioneer Real Estate Shares (the “Fund”) is a Delaware statutory trust. The Fund is registered under the Investment Company Act of 1940 as a diversified, open-end management investment company. The investment objective of the Fund is to seek long-term growth of capital. Current income is a secondary objective.
The Fund offers three classes of shares designated as Class A, Class C and Class Y shares. Each class of shares represents an interest in the same portfolio of investments of the Fund and has identical rights (based on relative net asset values) to assets and liquidation proceeds. Share classes can bear different rates of class-specific fees and expenses, such as transfer agent and distribution fees. Differences in class-specific fees and expenses will result in differences in net investment income and, therefore, the payment of different dividends from net investment income earned by each class. The Amended and Restated Declaration of Trust of the Fund gives the Board of Trustees the flexibility to specify either per-share voting or dollar-weighted voting when submitting matters for shareowner approval. Under per-share voting, each share of a class of the Fund is entitled to one vote. Under dollar-weighted voting, a shareowner’s voting power is determined not by the number of shares owned, but by the dollar value of the shares on the record date. Each share class has exclusive voting rights with respect to matters affecting only that class, including with respect to the distribution plan for that class. There is no distribution plan for Class Y shares.
Amundi Pioneer Asset Management, Inc., an indirect, wholly owned subsidiary of Amundi and Amundi’s wholly owned subsidiary, Amundi USA, Inc., serves as the Fund’s investment adviser (the “Adviser”). Amundi Pioneer Distributor, Inc., an affiliate of Amundi Pioneer Asset Management, Inc., serves as the Fund’s distributor (the “Distributor”).
In August 2018, the Securities and Exchange Commission (“SEC”) released a Disclosure Update and Simplification Final Rule. The Final Rule amends Regulation S-X disclosures requirements to conform them to U.S. Generally Accepted Accounting Principles (“U.S. GAAP”) for investment companies. The Fund’s financial statements were prepared in compliance with the new amendments to Regulation S-X.
Pioneer Real Estate Shares | Semiannual Report | 6/30/20 27
The Fund is an investment company and follows investment company accounting and reporting guidance under U.S. GAAP. U.S. GAAP requires the management of the Fund to make estimates and assumptions that affect the reported amounts of assets and liabilities, the disclosure of contingent assets and liabilities at the date of the financial statements, and the reported amounts of income, expenses and gain or loss on investments during the reporting period. Actual results could differ from those estimates.
The following is a summary of significant accounting policies followed by the Fund in the preparation of its financial statements:
A. Security Valuation
The net asset value of the Fund is computed once daily, on each day the New York Stock Exchange (“NYSE”) is open, as of the close of regular trading on the NYSE.
Equity securities that have traded on an exchange are valued by using the last sale price on the principal exchange where they are traded. Equity securities that have not traded on the date of valuation, or securities for which sale prices are not available, generally are valued using the mean between the last bid and asked prices or, if both last bid and asked prices are not available, at the last quoted bid price. Last sale and bid and asked prices are provided by independent third party pricing services. In the case of equity securities not traded on an exchange, prices are typically determined by independent third party pricing services using a variety of techniques and methods.
The value of foreign securities is translated into U.S. dollars based on foreign currency exchange rate quotations supplied by a third party pricing source. Trading in non-U.S. equity securities is substantially completed each day at various times prior to the close of the NYSE. The values of such securities used in computing the net asset value of the Fund’s shares are determined as of such times. The Fund may use a fair value model developed by an independent pricing service to value non-U.S. equity securities.
Securities for which independent pricing services or broker-dealers are unable to supply prices or for which market prices and/or quotations are not readily available or are considered to be unreliable are valued by a fair valuation team comprised of certain personnel of the Adviser pursuant to procedures adopted by the Fund’s Board of Trustees. The Adviser’s fair valuation team uses fair value methods approved by the Valuation Committee of the Board of Trustees. The Adviser’s fair valuation team is responsible for monitoring developments that may impact fair valued securities and for discussing and assessing fair values on an ongoing basis, and at least quarterly, with the Valuation Committee of the Board of Trustees.
28 Pioneer Real Estate Shares | Semiannual Report | 6/30/20
Inputs used when applying fair value methods to value a security may include credit ratings, the financial condition of the company, current market conditions and comparable securities. The Fund may use fair value methods if it is determined that a significant event has occurred after the close of the exchange or market on which the security trades and prior to the determination of the Fund’s net asset value. Examples of a significant event might include political or economic news, corporate restructurings, natural disasters, terrorist activity or trading halts. Thus, the valuation of the Fund’s securities may differ significantly from exchange prices, and such differences could be material.
At June 30, 2020, no securities were valued using fair value methods (other than securities valued using prices supplied by independent pricing services, broker-dealers or using a third party insurance industry pricing model).
B. Investment Income and Transactions
Dividend income is recorded on the ex-dividend date, except that certain dividends from foreign securities where the ex-dividend date may have passed are recorded as soon as the Fund becomes aware of the ex-dividend data in the exercise of reasonable diligence.
Interest income, including interest on income-bearing cash accounts, is recorded on the accrual basis. Dividend and interest income are reported net of unrecoverable foreign taxes withheld at the applicable country rates and net of income accrued on defaulted securities.
Interest and dividend income payable by delivery of additional shares is reclassified as PIK (payment-in-kind) income upon receipt and is included in interest and dividend income, respectively.
Security transactions are recorded as of trade date. Gains and losses on sales of investments are calculated on the identified cost method for both financial reporting and federal income tax purposes.
C. Foreign Currency Translation
The books and records of the Fund are maintained in U.S. dollars. Amounts denominated in foreign currencies are translated into U.S. dollars using current exchange rates.
Net realized gains and losses on foreign currency transactions, if any, represent, among other things, the net realized gains and losses on foreign currency exchange contracts, disposition of foreign currencies and the difference between the amount of income accrued and the U.S. dollars actually received. Further, the effects of changes in foreign currency exchange
Pioneer Real Estate Shares | Semiannual Report | 6/30/20 29
rates on investments are not segregated on the Statement of Operations from the effects of changes in the market prices of those securities, but are included with the net realized and unrealized gain or loss on investments.
D. Federal Income Taxes
It is the Fund’s policy to comply with the requirements of the Internal Revenue Code applicable to regulated investment companies and to distribute all of its net taxable income and net realized capital gains, if any, to its shareowners. Therefore, no provision for federal income taxes is required. As of December 31, 2019, the Fund did not accrue any interest or penalties with respect to uncertain tax positions, which, if applicable, would be recorded as an income tax expense on the Statement of Operations. Tax returns filed within the prior three years remain subject to examination by federal and state tax authorities.
A portion of the dividend income recorded by the Fund is from distributions by publicly traded Real Estate Investment Trusts (“REITs”), and such distributions for tax purposes may also consist of capital gains and return of capital. The actual return of capital and capital gains portions of such distributions will be determined by formal notifications from the REITs subsequent to the calendar year-end. Distributions received from the REITs that are determined to be a return of capital are recorded by the Fund as a reduction of the cost basis of the securities held and those determined to be capital gain are reflected as such on the Statement of Operations.
The amount and character of income and capital gain distributions to shareowners are determined in accordance with federal income tax rules, which may differ from U.S. GAAP. Distributions in excess of net investment income or net realized gains are temporary over distributions for financial statement purposes resulting from differences in the recognition or classification of income or distributions for financial statement and tax purposes. Capital accounts within the financial statements are adjusted for permanent book/tax differences to reflect tax character, but are not adjusted for temporary differences.
The tax character of current year distributions payable will be determined at the end of the current taxable year. The tax character of distributions paid during the year ended December 31, 2019 was as follows:
| | 2019 | |
| Distributions paid from: | | | |
Ordinary income | | $ | 1,512,258 | |
Long-term capital gain | | | 16,340,167 | |
| Total | | $ | 17,852,425 | |
30 Pioneer Real Estate Shares | Semiannual Report | 6/30/20
The following shows the components of distributable earnings on a federal income tax basis at December 31, 2019:
| | 2019 | |
| Distributable earnings: | | | |
Undistributed long term capital gain | | $ | 858,331 | |
Net unrealized appreciation | | | 16,673,643 | |
Current year late year loss | | | (409,316 | ) |
| Total | | $ | 17,122,658 | |
The difference between book-basis and tax-basis net unrealized appreciation is attributable to the tax deferral of losses on wash sales.
E. Fund Shares
The Fund records sales and repurchases of its shares as of trade date. The Distributor earned $2,489 in underwriting commissions on the sale of Class A shares during the six months ended June 30, 2020.
F. Class Allocations
Income, common expenses and realized and unrealized gains and losses are calculated at the Fund level and allocated daily to each class of shares based on its respective percentage of adjusted net assets at the beginning of the day.
Distribution fees are calculated based on the average daily net asset value attributable to Class A and Class C shares of the Fund, respectively (see Note 4). Class Y shares do not pay distribution fees. All expenses and fees paid to the Fund’s transfer agent for its services are allocated among the classes of shares based on the number of accounts in each class and the ratable allocation of related out-of-pocket expenses (see Note 3).
Distributions to shareowners are recorded as of the ex-dividend date. Distributions paid by the Fund with respect to each class of shares are calculated in the same manner and at the same time, except that net investment income dividends to Class A, Class C and Class Y shares can reflect different transfer agent and distribution expense rates.
G. Risks
The value of securities held by the Fund may go up or down, sometimes rapidly or unpredictably, due to general market conditions, such as real or perceived adverse economic, political or regulatory conditions, recessions, the spread of infectious illness or other public health issues, inflation, changes in interest rates, lack of liquidity in the bond markets or adverse investor
Pioneer Real Estate Shares | Semiannual Report | 6/30/20 31
sentiment. In the past several years, financial markets have experienced increased volatility, depressed valuations, decreased liquidity and heightened uncertainty. These conditions may continue, recur, worsen or spread.
Because the Fund may invest a substantial portion of its assets in REITs, the Fund may be subject to certain risks associated with direct investments in REITs. REITs may be affected by changes in the value of their underlying properties and by defaults of their borrowers or tenants. REITs depend generally on their ability to generate cash flow to make distributions to shareowners, and certain REITs have self-liquidation provisions by which mortgages held may be paid in full and distributions of capital returns may be made at any time. In addition, the performance of a REIT may be affected by its failure to qualify for tax-free pass through of income under the Internal Revenue Code or its failure to maintain exemption from registration under the Investment Company Act of 1940.
With the increased use of technologies such as the Internet to conduct business, the Fund is susceptible to operational, information security and related risks. While the Fund’s Adviser has established business continuity plans in the event of, and risk management systems to prevent, limit or mitigate, such cyber-attacks, there are inherent limitations in such plans and systems, including the possibility that certain risks have not been identified. Furthermore, the Fund cannot control the cybersecurity plans and systems put in place by service providers to the Fund such as Brown Brothers Harriman & Co., the Fund’s custodian and accounting agent, and DST Asset Manager Solutions, Inc., the Fund’s transfer agent. In addition, many beneficial owners of Fund shares hold them through accounts at broker-dealers, retirement platforms and other financial market participants over which neither the Fund nor Amundi Pioneer exercises control. Each of these may in turn rely on service providers to them, which are also subject to the risk of cyber-attacks. Cybersecurity failures or breaches at Amundi Pioneer or the Fund’s service providers or intermediaries have the ability to cause disruptions and impact business operations, potentially resulting in financial losses, interference with the Fund’s ability to calculate its net asset value, impediments to trading, the inability of Fund shareowners to effect share purchases or redemptions or exchanges or receive distributions, loss of or unauthorized access to private shareowner information and violations of applicable privacy and other laws, regulatory fines, penalties, reputational damage, or additional compliance costs. Such costs and losses may not be covered under any insurance. In addition, maintaining vigilance against cyber-attacks may involve substantial costs over time, and system enhancements may themselves be subject to cyber-attacks.
32 Pioneer Real Estate Shares | Semiannual Report | 6/30/20
COVID-19
The respiratory illness COVID-19 caused by a novel coronavirus has resulted in a global pandemic and major disruption to economies and markets around the world, including the United States. Global financial markets have experienced extreme volatility and severe losses, and trading in many instruments has been disrupted. Liquidity for many instruments has been greatly reduced for periods of time. Some interest rates are very low and in some cases yields are negative. Some sectors of the economy and individual issuers have experienced particularly large losses. These circumstances may continue for an extended period of time, and may continue to affect adversely the value and liquidity of the Fund’s investments. The ultimate economic fallout from the pandemic, and the long-term impact on economies, markets, industries and individual issuers, are not known. Governments and central banks, including the Federal Reserve in the U.S., have taken extraordinary and unprecedented actions to support local and global economies and the financial markets. These actions have resulted in significant expansion of public debt, including in the U.S. The impact of these measures, and whether they will be effective to mitigate the economic and market disruption, will not be known for some time. The consequences of high public debt, including its future impact on the economy and securities markets, likewise may not be known for some time.
The Fund’s prospectus contains unaudited information regarding the Fund’s principal risks. Please refer to that document when considering the Fund’s principal risks.
2. Management Agreement
The Adviser manages the Fund’s portfolio. Management fees are calculated daily and paid monthly at the annual rate of 0.80% of the Fund’s average daily net assets up to $1 billion and 0.75% on average daily net assets over $1 billion. For the six months ended June 30, 2020, the effective management fee (excluding waivers and/or assumption of expenses) was equivalent to 0.80% (annualized) of the Fund’s average daily net assets.
The Adviser has contractually agreed to limit ordinary operating expenses (ordinary operating expenses means all fund expenses other than extraordinary expenses, such as litigation, taxes, brokerage commissions and acquired fund fees and expenses) of the Fund to the extent required to reduce Fund expenses to 1.50% and 1.20% of the average daily net assets attributable to Class A and Class Y shares, respectively. Class C shares do not have an expense limitation. These expense limitations are in effect through May 1, 2021. Fees waived and expenses reimbursed during the six months ended June 30, 2020 are reflected on the Statement of Operations.
Pioneer Real Estate Shares | Semiannual Report | 6/30/20 33
In addition, under the management and administration agreements, certain other services and costs, including accounting, regulatory reporting and insurance premiums, are paid by the Fund as administrative reimbursements. Included in “Due to affiliates” reflected on the Statement of Assets and Liabilities is $5,915 in management fees, administrative costs and certain other reimbursements payable to the Adviser at June 30, 2020.
3. Transfer Agent
DST Asset Manager Solutions, Inc. serves as the transfer agent to the Fund at negotiated rates. Transfer agent fees and payables shown on the Statement of Operations and the Statement of Assets and Liabilities, respectively, include sub-transfer agent expenses incurred through the Fund’s omnibus relationship contracts.
In addition, the Fund reimbursed the transfer agent for out-of-pocket expenses incurred by the transfer agent related to shareowner communications activities such as proxy and statement mailings, and outgoing phone calls. For the six months ended June 30, 2020, such out-of-pocket expenses by class of shares were as follows:
| Shareowner Communications: | | | |
Class A | | $ | 18,193 | |
Class C | | | 2,576 | |
Class Y | | | 560 | |
| Total | | $ | 21,329 | |
4. Distribution Plan
The Fund has adopted a distribution plan (the “Plan”) pursuant to Rule 12b-1 of the Investment Company Act of 1940 with respect to its Class A and Class C shares. Pursuant to the Plan, the Fund pays the Distributor 0.25% of the average daily net assets attributable to Class A shares as compensation for personal services and/or account maintenance services or distribution services with regard to Class A shares. Pursuant to the Plan, the Fund also pays the Distributor 1.00% of the average daily net assets attributable to Class C shares. The fee for Class C shares consists of a 0.25% service fee and a 0.75% distribution fee paid as compensation for personal services and/or account maintenance services or distribution services with regard to Class C shares. Included in “Due to affiliates” reflected on the Statement of Assets and Liabilities is $2,551 in distribution fees payable to the Distributor at June 30, 2020.
34 Pioneer Real Estate Shares | Semiannual Report | 6/30/20
In addition, redemptions Class A and Class C shares may be subject to a contingent deferred sales charge (“CDSC”). A CDSC of 1.00% may be imposed on redemptions of certain net asset value purchases of Class A shares within 12 months of purchase. Redemptions of Class C shares within 12 months of purchase are subject to a CDSC of 1.00%, based on the lower of cost or market value of shares being redeemed. Shares purchased as part of an exchange remain subject to any CDSC that applied to the original purchase of those shares. There is no CDSC for Class Y shares. Proceeds from the CDSCs are paid to the Distributor. For the six months ended June 30, 2020, CDSCs in the amount of $236 were paid to the Distributor.
5. Line of Credit Facility
The Fund, along with certain other funds in the Pioneer Family of Funds (the “Funds”), participates in a committed, unsecured revolving line of credit facility. Borrowings are used solely for temporary or emergency purposes. The Fund may borrow up to the lesser of the amount available under the credit facility or the limits set for borrowing by the Fund’s prospectus and the 1940 Act. The Fund currently participates in a facility in the amount of $300 million. Prior to February 5, 2020, the Fund participated in a facility in the amount of $25 million. Under such facility, depending on the type of loan, interest on borrowings is payable at the London Interbank Offered Rate (“LIBOR”) plus a credit spread. The Fund also pays an annual commitment fee to participate in a credit facility. The commitment fee is allocated among participating Funds based on an allocation schedule set forth in the credit agreement. For the six months ended June 30, 2020, the Fund had no borrowings under the credit facility.
Pioneer Real Estate Shares | Semiannual Report | 6/30/20 35
Statement Regarding Liquidity Risk Management Program
As required by law, the Fund has adopted and implemented a liquidity risk management program (the “Program”) that is designed to assess and manage liquidity risk. Liquidity risk is the risk that the Fund could not meet requests to redeem its shares without significant dilution of remaining investors’ interests in the Fund. The Fund’s Board of Trustees designated a liquidity risk management committee (the “Committee”) consisting of employees of Amundi Pioneer Asset Management, Inc. (the “Adviser”) to administer the Program.
The Committee provided the Board of Trustees with a report that addressed the operation of the Program and assessed its adequacy and effectiveness of implementation (the “Report”). The Report covered the period from December 1, 2018 through March 31, 2020 (the “Reporting Period”).
The Report confirmed that, throughout the Reporting Period, the Committee had monitored the Fund’s portfolio liquidity and liquidity risk on an ongoing basis, as described in the Program and in Board reporting throughout the Reporting Period.
The Report discussed the Committee’s annual review of the Program, which addressed, among other things, the following elements of the Program:
The Committee reviewed the Fund’s investment strategy and liquidity of portfolio investments during both normal and reasonably foreseeable stressed conditions. The Committee noted that the Fund’s investment strategy continues to be appropriate for an open-end fund, taking into account, among other things, whether and to what extent the Fund held less liquid and illiquid assets and the extent to which any such investments affected the Fund’s ability to meet redemption requests. In managing and reviewing the Fund’s liquidity risk, the Committee also considered the extent to which the Fund’s investment strategy involves a relatively concentrated portfolio or large positions in particular issuers, the extent to which the Fund uses borrowing for investment purposes, and the extent to which the Fund uses derivatives (including for hedging purposes). The Committee also reviewed the Fund’s short-term and long-term cash flow projections during both normal and reasonably foreseeable stressed conditions. In assessing the Fund’s cash flow projections, the Committee considered, among other factors, historical net redemption activity, redemption policies, ownership concentration, distribution channels, and the degree of certainty associated with the Fund’s short-term and long-term cash flow projections. The Committee also considered the Fund’s holdings of cash and cash equivalents, as well as borrowing arrangements and other funding sources, including, if applicable, the Fund’s participation in a credit
36 Pioneer Real Estate Shares | Semiannual Report | 6/30/20
facility, as components of the Fund’s ability to meet redemption requests. The Fund has adopted an in-kind redemption policy which may be utilized to meet larger redemption requests.
The Committee reviewed the Program’s liquidity classification methodology for categorizing the Fund’s investments into one of four liquidity buckets. In reviewing the Fund’s investments, the Committee considered, among other factors, whether trading varying portions of a position in a particular portfolio investment or asset class in sizes the Fund would reasonably anticipate trading, would be reasonably expected to significantly affect liquidity.
The Committee performed an analysis to determine whether the Fund is required to maintain a Highly Liquid Investment Minimum, and determined that no such minimum is required because the Fund primarily holds highly liquid investments.
The Report stated that the Committee concluded the Program operates adequately and effectively, in all material respects, to assess and manage the Fund’s liquidity risk throughout the Reporting Period.
Pioneer Real Estate Shares | Semiannual Report | 6/30/20 37
Trustees, Officers and Service Providers
| | |
Trustees Thomas J. Perna, Chairman
John E. Baumgardner, Jr. Diane Durnin Benjamin M. Friedman Lisa M. Jones Lorraine H. Monchak Marguerite A. Piret Fred J. Ricciardi Kenneth J. Taubes | Officers Lisa M. Jones, President and Chief Executive Officer Mark E. Bradley, Treasurer and Chief Financial and Accounting Officer Christopher J. Kelley, Secretary and Chief Legal Officer |
Investment Adviser and Administrator
Amundi Pioneer Asset Management, Inc.
Custodian and Sub-Administrator
Brown Brothers Harriman & Co.
Principal Underwriter
Amundi Pioneer Distributor, Inc.
Legal Counsel
Morgan, Lewis & Bockius LLP
Transfer Agent
DST Asset Manager Solutions, Inc.
Proxy Voting Policies and Procedures of the Fund are available without charge, upon request, by calling our toll free number (1-800-225-6292). Information regarding how the Fund voted proxies relating to portfolio securities during the most recent 12-month period ended June 30 is publicly available to shareowners at www.amundipioneer.com/us. This information is also available on the Securities and Exchange Commission’s web site at www.sec.gov.
38 Pioneer Real Estate Shares | Semiannual Report | 6/30/20
This page was intentionally left blank.
Pioneer Real Estate Shares | Semiannual Report | 6/30/20 39
This page was intentionally left blank.
40 Pioneer Real Estate Shares | Semiannual Report | 6/30/20
This page was intentionally left blank.
Pioneer Real Estate Shares | Semiannual Report | 6/30/20 41
This page was intentionally left blank.
42 Pioneer Real Estate Shares | Semiannual Report | 6/30/20
This page was intentionally left blank.
Pioneer Real Estate Shares | Semiannual Report | 6/30/20 43
This page was intentionally left blank.
44 Pioneer Real Estate Shares | Semiannual Report | 6/30/20
How to Contact Amundi Pioneer
We are pleased to offer a variety of convenient ways for you to contact us for assistance or information.
| Call us for: | | |
Account Information, including existing accounts, | |
new accounts, prospectuses, applications | |
and service forms | | 1-800-225-6292 |
| | | |
FactFoneSM for automated fund yields, prices, | |
account information and transactions | 1-800-225-4321 |
| | |
| Retirement plans information | 1-800-622-0176 |
|
| Write to us: | | |
Amundi Pioneer | | |
P.O. Box 219427 | | |
Kansas City, MO 64121-9427 | | |
| | | |
| Our toll-free fax | | 1-800-225-4240 |
| | | |
| Our internet e-mail address | us.askamundipioneer@amundipioneer.com |
(for general questions about Amundi Pioneer only) | |
| | |
|
| Visit our web site: www.amundipioneer.com/us | |
This report must be preceded or accompanied by a prospectus.
The Fund files a complete schedule of portfolio holdings with the Securities and Exchange Commission for the first and third quarters of each fiscal year as an exhibit to its reports on Form N-PORT. Shareholders may view the filed Form N-PORT by visiting the Commission’s web site at https://www.sec.gov.
Amundi Pioneer Asset Management, Inc.
60 State Street
Boston, MA 02109
www.amundipioneer.com/us
Securities offered through Amundi Pioneer Distributor, Inc.
60 State Street, Boston, MA 02109
Underwriter of Pioneer Mutual Funds, Member SIPC
© 2020 Amundi Pioneer Asset Management 19407-15-0820
ITEM 2. CODE OF ETHICS.
(a) Disclose whether, as of the end of the period covered by the report, the registrant has adopted a code of ethics that applies to the registrant’s principal executive officer, principal financial officer, principal accounting officer or controller, or persons performing similar functions, regardless of whether these individuals are employed by the registrant or a third party. If the registrant has not adopted such a code of ethics, explain why it has not done so.
The registrant has adopted, as of the end of the period covered by this report, a code of ethics that applies to the registrant’s principal executive officer, principal financial officer, principal accounting officer and controller.
(b) For purposes of this Item, the term “code of ethics” means written standards that are reasonably designed to deter wrongdoing and to promote:
(1) Honest and ethical conduct, including the ethical handling of actual or apparent conflicts of interest between personal and professional relationships;
(2) Full, fair, accurate, timely, and understandable disclosure in reports and documents that a registrant files with, or submits to, the Commission and in other public communications made by the registrant;
(3) Compliance with applicable governmental laws, rules, and regulations;
(4) The prompt internal reporting of violations of the code to an appropriate person or persons identified in the code; and
(5) Accountability for adherence to the code.
(c) The registrant must briefly describe the nature of any amendment, during the period covered by the report, to a provision of its code of ethics that applies to the registrant’s principal executive officer, principal financial officer, principal accounting officer or controller, or persons performing similar functions, regardless of whether these individuals are employed by the registrant or a third party, and that relates to any element of the code of ethics definition enumerated in paragraph (b) of this Item. The registrant must file a copy of any such amendment as an exhibit pursuant to Item 10(a), unless the registrant has elected to satisfy paragraph (f) of this Item by posting its code of ethics on its website pursuant to paragraph (f)(2) of this Item, or by undertaking to provide its code of ethics to any person without charge, upon request, pursuant to paragraph (f)(3) of this Item.
The registrant has made no amendments to the code of ethics during the period covered by this report.
(d) If the registrant has, during the period covered by the report, granted a waiver, including an implicit waiver, from a provision of the code of ethics to the registrant’s principal executive officer, principal financial officer, principal accounting officer or controller, or persons performing similar functions, regardless of whether these individuals are employed by the registrant or a third party, that relates to one or more of the items set forth in paragraph (b) of this Item, the registrant must briefly describe the nature of the waiver, the name of the person to whom the waiver was granted, and the date of the waiver.
Not applicable.
(e) If the registrant intends to satisfy the disclosure requirement under paragraph (c) or (d) of this Item regarding an amendment to, or a waiver from, a provision of its code of ethics that applies to the registrant’s principal executive officer, principal financial officer, principal accounting officer or controller, or persons performing similar functions and that relates to any element of the code of ethics definition enumerated in paragraph (b) of this Item by posting such information on its Internet website, disclose the registrant’s Internet address and such intention.
Not applicable.
(f) The registrant must:
(1) File with the Commission, pursuant to Item 12(a)(1), a copy of its code of ethics that applies to the registrant’s principal executive officer, principal financial officer, principal accounting officer or controller, or persons performing similar functions, as an exhibit to its annual report on this Form N-CSR (see attachment);
(2) Post the text of such code of ethics on its Internet website and disclose, in its most recent report on this Form N-CSR, its Internet address and the fact that it has posted such code of ethics on its Internet website; or
(3) Undertake in its most recent report on this Form N-CSR to provide to any person without charge, upon request, a copy of such code of ethics and explain the manner in which such request may be made. See Item 10(2)
ITEM 3. AUDIT COMMITTEE FINANCIAL EXPERT.
(a) (1) Disclose that the registrant’s board of trustees has determined that the registrant either:
(i) Has at least one audit committee financial expert serving on its audit committee; or
(ii) Does not have an audit committee financial expert serving on its audit committee.
The registrant’s Board of Trustees has determined that the registrant has at least one audit committee financial expert.
(2) If the registrant provides the disclosure required by paragraph (a)(1)(i) of this Item, it must disclose the name of the audit committee financial expert and whether that person is “independent.” In order to be considered “independent” for purposes of this Item, a member of an audit committee may not, other than in his or her capacity as a member of the audit committee, the board of trustees, or any other board committee:
(i) Accept directly or indirectly any consulting, advisory, or other compensatory fee from the issuer; or
(ii) Be an “interested person” of the investment company as defined in Section 2(a)(19) of the Act (15 U.S.C. 80a-2(a)(19)).
Mr. Fred J. Ricciardi, an independent trustee, is such an audit committee financial expert.
(3) If the registrant provides the disclosure required by paragraph (a)(1) (ii) of this Item, it must explain why it does not have an audit committee financial expert.
Not applicable.
ITEM 4. PRINCIPAL ACCOUNTANT FEES AND SERVICES.
(a) Disclose, under the caption AUDIT FEES, the aggregate fees billed for each of the last two fiscal years for professional services rendered by the principal accountant for the audit of the registrant’s annual financial statements or services that are normally provided by the accountant in connection with statutory and regulatory filings or engagements for those fiscal years.
N/A
(b) Disclose, under the caption AUDIT-RELATED FEES, the aggregate fees billed in each of the last two fiscal years for assurance and related services by the principal accountant that are reasonably related to the performance of the audit of the registrant’s financial statements and are not reported under paragraph (a) of this Item. Registrants shall describe the nature of the services comprising the fees disclosed under this category.
N/A
(c) Disclose, under the caption TAX FEES, the aggregate fees billed in each of the last two fiscal years for professional services rendered by the principal accountant for tax compliance, tax advice, and tax planning. Registrants shall describe the nature of the services comprising the fees disclosed under this category.
N/A
(d) Disclose, under the caption ALL OTHER FEES, the aggregate fees billed in each of the last two fiscal years for products and services provided by the principal accountant, other than the services reported in paragraphs (a) through (c) of this Item. Registrants shall describe the nature of the services comprising the fees disclosed under this category.
N/A
(e) (1) Disclose the audit committee’s pre-approval policies and procedures described in paragraph (c)(7) of Rule 2-01 of Regulation S-X.
PIONEER FUNDS
APPROVAL OF AUDIT, AUDIT-RELATED, TAX AND OTHER SERVICES
PROVIDED BY THE INDEPENDENT AUDITOR
SECTION I - POLICY PURPOSE AND APPLICABILITY
The Pioneer Funds recognize the importance of maintaining the independence of their outside auditors. Maintaining independence is a shared responsibility involving Amundi Pioneer Asset Management, Inc, the audit committee and the independent auditors.
The Funds recognize that a Fund’s independent auditors: 1) possess knowledge of the Funds, 2) are able to incorporate certain services into the scope of the audit, thereby avoiding redundant work, cost and disruption of Fund personnel and processes, and 3) have expertise that has value to the Funds. As a result, there are situations where it is desirable to use the Fund’s independent auditors for services in addition to the annual audit and where the potential for conflicts of interests are minimal. Consequently, this policy, which is intended to comply with Rule 210.2-01(C)(7), sets forth guidelines and procedures to be followed by the Funds when retaining the independent audit firm to perform audit, audit-related tax and other services under those circumstances, while also maintaining independence.
Approval of a service in accordance with this policy for a Fund shall also constitute approval for any other Fund whose pre-approval is required pursuant to Rule 210.2-01(c)(7)(ii).
In addition to the procedures set forth in this policy, any non-audit services that may be provided consistently with Rule 210.2-01 may be approved by the Audit Committee itself and any pre-approval that may be waived in accordance with Rule 210.2-01(c)(7)(i)(C) is hereby waived.
Selection of a Fund’s independent auditors and their compensation shall be determined by the Audit Committee and shall not be subject to this policy.
| | | |
| SECTION II - POLICY |
| |
SERVICE CATEGORY | SERVICE CATEGORY DESCRIPTION | SPECIFIC PRE-APPROVED SERVICE SUBCATEGORIES |
| | | |
I. AUDIT SERVICES | Services that are directly | o Accounting research assistance |
| | related to performing the | o SEC consultation, registration |
| | independent audit of the Funds | statements, and reporting |
| | | o Tax accrual related matters |
| | | o Implementation of new accounting standards |
| | | o Compliance letters (e.g. rating agency letters) |
| | | o Regulatory reviews and assistance |
| | | regarding financial matters |
| | | o Semi-annual reviews (if requested) |
| | | o Comfort letters for closed end offerings |
II. AUDIT-RELATED | Services which are not | o AICPA attest and agreed-upon procedures |
SERVICES | prohibited under Rule | o Technology control assessments |
| | 210.2-01(C)(4) (the “Rule”) | o Financial reporting control assessments |
| | and are related extensions of | o Enterprise security architecture |
| | the audit services support the | assessment |
| | audit, or use the knowledge/expertise | |
| | gained from the audit procedures as a | |
| | foundation to complete the project. | |
| | In most cases, if the Audit-Related | |
| | Services are not performed by the | |
| | Audit firm, the scope of the Audit | |
| | Services would likely increase. | |
| | The Services are typically well-defined | |
| | and governed by accounting | |
| | professional standards (AICPA, | |
| | SEC, etc.) | |
| | |
AUDIT COMMITTEE APPROVAL POLICY | AUDIT COMMITTEE REPORTING POLICY |
| o “One-time” pre-approval | o A summary of all such |
| for the audit period for all | services and related fees |
| pre-approved specific service | reported at each regularly |
| subcategories. Approval of the | scheduled Audit Committee |
| independent auditors as | meeting. |
| auditors for a Fund shall | |
| constitute pre approval for | |
| these services. | |
| |
| o “One-time” pre-approval | o A summary of all such |
| for the fund fiscal year within | services and related fees |
| a specified dollar limit | (including comparison to |
| for all pre-approved | specified dollar limits) |
| specific service subcategories | reported quarterly. |
| |
| o Specific approval is | |
| needed to exceed the | |
| pre-approved dollar limit for | |
| these services (see general | |
Audit Committee approval policy | |
| below for details on obtaining | |
| specific approvals) | |
| |
| o Specific approval is | |
| needed to use the Fund’s | |
| auditors for Audit-Related | |
| Services not denoted as | |
| “pre-approved”, or | |
| to add a specific service | |
| subcategory as “pre-approved” | |
SECTION III - POLICY DETAIL, CONTINUED
| | |
SERVICE CATEGORY | SERVICE CATEGORY DESCRIPTION | SPECIFIC PRE-APPROVED SERVICE |
| | | SUBCATEGORIES |
III. TAX SERVICES | Services which are not | o Tax planning and support |
| | prohibited by the Rule, | o Tax controversy assistance |
| | if an officer of the Fund | o Tax compliance, tax returns, excise |
| | determines that using the | tax returns and support |
| | Fund’s auditor to provide | o Tax opinions |
| | these services creates | |
| | significant synergy in | |
| | the form of efficiency, | |
| | minimized disruption, or | |
| | the ability to maintain a | |
| | desired level of | |
| | confidentiality. | |
| | |
| AUDIT COMMITTEE APPROVAL POLICY | AUDIT COMMITTEE REPORTING POLICY |
o “One-time” pre-approval | o A summary of |
for the fund fiscal year | all such services and |
within a specified dollar limit | related fees |
| | (including comparison |
| | to specified dollar |
| | limits) reported |
| | quarterly. |
| |
o Specific approval is | |
| needed to exceed the | |
| pre-approved dollar limits for | |
| these services (see general | |
| Audit Committee approval policy | |
| below for details on obtaining | |
| specific approvals) | |
| |
o Specific approval is | |
| needed to use the Fund’s | |
| auditors for tax services not | |
| denoted as pre-approved, or to | |
add a specific service subcategory as | |
| “pre-approved” | |
SECTION III - POLICY DETAIL, CONTINUED
| |
SERVICE CATEGORY | SERVICE CATEGORY DESCRIPTION | SPECIFIC PRE-APPROVED SERVICE |
| | | SUBCATEGORIES |
IV. OTHER SERVICES | Services which are not | o Business Risk Management support |
| | prohibited by the Rule, | o Other control and regulatory |
A. SYNERGISTIC, | if an officer of the Fund | compliance projects |
UNIQUE QUALIFICATIONS | determines that using the | |
| | Fund’s auditor to provide | |
| | these services creates | |
| | significant synergy in | |
| | the form of efficiency, | |
| | minimized disruption, | |
| | the ability to maintain a | |
| | desired level of | |
| | confidentiality, or where | |
| | the Fund’s auditors | |
| | posses unique or superior | |
| | qualifications to provide | |
| | these services, resulting | |
| | in superior value and | |
| | results for the Fund. | |
| | |
AUDIT COMMITTEE APPROVAL POLICY | AUDIT COMMITTEE REPORTING POLICY |
o “One-time” pre-approval | o A summary of |
| for the fund fiscal year within | all such services and |
| a specified dollar limit | related fees |
| | (including comparison |
| | to specified dollar |
| | limits) reported |
| | quarterly. |
o Specific approval is | |
| needed to exceed the | |
| pre-approved dollar limits for | |
| these services (see general | |
| Audit Committee approval policy | |
| below for details on obtaining | |
| specific approvals) | |
| |
o Specific approval is | |
| needed to use the Fund’s | |
| auditors for “Synergistic” or | |
| “Unique Qualifications” Other | |
| Services not denoted as | |
| pre-approved to the left, or to | |
| add a specific service | |
| subcategory as “pre-approved” | |
SECTION III - POLICY DETAIL, CONTINUED
| |
SERVICE CATEGORY | SERVICE CATEGORY DESCRIPTION | SPECIFIC PROHIBITED SERVICE |
| | | SUBCATEGORIES |
PROHIBITED SERVICES | Services which result | 1. Bookkeeping or other services |
| | in the auditors losing | related to the accounting records or |
| | independence status | financial statements of the audit |
| | under the Rule. | client* |
| | | 2. Financial information systems design |
| | | and implementation* |
| | | 3. Appraisal or valuation services, |
| | | fairness* opinions, or |
| | | contribution-in-kind reports |
| | | 4. Actuarial services (i.e., setting |
| | | actuarial reserves versus actuarial |
| | | audit work)* |
| | | 5. Internal audit outsourcing services* |
| | | 6. Management functions or human |
| | | resources |
| | | 7. Broker or dealer, investment |
| | | advisor, or investment banking services |
| | | 8. Legal services and expert services |
| | | unrelated to the audit |
| | | 9. Any other service that the Public |
| | | Company Accounting Oversight Board |
| | | determines, by regulation, is |
| | | impermissible |
| | |
AUDIT COMMITTEE APPROVAL POLICY | AUDIT COMMITTEE REPORTING POLICY |
o These services are not to be | o A summary of all |
| performed with the exception of the(*) | services and related |
| services that may be permitted | fees reported at each |
| if they would not be subject to audit | regularly scheduled |
| procedures at the audit client (as | Audit Committee meeting |
| defined in rule 2-01(f)(4)) level | will serve as continual |
| the firm providing the service. | confirmation that has |
| | not provided any |
| | restricted services. |
GENERAL AUDIT COMMITTEE APPROVAL POLICY:
o For all projects, the officers of the Funds and the Fund’s auditors will each make an assessment to determine that any proposed projects will not impair independence.
o Potential services will be classified into the four non-restricted service categories and the “Approval of Audit, Audit-Related, Tax and Other Services” Policy above will be applied. Any services outside the specific pre-approved service subcategories set forth above must be specifically approved by the Audit Committee.
o At least quarterly, the Audit Committee shall review a report summarizing the services by service category, including fees, provided by the Audit firm as set forth in the above policy.
(2) Disclose the percentage of services described in each of paragraphs (b) through (d) of this Item that were approved by the audit committee pursuant to paragraph (c)(7)(i)(C) of Rule 2-01 of Regulation S-X.
N/A
(f) If greater than 50 percent, disclose the percentage of hours expended on the principal accountants engagement to audit the registrant’s financial statements for the most recent fiscal year that were attributed to work performed by persons other than the principal accountant’s full-time, permanent employees.
N/A
(g) Disclose the aggregate non-audit fees billed by the registrants accountant for services rendered to the registrant, and rendered to the registrants investment adviser (not including any sub-adviser whose role is primarily portfolio management and is subcontracted with or overseen by another investment adviser), and any entity controlling, controlled by, or under common control with the adviser that provides ongoing services to the registrant for each of the last two fiscal years of the registrant.
N/A
(h) Disclose whether the registrants audit committee of the board of trustees has considered whether the provision of non-audit services that were rendered to the registrants investment adviser (not including any subadviser whose role is primarily portfolio management and is subcontracted with or overseen by another investment adviser), and any entity controlling, controlled by, or under common control with the investment adviser that provides ongoing services to the registrant that were not pre-approved pursuant to paragraph (c)(7)(ii) of Rule 2-01 of Regulation S-X is compatible with maintaining the principal accountant’s independence.
The Fund’s audit committee of the Board of Trustees has considered whether the provision of non-audit services that were rendered to the Affiliates (as defined) that were not pre- approved pursuant to paragraph (c)(7)(ii) of Rule 2-01 of Regulation S-X is compatible with maintaining the principal accountant’s independence.
ITEM 5. AUDIT COMMITTEE OF LISTED REGISTRANTS
(a) If the registrant is a listed issuer as defined in Rule 10A-3 under the Exchange Act (17 CFR 240.10A-3), state whether or not the registrant has a separately-designated standing audit committee established in accordance with Section 3(a)(58)(A) of the Exchange Act (15 U.S.C. 78c(a)(58)(A)). If the registrant has such a committee, however designated, identify each committee member. If the entire board of directors is acting as the registrant’s audit committee as specified in Section 3(a)(58)(B) of the Exchange Act (15 U.S.C. 78c(a)(58)(B)), so state.
N/A
(b) If applicable, provide the disclosure required by Rule 10A-3(d) under the Exchange Act (17 CFR 240.10A-3(d)) regarding an exemption from the listing standards for audit committees.
N/A
ITEM 6. SCHEDULE OF INVESTMENTS.
File Schedule of Investments in securities of unaffiliated issuers as of the close of the reporting period as set forth in 210.1212 of Regulation S-X [17 CFR 210.12-12], unless the schedule is included as part of the report to shareholders filed under Item 1 of this Form.
Included in Item 1
ITEM 7. DISCLOSURE OF PROXY VOTING POLICIES AND PROCEDURES FOR CLOSED-END MANAGEMENT INVESTMENT COMPANIES.
A closed-end management investment company that is filing an annual report on this Form N-CSR must, unless it invests exclusively in non-voting securities, describe the policies and procedures that it uses to determine how to vote proxies relating to portfolio securities, including the procedures that the company uses when a vote presents a conflict between the interests of its shareholders, on the one hand, and those of the company’s investment adviser; principal underwriter; or any affiliated person (as defined in Section 2(a)(3) of the Investment Company Act of 1940 (15 U.S.C. 80a-2(a)(3)) and the rules thereunder) of the company, its investment adviser, or its principal underwriter, on the other. Include any policies and procedures of the company’s investment adviser, or any other third party, that the company uses, or that are used on the company’s behalf, to determine how to vote proxies relating to portfolio securities.
N/A
ITEM 8. PORTFOLIO MANAGERS OF CLOSED-END MANAGEMENT INVESTMENT COMPANIES.
(a) If the registrant is a closed-end management investment company that is filing an annual report on this Form N-CSR, provide the following information:
(1) State the name, title, and length of service of the person or persons employed by or associated with the registrant or an investment adviser of the registrant who are primarily responsible for the day-to-day management of the registrant’s portfolio (“Portfolio Manager”). Also state each Portfolio Manager’s business experience during the past 5 years.
N/A
ITEM 9. PURCHASES OF EQUITY SECURITIES BY CLOSED-END MANAGEMENT INVESTMENT COMPANY AND AFFILIATED PURCHASERS.
(a) If the registrant is a closed-end management investment company, in the following tabular format, provide the information specified in paragraph (b) of this Item with respect to any purchase made by or on behalf of the registrant or any affiliated purchaser, as defined in Rule 10b-18(a)(3) under the Exchange Act (17 CFR 240.10b-18(a)(3)), of shares or other units of any class of the registrant’s equity securities that is registered by the registrant pursuant to Section 12 of the Exchange Act (15 U.S.C. 781).
N/A
ITEM 10. SUBMISSION OF MATTERS TO A VOTE OF SECURITY HOLDERS.
Describe any material changes to the procedures by which shareholders may recommend nominees to the registrant’s board of directors, where those changes were implemented after the registrant last provided disclosure in response to the requirements of Item 407(c)(2)(iv) of Regulation S-R(17 CFR 229.407)(as required by Item 22(b)(15)) of Schedule 14A (17 CFR 240.14a-101), or this Item.
There have been no material changes to the procedures by which the shareholders may recommend nominees to the registrant’s board of directors since the registrant last provided disclosure in response to the requirements of Item 407(c)(2)(iv) of Regulation S-R of Schedule 14(A) in its definitive proxy statement, or this item.
ITEM 11. CONTROLS AND PROCEDURES.
(a) Disclose the conclusions of the registrant’s principal executive and principal financials officers, or persons performing similar functions, regarding the effectiveness of the registrant’s disclosure controls and procedures (as defined in Rule 30a-3(c) under the Act (17 CFR 270.30a-3(c))) as of a date within 90 days of the filing date of the report that includes the disclosure required by this paragraph, based on the evaluation of these controls and procedures required by Rule 30a-3(b) under the Act (17 CFR 270.30(a)-3(b) and Rules 13a-15(b) or 15d-15(b) under the Exchange Act (17 CFR 240.13a-15(b) or 240.15d-15(b)).
The registrant’s principal executive officer and principal financial officer have concluded that the registrant’s disclosure controls and procedures are effective based on the evaluation of these controls and procedures as of a date within 90 days of the filing date of this report.
(b) Disclose any change in the registrant’s internal control over financial reporting (as defined in Rule 30a-3(d) under the Act (17CFR 270.30a-3(d)) that occured during the second fiscal quarter of the period covered by this report that has materially affected, or is reasonably likely to materially affect, the registrant’s internal control over financial reporting.
There were no significant changes in the registrant’s internal control over financial reporting that occurred during the second fiscal quarter of the period covered by this report that have materially affected, or are reasonably likely to materially affect, the registrant’s internal control over financial reporting.
Item 12. Disclosure of Securities Lending Activities for Closed-End Management Investment Companies.
(a) If the registrant is a closed-end management investment company, provide the following dollar amounts of income and compensation related to the securities lending activities of the registrant during its most recent fiscal year:
N/A
(1) Gross income from securities lending activities;
N/A
(2) All fees and/or compensation for each of the following securities lending activities and related services: any share of revenue generated by the securities lending program paid to the securities lending agent(s) (revenue split); fees paid for cash collateral management services (including fees deducted from a pooled cash collateral reinvestment vehicle) that are not included in the revenue split; administrative fees that are not included in the revenue split; fees for indemnification that are not included in the revenue split; rebates paid to borrowers; and any other fees relating to the securities lending program that are not included in the revenue split, including a description of those other fees;
N/A
(3) The aggregate fees/compensation disclosed pursuant to paragraph (2); and
N/A
(4) Net income from securities lending activities (i.e., the dollar amount in paragraph (1) minus the dollar amount in paragraph (3)).
If a fee for a service is included in the revenue split, state that the fee is included in the revenue split.
N/A
(b) If the registrant is a closed-end management investment company, describe the services provided to the registrant by the securities lending agent in the registrants most recent fiscal year.
N/A
ITEM 13. EXHIBITS.
(a) File the exhibits listed below as part of this Form. Letter or number the exhibits in the sequence indicated.
SIGNATURES
[See General Instruction F]
Pursuant to the requirements of the Securities Exchange Act of 1934 and the Investment Company Act of 1940, the registrant has duly caused this report to be signed on its behalf by the undersigned, thereunto duly authorized.
(Registrant) Pioneer Real Estate Shares
By (Signature and Title)* /s/ Lisa M. Jones
Lisa M. Jones, President & Chief Executive Officer
Date September 4, 2020
Pursuant to the requirements of the Securities Exchange Act of 1934 and the Investment Company Act of 1940, this report has been signed below by the following persons on behalf of the registrant and in the capacities and on the dates indicated.
By (Signature and Title)* /s/ Lisa M. Jones
Lisa M. Jones, President & Chief Executive Officer
Date September 4, 2020
By (Signature and Title)* /s/ Mark E. Bradley
Mark E. Bradley, Treasurer & Chief Accounting & Financial Officer
Date September 4, 2020
* Print the name and title of each signing officer under his or her signature.