UNITED STATES
SECURITIES AND EXCHANGE COMMISSION
Washington, D.C. 20549
FORM N-CSR
CERTIFIED SHAREHOLDER REPORT OF REGISTERED
MANAGEMENT INVESTMENT COMPANIES
Investment Company Act file number 811- 07870
Pioneer Real Estate Shares
(Exact name of registrant as specified in charter)
60 State Street, Boston, MA 02109
(Address of principal executive offices) (ZIP code)
Terrence J. Cullen, Amundi Pioneer Asset Management, Inc.,
60 State Street, Boston, MA 02109
(Name and address of agent for service)
Registrant’s telephone number, including area code: (617) 742-7825
Date of fiscal year end: December 31, 2020
Date of reporting period: January 1, 2020 through December 31, 2020
Form N-CSR is to be used by management investment companies to file reports with the Commission not later than 10 days after the transmission to stockholders of any report that is required to be transmitted to stockholders under Rule 30e-1 under the Investment Company Act of 1940 (17 CFR 270.30e-1). The Commission may use the information provided on Form N-CSR in its regulatory, disclosure review, inspection, and policymaking roles.
A registrant is required to disclose the information specified by Form N-CSR, and the Commission will make this information public. A registrant is not required to respond to the collection of information contained in Form N-CSR unless the Form displays a currently valid Office of Management and Budget (“OMB”) control number. Please direct comments concerning the accuracy of the information collection burden estimate and any suggestions for reducing the burden to Secretary, Securities and Exchange Commission, 450 Fifth Street, NW, Washington, DC 20549-0609. The OMB has reviewed this collection of information under the clearance requirements of 44 U.S.C. ss. 3507.
Pioneer Real
Estate Shares
Annual Report | December 31, 2020
| A: PWREX | C: PCREX | Y: PYREX |
Paper copies of the Fund’s shareholder reports may no longer be sent by mail, unless you specifically request paper copies of the reports from the Fund or from your financial intermediary, such as a broker-dealer, bank or insurance company. Instead, the reports will be made available on the Fund’s website, and you will be notified by mail each time a report is posted and provided with a website link to access the report.
You may elect to receive all future reports in paper free of charge. If you invest directly with the Fund, you can inform the Fund that you wish to continue receiving paper copies of your shareholder reports by calling 1-800-225-6292. If you invest through a financial intermediary, you can contact your financial intermediary to request that you continue to receive paper copies of your shareholder reports. Your election to receive reports in paper will apply to all funds held in your account if you invest through your financial intermediary or all funds held within the Pioneer Fund complex if you invest directly.
visit us: www.amundi.com/us
| | |
| |
| | |
| 2 |
| | |
| 4 |
| | |
| 10 |
| | |
| 11 |
| | |
| 12 |
| | |
| 15 |
| | |
| 17 |
| | |
| 20 |
| | |
| 27 |
| | |
| 37 |
| | |
| 39 |
| | |
| 40 |
| | |
| 45 |
Pioneer Real Estate Shares | Annual Report | 12/31/20 1
President’s Letter
Dear Shareholders,
With a very turbulent 2020 calendar year finally behind us, the U.S. and global economies still face numerous challenges as the new calendar year dawns. The COVID-19 pandemic has continued to spread, with high numbers of new cases reported in many U.S. states and in other countries. In response, some governments have retightened restrictions on both business and personal activities. However, as 2021 arrived, deployment of the first approved COVID-19 vaccines had already begun, and expectations are for widespread vaccine distribution by the middle of the year.
While there may finally be a light visible at the end of the pandemic tunnel, the long-term impact on the global economy from COVID-19, while currently unknown, is likely to be considerable. It is clear that several industries have already felt greater effects than others, and the markets, which do not thrive on uncertainty, have been volatile, delivering significantly negative performance in the first quarter of 2020, and then recovering most of those losses throughout the following quarters. In fact, the U.S. stock market, as measured by the Standard & Poor’s 500 Index, returned more than 18% for the full 2020 calendar year, an impressive performance given all of the obstacles market participants faced during those 12 months.
However, despite the market rebound since its March 2020 low point, volatility has remained elevated, with momentum rising and falling on seemingly every bit of positive or negative news about the virus, from vaccines to spikes in the number of cases as well as rising hospitalization rates in some areas. In addition, the recent U.S. Presidential and Congressional elections have resulted in a power shift in Washington, D.C., and that most likely portends some changes in fiscal policy. That, too, could lead to increased market volatility as investors analyze the various tax and spending plans, and wait to see what proposed policy alterations actually become law.
With the advent of COVID-19 last winter, we implemented our business continuity plan according to the new COVID-19 guidelines, and most of our employees have been working remotely since March. To date, our operating environment has faced no interruption. I am proud of the careful planning that has taken place and confident we can maintain this environment for as long as is prudent. History in the making for a company that first opened its doors way back in 1928.
2 Pioneer Real Estate Shares | Annual Report | 12/31/20
Since 1928, Amundi US’s investment process has been built on a foundation of fundamental research and active management, principles which have guided our investment decisions for more than 90 years. We believe active management – that is, making active investment decisions – can help mitigate the risks during periods of market volatility. As 2020 has reminded us, investment risk can arise from a number of factors in today’s global economy, including slower or stagnating growth, changing U.S. Federal Reserve policy, oil price shocks, political and geopolitical factors and, unfortunately, major public health concerns such as a viral pandemic.
At Amundi US, active management begins with our own fundamental, bottom-up research process. Our team of dedicated research analysts and portfolio managers analyzes each security under consideration, communicating directly with the management teams of the companies issuing the securities and working together to identify those securities that best meet our investment criteria for our family of funds. Our risk management approach begins with each and every security, as we strive to carefully understand the potential opportunity, while considering any and all risk factors.
Today, as investors, we have many options. It is our view that active management can serve shareholders well, not only when markets are thriving, but also during periods of market stress.
As you consider your long-term investment goals, we encourage you to work with your financial professional to develop an investment plan that paves the way for you to pursue both your short-term and long-term goals.
We remain confident that the current crisis, like others in human history, will pass, and we greatly appreciate the trust you have placed in us and look forward to continuing to serve you in the future.
Sincerely,
Lisa M. Jones
Head of the Americas, President and CEO of US.
Amundi Asset Management US, Inc.
February 2021
Any information in this shareowner report regarding market or economic trends or the factors influencing the Fund’s historical or future performance are statements of opinion as of the date of this report. Past performance is no guarantee of future results.
Pioneer Real Estate Shares | Annual Report | 12/31/20 3
Portfolio Management Discussion |
12/31/20 In the following interview, Raymond Haddad discusses the market environment for real estate investment trusts (REITs) and other real estate-related investments, and the factors that influenced the performance of Pioneer Real Estate Shares during the 12-month reporting period ended December 31, 2020. Mr. Haddad, a vice president and portfolio manager at Amundi Asset Management US, Inc. (Amundi US), is responsible for the day-to-day management of the Fund.
Q How did the Fund perform during the 12-month period ended December 31, 2020?
A Pioneer Real Estate Shares Class A shares returned -6.96% at net asset value during the 12-month period ended December 31, 2020, while the Fund’s benchmark, the Morgan Stanley Capital International (MSCI) US Real Estate Investment Trust (REIT) Index1, returned -7.57%. During the same 12-month period, the average return of the 248 mutual funds in Morningstar’s Real Estate Funds Category was -4.49%.
Q How would you describe the market environment for REIT investors during the 12-month period ended December 31, 2020?
A The 12-month reporting period was quite volatile, marked by historic swings in market performance within and across asset classes. The year began on an upbeat note, with investors showing optimism about improving US economic growth. However, market conditions quickly deteriorated in March when the COVID-19 virus completely disrupted global economic activity, as governments around the globe issued shelter-in-place and lockdown orders, and shuttered businesses deemed non-essential in an attempt to curb the spread of the virus. The virus-containment measures had the effect of bringing the US economy to a near-standstill and had tipped the country into recessionary territory by the end of the first quarter.
1 The MSCI information may only be used for your internal use, may not be reproduced or redissemi-nated in any form and may not be used as a basis for or a component of any financial instruments or products or indices. None of the MSCI information is intended to constitute investment advice or a recommendation to make (or refrain from making) any kind of investment decision and may not be relied on as such. Historical data and analysis should not be taken as an indication or guarantee of any future performance analysis, forecast or prediction. The MSCI information is provided on an “as is” basis and the user of this information assumes the entire risk of any use made of this information. MSCI, each of its affiliates and each other person involved in or related to compiling, computing or creating any MSCI information (collectively, the “MSCI Parties”) expressly disclaims all warranties (including, without limitation, any warranties of originality, accuracy, completeness, timeliness, non-infringement, merchantability and fitness for a particular purpose) with respect to this information. Without limiting any of the foregoing, in no event shall any MSCI Party have any liability for any direct, indirect, special, incidental, punitive, consequential (including, without limitation, lost profits) or any other damages.
4 Pioneer Real Estate Shares | Annual Report | 12/31/20
Amid the uncertainty, investors sold higher-risk assets and moved into so-called “safe havens,” such as US Treasuries. With economic conditions deteriorating rapidly and unemployment climbing, the US Federal Reserve (Fed) lowered the target range for the federal funds rate to near zero, re-implemented some of its stimulus programs from the 2008/2009 financial crisis era, and announced new programs aimed at injecting liquidity into the financial markets. Congress and the White House then approved a massive financial relief package aimed at helping to ease the economic toll of the pandemic on individuals and businesses.
Due to the historic levels of monetary and fiscal stimulus, the second quarter saw a reversal in market sentiment and raised expectations for an economic recovery as businesses began to reopen. The rebound was especially strong in April, led by many of the stocks that had struggled the most during the March sell-off.
Riskier assets continued to recover into the summer months, with the rally sustained by signs that the US economy was recovering more quickly than anticipated as well as stronger-than-expected corporate earnings reports. Towards the end of the third quarter, however, market sentiment reversed course again as investors weighed the possible effects of the upcoming US elections, lack of agreement on another fiscal stimulus package from the government, and rising numbers of COVID-19 cases, which raised fears of renewed and potentially stricter lockdowns than had been seen during the late winter and spring.
In November, market sentiment flipped to the positive side again in the wake of announcements by Pfizer and Moderna about the high efficacy of their COVID-19 vaccine trials, and resolution of the US elections. (Neither Pfizer nor Moderna is a portfolio holding). Riskier assets, especially equities, rallied strongly during the final weeks of the 12-month period, and in the closing days of December, Congress passed a new COVID-19 aid bill as well as a shorter-term spending package into law, thus adding more fuel to the rally as the fiscal year ended.
With the COVID-19 situation raising concerns about the resilience of the commercial real estate market practically overnight, REITs that had flourished prior to the pandemic declined in value, along with other riskier assets, during the first and third quarters of 2020. The REIT asset class rallied in the second and fourth quarters of the year, but not as much as other equity sectors. As a result, REITs underperformed other equities for the full 12-month period, as the Standard & Poor’s 500 Index, a broad measure of US equity performance, returned more than 18%, while the Fund’s benchmark, the MSCI US REIT Index (the MSCI Index), returned -7.57%.
Pioneer Real Estate Shares | Annual Report | 12/31/20 5
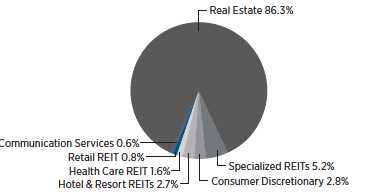
Within the MSCI Index, seven of the 11 subsectors delivered positive performance for the 12-month period, led by industrial REITs, specialized REITs (mainly data centers), and health care REITs. The worst performers within the MSCI Index for 2020 were retail, lodging, and office REITs.
Q Which investments or strategies aided the Fund’s benchmark-relative performance during the 12-month period ended December 31, 2020?
A The Fund outperformed the MSCI Index for the 12-month period, with positive benchmark-relative returns driven by security selection results.
At the individual security level, the Fund’s largest positive performance contributors were not components of the MSCI US REIT Index: Hannon Armstrong Sustainable Infrastructure (HASI); Safehold; and Innovative Industrial Properties (IIPR).
HASI was the top performer for the Fund during the period. HASI is a mortgage REIT dedicated to investments in climate change solutions and infrastructure. We have viewed HASI as a “defensive” play within REITs, as the company has continued to benefit from the secular trends of alternative energy and climate change-related investments. We eventually reduced the size of the Fund’s position to pursue other opportunities that we believed offered better value. The Fund’s second-best performer during the period was a position in Safehold, a specialized REIT focused on acquiring, owning, managing, and capitalizing on ground leases. A ground lease is an agreement that allows a tenant to develop a property during the lease period, after which the land and all improvements are turned over to the property operator — in this case, Safehold. In essence, Safehold’s clients are no longer saddled with ownership of the underlying land once the lease period expires. We believe Safehold has been revolutionizing commercial real estate ownership by providing growing income and capital appreciation to its shareholders through a diversified portfolio of high-quality ground leases.
Finally, a position in IIPR, one of the largest medicinal cannabis warehouse owners in the US, was another strong positive contributor to the Fund’s benchmark-relative returns for the 12-month period. Due to the nature of warehouse operators’ businesses, access to capital through traditional banking channels has not been widely accessible to them. Enter IIPR, which provides capital in the form of purchasing warehouses from customers, and then leasing those warehouses back to them in a lease-buyback arrangement. Continued limited access to capital for
6 Pioneer Real Estate Shares | Annual Report | 12/31/20
cannabis warehouse operators, coupled with a fast-growing end-demand market, has allowed IIPR to increase its footprint and earnings. IIPR also has applied its business model to other growing industries, including solar and wind within the renewable energy segment.
Q Which investments or strategies detracted from the Fund’s benchmark-relative performance during the 12-month period ended December 31, 2020?
A Sector allocation decisions within residential and health care REITs detracted from the Fund’s benchmark-relative results for the 12-month period. With regard to residential REITs, our decision to overweight the portfolio to manufactured housing and take an underweight position in coastal apartment REITs (relative to the MSCI Index) weighed on relative performance. In 2020, manufactured housing, which is a secular play based on housing affordability concerns and supply constraints in the US, underperformed the traditional apartment-building rental market, a segment that generated solid returns for the 12-month period.
In health care, our decision to be more defensive and overweight the Fund to medical office buildings, while underweighting nursing homes, detracted from benchmark-relative performance over the 12-month period. During the pandemic, nursing homes have faced challenges that have led to weak rental pricing, lower admission rates, and an oversupply of new facilities. During the sharp market sell-off in the first quarter of 2020, our strategy was beneficial. However, with the government stimulus packages passed during mid-2020 came dollars earmarked for nursing homes. As a result, investors bid up the prices of those REITs during the rallies in the second and fourth quarters. Due to that development, the portfolio’s lower-than-benchmark exposure to nursing homes ended up as a headwind for the Fund’s relative returns over the full 12-month period.
Individual positions that detracted from the Fund’s benchmark-relative performance during the 12-month period included Digital Realty Trust, Gaming & Leisure Properties, and NextPoint Residential Trust. Digital Realty Trust is a data-center REIT. The sector in general performed well during the year due to the work-from-home environment caused by the pandemic, and Digital Realty initially rode that wave. However, the stock price pulled back over the final months of the year as investors’ appetites began shifting towards value stocks in the more cyclical sectors. Gaming & Leisure Properties, not surprisingly, was hard-hit by the pandemic-related shutdowns and/or capacity limitations applied to businesses where consumers have tended to spend discretionary income, such as
Pioneer Real Estate Shares | Annual Report | 12/31/20 7
resorts and casinos. Finally, NextPoint’s stock price plummeted last spring as the economic effects of COVID-19 on the rental property and hospitality segments within the REIT sector began to ramp up. We eventually exited the Fund’s position.
Q Did the Fund have exposure to any derivative securities during the 12-month period ended December 31, 2020?
A No, the Fund had no exposure to derivative investments during the 12-month period.
Q What is your view of the REIT market as 2021 begins, and how have you positioned the Fund’s portfolio?
A The availability of COVID-19 vaccines has, in our view, significantly reduced the downside risk of a prolonged economic lockdown and social-distancing measures. In addition, President Biden and the new Congress have committed to passing a $1.9 trillion stimulus plan to support individuals, businesses, and state and local governments, while expanding and expediting COVID-19 relief efforts. We believe those developments could help the US economy recover faster and ease the negative sentiment within the REIT sector toward property types that have struggled during the pandemic.
During the fourth quarter of 2020, we increased the portfolio’s exposure to economically sensitive, cyclical subsectors that we believe could perform well as the US economy moves toward fully reopening in 2021. As part of the strategy, we moved the Fund to overweight positions (relative to the benchmark) in smaller-cap retail REITs and hotels. We also added select positions in nursing homes to the portfolio.
As always, we will continue to seek out what we believe are high-quality REIT companies with resilient business models, strong balance sheets, ample liquidity, and will strive to avoid investing in situations where we believe the market has overestimated a company’s future growth potential.
8 Pioneer Real Estate Shares | Annual Report | 12/31/20
Please refer to the Schedule of Investments on pages 17–19 for a full listing of Fund securities.
All investments are subject to risk, including the possible loss of principal. In the past several years, financial markets have experienced increased volatility and heightened uncertainty. The market prices of securities may go up or down, sometimes rapidly or unpredictably, due to general market conditions, such as real or perceived adverse economic, political, or regulatory conditions, recessions, inflation, changes in interest or currency rates, lack of liquidity in the bond markets, the spread of infectious illness or other public health issues or adverse investor sentiment. These conditions may continue, recur, worsen or spread.
The Fund invests in REIT securities, the value of which can fall for a variety of reasons, such as declines in rental income, fluctuating interest rates, poor property management, environmental liabilities, uninsured damage, increased competition, or changes in real estate tax laws.
The Fund invests in a limited number of securities and, as a result, the Fund’s performance may be more volatile than the performance of other funds holding more securities.
Investing in foreign and/or emerging markets securities involves risks relating to interest rates, currency exchange rates, economic, and political conditions.
When interest rates rise, the prices of fixed-income securities in the Fund will generally fall. Conversely, when interest rates fall, the prices of fixed-income securities in the Fund will generally rise.
At times, the Fund’s investments may represent industries or industry sectors that are interrelated or have common risks, making the Fund more susceptible to any economic, political, or regulatory developments or other risks affecting those industries or sectors.
These risks may increase share price volatility.
Before investing, consider the product’s investment objectives, risks, charges and expenses. Contact your financial professional or Amundi Asset Management US, Inc., for a prospectus or summary prospectus containing this information. Read it carefully.
Any information in this shareholder report regarding market or economic trends or the factors influencing the Fund’s historical or future performance are statements of opinion as of the date of this report. Past performance is no guarantee of future results.
Pioneer Real Estate Shares | Annual Report | 12/31/20 9
| |
Portfolio Summary | 12/31/20 |
|
| Sector Distribution |
(As a percentage of total investments)* |
| 10 Largest Holdings | |
(As a percentage of total investments)* | |
| 1. | Equinix, Inc. | 8.13% |
| 2. | Prologis, Inc. | 8.06 |
| 3. | Hannon Armstrong Sustainable Infrastructure Capital, Inc. | 5.92 |
| 4. | Sun Communities, Inc. | 5.26 |
| 5. | Innovative Industrial Properties, Inc. | 3.78 |
| 6. | Alexandria Real Estate Equities, Inc. | 3.69 |
| 7. | Safehold, Inc. | 3.28 |
| 8. | National Storage Affiliates Trust | 3.05 |
| 9. | UDR, Inc., Class REIT | 2.66 |
| 10. | EastGroup Properties, Inc. | 2.55 |
* | Excludes temporary cash investments and all derivative contracts except for options purchased. The Fund is actively managed, and current holdings may be different. The holdings listed should not be considered recommendations to buy or sell any securities. |
10 Pioneer Real Estate Shares | Annual Report | 12/31/20
Prices and Distributions |
12/31/20 Net Asset Value per Share
| Class | 12/31/20 | 12/31/19 |
A | $13.13 | $14.56 |
C | $12.55 | $13.92 |
Y | $13.09 | $14.52 |
| Distributions per Share: 1/1/20 – 12/31/20 | |
|
| Net Investment | Short-Term | Long-Term | Tax Return |
| Class | Income | Capital Gains | Capital Gains | of Capital |
A | $0.0925 | $ — | $0.1613 | $0.1286 |
C | $ — | $ — | $0.1613 | $0.0933 |
Y | $0.1319 | $ — | $0.1613 | $0.1286 |
Index Definition
The MSCI US REIT Index is an unmanaged, widely used index comprising a broad representation of the most actively traded real estate trusts, and is designed to be a measure of real estate equity performance. Index returns are calculated monthly, assume reinvestment of dividends and, unlike Fund returns, do not reflect any fees, expenses or sales charges. It is not possible to invest directly in an index.
The index defined here pertains to the “Value of $10,000 Investment” and “Value of $5 Million Investment” charts on pages 12–14.
Pioneer Real Estate Shares | Annual Report | 12/31/20 11
| | |
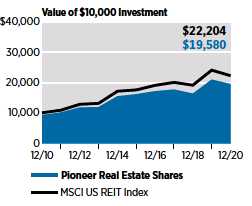
Performance Update | 12/31/20 | Class A Shares |
Investment Returns
The mountain chart on the right shows the change in value of a $10,000 investment made in Class A shares of Pioneer Real Estate Shares at public offering price during the periods shown, compared to that of the Morgan Stanley Capital International (MSCI) US REIT Index.
| | | | |
| Average Annual Total Returns | |
(As of December 31, 2020) | |
| Net | Public | MSCI |
| Asset | Offering | US
|
| Value | Price | REIT |
| Period | (NAV) | (POP) | Index |
10 years | 7.59% | 6.95% | 8.30% |
5 years | 3.81 | 2.59 | 4.84 |
1 year | -6.96 | -12.31 | -7.57 |
|
| Expense Ratio | | |
(Per prospectus dated May 1, 2020) |
| Gross | Net | | |
1.59% | 1.50% | | |
Call 1-800-225-6292 or visit www.amundi.com/us for the most recent month-end performance results. Current performance may be lower or higher than the performance data quoted.
The performance data quoted represents past performance, which is no guarantee of future results. Investment return and principal value will fluctuate, and shares, when redeemed, may be worth more or less than their original cost.
NAV results represent the percent change in net asset value per share. NAV returns would have been lower had sales charges been reflected. POP returns reflect deduction of maximum 5.75% sales charge. All results are historical and assume the reinvestment of dividends and capital gains. Other share classes are available for which performance and expenses will differ.
Performance results reflect any applicable expense waivers in effect during the periods shown. Without such waivers Fund performance would be lower. Waivers may not be in effect for all funds. Certain fee waivers are contractual through a specified period. Otherwise, fee waivers can be rescinded at any time. See the prospectus and financial statements for more information.
The net expense ratio reflects the contractual expense limitation currently in effect through May 1, 2021, for Class A shares. There can be no assurance that Amundi US will extend the expense limitation beyond such time. Please see the prospectus and financial statements for more information.
The performance table and graph do not reflect the deduction of fees and taxes that a shareowner would pay on Fund distributions or the redemption of Fund shares.
Effective January 1, 2018, Amundi US became directly responsible for the day-to-day management of the Fund. The performance shown for periods prior to January 1, 2018, reflects the investment strategies employed during those periods.
Please refer to the financial highlights for more current expense ratios.
12 Pioneer Real Estate Shares | Annual Report | 12/31/20
| | |
Performance Update | 12/31/20 | Class C Shares |
Investment Returns
The mountain chart on the right shows the change in value of a $10,000 investment made in Class C shares of Pioneer Real Estate Shares during the periods shown, compared to that of the Morgan Stanley Capital International (MSCI) US REIT Index.
| | | | |
| Average Annual Total Returns | |
(As of December 31, 2020) | |
| | | MSCI |
| | | US |
| If | If | REIT |
| Period | Held | Redeemed
| Index |
10 years | 6.71% | 6.71% | 8.30% |
5 years | 2.99 | 2.99 | 4.84 |
1 year | -7.89 | -7.89 | -7.57 |
| Expense Ratio | | |
(Per prospectus dated May 1, 2020) |
| Gross | | | |
2.39% | | | |
Call 1-800-225-6292 or visit www.amundi.com/us for the most recent month-end performance results. Current performance may be lower or higher than the performance data quoted.
The performance data quoted represents past performance, which is no guarantee of future results. Investment return and principal value will fluctuate, and shares, when redeemed, may be worth more or less than their original cost.
Class C shares held for less than one year are also subject to a 1.00% contingent deferred sales charge (CDSC). If you paid a 1.00% sales charge, your returns would be lower than those shown above. “If Held” results represent the percent change in net asset value per share. NAV returns would have been lower had sales charges been reflected. All results are historical and assume the reinvestment of dividends and capital gains. Other share classes are available for which performance and expenses will differ.
Performance results reflect any applicable expense waivers in effect during the periods shown. Without such waivers Fund performance would be lower. Waivers may not be in effect for all funds. Certain fee waivers are contractual through a specified period. Otherwise, fee waivers can be rescinded at any time. See the prospectus and financial statements for more information.
The performance table and graph do not reflect the deduction of fees and taxes that a shareowner would pay on Fund distributions or the redemption of Fund shares.
Effective January 1, 2018, Amundi US became directly responsible for the day-to-day management of the Fund. The performance shown for periods prior to January 1, 2018, reflects the investment strategies employed during those periods.
Please refer to the financial highlights for a more current expense ratio.
Pioneer Real Estate Shares | Annual Report | 12/31/20 13
| | |
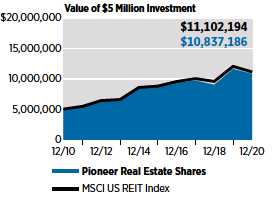
Performance Update | 12/31/20 | Class Y Shares |
Investment Returns
The mountain chart on the right shows the change in value of a $5 million investment made in Class Y shares of Pioneer Real Estate Shares during the periods shown, compared to that of the Morgan Stanley Capital International (MSCI) US REIT Index.
| | | |
| Average Annual Total Returns |
(As of December 31, 2020) |
| Net | MSCI |
| Asset | US |
| Value | REIT |
| Period | (NAV) | Index |
10 years | 8.04% | 8.30% |
5 years | 4.20 | 4.84 |
1 year | -6.67 | -7.57 |
| Expense Ratio | |
(Per prospectus dated May 1, 2020) |
| Gross | Net | |
1.21% | 1.20% |
Call 1-800-225-6292 or visit www.amundi.com/us for the most recent month-end performance results. Current performance may be lower or higher than the performance data quoted.
The performance data quoted represents past performance, which is no guarantee of future results. Investment return and principal value will fluctuate, and shares, when redeemed, may be worth more or less than their original cost.
Class Y shares are not subject to sales charges and are available for limited groups of eligible investors, including institutional investors. All results are historical and assume the reinvestment of dividends and capital gains. Other share classes are available for which performance and expenses will differ.
Performance results reflect any applicable expense waivers in effect during the periods shown. Without such waivers Fund performance would be lower. Waivers may not be in effect for all funds. Certain fee waivers are contractual through a specified period. Otherwise, fee waivers can be rescinded at any time. See the prospectus and financial statements for more information.
The net expense ratio reflects the contractual expense limitation currently in effect through May 1, 2021, for Class Y shares. There can be no assurance that Amundi US will extend the expense limitation beyond such time. Please see the prospectus and financial statements for more information.
The performance table and graph do not reflect the deduction of fees and taxes that a shareowner would pay on Fund distributions or the redemption of Fund shares.
Effective January 1, 2018, Amundi US became directly responsible for the day-to-day management of the Fund. The performance shown for periods prior to January 1, 2018, reflects the investment strategies employed during those periods.
Please refer to the financial highlights for a more current expense ratio.
14 Pioneer Real Estate Shares | Annual Report | 12/31/20
Comparing Ongoing Fund Expenses
As a shareowner in the Fund, you incur two types of costs:
(1) | ongoing costs, including management fees, distribution and/or service (12b-1) fees, and other Fund expenses; and |
(2) | transaction costs, including sales charges (loads) on purchase payments. |
This example is intended to help you understand your ongoing expenses (in dollars) of investing in the Fund and to compare these costs with the ongoing costs of investing in other mutual funds. The example is based on an investment of $1,000 at the beginning of the Fund’s latest six-month period and held throughout the six months.
Using the Tables
Actual ExpensesThe first table below provides information about actual account values and actual expenses. You may use the information in this table, together with the amount you invested, to estimate the expenses that you paid over the period as follows:
(1) | Divide your account value by $1,000 |
| Example: an $8,600 account value ÷ $1,000 = 8.6 |
(2) | Multiply the result in (1) above by the corresponding share class’s number in the third row under the heading entitled “Expenses Paid During Period” to estimate the expenses you paid on your account during this period. |
Expenses Paid on a $1,000 Investment in Pioneer Real Estate Shares
Based on actual returns from July 1, 2020 through December 31, 2020.
| Share Class | A | C | Y |
Beginning Account | $1,000.00 | $1,000.00 | $1,000.00 |
Value on 7/1/20 | | | |
Ending Account | $1,139.64 | $1,134.36 | $1,141.79 |
Value on 12/31/20 | | | |
Expenses Paid | $8.07 | $13.31 | $6.46 |
During Period* | | | |
* | Expenses are equal to the Fund’s annualized expense ratio of 1.50%, 2.48%, and 1.20% for Class A, Class C, and Class Y shares, respectively, multiplied by the average account value over the period, multiplied by 184/366 (to reflect the one-half year period). |
Pioneer Real Estate Shares | Annual Report | 12/31/20 15
Hypothetical Example for Comparison Purposes
The table below provides information about hypothetical account values and hypothetical expenses based on the Fund’s actual expense ratio and an assumed rate of return of 5% per year before expenses, which is not the Fund’s actual return. The hypothetical account values and expenses may not be used to estimate the actual ending account balance or expenses you paid for the period.
You may use this information to compare the ongoing costs of investing in the Fund and other funds. To do so, compare this 5% hypothetical example with the 5% hypothetical examples that appear in the shareholder reports of the other funds.
Please note that the expenses shown in the tables are meant to highlight your ongoing costs only and do not reflect any transaction costs, such as sales charges (loads) that are charged at the time of the transaction. Therefore, the table below is useful in comparing ongoing costs only and will not help you determine the relative total costs of owning different funds. In addition, if these transaction costs were included, your costs would have been higher.
Expenses Paid on a $1,000 Investment in Pioneer Real Estate Shares
Based on a hypothetical 5% per year return before expenses, reflecting the period from July 1, 2020 through December 31, 2020.July 1, 2020 through December 31, 2020.
| Share Class | A | C | Y |
Beginning Account | $1,000.00 | $1,000.00 | $1,000.00 |
Value on 7/1/20 | | | |
Ending Account | $1,017.60 | $1,012.67 | $1,019.10 |
Value on 12/31/20 | | | |
Expenses Paid | $7.61 | $12.55 | $6.09 |
During Period* | | | |
* | Expenses are equal to the Fund’s annualized expense ratio of 1.50%, 2.48%, and 1.20% for Class A, Class C, and Class Y shares, respectively, multiplied by the average account value over the period, multiplied by 184/366 (to reflect the one-half year period). |
16 Pioneer Real Estate Shares | Annual Report | 12/31/20
Schedule of Investments |
12/31/20 Shares
| | | Value
|
| | UNAFFILIATED ISSUERS — 98.7% | |
| | COMMON STOCKS — 98.7% of Net Assets | |
| | Diversified Consumer Services — 0.7% | |
| 16,197 | | Carriage Services, Inc. | $ 507,290 |
| | Total Diversified Consumer Services | $ 507,290 |
| | Equity Real Estate Investment Trusts (REITs) — 93.9% | |
| 12,478 | | Agree Realty Corp. | $ 830,785 |
| 14,225 | | Alexandria Real Estate Equities, Inc. | 2,535,180 |
| 17,266 | | American Campus Communities, Inc. | 738,467 |
| 44,992 | | American Homes 4 Rent | 1,349,760 |
| 37,557 | | Brixmor Property Group, Inc. | 621,568 |
| 10,711 | | Camden Property Trust | 1,070,243 |
| 46,192 | | Cedar Realty Trust, Inc. | 467,925 |
| 25,344 | | Chatham Lodging Trust | 273,715 |
| 31,836 | | Cousins Properties, Inc. | 1,066,506 |
| 18,825(a) | | Cushman & Wakefield PLC | 279,175 |
| 22,893 | | Douglas Emmett, Inc. | 668,018 |
| 12,678 | | EastGroup Properties, Inc. | 1,750,325 |
| 7,810 | | Equinix, Inc. | 5,577,746 |
| 19,572 | | Equity LifeStyle Properties, Inc. | 1,240,082 |
| 20,130 | | Essential Properties Realty Trust, Inc. | 426,756 |
| 13,608 | | Extra Space Storage, Inc. | 1,576,623 |
| 34,876 | | Four Corners Property Trust, Inc. | 1,038,259 |
| 25,038 | | Gaming & Leisure Properties, Inc. | 1,061,611 |
| 33,301 | | Global Medical REIT, Inc. | 434,911 |
| 64,070 | | Hannon Armstrong Sustainable Infrastructure Capital, Inc. | 4,063,960 |
| 37,818 | | Healthpeak Properties, Inc. | 1,143,238 |
| 9,599 | | Highwoods Properties, Inc. | 380,408 |
| 33,746 | | Independence Realty Trust, Inc. | 453,209 |
| 14,178 | | Innovative Industrial Properties, Inc. | 2,596,417 |
| 36,812 | | Kimco Realty Corp. | 552,548 |
| 4,488 | | Lamar Advertising Co. | 373,491 |
| 3,396 | | Life Storage, Inc. | 405,448 |
| 62,035 | | Macerich Co. | 661,913 |
| 71,954 | | Medical Properties Trust, Inc. | 1,567,878 |
| 24,300 | | MGM Growth Properties LLC | 760,590 |
| 8,425 | | Mid-America Apartment Communities, Inc. | 1,067,363 |
| 6,711 | | National Health Investors, Inc. | 464,200 |
| 58,075 | | National Storage Affiliates Trust | 2,092,442 |
| 47,051 | | New Senior Investment Group, Inc. | 243,724 |
| 30,882 | | Omega Healthcare Investors, Inc. | 1,121,634 |
| 58,604 | | Park Hotels & Resorts, Inc. | 1,005,059 |
| 19,584 | | Pebblebrook Hotel Trust | 368,179 |
| 55,503 | | Prologis, Inc. | 5,531,429 |
| 89,475 | | Retail Properties of America, Inc. | 765,906 |
| 27,696 | | Rexford Industrial Realty, Inc. | 1,360,151 |
The accompanying notes are an integral part of these financial statements.
Pioneer Real Estate Shares | Annual Report | 12/31/20 17
Schedule of Investments | 12/31/20 (continued)
Shares
| | | Value |
| | Equity Real Estate Investment Trusts | |
| | (REITs) — (continued) | |
| 22,782 | | RLJ Lodging Trust | $ 322,365 |
| 12,897 | | Ryman Hospitality Properties, Inc. | 873,901 |
| 50,277 | | Sabra Health Care Real Estate Investment Trust, Inc. | 873,311 |
| 31,046 | | Safehold, Inc. | 2,250,525 |
| 33,840 | | SITE Centers Corp. | 342,461 |
| 30,755 | | STORE Capital Corp. | 1,045,055 |
| 23,741 | | Sun Communities, Inc. | 3,607,445 |
| 42,126 | | Tanger Factory Outlet Centers, Inc. | 419,575 |
| 18,294 | | Terreno Realty Corp. | 1,070,382 |
| 47,551 | | UDR, Inc., Class REIT | 1,827,385 |
| 17,414 | | Ventas, Inc. | 853,983 |
| 55,850 | | VICI Properties, Inc. | 1,424,175 |
| 27,242 | | Xenia Hotels & Resorts, Inc. | 414,078 |
| | | Total Equity Real Estate Investment Trusts (REITs) | $65,311,483 |
| | | Hotels, Restaurants & Leisure — 0.3% | |
| 5,749 | | BJ’s Restaurants, Inc. | $ 221,279 |
| | | Total Hotels, Restaurants & Leisure | $ 221,279 |
| | | Interactive Media & Services — 0.6% | |
| 3,143(a) | | Zillow Group, Inc., Class C | $ 407,961 |
| | | Total Interactive Media & Services | $ 407,961 |
| | | Real Estate Management & Development — 1.5% | |
| 2,424(a) | | Jones Lang LaSalle, Inc. | $ 359,649 |
| 38,013 | | Newmark Group, Inc. | 277,115 |
| 27,854(a) | | Realogy Holdings Corp. | 365,444 |
| | | Total Real Estate Management & Development | $ 1,002,208 |
| | | Specialty Retail — 1.7% | |
| 18,890 | | American Eagle Outfitters, Inc. | $ 379,122 |
| 8,306 | | L Brands, Inc. | 308,900 |
| 19,209(a) | | Urban Outfitters, Inc. | 491,751 |
| | Total Specialty Retail | $ 1,179,773 |
| | TOTAL COMMON STOCKS | |
| | (Cost $51,308,090) | $68,629,994 |
| | TOTAL INVESTMENTS IN UNAFFILIATED ISSUERS — 98.7% | |
| | (Cost $51,308,090) | $68,629,994 |
| | OTHER ASSETS AND LIABILITIES — 1.3% | $ 925,486 |
| | NET ASSETS — 100.0% | $69,555,480 |
REIT | Real Estate Investment Trust. | |
(a) | Non-income producing security. | |
The accompanying notes are an integral part of these financial statements.
18 Pioneer Real Estate Shares | Annual Report | 12/31/20
Purchases and sales of securities (excluding temporary cash investments) for the year ended December 31, 2020, aggregated $110,970,506 and $124,009,704, respectively.
The Fund is permitted to engage in purchase and sale transactions (“cross trades”) with certain funds and accounts for which Amundi Asset Management US, Inc. (the “Adviser”) serves as the Fund’s investment adviser, as set forth in Rule 17a-7 under the Investment Company Act of 1940, pursuant to procedures adopted by the Board of Trustees. Under these procedures, cross trades are effected at current market prices. During the year ended December 31, 2020, the Fund did not engage in any cross trade activity.
At December 31, 2020, the net unrealized appreciation on investments based on cost for federal tax purposes of $51,428,279 was as follows:
| Aggregate gross unrealized appreciation for all investments in which | |
| there is an excess of value over tax cost | $ 17,596,986 |
| Aggregate gross unrealized depreciation for all investments in which | |
| there is an excess of tax cost over value | (395,271) |
| Net unrealized appreciation | $ 17,201,715 |
Various inputs are used in determining the value of the Fund’s investments. These inputs are summarized in the three broad levels below.
Level 1 – unadjusted quoted prices in active markets for identical securities.
Level 2 – other significant observable inputs (including quoted prices for similar securities, interest rates, prepayment speeds, credit risks, etc.). See Notes to Financial Statements — Note 1A.
Level 3 – significant unobservable inputs (including the Fund’s own assumptions in determining fair value of investments). See Notes to Financial Statements — Note 1A.
The following is a summary of the inputs used as of December 31, 2020, in valuing the Fund’s investments:
| | Level 1 | | | Level 2 | | | Level 3 | | | Total | |
Common Stocks | | $ | 68,629,994 | | | $ | — | | | $ | — | | | $ | 68,629,994 | |
| Total Investments in Securities | | $ | 68,629,994 | | | $ | — | | | $ | — | | | $ | 68,629,994 | |
During the year ended December 31, 2020, there were no transfers in or out of Level 3.
The accompanying notes are an integral part of these financial statements.
Pioneer Real Estate Shares | Annual Report | 12/31/20 19
Statement of Assets and Liabilities |
12/31/20 | ASSETS: | | | |
| Investments in unaffiliated issuers, at value (cost $51,308,090) | | $ | 68,629,994 | |
| Cash | | | 832,570 | |
| Receivables — | | | | |
| Fund shares sold | | | 49,493 | |
| Dividends | | | 253,432 | |
| Due from the Adviser | | | 9,610 | |
| Other assets | | | 20,411 | |
| Total assets | | $ | 69,795,510 | |
| LIABILITIES: | | | | |
| Payables — | | | | |
| Fund shares repurchased | | $ | 146,918 | |
| Trustees’ fees | | | 6 | |
| Administrative fees | | | 9,691 | |
| Professional fees | | | 44,192 | |
| Transfer agent fees | | | 22,989 | |
| Due to affiliates | | | 7,370 | |
| Accrued expenses | | | 8,864 | |
| Total liabilities | | $ | 240,030 | |
| NET ASSETS: | | | | |
| Paid-in capital | | $ | 61,310,480 | |
| Distributable earnings | | | 8,245,000 | |
| Net assets | | $ | 69,555,480 | |
| NET ASSET VALUE PER SHARE: | | | | |
No par value (unlimited number of shares authorized) | | | | |
| Class A (based on $63,597,957/4,842,525 shares) | | $ | 13.13 | |
| Class C (based on $3,254,573/259,300 shares) | | $ | 12.55 | |
| Class Y (based on $2,702,950/206,505 shares) | | $ | 13.09 | |
| MAXIMUM OFFERING PRICE PER SHARE: | | | | |
| Class A (based on $13.13 net asset value per share/100%-5.75% | | | | |
| maximum sales charge) | | $ | 13.93 | |
The accompanying notes are an integral part of these financial statements.
20 Pioneer Real Estate Shares | Annual Report | 12/31/20
| Statement of Operations |
| FOR THE YEAR ENDED 12/31/20 |
| INVESTMENT INCOME: | | | | | | |
| Dividends from unaffiliated issuers (net of foreign taxes | | | | | | |
| withheld $(338)) | | $ | 1,630,312 | | | | |
| Interest from unaffiliated issuers | | | 1,615 | | | | |
| Total investment income | | | | | | $ | 1,631,927 | |
| EXPENSES: | | | | | | | | |
| Management fees | | $ | 584,901 | | | | | |
| Administrative expense | | | 90,398 | | | | | |
| Transfer agent fees | | | | | | | | |
| Class A | | | 111,351 | | | | | |
| Class C | | | 8,281 | | | | | |
| Class Y | | | 5,767 | | | | | |
| Distribution fees | | | | | | | | |
| Class A | | | 163,277 | | | | | |
| Class C | | | 39,776 | | | | | |
| Shareowner communications expense | | | 43,324 | | | | | |
| Custodian fees | | | 10,070 | | | | | |
| Registration fees | | | 58,636 | | | | | |
| Professional fees | | | 53,531 | | | | | |
| Printing expense | | | 35,105 | | | | | |
| Trustees’ fees | | | 7,766 | | | | | |
| Miscellaneous | | | 14,618 | | | | | |
| Total expenses | | | | | | $ | 1,226,801 | |
| Less fees waived and expenses reimbursed by the Adviser | | | | | | | (102,495 | ) |
| Net expenses | | | | | | $ | 1,124,306 | |
| Net investment income | | | | | | $ | 507,621 | |
| REALIZED AND UNREALIZED GAIN (LOSS) ON INVESTMENTS: | | | | | | | | |
| Net realized gain (loss) on: | | | | | | | | |
| Investments in unaffiliated issuers | | | | | | $ | (8,528,858 | ) |
| Change in net unrealized appreciation (depreciation) on: | | | | | | | | |
| Investments in unaffiliated issuers | | $ | 509,496 | | | | | |
| Other assets and liabilities denominated in foreign currencies | | | 35 | | | $ | 509,531 | |
| Net realized and unrealized gain (loss) on investments | | | | | | $ | (8,019,327 | ) |
| Net decrease in net assets resulting from operations | | | | | | $ | (7,511,706 | ) |
The accompanying notes are an integral part of these financial statements.
Pioneer Real Estate Shares | Annual Report | 12/31/20 21
Statements of Changes in Net Assets
| | Year | | | Year | |
| | Ended | | | Ended | |
| | 12/31/20 | | | 12/31/19 | |
| FROM OPERATIONS: | | | | | | |
Net investment income (loss) | | $ | 507,621 | | | $ | 898,844 | |
Net realized gain (loss) on investments | | | (8,528,858 | ) | | | 18,946,950 | |
Change in net unrealized appreciation (depreciation) | | | | | | | | |
| on investments | | | 509,531 | | | | 1,601,616 | |
| Net increase (decrease) in net assets resulting | | | | | | | | |
| from operations | | $ | (7,511,706 | ) | | $ | 21,447,410 | |
| DISTRIBUTIONS TO SHAREOWNERS: | | | | | | | | |
| Class A ($0.25 and $3.36 per share, respectively) | | $ | (1,249,317 | ) | | $ | (15,559,984 | ) |
| Class C ($0.16 and $3.26 per share, respectively) | | | (46,647 | ) | | | (1,032,470 | ) |
| Class Y ($0.29 and $3.41 per share, respectively) | | | (69,988 | ) | | | (1,259,971 | ) |
Tax return of capital: | | | | | | | | |
| Class A ($0.13 and $— per share, respectively) | | | (654,008 | ) | | | — | |
| Class C ($0.09 and $— per share, respectively) | | | (30,063 | ) | | | — | |
| Class Y ($0.13 and $— per share, respectively) | | | (35,645 | ) | | | — | |
| Total distributions to shareowners | | $ | (2,085,668 | ) | | $ | (17,852,425 | ) |
| FROM FUND SHARE TRANSACTIONS: | | | | | | | | |
Net proceeds from sales of shares | | $ | 4,100,292 | | | $ | 12,646,046 | |
Reinvestment of distributions | | | 2,041,457 | | | | 17,529,634 | |
Cost of shares repurchased | | | (18,288,948 | ) | | | (22,330,487 | ) |
| Net increase (decrease) in net assets resulting from | | | | | | | | |
| Fund share transactions | | $ | (12,147,199 | ) | | $ | 7,845,193 | |
| Net increase (decrease) in net assets | | $ | (21,744,573 | ) | | $ | 11,440,178 | |
| NET ASSETS: | | | | | | | | |
Beginning of year | | $ | 91,300,053 | | | $ | 79,859,875 | |
End of year | | $ | 69,555,480 | | | $ | 91,300,053 | |
The accompanying notes are an integral part of these financial statements.
22 Pioneer Real Estate Shares | Annual Report | 12/31/20
| | Year Ended | | | Year Ended | | | Year Ended | | | Year Ended | |
| | 12/31/20 | | | 12/31/20 | | | 12/31/19 | | | 12/31/19 | |
| | Shares | | | Amount | | | Shares | | | Amount | |
| Class A | | | | | | | | | | | | |
Shares sold | | | 244,191 | | | $ | 3,103,468 | | | | 398,267 | | | $ | 6,651,634 | |
Reinvestment of distributions | | | 153,272 | | | | 1,867,242 | | | | 1,021,379 | | | | 15,290,770 | |
Less shares repurchased | | | (1,037,496 | ) | | | (13,052,509 | ) | | | (863,233 | ) | | | (13,983,560 | ) |
| Net increase (decrease) | | | (640,033 | ) | | $ | (8,081,799 | ) | | | 556,413 | | | $ | 7,958,844 | |
| Class C | | | | | | | | | | | | | | | | |
Shares sold | | | 45,078 | | | $ | 547,379 | | | | 93,487 | | | $ | 1,438,478 | |
Reinvestment of distributions | | | 6,450 | | | | 75,932 | | | | 71,348 | | | | 1,018,455 | |
Less shares repurchased | | | (174,167 | ) | | | (2,068,774 | ) | | | (137,760 | ) | | | (2,157,628 | ) |
| Net increase (decrease) | | | (122,639 | ) | | $ | (1,445,463 | ) | | | 27,075 | | | $ | 299,305 | |
| Class Y | | | | | | | | | | | | | | | | |
Shares sold | | | 36,129 | | | $ | 449,445 | | | | 279,444 | | | $ | 4,555,934 | |
Reinvestment of distributions | | | 8,254 | | | | 98,283 | | | | 81,621 | | | | 1,220,409 | |
Less shares repurchased | | | (261,022 | ) | | | (3,167,665 | ) | | | (386,217 | ) | | | (6,189,299 | ) |
| Net decrease | | | (216,639 | ) | | $ | (2,619,937 | ) | | | (25,152 | ) | | $ | (412,956 | ) |
The accompanying notes are an integral part of these financial statements.
Pioneer Real Estate Shares | Annual Report | 12/31/20 23
Financial Highlights
| | | | | | | | | | | | | | | | |
| | Year | | | Year | | | Year | | | Year | | | Year | |
| | Ended | | | Ended | | | Ended | | | Ended | | | Ended | |
| | 12/31/20 | | | 12/31/19 | | | 12/31/18 | | | 12/31/17 | | | 12/31/16* | |
| Class A | | | | | | | | | | | | | | | |
Net asset value, beginning of period | | $ | 14.56 | | | $ | 13.97 | | | $ | 24.59 | | | $ | 25.79 | | | $ | 26.83 | |
Increase (decrease) from investment operations: | | | | | | | | | | | | | | | | | | | | |
| Net investment income (loss) (a) | | $ | 0.09 | | | $ | 0.17 | | | $ | 0.30 | | | $ | 0.33 | | | $ | 0.30 | |
| Net realized and unrealized gain (loss) on investments | | | (1.14 | ) | | | 3.78 | | | | (1.52 | ) | | | 0.48 | | | | 1.26 | |
| Net increase (decrease) from investment operations | | $ | (1.05 | ) | | $ | 3.95 | | | $ | (1.22 | ) | | $ | 0.81 | | | $ | 1.56 | |
Distributions to shareowners: | | | | | | | | | | | | | | | | | | | | |
| Net investment income | | $ | (0.09 | ) | | $ | (0.18 | ) | | $ | (0.28 | ) | | $ | (0.33 | ) | | $ | (0.29 | ) |
| Net realized gain | | | (0.16 | ) | | | (3.18 | ) | | | (9.10 | ) | | | (1.68 | ) | | | (2.31 | ) |
Tax return of capital | | | (0.13 | ) | | | — | | | | (0.02 | ) | | | — | | | | — | |
| Total distributions | | $ | (0.38 | ) | | $ | (3.36 | ) | | $ | (9.40 | ) | | $ | (2.01 | ) | | $ | (2.60 | ) |
| Net increase (decrease) in net asset value | | $ | (1.43 | ) | | $ | 0.59 | | | $ | (10.62 | ) | | $ | (1.20 | ) | | $ | (1.04 | ) |
Net asset value, end of period | | $ | 13.13 | | | $ | 14.56 | | | $ | 13.97 | | | $ | 24.59 | | | $ | 25.79 | |
| Total return (b) | | | (6.96 | )% | | | 28.04 | % | | | (7.55 | )% | | | 3.20 | % | | | 6.10 | % |
Ratio of net expenses to average net assets | | | 1.50 | % | | | 1.59 | % | | | 1.68 | % | | | 1.48 | % | | | 1.41 | % |
Ratio of net investment income (loss) to average net assets | | | 0.74 | % | | | 1.03 | % | | | 1.35 | % | | | 1.29 | % | | | 1.09 | % |
Portfolio turnover rate | | | 152 | % | | | 126 | % | | | 155 | % | | | 8 | % | | | 15 | % |
Net assets, end of period (in thousands) | | $ | 63,598 | | | $ | 79,841 | | | $ | 68,829 | | | $ | 85,681 | | | $ | 98,007 | |
Ratios with no waiver of fees and assumption of expenses by | | | | | | | | | | | | | | | | | | | | |
| the Adviser and no reduction for fees paid indirectly: | | | | | | | | | | | | | | | | | | | | |
| Total expenses to average net assets | | | 1.65 | % | | | 1.59 | % | | | 1.68 | % | | | 1.48 | % | | | 1.41 | % |
| Net investment income (loss) to average net assets | | | 0.59 | % | | | 1.03 | % | | | 1.35 | % | | | 1.29 | % | | | 1.09 | % |
* | The Fund was audited by an independent registered public accounting firm other than Ernst & Young LLP. |
(a) | The per-share data presented above is based on the average shares outstanding for the period presented. |
(b) | Assumes initial investment at net asset value at the beginning of each period, reinvestment of all distributions, the complete redemption of the investment at net asset value at the end of each period and no sales charges. Total return would be reduced if sales charges were taken into account. |
The accompanying notes are an integral part of these financial statements.
24 Pioneer Real Estate Shares | Annual Report | 12/31/20
| | Year | | | Year | | | Year | | | Year | | | Year | |
| | Ended | | | Ended | | | Ended | | | Ended | | | Ended | |
| | 12/31/20 | | | 12/31/19 | | | 12/31/18 | | | 12/31/17 | | | 12/31/16* | |
| Class C | | | | | | | | | | | | | | | |
Net asset value, beginning of period | | $ | 13.92 | | | $ | 13.49 | | | $ | 24.09 | | | $ | 25.30 | | | $ | 26.38 | |
Increase (decrease) from investment operations: | | | | | | | | | | | | | | | | | | | | |
| Net investment income (loss) (a) | | $ | (0.03 | ) | | $ | 0.03 | | | $ | 0.19 | | | $ | 0.13 | | | $ | 0.08 | |
| Net realized and unrealized gain (loss) on investments | | | (1.09 | ) | | | 3.66 | | | | (1.52 | ) | | | 0.48 | | | | 1.23 | |
| Net increase (decrease) from investment operations | | $ | (1.12 | ) | | $ | 3.69 | | | $ | (1.33 | ) | | $ | 0.61 | | | $ | 1.31 | |
Distributions to shareowners: | | | | | | | | | | | | | | | | | | | | |
| Net investment income | | $ | — | | | $ | (0.08 | ) | | $ | (0.15 | ) | | $ | (0.14 | ) | | $ | (0.08 | ) |
| Net realized gain | | | (0.16 | ) | | | (3.18 | ) | | | (9.10 | ) | | | (1.68 | ) | | | (2.31 | ) |
| Tax return of capital | | | (0.09 | ) | | | — | | | | (0.02 | ) | | | — | | | | — | |
| Total distributions | | $ | (0.25 | ) | | $ | (3.26 | ) | | $ | (9.27 | ) | | $ | (1.82 | ) | | $ | (2.39 | ) |
| Net increase (decrease) in net asset value | | $ | (1.37 | ) | | $ | 0.43 | | | $ | (10.60 | ) | | $ | (1.21 | ) | | $ | (1.08 | ) |
Net asset value, end of period | | $ | 12.55 | | | $ | 13.92 | | | $ | 13.49 | | | $ | 24.09 | | | $ | 25.30 | |
| Total return (b) | | | (7.89 | )% | | | 27.05 | % | | | (8.17 | )% | | | 2.46 | % | | | 5.22 | % |
Ratio of net expenses to average net assets | | | 2.48 | % | | | 2.39 | % | | | 2.35 | % | | | 2.23 | % | | | 2.22 | % |
Ratio of net investment income (loss) to average net assets | | | (0.28 | )% | | | 0.21 | % | | | 0.83 | % | | | 0.50 | % | | | 0.29 | % |
Portfolio turnover rate | | | 152 | % | | | 126 | % | | | 155 | % | | | 8 | % | | | 15 | % |
Net assets, end of period (in thousands) | | $ | 3,255 | | | $ | 5,316 | | | $ | 4,788 | | | $ | 10,347 | | | $ | 13,317 | |
* | The Fund was audited by an independent registered public accounting firm other than Ernst & Young LLP. |
(a) | The per-share data presented above is based on the average shares outstanding for the period presented. |
(b) | Assumes initial investment at net asset value at the beginning of each period, reinvestment of all distributions, the complete redemption of the investment at net asset value at the end of each period and no sales charges. Total return would be reduced if sales charges were taken into account. |
The accompanying notes are an integral part of these financial statements.
Pioneer Real Estate Shares | Annual Report | 12/31/20 25
Financial Highlights (continued)| | | | | | | | | | | | | | | | |
| | Year | | | Year | | | Year | | | Year | | | Year | |
| | Ended | | | Ended | | | Ended | | | Ended | | | Ended | |
| | 12/31/20 | | | 12/31/19 | | | 12/31/18 | | | 12/31/17 | | | 12/31/16* | |
| Class Y | | | | | | | | | | | | | | | |
Net asset value, beginning of period | | $ | 14.52 | | | $ | 13.93 | | | $ | 24.55 | | | $ | 25.76 | | | $ | 26.79 | |
Increase (decrease) from investment operations: | | | | | | | | | | | | | | | | | | | | |
| Net investment income (loss) (a) | | $ | 0.12 | | | $ | 0.22 | | | $ | 0.50 | | | $ | 0.39 | | | $ | 0.37 | |
| Net realized and unrealized gain (loss) on investments | | | (1.13 | ) | | | 3.78 | | | | (1.61 | ) | | | 0.50 | | | | 1.29 | |
| Net increase (decrease) from investment operations | | $ | (1.01 | ) | | $ | 4.00 | | | $ | (1.11 | ) | | $ | 0.89 | | | $ | 1.66 | |
Distributions to shareowners: | | | | | | | | | | | | | | | | | | | | |
| Net investment income | | $ | (0.13 | ) | | $ | (0.23 | ) | | $ | (0.39 | ) | | $ | (0.42 | ) | | $ | (0.38 | ) |
| Net realized gain | | | (0.16 | ) | | | (3.18 | ) | | | (9.10 | ) | | | (1.68 | ) | | | (2.31 | ) |
| Tax return of capital | | | (0.13 | ) | | | — | | | | (0.02 | ) | | | — | | | | — | |
| Total distributions | | $ | (0.42 | ) | | $ | (3.41 | ) | | $ | (9.51 | ) | | $ | (2.10 | ) | | $ | (2.69 | ) |
| Net increase (decrease) in net asset value | | $ | (1.43 | ) | | $ | 0.59 | | | $ | (10.62 | ) | | $ | (1.21 | ) | | $ | (1.03 | ) |
Net asset value, end of period | | $ | 13.09 | | | $ | 14.52 | | | $ | 13.93 | | | $ | 24.55 | | | $ | 25.76 | |
| Total return (b) | | | (6.67 | )% | | | 28.52 | % | | | (7.11 | )% | | | 3.54 | % | | | 6.47 | % |
Ratio of net expenses to average net assets | | | 1.20 | % | | | 1.21 | % | | | 1.23 | % | | | 1.12 | % | | | 1.07 | % |
Ratio of net investment income (loss) to average net assets | | | 0.96 | % | | | 1.36 | % | | | 2.20 | % | | | 1.50 | % | | | 1.34 | % |
Portfolio turnover rate | | | 152 | % | | | 126 | % | | | 155 | % | | | 8 | % | | | 15 | % |
Net assets, end of period (in thousands) | | $ | 2,703 | | | $ | 6,143 | | | $ | 6,243 | | | $ | 17,298 | | | $ | 33,655 | |
Ratios with no waiver of fees and assumption of expenses by | | | | | | | | | | | | | | | | | | | | |
| the Adviser and no reduction for fees paid indirectly: | | | | | | | | | | | | | | | | | | | | |
| Total expenses to average net assets | | | 1.33 | % | | | 1.21 | % | | | 1.23 | % | | | 1.12 | % | | | 1.07 | % |
| Net investment income (loss) to average net assets | | | 0.83 | % | | | 1.36 | % | | | 2.20 | % | | | 1.50 | % | | | 1.34 | % |
* The Fund was audited by an independent registered public accounting firm other than Ernst & Young LLP.
(a) The per-share data presented above is based on the average shares outstanding for the period presented.
(b) Assumes initial investment at net asset value at the beginning of each period, reinvestment of all distributions and the complete redemption of the investment at net asset value at the end of each period.
The accompanying notes are an integral part of these financial statements.
26 Pioneer Real Estate Shares | Annual Report | 12/31/20
Notes to Financial Statements |
12/31/20 1. Organization and Significant Accounting Policies
Pioneer Real Estate Shares (the “Fund”) is a Delaware statutory trust. The Fund is registered under the Investment Company Act of 1940 as a diversified, open-end management investment company. The investment objective of the Fund is to seek long-term growth of capital. Current income is a secondary objective.
The Fund offers three classes of shares designated as Class A, Class C and Class Y shares. Each class of shares represents an interest in the same portfolio of investments of the Fund and has identical rights (based on relative net asset values) to assets and liquidation proceeds. Share classes can bear different rates of class-specific fees and expenses, such as transfer agent and distribution fees. Differences in class-specific fees and expenses will result in differences in net investment income and, therefore, the payment of different dividends from net investment income earned by each class. The Amended and Restated Declaration of Trust of the Fund gives the Board of Trustees the flexibility to specify either per-share voting or dollar-weighted voting when submitting matters for shareowner approval. Under per-share voting, each share of a class of the Fund is entitled to one vote. Under dollar-weighted voting, a shareowner’s voting power is determined not by the number of shares owned, but by the dollar value of the shares on the record date. Each share class has exclusive voting rights with respect to matters affecting only that class, including with respect to the distribution plan for that class. There is no distribution plan for Class Y shares.
Amundi Asset Management US, Inc., an indirect, wholly owned subsidiary of Amundi and Amundi’s wholly owned subsidiary, Amundi USA, Inc., serves as the Fund’s investment adviser (the “Adviser”). Prior to January 1, 2021, the Adviser was named Amundi Pioneer Asset Management, Inc. Amundi Distributor US, Inc., an affiliate of Amundi Asset Management US, Inc., serves as the Fund’s distributor (the “Distributor”).
In August 2018, the Financial Accounting Standards Board (FASB) issued Accounting Standards Update 2018-13 “Disclosure Framework – Changes to the Disclosure Requirements for Fair Value Measurement” (“ASU 2018-13”) which modifies disclosure requirements for fair value measurements, principally for Level 3 securities and transfers between levels of the fair value hierarchy. ASU 2018-13 is effective for fiscal years beginning after December 15, 2019 and for interim periods within those fiscal years. The Fund has adopted ASU 2018-13 for the year ended December 31, 2020. The impact to the Fund’s adoption was limited to changes in the Fund’s
Pioneer Real Estate Shares | Annual Report | 12/31/20 27
disclosures regarding fair value, primarily those disclosures related to transfers between levels of the fair value hierarchy and disclosure of the range and weighted average used to develop significant unobservable inputs for Level 3 fair value investments, when applicable.
In March 2020, FASB issued an Accounting Standard Update, ASU 2020-04, Reference Rate Reform (Topic 848) — Facilitation of the Effects of Reference Rate Reform on Financial Reporting (“ASU 2020-04”), which provides optional, temporary relief with respect to the financial reporting of contracts subject to certain types of modifications due to the planned discontinuation of the London Interbank Offered Rate (“LIBOR”) and other LIBOR-based reference rates at the end of 2021. The temporary relief provided by ASU 2020-04 is effective for certain reference rate-related contract modifications that occur during the period from March 12, 2020 through December 31, 2022. Management is evaluating the impact of ASU 2020-04 on the Trust’s investments, derivatives, debt and other contracts that will undergo reference rate-related modifications as a result of the reference rate reform.
The Fund is an investment company and follows investment company accounting and reporting guidance under U.S. Generally Accepted Accounting Principles (“U.S. GAAP”). U.S. GAAP requires the management of the Fund to make estimates and assumptions that affect the reported amounts of assets and liabilities, the disclosure of contingent assets and liabilities at the date of the financial statements, and the reported amounts of income, expenses and gain or loss on investments during the reporting period. Actual results could differ from those estimates.
The following is a summary of significant accounting policies followed by the Fund in the preparation of its financial statements:
A. Security Valuation
The net asset value of the Fund is computed once daily, on each day the New York Stock Exchange (“NYSE”) is open, as of the close of regular trading on the NYSE.
Equity securities which may include restricted securities that have traded on an exchange are valued by using the last sale price on the principal exchange where they are traded. Equity securities which may include restricted securities that have not traded on the date of valuation, or securities for which sale prices are not available, generally are valued using the mean between the last bid and asked prices or, if both last bid and asked prices are not available, at the last quoted bid price. Last sale and bid and asked prices are provided by independent third party pricing services. In the case of equity securities which may include restricted
28 Pioneer Real Estate Shares | Annual Report | 12/31/20
securities not traded on an exchange, prices are typically determined by independent third party pricing services using a variety of techniques and methods.
The value of foreign securities is translated into U.S. dollars based on foreign currency exchange rate quotations supplied by a third party pricing source. Trading in non-U.S. equity securities is substantially completed each day at various times prior to the close of the NYSE. The values of such securities used in computing the net asset value of the Fund’s shares are determined as of such times. The Fund may use a fair value model developed by an independent pricing service to value non-U.S. equity securities.
Securities for which independent pricing services or broker-dealers are unable to supply prices or for which market prices and/or quotations are not readily available or are considered to be unreliable are valued by a fair valuation team comprised of certain personnel of the Adviser pursuant to procedures adopted by the Fund’s Board of Trustees. The Adviser’s fair valuation team uses fair value methods approved by the Valuation Committee of the Board of Trustees. The Adviser’s fair valuation team is responsible for monitoring developments that may impact fair valued securities and for discussing and assessing fair values on an ongoing basis, and at least quarterly, with the Valuation Committee of the Board of Trustees.
Inputs used when applying fair value methods to value a security may include credit ratings, the financial condition of the company, current market conditions and comparable securities. The Fund may use fair value methods if it is determined that a significant event has occurred after the close of the exchange or market on which the security trades and prior to the determination of the Fund’s net asset value. Examples of a significant event might include political or economic news, corporate restructurings, natural disasters, terrorist activity or trading halts. Thus, the valuation of the Fund’s securities may differ significantly from exchange prices, and such differences could be material.
At December 31, 2020, no securities were valued using fair value methods (other than securities valued using prices supplied by independent pricing services, broker-dealers or using a third party insurance industry pricing model).
B. Investment Income and Transactions
Dividend income is recorded on the ex-dividend date, except that certain dividends from foreign securities where the ex-dividend date may have passed are recorded as soon as the Fund becomes aware of the ex-dividend data in the exercise of reasonable diligence.
Pioneer Real Estate Shares | Annual Report | 12/31/20 29
Interest income, including interest on income-bearing cash accounts, is recorded on the accrual basis. Dividend and interest income are reported net of unrecoverable foreign taxes withheld at the applicable country rates and net of income accrued on defaulted securities.
Interest and dividend income payable by delivery of additional shares is reclassified as PIK (payment-in-kind) income upon receipt and is included in interest and dividend income, respectively.
Security transactions are recorded as of trade date. Gains and losses on sales of investments are calculated on the identified cost method for both financial reporting and federal income tax purposes.
C. Foreign Currency Translation
The books and records of the Fund are maintained in U.S. dollars. Amounts denominated in foreign currencies are translated into U.S. dollars using current exchange rates.
Net realized gains and losses on foreign currency transactions, if any, represent, among other things, the net realized gains and losses on foreign currency exchange contracts, disposition of foreign currencies and the difference between the amount of income accrued and the U.S. dollars actually received. Further, the effects of changes in foreign currency exchange rates on investments are not segregated on the Statement of Operations from the effects of changes in the market prices of those securities, but are included with the net realized and unrealized gain or loss on investments.
D. Federal Income Taxes
It is the Fund’s policy to comply with the requirements of the Internal Revenue Code applicable to regulated investment companies and to distribute all of its net taxable income and net realized capital gains, if any, to its shareowners. Therefore, no provision for federal income taxes is required. As of December 31, 2020, the Fund did not accrue any interest or penalties with respect to uncertain tax positions, which, if applicable, would be recorded as an income tax expense on the Statement of Operations. Tax returns filed within the prior three years remain subject to examination by federal and state tax authorities.
A portion of the dividend income recorded by the Fund is from distributions by publicly traded Real Estate Investment Trusts (“REITs”), and such distributions for tax purposes may also consist of capital gains and return of capital. The actual return of capital and capital gains portions of such distributions will be determined by formal notifications from the REITs subsequent to the calendar year-end. Distributions received from the REITs
30 Pioneer Real Estate Shares | Annual Report | 12/31/20
that are determined to be a return of capital are recorded by the Fund as a reduction of the cost basis of the securities held and those determined to be capital gain are reflected as such on the Statement of Operations.
The amount and character of income and capital gain distributions to shareowners are determined in accordance with federal income tax rules, which may differ from U.S. GAAP. Distributions in excess of net investment income or net realized gains are temporary over distributions for financial statement purposes resulting from differences in the recognition or classification of income or distributions for financial statement and tax purposes. Capital accounts within the financial statements are adjusted for permanent book/tax differences to reflect tax character, but are not adjusted for temporary differences.
At December 31, 2020, the Fund was permitted to carry forward indefinitely $8,956,737 of short-term losses.
The tax character of distributions paid during the years ended December 31, 2020 and December 31, 2019, were as follows:
| | | 2020 | | | 2019 | |
| Distributions paid from: | | | | | | |
| Ordinary income | | $ | 507,397 | | | $ | 1,512,258 | |
| Long-term capital gain | | | 858,555 | | | | 16,340,167 | |
| Return of capital | | | 719,716 | | | | — | |
| Total | | $ | 2,085,668 | | | $ | 17,852,425 | |
The following shows the components of distributable earnings on a federal income tax basis at December 31, 2020:
| | | 2020 | |
| Distributable earnings: | | | |
| Undistributed long term capital gain | | $ | — | |
| Net unrealized appreciation | | | 17,201,737 | |
| Capital loss carry forward | | | (8,956,737 | ) |
| Total | | $ | 8,245,000 | |
The difference between book-basis and tax-basis net unrealized appreciation is attributable to the tax deferral of losses on wash sales.
E. Fund Shares
The Fund records sales and repurchases of its shares as of trade date. The Distributor earned $3,799 in underwriting commissions on the sale of Class A shares during the year ended December 31, 2020.
Pioneer Real Estate Shares | Annual Report | 12/31/20 31
F. Class Allocations
Income, common expenses and realized and unrealized gains and losses are calculated at the Fund level and allocated daily to each class of shares based on its respective percentage of adjusted net assets at the beginning of the day.
Distribution fees are calculated based on the average daily net asset value attributable to Class A and Class C shares of the Fund, respectively (see Note 5). Class Y shares do not pay distribution fees. All expenses and fees paid to the Fund’s transfer agent for its services are allocated among the classes of shares based on the number of accounts in each class and the ratable allocation of related out-of-pocket expenses (see Note 4).
Distributions to shareowners are recorded as of the ex-dividend date. Distributions paid by the Fund with respect to each class of shares are calculated in the same manner and at the same time, except that net investment income dividends to Class A, Class C and Class Y shares can reflect different transfer agent and distribution expense rates.
G. Risks
The value of securities held by the Fund may go up or down, sometimes rapidly or unpredictably, due to general market conditions, such as real or perceived adverse economic, political or regulatory conditions, recessions, the spread of infectious illness or other public health issues, inflation, changes in interest rates, lack of liquidity in the bond markets or adverse investor sentiment. In the past several years, financial markets have experienced increased volatility, depressed valuations, decreased liquidity and heightened uncertainty. These conditions may continue, recur, worsen or spread. A general rise in interest rates could adversely affect the price and liquidity of fixed-income securities and could also result in increased redemptions from the Fund.
At times, the Fund’s investments may represent industries or industry sectors that are interrelated or have common risks, making the Fund more susceptible to any economic, political, or regulatory developments or other risks affecting those industries and sectors. The Fund’s investments in foreign markets and countries with limited developing markets may subject the Fund to a greater degree of risk than investments in a developed market. These risks include disruptive political or economic conditions and the imposition of adverse governmental laws or currency exchange restrictions.
Because the Fund may invest a substantial portion of its assets in REITs, the Fund may be subject to certain risks associated with direct investments in REITs. REITs may be affected by changes in the value of their underlying
32 Pioneer Real Estate Shares | Annual Report | 12/31/20
properties and by defaults of their borrowers or tenants. REITs depend generally on their ability to generate cash flow to make distributions to shareowners, and certain REITs have self-liquidation provisions by which mortgages held may be paid in full and distributions of capital returns may be made at any time. In addition, the performance of a REIT may be affected by its failure to qualify for tax-free pass through of income under the Internal Revenue Code or its failure to maintain exemption from registration under the Investment Company Act of 1940.
With the increased use of technologies such as the Internet to conduct business, the Fund is susceptible to operational, information security and related risks. While the Fund’s Adviser has established business continuity plans in the event of, and risk management systems to prevent, limit or mitigate, such cyber-attacks, there are inherent limitations in such plans and systems, including the possibility that certain risks have not been identified. Furthermore, the Fund cannot control the cybersecurity plans and systems put in place by service providers to the Fund such as Brown Brothers Harriman & Co., the Fund’s custodian and accounting agent, and DST Asset Manager Solutions, Inc., the Fund’s transfer agent. In addition, many beneficial owners of Fund shares hold them through accounts at broker-dealers, retirement platforms and other financial market participants over which neither the Fund nor Amundi US exercises control. Each of these may in turn rely on service providers to them, which are also subject to the risk of cyber-attacks. Cybersecurity failures or breaches at Amundi US or the Fund’s service providers or intermediaries have the ability to cause disruptions and impact business operations, potentially resulting in financial losses, interference with the Fund’s ability to calculate its net asset value, impediments to trading, the inability of Fund shareowners to effect share purchases, redemptions or exchanges or receive distributions, loss of or unauthorized access to private shareowner information and violations of applicable privacy and other laws, regulatory fines, penalties, reputational damage, or additional compliance costs. Such costs and losses may not be covered under any insurance. In addition, maintaining vigilance against cyber-attacks may involve substantial costs over time, and system enhancements may themselves be subject to cyber-attacks.
COVID-19
The respiratory illness COVID-19 caused by a novel coronavirus has resulted in a global pandemic and major disruption to economies and markets around the world, including the United States. Global financial markets have experienced extreme volatility and severe losses, and trading in many instruments has been disrupted. Liquidity for many instruments has been
Pioneer Real Estate Shares | Annual Report | 12/31/20 33
greatly reduced for periods of time. Some interest rates are very low and in some cases yields are negative. Some sectors of the economy and individual issuers have experienced particularly large losses. These circumstances may continue for an extended period of time, and may continue to affect adversely the value and liquidity of the Fund’s investments. The ultimate economic fallout from the pandemic, and the long-term impact on economies, markets, industries and individual issuers, are not known. Governments and central banks, including the Federal Reserve in the U.S., have taken extraordinary and unprecedented actions to support local and global economies and the financial markets. These actions have resulted in significant expansion of public debt, including in the U.S. The impact of these measures, and whether they will be effective to mitigate the economic and market disruption, will not be known for some time. The consequences of high public debt, including its future impact on the economy and securities markets, likewise may not be known for some time.
The Fund’s prospectus contains unaudited information regarding the Fund’s principal risks. Please refer to that document when considering the Fund’s principal risks.
2. Management Agreement
The Adviser manages the Fund’s portfolio. Management fees are calculated daily and paid monthly at the annual rate of 0.80% of the Fund’s average daily net assets up to $1 billion and 0.75% on average daily net assets over $1 billion. For the year ended December 31, 2020, the effective management fee (excluding waivers and/or assumption of expenses) was equivalent to 0.80% of the Fund’s average daily net assets.
The Adviser has contractually agreed to limit ordinary operating expenses (ordinary operating expenses means all fund expenses other than extraordinary expenses, such as litigation, taxes, brokerage commissions and acquired fund fees and expenses) of the Fund to the extent required to reduce Fund expenses to 1.50% and 1.20% of the average daily net assets attributable to Class A and Class Y shares, respectively. Class C shares do not have an expense limitation. These expense limitations are in effect through May 1, 2021. Fees waived and expenses reimbursed during the year ended December 31, 2020 are reflected on the Statement of Operations.
In addition, under the management and administration agreements, certain other services and costs, including accounting, regulatory reporting and insurance premiums, are paid by the Fund as administrative reimbursements. Included in “Due to affiliates” reflected on the Statement of Assets and Liabilities is $5,803 in management fees, administrative costs and certain other reimbursements payable to the Adviser at December 31, 2020.
34 Pioneer Real Estate Shares | Annual Report | 12/31/20
3. Compensation of Trustees and Officers
The Fund pays an annual fee to its Trustees. The Adviser reimburses the Fund for fees paid to the Interested Trustees. The Fund does not pay any salary or other compensation to its officers. For the year ended December 31, 2020, the Fund paid $7,766 in Trustees’ compensation, which is reflected on the Statement of Operations as Trustees’ fees. At December 31, 2020, the Fund had a payable for Trustees’ fees on its Statement of Assets and Liabilities of $6.
4. Transfer Agent
DST Asset Manager Solutions, Inc. serves as the transfer agent to the Fund at negotiated rates. Transfer agent fees and payables shown on the Statement of Operations and the Statement of Assets and Liabilities, respectively, include sub-transfer agent expenses incurred through the Fund’s omnibus relationship contracts.
In addition, the Fund reimbursed the transfer agent for out-of-pocket expenses incurred by the transfer agent related to shareowner communications activities such as proxy and statement mailings, and outgoing phone calls. For the year ended December 31, 2020, such out-of-pocket expenses by class of shares were as follows:
| Shareowner Communications: | | | |
Class A | | $ | 38,154 | |
Class C | | | 4,285 | |
Class Y | | | 885 | |
| Total | | $ | 43,324 | |
5. Distribution and Service Plans
The Fund has adopted a distribution plan (the “Plan”) pursuant to Rule 12b-1 of the Investment Company Act of 1940 with respect to its Class A and Class C shares. Pursuant to the Plan, the Fund pays the Distributor 0.25% of the average daily net assets attributable to Class A shares as compensation for personal services and/or account maintenance services or distribution services with regard to Class A shares. Pursuant to the Plan, the Fund also pays the Distributor 1.00% of the average daily net assets attributable to Class C shares. The fee for Class C shares consists of a 0.25% service fee and a 0.75% distribution fee paid as compensation for personal services and/or account maintenance services or distribution services with regard to Class C shares. Included in “Due to affiliates” reflected on the Statement of Assets and Liabilities is $1,567 in distribution fees payable to the Distributor at December 31, 2020.
Pioneer Real Estate Shares | Annual Report | 12/31/20 35
In addition, redemptions of Class A and Class C shares may be subject to a contingent deferred sales charge (“CDSC”). A CDSC of 1.00% may be imposed on redemptions of certain net asset value purchases of Class A shares within 12 months of purchase. Redemptions of Class C shares within 12 months of purchase are subject to a CDSC of 1.00%, based on the lower of cost or market value of shares being redeemed. Shares purchased as part of an exchange remain subject to any CDSC that applied to the original purchase of those shares. There is no CDSC for Class Y shares. Proceeds from the CDSCs are paid to the Distributor. For the year ended December 31, 2020, CDSCs in the amount of $607 were paid to the Distributor.
6. Line of Credit Facility
The Fund, along with certain other funds in the Pioneer Family of Funds (the “Funds”), participates in a committed, unsecured revolving line of credit (“credit facility”). Borrowings are used solely for temporary or emergency purposes. The Fund may borrow up to the lesser of the amount available under the credit facility or the limits set for borrowing by the Fund’s prospectus and the 1940 Act. Effective March 11, 2020, the Fund participates in a facility in the amount of $300 million. Prior to March 11, 2020, the Fund participated in a facility in the amount of $250 million. Under such facility, depending on the type of loan, interest on borrowings is payable at the London Interbank Offered Rate (“LIBOR”) plus a credit spread. The Fund also pays an annual commitment fee to participate in the credit facility. The commitment fee in the amount of 0.30% of the daily unused portion of the credit facility is allocated among participating Funds based on an allocation schedule set forth in the credit agreement. For the year ended December 31, 2020, the Fund had no borrowings under the credit facility.
36 Pioneer Real Estate Shares | Annual Report | 12/31/20
Report of Independent Registered Public Accounting Firm
To the Board of Trustees and the Shareholders of Pioneer Real Estate Shares:
Opinion on the Financial Statements
We have audited the accompanying statement of assets and liabilities of Pioneer Real Estate Shares (the “Fund”), including the schedule of investments, as of December 31, 2020, and the related statement of operations for the year then ended, the statements of changes in net assets for each of the two years in the period then ended, the financial highlights for each of the four years in the period then ended and the related notes (collectively referred to as the “financial statements”). The financial highlights for the period ended December 31, 2016 were audited by another independent registered public accounting firm whose report, dated February 22, 2017, expressed an unqualified opinion on those financial highlights. In our opinion, the financial statements present fairly, in all material respects, the financial position of the Fund at December 31, 2020, the results of its operations for the year then ended, the changes in its nets assets for each of the two years in the period then ended, and its financial highlights for each of the four years in the period then ended in conformity with U.S. generally accepted accounting principles.
Basis for Opinion
These financial statements are the responsibility of the Fund’s management. Our responsibility is to express an opinion on the Fund’s financial statements based on our audits. We are a public accounting firm registered with the Public Company Accounting Oversight Board (United States) (“PCAOB”) and are required to be independent with respect to the Fund in accordance with the U.S. federal securities laws and the applicable rules and regulations of the Securities and Exchange Commission and the PCAOB.
We conducted our audits in accordance with the standards of the PCAOB. Those standards require that we plan and perform the audit to obtain reasonable assurance about whether the financial statements are free of material misstatement, whether due to error or fraud. The Fund is not required to have, nor were we engaged to perform, an audit of the Fund’s internal control over financial reporting. As part of our audits, we are required to obtain an understanding of internal control over financial reporting, but not for the purpose of expressing an opinion on the effectiveness of the Fund’s internal control over financial reporting. Accordingly, we express no such opinion.
Pioneer Real Estate Shares | Annual Report | 12/31/20 37
Our audits included performing procedures to assess the risks of material misstatement of the financial statements, whether due to error or fraud, and performing procedures that respond to those risks. Such procedures included examining, on a test basis, evidence regarding the amounts and disclosures in the financial statements. Our procedures included confirmation of securities owned as of December 31, 2020, by correspondence with the custodian and brokers or by other appropriate auditing procedures where replies from brokers were not received. Our audits also included evaluating the accounting principles used and significant estimates made by management, as well as evaluating the overall presentation of the financial statements. We believe that our audits provide a reasonable basis for our opinion.
We have served as the auditor of one or more Amundi Pioneer investment companies since 2017.
Boston, Massachusetts
February 25, 2021
38 Pioneer Real Estate Shares | Annual Report | 12/31/20
ADDITIONAL INFORMATION (unaudited)
Proposed regulations dated January 18, 2019 enable a regulated investment company to pay Section 199A dividends to its shareowners. Section 199A, enacted as part of the Tax Cuts and Jobs Act of 2017, may allow non-corporate taxpayers a deduction of up to 20% on qualified business income from flow-through entities, including dividends from real estate investment trusts.
The qualifying percentage of the Fund’s ordinary income and short-term capital gain distributions, if any, for the purpose of the Section 199A deduction was 93.15%.
Pioneer Real Estate Shares | Annual Report | 12/31/20 39
Approval of Investment Management Agreement
Amundi Pioneer Asset Management, Inc.1 (“APAM”) serves as the investment adviser to Pioneer Real Estate Shares (the “Fund”) pursuant to an investment management agreement between APAM and the Fund. In order for APAM to remain the investment adviser of the Fund, the Trustees of the Fund must determine annually whether to renew the investment management agreement for the Fund.
The contract review process began in January 2020 as the Trustees of the Fund agreed on, among other things, an overall approach and timeline for the process. Contract review materials were provided to the Trustees in March 2020, July 2020 and September 2020. In addition, the Trustees reviewed and discussed the Fund’s performance at regularly scheduled meetings throughout the year, and took into account other information related to the Fund provided to the Trustees at regularly scheduled meetings, in connection with the review of the Fund’s investment management agreement.
In March 2020, the Trustees, among other things, discussed the memorandum provided by Fund counsel that summarized the legal standards and other considerations that are relevant to the Trustees in their deliberations regarding the renewal of the investment management agreement, and reviewed and discussed the qualifications of the investment management teams for the Fund, as well as the level of investment by the Fund’s portfolio managers in the Fund. In July 2020, the Trustees, among other things, reviewed the Fund’s management fees and total expense ratios, the financial statements of APAM and its parent companies, profitability analyses provided by APAM, and analyses from APAM as to possible economies of scale. The Trustees also reviewed the profitability of the institutional business of APAM and APAM’s affiliate, Amundi Pioneer Institutional Asset Management, Inc.2 (“APIAM” and, together with APAM, “Amundi Pioneer”), as compared to that of APAM’s fund management business, and considered the differences between the fees and expenses of the Fund and the fees and expenses of APAM’s and APIAM’s institutional accounts, as well as the different services provided by APAM to the Fund and by APAM and APIAM to the institutional accounts. The Trustees further considered contract review materials, including additional materials received in response to the Trustees’ request, in September 2020.
1 | Effective January 1, 2021, Amundi Pioneer Asset Management, Inc. changed its name to Amundi Asset Management US, Inc. (“Amundi US”). |
| | |
2 | Effective January 1, 2021, Amundi Pioneer Institutional Asset Management, Inc. (“APIAM”) merged with and into Amundi US. After the Merger, the investment advisory services previously provided by APIAM are now provided through Amundi US. |
40 Pioneer Real Estate Shares | Annual Report | 12/31/20
At a meeting held on September 15, 2020, based on their evaluation of the information provided by APAM and third parties, the Trustees of the Fund, including the Independent Trustees voting separately, unanimously approved the renewal of the investment management agreement for another year. In approving the renewal of the investment management agreement, the Trustees considered various factors that they determined were relevant, including the factors described below. The Trustees did not identify any single factor as the controlling factor in determining to approve the renewal of the agreement.
Nature, Extent and Quality of Services
The Trustees considered the nature, extent and quality of the services that had been provided by APAM to the Fund, taking into account the investment objective and strategy of the Fund. The Trustees also reviewed APAM’s investment approach for the Fund and its research process. The Trustees considered the resources of APAM and the personnel of APAM who provide investment management services to the Fund. They also reviewed the amount of non-Fund assets managed by the portfolio managers of the Fund. They considered the non-investment resources and personnel of APAM that are involved in APAM’s services to the Fund, including APAM’s compliance, risk management, and legal resources and personnel. The Trustees noted the substantial attention and high priority given by APAM’s senior management to the Pioneer Fund complex. The Trustees considered the implementation and effectiveness of APAM’s business continuity plan in response to the COVID-19 pandemic.
The Trustees considered that APAM supervises and monitors the performance of the Fund’s service providers and provides the Fund with personnel (including Fund officers) and other resources that are necessary for the Fund’s business management and operations. The Trustees also considered that, as administrator, APAM is responsible for the administration of the Fund’s business and other affairs. The Trustees considered the fees paid to APAM for the provision of administration services.
Based on these considerations, the Trustees concluded that the nature, extent and quality of services that had been provided by APAM to the Fund were satisfactory and consistent with the terms of the investment management agreement.
Performance of the Fund
In considering the Fund’s performance, the Trustees regularly review and discuss throughout the year data prepared by APAM and information comparing the Fund’s performance with the performance of its peer group of funds, as classified by Morningstar, Inc. (Morningstar), and with the
Pioneer Real Estate Shares | Annual Report | 12/31/20 41
performance of the Fund’s benchmark index. They also discuss the Fund’s performance with APAM on a regular basis. The Trustees’ regular reviews and discussions were factored into the Trustees’ deliberations concerning the renewal of the investment management agreement.
Management Fee and Expenses
The Trustees considered information showing the fees and expenses of the Fund in comparison to the management fees of its peer group of funds as classified by Morningstar and also to the expense ratios of a peer group of funds selected on the basis of criteria determined by the Independent Trustees for this purpose using data provided by Strategic Insight Mutual Fund Research and Consulting, LLC (Strategic Insight), an independent third party. The peer group comparisons referred to below are organized in quintiles. Each quintile represents one-fifth of the peer group. In all peer group comparisons referred to below, first quintile is most favorable to the Fund’s shareowners. The Trustees noted that they separately review and consider the impact of the Fund’s transfer agency and Fund- and APAM-paid expenses for sub-transfer agency and intermediary arrangements, and that the results of the most recent such review were considered in the consideration of the Fund’s expense ratio.
The Trustees considered that the Fund’s management fee for the most recent fiscal year was in the fourth quintile relative to the management fees paid by other funds in its Morningstar category for the comparable period. The Trustees noted the resource commitment necessary to manage a real estate fund that invests more significantly in non-U.S. securities than its peers. The Trustees considered that the expense ratio of the Fund’s Class A shares for the most recent fiscal year was in the fifth quintile relative to its Strategic Insight peer group for the comparable period. The Trustees noted the Fund’s relatively small asset size compared to most of the other funds in its peer group. The Trustees considered that non-management fee operating expenses generally are spread over a smaller asset base than the other funds in the peer group, which results in these fees being significantly higher as a percentage of assets. The Trustees noted that APAM had agreed to waive fees and/or reimburse expenses in order to limit the ordinary operating expenses of the Fund.
The Trustees reviewed management fees charged by APAM and APIAM to institutional and other clients, including publicly offered European funds sponsored by APAM’s affiliates, unaffiliated U.S. registered investment companies (in a sub-advisory capacity), and unaffiliated foreign and domestic separate accounts. The Trustees also considered APAM’s costs in providing services to the Fund and APAM’s and APIAM’s costs in providing services to the other clients and considered the differences in management fees and profit margins for fund and non-fund services. In evaluating the
42 Pioneer Real Estate Shares | Annual Report | 12/31/20
fees associated with APAM’s and APIAM’s client accounts, the Trustees took into account the respective demands, resources and complexity associated with the Fund and other client accounts. The Trustees noted that, in some instances, the fee rates for those clients were lower than the management fee for the Fund and considered that, under the investment management agreement with the Fund, APAM performs additional services for the Fund that it does not provide to those other clients or services that are broader in scope, including oversight of the Fund’s other service providers and activities related to compliance and the extensive regulatory and tax regimes to which the Fund is subject. The Trustees also considered the entrepreneurial risks associated with APAM’s management of the Fund.
The Trustees concluded that the management fee payable by the Fund to APAM was reasonable in relation to the nature and quality of the services provided by APAM.
Profitability
The Trustees considered information provided by APAM regarding the profitability of APAM with respect to the advisory services provided by APAM to the Fund, including the methodology used by APAM in allocating certain of its costs to the management of the Fund. The Trustees also considered APAM’s profit margin in connection with the overall operation of the Fund. They further reviewed the financial results, including the profit margins, realized by APAM and APIAM from non-fund businesses. The Trustees considered APAM’s profit margins in comparison to the limited industry data available and noted that the profitability of any adviser was affected by numerous factors, including its organizational structure and method for allocating expenses. The Trustees concluded that APAM’s profitability with respect to the management of the Fund was not unreasonable.
Economies of Scale
The Trustees considered APAM’s views relating to economies of scale in connection with the Pioneer Funds as fund assets grow and the extent to which any such economies of scale are shared with the Fund and Fund shareholders. The Trustees recognize that economies of scale are difficult to identify and quantify, and that, among other factors that may be relevant, are the following: fee levels, expense subsidization, investment by APAM in research and analytical capabilities and APAM’s commitment and resource allocation to the Fund. The Trustees noted that profitability also may be an indicator of the availability of any economies of scale, although profitability may vary for other reasons including due to reductions in expenses. The Trustees concluded that economies of scale, if any, were being appropriately shared with the Fund.
Pioneer Real Estate Shares | Annual Report | 12/31/20 43
Other Benefits
The Trustees considered the other benefits that APAM enjoys from its relationship with the Fund. The Trustees considered the character and amount of fees paid or to be paid by the Fund, other than under the investment management agreement, for services provided by APAM and its affiliates. The Trustees further considered the revenues and profitability of APAM’s businesses other than the Fund business. To the extent applicable, the Trustees also considered the benefits to the Fund and to APAM and its affiliates from the use of “soft” commission dollars generated by the Fund to pay for research and brokerage services.
The Trustees considered that Amundi Pioneer is the principal U.S. asset management business of Amundi, which is one of the largest asset managers globally. Amundi’s worldwide asset management business manages over $1.7 trillion in assets (including the Pioneer Funds). The Trustees considered that APAM’s relationship with Amundi creates potential opportunities for APAM, APIAM and Amundi that derive from APAM’s relationships with the Fund, including Amundi’s ability to market the services of APAM globally. The Trustees noted that APAM has access to additional research and portfolio management capabilities as a result of its relationship with Amundi and Amundi’s enhanced global presence that may contribute to an increase in the resources available to APAM. The Trustees considered that APAM and the Fund receive reciprocal intangible benefits from the relationship, including mutual brand recognition and, for the Fund, direct and indirect access to the resources of a large global asset manager. The Trustees concluded that any such benefits received by APAM as a result of its relationship with the Fund were reasonable.
Conclusion
After consideration of the factors described above as well as other factors, the Trustees, including the Independent Trustees, concluded that the investment management agreement for the Fund, including the fees payable thereunder, was fair and reasonable and voted to approve the proposed renewal of the investment management agreement.
44 Pioneer Real Estate Shares | Annual Report | 12/31/20
Trustees, Officers
and Service Providers
Investment Adviser and Administrator
Amundi Asset Management US, Inc.
Custodian and Sub-Administrator
Brown Brothers Harriman & Co.
Independent Registered Public Accounting Firm
Ernst & Young LLP
Principal Underwriter
Amundi Distributor US, Inc.
Legal Counsel
Morgan, Lewis & Bockius LLP
Transfer Agent
DST Asset Manager Solutions, Inc.
Proxy Voting Policies and Procedures of the Fund are available without charge, upon request, by calling our toll free number (1-800-225-6292). Information regarding how the Fund voted proxies relating to portfolio securities during the most recent 12-month period ended June 30 is publicly available to shareowners at www.amundi.com/us. This information is also available on the Securities and Exchange Commission’s web site at www.sec.gov.
Trustees and Officers
The Fund’s Trustees and officers are listed below, together with their principal occupations and other directorships they have held during at least the past five years. Trustees who are interested persons of the Fund within the meaning of the 1940 Act are referred to as Interested Trustees. Trustees who are not interested persons of the Fund are referred to as Independent Trustees. Each of the Trustees serves as a Trustee of each of the 45 US registered investment portfolios for which Amundi US serves as investment adviser (the “Pioneer Funds”). The address for all Trustees and all officers of the Fund is 60 State Street, Boston, Massachusetts 02109.
The Statement of Additional Information of the Fund includes additional information about the Trustees and is available, without charge, upon request, by calling 1-800-225-6292.
Pioneer Real Estate Shares | Annual Report | 12/31/20 45
Independent Trustees
| Name, Age and Position | Term of Office and | | Other Directorships |
| Held With the Fund | Length of Service | Principal Occupation | Held by Trustee |
| Thomas J. Perna (70) | Trustee since 2006. | Private investor (2004 – 2008 and 2013 – present); Chairman (2008 – 2013) | Director, Broadridge Financial |
Chairman of the Board | Serves until a successor | and Chief Executive Officer (2008 – 2012), Quadriserv, Inc. (technology | Solutions, Inc. (investor |
and Trustee | trustee is elected or | products for securities lending industry); and Senior Executive Vice | communications and securities |
| earlier retirement | President, The Bank of New York (financial and securities services) | processing provider for financial |
| or removal. | (1986 – 2004) | services industry) (2009 – present); |
| | | Director, Quadriserv, Inc. (2005 – |
| | | 2013); and Commissioner, New |
| | | Jersey State Civil Service |
| | | Commission (2011 – 2015) |
| John E. Baumgardner, Jr. (69) | Trustee since 2019. | Of Counsel (2019 – present), Partner (1983-2018), Sullivan & Cromwell | Chairman, The Lakeville Journal |
Trustee | Serves until a successor | LLP (law firm). | Company, LLC, (privately-held |
| trustee is elected or | | community newspaper group) |
| earlier retirement | | (2015-present) |
| or removal. | | |
| Diane Durnin (63) | Trustee since 2019. | Managing Director – Head of Product Strategy and Development, BNY | None |
Trustee | Serves until a successor | Mellon Investment Management (investment management firm) | |
| trustee is elected or | (2012-2018); Vice Chairman – The Dreyfus Corporation (2005 – 2018): | |
| earlier retirement | Executive Vice President Head of Product, BNY Mellon Investment | |
| or removal. | Management (2007-2012); Executive Director- Product Strategy, Mellon | |
| | Asset Management (2005-2007); Executive Vice President Head of Products, | |
| | Marketing and Client Service, Dreyfus Corporation (investment management | |
| | firm) (2000-2005); and Senior Vice President Strategic Product and Business | |
| | Development, Dreyfus Corporation (1994-2000) | |
46 Pioneer Real Estate Shares | Annual Report | 12/31/20
| | | | |
| Name, Age and Position | Term of Office and | | Other Directorships |
| Held With the Fund | Length of Service | Principal Occupation | Held by Trustee |
| Benjamin M. Friedman (76) | Trustee since 2008. | William Joseph Maier Professor of Political Economy, Harvard University | Trustee, Mellon Institutional Funds |
Trustee | Serves until a successor | (1972 – present) | Investment Trust and Mellon |
| trustee is elected or | | Institutional Funds Master Portfolio |
| earlier retirement | | (oversaw 17 portfolios in fund |
| or removal. | | complex) (1989 - 2008) |
| Lorraine H. Monchak (64) | Trustee since 2017. | Chief Investment Officer, 1199 SEIU Funds (healthcare workers union | None |
Trustee | (Advisory Trustee from | pension funds) (2001 – present); Vice President – International Investments | |
| 2014 – 2017). Serves | Group, American International Group, Inc. (insurance company) | |
| until a successor trustee | (1993 – 2001); Vice President – Corporate Finance and Treasury Group, | |
| is elected or earlier | Citibank, N.A. (1980 – 1986 and 1990 – 1993); Vice President – | |
| retirement or removal. | Asset/Liability Management Group, Federal Farm Funding Corporation | |
| | (government-sponsored issuer of debt securities) (1988 – 1990); Mortgage | |
| | Strategies Group, Shearson Lehman Hutton, Inc. (investment bank) | |
| | (1987 – 1988); and Mortgage Strategies Group, Drexel Burnham Lambert, | |
| | Ltd. (investment bank) (1986 – 1987) | |
| Marguerite A. Piret (72) | Trustee since 1995. | Chief Financial Officer, American Ag Energy, Inc. (controlled environment | Director of New America High |
Trustee | Serves until a successor | and agriculture company) (2016 – present); and President and Chief | Income Fund, Inc. (closed-end |
| trustee is elected or | Executive Officer, Metric Financial Inc. (formerly known as Newbury Piret | investment company) (2004 – |
| earlier retirement | Company) (investment banking firm) (1981 – 2019) | present); and Member, Board of |
| or removal. | | Governors, Investment Company |
| | | Institute (2000 – 2006) |
Pioneer Real Estate Shares | Annual Report | 12/31/20 47
Independent Trustees (continued)
| | | | |
| Name, Age and Position | Term of Office and | | Other Directorships |
| Held With the Fund | Length of Service | Principal Occupation | Held by Trustee |
| Fred J. Ricciardi (73) | Trustee since 2014. | Private investor (2020 – present); Consultant (investment company services) | None |
Trustee | Serves until a successor | (2012 – 2020); Executive Vice President, BNY Mellon (financial and | |
| trustee is elected or | investment company services) (1969 – 2012); Director, BNY International | |
| earlier retirement | Financing Corp. (financial services) (2002 – 2012); Director, Mellon Overseas | |
| or removal. | Investment Corp. (financial services) (2009 – 2012); Director, Financial | |
| | Models (technology) (2005-2007); Director, BNY Hamilton Funds, Ireland | |
| | (offshore investment companies) (2004-2007); Chairman/Director, AIB/BNY | |
| | Securities Services, Ltd., Ireland (financial services) (1999-2006); and | |
| | Chairman, BNY Alternative Investment Services, Inc. (financial services) | |
| | (2005-2007) | |
48 Pioneer Real Estate Shares | Annual Report | 12/31/20
Interested Trustees
| | | | |
| Name, Age and Position | Term of Office and | | Other Directorships |
| Held With the Fund | Length of Service | Principal Occupation | Held by Trustee |
| Lisa M. Jones (58)* | Trustee since 2017. | Director, CEO and President of Amundi US, Inc. (investment management | None |
Trustee, President and | Serves until a successor | firm) (since September 2014); Director, CEO and President of Amundi | |
Chief Executive Officer | trustee is elected or | Asset Management US, Inc. (since September 2014); Director, CEO and | |
| earlier retirement | President of Amundi Distributor US, Inc. (since September 2014); Director, | |
| or removal | CEO and President of Amundi Asset Management US, Inc. (since September | |
| | 2014); Chair, Amundi US, Inc., Amundi Distributor US, Inc. and Amundi Asset | |
| | Management US, Inc. (September 2014 – 2018); Managing Director, Morgan | |
| | Stanley Investment Management (investment management firm) (2010 – 2013); | |
| | Director of Institutional Business, CEO of International, Eaton Vance | |
| | Management (investment management firm) (2005 – 2010); and Director of | |
| | | Amundi Holdings US, Inc. (since 2017) | |
| Kenneth J. Taubes (62)* | Trustee since 2014. | Director and Executive Vice President (since 2008) and Chief Investment | None |
Trustee | Serves until a successor | Officer, U.S. (since 2010) of Amundi US, Inc. (investment management firm); | |
| trustee is elected or | Director and Executive Vice President and Chief Investment Officer, U.S. of | |
| earlier retirement | Amundi US (since 2008); Executive Vice President and Chief Investment | |
| or removal | Officer, U.S. of Amundi Asset Management US, Inc. (since 2009); Portfolio | |
| | Manager of Amundi US (since 1999); and Director of Amundi Holdings US, Inc. | |
| | (since 2017) | |
* | Ms. Jones and Mr. Taubes are Interested Trustees because they are officers or directors of the Fund’s investment adviser and certain of its affiliates. |
Pioneer Real Estate Shares | Annual Report | 12/31/20 49
Fund Officers
| | | | |
| Name, Age and Position | Term of Office and | | Other Directorships |
| Held With the Fund | Length of Service | Principal Occupation | Held by Officer |
| Christopher J. Kelley (56) | Since 2003. Serves | Vice President and Associate General Counsel of Amundi US since | None |
Secretary and | at the discretion of | January 2008; Secretary and Chief Legal Officer of all of the Pioneer Funds | |
Chief Legal Officer | the Board | since June 2010; Assistant Secretary of all of the Pioneer Funds from | |
| | September 2003 to May 2010; and Vice President and Senior Counsel of | |
| | Amundi US from July 2002 to December 2007 | |
| Carol B. Hannigan (59) | Since 2010. Serves | Fund Governance Director of Amundi US since December 2006 and | None |
Assistant Secretary | at the discretion of | Assistant Secretary of all the Pioneer Funds since June 2010; Manager – | |
| the Board | Fund Governance of Amundi US from December 2003 to November 2006; | |
| | and Senior Paralegal of Amundi US from January 2000 to November 2003 | |
| Thomas Reyes (58) | Since 2010. Serves | Assistant General Counsel of Amundi US since May 2013 and Assistant | None |
Assistant Secretary | at the discretion of | Secretary of all the Pioneer Funds since June 2010; and Counsel of Amundi | |
| the Board | US from June 2007 to May 2013 | |
| Mark E. Bradley (61) | Since 2008. Serves | Vice President – Fund Treasury of Amundi US; Treasurer of all of the | None |
Treasurer and Chief | at the discretion of | Pioneer Funds since March 2008; Deputy Treasurer of Amundi US from | |
Financial and | the Board | March 2004 to February 2008; and Assistant Treasurer of all of the Pioneer | |
Accounting Officer | | Funds from March 2004 to February 2008 | |
| Anthony J. Koenig, Jr. (57) | Since 2021. Serves | Senior Vice President – Fund Treasury of Amundi US; Assistant Treasurer | None |
Assistant Treasurer | at the discretion of | of all of the Pioneer Funds since January 2021; and Chief of Staff, US | |
| the Board | Investment Management of Amundi US from May 2008 to January 2021 | |
| Luis I. Presutti (55) | Since 2000. Serves | Director – Fund Treasury of Amundi US since 1999; and Assistant Treasurer | None |
Assistant Treasurer | at the discretion of | of all of the Pioneer Funds since 1999 | |
| the Board | | |
| Gary Sullivan (62) | Since 2002. Serves | Senior Manager – Fund Treasury of Amundi US since 2012; and Assistant | |
Assistant Treasurer | at the discretion of | Treasurer of all of the Pioneer Funds since 2002 | |
| the Board | | |
50 Pioneer Real Estate Shares | Annual Report
| 12/31/20
| | | | |
| Name, Age and Position | Term of Office and | | Other Directorships |
| Held With the Fund | Length of Service | Principal Occupation | Held by Officer |
| Antonio Furtado (38) | Since 2020. Serves | Fund Oversight Manager – Fund Treasury of Amundi US since 2020; | None |
Assistant Treasurer | at the discretion of | Assistant Treasurer of all of the Pioneer Funds since 2020; and Senior Fund | |
| the Board | Treasury Analyst from 2012 – 2020 | |
| John Malone (50) | Since 2018. Serves | Managing Director, Chief Compliance Officer of Amundi US Asset | None |
Chief Compliance Officer | at the discretion of | Management; Amundi Asset Management US, Inc.; and the Pioneer Funds | |
| the Board | since September 2018; and Chief Compliance Officer of Amundi Distributor | |
| | US, Inc. since January 2014. | |
| Kelly O’Donnell (49) | Since 2006. Serves | Vice President – Amundi Asset Management; and Anti-Money Laundering | None |
Anti-Money | at the discretion of | Officer of all the Pioneer Funds since 2006 | |
Laundering Officer | the Board | | |
Pioneer Real Estate Shares | Annual Report | 12/31/20 51
This page was intentionally left blank.
52 Pioneer Real Estate Shares | Annual Report | 12/31/20
How to Contact Amundi
We are pleased to offer a variety of convenient ways for you to contact us for assistance or information.
| Call us for: | |
Account Information, including existing accounts, | |
new accounts, prospectuses, applications | |
and service forms | 1-800-225-6292 |
FactFoneSM for automated fund yields, prices, | |
account information and transactions | 1-800-225-4321 |
| Retirement plans information | 1-800-622-0176 |
Write to us:
Amundi
P.O. Box 219427
Kansas City, MO 64121-9427| | |
| Our toll-free fax | 1-800-225-4240 |
| | |
| Our internet e-mail address | us.askamundi@amundi.com/us |
(for general questions about Amundi only) | |
|
| Visit our web site: www.amundi.com/us. | |
This report must be preceded or accompanied by a prospectus.
The Fund files a complete schedule of portfolio holdings with the Securities and Exchange Commission for the first and third quarters of each fiscal year as an exhibit to its reports on Form N-PORT. Shareholders may view the filed Form N-PORT by visiting the Commission’s web site at https://www.sec.gov.
Amundi Asset Management US, Inc.
60 State Street
Boston, MA 02109
www.amundi.com/us
Securities offered through Amundi Distributor US, Inc.,
60 State Street, Boston, MA 02109
Underwriter of Pioneer Mutual Funds, Member SIPC
© 2021 Amundi Asset Management US, Inc. 18631-15-0221
ITEM 2. CODE OF ETHICS.
(a) Disclose whether, as of the end of the period covered by the report, the registrant has adopted a code of ethics that applies to the registrant’s principal executive officer, principal financial officer, principal accounting officer or controller, or persons performing similar functions, regardless of whether these individuals are employed by the registrant or a third party. If the registrant has not adopted such a code of ethics, explain why it has not done so.
The registrant has adopted, as of the end of the period covered by this report, a code of ethics that applies to the registrant’s principal executive officer, principal financial officer, principal accounting officer and controller.
(b) For purposes of this Item, the term “code of ethics” means written standards that are reasonably designed to deter wrongdoing and to promote:
(1) Honest and ethical conduct, including the ethical handling of actual or apparent conflicts of interest between personal and professional relationships;
(2) Full, fair, accurate, timely, and understandable disclosure in reports and documents that a registrant files with, or submits to, the Commission and in other public communications made by the registrant;
(3) Compliance with applicable governmental laws, rules, and regulations;
(4) The prompt internal reporting of violations of the code to an appropriate person or persons identified in the code; and
(5) Accountability for adherence to the code.
(c) The registrant must briefly describe the nature of any amendment, during the period covered by the report, to a provision of its code of ethics that applies to the registrant’s principal executive officer, principal financial officer, principal accounting officer or controller, or persons performing similar functions, regardless of whether these individuals are employed by the registrant or a third party, and that relates to any element of the code of ethics definition enumerated in paragraph (b) of this Item. The registrant must file a copy of any such amendment as an exhibit pursuant to Item 10(a), unless the registrant has elected to satisfy paragraph (f) of this Item by posting its code of ethics on its website pursuant to paragraph (f)(2) of this Item, or by undertaking to provide its code of ethics to any person without charge, upon request, pursuant to paragraph (f)(3) of this Item.
The registrant has made no amendments to the code of ethics during the period covered by this report.
(d) If the registrant has, during the period covered by the report, granted a waiver, including an implicit waiver, from a provision of the code of ethics to the registrant’s principal executive officer, principal financial officer, principal accounting officer or controller, or persons performing similar functions, regardless of whether these individuals are employed by the registrant or a third party, that relates to one or more of the items set forth in paragraph (b) of this Item, the registrant must briefly describe the nature of the waiver, the name of the person to whom the waiver was granted, and the date of the waiver.
Not applicable.
(e) If the registrant intends to satisfy the disclosure requirement under paragraph (c) or (d) of this Item regarding an amendment to, or a waiver from, a provision of its code of ethics that applies to the registrant’s principal executive officer, principal financial officer, principal accounting officer or controller, or persons performing similar functions and that relates to any element of the code of ethics definition
enumerated in paragraph (b) of this Item by posting such information on its Internet website, disclose the registrant’s Internet address and such intention.
Not applicable.
(f) The registrant must:
(1) File with the Commission, pursuant to Item 12(a)(1), a copy of its code of ethics that applies to the registrant’s principal executive officer, principal financial officer, principal accounting officer or controller, or persons performing similar functions, as an exhibit to its annual report on this Form N-CSR (see attachment);
(2) Post the text of such code of ethics on its Internet website and disclose, in its most recent report on this Form N-CSR, its Internet address and the fact that it has posted such code of ethics on its Internet website; or
(3) Undertake in its most recent report on this Form N-CSR to provide to any person without charge, upon request, a copy of such code of ethics and explain the manner in which such request may be made. See Item 10(2)
ITEM 3. AUDIT COMMITTEE FINANCIAL EXPERT.
(a) (1) Disclose that the registrant’s board of trustees has determined that the registrant either:
(i) Has at least one audit committee financial expert serving on its audit committee; or
(ii) Does not have an audit committee financial expert serving on its audit committee.
The registrant’s Board of Trustees has determined that the registrant has at least one audit committee financial expert.
(2) If the registrant provides the disclosure required by paragraph (a)(1)(i) of this Item, it must disclose the name of the audit committee financial expert and whether that person is “independent.” In order to be considered “independent” for purposes of this Item, a member of an audit committee may not, other than in his or her capacity as a member of the audit committee, the board of trustees, or any other board committee:
(i) Accept directly or indirectly any consulting, advisory, or other compensatory fee from the issuer; or
(ii) Be an “interested person” of the investment company as defined in Section 2(a)(19) of the Act (15 U.S.C. 80a-2(a)(19)).
Mr. Fred J. Ricciardi, an independent trustee, is such an audit committee financial expert.
(3) If the registrant provides the disclosure required by paragraph (a)(1) (ii) of this Item, it must explain why it does not have an audit committee financial expert.
Not applicable.
ITEM 4. PRINCIPAL ACCOUNTANT FEES AND SERVICES.
(a) Disclose, under the caption AUDIT FEES, the aggregate fees billed for each of the last two fiscal years for professional services rendered by the principal accountant for the audit of the registrant’s annual financial statements or services that are normally provided by the accountant in connection with statutory and regulatory filings or engagements for those fiscal years.
The audit fees for the Fund were $31,110 payable to Ernst & Young LLP for the year ended December 31, 2020 and $30,500 for the year ended December 31, 2019.
(b) Disclose, under the caption AUDIT-RELATED FEES, the aggregate fees billed in each of the last two fiscal years for assurance and related services by the principal accountant that are reasonably related to the performance of the audit of the registrant’s financial statements and are not reported under paragraph (a) of this Item. Registrants shall describe the nature of the services comprising the fees disclosed under this category.
There were no audit-related services in 2020 or 2019.
(c) Disclose, under the caption TAX FEES, the aggregate fees billed in each of the last two fiscal years for professional services rendered by the principal accountant for tax compliance, tax advice, and tax planning. Registrants shall describe the nature of the services comprising the fees disclosed under this category.
The Fund paid aggregate non-audit fees to Ernst & Young LLP for tax services of $8,189 and $8,028 during the fiscal years ended December 31, 2020 and 2019, respectively.
(d) Disclose, under the caption ALL OTHER FEES, the aggregate fees billed in each of the last two fiscal years for products and services provided by the principal accountant, other than the services reported in paragraphs (a) through (c) of this Item. Registrants shall describe the nature of the services comprising the fees disclosed under this category.
There were no audit-related services in 2020 or 2019.
(e) (1) Disclose the audit committee’s pre-approval policies and procedures described in paragraph (c)(7) of Rule 2-01 of Regulation S-X.
PIONEER FUNDS
APPROVAL OF AUDIT, AUDIT-RELATED, TAX AND OTHER SERVICES
PROVIDED BY THE INDEPENDENT AUDITOR
SECTION I - POLICY PURPOSE AND APPLICABILITY
The Pioneer Funds recognize the importance of maintaining the independence of their outside auditors. Maintaining independence is a shared responsibility involving Amundi Pioneer Asset Management, Inc, the audit committee and the independent auditors.
The Funds recognize that a Fund’s independent auditors: 1) possess knowledge of the Funds, 2) are able to incorporate certain services into the scope of the audit, thereby avoiding redundant work, cost and disruption of Fund personnel and processes, and 3) have expertise that has value to the Funds. As a result, there are situations where it is desirable to use the Fund’s independent auditors for services in addition to the annual audit and where the potential for conflicts of interests are minimal. Consequently, this policy, which is intended to comply with Rule 210.2-01(C)(7), sets forth guidelines and procedures to be followed by the Funds when retaining the independent audit firm to perform audit, audit-related tax and other services under those circumstances, while also maintaining independence.
Approval of a service in accordance with this policy for a Fund shall also constitute approval for any other Fund whose pre-approval is required pursuant to Rule 210.2-01(c)(7)(ii).
In addition to the procedures set forth in this policy, any non-audit services that may be provided consistently with Rule 210.2-01 may be approved by the Audit Committee itself and any pre-approval that may be waived in accordance with Rule 210.2-01(c)(7)(i)(C) is hereby waived.
Selection of a Fund’s independent auditors and their compensation shall be determined by the Audit Committee and shall not be subject to this policy.
| | | |
| SECTION II - POLICY |
| |
SERVICE CATEGORY | SERVICE CATEGORY DESCRIPTION | SPECIFIC PRE-APPROVED SERVICE SUBCATEGORIES |
| | | |
I. AUDIT SERVICES | Services that are directly | o Accounting research assistance |
| | related to performing the | o SEC consultation, registration |
| | independent audit of the Funds | statements, and reporting |
| | | o Tax accrual related matters |
| | | o Implementation of new accounting standards |
| | | o Compliance letters (e.g. rating agency letters) |
| | | o Regulatory reviews and assistance |
| | | regarding financial matters |
| | | o Semi-annual reviews (if requested) |
| | | o Comfort letters for closed end offerings |
II. AUDIT-RELATED | Services which are not | o AICPA attest and agreed-upon procedures |
SERVICES | prohibited under Rule | o Technology control assessments |
| | 210.2-01(C)(4) (the “Rule”) | o Financial reporting control assessments |
| | and are related extensions of | o Enterprise security architecture |
| | the audit services support the | assessment |
| | audit, or use the knowledge/expertise | |
| | gained from the audit procedures as a | |
| | foundation to complete the project. | |
| | In most cases, if the Audit-Related | |
| | Services are not performed by the | |
| | Audit firm, the scope of the Audit | |
| | Services would likely increase. | |
| | The Services are typically well-defined | |
| | and governed by accounting | |
| | professional standards (AICPA, | |
| | SEC, etc.) | |
| | |
AUDIT COMMITTEE APPROVAL POLICY | AUDIT COMMITTEE REPORTING POLICY |
| o “One-time” pre-approval | o A summary of all such |
| for the audit period for all | services and related fees |
| pre-approved specific service | reported at each regularly |
| subcategories. Approval of the | scheduled Audit Committee |
| independent auditors as | meeting. |
| auditors for a Fund shall | |
| constitute pre approval for | |
| these services. | |
| |
| o “One-time” pre-approval | o A summary of all such |
| for the fund fiscal year within | services and related fees |
| a specified dollar limit | (including comparison to |
| for all pre-approved | specified dollar limits) |
| specific service subcategories | reported quarterly. |
| |
| o Specific approval is | |
| needed to exceed the | |
| pre-approved dollar limit for | |
| these services (see general | |
Audit Committee approval policy | |
| below for details on obtaining | |
| specific approvals) | |
| |
| o Specific approval is | |
| needed to use the Fund’s | |
| auditors for Audit-Related | |
| Services not denoted as | |
| “pre-approved”, or | |
| to add a specific service | |
| subcategory as “pre-approved” | |
SECTION III - POLICY DETAIL, CONTINUED
| | |
SERVICE CATEGORY | SERVICE CATEGORY DESCRIPTION | SPECIFIC PRE-APPROVED SERVICE |
| | | SUBCATEGORIES |
III. TAX SERVICES | Services which are not | o Tax planning and support |
| | prohibited by the Rule, | o Tax controversy assistance |
| | if an officer of the Fund | o Tax compliance, tax returns, excise |
| | determines that using the | tax returns and support |
| | Fund’s auditor to provide | o Tax opinions |
| | these services creates | |
| | significant synergy in | |
| | the form of efficiency, | |
| | minimized disruption, or | |
| | the ability to maintain a | |
| | desired level of | |
| | confidentiality. | |
| | |
| AUDIT COMMITTEE APPROVAL POLICY | AUDIT COMMITTEE REPORTING POLICY |
o “One-time” pre-approval | o A summary of |
for the fund fiscal year | all such services and |
within a specified dollar limit | related fees |
| | (including comparison |
| | to specified dollar |
| | limits) reported |
| | quarterly. |
| |
o Specific approval is | |
| needed to exceed the | |
| pre-approved dollar limits for | |
| these services (see general | |
| Audit Committee approval policy | |
| below for details on obtaining | |
| specific approvals) | |
| |
o Specific approval is | |
| needed to use the Fund’s | |
| auditors for tax services not | |
| denoted as pre-approved, or to | |
add a specific service subcategory as | |
| “pre-approved” | |
SECTION III - POLICY DETAIL, CONTINUED
| |
SERVICE CATEGORY | SERVICE CATEGORY DESCRIPTION | SPECIFIC PRE-APPROVED SERVICE |
| | | SUBCATEGORIES |
IV. OTHER SERVICES | Services which are not | o Business Risk Management support |
| | prohibited by the Rule, | o Other control and regulatory |
A. SYNERGISTIC, | if an officer of the Fund | compliance projects |
UNIQUE QUALIFICATIONS | determines that using the | |
| | Fund’s auditor to provide | |
| | these services creates | |
| | significant synergy in | |
| | the form of efficiency, | |
| | minimized disruption, | |
| | the ability to maintain a | |
| | desired level of | |
| | confidentiality, or where | |
| | the Fund’s auditors | |
| | posses unique or superior | |
| | qualifications to provide | |
| | these services, resulting | |
| | in superior value and | |
| | results for the Fund. | |
| | |
AUDIT COMMITTEE APPROVAL POLICY | AUDIT COMMITTEE REPORTING POLICY |
o “One-time” pre-approval | o A summary of |
| for the fund fiscal year within | all such services and |
| a specified dollar limit | related fees |
| | (including comparison |
| | to specified dollar |
| | limits) reported |
| | quarterly. |
o Specific approval is | |
| needed to exceed the | |
| pre-approved dollar limits for | |
| these services (see general | |
| Audit Committee approval policy | |
| below for details on obtaining | |
| specific approvals) | |
| |
o Specific approval is | |
| needed to use the Fund’s | |
| auditors for “Synergistic” or | |
| “Unique Qualifications” Other | |
| Services not denoted as | |
| pre-approved to the left, or to | |
| add a specific service | |
| subcategory as “pre-approved” | |
SECTION III - POLICY DETAIL, CONTINUED
| |
SERVICE CATEGORY | SERVICE CATEGORY DESCRIPTION | SPECIFIC PROHIBITED SERVICE |
| | | SUBCATEGORIES |
PROHIBITED SERVICES | Services which result | 1. Bookkeeping or other services |
| | in the auditors losing | related to the accounting records or |
| | independence status | financial statements of the audit |
| | under the Rule. | client* |
| | | 2. Financial information systems design |
| | | and implementation* |
| | | 3. Appraisal or valuation services, |
| | | fairness* opinions, or |
| | | contribution-in-kind reports |
| | | 4. Actuarial services (i.e., setting |
| | | actuarial reserves versus actuarial |
| | | audit work)* |
| | | 5. Internal audit outsourcing services* |
| | | 6. Management functions or human |
| | | resources |
| | | 7. Broker or dealer, investment |
| | | advisor, or investment banking services |
| | | 8. Legal services and expert services |
| | | unrelated to the audit |
| | | 9. Any other service that the Public |
| | | Company Accounting Oversight Board |
| | | determines, by regulation, is |
| | | impermissible |
| | |
AUDIT COMMITTEE APPROVAL POLICY | AUDIT COMMITTEE REPORTING POLICY |
o These services are not to be | o A summary of all |
| performed with the exception of the(*) | services and related |
| services that may be permitted | fees reported at each |
| if they would not be subject to audit | regularly scheduled |
| procedures at the audit client (as | Audit Committee meeting |
| defined in rule 2-01(f)(4)) level | will serve as continual |
| the firm providing the service. | confirmation that has |
| | not provided any |
| | restricted services. |
GENERAL AUDIT COMMITTEE APPROVAL POLICY:
o For all projects, the officers of the Funds and the Fund’s auditors will each make an assessment to determine that any proposed projects will not impair independence.
o Potential services will be classified into the four non-restricted service categories and the “Approval of Audit, Audit-Related, Tax and Other Services” Policy above will be applied. Any services outside the specific pre-approved service subcategories set forth above must be specifically approved by the Audit Committee.
o At least quarterly, the Audit Committee shall review a report summarizing the services by service category, including fees, provided by the Audit firm as set forth in the above policy.
(2) Disclose the percentage of services described in each of paragraphs (b) through (d) of this Item that were approved by the audit committee pursuant to paragraph (c)(7)(i)(C) of Rule 2-01 of Regulation S-X.
Non-Audit Services
Beginning with non-audit service contracts entered into on or after May 6, 2003, the effective date of the new SEC pre-approval rules, the Fund's audit committee is required to pre-approve services to affiliates defined by SEC rules to the extent that the services are determined to have a direct impact on the operations or financial reporting of the Fund. For the years ended December 31, 2020 and 2019, there were no services provided to an affiliate that required the Fund's audit committee pre-approval.
(f) If greater than 50 percent, disclose the percentage of hours expended on the principal accountants engagement to audit the registrant’s financial statements for the most recent fiscal year that were attributed to work performed by persons other than the principal accountant’s full-time, permanent employees.
N/A
(g) Disclose the aggregate non-audit fees billed by the registrants accountant for services rendered to the registrant, and rendered to the registrants investment adviser (not including any sub-adviser whose role is primarily portfolio management and is subcontracted with or overseen by another investment adviser), and any entity controlling, controlled by, or under common control with the adviser that provides ongoing services to the registrant for each of the last two fiscal years of the registrant.
The Fund paid aggregate non-audit fees to Ernst & Young LLP for tax services of $8,189 and $8,028 during the fiscal years ended December 31, 2020 and 2019, respectively.
(h) Disclose whether the registrants audit committee of the board of trustees has considered whether the provision of non-audit services that were rendered to the registrants investment adviser (not including any subadviser whose role is primarily portfolio management and is subcontracted with or overseen by another investment adviser), and any entity controlling, controlled by, or under common control with the investment adviser that provides ongoing services to the registrant that were not pre-approved pursuant to paragraph (c)(7)(ii) of Rule 2-01 of Regulation S-X is compatible with maintaining the principal accountant’s independence.
The Fund’s audit committee of the Board of Trustees has considered whether the provision of non-audit services that were rendered to the Affiliates (as defined) that were not pre- approved pursuant to paragraph (c)(7)(ii) of Rule 2-01 of Regulation S-X is compatible with maintaining the principal accountant’s independence.
ITEM 5. AUDIT COMMITTEE OF LISTED REGISTRANTS
(a) If the registrant is a listed issuer as defined in Rule 10A-3 under the Exchange Act (17 CFR 240.10A-3), state whether or not the registrant has a separately-designated standing audit committee established in accordance with Section 3(a)(58)(A) of the Exchange Act (15 U.S.C. 78c(a)(58)(A)). If the registrant has such a committee, however designated, identify each committee member. If the entire board of directors is acting as the registrant’s audit committee as specified in Section 3(a)(58)(B) of the Exchange Act (15 U.S.C. 78c(a)(58)(B)), so state.
N/A
(b) If applicable, provide the disclosure required by Rule 10A-3(d) under the Exchange Act (17 CFR 240.10A-3(d)) regarding an exemption from the listing standards for audit committees.
N/A
ITEM 6. SCHEDULE OF INVESTMENTS.
File Schedule of Investments in securities of unaffiliated issuers as of the close of the reporting period as set forth in 210.1212 of Regulation S-X [17 CFR 210.12-12], unless the schedule is included as part of the report to shareholders filed under Item 1 of this Form.
Included in Item 1
ITEM 7. DISCLOSURE OF PROXY VOTING POLICIES AND PROCEDURES FOR CLOSED-END MANAGEMENT INVESTMENT COMPANIES.
A closed-end management investment company that is filing an annual report on this Form N-CSR must, unless it invests exclusively in non-voting securities, describe the policies and procedures that it uses to determine how to vote proxies relating to portfolio securities, including the procedures that the company uses when a vote presents a conflict between the interests of its shareholders, on the one hand, and those of the company’s investment adviser; principal underwriter; or any affiliated person (as defined in Section 2(a)(3) of the Investment Company Act of 1940 (15 U.S.C. 80a-2(a)(3)) and the rules thereunder) of the company, its investment adviser, or its principal underwriter, on the other. Include any policies and procedures of the company’s investment adviser, or any other third party, that the company uses, or that are used on the company’s behalf, to determine how to vote proxies relating to portfolio securities.
Not applicable to open-end management investment companies.
ITEM 8. PORTFOLIO MANAGERS OF CLOSED-END MANAGEMENT INVESTMENT COMPANIES.
(a) If the registrant is a closed-end management investment company that is filing an annual report on this Form N-CSR, provide the following information:
(1) State the name, title, and length of service of the person or persons employed by or associated with the registrant or an investment adviser of the registrant who are primarily responsible for the day-to-day management of the registrant’s portfolio (“Portfolio Manager”). Also state each Portfolio Manager’s business experience during the past 5 years.
Not applicable to open-end management investment companies.
ITEM 9. PURCHASES OF EQUITY SECURITIES BY CLOSED-END MANAGEMENT INVESTMENT COMPANY AND AFFILIATED PURCHASERS.
(a) If the registrant is a closed-end management investment company, in the following tabular format, provide the information specified in paragraph (b) of this Item with respect to any purchase made by or on behalf of the registrant or any affiliated purchaser, as defined in Rule 10b-18(a)(3) under the Exchange Act (17 CFR 240.10b-18(a)(3)), of shares or other units of any class of the registrant’s equity securities that is registered by the registrant pursuant to Section 12 of the Exchange Act (15 U.S.C. 781).
Not applicable to open-end management investment companies.
ITEM 10. SUBMISSION OF MATTERS TO A VOTE OF SECURITY HOLDERS.
Describe any material changes to the procedures by which shareholders may recommend nominees to the registrant’s board of directors, where those changes were implemented after the registrant last provided disclosure in response to the requirements of Item 407(c)(2)(iv) of Regulation S-R(17 CFR 229.407)(as required by Item 22(b)(15)) of Schedule 14A (17 CFR 240.14a-101), or this Item.
There have been no material changes to the procedures by which the shareholders may recommend nominees to the registrant’s board of directors since the registrant last provided disclosure in response to the requirements of Item 407(c)(2)(iv) of Regulation S-R of Schedule 14(A) in its definitive proxy statement, or this item.
ITEM 11. CONTROLS AND PROCEDURES.
(a) Disclose the conclusions of the registrant’s principal executive and principal financials officers, or persons performing similar functions, regarding the effectiveness of the registrant’s disclosure controls and procedures (as defined in Rule 30a-3(c) under the Act (17 CFR 270.30a-3(c))) as of a date within 90 days of the filing date of the report that includes the disclosure required by this paragraph, based on the evaluation of these controls and procedures required by Rule 30a-3(b) under the Act (17 CFR 270.30(a)-3(b) and Rules 13a-15(b) or 15d-15(b) under the Exchange Act (17 CFR 240.13a-15(b) or 240.15d-15(b)).
The registrant’s principal executive officer and principal financial officer have concluded that the registrant’s disclosure controls and procedures are effective based on the evaluation of these controls and procedures as of a date within 90 days of the filing date of this report.
(b) Disclose any change in the registrant’s internal control over financial reporting (as defined in Rule 30a-3(d) under the Act (17CFR 270.30a-3(d)) that occured during the second fiscal quarter of the period covered by this report that has materially affected, or is reasonably likely to materially affect, the registrant’s internal control over financial reporting.
There were no significant changes in the registrant’s internal control over financial reporting that occurred during the second fiscal quarter of the period covered by this report that have materially affected, or are reasonably likely to materially affect, the registrant’s internal control over financial reporting.
Item 12. Disclosure of Securities Lending Activities for Closed-End Management Investment Companies.
(a) If the registrant is a closed-end management investment company, provide the following dollar amounts of income and compensation related to the securities lending activities of the registrant during its most recent fiscal year:
N/A
(1) Gross income from securities lending activities;
N/A
(2) All fees and/or compensation for each of the following securities lending activities and related services: any share of revenue generated by the securities lending program paid to the securities lending agent(s) (revenue split); fees paid for cash collateral management services (including fees deducted from a pooled cash collateral reinvestment vehicle) that are not included in the revenue split; administrative fees that are not included in the revenue split; fees for indemnification that are not included in the revenue split; rebates paid to borrowers; and any other fees relating to the securities lending program that are not included in the revenue split, including a description of those other fees;
N/A
(3) The aggregate fees/compensation disclosed pursuant to paragraph (2); and
N/A
(4) Net income from securities lending activities (i.e., the dollar amount in paragraph (1) minus the dollar amount in paragraph (3)).
If a fee for a service is included in the revenue split, state that the fee is included in the revenue split.
N/A
(b) If the registrant is a closed-end management investment company, describe the services provided to the registrant by the securities lending agent in the registrants most recent fiscal year.
N/A
ITEM 13. EXHIBITS.
(a) File the exhibits listed below as part of this Form. Letter or number the exhibits in the sequence indicated.
SIGNATURES
[See General Instruction F]
Pursuant to the requirements of the Securities Exchange Act of 1934 and the Investment Company Act of 1940, the registrant has duly caused this report to be signed on its behalf by the undersigned, thereunto duly authorized.
(Registrant) Pioneer Real Estate Shares
By (Signature and Title)* /s/ Lisa M. Jones
Lisa M. Jones, President & Chief Executive Officer
Date March 4, 2021
Pursuant to the requirements of the Securities Exchange Act of 1934 and the Investment Company Act of 1940, this report has been signed below by the following persons on behalf of the registrant and in the capacities and on the dates indicated.
By (Signature and Title)* /s/ Lisa M. Jones
Lisa M. Jones, President & Chief Executive Officer
Date March 4, 2021
By (Signature and Title)* /s/ Mark E. Bradley
Mark E. Bradley, Treasurer & Chief Accounting & Financial Officer
Date March 4, 2021
* Print the name and title of each signing officer under his or her signature.