Exhibit 96.3

TECHNICAL REPORT SUMMARY
FEASIBILITY STUDY
Pampa Orcoma
Sociedad Química y Minera de Chile

Date: April, 2022
| WSP-SQM0011-TRS-Pampa Orcoma-Rev1 | Rev1 |
TECHNICAL REPORT SUMMARY
FEASIBILITY STUDY
Pampa Orcoma
Sociedad Química y Minera de Chile
WSP-SQM0011-TRS-Pampa Orcoma-Rev0
April, 2022
WSP
Av. Las Condes 11.700, Vitacura.
Santiago, Chile
TELÉFONO:
+56 2 2653 8000 wsp.com
| WSP-SQM0011-TRS-Pampa Orcoma-Rev1 | Rev1 |
Statement of Limitations
Sociedad Química y Minera de Chile (SQM) commissioned WSP Ambiental Chile (WSP) to prepare this Technical Report Summary (TRS) on the Orcoma Project in the Tarapacá Region of northern Chile. The disclosure of any information contained in this report is the sole responsibility of the recipient. The content of the TRS has been prepared based on the professional judgment of WSP from the information made available to WSP by SQM at the time of its compilation. Any use made by a third party of this TRS, including any decision made by a third party based on the TRS, is the sole responsibility of the third party. WSP is will not be held responsible for any damages incurred by third parties as a result of decisions taken or actions based on this TRS.
WSP will keep an original copy of this TRS on file for ten years (10 years) from the date of its finalization. This copy, held securely by WSP, will be termed the Master Copy. Any copy of the TRS other than the Master Copy is to be considered a non-controlled copy. WSP cannot vouch for the content or veracity of a non-controlled copy of the TRS. However, if requested to by SQM, or required to by law, WSP will be able to make available a direct copy of the Master Copy for comparison purposes.
| WSP-SQM0011-TRS-Pampa Orcoma-Rev1 | Rev1 |
Table of contents
| | 1 | Executive Summary | 1 |
| | 1.1 | Property Summary and Ownership | 1 |
| | 1.2 | Geology and Mineralization | 1 |
| | 1.3 | Status of Exploration | 1 |
| | 1.4 | Mineral Resource Statement | 2 |
| | 1.5 | Mineral Reserve Statement | 3 |
| | 1.6 | Metallurgy and Mineral Processing | 3 |
| | 1.6.1 | Metallurgical Test Work Summary | 3 |
| | 1.6.2 | Processing Summary | 4 |
| | 1.7 | Mine Design, Optimization, and Scheduling | 5 |
| | 1.8 | Capital Costs, Operating Costs, and Financial Analysis | 6 |
| | 1.8.1 | Capital and Operating Costs | 6 |
| | 1.8.2 | Financial Analysis | 6 |
| | 1.9 | Conclusions and Recommendations | 10 |
| | 2 | Introduction | 11 |
| | 2.1 | Terms of Reference and Purpose of the Report | 11 |
| | 2.2 | Source of Data and Information | 11 |
| | 2.3 | Details of Inspection | 16 |
| | 2.4 | Previous Reports on Project | 16 |
| | 3 | Description and Location | 17 |
| | 3.1 | Location | 17 |
| | 3.2 | Area of the property | 18 |
| | 3.3 | Mineral Titles, Claims, Rights, Leases, and Options | 18 |
| | 3.4 | Mineral Rights | 21 |
| | 3.5 | Environmental Impacts and Permitting | 21 |
| | 3.6 | Other Significant Factors and Risks | 22 |
| | 3.7 | Royalties and Agreements | 23 |
| | 4 | Accessibility, Climate, Local Resources, Infrastructure and Physiography | 24 |
| | 4.1 | Topography, Elevation and Vegetation | 24 |
| | 4.2 | Accessibility and Transportation to the Property | 24 |
| | 4.3 | Climate and Length of Operating Season | 26 |
| | 4.4 | Infrastructure Availability and Sources | 26 |
| WSP-SQM0011-TRS-Pampa Orcoma-Rev1 | Rev1 |
| | 5 | History | 28 |
| | 6 | Geological Setting, Mineralization, and Deposit | 29 |
| | 6.1 | Geomorphological setting of the Pampa Orcoma Property | 29 |
| | 6.2 | Regional Geology | 31 |
| | 6.3 | Local Geology | 33 |
| | 6.3.1 | Subsurface Units (within the Surface Unit Alluvial and Colluvial Deposits) | 36 |
| | 6.3.2 | Sedimentary Units | 36 |
| | 6.3.3 | Volcanic Rocks | 37 |
| | 6.4 | Deposit Types | 37 |
| | 7 | Exploration | 38 |
| | 7.1 | Surveys and Investigations | 38 |
| | 7.1.1 | Trial Pit Exploration | 38 |
| | 7.1.2 | Borehole Exploration | 38 |
| | 7.1.3 | 400-x-400 m, 200-x-200 m, and 50-x-50 m Grids Drilling Campaign Results | 39 |
| | 7.1.4 | Diamond Drilling (DDH) Campaign Results | 42 |
| | 7.1.5 | 100T Grid Drilling Campaign Results | 43 |
| | 7.2 | Hydrogeology | 43 |
| | 7.3 | Geotechnical Data, Testing, and Analysis | 44 |
| | 8 | Sample Preparation, Analysis and Security | 46 |
| | 8.1 | Methods, Splitting and Reduction, and Security Measures | 46 |
| | 8.2 | Sample Preparation, Assaying, and Analytical Procedures | 49 |
| | 8.3 | Opinion of Adequacy | 50 |
| | 9 | Data Verification | 51 |
| | 9.1 | Data Verification Procedures | 51 |
| | 9.2 | Data Management | 51 |
| | 9.3 | Technical Procedures | 51 |
| | 9.4 | Quality Control Procedures | 51 |
| | 9.5 | Precision Evaluation | 51 |
| | 9.6 | Accuracy Evaluation | 52 |
| WSP-SQM0011-TRS-Pampa Orcoma-Rev1 | Rev1 |
| | 9.7 | Laboratory Certification | 52 |
| | 9.8 | Quality Control Procedures and Quality Assurance | 52 |
| | 9.8.1 | Quality Control Measures and Results | 52 |
| | 9.8.2 | Quality Assurance Measures | 55 |
| | 9.9 | Qualified Person’s Opinion of Data Adequacy | 55 |
| | 10 | Mineral Processing and Metallurgical Testing | 56 |
| | 10.1 | Metallurgical Testing | 56 |
| | 10.1.1 | Sampling and Sample Preparation | 58 |
| | 10.1.2 | Caliche Chemical and Mineralogical Characterization | 61 |
| | 10.1.3 | Caliche Physical Properties | 65 |
| | 10.1.4 | Agitated Leaching Tests | 68 |
| | 10.1.5 | Leaching in Isocontainers | 72 |
| | 10.1.6 | Column Leach Test using Seawater | 74 |
| | 10.1.7 | Laboratory Control Procedures | 77 |
| | 10.2 | Sample Representativeness | 79 |
| | 10.3 | Analytical and Testing Laboratories | 80 |
| | 10.4 | Test works and Relevant Results | 82 |
| | 10.4.1 | Metallurgical Recovery Estimation | 82 |
| | 10.4.2 | Irrigation Strategy Selection | 83 |
| | 10.4.3 | Industrial Scale Yield Estimation | 85 |
| | 10.5 | Significant Risk Factors | 89 |
| | 10.6 | Qualified Person´s Opinion | 89 |
| | 11 | Mineral Resource Estimate | 91 |
| | 11.1 | Estimation Methods, Parameters, and Assumptions | 91 |
| | 11.2 | Estimation Methodology and Assumptions | 92 |
| | 11.2.1 | Calculation of Drill Hole Average Iodine and Nitrate Grades | 92 |
| | 11.2.2 | Estimation of the Caliche Mineral Resources | 94 |
| | 11.2.3 | Estimation of Mineral Resource Grades | 96 |
| | 11.3 | Cut-off Grades | 96 |
| | 11.4 | Mineral Resource Classification | 97 |
| | 11.5 | Mineral Resource Estimate | 99 |
| | 11.6 | Qualified Person’s Opinion | 100 |
| WSP-SQM0011-TRS-Pampa Orcoma-Rev1 | Rev1 |
| | 12 | Mineral Reserve Estimate | 101 |
| | 12.1 | Estimation Methods, Parameters, and Assumptions | 101 |
| | 12.2 | Classification Criteria | 102 |
| | 12.3 | Mineral Reserve Estimate | 104 |
| | 12.4 | Qualified Person’s Opinion | 104 |
| | 13 | Mining Methods | 105 |
| | 13.1 | Geotechnical and Hydrological Models, and Other Parameters Relevant to Mine Designs and Plans | 105 |
| | 13.2 | Production Rates, Expected Mine Life, Mining Unit Dimensions, and Mining Dilution and Recovery Factors | 106 |
| | 13.3 | Requirements for Stripping, and Backfilling | 111 |
| | 13.4 | Required Mining Equipment Fleet and Machinery, and Personnel | 113 |
| | 13.5 | Map of the Final Mine Outline | 114 |
| | 14 | Processing and Recovery Methods | 116 |
| | 14.1 | Process Description | 120 |
| | 14.1.1 | Mining Zone and Operation Center | 122 |
| | 14.1.2 | Heap Leaching | 123 |
| | 14.1.3 | Iodide-Iodine Production | 124 |
| | 14.1.4 | Neutralization Plant | 129 |
| | 14.1.5 | Solar Evaporation Ponds | 129 |
| | 14.2 | Process Specifications and Efficiencies | 131 |
| | 14.2.1 | Process Criteria | 131 |
| | 14.2.2 | Heap Leaching Balance | 132 |
| | 14.2.3 | Balance Solutions in Evaporation Ponds | 133 |
| | 14.2.4 | Process Balance Sheet | 133 |
| | 14.2.5 | Production Estimate | 135 |
| | 14.3 | Process requirements | 138 |
| | 14.3.1 | Energy and Fuel Requirements | 138 |
| | 14.3.2 | Water Consumption and Supply | 139 |
| | 14.3.3 | Staff Requirements | 141 |
| | 14.3.4 | Process Plant Consumables | 141 |
| | 14.3.5 | Air Supply | 143 |
| | 14.4 | Qualified Person’s Opinion | 143 |
| WSP-SQM0011-TRS-Pampa Orcoma-Rev1 | Rev1 |
| | 15 | Project Infrastructure | 145 |
| | 15.1 | Access Roads to the Project | 146 |
| | 15.2 | Permanent Works | 147 |
| | 15.2.1 | Seawater Supply System | 147 |
| | 15.2.2 | Power Supply System | 150 |
| | 15.2.3 | Mine Area | 150 |
| | 15.2.4 | Industrial Area | 152 |
| | 16 | Market Studies | 155 |
| | 16.1 | The Company | 155 |
| | 16.2 | Iodine and its Derivatives, Market, Competition, Products, Customers | 156 |
| | 16.2.1 | Iodine Market | 156 |
| | 16.2.2 | Iodine Products | 158 |
| | 16.2.3 | odine Marketing and Customers | 159 |
| | 16.2.4 | Iodine Competition | 160 |
| | 16.3 | Nitrates | 161 |
| | 16.3.1 | Specialty Plant Nutrition, Market, Competition, Products, and Customers | 163 |
| | 16.3.2 | Industrial Chemicals, Market, Competition, Products, and Customers | 168 |
| | 17 | Environmental Studies, Permitting and Social or Community Impact | 173 |
| | 17.1 | Environmental Studies | 173 |
| | 17.1.1 | Baseline Studies | 174 |
| | 17.1.2 | Environmental Impact Assessment | 179 |
| | 17.2 | Operating and Post Closure Requirements and Plans | 182 |
| | 17.2.1 | Waste disposal requirements and plans | 182 |
| | 17.2.2 | Monitoring and Management Plan as Defined in the Environmental Authorization | 183 |
| | 17.2.3 | Requirements and plans for water management during operations and after closure | 188 |
| | 17.3 | Environmental and Sectorial Permits Status | 188 |
| | 17.4 | Social and Community | 190 |
| | 17.4.1 | Plans, Negotiations, or Agreements with Individuals, or Local Groups | 190 |
| | 17.4.2 | Commitments to Local Procurement or Hiring | 191 |
| WSP-SQM0011-TRS-Pampa Orcoma-Rev1 | Rev1 |
| | 17.4.3 | Social Risk Matrix | 191 |
| | 17.5 | Mine Closure | 191 |
| | 17.5.1 | Closure, Remediation, and Reclamation Plans | 192 |
| | 17.5.2 | Closure Cost | 195 |
| | 17.6 | The Qualified Person’s Opinion on the Adequacy of Current Plans to Address any Issues Related to Environmental Compliance, Permitting, and Local Individuals, or Groups | 197 |
| | 18 | Capital and Operating Costs | 198 |
| | 18.1 | Capital Cost Estimates | 198 |
| | 18.2 | Basis for Capital and Operating Cost Estimates | 199 |
| | 19 | Economic Analysis | 201 |
| | 19.1 | Principal Assumptions | 201 |
| | 19.2 | Production and Sales | 201 |
| | 19.3 | Prices and Revenue | 201 |
| | 19.4 | Operating Costs | 205 |
| | 19.5 | Capital Expenditure | 206 |
| | 19.6 | Cashflow Forecast | 207 |
| | 19.7 | Sensitivity Analysis | 209 |
| | 20 | Adjacent Properties | 210 |
| | 21 | Other Relevant Data and Information | 213 |
| | 22 | Interpretation and Conclusions | 214 |
| | 22.1 | Results | 214 |
| | 22.1.1 | Sample Preparation, Analysis, and Security | 214 |
| | 22.1.2 | Data Verification | 214 |
| | 22.1.3 | Mineral Processing and Metallurgical Testing | 214 |
| | 22.1.4 | Mineral Resource Estimate | 215 |
| | 22.1.5 | Mineral Reserve Estimate | 215 |
| | 22.1.6 | Processing and Recovery Methods | 215 |
| | 22.2 | Significant Risks | 216 |
| | 22.2.1 | Sample Preparation, Analysis, and Security | 216 |
| | 22.2.2 | Geology and Mineral Resources | 216 |
| | 22.2.3 | Permitting | 216 |
| | 22.2.4 | Processing and Recovery Methods | 216 |
| | 22.2.5 | Metal Pricing and Market Conditions | 216 |
| WSP-SQM0011-TRS-Pampa Orcoma-Rev1 | Rev1 |
| | 22.2.6 | Mineral Processing and Metallurgical Testing | 217 |
| | 22.2.7 | Environmental Studies, Permitting and Social or Community Impact | 217 |
| | 22.3 | Significant Opportunities | 217 |
| | 22.3.1 | Mineral Resource Statement | 217 |
| | 22.3.2 | Geology and Mineral Resources | 217 |
| | 22.3.3 | Metallurgy and Mineral Processing | 217 |
| | 23 | Recommendations | 218 |
| | 24 | References | 219 |
| | 25 | Reliance on Information Provided by Registrant | 221 |
| WSP-SQM0011-TRS-Pampa Orcoma-Rev1 | Rev1 |
| | TablES | |
| | | |
| | Table 1-1. Mineral Resource Estimate Exclusive of Mineral Reserves (Effective December 31, 2021) | 2 |
| | | |
| | Table 1-2. Mineral Reserve Estimate (Effective December 31, 2021) | 3 |
| | | |
| | Table 1-3. Estimated Net Present Value (NPV) for the Period | 9 |
| | | |
| | Table 2-1. Abbreviations and Acronyms | 12 |
| | | |
| | Table 2-2. Site Visits | 16 |
| | | |
| | Table 3-1. Pampa Orcoma project concessions | 18 |
| | | |
| | Table 3-2. Summary of Current Permits | 21 |
| | | |
| | Table 7-1. Data Available for 400-x-400-m, 200-x-200-m, and 50-x-50-m Drill Hole Grids | 42 |
| | | |
| | Table 7-2. Data Available for 100T Drill Hole Grid | 43 |
| | | |
| | Table 8-1. Analytical Procedures for Salts in SQM's Nitrate-Iodine Lab | 49 |
| | | |
| | Table 9-1. Statistics of Iodine and Nitrate Grades in Original versus Duplicate Samples of the 400-x-400 Drill Hole Grid (n = 212) | 53 |
| | | |
| | Table 9-2. Statistics of Iodine and Nitrate Grades in Original Versus Duplicate Samples of the 400-x-400-m, 200-x-200-m, and 50-x-50-m Drill Hole Grid (n = 511) | 55 |
| | | |
| | Table 10-1. Applied Methods for the Characterization of Caliche or Composite | 61 |
| | | |
| | Table 10-2. Salt Matrix of Pampa Orcoma Sampling Points (piques), taken from 200-x-200-mesh Drillings | 63 |
| | | |
| | Table 10-3. Determination of Physical Properties of Caliche Minerals | 66 |
| | | |
| | Table 10-4. Comparative Results of Physical Tests for Pampa Orcoma and TEA Exploitation Project | 67 |
| | | |
| | Table 10-5. DDH 2020 -Chemical Characterization of Samples Obtained from Successive Leach Test Results | 70 |
| | | |
| | Table 10-6. Conditions for Leaching Experiments in Isocontainers | 72 |
| | | |
| | Table 10-7. Head Grade Samples Loaded to Isocontainers | 73 |
| WSP-SQM0011-TRS-Pampa Orcoma-Rev1 | Rev1 |
| | Table 10-8. Results of isocontainer leaching of samples obtained from trial pits Pampa Orcoma | 73 |
| | | |
| | Table 10-9. Sumo Project 2014 -Result of simulated pile scaling for 6 Pampa Orcoma trial pits | 74 |
| | | |
| | Table 10-10. Conditions for Leaching Experiments with Seawater | 75 |
| | | |
| | Table 10-11. Characteristic Composition of the Caliche used in the Tests | 75 |
| | | |
| | Table 10-12. List of requested analyses for caliche leach brines and iodine prill | 77 |
| | | |
| | Table 10-13. Average Chemical Composition of Pampa Orcoma Brine Feed and Directed Out to the Process | 78 |
| | | |
| | Table 10-14. List of Installations Available for Analysis | 81 |
| | | |
| | Table 10-15. Comparison of the Composition Determined for the 476 Heap Leaching Pile in Operation at Nueva Victoria | 85 |
| | | |
| | Table 10-16. Comparison of Industrial Yield with the Values Predicted by the Model for Nueva Victoria | 88 |
| | | |
| | Table 11-1. Example of Selection of Drill Hole Sections for Average Grade Calculation, in Drill Hole PO-007 | 93 |
| | | |
| | Table 11-2. Mineral Resource Estimate, Exclusive of Mineral Reserves (Effective December 31, 2021) | 99 |
| | | |
| | Table 12-1. Historical Operational Modifying Factors for Iodine and Sodium Nitrate Grades | 101 |
| | | |
| | Table 12-2. Mineral Reserve Statement for Pampa Orcoma (Effective December 31, 2021) | 104 |
| | | |
| | Table 13-1. Mining Plan for Pampa Orcoma project (2024-2040) | 107 |
| | | |
| | Table 13-2. Mining Equipment for mining process – Pampa Orcoma project (20 Mtpy) | 113 |
| | | |
| | Table 13-3. Mine and PAD leaching production for Pampa Orcoma mine – period 2024-2030 | 114 |
| | | |
| | Table 14-1. Description of Water and Brine Reception Ponds by COM | 122 |
| | | |
| | Table 14-2. Solar Evaporation Pond Types | 130 |
| WSP-SQM0011-TRS-Pampa Orcoma-Rev1 | Rev1 |
| | Table 14-3. Process criteria summary. Mine site and caliche heap leaching | 131 |
| | | |
| | Table 14-4. Pampa Orcoma average composition per mining radius | 137 |
| | | |
| | Table 14-5. Pampa Orcoma Process Plant Production Summary | 137 |
| | | |
| | Table 14-6. Projection of energy and fuel requirements to 2024-2028 | 139 |
| | | |
| | Table 14-7. Pampa Orcoma industrial and potable water consumption | 140 |
| | | |
| | Table 14-8. Personnel required by operational activity | 141 |
| | | |
| | Table 14-9. Pampa Orcoma Process Reagents and Consumption rates per year | 142 |
| | | |
| | Table 16-1. Breakdown (%) of Revenues by SQM Production Line for the Years 2020, 2019, and 2018 | 156 |
| | | |
| | Table 16-2. Volumes of and Revenues from Iodine and Iodine Derivatives | 159 |
| | | |
| | Table 16-3. Breakdown of the Revenue | 159 |
| | | |
| | Table 16-4. Volumes of and revenues from specialty plant nutrients | 166 |
| | | |
| | Table 16-5. Breakdown of the sales from Specialty plant nutrition | 167 |
| | | |
| | Table 16-6. Volumes of and Revenues from Industrial Chemicals | 170 |
| | | |
| | Table 16-7. Breakdown of the Sales from Industrial Chemicals | 171 |
| | | |
| | Table 17-1. Pre-construction Activities | 181 |
| | | |
| | Table 17-2. Measures Committed in the RCA 75/2017 | 184 |
| | | |
| | Table 17-3. Committed Follow-up Activities | 186 |
| | | |
| | Table 17-4. Applicable permits related with RCA N° 75/2021 | 189 |
| | | |
| | Table 17-5. Closure Measures of Remaining Facilities ORCOMA Mining Site | 193 |
| | | |
| | Table 17-6. Post-Closure Measures | 193 |
| | | |
| | Table 17-7. ORCOMA Mining Site Remaining Facilities Risk Assessment Summary | 194 |
| | | |
| | Table 17-8. Detail of Closing Cost | 195 |
| | | |
| | Table 17-9. Detail of Post-Closing Cost | 196 |
| | | |
| | Table 17-10. Parameters for Estimation of Pampa Orcoma Guarantees | 196 |
| WSP-SQM0011-TRS-Pampa Orcoma-Rev1 | Rev1 |
| | Table 18-1. Capital Cost for Nitrate and Iodine at the Orcoma Project | 199 |
| | | |
| | Table 18-2. Productions Assumptions for Pampa Orcoma Project | 199 |
| | | |
| | Table 18-3. Estimated Operating costs, per Tonne of Caliche Extracted | 200 |
| | | |
| | Table 18-4. Estimated Costs to Produce Iodine (kg) | 200 |
| | | |
| | Table 18-5. Estimated Costs to Produce Nitrate (per tonne) | 200 |
| | | |
| | Table 19-1. Production of Iodine and Nitrates with and without Orcoma Project | 203 |
| | | |
| | Table 19-2. Sales of Iodine and Nitrates for the Orcoma Project | 204 |
| | | |
| | Table 19-3. Main Costs of Iodine and Nitrates Production | 205 |
| | | |
| | Table 19-4. Estimated Investments | 208 |
| | | |
| | Table 19-5. Estimated Net Present Value (NPV) for the Period | 208 |
| | FigurEs | |
| | | |
| | Figure 1-1 Sensitivity Analysis of the Pampa Orcoma Project | 8 |
| | | |
| | Figure 3-1. General Location Map | 17 |
| | | |
| | Figure 3-2. Location of Pampa Orcoma property | 20 |
| | | |
| | Figure 4-1. Slope Parameter Map Sr and Elevation Profile Trace BB" | 25 |
| | | |
| | Figure 6-1. Geomorphological Map of the Exploration Area | 30 |
| | | |
| | Figure 6-2. Regional Geological Map | 32 |
| | | |
| | Figure 6-3. Local Geology Map | 34 |
| | | |
| | Figure 6-4. Stratigraphic Column of Pampa Orcoma | 35 |
| | | |
| | Figure 7-1. Distribution of SQM Exploration Drill Holes and Soil Pits | 41 |
| | | |
| | Figure 8-1. Process Sequence from the Start of Drilling, Sampling, and Storage | 46 |
| | | |
| | Figure 8-2. Process Sequence from Initial Sample, Reduction, and Final Sample | 48 |
| WSP-SQM0011-TRS-Pampa Orcoma-Rev1 | Rev1 |
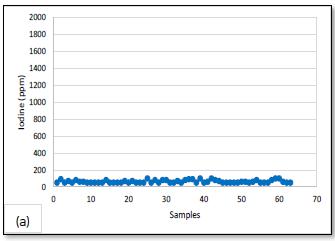
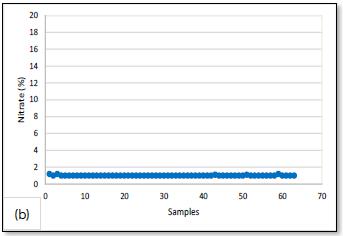
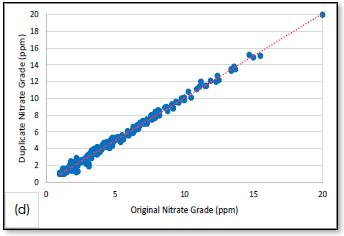
| | Figure 9-1. Results of 400-x-400-m Drill Hole grid Sample Quality Control | 53 |
| | | |
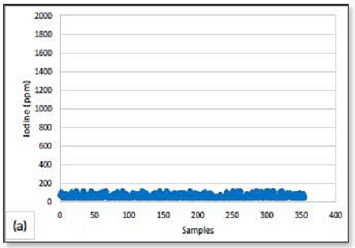
| | Figure 9-2. Results of 400-x-400-m, 200-x-200-m and 50-x-50-m Drill Hole Grid Sample Quality Control | 54 |
| | | |
| | Figure 10-1. General Stages of the Sampling Methodology and Development of Metallurgical Tests at Pampa Orcoma | 58 |
| | | |
| | Figure 10-2. Test Pits and Diamond Drilling (DDH) Campaign for Composite Samples from the Orcoma Sector for Metallurgical Testing | 60 |
| | | |
| | Figure 10-3. Samples Obtained from Drill Holes 2014 -Sumo Project | 64 |
| | | |
| | Figure 10-4. Embedding, Compaction, and Sedimentation Tests Performed at the Iris Pilot Plant Laboratory | 67 |
| | | |
| | Figure 10-5. Successive Leach Test Development Procedure | 69 |
| | | |
| | Figure 10-6. Nitrate and Iodine Yield Obtained by Successive Agitated Leaching Test | 71 |
| | | |
| | Figure 10-7. Loaded isocontainer and Distribution of Material According to Granulometry | 72 |
| | | |
| | Figure 10-8. Results of Nitrate and Iodine Extraction by Seawater Leaching | 76 |
| | | |
| | Figure 10-9. Iodine Recovery as a Function of Total Sales Content Test Work with Samples from Two Different Resource Sectors to be Exploited by the Company | 83 |
| | | |
| | Figure 10-10. Parameter Scales and Irrigation Strategy in the Impregnation Stage Impregnation | 84 |
| | | |
| | Figure 10-11. Heap Yield Characterization and Irrigation Strategy Selection - Pile 476 of Nueva Victoria | 86 |
| | | |
| | Figure 10-12. Nitrate and Iodine Yield Estimation and Industrial Correlation for the Period 2008 to 2020 at Nueva Victoria | 86 |
| | | |
| | Figure 11-1. 200-x-200-m Drill Hole Grid and Polygons of Average Iodine Grades Associated with each Drill Hole | 95 |
| | | |
| | Figure 11-2. Tonnage-Grade Curve for Different Values of Iodine Cut-off grades in Pampa Orcoma | 97 |
| WSP-SQM0011-TRS-Pampa Orcoma-Rev1 | Rev1 |
| | Figure 11-3. Experimental Variograms of Iodine and Nitrate for Pampa Orcoma | 98 |
| | | |
| | Figure 12-1. Mining Phases and Infrastructure in Pampa Orcoma, showing Iodine Grade Polygons from 200-x-200-m Grid Drill Holes | 103 |
| | | |
| | Figure 13-1. Pad Construction and morphology in Caliche Mines | 110 |
| | | |
| | Figure 13-2. Picture of a Typical Blast at Caliche Mines | 112 |
| | | |
| | Figure 13-3. Terrain Leveler Surface Excavation Machine (SEM) | 112 |
| | | |
| | Figure 13-4. Ten Year Plan -2024-2033 Pampa Orcoma Mine | 115 |
| | | |
| | Figure 14-1. Simplified Pampa Orcoma Process Flowsheet | 118 |
| | | |
| | Figure 14-2. General Layout of the Facilities of Pampa Orcoma | 119 |
| | | |
| | Figure 14-3. General Block Process Diagram for Pampa Orcoma | 121 |
| | | |
| | Figure 14-4. Schematic Process Flow of Caliche Leaching | 124 |
| | | |
| | Figure 14-5. Block Diagram of Iodide-Iodine Production Process Plants | 125 |
| | | |
| | Figure 14-6. Process Diagram of Blow-out Production of Iodine Contrate Solution | 128 |
| | | |
| | Figure 14-7. Pampa Orcoma Heap leaching scheme | 132 |
| | | |
| | Figure 14-8. Pampa Orcoma volumetric balance in solar evaporation area | 133 |
| | | |
| | Figure 14-9. Mass balance of Pampa Orcoma per year of production | 134 |
| | | |
| | Figure 14-10. 10-year Orcoma. NaNO3 Plan exploitation | 135 |
| | | |
| | Figure 15-1. Project Location | 146 |
| | | |
| | Figure 15-2. Seawater Suction System | 148 |
| | | |
| | Figure 15-3. Seawater Supply System | 149 |
| | | |
| | Figure 15-4. Characteristic Diagram of the Iodine-Iodide Plant | 154 |
| | | |
| | Figure 16-1. Iodine and Derivates, Production Evolution 1996-2020 | 158 |
| | | |
| | Figure 16-2. Annual production of Nitrates in Chile | 163 |
| | | |
| | Figure 17-1. Disposition of Pampa Orcoma's Financial Guarantees | 197 |
| WSP-SQM0011-TRS-Pampa Orcoma-Rev1 | Rev1 |
| | Figure 19-1. Sensitivity Analysis | 209 |
| | | |
| | Figure 20-1. Pampa Orcoma Adjacent Properties | 211 |
| | | |
| | Figure 20-2. Pampa Orcoma Adjacent Properties | 212 |
| WSP-SQM0011-TRS-Pampa Orcoma-Rev1 | Rev1 |
| 1.1 | Property Summary and Ownership |
Pampa Orcoma, located in northern Chile’s Tarapacá Region, covers a property area of 10,296 ha.
The Pampa Orcoma Project (the Project, or Orcoma Project), which includes the mine area as well as temporary and permanent facilities for the mining operation, involves a surface area of 7,387 ha. In the access sector to the area, there is a "BHP aqueduct easement," and in the surrounding area, there are the populated areas of Huara, Bajo Soga, Colonos Rurales, Pisagua, and also the Pampa del Tamarugal Reserve.
| 1.2 | Geology and Mineralization |
Pliocene to Holocene alluvial and colluvial deposits overlie most of the Pampa Orcoma property’s surface area, overlaying Jurassic volcaniclastic sequences with minor outcrops to the edges of the property, and outcrops of calcareous sedimentary units and evaporite deposits occurring to the northeast of the property.
Alluvial deposits host iodine and nitrate bearing caliche deposits, showing lateral continuity with an average thickness of 4 m throughout the property.
The property is located on Jurassic volcaniclastic sequences overlain by alluvial and colluvial sediments of Pliocene to Holocene age. The Jurassic volcaniclastics are exposed at the surface in the vicinity of the property limit and beyond. Calcareous sedimentary units and evaporite deposits occur to the northeast of the property, along the western edge of the Ruta 5 trunk road. Alluvial fans cover the solid geology on the eastern side of Ruta 5 and extend to the settlement of Negreiros to the west of Ruta 5.
Geologic exploration of Pampa Orcoma includes pit soil and drilling surveys mostly developed in the last seven years. The most recent pit soil survey in 2021, totals 5 out of 86 trenches that have been dug to improving geologic and physical characterization of the caliche deposit. Drilling surveys carried out in 2014 and 2021, total 2,756 drill holes differentiated mainly by grid spacing, with those carried out in 2014 comprising 400-x-400-m and 200-x-200-m RC drilling grids that cover most of the project’s area as the basis for resource estimation, and a 50-x-50-m grid covering three localized areas. Findings from these surveys include iodine and nitrate grades, drill hole characteristics, rock cutting data, geomechanical descriptions, among others.
The 2021 drilling surveys included a diamond drilling campaign, showing core sample descriptions aiming at improving geologic and physical characterization of caliche deposits, and a current RC drilling grid of 100m spacing in an E-W direction and 50m in a NW-SE for recategorization of the 400-x-400-m and 200-x-200-m grids.
| WSP-SQM0011-TRS-Pampa Orcoma-Rev1 | Rev1 | Page 1 |
| 1.4 | Mineral Resource Statement |
This sub-section contains forward-looking information related to Mineral Resource estimates for the Project. The material factors that could cause actual results to differ materially from the conclusions, estimates, designs, forecasts or projections in the forward-looking information include any significant differences from one or more of the material factors or assumptions that were set forth in this sub-section including geological and grade interpretations and controls and assumptions and forecasts associated with establishing the prospects for economic extraction.
Iodine and nitrate Mineral Resources, exclusive of Mineral Reserves, were estimated (Table 1-1.) based on lithologies and iodine and nitrate grades, from a 200-x-200-meter (m) grid of drill holes, considering an iodine cut-off grade of 300 ppm. The Mineral Resource is classified as Indicated, since geologic uncertainty and actual grid spacing do not allow a more precise estimation of the Mineral Resource. The 100 truncated grid (100-x-50-m) drill hole grid currently in process, will likely allow for a future updated Mineral Resource estimates that may result in upgrading a portion of the current Mineral Resources to a Measured level of confidence (SQM(j), 2021). The diamond drilling (DDH) campaign currently in process, will provide, when finished, a comparison of caliche depths and iodine and nitrate grades with respect to the 200-x-200-m grid Mineral Resource estimation.
Table 1-1. Mineral Resource Estimate Exclusive of Mineral Reserves (Effective December 31, 2021)
| Resource Classification | | Resources (Mt) | | | Iodine (ppm) | | | Nitrate (%) | |
| Indicated | | | 18 | | | | 457 | | | | 7.4 | |
Notes:
(1) Mineral Resources are not Mineral Reserves and do not have demonstrated economic viability. There is no certainty that all or any part of the Mineral Resource will be converted into Mineral Reserves upon the application of modifying factors.
(2) Mineral Resources are reported as in-situ and exclusive of Mineral Reserves, where the estimated Mineral Reserve without processing losses during the reported LOM was subtracted from the Mineral Resource inclusive of Mineral Reserves.
(3) Comparisons of values may not add due to rounding of numbers and the differences caused by use of averaging methods.
(4) The units “Mt” and “ppm” refers to million tonnes and parts per million respectively.
(5) The Mineral Resource estimate considers an iodine cut-off grade of 300 ppm, based on accumulated cut-off iodine grades and operational average grades, as well as the cost and medium and long term prices forecast for prilled iodine production (Section 16).
(6) Donald Hulse is the QP responsible for the Mineral Resources.
| WSP-SQM0011-TRS-Pampa Orcoma-Rev1 | Rev1 | Page 2 |
| 1.5 | Mineral Reserve Statement |
This sub-section contains forward-looking information related to Mineral Reserve estimates for the Project. The material factors that could cause actual results to differ materially from the conclusions, estimates, designs, forecasts or projections in the forward-looking information include any significant differences from one or more of the material factors or assumptions that were set forth in this sub-section including Mineral Resource model tonnes and grade, modifying factors including mining and recovery factors, production rate and schedule, mining equipment productivity, commodity market and prices and projected operating and capital costs.
A Probable Mineral Reserve estimate for Pampa Orcoma (Table 1-2) was determined by applying modifying factors to Indicated Mineral Resource estimates. Modifying factors, considering dilution and loss, are considered in the estimation of average iodine and nitrate grades, based on historical operational use in SQM’s various mining facilities. Mineral Reserves are reported as in-situ ore (caliche).
Table 1-2. Mineral Reserve Estimate (Effective December 31, 2021)
| Reserves Classification | | Reserves (Mt) | | | Iodine (ppm) | | | Nitrate (%) | |
| Probable | | | 309 | | | | 413 | | | | 6.9 | |
Notes:
(1) Comparisons of values may not add due to rounding of numbers and the differences caused by use of averaging methods.
(2) The units “Mt” and “ppm” refer to million tonnes and parts per million respectively.
(3) The Mineral Reserve estimate considers an iodine cut-off grade of 300 ppm, based on accumulated cut-off iodine grades and operational average grades, as well as the cost and medium- and long-term prices forecast of generating iodine (Sections 11, 16 and 19).
(4) Modifying factors of historical operational use in various of SQM’s mining facilities, are applied to iodine and nitrate grades, the factors applied to iodine and nitrate grades are 0.9 and 0.85, respectively.
(5) Mineral Resources in the area without an environmental permit are estimated at 18 Mt.
(6) Mineral Reserves are reported as in-situ ore
(7) Donald Hulse is the QP responsible for the Mineral Reserves.
(8) The QP is not aware of any environmental, permitting, legal, title, taxation, socioeconomic, marketing, political or other relevant factors that could materially affect the Mineral Reserve estimate that are not discussed in this TRS.
| 1.6 | Metallurgy and Mineral Processing |
| 1.6.1 | Metallurgical Test Work Summary |
Metallurgical test work performed to date on the project shows that the Orcoma ore outperforms the company's other resources based on its salt composition and leaching tests. SQM's analytical and pilot test laboratories perform the following chemical, mineralogical and metallurgical tests which constitutes the bank of tests carried out on operating projects: 1) Microscopy and chemical composition, 2) Determination of Physical properties: Tail Test, Borra test, Laboratory granulometry, Embedding tests, Permeability, and 3) Leaching tests.
| WSP-SQM0011-TRS-Pampa Orcoma-Rev1 | Rev1 | Page 3 |
For Pampa Orcoma, tests were conducted in 2014 and during 2020. During 2014, through the "Sumo Project (pits or calicatas)", leaching tests were conducted in isocontainers, resulting in an average iodine yield of 67.7% and in the case of nitrate, a yield of 77.6%. The average soluble salt content of Pampa Orcoma in this test is defined as 49.1% on average.
Meanwhile, in 2020 and through the Diamantina Project (DDH), agitated leaching tests were carried out in vessels and successive stages, concluding that the recovery is favorable from a Soluble Salts content about than 50%. In these tests the soluble salts matrix was 53.4% and an iodine content of 65.3% was obtained.
On the other hand, this project contemplates the use of seawater as a leaching solution to replace industrial water. In this way, SQM previously developed a caliche leaching test plan with seawater, to determine the technical feasibility, positive and negative impacts or equivalence on recovery and metallurgical yield. By means of column leaching tests, the feasibility of the process was demonstrated in a pilot plant located at the Iris plant of the Nueva Victoria mine.
The test work developed was adequate to establish appropriate processing routes for the caliche resource and supports the future yield estimates indicated in the planning. Therefore, the deposit is considered favorable for the extraction process.
The Project aims to produce iodide, iodine, and nitrate-rich salts from caliche processing, which will be extracted from deposits rich in this mineral, located in the area known as Pampa Orcoma, commune of Huara. Mining and ore processing at the future Pampa Orcoma mining operation corresponds, in both cases, to conventional methods and stages usually employed by SQM in its other caliche operations.
The production process starts with caliche exploitation (mine) at a rate of up to 11,000,000 tonnes per year (tpy), heap leaching and processing plants to obtain iodine as the main product, and salts rich in sodium nitrate and potassium nitrate as a by-product.
An iodate-rich solution will be obtained through leaching with seawater, or recirculated solutions (a fraction of Brine Feeble [BF] recirculated from the iodide plant), which are then treated in chemical plants to elemental iodine produced for sale as prill. After neutralization, the remaining solution is taken to evaporation areas to obtain sodium nitrate and other salts that will be sent to the Coya Sur Plant, located in the Antofagasta Region.
Pampa Orcoma, through its two iodide plants and one iodine (fusion) plant, is projected to begin operation in 2024 with an annual production of around 2,500 tonnes (t) of iodine and 320 kilotonnes (Kt) per year of nitrate salts, each ones, with an average total recovery of 66% and 63%, respectively.
| WSP-SQM0011-TRS-Pampa Orcoma-Rev1 | Rev1 | Page 4 |
| 1.7 | Mine Design, Optimization, and Scheduling |
Pampa Orcoma's Mining Plan considers caliche extraction at a first year rate of 7 Million tonnes (Mt) per year (Mtpy) ramping up to a nominal 20 Mtpy. For the period 2024-2040, a total extraction of 309 Mt of caliche with an average grade of 408 parts per million (ppm) iodine and 6.8% nitrates is projected. The area to be mined is 2,395 ha.
Exploitation at the future Pampa Orcoma mine corresponds to SQM's usual method employed in its caliche mining operations, which consists of land preparation (soil and overburden removal), surface extraction of the mineral (caliches), loading, and transport of the mineral (caliche) for leaching heaps to obtain the solutions (fresh brine) enriched in iodine and nitrates.
Mining at Pampa Orcoma is superficial, removing a superficial layer of sterile material (soil + overburden), which is up to 1.50 m thick (sandstones, breccias, and anhydrite crusts). The mineral (caliche) is then extracted, having a thickness of 1.50 m to 6.00 m (average of 3.50 m).
At Pampa Orcoma, between 20% to 30% of the material to be mined is classified as hard to semi-hard, and 70-80% as soft to semi-soft. It also has low clay content and thus favors the use of a continuous miner (CM) and better recovery rates in the leaching heaps (drainage in the heaps is improved).
In the mining processes, SQM considers an efficiency close to 90%, including material losses due to modifying factors and those inherent to the mining process, as well as for the mineral dilution processes. For this mining process performance, the heap leach load expected is a total of 126.2 kt of iodine (21.6 tonnes per day [tpd] of iodine – 7.7 ktpy of iodine-) and 20,966 kt of nitrate salts (3,582 tpd of nitrates -1,286 ktpy of nitrate-). For an average load of 0.85 Mt of caliche in heap leach, there is an average load of 313 t of iodine and 51,908 t of nitrate salts per heap leach for the 2024-2040 period.
In the heap leaching processes, the total seawater demand averages 336 liters per second (L/s) (1,190 cubic meters per hour [m³/h]). Considering the porjected heap leach yields (73.7% for iodine and 76.9% for nitrates), a flow of enriched solutions (Brine flow) of 1,034 m³/h is expected, which means a hydraulic efficiency near of 80%. Average unit consumptions are set at 0.55 cubic meters per tonne (m³/t). For the Mining Plan elaborated by SQM (2024-2040 period), the production of Iodine in piles is planned to be 84 kt (14.3 tpd) and 14,482 Kt of nitrates (2,474 tpd), which implies an average production of 231 t of Iodine and 39,838 t of nitrate salts per pile.
SQM has planned acquisition of the necessary equipment to achieve caliche production, complete the mining and construction of the heap leach, and obtain the enriched liquors that will be sent to the treatment plants to obtain the final products of iodine and nitrate.
Pampa Orcoma's mining operation will be staffed with 155 professionals for mining and heap leaching operations. It is planned that a total of 45 professionals will be employed for heap leach and associated pit maintenance. The unit cost of mining production at Pampa Orcoma is set at 2.13 United States Dollars per tonne (USD/t) of caliche mined, including leach heap drainage construction; and 1.43 USD/t of caliche leached in heap pads, including irrigation, heap pad operations and seawater pipeline.
| WSP-SQM0011-TRS-Pampa Orcoma-Rev1 | Rev1 | Page 5 |
| 1.8 | Capital Costs, Operating Costs, and Financial Analysis |
| 1.8.1 | Capital and Operating Costs |
SQM is the world’s largest producer of potassium nitrate and iodine and one of the world´s largest lithium producers. It also produces specialty plant nutrients, iodine derivatives, lithium derivatives, potassium chloride, potassium sulfate, and certain industrial chemicals (including industrial nitrates and solar salts). The products are sold in approximately 110 countries through SQM worldwide distribution network, with more than 90% of the sales derived from countries outside Chile.
The Orcoma Project contemplates:
| · | Open pit exploitation of mining deposits. |
| · | Enabling support facilities called the Mining Operations Center (COM). |
| · | Construction of an iodide production plant, with a capacity of 2,500 tpy (of equivalent iodine). |
| · | Construction of an iodine plant, to process up to 2,500 tpy. |
| · | Construction of evaporation ponds to produce salts rich in nitrate at a rate of 320,325 tpy. |
| · | Construction of a seawater adduction pipe from the northern sector of Caleta Buena to the mining area, to meet the water needs during the operation phase. |
| · | Connection of the industrial areas of the Project to the Norte Grande Interconnected System (SING), in order to provide sufficient energy for their electrical requirements. |
Orcoma's operating cost comprises the cost to produce the base solution, the cost of iodine production, and the cost of transport the brine nitrate concentrated to the Coya Sur site.
The common variable costs are 3,59 USD per caliche t.
The Iodine variable cost is 16.1 USD per iodine kilogram (kg).
The salt variable cost (including transportation to Coya Sur) is 82.6 USD per nitrate tonne (brine enriched in nitrate).
To obtain the flow of costs, which considers operating and non-operating costs, unit costs have been included for the different production stages, which considers common production cost for iodine and nitrates, such as Mining, Leaching and Seawater.
In addition, the production costs directly associated with the production of iodine in the plant, and the production of nitrates before processing at the Coya Sur site were added.
To the costs indicated above, those related to Depreciation and Others have been added, which include, among other costs, marketing, and exportation.
| WSP-SQM0011-TRS-Pampa Orcoma-Rev1 | Rev1 | Page 6 |
The key valuation assumptions used in the financial model consider a discount rate of 10% and a tax rate of 28% in the period 2024 to 2040.
The estimated production of iodine and nitrates for the period 2024 to 2040 corresponds to the Mining Plan of SQM reviewed by WSP, which implies a total production of 84 kt prilled iodine and 14,482 kt of nitrate concentrate brine. nitrate concentrate brine produced in Nueva Victoria complex will be transported to Coya Sur plant to mix with KCl from Salar de Atacama to produce Potassium Nitrate Fertilizers and Solar Salts.
The economic analysis considers the unit costs for prilled iodine and nitrate concentrate brine production and an unit value for the prilled Iodine selling price and an unit internal price for the nitrate concentrate brine produced in Nueva Victoria complex.
The estimated Net Present Value (NPV) Base Case imply a Net Present Value (NPV) before Financial Cost (FC) & Taxes (kUSD) of $1,012,558; and a NPV after FC and Taxes (kUSD) of $680,060.
For the whole of the iodine and nitrate business, the financial analysis is presented in Table 1-3.
Sensitivity analysis gives visibility to the assumptions that present the key risks to the value of the Project. The analysis also identifies the relative impact of each assumption in terms the net present value (Figure 1-1).
| WSP-SQM0011-TRS-Pampa Orcoma-Rev1 | Rev1 | Page 7 |
Figure 1-1 Sensitivity Analysis of the Pampa Orcoma Project
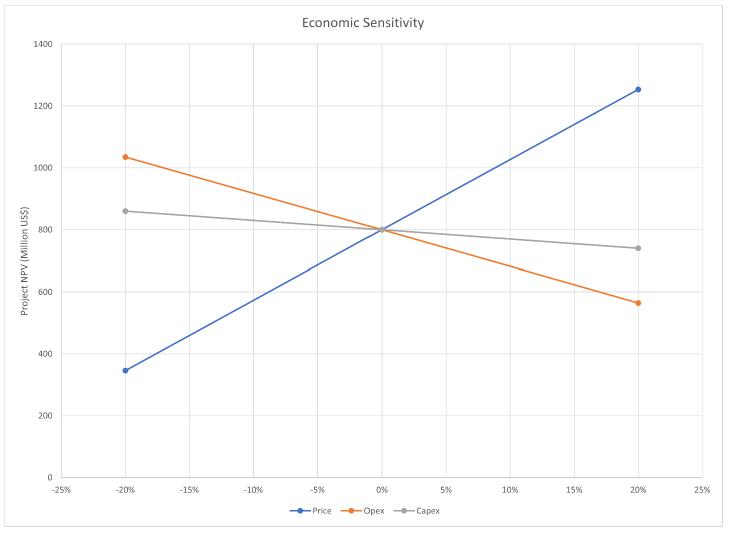
As seen in the above figure, the project NPV is more sensitive to product price while being least sensitive to capital and operational costs.
| WSP-SQM0011-TRS-Pampa Orcoma-Rev1 | Rev1 | Page 8 |
Table 1-3. Estimated Net Present Value (NPV) for the Period
| NPV | | | | 2022 | | | 2023 | | | 2024 | | | 2025 | | | 2026 | | | 2027 | | | 2028 | | | 2029 | | | 2030 | | | 2031 | | | 2032 | | | 2033 | | | 2034 | | | 2035 | | | 2036 | | | 2037 | | | 2038 | | | 2039 | | | 2040 | | | TOTAL | |
| REVENUE | | | | | | | | | | | | | | | | | | | | | | | | | | | | | | | | | | | | | | | | | | | | | | | | | | | | | | | | | | | | | | | | | | | | | | | | | | | | | | | | | | |
| Total Revenues (M US$) | | US$M | | | - | | | | - | | | | 167 | | | | 244 | | | | 297 | | | | 377 | | | | 458 | | | | 453 | | | | 419 | | | | 441 | | | | 468 | | | | 438 | | | | 461 | | | | 461 | | | | 461 | | | | 461 | | | | 461 | | | | 461 | | | | 461 | | | | 6,987 | |
| COSTS | | | | | | | | | | | | | | | | | | | | | | | | | | | | | | | | | | | | | | | | | | | | | | | | | | | | | | | | | | | | | | | | | | | | | | | | | | | | | | | | | | |
| Common Costs (mining, leaching) | | US$M | | | - | | | | - | | | | 27 | | | | 38 | | | | 48 | | | | 63 | | | | 72 | | | | 72 | | | | 72 | | | | 72 | | | | 72 | | | | 72 | | | | 72 | | | | 72 | | | | 72 | | | | 72 | | | | 72 | | | | 72 | | | | 72 | | | | 1,109 | |
| Iodine Production Costs | | US$M | | | - | | | | - | | | | 30 | | | | 43 | | | | 52 | | | | 68 | | | | 87 | | | | 80 | | | | 77 | | | | 85 | | | | 79 | | | | 77 | | | | 81 | | | | 81 | | | | 81 | | | | 81 | | | | 81 | | | | 81 | | | | 81 | | | | 1,249 | |
| Nitrate Production Costs | | US$M | | | - | | | | - | | | | 28 | | | | 42 | | | | 51 | | | | 64 | | | | 75 | | | | 78 | | | | 71 | | | | 72 | | | | 83 | | | | 76 | | | | 80 | | | | 80 | | | | 80 | | | | 80 | | | | 80 | | | | 80 | | | | 80 | | | | 1,196 | |
| TOTAL OPERATING COST | | US$M | | | - | | | | - | | | | 85 | | | | 123 | | | | 152 | | | | 195 | | | | 234 | | | | 230 | | | | 219 | | | | 229 | | | | 234 | | | | 225 | | | | 233 | | | | 233 | | | | 233 | | | | 233 | | | | 233 | | | | 233 | | | | 233 | | | | 3,554 | |
| EBITDA | | US$M | | | - | | | | - | | | | 81 | | | | 121 | | | | 145 | | | | 182 | | | | 224 | | | | 223 | | | | 200 | | | | 212 | | | | 234 | | | | 213 | | | | 228 | | | | 228 | | | | 228 | | | | 228 | | | | 228 | | | | 228 | | | | 228 | | | | 3,433 | |
| Depreciation | | US$M | | | - | | | | - | | | | 15 | | | | 16 | | | | 16 | | | | 17 | | | | 18 | | | | 18 | | | | 18 | | | | 18 | | | | 19 | | | | 19 | | | | 20 | | | | 20 | | | | 21 | | | | 21 | | | | 21 | | | | 22 | | | | 22 | | | | 321 | |
| Interest Payments | | US$M | | | - | | | | - | | | | 10 | | | | 9 | | | | 7 | | | | 6 | | | | 5 | | | | 4 | | | | 3 | | | | 1 | | | | - | | | | - | | | | - | | | | - | | | | - | | | | - | | | | - | | | | - | | | | - | | | | 45 | |
| Pre-Tax Gross Income | | US$M | | | - | | | | - | | | | 57 | | | | 97 | | | | 121 | | | | 158 | | | | 201 | | | | 201 | | | | 179 | | | | 193 | | | | 215 | | | | 194 | | | | 208 | | | | 208 | | | | 208 | | | | 207 | | | | 207 | | | | 206 | | | | 206 | | | | 3,066 | |
| Taxes | | 28% | | | - | | | | - | | | | 16 | | | | 27 | | | | 34 | | | | 44 | | | | 56 | | | | 56 | | | | 50 | | | | 54 | | | | 60 | | | | 54 | | | | 58 | | | | 58 | | | | 58 | | | | 58 | | | | 58 | | | | 58 | | | | 58 | | | | 859 | |
| Operating Income | | US$M | | | - | | | | - | | | | 41 | | | | 70 | | | | 87 | | | | 114 | | | | 145 | | | | 145 | | | | 129 | | | | 139 | | | | 155 | | | | 140 | | | | 150 | | | | 150 | | | | 149 | | | | 149 | | | | 149 | | | | 149 | | | | 148 | | | | 2,208 | |
| Add back depreciation | | US$M | | | - | | | | - | | | | 15 | | | | 16 | | | | 16 | | | | 17 | | | | 18 | | | | 18 | | | | 18 | | | | 18 | | | | 19 | | | | 19 | | | | 20 | | | | 20 | | | | 21 | | | | 21 | | | | 21 | | | | 22 | | | | 22 | | | | 321 | |
| NET INCOME AFTER TAXES | | US$M | | | - | | | | - | | | | 56 | | | | 85 | | | | 103 | | | | 131 | | | | 162 | | | | 163 | | | | 147 | | | | 157 | | | | 174 | | | | 159 | | | | 170 | | | | 170 | | | | 170 | | | | 170 | | | | 170 | | | | 170 | | | | 170 | | | | 2,529 | |
| Total CAPEX | | US$M | | | 150 | | | | 144 | | | | 8 | | | | 8 | | | | 12 | | | | 25 | | | | 9 | | | | 4 | | | | 4 | | | | 4 | | | | 9 | | | | 5 | | | | 10 | | | | 10 | | | | 7 | | | | 8 | | | | 12 | | | | 7 | | | | 5 | | | | 442 | |
| Bank Loan | | US$M | | | 95 | | | | 96 | | | | - | | | | - | | | | - | | | | - | | | | - | | | | - | | | | - | | | | - | | | | - | | | | - | | | | - | | | | - | | | | - | | | | - | | | | - | | | | - | | | | - | | | | 190 | |
| Loan Amortization | | US$M | | | - | | | | - | | | | 20 | | | | 21 | | | | 22 | | | | 23 | | | | 24 | | | | 25 | | | | 27 | | | | 28 | | | | - | | | | - | | | | - | | | | - | | | | - | | | | - | | | | - | | | | - | | | | - | | | | 190 | |
| Working Capital | | US$M | | | - | | | | - | | | | 14 | | | | 7 | | | | 4 | | | | 6 | | | | 7 | | | | -0 | | | | -4 | | | | 2 | | | | 4 | | | | -4 | | | | 2 | | | | - | | | | - | | | | - | | | | - | | | | - | | | | - | | | | 38 | |
| Pre-Tax Cashflow | | US$M | | | -55 | | | | -48 | | | | 30 | | | | 77 | | | | 99 | | | | 122 | | | | 179 | | | | 190 | | | | 170 | | | | 176 | | | | 222 | | | | 211 | | | | 216 | | | | 218 | | | | 221 | | | | 220 | | | | 216 | | | | 221 | | | | 223 | | | | 2,908 | |
| After-Tax Cashflow | | US$M | | | -55 | | | | -48 | | | | 14 | | | | 50 | | | | 66 | | | | 77 | | | | 122 | | | | 133 | | | | 120 | | | | 123 | | | | 161 | | | | 157 | | | | 157 | | | | 160 | | | | 163 | | | | 162 | | | | 158 | | | | 164 | | | | 165 | | | | 2,049 | |
| Pre-Tax NPV | | US$M | | | 1,013 | | | | | | | | | | | | | | | | | | | | | | | | | | | | | | | | | | | | | | | | | | | | | | | | | | | | | | | | | | | | | | | | | | | | | | | | | | | | | |
| After-Tax NPV | | US$M | | | 680 | | | | | | | | | | | | | | | | | | | | | | | | | | | | | | | | | | | | | | | | | | | | | | | | | | | | | | | | | | | | | | | | | | | | | | | | | | | | | |
| Discount Rate | | US$M | | | 10 | % | | | | | | | | | | | | | | | | | | | | | | | | | | | | | | | | | | | | | | | | | | | | | | | | | | | | | | | | | | | | | | | | | | | | | | | | | | | | |
| WSP-SQM0011-TRS-Pampa Orcoma-Rev1 | Rev1 | Page 9 |
| 1.9 | Conclusions and Recommendations |
Mr. Donald Hulse, Qualified Person (QP) for Mineral Reserves, concludes that the work performed in the preparation of this Technical Report Summary (TRS) includes adequate details and information to declare the Mineral Resources and Reserves.
In relation to the resource treatment processes, the conclusion of the responsible QP, Gino Slanzi, is that appropriate work practices and equipment, design methods and processing equipment selection criteria have been used.
In addition, the company has developed new processes that have continuously and systematically optimized operations.
Some recommendations are given in the following areas:
| · | Analyze the mineral distribution and statistical characteristics of drill hole grids currently in process have the potential to upgrade the mineral resource and mineral reserve classification. |
| · | Expand the block model approach for resource estimation to larger drill hole grids to avoid separating the resource model and databases by drill hole spacing. |
| · | Improvements are required for the Quality Assurance/Quality Control (QA/QC) program to align with industry best practice and facilitate more meaningful QC. |
| · | Confirm the accuracy and precision of SQM internal laboratory implementing an external QA/QC check with a representative number of samples as a routine procedure. |
| · | Maintain original and/or digitized records of collar surveys, geological, and geochemical data in a secure database. |
| · | Infilling RC drill hole grids with 100-x-50 -m spacing, which is currently in progress, has the potential to upgrade the Mineral Resource estimates from Indicated to Measured Mineral Resources, and in turn upgrade Mineral Reserves from Probable to Proven. It is recommended to re-estimate Pampa Orcoma’s Mineral Reserves when Mineral Resource have been updated based on the additional drilling |
| · | Estimate caliche density specifically for the Pampa Orcoma project area. This is currently based on operating experience at the Nueva Victoria operation and may improve the accuracy of the mineral resource estimate. |
| · | Construct updated procedures that describe in sufficient detail the activities of capture, administration, and backup of the data. |
| · | Update all the procedures, methodologies, and results in the annual reports. |
| · | Detail the construction development timeline to a feasibility level to best account for the timing of cash flows and risk points to the time and cost. |
All the above recommendations are considered within the declared capital and operating expenditures and do not imply additional costs for their execution.
| WSP-SQM0011-TRS-Pampa Orcoma-Rev1 | Rev1 | Page 10 |
This Technical Report Summary (TRS) was prepared for the Sociedad Química y Minera de Chile (SQM.) The purpose of the TRS is to provide a comprehensive understanding of SQM’s Pampa Orcoma Project in northern Chile based on the requirements of Regulation S-K, Subpart 1300 of the United States Securities Exchange Commission (SEC), which hereafter is referred to as the S-K 1300.
| 2.1 | Terms of Reference and Purpose of the Report |
When the Pampa Orcoma site becomes operational in the year 2024, SQM will produce iodide, iodine and nitrate derived by-products (nitrate-rich salts, sodium nitrate and potassium nitrate), through heap leaching and its process plants. This TRS provides technical information to support the Mineral Resource and Mineral Reserve estimates for SQM's operations at the Pampa Orcoma project.
The date of this TRS Report was March 30, 2022, while the effective date of the Mineral Resource and Mineral Reserve estimates was December 31, 2021. It is the QP’s opinion that there are no known material changes impacting the Mineral Resource and Mineral Reserve estimates between December 31, 2021, and March 30, 2022.
This TRS uses English spelling and Metric units of measure. Nitrate grades are presented in weight percent (wt.%) and iodine grades in parts per million (ppm). Costs are presented in constant US Dollars (USD) as of December 31, 2021.
Except where noted, coordinates in this TRS are presented in Metric units using the World Geodetic System (WGS) 1984 Universal Transverse Mercator (UTM) ZONE 19 South (19S).
The purpose of this TRS is to report Mineral Resources and Mineral Reserves for SQM’s Pampa Orcoma Project.
| 2.2 | Source of Data and Information |
This TRS is based on information provided directly by SQM and public data extracted from published government reports. All information relied upon is cited throughout this TRS and listed in Section 24.
Table 2-1 provides the abbreviations (abbv.) and acronyms used in this TRS.
| WSP-SQM0011-TRS-Pampa Orcoma-Rev1 | Rev1 | Page 11 |
Table 2-1. Abbreviations and Acronyms
| Acronym/Abbv. | Definition |
| ' | minute |
| '' | second |
| % | percent |
| ° | degrees |
| °C | degrees Celsius |
| 100T | 100 truncated grid |
| AA | Atomic absorption |
| AAA | Andes Analytical Assay |
| AFA | Weakly acidic water |
| AFN | Feeble Neutral Water |
| Ajay | Ajay Chemicals Inc. |
| AS | Auxiliary Station |
| ASG | Ajay-SQM Group |
| BF | Brine Feeble |
| BFN | Neutral Brine Feeble |
| BWn | abundant cloudiness |
| CIM | Centro de Investigación Minera y Metalúrgica |
| cm | centimeter |
| CM | continuous miner |
| CU | Water consumption |
| COM | Mining Operations Center |
| CSP | Concentrated solar power |
| CONAF | National Forestry Development Corporation |
| DDH | diamond drill hole |
| DGA | General Directorate of Water |
| DTH | down-the-hole |
| EB 1 | Pumping Station No. 1 |
| EB2 | Pumping Station No. 2 |
| EIA | environmental impact statement |
| EW | east-west |
| FC | financial cost |
| FNW | Feeble neutral water |
| g | gram |
| GU | geological unit |
| g/cc | grams per centimeter |
| g/mL | grams per milliliter |
| g/t | grams per tonne |
| g/L | grams per liter |
| GPS | global positioning system |
| WSP-SQM0011-TRS-Pampa Orcoma-Rev1 | Rev1 | Page 12 |
| h | hour |
| ha | hectare |
| ha/y | hectares per year |
| HDPE | High-density Polyethylene |
| ICH | industrial chemicals |
| ICP | inductively coupled plasma |
| IS | Intermediate solution |
| ISO | International Organization for Standardization |
| kg | kilogram |
| kh | horizontal seismic coefficient |
| kg/m3 | kilogram per cubic meter |
| km | kilometer |
| kv | vertical seismic coefficient |
| kN/m3 | kilonewton per cubic meter |
| km2 | square kilometer |
| kPa | kiloPascal |
| kt | kilotonne |
| ktpd | thousand tonnes per day |
| ktpy | kilotonne per year |
| kUSD | thousand USD |
| kV | kilovolt |
| kVa | kilovolt-amperes |
| L/h-m2 | liters per hour square meter |
| L/m2/d | liters per square meter per day |
| L/s | liters per second |
| LR | Leaching rate |
| LCD/LED | liquid crystal displays/light-emitting diode |
| LCY | Caliche and Iodine Laboratories |
| LdTE | medium voltage electrical transmission line |
| LIMS | Laboratory Information Management System |
| LOM | life-of-mine |
| m | meter |
| M&A | mergers and acquisitions |
| m/km2 | meters per square kilometer |
| m/s | meters per second |
| m2 | square meter |
| m3 | cubic meter |
| m3/d | cubic meter per day |
| m3/h | cubic meter per hour |
| m3/t | cubic meter per tonne |
| WSP-SQM0011-TRS-Pampa Orcoma-Rev1 | Rev1 | Page 13 |
| masl | meters above sea level |
| mbgl | meter below ground level |
| mbsl | meters below sea level |
| mm | millimeter |
| mm/y | millimeters per year |
| Mpa | megapascal |
| Mt | million tonne |
| Mtpy | million tonnes per year |
| MW | megawatt |
| MWh/y | Megawatt hour per year |
| NNE | north-northeast |
| NNW | north-northwest |
| NPV | net present value |
| NS | north-south |
| O3 | ozone |
| ORP | oxidation reduction potential |
| PLS | pregnant leach solution |
| PMA | particle mineral analysis |
| ppbv | parts per billion volume |
| ppm | parts per million |
| PVC | Polyvinyl chloride |
| QA | Quality assurance |
| QA/QC | Quality Assurance/Quality Control |
| QC | Quality control |
| QP | Qualified Person |
| RC | reverse circulation |
| RCA | environmental qualification resolution |
| RMR | Rock Mass Rating |
| ROM | run-of-mine |
| RPM | revolutions per minute |
| RQD | rock quality index |
| SG | Specific gravity |
| SEC | Securities Exchange Commission of the United States |
| SSE | South-southeast |
| SEIA | Environmental Impact Assessment System |
| MMA | Ministry of Environment |
| SMA | Environmental Superintendency |
| SNIFA | National Environmental Qualification Information System (SMA online System) |
| PSA | Environmental Following Plan (Plan de Seguimiento Ambiental) |
| SEM | Terrain Leveler Surface Excavation Machine |
| WSP-SQM0011-TRS-Pampa Orcoma-Rev1 | Rev1 | Page 14 |
| Acronym/Abbv. | Definition |
| SFF | specialty field fertilizer |
| SI | intermediate solution |
| SING | Norte Grande Interconnected System |
| S-K 1300 | of Regulation S-K, Subpart 1300 of the Securities Exchange Commission of the United States |
| SM | salt matrix |
| SPM | sedimentable particulate matter |
| Sr | relief value, or maximum elevation difference in an area of 1 km² |
| SS | soluble salt |
| SX | solvent extraction |
| t | metric tonne |
| TR | Irrigation rate |
| TAS | sewage treatment plant |
| TEA project | Tente en el Aire project |
| tpy | tonnes per year |
| t/m3 | tonnes per cubic meter |
| the Project or Orcoma Project | Pampa Orcoma Project |
| tpd | tonnes per day |
| TRS | Technical Report Summary |
| UF | Development Unit (Unidad de Fomento) is a Chilean financial instrument that is resistant to inflation. Currently valued at 38.7 US$ |
| ug/m3 | microgram per cubic meter |
| USD | United States Dollars |
| USD/kg | United States Dollars per kilogram |
| USD/t | United States Dollars per tonne |
| UTM | Universal Transverse Mercator |
| UV | ultraviolet |
| VEC | Voluntary Environmental Commitments |
| WGS | World Geodetic System |
| WSF | Water soluble fertilizer |
| wt.% | weight percent |
| XRD | X-Ray diffraction |
| XRF | X-ray fluorescence |
| WSP-SQM0011-TRS-Pampa Orcoma-Rev1 | Rev1 | Page 15 |
The details of the site inspections by the QPs are summarized in Table 2-2.
Table 2-2. Site Visits
| QP | | Expertise | | Date of Visit | | Detail of Visit |
| Álvaro Henríquez | | Exploration, Geology | | 6 Dec 2021 | | Drilling grid, extents of the deposit, soil pits |
| Donald Hulse | | Resources and Reserves | | 6 Dec 2021 | | Drilling grid, extents of the deposit, soil pits |
In the visit to Pampa Orcoma, the QPs reviewed the drilling grid, the extents of the deposit, and selected trenches that exposed the thickness and quality of caliche and overburden.
| 2.4 | Previous Reports on Project |
This Report is the first TRS prepared for SQM’s Pampa Orcoma deposit. This TRS is not an update of a previously filed TRS.
| WSP-SQM0011-TRS-Pampa Orcoma-Rev1 | Rev1 | Page 16 |
| 3 | Description and Location |
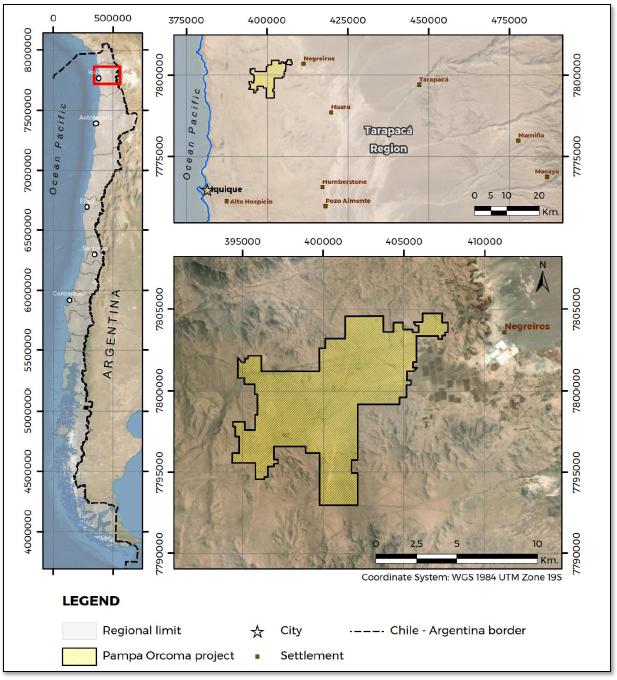
The Pampa Orcoma Project is in the Tarapacá Region of northern Chile. It is situated 99 kilometers (km) to the northeast of the city of Iquique, in the community of Huara (SQM(a), 2019). The property is centered on Latitude 19° 53’ 58’’ S, Longitude 69° 56’ 58’’ W (Figure 3-1).
Figure 3-1. General Location Map
| WSP-SQM0011-TRS-Pampa Orcoma-Rev1 | Rev1 | Page 17 |
The mining property comprises 43 mining concessions covering a total area of 10,296 ha. The Pampa Orcoma project (the Project, or Orcoma Project) covers 7,387 ha including the mine area of 6,883 ha, as well as temporal and permanent facilities for the mining operation.
| 3.3 | Mineral Titles, Claims, Rights, Leases, and Options |
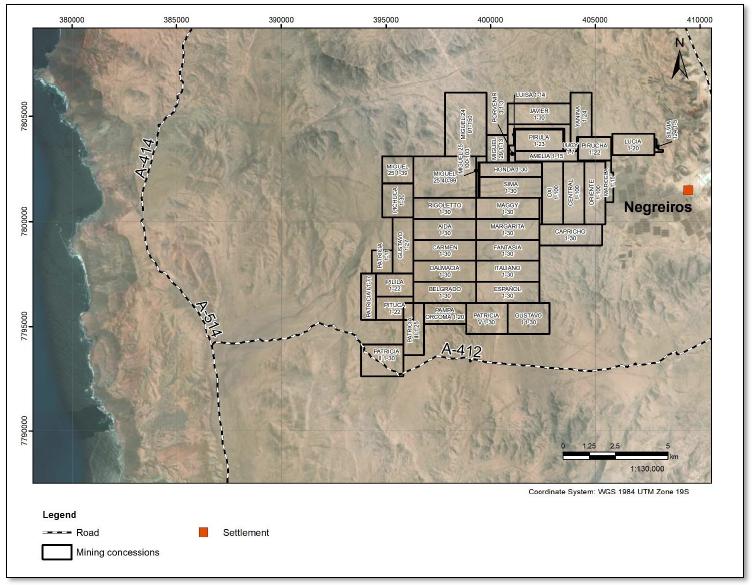
SQM currently has four areas for the generation of Resources and Mineral Reserves located in the I and II Region of Chile, including Pampa Orcoma, covering an area of approximately 291,780 ha with a prospecting grid of less than or equal to 400-x-400 m. Pampa Orcoma covers a mine area of 6,883 ha. Figure 3-2 shows the outline Pampa Orcoma’s mining property and concessions, within which the area considered for resource estimations is contained.
The Pampa Orcoma property comprises 43 mining concessions (Table 3-1) without expiration date, which are maintained through payment of an annual mining patent fee, all of them belong to SQM.
Table 3-1. Pampa Orcoma project concessions
| Rol Nacional | | Nombre Concesión | | Nombre
Titular | | Situación | | Año de
Inscripción |
| 01404-0333-4 | | SILVIA 124 1/5 | | ORCOMA SPA | | CONSTITUIDA | | 2011 |
| 01206-1602-1 | | PORVENIR 3 1/3 | | ORCOMA SPA | | CONSTITUIDA | | 2010 |
| 01206-1215-8 | | MIGUEL 29 1/13 | | ORCOMA SPA | | CONSTITUIDA | | 2003 |
| 01206-1207-7 | | MIGUEL 25 100/103 | | ORCOMA SPA | | CONSTITUIDA | | 2014 |
| 01206-1206-9 | | MIGUEL 25 40/99 | | ORCOMA SPA | | CONSTITUIDA | | 2003 |
| 01206-1205-0 | | MIGUEL 25 1/39 | | ORCOMA SPA | | CONSTITUIDA | | 2003 |
| 01206-1204-2 | | MIGUEL 24 91/150 | | ORCOMA SPA | | CONSTITUIDA | | 2003 |
| 01206-0923-8 | | PAMPA ORCOMA 1/20 | | ORCOMA SPA | | CONSTITUIDA | | 1999 |
| 01206-0816-9 | | LUISA 1/14 | | ORCOMA SPA | | CONSTITUIDA | | 1996 |
| 01206-0815-0 | | JAVIER 1/30 | | ORCOMA SPA | | CONSTITUIDA | | 1996 |
| 01206-0814-2 | | YANINA 1/24 | | ORCOMA SPA | | CONSTITUIDA | | 1996 |
| 01206-0812-6 | | LUCY 1/7 | | ORCOMA SPA | | CONSTITUIDA | | 1996 |
| 01206-0477-5 | | PILILA 1/22 | | ORCOMA SPA | | CONSTITUIDA | | 1989 |
| 01206-0476-7 | | PITUCA 1/22 | | ORCOMA SPA | | CONSTITUIDA | | 1989 |
| 01206-0475-9 | | PICHUCA 1/30 | | ORCOMA SPA | | CONSTITUIDA | | 1989 |
| WSP-SQM0011-TRS-Pampa Orcoma-Rev1 | Rev1 | Page 18 |
| Rol Nacional | | Nombre Concesión | | Nombre Titular | | Situación | | Año de Inscripción |
| 01206-0474-0 | | PIRULA 1/23 | | ORCOMA SPA | | CONSTITUIDA | | 1989 |
| 01206-0473-2 | | PIRUCHA 1/22 | | ORCOMA SPA | | CONSTITUIDA | | 1989 |
| 01206-0459-7 | | HONDA 1/30 | | ORCOMA SPA | | CONSTITUIDA | | 1988 |
| 01206-0458-9 | | SIMA 1/30 | | ORCOMA SPA | | CONSTITUIDA | | 1988 |
| 01206-0410-4 | | LUCIA 1/20 | | ORCOMA SPA | | CONSTITUIDA | | 1988 |
| 01206-0409-0 | | MARGARITA 1/30 | | ORCOMA SPA | | CONSTITUIDA | | 1988 |
| 01206-0408-2 | | AMELIA 1/15 | | ORCOMA SPA | | CONSTITUIDA | | 1988 |
| 01206-0407-4 | | MAGGI 1/30 | | ORCOMA SPA | | CONSTITUIDA | | 1988 |
| 01206-0405-8 | | RIGOLETTO 1/30 | | ORCOMA SPA | | CONSTITUIDA | | 1988 |
| 01206-0404-K | | ITALIANO 1/30 | | ORCOMA SPA | | CONSTITUIDA | | 1988 |
| 01206-0403-1 | | FANTASIA 1/30 | | ORCOMA SPA | | CONSTITUIDA | | 1988 |
| 01206-0402-3 | | ESPANOL 1/30 | | ORCOMA SPA | | CONSTITUIDA | | 1988 |
| 01206-0401-5 | | DALMACIA 1/30 | | ORCOMA SPA | | CONSTITUIDA | | 1988 |
| 01206-0400-7 | | CARMEN 1/30 | | ORCOMA SPA | | CONSTITUIDA | | 1988 |
| 01206-0399-K | | CAPRICHO 1/30 | | ORCOMA SPA | | CONSTITUIDA | | 1988 |
| 01206-0398-1 | | BELGRADO 1/30 | | ORCOMA SPA | | CONSTITUIDA | | 1988 |
| 01206-0397-3 | | AIDA 1/30 | | ORCOMA SPA | | CONSTITUIDA | | 1988 |
| 01206-0348-5 | | MARCELA 1/15 | | ORCOMA SPA | | CONSTITUIDA | | 1987 |
| 01206-0265-9 | | OXI 1/100 | | ORCOMA SPA | | CONSTITUIDA | | 1985 |
| 01206-0264-0 | | ORIENTE 1/100 | | ORCOMA SPA | | CONSTITUIDA | | 1985 |
| 01206-0258-6 | | CENTRAL 1/100 | | ORCOMA SPA | | CONSTITUIDA | | 1985 |
| 01201-1875-7 | | PATRICIA V 1/30 | | ORCOMA SPA | | CONSTITUIDA | | 1997 |
| 01201-1873-0 | | PATRICIA III 1/25 | | ORCOMA SPA | | CONSTITUIDA | | 1997 |
| 01201-1872-2 | | PATRICIA II 1/30 | | ORCOMA SPA | | CONSTITUIDA | | 1997 |
| 01201-1871-4 | | PATRICIA I 1/77 | | ORCOMA SPA | | CONSTITUIDA | | 1997 |
| 01201-1870-6 | | PATRICIA 1/11 | | ORCOMA SPA | | CONSTITUIDA | | 1997 |
| 01201-1865-K | | GUSTAVO I 1/30 | | ORCOMA SPA | | CONSTITUIDA | | 1997 |
| 01201-1864-1 | | GUSTAVO 1/27 | | ORCOMA SPA | | CONSTITUIDA | | 1998 |
| WSP-SQM0011-TRS-Pampa Orcoma-Rev1 | Rev1 | Page 19 |
Figure 3-2. Location of Pampa Orcoma property
| WSP-SQM0011-TRS-Pampa Orcoma-Rev1 | Rev1 | Page 20 |
As of the end of 2020, SQM has the right to explore and/or exploit the caliche mineral resources by the Environmental Qualification Resolution (Comisión de Evaluación Región de Tarapacá, 2017) RCA N° 75/2021. The approved area covers more than 1,563,169 ha in the north of Chile, Region I and II. The Company mines annually under 1% of the total area in which it has property rights.
| 3.5 | Environmental Impacts and Permitting |
Environmental permits for mining operations were approved in 2017, as Sectorial Environmental Plans or PAS under the common RCA N° 75/2021. The permit covers water and electricity supply, as well as the infrastructure required for the mining operation. The current PAS are listed in Table 3-2
Table 3-2. Summary of Current Permits
| Permit | Description | Authorization |
| PAS N°119 | Research collection of Marine Life | There is no information |
| PAS N° 132 | Permit for archaeological and anthropological excavations | Ord. N° 2673/2021 (for archeological sites) |
| PAS N° 136 | Permit to establish tailings dump or mineral accumulation | Res. Ex. N° 1985/2021 |
| PAS 137 | Mining Closure Plan | The documents were submitted and currently is under process. |
| PAS N° 138 | Permit for the construction, repair, modification and expansion of any public or private works for the evacuation, treatment or final disposal of wastewater, sewage of any nature | There is no information |
| PAS N° 140 | Permit for the construction, repair, modification and expansion of any garbage and waste treatment plant of any kind or for the installation of any place for the accumulation, selection, industrialization, trade or final disposal of garbage and waste of any kind | There is no information |
| PAS N° 142 | Permit for all hazardous waste storage sites: The project involves the construction of two warehouses in two sectors for the temporary disposal of hazardous waste | There is no information |
| PAS N° 146 | Permit to hunt or capture specimens of animals of protected species for research purposes, for the establishment of breeding centers or hatcheries and for the sustainable use of the resource | There is no information |
| PAS N° 155 | Permit for the construction of certain hydraulic works | The documents were submitted on May 13, 2021, and currently is under process. |
| PAS N° 156 | Permit to make modifications to the riverbed | The documents were submitted on May 10, 2021, and currently is under process. |
| PAS N° 160 | Permit to subdivide and urbanize rural land or for construction outside urban limits | There is no information |
| - | Authorization of the mining exploitation method | Res. Ex. N° 1860/2021 |
| - | Beneficiation Plant Authorization | The documents were submitted and currently is under process. |
It should be noted that the project has not yet been built and construction is expected to begin in 2022. Preconstruction activities are currently underway and sectoral permits are being processed. It is important to mention that to avoid the expiration of the environmental resolution the construction of the project must start before September 2022.
| WSP-SQM0011-TRS-Pampa Orcoma-Rev1 | Rev1 | Page 21 |
SQM has informed of a new environmental impact assessment (EIA) study, currently under execution, that will submit to the Environmental Impact Assessment System (SEIA) in 2023. The new project has as objective to expand Orcoma’s operation with respect to its current environmental authorization. The new project is expected to be authorized by mid-2025.
| 3.6 | Other Significant Factors and Risks |
Certain normal risk factors are associated with the properties, which may affect SQM's business, financial condition, cash flows, or results of operations. There are no other known factors or risks that affect access, title, entitlement, or ability to perform work on the property such that they would have a material impact on the statement of resources.
The factors or risks include, among others, the following:
| · | The risk of obtaining final environmental approvals from the necessary authorities promptly. There are cases where obtaining permits may cause significant delays in the execution and implementation of new projects. |
| · | The risk of obtaining all necessary licenses and permits on acceptable terms, promptly, or in their entirety. Obtaining regulatory approvals, including environmental permits, as well as opposition from political, environmental, and local and/or international ethnic groups, particularly in environmentally sensitive areas or in areas inhabited by indigenous populations, may consequently affect operating projects. |
| · | Risks associated with governmental regulation concerning exploitation. Changes in policies involving natural resource exploitation, taxation, and other industry-related matters may adversely affect the business, financial condition, and results of operations. |
| · | The risk from changes in laws Under current Chilean law, indigenous groups must be notified and consulted before any project is developed on land defined as indigenous. Failure to consult when required by law can result in the revocation or cancellation of regulatory approvals, including environmental permits already granted. |
| · | The risk that activities on adjacent properties will have an impact on the project. |
| · | The risk for the process, as currently defined, will not produce the expected quantity and/or quality required. However, extensive testing has been performed and all process steps are conventional and commonly used in the industry. |
| · | The risk of estimation methods involves numerous uncertainties in reserve quantity and quality, whether expressed in upward or downward changes. A downward shift in reserve estimates and/or quality could affect future production volumes and costs. |
| · | The risk of impurity levels in natural resources increasing over time more than predicted by the model may result in non-compliance with certain governmental or customer product standards. Consequently, the cost of production may increase to comply with the standards. |
| WSP-SQM0011-TRS-Pampa Orcoma-Rev1 | Rev1 | Page 22 |
| · | Risks associated with rising raw material and energy prices as well as difficulties and disruptions in supply chains, directly impact costs and production capacity. |
| · | Market and competitive risk factors could negatively affect market prices and the company's market share, which in turn could have a material adverse effect on business, financial position, and results of operations. World prices for lithium, fertilizers, and other chemicals vary depending on the relationship between supply and demand at any given time and in recent years, new and existing competitors have increased the supply of iodine, potassium nitrate, and lithium, and this has had an impact on the prices of both products. Additional production increases could harm prices. |
| 3.7 | Royalties and Agreements |
SQM has no obligations to any third party in respect of payments related to licenses, franchises or royalties for its Orcoma Property, as they do not apply to caliche production.
| WSP-SQM0011-TRS-Pampa Orcoma-Rev1 | Rev1 | Page 23 |
| 4 | Accessibility, Climate, Local Resources, Infrastructure and Physiography |
| 4.1 | Topography, Elevation and Vegetation |
The mining property is located at an elevation of 1,147 masl, within the range of 976 and 1,244 masl (SQM(a), 2019). Specifically, the mining area and industrial area are located mainly in the Cordillera de la Costa (Geobiota, 2015).
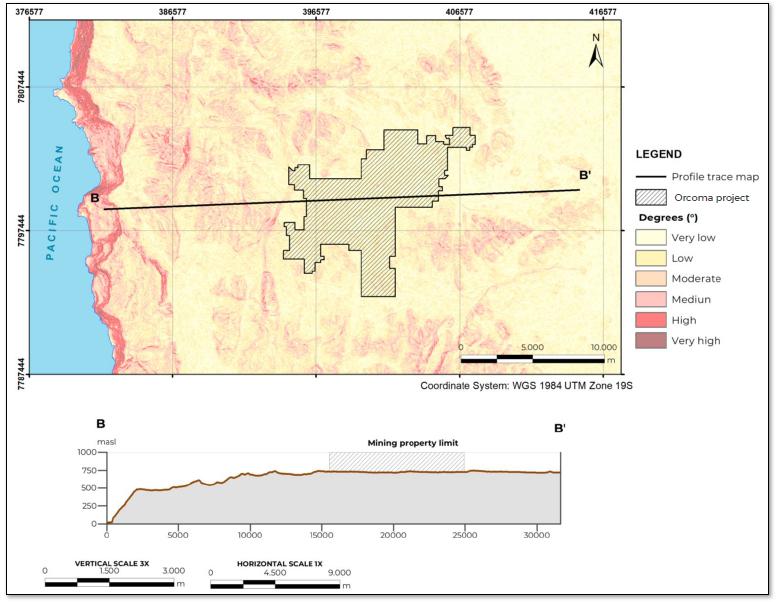
Topographic relief on a regional scale contains slopes ranging between 0 to 39°, with the steepest slopes observed close to the coast, due to the coastal scarp. In Pampa Orcoma relief is almost flat (Figure 4-1), the lower slopes imply a low relief factor Sr, close to zero, especially in the Exploration Area.
Regarding vegetation, during the field campaign carried out in July 2015, the absence of vegetation in the project area was indicated. According to studies carried out in 2010, called "Study of Coastal Flora, Tarapacá Region", it is stated that for the project area, the necessary conditions to name the area as an oasis, as well as the presence of vascular plants, have not been documented since 2002 (Pinto, 2010).
| 4.2 | Accessibility and Transportation to the Property |
The Pampa Orcoma Property is situated 40 km north-northeast (NNE) of the coastal city of Iquique, the capital of the Tarapacá Region. There are multiple daily flights between Iquique Airport and Santiago Airport. From Iquique, the Pampa Orcoma Property is reached by road, traveling 46 km east on the paved Ruta 16 (Route 16), then 26.5 km north on the paved Ruta 5 (Route 5) to the town of Huara, from where the access control checkpoint of the property lies 24 km to the northwest and west along local gravel roads (SQM(a), 2019).
| WSP-SQM0011-TRS-Pampa Orcoma-Rev1 | Rev1 | Page 24 |
Figure 4-1. Slope Parameter Map Sr and Elevation Profile Trace BB"
| WSP-SQM0011-TRS-Pampa Orcoma-Rev1 | Rev1 | Page 25 |
| 4.3 | Climate and Length of Operating Season |
The Tarapacá region is characterized as a mostly arid climate. The temperature tends to decrease as the terrain presents higher elevations, since geomorphologically this region can be divided into three main morphologies to include the Altiplanic zone, the intermediate zone, and the coastal zone. The records of the highest temperatures fall in the field of this last, and they tend to decrease toward the east. In the Cordillera de los Andes sector, the records indicate average temperatures between 11 degrees Celsius (°C) and 13°C, in the intermediate zone the average temperatures oscillate between 15°C and 17°C for the coastal zone. In this last zone, the oceanic influence can be noticed, which generates a non-negligible number of days with high cloudiness and the presence of coastal fog, on the other hand, in the sectors of the Altiplano, the atmosphere is arid with large variation thermal
In relation to rainfall, there are records that indicate that in the coastal area there is a very low fall of water (only a few millimeters per year). On the other hand, in the Altiplano area, the “Bolivian winter” controls the rainfall generated in the summer seasons, which often exceeds 100 millimeters per year (mm/year).
According to the Köppen classification, the climate in the sector where the Project is located is classified as arid with abundant cloudiness (BWn).
| 4.4 | Infrastructure Availability and Sources |
There is no infrastructure currently in the property, as mining operations are planned to begin in the year 2024. The facilities contemplated for future operations are temporal or permanent based upon their function in the mining operation (Geobiota, 2015).
Temporal facilities refer to infrastructure with the purpose of backing up construction of other facilities, such as those destined for stockpiling supplies and personnel involved in construction work. Permanent facilities refer to infrastructure required for extraction and processing of minerals during the mining operation, such as the supply of water and electricity, and facilities associated to the mining zone and industrial area.
The source of water for industrial use is planned to be seawater, which will be extracted, supplied, and delivered through a system of suction, adduction tubes, auxiliary and pumping stations, decantation chambers, and emergency and collection pools. Seawater will be extracted at a depth of 20.2 m below sea level (mbsl), through a filter anchored to the ocean floor. 30 km of pipeline will carry water from the point of extraction to two pools with a volume of 26,000 m³ each, designed for 3 days of operation.
Electricity supply is planned to take place through medium voltage (33-kilovolt [kV]) power lines with a length of 37 km and supported by eight electrical substations, originating from the Cóndores-Parinacota power line belonging to the company Transelec.
| WSP-SQM0011-TRS-Pampa Orcoma-Rev1 | Rev1 | Page 26 |
The mining zone is projected to include the following infrastructure:
| · | Centers for mining operations located in the northern, southern and plant sectors, comprised of ore stockpiles for leaching processes and pools for brine accumulation and other solutions. |
| · | Workshop for mechanical maintenance of mine trucks and storage. |
| · | Facilities for waste disposal, including areas destined for debris, non-hazardous and hazardous industrial waste, and clay and mud. |
| · | Powder keg storage area and silo for ammonium nitrate storage. |
The industrial area, destined for production of iodide, iodine, and nitrate salts, is projected to include the following infrastructure:
| · | Solar evaporation pools. |
| · | Iodide, iodine, and neutralization plants. |
| WSP-SQM0011-TRS-Pampa Orcoma-Rev1 | Rev1 | Page 27 |
There has been no previous operation of the property.
In 1995, background information was received from a previous drill hole prospecting campaign by the Minera Mapocho Company. There are no details available to SQM pertaining previous exploration campaigns for preparation of the Mineral Resource estimate, or for inclusion in this TRS.
| WSP-SQM0011-TRS-Pampa Orcoma-Rev1 | Rev1 | Page 28 |
| 6 | Geological Setting, Mineralization, and Deposit |
| 6.1 | Geomorphological setting of the Pampa Orcoma Property |
Figure 6-1 presents a map of the regional geomorphology of the study area. The study area straddles the boundary between the Coastal Range and the Intermediate Depression. The Pampa Orcoma Property is of gentle topographic relief with slopes typically not exceeding 3° (Geobiota, 2015).
The Intermediate Depression is occupied by the Pampa del Tamarugal, named for the drought and salinity resistant tamarugo trees which are endemic to this plain. A forest of tamarugo trees located along the Ruta 5 trunk road, approximately 6 km to the northeast of the Pampa Orcoma Property limit constitutes part of the Reserva Nacional Pampa del Tamarugal, a national ecological reserve. To the east of the plain of the Intermediate Depression, the land slopes up toward the Cordillera de los Andes.
| WSP-SQM0011-TRS-Pampa Orcoma-Rev1 | Rev1 | Page 29 |
Figure 6-1. Geomorphological Map of the Exploration Area
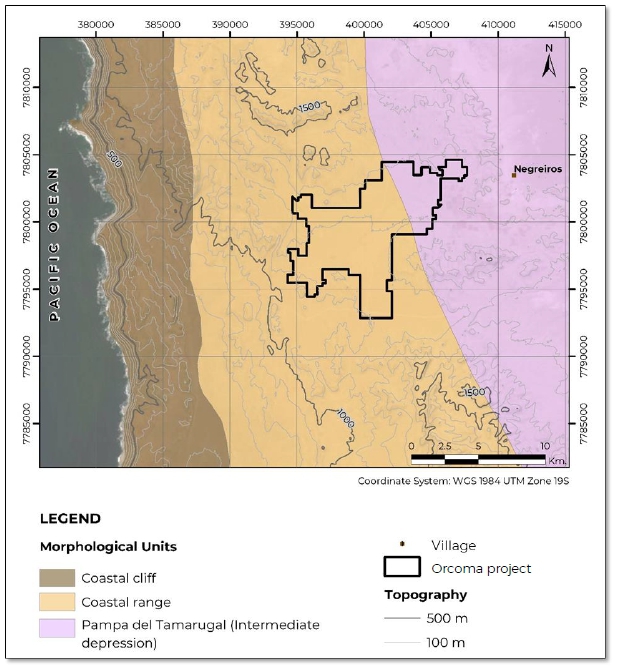
| WSP-SQM0011-TRS-Pampa Orcoma-Rev1 | Rev1 | Page 30 |
Figure 6-2 presents a regional-scale geological map of Pampa Orcoma Property. The property is located on Jurassic volcaniclastic sequences. These are overlain by alluvial and colluvial sediments of Pliocene to Holocene age. These unconsolidated sediments cover most of the property and extend along the local gravel-surfaced access road between the town of Huara and the property. The alluvium has a fine grainsize and the colluvium is identified by its wider range of grainsizes and predominance of angular clasts (Geobiota, 2015). The Jurassic volcaniclastics are exposed in the vicinity of the property limit and beyond.
Calcareous sedimentary units and evaporite deposits occur to the northeast of the property, along the western edge of the Ruta 5 trunk road. Alluvial fans cover the solid geology on the eastern side of Ruta 5 and extend to the settlement of Negreiros to the west of Ruta 5.
Jurassic age volcanic sequences and marine sedimentary units crop-out to the west of the property; the volcanics comprise andesites, volcanic breccias and andesitic tuffs. Granodioritic batholiths of Jurassic to Cretaceous age, the Punta Negra and Huara-Pozo Almonte batholiths, crop-out to the northwest and southeast of the property.
| WSP-SQM0011-TRS-Pampa Orcoma-Rev1 | Rev1 | Page 31 |
Figure 6-2. Regional Geological Map
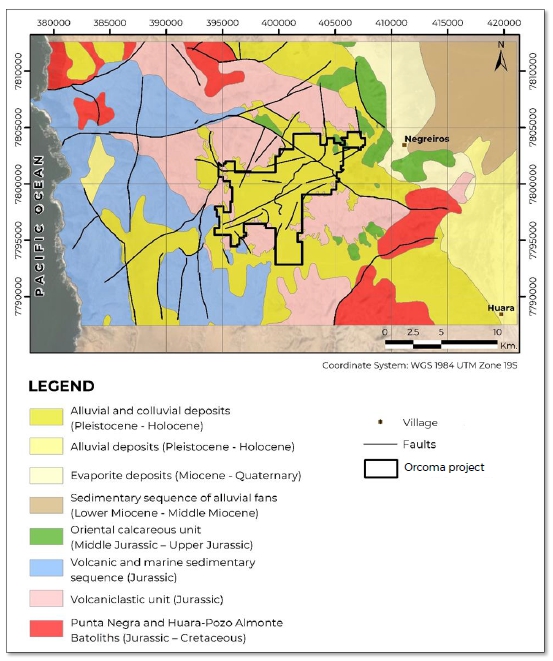
| WSP-SQM0011-TRS-Pampa Orcoma-Rev1 | Rev1 | Page 32 |
Figure 6-3 presents a geologic cross section of the Pampa Orcoma project area. Figure 6-4 presents a representative stratigraphic column for the project area.
There are four geologic units present at Pampa Orcoma; these include modern sands, silts, and clays that make up the sedimentary filling of ravines; old alluvial piedmont deposits, which are cross-cut by modern alluvial deposits; volcanoclastic rocks; and calcareous rocks.
The alluvial sediments, which host caliche deposits, comprise modern silts, sands & clays and older piedmont deposits of gravel, sand & silt. They are followed by Calcareous rocks, which correspond to marine calcareous rocks of Jurassic age located west of the study area, and the volcaniclastic rocks correspond to rocks volcanic and sedimentary Jurassic age. (Figure 6-3). The lithological description of each unit is detailed below.
Alluvial and colluvial deposits: Continental alluvial and colluvial sedimentary sequences, from the Pleistocene - Holocene age. Composed of abundant fine, angular clasts and a saline crust. This sequence is widely distributed throughout the exploration area and overlaps the other units.
Oriental calcareous unit: Coastal marine sedimentary sequences, Middle Jurassic - Upper Jurassic. Composed of oolitic gray-reddish limestones, gray sandstones, limestones with high content of fines and evaporites. Located to the east of the exploration area.
Volcanic and marine sedimentary units: Volcanic and marine sequence belonging to the Jurassic, composed almost entirely of andesitic volcanic breccia and andesitic tuff. It stretches along the coast.
Volcanoclastic unit: continental and marine volcanic sequences of Jurassic age. Composed of sandstones and breccias, shales and limestones, and toward the lower portion are lavas and breccias. This unit has a wide distribution and borders the mining area and industrial area.
| WSP-SQM0011-TRS-Pampa Orcoma-Rev1 | Rev1 | Page 33 |
Figure 6-3. Local Geology Map
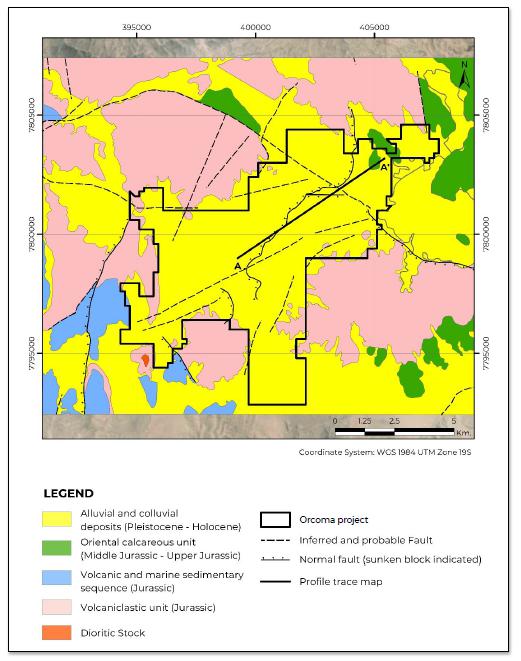
| WSP-SQM0011-TRS-Pampa Orcoma-Rev1 | Rev1 | Page 34 |
Figure 6-4. Stratigraphic Column of Pampa Orcoma
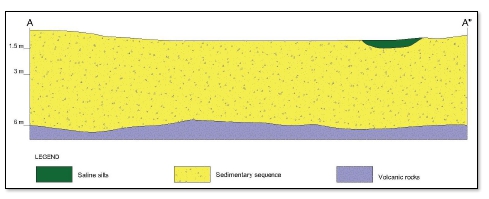
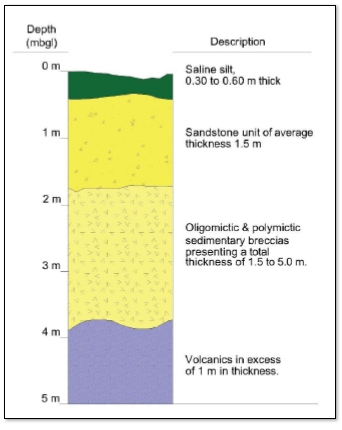
| WSP-SQM0011-TRS-Pampa Orcoma-Rev1 | Rev1 | Page 35 |
| 6.3.1 | Subsurface Units (within the Surface Unit Alluvial and Colluvial Deposits) |
Numerous investigation pits (trial pits or test pits), trenches and boreholes distributed over the surface of the Orcoma Mining project have been geologically logged by SQM. Figure 6-4 presents a representative schematic of the uppermost part of the stratigraphic column based on the geological logs obtained. The 4 units depicted are described below.
Silt Unit
Silt to fine sand sized sediments, with minor gravel-sized clasts, friable at the surface, becoming more consolidated with depth. The composition of this unit is of quartz, feldspar, gypsum & anhydrite composition. Its thickness over the Pampa Orcoma Property varies between 30 and 60 centimters (cm). These silts are known locally as “Chuca” or “Chusca” (Chong, 1994; Geobiota, 2015).
Sandstone Unit
Light brown, poorly sorted (well graded) gravelly sandstone, composed of sub-rounded to rounded grains of fine to very coarse sand size, with clasts of up to 10 millimeters (mm) in diameter (medium gravel size). The average thickness of this unit at Pampa Orcoma is around 1.5 m. It overlies the Oligomictic Sedimentary Breccia.
Oligomictic Sedimentary Breccia
Brown to light gray matrix-supported sedimentary breccia with a composition dominated by subangular andesitic clasts ranging in diameter from 2 to 100 mm (very coarse sand to cobble size). This breccia can be described as oligomictic, that is, composed of clasts of one main composition (porphyritic andesite). It is a matrix-supported breccia, the andesite clasts being supported by a matrix of fine sand with some clay content. The average thickness of this unit at Pampa Orcoma is around 1.5 m. It overlies the Polymictic Sedimentary Breccia.
Polymictic Sedimentary Breccia
Dark brown matrix-supported sedimentary breccia with a polymictic composition (composed of clasts of several rock types) of angular to subangular porphyritic andesite, tonalite & diorite clasts with plagioclase and to a lesser degree quartz crystals. The average thickness of this unit at Pampa Orcoma is around 5 m. It overlies the volcanic basement.
| WSP-SQM0011-TRS-Pampa Orcoma-Rev1 | Rev1 | Page 36 |
Andesite
Volcanic rock of a red and lilac tones, of porphyritic texture, with 1% of subhedral phenocrysts of plagioclase with sizes from 1 to 5 mm approximately, in an aphanitic mass. This rock is found underlying the sedimentary deposits, with a thickness of 1.5 m measured in a single borehole. The rock also has veinlets filled with chlorides and sulfates.
Tuff
Volcanic rock of a dark gray color, with a fragmental texture, formed by 90% of an ash-size matrix and 10% of lapilli-size pyroclasts, composed of lithics of andesites and diorites, and crystals of plagioclase, micas and amphibole, it also presents veinlets filled with chlorides and sulfates. The rock is classified as andesitic lithic ash tuff and is found underlying sedimentary deposits. Its thickness measured in a single borehole indicates a power of 1 m.
The caliche has good lateral continuity as a deposit and approximately 4 m thick on average. The lithology presented by the deposit is mostly sandstones, fine conglomerate sandstones, and breccia with angular clasts of volcanic origin and a sand-size matrix cemented by salts.
| WSP-SQM0011-TRS-Pampa Orcoma-Rev1 | Rev1 | Page 37 |
| 7.1 | Surveys and Investigations |
Geologic exploration of Pampa Orcoma has been developed through pit soil surveys and drilling, mostly throughout the last seven years. The procedures and results of these investigations are presented in the following subsections.
| 7.1.1 | Trial Pit Exploration |
Non-drilling exploration work within the Project area is via soil pits. The soil pit excavation work was performed during two campaigns. the first occured in 2015 with a more recent one in 2021. In the 2015 campaign, 13 trenches were dug with ample distance between the pits, distributed from coast to the Tamarugal Pampa. Only 6 of those pits are found in the project area, with general geologic and soil descriptions available for each of them (Geobiota, 2015) (Figure 7-1).
In 2021, 5 trenches were dug in the southeastern sector of Pampa Orcoma (Figure 7-1), as part of an ongoing exploration campaign planned to generate 86 pits, with the objective of improving the geologic and physical characterization of the caliche deposit. Pit walls were geologically and geomechanically mapped through identification of lithologies, color, clasts, alteration type and intensity, and mineralization, as well as resistance of pit walls to geologic pick. The results of mapping of pit walls show an overburden unit of 30 cm to 60 cm thick, composed of silt with powdery anhydrite, overlaying sandstones with an average thickness of 1.5 m. The sandstone’s resistance was measured as moderately resistant, with an approximate value of 25 – 50 megapascals (MPa) (ARVI Mining, 2021).
There’s also a reference to a 1996 soil pit exploration campaign, for which raw data is not available. However, conclusions from that investigation indicate that presence of iodine does not follow a specific lithologic pattern, with it being identified indistinctively from lithology within the sedimentary sequence (SQM(b), 2014).
| 7.1.2 | Borehole Exploration |
There’s a total of 2,756 drill holes located within and slightly outside of the project area, with 2,507 of them strictly inside (Figure 7-1). Drill holes in Pampa Orcoma belong to different groups, defined by drilling campaign characteristics and grid spacing. Initial drilling was performed on a widely spaced grid which over time evolved to a narrower spacing between drill holes. This closer spaced drilling better captured geological continuity and thus was a key element in establishing higher reliability of geological models and resultant Mineral Resource estimates. Drill hole groups are described as follows:
| · | PO: Year 2014 reverse circulation (RC) drilling campaign, making up a grid of 445 drill holes with a spacing of 400-x-400 m, the grid of widest spacing in Pampa Orcoma. |
| WSP-SQM0011-TRS-Pampa Orcoma-Rev1 | Rev1 | Page 38 |
| · | O: Year 2014 RC drilling campaign, making up a grid of 1,323 drill holes with 200-x-200-m spacing. The 200m grid represents an infill of the 400-x-400 m grid to a narrower spacing between drill holes. |
| · | PS: Year 2014 RC drilling campaign, making up three grids of 21 drill holes each, with 50-x-50 m spacing. These grids are distributed as “stamps” between the wider grids defined by “O” and “PO” drill holes (SQM(a), 2014). |
| · | O-DDH: Year 2021 and current diamond drilling campaign, of which 60 drill holes have been perforated to date (SQM(a), 2021), with the objective of obtaining a general prospect of geological and physical characteristics of caliche in Orcoma (SQM(b), 2021). Drill holes are distributed without a specific grid spacing. |
| · | OR: Year 2021 and current RC drilling campaign, making up the 100T grid of 865 drill holes. These drill holes comprise a truncated grid of 100m spacing in an E-W direction and 50m in a NW-SE direction, providing infill to the 400-x-400-m and 200-x-200-m grids covered by “PO” and “O” drill holes respectively, in the southeastern sector of Orcoma (SQM(c), 2021). |
Before drilling, the shallow material covering Pampa Orcoma’s surface is removed with a backhoe until a depth of higher resistance to excavation is reached. This shallow unit is composed of non-consolidated sand and sulfates, overlaying a sedimentary sequence comprised of alluvial deposits. Drilling is done on the ground after excavation of the shallow material, with the first drilled unit being categorized as a geologic overburden unit of no economic interest, defined based on geomechanical mapping of the drill hole. If the material is mapped as a unit of low geomechanical quality, either as leached or rough (Section 7.3) then it is defined as overburden.
Other criteria applied to define overburden are related to the weight of the sample, which must be less than 8 kg and greater than 5 kg for it to be considered as overburden (in this case it is still considered as overburden despite of iodine grades). On the other hand, if the sample weights less than 5 kg, the section is defined as "not recovered" (completely leached material). Geologic overburden can also be defined for units with a low degree of compaction.
Total overburden is then defined as the unit comprised of the shallow material removed by backhoe and geologic overburden (SQM(h), 2021).
| 7.1.3 | 400-x-400 m, 200-x-200 m, and 50-x-50 m Grids Drilling Campaign Results |
The objective of drill hole campaigns in Pampa Orcoma, is the estimation of geologic resources and reserves. The drill holes covering the largest area are the 400-x-400 m and 200-x-200 m grids, which along with the 50-x-50 m grid were drilled with a 5 ¼’ diameter drill hole and sampled every 0.5 m. The maximum drilling depth accounted for in the wider grids is 8 m, with an average overburden thickness of 0.4 m (SQM(a), 2014). “PO” drill holes have an average recovery of 89% of material from the caliche deposit, and their geologic description shows a thickness of the overburden unit, that tends to increase 1 to 2 m to the northeast, with intermediate sectors of values lower than 0.5 m (SQM(b), 2014).
| WSP-SQM0011-TRS-Pampa Orcoma-Rev1 | Rev1 | Page 39 |
Caliche mineralization, as described in “PO” and “O” drill holes, has a range of average thicknesses when considering different iodine cut-off grades. For cut-off grades of 200, 300 and 400 ppm, average thicknesses are 4.0, 2.9, and 2.3 m, respectively (SQM(a), 2014). Findings from the “PO” drilling campaign indicate that mineralization is continuous horizontally, and has a larger thickness in north-northwest (NNW), north-south (NS), and east-west (EW) directions, with values between 2.0 and 4.0 m. Lower thicknesses are present in the northeastern sector of Orcoma, with values lower than 1 m. The mineralized deposit has a 6 to 8% sodium nitrate (from now on referred to as nitrate) grade associated to iodine grades larger than 400 ppm, generally with a direct correlation between grades of both compounds.
Data from the 400-x-400-m and 200-x-200-m grids show that caliche mantle is made up of sandstone, fine conglomeratic sandstone, sedimentary breccia with angular clasts generally of volcanic origin and a sandy matrix cemented by salts. Sedimentary breccia comprises 94.6% of the mineralized unit. The unit underlaying the mineralized zone is composed of a polymictic conglomerate with a compacted sand matrix, and toward the outer areas of the properties, the underlaying unit is made up of volcanic rocks with no mineralization (SQM(b), 2014) (SQM(l), 2014).
| WSP-SQM0011-TRS-Pampa Orcoma-Rev1 | Rev1 | Page 40 |
Figure 7-1. Distribution of SQM Exploration Drill Holes and Soil Pits
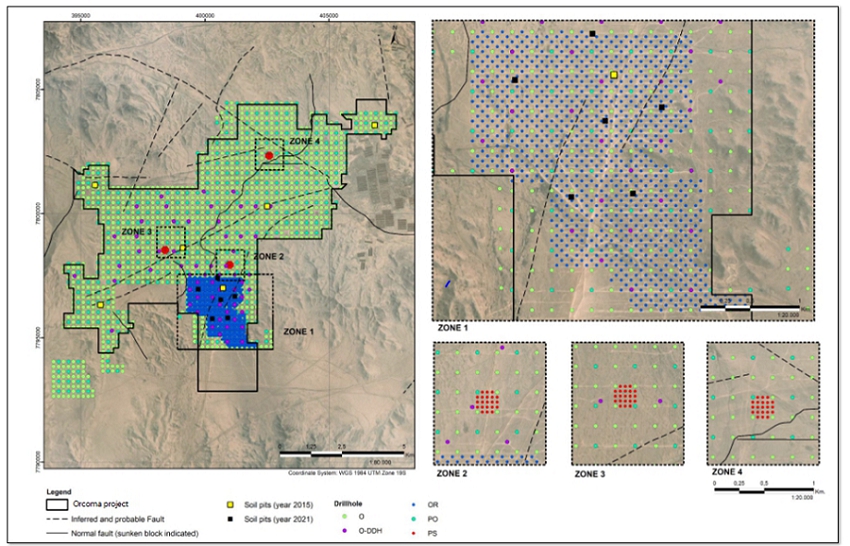
| WSP-SQM0011-TRS-Pampa Orcoma-Rev1 | Rev1 | Page 41 |
Findings from the three campaigns executed in 2014, for grids of 400-x-400, 200-x-200 and 50-x-50 m spacing, show abundant information for each drill hole, has been compiled into a digital database (SQM(a), 2014). The database for the 400-x-400-m and 200-x-200-m grids is the basis for estimation of geologic resources in Pampa Orcoma, while the 50-x-50-m grid’s localized area is used as a reference for geologic and physical characterization of the deposit. Relevant information available in the database is described in Table 7-1.
Table 7-1. Data Available for 400-x-400-m, 200-x-200-m, and 50-x-50-m Drill Hole Grids
| Information available | Description |
| Geographic information | Elevation in meters above sea level, and coordinates in coordinate system WGS84 UTM Zone 19S. |
| Iodine and nitrate grades | Iodine and nitrate grades for every section of the drill hole under scraped soil, indicating sample identification. |
| Drill hole and rock cutting data | General information of the drill hole, such as diameter, drilling method and grid spacing. Geologic data obtained from perforation and rock cuttings, including scrape and overburden depth, lithology and degree of compaction, among other variables indicated for every section of the drill hole. Sections used for blank sampling are also indicated. |
| Geomechanical description | Geomechanical description based on geologist’s visual evaluation of the degree of integrity of the wall of the drill hole. |
| Chemical concentrations | Concentrations of various compounds and elements analyzed in rock samples, including sodium nitrate (%), iodine (ppm), sodium sulfate (%), calcium (%), magnesium (%), potassium (%), potassium perchlorate (%), sodium chloride (%), sodium (%) and boric acid (%). Insoluble and soluble salt percentage is also indicated. Concentrations are shown generally for each drill hole, without specifying the section of the drill hole for which the result is presented. |
| Drill hole data for given iodine cut-off grades | Overburden and caliche thickness in drill holes are indicated for iodine cut-off grades of 200, 300 and 400 ppm. |
| 7.1.4 | Diamond Drilling (DDH) Campaign Results |
The DDH campaign of 2021 is an ongoing exploration campaign; however, 34 out of the 60 drill holes that have been completed, have been geologically described from core samples. The core samples allow for description only of consolidated deposits, due to drilling method. The sequence is incomplete in most core samples, generally showing a sequence of sandstone overlaying polymictic breccia, present in 53% of drill holes, followed by sandstone overlaying oligomictic breccia and polymictic breccia in the base for 18 % of drill holes, and finally solely polymictic breccia in 18% of drill holes. Isolated drill holes show a few lithological differences, such as andesite or tuff in the base, or slight variations in the sedimentary sequence (ARVI Mining, 2021).
| WSP-SQM0011-TRS-Pampa Orcoma-Rev1 | Rev1 | Page 42 |
The database containing available information to date from 60 DDHs, includes the depth of the base of caliche mineralization, and chemical data for core samples every 0.5 m. The database shows concentrations of various compounds and elements relevant for characterization of soluble and insoluble salts in the deposit, including iodine (ppm), sodium nitrate (%), calcium (%), boric acid (%), potassium (%), potassium perchlorate (%), magnesium (%), sodium (%), sodium chloride (%), sodium sulfate (%), and sodium carbonate (%) (SQM(a), 2021).
| 7.1.5 | 100T Grid Drilling Campaign Results |
Findings for the 100T grid are shown in its database (SQM(c), 2021), with the main information it contains described in Table 7-2.
Table 7-2. Data Available for 100T Drill Hole Grid
| Information available | Description |
| Geographic information | Elevation in meters above sea level, and coordinates in coordinate system WGS84 UTM Zone 19S. |
| Drill hole data | Lithologic description of drill holes. |
| Assays | Sample identification and results for each drill hole, including concentrations of iodine (ppm), sodium nitrate (%), calcium (%), boric acid (%), potassium (%), potassium perchlorate (%), magnesium (%), sodium (%), sodium carbonate (%), as well as degree of compaction and labeling of duplicate samples. |
Two main hydrogeological units are defined, called Sedimentary Fill and Hydrogeological Basement, which are described below:
| · | Sedimentary Fill Unit: Fill of colluvial - alluvial origin, distributed in the mine zone and industrial area. In the first meters it is composed of a polymictic sandy gravel/breccia, supported matrix, well consolidated and highly cemented by salts. Although permeability tests have not been performed with this unit, due to its high cementation and absence of fractures, low permeability is inferred. |
| · | Hydrogeological Basement Unit: Intrusive from the Jurassic-Cretaceous with volcanic sequences and marine sedimentary from the Jurassic, distributed in the surrounding of the mine and industrial area. These rocks have almost zero permeability, being irrelevant from the hydrogeological point of view. |
The Pampa del Tamarugal aquifer occurs approximately 2 km east of the exploration area. This hydrogeological body is in contact with the Hydrogeological Base Unit and Landfill Unit. In this sector, within the domain of the Pampa del Tamarugal aquifer, the Negreiros iodine mine (COSAYACH) has in operation deep wells, wich are the closest wells to the area of influence of the Orcoma Project.
| WSP-SQM0011-TRS-Pampa Orcoma-Rev1 | Rev1 | Page 43 |
The exploration area is mostly on the sedimentary fill, located in a zone of very low hydrogeological importance, this was determined in-situ by direct observation when analyzing the completely dry drill holes. In addition, the excavated soil pits did not show the presence of water in the first meters from the surface,
| 7.3 | Geotechnical Data, Testing, and Analysis |
The geomechanical units are define through the observation and direct measurement of physical properties from drill holes. This are smooth, rough, intercalation A (more than 75% smooth), intercalation B (half rough and half smooth) and intercalation C (more than 75% rough) of said drill holes. Additionally, for each section of the drill hole, its degree of compaction was determined according to one of the following three categories: leached, semi-compact or compact.
Mapping of geomechanical units is carried out by manually checking the walls of the drill hole, to describe the different levels of roughness throughout the column, and thus be able to determine the degree of diameter loss of the drill hole wall. If the drill hole walls collapse, this does not allow mapping below the collapsed interval. The degree of compaction refers to the level of compaction that the well presents at the time of drilling.
The degree of weathering of the sedimentary rocks described is between IV and V (heavily weathered to completely weathered rocks) in the ISMR weathering classification (1981). With the exception for the andesites that exhibits a grade II (slightly weathered rock). The clay contents associated with weathering grades IV and V are low.
The resistance in semi-compact and smooth sandstones and breccias is less than 50 MPa. This is lower than in compact and smooth volcanic rocks, which have a resistance between 100 and 250 MPa. Rock resistance is estimated by correlation of the rebound of a Schmidt hammer to rock density and hammer orientation with respect to the assayed plain (Miller, 1965).
Tests were carried out to determine the rock quality index (RQD), determining that the sandstones have a RQD of less than 25%, indicating a very poor rock quality. For the vast majority of breccias, their RQD is less than 50%, indicating poor rock quality. The RQD values for the andesite range from75% to 90%, indicating a good quality compared to the tuffs, which returned RQD values between 25% and 50%, indicating a poor-quality rock.
Discontinuities are characterized by direct observation, taking into account the parameters of length, opening, roughness, filling and alteration that were observed. In described drill holes, discontinuities ranging from 1 to 3 m, with a width of 1 to 5 mm, are estimated, those that present rough textures, do not present fill and are slightly altered. In the case of andesites and tuffs, these exhibit within their cavities a hard filling less than 5 mm wide.
Finally, the RMR system (Rock Mass Rating by Bieniawski, 1989) is used to classify rock qualities, resulting in a general range of 41 to 60 points, both for sandstones and breccias, indicating that they are rocks of mostly average quality. For the Andesites, one section presents a range of 41 to 60 points, indicating a rock of medium quality, a second section indicates a range of 61 to 80 points, indicating a rock of good quality. Finally, the tuff is classified as medium quality rock with 41 to 60 points.
| WSP-SQM0011-TRS-Pampa Orcoma-Rev1 | Rev1 | Page 44 |
Based on all the empirical approximation systems used for the geomechanical classification of the rocks present in the Pampa Orcoma sector, it is concluded that the rocks described in most of the drill holes are of medium to poor quality, except for the cores that show a medium quality, and are mostly smooth.
Geotechnical considerations for the mining operation and leach heaps are described in Section 13.1.
| WSP-SQM0011-TRS-Pampa Orcoma-Rev1 | Rev1 | Page 45 |
| 8 | Sample Preparation, Analysis and Security |
The utilized sampling methods in Pampa Orcoma pertain mainly to reverse circulation drilling and diamond drilling. Samples are collected during perforation, selected, and prepared according to internal procedures for sample handling, and sent for chemical analysis in laboratory. Core samples are also analyzed for the diamond drilling campaign currently in process. The main ions and compounds analyzed are listed and correspond to chemical species of economic interest and salts relevant for geologic resource estimation. Each analyte is analyzed in the laboratory using the detection methods agreed by the industry, which are summarized in Table 8-1.
| 8.1 | Methods, Splitting and Reduction, and Security Measures |
The handling of drill hole samples is carried out under strict rigor. After drilling, sample recovery, collection, ordering and classification, these are carefully transferred by pallets to a sector where they are permanent (collection sector), always keeping the supervisor informed of any deviation detected during the transfer. The unloading of the samples in the sector where they are stored is carried out carefully to avoid a potential internal disorder in the boxes with drillings, this process is summarized in the Figure 8-1.
Figure 8-1. Process Sequence from the Start of Drilling, Sampling, and Storage

From the storage sector the boxes are relocated to the sector where the Cone Divider is available to begin with the first stage of reducing the size of the samples.
The sample reduction process is carried out following high safety standards, which ensures correct handling of the machinery and careful handling of the samples. The machines used to carry out this process (Cone Divider, Crushers, Rifle Cutter, and Pulverizer), are checked before and after any reduction operation, to guarantee the cleanliness of the machinery, its good condition, and to avoid contamination due to mixing of material in the samples, Possible air leaks, which could generate a possible loss of material, are also avoided.
| WSP-SQM0011-TRS-Pampa Orcoma-Rev1 | Rev1 | Page 46 |
Bags are used during the reduction process, which are located to receive the discard samples during the operation in the dividing cone, which are subsequently sent to the "discard collection sector". The samples that continue with the reduction process are discharged into a metal tray with the label corresponding to the initial sample and are stored to continue with the crushing stage.
During the crushing stage, the samples entering the machine are carefully handled to avoid material loss. In the process, the crushed samples are temporarily stored in a labeled tray.
The trays with the crushed samples are diverted to the sector where the Riffle Cutter is located, and they are incorporated into the machine quickly, to avoid increasing sampling errors in the equipment, this machine splits the sample in two; therefore, the mineral is deposited in two trays in equal proportions, one of this is chosen as a discard sample and the other sample, must be less than 500 grams (g). Each tray must have its corresponding label and the latter must be stored in a collection counter to later continue with the Pulverized stage.
In the pulverization stage of the samples, the trays are slowly transferred into the machine. This ensures a longer time of permanence of the sample inside the pulverizer, and it is possible to obtain a lower granulometry in the discharge. This process is repeated several times to better ensure the required granulometry. Once the sample is pulverized, it is deposited on a tray with its respective label and stored in a sample cart.
The trolley with the pulverized samples is transferred to a packaging and labeling area. In this sector, each sample is introduced into a bag, in which it is shaken to ensure its homogenization. Later it is carefully returned to the same trays. The next step is to separate them into two portions one of 200 g, which is used for the preparation of composites, and another of 150 g that is used for analysis in the laboratory. Each one of the portions with samples must be stored in bags, which must be sealed with tape at the top of the bag. In addition, each one must have its respective labeling, differentiating the purpose and destination (Figure 8-2).
| WSP-SQM0011-TRS-Pampa Orcoma-Rev1 | Rev1 | Page 47 |
Figure 8-2. Process Sequence from Initial Sample, Reduction, and Final Sample
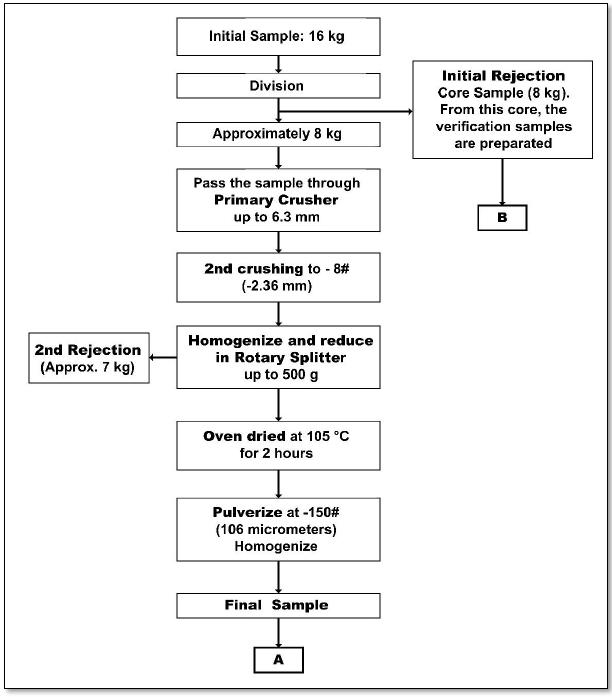
| WSP-SQM0011-TRS-Pampa Orcoma-Rev1 | Rev1 | Page 48 |
| 8.2 | Sample Preparation, Assaying, and Analytical Procedures |
Samples are sent from Iris pilot plant to SQM’s Nitrate-Iodine Laboratory, following a traceable chain of custody and indicating if the sample is original or a duplicate. The sample is leached and filtered to analyzed for nitrate, by using a Molecular Absorption Spectrophotometer for ultraviolet-visible spectroscopy, an analytic procedure that consists of measuring absorbance of ultraviolet and visible radiation by the analyte. According to Beer’s Law, absorbance is linearly related to concentration of the absorbent species, thus obtaining the concentration of nitrate as a percentage (SQM(d), 2021).
Samples are leached and filtered to be analyzed for iodine, by using redox titration and X-ray fluorescence (XRF). Redox titration allows for determination of an unknown iodine concentration of the analyte in an iodine rich solution, by gradually adding a standard solution of known concentration until the reaction is complete. On the other hand, XRF is executed on a compacted caliche sample with an X-ray Spectrometer Asoma Analyzer (SQM(e), 2021). Iodine and nitrate concentrations obtained from the described methods are uploaded to the SQM’s Laboratory Information Management System (LIMS).
Due to the analytical procedures used, for sodium nitrate the detection limit is 1% with a maximum of 20%, while for iodine the detection limit is 50 ppm with a maximum of 2,000 ppm (0.200%) (SQM, 2018).
Regarding other analyzed salts, various analytical procedures are used (Table 8-1) (SQM(g), 2021).
Table 8-1. Analytical Procedures for Salts in SQM's Nitrate-Iodine Lab
| Analyte | Analytical procedure |
| Iodine | Redox titration and XRF |
| Nitrate | Ultraviolet-visible spectroscopy |
| Perchlorate | Potentiometry |
| Sodium | Atomic absorption (AA) and inductively coupled plasma (ICP) |
| Potassium | AA and ICP |
| Sulfates | Gravimetry and ICP |
| Chlorides | Volumetry |
| Boric acid | Volumetry and ICP |
| Calcium | Potentiometry, AA, and ICP |
| Magnesium | Potentiometry, AA, and ICP |
| WSP-SQM0011-TRS-Pampa Orcoma-Rev1 | Rev1 | Page 49 |
Although the difference in the means of the original and duplicate samples are not statistically significant, the QP recommends that an audit of the sample collection and preparation be performed and monitored after each drilling campaign to avoid systemic bias in the results and thus the Mineral Resource estimate.
| WSP-SQM0011-TRS-Pampa Orcoma-Rev1 | Rev1 | Page 50 |
| 9.1 | Data Verification Procedures |
Verification by the QP covered drilling, sample collection, handling, and quality control, geologic mapping of drill cores and cuttings, and laboratory quality assurance and analytical procedures. Based on the review of SQM procedures and standards, protocols are deemed adequate for ensuring the quality of data obtained from drilling campaigns and laboratory analysis.
Data management is done in excel spreadsheets, presenting the required information for the 400-x-400-m, 200-x-200-m, and 50-x-50-m database, with exception of chemical analysis data. Regarding such data, iodine and nitrate grades are shown adequately, for each section of the drill hole; however, other chemical species concentrations are shown for each drill hole without specifying the section of the drill hole for which the result is shown.
“DDH” diamond drilling’s database and the 100T grid database, are also managed with excel spreadsheets, showing the available data to date in the first case. The 100T grid database on the other hand, shows available information to date from its block model and chemical analysis of original samples, indicating duplicate sample IDs, but does not present the data results of the duplicates.
The QP reviewed data collection procedures, associated to drilling, sample handling and laboratory analysis. The set of procedures seek to establish a technical and security standard that allows field and lab data to be optimally obtained, while guaranteeing worker’s safety.
| 9.4 | Quality Control Procedures |
The QP reviewed quality control procedures that consider the analysis of duplicate samples, of adequate rates of repetition for this type of control. Blank samples are also obtained, but do not have a specified procedure for frequency of sampling. Procedures mention internal standard samples of which frequency of sampling is indicated; however, criteria for selection of the sample are not specified.
The QP reviewed results of iodine and nitrate grades from duplicate sampling in the 400-x-400-m and 200-x-200-m drill hole grids. Duplicate samples’ relative errors are within acceptable margins, with a high correlation index with corresponding original samples.
| WSP-SQM0011-TRS-Pampa Orcoma-Rev1 | Rev1 | Page 51 |
The QP reviewed results of iodine and nitrate grades from blank sampling in the 400-x-400-m and 200-x-200-m drill hole grids. Blank sample concentrations are within acceptable margins, with a maximum of 110 ppm and 1.2% of iodine and nitrate grades.
| 9.7 | Laboratory Certification |
The Nitrate-Iodine Laboratory is ISO 9001:2015 certified by the international certification organism TÜV Rheinland, from the 16 of March, 2020, to the 15 of March, 2023 (TÜV Rheinland(a), 2019) (TÜV Rheinland(b), 2019). There’s no previous certification available.
| 9.8 | Quality Control Procedures and Quality Assurance |
For the analysis of iodine, sodium nitrate, and other chemical species, SQM has implemented standardized protocols designed to ensure sample representativity, from procedures applied to sample handling and procurement of control samples to laboratory protocols.
| 9.8.1 | Quality Control Measures and Results |
Quality control (QC) samples are incorporated for lab analysis, with the objective of monitoring the precision, accuracy, and potential contamination during analytical processes and sample handling. These controls comprise duplicate sampling to monitor precision, internal standard samples to establish an internal comparative framework, and blank sampling to identify potential contamination. QC procedures don’t mention criteria for blank sampling, however, such samples are obtained and analyzed.
Standard samples and duplicates are incorporated every 60 and 20 samples respectively (SQM(f), 2021), and sent from the Iris plant. The sample chosen as a standard is selected randomly, divided into six samples and analyzed three times, obtaining iodine and nitrate concentrations whose average and standard deviation define the certified value, allowing for results with a tolerance of ±2 standard deviations with respect to such value (SQM(n), 2021). A lab specialist reviews and validates the information obtained from standard samples, and from comparison of duplicates with respect to the original sample, admitting a maximum discrepancy of ±0.0014 ppm for iodine and ±0.4% for sodium nitrate. The LIMS system randomly sorts the duplicates and standard samples, identifying deviations which are reviewed by the head of the laboratory, subsequently soliciting a checkup of the samples (SQM, 2018).
For drill holes from the 400-x-400-grid, 63 blank samples and 212 duplicates were collected. Blank samples were found to have a low dispersion of data, with nitrate grades between 1 and 1.2% and iodine grades between 50 and 100 ppm. Duplicate versus original samples have concentrations, showing a low dispersion of original versus duplicate concentrations (Figure 9-1 and Table 9-1), with iodine having an average relative error of 14.9% and correlation index of 0.982 and nitrate grades an average relative error of 8.2% and correlation index of 0.996 (SQM(b), 2014).
| WSP-SQM0011-TRS-Pampa Orcoma-Rev1 | Rev1 | Page 52 |
Figure 9-1. Results of 400-x-400-m Drill Hole grid Sample Quality Control
Note: (a) iodine grades in blank samples, (b) nitrate grades in blank samples, (c) original versus duplicate iodine grades, (d) original versus duplicate nitrate grades.
Table 9-1. Statistics of Iodine and Nitrate Grades in Original versus Duplicate Samples of the 400-x-400 Drill Hole Grid (n = 212)
| | Iodine grade (ppm) | | | Nitrate grade (%) | |
| Mont | | Original | | | Duplicate | | | Original | | | Duplicate | |
| Mean | | | 305 | | | | 270 | | | | 5.0 | | | | 5.0 | |
| Standard deviation | | | 244 | | | | 223 | | | | 3.497 | | �� | | 3.539 | |
| Minimum | | | 50 | | | | 50 | | | | 1.0 | | | | 1.0 | |
| 25th percentile | | | 150 | | | | 140 | | | | 2.2 | | | | 2.2 | |
| Median | | | 240 | | | | 200 | | | | 4.0 | | | | 4.1 | |
| 75th percentile | | | 370 | | | | 320 | | | | 7.0 | | | | 7.1 | |
| Maximum | | | 2,000 | | | | 2,000 | | | | 20.0 | | | | 20.0 | |
| WSP-SQM0011-TRS-Pampa Orcoma-Rev1 | Rev1 | Page 53 |
Another quality control assessment was done on the total of drill holes perforated in the 400-x-400-m, 200-x-200-m, and 50-x-50-m grids, collecting 354 blanks and 511 duplicates.
Blank samples were found to have a low dispersion of data, with nitrate grades between 1 and 1.2% and iodine grades between 50 and 110 ppm. Duplicate versus original samples have concentrations showing a low dispersion of original versus duplicate concentrations (Figure 9-2 and Table 9-2), with iodine having an average relative error of 15.1% and correlation index of 0.979 and nitrate grades an average relative error of 10% and correlation index of 0.994 (SQM(b), 2014). (SQM(l), 2014).
The T Statistic is 2.2 against a threshold of 3, signifying that the difference is not significant.
Figure 9-2. Results of 400-x-400-m, 200-x-200-m and 50-x-50-m Drill Hole Grid Sample Quality Control
Notes: (a) iodine grades in blank samples, (b) nitrate grades in blank samples, (c) original versus duplicate iodine grades, (d) original versus duplicate nitrate grades.
| WSP-SQM0011-TRS-Pampa Orcoma-Rev1 | Rev1 | Page 54 |
Table 9-2. Statistics of Iodine and Nitrate Grades in Original Versus Duplicate Samples of the 400-x-400-m, 200-x-200-m, and 50-x-50-m Drill Hole Grid (n = 511)
| | | Iodine grade (ppm) | | | Nitrate grade (%) | |
| Statistics | | Original | | | Duplicate | | | Original | | | Duplicate | |
| Mean | | | 282 | | | | 264 | | | | 4.9 | | | | 4.7 | |
| Standard deviation | | | 224 | | | | 212 | | | | 3.421 | | | | 3.463 | |
| Minimum | | | 50 | | | | 50 | | | | 1.0 | | | | 1.0 | |
| 25th percentile | | | 150 | | | | 140 | | | | 2.2 | | | | 2.1 | |
| Median | | | 220 | | | | 210 | | | | 4.0 | | | | 3.8 | |
| 75th percentile | | | 340 | | | | 320 | | | | 6.7 | | | | 6.5 | |
| Maximum | | | 2,000 | | | | 2,000 | | | | 20.0 | | | | 20.0 | |
| 9.8.2 | Quality Assurance Measures |
Protocols for quality assurance (QA) in the lab encompass measures for nitrate and iodine values. For iodine grades, the standard sample is checked to be within a defined range of ±0.4; another measure involves selecting 5 samples that are analyzed by volumetry and XRF, applying a correction factor if necessary or calibrating the corresponding equipment if values are not within their expected range (SQM, 2018).
For nitrate grade analysis, the mass balance is checked daily for a standard 20-g mass certified with an error range of ±0.0002 g. A comparative analysis is also done once in each lab shift, analyzing the same samples with another spectrophotometer. If the sample has a slight yellow color, readings are checked with a distiller equipment using the Kjeldalh method. Every 10 samples, readings are compared to the quality control and standard samples (SQM(d), 2021).
| 9.9 | Qualified Person’s Opinion of Data Adequacy |
In the Pampa Orcoma duplicate data, the duplicate samples, although analyzed by the same method in the same lab consistently measure slightly lower for iodine, although calculation of a Student T value shows it to be insignificant. This difference in not seen in the Nueva Victoria samples analyzed by the same laboratory. The QP recommends that SQM undergo an audit of the sample preparation and splitting procedures and that attention also be focused on certified reference materials.
The data available from the 400-x-400-m and 200-x-200-m grids, regarding analytical results of geotechnical and chemical analysis of caliche in Pampa Orcoma, is adequate for estimation of geologic resources and reserves present in the project area.
| WSP-SQM0011-TRS-Pampa Orcoma-Rev1 | Rev1 | Page 55 |
| 10 | Mineral Processing and Metallurgical Testing |
SQM nitrates have been operating mines and heap leaching facilities to produce ore, iodine, and nitrates from caliche at its Nueva Victoria process plants since 2002. Therefore, the operations and form of ore treatment proposed for the Pampa Orcoma project are based on extensive operating experience.
Additionally, since 2009, SQM-nitrates has carried out a caliche characterization plan through laboratory tests to continuously improve the yield estimation. These efforts emphasized on the chemical and physical characterization of caliche, have allowed the development of a set of strategies that give way to better recovery prediction.
In 2016, faced with water scarcity in northern Chile, the industry seeks to incorporate seawater in its processes. In this way, a caliche leaching test plan is generated with seawater, to determine the technical feasibility and impacts on recovery. The test plan demonstrated the feasibility of the process in a pilot plant located in the Iris sector of the Nueva Victoria mine.
After reviewing the available data (SQM (n); (o); (p)), it has been determined that there is sufficient information as background to the definitive feasibility study. The records of the operations in aspects such as performance and consumption of reagents, as well as the historical test work developed by the company. It has been determined that there is sufficient information to:
| · | Support current operations and mineral processing. |
| · | Support Pampa Orcoma's future exploitation project, along with plant and process equipment design. |
Summaries of the analytical and experimental procedure and the main test results are presented below.
| 10.1 | Metallurgical Testing |
The metallurgical tests, as detailed below, are intended to estimate the response of different minerals to leaching. The pilot plant laboratory is in charge of generating test data to form the characterization and recovery database of composites.
The tests have the following objectives:
| · | Determine if the analyzed material is reasonably suitable for concentration production using separation and recovery methods established in the plant. |
| · | Optimize process to guarantee a recovery that inherently will be linked to a mineralogical and chemical characterization, including physical and granulometric characterization of the mineral to treat. |
| · | Determine deleterious elements to establish mechanisms in the operations so that these can be kept below the limits that guarantee certain product quality. |
| WSP-SQM0011-TRS-Pampa Orcoma-Rev1 | Rev1 | Page 56 |
SQM's analytical and pilot test laboratories perform the following chemical, mineralogical and metallurgical tests which constitutes the bank of tests carried out on operating projects:
| · | Microscopy and chemical composition |
| · | Physical properties: Tail test, borra test, laboratory granulometry, embedding tests, and permeability |
Historically, SQM through its Research and Development area, executed the following tests at the plant and/or pilot scale that have allowed improving the recovery process and quality of the product: Iodide solution cleaning tests, Iodide oxidation tests with Hydrogen Peroxide (H2O2), Incorporation of Chlorine in the Iodine Plant. Tests that have finally allowed to obtain a successful scheme of operations applied to other sites of the company, and that have great maturity of knowledge. Currently, the Research Vice-Presidency is conducting plant scale tests for the optimization of heap leach operations using the CM method of mining. This material has preliminarily resulted in higher recoveries.
At the industrial level, it is intended to monitor the recovery to establish annual sequential mining levels and/or define for each year the percentage of minerals to be reamed during the life of the mine to increase the recovery.
To develop the tests, two different CM equipment have been acquired and evaluated in terms of:
| · | Availability in the rolling system. |
| · | Design of the cutting system. |
| · | Sensitivity to rock conditions. |
| · | Productivity variability. |
| · | Consumption and replacement of components. |
It is expected that the results of recovery tests with continuous mining material will be included in a future report. The present review will focus on the physicochemical and leach response characterization of Pampa Orcoma ores, and how this knowledge contributes to the recovery estimation.
In the following sections, a description of sample preparation and characterization procedures, for metallurgical tests, and process and product monitoring/control activities of the operations through chemical analysis is given.
| WSP-SQM0011-TRS-Pampa Orcoma-Rev1 | Rev1 | Page 57 |
| 10.1.1 | Sampling and Sample Preparation |
The sampling methods are related to the different drilling methodologies used in the several campaigns to obtain samples for analysis (see Section 7.1.2. Borehole Exploration) With the material sorted from the trial pits, loading faces, piles, drill holes and diamond piles, composite samples are prepared to determine iodine and nitrate grades, and to determine physicochemical properties of the material to predict its behavior during leaching.
As for the processing of samples, these are segregated according to a mechanical preparation guide, which aims to provide an effective guideline for minimum required mass and characteristic sizes for each test, to optimize in the best possible way any available material. In this way, it is possible to achieve successful metallurgical tests of interest, ensuring their validity and reproducibility. The method of sampling and development of metallurgical tests on samples from Pampa Orcoma, for the projection of future mineral resources, consists in summary of the stages outlined below.
Figure 10-1. General Stages of the Sampling Methodology and Development of Metallurgical Tests at Pampa Orcoma.

As for the development of metallurgical, characterization, leaching and physical properties tests, these are developed by teams of specialized professionals with extensive experience in the mining-geo-metallurgical field. The work program in metallurgical tests contemplates that the samples are sent to internal laboratories to perform the analysis and test work according to the following detail:
| · | Analysis laboratories located in Antofagasta provide chemical and mineralogical analysis. |
| · | Pilot plant laboratory, located in Iris- Nueva Victoria, for completion of the physical and leaching response tests. |
Details of the names, locations, and responsibilities of each laboratory involved in the development of the metallurgical tests are reported in Section 10.3 Analytical and Testing Laboratories.
| WSP-SQM0011-TRS-Pampa Orcoma-Rev1 | Rev1 | Page 58 |
The reports reviewed and documenting the drilling programs provide detailed descriptions of sampling and sample preparation methodologies, analytical procedures and/or safety considerations, meeting current industry standards. Quality control is implemented at all stages to ensure and verify that the collection process occurs at each stage successfully and is representative.
For Pampa Orcoma tests were conducted in 2014 and during 2020:
| · | 2014 Sumo Project (piques or calicatas). |
| · | 2020 Diamantina Project (DDH) |
For the 2014 campaign, the sampling of the reserve was based on the basic unit known as "piques or calicata ", consisting of some trial pits of approximately 3.5 m x 3.5 x, with a depth of 3 m, to extract a mass of approximately 70 t. In this case, six pits were chosen covering the entire reserve, a number selected for cost and response time considerations available for the physical tests and iso-containers leaching test.
2020 Diamantina Project (DDH), 30 DDH drilling samples (details available in borehole section) are selected under lithological criteria, salt content and Iodine-Nitrate laws, which are subjected to different physical tests for each DDH: Gravel test, erasure, rock embedded, embedded test tube, granulometric tests and agitated leaching test.
To establish the representativeness of the samples to estimate the physical and chemical properties of the caliche of the resource to be exploited, a map of geographical distribution of sampling points Pampa Orcoma for a “calicatas” and diamond drilling campaign is shown Figure 10-2.
| WSP-SQM0011-TRS-Pampa Orcoma-Rev1 | Rev1 | Page 59 |
Figure 10-2. Test Pits and Diamond Drilling (DDH) Campaign for Composite Samples from the Orcoma Sector for Metallurgical Testing

| WSP-SQM0011-TRS-Pampa Orcoma-Rev1 | Rev1 | Page 60 |
| 10.1.2 | Caliche Chemical and Mineralogical Characterization |
SQM nitrates mineralogical tests were realized in the composite as part of the test work. To know the mineralogical characteristics and alterations, the elemental composition is studied by X-Ray Diffraction (XRD). A particle mineral analysis (PMA) is performed to determine the mineral content of the sample.
The mineralogical characterization of caliche is performed by the following components to include nitrate, chloride iodate, sulfate, and silicate.
In-house analytical laboratories operated by company personnel are responsible for the chemical and mineralogical analysis of samples. These laboratories are in the city of Antofagasta and correspond to the following four sub-facilities:
| · | Caliche-Iodine Laboratory |
| · | Research and Development Laboratory |
| · | Quality Control Laboratory |
The chemical characterization of caliche in the concentrations corresponding to iodine, nitrate, and Na2SO4 (%), Ca (%), K (%), Mg (%), KClO4 (%), NaCl (%), Na (%), Na (%), H3BO3 (%)), and SO4 have obtained thanks to chemical analyses carried out in an internal laboratory of the company. The analysis methods are shown in Table 10-1.
Table 10-1. Applied Methods for the Characterization of Caliche or Composite
| Parameter | Unit | Method |
| Iodine grade | (ppm) | Volumetric redox |
| Nitrate grade | (%) | UV-Vis |
| Na2SO4 | (%) | Gravimetric/ICP |
| Ca | (%) | Potenciometric/Direct Aspiration-AA or ICP Finish |
| Mg | (%) | Potenciometric/Direct Aspiration-AA or ICP Finish |
| K | (%) | Direct Aspiration-AA or ICP Finish |
| SO4 | (%) | Gravimetric/ICP |
| KClO4 | (%) | Potenciometric |
| NaCl | (%) | Volumetric |
| Na | (%) | Direct Aspiration-AA/ICP or ICP Finish |
| H3BO3 | (%) | Volumetric or ICP Finish |
| WSP-SQM0011-TRS-Pampa Orcoma-Rev1 | Rev1 | Page 61 |
Composite samples are analyzed by iodine and nitrate grades. The analyses are conducted by Caliche and Iodine laboratory located in the city of Antofagasta. Facilities for iodine and nitrate analysis have qualified under ISO- 9001:2015 for which TÜV Rheinland provides quality management system certification. The latest recertification process was approved in November 2020 and is valid until March 15, 2023.
The protocols used for each of them are properly documented about materials, equipment, procedures, and control measures. The procedure used to calculate the iodine and nitrate grade, are summarized below.
Iodine Determination
There are two methodologies to determine iodine in caliche: Redox volumetry and XRF. Redox volumetry involves the titration of a solution of exactly known concentration, called standard solution, which is gradually added to another solution of unknown concentration until the chemical reaction between the two solutions is complete (equivalence point).
The determination of iodine by XRF uses the XRF Spectro ASOMA equipment, in which a sample of the pressed mineral placed in a reading cell is available.
Quality assurance controls consist of checking the condition of the equipment, analyzing a reagent blank together with the samples, verifying the concentration of the titrant, repeating the analysis for a standard together with the set of reagents to confirm its value.
Nitrate Determination
The nitrate content in caliches can be determined by UV-Visible Molecular Absorption Spectroscopy. This technique allows quantifying parameters in solution, based on their absorption at a specific wavelength of the UV Visible spectrum (between 100 to 800 nm).
Determination uses the Molecular Absorption Spectrophotometer POE-011-01, or POE-017-01, in which a glass test tube containing a filtered solution obtained by leaching with filtered distilled water flows in. The result obtained is expressed in percent nitrate.
The quality assurance criteria and validity of the results are described below:
| · | Previous verification of equipment. |
| · | Perform a comparative analysis of nitrate analysis once a shift, contrasting results of the same samples with other UV-VIS equipment and checking readings in the Kjeldahl method distillation unit, for Nitrogen determination. |
| · | Standard and QC sample input every ten samples. |
The trial pits presented the following salt matrix, shown in Table 10-2, were determined from 200-x-200-mesh exploration drillings.
| WSP-SQM0011-TRS-Pampa Orcoma-Rev1 | Rev1 | Page 62 |
Table 10-2. Salt Matrix of Pampa Orcoma Sampling Points (piques), taken from 200-x-200-mesh Drillings
| Sumo Project | | Sahft | | 0-1283 | | | 0-447 | | | 0-081 | | | PO-225 | | | PO-236 | | | PO-275 | |
| | | Coord X | | | 396,3 | | | | 405,7 | | | | 402,5 | | | | 396,3 | | | | 400,7 | | | | 398,3 | |
| | | Coord Y | | | 7,794,600 | | | | 7,801,400 | | | | 7,804,000 | | | | 7,800,000 | | | | 7,800,000 | | | | 7,799,200 | |
| Parameter | | Unit | | | Concentration | |
| I2 | | ppm | | | 430 | | | | 460 | | | | 440 | | | | 506 | | | | 561 | | | | 415 | |
| NaN03 | | % | | | 5.5 | | | | 9.4 | | | | 6.6 | | | | 6.7 | | | | 10.2 | | | | 10.0 | |
| Na2S04 | | % | | | 27.6 | | | | 23.5 | | | | 20.9 | | | | 40.7 | | | | 20.9 | | | | 22.7 | |
| Ca | | % | | | 5.07 | | | | 2.59 | | | | 2.92 | | | | 4.95 | | | | 3.65 | | | | 2.29 | |
| Mg | | % | | | 0.59 | | | | 1.15 | | | | 0.80 | | | | 1.66 | | | | 0.50 | | | | 1.22 | |
| K | | % | | | 0.85 | | | | 1.32 | | | | 0.82 | | | | 1.57 | | | | 0.92 | | | | 1.38 | |
| S04AP | | % | | | 9.6 | | | | 14.3 | | | | 10.6 | | | | 23.2 | | | | 8.0 | | | | 14.6 | |
| KCI04 | | % | | | 0.03 | | | | 0.05 | | | | 0.02 | | | | 0.03 | | | | 0.04 | | | | 0.04 | |
| NaCI | | % | | | 12.9 | | | | 15.3 | | | | 8.8 | | | | 10.6 | | | | 6.5 | | | | 20.0 | |
| Na | | % | | | 7.7 | | | | 9.9 | | | | 6.7 | | | | 9.2 | | | | 6.3 | | | | 12.2 | |
| H3B03 | | % | | | 0.55 | | | | 0.31 | | | | 0.28 | | | | 0.41 | | | | 0.40 | | | | 0.23 | |
| K/Mg | | % | | | 1.44 | | | | 1.15 | | | | 1.03 | | | | 0.95 | | | | 1.84 | | | | 1.13 | |
| WSP-SQM0011-TRS-Pampa Orcoma-Rev1 | Rev1 | Page 63 |
The geographic distribution of the points is shown in Figure 10-3.
Figure 10-3. Samples Obtained from Drill Holes 2014 -Sumo Project
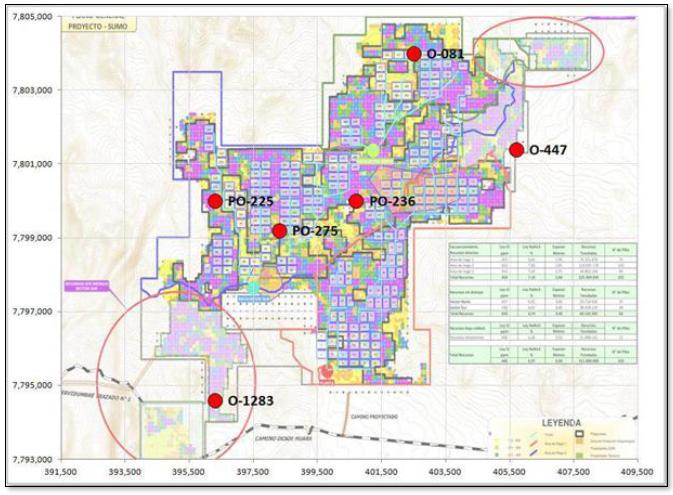
The results provided by the company for Pampa Orcoma highlight the following points:
| · | The most soluble part of the saline matrix is composed of sulphates, nitrates, and chlorides. |
| · | There are differences in the ion compositions present in salt matrix (SM). |
| · | Anhydrite, polyhalite, and glauberite, less soluble minerals, have calcium sulphate associations. |
| · | From the chemical-salt point of view, the deposit is favorable for the extraction procedure, since it contains an average of 49% of soluble salts, high contents of calcium (>2.5), and high concentrations of chlorides, and sulfates. In this respect, extraction yields over 65% are expected with higher values concerning the caliches in current exploitation. |
| · | Being a mostly semi-soft deposit, it favors the development of CM, in practically all the deposits. This geomechanical condition added to the low clastic content and low abrasiveness (confirmed by trial pits, "calicatas") would allow for the estimation of a lower mining cost when applying this technology. |
| WSP-SQM0011-TRS-Pampa Orcoma-Rev1 | Rev1 | Page 64 |
| 10.1.3 | Caliche Physical Properties |
To measure, identify, and describe a mineral as well as to contribute to a better understanding of it, physical tests of mineral properties that predict how it will react under certain treatment conditions are developed. To measure, identify and describe an ore as well as contribute to a better understanding, physical tests of the ore properties are developed to predict how it will react under certain treatment conditions. The determination of the physical properties, through the tail test, borra test, laboratory granulometry, embedding tests, and permeability, are carried out in the laboratory facilities of the Iris Pilot Plant, located in that sector in Nueva Victoria.
The following are the test conditions established, as described below.
Tailings Test
To predict the physical quality of the material generated in the leaching process, the riprap test consists of a leaching test followed by a sedimentation test of the pulp generated in the previous stage, the information generated corresponds to the volume of a clear liquid that is formed as the fine material sediments.
A mass of 1 kg of caliche contact for 30 minutes with water at a liquid/solid ratio of 0.5, in an agitated container at a temperature of 45°C, in a thermal bath regulated at 45°C. The pulp obtained flows into a 1.0-L graduated cylinder, where the solids begin to settle. After 24 hours, a record is made of the volume of clear liquid generated to determine the sedimentation curve and speed, as well as the degree of compaction.
Borras Test
This test determines the content of fines according to the type of caliche. For this purpose, a 1-kg mass of caliche is contacted with hot water at 80°C for 20 minutes. The pulp obtained is passed through ¼" and 35 mesh Tyler sieves and washed at each step with distilled water. Then, the material retained in the 100 mesh is displaced with water and received in one of the tared trays and put to dry in the cooker. Similarly, the material passing through the 100 mesh received at the bottom is decanted before drying. Finally, the total percentage of flotsam generated is obtained.
Size Distribution
This determines the different particle sizes of soil and obtains the quantity, expressed as a percentage, that passes through the different sieves of the series used in the tests. The sieves were placed with each of the samples in the mechanical shaker and passage and retention were recorded to obtain the granulometric curves.
| WSP-SQM0011-TRS-Pampa Orcoma-Rev1 | Rev1 | Page 65 |
Embedding Test
The test consists of placing a mineral rock (from 2 to 5 kg) in a tray with a certain height of solution (2 cm to 5 cm of water) and measuring the wetting advance front. This test has a duration of 36 hours.
Up to this point, the physical determinations described above allows for the categorization of whether a caliche is very unstable, unstable, stable, or very physically stable to generate the best irrigation strategy in the impregnation stage (irrigation rate, impregnation solution, pulse days). In the future, it is intended to incorporate other tests, such as capillarity tests, that measure the liquid suction using medium and large particles of mineral. In addition, the saturation level in the heap is intended to be measured by determining the concentration of different ions along a column of mineral during leaching. Finally, it is intended that permeability tests will occur using a constant load permeameter.
The tests developed are summarized Table 10-3.
During the site visit, it was possible to verify the development of embedding, sedimentation, and compaction tests in the Iris Pilot Plant Laboratory, which are shown in the Figure 10-4
Table 10-3. Determination of Physical Properties of Caliche Minerals
| Test | Parameter | Procedure | Objective | Impact |
| Tails test | Sedimentation and Compaction | Sedimentation test, measuring the clearance and riprap cake every hour for a period of about 12 hours. | Obtain the rate of sedimentation and compaction of fines. | Evidence of crown instability and mud generation. Irrigation rate |
| Borra test | % of fine material | The retained material is measured between the - #35 #+100 and -#100 after a flocculation and decantation process. flocculation and decantation of ore | To obtain the amount of ore flocculation and decantation process | % of fine that could delay irrigation. Irrigation rate. Canalizations. |
| Size distribution | % of microfine | Standard test of granulometry, the percentage under 200 mesh is given. | Obtain % microfine | % water retention and yield losses |
| Permeability | k (cm/h) | Using constant load permeameter and Darcy's law | To measure the degree of permeability of ore | Decrease in extraction kinetics of extraction |
| Embedded | alpha | Wettability measurement procedure of rock | To measure the degree of wettability of the ore | Variability in impregnation impregnation times |
| WSP-SQM0011-TRS-Pampa Orcoma-Rev1 | Rev1 | Page 66 |
Figure 10-4. Embedding, Compaction, and Sedimentation Tests Performed at the Iris Pilot Plant Laboratory
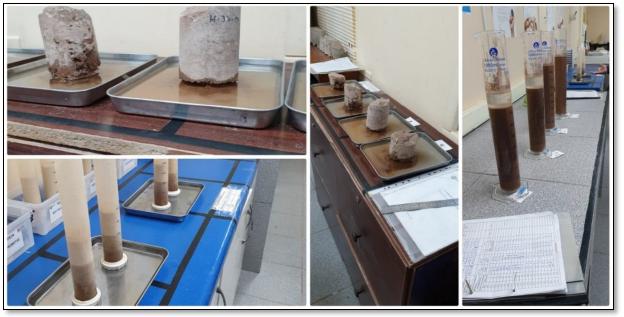
Orcoma’s physical test results are compared with those of TEA (Table 10-4). TEA is another SQM property some km to the south of Pampa Orcoma.
Table 10-4. Comparative Results of Physical Tests for Pampa Orcoma and TEA Exploitation Project
| Sector | | Sedimentation | | | Compaction | | | %Fines | | | #-200 | | | Alpha | |
| TEA | | | 0.024 | | | | 7.37 | | | | 29.47 | | | | 10.89 | | | | 2.72 | |
| Orcoma | | | 0.025 | | | | 10.05 | | | | 32.98 | | | | 12.29 | | | | 2.29 | |
According to the tests, it is possible to highlight the following points:
| · | Sedimentation: Both have medium sedimentation velocity, which implies the need for impregnation and prolonged resting for stabilization. |
| · | Compaction: Orcoma has a good compaction. This indicates a greater uniformity in the porous bed, allowing for higher irrigation rates, and therefore, better kinetics. |
| · | Fines: Both pampas present high percentage of fines and this implies that the best impregnant to use should be a solution other than water. The negative impact of this condition could be increased, depending on the type of fine material (e.g., clays) generating water pockets, and channeling. |
| · | Material #-200: Corresponds to the microfines and give rise to channeling very high value in both pampas. |
| · | Parameter Alpha: Both values in medium quality, implying acceptable embedding speed that can be improved with a slow controlled impregnation. |
| WSP-SQM0011-TRS-Pampa Orcoma-Rev1 | Rev1 | Page 67 |
As the physical properties measured are directly related to the irrigation strategy, the conclusion is that both caliches should be treated in a similar manner and consider a standard impregnation stage of mixed drip and sprinkler irrigation.
| 10.1.4 | Agitated Leaching Tests |
The agitated leaching tests are developed with the objective of representing the leaching mechanism implemented in the plant by means of the different irrigation solutions and to obtain the maximum recovery potential. The protocol for the development of the agitated leaching tests is summarized below.
Leaching in Stirred Reactors
Leaching experiments run at atmospheric pressure and temperature in a glass reactor without baffles. A propeller agitator at 400 revolutions per minute (RPM) was used to agitate the leach suspension. In summary, all experiments are performed with:
| · | Environmental conditions. |
| · | Caliche sample particle size 100% mesh -65# mesh. |
| · | Three contact leaching procedures with drainage solution use. |
To start the leaching experiment, the initial filling of the reactor was done with distilled water and this solution was agitated carefully. After a few minutes, the pH and oxidation reduction potential (ORP) values were set, caliche concentrate is added to the solution, and the agitation is increased to the final speed.
Once finished, the product is filtered and the resulting brine solution is analyzed, checking the extraction of analytes and minerals by contact with the bleaching agent, unit consumption, and iodine extraction response.
Consecutive leaching is a complement of the agitated vessel leaching, which is also performed in an agitated vessel with the same parameters explained above, however, it contemplates leaching three caliche samples successively with the drainage solution resulting from each stage. The purpose of this test is to enrich the solution of an element of interest such as iodine and nitrates to evaluate the performance of a heap as this solution percolates through a heap. The representative scheme of successive leaching in stirred vessel reactors is shown in Figure 10-5.
| WSP-SQM0011-TRS-Pampa Orcoma-Rev1 | Rev1 | Page 68 |
Figure 10-5. Successive Leach Test Development Procedure
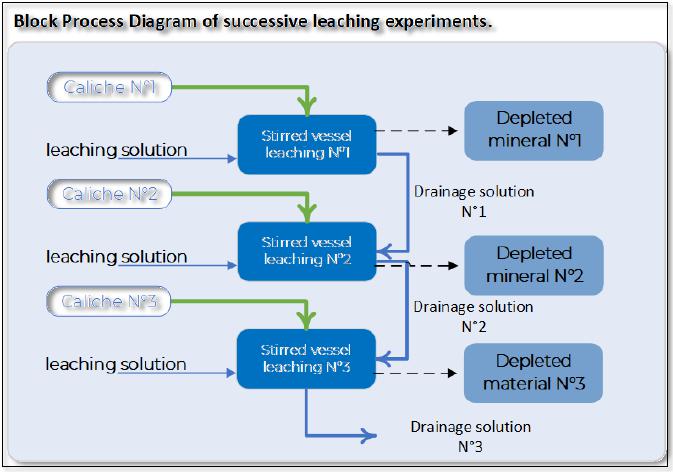
The results given by the company have been conclusive on the following points:
| · | The higher the amount of soluble salts, the lower the extraction. |
| · | A higher proportion of calcium in salt matrix implies higher extraction. |
| · | The physical and chemical quality favorable for Leaching results from a soluble salts content lower than 50%. |
| · | Calcium: In the Orcoma leach brine contains 0.22 (gpl) and implies a lower degree of incrustations in the plant. |
| · | Sulfate: No effect is seen since the solutions would not be at the Decahydrated Sulfate field. |
| · | NTU: There is a threat due to the presence of fines in the caliche, an additional 30 NTU (80 v/s 110). This result would translate into an impact of one additional day of maintenance per year. |
For Pampa Orcoma, reports indicate that the Diamantina Project involved leaching trials of 30 DDH, resulting in an iodine yield of 65.3% and a nitrate yield of 66.3%.
For a caliche of Pampa Orcoma sector, the chemical characterization of leaching solution results are show in Table 10-5, where an average salt matrix of 63.7% soluble salts and an iodine yield of 56.4%.
| WSP-SQM0011-TRS-Pampa Orcoma-Rev1 | Rev1 | Page 69 |
Table 10-5. DDH 2020 -Chemical Characterization of Samples Obtained from Successive Leach Test Results.
| Element | | | Soluble | | Iodine | |
| Yodo (ppm) | | NaNO3 | | Na2SO4 | | Ca | | Mg | | K | | SO4ap | | KCl04 | | NaCl | | Na | | H3BO3 | | | salts (SS, %) | | Yield | |
| | 373 | | | 6.3 | | | 19.6 | | | 3.1 | | | 0.67 | | | 0.75 | | | 8.52 | | | 0.04 | | | 13.5 | | | 7.99 | | | 0.35 | | | | 53.4 | | | 65.3 | |
Orcoma has a higher yield than other sectors. Figure 10-6 shows the results of the agitated leaching tests of two resources from TEA and Pampa Orcoma. The graphs represent the nitrate and iodine yield achieved as a function of soluble salt content.
In the graphs, the green line corresponds to the experimental yield result, while the orange line indicates a modeling result of the Pampa Orcoma yield factored at 90%. The yield equivalent to 90% of what the model indicates is 66.3% for Iodine and 63.4% for Nitrate. These factored yields are conservatively used for the economic evaluation of the project.
The green line, which corresponds to the experimental results, shows that an ore from Pampa Orcoma with a content of soluble salts of 46.5% has a yield of 73% for iodine and 70.5% for nitrate. Ore from TEA, with a content of 62.9% of soluble salts, has a yield of 55.5% for iodine and 60.7% for nitrate. Both resources show a difference in nitrate yield of 70.5% versus 60.7% and a difference in iodine yield of 73% versus 55.5%.
Both resources show a difference in nitrate and iodine yield of 9% to 17%, respectively.
| WSP-SQM0011-TRS-Pampa Orcoma-Rev1 | Rev1 | Page 70 |
Figure 10-6. Nitrate and Iodine Yield Obtained by Successive Agitated Leaching Test
| WSP-SQM0011-TRS-Pampa Orcoma-Rev1 | Rev1 | Page 71 |
| 10.1.5 | Leaching in Isocontainers |
The isocontainer leaching tests are developed with the objective of representing the heap leaching process. The first isocontainer tests, in 2012, were conducted on an exploratory basis to compare leaching variables (such as grade and grain size). In these early isocontainer tests, a significant closeness between reactor and heap results was detected. It was found that the closer the test parameters were to those used in the industrial process, the closer the correlation was 1:1.
The isocontainers are plastic receptacles that are loaded in such a way as to replicate the segregation presented by industrial piles because of their loading method, and therefore the material is stacked in layers inside the reactor, as illustrated in Figure 10-7.
Figure 10-7. Loaded isocontainer and Distribution of Material According to Granulometry
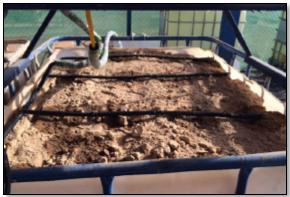 | | 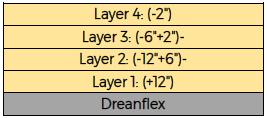 |
| a) Isocontainer test with Pampa Orcoma material. | | b) Iso container loading diagram |
The tests, corresponding to the 2014 campaign, were carried out with parameters corresponding to those of the Nueva Victoria industrial process on the test date, using seawater obtained from Caleta Buena, the point foreseen for future extraction. The test development conditions are as indicated in Table 10-6.
Table 10-6. Conditions for Leaching Experiments in Isocontainers
| Parameter | Detall |
| Mass | 1,500 kg |
| Granulometry | +12"-(-12"+6")- (-6"+2")- (-2") |
| Test Duration | 25.8 days |
| Impregnation | 0.05 m3/ton-1 l/h/m2 |
| Irrigation/ rate | Water : 0.07 m3/ton- 2/h/m2 SI : 0.41 m3/ton-2 l/h/m2 Mixed : 0.09 m3/ton-2 l/h/m2 Washing : 0.28m3/ton-2 l/h/m2 |
From this same sampling and loading process, head samples are obtained to determine the caliche grades. The head grades are detailed in Table 10-7.
| WSP-SQM0011-TRS-Pampa Orcoma-Rev1 | Rev1 | Page 72 |
Table 10-7. Head Grade Samples Loaded to Isocontainers
| Element | | K | | Mg | | Ca | | NaCl | | Na2SO4 | | NaNO3 % | | KClO4 | | I2 | | H3BO3 | | Na2CO3 | |
| Unit | | % | | % | | % | | % | | % | | % | | % | | ppm | | % | | % | |
| 0-081 | | | 0.70 | | | 0.72 | | | 3.57 | | | 12.00 | | | 22.60 | | | 5.1 | | | 0.02 | | | 360 | | | 0.33 | | | 0.05 | |
| PO-225 | | | 1.20 | | | 0.98 | | | 3.73 | | | 15.90 | | | 26.10 | | | 5.3 | | | 0.03 | | | 370 | | | 0.44 | | | 0.06 | |
| PO-236 | | | 1.04 | | | 0.79 | | | 2.24 | | | 16.30 | | | 17.90 | | | 5.2 | | | 0.03 | | | 170 | | | 0.35 | | | 0.03 | |
| PO-275 | | | 0.82 | | | 0.93 | | | 3.87 | | | 11.40 | | | 25.0 | | | 4.6 | | | 0.02 | | | 400 | | | 0.54 | | | 0.06 | |
| 0-447 | | | 0.96 | | | 0.95 | | | 2.77 | | | 13.90 | | | 23,00 | | | 6.3 | | | 0.02 | | | 270 | | | 0.33 | | | 0.06 | |
| 0-1283 | | | 0.73 | | | 0.62 | | | 4.62 | | | 17.79 | | | 33.30 | | | 3.1 | | | 0.02 | | | 250 | | | 0.38 | | | 0.04 | |
It is important to note that the compositions in Table 10-7 differ significantly from those of the drill holes in Table 10-2.
The tests occur, per associated pique sample, in four receptacles. The isocontainer results for Pampa Orcoma are summarized in Table 10-8, corresponding to averages of the four representative isocontainers.
Table 10-8. Results of isocontainer leaching of samples obtained from trial pits Pampa Orcoma
| Yield, % | | PO-1283 | | | PO-225 | | | PO-447 | | | PO-081 | | | PO-275 | | | PO-236 | | | Average | |
| I2 | | | 55.8 | | | | 70.2 | | | | 64.7 | | | | 66.4 | | | | 67.8 | | | | 69.3 | | | | 67.7 | |
| NaNO3 | | | 70.5 | | | | 79.8 | | | | 74.3 | | | | 84.9 | | | | 75.1 | | | | 74.2 | | | | 77.6 | |
Isocontainer leachin test of O-1283 sample presented anomalous behavior (manifesting as ponding or flooding) during the tests, which is another reason to exclude it from the report of results.
The isocontainer results were used to calibrate a phenomenological model based on chemical equilibria and wetting kinetics (embedded). The equilibria were simulated by gPROMS using the SQMPPFO property package (originally developed for Salar de Atacama brine equilibria).
Other variables were added to the isocontainer results:
This data is introduced into the model to represent the isocontainer data, scaling the parameters to pile to obtain a projection of the caliche behavior at industrial scale (Table 10-9).
| WSP-SQM0011-TRS-Pampa Orcoma-Rev1 | Rev1 | Page 73 |
Table 10-9. Sumo Project 2014 -Result of simulated pile scaling for 6 Pampa Orcoma trial pits
Sample | | Elements | | | | | |
| | Yodo
(ppm) | | NaNO3 | | Na2SO4 | | Ca | | Mg | | K | | SO4ap | | KCl04 | | NaCl | | Na | | H3BO3 | | Soluble salts
(SS, %) | | Iodine
Yield | |
| PO-081 | | | 370 | | | 5.3 | | | 26.1 | | | 3.7 | | | 0.98 | | | 1.20 | | | 12.9 | | | 0.03 | | | 15.9 | | | 9.5 | | | 0.44 | | | 47.0 | | | 69.8 | |
| PO-225 | | | 270 | | | 6.3 | | | 23.0 | | | 2.8 | | | 0.95 | | | 0.96 | | | 13.2 | | | 0.02 | | | 13.9 | | | 9.2 | | | 0.33 | | | 56.3 | | | 67.2 | |
| PO-236 | | | 360 | | | 5.1 | | | 22.6 | | | 3.6 | | | 0.72 | | | 0.70 | | | 10.0 | | | 0.00 | | | 12.0 | | | 7.7 | | | 0.33 | | | 42.6 | | | 67.8 | |
| PO-275 | | | 400 | | | 4.6 | | | 25.0 | | | 3.9 | | | 0.93 | | | 0.82 | | | 11.3 | | | 0.02 | | | 11.4 | | | 7.3 | | | 0.54 | | | 38.5 | | | 69.7 | |
| PO-447 | | | 170 | | | 5.2 | | | 17.9 | | | 2.2 | | | 0.79 | | | 1.04 | | | 10.0 | | | 0.03 | | | 16.3 | | | 9.1 | | | 0.35 | | | 61.3 | | | 62.0 | |
| Average | | | 314 | | | 5.3 | | | 22.9 | | | 3.2 | | | 0.87 | | | 0.94 | | | 11.5 | | | 0.02 | | | 13.9 | | | 8.6 | | | 0.40 | | | 49.1 | | | 67.3 | |
Thus, the results of simulation of leaching in isocontainers of five pits gave an average yield of 67.3% for iodine and 75.4% for nitrate. The average soluble salt content of Pampa Orcoma in this test is defined as 49.1% on average.
| 10.1.6 | Column Leach Test using Seawater |
Water availability is scarce, being a critical issue for the mining industries so the use of other leaching agents such as seawater can be a viable alternative. Therefore, experimental studies of caliche leaching in mini-columns were conducted to evaluate the effect of seawater.
This study aims to analyze seawater's effect on caliche leaching from different sectors of nitrate-iodine mining properties, using seawater sampled in Mejillones Bay at 100 m offshore, below 15 m depth.
The types of tests executed are in duplicate under the following impregnation-irrigation strategy and conditions:
| · | Water Impregnation: Irrigation with Water (MC 1-MC2) |
| · | Water Impregnation: Irrigation with 60%v/v Water - 40%v/v with a recirculated weakly acidic water (agua Feeble ácida, AFA). (MC 3-MC 4) |
| · | Seawater Impregnation: Irrigation with Seawater (MC 5-MC 6) |
| · | Seawater Impregnation: Irrigation with Mixed 60%v/v Seawater - 40%v/v AFA (MC 7-MC 8) |
| · | Composition determined by granulometry of the material disposed in the columns. |
The test development conditions are as indicated in Table 10-10.
| WSP-SQM0011-TRS-Pampa Orcoma-Rev1 | Rev1 | Page 74 |
Table 10-10. Conditions for Leaching Experiments with Seawater
| Parámeter | Detall |
| Mass | 3031,3 g |
| Granulometry | 1" - ¾" - ½" - ¼" - ¼" - 20" mesh |
| Test Duration | 7 days |
| Total impregnation | 19 hours |
| Regime watering/rest | 1 hour to watering /2 hours to rest 1 hour to watering /2 hours to rest 1 hour to watering /2 hours to rest 1 hour to watering h/1 h hours to rest 1 hour to watering h/1 h hours to rest 2 hour to watering h/1 h hours to rest 2 hour to watering h/1 h hours to rest |
| Irrigation Rate Flow-Flow | 5 days and 20 h |
The composition determined by granulometry of the material disposed of in the columns is as shown in Table 10-11.
Table 10-11. Characteristic Composition of the Caliche used in the Tests
| | | Caliche Composition (%) | |
| Type | | NO3 | | IO3 | | CI | | SO4 | | | CIO4 | | BO3 | | Na | | K | | Mg | | Ca | | CO3 | |
| Caliche Type +1" | | | 3.83 | | | 0.05 | | | 5.13 | | | 22.52 | | | | 0.04 | | | 0.58 | | | 8.43 | | | 1.08 | | | 0.84 | | | 4.88 | | | 0.04 | |
| Caliche Type +3/4" | | | 4.96 | | | 0.06 | | | 5.43 | | | 19.98 | | | | 0.05 | | | 0.49 | | | 7.93 | | | 1.02 | | | 0.88 | | | 4.67 | | | 0.03 | |
| Caliche Type +1/2" | | | 5.76 | | | 0.07 | | | 5.34 | | | 14.78 | | | | 0.05 | | | 0.79 | | | 9.08 | | | 0.89 | | | 0.45 | | | 2.80 | | | 0.05 | |
| Caliche Type +1/4" | | | 5.80 | | | 0.07 | | | 5.31 | | | 14.74 | | | | 0.05 | | | 1.01 | | | 9.08 | | | 0.87 | | | 0.51 | | | 2.93 | | | 0.06 | |
| Caliche Type +#20 | | | 5.87 | | | 0.07 | | | 5.37 | | | 10.62 | | | | 0.05 | | | 1.15 | | | 9.12 | | | 0.85 | | | 0.34 | | | 1.64 | | | 0.05 | |
Source: SQM- Report-Effect Sea Water 231208
Experiments have shown that highly soluble minerals such as nitrate and iodate are rapidly leached with seawater without much difference concerning the raw water method.
Regarding nitrate and iodine extraction, higher NO3 extraction, Figure 10-8., is observed when leaching with seawater as well as a higher IO3 extraction is observed when leaching with seawater (MC5- 5 and MC 6 curves versus MC1 and MC 2 curves). In addition, when comparing the extractions achieved in iodine leaching by water/AFA and seawater/AFA, curves MC 3 and MC 4 versus MC 7 and MC 8. The seawater/AFA mixture is better (MC 7 and MC 8). For nitrate, there is no appreciable difference in increase when using seawater as a mixture. The extraction is similar to that of iodine.
| WSP-SQM0011-TRS-Pampa Orcoma-Rev1 | Rev1 | Page 75 |
Figure 10-8. Results of Nitrate and Iodine Extraction by Seawater Leaching
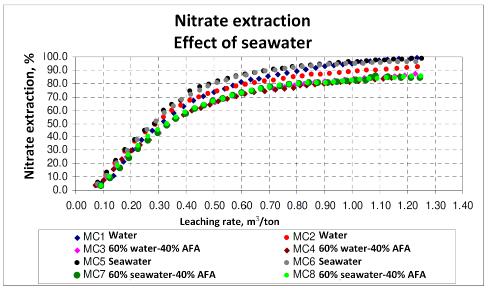 |
| a) Nitrate extraction with seawater |
|
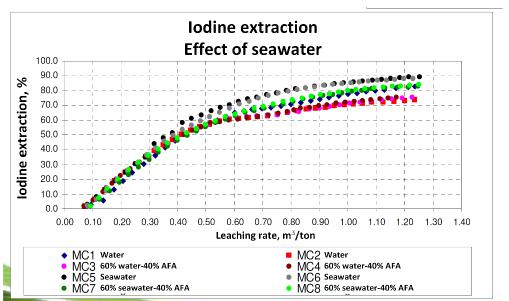 |
| b) Iodine extraction with seawater |
Source: SQM- Report-Effect Sea Water 231208
In the future, SQM intends to study heap behavior through column leaching tests using seawater, by including different irrigation rates and heights of the bed in the column and analyzing the experimental concentrations of each species.
| WSP-SQM0011-TRS-Pampa Orcoma-Rev1 | Rev1 | Page 76 |
| 10.1.7 | Laboratory Control Procedures |
There is currently a quality control system for iodine production, consisting of monitoring the process from the characterization of the input brine, followed by the sampling and characterization of the cutting and oxidation brine, as well as the prill product obtained. The product obtained from the iodine prill plant undergoes a series of analyses to quantify purity, chloride/bromine ratio, sulfate, mercury, residues, and color index.
The control analyses, on liquid and solid samples, will be performed in the laboratory facilities located in the city of Antofagasta, Analysis laboratory, involving two installations:
| · | Caliche-Iodine Laboratory: Determination of iodine and nitrate in caliches. |
| · | Research and Development Laboratory: Facility in charge of performing determination by AAS, ICP-OES, potentiometry, conventional titration, and solution density. |
Table 10-12 lists the basic set of analyses requested from laboratories and the methodologies used for their determination.
Table 10-12. List of requested analyses for caliche leach brines and iodine prill
| Parameter | Method |
| Iodine solutions |
| Iodine grade | Volumetric redox |
| Nitrate grade | UV-Vis |
| pH | Potenciometric |
| Acidity | Volumetric acid-base |
| Alkalinity | Volumetric acid-base |
| H3BO3 | Volumetric or ICP Finish |
| Na2SO4 | Gravimetric/ICP |
| Ca | Potenciometric/Direct Aspiration-AA or ICP Finish |
| Mg | Potenciometric/Direct Aspiration-AA or ICP Finish |
| K | Direct Aspiration-AA or ICP Finish |
| SO4 | Gravimetric/ICP |
| KClO4 | Potenciometric |
| NaCl | Volumetric |
| Na | Direct Aspiration-AA/ICP or ICP Finish |
| Iodine Prill |
| Purity or iodine count | Potenciometric |
| Bromide and chloride | Volumetric |
| Non-volatile material (residue) | Gravimetric |
| Sulfate | Turbidimetry |
| Mercury | spectrophotometry |
| Coloration index | colorimetric |
| WSP-SQM0011-TRS-Pampa Orcoma-Rev1 | Rev1 | Page 77 |
Pampa Orcoma's mineral treatment tests have resulted in an average of the following components of brines that will enter the plant and be sent to evaporation ponds (Table 10-13).
Table 10-13. Average Chemical Composition of Pampa Orcoma Brine Feed and Directed Out to the Process
| Parameter | Unit | Brine Feed to Process | Brine Out Directed to Evaporation Ponds |
| Iodine | (gpl) | 0.56 | ≈0.02 |
| NaNO3 | (gpl) | 128 | 128 |
| Na2SO4 | (gpl) | 127 | 127 |
| NaCl | (gpl) | | 226 |
| Ca | (gpl) | 0.22 | 0.22 |
| Mg | (gpl) | 15.5 | 15.5 |
| K | (gpl) | 10.7 | 10.7 |
| KCl04 | (gpl) | 0.9 | 0.9 |
| H3BO3 | (gpl) | 4.9 | 4.9 |
| Na2CO3 | (gpl) | 1.0 | 4.6 |
| MgL | (gpl) | 4.6 | 11.9 |
| NO3/K | --- | 11.9 | 143 |
| NO3/ClO4 | --- | 143 | 26.0 |
| NO3/B | --- | 26.0 | 3.55 |
| Alkalinity/iodine | --- | 1.70 | |
| Evaporation Rate | (l/m²d) | 3.55 | 128 |
Source: SQM-Plan Industrial Abril Orcoma – final.
| WSP-SQM0011-TRS-Pampa Orcoma-Rev1 | Rev1 | Page 78 |
The relevant results of the brine produced at Orcoma are:
| · | The chemical quality of the Orcoma BF is richer in relative nitrate content and has a lower magnesium content versus other brines. This can positively affect the yield of ponds. |
| · | The NaNO3/K ratio in BF Orcoma is similar to the composition other brines. |
| · | The NaNO3/KClO4 ratio is 26 in Orcoma which allows for low values of Perchlorate to be maintained in the product salt, suitable for NPT plants. |
Once the pond systems are in operation, the sampling and assay procedures for the evaporation tests are as follows:
| · | Collection of brine samples periodically to measure brine properties such as chemical analysis, density, brine activity, etc. Samples are taken by the in-house laboratory using the same methods and quality control procedures as those applied to other brine samples. |
| · | Collection of precipitated salts from the ponds for chemical analysis to evaluate evaporation pathways, brine evolution, and physical and chemical properties of the salts. |
| 10.2 | Sample Representativeness |
The company establishes QA/QC measures to ensure the reliability and accuracy of sampling, preparation, and assays, as well as the data obtained from assays on them. These measures include field procedures and checks that cover aspects such as monitoring to detect and correct any errors during drilling, prospecting, sampling and assaying, as well as data management and database integrity. So that the data generated are reliable and can be used in both resource estimation and prediction of recovery estimates.
According to the sampling protocol, samples are delivered from the drilling site to the secure and private facility for logging by technical personnel in charge of the campaign. The protocol ensures the correct entry in the database by tracking the samples from their sampling or collection points, identifying them with an ID, and recording accordingly, what has been done for the samples delivered/received. The set of procedures and instructions for traceability corresponds to a document called "Caliche AR Sample Preparation Procedure".
The company applies a quality control protocol established in the laboratory to receive caliche samples from all the areas developed according to the campaign, preparing the dispatches together with the documentation for sending the samples, preparing, and inserting the quality controls, which will be the verification of the precision and accuracy of the results. On the other hand, the Lims data management system is used, which randomly orders the standards and duplicates in the corresponding request. By chemical species analysis, an insertion rate of standard or standard QA/QC samples and duplicates is established.
| WSP-SQM0011-TRS-Pampa Orcoma-Rev1 | Rev1 | Page 79 |
Regarding the treatment of the results, the following criteria are established:
| · | Numbers of samples that are above and below the lower detection limits. |
| · | Differences of values in duplicates are evaluated. For example, when comparing duplicates of nitrate and iodine grades, a maximum difference, calculated in absolute value, of 0.4% for NaNO3and 0.014% for iodine is accepted. |
| · | For standards measured, results with a tolerance of +/- 2 standard deviations from the certified value are accepted. |
| · | In the case of any deviation, it is the laboratory manager who reviews and requests checks of the samples, in case the duplicate or standard is out of control. |
| · | As concerns physical characterization and leaching tests, all tests are developed in duplicate. Determination results are accepted with a difference of values in the duplicates of 2%. |
Given that, as described above, the sampling method, from the different exploration and prospecting sites, as well as the preparation of the samples to prepare a composite on which the characterization tests are performed, are duly documented, as well as the quality assurance and quality controls, it is considered that the test samples are representative of the different types and styles of mineralization and of the mineral deposit as a whole. Sampling for operations control is representative of caliche as they are obtained directly from the areas being mined or scheduled for mining. The caliche analysis and characterization tests are appropriate for a good planning of operations based on a recovery estimation.
| 10.3 | Analytical and Testing Laboratories |
Pampa Orcoma's metallurgical test work program involves samples being sent to internal laboratories, located at the site. Metallurgical test work program involves samples being sent to internal laboratories that are responsible for analysis and test works:
| · | Analysis laboratory located in Antofagasta, which is in charge of chemical and mineralogical analysis. |
| · | Pilot Plant Laboratory, located in Iris- Nueva Victoria, is in charge of receiving samples and applying physical and leaching response assays. |
| WSP-SQM0011-TRS-Pampa Orcoma-Rev1 | Rev1 | Page 80 |
Table 10-14 details the name, location, and analysis conducted.
Table 10-14. List of Installations Available for Analysis
| Laboratory name | Location | Analysis |
| Caliche-Iodine Laboratory | Antofagasta | Determination of iodine and nitrate in caliches, probing. |
| Research and Development Laboratory | Antofagasta | AAS, ICP-OES, potentiometry, conventional titration, solution density. |
| Quality Control Laboratory | Antofagasta | Polarized light microscopy, particle size distribution. |
| SEM and XRD Laboratory | Antofagasta | SEM and XRD |
| Pilot Plant Laboratory | Nueva Victoria | Physical characterization and ore leaching tests |
The facilities available for iodine and nitrate analysis at Caliche and Iodine Laboratories (LCY) in Antofagasta have qualified by ISO-9001:2015 (certification granted by TÜV Rheinland valid 2020-2023). Although the certification is specific to iodine and nitrate grade determination, the laboratory specializes in the chemical and mineralogical analysis of mineral resources, with extensive experience in this field going back a long way. In the opinion of the authors, the quality control and analytical procedures used at the Antofagasta Caliches and Iodine laboratory are of high quality.
On the other hand, it is necessary to highlight that, part of the exploration efforts are focused on the possible metallic mineralizations of gold and copper found underneath the caliche. Therefore, samples are sent to analytical laboratories that are external and independent from SQM and are accredited and/or certified by the International Organization for Standardization (ISO):
| · | Andes Analytical Assay (AAA) (ISO 9001 Certification). |
| · | ALS Global Chile (accredited to international standard ISO/IEC 17025). |
| · | Centro de Investigación Minera y Metalúrgica (CIMM) (accredited to international standard ISO/IEC 17025). |
Regarding drill samples processing, those are segregated according to a mechanical preparation guide, which aims to provide an effective guideline of the minimum required mass and characteristic sizes for each test, seeking to optimize in the best possible way the available material. In this way, it is possible to perform the metallurgical tests of interest, ensuring their validity and reproducibility.
| WSP-SQM0011-TRS-Pampa Orcoma-Rev1 | Rev1 | Page 81 |
| 10.4 | Test works and Relevant Results |
| 10.4.1 | Metallurgical Recovery Estimation |
Caliche characterization results are contrasted with metallurgical results attempting to formulate relationships between elemental concentrations and recovery rates of the elements of interest or valuable elements and reagent consumption.
The relationships between reported analyses and recoveries achieved are as follows:
| · | It is possible to establish an impact regarding recovery based on the type of salt matrix and the effect of salts in the leaching solution. With higher amounts of soluble salts, lower is the extraction while higher calcium in SM, higher is the extraction. |
| · | Caliches with better recovery performance tend to decant faster (speed) and compact better (cm). |
| · | The higher presence of fines hinders bed percolation, compromising the ability to leach and ultrafine that could delay irrigation or cause areas to avoid being irrigated. |
| · | The higher hydraulic conductivity or permeability coefficient, better leachability behavior of the bed. |
For metallurgical recovery estimation, the formulated model contains the following grades:
| · | Chemical-mineralogical composition. |
| · | Physical characteristics: sedimentation velocity, compaction, percentage of fines and ultrafines, uniformity coefficient and wetting. |
Therefore, this metallurgical analysis is focused on determining the relationships associated with these variables, since the relationships could be applied to the blocks to determine deposit results. From a chemical and yield point of view, a relationship is established between unit consumption (UC, amount of water) or total irrigation salts (salt concentration, g/L) and iodine extraction. As reported by the company, it was used the best subset regression to determine the optimal linear relationships between these predictors and metallurgical results, setting a linear relationship between yield and total salts depending on soluble salts concentration. In this way, iodine and nitrate recovery equations are represented by the following formulas and Figure 10-9.
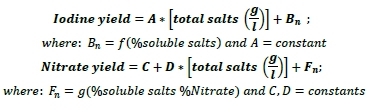
| WSP-SQM0011-TRS-Pampa Orcoma-Rev1 | Rev1 | Page 82 |
Figure 10-9. Iodine Recovery as a Function of Total Sales Content Test Work with Samples from Two Different Resource Sectors to be Exploited by the Company

The graph of Figure 10-9 compares iodine yield results for samples from two SQM resources, TEA and Pampa Orcoma (abbreviated as ORC), as a function of total salts. The mineral samples (MS) are differentiated by their percentage soluble salt content, so that sample MS-45 (TEA), for example, corresponds to a mineral sample from the TEA sector characterized by 45% soluble salts. Following this logic, MS-45 (ORC), corresponds to a mineral sample from Pampa Orcoma, which has a soluble salt content of 45%. As can be seen, an output matrix content of 65% implies a lower recovery compared to an ore content of 45%.
From the comparative graph, it is possible to conclude that the recovery is favorable from a Soluble Salts content about than 50% and Pampa Orcoma, with a characteristic soluble salt content of 49.1%-53.4% on average, would give rise to iodine recoveries of 65.3%-67.7%.
In conclusion, the metallurgical tests, as previously stated, have allowed establishing baseline relationships between caliche characteristics and recovery. In the case of iodine, a relationship is established between unit consumption and soluble salt content, while for nitrate, a relationship is established depending on the degree of nitrate, unit consumption and the salt matrix. Relationships that allow estimating the yield at industrial scale.
| 10.4.2 | Irrigation Strategy Selection |
In terms of physical properties, the metallurgical analysis allows to determine caliche classification as unstable, very unstable, stable and very stable, which gives rise to an irrigation strategy in impregnation stage. As a result, a parameter impact ranking is established in caliche classification, in the order indicated below (from higher to lower impact):
| WSP-SQM0011-TRS-Pampa Orcoma-Rev1 | Rev1 | Page 83 |
| 2. | Sedimentation velocity (S). |
| 3. | Fines and ultrafines percentage (%f; percent passing #200) with wetting degree (A, Alpha). |
| 4. | Uniformity degree (Cu). |
The weighting establishes a value to be placed on a scale of selection depending on the type of impregnation for the highest yield (see Figure 10-10):
| · | Scale 1.1 to 1.9; pulse ramp 70 days of irrigation with intermediate solution. |
| · | Scale 1.9 to 2.6; pulse ramp 60 days of irrigation with intermediate solution. |
| · | Scale 2.6 to 3.3; pulse ramp 50 days of irrigation with water. |
| · | Scale 3.3 to 3.9; pulse ramp 40 days of irrigation with water. |
Figure 10-10. Parameter Scales and Irrigation Strategy in the Impregnation Stage Impregnation
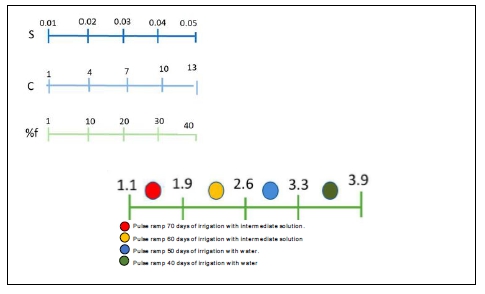
The physical tests on the Orcoma caliche and the application of the established weighting for the determined parameters, indicate that the resource disposed in leaching heaps must be treated through an impregnation stage by drip irrigation with the following scheme: Water/50 days/Slow Pulse, to then change changes to sprinkler irrigation with intermediate solution for SI/60-70 days/Slow Pulse Ramp. Thus, avoiding possible canalization of the piles and consequently, low yields.
| WSP-SQM0011-TRS-Pampa Orcoma-Rev1 | Rev1 | Page 84 |
| 10.4.3 | Industrial Scale Yield Estimation |
All the knowledge generated from the metallurgical tests carried out, is translated into the execution of a procedure for the estimation of the industrial scale performance of the pile in operation and the selection of the irrigation strategy is as follows:
| · | We proceed with a comparative review of the actual heap Salt Matrix versus that delivered by diamantine from the different mining polygons. The correlation factor between both is obtained, which allows determining, from the tests applied to diamond samples, how the heap performs in a more precise way. |
| · | With the salt matrix value, we estimate a yield per exploitation polygon (with the empirical models) and then, through a percentage contribution of each polygon's material to heap construction, a heap yield is estimated. |
| · | Based on percentage physical quality results for each polygon, i.e., Cm/min, compac, % fine material, Alpha, #-200, an irrigation strategy is selected for each heap. |
The methodology indicated and summarized in the previous steps, has been developed exclusively by SQM throughout the time of development of assays and operation of piles in other operations such as Nueva Victoria. This methodology will be applied to future exploitation resources such as Pampa Orcoma. To exemplify the application to the industrial scale yield estimation of piles, which will be carried out at Pampa Orcoma, the following is the treatment of the pile and the annual yield estimation at another property of the company.
For example, for Pile 476 of Nueva Victoria, the physical test determine that the pile tends to generate mud in the crown and instability. A 60-day wetting is recommended without tendency to generate turbidity. It is recommended to irrigate at design rate.
The real composition for Pile 476, is determined by the diamond campaign by polygon is shown in Table 10-15, in which some differences can be observed and in terms of salt matrix, a difference of four percentage points.
Table 10-15. Comparison of the Composition Determined for the 476 Heap Leaching Pile in Operation at Nueva Victoria
| Real vs. Diamond Salts Matrix |
| Type | | Iodine
grade
(ppm) | | | Nitrate
grade
(%) | | | Na2SO4 | | | Ca | | | Mg | | | K | | | KCIO4 | | | NaCI | | | Na | | | H3BO3 | | | Saline
Matrix | |
| Sample | | | 411 | | | | 4.71 | | | | 19.6 | | | | 2.32 | | | | 1.09 | | | | 0.83 | | | | 0.68 | | | | 12.96 | | | | 7.39 | | | | 0.31 | | | | 64.4 | |
| Real | | | 422 | | | | 5.40 | | | | 19.6 | | | | 1.98 | | | | 1.25 | | | | 0.81 | | | | 0.68 | | | | 12.62 | | | | 7.04 | | | | 0.27 | | | | 60.1 | |
| WSP-SQM0011-TRS-Pampa Orcoma-Rev1 | Rev1 | Page 85 |
Through the established methodology, composition and physical properties, the resulting 476 pile yield estimate is 50.77%. The estimation scheme is as shown in Figure 10-11.
Figure 10-11. Heap Yield Characterization and Irrigation Strategy Selection - Pile 476 of Nueva Victoria
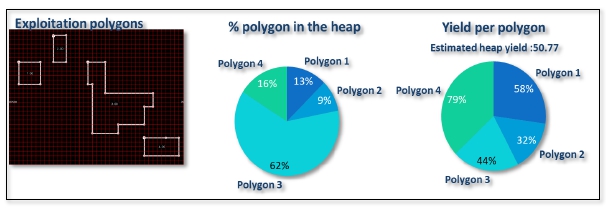
Following the example and in relation to the observed yield values contrasted with the values of the yield estimation calculated by empirical models, Figure 10-2 shows and Table 10-16 , respectively, the annual yield of Nueva Victoria plant, both for iodine and nitrate, for the period 2008 to 2020.
Figure 10-12. Nitrate and Iodine Yield Estimation and Industrial Correlation for the Period 2008 to 2020 at Nueva Victoria
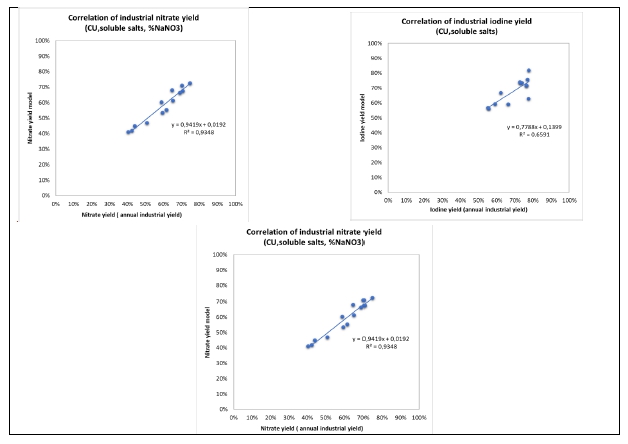
| WSP-SQM0011-TRS-Pampa Orcoma-Rev1 | Rev1 | Page 86 |
In Figure 10-2 shows a good degree of correlation between the annual industrial yield values and the values predicted by the model.
In view of the results and the knowledge, which allows a good estimate of the yield, both for nitrate and iodine, that has been applied by the company to other resources, it is possible to state that:
| · | Pampa Orcoma ore is amenable to treatment by separation and recovery methods established in the project and otherwise applied for quite some time by the company. |
| · | Given the characteristics of the mineral in its composition of soluble salts, a higher iodine recovery will be obtained compared to other resources treated by the company, complying with the industrial plans committed. |
| WSP-SQM0011-TRS-Pampa Orcoma-Rev1 | Rev1 | Page 87 |
Table 10-16. Comparison of Industrial Yield with the Values Predicted by the Model for Nueva Victoria
| Nitrate and Iodine yield correlation |
| Parameter | | Unit | | 2008 | | 2009 | | 2010 | | 2011 | | 2012 | | 2013 | | 2014 | | 2015 | | 2016 | | 2017 | | 2018 | | 2019 | | 2020 | |
| Iodine grade | | ppm | | | 476 | | | 470 | | | 460 | | | 457 | | | 465 | | | 461 | | | 466 | | | 459 | | | 456 | | | 456 | | | 460 | | | 459 | | | 460 | |
| Nitrate grade | | % | | | 3,2 | % | | 3,9 | % | | 4,1 | % | | 5,0 | % | | 5,2 | % | | 4,5 | % | | 5,1 | % | | 5,8 | % | | 6,2 | % | | 6,2 | % | | 6,4 | % | | 6,2 | % | | 5,1 | % |
| CU water (unit consumption) | | m3/t | | | 0,407 | | | 0,433 | | | 0,482 | | | 0,470 | | | 0,411 | | | 0,408 | | | 0,540 | | | 0,537 | | | 0,602 | | | 0,578 | | | 0,386 | | | 0,390 | | | 0,408 | |
| Caliche (SS) |
| Industrial yield |
| Industrial iodine yield | | % | | | 72,7 | % | | 76,2 | % | | 77,6 | % | | 77,4 | % | | 66,2 | % | | 62,2 | % | | 73,0 | % | | 73,7 | % | | 76,9 | % | | 76,3 | % | | 59,0 | % | | 55,0 | % | | 55,5 | % |
| Industrial nitrate yield | | % | | | 65,2 | % | | 58,8 | % | | 70,3 | % | | 61,5 | % | | 50,8 | % | | 59,4 | % | | 64,8 | % | | 69,0 | % | | 74,6 | % | | 70,6 | % | | 42,4 | % | | 40,3 | % | | 44,0 | % |
|
| Model yield |
| Iodine yield correlation | | % | | | 74,1 | % | | 71,9 | % | | 82,0 | % | | 63,0 | % | | 59,2 | % | | 66,9 | % | | 73,5 | % | | 73,6 | % | | 75,8 | % | | 71,5 | % | | 59,3 | % | | 56,9 | % | | 56,2 | % |
| Nitrate yield correlation | | % | | | 61,4 | % | | 60,4 | % | | 71,0 | % | | 55,4 | % | | 47,0 | % | | 53,6 | % | | 68,0 | % | | 66,4 | % | | 72,6 | % | | 67,6 | % | | 41,9 | % | | 41,1 | % | | 45,1 | % |
| WSP-SQM0011-TRS-Pampa Orcoma-Rev1 | Rev1 | Page 88 |
| 10.5 | Significant Risk Factors |
In this area, the impact factors in the processing or elements detrimental to recovery or the quality of the product obtained are the potentially harmful elements present. Those related to the raw material are insoluble materials and other elements such as magnesium and perchlorate. In this regard, this report has provided information on tests carried out on the process input and output flows, such as brine and finished products of iodine, potassium nitrate, and sodium nitrate, for these elements, thus showing the company's constant concern to improve the operation and obtain the best product.
Plant control systems analyze factor grades and ensure that they are below threshold values and will not affect the concentration of valuable species in the brine or plant performance. Consequently, any processing factors or deleterious elements that may have a significant impact on economic extraction potential are controlled.
Along with the above, the company is also interested in developing or incorporating a new stage, process, and/or technology that can mitigate the impact of some factor, so far controlled, which gives way to additional and constant work to determine this in a framework of continuous improvement of the processes.
| 10.6 | Qualified Person´s Opinion |
Gino Slanzi Guerra, QP responsible for the metallurgy and processing of the resource, declares that the metallurgical test work developed to date has been adequate to establish the appropriate processing routes for the caliche resource:
| · | The metallurgical test work completed to date has been adequate to establish appropriate processing routes for the caliche resource. |
| · | The samples used to generate the metallurgical data have been representative and support estimates of future throughput. |
| · | The data derived from test work activities described above are adequate for estimating recovery from mineral resources. |
| · | From the information reviewed, no processing factors or deleterious elements were verified which could significantly affect the economic extraction potential projected for the project. This is based on the fact that the mineral body that supports it corresponds in composition and chemical-metallurgical responses similar to typical caliche deposits, in which the company has extensive historical know-how and a body of professionals with extensive experience, with finished and successful knowledge regarding the search and solution of operational problems. This aspect was recognized in field visits where this characteristic was confirmed in all the plants visited. |
| · | The metallurgical test data for the resources to be processed in the production plan projected to 2040 indicate that the recovery methods are adequate. |
| WSP-SQM0011-TRS-Pampa Orcoma-Rev1 | Rev1 | Page 89 |
In addition, it is necessary to highlight that the research and development team has demonstrated significant progress in the development of new processes and products to maximize the returns obtained from the resources they exploit. An example of this is that, since 2002, SQM nitrates have sought options to expand and improve iodine production by initiating a test plan for an oxidative treatment of the concentrate. Trials demonstrated that it is possible to dispense without the flotation stage, that the process of obtaining iodine with oxidative treatment works well, and that it is economically viable and less costly to build and operate than the conventional process with the flotation stage. In this sense, continuous tests were completed in the pilot plant with different iodine brines from different resources to confirm these results.
The research is developed by three different units, which adequately cover the characterization of raw materials, traceability of operations, and finished product, covering topics such as chemical process design, phase chemistry, chemical analysis methodologies, and physical properties of finished products.
| WSP-SQM0011-TRS-Pampa Orcoma-Rev1 | Rev1 | Page 90 |
| 11 | Mineral Resource Estimate |
| 11.1 | Estimation Methods, Parameters, and Assumptions |
Iodine and nitrate Mineral Resources were estimated based on lithologies and iodine and nitrate grades, from the 200-x-200-m drill hole grid, comprising “PO” and “O” drill holes. The Mineral Resource is classified as indicated, since actual grid spacing does not allow for a more precise estimation of the Mineral Resource. The 100T drill hole grid currently in process, will potentially allow for a future upgrading of the Mineral Resource to the Measured category (SQM(j), 2021). The diamond drilling campaign currently in process, will provide a comparison of caliche depths and iodine and nitrate grades with respect to the Mineral Resources estimated using the 200-x-200-m grid data.
The Indicated Mineral Resource was estimated considering an iodine cut-off grade of 300 ppm, by means of the following steps (SQM(a), 2014) (SQM(h), 2021) (SQM(i), 2021):
Calculation of drill hole average iodine and nitrate grades: To obtain a representative database of single values of iodine and nitrate grades for each drill hole, grades were analyzed for each 0.5-m section of the drill hole underlaying the overburden unit. Vertical continuity of mineralization was evaluated by identifying drill hole sections with iodine grades that followed a set of criteria in relation to the cut-off grade. By identifying the bottom of the mineralized zone in each drill hole, an average iodine and nitrate grade was calculated considering the grades of each selected section of the drill hole.
Calculation of caliche Mineral Resources: A database was generated containing overburden and caliche thickness, and average iodine and nitrate grades for each drill hole. Using this database, Mineral Resources were estimated as the aggregate tonnage of 200-x-200-m blocks of caliche with grades greater or equal to 300 ppm and a caliche thickness greater or equal to 1.5 m, considering blocks within the area of Pampa Orcoma.
Calculation of Mineral Resource grades: Iodine and nitrate grades of Orcoma’s Mineral Resources, were calculated as the aggregate weighted average of the grades of each caliche block with respect to the total caliche Mineral Resource.
| WSP-SQM0011-TRS-Pampa Orcoma-Rev1 | Rev1 | Page 91 |
| 11.2 | Estimation Methodology and Assumptions |
This sub-section contains forward-looking information related to density and grade for the Project. The material factors that could cause actual results to differ materially from the conclusions, estimates, designs, forecasts or projections in the forward-looking information include any significant differences from one or more of the material factors or assumptions that were set forth in this sub-section including actual in-situ characteristics that are different from the samples collected and tested to date, equipment and operational performance that yield different results from current test work results.
| 11.2.1 | Calculation of Drill Hole Average Iodine and Nitrate Grades |
Grades were analyzed for each 0.5 m section of the drill hole, underlaying the overburden unit, with the objective of determining a single value of iodine and nitrate grade for each drill hole. The selection of sections of the drill hole to be considered in the calculation of average grades was performed through a set of criteria that follow from a 300 ppm iodine cut-off grade, as well as expert field criteria, detailed below.
Below the overburden unit, the sections of the drill hole that are considered for its average grade calculation correspond to those of iodine grades greater or equal to 300 ppm. If the shallower sections of the drill hole have a lower iodine grade than 300 ppm, or there is an intercalation of barren intervals within the mineralized mantle, criteria for defining the maximum depth of interest imposes a minimum average iodine grade of 300 ppm, if the proportion of the thickness of the barren intervals to mineralized intervals selected for grade average is less than 1.
For drill holes without mineralization of interest, the thickness of the deposit is imposed as a value similar to the average thickness calculated from mineralized drill holes.
When the sections of interest are selected for each drill hole, the grades of iodine and nitrate are calculated as an arithmetic mean of the grades of the selected sections (Table 11-1) (SQM(h), 2021).
| WSP-SQM0011-TRS-Pampa Orcoma-Rev1 | Rev1 | Page 92 |
Table 11-1. Example of Selection of Drill Hole Sections for Average Grade Calculation, in Drill Hole PO-007
| Drill hole section | | | Iodine
grade | | | Nitrate
grade | | | | | | | Selected
for mean |
| From (m) | | | | To (m) | | | (ppm) | | | (%) | | | Unit | | Description | | calculation |
| | 0.00 | | | | 0.40 | | | | | | | | | | | Overburden | | Overburden unit | | No |
| | 0.40 | | | | 0.90 | | | | 520 | | | | 7.1 | | | Mineral | | Iodine grade greater than 300 ppm | | Yes |
| | 0.90 | | | | 1.40 | | | | 430 | | | | 7.7 | | | Mineral | | Iodine grade greater than 300 ppm | | Yes |
| | 1.40 | | | | 1.90 | | | | 230 | | | | 2.9 | | | Waste | | Accumulated average iodine grade greater than 300 ppm and sterile:mineral < 1 | | Yes |
| | 1.90 | | | | 2.40 | | | | 170 | | | | 2.2 | | | Waste | | Accumulated average iodine grade greater than 300 ppm and sterile:mineral ≥ 1 | | No |
| | 2.40 | | | | 2.90 | | | | 180 | | | | 2.1 | | | Waste | | Accumulated average iodine grade greater than 300 ppm and sterile:mineral ≥ 1 | | No |
| | 2.90 | | | | 3.40 | | | | 230 | | | | 2.3 | | | Waste | | Accumulated average iodine grade lower than 300 ppm | | No |
| | 3.40 | | | | 3.90 | | | | 190 | | | | 2.0 | | | Waste | | Accumulated average iodine grade lower than 300 ppm | | No |
| | 3.90 | | | | 4.40 | | | | 150 | | | | 3.9 | | | Waste | | Accumulated average iodine grade lower than 300 ppm | | No |
| | 4.40 | | | | 4.90 | | | | 120 | | | | 3.6 | | | Waste | | Accumulated average iodine grade lower than 300 ppm | | No |
| | 4.90 | | | | 5.40 | | | | 150 | | | | 3.2 | | | Waste | | Accumulated average iodine grade lower than 300 ppm | | No |
| | | | | | | | | | | | | | | | | | | Mean Iodine grade (ppm) | | 393 |
| | | | | | | | | | | | | | | | | | | Mean Nitrate grade (%) | | 5.9 |
| | | | | | | | | | | | | | | | | | | Depth of mineralization (m) | | 1.4 |
In 178 drill holes, the overburden unit is defined with a depth greater than originally mapped, considering only the sections of the drill hole below such unit when calculating its average grades and mineralization depth. Some drill holes are also evaluated individually, including waste units below a mineral unit, as long as the average iodine grade is greater, or equal to 300 ppm, not including the sterile unit, even if its inclusion meets such criteria.
| WSP-SQM0011-TRS-Pampa Orcoma-Rev1 | Rev1 | Page 93 |
| 11.2.2 | Estimation of the Caliche Mineral Resources |
Once iodine and nitrate grades were calculated for each drill hole, the results were compiled in a database that also included overburden unit and caliche thickness. Square polygons of 200-x-200 m were generated with drill hole coordinates as the polygons’ centroids. Since some drill holes were not exactly 200 m apart, there was an overlap of polygons that generated an irregular mesh. The mesh was intersected with Pampa Orcoma’s permit area to obtain only the polygons inside such area.
Each polygon has a specific area, caliche thickness, and average iodine and nitrate grades associated to each drill hole (Figure 11-1) The volume of caliche was calculated from the area and thickness of each mineralized block, and its tonnage was then calculated by assuming a homogenous caliche density of 2.1 t/m3 obtained from several analyses made by SQM in Nueva Victoria mine and other operations involving caliche deposits. The tonnage of mineralized blocks is summed for all blocks with an average iodine grade greater or equal than 300 ppm and a thickness greater or equal than 1.5 m, thus obtaining a resource estimation.
Since Mineral Resources are reported exclusive of Mineral Reserves, the Mineral Resource was estimated considering portions of the Mineral Resource polygons outside of the permit area for mining operations (Section 12.1).
| WSP-SQM0011-TRS-Pampa Orcoma-Rev1 | Rev1 | Page 94 |
Figure 11-1. 200-x-200-m Drill Hole Grid and Polygons of Average Iodine Grades Associated with each Drill Hole
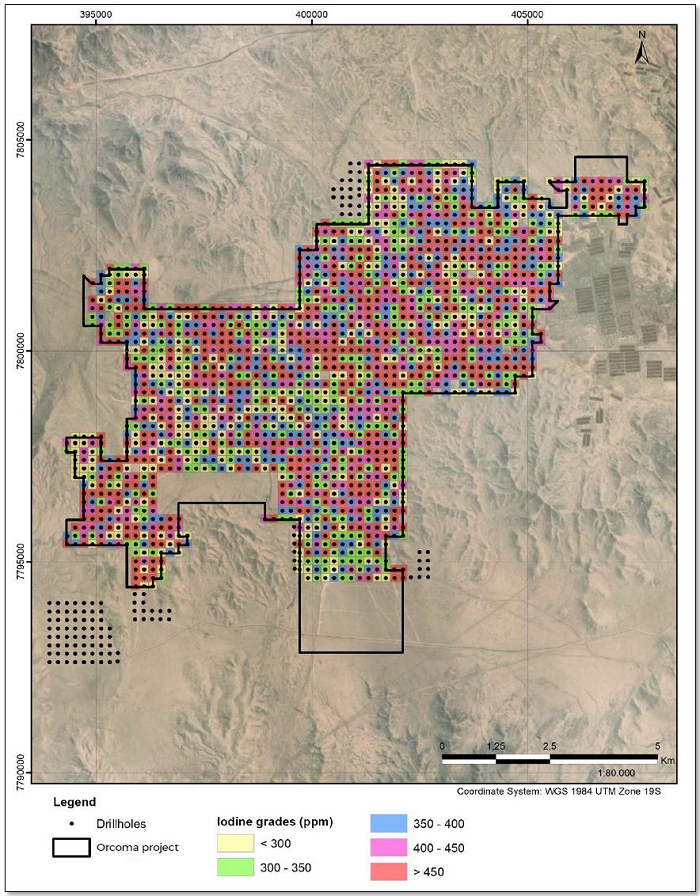
| WSP-SQM0011-TRS-Pampa Orcoma-Rev1 | Rev1 | Page 95 |
| 11.2.3 | Estimation of Mineral Resource Grades |
The iodine and nitrate tonnage of each block was calculated as the weighted caliche tonnage of the block by its respective grade. Total iodine and nitrate tonnage was then determined as the sum of the iodine and nitrate tonnage of every block, as long as the iodine grade of the block was greater or equal to 300 ppm and its thickness is greater or equal to 1.5 m. The results for iodine and nitrate are then divided by the estimated caliche Mineral Resources, obtaining the average grades of the Mineral Resource.
Since Mineral Resources are estimated exclusive of Mineral Reserves, the estimate is done by considering portions of the Mineral Resource polygons outside of the project area with environmental approval for mining operations (Section 12.1).
This sub-section contains forward-looking information related to establishing the prospects of economic extraction for Mineral Resources for the Project. The material factors that could cause actual results to differ materially from the conclusions, estimates, designs, forecasts or projections in the forward-looking information include any significant differences from one or more of the material factors or assumptions that were set forth in this sub-section including cut-off grade assumptions, costing forecasts and product pricing forecasts.
The iodine cut-off grade was established by SQM at 300 ppm. The cut-off grade was established using a tonnage-grade curve showing the relation between variable accumulated cut-off iodine grades and operational average grades in Pampa Orcoma. A 300 ppm iodine cut-off grade implies that the average grade is greater than 450 ppm (Figure 11-2), enabling incurring costs of 15 to 20 United States Dollars per kilogram (USD/kg) of iodine, by mining 4.0 kt of caliche to produce 1 t of iodine.
Iodine prices in the medium and long term are estimated to be between 40 and 50 USD/kg, allowing for a margin of at least 20 USD/kg of iodine. Projections for annual iodine production and sales reach 11.8 kt in 2022 with a 4% growth rate, for which the net present value in a 15 year period is 2,550 million USD. Once all the Mineral Resources have been extracted with a cut-off grade of 300 ppm, the remaining mineralization of lower grades will be mined (SQM(m), 2022).
These cost and revenue data indicate an adequate cut-off grade set by SQM, as it ensures an operating profit, as demonstrated in the economic analysis section of this document.
| WSP-SQM0011-TRS-Pampa Orcoma-Rev1 | Rev1 | Page 96 |
Figure 11-2. Tonnage-Grade Curve for Different Values of Iodine Cut-off grades in Pampa Orcoma
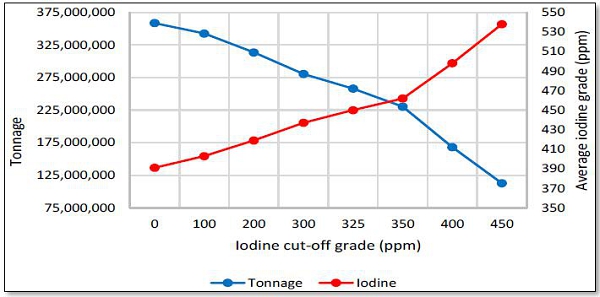
Source: (SQM(m), 2022)
| 11.4 | Mineral Resource Classification |
This sub-section contains forward-looking information related to Mineral Resource classification for the Project. The material factors that could cause actual results to differ materially from the conclusions, estimates, designs, forecasts or projections in the forward-looking information include any significant differences from one or more of the material factors or assumptions that were set forth in this sub-section including geological and grade continuity analysis and assumptions.
Caliche mineralization is of sedimentary origin and arises from a depositional formation process, which in the sub-horizontal geomorphology of the pampa forms a deposit with high horizontal continuity (greater than 5 km) and limited thickness and depth (less than 8 m in general). The horizontal continuity of caliche mineralization exceeds that of porphyry copper, epithermal or IOCG-type metalliferous deposits.
The Mineral Resource classification defined by SQM is based on drill hole spacing grid as a reflection of confidence of geological continuity:
Inferred Mineral Resource: 400-x-400-m prospecting grids are carried out in the earlier stages of the project. When prospecting is carried out in districts or areas of recognized presence of caliche or when the drill hole grid is accompanied by some punctual prospecting in a smaller grid confirming the continuity of mineralization, it is possible to anticipate that such identified Mineral Resources have a sustainable base to give them a reasonable level of confidence and therefore to define dimensions, mantle thickness, tonnages and grades of the mineralized bodies. The information obtained is complemented by surface geology and the definition of geological units.
Indicated Mineral Resource: a denser grid (200-x-200 m) enables a reasonable level of confidence in the dimensions, mantle thickness, tonnage and grades of the mineralized bodies as well as the continuity of mineralization, improving the characterization of geological units. These sectors have sufficient confidence in the Mineral Resource to allow the application of modifying factors.
| WSP-SQM0011-TRS-Pampa Orcoma-Rev1 | Rev1 | Page 97 |
The QP carried out an independent analysis of the variography on Pampa Orcoma. The spatial continuity of caliche mineralization was analyzed by calculating experimental variograms of iodine and nitrate grades, and mineralized thickness (Figure 11-3). The variograms were calculated using the elevation relative to topography as a reference system, concluding that grades decrease with depth.
The variograms range is greater than 200 m for iodine and nitrate grades (distance from which the data are uncorrelated), showing a high horizontal/lateral continuity for both grades. In the case of the thickness of caliche mantle there is a zonal anisotropy. Additionally, down-the-hole (DTH) variogram grades also show low nugget effect, concluding that iodine and nitrate grades, and mineralized thickness, present a high continuity.
Figure 11-3. Experimental Variograms of Iodine and Nitrate for Pampa Orcoma
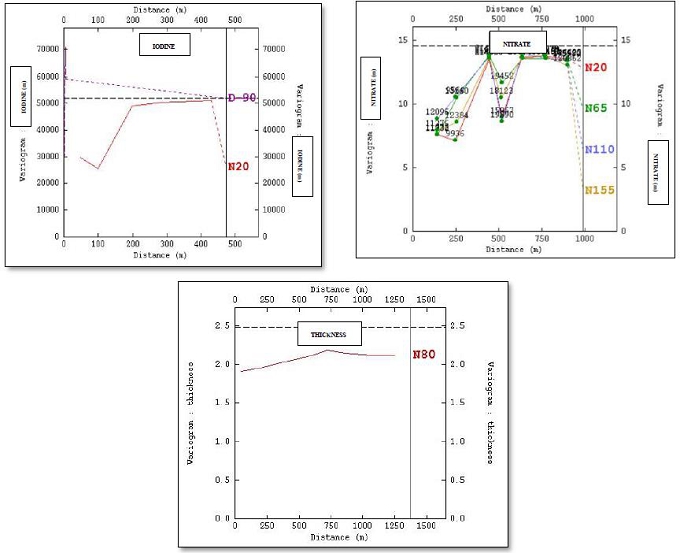
It is the QP’s opinion that these analyses show that the selected drill hole grids for Indicated Mineral Resources in Pampa Orcoma are adequate considering the high level of continuity of both grade and mantle thickness, and the type of mineralization.
| WSP-SQM0011-TRS-Pampa Orcoma-Rev1 | Rev1 | Page 98 |
| 11.5 | Mineral Resource Estimate |
This sub-section contains forward-looking information related to Mineral Resource estimates for the Project. The material factors that could cause actual results to differ materially from the conclusions, estimates, designs, forecasts or projections in the forward-looking information include any significant differences from one or more of the material factors or assumptions that were set forth in this sub-section including geological and grade interpretations and controls and assumptions and forecasts associated with establishing the prospects for economic extraction.
Mineral Resource uncertainty was analyzed by variography of grades and thickness of caliche by the QP (section 11.4). Grade and thickness continuity is greater than drill hole spacing. Estimations have been replicated and validated by the QP following SQM’s approach (section 11.1), with minor differences that have no material implications on Indicated Mineral Resource estimates.
Table 11-2 summarizes the Mineral Resource estimate, exclusive of Mineral Reserves, for iodine and nitrate in Pampa Orcoma.
Mineral Resources are reported in-situ and are exclusive of Mineral Reserves (Section 12).
Table 11-2. Mineral Resource Estimate, Exclusive of Mineral Reserves (Effective December 31, 2021)
| | | | | | Average grade | |
| Resource Classification | | Resources (Mt) | | | I2(ppm) | | | NaNO3(%) | |
| Indicated | | | 18 | | | | 457 | | | | 7.4 | |
Notes:
(1) Mineral Resources are not Mineral Reserves and do not have demonstrated economic viability. There is no certainty that all or any part of the Mineral Resource will be converted into Mineral Reserves upon the application of modifying factors.
(2) Mineral Resources are reported as in-situ and exclusive of Mineral Reserves, where the estimated Mineral Reserve without processing losses during the reported LOM was subtracted from the Mineral Resource inclusive of Mineral Reserves.
(3) Comparisons of values may not add due to rounding of numbers and the differences caused by use of averaging methods.
(4) The units “Mt” and “ppm” refers to million tonnes and parts per million respectively.
(5) The Mineral Resource estimate considers an iodine cut-off grade of 300 ppm, based on accumulated cut-off iodine grades and operational average grades, as well as the cost and medium and long term prices forecast for prilled iodine production (Section 16).
(6) Donald Hulse is the QP responsible for the Mineral Resources.
| WSP-SQM0011-TRS-Pampa Orcoma-Rev1 | Rev1 | Page 99 |
| 11.6 | Qualified Person’s Opinion |
It is the QP’s opinion that the drill hole data collected by SQM in Pampa Orcoma is sufficient to characterize iodine and nitrate grades, as well as mineralized thickness throughout the project area.
Estimations have been verified independently, with minor differences that have no material implications on Indicated Mineral Resource estimates.
Additional diamond drilling currently in progress, is being completed on tighter spaced grids than that used for the current estimates; this infill drilling has the potential to upgrade the Mineral Resource categorization to the Measured category.
| WSP-SQM0011-TRS-Pampa Orcoma-Rev1 | Rev1 | Page 100 |
| 12 | Mineral Reserve Estimate |
| 12.1 | Estimation Methods, Parameters, and Assumptions |
This sub-section contains forward-looking information related to the key assumptions, parameters and methods for the Mineral Reserve estimates for the Project. The material factors that could cause actual results to differ materially from the conclusions, estimates, designs, forecasts or projections in the forward-looking information include any significant differences from one or more of the material factors or assumptions that were set forth in this sub-section including Mineral Resource model tonnes and grade and mine design parameters.
SQM provided the mineral reserve estimation (tonnage and average grade) based on the data obtained from the 200-x-200-m drill hole grid executed. SQM used a geometric method to evaluate mineral reserves in situ, considering the average grade of Iodine and Nitrate from each drill hole, setting a cut-off of 300 ppm for Iodine grades and applying each average grade evaluated to a 200-x-200-m unit volume block. WSP have checked these calculations considering the unit blocks referred to the total area includes into the environmental license. For volume to mass conversion a caliche density of 2.1 t/m³ was used.
WSP has reproduced the total tonnage of ore mineral and average grades of mineral resources estimated by SQM, obtaining negligible differences which the QP considers not material.
Considering the mineral resources estimation executed by SQM and validated by WSP, mineral reserve estimate for Pampa Orcoma was prepared by applying a direct relation to mineral resource estimates (Table 11-2). A modifying factor equal to one is used for tonnage, considering the layered, shallow, and sub-horizontal geological features of the caliche deposit and the mining process for ore extraction. For iodine and nitrate grades, modifying factors of 0.9 and 0.85 respectively are used as a consequence of natural variability of grades in the mineral deposit and based on historical operational use in SQM’s various mining facilities (Table 12-1) (SQM(k), 2021).
Table 12-1. Historical Operational Modifying Factors for Iodine and Sodium Nitrate Grades
| | Iodine factor | | | Nitrate factor | |
| | | 90 | % | | 85 | % |
Mine planning is defined by sequential yearly mining phases (Figure 12-1), extracting material from zones categorized as resources before construction of infrastructure. This material is stockpiled for processing when mining operations begin, such that the resources in areas covered by infrastructure can be mined.
The estimate is done by considering portions of the resource polygons inside of the project area with environmental approval for mining operations. Therefore, reserves are also calculated for polygons strictly within the environmentally approved area of the project area, as those outside of the approved limits will require a modification of the approved area. Considering the area for which the permit applies, the mining plan is justified until the year 2040 (Section 13), while incorporating the surrounding area will be possible as long as the environmental authorization currently under execution for the project’s expansion is obtained within the required timeframe for the operation and in the projected manner required (Chapter 17.1).
| WSP-SQM0011-TRS-Pampa Orcoma-Rev1 | Rev1 | Page 101 |
| 12.2 | Classification Criteria |
This sub-section contains forward-looking information related to the key assumptions, parameters and methods for the Mineral Reserve estimates for the Project. The material factors that could cause actual results to differ materially from the conclusions, estimates, designs, forecasts or projections in the forward-looking information include any significant differences from one or more of the material factors or assumptions that were set forth in this sub-section including Mineral Resource model tonnes and grade and mine design parameters.
Mineral Reserves were all categorized as probable, as they are based on indicated resources whose iodine and nitrate grades are diluted by modifying factors. With such considerations, iodine and nitrate reserves are estimated as having the same tonnage as the calculated resources, but lower average grades.
When considering a dense recategorized grid, such as the 100T grid currently in process, reserve estimates will be estimated in the future through use of a block model generated from interpolation of drill hole samples, allowing for estimation of Proven Reserves.
| WSP-SQM0011-TRS-Pampa Orcoma-Rev1 | Rev1 | Page 102 |
Figure 12-1. Mining Phases and Infrastructure in Pampa Orcoma, showing Iodine Grade Polygons from 200-x-200-m Grid Drill Holes
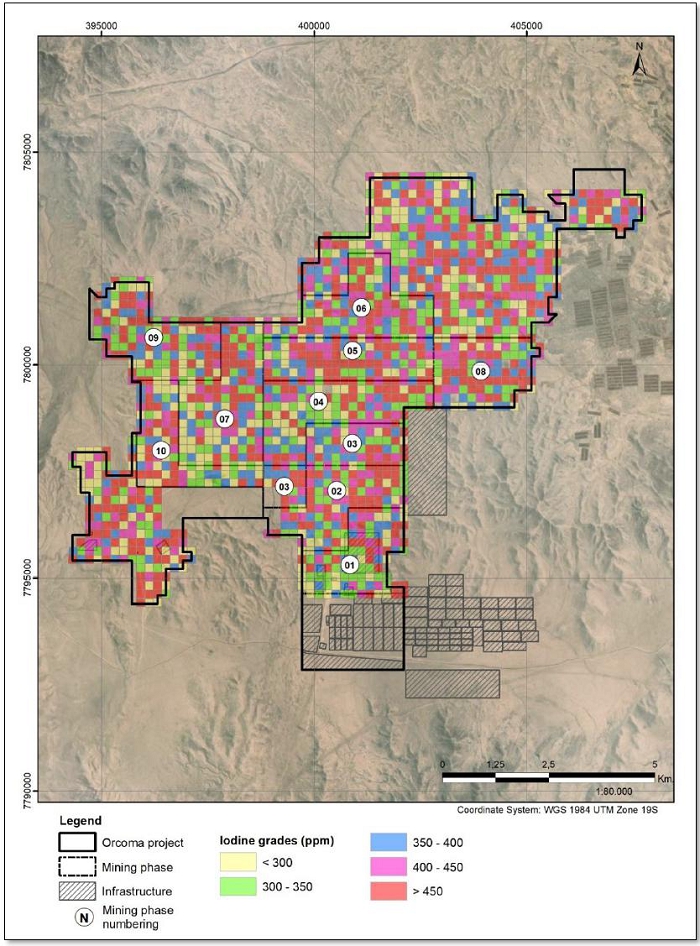
| WSP-SQM0011-TRS-Pampa Orcoma-Rev1 | Rev1 | Page 103 |
| 12.3 | Mineral Reserve Estimate |
This sub-section contains forward-looking information related to Mineral Reserve estimates for the Project. The material factors that could cause actual results to differ materially from the conclusions, estimates, designs, forecasts or projections in the forward-looking information include any significant differences from one or more of the material factors or assumptions that were set forth in this sub-section including Mineral Resource model tonnes and grade, modifying factors including mining and recovery factors, production rate and schedule, mining equipment productivity, commodity market and prices and projected operating and capital costs.
Table 12-2 summarizes the reserve estimate exclusive of mineral resources for iodine and nitrate in Pampa Orcoma. Estimates are shown for the area with actual environmental permits, as described in Section 12.1. Reserves with environmental permit represent a 93% of total resources. Mineral Reserve are reported as in-situ ore (caliche).
Table 12-2. Mineral Reserve Statement for Pampa Orcoma (Effective December 31, 2021)
| Reserve | | | | | Average Grade | |
| Classification | | Reserves (Mt) | | | I2(ppm) | | | NaNO3(%) | |
| Probable | | | 309 | | | | 413 | | | | 6.9 | |
Notes:
(1) Comparisons of values may not add due to rounding of numbers and the differences caused by use of averaging methods.
(2) The units “Mt” and “ppm” refer to million tonnes and parts per million respectively.
(3) The Mineral Reserve estimate considers an iodine cut-off grade of 300 ppm, based on accumulated cut-off iodine grades and operational average grades, as well as the cost and medium- and long-term prices forecast of generating iodine (Sections 11, 16 and 19).
(4) Modifying factors of historical operational use in various of SQM’s mining facilities, are applied to iodine and nitrate grades, the factors applied to iodine and nitrate grades are 0.9 and 0.85, respectively.
(5) Mineral Resources in the area without an environmental permit are estimated at 18 Mt.
(6) Mineral Reserves are reported as in-situ ore
(7) Donald Hulse is the QP responsible for the Mineral Reserves.
(8) The QP is not aware of any environmental, permitting, legal, title, taxation, socioeconomic, marketing, political or other relevant factors that could materially affect the Mineral Reserve estimate that are not discussed in this TRS.
| 12.4 | Qualified Person’s Opinion |
Mineral Resource calculations are the basis for Mineral Reserves estimation, accounting for dilution of iodine and sodium nitrate grades through modifying factors. Calculations have been verified independently, reporting reserve values for approved and pending environmental area permits, with minor differences that have no material implications on Probable Reserve estimations.
Diamond drilling and recategorization of drill hole grids currently in process, have the potential to upgrade reserve classification to Proven. It is recommended to re-estimate Pampa Orcoma’s reserves when resources are calculated for the recategorized grid.
| WSP-SQM0011-TRS-Pampa Orcoma-Rev1 | Rev1 | Page 104 |
SQM provided WSP the production data from their Mining Plan covering mining years 2022 to 2040, with more detail for the 2022-2030 period (10YP). WSP has checked that the exploitation sectors have environmental license approved by the Chilean authorities; the total tonnage and average Iodine and Nitrate grades are coincident with Mineral Reserves declared; the total volume of mineral ore (caliche) is economically mineable and the production of prilled Iodine and Brine Nitrate Concentrate (Brine Nitrate) set by SQM is attainable, considering the dilution and recovery coefficients for mining, leaching, and plants/ponds treatments. Besides, WSP has been evaluated the cut-off for Iodine (I2) grade given the unit costs for Iodine and Brine Nitrate production and the price sales for prilled Iodine and internal price por Brine Nitrate established at the economic analysis (Section 18).
SQM intends to utilize surface area mining methods for Pampa's future mining operation, consistent with methods currently used by SQM in its traditional caliche mining operations. Unit operations include land preparation (removal of soil and overburden), surface extraction of ore (caliche), and loading and transport of ore for the construction of leaching heaps to obtain solutions (fresh brine) enriched in iodine and nitrates. Mineralization is stratified, sub-horizontal, superficial and averages 3.5 m in thickness.
The mineral extraction process is conditioned by the tabular and superficial disposition of the geological formations that contain the mineral resource (caliches). Chile's competent mining authorities, The National Mining and Geological Service (SERNAGEOMIN) have approved this mining process.
Usually, the mining operation corresponds to quarries of a few meters thick (exploitation in only one continuous bench of up to 7.5 m high -overburden + caliche-) where the mineral is extracted using the traditional method (drilling and blasting) and continuous miner (Terrain Leveler Surface Excavation Machine [SEM]).
The mineral is loaded by front loaders and/or shovels and transported to the leaching heaps (run-of-mine [ROM] material heaps, or ROM heaps) by rigid hopper mining trucks.
This initial concentration process involves in-situ leaching using heaps (leach pad) that are irrigated by drip/spray to obtain a solution enriched in iodine and nitrate that is sent to the treatment plants to obtain the final products.
| 13.1 | Geotechnical and Hydrological Models, and Other Parameters Relevant to Mine Designs and Plans |
This sub-section contains forward-looking information related to mine design for the Project. The material factors that could cause actual results to differ materially from the conclusions, estimates, designs, forecasts or projections in the forward-looking information include any significant differences from one or more of the material factors or assumptions that were set forth in this sub-section.
| WSP-SQM0011-TRS-Pampa Orcoma-Rev1 | Rev1 | Page 105 |
Pampa Orcoma mining is superficial, and it is necessary to remove a surface layer of waste material (soil + overburden) up to 1.50 m thick (sandstone, breccia, and anhydrite crusts), which is removed. The ore (caliche) is then extracted, which has a thickness of 1.50 m to 6.00 m (average of 3.50 m). Therefore, the mining face has a maximum height of 6 m once the soil and overburden have been removed. The minimal depth of operations and geotechnical characteristics of caliche (Polymictic Sedimentary Breccia) allow mining with a near vertical slope, achieving maximum efficiency in the use of the mining resources.
The single bench mining conditions do not require a physical stability analysis of the mining advancement front. Therefore, no specific geotechnical works are required in this mining operation (1 single final bench of about 4.70 m average height -1.50 m of soil+overburden and 3.2 m of caliche).
The mining operation uses two techniques for fragmentation of waste and ore, namely drilling and blasting and continuous surface mining. The choice of the method to be used in each sector depends on the hardness of the caliche to be excavated and the proximity to infrastructure where blasting damage risk is assessed as possible.
The extracted mineral (caliche) is stockpiled in heaps, where it is leached with water to extract the target components (iodine and nitrates). These heaps have a general slope of 28º (two benches of 6 to 7.5 m in thickness with a wide berm of 12 m.) SQM executed stability analyses in the leach heaps that it exploits in the Nueva Victoria mine to verify the physical stability of these mining structures in the long term and in adverse conditions (maximum credible earthquake)1, concluding that:
| · | The slopes of the analyzed heaps are stable against landslides. |
| · | None of the piles will require slope profiling treatment after closure. |
SQM executed a DDH drilling campaign and trenches in the first quarter of 2021 that has confirmed the presence of "semi-soft" caliches in the first 2.5 to 3.0 meters (semi-soft ore), which correspond mainly to anhydrite in the crust, sandstones, and mineralized medium breccias. Under this "semi-soft" unit there are thick breccias with clasts contents > 35% with an increase in their diameter (5- 10 cm), and this unit grades in-depth to conglomerates.
Also, the low concentration of soluble salts is confirmed compared to other reservoirs such as TEA.
| 13.2 | Production Rates, Expected Mine Life, Mining Unit Dimensions, and Mining Dilution and Recovery Factors |
Pampa Orcoma's Mining Plan considers caliche extraction at a nominal rate of 20 Mtpy. Therefore for 2024 to 2040, a total extraction of 309 Mt of caliche with an average grade of 408 ppm iodine and 6.8% nitrates is projected.
1 TECHNICAL REPORT ‘’ANÁLISIS DE ESTABILIDAD DE TALUDES PILAS 300 Y 350’’. Document SQM N° 14220M-6745-800-IN-001. PROCURE Servicios de Ingeniería (21146-800-IN-001). May 2021.
| WSP-SQM0011-TRS-Pampa Orcoma-Rev1 | Rev1 | Page 106 |
Table 13-1. Mining Plan for Pampa Orcoma project (2024-2040)
| Mining Plan (2024-2040) | | 2024 | | | 2025 | | | 2026 | | | 2027 | | | 2028 | | | 2029 | | | 2030 | | | 2031 | | | 2032 | | | 2033 | | | 2034 | | | 2035 | | | 2036 | | | 2037 | | | 2038 | | | 2039 | | | 2040 | | | TOTALS | | | AVERAGE | |
| Ore mineral production (Mtonnes) | | 7.5 | | | 10.5 | | | 13.5 | | | 17.5 | | | 20.0 | | | 20.0 | | | 20.0 | | | 20.0 | | | 20.0 | | | 20.0 | | | 20.0 | | | 20.0 | | | 20.0 | | | 20.0 | | | 20.0 | | | 20.0 | | | 20.0 | | | 309.0 | | | | |
| Drill & Blast ore production (Mt) | | 2.3 | | | 3.2 | | | 4.1 | | | 5.3 | | | 6.0 | | | 6.0 | | | 6.0 | | | 6.0 | | | 6.0 | | | 6.0 | | | 6.0 | | | 6.0 | | | 6.0 | | | 6.0 | | | 6.0 | | | 6.0 | | | 6.0 | | | 92.7 | | | 5.7 | |
| Continous Mining production (Mt) (a) | | 5.3 | | | 7.4 | | | 9.5 | | | 12.3 | | | 14.0 | | | 14.0 | | | 14.0 | | | 14.0 | | | 14.0 | | | 14.0 | | | 14.0 | | | 14.0 | | | 14.0 | | | 14.0 | | | 14.0 | | | 14.0 | | | 14.0 | | | 216.3 | | | 13.3 | |
| Iodine average grade (I2, ppm) | | 408 | | | 410 | | | 403 | | | 406 | | | 421 | | | 408 | | | 410 | | | 415 | | | 405 | | | 407 | | | 407 | | | 407 | | | 407 | | | 407 | | | 407 | | | 407 | | | 407 | | | | | | 408 | |
| Nitrate salts average grade (NaNO3, %) | | 6.6 | % | | 7.0 | % | | 6.7 | % | | 6.5 | % | | 6.4 | % | | 6.9 | % | | 6.6 | % | | 6.1 | % | | 7.4 | % | | 6.9 | % | | 6.9 | % | | 6.9 | % | | 6.9 | % | | 6.9 | % | | 6.9 | % | | 6.9 | % | | 6.9 | % | | | | | 6.8 | % |
| Total Soluble Salts (TSS) (%) | | 48.1 | % | | 46.9 | % | | 48.6 | % | | 50.3 | % | | 46.0 | % | | 48.2 | % | | 54.5 | % | | 46.8 | % | | 47.7 | % | | 51.6 | % | | 46.5 | % | | 46.5 | % | | 46.5 | % | | 46.5 | % | | 46.5 | % | | 46.5 | % | | 46.5 | % | | | | | 47.9 | % |
| Iodine in situ (mineral reserves) (kt) | | 3.1 | | | 4.3 | | | 5.4 | | | 7.1 | | | 8.4 | | | 8.2 | | | 8.2 | | | 8.3 | | | 8.1 | | | 8.1 | | | 8.1 | | | 8.1 | | | 8.1 | | | 8.1 | | | 8.1 | | | 8.1 | | | 8.1 | | | 126.2 | | | 7.7 | |
| Nitrate in situ (mineral reserves) (kt) | | 493 | | | 732 | | | 900 | | | 1,139 | | | 1,288 | | | 1,370 | | | 1,316 | | | 1,226 | | | 1,478 | | | 1,378 | | | 1,378 | | | 1,378 | | | 1,378 | | | 1,378 | | | 1,378 | | | 1,378 | | | 1,378 | | | 20,966 | | | 1,286 | |
| | | | | | | | | | | | | | | | | | | | | | | | | | | | | | | | | | | | | | | | | | | | | | | | | | | | | | | | | | |
| Water consumption for heap pads irrigation (m³/t caliche) | | 0.55 | | | 0.55 | | | 0.55 | | | 0.55 | | | 0.55 | | | 0.55 | | | 0.55 | | | 0.55 | | | 0.55 | | | 0.55 | | | 0.55 | | | 0.55 | | | 0.55 | | | 0.55 | | | 0.55 | | | 0.55 | | | 0.55 | | | | | | 0.55 | |
| Brine Fresh Flush expected (m³/d) | | 9,820 | | | 13,748 | | | 17,676 | | | 22,913 | | | 26,186 | | | 26,186 | | | 26,186 | | | 26,186 | | | 26,186 | | | 26,186 | | | 26,186 | | | 26,186 | | | 26,186 | | | 26,186 | | | 26,186 | | | 26,186 | | | 26,186 | | | | | | 24,809 | |
| Iodine leaching yield (average) (%) | | 73.5 | % | | 74.9 | % | | 71.6 | % | | 71.3 | % | | 78.8 | % | | 73.4 | % | | 69.5 | % | | 76.4 | % | | 72.8 | % | | 70.7 | % | | 74.3 | % | | 74.3 | % | | 74.3 | % | | 74.3 | % | | 74.3 | % | | 74.3 | % | | 74.3 | % | | | | | 73.6 | % |
| Nitrate leaching yield (average) (%) | | 77.2 | % | | 77.1 | % | | 76.6 | % | | 75.7 | % | | 79.2 | % | | 76.5 | % | | 72.3 | % | | 78.6 | % | | 75.4 | % | | 73.8 | % | | 77.6 | % | | 77.6 | % | | 77.6 | % | | 77.6 | % | | 77.6 | % | | 77.6 | % | | 77.6 | % | | | | | 76.8 | % |
| | | | | | | | | | | | | | | | | | | | | | | | | | | | | | | | | | | | | | | | | | | | | | | | | | | | | | | | | | |
| Iodine production in heap pads (kt) | | 2.0 | | | 2.9 | | | 3.5 | | | 4.6 | | | 6.0 | | | 5.4 | | | 5.1 | | | 5.7 | | | 5.3 | | | 5.2 | | | 5.5 | | | 5.5 | | | 5.5 | | | 5.5 | | | 5.5 | | | 5.5 | | | 5.5 | | | 83.9 | | | 5.1 | |
| Iodine production in heap pads (tdp) | | 5.6 | | | 8.1 | | | 9.8 | | | 12.7 | | | 16.7 | | | 15.0 | | | 14.3 | | | 15.9 | | | 14.8 | | | 14.5 | | | 15.2 | | | 15.2 | | | 15.2 | | | 15.2 | | | 15.2 | | | 15.2 | | | 15.2 | | | | | | 14.3 | |
| Nitrate salts production in heap pads (kt) | | 343 | | | 508 | | | 621 | | | 777 | | | 918 | | | 943 | | | 856 | | | 876 | | | 1,003 | | | 915 | | | 963 | | | 963 | | | 963 | | | 963 | | | 963 | | | 963 | | | 963 | | | 14,482 | | | 889 | |
| Nitrate salts production in heap pads (tdp) | | 954 | | | 1,415 | | | 1,729 | | | 2,162 | | | 2,556 | | | 2,625 | | | 2,384 | | | 2,439 | | | 2,793 | | | 2,547 | | | 2,681 | | | 2,681 | | | 2,681 | | | 2,681 | | | 2,681 | | | 2,681 | | | 2,681 | | | | | | 2,474 | |
| | | | | | | | | | | | | | | | | | | | | | | | | | | | | | | | | | | | | | | | | | | | | | | | | | | | | | | | | | |
| Prilled Iodine production (kt) | | 1.7 | | | 2.7 | | | 3.3 | | | 4.2 | | | 5.5 | | | 5.0 | | | 4.8 | | | 5.3 | | | 4.9 | | | 4.8 | | | 5.0 | | | 5.0 | | | 5.0 | | | 5.0 | | | 5.0 | | | 5.0 | | | 5.0 | | | 77.4 | | | 4.8 | |
| Prilled Iodine production (tpd) | | 0.2 | | | 0.6 | | | 0.6 | | | 0.6 | | | 0.7 | | | 0.6 | | | 0.6 | | | 0.6 | | | 0.6 | | | 0.6 | | | 0.6 | | | 0.6 | | | 0.6 | | | 0.6 | | | 0.6 | | | 0.6 | | | 0.6 | | | | | | 0.6 | |
| Iodine process efficiency (%) | | 61.3 | % | | 62.5 | % | | 59.8 | % | | 59.5 | % | | 65.7 | % | | 61.3 | % | | 58.0 | % | | 63.8 | % | | 60.8 | % | | 59.0 | % | | 62.0 | % | | 62.0 | % | | 62.0 | % | | 62.0 | % | | 62.0 | % | | 62.0 | % | | 62.0 | % | | | | | 61.5 | % |
| | | | | | | | | | | | | | | | | | | | | | | | | | | | | | | | | | | | | | | | | | | | | | | | | | | | | | | | | | |
| Brine Nitrate production (kt) | | 343 | | | 508 | | | 621 | | | 777 | | | 918 | | | 943 | | | 856 | | | 867 | | | 1,003 | | | 915 | | | 963 | | | 963 | | | 963 | | | 963 | | | 963 | | | 963 | | | 963 | | | 14,482 | | | 889 | |
| Brine Nitrate process efficiency (%) | | 69.5 | % | | 69.4 | % | | 69.0 | % | | 68.2 | % | | 71.3 | % | | 68.8 | % | | 65.1 | % | | 70.7 | % | | 67.9 | % | | 66.4 | % | | 69.9 | % | | 69.9 | % | | 69.9 | % | | 69.9 | % | | 69.9 | % | | 69.9 | % | | 69.9 | % | | | | | 69.2 | % |
| (a) | At Pampa Orcoma, between 20% to 30% of the material to be mined is classified as hard to semi-hard, and 70-80% as soft to semi-soft. It also has low clay content and thus favors the use of a continuous miner (CM). |
| WSP-SQM0011-TRS-Pampa Orcoma-Rev1 | Rev1 | Page 107 |
The mining zone extends over a large area of 2,400 ha and the mining is organized by mining areas of 25mx25m, that verify the following requirements:
| · | Caliche Thickness ≥ 2,0 m |
| · | Overburden Thickness ≤ 3,0 m |
| · | Stripping Ratio (waste / ore) [weight/weight] ≤ 1.5 |
| · | Iodine operational cut-off grade (300 ppm). |
The mining sequence is defined considering the productive thickness data established for the caliche from the geological investigations carried out, the areas where there are mining permits, the distances to the treatment plants, and avoiding the loss of ore under areas where the installation of infrastructure (pile bases, pipes, roads, channels, trunk lines, etc.) is planned. So, before these elements are installed, the mineral is extracted in the areas where these infrastructures are planned to be located.
Therefore, mineral (caliche) to be extracted in its entirety, verifying the exploitation conditions established, and is located in the environmentally authorized areas, in other words, in Pampa Orcoma the total declared mining reserves will be mined since the rest of the modifying factors, that could affect the mining process, do not limit the production of mineral (extraction, loading, and transport to the heaps leaching).
During caliche extraction, SQM minimizes the processes that cause a dilution of iodine and nitrate grade into the ore mass to accumulate in the heap leaching, controlling the floor of the mining area (25-m-x-25-m), at the target depth, by a global positioning system (GPS)).
It is estimated a grade dilution of less than 2.5% (±10 ppm of iodine) due to the mining system used. In the exploitation process of the caliche, being low mineralized thicknesses (< 5.0m), there is a double effect on the floor of the mineralized mantle resulting from the blasting process; obtaining sectors with the inclusion of underlying and in other cases generation of overburden. Both effects tend to compensate, so the dilution effect or loss of grade is minor or negligible (± 10 ppm). The control of this effect is controlled with GPS that the loading equipment has, plus the topographic control of floors. Once this condition is identified, a geological review is carried out to determine if the overburdened floors are recoverable or not. Due to this review methodology, mineral polygon exploitation is optimized and reduces the impact of the loading of the material underneath the heaps. Underlying and floor volume is negligible about the caliche mined.
However, in the mining processes, SQM considers an efficiency close to 90%, including material losses due to modifying factors and those inherent to the mining process, as well as mineral dilution processes.
Based on these mining process yields; the expected heap leach load is a total of 114 kt of iodine (19.4 tdp of iodine) and 18,870 kt of nitrate salts (3,224 tpa of nitrates). For a load of 0.85 Mt of ROM or continuous miner caliche in leach pads, there is an average load of 313 t of iodine and 51,908 t of nitrate salts per heap pad (SQM mining plan 2024-2040 period).
| WSP-SQM0011-TRS-Pampa Orcoma-Rev1 | Rev1 | Page 108 |
The processes of extraction, loading, and transport of the mineral (caliche) are as follows:
| · | Removal of the surface layer and overburden (between 0.50 to 1.5 m thick) deposited in nearby sectors already mined or without ore. |
| · | Caliche extraction, up to a maximum depth of 6 meters, using explosives (drill & blast) or surface excavator (Terrain Leveler Surface Excavation Machine -SEM- type CM). |
Continuous mining permits exploitation of areas that are close to infrastructure that can be damaged by blasting, to extract softer caliche zones, and to obtain a more homogeneous granulometry of the extracted mineral, which generates better recovery rates in the iodine and nitrate leaching process. Additionally, it generates less dust emission than the drill & blast system. Miner decision-making concerning drill & blast is based on simple compressive strength parameters of the rock (up to 35 MPa), to limit the abrasiveness of the material to be mined, and the presence of clasts in the caliche. The higher proportion of semi-soft to soft material in Pampa Orcoma (70-80%) favors the use of the continuous miner.
The 2024 to 2030 Mining Plan includes an annual production of 7.5 to 20 Mt of fresh caliche (408 ppm iodine, 6.8% NaNO3, and 47.9% SS, in average) (Table 13-1).
| · | Caliche charge, using front loaders and/or shovels. |
| · | Transport of the mineral to heap leaching, using mining trucks (rigid hopper) of high tonnage (100 t to 150 t). |
Caliche charge, using front loaders and/or shovels. Heap leaching facilities consist of 1 Mt, with heights ranging from 7 m to 15 m and a crown area of 65,000 square meters (m²).
In heap leaching, we operate with run of mine (ROM) material, which is material directly from the mine, coming from the start-up process with traditional methods (drilling and blasting), loading, and transport, where it is possible to find particles ranging in size from millimeters to 1 m in diameter.
Heap construction process involves several stages (Figure 13-1):
| · | Site preparation (soil removal by tractor) and construction of heap base and perimeter berms to facilitate the collection of the enriched solutions. |
Heap base has an area of 84,000 m² and a maximum cross slope of 2.5% (to facilitate drainage of iodine and nitrate enriched solutions).
Construction material for heap base (0.40 m thick) comes from waste rock (30,000 tonnes of barren per heap) and is compacted with a roller to 95% of Normal Proctor (moisture and/or density are not tested in-situ).
An HDPE waterproof geomembrane is placed on top of the base layer.
To protect the geomembrane, a 0.5 m thick layer of barren material is placed (to avoid puncturing the sheet by the ROM/MC fragments stored in the heap).
| WSP-SQM0011-TRS-Pampa Orcoma-Rev1 | Rev1 | Page 109 |
Figure 13-1. Pad Construction and morphology in Caliche Mines

| · | Heap loading using high tonnage trucks (100 t to 150 t). |
| · | The impregnation process consists of an initial wetting of a heap with industrial water, in alternating cycles of irrigation and rest, for 55 days. During this stage, the pile begins its initial solution drainage (brine). |
Pampa Orcoma's heap treatment process will be like the one applied by SQM at Nueva Victoria, although the standard impregnation stage (dripper/water/50 days/slow ramp) will be changed to (sprinkler/Intermediate Brine/60-70 days/slow pulse ramp).
| · | Continuous irrigation until leaching cycle is completed, considering the following stages: |
| o | Irrigation with Intermediate Brine: stage in which drained solutions are irrigated by the oldest half of the heaps in the system. It lasts up to 190 days. |
| o | Mixing: irrigation stage composed of a mixture of recirculated Brine Feeble and water. The drainage from these piles is considered SI and is used to irrigate other heaps. This stage lasts about 120 days. |
| o | Washing: last stage of a pile's life, with final water irrigation of water, for approximately 60 days. |
Approximately 400 to 430 days is the total duration of each heap cycle, and in that time, the height of the heap decreases by 15%-20%.
The irrigation system applied to the heaps is a mixed system, which means that both drippers and sprinklers are used. In the case of drippers, an alternative is to cover the heap with a plastic sheet or blanket to reduce evaporation losses and improve the efficiency of the irrigation system.
| · | The leaching solutions are collected by gravity via ditches, which will lead the liquids to a sump where they will be recirculated to the Brine reception and accumulation ponds using a portable pump and piping. |
| · | Once a heap is no longer in operation, the tailings can be used for the construction of the base of other heaps or remain in place (depleted heaps). |
| WSP-SQM0011-TRS-Pampa Orcoma-Rev1 | Rev1 | Page 110 |
In the heap leaching processes, total water demand of 130-355 L/s (470-1,250 m³/h) is required. Considering heap leach yields expected (73.6% for iodide and 76.7% for nitrates -the high rate of water for heap leaching irrigation -0.55 m³/t- and the minor concentration of Total Soluble Salts allow to reach a high yield in heap leaching process-), it is obtained that the enriched solution flow (brine flow), from the heap leach to the concentration plants, would be 1,034 m³/h in average, which means a hydraulic efficiency near of 80%. These solutions will be processed in the Iodide and Iodine plants to be built as part of the Pampa Orcoma Project and the nitrate treatment ponds to process up to 2,500 tpa). The average unit water consumption is 0.55 m³/t.
With these yields, for the 2024-2040 Mining Plan, the iodine heap production will be 84 kt (14.3 tpd) and 14,482 kt for nitrate salts (2,474 tpd).
Heap leaching process performance constraints correspond to the amount of water available, slope shaping (slopes cannot be irrigated), re-impregnation, and the errors associated with the resource/reserve model, the latter factor being the most influential in the deviations between the annual target production and the realized production. These deviations usually reach -5% for iodine and -10% for nitrate.
Other mining facilities besides heaps are the solution ponds (brine, blending, intermediate solution -SI-) and the water and back-up ponds (brine and intermediate solution). These ponds will have pump systems, whose function is to propel the industrial water, Brine Flebe, and Intermediate Solution to the heap leach through High-density Polyethylene (HDPE) pipes to extract the maximum amount of iodine and nitrate from the caliche in the heaps.
From the brine pond, through HPDE pipes, the enriched solutions are sent to the iodide plants.
In addition to the general service facilities for site personnel to include offices, restrooms, maintenance, and truck washing shed, change rooms, dining rooms (fixed or mobile), warehouses, drinking water plant (reverse osmosis), and/or drinking water storage tank, wastewater treatment plant and transformers.
| 13.3 | Requirements for Stripping, and Backfilling |
The initial ground preparation work involves digging a surface layer of soil-type material (50 cm average thickness) and the overburden or sterile material above the ore (caliche) that reaches average thicknesses of between 50 cm to 100 cm.
This work is executed by bulldozer-type tracked tractors and wheel dozer-type wheeled tractors.
Caliche extraction is executed using explosives and/or surface excavator (tractor with cutting drum) to a maximum depth of 6 m (3.2 m average and 1.5 m minimum exploitable thickness).
Blasting will proceed considering an intact rock density of 2.1 t/m³, with an explosives load factor of 365 grams per tonne (g/t) (load factor of 0.767 kg/m³ of caliche blasted).
| WSP-SQM0011-TRS-Pampa Orcoma-Rev1 | Rev1 | Page 111 |
Figure 13-2. Picture of a Typical Blast at Caliche Mines
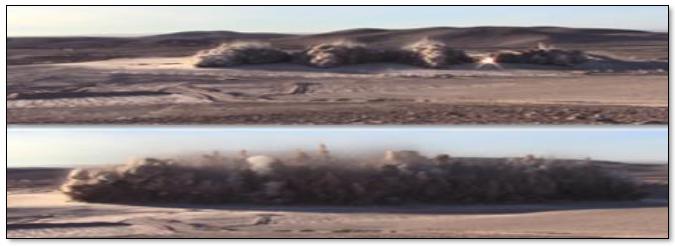
A CM is used to exploit areas that are close to infrastructure that can damage blasting, extract softer caliche zones, and allows to obtain a more homogeneous granulometry of the mineral extracted, which generates better recovery rates in the iodine and nitrate leaching process. Additionally, it generates less dust emission than the drill-and-blast system.
SQM may use either SME-Vermeer T1655 series equipment or SME-Wirtgen 2500SM Each unit can produce 3 Mtpa. The SME-Wirtgen 2500SM Series equipment, has a different cutting design than the Vermeer equipment, with tracks for transport and the possibility of working with a conveyor belt stacking or loading material directly onto a truck. The better performance of SME-Wirtgen equipment in mining means that SQM will opt for this type of Wirtgen equipment over the Vermeer models.
Figure 13-3. Terrain Leveler Surface Excavation Machine (SEM)

Pampa Orcoma's unit mine production cost is set at 2.13 USD/t of caliche mined, including heap leach drainage construction.
The production costs of solutions enriched in iodine and nitrates (heap leach) are set at 1.63 USD/t of caliche mined.
| WSP-SQM0011-TRS-Pampa Orcoma-Rev1 | Rev1 | Page 112 |
| 13.4 | Required Mining Equipment Fleet and Machinery, and Personnel |
This sub-section contains forward-looking information related to equipment selection for the Project. The material factors that could cause actual results to differ materially from the conclusions, estimates, designs, forecasts or projections in the forward-looking information include any significant differences from one or more of the material factors or assumptions that were set forth in this sub-section including labor and equipment availability and productivity.
SQM will have at its disposal at the Pampa Orcoma mine equipment similar to that currently used at Nueva Victoria mine, where it operates at annual production targets (44 Mt), but adapted to Pampa Orcoma's annual caliche production (7 Mtpy ramping to 20 Mtpy in year four).
SQM will have at its disposal the necessary equipment to reach the required caliche production, to mine and build the heaps, and to obtain the enriched liquors that are sent to the treatment plants to obtain iodine and nitrate as final products (Table 13-2):
| · | Front loader and shovels. |
| · | Equipment with cutting drum |
| · | Bulldozer and Wheeldozer |
| · | Motor grader, roller, and excavators |
Table 13-2. Mining Equipment for mining process – Pampa Orcoma project (20 Mtpy)
| Equipment | | Quantity | | | Type or size |
| Front loader | | | 5 | | | 12,5 y 15 m³ |
| Shovels | | | 2 | | | 13 a 15 m³ |
| | | | | | | 150 a 200 tonnes |
| Surface Excavation Machines (SME) | | | 2 | | | 100 a 200 tonnes |
| Trucks | | | 15 | | | 100 - 150 tonnes-c |
| Bulldozer | | | 4 | | | 50 a 70 tonnes |
| Wheeldozer | | | 2 | | | 35 tonnes |
| Drill | | | 5 | | | Top hammer de 3,5 to 4,5 inches (diameter) |
| Grader | | | 3 | | | 5 – 7 m |
| Roller | | | 2 | | | 10-15 tonnes |
| Excavator | | | 3 | | | Bucket capacity 1 -1,5 m³ |
In addition, Pampa Orcoma's mining operation will employ a team of 155 professionals for mining and heap leach operation.
It is also planned that a total of 45 professionals for the maintenance of the leaching heaps and ponds will be employed.
| WSP-SQM0011-TRS-Pampa Orcoma-Rev1 | Rev1 | Page 113 |
| 13.5 | Map of the Final Mine Outline |
SQM operates its caliche operations concerning an initial topography of the terrain concerning which, using topography and continuous control of the mining operations, the removal of soil and overburden (total thickness of 1.50 m on average at Pampa Orcoma) and the extraction of caliche (3.50 m average thickness) proceed.
The reduced magnitude of the excavations (5.00 m average) concerning the surface involved (120 to 300 hectares per year [ha/y], around 46 km² in total for the Mining Plan 2024-2040), does not allow a correct visualization of a topographic map of the final situation of the mine. The caliche production data for the LOM of 2024 to 2040 implies a total production of 309 Mt, with average grades of 408 ppm iodine and 6.8% nitrates.
Given mining and leaching production factors, total production of 84.0 kt of Iodine and 14,482 kt of Nitrate salts is expected for this period (2024-2040), which implies producing enriched leachates with average contents of 5.1 thousand tonnes per day (ktpd) of Iodine and 889 thousand tonnes per annum (ktpa) of nitrate salts that would be sent to the processing plants.
Table 13-3. Mine and PAD leaching production for Pampa Orcoma mine – period 2024-2030
| LoM 2024-2040 | | Caliches ore | | | Percentage | | | Iodine | | | Nitrate | |
| Production (kt) | | | 309,000 | | | | | | | | | | | | | |
| Average grades (Iodine ppm / Nitrates ppm) | | | | | | | | | | | 408 | | | | 6.8 | % |
| Ore in-situ (kt) | | | | | | | | | | | 126.2 | | | | 20,966 | |
| Traditional mining (kt) | | | 92,700 | | | | 30 | % | | | | | | | | |
| Continuous mining (kt) | | | 216,300 | | | | 70 | %(a) | | | | | | | | |
| Mining yield | | | | | | | 92 | % | | | | | | | | |
| Dilution Factor Grades | | | | | | | | | | | 2.25 | % | | | 2.50 | % |
| Mining process efficiency | | | | | | | | | | | 90 | % | | | 90 | % |
| ROM heap recovery traditional mining | | | | | | | | | | | 65 | % | | | 73 | % |
| Heap recovery continuous mining | | | | | | | | | | | 77 | % | | | 79 | % |
| Heap ROM production traditional mining (kt) | | | | | | | | | | | 22.3 | | | | 4,112 | |
| Heap production continuous mining (kt) | | | | | | | | | | | 61.5 | | | | 10,370 | |
| Leaching process efficiency (%) | | | | | | | | | | | 73.6 | % | | | 76.7 | % |
| Mining & Leaching process efficiency (%) | | | | | | | | | | | 66.4 | % | | | 69.1 | % |
| TOTAL ROM heap production (kt) | | | | | | | | | | | 84.0 | | | | 14,482 | |
| TOTAL ROM heap production (ktpa) | | | | | | | | | | | 5.1 | | | | 889 | |
(a) At Pampa Orcoma, between 20% to 30% of the material to be mined is classified as hard to semi-hard, and 70-80% as soft to semi-soft. It also has low clay content and thus favors the use of a continuous miner (CM).
| WSP-SQM0011-TRS-Pampa Orcoma-Rev1 | Rev1 | Page 114 |
Figure 13-4. Ten Year Plan -2024-2033 Pampa Orcoma Mine
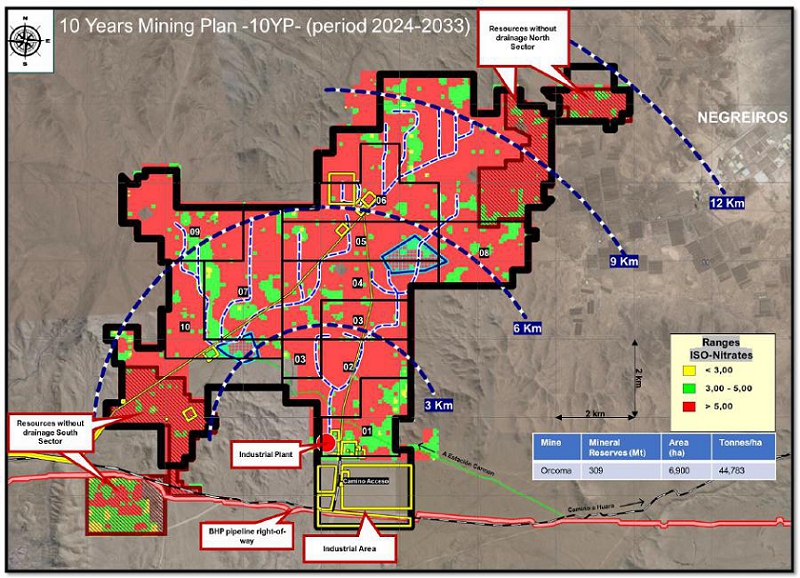
| WSP-SQM0011-TRS-Pampa Orcoma-Rev1 | Rev1 | Page 115 |
| 14 | Processing and Recovery Methods |
This sub-section contains forward-looking information related to the copper concentrators, leaching and solvent extraction throughputs and designs, equipment characteristics, and specifications for the Project. The material factors that could cause actual results to differ materially from the conclusions, estimates, designs, forecasts or projections in the forward-looking information include any significant differences from one or more of the material factors or assumptions that were set forth in this sub-section including actual ore feed characteristics that are different from the historical operations or from samples tested to date, equipment and operational performance that yield different results from the historical operations, historical and current test work results, and metallurgical recovery factors.
The " Orcoma" project aims to produce iodide, iodine, and nitrate-rich salts from the processing of caliche that will be extracted from deposits rich in this mineral, located in the area called Pampa Orcoma, commune of Huara. The production process begins with the exploitation of caliche, which is a mineral composed of a high proportion of water-soluble species found naturally in deposits containing nitrates, iodine, and potassium. The site includes caliche extraction processes (mine), heap leaching, and processing plants to obtain iodine as the main product and nitrate as a by-product (nitrate-rich salts, sodium nitrate, and potassium nitrate). The Pampa Orcoma mineral is estimated to contain an average of 6.9% nitrate and 413 ppm iodine, according to the mine plan used for this study. The mine area operation consists of caliche mining.
The caliche will be extracted at a rate of up to 11,000 to 20,000 tpy, using open pit mining methods including loader and shovel and continuous mining machine. The current mine plan covers an area of approximately 4,600 ha (46 km²).
The production of iodine and nitrate salts based on heap leaching with seawater or recirculated solutions (a fraction of Brine Feeble (BF) recirculated from the iodide plant), from which an iodate-rich solution is obtained, which is then treated in chemical plants to transform it into elemental iodine. Further, the remaining solution is sent to evaporation areas to obtain sodium nitrate and other salts. In the solar evaporation ponds, nitrate-rich salts produced are sent to the Coya Sur mine located in Antofagasta Region.
These facilities have been under construction since January 2022 and their completion is scheduled for 2024. The Pampa Orcoma plant, through its two iodide plants and one iodine (fusion) plant, will start operating in 2024 with an annual production of 2,500 t of iodine and 320 Kt of nitrate salts per year, each, with an average recovery of 66% and 63%, respectively.
Once all the construction work is completed, commissioning will be started, which consists of operating tests to verify the operation of the control loops and motor start-up and shutdown, mainly. After the commissioning stage, the equipment and systems will be put into operation, consisting of the execution of the necessary tests to verify the proper functioning of the equipment. The commissioning and start-up are defined for three months, after which the plants in the industrial area will start operating.
| WSP-SQM0011-TRS-Pampa Orcoma-Rev1 | Rev1 | Page 116 |
To produce a solution rich in iodate, which is then treated in chemical plants to transform it into elemental iodine and sodium nitrate, and other salts, from the remaining solution that is taken to evaporation areas, the project will have the following facilities:
| · | Caliche mine and mine operation centers |
| · | Household waste landfill |
| · | Non-hazardous industrial waste yard |
Figure 14-1 shows a block diagram of the main stages of caliche mineral processing to produce iodine prill and nitrate salts at Pampa Orcoma. Figure 14-2 is a general layout plant of Pampa Orcoma.
In the following sections, the operation stages and mineral processing facilities will be described.
| WSP-SQM0011-TRS-Pampa Orcoma-Rev1 | Rev1 | Page 117 |
Figure 14-1. Simplified Pampa Orcoma Process Flowsheet

| WSP-SQM0011-TRS-Pampa Orcoma-Rev1 | Rev1 | Page 118 |

Figure 14-2. General Layout of the Facilities of Pampa Orcoma
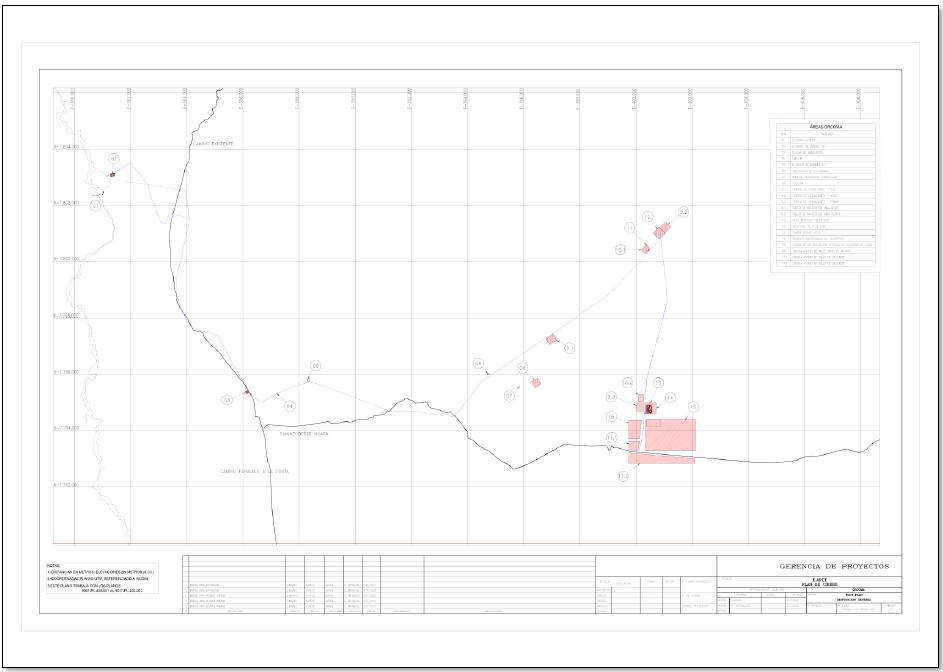
| WSP-SQM0011-TRS-Pampa Orcoma-Rev1 | Rev1 | Page 119 |
The extraction processes will begin with the removal of chusca and overburden, material that will be deposited in nearby sectors already exploited or lacking minerals. Then, we proceed with the drilling of blast holes, start-up (which will require traditional blasting and/or continuous mining equipment) and will end with the loading and transport of caliche. These operations involve caliche loading and transportation using shovels and front-end loaders that load the material removed from the quarries onto a high tonnage truck for transport to the leaching heaps.
The site will work with two mineral categories, classified as described below:
| - | Mineral category 1 "Run of Mine" (ROM) material: material direct from the mine without further comminution, where it is possible to find particles ranging in size from the order of millimeters to 1 meter. |
| - | Mineral category 2 from continuous mining: material extracted using a tractor with a cutting drum. |
Caliche to be leached must be prepared to level the site where the heap is to be built (loaded). This land will have a gradient of 1 to 4% with an approximate slope of 2.5%, to take advantage of gravity to transport the drained solution from the heap. Details on the stages of removal and loading of material in piles, as well as their construction, are given in the preceding section 13.2.
The piles are irrigated with a mixture of industrial water and/or Brine Feeble, dissolving the minerals present in the caliche during lixiviation. The heap leaching operation is designed to treat the heap with seawater, adding it in alternating irrigation and rest cycles. The following are the operations:
| 1. | Impregnation/Water irrigation: initial irrigation stage of about 50-to-70-day duration. During this stage, the heap begins its Brine drainage. |
| 2. | Intermediate Solution Irrigation (SI): stage in which the oldest half of the heaps in the system are irrigated with drained solutions. It lasts about 190-280 days. |
| 3. | Mixture: irrigation stage composed of a mixture of recirculated weak acidic water (AFA) and water. The drainage from these heaps is considered an Intermediate Solution and is used to irrigate other heaps. This stage lasts about 120 days. |
| 4. | Washing: the last stage of a heap's life, with final water irrigation for approximately 60 days. The irrigation system used corresponds to a mixed system, in other words, using drippers and sprinklers. |
The rich or pregnant solution obtained from the heap leaching ("brine") is processed in the iodide and iodine plants, together with several inputs. The Brine is taken through pipelines to the iodide plant. In this plant through a series of stages, a concentrated solution of iodide and spent solution (Brine Feeble [BF]) is obtained.
The BF produced in the iodide plant can follow two alternative paths, one part is recirculated to the heap leach and the other fraction is sent to the neutralization plant, where, through the addition of lime or sodium carbonate, Neutral Brine Feeble (BFN) is produced. The latter is sent to the solar evaporation ponds, where nitrate-rich salts are produced and sent for processing in the Nitrate Plants. The process steps described are summarized in the block diagram shown in the Figure 14-3.
| WSP-SQM0011-TRS-Pampa Orcoma-Rev1 | Rev1 | Page 120 |
Figure 14-3. General Block Process Diagram for Pampa Orcoma
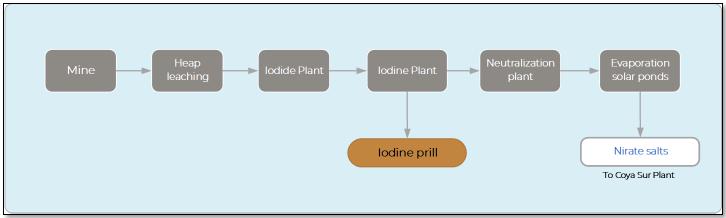
The mining waste generated at the site corresponds to the exhausted leaching heaps, overburden and waste salts. The discard salts generated from the process correspond to an inert, cohesive, and highly cemented material that is disposed of in discard salt deposits adjacent to the evaporation ponds.
As shown in the general process diagram, Figure 14-3 , the operations involved in the treatment of minerals and the production of iodine and nitrate salts requires the following process facilities:
| · | Caliche mine and mine operation centers. |
| WSP-SQM0011-TRS-Pampa Orcoma-Rev1 | Rev1 | Page 121 |
| 14.1.1 | Mining Zone and Operation Center |
The first stage of the process considers the extraction of caliche at a rate which ranges from 11 Mtpy to 20 Mtpy. With advances in operations, internal roads that connect different sectors are to be built. The processes of extraction, loading, and transport of caliche will be as follows:
| · | Chusca and overburden removal |
| · | Caliche loading and transport |
The processes of extraction, loading and transport of the caliche consist of: removing the chusca (aeolian weathered surface layer up to 50 cm thick) and the overburden (intermediate layer from 0 to 1.5 m thick) using tractors or bulldozers, to deposit it in nearby sectors already exploited or lacking ore, then, The caliche is then extracted using explosives and/or surface excavator (extractor with cutting drum) to a maximum depth of 6 meters, given the above, the exploitation is carried out in low benches, in a single pass, which is why the typical amphitheaters common in open pit mine operations are not generated. Subsequently, the caliche is loaded using front loaders and/or excavators. Finally, trucks transport the mineral to heap leaching sites.
At the interior of the mine areas, there will be the COM that corresponds to a support facility, whose objective is the handling of the different solutions. They include the facilities associated with the leaching heaps, as well as a system of solution ponds where Brine comes from heap leaching, and seawater from the reception ponds, intermediate solution, and the mixed solution will be accumulated. The types of storage ponds for irrigation and brine solutions are shown in Table 14-1.
Accumulation ponds will be internally covered with HDPE and/or Polyvinyl chloride (PVC), or other material with similar waterproofing characteristics. The COM brine accumulation pond for each of the three units allows the brine generated and collected in the piles to reach the plant with an intermediate concentration of ~0.56 g/L of iodine. HDPE spheres will be used in water accumulation ponds to reduce evaporation losses at the surface.
Table 14-1. Description of Water and Brine Reception Ponds by COM
| Pond | | Size (M) | | N° of Ponds | | | TOTAL VOLUME (m³) | |
| Brine | | 50x40 | | | 1 | | | | 500 | |
| Water | | 50x40 | | | 1 | | | | 500 | |
| Mixed solution | | 50x40 | | | 1 | | | | 500 | |
| Intermediate solutions (SI) | | 50x40 | | | 1 | | | | 500 | |
| Emergency brine | | 54x94 | | | 1 | | | | 1,000 | |
| Emergency SI | | 54x94 | | | 1 | | | | 1,000 | |
| WSP-SQM0011-TRS-Pampa Orcoma-Rev1 | Rev1 | Page 122 |
Three COMs are expected to be installed during Project life (COM North, COM Plant, and COM South). The location of the COMs, heaps leaching and associated piping network depends on the geology, the volume of mineable ore, and the ore grades. Therefore, such location depends strongly on the annual mine planning of the deposit.
The leach heaps correspond to caliche accumulation stockpiles shaped like a truncated pyramidal. The piles will have an iodine and nitrate pregnant solution collection system. The base of the pile consists of a platform with perimeter berms, a liner to keep the soil impermeable, and a protective layer of fine material. These heaps are being built gradually as the mining operation progresses.
The protective layer of material called "chusca", which has the purpose of maintaining a smooth contact surface between the material loaded by the dump trucks, machines, and the membrane so that it is not perforated by the impact of coarse mineral particles, irregularities, or traffic. The fine material is composed of:
| 1. | Barren material coming from the areas under exploitation. |
| 2. | Tailings from the depleted heap leaching. Unclassified material extracted 3 m from the top of the heap. |
Caliche extracted in the mine areas is heaped on top of this protective layer and then irrigated with different solutions according to a leaching strategy of four stages. The solutions, pumped and impelled from different COMs and irrigated at the top of the heap, are industrial quality water, intermediate solution, a mixture of industrial water, and Brine Feeble (recirculated from the plants), producing the leaching of the minerals present in the caliche.
After completing a heap cycle, irrigation ends and the heap drains until the flow rate reaches approximately 10 to 20% of the flow rate drainage during continuous irrigation, a stage known as "squeezing".
Heaps are organized to reuse the solutions they deliver, production heaps (the newest ones), which produce a rich solution that is sent to the iodine plant, and older heaps whose drainage feeds the production heaps. At the end of its irrigation cycle, an old heap leaves the system as inert tailings, and a new heap enters at the other end, thus forming a continuous process (see Figure 14-4).
It is important to note that due to heap leaching operating conditions, a considerable portion of the aggregate water evaporates. Therefore, the company is developing a plan to mitigate evaporation losses. SQM declares efforts to optimize resources using plastic film to cover irrigated heaps, HDPE spheres in water accumulation ponds that reduce the area of exposure to radiation and consequently evaporation. The company is currently evaluating different types of plastic film.
| WSP-SQM0011-TRS-Pampa Orcoma-Rev1 | Rev1 | Page 123 |
On the other hand, when using seawater in the process and due to its saline load, it is possible that the drippers may lose efficiency due to clogging. In this matter, the company is working on the evaluation of drippers that allow working with saline solutions without loss of irrigation efficiency.
However, from month two of the construction phase, it is planned to start caliche mining activities, construction of leaching and impregnation heaps (alternating cycles of irrigation and rest), to obtain sufficient brine to start the operation of the other industrial plants.
Figure 14-4. Schematic Process Flow of Caliche Leaching

| 14.1.3 | Iodide-Iodine Production |
The iodine production process involves two stages: Production of iodide from iodate (iodide plant) and production of iodine from iodide (iodine plant). The capacity to produce iodide and iodine is 2,500 tpy.
Iodide concentrate solution produced is sent to an iodine production plant, where the final product is prilled iodine, or it will be sent to a third-party iodine plant. The BF generated during iodide production is reused in two processes: (a) a portion is recirculated to the COMs located in the mine areas, for the heap leaching process and (b) the remaining fraction is sent to the neutralization process, whereby adding a slurry of lime or sodium carbonate, BFN is produced. This last one is sent to the solar evaporation ponds system, to produce nitrate-rich salts and waste salts.
In this post-cutting plant, it is possible to use a solvent extraction (SX)-filtration or SX-Blow Out-filtration route.
Figure 14-5 shows a block diagram of the iodate to iodine prill process. The following sections will describe the process by stages developed in the iodide plant and iodine plant contemplated for the Project.
| WSP-SQM0011-TRS-Pampa Orcoma-Rev1 | Rev1 | Page 124 |
Figure 14-5. Block Diagram of Iodide-Iodine Production Process Plants
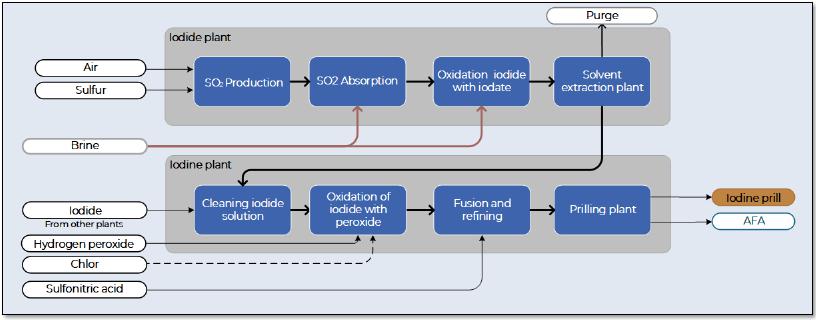
| WSP-SQM0011-TRS-Pampa Orcoma-Rev1 | Rev1 | Page 125 |
| 14.1.3.1 | Iodide Production |
To reduce the sodium iodate in the caliche leaching solutions with an oxidation to free iodine through reduction with sulfur dioxide, and then to separate and purify it. The production of SO2 serves two purposes: the iodination of the brine in the absorption tower and the reduction of the free iodine to iodide in the stripping stage.
The iodide plant will have the following process areas:
| · | Sulfur storage and SO2 production: |
The required sulfur dioxide is produced by burning sulfur, which is received in bulk at a stockpile site. From here it is transported to a receiving hopper, which feeds sulfur to a dosing screw that enters a rotary kiln and combustion chamber, where it is melted and oxidized to SO2. The SO2 gases generated at the SO2 production plant will pass through an abatement system to control atmospheric emissions. The system consists of a scrubber tower for the stripping unit. This scrubbing tower will recirculate the brine available in the plant, and then feed it to the process. Efficiency is estimated at 95%.
This process converts the ionic iodine (iodate), which is present in the Brine, to elemental iodine. It occurs in a packed absorption tower. The cut Brine enters the solvent extraction unit, blending it with kerosene.
| · | Solvent extraction (SX): |
Solutions containing free iodine are recovered by solvent extraction using kerosene in mixer settler tanks. The iodine-containing cut Brine is discharged in the first extraction stage, transferring the iodine to the organic phase. In the second extraction stage, the iodine extraction becomes complete.
The kerosene phase settles in a second regeneration tank, where stripping or re-extraction takes place with the iodide solution. The effluent solution left by the plant is neutralized with soda ash and then returned to the leaching process. The iodide solution used for stripping is maintained at a certain pH and is used to cool the SO2 produced in the sulfur burning system.
The iodine from the organic phase passes into an iodide stream in the stripping stage. The aqueous phase leaving the separators is sent to the acid Feeble water (AFA) ponds, passing first through a kerosene trace recovery stage (coalescer).
The operation of the plant generates sludge, which is a gel-like solid impregnated with kerosene and iodine. From time to time, we stop the plant and the sludge flows to a tank washing and separation system, where the solvent (kerosene or another similar solvent) and iodine solution are recovered and recirculated back into the system. The residue generated (clays) is removed from the system, sent to a separation pond, where the solution is recovered and the final clay is placed in depleted leach heaps.
| WSP-SQM0011-TRS-Pampa Orcoma-Rev1 | Rev1 | Page 126 |
To remove impurities from iodide solutions extracted in the solvent extraction plant, there are two cleaning stages of the solution before oxidation (with 70% hydrogen peroxide). The first stage is the filtration of the solution with a filter aid, which allows the trapping and removal of suspended solid particles. The second stage, which follows the first, also corresponds to filtration by activated carbon, a material that allows the removal of organic impurities contained in the iodide solution. Before entering this second cleaning stage, we determined to add traces of sulfur dioxide to the iodide solution, to intensify the cleaning work of this stage.
| 14.1.3.2 | Iodine Production |
Iodide plant product is a clean and concentrated Iodide (I-) solution sent to the Iodine Plant, where the final product, corresponding to Prill Iodine, is obtained. However, the iodine plant could also process iodide solutions from other facilities (third parties). Iodine plant areas will be as follows:
| · | Iodide storage and conditioning: |
The iodide-rich solution undergoes storage and conditioning. Conditioning consists of pumping the iodide into activated carbon towers to retain organic carryover among other impurities filtered out of the iodide, passing through two duplex filters. The treated iodide flows through two duplex filters. The conditioned solution then passes through two duplex filters before going to the oxidizers, which retain any carryover from the activated carbon.
| · | Oxidation, fusion, and refining: |
Subsequently, this solution is oxidized with an external agent, hydrogen peroxide (H2O2) or chlorine gas (Cl2), resulting in a metallic iodide slurry.
Specifically, the oxidizers are two stirred tanks, which are used for iodide oxidation in batch mode. The exothermic reaction raises the temperature to about 60°C, resulting in the formation of a slurry. Once oxidation is complete, it is transferred to the next stage of smelting and refining.
The melting stage takes place in reactors where a slurry with a residence time of 2-2.5 h is processed. This reactor is prepared for slurry reception, first by displacement with carbon dioxide. Once the iodine solution has finished melting, it is fed to the refining reactors that receive and hold the molten iodine. The reactors are pre-charged with a mixture of nitric and sulfuric acid (sulfonitric) to remove the organic matter present.
| · | Prilling and classification: |
The prilling tower is a column through which compressed air circulates upward and is cooled with a water spray as it rises the tower (nebulizers). In this way, melted iodine falling from the top of the tower cools sharply to form solid prill iodine. On the bottom of the tower, a sieve separates the iodine prills with the right size and sends them to the packing line.
| WSP-SQM0011-TRS-Pampa Orcoma-Rev1 | Rev1 | Page 127 |
The next step is grinding, sampling and packing. The iodine produced in the plant is stored and then shipped.
The prilled iodine is tested for quality control purposes, using international standard procedures and then packed in 20-50-kg drums or 350-700-kg maxi bags and transported by truck to Antofagasta, Mejillones, or Iquique, for export.
| 14.1.3.3 | SX-Blow-out Production |
The iodide-iodine plant produces iodized brine in its SX and Blow-out process modules. This plant can work with feed brine with low iodine concentration (0.02 g/L), which is sent to absorption towers where it is put in contact with SO2 to produce iodide. The absorption tower is filled with elements that allow the solutions to have a longer residence time in the tower, allowing better contact between the reagents.
The iodide produced in the SO2 absorption towers is taken to the cutting pond or reactor, where it is mixed with the iodate (IO3-) coming from the plant's feed ponds. This is a redox reaction known as the Dushman reaction and, therefore, its effectiveness is controlled by the pH of the mixture. As a result, the brine is transferred to the next solvent extraction step in three steps.
The solution from the cutter is pumped to the blowing towers, where it is counter-flowed with air. To recover iodine from the gas stream, it is sent to iodine absorption-desorption towers, using a solution containing iodide ions in counterflow, which forms triiodide ions, which are unstable. Finally, the iodine released from the vapor solution is absorbed with caustic soda.
The triiodide ion solution is sent to reducing towers (coolers) where, by contact with the cooling SO2 (150 - 26 ºC), it dissociates, giving elemental iodine.
The solution returns to the iodide recirculation tank, forming a concentration cycle. Concentrated iodide is sent from the recirculation tanks to the iodine plant for refining.
Figure 14-6 shows a schematic of the production Blow-out process.
Figure 14-6. Process Diagram of Blow-out Production of Iodine Contrate Solution
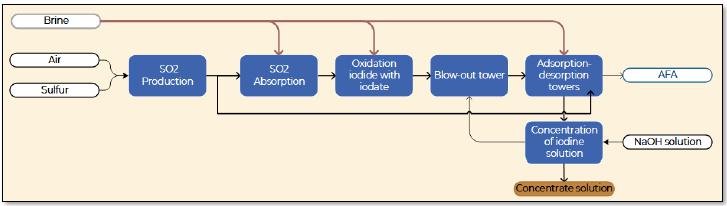
| WSP-SQM0011-TRS-Pampa Orcoma-Rev1 | Rev1 | Page 128 |
| 14.1.4 | Neutralization Plant |
The neutralization plant receives the brine Feeble (AFA) from the iodide plant. The Brine Feeble Neutral (BFN) will be produced in the neutralization system by adding lime and seawater to the Brine Feeble. The neutralization systems include solution receiving ponds, solids settling ponds, neutralization ponds and industrial water ponds.
The lime will be received and stored in a confined system equipped with an emission capture system. The ground lime will be dosed together with the water in lime slurry preparation ponds equipped with agitation.
The lime slurry solution obtained in agitated ponds will be pumped to the neutralization tank. Finally, the neutralized solution will be pumped through pumps and pipes to the solar evaporation ponds.
The neutralization residue (gypsum) will be deposited in the residual salt tank.
| 14.1.5 | Solar Evaporation Ponds |
The solar evaporation pond is a functional unit for producing nitrate-rich salts at a rate of 320,325 tpy, which involves the ponds; brine transfers from one pond to another via pumps and pipelines; and salt collection and transport systems.
The discard salts are sodium chloride, magnesium, and sodium sulfates, and the harvest salts are sodium nitrate (NaNO3) and potassium nitrate (KNO3). The discard salts are stored in a salt disposal yard and the production salts are stored in a slurry yard and finally shipped to other third-party processing plants by truck.
The evaporation system will have the following components: Pretreatment Pits, Cutting Pits, Production Pits, and Purging Pits.
To process all the Brine Feeble generated in the iodide plant, a solar evaporation area of approximately 2,000,000 m² (surface area of 194.12 ha) will be required. To prevent infiltration, the ponds will be covered with HDPE sheets, which in turn will be protected with geotextile to prevent damage from stones.
The average annual solar evaporation of the ponds is approximately 5.0 liters per square meter per day (L/m2/d). The ponds will have a capacity of 4.537.200 m³ and the dimensions of the ponds are detailed in Table 14-2.
| WSP-SQM0011-TRS-Pampa Orcoma-Rev1 | Rev1 | Page 129 |
Table 14-2. Solar Evaporation Pond Types
| Type | | Area (m²) | | | Size (m) | | Volume (m³) | | | N° of Ponds | | | Total, Volume (m³) * | |
| Preconcentration | | | 124,200 | | | 540x230 | | | 372,000 | | | | 10 | | | | 3,796,000 | |
| Cutting ponds | | | 33,800 | | | 130x260 | | | 101,400 | | | | 2 | | | | 202,800 | |
| Purging ponds | | | 33,800 | | | 130x260 | | | 67,600 | | | | 1 | | | | 67,600 | |
| Production | | | 33,800 | | | 130x260 | | | 67,600 | | | | 8 | | | | 540,800 | |
| | | | | | | | | Total | | | | 21 | | | | 4,537,200 | |
Note : *Maximum effective volume stored
The following five relevant stages of the evaporation system are described below.
Acid Feeble Water Alkalization: This consists of a neutralization plant (Chemco) equipped with a lime storage silo, a lime preparation or lime slaking system, and a reactor with an agitator to produce the slurry/AFA contact. The main objective of this stage is to increase the pH from 1.6-2.0 to 5.4-6.0 (measured directly). Lime consumption (kg/m³ AFA) will depend on the initial acidity of the solution, with a variation between 0.30 to 0.60 (kg/m³). The result of this process is the Feeble Neutral Water (AFN) solution.
Pretreatment Area or Zone: A string of ponds in series of 125,000 and 250,000 [m²] of evaporation area. This process aims to evaporate the solution from its AFN condition to a solution close to saturation in KNO3 and NaNO3. In these ponds, nitrate-poor salts (discard salts) will precipitate, crystals of Halite (NaCl) and Astrakanite (Na2SO4XMgSO4X4H2O) being the predominant precipitates.
These ponds will be operated in series and the solution will be transferred from one pond to another by pumping.
Cut-off or Boundary Pond: At the end of the pretreatment stage, a cut-off pond will establish (control pretreatment), whose function will feed the solution to the production ponds. Therefore, it will be the pond where the fine adjustment takes place before sending the solution to production and where the most chemical controls will be found, due to their influence on the quality of the final product. The objective of this well will be to obtain a solution as close as possible to the saturation levels of KNO3 and NaNO3.
High Grade Sales Production Area or Zone
Ponds located in parallel, and series are fed from the cutting pond. In these ponds, high potassium nitrate (KNO3) and sodium nitrate (NaNO3) salts will precipitate, which are the products of interest in the process, along with other impurities (NaCl, Astrakanite, KClO4, H3BO3, MgSO4, among others).
| WSP-SQM0011-TRS-Pampa Orcoma-Rev1 | Rev1 | Page 130 |
Volume fed to each pond is equivalent to the volume of water lost by evaporation, to maintain a constant free solution level. The amount of solution fed to each pond may vary according to other operational requirements (harvesting, filling, emptying, etc.) or according to the need to adjust the chemical composition of the supernatant solution in a pond, which will be defined week by week according to system requirements.
System Purge: This last stage of the system corresponds to the purge, where a higher proportion of impurities will precipitate concerning the nitrate and potassium salts. The solution will be dried to total dryness as the salt counts as a loss (discard deposit).
| 14.2 | Process Specifications and Efficiencies |
Table 14-3 provides a summary list of the main criteria to design the processing circuit:
Table 14-3. Process criteria summary. Mine site and caliche heap leaching
| Criteria | Detail |
| Exploitation capacity and grades |
| Caliche mine exploitation | 11 Mtonnes/year to 20 Mtonnes/year |
| Average grades | 6.8% nitrate, 408 ppm iodine |
| Cut-off grade | 300 ppm iodine |
| Availability/Use of availability |
| Mining exploitation factor | 90% |
| Plant availability factors | 85% |
| Caliche factor Iodine PO | 3.7 Mtonnes caliche/kg Iodine |
| Caliche factor Nitrate PO | 21 T Caliche/T Nitrate |
| Heap leaching |
| Caliche load | 400-1,000 Mtonnes |
| Protective layer | 40-50 cm of fine material ("chusca") |
| Overall metallurgical recovery nitrate | 60-80% (range); 61.5% (average) |
| Overall metallurgical recovery iodine | 60-80% (range); 69% (average) |
| Impregnation stage | 50-70 days |
| Intermediate Solution Irrigation (SI) | 280 days |
| Mixed irrigation stage Water + AFA | 20 days |
| Washing stage with industrial water | 60 days |
| Iodate brine (Brine) | 8,910,000 m³/year |
| Concentration | 0.55-0.62 g/L iodine |
| Turbidity of iodate brine | 80 NTU (maximum 250 NTU) |
| WSP-SQM0011-TRS-Pampa Orcoma-Rev1 | Rev1 | Page 131 |
| Criteria | Detail |
| Yield and plants capacity |
| Iodate/iodide yield | 94-95% |
| Iodide/iodine yield | 97% |
| Iodate/iodide yield | 91.9% |
| Iodine production | 2,500 tpy |
| Purity of product iodine prill | 99.8% |
| Evaporation ponds |
| Evaporation rate | 2.5 l/m² winter/4-5 l/m² summer |
| Pond yields | 77.3% |
The following sections describe the material balance in heap leaching, evaporation ponds, and general process balance. Yield values and production projection are also detailed.
| 14.2.2 | Heap Leaching Balance |
Figure 14-7 shows a simplified and general scheme of the cycle of each heap. Each stage is composed of several heaps, having a total of 25 heaps operating simultaneously, approximately and with a maximum water requirement of 350 L/s.
Figure 14-7. Pampa Orcoma Heap leaching scheme.
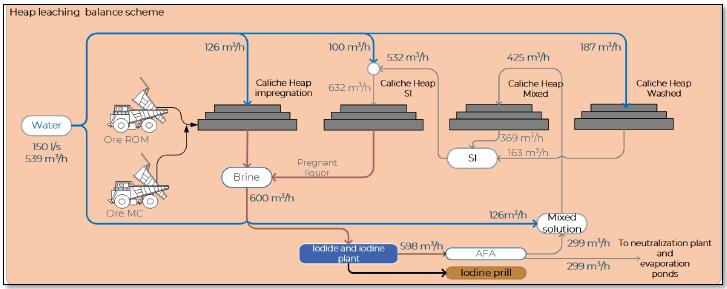
As can be seen, the maximum fresh water consumption is found in the pile washing stage. This balance also shows that the percentage of recycled Feeble solution is 50%.
| WSP-SQM0011-TRS-Pampa Orcoma-Rev1 | Rev1 | Page 132 |
| 14.2.3 | Balance Solutions in Evaporation Ponds |
To estimate inflows and outflows from the evaporation ponds, the following balance criteria were given:
| · | The nominal evaporation rate is 3.78-4.50 l/h/m². |
| · | The moisture content of discarded and harvested salts is 8-12%. |
| · | The AFA fraction for re-circulation in the heap leaching process will be 50%, as well as that for the solar evaporation ponds. Depending on the quality of the caliche extracted, these percentages could vary, but always respect the production values indicated. |
Figure 14-8 shows a simplified and general scheme of the volumetric balance in solar evapoconcentration system.
Figure 14-8. Pampa Orcoma volumetric balance in solar evaporation area.

| 14.2.4 | Process Balance Sheet |
Figure 14-9 below shows the flow diagram and general balance of the Orcoma Project's production process. This balance will depend on caliche chemical properties, as well as on the operation of the Iodide Plant (whether it operates in SX or Blow out mode), without exceeding the quantities indicated in the diagram Figure 14-9.
This balance is developed to perform a feasibility level assessment of resource and process water management. This assessment included the development of a deterministic water balance that takes to account inflows, such as seawater abstraction and leach solution, outflows, such as evaporation, and consumption losses due to ore and waste rock wetting.
To estimate the input and output water requirements, the following balancing criteria were given:
| · | The average mine moisture content and specific mineral and waste rock moisture retention is 1.00%. |
| · | The nominal leach solution application rate is 1.85 L/h/m². |
| WSP-SQM0011-TRS-Pampa Orcoma-Rev1 | Rev1 | Page 133 |
| · | The average solution flow rate to leach is 100-120 m³/h, respectively. |
| · | The solution applies with drip irrigation emitters and sprinklers. |
| · | Total waste rock produced during mining activities has been estimated to be approximately 0.5-2.00 Mt. |
| · | The moisture content of the waste rock after the leaching cycle is 8-10%. |
| · | The fraction of AFA that will be recirculated in the heap leaching process will be 50%, as well as that destined for the solar evaporation ponds. Depending on the quality of the caliche extracted, these percentages could vary, but always respect the production values indicated. |
Figure 14-9. Mass balance of Pampa Orcoma per year of production
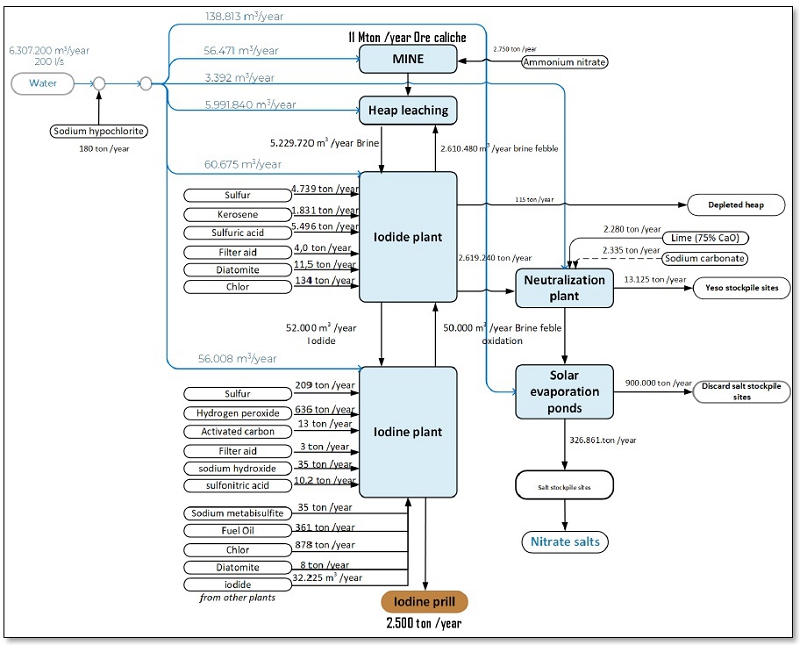
| WSP-SQM0011-TRS-Pampa Orcoma-Rev1 | Rev1 | Page 134 |
| 14.2.5 | Production Estimate |
It is worth mentioning that the Project's Useful Life is 25 years (RCA N° 075/17), during which it is estimated to produce 2,500 tpy of iodine (from 32,225 m³/year of iodide) and 320,325 tpy of nitrate-rich salts. However, depending on the level of exploitation, the reserves would be available for up to 28 years. The projection of the exploited sectors in 10 years, starting operations in 2024, is shown in Figure 14-10.
Figure 14-10. 10-year Orcoma. NaNO3 Plan exploitation
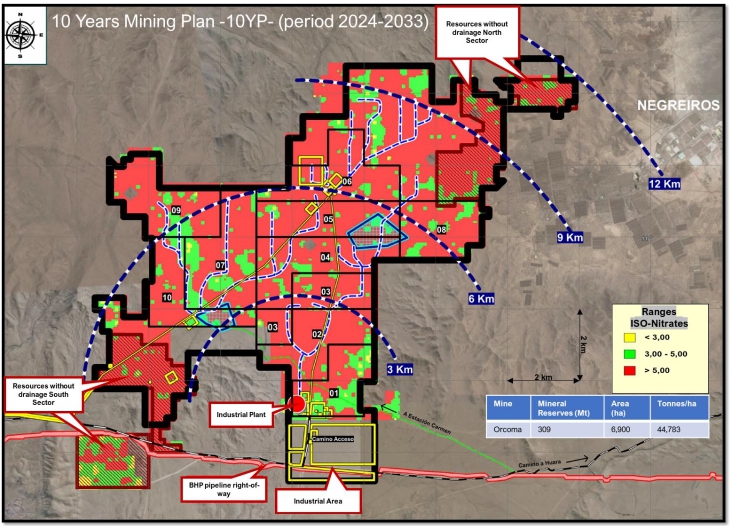
In Figure 14-10, it is also possible to observe the demarcation of the radii of the areas to be exploited with respect to the process plant. According to the information provided by the declarant, SQM has estimated the average composition per mining radius (Table 14-4).
It can be seen that, except for years 6-8 and 9 of project operation, the plan indicates resource exploitation within a radius of 3 to 6 km from the process plant, which means that on average minerals with soluble salt content between 45.2% and 48.2% will be treated with nitrate grades of 6.6%-6.9% and iodine of 409 ppm to 418 ppm.
| WSP-SQM0011-TRS-Pampa Orcoma-Rev1 | Rev1 | Page 135 |
As can be inferred from Table 14-4 and for the year 10 of operation onward, the mining radii will be 9-12 km and therefore, the estimated average iodine and nitrate grade is in the range of 405 to 410 ppm and 6.4% -7.0% respectively. While the soluble salt content will be around 45.6-47.9%.
The production per project year for the period 2024-2040, is shown in Table 14-5, showing the production of the heap leaching process set out in the short and long-term Mining Plan.
Regarding plans, as shown in the mining-industrial project in Table 14-5, there is a project to expand iodide and iodine plant treatment capacity from a production of 2,500 tpy of iodine equivalent to 5,000 tpy. The exploitation strategy focuses on an operation sequencing away from the plant and operations centers to the north, which allows the growth of the trunk lines that transport gravity solutions to the plant and/or operations centers. Consequently, an 11 Mtpy rate applies for the first two years, and from the third year onward, this rate is doubled to 20 Mtpy.
However, to increase iodide and nitrate production from seawater, there must be a sequential increase in the water supply from 200L/s to 400 L/s. It is estimated that this treatment capacity increase plan, in conjunction with the implementation of investment plans for continuous mining technology and magnesium abatement, would increase the leaching yields for Iodine and nitrate.
Orcoma's Industrial Plan considers a production of 5.0 ktpy of iodine and a mine rate of 20 Mtpy starting in 2027. However, Orcoma's current RCA indicates a rate of 2.5 ktpy of iodine and for the mine a rate of 11 Mtpy. SQM is currently preparing the "Orcoma Expansion EIA". This document is scheduled to be submitted to the SEIA in March 2023, and its approval is estimated for mid-2025, so the change in production rate would be anticipated. However, it should be noted that approval corresponds to a project risk factor. The risk of not obtaining final environmental approvals from the authorities in the appropriate period may cause significant delays in the execution and start-up of the expanded project.
Table 14-5 shows an average heap leach yield for the period of 64% for iodine and 61% for nitrate. The value reported for each year has been calculated using empirical relationships between soluble salts, grades, and planned unit consumption for the period.
| WSP-SQM0011-TRS-Pampa Orcoma-Rev1 | Rev1 | Page 136 |
Table 14-4. Pampa Orcoma average composition per mining radius
| Radius | | | Grades | | | Saline matrix | | | Soluble salts | |
| Km | | | NaNO3 (%) | | | I (ppm) | | | Na2SO4 (%) | | | Ca (%) | | | Mg (%) | | | K (%) | | | SO4 (%) | | | KClO4 (%) | | | NaCl (%) | | | Na (%) | | | H3BO3 (%) | | | % | |
| 3 | | | | 6.6 | | | | 409 | | | | 23.05 | | | | 3.56 | | | | 0.87 | | | | 0.88 | | | | 10.88 | | | | 0.036 | | | | 12.41 | | | | 7.93 | | | | 0.49 | | | | 45.4 | |
| 6 | | | | 6.9 | | | | 418 | | | | 22.78 | | | | 3.33 | | | | 0.9 | | | | 0.94 | | | | 10.98 | | | | 0.042 | | | | 12.14 | | | | 8.16 | | | | 0.44 | | | | 48.2 | |
| 9 | | | | 7 | | | | 410 | | | | 23.34 | | | | 3.44 | | | | 0.92 | | | | 0.91 | | | | 11.15 | | | | 0.039 | | | | 12.75 | | | | 7.72 | | | | 0.46 | | | | 45.6 | |
| 12 | | | | 6.4 | | | | 405 | | | | 23.50 | | | | 3.30 | | | | 0.88 | | | | 0.95 | | | | 11.8 | | | | 0.042 | | | | 10.92 | | | | 7.56 | | | | 0.5 | | | | 47.9 | |
Table 14-5. Pampa Orcoma Process Plant Production Summary
| Term | | Short Term | | | Long Term | |
| Parameter | | 2024 | | | 2025 | | | 2026 | | | 2027 | | | 2028 | | | 2029 | | | 2030 | | | 2031 | | | 2033 | | | 2034 | | | 2035-2039 | | | 2040 | |
| Average caliche (Mt) | | | 7.5 | | | | 10.5 | | | | 13.5 | | | | 17.5 | | | | 20 | | | | 20 | | | | 20 | | | | 20 | | | | 20 | | | | 20 | | | | 20 | | | | 20 | |
| Unit water (m³/tonnes) consumption | | | 0.55 | | | | 0.55 | | | | 0.55 | | | | 0.55 | | | | 0.55 | | | | 0.55 | | | | 0.55 | | | | 0.55 | | | | 0.55 | | | | 0.55 | | | | 0.55 | | | | 0.55 | |
| Ore grade (I2, ppm) | | | 408 | | | | 410 | | | | 403 | | | | 406 | | | | 421 | | | | 408 | | | | 410 | | | | 415 | | | | 405 | | | | 407 | | | | 407 | | | | 407 | |
| Ore grade (nitrate, %) | | | 6.57 | % | | | 6.97 | % | | | 6.67 | % | | | 6.51 | % | | | 6.44 | % | | | 6.85 | % | | | 6.58 | % | | | 6.13 | % | | | 7.39 | % | | | 6.89 | % | | | 6.89 | % | | | 6.89 | % |
| Soluble salts, % | | | 48.08 | % | | | 46.87 | % | | | 48.56 | % | | | 50.26 | % | | | 45.98 | % | | | 48.17 | % | | | 54.50 | % | | | 46.76 | % | | | 47.73 | % | | | 51.56 | % | | | 46.50 | % | | | 46.50 | % |
| Model yield | | | | | | | | | | | | | | | | | | | | | | | | | | | | | | | | | | | | | | | | | | | | | | | | |
| Iodine leaching yield correlation, % | | | 73.5 | % | | | 74.9 | % | | | 71.6 | % | | | 71.3 | % | | | 78.8 | % | | | 73.4 | % | | | 69.5 | % | | | 76.5 | % | | | 72.8 | % | | | 70.7 | % | | | 74.3 | % | | | 74.3 | % |
| Nitrate leaching yield correlation % | | | 77.2 | % | | | 77.1 | % | | | 76.6 | % | | | 75.7 | % | | | 79.2 | % | | | 76.5 | % | | | 72.3 | % | | | 79.4 | % | | | 75.4 | % | | | 73.8 | % | | | 77.6 | % | | | 77.6 | % |
| | | | | | | | | | | | | | | | | | | | | | | | | | | | | | | | | | | | | | | | | | | | | | | | | |
| Industrial plan target | | | | | | | | | | | | | | | | | | | | | | | | | | | | | | | | | | | | | | | | | | | | | | | | |
| Iodine produced (kt) | | | 1.9 | | | | 2.7 | | | | 3.3 | | | | 4.2 | | | | 5.5 | | | | 5.0 | | | | 4.8 | | | | 5.3 | | | | 4.9 | | | | 4.8 | | | | 5.0 | | | | 5.0 | |
| Nitrate produced (kt) | | | 230 | | | | 340 | | | | 416 | | | | 520 | | | | 615 | | | | 632 | | | | 574 | | | | 587 | | | | 672 | | | | 613 | | | | 645 | | | | 645 | |
| WSP-SQM0011-TRS-Pampa Orcoma-Rev1 | Rev1 | Page 137 |
This sub-section contains forward-looking information related to the projected requirements for energy, water, process materials and personnel for the Project. The material factors that could cause actual results to differ materially from the conclusions, estimates, designs, forecasts or projections in the forward-looking information include any significant differences from one or more of the material factors, or assumptions, that were set forth in this sub-section including actual plant requirements that yield different results from the historical operations.
Nitrate and iodine process needs, such as energy, water, labor, and supplies, will be supported by committed infrastructure. The following sections detail energy, water, staff and process input consumption.
| 14.3.1 | Energy and Fuel Requirements |
Energy
The power supply comes from the permanent power line installations at the site. The purpose of the power supply system is to supply electricity to the industrial areas for the operations required and to supply electricity to the adduction system specifically through Substations installed in EA, E.B N°1, and E.B. N°2, which will be operated remotely from the plant room.
In addition, there will be an internal connection network in the mine areas and industrial zones (33 kV medium voltage power lines). The operation considers the consumption of 195,000 MWh/year, which comes from the 1x220 kV high voltage line Cóndores - Parinacota.
Also, the option of using a backup generator (2 MW) for the COM is considered, to operate this equipment in the event of a power outage and to be able to attend the pumps (iodide plant, iodine plant, neutralization plant, exchange house, bathrooms, office, seawater reception pool, and other minor consumptions) that must be in permanent operation.
Fuel
The operation will require the consumption of 7,400 m³/year of diesel fuel. It will be supplied by duly authorized fuel trucks.
The fuel destination sites will be the substations (EA, EB1, EB2), Industrial Area Plant, evaporation ponds, and seawater reception pools. All liquid fuel storage systems will be designed based on the minimum requirements established in Art. 324 of D.S. 132 of the Mining Safety Regulations, regulatory provisions of D.S. 160/08 and 160/09 of the Ministry of Economy, Development and Reconstruction, Safety Regulations for Facilities and Operations of Production and Refining, Transport, Storage, Distribution and Supply of Liquid Fuels.
The projection of energy and fuel consumption between 2024 and 2028 is shown in Table 14-6.
| WSP-SQM0011-TRS-Pampa Orcoma-Rev1 | Rev1 | Page 138 |
Table 14-6. Projection of energy and fuel requirements to 2024-2028
| Sector | | Requirement | | Unit | | 2024 | | | 2025 | | | 2026 | | | 2027 | | | 2028 | |
| | Gas | | Mm³ | | - | | | - | | | - | | | - | | | - | |
| Mine | | Diesel | | Mm³ | | | 2.5 | | | | 5.1 | | | | 9.6 | | | | 9.9 | | | | 9.9 | |
| | | Energy | | GWh | | | 9.1 | | | | 18.2 | | | | 34.7 | | | | 35.8 | | | | 35.8 | |
| | Gas | | Mm³ | | | - | | | | - | | | | - | | | | - | | | | - | |
| Process | | Diesel | | Mm³ | | | - | | | | - | | | | - | | | | - | | | | - | |
| Plant | | Energy | | GWh | | | 1.0 | | | | 4.2 | | | | 4.3 | | | | 7.0 | | | | 8.6 | |
| | | Kerosene | | Mm³ | | | 0.3 | | | | 1.2 | | | | 1.2 | | | | 2.0 | | | | 2.4 | |
Source: SQM
| 14.3.2 | Water Consumption and Supply |
Regarding the sources to be used, it is indicated that the owner will contract supply services from authorized companies or sources. The water requirement will not exceed 6,307,200 m³/year. The extraction permit contemplates an abstraction of 200 L/s of seawater.
Water Supply System
Water supplies are covered for primary consumption, potable water consumption (treated and available in drums, dispensed by an external supplier), and the water required for industrial quality work.
The seawater supply system will ensure the water supply required for caliche processing with a maximum flow of up to 200 L/s during operation.
The system considers an early detection of leaks using comparative and redundant flow meter readings at the beginning and end of each section. There will also be pressure reading systems related to the expected power lines for each operating condition. If a fault is detected, the sectioning valves located every 5 km will be closed. This measure will reduce the potential spill to a maximum of 1,500 m³.
The seawater storage system includes ponds for industrial and sanitary water storage.
The raw water is treated and used for all purposes requiring clean water with low dissolved solids and salt content, mainly for reagent replenishment.
A storage tank will be installed for sanitary water, with a built-in chlorination system. The water storage tank will also supply water for sanitary use in safety showers and other similar applications:
| · | Firefighting water for use in the sprinkler and hydrant system. Water storage tank with its respective pump and piping system distributed throughout the plant installation. |
| · | Cooling water and/or boilers for steam production. |
| WSP-SQM0011-TRS-Pampa Orcoma-Rev1 | Rev1 | Page 139 |
Water consumption
Drinking Water
In the Project's operation phase, drinking water is required to cover all workers' consumption needs and for sanitary services. Drinking water supply (100 l/person/day, of which 2 l/person/day is drinking water) at the work fronts and cafeterias will require jerry cans and/or bottles provided by authorized companies, and sanitary water supplied at the worksite facilities from tanks located in the worksite sector, which will have a chlorination system and will be supplied by cistern trucks. An average of 450 workers per month will be required when operating the project at full capacity, so the total amount of drinking water during this period will be 45 m³/day.
Industrial Water
The total consumption of seawater used during the operation phase will amount to approximately 6,307,200 m³/year. It will come from the seawater suction system and be stored in the reception ponds.
Water for Dust Control
As an emission control measure, the project considers humidifying work areas and interior roads during the construction and operation phases (at a frequency of 5 times per day).
Table 14-7 provides a breakdown of the estimated annual water consumption during the operation phase in terms of potable, industrial, and dedicated water for monthly and yearly humidification.
Table 14-7. Pampa Orcoma industrial and potable water consumption
Process
Industrial Water 1 | | Volume (m³/Month) | | | Volume (m³/Year) | |
| | | | | | | |
| Mine | | 499,320 | | | 56,471 | |
| Leaching heaps | | 5,056 | | | 5,991,840 | |
| Iodide plant | | 4,667 | | | 60,675 | |
| Iodine plant | | 283 | | | 56,008 | |
| Neutralization plant | | 11,568 | | | 3,392 | |
| Solar evaporation ponds | | 499,320 | | | 138,813 | |
| Total industrial process | | 525,600 | | | 6,307,200 | |
| Drinking Water1 | | 1,350 | | | 16,200 | |
| Road Wetting Requirements 2 |
| Access Ruta 5 a Ruta A-412 | | 3 | | | 36 | |
| Roads Internal roads in mine area | | 4 | | | 45 | |
| Pipeline and power line roads | | 23 | | | 270 | |
| Total road wetting | | 29 | | | 351 | |
Source: 1. SQM-ORCOMA Sectorial Permits. Report Mine Closure Plan; 2.RCA 75/2017
A sequential increase in seawater supply from 200L/s to 400 l/s is required to increase iodine and nitrate production as planned from the third year of operation.
| WSP-SQM0011-TRS-Pampa Orcoma-Rev1 | Rev1 | Page 140 |
The operation requires an average of 450 workers. At this stage, the project will operate 24 hours a day. Table 14-8 provides an initial summary of the workers' requirements by operating activity.
Table 14-8. Personnel required by operational activity
| Actividad operativa | | Pampa Orcoma | |
| Caliche mining | | 297 | |
| Maintenance (mine-plant) | | 24 | |
| Iodide production | | 11 | |
| Iodine production | | 25 | |
| Neutralization system | | 1 | |
| Evaporation system-operations | | 47 | |
| Evaporation system, maintenance | | 45 | |
| Total | | 450 | |
| 14.3.4 | Process Plant Consumables |
In the plants, inputs such as sulfur, chlorine, kerosene, sodium hydroxide, or sulfuric acid to produce a concentrated iodine solution are added to produce iodide, then used to produce iodine. These inputs arrive by truck from different parts of the country. The main routes and associated vehicular flows for input supply and raw material dispatch are the A-412, road that connects with Route 5.
Reagent Consumption Summary
Table 14-9 includes a summary of the most significant inputs and materials used to operate the project. Some of the elements can be replaced by an alternative compound, for example, sulfur can replace sulfur by liquid sulfur dioxide, kerosene by sodium hydroxide, and finally, lime by sodium carbonate.
| WSP-SQM0011-TRS-Pampa Orcoma-Rev1 | Rev1 | Page 141 |
Table 14-9. Pampa Orcoma Process Reagents and Consumption rates per year
| Reagent & Consumables | Function Or Process Area | Units | Consumption | Storage Place / Tank Volume |
| Sodium hypochlorite | addition of sodium hypochlorite solution in the seawater pipeline suction. | tpy | 118 | 20 m³ |
| Ammonium nitrate | necessary for the blasting to be carried out during the extraction of caliche in the mine area. | tpy | 2,750 | stored at the Explosives Store |
| Sulfuric acid | iodide plant | tpy | 5,496 | carbon steel pond |
| Sulfur | iodide and iodine consumption in iodide and iodine plants | tpy | 4,739 (iodide plant) | 400-m² concrete field |
| 209 (iodine plant) |
| liquid sulfur dioxide | used as an alternative to solid sulfur | tpy | 5,000 | 15-m³ ISO tank |
| Kerosene | at the iodide plant as a solvent | tpy | 1,831 | two tanks of 75 m³ each |
| Sodium hydroxide | at the iodine plants and at de iodide plant in replacement of kerosene | tpy | 3,795 (iodide plant) | stored in the warehouse |
| 35 (iodine plant) |
| Chlorine | supply chlorine to the iodine plants as an oxidizer | tpy | 879 | iso-tank with net capacity varying between 14 and 20 tonnes. |
| Filter aid | alpha cellulose powder used at iodide and iodine plants | tpy | 4 (iodine plant) 3 (iodide plant) | input warehouse |
| Diatomite | iodide plant | tpy | 11.5 | in input warehouse |
| Hydrogen peroxide | iodine plant as an oxidizer | tpy | 636 | Reception in 15 m³ tanks
Storage in 2 tanks of 24 m³ each |
| Activated carbon | at the iodine plant | tpy | 13 | input warehouse |
| Sulfonitric acid | at the iodine plant | tpy | 10.2 | tank |
| Sodium Metabisulfite | iodine plant | tpy | 35 | input warehouses |
| Lime (75 % CaO) | neutralization plant | tpy | 2,280 | 2 silos of 50 m³ |
| 40-m³ lime tanks |
| Sodium carbonate | neutralization plant for lime replacement | tpy | 2,335 | input warehouse |
| Fuel oil | Iodine plant | tpy | 361 | 70-m³ tanks |
| Barrels | packaging | units/month | 3,433 | Warehouses |
| Polyethylene bags | packaging | units/month | 4,079 | Warehouses |
| Krealon bags | packaging | units/month | 3,739 | Warehouses |
| Maxi bags | packaging | units/month | 94 | Warehouses |
| WSP-SQM0011-TRS-Pampa Orcoma-Rev1 | Rev1 | Page 142 |
Reagent Handling and Storage
It should be noted that the inputs used in the operation are stored in stockpiles and ponds, facilities available in the so-called input reception and storage area. The following infrastructure will be available for the storage of inputs used at Pampa Orcoma's plants:
| · | Chlorine ponds (mobile). |
Each reagent storage system assembly is segregated for compatibility and located in containment areas with curbs to prevent spills from spreading and incompatible reagents from mixing. Sump sumps and sump pumps are available for spill control.
High-pressure air at 6-7 bar (600-700 kPa) comes from the existing compressors to satisfy the needs of the plant as well as the instruments. The high-pressure air supply is dried and distributed through air receivers located throughout the plant. Each process plant has a compressor room to provide the supply.
| 14.4 | Qualified Person’s Opinion |
Gino Slanzi Guerra, QP responsible for the metallurgy and treatment of the resource said:
| · | The level of laboratory, bench, and pilot plant scale metallurgical testing conducted in recent years has determined that the raw material is reasonably amenable to production. Reagent forecasting and dosing will be based on analytical processes that establish mineral grades, valuable element content, and impurity content to ensure that the system's treatment requirements are effective. |
| WSP-SQM0011-TRS-Pampa Orcoma-Rev1 | Rev1 | Page 143 |
| · | From a heap feed point of view, most of the material fed to the heaps comprises ROM minerals in granulometry. There is also a mining method called "continuous mining", where caliche mantles break up using reaming equipment, which allows obtaining a smaller and more homogeneous grain size mineral that has meant obtaining higher recoveries of approximately ten percentage points over the recovery in the ROM heaps. |
| · | Water incorporation in the process is a relevant aspect, a decision that is valued given the current water shortage and that is a contribution to the project since the tests carried out even show a benefit, from the perspective of its contribution to an increase in the recovery of iodine and nitrate. |
| WSP-SQM0011-TRS-Pampa Orcoma-Rev1 | Rev1 | Page 144 |
This section contains forward-looking information related to locations and designs of facilities comprising infrastructure for the Project. The material factors that could cause actual results to differ materially from the conclusions, estimates, designs, forecasts or projections in the forward-looking information include any significant differences from one or more of the material factors or assumptions that were set forth in this sub-section including Project development plan and schedule, available routes and facilities sites with the characteristics described, facilities design criteria, access and approvals timing.
The "Orcoma" project under the Environmental Impact Assessment System (SEIA), aims to produce iodide, iodine, and nitrate-rich salts from the extraction and processing of caliche, from deposits rich in this mineral, located in the area called Pampa Orcoma, commune of Huara.
For this purpose, it is considered the execution of the following projects and activities:
| · | Open-pit exploitation of mining deposits, in an approximate surface of 6,883 ha (69 km2), with a caliche extraction rate of up to 11 Mtpy. Support facilities, known as the COM, will be built in association with the mine area. |
| · | Construction of an iodide production plant, with a capacity of 2,500 tpy (iodine equivalent). |
| · | Construction of an iodine plant, to process up to 2,500 tpy. |
| · | Construction of evaporation ponds to produce nitrate-rich salts at a rate of 320,325 tpy. |
| · | Construction of a seawater adduction pipeline from the northern sector of Caleta Buena to the mining area, to meet the water needs during the operation phase, with a maximum flow of up to 200 L/s. |
| · | Connection of the industrial areas of the Project to the Norte Grande Interconnected System (SING), to provide sufficient energy for their electrical requirements. |
The Project, as shown in Figure 15-1, is in the Tarapacá region, Tamarugal province, Huara commune, 20 km northwest of Huara, its nearest town. due to the existence of the adduction works and the power transmission line, the Project expands to the west of the commune, up to the north of Caleta Buena, where the seawater intake is located.
| WSP-SQM0011-TRS-Pampa Orcoma-Rev1 | Rev1 | Page 145 |
Figure 15-1. Project Location

| 15.1 | Access Roads to the Project |
General access to the Project, suitable for all types of vehicles, is near the 23rd-kilometer point of Route A-412.
Access to Route A-412 may be via Route A-514 or from Route 5, through a 3.4 km long connecting road that will make it approximately 3.8 km north of Huara. Conditions on Route A-412, between the plant access and Route 5, will be improved by applying bischofite, which acts as a dust suppressant and stabilizer, thus creating a road surface that is resistant to vehicular traffic.
In addition, a road will be built from Route A-514 to the west, which will reach the coast to access the works that make up the seawater intake system and the power transmission line, according to the conceptual engineering.
From the interior of the mine area, access to the rest of the linear works will be possible through the construction of a service road, which will be located parallel to them.
All the roads to be built will have a width of 10 m, with a soil running surface.
| WSP-SQM0011-TRS-Pampa Orcoma-Rev1 | Rev1 | Page 146 |
The following is a description of the parts that will make up the permanent works of the Project.
| 15.2.1 | Seawater Supply System |
The seawater supply system that will be required for the operation of the Project consists of the following components:
Seawater Intake System
The seawater intake system (Figure 15-2) consists of a suction inlet, with the respective intake filter; a section of underwater piping, located on top of the seabed; a section of intertidal piping, which will be installed on the seabed with reinforced concrete supports; and finally, an auxiliary station, consisting of the pump and electrical room, where the main pumps will be installed with all the elements necessary for their operation and the sodium hypochlorite addition equipment.
The underwater pipeline, defined between the intake filter and the beginning of the intertidal pipeline section, will be installed on the seabed, will be made of 600-800 mm diameter HDPE, PN16 thickness and will have an extension of 327 m.
In the Auxiliary Station (AS), with an area of 150 m2, three pumps will be installed (1 stand by) driven by an electric motor, with a capacity of 100 L/s each, and the necessary equipment for their operation, such as gate valves; suction and discharge manifold; check valves; vacuum pump for priming the main pumps; in addition to the above, all the electrical power and control system will be installed. Its location makes it necessary to consider a protection system, for which a retaining wall is planned, located immediately to the east of the pump room.
| WSP-SQM0011-TRS-Pampa Orcoma-Rev1 | Rev1 | Page 147 |
Figure 15-2. Seawater Suction System
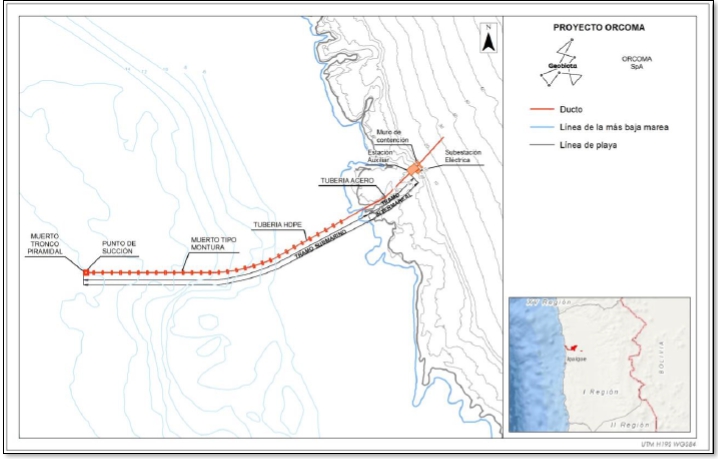
Pipeline from Auxiliary Station to Pumping Station N°1
Transports seawater from the Auxiliary Station to the settling ponds located around Pumping Station No. 1 (EB1).
Pumping Station Nº1
EB 1 will be in the "Punta rabo de ballena" (Whale Tail Point) sector and will consist of: 2 settling ponds of 6,000 m³ each, discharge pump for the ponds, filter, 505 m3 pond, and impulsion pump.
In addition to the above, an electrical substation will supply the energy for the operation of the equipment.
Pipeline from Pumping Station Nº1 to Pumping Station Nº2
It corresponds to a steel or HDPE pipeline or both combinations, with an approximate length of 14.5 km, which will be installed superficially and eventually covered.
| WSP-SQM0011-TRS-Pampa Orcoma-Rev1 | Rev1 | Page 148 |
Emergency pool
A 7,500-m3 capacity pool will be built with 3 m to 4.5 m high walls, to accumulate the water in the pipeline in case of a possible breakage, or operational failure.
Pumping Station No. 2
Pumping Station No. 2 (EB2), situated at approximately km 15 of the route, contains a high-pressure pump, a 505 m3 seawater storage tank, and controls for pump operation. An electrical substation is associated with this station, which will provide the energy necessary for its operation.
Pipeline from Pumping Station No. 2 to Seawater Reception Pools.
This corresponds to a pipeline of steel, HDPE, or a combination of both, with an approximate 15.3 km length, which will be installed superficially and covered, if necessary.
Seawater Reception Pools
Two seawater reception pools of 26,000 m3 each, equal to the volume required for three days of operation, are considered. Both pools have pumps to drive seawater to the COM and iodine plant.
Figure 15-3. Seawater Supply System
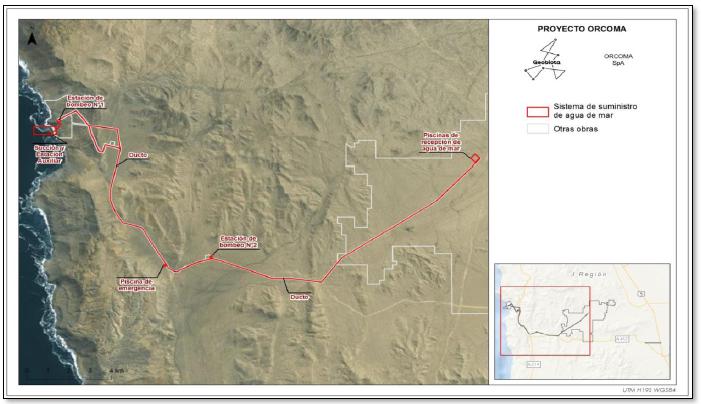
| WSP-SQM0011-TRS-Pampa Orcoma-Rev1 | Rev1 | Page 149 |
| 15.2.2 | Power Supply System |
To supply the energy required for project operations, as well as for the operation of the water supply system, the installation of an electrical transmission network is contemplated, consisting of the following parts:
Electric Transmission Line
The construction of a 33-kilovolt (kV), medium voltage electrical transmission line (LdTE) is considered, starting from the current 1-x-220-kV Cóndores - Parinacota electrical transmission line, owned by Transelec, through the installation of a Tap Off. From this point, the distribution to the pumping stations, the Industrial Area, and the Neutralization Plant will be contemplated.
Electrical Substations (S/E)
Their characteristics, location, and main elements will depend on the type of substation in question (connection to the generator, tap-off to SING high voltage line, or downstream transformation, etc.), which may include transformation yard, distribution yard, compensation yard, line yard, transformers, common facilities.
The Project contemplates the construction of eight substations, as follows:
| · | A Tap-Off on one side of the 1-x-220-kV Transelec Condors - Parinacota power line. |
| · | One S/E at the auxiliary station |
| · | One S/E at pumping station N°1. |
| · | One S/E at pumping station N°2. |
| · | One S/E at seawater reception pools. |
| · | Two S/E at the iodine plant. |
| · | One S/E at the neutralization plant. |
The Project considers a caliche mining area for the exploitation of caliche. In total, it involves an area of approximately 6,883 ha (69 km2), in which the construction of the following facilities is also contemplated:
Mine Operation Center
The COM is a support facility located inside the mine, whose purpose is to manage the different solutions. A COM comprises the heap leaching and wall height ponds between 3 and 4.5 m high, with HDPE lining, where brine from the leaching heaps, seawater from the reception ponds, intermediate solution, and mixed solution is accumulated. Besides the pumps associated with each pond that deliver the brine solution to the iodide plant.
| WSP-SQM0011-TRS-Pampa Orcoma-Rev1 | Rev1 | Page 150 |
The COM could consider other associated facilities corresponding to general service facilities for mine site personnel, offices, workshops, dining rooms, exchange houses, among others. A total of 3 COMs are expected to be installed during the life of the Project.
Mine Maintenance Workshop
Near both the COM North and COM Plant, a mine maintenance workshop will be installed, each consisting of a 5 ha surface area, which will include the following activities:
| · | Truck maintenance shop for periodic maintenance of the mine truck mechanical systems. New oil tanks and a 30 m3 capacity waste oil disposal tank will be installed. |
| · | Truck and machinery washing area. This area will have a washing slab and a settling pool, with three sedimentation ponds in which the water will circulate gravitationally. |
| · | Warehouse for supplies and spare parts |
| · | Welding workshop. Its objective is to provide corrective maintenance to the structure, chassis, and hoppers of the mine trucks |
| · | Civic neighborhood in the North Mine Workshop |
| · | Sewage plant in the North Mine Workshop |
Waste Storage
A waste generation point will be installed, which will later be transferred to the temporary disposal sectors described in greater detail below.
Powder Magazine
An ammonium nitrate silo, a powder magazine, and a controlled blasting area will be installed in the mine area.
| WSP-SQM0011-TRS-Pampa Orcoma-Rev1 | Rev1 | Page 151 |
The production of iodine, iodide, and nitrate salts requires the establishment of an industrial area that includes the following facilities, which are identified in Figure 15 4:
Solar Evaporation Ponds
With an area of approximately 427 ha, this facility will be located at the southern end of the mining area. The infrastructure associated with this facility corresponds to:
| · | Solar evaporation ponds with an area of approximately 194.12 ha. It involves a set of ponds and solution transfer pumps between them. The salts precipitated in the ponds are harvested with earth-moving equipment and transported in trucks to the storage sector. |
| · | Production and discard salt storage sector with an approximate area of 28 and 85 ha, respectively. |
| · | Final location of the solar evaporation ponds could be determined based on the information provided by the following stages of the project. |
Iodide, Iodine, and Neutralization Plants
| · | A 10,000 m2 iodide plant, consisting of a reception area for mineral or liquid sulfur; concrete piles for equipment installation; brine Feeble storage pool; chlorine reception and storage area; sulfuric acid reception and storage area; and kerosene reception and storage area. |
| · | A 5,000 m2 iodine plant, consisting of iodide reception and storage, foundations for equipment installation, peroxide reception and storage area, chlorine reception and storage area, metabisulfite reception and storage area, and prill iodine storage area. |
A typical layout of the iodine and iodide plant is shown in Figure 15-4.
| · | A neutralization plant with an area of approximately 100,000 m2, with lime or sodium carbonate reception and storage facilities; lime slurry preparation ponds, and neutralization ponds |
| · | Three medium voltage electrical substations |
| WSP-SQM0011-TRS-Pampa Orcoma-Rev1 | Rev1 | Page 152 |
| · | Drinking water supply system |
| · | 2-MW backup generator set |
| · | Product storage: to be located inside the iodide-iodine plant, to temporarily store the product for its subsequent transfer to the shipping point. A surface area of 840 m2 is considered. |
| · | Maintenance workshop: It will be located inside the iodide-iodine plant to meet the maintenance requirements of pumps and all types of minor equipment. It is considered an area of 750 m2. |
| WSP-SQM0011-TRS-Pampa Orcoma-Rev1 | Rev1 | Page 153 |
Figure 15-4. Characteristic Diagram of the Iodine-Iodide Plant
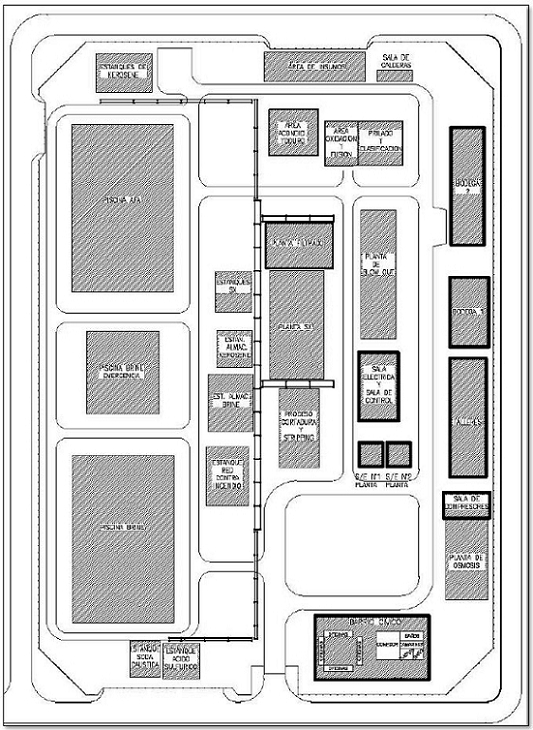
| WSP-SQM0011-TRS-Pampa Orcoma-Rev1 | Rev1 | Page 154 |
This section contains forward-looking information related to commodity demand and prices for the Project. The material factors that could cause actual results to differ materially from the conclusions, estimates, designs, forecasts or projections in the forward-looking information include any significant differences from one or more of the material factors or assumptions that were set forth in this section including prevailing economic conditions, commodity demand and prices are as forecasted over the LOM period.
SQM is the world’s largest producer of potassium nitrate and iodine and one of the world´s largest lithium producers. It also produces specialty plant nutrients, iodine derivatives, lithium derivatives, potassium chloride, potassium sulfate and certain industrial chemicals (including industrial nitrates and solar salts). The products are sold in approximately 110 countries through SQM worldwide distribution network, with more than 90% of the sales derived from countries outside Chile.
The business strategy is to maintain the world leadership position in the market for iodine, potassium nitrate, lithium and salts.
The products are mainly derived from mineral deposits found in northern Chile. Mine and process caliche ore and brine deposits.
Caliche ore in northern Chile contains the only known nitrate and iodine deposits in the world and is the world's largest commercially exploited slice of natural nitrate.
From the caliche ore deposits, SQM produces a wide range of nitrate-based products used for specialty plant nutrients and industrial applications, as well as iodine and its derivatives.
The SQM´s products are divided into six categories:
| · | Specialty plant nutrients |
| · | Iodine and its derivatives |
| · | Lithium and its derivatives |
| · | Potassium chloride and potassium sulfate |
| · | Other commodity fertilizers |
| WSP-SQM0011-TRS-Pampa Orcoma-Rev1 | Rev1 | Page 155 |
Table 16-1 presents the percentage breakdown of SQM's revenues for 2020, 2019 and 2018 according to the product lines:
Table 16-1. Breakdown (%) of Revenues by SQM Production Line for the Years 2020, 2019, and 2018
| Revenue Breakdown | | 2020 | | | 2019 | | | 2018 | |
| Specialty Plant Nutrition | | | 39.2 | % | | | 37.9 | % | | | 35.3 | % |
| Lithium and derivatives | | | 21.4 | % | | | 26.5 | % | | | 33.1 | % |
| Iodine and derivatives | | | 18.7 | % | | | 19.4 | % | | | 14.7 | % |
| Potassium | | | 11.7 | % | | | 11.1 | % | | | 12.1 | % |
| Industrial Chemicals | | | 9.0 | % | | | 5.0 | % | | | 4.9 | % |
| 16.2 | Iodine and its Derivatives, Market, Competition, Products, Customers |
SQM is one of the world's leading producers of iodine and its derivatives, which are used in a wide range of medical, pharmaceutical, agricultural and industrial applications, including x-ray contrast media, polarizing films for liquid crystal displays (LCD/LED), antiseptics, biocides and disinfectants, in the synthesis of pharmaceuticals, electronics, pigments and dye components.
In 2020, the SQM´s revenues from iodine and iodine derivatives amounted to USD334.7 million, representing 18.4% of the total revenues in that year. It is estimated that SQM´s sales accounted for approximately 28% of global iodine sales by volume in 2020.
SQM's strategy for the iodine business is:
| i. | To achieve and maintain sufficient market share to optimize the use of the available production capacity. |
| ii. | Encourage demand growth and develop new uses for iodine. |
| iii. | Participate in the iodine recycling projects through the Ajay-SQM Group (ASG), a joint venture with the US company Ajay Chemicals Inc. (Ajay). |
| iv. | Reduce the production costs through improved processes and increased productivity to compete more effectively. |
| v. | Provide a product of consistent quality according to the requirements of the customers. |
Iodine and iodine derivatives are used in a wide range of medical, agricultural and industrial applications as well as in human and animal nutrition products. Iodine and iodine derivatives are used as raw materials or catalysts in the formulation of products such as X-ray contrast media, biocides, antiseptics and disinfectants, pharmaceutical intermediates, polarizing films for LCD and LED screens, chemicals, organic compounds and pigments. Iodine is also added in the form of potassium iodate or potassium iodide to edible salt to prevent iodine deficiency disorders.
| WSP-SQM0011-TRS-Pampa Orcoma-Rev1 | Rev1 | Page 156 |
X-ray contrast media is the leading application of iodine, accounting for approximately 23% of demand. Iodine’s high atomic number and density make it ideally suited for this application, as its presence in the body can help to increase contrast between tissues, organs, and blood vessels with similar X-ray densities. Other applications include pharmaceuticals, which account for 13% of demand; LCD and LED screens, 12%; iodophors and povidone-iodine, 9%; animal nutrition, 8%; fluoride derivatives, 7%; biocides, 6%; nylon, 4%; human nutrition, 4% and other applications, 14%.
Japan has the world's largest reserves of iodine, contained in brines rich in sodium iodide (NaI) in natural gas wells east of Tokyo, and estimated at 5 Mt million tonnes of contained iodine. For reasons of geotechnical stability of the wells, the extraction of brine has a controlled flow, so its production is limited in its level current.
Iodine resources in Chile are found in the nitrate deposits of the regions of Tarapacá and Antofagasta, in the form of calcium iodate, Ca(IO3)2 in typical concentrations of 400 ppm (0.04% iodine by weight). It is obtained in co-production with sodium nitrate. The reserves in these deposits are estimated at 1.8 Mt of iodine, the second in the world.
The USA has similar resources in its type to Japan, but to a lesser extent (250,000 t).
During 2020, the world production level is estimated at 39,300 t, led by Chile, Japan, and USA. Chile contributes with about 21,941 t produced that year. SQM contributes 12,000 t of iodine and derivatives.
During 2020, iodine demand was impacted significantly due to the economic crisis caused by Covid-19, with total global demand decreasing by approximately 9% to 33,200 t, of which 9,700 were sold by SQM.
Although the decrease in demand occurred across product lines, two uses of iodine had growth compared to 2019: the use of povidone-iodine grew by 6%, and the use of iodine for human nutrition grew by 1%. It is expected that most iodine applications will begin to recover demand during the course of 2021.
| WSP-SQM0011-TRS-Pampa Orcoma-Rev1 | Rev1 | Page 157 |
Figure 16-1 shows the evolution of the production of iodine and its derivatives in Chile from 1996 to 2020.
Figure 16-1. Iodine and Derivates, Production Evolution 1996-2020
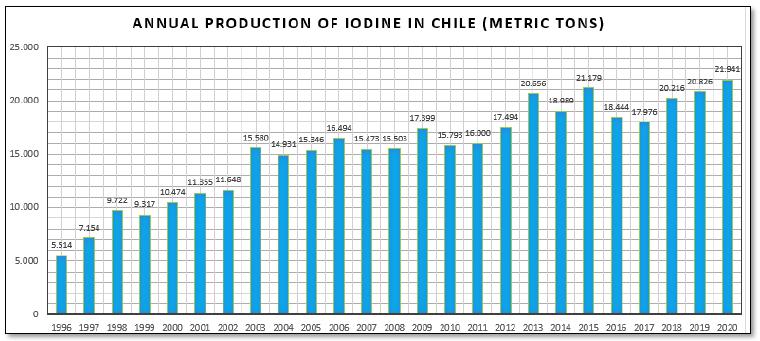
Source: Chilean Copper Commission Non-Metallic Mining Statistics.
SQM supplies 12,000 t of iodine and derivatives and other companies contribute the difference. The other Chilean producers are Atacama Chemical S.A. (Cosayach), controlled by the Chilean holding company Inverraz S.A.; ACF Minera S.A., owned by the Chilean Urruticoechea family; Algorta Norte S.A., a joint venture between ACF Minera S.A. and Toyota Tsusho; and Atacama Minerals, which is owned by Chinese company Tewoo.
SQM produces iodine in Nueva Victoria plant, near Iquique, and in Pedro de Valdivia plant, close to María Elena. The production capacity is 14,800 t of iodine per year, including the Iris plant, which is located near the Nueva Victoria plant.
Through ASG, SQM produces organic and inorganic iodine derivatives. ASG was established in the mid-1990s and has production plants in the United States, Chile and France. ASG is one of the world’s leading inorganic and organic iodine derivatives producer.
Consistent with the business strategy, SQM works on the development of new applications for iodine-based products, pursuing a continuing expansion of the businesses and maintaining the market leadership.
SQM manufactures its iodine and iodine derivatives in accordance with international quality standards and have qualified its iodine facilities and production processes under the ISO 9001:2015 program, providing third party certification of the quality management system and international quality control standards that SQM has implemented.
| WSP-SQM0011-TRS-Pampa Orcoma-Rev1 | Rev1 | Page 158 |
SQM´s revenues decreased to USD334.7 million in 2020 from USD371.0 million in 2019. This decrease was primarily attributable to lower sales volumes during 2020. SQM's sales volumes decreased 24.1% in 2020. Average iodine prices were more than 18.9% higher in 2020 than in 2019.
Table 16-2 shows the total sales volumes and revenues from iodine and iodine derivatives for 2020, 2019, and 2018.
Table 16-2. Volumes of and Revenues from Iodine and Iodine Derivatives
| Sales volumes (kt) | | 2020 | | | 2019 | | | 2018 | |
| Iodine and derivatives | | | 9.7 | | | | 12.7 | | | | 13.3 | |
| Total revenues (in USD millions) | | | 334.7 | | | | 371.0 | | | | 325.0 | |
| 16.2.3 | odine Marketing and Customers |
In 2020, SQM sold iodine products in 47 countries to 250 customers, and most of the sales were exports. Two customers each accounted for more than 10% of the iodine revenues in 2020. These two customers accounted for approximately 42% of revenues, and the ten largest customers accounted in the aggregate for approximately 77% of revenues. No supplier accounted for more than 10% of the cost of sales of this business line.
Table 16-3 shows the geographical breakdown of the revenues.
Table 16-3. Breakdown of the Revenue
| Revenues breakdown | | 2020 | | | 2019 | | | 2018 | |
| North America | | | 27 | % | | | 24 | % | | | 26 | % |
| Europe | | | 42 | % | | | 33 | % | | | 34 | % |
| Chile | | | 0 | % | | | 0 | % | | | 0 | % |
| Central and South America (excluding Chile) | | | 3 | % | | | 2 | % | | | 2 | % |
| Asia and Others | | | 27 | % | | | 40 | % | | | 37 | % |
SQM sells iodine through its own worldwide network of representative offices and through its sales, support and distribution affiliates. SQM maintains inventories of iodine at its facilities throughout the world to facilitate prompt delivery to customers. Iodine sales are made pursuant to spot purchase orders or within the framework of supply agreements. Supply agreements generally specify annual minimum and maximum purchase commitments, and prices are adjusted periodically, according to prevailing market prices.
| WSP-SQM0011-TRS-Pampa Orcoma-Rev1 | Rev1 | Page 159 |
The world’s main iodine producers are based in Chile, Japan and the United States. Iodine is also produced in Russia, Turkmenistan, Azerbaijan, Indonesia, and China.
Iodine is produced in Chile using a unique mineral known as caliche ore, whereas in Japan, the United States, Russia, Turkmenistan, Azerbaijan, and Indonesia, producers extract iodine from underground brines that are mainly obtained together with the extraction of natural gas and petroleum. In China, iodine is extracted from seaweed.
Five Chilean companies accounted for approximately 55% of total global sales of iodine in 2020, including SQM, with approximately 28%, and four other producers accounting for the remaining 27%.
The other Chilean producers are Atacama Chemical S.A. (Cosayach), controlled by the Chilean holding company Inverraz S.A.; ACF Minera S.A., owned by the Chilean Urruticoechea family; Algorta Norte S.A., a joint venture between ACF Minera S.A. and Toyota Tsusho; and Atacama Minerals, which is owned by Chinese company Tewoo.
Eight Japanese iodine producers accounted for approximately 28% of global iodine sales in 2020, including recycled iodine.
Iodine producers in the United States (one of which is owned by Toyota Tsusho and another by Ise Chemicals Ltd., both of which are Japanese companies) accounted for nearly 5% of world iodine sales in 2020.
Iodine recycling is a growing trend worldwide. Several producers have recycling facilities, where they recover iodine and iodine derivatives from iodine waste streams.
It is estimated that 19% of the iodine supply comes from iodine recycling. SQM, through ASG, or alone, is also actively involved in the iodine recycling business using iodinated side streams from a variety of chemical processes in Europe and the United States.
The prices of iodine and iodine derivative products are determined by market conditions. World iodine prices vary depending upon, among other things, the relationship between supply and demand at any given time. Iodine supply varies primarily as a result of the production levels of the iodine producers and their respective business strategies.
The price of iodine recovered after the low level of USD12/kg registered in 2003, stabilizing between USD22 and USD26/kg in the period 2006-2010, and then enjoy significant growth in 2011 and 2012, exceeding USD 52/kg. The reason for this increase of four times in relation to ten years ago is mainly in a narrow of the market due to strong demand. The main cause is attributed to the explosive demand registered as a result of the earthquake in Japan that affected nuclear power plants, forcing the supply of iodine (potassium iodide tablets) to the population to avoid thyroid complications due to effects of possible nuclear radiation. In addition, this increased the medical controls that require RX, the main application of iodine. In 2013 there was a fall attributed to a more stabilized demand and to the greater Chilean supply available, which led to the price of iodine in the coming years being located at an intermediate level between the value registered in 2010 and the maximum in 2012, more in line with market fundamentals.
| WSP-SQM0011-TRS-Pampa Orcoma-Rev1 | Rev1 | Page 160 |
The annual average iodine sales prices increased to approximately USD35 per kilogram in 2020, from the average sales prices of approximately USD29 per kilogram observed in 2019 and USD24 per kilogram observed in 2018.
During 2021, the demand for iodine recovered to pre-pandemic levels, and sales volumes per SQM were close to 12,000 t, with a price close to USD35/kg.
Demand for iodine varies depending upon overall levels of economic activity and the level of demand in the medical, pharmaceutical, industrial and other sectors that are the main users of iodine and iodine-derivative products. Certain substitutes for iodine are available for certain applications, such as antiseptics and disinfectants, which could represent a cost-effective alternative to iodine depending on prevailing prices.
The main factors of competition in the sale of iodine and iodine derivative products are reliability, price, quality, customer service and the price and availability of substitutes. SQM has competitive advantages over other producers due to the size and quality of its Mineral Reserves and the production capacity available. Iodine is competitive with that produced by other manufacturers in certain advanced industrial processes. SQM also benefits from the long-term relationships it has established with its main clients.
Nitrates are obtained in Chile from the exploitation of the fields of nitrates that are located in a strip of approximately 700 km long by 30 km to 50 km wide, which is located in the north of Chile, to the east of the Cordillera de la Costa, in the regions of Tarapacá and Antofagasta. This is the only area in the world where nitrate deposits have reserves and resources with economic content, where it is feasible to obtain different products such as sodium nitrate, potassium nitrate, iodine and sodium sulfate. Its ore, called caliche, is presented preferably as a dense, hard surface layer of salt-cemented sands and gravels, with variable thicknesses between 0.5 m to 5 m.
The caliche resources and reserves estimated by SERNAGEOMIN for the year 2007, amounted to 2,459 Mt with an average grade of 6.3% nitrates. In turn, SQM reports that its total reserves amount to 1,378 Mt of caliche with an average grade of 6.29% of nitrates, this is 56% of national total.
Nitrates, in general, are considered specialty fertilizers, because they are applied in a relatively narrow range of crops where it is possible to obtain higher yields and better products in their crops compared to massive fertilizers (urea and others).
Of these, potassium nitrate is today the main nitric fertilizer due to the combination of two primary nutrients, Nitrogen (N), and Potassium (K). Other nitric fertilizers are nitrate of sodium, ammonium nitrate and calcium nitrate. Nitrates explain less than 1% of the world market for nitrogenous fertilizers.
The most relevant crops for the potassium nitrate market are fruits, vines, citrus, tobacco, cotton and vegetables, where higher yields and specific benefits are achieved such as improvements in color, flavor, skin strength, disease resistance, etc.
| WSP-SQM0011-TRS-Pampa Orcoma-Rev1 | Rev1 | Page 161 |
Potassium nitrate competes favorably against ammoniacal fertilizers in Market niches indicated Its greatest advantage is the solubility and speed of assimilation by the plants. These properties have been key to gaining a solid position in the applications of drip irrigation and foliar fertilization that are applied in specialty crops and higher value, is that is, those that clearly bear the highest cost of this type of fertilizer.
In addition, sodium nitrate, historically recognized in the international market as "Salitre de Chile", fulfills functions like potassium nitrate, although the functionality of the sodium is more limited. For this reason, it has been losing importance to the benefit of potassium nitrate.
For some applications, a more balanced dose of sodium and potassium is required; and therefore, potassium-sodium is especially elaborated, which corresponds to a mixture of 70% by weight of sodium nitrate and 30% potassium nitrate.
Additionally, nitrates can be modified by adding other functional nutrients, such as phosphorus, sulfur, boron, magnesium, silicon, etc., seeking to enhance certain fertilizer properties for more specific crops. These products fall into the range of fertilizer mixtures.
Sodium and potassium nitrates also have industrial applications based on their chemical properties.
The alkaline oxides of sodium and potassium (Na2O and K2O) give it properties to melt as a source of sodium or potassium, required in the special glass industry. The nitrate, for its composition rich in oxygen, strengthens the oxidizing properties. Its main applications industrial are found in high-resolution glasses for TV screens and computers, ceramics, explosives, charcoal briquettes, metal treatment and various chemical processes as a powerful industrial oxidant.
It is relevant to mention the great growth potential of the application of nitrates in solar thermal installations, where it plays the role of a heat accumulator that allows capturing the solar energy in the day and release heat at night to allow almost continuous operation of power generation plants. The most efficient solar salt for this purpose is a mixture of 60% by weight of sodium nitrate and 40% of potassium nitrate.
In Chile, the main companies producing nitrate are SQM, Cosayach and ACF. However, it is estimated that SQM produces close to 95% of the nitrates produced in Chile.
| WSP-SQM0011-TRS-Pampa Orcoma-Rev1 | Rev1 | Page 162 |
Figure 16-2 shows the evolution of the production of nitrates in Chile from 1996 to 2020.
Figure 16-2. Annual production of Nitrates in Chile
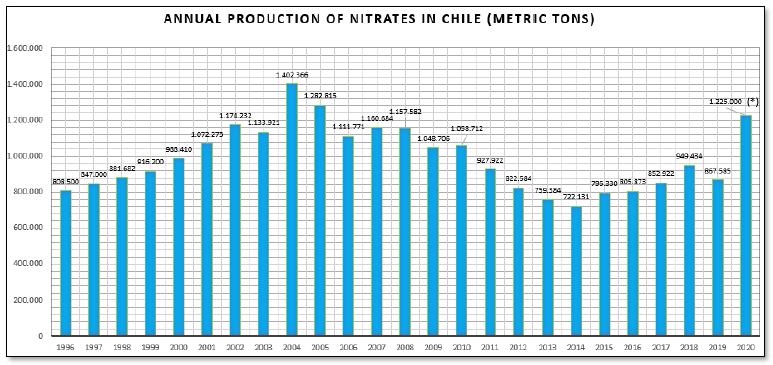
Source: Chilean Copper Commission Non-Metallic Mining Statistics.
Note: (*): value considers the production of nitrates in fertilizer and in the chemical industry.
In 2020, SQM supplied more than 1,000,000 t of nitrates to the specialty plant nutrition market and nearly 225,000 t of nitrates to the Industrial chemicals market.
It is estimated that the Chilean participation in the potassium nitrate market is between 47% and 53% of world sales. It should be noted that Chilean natural nitrates, although unique in nature, must compete on the international market with similar products of synthetic origin, produced mainly in Israel, Jordan and China.
The price of nitrates has varied from USD241/t registered in 2003, reaching USD400/t in 2006 and 2007, and stabilizing between USD650 to 900 in the period 2009-2019. In 2020, the price for Specialty Plant Nutrition was on average USD677/t and for Industrial Chemicals it was USD713/t.
In 2021, it is estimated that the demand for potassium nitrate increased by 5%, as its average price rose to around USD730/t.
| 16.3.1 | Specialty Plant Nutrition, Market, Competition, Products, and Customers |
In 2020, SQM's revenues from the sale of specialty plant nutrients was USD701.7 M, representing 39% of the total revenues for that year.
Specialty Plant Nutrients are premium fertilizers that allow farmers to improve their yields and the quality of certain crops.
SQM produces four main types of specialty plant nutrients that offer nutritional solutions for fertigation, soil and foliar applications, such as potassium nitrate, sodium nitrate, sodium potassium nitrate, and specialty blends.
| WSP-SQM0011-TRS-Pampa Orcoma-Rev1 | Rev1 | Page 163 |
In addition, SQM markets other specialty fertilizers including third-party products.
All these products are commercialized in solid or liquid form, for use mainly in high-value crops such as fruits, flowers and certain vegetables.
These fertilizers are widely used in crops using modern farming techniques such as hydroponics, greenhouses, foliar-applied crops and fertigation (in the latter case, the fertilizer is dissolved in water before irrigation).
Specialty plant nutrients have certain advantages over commodity fertilizers. Such advantages include rapid and effective absorption (no need for nitrification), higher water solubility, alkaline pH (which reduces soil acidity), and low chloride content.
One of the most important products in the field of specialty plant nutrients is potassium nitrate, which is available in crystallized and granulated (prilled) form, which allows different application methods. Crystalline potassium nitrate products are ideal for application by fertigation and foliar applications. Potassium Nitrate Granules are suitable for direct use in soil.
SQM has developed brands for marketing according to the different applications and uses of the products. The main brands are: UltrasolR (fertigation), QropR (soil application), SpeedfolR (foliar application) and AllganicR (organic agriculture).
The new needs of more sophisticated customers demand that the industry provide integrated solutions rather than individual products. The products, including customized specialty blends that meet specific needs along with the agronomic service provided, allow to create plant nutrition solutions that add value to crops through higher yields and better-quality production.
Because SQM products come from natural nitrate deposits or natural potassium brines, they have certain advantages over synthetically produced fertilizers.
One of these advantages is the presence in the products of certain beneficial micronutrients, valued by those customers who prefer products of natural origin.
As a result, specialty plant nutrients are sold at a premium price compared to commodity fertilizers.
SQM's strategy in the specialty plant nutrition business is:
| i. | Leverage (take) the advantages of the specialty products over commodity-type fertilizers. |
| ii. | Selectively expanding the business by increasing sales of higher-margin specialty plant nutrients based on potassium and natural nitrates, particularly soluble potassium nitrate and specialty blends. |
| iii. | Pursue (seek) investment opportunities in complementary businesses to enhance (improve) the product portfolio, increase production, reduce costs, and add value to the marketing of the products. |
| iv. | Develop new specialty nutrient blends produced at the mixing plants that are strategically located in or near the principal markets to meet specific customer needs. |
| WSP-SQM0011-TRS-Pampa Orcoma-Rev1 | Rev1 | Page 164 |
| v. | Focus primarily on the markets where SQM can sell plant nutrients in soluble and foliar applications to establish a leadership position. |
| vi. | Further develop the global distribution and marketing system directly and through strategic alliances with other producers and global or local distributors. |
| vii. | Reduce production costs through improved processes and higher labor productivity to compete more effectively. |
| viii. | Supply a product with consistent quality according to the specific requirements of customers. |
Specialty Plant Nutrition: Market
The target market for the specialty plant nutrients includes producers of high-value crops such as vegetables, fruits, industrial crops, flowers, cotton, and others. Furthermore, SQM sells specialty plant nutrients to producers of chloride-sensitive crops.
Since 1990, the international market for specialty plant nutrients has grown at a faster rate than the international market for commodity-type fertilizers. This is mainly due to:
| i. | The application of new agricultural technologies such as fertigation, hydroponics and greenhouses. |
| ii. | The increase in the cost of land and the scarcity of water, which has forced farmers to improve their yields and reduce water use. |
| iii. | The increase in the demand for higher quality crops. |
Over the last ten years the compound annual growth rate for per capita vegetable production was 3% while the same rate for the world population was close to 1%.
The global scarcity of water and arable land is driving the development of new agricultural techniques to maximize the use of these resources. An example of this is the more efficient use of water. While total irrigation has grown at an annual average of 1% over the last 20 years (like population growth), micro-irrigation (more efficient in water use) has grown by 10% per year in the same period. Micro-irrigation systems, which include drip irrigation and micro-sprinklers, are the most efficient forms of technical irrigation. These applications require fully water-soluble plant nutrients. The specialty nitrate-based plant nutrients are fully water soluble and provide nitric nitrogen, which allows faster nutrient uptake by the crop than when using urea or ammonium-based fertilizers. This facilitates the efficiency in the consumption of nutrients in the plant and, therefore, increases the yield of the harvest and improves its quality.
The lowest global share of hectares under micro-irrigation over total irrigated hectares is recorded in Asia with a figure of around 3%. This means that there is a high potential for the introduction of this technology in the region in the next years.
China is an important market for potassium nitrate, however agricultural demand for this product is largely met by local producers. The demand for potassium nitrate in the Asian country reaches approximately 400,000 to 420,000 t, of which approximately 130,000 t are linked to the tobacco industry and approximately another 120,000 t are related to horticulture. Of this total, between 15,000 and 35,000 t of potassium nitrate correspond to imports.
| WSP-SQM0011-TRS-Pampa Orcoma-Rev1 | Rev1 | Page 165 |
Specialty Plant Nutrition: Products
Potassium nitrate, sodium potassium nitrate, and specialty blends are higher margin products that use sodium nitrate as a feedstock. These products can be manufactured in crystallized or prilled form. Specialty blends are produced using the company’s own specialty plant nutrients and other components at blending plants operated by the Company or its affiliates and related companies in Brazil, Chile, China, Spain, the United States, the Netherlands, Italy, Mexico, Peru and South Africa.
Table 16-4 shows sales volumes and revenue for specialty plant nutrients for 2020, 2019, and 2018.
Table 16-4. Volumes of and revenues from specialty plant nutrients
| | | 2020 | | | 2019 | | | 2018 | |
| Sales volumes (kt) | | | | | | | | | | | | |
| Sodium nitrate | | | 25.6 | | | | 30.2 | | | | 25.0 | |
| Potassium nitrate and Sodium potassium nitrate | | | 575.2 | | | | 617.4 | | | | 673.4 | |
| Specialty blends | | | 271.3 | | | | 238.9 | | | | 242.5 | |
| Blended nutrients and other specialty plant nutrients | | | 164.4 | | | | 155.3 | | | | 141.6 | |
| Total revenues (in USD millions) | | | 701.7 | | | | 723.9 | | | | 781.8 | |
In 2020, SQM's revenues from the sale of specialty plant nutrients decreased to USD701.7 million, representing 39% of the total revenues for that year and 3.1% less than USD723.9 million for sales of the previous year. Average prices during 2020 were down approximately 2.6%.
It is estimated that SQM's sales volume of potassium nitrate marketed during 2020 represented close to 50% of the total potassium nitrate marketed in the world for all its applications (including agricultural use). During 2020, the agricultural potassium nitrate market increased approximately 5% when compared to 2019. These estimates do not include potassium nitrate produced and sold locally in China, only Chinese net imports and exports.
Depending on the application systems used to deliver specialty nutrients, fertilizers can be classified as granular (also known as Specialty Field Fertilizer [SFF]), or soluble (also known as Water soluble fertilizer [WSF]).
| WSP-SQM0011-TRS-Pampa Orcoma-Rev1 | Rev1 | Page 166 |
Granulated specialty nutrients are those for direct application to the soil, either manually or mechanized, which have the characteristics of high solubility, are free of chloride and do not present acid reactions, which makes them especially recommended for crops of tobacco, potatoes, coffee, cotton, and for various fruit trees and vegetables.
In the soluble line, all those specialty nutrients that are incorporated into specialized irrigation systems are considered. Due to the high-tech characteristics of these systems, the products used must be highly soluble, highly nutritional, free of impurities and insoluble particles, and with a low salt index. Potassium nitrate stands out in this segment, which, due to its optimal balance of nitric nitrogen and chloride-free potassium (the two macronutrients most required by plants), becomes an irreplaceable source for crop nutrition under technical irrigation systems.
Potassium nitrate is widely known to be a vital component in foliar applications, where it is recommended to prevent nutritional deficiencies before the appearance of the first symptoms, to correct deficiencies and increase resistance to pests and diseases, to prevent stress situations and promote a good balance of fruits and/or plant growth along with its development, especially in crops affected by physiological disorders.
Specialty Plant Nutrition: Marketing and Customers
In 2020, SQM sold specialty plant nutrients in approximately 102 countries and to more than 1,100 customers. No customer represented more than 10% of specialty plant nutrition revenues during 2020, and the ten largest customers accounted in the aggregate for approximately 33% of revenues during that period. No supplier accounted for more than 10% of the costs of sales for this business line.
Table 16-5 shows the geographical breakdown of the sales.
Table 16-5. Breakdown of the sales from Specialty plant nutrition
| Sales breakdown | | 2020 | | | 2019 | | | 2018 | |
| North America | | | 35 | % | | | 34 | % | | | 31 | % |
| Europe | | | 21 | % | | | 21 | % | | | 26 | % |
| Chile | | | 14 | % | | | 15 | % | | | 14 | % |
| Central and South America (excluding Chile) | | | 10 | % | | | 11 | % | | | 10 | % |
| Asia and Others | | | 20 | % | | | 20 | % | | | 19 | % |
SQM sells specialty plant nutrition products worldwide mainly through its own global network of sales offices and distributors.
| WSP-SQM0011-TRS-Pampa Orcoma-Rev1 | Rev1 | Page 167 |
Specialty Plant Nutrition: Competition
The main competitive factors in potassium nitrate sales are product quality, customer service, location, logistics, agronomic expertise, and price.
SQM is the largest producer of sodium nitrate and potassium nitrate for agricultural use in the world.
Sodium nitrate products compete indirectly with specialty substitutes and other commodities, which may be used by some customers instead of sodium nitrate depending on the type of soil and crop to which the product will be applied. Such substitute products include calcium nitrate, ammonium nitrate, and calcium ammonium nitrate.
In the potassium nitrate market, SQM´s largest competitor is Haifa Chemicals Ltd. (Haifa), in Israel, which is a subsidiary of Trans Resources International Inc. It is estimate that sales of potassium nitrate by Haifa accounted for approximately 18% of total world sales during 2020 (excluding sales by Chinese producers to the domestic Chinese market). SQM's sales represented approximately 48% of global potassium nitrate sales by volume for the period.
ACF, another Chilean producer, mainly oriented to iodine production, has been producing potassium nitrate from caliche and potassium chloride since 2005.
Kemapco, a Jordanian producer owned by Arab Potash, produces potassium nitrate in a plant located close to the Port of Aqaba, Jordan.
In addition, there are several potassium nitrate producers in China, the largest of which are Yuantong and Migao. Most of the Chinese production is consumed by the Chinese domestic market.
In Chile, the products mainly compete with imported fertilizer blends that use calcium ammonium nitrate or potassium magnesium sulfate. Specialty plant nutrients also compete indirectly with lower-priced synthetic commodity-type fertilizers such as ammonia and urea, which are produced by many producers in a highly price-competitive market. Products compete on the basis of advantages that make them more suitable for certain applications as described above.
| 16.3.2 | Industrial Chemicals, Market, Competition, Products, and Customers |
In 2020, the SQM´s revenues from Industrial Chemicals sales amounted to USD160.6 million, representing 8,8% of the total revenues for that year.
SQM produces and markets three industrial chemicals: sodium nitrate, potassium nitrate and potassium chloride.
Sodium nitrate is mainly used in the production of glass and explosives, in metal treatments, metal recycling and the production of insulating materials, among others.
Potassium nitrate is used as a raw material to produce frits for ceramic and metal surfaces, in the production of special glasses, in the enamel industry, metal treatment, and pyrotechnics.
| WSP-SQM0011-TRS-Pampa Orcoma-Rev1 | Rev1 | Page 168 |
Solar salts, a combination of potassium nitrate and sodium nitrate, are used as a thermal storage medium in concentrated solar power plants.
Potassium chloride is a basic chemical used to produce potassium hydroxide, and it is also used as an additive in oil drilling as well as in food processing, among other uses.
In addition to producing sodium and potassium nitrate for agricultural applications, SQM produces different grades of these products, including prilled grades, for industrial applications. The grades differ mainly in their chemical purity.
At SQM there is some operational flexibility in the production of industrial nitrates because they are produced from the same process as their equivalent agricultural grades, needing only an additional step of purification.
SQM, with certain constraints, shift production from one grade to the other depending on market conditions. This flexibility allows to maximize yields and to reduce commercial risk.
In addition to producing industrial nitrates, SQM produces, markets and sells industrial potassium chloride.
The strategy in industrial chemical business is to:
| (i) | Maintain the leadership position in the industrial nitrates market. |
| (ii) | Encourage demand growth in different applications as well as exploring new potential applications. |
| (iii) | Reliable supplier for the thermal storage industry, maintaining close relationships with R&D programs and industrial initiatives. |
| (iv) | Reduce production costs through improved processes and higher productivity to compete more effectively |
| (v) | Supply a product with consistent quality according to the requirements of the customers. |
Industrial Chemicals: Market
Industrial sodium and potassium nitrates are used in a wide range of industrial applications, including the production of glass, ceramics and explosives, metal recycling, insulation materials, metal treatments, thermal solar and various chemical processes.
In addition, this product line has also experienced growth from the use of industrial nitrates as thermal storage in concentrated solar power plants (commonly known as “concentrated solar power” or “CSP”). Solar salts for this specific application contain a blend of 60% sodium nitrate and 40% potassium nitrate by weight ratio and are used as a storage and heat transfer medium. Unlike traditional photovoltaic plants, these new plants use a “thermal battery” that contains molten sodium nitrate and potassium nitrate, which store the heat collected during the day. The salts are heated up during the day, while the plants are operating under direct sunlight, and at night they release the solar energy that they have captured, allowing the plants to operate even during hours of darkness. Depending on the power plant technology, solar salts are also used as a heat transfer fluid in the plant system and thereby make CSP plants even more efficient, increasing their output and reducing the Levelized Cost of Electricity (LCOE).
| WSP-SQM0011-TRS-Pampa Orcoma-Rev1 | Rev1 | Page 169 |
A growing trend for the CSP application is seen because of its economical long duration electricity storage. The thermal storage of CSP plants helps to improve the stabilization of the electricity grid. Like all large power generation plants, such large CSP power plants are capital intensive and require a relatively long development period.
SQM supplies solar salts to CSP projects around the world. In 2020, it sold approximately 160,000 t of solar salts to supply a CSP project in the Middle East. Expect to supply over 400,000 t to this project between 2020-2022. In addition, there are ten major projects currently under development worldwide that SQM believes could supply between 2020-2025. As a result, expect SQM´s sales volumes of this product to surpass 1 Mt during the 2020-2025 period.
There is also a growing interest in using solar salts in thermal storage solutions not related to CSP technology. Due to their proven performance, solar salts are being tested in industrial heat processes and heat waste solutions. These new applications may open new opportunities for solar salts uses in the near future, such as retrofitting coal plants.
Industrial Chemicals: Products
Revenues for industrial chemicals increased to USD160.6 million in 2020 from USD94.9 million in 2019, as a result of higher sales volumes in this business line. Sales volumes in 2020 increased 82.3% compared to sales volumes reported last year.
Table 16-6 shows the sales volumes of industrial chemicals and total revenues for 2020, 2019 and 2018:
Table 16-6. Volumes of and Revenues from Industrial Chemicals
| | | 2020 | | | 2019 | | | 2018 | |
| Sales volumes (kt) |
| Industrial chemicals | | | 225.1 | | | | 123.5 | | | | 135.9 | |
| Total revenues (in USD millions) | | | 160.6 | | | | 94.9 | | | | 108.3 | |
Industrial Chemicals: Marketing and Customers
In 2020 SQM sold industrial nitrate products in 54 countries to 268 customers. One customer accounted for more than 10% of SQM´s revenues of industrial chemicals in 2020, accounting for approximately 69%, and the ten largest customers accounted in the aggregate for approximately 79% of such revenues.
No supplier accounted for more than 10% of the cost of sales of this business line.
SQM makes lease payments to CORFO, which are associated with the sale of different products produced in the Salar de Atacama, including lithium carbonate, lithium hydroxide and potassium chloride.
| WSP-SQM0011-TRS-Pampa Orcoma-Rev1 | Rev1 | Page 170 |
Table 16-7 shows the geographical breakdown of the revenues for 2020, 2019, and 2018.
Table 16-7. Breakdown of the Sales from Industrial Chemicals
| Sales breakdown | | 2020 | | | 2019 | | | 2018 | |
| North America | | | 15 | % | | | 29 | % | | | 25 | % |
| Europe | | | 7 | % | | | 16 | % | | | 16 | % |
| Chile | | | 3 | % | | | 42 | % | | | 4 | % |
| Central and South America (excluding Chile) | | | 3 | % | | | 7 | % | | | 11 | % |
| Asia and Others | | | 72 | % | | | 6 | % | | | 43 | % |
SQM´s industrial chemical products are marketed mainly through its own network of offices, representatives and distributors. SQM maintains updated inventories of the stocks of sodium nitrate and potassium nitrate, classified according to graduation, to facilitate prompt dispatch from its warehouses. SQM provides support to its customers and continuously work with them to develop new products and applications for its products.
Industrial Chemicals: Competition
SQM is one of the world's largest producers of industrial sodium nitrate and potassium nitrate. In 2020, SQM's estimated market share by volume for industrial potassium nitrate was 73% and for industrial sodium nitrate was 44% (excluding domestic demand in China and India).
The competitors are mainly based in Europe and Asia, producing sodium nitrate as a by-product of other production processes. In refined grade sodium nitrate, BASF AG, a German corporation, and several producers in China and Eastern Europe are highly competitive. They produce industrial sodium nitrate as a by-product of other production processes.
SQM´s industrial sodium nitrate products also compete indirectly with substitute chemicals, including sodium carbonate, sodium sulfate, calcium nitrate and ammonium nitrate, which may be used in certain applications instead of sodium nitrate and are available from many producers worldwide.
The main competitor in the industrial potassium nitrate business is Haifa, which had a market share of 16% for 2020. SQM's market share was approximately 73% for 2020. Other competitors are mainly based in China.
| WSP-SQM0011-TRS-Pampa Orcoma-Rev1 | Rev1 | Page 171 |
Producers of industrial sodium nitrate and industrial potassium nitrate compete in the marketplace based on attributes such as product quality, delivery reliability, price, and customer service. SQM´s operation offers both products at high quality and with low cost. In addition, SQM´s operation is flexible, allowing to produce industrial or agricultural nitrates, maximizing the yields, and reducing commercial risk. In addition, with certain restrictions, SQM can adapt production from one grade to another depending on market needs.
In the potassium chloride market, SQM is a relatively small producer, mainly focused on supplying regional needs.
Pricing Estimates
The QP has determined that using $35/kg for iodine at the port of Tocopilla is the appropriate price for this study. Nitrates are more complicated since various products are produced based on market conditions, however the QP has determined that an appropriate average price for nitrates at Tocopilla is $US680. The derivation of a price for delivery of nitrates for refining in Coya Sur is detailed in Section 19.
| WSP-SQM0011-TRS-Pampa Orcoma-Rev1 | Rev1 | Page 172 |
| 17 | Environmental Studies, Permitting and Social or Community Impact |
The following section details the environmental components of the Project. It presents the applicable laws and regulations and lists the permits that will be needed in order to begin the mining operations. The environmental impact assessment (EIA) process requires that data be gathered on many components and consultations be held to inform the Project relevant stakeholders. The main results of this inventory and consultation process are also documented in this section. The design criteria for the water and mining waste infrastructure are also outlined. Finally, the general outline of the mine’s rehabilitation plan is presented to the extent of the information available.
| 17.1 | Environmental Studies |
The Law 19.300/1994 General Bases of the Environment (Law 19.300 or Environmental Law), its modification by Law 20.417/2010 and Supreme Decree N°40/2012 Environmental Impact Assessment Service regulations (DS N°40/2012 or RSEIA)) determine how projects that generate some type of environmental impact must be developed, operated and closed. Regarding mining projects, the art. 3.i of the Environmental Law defines that mining project must be submitted to the Environmental Impact Assessment System (SEIA) before being developed.
The Orcoma project was submitted to the SEIA in December 2015 and was approved by the environmental qualification resolution (RCA) N°75 in September 2017.
The Orcoma project aims to produce iodide, iodine and nitrate-rich salts from the extraction and processing of caliche, from deposits rich in this mineral, located in the area called “Pampa Orcoma”, in the commune of Huara.
To achieve the previously mentioned objective, the project contemplates executing the works and actions indicated below:
| · | Open pit exploitation of mining deposits, in an approximate area of 6,883 ha (69 km2), with a caliche extraction rate of up to 11 Mtpy. Associated with the mine area, there will be a backup facility called the COM. |
| · | Construction of an iodide production plant, with a capacity of 2,500 tpy (iodine equivalent). |
| · | Construction of an iodine plant to process up to 2,500 tpy. |
| · | Construction of evaporation ponds to produce nitrate-rich salts at a rate of 320,325 tpy. |
| · | Construction of a seawater adduction pipeline from the northern sector of Caleta Buena to the mining area, to cover the water needs during the operation phase, with a maximum flow of up to 200 L/s. |
| · | Connection of the industrial areas of the Project to the Norte Grande Interconnected System (SING), in order to provide sufficient energy for their electrical requirements. |
| WSP-SQM0011-TRS-Pampa Orcoma-Rev1 | Rev1 | Page 173 |
It should be noted that the project has not yet been built and construction is expected to begin in 2022. Preconstruction activities are currently underway and sectoral permits are being processed as indicated below. In order to avoid the expiration of the environmental resolution, the construction of the Project must start before September 2022.
Accordingly, with information provided by SQM a new EIA will be submitted to the SEIA during 2023. The new project has as objective to expand Orcoma's operation with respect to its actual environmental authorization, from 2,500 ton prill Iodine/year up to 5,000 ton prill Iodine/year considering the same mining area and emplacement for productions facilities.
It is expected to have the environmental authorization of this new project by mid-2025. There is no detailed information regarding the characteristics of the project, so it is not possible no assess the risks and the main measures that may be generated as consequence of this project.
SQM has experience presented and submitted several successful projects under SEA with similar characteristics.
Finally, there is a risk that the environmental authorization will not be obtained within the required timeframe.
In the Environmental Impact Statement (EIA), approved by RCA N° 75/2017, an environmental baseline study was conducted that included the following components, among others:
Climate and Weather
The Orcoma Project is located in the Tarapacá Region, characterized by its mostly arid climate. The average annual temperature fields show a marked east-west distribution, which is characterized by a decrease in temperature as the terrain has higher elevations.
According to the document prepared by the Meteorological Directorate of Chile, this field is divided into highland, intermediate and coastal zones, where the highest average temperature records are obtained in the coastal zone and decrease toward the east, reaching their minimum values in the Andes Mountains. The latter zone has records between 11°C and 13°C, while in the intermediate and coastal zones the records vary between 14°C-16°C and 16°C-18°C, respectively.
The records indicate winds from the southwest during the day with speeds between 4.5 and 6.5 m/s, while at night winds from the northeast with speeds between 2.5 meters per second (m/s) and 3 m/s are generally observed.
Due to the location of the project, the relative humidity values of the atmosphere vary greatly, reaching ranges close to 100% at night.
| WSP-SQM0011-TRS-Pampa Orcoma-Rev1 | Rev1 | Page 174 |
Air Quality
The company adopted as a voluntary commitment the monitoring of air quality in four surrounding sectors: Huara, Colonos Rurales, Bajo Soga and Zapiga, commitment which was made from pre-construction stage, six months before construction began. During this stage, concentrations of PM10, PM2.5 at the Colonos Rurales and Bajo Soga stations, concentrations of PM10 and gases (SO2, NOx, CO, and O3) at Huara, and sedimentable particulate matter (SPM) at Zapiga will be monitored. This is done to verify that there are no significant impacts on this environmental component. To date, one monitoring has been carried out, corresponding to October 2021.
At Huara station, average concentrations for PM10 were 61 microgram per cubic meter (ug/m3)N, for SO2 2.9 parts per billion volume (ppbv), for NO217.9 ppbv, for CO 1.35 ppbv and for ozone (O3) 75.8 ppbv.
At Colonos Rurales station, daily maximum PM10was 45 ug/m3N, and PM2.5 was 20 ug/m3N; and at Bajo Soga station, daily maximums for PM10and PM2.5 were 44 ug/m3N and 9 ug/m3N, respectively.
At Zapiga station, sedimentable particulate matter (SPM) was measured, which ranged from 15 to 34 mg/m3 per day.
Considering that D.S. 59/1998 of MINSEGPRES establishes a limit of 150 ug/m3N of PM10 concentration, and D.S. 12/2012 of the Environmental Ministry (MMA) establishes a limit of 50 ug/m3N of PM2.5, all stations are currently in compliance with the standard.
Hydrology
Precipitation in this area is almost null, with annual average values varying from 0.7 to 5 mm/year.
Information from the General Directorate of Water (DGA), regarding the meteorological stations closest to the project area, these are Iquique and Huara in Fort Baquedano, indicate that the average annual precipitation in the project area would be between 0.8 - 1.3 mm per year,
Due to the extreme aridity of the area, there is no permanent surface runoff in the area of influence; there may only be sporadic or intermittent runoff associated with precipitation events. There is no defined drainage network for the area of influence, which corroborates the above.
An average temperature of 16.4 °C was calculated, with average maximum minimum temperatures of 19.3°C in February and average minimum temperature of 14.4°C in July (DGA information at the Baquedano Fort station 1993-2013).
Evaporation is estimated at 3,043 mm/year with 4 years of records at the Huara station at Fort Baquedano.
| WSP-SQM0011-TRS-Pampa Orcoma-Rev1 | Rev1 | Page 175 |
Hydrogeology
In the area of influence there are two hydrogeological units, fill and hydrogeological basement. The area of influence is located almost exclusively on the Sedimentary Fill unit. The fill corresponds to polymictic sandy gravels, supported matrix, well cemented by salts, while the hydrogeological basement corresponds to intrusive and volcanic sequences.
There are no groundwater resources in the project site area.
Soil
The soils observed in the area of influence correspond to soils with a very low degree of edaphic development, according to the extreme environmental conditions of aridity, which have limited the intensity with which soil-forming processes have acted.
Two homogeneous soil units have been identified, catalogued as "Pampas desert soil" and "Desert alluvial soils", mainly associated with the depositional plains or alluvial plains sectors. The main characteristics of the "Pampas Desert Soil" unit are a limiting stratum close to the soil surface, without structuring throughout the profile, and extremely high salinity values. The "Alluvial desert soils" unit has been formed from successive alluvial events caused by rainfall in the altiplano zone. It is characterized by strata of gravels, sands or clays.
Two miscellaneous units have also been identified, corresponding to the "Miscellaneous Coastal Farellón slope terrain" unit and the "Miscellaneous Coastal Dune" unit. These correspond to deposits of mineral material deposited by eolian and alluvial-colluvial mechanisms, respectively, without any evidence of edaphic evolution, located within the Farellón Costero morphostructural unit.
Of the total area of influence, 95.5% is associated with the homogeneous unit "Pampas Desert Soils" and 1.1% with "Desert Alluvial Soils"; while the representation of the miscellaneous units "Coastal Farellón Slope Land" and "Coastal Dune" is very marginal, each representing 2.7% and 0.7% of the total area of influence, respectively.
The main limitations identified, which define the assigned use capacity class, are related to the shallow effective depth, excessive soluble salt content, and low inherent fertility (very low organic matter content).
Flora and Vegetation
The area of influence considered for this component corresponds to the area where the works and/or activities of the Project will be executed (Huara-Caleta Buena Sector) and the Zapiga sector, corresponding to the surface where the vascular flora or terrestrial vegetation could be affected:
| · | Huara- Caleta Buena Sector: |
The studies show an absolute absence of flora and vegetation on the coastal edge. The rest of the sector (toward the east) is inserted in an area of absolute desert, where extreme arid conditions prevent the development of flora and the existence of vegetation formations.
| WSP-SQM0011-TRS-Pampa Orcoma-Rev1 | Rev1 | Page 176 |
| · | Zapiga Sector- Pampa del Tamarugal: |
Within the area planted with P. tamarugo in the Zapiga sector, 5 strata were identified.
The forest inventory determined a total of 276.541 specimens present in the planted area in this sector. Of these, 4.4% (12.101 specimens) correspond to standing dead trees.
The dominant height of the trees in the Zapiga sector was very variable, with trees ranging from 2,5 m to 14 m in height. The most frequently occurring dominant heights varied between 3,5 and 4,5 m, which was observed in 51.9% of the total area inventoried (2.749 ha).
Fauna
Eight species were recorded in the Pampa, seven of which were native and one introduced species. The endemic species Microlophus theresioides (Teresa's racer) is classified as "Rare", and Phrynosaura reichei (Reiche's dragon) as "Insufficiently known". Phyllodactylus gerrhopygus (Great northern gecko) is in the "Vulnerable" conservation category and has a "High" risk index, being a species sensitive to disturbances. Leucophaeus modestus (garuma gull) is classified as "Vulnerable", with a "Medium" risk index, and is considered endemic and a highly sensitive species. Finally, the presence of Pseudalopex culpaeus (culpeo fox), a highly mobile species with a conservation category of "Least Concern".
A total of 16 species were counted on the coastal edge, of which the endemics correspond to: Microlophus quadrivittatus (four-banded racer), Cinclodes nigrofumosus (coastal churrete), L. modestus (garuma gull), and Numenius phaeopus (curlew), which is a boreal migratory bird. Eight species are in some conservation category: the species Lontra felina (chungungo) is highly sensitive to disturbance because it is in the "Vulnerable" conservation category and has a "High" risk index because it is a habitat specialist. However, it is highly mobile along the coastal edge, which allows it to use this type of environment extensively. The species Phalacrocorax bougainvillii (guanay) and Leucophaeus modestus (garuma gull), classified as "Vulnerable", and M. quadrivittatus (four-banded racer), in the "Insufficiently known" conservation category, have a "Medium" risk index. The species Phalacrocorax gaimardi (sandpiper) and Sula variegata (booby) have a "Low" risk index and "Insufficiently known" conservation category. Finally, Spheniscus humboldti (Humboldt penguin) is in the "Vulnerable" category and was detected only through the remains of one specimen, establishing it as a circumstantial record.
It was also possible to see numerous groups of Otaria flavescens (common sea lion), a species listed as "Least Concern" and considered highly mobile. Although specimens were observed along the coastal strip in both field campaigns, no out-of-water specimens or reproductive sea lions were detected in the area proposed for the installation of the seawater intake pipeline. This allows us to dismiss the possibility that the Project's works will have a significant impact on reproductive colonies of this marine mammal.
In the Zapiga sector, thirteen species were recorded, five of which are in conservation status: P. gerrhopygus (northern gecko) classified as "Vulnerable", M. theresioides (Teresa's racer) classified as "Rare", in addition to being the only endemic of this sector, Conirostrum tamarugense (tamarack comesebo) classified as "Insufficiently known", while Eligmodontia puerulus (silky-footed mouse) and P. culpaeus (culpeo fox) are classified as "Least concern".
| WSP-SQM0011-TRS-Pampa Orcoma-Rev1 | Rev1 | Page 177 |
Cultural Heritage
In terms of archaeology, a total area of 114.5 m2 was excavated, which represents a sample fraction of 8.02 % of the surface of the intervened sites. The excavation of 459 test pits in 103 heritage sites made possible; i), the precise morpho-functional classification of heritage elements; ii), the delimitation of their subsurface deposits; and iii), the characterization of the cultural contexts of these deposits.
With the fulfillment of these objectives, the final design and specific quantification of the mitigation, repair and compensation measures plan for the impact of the Orcoma project on the cultural heritage elements was made possible.
Regarding paleontology, at observation points Nº 8 and 9, the existence of fossil material remains in-situ corresponding to superficial exposures of the Santa Rosa Formation was identified. In the remaining monitoring points, where the presence of paleontological components was also detected (27, 29, 30, 31, 34, 34, 35, 35, 37, 39, 40, 40, 51, 53, 54, 54, 55, 56, and 61), they only revealed the presence of allochthonous fossils, without identifying any outcrops with in-situ material.
Human Environment
For the characterization of the human environment, the area of influence of the project is considered to be the settlements of Huara, Bajo Soga, Colonos Rurales and Pisagua, all belonging to the commune of Huara, Tarapacá region.
The commune of Huara has a total area of 10,474.6 km2 and is characterized by being 100% rural. Its main localities correspond to the settlements of Huara, Pisagua, Tarapacá, Pachica, Mocha, Sibaya, Sotoca, Chiapa, Jaiña Huaviña, Miñimiñe, Achacagua, and Chusmiza.
This territory has been used ancestrally since pre-Hispanic times by Andean populations in its different ecological levels through the mountain ravines, pampas and coastal areas. Since the political-cultural processes produced by Tiwanaku, later with the Inca expansion of Tawantinsuyu and then with the arrival of the Spanish invasion to the area, the Aymara population has managed to resist culturally to the western assimilation, due - among other things - to the wide use of the territory and the management of its resources, configuring itself as an essentially commercial culture that has achieved the exchange of goods and territorial management.
| WSP-SQM0011-TRS-Pampa Orcoma-Rev1 | Rev1 | Page 178 |
The settlements in the project’s influence area have the following characteristics:
In terms of geography, in all the settlements there is a natural flow toward Iquique, due to its role as a nodal pole. There, the population obtains products, carries out procedures, receives health care and accesses more complex and specialized education, and more. In addition, an important part of the population of these settlements has family members who live in Iquique and sell their agricultural products in this city, so they maintain a constant link with it.
In anthropological terms, the settlements have an indigenous character. There are Aymara indigenous communities and associations (mainly) in all of them. Bajo Soga and Colonos Rurales are mainly composed of Aymara population, although in Colonos Rurales the plot owners reside more permanently in Arica. Also, although Bajo Soga has a larger indigenous population than the other localities, the indigenous organizations (Indigenous People of Colchane, Pisiga Choque Indigenous Community, and Central Citani Indigenous Community) are not currently active, which is mainly due to migration to other mountainous sectors.
It is worth mentioning, with respect to cultural events, the celebration of San Lorenzo de Tarapacá, which takes place on August 10. This festival attracts inhabitants of the towns of Huara, Bajo Soga and other surrounding areas and is the second most important in the region, after La Tirana, due to its high attendance.
In terms of socioeconomics, both Bajo Soga and Colonos Rurales are predominantly agricultural settlements, where the main economic activities are the cultivation of vegetables and fruits. In the case of Bajo Soga, production is higher, so they sell products to regional markets, such as Iquique and Arica. In Pisagua, the settlement's economy revolves around the extraction of marine resources (fishing, diving and seaweed collection). According to interviews, fishermen and seaweed gatherers use the Caleta Buena sector sporadically as a free area for fishing and seaweed gathering. In this sense, it is not an area of preferential productive use for fishermen, who regularly extract seaweed in Caletas Pisagua, Junin, and Mejillones. The Caleta Buena area would serve to protect the boats that use it occasionally.
Finally, with respect to basic social welfare, the settlements of Huara and Pisagua have few lodging and food establishments, while the rest of the localities do not have any type of establishments. Nevertheless, the locality of Huara has a Family Health Center, which has the capacity to exclusively serve the inhabitants of the commune.
| 17.1.2 | Environmental Impact Assessment |
Based on the results of the EIA (Section 5), the project activities and their potential environmental impacts were analyzed. This made it possible to identify the environmental components that could be directly or indirectly affected during the different phases of the project and where they are located.
For those significant environmental impacts, management measures were designed to mitigate, repair and compensate the relevant affected elements.
In addition, other components whose impacts are not significant were included and actions will also be taken to minimize the effects in the project area.
| WSP-SQM0011-TRS-Pampa Orcoma-Rev1 | Rev1 | Page 179 |
The environmental components and types of measures included in the project's mitigation, reparation and compensation measures plan are listed below:
| · | With respect to air quality, in view of the increase in the concentration of particulate matter and polluting gases, a mitigation measure is proposed (non-significant impact). |
| · | Regarding wild animals, mitigation and compensation measures are proposed for habitat disturbance of low mobility species in the conservation category (reptiles) (significant impact). |
| · | Also, for the wildlife component, a mitigation measure is proposed for the collision and/or electrocution of birds (non-significant impact). |
| · | Regarding marine biota, mitigation measures are proposed for the alteration of intertidal and subtidal biota, planktonic communities and marine currents (non-significant impact). |
| · | Mitigation and compensation measures are proposed for the alteration of archaeological terrestrial heritage (significant impact). |
| · | Mitigation measures are proposed for the alteration of paleontological cultural heritage (non-significant impact). |
| · | Finally, in relation to the human environment, in view of the impact on the supply of basic goods and services and the alteration of specific economic activities, mitigation measures are proposed (non-significant impact). |
Additionally, it’s important to mention that the environmental resolution defines some commitments that must be complied before starting with the construction phase. Table 17-1 shows that SQM is developing the commitments defined for the pre-construction phase.
| WSP-SQM0011-TRS-Pampa Orcoma-Rev1 | Rev1 | Page 180 |
Table 17-1. Pre-construction Activities
| Commitment | When has to be done | Status of execution |
| Rescue and relocation of commercially important mobile hydrobiological species and macroalgae specimens (Lessonia trabeculata). | 15 days before starting with the works in the submareal zone to install the pipeline | The construction of the pipeline should start in 2022. |
| Plan de Seguimiento de Calidad de Aire | | There are reports of the following monitoring activities: |
| | | - | Colonos Rurales Station-, |
| | | | i. | Report of October 2021: send it by SQM and available in SNIFA |
| | | | ii. | Report of November 2021: available in SNIFA |
| | | | iii. | Report of December 2021: available in SNIFA |
| | | - | Huara Station: |
| | | | i. | Report of October 2021: send it by SQM |
| | | | ii. | Report of November 2021: available in SNIFA |
| | | | iii. | Report of December 2021: available in SNIFA |
| | 6 months before starting with the construction phase | - | Zapiga Station: |
| | | | i. | Report of October 2021: send it by SQM and available in SNIFA |
| | | | ii. | Report of November 2021: available in SNIFA |
| | | | iii. | Report of December 2021: available in SNIFA |
| | | - | Bajo Soga Station: |
| | | | i. | Report of October 2021: send it by SQM and available in SNIFA |
| | | | ii. | Report of November 2021: available in SNIFA |
| | | | iii. | Report of December 2021: available in SNIFA |
| | | Before starting with the construction of the project monitoring activities during January, February and March of 2022 must be developed. |
Source: Own elaboration.
| WSP-SQM0011-TRS-Pampa Orcoma-Rev1 | Rev1 | Page 181 |
| 17.2 | Operating and Post Closure Requirements and Plans |
| 17.2.1 | Waste disposal requirements and plans |
Two types of waste are generated during mining operations. Mineral and non-mineral wastes.
Mineral waste
In this case, the mineral wastes or mining residues correspond to inert salts that are called waste salts. These salts are transported to certain areas for deposit, stacked on the ground in the form of piles.
For this purpose, the Orcoma mine has a Sectoral Waste Salt Stockpile Permit presented and approved by the authority in accordance with current regulations (article 339 of D.S. No. 132/2002, Mining Safety Regulations of the Ministry of Mining, for the establishment of a tailings dump), and it also has the corresponding environmental authorization.
The Orcoma Project considers two contiguous sectors for the tailings deposit called "waste salts deposit", which will be the destination of the waste salts generated during the evaporation stage of the process in the solar evaporation ponds, as well as the waste generated from the neutralization process (gypsum).
In particular, the waste salt deposits will be located within the industrial area of the site and will cover an area of 63.8 ha and 11.6 ha each.
The construction of these reservoirs requires the installation of a waterproofing system and material movements (backfilling and compaction) for the formation of platforms. Subsequently, the salts to be disposed of during the operation are neutral, without presenting any health risks.
The tanks will not have drainage pipes, but a perimeter drainage system will be established, which will have two functions. On one hand, it will allow for the collection of solutions generated by the runoff generated by the impregnation solutions, which will be channeled to a collection pool and then pumped to the evaporation ponds. The other function of this drainage system will be to channel rainwater.
During operation, it should be noted that the hygroscopic properties of the salts that make up the deposits favor their high capacity for compaction and subsequent cementation. The front loaders will be utilized to spread the waste salts and create safety berms on the edges of the tanks to facilitate the unloading of the trucks.
The waste salt deposits will be monitored annually to verify that they are in accordance with the design variables.
Given the characteristics of the waste (salts that form a crust and the final brine impregnation level of the residue from the neutralization process is approximately 20%), there will be no particulate, or gas emissions.
| WSP-SQM0011-TRS-Pampa Orcoma-Rev1 | Rev1 | Page 182 |
Non-Mineral Waste
Within non-mineral waste we can find all types of waste, which in turn can be classified into hazardous waste and non-hazardous waste according to the environmental and sectorial regulations in force in Chile.
Non-hazardous waste associated with this type of project includes solid waste similar to household waste, sludge from the sewage treatment system, packaging of non-hazardous supplies, non-hazardous discards, waste associated with maintenance, and waste generated as a result of actions taken in contingencies, among others.
Hazardous waste (RESPEL) comes from process discards, maintenance of used lubricant oils generated by changes in equipment and machinery, batteries, paint residue, ink cartridges, fluorescent tubes, contaminated cleaning materials, among others.
The disposal of this type of waste has the current environmental and sectoral legal authorizations described in section 17.3 below.
In addition, the company's 2020 Sustainable Development Plan contains a set of commitments, including reducing industrial waste generation by 50% by 2025.
| 17.2.2 | Monitoring and Management Plan as Defined in the Environmental Authorization |
The project requires the presentation of a Mitigation and Compensation measures Plan, including generic and specific measures for air quality, wild animals, marine biota, archaeological and paleontological cultural heritage, and human environment. In this sense, Table 17-2 summarizes the impacts identified and the measures committed.
| WSP-SQM0011-TRS-Pampa Orcoma-Rev1 | Rev1 | Page 183 |
Table 17-2. Measures Committed in the RCA 75/2017
Environmental
component | Assessed impact | Type of measure | Measure |
| Air quality | Increased concentration of particulate matter and pollutant gases | Mitigation | Control of emissions of particulate matter and pollutant gases |
| Wetting of roads and work areas |
| Dust suppression |
| Speed restriction on unpaved roads |
| SO2 abatement system at Iodide Plant |
| Lime silo in sleeve filter |
| Wild animals | Habitat disturbance of low-mobility species in conservation category (reptiles) | Mitigation | Rescue and relocation of low mobility fauna (reptiles). |
| Mitigation | Controlled disturbance plan for low mobility fauna (reptiles). |
| Compensation | Provision of micro-shelters for rescued reptiles. |
| Collision and/or electrocution of birds | Mitigation | Installation of anti-collision devices. |
| Design of support of conductors on poles to avoid electrocution. |
| Marine biota | Alteration of intertidal biota | Mitigation | Use of rock billers in intertidal zone |
| Alteration of subtidal biota | Control of suction speed and depth |
| Alteration of planktonic communities |
| Alteration of currents |
| Terrestrial archeology | Alteration of terrestrial archaeological heritage | Mitigation | Creation of archaeological heritage protection areas |
| Compensation | Intensive archaeological survey and documentation |
| Compensation | Improvement or fitting out of rooms for the conservation of pieces of tangible cultural heritage (archeology and paleontology) |
| Paleontology | Alteration of paleontological cultural heritage | Mitigation | Rescue of elements of paleontological interest |
| Compensation | Scientific-educational publication on local and regional paleontology |
| Compensation | Improvement or fitting out of rooms for the conservation of pieces of material cultural heritage (archeology and paleontology) |
| Human environment | Impact on the supply of basic goods and services | Mitigation | Implementation of a protocol of good practices in community relations between contractors and workers |
| Disruption of specific economic activities |
Source: Own elaboration
| WSP-SQM0011-TRS-Pampa Orcoma-Rev1 | Rev1 | Page 184 |
The generic mitigation measures will be implemented to avoid or prevent the execution of activities that generate negative effects on the environment and to promote actions that produce beneficial effects. In this regard, the measures to be implemented are as follows:
| · | Inductions for all personnel (Owner and Contractors) with the objective of generating awareness among workers regarding the importance of caring for and protecting the natural, social and cultural resources present in and interacting with the Project. |
| · | Waste management will be explained to all workers. It will be strictly forbidden to dispose of any type of waste inside the project area outside the containers or areas defined for this purpose. Waste management considers additional measures to restrict access to fauna, such as the use of containers with hermetic lids and the frequency of removal to prevent excessive accumulation. It should be made clear that internal regulations strictly prohibit the feeding of wildlife. |
| · | The washing of machinery and vehicles using water from unauthorized sources and in places not intended for such activity is strictly prohibited. |
| · | The transportation of fuel within the area of influence will be carried out in accordance with the protocols established by the applicable environmental regulations, and each of the trucks involved in the transportation will have containment and rapid response equipment to deal with potential spills. |
| · | All loading and unloading of material that could be a source of particulate matter shall be carried out with due care to avoid excessive dust generation. |
| · | Prior to the execution of any work on the Project, the internal procedure for environmental clearance of the work areas will be complied with. The main objective of this procedure is to ensure that any intervention of natural resources has been identified, declared and approved in accordance with the EIA and its subsequent RCA. |
Additionally, the environmental resolution defined a monitoring and following up plan regarding the different components affected by the project. Table 17-3 shows the monitoring activities committed to.
| WSP-SQM0011-TRS-Pampa Orcoma-Rev1 | Rev1 | Page 185 |
Table 17-3. Committed Follow-up Activities
| Component | Monitoring
Activities | Phase of the
Project | Report |
| Air Quality | Air monitoring | Pre-construction/ Construction/ operation/ Closure | Pre-Construction: monthly report during 6 months before the beginning of the construction. Construction: semi-annual report and final report Operation: annual report |
| Monitoring of road irrigation activities | Construction/ operation | Construction: annual report Operation: annual report |
| Monitoring of dust suppression activities | Construction/ Operation | Construction: annual report Operation: annual report |
| Monitoring of speed restriction activities | Construction/ operation/ Closure | Construction: semi-annual report and final report Operation: annual report |
| Monitoring of SO2 abatement system | Operation | Annual report |
| Monitoring of sleeve filter | Operation | Annual report |
| Fauna | Monitoring rescue and relocation activities | Construction/ operation | 10, 30 and 60 days after de relocation |
| Monitoring controlled disturbance activities | Construction | After each activity |
| Monitoring of efficiency of anti-collision devices | Operation (3 first years of operation) | Annual report |
| Monitoring of the efficiency of conductors on poles to avoid electrocution | Operation (3 first years of operation) | Annual report |
| Marine Biota | Monitoring of using of rock billers in intertidal zone | Construction | One report to describe the process |
| Monitoring of the suction speed and depth | Operation | Annual report |
| WSP-SQM0011-TRS-Pampa Orcoma-Rev1 | Rev1 | Page 186 |
| Component | Monitoring
Activities | Phase of the
Project | Report |
| Archeological and Paleontological component | Monitoring of Intensive archaeological survey and documentation activities | Construction/ operation | Construction: semi-annual report Operation: semi-annual report |
| Monitoring of the Creation of archaeological heritage protection areas | Construction/ operation | Construction: semi-annual report and final report Operation: semi-annual report |
| Monitoring of paleontological rescue activities | Construction/ Operation | Construction: semi-annual report and final report Operation: semi-annual report |
| Monitoring of activities of improving of the rooms for conservation pieces | Construction | Report at the end of the activity enacted by the saltpeter museum corporation |
| Monitoring of Scientific-educational publication on local and regional paleontology activities | Operation | Annual report |
| Social component | Monitoring of the implementation of the protocol of good practices in community relations between contractor and workers | Construction/ operation | Construction: semi-annual report Operation: Annual report. |
Source: own elaboration
| WSP-SQM0011-TRS-Pampa Orcoma-Rev1 | Rev1 | Page 187 |
| 17.2.3 | Requirements and plans for water management during operations and after closure |
The Orcoma Project considers the use of seawater. The seawater supply system will ensure during operation the water supply required for caliche processing with a maximum flow of up to 200 L/s. The total seawater consumption used during the operation phase will amount to approximately 6,307,200 m3/year.
The total consumption of seawater used during the operation phase will amount to approximately 6,307,200 m3/year. This will come from the seawater suction system and will be stored in the reception pools.
At the end of the operation, the seawater supply system will be shut down and all installations will be removed.
| 17.3 | Environmental and Sectorial Permits Status |
This sub-section contains forward-looking information related to permitting requirements for the Project. The material factors that could cause actual results to differ materially from the conclusions, estimates, designs, forecasts or projections in the forward-looking information include any significant differences from one or more of the material factors or assumptions that were set forth in this sub-section including regulatory framework is unchanged for Study period and no unforeseen environmental, social or community events disrupt timely approvals.
In accordance with current legislation, in particular the General Environmental Law and Supreme Decree 132 of 2002, which approves the Mining Safety Regulations, there are a series of permits required to operate a mining project: sectoral or mining permits, which can be filed with SERNAGEOMIN; and mixed environmental permits, which can be filed with the corresponding SEREMI of the Environment.
For this project, in concordance with the RCA N° 75/2021 and the mining and environmental legislation, the applicable permits are those detailed in the following table.
| WSP-SQM0011-TRS-Pampa Orcoma-Rev1 | Rev1 | Page 188 |
Table 17-4. Applicable permits related with RCA N° 75/2021
| Permit | Description | Authorization |
| PAS N°119 | Research collection of Marine Life | There is no information |
| PAS N° 132 | Permit for archaeological and anthropological excavations | Ord. N° 2673/2021 (for archeological sites) |
| PAS N° 136 | Permit to establish tailings dump or mineral accumulation | Res. Ex. N° 1985/2021 |
| PAS 137 | Mining Closure Plan | The documents were submitted and currently is under process. |
| PAS N° 138 | Permit for the construction, repair, modification and expansion of any public or private works for the evacuation, treatment or final disposal of wastewater, sewage of any nature | There is no information |
| PAS N° 140 | Permit for the construction, repair, modification and expansion of any garbage and waste treatment plant of any kind or for the installation of any place for the accumulation, selection, industrialization, trade or final disposal of garbage and waste of any kind | There is no information |
| PAS N° 142 | Permit for all hazardous waste storage sites: The project involves the construction of two warehouses in two sectors for the temporary disposal of hazardous waste | There is no information |
| PAS N° 146 | Permit to hunt or capture specimens of animals of protected species for research purposes, for the establishment of breeding centers or hatcheries and for the sustainable use of the resource | There is no information |
| PAS N° 155 | Permit for the construction of certain hydraulic works | The documents were submitted on May 13, 2021, and currently is under process. |
| PAS N° 156 | Permit to make modifications to the riverbed | The documents were submitted on May 10, 2021, and currently is under process. |
| PAS N° 160 | Permit to subdivide and urbanize rural land or for construction outside urban limits | There is no information |
| - | Authorization of the mining exploitation method | Res. Ex. N° 1860/2021 |
| - | Beneficiation Plant Authorization | The documents were submitted and currently is under process. |
Source: own elaboration
| WSP-SQM0011-TRS-Pampa Orcoma-Rev1 | Rev1 | Page 189 |
This sub-section contains forward-looking information related to plans, negotiations or agreements with local individuals or groups for the Project. The material factors that could cause actual results to differ materially from the conclusions, estimates, designs, forecasts or projections in the forward-looking information include any significant differences from one or more of the material factors or assumptions that were set forth in this sub-section including that regulatory framework is unchanged for Study period; no unforeseen environmental, social or community events disrupt timely approvals.
| 17.4.1 | Plans, Negotiations, or Agreements with Individuals, or Local Groups |
Additionally, the environmental authorization of the project (RCA No. 75/17) defined, the following environmental impacts associated with human groups in the territory were identified:
| 1) | Affectation of the supply of basic goods and services. |
| 2) | Alteration of specific economic activities. |
Accordingly, the following measure was approved: "Implementation of a protocol of good practices in community relations for Orcoma's own contractors and workers", which includes provisions and requirements for behavior with the local community applicable to contractors and workers of the project, during all stages of the project.
Additionally, and in relation to non-significant impacts, the Project defined four Voluntary Environmental Commitments (VEC) for the Human Environment component in the territory, defined in the following terms, as discussed below.
Connection road between Route 5 and Route A412
The objective is to minimize the occurrence of negative effects in the town of Huara, associated with increased vehicular traffic, and considers the construction of an access to the Project area.
Incorporation of informative vertical signs
The measure consists of the implementation of informative vertical signs to increase safety levels and standards associated with the intersections and vehicular routes to be used by the Project.
Implementation of early informative meetings
The objective is to inform the local community about the main works, operations and activities that are contemplated for the development of the Project, defining together with the community, the most appropriate procedures with regard to the localities of: Huara, Bajo Soga, Colonos Rurales and Pisagua. Early community briefings were developed in January 2018 with the communities of Huara, Bajo Soga, Colonos Rurales and Pisagua. The report of these activities was uploaded to the Superintendence of Environment online system called SNIFA (Sistema Nacional de Información de Fiscalización).
| WSP-SQM0011-TRS-Pampa Orcoma-Rev1 | Rev1 | Page 190 |
Implementation of a mechanism for managing community consultations and complaints
The measure seeks to formally manage community concerns and complaints in the area of influence of the project, based on a record that considers a management report and community contingencies, available in the field, for all phases of the Project.
Permanent Communication Channel
The channel will be available for all phases of the project, through meetings that will inform the local community about the main works, works and activities that are contemplated for the development of the project. Its management is contemplated with representatives of the localities of Huara, Bajo Soga, Colonos Rurales, Pisagua, and Alto Hospicio.
Working Table
The commitment will apply to all phases of the project (construction, operation and closure), as a mechanism for dialogue and the generation of permanent agreements between the Contractor and the relevant social organizations of Huara, Bajo Soga, and Colonos Rurales.
At the table, central aspects of the project will be addressed (management, impacts, mitigation measures, project progress), and the requirements of the community will be managed in areas such as: historical heritage; education and culture; social development.
| 17.4.2 | Commitments to Local Procurement or Hiring |
No commitments regarding the hiring of local labor were made as part of the environmental proceedings.
There is no specific risk matrix to evaluate these aspects at corporate level. In the framework of the work meetings for the preparation of this report, it was indicated that there are initiatives to evaluate these aspects, but they lack a specific program, or derive in a specific commitment, or goal.
This sub-section contains forward-looking information related to mine closure for the Project. The material factors that could cause actual results to differ materially from the conclusions, estimates, designs, forecasts or projections in the forward-looking information include any significant differences from one or more of the material factors or assumptions that were set forth in this sub-section including prevailing economic conditions continue such that unit costs are as estimated in constant (or real) dollar terms, projected labor and equipment productivity levels are appropriate at time of closure and estimated infrastructure and mining facilities are appropriate at the time of closure.
| WSP-SQM0011-TRS-Pampa Orcoma-Rev1 | Rev1 | Page 191 |
| 17.5.1 | Closure, Remediation, and Reclamation Plans |
Currently the Orcoma Mining Site approved by RCA N°75/2017, has a sectorial closure plan permit (in process). It details the activities and closure measures included in the original Environmental Qualification Resolution document RCA N°75/2017, and new closure measures from the risk assessment carried out.
Additionally, the site has three sectorial permits, associated with mine area "Method of Exploitation, ORCOMA project" approved by Res. Exe. N° 1860/2021, Iodine-Iodide Plant "Beneficiation Plant, ORCOMA project" (in process), and stockpiling of waste salts "Permit for the establishment of tailings deposit, ORCOMA project" approved by Res. Exe. N° °1985/2021, “Permit for major hydraulic works for evaporation ponds PAS 155” (in process), and “PAS 156 Channel Modification Permit” (in process).
Closing Measures
The closure measures detailed in the closure plan permit in process for the non-remaining facilities correspond to de-energization, removal of pipes, equipment and structures, removal of steel, concrete, removal of supplies, road closures and installation of signage.
The remaining facilities correspond to the Mine Zone, Mine Operations Center, Solar Evaporation Ponds, and Discard Salts Stockpiles. The closure measures associated with these facilities are shown in Table 17-5.
Discarded salts will be removed from the site.
For all closure measures, the objective is to achieve and ensure the safety of people. The means of verification will be the photographic record.
| WSP-SQM0011-TRS-Pampa Orcoma-Rev1 | Rev1 | Page 192 |
Table 17-5. Closure Measures of Remaining Facilities ORCOMA Mining Site
| Installation | Main Characteristics | Closure Measure |
| Mine area | 6506 ha caliche mining area | Closure of explosives warehouse |
| Removal of supplies (powder magazine) |
| Waste removal |
| Mine operation center | Set of ponds and basins for solution handling | HDPE pipe removal |
| Removal of metal structures, piping and equipment |
| Removal of concrete structures |
| Removal of support structures |
| Waste removal |
| Liner removal |
| Leveling of parapets |
| Neutralization plant and evaporation ponds | 194,12 ha of ponds for nitrate salt production. | HDPE pipe removal |
| Removal of metal structures, piping and equipment |
| Removal of concrete structures |
| Removal of support structures |
| Removal of nitrate-rich salts |
| Removal of supplies |
| Waste removal |
Source: Adenda 1 Closure Plan Permit (in process)
Closure and post-closure measures (Table 17-6) correspond to the maintenance of signage and roads.
Table 17-6. Post-Closure Measures
| Installation | Measure | Tracking points (quantity) | Unit | Frequency (years) | Duration |
| Plant iodine - iodide | Maintenance of signage | 12 | unit | 5 | Perpetuity |
| Road closure maintenance | 3 | N° closures | 5 | Perpetuity |
| Seawater supply system | Maintenance of signage | 2 | unit | 5 | Perpetuity |
| Road closure maintenance | 1 | N° closures | 5 | Perpetuity |
Source: Closure Plan (in process)
| WSP-SQM0011-TRS-Pampa Orcoma-Rev1 | Rev1 | Page 193 |
Risk Analysis
Law No. 20.551, which regulates the closure of mining sites, indicates that at the time of closure, a risk assessment is required for the different facilities of a mining site. For this purpose, it proposes the "methodological guide for risk assessment for the closure of mining sites".
It should be noted that the same guide states that "It should be noted that this Methodological Guide is not mandatory, although its objective is to guide the risk assessment, and each mining company may use the methodology that best suits the reality of its site".
The Risk Assessment conducted in the Closure Plan (in process) indicates that all risks associated with the remaining facilities are low and not significant, safeguarding the health of people and the environment. The summary of the Risk Assessment presented in Annex 7 of the Closure Plan Permit (in process) is presented in Table 17-7.
Table 17-7. ORCOMA Mining Site Remaining Facilities Risk Assessment Summary
| Record | Risks | Level | Significance |
| Mine Pit |
| MR1 | MR1.P | To people due to failure of the pit slope, which exceeds the exclusion zone due to an earthquake. | LOW | Non-significant |
| MR1.MA | To the environment due to failure of the pit slope that exceeds the exclusion zone as a result of an earthquake. | LOW | Non-significant |
| MR2 | MR2.P | To people due to DAR infiltration from the mine | LOW | Non-significant |
| MR2.MA | To the environment due to DAR infiltration from the mine | LOW | Non-significant |
| Sterile Storage |
| DE1 | DE1.P | To people due to groundwater contamination from rainfall (infiltration of solutions). | LOW | Non-significant |
| DE1.MA | To the environment due to groundwater contamination caused by rainfall (infiltration of solutions). | LOW | Non-significant |
| DE2 | DE2.P | To people due to groundwater contamination from floods/floods | LOW | Non-significant |
| DE2.MA | To the environment due to groundwater contamination caused by floods/floods | LOW | Non-significant |
| DE3 | DE3.P | To people due to emissions of particulate matter into the atmosphere caused by wind | LOW | Non-significant |
| DE3.MA | To the environment due to particulate emissions into the atmosphere caused by wind | LOW | Non-significant |
| DE4 | DE4.P | To people due to surface water contamination caused by heavy rainfall | LOW | Non-significant |
| WSP-SQM0011-TRS-Pampa Orcoma-Rev1 | Rev1 | Page 194 |
| Record | Risks | Level | Significance |
| | DE4.MA | To the Environment due to surface water pollution caused by heavy rainfall | LOW | Non-significant |
| DE5 | DE5.P | To people due to surface water contamination caused by floods | LOW | Non-significant |
| DE5.MA | To the Environment due to surface water contamination caused by floods | LOW | Non-significant |
| DE6 | DE6.P | To people as a result of slope failure due to water erosion | LOW | Non-significant |
| DE6.MA | To the environment for slope failure due to water erosion | LOW | Non-significant |
| DE7 | DE7.P | To people due to slope failure as a result of an earthquake | LOW | Non-significant |
| DE7.MA | To the Environment due to slope failure caused by an earthquake | LOW | Non-significant |
| Evaporation ponds |
| PE1 | PE1.P | To people due to failure in the slope of the pool, which exceeds the exclusion zone due to an earthquake. | LOW | Non-significant |
| PE1.MA | To the Environment due to failure in the slope of the pool, which exceeds the exclusion zone as a result of an earthquake. | LOW | Non-significant |
| PE2 | PE2.P | To persons for DAR infiltration | LOW | Non-significant |
| PE2.MA | To the environment by infiltration of DAR | LOW | Non-significant |
Source: Annex 7 – Closure Plan (in process)
The total amount of the closure of the Orcoma Mine site, considering closure detail in the valorization of de closure plan (in process), adds up to 105,340 UF (4.08 million USD) (93,810 UF closure cost and 11,530 UF post-closing cost). See Table 17-8 and Table 17-9.
Table 17-8. Detail of Closing Cost
| Item | | Detail | |
| Total direct cost per installation (UF) | | | 59,721 | |
| Indirect costs (UF) | | | 5,972 | |
| Contingencies 20% (UF) | | | 13,139 | |
| IVA 19% (UF) | | | 14,978 | |
| Total cost (UF/Million US$) | | | 93,810(UF) Million US$ 3.63 | |
Source: Annex 3 of Adenda 1 Closure Plan (in process)
| WSP-SQM0011-TRS-Pampa Orcoma-Rev1 | Rev1 | Page 195 |
Table 17-9. Detail of Post-Closing Cost
| Item | | Detail | |
| Direct cost | | | 598 | |
| Indirect cost | | | 60 | |
| Contingencies | | | 132 | |
| IVA (19%) | | | 150 | |
| Total cost | | | 940 | |
| Frequency (years) | | | 5 | |
| Post closure total cost (UF/ US$) Current value | | | 11,530 UF US$ 446,200 | |
Source: Annex 3 of Addenda 1 Closure Plan (in process)
The result of the calculation of the useful life for the ORCOMA mine according to the Res Exe. N°1421/2015 is 17 years (2015-2032). The constitution of the guarantees will be carried out as follows. See Table 17-10.
According to RCA No. 75/2017, the mine has an environmentally approved useful life of 25 years. However, considering the Mineral Reserves and the caliche exploitation rate of the total mine areas (11 Mtpy), the Orcoma Mine is expected to have a useful life of 28. The estimate of warranties was made considering the parameters set out in Table 17-10.
The estimated warranties are presented in Figure 17-1.
Table 17-10. Parameters for Estimation of Pampa Orcoma Guarantees
| BCU Rate 30 years | | | 1.58% | | | | Average from March 2016 to February 2021 | |
| Useful life | | | 29 | | | | years | |
| Guarantee provision period | | | 15 | | | | years | |
| Closing phase | | | 3 | | | | years | |
| Warranty life cycle | | | 32 | | | | years | |
Source: Annex 3 of Addenda 1 Closure Plan (in process)
| WSP-SQM0011-TRS-Pampa Orcoma-Rev1 | Rev1 | Page 196 |
Figure 17-1. Disposition of Pampa Orcoma's Financial Guarantees
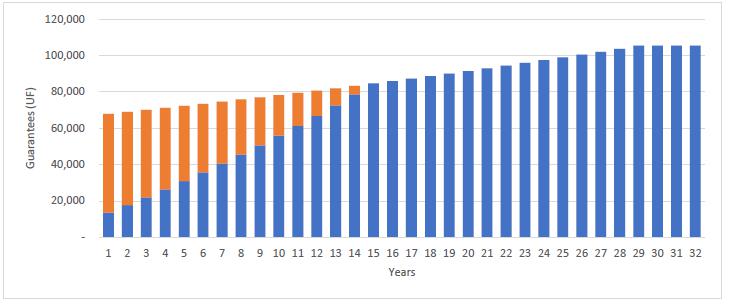
Source: Annex 3 of Addenda 1 Closure Plan (in process). Blue color is the guarantee or bond (UF), orange color is the difference with protected value (UF).
| 17.6 | The Qualified Person’s Opinion on the Adequacy of Current Plans to Address any Issues Related to Environmental Compliance, Permitting, and Local Individuals, or Groups. |
In terms of environmental studies, permits, plans, and relations with local groups, the Orcoma Project submitted an EIA, complying with the established contents and criteria, and the legal requirements of current environmental regulations. Since it is a project (construction has not begun), it is possible to conclude the following:
Generally, the main effects generated by this type of project are the result of the extraction of fresh water, but, since this particular Project does not consider the extraction of fresh water and, on the other hand, it considers the supply of the required water from a seawater supply system, it can be concluded that this will be sufficient to avoid any effects that the project could generate on the water, fauna and flora as a consequence of the water requirement of the Project.
In addition, the Project committed to some monitoring measures to follow-up on the different components and detect any effects on them as a result of project implementation. This will allow the project owner to define measures, if necessary.
Additionally, SQM is elaborating a new EIA for the increment of prill Iodine production of Orcoma's operation. There is no detailed information regarding the characteristic of the project to assess the main risks, measures or costs that may be generated by its approval and execution. SQM has experience presented and submitted several successful projects under SEA with similar characteristics. Finally, there is a risk of not obtain the environmental authorization in the timeframe and/or terms required.
| WSP-SQM0011-TRS-Pampa Orcoma-Rev1 | Rev1 | Page 197 |
| 18 | Capital and Operating Costs |
This section contains forward-looking information related to capital and operating cost estimates for the Project. The material factors that could cause actual results to differ materially from the conclusions, estimates, designs, forecasts or projections in the forward-looking information include any significant differences from one or more of the material factors or assumptions that were set forth in this section including prevailing economic conditions continue such that unit costs are as estimated in constant (or real) dollar terms, projected labor and equipment productivity levels and that contingency is sufficient to account for changes in material factors or assumptions.
SQM is the world’s largest producer of potassium nitrate and iodine and one of the world’s largest lithium producers. It also produces specialty plant nutrients, iodine derivatives, lithium derivatives, potassium chloride, potassium sulfate and certain industrial chemicals (including industrial nitrates and solar salts). The products are sold in approximately 110 countries through SQM worldwide distribution network, with more than 90% of the sales derived to countries outside Chile.
The Pampa Orcoma Project contemplates:
| · | Open pit exploitation of mining deposits. |
| · | Enabling support facilities called the COM. |
| · | Construction of an iodide production plant, with a capacity of 2,500 tpy (of equivalent iodine). |
| · | Construction of an iodine plant, to process up to 2,500 tpy. |
| · | Construction of evaporation ponds to produce salts rich in nitrate at a rate of 320,325 tpy. |
| · | Construction of a seawater adduction pipe from the northern sector of Caleta Buena to the mining area, to meet the water needs during the operation phase, at a maximum flow rate of 200 L/s. |
| · | Connection of the industrial areas of the Project to the Norte Grande Interconnected System (SING), in order to provide sufficient energy for their electrical requirements. |
| 18.1 | Capital Cost Estimates |
The facilities for the production operations of iodide and iodine salts at the Pampa Orcoma Project mainly include caliche extraction mine, leaching, iodide and iodine production plants, solar evaporation ponds, water resources, as well as other minor facilities.
The cost of capital distributed in the areas related to Pampa Orcoma Project is shown in Table 18-1.
| WSP-SQM0011-TRS-Pampa Orcoma-Rev1 | Rev1 | Page 198 |
Table 18-1. Capital Cost for Nitrate and Iodine at the Orcoma Project
| | | | | | Capital Cost | |
| | | | | | % Total | | | MMUSD | |
| | | | Nitrates & Iodine Orcoma Project Operation | | 100% | | | 294 | |
| 1 | | | Caliche Mine Extraction (*) | | | 0 | % | | | 0 | |
| 2 | | | Leaching (COM & porterage system) | | | 5 | % | | | 14 | |
| 3 | | | Iodide & Iodine Plant | | | 10 | % | | | 29 | |
| 4 | | | Solar Evaporation Ponds | | | 32 | % | | | 95 | |
| 5 | | | Water resources (Seawater system) | | | 30 | % | | | 89 | |
| 6 | | | Electrical Distribution System | | | 4 | % | | | 13 | |
| 7 | | | Roads | | | 4 | % | | | 12 | |
| |
| Note: (*): Does not include investment in mining equipment (~50 MMUSD included in the operational cost of the mine). |
| 18.2 | Basis for Capital and Operating Cost Estimates |
The operating costs of the Orcoma Project are divided according to the production of iodine and production of solar salts sent to the Coya Sur site for production of nitrates.
The Orcoma Project is expected to be in operation between 2024 and 2040.
The production relies on the following assumptions, as shown in Table 18-2.
Table 18-2. Productions Assumptions for Pampa Orcoma Project
| Iodine | | Kt | | | 5.0 | |
| AFA | | Kt nitrate | | | 940 | |
| Caliche | | Mt | | | 20 | |
| Iodine grade (I2) | | ppm | | | 408 | |
| Nitrate grade (NaNO3) | | % | | | 6.8 | % |
| Iodine leaching yield | | % | | | 66.4 | % |
| NaNO3 leaching yield | | % | | | 69.1 | % |
| Soluble Salts | | % | | | 47.9 | % |
| Iodine plants yield | | % | | | 92.5 | % |
| Ponds yield | | % | | | 77.3 | % |
| Coya Sur yield for solar salts | | % | | | 58.1 | % |
Orcoma's operating cost comprises the cost to produce the base solution, the cost of iodine production, and the cost of producing solar salts, the latter being delivered to the Coya Sur site.
The estimated operating mining costs are presented in Table 18-3.
| WSP-SQM0011-TRS-Pampa Orcoma-Rev1 | Rev1 | Page 199 |
The estimated costs to produce the base solution for iodine and nitrate are presented in Table 18-3 The cost presented is per t of caliche extracted.
Table 18-3. Estimated Operating costs, per Tonne of Caliche Extracted
| Mining | | | | 2.13 | | | US$/T Caliche |
| Leaching | | | | 0.95 | | | US$/T Caliche |
| Seawater | | | | 0.51 | | | US$/T Caliche |
Source: SQM
To produce iodine, it is estimated that approximately 1 kg of iodine is obtained for every 4 t of caliche. In the case of the production of nitrates, it is estimated that for every 22.9 t of caliche, 1 t of nitrate is obtained, which is taken to the Coya Sur site for final processing.
The estimated costs to produce iodine are presented in Table 18-4. The cost presented is per kg of iodine produced and left in port.
Table 18-4. Estimated Costs to Produce Iodine (kg)
| Solution Cost | | | 12.5 | | | | US$/kg I2 | | | | 78 | % |
| Plant Iodide | | | 1.7 | | | | US$/kg I2 | | | | 11 | % |
| Plant Iodine Prill | | | 1.9 | | | | US$/kg I2 | | | | 12 | % |
| Iodine Variable Cost | | | 16.1 | | | | US$/kg I2 | | | | 100 | % |
The estimated costs to produce nitrates are presented in Table 18-5. The cost presented is per tonne of intermediate salts produced by the Orcoma Project that are then taken to the Coya Sur site for the final production of nitrates.
Table 18-5. Estimated Costs to Produce Nitrate (per tonne)
| Solution Cost | | | 10.5 | | | US$ / t nitrate | | | 13 | % |
| Ponds + preharvest | | | 11.2 | | | US$ / t nitrate | | | 14 | % |
| Ponds depreciation | | | 11.2 | | | US$ / t nitrate | | | 14 | % |
| Others (G&A) | | | 9.6 | | | US$ / t nitrate | | | 12 | % |
| Harvest + screen | | | 4.9 | | | US$ / t nitrate | | | 6 | % |
| Transportation to Coya Sur | | | 35.1 | | | US$ / t nitrate | | | 42 | % |
| Intermediate Salts Variable Cost | | | 82.5 | | | US$ / t nitrate | | | 100 | % |
| WSP-SQM0011-TRS-Pampa Orcoma-Rev1 | Rev1 | Page 200 |
This section contains forward-looking information related to economic analysis for the Project. The material factors that could cause actual results to differ materially from the conclusions, estimates, designs, forecasts or projections in the forward-looking information include any significant differences from one or more of the material factors or assumptions that were set forth in this sub-section including estimated capital and operating costs, project schedule and approvals timing, availability of funding, projected commodities markets and prices.
WSP utilized operating costs and capital expense estimates provided by SQM. SQM is a well-established operation with a long history and the staff well experienced in the planning and cost estimation for all aspects of the operation. Therefore, since estimates are based on actual operating experience, it is WSP’s opinion that the costs provided and considered for this study meets the requirements of accuracy and contingency required of a pre-feasibility level study for the economics required to support Mineral Reserve estimates.
| 19.1 | Principal Assumptions |
Capital and operating costs used in the economic analysis are as described in Section 18. Sales prices used for Iodine and Nitrates are as described in Section 16. A 10% discount rate was used for the cashflow and is deemed reasonable to account for cost of capital and project risk. A 28% income tax rate was assumed based on information provided by SQM.
All costs, prices, and values shown in this section are in Q4 2021 US$.
The estimated production of iodine and nitrates for the period 2024 to 2040 is presented in Table 19-1.
To obtain an income flow in relation to the production of Iodine and Nitrates in the period 2022 to 2040. The year 2022 has been considered as the beginning, to show the investment made in the period, and the first year of sales is 2024.
In turn, the income from sales of each of the products has been considered, as well as the current projection of their prices. In the case of the price of Iodine, a base value of 35 USD/kg has been considered and for the price of Nitrates it has been considered at 680 US$/tonne as a final product. As the nitrates finish their process in Coya Sur (CS), it has been considered a cost of production (according to SQM numbers) in CS of 275 US$/tonne plus a 20% for component losses during process and a 20% gross margin, so the price (internal price) to estimate the revenues is 295 US$/tonne.
To obtain the flow of costs, which considers operating and non-operating costs, unit costs have been included for the different production stages, which considers common production cost for iodine and nitrates, such as mining, leaching and seawater.
| WSP-SQM0011-TRS-Pampa Orcoma-Rev1 | Rev1 | Page 201 |
In addition, the production costs directly associated with the production of iodine in the plant, and the production of nitrates before processing at the Coya Sur site were added.
To the costs indicated above, those related to Depreciation and Others have been added, which include, among other costs, marketing, and exportation.
Lastly, it has been considered to apply a discount rate of 10% and a tax of around 28% to the profit.
Once the revenues flow for the Base Case were obtained, the sensitivities to production, sales prices, and operating costs were carried out. The foregoing allows for the estimation of revenues in situations other than the base case that have a certain probability of occurrence during the operation (between 2024 and 2040).
| WSP-SQM0011-TRS-Pampa Orcoma-Rev1 | Rev1 | Page 202 |
Table 19-1. Production of Iodine and Nitrates with and without Orcoma Project
| | | 2024 | | | 2025 | | | 2026 | | | 2027 | | | 2028 | | | 2029 | | | 2030 | | | 2031 | | | 2032 | | | 2033 | | | 2034 | | | 2035 | | | 2036 | | | 2037 | | | 2038 | | | 2039 | | | 2040 | | | TOTAL | |
| Orcoma Ore Tonnage (Mt) | | | 7.5 | | | | 10.5 | | | | 13.5 | | | | 17.5 | | | | 20.0 | | | | 20.0 | | | | 20.0 | | | | 20.0 | | | | 20.0 | | | | 20.0 | | | | 20.0 | | | | 20.0 | | | | 20.0 | | | | 20.0 | | | | 20.0 | | | | 20.0 | | | | 20.0 | | | | 309.0 | |
| Average grade Iodine in situ (I2, %) | | | 408 | | | | 410 | | | | 403 | | | | 406 | | | | 421 | | | | 408 | | | | 410 | | | | 415 | | | | 405 | | | | 407 | | | | 407 | | | | 407 | | | | 407 | | | | 407 | | | | 407 | | | | 407 | | | | 407 | | | | 408 | |
| Iodine in situ (kt) | | | 6.6 | % | | | 7.0 | % | | | 6.7 | % | | | 6.5 | % | | | 6.4 | % | | | 6.9 | % | | | 6.6 | % | | | 6.1 | % | | | 7.4 | % | | | 6.9 | % | | | 6.9 | % | | | 6.9 | % | | | 6.9 | % | | | 6.9 | % | | | 6.9 | % | | | 6.9 | % | | | 6.9 | % | | | 6.8 | % |
| Yield process to produce prilled Iodine (%) | | | 3.1 | | | | 4.3 | | | | 5.4 | | | | 7.1 | | | | 8.4 | | | | 8.2 | | | | 8.2 | | | | 8.3 | | | | 8.1 | | | | 8.1 | | | | 8.1 | | | | 8.1 | | | | 8.1 | | | | 8.1 | | | | 8.1 | | | | 8.1 | | | | 8.1 | | | | 126.2 | |
| Prilled Iodine production (kt) | | | 61.3 | % | | | 62.5 | % | | | 59.8 | % | | | 59.5 | % | | | 64.4 | % | | | 61.3 | % | | | 58.0 | % | | | 63.8 | % | | | 60.8 | % | | | 59.0 | % | | | 62.0 | % | | | 62.0 | % | | | 62.0 | % | | | 62.0 | % | | | 62.0 | % | | | 62.0 | % | | | 62.0 | % | | | 61.5 | % |
| Average grade Nitrate Salts in situ (NaNO3, %) | | | 1.9 | | | | 2.7 | | | | 3.3 | | | | 4.2 | | | | 5.4 | | | | 5.0 | | | | 4.8 | | | | 5.3 | | | | 4.9 | | | | 4.8 | | | | 5.0 | | | | 5.0 | | | | 5.0 | | | | 5.0 | | | | 5.0 | | | | 5.0 | | | | 5.0 | | | | 77.6 | |
| Nitrate salts in situ (kt) | | | 493 | | | | 732 | | | | 901 | | | | 1,139 | | | | 1,288 | | | | 1,370 | | | | 1,316 | | | | 1,226 | | | | 1,478 | | | | 1,378 | | | | 1,378 | | | | 1,378 | | | | 1,378 | | | | 1,378 | | | | 1,378 | | | | 1,378 | | | | 1,378 | | | | 20,966 | |
| Yields process to produce Brine Nitrate (%) | | | 69.5 | % | | | 69.4 | % | | | 69.0 | % | | | 68.2 | % | | | 70.6 | % | | | 68.8 | % | | | 65.1 | % | | | 70.7 | % | | | 67.9 | % | | | 66.4 | % | | | 69.9 | % | | | 69.9 | % | | | 69.9 | % | | | 69.9 | % | | | 69.9 | % | | | 69.9 | % | | | 69.9 | % | | | 69.9 | % |
| Brine Nitrate production (kt) | | | 343 | | | | 508 | | | | 621 | | | | 777 | | | | 910 | | | | 943 | | | | 856 | | | | 867 | | | | 1,003 | | | | 915 | | | | 963 | | | | 963 | | | | 963 | | | | 963 | | | | 963 | | | | 963 | | | | 963 | | | | 14,482 | |
| WSP-SQM0011-TRS-Pampa Orcoma-Rev1 | Rev1 | Page 203 |
Estimated sales of Iodine and Nitrates are shown in Table 19-2.
Table 19-2. Sales of Iodine and Nitrates for the Orcoma Project
| Prices | | 2022 | | | 2023 | | | 2024 | | | 2025 | | | 2026 | | | 2027 | | | 2028 | | | 2029 | | | 2030 | | | 2031 | | | 2032 | | | 2033 | | | 2034 | | | 2035 | | | 2036 | | | 2037 | | | 2038 | | | 2039 | | | 2040 | | | TOTAL | |
| Iodine (US$/Tonne) | | | 35,000 | | | | 35,000 | | | | 35,000 | | | | 35,000 | | | | 35,000 | | | | 35,000 | | | | 35,000 | | | | 35,000 | | | | 35,000 | | | | 35,000 | | | | 35,000 | | | | 35,000 | | | | 35,000 | | | | 35,000 | | | | 35,000 | | | | 35,000 | | | | 35,000 | | | | 35,000 | | | | 35,000 | | | | 35,000 | |
| Nitrates @ Coya Sur (US$/Tonne) | | | 295.0 | | | | 295.0 | | | | 295.0 | | | | 295.0 | | | | 295.0 | | | | 295.0 | | | | 295.0 | | | | 295.0 | | | | 295.0 | | | | 295.0 | | | | 295.0 | | | | 295.0 | | | | 295.0 | | | | 295.0 | | | | 295.0 | | | | 295.0 | | | | 295.0 | | | | 295.0 | | | | 295.0 | | | | 295.0 | |
| | | | | | | | | | | | | | | | | | | | | | | | | | | | | | | | | | | | | | | | | | | | | | | | | | | | | | | | | | | | | | | | | | | | | | | | | | | | | | | | | |
| Sales | | | | | | | | | | | | | | | | | | | | | | | | | | | | | | | | | | | | | | | | | | | | | | | | | | | | | | | | | | | | | | | | | | | | | | | | | | | | | | | | |
| Iodine (kt) | | | - | | | | - | | | | 1.9 | | | | 2.7 | | | | 3.3 | | | | 4.2 | | | | 5.4 | | | | 5.0 | | | | 4.8 | | | | 5.3 | | | | 4.9 | | | | 4.8 | | | | 5.0 | | | | 5.0 | | | | 5.0 | | | | 5.0 | | | | 5.0 | | | | 5.0 | | | | 5.0 | | | | 78 | |
| Nitrates @ Coya Sur (kt) | | | - | | | | - | | | | 342.6 | | | | 508.2 | | | | 621.0 | | | | 776.5 | | | | 910.0 | | | | 942.8 | | | | 856.4 | | | | 866.8 | | | | 1,003.1 | | | | 914.8 | | | | 962.9 | | | | 962.9 | | | | 962.9 | | | | 962.9 | | | | 962.9 | | | | 962.9 | | | | 962.9 | | | | 14,482 | |
| | | | | | | | | | | | | | | | | | | | | | | | | | | | | | | | | | | | | | | | | | | | | | | | | | | | | | | | | | | | | | | | | | | | | | | | | | | | | | | | | |
| Revenues | | | | | | | | | | | | | | | | | | | | | | | | | | | | | | | | | | | | | | | | | | | | | | | | | | | | | | | | | | | | | | | | | | | | | | | | | | | | | | | | |
| Iodine (M US$) | | | - | | | | - | | | | 65.7 | | | | 94.2 | | | | 113.9 | | | | 148.0 | | | | 189.7 | | | | 175.0 | | | | 166.5 | | | | 185.3 | | | | 172.3 | | | | 168.1 | | | | 176.6 | | | | 176.6 | | | | 176.6 | | | | 176.6 | | | | 176.6 | | | | 176.6 | | | | 176.6 | | | | 2,715 | |
| Nitrates @ Coya Sur (M US$) | | | - | | | | - | | | | 101.1 | | | | 149.9 | | | | 183.2 | | | | 229.1 | | | | 268.4 | | | | 278.1 | | | | 252.6 | | | | 255.7 | | | | 295.9 | | | | 269.9 | | | | 284.0 | | | | 284.0 | | | | 284.0 | | | | 284.0 | | | | 284.0 | | | | 284.0 | | | | 284.0 | | | | 4,272 | |
| Total Revenues (M US$) | | | - | | | | - | | | | 166.7 | | | | 244.1 | | | | 297.1 | | | | 377.1 | | | | 458.1 | | | | 453.1 | | | | 419.1 | | | | 441.0 | | | | 468.2 | | | | 438.0 | | | | 460.7 | | | | 460.7 | | | | 460.7 | | | | 460.7 | | | | 460.7 | | | | 460.7 | | | | 460.7 | | | | 6,987 | |
As the nitrates finish their process in Coya Sur (CS), it has been considered a cost of production (according to SQM numbers) in CS of 275 US$/tonnes plus a 20% for component losses during process and a 20% gross margin, so the price to estimate the revenues is 295 US$/tonnes.
| WSP-SQM0011-TRS-Pampa Orcoma-Rev1 | Rev1 | Page 204 |
The main costs to produce Iodine and Nitrates involve the common production cost for iodine and nitrates, such as Mining, Leaching and Seawater, production cost of iodine in the plant, and the production cost of nitrate before processing at the Coya Sur site.
The production cost of nitrate at Coya Sur Plant is not considered in this analysis, as we have considered a nitrate price before any process in Coya Sur.
The estimate of total costs per item is obtained from approximate estimates of its unit cost, considering a variable part and a fixed part, independent of the volume of production. These unit costs are shown in Table 19-3.
Table 19-3. Main Costs of Iodine and Nitrates Production
| | | | | 2024 | | | 2025 | | | 2026 | | | 2027 | | | 2028 | | | 2029 | | | 2030 | | | 2031 | | | 2032 | | | 2033 | | | 2034 | | | 2035 | | | 2036 | | | 2037 | | | 2038 | | | 2039 | | | 2040 | | | TOTAL | |
| COSTS | | | | | | | | | | | | | | | | | | | | | | | | | | | | | | | | | | | | | | | | | | | | | | | | | | | | | | | | |
| COMMON | | | | | | | | | | | | | | | | | | | | | | | | | | | | | | | | | | | | | | | | | | | | | | | | | | | | | | | | |
| Mining | | US$M | | 16.0 | | | 22.4 | | | 28.8 | | | 37.3 | | | 42.6 | | | 42.6 | | | 42.6 | | | 42.6 | | | 42.6 | | | 42.6 | | | 42.6 | | | 42.6 | | | 42.6 | | | 42.6 | | | 42.6 | | | 42.6 | | | 42.6 | | | 658 | |
| Leaching | | US$M | | 7.1 | | | 10.0 | | | 12.8 | | | 16.6 | | | 19.0 | | | 19.0 | | | 19.0 | | | 19.0 | | | 19.0 | | | 19.0 | | | 19.0 | | | 19.0 | | | 19.0 | | | 19.0 | | | 19.0 | | | 19.0 | | | 19.0 | | | 294 | |
| Seawater | | US$M | | 3.8 | | | 5.4 | | | 6.9 | | | 8.9 | | | 10.2 | | | 10.2 | | | 10.2 | | | 10.2 | | | 10.2 | | | 10.2 | | | 10.2 | | | 10.2 | | | 10.2 | | | 10.2 | | | 10.2 | | | 10.2 | | | 10.2 | | | 158 | |
| Total Mining Costs | | US$M | | 26.9 | | | 37.7 | | | 48.5 | | | 62.8 | | | 71.8 | | | 71.8 | | | 71.8 | | | 71.8 | | | 71.8 | | | 71.8 | | | 71.8 | | | 71.8 | | | 71.8 | | | 71.8 | | | 71.8 | | | 71.8 | | | 71.8 | | | 1,109 | |
| IODINE PRODUCTION | | | | | | | | | | | | | | | | | | | | | | | | | | | | | | | | | | | | | | | | | | | | | | | | | | | | | | | | |
| Solution Cost | | US$M | | 23.5 | | | 33.6 | | | 40.7 | | | 52.9 | | | 67.7 | | | 62.5 | | | 59.4 | | | 66.2 | | | 61.5 | | | 60.0 | | | 63.1 | | | 63.1 | | | 63.1 | | | 63.1 | | | 63.1 | | | 63.1 | | | 63.1 | | | 970 | |
| Iodide Plant | | US$M | | 3.2 | | | 4.6 | | | 5.5 | | | 7.2 | | | 9.2 | | | 8.5 | | | 8.1 | | | 9.0 | | | 8.4 | | | 8.2 | | | 8.6 | | | 8.6 | | | 8.6 | | | 8.6 | | | 8.6 | | | 8.6 | | | 8.6 | | | 132 | |
| Iodine Plant | | US$M | | 3.6 | | | 5.1 | | | 6.2 | | | 8.0 | | | 10.3 | | | 9.5 | | | 9.0 | | | 10.1 | | | 9.4 | | | 9.1 | | | 9.6 | | | 9.6 | | | 9.6 | | | 9.6 | | | 9.6 | | | 9.6 | | | 9.6 | | | 147 | |
| Total Iodine Production Cost | | US$M | | 30.2 | | | 43.3 | | | 52.4 | | | 68.1 | | | 87.3 | | | 80.5 | | | 76.6 | | | 85.2 | | | 79.3 | | | 77.3 | | | 81.3 | | | 81.3 | | | 81.3 | | | 81.3 | | | 81.3 | | | 81.3 | | | 81.3 | | | 1,249 | |
| Total Iodine Production Cost | | US$/kg Iodine | | 16 | | | 16 | | | 16 | | | 16 | | | 16 | | | 16 | | | 16 | | | 16 | | | 16 | | | 16 | | | 16 | | | 16 | | | 16 | | | 16 | | | 16 | | | 16 | | | 16 | | | 16 | |
| NITRATE PRODUCTION | | | | | | | | | | | | | | | | | | | | | | | | | | | | | | | | | | | | | | | | | | | | | | | | | | | | | | | | |
| Solution Cost | | US$M | | 3.6 | | | 5.3 | | | 6.5 | | | 8.2 | | | 9.6 | | | 9.9 | | | 9.0 | | | 9.1 | | | 10.5 | | | 9.6 | | | 10.1 | | | 10.1 | | | 10.1 | | | 10.1 | | | 10.1 | | | 10.1 | | | 10.1 | | | 152 | |
| Ponds and preparation | | US$M | | 7.7 | | | 11.4 | | | 13.9 | | | 17.4 | | | 20.4 | | | 21.1 | | | 19.2 | | | 19.4 | | | 22.5 | | | 20.5 | | | 21.6 | | | 21.6 | | | 21.6 | | | 21.6 | | | 21.6 | | | 21.6 | | | 21.6 | | | 324 | |
| Harvest production | | US$M | | 1.7 | | | 2.5 | | | 3.0 | | | 3.8 | | | 4.5 | | | 4.6 | | | 4.2 | | | 4.2 | | | 4.9 | | | 4.5 | | | 4.7 | | | 4.7 | | | 4.7 | | | 4.7 | | | 4.7 | | | 4.7 | | | 4.7 | | | 71 | |
| Others (G&A) | | US$M | | 3.3 | | | 4.9 | | | 6.0 | | | 7.5 | | | 8.8 | | | 9.1 | | | 8.3 | | | 8.4 | | | 9.7 | | | 8.9 | | | 9.3 | | | 9.3 | | | 9.3 | | | 9.3 | | | 9.3 | | | 9.3 | | | 9.3 | | | 140 | |
| Transport to Coya Sur | | US$M | | 12.0 | | | 17.8 | | | 21.8 | | | 27.3 | | | 31.9 | | | 33.1 | | | 30.1 | | | 30.4 | | | 35.2 | | | 32.1 | | | 33.8 | | | 33.8 | | | 33.8 | | | 33.8 | | | 33.8 | | | 33.8 | | | 33.8 | | | 508 | |
| Total Nitrate Production Cost | | US$M | | 28.3 | | | 42.0 | | | 51.3 | | | 64.1 | | | 75.2 | | | 77.9 | | | 70.7 | | | 71.6 | | | 82.9 | | | 75.6 | | | 79.5 | | | 79.5 | | | 79.5 | | | 79.5 | | | 79.5 | | | 79.5 | | | 79.5 | | | 1,196 | |
| Total Nitrate Production Cost | | US$/t Nitrate | | 83 | | | 83 | | | 83 | | | 83 | | | 83 | | | 83 | | | 83 | | | 83 | | | 83 | | | 83 | | | 83 | | | 83 | | | 83 | | | 83 | | | 83 | | | 83 | | | 83 | | | 83 | |
| TOTAL OPERATING COST | | US$M | | 85 | | | 123 | | | 152 | | | 195 | | | 234 | | | 230 | | | 219 | | | 229 | | | 234 | | | 225 | | | 233 | | | 233 | | | 233 | | | 233 | | | 233 | | | 233 | | | 233 | | | 3,554 | |
| TOTAL OPERATING COST | | US$/t Caliche | | 11.4 | | | 11.7 | | | 11.3 | | | 11.1 | | | 11.7 | | | 11.5 | | | 11.0 | | | 11.4 | | | 11.7 | | | 11.2 | | | 11.6 | | | 11.6 | | | 11.6 | | | 11.6 | | | 11.6 | | | 11.6 | | | 11.6 | | | 11.5 | |
| WSP-SQM0011-TRS-Pampa Orcoma-Rev1 | Rev1 | Page 205 |
SQM has developed a production strategy to face the future demand for Iodine and Nitrate. The strategy for Pampa Orcoma is described herein.
Base case for investment considers increasing the production of iodine and nitrate from seawater for Orcoma Project, sequentially from a capacity of 200 to 400 L/s of seawater.
The supply of seawater from the Orcoma project allows the project to move forward with the commitment to sustainable development, in addition to supporting production of at least 400 L/s with seawater without using continental resources.
These scenarios allow establishing a balance between the exploitation sectors (quality/laws) and productive processes that allow balancing the supply of Iodine and Nitrate.
The Orcoma project considers 400 l/s of seawater, 5,000 tpy of Iodine, 730 Ktpyear of Nitrate Salts and 5.0 MMm2 of Evaporation ponds, with a useful life of 25 years.
Pampa Orcoma reserves have been quantified at 309 Mtpy with 408 ppm of iodine, 6.8% NaN03 and 47.9%. of Soluble Salts.
The Orcoma project initial investment is close to USD 294 million, distributed as follows:
| · | Seawater Intake and Piping: |
| o | Investment USD 101 million (includes Road) |
| o | 33 km pipeline from Caleta Buena bay |
| o | Total water cost of 1.20 USD/m3 |
| · | Iodide Plant: USD 29 million. |
| · | Solar Evaporation Ponds 5.0 Km2, USD 95 million (19 USD/m2). |
| · | Operation Centers (COP) & Port System, USD 14 million. |
| · | Electrical Connection System, USD 13 million. |
| · | Other Investments, USD 42 million (Mining Workshop, General Services, Environment Studies and Monitoring, and Contingencies). |
The estimated investments in the period 2022 to 2040 are presented in Table 19-4.
It is assumed that the initial investments (2022-2023) are financed:
a) 60% by a bank loan, and
b) 40% equity.
The bank loan had been simulated with a payment period of 8 years, and a real interest rate (all in) of 5% annually.
| WSP-SQM0011-TRS-Pampa Orcoma-Rev1 | Rev1 | Page 206 |
The key valuation assumptions used in the financial model consider a discount rate of 10% and a tax rate of 28% in the period 2022 to 2040.
The cashflow for the Nueva Victoria Project is presented in Table 19-5.
The following is a summary of key results from the cashflow:
| · | Total Revenue: estimated to be USD 6.99 billion including sales of iodine and nitrates |
| · | Total Operating Cost: estimated to be USD 3.55 billion. |
| · | EBITDA: estimated at USD 3.43 billion |
| · | Tax Rate of 28% on pre-tax gross income |
| · | Capital Expenditure estimated at USD 442 million |
| · | Bank Loan and Loan Amortization estimated at USD 380 million. |
| · | Net Change in Working Capital is based on two months of EBITDA. |
· A discount rate of 10% was utilized to determine NPV. The QP deems this to be a reasonable discount rate to apply for this TRS which reasonable accounts for cost of capital and project risk.]
· After-tax Cashflow: The cashflow is calculated by subtracting all operating costs, taxes, capital costs, interest payments, and closure costs from the total revenue.
| · | Net Present Value: The after tax NPV is estimated to be USD 680 million at a discount rate of 10% |
The QP considers the accuracy and contingency of cost estimates to be well within a Prefeasibility Study (PFS) standard and sufficient for the economic analysis supporting the Mineral Reserve estimate for Orcoma project.
| WSP-SQM0011-TRS-Pampa Orcoma-Rev1 | Rev1 | Page 207 |
Table 19-4. Estimated Investments
| Investments (M US$) | | 2022 | | | 2023 | | | 2024 | | | 2025 | | | 2026 | | | 2027 | | | 2028 | | | 2029 | | | 2030 | | | 2031 | | | 2032 | | | 2033 | | | 2034 | | | 2035 | | | 2036 | | | 2037 | | | 2038 | | | 2039 | | | 2040 | | | TOTAL | |
| Orcoma | | | 150.0 | | | | 144.0 | | | | 8.2 | | | | 8.0 | | | | 12.0 | | | | 24.8 | | | | 8.8 | | | | 4.0 | | | | 4.2 | | | | 4.4 | | | | 9.0 | | | | 5.4 | | | | 9.8 | | | | 10.2 | | | | 7.2 | | | | 8.0 | | | | 11.8 | | | | 6.8 | | | | 5.4 | | | | 442.0 | |
Table 19-5. Estimated Net Present Value (NPV) for the Period
| NPV | | | | | 2022 | | | 2023 | | | 2024 | | | 2025 | | | 2026 | | | 2027 | | | 2028 | | | 2029 | | | 2030 | | | 2031 | | | 2032 | | | 2033 | | | 2034 | | | 2035 | | | 2036 | | | 2037 | | | 2038 | | | 2039 | | | 2040 | | | TOTAL | |
| REVENUE | | | | | | | | | | | | | | | | | | | | | | | | | | | | | | | | | | | | | | | | | | | | | | | | | | | | | | | | | | | | | | | |
| Total Revenues (M US$) | | US$M | | | - | | | - | | | 167 | | | 244 | | | 297 | | | 377 | | | 458 | | | 453 | | | 419 | | | 441 | | | 468 | | | 438 | | | 461 | | | 461 | | | 461 | | | 461 | | | 461 | | | 461 | | | 461 | | | 6,987 | |
| COSTS | | | | | | | | | | | | | | | | | | | | | | | | | | | | | | | | | | | | | | | | | | | | | | | | | | | | | | | | | | | | | | | |
| Common Costs (mining, leaching) | | US$M | | | - | | | - | | | 27 | | | 38 | | | 48 | | | 63 | | | 72 | | | 72 | | | 72 | | | 72 | | | 72 | | | 72 | | | 72 | | | 72 | | | 72 | | | 72 | | | 72 | | | 72 | | | 72 | | | 1,109 | |
| Iodine Production Costs | | US$M | | | - | | | - | | | 30 | | | 43 | | | 52 | | | 68 | | | 87 | | | 80 | | | 77 | | | 85 | | | 79 | | | 77 | | | 81 | | | 81 | | | 81 | | | 81 | | | 81 | | | 81 | | | 81 | | | 1,249 | |
| Nitrate Production Costs | | US$M | | | - | | | - | | | 28 | | | 42 | | | 51 | | | 64 | | | 75 | | | 78 | | | 71 | | | 72 | | | 83 | | | 76 | | | 80 | | | 80 | | | 80 | | | 80 | | | 80 | | | 80 | | | 80 | | | 1,196 | |
| TOTAL OPERATING COST | | US$M | | | - | | | - | | | 85 | | | 123 | | | 152 | | | 195 | | | 234 | | | 230 | | | 219 | | | 229 | | | 234 | | | 225 | | | 233 | | | 233 | | | 233 | | | 233 | | | 233 | | | 233 | | | 233 | | | 3,554 | |
| EBITDA | | US$M | | | - | | | - | | | 81 | | | 121 | | | 145 | | | 182 | | | 224 | | | 223 | | | 200 | | | 212 | | | 234 | | | 213 | | | 228 | | | 228 | | | 228 | | | 228 | | | 228 | | | 228 | | | 228 | | | 3,433 | |
| Depreciation | | US$M | | | - | | | - | | | 15 | | | 16 | | | 16 | | | 17 | | | 18 | | | 18 | | | 18 | | | 18 | | | 19 | | | 19 | | | 20 | | | 20 | | | 21 | | | 21 | | | 21 | | | 22 | | | 22 | | | 321 | |
| Interest Payments | | US$M | | | - | | | - | | | 10 | | | 9 | | | 7 | | | 6 | | | 5 | | | 4 | | | 3 | | | 1 | | | - | | | - | | | - | | | - | | | - | | | - | | | - | | | - | | | - | | | 45 | |
| Pre-Tax Gross Income | | US$M | | | - | | | - | | | 57 | | | 97 | | | 121 | | | 158 | | | 201 | | | 201 | | | 179 | | | 193 | | | 215 | | | 194 | | | 208 | | | 208 | | | 208 | | | 207 | | | 207 | | | 206 | | | 206 | | | 3,066 | |
| Taxes | | 28 | % | | - | | | - | | | 16 | | | 27 | | | 34 | | | 44 | | | 56 | | | 56 | | | 50 | | | 54 | | | 60 | | | 54 | | | 58 | | | 58 | | | 58 | | | 58 | | | 58 | | | 58 | | | 58 | | | 859 | |
| Operating Income | | US$M | | | - | | | - | | | 41 | | | 70 | | | 87 | | | 114 | | | 145 | | | 145 | | | 129 | | | 139 | | | 155 | | | 140 | | | 150 | | | 150 | | | 149 | | | 149 | | | 149 | | | 149 | | | 148 | | | 2,208 | |
| Add back depreciation | | US$M | | | - | | | - | | | 15 | | | 16 | | | 16 | | | 17 | | | 18 | | | 18 | | | 18 | | | 18 | | | 19 | | | 19 | | | 20 | | | 20 | | | 21 | | | 21 | | | 21 | | | 22 | | | 22 | | | 321 | |
| NET INCOME AFTER TAXES | | US$M | | | - | | | - | | | 56 | | | 85 | | | 103 | | | 131 | | | 162 | | | 163 | | | 147 | | | 157 | | | 174 | | | 159 | | | 170 | | | 170 | | | 170 | | | 170 | | | 170 | | | 170 | | | 170 | | | 2,529 | |
| Total CAPEX | | US$M | | | 150 | | | 144 | | | 8 | | | 8 | | | 12 | | | 25 | | | 9 | | | 4 | | | 4 | | | 4 | | | 9 | | | 5 | | | 10 | | | 10 | | | 7 | | | 8 | | | 12 | | | 7 | | | 5 | | | 442 | |
| Bank Loan | | US$M | | | 95 | | | 96 | | | - | | | - | | | - | | | - | | | - | | | - | | | - | | | - | | | - | | | - | | | - | | | - | | | - | | | - | | | - | | | - | | | - | | | 190 | |
| Loan Amortization | | US$M | | | - | | | - | | | 20 | | | 21 | | | 22 | | | 23 | | | 24 | | | 25 | | | 27 | | | 28 | | | - | | | - | | | - | | | - | | | - | | | - | | | - | | | - | | | - | | | 190 | |
| Working Capital | | US$M | | | - | | | - | | | 14 | | | 7 | | | 4 | | | 6 | | | 7 | | | -0 | | | -4 | | | 2 | | | 4 | | | -4 | | | 2 | | | - | | | - | | | - | | | - | | | - | | | - | | | 38 | |
| Pre-Tax Cashflow | | US$M | | | -55 | | | -48 | | | 30 | | | 77 | | | 99 | | | 122 | | | 179 | | | 190 | | | 170 | | | 176 | | | 222 | | | 211 | | | 216 | | | 218 | | | 221 | | | 220 | | | 216 | | | 221 | | | 223 | | | 2,908 | |
| After-Tax Cashflow | | US$M | | | -55 | | | -48 | | | 14 | | | 50 | | | 66 | | | 77 | | | 122 | | | 133 | | | 120 | | | 123 | | | 161 | | | 157 | | | 157 | | | 160 | | | 163 | | | 162 | | | 158 | | | 164 | | | 165 | | | 2,049 | |
| Pre-Tax NPV | | US$M | | | 1,013 | | | | | | | | | | | | | | | | | | | | | | | | | | | | | | | | | | | | | | | | | | | | | | | | | | | | | | | | | | |
| After-Tax NPV | | US$M | | | 680 | | | | | | | | | | | | | | | | | | | | | | | | | | | | | | | | | | | | | | | | | | | | | | | | | | | | | | | | | | |
| Discount Rate | | US$M | | | 10 | % | | | | | | | | | | | | | | | | | | | | | | | | | | | | | | | | | | | | | | | | | | | | | | | | | | | | | | | | | |
| WSP-SQM0011-TRS-Pampa Orcoma-Rev1 | Rev1 | Page 208 |
Sensitivity analysis gives visibility to the assumptions that present the key risks to the value of the Project. The analysis also identifies the skew of the impact of each assumption in terms of the rise and fall of the value. Figure 19-1 shows the sensitivity of changes to the base case on pre-tax NPV.
Figure 19-1. Sensitivity Analysis
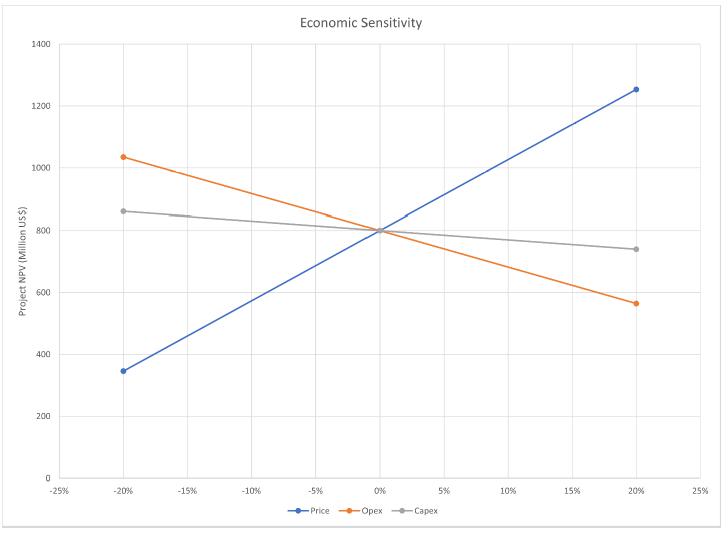
As seen in the above figure, the project NPV is more sensitive to product price while being least sensitive to capital and operational costs.
| WSP-SQM0011-TRS-Pampa Orcoma-Rev1 | Rev1 | Page 209 |
The Project is in the Tarapacá region, Tamarugal province, Huara commune. The mine area comprises an approximate surface of 6,883 ha, while the Project works involve an area of 7,387 ha (Geobiota, 2015). Because of the seawater adduction works and the power transmission line, the Project extends to the west of the commune and to the north of Caleta Buena, at which point the seawater intake system is placed. Near the site, specifically in the access sector, is the "BHP aqueduct easement.
The most significant areas near the project's mineral processing plants is Pampa del Tamarugal Reserve - Zapiga sector located approximately 6 km from the project.
Exploration program results have indicated that these prospects reflect a mineralized trend hosting nitrate and iodine. Also, exploration efforts are focused on possible metallic mineralization beneath the caliche. The area has significant potential for metallic mineralization, especially copper and gold. Exploration has generated discoveries that in some cases may lead to exploitation, discovery sales, and future royalty generation.
Within SQM-Pampa Orcoma's boundary, as presented in Figure 20 1, it is stated that:
| · | There are properties adjacent to the project with mineral resources with geological characteristics similar to those of the SQM-Pampa Orcoma property. |
| · | The issuer has no interests in adjacent properties. There is no prospecting work in any of the adjacent areas. |
| · | There are some other properties adjacent to the Project which are being exploited by third parties and there are some mining rights. |
Four adjacent mining lots belong to SCM Bullmine and COSAYACH, which also mine for iodine production. SCM Bullmine is adjacent to sector 1, while COSAYACH's mining and production sectors adjacent to the project are four and identified below:
| · | Chiquiquiray mine adjacent to the northeast. |
| · | Huara Project adjacent to the southeast. |
| · | Cala Cala site adjacent to and south of Mapocho. |
| WSP-SQM0011-TRS-Pampa Orcoma-Rev1 | Rev1 | Page 210 |
Figure 20-1. Pampa Orcoma Adjacent Properties.
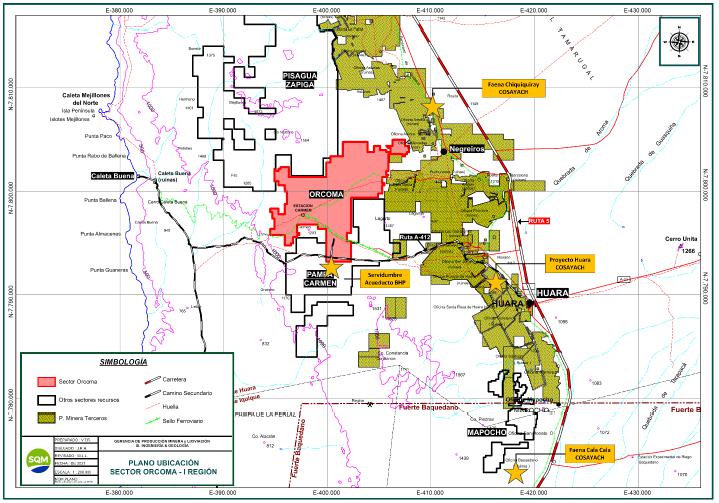
Source: Plano_Ubicación_Orcoma_v2, SQM.
| WSP-SQM0011-TRS-Pampa Orcoma-Rev1 | Rev1 | Page 211 |
Figure 20-2. Pampa Orcoma Adjacent Properties.
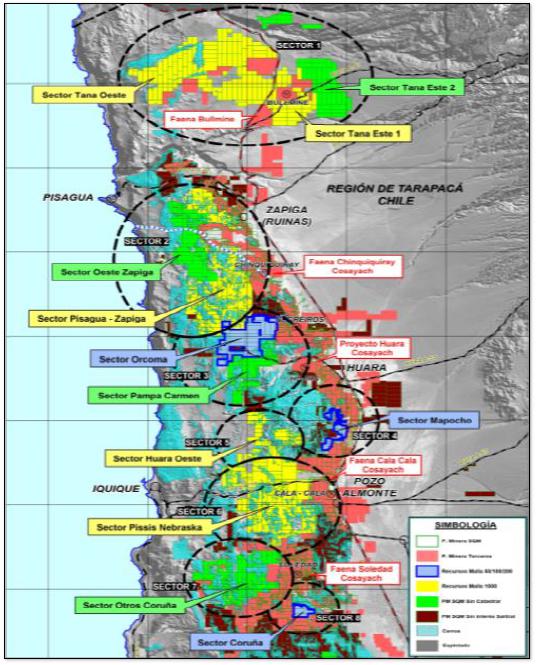
Source: Plan Industrial Abril Orcoma - final (1).
| WSP-SQM0011-TRS-Pampa Orcoma-Rev1 | Rev1 | Page 212 |
| 21 | Other Relevant Data and Information |
The QP is not aware of any other relevant data or information to disclose in this TRS.
| WSP-SQM0011-TRS-Pampa Orcoma-Rev1 | Rev1 | Page 213 |
| 22 | Interpretation and Conclusions |
This section contains forward-looking information related to Mineral Resources and the LOM plan for the Project. The material factors that could cause actual results to differ materially from the conclusions, estimates, designs, forecasts or projections in the forward-looking information include any significant differences from one or more of the material factors or assumptions that were forth in this sub-section including: geological and grade interpretations and controls and assumptions and forecasts associated with establishing the prospects for economic extraction; grade continuity analysis and assumptions; Mineral Resource model tonnes and grade and mine design parameters; actual plant feed characteristics that are different from the historical operations or from samples tested to date; equipment and operational performance that yield different results from the historical operations and historical and current test work results; mining strategy and production rates; expected mine life and mining unit dimensions; prevailing economic conditions, commodity markets and prices over the LOM period; regulatory framework is unchanged during the Study period and no unforeseen environmental, social or community events disrupt timely approvals; estimated capital and operating costs; and project schedule and approvals timing with availability of funding.
| 22.1.1 | Sample Preparation, Analysis, and Security |
Sample preparation, sample safety, and analytical procedures used by SQM in Pampa Orcoma follow industry standards mostly with no noted issues. SQM has detailed procedures that allow for the viable execution of the necessary activities, both in the field and laboratory, for an optimal assurance of the results. QA/QC results are satisfactory for 400-x-400 m and 200-x-200 m grid drill holes.
The data available from the exploration, regarding analytical results of geotechnical and chemical analysis of caliche in Pampa Orcoma is adequate for estimation of geologic resources and reserves present in the project area.
| 22.1.3 | Mineral Processing and Metallurgical Testing |
Gino Slanzi Guerra, QP who is responsible for the metallurgy and processing of the resource, said: "The metallurgical test work developed to date has been adequate to establish the appropriate processing routes for the caliche resource:
| · | The metallurgical test work completed to date has been adequate to establish appropriate processing routes for the caliche resource. |
| · | The samples used to generate the metallurgical data have been representative and support estimates of future throughput. |
| WSP-SQM0011-TRS-Pampa Orcoma-Rev1 | Rev1 | Page 214 |
| · | The data derived from test work activities described above are adequate for estimating recovery from mineral resources. |
| · | From the information reviewed, no processing factors or deleterious elements were found which could significantly affect the economic extraction potential projected for the project. The mineral deposit that supports it corresponds in composition and chemical-metallurgical similar responses to nearby caliche deposits, in which the company has extensive historical know-how and a body of professionals with extensive experience, with finished and successful knowledge regarding the search and solution of operational problems. This aspect was recognized in field visits where this characteristic was confirmed in all the plants visited. |
| · | The metallurgical test data for the resources to be processed in the production plan projected to 2040 indicate that the recovery methods are adequate. |
| 22.1.4 | Mineral Resource Estimate |
Drill hole data collected by SQM in Pampa Orcoma is sufficient to characterize iodine and nitrate grades, as well as mineralized thickness throughout the project area. Calculations have been verified independently, with minor differences that have no implications on indicated resource estimations. Diamond drilling and recategorization of drill hole grids currently in process, have the potential to upgrade resource classification to measured.
| 22.1.5 | Mineral Reserve Estimate |
Mineral Resource estimate is the basis for Mineral Reserve estimation, accounting for dilution of iodine and sodium nitrate grades through modifying factors. Estimates have been verified independently, reporting reserve values for approved and pending environmental area permits, with minor differences that have no implications on Probable Reserve estimates.
| 22.1.6 | Processing and Recovery Methods |
The level of laboratory, bench, and pilot plant scale metallurgical testing conducted in recent years has determined that the raw material is reasonably amenable to production. Reagent forecasting and dosing will be based on analytical processes that establish mineral grades, valuable element content, and impurity content to ensure that the system's treatment requirements are effective.
Most of the material fed to the heaps is ROM minerals in granulometry. Continuous surface mining machines are used where caliche mantles break up using cutting equipment, which provides a smaller and more homogeneous grain size of the ore that produces higher recoveries, approximately ten percent higher the recovery in the ROM heaps.
| WSP-SQM0011-TRS-Pampa Orcoma-Rev1 | Rev1 | Page 215 |
| 22.2.1 | Sample Preparation, Analysis, and Security |
QC results of original and duplicate samples, show a data bias for iodine and nitrate grades. As described in Section 9, the error is not statistically significant; however, an audit of the sample preparation and analyses should be completed.
| 22.2.2 | Geology and Mineral Resources |
The mineral resource estimate is based on sample analysis and geological controls. Unknown variability in either of these parameters could render the resulting mineral resource estimate biased. Best practice procedures have been used to test this information.
No specific study of bulk material density is available for Pampa Orcoma. Should this be different than assumed from operating experience at other locations and could result in a bias to the mineral resource estimate.
The Pampa Orcoma Project is currently permitted for exploration, environmental and pre-production works. The application for construction and operation is in preparation and is planned for submission is 2023. Currently there is an initiative in Chile to modify the management of mining rights which presents a risk for the future operating conditions for the project.
| 22.2.4 | Processing and Recovery Methods |
Water incorporation in the process is a risk aspect, bearing in mind the current water shortage and that is a contribution to the project since the tests carried out even show a benefit, from the perspective of its contribution to an increase in the recovery of iodine and nitrate. The planned use of seawater and construction of the intake in Caleta Buena will limit this risk.
| 22.2.5 | Metal Pricing and Market Conditions |
The estimated product prices used in this evaluation will have changed when the project is in production in 2024. Both prices and costs will provide a source of risk, which can be mitigated in the short to medium term by strategic planning and contract negotiations.
| WSP-SQM0011-TRS-Pampa Orcoma-Rev1 | Rev1 | Page 216 |
| 22.2.6 | Mineral Processing and Metallurgical Testing |
The impact factors in the processing or elements detrimental to recovery or the quality of the product obtained are the potentially harmful elements present. Those related to the raw material are insoluble materials and other elements such as magnesium and perchlorate. In this regard, the company's constant concern to improve the operation and obtain the best product.
| 22.2.7 | Environmental Studies, Permitting and Social or Community Impact |
There is a risk that the environmental authorization for production increasing from 2,500 tonnes prill Iodine/year to 5,000 tonnes prill Iodine/year will not be obtained within the required timeframe.
| 22.3 | Significant Opportunities |
| 22.3.1 | Mineral Resource Statement |
The 100-m spacing drill hole grid currently in process will allow for a future recategorization of the resource as Measured (SQM(j), 2021). The diamond drilling campaign currently in process will provide a comparison of caliche depths and iodine and nitrate grades with respect to the 200-x-200 m grid resource estimation.
| 22.3.2 | Geology and Mineral Resources |
There is an opportunity to improve the resource estimation simplicity and reproducibility using a block model approach not only in the case of smaller drill hole grids (100T m), which is considered once the drilling campaign finished, but also for larger drill hole grids to avoid separating the resource model and databases by drill hole spacing, bringing the estimation and management of the resource model to industry standards.
SQM has exploration rights to a large land area around Pampa Orcoma. With further exploration there is potential to increase the mineral resources and eventually mineral reserves for the project.
| 22.3.3 | Metallurgy and Mineral Processing |
The research and development team has demonstrated significant progress in the development of new processes and products to maximize the returns obtained from the resources they exploit. An example of this is that, since 2002, SQM nitrates have sought options to expand and improve iodine production by initiating a test plan for an oxidative treatment of the concentrate. Trials demonstrated that it is possible to dispense the flotation stage, that the process of obtaining iodine with oxidative treatment works well, and that it is economically viable and less costly to build and operate than the conventional process with the flotation stage. In this sense, continuous tests were completed in the pilot plant with different iodine brines from different resources to confirm these results.
The research is developed by three different units, which adequately cover the characterization of raw materials, traceability of operations, and finished product, covering topics such as chemical process design, phase chemistry, chemical analysis methodologies, and physical properties of finished products.
| WSP-SQM0011-TRS-Pampa Orcoma-Rev1 | Rev1 | Page 217 |
| · | Analyze the mineral distribution and statistical characteristics of drill hole grids currently in process have the potential to upgrade the mineral resource and mineral reserve classification. |
| · | Expand the block model approach for resource estimation to larger drill hole grids to avoid separating the resource model and databases by drill hole spacing. |
| · | Improvements are required for the Quality Assurance/Quality Control (QA/QC) program to align with industry best practice and facilitate more meaningful QC. |
| · | Confirm the accuracy and precision of SQM internal laboratory implementing an external QA/QC check with a representative number of samples as a routine procedure. |
| · | Maintain original and/or digitized records of collar surveys, geological, and geochemical data in a secure database. |
| · | Infilling RC drill hole grids with 100-x-50 -m spacing, which is currently in progress, has the potential to upgrade the Mineral Resource estimates from Indicated to Measured Mineral Resources, and in turn upgrade Mineral Reserves from Probable to Proven. It is recommended to re-estimate Pampa Orcoma’s Mineral Reserves when Mineral Resource have been updated based on the additional drilling |
| · | Estimate caliche density specifically for the Pampa Orcoma project area. This is currently based on operating experience at the Nueva Victoria operation and may improve the accuracy of the mineral resource estimate. |
| · | Construct updated procedures that describe in sufficient detail the activities of capture, administration, and backup of the data. |
| · | Update all the procedures, methodologies, and results in the annual reports. |
| · | Detail the construction development timeline to a feasibility level to best account for the timing of cash flows and risk points to the time and cost. |
All the above recommendations are considered within the declared capital and operating expenditures and do not imply additional costs for their execution.
| WSP-SQM0011-TRS-Pampa Orcoma-Rev1 | Rev1 | Page 218 |
ARVI Mining. (2021). Prioridades diamantinas y calicatas Sector Orcoma.
Comisión de Evaluación Región de Tarapacá. (2017). Resolución de Calificación Ambiental del proyecto "Orcoma".
Geobiota. (2015). Estudio de Impacto Ambiental Proyecto Orcoma.
SQM. (2018). Análisis de sondajes en LCY (LCY-P029/02).
SQM. (2021). Datos históricos y proyección de producción Plan Minero 2022_ID_13_Codigo_13-2, noviembre de 2021.
SQM. (2021). Informe de Metodología, Procedimientos y Clasificación de Recursos y Reservas, febrero de 2021.
SQM. (2021). Procedimientos de Análisis realizados LCY e Informe Test Planta Piloto, del 26 de noviembre de 2021.
SQM(a). (2014). Excel spreadsheet "BD_Sonda_Orcoma".
SQM(a). (2019). Proyecto Sumo - Faena Nueva Victoria.
SQM(a). (2021). Excel spreadsheet "BASE DATOS_DDH ORCOMA_Final".
SQM(b). (2014). Reconocimiento y evaluación prelimininar de recursos de yodo y nitrato malla 400x400, Pampa Orcoma - Carmen.
SQM(b). (2021). Estatus Proyecto Orcoma.
SQM(c). (2021). Excel spreadsheet "BASE DATOS_ORCOMA_Final".
SQM(d). (2021). Procedimiento análisis de nitratos en caliche LCY-P007/06.
SQM(e). (2021). Procedimiento análisis de yodo en caliche LCY-P011/06.
SQM(f). (2021). Procedimiento preparación de muestras de AR de caliche.
SQM(g). (2021). Análisis realizados en el Laboratorio Nitrato-Yodo.
SQM(h). (2021). Metodología corte de sondajes caliche SQM.
SQM(i). (2021). Video "SK1300 - Reunión_Taller Calculo recursos Nitratos-P2".
SQM(j). (2021). Metodología, procedimientos y clasificación de recursos y reservas minerales nitrato y yodode SQM, balance año 2020 Mina Nueva Victoria.
SQM(k). (2021). Excel spreadsheet "Archivos Respaldos 20_F_2020".
SQM(l). (2014). Proyecto Sumo, reconocimiento y evaluación de recursos de yodo y nitrato malla 200x200, Pampa Orcoma - Carmen.
SQM(m). (2022). Respuesta a brecha N°12 Recursos - Reservas/Ley de corte.
SQM(n). (2021). Excel spreadsheet "Patrón 500".
TÜV Rheinland(a). (2019). Certificado normativa de aplicación ISO 9001:2015.
| WSP-SQM0011-TRS-Pampa Orcoma-Rev1 | Rev1 | Page 219 |
TÜV Rheinland(b). (2019). Anexo de certificado normativa de aplicación ISO 9001:2015.
SQM(n). (2021). Informe de Metodología, Procedimientos y Clasificación de Recursos y Reservas, febrero de 2021.
SQM(o). (2021). Procedimientos de Análisis realizados LCY e Informe Test Planta Piloto, del 26 de noviembre de 2021.
SQM(p). (2021). Datos históricos y proyección de producción Plan Minero 2022_ID_13_Codigo_13-2, noviembre de 2021.
| WSP-SQM0011-TRS-Pampa Orcoma-Rev1 | Rev1 | Page 220 |
| 25 | Reliance on Information Provided by Registrant |
The qualified person has relied on information provided by the registrant in preparing its findings and conclusions regarding the following aspects of modifying factors:
| 1. | Macroeconomic trends, data, and assumptions, and interest rates. |
| 2. | Mine and process operating costs. |
| 3. | Projected sales quantities and prices. |
| 4. | Marketing information and plans within the control of the registrant. |
| 5. | Environmental and Social licenses |
| WSP-SQM0011-TRS-Pampa Orcoma-Rev1 | Rev1 | Page 221 |
APPENDIX
A Glossary
| WSP-SQM0011-TRS-Pampa Orcoma-Rev1 | Rev1 | |
APPENDIX
| Term | Description |
| 100T | The “100 truncated grid” at Pampa Orcoma, which comprises 865 drill holes at 100x50 m spacing, enabling the recategorizing of the resource estimate based on the 400-x-400 m and 200-x-200 m grids corresponding to the “PO” and “O” series drill holes respectively, in the south-eastern sector of the Pampa Orcoma project. |
| Blank | Blank Sample. |
| Blank Sample | Sample prepared during water sampling campaigns, each comprising an aliquot of analyte-free reagent water sent to the field which is handled identically to a regular sample. its purpose within the quality control process is to quantify the degree to which field samples might be contaminated or chemical altered by the sample collection equipment (pumps, tubes, bailers), sample preparation equipment (eg filtration equipment), sample storage & transport (bottles) or site conditions during sampling (eg windblown dust). Standard practice is to prepare blanks at around 10% of the field sampling points. |
| Caliche | Sediments bearing quantities of sodium nitrate of potential economic value. |
| Cuttings | Sediment or rock fragment samples obtained from drilling. |
| DDH | Diamond Drill Hole |
| Diamond Drill Hole | Diamond core hole drilled using a diamond coring bit which produces continuous core samples of the geologic materials drilled. |
| Duplicate | Duplicate Sample. |
| Duplicate | A sample collected concurrently under comparable conditions, with another sample. Used to assess the variability of laboratory analytical results. |
| Duplicate Sample | Replicate Sample where 2 samples are prepared. |
| Overburden | Soil, sterile sediments or waste rock overlaying an economic mineral deposit. |
| RC | Dual Tube Reverse Circulation (DTRC) drill holes, the RC drilling method uses air as the drilling fluid and produces cuttings. |
| Recategorization | Process by which the degree of uncertainty associated with the estimation of a mineral resource is reduced by drilling boreholes in the spaces between drill holes in an existing grid of drill holes, for example to densify a 200-x-200m drill hole grid to a 100x100m grid. By this process, the classification of the mineral resource may be improved from, for example, indicated to measured. |
| Recovery | Mass of caliche returned during RC drilling over a drilled interval of 0.5 m at a diameter of 5½", expressed as a percentage relative to a reference mass of 14 kg. |
| Replicate | Replicate Sample. |
| Replicate Sample | Samples prepared during water sampling campaigns. Replicate samples are multiple samples prepared in the field at the same location and time by the same person using the same sampling procedure and equipment. The smallest number of replicates is two, such a pair can be referred to as a duplicate sample. The purpose of collecting replicate samples is to evaluate the precision with which the concentration of each analyte is determined. The observed variance between replicates will be the sum of the environmental variance in the field, the sampling variance in the field and the analytical variance in the laboratory. |
| Stamps | Areas of 50 m x 50 m drill hole spacing, used to support densification to a 50 x 50 m grid of resource estimates that were originally based 100 m x 100 m or 100 m x 50 m drill hole grids. |
| Sterile sediments | Sediments with mineral grades below the cut-off grade. |
| WSP-SQM0011-TRS-Pampa Orcoma-Rev1 | Rev1 | |